UNITED STATES
SECURITIES AND EXCHANGE COMMISSION
Washington, D.C. 20549
FORM N-CSR
CERTIFIED SHAREHOLDER REPORT OF REGISTERED
MANAGEMENT INVESTMENT COMPANIES
Investment Company Act file number 811-02105
Fidelity Salem Street Trust
(Exact name of registrant as specified in charter)
245 Summer St., Boston, Massachusetts 02210
(Address of principal executive offices) (Zip code)
Cynthia Lo Bessette, Secretary
245 Summer St.
Boston, Massachusetts 02210
(Name and address of agent for service)
Registrant's telephone number, including area code:
617-563-7000
| |
Date of fiscal year end: | October 31 |
|
|
Date of reporting period: | October 31, 2022 |
Item 1.
Reports to Stockholders
Fidelity® Total International Index Fund
Annual Report
October 31, 2022
Contents
To view a fund's proxy voting guidelines and proxy voting record for the 12-month period ended June 30, visit http://www.fidelity.com/proxyvotingresults or visit the Securities and Exchange Commission's (SEC) web site at http://www.sec.gov.
You may also call 1-800-544-8544 to request a free copy of the proxy voting guidelines.
The funds or securities referred to herein are not sponsored, endorsed, or promoted by MSCI, and MSCI bears no liability with respect to any such funds or securities or any index on which such funds or securities are based. The prospectus contains a more detailed description of the limited relationship MSCI has with Fidelity and any related funds.
Standard & Poor's, S&P and S&P 500 are registered service marks of The McGraw-Hill Companies, Inc. and have been licensed for use by Fidelity Distributors Corporation.
Other third-party marks appearing herein are the property of their respective owners.
All other marks appearing herein are registered or unregistered trademarks or service marks of FMR LLC or an affiliated company. © 2022 FMR LLC. All rights reserved.
This report and the financial statements contained herein are submitted for the general information of the shareholders of the Fund. This report is not authorized for distribution to prospective investors in the Fund unless preceded or accompanied by an effective prospectus.
A fund files its complete schedule of portfolio holdings with the SEC for the first and third quarters of each fiscal year on Form N-PORT. Forms N-PORT are available on the SEC's web site at http://www.sec.gov. A fund's Forms N-PORT may be reviewed and copied at the SEC's Public Reference Room in Washington, DC. Information regarding the operation of the SEC's Public Reference Room may be obtained by calling 1-800-SEC-0330.
For a complete list of a fund's portfolio holdings, view the most recent holdings listing, semiannual report, or annual report on Fidelity's web site at http://www.fidelity.com, http://www.institutional.fidelity.com, or http://www.401k.com, as applicable.
NOT FDIC INSURED •MAY LOSE VALUE •NO BANK GUARANTEE
Neither the Fund nor Fidelity Distributors Corporation is a bank.
Average annual total return reflects the change in the value of an investment, assuming reinvestment of distributions from dividend income and capital gains (the profits earned upon the sale of securities that have grown in value, if any) and assuming a constant rate of performance each year. The hypothetical investment and the average annual total returns do not reflect the deduction of taxes that a shareholder would pay on fund distributions or the redemption of fund shares. During periods of reimbursement by Fidelity, a fund's total return will be greater than it would be had the reimbursement not occurred. How a fund did yesterday is no guarantee of how it will do tomorrow.
| Average Annual Total Returns |
| | | | |
Periods ended October 31, 2022 | Past 1 year | Past 5 years | Life of Fund A |
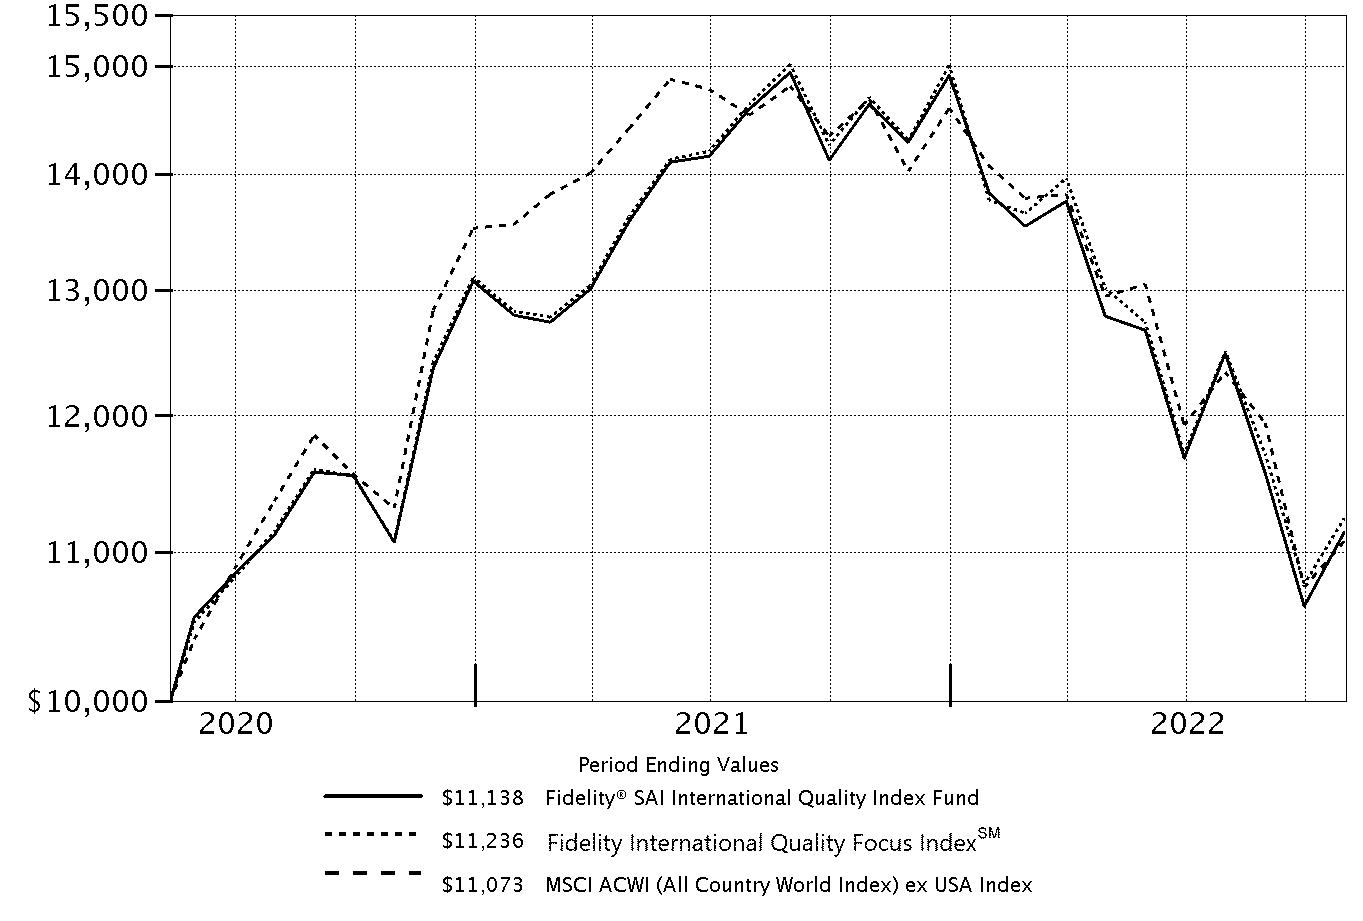
| Fidelity® Total International Index Fund | -25.01% | -0.53% | 3.05% |
A From June 07, 2016
| $10,000 Over Life of Fund |
| |
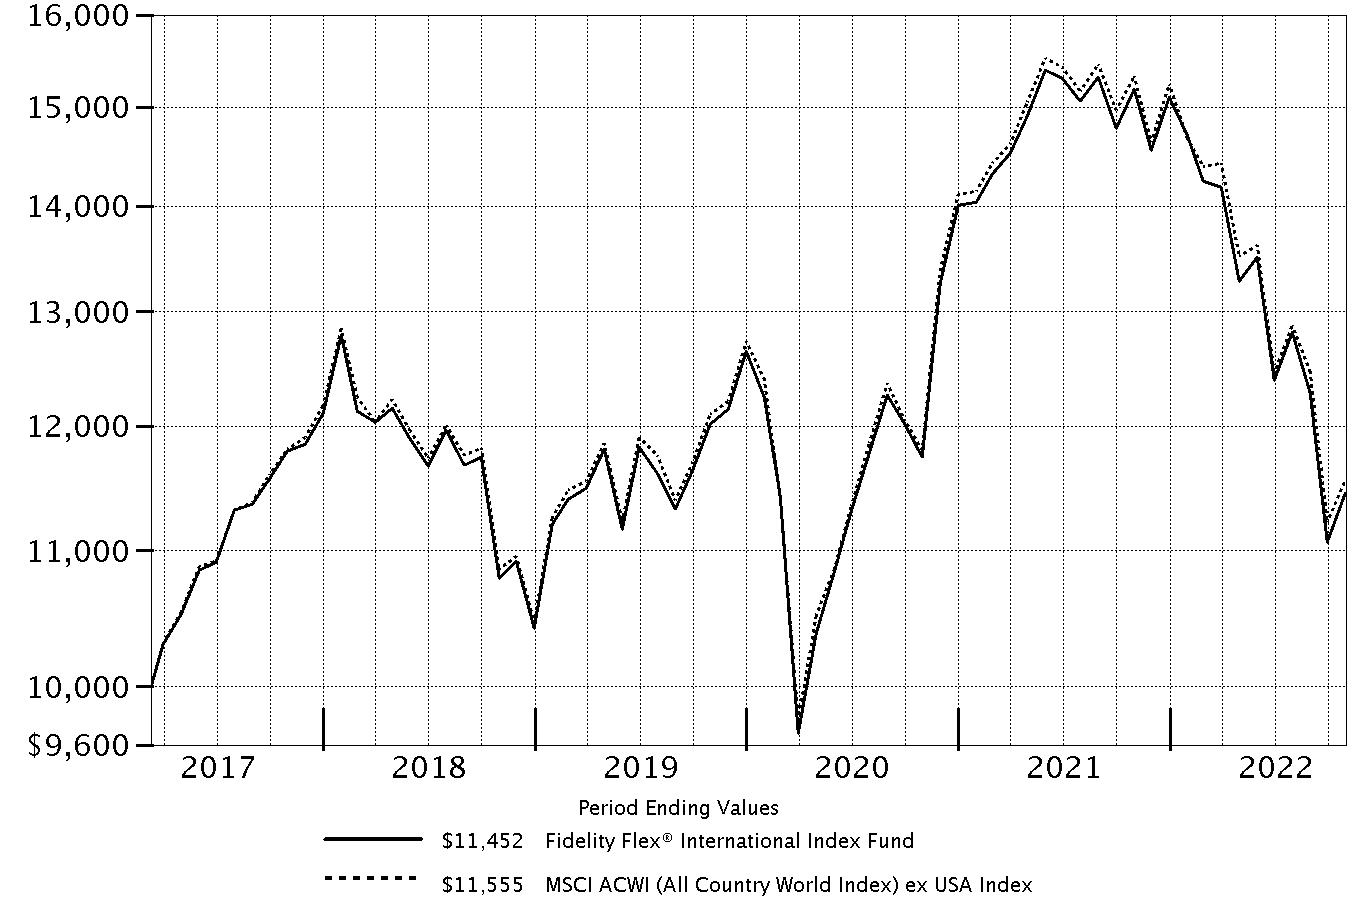
Let's say hypothetically that $10,000 was invested in Fidelity® Total International Index Fund, on June 07, 2016, when the fund started. The chart shows how the value of your investment would have changed, and also shows how the MSCI ACWI (All Country World Index) ex USA Investable Market Index performed over the same period. |
|
|
Market Recap:
International equities returned -24.61% for the 12 months ending October 31, 2022, according to the MSCI ACWI (All Country World Index) ex USA Index. After gaining 7.98% in 2021, non-U.S. stocks retreated in the new year, as a multitude of risk factors challenged the global economy and financial markets. Persistently high inflation in some markets, exacerbated by energy price shocks from the Russia-Ukraine conflict, spurred the U.S. Federal Reserve and other central banks to aggressively tighten monetary policy, and market interest rates eclipsed their highest level in roughly a decade, stoking recession fears and sending stocks into bear market territory. Other factors influencing equities abroad included surging global commodity prices, rising sovereign bond yields in some markets, ongoing global supply-chain disruption, a broadly strong U.S. dollar and the potential for variants of the coronavirus to upend global economic growth. Against this backdrop, the index returned -24.20% year to date through October. For the full 12 months, emerging markets (-31%) and Europe ex U.K. (-25%) notably lagged. Conversely, Canada (-13%) and the U.K. (-12%) held up best. Among the 11 sectors, information technology and consumer discretionary (-37% each) fared worst. Communication services (-34%) also trailed the broader market. In contrast, energy gained 2% amid high prices for oil and natural gas. The defensive-oriented utilities (-16%) sector also outperformed, as did financials and consumer staples (-18% each).
Comments from the Geode Capital Management, LLC, passive equity index team:
For the fiscal year, the fund returned -25.01%, roughly in line with the -25.05% result of the benchmark, the MSCI All Country World ex US IMI Index. (The fund's relative performance can be affected by Fidelity's methodologies for valuing certain foreign stocks and for incorporating foreign exchange rates, which differ from those used by the index, as well as by local tax laws or regulations, which vary by country.) By region, Europe ex U.K. returned about -27% and detracted most, followed by emerging markets (-30%). By sector, stocks in information technology returned -37% and detracted most, followed by consumer discretionary, which returned -36%, hampered by the retailing industry (-47%). Industrials returned -25%, held back by the capital goods industry (-26%), and financials (-18%) also detracted. Communication services returned approximately -34%, hampered by the media & entertainment industry (-50%). Health care returned about -22%, with the pharmaceuticals, biotechnology & life sciences industry (-18%) hurting most. Other notable detractors included the materials (-20%), and consumer staples (-19%) sectors. Real estate (-33%) and utilities (-16%) also hurt. In contrast, energy gained roughly 7% and contributed. Turning to individual stocks, the biggest individual detractor was Taiwan Semiconductor (-42%), from the semiconductors & semiconductor equipment segment, followed by Tencent Holdings (-56%), which is in the media & entertainment category. Within retailing, Alibaba Group Holding returned about -63% and hurt. Other noteworthy detractors were ASML Holding (-41%), a stock in the semiconductors & semiconductor equipment industry, and Shopify (-76%), from the software & services group. Conversely, the biggest individual contributor was Shell (+24%), from the energy sector. Also in energy, Petroleo Brasileiro-Petrobras (+100%), Canadian National Resources (+49%), BP (+20%), and TotalEnergies (+14%) all boosted the fund.
The views expressed above reflect those of the portfolio manager(s) only through the end of the period as stated on the cover of this report and do not necessarily represent the views of Fidelity or any other person in the Fidelity organization. Any such views are subject to change at any time based upon market or other conditions and Fidelity disclaims any responsibility to update such views. These views may not be relied on as investment advice and, because investment decisions for a Fidelity fund are based on numerous factors, may not be relied on as an indication of trading intent on behalf of any Fidelity fund.
Top Holdings (% of Fund's net assets) |
| |
| Nestle SA (Reg. S) (Switzerland, Food Products) | 1.3 | |
| Taiwan Semiconductor Manufacturing Co. Ltd. (Taiwan, Semiconductors & Semiconductor Equipment) | 1.3 | |
| Roche Holding AG (participation certificate) (Switzerland, Pharmaceuticals) | 0.9 | |
| Shell PLC (London) (United Kingdom, Oil, Gas & Consumable Fuels) | 0.9 | |
| Samsung Electronics Co. Ltd. (Korea (South), Technology Hardware, Storage & Peripherals) | 0.9 | |
| ASML Holding NV (Netherlands) (Netherlands, Semiconductors & Semiconductor Equipment) | 0.8 | |
| AstraZeneca PLC (United Kingdom) (United Kingdom, Pharmaceuticals) | 0.8 | |
| Novo Nordisk A/S Series B (Denmark, Pharmaceuticals) | 0.8 | |
| LVMH Moet Hennessy Louis Vuitton SE (France, Textiles, Apparel & Luxury Goods) | 0.8 | |
| Novartis AG (Switzerland, Pharmaceuticals) | 0.8 | |
| | 9.3 | |
| |
| Market Sectors (% of Fund's net assets) |
| |
| Financials | 21.8 | |
| Industrials | 11.8 | |
| Information Technology | 10.3 | |
| Consumer Discretionary | 10.2 | |
| Health Care | 9.9 | |
| Consumer Staples | 8.6 | |
| Materials | 8.6 | |
| Energy | 6.5 | |
| Communication Services | 5.6 | |
| Utilities | 3.3 | |
| Real Estate | 2.1 | |
| |
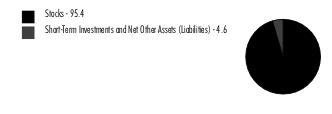
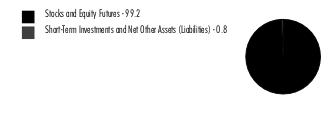
Asset Allocation (% of Fund's net assets) |
|
Foreign investments - 98.7% |
|
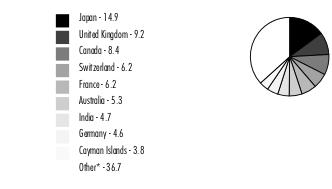
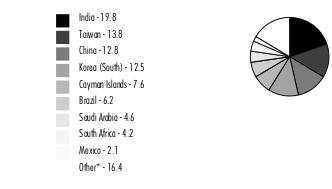
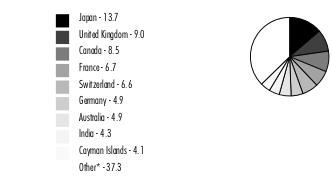
Geographic Diversification (% of Fund's net assets) |
|
* Includes Short-Term investments and Net Other Assets (Liabilities). Percentages are based on country or territory of incorporation and are adjusted for the effect of futures contracts, if applicable. |
| |
Showing Percentage of Net Assets
| Common Stocks - 97.9% |
| | | Shares | Value ($) |
| Australia - 5.3% | | | |
| 29Metals Ltd. | | 127,522 | 150,903 |
| Abacus Property Group unit | | 133,034 | 238,267 |
| Accent Group Ltd. | | 148,620 | 140,696 |
| Adbri Ltd. | | 161,680 | 162,884 |
| AGL Energy Ltd. | | 224,953 | 979,899 |
| Allkem Ltd. (a) | | 194,871 | 1,799,935 |
| ALS Ltd. | | 157,568 | 1,153,019 |
| Altium Ltd. | | 39,608 | 897,121 |
| Alumina Ltd. | | 833,681 | 719,906 |
| AMP Ltd. (a) | | 1,057,843 | 852,578 |
| Ampol Ltd. | | 79,480 | 1,384,356 |
| Ansell Ltd. | | 45,214 | 816,444 |
| APA Group unit | | 387,183 | 2,602,923 |
| APM Human Services International ltd. | | 103,756 | 217,022 |
| Appen Ltd. | | 40,543 | 65,871 |
| ARB Corp. Ltd. | | 32,387 | 600,981 |
| Arena (REIT) unit | | 111,513 | 280,324 |
| Aristocrat Leisure Ltd. | | 202,755 | 4,807,691 |
| ASX Ltd. | | 64,447 | 2,790,833 |
| Atlas Arteria Ltd. unit | | 479,537 | 2,021,389 |
| Aub Group Ltd. | | 31,564 | 417,527 |
| Aurizon Holdings Ltd. | | 603,717 | 1,397,927 |
| Aussie Broadband Ltd. (a) | | 72,985 | 109,243 |
| Austal Ltd. | | 141,807 | 225,860 |
| Australia & New Zealand Banking Group Ltd. | | 999,759 | 16,379,790 |
| Australian Agricultural Co. Ltd. (a) | | 71,591 | 80,138 |
| AVZ Minerals Ltd. (a)(b) | | 729,530 | 363,982 |
| Bank of Queensland Ltd. | | 218,954 | 1,030,797 |
| Bapcor Ltd. | | 116,554 | 493,546 |
| Beach Energy Ltd. | | 547,056 | 556,380 |
| Bega Cheese Ltd. | | 112,811 | 231,632 |
| Bellevue Gold Ltd. (a) | | 496,287 | 234,913 |
| Bendigo & Adelaide Bank Ltd. | | 190,211 | 1,096,233 |
| BHP Group Ltd. | | 1,707,432 | 40,803,056 |
| Blackmores Ltd. | | 6,215 | 270,329 |
| BlueScope Steel Ltd. | | 164,038 | 1,650,500 |
| Boral Ltd. | | 148,172 | 272,961 |
| Boss Energy Ltd. (a) | | 126,299 | 212,470 |
| BrainChip Holdings Ltd. (a)(c) | | 504,172 | 208,008 |
| Brambles Ltd. | | 482,742 | 3,606,620 |
| Breville Group Ltd. | | 41,347 | 524,985 |
| Brickworks Ltd. | | 32,102 | 454,418 |
| BWP Trust | | 170,528 | 445,039 |
| Calix Ltd. (a) | | 49,484 | 128,825 |
| Capricorn Metals Ltd. (a) | | 120,096 | 260,418 |
| carsales.com Ltd. | | 112,479 | 1,461,967 |
| Centuria Capital Group unit | | 310,371 | 334,521 |
| Centuria Industrial REIT | | 201,009 | 389,583 |
| Centuria Office REIT unit | | 164,138 | 158,011 |
| Chalice Mining Ltd. (a) | | 112,449 | 307,133 |
| Challenger Ltd. | | 196,146 | 880,763 |
| Champion Iron Ltd. | | 117,857 | 352,812 |
| Charter Hall Group unit | | 159,772 | 1,322,444 |
| Charter Hall Long Wale REIT unit | | 193,436 | 538,231 |
| Charter Hall Retail REIT | | 218,368 | 560,113 |
| Charter Hall Social Infrastruc | | 111,042 | 246,467 |
| Cleanaway Waste Management Ltd. | | 699,483 | 1,208,046 |
| Clinuvel Pharmaceuticals Ltd. | | 15,165 | 189,738 |
| Cochlear Ltd. | | 22,213 | 2,837,589 |
| Codan Ltd./Australia | | 35,520 | 87,928 |
| Coles Group Ltd. | | 446,620 | 4,665,162 |
| Collins Foods Ltd. | | 47,402 | 285,014 |
| Commonwealth Bank of Australia | | 573,564 | 38,405,021 |
| Computershare Ltd. | | 182,219 | 2,945,380 |
| Core Lithium Ltd. (a) | | 502,541 | 445,209 |
| Corporate Travel Management Ltd. | | 41,639 | 465,303 |
| Costa Group Holdings Ltd. | | 194,062 | 315,295 |
| Credit Corp. Group Ltd. | | 24,666 | 293,148 |
| Cromwell Property Group unit | | 558,536 | 250,087 |
| CSL Ltd. | | 162,247 | 29,108,577 |
| CSR Ltd. | | 184,554 | 546,571 |
| Data#3 Ltd. | | 86,693 | 382,627 |
| De Grey Mining Ltd. (a) | | 444,361 | 301,290 |
| Deterra Royalties Ltd. | | 160,432 | 419,717 |
| Dexus unit | | 348,907 | 1,731,864 |
| Dexus Industria (REIT) | | 82,954 | 140,613 |
| Domain Holdings Australia Ltd. | | 106,547 | 227,630 |
| Dominos Pizza Enterprises Ltd. | | 20,758 | 846,463 |
| Downer EDI Ltd. | | 234,166 | 672,531 |
| Eagers Automotive Ltd. | | 55,562 | 440,343 |
| Elders Ltd. | | 61,195 | 508,864 |
| Endeavour Group Ltd. | | 453,516 | 2,074,154 |
| Evolution Mining Ltd. | | 625,233 | 831,855 |
| EVT Ltd. | | 37,964 | 362,798 |
| Firefinch Ltd. (a)(b) | | 386,763 | 49,479 |
| Flight Centre Travel Group Ltd. (a)(c) | | 53,838 | 573,384 |
| Fortescue Metals Group Ltd. | | 571,289 | 5,382,117 |
| G8 Education Ltd. | | 297,462 | 183,612 |
| GDI Property Group unit | | 218,126 | 110,224 |
| Genworth Mortgage Insurance Ltd. | | 146,254 | 253,524 |
| Gold Road Resources Ltd. | | 370,947 | 321,509 |
| Goodman Group unit | | 563,519 | 6,127,734 |
| GrainCorp Ltd. | | 80,795 | 432,566 |
| Grange Resources Ltd. | | 198,597 | 78,760 |
| Growthpoint Properties Australia Ltd. | | 103,245 | 219,255 |
| GUD Holdings Ltd. | | 48,840 | 251,174 |
| Harvey Norman Holdings Ltd. | | 182,283 | 485,045 |
| Healius Ltd. | | 227,615 | 499,387 |
| HomeCo Daily Needs (REIT) unit | | 464,161 | 380,033 |
| HUB24 Ltd. | | 29,273 | 474,478 |
| IDP Education Ltd. | | 72,105 | 1,364,749 |
| IGO Ltd. | | 232,933 | 2,278,143 |
| Iluka Resources Ltd. | | 146,739 | 811,903 |
| Imdex Ltd. | | 162,028 | 211,428 |
| Imugene Ltd. (a) | | 1,722,567 | 192,822 |
| Incitec Pivot Ltd. | | 655,299 | 1,571,858 |
| Ingenia Communities Group unit | | 125,588 | 314,903 |
| Inghams Group Ltd. | | 150,420 | 243,427 |
| Insignia Financial Ltd. | | 235,397 | 474,301 |
| Insurance Australia Group Ltd. | | 834,241 | 2,614,749 |
| Invocare Ltd. | | 49,687 | 324,815 |
| ioneer Ltd. (a) | | 532,133 | 188,910 |
| IPH Ltd. | | 81,761 | 519,846 |
| Iress Ltd. | | 62,699 | 407,070 |
| JB Hi-Fi Ltd. | | 37,252 | 1,022,470 |
| Jervois Global Ltd. (a) | | 504,424 | 158,101 |
| Johns Lyng Group Ltd. | | 59,307 | 246,582 |
| Judo Capital Holdings Ltd. | | 220,265 | 164,844 |
| Jumbo Interactive Ltd. | | 20,133 | 175,657 |
| Karoon Energy Ltd. (a) | | 244,260 | 331,231 |
| Kelsian Group Ltd. | | 54,851 | 163,849 |
| Lake Resources NL (a)(c) | | 408,993 | 277,309 |
| Lendlease Group unit | | 229,387 | 1,275,061 |
| Leo Lithium Ltd. | | 333,887 | 132,414 |
| Lifestyle Communities Ltd. | | 36,922 | 414,481 |
| Link Administration Holdings Ltd. | | 168,513 | 369,717 |
| Liontown Resources Ltd. (a) | | 562,507 | 678,237 |
| Lovisa Holdings Ltd. | | 21,270 | 331,971 |
| Lynas Rare Earths Ltd. (a) | | 306,432 | 1,632,757 |
| Macquarie Group Ltd. | | 122,022 | 13,229,708 |
| Magellan Financial Group Ltd. (c) | | 47,452 | 301,402 |
| Magellan Financial Group Ltd. warrants 4/16/27 (a) | | 4,999 | 991 |
| McMillan Shakespeare Ltd. | | 32,076 | 268,778 |
| Medibank Private Ltd. | | 925,476 | 1,663,466 |
| Megaport Ltd. (a) | | 55,420 | 215,887 |
| Mesoblast Ltd. (a)(c) | | 284,884 | 168,559 |
| Metcash Ltd. | | 332,201 | 871,219 |
| Mincor Resources NL (a) | | 141,407 | 121,204 |
| Mineral Resources Ltd. | | 57,803 | 2,703,886 |
| Mirvac Group unit | | 1,296,382 | 1,716,508 |
| Monadelphous Group Ltd. | | 33,820 | 295,939 |
| Nanosonics Ltd. (a) | | 98,435 | 258,782 |
| National Australia Bank Ltd. | | 1,077,088 | 22,373,323 |
| National Storage REIT unit | | 355,694 | 593,826 |
| Nearmap Ltd. (a) | | 181,326 | 238,929 |
| Neometals Ltd. (a) | | 183,356 | 129,598 |
| Netwealth Group Ltd. | | 44,053 | 342,651 |
| New Hope Corp. Ltd. | | 172,094 | 621,952 |
| Newcrest Mining Ltd. | | 280,056 | 3,101,699 |
| Newcrest Mining Ltd. | | 20,461 | 225,071 |
| NEXTDC Ltd. (a) | | 153,372 | 816,229 |
| NIB Holdings Ltd. | | 163,800 | 698,847 |
| Nickel Industries Ltd. | | 454,355 | 212,159 |
| Nine Entertainment Co. Holdings Ltd. | | 486,901 | 641,579 |
| Northern Star Resources Ltd. | | 397,370 | 2,221,513 |
| Novonix Ltd. (a)(c) | | 107,100 | 183,597 |
| NRW Holdings Ltd. | | 169,950 | 277,207 |
| Nufarm Ltd. | | 142,775 | 508,686 |
| Omni Bridgeway Ltd. (a) | | 93,916 | 271,532 |
| oOh!media Ltd. | | 170,079 | 137,621 |
| Orica Ltd. | | 149,490 | 1,327,223 |
| Origin Energy Ltd. | | 592,742 | 2,111,851 |
| Orora Ltd. | | 310,919 | 602,604 |
| OZ Minerals Ltd. | | 113,171 | 1,749,662 |
| Paladin Energy Ltd. (Australia) (a) | | 919,235 | 499,790 |
| Pendal Group Ltd. | | 125,993 | 395,704 |
| Perpetual Trustees Australia Ltd. (c) | | 21,416 | 341,099 |
| Perseus Mining Ltd. (Australia) | | 475,359 | 554,916 |
| PEXA Group Ltd. (a) | | 32,632 | 322,906 |
| Pilbara Minerals Ltd. (a) | | 809,148 | 2,634,439 |
| Pinnacle Investment Management Group Ltd. | | 42,870 | 223,213 |
| Platinum Asset Management Ltd. | | 213,392 | 244,328 |
| PointsBet Holdings Ltd. | | 72,896 | 95,121 |
| PolyNovo Ltd. (a)(c) | | 209,942 | 268,579 |
| Premier Investments Ltd. | | 34,131 | 546,452 |
| Pro Medicus Ltd. | | 15,299 | 546,255 |
| Qantas Airways Ltd. (a) | | 308,814 | 1,153,592 |
| QBE Insurance Group Ltd. | | 498,833 | 3,905,521 |
| Qube Holdings Ltd. | | 546,775 | 951,305 |
| Ramelius Resources Ltd. | | 328,183 | 154,293 |
| Ramsay Health Care Ltd. | | 61,166 | 2,291,541 |
| REA Group Ltd. | | 17,995 | 1,399,562 |
| Red 5 Ltd. (a) | | 881,209 | 90,186 |
| Reece Ltd. | | 84,902 | 843,396 |
| Regis Resources Ltd. | | 302,383 | 294,964 |
| Reliance Worldwide Corp. Ltd. | | 273,938 | 562,470 |
| Rio Tinto Ltd. | | 124,457 | 7,021,507 |
| Rural Funds Group unit | | 193,695 | 315,937 |
| Sandfire Resources NL | | 147,170 | 327,598 |
| Santos Ltd. | | 1,082,694 | 5,285,343 |
| Sayona Mining Ltd. (a)(c) | | 2,297,441 | 345,346 |
| Scentre Group unit | | 1,705,238 | 3,163,191 |
| SEEK Ltd. | | 115,752 | 1,598,540 |
| Select Harvests Ltd. | | 56,802 | 192,567 |
| Seven Group Holdings Ltd. | | 52,101 | 611,206 |
| Shopping Centres Australasia Property Group unit | | 355,640 | 618,760 |
| Sigma Healthcare Ltd. | | 524,060 | 212,862 |
| Silver Lake Resources Ltd. (a) | | 341,306 | 242,331 |
| Sims Ltd. | | 58,297 | 455,680 |
| SiteMinder Ltd. | | 82,669 | 163,926 |
| Smartgroup Corp. Ltd. | | 58,636 | 184,532 |
| Sonic Healthcare Ltd. | | 152,665 | 3,200,062 |
| South32 Ltd. | | 1,563,893 | 3,587,992 |
| St Barbara Ltd. | | 291,036 | 94,942 |
| Steadfast Group Ltd. | | 329,664 | 1,067,000 |
| Stockland Corp. Ltd. unit | | 773,237 | 1,780,564 |
| Suncorp Group Ltd. | | 425,145 | 3,102,881 |
| Super Retail Group Ltd. | | 63,618 | 418,327 |
| Syrah Resources Ltd. (a) | | 222,828 | 340,651 |
| Tabcorp Holdings Ltd. | | 781,473 | 482,374 |
| Tassal Group Ltd. | | 69,979 | 232,315 |
| Technology One Ltd. | | 107,114 | 825,611 |
| Telix Pharmaceuticals Ltd. (a) | | 80,726 | 357,840 |
| Telstra Group Ltd. | | 1,334,327 | 3,345,729 |
| The GPT Group unit | | 628,039 | 1,731,435 |
| The Lottery Corp. Ltd. (a) | | 738,240 | 2,025,803 |
| The Star Entertainment Group Ltd. (a) | | 309,297 | 581,655 |
| Transurban Group unit | | 1,017,604 | 8,631,072 |
| Treasury Wine Estates Ltd. | | 244,860 | 2,028,290 |
| United Malt Group Ltd. | | 99,290 | 197,519 |
| Vicinity Centres unit | | 1,279,863 | 1,592,302 |
| Viva Energy Group Ltd. (d) | | 292,470 | 529,432 |
| Vulcan Energy Resources Ltd. (a)(c) | | 32,326 | 157,561 |
| Washington H. Soul Pattinson & Co. Ltd. | | 74,646 | 1,334,060 |
| Waypoint (REIT) unit | | 323,125 | 564,255 |
| Webjet Ltd. | | 133,712 | 451,592 |
| Wesfarmers Ltd. | | 378,960 | 10,997,058 |
| West African Resources Ltd. (a) | | 361,049 | 240,183 |
| Westgold Resources Ltd. | | 191,433 | 89,389 |
| Westpac Banking Corp. | | 1,174,382 | 18,111,274 |
| Whitehaven Coal Ltd. | | 310,769 | 1,795,014 |
| WiseTech Global Ltd. | | 49,221 | 1,831,122 |
| Woodside Energy Group Ltd. | | 640,377 | 14,738,025 |
| Woolworths Group Ltd. | | 406,836 | 8,592,882 |
| WorleyParsons Ltd. | | 105,960 | 967,182 |
| Zip Co. Ltd. (a)(c) | | 206,098 | 80,417 |
TOTAL AUSTRALIA | | | 422,761,843 |
| Austria - 0.2% | | | |
| Andritz AG | | 22,805 | 1,060,593 |
| AT&S Austria Technologie & Systemtechnik AG | | 8,674 | 267,878 |
| BAWAG Group AG (d) | | 30,970 | 1,497,251 |
| CA Immobilien Anlagen AG | | 15,841 | 500,173 |
| DO & CO Restaurants & Catering AG (a) | | 2,981 | 234,499 |
| Erste Group Bank AG | | 116,075 | 2,860,662 |
| EVN AG | | 13,362 | 222,372 |
| Immofinanz AG | | 10,050 | 118,587 |
| Immofinanz AG (b) | | 23,102 | 0 |
| Kontron AG (c) | | 16,076 | 232,746 |
| Lenzing AG (c) | | 4,907 | 234,708 |
| Oesterreichische Post AG (c) | | 14,623 | 416,917 |
| OMV AG | | 49,667 | 2,289,250 |
| Raiffeisen International Bank-Holding AG | | 50,033 | 695,693 |
| S IMMO AG rights (a)(b) | | 14,648 | 0 |
| Schoeller-Bleckmann Oilfield Equipment AG | | 4,330 | 238,347 |
| Telekom Austria AG | | 67,655 | 393,137 |
| UNIQA Insurance Group AG | | 49,820 | 322,979 |
| Verbund AG | | 23,117 | 1,810,496 |
| Vienna Insurance Group AG | | 14,195 | 317,739 |
| Voestalpine AG | | 39,766 | 863,787 |
| Wienerberger AG | | 41,637 | 952,159 |
TOTAL AUSTRIA | | | 15,529,973 |
| Bailiwick of Guernsey - 0.0% | | | |
| Balanced Commercial Property Trust Ltd. | | 251,801 | 241,119 |
| Burford Capital Ltd. | | 63,273 | 511,558 |
| Picton Property Income Ltd. | | 201,731 | 198,957 |
| Regional REIT Ltd. (d) | | 162,108 | 124,185 |
| Sirius Real Estate Ltd. | | 403,475 | 326,207 |
| UK Commercial Property REIT Ltd. | | 279,644 | 195,624 |
TOTAL BAILIWICK OF GUERNSEY | | | 1,597,650 |
| Bailiwick of Jersey - 0.6% | | | |
| Boohoo.Com PLC (a)(c) | | 356,034 | 165,729 |
| Breedon Group PLC | | 613,240 | 367,807 |
| Centamin PLC | | 417,974 | 425,264 |
| Experian PLC | | 310,815 | 9,910,422 |
| Ferguson PLC | | 73,478 | 8,013,561 |
| Glencore PLC | | 3,326,159 | 19,069,115 |
| IWG PLC (a) | | 253,567 | 383,844 |
| JTC PLC (d) | | 46,854 | 375,588 |
| Man Group PLC | | 450,031 | 1,118,379 |
| Petrofac Ltd. (a) | | 200,937 | 248,178 |
| TP ICAP Group PLC | | 280,901 | 592,733 |
| WPP PLC | | 366,742 | 3,227,385 |
| Yellow Cake PLC (a)(d) | | 68,810 | 338,214 |
TOTAL BAILIWICK OF JERSEY | | | 44,236,219 |
| Belgium - 0.6% | | | |
| Ackermans & Van Haaren SA | | 7,961 | 1,110,098 |
| Aedifica SA | | 11,933 | 910,403 |
| Ageas | | 54,716 | 1,894,180 |
| Agfa-Gevaert NV (a) | | 42,967 | 129,722 |
| Anheuser-Busch InBev SA NV | | 291,526 | 14,582,251 |
| Barco NV | | 24,174 | 522,234 |
| Bekaert SA | | 13,338 | 371,712 |
| Bpost SA (c) | | 49,045 | 242,344 |
| Cofinimmo SA | | 10,072 | 835,609 |
| Colruyt NV | | 20,288 | 489,010 |
| D'ieteren Group | | 8,373 | 1,392,618 |
| DEME Group NV (a) | | 3,259 | 362,652 |
| Econocom Group SA | | 65,492 | 178,310 |
| ELIA GROUP SA/NV | | 11,042 | 1,395,678 |
| Euronav NV | | 59,881 | 1,043,298 |
| Fagron NV | | 29,105 | 362,414 |
| Galapagos NV (a) | | 15,622 | 712,521 |
| Gimv NV | | 6,774 | 289,533 |
| Groupe Bruxelles Lambert SA | | 32,268 | 2,378,908 |
| Intervest Offices & Warehouses NV | | 10,896 | 236,357 |
| KBC Ancora | | 12,775 | 454,244 |
| KBC Group NV | | 83,872 | 4,203,309 |
| Kinepolis Group NV (a) | | 4,707 | 177,509 |
| Melexis NV | | 7,151 | 493,275 |
| Montea SICAFI SCA | | 4,240 | 289,541 |
| Ontex Group NV (a) | | 25,745 | 151,892 |
| Orange Belgium (a) | | 9,765 | 165,405 |
| Proximus | | 51,663 | 541,704 |
| Recticel SA | | 18,227 | 251,819 |
| Retail Estates NV | | 4,319 | 254,388 |
| Sofina SA | | 5,126 | 1,000,489 |
| Solvay SA Class A | | 25,239 | 2,275,748 |
| Telenet Group Holding NV | | 15,853 | 241,738 |
| Tessenderlo Group (a) | | 8,233 | 249,376 |
| Titan Cement International Trading SA | | 20,111 | 224,584 |
| UCB SA | | 42,601 | 3,213,105 |
| Umicore SA | | 71,208 | 2,347,437 |
| VGP NV | | 3,521 | 267,235 |
| Warehouses de Pauw | | 54,521 | 1,399,812 |
| Xior Student Housing NV (a) | | 8,311 | 233,670 |
TOTAL BELGIUM | | | 47,876,132 |
| Bermuda - 0.3% | | | |
| Alibaba Health Information Technology Ltd. (a) | | 1,606,000 | 679,256 |
| Alibaba Pictures Group Ltd. (a) | | 4,700,000 | 173,638 |
| Beijing Enterprises Water Group Ltd. | | 1,674,000 | 351,876 |
| Boe Varitronix Ltd. | | 121,000 | 179,427 |
| Borr Drilling Ltd. (a)(c) | | 48,973 | 238,832 |
| Brightoil Petroleum Holdings Ltd. (a)(b) | | 26,000 | 0 |
| Brookfield Asset Management Reinsurance Partners Ltd. | | 6,180 | 244,279 |
| BW LPG Ltd. (d) | | 31,577 | 255,443 |
| Cafe de Coral Holdings Ltd. | | 162,000 | 189,043 |
| CGN New Energy Holdings Co. Ltd. (d) | | 670,000 | 180,097 |
| China Foods Ltd. | | 454,000 | 115,674 |
| China Gas Holdings Ltd. | | 1,019,400 | 903,865 |
| China Resource Gas Group Ltd. | | 313,900 | 803,780 |
| China Ruyi Holdings Ltd. (a)(c) | | 1,685,600 | 264,125 |
| China Water Affairs Group Ltd. | | 334,000 | 236,576 |
| Chow Sang Sang Holdings International Ltd. | | 286,000 | 263,788 |
| CK Infrastructure Holdings Ltd. | | 211,500 | 1,005,007 |
| Concord New Energy Group Ltd. | | 3,120,000 | 238,482 |
| Cosco Shipping Ports Ltd. | | 689,086 | 339,730 |
| Credicorp Ltd. (United States) | | 24,213 | 3,543,815 |
| First Pacific Co. Ltd. | | 1,074,000 | 284,588 |
| FLEX LNG Ltd. | | 10,458 | 324,922 |
| Frontline Ltd. (c) | | 42,320 | 528,789 |
| Gemdale Properties and Investment Corp. Ltd. | | 2,342,000 | 128,294 |
| Golden Ocean Group Ltd. | | 46,221 | 379,686 |
| GOME Retail Holdings Ltd. (a)(c) | | 4,764,000 | 77,684 |
| Grand Pharmaceutical Group, Ltd. | | 511,500 | 218,945 |
| Gulf Keystone Petroleum Ltd. | | 84,096 | 201,562 |
| Hafnia Ltd. | | 45,710 | 235,670 |
| Hiscox Ltd. | | 118,766 | 1,224,718 |
| Hongkong Land Holdings Ltd. | | 371,239 | 1,429,270 |
| Hopson Development Holdings Ltd. | | 282,900 | 227,051 |
| Huabao International Holdings Ltd. | | 365,000 | 168,326 |
| Jardine Matheson Holdings Ltd. | | 54,058 | 2,487,749 |
| Johnson Electric Holdings Ltd. | | 160,427 | 165,339 |
| K Wah International Holdings Ltd. | | 524,902 | 147,113 |
| Kerry Logistics Network Ltd. | | 168,000 | 266,672 |
| Kerry Properties Ltd. | | 174,000 | 275,309 |
| Kunlun Energy Co. Ltd. | | 1,326,000 | 792,257 |
| Lancashire Holdings Ltd. | | 88,494 | 502,553 |
| Luk Fook Holdings International Ltd. | | 200,000 | 434,669 |
| Luye Pharma Group Ltd. (a)(d) | | 1,041,000 | 253,299 |
| Man Wah Holdings Ltd. | | 609,200 | 339,925 |
| Nine Dragons Paper (Holdings) Ltd. | | 591,000 | 350,098 |
| NWS Holdings Ltd. | | 577,367 | 409,691 |
| Orient Overseas International Ltd. | | 46,000 | 672,157 |
| Pacific Basin Shipping Ltd. | | 1,754,000 | 424,554 |
| PAX Global Technology Ltd. | | 272,000 | 213,798 |
| Realord Group Holdings Ltd. (a)(c) | | 166,000 | 194,768 |
| Shanghai Industrial Urban Development Group Ltd. | | 1,639,400 | 92,938 |
| Shangri-La Asia Ltd. (a) | | 410,000 | 226,685 |
| Shenzhen International Holdings Ltd. | | 516,456 | 347,390 |
| Sihuan Pharmaceutical Holdings Group Ltd. | | 1,676,000 | 143,054 |
| Sinopec Kantons Holdings Ltd. | | 470,000 | 126,936 |
| Skyworth Group Ltd. | | 531,589 | 195,038 |
| SMI Corp. Ltd. (a)(b) | | 7,200 | 2,146 |
| Theme International Holdings Ltd. (a) | | 1,860,000 | 177,715 |
| United Energy Group Ltd. | | 2,840,000 | 274,968 |
| Vtech Holdings Ltd. | | 64,200 | 341,461 |
| Yue Yuen Industrial (Holdings) Ltd. | | 290,000 | 294,816 |
| Yuexiu Transport Infrastructure Ltd. | | 412,000 | 161,133 |
TOTAL BERMUDA | | | 25,950,469 |
| Brazil - 1.4% | | | |
| 3R Petroleum Oleo e Gas SA (a) | | 64,800 | 583,332 |
| AES Brasil Energia SA | | 153,987 | 295,126 |
| Aliansce Sonae Shopping Centers SA | | 63,272 | 266,170 |
| Alupar Investimento SA unit | | 84,900 | 464,645 |
| Ambev SA | | 1,597,263 | 4,947,480 |
| Americanas SA | | 215,659 | 648,793 |
| Anima Holding SA (a) | | 130,600 | 173,189 |
| Arezzo Industria e Comercio SA | | 27,200 | 550,266 |
| Atacadao SA | | 176,100 | 663,422 |
| Auren Energia SA | | 127,389 | 367,950 |
| B3 SA - Brasil Bolsa Balcao | | 2,068,534 | 6,022,796 |
| Banco Bradesco SA | | 657,430 | 2,117,827 |
| Banco BTG Pactual SA unit | | 396,700 | 2,222,534 |
| Banco do Brasil SA | | 289,300 | 2,073,349 |
| Banco Santander SA (Brasil) unit | | 123,400 | 711,422 |
| BB Seguridade Participacoes SA | | 238,200 | 1,369,114 |
| BR Malls Participacoes SA | | 310,605 | 610,326 |
| BRF SA (a) | | 205,172 | 498,879 |
| CCR SA | | 395,984 | 993,506 |
| Centrais Eletricas Brasileiras SA (Electrobras) | | 335,476 | 3,235,585 |
| Cielo SA | | 429,300 | 494,499 |
| Cogna Educacao (a) | | 736,954 | 469,379 |
| Companhia Brasileira de Aluminio | | 53,600 | 114,557 |
| Companhia de Saneamento Basico do Estado de Sao Paulo (SABESP) | | 117,900 | 1,371,753 |
| Companhia Siderurgica Nacional SA (CSN) | | 232,387 | 552,456 |
| Compania de Saneamento do Parana unit | | 115,600 | 428,339 |
| Cosan SA | | 409,364 | 1,336,149 |
| CPFL Energia SA | | 78,800 | 540,334 |
| CVC Brasil Operadora e Agencia de Viagens SA (a) | | 107,506 | 149,224 |
| Cyrela Brazil Realty SA (a) | | 111,600 | 401,851 |
| Dexco SA | | 127,160 | 238,540 |
| EDP Energias do Brasil SA | | 95,600 | 426,966 |
| Embraer SA (a) | | 246,388 | 655,858 |
| Enauta Participacoes SA | | 41,100 | 121,259 |
| Energisa SA unit | | 68,700 | 644,906 |
| Eneva SA (a) | | 364,900 | 1,001,700 |
| ENGIE Brasil Energia SA | | 74,181 | 577,594 |
| Equatorial Energia SA | | 348,500 | 2,026,029 |
| Fleury SA | | 72,900 | 262,499 |
| Fleury SA rights 11/21/22 (a) | | 16,210 | 4,080 |
| Gol Linhas Aereas Inteligentes SA warrants 7/23/24 (a) | | 900 | 725 |
| GPA | | 62,661 | 267,481 |
| GPS Participacoes e Empreendimentos SA (d) | | 118,800 | 317,843 |
| Grendene SA | | 126,100 | 177,231 |
| Grupo de Moda Soma SA | | 199,016 | 560,967 |
| Grupo Mateus SA (a) | | 218,600 | 308,930 |
| Grupo SBF SA | | 40,800 | 149,599 |
| Hapvida Participacoes e Investimentos SA (d) | | 1,572,935 | 2,375,161 |
| Hypera SA | | 141,700 | 1,393,820 |
| Iguatemi SA unit | | 89,810 | 381,112 |
| IRB Brasil Resseguros SA (a) | | 807,413 | 146,930 |
| JBS SA | | 261,200 | 1,262,134 |
| JHSF Participacoes SA | | 167,100 | 237,443 |
| Klabin SA unit | | 271,100 | 1,134,679 |
| Light SA (a) | | 101,400 | 111,500 |
| Localiza Rent a Car SA | | 742 | 10,133 |
| Localiza Rent a Car SA | | 251,279 | 3,431,463 |
| Locaweb Servicos de Internet SA (a)(d) | | 154,300 | 326,493 |
| Lojas Renner SA | | 339,437 | 2,030,511 |
| M. Dias Branco SA | | 34,557 | 291,013 |
| Magazine Luiza SA | | 1,038,368 | 898,559 |
| Marfrig Global Foods SA | | 120,000 | 248,572 |
| Minerva SA | | 98,300 | 260,332 |
| MRV Engenharia e Participacoes SA | | 120,400 | 237,280 |
| Multiplan Empreendimentos Imobiliarios SA | | 109,396 | 558,257 |
| Natura & Co. Holding SA (a) | | 305,852 | 885,197 |
| Odontoprev SA | | 112,390 | 180,155 |
| Omega Energia SA (a) | | 109,251 | 227,364 |
| Omega Energia SA rights 11/7/22 (a) | | 13,758 | 53 |
| Pet Center Comercio e Participacoes SA | | 127,500 | 216,223 |
| Petro Rio SA (a) | | 242,200 | 1,659,367 |
| Petroleo Brasileiro SA - Petrobras (ON) | | 1,161,988 | 7,481,894 |
| Petroreconcavo SA | | 59,000 | 358,192 |
| Qualicorp Consultoria E Corret | | 70,900 | 108,158 |
| Raia Drogasil SA | | 369,800 | 1,883,542 |
| Rede D'Oregon Sao Luiz SA (d) | | 138,700 | 863,804 |
| Rumo SA | | 435,600 | 1,867,038 |
| Santos Brasil Participacoes SA | | 226,500 | 399,022 |
| Sao Martinho SA | | 59,300 | 309,616 |
| Sendas Distribuidora SA | | 282,905 | 1,085,505 |
| Simpar SA | | 142,800 | 299,395 |
| SLC Agricola SA | | 40,810 | 363,028 |
| Smartfit Escola de Ginastica e Danca SA (a) | | 120,000 | 402,594 |
| Sul America SA unit | | 103,020 | 475,462 |
| Suzano Papel e Celulose SA | | 253,389 | 2,609,679 |
| Telefonica Brasil SA | | 168,200 | 1,345,144 |
| TIM SA | | 301,280 | 769,896 |
| Totvs SA | | 178,800 | 1,147,809 |
| Transmissora Alianca de Energia Eletrica SA unit | | 70,700 | 550,079 |
| Ultrapar Participacoes SA | | 248,600 | 645,383 |
| Vale SA | | 1,350,083 | 17,545,460 |
| Vamos Locacao de Caminhoes Maquinas e Equipamentos SA | | 109,000 | 340,157 |
| Via S/A (a) | | 464,600 | 281,521 |
| Vibra Energia SA | | 399,442 | 1,411,251 |
| Weg SA | | 570,180 | 4,446,201 |
| YDUQS Participacoes SA | | 107,800 | 336,621 |
TOTAL BRAZIL | | | 108,246,661 |
| British Virgin Islands - 0.0% | | | |
| VK Co. Ltd. unit (a)(b) | | 39,795 | 17,729 |
| Canada - 8.4% | | | |
| Absolute Software Corp. | | 22,331 | 268,165 |
| Advantage Energy Ltd. (a) | | 65,410 | 494,530 |
| Aecon Group, Inc. | | 24,865 | 176,310 |
| AG Growth International, Inc. | | 7,195 | 184,318 |
| Agnico Eagle Mines Ltd. (Canada) | | 154,372 | 6,790,850 |
| Air Canada (a) | | 59,762 | 860,229 |
| Alamos Gold, Inc. | | 137,356 | 1,083,846 |
| Algoma Steel Group, Inc. | | 36,642 | 249,532 |
| Algonquin Power & Utilities Corp. | | 216,184 | 2,392,964 |
| Alimentation Couche-Tard, Inc. Class A (multi-vtg.) | | 279,313 | 12,506,399 |
| Allied Properties (REIT) | | 23,665 | 458,413 |
| AltaGas Ltd. | | 88,826 | 1,601,978 |
| Altius Minerals Corp. | | 17,814 | 278,779 |
| Altus Group Ltd. | | 15,073 | 535,607 |
| Andlauer Healthcare Group, Inc. | | 8,544 | 327,499 |
| ARC Resources Ltd. | | 230,352 | 3,243,037 |
| Aritzia, Inc. (a) | | 31,000 | 1,202,364 |
| Artis (REIT) | | 26,390 | 184,992 |
| ATCO Ltd. Class I (non-vtg.) | | 23,113 | 717,642 |
| Athabasca Oil Corp. (a) | | 203,624 | 411,029 |
| ATS Automation Tooling System, Inc. (a) | | 25,474 | 805,908 |
| Aurora Cannabis, Inc. (a)(c) | | 136,778 | 196,781 |
| AutoCanada, Inc. (a) | | 9,108 | 142,134 |
| Aya Gold & Silver, Inc. (a)(c) | | 37,626 | 218,186 |
| B2Gold Corp. | | 365,043 | 1,114,676 |
| Badger Infrastructure Solution | | 13,287 | 280,691 |
| Ballard Power Systems, Inc. (a)(c) | | 84,232 | 477,316 |
| Bank of Montreal | | 224,428 | 20,672,712 |
| Bank of Nova Scotia | | 400,685 | 19,367,349 |
| Barrick Gold Corp. (Canada) | | 600,684 | 9,034,400 |
| Bausch Health Cos., Inc. (Canada) (a) | | 92,718 | 602,989 |
| Baytex Energy Corp. (a) | | 195,091 | 1,059,693 |
| BCE, Inc. | | 21,109 | 952,140 |
| BELLUS Health, Inc. (a) | | 28,605 | 265,400 |
| Birchcliff Energy Ltd. | | 91,875 | 714,175 |
| BlackBerry Ltd. (a) | | 181,801 | 844,717 |
| Boardwalk (REIT) | | 9,704 | 345,322 |
| Bombardier, Inc. Class B (sub. vtg.) (a) | | 29,124 | 855,324 |
| Boralex, Inc. Class A | | 33,945 | 962,525 |
| Boyd Group Services, Inc. | | 7,385 | 1,050,872 |
| Brookfield Asset Management, Inc. (Canada) Class A | | 473,034 | 18,732,473 |
| Brookfield Infrastructure Corp. Class A | | 34,554 | 1,490,868 |
| Brookfield Renewable Corp. | | 46,719 | 1,451,621 |
| BRP, Inc. | | 12,839 | 858,446 |
| BSR Real Estate Investment Trust | | 19,300 | 272,130 |
| CAE, Inc. (a) | | 107,648 | 2,054,427 |
| Cameco Corp. | | 146,451 | 3,473,286 |
| Canaccord Genuity Group, Inc. | | 38,205 | 195,743 |
| Canacol Energy Ltd. (c) | | 76,702 | 113,166 |
| Canada Goose Holdings, Inc. (a) | | 21,573 | 352,965 |
| Canadian Apartment Properties (REIT) unit | | 31,765 | 983,716 |
| Canadian Imperial Bank of Commerce | | 300,177 | 13,632,291 |
| Canadian National Railway Co. | | 197,102 | 23,351,021 |
| Canadian Natural Resources Ltd. | | 389,211 | 23,343,804 |
| Canadian Pacific Railway Ltd. | | 312,392 | 23,288,092 |
| Canadian Tire Ltd. Class A (non-vtg.) | | 18,662 | 2,091,607 |
| Canadian Utilities Ltd. Class A (non-vtg.) | | 38,623 | 1,027,698 |
| Canadian Western Bank, Edmonton | | 31,033 | 539,863 |
| Canfor Corp. (a) | | 21,679 | 325,738 |
| Capital Power Corp. | | 40,931 | 1,370,025 |
| Capstone Copper Corp. (a) | | 125,173 | 290,341 |
| Cardinal Energy Ltd. | | 47,327 | 320,991 |
| Cargojet, Inc. | | 3,279 | 319,632 |
| Cascades, Inc. | | 26,623 | 172,751 |
| CCL Industries, Inc. Class B | | 52,724 | 2,476,850 |
| Celestica, Inc. (sub. vtg.) (a) | | 38,740 | 425,121 |
| Cenovus Energy, Inc. (Canada) | | 468,923 | 9,479,311 |
| Centerra Gold, Inc. | | 78,159 | 363,157 |
| CGI, Inc. Class A (sub. vtg.) (a) | | 71,956 | 5,796,199 |
| Choice Properties REIT | | 48,673 | 467,670 |
| CI Financial Corp. | | 66,470 | 665,505 |
| Cineplex, Inc. (a)(c) | | 26,951 | 183,188 |
| Cogeco Communications, Inc. | | 4,694 | 239,395 |
| Colliers International Group, Inc. | | 11,308 | 1,061,284 |
| Constellation Software, Inc. | | 6,740 | 9,745,703 |
| Converge Technology Solutions Corp. (a) | | 72,811 | 298,224 |
| Corus Entertainment, Inc. Class B (non-vtg.) | | 65,189 | 102,878 |
| Crescent Point Energy Corp. | | 195,378 | 1,527,343 |
| Crew Energy, Inc. (a) | | 51,837 | 229,059 |
| Cronos Group, Inc. (a)(c) | | 78,272 | 261,414 |
| Definity Financial Corp. | | 28,250 | 836,707 |
| Denison Mines Corp. (a) | | 289,947 | 366,065 |
| Descartes Systems Group, Inc. (Canada) (a) | | 28,605 | 1,973,700 |
| Docebo, Inc. (a) | | 6,669 | 193,900 |
| Dollarama, Inc. | | 93,098 | 5,531,826 |
| Dream Industrial (REIT) | | 59,514 | 478,349 |
| DREAM Unlimited Corp. | | 9,565 | 174,471 |
| Dundee Precious Metals, Inc. | | 76,337 | 346,286 |
| Dye & Durham Ltd. | | 20,874 | 230,903 |
| ECN Capital Corp. | | 85,768 | 258,749 |
| Eldorado Gold Corp. (a) | | 67,557 | 377,369 |
| Element Fleet Management Corp. | | 136,649 | 1,820,516 |
| Emera, Inc. | | 86,110 | 3,191,319 |
| Empire Co. Ltd. Class A (non-vtg.) | | 56,275 | 1,445,756 |
| Enbridge, Inc. | | 680,203 | 26,502,129 |
| Endeavour Silver Corp. (a) | | 67,819 | 230,983 |
| Enerflex Ltd. | | 36,289 | 187,525 |
| Energy Fuels, Inc. (a) | | 54,263 | 392,330 |
| Enerplus Corp. | | 83,096 | 1,440,693 |
| Enghouse Systems Ltd. | | 16,407 | 364,787 |
| EQB, Inc. | | 9,477 | 335,853 |
| Equinox Gold Corp. (a) | | 111,188 | 366,451 |
| ERO Copper Corp. (a) | | 35,777 | 407,312 |
| Exchange Income Corp. | | 6,782 | 226,506 |
| Extendicare, Inc. | | 36,578 | 188,213 |
| Fairfax Financial Holdings Ltd. (sub. vtg.) | | 7,759 | 3,810,672 |
| Fiera Capital Corp. (c) | | 29,808 | 189,698 |
| Filo Mining Corp. (a) | | 30,569 | 366,195 |
| Finning International, Inc. | | 53,133 | 1,129,859 |
| First Capital (REIT) unit | | 52,743 | 613,628 |
| First Majestic Silver Corp. | | 83,839 | 705,248 |
| First National Financial Corp. | | 8,979 | 225,406 |
| First Quantum Minerals Ltd. | | 199,240 | 3,514,322 |
| FirstService Corp. | | 13,402 | 1,675,410 |
| Fortis, Inc. | | 157,271 | 6,135,687 |
| Fortuna Silver Mines, Inc. (a) | | 106,069 | 295,079 |
| Franco-Nevada Corp. | | 64,681 | 7,991,891 |
| Freehold Royalties Ltd. (c) | | 49,266 | 612,955 |
| Frontera Energy Corp. (a) | | 22,664 | 189,650 |
| George Weston Ltd. | | 24,626 | 2,710,514 |
| GFL Environmental, Inc. | | 61,635 | 1,663,537 |
| Gibson Energy, Inc. | | 50,373 | 859,671 |
| Gildan Activewear, Inc. | | 63,464 | 2,002,655 |
| goeasy Ltd. | | 4,438 | 360,063 |
| GoGold Resources, Inc. (a)(c) | | 120,122 | 133,141 |
| Granite (REIT) | | 9,881 | 504,948 |
| Great-West Lifeco, Inc. | | 89,115 | 2,063,117 |
| H&R (REIT) unit | | 41,048 | 337,761 |
| Headwater Exploration, Inc. | | 73,537 | 389,722 |
| Home Capital Group, Inc. | | 17,278 | 334,057 |
| HudBay Minerals, Inc. | | 82,614 | 313,513 |
| Hut 8 Mining Corp. (a)(c) | | 60,350 | 135,553 |
| Hydro One Ltd. (d) | | 106,989 | 2,682,676 |
| iA Financial Corp, Inc. | | 36,729 | 2,044,110 |
| IAMGOLD Corp. (a) | | 159,921 | 234,772 |
| IGM Financial, Inc. | | 27,516 | 736,601 |
| Imperial Oil Ltd. | | 79,052 | 4,300,322 |
| Innergex Renewable Energy, Inc. | | 49,820 | 548,537 |
| Intact Financial Corp. | | 59,081 | 8,977,398 |
| Interfor Corp. (a) | | 19,946 | 354,309 |
| InterRent REIT | | 28,813 | 242,585 |
| Ivanhoe Mines Ltd. (a)(c) | | 207,768 | 1,441,192 |
| Jamieson Wellness, Inc. (d) | | 15,449 | 377,961 |
| K92 Mining, Inc. (a) | | 77,790 | 353,448 |
| Karora Resources, Inc. (a) | | 69,220 | 144,806 |
| Kelt Exploration Ltd. (a) | | 59,081 | 255,431 |
| Keyera Corp. | | 76,526 | 1,640,224 |
| Killam Apartment (REIT) | | 25,708 | 297,963 |
| Kinaxis, Inc. (a) | | 9,462 | 1,009,924 |
| Kinross Gold Corp. | | 446,384 | 1,618,627 |
| Knight Therapeutics, Inc. (a) | | 46,978 | 191,381 |
| Labrador Iron Ore Royalty Corp. | | 22,179 | 459,746 |
| Lassonde Industries, Inc. Class A (sub. vtg.) | | 1,440 | 124,292 |
| Laurentian Bank of Canada | | 21,572 | 481,366 |
| Lightspeed Commerce, Inc. (Canada) (a) | | 45,646 | 874,824 |
| Linamar Corp. | | 15,866 | 679,081 |
| Lithium Americas Corp. (a)(c) | | 36,327 | 903,942 |
| Loblaw Companies Ltd. | | 55,935 | 4,582,864 |
| Lundin Gold, Inc. | | 30,946 | 223,517 |
| Lundin Mining Corp. | | 228,466 | 1,197,378 |
| MAG Silver Corp. (a) | | 32,387 | 430,289 |
| Magna International, Inc. Class A (sub. vtg.) | | 93,634 | 5,217,964 |
| Major Drilling Group International, Inc. (a) | | 37,310 | 224,569 |
| Manulife Financial Corp. | | 644,637 | 10,684,408 |
| Maple Leaf Foods, Inc. | | 27,854 | 412,796 |
| Martinrea International, Inc. | | 30,018 | 192,357 |
| MDA Ltd. (a) | | 26,247 | 128,889 |
| MEG Energy Corp. (a) | | 95,744 | 1,431,574 |
| Methanex Corp. | | 20,278 | 707,762 |
| Metro, Inc. | | 80,830 | 4,234,475 |
| Minto Apartment (REIT) (d) | | 17,666 | 172,854 |
| Morguard North American Resources (REIT) (c) | | 10,443 | 121,880 |
| MTY Food Group, Inc. | | 7,711 | 312,549 |
| Mullen Group Ltd. | | 40,081 | 402,766 |
| National Bank of Canada | | 111,307 | 7,578,697 |
| New Gold, Inc. (a) | | 252,960 | 228,385 |
| NexGen Energy Ltd. (a) | | 140,268 | 588,933 |
| Nfi Group, Inc. (c) | | 24,094 | 155,633 |
| North West Co., Inc. | | 24,904 | 648,032 |
| Northland Power, Inc. | | 78,395 | 2,281,042 |
| Northwest Healthcare Properties REIT | | 29,000 | 228,620 |
| Novagold Resources, Inc. (a) | | 95,518 | 441,009 |
| Nutrien Ltd. | | 186,053 | 15,720,307 |
| Nuvei Corp. (a)(d) | | 23,696 | 713,132 |
| NuVista Energy Ltd. (a) | | 64,758 | 642,185 |
| Obsidian Energy Ltd. (a) | | 25,594 | 232,767 |
| OceanaGold Corp. (a) | | 256,364 | 372,592 |
| Onex Corp. (sub. vtg.) | | 27,671 | 1,392,741 |
| Open Text Corp. | | 90,404 | 2,618,521 |
| Orla Mining Ltd. (a)(c) | | 72,393 | 228,495 |
| Osisko Gold Royalties Ltd. | | 65,154 | 698,719 |
| Osisko Mining, Inc. (a) | | 118,717 | 247,481 |
| Pan American Silver Corp. | | 73,482 | 1,174,242 |
| Paramount Resources Ltd. Class A | | 27,362 | 579,636 |
| Parex Resources, Inc. | | 40,349 | 615,446 |
| Park Lawn Corp. | | 14,149 | 219,658 |
| Parkland Corp. | | 52,517 | 1,061,635 |
| Pason Systems, Inc. | | 30,677 | 325,831 |
| Pembina Pipeline Corp. | | 182,113 | 6,012,730 |
| Pet Valu Holdings Ltd. | | 12,973 | 349,381 |
| Peyto Exploration & Development Corp. | | 60,169 | 561,786 |
| Pipestone Energy Corp. (a) | | 51,034 | 153,962 |
| Power Corp. of Canada (sub. vtg.) | | 182,865 | 4,540,920 |
| PrairieSky Royalty Ltd. | | 74,192 | 1,152,349 |
| Precision Drilling Corp. (a) | | 5,091 | 375,561 |
| Premium Brands Holdings Corp. | | 15,104 | 891,040 |
| Primaris Real Estate Investmen | | 16,910 | 174,146 |
| Primo Water Corp. | | 66,907 | 976,173 |
| Quebecor, Inc. Class B (sub. vtg.) | | 51,545 | 971,612 |
| Restaurant Brands International, Inc. | | 98,446 | 5,849,601 |
| Richelieu Hardware Ltd. | | 19,373 | 520,036 |
| RioCan (REIT) | | 48,595 | 692,354 |
| Ritchie Bros. Auctioneers, Inc. | | 37,477 | 2,448,308 |
| Rogers Communications, Inc. Class B (non-vtg.) | | 118,711 | 4,941,535 |
| Rogers Sugar, Inc. | | 82,659 | 363,436 |
| Royal Bank of Canada | | 476,020 | 44,043,250 |
| Russel Metals, Inc. | | 22,471 | 465,469 |
| Sabina Gold & Silver Corp. (a) | | 150,014 | 122,227 |
| Sandstorm Gold Ltd. | | 77,365 | 381,047 |
| Saputo, Inc. | | 83,693 | 2,037,112 |
| Seabridge Gold, Inc. (a) | | 23,674 | 252,840 |
| Secure Energy Services, Inc. | | 111,561 | 585,504 |
| Shaw Communications, Inc. Class B | | 157,733 | 4,051,145 |
| Shopify, Inc. Class A (a) | | 385,533 | 13,218,517 |
| Sienna Senior Living, Inc. | | 27,414 | 236,440 |
| Sierra Wireless, Inc. (a) | | 13,162 | 390,648 |
| Silvercorp Metals, Inc. | | 92,730 | 225,980 |
| SilverCrest Metals, Inc. (a) | | 53,960 | 270,523 |
| Slate Grocery REIT | | 23,663 | 245,949 |
| Sleep Country Canada Holdings, Inc. (d) | | 14,229 | 234,165 |
| Smart (REIT) | | 36,671 | 718,696 |
| SNC-Lavalin Group, Inc. | | 60,550 | 1,048,464 |
| Softchoice Corp. | | 12,042 | 154,420 |
| Solaris Resources, Inc. (a) | | 22,786 | 81,119 |
| Spartan Delta Corp. (a) | | 47,267 | 435,078 |
| Spin Master Corp. (d) | | 12,090 | 373,611 |
| Sprott, Inc. (c) | | 8,490 | 304,303 |
| SSR Mining, Inc. | | 74,010 | 1,019,142 |
| Stantec, Inc. | | 38,346 | 1,876,276 |
| Stelco Holdings, Inc. | | 17,050 | 429,394 |
| Stella-Jones, Inc. | | 19,622 | 590,957 |
| StorageVault Canada, Inc. | | 84,219 | 386,368 |
| Summit Industrial Income REIT | | 34,545 | 441,464 |
| Sun Life Financial, Inc. | | 194,516 | 8,261,237 |
| Suncor Energy, Inc. | | 484,641 | 16,669,929 |
| SunOpta, Inc. (a) | | 26,369 | 296,124 |
| Superior Plus Corp. | | 67,748 | 515,190 |
| Surge Energy, Inc. | | 27,555 | 206,913 |
| Tamarack Valley Energy Ltd. | | 152,298 | 586,901 |
| TC Energy Corp. | | 329,628 | 14,478,614 |
| Teck Resources Ltd. Class B (sub. vtg.) | | 161,816 | 4,925,687 |
| TELUS Corp. | | 151,485 | 3,163,466 |
| TELUS Corp. | | 11,115 | 232,115 |
| TFI International, Inc. (Canada) | | 27,900 | 2,539,640 |
| The Toronto-Dominion Bank | | 610,111 | 39,046,925 |
| Thomson Reuters Corp. | | 56,357 | 5,993,736 |
| Timbercreek Financial Corp. | | 85,564 | 482,980 |
| TMX Group Ltd. | | 18,693 | 1,797,195 |
| Topaz Energy Corp. | | 34,629 | 585,644 |
| Torex Gold Resources, Inc. (a) | | 33,478 | 228,044 |
| Toromont Industries Ltd. | | 27,581 | 2,119,669 |
| Tourmaline Oil Corp. | | 107,206 | 6,040,395 |
| TransAlta Corp. | | 86,418 | 761,196 |
| TransAlta Renewables, Inc. | | 39,994 | 429,487 |
| Transcontinental, Inc. Class A | | 29,522 | 336,967 |
| Trican Well Service Ltd. (a) | | 91,666 | 243,572 |
| Tricon Residential, Inc. | | 84,069 | 708,417 |
| Trisura Group Ltd. (a) | | 15,060 | 438,087 |
| Turquoise Hill Resources Ltd. (a) | | 27,328 | 769,481 |
| Uni-Select, Inc. (a) | | 14,183 | 384,675 |
| Vermilion Energy, Inc. | | 56,209 | 1,311,619 |
| Village Farms International, Inc. (a) | | 35,154 | 75,933 |
| Voyager Digital Ltd. (a) | | 76,288 | 2,846 |
| Well Health Technologies Corp. (a)(c) | | 78,939 | 169,194 |
| Wesdome Gold Mines, Inc. (a) | | 51,060 | 306,206 |
| West Fraser Timber Co. Ltd. | | 20,553 | 1,543,191 |
| Westshore Terminals Investment Corp. | | 14,152 | 253,154 |
| Wheaton Precious Metals Corp. | | 153,428 | 5,019,478 |
| Whitecap Resources, Inc. | | 211,970 | 1,643,046 |
| Winpak Ltd. | | 12,396 | 377,790 |
| WSP Global, Inc. | | 41,936 | 5,154,156 |
| Yamana Gold, Inc. | | 327,595 | 1,437,970 |
TOTAL CANADA | | | 670,219,494 |
| Cayman Islands - 3.8% | | | |
| 3SBio, Inc. (d) | | 673,500 | 475,332 |
| AAC Technology Holdings, Inc. (a) | | 271,500 | 497,329 |
| Advanced Energy Solution Holding Co. Ltd. | | 8,000 | 139,890 |
| Agile Property Holdings Ltd. (a)(c) | | 462,000 | 87,696 |
| Airtac International Group | | 48,673 | 1,116,699 |
| AK Medical Holdings Ltd. (d) | | 212,000 | 220,382 |
| Akeso, Inc. (a)(d) | | 163,000 | 654,106 |
| Alchip Technologies Ltd. | | 25,000 | 503,038 |
| Alibaba Group Holding Ltd. (a) | | 5,122,964 | 39,830,567 |
| Alphamab Oncology (a)(d) | | 170,000 | 119,330 |
| Anta Sports Products Ltd. | | 414,400 | 3,642,659 |
| Apex International Co. Ltd. | | 64,000 | 98,022 |
| Asia Cement (China) Holdings Corp. | | 324,000 | 113,095 |
| ASMPT Ltd. | | 104,800 | 576,759 |
| Autohome, Inc. ADR Class A | | 26,253 | 685,728 |
| Baidu, Inc. Class A (a) | | 746,168 | 7,153,515 |
| Baozun, Inc. sponsored ADR (a) | | 21,050 | 82,937 |
| BeiGene Ltd. ADR (a)(c) | | 16,101 | 2,719,298 |
| Bilibili, Inc. Class Z (a) | | 62,651 | 558,308 |
| BizLink Holding, Inc. | | 47,062 | 359,670 |
| Bosideng International Holdings Ltd. | | 1,160,000 | 500,965 |
| Budweiser Brewing Co. APAC Ltd. (d) | | 602,900 | 1,268,835 |
| C&D International Investment Group Ltd. | | 183,584 | 285,328 |
| Canaan, Inc. ADR (a)(c) | | 62,751 | 181,978 |
| CARsgen Therapeutics Holdings Ltd. (a)(d) | | 51,000 | 86,022 |
| Chailease Holding Co. Ltd. | | 463,716 | 2,142,174 |
| China Conch Environment Protection Holdings Ltd. (a) | | 589,500 | 173,478 |
| China Conch Venture Holdings Ltd. | | 580,000 | 855,631 |
| China Education Group Holdings Ltd. | | 337,000 | 197,057 |
| China Feihe Ltd. (d) | | 1,276,000 | 734,749 |
| China Hongqiao Group Ltd. | | 836,000 | 593,214 |
| China Huishan Dairy Holdings Co. Ltd. (a)(b) | | 51,000 | 0 |
| China Liansu Group Holdings Ltd. | | 399,000 | 323,789 |
| China Literature Ltd. (a)(d) | | 147,000 | 396,075 |
| China Medical System Holdings Ltd. | | 507,000 | 553,527 |
| China Meidong Auto Holding Ltd. | | 212,000 | 278,718 |
| China Mengniu Dairy Co. Ltd. | | 1,078,000 | 3,453,874 |
| China Modern Dairy Holdings Ltd. (c) | | 1,518,000 | 154,708 |
| China Overseas Property Holdings Ltd. | | 495,000 | 311,517 |
| China Resources Cement Holdings Ltd. | | 930,000 | 336,474 |
| China Resources Land Ltd. | | 1,090,000 | 3,415,948 |
| China Resources Medical Holdin | | 377,500 | 180,342 |
| China Resources Microelectronics Ltd. (A Shares) | | 23,382 | 162,200 |
| China Resources Mixc Lifestyle Services Ltd. (d) | | 241,400 | 707,318 |
| China State Construction International Holdings Ltd. | | 715,750 | 643,748 |
| ChinaSoft International Ltd. | | 982,000 | 650,526 |
| Chindata Group Holdings Ltd. ADR (a)(c) | | 46,627 | 247,589 |
| Chow Tai Fook Jewellery Group Ltd. | | 697,800 | 1,194,758 |
| CIFI Ever Sunshine Services Group Ltd. | | 294,000 | 64,795 |
| CIFI Holdings Group Co. Ltd. (b)(c) | | 1,407,187 | 93,219 |
| Cimc Enric Holdings Ltd. | | 290,000 | 282,624 |
| CK Asset Holdings Ltd. | | 665,488 | 3,679,423 |
| CK Hutchison Holdings Ltd. | | 903,000 | 4,494,984 |
| CMGE Technology Group Ltd. (a) | | 622,000 | 97,464 |
| COFCO Meat Holdings Ltd. | | 942,000 | 198,009 |
| Comba Telecom Systems Holdings Ltd. | | 1,076,000 | 150,784 |
| Country Garden Holdings Co. Ltd. | | 2,784,081 | 358,223 |
| Country Garden Services Holdings Co. Ltd. | | 692,000 | 604,756 |
| Cowell e Holdings, Inc. (a) | | 106,000 | 129,636 |
| CStone Pharmaceuticals Co. Ltd. (a)(d) | | 261,000 | 112,385 |
| CT Environmental Group Ltd. (a)(b) | | 26,000 | 0 |
| Dali Foods Group Co. Ltd. (d) | | 852,500 | 350,790 |
| Daqo New Energy Corp. ADR (a) | | 20,347 | 895,065 |
| Differ Group Auto Ltd. (c) | | 1,198,000 | 239,611 |
| Dongyue Group Co. Ltd. | | 545,000 | 473,512 |
| ENN Energy Holdings Ltd. | | 267,500 | 2,659,784 |
| ESR Group Ltd. (d) | | 688,400 | 1,175,156 |
| Far East Consortium International Ltd. | | 703,311 | 158,588 |
| FIH Mobile Ltd. (a) | | 1,355,000 | 110,476 |
| FinVolution Group ADR | | 55,365 | 240,284 |
| Fu Shou Yuan International Group Ltd. | | 546,000 | 272,664 |
| Fufeng Group Ltd. | | 555,000 | 287,764 |
| Fulgent Sun International Holding Co. Ltd. | | 50,000 | 211,602 |
| Futu Holdings Ltd. ADR (a) | | 20,424 | 691,557 |
| GDS Holdings Ltd. Class A (a) | | 303,784 | 339,069 |
| Geely Automobile Holdings Ltd. | | 2,005,000 | 2,155,790 |
| General Interface Solution Holding Ltd. | | 101,000 | 243,623 |
| Genscript Biotech Corp. (a) | | 408,000 | 1,031,221 |
| Golden Solar New Energy Technology Holdings Ltd. (a) | | 300,000 | 299,631 |
| Grab Holdings Ltd. (a) | | 439,588 | 1,142,929 |
| Greentown China Holdings Ltd. | | 312,000 | 296,910 |
| Greentown Service Group Co. Ltd. | | 564,000 | 231,358 |
| H World Group Ltd. ADR | | 65,988 | 1,786,955 |
| Haichang Ocean Park Holdings Ltd. (a)(c)(d) | | 483,000 | 427,643 |
| Haidilao International Holding Ltd. (a)(c)(d) | | 389,000 | 577,827 |
| Haitian International Holdings Ltd. | | 232,000 | 464,612 |
| Hansoh Pharmaceutical Group Co. Ltd. (d) | | 428,000 | 660,840 |
| Helens International Holdings Co. Ltd. (a)(c) | | 96,500 | 92,816 |
| Hello Group, Inc. ADR | | 57,324 | 269,423 |
| Hengan International Group Co. Ltd. | | 229,000 | 888,326 |
| HKBN Ltd. | | 355,000 | 239,692 |
| HUTCHMED China Ltd. sponsored ADR (a)(c) | | 31,566 | 279,043 |
| HUYA, Inc. ADR (a) | | 39,622 | 74,093 |
| Hygeia Healthcare Holdings Co. (a)(d) | | 119,200 | 516,303 |
| I-Mab ADR (a) | | 18,997 | 70,479 |
| iDreamSky Technology Holdings Ltd. (a)(d) | | 274,800 | 103,273 |
| IGG, Inc. (a) | | 308,000 | 80,044 |
| Innovent Biologics, Inc. (a)(d) | | 354,500 | 1,255,483 |
| iQIYI, Inc. ADR (a)(c) | | 122,738 | 247,931 |
| JD Health International, Inc. (a)(d) | | 375,850 | 2,061,282 |
| JD.com, Inc. Class A | | 727,302 | 13,244,548 |
| JinkoSolar Holdings Co. Ltd. ADR (a)(c) | | 13,826 | 656,458 |
| Jinxin Fertility Group Ltd. (d) | | 580,500 | 286,196 |
| Jiumaojiu International Holdings Ltd. (d) | | 255,000 | 400,222 |
| JOYY, Inc. ADR | | 16,915 | 426,765 |
| Kanzhun Ltd. ADR (a) | | 62,386 | 681,879 |
| KE Holdings, Inc. ADR (a) | | 225,798 | 2,298,624 |
| Kingboard Chemical Holdings Ltd. | | 233,000 | 574,660 |
| Kingboard Laminates Holdings Ltd. | | 356,500 | 284,759 |
| Kingdee International Software Group Co. Ltd. (a) | | 887,000 | 1,450,903 |
| Kingsoft Cloud Holdings Ltd. ADR (a)(c) | | 41,812 | 105,784 |
| Kingsoft Corp. Ltd. | | 332,200 | 1,005,109 |
| Kintor Pharmaceutical Ltd. (a)(c)(d) | | 69,500 | 110,142 |
| Koolearn Technology Holding Ltd. (a)(c)(d) | | 118,000 | 571,987 |
| Kuaishou Technology Class B (a)(d) | | 594,300 | 2,445,445 |
| KWG Group Holdings Ltd. | | 553,123 | 53,553 |
| Lee & Man Paper Manufacturing Ltd. | | 599,000 | 181,616 |
| Li Ning Co. Ltd. | | 798,000 | 4,127,420 |
| Lifetech Scientific Corp. (a) | | 1,534,000 | 480,740 |
| LK Technology Holdings Ltd. (c) | | 192,500 | 174,361 |
| Longfor Properties Co. Ltd. (d) | | 622,000 | 792,392 |
| Lonking Holdings Ltd. | | 922,000 | 126,854 |
| Lufax Holding Ltd. ADR | | 234,569 | 372,965 |
| Maoyan Entertainment (a)(d) | | 232,000 | 135,068 |
| Meituan Class B (a)(d) | | 1,486,400 | 23,798,075 |
| Melco Crown Entertainment Ltd. sponsored ADR (a)(c) | | 73,179 | 400,289 |
| MGM China Holdings Ltd. (a) | | 410,400 | 165,213 |
| MH Development Ltd. (a)(b) | | 74,000 | 0 |
| Microport Scientific Corp. (a)(c) | | 231,072 | 488,069 |
| Midea Real Estate Holding Ltd. (d) | | 147,800 | 103,182 |
| Ming Yuan Cloud Group Holdings Ltd. | | 254,000 | 116,813 |
| Minth Group Ltd. | | 268,000 | 529,196 |
| NetDragon WebSoft, Inc. | | 100,000 | 167,906 |
| NetEase, Inc. | | 699,805 | 7,764,514 |
| New Horizon Health Ltd. (a)(d) | | 70,000 | 156,058 |
| New Oriental Education & Technology Group, Inc. (a) | | 517,250 | 1,211,219 |
| Nexteer Auto Group Ltd. | | 339,000 | 183,543 |
| NIO, Inc. sponsored ADR (a) | | 460,284 | 4,450,946 |
| Noah Holdings Ltd. sponsored ADR (a) | | 12,588 | 165,155 |
| Ocumension Therapeutics Class H (a)(d) | | 119,000 | 109,606 |
| Pacific Textile Holdings Ltd. | | 458,000 | 136,531 |
| Parade Technologies Ltd. | | 27,000 | 509,797 |
| Pinduoduo, Inc. ADR (a) | | 170,744 | 9,361,894 |
| Ping An Healthcare and Technology Co. Ltd. (a)(c)(d) | | 167,200 | 308,429 |
| Pop Mart International Group Ltd. (c)(d) | | 198,400 | 256,794 |
| Powerlong Real Estate Holding Ltd. | | 641,000 | 52,262 |
| Redco Properties Group Ltd. (a)(d) | | 460,000 | 97,864 |
| RLX Technology, Inc. ADR (a)(c) | | 167,031 | 208,789 |
| Sands China Ltd. (a) | | 828,800 | 1,446,505 |
| Sany Heavy Equipment International Holdings Co. Ltd. | | 435,000 | 356,882 |
| Sapiens International Corp. NV | | 12,075 | 237,430 |
| Sea Ltd. ADR (a) | | 121,974 | 6,059,668 |
| Seazen Group Ltd. (a) | | 728,000 | 116,856 |
| Shenzhou International Group Holdings Ltd. | | 281,500 | 1,954,455 |
| Silergy Corp. | | 110,000 | 1,275,501 |
| Sino Biopharmaceutical Ltd. | | 3,608,000 | 1,751,222 |
| SITC International Holdings Co. Ltd. | | 473,000 | 774,911 |
| Smoore International Holdings Ltd. (c)(d) | | 615,000 | 654,201 |
| SOHO China Ltd. (a) | | 889,000 | 130,241 |
| SSY Group Ltd. | | 590,000 | 244,278 |
| Sun King Power Electronics Group Ltd. (a) | | 590,000 | 104,476 |
| Sunac Services Holdings Ltd. (d) | | 456,000 | 80,167 |
| Sunevision Holdings Ltd. | | 287,000 | 152,099 |
| Sunny Optical Technology Group Co. Ltd. | | 242,100 | 2,098,808 |
| TAL Education Group ADR (a) | | 154,853 | 729,358 |
| TCL Electronics Holdings Ltd. | | 345,000 | 131,853 |
| Tencent Holdings Ltd. | | 2,109,025 | 55,418,415 |
| Tencent Music Entertainment Group ADR (a) | | 245,164 | 885,042 |
| The United Laboratories International Holdings Ltd. | | 414,000 | 173,519 |
| Tianneng Power International Ltd. (c) | | 266,000 | 255,846 |
| Tingyi (Cayman Islands) Holding Corp. | | 696,000 | 1,088,823 |
| Tongcheng Travel Holdings Ltd. (a) | | 430,800 | 671,749 |
| Tongdao Liepin Group (a) | | 98,400 | 85,743 |
| Topsports International Holdings Ltd. (d) | | 761,000 | 383,910 |
| Towngas Smart Energy Co. Ltd. | | 394,892 | 138,344 |
| TPK Holding Co. Ltd. | | 194,000 | 171,421 |
| Trip.com Group Ltd. ADR (a) | | 185,096 | 4,188,722 |
| Truly International Holdings Ltd. | | 824,000 | 100,774 |
| Tuya, Inc. ADR (a)(c) | | 76,723 | 68,560 |
| Uni-President China Holdings Ltd. | | 509,000 | 376,093 |
| Up Fintech Holdings Ltd. ADR (a)(c) | | 35,619 | 131,790 |
| Value Partners Group Ltd. | | 542,000 | 129,119 |
| Vinda International Holdings Ltd. | | 139,000 | 260,659 |
| Vipshop Holdings Ltd. ADR (a) | | 146,974 | 1,024,409 |
| Viva China Holdings Ltd. (a) | | 1,712,000 | 213,737 |
| Vnet Group, Inc. ADR (a) | | 36,800 | 154,192 |
| Vobile Group Ltd. (a) | | 532,000 | 126,737 |
| Want Want China Holdings Ltd. | | 1,664,000 | 1,093,837 |
| Weibo Corp. sponsored ADR (a) | | 26,013 | 294,467 |
| Weimob, Inc. (a)(c)(d) | | 697,000 | 244,183 |
| WH Group Ltd. (d) | | 2,895,500 | 1,464,414 |
| Wharf Real Estate Investment Co. Ltd. | | 567,000 | 2,235,596 |
| Wisdom Marine Lines Co. Ltd. | | 160,000 | 259,441 |
| Wuxi Biologics (Cayman), Inc. (a)(d) | | 1,214,000 | 5,462,566 |
| Wynn Macau Ltd. (a) | | 574,800 | 229,198 |
| XD, Inc. (a) | | 80,800 | 139,991 |
| Xiaomi Corp. Class B (a)(d) | | 5,183,800 | 5,818,002 |
| Xinyi Glass Holdings Ltd. | | 625,000 | 804,176 |
| Xinyi Solar Holdings Ltd. | | 1,669,379 | 1,656,693 |
| XPeng, Inc. ADR (a) | | 141,684 | 937,948 |
| XTEP International Holdings Ltd. | | 465,719 | 427,175 |
| Yadea Group Holdings Ltd. (d) | | 424,000 | 647,101 |
| Yihai International Holding Ltd. | | 174,000 | 286,392 |
| Zai Lab Ltd. ADR (a) | | 30,084 | 670,272 |
| Zhen Ding Technology Holding Ltd. | | 233,000 | 765,734 |
| Zhongsheng Group Holdings Ltd. Class H | | 214,500 | 814,317 |
| Zhou Hei Ya International Holdings Co. Ltd. (d) | | 403,000 | 177,636 |
| ZTO Express, Inc. sponsored ADR | | 144,653 | 2,443,189 |
TOTAL CAYMAN ISLANDS | | | 306,484,090 |
| Chile - 0.1% | | | |
| Aguas Andinas SA | | 1,126,643 | 237,628 |
| Banco de Chile | | 15,204,396 | 1,390,554 |
| Banco de Credito e Inversiones | | 19,828 | 552,494 |
| Banco Santander Chile | | 22,304,874 | 799,051 |
| CAP SA | | 31,201 | 166,961 |
| Cencosud SA | | 528,324 | 711,152 |
| Cencosud Shopping SA | | 173,012 | 189,204 |
| Colbun SA | | 2,846,378 | 279,690 |
| Compania Cervecerias Unidas SA | | 52,151 | 286,043 |
| Compania Sud Americana de Vapores SA | | 5,380,472 | 373,525 |
| Empresa Nacional de Telecomunicaciones SA (ENTEL) | | 58,026 | 180,812 |
| Empresas CMPC SA | | 370,784 | 588,303 |
| Empresas COPEC SA | | 127,855 | 881,095 |
| Enel Americas SA | | 7,049,064 | 698,406 |
| Enel Chile SA | | 10,042,968 | 353,393 |
| Falabella SA | | 246,152 | 481,294 |
| Parque Arauco SA | | 174,455 | 148,661 |
| Vina Concha y Toro SA | | 255,598 | 288,784 |
TOTAL CHILE | | | 8,607,050 |
| China - 2.7% | | | |
| 360 Security Technology, Inc. (A Shares) | | 356,500 | 345,619 |
| 37 Interactive Entertainment Network Technology Group Co. Ltd. (A Shares) | | 76,800 | 152,382 |
| A-Living Smart City Services C (H Shares) (d) | | 307,750 | 174,465 |
| Advanced Micro-Fabrication Equipment, Inc., China (A Shares) (a) | | 11,367 | 172,756 |
| AECC Aviation Power Co. Ltd. | | 46,000 | 306,377 |
| Agricultural Bank of China Ltd.: | | | |
| (A Shares) | | 2,493,200 | 942,260 |
| (H Shares) | | 8,616,000 | 2,459,295 |
| Aier Eye Hospital Group Co. Ltd. (A Shares) | | 156,553 | 529,496 |
| Air China Ltd.: | | | |
| (A Shares) (a) | | 197,600 | 261,648 |
| (H Shares) (a) | | 536,000 | 372,827 |
| Aluminum Corp. of China Ltd. (H Shares) | | 2,068,000 | 589,549 |
| Anhui Conch Cement Co. Ltd. (H Shares) | | 543,000 | 1,397,336 |
| Anhui Gujing Distillery Co. Ltd. (B Shares) | | 106,155 | 1,251,333 |
| Anjoy Foods Group Co. Ltd. (A Shares) | | 9,100 | 167,386 |
| Asymchem Laboratories Tianjin Co. Ltd. (A Shares) | | 7,700 | 150,976 |
| Avary Holding Shenzhen Co. Ltd. (A Shares) | | 24,700 | 100,621 |
| AVIC Electromechanical Systems Co. Ltd. (A Shares) | | 227,300 | 364,158 |
| AviChina Industry & Technology Co. Ltd. (H Shares) | | 953,000 | 417,639 |
| Bank of Beijing Co. Ltd. (A Shares) | | 457,900 | 253,313 |
| Bank of Chengdu Co. Ltd. (A Shares) | | 92,200 | 171,954 |
| Bank of China Ltd.: | | | |
| (A Shares) | | 3,473,300 | 1,431,573 |
| (H Shares) | | 23,187,000 | 7,468,009 |
| Bank of Communications Co. Ltd.: | | | |
| (A Shares) | | 373,200 | 227,408 |
| (H Shares) | | 3,396,000 | 1,656,976 |
| Bank of Hangzhou Co. Ltd. (A Shares) | | 175,300 | 290,690 |
| Bank of Jiangsu Co. Ltd. (A Shares) | | 232,310 | 220,130 |
| Bank of Nanjing Co. Ltd. (A Shares) | | 297,600 | 420,550 |
| Bank of Ningbo Co. Ltd. (A Shares) | | 121,550 | 395,463 |
| Bank of Shanghai Co. Ltd. (A Shares) | | 348,700 | 266,435 |
| Baoshan Iron & Steel Co. Ltd. (A Shares) | | 405,900 | 267,343 |
| Beijing Capital International Airport Co. Ltd. (H Shares) (a) | | 702,000 | 380,081 |
| Beijing Enlight Media Co. Ltd. (A Shares) | | 224,200 | 206,612 |
| Beijing Kingsoft Office Software, Inc. (A Shares) | | 9,912 | 394,612 |
| Beijing New Building Materials PLC (A Shares) | | 47,200 | 128,165 |
| Beijing Shiji Information Technology Co. Ltd. (A Shares) | | 82,320 | 142,481 |
| Beijing Wantai Biological Pharmacy Enterprise Co. Ltd. (A Shares) | | 11,310 | 194,393 |
| Beijing-Shanghai High Speed Railway Co. Ltd. (A Shares) | | 621,100 | 379,316 |
| BGI Genomics Co. Ltd. | | 13,100 | 99,503 |
| Bloomage Biotechnology Corp. Ltd. (A Shares) | | 12,941 | 187,818 |
| BOE Technology Group Co. Ltd. (A Shares) | | 592,500 | 270,981 |
| BYD Co. Ltd.: | | | |
| (A Shares) | | 15,300 | 516,788 |
| (H Shares) | | 306,500 | 6,860,440 |
| CanSino Biologics, Inc. (H Shares) (c)(d) | | 44,400 | 412,910 |
| CGN Power Co. Ltd. (H Shares) (d) | | 4,051,000 | 820,558 |
| Changchun High & New Technology Industry Group, Inc. (A Shares) | | 9,100 | 201,740 |
| Chaozhou Three-Circle Group Co. (A Shares) | | 44,400 | 172,666 |
| Chengxin Lithium Group Co. Ltd. (A Shares) | | 21,700 | 128,425 |
| China BlueChemical Ltd. (H Shares) | | 748,000 | 142,936 |
| China Cinda Asset Management Co. Ltd. (H Shares) | | 3,430,000 | 318,982 |
| China CITIC Bank Corp. Ltd. (H Shares) | | 3,023,000 | 1,139,934 |
| China Coal Energy Co. Ltd. (H Shares) | | 729,000 | 536,791 |
| China Communications Services Corp. Ltd. (H Shares) | | 996,000 | 277,877 |
| China Construction Bank Corp.: | | | |
| (A Shares) | | 772,300 | 564,718 |
| (H Shares) | | 31,602,000 | 16,770,817 |
| China CSSC Holdings Ltd. (A Shares) | | 119,800 | 435,046 |
| China Datang Corp. Renewable Power Co. Ltd. | | 1,029,000 | 277,908 |
| China Eastern Airlines Corp. Ltd. (A Shares) (a) | | 352,700 | 231,820 |
| China Energy Engineering Corp. Ltd. (A Shares) | | 879,000 | 275,632 |
| China Everbright Bank Co. Ltd.: | | | |
| (A Shares) | | 265,800 | 98,998 |
| (H Shares) | | 1,917,000 | 495,756 |
| China Galaxy Securities Co. Ltd. (H Shares) | | 1,493,000 | 559,187 |
| China International Capital Corp. Ltd. (H Shares) (d) | | 628,400 | 874,195 |
| China Jushi Co. Ltd. (A Shares) | | 110,030 | 176,279 |
| China Life Insurance Co. Ltd. (H Shares) | | 2,740,000 | 2,987,854 |
| China Longyuan Power Grid Corp. Ltd. (H Shares) | | 1,158,000 | 1,323,277 |
| China Merchants Bank Co. Ltd.: | | | |
| (A Shares) | | 147,400 | 541,329 |
| (H Shares) | | 1,601,500 | 5,263,763 |
| China Merchants Securities Co. Ltd. (A Shares) | | 99,060 | 169,556 |
| China Merchants Shekou Industrial Zone Holdings Co. Ltd. (A Shares) | | 194,000 | 348,264 |
| China Minsheng Banking Corp. Ltd.: | | | |
| (A Shares) | | 969,100 | 437,912 |
| (H Shares) | | 1,607,000 | 466,767 |
| China National Building Materials Co. Ltd. (H Shares) | | 1,363,350 | 791,994 |
| China National Chemical Engineering Co. Ltd. (A Shares) | | 227,100 | 219,857 |
| China National Nuclear Power Co. Ltd. (A Shares) | | 437,400 | 361,161 |
| China Northern Rare Earth Group High-Tech Co. Ltd. | | 74,700 | 247,537 |
| China Oilfield Services Ltd. (H Shares) | | 652,000 | 734,259 |
| China Pacific Insurance (Group) Co. Ltd. (H Shares) | | 1,145,000 | 1,846,668 |
| China Petroleum & Chemical Corp.: | | | |
| (A Shares) | | 997,100 | 555,697 |
| (H Shares) | | 8,104,000 | 3,211,830 |
| China Railway Group Ltd.: | | | |
| (A Shares) | | 193,400 | 132,148 |
| (H Shares) | | 1,794,000 | 779,339 |
| China Railway Signal & Communications Corp. (A Shares) | | 441,886 | 274,103 |
| China Resources Sanjiu Medical & Pharmaceutical Co. Ltd. (A Shares) | | 27,400 | 204,630 |
| China Shenhua Energy Co. Ltd.: | | | |
| (A Shares) | | 323,800 | 1,242,810 |
| (H Shares) | | 873,000 | 2,296,593 |
| China Southern Airlines Ltd.: | | | |
| (A Shares) (a) | | 373,300 | 330,214 |
| (H Shares) (a) | | 446,000 | 230,112 |
| China State Construction Engineering Corp. Ltd. (A Shares) | | 873,300 | 568,018 |
| China Suntien Green Energy Corp. Ltd. (H Shares) | | 675,000 | 256,253 |
| China Three Gorges Renewables Group Co. Ltd. (A Shares) | | 651,000 | 496,525 |
| China Tourism Group Duty Free Corp. Ltd. (A Shares) | | 39,300 | 862,965 |
| China Tower Corp. Ltd. (H Shares) (d) | | 15,282,000 | 1,382,255 |
| China United Network Communications Ltd. (A Shares) | | 1,588,700 | 730,947 |
| China Vanke Co. Ltd. (H Shares) | | 860,100 | 1,104,483 |
| China Yangtze Power Co. Ltd. (A Shares) | | 428,200 | 1,187,930 |
| China Zhenhua (Group) Science & Technology Co. Ltd. (A Shares) | | 13,400 | 247,435 |
| China Zheshang Bank Co. Ltd. (a) | | 425,900 | 160,961 |
| Chongqing Brewery Co. Ltd. (A Shares) | | 10,900 | 130,479 |
| Chongqing Changan Automobile Co. Ltd. (A Shares) | | 163,982 | 253,510 |
| Chongqing Rural Commercial Bank Co. Ltd. (A Shares) | | 181,000 | 86,499 |
| Chongqing Zhifei Biological Products Co. Ltd. (A Shares) | | 27,700 | 323,923 |
| CITIC Securities Co. Ltd. (H Shares) | | 1,087,350 | 1,626,249 |
| Cmoc Group Ltd. (H Shares) | | 1,995,000 | 643,003 |
| CNGR Advanced Material Co. Ltd. | | 12,300 | 121,486 |
| Contemporary Amperex Technology Co. Ltd. | | 42,600 | 2,175,121 |
| COSCO SHIPPING Holdings Co. Ltd. (H Shares) | | 1,467,100 | 1,583,043 |
| CRRC Corp. Ltd. (A Shares) | | 1,630,800 | 1,060,716 |
| CSC Financial Co. Ltd. (A Shares) | | 89,800 | 290,320 |
| Daqin Railway Co. Ltd. (A Shares) | | 226,300 | 198,631 |
| Dongfeng Motor Group Co. Ltd. (H Shares) | | 970,000 | 438,682 |
| East Money Information Co. Ltd. (A Shares) | | 262,920 | 561,993 |
| Eastern Communications Co. Ltd. (B Shares) | | 794,450 | 326,519 |
| Ecovacs Robotics Co. Ltd. Class A | | 9,100 | 72,646 |
| Eve Energy Co. Ltd. (A shares) | | 39,400 | 448,011 |
| Everbright Securities Co. Ltd. (A Shares) | | 102,900 | 197,546 |
| FAW Jiefang Group Co. Ltd. (A Shares) | | 201,900 | 192,420 |
| Flat Glass Group Co. Ltd. (A Shares) (a) | | 112,800 | 529,795 |
| Focus Media Information Technology Co. Ltd. (A Shares) | | 375,500 | 230,352 |
| Foshan Haitian Flavouring & Food Co. Ltd. (A Shares) | | 66,638 | 544,572 |
| Founder Securities Co. Ltd. (A Shares) | | 236,700 | 205,167 |
| Foxconn Industrial Internet Co. Ltd. (A Shares) | | 280,700 | 315,182 |
| Fuyao Glass Industries Group Co. Ltd. (H Shares) (d) | | 261,600 | 938,136 |
| G-bits Network Technology Xiamen Co. Ltd. (A Shares) | | 5,900 | 205,731 |
| Ganfeng Lithium Group Co. Ltd. (A Shares) | | 72,660 | 786,207 |
| GD Power Development Co. Ltd. (A Shares) (a) | | 580,500 | 347,367 |
| Gemdale Corp. (A Shares) | | 135,900 | 145,523 |
| GF Securities Co. Ltd. (H Shares) | | 623,600 | 634,750 |
| Giant Network Group Co. Ltd. (A Shares) | | 140,314 | 148,712 |
| Gigadevice Semiconductor Beijing, Inc. (A Shares) | | 9,844 | 110,896 |
| Ginlong Technologies Co. Ltd. (A Shares) | | 6,150 | 157,310 |
| GoerTek, Inc. (A Shares) | | 46,100 | 136,856 |
| Gotion High-tech Co. Ltd. (A Shares) | | 36,200 | 148,956 |
| Great Wall Motor Co. Ltd.: | | | |
| (A Shares) | | 70,800 | 282,700 |
| (H Shares) | | 960,500 | 1,048,644 |
| Gree Electric Appliances, Inc. of Zhuhai (A Shares) | | 38,500 | 151,145 |
| Guangdong Haid Group Co. Ltd. (A Shares) | | 38,300 | 302,869 |
| Guanghui Energy Co. Ltd. (A Shares) | | 140,400 | 197,635 |
| Guangzhou Automobile Group Co. Ltd. | | 138,400 | 214,719 |
| Guangzhou Automobile Group Co. Ltd. (H Shares) | | 893,600 | 544,153 |
| Guangzhou Kingmed Diagnostics Group Co. Ltd. (A Shares) | | 14,400 | 148,991 |
| Guangzhou R&F Properties Co. Ltd. (H Shares) (c) | | 707,200 | 96,400 |
| Guangzhou Shiyuan Electronic Technology Co. Ltd. (A Shares) | | 20,600 | 183,521 |
| Guangzhou Tinci Materials Technology Co. Ltd. (A Shares) | | 30,600 | 178,080 |
| Guizhou Zhongyida Co. Ltd. (B Shares) (a) | | 1,136,000 | 449,856 |
| Guotai Junan Securities Co. Ltd. (A Shares) | | 258,300 | 467,585 |
| Haier Smart Home Co. Ltd. | | 691,200 | 1,729,398 |
| Haier Smart Home Co. Ltd. (A Shares) | | 203,600 | 579,890 |
| Hainan Meilan International Airport Co. Ltd. (a) | | 82,000 | 127,445 |
| Haitong Securities Co. Ltd. (H Shares) | | 1,496,400 | 732,030 |
| Hangzhou First Applied Material Co. Ltd. (A Shares) | | 29,000 | 254,384 |
| Hangzhou Silan Microelectronics Co. Ltd. (A Shares) | | 38,200 | 164,247 |
| Hangzhou Steam Turbine Power G | | 563,055 | 770,380 |
| Hangzhou Tigermed Consulting Co. Ltd. (A Shares) | | 41,900 | 478,216 |
| Henan Shuanghui Investment & Development Co. Ltd. (A Shares) | | 52,100 | 162,516 |
| Hengli Petrochemical Co. Ltd. (A Shares) | | 113,920 | 239,293 |
| Hengyi Petrochemical Co. Ltd. (A Shares) | | 144,600 | 132,662 |
| Hoshine Silicon Industry Co. Ltd. (A Shares) | | 11,800 | 154,632 |
| Huadong Medicine Co. Ltd. (A Shares) | | 39,400 | 220,822 |
| Huaneng Power International, Inc.: | | | |
| (A Shares) (a) | | 152,100 | 139,543 |
| (H Shares) (a) | | 1,508,000 | 539,830 |
| Huangshan Tourism Development Co. Ltd. | | 915,889 | 640,206 |
| Huatai Securities Co. Ltd. (H Shares) (d) | | 772,400 | 756,691 |
| Huaxia Bank Co. Ltd. (A Shares) | | 315,000 | 206,610 |
| Huayu Automotive Systems Co. Ltd. (A Shares) | | 56,800 | 130,433 |
| Hubei Xingfa Chemicals Group Co. Ltd. (A Shares) | | 32,100 | 124,261 |
| Huizhou Desay SV Automotive Co. Ltd. | | 13,300 | 188,676 |
| Hundsun Technologies, Inc. (A Shares) | | 36,400 | 207,747 |
| iFlytek Co. Ltd. (A Shares) | | 45,100 | 216,332 |
| IMEIK Technology Development Co. Ltd. (A Shares) | | 3,100 | 178,710 |
| Industrial & Commercial Bank of China Ltd.: | | | |
| (A Shares) | | 1,236,300 | 702,549 |
| (H Shares) | | 18,934,000 | 8,220,488 |
| Industrial Bank Co. Ltd. (A Shares) | | 330,000 | 679,169 |
| Ingenic Semiconductor Co. Ltd. (A Shares) | | 11,700 | 108,879 |
| Inner Mongoli Yili Industries Co. Ltd. (A Shares) | | 81,400 | 281,332 |
| Inner Mongolia Baotou Steel Union Co. Ltd. (A Shares) | | 744,800 | 179,497 |
| Inner Mongolia Junzheng Energy & Chemical Industry Group Co. Ltd. (A Shares) | | 207,700 | 110,350 |
| Inner Mongolia Yitai Coal Co. Ltd. (B Shares) | | 767,373 | 1,085,065 |
| JA Solar Technology Co. Ltd. (A Shares) | | 41,440 | 354,654 |
| Jafron Biomedical Co. Ltd. (A Shares) | | 23,100 | 100,208 |
| JCET Group Co. Ltd. (A Shares) | | 49,900 | 164,536 |
| Jiangsu Eastern Shenghong Co. Ltd. | | 75,000 | 125,703 |
| Jiangsu Expressway Co. Ltd. (H Shares) | | 404,000 | 284,614 |
| Jiangsu Hengli Hydraulic Co. Ltd. | | 24,736 | 186,869 |
| Jiangsu Hengrui Medicine Co. Ltd. (A Shares) | | 116,424 | 640,875 |
| Jiangsu King's Luck Brewery JSC Ltd. (A Shares) | | 36,200 | 185,290 |
| Jiangsu Yanghe Brewery JSC Ltd. (A Shares) | | 23,700 | 423,997 |
| Jiangsu Zhongtian Technology Co. Ltd. (A Shares) | | 82,900 | 249,396 |
| Jiangxi Copper Co. Ltd. (H Shares) | | 542,000 | 592,429 |
| Jiangxi Special Electric Motor Co. Ltd. (A Shares) (a) | | 38,700 | 101,110 |
| JiuGui Liquor Co. Ltd. (A Shares) | | 7,500 | 104,804 |
| Konka Group Co. Ltd. (B Shares) | | 1,930,700 | 487,001 |
| Kuang-Chi Technologies Co. Ltd. (A Shares) (a) | | 44,500 | 105,417 |
| Kunlun Tech Co. Ltd. (A Shares) | | 72,621 | 129,373 |
| Kweichow Moutai Co. Ltd. (A Shares) | | 21,900 | 4,029,521 |
| Lb Group Co. Ltd. (A Shares) | | 44,200 | 93,025 |
| Lens Technology Co. Ltd. (A Shares) | | 121,400 | 165,570 |
| LONGi Green Energy Technology Co. Ltd. | | 133,056 | 874,177 |
| Luxshare Precision Industry Co. Ltd. (A Shares) | | 117,878 | 460,026 |
| Luzhou Laojiao Co. Ltd. (A Shares) | | 30,500 | 652,984 |
| Mango Excellent Media Co. Ltd. (A Shares) | | 50,479 | 151,584 |
| Maxscend Microelectronics Co. Ltd. (A Shares) | | 9,088 | 114,936 |
| Metallurgical Corp. China Ltd. (A Shares) | | 638,200 | 251,683 |
| Ming Yang Smart Energy Group Ltd. (A Shares) | | 69,700 | 237,649 |
| Montage Technology Co. Ltd. (A Shares) | | 20,717 | 160,961 |
| Muyuan Foodstuff Co. Ltd. (A Shares) | | 109,266 | 699,922 |
| NARI Technology Co. Ltd. (A Shares) | | 117,192 | 391,555 |
| National Silicon Industry Group Co. Ltd. (A Shares) (a) | | 50,067 | 139,241 |
| NAURA Technology Group Co. Ltd. | | 9,400 | 341,998 |
| New China Life Insurance Co. Ltd. (H Shares) | | 399,600 | 634,298 |
| New Hope Liuhe Co. Ltd. (A Shares) (a) | | 70,300 | 124,083 |
| Ninestar Corp. (A Shares) | | 42,000 | 328,448 |
| Ningbo Deye Technology Co. Ltd. (A Shares) | | 3,200 | 143,360 |
| Ningbo Orient Wires & Cables Co. Ltd. (A Shares) | | 16,100 | 169,754 |
| Ningbo Ronbay New Energy Technology Co. Ltd. (A Shares) | | 13,082 | 140,280 |
| Ningbo Shanshan Co. Ltd. (A Shares) | | 76,900 | 189,331 |
| Ningbo Tuopu Group Co. Ltd. (A Shares) | | 26,500 | 235,139 |
| Ningxia Baofeng Energy Group Co. Ltd. | | 156,900 | 246,429 |
| Nongfu Spring Co. Ltd. (H Shares) (d) | | 602,800 | 3,029,493 |
| Oppein Home Group, Inc. (A Shares) | | 18,100 | 201,797 |
| Orient Securities Co. Ltd. (A Shares) | | 121,984 | 129,619 |
| Ovctek China, Inc. (A Shares) | | 18,700 | 76,102 |
| People's Insurance Co. of China Group Ltd. (H Shares) | | 3,295,000 | 910,888 |
| Perfect World Co. Ltd. (A Shares) | | 85,200 | 132,883 |
| PetroChina Co. Ltd. (H Shares) | | 7,854,000 | 3,001,662 |
| Pharmaron Beijing Co. Ltd.: | | | |
| (A Shares) | | 17,550 | 124,964 |
| (H Shares) (d) | | 80,250 | 269,897 |
| PICC Property & Casualty Co. Ltd. (H Shares) | | 2,369,000 | 2,185,010 |
| Ping An Bank Co. Ltd. (A Shares) | | 436,300 | 617,747 |
| Ping An Insurance Group Co. of China Ltd.: | | | |
| (A Shares) | | 239,590 | 1,185,992 |
| (H Shares) | | 2,115,000 | 8,467,171 |
| Pingdingshan Tianan Coal Mining Co. Ltd. A Shares | | 61,000 | 92,048 |
| Poly Developments & Holdings (A Shares) | | 276,300 | 522,113 |
| Postal Savings Bank of China Co. Ltd. (H Shares) (d) | | 3,275,000 | 1,518,666 |
| Power Construction Corp. of China Ltd. (A Shares) | | 312,200 | 300,961 |
| Rongsheng Petrochemical Co. Ltd. (A Shares) | | 178,650 | 261,753 |
| SAIC Motor Corp. Ltd. (A Shares) | | 181,600 | 341,919 |
| Sangfor Technologies, Inc. | | 10,400 | 179,436 |
| Sany Heavy Industry Co. Ltd. (A Shares) | | 154,100 | 284,866 |
| Satellite Chemical Co. Ltd. (A Shares) | | 84,819 | 144,019 |
| SDIC Power Holdings Co. Ltd. (A Shares) | | 259,500 | 358,892 |
| Seazen Holdings Co. Ltd. (A Shares) (a) | | 60,500 | 109,271 |
| SF Holding Co. Ltd. (A Shares) | | 102,300 | 676,033 |
| SG Micro Corp. (A Shares) | | 8,550 | 175,217 |
| Shaanxi Coal Industry Co. Ltd. (A Shares) | | 169,600 | 461,222 |
| Shandong Gold Mining Co. Ltd. (A Shares) | | 221,560 | 524,858 |
| Shandong Hualu Hengsheng Chemical Co. Ltd. (A Shares) | | 28,100 | 100,735 |
| Shandong Weigao Medical Polymer Co. Ltd. (H Shares) | | 876,400 | 1,208,035 |
| Shanghai Baosight Software Co. Ltd. | | 463,082 | 1,395,266 |
| Shanghai Baosight Software Co. Ltd. (A Shares) | | 59,540 | 345,032 |
| Shanghai Chlor Alkali Co. Ltd. (B Shares) | | 786,942 | 485,543 |
| Shanghai Diesel Engine Co. Ltd. (B Shares) | | 599,986 | 239,994 |
| Shanghai Electric Group Co. Ltd. (A Shares) (a) | | 365,700 | 194,295 |
| Shanghai Fosun Pharmaceutical (Group) Co. Ltd. (H Shares) | | 261,000 | 659,013 |
| Shanghai Haixin Group Co. Ltd. (B Shares) | | 2,222,826 | 686,853 |
| Shanghai Highly Group Co. Ltd. (B Shares) | | 1,069,645 | 489,897 |
| Shanghai International Port Group Co. Ltd. (A Shares) | | 299,300 | 211,886 |
| Shanghai Jinjiang International Hotels Co. Ltd. (A Shares) | | 40,000 | 298,402 |
| Shanghai Jinqiao Export Processing Zone Development Co. Ltd. (B Shares) | | 781,771 | 673,887 |
| Shanghai Junshi Biosciences Co. Ltd. (A Shares) (a) | | 14,900 | 144,983 |
| Shanghai Lujiazui Finance Trust Ltd. (B Shares) | | 2,466,942 | 1,830,471 |
| Shanghai M&G Stationery, Inc. (A Shares) | | 26,000 | 143,477 |
| Shanghai Pharmaceuticals Holding Co. Ltd. (H Shares) | | 377,500 | 511,692 |
| Shanghai Pudong Development Bank Co. Ltd. (A Shares) | | 580,400 | 527,716 |
| Shanghai Putailai New Energy Technology Co. Ltd. | | 24,000 | 164,023 |
| Shanghai Shangling Electric Appliances Co. Ltd. (B Shares) | | 682,746 | 703,228 |
| Shanxi Lu'an Environmental Energy Development Co. Ltd. (A Shares) | | 86,700 | 199,331 |
| Shanxi Meijin Energy Co. Ltd. (A Shares) | | 117,600 | 141,064 |
| Shanxi Xinghuacun Fen Wine Factory Co. Ltd. (A Shares) | | 24,200 | 770,050 |
| Shanxi Xishan Coal & Electricity Power Co. Ltd. (A Shares) | | 102,700 | 160,177 |
| Shenwan Hongyuan Group Co. Ltd. (A Shares) | | 313,800 | 167,150 |
| Shenzhen Dynanonic Co. Ltd. (A Shares) | | 3,700 | 130,715 |
| Shenzhen Inovance Technology Co. Ltd. (A Shares) | | 59,500 | 543,435 |
| Shenzhen Kangtai Biological Products Co. Ltd. | | 17,760 | 75,681 |
| Shenzhen Mindray Bio-Medical Electronics Co. Ltd. (A Shares) | | 21,900 | 975,932 |
| Shenzhen Overseas Chinese Town Co. Ltd. (A Shares) | | 353,500 | 203,303 |
| Shenzhen Transsion Holdings Co. Ltd. (A Shares) | | 18,491 | 157,314 |
| Sichuan Road & Bridge (Group) Co. Ltd. (A Shares) | | 158,400 | 244,013 |
| Sichuan Swellfun Co. Ltd. (A Shares) | | 12,500 | 96,845 |
| Sinoma Science & Technology Co. Ltd. (A Shares) | | 60,100 | 147,392 |
| Sinopec Engineering Group Co. Ltd. (H Shares) | | 809,500 | 289,783 |
| Sinopharm Group Co. Ltd. (H Shares) | | 485,600 | 925,465 |
| SKSHU Paint Co. Ltd. (A Shares) (a) | | 10,500 | 124,944 |
| Songcheng Performance Development Co. Ltd. (A Shares) | | 75,982 | 119,858 |
| StarPower Semiconductor Ltd. (A Shares) | | 4,100 | 209,242 |
| Sungrow Power Supply Co. Ltd. (A Shares) | | 26,400 | 471,070 |
| Sunwoda Electronic Co. Ltd. (A Shares) | | 44,800 | 142,935 |
| Suzhou Maxwell Technologies Co. Ltd. (A Shares) | | 4,960 | 324,310 |
| Suzhou TA&A Ultra Clean Technology Co. Ltd. (A Shares) | | 15,900 | 134,661 |
| TBEA Co. Ltd. (A Shares) | | 112,800 | 315,251 |
| TCL Technology Group Corp. (A Shares) | | 260,100 | 139,259 |
| TCL Zhonghuan Renewable Energy Technology Co. Ltd. (A Shares) | | 58,700 | 317,497 |
| Thunder Software Technology Co. Ltd. (A Shares) | | 13,300 | 179,825 |
| Tianma Microelectronics Co. Ltd. (A Shares) | | 100,800 | 122,016 |
| Tianshui Huatian Technology Co. Ltd. (A Shares) | | 163,600 | 197,586 |
| Tong Ren Tang Technologies Co. Ltd. (H Shares) | | 328,000 | 168,395 |
| TongFu Microelectronics Co. Ltd. (A Shares) (a) | | 68,600 | 176,880 |
| Tongwei Co. Ltd. (A Shares) | | 89,500 | 533,110 |
| Topchoice Medical Corp. (a) | | 7,100 | 118,853 |
| TravelSky Technology Ltd. (H Shares) | | 336,000 | 487,971 |
| Trina Solar Co. Ltd. (A Shares) | | 39,313 | 357,606 |
| Tsingtao Brewery Co. Ltd. (H Shares) | | 236,000 | 1,653,577 |
| Unigroup Guoxin Microelectronics Co. Ltd. | | 14,559 | 327,168 |
| Unisplendour Corp. Ltd. (A Shares) | | 70,160 | 164,762 |
| Venus MedTech Hangzhou, Inc. (H Shares) (a)(d) | | 116,000 | 142,605 |
| Walvax Biotechnology Co. Ltd. (A Shares) | | 40,600 | 213,760 |
| Wanhua Chemical Group Co. Ltd. (A Shares) | | 56,600 | 622,818 |
| Weichai Power Co. Ltd. (H Shares) | | 840,000 | 804,724 |
| Wens Foodstuffs Group Co. Ltd. (A Shares) (a) | | 151,800 | 372,074 |
| Western Superconducting Technologies Co. Ltd. (A Shares) | | 14,052 | 224,473 |
| Will Semiconductor Ltd. | | 21,195 | 212,940 |
| Wingtech Technology Co. Ltd. (A Shares) | | 28,400 | 186,199 |
| Winning Health Technology Group Co. Ltd. (A Shares) | | 226,004 | 299,568 |
| Wuhan Guide Infrared Co. Ltd. (A Shares) | | 94,236 | 149,814 |
| Wuliangye Yibin Co. Ltd. (A Shares) | | 68,900 | 1,259,520 |
| WuXi AppTec Co. Ltd. | | 17,516 | 183,245 |
| WuXi AppTec Co. Ltd. (H Shares) (d) | | 170,897 | 1,369,414 |
| Wuxi Shangji Automation Co. Ltd. (A Shares) | | 11,760 | 197,232 |
| Xiamen Faratronic Co. Ltd. (A Shares) | | 8,000 | 194,016 |
| Xinjiang Goldwind Science & Technology Co. Ltd. (H Shares) | | 404,192 | 350,659 |
| Yankuang Energy Group Co. Ltd. (H Shares) | | 614,000 | 1,728,663 |
| Yealink Network Technology Corp. Ltd. | | 19,800 | 186,751 |
| Yihai Kerry Arawana Holdings Co. Ltd. (A Shares) | | 26,600 | 139,321 |
| YongXing Special Materials Technology Co. Ltd. (A Shares) | | 10,200 | 162,674 |
| Yonyou Network Technology Co. Ltd. (A Shares) | | 117,759 | 394,094 |
| YTO Express Group Co. Ltd. (A Shares) | | 84,900 | 219,257 |
| Yunda Holding Co. Ltd. (A Shares) | | 73,060 | 131,856 |
| Yunnan Baiyao Group Co. Ltd. (A Shares) | | 44,940 | 335,747 |
| Yunnan Botanee Bio-Technology Group Co., Ltd. (A Shares) | | 9,200 | 180,148 |
| Yunnan Energy New Material Co. Ltd. | | 18,100 | 366,912 |
| Zhangzhou Pientzehuang Pharmaceutical Co. Ltd. (A Shares) | | 15,900 | 496,406 |
| Zhaojin Mining Industry Co. Ltd. (H Shares) (a) | | 465,000 | 383,864 |
| Zhejiang Century Huatong Group Co. Ltd. (A Shares) (a) | | 399,300 | 201,758 |
| Zhejiang Chint Electric Co. Ltd. (A Shares) | | 59,900 | 208,336 |
| Zhejiang Dahua Technology Co. Ltd. (A Shares) | | 51,300 | 81,345 |
| Zhejiang Expressway Co. Ltd. (H Shares) | | 488,000 | 302,760 |
| Zhejiang Huayou Cobalt Co. Ltd. (A Shares) | | 31,460 | 234,693 |
| Zhejiang Jingsheng Mechanical & Electrical Co. Ltd. (A Shares) | | 24,200 | 236,138 |
| Zhejiang NHU Co. Ltd. (A Shares) | | 92,840 | 227,813 |
| Zhejiang Semir Garment Co. Ltd. (A Shares) | | 161,500 | 99,073 |
| Zhejiang Weiming Enviroment Protection Co. Ltd. (A Shares) | | 67,080 | 173,879 |
| Zhejiang Yongtai Technology Co. Ltd. (A Shares) | | 24,700 | 73,800 |
| ZhongAn Online P & C Insurance Co. Ltd. (H Shares) (a)(d) | | 252,900 | 471,027 |
| Zhuzhou CRRC Times Electric Co. Ltd.: | | | |
| (A Shares) | | 21,033 | 180,812 |
| (H Shares) | | 172,000 | 746,097 |
| Zijin Mining Group Co. Ltd. (H Shares) | | 2,430,000 | 2,321,760 |
| Zoomlion Heavy Industry Science and Technology Co. Ltd.: | | | |
| (A Shares) | | 216,400 | 158,532 |
| (H Shares) | | 398,200 | 128,343 |
| ZTE Corp. (H Shares) | | 397,200 | 708,414 |
TOTAL CHINA | | | 213,509,585 |
| Colombia - 0.0% | | | |
| Bancolombia SA | | 102,055 | 733,577 |
| Cementos Argos SA | | 183,582 | 123,782 |
| Corporacion Financiera Colombiana SA | | 33,501 | 109,211 |
| Ecopetrol SA | | 1,642,716 | 814,914 |
| Grupo Argos SA | | 110,915 | 230,196 |
| Interconexion Electrica SA ESP | | 151,358 | 590,568 |
TOTAL COLOMBIA | | | 2,602,248 |
| Cyprus - 0.0% | | | |
| Galaxy Cosmos Mezz PLC (a) | | 26,761 | 4,321 |
| Ozon Holdings PLC ADR (a)(b) | | 17,054 | 53,578 |
| Sunrisemezz Ltd. (a) | | 44,592 | 3,609 |
| TCS Group Holding PLC unit (a)(b) | | 36,283 | 69,283 |
TOTAL CYPRUS | | | 130,791 |
| Czech Republic - 0.0% | | | |
| CEZ A/S | | 54,465 | 1,781,195 |
| Komercni Banka A/S | | 28,462 | 816,467 |
| MONETA Money Bank A/S (d) | | 148,575 | 433,704 |
TOTAL CZECH REPUBLIC | | | 3,031,366 |
| Denmark - 1.7% | | | |
| A.P. Moller - Maersk A/S: | | | |
| Series A | | 1,201 | 2,403,817 |
| Series B | | 1,530 | 3,196,434 |
| ALK-Abello A/S (a) | | 44,178 | 731,775 |
| Alm. Brand A/S | | 292,060 | 399,270 |
| Ambu A/S Series B (c) | | 57,273 | 641,274 |
| Bavarian Nordic A/S (a) | | 24,038 | 765,714 |
| Better Collective A/S (a) | | 12,428 | 161,524 |
| Carlsberg A/S Series B | | 32,393 | 3,814,137 |
| Chemometec A/S | | 5,841 | 550,818 |
| Chr. Hansen Holding A/S | | 35,226 | 1,956,490 |
| Coloplast A/S Series B | | 39,837 | 4,440,638 |
| D/S Norden A/S | | 7,913 | 410,443 |
| Danske Bank A/S | | 226,650 | 3,658,023 |
| Demant A/S (a) | | 30,919 | 844,965 |
| DFDS A/S | | 12,564 | 381,541 |
| DSV A/S | | 63,087 | 8,540,772 |
| FLSmidth & Co. A/S | | 16,963 | 392,313 |
| Genmab A/S (a) | | 22,171 | 8,540,441 |
| GN Store Nord A/S | | 43,292 | 920,507 |
| H Lundbeck A/S | | 107,511 | 401,973 |
| ISS A/S (a) | | 52,920 | 971,402 |
| Jyske Bank A/S (Reg.) (a) | | 17,488 | 944,231 |
| Matas A/S | | 18,241 | 174,559 |
| Netcompany Group A/S (a)(d) | | 13,389 | 459,551 |
| Nilfisk Holding A/S (a) | | 5,420 | 100,713 |
| NKT A/S (a) | | 14,324 | 715,601 |
| Novo Nordisk A/S Series B | | 558,158 | 60,689,223 |
| Novozymes A/S Series B | | 68,328 | 3,588,574 |
| ORSTED A/S (d) | | 63,410 | 5,231,690 |
| Pandora A/S | | 30,104 | 1,586,650 |
| Per Aarsleff Holding A/S | | 7,251 | 202,585 |
| Ringkjoebing Landbobank A/S | | 9,392 | 1,022,184 |
| Rockwool International A/S Series B | | 2,973 | 591,893 |
| Royal Unibrew A/S | | 17,081 | 975,532 |
| Scandinavian Tobacco Group A/S (d) | | 18,962 | 317,866 |
| Schouw & Co. | | 4,176 | 264,939 |
| SimCorp A/S | | 13,320 | 795,562 |
| Solar Holding A/S | | 1,894 | 142,786 |
| Spar Nord Bank A/S | | 30,293 | 366,686 |
| Sydbank A/S | | 21,176 | 645,317 |
| Topdanmark A/S | | 15,007 | 693,155 |
| Tryg A/S | | 115,659 | 2,502,980 |
| Vestas Wind Systems A/S | | 340,231 | 6,707,200 |
| Zealand Pharma A/S (a) | | 12,854 | 331,318 |
TOTAL DENMARK | | | 133,175,066 |
| Egypt - 0.0% | | | |
| Commercial International Bank SAE | | 939,500 | 1,259,144 |
| Eastern Co. SAE | | 551,870 | 271,426 |
| EFG-Hermes Holding SAE | | 480,154 | 266,145 |
| Elsewedy Electric Co. (a) | | 541,769 | 190,936 |
| Fawry for Banking & Payment Technology Services SAE (a) | | 667,019 | 109,261 |
| Talaat Moustafa Group Holding | | 660,996 | 225,573 |
TOTAL EGYPT | | | 2,322,485 |
| Faroe Islands - 0.0% | | | |
| Bakkafrost | | 17,281 | 863,539 |
| Finland - 0.8% | | | |
| Cargotec Corp. (B Shares) | | 14,210 | 534,759 |
| Caverion Oyj | | 57,239 | 254,266 |
| Citycon Oyj | | 39,588 | 246,670 |
| Elisa Corp. (A Shares) | | 48,827 | 2,360,068 |
| F-Secure Corp. (a) | | 44,486 | 125,735 |
| Fortum Corp. | | 151,450 | 2,132,056 |
| Harvia Oyj | | 8,275 | 117,433 |
| Huhtamaki Oyj | | 34,973 | 1,256,331 |
| Kemira Oyj | | 45,313 | 598,268 |
| Kesko Oyj | | 95,129 | 1,852,021 |
| Kojamo OYJ | | 45,666 | 594,355 |
| Kone OYJ (B Shares) | | 114,920 | 4,705,492 |
| Konecranes Oyj | | 22,697 | 571,076 |
| Metsa Board OYJ (B Shares) | | 65,586 | 493,245 |
| Metso Outotec Oyj | | 226,842 | 1,722,125 |
| Musti Group OYJ | | 14,256 | 267,963 |
| Neste OYJ | | 142,769 | 6,255,996 |
| Nokia Corp. | | 1,824,996 | 8,110,133 |
| Nokian Tyres PLC | | 47,197 | 532,190 |
| Nordea Bank ABP | | 1,145,436 | 10,946,854 |
| Oriola-KD Oyj | | 62,325 | 113,084 |
| Orion Oyj (B Shares) | | 36,345 | 1,671,980 |
| Outokumpu Oyj (A Shares) | | 135,107 | 542,490 |
| Qt Group Oyj (a)(c) | | 5,814 | 248,558 |
| Revenio Group Oyj | | 9,899 | 368,416 |
| Sampo Oyj (A Shares) | | 162,215 | 7,419,099 |
| Sanoma Corp. | | 26,408 | 309,519 |
| Stora Enso Oyj (R Shares) | | 186,670 | 2,433,247 |
| TietoEVRY Oyj | | 31,843 | 759,658 |
| Tokmanni Group Corp. | | 21,697 | 262,451 |
| UPM-Kymmene Corp. | | 179,815 | 6,025,881 |
| Uponor Oyj | | 26,301 | 349,332 |
| Valmet Corp. | | 57,444 | 1,307,391 |
| Wartsila Corp. | | 163,626 | 1,115,753 |
| YIT OYJ | | 65,895 | 165,276 |
TOTAL FINLAND | | | 66,769,171 |
| France - 6.2% | | | |
| Accor SA (a) | | 57,641 | 1,381,163 |
| Aeroports de Paris SA (a) | | 9,354 | 1,266,903 |
| Air France KLM (Reg.) (a) | | 461,277 | 606,974 |
| Air Liquide SA | | 175,582 | 22,968,542 |
| ALD SA (c)(d) | | 32,075 | 342,340 |
| Alstom SA | | 106,089 | 2,183,444 |
| Altarea SCA (c) | | 1,443 | 192,231 |
| ALTEN | | 9,924 | 1,160,215 |
| Amundi SA (d) | | 19,539 | 922,604 |
| Antin Infrastructure Partners SA | | 12,068 | 262,615 |
| Arkema SA | | 20,078 | 1,589,748 |
| Atos SE (a)(c) | | 33,678 | 328,829 |
| AXA SA | | 626,354 | 15,467,754 |
| Beneteau SA | | 14,177 | 157,197 |
| BIC SA | | 8,940 | 513,311 |
| bioMerieux SA | | 14,261 | 1,261,926 |
| BNP Paribas SA | | 372,599 | 17,472,628 |
| Boiron SA | | 3,954 | 180,528 |
| Bollore SA | | 282,033 | 1,411,712 |
| Bonduelle SCA | | 8,084 | 93,951 |
| Bouygues SA | | 75,186 | 2,145,145 |
| Bureau Veritas SA | | 99,733 | 2,470,928 |
| Capgemini SA | | 54,973 | 9,009,572 |
| Carmila SA | | 20,433 | 285,932 |
| Carrefour SA | | 203,487 | 3,275,216 |
| Casino Guichard Perrachon SA (a)(c) | | 19,278 | 185,561 |
| CGG SA (a) | | 250,941 | 213,026 |
| Chargeurs SA (c) | | 9,139 | 120,843 |
| Coface SA | | 40,264 | 448,443 |
| Compagnie de St. Gobain | | 168,435 | 6,885,786 |
| Compagnie Generale des Etablissements Michelin SCA Series B | | 226,593 | 5,774,510 |
| Compagnie Plastic Omnium SA | | 20,842 | 292,273 |
| Covivio | | 16,479 | 882,667 |
| Credit Agricole SA | | 396,574 | 3,598,378 |
| Danone SA | | 214,426 | 10,656,869 |
| Dassault Aviation SA | | 8,537 | 1,268,878 |
| Dassault Systemes SA | | 222,106 | 7,444,722 |
| Derichebourg | | 37,238 | 162,732 |
| Edenred SA | | 83,028 | 4,263,444 |
| Eiffage SA | | 27,828 | 2,517,443 |
| Electricite de France SA | | 186,930 | 2,207,566 |
| Elior SA (a)(c)(d) | | 61,863 | 137,556 |
| Elis SA | | 66,405 | 761,903 |
| Engie SA | | 610,785 | 7,936,153 |
| Eramet SA | | 3,598 | 235,922 |
| Esker SA | | 1,973 | 259,131 |
| EssilorLuxottica SA | | 96,960 | 15,364,853 |
| Eurazeo SA | | 14,514 | 829,052 |
| Euroapi SASU (a) | | 23,237 | 406,577 |
| Eutelsat Communications (c) | | 58,209 | 584,454 |
| Faurecia SA (a) | | 53,917 | 805,646 |
| Fnac Darty SA | | 6,694 | 206,928 |
| Gaztransport et Technigaz SA | | 8,823 | 1,026,265 |
| Gecina SA | | 15,112 | 1,347,833 |
| Getlink SE | | 143,562 | 2,274,259 |
| Hermes International SCA | | 10,636 | 13,774,701 |
| ICADE | | 11,216 | 417,431 |
| ID Logistics Group (a) | | 1,132 | 304,286 |
| Imerys SA | | 13,920 | 570,342 |
| Interparfums SA | | 7,441 | 358,854 |
| Ipsen SA | | 12,785 | 1,314,017 |
| Ipsos SA | | 13,471 | 652,323 |
| JCDecaux SA (a) | | 21,684 | 273,651 |
| Kaufman & Broad SA | | 5,799 | 140,979 |
| Kering SA | | 24,961 | 11,431,172 |
| Klepierre SA | | 71,736 | 1,442,675 |
| Korian SA | | 26,957 | 254,681 |
| L'Oreal SA | | 81,112 | 25,469,524 |
| La Francaise des Jeux SAEM (d) | | 36,789 | 1,199,772 |
| Legrand SA | | 90,312 | 6,882,199 |
| LISI | | 7,750 | 153,026 |
| LVMH Moet Hennessy Louis Vuitton SE | | 93,202 | 58,809,986 |
| Maisons du Monde SA (d) | | 12,649 | 124,004 |
| Mercialys SA | | 30,370 | 263,065 |
| Mersen SA | | 9,207 | 298,441 |
| Neoen SA (d) | | 17,455 | 609,267 |
| Nexans SA | | 8,754 | 818,398 |
| Nexity | | 14,813 | 296,878 |
| Orange SA | | 664,768 | 6,333,853 |
| Orpea (a)(c) | | 18,039 | 146,396 |
| Pernod Ricard SA | | 70,503 | 12,381,175 |
| Peugeot Invest | | 1,998 | 164,675 |
| Publicis Groupe SA | | 76,626 | 4,291,393 |
| Quadient SA | | 13,105 | 184,422 |
| Remy Cointreau SA | | 7,915 | 1,213,192 |
| Renault SA (a) | | 64,154 | 1,976,184 |
| Rexel SA | | 82,782 | 1,481,158 |
| Rubis SCA | | 32,129 | 730,284 |
| Safran SA | | 114,872 | 12,793,293 |
| Sanofi SA | | 383,858 | 33,033,999 |
| Sartorius Stedim Biotech | | 9,412 | 2,987,613 |
| Schneider Electric SA | | 182,896 | 23,128,373 |
| SCOR SE | | 51,905 | 780,968 |
| SEB SA | | 8,409 | 547,642 |
| SES-imagotag SA (a) | | 1,812 | 205,932 |
| Societe Generale Series A | | 265,745 | 6,095,404 |
| Sodexo SA | | 29,755 | 2,638,839 |
| Soitec SA (a) | | 8,881 | 1,140,525 |
| Somfy SA | | 2,759 | 293,926 |
| Sopra Steria Group | | 5,360 | 709,801 |
| SPIE SA | | 45,934 | 1,074,936 |
| Technicolor Creative Studios (a)(c) | | 94,940 | 147,961 |
| Teleperformance | | 19,849 | 5,321,760 |
| Television Francaise 1 SA | | 15,595 | 98,943 |
| Thales SA | | 35,949 | 4,570,497 |
| TotalEnergies SE | | 835,825 | 45,597,068 |
| Trigano SA | | 3,224 | 330,082 |
| Ubisoft Entertainment SA (a) | | 31,495 | 864,339 |
| Valeo SA | | 69,855 | 1,152,181 |
| Vallourec SA (a) | | 33,231 | 353,857 |
| Valneva SE (a)(c) | | 37,984 | 256,983 |
| Vantiva SA (a) | | 94,940 | 70,603 |
| Veolia Environnement SA | | 222,739 | 4,970,648 |
| Verallia SA (d) | | 26,796 | 759,479 |
| Vicat SA | | 9,264 | 212,399 |
| VINCI SA | | 178,398 | 16,419,220 |
| Virbac SA | | 1,443 | 353,659 |
| Vivendi SA | | 233,390 | 1,910,293 |
| Voltalia SA (a) | | 11,992 | 228,489 |
| Wendel SA | | 9,343 | 732,194 |
| Worldline SA (a)(d) | | 80,534 | 3,515,027 |
TOTAL FRANCE | | | 494,110,418 |
| Germany - 4.3% | | | |
| 1&1 AG | | 27,049 | 356,594 |
| Aareal Bank AG (a) | | 20,889 | 660,594 |
| Adesso AG | | 1,325 | 131,205 |
| adidas AG | | 57,594 | 5,622,045 |
| Aixtron AG | | 39,058 | 960,731 |
| Allianz SE | | 136,420 | 24,542,574 |
| Amadeus Fire AG | | 2,392 | 241,590 |
| AURELIUS AG | | 12,349 | 261,408 |
| Aurubis AG | | 10,841 | 684,814 |
| Auto1 Group SE (a)(d) | | 30,684 | 206,654 |
| BASF AG | | 308,983 | 13,864,277 |
| Bayer AG | | 330,598 | 17,383,198 |
| Bayerische Motoren Werke AG (BMW) | | 89,646 | 7,036,489 |
| BayWa AG | | 6,918 | 312,096 |
| Bechtle AG | | 28,172 | 974,434 |
| Befesa SA (d) | | 15,195 | 527,678 |
| Beiersdorf AG | | 33,620 | 3,227,359 |
| Bilfinger Berger AG (c) | | 11,180 | 311,572 |
| Borussia Dortmund GmbH & Co. KGaA (a)(c) | | 32,518 | 120,510 |
| Brenntag SE | | 51,334 | 3,114,760 |
| CANCOM AG | | 13,983 | 346,020 |
| Carl Zeiss Meditec AG | | 13,561 | 1,642,373 |
| CECONOMY AG (c) | | 61,062 | 99,508 |
| Cewe Stiftung & Co. KGAA | | 3,508 | 274,916 |
| Commerzbank AG (a) | | 358,571 | 2,868,881 |
| CompuGroup Medical AG | | 9,178 | 290,245 |
| Continental AG | | 36,732 | 1,902,559 |
| Covestro AG (d) | | 65,742 | 2,231,680 |
| CTS Eventim AG (a) | | 21,475 | 1,025,904 |
| Daimler Truck Holding AG (a) | | 149,699 | 3,994,381 |
| Delivery Hero AG (a)(d) | | 54,678 | 1,799,394 |
| Dermapharm Holding SE | | 6,635 | 252,446 |
| Deutsche Bank AG | | 692,138 | 6,607,492 |
| Deutsche Beteiligungs AG (c) | | 6,402 | 162,282 |
| Deutsche Borse AG | | 63,636 | 10,348,472 |
| Deutsche EuroShop AG (c) | | 6,500 | 139,393 |
| Deutsche Lufthansa AG (a) | | 199,373 | 1,363,115 |
| Deutsche Pfandbriefbank AG (d) | | 50,979 | 380,117 |
| Deutsche Post AG | | 334,264 | 11,816,175 |
| Deutsche Telekom AG | | 1,082,878 | 20,439,863 |
| Deutz AG | | 49,613 | 187,491 |
| DIC Asset AG | | 29,110 | 200,800 |
| Draegerwerk AG & Co. KGaA | | 423 | 15,279 |
| Duerr AG | | 19,386 | 513,057 |
| E.ON SE | | 745,339 | 6,241,464 |
| Eckert & Ziegler Strahlen-und Medizintechnik AG | | 5,547 | 219,492 |
| ELMOS Semiconductor AG | | 3,634 | 166,098 |
| Encavis AG (c) | | 41,926 | 781,019 |
| Energiekontor AG | | 2,635 | 234,103 |
| Evonik Industries AG | | 72,075 | 1,328,761 |
| Evotec OAI AG (a) | | 48,350 | 922,907 |
| Fielmann AG | | 10,278 | 327,672 |
| Flatex AG (a)(c) | | 29,651 | 259,562 |
| Fraport AG Frankfurt Airport Services Worldwide (a) | | 12,091 | 466,486 |
| Freenet AG | | 41,306 | 812,739 |
| Fresenius Medical Care AG & Co. KGaA | | 68,376 | 1,891,321 |
| Fresenius SE & Co. KGaA | | 139,111 | 3,201,384 |
| GEA Group AG | | 49,754 | 1,740,596 |
| Gerresheimer AG | | 10,919 | 625,861 |
| GFT Technologies AG | | 6,726 | 219,682 |
| Grenkeleasing AG | | 10,423 | 212,603 |
| Hamborner (REIT) AG | | 37,362 | 266,584 |
| Hamburger Hafen und Logistik AG (c) | | 9,565 | 112,108 |
| Hannover Reuck SE | | 20,283 | 3,303,362 |
| HeidelbergCement AG | | 49,176 | 2,261,447 |
| Heidelberger Druckmaschinen AG (a)(c) | | 105,172 | 145,303 |
| HelloFresh AG (a) | | 55,918 | 1,119,587 |
| Henkel AG & Co. KGaA | | 44,554 | 2,615,548 |
| Hensoldt AG | | 13,516 | 317,901 |
| Hochtief AG | | 9,585 | 509,614 |
| Hornbach Holding AG & Co. KGaA | | 3,356 | 228,843 |
| Hugo Boss AG | | 20,257 | 933,685 |
| Hypoport AG (a) | | 1,449 | 141,765 |
| INDUS Holding AG (c) | | 9,410 | 185,803 |
| Infineon Technologies AG | | 438,330 | 10,636,289 |
| Instone Real Estate Group BV (c)(d) | | 22,022 | 160,395 |
| Jenoptik AG | | 20,284 | 445,415 |
| JOST Werke AG (d) | | 6,321 | 269,859 |
| K+S AG | | 64,718 | 1,430,091 |
| KION Group AG | | 23,726 | 526,013 |
| Kloeckner & Co. AG (c) | | 27,553 | 216,064 |
| Knorr-Bremse AG | | 24,041 | 1,082,344 |
| Krones AG | | 6,313 | 584,890 |
| KWS Saat AG | | 5,912 | 343,541 |
| Lanxess AG | | 28,373 | 960,357 |
| LEG Immobilien AG | | 23,694 | 1,548,239 |
| Mercedes-Benz Group AG (Germany) | | 266,235 | 15,410,105 |
| Merck KGaA | | 43,114 | 7,026,079 |
| Metro Wholesale & Food Specialist AG (a) | | 48,457 | 370,171 |
| Morphosys AG (a)(c) | | 13,570 | 256,879 |
| MTU Aero Engines AG | | 17,899 | 3,206,074 |
| Muenchener Rueckversicherungs-Gesellschaft AG in Muenchen | | 46,946 | 12,392,620 |
| Nagarro SE (a)(c) | | 3,165 | 315,283 |
| Nemetschek SE | | 19,046 | 910,242 |
| Nordex SE (a)(c) | | 44,498 | 415,917 |
| NORMA Group AG | | 11,724 | 185,959 |
| Patrizia Immobilien AG | | 16,899 | 124,084 |
| Pfeiffer Vacuum Technology AG | | 1,273 | 179,900 |
| ProSiebenSat.1 Media AG | | 59,809 | 406,651 |
| Puma AG | | 35,403 | 1,567,768 |
| PVA TePla AG (a)(c) | | 10,411 | 174,907 |
| Rational AG | | 1,737 | 980,173 |
| Rheinmetall AG | | 14,654 | 2,382,259 |
| RWE AG | | 216,660 | 8,348,314 |
| Salzgitter AG (c) | | 11,124 | 248,888 |
| SAP SE | | 348,701 | 33,563,475 |
| Schaeffler AG (c) | | 63,424 | 326,243 |
| Scout24 AG (d) | | 27,266 | 1,397,939 |
| secunet Security Network AG (c) | | 639 | 140,191 |
| Shop Apotheke Europe NV (a)(d) | | 5,079 | 210,561 |
| Siemens AG | | 257,212 | 28,089,874 |
| Siemens Energy AG | | 145,883 | 1,703,355 |
| Siemens Healthineers AG (d) | | 94,135 | 4,312,567 |
| Siltronic AG | | 5,594 | 348,557 |
| Sixt SE | | 6,034 | 566,495 |
| SMA Solar Technology AG (a)(c) | | 3,663 | 177,523 |
| Software AG (Bearer) (c) | | 16,856 | 369,473 |
| Stabilus Se | | 10,001 | 549,028 |
| STRATEC Biomedical Systems AG (c) | | 3,246 | 272,347 |
| Stroeer SE & Co. KGaA | | 16,141 | 658,152 |
| Suedzucker AG (Bearer) | | 32,964 | 420,239 |
| Symrise AG | | 44,482 | 4,540,392 |
| Synlab AG | | 24,154 | 311,029 |
| TAG Immobilien AG | | 62,742 | 393,420 |
| Takkt AG (c) | | 10,011 | 129,603 |
| TeamViewer AG (a)(d) | | 50,744 | 488,138 |
| Telefonica Deutschland Holding AG | | 345,348 | 752,886 |
| Thyssenkrupp AG (a) | | 158,289 | 834,080 |
| TUI AG (GB) (a)(c) | | 404,932 | 612,048 |
| Uniper SE (c) | | 33,212 | 99,516 |
| United Internet AG | | 33,291 | 622,629 |
| Varta AG (c) | | 6,603 | 177,296 |
| VERBIO Vereinigte BioEnergie AG | | 7,486 | 589,624 |
| Vitesco Technologies Group AG (a) | | 6,461 | 346,072 |
| Volkswagen AG | | 11,334 | 1,937,343 |
| Vonovia SE | | 238,790 | 5,279,794 |
| Vossloh AG | | 8,260 | 297,131 |
| Wacker Construction Equipment AG | | 10,270 | 162,085 |
| Wuestenrot & Wuerttembergische AG | | 15,478 | 218,429 |
| Zalando SE (a)(d) | | 74,587 | 1,719,096 |
TOTAL GERMANY | | | 346,958,125 |
| Gibraltar - 0.0% | | | |
| 888 Holdings PLC | | 146,155 | 155,543 |
| Greece - 0.1% | | | |
| Alpha Bank SA (a) | | 722,573 | 669,810 |
| Eurobank Ergasias Services and Holdings SA (a) | | 825,362 | 815,664 |
| Ff Group (a)(b) | | 881 | 1,045 |
| GEK Terna Holding Real Estate Construction SA | | 17,635 | 167,830 |
| Hellenic Telecommunications Organization SA | | 65,352 | 1,026,887 |
| Holding Co. ADMIE IPTO SA | | 49,556 | 82,080 |
| Jumbo SA | | 36,450 | 518,352 |
| Motor Oil (HELLAS) Corinth Refineries SA | | 20,781 | 356,930 |
| Mytilineos SA | | 32,936 | 552,682 |
| National Bank of Greece SA (a) | | 187,994 | 681,831 |
| OPAP SA | | 65,468 | 802,265 |
| Piraeus Financial Holdings SA (a) | | 312,150 | 384,986 |
| Public Power Corp. of Greece (a) | | 69,031 | 435,925 |
| Terna Energy SA | | 20,617 | 383,453 |
TOTAL GREECE | | | 6,879,740 |
| Hong Kong - 1.4% | | | |
| AIA Group Ltd. | | 4,068,000 | 30,814,262 |
| Bank of East Asia Ltd. | | 591,581 | 566,737 |
| Beijing Enterprises Holdings Ltd. | | 175,000 | 444,096 |
| BOC Hong Kong (Holdings) Ltd. | | 1,251,000 | 3,888,632 |
| BYD Electronic International Co. Ltd. (c) | | 232,500 | 675,317 |
| Champion (REIT) | | 964,000 | 288,599 |
| China Everbright International Ltd. | | 1,361,370 | 452,654 |
| China Everbright Ltd. | | 412,000 | 217,294 |
| China Jinmao Holdings Group Ltd. | | 2,050,000 | 271,604 |
| China Merchants Holdings International Co. Ltd. | | 467,718 | 548,178 |
| China Nonferrous Mining Co. Ltd. | | 589,000 | 213,850 |
| China Overseas Grand Oceans Group Ltd. | | 793,034 | 224,282 |
| China Overseas Land and Investment Ltd. | | 1,302,000 | 2,484,692 |
| China Power International Development Ltd. | | 1,886,042 | 545,415 |
| China Resources Beer Holdings Co. Ltd. | | 556,666 | 2,623,893 |
| China Resources Power Holdings Co. Ltd. | | 672,000 | 977,654 |
| China South City Holdings Ltd. | | 1,980,000 | 94,590 |
| China Taiping Insurance Group Ltd. | | 608,200 | 421,498 |
| China Tobacco International Co. Ltd. | | 126,000 | 121,351 |
| China Traditional Chinese Medicine Holdings Co. Ltd. | | 1,040,000 | 449,141 |
| CITIC 1616 Holdings Ltd. | | 794,000 | 234,670 |
| CITIC Pacific Ltd. | | 1,976,000 | 1,769,669 |
| CLP Holdings Ltd. | | 552,000 | 3,704,917 |
| CSPC Pharmaceutical Group Ltd. | | 3,085,600 | 3,169,411 |
| Dah Sing Banking Group Ltd. | | 242,000 | 144,282 |
| Dah Sing Financial Holdings Ltd. | | 74,800 | 148,082 |
| Everest Medicines Ltd. (a)(d) | | 70,500 | 55,504 |
| Far East Horizon Ltd. | | 571,000 | 440,817 |
| Fortune (REIT) | | 540,000 | 344,652 |
| Fosun International Ltd. | | 913,000 | 558,292 |
| Galaxy Entertainment Group Ltd. | | 744,000 | 3,397,909 |
| Ganfeng Lithium Group Co. Ltd. (H Shares) (d) | | 61,800 | 418,054 |
| Genertec Universal Medical Group Co. Ltd. (d) | | 542,500 | 226,685 |
| Guangdong Investment Ltd. | | 1,104,000 | 696,184 |
| Hang Lung Group Ltd. | | 275,000 | 356,640 |
| Hang Lung Properties Ltd. | | 689,000 | 866,737 |
| Hang Seng Bank Ltd. | | 259,700 | 3,656,002 |
| Henderson Land Development Co. Ltd. | | 451,345 | 1,105,010 |
| Hong Kong & China Gas Co. Ltd. | | 3,665,038 | 2,824,900 |
| Hong Kong Exchanges and Clearing Ltd. | | 406,874 | 10,799,908 |
| Hong Kong Television Network Ltd. | | 269,000 | 140,503 |
| Hua Hong Semiconductor Ltd. (a)(d) | | 215,000 | 503,424 |
| Hysan Development Co. Ltd. | | 206,000 | 449,284 |
| Lenovo Group Ltd. | | 2,502,000 | 2,001,689 |
| Link (REIT) | | 708,578 | 4,188,469 |
| Melco International Development Ltd. (a) | | 270,000 | 141,025 |
| MMG Ltd. (a) | | 1,076,000 | 212,468 |
| MTR Corp. Ltd. | | 511,028 | 2,249,274 |
| New World Development Co. Ltd. | | 504,822 | 1,032,841 |
| PCCW Ltd. | | 1,551,886 | 593,104 |
| Poly Property Group Co. Ltd. | | 848,327 | 132,929 |
| Power Assets Holdings Ltd. | | 468,000 | 2,238,750 |
| Shanghai Industrial Holdings Ltd. | | 194,000 | 189,313 |
| Shenzhen Investment Ltd. | | 1,094,810 | 149,236 |
| Shougang Fushan Resources Group Ltd. | | 756,335 | 205,231 |
| Sino Land Ltd. | | 1,166,350 | 1,246,639 |
| Sino-Ocean Group Holding Ltd. | | 1,241,000 | 82,210 |
| Sinotruk Hong Kong Ltd. | | 269,000 | 239,883 |
| SJM Holdings Ltd. (a)(c) | | 1,072,250 | 334,666 |
| Sun Hung Kai Properties Ltd. | | 477,000 | 5,125,996 |
| Sunlight (REIT) | | 436,000 | 138,860 |
| Swire Pacific Ltd. (A Shares) | | 169,000 | 1,118,464 |
| Swire Properties Ltd. | | 372,800 | 716,188 |
| Techtronic Industries Co. Ltd. | | 465,500 | 4,407,712 |
| Vitasoy International Holdings Ltd. (a) | | 316,000 | 539,438 |
| Wharf Holdings Ltd. | | 412,000 | 1,178,320 |
| Yuexiu (REIT) | | 1,028,000 | 176,798 |
| Yuexiu Property Co. Ltd. | | 508,400 | 433,940 |
TOTAL HONG KONG | | | 111,408,718 |
| Hungary - 0.0% | | | |
| Magyar Telekom PLC | | 169,238 | 121,331 |
| MOL Hungarian Oil and Gas PLC Series A (For. Reg.) | | 134,174 | 804,524 |
| OTP Bank PLC | | 74,621 | 1,626,551 |
| Richter Gedeon PLC | | 50,382 | 994,827 |
TOTAL HUNGARY | | | 3,547,233 |
| India - 4.7% | | | |
| 3M India Ltd. (a) | | 1,170 | 329,153 |
| Aarti Industries Ltd. | | 95,921 | 810,079 |
| Aarti Pharmalabs Ltd. (a)(b) | | 23,980 | 109,848 |
| Aavas Financiers Ltd. (a) | | 21,384 | 521,503 |
| ACC Ltd. | | 30,719 | 887,021 |
| Adani Enterprises Ltd. | | 98,207 | 3,971,286 |
| Adani Green Energy Ltd. (a) | | 107,785 | 2,738,114 |
| Adani Ports & Special Economic Zone Ltd. | | 180,382 | 1,794,559 |
| Adani Power Ltd. (a) | | 266,876 | 1,079,690 |
| Adani Total Gas Ltd. | | 92,861 | 4,041,607 |
| Adani Transmissions Ltd. (a) | | 94,490 | 3,822,405 |
| Aditya Birla Capital Ltd. (a) | | 218,689 | 308,695 |
| Aditya Birla Fashion and Retail Ltd. (a) | | 133,189 | 569,408 |
| Affle (India) Ltd. (a) | | 20,721 | 288,988 |
| AIA Engineering Ltd. | | 17,884 | 579,372 |
| Ajanta Pharma Ltd. | | 20,293 | 317,449 |
| Alembic Pharmaceuticals Ltd. | | 40,230 | 267,341 |
| Alkyl Amines Chemicals | | 6,901 | 246,191 |
| Alok Industries Ltd. (a) | | 605,923 | 113,455 |
| Amara Raja Batteries Ltd. | | 70,250 | 435,392 |
| Amber Enterprises India Ltd. (a) | | 7,740 | 193,084 |
| Ambuja Cements Ltd. | | 215,977 | 1,390,492 |
| Angel One Ltd. | | 10,681 | 206,788 |
| APL Apollo Tubes Ltd. | | 51,552 | 671,926 |
| Apollo Hospitals Enterprise Ltd. | | 34,889 | 1,903,975 |
| Apollo Tyres Ltd. | | 129,115 | 453,415 |
| Aptus Value Housing Finance India Ltd. (a) | | 51,277 | 195,556 |
| Ashok Leyland Ltd. | | 512,034 | 948,234 |
| Asian Paints Ltd. | | 130,342 | 4,893,257 |
| Astral Poly Technik Ltd. | | 31,749 | 779,016 |
| Atul Ltd. | | 5,870 | 593,758 |
| AU Small Finance Bank Ltd. (d) | | 81,365 | 579,473 |
| Aurobindo Pharma Ltd. | | 100,029 | 650,285 |
| Avenue Supermarts Ltd. (a)(d) | | 55,648 | 2,904,680 |
| Axis Bank Ltd. | | 775,518 | 8,487,791 |
| Bajaj Auto Ltd. | | 22,748 | 1,009,027 |
| Bajaj Electricals Ltd. | | 20,024 | 282,786 |
| Bajaj Finance Ltd. | | 92,270 | 7,963,108 |
| Bajaj Finserv Ltd. | | 129,695 | 2,643,879 |
| Balkrishna Industries Ltd. | | 28,804 | 682,955 |
| Balrampur Chini Mills Ltd. | | 51,643 | 197,108 |
| Bandhan Bank Ltd. (a)(d) | | 231,001 | 665,684 |
| Bata India Ltd. | | 20,373 | 449,976 |
| Bayer CropScience Ltd. | | 5,644 | 318,980 |
| Beml Land Assets Ltd. (b) | | 9,676 | 43,827 |
| Beml Ltd. | | 9,676 | 184,227 |
| Berger Paints India Ltd. | | 91,147 | 645,010 |
| Bharat Electronics Ltd. | | 1,287,235 | 1,661,525 |
| Bharat Forge Ltd. | | 91,273 | 919,787 |
| Bharat Heavy Electricals Ltd. | | 402,764 | 360,288 |
| Bharat Petroleum Corp. Ltd. | | 298,760 | 1,095,898 |
| Bharti Airtel Ltd. | | 747,705 | 7,514,986 |
| Biocon Ltd. | | 157,796 | 514,391 |
| Birlasoft Ltd. | | 68,426 | 223,885 |
| Blue Star Ltd. | | 27,676 | 413,284 |
| Brigade Enterprises Ltd. | | 48,829 | 294,667 |
| Brightcom Group Ltd. | | 367,641 | 146,781 |
| Britannia Industries Ltd. | | 37,958 | 1,727,117 |
| BSE Ltd. | | 26,867 | 191,522 |
| Canara Bank Ltd. | | 136,957 | 480,458 |
| Carborundum Universal Ltd. | | 41,384 | 422,864 |
| Central Depository Services (India) Ltd. | | 25,948 | 383,531 |
| CESC Ltd. GDR | | 336,184 | 311,695 |
| Cg Power & Industrial Soluti (a) | | 209,406 | 657,714 |
| Chambal Fertilizers & Chemicals Ltd. | | 67,463 | 266,005 |
| Cholamandalam Financial Holdings Ltd. | | 42,001 | 318,762 |
| Cholamandalam Investment and Finance Co. Ltd. | | 142,692 | 1,222,742 |
| Cipla Ltd./India | | 169,307 | 2,387,642 |
| City Union Bank Ltd. | | 155,095 | 348,486 |
| Coal India Ltd. | | 532,135 | 1,581,041 |
| Coforge Ltd. | | 12,022 | 553,262 |
| Colgate-Palmolive Ltd. | | 49,426 | 974,280 |
| Computer Age Management Services Private Ltd. | | 11,312 | 348,345 |
| Container Corp. of India Ltd. | | 96,737 | 932,546 |
| Coromandel International Ltd. | | 48,226 | 560,646 |
| CreditAccess Grameen Ltd. (a) | | 18,148 | 213,795 |
| CRISIL Ltd. | | 5,802 | 210,114 |
| Crompton Greaves Consumer Electricals Ltd. | | 210,070 | 919,405 |
| Cummins India Ltd. | | 46,840 | 762,692 |
| Cyient Ltd. | | 31,301 | 283,327 |
| Dabur India Ltd. | | 225,003 | 1,507,721 |
| Dalmia Bharat Ltd. | | 30,287 | 585,745 |
| Deepak Fertilisers and Petrochemicals Corp. Ltd. | | 27,452 | 320,334 |
| Deepak Nitrite Ltd. | | 25,804 | 721,299 |
| Divi's Laboratories Ltd. | | 46,016 | 2,006,126 |
| Dixon Technologies India Ltd. | | 10,836 | 591,228 |
| DLF Ltd. | | 219,066 | 1,020,173 |
| Dr Lal Pathlabs Ltd. (d) | | 13,694 | 423,996 |
| Dr. Reddy's Laboratories Ltd. | | 41,727 | 2,245,961 |
| Edelweiss Financial Services Ltd. | | 245,328 | 171,593 |
| Eicher Motors Ltd. | | 50,500 | 2,348,970 |
| Emami Ltd. | | 80,003 | 458,147 |
| Embassy Office Parks (REIT) | | 153,045 | 636,695 |
| Endurance Technologies Ltd. (d) | | 13,199 | 215,939 |
| Exide Industries Ltd. | | 194,097 | 388,640 |
| Federal Bank Ltd. | | 592,783 | 941,664 |
| Fine Organic Industries Ltd. | | 3,236 | 224,433 |
| Firstsource Solutions Ltd. | | 161,379 | 202,455 |
| Fortis Healthcare Ltd. (a) | | 166,733 | 558,831 |
| GAIL India Ltd. | | 804,956 | 887,805 |
| GHCL Ltd. | | 29,413 | 229,729 |
| Gillette India Ltd. | | 4,275 | 265,576 |
| Glenmark Pharmaceuticals Ltd. | | 65,923 | 322,169 |
| GMR Airports Infrastructure Ltd. (a) | | 839,875 | 379,963 |
| Godrej Consumer Products Ltd. (a) | | 152,353 | 1,526,291 |
| Godrej Industries Ltd. (a) | | 32,194 | 166,979 |
| Godrej Properties Ltd. (a) | | 45,419 | 692,972 |
| Granules India Ltd. | | 83,203 | 374,554 |
| Grasim Industries Ltd. | | 95,811 | 1,992,725 |
| Great Eastern Shipping Co. Ltd. | | 38,027 | 255,940 |
| Grindwell Norton Ltd. | | 18,944 | 481,266 |
| Gujarat Fluorochemicals Ltd. | | 10,317 | 472,472 |
| Gujarat Gas Ltd. | | 77,864 | 487,802 |
| Gujarat Narmada Valley Fertilizers Co. | | 30,577 | 261,943 |
| Gujarat State Petronet Ltd. | | 110,430 | 301,688 |
| Happiest Minds Technologies Ltd. | | 23,469 | 275,104 |
| Havells India Ltd. | | 90,709 | 1,332,802 |
| HCL Technologies Ltd. | | 370,547 | 4,660,486 |
| HDFC Standard Life Insurance Co. Ltd. (d) | | 330,140 | 2,155,402 |
| Hero Motocorp Ltd. | | 37,014 | 1,196,919 |
| Hfcl Ltd. (a) | | 289,209 | 288,930 |
| Hindalco Industries Ltd. | | 466,532 | 2,286,165 |
| Hindustan Petroleum Corp. Ltd. | | 223,085 | 576,307 |
| Hindustan Unilever Ltd. | | 279,258 | 8,604,776 |
| Hitachi Energy India Ltd. | | 4,690 | 179,272 |
| Housing Development Finance Corp. Ltd. | | 580,993 | 17,334,338 |
| ICICI Bank Ltd. | | 1,742,148 | 19,154,950 |
| ICICI Lombard General Insurance Co. Ltd. (d) | | 85,850 | 1,213,339 |
| ICICI Prudential Life Insurance Co. Ltd. (d) | | 132,443 | 812,049 |
| ICICI Securities Ltd. (d) | | 36,539 | 227,916 |
| IDFC Bank Ltd. (a) | | 1,127,726 | 764,260 |
| IDFC Ltd. | | 486,656 | 455,321 |
| Iifl Finance Ltd. | | 78,728 | 399,346 |
| IIFL Wealth Management Ltd. | | 14,227 | 304,442 |
| India Cements Ltd./The | | 73,489 | 214,040 |
| Indiabulls Housing Finance Ltd. (a) | | 136,227 | 212,865 |
| Indiabulls Real Estate Ltd. (a) | | 227,831 | 214,125 |
| IndiaMart InterMesh Ltd. (d) | | 5,572 | 309,055 |
| Indian Energy Exchange Ltd. (d) | | 191,230 | 323,183 |
| Indian Oil Corp. Ltd. | | 1,020,821 | 841,641 |
| Indian Railway Catering & Tourism Corp. Ltd. | | 91,888 | 822,752 |
| Indraprastha Gas Ltd. | | 138,928 | 718,723 |
| Indus Towers Ltd. | | 252,286 | 565,343 |
| Info Edge India Ltd. | | 25,019 | 1,185,274 |
| Infosys Ltd. | | 1,137,562 | 21,130,372 |
| Intellect Design Arena Ltd. | | 31,966 | 166,665 |
| InterGlobe Aviation Ltd. (a)(d) | | 34,062 | 733,127 |
| Ipca Laboratories Ltd. | | 56,027 | 612,588 |
| ITC Ltd. | | 996,196 | 4,196,346 |
| Jindal Steel & Power Ltd. | | 148,149 | 822,980 |
| JK Cement Ltd. | | 15,335 | 502,519 |
| JSW Steel Ltd. (a) | | 248,500 | 2,023,153 |
| Jubilant Foodworks Ltd. | | 141,480 | 1,042,471 |
| Kajaria Ceramics Ltd. | | 30,490 | 398,252 |
| Kansai Nerolac Paints Ltd. | | 55,259 | 324,425 |
| KEC International Ltd. | | 52,910 | 281,232 |
| KEI Industries Ltd. | | 23,482 | 458,180 |
| Kotak Mahindra Bank Ltd. | | 189,728 | 4,359,183 |
| KPIT Technologies Ltd. | | 61,988 | 531,106 |
| KPR Mill Ltd. | | 35,682 | 237,894 |
| L&T Finance Holdings Ltd. | | 430,977 | 422,230 |
| Larsen & Toubro Infotech Ltd. (d) | | 18,595 | 1,064,720 |
| Larsen & Toubro Ltd. | | 236,263 | 5,774,144 |
| Laurus Labs Ltd. (d) | | 128,433 | 705,233 |
| LIC Housing Finance Ltd. | | 120,828 | 591,587 |
| Linde India Ltd. | | 8,164 | 302,940 |
| Lupin Ltd. | | 74,762 | 631,295 |
| Mahanagar Gas Ltd. | | 21,960 | 228,580 |
| Mahindra & Mahindra Financial Services Ltd. | | 290,914 | 709,889 |
| Mahindra & Mahindra Ltd. | | 291,024 | 4,741,181 |
| Mahindra Lifespace Developers Ltd. | | 34,444 | 166,977 |
| Manappuram General Finance & Leasing Ltd. | | 223,324 | 284,078 |
| Marico Ltd. | | 186,705 | 1,183,089 |
| Maruti Suzuki India Ltd. | | 40,308 | 4,639,267 |
| Max Financial Services Ltd. (a) | | 83,370 | 713,097 |
| Max Healthcare Institute Ltd. (a) | | 261,400 | 1,440,889 |
| Metropolis Healthcare Ltd. (d) | | 11,494 | 234,906 |
| MindTree Consulting Ltd. | | 21,459 | 882,352 |
| Motherson Sumi Wiring India Ltd. | | 468,143 | 494,836 |
| Mphasis BFL Ltd. | | 31,016 | 741,304 |
| MRF Ltd. | | 688 | 754,381 |
| Multi Commodity Exchange of India Ltd. | | 13,661 | 253,540 |
| Muthoot Finance Ltd. | | 43,890 | 553,238 |
| Narayana Hrudayalaya Ltd. | | 37,325 | 356,860 |
| Natco Pharma Ltd. | | 34,768 | 252,318 |
| National Aluminium Co. Ltd. | | 388,740 | 329,664 |
| Navin Fluorine International Ltd. | | 11,945 | 656,809 |
| Nestle India Ltd. | | 11,642 | 2,863,864 |
| NIIT Ltd. | | 35,158 | 118,475 |
| Nippon Life India Asset Management Ltd. (d) | | 65,535 | 214,149 |
| NTPC Ltd. | | 1,358,078 | 2,839,856 |
| Oberoi Realty Ltd. | | 48,386 | 540,470 |
| Oil & Natural Gas Corp. Ltd. | | 856,248 | 1,386,567 |
| Oil India Ltd. | | 102,706 | 239,457 |
| Oracle Financial Services Soft | | 9,630 | 338,859 |
| Page Industries Ltd. | | 2,382 | 1,432,096 |
| PB Fintech Ltd. | | 49,226 | 229,569 |
| Persistent Systems Ltd. | | 18,104 | 807,671 |
| Petronet LNG Ltd. | | 277,412 | 688,838 |
| Phoenix Mills Ltd. | | 35,900 | 619,229 |
| PI Industries Ltd. | | 27,755 | 1,086,981 |
| Pidilite Industries Ltd. | | 52,955 | 1,653,260 |
| Piramal Enterprises Ltd. | | 47,080 | 483,085 |
| Piramal Pharma Ltd. (a) | | 188,320 | 375,139 |
| Polycab India Ltd. | | 18,739 | 628,734 |
| Poonawalla Fincorp Ltd. | | 84,563 | 321,172 |
| Power Grid Corp. of India Ltd. | | 1,109,346 | 3,057,469 |
| Prestige Estates Projs. Ltd. | | 55,915 | 298,556 |
| Procter & Gamble Health Ltd. | | 5,164 | 251,578 |
| PVR Ltd. (a) | | 21,842 | 468,344 |
| Quess Corp. Ltd. (d) | | 36,231 | 241,949 |
| Radico Khaitan Ltd. | | 32,365 | 407,338 |
| Rajesh Exports Ltd. | | 30,685 | 256,363 |
| Ratnamani Metals & Tubes Ltd. | | 13,194 | 328,559 |
| RBL Bank Ltd. (a)(d) | | 215,156 | 351,272 |
| REC Ltd. | | 445,649 | 552,081 |
| Redington (India) Ltd. | | 211,597 | 349,424 |
| Reliance Industries Ltd. | | 1,027,369 | 31,642,667 |
| Reliance Power Ltd. (a) | | 1,259,948 | 245,049 |
| Route Mobile Ltd. | | 11,154 | 176,520 |
| Samvardhana Motherson International Ltd. | | 964,815 | 751,758 |
| Sanofi India Ltd. | | 3,826 | 259,415 |
| SBI Cards & Payment Services Ltd. | | 83,779 | 836,626 |
| SBI Life Insurance Co. Ltd. (d) | | 156,730 | 2,396,863 |
| Schaeffler India Ltd. | | 17,147 | 570,586 |
| Sheela Foam Private Ltd. (a) | | 7,431 | 249,295 |
| Shree Cement Ltd. | | 3,940 | 1,082,358 |
| Shree Renuka Sugars Ltd. (a) | | 255,554 | 166,860 |
| Shriram Transport Finance Co. Ltd. | | 66,036 | 980,529 |
| Siemens Ltd. | | 26,093 | 922,175 |
| SKF India Ltd. | | 10,043 | 533,621 |
| Solar Industries India Ltd. | | 10,527 | 496,192 |
| Sonata Software Ltd. | | 45,114 | 285,273 |
| SRF Ltd. | | 51,992 | 1,607,023 |
| State Bank of India | | 612,222 | 4,243,694 |
| Sun Pharmaceutical Industries Ltd. | | 329,881 | 4,052,380 |
| Sun TV Ltd. | | 49,788 | 314,468 |
| Sundram Fasteners Ltd. | | 39,345 | 445,091 |
| Supreme Industries Ltd. | | 24,818 | 650,671 |
| Suven Pharmaceuticals Ltd. | | 44,726 | 215,228 |
| Suzlon Energy Ltd. (a) | | 2,118,445 | 203,451 |
| Syngene International Ltd. (d) | | 50,316 | 383,722 |
| Tanla Solutions Ltd. | | 24,240 | 217,290 |
| Tata Chemicals Ltd. | | 55,237 | 755,889 |
| Tata Communications Ltd. | | 43,092 | 655,360 |
| Tata Consultancy Services Ltd. | | 308,602 | 11,903,992 |
| Tata Consumer Products Ltd. | | 194,146 | 1,806,252 |
| Tata Elxsi Ltd. | | 11,749 | 992,924 |
| Tata Investment Corp. Ltd. | | 6,516 | 184,692 |
| Tata Motors Ltd. (a) | | 554,120 | 2,774,309 |
| Tata Power Co. Ltd./The | | 507,650 | 1,385,950 |
| Tata Steel Ltd. | | 2,505,247 | 3,073,301 |
| Tata Teleservices (Maharashtra) Ltd. (a) | | 176,694 | 217,612 |
| Tech Mahindra Ltd. | | 199,590 | 2,563,953 |
| Tejas Networks Ltd. (a)(d) | | 25,086 | 207,949 |
| The Indian Hotels Co. Ltd. | | 280,747 | 1,132,077 |
| The Ramco Cements Ltd. | | 59,911 | 522,394 |
| Thermax Ltd. | | 15,402 | 404,112 |
| Timken India Ltd. | | 10,046 | 364,140 |
| Titan Co. Ltd. | | 120,999 | 4,036,467 |
| Torrent Pharmaceuticals Ltd. | | 38,996 | 777,282 |
| Torrent Power Ltd. | | 91,232 | 555,845 |
| Trent Ltd. | | 65,585 | 1,210,526 |
| Trident Ltd. | | 502,647 | 214,041 |
| TTK Prestige Ltd. | | 19,330 | 217,468 |
| Tube Investments of India Ltd. | | 37,531 | 1,243,741 |
| Tvs Motor Co. Ltd. | | 67,323 | 932,055 |
| Ultratech Cement Ltd. | | 35,352 | 2,867,684 |
| United Spirits Ltd. (a) | | 107,805 | 1,167,323 |
| Uno Minda Ltd. | | 63,599 | 412,341 |
| UPL Ltd. | | 175,467 | 1,547,789 |
| Vardhman Textiles Ltd. | | 44,534 | 181,057 |
| Vedanta Ltd. | | 266,389 | 903,624 |
| Vinati Organics Ltd. | | 12,892 | 297,047 |
| Vodafone Idea Ltd. (a) | | 3,859,769 | 398,659 |
| Voltas Ltd. | | 79,890 | 845,610 |
| Whirlpool of India Ltd. | | 14,163 | 269,547 |
| Wipro Ltd. | | 468,053 | 2,190,165 |
| Yes Bank Ltd. (a) | | 4,074,918 | 765,462 |
| Yes Bank Ltd. (a) | | 207,098 | 35,013 |
| Zee Entertainment Enterprises Ltd. | | 303,552 | 962,397 |
| Zensar Technologies Ltd. | | 50,705 | 136,839 |
| Zomato Ltd. (a) | | 808,386 | 616,201 |
TOTAL INDIA | | | 380,690,480 |
| Indonesia - 0.6% | | | |
| PT ACE Hardware Indonesia Tbk | | 3,247,100 | 117,622 |
| PT Adaro Energy Tbk | | 4,937,400 | 1,259,872 |
| PT Adaro Minerals Indonesia Tbk | | 2,914,000 | 323,207 |
| PT AKR Corporindo Tbk | | 3,056,100 | 305,659 |
| PT Aneka Tambang Tbk | | 3,275,800 | 387,488 |
| PT Astra International Tbk | | 6,748,500 | 2,877,226 |
| PT Bank Aladin Syariah Tbk (a) | | 2,053,700 | 173,802 |
| PT Bank BTPN Syariah Tbk | | 1,059,800 | 200,443 |
| PT Bank Central Asia Tbk | | 18,740,700 | 10,573,371 |
| PT Bank Jago Tbk (a) | | 1,432,800 | 468,490 |
| PT Bank Mandiri (Persero) Tbk | | 6,341,000 | 4,288,992 |
| PT Bank Negara Indonesia (Persero) Tbk | | 2,578,100 | 1,553,720 |
| PT Bank Neo Commerce Tbk (a) | | 1,669,700 | 95,274 |
| PT Bank Rakyat Indonesia (Persero) Tbk | | 23,062,071 | 6,875,373 |
| PT Bank Tabungan Negara Tbk | | 2,670,500 | 264,525 |
| PT Barito Pacific Tbk | | 10,036,700 | 530,872 |
| PT Berkah Beton Sadaya Tbk | | 1,433,500 | 372,218 |
| PT BFI Finance Indonesia Tbk | | 2,856,900 | 202,396 |
| PT Bukit Asam Tbk | | 1,438,500 | 360,605 |
| PT Bumi Resources Minerals Tbk (a) | | 15,469,700 | 179,517 |
| PT Bumi Serpong Damai Tbk (a) | | 3,101,700 | 184,939 |
| PT Charoen Pokphand Indonesia Tbk | | 2,893,700 | 1,034,293 |
| PT Ciputra Development Tbk | | 3,618,000 | 218,043 |
| PT Gudang Garam Tbk | | 174,500 | 269,623 |
| PT Hanson International Tbk (a)(b) | | 3,268,900 | 10,479 |
| PT Indah Kiat Pulp & Paper Tbk | | 966,900 | 595,111 |
| PT Indo Tambangraya Megah Tbk | | 146,100 | 421,978 |
| PT Indocement Tunggal Prakarsa Tbk | | 562,700 | 334,608 |
| PT Indofood CBP Sukses Makmur Tbk | | 872,800 | 544,188 |
| PT Indofood Sukses Makmur Tbk | | 1,639,200 | 677,855 |
| PT Inti Agriculture Resources Tbk (a)(b) | | 1,180,800 | 3,785 |
| PT Jasa Marga Tbk (a) | | 863,796 | 188,847 |
| PT Kalbe Farma Tbk | | 7,745,200 | 1,017,962 |
| PT M Cash Integrasi Tbk (a) | | 170,800 | 119,360 |
| PT Matahari Department Store Tbk | | 513,100 | 153,626 |
| PT Medco Energi International Tbk | | 3,517,600 | 260,479 |
| PT Media Nusantara Citra Tbk (a) | | 2,782,700 | 146,294 |
| PT Medikaloka Hermina Tbk | | 2,490,500 | 237,913 |
| PT Merdeka Copper Gold Tbk (a) | | 4,171,925 | 1,008,377 |
| PT Metro Healthcare Indonesia Tbk (a) | | 7,426,100 | 242,815 |
| PT Mitra Adiperkasa Tbk (a) | | 3,355,900 | 259,263 |
| PT Pabrik Kertas Tjiwi Kimia Tbk | | 568,500 | 284,296 |
| PT Pakuwon Jati Tbk | | 6,812,100 | 191,293 |
| PT Panin Financial Tbk | | 5,298,300 | 215,703 |
| PT Perusahaan Gas Negara Tbk Series B | | 3,749,900 | 474,823 |
| PT Pool Advista Indonesia Tbk (a)(b) | | 184,900 | 593 |
| PT Sarana Menara Nusantara Tbk | | 9,585,700 | 709,824 |
| PT Semen Indonesia (Persero) Tbk | | 1,227,400 | 625,602 |
| PT Smartfren Telecom Tbk (a) | | 37,864,300 | 189,352 |
| PT Sugih Energy Tbk (a)(b) | | 40,500 | 130 |
| PT Sumber Alfaria Trijaya Tbk | | 5,909,500 | 1,068,427 |
| PT Summarecon Agung Tbk | | 6,089,200 | 230,334 |
| PT Surya Citra Media Tbk | | 8,173,400 | 122,621 |
| PT Surya Esa Perkasa Tbk | | 2,880,800 | 196,702 |
| PT Telkom Indonesia Persero Tbk | | 16,842,900 | 4,730,344 |
| PT Tower Bersama Infrastructure Tbk | | 2,242,870 | 353,740 |
| PT Transcoal Pacific Tbk | | 392,800 | 258,761 |
| PT Unilever Indonesia Tbk | | 2,649,200 | 788,093 |
| PT United Tractors Tbk | | 576,200 | 1,193,221 |
| PT Vale Indonesia Tbk (a) | | 917,000 | 382,145 |
| PT XL Axiata Tbk | | 1,536,500 | 248,244 |
TOTAL INDONESIA | | | 51,604,758 |
| Ireland - 0.5% | | | |
| AIB Group PLC | | 268,331 | 776,972 |
| Bank of Ireland Group PLC | | 340,931 | 2,458,205 |
| C&C Group PLC (United Kingdom) (a) | | 145,449 | 272,720 |
| Cairn Homes PLC | | 283,912 | 274,965 |
| CRH PLC | | 255,632 | 9,207,317 |
| Dalata Hotel Group PLC (a) | | 64,629 | 207,257 |
| DCC PLC (United Kingdom) | | 33,330 | 1,849,986 |
| Flutter Entertainment PLC (a) | | 24,858 | 3,301,128 |
| Flutter Entertainment PLC (Ireland) (a) | | 31,907 | 4,222,147 |
| Glanbia PLC | | 62,876 | 726,384 |
| Glenveagh Properties PLC (a)(d) | | 243,350 | 238,086 |
| Grafton Group PLC unit | | 86,211 | 682,181 |
| Greencore Group PLC (a)(c) | | 248,008 | 190,558 |
| Irish Residential Properties REIT PLC | | 155,957 | 168,612 |
| James Hardie Industries PLC CDI | | 151,671 | 3,311,430 |
| Kerry Group PLC Class A | | 52,420 | 4,558,758 |
| Kingspan Group PLC (Ireland) | | 51,789 | 2,615,323 |
| Origin Enterprises PLC | | 51,948 | 192,516 |
| Smurfit Kappa Group PLC | | 83,339 | 2,761,523 |
| Uniphar PLC | | 76,328 | 264,009 |
TOTAL IRELAND | | | 38,280,077 |
| Isle of Man - 0.0% | | | |
| Entain PLC | | 199,648 | 2,888,224 |
| Kape Technologies PLC (a) | | 61,214 | 154,440 |
| Playtech Ltd. (a) | | 79,616 | 473,866 |
| Strix Group PLC (c) | | 75,682 | 93,735 |
TOTAL ISLE OF MAN | | | 3,610,265 |
| Israel - 0.8% | | | |
| AFI Properties Ltd. | | 4,158 | 124,732 |
| Airport City Ltd. (a) | | 23,680 | 392,371 |
| Alony Hetz Properties & Investments Ltd. | | 51,372 | 603,342 |
| Amot Investments Ltd. | | 83,109 | 503,327 |
| Ashtrom Group Ltd. | | 17,167 | 373,845 |
| AudioCodes Ltd. | | 10,696 | 218,427 |
| Azrieli Group | | 14,503 | 1,075,756 |
| Bank Hapoalim BM (Reg.) | | 431,568 | 4,164,783 |
| Bank Leumi le-Israel BM | | 523,565 | 5,000,727 |
| Bezeq The Israel Telecommunication Corp. Ltd. | | 763,537 | 1,352,242 |
| Big Shopping Centers Ltd. | | 4,183 | 469,493 |
| Camtek Ltd. (a) | | 11,230 | 254,153 |
| Check Point Software Technologies Ltd. (a) | | 34,676 | 4,481,179 |
| Clal Insurance Enterprises Holdings Ltd. (a) | | 23,699 | 409,185 |
| Cognyte Software Ltd. (a) | | 28,232 | 76,791 |
| CyberArk Software Ltd. (a) | | 13,959 | 2,190,307 |
| Danel Adir Yeoshua Ltd. | | 2,144 | 248,770 |
| Delek Group Ltd. (a) | | 3,211 | 491,253 |
| Elbit Systems Ltd. (Israel) | | 9,187 | 1,859,473 |
| Electra Israel Ltd. | | 839 | 488,529 |
| Electra Real Estate Ltd. | | 12,438 | 152,943 |
| Energix-Renewable Energies Ltd. | | 92,598 | 323,898 |
| Enlight Renewable Energy Ltd. (a) | | 353,140 | 716,064 |
| Equital Ltd. (a) | | 8,892 | 274,293 |
| Fattal Holdings 1998 Ltd. (a) | | 2,618 | 266,353 |
| First International Bank of Israel | | 20,895 | 902,963 |
| Formula Systems (1985) Ltd. | | 3,752 | 304,743 |
| Fox Wizel Ltd. | | 3,042 | 371,044 |
| G City Ltd. | | 35,296 | 114,072 |
| Harel Insurance Investments and Financial Services Ltd. | | 46,255 | 445,592 |
| Hilan Ltd. | | 5,674 | 297,385 |
| Icl Group Ltd. | | 242,140 | 2,187,349 |
| InMode Ltd. (a)(c) | | 24,574 | 843,380 |
| Isracard Ltd. | | 84,382 | 249,787 |
| Israel Canada T.R Ltd. | | 64,732 | 186,856 |
| Israel Corp. Ltd. (Class A) | | 1,391 | 602,686 |
| Israel Discount Bank Ltd. (Class A) | | 431,608 | 2,457,572 |
| Ituran Location & Control Ltd. | | 9,652 | 231,455 |
| Kornit Digital Ltd. (a) | | 17,393 | 464,741 |
| Matrix IT Ltd. | | 14,998 | 323,725 |
| Maytronics Ltd. | | 20,969 | 226,333 |
| Mega Or Holdings Ltd. | | 10,876 | 316,411 |
| Melisron Ltd. | | 8,362 | 620,959 |
| Migdal Insurance & Financial Holdings Ltd. | | 188,098 | 225,651 |
| Mivne Real Estate KD Ltd. | | 213,733 | 665,354 |
| Mizrahi Tefahot Bank Ltd. | | 53,197 | 2,012,831 |
| Nano Dimension Ltd. ADR (a)(c) | | 93,713 | 232,408 |
| Neto Malinda Trading Ltd. (a) | | 5,014 | 168,715 |
| NICE Ltd. (a) | | 21,487 | 4,072,956 |
| Nova Ltd. (a) | | 10,177 | 747,388 |
| Oil Refineries Ltd. | | 756,442 | 282,150 |
| OPC Energy Ltd. (a) | | 38,427 | 473,058 |
| Partner Communications Co. Ltd. (a) | | 56,793 | 428,332 |
| Paz Oil Co. Ltd. (a) | | 3,713 | 443,746 |
| Perion Network Ltd. (a) | | 15,413 | 353,009 |
| Plus500 Ltd. | | 34,525 | 714,659 |
| RADA Electronic Industries Ltd. (a)(c) | | 17,714 | 203,711 |
| Radware Ltd. (a) | | 15,914 | 366,340 |
| Reit 1 Ltd. | | 90,098 | 472,986 |
| Sella Capital Real Estate Ltd. | | 122,653 | 315,592 |
| Shapir Engineering and Industry Ltd. | | 60,493 | 498,523 |
| Shikun & Binui Ltd. (a) | | 95,416 | 378,850 |
| Shufersal Ltd. | | 103,106 | 704,093 |
| Strauss Group Ltd. | | 20,552 | 514,622 |
| Summit Real Estate Holdings Ltd. | | 15,884 | 221,703 |
| Teva Pharmaceutical Industries Ltd. sponsored ADR (a) | | 376,535 | 3,358,692 |
| The Phoenix Holdings Ltd. | | 58,998 | 639,644 |
| Tower Semiconductor Ltd. (a) | | 37,264 | 1,594,520 |
| Tremor International Ltd. (a) | | 36,226 | 141,951 |
| Wix.com Ltd. (a) | | 19,670 | 1,654,247 |
| YH Dimri Construction & Development Ltd. | | 3,757 | 228,596 |
| ZIM Integrated Shipping Services Ltd. (c) | | 28,923 | 679,401 |
TOTAL ISRAEL | | | 60,453,017 |
| Italy - 1.2% | | | |
| A2A SpA | | 550,489 | 610,391 |
| ACEA SpA | | 16,504 | 207,954 |
| Amco - Asset Management Co. SpA Class B (a)(b) | | 141 | 0 |
| Amplifon SpA | | 42,592 | 1,058,181 |
| Anima Holding SpA (d) | | 102,476 | 317,589 |
| Ascopiave SpA | | 78,844 | 186,613 |
| Assicurazioni Generali SpA | | 371,847 | 5,580,351 |
| Atlantia SpA | | 161,314 | 3,599,671 |
| Autogrill SpA (a) | | 66,941 | 418,758 |
| Azimut Holding SpA | | 41,811 | 673,511 |
| Banca Generali SpA | | 23,020 | 688,400 |
| Banca Mediolanum S.p.A. | | 93,459 | 700,095 |
| Banca Popolare di Sondrio SCARL | | 180,242 | 646,591 |
| Banco BPM SpA | | 498,746 | 1,508,723 |
| BFF Bank SpA (d) | | 71,475 | 504,335 |
| BPER Banca | | 380,959 | 704,964 |
| Brembo SpA | | 55,201 | 577,164 |
| Brunello Cucinelli SpA | | 12,252 | 710,136 |
| Buzzi Unicem SpA | | 37,054 | 615,010 |
| Carel Industries SpA (d) | | 14,513 | 316,252 |
| CIR SpA (a) | | 309,618 | 130,806 |
| Credito Emiliano SpA | | 43,402 | 257,352 |
| De'Longhi SpA | | 29,406 | 507,687 |
| DiaSorin SpA | | 8,671 | 1,133,694 |
| Digital Bros SpA | | 5,416 | 127,707 |
| Dovalue SpA (d) | | 31,044 | 178,860 |
| El.En. Group SpA | | 19,014 | 232,627 |
| Enav SpA (d) | | 91,020 | 351,707 |
| Enel SpA | | 2,707,812 | 12,096,742 |
| Eni SpA | | 839,393 | 11,024,365 |
| ERG SpA | | 21,720 | 681,292 |
| FinecoBank SpA | | 209,508 | 2,824,111 |
| Gruppo MutuiOnline SpA | | 10,268 | 227,301 |
| GVS SpA (a)(d) | | 24,631 | 126,333 |
| Hera SpA | | 278,803 | 664,571 |
| Illimity Bank SpA (a) | | 28,562 | 194,198 |
| Infrastrutture Wireless Italiane SpA (d) | | 117,329 | 1,035,669 |
| Interpump Group SpA | | 25,237 | 977,167 |
| Intesa Sanpaolo SpA | | 5,518,140 | 10,520,502 |
| Iren SpA | | 252,993 | 376,031 |
| Italgas SpA | | 159,977 | 824,477 |
| Italmobiliare SpA | | 4,894 | 125,023 |
| Iveco Group NV (a) | | 77,880 | 420,998 |
| Leonardo SpA | | 139,854 | 1,123,930 |
| Maire Tecnimont SpA (c) | | 71,667 | 222,532 |
| MARR SpA | | 20,959 | 220,798 |
| Mediobanca SpA | | 208,512 | 1,890,001 |
| Moncler SpA | | 69,192 | 2,987,478 |
| Nexi SpA (a)(d) | | 178,491 | 1,546,973 |
| OVS (d) | | 98,071 | 183,176 |
| Piaggio & C SpA | | 83,956 | 215,721 |
| Pirelli & C. SpA (d) | | 133,193 | 502,556 |
| Poste Italiane SpA (d) | | 184,288 | 1,606,321 |
| Prysmian SpA | | 87,831 | 2,863,499 |
| Rai Way SpA (d) | | 56,156 | 269,045 |
| Recordati SpA | | 35,393 | 1,330,180 |
| Reply SpA | | 7,840 | 853,042 |
| Saipem SpA (a)(c) | | 384,350 | 373,757 |
| Salvatore Ferragamo Italia SpA | | 19,135 | 281,383 |
| Saras SpA (a) | | 201,909 | 244,033 |
| Sesa SpA | | 3,197 | 346,590 |
| Snam SpA | | 650,625 | 2,893,014 |
| Tamburi Investment Partners SpA | | 52,841 | 371,807 |
| Technogym SpA (d) | | 61,103 | 420,280 |
| Technoprobe SpA | | 45,323 | 311,742 |
| Telecom Italia SpA (a) | | 3,398,747 | 664,940 |
| Terna - Rete Elettrica Nazionale | | 469,976 | 3,115,556 |
| Tinexta SpA | | 9,975 | 201,099 |
| UniCredit SpA | | 699,081 | 8,669,496 |
| Unipol Gruppo SpA | | 145,160 | 624,887 |
| Webuild SpA (c) | | 194,490 | 264,666 |
| Webuild SpA warrants 8/2/30 (a)(b)(c) | | 5,662 | 4,823 |
TOTAL ITALY | | | 99,267,234 |
| Japan - 14.9% | | | |
| 77 Bank Ltd. | | 20,300 | 245,874 |
| ABC-MART, Inc. | | 12,507 | 557,661 |
| Activia Properties, Inc. | | 228 | 675,436 |
| Adeka Corp. | | 29,100 | 435,634 |
| Advance Logistics Investment Corp. | | 206 | 201,435 |
| Advance Residence Investment Corp. | | 428 | 995,918 |
| Advantest Corp. | | 63,859 | 3,375,579 |
| Aeon (REIT) Investment Corp. | | 546 | 587,511 |
| AEON Co. Ltd. | | 221,225 | 4,130,813 |
| Aeon Delight Co. Ltd. | | 11,200 | 224,008 |
| AEON Financial Service Co. Ltd. | | 48,599 | 475,874 |
| AEON MALL Co. Ltd. | | 33,700 | 366,474 |
| AGC, Inc. | | 63,063 | 1,978,472 |
| Ai Holdings Corp. | | 16,000 | 237,157 |
| Aica Kogyo Co. Ltd. | | 22,100 | 475,604 |
| Aiful Corp. | | 145,700 | 396,843 |
| Ain Holdings, Inc. | | 9,000 | 378,291 |
| Air Water, Inc. | | 63,900 | 714,656 |
| Aisin Seiki Co. Ltd. | | 48,200 | 1,236,645 |
| Ajinomoto Co., Inc. | | 153,625 | 4,231,803 |
| Alfresa Holdings Corp. | | 64,539 | 742,636 |
| Alps Alpine Co. Ltd. | | 66,498 | 572,430 |
| Amada Co. Ltd. | | 108,300 | 762,568 |
| Amano Corp. | | 19,000 | 325,451 |
| Ana Holdings, Inc. (a) | | 51,441 | 1,000,141 |
| AnGes MG, Inc. (a)(c) | | 52,500 | 57,551 |
| Anicom Holdings, Inc. | | 38,300 | 153,257 |
| Anritsu Corp. | | 46,700 | 470,784 |
| Aozora Bank Ltd. | | 39,300 | 675,814 |
| Appier Group, Inc. (a) | | 21,400 | 205,660 |
| Arata Corp. | | 6,900 | 190,719 |
| ARCS Co. Ltd. | | 22,200 | 296,209 |
| Ariake Japan Co. Ltd. | | 7,300 | 252,833 |
| As One Corp. | | 10,500 | 449,107 |
| Asahi Group Holdings | | 154,459 | 4,325,413 |
| Asahi Holdings, Inc. | | 30,000 | 383,133 |
| ASAHI INTECC Co. Ltd. | | 74,860 | 1,275,734 |
| Asahi Kasei Corp. | | 414,500 | 2,657,739 |
| Asics Corp. | | 55,300 | 849,425 |
| ASKUL Corp. | | 12,600 | 131,766 |
| Astellas Pharma, Inc. | | 617,403 | 8,519,041 |
| Atom Corp. (a)(c) | | 43,900 | 233,236 |
| Autobacs Seven Co. Ltd. | | 29,700 | 282,629 |
| Avex, Inc. | | 12,200 | 136,773 |
| Axial Retailing, Inc. | | 9,800 | 223,424 |
| AZ-Com Maruwa Holdings, Inc. | | 17,700 | 168,435 |
| Azbil Corp. | | 39,900 | 1,085,413 |
| Bandai Namco Holdings, Inc. | | 67,100 | 4,441,294 |
| Bank of Kyoto Ltd. | | 19,500 | 702,915 |
| BayCurrent Consulting, Inc. | | 46,000 | 1,296,210 |
| Belc Co. Ltd. | | 6,500 | 248,731 |
| Bell System24 Holdings, Inc. | | 13,600 | 126,492 |
| Benefit One, Inc. | | 31,200 | 433,080 |
| Benesse Holdings, Inc. | | 26,600 | 392,484 |
| BeNext-Yumeshin Group Co. | | 32,300 | 390,567 |
| Bic Camera, Inc. | | 39,900 | 310,463 |
| Biprogy, Inc. | | 24,300 | 525,401 |
| BML, Inc. | | 8,500 | 192,357 |
| Bridgestone Corp. | | 188,258 | 6,808,624 |
| Brother Industries Ltd. | | 80,300 | 1,366,820 |
| Calbee, Inc. | | 30,800 | 618,299 |
| Canon Marketing Japan, Inc. | | 16,800 | 354,766 |
| Canon, Inc. | | 335,243 | 7,106,309 |
| Capcom Co. Ltd. | | 59,300 | 1,653,038 |
| Casio Computer Co. Ltd. | | 64,400 | 560,433 |
| Central Glass Co. Ltd. | | 10,900 | 257,299 |
| Central Japan Railway Co. | | 48,155 | 5,575,220 |
| Change, Inc. | | 15,000 | 200,948 |
| Chiba Bank Ltd. | | 181,200 | 990,723 |
| Chiyoda Corp. (a) | | 64,600 | 160,311 |
| Chubu Electric Power Co., Inc. | | 212,816 | 1,733,213 |
| Chugai Pharmaceutical Co. Ltd. | | 226,300 | 5,243,793 |
| Chugin Financial Group, Inc. | | 48,300 | 291,044 |
| Chugoku Electric Power Co., Inc. | | 88,900 | 417,312 |
| Chugoku Marine Paints Ltd. | | 28,600 | 175,799 |
| Citizen Watch Co. Ltd. | | 89,400 | 375,769 |
| CKD Corp. | | 18,965 | 233,021 |
| Coca-Cola West Co. Ltd. | | 49,050 | 443,345 |
| COLOPL, Inc. | | 27,800 | 131,059 |
| Colowide Co. Ltd. | | 34,400 | 422,207 |
| Comforia Residential REIT, Inc. | | 212 | 449,820 |
| COMSYS Holdings Corp. | | 40,200 | 659,659 |
| Comture Corp. | | 9,100 | 148,347 |
| Concordia Financial Group Ltd. | | 368,200 | 1,121,723 |
| Cosmo Energy Holdings Co. Ltd. | | 25,800 | 663,674 |
| Cosmos Pharmaceutical Corp. | | 7,200 | 697,266 |
| CRE Logistics REIT, Inc. | | 202 | 277,946 |
| Create Restaurants Holdings, Inc. | | 45,300 | 286,067 |
| Create SD Holdings Co. Ltd. | | 13,800 | 294,200 |
| Credit Saison Co. Ltd. | | 55,701 | 595,612 |
| CyberAgent, Inc. | | 146,000 | 1,201,816 |
| CYBERDYNE, Inc. (a)(c) | | 48,600 | 108,512 |
| Dai Nippon Printing Co. Ltd. | | 75,800 | 1,520,639 |
| Dai-ichi Mutual Life Insurance Co. | | 329,899 | 5,230,417 |
| Daicel Chemical Industries Ltd. | | 94,821 | 540,759 |
| Daido Steel Co. Ltd. | | 10,600 | 275,167 |
| Daifuku Co. Ltd. | | 34,000 | 1,559,434 |
| Daihen Corp. | | 9,900 | 255,997 |
| Daiichi Sankyo Kabushiki Kaisha | | 591,600 | 18,937,569 |
| Daiichikosho Co. Ltd. | | 13,800 | 396,288 |
| Daikin Industries Ltd. | | 83,868 | 12,562,351 |
| Daio Paper Corp. | | 31,000 | 228,912 |
| Daiseki Co. Ltd. | | 15,620 | 483,217 |
| Daishi Hokuetsu Financial Group, Inc. | | 16,042 | 283,199 |
| Daito Trust Construction Co. Ltd. | | 20,444 | 2,022,470 |
| Daiwa House Industry Co. Ltd. | | 197,044 | 3,969,912 |
| Daiwa House REIT Investment Corp. | | 729 | 1,470,796 |
| Daiwa Office Investment Corp. | | 106 | 500,434 |
| Daiwa Securities Group, Inc. | | 430,700 | 1,679,989 |
| Daiwa Securities Living Invest | | 611 | 474,188 |
| Daiwabo Holdings Co. Ltd. | | 35,500 | 459,104 |
| DCM Holdings Co. Ltd. | | 42,900 | 334,383 |
| DeNA Co. Ltd. | | 29,900 | 390,302 |
| Denka Co. Ltd. | | 27,100 | 627,859 |
| DENSO Corp. | | 145,122 | 7,200,363 |
| Dentsu Group, Inc. | | 72,400 | 2,256,794 |
| Descente Ltd. | | 11,500 | 276,875 |
| Dexerials Corp. | | 18,700 | 437,019 |
| Dic Corp. | | 32,400 | 544,303 |
| Digital Arts, Inc. | | 4,300 | 181,317 |
| Digital Garage, Inc. | | 13,300 | 319,318 |
| Dip Corp. | | 14,700 | 412,247 |
| Disco Corp. | | 9,700 | 2,328,861 |
| Dmg Mori Co. Ltd. | | 39,700 | 460,557 |
| Dowa Holdings Co. Ltd. | | 18,200 | 579,555 |
| DTS Corp. | | 16,500 | 392,818 |
| Duskin Co. Ltd. | | 17,600 | 337,572 |
| Dydo Group Holdings, Inc. | | 5,600 | 170,981 |
| Earth Corp. | | 6,900 | 238,979 |
| East Japan Railway Co. | | 101,310 | 5,398,342 |
| Ebara Corp. | | 31,900 | 1,039,413 |
| EDION Corp. | | 30,600 | 243,038 |
| eGuarantee, Inc. | | 16,500 | 266,983 |
| Eiken Chemical Co. Ltd. | | 15,900 | 196,538 |
| Eisai Co. Ltd. | | 85,400 | 5,154,037 |
| Eizo Corp. | | 7,100 | 172,850 |
| Elecom Co. Ltd. | | 20,100 | 186,543 |
| Electric Power Development Co. Ltd. | | 50,500 | 702,337 |
| en japan, Inc. | | 11,700 | 203,714 |
| ENEOS Holdings, Inc. | | 1,015,350 | 3,344,554 |
| eRex Co. Ltd. | | 11,400 | 193,431 |
| euglena Co. Ltd. (a) | | 36,500 | 218,713 |
| Exedy Corp. | | 15,400 | 180,519 |
| Exeo Group, Inc. | | 38,000 | 556,858 |
| Ezaki Glico Co. Ltd. | | 19,000 | 427,419 |
| Fancl Corp. | | 28,800 | 546,386 |
| FANUC Corp. | | 64,285 | 8,411,797 |
| Fast Retailing Co. Ltd. | | 19,636 | 10,959,290 |
| FCC Co. Ltd. | | 16,200 | 157,539 |
| Ferrotec Holdings Corp. | | 15,500 | 262,894 |
| Financial Products Group Co. Ltd. | | 23,900 | 186,770 |
| Food & Life Companies Ltd. | | 38,400 | 647,941 |
| FP Corp. | | 17,500 | 417,213 |
| Freee KK (a)(c) | | 13,800 | 270,070 |
| Frontier Real Estate Investment Corp. | | 159 | 561,384 |
| Fuji Co. Ltd. | | 13,900 | 172,190 |
| Fuji Corp. | | 25,800 | 341,467 |
| Fuji Electric Co. Ltd. | | 43,500 | 1,685,060 |
| Fuji Kyuko Co. Ltd. | | 9,600 | 296,984 |
| Fuji Media Holdings, Inc. | | 14,700 | 102,320 |
| Fuji Oil Holdings, Inc. | | 18,900 | 297,555 |
| Fuji Seal International, Inc. | | 24,900 | 291,877 |
| Fuji Soft ABC, Inc. | | 8,600 | 468,476 |
| FUJIFILM Holdings Corp. | | 120,600 | 5,530,592 |
| Fujikura Ltd. | | 80,600 | 477,003 |
| Fujimi, Inc. | | 6,500 | 271,899 |
| Fujimori Kogyo Co. Ltd. | | 9,000 | 188,238 |
| Fujitec Co. Ltd. | | 22,500 | 447,594 |
| Fujitsu General Ltd. | | 20,600 | 471,031 |
| Fujitsu Ltd. | | 66,242 | 7,621,707 |
| Fukuoka (REIT) Investment Fund | | 226 | 263,853 |
| Fukuoka Financial Group, Inc. | | 59,812 | 1,015,269 |
| Fukuyama Transporting Co. Ltd. | | 9,100 | 198,591 |
| Funai Soken Holdings, Inc. | | 22,200 | 396,090 |
| Furukawa Electric Co. Ltd. | | 28,700 | 443,157 |
| Fuso Chemical Co. Ltd. | | 8,100 | 183,305 |
| Future Corp. | | 15,400 | 173,269 |
| Fuyo General Lease Co. Ltd. | | 6,000 | 333,300 |
| Giken Ltd. | | 7,600 | 164,067 |
| Global One Real Estate Investment Corp. | | 352 | 271,762 |
| Glory Ltd. | | 17,800 | 274,730 |
| GLP J-REIT | | 1,402 | 1,452,962 |
| GMO Internet, Inc. | | 24,100 | 416,699 |
| GMO Payment Gateway, Inc. | | 14,400 | 1,039,120 |
| GNI Group Ltd. (a) | | 21,200 | 201,884 |
| GOLDWIN, Inc. | | 8,500 | 444,736 |
| GREE, Inc. (c) | | 25,100 | 141,287 |
| GS Yuasa Corp. | | 25,800 | 393,346 |
| GungHo Online Entertainment, Inc. | | 16,700 | 247,420 |
| Gunma Bank Ltd. | | 125,200 | 341,007 |
| Gunze Ltd. | | 7,300 | 187,538 |
| H.I.S. Co. Ltd. (a)(c) | | 19,300 | 267,250 |
| H.U. Group Holdings, Inc. | | 19,147 | 356,684 |
| H2O Retailing Corp. | | 33,800 | 284,139 |
| Hakuhodo DY Holdings, Inc. | | 84,400 | 712,912 |
| Halows Co. Ltd. | | 6,900 | 138,701 |
| Hamakyorex Co. Ltd. | | 11,100 | 248,209 |
| Hamamatsu Photonics K.K. | | 48,300 | 2,189,327 |
| Hankyu Hanshin Holdings, Inc. | | 76,700 | 2,277,350 |
| Hankyu REIT, Inc. | | 236 | 244,896 |
| Hanwa Co. Ltd. | | 11,900 | 288,107 |
| Harmonic Drive Systems, Inc. | | 16,600 | 554,840 |
| Haseko Corp. | | 81,400 | 838,662 |
| Hazama Ando Corp. | | 66,200 | 384,213 |
| Heiwa Corp. | | 23,300 | 376,072 |
| Heiwa Real Estate (REIT), Inc. | | 322 | 333,705 |
| Heiwa Real Estate Co. Ltd. | | 11,300 | 313,857 |
| Heiwado Co. Ltd. | | 17,400 | 220,345 |
| Hiday Hidaka Corp. | | 12,076 | 151,625 |
| Hikari Tsushin, Inc. | | 7,200 | 870,130 |
| Hino Motors Ltd. | | 98,300 | 408,550 |
| Hirogin Holdings, Inc. | | 87,800 | 361,958 |
| Hirose Electric Co. Ltd. | | 10,455 | 1,357,719 |
| Hisamitsu Pharmaceutical Co., Inc. | | 20,900 | 515,841 |
| Hitachi Construction Machinery Co. Ltd. | | 36,200 | 709,417 |
| Hitachi Ltd. | | 325,776 | 14,810,490 |
| Hitachi Transport System Ltd. | | 14,100 | 842,994 |
| Hitachi Zosen Corp. | | 57,400 | 331,596 |
| Hogy Medical Co. Ltd. | | 13,300 | 295,168 |
| Hokkaido Electric Power Co., Inc. | | 61,000 | 185,837 |
| Hokkoku Financial Holdings, Inc. | | 7,900 | 241,205 |
| Hokuetsu Corp. | | 43,200 | 224,287 |
| Hokuhoku Financial Group, Inc. | | 46,200 | 277,458 |
| Hokuriku Electric Power Co., Inc. | | 64,700 | 216,689 |
| Honda Motor Co. Ltd. | | 536,672 | 12,237,450 |
| Horiba Ltd. | | 12,100 | 498,013 |
| Hoshino Resorts REIT, Inc. | | 82 | 389,334 |
| Hoshizaki Corp. | | 36,900 | 1,058,398 |
| Hosiden Corp. | | 21,300 | 224,897 |
| House Foods Group, Inc. | | 22,400 | 419,242 |
| Hoya Corp. | | 123,618 | 11,535,020 |
| Hulic (REIT), Inc. | | 442 | 517,517 |
| Hulic Co. Ltd. | | 117,300 | 851,972 |
| Ibiden Co. Ltd. | | 38,700 | 1,309,129 |
| Ichibanya Co. Ltd. | | 6,600 | 203,732 |
| Ichigo Real Estate Investment Corp. | | 438 | 247,138 |
| Ichigo, Inc. | | 98,600 | 222,139 |
| Idec Corp. | | 12,800 | 274,602 |
| Idemitsu Kosan Co. Ltd. | | 69,700 | 1,523,420 |
| IDOM, Inc. | | 28,400 | 142,291 |
| IHI Corp. | | 46,472 | 1,037,607 |
| Iida Group Holdings Co. Ltd. | | 48,500 | 673,869 |
| Inaba Denki Sangyo Co. Ltd. | | 23,600 | 440,908 |
| Inabata & Co. Ltd. | | 16,200 | 267,685 |
| Industrial & Infrastructure Fund Investment Corp. | | 685 | 723,259 |
| Infomart Corp. | | 74,800 | 242,970 |
| Information Services Inter-Dentsu Ltd. | | 9,600 | 294,078 |
| INFRONEER Holdings, Inc. | | 98,404 | 682,961 |
| INPEX Corp. | | 350,300 | 3,535,367 |
| Internet Initiative Japan, Inc. | | 36,700 | 577,051 |
| Invincible Investment Corp. | | 2,102 | 660,166 |
| Iriso Electronics Co. Ltd. | | 7,300 | 212,085 |
| Isetan Mitsukoshi Holdings Ltd. | | 115,571 | 1,025,951 |
| Isuzu Motors Ltd. | | 191,968 | 2,251,536 |
| ITO EN Ltd. | | 19,360 | 683,547 |
| Itochu Corp. | | 399,150 | 10,332,078 |
| Itochu Enex Co. Ltd. | | 17,100 | 117,646 |
| ITOCHU Techno-Solutions Corp. | | 31,812 | 738,097 |
| Itoham Yonekyu Holdings, Inc. | | 58,400 | 261,179 |
| Iwatani Corp. | | 15,800 | 582,293 |
| Iyogin Holdings, Inc. | | 82,300 | 385,777 |
| Izumi Co. Ltd. | | 12,800 | 258,161 |
| J. Front Retailing Co. Ltd. | | 82,600 | 667,710 |
| JACCS Co. Ltd. | | 9,300 | 225,784 |
| JAFCO Co. Ltd. | | 26,400 | 405,334 |
| Japan Airlines Co. Ltd. (a) | | 47,300 | 882,730 |
| Japan Airport Terminal Co. Ltd. (a) | | 21,600 | 926,783 |
| Japan Aviation Electronics Industry Ltd. | | 16,600 | 258,888 |
| Japan Elevator Service Holdings Co. Ltd. | | 24,500 | 289,660 |
| Japan Excellent, Inc. | | 443 | 409,647 |
| Japan Exchange Group, Inc. | | 169,000 | 2,220,962 |
| Japan Hotel REIT Investment Corp. | | 1,536 | 808,829 |
| Japan Lifeline Co. Ltd. | | 29,400 | 198,511 |
| Japan Logistics Fund, Inc. | | 272 | 582,615 |
| Japan Material Co. Ltd. | | 24,900 | 328,550 |
| Japan Petroleum Exploration Co. Ltd. | | 12,100 | 314,106 |
| Japan Post Bank Co. Ltd. | | 126,034 | 839,125 |
| Japan Post Holdings Co. Ltd. | | 781,338 | 5,252,533 |
| Japan Post Insurance Co. Ltd. | | 67,600 | 998,804 |
| Japan Prime Realty Investment Corp. | | 292 | 792,374 |
| Japan Real Estate Investment Corp. | | 403 | 1,688,483 |
| Japan Retail Fund Investment Corp. | | 2,311 | 1,701,836 |
| Japan Securities Finance Co. Ltd. | | 58,300 | 349,341 |
| Japan Steel Works Ltd. | | 20,200 | 417,734 |
| Japan Tobacco, Inc. | | 394,243 | 6,602,560 |
| Japan Wool Textile Co. Ltd./The | | 22,300 | 149,522 |
| JCR Pharmaceuticals Co. Ltd. | | 24,400 | 363,469 |
| Jcu Corp. | | 13,200 | 250,604 |
| JEOL Ltd. | | 16,400 | 602,199 |
| JFE Holdings, Inc. | | 162,600 | 1,490,459 |
| JGC Holdings Corp. | | 74,742 | 900,754 |
| JINS Holdings, Inc. | | 5,700 | 171,734 |
| JMDC, Inc. | | 8,200 | 291,725 |
| Joshin Denki Co. Ltd. | | 10,800 | 139,090 |
| Joyful Honda Co. Ltd. | | 24,400 | 297,667 |
| JSR Corp. | | 61,500 | 1,172,138 |
| JTEKT Corp. | | 72,200 | 509,836 |
| JTOWER, Inc. (a) | | 3,300 | 134,268 |
| Justsystems Corp. | | 14,000 | 295,639 |
| K's Holdings Corp. | | 55,400 | 434,422 |
| Kadokawa Corp. | | 31,400 | 564,248 |
| Kagome Co. Ltd. | | 30,800 | 616,021 |
| Kajima Corp. | | 142,400 | 1,341,689 |
| Kakaku.com, Inc. | | 46,800 | 793,455 |
| Kaken Pharmaceutical Co. Ltd. | | 12,356 | 316,181 |
| Kameda Seika Co. Ltd. | | 7,200 | 222,496 |
| Kamigumi Co. Ltd. | | 32,600 | 620,013 |
| Kanamoto Co. Ltd. | | 14,600 | 210,907 |
| Kandenko Co. Ltd. | | 48,800 | 274,366 |
| Kaneka Corp. | | 22,000 | 545,950 |
| Kanematsu Corp. | | 31,200 | 308,653 |
| Kansai Electric Power Co., Inc. | | 235,699 | 1,786,427 |
| Kansai Paint Co. Ltd. | | 60,739 | 792,452 |
| Kao Corp. | | 160,091 | 5,979,710 |
| Katitas Co. Ltd. | | 17,600 | 394,741 |
| Kato Sangyo | | 12,000 | 280,843 |
| Kawasaki Heavy Industries Ltd. | | 49,400 | 839,197 |
| Kawasaki Kisen Kaisha Ltd. | | 52,800 | 802,857 |
| KDDI Corp. | | 542,137 | 16,023,929 |
| Keihan Electric Railway Co., Ltd. | | 33,900 | 872,037 |
| Keikyu Corp. | | 76,139 | 781,898 |
| Keio Corp. | | 35,103 | 1,232,305 |
| Keisei Electric Railway Co. | | 45,106 | 1,198,216 |
| Kenedix Office Investment Corp. | | 284 | 646,518 |
| Kenedix Residential Investment Corp. | | 329 | 481,901 |
| Kenedix Retail REIT Corp. | | 184 | 330,766 |
| Kewpie Corp. | | 33,100 | 522,895 |
| Keyence Corp. | | 65,550 | 24,827,842 |
| Kfc Holdings Japan Ltd. | | 7,300 | 136,579 |
| KH Neochem Co. Ltd. | | 15,500 | 264,666 |
| Ki-Star Real Estate Co. Ltd. | | 3,100 | 96,526 |
| Kikkoman Corp. | | 49,100 | 2,668,066 |
| Kinden Corp. | | 46,892 | 477,450 |
| Kintetsu Group Holdings Co. Ltd. | | 58,453 | 1,977,327 |
| Kirin Holdings Co. Ltd. | | 278,670 | 4,103,352 |
| Kisoji Co. Ltd. | | 11,400 | 168,667 |
| Kissei Pharmaceutical Co. Ltd. | | 12,100 | 213,934 |
| Kitz Corp. | | 30,900 | 183,702 |
| Kobayashi Pharmaceutical Co. Ltd. | | 18,600 | 988,197 |
| Kobe Bussan Co. Ltd. | | 52,000 | 1,131,309 |
| Kobe Steel Ltd. | | 114,400 | 469,310 |
| Koei Tecmo Holdings Co. Ltd. | | 39,496 | 597,108 |
| Kohnan Shoji Co. Ltd. | | 9,400 | 196,920 |
| Koito Manufacturing Co. Ltd. | | 69,700 | 990,926 |
| Kokuyo Co. Ltd. | | 34,200 | 424,582 |
| Komatsu Ltd. | | 308,511 | 6,043,791 |
| KOMEDA Holdings Co. Ltd. | | 20,400 | 340,652 |
| KOMERI Co. Ltd. | | 12,700 | 221,638 |
| Konami Group Corp. | | 31,100 | 1,365,769 |
| Konica Minolta, Inc. | | 149,700 | 456,062 |
| Kose Corp. | | 11,600 | 1,160,039 |
| Kotobuki Spirits Co. Ltd. | | 6,900 | 354,060 |
| Kubota Corp. | | 341,610 | 4,770,525 |
| Kumagai Gumi Co. Ltd. | | 13,800 | 233,318 |
| Kumiai Chemical Industry Co. Ltd. | | 42,600 | 280,190 |
| Kura Sushi, Inc. | | 8,300 | 194,250 |
| Kuraray Co. Ltd. | | 118,752 | 816,997 |
| Kureha Chemical Industry Co. Ltd. | | 6,300 | 405,044 |
| Kurita Water Industries Ltd. | | 35,400 | 1,299,869 |
| Kusuri No Aoki Holdings Co. Ltd. | | 6,300 | 304,207 |
| Kyb Corp. | | 7,500 | 164,178 |
| Kyocera Corp. | | 106,537 | 5,331,328 |
| Kyokuto Kaihatsu Kogyo Co. Ltd. | | 13,500 | 125,562 |
| Kyorin Holdings, Inc. | | 17,200 | 212,723 |
| Kyoritsu Maintenance Co. Ltd. | | 11,900 | 490,581 |
| Kyowa Hakko Kirin Co., Ltd. | | 92,000 | 2,168,600 |
| Kyudenko Corp. | | 19,600 | 416,530 |
| Kyushu Electric Power Co., Inc. | | 135,878 | 673,473 |
| Kyushu Financial Group, Inc. | | 143,285 | 362,320 |
| Kyushu Railway Co. | | 46,400 | 970,470 |
| LaSalle Logiport REIT | | 584 | 623,295 |
| Lasertec Corp. | | 25,400 | 3,568,978 |
| Lawson, Inc. | | 16,300 | 520,697 |
| LIFE Corp. | | 11,800 | 176,014 |
| Lintec Corp. | | 16,900 | 253,679 |
| Lion Corp. | | 80,736 | 816,618 |
| LIXIL Group Corp. | | 101,095 | 1,530,414 |
| M&A Capital Partners Co. Ltd. (a) | | 6,900 | 176,334 |
| M3, Inc. | | 148,190 | 4,430,900 |
| Mabuchi Motor Co. Ltd. | | 19,500 | 529,809 |
| Macnica Fuji Electronics Holdings, Inc. | | 22,600 | 452,623 |
| Makino Milling Machine Co. Ltd. | | 8,500 | 262,669 |
| Makita Corp. | | 75,100 | 1,372,341 |
| Mandom Corp. | | 17,600 | 178,373 |
| Mani, Inc. | | 29,200 | 426,134 |
| Marubeni Corp. | | 518,700 | 4,545,318 |
| Maruha Nichiro Corp. | | 17,700 | 272,949 |
| Marui Group Co. Ltd. | | 59,902 | 988,598 |
| Maruichi Steel Tube Ltd. | | 22,300 | 421,570 |
| Maruka Furusato Corp. | | 8,100 | 201,826 |
| Maruwa Ceramic Co. Ltd. | | 3,100 | 365,049 |
| Matsui Securities Co. Ltd. | | 50,600 | 269,513 |
| MatsukiyoCocokara & Co. | | 37,000 | 1,348,667 |
| Maxell Ltd. | | 19,000 | 157,806 |
| Mazda Motor Corp. | | 191,600 | 1,290,036 |
| McDonald's Holdings Co. (Japan) Ltd. | | 27,328 | 948,334 |
| MCJ Co. Ltd. | | 27,800 | 175,742 |
| Mebuki Financial Group, Inc. | | 334,368 | 649,870 |
| Medipal Holdings Corp. | | 61,800 | 766,811 |
| Medley, Inc. (a) | | 9,500 | 231,279 |
| Megachips Corp. | | 6,800 | 116,706 |
| Megmilk Snow Brand Co. Ltd. | | 18,200 | 198,285 |
| Meidensha Corp. | | 12,200 | 162,535 |
| Meiji Holdings Co. Ltd. | | 36,900 | 1,518,733 |
| Meiko Electronics Co. Ltd. | | 9,300 | 165,304 |
| Meitec Corp. | | 31,600 | 533,202 |
| Menicon Co. Ltd. | | 22,300 | 381,977 |
| Mercari, Inc. (a) | | 35,400 | 589,226 |
| Milbon Co. Ltd. | | 10,100 | 417,055 |
| Minebea Mitsumi, Inc. | | 121,695 | 1,803,798 |
| Mirai Corp. | | 774 | 249,333 |
| Mirait One Corp. | | 37,400 | 359,424 |
| Misumi Group, Inc. | | 96,405 | 2,061,723 |
| Mitsubishi Chemical Holdings Corp. | | 422,957 | 1,911,762 |
| Mitsubishi Corp. | | 424,151 | 11,498,387 |
| Mitsubishi Electric Corp. | | 650,692 | 5,725,187 |
| Mitsubishi Estate Co. Ltd. | | 392,771 | 4,939,213 |
| Mitsubishi Estate Logistics REIT Investment Corp. | | 142 | 420,189 |
| Mitsubishi Gas Chemical Co., Inc. | | 54,245 | 690,215 |
| Mitsubishi Heavy Industries Ltd. | | 107,666 | 3,707,253 |
| Mitsubishi Logistics Corp. | | 22,600 | 496,244 |
| Mitsubishi Materials Corp. | | 51,600 | 675,299 |
| Mitsubishi Motors Corp. of Japan (a) | | 227,734 | 765,776 |
| Mitsubishi Pencil Co. Ltd. | | 18,300 | 178,329 |
| Mitsubishi Research Institute, Inc. | | 5,600 | 195,837 |
| Mitsubishi Shokuhin Co. Ltd. | | 9,100 | 184,209 |
| Mitsubishi UFJ Financial Group, Inc. | | 3,996,939 | 18,880,944 |
| Mitsubishi UFJ Lease & Finance Co. Ltd. | | 212,280 | 910,822 |
| Mitsuboshi Belting Ltd. | | 7,800 | 166,024 |
| Mitsui & Co. Ltd. | | 469,582 | 10,399,365 |
| Mitsui Chemicals, Inc. | | 61,800 | 1,145,022 |
| Mitsui Fudosan Co. Ltd. | | 301,940 | 5,786,193 |
| Mitsui Fudosan Logistics Park, Inc. | | 178 | 590,161 |
| Mitsui High-Tec, Inc. | | 6,600 | 341,773 |
| Mitsui Mining & Smelting Co. Ltd. | | 18,600 | 376,516 |
| Mitsui OSK Lines Ltd. | | 115,600 | 2,294,197 |
| Miura Co. Ltd. | | 30,455 | 621,614 |
| mixi, Inc. | | 13,200 | 207,017 |
| Mizuho Financial Group, Inc. | | 796,868 | 8,606,678 |
| Mizuho Leasing Co. Ltd. | | 10,400 | 226,612 |
| Mochida Pharmaceutical Co. Ltd. | | 9,700 | 223,427 |
| Monex Group, Inc. | | 68,200 | 237,584 |
| Money Forward, Inc. (a) | | 14,700 | 419,167 |
| MonotaRO Co. Ltd. | | 84,900 | 1,294,954 |
| Mori Hills REIT Investment Corp. | | 516 | 564,600 |
| MORI TRUST Sogo (REIT), Inc. | | 373 | 372,009 |
| Morinaga & Co. Ltd. | | 13,900 | 347,745 |
| Morinaga Milk Industry Co. Ltd. | | 13,200 | 374,619 |
| Morita Holdings Corp. | | 24,600 | 211,266 |
| MOS Food Services, Inc. | | 9,800 | 207,936 |
| MS&AD Insurance Group Holdings, Inc. | | 149,297 | 3,953,564 |
| Murata Manufacturing Co. Ltd. | | 192,402 | 9,108,204 |
| Musashi Seimitsu Industry Co. Ltd. | | 19,000 | 219,395 |
| Nabtesco Corp. | | 38,800 | 825,865 |
| Nachi-Fujikoshi Corp. | | 5,900 | 154,746 |
| Nagaileben Co. Ltd. | | 16,800 | 230,711 |
| Nagase & Co. Ltd. | | 33,700 | 459,623 |
| Nagawa Co. Ltd. | | 3,400 | 169,891 |
| Nagoya Railroad Co. Ltd. | | 64,116 | 982,254 |
| Nakanishi, Inc. | | 26,300 | 480,385 |
| Nankai Electric Railway Co. Ltd. | | 36,200 | 732,789 |
| NEC Corp. | | 81,800 | 2,709,338 |
| NEC Networks & System Integration Corp. | | 23,700 | 254,062 |
| Net One Systems Co. Ltd. | | 27,400 | 563,866 |
| Nexon Co. Ltd. | | 166,300 | 2,792,637 |
| Nextage Co. Ltd. | | 16,700 | 322,331 |
| NGK Insulators Ltd. | | 76,000 | 887,804 |
| NGK Spark Plug Co. Ltd. | | 51,300 | 934,954 |
| NH Foods Ltd. | | 27,013 | 644,010 |
| NHK Spring Co. Ltd. | | 67,287 | 372,874 |
| Nichias Corp. | | 21,500 | 331,982 |
| Nichiha Corp. | | 12,400 | 234,999 |
| Nichirei Corp. | | 37,110 | 577,508 |
| Nidec Corp. | | 150,890 | 8,296,538 |
| Nifco, Inc. | | 28,200 | 655,241 |
| Nihon Kohden Corp. | | 29,900 | 670,611 |
| Nihon M&A Center Holdings, Inc. | | 104,800 | 1,186,176 |
| Nihon Parkerizing Co. Ltd. | | 42,500 | 276,674 |
| Nikkiso Co. Ltd. | | 18,400 | 122,753 |
| Nikkon Holdings Co. Ltd. | | 20,100 | 314,284 |
| Nikon Corp. | | 100,900 | 976,463 |
| Nintendo Co. Ltd. | | 371,380 | 15,077,693 |
| Nippn Corp. | | 20,200 | 212,603 |
| Nippon Accommodations Fund, Inc. | | 163 | 693,897 |
| Nippon Building Fund, Inc. | | 497 | 2,209,335 |
| Nippon Carbon Co. Ltd. | | 9,200 | 260,789 |
| Nippon Ceramic Co. Ltd. | | 10,700 | 186,087 |
| Nippon Densetsu Kogyo Co. Ltd. | | 18,800 | 210,511 |
| Nippon Electric Glass Co. Ltd. | | 26,500 | 459,444 |
| Nippon Express Holdings, Inc. | | 27,066 | 1,359,716 |
| Nippon Gas Co. Ltd. | | 36,600 | 531,912 |
| Nippon Kayaku Co. Ltd. | | 50,200 | 399,048 |
| Nippon Light Metal Holding Co. Ltd. | | 24,240 | 236,539 |
| Nippon Paint Holdings Co. Ltd. | | 281,385 | 1,797,745 |
| Nippon Paper Industries Co. Ltd. | | 32,945 | 191,872 |
| Nippon Prologis REIT, Inc. | | 698 | 1,462,235 |
| Nippon REIT Investment Corp. | | 160 | 394,902 |
| Nippon Sanso Holdings Corp. | | 58,600 | 934,794 |
| Nippon Seiki Co. Ltd. | | 19,900 | 101,176 |
| Nippon Shinyaku Co. Ltd. | | 17,000 | 942,063 |
| Nippon Shokubai Co. Ltd. | | 11,000 | 395,037 |
| Nippon Signal Co. Ltd. | | 24,900 | 168,964 |
| Nippon Soda Co. Ltd. | | 8,300 | 247,557 |
| Nippon Steel & Sumikin Bussan Corp. | | 7,500 | 258,247 |
| Nippon Steel & Sumitomo Metal Corp. | | 270,883 | 3,720,895 |
| Nippon Suisan Kaisha Co. Ltd. | | 102,900 | 366,771 |
| Nippon Telegraph & Telephone Corp. | | 401,264 | 11,067,145 |
| Nippon Television Network Corp. | | 15,600 | 116,453 |
| Nippon Yusen KK | | 162,800 | 2,949,036 |
| Nipro Corp. | | 68,138 | 514,145 |
| Nishi-Nippon Financial Holdings, Inc. | | 47,800 | 243,669 |
| Nishi-Nippon Railroad Co. Ltd. | | 24,100 | 473,102 |
| Nishimatsu Construction Co. Ltd. | | 14,800 | 360,308 |
| Nishimatsuya Chain Co. Ltd. | | 18,200 | 167,074 |
| Nissan Chemical Corp. | | 43,300 | 1,951,041 |
| Nissan Motor Co. Ltd. | | 756,648 | 2,411,667 |
| Nissha Co. Ltd. | | 14,500 | 170,944 |
| Nisshin Oillio Group Ltd. | | 9,900 | 212,388 |
| Nisshin Seifun Group, Inc. | | 66,800 | 722,381 |
| Nisshinbo Holdings, Inc. | | 49,900 | 346,325 |
| Nissin Electric Co. Ltd. | | 22,200 | 206,331 |
| Nissin Food Holdings Co. Ltd. | | 21,200 | 1,372,985 |
| Nitori Holdings Co. Ltd. | | 27,200 | 2,464,785 |
| Nitta Corp. | | 8,000 | 155,432 |
| Nitto Boseki Co. Ltd. | | 10,100 | 150,045 |
| Nitto Denko Corp. | | 47,842 | 2,519,270 |
| Noevir Holdings Co. Ltd. | | 6,800 | 251,522 |
| NOF Corp. | | 23,400 | 805,730 |
| Nojima Co. Ltd. | | 23,400 | 195,138 |
| NOK Corp. | | 36,500 | 298,490 |
| NOMURA Co. Ltd. | | 59,200 | 433,564 |
| Nomura Holdings, Inc. | | 949,354 | 3,072,071 |
| Nomura Real Estate Holdings, Inc. | | 39,900 | 902,946 |
| Nomura Real Estate Master Fund, Inc. | | 1,389 | 1,583,345 |
| Nomura Research Institute Ltd. | | 112,610 | 2,502,949 |
| North Pacific Bank Ltd. | | 130,300 | 206,805 |
| NS Solutions Corp. | | 12,200 | 281,011 |
| NSD Co. Ltd. | | 26,400 | 451,674 |
| NSK Ltd. | | 125,600 | 663,920 |
| NTN Corp. | | 184,900 | 329,524 |
| NTT Data Corp. | | 211,400 | 3,066,612 |
| Ntt Ud (REIT) Investment Corp. | | 472 | 462,176 |
| Obayashi Corp. | | 219,200 | 1,407,821 |
| OBIC Business Consultants Ltd. | | 10,300 | 296,473 |
| OBIC Co. Ltd. | | 23,241 | 3,496,427 |
| Odakyu Electric Railway Co. Ltd. | | 100,500 | 1,195,632 |
| Ogaki Kyoritsu Bank Ltd. | | 14,200 | 167,598 |
| Ohsho Food Service Corp. | | 5,200 | 221,716 |
| Oisix Ra Daichi, Inc. (a) | | 10,500 | 118,844 |
| Oji Holdings Corp. | | 262,200 | 909,884 |
| Okamoto Industries, Inc. | | 6,500 | 162,178 |
| Okasan Securities Group, Inc. | | 74,434 | 177,206 |
| Oki Electric Industry Co. Ltd. | | 34,500 | 170,998 |
| Okinawa Financial Group, Inc. | | 11,300 | 156,701 |
| Okuma Corp. | | 9,300 | 312,095 |
| Okumura Corp. | | 12,100 | 228,825 |
| Olympus Corp. | | 417,100 | 8,807,922 |
| OMRON Corp. | | 62,700 | 2,933,126 |
| One (REIT), Inc. | | 109 | 181,722 |
| Ono Pharmaceutical Co. Ltd. | | 122,080 | 2,870,249 |
| Open House Group Co. Ltd. | | 27,700 | 987,323 |
| Optex Group Co. Ltd. | | 15,700 | 216,344 |
| Optorun Co. Ltd. | | 13,200 | 187,842 |
| Oracle Corp. Japan | | 12,700 | 678,153 |
| Orient Corp. | | 28,650 | 232,175 |
| Oriental Land Co. Ltd. | | 67,434 | 9,047,435 |
| ORIX Corp. | | 396,120 | 5,820,789 |
| ORIX JREIT, Inc. | | 866 | 1,161,888 |
| Osaka Gas Co. Ltd. | | 122,300 | 1,811,121 |
| OSG Corp. | | 31,900 | 406,111 |
| Otsuka Corp. | | 38,500 | 1,215,626 |
| Otsuka Holdings Co. Ltd. | | 130,518 | 4,183,691 |
| Outsourcing, Inc. | | 44,300 | 347,083 |
| Pacific Industrial Co. Ltd. | | 24,500 | 172,511 |
| PALTAC Corp. | | 12,900 | 366,973 |
| Pan Pacific International Holdings Ltd. | | 128,792 | 2,114,269 |
| Panasonic Holdings Corp. | | 727,589 | 5,182,336 |
| Paramount Bed Holdings Co. Ltd. | | 21,800 | 388,220 |
| Park24 Co. Ltd. (a) | | 49,040 | 654,658 |
| Penta-Ocean Construction Co. Ltd. | | 103,100 | 513,091 |
| PeptiDream, Inc. (a) | | 34,600 | 379,985 |
| Persol Holdings Co. Ltd. | | 62,200 | 1,249,062 |
| Pigeon Corp. | | 41,200 | 539,746 |
| Pilot Corp. | | 11,900 | 463,371 |
| Piolax, Inc. | | 12,700 | 158,008 |
| Pola Orbis Holdings, Inc. | | 36,289 | 401,462 |
| Prestige International, Inc. | | 42,800 | 207,243 |
| Raito Kogyo Co. Ltd. | | 17,800 | 242,888 |
| Raksul, Inc. (a) | | 8,800 | 173,875 |
| Rakus Co. Ltd. | | 30,800 | 344,466 |
| Rakuten Group, Inc. | | 287,995 | 1,285,716 |
| Recruit Holdings Co. Ltd. | | 486,754 | 14,977,990 |
| Relia, Inc. | | 22,100 | 148,329 |
| Relo Group, Inc. | | 39,600 | 559,798 |
| Renesas Electronics Corp. (a) | | 393,755 | 3,294,057 |
| Rengo Co. Ltd. | | 75,700 | 420,004 |
| RENOVA, Inc. (a) | | 13,800 | 303,480 |
| Resona Holdings, Inc. | | 724,746 | 2,728,003 |
| Resorttrust, Inc. | | 29,300 | 451,239 |
| Ricoh Co. Ltd. | | 196,900 | 1,443,364 |
| Riken Keiki Co. Ltd. | | 5,700 | 157,167 |
| Ringer Hut Co. Ltd. (c) | | 11,100 | 163,557 |
| Rinnai Corp. | | 12,661 | 863,395 |
| Riso Kyoiku Co. Ltd. | | 71,800 | 148,723 |
| ROHM Co. Ltd. | | 29,500 | 2,077,171 |
| Rohto Pharmaceutical Co. Ltd. | | 32,600 | 1,013,988 |
| Roland Corp. | | 6,200 | 176,374 |
| Rorze Corp. | | 3,900 | 196,449 |
| Round One Corp. | | 70,700 | 300,972 |
| Royal Holdings Co. Ltd. | | 12,300 | 196,707 |
| Ryohin Keikaku Co. Ltd. | | 85,930 | 809,630 |
| S Foods, Inc. | | 9,200 | 168,600 |
| S-Pool, Inc. | | 34,500 | 221,114 |
| Saizeriya Co. Ltd. | | 12,100 | 225,896 |
| Sakai Moving Service Co. Ltd. | | 4,600 | 145,708 |
| Sakata Seed Corp. | | 10,200 | 336,124 |
| San-A Co. Ltd. | | 10,400 | 303,198 |
| San-Ai Obbli Co. Ltd. | | 26,600 | 220,034 |
| Sangetsu Corp. | | 16,100 | 170,642 |
| Sanken Electric Co. Ltd. | | 8,700 | 298,981 |
| Sankyo Co. Ltd. (Gunma) | | 13,800 | 456,148 |
| Sankyu, Inc. | | 18,700 | 559,007 |
| Sanrio Co. Ltd. | | 18,800 | 501,308 |
| Sansan, Inc. (a) | | 27,700 | 276,637 |
| Santen Pharmaceutical Co. Ltd. | | 124,360 | 851,397 |
| Sanwa Holdings Corp. | | 63,300 | 545,752 |
| Sanyo Chemical Industries Ltd. | | 5,600 | 158,741 |
| Sapporo Holdings Ltd. | | 24,400 | 538,229 |
| Sato Holding Corp. | | 17,500 | 216,198 |
| Sawai Group Holdings Co. Ltd. | | 14,400 | 414,970 |
| SBI Holdings, Inc. Japan | | 80,900 | 1,462,451 |
| Screen Holdings Co. Ltd. | | 12,400 | 682,982 |
| SCSK Corp. | | 53,000 | 783,086 |
| Secom Co. Ltd. | | 70,633 | 4,023,997 |
| Sega Sammy Holdings, Inc. | | 53,419 | 684,375 |
| Seibu Holdings, Inc. | | 80,100 | 717,531 |
| Seiko Epson Corp. | | 95,173 | 1,296,752 |
| Seiko Group Corp. | | 13,300 | 281,751 |
| Seino Holdings Co. Ltd. | | 46,500 | 357,752 |
| Seiren Co. Ltd. | | 17,000 | 266,727 |
| Sekisui Chemical Co. Ltd. | | 120,700 | 1,509,815 |
| Sekisui House (REIT), Inc. | | 1,364 | 734,768 |
| Sekisui House Ltd. | | 202,780 | 3,375,235 |
| Sekisui Jushi Corp. | | 18,100 | 207,421 |
| SENKO Co. Ltd. | | 41,100 | 274,746 |
| Seria Co. Ltd. | | 17,200 | 281,317 |
| Seven & i Holdings Co. Ltd. | | 254,029 | 9,482,490 |
| Seven Bank Ltd. | | 196,400 | 353,981 |
| SG Holdings Co. Ltd. | | 99,700 | 1,322,226 |
| Sharp Corp. | | 81,600 | 489,444 |
| SHIFT, Inc. (a) | | 4,300 | 674,085 |
| Shiga Bank Ltd. | | 14,200 | 240,367 |
| Shikoku Electric Power Co., Inc. | | 56,100 | 270,134 |
| Shima Seiki Manufacturing Ltd. | | 10,500 | 146,666 |
| Shimadzu Corp. | | 79,900 | 2,109,066 |
| Shimamura Co. Ltd. | | 7,800 | 631,050 |
| SHIMANO, Inc. | | 24,565 | 3,801,269 |
| SHIMIZU Corp. | | 189,500 | 946,895 |
| Shin-Etsu Chemical Co. Ltd. | | 126,335 | 13,129,991 |
| Shinko Electric Industries Co. Ltd. | | 23,200 | 559,346 |
| Shinmaywa Industries Ltd. | | 24,200 | 165,028 |
| Shinsei Bank Ltd. (c) | | 26,500 | 393,860 |
| Shionogi & Co. Ltd. | | 89,400 | 4,151,490 |
| Ship Healthcare Holdings, Inc. | | 28,000 | 536,857 |
| Shiseido Co. Ltd. | | 135,755 | 4,706,392 |
| Shizuoka Financial Group | | 152,600 | 962,634 |
| Shizuoka Gas Co. Ltd. | | 31,400 | 230,176 |
| SHO-BOND Holdings Co. Ltd. | | 14,700 | 636,659 |
| Shochiku Co. Ltd. (a) | | 3,300 | 262,100 |
| Shoei Co. Ltd. | | 8,800 | 324,907 |
| Showa Denko K.K. | | 60,082 | 877,623 |
| Siix Corp. | | 19,700 | 152,226 |
| SKY Perfect JSAT Holdings, Inc. | | 54,700 | 191,659 |
| Skylark Holdings Co. Ltd. | | 77,900 | 831,415 |
| SMC Corp. | | 19,267 | 7,733,818 |
| SMS Co., Ltd. | | 25,800 | 593,403 |
| Snow Peak, Inc. (c) | | 9,800 | 129,309 |
| SoftBank Corp. | | 952,900 | 9,399,776 |
| SoftBank Group Corp. | | 406,912 | 17,467,195 |
| Sohgo Security Services Co., Ltd. | | 27,300 | 681,146 |
| Sojitz Corp. | | 77,040 | 1,136,728 |
| Sompo Holdings, Inc. | | 105,619 | 4,398,927 |
| Sony Group Corp. | | 424,405 | 28,619,607 |
| Sosei Group Corp. (a) | | 31,312 | 428,107 |
| SOSiLA Logistics REIT, Inc. | | 247 | 236,709 |
| Sotetsu Holdings, Inc. | | 28,400 | 430,312 |
| Square Enix Holdings Co. Ltd. | | 29,000 | 1,295,000 |
| Stanley Electric Co. Ltd. | | 45,039 | 765,719 |
| Star Asia Investment Corp. | | 680 | 259,296 |
| Star Micronics Co. Ltd. | | 12,400 | 142,184 |
| Starts Corp., Inc. | | 10,700 | 189,253 |
| Subaru Corp. | | 204,125 | 3,178,664 |
| Sugi Holdings Co. Ltd. | | 12,900 | 517,926 |
| Sumco Corp. | | 114,300 | 1,452,051 |
| Sumitomo Bakelite Co. Ltd. | | 13,300 | 360,463 |
| Sumitomo Chemical Co. Ltd. | | 494,000 | 1,664,441 |
| Sumitomo Corp. | | 375,300 | 4,771,477 |
| Sumitomo Dainippon Pharma Co., Ltd. | | 63,100 | 440,060 |
| Sumitomo Electric Industries Ltd. | | 234,400 | 2,449,696 |
| Sumitomo Forestry Co. Ltd. | | 50,423 | 790,111 |
| Sumitomo Heavy Industries Ltd. | | 35,547 | 674,866 |
| Sumitomo Metal Mining Co. Ltd. | | 83,600 | 2,343,379 |
| Sumitomo Mitsui Construction Co. Ltd. | | 70,660 | 207,663 |
| Sumitomo Mitsui Financial Group, Inc. | | 432,233 | 12,137,780 |
| Sumitomo Mitsui Trust Holdings, Inc. | | 112,400 | 3,233,639 |
| Sumitomo Osaka Cement Co. Ltd. | | 11,503 | 244,843 |
| Sumitomo Realty & Development Co. Ltd. | | 102,687 | 2,358,358 |
| Sumitomo Rubber Industries Ltd. | | 59,800 | 513,163 |
| Sundrug Co. Ltd. | | 26,141 | 608,278 |
| Suntory Beverage & Food Ltd. | | 47,600 | 1,594,189 |
| Suruga Bank Ltd. | | 72,400 | 191,840 |
| Suzuken Co. Ltd. | | 23,400 | 520,892 |
| Suzuki Motor Corp. | | 121,540 | 4,103,237 |
| Sysmex Corp. | | 57,000 | 3,077,414 |
| Systena Corp. | | 102,400 | 287,170 |
| T Hasegawa Co. Ltd. | | 13,500 | 287,804 |
| T&D Holdings, Inc. | | 180,400 | 1,779,796 |
| T-Gaia Corp. | | 14,100 | 156,935 |
| Tadano Ltd. | | 36,000 | 220,317 |
| Taiheiyo Cement Corp. | | 43,991 | 597,907 |
| Taikisha Ltd. | | 12,800 | 302,149 |
| Taisei Corp. | | 61,200 | 1,668,960 |
| Taisho Pharmaceutical Holdings Co. Ltd. | | 13,400 | 483,029 |
| Taiyo Holdings Co. Ltd. | | 14,300 | 252,350 |
| Taiyo Yuden Co. Ltd. | | 39,300 | 1,071,734 |
| Takara Bio, Inc. | | 19,100 | 223,890 |
| Takara Holdings, Inc. | | 58,969 | 410,854 |
| Takasago International Corp. | | 9,800 | 184,407 |
| Takasago Thermal Engineering Co. Ltd. | | 20,700 | 251,972 |
| Takashimaya Co. Ltd. | | 48,500 | 599,502 |
| Takeda Pharmaceutical Co. Ltd. | | 503,770 | 13,304,062 |
| Takeuchi Manufacturing Co. Ltd. | | 12,600 | 254,212 |
| Takuma Co. Ltd. | | 24,400 | 202,821 |
| Tbs Holdings, Inc. | | 14,400 | 149,234 |
| TDK Corp. | | 131,143 | 4,105,522 |
| Techmatrix Corp. | | 18,600 | 211,900 |
| TechnoPro Holdings, Inc. | | 39,400 | 945,220 |
| Teijin Ltd. | | 61,100 | 554,726 |
| Terumo Corp. | | 218,300 | 6,641,711 |
| The Awa Bank Ltd. | | 15,000 | 188,540 |
| The Hachijuni Bank Ltd. | | 120,700 | 384,759 |
| The Hyakugo Bank Ltd. | | 96,800 | 214,178 |
| The Keiyo Bank Ltd. | | 45,000 | 157,974 |
| The Kiyo Bank Ltd. | | 24,200 | 233,220 |
| The Nanto Bank Ltd. | | 12,500 | 179,142 |
| The Okinawa Electric Power Co., Inc. | | 19,201 | 133,391 |
| The San-In Godo Bank Ltd. | | 58,200 | 277,115 |
| The Sumitomo Warehouse Co. Ltd. | | 21,600 | 293,288 |
| THK Co. Ltd. | | 38,700 | 676,167 |
| TIS, Inc. | | 75,900 | 2,049,420 |
| TKC Corp. | | 13,200 | 337,335 |
| Toagosei Co. Ltd. | | 43,700 | 335,916 |
| Tobu Railway Co. Ltd. | | 63,700 | 1,473,674 |
| Tocalo Co. Ltd. | | 24,400 | 195,272 |
| Toda Corp. | | 85,000 | 424,728 |
| Toei Animation Co. Ltd. | | 2,900 | 298,591 |
| Toei Co. Ltd. | | 2,100 | 258,590 |
| Toho Co. Ltd. | | 37,500 | 1,336,629 |
| Toho Gas Co. Ltd. | | 25,500 | 475,890 |
| Toho Holdings Co. Ltd. | | 20,700 | 281,485 |
| Toho Titanium Co. Ltd. | | 11,800 | 178,315 |
| Tohoku Electric Power Co., Inc. | | 152,800 | 642,254 |
| Tokai Carbon Co. Ltd. | | 74,600 | 487,149 |
| TOKAI Holdings Corp. | | 42,900 | 256,197 |
| Tokai Rika Co. Ltd. | | 21,400 | 223,362 |
| Tokai Tokyo Financial Holdings | | 74,400 | 170,620 |
| Tokio Marine Holdings, Inc. | | 619,179 | 11,205,560 |
| Tokuyama Corp. | | 23,735 | 276,944 |
| Tokyo Century Corp. | | 13,200 | 450,076 |
| Tokyo Electric Power Co., Inc. (a) | | 515,428 | 1,681,177 |
| Tokyo Electron Ltd. | | 50,323 | 13,239,811 |
| Tokyo Gas Co. Ltd. | | 131,035 | 2,341,437 |
| Tokyo Ohka Kogyo Co. Ltd. | | 11,700 | 505,155 |
| Tokyo Seimitsu Co. Ltd. | | 13,100 | 395,128 |
| Tokyo Steel Manufacturing Co. Ltd. | | 26,000 | 223,114 |
| Tokyo Tatemono Co. Ltd. | | 61,300 | 844,707 |
| Tokyotokeiba Co. Ltd. | | 7,600 | 211,856 |
| Tokyu Construction Co. Ltd. | | 37,800 | 158,628 |
| Tokyu Corp. | | 179,100 | 2,066,886 |
| Tokyu Fudosan Holdings Corp. | | 208,100 | 1,056,629 |
| Tokyu REIT, Inc. | | 300 | 427,116 |
| TOMONY Holdings, Inc. | | 109,400 | 237,642 |
| Tomy Co. Ltd. | | 32,100 | 281,937 |
| Topcon Corp. | | 35,360 | 387,855 |
| Toppan, Inc. | | 89,300 | 1,332,639 |
| Toray Industries, Inc. | | 465,200 | 2,266,636 |
| TORIDOLL Holdings Corp. | | 18,000 | 349,844 |
| Toshiba Corp. | | 130,952 | 4,562,778 |
| Toshiba Tec Corp. | | 11,600 | 300,736 |
| Tosoh Corp. | | 87,700 | 954,883 |
| Totetsu Kogyo Co. Ltd. | | 12,900 | 214,198 |
| Toto Ltd. | | 48,500 | 1,386,227 |
| Towa Pharmaceutical Co. Ltd. | | 12,200 | 183,375 |
| Toyo Gosei Co. Ltd. (c) | | 2,300 | 118,484 |
| Toyo Ink South Carolina Holdings Co. Ltd. | | 24,349 | 313,584 |
| Toyo Seikan Group Holdings Ltd. | | 47,900 | 547,953 |
| Toyo Suisan Kaisha Ltd. | | 30,536 | 1,145,909 |
| Toyo Tire Corp. | | 37,100 | 434,886 |
| Toyobo Co. Ltd. | | 36,200 | 253,189 |
| Toyoda Gosei Co. Ltd. | | 23,500 | 375,507 |
| Toyota Boshoku Corp. | | 26,000 | 331,175 |
| Toyota Industries Corp. | | 48,300 | 2,488,167 |
| Toyota Motor Corp. | | 3,541,160 | 49,132,220 |
| Toyota Tsusho Corp. | | 71,149 | 2,392,448 |
| Trancom Co. Ltd. | | 3,700 | 189,858 |
| Transcosmos, Inc. | | 9,100 | 209,607 |
| TRE Holdings Corp. | | 18,600 | 200,892 |
| Trend Micro, Inc. | | 44,900 | 2,267,723 |
| Tri Chemical Laboratories, Inc. | | 9,600 | 143,908 |
| Trusco Nakayama Corp. | | 19,000 | 254,918 |
| TS tech Co. Ltd. | | 30,900 | 323,141 |
| Tsubakimoto Chain Co. | | 9,000 | 192,777 |
| Tsugami Corp. | | 18,000 | 135,216 |
| Tsumura & Co. | | 21,784 | 454,886 |
| Tsuruha Holdings, Inc. | | 14,000 | 814,419 |
| Uacj Corp. | | 13,500 | 192,565 |
| Ube Corp. | | 37,400 | 482,167 |
| Ulvac, Inc. | | 15,959 | 631,083 |
| Unicharm Corp. | | 135,900 | 4,130,196 |
| United Super Markets Holdings, Inc. | | 28,900 | 203,687 |
| United Urban Investment Corp. | | 990 | 1,046,626 |
| Universal Entertainment Corp. (a) | | 9,700 | 131,121 |
| USEN-NEXT HOLDINGS Co. Ltd. | | 8,600 | 132,156 |
| Ushio, Inc. | | 44,100 | 458,513 |
| USS Co. Ltd. | | 74,900 | 1,131,849 |
| UT Group Co. Ltd. | | 11,600 | 189,803 |
| Valor Holdings Co. Ltd. | | 22,800 | 263,734 |
| ValueCommerce Co. Ltd. | | 6,700 | 97,913 |
| Visional, Inc. (a) | | 5,800 | 395,521 |
| Wacoal Holdings Corp. | | 27,900 | 449,380 |
| Wacom Co. Ltd. | | 56,400 | 245,407 |
| WealthNavi, Inc. (a)(c) | | 10,900 | 101,966 |
| Welcia Holdings Co. Ltd. | | 33,800 | 706,937 |
| West Holdings Corp. | | 8,649 | 259,130 |
| West Japan Railway Co. | | 73,156 | 2,903,215 |
| Workman Co. Ltd. | | 8,700 | 297,811 |
| Yakult Honsha Co. Ltd. | | 43,300 | 2,399,489 |
| Yamada Holdings Co. Ltd. | | 252,110 | 812,137 |
| Yamaguchi Financial Group, Inc. | | 68,400 | 359,722 |
| Yamaha Corp. | | 47,100 | 1,780,167 |
| Yamaha Motor Co. Ltd. | | 97,007 | 2,002,835 |
| Yamato Holdings Co. Ltd. | | 102,800 | 1,523,731 |
| Yamato Kogyo Co. Ltd. | | 15,700 | 456,128 |
| Yamazaki Baking Co. Ltd. | | 42,800 | 436,074 |
| Yamazen Co. Ltd. | | 29,400 | 182,891 |
| Yaoko Co. Ltd. | | 8,100 | 352,446 |
| Yaskawa Electric Corp. | | 80,600 | 2,238,663 |
| Yokogawa Bridge Holdings Corp. | | 17,800 | 236,543 |
| Yokogawa Electric Corp. | | 77,312 | 1,295,163 |
| Yokohama Rubber Co. Ltd. | | 45,800 | 717,054 |
| YONEX Co. Ltd. | | 23,300 | 216,711 |
| Yoshinoya Holdings Co. Ltd. | | 23,000 | 361,640 |
| Yuasa Trading Co. Ltd. | | 7,100 | 176,909 |
| Z Holdings Corp. | | 898,865 | 2,319,755 |
| Zenkoku Hosho Co. Ltd. | | 19,500 | 643,902 |
| Zensho Holdings Co. Ltd. | | 32,200 | 803,403 |
| Zeon Corp. | | 47,500 | 400,585 |
| ZERIA Pharmaceutical Co. Ltd. | | 12,200 | 181,899 |
| Zojirushi Thermos | | 12,800 | 129,209 |
| ZOZO, Inc. | | 41,100 | 874,821 |
TOTAL JAPAN | | | 1,191,047,995 |
| Korea (South) - 3.1% | | | |
| ABL Bio, Inc. (a) | | 13,287 | 186,647 |
| Ace Technologies Corp. (a) | | 23,131 | 79,733 |
| Advanced Nano Products Co. Ltd. | | 2,928 | 190,780 |
| AfreecaTV Co. Ltd. | | 3,288 | 183,368 |
| AhnLab, Inc. | | 2,059 | 89,872 |
| Alteogen, Inc. | | 11,937 | 306,930 |
| AMOREPACIFIC Corp. | | 10,230 | 664,407 |
| AMOREPACIFIC Group, Inc. | | 12,875 | 222,804 |
| Ananti, Inc. (a) | | 29,739 | 110,220 |
| AptaBio Therapeutics, Inc. (a) | | 7,371 | 72,816 |
| BGF Retail Co. Ltd. | | 3,057 | 399,441 |
| Bioneer Corp. (a) | | 9,149 | 170,824 |
| BNC Korea Co. Ltd. (a) | | 19,633 | 73,040 |
| BNK Financial Group, Inc. | | 99,473 | 446,727 |
| Bukwang Pharmaceutical Co. Ltd. | | 26,648 | 140,958 |
| Celltrion Healthcare Co. Ltd. | | 29,668 | 1,444,614 |
| Celltrion Pharm, Inc. | | 6,630 | 314,936 |
| Celltrion, Inc. | | 33,370 | 4,488,860 |
| CHA Biotech Co. Ltd. (a) | | 17,263 | 159,650 |
| Cheil Worldwide, Inc. | | 29,151 | 499,357 |
| Chong Kun Dang Pharmaceutical Corp. | | 3,542 | 208,452 |
| Chunbo Co. Ltd. | | 1,798 | 275,371 |
| CJ CGV Co. Ltd. (a) | | 19,941 | 188,608 |
| CJ CheilJedang Corp. | | 2,942 | 853,339 |
| CJ Corp. | | 6,325 | 318,173 |
| CJ ENM Co. Ltd. | | 3,873 | 199,169 |
| CJ Logistics Corp. (a) | | 3,515 | 216,468 |
| Com2uS Corp. | | 3,114 | 155,120 |
| Cosmax, Inc. | | 3,830 | 122,897 |
| Cosmo AM&T Co. Ltd. (a) | | 7,929 | 372,752 |
| Coway Co. Ltd. | | 19,237 | 745,317 |
| Creative & Innovative System (a) | | 17,006 | 155,486 |
| CS Wind Corp. | | 10,680 | 439,974 |
| Daeduck Electronics Co. Ltd. | | 13,745 | 236,896 |
| Daejoo Electronic Materials Co. Ltd. | | 3,910 | 246,272 |
| Daesang Corp. | | 10,122 | 148,569 |
| Daewoo Engineering & Construction Co. Ltd. (a) | | 79,585 | 234,464 |
| Daewoo Shipbuilding & Marine Engineering Co. Ltd. (a) | | 19,836 | 254,322 |
| Daewoong Co. Ltd. | | 9,139 | 132,220 |
| Daewoong Pharmaceutical Co. Ltd. | | 2,334 | 264,090 |
| Daou Technology, Inc. | | 11,054 | 140,177 |
| Dawonsys Co. Ltd. | | 13,461 | 161,269 |
| DB HiTek Co. Ltd. | | 14,580 | 452,011 |
| Db Insurance Co. Ltd. | | 16,146 | 636,872 |
| DGB Financial Group Co. Ltd. | | 58,048 | 276,144 |
| DL E&C Co. Ltd. | | 11,505 | 277,686 |
| DL Holdings Co. Ltd. | | 6,268 | 270,074 |
| Dong-A St. Co. Ltd. | | 3,614 | 137,995 |
| Dongjin Semichem Co. Ltd. | | 12,058 | 254,285 |
| DongKook Pharmaceutical Co. Ltd. | | 14,602 | 160,617 |
| Dongkuk Steel Mill Co. Ltd. | | 24,219 | 194,285 |
| Dongsuh Co., Inc. | | 15,594 | 222,878 |
| Doosan Bobcat, Inc. | | 17,610 | 413,317 |
| Doosan Co. Ltd. | | 2,763 | 149,831 |
| Doosan Fuel Cell Co. Ltd. (a) | | 15,427 | 294,528 |
| Doosan Heavy Industries & Construction Co. Ltd. (a) | | 139,720 | 1,297,039 |
| Douzone Bizon Co. Ltd. | | 7,315 | 156,312 |
| E-Mart, Inc. | | 7,570 | 448,688 |
| Ecopro BM Co. Ltd. | | 16,583 | 1,337,264 |
| Ecopro Co. Ltd. | | 6,393 | 636,021 |
| Ecopro HN Co. Ltd. | | 4,456 | 161,404 |
| Enchem Co. Ltd. | | 3,231 | 168,644 |
| EO Technics Co. Ltd. | | 3,940 | 179,979 |
| ESR Kendall Square Co. Ltd. (REIT) | | 79,032 | 197,397 |
| Eubiologics Co. Ltd. (a) | | 12,222 | 89,054 |
| Eugene Technology Co. Ltd. | | 7,492 | 113,116 |
| F&F Co. Ltd. | | 5,981 | 609,699 |
| Fila Holdings Corp. | | 19,919 | 456,346 |
| Foosung Co. Ltd. | | 18,817 | 163,475 |
| GC Cell Corp. (a) | | 4,879 | 154,507 |
| GemVax & Kael Co. Ltd. (a) | | 17,423 | 151,364 |
| GeneOne Life Science, Inc. | | 27,607 | 142,936 |
| Genexine Co. Ltd. (a) | | 9,106 | 142,907 |
| Golfzon Co. Ltd. | | 1,752 | 141,528 |
| Grand Korea Leisure Co. Ltd. (a) | | 16,280 | 161,965 |
| Green Cross Corp. | | 2,358 | 210,636 |
| Green Cross Holdings Corp. | | 15,908 | 193,372 |
| GS Engineering & Construction Corp. | | 23,284 | 353,994 |
| GS Holdings Corp. | | 16,136 | 520,035 |
| GS Retail Co. Ltd. | | 18,138 | 322,776 |
| HAESUNG DS Co. Ltd. | | 4,375 | 116,477 |
| Hana Financial Group, Inc. | | 100,252 | 2,897,315 |
| Hana Micron, Inc. | | 17,893 | 117,212 |
| Hana Tour Service, Inc. (a) | | 6,830 | 238,542 |
| HanAll BioPharma Co. Ltd. (a) | | 18,902 | 188,051 |
| Handsome Co. Ltd. | | 6,327 | 111,263 |
| Hankook Tire Co. Ltd. | | 28,104 | 719,671 |
| Hanmi Pharm Co. Ltd. | | 2,735 | 484,793 |
| Hanmi Semiconductor Co. Ltd. | | 17,356 | 143,486 |
| Hanon Systems | | 79,203 | 432,828 |
| Hansol Chemical Co. Ltd. | | 3,282 | 426,541 |
| Hanssem Co. Ltd. | | 3,605 | 94,588 |
| Hanwha Aerospace Co. Ltd. | | 12,826 | 595,777 |
| Hanwha Corp. | | 16,913 | 300,977 |
| Hanwha Life Insurance Co. Ltd. (a) | | 125,521 | 192,153 |
| Hanwha Solutions Corp. (a) | | 39,162 | 1,295,047 |
| Hanwha Systems Co. Ltd. | | 25,566 | 199,718 |
| HD Hyundai Co. Ltd. | | 19,129 | 816,184 |
| HDC Hyundai Development Co. | | 18,160 | 127,231 |
| Helixmith Co., Ltd. | | 14,559 | 127,503 |
| Hite Jinro Co. Ltd. | | 13,394 | 240,700 |
| HL Holdings Corp. | | 5,854 | 129,194 |
| HL Mando Co. Ltd. | | 11,785 | 408,295 |
| HLB Life Science Co. Ltd. (a) | | 28,112 | 239,302 |
| HLB, Inc. (a) | | 32,576 | 924,339 |
| HLB, Inc. rights 12/2/22 (a) | | 2,917 | 20,028 |
| HMM Co. Ltd. | | 92,613 | 1,239,321 |
| Hotel Shilla Co. | | 12,488 | 568,702 |
| HUGEL, Inc. (a) | | 2,723 | 213,289 |
| HYBE Co. Ltd. (a) | | 6,363 | 539,419 |
| Hyosung Advanced Materials Co. | | 1,051 | 234,894 |
| Hyosung Corp. | | 3,764 | 180,642 |
| Hyosung TNC Co. Ltd. | | 1,114 | 204,096 |
| Hyundai Autoever Corp. | | 2,895 | 240,351 |
| Hyundai Bioscience Co. Ltd. (a) | | 12,490 | 187,264 |
| Hyundai Construction Equipment Co. Ltd. | | 6,841 | 206,095 |
| Hyundai Department Store Co. Ltd. | | 5,261 | 199,409 |
| Hyundai Doosan Infracore Co. Lt (a) | | 49,630 | 192,982 |
| Hyundai Electric & Energy System Co. Ltd. (a) | | 9,898 | 238,206 |
| Hyundai Elevator Co. Ltd. | | 12,047 | 212,695 |
| Hyundai Engineering & Construction Co. Ltd. | | 27,351 | 668,771 |
| Hyundai Fire & Marine Insurance Co. Ltd. | | 21,126 | 492,879 |
| Hyundai Glovis Co. Ltd. | | 6,823 | 831,770 |
| Hyundai Greenfood Co. Ltd. | | 34,930 | 159,316 |
| Hyundai Heavy Industries Co. Ltd. (a) | | 6,072 | 463,700 |
| Hyundai Mipo Dockyard Co. Ltd. (a) | | 8,162 | 524,950 |
| Hyundai Mobis | | 20,512 | 3,147,247 |
| Hyundai Motor Co. | | 43,963 | 5,066,778 |
| Hyundai Rotem Co. Ltd. (a) | | 27,251 | 464,901 |
| Hyundai Steel Co. | | 30,382 | 598,138 |
| Hyundai Wia Corp. | | 6,180 | 264,550 |
| Il Dong Pharmaceutical Co. Ltd. (a) | | 5,453 | 105,062 |
| Iljin Materials Co. Ltd. | | 8,215 | 348,786 |
| Industrial Bank of Korea | | 86,890 | 636,158 |
| Innox Advanced Materials Co. Ltd. | | 6,390 | 122,444 |
| JB Financial Group Co. Ltd. | | 48,096 | 241,942 |
| JR Global (REIT) | | 57,230 | 169,005 |
| Jusung Engineering Co. Ltd. | | 14,816 | 118,854 |
| JW Pharmaceutical Corp. | | 8,397 | 110,307 |
| JYP Entertainment Corp. | | 11,769 | 457,627 |
| Kakao Corp. | | 104,919 | 3,726,840 |
| Kakao Games Corp. (a) | | 12,075 | 334,589 |
| KakaoBank Corp. (a) | | 40,832 | 489,188 |
| Kangwon Land, Inc. (a) | | 33,581 | 541,128 |
| KB Financial Group, Inc. | | 132,056 | 4,434,627 |
| KCC Corp. | | 1,683 | 287,708 |
| KEPCO E&C | | 4,815 | 167,492 |
| KEPCO Plant Service & Engineering Co. Ltd. | | 10,745 | 240,146 |
| Kia Corp. | | 87,212 | 4,051,058 |
| Kiwoom Securities Co. Ltd. | | 5,825 | 329,751 |
| KMW Co. Ltd. (a) | | 10,257 | 169,954 |
| Koh Young Technology, Inc. | | 22,090 | 184,945 |
| Kolmar Korea Co. Ltd. | | 10,879 | 261,053 |
| Kolon Industries, Inc. | | 7,285 | 222,023 |
| Komipharm International Co. Ltd. (a) | | 26,625 | 133,935 |
| Korea Aerospace Industries Ltd. | | 24,575 | 815,253 |
| Korea Electric Power Corp. (a) | | 86,241 | 1,009,271 |
| Korea Investment Holdings Co. Ltd. | | 14,218 | 493,584 |
| Korea Line Corp. (a) | | 82,128 | 113,354 |
| Korea Shipbuilding & Offshore Engineering Co. Ltd. (a) | | 14,474 | 737,228 |
| Korea Zinc Co. Ltd. | | 3,064 | 1,373,876 |
| Korean Air Lines Co. Ltd. (a) | | 58,595 | 948,312 |
| Korean Reinsurance Co. | | 35,693 | 183,802 |
| KRAFTON, Inc. (a) | | 8,285 | 1,030,314 |
| KT&G Corp. | | 36,362 | 2,438,026 |
| Kumho Petro Chemical Co. Ltd. | | 6,445 | 591,525 |
| Kumho Tire Co., Inc. (a) | | 52,370 | 113,192 |
| L&C Bio Co. Ltd. | | 7,471 | 117,510 |
| L&F Co. Ltd. (a) | | 7,962 | 1,255,114 |
| Leeno Industrial, Inc. | | 3,611 | 346,093 |
| LegoChem Biosciences, Inc. (a) | | 8,271 | 197,022 |
| LG Chemical Ltd. | | 15,827 | 6,941,472 |
| LG Corp. | | 32,003 | 1,775,802 |
| LG Display Co. Ltd. | | 79,004 | 703,637 |
| LG Electronics, Inc. | | 35,322 | 2,019,362 |
| LG Energy Solution (a) | | 7,936 | 2,935,717 |
| LG H & H Co. Ltd. | | 3,013 | 1,076,584 |
| LG Innotek Co. Ltd. | | 4,822 | 1,001,684 |
| LG Uplus Corp. | | 78,917 | 633,074 |
| LIG Nex1 Co. Ltd. | | 4,305 | 306,138 |
| Lotte Chemical Corp. | | 6,327 | 656,052 |
| Lotte Fine Chemical Co. Ltd. | | 6,413 | 252,059 |
| Lotte REIT Co. Ltd. | | 64,151 | 161,353 |
| Lotte Shopping Co. Ltd. | | 4,761 | 291,533 |
| Lotte Tour Development Co. Ltd. (a) | | 24,273 | 153,564 |
| LS Corp. | | 7,194 | 335,174 |
| LS Electric Co. Ltd. | | 8,786 | 338,558 |
| LX Hausys Ltd. | | 4,577 | 103,256 |
| LX International Corp. | | 10,201 | 290,524 |
| Lx Semicon Co. Ltd. | | 4,308 | 250,212 |
| MedPacto, Inc. (a) | | 7,107 | 115,021 |
| MegaStudyEdu Co. Ltd. | | 4,722 | 283,852 |
| Meritz Financial Holdings Co. | | 12,364 | 187,974 |
| Meritz Fire & Marine Insurance Co. Ltd. | | 13,578 | 299,182 |
| Meritz Securities Co. Ltd. | | 107,402 | 278,415 |
| Mirae Asset Securities Co. Ltd. | | 96,754 | 430,449 |
| Naturecell Co. Ltd. (a) | | 17,754 | 215,189 |
| NAVER Corp. | | 44,218 | 5,251,066 |
| NCSOFT Corp. | | 5,574 | 1,523,036 |
| Neowiz (a) | | 8,181 | 206,915 |
| Netmarble Corp. (d) | | 7,629 | 238,386 |
| Nexon Games Co. Ltd. (a) | | 8,449 | 86,720 |
| NH Investment & Securities Co. Ltd. | | 51,269 | 322,200 |
| NHN Corp. | | 8,348 | 134,228 |
| NICE Information Service Co. Ltd. | | 18,196 | 165,729 |
| NKMax Co. Ltd. (a) | | 14,518 | 136,298 |
| NongShim Co. Ltd. | | 1,218 | 257,711 |
| Oci Co. Ltd. | | 6,710 | 479,514 |
| Orion Corp./Republic of Korea | | 8,404 | 597,628 |
| Oscotec, Inc. (a) | | 12,729 | 162,310 |
| Oscotec, Inc. rights 11/8/22 (a) | | 2,176 | 5,260 |
| Ottogi Corp. | | 642 | 198,584 |
| Pan Ocean Co., Ltd. (Korea) | | 102,375 | 308,419 |
| Paradise Co. Ltd. (a) | | 19,108 | 190,100 |
| Pearl Abyss Corp. (a) | | 9,939 | 289,677 |
| People & Technology, Inc. | | 6,900 | 223,100 |
| Pharmicell Co. Ltd. (a) | | 22,473 | 160,598 |
| PI Advanced Materials Co. Ltd. | | 6,522 | 135,483 |
| POSCO | | 26,465 | 4,603,331 |
| POSCO Chemtech Co. Ltd. | | 9,404 | 1,314,420 |
| Posco International Corp. | | 17,953 | 259,738 |
| RFHIC Corp. | | 10,728 | 158,216 |
| S&S Tech Corp. | | 8,821 | 153,576 |
| S-Oil Corp. | | 15,216 | 921,071 |
| S.M. Entertainment Co. Ltd. | | 6,180 | 307,848 |
| S1 Corp. | | 6,950 | 303,842 |
| Sam Chun Dang Pharm Co. Ltd. (a) | | 8,538 | 182,745 |
| SamKang M&T Co. Ltd. (a) | | 10,142 | 143,889 |
| Samsung Biologics Co. Ltd. (a)(d) | | 6,038 | 3,709,978 |
| Samsung C&T Corp. | | 28,459 | 2,362,744 |
| Samsung Electro-Mechanics Co. Ltd. | | 18,904 | 1,602,573 |
| Samsung Electronics Co. Ltd. | | 1,603,916 | 66,749,300 |
| Samsung Engineering Co. Ltd. (a) | | 54,837 | 916,306 |
| Samsung Fire & Marine Insurance Co. Ltd. | | 10,547 | 1,477,875 |
| Samsung Heavy Industries Co. Ltd. (a) | | 209,434 | 755,672 |
| Samsung Life Insurance Co. Ltd. | | 27,773 | 1,311,479 |
| Samsung SDI Co. Ltd. | | 18,608 | 9,608,284 |
| Samsung SDS Co. Ltd. | | 11,584 | 1,014,489 |
| Samsung Securities Co. Ltd. | | 22,460 | 499,611 |
| Sangsangin Co. Ltd. | | 19,291 | 87,581 |
| SD Biosensor, Inc. | | 13,245 | 274,213 |
| Seegene, Inc. | | 13,364 | 268,718 |
| Seojin System Co. Ltd. | | 12,164 | 125,277 |
| Seoul Semiconductor Co. Ltd. | | 27,892 | 204,209 |
| SFA Engineering Corp. | | 9,713 | 259,613 |
| Shin Poong Pharmaceutical Co. (a) | | 12,549 | 190,347 |
| Shinhan Financial Group Co. Ltd. | | 155,886 | 3,954,118 |
| Shinsegae Co. Ltd. | | 2,742 | 408,230 |
| Shinsegae International Co. Ltd. | | 7,222 | 119,159 |
| SIMMTECH Co. Ltd. | | 8,806 | 218,096 |
| SK Biopharmaceuticals Co. Ltd. (a) | | 11,258 | 458,264 |
| SK Bioscience Co. Ltd. (a) | | 7,885 | 417,640 |
| SK Chemicals Co. Ltd. | | 4,231 | 262,044 |
| SK Hynix, Inc. | | 183,891 | 10,654,784 |
| SK IE Technology Co. Ltd. (a)(d) | | 9,062 | 330,146 |
| SK Innovation Co., Ltd. | | 18,790 | 2,277,464 |
| SK Networks Co. Ltd. | | 55,232 | 155,946 |
| SK Square Co. Ltd. (a) | | 33,796 | 874,900 |
| SK, Inc. | | 12,705 | 1,904,878 |
| SKC Co. Ltd. | | 7,578 | 549,507 |
| SOLUM Co. Ltd. (a) | | 25,347 | 306,333 |
| Solus Advanced Materials Co. Lt | | 8,364 | 196,894 |
| Soulbrain Co. Ltd. | | 1,880 | 269,621 |
| ST Pharm Co. Ltd. | | 4,307 | 251,361 |
| Taihan Electric Wire Co. Ltd. (a) | | 210,542 | 221,263 |
| Tokai Carbon Korea Co. Ltd. | | 2,366 | 168,252 |
| UniTest, Inc. (a) | | 9,956 | 88,935 |
| Vaxcell-Bio Therapeutics Co. Ltd. (a) | | 3,892 | 98,846 |
| Vidente Co. Ltd. (a) | | 18,924 | 47,266 |
| Webzen, Inc. (a) | | 12,597 | 131,943 |
| WeMade Entertainment Co. Ltd. | | 6,402 | 198,924 |
| WONIK IPS Co. Ltd. | | 12,292 | 236,828 |
| Woori Financial Group, Inc. | | 185,356 | 1,525,890 |
| Wysiwyg Studios Co. Ltd. (a) | | 8,992 | 95,444 |
| YG Entertainment, Inc. | | 6,278 | 188,034 |
| Youngone Corp. | | 8,523 | 282,444 |
| Yuhan Corp. | | 18,284 | 766,039 |
| YUNGJIN Pharmaceutical Co. Ltd. (a) | | 60,303 | 114,918 |
| Zinus, Inc. | | 4,275 | 93,747 |
TOTAL KOREA (SOUTH) | | | 247,885,950 |
| Kuwait - 0.3% | | | |
| Agility Public Warehousing Co. KSC | | 509,169 | 1,288,328 |
| Al Ahli Bank of Kuwait KSCP | | 269,008 | 287,370 |
| Boubyan Bank KSC | | 433,196 | 1,152,020 |
| Boubyan Petrochemicals Co. KSCP | | 168,773 | 434,120 |
| Boursa Kuwait Securities Co. KPSC | | 35,102 | 257,388 |
| Commercial Real Estate Co. | | 719,887 | 231,172 |
| Gulf Bank | | 580,611 | 642,729 |
| Gulf Cable & Electrical Industries Co. KSCP | | 39,326 | 152,938 |
| Human Soft Holding Co. KSCC | | 32,194 | 349,318 |
| Jazeera Airways Co. KSCP | | 36,421 | 196,416 |
| Kuwait Finance House KSCP | | 2,467,728 | 6,451,056 |
| Mabanee Co. SAKC | | 245,773 | 691,670 |
| Mobile Telecommunication Co. | | 716,449 | 1,385,035 |
| National Bank of Kuwait | | 2,391,301 | 8,319,582 |
| National Industries Group Holding SAK | | 739,802 | 558,702 |
| National Investments Co. KSCC | | 132,923 | 102,529 |
| Qurain Petrochemical Industries Co. | | 287,856 | 234,112 |
| Shamal Az-Zour Al-Oula for the First Phase of Az-Zour Power Plant KSC | | 276,147 | 172,007 |
| Warba Bank KSCP (a) | | 594,942 | 462,743 |
TOTAL KUWAIT | | | 23,369,235 |
| Luxembourg - 0.2% | | | |
| Allegro.eu SA (a)(d) | | 124,449 | 604,767 |
| Aperam SA | | 19,429 | 507,859 |
| ArcelorMittal SA (Netherlands) | | 177,211 | 3,967,542 |
| Aroundtown SA | | 326,445 | 647,799 |
| B&M European Value Retail SA | | 322,436 | 1,192,877 |
| Eurofins Scientific SA | | 45,740 | 2,928,222 |
| Grand City Properties SA | | 33,783 | 328,853 |
| InPost SA (a) | | 81,589 | 521,033 |
| Millicom International Cellular SA: | | | |
| unit (a) | | 22,820 | 250,107 |
| (depository receipt) (a) | | 58,728 | 637,215 |
| Reinet Investments SCA | | 47,827 | 768,461 |
| SES SA (France) (depositary receipt) | | 142,746 | 1,012,591 |
| Shurgard Self Storage Europe SARL | | 8,636 | 375,946 |
| Solutions 30 SE (a) | | 37,277 | 71,983 |
| Subsea 7 SA (c) | | 84,579 | 846,103 |
| Tenaris SA | | 159,938 | 2,503,215 |
TOTAL LUXEMBOURG | | | 17,164,573 |
| Malaysia - 0.5% | | | |
| Alliance Bank Malaysia Bhd | | 413,500 | 323,593 |
| AMMB Holdings Bhd | | 685,300 | 592,825 |
| Axiata Group Bhd | | 1,036,558 | 624,829 |
| Axis (REIT) | | 609,263 | 240,973 |
| British American Tobacco (Malaysia) Bhd | | 80,700 | 179,561 |
| Bursa Malaysia Bhd | | 337,000 | 459,740 |
| Carlsberg Brewery Bhd | | 84,600 | 399,023 |
| CIMB Group Holdings Bhd | | 2,383,848 | 2,783,173 |
| Dagang Nexchange Bhd | | 1,060,000 | 170,389 |
| Dialog Group Bhd | | 1,310,600 | 571,031 |
| DiGi.com Bhd | | 1,139,200 | 913,191 |
| DRB-Hicom Bhd | | 341,600 | 96,816 |
| Fraser & Neave Holdings Bhd | | 62,900 | 273,258 |
| Frontken Corp. Bhd | | 428,900 | 222,251 |
| Gamuda Bhd | | 723,319 | 588,997 |
| Genting Bhd | | 756,000 | 709,949 |
| Genting Malaysia Bhd | | 1,131,200 | 655,560 |
| Hap Seng Consolidated Bhd | | 248,800 | 338,364 |
| Hartalega Holdings Bhd | | 662,200 | 302,528 |
| Heineken Malaysia Bhd | | 74,100 | 362,037 |
| Hibiscus Petroleum Bhd | | 688,700 | 141,294 |
| Hong Leong Bank Bhd | | 225,500 | 1,009,217 |
| Hong Leong Credit Bhd | | 94,100 | 379,744 |
| IGB (REIT) | | 738,500 | 245,229 |
| IHH Healthcare Bhd | | 614,800 | 773,701 |
| IJM Corp. Bhd | | 1,151,100 | 396,847 |
| Inari Amertron Bhd | | 1,022,550 | 538,526 |
| IOI Corp. Bhd | | 1,008,400 | 870,193 |
| Kossan Rubber Industries Bhd | | 594,400 | 157,149 |
| KPJ Healthcare Bhd | | 1,106,400 | 191,888 |
| Kuala Lumpur Kepong Bhd | | 154,027 | 706,283 |
| Malayan Banking Bhd | | 1,611,218 | 2,927,319 |
| Malaysia Airports Holdings Bhd (a) | | 348,900 | 441,291 |
| Malaysian Pacific Industries Bhd | | 37,100 | 188,325 |
| Maxis Bhd | | 885,000 | 720,654 |
| MISC Bhd | | 488,700 | 747,314 |
| MR DIY Group M Sdn Bhd (d) | | 912,500 | 389,858 |
| My E.G.Services Bhd | | 2,094,275 | 392,012 |
| Nestle (Malaysia) Bhd | | 25,600 | 720,135 |
| Petronas Chemicals Group Bhd | | 838,200 | 1,545,919 |
| Petronas Dagangan Bhd | | 107,900 | 494,770 |
| Petronas Gas Bhd | | 264,900 | 958,077 |
| PPB Group Bhd | | 228,440 | 806,884 |
| Press Metal Bhd | | 1,297,300 | 1,193,582 |
| Public Bank Bhd | | 4,914,500 | 4,646,323 |
| QL Resources Bhd | | 428,975 | 464,541 |
| RHB Bank Bhd | | 529,368 | 640,437 |
| Sime Darby Bhd | | 1,079,989 | 513,954 |
| Sime Darby Plantation Bhd | | 741,871 | 690,404 |
| SP Setia Bhd | | 654,161 | 66,412 |
| Sunway (REIT) | | 773,700 | 229,099 |
| Supermax Corp. Bhd | | 833,688 | 170,158 |
| Telekom Malaysia Bhd | | 432,615 | 508,744 |
| Tenaga Nasional Bhd | | 899,000 | 1,601,011 |
| TIME dotCom Bhd | | 489,300 | 470,879 |
| Top Glove Corp. Bhd | | 2,017,400 | 339,220 |
| V.S. Industry Bhd | | 1,312,000 | 234,484 |
| Yinson Holdings Bhd | | 533,100 | 239,038 |
TOTAL MALAYSIA | | | 38,559,003 |
| Malta - 0.0% | | | |
| Kambi Group PLC (a)(c) | | 12,823 | 202,776 |
| Kindred Group PLC (depositary receipt) | | 79,069 | 687,482 |
TOTAL MALTA | | | 890,258 |
| Marshall Islands - 0.0% | | | |
| Atlas Corp. | | 34,687 | 513,021 |
| Mauritius - 0.0% | | | |
| Golden Agri-Resources Ltd. | | 2,220,100 | 454,810 |
| Mexico - 0.7% | | | |
| Alfa SA de CV Series A | | 1,076,100 | 714,214 |
| Alsea S.A.B. de CV (a) | | 236,111 | 452,726 |
| America Movil S.A.B. de CV Series L | | 9,378,596 | 8,875,419 |
| Arca Continental S.A.B. de CV | | 145,900 | 1,195,080 |
| Banco del Bajio SA (d) | | 272,400 | 768,269 |
| Bolsa Mexicana de Valores S.A.B. de CV | | 188,300 | 342,899 |
| CEMEX S.A.B. de CV unit (a) | | 5,149,832 | 2,001,398 |
| Coca-Cola FEMSA S.A.B. de CV unit | | 178,450 | 1,124,128 |
| Concentradora Fibra Danhos SA de CV (c) | | 101,245 | 125,196 |
| Controladora Vuela Compania de Aviacion S.A.B. de CV (a) | | 289,600 | 246,145 |
| Corporacion Inmobiliaria Vesta S.A.B. de CV | | 193,600 | 420,755 |
| FIBRA Macquarie Mexican (REIT) (d) | | 248,978 | 331,125 |
| Fibra Uno Administracion SA de CV | | 1,015,635 | 1,185,155 |
| Fomento Economico Mexicano S.A.B. de CV unit | | 654,491 | 4,698,342 |
| GCC S.A.B. de CV | | 65,100 | 404,209 |
| Genomma Lab Internacional SA de CV | | 279,000 | 215,027 |
| Gentera S.A.B. de CV | | 390,700 | 401,487 |
| Gruma S.A.B. de CV Series B | | 70,150 | 813,737 |
| Grupo Aeroportuario del Pacifico S.A.B. de CV Series B | | 119,796 | 1,855,620 |
| Grupo Aeroportuario del Sureste S.A.B. de CV Series B | | 62,725 | 1,468,005 |
| Grupo Aeroportuario Norte S.A.B. de CV | | 100,600 | 801,429 |
| Grupo Bimbo S.A.B. de CV Series A | | 448,477 | 1,736,369 |
| Grupo Carso SA de CV Series A1 | | 152,027 | 612,620 |
| Grupo Comercial Chedraui S.A.B. de CV | | 79,400 | 320,037 |
| Grupo Financiero Banorte S.A.B. de CV Series O | | 876,319 | 7,123,160 |
| Grupo Financiero Inbursa S.A.B. de CV Series O (a) | | 731,000 | 1,349,249 |
| Grupo Herdez S.A.B. de CV | | 95,700 | 193,110 |
| Grupo Mexico SA de CV Series B | | 1,045,517 | 3,790,415 |
| Grupo Televisa SA de CV | | 787,270 | 835,230 |
| Industrias Penoles SA de CV | | 47,780 | 542,020 |
| Kimberly-Clark de Mexico SA de CV Series A | | 513,867 | 810,755 |
| La Comer S.A.B. de CV | | 185,700 | 344,913 |
| Nemak S.A.B. de CV (a)(d) | | 961,075 | 263,880 |
| Operadora de Sites Mexicanos, SA de CV | | 452,663 | 492,576 |
| Orbia Advance Corp. S.A.B. de CV | | 333,528 | 563,090 |
| Prologis Property Mexico SA (c) | | 254,931 | 654,666 |
| Promotora y Operadora de Infraestructura S.A.B. de CV | | 74,980 | 564,025 |
| Qualitas Controladora S.A.B. de CV | | 72,200 | 283,691 |
| Regional S.A.B. de CV | | 86,800 | 606,588 |
| Sitios Latinoamerica S.A.B. de CV (a) | | 452,545 | 132,020 |
| Terrafina (c) | | 249,471 | 349,534 |
| Wal-Mart de Mexico SA de CV Series V | | 1,759,330 | 6,795,615 |
TOTAL MEXICO | | | 56,803,928 |
| Multi-National - 0.1% | | | |
| HK Electric Investments & HK Electric Investments Ltd. unit | | 926,500 | 588,973 |
| HKT Trust/HKT Ltd. unit | | 1,290,000 | 1,457,683 |
| Unibail-Rodamco SE & WFD Unibail-Rodamco NV unit (a) | | 39,270 | 1,858,155 |
TOTAL MULTI-NATIONAL | | | 3,904,811 |
| Netherlands - 3.2% | | | |
| Aalberts Industries NV | | 33,135 | 1,151,992 |
| ABN AMRO Bank NV GDR (d) | | 139,546 | 1,372,995 |
| Adyen BV (a)(d) | | 7,307 | 10,431,470 |
| AEGON NV | | 596,916 | 2,763,221 |
| AerCap Holdings NV (a) | | 45,608 | 2,435,923 |
| Airbus Group NV | | 199,119 | 21,545,428 |
| Akzo Nobel NV | | 61,145 | 3,774,815 |
| Alfen Beheer BV (a)(d) | | 7,540 | 801,399 |
| AMG Advanced Metallurgical Group NV | | 11,563 | 361,783 |
| Arcadis NV | | 26,075 | 885,925 |
| Argenx SE (a) | | 18,610 | 7,225,344 |
| Ariston Holding NV | | 32,494 | 277,128 |
| ASM International NV (Netherlands) | | 15,772 | 3,503,885 |
| ASML Holding NV (Netherlands) | | 137,044 | 64,285,581 |
| ASR Nederland NV | | 46,098 | 2,031,358 |
| Basic-Fit NV (a)(c)(d) | | 17,941 | 452,120 |
| BE Semiconductor Industries NV | | 24,678 | 1,261,349 |
| CNH Industrial NV | | 341,287 | 4,420,014 |
| Corbion NV | | 21,049 | 560,813 |
| COSMO Pharmaceuticals NV | | 5,173 | 302,213 |
| CureVac NV (a) | | 21,048 | 153,363 |
| Davide Campari Milano NV | | 181,270 | 1,629,100 |
| Eurocommercial Properties NV | | 14,994 | 329,845 |
| Euronext NV (d) | | 28,636 | 1,819,660 |
| EXOR NV | | 35,119 | 2,360,032 |
| Ferrari NV (Italy) | | 41,916 | 8,263,986 |
| Flow Traders BV (d) | | 12,359 | 297,528 |
| Fugro NV (Certificaten Van Aandelen) (a) | | 35,173 | 457,090 |
| Heineken Holding NV | | 33,770 | 2,306,088 |
| Heineken NV (Bearer) | | 86,565 | 7,237,349 |
| IMCD NV | | 19,107 | 2,479,271 |
| ING Groep NV (Certificaten Van Aandelen) | | 1,312,922 | 12,918,620 |
| Intertrust NV (a)(d) | | 30,029 | 592,336 |
| JDE Peet's BV | | 33,200 | 950,831 |
| Just Eat Takeaway.com NV (a)(d) | | 60,682 | 1,041,309 |
| Koninklijke Ahold Delhaize NV | | 351,320 | 9,797,716 |
| Koninklijke BAM Groep NV (a) | | 109,234 | 238,571 |
| Koninklijke DSM NV | | 58,891 | 6,927,372 |
| Koninklijke KPN NV | | 1,092,167 | 3,054,907 |
| Koninklijke Philips Electronics NV | | 298,235 | 3,783,079 |
| Koninklijke Vopak NV | | 24,395 | 499,043 |
| MFE-MediaForEurope NV | | 72,020 | 35,943 |
| MFE-MediaForEurope NV Class A | | 303,500 | 106,357 |
| NEPI Rockcastle PLC | | 180,913 | 911,028 |
| NN Group NV | | 93,050 | 3,940,343 |
| NSI NV | | 7,465 | 178,530 |
| OCI NV | | 36,064 | 1,379,990 |
| Pharming Group NV (a) | | 331,772 | 343,612 |
| PostNL NV (c) | | 138,448 | 217,135 |
| Prosus NV | | 278,815 | 12,056,434 |
| QIAGEN NV (Germany) (a) | | 76,278 | 3,294,182 |
| Randstad NV | | 40,926 | 2,040,052 |
| RHI Magnesita NV | | 10,946 | 232,479 |
| SBM Offshore NV | | 46,871 | 634,588 |
| Signify NV (d) | | 43,901 | 1,217,388 |
| Steinhoff International Holdings NV (South Africa) (a) | | 1,475,366 | 151,804 |
| Stellantis NV (Italy) | | 726,073 | 9,801,619 |
| STMicroelectronics NV (France) | | 230,319 | 7,161,528 |
| Technip Energies NV | | 47,635 | 615,039 |
| TKH Group NV (depositary receipt) | | 16,525 | 585,624 |
| TomTom Group BV (a) | | 24,546 | 192,241 |
| Universal Music Group NV | | 242,749 | 4,766,487 |
| Van Lanschot Kempen NV (Bearer) | | 14,614 | 315,564 |
| Wereldhave NV | | 12,130 | 148,645 |
| Wolters Kluwer NV | | 88,361 | 9,391,563 |
| X5 Retail Group NV GDR (b) | | 33,857 | 11,978 |
| Yandex NV Class A (a)(b) | | 90,012 | 503,951 |
TOTAL NETHERLANDS | | | 257,215,956 |
| New Zealand - 0.2% | | | |
| Air New Zealand Ltd. (a) | | 581,772 | 263,829 |
| Argosy Property Ltd. | | 298,019 | 205,323 |
| Auckland International Airport Ltd. (a) | | 398,444 | 1,783,746 |
| Chorus Ltd. | | 181,750 | 878,113 |
| Contact Energy Ltd. | | 261,090 | 1,146,073 |
| Fisher & Paykel Healthcare Corp. | | 197,315 | 2,246,197 |
| Fletcher Building Ltd. | | 323,800 | 967,643 |
| Genesis Energy Ltd. | | 190,270 | 313,063 |
| Goodman Property Trust | | 321,198 | 386,561 |
| Infratil Ltd. | | 280,747 | 1,426,598 |
| Kiwi Property Group Ltd. | | 507,408 | 266,981 |
| Mercury Nz Ltd. | | 237,878 | 804,919 |
| Meridian Energy Ltd. | | 447,794 | 1,270,495 |
| Precinct Properties New Zealand Ltd. | | 472,103 | 338,984 |
| Pushpay Holdings Ltd. (a) | | 372,417 | 270,654 |
| Ryman Healthcare Ltd. | | 141,267 | 688,271 |
| SKYCITY Entertainment Group Ltd. (a) | | 265,614 | 447,841 |
| Spark New Zealand Ltd. | | 632,550 | 1,882,955 |
| Summerset Group Holdings Ltd. | | 77,339 | 435,260 |
| The a2 Milk Co. Ltd. (a) | | 277,276 | 935,008 |
| Xero Ltd. (a) | | 45,147 | 2,254,527 |
TOTAL NEW ZEALAND | | | 19,213,041 |
| Norway - 0.6% | | | |
| Adevinta ASA Class B (a) | | 98,237 | 672,795 |
| Aker ASA (A Shares) | | 7,658 | 539,573 |
| Aker BP ASA | | 106,664 | 3,400,148 |
| Aker Carbon Capture A/S (a) | | 123,644 | 138,913 |
| Aker Solutions ASA | | 88,595 | 339,172 |
| Atea ASA | | 33,144 | 368,545 |
| Austevoll Seafood ASA | | 35,030 | 259,116 |
| Bonheur A/S | | 9,951 | 282,847 |
| Borregaard ASA | | 32,477 | 436,728 |
| Crayon Group Holding A/S (a)(c)(d) | | 25,078 | 207,814 |
| DNB Bank ASA | | 308,117 | 5,449,629 |
| DNO ASA (A Shares) | | 166,175 | 216,747 |
| Elkem ASA (d) | | 120,152 | 399,653 |
| Entra ASA (d) | | 20,056 | 182,404 |
| Equinor ASA | | 329,104 | 11,990,484 |
| Europris ASA (d) | | 58,033 | 345,536 |
| Gjensidige Forsikring ASA | | 66,785 | 1,219,920 |
| Grieg Seafood ASA | | 16,278 | 112,736 |
| Kahoot! A/S (a) | | 96,745 | 206,311 |
| Kongsberg Gruppen ASA | | 30,567 | 1,095,527 |
| Leroy Seafood Group ASA | | 89,588 | 411,913 |
| Mowi ASA | | 138,617 | 2,067,358 |
| MPC Container Ships ASA | | 115,557 | 182,292 |
| NEL ASA (a)(c) | | 535,490 | 654,415 |
| Nordic VLSI ASA (a) | | 55,955 | 790,657 |
| Norsk Hydro ASA | | 454,817 | 2,886,414 |
| Norwegian Air Shuttle A/S (a)(c) | | 332,053 | 265,805 |
| Nykode Therapeutics A/S (a) | | 39,217 | 94,080 |
| Orkla ASA | | 246,125 | 1,660,152 |
| Protector Forsikring ASA | | 24,438 | 291,014 |
| REC Silicon ASA (a) | | 105,508 | 202,772 |
| Salmar ASA | | 19,516 | 661,162 |
| Scatec Solar AS (d) | | 43,930 | 311,004 |
| Schibsted ASA: | | | |
| (A Shares) | | 22,837 | 351,688 |
| (B Shares) | | 34,191 | 507,464 |
| Sparebank 1 Sr Bank ASA (primary capital certificate) | | 58,756 | 597,951 |
| Sparebanken Midt-Norge | | 42,782 | 461,723 |
| Sparebanken Nord-Norge | | 32,931 | 273,365 |
| Storebrand ASA (A Shares) | | 159,675 | 1,241,011 |
| Telenor ASA | | 234,616 | 2,132,159 |
| TGS ASA | | 42,135 | 575,518 |
| Tomra Systems ASA | | 80,012 | 1,293,134 |
| Veidekke ASA | | 53,869 | 448,211 |
| Wallenius Wilhelmsen ASA | | 38,582 | 274,442 |
| Yara International ASA | | 56,002 | 2,499,476 |
TOTAL NORWAY | | | 48,999,778 |
| Panama - 0.0% | | | |
| Intercorp Financial Services, Inc. (c) | | 12,411 | 305,311 |
| Peru - 0.0% | | | |
| Compania de Minas Buenaventura SAA sponsored ADR (c) | | 77,718 | 539,363 |
| Philippines - 0.2% | | | |
| Aboitiz Equity Ventures, Inc. | | 621,840 | 609,320 |
| ACEN Corp. | | 3,181,405 | 344,887 |
| Alliance Global Group, Inc. | | 1,151,800 | 179,128 |
| Ayala Corp. | | 88,095 | 1,019,247 |
| Ayala Land, Inc. | | 2,546,700 | 1,126,797 |
| Bank of the Philippine Islands (BPI) | | 636,414 | 1,055,211 |
| BDO Unibank, Inc. | | 687,703 | 1,515,513 |
| Bloomberry Resorts Corp. (a) | | 1,727,200 | 209,379 |
| Converge ICT Solutions, Inc. (a) | | 850,100 | 181,525 |
| D&L Industries, Inc. | | 1,516,400 | 205,381 |
| Globe Telecom, Inc. | | 11,338 | 455,720 |
| GT Capital Holdings, Inc. | | 38,260 | 272,736 |
| International Container Terminal Services, Inc. | | 358,790 | 1,072,296 |
| JG Summit Holdings, Inc. | | 1,066,150 | 795,689 |
| Jollibee Food Corp. | | 167,020 | 667,954 |
| Manila Electric Co. | | 83,070 | 431,814 |
| Megaworld Corp. | | 3,899,000 | 140,238 |
| Metro Pacific Investments Corp. | | 4,880,600 | 307,869 |
| Metropolitan Bank & Trust Co. | | 684,698 | 612,858 |
| Monde Nissin Corp. (d) | | 2,226,400 | 449,979 |
| PLDT, Inc. | | 31,120 | 874,940 |
| PUREGOLD Price Club, Inc. | | 479,900 | 248,253 |
| Robinsons Land Corp. | | 751,756 | 192,843 |
| Security Bank Corp. | | 204,490 | 305,269 |
| SM Investments Corp. | | 85,045 | 1,208,443 |
| SM Prime Holdings, Inc. | | 3,900,100 | 2,123,522 |
| Universal Robina Corp. | | 312,880 | 659,933 |
| Wilcon Depot, Inc. | | 724,400 | 367,055 |
TOTAL PHILIPPINES | | | 17,633,799 |
| Poland - 0.2% | | | |
| Alior Bank SA (a) | | 36,069 | 222,121 |
| Asseco Poland SA | | 20,530 | 295,645 |
| Bank Millennium SA (a) | | 267,572 | 244,363 |
| Bank Polska Kasa Opieki SA | | 64,420 | 1,058,441 |
| Budimex SA (c) | | 5,149 | 258,847 |
| CCC SA (a) | | 18,432 | 142,272 |
| CD Projekt RED SA (c) | | 23,139 | 616,025 |
| Cyfrowy Polsat SA | | 91,205 | 341,964 |
| Dino Polska SA (a)(d) | | 17,006 | 1,112,099 |
| ENEA SA (a) | | 94,099 | 102,789 |
| Grupa Azoty SA (a) | | 21,133 | 145,192 |
| Jastrzebska Spolka Weglowa SA (a)(c) | | 20,106 | 174,945 |
| KGHM Polska Miedz SA (Bearer) | | 48,943 | 980,685 |
| Kruk SA | | 6,342 | 369,832 |
| LPP SA | | 386 | 670,271 |
| mBank SA (a) | | 5,927 | 332,223 |
| Orange Polska SA | | 264,253 | 333,880 |
| PGE Polska Grupa Energetyczna SA (a) | | 316,794 | 361,645 |
| Polski Koncern Naftowy Orlen SA | | 139,588 | 1,605,784 |
| Polskie Gornictwo Naftowe i Gazownictwo SA (a) | | 608,077 | 647,052 |
| Powszechna Kasa Oszczednosci Bank SA | | 300,978 | 1,643,555 |
| Powszechny Zaklad Ubezpieczen SA | | 213,186 | 1,196,746 |
| Santander Bank Polska SA | | 13,378 | 712,320 |
| Tauron Polska Energia SA (a) | | 401,387 | 163,023 |
TOTAL POLAND | | | 13,731,719 |
| Portugal - 0.1% | | | |
| Banco Comercial Portugues SA (Reg.) | | 2,901,415 | 414,042 |
| Energias de Portugal SA | | 922,678 | 4,034,877 |
| Galp Energia SGPS SA Class B | | 171,076 | 1,736,952 |
| Jeronimo Martins SGPS SA | | 96,540 | 2,001,611 |
| NOS SGPS | | 91,127 | 356,983 |
| REN - Redes Energeticas Nacionais SGPS SA | | 140,975 | 365,015 |
| Sonae SGPS SA | | 435,270 | 418,756 |
| The Navigator Co. SA | | 82,119 | 313,093 |
TOTAL PORTUGAL | | | 9,641,329 |
| Qatar - 0.3% | | | |
| Barwa Real Estate Co. (a) | | 681,167 | 635,949 |
| Doha Bank (a) | | 578,596 | 350,486 |
| Gulf International Services QSC (a) | | 365,214 | 182,720 |
| Gulf Warehousing Co. (a) | | 174,951 | 205,421 |
| Industries Qatar QSC (a) | | 520,010 | 2,251,818 |
| Masraf al Rayan | | 1,918,137 | 2,020,977 |
| Medicare Group | | 74,966 | 143,273 |
| Mesaieed Petrochemical Holding Co. (a) | | 1,588,510 | 990,161 |
| Ooredoo QSC | | 298,947 | 802,008 |
| Qatar Aluminum Manufacturing Co. (a) | | 1,040,550 | 463,737 |
| Qatar Electricity & Water Co. (a) | | 165,399 | 840,223 |
| Qatar Fuel Co. (a) | | 175,923 | 921,703 |
| Qatar Gas Transport Co. Ltd. (Nakilat) (a) | | 873,598 | 983,525 |
| Qatar Insurance Co. SAQ (a) | | 664,914 | 394,375 |
| Qatar International Islamic Bank QSC (a) | | 265,444 | 843,327 |
| Qatar Islamic Bank (a) | | 565,107 | 3,784,708 |
| Qatar National Bank SAQ (a) | | 1,566,547 | 8,577,455 |
| Qatar National Cement Co. QSC (a) | | 192,372 | 240,614 |
| Qatar Navigation QPSC | | 228,232 | 641,751 |
| The Commercial Bank of Qatar (a) | | 1,124,419 | 1,943,322 |
| United Development Co. (a) | | 737,213 | 290,088 |
| Vodafone Qatar QSC (a) | | 790,707 | 363,464 |
TOTAL QATAR | | | 27,871,105 |
| Russia - 0.0% | | | |
| Aeroflot Pjsc (a)(b) | | 402,869 | 43,007 |
| Alrosa Co. Ltd. (b) | | 739,283 | 184,434 |
| Credit Bank of Moscow (a)(b) | | 4,537,000 | 67,873 |
| Detsky Mir PJSC (b)(d) | | 227,830 | 56,574 |
| Gazprom OAO (b) | | 3,442,771 | 540,225 |
| Inter Rao Ues JSC (b) | | 11,220,073 | 92,762 |
| LUKOIL PJSC (b) | | 120,075 | 55,733 |
| Magnit OJSC GDR (Reg. S) (b) | | 100,509 | 489 |
| MMC Norilsk Nickel PJSC (b) | | 18,318 | 182,686 |
| Mobile TeleSystems OJSC sponsored ADR (b) | | 173,383 | 172,688 |
| Moscow Exchange MICEX-RTS OAO (a)(b) | | 449,874 | 129,681 |
| Novatek PJSC GDR (Reg. S) (b) | | 26,560 | 6,785 |
| Novolipetsk Steel OJSC (b) | | 409,801 | 5,900 |
| PhosAgro PJSC: | | | |
| GDR (b) | | 277 | 6 |
| GDR (Reg. S) (b) | | 43,237 | 887 |
| Polyus PJSC (b) | | 10,038 | 35,398 |
| Rosneft Oil Co. OJSC (b) | | 315,946 | 79,235 |
| Rostelecom PJSC (b) | | 298,140 | 99,815 |
| Sberbank of Russia (a)(b) | | 3,156,853 | 29,106 |
| Segezha Group PJSC (b)(d) | | 1,842,700 | 41,374 |
| Severstal PAO (b) | | 63,766 | 2,135 |
| Sistema JSFC sponsored GDR (a)(b) | | 40,315 | 71,280 |
| Surgutneftegas OJSC (b) | | 2,091,286 | 38,374 |
| Tatneft PAO (b) | | 399,435 | 74,501 |
| Unipro PJSC (b) | | 8,778,000 | 41,990 |
| United Co. RUSAL International PJSC (b) | | 983,490 | 177,741 |
| VTB Bank OJSC (a)(b) | | 963,847,980 | 55,221 |
TOTAL RUSSIA | | | 2,285,900 |
| Saudi Arabia - 1.3% | | | |
| Abdullah Al Othaim Markets Co. | | 17,262 | 521,873 |
| ACWA Power Co. | | 28,024 | 1,297,701 |
| Advanced Polypropylene Co. | | 49,045 | 578,221 |
| Al Hammadi Co. for Development and Investment | | 37,447 | 447,963 |
| Al Rajhi Bank | | 663,308 | 15,040,077 |
| Al Rajhi Co. for Co-operative Insurance (a) | | 8,763 | 238,808 |
| Aldrees Petroleum and Transport Services Co. | | 15,657 | 302,510 |
| Alinma Bank | | 337,354 | 3,366,762 |
| Almarai Co. Ltd. | | 89,367 | 1,339,001 |
| Alujain Corp. | | 15,033 | 188,435 |
| Arab National Bank | | 207,935 | 1,784,648 |
| Bank Al-Jazira | | 146,429 | 911,102 |
| Bank Albilad | | 169,632 | 2,288,816 |
| Banque Saudi Fransi | | 202,548 | 2,328,665 |
| Bupa Arabia for Cooperative Insurance Co. | | 21,443 | 1,101,382 |
| Dallah Healthcare Co. | | 13,492 | 575,938 |
| Dar Al Arkan Real Estate Development Co. (a) | | 195,786 | 699,245 |
| Dr Sulaiman Al Habib Medical Services Group Co. | | 30,463 | 1,837,079 |
| Elm Co. | | 8,424 | 742,064 |
| Emaar The Economic City (a) | | 153,132 | 390,823 |
| Etihad Etisalat Co. | | 135,133 | 1,316,248 |
| Jadwa (REIT) Saudi Fund | | 80,634 | 281,115 |
| Jarir Marketing Co. | | 20,787 | 907,258 |
| Leejam Sports Co. JSC | | 12,894 | 271,431 |
| Mobile Telecommunications Co. Saudi Arabia (a) | | 168,674 | 582,664 |
| Mouwasat Medical Services Co. | | 17,402 | 1,014,235 |
| National Industrialization Co. (a) | | 131,211 | 467,220 |
| Qassim Cement Co. | | 20,179 | 404,917 |
| Rabigh Refining & Petrochemical Co. (a) | | 145,859 | 529,472 |
| Riyad Bank | | 460,152 | 4,402,460 |
| Sabic Agriculture-Nutrients Co. | | 73,382 | 3,105,145 |
| Sahara International Petrochemical Co. | | 125,163 | 1,350,710 |
| Saudi Airlines Catering Co. (a) | | 17,558 | 362,136 |
| Saudi Arabian Mining Co. | | 292,743 | 6,520,895 |
| Saudi Arabian Oil Co. (d) | | 808,806 | 7,512,163 |
| Saudi Basic Industries Corp. | | 305,237 | 7,180,996 |
| Saudi Cement Co. | | 35,015 | 496,680 |
| Saudi Dairy & Foodstuffs Co. | | 7,297 | 456,360 |
| Saudi Electricity Co. | | 286,808 | 2,060,868 |
| Saudi Ground Services Co. (a) | | 39,214 | 271,337 |
| Saudi Industrial Investment Group | | 135,634 | 811,447 |
| Saudi Investment Bank/The | | 174,545 | 842,636 |
| Saudi Kayan Petrochemical Co. (a) | | 264,002 | 924,609 |
| Saudi Pharmaceutical Industries & Medical Appliances Corp. | | 27,964 | 197,215 |
| Saudi Real Estate Co. (a) | | 77,781 | 260,405 |
| Saudi Research & Marketing Group (a) | | 12,810 | 686,600 |
| Saudi Tadawul Group Holding Co. | | 13,264 | 766,707 |
| Saudi Telecom Co. | | 509,767 | 5,480,855 |
| Seera Group Holding (a) | | 63,802 | 323,972 |
| Southern Province Cement Co. | | 33,175 | 483,823 |
| The Co. for Cooperative Insurance (a) | | 23,594 | 531,839 |
| The National Agriculture Development Co. (a) | | 27,406 | 190,363 |
| The Saudi British Bank | | 316,123 | 3,659,659 |
| The Saudi National Bank | | 742,154 | 11,732,099 |
| The Savola Group | | 95,189 | 742,249 |
| United Electronics Co. | | 15,906 | 323,830 |
| Yamama Cement Co. (a) | | 48,620 | 380,415 |
| Yanbu Cement Co. | | 39,791 | 441,587 |
| Yanbu National Petrochemical Co. | | 93,283 | 1,109,699 |
TOTAL SAUDI ARABIA | | | 105,365,432 |
| Singapore - 0.9% | | | |
| AEM Holdings Ltd. | | 95,000 | 215,421 |
| Best World International Ltd. (a)(b) | | 12,300 | 11,278 |
| BOC Aviation Ltd. Class A (d) | | 72,700 | 486,695 |
| CapitaLand Ascendas REIT | | 1,098,041 | 2,032,260 |
| Capitaland Ascott Trust unit | | 656,924 | 443,178 |
| Capitaland India Trust | | 398,800 | 315,524 |
| CapitaLand Investment Ltd. | | 863,925 | 1,836,970 |
| CapitaMall Trust | | 1,748,837 | 2,322,558 |
| CapitaRetail China Trust | | 520,374 | 356,572 |
| CDL Hospitality Trusts unit | | 330,424 | 270,763 |
| China XLX Fertiliser Ltd. | | 272,000 | 103,954 |
| City Developments Ltd. | | 159,900 | 861,852 |
| ComfortDelgro Corp. Ltd. | | 722,800 | 648,457 |
| Cromwell European (REIT) | | 137,562 | 213,435 |
| DBS Group Holdings Ltd. | | 606,275 | 14,647,220 |
| Digital Core (REIT) | | 341,700 | 170,850 |
| ESR-LOGOS (REIT) | | 1,863,197 | 447,504 |
| Ezion Holdings Ltd. warrants 4/16/23 (a)(b) | | 30,780 | 34 |
| First Resources Ltd. | | 213,300 | 224,510 |
| Frasers Centrepoint Trust | | 340,783 | 500,727 |
| Frasers Logistics & Industrial Trust | | 1,107,465 | 860,562 |
| Genting Singapore Ltd. | | 2,363,800 | 1,344,207 |
| Hutchison Port Holdings Trust | | 1,810,000 | 295,030 |
| iFast Corp. Ltd. | | 59,300 | 169,656 |
| Kenon Holdings Ltd. | | 7,993 | 306,505 |
| Keppel (REIT) | | 612,494 | 387,244 |
| Keppel Corp. Ltd. | | 492,200 | 2,423,449 |
| Keppel DC (REIT) | | 471,374 | 586,054 |
| Keppel Infrastructure Trust | | 1,049,843 | 393,061 |
| Keppel Pacific Oak U.S. (REIT) | | 429,900 | 232,146 |
| Lendlease Global Commercial (REIT) | | 844,700 | 417,696 |
| Manulife U.S. REIT | | 633,249 | 231,136 |
| Mapletree Industrial (REIT) | | 652,486 | 1,014,036 |
| Mapletree Logistics Trust (REIT) | | 1,087,170 | 1,167,348 |
| Mapletree Pan Asia Commercial | | 778,615 | 874,539 |
| Maxeon Solar Technologies Ltd. (a)(c) | | 8,825 | 152,496 |
| Nanofilm Technologies International Ltd. | | 122,600 | 150,695 |
| NetLink NBN Trust | | 1,049,269 | 633,742 |
| Olam Group Ltd. | | 421,700 | 399,179 |
| OUE Commercial (REIT) | | 774,085 | 177,718 |
| Oversea-Chinese Banking Corp. Ltd. | | 1,122,978 | 9,622,579 |
| Parkway Life REIT | | 134,000 | 378,638 |
| Raffles Medical Group Ltd. | | 314,655 | 295,628 |
| SATS Ltd. (a) | | 217,700 | 419,837 |
| Sembcorp Industries Ltd. | | 329,800 | 677,958 |
| Sembcorp Marine Ltd. (a) | | 5,916,600 | 530,805 |
| Sheng Siong Group Ltd. | | 317,500 | 349,887 |
| SIA Engineering Co. Ltd. (a) | | 118,400 | 180,661 |
| Singapore Airlines Ltd. | | 416,150 | 1,546,305 |
| Singapore Exchange Ltd. | | 284,300 | 1,691,019 |
| Singapore Post Ltd. | | 686,000 | 261,684 |
| Singapore Technologies Engineering Ltd. | | 515,200 | 1,201,017 |
| Singapore Telecommunications Ltd. | | 2,769,300 | 4,890,682 |
| SPH REIT | | 640,700 | 368,869 |
| Starhill Global (REIT) | | 725,783 | 264,042 |
| StarHub Ltd. | | 280,800 | 212,246 |
| Suntec (REIT) | | 740,000 | 674,343 |
| The Hour Glass Ltd. | | 119,700 | 164,888 |
| United Overseas Bank Ltd. | | 390,814 | 7,663,886 |
| UOL Group Ltd. | | 194,531 | 850,627 |
| Venture Corp. Ltd. | | 92,300 | 1,038,668 |
| Wilmar International Ltd. | | 618,900 | 1,696,335 |
| Yangzijiang Financial Holding Ltd. (a) | | 907,700 | 198,776 |
| Yangzijiang Shipbuilding Holdings Ltd. | | 926,000 | 784,968 |
| Yanlord Land Group Ltd. | | 237,700 | 145,246 |
TOTAL SINGAPORE | | | 74,435,855 |
| South Africa - 1.0% | | | |
| Absa Group Ltd. | | 279,717 | 3,041,615 |
| Aeci Ltd. | | 52,276 | 262,678 |
| African Rainbow Minerals Ltd. | | 39,290 | 553,263 |
| Anglo American Platinum Ltd. | | 18,030 | 1,434,175 |
| AngloGold Ashanti Ltd. | | 141,933 | 1,853,605 |
| Aspen Pharmacare Holdings Ltd. | | 128,934 | 1,061,725 |
| Astral Foods Ltd. | | 15,219 | 145,870 |
| AVI Ltd. | | 130,650 | 522,564 |
| Barloworld Ltd. | | 62,309 | 349,219 |
| Bid Corp. Ltd. | | 112,437 | 1,809,153 |
| Bidvest Group Ltd./The | | 93,658 | 1,083,386 |
| Capitec Bank Holdings Ltd. | | 29,297 | 3,031,290 |
| Clicks Group Ltd. | | 81,828 | 1,386,538 |
| Coronation Fund Managers Ltd. | | 86,487 | 154,529 |
| DataTec Ltd. | | 82,668 | 185,149 |
| Dis-Chem Pharmacies Ltd. (d) | | 153,452 | 281,028 |
| Discovery Ltd. (a) | | 167,921 | 1,099,011 |
| Distell Group Holdings Ltd. (a) | | 49,379 | 466,753 |
| Equites Property Fund Ltd. | | 274,200 | 234,362 |
| Exxaro Resources Ltd. | | 80,945 | 901,252 |
| FirstRand Ltd. | | 1,656,412 | 5,802,796 |
| Fortress (REIT) Ltd. Class A (a) | | 560,043 | 314,950 |
| Foschini Group Ltd./The | | 111,251 | 695,957 |
| Gold Fields Ltd. | | 301,314 | 2,413,767 |
| Grindrod Ltd. | | 54,805 | 30,910 |
| Growthpoint Properties Ltd. | | 1,059,468 | 746,927 |
| Harmony Gold Mining Co. Ltd. | | 195,101 | 540,341 |
| Hyprop Investments Ltd. | | 131,200 | 264,489 |
| Impala Platinum Holdings Ltd. | | 287,290 | 2,941,466 |
| Investec Ltd. | | 87,418 | 429,981 |
| Investec Property Fund Ltd. | | 410,712 | 228,065 |
| JSE Ltd. | | 34,577 | 191,325 |
| KAP Industrial Holdings Ltd. | | 924,173 | 232,443 |
| Kumba Iron Ore Ltd. | | 21,991 | 414,218 |
| Life Healthcare Group Holdings Ltd. | | 506,903 | 545,020 |
| Momentum Metropolitan Holdings | | 406,475 | 380,170 |
| Motus Holdings Ltd. | | 50,004 | 316,051 |
| Mr Price Group Ltd. | | 84,293 | 811,507 |
| MTN Group Ltd. | | 568,281 | 4,016,909 |
| MultiChoice Group Ltd. | | 121,046 | 790,971 |
| Naspers Ltd. Class N | | 73,234 | 7,549,098 |
| Nedbank Group Ltd. | | 149,817 | 1,774,437 |
| Netcare Ltd. | | 363,177 | 308,039 |
| Ninety One Ltd. | | 74,565 | 175,363 |
| Northam Platinum Holdings Ltd. (a) | | 115,504 | 1,083,938 |
| Old Mutual Ltd. | | 1,559,073 | 886,109 |
| Omnia Holdings Ltd. | | 68,481 | 268,462 |
| Pepkor Holdings Ltd. (d) | | 550,190 | 679,023 |
| Pick 'n Pay Stores Ltd. | | 133,787 | 430,012 |
| PSG Konsult Ltd. | | 210,639 | 125,796 |
| Rand Merchant Insurance Holdings Ltd. | | 267,214 | 414,886 |
| Redefine Properties Ltd. | | 2,168,276 | 481,610 |
| Remgro Ltd. | | 178,470 | 1,328,269 |
| Resilient Property Income Fund Ltd. | | 98,449 | 274,465 |
| Royal Bafokeng Holdings (Pty) Ltd. | | 31,012 | 249,312 |
| Sanlam Ltd. | | 588,131 | 1,711,043 |
| Santam Ltd. | | 18,018 | 249,493 |
| Sappi Ltd. (a) | | 195,412 | 602,765 |
| Sasol Ltd. | | 190,247 | 3,198,063 |
| Shoprite Holdings Ltd. | | 169,150 | 2,153,886 |
| Sibanye-Stillwater Ltd. | | 958,869 | 2,245,886 |
| Spar Group Ltd./The | | 66,911 | 567,343 |
| Standard Bank Group Ltd. | | 442,769 | 4,137,532 |
| Super Group Ltd./South Africa | | 137,814 | 194,918 |
| Telkom SA Ltd. (a) | | 118,772 | 236,073 |
| Thungela Resources Ltd. | | 43,717 | 686,882 |
| Tiger Brands Ltd. | | 57,435 | 581,674 |
| Transaction Capital Ltd. | | 186,965 | 418,232 |
| Truworths International Ltd. | | 133,669 | 380,295 |
| Vodacom Group Ltd. | | 198,913 | 1,356,967 |
| Vukile Property Fund Ltd. | | 343,462 | 251,490 |
| Woolworths Holdings Ltd. | | 338,537 | 1,162,752 |
TOTAL SOUTH AFRICA | | | 78,129,541 |
| Spain - 1.5% | | | |
| Acciona SA | | 8,245 | 1,483,773 |
| Acerinox SA | | 70,740 | 619,532 |
| ACS Actividades de Construccion y Servicios SA | | 77,255 | 1,981,211 |
| Aena SME SA (a)(d) | | 24,323 | 2,858,720 |
| Almirall SA | | 27,611 | 257,449 |
| Amadeus IT Holding SA Class A (a) | | 150,926 | 7,871,591 |
| Applus Services SA | | 52,362 | 309,963 |
| Atresmedia Corporacion de Medios de Comunicacion SA (c) | | 49,558 | 143,009 |
| Banco Bilbao Vizcaya Argentaria SA | | 2,241,976 | 11,565,893 |
| Banco de Sabadell SA | | 1,894,795 | 1,489,786 |
| Banco Santander SA (Spain) | | 5,736,881 | 14,865,357 |
| Bankinter SA | | 230,581 | 1,393,663 |
| CaixaBank SA | | 1,491,647 | 4,946,369 |
| Cellnex Telecom SA (d) | | 183,113 | 5,993,336 |
| Cie Automotive SA | | 20,870 | 530,882 |
| Compania de Distribucion Integral Logista Holdings SA | | 28,229 | 584,170 |
| Construcciones y Auxiliar de Ferrocarriles | | 6,907 | 180,202 |
| Corporacion Financiera Alba SA | | 5,603 | 249,172 |
| Ebro Foods SA | | 25,773 | 401,919 |
| EDP Renovaveis SA | | 99,643 | 2,098,442 |
| Enagas SA | | 76,472 | 1,241,439 |
| Ence Energia y Celulosa SA | | 54,760 | 187,460 |
| Endesa SA | | 100,797 | 1,681,959 |
| Faes Farma SA | | 110,392 | 416,197 |
| Ferrovial SA | | 160,887 | 3,928,805 |
| Fluidra SA | | 34,347 | 466,043 |
| Gestamp Automocion SA (d) | | 67,319 | 236,574 |
| Global Dominion Access SA (d) | | 69,151 | 253,536 |
| Grifols SA (a) | | 100,846 | 857,683 |
| Grupo Catalana Occidente SA | | 18,214 | 495,000 |
| Iberdrola SA | | 1,992,777 | 20,265,107 |
| Indra Sistemas SA | | 48,910 | 437,435 |
| Industria de Diseno Textil SA | | 366,626 | 8,311,578 |
| Inmobiliaria Colonial SA | | 105,278 | 555,059 |
| Laboratorios Farmaceuticos ROVI SA | | 6,947 | 315,944 |
| Lar Espana Real Estate Socimi SA | | 35,719 | 139,256 |
| Linea Directa Aseguradora SA Compania de Seguros y Reaseguros | | 263,563 | 247,052 |
| MAPFRE SA (Reg.) | | 304,308 | 521,771 |
| Melia Hotels International SA (a) | | 64,887 | 301,386 |
| Merlin Properties Socimi SA | | 109,996 | 931,589 |
| Miquel y Costas & Miquel SA | | 10,456 | 110,771 |
| Naturgy Energy Group SA | | 44,518 | 1,142,108 |
| Neinor Homes SLU (d) | | 16,736 | 133,473 |
| Pharma Mar SA | | 5,314 | 318,350 |
| Prosegur Compania de Seguridad SA (Reg.) | | 93,697 | 174,729 |
| Red Electrica Corporacion SA | | 133,556 | 2,160,364 |
| Repsol SA | | 487,929 | 6,638,020 |
| Sacyr SA | | 147,377 | 361,492 |
| Siemens Gamesa Renewable Energy SA (a) | | 78,565 | 1,394,448 |
| Solaria Energia y Medio Ambiente SA (a) | | 26,521 | 419,350 |
| Tecnicas Reunidas SA (a)(c) | | 15,628 | 111,586 |
| Telefonica SA | | 1,747,454 | 6,023,819 |
| Unicaja Banco SA (d) | | 503,760 | 446,065 |
| Viscofan Envolturas Celulosicas SA | | 13,263 | 789,706 |
TOTAL SPAIN | | | 121,839,593 |
| Sweden - 2.2% | | | |
| AAK AB | | 61,462 | 896,223 |
| AcadeMedia AB (d) | | 36,957 | 158,188 |
| Addlife AB | | 41,856 | 391,220 |
| AddTech AB (B Shares) | | 88,461 | 1,070,390 |
| AFRY AB (B Shares) | | 35,872 | 481,815 |
| Alfa Laval AB | | 97,043 | 2,391,534 |
| Alimak Group AB (d) | | 15,908 | 99,846 |
| Alleima AB (a) | | 75,662 | 257,798 |
| Arjo AB | | 79,221 | 316,132 |
| ASSA ABLOY AB (B Shares) | | 335,682 | 6,778,118 |
| Atlas Copco AB: | | | |
| (A Shares) | | 839,356 | 8,958,660 |
| (B Shares) | | 593,249 | 5,737,407 |
| Atrium Ljungberg AB (B Shares) | | 25,355 | 339,178 |
| Avanza Bank Holding AB (c) | | 43,912 | 876,951 |
| Axfood AB | | 36,440 | 902,320 |
| Beijer Alma AB (B Shares) | | 22,292 | 311,731 |
| Beijer Ref AB (B Shares) | | 85,071 | 1,319,844 |
| Betsson AB (B Shares) | | 51,843 | 377,511 |
| BHG Group AB (a) | | 36,294 | 60,878 |
| Bilia AB (A Shares) | | 29,965 | 317,529 |
| Billerud AB | | 85,778 | 1,107,845 |
| BioArctic AB (a)(d) | | 11,655 | 243,208 |
| BioGaia AB | | 33,095 | 262,273 |
| Biotage AB (A Shares) | | 25,829 | 423,886 |
| Boliden AB | | 92,885 | 2,705,486 |
| Boozt AB (a)(c)(d) | | 20,975 | 153,116 |
| Bravida Holding AB (d) | | 84,327 | 790,480 |
| Bufab AB | | 12,462 | 235,330 |
| Bure Equity AB | | 19,749 | 381,701 |
| Camurus AB (a) | | 11,315 | 262,553 |
| Castellum AB | | 85,057 | 972,965 |
| Catena AB | | 11,246 | 382,363 |
| Cellavision AB | | 6,730 | 126,174 |
| Cibus Nordic Real Estate AB | | 15,246 | 208,298 |
| Cint Group AB (a)(c) | | 54,950 | 290,148 |
| Clas Ohlson AB (B Shares) | | 15,964 | 106,632 |
| Cloetta AB | | 83,904 | 153,351 |
| Coor Service Management Holding AB (d) | | 37,299 | 198,129 |
| Corem Property Group AB | | 200,916 | 125,195 |
| Creades AB (A Shares) (c) | | 28,441 | 191,003 |
| Dios Fastigheter AB | | 28,715 | 188,682 |
| Dometic Group AB (d) | | 109,999 | 630,234 |
| Dustin Group AB (d) | | 26,972 | 112,371 |
| Electrolux AB (B Shares) (c) | | 71,869 | 886,939 |
| Electrolux Professional AB | | 82,820 | 312,792 |
| Elekta AB (B Shares) | | 130,709 | 664,128 |
| Embracer Group AB (a)(c) | | 225,526 | 1,086,043 |
| Epiroc AB: | | | |
| (A Shares) | | 197,895 | 3,029,467 |
| (B Shares) | | 155,413 | 2,088,135 |
| EQT AB | | 100,567 | 1,981,975 |
| Ericsson (B Shares) | | 977,160 | 5,432,370 |
| Essity AB (B Shares) | | 204,974 | 4,332,947 |
| Evolution AB (d) | | 61,774 | 5,762,446 |
| Fabege AB | | 86,830 | 630,550 |
| Fastighets AB Balder (a) | | 208,500 | 783,584 |
| Fortnox AB | | 166,207 | 707,583 |
| Garo AB | | 17,106 | 172,591 |
| Getinge AB (B Shares) | | 77,938 | 1,583,297 |
| Granges AB | | 38,219 | 258,400 |
| H&M Hennes & Mauritz AB (B Shares) (c) | | 246,533 | 2,483,120 |
| Hemnet Group AB | | 19,444 | 241,615 |
| Hexagon AB (B Shares) | | 650,911 | 6,434,839 |
| Hexatronic Group AB | | 54,860 | 743,809 |
| HEXPOL AB (B Shares) | | 92,187 | 910,081 |
| HMS Networks AB | | 11,486 | 295,649 |
| Holmen AB (B Shares) | | 31,424 | 1,140,135 |
| Hufvudstaden AB (A Shares) | | 36,312 | 432,803 |
| Humble Group AB (a) | | 83,843 | 63,977 |
| Husqvarna AB (B Shares) | | 141,482 | 840,000 |
| Industrivarden AB: | | | |
| (A Shares) | | 42,819 | 970,303 |
| (C Shares) | | 50,364 | 1,131,698 |
| Indutrade AB | | 91,693 | 1,605,699 |
| Instalco AB | | 68,404 | 273,927 |
| Intrum AB | | 27,213 | 342,837 |
| Investment AB Latour (B Shares) | | 50,598 | 855,811 |
| Investment AB Oresund | | 13,550 | 140,640 |
| Investor AB: | | | |
| (A Shares) | | 221,398 | 3,767,768 |
| (B Shares) | | 538,785 | 8,801,150 |
| INVISIO AB | | 15,404 | 228,803 |
| Inwido AB | | 22,018 | 197,821 |
| JM AB (B Shares) | | 22,520 | 339,395 |
| Kinnevik AB (B Shares) (a) | | 81,850 | 1,011,894 |
| Know IT AB | | 9,765 | 194,394 |
| L E Lundbergforetagen AB | | 26,568 | 1,049,611 |
| Lifco AB | | 79,778 | 1,152,826 |
| Lindab International AB | | 28,282 | 300,976 |
| Loomis AB (B Shares) | | 26,732 | 747,156 |
| Meko AB | | 16,588 | 156,698 |
| MIPS AB | | 9,129 | 295,503 |
| Modern Times Group MTG AB (B Shares) | | 38,735 | 290,165 |
| Munters Group AB (d) | | 48,031 | 374,766 |
| Mycronic AB | | 27,094 | 425,997 |
| NCC AB (B Shares) | | 30,436 | 253,744 |
| New Wave Group AB (B Shares) | | 17,802 | 247,492 |
| Nibe Industrier AB (B Shares) | | 510,877 | 4,076,392 |
| Nobia AB | | 44,603 | 74,371 |
| Nolato AB (B Shares) | | 77,630 | 327,642 |
| Nordnet AB | | 48,600 | 603,032 |
| Nordnet AB (B Shares) (a)(b) | | 492 | 0 |
| Nyfosa AB | | 57,584 | 343,954 |
| OX2 AB (a) | | 29,935 | 206,594 |
| Pandox AB (a) | | 34,712 | 425,050 |
| Paradox Interactive AB | | 11,400 | 196,794 |
| Peab AB | | 71,144 | 369,213 |
| Platzer Fastigheter Holding AB | | 33,183 | 205,869 |
| PowerCell Sweden AB (a)(c) | | 16,766 | 184,497 |
| Ratos AB (B Shares) | | 85,456 | 320,193 |
| Resurs Holding AB (d) | | 70,340 | 152,896 |
| Saab AB (B Shares) | | 24,928 | 880,965 |
| Sagax AB | | 63,315 | 1,167,530 |
| Samhallsbyggnadsbolaget I Norden AB: | | | |
| (B Shares) (c) | | 291,657 | 400,985 |
| (D Shares) (c) | | 87,026 | 143,136 |
| Sandvik AB | | 356,414 | 5,569,592 |
| Scandic Hotels Group AB (a)(c)(d) | | 84,462 | 267,969 |
| Sdiptech AB (a) | | 12,059 | 232,635 |
| Sectra AB (B Shares) | | 43,992 | 583,309 |
| Securitas AB (B Shares) | | 233,379 | 1,909,526 |
| Sinch AB (a)(c)(d) | | 183,371 | 431,722 |
| Skandinaviska Enskilda Banken AB (A Shares) | | 546,020 | 5,761,270 |
| Skanska AB (B Shares) | | 116,472 | 1,812,293 |
| SKF AB (B Shares) | | 128,502 | 1,860,147 |
| SkiStar AB | | 21,575 | 206,543 |
| SSAB AB: | | | |
| (A Shares) | | 83,861 | 403,613 |
| (B Shares) | | 213,612 | 993,265 |
| Stillfront Group AB (a) | | 160,341 | 312,370 |
| Storskogen Group AB | | 469,852 | 344,095 |
| Storytel AB (a)(c) | | 18,546 | 65,509 |
| Surgical Science Sweden AB (a) | | 16,499 | 238,044 |
| Svenska Cellulosa AB SCA (B Shares) | | 201,783 | 2,381,292 |
| Svenska Handelsbanken AB (A Shares) | | 488,843 | 4,541,857 |
| Sweco AB (B Shares) | | 78,576 | 590,679 |
| Swedbank AB (A Shares) | | 303,478 | 4,524,265 |
| Swedencare AB | | 31,335 | 107,986 |
| Swedish Match Co. AB | | 510,318 | 5,248,566 |
| Swedish Orphan Biovitrum AB (a) | | 57,779 | 1,063,876 |
| Tele2 AB (B Shares) | | 190,519 | 1,561,948 |
| Telia Co. AB | | 882,002 | 2,337,099 |
| Thule Group AB (d) | | 35,635 | 702,295 |
| Trelleborg AB (B Shares) | | 80,770 | 1,779,819 |
| Troax Group AB | | 14,697 | 218,301 |
| Vestum AB (a)(c) | | 67,928 | 94,966 |
| Viaplay Group AB (B Shares) (a) | | 25,463 | 464,926 |
| Vimian Group AB (a)(c) | | 49,331 | 161,917 |
| Vitec Software Group AB | | 9,905 | 363,862 |
| Vitrolife AB | | 20,992 | 339,562 |
| Volvo AB: | | | |
| (A Shares) | | 123,775 | 2,114,260 |
| (B Shares) | | 441,216 | 7,221,354 |
| Volvo Car AB | | 193,067 | 819,921 |
| Wallenstam AB (B Shares) | | 116,989 | 413,020 |
| Wihlborgs Fastigheter AB | | 92,424 | 606,048 |
| Xvivo Perfusion AB (a) | | 9,143 | 131,499 |
TOTAL SWEDEN | | | 179,611,378 |
| Switzerland - 6.2% | | | |
| ABB Ltd. (Reg.) | | 552,989 | 15,356,672 |
| Accelleron Industries Ltd. (a) | | 27,400 | 464,625 |
| Adecco SA (Reg.) | | 56,065 | 1,754,608 |
| Alcon, Inc. (Switzerland) | | 168,730 | 10,268,544 |
| Allreal Holding AG | | 4,930 | 706,009 |
| ALSO Holding AG | | 2,674 | 420,320 |
| ams-OSRAM AG (a) | | 95,475 | 541,186 |
| APG SGA SA | | 936 | 152,830 |
| Arbonia AG | | 22,831 | 278,163 |
| Aryzta AG (a) | | 347,091 | 355,635 |
| Autoneum Holding AG (c) | | 1,533 | 146,510 |
| Bachem Holding AG (B Shares) | | 11,745 | 842,741 |
| Baloise Holdings AG | | 15,632 | 2,135,575 |
| Banque Cantonale Vaudoise | | 10,317 | 918,005 |
| Barry Callebaut AG | | 1,189 | 2,248,930 |
| Basilea Pharmaceutica AG (a) | | 6,409 | 294,737 |
| Belimo Holding AG (Reg.) | | 3,421 | 1,393,886 |
| Bell Food Group AG | | 899 | 219,060 |
| BKW AG | | 7,392 | 862,222 |
| Bobst Group SA | | 2,961 | 181,856 |
| Bossard Holding AG | | 2,204 | 437,564 |
| Bucher Industries AG | | 2,382 | 802,603 |
| Burckhardt Compression Holding AG | | 1,161 | 502,035 |
| Bystronic AG | | 505 | 289,984 |
| Cembra Money Bank AG | | 11,661 | 845,447 |
| Clariant AG (Reg.) | | 74,689 | 1,201,618 |
| Coca-Cola HBC AG | | 69,371 | 1,513,527 |
| Comet Holding AG | | 2,847 | 454,337 |
| Compagnie Financiere Richemont SA Series A | | 175,968 | 17,197,979 |
| Credit Suisse Group AG (c) | | 895,033 | 3,707,642 |
| Daetwyler Holdings AG | | 2,868 | 509,243 |
| DKSH Holding AG | | 13,144 | 947,061 |
| Dorma Kaba Holding AG | | 1,160 | 368,383 |
| Dottikon ES Holding AG (a) | | 1,166 | 270,147 |
| Dufry AG (a) | | 25,102 | 828,053 |
| EFG International | | 35,765 | 292,878 |
| Emmi AG | | 804 | 641,530 |
| Ems-Chemie Holding AG | | 2,449 | 1,539,567 |
| Flughafen Zuerich AG (a) | | 6,626 | 1,028,292 |
| Forbo Holding AG (Reg.) | | 345 | 417,576 |
| Galenica AG (d) | | 17,261 | 1,239,393 |
| Geberit AG (Reg.) | | 12,158 | 5,406,658 |
| Georg Fischer AG (Reg.) | | 28,300 | 1,567,119 |
| Givaudan SA | | 3,115 | 9,301,293 |
| Gurit-Heberlein AG (Bearer) (c) | | 1,606 | 148,355 |
| Helvetia Holding AG (Reg.) | | 12,875 | 1,278,050 |
| Holcim AG | | 187,521 | 8,519,519 |
| Huber+Suhner AG | | 6,603 | 588,194 |
| Idorsia Ltd. (a)(c) | | 40,329 | 624,257 |
| INFICON Holding AG | | 656 | 521,472 |
| Interroll Holding AG | | 230 | 484,646 |
| Intershop Holding AG | | 414 | 251,786 |
| Julius Baer Group Ltd. | | 74,515 | 3,575,146 |
| Kardex AG | | 2,366 | 361,510 |
| Komax Holding AG (Reg.) | | 1,359 | 318,934 |
| Kuehne & Nagel International AG | | 18,449 | 3,931,709 |
| Landis+Gyr Group AG | | 8,264 | 476,190 |
| LEM Holding SA | | 215 | 358,137 |
| Leonteq AG | | 4,296 | 173,324 |
| Lindt & Spruengli AG | | 35 | 3,400,909 |
| Lindt & Spruengli AG (participation certificate) | | 375 | 3,595,147 |
| Logitech International SA (Reg.) | | 59,322 | 2,953,215 |
| Lonza Group AG | | 25,211 | 12,978,225 |
| Medacta Group SA (d) | | 3,104 | 279,293 |
| Medartis Holding AG (a)(d) | | 2,076 | 161,710 |
| Medmix AG (d) | | 10,399 | 183,191 |
| Meyer Burger Technology AG (a)(c) | | 826,809 | 396,333 |
| Mobilezone Holding AG | | 24,040 | 381,241 |
| Mobimo Holding AG | | 2,473 | 576,667 |
| Nestle SA (Reg. S) | | 948,290 | 103,229,706 |
| Novartis AG | | 726,618 | 58,776,686 |
| OC Oerlikon Corp. AG (Reg.) | | 77,128 | 497,960 |
| Orior AG | | 3,359 | 234,142 |
| Partners Group Holding AG | | 7,665 | 6,884,607 |
| PolyPeptide Group AG (d) | | 5,583 | 162,358 |
| PSP Swiss Property AG | | 15,059 | 1,609,141 |
| Roche Holding AG: | | | |
| (Bearer) | | 18,545 | 7,522,823 |
| (participation certificate) | | 224,560 | 74,508,601 |
| Schindler Holding AG: | | | |
| (participation certificate) | | 11,866 | 1,934,513 |
| (Reg.) | | 9,617 | 1,513,596 |
| Schweiter Technologies AG | | 388 | 259,997 |
| Sensirion Holding AG (a)(d) | | 4,020 | 366,130 |
| SFS Group AG | | 7,002 | 632,827 |
| SGS SA (Reg.) | | 2,158 | 4,757,336 |
| Siegfried Holding AG | | 1,452 | 864,225 |
| Sig Group AG | | 104,398 | 2,005,910 |
| Sika AG | | 49,383 | 11,134,673 |
| Softwareone Holding AG | | 35,175 | 395,888 |
| Sonova Holding AG | | 18,183 | 4,298,114 |
| St.Galler Kantonalbank AG | | 1,144 | 538,669 |
| Stadler Rail AG (c) | | 17,652 | 520,032 |
| Straumann Holding AG | | 37,945 | 3,611,277 |
| Sulzer AG (Reg.) | | 7,099 | 473,219 |
| Swatch Group AG (Bearer) | | 8,933 | 2,007,330 |
| Swatch Group AG (Bearer) (Reg.) | | 21,837 | 912,428 |
| Swiss Life Holding AG | | 10,566 | 5,116,546 |
| Swiss Prime Site AG | | 25,348 | 2,045,357 |
| Swiss Re Ltd. | | 101,390 | 7,531,734 |
| Swisscom AG | | 8,638 | 4,264,007 |
| Swissquote Group Holding SA | | 4,859 | 575,500 |
| Tecan Group AG | | 4,416 | 1,620,251 |
| Temenos Group AG | | 21,424 | 1,277,288 |
| u-blox Holding AG | | 2,312 | 236,891 |
| UBS Group AG | | 1,184,979 | 18,803,931 |
| Valiant Holding AG | | 6,010 | 588,786 |
| VAT Group AG (d) | | 9,175 | 2,096,410 |
| Vetropack Holding AG | | 6,769 | 216,316 |
| Vontobel Holdings AG | | 10,091 | 568,365 |
| Ypsomed Holding AG | | 1,656 | 266,587 |
| Zehnder Group AG | | 4,875 | 262,895 |
| Zur Rose Group AG (a)(c) | | 3,631 | 98,122 |
| Zurich Insurance Group Ltd. | | 50,547 | 21,541,815 |
TOTAL SWITZERLAND | | | 494,132,192 |
| Taiwan - 3.8% | | | |
| Accton Technology Corp. | | 173,000 | 1,303,373 |
| Acer, Inc. | | 1,079,000 | 739,316 |
| ADATA Technology Co. Ltd. | | 125,000 | 208,889 |
| Adimmune Corp. | | 149,000 | 151,753 |
| Advanced Ceramic X Corp. | | 21,000 | 99,941 |
| Advantech Co. Ltd. | | 147,741 | 1,342,101 |
| Allied Supreme Corp. | | 19,341 | 155,908 |
| Amazing Microelectronic Corp. | | 37,000 | 94,639 |
| Andes Technology Corp. | | 16,000 | 185,031 |
| AP Memory Technology Corp. | | 35,000 | 163,856 |
| Arcadyan Technology Corp. | | 70,000 | 195,759 |
| ASE Technology Holding Co. Ltd. | | 1,111,718 | 2,742,318 |
| Asia Cement Corp. | | 836,000 | 966,789 |
| Asia Optical Co., Inc. | | 119,000 | 211,406 |
| Asia Pacific Telecom Co. Ltd. (a) | | 952,723 | 186,976 |
| Asia Vital Components Co. Ltd. | | 105,000 | 332,052 |
| ASMedia Technology, Inc. | | 10,000 | 180,443 |
| ASPEED Tech, Inc. | | 10,000 | 520,866 |
| ASUSTeK Computer, Inc. | | 242,000 | 1,770,695 |
| AUO Corp. | | 2,774,800 | 1,453,901 |
| Bank of Kaohsiung Co. Ltd. | | 680,191 | 259,390 |
| Brighton-Best International Taiwan, Inc. | | 195,000 | 202,533 |
| Capital Securities Corp. | | 923,490 | 286,318 |
| Catcher Technology Co. Ltd. | | 232,000 | 1,219,198 |
| Cathay Financial Holding Co. Ltd. | | 2,670,216 | 3,129,353 |
| Center Laboratories, Inc. | | 204,044 | 275,504 |
| Century Iron & Steel Industrial Co. Ltd. | | 70,000 | 167,111 |
| Chang Hwa Commercial Bank | | 1,646,501 | 847,396 |
| Cheng Loong Corp. | | 397,000 | 322,484 |
| Cheng Shin Rubber Industry Co. Ltd. | | 652,000 | 652,930 |
| Cheng Uei Precision Industries Co. Ltd. | | 206,000 | 214,597 |
| Chicony Electronics Co. Ltd. | | 226,125 | 561,562 |
| Chin-Poon Industrial Co. Ltd. | | 215,000 | 183,311 |
| China Airlines Ltd. | | 983,000 | 516,582 |
| China Bills Finance Corp. | | 340,000 | 149,687 |
| China Development Financial Ho | | 5,364,957 | 1,954,432 |
| China Motor Co. Ltd. | | 104,800 | 135,654 |
| China Petrochemical Development Corp. | | 1,407,532 | 409,770 |
| China Steel Chemical Corp. | | 74,000 | 236,312 |
| China Steel Corp. | | 4,007,000 | 3,335,647 |
| Chipbond Technology Corp. | | 240,000 | 404,787 |
| ChipMOS TECHNOLOGIES, Inc. | | 243,000 | 239,203 |
| Chroma ATE, Inc. | | 127,000 | 694,968 |
| Chung Hsin Electric & Machinery Manufacturing Corp. | | 202,000 | 309,382 |
| Chung Hung Steel Co. Ltd. | | 347,000 | 211,940 |
| Chunghwa Telecom Co. Ltd. | | 1,279,000 | 4,405,578 |
| Clevo Co. Ltd. | | 228,000 | 217,368 |
| Compal Electronics, Inc. | | 1,440,000 | 942,023 |
| Compeq Manufacturing Co. Ltd. | | 350,000 | 474,205 |
| Coretronic Corp. | | 124,000 | 192,224 |
| CTBC Financial Holding Co. Ltd. | | 5,928,960 | 3,749,947 |
| CTCI Corp. | | 230,000 | 334,439 |
| Delta Electronics, Inc. | | 659,000 | 5,261,130 |
| E Ink Holdings, Inc. | | 291,000 | 1,854,049 |
| E.SUN Financial Holdings Co. Ltd. | | 4,327,035 | 3,112,396 |
| ECLAT Textile Co. Ltd. | | 66,060 | 869,426 |
| EirGenix, Inc. (a) | | 102,000 | 320,983 |
| Elan Microelectronics Corp. | | 106,500 | 268,116 |
| Elite Material Co. Ltd. | | 103,000 | 467,833 |
| Elite Semiconductor Memory Technology, Inc. | | 96,000 | 185,726 |
| eMemory Technology, Inc. | | 22,000 | 733,242 |
| Ennoconn Corp. | | 29,920 | 171,613 |
| ENNOSTAR, Inc. | | 252,000 | 321,114 |
| Episil Technologies, Inc. | | 90,398 | 243,834 |
| Eternal Materials Co. Ltd. | | 356,426 | 330,413 |
| Etron Technology, Inc. | | 114,389 | 123,418 |
| EVA Airways Corp. | | 851,040 | 617,422 |
| Evergreen International Storage & Transport Corp. | | 200,000 | 161,220 |
| Evergreen Marine Corp. (Taiwan) | | 345,151 | 1,471,392 |
| Everlight Electronics Co. Ltd. | | 207,000 | 219,810 |
| Far Eastern Department Stores Co. Ltd. | | 286,000 | 159,608 |
| Far Eastern New Century Corp. | | 1,132,000 | 1,128,350 |
| Far EasTone Telecommunications Co. Ltd. | | 552,000 | 1,209,971 |
| Faraday Technology Corp. | | 73,000 | 321,386 |
| Feng Hsin Iron & Steel Co. | | 173,000 | 301,975 |
| Feng Tay Enterprise Co. Ltd. | | 154,758 | 770,095 |
| First Financial Holding Co. Ltd. | | 3,653,332 | 2,803,372 |
| Fitipower Integrated Technology, Inc. | | 49,159 | 158,509 |
| FLEXium Interconnect, Inc. | | 143,940 | 408,784 |
| FocalTech Systems Co. Ltd. | | 84,000 | 178,396 |
| Formosa Chemicals & Fibre Corp. | | 1,200,000 | 2,585,726 |
| Formosa Petrochemical Corp. | | 382,000 | 983,010 |
| Formosa Plastics Corp. | | 1,397,000 | 3,599,265 |
| Formosa Sumco Technology Corp. | | 33,000 | 148,865 |
| Formosa Taffeta Co. Ltd. | | 322,000 | 256,071 |
| Foxconn Technology Co. Ltd. | | 338,010 | 473,679 |
| Fubon Financial Holding Co. Ltd. | | 2,513,070 | 3,973,664 |
| Fusheng Precision Co. Ltd. | | 44,000 | 247,597 |
| Genesys Logic, Inc. | | 33,000 | 85,329 |
| Genius Electronic Optical Co. Ltd. | | 36,792 | 342,779 |
| Getac Holdings Corp. | | 191,000 | 230,652 |
| Giant Manufacturing Co. Ltd. | | 103,000 | 656,244 |
| Gigabyte Technology Co. Ltd. | | 187,000 | 536,290 |
| Global Unichip Corp. | | 31,000 | 468,547 |
| GlobalWafers Co. Ltd. | | 75,000 | 833,618 |
| Gold Circuit Electronics Ltd. | | 131,400 | 348,727 |
| Goldsun Development & Construction Co. Ltd. | | 447,101 | 313,972 |
| Grand Pacific Petrochemical Corp. | | 447,000 | 241,142 |
| Grape King Bio Ltd. | | 60,000 | 226,018 |
| Great Tree Pharmacy Co. Ltd. | | 20,000 | 167,731 |
| Great Wall Enterprise Co. Ltd. | | 249,025 | 310,374 |
| Greatek Electronics, Inc. | | 166,000 | 239,319 |
| Gudeng Precision Industrial Co. Ltd. | | 22,000 | 147,672 |
| HannStar Display Corp. | | 867,000 | 307,780 |
| Highwealth Construction Corp. | | 314,034 | 403,569 |
| HIWIN Technologies Corp. | | 100,218 | 515,787 |
| Holy Stone Enterprise Co. Ltd. | | 79,000 | 213,825 |
| Hon Hai Precision Industry Co. Ltd. (Foxconn) | | 4,197,600 | 13,339,555 |
| Hota Industrial Manufacturing Co. Ltd. | | 85,014 | 197,155 |
| Hotai Motor Co. Ltd. | | 103,000 | 1,864,947 |
| HTC Corp. (a) | | 227,000 | 355,413 |
| Hua Nan Financial Holdings Co. Ltd. | | 3,106,806 | 2,027,602 |
| Huaku Development Co. Ltd. | | 97,000 | 258,935 |
| IBF Financial Holdings Co. Ltd. | | 895,775 | 308,275 |
| Innolux Corp. | | 3,401,740 | 1,249,787 |
| International CSRC Investment Holdings Co. | | 387,579 | 227,111 |
| International Games Systems Co. Ltd. | | 44,000 | 479,506 |
| Inventec Corp. | | 900,000 | 680,846 |
| ITEQ Corp. | | 91,931 | 156,192 |
| Jentech Precision Industrial Co. Ltd. | | 29,699 | 323,196 |
| Kenda Rubber Industrial Co. Ltd. | | 224,622 | 212,755 |
| King Slide Works Co. Ltd. | | 24,000 | 311,775 |
| King Yuan Electronics Co. Ltd. | | 441,000 | 447,098 |
| Kings Town Bank Co. Ltd. | | 318,000 | 302,679 |
| Kinik Co. | | 38,000 | 120,171 |
| Kinpo Electronics, Inc. | | 434,000 | 190,398 |
| Kinsus Interconnect Technology Corp. | | 104,000 | 336,950 |
| LandMark Optoelectronics Corp. | | 41,000 | 117,837 |
| Largan Precision Co. Ltd. | | 34,000 | 1,950,146 |
| Lien Hwa Industrial Corp. | | 309,415 | 446,558 |
| Lite-On Technology Corp. | | 691,009 | 1,371,135 |
| Lotes Co. Ltd. | | 28,444 | 684,335 |
| Lotus Pharmaceutical Co. Ltd. | | 57,000 | 273,036 |
| Macronix International Co. Ltd. | | 680,380 | 628,614 |
| Makalot Industrial Co. Ltd. | | 80,701 | 500,409 |
| Marketech International Corp. | | 44,000 | 133,552 |
| MediaTek, Inc. | | 513,000 | 9,383,952 |
| Medigen Vaccine Biologics Corp. | | 91,933 | 183,558 |
| Mega Financial Holding Co. Ltd. | | 3,757,875 | 3,483,613 |
| Merida Industry Co. Ltd. | | 74,000 | 403,795 |
| Merry Electronics Co. Ltd. | | 86,006 | 209,855 |
| Micro-Star International Co. Ltd. | | 238,000 | 807,993 |
| Microbio Co. Ltd. | | 164,349 | 276,174 |
| MiTAC Holdings Corp. | | 353,483 | 296,998 |
| momo.com, Inc. | | 22,440 | 335,689 |
| Nan Ya Plastics Corp. | | 1,613,000 | 3,415,635 |
| Nan Ya Printed Circuit Board Corp. | | 80,000 | 524,586 |
| Nankang Rubber Tire Co. Ltd. (a) | | 185,000 | 195,875 |
| Nantex Industry Co. Ltd. | | 158,000 | 166,063 |
| Nanya Technology Corp. | | 461,000 | 778,958 |
| Nien Made Enterprise Co. Ltd. | | 63,000 | 486,358 |
| Novatek Microelectronics Corp. | | 198,000 | 1,479,444 |
| Nuvoton Technology Corp. | | 68,000 | 216,097 |
| OBI Pharma, Inc. (a) | | 71,723 | 145,207 |
| Oneness Biotech Co. Ltd. (a) | | 80,000 | 565,511 |
| Pan Jit International, Inc. | | 120,000 | 204,998 |
| Pegatron Corp. | | 686,000 | 1,254,852 |
| Phison Electronics Corp. | | 58,000 | 531,376 |
| PixArt Imaging, Inc. | | 71,000 | 177,643 |
| Pou Chen Corp. | | 880,000 | 743,474 |
| Powerchip Semiconductor Manufacturing Corp. | | 1,026,629 | 980,349 |
| Powertech Technology, Inc. | | 283,000 | 654,548 |
| Poya International Co. Ltd. | | 20,816 | 264,605 |
| President Chain Store Corp. | | 197,000 | 1,636,882 |
| Primax Electronics Ltd. | | 161,000 | 270,047 |
| Qisda Corp. | | 553,000 | 420,914 |
| Quanta Computer, Inc. | | 915,000 | 1,940,410 |
| Radiant Opto-Electronics Corp. | | 159,000 | 485,075 |
| Raydium Semiconductor Corp. | | 24,445 | 176,588 |
| RDC Semiconductor Co. Ltd. (a) | | 20,000 | 86,501 |
| Realtek Semiconductor Corp. | | 158,000 | 1,249,147 |
| RichWave Technology Corp. | | 33,302 | 98,500 |
| Ruentex Development Co. Ltd. | | 596,550 | 732,417 |
| Ruentex Industries Ltd. | | 272,824 | 466,915 |
| SDI Corp. | | 52,000 | 143,970 |
| SerComm Corp. | | 96,000 | 225,014 |
| Shin Kong Financial Holding Co. Ltd. | | 4,623,410 | 1,146,750 |
| Shin Zu Shing Co. Ltd. | | 89,279 | 215,627 |
| Shinkong Synthetic Fiber Co. | | 592,000 | 296,422 |
| Shiny Chemical Industrial Co. Ltd. | | 46,250 | 144,110 |
| Simplo Technology Co. Ltd. | | 63,000 | 501,008 |
| SINBON Electronics Co. Ltd. | | 81,000 | 629,085 |
| Sino-American Silicon Products, Inc. | | 171,000 | 657,407 |
| Sinopac Financial Holdings Co. | | 3,513,019 | 1,753,569 |
| Sitronix Technology Corp. | | 47,000 | 241,164 |
| St. Shine Optical Co. Ltd. | | 31,000 | 202,797 |
| Standard Foods Corp. | | 193,714 | 232,128 |
| Synnex Technology International Corp. | | 465,100 | 758,488 |
| Systex Corp. | | 76,000 | 155,987 |
| Ta Chen Stainless Pipe Co. Ltd. | | 690,465 | 808,118 |
| Taichung Commercial Bank Co. Ltd. | | 1,525,566 | 593,596 |
| TaiDoc Technology Corp. | | 25,000 | 131,767 |
| TaiMed Biologics, Inc. (a) | | 73,000 | 127,423 |
| Tainan Spinning Co. Ltd. | | 505,000 | 253,643 |
| Taishin Financial Holdings Co. Ltd. | | 4,092,614 | 1,681,253 |
| Taiwan Business Bank | | 2,128,270 | 788,517 |
| Taiwan Cement Corp. | | 2,078,387 | 1,949,253 |
| Taiwan Cooperative Financial Holding Co. Ltd. | | 3,326,682 | 2,578,503 |
| Taiwan Fertilizer Co. Ltd. | | 287,000 | 465,372 |
| Taiwan Glass Industry Corp. | | 471,000 | 297,898 |
| Taiwan High Speed Rail Corp. | | 658,000 | 573,256 |
| Taiwan Hon Chuan Enterprise Co. Ltd. | | 134,000 | 346,487 |
| Taiwan Mask Corp. | | 84,000 | 153,655 |
| Taiwan Mobile Co. Ltd. | | 583,000 | 1,718,959 |
| Taiwan Paiho Ltd. | | 127,000 | 192,150 |
| Taiwan Secom Co. | | 108,000 | 309,394 |
| Taiwan Semiconductor Co. Ltd. | | 108,000 | 251,132 |
| Taiwan Semiconductor Manufacturing Co. Ltd. | | 8,310,000 | 99,806,989 |
| Taiwan Surface Mounting Technology Co. Ltd. | | 96,000 | 243,765 |
| Taiwan Union Technology Corp. | | 105,000 | 142,750 |
| Tatung Co. Ltd. (a) | | 639,000 | 620,100 |
| TCI Co. Ltd. | | 38,557 | 128,507 |
| TECO Electric & Machinery Co. Ltd. | | 620,000 | 547,839 |
| The Shanghai Commercial & Savings Bank Ltd. | | 1,235,842 | 1,777,859 |
| The Shanghai Commercial & Savings Bank Ltd. rights (a) | | 90,595 | 26,403 |
| Tong Hsing Electronics Industries Ltd. | | 56,286 | 301,900 |
| Tong Yang Industry Co. Ltd. | | 168,000 | 235,692 |
| Topco Scientific Co. Ltd. | | 76,304 | 353,675 |
| Transcend Information, Inc. | | 118,000 | 235,605 |
| Tripod Technology Corp. | | 168,000 | 464,612 |
| TSEC Corp. (a) | | 196,673 | 204,271 |
| TSRC Corp. | | 330,000 | 270,618 |
| TTY Biopharm Co. Ltd. | | 158,000 | 366,906 |
| Tung Ho Steel Enterprise Corp. | | 207,040 | 317,101 |
| Tung Thih Electronic Co. Ltd. | | 29,000 | 120,481 |
| TXC Corp. | | 123,000 | 290,969 |
| U-Ming Marine Transport Corp. | | 198,000 | 216,085 |
| Uni-President Enterprises Corp. | | 1,629,000 | 3,308,101 |
| Unimicron Technology Corp. | | 426,000 | 1,644,354 |
| Union Bank of Taiwan | | 878,419 | 412,601 |
| United Integrated Services Co. | | 71,000 | 319,185 |
| United Microelectronics Corp. | | 4,025,000 | 4,835,179 |
| United Renewable Energy Co. Ltd. (a) | | 581,796 | 378,797 |
| UPI Semiconductor Corp. | | 17,049 | 122,632 |
| USI Corp. | | 329,000 | 206,556 |
| Vanguard International Semiconductor Corp. | | 321,000 | 660,830 |
| Via Technologies, Inc. | | 83,000 | 164,950 |
| Visual Photonics Epitaxy Co. Ltd. | | 71,000 | 127,234 |
| Voltronic Power Technology Corp. | | 23,075 | 937,194 |
| Wafer Works Corp. | | 207,511 | 256,703 |
| Walsin Lihwa Corp. | | 882,457 | 978,106 |
| Walsin Technology Corp. | | 129,875 | 318,104 |
| Wan Hai Lines Ltd. | | 253,305 | 531,678 |
| Win Semiconductors Corp. | | 118,389 | 447,804 |
| Winbond Electronics Corp. | | 1,101,363 | 665,858 |
| Wistron Corp. | | 1,000,829 | 808,321 |
| Wistron NeWeb Corp. | | 117,460 | 304,812 |
| Wiwynn Corp. | | 32,000 | 718,299 |
| WPG Holding Co. Ltd. | | 549,760 | 749,115 |
| WT Microelectronics Co. Ltd. | | 148,235 | 267,939 |
| XinTec, Inc. | | 66,000 | 195,827 |
| Yageo Corp. | | 118,061 | 1,343,349 |
| Yang Ming Marine Transport Corp. | | 600,000 | 1,119,861 |
| YFY, Inc. | | 429,000 | 339,832 |
| Yieh Phui Enterprise Co. | | 505,996 | 224,336 |
| Yuanta Financial Holding Co. Ltd. | | 3,548,987 | 2,167,639 |
| Yulon Finance Corp. | | 71,130 | 301,025 |
| Yulon Motor Co. Ltd. | | 194,364 | 274,788 |
TOTAL TAIWAN | | | 300,826,290 |
| Thailand - 0.7% | | | |
| Advanced Info Service PCL (For. Reg.) | | 207,800 | 1,043,233 |
| Advanced Information Service PCL NVDR | | 219,500 | 1,101,971 |
| Airports of Thailand PCL NVDR (a) | | 1,480,400 | 2,879,474 |
| Amata Corp. PCL NVDR | | 693,500 | 355,454 |
| AP Thailand PCL NVDR | | 1,361,000 | 350,580 |
| Asset World Corp. PCL (For. Reg.) | | 2,400,600 | 384,904 |
| B. Grimm Power PCL (For. Reg.) | | 232,200 | 205,986 |
| Bangchak Corp. PCL (For. Reg.) | | 266,300 | 213,488 |
| Bangkok Chain Hospital PCL (For. Reg.) | | 273,800 | 133,140 |
| Bangkok Commercial Asset Management PCL (For. Reg.) | | 444,400 | 178,718 |
| Bangkok Dusit Medical Services PCL: | | | |
| (For. Reg.) | | 1,755,900 | 1,361,521 |
| NVDR | | 1,864,400 | 1,445,651 |
| Bangkok Expressway and Metro PCL (For. Reg.) | | 2,773,700 | 685,314 |
| Bangkok Life Assurance PCL NVDR | | 268,400 | 231,045 |
| Banpu PCL: | | | |
| (For. Reg.) | | 844,800 | 277,566 |
| NVDR | | 1,317,300 | 432,810 |
| BEC World PCL NVDR | | 531,800 | 134,889 |
| Berli Jucker PCL (For. Reg.) | | 296,700 | 267,104 |
| BTS Group Holdings PCL: | | | |
| (For. Reg.) | | 1,410,700 | 307,762 |
| NVDR | | 1,890,200 | 412,371 |
| Bumrungrad Hospital PCL: | | | |
| NVDR | | 88,500 | 528,046 |
| (For. Reg.) | | 112,800 | 673,035 |
| Carabao Group PCL NVDR | | 161,000 | 381,923 |
| Central Pattana PCL: | | | |
| (For. Reg.) | | 494,900 | 894,319 |
| NVDR | | 222,400 | 401,893 |
| Central Plaza Hotel PCL unit (a) | | 262,600 | 350,294 |
| Central Retail Corp. PCL (For. Reg.) | | 570,683 | 630,009 |
| CH. Karnchang PCL (For. Reg.) | | 388,600 | 236,970 |
| Charoen Pokphand Foods PCL: | | | |
| (For. Reg.) | | 726,960 | 482,474 |
| (NVDR) | | 752,100 | 499,160 |
| Chularat Hospital PCL (For. Reg.) | | 1,771,600 | 164,843 |
| Com7 PCL (For. Reg.) | | 395,700 | 314,625 |
| CP ALL PCL: | | | |
| (For. Reg.) | | 1,189,800 | 1,876,410 |
| NVDR | | 859,200 | 1,355,027 |
| Delta Electronics PCL: | | | |
| (For. Reg.) | | 71,300 | 1,086,976 |
| NVDR | | 43,000 | 655,539 |
| Dhipaya Group Holdings PCL NVDR | | 154,400 | 220,166 |
| Dohome PCL NVDR unit | | 511,700 | 173,503 |
| Dynasty Ceramic PCL (For. Reg.) | | 1,960,860 | 139,159 |
| Electricity Generating PCL (For. Reg.) | | 81,000 | 363,004 |
| Energy Absolute PCL: | | | |
| (For. Reg.) | | 372,400 | 944,581 |
| NVDR | | 268,900 | 682,057 |
| Energy Earth PCL (For. Reg.) (a)(b) | | 7,600 | 0 |
| Global Power Synergy Public Co. Ltd. (For. Reg.) | | 180,500 | 294,152 |
| Gulf Energy Development PCL: | | | |
| (For. Reg.) | | 211,600 | 280,873 |
| NVDR | | 867,300 | 1,151,233 |
| Gunkul Engineering PCL (For. Reg.) | | 1,929,339 | 261,167 |
| Hana Microelectronics PCL (For. Reg.) | | 154,400 | 141,028 |
| Home Product Center PCL (For. Reg.) | | 1,427,700 | 547,889 |
| Indorama Ventures PCL: | | | |
| (For. Reg.) | | 476,600 | 526,145 |
| NVDR | | 251,600 | 277,755 |
| Intouch Holdings PCL (For. Reg.) | | 287,200 | 543,525 |
| IRPC PCL (For. Reg.) | | 2,406,200 | 198,593 |
| Jay Mart PCL unit | | 226,000 | 268,800 |
| JMT Network Services PCL: | | | |
| (For. Reg.) | | 188,038 | 321,264 |
| NVDR | | 86,900 | 148,469 |
| warrants (a) | | 9,695 | 2,854 |
| Kasikornbank PCL NVDR | | 235,500 | 903,746 |
| KCE Electronics PCL (For. Reg.) | | 228,200 | 251,923 |
| Krung Thai Bank PCL: | | | |
| (For. Reg.) | | 599,200 | 275,621 |
| NVDR | | 779,800 | 358,694 |
| Krungthai Card PCL (For. Reg.) | | 264,900 | 396,880 |
| Land & House PCL (For. Reg.) | | 1,812,800 | 438,369 |
| Major Cineplex Group PCL (For. Reg.) | | 300,500 | 143,753 |
| Mega Lifesciences PCL NVDR unit | | 175,900 | 204,589 |
| Minor International PCL: | | | |
| unit (a) | | 818,900 | 608,067 |
| (For. Reg.) (a) | | 375,749 | 279,009 |
| Muangthai Leasing PCL (For. Reg.) | | 195,300 | 186,086 |
| Ngern Tid Lor PCL NVDR | | 486,769 | 332,659 |
| Osotspa PCL NVDR | | 661,000 | 460,415 |
| Plan B Media PCL unit (a) | | 1,484,300 | 275,051 |
| Precious Shipping PCL unit | | 521,200 | 179,464 |
| PTG Energy PCL (For. Reg.) | | 341,200 | 124,660 |
| PTT Exploration and Production PCL: | | | |
| (For. Reg.) | | 321,100 | 1,531,861 |
| NVDR | | 167,700 | 800,041 |
| PTT Global Chemical PCL: | | | |
| (For. Reg.) | | 441,700 | 505,032 |
| NVDR | | 430,800 | 492,569 |
| PTT Oil & Retail Business PCL (For. Reg.) | | 650,800 | 412,256 |
| PTT PCL: | | | |
| (For. Reg.) | | 2,469,500 | 2,336,759 |
| NVDR | | 969,700 | 917,577 |
| Quality Houses PCL (For. Reg.) | | 2,204,300 | 125,149 |
| Ratch Group PCL: | | | |
| unit | | 329,700 | 355,308 |
| (For. Reg.) | | 130,200 | 140,313 |
| Regional Container Lines PCL NVDR | | 232,100 | 161,668 |
| RS PCL NVDR | | 512,400 | 211,452 |
| SCB X PCL: | | | |
| (For. Reg.) | | 119,800 | 333,784 |
| NVDR unit | | 148,200 | 412,911 |
| SCG Packaging PCL NVDR | | 510,700 | 698,026 |
| Siam Cement PCL: | | | |
| (For. Reg.) | | 177,000 | 1,507,373 |
| NVDR | | 100,900 | 859,288 |
| Siam Commercial Bank PCL (For. Reg.) | | 74,700 | 172,892 |
| Singer Thailand PCL: | | | |
| NVDR | | 159,700 | 152,165 |
| rights (a)(b) | | 111,475 | 5,247 |
| Sino-Thai Engineering & Construction PCL (For. Reg.) | | 521,300 | 160,316 |
| Sri Trang Agro-Industry PCL (For. Reg.) | | 263,160 | 132,808 |
| Sri Trang Gloves Thailand PCL (For. Reg.) | | 279,400 | 81,518 |
| Srisawad Corp. PCL (For. Reg.) | | 187,130 | 201,665 |
| Star Petroleum Refining PCL (For. Reg.) | | 469,800 | 146,948 |
| STARK Corp. PCL unit (a) | | 2,083,400 | 175,237 |
| Supalai PCL (For. Reg.) | | 381,875 | 210,787 |
| Thai Airways International PCL (For. Reg.) (a)(b) | | 126,000 | 10,995 |
| Thai Oil PCL: | | | |
| (For. Reg.) | | 284,697 | 407,832 |
| NVDR | | 212,300 | 304,123 |
| Thai Union Frozen Products PCL: | | | |
| (For. Reg.) | | 817,400 | 386,732 |
| rights (a)(b) | | 23,178 | 10,726 |
| Thai Vegetable Oil PCL | | 155,980 | 116,847 |
| Thonburi Healthcare Group PCL NVDR | | 142,200 | 252,293 |
| Thoresen Thai Agencies PCL NVDR | | 849,600 | 167,486 |
| TQM Alpha PCL (For. Reg.) | | 174,000 | 171,507 |
| True Corp. PCL: | | | |
| (For. Reg.) | | 2,301,300 | 300,025 |
| NVDR | | 2,352,000 | 306,635 |
| TTW PCL (For. Reg.) | | 454,400 | 103,911 |
| VGI PCL: | | | |
| (For. Reg.) | | 2,099,130 | 200,837 |
| warrants (For. Reg.) (a) | | 513,930 | 2,296 |
| Vibhavadi Medical Center PCL NVDR unit | | 3,553,800 | 267,154 |
| WHA Corp. PCL (For. Reg.) | | 1,819,200 | 188,399 |
TOTAL THAILAND | | | 52,278,475 |
| Turkey - 0.2% | | | |
| Akbank TAS | | 1,106,482 | 869,053 |
| Aksa Akrilik Kimya Sanayii | | 67,557 | 252,782 |
| Aksa Enerji Uretim A/S | | 164,063 | 364,893 |
| Anadolu Efes Biracilik Ve Malt Sanayii A/S | | 115,435 | 297,421 |
| Aselsan A/S | | 254,595 | 440,687 |
| Bim Birlesik Magazalar A/S JSC | | 181,586 | 1,307,199 |
| Coca-Cola Icecek Sanayi A/S | | 44,085 | 407,356 |
| Emlak Konut Gayrimenkul Yatirim Ortakligi A/S | | 1,009,940 | 239,270 |
| Eregli Demir ve Celik Fabrikalari T.A.S. | | 548,114 | 874,544 |
| Ford Otomotiv Sanayi A/S | | 28,470 | 555,199 |
| Haci Omer Sabanci Holding A/S | | 446,686 | 804,859 |
| Hektas Ticaret A/S (a) | | 420,732 | 647,341 |
| Is Gayrimenkul Yatirim Ortakligi A/S (a) | | 165,114 | 67,592 |
| Kardemir Karabuk Demir Celik Sanayi ve Ticaret A/S Class D | | 384,922 | 247,526 |
| Koc Holding A/S | | 258,317 | 771,582 |
| Petkim Petrokimya Holding A/S (a) | | 653,396 | 471,770 |
| TAV Havalimanlari Holding A/S (a) | | 83,235 | 350,571 |
| Tekfen Holding A/S | | 93,195 | 165,019 |
| Turk Hava Yollari AO (a) | | 215,639 | 1,173,522 |
| Turk Sise ve Cam Fabrikalari A/S | | 526,747 | 940,061 |
| Turkcell Iletisim Hizmet A/S | | 433,832 | 597,577 |
| Turkiye Is Bankasi A/S Series C | | 1,374,149 | 688,025 |
| Turkiye Petrol Rafinerileri A/S (a) | | 42,697 | 869,343 |
TOTAL TURKEY | | | 13,403,192 |
| United Arab Emirates - 0.4% | | | |
| Abu Dhabi Commercial Bank PJSC | | 943,859 | 2,428,321 |
| Abu Dhabi Islamic Bank | | 496,146 | 1,283,218 |
| Abu Dhabi National Oil Co. for Distribution PJSC | | 1,077,552 | 1,323,068 |
| Air Arabia PJSC (a) | | 858,937 | 477,044 |
| Al Yah Satellite Communications Co. PJSC (Yahsat) | | 450,464 | 336,030 |
| Aldar Properties PJSC | | 1,274,216 | 1,498,629 |
| Aramex Co. | | 319,813 | 316,060 |
| Dana Gas PJSC | | 1,508,561 | 386,063 |
| Dubai Investments Ltd. | | 797,950 | 473,587 |
| Dubai Islamic Bank Pakistan Ltd. | | 973,213 | 1,542,049 |
| Emaar Properties PJSC (a) | | 1,333,649 | 2,200,298 |
| Emirates NBD Bank PJSC | | 639,448 | 2,306,685 |
| Emirates Telecommunications Corp. | | 1,175,975 | 8,260,095 |
| First Abu Dhabi Bank PJSC | | 1,484,565 | 7,234,683 |
TOTAL UNITED ARAB EMIRATES | | | 30,065,830 |
| United Kingdom - 9.2% | | | |
| 3i Group PLC | | 326,980 | 4,354,844 |
| A.G. Barr PLC | | 46,358 | 238,703 |
| Abcam PLC (a) | | 75,037 | 1,161,525 |
| Abrdn PLC (c) | | 733,993 | 1,338,372 |
| Admiral Group PLC | | 60,985 | 1,410,641 |
| Advanced Medical Solutions Group PLC | | 84,043 | 263,119 |
| Airtel Africa PLC (d) | | 320,765 | 416,042 |
| AJ Bell PLC | | 113,269 | 421,905 |
| Alpha FX Group PLC | | 11,696 | 254,846 |
| Alphawave IP Group PLC (a) | | 102,089 | 132,061 |
| Anglo American PLC (United Kingdom) | | 428,650 | 12,839,875 |
| Antofagasta PLC | | 133,605 | 1,801,080 |
| Ascential PLC (a) | | 167,046 | 367,811 |
| Ashmore Group PLC | | 177,093 | 419,178 |
| Ashtead Group PLC | | 149,404 | 7,795,811 |
| ASOS PLC (a)(c) | | 23,502 | 151,875 |
| Associated British Foods PLC | | 119,425 | 1,851,003 |
| Assura PLC | | 968,577 | 621,473 |
| Aston Martin Lagonda Global Holdings PLC (a)(d) | | 176,461 | 213,698 |
| AstraZeneca PLC (United Kingdom) | | 522,480 | 61,303,724 |
| Auction Technology Group PLC (a) | | 29,363 | 251,541 |
| Auto Trader Group PLC (d) | | 319,601 | 1,913,062 |
| Avacta Group PLC (a)(c) | | 89,523 | 129,358 |
| Avacta Group PLC rights (a) | | 734 | 261 |
| Aveva Group PLC | | 40,623 | 1,453,497 |
| Aviva PLC | | 952,586 | 4,569,201 |
| Avon Protection PLC | | 12,054 | 143,765 |
| Babcock International Group PLC (a) | | 93,012 | 293,972 |
| BAE Systems PLC | | 1,064,684 | 9,958,596 |
| Balfour Beatty PLC | | 235,869 | 807,697 |
| Bank of Georgia Group PLC | | 14,643 | 356,843 |
| Barclays PLC | | 5,589,186 | 9,497,446 |
| Barratt Developments PLC | | 342,136 | 1,475,664 |
| Beazley PLC | | 207,077 | 1,483,037 |
| Bellway PLC | | 41,496 | 882,750 |
| Berkeley Group Holdings PLC | | 37,263 | 1,483,270 |
| Biffa PLC (d) | | 115,789 | 546,285 |
| Big Yellow Group PLC | | 57,877 | 747,364 |
| Bodycote PLC | | 70,348 | 399,826 |
| BP PLC | | 6,510,366 | 36,019,304 |
| Bridgepoint Group Holdings Ltd. (d) | | 228,107 | 521,355 |
| British American Tobacco PLC (United Kingdom) | | 719,978 | 28,434,431 |
| British Land Co. PLC | | 289,680 | 1,215,538 |
| Britvic PLC | | 99,830 | 832,879 |
| BT Group PLC | | 2,339,596 | 3,482,597 |
| Bunzl PLC | | 112,599 | 3,668,542 |
| Burberry Group PLC | | 133,935 | 2,787,779 |
| Bytes Technology Group PLC | | 83,696 | 344,769 |
| Capita Group PLC (a) | | 733,065 | 204,285 |
| Capital & Counties Properties PLC | | 259,204 | 318,360 |
| Capricorn Energy PLC (a) | | 113,801 | 323,135 |
| Carnival PLC (a)(c) | | 50,155 | 398,499 |
| Central Asia Metals PLC | | 99,540 | 244,857 |
| Centrica PLC | | 1,983,764 | 1,743,090 |
| Ceres Power Holdings PLC (a)(c) | | 44,550 | 167,473 |
| Chemring Group PLC | | 112,078 | 388,164 |
| Civitas Social Housing PLC | | 229,221 | 156,671 |
| Clarkson PLC | | 11,419 | 362,085 |
| Close Brothers Group PLC | | 54,053 | 608,722 |
| Coats Group PLC | | 505,350 | 350,619 |
| Compass Group PLC | | 598,736 | 12,610,474 |
| Computacenter PLC | | 28,463 | 590,809 |
| ContourGlobal PLC (d) | | 72,106 | 209,209 |
| ConvaTec Group PLC (d) | | 561,040 | 1,402,613 |
| Countryside Partnerships PLC (a)(d) | | 163,218 | 397,941 |
| Craneware PLC | | 10,056 | 213,346 |
| Cranswick PLC | | 18,332 | 625,228 |
| Crest Nicholson Holdings PLC | | 91,112 | 211,064 |
| Croda International PLC | | 47,333 | 3,669,428 |
| Currys PLC | | 420,308 | 314,270 |
| Custodian (REIT) PLC | | 176,590 | 179,224 |
| CVS Group PLC | | 28,279 | 613,258 |
| Darktrace PLC (a)(c) | | 72,741 | 298,224 |
| Dechra Pharmaceuticals PLC | | 36,898 | 1,108,643 |
| Deliveroo PLC Class A (a)(d) | | 364,838 | 364,674 |
| Derwent London PLC | | 33,650 | 835,084 |
| Diageo PLC | | 769,490 | 31,666,449 |
| Diploma PLC | | 43,037 | 1,226,961 |
| Direct Line Insurance Group PLC | | 449,533 | 1,040,328 |
| Diversified Gas & Oil PLC | | 306,360 | 441,978 |
| Domino's Pizza UK & IRL PLC | | 143,548 | 372,372 |
| Dr. Martens Ltd. | | 209,042 | 596,447 |
| Drax Group PLC | | 136,388 | 814,895 |
| DS Smith PLC | | 480,766 | 1,599,996 |
| Dunelm Group PLC | | 44,750 | 444,938 |
| easyJet PLC (a) | | 98,150 | 392,154 |
| Elementis PLC (a) | | 238,315 | 252,802 |
| EMIS Group PLC | | 19,237 | 409,893 |
| Empiric Student Property PLC | | 222,673 | 209,396 |
| Energean PLC | | 43,885 | 720,184 |
| EnQuest PLC (a) | | 559,342 | 173,192 |
| Ergomed PLC (a) | | 16,701 | 234,812 |
| Essentra PLC | | 121,631 | 313,844 |
| Euromoney Institutional Invest | | 36,401 | 604,463 |
| FD Technologies PLC (a) | | 8,620 | 132,860 |
| Ferrexpo PLC | | 111,827 | 130,936 |
| Fever-Tree Drinks PLC | | 37,731 | 413,444 |
| Firstgroup PLC | | 261,194 | 315,113 |
| Forterra PLC (d) | | 97,535 | 244,399 |
| Frasers Group PLC (a) | | 59,175 | 439,406 |
| Frontier Developments PLC (a)(c) | | 11,742 | 178,556 |
| Future PLC | | 39,346 | 549,586 |
| Games Workshop Group PLC | | 11,482 | 842,724 |
| Gamma Communications PLC | | 30,771 | 375,466 |
| GB Group PLC | | 82,434 | 359,423 |
| Genuit Group PLC | | 92,438 | 270,850 |
| Genus PLC | | 22,867 | 669,758 |
| Grainger Trust PLC | | 275,790 | 717,946 |
| Great Portland Estates PLC | | 75,983 | 447,886 |
| Greatland Gold PLC (a) | | 1,574,632 | 142,296 |
| Greggs PLC | | 38,011 | 879,667 |
| GSK PLC | | 1,372,423 | 22,481,796 |
| Haleon PLC (a) | | 1,717,945 | 5,279,973 |
| Halfords Group PLC | | 91,018 | 184,021 |
| Halma PLC | | 128,500 | 3,116,744 |
| Hammerson PLC | | 1,404,461 | 308,034 |
| Harbour Energy PLC | | 157,018 | 680,478 |
| Hargreaves Lansdown PLC | | 122,506 | 1,072,219 |
| Hays PLC | | 634,382 | 799,533 |
| Helical PLC | | 38,661 | 146,310 |
| Helios Towers PLC (a) | | 271,674 | 391,002 |
| Hikma Pharmaceuticals PLC | | 57,039 | 817,000 |
| Hill & Smith Holdings PLC | | 31,599 | 358,029 |
| Hochschild Mining PLC | | 142,669 | 87,287 |
| Home (REIT) PLC | | 393,171 | 379,197 |
| HomeServe PLC | | 100,584 | 1,368,048 |
| Howden Joinery Group PLC | | 195,511 | 1,152,450 |
| HSBC Holdings PLC (United Kingdom) | | 6,768,868 | 34,738,193 |
| Hunting PLC | | 53,748 | 164,882 |
| Ibstock PLC (d) | | 164,143 | 292,712 |
| IG Group Holdings PLC | | 138,115 | 1,259,995 |
| IMI PLC | | 90,885 | 1,279,907 |
| Impax Asset Management Group PLC | | 33,185 | 254,979 |
| Imperial Brands PLC | | 299,525 | 7,296,159 |
| Inchcape PLC | | 126,812 | 1,081,984 |
| Indivior PLC (a) | | 48,582 | 924,293 |
| Informa PLC | | 489,415 | 3,118,367 |
| IntegraFin Holdings PLC | | 106,810 | 308,674 |
| InterContinental Hotel Group PLC | | 61,838 | 3,322,602 |
| Intermediate Capital Group PLC | | 98,820 | 1,203,530 |
| International Distributions Services PLC | | 268,489 | 622,888 |
| Intertek Group PLC | | 54,847 | 2,298,313 |
| Investec PLC | | 236,328 | 1,188,427 |
| IP Group PLC | | 381,769 | 258,309 |
| ITM Power PLC (a)(c) | | 158,930 | 150,657 |
| ITV PLC | | 1,230,908 | 945,776 |
| J Sainsbury PLC | | 598,935 | 1,335,082 |
| J.D. Wetherspoon PLC (a) | | 38,204 | 197,594 |
| JD Sports Fashion PLC | | 876,554 | 979,498 |
| Jet2 PLC (a) | | 53,025 | 516,755 |
| John Wood Group PLC (a) | | 242,809 | 389,556 |
| Johnson Matthey PLC | | 62,274 | 1,381,539 |
| Johnson Service Group PLC | | 188,319 | 200,199 |
| Jupiter Fund Management PLC | | 239,030 | 284,536 |
| Just Group PLC | | 391,667 | 260,515 |
| Kainos Group PLC | | 28,673 | 406,753 |
| Keller Group PLC | | 31,287 | 225,326 |
| Keywords Studios PLC | | 25,080 | 693,158 |
| Kingfisher PLC | | 679,014 | 1,705,978 |
| Land Securities Group PLC | | 233,100 | 1,524,788 |
| Learning Technologies Group PLC | | 203,256 | 250,809 |
| Legal & General Group PLC | | 2,007,248 | 5,369,915 |
| Liontrust Asset Management PLC | | 27,203 | 266,417 |
| Lloyds Banking Group PLC | | 23,302,231 | 11,191,315 |
| London Stock Exchange Group PLC | | 110,440 | 9,573,165 |
| Londonmetric Properity PLC | | 330,139 | 707,610 |
| LXI REIT PLC | | 622,258 | 869,171 |
| M&G PLC | | 867,575 | 1,743,126 |
| Marks & Spencer Group PLC (a) | | 679,707 | 822,360 |
| Marlowe PLC (a) | | 30,093 | 276,085 |
| Marshalls PLC | | 85,386 | 247,152 |
| Marston's PLC (a) | | 428,747 | 172,385 |
| Mediclinic International PLC (London) | | 131,974 | 750,685 |
| Melrose Industries PLC | | 1,474,670 | 1,976,956 |
| Micro Focus International PLC | | 113,874 | 678,989 |
| Mitchells & Butlers PLC (a) | | 99,019 | 131,951 |
| Mitie Group PLC | | 590,018 | 483,116 |
| Mondi PLC | | 164,056 | 2,751,539 |
| Moneysupermarket.com Group PLC | | 198,400 | 417,281 |
| Moonpig Group PLC (a) | | 76,715 | 121,144 |
| Morgan Advanced Materials PLC | | 108,347 | 305,661 |
| Morgan Sindall PLC | | 17,201 | 303,782 |
| National Express Group PLC Class L (a) | | 183,651 | 356,354 |
| National Grid PLC | | 1,215,686 | 13,245,053 |
| NatWest Group PLC | | 1,782,432 | 4,799,530 |
| NCC Group Ltd. | | 116,431 | 265,711 |
| Network International Holdings PLC (a)(d) | | 205,150 | 764,615 |
| Next Fifteen Communications Group PLC | | 29,754 | 299,590 |
| Next PLC | | 43,811 | 2,476,451 |
| Ninety One PLC | | 148,065 | 345,715 |
| NMC Health PLC (a) | | 17,953 | 359 |
| Ocado Group PLC (a) | | 196,329 | 1,064,358 |
| OSB Group PLC | | 150,570 | 716,250 |
| Oxford Nanopore Technologies Ltd. | | 117,893 | 354,899 |
| Pagegroup PLC | | 123,858 | 599,694 |
| Pan African Resources PLC | | 881,934 | 171,129 |
| Pantheon Resources PLC (a)(c) | | 252,378 | 289,717 |
| Paragon Banking Group PLC | | 103,143 | 506,257 |
| Pearson PLC | | 224,070 | 2,476,673 |
| Pennon Group PLC | | 91,850 | 882,169 |
| Persimmon PLC | | 106,778 | 1,598,012 |
| Pets At Home Group PLC | | 174,470 | 575,837 |
| Phoenix Group Holdings PLC | | 251,638 | 1,565,250 |
| Premier Foods PLC | | 233,902 | 277,895 |
| Primary Health Properties PLC | | 461,427 | 587,902 |
| Provident Financial PLC | | 90,630 | 169,725 |
| Prudential PLC | | 928,680 | 8,627,132 |
| PZ Cussons PLC Class L | | 109,733 | 251,684 |
| QinetiQ Group PLC | | 202,915 | 836,334 |
| Quilter PLC (d) | | 461,551 | 511,628 |
| Rathbone Brothers PLC | | 22,276 | 478,734 |
| Reach PLC | | 121,788 | 128,284 |
| Reckitt Benckiser Group PLC | | 240,300 | 15,947,274 |
| Redde Northgate PLC | | 89,139 | 340,408 |
| Redrow PLC | | 119,061 | 571,553 |
| RELX PLC (London Stock Exchange) | | 645,905 | 17,349,328 |
| Renewi PLC (a) | | 35,482 | 215,254 |
| Renishaw PLC | | 14,002 | 562,333 |
| Rentokil Initial PLC | | 843,169 | 5,261,468 |
| Restore PLC | | 50,039 | 206,585 |
| Rightmove PLC | | 283,960 | 1,599,034 |
| Rio Tinto PLC | | 379,137 | 19,814,326 |
| Rolls-Royce Holdings PLC (a) | | 2,838,894 | 2,546,101 |
| Rotork PLC | | 301,253 | 885,112 |
| RS GROUP PLC | | 162,059 | 1,781,365 |
| RWS Holdings PLC | | 107,068 | 375,969 |
| S4 Capital PLC (a) | | 100,305 | 202,107 |
| Sabre Insurance Group PLC (d) | | 101,037 | 104,051 |
| Safestore Holdings PLC | | 71,199 | 737,717 |
| Sage Group PLC | | 332,696 | 2,773,002 |
| Savills PLC | | 48,716 | 461,186 |
| Schroders PLC | | 243,826 | 1,095,270 |
| Segro PLC | | 404,514 | 3,641,589 |
| Senior Engineering Group PLC | | 166,722 | 248,556 |
| Serco Group PLC | | 410,964 | 770,094 |
| Serica Energy PLC | | 71,053 | 244,451 |
| Severn Trent PLC | | 84,306 | 2,419,953 |
| Shaftesbury PLC | | 65,984 | 278,165 |
| Shell PLC (London) | | 2,505,788 | 69,414,356 |
| Smart Metering Systems PLC | | 45,791 | 384,396 |
| Smith & Nephew PLC | | 295,099 | 3,487,160 |
| Smiths Group PLC | | 128,430 | 2,298,359 |
| Softcat PLC | | 44,975 | 577,666 |
| Spectris PLC | | 36,810 | 1,274,854 |
| Spirax-Sarco Engineering PLC | | 24,908 | 3,070,683 |
| Spire Healthcare Group PLC (a)(d) | | 137,683 | 342,632 |
| Spirent Communications PLC | | 212,500 | 633,607 |
| SSE PLC | | 358,622 | 6,408,893 |
| SSP Group PLC (a) | | 278,789 | 646,784 |
| St. James's Place PLC | | 184,044 | 2,247,807 |
| Standard Chartered PLC (United Kingdom) | | 848,619 | 5,062,567 |
| SThree PLC | | 56,708 | 241,922 |
| Supermarket Income (REIT) PLC | | 411,666 | 483,901 |
| Synthomer PLC | | 134,387 | 173,379 |
| Tate & Lyle PLC | | 132,235 | 1,063,046 |
| Taylor Wimpey PLC | | 1,192,854 | 1,282,878 |
| TBC Bank Group PLC | | 13,946 | 301,313 |
| Team17 Group PLC (a) | | 40,289 | 190,589 |
| Telecom Plus PLC | | 21,864 | 532,815 |
| Tesco PLC | | 2,542,576 | 6,279,869 |
| The Restaurant Group PLC (a) | | 308,699 | 112,577 |
| The Weir Group PLC | | 88,375 | 1,543,030 |
| THG PLC (a) | | 228,436 | 139,368 |
| TI Fluid Systems PLC (d) | | 144,328 | 229,735 |
| TORM PLC | | 10,104 | 270,627 |
| Trainline PLC (a)(d) | | 166,157 | 633,956 |
| Travis Perkins PLC | | 72,949 | 688,337 |
| Tritax Big Box REIT PLC | | 620,482 | 998,331 |
| Tullow Oil PLC (a) | | 438,102 | 203,478 |
| Tyman PLC | | 90,868 | 200,287 |
| Unilever PLC | | 859,890 | 39,085,749 |
| Unite Group PLC | | 113,481 | 1,159,547 |
| United Utilities Group PLC | | 229,051 | 2,468,300 |
| Urban Logistics REIT PLC | | 167,435 | 252,499 |
| Vesuvius PLC | | 79,348 | 308,659 |
| Victoria PLC (a)(c) | | 23,616 | 136,497 |
| Victrex PLC | | 31,978 | 606,194 |
| Virgin Money UK PLC | | 435,577 | 679,846 |
| Vistry Group PLC | | 73,829 | 510,543 |
| Vodafone Group PLC | | 8,972,004 | 10,473,941 |
| Volution Group PLC | | 78,011 | 276,441 |
| Warehouse (REIT) PLC | | 247,006 | 339,920 |
| WH Smith PLC (a) | | 46,066 | 621,791 |
| Whitbread PLC | | 68,255 | 2,008,888 |
| Wickes Group PLC | | 112,155 | 163,089 |
| Workspace Group PLC | | 61,232 | 287,484 |
| YouGov PLC | | 36,770 | 376,980 |
TOTAL UNITED KINGDOM | | | 734,268,505 |
| United States of America - 0.2% | | | |
| 360 DigiTech, Inc. ADR | | 38,088 | 386,974 |
| 5E Advanced Materials, Inc. unit (a) | | 93,949 | 120,790 |
| Coca-Cola European Partners PLC | | 69,618 | 3,275,527 |
| Coronado Global Resources, Inc. unit (d) | | 275,456 | 327,724 |
| Dada Nexus Ltd. ADR (a) | | 26,232 | 81,057 |
| Fiverr International Ltd. (a) | | 10,866 | 336,303 |
| Legend Biotech Corp. ADR (a) | | 17,499 | 871,800 |
| Li Auto, Inc. ADR (a) | | 183,504 | 2,499,324 |
| Nano-X Imaging Ltd. (a)(c) | | 14,961 | 212,446 |
| Resolute Forest Products, Inc. (a) | | 17,064 | 355,102 |
| Southern Copper Corp. | | 28,813 | 1,353,347 |
| Yum China Holdings, Inc. | | 143,209 | 5,921,692 |
TOTAL UNITED STATES OF AMERICA | | | 15,742,086 |
| TOTAL COMMON STOCKS (Cost $9,156,421,704) | | | 7,849,026,423 |
| | | | |
| Nonconvertible Preferred Stocks - 1.0% |
| | | Shares | Value ($) |
| Brazil - 0.5% | | | |
| Alpargatas SA (PN) | | 77,400 | 329,049 |
| Azul SA (a) | | 101,900 | 318,197 |
| Banco ABC Brasil SA Series A | | 52,789 | 211,136 |
| Banco Bradesco SA (PN) | | 1,693,152 | 6,509,728 |
| Banco do Estado Rio Grande do Sul SA Class B | | 92,900 | 209,882 |
| Banco Pan SA | | 188,900 | 282,683 |
| Bradespar SA (PN) | | 112,056 | 520,853 |
| Braskem SA Class A | | 65,600 | 428,105 |
| Centrais Eletricas Brasileiras SA (Electrobras) (PN-B) | | 102,911 | 1,062,281 |
| Companhia Energetica de Minas Gerais (CEMIG) (PN) | | 473,494 | 1,042,228 |
| Companhia Paranaense de Energia-COPEL (PN-B) | | 467,200 | 669,302 |
| Gerdau SA | | 391,103 | 1,949,647 |
| Gol Linhas Aereas Inteligentes SA (PN) (a) | | 92,946 | 172,919 |
| Itau Unibanco Holding SA | | 1,633,860 | 9,615,593 |
| Itausa-Investimentos Itau SA (PN) | | 1,559,063 | 3,241,571 |
| Metalurgica Gerdau SA (PN) | | 260,200 | 566,692 |
| Petroleo Brasileiro SA - Petrobras (PN) (non-vtg.) | | 1,707,686 | 9,855,023 |
| Unipar Carbocloro SA | | 17,790 | 367,785 |
TOTAL BRAZIL | | | 37,352,674 |
| Chile - 0.0% | | | |
| Embotelladora Andina SA Class B | | 156,427 | 273,561 |
| Sociedad Quimica y Minera de Chile SA (PN-B) | | 48,284 | 4,595,552 |
TOTAL CHILE | | | 4,869,113 |
| Colombia - 0.0% | | | |
| Bancolombia SA (PN) | | 130,824 | 827,790 |
| Germany - 0.3% | | | |
| Bayerische Motoren Werke AG (BMW) (non-vtg.) | | 39,187 | 2,892,874 |
| Dr. Ing. h.c. F. Porsche AG Series F (a) | | 37,948 | 3,881,469 |
| Draegerwerk AG & Co. KGaA (non-vtg.) | | 4,111 | 165,555 |
| Einhell Germany AG | | 1,402 | 192,311 |
| Fuchs Petrolub AG | | 24,402 | 699,343 |
| Henkel AG & Co. KGaA | | 48,639 | 3,064,190 |
| Jungheinrich AG | | 17,747 | 441,619 |
| Porsche Automobil Holding SE (Germany) | | 50,642 | 2,829,485 |
| Sartorius AG (non-vtg.) | | 8,223 | 2,901,930 |
| Sixt SE Preference Shares | | 3,271 | 190,721 |
| Sto SE & Co. KGaA | | 1,245 | 160,440 |
| Volkswagen AG | | 59,312 | 7,592,021 |
TOTAL GERMANY | | | 25,011,958 |
| Italy - 0.0% | | | |
| Danieli & C. Officine Meccaniche SpA | | 21,782 | 299,212 |
| Korea (South) - 0.2% | | | |
| Daishin Securities Co. Ltd. | | 17,082 | 157,976 |
| Hyundai Motor Co. | | 5,432 | 298,370 |
| Hyundai Motor Co. Series 2 | | 18,520 | 1,035,434 |
| LG Chemical Ltd. | | 4,504 | 911,958 |
| LG H & H Co. Ltd. | | 1,118 | 219,712 |
| Samsung Electronics Co. Ltd. | | 284,458 | 10,622,433 |
TOTAL KOREA (SOUTH) | | | 13,245,883 |
| Russia - 0.0% | | | |
| Surgutneftegas OJSC (b) | | 1,961,555 | 51,177 |
| TOTAL NONCONVERTIBLE PREFERRED STOCKS (Cost $91,795,136) | | | 81,657,807 |
| | | | |
| Government Obligations - 0.1% |
| | | Principal Amount (e) | Value ($) |
| United States of America - 0.1% | | | |
U.S. Treasury Bills, yield at date of purchase 1.23% 1/26/23 (f) (Cost $11,167,505) | | 11,200,000 | 11,093,312 |
| | | | |
| Money Market Funds - 1.3% |
| | | Shares | Value ($) |
| Fidelity Cash Central Fund 3.10% (g) | | 50,469,204 | 50,479,298 |
| Fidelity Securities Lending Cash Central Fund 3.10% (g)(h) | | 54,398,562 | 54,404,001 |
| TOTAL MONEY MARKET FUNDS (Cost $104,883,299) | | | 104,883,299 |
| | | | |
| TOTAL INVESTMENT IN SECURITIES - 100.3% (Cost $9,364,267,644) | 8,046,660,841 |
NET OTHER ASSETS (LIABILITIES) - (0.3)% | (27,811,520) |
| NET ASSETS - 100.0% | 8,018,849,321 |
| | |
| Futures Contracts |
| | Number of contracts | Expiration Date | Notional Amount ($) | Value ($) | Unrealized Appreciation/ (Depreciation) ($) |
| Purchased | | | | | |
| | | | | | |
| Equity Index Contracts | | | | | |
| ICE E-mini MSCI EAFE Index Contracts (United States) | 628 | Dec 2022 | 55,135,260 | 2,641,569 | 2,641,569 |
| ICE E-mini MSCI Emerging Markets Index Contracts (United States) | 554 | Dec 2022 | 23,644,720 | (266,360) | (266,360) |
| TME S&P/TSX 60 Index Contracts (Canada) | 42 | Dec 2022 | 7,260,865 | 363,069 | 363,069 |
| | | | | | |
| TOTAL FUTURES CONTRACTS | | | | | 2,738,278 |
| The notional amount of futures purchased as a percentage of Net Assets is 1.1% |
Categorizations in the Schedule of Investments are based on country or territory of incorporation.
Legend
| (c) | Security or a portion of the security is on loan at period end. |
| (d) | Security exempt from registration under Rule 144A of the Securities Act of 1933. These securities may be resold in transactions exempt from registration, normally to qualified institutional buyers. At the end of the period, the value of these securities amounted to $204,132,831 or 2.5% of net assets. |
| (e) | Amount is stated in United States dollars unless otherwise noted. |
| (f) | Security or a portion of the security was pledged to cover margin requirements for futures contracts. At period end, the value of securities pledged amounted to $4,232,297. |
| (g) | Affiliated fund that is generally available only to investment companies and other accounts managed by Fidelity Investments. The rate quoted is the annualized seven-day yield of the fund at period end. A complete unaudited listing of the fund's holdings as of its most recent quarter end is available upon request. In addition, each Fidelity Central Fund's financial statements, which are not covered by the Fund's Report of Independent Registered Public Accounting Firm, are available on the SEC's website or upon request. |
| (h) | Investment made with cash collateral received from securities on loan. |
Affiliated Central Funds
Fiscal year to date information regarding the Fund's investments in Fidelity Central Funds, including the ownership percentage, is presented below.
| Affiliate | Value, beginning of period ($) | Purchases ($) | Sales Proceeds ($) | Dividend Income ($) | Realized Gain (loss) ($) | Change in Unrealized appreciation (depreciation) ($) | Value, end of period ($) | % ownership, end of period |
| Fidelity Cash Central Fund 3.10% | - | 2,065,181,007 | 2,014,701,709 | 1,978,293 | - | - | 50,479,298 | 0.1% |
| Fidelity Securities Lending Cash Central Fund 3.10% | 53,637,748 | 327,436,017 | 326,669,764 | 1,461,660 | - | - | 54,404,001 | 0.2% |
| Total | 53,637,748 | 2,392,617,024 | 2,341,371,473 | 3,439,953 | - | - | 104,883,299 | |
| | | | | | | | | |
Amounts in the income column in the above table include any capital gain distributions from underlying funds, which are presented in the corresponding line item in the Statement of Operations, if applicable.
Amount for Fidelity Securities Lending Cash Central Fund represents the income earned on investing cash collateral, less rebates paid to borrowers and any lending agent fees associated with the loan, plus any premium payments received for lending certain types of securities.
Investment Valuation
The following is a summary of the inputs used, as of October 31, 2022, involving the Fund's assets and liabilities carried at fair value. The inputs or methodology used for valuing securities may not be an indication of the risk associated with investing in those securities. For more information on valuation inputs, and their aggregation into the levels used below, please refer to the Investment Valuation section in the accompanying Notes to Financial Statements.
| Valuation Inputs at Reporting Date: |
| Description | Total ($) | Level 1 ($) | Level 2 ($) | Level 3 ($) |
Investments in Securities: | | | | |
|
| Equities: | | | | |
Communication Services | 430,309,612 | 198,763,456 | 230,678,547 | 867,609 |
Consumer Discretionary | 854,679,959 | 441,983,885 | 412,579,630 | 116,444 |
Consumer Staples | 687,421,484 | 340,228,499 | 347,154,729 | 38,256 |
Energy | 502,396,052 | 304,593,554 | 196,956,304 | 846,194 |
Financials | 1,551,465,818 | 1,052,903,907 | 498,210,154 | 351,757 |
Health Care | 759,187,819 | 303,306,078 | 455,771,893 | 109,848 |
Industrials | 1,073,029,741 | 707,781,832 | 365,189,084 | 58,825 |
Information Technology | 858,249,239 | 528,619,901 | 329,629,338 | - |
Materials | 685,918,473 | 488,381,197 | 196,449,427 | 1,087,849 |
Real Estate | 260,066,035 | 235,092,275 | 24,870,062 | 103,698 |
Utilities | 267,959,998 | 174,350,590 | 93,474,656 | 134,752 |
|
| Government Obligations | 11,093,312 | - | 11,093,312 | - |
|
| Money Market Funds | 104,883,299 | 104,883,299 | - | - |
| Total Investments in Securities: | 8,046,660,841 | 4,880,888,473 | 3,162,057,136 | 3,715,232 |
Derivative Instruments: | | | | |
|
| Assets | | | | |
Futures Contracts | 3,004,638 | 3,004,638 | - | - |
| Total Assets | 3,004,638 | 3,004,638 | - | - |
|
| Liabilities | | | | |
Futures Contracts | (266,360) | (266,360) | - | - |
| Total Liabilities | (266,360) | (266,360) | - | - |
| Total Derivative Instruments: | 2,738,278 | 2,738,278 | - | - |
The following is a reconciliation of Investments in Securities for which Level 3 inputs were used in determining value:
| |
| Investments in Securities: | |
| Beginning Balance | $ | 2,895,481 | |
| Net Realized Gain (Loss) on Investment Securities | | (864,591) | |
| Net Unrealized Gain (Loss) on Investment Securities | | (92,066,596) | |
| Cost of Purchases | | 10,310,579 | |
| Proceeds of Sales | | (3,801,560) | |
| Amortization/Accretion | | - | |
| Transfers into Level 3 | | 87,393,057 | |
| Transfers out of Level 3 | | (151,138) | |
| Ending Balance | $ | 3,715,232 | |
| The change in unrealized gain (loss) for the period attributable to Level 3 securities held at October 31, 2022 | $ | (92,296,716) | |
| The information used in the above reconciliation represents fiscal year to date activity for any Investments in Securities identified as using Level 3 inputs at either the beginning or the end of the current fiscal period. Cost of purchases and proceeds of sales may include securities received and/or delivered through in-kind transactions. Transfers into Level 3 were attributable to a lack of observable market data resulting from decreases in market activity, decreases in liquidity, security restructurings or corporate actions. Transfers out of Level 3 were attributable to observable market data becoming available for those securities. Transfers in or out of Level 3 represent the beginning value of any Security or Instrument where a change in the pricing level occurred from the beginning to the end of the period. The cost of purchases and the proceeds of sales may include securities received or delivered through corporate actions or exchanges. Realized and unrealized gains (losses) disclosed in the reconciliation are included in Net Gain (Loss) on the Fund's Statement of Operations. | |
Value of Derivative Instruments
The following table is a summary of the Fund's value of derivative instruments by primary risk exposure as of October 31, 2022. For additional information on derivative instruments, please refer to the Derivative Instruments section in the accompanying Notes to Financial Statements.
Primary Risk Exposure / Derivative Type | Value |
| Asset ($) | Liability ($) |
| Equity Risk | | |
Futures Contracts (a) | 3,004,638 | (266,360) |
| Total Equity Risk | 3,004,638 | (266,360) |
| Total Value of Derivatives | 3,004,638 | (266,360) |
(a)Reflects gross cumulative appreciation (depreciation) on futures contracts as presented in the Schedule of Investments. In the Statement of Assets and Liabilities, the period end daily variation margin is included in receivable or payable for daily variation margin on futures contracts, and the net cumulative appreciation (depreciation) is included in Total accumulated earnings (loss).
| Statement of Assets and Liabilities |
| | | | October 31, 2022 |
| | | | | |
| Assets | | | | |
| Investment in securities, at value (including securities loaned of $47,227,196) - See accompanying schedule: | | | | |
Unaffiliated issuers (cost $9,259,384,345) | | $7,941,777,542 | | |
Fidelity Central Funds (cost $104,883,299) | | 104,883,299 | | |
| | | | | |
| Total Investment in Securities (cost $9,364,267,644) | | | $ | 8,046,660,841 |
| Foreign currency held at value (cost $5,128,463) | | | | 5,045,706 |
| Receivable for investments sold | | | | 1,063,402 |
| Receivable for fund shares sold | | | | 8,978,232 |
| Dividends receivable | | | | 16,100,814 |
| Reclaims receivable | | | | 11,844,025 |
| Distributions receivable from Fidelity Central Funds | | | | 471,132 |
| Other receivables | | | | 40,287 |
Total assets | | | | 8,090,204,439 |
| Liabilities | | | | |
| Payable for investments purchased | | $21,247 | | |
| Payable for fund shares redeemed | | 5,305,109 | | |
| Accrued management fee | | 397,770 | | |
| Payable for daily variation margin on futures contracts | | 537,353 | | |
| Other payables and accrued expenses | | 10,688,355 | | |
| Collateral on securities loaned | | 54,405,284 | | |
| Total Liabilities | | | | 71,355,118 |
| Net Assets | | | $ | 8,018,849,321 |
| Net Assets consist of: | | | | |
| Paid in capital | | | $ | 9,348,438,411 |
| Total accumulated earnings (loss) | | | | (1,329,589,090) |
| Net Assets | | | $ | 8,018,849,321 |
Net Asset Value , offering price and redemption price per share ($8,018,849,321 ÷ 740,834,308 shares) | | | $ | 10.82 |
| | | | | |
| Statement of Operations |
| | | | Year ended October 31, 2022 |
| Investment Income | | | | |
| Dividends | | | $ | 268,849,327 |
| Non-Cash dividends | | | | 17,175,004 |
| Interest | | | | 105,085 |
| Income from Fidelity Central Funds (including $1,461,660 from security lending) | | | | 3,439,953 |
| Income before foreign taxes withheld | | | | 289,569,369 |
| Less foreign taxes withheld | | | | (26,574,415) |
| Total Income | | | | 262,994,954 |
| Expenses | | | | |
| Management fee | $ | 5,099,754 | | |
| Independent trustees' fees and expenses | | 27,910 | | |
| Interest | | 249 | | |
| Total expenses before reductions | | 5,127,913 | | |
| Expense reductions | | (1,667) | | |
| Total expenses after reductions | | | | 5,126,246 |
| Net Investment income (loss) | | | | 257,868,708 |
| Realized and Unrealized Gain (Loss) | | | | |
| Net realized gain (loss) on: | | | | |
| Investment Securities: | | | | |
| Unaffiliated issuers(net of foreign taxes of $150,914) | | (23,834,679) | | |
| Foreign currency transactions | | (3,535,431) | | |
| Futures contracts | | (54,396,111) | | |
| Total net realized gain (loss) | | | | (81,766,221) |
| Change in net unrealized appreciation (depreciation) on: | | | | |
| Investment Securities: | | | | |
| Unaffiliated issuers (net of decrease in deferred foreign taxes of $1,664,700) | | (2,622,760,828) | | |
| Assets and liabilities in foreign currencies | | (1,764,217) | | |
| Futures contracts | | 2,735,041 | | |
| Total change in net unrealized appreciation (depreciation) | | | | (2,621,790,004) |
| Net gain (loss) | | | | (2,703,556,225) |
| Net increase (decrease) in net assets resulting from operations | | | $ | (2,445,687,517) |
| Statement of Changes in Net Assets |
| |
| | Year ended October 31, 2022 | | Year ended October 31, 2021 |
| Increase (Decrease) in Net Assets | | | | |
| Operations | | | | |
| Net investment income (loss) | $ | 257,868,708 | $ | 177,250,777 |
| Net realized gain (loss) | | (81,766,221) | | (9,815,269) |
| Change in net unrealized appreciation (depreciation) | | (2,621,790,004) | | 1,329,118,103 |
| Net increase (decrease) in net assets resulting from operations | | (2,445,687,517) | | 1,496,553,611 |
| Distributions to shareholders | | (217,671,505) | | (90,362,587) |
| Share transactions | | | | |
| Proceeds from sales of shares | | 3,856,408,422 | | 4,282,334,390 |
| Reinvestment of distributions | | 206,193,841 | | 85,865,324 |
| Cost of shares redeemed | | (1,938,049,642) | | (1,873,000,573) |
Net increase (decrease) in net assets resulting from share transactions | | 2,124,552,621 | | 2,495,199,141 |
| Total increase (decrease) in net assets | | (538,806,401) | | 3,901,390,165 |
| | | | | |
| Net Assets | | | | |
| Beginning of period | | 8,557,655,722 | | 4,656,265,557 |
| End of period | $ | 8,018,849,321 | $ | 8,557,655,722 |
| | | | | |
| Other Information | | | | |
| Shares | | | | |
| Sold | | 300,730,591 | | 299,302,742 |
| Issued in reinvestment of distributions | | 14,892,066 | | 6,485,296 |
| Redeemed | | (152,548,294) | | (131,651,107) |
| Net increase (decrease) | | 163,074,363 | | 174,136,931 |
| | | | | |
Financial Highlights
| Fidelity® Total International Index Fund |
| |
| Years ended October 31, | | 2022 | | 2021 | | 2020 | | 2019 | | 2018 |
Selected Per-Share Data | | | | | | | | | | |
| Net asset value, beginning of period | $ | 14.81 | $ | 11.54 | $ | 12.09 | $ | 11.14 | $ | 12.39 |
| Income from Investment Operations | | | | | | | | | | |
Net investment income (loss) A,B | | .38 | | .35 | | .27 | | .37 | | .34 |
| Net realized and unrealized gain (loss) | | (4.00) | | 3.14 | | (.50) | | .81 | | (1.36) |
| Total from investment operations | | (3.62) | | 3.49 | | (.23) | | 1.18 | | (1.02) |
| Distributions from net investment income | | (.37) | | (.22) | | (.32) | | (.23) | | (.17) |
| Distributions from net realized gain | | - | | - | | - | | - | | (.06) |
| Total distributions | | (.37) | | (.22) | | (.32) | | (.23) | | (.23) |
Redemption fees added to paid in capital A | | - | | - | | - | | - | | - C |
| Net asset value, end of period | $ | 10.82 | $ | 14.81 | $ | 11.54 | $ | 12.09 | $ | 11.14 |
Total Return D | | (25.01)% | | 30.47% | | (1.97)% | | 10.88% | | (8.42)% |
Ratios to Average Net Assets B,E,F | | | | | | | | | | |
| Expenses before reductions | | .06% | | .06% | | .06% | | .06% | | .06% |
| Expenses net of fee waivers, if any | | .06% | | .06% | | .06% | | .06% | | .06% |
| Expenses net of all reductions | | .06% | | .06% | | .06% | | .06% | | .06% |
| Net investment income (loss) | | 3.04% | | 2.47% | | 2.41% | | 3.25% | | 2.81% |
| Supplemental Data | | | | | | | | | | |
| Net assets, end of period (000 omitted) | $ | 8,018,849 | $ | 8,557,656 | $ | 4,656,266 | $ | 3,254,707 | $ | 589,295 |
Portfolio turnover rate G | | 3% H | | 5% | | 4% | | 4% | | 3% |
A Calculated based on average shares outstanding during the period.
B Net investment income (loss) is affected by the timing of the declaration of dividends by any underlying mutual funds or exchange-traded funds (ETFs). Net investment income (loss) of any mutual funds or ETFs is not included in the Fund's net investment income (loss) ratio.
C Amount represents less than $.005 per share.
D Total returns would have been lower if certain expenses had not been reduced during the applicable periods shown.
E Fees and expenses of any underlying mutual funds or exchange-traded funds (ETFs) are not included in the Fund's expense ratio. The Fund indirectly bears its proportionate share of these expenses. For additional expense information related to investments in Fidelity Central Funds, please refer to the "Investments in Fidelity Central Funds" note found in the Notes to Financial Statements section of the most recent Annual or Semi-Annual report.
F Expense ratios reflect operating expenses of the class. Expenses before reductions do not reflect amounts reimbursed, waived, or reduced through arrangements with the investment adviser, brokerage services, or other offset arrangements, if applicable, and do not represent the amount paid by the class during periods when reimbursements, waivers or reductions occur.
G Amount does not include the portfolio activity of any underlying mutual funds or exchange-traded funds (ETFs).
H Portfolio turnover rate excludes securities received or delivered in-kind.
For the period ended October 31, 2022
1. Organization.
Fidelity Total International Index Fund (the Fund) is a fund of Fidelity Salem Street Trust (the Trust) and is authorized to issue an unlimited number of shares. Share transactions on the Statement of Changes in Net Assets may contain exchanges between affiliated funds. The Trust is registered under the Investment Company Act of 1940, as amended (the 1940 Act), as an open-end management investment company organized as a Massachusetts business trust. The Fund's investments in emerging markets can be subject to social, economic, regulatory, and political uncertainties and can be extremely volatile.
2. Investments in Fidelity Central Funds.
Funds may invest in Fidelity Central Funds, which are open-end investment companies generally available only to other investment companies and accounts managed by the investment adviser and its affiliates. The Schedule of Investments lists any Fidelity Central Funds held as an investment as of period end, but does not include the underlying holdings of each Fidelity Central Fund. An investing fund indirectly bears its proportionate share of the expenses of the underlying Fidelity Central Funds.
Based on its investment objective, each Fidelity Central Fund may invest or participate in various investment vehicles or strategies that are similar to those of the investing fund. These strategies are consistent with the investment objectives of the investing fund and may involve certain economic risks which may cause a decline in value of each of the Fidelity Central Funds and thus a decline in the value of the investing fund.
| Fidelity Central Fund | Investment Manager | Investment Objective | Investment Practices | Expense Ratio A |
| Fidelity Money Market Central Funds | Fidelity Management & Research Company LLC (FMR) | Each fund seeks to obtain a high level of current income consistent with the preservation of capital and liquidity. | Short-term Investments | Less than .005% |
A Expenses expressed as a percentage of average net assets and are as of each underlying Central Fund's most recent annual or semi-annual shareholder report.
A complete unaudited list of holdings for each Fidelity Central Fund is available upon request or at the Securities and Exchange Commission website at www.sec.gov. In addition, the financial statements of the Fidelity Central Funds which contain the significant accounting policies (including investment valuation policies) of those funds, and are not covered by the Report of Independent Registered Public Accounting Firm, are available on the Securities and Exchange Commission website or upon request.
3. Significant Accounting Policies.
The Fund is an investment company and applies the accounting and reporting guidance of the Financial Accounting Standards Board (FASB) Accounting Standards Codification Topic 946 Financial Services - Investment Companies . The financial statements have been prepared in conformity with accounting principles generally accepted in the United States of America (GAAP), which require management to make certain estimates and assumptions at the date of the financial statements. Actual results could differ from those estimates. Subsequent events, if any, through the date that the financial statements were issued have been evaluated in the preparation of the financial statements. The Fund's Schedule of Investments lists any underlying mutual funds or exchange-traded funds (ETFs) but does not include the underlying holdings of these funds. The following summarizes the significant accounting policies of the Fund:
Investment Valuation. Investments are valued as of 4:00 p.m. Eastern time on the last calendar day of the period. The Board of Trustees (the Board) has designated the Fund's investment adviser as the valuation designee responsible for the fair valuation function and performing fair value determinations as needed. The investment adviser has established a Fair Value Committee (the Committee) to carry out the day-to-day fair valuation responsibilities and has adopted policies and procedures to govern the fair valuation process and the activities of the Committee. In accordance with these fair valuation policies and procedures, which have been approved by the Board, the Fund attempts to obtain prices from one or more third party pricing services or brokers to value its investments. When current market prices, quotations or currency exchange rates are not readily available or reliable, investments will be fair valued in good faith by the Committee, in accordance with the policies and procedures. Factors used in determining fair value vary by investment type and may include market or investment specific events, transaction data, estimated cash flows, and market observations of comparable investments. The frequency that the fair valuation procedures are used cannot be predicted and they may be utilized to a significant extent. The Committee manages the Fund's fair valuation practices and maintains the fair valuation policies and procedures. The Fund's investment adviser reports to the Board information regarding the fair valuation process and related material matters.
The Fund categorizes the inputs to valuation techniques used to value its investments into a disclosure hierarchy consisting of three levels as shown below:
Level 1 - unadjusted quoted prices in active markets for identical investments
Level 2 - other significant observable inputs (including quoted prices for similar investments, interest rates, prepayment speeds, etc.)
Level 3 - unobservable inputs (including the Fund's own assumptions based on the best information available)
Valuation techniques used to value the Fund's investments by major category are as follows:
Equity securities, including restricted securities, for which market quotations are readily available, are valued at the last reported sale price or official closing price as reported by a third party pricing service on the primary market or exchange on which they are traded and are categorized as Level 1 in the hierarchy. In the event there were no sales during the day or closing prices are not available, securities are valued at the last quoted bid price or may be valued using the last available price and are generally categorized as Level 2 in the hierarchy. For foreign equity securities, when market or security specific events arise, comparisons to the valuation of American Depositary Receipts (ADRs), futures contracts, ETFs and certain indexes as well as quoted prices for similar securities may be used and would be categorized as Level 2 in the hierarchy. For equity securities, including restricted securities, where observable inputs are limited, assumptions about market activity and risk are used and these securities may be categorized as Level 3 in the hierarchy.
Debt securities, including restricted securities, are valued based on evaluated prices received from third party pricing services or from brokers who make markets in such securities. U.S. government and government agency obligations are valued by pricing services who utilize matrix pricing which considers yield or price of bonds of comparable quality, coupon, maturity and type or by broker-supplied prices. When independent prices are unavailable or unreliable, debt securities may be valued utilizing pricing methodologies which consider similar factors that would be used by third party pricing services. Debt securities are generally categorized as Level 2 in the hierarchy but may be Level 3 depending on the circumstances.
Futures contracts are valued at the settlement price established each day by the board of trade or exchange on which they are traded and are categorized as Level 1 in the hierarchy. Investments in open-end mutual funds, including the Fidelity Central Funds, are valued at their closing net asset value (NAV) each business day and are categorized as Level 1 in the hierarchy.
Changes in valuation techniques may result in transfers in or out of an assigned level within the disclosure hierarchy. The aggregate value of investments by input level as of October 31, 2022 is included at the end of the Fund's Schedule of Investments.
Foreign Currency. Certain Funds may use foreign currency contracts to facilitate transactions in foreign-denominated securities. Gains and losses from these transactions may arise from changes in the value of the foreign currency or if the counterparties do not perform under the contracts' terms.
Foreign-denominated assets, including investment securities, and liabilities are translated into U.S. dollars at the exchange rates at period end. Purchases and sales of investment securities, income and dividends received, and expenses denominated in foreign currencies are translated into U.S. dollars at the exchange rate in effect on the transaction date.
The effects of exchange rate fluctuations on investments are included with the net realized and unrealized gain (loss) on investment securities. Other foreign currency transactions resulting in realized and unrealized gain (loss) are disclosed separately.
Investment Transactions and Income. For financial reporting purposes, the Fund's investment holdings and NAV include trades executed through the end of the last business day of the period. The NAV per share for processing shareholder transactions is calculated as of the close of business of the New York Stock Exchange (NYSE), normally 4:00 p.m. Eastern time and includes trades executed through the end of the prior business day. Gains and losses on securities sold are determined on the basis of identified cost. Commissions paid to certain brokers with whom the investment adviser, or its affiliates, places trades on behalf of a fund include an amount in addition to trade execution, which may be rebated back to a fund. Any such rebates are included in net realized gain (loss) on investments in the Statement of Operations. Dividend income is recorded on the ex-dividend date, except for certain dividends from foreign securities where the ex-dividend date may have passed, which are recorded as soon as the Fund is informed of the ex-dividend date. Non-cash dividends included in dividend income, if any, are recorded at the fair market value of the securities received. Income and capital gain distributions from Fidelity Central Funds, if any, are recorded on the ex-dividend date. Certain distributions received by the Fund represent a return of capital or capital gain. The Fund determines the components of these distributions subsequent to the ex-dividend date, based upon receipt of tax filings or other correspondence relating to the underlying investment. These distributions are recorded as a reduction of cost of investments and/or as a realized gain. Interest income is accrued as earned and includes coupon interest and amortization of premium and accretion of discount on debt securities as applicable. Investment income is recorded net of foreign taxes withheld where recovery of such taxes is uncertain. Funds may file withholding tax reclaims in certain jurisdictions to recover a portion of amounts previously withheld. Any withholding tax reclaims income is included in the Statement of Operations in foreign taxes withheld. Any receivables for withholding tax reclaims are included in the Statement of Assets and Liabilities in reclaims receivable.
Expenses. Expenses directly attributable to a fund are charged to that fund. Expenses attributable to more than one fund are allocated among the respective funds on the basis of relative net assets or other appropriate methods. Expenses included in the accompanying financial statements reflect the expenses of that fund and do not include any expenses associated with any underlying mutual funds or exchange-traded funds. Although not included in a fund's expenses, a fund indirectly bears its proportionate share of these expenses through the net asset value of each underlying mutual fund or exchange-traded fund. Expense estimates are accrued in the period to which they relate and adjustments are made when actual amounts are known.
Income Tax Information and Distributions to Shareholders. Each year, the Fund intends to qualify as a regulated investment company under Subchapter M of the Internal Revenue Code, including distributing substantially all of its taxable income and realized gains. As a result, no provision for U.S. Federal income taxes is required. As of October 31, 2022, the Fund did not have any unrecognized tax benefits in the financial statements; nor is the Fund aware of any tax positions for which it is reasonably possible that the total amounts of unrecognized tax benefits will significantly change in the next twelve months. The Fund files a U.S. federal tax return, in addition to state and local tax returns as required. The Fund's federal income tax returns are subject to examination by the Internal Revenue Service (IRS) for a period of three fiscal years after they are filed. State and local tax returns may be subject to examination for an additional fiscal year depending on the jurisdiction. Foreign taxes are provided for based on the Fund's understanding of the tax rules and rates that exist in the foreign markets in which it invests. The Fund is subject to a tax imposed on capital gains by certain countries in which it invests. An estimated deferred tax liability for net unrealized appreciation on the applicable securities is included in Other payables and accrued expenses on the Statement of Assets & Liabilities.
Distributions are declared and recorded on the ex-dividend date. Income and capital gain distributions are determined in accordance with income tax regulations, which may differ from GAAP. In addition, the Fund claimed a portion of the payment made to redeeming shareholders as a distribution for income tax purposes.
Capital accounts within the financial statements are adjusted for permanent book-tax differences. These adjustments have no impact on net assets or the results of operations. Capital accounts are not adjusted for temporary book-tax differences which will reverse in a subsequent period.
Book-tax differences are primarily due to futures contracts, foreign currency transactions, certain foreign taxes, passive foreign investment companies (PFIC), redemptions in-kind, partnerships, capital loss carryforwards and losses deferred due to wash sales.
As of period end, the cost and unrealized appreciation (depreciation) in securities, and derivatives if applicable, for federal income tax purposes were as follows:
| Gross unrealized appreciation | $745,314,277 |
| Gross unrealized depreciation | (2,124,744,767) |
| Net unrealized appreciation (depreciation) | $(1,379,430,490) |
| Tax Cost | $9,426,454,399 |
The tax-based components of distributable earnings as of period end were as follows:
| Undistributed ordinary income | $185,862,882 |
| Capital loss carryforward | $(123,525,260) |
| Net unrealized appreciation (depreciation) on securities and other investments | $(1,381,238,348) |
Capital loss carryforwards are only available to offset future capital gains of the Fund to the extent provided by regulations and may be limited. The capital loss carryforward information presented below, including any applicable limitation, is estimated as of fiscal period end and is subject to adjustment.
| Short-term | $(44,289,716) |
| Long-term | (79,235,544) |
| Total capital loss carryforward | $(123,525,260) |
The tax character of distributions paid was as follows:
| | October 31, 2022 | October 31, 2021 |
| Ordinary Income | $217,671,505 | $ 90,362,587 |
| Total | $217,671,505 | $ 90,362,587 |
Restricted Securities (including Private Placements). Funds may invest in securities that are subject to legal or contractual restrictions on resale. These securities generally may be resold in transactions exempt from registration or to the public if the securities are registered. Disposal of these securities may involve time-consuming negotiations and expense, and prompt sale at an acceptable price may be difficult. Information regarding restricted securities held at period end is included at the end of the Schedule of Investments, if applicable.
4. Derivative Instruments.
Risk Exposures and the Use of Derivative Instruments. The Fund's investment objectives allow for various types of derivative instruments, including futures contracts. Derivatives are investments whose value is primarily derived from underlying assets, indices or reference rates and may be transacted on an exchange or over-the-counter (OTC). Derivatives may involve a future commitment to buy or sell a specified asset based on specified terms, to exchange future cash flows at periodic intervals based on a notional principal amount, or for one party to make one or more payments upon the occurrence of specified events in exchange for periodic payments from the other party.
Derivatives were used to increase returns and to manage exposure to certain risks as defined below. The success of any strategy involving derivatives depends on analysis of numerous economic factors, and if the strategies for investment do not work as intended, the objectives may not be achieved.
Derivatives were used to increase or decrease exposure to the following risk(s):
| | |
| Equity Risk | Equity risk relates to the fluctuations in the value of financial instruments as a result of changes in market prices (other than those arising from interest rate risk or foreign exchange risk), whether caused by factors specific to an individual investment, its issuer, or all factors affecting all instruments traded in a market or market segment. |
Funds are also exposed to additional risks from investing in derivatives, such as liquidity risk and counterparty credit risk. Liquidity risk is the risk that a fund will be unable to close out the derivative in the open market in a timely manner. Counterparty credit risk is the risk that the counterparty will not be able to fulfill its obligation to a fund. Counterparty credit risk related to exchange-traded contracts may be mitigated by the protection provided by the exchange on which they trade.
Investing in derivatives may involve greater risks than investing in the underlying assets directly and, to varying degrees, may involve risk of loss in excess of any initial investment and collateral received and amounts recognized in the Statement of Assets and Liabilities. In addition, there may be the risk that the change in value of the derivative contract does not correspond to the change in value of the underlying instrument.
Futures Contracts. A futures contract is an agreement between two parties to buy or sell a specified underlying instrument for a fixed price at a specified future date. Futures contracts were used to manage exposure to the stock market.
Upon entering into a futures contract, a fund is required to deposit either cash or securities (initial margin) with a clearing broker in an amount equal to a certain percentage of the face value of the contract. Futures contracts are marked-to-market daily and subsequent daily payments are made or received by a fund depending on the daily fluctuations in the value of the futures contracts and are recorded as unrealized appreciation or (depreciation). This receivable and/or payable, if any, is included in daily variation margin on futures contracts in the Statement of Assets and Liabilities. Realized gain or (loss) is recorded upon the expiration or closing of a futures contract. The net realized gain (loss) and change in net unrealized appreciation (depreciation) on futures contracts during the period is presented in the Statement of Operations.
Any open futures contracts at period end are presented in the Schedule of Investments under the caption "Futures Contracts". The notional amount at value reflects each contract's exposure to the underlying instrument or index at period end, and is representative of volume of activity during the period unless an average notional amount is presented. Any securities deposited to meet initial margin requirements are identified in the Schedule of Investments. Any cash deposited to meet initial margin requirements is presented as segregated cash with brokers for derivative instruments in the Statement of Assets and Liabilities.
5. Purchases and Sales of Investments.
Purchases and sales of securities, other than short-term securities and in-kind transactions, as applicable, are noted in the table below.
| | Purchases ($) | Sales ($) |
| Fidelity Total International Index Fund | 2,442,347,329 | 274,908,293 |
Unaffiliated Redemptions In-Kind. Shares that were redeemed in-kind for investments, including accrued interest and cash, if any, are shown in the table below. The net realized gain or loss on investments delivered through in-kind redemptions is included in the accompanying Statement of Operations. The amount of the in-kind redemptions is included in share transactions in the accompanying Statement of Changes in Net Assets. There was no gain or loss for federal income tax purposes.
| | Shares | Total net realized gain or loss ($) | Total Proceeds ($) |
| Fidelity Total International Index Fund | 13,066,155 | 51,582,020 | 176,131,768 |
6. Fees and Other Transactions with Affiliates.
Management Fee. Fidelity Management & Research Company LLC (the investment adviser) and its affiliates provide the Fund with investment management related services for which the Fund pays a monthly management fee. The management fee is based on an annual rate of .06% of the Fund's average net assets. Under the management contract, the investment adviser pays all other operating expenses, except the compensation of the independent Trustees and certain other expenses such as interest expense.
Sub-Adviser. Geode Capital Management, LLC (Geode), serves as sub-adviser for the Fund. Geode provides discretionary investment advisory services to the Fund and is paid by the investment adviser for providing these services.
Interfund Lending Program. Pursuant to an Exemptive Order issued by the Securities and Exchange Commission (the SEC), the Fund, along with other registered investment companies having management contracts with Fidelity Management & Research Company LLC (FMR), or other affiliated entities of FMR, may participate in an interfund lending program. This program provides an alternative credit facility allowing the Fund to borrow from, or lend money to, other participating affiliated funds. At period end, there were no interfund loans outstanding. Activity in this program during the period for which loans were outstanding was as follows:
| | Borrower or Lender | Average Loan Balance | Weighted Average Interest Rate | Interest Expense |
| Fidelity Total International Index Fund | Borrower | $14,441,000 | .31% | $249 |
Interfund Trades. Funds may purchase from or sell securities to other Fidelity Funds under procedures adopted by the Board. The procedures have been designed to ensure these interfund trades are executed in accordance with Rule 17a-7 of the 1940 Act. Any interfund trades are included within the respective purchases and sales amounts shown in the Purchases and Sales of Investments note. During the period, there were no interfund trades.
7. Committed Line of Credit.
Certain Funds participate with other funds managed by the investment adviser or an affiliate in a $4.25 billion credit facility (the "line of credit") to be utilized for temporary or emergency purposes to fund shareholder redemptions or for other short-term liquidity purposes. The commitment fees on the pro-rata portion of the line of credit are borne by the investment adviser. During the period, there were no borrowings on this line of credit.
8. Security Lending.
Funds lend portfolio securities from time to time in order to earn additional income. Lending agents are used, including National Financial Services (NFS), an affiliate of the investment adviser. Pursuant to a securities lending agreement, NFS will receive a fee, which is capped at 9.9% of a fund's daily lending revenue, for its services as lending agent. A fund may lend securities to certain qualified borrowers, including NFS. On the settlement date of the loan, a fund receives collateral (in the form of U.S. Treasury obligations, letters of credit and/or cash) against the loaned securities and maintains collateral in an amount not less than 100% of the market value of the loaned securities during the period of the loan. The market value of the loaned securities is determined at the close of business of a fund and any additional required collateral is delivered to a fund on the next business day. A fund or borrower may terminate the loan at any time, and if the borrower defaults on its obligation to return the securities loaned because of insolvency or other reasons, a fund may apply collateral received from the borrower against the obligation. A fund may experience delays and costs in recovering the securities loaned. Any cash collateral received is invested in the Fidelity Securities Lending Cash Central Fund. Any loaned securities are identified as such in the Schedule of Investments, and the value of loaned securities and cash collateral at period end, as applicable, are presented in the Statement of Assets and Liabilities. Security lending income represents the income earned on investing cash collateral, less rebates paid to borrowers and any lending agent fees associated with the loan, plus any premium payments received for lending certain types of securities. Security lending income is presented in the Statement of Operations as a component of income from Fidelity Central Funds. Affiliated security lending activity, if any, was as follows:
| | Total Security Lending Fees Paid to NFS | Security Lending Income From Securities Loaned to NFS | Value of Securities Loaned to NFS at Period End |
| Fidelity Total International Index Fund | $153,741 | $705 | $- |
9. Expense Reductions.
Through arrangements with the Fund's custodian, credits realized as a result of certain uninvested cash balances were used to reduce the Fund's expenses by $1,667.
10. Other.
A fund's organizational documents provide former and current trustees and officers with a limited indemnification against liabilities arising in connection with the performance of their duties to the fund. In the normal course of business, a fund may also enter into contracts that provide general indemnifications. A fund's maximum exposure under these arrangements is unknown as this would be dependent on future claims that may be made against a fund. The risk of material loss from such claims is considered remote.
11. Risk and Uncertainties.
Many factors affect a fund's performance. Developments that disrupt global economies and financial markets, such as pandemics, epidemics, outbreaks of infectious diseases, war, terrorism, and environmental disasters, may significantly affect a fund's investment performance. The effects of these developments to a fund will be impacted by the types of securities in which a fund invests, the financial condition, industry, economic sector, and geographic location of an issuer, and a fund's level of investment in the securities of that issuer.
Report of Independent Registered Public Accounting Firm
To the Board of Trustees of Fidelity Salem Street Trust and Shareholders of Fidelity Total International Index Fund
Opinion on the Financial Statements
We have audited the accompanying statement of assets and liabilities, including the schedule of investments, of Fidelity Total International Index Fund (one of the funds constituting Fidelity Salem Street Trust, referred to hereafter as the "Fund") as of October 31, 2022, the related statement of operations for the year ended October 31, 2022, the statement of changes in net assets for each of the two years in the period ended October 31, 2022, including the related notes, and the financial highlights for each of the five years in the period ended October 31, 2022 (collectively referred to as the "financial statements"). In our opinion, the financial statements present fairly, in all material respects, the financial position of the Fund as of October 31, 2022, the results of its operations for the year then ended, the changes in its net assets for each of the two years in the period ended October 31, 2022 and the financial highlights for each of the five years in the period ended October 31, 2022 in conformity with accounting principles generally accepted in the United States of America.
Basis for Opinion
These financial statements are the responsibility of the Fund's management. Our responsibility is to express an opinion on the Fund's financial statements based on our audits. We are a public accounting firm registered with the Public Company Accounting Oversight Board (United States) (PCAOB) and are required to be independent with respect to the Fund in accordance with the U.S. federal securities laws and the applicable rules and regulations of the Securities and Exchange Commission and the PCAOB.
We conducted our audits of these financial statements in accordance with the standards of the PCAOB. Those standards require that we plan and perform the audit to obtain reasonable assurance about whether the financial statements are free of material misstatement, whether due to error or fraud.
Our audits included performing procedures to assess the risks of material misstatement of the financial statements, whether due to error or fraud, and performing procedures that respond to those risks. Such procedures included examining, on a test basis, evidence regarding the amounts and disclosures in the financial statements. Our audits also included evaluating the accounting principles used and significant estimates made by management, as well as evaluating the overall presentation of the financial statements.
Our procedures included confirmation of securities owned as of October 31, 2022 by correspondence with the custodian and brokers; when replies were not received from brokers, we performed other auditing procedures. We believe that our audits provide a reasonable basis for our opinion.
/s/ PricewaterhouseCoopers LLP
Boston, Massachusetts
December 16, 2022
We have served as the auditor of one or more investment companies in the Fidelity group of funds since 1932.
The Trustees, Members of the Advisory Board (if any), and officers of the trust and fund, as applicable, are listed below. The Board of Trustees governs the fund and is responsible for protecting the interests of shareholders. The Trustees are experienced executives who meet periodically throughout the year to oversee the fund's activities, review contractual arrangements with companies that provide services to the fund, oversee management of the risks associated with such activities and contractual arrangements, and review the fund's performance. Except for Jonathan Chiel, each of the Trustees oversees 293 funds. Mr. Chiel oversees 184 funds.
The Trustees hold office without limit in time except that (a) any Trustee may resign; (b) any Trustee may be removed by written instrument, signed by at least two-thirds of the number of Trustees prior to such removal; (c) any Trustee who requests to be retired or who has become incapacitated by illness or injury may be retired by written instrument signed by a majority of the other Trustees; and (d) any Trustee may be removed at any special meeting of shareholders by a two-thirds vote of the outstanding voting securities of the trust. Each Trustee who is not an interested person (as defined in the 1940 Act) of the trust and the fund is referred to herein as an Independent Trustee. Each Independent Trustee shall retire not later than the last day of the calendar year in which his or her 75th birthday occurs. The Independent Trustees may waive this mandatory retirement age policy with respect to individual Trustees. Officers and Advisory Board Members hold office without limit in time, except that any officer or Advisory Board Member may resign or may be removed by a vote of a majority of the Trustees at any regular meeting or any special meeting of the Trustees. Except as indicated, each individual has held the office shown or other offices in the same company for the past five years.
The fund's Statement of Additional Information (SAI) includes more information about the Trustees. To request a free copy, call Fidelity at 1-800-544-8544.
Experience, Skills, Attributes, and Qualifications of the Trustees. The Governance and Nominating Committee has adopted a statement of policy that describes the experience, qualifications, attributes, and skills that are necessary and desirable for potential Independent Trustee candidates (Statement of Policy). The Board believes that each Trustee satisfied at the time he or she was initially elected or appointed a Trustee, and continues to satisfy, the standards contemplated by the Statement of Policy. The Governance and Nominating Committee also engages professional search firms to help identify potential Independent Trustee candidates who have the experience, qualifications, attributes, and skills consistent with the Statement of Policy. From time to time, additional criteria based on the composition and skills of the current Independent Trustees, as well as experience or skills that may be appropriate in light of future changes to board composition, business conditions, and regulatory or other developments, have also been considered by the professional search firms and the Governance and Nominating Committee. In addition, the Board takes into account the Trustees' commitment and participation in Board and committee meetings, as well as their leadership of standing and ad hoc committees throughout their tenure.
In determining that a particular Trustee was and continues to be qualified to serve as a Trustee, the Board has considered a variety of criteria, none of which, in isolation, was controlling. The Board believes that, collectively, the Trustees have balanced and diverse experience, qualifications, attributes, and skills, which allow the Board to operate effectively in governing the fund and protecting the interests of shareholders. Information about the specific experience, skills, attributes, and qualifications of each Trustee, which in each case led to the Board's conclusion that the Trustee should serve (or continue to serve) as a trustee of the fund, is provided below.
Board Structure and Oversight Function. Abigail P. Johnson is an interested person and currently serves as Chairman. The Trustees have determined that an interested Chairman is appropriate and benefits shareholders because an interested Chairman has a personal and professional stake in the quality and continuity of services provided to the fund. Independent Trustees exercise their informed business judgment to appoint an individual of their choosing to serve as Chairman, regardless of whether the Trustee happens to be independent or a member of management. The Independent Trustees have determined that they can act independently and effectively without having an Independent Trustee serve as Chairman and that a key structural component for assuring that they are in a position to do so is for the Independent Trustees to constitute a substantial majority for the Board. The Independent Trustees also regularly meet in executive session. Michael E. Kenneally serves as Chairman of the Independent Trustees and as such (i) acts as a liaison between the Independent Trustees and management with respect to matters important to the Independent Trustees and (ii) with management prepares agendas for Board meetings.
Fidelity ® funds are overseen by different Boards of Trustees. The fund's Board oversees Fidelity's investment-grade bond, money market, asset allocation and certain equity funds, and other Boards oversee Fidelity's high income and other equity funds. The asset allocation funds may invest in Fidelity ® funds that are overseen by such other Boards. The use of separate Boards, each with its own committee structure, allows the Trustees of each group of Fidelity ® funds to focus on the unique issues of the funds they oversee, including common research, investment, and operational issues. On occasion, the separate Boards establish joint committees to address issues of overlapping consequences for the Fidelity ® funds overseen by each Board.
The Trustees operate using a system of committees to facilitate the timely and efficient consideration of all matters of importance to the Trustees, the fund, and fund shareholders and to facilitate compliance with legal and regulatory requirements and oversight of the fund's activities and associated risks. The Board, acting through its committees, has charged FMR and its affiliates with (i) identifying events or circumstances the occurrence of which could have demonstrably adverse effects on the fund's business and/or reputation; (ii) implementing processes and controls to lessen the possibility that such events or circumstances occur or to mitigate the effects of such events or circumstances if they do occur; and (iii) creating and maintaining a system designed to evaluate continuously business and market conditions in order to facilitate the identification and implementation processes described in (i) and (ii) above. Because the day-to-day operations and activities of the fund are carried out by or through FMR, its affiliates, and other service providers, the fund's exposure to risks is mitigated but not eliminated by the processes overseen by the Trustees. While each of the Board's committees has responsibility for overseeing different aspects of the fund's activities, oversight is exercised primarily through the Operations and Audit Committees. In addition, an ad hoc Board committee of Independent Trustees has worked with FMR to enhance the Board's oversight of investment and financial risks, legal and regulatory risks, technology risks, and operational risks, including the development of additional risk reporting to the Board. Appropriate personnel, including but not limited to the fund's Chief Compliance Officer (CCO), FMR's internal auditor, the independent accountants, the fund's Treasurer and portfolio management personnel, make periodic reports to the Board's committees, as appropriate, including an annual review of Fidelity's risk management program for the Fidelity ® funds. The responsibilities of each standing committee, including their oversight responsibilities, are described further under "Standing Committees of the Trustees."
Interested Trustees*:
Correspondence intended for a Trustee who is an interested person may be sent to Fidelity Investments, 245 Summer Street, Boston, Massachusetts 02210.
Name, Year of Birth; Principal Occupations and Other Relevant Experience+
Jonathan Chiel (1957)
Year of Election or Appointment: 2016
Trustee
Mr. Chiel also serves as Trustee of other Fidelity ® funds. Mr. Chiel is Executive Vice President and General Counsel for FMR LLC (diversified financial services company, 2012-present). Previously, Mr. Chiel served as general counsel (2004-2012) and senior vice president and deputy general counsel (2000-2004) for John Hancock Financial Services; a partner with Choate, Hall & Stewart (1996-2000) (law firm); and an Assistant United States Attorney for the United States Attorney's Office of the District of Massachusetts (1986-95), including Chief of the Criminal Division (1993-1995). Mr. Chiel is a director on the boards of the Boston Bar Foundation and the Maimonides School.
Abigail P. Johnson (1961)
Year of Election or Appointment: 2009
Trustee
Chairman of the Board of Trustees
Ms. Johnson also serves as Trustee of other Fidelity ® funds. Ms. Johnson serves as Chairman (2016-present), Chief Executive Officer (2014-present), and Director (2007-present) of FMR LLC (diversified financial services company), President of Fidelity Financial Services (2012-present) and President of Personal, Workplace and Institutional Services (2005-present). Ms. Johnson is Chairman and Director of Fidelity Management & Research Company LLC (investment adviser firm, 2011-present). Previously, Ms. Johnson served as Chairman and Director of FMR Co., Inc. (investment adviser firm, 2011-2019), Vice Chairman (2007-2016) and President (2013-2016) of FMR LLC, President and a Director of Fidelity Management & Research Company (2001-2005), a Trustee of other investment companies advised by Fidelity Management & Research Company, Fidelity Investments Money Management, Inc. (investment adviser firm), and FMR Co., Inc. (2001-2005), Senior Vice President of the Fidelity ® funds (2001-2005), and managed a number of Fidelity ® funds. Ms. Abigail P. Johnson and Mr. Arthur E. Johnson are not related.
Jennifer Toolin McAuliffe (1959)
Year of Election or Appointment: 2016
Trustee
Ms. McAuliffe also serves as Trustee of other Fidelity ® funds and as Trustee of Fidelity Charitable (2020-present). Previously, Ms. McAuliffe served as Co-Head of Fixed Income of Fidelity Investments Limited (now known as FIL Limited (FIL)) (diversified financial services company), Director of Research for FIL's credit and quantitative teams in London, Hong Kong and Tokyo and Director of Research for taxable and municipal bonds at Fidelity Investments Money Management, Inc. Ms. McAuliffe previously served as a member of the Advisory Board of certain Fidelity ® funds (2016). Ms. McAuliffe was previously a lawyer at Ropes & Gray LLP and currently serves as director or trustee of several not-for-profit entities.
* Determined to be an "Interested Trustee" by virtue of, among other things, his or her affiliation with the trust or various entities under common control with FMR.
+ The information includes the Trustee's principal occupation during the last five years and other information relating to the experience, attributes, and skills relevant to the Trustee's qualifications to serve as a Trustee, which led to the conclusion that the Trustee should serve as a Trustee for the fund.
Independent Trustees:
Correspondence intended for an Independent Trustee may be sent to Fidelity Investments, P.O. Box 55235, Boston, Massachusetts 02205-5235.
Name, Year of Birth; Principal Occupations and Other Relevant Experience+
Elizabeth S. Acton (1951)
Year of Election or Appointment: 2013
Trustee
Ms. Acton also serves as Trustee of other Fidelity ® funds. Prior to her retirement, Ms. Acton served as Executive Vice President, Finance (2011-2012), Executive Vice President, Chief Financial Officer (2002-2011) and Treasurer (2004-2005) of Comerica Incorporated (financial services). Prior to joining Comerica, Ms. Acton held a variety of positions at Ford Motor Company (1983-2002), including Vice President and Treasurer (2000-2002) and Executive Vice President and Chief Financial Officer of Ford Motor Credit Company (1998-2000). Ms. Acton currently serves as a member of the Board and Audit and Finance Committees of Beazer Homes USA, Inc. (homebuilding, 2012-present). Ms. Acton previously served as a member of the Advisory Board of certain Fidelity ® funds (2013-2016).
Ann E. Dunwoody (1953)
Year of Election or Appointment: 2018
Trustee
General Dunwoody also serves as Trustee of other Fidelity ® funds. General Dunwoody (United States Army, Retired) was the first woman in U.S. military history to achieve the rank of four-star general and prior to her retirement in 2012 held a variety of positions within the U.S. Army, including Commanding General, U.S. Army Material Command (2008-2012). General Dunwoody currently serves as President of First to Four LLC (leadership and mentoring services, 2012-present), a member of the Board and Nomination and Corporate Governance Committees of Kforce Inc. (professional staffing services, 2016-present) and a member of the Board of Automattic Inc. (software engineering, 2018-present). Previously, General Dunwoody served as a member of the Advisory Board and Nominating and Corporate Governance Committee of L3 Technologies, Inc. (communication, electronic, sensor and aerospace systems, 2013-2019) and a member of the Board and Audit and Sustainability and Corporate Responsibility Committees of Republic Services, Inc. (waste collection, disposal and recycling, 2013-2016). Ms. Dunwoody also serves on several boards for non-profit organizations, including as a member of the Board, Chair of the Nomination and Governance Committee and a member of the Audit Committee of Logistics Management Institute (consulting non-profit, 2012-present), a member of the Council of Trustees for the Association of the United States Army (advocacy non-profit, 2013-present), a member of the Board of Florida Institute of Technology (2015-present) and a member of the Board of ThanksUSA (military family education non-profit, 2014-present). General Dunwoody previously served as a member of the Advisory Board of certain Fidelity ® funds (2018).
John Engler (1948)
Year of Election or Appointment: 2014
Trustee
Mr. Engler also serves as Trustee of other Fidelity ® funds. Previously, Mr. Engler served as Governor of Michigan (1991-2003), President of the Business Roundtable (2011-2017) and interim President of Michigan State University (2018-2019). Mr. Engler currently serves as a member of the Board of Stride, Inc. (formerly K12 Inc.) (technology-based education company, 2012-present). Previously, Mr. Engler served as a member of the Board of Universal Forest Products (manufacturer and distributor of wood and wood-alternative products, 2003-2019) and Trustee of The Munder Funds (2003-2014). Mr. Engler previously served as a member of the Advisory Board of certain Fidelity ® funds (2014-2016).
Robert F. Gartland (1951)
Year of Election or Appointment: 2010
Trustee
Mr. Gartland also serves as Trustee of other Fidelity ® funds. Prior to his retirement, Mr. Gartland held a variety of positions at Morgan Stanley (financial services, 1979-2007), including Managing Director (1987-2007) and Chase Manhattan Bank (1975-1978). Mr. Gartland previously served as Chairman and an investor in Gartland & Mellina Group Corp. (consulting, 2009-2019), as a member of the Board of National Securities Clearing Corporation (1993-1996) and as Chairman of TradeWeb (2003-2004).
Arthur E. Johnson (1947)
Year of Election or Appointment: 2008
Trustee
Mr. Johnson also serves as Trustee of other Fidelity ® funds. Prior to his retirement, Mr. Johnson served as Senior Vice President of Corporate Strategic Development of Lockheed Martin Corporation (defense contractor, 1999-2009). Mr. Johnson currently serves as a member of the Board of Booz Allen Hamilton (management consulting, 2011-present). Mr. Johnson previously served as a member of the Board of Eaton Corporation plc (diversified power management, 2009-2019) and a member of the Board of AGL Resources, Inc. (holding company, 2002-2016). Mr. Johnson previously served as Chairman (2018-2021) and Vice Chairman (2015-2018) of the Independent Trustees of certain Fidelity® funds. Mr. Arthur E. Johnson is not related to Ms. Abigail P. Johnson.
Michael E. Kenneally (1954)
Year of Election or Appointment: 2009
Trustee
Chairman of the Independent Trustees
Mr. Kenneally also serves as Trustee of other Fidelity ® funds and was Vice Chairman (2018-2021) of the Independent Trustees of certain Fidelity ® funds. Prior to retirement in 2005, he was Chairman and Global Chief Executive Officer of Credit Suisse Asset Management, the worldwide fund management and institutional investment business of Credit Suisse Group. Previously, Mr. Kenneally was an Executive Vice President and the Chief Investment Officer for Bank of America. In this role, he was responsible for the investment management, strategy and products delivered to the bank's institutional, high-net-worth and retail clients. Earlier, Mr. Kenneally directed the organization's equity and quantitative research groups. He began his career as a research analyst and then spent more than a dozen years as a portfolio manager for endowments, pension plans and mutual funds. He earned the Chartered Financial Analyst (CFA) designation in 1991.
Marie L. Knowles (1946)
Year of Election or Appointment: 2001
Trustee
Ms. Knowles also serves as Trustee of other Fidelity ® funds. Prior to her retirement, Ms. Knowles held several positions at Atlantic Richfield Company (diversified energy), including Executive Vice President and Chief Financial Officer (1996-2000), Senior Vice President (1993-1996) and President of ARCO Transportation Company (pipeline and tanker operations, 1993-1996). Ms. Knowles currently serves as a member of the Board of the Santa Catalina Island Company (real estate, 2009-present), a member of the Investment Company Institute Board of Governors and a member of the Governing Council of the Independent Directors Council (2014-present). Ms. Knowles also serves as a member of the Advisory Board for the School of Engineering of the University of Southern California. Ms. Knowles previously served as a member of the Board of McKesson Corporation (healthcare service, 2002-2021). In addition, Ms. Knowles previously served as Chairman (2015-2018) and Vice Chairman (2012-2015) of the Independent Trustees of certain Fidelity ® funds.
Mark A. Murray (1954)
Year of Election or Appointment: 2016
Trustee
Mr. Murray also serves as Trustee of other Fidelity ® funds. Previously, Mr. Murray served as Co-Chief Executive Officer (2013-2016), President (2006-2013) and Vice Chairman (2013-2020) of Meijer, Inc. Mr. Murray serves as a member of the Board (2009-present) and Public Policy and Responsibility Committee (2009-present) and Chair of the Nuclear Review Committee (2019-present) of DTE Energy Company (diversified energy company). Mr. Murray previously served as a member of the Board of Spectrum Health (not-for-profit health system, 2015-2019) and as a member of the Board and Audit Committee and Chairman of the Nominating and Corporate Governance Committee of Universal Forest Products, Inc. (manufacturer and distributor of wood and wood-alternative products, 2004-2016). Mr. Murray also serves as a member of the Board of many community and professional organizations. Mr. Murray previously served as a member of the Advisory Board of certain Fidelity ® funds (2016).
+ The information includes the Trustee's principal occupation during the last five years and other information relating to the experience, attributes, and skills relevant to the Trustee's qualifications to serve as a Trustee, which led to the conclusion that the Trustee should serve as a Trustee for the fund.
Advisory Board Members and Officers:
Correspondence intended for a Member of the Advisory Board (if any) may be sent to Fidelity Investments, P.O. Box 55235, Boston, Massachusetts 02205-5235. Correspondence intended for an officer may be sent to Fidelity Investments, 245 Summer Street, Boston, Massachusetts 02210. Officers appear below in alphabetical order.
Name, Year of Birth; Principal Occupation
Laura M. Bishop (1961)
Year of Election or Appointment: 2022
Member of the Advisory Board
Ms. Bishop also serves as a Member of the Advisory Board of other funds. Prior to her retirement, Ms. Bishop held a variety of positions at United Services Automobile Association (2001-2020), including Executive Vice President and Chief Financial Officer (2014-2020) and Senior Vice President and Deputy Chief Financial Officer (2012-2014). Ms. Bishop currently serves as a member of the Audit Committee and Compensation and Personnel Committee (2021-present) of the Board of Directors of Korn Ferry (global organizational consulting).
Robert W. Helm (1957)
Year of Election or Appointment: 2021
Member of the Advisory Board
Mr. Helm also serves as a Member of the Advisory Board of other Fidelity® funds. Mr. Helm was formerly Deputy Chairman (2003-2020), partner (1991-2020) and an associate (1984-1991) of Dechert LLP (formerly Dechert Price & Rhoads). Mr. Helm currently serves on boards and committees of several not-for-profit organizations.
Craig S. Brown (1977)
Year of Election or Appointment: 2019
Assistant Treasurer
Mr. Brown also serves as an officer of other funds. Mr. Brown serves as Assistant Treasurer of FIMM, LLC (2021-present) and is an employee of Fidelity Investments (2013-present). Previously, Mr. Brown served as Assistant Treasurer of certain Fidelity ® funds (2019-2022).
John J. Burke III (1964)
Year of Election or Appointment: 2018
Chief Financial Officer
Mr. Burke also serves as Chief Financial Officer of other funds. Mr. Burke serves as Head of Investment Operations for Fidelity Fund and Investment Operations (2018-present) and is an employee of Fidelity Investments (1998-present). Previously Mr. Burke served as head of Asset Management Investment Operations (2012-2018).
David J. Carter (1973)
Year of Election or Appointment: 2020
Assistant Secretary
Mr. Carter also serves as Assistant Secretary of other funds. Mr. Carter serves as Senior Vice President, Deputy General Counsel (2022-present) and is an employee of Fidelity Investments (2005-present).
Jonathan Davis (1968)
Year of Election or Appointment: 2010
Assistant Treasurer
Mr. Davis also serves as an officer of other funds. Mr. Davis serves as Assistant Treasurer of FIMM, LLC (2021-present), FMR Capital, Inc. (2017-present), FD Funds GP LLC (2021-present), FD Funds Holding LLC (2021-present), and FD Funds Management LLC (2021-present); and is an employee of Fidelity Investments. Previously, Mr. Davis served as Vice President and Associate General Counsel of FMR LLC (diversified financial services company, 2003-2010).
Laura M. Del Prato (1964)
Year of Election or Appointment: 2018
President and Treasurer
Ms. Del Prato also serves as an officer of other funds. Ms. Del Prato serves as Assistant Treasurer of FIMM, LLC (2021-present) and is an employee of Fidelity Investments (2017-present). Previously, Ms. Del Prato served as President and Treasurer of The North Carolina Capital Management Trust: Cash Portfolio and Term Portfolio (2018-2020). Prior to joining Fidelity Investments, Ms. Del Prato served as a Managing Director and Treasurer of the JPMorgan Mutual Funds (2014-2017). Prior to JPMorgan, Ms. Del Prato served as a partner at Cohen Fund Audit Services (accounting firm, 2012-2013) and KPMG LLP (accounting firm, 2004-2012).
Colm A. Hogan (1973)
Year of Election or Appointment: 2016
Assistant Treasurer
Mr. Hogan also serves as an officer of other funds. Mr. Hogan serves as Assistant Treasurer of FIMM, LLC (2021-present) and FMR Capital, Inc. (2017-present) and is an employee of Fidelity Investments (2005-present). Previously, Mr. Hogan served as Deputy Treasurer of certain Fidelity ® funds (2016-2020) and Assistant Treasurer of certain Fidelity ® funds (2016-2018).
Cynthia Lo Bessette (1969)
Year of Election or Appointment: 2019
Secretary and Chief Legal Officer (CLO)
Ms. Lo Bessette also serves as an officer of other funds. Ms. Lo Bessette serves as CLO, Secretary, and Senior Vice President of Fidelity Management & Research Company LLC (investment adviser firm, 2019-present); CLO of Fidelity Management & Research (Hong Kong) Limited, FMR Investment Management (UK) Limited, and Fidelity Management & Research (Japan) Limited (investment adviser firms, 2019-present); Secretary of FD Funds GP LLC (2021-present), FD Funds Holding LLC (2021-present), FD Funds Management LLC (2021-present), and Fidelity Diversifying Solutions LLC (investment adviser firm, 2022-present); and Assistant Secretary of FIMM, LLC (2019-present). She is a Senior Vice President and Deputy General Counsel of FMR LLC (diversified financial services company, 2019-present), and is an employee of Fidelity Investments. Previously, Ms. Lo Bessette served as CLO, Secretary, and Senior Vice President of FMR Co., Inc. (investment adviser firm, 2019); Secretary of Fidelity SelectCo, LLC and Fidelity Investments Money Management, Inc. (investment adviser firms, 2019). Prior to joining Fidelity Investments, Ms. Lo Bessette was Executive Vice President, General Counsel (2016-2019) and Senior Vice President, Deputy General Counsel (2015-2016) of OppenheimerFunds (investment management company) and Deputy Chief Legal Officer (2013-2015) of Jennison Associates LLC (investment adviser firm).
Chris Maher (1972)
Year of Election or Appointment: 2013
Assistant Treasurer
Mr. Maher also serves as an officer of other funds. Mr. Maher serves as Assistant Treasurer of FIMM, LLC (2021-present) and FMR Capital, Inc. (2017-present), and is an employee of Fidelity Investments (2008-present). Previously, Mr. Maher served as Assistant Treasurer of certain funds (2013-2020); Vice President of Asset Management Compliance (2013), Vice President of the Program Management Group of FMR (investment adviser firm, 2010-2013), and Vice President of Valuation Oversight (2008-2010).
Jamie Pagliocco (1964)
Year of Election or Appointment: 2020
Vice President
Mr. Pagliocco also serves as Vice President of other funds. Mr. Pagliocco serves as President of Fixed Income (2020-present), and is an employee of Fidelity Investments (2001-present). Previously, Mr. Pagliocco served as Co-Chief Investment Officer - Bond (2017-2020), Global Head of Bond Trading (2016-2019), and as a portfolio manager.
Kenneth B. Robins (1969)
Year of Election or Appointment: 2020
Chief Compliance Officer
Mr. Robins also serves as an officer of other funds. Mr. Robins serves as Compliance Officer of Fidelity Management & Research Company LLC (investment adviser firm, 2016-present) and is an employee of Fidelity Investments (2004-present). Previously, Mr. Robins served as Compliance Officer of FMR Co., Inc. (investment adviser firm, 2016-2019), as Executive Vice President of Fidelity Investments Money Management, Inc. (investment adviser firm, 2013-2016) and served in other fund officer roles.
Brett Segaloff (1972)
Year of Election or Appointment: 2021
Anti-Money Laundering (AML) Officer
Mr. Segaloff also serves as an AML Officer of other funds and other related entities. He is Director, Anti-Money Laundering (2007-present) of FMR LLC (diversified financial services company) and is an employee of Fidelity Investments (1996-present).
Stacie M. Smith (1974)
Year of Election or Appointment: 2013
Assistant Treasurer
Ms. Smith also serves as an officer of other funds. Ms. Smith serves as Assistant Treasurer of FIMM, LLC (2021-present) and FMR Capital, Inc. (2017-present), is an employee of Fidelity Investments (2009-present), and has served in other fund officer roles. Prior to joining Fidelity Investments, Ms. Smith served as Senior Audit Manager of Ernst & Young LLP (accounting firm, 1996-2009). Previously, Ms. Smith served as Assistant Treasurer (2013-2019) and Deputy Treasurer (2013-2016) of certain Fidelity ® funds.
Jim Wegmann (1979)
Year of Election or Appointment: 2021
Deputy Treasurer
Mr. Wegmann also serves as an officer of other funds. Mr. Wegmann serves as Assistant Treasurer of FIMM, LLC (2021-present) and is an employee of Fidelity Investments (2011-present). Previously, Mr. Wegmann served as Assistant Treasurer of certain Fidelity ® funds (2019-2021).
As a shareholder, you incur two types of costs: (1) transaction costs, which may include sales charges (loads) on purchase payments or redemption proceeds, as applicable and (2) ongoing costs, which generally include management fees, distribution and/or service (12b-1) fees and other Fund expenses. This Example is intended to help you understand your ongoing costs (in dollars) of investing in a fund and to compare these costs with the ongoing costs of investing in other mutual funds.
| The Example is based on an investment of $1,000 invested at the beginning of the period and held for the entire period (May 1, 2022 to October 31, 2022). |
Actual Expenses
The first line of the accompanying table provides information about actual account values and actual expenses. You may use the information in this line, together with the amount you invested, to estimate the expenses that you paid over the period. Simply divide your account value by $1,000.00 (for example, an $8,600 account value divided by $1,000.00 = 8.6), then multiply the result by the number in the first line for a class/Fund under the heading entitled "Expenses Paid During Period" to estimate the expenses you paid on your account during this period. If any fund is a shareholder of any underlying mutual funds or exchange-traded funds (ETFs) (the Underlying Funds), such fund indirectly bears its proportional share of the expenses of the Underlying Funds in addition to the direct expenses incurred presented in the table. These fees and expenses are not included in the annualized expense ratio used to calculate the expense estimate in the table below.
Hypothetical Example for Comparison Purposes
The second line of the accompanying table provides information about hypothetical account values and hypothetical expenses based on the actual expense ratio and an assumed rate of return of 5% per year before expenses, which is not the actual return. The hypothetical account values and expenses may not be used to estimate the actual ending account balance or expenses you paid for the period. You may use this information to compare the ongoing costs of investing in the Fund and other funds. To do so, compare this 5% hypothetical example with the 5% hypothetical examples that appear in the shareholder reports of the other funds. If any fund is a shareholder of any Underlying Funds, such fund indirectly bears its proportional share of the expenses of the Underlying Funds in addition to the direct expenses as presented in the table. These fees and expenses are not included in the annualized expense ratio used to calculate the expense estimate in the table below.
Please note that the expenses shown in the table are meant to highlight your ongoing costs only and do not reflect any transaction costs. Therefore, the second line of the table is useful in comparing ongoing costs only, and will not help you determine the relative total costs of owning different funds. In addition, if these transactional costs were included, your costs would have been higher.
| | | | | Annualized Expense Ratio- A | | Beginning Account Value May 1, 2022 | | Ending Account Value October 31, 2022 | | Expenses Paid During Period- C May 1, 2022 to October 31, 2022 |
| | | | | | | | | | |
| Fidelity® Total International Index Fund | | | | .06% | | | | | | |
| Actual | | | | | | $ 1,000 | | $ 860.10 | | $ .28 |
Hypothetical- B | | | | | | $ 1,000 | | $ 1,024.90 | | $ .31 |
| |
A Annualized expense ratio reflects expenses net of applicable fee waivers.
B 5% return per year before expenses
C Expenses are equal to the annualized expense ratio, multiplied by the average account value over the period, multiplied by 184/ 365 (to reflect the one-half year period). The fees and expenses of any Underlying Funds are not included in each annualized expense ratio.
The dividend and capital gains distributions for the fund(s) are available on Fidelity.com or Institutional.Fidelity.com .
The fund designates 71% and 75% of the dividends distributed in December during the fiscal year as amounts which may be taken into account as a dividend for the purposes of the maximum rate under section 1(h)(11) of the Internal Revenue Code.
The amounts per share which represent income derived from sources within, and taxes paid to, foreign countries or possessions of the United States are as follows:
| | Pay Date | Income | Taxes |
| Fidelity Total International Index Fund | 12/06/21 | $0.3890 | $0.0350 |
| Fidelity Total International Index Fund | 12/29/21 | $0.0056 | $0.0000 |
The fund will notify shareholders in January 2023 of amounts for use in preparing 2022 income tax returns.
Fidelity Total International Index Fund
Each year, the Board of Trustees, including the Independent Trustees (together, the Board), votes on the renewal of the management contract with Fidelity Management & Research Company LLC (FMR) and the sub-advisory agreement (Sub-Advisory Agreement) for the fund with Geode Capital Management, LLC (Geode) (together, the Advisory Contracts). FMR and Geode are referred to herein as the Investment Advisers. The Board, assisted by the advice of fund counsel and Independent Trustees' counsel, requests and considers a broad range of information relevant to the renewal of the Advisory Contracts throughout the year.
The Board meets regularly and, at each of its meetings, covers an extensive agenda of topics and materials and considers factors that are relevant to its annual consideration of the renewal of the fund's Advisory Contracts, including the services and support provided to the fund and its shareholders. The Board has established four standing committees (Committees) - Operations, Audit, Fair Valuation, and Governance and Nominating - each composed of and chaired by Independent Trustees with varying backgrounds, to which the Board has assigned specific subject matter responsibilities in order to enhance effective decision-making by the Board. The Operations Committee, of which all the Independent Trustees are members, meets regularly throughout the year and requests, receives and considers, among other matters, information related to the annual consideration of the renewal of the fund's Advisory Contracts before making its recommendation to the Board. The Board also meets as needed to review matters specifically related to the Board's annual consideration of the renewal of the Advisory Contracts. Members of the Board may also meet from time to time with trustees of other Fidelity funds through joint ad hoc committees to discuss certain matters relevant to all of the Fidelity funds.
At its September 2022 meeting, the Board unanimously determined to renew the fund's Advisory Contracts. In reaching its determination, the Board considered all factors it believed relevant, including (i) the nature, extent, and quality of the services provided to the fund and its shareholders (including the investment performance of the fund); (ii) the competitiveness relative to peer funds of the fund's management fee and total expense ratio; (iii) the total costs of the services provided by and the profits realized by Fidelity and Geode from their respective relationships with the fund; and (iv) the extent to which, if any, economies of scale exist and are realized as the fund grows, and whether any economies of scale are appropriately shared with fund shareholders.
In considering whether to renew the Advisory Contracts for the fund, the Board reached a determination, with the assistance of fund counsel and Independent Trustees' counsel and through the exercise of its business judgment, that the renewal of the Advisory Contracts was in the best interests of the fund and its shareholders and that the compensation payable under the Advisory Contracts was fair and reasonable. The Board's decision to renew the Advisory Contracts was not based on any single factor, but rather was based on a comprehensive consideration of all the information provided to the Board at its meetings throughout the year. The Board, in reaching its determination to renew the Advisory Contracts, was aware that shareholders of the fund have a broad range of investment choices available to them, including a wide choice among funds offered by Fidelity's competitors, and that the fund's shareholders, who have the opportunity to review and weigh the disclosure provided by the fund in its prospectus and other public disclosures, have chosen to invest in this fund, which is part of the Fidelity family of funds.
Nature, Extent, and Quality of Services Provided . The Board considered staffing as it relates to the fund, including the backgrounds of investment personnel of Fidelity and Geode, and also considered the fund's investment objective, strategies, and related investment philosophy. The Independent Trustees also had discussions with senior management of Fidelity's investment operations and investment groups and with senior management of Geode. The Board considered the structure of the investment personnel compensation programs and whether the structures provide appropriate incentives to act in the best interests of the fund. The Board also considered the steps Fidelity and Geode had taken to ensure the continued provision of high quality services to the Fidelity funds throughout the COVID-19 pandemic, including the expansion of staff in client facing positions to maintain service levels in periods of high volumes and volatility.
The Trustees also discussed with representatives of Fidelity, at meetings throughout the year, Fidelity's role in, among other things, overseeing compliance with federal securities laws and other applicable requirements by Geode with respect to the fund and monitoring and overseeing the performance and investment capabilities of Geode. The Trustees considered that the Board had received from Fidelity periodic reports about its oversight and due diligence processes, as well as periodic reports regarding the performance of Geode.
The Board also considered the nature, extent and quality of services provided by Geode. The Trustees noted that under the Sub-Advisory Agreement, subject to oversight by Fidelity, Geode is responsible for, among other things, identifying investments and arranging for execution of portfolio transactions to implement the fund's investment strategy. In addition, the Trustees noted that Geode is responsible for providing such reporting as may be requested by Fidelity to fulfill its oversight responsibilities discussed above.
Resources Dedicated to Investment Management and Support Services . The Board reviewed the general qualifications and capabilities of Fidelity's and Geode's investment staffs, including their size, education, experience, and resources, as well as Fidelity's and Geode's approach to recruiting, training, managing, and compensating investment personnel. The Board noted the resources devoted to Fidelity's global investment organization and that Fidelity's and Geode's analysts have extensive resources, tools and capabilities that allow them to conduct quantitative and fundamental analysis, as well as credit analysis of issuers, counterparties, and guarantors. Further, the Board considered that Fidelity's and Geode's investment professionals have sufficient access to information and data so as to provide competitive investment results over time, and that those professionals also have access to sophisticated tools that permit them to assess portfolio construction and risk and performance attribution characteristics continuously. Additionally, in its deliberations, the Board considered Fidelity's and Geode's trading, risk management, compliance, cybersecurity, and technology and operations capabilities and resources, which are integral parts of the investment management process.
Shareholder and Administrative Services . The Board considered (i) the nature, extent, quality, and cost of advisory, administrative, and shareholder services performed by the Investment Advisers and their affiliates under the Advisory Contracts and by FMR's affiliates under separate agreements covering transfer agency, pricing and bookkeeping, and securities lending services for the fund; (ii) the nature and extent of the supervision of third party service providers, principally custodians, subcustodians, and pricing vendors; and (iii) the resources devoted to, and the record of compliance with, the fund's compliance policies and procedures. The Board also reviewed the allocation of fund brokerage, including allocations to brokers affiliated with the Investment Advisers.
The Board noted that the growth of fund assets over time across the complex allows Fidelity to reinvest in the development of services designed to enhance the value and convenience of the Fidelity funds as investment vehicles. These services include 24-hour access to account information and market information over the Internet and through telephone representatives, investor education materials and asset allocation tools. The Board also considered that it reviews customer service metrics such as telephone response times, continuity of services on the website and metrics addressing services at Fidelity Investor Centers.
Investment in a Large Fund Family. The Board considered the benefits to shareholders of investing in a Fidelity fund, including the benefits of investing in a fund that is part of a large family of funds offering a variety of investment disciplines and providing a large variety of mutual fund investor services. The Board noted that Fidelity had taken, or had made recommendations to the Board that resulted in the Fidelity funds taking, a number of actions over the previous year that benefited particular funds, including: (i) continuing to dedicate additional resources to Fidelity's investment research process, which includes meetings with management of issuers of securities in which the funds invest; (ii) continuing efforts to enhance Fidelity's global research capabilities; (iii) launching new funds, ETFs, and share classes with innovative structures, strategies and pricing and making other enhancements to meet investor needs; (iv) broadening eligibility requirements for certain funds and share classes; (v) reducing management fees and total expenses for certain funds and classes; (vi) lowering expenses for certain existing funds and classes by implementing or lowering expense caps; (vii) rationalizing product lines and gaining increased efficiencies from fund mergers and liquidations; (viii) continuing to develop, acquire and implement systems and technology to improve services to the funds and shareholders, strengthen information security, and increase efficiency; and (ix) continuing to implement enhancements to further strengthen Fidelity's product line to increase investors' probability of success in achieving their investment goals, including their retirement income goals.
Investment Performance . The Board considered whether the fund has operated in accordance with its investment objective, as well as its record of compliance with its investment restrictions and its performance history.
The Board took into account discussions that occur at Board meetings throughout the year with representatives of the Investment Advisers about fund investment performance. In this regard the Board noted that as part of regularly scheduled fund reviews and other reports to the Board on fund performance, the Board considers annualized return information for the fund for different time periods, measured against the securities market index the fund seeks to track. The Board also periodically considers the fund's tracking error versus its benchmark index.
In addition to reviewing absolute and relative fund performance, the Independent Trustees periodically consider the appropriateness of fund performance metrics in evaluating the results achieved. In general, the Independent Trustees believe that an index fund's performance should be evaluated based on gross performance (before fees and expenses but after transaction costs) compared to the fund's benchmark index, over appropriate time periods, taking into account relevant factors including the following: general market conditions; the characteristics of the fund's benchmark index; the extent to which statistical sampling is employed; any securities lending revenues; and fund cash flows and other factors. The Independent Trustees generally give greater weight to fund performance over longer time periods than over shorter time periods. Depending on the circumstances, the Independent Trustees may be satisfied with a fund's performance notwithstanding that it lags its benchmark index for certain periods.
The Independent Trustees recognize that shareholders evaluate performance on a net basis (after fees and expenses) over their own holding periods, for which one-, three-, and five-year periods are often used as a proxy. For this reason, the performance information reviewed by the Board also included net cumulative calendar year total return information for the fund and its benchmark index for the most recent one-, three-, and five-year periods. No performance peer group information was considered by the Board as Fidelity advised the Board that the peer group, which is created by a third-party provider, includes a number of actively-managed funds. The Independent Trustees recognize that shareholders who are not investing through a tax-advantaged retirement account also consider tax consequences in evaluating performance.
Based on its review, the Board concluded that the nature, extent, and quality of services provided to the fund under the Advisory Contracts should continue to benefit the shareholders of the fund.
Competitiveness of Management Fee and Total Expense Ratio . The Board considered the fund's management fee and total expense ratio compared to selected groups of competitive funds and classes (referred to as "mapped groups" below) for the purpose of facilitating the Trustees' competitive analysis of management fees and total expenses. Fidelity creates "mapped groups" by combining similar investment objective categories (as classified by Lipper) that have comparable investment mandates. Combining funds with similar investment objective categories aids the Board's comparison of management fees and total expense ratios by broadening the competitive group used for such comparison.
Management Fee . The Board considered two proprietary management fee comparisons for the 12-month periods shown in basis points (BP) in the chart below. The group of Lipper funds used by the Board for management fee comparisons is referred to below as the "Total Mapped Group." The Total Mapped Group comparison focuses on a fund's standing in terms of gross management fees before expense reimbursements or caps relative to the total universe of funds with comparable investment mandates, regardless of whether their management fee structures also are comparable. Funds with comparable investment mandates offer exposure to similar types of securities. Funds with comparable management fee structures have similar management fee contractual arrangements (e.g., flat rate charged for advisory services, all-inclusive fee rate, etc.). "TMG %" represents the percentage of funds in the Total Mapped Group that had management fees that were lower than the fund's. For example, a hypothetical TMG % of 20% would mean that 80% of the funds in the Total Mapped Group had higher, and 20% had lower, management fees than the fund. The fund's actual TMG %s and the number of funds in the Total Mapped Group are in the chart below. The "Asset-Sized Peer Group" (ASPG) comparison focuses on a fund's standing relative to a subset of non-Fidelity funds within the Total Mapped Group that are similar in size and management fee structure. For example, if a fund is in the first quartile of the ASPG, the fund's management fee ranks in the least expensive or lowest 25% of funds in the ASPG. The ASPG represents at least 15% of the funds in the Total Mapped Group with comparable asset size and management fee structures, subject to a minimum of 50 funds (or all funds in the Total Mapped Group if fewer than 50). Additional information, such as the ASPG quartile in which the fund's management fee rate ranked, is also included in the chart and was considered by the Board.

The Board noted that the fund's management fee rate ranked below the median of its Total Mapped Group and below the median of its ASPG for 2021.
At its September 2022 meeting, the Board also approved an amendment to the fund's sub-advisory agreement with Geode (effective October 1, 2022) that reduced the sub-advisory fee rate that FMR pays to Geode.
Based on its review, the Board concluded that the fund's management fee is fair and reasonable in light of the services that the fund receives and the other factors considered.
Total Expense Ratio . In its review of the fund's total expense ratio, the Board considered the fund's unitary (subject to certain limited exceptions) fee rate as well as fund expenses paid by FMR under the fund's management contract, such as transfer agent fees, pricing and bookkeeping fees, and custodial, legal, and audit fees. The Board also noted that Fidelity may agree to waive fees or reimburse expenses from time to time, and the extent to which, if any, it has done so for the fund. The fund is compared to those funds and classes in the Total Mapped Group (used by the Board for management fee comparisons) that have a similar sales load structure. The Board also considered a total expense ASPG comparison, which focuses on the total expenses of the fund relative to a subset of non-Fidelity funds within the similar sales load structure group that are similar in size and management fee structure. The total expense ASPG is limited to 15 larger and 15 smaller classes of different funds, where possible. The total expense ASPG comparison excludes performance adjustments and fund-paid 12b-1 fees to eliminate variability in expenses relating to these items.
The Board noted that the fund's total net expense ratio ranked below the similar sales load structure group competitive median and below the ASPG competitive median for 2021.
Fees Charged to Other Clients. The Board also considered fee structures and other information with respect to clients of Fidelity and Geode, such as other funds advised or subadvised by Fidelity or Geode, pension plan clients, and other institutional clients with similar mandates. The Board noted that a joint ad hoc committee created by it and the boards of other Fidelity funds periodically reviews and compares Fidelity's institutional investment advisory business with its business of providing services to the Fidelity funds and also noted the most recent findings of the committee. The Board noted that the committee's review included a consideration of the differences in services provided, fees charged, and costs incurred, as well as competition in the markets serving the different categories of clients.
Based on its review of total expense ratios and fees charged to other Fidelity clients, the Board concluded that the fund's total expense ratio was reasonable in light of the services that the fund and its shareholders receive and the other factors considered.
Costs of the Services and Profitability . The Board considered the revenues earned and the expenses incurred by Fidelity in conducting the business of developing, marketing, distributing, managing, administering and servicing the fund and servicing the fund's shareholders. The Board also considered the level of Fidelity's profits in respect of all the Fidelity funds.
On an annual basis, Fidelity presents to the Board information about the profitability of its relationships with the fund. Fidelity calculates profitability information for each fund, as well as aggregate profitability information for groups of Fidelity funds and all Fidelity funds, using a series of detailed revenue and cost allocation methodologies which originate with the books and records of Fidelity on which Fidelity's audited financial statements are based. The Audit Committee of the Board reviews any significant changes from the prior year's methodologies and the full Board approves such changes.
A public accounting firm has been engaged annually by the Board as part of the Board's assessment of Fidelity's profitability analysis. The engagement includes the review and assessment of the methodologies used by Fidelity in determining the revenues and expenses attributable to Fidelity's mutual fund business, and completion of agreed-upon procedures in respect of the mathematical accuracy of certain fund profitability information and its conformity to established allocation methodologies. After considering the reports issued under the engagement and information provided by Fidelity, the Board concluded that while other allocation methods may also be reasonable, Fidelity's profitability methodologies are reasonable in all material respects.
The Board also reviewed Fidelity's and Geode's non-fund businesses and potential indirect benefits such businesses may have received as a result of their association with Fidelity's mutual fund business (i.e., fall-out benefits) as well as cases where Fidelity's and Geode's affiliates may benefit from the funds' business. The Board considered areas where potential indirect benefits to the Fidelity funds from their relationships with Fidelity may exist. The Board's consideration of these matters was informed by the findings of a joint ad hoc committee created by it and the boards of other Fidelity funds to evaluate potential fall-out benefits.
The Board considered the costs of the services provided by and the profits realized by Fidelity in connection with the operation of the fund and was satisfied that the profitability was not excessive.
The Board also considered information regarding the profitability of Geode's relationship with the fund.
Economies of Scale . The Board considered whether there have been economies of scale in respect of the management of the Fidelity funds, whether the Fidelity funds (including the fund) have appropriately benefited from any such economies of scale, and whether there is potential for realization of any further economies of scale. The Board considered the extent to which the fund will benefit from economies of scale as assets grow through increased services to the fund, through waivers or reimbursements, or through fee or expense ratio reductions. The Board recognized that, due to the fund's current contractual arrangements, its expense ratio will not decline if the fund's operating costs decrease as assets grow, or rise as assets decrease. The Board also noted that a committee (the Economies of Scale Committee) created by it and the boards of other Fidelity funds periodically analyzes whether Fidelity attains economies of scale in respect of the management and servicing of the Fidelity funds, whether the Fidelity funds have appropriately benefited from such economies of scale, and whether there is potential for realization of any further economies of scale.
The Board concluded, taking into account the analysis of the Economies of Scale Committee, that economies of scale, if any, are being appropriately shared between fund shareholders and Fidelity.
Additional Information Requested by the Board . In order to develop fully the factual basis for consideration of the Fidelity funds' advisory contracts, the Board requested and received additional information on certain topics, including: (i) Fidelity's fund profitability methodology, profitability trends for certain funds, the allocation of various costs to different funds, and the impact of certain factors on fund profitability results; (ii) portfolio manager changes that have occurred during the past year and the amount of the investment that each portfolio manager has made in the Fidelity fund(s) that he or she manages; (iii) the extent to which current market conditions have affected retention and recruitment of personnel; (iv) the arrangements with and compensation paid to certain fund sub-advisers on behalf of the Fidelity funds and the treatment of such compensation within Fidelity's fund profitability methodology; (v) the terms of the funds' various management fee structures, including the basic group fee and the terms of Fidelity's voluntary expense limitation arrangements; (vi) Fidelity's transfer agent, pricing and bookkeeping fees, expense and service structures for different funds and classes relative to competitive trends; (vii) the impact on fund profitability of recent industry trends, such as the growth in passively managed funds and the changes in flows for different types of funds; (viii) the types of management fee and total expense comparisons provided, and the challenges and limitations associated with such information; and (ix) explanations regarding the relative total expense ratios and management fees of certain funds and classes, total expense and management fee competitive trends, and methodologies for total expense and management fee competitive comparisons. In addition, the Board considered its discussions with Fidelity regarding Fidelity's efforts to maintain the continuous investment and shareholder services necessary for the funds during the current pandemic and economic circumstances.
Based on its evaluation of all of the conclusions noted above, and after considering all factors it believed relevant, the Board concluded that the advisory and sub-advisory fee arrangements are fair and reasonable and that the fund's Advisory Contracts should be renewed.
1.9879613.106
TI1-I-ANN-1222
Fidelity® SAI International Value Index Fund
Annual Report
October 31, 2022
Offered exclusively to certain clients of the Adviser, or its affiliates, including Strategic Advisers LLC (Strategic Advisers) - not available for sale to the general public. Fidelity ® SAI is a product name of Fidelity ® funds dedicated to certain programs affiliated with Strategic Advisers.
Contents
To view a fund's proxy voting guidelines and proxy voting record for the 12-month period ended June 30, visit http://www.fidelity.com/proxyvotingresults or visit the Securities and Exchange Commission's (SEC) web site at http://www.sec.gov.
You may also call 1-800-544-3455 to request a free copy of the proxy voting guidelines.
The funds or securities referred to herein are not sponsored, endorsed, or promoted by Fidelity Product Services LLC (FPS), and FPS bears no liability with respect to any such funds or securities or any index on which such funds or securities are based. The prospectus contains a more detailed description of the relationship between FPS and any related funds.
Standard & Poor's, S&P and S&P 500 are registered service marks of The McGraw-Hill Companies, Inc. and have been licensed for use by Fidelity Distributors Corporation.
Other third-party marks appearing herein are the property of their respective owners.
All other marks appearing herein are registered or unregistered trademarks or service marks of FMR LLC or an affiliated company. © 2022 FMR LLC. All rights reserved.
This report and the financial statements contained herein are submitted for the general information of the shareholders of the Fund. This report is not authorized for distribution to prospective investors in the Fund unless preceded or accompanied by an effective prospectus.
A fund files its complete schedule of portfolio holdings with the SEC for the first and third quarters of each fiscal year on Form N-PORT. Forms N-PORT are available on the SEC's web site at http://www.sec.gov. A fund's Forms N-PORT may be reviewed and copied at the SEC's Public Reference Room in Washington, DC. Information regarding the operation of the SEC's Public Reference Room may be obtained by calling 1-800-SEC-0330.
For a complete list of a fund's portfolio holdings, view the most recent holdings listing, semiannual report, or annual report on Fidelity's web site at http://www.fidelity.com, http://www.institutional.fidelity.com, or http://www.401k.com, as applicable.
NOT FDIC INSURED •MAY LOSE VALUE •NO BANK GUARANTEE
Neither the Fund nor Fidelity Distributors Corporation is a bank.
Average annual total return reflects the change in the value of an investment, assuming reinvestment of distributions from dividend income and capital gains (the profits earned upon the sale of securities that have grown in value, if any) and assuming a constant rate of performance each year. The hypothetical investment and the average annual total returns do not reflect the deduction of taxes that a shareholder would pay on fund distributions or the redemption of fund shares. During periods of reimbursement by Fidelity, a fund's total return will be greater than it would be had the reimbursement not occurred. How a fund did yesterday is no guarantee of how it will do tomorrow.
| Average Annual Total Returns |
| | | | |
Periods ended October 31, 2022 | Past 1 year | Life of Fund A |
| Fidelity® SAI International Value Index Fund | -16.93% | -2.24% |
A From December 19, 2017
| $10,000 Over Life of Fund |
| |
Let's say hypothetically that $10,000 was invested in Fidelity® SAI International Value Index Fund on December 19, 2017, when the fund started. The chart shows how the value of your investment would have changed, and also shows how the Fidelity International Value Focus Index℠ and MSCI ACWI (All Country World Index) ex USA Index performed over the same period. |
|
|
Market Recap:
International equities returned -24.61% for the 12 months ending October 31, 2022, according to the MSCI ACWI (All Country World Index) ex USA Index. After gaining 7.98% in 2021, non-U.S. stocks retreated in the new year, as a multitude of risk factors challenged the global economy and financial markets. Persistently high inflation in some markets, exacerbated by energy price shocks from the Russia-Ukraine conflict, spurred the U.S. Federal Reserve and other central banks to aggressively tighten monetary policy, and market interest rates eclipsed their highest level in roughly a decade, stoking recession fears and sending stocks into bear market territory. Other factors influencing equities abroad included surging global commodity prices, rising sovereign bond yields in some markets, ongoing global supply-chain disruption, a broadly strong U.S. dollar and the potential for variants of the coronavirus to upend global economic growth. Against this backdrop, the index returned -24.20% year to date through October. For the full 12 months, emerging markets (-31%) and Europe ex U.K. (-25%) notably lagged. Conversely, Canada (-13%) and the U.K. (-12%) held up best. Among the 11 sectors, information technology and consumer discretionary (-37% each) fared worst. Communication services (-34%) also trailed the broader market. In contrast, energy gained 2% amid high prices for oil and natural gas. The defensive-oriented utilities (-16%) sector also outperformed, as did financials and consumer staples (-18% each).
Comments from the Geode Capital Management, LLC, passive equity index team:
For the fiscal year, the fund returned -16.93%, roughly in line with the -16.53% result of the benchmark, the Fidelity International Value Focus Index. (The fund's relative performance can be affected by Fidelity's methodologies for valuing certain foreign stocks and for incorporating foreign exchange rates, which differ from those used by the index, as well as by local tax laws or regulations, which vary by country.) By region, Europe ex U.K. returned -21% and detracted most, followed by Japan (-15%). By sector, stocks in consumer discretionary returned -29% and detracted most, followed by financials, which returned about -17%. Industrials returned -17%, hampered by the capital goods industry (-17%), and information technology (-31%) also detracted. Health care (-14%) and materials (-14%) hampered the fund's result. Other notable detractors included the communication services (-14%) and real estate (-34%) sectors, alongside utilities (-16%) and consumer staples (-3%). In contrast, energy gained about 12% and contributed. Turning to individual stocks, the biggest individual detractor was BNP Paribas (-26%), from the banks industry, followed by Koninklijke Philips (-60%), which is in the health care equipment & services category. Within banks, Barclays returned roughly -36% and hurt. Other detractors were Mercedes-Benz (-24%), a stock in the automobiles & components segment, and Ericsson (-48%), from the technology hardware & equipment group. Conversely, the biggest individual contributor was BHP (+9%), from the materials sector. British American Tobacco, within the food, beverage & tobacco segment, advanced roughly 21% and lifted the fund. In energy, TotalEnergies (+13%) and Shell (+24%) helped. Another notable contributor was Bayer (+17%), a stock in the pharmaceuticals, biotechnology & life sciences category.
The views expressed above reflect those of the portfolio manager(s) only through the end of the period as stated on the cover of this report and do not necessarily represent the views of Fidelity or any other person in the Fidelity organization. Any such views are subject to change at any time based upon market or other conditions and Fidelity disclaims any responsibility to update such views. These views may not be relied on as investment advice and, because investment decisions for a Fidelity fund are based on numerous factors, may not be relied on as an indication of trading intent on behalf of any Fidelity fund.
Top Holdings (% of Fund's net assets) |
| |
| Novartis AG (Switzerland, Pharmaceuticals) | 3.4 | |
| Sanofi SA (France, Pharmaceuticals) | 2.8 | |
| British American Tobacco PLC (United Kingdom) (United Kingdom, Tobacco) | 2.7 | |
| TotalEnergies SE (France, Oil, Gas & Consumable Fuels) | 2.1 | |
| Shell PLC (London) (United Kingdom, Oil, Gas & Consumable Fuels) | 1.9 | |
| BNP Paribas SA (France, Banks) | 1.9 | |
| Rio Tinto PLC (United Kingdom, Metals & Mining) | 1.8 | |
| Anheuser-Busch InBev SA NV (Belgium, Beverages) | 1.7 | |
| Bayer AG (Germany, Pharmaceuticals) | 1.6 | |
| BHP Group Ltd. (Australia, Metals & Mining) | 1.6 | |
| | 21.5 | |
| |
| Market Sectors (% of Fund's net assets) |
| |
| Financials | 19.4 | |
| Industrials | 14.4 | |
| Health Care | 11.5 | |
| Consumer Discretionary | 10.4 | |
| Materials | 8.9 | |
| Consumer Staples | 8.7 | |
| Energy | 7.3 | |
| Communication Services | 6.7 | |
| Information Technology | 5.5 | |
| Utilities | 3.2 | |
| Real Estate | 3.1 | |
| |
Asset Allocation (% of Fund's net assets) |
|
Foreign investments - 99.1% |
|
Geographic Diversification (% of Fund's net assets) |
|
* Includes Short-Term investments and Net Other Assets (Liabilities). Percentages are based on country or territory of incorporation and are adjusted for the effect of futures contracts, if applicable. |
| |
Showing Percentage of Net Assets
| Common Stocks - 99.1% |
| | | Shares | Value ($) |
| Australia - 4.3% | | | |
| AGL Energy Ltd. | | 882,032 | 3,842,146 |
| Aurizon Holdings Ltd. | | 2,711,607 | 6,278,815 |
| Bendigo & Adelaide Bank Ltd. | | 832,345 | 4,797,009 |
| BHP Group Ltd. | | 2,825,704 | 67,526,764 |
| BlueScope Steel Ltd. | | 693,261 | 6,975,380 |
| Fortescue Metals Group Ltd. | | 1,802,237 | 16,978,884 |
| New Hope Corp. Ltd. | | 735,705 | 2,658,854 |
| Rio Tinto Ltd. | | 546,852 | 30,851,820 |
| Sonic Healthcare Ltd. | | 707,242 | 14,824,733 |
| South32 Ltd. | | 6,818,308 | 15,643,035 |
| Whitehaven Coal Ltd. | | 1,408,718 | 8,136,811 |
TOTAL AUSTRALIA | | | 178,514,251 |
| Austria - 0.5% | | | |
| Erste Group Bank AG | | 508,532 | 12,532,744 |
| OMV AG | | 212,132 | 9,777,584 |
TOTAL AUSTRIA | | | 22,310,328 |
| Belgium - 1.8% | | | |
| Anheuser-Busch InBev SA NV | | 1,404,851 | 70,271,226 |
| Sofina SA | | 23,209 | 4,529,918 |
TOTAL BELGIUM | | | 74,801,144 |
| Bermuda - 0.4% | | | |
| Jardine Matheson Holdings Ltd. | | 358,133 | 16,481,281 |
| Cayman Islands - 0.9% | | | |
| CK Asset Holdings Ltd. | | 2,898,500 | 16,025,543 |
| CK Hutchison Holdings Ltd. | | 3,954,000 | 19,682,354 |
TOTAL CAYMAN ISLANDS | | | 35,707,897 |
| Denmark - 1.2% | | | |
| A.P. Moller - Maersk A/S Series B | | 12,378 | 25,859,781 |
| Danske Bank A/S | | 998,572 | 16,116,475 |
| Pandora A/S | | 140,684 | 7,414,838 |
TOTAL DENMARK | | | 49,391,094 |
| Finland - 1.2% | | | |
| Fortum Corp. | | 641,203 | 9,026,613 |
| Kojamo OYJ | | 262,135 | 3,411,753 |
| Nokia Corp. | | 7,971,796 | 35,426,010 |
| TietoEVRY Oyj | | 155,263 | 3,704,009 |
TOTAL FINLAND | | | 51,568,385 |
| France - 13.2% | | | |
| BNP Paribas SA | | 1,672,871 | 78,447,480 |
| Bouygues SA | | 309,915 | 8,842,240 |
| Carrefour SA | | 863,705 | 13,901,725 |
| Compagnie de St. Gobain | | 766,122 | 31,319,811 |
| Compagnie Generale des Etablissements Michelin SCA Series B | | 1,051,995 | 26,809,106 |
| Credit Agricole SA | | 2,005,904 | 18,200,894 |
| Dassault Aviation SA | | 34,438 | 5,118,616 |
| Eiffage SA | | 115,494 | 10,448,096 |
| Elis SA | | 289,082 | 3,316,806 |
| Engie SA | | 2,726,504 | 35,426,464 |
| Eurazeo SA | | 77,028 | 4,399,905 |
| Orange SA | | 2,782,223 | 26,508,785 |
| Publicis Groupe SA | | 347,781 | 19,477,265 |
| Renault SA (a) | | 304,947 | 9,393,512 |
| Rexel SA | | 361,676 | 6,471,203 |
| Sanofi SA | | 1,362,049 | 117,215,027 |
| SCOR SE | | 240,444 | 3,617,746 |
| Societe Generale Series A | | 1,164,355 | 26,706,858 |
| TotalEnergies SE | | 1,586,167 | 86,530,750 |
| Valeo SA | | 339,479 | 5,599,330 |
| Vivendi SA | | 1,192,134 | 9,757,594 |
TOTAL FRANCE | | | 547,509,213 |
| Germany - 12.1% | | | |
| Bayer AG | | 1,292,192 | 67,944,844 |
| Bayerische Motoren Werke AG (BMW) | | 552,819 | 43,391,837 |
| Continental AG | | 159,103 | 8,240,850 |
| Covestro AG (b) | | 284,610 | 9,661,381 |
| Daimler Truck Holding AG (a) | | 763,762 | 20,379,271 |
| Deutsche Bank AG | | 3,044,638 | 29,065,622 |
| Deutsche Post AG | | 1,460,242 | 51,619,304 |
| Deutsche Telekom AG | | 3,263,022 | 61,591,169 |
| E.ON SE | | 3,307,367 | 27,695,871 |
| Fresenius Medical Care AG & Co. KGaA | | 293,535 | 8,119,355 |
| Fresenius SE & Co. KGaA | | 600,607 | 13,821,868 |
| HeidelbergCement AG | | 213,338 | 9,810,732 |
| K+S AG | | 281,958 | 6,230,502 |
| LEG Immobilien AG | | 109,173 | 7,133,701 |
| Mercedes-Benz Group AG (Germany) | | 1,150,491 | 66,592,250 |
| RWE AG | | 991,380 | 38,199,723 |
| Siemens Energy AG | | 588,746 | 6,874,301 |
| Vonovia SE | | 1,172,395 | 25,922,376 |
TOTAL GERMANY | | | 502,294,957 |
| Hong Kong - 1.2% | | | |
| BOC Hong Kong (Holdings) Ltd. | | 5,295,500 | 16,460,632 |
| Henderson Land Development Co. Ltd. | | 1,925,930 | 4,715,178 |
| New World Development Co. Ltd. | | 2,039,000 | 4,171,694 |
| Sun Hung Kai Properties Ltd. | | 2,220,000 | 23,856,835 |
TOTAL HONG KONG | | | 49,204,339 |
| Ireland - 0.2% | | | |
| DCC PLC (United Kingdom) | | 146,121 | 8,110,464 |
| Israel - 0.2% | | | |
| Tower Semiconductor Ltd. (a) | | 152,490 | 6,525,021 |
| Italy - 2.3% | | | |
| Banco BPM SpA | | 2,232,068 | 6,752,080 |
| Eni SpA | | 3,718,071 | 48,832,157 |
| Leonardo SpA | | 596,185 | 4,791,210 |
| Telecom Italia SpA (a) | | 23,458,918 | 4,589,568 |
| UniCredit SpA | | 2,564,514 | 31,803,244 |
TOTAL ITALY | | | 96,768,259 |
| Japan - 23.7% | | | |
| AGC, Inc. | | 335,100 | 10,513,074 |
| Aisin Seiki Co. Ltd. | | 269,100 | 6,904,176 |
| Alfresa Holdings Corp. | | 298,800 | 3,438,225 |
| Amada Co. Ltd. | | 529,000 | 3,724,826 |
| Brother Industries Ltd. | | 386,300 | 6,575,374 |
| Canon, Inc. | | 1,525,200 | 32,330,407 |
| Cosmo Energy Holdings Co. Ltd. | | 118,600 | 3,050,842 |
| Dai Nippon Printing Co. Ltd. | | 397,200 | 7,968,308 |
| Electric Power Development Co. Ltd. | | 256,200 | 3,563,143 |
| ENEOS Holdings, Inc. | | 4,668,200 | 15,377,009 |
| FUJIFILM Holdings Corp. | | 588,500 | 26,988,006 |
| Haseko Corp. | | 332,300 | 3,423,677 |
| Honda Motor Co. Ltd. | | 2,508,400 | 57,197,730 |
| IHI Corp. | | 227,900 | 5,088,456 |
| Iida Group Holdings Co. Ltd. | | 259,100 | 3,599,991 |
| INPEX Corp. | | 1,552,500 | 15,668,447 |
| Isuzu Motors Ltd. | | 916,200 | 10,745,841 |
| Itochu Corp. | | 2,171,300 | 56,204,537 |
| Japan Post Holdings Co. Ltd. | | 3,556,400 | 23,907,848 |
| Japan Post Insurance Co. Ltd. | | 294,400 | 4,349,822 |
| Japan Tobacco, Inc. | | 1,620,400 | 27,137,546 |
| JFE Holdings, Inc. | | 850,800 | 7,798,785 |
| Kajima Corp. | | 700,900 | 6,603,860 |
| Kawasaki Kisen Kaisha Ltd. | | 347,500 | 5,283,954 |
| Kyocera Corp. | | 350,000 | 17,514,711 |
| Marubeni Corp. | | 2,530,200 | 22,171,900 |
| Mazda Motor Corp. | | 884,200 | 5,953,286 |
| Mebuki Financial Group, Inc. | | 1,604,300 | 3,118,079 |
| Medipal Holdings Corp. | | 309,800 | 3,843,983 |
| Mitsubishi Corp. | | 2,188,700 | 59,333,869 |
| Mitsui & Co. Ltd. | | 2,419,400 | 53,580,041 |
| Mitsui OSK Lines Ltd. | | 533,200 | 10,581,884 |
| Mizuho Financial Group, Inc. | | 3,740,700 | 40,401,925 |
| NEC Corp. | | 401,900 | 13,311,527 |
| NGK Spark Plug Co. Ltd. | | 252,700 | 4,605,515 |
| Nippon Steel & Sumitomo Metal Corp. | | 1,399,900 | 19,229,266 |
| Nippon Yusen KK | | 751,500 | 13,613,026 |
| Nissan Motor Co. Ltd. | | 3,481,920 | 11,097,939 |
| Panasonic Holdings Corp. | | 3,434,400 | 24,461,909 |
| Renesas Electronics Corp. (a) | | 2,071,400 | 17,328,819 |
| Ricoh Co. Ltd. | | 939,100 | 6,884,018 |
| SBI Holdings, Inc. Japan | | 401,000 | 7,248,986 |
| Screen Holdings Co. Ltd. | | 68,800 | 3,789,448 |
| Seiko Epson Corp. | | 471,000 | 6,417,472 |
| SoftBank Group Corp. | | 1,442,300 | 61,912,490 |
| Sojitz Corp. | | 306,000 | 4,515,041 |
| Subaru Corp. | | 906,500 | 14,116,149 |
| Sumitomo Chemical Co. Ltd. | | 2,373,600 | 7,997,401 |
| Sumitomo Corp. | | 1,843,500 | 23,437,831 |
| Sumitomo Forestry Co. Ltd. | | 281,600 | 4,412,576 |
| Sumitomo Heavy Industries Ltd. | | 181,100 | 3,438,214 |
| Sumitomo Metal Mining Co. Ltd. | | 402,700 | 11,288,024 |
| Sumitomo Mitsui Financial Group, Inc. | | 2,025,100 | 56,867,980 |
| Taisei Corp. | | 295,800 | 8,066,640 |
| Takeda Pharmaceutical Co. Ltd. | | 2,330,900 | 61,556,741 |
| Tokyo Electric Power Co., Inc. (a) | | 1,183,700 | 3,860,886 |
| Toppan, Inc. | | 515,200 | 7,688,415 |
| Tosoh Corp. | | 478,900 | 5,214,292 |
| Yamada Holdings Co. Ltd. | | 1,096,600 | 3,532,542 |
| Yamaha Motor Co. Ltd. | | 515,900 | 10,651,421 |
| Yokohama Rubber Co. Ltd. | | 197,300 | 3,088,970 |
TOTAL JAPAN | | | 983,577,100 |
| Luxembourg - 0.6% | | | |
| ArcelorMittal SA (Netherlands) | | 840,537 | 18,818,618 |
| SES SA (France) (depositary receipt) | | 564,886 | 4,007,108 |
TOTAL LUXEMBOURG | | | 22,825,726 |
| Netherlands - 4.4% | | | |
| AEGON NV | | 2,085,284 | 9,653,118 |
| Heineken Holding NV | | 161,237 | 11,010,564 |
| Koninklijke Ahold Delhaize NV | | 1,540,495 | 42,961,781 |
| Koninklijke Philips Electronics NV | | 1,310,081 | 16,618,236 |
| NN Group NV | | 456,672 | 19,338,467 |
| Randstad NV | | 184,278 | 9,185,766 |
| Signify NV (b) | | 189,068 | 5,242,911 |
| Stellantis NV (Italy) | | 3,186,428 | 43,015,169 |
| STMicroelectronics NV (Italy) | | 864,929 | 26,896,189 |
TOTAL NETHERLANDS | | | 183,922,201 |
| New Zealand - 0.1% | | | |
| Fletcher Building Ltd. | | 1,153,530 | 3,447,204 |
| Singapore - 2.3% | | | |
| Jardine Cycle & Carriage Ltd. | | 145,553 | 3,057,888 |
| Oversea-Chinese Banking Corp. Ltd. | | 5,964,986 | 51,112,800 |
| United Overseas Bank Ltd. | | 2,036,482 | 39,935,533 |
TOTAL SINGAPORE | | | 94,106,221 |
| Spain - 3.4% | | | |
| Banco Bilbao Vizcaya Argentaria SA | | 4,108,649 | 21,195,674 |
| Banco Santander SA (Spain) | | 24,740,430 | 64,107,192 |
| Repsol SA | | 2,087,773 | 28,403,063 |
| Telefonica SA | | 8,308,150 | 28,639,833 |
TOTAL SPAIN | | | 142,345,762 |
| Sweden - 4.3% | | | |
| Castellum AB | | 422,727 | 4,835,563 |
| Electrolux AB (B Shares) (c) | | 332,053 | 4,097,883 |
| Ericsson (B Shares) | | 4,526,056 | 25,161,908 |
| Fastighets AB Balder (a) | | 929,513 | 3,493,293 |
| H&M Hennes & Mauritz AB (B Shares) (c) | | 1,054,366 | 10,619,745 |
| Industrivarden AB (A Shares) | | 518,282 | 11,744,571 |
| Investor AB (B Shares) | | 3,550,539 | 57,998,697 |
| Kinnevik AB (B Shares) (a) | | 357,506 | 4,419,770 |
| Securitas AB (B Shares) (c) | | 740,968 | 6,062,661 |
| Skanska AB (B Shares) | | 589,609 | 9,174,259 |
| SSAB AB (A Shares) | | 1,214,585 | 5,845,655 |
| Volvo AB (B Shares) | | 1,975,387 | 32,331,032 |
| Volvo Car AB | | 790,064 | 3,355,260 |
TOTAL SWEDEN | | | 179,140,297 |
| Switzerland - 3.8% | | | |
| Adecco SA (Reg.) | | 248,116 | 7,765,029 |
| Nestle SA (Reg. S) | | 67,797 | 7,380,300 |
| Novartis AG | | 1,753,340 | 141,829,022 |
TOTAL SWITZERLAND | | | 156,974,351 |
| United Kingdom - 17.0% | | | |
| 3i Group PLC | | 1,433,763 | 19,095,400 |
| Abrdn PLC | | 3,212,501 | 5,857,713 |
| Anglo American PLC (United Kingdom) | | 1,785,315 | 53,477,712 |
| Associated British Foods PLC | | 524,809 | 8,134,167 |
| Barclays PLC | | 23,468,290 | 39,878,584 |
| Barratt Developments PLC | | 1,506,333 | 6,496,952 |
| Bellway PLC | | 181,904 | 3,869,669 |
| British American Tobacco PLC (United Kingdom) | | 2,841,391 | 112,216,398 |
| British Land Co. PLC | | 1,381,754 | 5,798,035 |
| BT Group PLC | | 10,279,084 | 15,300,893 |
| Centrica PLC | | 8,702,479 | 7,646,678 |
| GSK PLC | | 1,519,087 | 24,884,314 |
| Hikma Pharmaceuticals PLC | | 261,642 | 3,747,638 |
| Imperial Brands PLC | | 1,413,628 | 34,434,704 |
| J Sainsbury PLC | | 2,589,917 | 5,773,168 |
| Kingfisher PLC | | 2,970,876 | 7,464,132 |
| Land Securities Group PLC | | 1,106,790 | 7,239,898 |
| Lloyds Banking Group PLC | | 104,648,878 | 50,259,503 |
| Marks & Spencer Group PLC (a) | | 2,893,280 | 3,500,504 |
| Micro Focus International PLC | | 537,076 | 3,202,387 |
| Persimmon PLC | | 470,399 | 7,039,869 |
| Rio Tinto PLC | | 1,464,844 | 76,555,169 |
| Segro PLC | | 1,781,159 | 16,034,670 |
| Shell PLC (London) | | 2,920,918 | 80,914,124 |
| Standard Chartered PLC (United Kingdom) | | 3,655,324 | 21,806,397 |
| Taylor Wimpey PLC | | 5,374,870 | 5,780,506 |
| Tesco PLC | | 11,032,813 | 27,249,774 |
| Tritax Big Box REIT PLC | | 2,753,036 | 4,429,526 |
| Vodafone Group PLC | | 39,479,530 | 46,088,509 |
TOTAL UNITED KINGDOM | | | 704,176,993 |
| TOTAL COMMON STOCKS (Cost $4,635,637,259) | | | 4,109,702,488 |
| | | | |
| Government Obligations - 0.1% |
| | | Principal Amount (d) | Value ($) |
| United States of America - 0.1% | | | |
U.S. Treasury Bills, yield at date of purchase 1.23% 1/26/23 (e) (Cost $2,891,586) | | 2,900,000 | 2,872,376 |
| | | | |
| Money Market Funds - 0.4% |
| | | Shares | Value ($) |
| Fidelity Cash Central Fund 3.10% (f) | | 1,842,158 | 1,842,526 |
| Fidelity Securities Lending Cash Central Fund 3.10% (f)(g) | | 16,039,068 | 16,040,672 |
| TOTAL MONEY MARKET FUNDS (Cost $17,883,198) | | | 17,883,198 |
| | | | |
| TOTAL INVESTMENT IN SECURITIES - 99.6% (Cost $4,656,412,043) | 4,130,458,062 |
NET OTHER ASSETS (LIABILITIES) - 0.4% | 18,260,014 |
| NET ASSETS - 100.0% | 4,148,718,076 |
| | |
| Futures Contracts |
| | Number of contracts | Expiration Date | Notional Amount ($) | Value ($) | Unrealized Appreciation/ (Depreciation) ($) |
| Purchased | | | | | |
| | | | | | |
| Equity Index Contracts | | | | | |
| ICE E-mini MSCI EAFE Index Contracts (United States) | 443 | Dec 2022 | 38,893,185 | 1,756,524 | 1,756,524 |
| | | | | | |
| The notional amount of futures purchased as a percentage of Net Assets is 0.9% |
Categorizations in the Schedule of Investments are based on country or territory of incorporation.
Legend
| (b) | Security exempt from registration under Rule 144A of the Securities Act of 1933. These securities may be resold in transactions exempt from registration, normally to qualified institutional buyers. At the end of the period, the value of these securities amounted to $14,904,292 or 0.4% of net assets. |
| (c) | Security or a portion of the security is on loan at period end. |
| (d) | Amount is stated in United States dollars unless otherwise noted. |
| (e) | Security or a portion of the security was pledged to cover margin requirements for futures contracts. At period end, the value of securities pledged amounted to $2,118,625. |
| (f) | Affiliated fund that is generally available only to investment companies and other accounts managed by Fidelity Investments. The rate quoted is the annualized seven-day yield of the fund at period end. A complete unaudited listing of the fund's holdings as of its most recent quarter end is available upon request. In addition, each Fidelity Central Fund's financial statements, which are not covered by the Fund's Report of Independent Registered Public Accounting Firm, are available on the SEC's website or upon request. |
| (g) | Investment made with cash collateral received from securities on loan. |
Affiliated Central Funds
Fiscal year to date information regarding the Fund's investments in Fidelity Central Funds, including the ownership percentage, is presented below.
| Affiliate | Value, beginning of period ($) | Purchases ($) | Sales Proceeds ($) | Dividend Income ($) | Realized Gain (loss) ($) | Change in Unrealized appreciation (depreciation) ($) | Value, end of period ($) | % ownership, end of period |
| Fidelity Cash Central Fund 3.10% | 45,610,810 | 1,000,079,147 | 1,043,847,431 | 101,304 | - | - | 1,842,526 | 0.0% |
| Fidelity Securities Lending Cash Central Fund 3.10% | - | 663,501,837 | 647,461,165 | 967,893 | - | - | 16,040,672 | 0.0% |
| Total | 45,610,810 | 1,663,580,984 | 1,691,308,596 | 1,069,197 | - | - | 17,883,198 | |
| | | | | | | | | |
Amounts in the income column in the above table include any capital gain distributions from underlying funds, which are presented in the corresponding line item in the Statement of Operations, if applicable.
Amount for Fidelity Securities Lending Cash Central Fund represents the income earned on investing cash collateral, less rebates paid to borrowers and any lending agent fees associated with the loan, plus any premium payments received for lending certain types of securities.
Investment Valuation
The following is a summary of the inputs used, as of October 31, 2022, involving the Fund's assets and liabilities carried at fair value. The inputs or methodology used for valuing securities may not be an indication of the risk associated with investing in those securities. For more information on valuation inputs, and their aggregation into the levels used below, please refer to the Investment Valuation section in the accompanying Notes to Financial Statements.
| Valuation Inputs at Reporting Date: |
| Description | Total ($) | Level 1 ($) | Level 2 ($) | Level 3 ($) |
Investments in Securities: | | | | |
|
| Equities: | | | | |
Communication Services | 277,873,214 | 19,308,001 | 258,565,213 | - |
Consumer Discretionary | 422,972,630 | 154,646,894 | 268,325,736 | - |
Consumer Staples | 363,971,857 | 14,511,068 | 349,460,789 | - |
Energy | 299,349,641 | 39,001,100 | 260,348,541 | - |
Financials | 805,728,666 | 441,087,187 | 364,641,479 | - |
Health Care | 477,843,986 | 25,854,579 | 451,989,407 | - |
Industrials | 603,674,179 | 389,203,771 | 214,470,408 | - |
Information Technology | 232,055,306 | 91,709,586 | 140,345,720 | - |
Materials | 369,903,420 | 176,488,483 | 193,414,937 | - |
Real Estate | 127,068,065 | 72,573,676 | 54,494,389 | - |
Utilities | 129,261,524 | 66,139,189 | 63,122,335 | - |
|
| Government Obligations | 2,872,376 | - | 2,872,376 | - |
|
| Money Market Funds | 17,883,198 | 17,883,198 | - | - |
| Total Investments in Securities: | 4,130,458,062 | 1,508,406,732 | 2,622,051,330 | - |
Derivative Instruments: | | | | |
|
| Assets | | | | |
Futures Contracts | 1,756,524 | 1,756,524 | - | - |
| Total Assets | 1,756,524 | 1,756,524 | - | - |
| Total Derivative Instruments: | 1,756,524 | 1,756,524 | - | - |
Value of Derivative Instruments
The following table is a summary of the Fund's value of derivative instruments by primary risk exposure as of October 31, 2022. For additional information on derivative instruments, please refer to the Derivative Instruments section in the accompanying Notes to Financial Statements.
Primary Risk Exposure / Derivative Type | Value |
| Asset ($) | Liability ($) |
| Equity Risk | | |
Futures Contracts (a) | 1,756,524 | 0 |
| Total Equity Risk | 1,756,524 | 0 |
| Total Value of Derivatives | 1,756,524 | 0 |
(a)Reflects gross cumulative appreciation (depreciation) on futures contracts as presented in the Schedule of Investments. In the Statement of Assets and Liabilities, the period end daily variation margin is included in receivable or payable for daily variation margin on futures contracts, and the net cumulative appreciation (depreciation) is included in Total accumulated earnings (loss).
| Statement of Assets and Liabilities |
| | | | October 31, 2022 |
| | | | | |
| Assets | | | | |
| Investment in securities, at value (including securities loaned of $14,898,741) - See accompanying schedule: | | | | |
Unaffiliated issuers (cost $4,638,528,845) | | $4,112,574,864 | | |
Fidelity Central Funds (cost $17,883,198) | | 17,883,198 | | |
| | | | | |
| Total Investment in Securities (cost $4,656,412,043) | | | $ | 4,130,458,062 |
| Receivable for investments sold | | | | 918,457 |
| Receivable for fund shares sold | | | | 68,465 |
| Dividends receivable | | | | 22,046,025 |
| Reclaims receivable | | | | 13,326,748 |
| Interest receivable | | | | 807 |
| Distributions receivable from Fidelity Central Funds | | | | 34,816 |
| Prepaid expenses | | | | 6,715 |
Total assets | | | | 4,166,860,095 |
| Liabilities | | | | |
| Payable to custodian bank | | $937,633 | | |
| Payable for fund shares redeemed | | 159,100 | | |
| Accrued management fee | | 506,924 | | |
| Payable for daily variation margin on futures contracts | | 342,073 | | |
| Other payables and accrued expenses | | 155,617 | | |
| Collateral on securities loaned | | 16,040,672 | | |
| Total Liabilities | | | | 18,142,019 |
| Net Assets | | | $ | 4,148,718,076 |
| Net Assets consist of: | | | | |
| Paid in capital | | | $ | 4,990,432,875 |
| Total accumulated earnings (loss) | | | | (841,714,799) |
| Net Assets | | | $ | 4,148,718,076 |
Net Asset Value , offering price and redemption price per share ($4,148,718,076 ÷ 541,969,875 shares) | | | $ | 7.65 |
| | | | | |
| Statement of Operations |
| | | | Year ended October 31, 2022 |
| Investment Income | | | | |
| Dividends: | | | | |
| Unaffiliated issuers | | | $ | 276,646,406 |
| Non-Cash dividends | | | | 15,261,007 |
| Interest | | | | 25,730 |
| Income from Fidelity Central Funds (including $967,893 from security lending) | | | | 1,069,197 |
| Income before foreign taxes withheld | | | | 293,002,340 |
| Less foreign taxes withheld | | | | (21,251,592) |
| Total Income | | | | 271,750,748 |
| Expenses | | | | |
| Management fee | $ | 8,202,005 | | |
| Custodian fees and expenses | | 500,289 | | |
| Independent trustees' fees and expenses | | 18,358 | | |
| Registration fees | | (3,448) | | |
| Audit | | 52,093 | | |
| Legal | | 6,221 | | |
| Interest | | 137,564 | | |
| Miscellaneous | | 23,465 | | |
| Total Expenses | | | | 8,936,547 |
| Net Investment income (loss) | | | | 262,814,201 |
| Realized and Unrealized Gain (Loss) | | | | |
| Net realized gain (loss) on: | | | | |
| Investment Securities: | | | | |
| Unaffiliated issuers | | (414,703,176) | | |
| Foreign currency transactions | | (3,454,187) | | |
| Futures contracts | | (13,794,499) | | |
| Total net realized gain (loss) | | | | (431,951,862) |
| Change in net unrealized appreciation (depreciation) on: | | | | |
| Investment Securities: | | | | |
| Unaffiliated issuers | | (833,759,671) | | |
| Assets and liabilities in foreign currencies | | (2,149,738) | | |
| Futures contracts | | 1,022,370 | | |
| Total change in net unrealized appreciation (depreciation) | | | | (834,887,039) |
| Net gain (loss) | | | | (1,266,838,901) |
| Net increase (decrease) in net assets resulting from operations | | | $ | (1,004,024,700) |
| Statement of Changes in Net Assets |
| |
| | Year ended October 31, 2022 | | Year ended October 31, 2021 |
| Increase (Decrease) in Net Assets | | | | |
| Operations | | | | |
| Net investment income (loss) | $ | 262,814,201 | $ | 184,240,516 |
| Net realized gain (loss) | | (431,951,862) | | 300,862,195 |
| Change in net unrealized appreciation (depreciation) | | (834,887,039) | | 591,438,016 |
| Net increase (decrease) in net assets resulting from operations | | (1,004,024,700) | | 1,076,540,727 |
| Distributions to shareholders | | (449,845,102) | | (51,993,306) |
| Share transactions | | | | |
| Proceeds from sales of shares | | 1,108,617,933 | | 2,803,272,597 |
| Reinvestment of distributions | | 447,410,521 | | 51,615,891 |
| Cost of shares redeemed | | (1,938,490,026) | | (152,783,351) |
Net increase (decrease) in net assets resulting from share transactions | | (382,461,572) | | 2,702,105,137 |
| Total increase (decrease) in net assets | | (1,836,331,374) | | 3,726,652,558 |
| | | | | |
| Net Assets | | | | |
| Beginning of period | | 5,985,049,450 | | 2,258,396,892 |
| End of period | $ | 4,148,718,076 | $ | 5,985,049,450 |
| | | | | |
| Other Information | | | | |
| Shares | | | | |
| Sold | | 118,980,904 | | 291,393,514 |
| Issued in reinvestment of distributions | | 49,328,613 | | 5,908,191 |
| Redeemed | | (222,929,982) | | (16,184,874) |
| Net increase (decrease) | | (54,620,465) | | 281,116,831 |
| | | | | |
Financial Highlights
| Fidelity® SAI International Value Index Fund |
| |
| Years ended October 31, | | 2022 | | 2021 | | 2020 | | 2019 | | 2018 A |
Selected Per-Share Data | | | | | | | | | | |
| Net asset value, beginning of period | $ | 10.03 | $ | 7.16 | $ | 9.19 | $ | 8.93 | $ | 10.00 |
| Income from Investment Operations | | | | | | | | | | |
Net investment income (loss) B,C | | .42 | | .38 | | .24 | | .37 | | .28 |
| Net realized and unrealized gain (loss) | | (1.99) | | 2.63 | | (1.95) | | .07 | | (1.34) |
| Total from investment operations | | (1.57) | | 3.01 | | (1.71) | | .44 | | (1.06) |
| Distributions from net investment income | | (.46) | | (.14) | | (.32) | | (.18) | | (.01) |
| Distributions from net realized gain | | (.35) | | - | | - | | - D | | - |
| Total distributions | | (.81) | | (.14) | | (.32) | | (.18) | | (.01) |
| Net asset value, end of period | $ | 7.65 | $ | 10.03 | $ | 7.16 | $ | 9.19 | $ | 8.93 |
Total Return E,F | | (16.93)% | | 42.33% | | (19.36)% | | 5.12% | | (10.64)% |
Ratios to Average Net Assets C,G,H | | | | | | | | | | |
| Expenses before reductions | | .16% | | .17% | | .18% | | .26% | | .37% I |
| Expenses net of fee waivers, if any | | .16% | | .17% | | .18% | | .20% | | .20% I |
| Expenses net of all reductions | | .16% | | .17% | | .18% | | .20% | | .20% I |
| Net investment income (loss) | | 4.82% | | 3.84% | | 3.04% | | 4.22% | | 3.32% I |
| Supplemental Data | | | | | | | | | | |
| Net assets, end of period (000 omitted) | $ | 4,148,718 | $ | 5,985,049 | $ | 2,258,397 | $ | 1,036,532 | $ | 475,509 |
Portfolio turnover rate J | | 79% | | 60% | | 57% | | 59% | | 54% I |
A For the period December 19, 2017 (commencement of operations) through October 31, 2018.
B Calculated based on average shares outstanding during the period.
C Net investment income (loss) is affected by the timing of the declaration of dividends by any underlying mutual funds or exchange-traded funds (ETFs). Net investment income (loss) of any mutual funds or ETFs is not included in the Fund's net investment income (loss) ratio.
D Amount represents less than $.005 per share.
E Total returns for periods of less than one year are not annualized.
F Total returns would have been lower if certain expenses had not been reduced during the applicable periods shown.
G Fees and expenses of any underlying mutual funds or exchange-traded funds (ETFs) are not included in the Fund's expense ratio. The Fund indirectly bears its proportionate share of these expenses. For additional expense information related to investments in Fidelity Central Funds, please refer to the "Investments in Fidelity Central Funds" note found in the Notes to Financial Statements section of the most recent Annual or Semi-Annual report.
H Expense ratios reflect operating expenses of the class. Expenses before reductions do not reflect amounts reimbursed, waived, or reduced through arrangements with the investment adviser, brokerage services, or other offset arrangements, if applicable, and do not represent the amount paid by the class during periods when reimbursements, waivers or reductions occur.
I Annualized.
J Amount does not include the portfolio activity of any underlying mutual funds or exchange-traded funds (ETFs).
For the period ended October 31, 2022
1. Organization.
Fidelity SAI International Value Index Fund (the Fund) is a fund of Fidelity Salem Street Trust (the Trust) and is authorized to issue an unlimited number of shares. Shares are offered exclusively to certain clients of Fidelity Management & Research Company LLC (FMR) or its affiliates. The Trust is registered under the Investment Company Act of 1940, as amended (the 1940 Act), as an open-end management investment company organized as a Massachusetts business trust.
2. Investments in Fidelity Central Funds.
Funds may invest in Fidelity Central Funds, which are open-end investment companies generally available only to other investment companies and accounts managed by the investment adviser and its affiliates. The Schedule of Investments lists any Fidelity Central Funds held as an investment as of period end, but does not include the underlying holdings of each Fidelity Central Fund. An investing fund indirectly bears its proportionate share of the expenses of the underlying Fidelity Central Funds.
Based on its investment objective, each Fidelity Central Fund may invest or participate in various investment vehicles or strategies that are similar to those of the investing fund. These strategies are consistent with the investment objectives of the investing fund and may involve certain economic risks which may cause a decline in value of each of the Fidelity Central Funds and thus a decline in the value of the investing fund.
| Fidelity Central Fund | Investment Manager | Investment Objective | Investment Practices | Expense Ratio A |
| Fidelity Money Market Central Funds | Fidelity Management & Research Company LLC (FMR) | Each fund seeks to obtain a high level of current income consistent with the preservation of capital and liquidity. | Short-term Investments | Less than .005% |
A Expenses expressed as a percentage of average net assets and are as of each underlying Central Fund's most recent annual or semi-annual shareholder report.
A complete unaudited list of holdings for each Fidelity Central Fund is available upon request or at the Securities and Exchange Commission website at www.sec.gov. In addition, the financial statements of the Fidelity Central Funds which contain the significant accounting policies (including investment valuation policies) of those funds, and are not covered by the Report of Independent Registered Public Accounting Firm, are available on the Securities and Exchange Commission website or upon request.
3. Significant Accounting Policies.
The Fund is an investment company and applies the accounting and reporting guidance of the Financial Accounting Standards Board (FASB) Accounting Standards Codification Topic 946 Financial Services - Investment Companies . The financial statements have been prepared in conformity with accounting principles generally accepted in the United States of America (GAAP), which require management to make certain estimates and assumptions at the date of the financial statements. Actual results could differ from those estimates. Subsequent events, if any, through the date that the financial statements were issued have been evaluated in the preparation of the financial statements. The Fund's Schedule of Investments lists any underlying mutual funds or exchange-traded funds (ETFs) but does not include the underlying holdings of these funds. The following summarizes the significant accounting policies of the Fund:
Investment Valuation. Investments are valued as of 4:00 p.m. Eastern time on the last calendar day of the period. The Board of Trustees (the Board) has designated the Fund's investment adviser as the valuation designee responsible for the fair valuation function and performing fair value determinations as needed. The investment adviser has established a Fair Value Committee (the Committee) to carry out the day-to-day fair valuation responsibilities and has adopted policies and procedures to govern the fair valuation process and the activities of the Committee. In accordance with these fair valuation policies and procedures, which have been approved by the Board, the Fund attempts to obtain prices from one or more third party pricing services or brokers to value its investments. When current market prices, quotations or currency exchange rates are not readily available or reliable, investments will be fair valued in good faith by the Committee, in accordance with the policies and procedures. Factors used in determining fair value vary by investment type and may include market or investment specific events, transaction data, estimated cash flows, and market observations of comparable investments. The frequency that the fair valuation procedures are used cannot be predicted and they may be utilized to a significant extent. The Committee manages the Fund's fair valuation practices and maintains the fair valuation policies and procedures. The Fund's investment adviser reports to the Board information regarding the fair valuation process and related material matters.
The Fund categorizes the inputs to valuation techniques used to value its investments into a disclosure hierarchy consisting of three levels as shown below:
Level 1 - unadjusted quoted prices in active markets for identical investments
Level 2 - other significant observable inputs (including quoted prices for similar investments, interest rates, prepayment speeds, etc.)
Level 3 - unobservable inputs (including the Fund's own assumptions based on the best information available)
Valuation techniques used to value the Fund's investments by major category are as follows:
Equity securities, including restricted securities, for which market quotations are readily available, are valued at the last reported sale price or official closing price as reported by a third party pricing service on the primary market or exchange on which they are traded and are categorized as Level 1 in the hierarchy. In the event there were no sales during the day or closing prices are not available, securities are valued at the last quoted bid price or may be valued using the last available price and are generally categorized as Level 2 in the hierarchy. For foreign equity securities, when market or security specific events arise, comparisons to the valuation of American Depositary Receipts (ADRs), futures contracts, Exchange-Traded Funds (ETFs) and certain indexes as well as quoted prices for similar securities may be used and would be categorized as Level 2 in the hierarchy. For equity securities, including restricted securities, where observable inputs are limited, assumptions about market activity and risk are used and these securities may be categorized as Level 3 in the hierarchy.
Debt securities, including restricted securities, are valued based on evaluated prices received from third party pricing services or from brokers who make markets in such securities. U.S. government and government agency obligations are valued by pricing services who utilize matrix pricing which considers yield or price of bonds of comparable quality, coupon, maturity and type or by broker-supplied prices. When independent prices are unavailable or unreliable, debt securities may be valued utilizing pricing methodologies which consider similar factors that would be used by third party pricing services. Debt securities are generally categorized as Level 2 in the hierarchy but may be Level 3 depending on the circumstances.
Futures contracts are valued at the settlement price established each day by the board of trade or exchange on which they are traded and are categorized as Level 1 in the hierarchy. Investments in open-end mutual funds, including the Fidelity Central Funds, are valued at their closing net asset value (NAV) each business day and are categorized as Level 1 in the hierarchy.
Changes in valuation techniques may result in transfers in or out of an assigned level within the disclosure hierarchy. The aggregate value of investments by input level as of October 31, 2022 is included at the end of the Fund's Schedule of Investments.
Foreign Currency. Certain Funds may use foreign currency contracts to facilitate transactions in foreign-denominated securities. Gains and losses from these transactions may arise from changes in the value of the foreign currency or if the counterparties do not perform under the contracts' terms.
Foreign-denominated assets, including investment securities, and liabilities are translated into U.S. dollars at the exchange rates at period end. Purchases and sales of investment securities, income and dividends received, and expenses denominated in foreign currencies are translated into U.S. dollars at the exchange rate in effect on the transaction date.
The effects of exchange rate fluctuations on investments are included with the net realized and unrealized gain (loss) on investment securities. Other foreign currency transactions resulting in realized and unrealized gain (loss) are disclosed separately.
Investment Transactions and Income. For financial reporting purposes, the Fund's investment holdings and NAV include trades executed through the end of the last business day of the period. The NAV per share for processing shareholder transactions is calculated as of the close of business of the New York Stock Exchange (NYSE), normally 4:00 p.m. Eastern time and includes trades executed through the end of the prior business day. Gains and losses on securities sold are determined on the basis of identified cost. Commissions paid to certain brokers with whom the investment adviser, or its affiliates, places trades on behalf of a fund include an amount in addition to trade execution, which may be rebated back to a fund. Any such rebates are included in net realized gain (loss) on investments in the Statement of Operations. Dividend income is recorded on the ex-dividend date, except for certain dividends from foreign securities where the ex-dividend date may have passed, which are recorded as soon as the Fund is informed of the ex-dividend date. Non-cash dividends included in dividend income, if any, are recorded at the fair market value of the securities received. Income and capital gain distributions from Fidelity Central Funds, if any, are recorded on the ex-dividend date. Interest income is accrued as earned and includes coupon interest and amortization of premium and accretion of discount on debt securities as applicable. Investment income is recorded net of foreign taxes withheld where recovery of such taxes is uncertain. Funds may file withholding tax reclaims in certain jurisdictions to recover a portion of amounts previously withheld. Any withholding tax reclaims income is included in the Statement of Operations in foreign taxes withheld. Any receivables for withholding tax reclaims are included in the Statement of Assets and Liabilities in reclaims receivable.
Expenses. Expenses directly attributable to a fund are charged to that fund. Expenses attributable to more than one fund are allocated among the respective funds on the basis of relative net assets or other appropriate methods. Expenses included in the accompanying financial statements reflect the expenses of that fund and do not include any expenses associated with any underlying mutual funds or exchange-traded funds. Although not included in a fund's expenses, a fund indirectly bears its proportionate share of these expenses through the net asset value of each underlying mutual fund or exchange-traded fund. Expense estimates are accrued in the period to which they relate and adjustments are made when actual amounts are known.
Income Tax Information and Distributions to Shareholders. Each year, the Fund intends to qualify as a regulated investment company under Subchapter M of the Internal Revenue Code, including distributing substantially all of its taxable income and realized gains. As a result, no provision for U.S. Federal income taxes is required. As of October 31, 2022, the Fund did not have any unrecognized tax benefits in the financial statements; nor is the Fund aware of any tax positions for which it is reasonably possible that the total amounts of unrecognized tax benefits will significantly change in the next twelve months. The Fund files a U.S. federal tax return, in addition to state and local tax returns as required. The Fund's federal income tax returns are subject to examination by the Internal Revenue Service (IRS) for a period of three fiscal years after they are filed. State and local tax returns may be subject to examination for an additional fiscal year depending on the jurisdiction. Foreign taxes are provided for based on the Fund's understanding of the tax rules and rates that exist in the foreign markets in which it invests.
Distributions are declared and recorded on the ex-dividend date. Income and capital gain distributions are determined in accordance with income tax regulations, which may differ from GAAP. In addition, the Fund claimed a portion of the payment made to redeeming shareholders as a distribution for income tax purposes.
Capital accounts within the financial statements are adjusted for permanent book-tax differences. These adjustments have no impact on net assets or the results of operations. Capital accounts are not adjusted for temporary book-tax differences which will reverse in a subsequent period.
Book-tax differences are primarily due to futures contracts, foreign currency transactions, passive foreign investment companies (PFIC), certain corporate actions, capital loss carryforwards and losses deferred due to wash sales.
As of period end, the cost and unrealized appreciation (depreciation) in securities, and derivatives if applicable, for federal income tax purposes were as follows:
| Gross unrealized appreciation | $189,223,644 |
| Gross unrealized depreciation | (777,762,926) |
| Net unrealized appreciation (depreciation) | $(588,539,282) |
| Tax Cost | $4,718,997,344 |
The tax-based components of distributable earnings as of period end were as follows:
| Undistributed ordinary income | $183,160,955 |
| Capital loss carryforward | $(433,866,188) |
| Net unrealized appreciation (depreciation) on securities and other investments | $(591,009,567) |
Capital loss carryforwards are only available to offset future capital gains of the Fund to the extent provided by regulations and may be limited. The capital loss carryforward information presented below, including any applicable limitation, is estimated as of fiscal period end and is subject to adjustment.
Short-term | $(321,591,098) |
Long-term | (112,275,090) |
| Total capital loss carryforward | $(433,866,188) |
The tax character of distributions paid was as follows:
| | October 31, 2022 | October 31, 2021 |
| Ordinary Income | $449,845,102 | $51,993,306 |
Restricted Securities (including Private Placements). Funds may invest in securities that are subject to legal or contractual restrictions on resale. These securities generally may be resold in transactions exempt from registration or to the public if the securities are registered. Disposal of these securities may involve time-consuming negotiations and expense, and prompt sale at an acceptable price may be difficult. Information regarding restricted securities held at period end is included at the end of the Schedule of Investments, if applicable.
4. Derivative Instruments.
Risk Exposures and the Use of Derivative Instruments. The Fund's investment objectives allow for various types of derivative instruments, including futures contracts. Derivatives are investments whose value is primarily derived from underlying assets, indices or reference rates and may be transacted on an exchange or over-the-counter (OTC). Derivatives may involve a future commitment to buy or sell a specified asset based on specified terms, to exchange future cash flows at periodic intervals based on a notional principal amount, or for one party to make one or more payments upon the occurrence of specified events in exchange for periodic payments from the other party.
Derivatives were used to increase returns and to manage exposure to certain risks as defined below. The success of any strategy involving derivatives depends on analysis of numerous economic factors, and if the strategies for investment do not work as intended, the objectives may not be achieved.
Derivatives were used to increase or decrease exposure to the following risk(s):
| | |
| Equity Risk | Equity risk relates to the fluctuations in the value of financial instruments as a result of changes in market prices (other than those arising from interest rate risk or foreign exchange risk), whether caused by factors specific to an individual investment, its issuer, or all factors affecting all instruments traded in a market or market segment. |
Funds are also exposed to additional risks from investing in derivatives, such as liquidity risk and counterparty credit risk. Liquidity risk is the risk that a fund will be unable to close out the derivative in the open market in a timely manner. Counterparty credit risk is the risk that the counterparty will not be able to fulfill its obligation to a fund. Counterparty credit risk related to exchange-traded contracts may be mitigated by the protection provided by the exchange on which they trade.
Investing in derivatives may involve greater risks than investing in the underlying assets directly and, to varying degrees, may involve risk of loss in excess of any initial investment and collateral received and amounts recognized in the Statement of Assets and Liabilities. In addition, there may be the risk that the change in value of the derivative contract does not correspond to the change in value of the underlying instrument.
Futures Contracts. A futures contract is an agreement between two parties to buy or sell a specified underlying instrument for a fixed price at a specified future date. Futures contracts were used to manage exposure to the stock market.
Upon entering into a futures contract, a fund is required to deposit either cash or securities (initial margin) with a clearing broker in an amount equal to a certain percentage of the face value of the contract. Futures contracts are marked-to-market daily and subsequent daily payments are made or received by a fund depending on the daily fluctuations in the value of the futures contracts and are recorded as unrealized appreciation or (depreciation). This receivable and/or payable, if any, is included in daily variation margin on futures contracts in the Statement of Assets and Liabilities. Realized gain or (loss) is recorded upon the expiration or closing of a futures contract. The net realized gain (loss) and change in net unrealized appreciation (depreciation) on futures contracts during the period is presented in the Statement of Operations.
Any open futures contracts at period end are presented in the Schedule of Investments under the caption "Futures Contracts". The notional amount at value reflects each contract's exposure to the underlying instrument or index at period end, and is representative of volume of activity during the period unless an average notional amount is presented. Any securities deposited to meet initial margin requirements are identified in the Schedule of Investments. Any cash deposited to meet initial margin requirements is presented as segregated cash with brokers for derivative instruments in the Statement of Assets and Liabilities.
5. Purchases and Sales of Investments.
Purchases and sales of securities, other than short-term securities and in-kind transactions, as applicable, are noted in the table below.
| | Purchases ($) | Sales ($) |
| Fidelity SAI International Value Index Fund | 4,217,452,817 | 4,770,615,485 |
6. Fees and Other Transactions with Affiliates.
Management Fee. Fidelity Management & Research Company LLC (the investment adviser) and its affiliates provide the Fund with investment management related services for which the Fund pays a monthly management fee that is based on an annual rate of .15% of the Fund's average net assets.
Sub-Adviser. Geode Capital Management, LLC (Geode), serves as sub-adviser for the Fund. Geode provides discretionary investment advisory services to the Fund and is paid by the investment adviser for providing these services.
Interfund Lending Program. Pursuant to an Exemptive Order issued by the Securities and Exchange Commission (the SEC), the Fund, along with other registered investment companies having management contracts with Fidelity Management & Research Company LLC (FMR), or other affiliated entities of FMR, may participate in an interfund lending program. This program provides an alternative credit facility allowing the Fund to borrow from, or lend money to, other participating affiliated funds. At period end, there were no interfund loans outstanding. Activity in this program during the period for which loans were outstanding was as follows:
| | Borrower or Lender | Average Loan Balance | Weighted Average Interest Rate | Interest Expense |
Fidelity SAI International Value Index Fund | Borrower | $ 31,907,159 | 1.78% | $129,160 |
Interfund Trades. Funds may purchase from or sell securities to other Fidelity Funds under procedures adopted by the Board. The procedures have been designed to ensure these interfund trades are executed in accordance with Rule 17a-7 of the 1940 Act. Any interfund trades are included within the respective purchases and sales amounts shown in the Purchases and Sales of Investments note. During the period, there were no interfund trades.
7. Committed Line of Credit.
Certain Funds participate with other funds managed by the investment adviser or an affiliate in a $4.25 billion credit facility (the "line of credit") to be utilized for temporary or emergency purposes to fund shareholder redemptions or for other short-term liquidity purposes. The participating funds have agreed to pay commitment fees on their pro-rata portion of the line of credit, which are reflected in Miscellaneous expenses on the Statement of Operations, and are listed below. During the period, there were no borrowings on this line of credit.
| | Amount |
| Fidelity SAI International Value Index Fund | $9,640 |
8. Security Lending.
Funds lend portfolio securities from time to time in order to earn additional income. Lending agents are used, including National Financial Services (NFS), an affiliate of the investment adviser. Pursuant to a securities lending agreement, NFS will receive a fee, which is capped at 9.9% of a fund's daily lending revenue, for its services as lending agent. A fund may lend securities to certain qualified borrowers, including NFS. On the settlement date of the loan, a fund receives collateral (in the form of U.S. Treasury obligations, letters of credit and/or cash) against the loaned securities and maintains collateral in an amount not less than 100% of the market value of the loaned securities during the period of the loan. The market value of the loaned securities is determined at the close of business of a fund and any additional required collateral is delivered to a fund on the next business day. A fund or borrower may terminate the loan at any time, and if the borrower defaults on its obligation to return the securities loaned because of insolvency or other reasons, a fund may apply collateral received from the borrower against the obligation. A fund may experience delays and costs in recovering the securities loaned. Any cash collateral received is invested in the Fidelity Securities Lending Cash Central Fund. Any loaned securities are identified as such in the Schedule of Investments, and the value of loaned securities and cash collateral at period end, as applicable, are presented in the Statement of Assets and Liabilities. Security lending income represents the income earned on investing cash collateral, less rebates paid to borrowers and any lending agent fees associated with the loan, plus any premium payments received for lending certain types of securities. Security lending income is presented in the Statement of Operations as a component of income from Fidelity Central Funds. Affiliated security lending activity, if any, was as follows:
| | Total Security Lending Fees Paid to NFS | Security Lending Income From Securities Loaned to NFS | Value of Securities Loaned to NFS at Period End |
| Fidelity SAI International Value Index Fund | $101,519 | $- | $- |
9. Bank Borrowings.
The Fund is permitted to have bank borrowings for temporary or emergency purposes to fund shareholder redemptions or for other short-term liquidity requirements. The Fund has established borrowing arrangements with certain banks. The interest rate on the borrowings is the bank's base rate, as revised from time to time. Any open loans, including accrued interest, at period end are presented under the caption "Notes payable" in the Statement of Assets and Liabilities, if applicable. Activity in this program during the period for which loans were outstanding was as follows:
| | Average Loan Balance | Weighted Average Interest Rate | Interest Expense |
| Fidelity SAI International Value Index Fund | $13,567,273 | 2.03% | $8,404 |
10. Other.
A fund's organizational documents provide former and current trustees and officers with a limited indemnification against liabilities arising in connection with the performance of their duties to the fund. In the normal course of business, a fund may also enter into contracts that provide general indemnifications. A fund's maximum exposure under these arrangements is unknown as this would be dependent on future claims that may be made against a fund. The risk of material loss from such claims is considered remote.
At the end of the period, the following mutual funds managed by the investment adviser or its affiliates were the owners of record of 10% or more of the total outstanding shares.
| | Strategic Advisers Fidelity International Fund | Strategic Advisers International Fund |
| Fidelity SAI International Value Index Fund | 81% | 13% |
Mutual funds managed by the investment adviser or its affiliates, in aggregate, were the owners of record of more than 20% of the total outstanding shares.
| Fund | % of shares held |
| Fidelity SAI International Value Index Fund | 94% |
11. Risk and Uncertainties.
Many factors affect a fund's performance. Developments that disrupt global economies and financial markets, such as pandemics, epidemics, outbreaks of infectious diseases, war, terrorism, and environmental disasters, may significantly affect a fund's investment performance. The effects of these developments to a fund will be impacted by the types of securities in which a fund invests, the financial condition, industry, economic sector, and geographic location of an issuer, and a fund's level of investment in the securities of that issuer.
To the Board of Trustees of Fidelity Salem Street Trust and Shareholders of Fidelity SAI International Value Index Fund
Opinion on the Financial Statements
We have audited the accompanying statement of assets and liabilities, including the schedule of investments, of Fidelity SAI International Value Index Fund (one of the funds constituting Fidelity Salem Street Trust, referred to hereafter as the "Fund") as of October 31, 2022, the related statement of operations for the year ended October 31, 2022, the statement of changes in net assets for each of the two years in the period ended October 31, 2022, including the related notes, and the financial highlights for each of the four years in the period ended October 31, 2022 and for the period December 19, 2017 (commencement of operations) through October 31, 2018 (collectively referred to as the "financial statements"). In our opinion, the financial statements present fairly, in all material respects, the financial position of the Fund as of October 31, 2022, the results of its operations for the year then ended, the changes in its net assets for each of the two years in the period ended October 31, 2022 and the financial highlights for each of the four years in the period ended October 31, 2022 and for the period December 19, 2017 (commencement of operations) through October 31, 2018 in conformity with accounting principles generally accepted in the United States of America.
Basis for Opinion
These financial statements are the responsibility of the Fund's management. Our responsibility is to express an opinion on the Fund's financial statements based on our audits. We are a public accounting firm registered with the Public Company Accounting Oversight Board (United States) (PCAOB) and are required to be independent with respect to the Fund in accordance with the U.S. federal securities laws and the applicable rules and regulations of the Securities and Exchange Commission and the PCAOB.
We conducted our audits of these financial statements in accordance with the standards of the PCAOB. Those standards require that we plan and perform the audit to obtain reasonable assurance about whether the financial statements are free of material misstatement, whether due to error or fraud.
Our audits included performing procedures to assess the risks of material misstatement of the financial statements, whether due to error or fraud, and performing procedures that respond to those risks. Such procedures included examining, on a test basis, evidence regarding the amounts and disclosures in the financial statements. Our audits also included evaluating the accounting principles used and significant estimates made by management, as well as evaluating the overall presentation of the financial statements. Our procedures included confirmation of securities owned as of October 31, 2022 by correspondence with the custodian and brokers. We believe that our audits provide a reasonable basis for our opinion.
/s/ PricewaterhouseCoopers LLP
Boston, Massachusetts
December 15, 2022
We have served as the auditor of one or more investment companies in the Fidelity group of funds since 1932.
The Trustees, Members of the Advisory Board (if any), and officers of the trust and fund, as applicable, are listed below. The Board of Trustees governs the fund and is responsible for protecting the interests of shareholders. The Trustees are experienced executives who meet periodically throughout the year to oversee the fund's activities, review contractual arrangements with companies that provide services to the fund, oversee management of the risks associated with such activities and contractual arrangements, and review the fund's performance. Except for Jonathan Chiel, each of the Trustees oversees 293 funds. Mr. Chiel oversees 184 funds.
The Trustees hold office without limit in time except that (a) any Trustee may resign; (b) any Trustee may be removed by written instrument, signed by at least two-thirds of the number of Trustees prior to such removal; (c) any Trustee who requests to be retired or who has become incapacitated by illness or injury may be retired by written instrument signed by a majority of the other Trustees; and (d) any Trustee may be removed at any special meeting of shareholders by a two-thirds vote of the outstanding voting securities of the trust. Each Trustee who is not an interested person (as defined in the 1940 Act) of the trust and the fund is referred to herein as an Independent Trustee. Each Independent Trustee shall retire not later than the last day of the calendar year in which his or her 75th birthday occurs. The Independent Trustees may waive this mandatory retirement age policy with respect to individual Trustees. Officers and Advisory Board Members hold office without limit in time, except that any officer or Advisory Board Member may resign or may be removed by a vote of a majority of the Trustees at any regular meeting or any special meeting of the Trustees. Except as indicated, each individual has held the office shown or other offices in the same company for the past five years.
The fund's Statement of Additional Information (SAI) includes more information about the Trustees. To request a free copy, call Fidelity at 1-800-544-3455.
Experience, Skills, Attributes, and Qualifications of the Trustees. The Governance and Nominating Committee has adopted a statement of policy that describes the experience, qualifications, attributes, and skills that are necessary and desirable for potential Independent Trustee candidates (Statement of Policy). The Board believes that each Trustee satisfied at the time he or she was initially elected or appointed a Trustee, and continues to satisfy, the standards contemplated by the Statement of Policy. The Governance and Nominating Committee also engages professional search firms to help identify potential Independent Trustee candidates who have the experience, qualifications, attributes, and skills consistent with the Statement of Policy. From time to time, additional criteria based on the composition and skills of the current Independent Trustees, as well as experience or skills that may be appropriate in light of future changes to board composition, business conditions, and regulatory or other developments, have also been considered by the professional search firms and the Governance and Nominating Committee. In addition, the Board takes into account the Trustees' commitment and participation in Board and committee meetings, as well as their leadership of standing and ad hoc committees throughout their tenure.
In determining that a particular Trustee was and continues to be qualified to serve as a Trustee, the Board has considered a variety of criteria, none of which, in isolation, was controlling. The Board believes that, collectively, the Trustees have balanced and diverse experience, qualifications, attributes, and skills, which allow the Board to operate effectively in governing the fund and protecting the interests of shareholders. Information about the specific experience, skills, attributes, and qualifications of each Trustee, which in each case led to the Board's conclusion that the Trustee should serve (or continue to serve) as a trustee of the fund, is provided below.
Board Structure and Oversight Function. Abigail P. Johnson is an interested person and currently serves as Chairman. The Trustees have determined that an interested Chairman is appropriate and benefits shareholders because an interested Chairman has a personal and professional stake in the quality and continuity of services provided to the fund. Independent Trustees exercise their informed business judgment to appoint an individual of their choosing to serve as Chairman, regardless of whether the Trustee happens to be independent or a member of management. The Independent Trustees have determined that they can act independently and effectively without having an Independent Trustee serve as Chairman and that a key structural component for assuring that they are in a position to do so is for the Independent Trustees to constitute a substantial majority for the Board. The Independent Trustees also regularly meet in executive session. Michael E. Kenneally serves as Chairman of the Independent Trustees and as such (i) acts as a liaison between the Independent Trustees and management with respect to matters important to the Independent Trustees and (ii) with management prepares agendas for Board meetings.
Fidelity ® funds are overseen by different Boards of Trustees. The fund's Board oversees Fidelity's investment-grade bond, money market, asset allocation and certain equity funds, and other Boards oversee Fidelity's high income and other equity funds. The asset allocation funds may invest in Fidelity ® funds that are overseen by such other Boards. The use of separate Boards, each with its own committee structure, allows the Trustees of each group of Fidelity ® funds to focus on the unique issues of the funds they oversee, including common research, investment, and operational issues. On occasion, the separate Boards establish joint committees to address issues of overlapping consequences for the Fidelity ® funds overseen by each Board.
The Trustees operate using a system of committees to facilitate the timely and efficient consideration of all matters of importance to the Trustees, the fund, and fund shareholders and to facilitate compliance with legal and regulatory requirements and oversight of the fund's activities and associated risks. The Board, acting through its committees, has charged FMR and its affiliates with (i) identifying events or circumstances the occurrence of which could have demonstrably adverse effects on the fund's business and/or reputation; (ii) implementing processes and controls to lessen the possibility that such events or circumstances occur or to mitigate the effects of such events or circumstances if they do occur; and (iii) creating and maintaining a system designed to evaluate continuously business and market conditions in order to facilitate the identification and implementation processes described in (i) and (ii) above. Because the day-to-day operations and activities of the fund are carried out by or through FMR, its affiliates, and other service providers, the fund's exposure to risks is mitigated but not eliminated by the processes overseen by the Trustees. While each of the Board's committees has responsibility for overseeing different aspects of the fund's activities, oversight is exercised primarily through the Operations and Audit Committees. In addition, an ad hoc Board committee of Independent Trustees has worked with FMR to enhance the Board's oversight of investment and financial risks, legal and regulatory risks, technology risks, and operational risks, including the development of additional risk reporting to the Board. Appropriate personnel, including but not limited to the fund's Chief Compliance Officer (CCO), FMR's internal auditor, the independent accountants, the fund's Treasurer and portfolio management personnel, make periodic reports to the Board's committees, as appropriate, including an annual review of Fidelity's risk management program for the Fidelity ® funds. The responsibilities of each standing committee, including their oversight responsibilities, are described further under "Standing Committees of the Trustees."
Interested Trustees*:
Correspondence intended for a Trustee who is an interested person may be sent to Fidelity Investments, 245 Summer Street, Boston, Massachusetts 02210.
Name, Year of Birth; Principal Occupations and Other Relevant Experience+
Jonathan Chiel (1957)
Year of Election or Appointment: 2016
Trustee
Mr. Chiel also serves as Trustee of other Fidelity ® funds. Mr. Chiel is Executive Vice President and General Counsel for FMR LLC (diversified financial services company, 2012-present). Previously, Mr. Chiel served as general counsel (2004-2012) and senior vice president and deputy general counsel (2000-2004) for John Hancock Financial Services; a partner with Choate, Hall & Stewart (1996-2000) (law firm); and an Assistant United States Attorney for the United States Attorney's Office of the District of Massachusetts (1986-95), including Chief of the Criminal Division (1993-1995). Mr. Chiel is a director on the boards of the Boston Bar Foundation and the Maimonides School.
Abigail P. Johnson (1961)
Year of Election or Appointment: 2009
Trustee
Chairman of the Board of Trustees
Ms. Johnson also serves as Trustee of other Fidelity ® funds. Ms. Johnson serves as Chairman (2016-present), Chief Executive Officer (2014-present), and Director (2007-present) of FMR LLC (diversified financial services company), President of Fidelity Financial Services (2012-present) and President of Personal, Workplace and Institutional Services (2005-present). Ms. Johnson is Chairman and Director of Fidelity Management & Research Company LLC (investment adviser firm, 2011-present). Previously, Ms. Johnson served as Chairman and Director of FMR Co., Inc. (investment adviser firm, 2011-2019), Vice Chairman (2007-2016) and President (2013-2016) of FMR LLC, President and a Director of Fidelity Management & Research Company (2001-2005), a Trustee of other investment companies advised by Fidelity Management & Research Company, Fidelity Investments Money Management, Inc. (investment adviser firm), and FMR Co., Inc. (2001-2005), Senior Vice President of the Fidelity ® funds (2001-2005), and managed a number of Fidelity ® funds. Ms. Abigail P. Johnson and Mr. Arthur E. Johnson are not related.
Jennifer Toolin McAuliffe (1959)
Year of Election or Appointment: 2016
Trustee
Ms. McAuliffe also serves as Trustee of other Fidelity ® funds and as Trustee of Fidelity Charitable (2020-present). Previously, Ms. McAuliffe served as Co-Head of Fixed Income of Fidelity Investments Limited (now known as FIL Limited (FIL)) (diversified financial services company), Director of Research for FIL's credit and quantitative teams in London, Hong Kong and Tokyo and Director of Research for taxable and municipal bonds at Fidelity Investments Money Management, Inc. Ms. McAuliffe previously served as a member of the Advisory Board of certain Fidelity ® funds (2016). Ms. McAuliffe was previously a lawyer at Ropes & Gray LLP and currently serves as director or trustee of several not-for-profit entities.
* Determined to be an "Interested Trustee" by virtue of, among other things, his or her affiliation with the trust or various entities under common control with FMR.
+ The information includes the Trustee's principal occupation during the last five years and other information relating to the experience, attributes, and skills relevant to the Trustee's qualifications to serve as a Trustee, which led to the conclusion that the Trustee should serve as a Trustee for the fund.
Independent Trustees:
Correspondence intended for an Independent Trustee may be sent to Fidelity Investments, P.O. Box 55235, Boston, Massachusetts 02205-5235.
Name, Year of Birth; Principal Occupations and Other Relevant Experience+
Elizabeth S. Acton (1951)
Year of Election or Appointment: 2013
Trustee
Ms. Acton also serves as Trustee of other Fidelity ® funds. Prior to her retirement, Ms. Acton served as Executive Vice President, Finance (2011-2012), Executive Vice President, Chief Financial Officer (2002-2011) and Treasurer (2004-2005) of Comerica Incorporated (financial services). Prior to joining Comerica, Ms. Acton held a variety of positions at Ford Motor Company (1983-2002), including Vice President and Treasurer (2000-2002) and Executive Vice President and Chief Financial Officer of Ford Motor Credit Company (1998-2000). Ms. Acton currently serves as a member of the Board and Audit and Finance Committees of Beazer Homes USA, Inc. (homebuilding, 2012-present). Ms. Acton previously served as a member of the Advisory Board of certain Fidelity ® funds (2013-2016).
Ann E. Dunwoody (1953)
Year of Election or Appointment: 2018
Trustee
General Dunwoody also serves as Trustee of other Fidelity ® funds. General Dunwoody (United States Army, Retired) was the first woman in U.S. military history to achieve the rank of four-star general and prior to her retirement in 2012 held a variety of positions within the U.S. Army, including Commanding General, U.S. Army Material Command (2008-2012). General Dunwoody currently serves as President of First to Four LLC (leadership and mentoring services, 2012-present), a member of the Board and Nomination and Corporate Governance Committees of Kforce Inc. (professional staffing services, 2016-present) and a member of the Board of Automattic Inc. (software engineering, 2018-present). Previously, General Dunwoody served as a member of the Advisory Board and Nominating and Corporate Governance Committee of L3 Technologies, Inc. (communication, electronic, sensor and aerospace systems, 2013-2019) and a member of the Board and Audit and Sustainability and Corporate Responsibility Committees of Republic Services, Inc. (waste collection, disposal and recycling, 2013-2016). Ms. Dunwoody also serves on several boards for non-profit organizations, including as a member of the Board, Chair of the Nomination and Governance Committee and a member of the Audit Committee of Logistics Management Institute (consulting non-profit, 2012-present), a member of the Council of Trustees for the Association of the United States Army (advocacy non-profit, 2013-present), a member of the Board of Florida Institute of Technology (2015-present) and a member of the Board of ThanksUSA (military family education non-profit, 2014-present). General Dunwoody previously served as a member of the Advisory Board of certain Fidelity ® funds (2018).
John Engler (1948)
Year of Election or Appointment: 2014
Trustee
Mr. Engler also serves as Trustee of other Fidelity ® funds. Previously, Mr. Engler served as Governor of Michigan (1991-2003), President of the Business Roundtable (2011-2017) and interim President of Michigan State University (2018-2019). Mr. Engler currently serves as a member of the Board of Stride, Inc. (formerly K12 Inc.) (technology-based education company, 2012-present). Previously, Mr. Engler served as a member of the Board of Universal Forest Products (manufacturer and distributor of wood and wood-alternative products, 2003-2019) and Trustee of The Munder Funds (2003-2014). Mr. Engler previously served as a member of the Advisory Board of certain Fidelity ® funds (2014-2016).
Robert F. Gartland (1951)
Year of Election or Appointment: 2010
Trustee
Mr. Gartland also serves as Trustee of other Fidelity ® funds. Prior to his retirement, Mr. Gartland held a variety of positions at Morgan Stanley (financial services, 1979-2007), including Managing Director (1987-2007) and Chase Manhattan Bank (1975-1978). Mr. Gartland previously served as Chairman and an investor in Gartland & Mellina Group Corp. (consulting, 2009-2019), as a member of the Board of National Securities Clearing Corporation (1993-1996) and as Chairman of TradeWeb (2003-2004).
Arthur E. Johnson (1947)
Year of Election or Appointment: 2008
Trustee
Mr. Johnson also serves as Trustee of other Fidelity ® funds. Prior to his retirement, Mr. Johnson served as Senior Vice President of Corporate Strategic Development of Lockheed Martin Corporation (defense contractor, 1999-2009). Mr. Johnson currently serves as a member of the Board of Booz Allen Hamilton (management consulting, 2011-present). Mr. Johnson previously served as a member of the Board of Eaton Corporation plc (diversified power management, 2009-2019) and a member of the Board of AGL Resources, Inc. (holding company, 2002-2016). Mr. Johnson previously served as Chairman (2018-2021) and Vice Chairman (2015-2018) of the Independent Trustees of certain Fidelity® funds. Mr. Arthur E. Johnson is not related to Ms. Abigail P. Johnson.
Michael E. Kenneally (1954)
Year of Election or Appointment: 2009
Trustee
Chairman of the Independent Trustees
Mr. Kenneally also serves as Trustee of other Fidelity ® funds and was Vice Chairman (2018-2021) of the Independent Trustees of certain Fidelity ® funds. Prior to retirement in 2005, he was Chairman and Global Chief Executive Officer of Credit Suisse Asset Management, the worldwide fund management and institutional investment business of Credit Suisse Group. Previously, Mr. Kenneally was an Executive Vice President and the Chief Investment Officer for Bank of America. In this role, he was responsible for the investment management, strategy and products delivered to the bank's institutional, high-net-worth and retail clients. Earlier, Mr. Kenneally directed the organization's equity and quantitative research groups. He began his career as a research analyst and then spent more than a dozen years as a portfolio manager for endowments, pension plans and mutual funds. He earned the Chartered Financial Analyst (CFA) designation in 1991.
Marie L. Knowles (1946)
Year of Election or Appointment: 2001
Trustee
Ms. Knowles also serves as Trustee of other Fidelity ® funds. Prior to her retirement, Ms. Knowles held several positions at Atlantic Richfield Company (diversified energy), including Executive Vice President and Chief Financial Officer (1996-2000), Senior Vice President (1993-1996) and President of ARCO Transportation Company (pipeline and tanker operations, 1993-1996). Ms. Knowles currently serves as a member of the Board of the Santa Catalina Island Company (real estate, 2009-present), a member of the Investment Company Institute Board of Governors and a member of the Governing Council of the Independent Directors Council (2014-present). Ms. Knowles also serves as a member of the Advisory Board for the School of Engineering of the University of Southern California. Ms. Knowles previously served as a member of the Board of McKesson Corporation (healthcare service, 2002-2021). In addition, Ms. Knowles previously served as Chairman (2015-2018) and Vice Chairman (2012-2015) of the Independent Trustees of certain Fidelity ® funds.
Mark A. Murray (1954)
Year of Election or Appointment: 2016
Trustee
Mr. Murray also serves as Trustee of other Fidelity ® funds. Previously, Mr. Murray served as Co-Chief Executive Officer (2013-2016), President (2006-2013) and Vice Chairman (2013-2020) of Meijer, Inc. Mr. Murray serves as a member of the Board (2009-present) and Public Policy and Responsibility Committee (2009-present) and Chair of the Nuclear Review Committee (2019-present) of DTE Energy Company (diversified energy company). Mr. Murray previously served as a member of the Board of Spectrum Health (not-for-profit health system, 2015-2019) and as a member of the Board and Audit Committee and Chairman of the Nominating and Corporate Governance Committee of Universal Forest Products, Inc. (manufacturer and distributor of wood and wood-alternative products, 2004-2016). Mr. Murray also serves as a member of the Board of many community and professional organizations. Mr. Murray previously served as a member of the Advisory Board of certain Fidelity ® funds (2016).
+ The information includes the Trustee's principal occupation during the last five years and other information relating to the experience, attributes, and skills relevant to the Trustee's qualifications to serve as a Trustee, which led to the conclusion that the Trustee should serve as a Trustee for the fund.
Advisory Board Members and Officers:
Correspondence intended for a Member of the Advisory Board (if any) may be sent to Fidelity Investments, P.O. Box 55235, Boston, Massachusetts 02205-5235. Correspondence intended for an officer may be sent to Fidelity Investments, 245 Summer Street, Boston, Massachusetts 02210. Officers appear below in alphabetical order.
Name, Year of Birth; Principal Occupation
Laura M. Bishop (1961)
Year of Election or Appointment: 2022
Member of the Advisory Board
Ms. Bishop also serves as a Member of the Advisory Board of other funds. Prior to her retirement, Ms. Bishop held a variety of positions at United Services Automobile Association (2001-2020), including Executive Vice President and Chief Financial Officer (2014-2020) and Senior Vice President and Deputy Chief Financial Officer (2012-2014). Ms. Bishop currently serves as a member of the Audit Committee and Compensation and Personnel Committee (2021-present) of the Board of Directors of Korn Ferry (global organizational consulting).
Robert W. Helm (1957)
Year of Election or Appointment: 2021
Member of the Advisory Board
Mr. Helm also serves as a Member of the Advisory Board of other Fidelity® funds. Mr. Helm was formerly Deputy Chairman (2003-2020), partner (1991-2020) and an associate (1984-1991) of Dechert LLP (formerly Dechert Price & Rhoads). Mr. Helm currently serves on boards and committees of several not-for-profit organizations.
Craig S. Brown (1977)
Year of Election or Appointment: 2019
Assistant Treasurer
Mr. Brown also serves as an officer of other funds. Mr. Brown serves as Assistant Treasurer of FIMM, LLC (2021-present) and is an employee of Fidelity Investments (2013-present). Previously, Mr. Brown served as Assistant Treasurer of certain Fidelity ® funds (2019-2022).
John J. Burke III (1964)
Year of Election or Appointment: 2018
Chief Financial Officer
Mr. Burke also serves as Chief Financial Officer of other funds. Mr. Burke serves as Head of Investment Operations for Fidelity Fund and Investment Operations (2018-present) and is an employee of Fidelity Investments (1998-present). Previously Mr. Burke served as head of Asset Management Investment Operations (2012-2018).
David J. Carter (1973)
Year of Election or Appointment: 2020
Assistant Secretary
Mr. Carter also serves as Assistant Secretary of other funds. Mr. Carter serves as Senior Vice President, Deputy General Counsel (2022-present) and is an employee of Fidelity Investments (2005-present).
Jonathan Davis (1968)
Year of Election or Appointment: 2010
Assistant Treasurer
Mr. Davis also serves as an officer of other funds. Mr. Davis serves as Assistant Treasurer of FIMM, LLC (2021-present), FMR Capital, Inc. (2017-present), FD Funds GP LLC (2021-present), FD Funds Holding LLC (2021-present), and FD Funds Management LLC (2021-present); and is an employee of Fidelity Investments. Previously, Mr. Davis served as Vice President and Associate General Counsel of FMR LLC (diversified financial services company, 2003-2010).
Laura M. Del Prato (1964)
Year of Election or Appointment: 2018
President and Treasurer
Ms. Del Prato also serves as an officer of other funds. Ms. Del Prato serves as Assistant Treasurer of FIMM, LLC (2021-present) and is an employee of Fidelity Investments (2017-present). Previously, Ms. Del Prato served as President and Treasurer of The North Carolina Capital Management Trust: Cash Portfolio and Term Portfolio (2018-2020). Prior to joining Fidelity Investments, Ms. Del Prato served as a Managing Director and Treasurer of the JPMorgan Mutual Funds (2014-2017). Prior to JPMorgan, Ms. Del Prato served as a partner at Cohen Fund Audit Services (accounting firm, 2012-2013) and KPMG LLP (accounting firm, 2004-2012).
Colm A. Hogan (1973)
Year of Election or Appointment: 2016
Assistant Treasurer
Mr. Hogan also serves as an officer of other funds. Mr. Hogan serves as Assistant Treasurer of FIMM, LLC (2021-present) and FMR Capital, Inc. (2017-present) and is an employee of Fidelity Investments (2005-present). Previously, Mr. Hogan served as Deputy Treasurer of certain Fidelity ® funds (2016-2020) and Assistant Treasurer of certain Fidelity ® funds (2016-2018).
Cynthia Lo Bessette (1969)
Year of Election or Appointment: 2019
Secretary and Chief Legal Officer (CLO)
Ms. Lo Bessette also serves as an officer of other funds. Ms. Lo Bessette serves as CLO, Secretary, and Senior Vice President of Fidelity Management & Research Company LLC (investment adviser firm, 2019-present); CLO of Fidelity Management & Research (Hong Kong) Limited, FMR Investment Management (UK) Limited, and Fidelity Management & Research (Japan) Limited (investment adviser firms, 2019-present); Secretary of FD Funds GP LLC (2021-present), FD Funds Holding LLC (2021-present), FD Funds Management LLC (2021-present), and Fidelity Diversifying Solutions LLC (investment adviser firm, 2022-present); and Assistant Secretary of FIMM, LLC (2019-present). She is a Senior Vice President and Deputy General Counsel of FMR LLC (diversified financial services company, 2019-present), and is an employee of Fidelity Investments. Previously, Ms. Lo Bessette served as CLO, Secretary, and Senior Vice President of FMR Co., Inc. (investment adviser firm, 2019); Secretary of Fidelity SelectCo, LLC and Fidelity Investments Money Management, Inc. (investment adviser firms, 2019). Prior to joining Fidelity Investments, Ms. Lo Bessette was Executive Vice President, General Counsel (2016-2019) and Senior Vice President, Deputy General Counsel (2015-2016) of OppenheimerFunds (investment management company) and Deputy Chief Legal Officer (2013-2015) of Jennison Associates LLC (investment adviser firm).
Chris Maher (1972)
Year of Election or Appointment: 2013
Assistant Treasurer
Mr. Maher also serves as an officer of other funds. Mr. Maher serves as Assistant Treasurer of FIMM, LLC (2021-present) and FMR Capital, Inc. (2017-present), and is an employee of Fidelity Investments (2008-present). Previously, Mr. Maher served as Assistant Treasurer of certain funds (2013-2020); Vice President of Asset Management Compliance (2013), Vice President of the Program Management Group of FMR (investment adviser firm, 2010-2013), and Vice President of Valuation Oversight (2008-2010).
Jamie Pagliocco (1964)
Year of Election or Appointment: 2020
Vice President
Mr. Pagliocco also serves as Vice President of other funds. Mr. Pagliocco serves as President of Fixed Income (2020-present), and is an employee of Fidelity Investments (2001-present). Previously, Mr. Pagliocco served as Co-Chief Investment Officer - Bond (2017-2020), Global Head of Bond Trading (2016-2019), and as a portfolio manager.
Kenneth B. Robins (1969)
Year of Election or Appointment: 2020
Chief Compliance Officer
Mr. Robins also serves as an officer of other funds. Mr. Robins serves as Compliance Officer of Fidelity Management & Research Company LLC (investment adviser firm, 2016-present) and is an employee of Fidelity Investments (2004-present). Previously, Mr. Robins served as Compliance Officer of FMR Co., Inc. (investment adviser firm, 2016-2019), as Executive Vice President of Fidelity Investments Money Management, Inc. (investment adviser firm, 2013-2016) and served in other fund officer roles.
Brett Segaloff (1972)
Year of Election or Appointment: 2021
Anti-Money Laundering (AML) Officer
Mr. Segaloff also serves as an AML Officer of other funds and other related entities. He is Director, Anti-Money Laundering (2007-present) of FMR LLC (diversified financial services company) and is an employee of Fidelity Investments (1996-present).
Stacie M. Smith (1974)
Year of Election or Appointment: 2013
Assistant Treasurer
Ms. Smith also serves as an officer of other funds. Ms. Smith serves as Assistant Treasurer of FIMM, LLC (2021-present) and FMR Capital, Inc. (2017-present), is an employee of Fidelity Investments (2009-present), and has served in other fund officer roles. Prior to joining Fidelity Investments, Ms. Smith served as Senior Audit Manager of Ernst & Young LLP (accounting firm, 1996-2009). Previously, Ms. Smith served as Assistant Treasurer (2013-2019) and Deputy Treasurer (2013-2016) of certain Fidelity ® funds.
Jim Wegmann (1979)
Year of Election or Appointment: 2021
Deputy Treasurer
Mr. Wegmann also serves as an officer of other funds. Mr. Wegmann serves as Assistant Treasurer of FIMM, LLC (2021-present) and is an employee of Fidelity Investments (2011-present). Previously, Mr. Wegmann served as Assistant Treasurer of certain Fidelity ® funds (2019-2021).
As a shareholder, you incur two types of costs: (1) transaction costs, which may include sales charges (loads) on purchase payments or redemption proceeds, as applicable and (2) ongoing costs, which generally include management fees, distribution and/or service (12b-1) fees and other Fund expenses. This Example is intended to help you understand your ongoing costs (in dollars) of investing in a fund and to compare these costs with the ongoing costs of investing in other mutual funds.
| The Example is based on an investment of $1,000 invested at the beginning of the period and held for the entire period (May 1, 2022 to October 31, 2022). |
Actual Expenses
The first line of the accompanying table provides information about actual account values and actual expenses. You may use the information in this line, together with the amount you invested, to estimate the expenses that you paid over the period. Simply divide your account value by $1,000.00 (for example, an $8,600 account value divided by $1,000.00 = 8.6), then multiply the result by the number in the first line for a class/Fund under the heading entitled "Expenses Paid During Period" to estimate the expenses you paid on your account during this period. If any fund is a shareholder of any underlying mutual funds or exchange-traded funds (ETFs) (the Underlying Funds), such fund indirectly bears its proportional share of the expenses of the Underlying Funds in addition to the direct expenses incurred presented in the table. These fees and expenses are not included in the annualized expense ratio used to calculate the expense estimate in the table below.
Hypothetical Example for Comparison Purposes
The second line of the accompanying table provides information about hypothetical account values and hypothetical expenses based on the actual expense ratio and an assumed rate of return of 5% per year before expenses, which is not the actual return. The hypothetical account values and expenses may not be used to estimate the actual ending account balance or expenses you paid for the period. You may use this information to compare the ongoing costs of investing in the Fund and other funds. To do so, compare this 5% hypothetical example with the 5% hypothetical examples that appear in the shareholder reports of the other funds. If any fund is a shareholder of any Underlying Funds, such fund indirectly bears its proportional share of the expenses of the Underlying Funds in addition to the direct expenses as presented in the table. These fees and expenses are not included in the annualized expense ratio used to calculate the expense estimate in the table below.
Please note that the expenses shown in the table are meant to highlight your ongoing costs only and do not reflect any transaction costs. Therefore, the second line of the table is useful in comparing ongoing costs only, and will not help you determine the relative total costs of owning different funds. In addition, if these transactional costs were included, your costs would have been higher.
| | | | | Annualized Expense Ratio- A | | Beginning Account Value May 1, 2022 | | Ending Account Value October 31, 2022 | | Expenses Paid During Period- C May 1, 2022 to October 31, 2022 |
| | | | | | | | | | |
| Fidelity® SAI International Value Index Fund | | | | .16% | | | | | | |
| Actual | | | | | | $ 1,000 | | $ 883.40 | | $ .76 |
Hypothetical- B | | | | | | $ 1,000 | | $ 1,024.40 | | $ .82 |
| |
A Annualized expense ratio reflects expenses net of applicable fee waivers.
B 5% return per year before expenses
C Expenses are equal to the annualized expense ratio, multiplied by the average account value over the period, multiplied by 184/ 365 (to reflect the one-half year period). The fees and expenses of any Underlying Funds are not included in each annualized expense ratio.
The dividend and capital gains distributions for the fund(s) are available on Fidelity.com or Institutional.Fidelity.com .
The fund designates 50% of the dividend distributed in December during the fiscal year as amounts which may be taken into account as a dividend for the purposes of the maximum rate under section 1(h)(11) of the Internal Revenue Code.
The amounts per share which represent income derived from sources within, and taxes paid to, foreign countries or possessions of the United States are $0.4106 and $0.0349 for the dividend paid December 13, 2021.
The fund will notify shareholders in January 2023 of amounts for use in preparing 2022 income tax returns.
Fidelity SAI International Value Index Fund
Each year, the Board of Trustees, including the Independent Trustees (together, the Board), votes on the renewal of the management contract with Fidelity Management & Research Company LLC (FMR) and the sub-advisory agreement (Sub-Advisory Agreement) for the fund with Geode Capital Management, LLC (Geode) (together, the Advisory Contracts). FMR and Geode are referred to herein as the Investment Advisers. The Board, assisted by the advice of fund counsel and Independent Trustees' counsel, requests and considers a broad range of information relevant to the renewal of the Advisory Contracts throughout the year.
The Board meets regularly and, at each of its meetings, covers an extensive agenda of topics and materials and considers factors that are relevant to its annual consideration of the renewal of the fund's Advisory Contracts, including the services and support provided to the fund and its shareholders. The Board has established four standing committees (Committees) - Operations, Audit, Fair Valuation, and Governance and Nominating - each composed of and chaired by Independent Trustees with varying backgrounds, to which the Board has assigned specific subject matter responsibilities in order to enhance effective decision-making by the Board. The Operations Committee, of which all the Independent Trustees are members, meets regularly throughout the year and requests, receives and considers, among other matters, information related to the annual consideration of the renewal of the fund's Advisory Contracts before making its recommendation to the Board. The Board also meets as needed to review matters specifically related to the Board's annual consideration of the renewal of the Advisory Contracts. Members of the Board may also meet from time to time with trustees of other Fidelity funds through joint ad hoc committees to discuss certain matters relevant to all of the Fidelity funds.
At its September 2022 meeting, the Board unanimously determined to renew the fund's Advisory Contracts. In reaching its determination, the Board considered all factors it believed relevant, including (i) the nature, extent, and quality of the services provided to the fund and its shareholders (including the investment performance of the fund); (ii) the competitiveness relative to peer funds of the fund's management fee and total expense ratio; (iii) the total costs of the services provided by and the profits realized by Fidelity and Geode from their respective relationships with the fund; and (iv) the extent to which, if any, economies of scale exist and are realized as the fund grows, and whether any economies of scale are appropriately shared with fund shareholders.
In considering whether to renew the Advisory Contracts for the fund, the Board reached a determination, with the assistance of fund counsel and Independent Trustees' counsel and through the exercise of its business judgment, that the renewal of the Advisory Contracts was in the best interests of the fund and its shareholders and that the compensation payable under the Advisory Contracts was fair and reasonable. The Board's decision to renew the Advisory Contracts was not based on any single factor, but rather was based on a comprehensive consideration of all the information provided to the Board at its meetings throughout the year. The Board, in reaching its determination to renew the Advisory Contracts, was aware that shareholders of the fund have a broad range of investment choices available to them, including a wide choice among funds offered by Fidelity's competitors, and that the fund's shareholders, who have the opportunity to review and weigh the disclosure provided by the fund in its prospectus and other public disclosures, have chosen to invest in this fund, which is part of the Fidelity family of funds.
Nature, Extent, and Quality of Services Provided . The Board considered staffing as it relates to the fund, including the backgrounds of investment personnel of Fidelity and Geode, and also considered the fund's investment objective, strategies, and related investment philosophy. The Independent Trustees also had discussions with senior management of Fidelity's investment operations and investment groups and with senior management of Geode. The Board considered the structure of the investment personnel compensation programs and whether the structures provide appropriate incentives to act in the best interests of the fund. The Board also considered the steps Fidelity and Geode had taken to ensure the continued provision of high quality services to the Fidelity funds throughout the COVID-19 pandemic, including the expansion of staff in client facing positions to maintain service levels in periods of high volumes and volatility.
The Trustees also discussed with representatives of Fidelity, at meetings throughout the year, Fidelity's role in, among other things, overseeing compliance with federal securities laws and other applicable requirements by Geode with respect to the fund and monitoring and overseeing the performance and investment capabilities of Geode. The Trustees considered that the Board had received from Fidelity periodic reports about its oversight and due diligence processes, as well as periodic reports regarding the performance of Geode.
The Board also considered the nature, extent and quality of services provided by Geode. The Trustees noted that under the Sub-Advisory Agreement, subject to oversight by Fidelity, Geode is responsible for, among other things, identifying investments and arranging for execution of portfolio transactions to implement the fund's investment strategy. In addition, the Trustees noted that Geode is responsible for providing such reporting as may be requested by Fidelity to fulfill its oversight responsibilities discussed above.
Resources Dedicated to Investment Management and Support Services . The Board reviewed the general qualifications and capabilities of Fidelity's and Geode's investment staffs, including their size, education, experience, and resources, as well as Fidelity's and Geode's approach to recruiting, managing, training, and compensating investment personnel. The Board noted the resources devoted to Fidelity's global investment organization and that Fidelity's and Geode's analysts have extensive resources, tools and capabilities that allow them to conduct quantitative and fundamental analysis, as well as credit analysis of issuers, counterparties, and guarantors. Further, the Board considered that Fidelity's and Geode's investment professionals have sufficient access to information and data so as to provide competitive investment results over time, and that those professionals also have access to sophisticated tools that permit them to assess portfolio construction and risk and performance attribution characteristics continuously. Additionally, in its deliberations, the Board considered Fidelity's and Geode's trading, risk management, compliance, cybersecurity, and technology and operations capabilities and resources, which are integral parts of the investment management process.
Shareholder and Administrative Services . The Board considered (i) the nature, extent, quality, and cost of advisory, administrative, and shareholder services performed by the Investment Advisers and their affiliates under the Advisory Contracts and by FMR's affiliates under separate agreements covering transfer agency, pricing and bookkeeping, and securities lending services for the fund; (ii) the nature and extent of the supervision of third party service providers, principally custodians, subcustodians, and pricing vendors; and (iii) the resources devoted to, and the record of compliance with, the fund's compliance policies and procedures. The Board also reviewed the allocation of fund brokerage, including allocations to brokers affiliated with the Investment Advisers.
The Board noted that the growth of fund assets over time across the complex allows Fidelity to reinvest in the development of services designed to enhance the value and convenience of the Fidelity funds as investment vehicles. These services include 24-hour access to account information and market information over the Internet and through telephone representatives, investor education materials and asset allocation tools. The Board also considered that it reviews customer service metrics such as telephone response times, continuity of services on the website and metrics addressing services at Fidelity Investor Centers.
Investment in a Large Fund Family . The Board considered the benefits to shareholders of investing in a Fidelity fund, including the benefits of investing in a fund that is part of a large family of funds offering a variety of investment disciplines and providing a large variety of mutual fund investor services. The Board noted that Fidelity had taken, or had made recommendations to the Board that resulted in the Fidelity funds taking, a number of actions over the previous year that benefited particular funds, including: (i) continuing to dedicate additional resources to Fidelity's investment research process, which includes meetings with management of issuers of securities in which the funds invest; (ii) continuing efforts to enhance Fidelity's global research capabilities; (iii) launching new funds, ETFs, and share classes with innovative structures, strategies and pricing and making other enhancements to meet investor needs; (iv) broadening eligibility requirements for certain funds and share classes; (v) reducing management fees and total expenses for certain funds and classes; (vi) lowering expenses for certain existing funds and classes by implementing or lowering expense caps; (vii) rationalizing product lines and gaining increased efficiencies from fund mergers and liquidations; (viii) continuing to develop, acquire and implement systems and technology to improve services to the funds and shareholders, strengthen information security, and increase efficiency; and (ix) continuing to implement enhancements to further strengthen Fidelity's product line to increase investors' probability of success in achieving their investment goals, including their retirement income goals.
Investment Performance . The Board considered whether the fund has operated in accordance with its investment objective, as well as its record of compliance with its investment restrictions and its performance history.
The Board took into account discussions that occur at Board meetings throughout the year with representatives of the Investment Advisers about fund investment performance. In this regard the Board noted that as part of regularly scheduled fund reviews and other reports to the Board on fund performance, the Board considers annualized return information for the fund for different time periods, measured against the securities market index the fund seeks to track. The Board also periodically considers the fund's tracking error versus its benchmark index.
In addition to reviewing absolute and relative fund performance, the Independent Trustees periodically consider the appropriateness of fund performance metrics in evaluating the results achieved. In general, the Independent Trustees believe that an index fund's performance should be evaluated based on gross performance (before fees and expenses but after transaction costs) compared to the fund's benchmark index, over appropriate time periods, taking into account relevant factors including the following: general market conditions; the characteristics of the fund's benchmark index; the extent to which statistical sampling is employed; any securities lending revenues; and fund cash flows and other factors. The Independent Trustees generally give greater weight to fund performance over longer time periods than over shorter time periods. Depending on the circumstances, the Independent Trustees may be satisfied with a fund's performance notwithstanding that it lags its benchmark index for certain periods.
The Independent Trustees recognize that shareholders evaluate performance on a net basis (after fees and expenses) over their own holding periods, for which one-, three-, and five-year periods are often used as a proxy. For this reason, the performance information reviewed by the Board also included net cumulative calendar year total return information for the fund and its benchmark index for the most recent one- and three-year periods. No performance peer group information was considered by the Board as Fidelity advised the Board that the peer group, which is created by a third-party provider, includes a number of actively-managed funds. The Independent Trustees recognize that shareholders who are not investing through a tax-advantaged retirement account also consider tax consequences in evaluating performance.
Based on its review, the Board concluded that the nature, extent, and quality of services provided to the fund under the Advisory Contracts should continue to benefit the shareholders of the fund.
Competitiveness of Management Fee and Total Expense Ratio . The Board considered the fund's management fee and total expense ratio compared to selected groups of competitive funds and classes (referred to as "mapped groups" below) for the purpose of facilitating the Trustees' competitive analysis of management fees and total expenses. Fidelity creates "mapped groups" by combining similar investment objective categories (as classified by Lipper) that have comparable investment mandates. Combining funds with similar investment objective categories aids the Board's comparison of management fees and total expense ratios by broadening the competitive group used for such comparison.
Management Fee . The Board considered two proprietary management fee comparisons for the 12-month (or shorter) periods shown in basis points (BP) in the chart below. The group of Lipper funds used by the Board for management fee comparisons is referred to below as the "Total Mapped Group." The Total Mapped Group comparison focuses on a fund's standing in terms of gross management fees before expense reimbursements or caps relative to the total universe of funds with comparable investment mandates, regardless of whether their management fee structures also are comparable. Funds with comparable investment mandates offer exposure to similar types of securities. Funds with comparable management fee structures have similar management fee contractual arrangements (e.g., flat rate charged for advisory services, all-inclusive fee rate, etc.). "TMG %" represents the percentage of funds in the Total Mapped Group that had management fees that were lower than the fund's. For example, a hypothetical TMG % of 20% would mean that 80% of the funds in the Total Mapped Group had higher, and 20% had lower, management fees than the fund. The fund's actual TMG %s and the number of funds in the Total Mapped Group are in the chart below. The "Asset-Sized Peer Group" (ASPG) comparison focuses on a fund's standing relative to a subset of non-Fidelity funds within the Total Mapped Group that are similar in size and management fee structure. For example, if a fund is in the first quartile of the ASPG, the fund's management fee ranks in the least expensive or lowest 25% of funds in the ASPG. The ASPG represents at least 15% of the funds in the Total Mapped Group with comparable asset size and management fee structures, subject to a minimum of 50 funds (or all funds in the Total Mapped Group if fewer than 50). Additional information, such as the ASPG quartile in which the fund's management fee rate ranked, is also included in the chart and was considered by the Board.

The Board noted that the fund's management fee rate ranked equal to the median of its Total Mapped Group and equal to the median of its ASPG for 2021.
Based on its review, the Board concluded that the fund's management fee is fair and reasonable in light of the services that the fund receives and the other factors considered.
Total Expense Ratio . In its review of the fund's total expense ratio, the Board considered the fund's management fee rate as well as other fund expenses, such as custodial, legal, and audit fees. The Board also noted that Fidelity may agree to waive fees or reimburse expenses from time to time, and the extent to which, if any, it has done so for the fund. The fund is compared to those funds and classes in the Total Mapped Group (used by the Board for management fee comparisons) that have a similar sales load structure. The Board also considered a total expense ASPG comparison, which focuses on the total expenses of the fund relative to a subset of non-Fidelity funds within the similar sales load structure group that are similar in size and management fee structure. The total expense ASPG is limited to 15 larger and 15 smaller classes of different funds, where possible. The total expense ASPG comparison excludes performance adjustments and fund-paid 12b-1 fees to eliminate variability in expenses relating to these items.
The Board noted that the fund's total net expense ratio ranked below the similar sales load structure group competitive median for 2021 and above the ASPG competitive median for 2021. The Board considered that, when compared to a subset of the ASPG that excludes funds in a fund complex with a unique at-cost service model, the fund would not be above the ASPG competitive median for 2021.
The Board further considered that FMR has contractually agreed to reimburse the fund to the extent that total operating expenses, with certain exceptions, as a percentage of its average net assets, exceed 0.20% through February 28, 2023.
Fees Charged to Other Clients. The Board also considered fee structures and other information with respect to clients of Fidelity and Geode, such as other funds advised or subadvised by Fidelity or Geode, pension plan clients, and other institutional clients with similar mandates. The Board noted that a joint ad hoc committee created by it and the boards of other Fidelity funds periodically reviews and compares Fidelity's institutional investment advisory business with its business of providing services to the Fidelity funds and also noted the most recent findings of the committee. The Board noted that the committee's review included a consideration of the differences in services provided, fees charged, and costs incurred, as well as competition in the markets serving the different categories of clients.
Based on its review of total expense ratios and fees charged to other Fidelity clients, the Board concluded that the fund's total expense ratio was reasonable in light of the services that the fund and its shareholders receive and the other factors considered.
Costs of the Services and Profitability . The Board considered the revenues earned and the expenses incurred by Fidelity in conducting the business of developing, marketing, distributing, managing, administering and servicing the fund and servicing the fund's shareholders. The Board also considered the level of Fidelity's profits in respect of all the Fidelity funds.
On an annual basis, Fidelity presents to the Board information about the profitability of its relationships with the fund. Fidelity calculates profitability information for each fund, as well as aggregate profitability information for groups of Fidelity funds and all Fidelity funds, using a series of detailed revenue and cost allocation methodologies which originate with the books and records of Fidelity on which Fidelity's audited financial statements are based. The Audit Committee of the Board reviews any significant changes from the prior year's methodologies and the full Board approves such changes.
A public accounting firm has been engaged annually by the Board as part of the Board's assessment of Fidelity's profitability analysis. The engagement includes the review and assessment of the methodologies used by Fidelity in determining the revenues and expenses attributable to Fidelity's mutual fund business, and completion of agreed-upon procedures in respect of the mathematical accuracy of certain fund profitability information and its conformity to established allocation methodologies. After considering the reports issued under the engagement and information provided by Fidelity, the Board concluded that while other allocation methods may also be reasonable, Fidelity's profitability methodologies are reasonable in all material respects.
The Board also reviewed Fidelity's and Geode's non-fund businesses and potential indirect benefits such businesses may have received as a result of their association with Fidelity's mutual fund business (i.e., fall-out benefits) as well as cases where Fidelity's and Geode's affiliates may benefit from the funds' business. The Board considered areas where potential indirect benefits to the Fidelity funds from their relationships with Fidelity may exist. The Board's consideration of these matters was informed by the findings of a joint ad hoc committee created by it and the boards of other Fidelity funds to evaluate potential fall-out benefits.
The Board considered the costs of the services provided by and the profits realized by Fidelity in connection with the operation of the fund and was satisfied that the profitability was not excessive.
The Board also considered information regarding the profitability of Geode's relationship with the fund.
Economies of Scale . The Board considered whether there have been economies of scale in respect of the management of the Fidelity funds, whether the Fidelity funds (including the fund) have appropriately benefited from any such economies of scale, and whether there is potential for realization of any further economies of scale. The Board considered the extent to which the fund will benefit from economies of scale as assets grow through increased services to the fund, through waivers or reimbursements, or through fee or expense ratio reductions. The Board also noted that a committee (the Economies of Scale Committee) created by it and the boards of other Fidelity funds periodically analyzes whether Fidelity attains economies of scale in respect of the management and servicing of the Fidelity funds, whether the Fidelity funds have appropriately benefited from such economies of scale, and whether there is potential for realization of any further economies of scale.
The Board concluded, taking into account the analysis of the Economies of Scale Committee, that economies of scale, if any, are being appropriately shared between fund shareholders and Fidelity.
Additional Information Requested by the Board . In order to develop fully the factual basis for consideration of the Fidelity funds' advisory contracts, the Board requested and received additional information on certain topics, including: (i) Fidelity's fund profitability methodology, profitability trends for certain funds, the allocation of various costs to different funds, and the impact of certain factors on fund profitability results; (ii) portfolio manager changes that have occurred during the past year and the amount of the investment that each portfolio manager has made in the Fidelity fund(s) that he or she manages; (iii) the extent to which current market conditions have affected retention and recruitment of personnel; (iv) the arrangements with and compensation paid to certain fund sub-advisers on behalf of the Fidelity funds and the treatment of such compensation within Fidelity's fund profitability methodology; (v) the terms of the funds' various management fee structures, including the basic group fee and the terms of Fidelity's voluntary expense limitation arrangements; (vi) Fidelity's transfer agent, pricing and bookkeeping fees, expense and service structures for different funds and classes relative to competitive trends; (vii) the impact on fund profitability of recent industry trends, such as the growth in passively managed funds and the changes in flows for different types of funds; (viii) the types of management fee and total expense comparisons provided, and the challenges and limitations associated with such information; and (ix) explanations regarding the relative total expense ratios and management fees of certain funds and classes, total expense and management fee competitive trends, and methodologies for total expense and management fee competitive comparisons. In addition, the Board considered its discussions with Fidelity regarding Fidelity's efforts to maintain the continuous investment and shareholder services necessary for the funds during the current pandemic and economic circumstances.
Based on its evaluation of all of the conclusions noted above, and after considering all factors it believed relevant, the Board concluded that the advisory and sub-advisory fee arrangements are fair and reasonable and that the fund's Advisory Contracts should be renewed.
1.9885501.104
IIV-ANN-1222
Fidelity® U.S. Sustainability Index Fund
Annual Report
October 31, 2022
Contents
To view a fund's proxy voting guidelines and proxy voting record for the 12-month period ended June 30, visit http://www.fidelity.com/proxyvotingresults or visit the Securities and Exchange Commission's (SEC) web site at http://www.sec.gov.
You may also call 1-800-544-8544 to request a free copy of the proxy voting guidelines.
The funds or securities referred to herein are not sponsored, endorsed, or promoted by MSCI, and MSCI bears no liability with respect to any such funds or securities or any index on which such funds or securities are based. The prospectus contains a more detailed description of the limited relationship MSCI has with Fidelity and any related funds.
Standard & Poor's, S&P and S&P 500 are registered service marks of The McGraw-Hill Companies, Inc. and have been licensed for use by Fidelity Distributors Corporation.
Other third-party marks appearing herein are the property of their respective owners.
All other marks appearing herein are registered or unregistered trademarks or service marks of FMR LLC or an affiliated company. © 2022 FMR LLC. All rights reserved.
This report and the financial statements contained herein are submitted for the general information of the shareholders of the Fund. This report is not authorized for distribution to prospective investors in the Fund unless preceded or accompanied by an effective prospectus.
A fund files its complete schedule of portfolio holdings with the SEC for the first and third quarters of each fiscal year on Form N-PORT. Forms N-PORT are available on the SEC's web site at http://www.sec.gov. A fund's Forms N-PORT may be reviewed and copied at the SEC's Public Reference Room in Washington, DC. Information regarding the operation of the SEC's Public Reference Room may be obtained by calling 1-800-SEC-0330.
For a complete list of a fund's portfolio holdings, view the most recent holdings listing, semiannual report, or annual report on Fidelity's web site at http://www.fidelity.com, http://www.institutional.fidelity.com, or http://www.401k.com, as applicable.
NOT FDIC INSURED •MAY LOSE VALUE •NO BANK GUARANTEE
Neither the Fund nor Fidelity Distributors Corporation is a bank.
Average annual total return reflects the change in the value of an investment, assuming reinvestment of distributions from dividend income and capital gains (the profits earned upon the sale of securities that have grown in value, if any) and assuming a constant rate of performance each year. The hypothetical investment and the average annual total returns do not reflect the deduction of taxes that a shareholder would pay on fund distributions or the redemption of fund shares. During periods of reimbursement by Fidelity, a fund's total return will be greater than it would be had the reimbursement not occurred. How a fund did yesterday is no guarantee of how it will do tomorrow.
| Average Annual Total Returns |
| | | | |
Periods ended October 31, 2022 | Past 1 year | Past 5 years | Life of Fund A |
| Fidelity® U.S. Sustainability Index Fund | -18.58% | 10.37% | 11.15% |
A From May 09, 2017
| $10,000 Over Life of Fund |
| |
Let's say hypothetically that $10,000 was invested in Fidelity® U.S. Sustainability Index Fund, on May 09, 2017, when the fund started. The chart shows how the value of your investment would have changed, and also shows how the MSCI USA ESG Leaders Index performed over the same period. |
|
|
Market Recap:
U.S. equities returned -14.61% for the 12 months ending October 31, 2022, according to the S&P 500 ® index, as a multitude of risk factors challenged the global economy and financial markets. Persistently high inflation prompted the Federal Reserve to aggressively tighten monetary policy, and market interest rates eclipsed their highest level in roughly a decade, stoking recession fears and sending stocks into bear market territory. In late 2021, the Fed shifted to a more "hawkish" (restrictive) policy stance and proceeded to hike its benchmark rate five times, by a total of 3%, between March and September - the fastest-ever pace of monetary tightening - while taking substantive steps to shrink its massive asset portfolio. Against this hostile backdrop for risk assets, the S&P 500 ® posted its worst year-to-date result (-23.87%) in 20 years through September, a seasonally weak month for stocks that stayed true to form, and then some, with volatility spiking due to growing certainty the Fed would persist in its effort to cool inflation, even at the expense of economic growth. Three of the index's worst monthly returns ever were recorded this period, with the S&P 500 shedding 8% to 9% in April, June and September. Gains of similar proportion were made in July and October, amid optimism on inflation and policy easing. For the full 12 months, the growth-oriented communication services (-41%) and consumer discretionary (-29%) sectors lagged most. In sharp contrast, energy (+65%) had a strong run, followed by consumer staples (+5%).
Comments from the Geode Capital Management, LLC, passive equity index team:
For the fiscal year ending October 31, 2022, the fund returned -18.58%, roughly in line with the -18.50% result of the benchmark MSCI USA ESG Leaders Index. By sector, information technology, the fund's largest weighting, returned roughly -28% and detracted most from performance, followed by communication services, which returned roughly -34%, primarily due to holdings in the media & entertainment industry (-35%). The consumer discretionary sector returned -27% and financials -14%. Other notable performance detractors included the industrials (-12%), real estate (-25%) and materials (-15%) sectors. Conversely, energy advanced 45% and contributed most. Health care stocks also helped (+2%), benefiting from the pharmaceuticals, biotechnology & life sciences industry (+8%). The consumer staples sector rose 4%, boosted by the food, beverage & tobacco industry (+14%), and utilities (+4%) also aided the fund's result. Turning to individual stocks, the biggest individual detractor was Microsoft (-29%), from the software & services category, followed by Alphabet (-36%), in the media & entertainment segment. Within automobiles & components, Tesla returned about -39%. Microsoft, Alphabet and Tesla are, in order, the three largest positions in the fund. Other detractors included Nvidia (-47%), a stock in the semiconductors & semiconductor equipment industry, and Adobe (-51%), from the software & services group. On the other hand, the biggest individual contributor was Eli Lilly (+44%), from the pharmaceuticals, biotechnology & life sciences category; within the same sub-sector, Bristol-Myers Squibb (+37%), Johnson & Johnson (+10%), Merck (+19%) and Amgen (+35%) all benefited the fund.
The views expressed above reflect those of the portfolio manager(s) only through the end of the period as stated on the cover of this report and do not necessarily represent the views of Fidelity or any other person in the Fidelity organization. Any such views are subject to change at any time based upon market or other conditions and Fidelity disclaims any responsibility to update such views. These views may not be relied on as investment advice and, because investment decisions for a Fidelity fund are based on numerous factors, may not be relied on as an indication of trading intent on behalf of any Fidelity fund.
Top Holdings (% of Fund's net assets) |
| |
| Microsoft Corp. | 9.7 | |
| Tesla, Inc. | 3.5 | |
| Alphabet, Inc. Class A | 3.4 | |
| Alphabet, Inc. Class C | 3.1 | |
| Johnson & Johnson | 2.7 | |
| Visa, Inc. Class A | 2.0 | |
| NVIDIA Corp. | 2.0 | |
| Procter & Gamble Co. | 1.9 | |
| The Home Depot, Inc. | 1.8 | |
| Eli Lilly & Co. | 1.7 | |
| | 31.8 | |
| |
| Market Sectors (% of Fund's net assets) |
| |
| Information Technology | 26.8 | |
| Health Care | 16.1 | |
| Financials | 11.5 | |
| Consumer Discretionary | 11.1 | |
| Communication Services | 9.3 | |
| Industrials | 8.5 | |
| Consumer Staples | 7.1 | |
| Materials | 2.9 | |
| Energy | 2.7 | |
| Real Estate | 2.6 | |
| Utilities | 1.1 | |
| |
Asset Allocation (% of Fund's net assets) |
|
Foreign investments - 4.8% |
|
Showing Percentage of Net Assets
| Common Stocks - 99.7% |
| | | Shares | Value ($) |
| COMMUNICATION SERVICES - 9.3% | | | |
| Diversified Telecommunication Services - 1.0% | | | |
| Lumen Technologies, Inc. (a) | | 119,297 | 878,026 |
| Verizon Communications, Inc. | | 540,300 | 20,191,011 |
| | | | 21,069,037 |
| Entertainment - 1.6% | | | |
| Electronic Arts, Inc. | | 36,010 | 4,535,820 |
| Take-Two Interactive Software, Inc. (b) | | 20,860 | 2,471,493 |
| The Walt Disney Co. (b) | | 234,344 | 24,967,010 |
| Warner Bros Discovery, Inc. (b) | | 296,643 | 3,856,359 |
| | | | 35,830,682 |
| Interactive Media & Services - 6.6% | | | |
| Alphabet, Inc.: | | | |
| Class A (b) | | 773,822 | 73,133,917 |
| Class C (b) | | 725,686 | 68,693,437 |
| Zoominfo Technologies, Inc. (b) | | 33,746 | 1,502,709 |
| | | | 143,330,063 |
| Media - 0.1% | | | |
| Cable One, Inc. | | 683 | 586,991 |
| Interpublic Group of Companies, Inc. | | 50,726 | 1,511,128 |
| Sirius XM Holdings, Inc. (a) | | 101,487 | 612,981 |
| | | | 2,711,100 |
TOTAL COMMUNICATION SERVICES | | | 202,940,882 |
| CONSUMER DISCRETIONARY - 11.1% | | | |
| Auto Components - 0.2% | | | |
| Aptiv PLC (b) | | 34,858 | 3,174,518 |
| BorgWarner, Inc. | | 30,855 | 1,157,988 |
| Lear Corp. | | 7,697 | 1,067,651 |
| | | | 5,400,157 |
| Automobiles - 3.6% | | | |
| Rivian Automotive, Inc. | | 40,204 | 1,405,934 |
| Tesla, Inc. (b) | | 339,862 | 77,332,199 |
| | | | 78,738,133 |
| Distributors - 0.3% | | | |
| Genuine Parts Co. | | 18,221 | 3,240,787 |
| LKQ Corp. | | 34,597 | 1,924,977 |
| Pool Corp. | | 5,143 | 1,564,655 |
| | | | 6,730,419 |
| Hotels, Restaurants & Leisure - 1.5% | | | |
| Hilton Worldwide Holdings, Inc. | | 35,820 | 4,845,013 |
| McDonald's Corp. | | 95,141 | 25,941,145 |
| Vail Resorts, Inc. | | 5,191 | 1,137,504 |
| | | | 31,923,662 |
| Household Durables - 0.0% | | | |
| Newell Brands, Inc. | | 50,586 | 698,593 |
| Internet & Direct Marketing Retail - 0.4% | | | |
| eBay, Inc. | | 72,035 | 2,869,874 |
| MercadoLibre, Inc. (b) | | 5,833 | 5,259,149 |
| | | | 8,129,023 |
| Leisure Products - 0.1% | | | |
| Hasbro, Inc. | | 17,056 | 1,112,904 |
| Multiline Retail - 0.4% | | | |
| Target Corp. | | 59,656 | 9,798,498 |
| Specialty Retail - 3.6% | | | |
| Advance Auto Parts, Inc. | | 7,810 | 1,483,275 |
| Best Buy Co., Inc. | | 25,983 | 1,777,497 |
| Burlington Stores, Inc. (b) | | 8,507 | 1,216,161 |
| CarMax, Inc. (a)(b) | | 20,539 | 1,294,162 |
| Lowe's Companies, Inc. | | 82,229 | 16,030,544 |
| The Home Depot, Inc. | | 132,219 | 39,154,012 |
| TJX Companies, Inc. | | 150,742 | 10,868,498 |
| Tractor Supply Co. | | 14,399 | 3,164,468 |
| Ulta Beauty, Inc. (b) | | 6,668 | 2,796,359 |
| | | | 77,784,976 |
| Textiles, Apparel & Luxury Goods - 1.0% | | | |
| lululemon athletica, Inc. (b) | | 15,011 | 4,939,219 |
| NIKE, Inc. Class B | | 163,221 | 15,127,322 |
| VF Corp. | | 42,482 | 1,200,117 |
| | | | 21,266,658 |
TOTAL CONSUMER DISCRETIONARY | | | 241,583,023 |
| CONSUMER STAPLES - 7.1% | | | |
| Beverages - 3.1% | | | |
| Keurig Dr. Pepper, Inc. | | 100,388 | 3,899,070 |
| PepsiCo, Inc. | | 177,873 | 32,298,179 |
| The Coca-Cola Co. | | 529,792 | 31,708,051 |
| | | | 67,905,300 |
| Food & Staples Retailing - 0.2% | | | |
| Kroger Co. | | 88,959 | 4,206,871 |
| Food Products - 0.9% | | | |
| Bunge Ltd. | | 19,462 | 1,920,899 |
| Campbell Soup Co. | | 27,204 | 1,439,364 |
| Conagra Brands, Inc. | | 61,770 | 2,266,959 |
| General Mills, Inc. | | 77,477 | 6,320,574 |
| Hormel Foods Corp. | | 38,556 | 1,790,926 |
| Kellogg Co. | | 32,590 | 2,503,564 |
| McCormick & Co., Inc. (non-vtg.) | | 32,199 | 2,532,129 |
| | | | 18,774,415 |
| Household Products - 2.6% | | | |
| Colgate-Palmolive Co. | | 102,410 | 7,561,954 |
| Kimberly-Clark Corp. | | 43,347 | 5,394,968 |
| Procter & Gamble Co. | | 308,655 | 41,566,569 |
| The Clorox Co. | | 15,840 | 2,313,274 |
| | | | 56,836,765 |
| Personal Products - 0.3% | | | |
| Estee Lauder Companies, Inc. Class A | | 29,822 | 5,979,013 |
TOTAL CONSUMER STAPLES | | | 153,702,364 |
| ENERGY - 2.7% | | | |
| Energy Equipment & Services - 0.8% | | | |
| Baker Hughes Co. Class A | | 126,662 | 3,503,471 |
| Halliburton Co. | | 116,044 | 4,226,322 |
| Schlumberger Ltd. | | 181,834 | 9,460,823 |
| | | | 17,190,616 |
| Oil, Gas & Consumable Fuels - 1.9% | | | |
| Cheniere Energy, Inc. | | 29,426 | 5,191,041 |
| Kinder Morgan, Inc. | | 262,511 | 4,756,699 |
| Marathon Petroleum Corp. | | 69,599 | 7,907,838 |
| ONEOK, Inc. | | 57,455 | 3,408,231 |
| Phillips 66 Co. | | 61,894 | 6,454,925 |
| Targa Resources Corp. | | 27,880 | 1,906,156 |
| The Williams Companies, Inc. | | 156,685 | 5,128,300 |
| Valero Energy Corp. | | 52,503 | 6,591,752 |
| | | | 41,344,942 |
TOTAL ENERGY | | | 58,535,558 |
| FINANCIALS - 11.5% | | | |
| Banks - 1.8% | | | |
| Citizens Financial Group, Inc. | | 63,746 | 2,607,211 |
| First Republic Bank | | 23,111 | 2,775,631 |
| Huntington Bancshares, Inc. | | 185,185 | 2,811,108 |
| KeyCorp | | 120,081 | 2,145,847 |
| PNC Financial Services Group, Inc. | | 53,198 | 8,609,032 |
| Regions Financial Corp. | | 120,232 | 2,639,092 |
| SVB Financial Group (b) | | 7,572 | 1,748,829 |
| Truist Financial Corp. | | 171,260 | 7,670,735 |
| U.S. Bancorp | | 181,561 | 7,707,264 |
| Webster Financial Corp. | | 22,935 | 1,244,453 |
| | | | 39,959,202 |
| Capital Markets - 5.0% | | | |
| Ameriprise Financial, Inc. | | 14,140 | 4,370,957 |
| Bank of New York Mellon Corp. | | 98,717 | 4,156,973 |
| BlackRock, Inc. Class A | | 19,490 | 12,588,786 |
| Carlyle Group LP | | 25,624 | 724,647 |
| Cboe Global Markets, Inc. | | 13,635 | 1,697,558 |
| Charles Schwab Corp. | | 187,006 | 14,898,768 |
| CME Group, Inc. | | 46,236 | 8,012,699 |
| FactSet Research Systems, Inc. | | 4,871 | 2,072,562 |
| Franklin Resources, Inc. (a) | | 38,621 | 905,662 |
| Intercontinental Exchange, Inc. | | 71,819 | 6,863,742 |
| Invesco Ltd. | | 43,992 | 673,957 |
| LPL Financial | | 10,289 | 2,630,383 |
| MarketAxess Holdings, Inc. | | 4,852 | 1,184,082 |
| Moody's Corp. | | 21,361 | 5,657,888 |
| Morgan Stanley | | 168,774 | 13,868,160 |
| NASDAQ, Inc. | | 44,485 | 2,768,746 |
| Northern Trust Corp. | | 25,467 | 2,148,141 |
| Raymond James Financial, Inc. | | 25,008 | 2,954,445 |
| S&P Global, Inc. | | 44,653 | 14,344,776 |
| State Street Corp. | | 47,232 | 3,495,168 |
| T. Rowe Price Group, Inc. | | 29,245 | 3,104,649 |
| | | | 109,122,749 |
| Consumer Finance - 0.9% | | | |
| Ally Financial, Inc. | | 41,562 | 1,145,449 |
| American Express Co. | | 82,348 | 12,224,561 |
| Discover Financial Services | | 36,155 | 3,776,751 |
| Synchrony Financial | | 64,430 | 2,291,131 |
| | | | 19,437,892 |
| Diversified Financial Services - 0.1% | | | |
| Equitable Holdings, Inc. | | 49,050 | 1,501,911 |
| Insurance - 3.6% | | | |
| AFLAC, Inc. | | 78,713 | 5,125,003 |
| Allstate Corp. | | 35,378 | 4,466,473 |
| American International Group, Inc. | | 101,930 | 5,810,010 |
| Arch Capital Group Ltd. (b) | | 48,314 | 2,778,055 |
| Arthur J. Gallagher & Co. | | 27,023 | 5,055,463 |
| Assurant, Inc. | | 6,967 | 946,537 |
| Chubb Ltd. | | 54,827 | 11,781,774 |
| Hartford Financial Services Group, Inc. | | 42,315 | 3,064,029 |
| Lincoln National Corp. | | 21,001 | 1,131,324 |
| Loews Corp. | | 26,931 | 1,535,606 |
| Marsh & McLennan Companies, Inc. | | 64,565 | 10,426,602 |
| Principal Financial Group, Inc. (a) | | 32,523 | 2,866,252 |
| Progressive Corp. | | 75,242 | 9,661,073 |
| Prudential Financial, Inc. | | 48,238 | 5,074,155 |
| The Travelers Companies, Inc. | | 30,871 | 5,694,465 |
| Willis Towers Watson PLC | | 14,344 | 3,130,004 |
| | | | 78,546,825 |
| Mortgage Real Estate Investment Trusts - 0.1% | | | |
| Annaly Capital Management, Inc. | | 55,515 | 1,029,803 |
TOTAL FINANCIALS | | | 249,598,382 |
| HEALTH CARE - 16.1% | | | |
| Biotechnology - 2.2% | | | |
| Amgen, Inc. | | 68,723 | 18,579,263 |
| Biogen, Inc. (b) | | 18,842 | 5,340,576 |
| BioMarin Pharmaceutical, Inc. (b) | | 23,778 | 2,059,888 |
| Gilead Sciences, Inc. | | 161,367 | 12,660,855 |
| Vertex Pharmaceuticals, Inc. (b) | | 32,904 | 10,266,048 |
| | | | 48,906,630 |
| Health Care Equipment & Supplies - 1.7% | | | |
| Abiomed, Inc. (b) | | 5,854 | 1,475,676 |
| Align Technology, Inc. (b) | | 9,625 | 1,870,138 |
| Baxter International, Inc. | | 64,793 | 3,521,500 |
| Dentsply Sirona, Inc. | | 27,759 | 855,532 |
| DexCom, Inc. (b) | | 50,502 | 6,099,632 |
| Edwards Lifesciences Corp. (b) | | 79,995 | 5,794,038 |
| Hologic, Inc. (b) | | 32,030 | 2,171,634 |
| IDEXX Laboratories, Inc. (b) | | 10,809 | 3,887,781 |
| Insulet Corp. (b) | | 8,918 | 2,308,068 |
| Novocure Ltd. (a)(b) | | 12,115 | 856,046 |
| ResMed, Inc. | | 18,821 | 4,210,069 |
| STERIS PLC | | 12,886 | 2,223,866 |
| Teleflex, Inc. | | 6,040 | 1,295,942 |
| | | | 36,569,922 |
| Health Care Providers & Services - 2.6% | | | |
| AmerisourceBergen Corp. | | 20,212 | 3,177,731 |
| Cardinal Health, Inc. | | 35,055 | 2,660,675 |
| Cigna Corp. | | 40,818 | 13,186,663 |
| DaVita HealthCare Partners, Inc. (b) | | 7,317 | 534,214 |
| Elevance Health, Inc. | | 31,015 | 16,958,072 |
| HCA Holdings, Inc. | | 30,414 | 6,614,133 |
| Humana, Inc. | | 16,274 | 9,082,194 |
| Laboratory Corp. of America Holdings | | 11,929 | 2,646,568 |
| Quest Diagnostics, Inc. | | 15,066 | 2,164,231 |
| | | | 57,024,481 |
| Health Care Technology - 0.0% | | | |
| Teladoc Health, Inc. (a)(b) | | 20,764 | 615,445 |
| Life Sciences Tools & Services - 2.1% | | | |
| Agilent Technologies, Inc. | | 38,468 | 5,322,048 |
| Bio-Techne Corp. | | 5,051 | 1,496,409 |
| Illumina, Inc. (b) | | 20,212 | 4,624,910 |
| Mettler-Toledo International, Inc. (b) | | 2,918 | 3,691,066 |
| Thermo Fisher Scientific, Inc. | | 50,360 | 25,883,529 |
| Waters Corp. (b) | | 7,750 | 2,318,568 |
| West Pharmaceutical Services, Inc. | | 9,531 | 2,193,083 |
| | | | 45,529,613 |
| Pharmaceuticals - 7.5% | | | |
| Bristol-Myers Squibb Co. | | 273,900 | 21,219,033 |
| Catalent, Inc. (b) | | 21,894 | 1,439,093 |
| Elanco Animal Health, Inc. (b) | | 54,953 | 724,830 |
| Eli Lilly & Co. | | 103,899 | 37,620,789 |
| Jazz Pharmaceuticals PLC (b) | | 8,008 | 1,151,470 |
| Johnson & Johnson | | 338,517 | 58,891,802 |
| Merck & Co., Inc. | | 325,321 | 32,922,485 |
| Zoetis, Inc. Class A | | 60,548 | 9,129,427 |
| | | | 163,098,929 |
TOTAL HEALTH CARE | | | 351,745,020 |
| INDUSTRIALS - 8.5% | | | |
| Air Freight & Logistics - 0.9% | | | |
| C.H. Robinson Worldwide, Inc. (a) | | 16,317 | 1,594,497 |
| Expeditors International of Washington, Inc. | | 21,602 | 2,113,756 |
| United Parcel Service, Inc. Class B | | 94,488 | 15,852,252 |
| | | | 19,560,505 |
| Airlines - 0.0% | | | |
| Delta Air Lines, Inc. (b) | | 20,660 | 700,994 |
| Building Products - 1.0% | | | |
| A.O. Smith Corp. | | 16,767 | 918,496 |
| Allegion PLC | | 11,181 | 1,171,433 |
| Carrier Global Corp. | | 109,151 | 4,339,844 |
| Fortune Brands Home & Security, Inc. | | 16,875 | 1,017,900 |
| Johnson Controls International PLC | | 89,516 | 5,177,605 |
| Lennox International, Inc. | | 4,165 | 972,819 |
| Masco Corp. | | 30,339 | 1,403,786 |
| Owens Corning | | 12,468 | 1,067,385 |
| Trane Technologies PLC | | 30,093 | 4,803,746 |
| | | | 20,873,014 |
| Commercial Services & Supplies - 0.4% | | | |
| Copart, Inc. (b) | | 27,525 | 3,165,926 |
| Republic Services, Inc. | | 28,447 | 3,772,641 |
| Rollins, Inc. | | 28,516 | 1,199,953 |
| | | | 8,138,520 |
| Construction & Engineering - 0.1% | | | |
| Quanta Services, Inc. | | 18,492 | 2,626,604 |
| Electrical Equipment - 0.6% | | | |
| Eaton Corp. PLC | | 51,341 | 7,704,744 |
| Generac Holdings, Inc. (b) | | 8,187 | 948,955 |
| Plug Power, Inc. (a)(b) | | 66,796 | 1,067,400 |
| Rockwell Automation, Inc. | | 14,963 | 3,820,054 |
| | | | 13,541,153 |
| Industrial Conglomerates - 0.4% | | | |
| 3M Co. | | 71,167 | 8,952,097 |
| Machinery - 2.8% | | | |
| Caterpillar, Inc. | | 68,618 | 14,853,052 |
| Cummins, Inc. | | 18,153 | 4,438,590 |
| Deere & Co. | | 37,353 | 14,785,064 |
| Dover Corp. | | 18,551 | 2,424,430 |
| Fortive Corp. | | 43,807 | 2,799,267 |
| IDEX Corp. | | 9,783 | 2,174,859 |
| Illinois Tool Works, Inc. | | 40,063 | 8,554,652 |
| Ingersoll Rand, Inc. | | 52,240 | 2,638,120 |
| Otis Worldwide Corp. | | 54,394 | 3,842,392 |
| Pentair PLC | | 21,310 | 915,265 |
| Snap-On, Inc. | | 6,870 | 1,525,484 |
| Xylem, Inc. | | 23,168 | 2,373,098 |
| | | | 61,324,273 |
| Professional Services - 0.1% | | | |
| Robert Half International, Inc. | | 14,203 | 1,085,961 |
| Road & Rail - 1.7% | | | |
| AMERCO | | 1,262 | 725,890 |
| CSX Corp. | | 279,715 | 8,128,518 |
| J.B. Hunt Transport Services, Inc. | | 10,786 | 1,845,161 |
| Knight-Swift Transportation Holdings, Inc. Class A | | 20,012 | 961,176 |
| Norfolk Southern Corp. | | 30,660 | 6,992,626 |
| Old Dominion Freight Lines, Inc. | | 12,397 | 3,404,216 |
| Union Pacific Corp. | | 80,837 | 15,936,206 |
| | | | 37,993,793 |
| Trading Companies & Distributors - 0.5% | | | |
| Fastenal Co. | | 74,056 | 3,579,126 |
| United Rentals, Inc. (b) | | 9,216 | 2,909,583 |
| W.W. Grainger, Inc. | | 5,917 | 3,457,599 |
| | | | 9,946,308 |
TOTAL INDUSTRIALS | | | 184,743,222 |
| INFORMATION TECHNOLOGY - 26.8% | | | |
| Communications Equipment - 1.3% | | | |
| Cisco Systems, Inc. | | 532,728 | 24,201,833 |
| Motorola Solutions, Inc. | | 21,524 | 5,374,758 |
| | | | 29,576,591 |
| Electronic Equipment & Components - 0.4% | | | |
| Cognex Corp. | | 22,315 | 1,031,622 |
| Keysight Technologies, Inc. (b) | | 23,418 | 4,078,245 |
| Trimble, Inc. (b) | | 32,169 | 1,935,287 |
| Zebra Technologies Corp. Class A (b) | | 6,742 | 1,909,469 |
| | | | 8,954,623 |
| IT Services - 6.1% | | | |
| Accenture PLC Class A | | 81,484 | 23,133,308 |
| Automatic Data Processing, Inc. | | 54,037 | 13,060,743 |
| IBM Corp. | | 115,709 | 16,001,398 |
| MasterCard, Inc. Class A | | 111,719 | 36,663,941 |
| The Western Union Co. (a) | | 49,756 | 672,204 |
| Visa, Inc. Class A | | 211,714 | 43,858,672 |
| | | | 133,390,266 |
| Semiconductors & Semiconductor Equipment - 4.6% | | | |
| Applied Materials, Inc. | | 111,920 | 9,881,417 |
| Intel Corp. | | 526,037 | 14,955,232 |
| Lam Research Corp. | | 17,846 | 7,223,704 |
| NVIDIA Corp. | | 322,136 | 43,478,696 |
| NXP Semiconductors NV | | 33,780 | 4,934,582 |
| Texas Instruments, Inc. | | 118,626 | 19,054,894 |
| | | | 99,528,525 |
| Software - 14.1% | | | |
| Adobe, Inc. (b) | | 60,787 | 19,360,660 |
| ANSYS, Inc. (b) | | 11,195 | 2,475,886 |
| Autodesk, Inc. (b) | | 27,987 | 5,997,614 |
| Cadence Design Systems, Inc. (b) | | 35,478 | 5,371,014 |
| Guidewire Software, Inc. (b) | | 10,195 | 605,685 |
| HubSpot, Inc. (b) | | 5,841 | 1,732,207 |
| Intuit, Inc. | | 34,475 | 14,738,063 |
| Microsoft Corp. | | 914,041 | 212,176,341 |
| NortonLifeLock, Inc. | | 77,053 | 1,736,004 |
| Roper Technologies, Inc. | | 13,626 | 5,648,522 |
| Salesforce.com, Inc. (b) | | 127,867 | 20,789,896 |
| ServiceNow, Inc. (b) | | 25,790 | 10,850,885 |
| Splunk, Inc. (b) | | 20,706 | 1,720,876 |
| VMware, Inc. Class A | | 27,106 | 3,050,238 |
| Zendesk, Inc. (b) | | 15,770 | 1,209,401 |
| | | | 307,463,292 |
| Technology Hardware, Storage & Peripherals - 0.3% | | | |
| Hewlett Packard Enterprise Co. | | 167,285 | 2,387,157 |
| HP, Inc. | | 135,531 | 3,743,366 |
| | | | 6,130,523 |
TOTAL INFORMATION TECHNOLOGY | | | 585,043,820 |
| MATERIALS - 2.9% | | | |
| Chemicals - 2.0% | | | |
| Celanese Corp. Class A | | 13,869 | 1,333,088 |
| Ecolab, Inc. | | 33,078 | 5,195,561 |
| International Flavors & Fragrances, Inc. | | 32,790 | 3,200,632 |
| Linde PLC | | 64,675 | 19,231,111 |
| PPG Industries, Inc. | | 30,387 | 3,469,588 |
| Sherwin-Williams Co. | | 31,794 | 7,154,604 |
| The Mosaic Co. | | 46,579 | 2,503,621 |
| | | | 42,088,205 |
| Construction Materials - 0.1% | | | |
| Martin Marietta Materials, Inc. | | 8,027 | 2,696,911 |
| Containers & Packaging - 0.3% | | | |
| Amcor PLC | | 193,190 | 2,237,140 |
| Ball Corp. | | 41,141 | 2,031,954 |
| International Paper Co. | | 45,323 | 1,523,306 |
| WestRock Co. | | 32,808 | 1,117,440 |
| | | | 6,909,840 |
| Metals & Mining - 0.5% | | | |
| Newmont Corp. | | 102,125 | 4,321,930 |
| Nucor Corp. | | 34,238 | 4,498,188 |
| Steel Dynamics, Inc. | | 24,211 | 2,277,045 |
| | | | 11,097,163 |
TOTAL MATERIALS | | | 62,792,119 |
| REAL ESTATE - 2.6% | | | |
| Equity Real Estate Investment Trusts (REITs) - 2.5% | | | |
| American Tower Corp. | | 58,698 | 12,161,639 |
| Boston Properties, Inc. | | 19,171 | 1,393,732 |
| Crown Castle International Corp. | | 55,705 | 7,423,248 |
| Equinix, Inc. | | 11,710 | 6,633,012 |
| Healthpeak Properties, Inc. | | 69,464 | 1,648,381 |
| Prologis (REIT), Inc. | | 118,725 | 13,148,794 |
| SBA Communications Corp. Class A | | 13,872 | 3,744,053 |
| Ventas, Inc. | | 51,414 | 2,011,830 |
| Welltower Op | | 58,396 | 3,564,492 |
| Weyerhaeuser Co. | | 95,783 | 2,962,568 |
| | | | 54,691,749 |
| Real Estate Management & Development - 0.1% | | | |
| CBRE Group, Inc. (b) | | 42,061 | 2,983,807 |
TOTAL REAL ESTATE | | | 57,675,556 |
| UTILITIES - 1.1% | | | |
| Electric Utilities - 0.3% | | | |
| Edison International | | 49,048 | 2,944,842 |
| Eversource Energy | | 44,371 | 3,384,620 |
| | | | 6,329,462 |
| Gas Utilities - 0.1% | | | |
| Atmos Energy Corp. | | 17,871 | 1,904,155 |
| UGI Corp. | | 27,040 | 955,323 |
| | | | 2,859,478 |
| Multi-Utilities - 0.5% | | | |
| Consolidated Edison, Inc. | | 45,572 | 4,008,513 |
| Sempra Energy | | 40,433 | 6,102,957 |
| | | | 10,111,470 |
| Water Utilities - 0.2% | | | |
| American Water Works Co., Inc. | | 23,378 | 3,397,759 |
| Essential Utilities, Inc. | | 32,038 | 1,416,720 |
| | | | 4,814,479 |
TOTAL UTILITIES | | | 24,114,889 |
| TOTAL COMMON STOCKS (Cost $2,260,578,206) | | | 2,172,474,835 |
| | | | |
| U.S. Treasury Obligations - 0.0% |
| | | Principal Amount (c) | Value ($) |
U.S. Treasury Bills, yield at date of purchase 1.23% 1/26/23 (d) (Cost $398,839) | | 400,000 | 396,190 |
| | | | |
| Money Market Funds - 0.6% |
| | | Shares | Value ($) |
| Fidelity Cash Central Fund 3.10% (e) | | 4,030,822 | 4,031,628 |
| Fidelity Securities Lending Cash Central Fund 3.10% (e)(f) | | 8,383,957 | 8,384,795 |
| TOTAL MONEY MARKET FUNDS (Cost $12,416,423) | | | 12,416,423 |
| | | | |
| TOTAL INVESTMENT IN SECURITIES - 100.3% (Cost $2,273,393,468) | 2,185,287,448 |
NET OTHER ASSETS (LIABILITIES) - (0.3)% | (5,886,838) |
| NET ASSETS - 100.0% | 2,179,400,610 |
| | |
| Futures Contracts |
| | Number of contracts | Expiration Date | Notional Amount ($) | Value ($) | Unrealized Appreciation/ (Depreciation) ($) |
| Purchased | | | | | |
| | | | | | |
| Equity Index Contracts | | | | | |
| CME E-mini S&P 500 Index Contracts (United States) | 37 | Dec 2022 | 7,183,550 | 441,349 | 441,349 |
| | | | | | |
| The notional amount of futures purchased as a percentage of Net Assets is 0.3% |
Legend
| (a) | Security or a portion of the security is on loan at period end. |
| (c) | Amount is stated in United States dollars unless otherwise noted. |
| (d) | Security or a portion of the security was pledged to cover margin requirements for futures contracts. At period end, the value of securities pledged amounted to $396,190. |
| (e) | Affiliated fund that is generally available only to investment companies and other accounts managed by Fidelity Investments. The rate quoted is the annualized seven-day yield of the fund at period end. A complete unaudited listing of the fund's holdings as of its most recent quarter end is available upon request. In addition, each Fidelity Central Fund's financial statements, which are not covered by the Fund's Report of Independent Registered Public Accounting Firm, are available on the SEC's website or upon request. |
| (f) | Investment made with cash collateral received from securities on loan. |
Affiliated Central Funds
Fiscal year to date information regarding the Fund's investments in Fidelity Central Funds, including the ownership percentage, is presented below.
| Affiliate | Value, beginning of period ($) | Purchases ($) | Sales Proceeds ($) | Dividend Income ($) | Realized Gain (loss) ($) | Change in Unrealized appreciation (depreciation) ($) | Value, end of period ($) | % ownership, end of period |
| Fidelity Cash Central Fund 3.10% | 15,023,399 | 629,976,193 | 640,967,964 | 62,906 | - | - | 4,031,628 | 0.0% |
| Fidelity Securities Lending Cash Central Fund 3.10% | 2,463,470 | 132,258,344 | 126,337,019 | 50,087 | - | - | 8,384,795 | 0.0% |
| Total | 17,486,869 | 762,234,537 | 767,304,983 | 112,993 | - | - | 12,416,423 | |
| | | | | | | | | |
Amounts in the income column in the above table include any capital gain distributions from underlying funds, which are presented in the corresponding line item in the Statement of Operations, if applicable.
Amount for Fidelity Securities Lending Cash Central Fund represents the income earned on investing cash collateral, less rebates paid to borrowers and any lending agent fees associated with the loan, plus any premium payments received for lending certain types of securities.
Investment Valuation
The following is a summary of the inputs used, as of October 31, 2022, involving the Fund's assets and liabilities carried at fair value. The inputs or methodology used for valuing securities may not be an indication of the risk associated with investing in those securities. For more information on valuation inputs, and their aggregation into the levels used below, please refer to the Investment Valuation section in the accompanying Notes to Financial Statements.
| Valuation Inputs at Reporting Date: |
| Description | Total ($) | Level 1 ($) | Level 2 ($) | Level 3 ($) |
Investments in Securities: | | | | |
|
| Equities: | | | | |
Communication Services | 202,940,882 | 202,940,882 | - | - |
Consumer Discretionary | 241,583,023 | 241,583,023 | - | - |
Consumer Staples | 153,702,364 | 153,702,364 | - | - |
Energy | 58,535,558 | 58,535,558 | - | - |
Financials | 249,598,382 | 249,598,382 | - | - |
Health Care | 351,745,020 | 351,745,020 | - | - |
Industrials | 184,743,222 | 184,743,222 | - | - |
Information Technology | 585,043,820 | 585,043,820 | - | - |
Materials | 62,792,119 | 62,792,119 | - | - |
Real Estate | 57,675,556 | 57,675,556 | - | - |
Utilities | 24,114,889 | 24,114,889 | - | - |
|
| U.S. Government and Government Agency Obligations | 396,190 | - | 396,190 | - |
|
| Money Market Funds | 12,416,423 | 12,416,423 | - | - |
| Total Investments in Securities: | 2,185,287,448 | 2,184,891,258 | 396,190 | - |
Derivative Instruments: | | | | |
|
| Assets | | | | |
Futures Contracts | 441,349 | 441,349 | - | - |
| Total Assets | 441,349 | 441,349 | - | - |
| Total Derivative Instruments: | 441,349 | 441,349 | - | - |
Value of Derivative Instruments
The following table is a summary of the Fund's value of derivative instruments by primary risk exposure as of October 31, 2022. For additional information on derivative instruments, please refer to the Derivative Instruments section in the accompanying Notes to Financial Statements.
Primary Risk Exposure / Derivative Type | Value |
| Asset ($) | Liability ($) |
| Equity Risk | | |
Futures Contracts (a) | 441,349 | 0 |
| Total Equity Risk | 441,349 | 0 |
| Total Value of Derivatives | 441,349 | 0 |
(a)Reflects gross cumulative appreciation (depreciation) on futures contracts as presented in the Schedule of Investments. In the Statement of Assets and Liabilities, the period end daily variation margin is included in receivable or payable for daily variation margin on futures contracts, and the net cumulative appreciation (depreciation) is included in Total accumulated earnings (loss).
| Statement of Assets and Liabilities |
| | | | October 31, 2022 |
| | | | | |
| Assets | | | | |
| Investment in securities, at value (including securities loaned of $8,118,472) - See accompanying schedule: | | | | |
Unaffiliated issuers (cost $2,260,977,045) | | $2,172,871,025 | | |
Fidelity Central Funds (cost $12,416,423) | | 12,416,423 | | |
| | | | | |
| Total Investment in Securities (cost $2,273,393,468) | | | $ | 2,185,287,448 |
| Segregated cash with brokers for derivative instruments | | | | 37,842 |
| Receivable for fund shares sold | | | | 1,589,363 |
| Dividends receivable | | | | 2,024,106 |
| Distributions receivable from Fidelity Central Funds | | | | 14,557 |
Total assets | | | | 2,188,953,316 |
| Liabilities | | | | |
| Payable for fund shares redeemed | | $915,869 | | |
| Accrued management fee | | 191,704 | | |
| Payable for daily variation margin on futures contracts | | 60,399 | | |
| Other payables and accrued expenses | | 9 | | |
| Collateral on securities loaned | | 8,384,725 | | |
| Total Liabilities | | | | 9,552,706 |
| Net Assets | | | $ | 2,179,400,610 |
| Net Assets consist of: | | | | |
| Paid in capital | | | $ | 2,264,722,910 |
| Total accumulated earnings (loss) | | | | (85,322,300) |
| Net Assets | | | $ | 2,179,400,610 |
Net Asset Value , offering price and redemption price per share ($2,179,400,610 ÷ 129,354,424 shares) | | | $ | 16.85 |
| | | | | |
| Statement of Operations |
| | | | Year ended October 31, 2022 |
| Investment Income | | | | |
| Dividends | | | $ | 33,333,484 |
| Interest | | | | 3,543 |
| Income from Fidelity Central Funds (including $50,087 from security lending) | | | | 112,993 |
| Total Income | | | | 33,450,020 |
| Expenses | | | | |
| Management fee | $ | 2,484,660 | | |
| Independent trustees' fees and expenses | | 7,207 | | |
| Total expenses before reductions | | 2,491,867 | | |
| Expense reductions | | (389) | | |
| Total expenses after reductions | | | | 2,491,478 |
| Net Investment income (loss) | | | | 30,958,542 |
| Realized and Unrealized Gain (Loss) | | | | |
| Net realized gain (loss) on: | | | | |
| Investment Securities: | | | | |
| Unaffiliated issuers | | (13,961,440) | | |
| Futures contracts | | (2,326,415) | | |
| Total net realized gain (loss) | | | | (16,287,855) |
| Change in net unrealized appreciation (depreciation) on: | | | | |
| Investment Securities: | | | | |
| Unaffiliated issuers | | (499,358,939) | | |
| Futures contracts | | 155,219 | | |
| Total change in net unrealized appreciation (depreciation) | | | | (499,203,720) |
| Net gain (loss) | | | | (515,491,575) |
| Net increase (decrease) in net assets resulting from operations | | | $ | (484,533,033) |
| Statement of Changes in Net Assets |
| |
| | Year ended October 31, 2022 | | Year ended October 31, 2021 |
| Increase (Decrease) in Net Assets | | | | |
| Operations | | | | |
| Net investment income (loss) | $ | 30,958,542 | $ | 14,040,418 |
| Net realized gain (loss) | | (16,287,855) | | 3,187,164 |
| Change in net unrealized appreciation (depreciation) | | (499,203,720) | | 364,587,836 |
| Net increase (decrease) in net assets resulting from operations | | (484,533,033) | | 381,815,418 |
| Distributions to shareholders | | (20,452,876) | | (5,983,382) |
| Share transactions | | | | |
| Proceeds from sales of shares | | 1,362,470,513 | | 1,187,275,553 |
| Reinvestment of distributions | | 19,223,799 | | 5,525,267 |
| Cost of shares redeemed | | (565,764,704) | | (188,928,085) |
Net increase (decrease) in net assets resulting from share transactions | | 815,929,608 | | 1,003,872,735 |
| Total increase (decrease) in net assets | | 310,943,699 | | 1,379,704,771 |
| | | | | |
| Net Assets | | | | |
| Beginning of period | | 1,868,456,911 | | 488,752,140 |
| End of period | $ | 2,179,400,610 | $ | 1,868,456,911 |
| | | | | |
| Other Information | | | | |
| Shares | | | | |
| Sold | | 69,593,522 | | 65,208,424 |
| Issued in reinvestment of distributions | | 949,791 | | 345,545 |
| Redeemed | | (30,563,531) | | (10,378,452) |
| Net increase (decrease) | | 39,979,782 | | 55,175,517 |
| | | | | |
Financial Highlights
| Fidelity® U.S. Sustainability Index Fund |
| |
| Years ended October 31, | | 2022 | | 2021 | | 2020 | | 2019 | | 2018 |
Selected Per-Share Data | | | | | | | | | | |
| Net asset value, beginning of period | $ | 20.91 | $ | 14.29 | $ | 13.18 | $ | 11.43 | $ | 10.90 |
| Income from Investment Operations | | | | | | | | | | |
Net investment income (loss) A,B | | .25 | | .23 | | .23 | | .23 | | .21 |
| Net realized and unrealized gain (loss) | | (4.10) | | 6.56 | | 1.08 | | 1.69 | | .41 |
| Total from investment operations | | (3.85) | | 6.79 | | 1.31 | | 1.92 | | .62 |
| Distributions from net investment income | | (.17) | | (.17) | | (.18) | | (.15) | | (.08) |
| Distributions from net realized gain | | (.04) | | - | | (.02) | | (.02) | | (.01) |
| Total distributions | | (.21) | | (.17) | | (.20) | | (.17) | | (.09) |
| Net asset value, end of period | $ | 16.85 | $ | 20.91 | $ | 14.29 | $ | 13.18 | $ | 11.43 |
Total Return C | | (18.58)% | | 47.84% | | 9.99% | | 17.06% | | 5.67% |
Ratios to Average Net Assets B,D,E | | | | | | | | | | |
| Expenses before reductions | | .11% | | .11% | | .11% | | .11% | | .11% |
| Expenses net of fee waivers, if any | | .11% | | .11% | | .11% | | .11% | | .11% |
| Expenses net of all reductions | | .11% | | .11% | | .11% | | .11% | | .11% |
| Net investment income (loss) | | 1.37% | | 1.28% | | 1.68% | | 1.84% | | 1.82% |
| Supplemental Data | | | | | | | | | | |
| Net assets, end of period (000 omitted) | $ | 2,179,401 | $ | 1,868,457 | $ | 488,752 | $ | 206,094 | $ | 6,125 |
Portfolio turnover rate F | | 9% | | 12% | | 10% | | 12% | | 15% |
A Calculated based on average shares outstanding during the period.
B Net investment income (loss) is affected by the timing of the declaration of dividends by any underlying mutual funds or exchange-traded funds (ETFs). Net investment income (loss) of any mutual funds or ETFs is not included in the Fund's net investment income (loss) ratio.
C Total returns would have been lower if certain expenses had not been reduced during the applicable periods shown.
D Fees and expenses of any underlying mutual funds or exchange-traded funds (ETFs) are not included in the Fund's expense ratio. The Fund indirectly bears its proportionate share of these expenses. For additional expense information related to investments in Fidelity Central Funds, please refer to the "Investments in Fidelity Central Funds" note found in the Notes to Financial Statements section of the most recent Annual or Semi-Annual report.
E Expense ratios reflect operating expenses of the class. Expenses before reductions do not reflect amounts reimbursed, waived, or reduced through arrangements with the investment adviser, brokerage services, or other offset arrangements, if applicable, and do not represent the amount paid by the class during periods when reimbursements, waivers or reductions occur.
F Amount does not include the portfolio activity of any underlying mutual funds or exchange-traded funds (ETFs).
For the period ended October 31, 2022
1. Organization.
Fidelity U.S. Sustainability Index Fund (the Fund) is a fund of Fidelity Salem Street Trust (the Trust) and is authorized to issue an unlimited number of shares. Share transactions on the Statement of Changes in Net Assets may contain exchanges between affiliated funds. The Trust is registered under the Investment Company Act of 1940, as amended (the 1940 Act), as an open-end management investment company organized as a Massachusetts business trust.
2. Investments in Fidelity Central Funds.
Funds may invest in Fidelity Central Funds, which are open-end investment companies generally available only to other investment companies and accounts managed by the investment adviser and its affiliates. The Schedule of Investments lists any Fidelity Central Funds held as an investment as of period end, but does not include the underlying holdings of each Fidelity Central Fund. An investing fund indirectly bears its proportionate share of the expenses of the underlying Fidelity Central Funds.
Based on its investment objective, each Fidelity Central Fund may invest or participate in various investment vehicles or strategies that are similar to those of the investing fund. These strategies are consistent with the investment objectives of the investing fund and may involve certain economic risks which may cause a decline in value of each of the Fidelity Central Funds and thus a decline in the value of the investing fund.
| Fidelity Central Fund | Investment Manager | Investment Objective | Investment Practices | Expense Ratio A |
| Fidelity Money Market Central Funds | Fidelity Management & Research Company LLC (FMR) | Each fund seeks to obtain a high level of current income consistent with the preservation of capital and liquidity. | Short-term Investments | Less than .005% |
A Expenses expressed as a percentage of average net assets and are as of each underlying Central Fund's most recent annual or semi-annual shareholder report.
A complete unaudited list of holdings for each Fidelity Central Fund is available upon request or at the Securities and Exchange Commission website at www.sec.gov. In addition, the financial statements of the Fidelity Central Funds which contain the significant accounting policies (including investment valuation policies) of those funds, and are not covered by the Report of Independent Registered Public Accounting Firm, are available on the Securities and Exchange Commission website or upon request.
3. Significant Accounting Policies.
The Fund is an investment company and applies the accounting and reporting guidance of the Financial Accounting Standards Board (FASB) Accounting Standards Codification Topic 946 Financial Services - Investment Companies . The financial statements have been prepared in conformity with accounting principles generally accepted in the United States of America (GAAP), which require management to make certain estimates and assumptions at the date of the financial statements. Actual results could differ from those estimates. Subsequent events, if any, through the date that the financial statements were issued have been evaluated in the preparation of the financial statements. The Fund's Schedule of Investments lists any underlying mutual funds or exchange-traded funds (ETFs) but does not include the underlying holdings of these funds. The following summarizes the significant accounting policies of the Fund:
Investment Valuation. Investments are valued as of 4:00 p.m. Eastern time on the last calendar day of the period. The Board of Trustees (the Board) has designated the Fund's investment adviser as the valuation designee responsible for the fair valuation function and performing fair value determinations as needed. The investment adviser has established a Fair Value Committee (the Committee) to carry out the day-to-day fair valuation responsibilities and has adopted policies and procedures to govern the fair valuation process and the activities of the Committee. In accordance with these fair valuation policies and procedures, which have been approved by the Board, the Fund attempts to obtain prices from one or more third party pricing services or brokers to value its investments. When current market prices, quotations or currency exchange rates are not readily available or reliable, investments will be fair valued in good faith by the Committee, in accordance with the policies and procedures. Factors used in determining fair value vary by investment type and may include market or investment specific events, transaction data, estimated cash flows, and market observations of comparable investments. The frequency that the fair valuation procedures are used cannot be predicted and they may be utilized to a significant extent. The Committee manages the Fund's fair valuation practices and maintains the fair valuation policies and procedures. The Fund's investment adviser reports to the Board information regarding the fair valuation process and related material matters.
The Fund categorizes the inputs to valuation techniques used to value its investments into a disclosure hierarchy consisting of three levels as shown below:
Level 1 - unadjusted quoted prices in active markets for identical investments
Level 2 - other significant observable inputs (including quoted prices for similar investments, interest rates, prepayment speeds, etc.)
Level 3 - unobservable inputs (including the Fund's own assumptions based on the best information available)
Valuation techniques used to value the Fund's investments by major category are as follows:
Equity securities, including restricted securities, for which market quotations are readily available, are valued at the last reported sale price or official closing price as reported by a third party pricing service on the primary market or exchange on which they are traded and are categorized as Level 1 in the hierarchy. In the event there were no sales during the day or closing prices are not available, securities are valued at the last quoted bid price or may be valued using the last available price and are generally categorized as Level 2 in the hierarchy. For foreign equity securities, when market or security specific events arise, comparisons to the valuation of American Depositary Receipts (ADRs), futures contracts, ETFs and certain indexes as well as quoted prices for similar securities may be used and would be categorized as Level 2 in the hierarchy. For equity securities, including restricted securities, where observable inputs are limited, assumptions about market activity and risk are used and these securities may be categorized as Level 3 in the hierarchy.
Debt securities, including restricted securities, are valued based on evaluated prices received from third party pricing services or from brokers who make markets in such securities. U.S. government and government agency obligations are valued by pricing services who utilize matrix pricing which considers yield or price of bonds of comparable quality, coupon, maturity and type or by broker-supplied prices. When independent prices are unavailable or unreliable, debt securities may be valued utilizing pricing methodologies which consider similar factors that would be used by third party pricing services. Debt securities are generally categorized as Level 2 in the hierarchy but may be Level 3 depending on the circumstances.
Futures contracts are valued at the settlement price established each day by the board of trade or exchange on which they are traded and are categorized as Level 1 in the hierarchy. Investments in open-end mutual funds, including the Fidelity Central Funds, are valued at their closing net asset value (NAV) each business day and are categorized as Level 1 in the hierarchy.
Changes in valuation techniques may result in transfers in or out of an assigned level within the disclosure hierarchy. The aggregate value of investments by input level as of October 31, 2022 is included at the end of the Fund's Schedule of Investments.
Investment Transactions and Income. For financial reporting purposes, the Fund's investment holdings and NAV include trades executed through the end of the last business day of the period. The NAV per share for processing shareholder transactions is calculated as of the close of business of the New York Stock Exchange (NYSE), normally 4:00 p.m. Eastern time and includes trades executed through the end of the prior business day. Gains and losses on securities sold are determined on the basis of identified cost and include proceeds received from litigation. Commissions paid to certain brokers with whom the investment adviser, or its affiliates, places trades on behalf of a fund include an amount in addition to trade execution, which may be rebated back to a fund. Any such rebates are included in net realized gain (loss) on investments in the Statement of Operations. Dividend income is recorded on the ex-dividend date, except for certain dividends from foreign securities where the ex-dividend date may have passed, which are recorded as soon as the Fund is informed of the ex-dividend date. Non-cash dividends included in dividend income, if any, are recorded at the fair market value of the securities received. Income and capital gain distributions from Fidelity Central Funds, if any, are recorded on the ex-dividend date. Certain distributions received by the Fund represent a return of capital or capital gain. The Fund determines the components of these distributions subsequent to the ex-dividend date, based upon receipt of tax filings or other correspondence relating to the underlying investment. These distributions are recorded as a reduction of cost of investments and/or as a realized gain. Interest income is accrued as earned and includes coupon interest and amortization of premium and accretion of discount on debt securities as applicable.
Expenses. Expenses directly attributable to a fund are charged to that fund. Expenses attributable to more than one fund are allocated among the respective funds on the basis of relative net assets or other appropriate methods. Expenses included in the accompanying financial statements reflect the expenses of that fund and do not include any expenses associated with any underlying mutual funds or exchange-traded funds. Although not included in a fund's expenses, a fund indirectly bears its proportionate share of these expenses through the net asset value of each underlying mutual fund or exchange-traded fund. Expense estimates are accrued in the period to which they relate and adjustments are made when actual amounts are known.
Income Tax Information and Distributions to Shareholders. Each year, the Fund intends to qualify as a regulated investment company under Subchapter M of the Internal Revenue Code, including distributing substantially all of its taxable income and realized gains. As a result, no provision for U.S. Federal income taxes is required. As of October 31, 2022, the Fund did not have any unrecognized tax benefits in the financial statements; nor is the Fund aware of any tax positions for which it is reasonably possible that the total amounts of unrecognized tax benefits will significantly change in the next twelve months. The Fund files a U.S. federal tax return, in addition to state and local tax returns as required. The Fund's federal income tax returns are subject to examination by the Internal Revenue Service (IRS) for a period of three fiscal years after they are filed. State and local tax returns may be subject to examination for an additional fiscal year depending on the jurisdiction.
Distributions are declared and recorded on the ex-dividend date. Income and capital gain distributions are determined in accordance with income tax regulations, which may differ from GAAP. In addition, the Fund claimed a portion of the payment made to redeeming shareholders as a distribution for income tax purposes.
Capital accounts within the financial statements are adjusted for permanent book-tax differences. These adjustments have no impact on net assets or the results of operations. Capital accounts are not adjusted for temporary book-tax differences which will reverse in a subsequent period.
Book-tax differences are primarily due to futures contracts, capital loss carryforwards and losses deferred due to wash sales.
As of period end, the cost and unrealized appreciation (depreciation) in securities, and derivatives if applicable, for federal income tax purposes were as follows:
| Gross unrealized appreciation | $234,758,044 |
| Gross unrealized depreciation | (333,617,158) |
| Net unrealized appreciation (depreciation) | $(98,859,114) |
| Tax Cost | $2,284,146,562 |
The tax-based components of distributable earnings as of period end were as follows:
| Undistributed ordinary income | $24,138,792 |
| Capital loss carryforward | $(10,601,978) |
| Net unrealized appreciation (depreciation) on securities and other investments | $(98,859,114) |
Capital loss carryforwards are only available to offset future capital gains of the Fund to the extent provided by regulations and may be limited. The capital loss carryforward information presented below, including any applicable limitation, is estimated as of fiscal period end and is subject to adjustment.
| Short-term | $(10,565,707) |
| Long-term | $(36,271) |
| Total capital loss carryforward | $(10,601,978) |
The tax character of distributions paid was as follows:
| | October 31, 2022 | October 31, 2021 |
| Ordinary Income | $18,202,081 | $5,983,382 |
| Long-term Capital Gains | 2,250,795 | - |
| Total | $20,452,876 | $5,983,382 |
4. Derivative Instruments.
Risk Exposures and the Use of Derivative Instruments. The Fund's investment objectives allow for various types of derivative instruments, including futures contracts. Derivatives are investments whose value is primarily derived from underlying assets, indices or reference rates and may be transacted on an exchange or over-the-counter (OTC). Derivatives may involve a future commitment to buy or sell a specified asset based on specified terms, to exchange future cash flows at periodic intervals based on a notional principal amount, or for one party to make one or more payments upon the occurrence of specified events in exchange for periodic payments from the other party.
Derivatives were used to increase returns and to manage exposure to certain risks as defined below. The success of any strategy involving derivatives depends on analysis of numerous economic factors, and if the strategies for investment do not work as intended, the objectives may not be achieved.
Derivatives were used to increase or decrease exposure to the following risk(s):
| Equity Risk | Equity risk relates to the fluctuations in the value of financial instruments as a result of changes in market prices (other than those arising from interest rate risk or foreign exchange risk), whether caused by factors specific to an individual investment, its issuer, or all factors affecting all instruments traded in a market or market segment. |
Funds are also exposed to additional risks from investing in derivatives, such as liquidity risk and counterparty credit risk. Liquidity risk is the risk that a fund will be unable to close out the derivative in the open market in a timely manner. Counterparty credit risk is the risk that the counterparty will not be able to fulfill its obligation to a fund. Counterparty credit risk related to exchange-traded contracts may be mitigated by the protection provided by the exchange on which they trade.
Investing in derivatives may involve greater risks than investing in the underlying assets directly and, to varying degrees, may involve risk of loss in excess of any initial investment and collateral received and amounts recognized in the Statement of Assets and Liabilities. In addition, there may be the risk that the change in value of the derivative contract does not correspond to the change in value of the underlying instrument.
Futures Contracts. A futures contract is an agreement between two parties to buy or sell a specified underlying instrument for a fixed price at a specified future date. Futures contracts were used to manage exposure to the stock market.
Upon entering into a futures contract, a fund is required to deposit either cash or securities (initial margin) with a clearing broker in an amount equal to a certain percentage of the face value of the contract. Futures contracts are marked-to-market daily and subsequent daily payments are made or received by a fund depending on the daily fluctuations in the value of the futures contracts and are recorded as unrealized appreciation or (depreciation). This receivable and/or payable, if any, is included in daily variation margin on futures contracts in the Statement of Assets and Liabilities. Realized gain or (loss) is recorded upon the expiration or closing of a futures contract. The net realized gain (loss) and change in net unrealized appreciation (depreciation) on futures contracts during the period is presented in the Statement of Operations.
Any open futures contracts at period end are presented in the Schedule of Investments under the caption "Futures Contracts". The notional amount at value reflects each contract's exposure to the underlying instrument or index at period end, and is representative of volume of activity during the period unless an average notional amount is presented. Any securities deposited to meet initial margin requirements are identified in the Schedule of Investments. Any cash deposited to meet initial margin requirements is presented as segregated cash with brokers for derivative instruments in the Statement of Assets and Liabilities.
5. Purchases and Sales of Investments.
Purchases and sales of securities, other than short-term securities, U.S. government securities and in-kind transactions, as applicable, are noted in the table below.
| | Purchases ($) | Sales ($) |
| Fidelity U.S. Sustainability Index Fund | 1,049,363,159 | 210,729,313 |
6. Fees and Other Transactions with Affiliates.
Management Fee. Fidelity Management & Research Company LLC (the investment adviser) and its affiliates provide the Fund with investment management related services for which the Fund pays a monthly management fee. The management fee is based on an annual rate of .11% of the Fund's average net assets. Under the management contract, the investment adviser pays all other operating expenses, except the compensation of the independent Trustees and certain miscellaneous expenses such as proxy and shareholder meeting expenses.
Sub-Adviser. Geode Capital Management, LLC (Geode), serves as sub-adviser for the Fund. Geode provides discretionary investment advisory services to the Fund and is paid by the investment adviser for providing these services.
Interfund Trades. Funds may purchase from or sell securities to other Fidelity Funds under procedures adopted by the Board. The procedures have been designed to ensure these interfund trades are executed in accordance with Rule 17a-7 of the 1940 Act. Any interfund trades are included within the respective purchases and sales amounts shown in the Purchases and Sales of Investments note. During the period, there were no interfund trades.
7. Committed Line of Credit.
Certain Funds participate with other funds managed by the investment adviser or an affiliate in a $4.25 billion credit facility (the "line of credit") to be utilized for temporary or emergency purposes to fund shareholder redemptions or for other short-term liquidity purposes. The commitment fees on the pro-rata portion of the line of credit are borne by the investment adviser. During the period, there were no borrowings on this line of credit.
8. Security Lending.
Funds lend portfolio securities from time to time in order to earn additional income. Lending agents are used, including National Financial Services (NFS), an affiliate of the investment adviser. Pursuant to a securities lending agreement, NFS will receive a fee, which is capped at 9.9% of a fund's daily lending revenue, for its services as lending agent. A fund may lend securities to certain qualified borrowers, including NFS. On the settlement date of the loan, a fund receives collateral (in the form of U.S. Treasury obligations, letters of credit and/or cash) against the loaned securities and maintains collateral in an amount not less than 100% of the market value of the loaned securities during the period of the loan. The market value of the loaned securities is determined at the close of business of a fund and any additional required collateral is delivered to a fund on the next business day. A fund or borrower may terminate the loan at any time, and if the borrower defaults on its obligation to return the securities loaned because of insolvency or other reasons, a fund may apply collateral received from the borrower against the obligation. A fund may experience delays and costs in recovering the securities loaned. Any cash collateral received is invested in the Fidelity Securities Lending Cash Central Fund. Any loaned securities are identified as such in the Schedule of Investments, and the value of loaned securities and cash collateral at period end, as applicable, are presented in the Statement of Assets and Liabilities. Security lending income represents the income earned on investing cash collateral, less rebates paid to borrowers and any lending agent fees associated with the loan, plus any premium payments received for lending certain types of securities. Security lending income is presented in the Statement of Operations as a component of income from Fidelity Central Funds. Affiliated security lending activity, if any, was as follows:
| | Total Security Lending Fees Paid to NFS | Security Lending Income From Securities Loaned to NFS | Value of Securities Loaned to NFS at Period End |
| Fidelity U.S. Sustainability Index Fund | $5,176 | $43 | $- |
9. Expense Reductions.
Through arrangements with the Fund's custodian, credits realized as a result of certain uninvested cash balances were used to reduce the Fund's expenses by $389.
10. Other.
A fund's organizational documents provide former and current trustees and officers with a limited indemnification against liabilities arising in connection with the performance of their duties to the fund. In the normal course of business, a fund may also enter into contracts that provide general indemnifications. A fund's maximum exposure under these arrangements is unknown as this would be dependent on future claims that may be made against a fund. The risk of material loss from such claims is considered remote.
11. Risk and Uncertainties.
Many factors affect a fund's performance. Developments that disrupt global economies and financial markets, such as pandemics, epidemics, outbreaks of infectious diseases, war, terrorism, and environmental disasters, may significantly affect a fund's investment performance. The effects of these developments to a fund will be impacted by the types of securities in which a fund invests, the financial condition, industry, economic sector, and geographic location of an issuer, and a fund's level of investment in the securities of that issuer.
To the Board of Trustees of Fidelity Salem Street Trust and Shareholders of Fidelity U.S. Sustainability Index Fund
Opinion on the Financial Statements
We have audited the accompanying statement of assets and liabilities, including the schedule of investments, of Fidelity U.S. Sustainability Index Fund (one of the funds constituting Fidelity Salem Street Trust, referred to hereafter as the "Fund") as of October 31, 2022, the related statement of operations for the year ended October 31, 2022, the statement of changes in net assets for each of the two years in the period ended October 31, 2022, including the related notes, and the financial highlights for each of the five years in the period ended October 31, 2022 (collectively referred to as the "financial statements"). In our opinion, the financial statements present fairly, in all material respects, the financial position of the Fund as of October 31, 2022, the results of its operations for the year then ended, the changes in its net assets for each of the two years in the period ended October 31, 2022 and the financial highlights for each of the five years in the period ended October 31, 2022 in conformity with accounting principles generally accepted in the United States of America.
Basis for Opinion
These financial statements are the responsibility of the Fund's management. Our responsibility is to express an opinion on the Fund's financial statements based on our audits. We are a public accounting firm registered with the Public Company Accounting Oversight Board (United States) (PCAOB) and are required to be independent with respect to the Fund in accordance with the U.S. federal securities laws and the applicable rules and regulations of the Securities and Exchange Commission and the PCAOB.
We conducted our audits of these financial statements in accordance with the standards of the PCAOB. Those standards require that we plan and perform the audit to obtain reasonable assurance about whether the financial statements are free of material misstatement, whether due to error or fraud.
Our audits included performing procedures to assess the risks of material misstatement of the financial statements, whether due to error or fraud, and performing procedures that respond to those risks. Such procedures included examining, on a test basis, evidence regarding the amounts and disclosures in the financial statements. Our audits also included evaluating the accounting principles used and significant estimates made by management, as well as evaluating the overall presentation of the financial statements. Our procedures included confirmation of securities owned as of October 31, 2022 by correspondence with the custodian and brokers. We believe that our audits provide a reasonable basis for our opinion.
/s/ PricewaterhouseCoopers LLP
Boston, Massachusetts
December 16, 2022
We have served as the auditor of one or more investment companies in the Fidelity group of funds since 1932.
The Trustees, Members of the Advisory Board (if any), and officers of the trust and fund, as applicable, are listed below. The Board of Trustees governs the fund and is responsible for protecting the interests of shareholders. The Trustees are experienced executives who meet periodically throughout the year to oversee the fund's activities, review contractual arrangements with companies that provide services to the fund, oversee management of the risks associated with such activities and contractual arrangements, and review the fund's performance. Except for Jonathan Chiel, each of the Trustees oversees 293 funds. Mr. Chiel oversees 184 funds.
The Trustees hold office without limit in time except that (a) any Trustee may resign; (b) any Trustee may be removed by written instrument, signed by at least two-thirds of the number of Trustees prior to such removal; (c) any Trustee who requests to be retired or who has become incapacitated by illness or injury may be retired by written instrument signed by a majority of the other Trustees; and (d) any Trustee may be removed at any special meeting of shareholders by a two-thirds vote of the outstanding voting securities of the trust. Each Trustee who is not an interested person (as defined in the 1940 Act) of the trust and the fund is referred to herein as an Independent Trustee. Each Independent Trustee shall retire not later than the last day of the calendar year in which his or her 75th birthday occurs. The Independent Trustees may waive this mandatory retirement age policy with respect to individual Trustees. Officers and Advisory Board Members hold office without limit in time, except that any officer or Advisory Board Member may resign or may be removed by a vote of a majority of the Trustees at any regular meeting or any special meeting of the Trustees. Except as indicated, each individual has held the office shown or other offices in the same company for the past five years.
The fund's Statement of Additional Information (SAI) includes more information about the Trustees. To request a free copy, call Fidelity at 1-800-544-8544.
Experience, Skills, Attributes, and Qualifications of the Trustees. The Governance and Nominating Committee has adopted a statement of policy that describes the experience, qualifications, attributes, and skills that are necessary and desirable for potential Independent Trustee candidates (Statement of Policy). The Board believes that each Trustee satisfied at the time he or she was initially elected or appointed a Trustee, and continues to satisfy, the standards contemplated by the Statement of Policy. The Governance and Nominating Committee also engages professional search firms to help identify potential Independent Trustee candidates who have the experience, qualifications, attributes, and skills consistent with the Statement of Policy. From time to time, additional criteria based on the composition and skills of the current Independent Trustees, as well as experience or skills that may be appropriate in light of future changes to board composition, business conditions, and regulatory or other developments, have also been considered by the professional search firms and the Governance and Nominating Committee. In addition, the Board takes into account the Trustees' commitment and participation in Board and committee meetings, as well as their leadership of standing and ad hoc committees throughout their tenure.
In determining that a particular Trustee was and continues to be qualified to serve as a Trustee, the Board has considered a variety of criteria, none of which, in isolation, was controlling. The Board believes that, collectively, the Trustees have balanced and diverse experience, qualifications, attributes, and skills, which allow the Board to operate effectively in governing the fund and protecting the interests of shareholders. Information about the specific experience, skills, attributes, and qualifications of each Trustee, which in each case led to the Board's conclusion that the Trustee should serve (or continue to serve) as a trustee of the fund, is provided below.
Board Structure and Oversight Function. Abigail P. Johnson is an interested person and currently serves as Chairman. The Trustees have determined that an interested Chairman is appropriate and benefits shareholders because an interested Chairman has a personal and professional stake in the quality and continuity of services provided to the fund. Independent Trustees exercise their informed business judgment to appoint an individual of their choosing to serve as Chairman, regardless of whether the Trustee happens to be independent or a member of management. The Independent Trustees have determined that they can act independently and effectively without having an Independent Trustee serve as Chairman and that a key structural component for assuring that they are in a position to do so is for the Independent Trustees to constitute a substantial majority for the Board. The Independent Trustees also regularly meet in executive session. Michael E. Kenneally serves as Chairman of the Independent Trustees and as such (i) acts as a liaison between the Independent Trustees and management with respect to matters important to the Independent Trustees and (ii) with management prepares agendas for Board meetings.
Fidelity ® funds are overseen by different Boards of Trustees. The fund's Board oversees Fidelity's investment-grade bond, money market, asset allocation and certain equity funds, and other Boards oversee Fidelity's high income and other equity funds. The asset allocation funds may invest in Fidelity ® funds that are overseen by such other Boards. The use of separate Boards, each with its own committee structure, allows the Trustees of each group of Fidelity ® funds to focus on the unique issues of the funds they oversee, including common research, investment, and operational issues. On occasion, the separate Boards establish joint committees to address issues of overlapping consequences for the Fidelity ® funds overseen by each Board.
The Trustees operate using a system of committees to facilitate the timely and efficient consideration of all matters of importance to the Trustees, the fund, and fund shareholders and to facilitate compliance with legal and regulatory requirements and oversight of the fund's activities and associated risks. The Board, acting through its committees, has charged FMR and its affiliates with (i) identifying events or circumstances the occurrence of which could have demonstrably adverse effects on the fund's business and/or reputation; (ii) implementing processes and controls to lessen the possibility that such events or circumstances occur or to mitigate the effects of such events or circumstances if they do occur; and (iii) creating and maintaining a system designed to evaluate continuously business and market conditions in order to facilitate the identification and implementation processes described in (i) and (ii) above. Because the day-to-day operations and activities of the fund are carried out by or through FMR, its affiliates, and other service providers, the fund's exposure to risks is mitigated but not eliminated by the processes overseen by the Trustees. While each of the Board's committees has responsibility for overseeing different aspects of the fund's activities, oversight is exercised primarily through the Operations and Audit Committees. In addition, an ad hoc Board committee of Independent Trustees has worked with FMR to enhance the Board's oversight of investment and financial risks, legal and regulatory risks, technology risks, and operational risks, including the development of additional risk reporting to the Board. Appropriate personnel, including but not limited to the fund's Chief Compliance Officer (CCO), FMR's internal auditor, the independent accountants, the fund's Treasurer and portfolio management personnel, make periodic reports to the Board's committees, as appropriate, including an annual review of Fidelity's risk management program for the Fidelity ® funds. The responsibilities of each standing committee, including their oversight responsibilities, are described further under "Standing Committees of the Trustees."
Interested Trustees*:
Correspondence intended for a Trustee who is an interested person may be sent to Fidelity Investments, 245 Summer Street, Boston, Massachusetts 02210.
Name, Year of Birth; Principal Occupations and Other Relevant Experience+
Jonathan Chiel (1957)
Year of Election or Appointment: 2016
Trustee
Mr. Chiel also serves as Trustee of other Fidelity ® funds. Mr. Chiel is Executive Vice President and General Counsel for FMR LLC (diversified financial services company, 2012-present). Previously, Mr. Chiel served as general counsel (2004-2012) and senior vice president and deputy general counsel (2000-2004) for John Hancock Financial Services; a partner with Choate, Hall & Stewart (1996-2000) (law firm); and an Assistant United States Attorney for the United States Attorney's Office of the District of Massachusetts (1986-95), including Chief of the Criminal Division (1993-1995). Mr. Chiel is a director on the boards of the Boston Bar Foundation and the Maimonides School.
Abigail P. Johnson (1961)
Year of Election or Appointment: 2009
Trustee
Chairman of the Board of Trustees
Ms. Johnson also serves as Trustee of other Fidelity ® funds. Ms. Johnson serves as Chairman (2016-present), Chief Executive Officer (2014-present), and Director (2007-present) of FMR LLC (diversified financial services company), President of Fidelity Financial Services (2012-present) and President of Personal, Workplace and Institutional Services (2005-present). Ms. Johnson is Chairman and Director of Fidelity Management & Research Company LLC (investment adviser firm, 2011-present). Previously, Ms. Johnson served as Chairman and Director of FMR Co., Inc. (investment adviser firm, 2011-2019), Vice Chairman (2007-2016) and President (2013-2016) of FMR LLC, President and a Director of Fidelity Management & Research Company (2001-2005), a Trustee of other investment companies advised by Fidelity Management & Research Company, Fidelity Investments Money Management, Inc. (investment adviser firm), and FMR Co., Inc. (2001-2005), Senior Vice President of the Fidelity ® funds (2001-2005), and managed a number of Fidelity ® funds. Ms. Abigail P. Johnson and Mr. Arthur E. Johnson are not related.
Jennifer Toolin McAuliffe (1959)
Year of Election or Appointment: 2016
Trustee
Ms. McAuliffe also serves as Trustee of other Fidelity ® funds and as Trustee of Fidelity Charitable (2020-present). Previously, Ms. McAuliffe served as Co-Head of Fixed Income of Fidelity Investments Limited (now known as FIL Limited (FIL)) (diversified financial services company), Director of Research for FIL's credit and quantitative teams in London, Hong Kong and Tokyo and Director of Research for taxable and municipal bonds at Fidelity Investments Money Management, Inc. Ms. McAuliffe previously served as a member of the Advisory Board of certain Fidelity ® funds (2016). Ms. McAuliffe was previously a lawyer at Ropes & Gray LLP and currently serves as director or trustee of several not-for-profit entities.
* Determined to be an "Interested Trustee" by virtue of, among other things, his or her affiliation with the trust or various entities under common control with FMR.
+ The information includes the Trustee's principal occupation during the last five years and other information relating to the experience, attributes, and skills relevant to the Trustee's qualifications to serve as a Trustee, which led to the conclusion that the Trustee should serve as a Trustee for the fund.
Independent Trustees:
Correspondence intended for an Independent Trustee may be sent to Fidelity Investments, P.O. Box 55235, Boston, Massachusetts 02205-5235.
Name, Year of Birth; Principal Occupations and Other Relevant Experience+
Elizabeth S. Acton (1951)
Year of Election or Appointment: 2013
Trustee
Ms. Acton also serves as Trustee of other Fidelity ® funds. Prior to her retirement, Ms. Acton served as Executive Vice President, Finance (2011-2012), Executive Vice President, Chief Financial Officer (2002-2011) and Treasurer (2004-2005) of Comerica Incorporated (financial services). Prior to joining Comerica, Ms. Acton held a variety of positions at Ford Motor Company (1983-2002), including Vice President and Treasurer (2000-2002) and Executive Vice President and Chief Financial Officer of Ford Motor Credit Company (1998-2000). Ms. Acton currently serves as a member of the Board and Audit and Finance Committees of Beazer Homes USA, Inc. (homebuilding, 2012-present). Ms. Acton previously served as a member of the Advisory Board of certain Fidelity ® funds (2013-2016).
Ann E. Dunwoody (1953)
Year of Election or Appointment: 2018
Trustee
General Dunwoody also serves as Trustee of other Fidelity ® funds. General Dunwoody (United States Army, Retired) was the first woman in U.S. military history to achieve the rank of four-star general and prior to her retirement in 2012 held a variety of positions within the U.S. Army, including Commanding General, U.S. Army Material Command (2008-2012). General Dunwoody currently serves as President of First to Four LLC (leadership and mentoring services, 2012-present), a member of the Board and Nomination and Corporate Governance Committees of Kforce Inc. (professional staffing services, 2016-present) and a member of the Board of Automattic Inc. (software engineering, 2018-present). Previously, General Dunwoody served as a member of the Advisory Board and Nominating and Corporate Governance Committee of L3 Technologies, Inc. (communication, electronic, sensor and aerospace systems, 2013-2019) and a member of the Board and Audit and Sustainability and Corporate Responsibility Committees of Republic Services, Inc. (waste collection, disposal and recycling, 2013-2016). Ms. Dunwoody also serves on several boards for non-profit organizations, including as a member of the Board, Chair of the Nomination and Governance Committee and a member of the Audit Committee of Logistics Management Institute (consulting non-profit, 2012-present), a member of the Council of Trustees for the Association of the United States Army (advocacy non-profit, 2013-present), a member of the Board of Florida Institute of Technology (2015-present) and a member of the Board of ThanksUSA (military family education non-profit, 2014-present). General Dunwoody previously served as a member of the Advisory Board of certain Fidelity ® funds (2018).
John Engler (1948)
Year of Election or Appointment: 2014
Trustee
Mr. Engler also serves as Trustee of other Fidelity ® funds. Previously, Mr. Engler served as Governor of Michigan (1991-2003), President of the Business Roundtable (2011-2017) and interim President of Michigan State University (2018-2019). Mr. Engler currently serves as a member of the Board of Stride, Inc. (formerly K12 Inc.) (technology-based education company, 2012-present). Previously, Mr. Engler served as a member of the Board of Universal Forest Products (manufacturer and distributor of wood and wood-alternative products, 2003-2019) and Trustee of The Munder Funds (2003-2014). Mr. Engler previously served as a member of the Advisory Board of certain Fidelity ® funds (2014-2016).
Robert F. Gartland (1951)
Year of Election or Appointment: 2010
Trustee
Mr. Gartland also serves as Trustee of other Fidelity ® funds. Prior to his retirement, Mr. Gartland held a variety of positions at Morgan Stanley (financial services, 1979-2007), including Managing Director (1987-2007) and Chase Manhattan Bank (1975-1978). Mr. Gartland previously served as Chairman and an investor in Gartland & Mellina Group Corp. (consulting, 2009-2019), as a member of the Board of National Securities Clearing Corporation (1993-1996) and as Chairman of TradeWeb (2003-2004).
Arthur E. Johnson (1947)
Year of Election or Appointment: 2008
Trustee
Mr. Johnson also serves as Trustee of other Fidelity ® funds. Prior to his retirement, Mr. Johnson served as Senior Vice President of Corporate Strategic Development of Lockheed Martin Corporation (defense contractor, 1999-2009). Mr. Johnson currently serves as a member of the Board of Booz Allen Hamilton (management consulting, 2011-present). Mr. Johnson previously served as a member of the Board of Eaton Corporation plc (diversified power management, 2009-2019) and a member of the Board of AGL Resources, Inc. (holding company, 2002-2016). Mr. Johnson previously served as Chairman (2018-2021) and Vice Chairman (2015-2018) of the Independent Trustees of certain Fidelity® funds. Mr. Arthur E. Johnson is not related to Ms. Abigail P. Johnson.
Michael E. Kenneally (1954)
Year of Election or Appointment: 2009
Trustee
Chairman of the Independent Trustees
Mr. Kenneally also serves as Trustee of other Fidelity ® funds and was Vice Chairman (2018-2021) of the Independent Trustees of certain Fidelity ® funds. Prior to retirement in 2005, he was Chairman and Global Chief Executive Officer of Credit Suisse Asset Management, the worldwide fund management and institutional investment business of Credit Suisse Group. Previously, Mr. Kenneally was an Executive Vice President and the Chief Investment Officer for Bank of America. In this role, he was responsible for the investment management, strategy and products delivered to the bank's institutional, high-net-worth and retail clients. Earlier, Mr. Kenneally directed the organization's equity and quantitative research groups. He began his career as a research analyst and then spent more than a dozen years as a portfolio manager for endowments, pension plans and mutual funds. He earned the Chartered Financial Analyst (CFA) designation in 1991.
Marie L. Knowles (1946)
Year of Election or Appointment: 2001
Trustee
Ms. Knowles also serves as Trustee of other Fidelity ® funds. Prior to her retirement, Ms. Knowles held several positions at Atlantic Richfield Company (diversified energy), including Executive Vice President and Chief Financial Officer (1996-2000), Senior Vice President (1993-1996) and President of ARCO Transportation Company (pipeline and tanker operations, 1993-1996). Ms. Knowles currently serves as a member of the Board of the Santa Catalina Island Company (real estate, 2009-present), a member of the Investment Company Institute Board of Governors and a member of the Governing Council of the Independent Directors Council (2014-present). Ms. Knowles also serves as a member of the Advisory Board for the School of Engineering of the University of Southern California. Ms. Knowles previously served as a member of the Board of McKesson Corporation (healthcare service, 2002-2021). In addition, Ms. Knowles previously served as Chairman (2015-2018) and Vice Chairman (2012-2015) of the Independent Trustees of certain Fidelity ® funds.
Mark A. Murray (1954)
Year of Election or Appointment: 2016
Trustee
Mr. Murray also serves as Trustee of other Fidelity ® funds. Previously, Mr. Murray served as Co-Chief Executive Officer (2013-2016), President (2006-2013) and Vice Chairman (2013-2020) of Meijer, Inc. Mr. Murray serves as a member of the Board (2009-present) and Public Policy and Responsibility Committee (2009-present) and Chair of the Nuclear Review Committee (2019-present) of DTE Energy Company (diversified energy company). Mr. Murray previously served as a member of the Board of Spectrum Health (not-for-profit health system, 2015-2019) and as a member of the Board and Audit Committee and Chairman of the Nominating and Corporate Governance Committee of Universal Forest Products, Inc. (manufacturer and distributor of wood and wood-alternative products, 2004-2016). Mr. Murray also serves as a member of the Board of many community and professional organizations. Mr. Murray previously served as a member of the Advisory Board of certain Fidelity ® funds (2016).
+ The information includes the Trustee's principal occupation during the last five years and other information relating to the experience, attributes, and skills relevant to the Trustee's qualifications to serve as a Trustee, which led to the conclusion that the Trustee should serve as a Trustee for the fund.
Advisory Board Members and Officers:
Correspondence intended for a Member of the Advisory Board (if any) may be sent to Fidelity Investments, P.O. Box 55235, Boston, Massachusetts 02205-5235. Correspondence intended for an officer may be sent to Fidelity Investments, 245 Summer Street, Boston, Massachusetts 02210. Officers appear below in alphabetical order.
Name, Year of Birth; Principal Occupation
Laura M. Bishop (1961)
Year of Election or Appointment: 2022
Member of the Advisory Board
Ms. Bishop also serves as a Member of the Advisory Board of other funds. Prior to her retirement, Ms. Bishop held a variety of positions at United Services Automobile Association (2001-2020), including Executive Vice President and Chief Financial Officer (2014-2020) and Senior Vice President and Deputy Chief Financial Officer (2012-2014). Ms. Bishop currently serves as a member of the Audit Committee and Compensation and Personnel Committee (2021-present) of the Board of Directors of Korn Ferry (global organizational consulting).
Robert W. Helm (1957)
Year of Election or Appointment: 2021
Member of the Advisory Board
Mr. Helm also serves as a Member of the Advisory Board of other Fidelity® funds. Mr. Helm was formerly Deputy Chairman (2003-2020), partner (1991-2020) and an associate (1984-1991) of Dechert LLP (formerly Dechert Price & Rhoads). Mr. Helm currently serves on boards and committees of several not-for-profit organizations.
Craig S. Brown (1977)
Year of Election or Appointment: 2019
Assistant Treasurer
Mr. Brown also serves as an officer of other funds. Mr. Brown serves as Assistant Treasurer of FIMM, LLC (2021-present) and is an employee of Fidelity Investments (2013-present). Previously, Mr. Brown served as Assistant Treasurer of certain Fidelity ® funds (2019-2022).
John J. Burke III (1964)
Year of Election or Appointment: 2018
Chief Financial Officer
Mr. Burke also serves as Chief Financial Officer of other funds. Mr. Burke serves as Head of Investment Operations for Fidelity Fund and Investment Operations (2018-present) and is an employee of Fidelity Investments (1998-present). Previously Mr. Burke served as head of Asset Management Investment Operations (2012-2018).
David J. Carter (1973)
Year of Election or Appointment: 2020
Assistant Secretary
Mr. Carter also serves as Assistant Secretary of other funds. Mr. Carter serves as Senior Vice President, Deputy General Counsel (2022-present) and is an employee of Fidelity Investments (2005-present).
Jonathan Davis (1968)
Year of Election or Appointment: 2010
Assistant Treasurer
Mr. Davis also serves as an officer of other funds. Mr. Davis serves as Assistant Treasurer of FIMM, LLC (2021-present), FMR Capital, Inc. (2017-present), FD Funds GP LLC (2021-present), FD Funds Holding LLC (2021-present), and FD Funds Management LLC (2021-present); and is an employee of Fidelity Investments. Previously, Mr. Davis served as Vice President and Associate General Counsel of FMR LLC (diversified financial services company, 2003-2010).
Laura M. Del Prato (1964)
Year of Election or Appointment: 2018
President and Treasurer
Ms. Del Prato also serves as an officer of other funds. Ms. Del Prato serves as Assistant Treasurer of FIMM, LLC (2021-present) and is an employee of Fidelity Investments (2017-present). Previously, Ms. Del Prato served as President and Treasurer of The North Carolina Capital Management Trust: Cash Portfolio and Term Portfolio (2018-2020). Prior to joining Fidelity Investments, Ms. Del Prato served as a Managing Director and Treasurer of the JPMorgan Mutual Funds (2014-2017). Prior to JPMorgan, Ms. Del Prato served as a partner at Cohen Fund Audit Services (accounting firm, 2012-2013) and KPMG LLP (accounting firm, 2004-2012).
Colm A. Hogan (1973)
Year of Election or Appointment: 2016
Assistant Treasurer
Mr. Hogan also serves as an officer of other funds. Mr. Hogan serves as Assistant Treasurer of FIMM, LLC (2021-present) and FMR Capital, Inc. (2017-present) and is an employee of Fidelity Investments (2005-present). Previously, Mr. Hogan served as Deputy Treasurer of certain Fidelity ® funds (2016-2020) and Assistant Treasurer of certain Fidelity ® funds (2016-2018).
Cynthia Lo Bessette (1969)
Year of Election or Appointment: 2019
Secretary and Chief Legal Officer (CLO)
Ms. Lo Bessette also serves as an officer of other funds. Ms. Lo Bessette serves as CLO, Secretary, and Senior Vice President of Fidelity Management & Research Company LLC (investment adviser firm, 2019-present); CLO of Fidelity Management & Research (Hong Kong) Limited, FMR Investment Management (UK) Limited, and Fidelity Management & Research (Japan) Limited (investment adviser firms, 2019-present); Secretary of FD Funds GP LLC (2021-present), FD Funds Holding LLC (2021-present), FD Funds Management LLC (2021-present), and Fidelity Diversifying Solutions LLC (investment adviser firm, 2022-present); and Assistant Secretary of FIMM, LLC (2019-present). She is a Senior Vice President and Deputy General Counsel of FMR LLC (diversified financial services company, 2019-present), and is an employee of Fidelity Investments. Previously, Ms. Lo Bessette served as CLO, Secretary, and Senior Vice President of FMR Co., Inc. (investment adviser firm, 2019); Secretary of Fidelity SelectCo, LLC and Fidelity Investments Money Management, Inc. (investment adviser firms, 2019). Prior to joining Fidelity Investments, Ms. Lo Bessette was Executive Vice President, General Counsel (2016-2019) and Senior Vice President, Deputy General Counsel (2015-2016) of OppenheimerFunds (investment management company) and Deputy Chief Legal Officer (2013-2015) of Jennison Associates LLC (investment adviser firm).
Chris Maher (1972)
Year of Election or Appointment: 2013
Assistant Treasurer
Mr. Maher also serves as an officer of other funds. Mr. Maher serves as Assistant Treasurer of FIMM, LLC (2021-present) and FMR Capital, Inc. (2017-present), and is an employee of Fidelity Investments (2008-present). Previously, Mr. Maher served as Assistant Treasurer of certain funds (2013-2020); Vice President of Asset Management Compliance (2013), Vice President of the Program Management Group of FMR (investment adviser firm, 2010-2013), and Vice President of Valuation Oversight (2008-2010).
Jamie Pagliocco (1964)
Year of Election or Appointment: 2020
Vice President
Mr. Pagliocco also serves as Vice President of other funds. Mr. Pagliocco serves as President of Fixed Income (2020-present), and is an employee of Fidelity Investments (2001-present). Previously, Mr. Pagliocco served as Co-Chief Investment Officer - Bond (2017-2020), Global Head of Bond Trading (2016-2019), and as a portfolio manager.
Kenneth B. Robins (1969)
Year of Election or Appointment: 2020
Chief Compliance Officer
Mr. Robins also serves as an officer of other funds. Mr. Robins serves as Compliance Officer of Fidelity Management & Research Company LLC (investment adviser firm, 2016-present) and is an employee of Fidelity Investments (2004-present). Previously, Mr. Robins served as Compliance Officer of FMR Co., Inc. (investment adviser firm, 2016-2019), as Executive Vice President of Fidelity Investments Money Management, Inc. (investment adviser firm, 2013-2016) and served in other fund officer roles.
Brett Segaloff (1972)
Year of Election or Appointment: 2021
Anti-Money Laundering (AML) Officer
Mr. Segaloff also serves as an AML Officer of other funds and other related entities. He is Director, Anti-Money Laundering (2007-present) of FMR LLC (diversified financial services company) and is an employee of Fidelity Investments (1996-present).
Stacie M. Smith (1974)
Year of Election or Appointment: 2013
Assistant Treasurer
Ms. Smith also serves as an officer of other funds. Ms. Smith serves as Assistant Treasurer of FIMM, LLC (2021-present) and FMR Capital, Inc. (2017-present), is an employee of Fidelity Investments (2009-present), and has served in other fund officer roles. Prior to joining Fidelity Investments, Ms. Smith served as Senior Audit Manager of Ernst & Young LLP (accounting firm, 1996-2009). Previously, Ms. Smith served as Assistant Treasurer (2013-2019) and Deputy Treasurer (2013-2016) of certain Fidelity ® funds.
Jim Wegmann (1979)
Year of Election or Appointment: 2021
Deputy Treasurer
Mr. Wegmann also serves as an officer of other funds. Mr. Wegmann serves as Assistant Treasurer of FIMM, LLC (2021-present) and is an employee of Fidelity Investments (2011-present). Previously, Mr. Wegmann served as Assistant Treasurer of certain Fidelity ® funds (2019-2021).
As a shareholder, you incur two types of costs: (1) transaction costs, which may include sales charges (loads) on purchase payments or redemption proceeds, as applicable and (2) ongoing costs, which generally include management fees, distribution and/or service (12b-1) fees and other Fund expenses. This Example is intended to help you understand your ongoing costs (in dollars) of investing in a fund and to compare these costs with the ongoing costs of investing in other mutual funds.
| The Example is based on an investment of $1,000 invested at the beginning of the period and held for the entire period (May 1, 2022 to October 31, 2022). |
Actual Expenses
The first line of the accompanying table provides information about actual account values and actual expenses. You may use the information in this line, together with the amount you invested, to estimate the expenses that you paid over the period. Simply divide your account value by $1,000.00 (for example, an $8,600 account value divided by $1,000.00 = 8.6), then multiply the result by the number in the first line for a class/Fund under the heading entitled "Expenses Paid During Period" to estimate the expenses you paid on your account during this period. If any fund is a shareholder of any underlying mutual funds or exchange-traded funds (ETFs) (the Underlying Funds), such fund indirectly bears its proportional share of the expenses of the Underlying Funds in addition to the direct expenses incurred presented in the table. These fees and expenses are not included in the annualized expense ratio used to calculate the expense estimate in the table below.
Hypothetical Example for Comparison Purposes
The second line of the accompanying table provides information about hypothetical account values and hypothetical expenses based on the actual expense ratio and an assumed rate of return of 5% per year before expenses, which is not the actual return. The hypothetical account values and expenses may not be used to estimate the actual ending account balance or expenses you paid for the period. You may use this information to compare the ongoing costs of investing in the Fund and other funds. To do so, compare this 5% hypothetical example with the 5% hypothetical examples that appear in the shareholder reports of the other funds. If any fund is a shareholder of any Underlying Funds, such fund indirectly bears its proportional share of the expenses of the Underlying Funds in addition to the direct expenses as presented in the table. These fees and expenses are not included in the annualized expense ratio used to calculate the expense estimate in the table below.
Please note that the expenses shown in the table are meant to highlight your ongoing costs only and do not reflect any transaction costs. Therefore, the second line of the table is useful in comparing ongoing costs only, and will not help you determine the relative total costs of owning different funds. In addition, if these transactional costs were included, your costs would have been higher.
| | | | | Annualized Expense Ratio- A | | Beginning Account Value May 1, 2022 | | Ending Account Value October 31, 2022 | | Expenses Paid During Period- C May 1, 2022 to October 31, 2022 |
| | | | | | | | | | |
| Fidelity® U.S. Sustainability Index Fund | | | | .11% | | | | | | |
| Actual | | | | | | $ 1,000 | | $ 924.30 | | $ .53 |
Hypothetical- B | | | | | | $ 1,000 | | $ 1,024.65 | | $ .56 |
| |
A Annualized expense ratio reflects expenses net of applicable fee waivers.
B 5% return per year before expenses
C Expenses are equal to the annualized expense ratio, multiplied by the average account value over the period, multiplied by 184/ 365 (to reflect the one-half year period). The fees and expenses of any Underlying Funds are not included in each annualized expense ratio.
The dividend and capital gains distributions for the fund(s) are available on Fidelity.com or Institutional.Fidelity.com .
The fund designates 95.12% of the short-term capital gain dividends distributed during the fiscal year as qualifying to be taxed as short-term capital gain dividends for nonresident alien shareholders.
The fund designates 92% of the dividend distributed during the fiscal year as qualifying for the dividends-received deduction for corporate shareholders.
The fund designates 96% of the dividends distributed in December, respectively during the fiscal year as amounts which may be taken into account as a dividend for the purposes of the maximum rate under section 1(h)(11) of the Internal Revenue Code.
The fund designates 3% of the dividend distributed during the fiscal year as a section 199A dividend.
The fund will notify shareholders in January 2023 of amounts for use in preparing 2022 income tax returns.
Fidelity U.S. Sustainability Index Fund
Each year, the Board of Trustees, including the Independent Trustees (together, the Board), votes on the renewal of the management contract with Fidelity Management & Research Company LLC (FMR) and the sub-advisory agreement (Sub-Advisory Agreement) for the fund with Geode Capital Management, LLC (Geode) (together, the Advisory Contracts). FMR and Geode are referred to herein as the Investment Advisers. The Board, assisted by the advice of fund counsel and Independent Trustees' counsel, requests and considers a broad range of information relevant to the renewal of the Advisory Contracts
throughout the year.
The Board meets regularly and, at each of its meetings, covers an extensive agenda of topics and materials and considers factors that are relevant to its annual consideration of the renewal of the fund's Advisory Contracts, including the services and support provided to the fund and its shareholders. The Board has established four standing committees (Committees) - Operations, Audit, Fair Valuation, and Governance and Nominating - each composed of and chaired by Independent Trustees with varying backgrounds, to which the Board has assigned specific subject matter responsibilities in order to enhance effective decision-making by the Board. The Operations Committee, of which all the Independent Trustees are members, meets regularly throughout the year and requests, receives and considers, among other matters, information related to the annual consideration of the renewal of the fund's Advisory Contracts before making its recommendation to the Board. The Board also meets as needed to review matters specifically related to the Board's annual consideration of the renewal of the Advisory Contracts. Members of the Board may also meet from time to time with trustees of other Fidelity funds through joint ad hoc committees to discuss certain matters relevant to all of the Fidelity funds.
At its September 2022 meeting, the Board unanimously determined to renew the fund's Advisory Contracts. In reaching its determination, the Board considered all factors it believed relevant, including (i) the nature, extent, and quality of the services provided to the fund and its shareholders (including the investment performance of the fund); (ii) the competitiveness relative to peer funds of the fund's management fee and total expense ratio; (iii) the total costs of the services provided by and the profits realized by Fidelity and Geode from their respective relationships with the fund; and (iv) the extent to which, if any, economies of scale exist and are realized as the fund grows, and whether any economies of scale are appropriately shared with fund shareholders.
In considering whether to renew the Advisory Contracts for the fund, the Board reached a determination, with the assistance of fund counsel and Independent Trustees' counsel and through the exercise of its business judgment, that the renewal of the Advisory Contracts was in the best interests of the fund and its shareholders and that the compensation payable under the Advisory Contracts was fair and reasonable. The Board's decision to renew the Advisory Contracts was not based on any single factor, but rather was based on a comprehensive consideration of all the information provided to the Board at its meetings throughout the year. The Board, in reaching its determination to renew the Advisory Contracts, was aware that shareholders of the fund have a broad range of investment choices available to them, including a wide choice among funds offered by Fidelity's competitors, and that the fund's shareholders, who have the opportunity to review and weigh the disclosure provided by the fund in its prospectus and other public disclosures, have chosen to invest in this fund, which is part of the Fidelity family of funds.
Nature, Extent, and Quality of Services Provided . The Board considered staffing as it relates to the fund, including the backgrounds of investment personnel of Fidelity and Geode, and also considered the fund's investment objective, strategies, and related investment philosophy. The Independent Trustees also had discussions with senior management of Fidelity's investment operations and investment groups and with senior management of Geode. The Board considered the structure of the investment personnel compensation programs and whether the structures provide appropriate incentives to act in the best interests of the fund. The Board also considered the steps Fidelity and Geode had taken to ensure the continued provision of high quality services to the Fidelity funds throughout the COVID-19 pandemic, including the expansion of staff in client facing positions to maintain service levels in periods of high volumes and volatility.
The Trustees also discussed with representatives of Fidelity, at meetings throughout the year, Fidelity's role in, among other things, overseeing compliance with federal securities laws and other applicable requirements by Geode with respect to the fund and monitoring and overseeing the performance and investment capabilities of Geode. The Trustees considered that the Board had received from Fidelity periodic reports about its oversight and due diligence processes, as well as periodic reports regarding the performance of Geode.
The Board also considered the nature, extent and quality of services provided by Geode. The Trustees noted that under the Sub-Advisory Agreement, subject to oversight by Fidelity, Geode is responsible for, among other things, identifying investments and arranging for execution of portfolio transactions to implement the fund's investment strategy. In addition, the Trustees noted that Geode is responsible for providing such reporting as may be requested by Fidelity to fulfill its oversight responsibilities discussed above.
Resources Dedicated to Investment Management and Support Services . The Board reviewed the general qualifications and capabilities of Fidelity's and Geode's investment staffs, including their size, education, experience, and resources, as well as Fidelity's and Geode's approach to recruiting, training, managing, and compensating investment personnel. The Board noted the resources devoted to Fidelity's global investment organization and that Fidelity's and Geode's analysts have extensive resources, tools and capabilities that allow them to conduct quantitative and fundamental analysis, as well as credit analysis of issuers, counterparties, and guarantors. Further, the Board considered that Fidelity's and Geode's investment professionals have sufficient access to information and data so as to provide competitive investment results over time, and that those professionals also have access to sophisticated tools that permit them to assess portfolio construction and risk and performance attribution characteristics continuously. Additionally, in its deliberations, the Board considered Fidelity's and Geode's trading, risk management, compliance, cybersecurity, and technology and operations capabilities and resources, which are integral parts of the investment management process.
Shareholder and Administrative Services . The Board considered (i) the nature, extent, quality, and cost of advisory, administrative, and shareholder services performed by the Investment Advisers and their affiliates under the Advisory Contracts and by FMR's affiliates under separate agreements covering transfer agency, pricing and bookkeeping, and securities lending services for the fund; (ii) the nature and extent of the supervision of third party service providers, principally custodians, subcustodians, and pricing vendors; and (iii) the resources devoted to, and the record of compliance with, the fund's compliance policies and procedures. The Board also reviewed the allocation of fund brokerage, including allocations to brokers affiliated with the Investment Advisers.
The Board noted that the growth of fund assets over time across the complex allows Fidelity to reinvest in the development of services designed to enhance the value and convenience of the Fidelity funds as investment vehicles. These services include 24-hour access to account information and market information over the Internet and through telephone representatives, investor education materials and asset allocation tools. The Board also considered that it reviews customer service metrics such as telephone response times, continuity of services on the website and metrics addressing services at Fidelity Investor Centers.
Investment in a Large Fund Family . The Board considered the benefits to shareholders of investing in a Fidelity fund, including the benefits of investing in a fund that is part of a large family of funds offering a variety of investment disciplines and providing a large variety of mutual fund investor services. The Board noted that Fidelity had taken, or had made recommendations to the Board that resulted in the Fidelity funds taking, a number of actions over the previous year that benefited particular funds, including: (i) continuing to dedicate additional resources to Fidelity's investment research process, which includes meetings with management of issuers of securities in which the funds invest; (ii) continuing efforts to enhance Fidelity's global research capabilities; (iii) launching new funds, ETFs, and share classes with innovative structures, strategies and pricing and making other enhancements to meet investor needs; (iv) broadening eligibility requirements for certain funds and share classes; (v) reducing management fees and total expenses for certain funds and classes; (vi) lowering expenses for certain existing funds and classes by implementing or lowering expense caps; (vii) rationalizing product lines and gaining increased efficiencies from fund mergers and liquidations; (viii) continuing to develop, acquire and implement systems and technology to improve services to the funds and shareholders, strengthen information security, and increase efficiency; and (ix) continuing to implement enhancements to further strengthen Fidelity's product line to increase investors' probability of success in achieving their investment goals, including their retirement income goals.
Investment Performance . The Board considered whether the fund has operated in accordance with its investment objective, as well as its record of compliance with its investment restrictions and its performance history.
The Board took into account discussions that occur at Board meetings throughout the year with representatives of the Investment Advisers about fund investment performance. In this regard the Board noted that as part of regularly scheduled fund reviews and other reports to the Board on fund performance, the Board considers annualized return information for the fund for different time periods, measured against the securities market index the fund seeks to track. The Board also periodically considers the fund's tracking error versus its benchmark index.
In addition to reviewing absolute and relative fund performance, the Independent Trustees periodically consider the appropriateness of fund performance metrics in evaluating the results achieved. In general, the Independent Trustees believe that an index fund's performance should be evaluated based on gross performance (before fees and expenses but after transaction costs) compared to the fund's benchmark index, over appropriate time periods, taking into account relevant factors including the following: general market conditions; the characteristics of the fund's benchmark index; the extent to which statistical sampling is employed; any securities lending revenues; and fund cash flows and other factors. The Independent Trustees generally give greater weight to fund performance over longer time periods than over shorter time periods. Depending on the circumstances, the Independent Trustees may be satisfied with a fund's performance notwithstanding that it lags its benchmark index for certain periods.
The Independent Trustees recognize that shareholders evaluate performance on a net basis (after fees and expenses) over their own holding periods, for which one-, three-, and five-year periods are often used as a proxy. For this reason, the performance information reviewed by the Board also included net cumulative calendar year total return information for the fund and its benchmark index for the most recent one- and three-year periods. No performance peer group information was considered by the Board as Fidelity advised the Board that the peer group, which is created by a third-party provider, includes a number of actively-managed funds. The Independent Trustees recognize that shareholders who are not investing through a tax-advantaged retirement account also consider tax consequences in evaluating performance.
Based on its review, the Board concluded that the nature, extent, and quality of services provided to the fund under the Advisory Contracts should continue to benefit the shareholders of the fund.
Competitiveness of Management Fee and Total Expense Ratio . The Board considered the fund's management fee and total expense ratio compared to selected groups of competitive funds and classes (referred to as "mapped groups" below) for the purpose of facilitating the Trustees' competitive analysis of management fees and total expenses. Fidelity creates "mapped groups" by combining similar investment objective categories (as classified by Lipper) that have comparable investment mandates. Combining funds with similar investment objective categories aids the Board's comparison of management fees and total expense ratios by broadening the competitive group used for such comparison.
Management Fee . The Board considered two proprietary management fee comparisons for the 12-month (or shorter) periods shown in basis points (BP) in the chart below. The group of Lipper funds used by the Board for management fee comparisons is referred to below as the "Total Mapped Group." The Total Mapped Group comparison focuses on a fund's standing in terms of gross management fees before expense reimbursements or caps relative to the total universe of funds with comparable investment mandates, regardless of whether their management fee structures also are comparable. Funds with comparable investment mandates offer exposure to similar types of securities. Funds with comparable management fee structures have similar management fee contractual arrangements (e.g., flat rate charged for advisory services, all-inclusive fee rate, etc.). "TMG %" represents the percentage of funds in the Total Mapped Group that had management fees that were lower than the fund's. For example, a hypothetical TMG % of 20% would mean that 80% of the funds in the Total Mapped Group had higher, and 20% had lower, management fees than the fund. The fund's actual TMG %s and the number of funds in the Total Mapped Group are in the chart below. The "Asset-Sized Peer Group" (ASPG) comparison focuses on a fund's standing relative to a subset of non-Fidelity funds within the Total Mapped Group that are similar in size and management fee structure. For example, if a fund is in the first quartile of the ASPG, the fund's management fee ranks in the least expensive or lowest 25% of funds in the ASPG. The ASPG represents at least 15% of the funds in the Total Mapped Group with comparable asset size and management fee structures, subject to a minimum of 50 funds (or all funds in the Total Mapped Group if fewer than 50). Additional information, such as the ASPG quartile in which the fund's management fee rate ranked, is also included in the chart and was considered by the Board.
The Board considered that effective August 1, 2019, the fund's management fee rate was increased from 0.08% to 0.11%, but the fund no longer paid operating expenses under separate agreements. The Board considered that the chart below reflects the fund's higher management fee rate for 2019, as if the higher fee rate were in effect for the entire year.
The Board noted that the fund's management fee rate ranked below the median of its Total Mapped Group and below the median of its ASPG for 2021.
At its September 2022 meeting, the Board also approved an amendment to the fund's sub-advisory agreement with Geode (effective October 1, 2022) that reduced the sub-advisory fee rate that FMR pays to Geode.
Based on its review, the Board concluded that the fund's management fee is fair and reasonable in light of the services that the fund receives and the other factors considered.
Total Expense Ratio . In its review of the fund's total expense ratio, the Board considered the fund's unitary (subject to certain limited exceptions) fee rate as well as fund expenses paid by FMR under the fund's management contract, such as transfer agent fees, pricing and bookkeeping fees, and custodial, legal, and audit fees. The Board also noted that Fidelity may agree to waive fees or reimburse expenses from time to time, and the extent to which, if any, it has done so for the fund. The fund is compared to those funds and classes in the Total Mapped Group (used by the Board for management fee comparisons) that have a similar sales load structure. The Board also considered a total expense ASPG comparison, which focuses on the total expenses of the fund relative to a subset of non-Fidelity funds within the similar sales load structure group that are similar in size and management fee structure. The total expense ASPG is limited to 15 larger and 15 smaller classes of different funds, where possible. The total expense ASPG comparison excludes performance adjustments and fund-paid 12b-1 fees to eliminate variability in expenses relating to these items.
The Board noted that the fund's total net expense ratio ranked equal to the similar sales load structure group competitive median for 2021 and below the ASPG competitive median for 2021.
Fees Charged to Other Clients . The Board also considered fee structures and other information with respect to clients of Fidelity and Geode, such as other funds advised or subadvised by Fidelity or Geode, pension plan clients, and other institutional clients with similar mandates. The Board noted that a joint ad hoc committee created by it and the boards of other Fidelity funds periodically reviews and compares Fidelity's institutional investment advisory business with its business of providing services to the Fidelity funds and also noted the most recent findings of the committee. The Board noted that the committee's review included a consideration of the differences in services provided, fees charged, and costs incurred, as well as competition in the markets serving the different categories of clients.
Based on its review of total expense ratios and fees charged to other Fidelity clients, the Board concluded that the fund's total expense ratio was reasonable in light of the services that the fund and its shareholders receive and the other factors considered.
Costs of the Services and Profitability. The Board considered the revenues earned and the expenses incurred by Fidelity in conducting the business of developing, marketing, distributing, managing, administering and servicing the fund and servicing the fund's shareholders. The Board also considered the level of Fidelity's profits in respect of all the Fidelity funds.
On an annual basis, Fidelity presents to the Board information about the profitability of its relationships with the fund. Fidelity calculates profitability information for each fund, as well as aggregate profitability information for groups of Fidelity funds and all Fidelity funds, using a series of detailed revenue and cost allocation methodologies which originate with the books and records of Fidelity on which Fidelity's audited financial statements are based. The Audit Committee of the Board reviews any significant changes from the prior year's methodologies and the full Board approves such changes.
A public accounting firm has been engaged annually by the Board as part of the Board's assessment of Fidelity's profitability analysis. The engagement includes the review and assessment of the methodologies used by Fidelity in determining the revenues and expenses attributable to Fidelity's mutual fund business, and completion of agreed-upon procedures in respect of the mathematical accuracy of certain fund profitability information and its conformity to established allocation methodologies. After considering the reports issued under the engagement and information provided by Fidelity, the Board concluded that while other allocation methods may also be reasonable, Fidelity's profitability methodologies are reasonable in all material respects.
The Board also reviewed Fidelity's and Geode's non-fund businesses and potential indirect benefits such businesses may have received as a result of their association with Fidelity's mutual fund business (i.e., fall-out benefits) as well as cases where Fidelity's and Geode's affiliates may benefit from the funds' business. The Board considered areas where potential indirect benefits to the Fidelity funds from their relationships with Fidelity may exist. The Board's consideration of these matters was informed by the findings of a joint ad hoc committee created by it and the boards of other Fidelity funds to evaluate potential fall-out benefits.
The Board considered the costs of the services provided by and the profits realized by Fidelity in connection with the operation of the fund and was satisfied that the profitability was not excessive.
The Board also considered information regarding the profitability of Geode's relationship with the fund.
Economies of Scale . The Board considered whether there have been economies of scale in respect of the management of the Fidelity funds, whether the Fidelity funds (including the fund) have appropriately benefited from any such economies of scale, and whether there is potential for realization of any further economies of scale. The Board considered the extent to which the fund will benefit from economies of scale as assets grow through increased services to the fund, through waivers or reimbursements, or through fee or expense ratio reductions. The Board recognized that, due to the fund's current contractual arrangements, its expense ratio will not decline if the fund's operating costs decrease as assets grow, or rise as assets decrease. The Board also noted that a committee (the Economies of Scale Committee) created by it and the boards of other Fidelity funds periodically analyzes whether Fidelity attains economies of scale in respect of the management and servicing of the Fidelity funds, whether the Fidelity funds have appropriately benefited from such economies of scale, and whether there is potential for realization of any further economies of scale.
The Board concluded, taking into account the analysis of the Economies of Scale Committee, that economies of scale, if any, are being appropriately shared between fund shareholders and Fidelity.
Additional Information Requested by the Board . In order to develop fully the factual basis for consideration of the Fidelity funds' advisory contracts, the Board requested and received additional information on certain topics, including: (i) Fidelity's fund profitability methodology, profitability trends for certain funds, the allocation of various costs to different funds, and the impact of certain factors on fund profitability results; (ii) portfolio manager changes that have occurred during the past year and the amount of the investment that each portfolio manager has made in the Fidelity fund(s) that he or she manages; (iii) the extent to which current market conditions have affected retention and recruitment of personnel; (iv) the arrangements with and compensation paid to certain fund sub-advisers on behalf of the Fidelity funds and the treatment of such compensation within Fidelity's fund profitability methodology; (v) the terms of the funds' various management fee structures, including the basic group fee and the terms of Fidelity's voluntary expense limitation arrangements; (vi) Fidelity's transfer agent, pricing and bookkeeping fees, expense and service structures for different funds and classes relative to competitive trends; (vii) the impact on fund profitability of recent industry trends, such as the growth in passively managed funds and the changes in flows for different types of funds; (viii) the types of management fee and total expense comparisons provided, and the challenges and limitations associated with such information; and (ix) explanations regarding the relative total expense ratios and management fees of certain funds and classes, total expense and management fee competitive trends, and methodologies for total expense and management fee competitive comparisons. In addition, the Board considered its discussions with Fidelity regarding Fidelity's efforts to maintain the continuous investment and shareholder services necessary for the funds during the current pandemic and economic circumstances.
Based on its evaluation of all of the conclusions noted above, and after considering all factors it believed relevant, the Board concluded that the advisory and sub-advisory fee arrangements are fair and reasonable and that the fund's Advisory Contracts should be renewed.
1.9883815.105
USY-ANN-1222
Fidelity® SAI International Momentum Index Fund
Annual Report
October 31, 2022
Offered exclusively to certain clients of the Adviser, or its affiliates, including Strategic Advisers LLC (Strategic Advisers) - not available for sale to the general public. Fidelity ® SAI is a product name of Fidelity ® funds dedicated to certain programs affiliated with Strategic Advisers.
Contents
To view a fund's proxy voting guidelines and proxy voting record for the 12-month period ended June 30, visit http://www.fidelity.com/proxyvotingresults or visit the Securities and Exchange Commission's (SEC) web site at http://www.sec.gov.
You may also call 1-800-544-3455 to request a free copy of the proxy voting guidelines.
The funds or securities referred to herein are not sponsored, endorsed, or promoted by Fidelity Product Services LLC (FPS), and FPS bears no liability with respect to any such funds or securities or any index on which such funds or securities are based. The prospectus contains a more detailed description of the relationship between FPS and any related funds.
Standard & Poor's, S&P and S&P 500 are registered service marks of The McGraw-Hill Companies, Inc. and have been licensed for use by Fidelity Distributors Corporation.
Other third-party marks appearing herein are the property of their respective owners.
All other marks appearing herein are registered or unregistered trademarks or service marks of FMR LLC or an affiliated company. © 2022 FMR LLC. All rights reserved.
This report and the financial statements contained herein are submitted for the general information of the shareholders of the Fund. This report is not authorized for distribution to prospective investors in the Fund unless preceded or accompanied by an effective prospectus.
A fund files its complete schedule of portfolio holdings with the SEC for the first and third quarters of each fiscal year on Form N-PORT. Forms N-PORT are available on the SEC's web site at http://www.sec.gov. A fund's Forms N-PORT may be reviewed and copied at the SEC's Public Reference Room in Washington, DC. Information regarding the operation of the SEC's Public Reference Room may be obtained by calling 1-800-SEC-0330.
For a complete list of a fund's portfolio holdings, view the most recent holdings listing, semiannual report, or annual report on Fidelity's web site at http://www.fidelity.com, http://www.institutional.fidelity.com, or http://www.401k.com, as applicable.
NOT FDIC INSURED •MAY LOSE VALUE •NO BANK GUARANTEE
Neither the Fund nor Fidelity Distributors Corporation is a bank.
Average annual total return reflects the change in the value of an investment, assuming reinvestment of distributions from dividend income and capital gains (the profits earned upon the sale of securities that have grown in value, if any) and assuming a constant rate of performance each year. The hypothetical investment and the average annual total returns do not reflect the deduction of taxes that a shareholder would pay on fund distributions or the redemption of fund shares. During periods of reimbursement by Fidelity, a fund's total return will be greater than it would be had the reimbursement not occurred. How a fund did yesterday is no guarantee of how it will do tomorrow.
| Average Annual Total Returns |
| | | | |
Periods ended October 31, 2022 | Past 1 year | Life of Fund A |
| Fidelity® SAI International Momentum Index Fund | -27.34% | 2.64% |
A From May 12, 2020
| $10,000 Over Life of Fund |
| |
Let's say hypothetically that $10,000 was invested in Fidelity® SAI International Momentum Index Fund on May 12, 2020, when the fund started. The chart shows how the value of your investment would have changed, and also shows how the Fidelity International Momentum Focus Index℠ and MSCI ACWI (All Country World Index) ex USA Index performed over the same period. |
|
|
Market Recap:
International equities returned -24.61% for the 12 months ending October 31, 2022, according to the MSCI ACWI (All Country World Index) ex USA Index. After gaining 7.98% in 2021, non-U.S. stocks retreated in the new year, as a multitude of risk factors challenged the global economy and financial markets. Persistently high inflation in some markets, exacerbated by energy price shocks from the Russia-Ukraine conflict, spurred the U.S. Federal Reserve and other central banks to aggressively tighten monetary policy, and market interest rates eclipsed their highest level in roughly a decade, stoking recession fears and sending stocks into bear market territory. Other factors influencing equities abroad included surging global commodity prices, rising sovereign bond yields in some markets, ongoing global supply-chain disruption, a broadly strong U.S. dollar and the potential for variants of the coronavirus to upend global economic growth. Against this backdrop, the index returned -24.20% year to date through October. For the full 12 months, emerging markets (-31%) and Europe ex U.K. (-25%) notably lagged. Conversely, Canada (-13%) and the U.K. (-12%) held up best. Among the 11 sectors, information technology and consumer discretionary (-37% each) fared worst. Communication services (-34%) also trailed the broader market. In contrast, energy gained 2% amid high prices for oil and natural gas. The defensive-oriented utilities (-16%) sector also outperformed, as did financials and consumer staples (-18% each).
Comments from the Geode Capital Management, LLC, passive equity index team:
For the fiscal year, the fund returned -27.34%, roughly in line with the -26.93% result of the benchmark, the Fidelity International Momentum Focus Index. ( The fund's relative performance can be affected by Fidelity's methodologies for valuing certain foreign stocks and for incorporating foreign exchange rates, which differ from those used by the index, as well as by local tax laws or regulations, which vary by country.) By region, Europe ex U.K. returned -28% and detracted most, followed by Japan (-30%). By sector, stocks in industrials returned approximately -30% and detracted most, followed by information technology, which returned roughly -43%, hampered by the semiconductors & semiconductor equipment industry (-43%). Financials (-22%) and consumer discretionary (-31%) also detracted, the latter held back by the consumer durables & apparel industry (-31%). Health care returned about -29%, hampered by the health care equipment & services industry (-37%). Consumer staples returned -26%, with the food, beverage & tobacco industry (-21%) hurting most. Other notable detractors included the materials (-14%), real estate (-52%), communication services (-32%) and utilities (-28%) sectors. In contrast, energy gained about 11% and contributed. Turning to individual stocks, the biggest individual detractor was Sony (-41%), from the consumer durables & apparel category. In semiconductors & semiconductor equipment, ASML Holding (-39%) and Tokyo Electron (-43%) hurt. Recruit Holdings, within the commercial & professional services segment, returned -37% and hindered the fund. Another detractor was L'oreal (-30%), a stock in the household & personal products group. Conversely, the biggest individual contributor was Glencore (+22%), from the materials sector. In energy, Equinor (+41%) and TotalEnergies (+11%) helped. Daiichi Sankyo, within the pharmaceuticals, biotechnology & life sciences industry, advanced roughly 9% and lifted the fund. Another notable contributor was Pilbara Minerals (+96%), a stock in the materials sector.
The views expressed above reflect those of the portfolio manager(s) only through the end of the period as stated on the cover of this report and do not necessarily represent the views of Fidelity or any other person in the Fidelity organization. Any such views are subject to change at any time based upon market or other conditions and Fidelity disclaims any responsibility to update such views. These views may not be relied on as investment advice and, because investment decisions for a Fidelity fund are based on numerous factors, may not be relied on as an indication of trading intent on behalf of any Fidelity fund.
Top Holdings (% of Fund's net assets) |
| |
| Novo Nordisk A/S Series B (Denmark, Pharmaceuticals) | 3.3 | |
| LVMH Moet Hennessy Louis Vuitton SE (France, Textiles, Apparel & Luxury Goods) | 2.8 | |
| Diageo PLC (United Kingdom, Beverages) | 2.6 | |
| British American Tobacco PLC (United Kingdom) (United Kingdom, Tobacco) | 2.4 | |
| L'Oreal SA (France, Personal Products) | 2.4 | |
| National Australia Bank Ltd. (Australia, Banks) | 2.3 | |
| Shell PLC (London) (United Kingdom, Oil, Gas & Consumable Fuels) | 2.3 | |
| Daiichi Sankyo Kabushiki Kaisha (Japan, Pharmaceuticals) | 2.2 | |
| Glencore PLC (Bailiwick of Jersey, Metals & Mining) | 2.2 | |
| Sony Group Corp. (Japan, Household Durables) | 1.9 | |
| | 24.4 | |
| |
| Market Sectors (% of Fund's net assets) |
| |
| Industrials | 17.7 | |
| Financials | 17.2 | |
| Health Care | 13.6 | |
| Consumer Discretionary | 12.4 | |
| Consumer Staples | 11.3 | |
| Materials | 7.6 | |
| Energy | 7.2 | |
| Information Technology | 5.7 | |
| Communication Services | 3.2 | |
| Utilities | 2.6 | |
| Real Estate | 0.7 | |
| |
Asset Allocation (% of Fund's net assets) |
|
Foreign investments - 99.2% |
|
Geographic Diversification (% of Fund's net assets) |
|
* Includes Short-Term investments and Net Other Assets (Liabilities). Percentages are based on country or territory of incorporation and are adjusted for the effect of futures contracts, if applicable. |
| |
Showing Percentage of Net Assets
| Common Stocks - 99.2% |
| | | Shares | Value ($) |
| Australia - 7.5% | | | |
| Allkem Ltd. (a) | | 118,734 | 1,096,692 |
| Altium Ltd. | | 25,101 | 568,538 |
| Ampol Ltd. | | 46,378 | 807,797 |
| BHP Group Ltd. | | 143,273 | 3,423,841 |
| Brambles Ltd. | | 284,248 | 2,123,649 |
| Computershare Ltd. | | 117,544 | 1,899,976 |
| IGO Ltd. | | 134,941 | 1,319,757 |
| Iluka Resources Ltd. | | 84,940 | 469,971 |
| Incitec Pivot Ltd. | | 388,869 | 932,775 |
| Macquarie Group Ltd. | | 60,553 | 6,565,197 |
| Mineral Resources Ltd. | | 33,919 | 1,586,650 |
| National Australia Bank Ltd. | | 643,197 | 13,360,518 |
| New Hope Corp. Ltd. | | 56,772 | 205,175 |
| NIB Holdings Ltd. | | 94,103 | 401,487 |
| Orica Ltd. | | 53,940 | 478,898 |
| Pilbara Minerals Ltd. (a) | | 519,789 | 1,692,339 |
| Santos Ltd. | | 147,229 | 718,722 |
| Sonic Healthcare Ltd. | | 96,123 | 2,014,866 |
| Steadfast Group Ltd. | | 195,732 | 633,512 |
| Whitehaven Coal Ltd. | | 195,852 | 1,131,249 |
| WiseTech Global Ltd. | | 35,437 | 1,318,329 |
TOTAL AUSTRALIA | | | 42,749,938 |
| Austria - 0.2% | | | |
| BAWAG Group AG (b) | | 13,921 | 673,013 |
| Verbund AG | | 6,639 | 519,959 |
TOTAL AUSTRIA | | | 1,192,972 |
| Bailiwick of Jersey - 3.1% | | | |
| Ferguson PLC | | 40,697 | 4,438,442 |
| Glencore PLC | | 2,188,885 | 12,549,039 |
| Man Group PLC | | 294,943 | 732,967 |
TOTAL BAILIWICK OF JERSEY | | | 17,720,448 |
| Belgium - 0.2% | | | |
| ELIA GROUP SA/NV | | 7,371 | 931,674 |
| Bermuda - 0.1% | | | |
| CK Infrastructure Holdings Ltd. | | 116,000 | 551,209 |
| Denmark - 5.0% | | | |
| A.P. Moller - Maersk A/S Series B | | 1,722 | 3,597,556 |
| Bavarian Nordic A/S (a) | | 14,445 | 460,136 |
| DSV A/S | | 39,342 | 5,326,154 |
| Novo Nordisk A/S Series B | | 172,142 | 18,717,218 |
| Ringkjoebing Landbobank A/S | | 5,682 | 618,404 |
TOTAL DENMARK | | | 28,719,468 |
| Finland - 1.3% | | | |
| Nordea Bank ABP | | 667,245 | 6,376,815 |
| Orion Oyj (B Shares) | | 21,851 | 1,005,212 |
TOTAL FINLAND | | | 7,382,027 |
| France - 16.6% | | | |
| Aeroports de Paris SA (a) | | 5,687 | 770,245 |
| Air Liquide SA | | 70,773 | 9,258,083 |
| ALTEN | | 1,532 | 179,106 |
| Bollore SA | | 182,941 | 915,709 |
| Bureau Veritas SA | | 57,966 | 1,436,132 |
| Compagnie de St. Gobain | | 104,836 | 4,285,797 |
| Dassault Aviation SA | | 4,681 | 695,750 |
| Edenred SA | | 51,162 | 2,627,142 |
| EssilorLuxottica SA | | 42,027 | 6,659,846 |
| Getlink SE | | 82,238 | 1,302,785 |
| Hermes International SCA | | 6,971 | 9,028,153 |
| Ipsen SA | | 7,867 | 808,555 |
| L'Oreal SA | | 42,947 | 13,485,547 |
| LVMH Moet Hennessy Louis Vuitton SE | | 24,978 | 15,760,990 |
| Pernod Ricard SA | | 40,362 | 7,088,053 |
| Publicis Groupe SA | | 47,174 | 2,641,951 |
| Remy Cointreau SA | | 4,711 | 722,091 |
| Renault SA (a) | | 42,399 | 1,306,048 |
| Sartorius Stedim Biotech | | 4,791 | 1,520,787 |
| Societe Generale Series A | | 155,735 | 3,572,100 |
| Teleperformance | | 11,752 | 3,150,855 |
| TotalEnergies SE | | 138,349 | 7,547,404 |
TOTAL FRANCE | | | 94,763,129 |
| Germany - 6.2% | | | |
| Aixtron AG | | 23,222 | 571,204 |
| Bayer AG | | 200,319 | 10,532,988 |
| Commerzbank AG (a) | | 153,747 | 1,230,110 |
| Deutsche Bank AG | | 413,542 | 3,947,877 |
| Encavis AG | | 24,800 | 461,987 |
| K+S AG | | 38,322 | 846,812 |
| Mercedes-Benz Group AG (Germany) | | 157,282 | 9,103,732 |
| Merck KGaA | | 13,059 | 2,128,162 |
| Rheinmetall AG | | 8,721 | 1,417,748 |
| RWE AG | | 138,595 | 5,340,324 |
TOTAL GERMANY | | | 35,580,944 |
| Hong Kong - 0.4% | | | |
| Power Assets Holdings Ltd. | | 273,500 | 1,308,329 |
| Sino Land Ltd. | | 648,000 | 692,607 |
TOTAL HONG KONG | | | 2,000,936 |
| Ireland - 0.2% | | | |
| Bank of Ireland Group PLC | | 184,297 | 1,328,832 |
| Israel - 1.6% | | | |
| Bank Hapoalim BM (Reg.) | | 237,887 | 2,295,693 |
| Bank Leumi le-Israel BM | | 290,635 | 2,775,942 |
| Bezeq The Israel Telecommunication Corp. Ltd. | | 409,739 | 725,657 |
| Icl Group Ltd. | | 141,808 | 1,281,010 |
| Israel Discount Bank Ltd. (Class A) | | 239,496 | 1,363,688 |
| Nova Ltd. (a) | | 5,373 | 394,587 |
TOTAL ISRAEL | | | 8,836,577 |
| Italy - 2.0% | | | |
| Atlantia SpA | | 103,249 | 2,303,969 |
| Banco BPM SpA | | 303,367 | 917,695 |
| Eni SpA | | 504,977 | 6,632,234 |
| FinecoBank SpA | | 89,150 | 1,201,718 |
| Interpump Group SpA | | 12,935 | 500,838 |
TOTAL ITALY | | | 11,556,454 |
| Japan - 25.6% | | | |
| Ajinomoto Co., Inc. | | 107,600 | 2,963,984 |
| Asics Corp. | | 38,000 | 583,691 |
| Bridgestone Corp. | | 121,400 | 4,390,607 |
| Brother Industries Ltd. | | 32,300 | 549,792 |
| Chugai Pharmaceutical Co. Ltd. | | 100,600 | 2,331,089 |
| Daiichi Sankyo Kabushiki Kaisha | | 399,100 | 12,775,497 |
| Dentsu Group, Inc. | | 49,100 | 1,530,505 |
| Electric Power Development Co. Ltd. | | 35,700 | 496,504 |
| Fast Retailing Co. Ltd. | | 12,800 | 7,143,966 |
| Hirose Electric Co. Ltd. | | 6,400 | 831,124 |
| Hitachi Ltd. | | 55,100 | 2,504,967 |
| Hitachi Transport System Ltd. | | 7,700 | 460,358 |
| IHI Corp. | | 31,500 | 703,319 |
| INPEX Corp. | | 205,300 | 2,071,969 |
| Isetan Mitsukoshi Holdings Ltd. | | 81,300 | 721,719 |
| Itochu Corp. | | 298,100 | 7,716,378 |
| JGC Holdings Corp. | | 53,200 | 641,141 |
| Kawasaki Kisen Kaisha Ltd. | | 47,700 | 725,308 |
| Keyence Corp. | | 7,100 | 2,689,209 |
| Kintetsu Group Holdings Co. Ltd. | | 39,100 | 1,322,660 |
| Marubeni Corp. | | 347,800 | 3,047,738 |
| Mazda Motor Corp. | | 122,900 | 827,481 |
| Mitsubishi Corp. | | 297,300 | 8,059,560 |
| Mitsubishi Heavy Industries Ltd. | | 68,800 | 2,368,983 |
| Mitsubishi Motors Corp. of Japan (a) | | 140,500 | 472,444 |
| Mitsui & Co. Ltd. | | 328,600 | 7,277,177 |
| Mitsui OSK Lines Ltd. | | 72,400 | 1,436,850 |
| NGK Spark Plug Co. Ltd. | | 35,200 | 641,528 |
| Nikon Corp. | | 71,300 | 690,008 |
| Nintendo Co. Ltd. | | 5,600 | 227,355 |
| Nippon Telegraph & Telephone Corp. | | 239,300 | 6,600,063 |
| Nippon Yusen KK | | 102,100 | 1,849,488 |
| Nomura Research Institute Ltd. | | 79,000 | 1,755,910 |
| Olympus Corp. | | 263,600 | 5,566,455 |
| Ono Pharmaceutical Co. Ltd. | | 97,600 | 2,294,695 |
| Open House Group Co. Ltd. | | 14,900 | 531,087 |
| ORIX Corp. | | 239,200 | 3,514,927 |
| Renesas Electronics Corp. (a) | | 280,600 | 2,347,430 |
| Rohto Pharmaceutical Co. Ltd. | | 22,300 | 693,618 |
| Screen Holdings Co. Ltd. | | 9,300 | 512,236 |
| Sega Sammy Holdings, Inc. | | 33,200 | 425,340 |
| Seibu Holdings, Inc. | | 54,400 | 487,312 |
| Seiko Epson Corp. | | 65,600 | 893,814 |
| SHIMANO, Inc. | | 16,600 | 2,568,738 |
| Shin-Etsu Chemical Co. Ltd. | | 59,300 | 6,163,046 |
| Sojitz Corp. | | 42,600 | 628,565 |
| Sony Group Corp. | | 162,600 | 10,964,876 |
| Subaru Corp. | | 126,000 | 1,962,090 |
| Sumitomo Corp. | | 171,500 | 2,180,411 |
| TDK Corp. | | 79,700 | 2,495,064 |
| TIS, Inc. | | 46,900 | 1,266,374 |
| Tokio Marine Holdings, Inc. | | 416,000 | 7,528,538 |
| Tokyo Electric Power Co., Inc. (a) | | 164,700 | 537,204 |
| Tokyo Tatemono Co. Ltd. | | 42,900 | 591,157 |
| Toyo Suisan Kaisha Ltd. | | 20,900 | 784,303 |
| USS Co. Ltd. | | 44,300 | 669,438 |
| Yakult Honsha Co. Ltd. | | 32,600 | 1,806,544 |
| Zensho Holdings Co. Ltd. | | 18,400 | 459,087 |
TOTAL JAPAN | | | 146,280,721 |
| Luxembourg - 0.3% | | | |
| SES SA (France) (depositary receipt) | | 76,775 | 544,616 |
| Tenaris SA | | 92,182 | 1,442,755 |
TOTAL LUXEMBOURG | | | 1,987,371 |
| Netherlands - 4.3% | | | |
| Alfen Beheer BV (a)(b) | | 4,458 | 473,824 |
| Argenx SE (a) | | 11,287 | 4,382,185 |
| ASM International NV (Netherlands) | | 7,688 | 1,707,955 |
| ASML Holding NV (Netherlands) | | 9,028 | 4,234,919 |
| IMCD NV | | 11,410 | 1,480,530 |
| OCI NV | | 16,435 | 628,886 |
| Stellantis NV (Italy) | | 130,893 | 1,766,989 |
| STMicroelectronics NV (Italy) | | 134,464 | 4,181,348 |
| Wolters Kluwer NV | | 52,531 | 5,583,325 |
TOTAL NETHERLANDS | | | 24,439,961 |
| New Zealand - 0.1% | | | |
| Infratil Ltd. | | 144,955 | 736,580 |
| Norway - 1.5% | | | |
| Equinor ASA | | 214,762 | 7,824,579 |
| Gjensidige Forsikring ASA | | 35,770 | 653,388 |
TOTAL NORWAY | | | 8,477,967 |
| Portugal - 0.2% | | | |
| Jeronimo Martins SGPS SA | | 55,438 | 1,149,423 |
| Singapore - 2.1% | | | |
| City Developments Ltd. | | 104,300 | 562,171 |
| DBS Group Holdings Ltd. | | 360,000 | 8,697,372 |
| Keppel Corp. Ltd. | | 282,728 | 1,392,070 |
| Singapore Airlines Ltd. | | 267,800 | 995,075 |
| Suntec (REIT) | | 436,800 | 398,045 |
TOTAL SINGAPORE | | | 12,044,733 |
| Spain - 0.3% | | | |
| Corp. ACCIONA Energias Renovables SA | | 11,473 | 450,807 |
| Naturgy Energy Group SA | | 37,812 | 970,066 |
TOTAL SPAIN | | | 1,420,873 |
| Sweden - 3.1% | | | |
| AddTech AB (B Shares) | | 52,038 | 629,667 |
| Epiroc AB (A Shares) | | 192,514 | 2,947,092 |
| Holmen AB (B Shares) | | 18,548 | 672,964 |
| Investor AB (B Shares) | | 490,310 | 8,009,303 |
| Nibe Industrier AB (B Shares) | | 212,035 | 1,691,871 |
| Sagax AB | | 36,237 | 668,211 |
| SSAB AB (A Shares) | | 163,540 | 787,099 |
| Swedish Match Co. AB | | 234,794 | 2,414,831 |
TOTAL SWEDEN | | | 17,821,038 |
| Switzerland - 2.8% | | | |
| Kuehne & Nagel International AG | | 10,154 | 2,163,942 |
| Lindt & Spruengli AG | | 42 | 4,081,091 |
| Lonza Group AG | | 4,707 | 2,423,089 |
| Nestle SA (Reg. S) | | 14,181 | 1,543,727 |
| Swiss Life Holding AG | | 6,313 | 3,057,047 |
| Swisscom AG | | 5,086 | 2,510,620 |
TOTAL SWITZERLAND | | | 15,779,516 |
| United Kingdom - 14.5% | | | |
| Auto Trader Group PLC (b) | | 113,454 | 679,111 |
| BAE Systems PLC | | 657,508 | 6,150,047 |
| Beazley PLC | | 124,955 | 894,898 |
| British American Tobacco PLC (United Kingdom) | | 346,629 | 13,689,583 |
| Bunzl PLC | | 58,867 | 1,917,921 |
| Centrica PLC | | 1,210,850 | 1,063,947 |
| Diageo PLC | | 360,185 | 14,822,519 |
| Drax Group PLC | | 83,817 | 500,792 |
| GSK PLC | | 173,370 | 2,839,991 |
| Halma PLC | | 72,040 | 1,747,317 |
| HSBC Holdings PLC (United Kingdom) | | 1,017,800 | 5,223,404 |
| IG Group Holdings PLC | | 78,330 | 714,588 |
| Inchcape PLC | | 76,866 | 655,835 |
| Indivior PLC (a) | | 28,128 | 535,147 |
| Investec PLC | | 139,369 | 700,847 |
| Lloyds Banking Group PLC | | 14,212,818 | 6,825,961 |
| NatWest Group PLC | | 1,036,730 | 2,791,589 |
| Pearson PLC | | 127,278 | 1,406,820 |
| QinetiQ Group PLC | | 118,628 | 488,937 |
| Segro PLC | | 101,146 | 910,555 |
| Serco Group PLC | | 249,655 | 467,821 |
| Shell PLC (London) | | 465,022 | 12,881,857 |
| Spirax-Sarco Engineering PLC | | 14,718 | 1,814,450 |
| Standard Chartered PLC (United Kingdom) | | 495,301 | 2,954,794 |
TOTAL UNITED KINGDOM | | | 82,678,731 |
| TOTAL COMMON STOCKS (Cost $607,041,315) | | | 566,131,522 |
| | | | |
| Government Obligations - 0.1% |
| | | Principal Amount (c) | Value ($) |
| United States of America - 0.1% | | | |
U.S. Treasury Bills, yield at date of purchase 1.23% 1/26/23 (d) (Cost $398,839) | | 400,000 | 396,190 |
| | | | |
| TOTAL INVESTMENT IN SECURITIES - 99.3% (Cost $607,440,154) | 566,527,712 |
NET OTHER ASSETS (LIABILITIES) - 0.7% | 4,033,710 |
| NET ASSETS - 100.0% | 570,561,422 |
| | |
| Futures Contracts |
| | Number of contracts | Expiration Date | Notional Amount ($) | Value ($) | Unrealized Appreciation/ (Depreciation) ($) |
| Purchased | | | | | |
| | | | | | |
| Equity Index Contracts | | | | | |
| ICE E-mini MSCI EAFE Index Contracts (United States) | 50 | Dec 2022 | 4,389,750 | 120,338 | 120,338 |
| | | | | | |
| The notional amount of futures purchased as a percentage of Net Assets is 0.8% |
Categorizations in the Schedule of Investments are based on country or territory of incorporation.
Legend
| (b) | Security exempt from registration under Rule 144A of the Securities Act of 1933. These securities may be resold in transactions exempt from registration, normally to qualified institutional buyers. At the end of the period, the value of these securities amounted to $1,825,948 or 0.3% of net assets. |
| (c) | Amount is stated in United States dollars unless otherwise noted. |
| (d) | Security or a portion of the security was pledged to cover margin requirements for futures contracts. At period end, the value of securities pledged amounted to $337,752. |
Affiliated Central Funds
Fiscal year to date information regarding the Fund's investments in Fidelity Central Funds, including the ownership percentage, is presented below.
| Affiliate | Value, beginning of period ($) | Purchases ($) | Sales Proceeds ($) | Dividend Income ($) | Realized Gain (loss) ($) | Change in Unrealized appreciation (depreciation) ($) | Value, end of period ($) | % ownership, end of period |
| Fidelity Cash Central Fund 3.10% | 8,855,470 | 459,929,882 | 468,785,352 | 29,516 | - | - | - | 0.0% |
| Fidelity Securities Lending Cash Central Fund 3.10% | - | 52,215,348 | 52,215,348 | 68,433 | - | - | - | 0.0% |
| Total | 8,855,470 | 512,145,230 | 521,000,700 | 97,949 | - | - | - | |
| | | | | | | | | |
Amounts in the income column in the above table include any capital gain distributions from underlying funds, which are presented in the corresponding line item in the Statement of Operations, if applicable.
Amount for Fidelity Securities Lending Cash Central Fund represents the income earned on investing cash collateral, less rebates paid to borrowers and any lending agent fees associated with the loan, plus any premium payments received for lending certain types of securities.
Investment Valuation
The following is a summary of the inputs used, as of October 31, 2022, involving the Fund's assets and liabilities carried at fair value. The inputs or methodology used for valuing securities may not be an indication of the risk associated with investing in those securities. For more information on valuation inputs, and their aggregation into the levels used below, please refer to the Investment Valuation section in the accompanying Notes to Financial Statements.
| Valuation Inputs at Reporting Date: |
| Description | Total ($) | Level 1 ($) | Level 2 ($) | Level 3 ($) |
Investments in Securities: | | | | |
|
| Equities: | | | | |
Communication Services | 17,782,407 | 6,227,107 | 11,555,300 | - |
Consumer Discretionary | 70,673,847 | 27,057,423 | 43,616,424 | - |
Consumer Staples | 65,245,314 | 19,289,107 | 45,956,207 | - |
Energy | 41,263,741 | 2,144,221 | 39,119,520 | - |
Financials | 99,562,224 | 70,580,241 | 28,981,983 | - |
Health Care | 76,995,918 | 20,865,699 | 56,130,219 | - |
Industrials | 100,956,707 | 79,946,316 | 21,010,391 | - |
Information Technology | 32,771,374 | 22,007,677 | 10,763,697 | - |
Materials | 43,187,862 | 15,217,694 | 27,970,168 | - |
Real Estate | 3,822,746 | 3,822,746 | - | - |
Utilities | 13,869,382 | 13,869,382 | - | - |
|
| Government Obligations | 396,190 | - | 396,190 | - |
| Total Investments in Securities: | 566,527,712 | 281,027,613 | 285,500,099 | - |
Derivative Instruments: | | | | |
|
| Assets | | | | |
Futures Contracts | 120,338 | 120,338 | - | - |
| Total Assets | 120,338 | 120,338 | - | - |
| Total Derivative Instruments: | 120,338 | 120,338 | - | - |
Value of Derivative Instruments
The following table is a summary of the Fund's value of derivative instruments by primary risk exposure as of October 31, 2022. For additional information on derivative instruments, please refer to the Derivative Instruments section in the accompanying Notes to Financial Statements.
Primary Risk Exposure / Derivative Type | Value |
| Asset ($) | Liability ($) |
| Equity Risk | | |
Futures Contracts (a) | 120,338 | 0 |
| Total Equity Risk | 120,338 | 0 |
| Total Value of Derivatives | 120,338 | 0 |
(a)Reflects gross cumulative appreciation (depreciation) on futures contracts as presented in the Schedule of Investments. In the Statement of Assets and Liabilities, the period end daily variation margin is included in receivable or payable for daily variation margin on futures contracts, and the net cumulative appreciation (depreciation) is included in Total accumulated earnings (loss).
| Statement of Assets and Liabilities |
| | | | October 31, 2022 |
| | | | | |
| Assets | | | | |
Investment in securities, at value - See accompanying schedule Unaffiliated issuers (cost $607,440,154): | | | $ | 566,527,712 |
| Foreign currency held at value (cost $726,426) | | | | 725,070 |
| Receivable for investments sold | | | | 518,539 |
| Receivable for fund shares sold | | | | 55,711 |
| Dividends receivable | | | | 2,394,680 |
| Reclaims receivable | | | | 1,491,220 |
| Distributions receivable from Fidelity Central Funds | | | | 21,608 |
| Prepaid expenses | | | | 1,291 |
Total assets | | | | 571,735,831 |
| Liabilities | | | | |
| Payable to custodian bank | | $227,818 | | |
| Payable for investments purchased | | 581,298 | | |
| Payable for fund shares redeemed | | 121,142 | | |
| Accrued management fee | | 71,562 | | |
| Notes payable | | 52,304 | | |
| Payable for daily variation margin on futures contracts | | 36,961 | | |
| Other payables and accrued expenses | | 83,324 | | |
| Total Liabilities | | | | 1,174,409 |
| Net Assets | | | $ | 570,561,422 |
| Net Assets consist of: | | | | |
| Paid in capital | | | $ | 844,854,417 |
| Total accumulated earnings (loss) | | | | (274,292,995) |
| Net Assets | | | $ | 570,561,422 |
Net Asset Value , offering price and redemption price per share ($570,561,422 ÷ 55,485,532 shares) | | | $ | 10.28 |
| | | | | |
| Statement of Operations |
| | | | Year ended October 31, 2022 |
| Investment Income | | | | |
| Dividends | | | $ | 31,985,529 |
| Income from Fidelity Central Funds (including $68,433 from security lending) | | | | 97,949 |
| Income before foreign taxes withheld | | | | 32,083,478 |
| Less foreign taxes withheld | | | | (2,975,369) |
| Total Income | | | | 29,108,109 |
| Expenses | | | | |
| Management fee | $ | 1,653,797 | | |
| Custodian fees and expenses | | 200,581 | | |
| Independent trustees' fees and expenses | | 3,658 | | |
| Registration fees | | 22,097 | | |
| Audit | | 46,634 | | |
| Legal | | 1,705 | | |
| Interest | | 73,436 | | |
| Miscellaneous | | 3,821 | | |
| Total Expenses | | | | 2,005,729 |
| Net Investment income (loss) | | | | 27,102,380 |
| Realized and Unrealized Gain (Loss) | | | | |
| Net realized gain (loss) on: | | | | |
| Investment Securities: | | | | |
| Unaffiliated issuers | | (233,196,463) | | |
| Foreign currency transactions | | (1,228,483) | | |
| Futures contracts | | (3,246,450) | | |
| Total net realized gain (loss) | | | | (237,671,396) |
| Change in net unrealized appreciation (depreciation) on: | | | | |
| Investment Securities: | | | | |
| Unaffiliated issuers | | (165,920,569) | | |
| Assets and liabilities in foreign currencies | | (207,479) | | |
| Futures contracts | | (45,884) | | |
| Total change in net unrealized appreciation (depreciation) | | | | (166,173,932) |
| Net gain (loss) | | | | (403,845,328) |
| Net increase (decrease) in net assets resulting from operations | | | $ | (376,742,948) |
| Statement of Changes in Net Assets |
| |
| | Year ended October 31, 2022 | | Year ended October 31, 2021 |
| Increase (Decrease) in Net Assets | | | | |
| Operations | | | | |
| Net investment income (loss) | $ | 27,102,380 | $ | 12,228,902 |
| Net realized gain (loss) | | (237,671,396) | | 10,707,226 |
| Change in net unrealized appreciation (depreciation) | | (166,173,932) | | 105,045,569 |
| Net increase (decrease) in net assets resulting from operations | | (376,742,948) | | 127,981,697 |
| Distributions to shareholders | | (37,303,193) | | (4,606,186) |
| Share transactions | | | | |
| Proceeds from sales of shares | | 594,269,522 | | 654,139,459 |
| Reinvestment of distributions | | 37,266,455 | | 4,604,063 |
| Cost of shares redeemed | | (682,501,019) | | (119,284,291) |
Net increase (decrease) in net assets resulting from share transactions | | (50,965,042) | | 539,459,231 |
| Total increase (decrease) in net assets | | (465,011,183) | | 662,834,742 |
| | | | | |
| Net Assets | | | | |
| Beginning of period | | 1,035,572,605 | | 372,737,863 |
| End of period | $ | 570,561,422 | $ | 1,035,572,605 |
| | | | | |
| Other Information | | | | |
| Shares | | | | |
| Sold | | 41,133,495 | | 47,007,361 |
| Issued in reinvestment of distributions | | 2,617,027 | | 366,566 |
| Redeemed | | (59,628,242) | | (8,899,729) |
| Net increase (decrease) | | (15,877,720) | | 38,474,198 |
| | | | | |
Financial Highlights
| Fidelity® SAI International Momentum Index Fund |
| |
| Years ended October 31, | | 2022 | | 2021 | | 2020 A |
Selected Per-Share Data | | | | | | |
| Net asset value, beginning of period | $ | 14.51 | $ | 11.33 | $ | 10.00 |
| Income from Investment Operations | | | | | | |
Net investment income (loss) B,C | | .30 | | .28 | | .08 |
| Net realized and unrealized gain (loss) | | (4.17) | | 3.05 | | 1.25 |
| Total from investment operations | | (3.87) | | 3.33 | | 1.33 |
| Distributions from net investment income | | (.27) D | | (.09) | | - |
| Distributions from net realized gain | | (.10) D | | (.05) | | - |
| Total distributions | | (.36) E | | (.15) E | | - |
| Net asset value, end of period | $ | 10.28 | $ | 14.51 | $ | 11.33 |
Total Return F,G | | (27.34)% | | 29.56% | | 13.30% |
Ratios to Average Net Assets C,H,I | | | | | | |
| Expenses before reductions | | .18% | | .19% | | .24% J,K |
| Expenses net of fee waivers, if any | | .18% | | .19% | | .20% J |
| Expenses net of all reductions | | .18% | | .19% | | .20% J |
| Net investment income (loss) | | 2.47% | | 2.03% | | 1.55% J |
| Supplemental Data | | | | | | |
| Net assets, end of period (000 omitted) | $ | 570,561 | $ | 1,035,573 | $ | 372,738 |
Portfolio turnover rate L | | 113% | | 73% | | 29% M |
A For the period May 12, 2020 (commencement of operations) through October 31, 2020.
B Calculated based on average shares outstanding during the period.
C Net investment income (loss) is affected by the timing of the declaration of dividends by any underlying mutual funds or exchange-traded funds (ETFs). Net investment income (loss) of any mutual funds or ETFs is not included in the Fund's net investment income (loss) ratio.
D The amount shown reflects reclassifications related to book to tax differences that were made in the year shown.
E Total distributions per share do not sum due to rounding.
F Total returns for periods of less than one year are not annualized.
G Total returns would have been lower if certain expenses had not been reduced during the applicable periods shown.
H Fees and expenses of any underlying mutual funds or exchange-traded funds (ETFs) are not included in the Fund's expense ratio. The Fund indirectly bears its proportionate share of these expenses. For additional expense information related to investments in Fidelity Central Funds, please refer to the "Investments in Fidelity Central Funds" note found in the Notes to Financial Statements section of the most recent Annual or Semi-Annual report.
I Expense ratios reflect operating expenses of the class. Expenses before reductions do not reflect amounts reimbursed, waived, or reduced through arrangements with the investment adviser, brokerage services, or other offset arrangements, if applicable, and do not represent the amount paid by the class during periods when reimbursements, waivers or reductions occur.
J Annualized.
K Audit fees are not annualized.
L Amount does not include the portfolio activity of any underlying mutual funds or exchange-traded funds (ETFs).
M Amount not annualized.
For the period ended October 31, 2022
1. Organization.
Fidelity SAI International Momentum Index Fund (the Fund) is a fund of Fidelity Salem Street Trust (the Trust) and is authorized to issue an unlimited number of shares. Shares are offered exclusively to certain clients of Fidelity Management & Research Company LLC (FMR) or its affiliates. The Trust is registered under the Investment Company Act of 1940, as amended (the 1940 Act), as an open-end management investment company organized as a Massachusetts business trust.
2. Investments in Fidelity Central Funds.
Funds may invest in Fidelity Central Funds, which are open-end investment companies generally available only to other investment companies and accounts managed by the investment adviser and its affiliates. The Schedule of Investments lists any Fidelity Central Funds held as an investment as of period end, but does not include the underlying holdings of each Fidelity Central Fund. An investing fund indirectly bears its proportionate share of the expenses of the underlying Fidelity Central Funds.
Based on its investment objective, each Fidelity Central Fund may invest or participate in various investment vehicles or strategies that are similar to those of the investing fund. These strategies are consistent with the investment objectives of the investing fund and may involve certain economic risks which may cause a decline in value of each of the Fidelity Central Funds and thus a decline in the value of the investing fund.
| Fidelity Central Fund | Investment Manager | Investment Objective | Investment Practices | Expense Ratio A |
| Fidelity Money Market Central Funds | Fidelity Management & Research Company LLC (FMR) | Each fund seeks to obtain a high level of current income consistent with the preservation of capital and liquidity. | Short-term Investments | Less than .005% |
A Expenses expressed as a percentage of average net assets and are as of each underlying Central Fund's most recent annual or semi-annual shareholder report.
A complete unaudited list of holdings for each Fidelity Central Fund is available upon request or at the Securities and Exchange Commission website at www.sec.gov. In addition, the financial statements of the Fidelity Central Funds which contain the significant accounting policies (including investment valuation policies) of those funds, and are not covered by the Report of Independent Registered Public Accounting Firm, are available on the Securities and Exchange Commission website or upon request.
3. Significant Accounting Policies.
The Fund is an investment company and applies the accounting and reporting guidance of the Financial Accounting Standards Board (FASB) Accounting Standards Codification Topic 946 Financial Services - Investment Companies . The financial statements have been prepared in conformity with accounting principles generally accepted in the United States of America (GAAP), which require management to make certain estimates and assumptions at the date of the financial statements. Actual results could differ from those estimates. Subsequent events, if any, through the date that the financial statements were issued have been evaluated in the preparation of the financial statements. The Fund's Schedule of Investments lists any underlying mutual funds or exchange-traded funds (ETFs) but does not include the underlying holdings of these funds. The following summarizes the significant accounting policies of the Fund:
Investment Valuation. Investments are valued as of 4:00 p.m. Eastern time on the last calendar day of the period. The Board of Trustees (the Board) has designated the Fund's investment adviser as the valuation designee responsible for the fair valuation function and performing fair value determinations as needed. The investment adviser has established a Fair Value Committee (the Committee) to carry out the day-to-day fair valuation responsibilities and has adopted policies and procedures to govern the fair valuation process and the activities of the Committee. In accordance with these fair valuation policies and procedures, which have been approved by the Board, the Fund attempts to obtain prices from one or more third party pricing services or brokers to value its investments. When current market prices, quotations or currency exchange rates are not readily available or reliable, investments will be fair valued in good faith by the Committee, in accordance with the policies and procedures. Factors used in determining fair value vary by investment type and may include market or investment specific events, transaction data, estimated cash flows, and market observations of comparable investments. The frequency that the fair valuation procedures are used cannot be predicted and they may be utilized to a significant extent. The Committee manages the Fund's fair valuation practices and maintains the fair valuation policies and procedures. The Fund's investment adviser reports to the Board information regarding the fair valuation process and related material matters.
The Fund categorizes the inputs to valuation techniques used to value its investments into a disclosure hierarchy consisting of three levels as shown below:
Level 1 - unadjusted quoted prices in active markets for identical investments
Level 2 - other significant observable inputs (including quoted prices for similar investments, interest rates, prepayment speeds, etc.)
Level 3 - unobservable inputs (including the Fund's own assumptions based on the best information available)
Valuation techniques used to value the Fund's investments by major category are as follows:
Equity securities, including restricted securities, for which market quotations are readily available, are valued at the last reported sale price or official closing price as reported by a third party pricing service on the primary market or exchange on which they are traded and are categorized as Level 1 in the hierarchy. In the event there were no sales during the day or closing prices are not available, securities are valued at the last quoted bid price or may be valued using the last available price and are generally categorized as Level 2 in the hierarchy. For foreign equity securities, when market or security specific events arise, comparisons to the valuation of American Depositary Receipts (ADRs), futures contracts, ETFs and certain indexes as well as quoted prices for similar securities may be used and would be categorized as Level 2 in the hierarchy. For equity securities, including restricted securities, where observable inputs are limited, assumptions about market activity and risk are used and these securities may be categorized as Level 3 in the hierarchy.
Debt securities, including restricted securities, are valued based on evaluated prices received from third party pricing services or from brokers who make markets in such securities. U.S. government and government agency obligations are valued by pricing services who utilize matrix pricing which considers yield or price of bonds of comparable quality, coupon, maturity and type or by broker-supplied prices. When independent prices are unavailable or unreliable, debt securities may be valued utilizing pricing methodologies which consider similar factors that would be used by third party pricing services. Debt securities are generally categorized as Level 2 in the hierarchy but may be Level 3 depending on the circumstances.
Futures contracts are valued at the settlement price established each day by the board of trade or exchange on which they are traded and are categorized as Level 1 in the hierarchy. Investments in open-end mutual funds, including the Fidelity Central Funds, are valued at their closing net asset value (NAV) each business day and are categorized as Level 1 in the hierarchy.
Changes in valuation techniques may result in transfers in or out of an assigned level within the disclosure hierarchy. The aggregate value of investments by input level as of October 31, 2022 is included at the end of the Fund's Schedule of Investments.
Foreign Currency. Certain Funds may use foreign currency contracts to facilitate transactions in foreign-denominated securities. Gains and losses from these transactions may arise from changes in the value of the foreign currency or if the counterparties do not perform under the contracts' terms.
Foreign-denominated assets, including investment securities, and liabilities are translated into U.S. dollars at the exchange rates at period end. Purchases and sales of investment securities, income and dividends received, and expenses denominated in foreign currencies are translated into U.S. dollars at the exchange rate in effect on the transaction date.
The effects of exchange rate fluctuations on investments are included with the net realized and unrealized gain (loss) on investment securities. Other foreign currency transactions resulting in realized and unrealized gain (loss) are disclosed separately.
Investment Transactions and Income. For financial reporting purposes, the Fund's investment holdings and NAV include trades executed through the end of the last business day of the period. The NAV per share for processing shareholder transactions is calculated as of the close of business of the New York Stock Exchange (NYSE), normally 4:00 p.m. Eastern time and includes trades executed through the end of the prior business day. Gains and losses on securities sold are determined on the basis of identified cost. Commissions paid to certain brokers with whom the investment adviser, or its affiliates, places trades on behalf of a fund include an amount in addition to trade execution, which may be rebated back to a fund. Any such rebates are included in net realized gain (loss) on investments in the Statement of Operations. Dividend income is recorded on the ex-dividend date, except for certain dividends from foreign securities where the ex-dividend date may have passed, which are recorded as soon as the Fund is informed of the ex-dividend date. Non-cash dividends included in dividend income, if any, are recorded at the fair market value of the securities received. Income and capital gain distributions from Fidelity Central Funds, if any, are recorded on the ex-dividend date. Investment income is recorded net of foreign taxes withheld where recovery of such taxes is uncertain. Funds may file withholding tax reclaims in certain jurisdictions to recover a portion of amounts previously withheld. Any withholding tax reclaims income is included in the Statement of Operations in foreign taxes withheld. Any receivables for withholding tax reclaims are included in the Statement of Assets and Liabilities in reclaims receivable.
Expenses. Expenses directly attributable to a fund are charged to that fund. Expenses attributable to more than one fund are allocated among the respective funds on the basis of relative net assets or other appropriate methods. Expenses included in the accompanying financial statements reflect the expenses of that fund and do not include any expenses associated with any underlying mutual funds or exchange-traded funds. Although not included in a fund's expenses, a fund indirectly bears its proportionate share of these expenses through the net asset value of each underlying mutual fund or exchange-traded fund. Expense estimates are accrued in the period to which they relate and adjustments are made when actual amounts are known.
Income Tax Information and Distributions to Shareholders. Each year, the Fund intends to qualify as a regulated investment company under Subchapter M of the Internal Revenue Code, including distributing substantially all of its taxable income and realized gains. As a result, no provision for U.S. Federal income taxes is required. As of October 31, 2022, the Fund did not have any unrecognized tax benefits in the financial statements; nor is the Fund aware of any tax positions for which it is reasonably possible that the total amounts of unrecognized tax benefits will significantly change in the next twelve months. The Fund files a U.S. federal tax return, in addition to state and local tax returns as required. The Fund's federal income tax returns are subject to examination by the Internal Revenue Service (IRS) for a period of three fiscal years after they are filed. State and local tax returns may be subject to examination for an additional fiscal year depending on the jurisdiction. Foreign taxes are provided for based on the Fund's understanding of the tax rules and rates that exist in the foreign markets in which it invests.
Distributions are declared and recorded on the ex-dividend date. Income and capital gain distributions are determined in accordance with income tax regulations, which may differ from GAAP. These differences resulted in distribution reclassifications. In addition, the Fund claimed a portion of the payment made to redeeming shareholders as a distribution for income tax purposes.
Capital accounts within the financial statements are adjusted for permanent book-tax differences. These adjustments have no impact on net assets or the results of operations. Capital accounts are not adjusted for temporary book-tax differences which will reverse in a subsequent period.
Book-tax differences are primarily due to futures contracts, foreign currency transactions, passive foreign investment companies (PFIC), certain corporate actions, capital loss carryforwards and losses deferred due to wash sales.
As of period end, the cost and unrealized appreciation (depreciation) in securities, and derivatives if applicable, for federal income tax purposes were as follows:
| Gross unrealized appreciation | $ 31,449,171 |
| Gross unrealized depreciation | (76,304,768) |
| Net unrealized appreciation (depreciation) | $(44,855,597) |
| Tax Cost | $611,383,309 |
The tax-based components of distributable earnings as of period end were as follows:
| Undistributed ordinary income | $ 11,988,284 |
| Capital loss carryforward | $ (241,189,616) |
| Net unrealized appreciation (depreciation) on securities and other investments | $(45,091,664) |
Capital loss carryforwards are only available to offset future capital gains of the Fund to the extent provided by regulations and may be limited. The capital loss carryforward information presented below, including any applicable limitation, is estimated as of fiscal period end and is subject to adjustment.
Short-term | $(218,422,010) |
Long-term | (22,767,606) |
| Total capital loss carryforward | $(241,189,616) |
The tax character of distributions paid was as follows:
| | October 31, 2022 | October 31, 2021 |
| Ordinary Income | $ 27,992,929 | $ 4,479,989 |
| Long-term Capital Gains | 9,310,264 | 126,197 |
| Total | $37,303,193 | $4,606,186 |
Restricted Securities (including Private Placements). Funds may invest in securities that are subject to legal or contractual restrictions on resale. These securities generally may be resold in transactions exempt from registration or to the public if the securities are registered. Disposal of these securities may involve time-consuming negotiations and expense, and prompt sale at an acceptable price may be difficult. Information regarding restricted securities held at period end is included at the end of the Schedule of Investments, if applicable.
4. Derivative Instruments.
Risk Exposures and the Use of Derivative Instruments. The Fund's investment objectives allow for various types of derivative instruments, including futures contracts. Derivatives are investments whose value is primarily derived from underlying assets, indices or reference rates and may be transacted on an exchange or over-the-counter (OTC). Derivatives may involve a future commitment to buy or sell a specified asset based on specified terms, to exchange future cash flows at periodic intervals based on a notional principal amount, or for one party to make one or more payments upon the occurrence of specified events in exchange for periodic payments from the other party.
Derivatives were used to increase returns and to manage exposure to certain risks as defined below. The success of any strategy involving derivatives depends on analysis of numerous economic factors, and if the strategies for investment do not work as intended, the objectives may not be achieved.
Derivatives were used to increase or decrease exposure to the following risk(s):
| | |
| Equity Risk | Equity risk relates to the fluctuations in the value of financial instruments as a result of changes in market prices (other than those arising from interest rate risk or foreign exchange risk), whether caused by factors specific to an individual investment, its issuer, or all factors affecting all instruments traded in a market or market segment. |
Funds are also exposed to additional risks from investing in derivatives, such as liquidity risk and counterparty credit risk. Liquidity risk is the risk that a fund will be unable to close out the derivative in the open market in a timely manner. Counterparty credit risk is the risk that the counterparty will not be able to fulfill its obligation to a fund. Counterparty credit risk related to exchange-traded contracts may be mitigated by the protection provided by the exchange on which they trade.
Investing in derivatives may involve greater risks than investing in the underlying assets directly and, to varying degrees, may involve risk of loss in excess of any initial investment and collateral received and amounts recognized in the Statement of Assets and Liabilities. In addition, there may be the risk that the change in value of the derivative contract does not correspond to the change in value of the underlying instrument.
Futures Contracts. A futures contract is an agreement between two parties to buy or sell a specified underlying instrument for a fixed price at a specified future date. Futures contracts were used to manage exposure to the stock market.
Upon entering into a futures contract, a fund is required to deposit either cash or securities (initial margin) with a clearing broker in an amount equal to a certain percentage of the face value of the contract. Futures contracts are marked-to-market daily and subsequent daily payments are made or received by a fund depending on the daily fluctuations in the value of the futures contracts and are recorded as unrealized appreciation or (depreciation). This receivable and/or payable, if any, is included in daily variation margin on futures contracts in the Statement of Assets and Liabilities. Realized gain or (loss) is recorded upon the expiration or closing of a futures contract. The net realized gain (loss) and change in net unrealized appreciation (depreciation) on futures contracts during the period is presented in the Statement of Operations.
Any open futures contracts at period end are presented in the Schedule of Investments under the caption "Futures Contracts". The notional amount at value reflects each contract's exposure to the underlying instrument or index at period end, and is representative of volume of activity during the period unless an average notional amount is presented. Any securities deposited to meet initial margin requirements are identified in the Schedule of Investments. Any cash deposited to meet initial margin requirements is presented as segregated cash with brokers for derivative instruments in the Statement of Assets and Liabilities.
5. Purchases and Sales of Investments.
Purchases and sales of securities, other than short-term securities, U.S. government securities and in-kind transactions, as applicable, are noted in the table below.
| | Purchases ($) | Sales ($) |
| Fidelity SAI International Momentum Index Fund | 1,213,299,960 | 1,271,081,997 |
6. Fees and Other Transactions with Affiliates.
Management Fee. Fidelity Management & Research Company LLC (the investment adviser) and its affiliates provide the Fund with investment management related services for which the Fund pays a monthly management fee that is based on an annual rate of .15% of the Fund's average net assets.
Sub-Adviser. Geode Capital Management, LLC (Geode), serves as sub-adviser for the Fund. Geode provides discretionary investment advisory services to the Fund and is paid by the investment adviser for providing these services.
Interfund Lending Program. Pursuant to an Exemptive Order issued by the Securities and Exchange Commission (the SEC), the Fund, along with other registered investment companies having management contracts with Fidelity Management & Research Company LLC (FMR), or other affiliated entities of FMR, may participate in an interfund lending program. This program provides an alternative credit facility allowing the Fund to borrow from, or lend money to, other participating affiliated funds. At period end, there were no interfund loans outstanding. Activity in this program during the period for which loans were outstanding was as follows:
| | Borrower or Lender | Average Loan Balance | Weighted Average Interest Rate | Interest Expense |
Fidelity SAI International Momentum Index Fund | Borrower | $ 18,666,923 | 1.73% | $35,075 |
Interfund Trades. Funds may purchase from or sell securities to other Fidelity Funds under procedures adopted by the Board. The procedures have been designed to ensure these interfund trades are executed in accordance with Rule 17a-7 of the 1940 Act. Any interfund trades are included within the respective purchases and sales amounts shown in the Purchases and Sales of Investments note. During the period, there were no interfund trades.
7. Committed Line of Credit.
Certain Funds participate with other funds managed by the investment adviser or an affiliate in a $4.25 billion credit facility (the "line of credit") to be utilized for temporary or emergency purposes to fund shareholder redemptions or for other short-term liquidity purposes. The participating funds have agreed to pay commitment fees on their pro-rata portion of the line of credit, which are reflected in Miscellaneous expenses on the Statement of Operations, and are listed below. During the period, there were no borrowings on this line of credit.
| | Amount |
| Fidelity SAI International Momentum Index Fund | $1,888 |
8. Security Lending.
Funds lend portfolio securities from time to time in order to earn additional income. Lending agents are used, including National Financial Services (NFS), an affiliate of the investment adviser. Pursuant to a securities lending agreement, NFS will receive a fee, which is capped at 9.9% of a fund's daily lending revenue, for its services as lending agent. A fund may lend securities to certain qualified borrowers, including NFS. On the settlement date of the loan, a fund receives collateral (in the form of U.S. Treasury obligations, letters of credit and/or cash) against the loaned securities and maintains collateral in an amount not less than 100% of the market value of the loaned securities during the period of the loan. The market value of the loaned securities is determined at the close of business of a fund and any additional required collateral is delivered to a fund on the next business day. A fund or borrower may terminate the loan at any time, and if the borrower defaults on its obligation to return the securities loaned because of insolvency or other reasons, a fund may apply collateral received from the borrower against the obligation. A fund may experience delays and costs in recovering the securities loaned. Any cash collateral received is invested in the Fidelity Securities Lending Cash Central Fund. Any loaned securities are identified as such in the Schedule of Investments, and the value of loaned securities and cash collateral at period end, as applicable, are presented in the Statement of Assets and Liabilities. Security lending income represents the income earned on investing cash collateral, less rebates paid to borrowers and any lending agent fees associated with the loan, plus any premium payments received for lending certain types of securities. Security lending income is presented in the Statement of Operations as a component of income from Fidelity Central Funds. Affiliated security lending activity, if any, was as follows:
| | Total Security Lending Fees Paid to NFS | Security Lending Income From Securities Loaned to NFS | Value of Securities Loaned to NFS at Period End |
| Fidelity SAI International Momentum Index Fund | $7,244 | $- | $- |
9. Bank Borrowings.
The Fund is permitted to have bank borrowings for temporary or emergency purposes to fund shareholder redemptions or for other short-term liquidity requirements. The Fund has established borrowing arrangements with certain banks. The interest rate on the borrowings is the bank's base rate, as revised from time to time. Any open loans, including accrued interest, at period end are presented under the caption "Notes payable" in the Statement of Assets and Liabilities, if applicable. Activity in this program during the period for which loans were outstanding was as follows:
| | Average Loan Balance | Weighted Average Interest Rate | Interest Expense |
| Fidelity SAI International Momentum Index Fund | $11,618,375 | 2.97% | $38,361 |
10. Other.
A fund's organizational documents provide former and current trustees and officers with a limited indemnification against liabilities arising in connection with the performance of their duties to the fund. In the normal course of business, a fund may also enter into contracts that provide general indemnifications. A fund's maximum exposure under these arrangements is unknown as this would be dependent on future claims that may be made against a fund. The risk of material loss from such claims is considered remote.
At the end of the period, the following mutual funds managed by the investment adviser or its affiliates were the owners of record of 10% or more of the total outstanding shares.
| | Strategic Advisers Fidelity International Fund | Strategic Advisers International Fund |
| Fidelity SAI International Momentum Index Fund | 43% | 18% |
Mutual funds managed by the investment adviser or its affiliates, in aggregate, were the owners of record of more than 20% of the total outstanding shares.
| Fund | % of shares held |
| Fidelity SAI International Momentum Index Fund | 61% |
11. Risk and Uncertainties.
Many factors affect a fund's performance. Developments that disrupt global economies and financial markets, such as pandemics, epidemics, outbreaks of infectious diseases, war, terrorism, and environmental disasters, may significantly affect a fund's investment performance. The effects of these developments to a fund will be impacted by the types of securities in which a fund invests, the financial condition, industry, economic sector, and geographic location of an issuer, and a fund's level of investment in the securities of that issuer.
To the Board of Trustees of Fidelity Salem Street Trust and Shareholders of Fidelity SAI International Momentum Index Fund
Opinion on the Financial Statements
We have audited the accompanying statement of assets and liabilities, including the schedule of investments, of Fidelity SAI International Momentum Index Fund (one of the funds constituting Fidelity Salem Street Trust, referred to hereafter as the "Fund") as of October 31, 2022, the related statement of operations for the year ended October 31, 2022, the statement of changes in net assets for each of the two years in the period ended October 31, 2022, including the related notes, and the financial highlights for each of the two years in the period ended October 31, 2022 and for the period May 12, 2020 (commencement of operations) through October 31, 2020 (collectively referred to as the "financial statements"). In our opinion, the financial statements present fairly, in all material respects, the financial position of the Fund as of October 31, 2022, the results of its operations for the year then ended, the changes in its net assets for each of the two years in the period ended October 31, 2022 and the financial highlights for each of the two years in the period ended October 31, 2022 and for the period May 12, 2020 (commencement of operations) through October 31, 2020 in conformity with accounting principles generally accepted in the United States of America.
Basis for Opinion
These financial statements are the responsibility of the Fund's management. Our responsibility is to express an opinion on the Fund's financial statements based on our audits. We are a public accounting firm registered with the Public Company Accounting Oversight Board (United States) (PCAOB) and are required to be independent with respect to the Fund in accordance with the U.S. federal securities laws and the applicable rules and regulations of the Securities and Exchange Commission and the PCAOB.
We conducted our audits of these financial statements in accordance with the standards of the PCAOB. Those standards require that we plan and perform the audit to obtain reasonable assurance about whether the financial statements are free of material misstatement, whether due to error or fraud.
Our audits included performing procedures to assess the risks of material misstatement of the financial statements, whether due to error or fraud, and performing procedures that respond to those risks. Such procedures included examining, on a test basis, evidence regarding the amounts and disclosures in the financial statements. Our audits also included evaluating the accounting principles used and significant estimates made by management, as well as evaluating the overall presentation of the financial statements. Our procedures included confirmation of securities owned as of October 31, 2022 by correspondence with the custodian and brokers; when replies were not received from brokers, we performed other auditing procedures. We believe that our audits provide a reasonable basis for our opinion.
/s/ PricewaterhouseCoopers LLP
Boston, Massachusetts
December 15, 2022
We have served as the auditor of one or more investment companies in the Fidelity group of funds since 1932.
The Trustees, Members of the Advisory Board (if any), and officers of the trust and fund, as applicable, are listed below. The Board of Trustees governs the fund and is responsible for protecting the interests of shareholders. The Trustees are experienced executives who meet periodically throughout the year to oversee the fund's activities, review contractual arrangements with companies that provide services to the fund, oversee management of the risks associated with such activities and contractual arrangements, and review the fund's performance. Except for Jonathan Chiel, each of the Trustees oversees 293 funds. Mr. Chiel oversees 184 funds.
The Trustees hold office without limit in time except that (a) any Trustee may resign; (b) any Trustee may be removed by written instrument, signed by at least two-thirds of the number of Trustees prior to such removal; (c) any Trustee who requests to be retired or who has become incapacitated by illness or injury may be retired by written instrument signed by a majority of the other Trustees; and (d) any Trustee may be removed at any special meeting of shareholders by a two-thirds vote of the outstanding voting securities of the trust. Each Trustee who is not an interested person (as defined in the 1940 Act) of the trust and the fund is referred to herein as an Independent Trustee. Each Independent Trustee shall retire not later than the last day of the calendar year in which his or her 75th birthday occurs. The Independent Trustees may waive this mandatory retirement age policy with respect to individual Trustees. Officers and Advisory Board Members hold office without limit in time, except that any officer or Advisory Board Member may resign or may be removed by a vote of a majority of the Trustees at any regular meeting or any special meeting of the Trustees. Except as indicated, each individual has held the office shown or other offices in the same company for the past five years.
The fund's Statement of Additional Information (SAI) includes more information about the Trustees. To request a free copy, call Fidelity at 1-800-544-3455.
Experience, Skills, Attributes, and Qualifications of the Trustees. The Governance and Nominating Committee has adopted a statement of policy that describes the experience, qualifications, attributes, and skills that are necessary and desirable for potential Independent Trustee candidates (Statement of Policy). The Board believes that each Trustee satisfied at the time he or she was initially elected or appointed a Trustee, and continues to satisfy, the standards contemplated by the Statement of Policy. The Governance and Nominating Committee also engages professional search firms to help identify potential Independent Trustee candidates who have the experience, qualifications, attributes, and skills consistent with the Statement of Policy. From time to time, additional criteria based on the composition and skills of the current Independent Trustees, as well as experience or skills that may be appropriate in light of future changes to board composition, business conditions, and regulatory or other developments, have also been considered by the professional search firms and the Governance and Nominating Committee. In addition, the Board takes into account the Trustees' commitment and participation in Board and committee meetings, as well as their leadership of standing and ad hoc committees throughout their tenure.
In determining that a particular Trustee was and continues to be qualified to serve as a Trustee, the Board has considered a variety of criteria, none of which, in isolation, was controlling. The Board believes that, collectively, the Trustees have balanced and diverse experience, qualifications, attributes, and skills, which allow the Board to operate effectively in governing the fund and protecting the interests of shareholders. Information about the specific experience, skills, attributes, and qualifications of each Trustee, which in each case led to the Board's conclusion that the Trustee should serve (or continue to serve) as a trustee of the fund, is provided below.
Board Structure and Oversight Function. Abigail P. Johnson is an interested person and currently serves as Chairman. The Trustees have determined that an interested Chairman is appropriate and benefits shareholders because an interested Chairman has a personal and professional stake in the quality and continuity of services provided to the fund. Independent Trustees exercise their informed business judgment to appoint an individual of their choosing to serve as Chairman, regardless of whether the Trustee happens to be independent or a member of management. The Independent Trustees have determined that they can act independently and effectively without having an Independent Trustee serve as Chairman and that a key structural component for assuring that they are in a position to do so is for the Independent Trustees to constitute a substantial majority for the Board. The Independent Trustees also regularly meet in executive session. Michael E. Kenneally serves as Chairman of the Independent Trustees and as such (i) acts as a liaison between the Independent Trustees and management with respect to matters important to the Independent Trustees and (ii) with management prepares agendas for Board meetings.
Fidelity ® funds are overseen by different Boards of Trustees. The fund's Board oversees Fidelity's investment-grade bond, money market, asset allocation and certain equity funds, and other Boards oversee Fidelity's high income and other equity funds. The asset allocation funds may invest in Fidelity ® funds that are overseen by such other Boards. The use of separate Boards, each with its own committee structure, allows the Trustees of each group of Fidelity ® funds to focus on the unique issues of the funds they oversee, including common research, investment, and operational issues. On occasion, the separate Boards establish joint committees to address issues of overlapping consequences for the Fidelity ® funds overseen by each Board.
The Trustees operate using a system of committees to facilitate the timely and efficient consideration of all matters of importance to the Trustees, the fund, and fund shareholders and to facilitate compliance with legal and regulatory requirements and oversight of the fund's activities and associated risks. The Board, acting through its committees, has charged FMR and its affiliates with (i) identifying events or circumstances the occurrence of which could have demonstrably adverse effects on the fund's business and/or reputation; (ii) implementing processes and controls to lessen the possibility that such events or circumstances occur or to mitigate the effects of such events or circumstances if they do occur; and (iii) creating and maintaining a system designed to evaluate continuously business and market conditions in order to facilitate the identification and implementation processes described in (i) and (ii) above. Because the day-to-day operations and activities of the fund are carried out by or through FMR, its affiliates, and other service providers, the fund's exposure to risks is mitigated but not eliminated by the processes overseen by the Trustees. While each of the Board's committees has responsibility for overseeing different aspects of the fund's activities, oversight is exercised primarily through the Operations and Audit Committees. In addition, an ad hoc Board committee of Independent Trustees has worked with FMR to enhance the Board's oversight of investment and financial risks, legal and regulatory risks, technology risks, and operational risks, including the development of additional risk reporting to the Board. Appropriate personnel, including but not limited to the fund's Chief Compliance Officer (CCO), FMR's internal auditor, the independent accountants, the fund's Treasurer and portfolio management personnel, make periodic reports to the Board's committees, as appropriate, including an annual review of Fidelity's risk management program for the Fidelity ® funds. The responsibilities of each standing committee, including their oversight responsibilities, are described further under "Standing Committees of the Trustees."
Interested Trustees*:
Correspondence intended for a Trustee who is an interested person may be sent to Fidelity Investments, 245 Summer Street, Boston, Massachusetts 02210.
Name, Year of Birth; Principal Occupations and Other Relevant Experience+
Jonathan Chiel (1957)
Year of Election or Appointment: 2016
Trustee
Mr. Chiel also serves as Trustee of other Fidelity ® funds. Mr. Chiel is Executive Vice President and General Counsel for FMR LLC (diversified financial services company, 2012-present). Previously, Mr. Chiel served as general counsel (2004-2012) and senior vice president and deputy general counsel (2000-2004) for John Hancock Financial Services; a partner with Choate, Hall & Stewart (1996-2000) (law firm); and an Assistant United States Attorney for the United States Attorney's Office of the District of Massachusetts (1986-95), including Chief of the Criminal Division (1993-1995). Mr. Chiel is a director on the boards of the Boston Bar Foundation and the Maimonides School.
Abigail P. Johnson (1961)
Year of Election or Appointment: 2009
Trustee
Chairman of the Board of Trustees
Ms. Johnson also serves as Trustee of other Fidelity ® funds. Ms. Johnson serves as Chairman (2016-present), Chief Executive Officer (2014-present), and Director (2007-present) of FMR LLC (diversified financial services company), President of Fidelity Financial Services (2012-present) and President of Personal, Workplace and Institutional Services (2005-present). Ms. Johnson is Chairman and Director of Fidelity Management & Research Company LLC (investment adviser firm, 2011-present). Previously, Ms. Johnson served as Chairman and Director of FMR Co., Inc. (investment adviser firm, 2011-2019), Vice Chairman (2007-2016) and President (2013-2016) of FMR LLC, President and a Director of Fidelity Management & Research Company (2001-2005), a Trustee of other investment companies advised by Fidelity Management & Research Company, Fidelity Investments Money Management, Inc. (investment adviser firm), and FMR Co., Inc. (2001-2005), Senior Vice President of the Fidelity ® funds (2001-2005), and managed a number of Fidelity ® funds. Ms. Abigail P. Johnson and Mr. Arthur E. Johnson are not related.
Jennifer Toolin McAuliffe (1959)
Year of Election or Appointment: 2016
Trustee
Ms. McAuliffe also serves as Trustee of other Fidelity ® funds and as Trustee of Fidelity Charitable (2020-present). Previously, Ms. McAuliffe served as Co-Head of Fixed Income of Fidelity Investments Limited (now known as FIL Limited (FIL)) (diversified financial services company), Director of Research for FIL's credit and quantitative teams in London, Hong Kong and Tokyo and Director of Research for taxable and municipal bonds at Fidelity Investments Money Management, Inc. Ms. McAuliffe previously served as a member of the Advisory Board of certain Fidelity ® funds (2016). Ms. McAuliffe was previously a lawyer at Ropes & Gray LLP and currently serves as director or trustee of several not-for-profit entities.
* Determined to be an "Interested Trustee" by virtue of, among other things, his or her affiliation with the trust or various entities under common control with FMR.
+ The information includes the Trustee's principal occupation during the last five years and other information relating to the experience, attributes, and skills relevant to the Trustee's qualifications to serve as a Trustee, which led to the conclusion that the Trustee should serve as a Trustee for the fund.
Independent Trustees:
Correspondence intended for an Independent Trustee may be sent to Fidelity Investments, P.O. Box 55235, Boston, Massachusetts 02205-5235.
Name, Year of Birth; Principal Occupations and Other Relevant Experience+
Elizabeth S. Acton (1951)
Year of Election or Appointment: 2013
Trustee
Ms. Acton also serves as Trustee of other Fidelity ® funds. Prior to her retirement, Ms. Acton served as Executive Vice President, Finance (2011-2012), Executive Vice President, Chief Financial Officer (2002-2011) and Treasurer (2004-2005) of Comerica Incorporated (financial services). Prior to joining Comerica, Ms. Acton held a variety of positions at Ford Motor Company (1983-2002), including Vice President and Treasurer (2000-2002) and Executive Vice President and Chief Financial Officer of Ford Motor Credit Company (1998-2000). Ms. Acton currently serves as a member of the Board and Audit and Finance Committees of Beazer Homes USA, Inc. (homebuilding, 2012-present). Ms. Acton previously served as a member of the Advisory Board of certain Fidelity ® funds (2013-2016).
Ann E. Dunwoody (1953)
Year of Election or Appointment: 2018
Trustee
General Dunwoody also serves as Trustee of other Fidelity ® funds. General Dunwoody (United States Army, Retired) was the first woman in U.S. military history to achieve the rank of four-star general and prior to her retirement in 2012 held a variety of positions within the U.S. Army, including Commanding General, U.S. Army Material Command (2008-2012). General Dunwoody currently serves as President of First to Four LLC (leadership and mentoring services, 2012-present), a member of the Board and Nomination and Corporate Governance Committees of Kforce Inc. (professional staffing services, 2016-present) and a member of the Board of Automattic Inc. (software engineering, 2018-present). Previously, General Dunwoody served as a member of the Advisory Board and Nominating and Corporate Governance Committee of L3 Technologies, Inc. (communication, electronic, sensor and aerospace systems, 2013-2019) and a member of the Board and Audit and Sustainability and Corporate Responsibility Committees of Republic Services, Inc. (waste collection, disposal and recycling, 2013-2016). Ms. Dunwoody also serves on several boards for non-profit organizations, including as a member of the Board, Chair of the Nomination and Governance Committee and a member of the Audit Committee of Logistics Management Institute (consulting non-profit, 2012-present), a member of the Council of Trustees for the Association of the United States Army (advocacy non-profit, 2013-present), a member of the Board of Florida Institute of Technology (2015-present) and a member of the Board of ThanksUSA (military family education non-profit, 2014-present). General Dunwoody previously served as a member of the Advisory Board of certain Fidelity ® funds (2018).
John Engler (1948)
Year of Election or Appointment: 2014
Trustee
Mr. Engler also serves as Trustee of other Fidelity ® funds. Previously, Mr. Engler served as Governor of Michigan (1991-2003), President of the Business Roundtable (2011-2017) and interim President of Michigan State University (2018-2019). Mr. Engler currently serves as a member of the Board of Stride, Inc. (formerly K12 Inc.) (technology-based education company, 2012-present). Previously, Mr. Engler served as a member of the Board of Universal Forest Products (manufacturer and distributor of wood and wood-alternative products, 2003-2019) and Trustee of The Munder Funds (2003-2014). Mr. Engler previously served as a member of the Advisory Board of certain Fidelity ® funds (2014-2016).
Robert F. Gartland (1951)
Year of Election or Appointment: 2010
Trustee
Mr. Gartland also serves as Trustee of other Fidelity ® funds. Prior to his retirement, Mr. Gartland held a variety of positions at Morgan Stanley (financial services, 1979-2007), including Managing Director (1987-2007) and Chase Manhattan Bank (1975-1978). Mr. Gartland previously served as Chairman and an investor in Gartland & Mellina Group Corp. (consulting, 2009-2019), as a member of the Board of National Securities Clearing Corporation (1993-1996) and as Chairman of TradeWeb (2003-2004).
Arthur E. Johnson (1947)
Year of Election or Appointment: 2008
Trustee
Mr. Johnson also serves as Trustee of other Fidelity ® funds. Prior to his retirement, Mr. Johnson served as Senior Vice President of Corporate Strategic Development of Lockheed Martin Corporation (defense contractor, 1999-2009). Mr. Johnson currently serves as a member of the Board of Booz Allen Hamilton (management consulting, 2011-present). Mr. Johnson previously served as a member of the Board of Eaton Corporation plc (diversified power management, 2009-2019) and a member of the Board of AGL Resources, Inc. (holding company, 2002-2016). Mr. Johnson previously served as Chairman (2018-2021) and Vice Chairman (2015-2018) of the Independent Trustees of certain Fidelity® funds. Mr. Arthur E. Johnson is not related to Ms. Abigail P. Johnson.
Michael E. Kenneally (1954)
Year of Election or Appointment: 2009
Trustee
Chairman of the Independent Trustees
Mr. Kenneally also serves as Trustee of other Fidelity ® funds and was Vice Chairman (2018-2021) of the Independent Trustees of certain Fidelity ® funds. Prior to retirement in 2005, he was Chairman and Global Chief Executive Officer of Credit Suisse Asset Management, the worldwide fund management and institutional investment business of Credit Suisse Group. Previously, Mr. Kenneally was an Executive Vice President and the Chief Investment Officer for Bank of America. In this role, he was responsible for the investment management, strategy and products delivered to the bank's institutional, high-net-worth and retail clients. Earlier, Mr. Kenneally directed the organization's equity and quantitative research groups. He began his career as a research analyst and then spent more than a dozen years as a portfolio manager for endowments, pension plans and mutual funds. He earned the Chartered Financial Analyst (CFA) designation in 1991.
Marie L. Knowles (1946)
Year of Election or Appointment: 2001
Trustee
Ms. Knowles also serves as Trustee of other Fidelity ® funds. Prior to her retirement, Ms. Knowles held several positions at Atlantic Richfield Company (diversified energy), including Executive Vice President and Chief Financial Officer (1996-2000), Senior Vice President (1993-1996) and President of ARCO Transportation Company (pipeline and tanker operations, 1993-1996). Ms. Knowles currently serves as a member of the Board of the Santa Catalina Island Company (real estate, 2009-present), a member of the Investment Company Institute Board of Governors and a member of the Governing Council of the Independent Directors Council (2014-present). Ms. Knowles also serves as a member of the Advisory Board for the School of Engineering of the University of Southern California. Ms. Knowles previously served as a member of the Board of McKesson Corporation (healthcare service, 2002-2021). In addition, Ms. Knowles previously served as Chairman (2015-2018) and Vice Chairman (2012-2015) of the Independent Trustees of certain Fidelity ® funds.
Mark A. Murray (1954)
Year of Election or Appointment: 2016
Trustee
Mr. Murray also serves as Trustee of other Fidelity ® funds. Previously, Mr. Murray served as Co-Chief Executive Officer (2013-2016), President (2006-2013) and Vice Chairman (2013-2020) of Meijer, Inc. Mr. Murray serves as a member of the Board (2009-present) and Public Policy and Responsibility Committee (2009-present) and Chair of the Nuclear Review Committee (2019-present) of DTE Energy Company (diversified energy company). Mr. Murray previously served as a member of the Board of Spectrum Health (not-for-profit health system, 2015-2019) and as a member of the Board and Audit Committee and Chairman of the Nominating and Corporate Governance Committee of Universal Forest Products, Inc. (manufacturer and distributor of wood and wood-alternative products, 2004-2016). Mr. Murray also serves as a member of the Board of many community and professional organizations. Mr. Murray previously served as a member of the Advisory Board of certain Fidelity ® funds (2016).
+ The information includes the Trustee's principal occupation during the last five years and other information relating to the experience, attributes, and skills relevant to the Trustee's qualifications to serve as a Trustee, which led to the conclusion that the Trustee should serve as a Trustee for the fund.
Advisory Board Members and Officers:
Correspondence intended for a Member of the Advisory Board (if any) may be sent to Fidelity Investments, P.O. Box 55235, Boston, Massachusetts 02205-5235. Correspondence intended for an officer may be sent to Fidelity Investments, 245 Summer Street, Boston, Massachusetts 02210. Officers appear below in alphabetical order.
Name, Year of Birth; Principal Occupation
Laura M. Bishop (1961)
Year of Election or Appointment: 2022
Member of the Advisory Board
Ms. Bishop also serves as a Member of the Advisory Board of other funds. Prior to her retirement, Ms. Bishop held a variety of positions at United Services Automobile Association (2001-2020), including Executive Vice President and Chief Financial Officer (2014-2020) and Senior Vice President and Deputy Chief Financial Officer (2012-2014). Ms. Bishop currently serves as a member of the Audit Committee and Compensation and Personnel Committee (2021-present) of the Board of Directors of Korn Ferry (global organizational consulting).
Robert W. Helm (1957)
Year of Election or Appointment: 2021
Member of the Advisory Board
Mr. Helm also serves as a Member of the Advisory Board of other Fidelity® funds. Mr. Helm was formerly Deputy Chairman (2003-2020), partner (1991-2020) and an associate (1984-1991) of Dechert LLP (formerly Dechert Price & Rhoads). Mr. Helm currently serves on boards and committees of several not-for-profit organizations.
Craig S. Brown (1977)
Year of Election or Appointment: 2019
Assistant Treasurer
Mr. Brown also serves as an officer of other funds. Mr. Brown serves as Assistant Treasurer of FIMM, LLC (2021-present) and is an employee of Fidelity Investments (2013-present). Previously, Mr. Brown served as Assistant Treasurer of certain Fidelity ® funds (2019-2022).
John J. Burke III (1964)
Year of Election or Appointment: 2018
Chief Financial Officer
Mr. Burke also serves as Chief Financial Officer of other funds. Mr. Burke serves as Head of Investment Operations for Fidelity Fund and Investment Operations (2018-present) and is an employee of Fidelity Investments (1998-present). Previously Mr. Burke served as head of Asset Management Investment Operations (2012-2018).
David J. Carter (1973)
Year of Election or Appointment: 2020
Assistant Secretary
Mr. Carter also serves as Assistant Secretary of other funds. Mr. Carter serves as Senior Vice President, Deputy General Counsel (2022-present) and is an employee of Fidelity Investments (2005-present).
Jonathan Davis (1968)
Year of Election or Appointment: 2010
Assistant Treasurer
Mr. Davis also serves as an officer of other funds. Mr. Davis serves as Assistant Treasurer of FIMM, LLC (2021-present), FMR Capital, Inc. (2017-present), FD Funds GP LLC (2021-present), FD Funds Holding LLC (2021-present), and FD Funds Management LLC (2021-present); and is an employee of Fidelity Investments. Previously, Mr. Davis served as Vice President and Associate General Counsel of FMR LLC (diversified financial services company, 2003-2010).
Laura M. Del Prato (1964)
Year of Election or Appointment: 2018
President and Treasurer
Ms. Del Prato also serves as an officer of other funds. Ms. Del Prato serves as Assistant Treasurer of FIMM, LLC (2021-present) and is an employee of Fidelity Investments (2017-present). Previously, Ms. Del Prato served as President and Treasurer of The North Carolina Capital Management Trust: Cash Portfolio and Term Portfolio (2018-2020). Prior to joining Fidelity Investments, Ms. Del Prato served as a Managing Director and Treasurer of the JPMorgan Mutual Funds (2014-2017). Prior to JPMorgan, Ms. Del Prato served as a partner at Cohen Fund Audit Services (accounting firm, 2012-2013) and KPMG LLP (accounting firm, 2004-2012).
Colm A. Hogan (1973)
Year of Election or Appointment: 2016
Assistant Treasurer
Mr. Hogan also serves as an officer of other funds. Mr. Hogan serves as Assistant Treasurer of FIMM, LLC (2021-present) and FMR Capital, Inc. (2017-present) and is an employee of Fidelity Investments (2005-present). Previously, Mr. Hogan served as Deputy Treasurer of certain Fidelity ® funds (2016-2020) and Assistant Treasurer of certain Fidelity ® funds (2016-2018).
Cynthia Lo Bessette (1969)
Year of Election or Appointment: 2019
Secretary and Chief Legal Officer (CLO)
Ms. Lo Bessette also serves as an officer of other funds. Ms. Lo Bessette serves as CLO, Secretary, and Senior Vice President of Fidelity Management & Research Company LLC (investment adviser firm, 2019-present); CLO of Fidelity Management & Research (Hong Kong) Limited, FMR Investment Management (UK) Limited, and Fidelity Management & Research (Japan) Limited (investment adviser firms, 2019-present); Secretary of FD Funds GP LLC (2021-present), FD Funds Holding LLC (2021-present), FD Funds Management LLC (2021-present), and Fidelity Diversifying Solutions LLC (investment adviser firm, 2022-present); and Assistant Secretary of FIMM, LLC (2019-present). She is a Senior Vice President and Deputy General Counsel of FMR LLC (diversified financial services company, 2019-present), and is an employee of Fidelity Investments. Previously, Ms. Lo Bessette served as CLO, Secretary, and Senior Vice President of FMR Co., Inc. (investment adviser firm, 2019); Secretary of Fidelity SelectCo, LLC and Fidelity Investments Money Management, Inc. (investment adviser firms, 2019). Prior to joining Fidelity Investments, Ms. Lo Bessette was Executive Vice President, General Counsel (2016-2019) and Senior Vice President, Deputy General Counsel (2015-2016) of OppenheimerFunds (investment management company) and Deputy Chief Legal Officer (2013-2015) of Jennison Associates LLC (investment adviser firm).
Chris Maher (1972)
Year of Election or Appointment: 2013
Assistant Treasurer
Mr. Maher also serves as an officer of other funds. Mr. Maher serves as Assistant Treasurer of FIMM, LLC (2021-present) and FMR Capital, Inc. (2017-present), and is an employee of Fidelity Investments (2008-present). Previously, Mr. Maher served as Assistant Treasurer of certain funds (2013-2020); Vice President of Asset Management Compliance (2013), Vice President of the Program Management Group of FMR (investment adviser firm, 2010-2013), and Vice President of Valuation Oversight (2008-2010).
Jamie Pagliocco (1964)
Year of Election or Appointment: 2020
Vice President
Mr. Pagliocco also serves as Vice President of other funds. Mr. Pagliocco serves as President of Fixed Income (2020-present), and is an employee of Fidelity Investments (2001-present). Previously, Mr. Pagliocco served as Co-Chief Investment Officer - Bond (2017-2020), Global Head of Bond Trading (2016-2019), and as a portfolio manager.
Kenneth B. Robins (1969)
Year of Election or Appointment: 2020
Chief Compliance Officer
Mr. Robins also serves as an officer of other funds. Mr. Robins serves as Compliance Officer of Fidelity Management & Research Company LLC (investment adviser firm, 2016-present) and is an employee of Fidelity Investments (2004-present). Previously, Mr. Robins served as Compliance Officer of FMR Co., Inc. (investment adviser firm, 2016-2019), as Executive Vice President of Fidelity Investments Money Management, Inc. (investment adviser firm, 2013-2016) and served in other fund officer roles.
Brett Segaloff (1972)
Year of Election or Appointment: 2021
Anti-Money Laundering (AML) Officer
Mr. Segaloff also serves as an AML Officer of other funds and other related entities. He is Director, Anti-Money Laundering (2007-present) of FMR LLC (diversified financial services company) and is an employee of Fidelity Investments (1996-present).
Stacie M. Smith (1974)
Year of Election or Appointment: 2013
Assistant Treasurer
Ms. Smith also serves as an officer of other funds. Ms. Smith serves as Assistant Treasurer of FIMM, LLC (2021-present) and FMR Capital, Inc. (2017-present), is an employee of Fidelity Investments (2009-present), and has served in other fund officer roles. Prior to joining Fidelity Investments, Ms. Smith served as Senior Audit Manager of Ernst & Young LLP (accounting firm, 1996-2009). Previously, Ms. Smith served as Assistant Treasurer (2013-2019) and Deputy Treasurer (2013-2016) of certain Fidelity ® funds.
Jim Wegmann (1979)
Year of Election or Appointment: 2021
Deputy Treasurer
Mr. Wegmann also serves as an officer of other funds. Mr. Wegmann serves as Assistant Treasurer of FIMM, LLC (2021-present) and is an employee of Fidelity Investments (2011-present). Previously, Mr. Wegmann served as Assistant Treasurer of certain Fidelity ® funds (2019-2021).
As a shareholder, you incur two types of costs: (1) transaction costs, which may include sales charges (loads) on purchase payments or redemption proceeds, as applicable and (2) ongoing costs, which generally include management fees, distribution and/or service (12b-1) fees and other Fund expenses. This Example is intended to help you understand your ongoing costs (in dollars) of investing in a fund and to compare these costs with the ongoing costs of investing in other mutual funds.
| The Example is based on an investment of $1,000 invested at the beginning of the period and held for the entire period (May 1, 2022 to October 31, 2022). |
Actual Expenses
The first line of the accompanying table provides information about actual account values and actual expenses. You may use the information in this line, together with the amount you invested, to estimate the expenses that you paid over the period. Simply divide your account value by $1,000.00 (for example, an $8,600 account value divided by $1,000.00 = 8.6), then multiply the result by the number in the first line for a class/Fund under the heading entitled "Expenses Paid During Period" to estimate the expenses you paid on your account during this period. If any fund is a shareholder of any underlying mutual funds or exchange-traded funds (ETFs) (the Underlying Funds), such fund indirectly bears its proportional share of the expenses of the Underlying Funds in addition to the direct expenses incurred presented in the table. These fees and expenses are not included in the annualized expense ratio used to calculate the expense estimate in the table below.
Hypothetical Example for Comparison Purposes
The second line of the accompanying table provides information about hypothetical account values and hypothetical expenses based on the actual expense ratio and an assumed rate of return of 5% per year before expenses, which is not the actual return. The hypothetical account values and expenses may not be used to estimate the actual ending account balance or expenses you paid for the period. You may use this information to compare the ongoing costs of investing in the Fund and other funds. To do so, compare this 5% hypothetical example with the 5% hypothetical examples that appear in the shareholder reports of the other funds. If any fund is a shareholder of any Underlying Funds, such fund indirectly bears its proportional share of the expenses of the Underlying Funds in addition to the direct expenses as presented in the table. These fees and expenses are not included in the annualized expense ratio used to calculate the expense estimate in the table below.
Please note that the expenses shown in the table are meant to highlight your ongoing costs only and do not reflect any transaction costs. Therefore, the second line of the table is useful in comparing ongoing costs only, and will not help you determine the relative total costs of owning different funds. In addition, if these transactional costs were included, your costs would have been higher.
| | | | | Annualized Expense Ratio- A | | Beginning Account Value May 1, 2022 | | Ending Account Value October 31, 2022 | | Expenses Paid During Period- C May 1, 2022 to October 31, 2022 |
| | | | | | | | | | |
| Fidelity® SAI International Momentum Index Fund | | | | .19% | | | | | | |
| Actual | | | | | | $ 1,000 | | $ 867.50 | | $ .89 |
Hypothetical- B | | | | | | $ 1,000 | | $ 1,024.25 | | $ .97 |
| |
A Annualized expense ratio reflects expenses net of applicable fee waivers.
B 5% return per year before expenses
C Expenses are equal to the annualized expense ratio, multiplied by the average account value over the period, multiplied by 184/ 365 (to reflect the one-half year period). The fees and expenses of any Underlying Funds are not included in each annualized expense ratio.
The dividend and capital gains distributions for the fund(s) are available on Fidelity.com or Institutional.Fidelity.com .
The fund designates 83% of the dividend distributed during the fiscal year as amounts which may be taken into account as a dividend for the purposes of the maximum rate under section 1(h)(11) of the Internal Revenue Code.
The amounts per share which represent income derived from sources within, and taxes paid to, foreign countries or possessions of the United States are $0.1636 and $0.0139 for the dividend paid December 13, 2021.
The fund will notify shareholders in January 2023 of amounts for use in preparing 2022 income tax returns.
Fidelity SAI International Momentum Index Fund
Each year, the Board of Trustees, including the Independent Trustees (together, the Board), votes on the renewal of the management contract with Fidelity Management & Research Company LLC (FMR) and the sub-advisory agreement (Sub-Advisory Agreement) for the fund with Geode Capital Management, LLC (Geode) (together, the Advisory Contracts). FMR and Geode are referred to herein as the Investment Advisers. The Board, assisted by the advice of fund counsel and Independent Trustees' counsel, requests and considers a broad range of information relevant to the renewal of the Advisory Contracts throughout the year.
The Board meets regularly and, at each of its meetings, covers an extensive agenda of topics and materials and considers factors that are relevant to its annual consideration of the renewal of the fund's Advisory Contracts, including the services and support provided to the fund and its shareholders. The Board has established four standing committees (Committees) - Operations, Audit, Fair Valuation, and Governance and Nominating - each composed of and chaired by Independent Trustees with varying backgrounds, to which the Board has assigned specific subject matter responsibilities in order to enhance effective decision-making by the Board. The Operations Committee, of which all the Independent Trustees are members, meets regularly throughout the year and requests, receives and considers, among other matters, information related to the annual consideration of the renewal of the fund's Advisory Contracts before making its recommendation to the Board. The Board also meets as needed to review matters specifically related to the Board's annual consideration of the renewal of the Advisory Contracts. Members of the Board may also meet from time to time with trustees of other Fidelity funds through joint ad hoc committees to discuss certain matters relevant to all of the Fidelity funds.
At its September 2022 meeting, the Board unanimously determined to renew the fund's Advisory Contracts. In reaching its determination, the Board considered all factors it believed relevant, including (i) the nature, extent, and quality of the services provided to the fund and its shareholders (including the investment performance of the fund); (ii) the competitiveness relative to peer funds of the fund's management fee and total expense ratio; (iii) the total costs of the services provided by and the profits realized by Fidelity and Geode from their respective relationships with the fund; and (iv) the extent to which, if any, economies of scale exist and are realized as the fund grows, and whether any economies of scale are appropriately shared with fund shareholders.
In considering whether to renew the Advisory Contracts for the fund, the Board reached a determination, with the assistance of fund counsel and Independent Trustees' counsel and through the exercise of its business judgment, that the renewal of the Advisory Contracts was in the best interests of the fund and its shareholders and that the compensation payable under the Advisory Contracts was fair and reasonable. The Board's decision to renew the Advisory Contracts was not based on any single factor, but rather was based on a comprehensive consideration of all the information provided to the Board at its meetings throughout the year. The Board, in reaching its determination to renew the Advisory Contracts, was aware that shareholders of the fund have a broad range of investment choices available to them, including a wide choice among funds offered by Fidelity's competitors, and that the fund's shareholders, who have the opportunity to review and weigh the disclosure provided by the fund in its prospectus and other public disclosures, have chosen to invest in this fund, which is part of the Fidelity family of funds.
Nature, Extent, and Quality of Services Provided . The Board considered staffing as it relates to the fund, including the backgrounds of investment personnel of Fidelity and Geode, and also considered the fund's investment objective, strategies, and related investment philosophy. The Independent Trustees also had discussions with senior management of Fidelity's investment operations and investment groups and with senior management of Geode. The Board considered the structure of the investment personnel compensation programs and whether the structures provide appropriate incentives to act in the best interests of the fund. The Board also considered the steps Fidelity and Geode had taken to ensure the continued provision of high quality services to the Fidelity funds throughout the COVID-19 pandemic, including the expansion of staff in client facing positions to maintain service levels in periods of high volumes and volatility.
The Trustees also discussed with representatives of Fidelity, at meetings throughout the year, Fidelity's role in, among other things, overseeing compliance with federal securities laws and other applicable requirements by Geode with respect to the fund and monitoring and overseeing the performance and investment capabilities of Geode. The Trustees considered that the Board had received from Fidelity periodic reports about its oversight and due diligence processes, as well as periodic reports regarding the performance of Geode.
The Board also considered the nature, extent and quality of services provided by Geode. The Trustees noted that under the Sub-Advisory Agreement, subject to oversight by Fidelity, Geode is responsible for, among other things, identifying investments and arranging for execution of portfolio transactions to implement the fund's investment strategy. In addition, the Trustees noted that Geode is responsible for providing such reporting as may be requested by Fidelity to fulfill its oversight responsibilities discussed above.
Resources Dedicated to Investment Management and Support Services . The Board reviewed the general qualifications and capabilities of Fidelity's and Geode's investment staffs, including their size, education, experience, and resources, as well as Fidelity's and Geode's approach to recruiting, managing, training, and compensating investment personnel. The Board noted the resources devoted to Fidelity's global investment organization and that Fidelity's and Geode's analysts have extensive resources, tools and capabilities that allow them to conduct quantitative and fundamental analysis, as well as credit analysis of issuers, counterparties, and guarantors. Further, the Board considered that Fidelity's and Geode's investment professionals have sufficient access to information and data so as to provide competitive investment results over time, and that those professionals also have access to sophisticated tools that permit them to assess portfolio construction and risk and performance attribution characteristics continuously. Additionally, in its deliberations, the Board considered Fidelity's and Geode's trading, risk management, compliance, cybersecurity, and technology and operations capabilities and resources, which are integral parts of the investment management process.
Shareholder and Administrative Services . The Board considered (i) the nature, extent, quality, and cost of advisory, administrative, and shareholder services performed by the Investment Advisers and their affiliates under the Advisory Contracts and by FMR's affiliates under separate agreements covering transfer agency, pricing and bookkeeping, and securities lending services for the fund; (ii) the nature and extent of the supervision of third party service providers, principally custodians, subcustodians, and pricing vendors; and (iii) the resources devoted to, and the record of compliance with, the fund's compliance policies and procedures. The Board also reviewed the allocation of fund brokerage, including allocations to brokers affiliated with the Investment Advisers.
The Board noted that the growth of fund assets over time across the complex allows Fidelity to reinvest in the development of services designed to enhance the value and convenience of the Fidelity funds as investment vehicles. These services include 24-hour access to account information and market information over the Internet and through telephone representatives, investor education materials and asset allocation tools. The Board also considered that it reviews customer service metrics such as telephone response times, continuity of services on the website and metrics addressing services at Fidelity Investor Centers.
Investment in a Large Fund Family . The Board considered the benefits to shareholders of investing in a Fidelity fund, including the benefits of investing in a fund that is part of a large family of funds offering a variety of investment disciplines and providing a large variety of mutual fund investor services. The Board noted that Fidelity had taken, or had made recommendations to the Board that resulted in the Fidelity funds taking, a number of actions over the previous year that benefited particular funds, including: (i) continuing to dedicate additional resources to Fidelity's investment research process, which includes meetings with management of issuers of securities in which the funds invest; (ii) continuing efforts to enhance Fidelity's global research capabilities; (iii) launching new funds, ETFs, and share classes with innovative structures, strategies and pricing and making other enhancements to meet investor needs; (iv) broadening eligibility requirements for certain funds and share classes; (v) reducing management fees and total expenses for certain funds and classes; (vi) lowering expenses for certain existing funds and classes by implementing or lowering expense caps; (vii) rationalizing product lines and gaining increased efficiencies from fund mergers and liquidations; (viii) continuing to develop, acquire and implement systems and technology to improve services to the funds and shareholders, strengthen information security, and increase efficiency; and (ix) continuing to implement enhancements to further strengthen Fidelity's product line to increase investors' probability of success in achieving their investment goals, including their retirement income goals.
Investment Performance . The Board considered whether the fund has operated in accordance with its investment objective, as well as its record of compliance with its investment restrictions and its performance history.
The Board took into account discussions that occur at Board meetings throughout the year with representatives of the Investment Advisers about fund investment performance. In this regard the Board noted that as part of regularly scheduled fund reviews and other reports to the Board on fund performance, the Board considers annualized return information for the fund for different time periods, measured against the securities market index the fund seeks to track. The Board also periodically considers the fund's tracking error versus its benchmark index.
In addition to reviewing absolute and relative fund performance, the Independent Trustees periodically consider the appropriateness of fund performance metrics in evaluating the results achieved. In general, the Independent Trustees believe that an index fund's performance should be evaluated based on gross performance (before fees and expenses but after transaction costs) compared to the fund's benchmark index, over appropriate time periods, taking into account relevant factors including the following: general market conditions; the characteristics of the fund's benchmark index; the extent to which statistical sampling is employed; any securities lending revenues; and fund cash flows and other factors. The Independent Trustees generally give greater weight to fund performance over longer time periods than over shorter time periods. Depending on the circumstances, the Independent Trustees may be satisfied with a fund's performance notwithstanding that it lags its benchmark index for certain periods.
The Independent Trustees recognize that shareholders evaluate performance on a net basis (after fees and expenses) over their own holding periods, for which one-, three-, and five-year periods are often used as a proxy. For this reason, the performance information reviewed by the Board also included net calendar year total return information for the fund and its benchmark index for the most recent one-year period. No performance peer group information was considered by the Board as Fidelity advised the Board that the peer group, which is created by a third-party provider, includes a number of actively-managed funds. The Independent Trustees recognize that shareholders who are not investing through a tax-advantaged retirement account also consider tax consequences in evaluating performance.
Based on its review, the Board concluded that the nature, extent, and quality of services provided to the fund under the Advisory Contracts should continue to benefit the shareholders of the fund.
Competitiveness of Management Fee and Total Expense Ratio . The Board considered the fund's management fee and total expense ratio compared to selected groups of competitive funds and classes (referred to as "mapped groups" below) for the purpose of facilitating the Trustees' competitive analysis of management fees and total expenses. Fidelity creates "mapped groups" by combining similar investment objective categories (as classified by Lipper) that have comparable investment mandates. Combining funds with similar investment objective categories aids the Board's comparison of management fees and total expense ratios by broadening the competitive group used for such comparison.
Management Fee . The Board considered two proprietary management fee comparisons for the 12-month (or shorter) periods shown in basis points (BP) in the chart below. The group of Lipper funds used by the Board for management fee comparisons is referred to below as the "Total Mapped Group." The Total Mapped Group comparison focuses on a fund's standing in terms of gross management fees before expense reimbursements or caps relative to the total universe of funds with comparable investment mandates, regardless of whether their management fee structures also are comparable. Funds with comparable investment mandates offer exposure to similar types of securities. Funds with comparable management fee structures have similar management fee contractual arrangements (e.g., flat rate charged for advisory services, all-inclusive fee rate, etc.). "TMG %" represents the percentage of funds in the Total Mapped Group that had management fees that were lower than the fund's. For example, a hypothetical TMG % of 20% would mean that 80% of the funds in the Total Mapped Group had higher, and 20% had lower, management fees than the fund. The fund's actual TMG %s and the number of funds in the Total Mapped Group are in the chart below. The "Asset-Sized Peer Group" (ASPG) comparison focuses on a fund's standing relative to a subset of non-Fidelity funds within the Total Mapped Group that are similar in size and management fee structure. For example, if a fund is in the first quartile of the ASPG, the fund's management fee ranks in the least expensive or lowest 25% of funds in the ASPG. The ASPG represents at least 15% of the funds in the Total Mapped Group with comparable asset size and management fee structures, subject to a minimum of 50 funds (or all funds in the Total Mapped Group if fewer than 50). Additional information, such as the ASPG quartile in which the fund's management fee rate ranked, is also included in the chart and was considered by the Board.

The Board noted that the fund's management fee rate ranked equal to the median of its Total Mapped Group and equal to the median of its ASPG for 2021.
Based on its review, the Board concluded that the fund's management fee is fair and reasonable in light of the services that the fund receives and the other factors considered.
Total Expense Ratio . In its review of the fund's total expense ratio, the Board considered the fund's management fee rate as well as other fund expenses, such as custodial, legal, and audit fees. The Board also noted that Fidelity may agree to waive fees or reimburse expenses from time to time, and the extent to which, if any, it has done so for the fund. The fund is compared to those funds and classes in the Total Mapped Group (used by the Board for management fee comparisons) that have a similar sales load structure. The Board also considered a total expense ASPG comparison, which focuses on the total expenses of the fund relative to a subset of non-Fidelity funds within the similar sales load structure group that are similar in size and management fee structure. The total expense ASPG is limited to 15 larger and 15 smaller classes of different funds, where possible. The total expense ASPG comparison excludes performance adjustments and fund-paid 12b-1 fees to eliminate variability in expenses relating to these items.
The Board noted that the fund's total net expense ratio ranked equal to the similar sales load structure group competitive median for 2021 and below the ASPG competitive median for 2021.
The Board further considered that FMR has contractually agreed to reimburse the fund to the extent that total operating expenses, with certain exceptions, as a percentage of its average net assets, exceed 0.20% through February 28, 2023.
Fees Charged to Other Clients . The Board also considered fee structures and other information with respect to clients of Fidelity and Geode, such as other funds advised or subadvised by Fidelity or Geode, pension plan clients, and other institutional clients with similar mandates. The Board noted that a joint ad hoc committee created by it and the boards of other Fidelity funds periodically reviews and compares Fidelity's institutional investment advisory business with its business of providing services to the Fidelity funds and also noted the most recent findings of the committee. The Board noted that the committee's review included a consideration of the differences in services provided, fees charged, and costs incurred, as well as competition in the markets serving the different categories of clients.
Based on its review of total expense ratios and fees charged to other Fidelity clients, the Board concluded that the fund's total expense ratio was reasonable in light of the services that the fund and its shareholders receive and the other factors considered.
Costs of the Services and Profitability . The Board considered the revenues earned and the expenses incurred by Fidelity in conducting the business of developing, marketing, distributing, managing, administering and servicing the fund and servicing the fund's shareholders. The Board also considered the level of Fidelity's profits in respect of all the Fidelity funds.
On an annual basis, Fidelity presents to the Board information about the profitability of its relationships with the fund. Fidelity calculates profitability information for each fund, as well as aggregate profitability information for groups of Fidelity funds and all Fidelity funds, using a series of detailed revenue and cost allocation methodologies which originate with the books and records of Fidelity on which Fidelity's audited financial statements are based. The Audit Committee of the Board reviews any significant changes from the prior year's methodologies and the full Board approves such changes.
A public accounting firm has been engaged annually by the Board as part of the Board's assessment of Fidelity's profitability analysis. The engagement includes the review and assessment of the methodologies used by Fidelity in determining the revenues and expenses attributable to Fidelity's mutual fund business, and completion of agreed-upon procedures in respect of the mathematical accuracy of certain fund profitability information and its conformity to established allocation methodologies. After considering the reports issued under the engagement and information provided by Fidelity, the Board concluded that while other allocation methods may also be reasonable, Fidelity's profitability methodologies are reasonable in all material respects.
The Board also reviewed Fidelity's and Geode's non-fund businesses and potential indirect benefits such businesses may have received as a result of their association with Fidelity's mutual fund business (i.e., fall-out benefits) as well as cases where Fidelity's and Geode's affiliates may benefit from the funds' business. The Board considered areas where potential indirect benefits to the Fidelity funds from their relationships with Fidelity may exist. The Board's consideration of these matters was informed by the findings of a joint ad hoc committee created by it and the boards of other Fidelity funds to evaluate potential fall-out benefits.
The Board considered the costs of the services provided by and the profits realized by Fidelity in connection with the operation of the fund and was satisfied that the profitability was not excessive.
��
The Board also considered information regarding the profitability of Geode's relationship with the fund.
Economies of Scale . The Board considered whether there have been economies of scale in respect of the management of the Fidelity funds, whether the Fidelity funds (including the fund) have appropriately benefited from any such economies of scale, and whether there is potential for realization of any further economies of scale. The Board considered the extent to which the fund will benefit from economies of scale as assets grow through increased services to the fund, through waivers or reimbursements, or through fee or expense ratio reductions. The Board also noted that a committee (the Economies of Scale Committee) created by it and the boards of other Fidelity funds periodically analyzes whether Fidelity attains economies of scale in respect of the management and servicing of the Fidelity funds, whether the Fidelity funds have appropriately benefited from such economies of scale, and whether there is potential for realization of any further economies of scale.
The Board concluded, taking into account the analysis of the Economies of Scale Committee, that economies of scale, if any, are being appropriately shared between fund shareholders and Fidelity.
Additional Information Requested by the Board . In order to develop fully the factual basis for consideration of the Fidelity funds' advisory contracts, the Board requested and received additional information on certain topics, including: (i) Fidelity's fund profitability methodology, profitability trends for certain funds, the allocation of various costs to different funds, and the impact of certain factors on fund profitability results; (ii) portfolio manager changes that have occurred during the past year and the amount of the investment that each portfolio manager has made in the Fidelity fund(s) that he or she manages; (iii) the extent to which current market conditions have affected retention and recruitment of personnel; (iv) the arrangements with and compensation paid to certain fund sub-advisers on behalf of the Fidelity funds and the treatment of such compensation within Fidelity's fund profitability methodology; (v) the terms of the funds' various management fee structures, including the basic group fee and the terms of Fidelity's voluntary expense limitation arrangements; (vi) Fidelity's transfer agent, pricing and bookkeeping fees, expense and service structures for different funds and classes relative to competitive trends; (vii) the impact on fund profitability of recent industry trends, such as the growth in passively managed funds and the changes in flows for different types of funds; (viii) the types of management fee and total expense comparisons provided, and the challenges and limitations associated with such information; and (ix) explanations regarding the relative total expense ratios and management fees of certain funds and classes, total expense and management fee competitive trends, and methodologies for total expense and management fee competitive comparisons. In addition, the Board considered its discussions with Fidelity regarding Fidelity's efforts to maintain the continuous investment and shareholder services necessary for the funds during the current pandemic and economic circumstances.
Based on its evaluation of all of the conclusions noted above, and after considering all factors it believed relevant, the Board concluded that the advisory and sub-advisory fee arrangements are fair and reasonable and that the fund's Advisory Contracts should be renewed.
1.9900587.102
IMI-ANN-1222
Fidelity Flex® Funds
Fidelity Flex® International Index Fund
Annual Report
October 31, 2022
Contents
To view a fund's proxy voting guidelines and proxy voting record for the 12-month period ended June 30, visit http://www.fidelity.com/proxyvotingresults or visit the Securities and Exchange Commission's (SEC) web site at http://www.sec.gov.
You may also call 1-800-544-3455 (for managed account clients) or 1-800-835-5092 (for retirement plan participants) to request a free copy of the proxy voting guidelines.
The funds or securities referred to herein are not sponsored, endorsed, or promoted by MSCI, and MSCI bears no liability with respect to any such funds or securities or any index on which such funds or securities are based. The prospectus contains a more detailed description of the limited relationship MSCI has with Fidelity and any related funds.
Standard & Poor's, S&P and S&P 500 are registered service marks of The McGraw-Hill Companies, Inc. and have been licensed for use by Fidelity Distributors Corporation.
Other third-party marks appearing herein are the property of their respective owners.
All other marks appearing herein are registered or unregistered trademarks or service marks of FMR LLC or an affiliated company. © 2022 FMR LLC. All rights reserved.
This report and the financial statements contained herein are submitted for the general information of the shareholders of the Fund. This report is not authorized for distribution to prospective investors in the Fund unless preceded or accompanied by an effective prospectus.
A fund files its complete schedule of portfolio holdings with the SEC for the first and third quarters of each fiscal year on Form N-PORT. Forms N-PORT are available on the SEC's web site at http://www.sec.gov. A fund's Forms N-PORT may be reviewed and copied at the SEC's Public Reference Room in Washington, DC. Information regarding the operation of the SEC's Public Reference Room may be obtained by calling 1-800-SEC-0330.
For a complete list of a fund's portfolio holdings, view the most recent holdings listing, semiannual report, or annual report on Fidelity's web site at http://www.fidelity.com, http://www.institutional.fidelity.com, or http://www.401k.com, as applicable.
NOT FDIC INSURED •MAY LOSE VALUE •NO BANK GUARANTEE
Neither the Fund nor Fidelity Distributors Corporation is a bank.
Average annual total return reflects the change in the value of an investment, assuming reinvestment of distributions from dividend income and capital gains (the profits earned upon the sale of securities that have grown in value, if any) and assuming a constant rate of performance each year. The hypothetical investment and the average annual total returns do not reflect the deduction of taxes that a shareholder would pay on fund distributions or the redemption of fund shares. During periods of reimbursement by Fidelity, a fund's total return will be greater than it would be had the reimbursement not occurred. How a fund did yesterday is no guarantee of how it will do tomorrow.
| Average Annual Total Returns |
| | | | |
Periods ended October 31, 2022 | Past 1 year | Past 5 years | Life of Fund A |
| Fidelity Flex® International Index Fund | -24.60% | -0.58% | 2.43% |
A From March 09, 2017
| $10,000 Over Life of Fund |
| |
Let's say hypothetically that $10,000 was invested in Fidelity Flex® International Index Fund, on March 09, 2017, when the fund started. The chart shows how the value of your investment would have changed, and also shows how the MSCI ACWI (All Country World Index) ex USA Index performed over the same period. |
|
|
Market Recap:
International equities returned -24.61% for the 12 months ending October 31, 2022, according to the MSCI ACWI (All Country World Index) ex USA Index. After gaining 7.98% in 2021, non-U.S. stocks retreated in the new year, as a multitude of risk factors challenged the global economy and financial markets. Persistently high inflation in some markets, exacerbated by energy price shocks from the Russia-Ukraine conflict, spurred the U.S. Federal Reserve and other central banks to aggressively tighten monetary policy, and market interest rates eclipsed their highest level in roughly a decade, stoking recession fears and sending stocks into bear market territory. Other factors influencing equities abroad included surging global commodity prices, rising sovereign bond yields in some markets, ongoing global supply-chain disruption, a broadly strong U.S. dollar and the potential for variants of the coronavirus to upend global economic growth. Against this backdrop, the index returned -24.20% year to date through October. For the full 12 months, emerging markets (-31%) and Europe ex U.K. (-25%) notably lagged. Conversely, Canada (-13%) and the U.K. (-12%) held up best. Among the 11 sectors, information technology and consumer discretionary (-37% each) fared worst. Communication services (-34%) also trailed the broader market. In contrast, energy gained 2% amid high prices for oil and natural gas. The defensive-oriented utilities (-16%) sector also outperformed, as did financials and consumer staples (-18% each).
Comments from the Geode Capital Management, LLC, passive equity index team:
For the fiscal year, the fund returned -24.60%, roughly in line with the -24.61% result of the benchmark, the MSCI All Country World ex US Index. (The fund's relative performance can be affected by Fidelity's methodologies for valuing certain foreign stocks and for incorporating foreign exchange rates, which differ from those used by the index, as well as by local tax laws or regulations, which vary by country.) By region, emerging markets returned -30% and detracted most, followed by Europe ex U.K. (-26%). By sector, stocks in information technology returned approximately -37% and detracted most, followed by consumer discretionary, which returned roughly -37%. Financials returned about -18% and industrials returned roughly -25%, with the capital goods industry (-26%) hurting most. Communication services returned -34%, hampered by the media & entertainment industry (-51%). Health care returned roughly -20%, held back by the pharmaceuticals, biotechnology & life sciences industry (-15%). Consumer staples (-18%) detracted, hampered by the food, beverage & tobacco industry (-16%). The materials sector (-19%) also detracted. Real estate (-33%) and utilities (-16%) also hurt. In contrast, energy gained 5% and contributed. Turning to individual stocks, the biggest individual detractor was Taiwan Semiconductor (-42%), from the semiconductors & semiconductor equipment category, followed by Tencent Holdings (-56%), which is in the media & entertainment industry. Within retailing, Alibaba Group Holding returned roughly -63% and hurt. Other noteworthy detractors were ASML Holding (-41%), a stock in the semiconductors & semiconductor equipment segment, and Shopify (-77%), from the software & services group. Conversely, the biggest individual contributor was Shell (+24%), from the energy sector. In energy, Petroleo Brasileiro-Petrobras (+101%), Canadian National Resources (+49%), BP (+20%), and TotalEnergies (+14%) all boosted the fund.
The views expressed above reflect those of the portfolio manager(s) only through the end of the period as stated on the cover of this report and do not necessarily represent the views of Fidelity or any other person in the Fidelity organization. Any such views are subject to change at any time based upon market or other conditions and Fidelity disclaims any responsibility to update such views. These views may not be relied on as investment advice and, because investment decisions for a Fidelity fund are based on numerous factors, may not be relied on as an indication of trading intent on behalf of any Fidelity fund.
Top Holdings (% of Fund's net assets) |
| |
| Nestle SA (Reg. S) (Switzerland, Food Products) | 1.4 | |
| Taiwan Semiconductor Manufacturing Co. Ltd. (Taiwan, Semiconductors & Semiconductor Equipment) | 1.4 | |
| Roche Holding AG (participation certificate) (Switzerland, Pharmaceuticals) | 1.1 | |
| Shell PLC (London) (United Kingdom, Oil, Gas & Consumable Fuels) | 1.0 | |
| Samsung Electronics Co. Ltd. (Korea (South), Technology Hardware, Storage & Peripherals) | 1.0 | |
| ASML Holding NV (Netherlands) (Netherlands, Semiconductors & Semiconductor Equipment) | 0.9 | |
| AstraZeneca PLC (United Kingdom) (United Kingdom, Pharmaceuticals) | 0.9 | |
| Novo Nordisk A/S Series B (Denmark, Pharmaceuticals) | 0.9 | |
| Novartis AG (Switzerland, Pharmaceuticals) | 0.8 | |
| LVMH Moet Hennessy Louis Vuitton SE (France, Textiles, Apparel & Luxury Goods) | 0.8 | |
| | 10.2 | |
| |
| Market Sectors (% of Fund's net assets) |
| |
| Financials | 22.4 | |
| Industrials | 10.6 | |
| Information Technology | 10.3 | |
| Health Care | 9.9 | |
| Consumer Discretionary | 9.3 | |
| Consumer Staples | 8.9 | |
| Materials | 7.6 | |
| Energy | 6.7 | |
| Communication Services | 5.2 | |
| Utilities | 2.9 | |
| Real Estate | 1.6 | |
| |
Asset Allocation (% of Fund's net assets) |
|
Foreign investments - 95.6% |
|
Geographic Diversification (% of Fund's net assets) |
|
* Includes Short-Term investments and Net Other Assets (Liabilities). Percentages are based on country or territory of incorporation and are adjusted for the effect of futures contracts, if applicable. |
| |
Showing Percentage of Net Assets
| Common Stocks - 94.4% |
| | | Shares | Value ($) |
| Australia - 4.8% | | | |
| Ampol Ltd. | | 13,902 | 242,140 |
| APA Group unit | | 68,915 | 463,296 |
| Aristocrat Leisure Ltd. | | 36,098 | 855,949 |
| ASX Ltd. | | 11,756 | 509,085 |
| Aurizon Holdings Ltd. | | 113,298 | 262,345 |
| Australia & New Zealand Banking Group Ltd. | | 179,580 | 2,942,192 |
| BHP Group Ltd. | | 305,436 | 7,299,103 |
| BlueScope Steel Ltd. | | 27,713 | 278,840 |
| Brambles Ltd. | | 86,916 | 649,359 |
| Cochlear Ltd. | | 3,995 | 510,339 |
| Coles Group Ltd. | | 80,907 | 845,113 |
| Commonwealth Bank of Australia | | 102,802 | 6,883,474 |
| Computershare Ltd. | | 32,430 | 524,197 |
| CSL Ltd. | | 29,111 | 5,222,776 |
| Dexus unit | | 66,256 | 328,874 |
| Dominos Pizza Enterprises Ltd. | | 3,438 | 140,194 |
| Endeavour Group Ltd. | | 80,625 | 368,738 |
| Evolution Mining Ltd. | | 116,815 | 155,419 |
| Fortescue Metals Group Ltd. | | 102,399 | 964,702 |
| Goodman Group unit | | 102,657 | 1,116,297 |
| IDP Education Ltd. | | 12,297 | 232,748 |
| Insurance Australia Group Ltd. | | 147,707 | 462,956 |
| Lendlease Group unit | | 40,453 | 224,860 |
| Macquarie Group Ltd. | | 21,998 | 2,385,038 |
| Magellan Financial Group Ltd. warrants 4/16/27 (a) | | 50 | 10 |
| Medibank Private Ltd. | | 165,696 | 297,825 |
| Mineral Resources Ltd. | | 10,377 | 485,411 |
| Mirvac Group unit | | 253,737 | 335,967 |
| National Australia Bank Ltd. | | 193,340 | 4,016,068 |
| Newcrest Mining Ltd. | | 54,497 | 603,570 |
| Northern Star Resources Ltd. | | 71,333 | 398,790 |
| Orica Ltd. | | 26,302 | 233,518 |
| Origin Energy Ltd. | | 102,899 | 366,614 |
| Qantas Airways Ltd. (a) | | 57,463 | 214,656 |
| QBE Insurance Group Ltd. | | 90,009 | 704,709 |
| Ramsay Health Care Ltd. | | 10,887 | 407,874 |
| REA Group Ltd. | | 3,108 | 241,725 |
| Reece Ltd. | | 12,760 | 126,755 |
| Rio Tinto Ltd. | | 22,435 | 1,265,718 |
| Santos Ltd. | | 191,774 | 936,175 |
| Scentre Group unit | | 324,033 | 601,076 |
| SEEK Ltd. | | 20,392 | 281,614 |
| Sonic Healthcare Ltd. | | 27,755 | 581,782 |
| South32 Ltd. | | 282,663 | 648,505 |
| Stockland Corp. Ltd. unit | | 152,545 | 351,271 |
| Suncorp Group Ltd. | | 77,360 | 564,605 |
| Telstra Group Ltd. | | 246,685 | 618,545 |
| The GPT Group unit | | 110,732 | 305,276 |
| The Lottery Corp. Ltd. (a) | | 136,154 | 373,620 |
| Transurban Group unit | | 185,909 | 1,576,835 |
| Treasury Wine Estates Ltd. | | 44,628 | 369,675 |
| Vicinity Centres unit | | 243,084 | 302,425 |
| Washington H. Soul Pattinson & Co. Ltd. | | 13,403 | 239,536 |
| Wesfarmers Ltd. | | 68,530 | 1,988,675 |
| Westpac Banking Corp. | | 210,869 | 3,252,014 |
| WiseTech Global Ltd. | | 8,601 | 319,975 |
| Woodside Energy Group Ltd. | | 114,830 | 2,642,767 |
| Woolworths Group Ltd. | | 73,341 | 1,549,053 |
TOTAL AUSTRALIA | | | 61,070,668 |
| Austria - 0.1% | | | |
| Erste Group Bank AG | | 21,017 | 517,963 |
| OMV AG | | 8,646 | 398,511 |
| Verbund AG | | 4,133 | 323,692 |
| Voestalpine AG | | 7,398 | 160,697 |
TOTAL AUSTRIA | | | 1,400,863 |
| Bailiwick of Jersey - 0.6% | | | |
| Experian PLC | | 55,707 | 1,776,233 |
| Ferguson PLC | | 12,955 | 1,412,881 |
| Glencore PLC | | 594,951 | 3,410,898 |
| WPP PLC | | 67,353 | 592,717 |
TOTAL BAILIWICK OF JERSEY | | | 7,192,729 |
| Belgium - 0.5% | | | |
| Ageas | | 9,512 | 329,290 |
| Anheuser-Busch InBev SA NV | | 52,428 | 2,622,470 |
| D'ieteren Group | | 1,526 | 253,808 |
| ELIA GROUP SA/NV | | 1,939 | 245,084 |
| Groupe Bruxelles Lambert SA | | 6,300 | 464,458 |
| KBC Group NV | | 15,193 | 761,409 |
| Proximus | | 8,731 | 91,547 |
| Sofina SA | | 972 | 189,714 |
| Solvay SA Class A | | 4,599 | 414,682 |
| UCB SA | | 7,528 | 567,786 |
| Umicore SA | | 12,838 | 423,216 |
| Warehouses de Pauw | | 9,755 | 250,457 |
TOTAL BELGIUM | | | 6,613,921 |
| Bermuda - 0.2% | | | |
| Alibaba Health Information Technology Ltd. (a) | | 298,000 | 126,039 |
| Alibaba Pictures Group Ltd. (a) | | 650,000 | 24,014 |
| Beijing Enterprises Water Group Ltd. | | 220,000 | 46,244 |
| China Gas Holdings Ltd. | | 184,000 | 163,146 |
| China Resource Gas Group Ltd. | | 55,100 | 141,090 |
| China Ruyi Holdings Ltd. (a) | | 288,000 | 45,128 |
| CK Infrastructure Holdings Ltd. | | 37,000 | 175,817 |
| Cosco Shipping Ports Ltd. | | 115,757 | 57,070 |
| Credicorp Ltd. (United States) | | 4,349 | 636,520 |
| Hongkong Land Holdings Ltd. | | 69,709 | 268,380 |
| Hopson Development Holdings Ltd. | | 41,800 | 33,548 |
| Jardine Matheson Holdings Ltd. | | 9,735 | 448,005 |
| Kunlun Energy Co. Ltd. | | 224,000 | 133,835 |
| Nine Dragons Paper (Holdings) Ltd. | | 102,000 | 60,423 |
| Orient Overseas International Ltd. | | 7,500 | 109,591 |
| Shenzhen International Holdings Ltd. | | 69,479 | 46,734 |
TOTAL BERMUDA | | | 2,515,584 |
| Brazil - 1.3% | | | |
| Ambev SA | | 290,000 | 898,267 |
| Americanas SA | | 38,076 | 114,549 |
| Atacadao SA | | 29,700 | 111,889 |
| B3 SA - Brasil Bolsa Balcao | | 373,000 | 1,086,036 |
| Banco Bradesco SA | | 107,168 | 345,228 |
| Banco BTG Pactual SA unit | | 70,500 | 394,980 |
| Banco do Brasil SA | | 50,300 | 360,489 |
| Banco Santander SA (Brasil) unit | | 22,100 | 127,410 |
| BB Seguridade Participacoes SA | | 43,400 | 249,452 |
| BRF SA (a) | | 35,604 | 86,572 |
| CCR SA | | 72,100 | 180,896 |
| Centrais Eletricas Brasileiras SA (Electrobras) | | 61,200 | 590,259 |
| Companhia de Saneamento Basico do Estado de Sao Paulo (SABESP) | | 21,300 | 247,823 |
| Companhia Siderurgica Nacional SA (CSN) | | 37,300 | 88,674 |
| Cosan SA | | 70,608 | 230,462 |
| CPFL Energia SA | | 14,000 | 95,998 |
| Energisa SA unit | | 11,000 | 103,260 |
| ENGIE Brasil Energia SA | | 13,250 | 103,168 |
| Equatorial Energia SA | | 60,300 | 350,558 |
| Hapvida Participacoes e Investimentos SA (b) | | 283,673 | 428,351 |
| Hypera SA | | 25,400 | 249,845 |
| JBS SA | | 45,500 | 219,859 |
| Klabin SA unit | | 47,600 | 199,228 |
| Localiza Rent a Car SA | | 44,763 | 611,283 |
| Localiza Rent a Car SA | | 137 | 1,871 |
| Lojas Renner SA | | 58,173 | 347,991 |
| Magazine Luiza SA | | 180,332 | 156,052 |
| Natura & Co. Holding SA (a) | | 52,793 | 152,794 |
| Petro Rio SA (a) | | 45,000 | 308,305 |
| Petroleo Brasileiro SA - Petrobras (ON) | | 230,044 | 1,481,224 |
| Raia Drogasil SA | | 67,300 | 342,786 |
| Rede D'Oregon Sao Luiz SA (b) | | 24,000 | 149,469 |
| Rumo SA | | 75,900 | 325,317 |
| Suzano Papel e Celulose SA | | 43,722 | 450,297 |
| Telefonica Brasil SA | | 29,200 | 233,521 |
| TIM SA | | 49,100 | 125,471 |
| Totvs SA | | 32,900 | 211,202 |
| Ultrapar Participacoes SA | | 41,600 | 107,997 |
| Vale SA | | 241,926 | 3,144,031 |
| Vibra Energia SA | | 69,078 | 244,056 |
| Weg SA | | 102,860 | 802,091 |
TOTAL BRAZIL | | | 16,059,011 |
| British Virgin Islands - 0.0% | | | |
| VK Co. Ltd. unit (a)(c) | | 6,898 | 3,073 |
| Canada - 8.1% | | | |
| Agnico Eagle Mines Ltd. (Canada) | | 27,712 | 1,219,055 |
| Air Canada (a) | | 10,796 | 155,400 |
| Algonquin Power & Utilities Corp. | | 39,315 | 435,182 |
| Alimentation Couche-Tard, Inc. Class A (multi-vtg.) | | 50,114 | 2,243,883 |
| AltaGas Ltd. | | 16,909 | 304,954 |
| ARC Resources Ltd. | | 41,826 | 588,852 |
| Bank of Montreal | | 40,513 | 3,731,770 |
| Bank of Nova Scotia | | 72,218 | 3,490,700 |
| Barrick Gold Corp. (Canada) | | 107,997 | 1,624,295 |
| Bausch Health Cos., Inc. (Canada) (a) | | 15,207 | 98,898 |
| BCE, Inc. | | 4,675 | 210,870 |
| BlackBerry Ltd. (a)(d) | | 32,520 | 151,100 |
| Brookfield Asset Management, Inc. (Canada) Class A | | 85,129 | 3,371,167 |
| Brookfield Renewable Corp. | | 7,755 | 240,958 |
| BRP, Inc. | | 2,237 | 149,571 |
| CAE, Inc. (a) | | 18,534 | 353,715 |
| Cameco Corp. | | 26,203 | 621,440 |
| Canadian Apartment Properties (REIT) unit | | 5,339 | 165,341 |
| Canadian Imperial Bank of Commerce | | 54,540 | 2,476,889 |
| Canadian National Railway Co. | | 35,399 | 4,193,782 |
| Canadian Natural Resources Ltd. | | 70,033 | 4,200,386 |
| Canadian Pacific Railway Ltd. | | 56,082 | 4,180,782 |
| Canadian Tire Ltd. Class A (non-vtg.) | | 3,288 | 368,514 |
| Canadian Utilities Ltd. Class A (non-vtg.) | | 7,476 | 198,925 |
| CCL Industries, Inc. Class B | | 9,263 | 435,154 |
| Cenovus Energy, Inc. (Canada) | | 84,276 | 1,703,645 |
| CGI, Inc. Class A (sub. vtg.) (a) | | 13,169 | 1,060,789 |
| Constellation Software, Inc. | | 1,217 | 1,759,721 |
| Dollarama, Inc. | | 16,756 | 995,631 |
| Emera, Inc. | | 16,256 | 602,463 |
| Empire Co. Ltd. Class A (non-vtg.) | | 9,680 | 248,688 |
| Enbridge, Inc. | | 122,439 | 4,770,479 |
| Fairfax Financial Holdings Ltd. (sub. vtg.) | | 1,400 | 687,581 |
| First Quantum Minerals Ltd. | | 35,776 | 631,040 |
| FirstService Corp. | | 2,422 | 302,779 |
| Fortis, Inc. | | 28,995 | 1,131,196 |
| Franco-Nevada Corp. | | 11,591 | 1,432,167 |
| George Weston Ltd. | | 4,476 | 492,661 |
| GFL Environmental, Inc. | | 10,625 | 286,770 |
| Gildan Activewear, Inc. | | 11,720 | 369,834 |
| Great-West Lifeco, Inc. | | 16,695 | 386,509 |
| Hydro One Ltd. (b) | | 20,017 | 501,913 |
| iA Financial Corp, Inc. | | 6,295 | 350,341 |
| IGM Financial, Inc. | | 4,766 | 127,585 |
| Imperial Oil Ltd. | | 14,475 | 787,420 |
| Intact Financial Corp. | | 10,611 | 1,612,349 |
| Ivanhoe Mines Ltd. (a) | | 37,580 | 260,675 |
| Keyera Corp. | | 13,666 | 292,911 |
| Kinross Gold Corp. | | 76,627 | 277,856 |
| Lightspeed Commerce, Inc. (Canada) (a) | | 7,862 | 150,678 |
| Loblaw Companies Ltd. | | 10,098 | 827,349 |
| Lundin Mining Corp. | | 39,315 | 206,048 |
| Magna International, Inc. Class A (sub. vtg.) | | 16,753 | 933,598 |
| Manulife Financial Corp. | | 116,402 | 1,929,282 |
| Metro, Inc. | | 14,388 | 753,750 |
| National Bank of Canada | | 20,464 | 1,393,358 |
| Northland Power, Inc. | | 14,222 | 413,814 |
| Nutrien Ltd. | | 33,313 | 2,814,739 |
| Nuvei Corp. (a)(b) | | 3,678 | 110,690 |
| Onex Corp. (sub. vtg.) | | 4,313 | 217,083 |
| Open Text Corp. | | 16,684 | 483,246 |
| Pan American Silver Corp. | | 12,417 | 198,424 |
| Parkland Corp. | | 8,865 | 179,207 |
| Pembina Pipeline Corp. | | 32,873 | 1,085,351 |
| Power Corp. of Canada (sub. vtg.) | | 34,001 | 844,316 |
| Quebecor, Inc. Class B (sub. vtg.) | | 9,439 | 177,923 |
| Restaurant Brands International, Inc. | | 14,250 | 846,726 |
| Restaurant Brands International, Inc. | | 3,193 | 189,600 |
| RioCan (REIT) | | 8,892 | 126,688 |
| Ritchie Bros. Auctioneers, Inc. | | 6,768 | 442,142 |
| Rogers Communications, Inc. Class B (non-vtg.) | | 21,207 | 882,775 |
| Royal Bank of Canada (d) | | 85,416 | 7,903,026 |
| Saputo, Inc. | | 15,394 | 374,694 |
| Shaw Communications, Inc. Class B | | 28,713 | 737,452 |
| Shopify, Inc. Class A (a) | | 69,133 | 2,370,318 |
| Sun Life Financial, Inc. | | 35,662 | 1,514,591 |
| Suncor Energy, Inc. | | 87,170 | 2,998,338 |
| TC Energy Corp. | | 59,453 | 2,611,420 |
| Teck Resources Ltd. Class B (sub. vtg.) | | 28,598 | 870,525 |
| TELUS Corp. | | 28,443 | 593,976 |
| TFI International, Inc. (Canada) | | 5,050 | 459,684 |
| The Toronto-Dominion Bank | | 109,628 | 7,016,160 |
| Thomson Reuters Corp. | | 10,218 | 1,086,715 |
| TMX Group Ltd. | | 3,421 | 328,904 |
| Toromont Industries Ltd. | | 5,157 | 396,328 |
| Tourmaline Oil Corp. | | 19,385 | 1,092,225 |
| West Fraser Timber Co. Ltd. | | 3,574 | 268,348 |
| Wheaton Precious Metals Corp. | | 27,586 | 902,491 |
| WSP Global, Inc. | | 7,420 | 911,957 |
TOTAL CANADA | | | 103,928,525 |
| Cayman Islands - 4.0% | | | |
| 3SBio, Inc. (b) | | 92,500 | 65,283 |
| AAC Technology Holdings, Inc. (a) | | 42,000 | 76,935 |
| Airtac International Group | | 8,278 | 189,921 |
| Alibaba Group Holding Ltd. (a) | | 917,144 | 7,130,709 |
| Anta Sports Products Ltd. | | 73,400 | 645,201 |
| Autohome, Inc. ADR Class A | | 4,499 | 117,514 |
| Baidu, Inc. Class A (a) | | 134,042 | 1,285,061 |
| BeiGene Ltd. ADR (a)(d) | | 2,929 | 494,679 |
| Bilibili, Inc. Class Z (a) | | 10,766 | 95,940 |
| Bosideng International Holdings Ltd. | | 190,000 | 82,055 |
| Budweiser Brewing Co. APAC Ltd. (b) | | 100,700 | 211,928 |
| Chailease Holding Co. Ltd. | | 82,054 | 379,055 |
| China Aoyuan Group Ltd. (a)(c) | | 2,000 | 301 |
| China Conch Venture Holdings Ltd. | | 103,000 | 151,948 |
| China Feihe Ltd. (b) | | 207,000 | 119,195 |
| China Hongqiao Group Ltd. | | 130,000 | 92,246 |
| China Liansu Group Holdings Ltd. | | 66,000 | 53,559 |
| China Literature Ltd. (a)(b) | | 23,400 | 63,049 |
| China Medical System Holdings Ltd. | | 81,000 | 88,433 |
| China Meidong Auto Holding Ltd. | | 32,000 | 42,071 |
| China Mengniu Dairy Co. Ltd. | | 189,000 | 605,549 |
| China Overseas Property Holdings Ltd. | | 75,000 | 47,200 |
| China Resources Cement Holdings Ltd. | | 144,000 | 52,099 |
| China Resources Land Ltd. | | 198,000 | 620,512 |
| China Resources Microelectronics Ltd. (A Shares) | | 4,411 | 30,599 |
| China Resources Mixc Lifestyle Services Ltd. (b) | | 42,600 | 124,821 |
| China State Construction International Holdings Ltd. | | 128,000 | 115,124 |
| ChinaSoft International Ltd. | | 162,000 | 107,317 |
| Chow Tai Fook Jewellery Group Ltd. | | 119,000 | 203,749 |
| CIFI Ever Sunshine Services Group Ltd. | | 2,000 | 441 |
| CIFI Holdings Group Co. Ltd. (c) | | 226,361 | 14,995 |
| CK Asset Holdings Ltd. | | 119,245 | 659,295 |
| CK Hutchison Holdings Ltd. | | 160,500 | 798,942 |
| Country Garden Holdings Co. Ltd. | | 481,784 | 61,990 |
| Country Garden Services Holdings Co. Ltd. | | 118,000 | 103,123 |
| Dali Foods Group Co. Ltd. (b) | | 121,000 | 49,789 |
| Daqo New Energy Corp. ADR (a) | | 3,478 | 152,997 |
| Dongyue Group Co. Ltd. | | 81,000 | 70,375 |
| ENN Energy Holdings Ltd. | | 47,000 | 467,327 |
| ESR Group Ltd. (b) | | 117,800 | 201,094 |
| Futu Holdings Ltd. ADR (a) | | 3,811 | 129,040 |
| GDS Holdings Ltd. Class A (a) | | 50,300 | 56,142 |
| Geely Automobile Holdings Ltd. | | 358,000 | 384,924 |
| Genscript Biotech Corp. (a) | | 72,000 | 181,980 |
| Grab Holdings Ltd. (a) | | 75,568 | 196,477 |
| Greentown China Holdings Ltd. | | 48,500 | 46,154 |
| Greentown Service Group Co. Ltd. | | 92,000 | 37,739 |
| H World Group Ltd. ADR | | 12,099 | 327,641 |
| Haidilao International Holding Ltd. (a)(b) | | 64,000 | 95,067 |
| Haitian International Holdings Ltd. | | 35,000 | 70,092 |
| Hansoh Pharmaceutical Group Co. Ltd. (b) | | 68,000 | 104,993 |
| Hengan International Group Co. Ltd. | | 37,500 | 145,468 |
| HUTCHMED China Ltd. sponsored ADR (a)(d) | | 4,873 | 43,077 |
| Hygeia Healthcare Holdings Co. (a)(b) | | 19,000 | 82,297 |
| Innovent Biologics, Inc. (a)(b) | | 60,000 | 212,494 |
| Inter & Co., Inc. unit | | 564 | 1,697 |
| iQIYI, Inc. ADR (a)(d) | | 19,202 | 38,788 |
| JD Health International, Inc. (a)(b) | | 68,900 | 377,870 |
| JD.com, Inc. Class A | | 130,473 | 2,375,981 |
| Jinxin Fertility Group Ltd. (b) | | 93,500 | 46,097 |
| Jiumaojiu International Holdings Ltd. (b) | | 42,000 | 65,919 |
| JOYY, Inc. ADR | | 2,749 | 69,357 |
| Kaisa Group Holdings Ltd. (a)(c) | | 4,285 | 459 |
| Kanzhun Ltd. ADR (a) | | 10,616 | 116,033 |
| KE Holdings, Inc. ADR (a) | | 40,614 | 413,451 |
| Kingboard Chemical Holdings Ltd. | | 37,500 | 92,488 |
| Kingboard Laminates Holdings Ltd. | | 54,500 | 43,533 |
| Kingdee International Software Group Co. Ltd. (a) | | 159,000 | 260,083 |
| Kingsoft Corp. Ltd. | | 54,600 | 165,198 |
| Kuaishou Technology Class B (a)(b) | | 104,700 | 430,823 |
| Li Ning Co. Ltd. | | 143,500 | 742,211 |
| Longfor Properties Co. Ltd. (b) | | 107,000 | 136,312 |
| Lufax Holding Ltd. ADR | | 40,107 | 63,770 |
| Meituan Class B (a)(b) | | 266,300 | 4,263,608 |
| Microport Scientific Corp. (a) | | 38,000 | 80,263 |
| Ming Yuan Cloud Group Holdings Ltd. | | 37,000 | 17,016 |
| Minth Group Ltd. | | 50,000 | 98,731 |
| NetEase, Inc. | | 125,790 | 1,395,672 |
| New Oriental Education & Technology Group, Inc. (a) | | 88,590 | 207,447 |
| NIO, Inc. sponsored ADR (a) | | 83,206 | 804,602 |
| Parade Technologies Ltd. | | 5,000 | 94,407 |
| Pinduoduo, Inc. ADR (a) | | 30,602 | 1,677,908 |
| Ping An Healthcare and Technology Co. Ltd. (a)(b) | | 30,600 | 56,447 |
| Pop Mart International Group Ltd. (b) | | 33,600 | 43,489 |
| RLX Technology, Inc. ADR (a)(d) | | 28,531 | 35,664 |
| Sands China Ltd. (a) | | 148,800 | 259,701 |
| Sany Heavy Equipment International Holdings Co. Ltd. | | 61,000 | 50,046 |
| Sea Ltd. ADR (a) | | 21,931 | 1,089,532 |
| Seazen Group Ltd. (a) | | 110,000 | 17,657 |
| Shenzhou International Group Holdings Ltd. | | 51,400 | 356,870 |
| Silergy Corp. | | 20,000 | 231,909 |
| Sino Biopharmaceutical Ltd. | | 613,250 | 297,654 |
| SITC International Holdings Co. Ltd. | | 79,000 | 129,425 |
| Smoore International Holdings Ltd. (b) | | 106,000 | 112,757 |
| Sunny Optical Technology Group Co. Ltd. | | 43,900 | 380,577 |
| TAL Education Group ADR (a) | | 26,385 | 124,273 |
| Tencent Holdings Ltd. | | 377,600 | 9,922,117 |
| Tencent Music Entertainment Group ADR (a) | | 44,116 | 159,259 |
| Tingyi (Cayman Islands) Holding Corp. | | 116,000 | 181,471 |
| Tongcheng Travel Holdings Ltd. (a) | | 70,400 | 109,775 |
| Topsports International Holdings Ltd. (b) | | 107,000 | 53,979 |
| Trip.com Group Ltd. ADR (a) | | 32,701 | 740,024 |
| Uni-President China Holdings Ltd. | | 80,000 | 59,111 |
| Vinda International Holdings Ltd. | | 26,000 | 48,756 |
| Vipshop Holdings Ltd. ADR (a) | | 25,551 | 178,090 |
| Want Want China Holdings Ltd. | | 280,000 | 184,059 |
| Weibo Corp. sponsored ADR (a) | | 4,266 | 48,291 |
| WH Group Ltd. (b) | | 526,266 | 266,162 |
| Wharf Real Estate Investment Co. Ltd. | | 103,000 | 406,114 |
| Wuxi Biologics (Cayman), Inc. (a)(b) | | 217,500 | 978,672 |
| Xiaomi Corp. Class B (a)(b) | | 938,200 | 1,052,982 |
| Xinyi Glass Holdings Ltd. | | 113,000 | 145,395 |
| Xinyi Solar Holdings Ltd. | | 302,968 | 300,666 |
| XPeng, Inc. ADR (a) | | 26,201 | 173,451 |
| XTEP International Holdings Ltd. | | 79,500 | 72,920 |
| Yadea Group Holdings Ltd. (b) | | 70,000 | 106,833 |
| Yihai International Holding Ltd. | | 27,000 | 44,440 |
| Zai Lab Ltd. ADR (a) | | 5,348 | 119,153 |
| Zhen Ding Technology Holding Ltd. | | 38,000 | 124,884 |
| Zhongsheng Group Holdings Ltd. Class H | | 34,500 | 130,974 |
| ZTO Express, Inc. sponsored ADR | | 25,148 | 424,750 |
TOTAL CAYMAN ISLANDS | | | 51,284,059 |
| Chile - 0.1% | | | |
| Banco de Chile | | 2,668,155 | 244,022 |
| Banco de Credito e Inversiones | | 3,726 | 103,823 |
| Banco Santander Chile | | 3,866,067 | 138,498 |
| Cencosud SA | | 81,478 | 109,674 |
| Compania Cervecerias Unidas SA | | 6,607 | 36,239 |
| Compania Sud Americana de Vapores SA | | 912,743 | 63,365 |
| Empresas CMPC SA | | 65,144 | 103,360 |
| Empresas COPEC SA | | 22,834 | 157,357 |
| Enel Americas SA | | 1,276,885 | 126,511 |
| Enel Chile SA | | 1,465,532 | 51,569 |
| Falabella SA | | 45,236 | 88,449 |
TOTAL CHILE | | | 1,222,867 |
| China - 3.0% | | | |
| 360 Security Technology, Inc. (A Shares) | | 27,700 | 26,855 |
| 37 Interactive Entertainment Network Technology Group Co. Ltd. (A Shares) | | 8,800 | 17,460 |
| A-Living Smart City Services C (H Shares) (b) | | 58,750 | 33,306 |
| Advanced Micro-Fabrication Equipment, Inc., China (A Shares) (a) | | 2,277 | 34,606 |
| AECC Aero-Engine Control Co. Ltd. (A Shares) | | 4,200 | 17,253 |
| AECC Aviation Power Co. Ltd. | | 8,700 | 57,945 |
| Agricultural Bank of China Ltd.: | | | |
| (A Shares) | | 367,800 | 139,003 |
| (H Shares) | | 1,696,000 | 484,095 |
| Aier Eye Hospital Group Co. Ltd. (A Shares) | | 23,734 | 80,274 |
| Air China Ltd.: | | | |
| (A Shares) (a) | | 46,700 | 61,837 |
| (H Shares) (a) | | 68,000 | 47,299 |
| Aluminum Corp. of China Ltd.: | | | |
| (A shares) | | 88,000 | 46,513 |
| (H Shares) | | 152,000 | 43,332 |
| Amlogic Shanghai Co. Ltd. (A Shares) (a) | | 1,229 | 9,653 |
| Angel Yeast Co. Ltd. (A Shares) | | 2,400 | 11,890 |
| Anhui Conch Cement Co. Ltd.: | | | |
| (A Shares) | | 8,200 | 27,263 |
| (H Shares) | | 91,500 | 235,463 |
| Anhui Gujing Distillery Co. Ltd. (B Shares) | | 13,200 | 155,599 |
| Anhui Honglu Steel Construction Group Co. Ltd. | | 2,990 | 13,953 |
| Anhui Kouzi Distillery Co. Ltd. (A Shares) | | 2,300 | 12,755 |
| Anhui Yingjia Distillery Co. Ltd. (A Shares) | | 2,500 | 16,124 |
| Anjoy Foods Group Co. Ltd. (A Shares) | | 1,000 | 18,394 |
| Apeloa Pharmaceutical Co. Ltd. A Shares | | 3,600 | 10,263 |
| Asia - Potash International Investment Guangzhou Co. Ltd. (A Shares) (a) | | 2,600 | 9,079 |
| Asymchem Laboratories Tianjin Co. Ltd. (A Shares) | | 1,260 | 24,705 |
| Avary Holding Shenzhen Co. Ltd. (A Shares) | | 7,400 | 30,146 |
| AVIC Capital Co. Ltd. (A Shares) | | 32,600 | 13,526 |
| AVIC Electromechanical Systems Co. Ltd. (A Shares) | | 10,900 | 17,463 |
| AviChina Industry & Technology Co. Ltd. (H Shares) | | 148,000 | 64,859 |
| Avicopter PLC (A Shares) | | 1,800 | 10,820 |
| Bank of Beijing Co. Ltd. (A Shares) | | 75,200 | 41,601 |
| Bank of Changsha Co. Ltd. (A Shares) | | 20,100 | 17,725 |
| Bank of Chengdu Co. Ltd. (A Shares) | | 10,400 | 19,396 |
| Bank of China Ltd.: | | | |
| (A Shares) | | 514,800 | 212,183 |
| (H Shares) | | 4,318,000 | 1,390,730 |
| Bank of Communications Co. Ltd.: | | | |
| (A Shares) | | 22,600 | 13,771 |
| (H Shares) | | 690,000 | 336,665 |
| Bank of Hangzhou Co. Ltd. (A Shares) | | 18,900 | 31,341 |
| Bank of Jiangsu Co. Ltd. (A Shares) | | 46,960 | 44,498 |
| Bank of Nanjing Co. Ltd. (A Shares) | | 38,600 | 54,547 |
| Bank of Ningbo Co. Ltd. (A Shares) | | 24,080 | 78,344 |
| Bank of Shanghai Co. Ltd. (A Shares) | | 51,018 | 38,982 |
| Baoshan Iron & Steel Co. Ltd. (A Shares) | | 85,200 | 56,116 |
| BBMG Corp. (A Shares) | | 27,500 | 8,774 |
| Beijing Capital International Airport Co. Ltd. (H Shares) (a) | | 118,000 | 63,888 |
| Beijing Dabeinong Technology Group Co. Ltd. (A Shares) (a) | | 13,400 | 16,808 |
| Beijing Easpring Material Technology Co. Ltd. (A Shares) | | 1,900 | 15,347 |
| Beijing Enlight Media Co. Ltd. (A Shares) | | 13,000 | 11,980 |
| Beijing Kingsoft Office Software, Inc. (A Shares) | | 1,625 | 64,694 |
| Beijing New Building Materials PLC (A Shares) | | 6,500 | 17,650 |
| Beijing Originwater Technology Co. Ltd. (A Shares) | | 7,000 | 4,515 |
| Beijing Roborock Technology Co. Ltd. (A Shares) | | 273 | 8,786 |
| Beijing Shiji Information Technology Co. Ltd. (A Shares) | | 8,092 | 14,006 |
| Beijing Shunxin Agriculture Co. Ltd. | | 2,200 | 6,164 |
| Beijing Sinnet Technology Co. Ltd. (A Shares) | | 6,900 | 8,182 |
| Beijing Tiantan Biological Products Corp. Ltd. (A Shares) | | 5,040 | 14,265 |
| Beijing Tongrentang Co. Ltd. (A Shares) | | 5,100 | 34,045 |
| Beijing United Information Technology Co. Ltd. (A Shares) | | 1,450 | 24,620 |
| Beijing Wantai Biological Pharmacy Enterprise Co. Ltd. (A Shares) | | 2,040 | 35,063 |
| Beijing Yuanliu Hongyuan Electronic Technology Co. Ltd. (A Shares) | | 900 | 14,150 |
| Beijing-Shanghai High Speed Railway Co. Ltd. (A Shares) | | 142,600 | 87,088 |
| Betta Pharmaceuticals Co. Ltd. (A Shares) | | 1,200 | 7,511 |
| BGI Genomics Co. Ltd. | | 1,300 | 9,874 |
| Bloomage Biotechnology Corp. Ltd. (A Shares) | | 1,099 | 15,950 |
| BOC International China Co. Ltd. | | 9,900 | 14,248 |
| BOE Technology Group Co. Ltd. (A Shares) | | 138,100 | 63,160 |
| BTG Hotels Group Co. Ltd. | | 4,200 | 12,497 |
| By-Health Co. Ltd. (A Shares) | | 5,100 | 12,235 |
| BYD Co. Ltd.: | | | |
| (A Shares) | | 6,000 | 202,662 |
| (H Shares) | | 51,000 | 1,141,541 |
| Caitong Securities Co. Ltd. | | 14,300 | 14,001 |
| CanSino Biologics, Inc.: | | | |
| (A Shares) | | 814 | 21,139 |
| (H Shares) (b) | | 3,800 | 35,339 |
| CECEP Solar Energy Co. Ltd. (A Shares) | | 16,700 | 15,459 |
| CECEP Wind-Power Corp. (A Shares) | | 13,500 | 7,912 |
| CGN Power Co. Ltd. (H Shares) (b) | | 803,000 | 162,653 |
| Chacha Food Co. Ltd. (A Shares) | | 1,400 | 8,470 |
| Changchun High & New Technology Industry Group, Inc. (A Shares) | | 1,400 | 31,037 |
| Changjiang Securities Co. Ltd. (A Shares) | | 16,200 | 11,557 |
| Changzhou Xingyu Automotive Lighting Systems Co. Ltd. (A Shares) | | 1,000 | 16,766 |
| Chaozhou Three-Circle Group Co. (A Shares) | | 6,300 | 24,500 |
| Chengtun Mining Group Co. Ltd. (A Shares) | | 7,000 | 5,310 |
| Chengxin Lithium Group Co. Ltd. (A Shares) | | 3,200 | 18,938 |
| Chifeng Jilong Gold Mining Co. Ltd. (A Shares) (a) | | 4,500 | 11,597 |
| China Baoan Group Co. Ltd. (A Shares) | | 7,400 | 11,714 |
| China Cinda Asset Management Co. Ltd. (H Shares) | | 621,000 | 57,752 |
| China CITIC Bank Corp. Ltd.: | | | |
| (A Shares) | | 34,400 | 20,396 |
| (H Shares) | | 471,000 | 177,608 |
| China Coal Energy Co. Ltd. (H Shares) | | 114,000 | 83,943 |
| China Communications Services Corp. Ltd. (H Shares) | | 134,000 | 37,385 |
| China Construction Bank Corp.: | | | |
| (A Shares) | | 291,400 | 213,076 |
| (H Shares) | | 5,512,000 | 2,925,155 |
| China CSSC Holdings Ltd. (A Shares) | | 15,000 | 54,472 |
| China Eastern Airlines Corp. Ltd. (A Shares) (a) | | 34,300 | 22,544 |
| China Energy Engineering Corp. Ltd. (A Shares) | | 101,000 | 31,671 |
| China Everbright Bank Co. Ltd.: | | | |
| (A Shares) | | 77,100 | 28,716 |
| (H Shares) | | 294,000 | 76,031 |
| China Galaxy Securities Co. Ltd.: | | | |
| (A Shares) | | 10,400 | 12,831 |
| (H Shares) | | 225,000 | 84,271 |
| China Great Wall Securities Co. Ltd. (A Shares) | | 14,800 | 16,375 |
| China Greatwall Technology Group Co. Ltd. (A Shares) | | 12,600 | 19,238 |
| China International Capital Corp. Ltd. (H Shares) (b) | | 113,200 | 157,478 |
| China Jushi Co. Ltd. (A Shares) | | 13,715 | 21,973 |
| China Life Insurance Co. Ltd.: | | | |
| (A Shares) | | 4,500 | 16,391 |
| (H Shares) | | 475,000 | 517,967 |
| China Longyuan Power Grid Corp. Ltd. (H Shares) | | 196,000 | 223,974 |
| China Meheco Co. Ltd. (A Shares) | | 5,180 | 8,951 |
| China Merchants Bank Co. Ltd.: | | | |
| (A Shares) | | 30,400 | 111,644 |
| (H Shares) | | 284,500 | 935,086 |
| China Merchants Energy Shipping Co. Ltd. (A Shares) | | 29,900 | 28,537 |
| China Merchants Securities Co. Ltd. (A Shares) | | 28,350 | 48,525 |
| China Merchants Shekou Industrial Zone Holdings Co. Ltd. (A Shares) | | 25,900 | 46,495 |
| China Minmetals Rare Earth Co. Ltd. (A Shares) (a) | | 2,600 | 10,268 |
| China Minsheng Banking Corp. Ltd.: | | | |
| (A Shares) | | 26,000 | 11,749 |
| (H Shares) | | 627,400 | 182,234 |
| China National Building Materials Co. Ltd. (H Shares) | | 229,000 | 133,030 |
| China National Chemical Engineering Co. Ltd. (A Shares) | | 21,700 | 21,008 |
| China National Nuclear Power Co. Ltd. (A Shares) | | 69,900 | 57,716 |
| China Northern Rare Earth Group High-Tech Co. Ltd. | | 13,800 | 45,730 |
| China Oilfield Services Ltd. (H Shares) | | 110,000 | 123,878 |
| China Pacific Insurance (Group) Co. Ltd. | | 23,600 | 61,497 |
| China Pacific Insurance (Group) Co. Ltd. (H Shares) | | 157,400 | 253,856 |
| China Petroleum & Chemical Corp.: | | | |
| (A Shares) | | 183,700 | 102,378 |
| (H Shares) | | 1,442,000 | 571,503 |
| China Railway Group Ltd.: | | | |
| (A Shares) | | 89,500 | 61,154 |
| (H Shares) | | 224,000 | 97,309 |
| China Railway Signal & Communications Corp. (A Shares) | | 29,107 | 18,055 |
| China Resources Sanjiu Medical & Pharmaceutical Co. Ltd. (A Shares) | | 3,000 | 22,405 |
| China Shenhua Energy Co. Ltd.: | | | |
| (A Shares) | | 14,800 | 56,805 |
| (H Shares) | | 215,000 | 565,598 |
| China Southern Airlines Ltd.: | | | |
| (A Shares) (a) | | 61,500 | 54,402 |
| (H Shares) (a) | | 56,000 | 28,893 |
| China State Construction Engineering Corp. Ltd. (A Shares) | | 152,100 | 98,930 |
| China Suntien Green Energy Corp. Ltd. (H Shares) | | 107,000 | 40,621 |
| China Three Gorges Renewables Group Co. Ltd. (A Shares) | | 106,300 | 81,076 |
| China Tourism Group Duty Free Corp. Ltd. (A Shares) | | 7,400 | 162,492 |
| China Tower Corp. Ltd. (H Shares) (b) | | 2,606,000 | 235,712 |
| China United Network Communications Ltd. (A Shares) | | 158,100 | 72,740 |
| China Vanke Co. Ltd.: | | | |
| (A Shares) | | 7,300 | 13,515 |
| (H Shares) | | 152,700 | 196,087 |
| China Yangtze Power Co. Ltd. (A Shares) | | 78,300 | 217,223 |
| China Zhenhua (Group) Science & Technology Co. Ltd. (A Shares) | | 1,700 | 31,391 |
| China Zheshang Bank Co. Ltd. (a) | | 64,000 | 24,188 |
| Chongqing Brewery Co. Ltd. (A Shares) | | 1,700 | 20,350 |
| Chongqing Changan Automobile Co. Ltd. (A Shares) | | 26,988 | 41,722 |
| Chongqing Fuling Zhacai Group Co. Ltd. Group (A Shares) | | 2,900 | 8,939 |
| Chongqing Rural Commercial Bank Co. Ltd. (H Shares) | | 51,000 | 15,463 |
| Chongqing Zhifei Biological Products Co. Ltd. (A Shares) | | 5,600 | 65,486 |
| CITIC Securities Co. Ltd.: | | | |
| (A Shares) | | 27,925 | 65,808 |
| (H Shares) | | 170,225 | 254,590 |
| Cmoc Group Ltd.: | | | |
| (A Shares) | | 48,200 | 27,390 |
| (H Shares) | | 240,000 | 77,354 |
| CNGR Advanced Material Co. Ltd. | | 1,300 | 12,840 |
| CNNC Hua Yuan Titanium Dioxide Co. Ltd. (A Shares) | | 7,540 | 6,897 |
| Contemporary Amperex Technology Co. Ltd. | | 8,100 | 413,579 |
| COSCO Shipping Development Co. Ltd. (A Shares) | | 37,900 | 12,663 |
| COSCO Shipping Energy Transportation Co. Ltd. (A Shares) (a) | | 10,400 | 24,081 |
| COSCO SHIPPING Holdings Co. Ltd.: | | | |
| (A Shares) | | 46,470 | 71,459 |
| (H Shares) | | 185,550 | 200,214 |
| CRRC Corp. Ltd.: | | | |
| (A Shares) | | 86,000 | 55,937 |
| (H Shares) | | 252,000 | 76,406 |
| CSC Financial Co. Ltd. (A Shares) | | 14,100 | 45,585 |
| Daan Gene Co. Ltd. | | 6,636 | 16,247 |
| Daqin Railway Co. Ltd. (A Shares) | | 53,000 | 46,520 |
| DaShenLin Pharmaceutical Group Co. Ltd. | | 4,360 | 21,761 |
| DHC Software Co. Ltd. (A Shares) | | 13,100 | 11,068 |
| Do-Fluoride New Materials Co. Ltd. (A Shares) | | 3,200 | 13,649 |
| Dong-E-E-Jiao Co. Ltd. (A Shares) | | 2,200 | 11,309 |
| Dongfang Electric Corp. Ltd. (A Shares) | | 11,400 | 36,231 |
| Dongfeng Motor Group Co. Ltd. (H Shares) | | 162,000 | 73,264 |
| Dongxing Securities Co. Ltd. (A Shares) | | 7,700 | 8,193 |
| East Money Information Co. Ltd. (A Shares) | | 47,950 | 102,493 |
| Ecovacs Robotics Co. Ltd. Class A | | 2,300 | 18,361 |
| ENN Natural Gas Co. Ltd. (A Shares) | | 9,300 | 19,713 |
| Eve Energy Co. Ltd. (A shares) | | 6,471 | 73,581 |
| Everbright Securities Co. Ltd. (A Shares) | | 15,000 | 28,797 |
| Fangda Carbon New Material Co. Ltd. (A Shares) (a) | | 11,940 | 9,826 |
| FAW Jiefang Group Co. Ltd. (A Shares) | | 7,300 | 6,957 |
| Fiberhome Telecommunication Technologies Co. Ltd. (A Shares) | | 3,600 | 6,793 |
| First Capital Securities Co. Ltd. (A Shares) | | 14,400 | 10,944 |
| Flat Glass Group Co. Ltd. | | 9,000 | 21,074 |
| Flat Glass Group Co. Ltd. (A Shares) (a) | | 14,400 | 67,633 |
| Focus Media Information Technology Co. Ltd. (A Shares) | | 49,200 | 30,182 |
| Foshan Haitian Flavouring & Food Co. Ltd. (A Shares) | | 15,094 | 123,350 |
| Founder Securities Co. Ltd. (A Shares) | | 33,900 | 29,384 |
| Foxconn Industrial Internet Co. Ltd. (A Shares) | | 36,800 | 41,321 |
| Fujian Sunner Development Co. Ltd. A Shares | | 3,700 | 11,126 |
| Fuyao Glass Industries Group Co. Ltd.: | | | |
| (A Shares) | | 2,500 | 11,444 |
| (H Shares) (b) | | 46,000 | 164,963 |
| G-bits Network Technology Xiamen Co. Ltd. (A Shares) | | 200 | 6,974 |
| Ganfeng Lithium Group Co. Ltd. (A Shares) | | 11,060 | 119,673 |
| GCL System Integration Technology Co. Ltd. (a) | | 16,400 | 7,343 |
| GD Power Development Co. Ltd. (A Shares) (a) | | 61,500 | 36,801 |
| GEM Co. Ltd. (A Shares) | | 13,600 | 13,855 |
| Gemdale Corp. (A Shares) | | 16,900 | 18,097 |
| GF Securities Co. Ltd.: | | | |
| (A Shares) | | 17,700 | 33,035 |
| (H Shares) | | 74,400 | 75,730 |
| Giant Network Group Co. Ltd. (A Shares) | | 4,100 | 4,345 |
| Gigadevice Semiconductor Beijing, Inc. (A Shares) | | 2,140 | 24,108 |
| Ginlong Technologies Co. Ltd. (A Shares) | | 1,350 | 34,531 |
| GoerTek, Inc. (A Shares) | | 12,500 | 37,109 |
| Gotion High-tech Co. Ltd. (A Shares) | | 5,400 | 22,220 |
| Great Wall Motor Co. Ltd.: | | | |
| (A Shares) | | 8,300 | 33,141 |
| (H Shares) | | 182,500 | 199,248 |
| Gree Electric Appliances, Inc. of Zhuhai (A Shares) | | 9,200 | 36,118 |
| GRG Banking Equipment Co. Ltd. (A Shares) | | 10,900 | 14,060 |
| Guangdong Haid Group Co. Ltd. (A Shares) | | 5,400 | 42,702 |
| Guangdong Kinlong Hardware Products Co. Ltd. (A Shares) | | 900 | 9,763 |
| Guanghui Energy Co. Ltd. (A Shares) | | 22,400 | 31,532 |
| Guangzhou Automobile Group Co. Ltd. | | 29,400 | 45,612 |
| Guangzhou Automobile Group Co. Ltd. (H Shares) | | 134,000 | 81,599 |
| Guangzhou Baiyunshan Pharma Health (A Shares) | | 5,100 | 18,849 |
| Guangzhou Haige Communications Group (A Shares) | | 11,300 | 13,075 |
| Guangzhou Kingmed Diagnostics Group Co. Ltd. (A Shares) | | 1,300 | 13,451 |
| Guangzhou Shiyuan Electronic Technology Co. Ltd. (A Shares) | | 1,900 | 16,927 |
| Guangzhou Tinci Materials Technology Co. Ltd. (A Shares) | | 6,560 | 38,177 |
| Guangzhou Yuexiu Financial Holdings Group Co. Ltd. (A Shares) | | 13,776 | 10,507 |
| Guolian Securities Co. Ltd. | | 6,400 | 8,194 |
| Guosen Securities Co. Ltd. (A Shares) | | 26,300 | 31,043 |
| Guotai Junan Securities Co. Ltd.: | | | |
| (A Shares) | | 19,300 | 34,938 |
| (H Shares) (b) | | 19,800 | 20,003 |
| Guoyuan Securities Co. Ltd. (A Shares) | | 14,510 | 12,418 |
| Haier Smart Home Co. Ltd. | | 145,000 | 362,793 |
| Haier Smart Home Co. Ltd. (A Shares) | | 21,800 | 62,090 |
| Haitong Securities Co. Ltd.: | | | |
| (A Shares) | | 16,400 | 18,954 |
| (H Shares) | | 218,000 | 106,644 |
| Hangzhou First Applied Material Co. Ltd. (A Shares) | | 4,312 | 37,824 |
| Hangzhou Lion Electronics Co. Ltd. (A Shares) | | 2,100 | 12,313 |
| Hangzhou Oxygen Plant Group Co. Ltd. (A Shares) | | 3,800 | 21,901 |
| Hangzhou Robam Appliances Co. Ltd. (A Shares) | | 3,100 | 8,702 |
| Hangzhou Silan Microelectronics Co. Ltd. (A Shares) | | 4,600 | 19,778 |
| Hangzhou Tigermed Consulting Co. Ltd.: | | | |
| (A Shares) | | 1,700 | 19,403 |
| (H Shares) (b) | | 6,400 | 43,497 |
| Heilongjiang Agriculture Co. Ltd. (A Shares) | | 5,300 | 10,015 |
| Henan Shenhuo Coal & Power Co. Ltd. (A Shares) | | 7,500 | 14,409 |
| Henan Shuanghui Investment & Development Co. Ltd. (A Shares) | | 11,300 | 35,248 |
| Hengli Petrochemical Co. Ltd. (A Shares) | | 18,800 | 39,490 |
| Hengtong Optic-electric Co. Ltd. (A Shares) | | 9,100 | 24,236 |
| Hengyi Petrochemical Co. Ltd. (A Shares) | | 10,900 | 10,000 |
| Hesteel Co. Ltd. (A Shares) | | 30,300 | 9,003 |
| Hithink RoyalFlush Information Network Co. Ltd. (A Shares) | | 2,000 | 23,295 |
| Hongfa Technology Co. Ltd. (A Shares) | | 4,060 | 19,074 |
| Hoshine Silicon Industry Co. Ltd. (A Shares) | | 1,700 | 22,277 |
| Huadian Power International Corp. Ltd.: | | | |
| (A Shares) | | 14,900 | 11,079 |
| (H Shares) | | 26,000 | 7,817 |
| Huadong Medicine Co. Ltd. (A Shares) | | 6,200 | 34,749 |
| Huafon Chemical Co. Ltd. (A Shares) | | 13,300 | 12,129 |
| Huagong Tech Co. Ltd. (A Shares) | | 2,800 | 6,430 |
| Huaibei Mining Holdings Co. Ltd. (A Shares) | | 8,100 | 14,452 |
| Hualan Biological Engineer, Inc. (A Shares) | | 7,410 | 17,990 |
| Huaneng Power International, Inc.: | | | |
| (A Shares) (a) | | 41,000 | 37,615 |
| (H Shares) (a) | | 216,000 | 77,323 |
| Huatai Securities Co. Ltd.: | | | |
| (A Shares) | | 16,700 | 27,373 |
| (H Shares) (b) | | 136,600 | 133,822 |
| HUAXI Securities Co. Ltd. | | 9,900 | 9,950 |
| Huaxia Bank Co. Ltd. (A Shares) | | 50,000 | 32,795 |
| Huaxin Cement Co. Ltd. (A Shares) | | 4,000 | 7,351 |
| Huayu Automotive Systems Co. Ltd. (A Shares) | | 10,300 | 23,652 |
| Hubei Xingfa Chemicals Group Co. Ltd. (A Shares) | | 4,300 | 16,646 |
| Huizhou Desay SV Automotive Co. Ltd. | | 1,800 | 25,535 |
| Humanwell Healthcare Group Co. Ltd. (A Shares) | | 5,400 | 14,811 |
| Hunan Valin Steel Co. Ltd. (A Shares) | | 20,300 | 11,119 |
| Hundsun Technologies, Inc. (A Shares) | | 6,008 | 34,290 |
| iFlytek Co. Ltd. (A Shares) | | 7,400 | 35,496 |
| IMEIK Technology Development Co. Ltd. (A Shares) | | 600 | 34,589 |
| Industrial & Commercial Bank of China Ltd.: | | | |
| (A Shares) | | 452,900 | 257,368 |
| (H Shares) | | 3,118,000 | 1,353,728 |
| Industrial Bank Co. Ltd. (A Shares) | | 74,000 | 152,298 |
| Industrial Securities Co. Ltd. (A Shares) (a) | | 23,270 | 17,366 |
| Ingenic Semiconductor Co. Ltd. (A Shares) | | 1,300 | 12,098 |
| Inner Mongoli Yili Industries Co. Ltd. (A Shares) | | 23,400 | 80,874 |
| Inner Mongolia Baotou Steel Union Co. Ltd. (A Shares) | | 147,800 | 35,620 |
| Inner Mongolia Dian Tou Energy Corp. Ltd. | | 6,200 | 10,485 |
| Inner Mongolia Eerduosi Resourses Co. Ltd. (A Shares) | | 3,780 | 7,205 |
| Inner Mongolia Junzheng Energy & Chemical Industry Group Co. Ltd. (A Shares) | | 25,400 | 13,495 |
| Inner Mongolia Yitai Coal Co. Ltd. (B Shares) | | 81,200 | 114,817 |
| Inner Mongolia Yuan Xing Energy Co. Ltd. (A Shares) | | 14,600 | 12,895 |
| Inspur Electronic Information Industry Co. Ltd. (A Shares) | | 4,045 | 12,751 |
| Intco Medical Technology Co. Ltd. (A Shares) | | 2,100 | 6,131 |
| JA Solar Technology Co. Ltd. (A Shares) | | 8,340 | 71,376 |
| Jafron Biomedical Co. Ltd. (A Shares) | | 2,400 | 10,411 |
| Jason Furniture Hangzhou Co. Ltd. (A Shares) | | 3,120 | 12,860 |
| JCET Group Co. Ltd. (A Shares) | | 5,100 | 16,816 |
| Jiangsu Eastern Shenghong Co. Ltd. | | 12,800 | 21,453 |
| Jiangsu Expressway Co. Ltd. (H Shares) | | 72,000 | 50,723 |
| Jiangsu Hengli Hydraulic Co. Ltd. | | 4,576 | 34,570 |
| Jiangsu Hengrui Medicine Co. Ltd. (A Shares) | | 22,932 | 126,233 |
| Jiangsu King's Luck Brewery JSC Ltd. (A Shares) | | 5,100 | 26,104 |
| Jiangsu Yanghe Brewery JSC Ltd. (A Shares) | | 5,400 | 96,607 |
| Jiangsu Yangnong Chemical Co. Ltd. (A Shares) | | 1,100 | 13,916 |
| Jiangsu Yoke Technology Co. Ltd. (A Shares) | | 1,200 | 9,662 |
| Jiangsu Yuyue Medical Equipment & Supply Co. Ltd. (A Shares) | | 2,500 | 11,143 |
| Jiangsu Zhongtian Technology Co. Ltd. (A Shares) | | 11,200 | 33,694 |
| Jiangxi Copper Co. Ltd.: | | | |
| (A Shares) | | 9,800 | 20,666 |
| (H Shares) | | 68,000 | 74,327 |
| Jiangxi Special Electric Motor Co. Ltd. (A Shares) (a) | | 5,700 | 14,892 |
| Jiangxi Zhengbang Technology Co. Ltd. (A Shares) (a) | | 9,700 | 4,649 |
| Jinke Properties Group Co. Ltd. (A Shares) (a) | | 24,300 | 5,890 |
| JiuGui Liquor Co. Ltd. (A Shares) | | 1,200 | 16,769 |
| Jizhong Energy Resources Co. Ltd. (A Shares) | | 11,700 | 9,741 |
| Joincare Pharmaceutical Group Industry Co. Ltd. (A Shares) | | 6,300 | 10,085 |
| Joinn Laboratories China Co. Ltd. (A Shares) | | 1,400 | 10,964 |
| Jointown Pharmaceutical Group (A Shares) | | 7,200 | 12,383 |
| Jonjee Hi-Tech Industrial & Commercial Holding Co. Ltd. (A Shares) | | 2,700 | 10,019 |
| Juewei Food Co. Ltd. | | 1,800 | 11,676 |
| Kangmei Pharmaceutical Co. Ltd. rights (a)(c) | | 809 | 0 |
| Keda Industrial Group Co. Ltd. | | 6,400 | 13,645 |
| Kingfa Sci & Tech Co. Ltd. (A Shares) | | 6,900 | 9,146 |
| Kuang-Chi Technologies Co. Ltd. (A Shares) (a) | | 5,800 | 13,740 |
| Kunlun Tech Co. Ltd. (A Shares) | | 5,700 | 10,154 |
| Kweichow Moutai Co. Ltd. (A Shares) | | 4,500 | 827,984 |
| Lb Group Co. Ltd. (A Shares) | | 8,900 | 18,731 |
| Lens Technology Co. Ltd. (A Shares) | | 20,300 | 27,686 |
| Lepu Medical Technology Beijing Co. Ltd. (A Shares) | | 5,000 | 17,315 |
| Liaoning Port Co. Ltd. (A Shares) | | 69,500 | 15,132 |
| Lingyi iTech Guangdong Co. (A Shares) (a) | | 30,900 | 20,014 |
| Livzon Pharmaceutical Group, Inc. (A Shares) | | 2,000 | 9,676 |
| LONGi Green Energy Technology Co. Ltd. | | 26,552 | 174,446 |
| Luoyang Xinqianglian Slewing Bearing Co. Ltd. (A Shares) | | 1,280 | 12,238 |
| Luxi Chemical Group Co. Ltd. | | 6,400 | 9,956 |
| Luxshare Precision Industry Co. Ltd. (A Shares) | | 25,193 | 98,317 |
| Luzhou Laojiao Co. Ltd. (A Shares) | | 5,600 | 119,892 |
| Maanshan Iron & Steel Co. Ltd. (A Shares) | | 18,700 | 6,453 |
| Mango Excellent Media Co. Ltd. (A Shares) | | 7,000 | 21,020 |
| Maxscend Microelectronics Co. Ltd. (A Shares) | | 1,824 | 23,068 |
| Meinian Onehealth Healthcare Holdings Co. Ltd. (A Shares) (a) | | 16,500 | 9,648 |
| Metallurgical Corp. China Ltd. (A Shares) | | 62,000 | 24,451 |
| Ming Yang Smart Energy Group Ltd. (A Shares) | | 7,300 | 24,890 |
| Montage Technology Co. Ltd. (A Shares) | | 3,394 | 26,370 |
| Muyuan Foodstuff Co. Ltd. (A Shares) | | 18,940 | 121,323 |
| Nanjing King-Friend Biochemical Pharmaceutical Co. Ltd. | | 6,501 | 14,483 |
| Nanjing Securities Co. Ltd. (A Shares) | | 11,300 | 12,255 |
| NARI Technology Co. Ltd. (A Shares) | | 22,200 | 74,173 |
| National Silicon Industry Group Co. Ltd. (A Shares) (a) | | 10,643 | 29,599 |
| NAURA Technology Group Co. Ltd. | | 1,800 | 65,489 |
| NavInfo Co. Ltd. (A Shares) | | 7,300 | 11,855 |
| New China Life Insurance Co. Ltd. | | 18,200 | 58,242 |
| New China Life Insurance Co. Ltd. (H Shares) | | 32,000 | 50,795 |
| New Hope Liuhe Co. Ltd. (A Shares) (a) | | 16,100 | 28,417 |
| Ninestar Corp. (A Shares) | | 4,500 | 35,191 |
| Ningbo Deye Technology Co. Ltd. (A Shares) | | 900 | 40,320 |
| Ningbo Joyson Electronic Corp. (A shares) (a) | | 3,600 | 7,567 |
| Ningbo Orient Wires & Cables Co. Ltd. (A Shares) | | 2,300 | 24,251 |
| Ningbo Ronbay New Energy Technology Co. Ltd. (A Shares) | | 1,425 | 15,280 |
| Ningbo Shanshan Co. Ltd. (A Shares) | | 7,100 | 17,480 |
| Ningbo Tuopu Group Co. Ltd. (A Shares) | | 3,700 | 32,831 |
| Ningxia Baofeng Energy Group Co. Ltd. | | 20,100 | 31,569 |
| Nongfu Spring Co. Ltd. (H Shares) (b) | | 109,200 | 548,807 |
| North Industries Group Red Arrow Co. Ltd. (A Shares) | | 5,900 | 16,602 |
| Northeast Securities Co. Ltd. (A Shares) | | 7,600 | 6,598 |
| Offshore Oil Enginering Co. Ltd. (A Shares) | | 15,000 | 9,654 |
| OFILM Group Co. Ltd. (A Shares) (a) | | 8,100 | 5,191 |
| Oppein Home Group, Inc. (A Shares) | | 1,760 | 19,622 |
| Orient Securities Co. Ltd. (A Shares) | | 26,240 | 27,882 |
| Ovctek China, Inc. (A Shares) | | 2,420 | 9,848 |
| Pangang Group Vanadium Titanium & Resources Co. Ltd. (A Shares) (a) | | 33,400 | 20,718 |
| People's Insurance Co. of China Group Ltd.: | | | |
| (A Shares) | | 50,800 | 33,737 |
| (H Shares) | | 495,000 | 136,841 |
| Perfect World Co. Ltd. (A Shares) | | 8,250 | 12,867 |
| PetroChina Co. Ltd.: | | | |
| (A Shares) | | 67,300 | 44,142 |
| (H Shares) | | 1,274,000 | 486,901 |
| Pharmaron Beijing Co. Ltd.: | | | |
| (A Shares) | | 3,550 | 25,278 |
| (H Shares) (b) | | 12,600 | 42,376 |
| PICC Property & Casualty Co. Ltd. (H Shares) | | 414,000 | 381,846 |
| Ping An Bank Co. Ltd. (A Shares) | | 69,800 | 98,828 |
| Ping An Insurance Group Co. of China Ltd.: | | | |
| (A Shares) | | 50,100 | 247,999 |
| (H Shares) | | 373,500 | 1,495,266 |
| Pingdingshan Tianan Coal Mining Co. Ltd. A Shares | | 7,700 | 11,619 |
| Poly Developments & Holdings (A Shares) | | 40,600 | 76,720 |
| Postal Savings Bank of China Co. Ltd. | | 120,000 | 63,755 |
| Postal Savings Bank of China Co. Ltd. (H Shares) (b) | | 482,000 | 223,511 |
| Power Construction Corp. of China Ltd. (A Shares) | | 49,700 | 47,911 |
| Proya Cosmetics Co. Ltd. (A Shares) | | 700 | 16,022 |
| Pylon Technologies Co. Ltd. (Series A) | | 565 | 23,868 |
| Qingdao Rural Commercial Bank Corp. (A Shares) | | 8,100 | 3,072 |
| Qinghai Salt Lake Potash Co. Ltd. Class A (a) | | 19,800 | 58,319 |
| Raytron Technology Co. Ltd. (A Shares) | | 908 | 5,912 |
| Riyue Heavy Industry Co. Ltd. (A Shares) | | 3,000 | 9,074 |
| Rongsheng Petrochemical Co. Ltd. (A Shares) | | 34,350 | 50,329 |
| SAIC Motor Corp. Ltd. (A Shares) | | 29,100 | 54,790 |
| Sailun Group Co. Ltd. A Shares | | 9,500 | 11,304 |
| Sangfor Technologies, Inc. | | 1,300 | 22,429 |
| Sany Heavy Industry Co. Ltd. (A Shares) | | 27,600 | 51,021 |
| Satellite Chemical Co. Ltd. (A Shares) | | 11,909 | 20,221 |
| SDIC Power Holdings Co. Ltd. (A Shares) | | 24,200 | 33,469 |
| Sealand Securities Co. Ltd. (A Shares) | | 17,400 | 7,744 |
| Seazen Holdings Co. Ltd. (A Shares) (a) | | 8,200 | 14,810 |
| SF Holding Co. Ltd. (A Shares) | | 17,500 | 115,646 |
| SG Micro Corp. (A Shares) | | 1,275 | 26,129 |
| Shaanxi Coal Industry Co. Ltd. (A Shares) | | 32,800 | 89,199 |
| Shan Xi Hua Yang Group New Energy Co. Ltd. | | 7,800 | 18,040 |
| Shandong Buchang Pharmaceuticals Co. Ltd. (A Shares) | | 4,200 | 11,031 |
| Shandong Gold Mining Co. Ltd.: | | | |
| (A Shares) | | 17,740 | 42,025 |
| (H Shares) (b) | | 32,500 | 51,754 |
| Shandong Hualu Hengsheng Chemical Co. Ltd. (A Shares) | | 7,260 | 26,026 |
| Shandong Linglong Tyre Co. Ltd. (A Shares) | | 4,000 | 8,966 |
| Shandong Nanshan Aluminum Co. Ltd. (A Shares) | | 55,000 | 23,196 |
| Shandong Sun Paper Industry JSC Ltd. (A Shares) | | 8,700 | 12,497 |
| Shandong Weigao Medical Polymer Co. Ltd. (H Shares) | | 160,000 | 220,545 |
| Shanghai Bairun Investment Holding Group Co. Ltd. (A Shares) | | 2,744 | 11,460 |
| Shanghai Baosight Software Co. Ltd. | | 50,472 | 152,072 |
| Shanghai Baosight Software Co. Ltd. (A Shares) | | 3,042 | 17,628 |
| Shanghai Construction Group Co. Ltd. (A Shares) | | 23,498 | 8,269 |
| Shanghai Electric Group Co. Ltd. (A Shares) (a) | | 51,500 | 27,362 |
| Shanghai Fosun Pharmaceutical (Group) Co. Ltd.: | | | |
| (A Shares) | | 3,100 | 14,021 |
| (H Shares) | | 38,500 | 97,211 |
| Shanghai Friendess Electronic Technology Corp. Ltd. (A Shares) | | 617 | 17,403 |
| Shanghai International Airport Co. Ltd. (A Shares) (a) | | 3,800 | 27,776 |
| Shanghai International Port Group Co. Ltd. (A Shares) | | 34,200 | 24,211 |
| Shanghai Jinjiang International Hotels Co. Ltd. (A Shares) | | 3,300 | 24,618 |
| Shanghai Junshi Biosciences Co. Ltd. (A Shares) (a) | | 2,376 | 23,119 |
| Shanghai Lingang Holdings Corp. Ltd. (A Shares) | | 10,480 | 16,474 |
| Shanghai Lujiazui Finance Trust Ltd. (B Shares) | | 126,318 | 93,728 |
| Shanghai M&G Stationery, Inc. (A Shares) | | 3,400 | 18,762 |
| Shanghai Medicilon, Inc. (A Shares) | | 236 | 7,161 |
| Shanghai Pharmaceuticals Holding Co. Ltd.: | | | |
| (A Shares) | | 10,800 | 25,998 |
| (H Shares) | | 48,200 | 65,334 |
| Shanghai Pudong Development Bank Co. Ltd. (A Shares) | | 90,600 | 82,376 |
| Shanghai Putailai New Energy Technology Co. Ltd. | | 4,680 | 31,984 |
| Shanghai RAAS Blood Products Co. Ltd. (A Shares) | | 26,800 | 19,964 |
| Shanghai Yuyuan Tourist Mart Group Co. Ltd. | | 11,700 | 10,045 |
| Shanghai Zhangjiang High Ltd. (A Shares) | | 3,500 | 5,392 |
| Shanxi Lu'an Environmental Energy Development Co. Ltd. (A Shares) | | 11,000 | 25,290 |
| Shanxi Meijin Energy Co. Ltd. (A Shares) | | 18,700 | 22,431 |
| Shanxi Securities Co. Ltd. (A Shares) | | 11,070 | 7,807 |
| Shanxi Taigang Stainless Steel Co. Ltd. (A Shares) | | 17,300 | 9,405 |
| Shanxi Xinghuacun Fen Wine Factory Co. Ltd. (A Shares) | | 4,560 | 145,100 |
| Shanxi Xishan Coal & Electricity Power Co. Ltd. (A Shares) | | 15,030 | 23,442 |
| Shenghe Resources Holding Co. Ltd. (A Shares) | | 5,500 | 10,062 |
| Shengyi Technology Co. Ltd. | | 6,200 | 11,775 |
| Shennan Circuits Co. Ltd. (A Shares) | | 1,740 | 17,886 |
| Shenwan Hongyuan Group Co. Ltd. (A Shares) | | 73,400 | 39,098 |
| Shenzhen Capchem Technology Co. Ltd. (A Shares) | | 3,180 | 15,750 |
| Shenzhen Dynanonic Co. Ltd. (A Shares) | | 700 | 24,730 |
| Shenzhen Energy Group Co. Ltd. (A Shares) | | 13,140 | 10,256 |
| Shenzhen Inovance Technology Co. Ltd. (A Shares) | | 9,650 | 88,137 |
| Shenzhen Kangtai Biological Products Co. Ltd. | | 4,320 | 18,409 |
| Shenzhen Kedali Industry Co. Ltd. | | 600 | 7,530 |
| Shenzhen Mindray Bio-Medical Electronics Co. Ltd. (A Shares) | | 4,300 | 191,621 |
| Shenzhen New Industries Biomedical Engineering Co. Ltd. | | 3,600 | 28,458 |
| Shenzhen Overseas Chinese Town Co. Ltd. (A Shares) | | 27,100 | 15,586 |
| Shenzhen Salubris Pharmaceuticals Co. Ltd. (A Shares) | | 3,300 | 14,008 |
| Shenzhen SC New Energy Technology Corp. (A Shares) | | 1,300 | 24,163 |
| Shenzhen Senior Technology Material Co. Ltd. (A Shares) | | 3,146 | 7,965 |
| Shenzhen Sunlord Electronics Co. Ltd. (A Shares) | | 3,300 | 9,670 |
| Shenzhen Transsion Holdings Co. Ltd. (A Shares) | | 2,362 | 20,095 |
| Shijiazhuang Yiling Pharmaceutical Co. Ltd. (A Shares) | | 5,940 | 24,792 |
| Sichuan Chuantou Energy Co. Ltd. (A Shares) | | 15,600 | 23,604 |
| Sichuan Hebang Biotechnology Co. Ltd. (A Shares) | | 23,300 | 9,221 |
| Sichuan Kelun Pharmaceutical Co. Ltd. (A Shares) | | 4,400 | 14,942 |
| Sichuan New Energy Power Co. Ltd. (A Shares) (a) | | 6,000 | 15,471 |
| Sichuan Road & Bridge (Group) Co. Ltd. (A Shares) | | 18,300 | 28,191 |
| Sichuan Swellfun Co. Ltd. (A Shares) | | 1,300 | 10,072 |
| Sichuan Yahua Industrial Group Co. Ltd. (A Shares) | | 3,100 | 11,355 |
| Sieyuan Electric Co. Ltd. (A Shares) | | 2,100 | 9,619 |
| Sinolink Securities Co. Ltd. (A Shares) | | 18,000 | 19,447 |
| Sinoma Science & Technology Co. Ltd. (A Shares) | | 6,700 | 16,431 |
| Sinomine Resource Group Co. Ltd. (A Shares) | | 1,540 | 18,979 |
| Sinopec Shanghai Petrochemical Co. Ltd.: | | | |
| (A Shares) | | 29,900 | 12,569 |
| (H Shares) | | 30,000 | 3,936 |
| Sinopharm Group Co. Ltd. (H Shares) | | 80,800 | 153,990 |
| Sinotrans Ltd. | | 5,900 | 2,868 |
| Sinotrans Ltd. (H Shares) | | 10,000 | 2,433 |
| SKSHU Paint Co. Ltd. (A Shares) (a) | | 1,140 | 13,565 |
| Songcheng Performance Development Co. Ltd. (A Shares) | | 10,220 | 16,122 |
| Soochow Securities Co. Ltd. (A Shares) | | 16,770 | 15,041 |
| Southwest Securities Co. Ltd. (A Shares) | | 20,800 | 10,538 |
| StarPower Semiconductor Ltd. (A Shares) | | 700 | 35,724 |
| Sungrow Power Supply Co. Ltd. (A Shares) | | 5,200 | 92,787 |
| Sunwoda Electronic Co. Ltd. (A Shares) | | 6,600 | 21,057 |
| Suzhou Dongshan Precision Manufacturing Co. Ltd. (A Shares) | | 6,700 | 23,184 |
| Suzhou Maxwell Technologies Co. Ltd. (A Shares) | | 580 | 37,923 |
| Suzhou TA&A Ultra Clean Technology Co. Ltd. (A Shares) | | 2,400 | 20,326 |
| Tangshan Jidong Cement Co. Ltd. A Shares | | 8,100 | 8,418 |
| TBEA Co. Ltd. (A Shares) | | 12,400 | 34,655 |
| TCL Technology Group Corp. (A Shares) | | 48,400 | 25,914 |
| TCL Zhonghuan Renewable Energy Technology Co. Ltd. (A Shares) | | 11,000 | 59,497 |
| Thunder Software Technology Co. Ltd. (A Shares) | | 1,700 | 22,985 |
| Tianjin 712 Communication & Broadcasting Co. Ltd. | | 1,900 | 10,248 |
| Tianma Microelectronics Co. Ltd. (A Shares) | | 13,200 | 15,978 |
| Tianqi Lithium Corp. (A Shares) (a) | | 5,300 | 69,344 |
| Tianshan Aluminum Group Co. Ltd. | | 12,200 | 10,424 |
| Tianshui Huatian Technology Co. Ltd. (A Shares) | | 14,800 | 17,875 |
| Tibet Summit Industrial Co. Ltd. (A Shares) (a) | | 2,500 | 7,172 |
| Titan Wind Energy Suzhou Co. Ltd. (A Shares) | | 4,900 | 7,877 |
| Toly Bread Co. Ltd. | | 4,368 | 6,735 |
| TongFu Microelectronics Co. Ltd. (A Shares) (a) | | 3,400 | 8,767 |
| Tongkun Group Co. Ltd. (A Shares) | | 9,400 | 15,575 |
| Tongling Nonferrous Metals Group Co. Ltd. (A Shares) | | 33,000 | 11,387 |
| Tongwei Co. Ltd. (A Shares) | | 15,200 | 90,539 |
| Topchoice Medical Corp. (a) | | 1,300 | 21,762 |
| Transfar Zhilian Co. Ltd. | | 8,400 | 5,671 |
| TravelSky Technology Ltd. (H Shares) | | 51,000 | 74,067 |
| Trina Solar Co. Ltd. (A Shares) | | 7,157 | 65,103 |
| Tsingtao Brewery Co. Ltd.: | | | |
| (A Shares) | | 500 | 5,601 |
| (H Shares) | | 40,000 | 280,267 |
| Unigroup Guoxin Microelectronics Co. Ltd. | | 2,799 | 62,899 |
| Unisplendour Corp. Ltd. (A Shares) | | 10,220 | 24,000 |
| Walvax Biotechnology Co. Ltd. (A Shares) | | 5,400 | 28,431 |
| Wanhua Chemical Group Co. Ltd. (A Shares) | | 11,300 | 124,343 |
| Weichai Power Co. Ltd.: | | | |
| (A Shares) | | 22,700 | 28,224 |
| (H Shares) | | 118,000 | 113,045 |
| Weihai Guangwei Composites Co. Ltd. (A Shares) | | 2,200 | 23,377 |
| Wens Foodstuffs Group Co. Ltd. (A Shares) (a) | | 23,060 | 56,522 |
| Western Mining Co. Ltd. (A Shares) | | 7,900 | 10,244 |
| Western Securities Co. Ltd. (A Shares) | | 13,000 | 10,627 |
| Western Superconducting Technologies Co. Ltd. (A Shares) | | 1,645 | 26,278 |
| Westone Information Industry, Inc. (A Shares) | | 2,200 | 10,941 |
| Will Semiconductor Ltd. | | 4,050 | 40,689 |
| Wingtech Technology Co. Ltd. (A Shares) | | 4,100 | 26,881 |
| Winning Health Technology Group Co. Ltd. (A Shares) | | 10,090 | 13,374 |
| Wuchan Zhongda Group Co. Ltd. | | 14,500 | 8,280 |
| Wuhan Guide Infrared Co. Ltd. (A Shares) | | 13,531 | 21,511 |
| Wuliangye Yibin Co. Ltd. (A Shares) | | 13,700 | 250,442 |
| WUS Printed Circuit Kunshan Co. Ltd. (A Shares) | | 5,140 | 7,665 |
| WuXi AppTec Co. Ltd. | | 7,860 | 82,228 |
| WuXi AppTec Co. Ltd. (H Shares) (b) | | 22,964 | 184,013 |
| Wuxi Shangji Automation Co. Ltd. (A Shares) | | 1,620 | 27,170 |
| XCMG Construction Machinery Co. Ltd. (A Shares) | | 21,600 | 13,694 |
| Xiamen C&D, Inc. (A Shares) | | 8,700 | 14,284 |
| Xiamen Faratronic Co. Ltd. (A Shares) | | 900 | 21,827 |
| Xiamen Intretech, Inc. | | 1,620 | 3,820 |
| Xiamen Tungsten Co. Ltd. (A Shares) | | 6,000 | 16,498 |
| Xinjiang Goldwind Science & Technology Co. Ltd.: | | | |
| (A Shares) | | 7,536 | 10,784 |
| (H Shares) | | 61,616 | 53,455 |
| Xinjiang Zhongtai Chemical Co. Ltd. (A Shares) | | 6,800 | 5,475 |
| Yangzhou Yangjie Electronic Technology Co. Ltd. (A Shares) | | 1,600 | 11,257 |
| Yankuang Energy Group Co. Ltd.: | | | |
| (A Shares) | | 12,100 | 67,269 |
| (H Shares) | | 84,000 | 236,495 |
| Yantai Jereh Oilfield Services (A Shares) | | 3,100 | 12,760 |
| Yealink Network Technology Corp. Ltd. | | 2,950 | 27,824 |
| Yifeng Pharmacy Chain Co. Ltd. | | 2,100 | 16,143 |
| Yihai Kerry Arawana Holdings Co. Ltd. (A Shares) | | 5,000 | 26,188 |
| Yintai Gold Co. Ltd. (A Shares) | | 8,120 | 15,878 |
| YongXing Special Materials Technology Co. Ltd. (A Shares) | | 1,500 | 23,923 |
| Yonyou Network Technology Co. Ltd. (A Shares) | | 13,020 | 43,573 |
| Youngor Group Co. Ltd. (A Shares) | | 20,800 | 17,032 |
| Youngy Co. Ltd. (A Shares) (a) | | 700 | 10,562 |
| YTO Express Group Co. Ltd. (A Shares) | | 11,100 | 28,666 |
| Yuan Longping High-tech Agriculture Co. Ltd. (A Shares) (a) | | 3,500 | 6,959 |
| Yunda Holding Co. Ltd. (A Shares) | | 10,180 | 18,372 |
| Yunnan Aluminium Co. Ltd. (A Shares) | | 12,100 | 15,194 |
| Yunnan Baiyao Group Co. Ltd. (A Shares) | | 5,800 | 43,332 |
| Yunnan Botanee Bio-Technology Group Co., Ltd. (A Shares) | | 900 | 17,623 |
| Yunnan Energy New Material Co. Ltd. | | 3,000 | 60,814 |
| Yunnan Tin Co. Ltd. (A Shares) | | 4,300 | 6,718 |
| Yunnan Yuntianhua Co. Ltd. (Series A) (a) | | 7,000 | 19,324 |
| Zangge Mining Co. Ltd. (Series A) | | 6,100 | 22,678 |
| Zhangzhou Pientzehuang Pharmaceutical Co. Ltd. (A Shares) | | 2,200 | 68,685 |
| Zhaojin Mining Industry Co. Ltd. (H Shares) (a) | | 71,500 | 59,024 |
| Zhefu Holding Group Co. Ltd. (A Shares) | | 15,500 | 8,299 |
| Zhejiang Century Huatong Group Co. Ltd. (A Shares) (a) | | 21,840 | 11,035 |
| Zhejiang China Commodities City Group Co. Ltd. (A Shares) | | 23,100 | 13,254 |
| Zhejiang Chint Electric Co. Ltd. (A Shares) | | 7,000 | 24,346 |
| Zhejiang Dahua Technology Co. Ltd. (A Shares) | | 13,200 | 20,931 |
| Zhejiang Dingli Machinery Co. Ltd. (A Shares) | | 1,600 | 9,844 |
| Zhejiang Expressway Co. Ltd. (H Shares) | | 78,000 | 48,392 |
| Zhejiang HangKe Technology, Inc. Co. (A Shares) | | 1,109 | 7,600 |
| Zhejiang Huahai Pharmaceutical Co. Ltd. (A Shares) | | 5,290 | 14,531 |
| Zhejiang Huayou Cobalt Co. Ltd. (A Shares) | | 5,840 | 43,567 |
| Zhejiang Jingsheng Mechanical & Electrical Co. Ltd. (A Shares) | | 4,300 | 41,958 |
| Zhejiang Jiuzhou Pharmaceutical Co. Ltd. (A Shares) | | 2,500 | 12,160 |
| Zhejiang Juhua Co. Ltd. (A Shares) | | 11,400 | 24,477 |
| Zhejiang NHU Co. Ltd. (A Shares) | | 10,632 | 26,089 |
| Zhejiang Orient Gene Biotech Co. Ltd. (A Shares) | | 574 | 6,492 |
| Zhejiang Semir Garment Co. Ltd. (A Shares) | | 8,300 | 5,092 |
| Zhejiang Supor Cookware Co. Ltd. | | 1,700 | 9,314 |
| Zhejiang Weiming Enviroment Protection Co. Ltd. (A Shares) | | 6,240 | 16,175 |
| Zhejiang Weixing New Building Materials Co. Ltd. (A Shares) | | 5,900 | 14,057 |
| Zhejiang Wolwo Bio-Pharmaceutical Co. Ltd. | | 2,300 | 14,802 |
| Zhejiang Yongtai Technology Co. Ltd. (A Shares) | | 2,400 | 7,171 |
| Zheshang Securities Co. Ltd. | | 16,700 | 23,256 |
| ZhongAn Online P & C Insurance Co. Ltd. (H Shares) (a)(b) | | 42,700 | 79,529 |
| Zhongji Innolight Co. Ltd. (A Shares) | | 1,900 | 7,618 |
| Zhongtai Securities Co. Ltd. (A Shares) | | 15,500 | 13,499 |
| Zhuzhou CRRC Times Electric Co. Ltd.: | | | |
| (A Shares) | | 2,148 | 18,465 |
| (H Shares) | | 31,900 | 138,375 |
| Zhuzhou Hongda Electronics Corp. Ltd. (A Shares) | | 1,700 | 10,324 |
| Zhuzhou Kibing Group Co. Ltd. (A Shares) | | 8,200 | 8,814 |
| Zibo Qixiang Tengda Chemical Co. Ltd. (A Shares) (a) | | 7,300 | 6,777 |
| Zijin Mining Group Co. Ltd.: | | | |
| (A Shares) | | 72,100 | 78,193 |
| (H Shares) | | 358,000 | 342,053 |
| Zoomlion Heavy Industry Science and Technology Co. Ltd.: | | | |
| (A Shares) | | 25,800 | 18,901 |
| (H Shares) | | 98,400 | 31,715 |
| ZTE Corp. (H Shares) | | 65,600 | 116,999 |
TOTAL CHINA | | | 38,046,056 |
| Colombia - 0.0% | | | |
| Bancolombia SA | | 15,748 | 113,197 |
| Ecopetrol SA | | 280,740 | 139,269 |
| Interconexion Electrica SA ESP | | 25,037 | 97,689 |
TOTAL COLOMBIA | | | 350,155 |
| Cyprus - 0.0% | | | |
| Galaxy Cosmos Mezz PLC (a) | | 4,640 | 749 |
| Ozon Holdings PLC ADR (a)(c) | | 2,304 | 7,238 |
| TCS Group Holding PLC unit (a)(c) | | 6,170 | 11,782 |
TOTAL CYPRUS | | | 19,769 |
| Czech Republic - 0.0% | | | |
| CEZ A/S | | 9,744 | 318,663 |
| Komercni Banka A/S | | 4,501 | 129,117 |
| MONETA Money Bank A/S (b) | | 19,849 | 57,941 |
TOTAL CZECH REPUBLIC | | | 505,721 |
| Denmark - 1.7% | | | |
| A.P. Moller - Maersk A/S: | | | |
| Series A | | 190 | 380,287 |
| Series B | | 304 | 635,109 |
| Carlsberg A/S Series B | | 5,849 | 688,695 |
| Chr. Hansen Holding A/S | | 6,375 | 354,074 |
| Coloplast A/S Series B | | 7,116 | 793,222 |
| Danske Bank A/S | | 40,975 | 661,317 |
| Demant A/S (a) | | 5,763 | 157,493 |
| DSV A/S | | 11,285 | 1,527,773 |
| Genmab A/S (a) | | 4,003 | 1,541,987 |
| GN Store Nord A/S | | 7,517 | 159,832 |
| Novo Nordisk A/S Series B | | 99,874 | 10,859,426 |
| Novozymes A/S Series B | | 12,356 | 648,935 |
| ORSTED A/S (b) | | 11,453 | 944,938 |
| Pandora A/S | | 5,631 | 296,785 |
| Rockwool International A/S Series B | | 531 | 105,717 |
| Tryg A/S | | 21,099 | 456,604 |
| Vestas Wind Systems A/S | | 61,111 | 1,204,722 |
TOTAL DENMARK | | | 21,416,916 |
| Egypt - 0.0% | | | |
| Commercial International Bank SAE | | 162,292 | 217,508 |
| Commercial International Bank SAE sponsored GDR | | 1,083 | 1,375 |
| Eastern Co. SAE | | 53,960 | 26,539 |
| EFG-Hermes Holding SAE | | 49,089 | 27,210 |
TOTAL EGYPT | | | 272,632 |
| Finland - 0.8% | | | |
| Elisa Corp. (A Shares) | | 8,713 | 421,146 |
| Fortum Corp. | | 27,427 | 386,107 |
| Kesko Oyj | | 16,783 | 326,740 |
| Kone OYJ (B Shares) | | 20,385 | 834,680 |
| Neste OYJ | | 25,587 | 1,121,197 |
| Nokia Corp. | | 326,511 | 1,450,988 |
| Nordea Bank ABP | | 205,347 | 1,962,487 |
| Orion Oyj (B Shares) | | 6,280 | 288,899 |
| Sampo Oyj (A Shares) | | 28,615 | 1,308,742 |
| Stora Enso Oyj (R Shares) | | 33,669 | 438,876 |
| UPM-Kymmene Corp. | | 32,157 | 1,077,631 |
| Wartsila Corp. | | 27,943 | 190,541 |
TOTAL FINLAND | | | 9,808,034 |
| France - 6.6% | | | |
| Accor SA (a) | | 9,811 | 235,086 |
| Aeroports de Paris SA (a) | | 1,738 | 235,394 |
| Air Liquide SA | | 31,483 | 4,118,410 |
| Alstom SA | | 19,122 | 393,555 |
| Amundi SA (b) | | 3,624 | 171,120 |
| Arkema SA | | 3,620 | 286,627 |
| AXA SA | | 112,495 | 2,778,054 |
| bioMerieux SA | | 2,466 | 218,211 |
| BNP Paribas SA | | 67,001 | 3,141,940 |
| Bollore SA | | 51,644 | 258,503 |
| Bouygues SA | | 14,020 | 400,007 |
| Bureau Veritas SA | | 18,013 | 446,280 |
| Capgemini SA | | 9,902 | 1,622,847 |
| Carrefour SA | | 36,268 | 583,750 |
| Compagnie de St. Gobain | | 30,414 | 1,243,354 |
| Compagnie Generale des Etablissements Michelin SCA Series B | | 40,524 | 1,032,716 |
| Covivio | | 2,730 | 146,227 |
| Credit Agricole SA | | 72,744 | 660,054 |
| Danone SA | | 38,766 | 1,926,652 |
| Dassault Aviation SA | | 1,643 | 244,204 |
| Dassault Systemes SA | | 40,218 | 1,348,058 |
| Edenred SA | | 14,993 | 769,883 |
| Eiffage SA | | 5,131 | 464,173 |
| Electricite de France SA | | 33,681 | 397,759 |
| Engie SA | | 110,081 | 1,430,323 |
| EssilorLuxottica SA | | 17,330 | 2,746,214 |
| Eurazeo SA | | 2,501 | 142,859 |
| Gecina SA | | 2,886 | 257,401 |
| Getlink SE | | 27,440 | 434,695 |
| Hermes International SCA | | 1,909 | 2,472,349 |
| Ipsen SA | | 2,317 | 238,137 |
| Kering SA | | 4,514 | 2,067,237 |
| Klepierre SA | | 12,606 | 253,518 |
| L'Oreal SA | | 14,579 | 4,577,870 |
| La Francaise des Jeux SAEM (b) | | 5,955 | 194,206 |
| Legrand SA | | 16,353 | 1,246,176 |
| LVMH Moet Hennessy Louis Vuitton SE | | 16,706 | 10,541,401 |
| Orange SA | | 120,943 | 1,152,335 |
| Pernod Ricard SA | | 12,646 | 2,220,790 |
| Publicis Groupe SA | | 14,010 | 784,622 |
| Remy Cointreau SA | | 1,439 | 220,566 |
| Renault SA (a) | | 11,910 | 366,873 |
| Safran SA | | 20,821 | 2,318,834 |
| Sanofi SA | | 68,745 | 5,916,048 |
| Sartorius Stedim Biotech | | 1,675 | 531,688 |
| Schneider Electric SA | | 32,794 | 4,147,012 |
| SEB SA | | 1,477 | 96,191 |
| Societe Generale Series A | | 48,184 | 1,105,198 |
| Sodexo SA | | 5,495 | 487,327 |
| Teleperformance | | 3,500 | 938,393 |
| Thales SA | | 6,411 | 815,084 |
| TotalEnergies SE | | 149,776 | 8,170,785 |
| Ubisoft Entertainment SA (a) | | 5,779 | 158,597 |
| Valeo SA | | 12,148 | 200,368 |
| Veolia Environnement SA | | 39,885 | 890,075 |
| VINCI SA | | 32,117 | 2,955,953 |
| Vivendi SA | | 44,550 | 364,641 |
| Wendel SA | | 1,562 | 122,411 |
| Worldline SA (a)(b) | | 14,517 | 633,616 |
TOTAL FRANCE | | | 84,322,657 |
| Germany - 4.5% | | | |
| adidas AG | | 10,539 | 1,028,766 |
| Allianz SE | | 24,601 | 4,425,831 |
| BASF AG | | 55,710 | 2,499,745 |
| Bayer AG | | 59,427 | 3,124,736 |
| Bayerische Motoren Werke AG (BMW) | | 19,272 | 1,512,697 |
| Bechtle AG | | 4,802 | 166,095 |
| Beiersdorf AG | | 6,141 | 589,507 |
| Brenntag SE | | 9,485 | 575,515 |
| Carl Zeiss Meditec AG | | 2,449 | 296,598 |
| Commerzbank AG (a) | | 64,819 | 518,609 |
| Continental AG | | 6,901 | 357,442 |
| Covestro AG (b) | | 11,690 | 396,829 |
| Daimler Truck Holding AG (a) | | 27,482 | 733,295 |
| Delivery Hero AG (a)(b) | | 9,952 | 327,510 |
| Deutsche Bank AG | | 125,310 | 1,196,271 |
| Deutsche Borse AG | | 11,435 | 1,859,557 |
| Deutsche Lufthansa AG (a) | | 34,537 | 236,130 |
| Deutsche Post AG | | 60,111 | 2,124,914 |
| Deutsche Telekom AG | | 195,488 | 3,689,934 |
| E.ON SE | | 136,259 | 1,141,032 |
| Evonik Industries AG | | 13,441 | 247,796 |
| Fresenius Medical Care AG & Co. KGaA | | 12,509 | 346,006 |
| Fresenius SE & Co. KGaA | | 24,830 | 571,417 |
| GEA Group AG | | 9,225 | 322,728 |
| Hannover Reuck SE | | 3,657 | 595,592 |
| HeidelbergCement AG | | 8,688 | 399,533 |
| HelloFresh AG (a) | | 9,656 | 193,332 |
| Henkel AG & Co. KGaA | | 6,116 | 359,040 |
| Infineon Technologies AG | | 79,241 | 1,922,821 |
| KION Group AG | | 4,262 | 94,490 |
| Knorr-Bremse AG | | 4,507 | 202,909 |
| LEG Immobilien AG | | 4,391 | 286,922 |
| Mercedes-Benz Group AG (Germany) | | 48,616 | 2,813,971 |
| Merck KGaA | | 7,827 | 1,275,528 |
| MTU Aero Engines AG | | 3,369 | 603,456 |
| Muenchener Rueckversicherungs-Gesellschaft AG in Muenchen | | 8,449 | 2,230,334 |
| Nemetschek SE | | 3,408 | 162,874 |
| Puma AG | | 6,341 | 280,802 |
| Rational AG | | 301 | 169,852 |
| Rheinmetall AG | | 2,667 | 433,567 |
| RWE AG | | 38,865 | 1,497,541 |
| SAP SE | | 62,908 | 6,055,076 |
| Scout24 AG (b) | | 4,694 | 240,663 |
| Siemens AG | | 46,274 | 5,053,539 |
| Siemens Energy AG | | 27,325 | 319,051 |
| Siemens Healthineers AG (b) | | 17,018 | 779,638 |
| Symrise AG | | 7,957 | 812,191 |
| Telefonica Deutschland Holding AG | | 59,176 | 129,008 |
| Uniper SE | | 5,030 | 15,072 |
| United Internet AG | | 5,557 | 103,931 |
| Volkswagen AG | | 1,799 | 307,507 |
| Vonovia SE | | 42,600 | 941,912 |
| Zalando SE (a)(b) | | 13,101 | 301,954 |
TOTAL GERMANY | | | 56,871,066 |
| Greece - 0.1% | | | |
| Alpha Bank SA (a) | | 125,291 | 116,142 |
| Eurobank Ergasias Services and Holdings SA (a) | | 158,535 | 156,672 |
| Ff Group (a)(c) | | 256 | 304 |
| Hellenic Telecommunications Organization SA | | 11,428 | 179,570 |
| Jumbo SA | | 7,698 | 109,473 |
| Mytilineos SA | | 5,062 | 84,943 |
| National Bank of Greece SA (a) | | 28,506 | 103,388 |
| OPAP SA | | 11,927 | 146,157 |
| Public Power Corp. of Greece (a) | | 13,614 | 85,971 |
TOTAL GREECE | | | 982,620 |
| Hong Kong - 1.5% | | | |
| AIA Group Ltd. | | 727,600 | 5,511,420 |
| Beijing Enterprises Holdings Ltd. | | 33,000 | 83,744 |
| BOC Hong Kong (Holdings) Ltd. | | 222,000 | 690,069 |
| BYD Electronic International Co. Ltd. | | 38,500 | 111,827 |
| China Everbright International Ltd. | | 214,888 | 71,450 |
| China Jinmao Holdings Group Ltd. | | 324,000 | 42,927 |
| China Merchants Holdings International Co. Ltd. | | 74,257 | 87,031 |
| China Overseas Land and Investment Ltd. | | 228,000 | 435,107 |
| China Power International Development Ltd. | | 305,805 | 88,434 |
| China Resources Beer Holdings Co. Ltd. | | 98,000 | 461,931 |
| China Resources Power Holdings Co. Ltd. | | 114,000 | 165,852 |
| China Taiping Insurance Group Ltd. | | 78,400 | 54,333 |
| China Traditional Chinese Medicine Holdings Co. Ltd. | | 172,000 | 74,281 |
| CITIC Pacific Ltd. | | 369,000 | 330,470 |
| CLP Holdings Ltd. | | 98,500 | 661,113 |
| CSPC Pharmaceutical Group Ltd. | | 563,760 | 579,073 |
| Far East Horizon Ltd. | | 110,000 | 84,921 |
| Fosun International Ltd. | | 149,000 | 91,112 |
| Galaxy Entertainment Group Ltd. | | 132,000 | 602,855 |
| Ganfeng Lithium Group Co. Ltd. (H Shares) (b) | | 12,460 | 84,287 |
| Guangdong Investment Ltd. | | 176,000 | 110,986 |
| Hang Lung Properties Ltd. | | 117,000 | 147,182 |
| Hang Seng Bank Ltd. | | 46,500 | 654,617 |
| Henderson Land Development Co. Ltd. | | 85,010 | 208,127 |
| Hong Kong & China Gas Co. Ltd. | | 687,865 | 530,186 |
| Hong Kong Exchanges and Clearing Ltd. | | 72,949 | 1,936,330 |
| Hua Hong Semiconductor Ltd. (a)(b) | | 33,000 | 77,270 |
| Lenovo Group Ltd. | | 424,000 | 339,215 |
| Link (REIT) | | 130,069 | 768,850 |
| MMG Ltd. (a) | | 164,000 | 32,384 |
| MTR Corp. Ltd. | | 93,445 | 411,295 |
| New World Development Co. Ltd. | | 88,267 | 180,590 |
| Power Assets Holdings Ltd. | | 85,000 | 406,610 |
| Sino Land Ltd. | | 202,824 | 216,786 |
| Sinotruk Hong Kong Ltd. | | 43,500 | 38,792 |
| Sun Hung Kai Properties Ltd. | | 88,500 | 951,050 |
| Swire Pacific Ltd. (A Shares) | | 31,000 | 205,162 |
| Swire Properties Ltd. | | 66,400 | 127,561 |
| Techtronic Industries Co. Ltd. | | 83,500 | 790,642 |
| Wharf Holdings Ltd. | | 76,000 | 217,360 |
| Yuexiu Property Co. Ltd. | | 84,800 | 72,380 |
TOTAL HONG KONG | | | 18,735,612 |
| Hungary - 0.0% | | | |
| MOL Hungarian Oil and Gas PLC Series A (For. Reg.) | | 24,271 | 145,532 |
| OTP Bank PLC | | 13,667 | 297,906 |
| Richter Gedeon PLC | | 8,057 | 159,091 |
TOTAL HUNGARY | | | 602,529 |
| India - 4.3% | | | |
| ACC Ltd. | | 4,475 | 129,217 |
| Adani Enterprises Ltd. | | 17,342 | 701,274 |
| Adani Green Energy Ltd. (a) | | 19,209 | 487,975 |
| Adani Ports & Special Economic Zone Ltd. | | 31,218 | 310,577 |
| Adani Power Ltd. (a) | | 47,234 | 191,093 |
| Adani Total Gas Ltd. | | 16,534 | 719,612 |
| Adani Transmissions Ltd. (a) | | 16,720 | 676,374 |
| Ambuja Cements Ltd. | | 37,614 | 242,165 |
| Apollo Hospitals Enterprise Ltd. | | 6,035 | 329,344 |
| Asian Paints Ltd. | | 22,914 | 860,230 |
| AU Small Finance Bank Ltd. (b) | | 10,166 | 72,401 |
| Aurobindo Pharma Ltd. | | 15,801 | 102,722 |
| Avenue Supermarts Ltd. (a)(b) | | 9,924 | 518,007 |
| Axis Bank Ltd. | | 139,003 | 1,521,342 |
| Bajaj Auto Ltd. | | 4,328 | 191,976 |
| Bajaj Finance Ltd. | | 16,582 | 1,431,064 |
| Bajaj Finserv Ltd. | | 23,581 | 480,707 |
| Balkrishna Industries Ltd. | | 4,421 | 104,824 |
| Bandhan Bank Ltd. (a)(b) | | 36,520 | 105,241 |
| Berger Paints India Ltd. | | 14,521 | 102,759 |
| Bharat Electronics Ltd. | | 211,455 | 272,940 |
| Bharat Forge Ltd. | | 16,296 | 164,220 |
| Bharat Petroleum Corp. Ltd. | | 49,121 | 180,184 |
| Bharti Airtel Ltd. | | 134,784 | 1,354,679 |
| Biocon Ltd. | | 24,910 | 81,203 |
| Britannia Industries Ltd. | | 6,378 | 290,204 |
| Cholamandalam Investment and Finance Co. Ltd. | | 24,258 | 207,869 |
| Cipla Ltd./India | | 28,946 | 408,209 |
| Coal India Ltd. | | 90,372 | 268,507 |
| Colgate-Palmolive Ltd. | | 6,843 | 134,888 |
| Container Corp. of India Ltd. | | 16,273 | 156,872 |
| Dabur India Ltd. | | 35,817 | 240,006 |
| Divi's Laboratories Ltd. | | 8,097 | 352,999 |
| DLF Ltd. | | 38,327 | 178,486 |
| Dr. Reddy's Laboratories Ltd. | | 7,023 | 378,014 |
| Eicher Motors Ltd. | | 8,058 | 374,812 |
| GAIL India Ltd. | | 184,413 | 203,393 |
| Godrej Consumer Products Ltd. (a) | | 23,651 | 236,939 |
| Godrej Properties Ltd. (a) | | 7,362 | 112,324 |
| Grasim Industries Ltd. | | 15,419 | 320,692 |
| Havells India Ltd. | | 14,630 | 214,961 |
| HCL Technologies Ltd. | | 66,642 | 838,177 |
| HDFC Standard Life Insurance Co. Ltd. (b) | | 55,853 | 364,650 |
| Hero Motocorp Ltd. | | 6,460 | 208,896 |
| Hindalco Industries Ltd. | | 80,506 | 394,507 |
| Hindustan Petroleum Corp. Ltd. | | 35,791 | 92,461 |
| Hindustan Unilever Ltd. | | 50,164 | 1,545,703 |
| Housing Development Finance Corp. Ltd. | | 104,525 | 3,118,577 |
| ICICI Bank Ltd. | | 311,670 | 3,426,817 |
| ICICI Lombard General Insurance Co. Ltd. (b) | | 13,685 | 193,413 |
| ICICI Prudential Life Insurance Co. Ltd. (b) | | 20,303 | 124,484 |
| Indian Oil Corp. Ltd. | | 163,600 | 134,884 |
| Indian Railway Catering & Tourism Corp. Ltd. | | 14,494 | 129,777 |
| Indraprastha Gas Ltd. | | 20,882 | 108,030 |
| Indus Towers Ltd. | | 39,045 | 87,495 |
| Info Edge India Ltd. | | 4,201 | 199,022 |
| Infosys Ltd. | | 203,743 | 3,784,555 |
| InterGlobe Aviation Ltd. (a)(b) | | 5,368 | 115,537 |
| ITC Ltd. | | 180,810 | 761,639 |
| Jindal Steel & Power Ltd. | | 25,991 | 144,382 |
| JSW Steel Ltd. (a) | | 42,406 | 345,247 |
| Jubilant Foodworks Ltd. | | 23,259 | 171,380 |
| Kotak Mahindra Bank Ltd. | | 34,047 | 782,263 |
| Larsen & Toubro Infotech Ltd. (b) | | 2,988 | 171,088 |
| Larsen & Toubro Ltd. | | 41,177 | 1,006,344 |
| Lupin Ltd. | | 12,568 | 106,125 |
| Mahindra & Mahindra Ltd. | | 52,302 | 852,071 |
| Marico Ltd. | | 30,791 | 195,113 |
| Maruti Suzuki India Ltd. | | 7,259 | 835,478 |
| MindTree Consulting Ltd. | | 3,435 | 141,240 |
| Mphasis BFL Ltd. | | 5,423 | 129,614 |
| MRF Ltd. | | 116 | 127,192 |
| Muthoot Finance Ltd. | | 6,791 | 85,601 |
| Nestle India Ltd. | | 1,976 | 486,085 |
| NTPC Ltd. | | 241,698 | 505,411 |
| Oil & Natural Gas Corp. Ltd. | | 147,706 | 239,188 |
| Page Industries Ltd. | | 355 | 213,432 |
| Petronet LNG Ltd. | | 42,943 | 106,631 |
| PI Industries Ltd. | | 4,270 | 167,228 |
| Pidilite Industries Ltd. | | 9,397 | 293,375 |
| Piramal Enterprises Ltd. | | 7,069 | 72,535 |
| Piramal Pharma Ltd. (a) | | 26,572 | 52,932 |
| Power Grid Corp. of India Ltd. | | 186,026 | 512,706 |
| Reliance Industries Ltd. | | 183,941 | 5,665,329 |
| Samvardhana Motherson International Ltd. | | 123,787 | 96,452 |
| SBI Cards & Payment Services Ltd. | | 13,606 | 135,871 |
| SBI Life Insurance Co. Ltd. (b) | | 26,919 | 411,671 |
| Shree Cement Ltd. | | 652 | 179,111 |
| Shriram Transport Finance Co. Ltd. | | 10,813 | 160,556 |
| Siemens Ltd. | | 4,298 | 151,899 |
| SRF Ltd. | | 8,765 | 270,918 |
| State Bank of India | | 109,402 | 758,334 |
| Sun Pharmaceutical Industries Ltd. | | 57,015 | 700,393 |
| Tata Consultancy Services Ltd. | | 55,414 | 2,137,536 |
| Tata Consumer Products Ltd. | | 35,483 | 330,119 |
| Tata Elxsi Ltd. | | 2,099 | 177,389 |
| Tata Motors Ltd. (a) | | 97,395 | 487,627 |
| Tata Power Co. Ltd./The | | 87,579 | 239,102 |
| Tata Steel Ltd. | | 449,658 | 551,616 |
| Tech Mahindra Ltd. | | 34,805 | 447,108 |
| Titan Co. Ltd. | | 21,757 | 725,803 |
| Torrent Pharmaceuticals Ltd. | | 6,058 | 120,750 |
| Trent Ltd. | | 10,274 | 189,631 |
| Ultratech Cement Ltd. | | 5,999 | 486,627 |
| United Spirits Ltd. (a) | | 16,970 | 183,753 |
| UPL Ltd. | | 29,635 | 261,409 |
| Vedanta Ltd. | | 42,770 | 145,081 |
| Wipro Ltd. | | 80,507 | 376,717 |
| Yes Bank Ltd. (a) | | 640,315 | 120,281 |
| Zomato Ltd. (a) | | 133,334 | 101,635 |
TOTAL INDIA | | | 54,395,308 |
| Indonesia - 0.6% | | | |
| PT Adaro Energy Tbk | | 876,400 | 223,630 |
| PT Adaro Minerals Indonesia Tbk | | 448,300 | 49,723 |
| PT Aneka Tambang Tbk | | 468,600 | 55,430 |
| PT Astra International Tbk | | 1,240,600 | 528,930 |
| PT Bank Central Asia Tbk | | 3,360,800 | 1,896,140 |
| PT Bank Jago Tbk (a) | | 233,600 | 76,381 |
| PT Bank Mandiri (Persero) Tbk | | 1,137,100 | 769,124 |
| PT Bank Negara Indonesia (Persero) Tbk | | 465,300 | 280,418 |
| PT Bank Rakyat Indonesia (Persero) Tbk | | 4,145,510 | 1,235,879 |
| PT Barito Pacific Tbk | | 1,619,400 | 85,655 |
| PT Charoen Pokphand Indonesia Tbk | | 440,600 | 157,483 |
| PT Gudang Garam Tbk | | 36,500 | 56,397 |
| PT Indah Kiat Pulp & Paper Tbk | | 165,100 | 101,616 |
| PT Indofood CBP Sukses Makmur Tbk | | 138,300 | 86,230 |
| PT Indofood Sukses Makmur Tbk | | 244,500 | 101,108 |
| PT Kalbe Farma Tbk | | 1,240,600 | 163,054 |
| PT Merdeka Copper Gold Tbk (a) | | 716,561 | 173,197 |
| PT Sarana Menara Nusantara Tbk | | 1,370,700 | 101,501 |
| PT Semen Indonesia (Persero) Tbk | | 166,700 | 84,967 |
| PT Sumber Alfaria Trijaya Tbk | | 1,048,400 | 189,549 |
| PT Telkom Indonesia Persero Tbk | | 3,036,500 | 852,804 |
| PT Tower Bersama Infrastructure Tbk | | 283,820 | 44,763 |
| PT Unilever Indonesia Tbk | | 453,800 | 134,998 |
| PT United Tractors Tbk | | 98,600 | 204,185 |
| PT Vale Indonesia Tbk (a) | | 152,100 | 63,385 |
TOTAL INDONESIA | | | 7,716,547 |
| Ireland - 0.5% | | | |
| CRH PLC | | 42,931 | 1,546,283 |
| CRH PLC sponsored ADR | | 3,255 | 117,864 |
| DCC PLC (United Kingdom) | | 5,796 | 321,708 |
| Flutter Entertainment PLC (a) | | 1,649 | 218,986 |
| Flutter Entertainment PLC (Ireland) (a) | | 8,543 | 1,130,467 |
| James Hardie Industries PLC CDI | | 27,290 | 595,822 |
| Kerry Group PLC Class A | | 9,489 | 825,220 |
| Kingspan Group PLC (Ireland) | | 9,171 | 463,132 |
| Smurfit Kappa Group PLC | | 15,104 | 500,486 |
TOTAL IRELAND | | | 5,719,968 |
| Isle of Man - 0.0% | | | |
| Entain PLC | | 36,596 | 529,419 |
| Israel - 0.5% | | | |
| Azrieli Group | | 2,487 | 184,472 |
| Bank Hapoalim BM (Reg.) | | 76,143 | 734,807 |
| Bank Leumi le-Israel BM | | 92,517 | 883,658 |
| Bezeq The Israel Telecommunication Corp. Ltd. | | 120,045 | 212,603 |
| Check Point Software Technologies Ltd. (a) | | 6,150 | 794,765 |
| CyberArk Software Ltd. (a) | | 2,515 | 394,629 |
| Elbit Systems Ltd. (Israel) | | 1,558 | 315,343 |
| Icl Group Ltd. | | 43,132 | 389,629 |
| Israel Discount Bank Ltd. (Class A) | | 75,236 | 428,393 |
| Kornit Digital Ltd. (a) | | 52 | 1,389 |
| Mizrahi Tefahot Bank Ltd. | | 9,321 | 352,682 |
| NICE Ltd. (a) | | 3,572 | 677,088 |
| Teva Pharmaceutical Industries Ltd. sponsored ADR (a) | | 67,589 | 602,894 |
| Tower Semiconductor Ltd. (a) | | 6,583 | 281,685 |
| Wix.com Ltd. (a) | | 3,534 | 297,209 |
| ZIM Integrated Shipping Services Ltd. (d) | | 5,311 | 124,755 |
TOTAL ISRAEL | | | 6,676,001 |
| Italy - 1.1% | | | |
| Amplifon SpA | | 7,721 | 191,825 |
| Assicurazioni Generali SpA | | 67,686 | 1,015,772 |
| Atlantia SpA | | 29,778 | 664,487 |
| DiaSorin SpA | | 1,586 | 207,362 |
| Enel SpA | | 492,998 | 2,202,394 |
| Eni SpA | | 153,815 | 2,020,165 |
| FinecoBank SpA | | 37,590 | 506,703 |
| Infrastrutture Wireless Italiane SpA (b) | | 21,795 | 192,386 |
| Intesa Sanpaolo SpA | | 1,003,101 | 1,912,443 |
| Mediobanca SpA | | 38,044 | 344,840 |
| Moncler SpA | | 12,580 | 543,162 |
| Nexi SpA (a)(b) | | 32,448 | 281,225 |
| Poste Italiane SpA (b) | | 33,830 | 294,875 |
| Prysmian SpA | | 15,731 | 512,868 |
| Recordati SpA | | 6,557 | 246,433 |
| Snam SpA | | 122,136 | 543,080 |
| Telecom Italia SpA (a) | | 572,552 | 112,016 |
| Terna - Rete Elettrica Nazionale | | 85,165 | 564,574 |
| UniCredit SpA | | 125,841 | 1,560,589 |
TOTAL ITALY | | | 13,917,199 |
| Japan - 13.4% | | | |
| Advantest Corp. | | 11,500 | 607,889 |
| AEON Co. Ltd. (d) | | 39,800 | 743,164 |
| AGC, Inc. | | 11,300 | 354,514 |
| Aisin Seiki Co. Ltd. | | 9,200 | 236,040 |
| Ajinomoto Co., Inc. | | 27,300 | 752,015 |
| Ana Holdings, Inc. (a) | | 9,500 | 184,704 |
| Asahi Group Holdings | | 27,300 | 764,499 |
| ASAHI INTECC Co. Ltd. | | 13,500 | 230,062 |
| Asahi Kasei Corp. | | 76,800 | 492,435 |
| Astellas Pharma, Inc. | | 111,500 | 1,538,498 |
| Azbil Corp. | | 7,300 | 198,584 |
| Bandai Namco Holdings, Inc. | | 12,000 | 794,270 |
| Bridgestone Corp. | | 34,400 | 1,244,126 |
| Brother Industries Ltd. | | 13,700 | 233,193 |
| Canon, Inc. | | 60,300 | 1,278,208 |
| Capcom Co. Ltd. | | 10,300 | 287,121 |
| Central Japan Railway Co. | | 8,700 | 1,007,256 |
| Chiba Bank Ltd. | | 31,200 | 170,588 |
| Chubu Electric Power Co., Inc. | | 37,600 | 306,221 |
| Chugai Pharmaceutical Co. Ltd. | | 40,900 | 947,729 |
| Concordia Financial Group Ltd. | | 63,800 | 194,367 |
| CyberAgent, Inc. | | 24,900 | 204,967 |
| Dai Nippon Printing Co. Ltd. | | 12,900 | 258,789 |
| Dai-ichi Mutual Life Insurance Co. | | 59,500 | 943,349 |
| Daifuku Co. Ltd. | | 6,200 | 284,367 |
| Daiichi Sankyo Kabushiki Kaisha | | 105,900 | 3,389,940 |
| Daikin Industries Ltd. | | 15,100 | 2,261,786 |
| Daito Trust Construction Co. Ltd. | | 3,700 | 366,031 |
| Daiwa House Industry Co. Ltd. | | 36,000 | 725,304 |
| Daiwa House REIT Investment Corp. | | 130 | 262,282 |
| Daiwa Securities Group, Inc. | | 77,900 | 303,857 |
| DENSO Corp. | | 26,200 | 1,299,937 |
| Dentsu Group, Inc. | | 12,600 | 392,757 |
| Disco Corp. | | 1,800 | 432,160 |
| East Japan Railway Co. | | 18,300 | 975,123 |
| Eisai Co. Ltd. | | 15,700 | 947,522 |
| ENEOS Holdings, Inc. | | 188,500 | 620,917 |
| FANUC Corp. | | 11,600 | 1,517,879 |
| Fast Retailing Co. Ltd. | | 3,500 | 1,953,428 |
| Fuji Electric Co. Ltd. | | 7,700 | 298,275 |
| FUJIFILM Holdings Corp. | | 21,900 | 1,004,312 |
| Fujitsu Ltd. | | 11,900 | 1,369,197 |
| GLP J-REIT | | 250 | 259,087 |
| GMO Payment Gateway, Inc. | | 2,600 | 187,619 |
| Hakuhodo DY Holdings, Inc. | | 14,900 | 125,858 |
| Hamamatsu Photonics K.K. | | 8,700 | 394,351 |
| Hankyu Hanshin Holdings, Inc. | | 13,900 | 412,714 |
| Hikari Tsushin, Inc. | | 1,300 | 157,107 |
| Hirose Electric Co. Ltd. | | 1,810 | 235,052 |
| Hitachi Construction Machinery Co. Ltd. | | 6,200 | 121,502 |
| Hitachi Ltd. | | 58,500 | 2,659,538 |
| Honda Motor Co. Ltd. | | 98,700 | 2,250,604 |
| Hoshizaki Corp. | | 6,300 | 180,702 |
| Hoya Corp. | | 22,100 | 2,062,191 |
| Hulic Co. Ltd. | | 23,000 | 167,053 |
| Ibiden Co. Ltd. | | 6,600 | 223,262 |
| Idemitsu Kosan Co. Ltd. | | 12,166 | 265,910 |
| Iida Group Holdings Co. Ltd. | | 8,500 | 118,101 |
| INPEX Corp. | | 63,500 | 640,867 |
| Isuzu Motors Ltd. | | 34,900 | 409,332 |
| ITO EN Ltd. | | 3,200 | 112,983 |
| Itochu Corp. | | 71,800 | 1,858,557 |
| ITOCHU Techno-Solutions Corp. | | 5,700 | 132,251 |
| Japan Airlines Co. Ltd. (a) | | 8,600 | 160,496 |
| Japan Exchange Group, Inc. | | 30,800 | 404,767 |
| Japan Post Bank Co. Ltd. | | 24,300 | 161,788 |
| Japan Post Holdings Co. Ltd. | | 142,100 | 955,265 |
| Japan Post Insurance Co. Ltd. | | 11,700 | 172,870 |
| Japan Real Estate Investment Corp. | | 73 | 305,854 |
| Japan Retail Fund Investment Corp. | | 410 | 301,927 |
| Japan Tobacco, Inc. | | 72,400 | 1,212,514 |
| JFE Holdings, Inc. | | 28,900 | 264,909 |
| JSR Corp. | | 11,200 | 213,462 |
| Kajima Corp. | | 24,400 | 229,896 |
| Kakaku.com, Inc. | | 7,500 | 127,156 |
| Kansai Electric Power Co., Inc. | | 43,300 | 328,183 |
| Kao Corp. | | 29,100 | 1,086,942 |
| KDDI Corp. | | 97,400 | 2,878,849 |
| Keio Corp. | | 6,500 | 228,185 |
| Keisei Electric Railway Co. | | 8,100 | 215,172 |
| Keyence Corp. | | 11,700 | 4,431,514 |
| Kikkoman Corp. | | 8,900 | 483,621 |
| Kintetsu Group Holdings Co. Ltd. | | 10,600 | 358,573 |
| Kirin Holdings Co. Ltd. | | 49,300 | 725,931 |
| Kobayashi Pharmaceutical Co. Ltd. | | 3,200 | 170,012 |
| Kobe Bussan Co. Ltd. | | 8,800 | 191,452 |
| Koei Tecmo Holdings Co. Ltd. | | 6,580 | 99,478 |
| Koito Manufacturing Co. Ltd. | | 12,400 | 176,291 |
| Komatsu Ltd. | | 55,800 | 1,093,133 |
| Konami Group Corp. | | 5,700 | 250,318 |
| Kose Corp. | | 2,100 | 210,007 |
| Kubota Corp. | | 61,100 | 853,251 |
| Kurita Water Industries Ltd. | | 6,500 | 238,676 |
| Kyocera Corp. | | 19,300 | 965,811 |
| Kyowa Hakko Kirin Co., Ltd. | | 15,800 | 372,434 |
| Lasertec Corp. | | 4,500 | 632,299 |
| LIXIL Group Corp. | | 17,400 | 263,408 |
| M3, Inc. | | 26,430 | 790,260 |
| Makita Corp. | | 13,900 | 254,002 |
| Marubeni Corp. | | 93,700 | 821,084 |
| Mazda Motor Corp. | | 33,200 | 223,534 |
| McDonald's Holdings Co. (Japan) Ltd. | | 5,100 | 176,980 |
| Meiji Holdings Co. Ltd. | | 7,000 | 288,107 |
| Minebea Mitsumi, Inc. | | 21,400 | 317,197 |
| Misumi Group, Inc. | | 17,500 | 374,256 |
| Mitsubishi Chemical Holdings Corp. | | 78,100 | 353,011 |
| Mitsubishi Corp. | | 76,300 | 2,068,431 |
| Mitsubishi Electric Corp. | | 117,300 | 1,032,077 |
| Mitsubishi Estate Co. Ltd. | | 70,500 | 886,559 |
| Mitsubishi Heavy Industries Ltd. | | 19,500 | 671,442 |
| Mitsubishi UFJ Financial Group, Inc. | | 720,400 | 3,403,062 |
| Mitsubishi UFJ Lease & Finance Co. Ltd. | | 38,300 | 164,332 |
| Mitsui & Co. Ltd. | | 84,400 | 1,869,123 |
| Mitsui Chemicals, Inc. | | 11,000 | 203,806 |
| Mitsui Fudosan Co. Ltd. | | 55,200 | 1,057,819 |
| Mitsui OSK Lines Ltd. | | 21,600 | 428,673 |
| Mizuho Financial Group, Inc. | | 144,610 | 1,561,879 |
| MonotaRO Co. Ltd. | | 14,700 | 224,215 |
| MS&AD Insurance Group Holdings, Inc. | | 26,700 | 707,048 |
| Murata Manufacturing Co. Ltd. | | 34,700 | 1,642,679 |
| NEC Corp. | | 14,600 | 483,574 |
| Nexon Co. Ltd. | | 30,100 | 505,462 |
| NGK Insulators Ltd. | | 13,600 | 158,870 |
| Nidec Corp. | | 27,100 | 1,490,067 |
| Nihon M&A Center Holdings, Inc. | | 17,800 | 201,469 |
| Nintendo Co. Ltd. | | 65,200 | 2,647,061 |
| Nippon Building Fund, Inc. | | 95 | 422,307 |
| Nippon Express Holdings, Inc. | | 4,800 | 241,138 |
| Nippon Paint Holdings Co. Ltd. | | 50,900 | 325,196 |
| Nippon Prologis REIT, Inc. | | 132 | 276,526 |
| Nippon Sanso Holdings Corp. | | 10,100 | 161,116 |
| Nippon Shinyaku Co. Ltd. | | 2,800 | 155,163 |
| Nippon Steel & Sumitomo Metal Corp. | | 49,000 | 673,072 |
| Nippon Telegraph & Telephone Corp. | | 72,000 | 1,985,811 |
| Nippon Yusen KK | | 29,100 | 527,131 |
| Nissan Chemical Corp. | | 7,500 | 337,940 |
| Nissan Motor Co. Ltd. | | 143,700 | 458,016 |
| Nisshin Seifun Group, Inc. | | 11,500 | 124,362 |
| Nissin Food Holdings Co. Ltd. | | 3,900 | 252,577 |
| Nitori Holdings Co. Ltd. | | 5,000 | 453,085 |
| Nitto Denko Corp. | | 8,740 | 460,232 |
| Nomura Holdings, Inc. | | 176,800 | 572,118 |
| Nomura Real Estate Holdings, Inc. | | 7,100 | 160,675 |
| Nomura Real Estate Master Fund, Inc. | | 249 | 283,839 |
| Nomura Research Institute Ltd. | | 20,000 | 444,534 |
| NTT Data Corp. | | 37,500 | 543,983 |
| Obayashi Corp. | | 41,000 | 263,324 |
| OBIC Co. Ltd. | | 4,200 | 631,857 |
| Odakyu Electric Railway Co. Ltd. | | 17,200 | 204,626 |
| Oji Holdings Corp. | | 45,900 | 159,282 |
| Olympus Corp. | | 74,600 | 1,575,332 |
| OMRON Corp. | | 11,400 | 533,296 |
| Ono Pharmaceutical Co. Ltd. | | 22,200 | 521,949 |
| Open House Group Co. Ltd. | | 4,900 | 174,653 |
| Oracle Corp. Japan | | 2,400 | 128,155 |
| Oriental Land Co. Ltd. | | 12,100 | 1,623,424 |
| ORIX Corp. | | 72,900 | 1,071,230 |
| Osaka Gas Co. Ltd. | | 22,600 | 334,680 |
| Otsuka Corp. | | 6,700 | 211,550 |
| Otsuka Holdings Co. Ltd. | | 23,500 | 753,281 |
| Pan Pacific International Holdings Ltd. | | 22,690 | 372,483 |
| Panasonic Holdings Corp. | | 131,700 | 938,048 |
| Persol Holdings Co. Ltd. | | 11,000 | 220,895 |
| Rakuten Group, Inc. | | 51,300 | 229,022 |
| Recruit Holdings Co. Ltd. | | 87,200 | 2,683,246 |
| Renesas Electronics Corp. (a) | | 71,100 | 594,805 |
| Resona Holdings, Inc. | | 131,800 | 496,106 |
| Ricoh Co. Ltd. | | 36,000 | 263,896 |
| ROHM Co. Ltd. | | 5,400 | 380,228 |
| SBI Holdings, Inc. Japan | | 14,000 | 253,082 |
| SCSK Corp. | | 9,300 | 137,409 |
| Secom Co. Ltd. | | 12,700 | 723,525 |
| Seiko Epson Corp. | | 17,400 | 237,079 |
| Sekisui Chemical Co. Ltd. | | 21,500 | 268,940 |
| Sekisui House Ltd. | | 37,800 | 629,174 |
| Seven & i Holdings Co. Ltd. | | 45,500 | 1,698,441 |
| SG Holdings Co. Ltd. | | 17,800 | 236,064 |
| Sharp Corp. | | 14,200 | 85,173 |
| Shimadzu Corp. | | 14,600 | 385,386 |
| SHIMANO, Inc. | | 4,400 | 680,870 |
| SHIMIZU Corp. | | 31,800 | 158,898 |
| Shin-Etsu Chemical Co. Ltd. | | 22,700 | 2,359,210 |
| Shionogi & Co. Ltd. | | 15,900 | 738,352 |
| Shiseido Co. Ltd. | | 23,900 | 828,572 |
| Shizuoka Financial Group | | 25,100 | 158,336 |
| SMC Corp. | | 3,500 | 1,404,908 |
| SoftBank Corp. | | 173,600 | 1,712,458 |
| SoftBank Group Corp. | | 73,000 | 3,133,614 |
| Sompo Holdings, Inc. | | 19,000 | 791,331 |
| Sony Group Corp. | | 76,200 | 5,138,521 |
| Square Enix Holdings Co. Ltd. | | 5,300 | 236,672 |
| Subaru Corp. | | 37,500 | 583,955 |
| Sumco Corp. | | 20,600 | 261,699 |
| Sumitomo Chemical Co. Ltd. | | 92,000 | 309,977 |
| Sumitomo Corp. | | 67,300 | 855,637 |
| Sumitomo Electric Industries Ltd. | | 42,600 | 445,209 |
| Sumitomo Metal Mining Co. Ltd. | | 15,000 | 420,463 |
| Sumitomo Mitsui Financial Group, Inc. | | 78,400 | 2,201,595 |
| Sumitomo Mitsui Trust Holdings, Inc. | | 20,400 | 586,888 |
| Sumitomo Realty & Development Co. Ltd. | | 18,100 | 415,693 |
| Suntory Beverage & Food Ltd. | | 8,200 | 274,629 |
| Suzuki Motor Corp. | | 22,100 | 746,104 |
| Sysmex Corp. | | 10,200 | 550,695 |
| T&D Holdings, Inc. | | 31,000 | 305,841 |
| Taisei Corp. | | 10,900 | 297,249 |
| Takeda Pharmaceutical Co. Ltd. | | 90,877 | 2,399,971 |
| TDK Corp. | | 23,276 | 728,671 |
| Terumo Corp. | | 39,200 | 1,192,648 |
| TIS, Inc. | | 13,800 | 372,622 |
| Tobu Railway Co. Ltd. | | 11,000 | 254,481 |
| Toho Co. Ltd. | | 6,600 | 235,247 |
| Tokio Marine Holdings, Inc. | | 109,400 | 1,979,861 |
| Tokyo Electric Power Co., Inc. (a) | | 92,800 | 302,687 |
| Tokyo Electron Ltd. | | 9,000 | 2,367,870 |
| Tokyo Gas Co. Ltd. | | 23,200 | 414,556 |
| Tokyu Corp. | | 32,700 | 377,371 |
| Toppan, Inc. | | 15,300 | 228,324 |
| Toray Industries, Inc. | | 84,900 | 413,666 |
| Toshiba Corp. | | 23,300 | 811,845 |
| Tosoh Corp. | | 16,100 | 175,298 |
| Toto Ltd. | | 8,700 | 248,663 |
| Toyota Industries Corp. | | 8,800 | 453,331 |
| Toyota Motor Corp. | | 639,700 | 8,875,589 |
| Toyota Tsusho Corp. | | 13,200 | 443,862 |
| Trend Micro, Inc. | | 8,100 | 409,099 |
| Unicharm Corp. | | 24,200 | 735,473 |
| USS Co. Ltd. | | 12,900 | 194,938 |
| Welcia Holdings Co. Ltd. | | 5,500 | 115,034 |
| West Japan Railway Co. | | 13,500 | 535,751 |
| Yakult Honsha Co. Ltd. | | 7,800 | 432,240 |
| Yamaha Corp. | | 8,300 | 313,703 |
| Yamaha Motor Co. Ltd. | | 17,400 | 359,245 |
| Yamato Holdings Co. Ltd. | | 17,900 | 265,319 |
| Yaskawa Electric Corp. | | 14,400 | 399,960 |
| Yokogawa Electric Corp. | | 13,400 | 224,482 |
| Z Holdings Corp. | | 163,300 | 421,438 |
| ZOZO, Inc. | | 7,900 | 168,153 |
TOTAL JAPAN | | | 171,450,062 |
| Korea (South) - 3.0% | | | |
| Alteogen, Inc. | | 2,005 | 51,554 |
| AMOREPACIFIC Corp. | | 1,562 | 101,447 |
| AMOREPACIFIC Group, Inc. | | 1,593 | 27,567 |
| BGF Retail Co. Ltd. | | 449 | 58,668 |
| Celltrion Healthcare Co. Ltd. | | 5,096 | 248,138 |
| Celltrion Pharm, Inc. | | 800 | 38,001 |
| Celltrion, Inc. | | 5,911 | 795,135 |
| Cheil Worldwide, Inc. | | 3,890 | 66,636 |
| CJ CheilJedang Corp. | | 495 | 143,577 |
| CJ Corp. | | 1,017 | 51,159 |
| CJ ENM Co. Ltd. | | 711 | 36,563 |
| CJ Logistics Corp. (a) | | 578 | 35,596 |
| Coway Co. Ltd. | | 3,224 | 124,910 |
| Db Insurance Co. Ltd. | | 2,752 | 108,551 |
| Doosan Bobcat, Inc. | | 2,772 | 65,060 |
| Doosan Heavy Industries & Construction Co. Ltd. (a) | | 24,883 | 230,992 |
| E-Mart, Inc. | | 1,144 | 67,807 |
| Ecopro BM Co. Ltd. | | 3,021 | 243,615 |
| F&F Co. Ltd. | | 960 | 97,862 |
| Green Cross Corp. | | 377 | 33,677 |
| GS Engineering & Construction Corp. | | 4,408 | 67,016 |
| GS Holdings Corp. | | 2,573 | 82,923 |
| Hana Financial Group, Inc. | | 17,367 | 501,912 |
| Hankook Tire Co. Ltd. | | 4,228 | 108,268 |
| Hanmi Pharm Co. Ltd. | | 412 | 73,029 |
| Hanon Systems | | 11,205 | 61,233 |
| Hanwha Solutions Corp. (a) | | 6,974 | 230,623 |
| HD Hyundai Co. Ltd. | | 2,816 | 120,151 |
| HLB, Inc. (a) | | 5,606 | 159,069 |
| HLB, Inc. rights 12/2/22 (a) | | 502 | 3,447 |
| HMM Co. Ltd. | | 15,816 | 211,645 |
| Hotel Shilla Co. | | 1,862 | 84,795 |
| HYBE Co. Ltd. (a) | | 1,105 | 93,676 |
| Hyundai Engineering & Construction Co. Ltd. | | 4,675 | 114,310 |
| Hyundai Glovis Co. Ltd. | | 1,126 | 137,267 |
| Hyundai Heavy Industries Co. Ltd. (a) | | 1,049 | 80,109 |
| Hyundai Mobis | | 3,810 | 584,585 |
| Hyundai Motor Co. | | 8,258 | 951,742 |
| Hyundai Steel Co. | | 5,608 | 110,406 |
| Iljin Materials Co. Ltd. | | 1,295 | 54,982 |
| Industrial Bank of Korea | | 15,888 | 116,323 |
| Kakao Corp. | | 18,609 | 661,012 |
| Kakao Games Corp. (a) | | 2,160 | 59,852 |
| KakaoBank Corp. (a) | | 7,718 | 92,465 |
| Kangwon Land, Inc. (a) | | 5,722 | 92,205 |
| KB Financial Group, Inc. | | 24,149 | 810,958 |
| Kia Corp. | | 15,744 | 731,320 |
| Korea Aerospace Industries Ltd. | | 4,178 | 138,601 |
| Korea Electric Power Corp. (a) | | 15,076 | 176,433 |
| Korea Investment Holdings Co. Ltd. | | 2,344 | 81,373 |
| Korea Shipbuilding & Offshore Engineering Co. Ltd. (a) | | 2,508 | 127,744 |
| Korea Zinc Co. Ltd. | | 555 | 248,858 |
| Korean Air Lines Co. Ltd. (a) | | 10,766 | 174,239 |
| KRAFTON, Inc. (a) | | 1,441 | 179,201 |
| KT&G Corp. | | 6,432 | 431,257 |
| Kumho Petro Chemical Co. Ltd. | | 1,209 | 110,963 |
| L&F Co. Ltd. (a) | | 1,364 | 215,018 |
| LG Chemical Ltd. | | 2,893 | 1,268,824 |
| LG Corp. | | 6,024 | 334,263 |
| LG Display Co. Ltd. | | 13,786 | 122,783 |
| LG Electronics, Inc. | | 6,342 | 362,573 |
| LG Energy Solution (a) | | 1,441 | 533,061 |
| LG H & H Co. Ltd. | | 536 | 191,520 |
| LG Innotek Co. Ltd. | | 883 | 183,427 |
| LG Uplus Corp. | | 12,020 | 96,425 |
| Lotte Chemical Corp. | | 1,041 | 107,942 |
| Lotte Shopping Co. Ltd. | | 712 | 43,598 |
| Meritz Financial Holdings Co. | | 1,855 | 28,202 |
| Meritz Fire & Marine Insurance Co. Ltd. | | 2,110 | 46,492 |
| Meritz Securities Co. Ltd. | | 14,153 | 36,688 |
| Mirae Asset Securities Co. Ltd. | | 18,991 | 84,489 |
| NAVER Corp. | | 8,089 | 960,601 |
| NCSOFT Corp. | | 972 | 265,589 |
| Netmarble Corp. (b) | | 1,298 | 40,559 |
| NH Investment & Securities Co. Ltd. | | 8,755 | 55,021 |
| Orion Corp./Republic of Korea | | 1,321 | 93,939 |
| Pan Ocean Co., Ltd. (Korea) | | 14,306 | 43,099 |
| Pearl Abyss Corp. (a) | | 1,612 | 46,983 |
| POSCO | | 4,819 | 838,219 |
| POSCO Chemtech Co. Ltd. | | 1,562 | 218,325 |
| S-Oil Corp. | | 2,799 | 169,432 |
| S1 Corp. | | 1,067 | 46,647 |
| Samsung Biologics Co. Ltd. (a)(b) | | 1,078 | 662,364 |
| Samsung C&T Corp. | | 5,243 | 435,288 |
| Samsung Electro-Mechanics Co. Ltd. | | 3,298 | 279,586 |
| Samsung Electronics Co. Ltd. | | 288,377 | 12,001,229 |
| Samsung Engineering Co. Ltd. (a) | | 9,851 | 164,607 |
| Samsung Fire & Marine Insurance Co. Ltd. | | 1,810 | 253,622 |
| Samsung Heavy Industries Co. Ltd. (a) | | 36,625 | 132,149 |
| Samsung Life Insurance Co. Ltd. | | 5,089 | 240,310 |
| Samsung SDI Co. Ltd. | | 3,341 | 1,725,133 |
| Samsung SDS Co. Ltd. | | 2,072 | 181,459 |
| Samsung Securities Co. Ltd. | | 3,566 | 79,324 |
| SD Biosensor, Inc. | | 2,263 | 46,851 |
| Seegene, Inc. | | 1,955 | 39,310 |
| Shinhan Financial Group Co. Ltd. | | 27,664 | 701,710 |
| SK Biopharmaceuticals Co. Ltd. (a) | | 1,932 | 78,643 |
| SK Bioscience Co. Ltd. (a) | | 1,360 | 72,034 |
| SK Chemicals Co. Ltd. | | 853 | 52,830 |
| SK Hynix, Inc. | | 33,098 | 1,917,723 |
| SK IE Technology Co. Ltd. (a)(b) | | 1,463 | 53,300 |
| SK Innovation Co., Ltd. | | 3,238 | 392,466 |
| SK Square Co. Ltd. (a) | | 5,594 | 144,816 |
| SK Telecom Co. Ltd. | | 90 | 3,159 |
| SK, Inc. | | 2,439 | 365,683 |
| SKC Co. Ltd. | | 1,252 | 90,787 |
| Woori Financial Group, Inc. | | 32,152 | 264,682 |
| Yuhan Corp. | | 2,962 | 124,098 |
TOTAL KOREA (SOUTH) | | | 37,627,389 |
| Kuwait - 0.3% | | | |
| Agility Public Warehousing Co. KSC | | 86,992 | 220,112 |
| Boubyan Bank KSC | | 77,155 | 205,182 |
| Gulf Bank | | 103,716 | 114,812 |
| Kuwait Finance House KSCP | | 445,885 | 1,165,618 |
| Mabanee Co. SAKC | | 36,370 | 102,355 |
| Mobile Telecommunication Co. | | 125,675 | 242,954 |
| National Bank of Kuwait | | 437,453 | 1,521,944 |
TOTAL KUWAIT | | | 3,572,977 |
| Luxembourg - 0.2% | | | |
| Allegro.eu SA (a)(b) | | 24,311 | 118,141 |
| ArcelorMittal SA (Netherlands) | | 31,952 | 715,367 |
| Aroundtown SA | | 57,813 | 114,724 |
| Eurofins Scientific SA | | 8,160 | 522,394 |
| Reinet Investments SCA | | 8,159 | 131,095 |
| Tenaris SA | | 29,533 | 462,226 |
TOTAL LUXEMBOURG | | | 2,063,947 |
| Malaysia - 0.4% | | | |
| AMMB Holdings Bhd | | 103,300 | 89,361 |
| Axiata Group Bhd | | 165,460 | 99,738 |
| CIMB Group Holdings Bhd | | 422,043 | 492,741 |
| Dialog Group Bhd | | 209,100 | 91,105 |
| DiGi.com Bhd | | 182,800 | 146,534 |
| Genting Bhd | | 118,900 | 111,657 |
| Genting Malaysia Bhd | | 170,900 | 99,041 |
| Hap Seng Consolidated Bhd | | 37,700 | 51,271 |
| Hartalega Holdings Bhd | | 96,000 | 43,858 |
| Hong Leong Bank Bhd | | 37,000 | 165,592 |
| Hong Leong Credit Bhd | | 13,100 | 52,865 |
| IHH Healthcare Bhd | | 101,000 | 127,104 |
| Inari Amertron Bhd | | 167,900 | 88,424 |
| IOI Corp. Bhd | | 141,800 | 122,365 |
| Kuala Lumpur Kepong Bhd | | 26,000 | 119,222 |
| Malayan Banking Bhd | | 287,498 | 522,337 |
| Malaysia Airports Holdings Bhd (a) | | 49,100 | 62,102 |
| Maxis Bhd | | 132,400 | 107,813 |
| MISC Bhd | | 79,300 | 121,265 |
| MR DIY Group M Sdn Bhd (b) | | 131,200 | 56,054 |
| Nestle (Malaysia) Bhd | | 4,500 | 126,586 |
| Petronas Chemicals Group Bhd | | 141,000 | 260,051 |
| Petronas Dagangan Bhd | | 17,100 | 78,411 |
| Petronas Gas Bhd | | 46,500 | 168,179 |
| PPB Group Bhd | | 37,440 | 132,244 |
| Press Metal Bhd | | 218,100 | 200,663 |
| Public Bank Bhd | | 906,100 | 856,655 |
| QL Resources Bhd | | 65,500 | 70,931 |
| RHB Bank Bhd | | 80,735 | 97,674 |
| Sime Darby Bhd | | 161,900 | 77,046 |
| Sime Darby Plantation Bhd | | 123,316 | 114,761 |
| Telekom Malaysia Bhd | | 68,521 | 80,579 |
| Tenaga Nasional Bhd | | 151,200 | 269,269 |
| Top Glove Corp. Bhd | | 290,500 | 48,847 |
TOTAL MALAYSIA | | | 5,352,345 |
| Mexico - 0.7% | | | |
| Alfa SA de CV Series A | | 166,800 | 110,706 |
| America Movil S.A.B. de CV Series L | | 1,705,800 | 1,614,281 |
| Arca Continental S.A.B. de CV | | 28,800 | 235,903 |
| CEMEX S.A.B. de CV unit (a) | | 884,880 | 343,894 |
| Coca-Cola FEMSA S.A.B. de CV unit | | 31,240 | 196,793 |
| Fibra Uno Administracion SA de CV | | 198,300 | 231,398 |
| Fomento Economico Mexicano S.A.B. de CV unit | | 116,900 | 839,181 |
| Gruma S.A.B. de CV Series B | | 11,870 | 137,692 |
| Grupo Aeroportuario del Pacifico S.A.B. de CV Series B | | 23,200 | 359,364 |
| Grupo Aeroportuario del Sureste S.A.B. de CV Series B | | 11,175 | 261,538 |
| Grupo Bimbo S.A.B. de CV Series A | | 77,900 | 301,605 |
| Grupo Carso SA de CV Series A1 | | 25,400 | 102,354 |
| Grupo Financiero Banorte S.A.B. de CV Series O | | 158,200 | 1,285,929 |
| Grupo Financiero Inbursa S.A.B. de CV Series O (a) | | 126,900 | 234,227 |
| Grupo Mexico SA de CV Series B | | 190,100 | 689,188 |
| Grupo Televisa SA de CV | | 138,800 | 147,256 |
| Industrias Penoles SA de CV | | 7,920 | 89,845 |
| Kimberly-Clark de Mexico SA de CV Series A | | 90,200 | 142,313 |
| Operadora de Sites Mexicanos, SA de CV | | 75,500 | 82,157 |
| Orbia Advance Corp. S.A.B. de CV | | 56,900 | 96,063 |
| Promotora y Operadora de Infraestructura S.A.B. de CV | | 15,030 | 113,061 |
| Sitios Latinoamerica S.A.B. de CV (a) | | 83,035 | 24,224 |
| Wal-Mart de Mexico SA de CV Series V | | 318,900 | 1,231,788 |
TOTAL MEXICO | | | 8,870,760 |
| Multi-National - 0.1% | | | |
| HK Electric Investments & HK Electric Investments Ltd. unit | | 168,000 | 106,797 |
| HKT Trust/HKT Ltd. unit | | 237,000 | 267,807 |
| Unibail-Rodamco SE & WFD Unibail-Rodamco NV unit (a) | | 7,133 | 337,515 |
TOTAL MULTI-NATIONAL | | | 712,119 |
| Netherlands - 3.4% | | | |
| ABN AMRO Bank NV GDR (b) | | 25,975 | 255,568 |
| Adyen BV (a)(b) | | 1,313 | 1,874,438 |
| AEGON NV | | 108,786 | 503,588 |
| AerCap Holdings NV (a) | | 7,893 | 421,565 |
| Airbus Group NV | | 35,812 | 3,874,994 |
| Akzo Nobel NV | | 11,072 | 683,535 |
| Argenx SE (a) | | 3,343 | 1,297,922 |
| ASM International NV (Netherlands) | | 2,814 | 625,154 |
| ASML Holding NV (Netherlands) | | 24,529 | 11,506,239 |
| CNH Industrial NV | | 62,363 | 807,664 |
| Davide Campari Milano NV | | 33,515 | 301,204 |
| Euronext NV (b) | | 5,213 | 331,257 |
| EXOR NV | | 8,427 | 566,303 |
| Ferrari NV (Italy) | | 7,621 | 1,502,525 |
| Heineken Holding NV | | 6,162 | 420,791 |
| Heineken NV (Bearer) | | 15,603 | 1,304,504 |
| IMCD NV | | 3,325 | 431,443 |
| ING Groep NV (Certificaten Van Aandelen) | | 236,101 | 2,323,138 |
| JDE Peet's BV | | 6,186 | 177,164 |
| Just Eat Takeaway.com NV (a)(b) | | 10,698 | 183,579 |
| Koninklijke Ahold Delhaize NV | | 63,024 | 1,757,632 |
| Koninklijke DSM NV | | 10,599 | 1,246,765 |
| Koninklijke KPN NV | | 199,453 | 557,891 |
| Koninklijke Philips Electronics NV | | 52,886 | 670,853 |
| NEPI Rockcastle PLC | | 26,774 | 134,827 |
| NN Group NV | | 16,828 | 712,607 |
| OCI NV | | 6,145 | 235,139 |
| Prosus NV | | 50,051 | 2,164,290 |
| QIAGEN NV (Germany) (a) | | 13,691 | 591,267 |
| Randstad NV | | 7,416 | 369,668 |
| Stellantis NV (Italy) | | 133,260 | 1,798,943 |
| STMicroelectronics NV (France) | | 41,353 | 1,285,828 |
| Universal Music Group NV | | 43,448 | 853,121 |
| Wolters Kluwer NV | | 15,784 | 1,677,623 |
| X5 Retail Group NV GDR (c) | | 5,899 | 2,087 |
| Yandex NV Class A (a)(c) | | 15,310 | 85,716 |
TOTAL NETHERLANDS | | | 43,536,832 |
| New Zealand - 0.1% | | | |
| Auckland International Airport Ltd. (a) | | 73,983 | 331,206 |
| Fisher & Paykel Healthcare Corp. | | 35,819 | 407,757 |
| Mercury Nz Ltd. | | 40,241 | 136,165 |
| Meridian Energy Ltd. | | 79,747 | 226,261 |
| Spark New Zealand Ltd. | | 110,963 | 330,311 |
| Xero Ltd. (a) | | 8,234 | 411,185 |
TOTAL NEW ZEALAND | | | 1,842,885 |
| Norway - 0.5% | | | |
| Adevinta ASA Class B (a) | | 16,742 | 114,661 |
| Aker BP ASA | | 19,105 | 609,014 |
| DNB Bank ASA | | 55,650 | 984,275 |
| Equinor ASA | | 59,078 | 2,152,431 |
| Gjensidige Forsikring ASA | | 11,772 | 215,032 |
| Kongsberg Gruppen ASA | | 5,580 | 199,988 |
| Mowi ASA | | 25,388 | 378,641 |
| Norsk Hydro ASA | | 81,683 | 518,386 |
| Orkla ASA | | 44,968 | 303,316 |
| Salmar ASA | | 3,435 | 116,371 |
| Telenor ASA | | 42,973 | 390,533 |
| Yara International ASA | | 10,081 | 449,934 |
TOTAL NORWAY | | | 6,432,582 |
| Peru - 0.0% | | | |
| Compania de Minas Buenaventura SAA sponsored ADR | | 12,595 | 87,409 |
| Philippines - 0.2% | | | |
| Aboitiz Equity Ventures, Inc. | | 98,590 | 96,605 |
| ACEN Corp. | | 444,200 | 48,154 |
| Ayala Corp. | | 14,230 | 164,639 |
| Ayala Land, Inc. | | 431,600 | 190,963 |
| Bank of the Philippine Islands (BPI) | | 107,190 | 177,727 |
| BDO Unibank, Inc. | | 116,450 | 256,625 |
| Converge ICT Solutions, Inc. (a) | | 140,400 | 29,980 |
| Globe Telecom, Inc. | | 1,763 | 70,862 |
| GT Capital Holdings, Inc. | | 5,417 | 38,615 |
| International Container Terminal Services, Inc. | | 63,150 | 188,733 |
| JG Summit Holdings, Inc. | | 175,601 | 131,055 |
| Jollibee Food Corp. | | 25,790 | 103,141 |
| Manila Electric Co. | | 13,390 | 69,604 |
| Metro Pacific Investments Corp. | | 543,200 | 34,265 |
| Metropolitan Bank & Trust Co. | | 103,883 | 92,983 |
| Monde Nissin Corp. (b) | | 414,800 | 83,835 |
| PLDT, Inc. | | 5,000 | 140,575 |
| SM Investments Corp. | | 13,745 | 195,309 |
| SM Prime Holdings, Inc. | | 689,500 | 375,418 |
| Universal Robina Corp. | | 52,860 | 111,493 |
TOTAL PHILIPPINES | | | 2,600,581 |
| Poland - 0.2% | | | |
| Bank Polska Kasa Opieki SA | | 10,442 | 171,565 |
| CD Projekt RED SA | | 3,577 | 95,230 |
| Cyfrowy Polsat SA | | 18,168 | 68,119 |
| Dino Polska SA (a)(b) | | 2,892 | 189,121 |
| KGHM Polska Miedz SA (Bearer) | | 8,928 | 178,893 |
| LPP SA | | 66 | 114,606 |
| mBank SA (a) | | 885 | 49,606 |
| Orange Polska SA | | 44,954 | 56,799 |
| PGE Polska Grupa Energetyczna SA (a) | | 54,683 | 62,425 |
| Polski Koncern Naftowy Orlen SA | | 24,027 | 276,400 |
| Polskie Gornictwo Naftowe i Gazownictwo SA (a) | | 104,107 | 110,780 |
| Powszechna Kasa Oszczednosci Bank SA | | 54,246 | 296,222 |
| Powszechny Zaklad Ubezpieczen SA | | 37,692 | 211,589 |
| Santander Bank Polska SA | | 2,150 | 114,478 |
TOTAL POLAND | | | 1,995,833 |
| Portugal - 0.1% | | | |
| Energias de Portugal SA | | 167,998 | 734,656 |
| Galp Energia SGPS SA Class B | | 29,279 | 297,273 |
| Jeronimo Martins SGPS SA | | 17,019 | 352,863 |
TOTAL PORTUGAL | | | 1,384,792 |
| Qatar - 0.3% | | | |
| Barwa Real Estate Co. (a) | | 116,183 | 108,470 |
| Industries Qatar QSC (a) | | 90,759 | 393,017 |
| Masraf al Rayan | | 354,264 | 373,258 |
| Mesaieed Petrochemical Holding Co. (a) | | 256,615 | 159,955 |
| Ooredoo QSC | | 45,175 | 121,194 |
| Qatar Electricity & Water Co. (a) | | 26,239 | 133,293 |
| Qatar Fuel Co. (a) | | 27,802 | 145,661 |
| Qatar Gas Transport Co. Ltd. (Nakilat) (a) | | 144,727 | 162,938 |
| Qatar International Islamic Bank QSC (a) | | 43,427 | 137,969 |
| Qatar Islamic Bank (a) | | 98,677 | 660,872 |
| Qatar National Bank SAQ (a) | | 283,369 | 1,551,556 |
| The Commercial Bank of Qatar (a) | | 190,514 | 329,263 |
TOTAL QATAR | | | 4,277,446 |
| Russia - 0.0% | | | |
| Alrosa Co. Ltd. (c) | | 120,680 | 30,107 |
| Gazprom OAO (c) | | 601,730 | 94,421 |
| Inter Rao Ues JSC (c) | | 1,756,400 | 14,521 |
| LUKOIL PJSC (c) | | 21,149 | 9,816 |
| Magnit OJSC GDR (Reg. S) (c) | | 18,175 | 89 |
| MMC Norilsk Nickel PJSC (c) | | 2,499 | 24,923 |
| MMC Norilsk Nickel PJSC sponsored ADR (c) | | 6,705 | 4,979 |
| Mobile TeleSystems OJSC sponsored ADR (c) | | 21,752 | 21,665 |
| Moscow Exchange MICEX-RTS OAO (a)(c) | | 72,930 | 21,023 |
| Novatek PJSC GDR (Reg. S) (c) | | 4,511 | 1,152 |
| Novolipetsk Steel OJSC (c) | | 71,070 | 1,023 |
| PhosAgro PJSC: | | | |
| GDR (c) | | 42 | 1 |
| GDR (Reg. S) (c) | | 6,442 | 132 |
| Polyus PJSC (c) | | 1,749 | 6,168 |
| Rosneft Oil Co. OJSC (c) | | 55,210 | 13,846 |
| Sberbank of Russia (a)(c) | | 551,355 | 5,083 |
| Severstal PAO (c) | | 7,553 | 253 |
| Severstal PAO GDR (Reg. S) (c) | | 2,375 | 56 |
| Surgutneftegas OJSC (c) | | 351,800 | 6,455 |
| Tatneft PAO (c) | | 71,609 | 13,356 |
| United Co. RUSAL International PJSC (c) | | 141,950 | 25,654 |
| VTB Bank OJSC (a)(c) | | 152,910,000 | 8,761 |
TOTAL RUSSIA | | | 303,484 |
| Saudi Arabia - 1.3% | | | |
| ACWA Power Co. | | 4,994 | 231,256 |
| Advanced Polypropylene Co. | | 7,512 | 88,563 |
| Al Rajhi Bank | | 118,690 | 2,691,218 |
| Alinma Bank | | 60,241 | 601,200 |
| Almarai Co. Ltd. | | 14,914 | 223,459 |
| Arab National Bank | | 35,185 | 301,983 |
| Bank Al-Jazira | | 23,491 | 146,164 |
| Bank Albilad | | 30,115 | 406,337 |
| Banque Saudi Fransi | | 34,555 | 397,274 |
| Bupa Arabia for Cooperative Insurance Co. | | 3,550 | 182,340 |
| Dar Al Arkan Real Estate Development Co. (a) | | 31,488 | 112,459 |
| Dr Sulaiman Al Habib Medical Services Group Co. | | 5,118 | 308,642 |
| Elm Co. | | 1,425 | 125,527 |
| Emaar The Economic City (a) | | 28,278 | 72,171 |
| Etihad Etisalat Co. | | 21,539 | 209,798 |
| Jarir Marketing Co. | | 3,439 | 150,097 |
| Mobile Telecommunications Co. Saudi Arabia (a) | | 24,727 | 85,416 |
| Mouwasat Medical Services Co. | | 3,034 | 176,830 |
| National Industrialization Co. (a) | | 20,242 | 72,078 |
| Rabigh Refining & Petrochemical Co. (a) | | 24,589 | 89,259 |
| Riyad Bank | | 82,377 | 788,134 |
| Sabic Agriculture-Nutrients Co. | | 13,149 | 556,397 |
| Sahara International Petrochemical Co. | | 21,166 | 228,415 |
| Saudi Arabian Mining Co. | | 51,385 | 1,144,609 |
| Saudi Arabian Oil Co. (b) | | 146,380 | 1,359,573 |
| Saudi Basic Industries Corp. | | 54,911 | 1,291,834 |
| Saudi Electricity Co. | | 48,704 | 349,964 |
| Saudi Industrial Investment Group | | 22,059 | 131,971 |
| Saudi Investment Bank/The | | 31,191 | 150,578 |
| Saudi Kayan Petrochemical Co. (a) | | 46,298 | 162,149 |
| Saudi Research & Marketing Group (a) | | 2,159 | 115,720 |
| Saudi Tadawul Group Holding Co. | | 2,320 | 134,104 |
| Saudi Telecom Co. | | 91,634 | 985,220 |
| The Saudi British Bank | | 54,951 | 636,151 |
| The Saudi National Bank | | 132,804 | 2,099,389 |
| The Savola Group | | 14,988 | 116,871 |
| Yanbu National Petrochemical Co. | | 15,239 | 181,284 |
TOTAL SAUDI ARABIA | | | 17,104,434 |
| Singapore - 0.8% | | | |
| BOC Aviation Ltd. Class A (b) | | 12,400 | 83,013 |
| CapitaLand Ascendas REIT | | 197,258 | 365,086 |
| CapitaLand Investment Ltd. | | 151,445 | 322,019 |
| CapitaMall Trust | | 318,123 | 422,486 |
| City Developments Ltd. | | 24,100 | 129,898 |
| DBS Group Holdings Ltd. | | 109,326 | 2,641,247 |
| Genting Singapore Ltd. | | 359,200 | 204,264 |
| Keppel Corp. Ltd. | | 91,900 | 452,489 |
| Mapletree Logistics Trust (REIT) | | 190,227 | 204,256 |
| Mapletree Pan Asia Commercial | | 140,600 | 157,922 |
| Oversea-Chinese Banking Corp. Ltd. | | 204,652 | 1,753,623 |
| Singapore Airlines Ltd. | | 77,300 | 287,227 |
| Singapore Exchange Ltd. | | 52,800 | 314,055 |
| Singapore Technologies Engineering Ltd. | | 92,200 | 214,934 |
| Singapore Telecommunications Ltd. | | 507,900 | 896,969 |
| United Overseas Bank Ltd. | | 71,603 | 1,404,139 |
| UOL Group Ltd. | | 26,900 | 117,626 |
| Venture Corp. Ltd. | | 18,100 | 203,683 |
| Wilmar International Ltd. | | 113,000 | 309,720 |
TOTAL SINGAPORE | | | 10,484,656 |
| South Africa - 0.9% | | | |
| Absa Group Ltd. | | 51,508 | 560,093 |
| African Rainbow Minerals Ltd. | | 6,408 | 90,234 |
| Anglo American Platinum Ltd. | | 3,267 | 259,870 |
| AngloGold Ashanti Ltd. | | 24,445 | 319,245 |
| Aspen Pharmacare Holdings Ltd. | | 21,989 | 181,071 |
| Bid Corp. Ltd. | | 20,881 | 335,983 |
| Bidvest Group Ltd./The | | 16,551 | 191,453 |
| Capitec Bank Holdings Ltd. | | 5,275 | 545,791 |
| Clicks Group Ltd. | | 14,330 | 242,815 |
| Discovery Ltd. (a) | | 29,520 | 193,203 |
| Exxaro Resources Ltd. | | 14,146 | 157,503 |
| FirstRand Ltd. | | 307,604 | 1,077,608 |
| Foschini Group Ltd./The | | 21,099 | 131,990 |
| Gold Fields Ltd. | | 54,231 | 434,434 |
| Growthpoint Properties Ltd. | | 202,891 | 143,039 |
| Harmony Gold Mining Co. Ltd. | | 33,464 | 92,680 |
| Impala Platinum Holdings Ltd. | | 50,634 | 518,425 |
| Kumba Iron Ore Ltd. | | 3,618 | 68,148 |
| Mr Price Group Ltd. | | 15,306 | 147,354 |
| MTN Group Ltd. | | 104,040 | 735,410 |
| MultiChoice Group Ltd. | | 23,718 | 154,985 |
| Naspers Ltd. Class N | | 13,156 | 1,356,145 |
| Nedbank Group Ltd. | | 28,436 | 336,797 |
| Northam Platinum Holdings Ltd. (a) | | 21,274 | 199,644 |
| Old Mutual Ltd. | | 268,503 | 152,605 |
| Pepkor Holdings Ltd. (b) | | 99,812 | 123,184 |
| Remgro Ltd. | | 31,180 | 232,058 |
| Sanlam Ltd. | | 104,710 | 304,632 |
| Sasol Ltd. | | 34,557 | 580,905 |
| Shoprite Holdings Ltd. | | 31,011 | 394,881 |
| Sibanye-Stillwater Ltd. | | 173,404 | 406,151 |
| Spar Group Ltd./The | | 11,895 | 100,859 |
| Standard Bank Group Ltd. | | 80,906 | 756,040 |
| Vodacom Group Ltd. | | 37,469 | 255,610 |
| Woolworths Holdings Ltd. | | 61,512 | 211,271 |
TOTAL SOUTH AFRICA | | | 11,992,116 |
| Spain - 1.5% | | | |
| Acciona SA | | 1,449 | 260,763 |
| ACS Actividades de Construccion y Servicios SA | | 14,474 | 371,187 |
| Aena SME SA (a)(b) | | 4,446 | 522,545 |
| Amadeus IT Holding SA Class A (a) | | 27,302 | 1,423,944 |
| Banco Bilbao Vizcaya Argentaria SA | | 403,015 | 2,079,071 |
| Banco Santander SA (Spain) | | 1,032,746 | 2,676,043 |
| CaixaBank SA | | 266,182 | 882,672 |
| Cellnex Telecom SA (b) | | 33,088 | 1,082,979 |
| EDP Renovaveis SA | | 17,622 | 371,112 |
| Enagas SA | | 14,706 | 238,736 |
| Endesa SA | | 19,048 | 317,846 |
| Ferrovial SA | | 29,027 | 708,829 |
| Grifols SA (a) | | 17,377 | 147,789 |
| Iberdrola SA | | 359,203 | 3,652,836 |
| Industria de Diseno Textil SA | | 66,375 | 1,504,751 |
| Naturgy Energy Group SA | | 8,299 | 212,911 |
| Red Electrica Corporacion SA | | 23,705 | 383,445 |
| Repsol SA | | 88,552 | 1,204,704 |
| Siemens Gamesa Renewable Energy SA (a) | | 14,591 | 258,975 |
| Telefonica SA | | 318,708 | 1,098,649 |
TOTAL SPAIN | | | 19,399,787 |
| Sweden - 2.0% | | | |
| Alfa Laval AB | | 17,578 | 433,193 |
| ASSA ABLOY AB (B Shares) | | 60,846 | 1,228,607 |
| Atlas Copco AB: | | | |
| (A Shares) (d) | | 161,542 | 1,724,179 |
| (B Shares) | | 94,808 | 916,904 |
| Boliden AB | | 16,636 | 484,561 |
| Electrolux AB (B Shares) | | 13,102 | 161,692 |
| Embracer Group AB (a)(d) | | 39,176 | 188,656 |
| Epiroc AB: | | | |
| (A Shares) | | 38,806 | 594,060 |
| (B Shares) | | 23,998 | 322,438 |
| EQT AB | | 17,442 | 343,747 |
| Ericsson (B Shares) | | 176,188 | 979,490 |
| Essity AB (B Shares) | | 36,553 | 772,694 |
| Evolution AB (b) | | 10,938 | 1,020,326 |
| Fastighets AB Balder (a) | | 39,094 | 146,923 |
| Getinge AB (B Shares) | | 13,959 | 283,575 |
| H&M Hennes & Mauritz AB (B Shares) (d) | | 45,593 | 459,220 |
| Hexagon AB (B Shares) | | 117,706 | 1,163,629 |
| Holmen AB (B Shares) | | 5,364 | 194,618 |
| Husqvarna AB (B Shares) | | 26,562 | 157,703 |
| Industrivarden AB: | | | |
| (A Shares) | | 7,399 | 167,666 |
| (C Shares) | | 10,709 | 240,635 |
| Indutrade AB | | 16,983 | 297,401 |
| Investment AB Latour (B Shares) | | 8,685 | 146,897 |
| Investor AB: | | | |
| (A Shares) | | 35,410 | 602,610 |
| (B Shares) | | 104,467 | 1,706,487 |
| Kinnevik AB (B Shares) (a) | | 13,807 | 170,693 |
| L E Lundbergforetagen AB | | 4,575 | 180,743 |
| Lifco AB | | 14,377 | 207,754 |
| Nibe Industrier AB (B Shares) | | 92,072 | 734,661 |
| Sagax AB | | 11,634 | 214,531 |
| Sandvik AB | | 63,754 | 996,268 |
| Securitas AB (B Shares) | | 41,133 | 336,554 |
| Sinch AB (a)(b) | | 1,122 | 2,642 |
| Skandinaviska Enskilda Banken AB (A Shares) | | 97,111 | 1,024,656 |
| Skanska AB (B Shares) | | 19,912 | 309,829 |
| SKF AB (B Shares) | | 22,518 | 325,962 |
| Svenska Cellulosa AB SCA (B Shares) | | 36,178 | 426,946 |
| Svenska Handelsbanken AB (A Shares) | | 88,032 | 817,908 |
| Swedbank AB (A Shares) | | 54,750 | 816,216 |
| Swedish Match Co. AB | | 91,694 | 943,063 |
| Swedish Orphan Biovitrum AB (a) | | 9,854 | 181,440 |
| Tele2 AB (B Shares) | | 33,160 | 271,858 |
| Telia Co. AB | | 162,016 | 429,305 |
| Volvo AB: | | | |
| (A Shares) | | 16,481 | 281,520 |
| (B Shares) | | 86,151 | 1,410,028 |
| Volvo Car AB | | 37,116 | 157,625 |
TOTAL SWEDEN | | | 24,978,113 |
| Switzerland - 6.4% | | | |
| ABB Ltd. (Reg.) | | 99,459 | 2,762,006 |
| Accelleron Industries Ltd. (a) | | 249 | 4,222 |
| Adecco SA (Reg.) | | 10,301 | 322,380 |
| Alcon, Inc. (Switzerland) | | 30,193 | 1,837,481 |
| Bachem Holding AG (B Shares) | | 1,978 | 141,928 |
| Baloise Holdings AG | | 2,842 | 388,261 |
| Barry Callebaut AG | | 221 | 418,010 |
| Clariant AG (Reg.) | | 12,399 | 199,479 |
| Coca-Cola HBC AG | | 11,756 | 256,491 |
| Compagnie Financiere Richemont SA Series A | | 31,530 | 3,081,539 |
| Credit Suisse Group AG | | 159,287 | 659,841 |
| Ems-Chemie Holding AG | | 412 | 259,004 |
| Geberit AG (Reg.) | | 2,146 | 954,325 |
| Givaudan SA | | 559 | 1,669,157 |
| Holcim AG | | 33,589 | 1,526,027 |
| Julius Baer Group Ltd. | | 13,534 | 649,346 |
| Kuehne & Nagel International AG | | 3,270 | 696,877 |
| Lindt & Spruengli AG | | 7 | 680,182 |
| Lindt & Spruengli AG (participation certificate) | | 65 | 623,159 |
| Logitech International SA (Reg.) | | 10,854 | 540,342 |
| Lonza Group AG | | 4,503 | 2,318,073 |
| Nestle SA (Reg. S) | | 169,764 | 18,480,321 |
| Novartis AG | | 130,422 | 10,549,935 |
| Partners Group Holding AG | | 1,381 | 1,240,397 |
| Roche Holding AG: | | | |
| (Bearer) | | 1,697 | 688,392 |
| (participation certificate) | | 42,290 | 14,031,745 |
| Schindler Holding AG: | | | |
| (participation certificate) | | 2,569 | 418,824 |
| (Reg.) | | 1,338 | 210,585 |
| SGS SA (Reg.) | | 381 | 839,919 |
| Sig Group AG | | 18,575 | 356,901 |
| Sika AG | | 8,873 | 2,000,647 |
| Sonova Holding AG | | 3,213 | 759,492 |
| Straumann Holding AG | | 6,805 | 647,641 |
| Swatch Group AG (Bearer) | | 1,725 | 387,624 |
| Swatch Group AG (Bearer) (Reg.) | | 3,441 | 143,777 |
| Swiss Life Holding AG | | 1,911 | 925,395 |
| Swiss Prime Site AG | | 4,444 | 358,591 |
| Swiss Re Ltd. | | 18,262 | 1,356,589 |
| Swisscom AG | | 1,592 | 785,865 |
| Temenos Group AG | | 3,715 | 221,486 |
| UBS Group AG | | 212,549 | 3,372,850 |
| VAT Group AG (b) | | 1,653 | 377,697 |
| Zurich Insurance Group Ltd. | | 9,055 | 3,859,005 |
TOTAL SWITZERLAND | | | 82,001,808 |
| Taiwan - 3.5% | | | |
| Accton Technology Corp. | | 31,000 | 233,552 |
| Acer, Inc. | | 161,000 | 110,315 |
| Advantech Co. Ltd. | | 24,798 | 225,269 |
| ASE Technology Holding Co. Ltd. | | 194,500 | 479,781 |
| Asia Cement Corp. | | 134,000 | 154,964 |
| ASMedia Technology, Inc. | | 2,000 | 36,089 |
| ASUSTeK Computer, Inc. | | 45,000 | 329,261 |
| AUO Corp. | | 385,600 | 202,041 |
| Catcher Technology Co. Ltd. | | 40,000 | 210,206 |
| Cathay Financial Holding Co. Ltd. | | 467,436 | 547,811 |
| Chang Hwa Commercial Bank | | 297,054 | 152,883 |
| Cheng Shin Rubber Industry Co. Ltd. | | 106,000 | 106,151 |
| China Airlines Ltd. | | 186,000 | 97,746 |
| China Development Financial Ho | | 986,313 | 359,310 |
| China Steel Corp. | | 723,000 | 601,865 |
| Chunghwa Telecom Co. Ltd. | | 227,000 | 781,913 |
| Compal Electronics, Inc. | | 249,000 | 162,891 |
| CTBC Financial Holding Co. Ltd. | | 1,079,000 | 682,446 |
| Delta Electronics, Inc. | | 118,000 | 942,054 |
| E Ink Holdings, Inc. | | 52,000 | 331,308 |
| E.SUN Financial Holdings Co. Ltd. | | 773,925 | 556,677 |
| ECLAT Textile Co. Ltd. | | 11,000 | 144,773 |
| eMemory Technology, Inc. | | 4,000 | 133,317 |
| EVA Airways Corp. | | 150,000 | 108,824 |
| Evergreen Marine Corp. (Taiwan) | | 59,343 | 252,981 |
| Far Eastern New Century Corp. | | 200,000 | 199,355 |
| Far EasTone Telecommunications Co. Ltd. | | 93,000 | 203,854 |
| Feng Tay Enterprise Co. Ltd. | | 26,200 | 130,375 |
| First Financial Holding Co. Ltd. | | 651,893 | 500,228 |
| Formosa Chemicals & Fibre Corp. | | 222,000 | 478,359 |
| Formosa Petrochemical Corp. | | 66,000 | 169,839 |
| Formosa Plastics Corp. | | 249,000 | 641,530 |
| Fubon Financial Holding Co. Ltd. | | 456,921 | 722,483 |
| Giant Manufacturing Co. Ltd. | | 19,000 | 121,055 |
| GlobalWafers Co. Ltd. | | 14,000 | 155,609 |
| Hon Hai Precision Industry Co. Ltd. (Foxconn) | | 754,800 | 2,398,679 |
| Hotai Motor Co. Ltd. | | 18,000 | 325,913 |
| Hua Nan Financial Holdings Co. Ltd. | | 520,281 | 339,552 |
| Innolux Corp. | | 537,570 | 197,501 |
| Inventec Corp. | | 140,000 | 105,909 |
| Largan Precision Co. Ltd. | | 6,000 | 344,143 |
| Lite-On Technology Corp. | | 122,000 | 242,079 |
| MediaTek, Inc. | | 92,000 | 1,682,892 |
| Mega Financial Holding Co. Ltd. | | 671,200 | 622,214 |
| Micro-Star International Co. Ltd. | | 43,000 | 145,982 |
| momo.com, Inc. | | 3,600 | 53,854 |
| Nan Ya Plastics Corp. | | 293,000 | 620,447 |
| Nan Ya Printed Circuit Board Corp. | | 13,000 | 85,245 |
| Nanya Technology Corp. | | 71,000 | 119,970 |
| Nien Made Enterprise Co. Ltd. | | 10,000 | 77,200 |
| Novatek Microelectronics Corp. | | 34,000 | 254,046 |
| Pegatron Corp. | | 122,000 | 223,166 |
| Pou Chen Corp. | | 139,000 | 117,435 |
| Powerchip Semiconductor Manufacturing Corp. | | 174,725 | 166,848 |
| President Chain Store Corp. | | 36,000 | 299,126 |
| Quanta Computer, Inc. | | 168,000 | 356,272 |
| Realtek Semiconductor Corp. | | 27,000 | 213,462 |
| Ruentex Development Co. Ltd. | | 111,750 | 137,202 |
| Shin Kong Financial Holding Co. Ltd. | | 813,393 | 201,747 |
| Sinopac Financial Holdings Co. | | 605,651 | 302,319 |
| Synnex Technology International Corp. | | 75,000 | 122,310 |
| Taishin Financial Holdings Co. Ltd. | | 635,354 | 261,005 |
| Taiwan Cement Corp. | | 381,667 | 357,953 |
| Taiwan Cooperative Financial Holding Co. Ltd. | | 581,376 | 450,623 |
| Taiwan High Speed Rail Corp. | | 119,000 | 103,674 |
| Taiwan Mobile Co. Ltd. | | 101,000 | 297,796 |
| Taiwan Semiconductor Manufacturing Co. Ltd. | | 1,487,000 | 17,859,566 |
| The Shanghai Commercial & Savings Bank Ltd. | | 223,899 | 322,097 |
| The Shanghai Commercial & Savings Bank Ltd. rights (a) | | 16,413 | 4,783 |
| Uni-President Enterprises Corp. | | 287,000 | 582,827 |
| Unimicron Technology Corp. | | 78,000 | 301,079 |
| United Microelectronics Corp. | | 711,000 | 854,115 |
| Vanguard International Semiconductor Corp. | | 51,000 | 104,992 |
| Voltronic Power Technology Corp. | | 4,000 | 162,460 |
| Walsin Lihwa Corp. | | 158,162 | 175,305 |
| Wan Hai Lines Ltd. | | 49,145 | 103,154 |
| Win Semiconductors Corp. | | 20,000 | 75,650 |
| Winbond Electronics Corp. | | 172,000 | 103,987 |
| Wiwynn Corp. | | 5,629 | 126,353 |
| WPG Holding Co. Ltd. | | 89,400 | 121,818 |
| Yageo Corp. | | 20,213 | 229,992 |
| Yang Ming Marine Transport Corp. | | 103,000 | 192,243 |
| Yuanta Financial Holding Co. Ltd. | | 589,372 | 359,975 |
TOTAL TAIWAN | | | 44,174,075 |
| Thailand - 0.6% | | | |
| Advanced Info Service PCL (For. Reg.) | | 27,500 | 138,060 |
| Advanced Information Service PCL NVDR | | 44,600 | 223,909 |
| Airports of Thailand PCL: | | | |
| (For. Reg.) (a) | | 171,900 | 334,357 |
| NVDR (a) | | 76,700 | 149,186 |
| Asset World Corp. PCL: | | | |
| (For. Reg.) | | 326,600 | 52,366 |
| NVDR | | 246,700 | 39,555 |
| B. Grimm Power PCL: | | | |
| (For. Reg.) | | 25,000 | 22,178 |
| NVDR | | 14,900 | 13,218 |
| Bangkok Commercial Asset Management PCL: | | | |
| (For. Reg.) | | 50,700 | 20,389 |
| NVDR | | 49,900 | 20,068 |
| Bangkok Dusit Medical Services PCL: | | | |
| (For. Reg.) | | 292,100 | 226,494 |
| NVDR | | 346,100 | 268,365 |
| Bangkok Expressway and Metro PCL: | | | |
| (For. Reg.) | | 154,900 | 38,272 |
| NVDR | | 271,800 | 67,155 |
| Berli Jucker PCL: | | | |
| unit | | 50,900 | 45,823 |
| (For. Reg.) | | 16,000 | 14,404 |
| BTS Group Holdings PCL: | | | |
| (For. Reg.) | | 53,600 | 11,694 |
| NVDR | | 421,400 | 91,934 |
| Bumrungrad Hospital PCL: | | | |
| NVDR | | 16,100 | 96,063 |
| (For. Reg.) | | 10,800 | 64,439 |
| Carabao Group PCL NVDR | | 16,900 | 40,090 |
| Central Pattana PCL: | | | |
| (For. Reg.) | | 74,500 | 134,627 |
| NVDR | | 55,700 | 100,654 |
| Central Retail Corp. PCL: | | | |
| (For. Reg.) | | 96,317 | 106,330 |
| NVDR | | 7,300 | 8,059 |
| Charoen Pokphand Foods PCL: | | | |
| (For. Reg.) | | 110,100 | 73,072 |
| (NVDR) | | 109,900 | 72,939 |
| CP ALL PCL: | | | |
| (For. Reg.) | | 143,900 | 226,942 |
| NVDR | | 215,200 | 339,388 |
| Delta Electronics PCL: | | | |
| (For. Reg.) | | 1,600 | 24,392 |
| NVDR | | 18,600 | 283,559 |
| Electricity Generating PCL: | | | |
| (For. Reg.) | | 6,900 | 30,923 |
| NVDR | | 10,500 | 47,056 |
| Energy Absolute PCL: | | | |
| (For. Reg.) | | 54,700 | 138,745 |
| NVDR | | 51,400 | 130,375 |
| Global Power Synergy Public Co. Ltd.: | | | |
| (For. Reg.) | | 24,100 | 39,275 |
| NVDR | | 19,400 | 31,615 |
| Gulf Energy Development PCL: | | | |
| (For. Reg.) | | 68,700 | 91,191 |
| NVDR | | 115,700 | 153,577 |
| Home Product Center PCL: | | | |
| (For. Reg.) | | 208,400 | 79,975 |
| NVDR | | 149,000 | 57,180 |
| Indorama Ventures PCL: | | | |
| (For. Reg.) | | 15,800 | 17,443 |
| NVDR | | 111,400 | 122,981 |
| Intouch Holdings PCL: | | | |
| (For. Reg.) | | 22,700 | 42,960 |
| NVDR | | 45,000 | 85,162 |
| JMT Network Services PCL NVDR | | 39,100 | 66,802 |
| Kasikornbank PCL NVDR | | 35,000 | 134,315 |
| Krung Thai Bank PCL: | | | |
| (For. Reg.) | | 95,600 | 43,974 |
| NVDR | | 114,400 | 52,622 |
| Krungthai Card PCL: | | | |
| (For. Reg.) | | 27,500 | 41,201 |
| NVDR | | 27,100 | 40,602 |
| Land & House PCL: | | | |
| NVDR | | 268,500 | 64,928 |
| (For. Reg.) | | 249,000 | 60,213 |
| Minor International PCL: | | | |
| unit (a) | | 86,641 | 64,335 |
| warrants 2/15/24 (a) | | 671 | 53 |
| (For. Reg.) (a) | | 98,681 | 73,275 |
| Muangthai Leasing PCL: | | | |
| (For. Reg.) | | 19,800 | 18,866 |
| NVDR | | 24,500 | 23,344 |
| Osotspa PCL: | | | |
| (For. Reg.) | | 17,500 | 12,190 |
| NVDR | | 66,800 | 46,529 |
| PTT Exploration and Production PCL: | | | |
| (For. Reg.) | | 33,000 | 157,432 |
| NVDR | | 49,200 | 234,717 |
| PTT Global Chemical PCL: | | | |
| (For. Reg.) | | 29,000 | 33,158 |
| NVDR | | 105,300 | 120,398 |
| PTT Oil & Retail Business PCL NVDR | | 171,200 | 108,448 |
| PTT PCL: | | | |
| (For. Reg.) | | 314,700 | 297,784 |
| NVDR | | 286,400 | 271,005 |
| Ratch Group PCL: | | | |
| unit | | 45,900 | 49,465 |
| (For. Reg.) | | 15,300 | 16,488 |
| SCB X PCL: | | | |
| (For. Reg.) | | 15,800 | 44,022 |
| NVDR unit | | 24,100 | 67,147 |
| SCG Packaging PCL NVDR | | 76,000 | 103,877 |
| Siam Cement PCL: | | | |
| (For. Reg.) | | 25,900 | 220,570 |
| NVDR | | 20,800 | 177,138 |
| Siam Commercial Bank PCL (For. Reg.) | | 15,800 | 36,569 |
| Srisawad Corp. PCL: | | | |
| warrants 8/29/25 (a) | | 712 | 61 |
| (For. Reg.) | | 23,500 | 25,325 |
| NVDR | | 18,400 | 19,829 |
| Thai Oil PCL: | | | |
| (For. Reg.) | | 22,133 | 31,706 |
| NVDR | | 59,766 | 85,616 |
| Thai Union Frozen Products PCL: | | | |
| (For. Reg.) | | 95,300 | 45,089 |
| NVDR | | 102,200 | 48,353 |
| rights (a)(c) | | 2,897 | 1,341 |
| rights (a)(c) | | 2,702 | 1,250 |
| True Corp. PCL: | | | |
| (For. Reg.) | | 174,800 | 22,789 |
| NVDR | | 591,800 | 77,154 |
TOTAL THAILAND | | | 7,456,419 |
| Turkey - 0.1% | | | |
| Akbank TAS | | 186,001 | 146,089 |
| Aselsan A/S | | 42,453 | 73,483 |
| Bim Birlesik Magazalar A/S JSC | | 26,487 | 190,674 |
| Eregli Demir ve Celik Fabrikalari T.A.S. | | 87,509 | 139,625 |
| Ford Otomotiv Sanayi A/S | | 4,199 | 81,885 |
| Haci Omer Sabanci Holding A/S | | 60,851 | 109,644 |
| Koc Holding A/S | | 44,865 | 134,010 |
| Turk Hava Yollari AO (a) | | 32,946 | 179,294 |
| Turk Sise ve Cam Fabrikalari A/S | | 88,899 | 158,654 |
| Turkcell Iletisim Hizmet A/S | | 72,920 | 100,443 |
| Turkiye Is Bankasi A/S Series C | | 214,897 | 107,597 |
| Turkiye Petrol Rafinerileri A/S (a) | | 7,269 | 148,002 |
TOTAL TURKEY | | | 1,569,400 |
| United Arab Emirates - 0.4% | | | |
| Abu Dhabi Commercial Bank PJSC | | 162,876 | 419,041 |
| Abu Dhabi Islamic Bank | | 84,530 | 218,626 |
| Abu Dhabi National Oil Co. for Distribution PJSC | | 179,268 | 220,113 |
| Aldar Properties PJSC | | 224,673 | 264,242 |
| Dubai Islamic Bank Pakistan Ltd. | | 167,910 | 266,052 |
| Emaar Properties PJSC (a) | | 233,980 | 386,028 |
| Emirates NBD Bank PJSC | | 111,181 | 401,064 |
| Emirates Telecommunications Corp. | | 214,109 | 1,503,910 |
| First Abu Dhabi Bank PJSC | | 271,783 | 1,324,471 |
TOTAL UNITED ARAB EMIRATES | | | 5,003,547 |
| United Kingdom - 8.9% | | | |
| 3i Group PLC | | 58,271 | 776,075 |
| Abrdn PLC | | 129,668 | 236,438 |
| Admiral Group PLC | | 10,571 | 244,517 |
| Anglo American PLC (United Kingdom) | | 76,709 | 2,297,758 |
| Antofagasta PLC | | 23,812 | 321,001 |
| Ashtead Group PLC | | 26,895 | 1,403,365 |
| Associated British Foods PLC | | 20,832 | 322,881 |
| AstraZeneca PLC (United Kingdom) | | 93,517 | 10,972,555 |
| Auto Trader Group PLC (b) | | 59,273 | 354,795 |
| Aveva Group PLC | | 7,036 | 251,749 |
| Aviva PLC | | 169,322 | 812,175 |
| BAE Systems PLC | | 191,305 | 1,789,385 |
| Barclays PLC | | 1,012,144 | 1,719,890 |
| Barratt Developments PLC | | 60,145 | 259,411 |
| Berkeley Group Holdings PLC | | 6,435 | 256,148 |
| BP PLC | | 1,142,987 | 6,323,699 |
| BP PLC sponsored ADR | | 3,945 | 131,290 |
| British American Tobacco PLC (United Kingdom) | | 129,687 | 5,121,790 |
| British Land Co. PLC | | 51,475 | 215,996 |
| BT Group PLC | | 418,691 | 623,241 |
| Bunzl PLC | | 20,290 | 661,060 |
| Burberry Group PLC | | 24,169 | 503,064 |
| Compass Group PLC | | 108,138 | 2,277,584 |
| Croda International PLC | | 8,497 | 658,719 |
| Diageo PLC | | 137,737 | 5,668,224 |
| GSK PLC | | 245,672 | 4,024,377 |
| Haleon PLC (a) | | 308,505 | 948,167 |
| Halma PLC | | 22,701 | 550,609 |
| Hargreaves Lansdown PLC | | 20,985 | 183,669 |
| Hikma Pharmaceuticals PLC | | 9,491 | 135,945 |
| HSBC Holdings PLC (United Kingdom) | | 1,211,656 | 6,218,283 |
| Imperial Brands PLC | | 54,193 | 1,320,093 |
| Informa PLC | | 90,969 | 579,620 |
| InterContinental Hotel Group PLC | | 11,597 | 623,115 |
| Intertek Group PLC | | 9,882 | 414,096 |
| J Sainsbury PLC | | 102,589 | 228,681 |
| JD Sports Fashion PLC | | 149,635 | 167,208 |
| Johnson Matthey PLC | | 11,275 | 250,134 |
| Kingfisher PLC | | 118,472 | 297,653 |
| Land Securities Group PLC | | 40,730 | 266,429 |
| Legal & General Group PLC | | 363,004 | 971,131 |
| Lloyds Banking Group PLC | | 4,200,024 | 2,017,137 |
| London Stock Exchange Group PLC | | 19,815 | 1,717,605 |
| M&G PLC | | 160,761 | 323,000 |
| Melrose Industries PLC | | 254,398 | 341,048 |
| Mondi PLC | | 26,775 | 449,069 |
| Mondi PLC | | 3,073 | 52,571 |
| National Grid PLC | | 219,567 | 2,392,210 |
| NatWest Group PLC | | 322,851 | 869,337 |
| Next PLC | | 7,858 | 444,180 |
| NMC Health PLC (a) | | 2,259 | 45 |
| Ocado Group PLC (a) | | 34,890 | 189,149 |
| Pearson PLC | | 40,884 | 451,896 |
| Persimmon PLC | | 18,672 | 279,440 |
| Phoenix Group Holdings PLC | | 46,487 | 289,160 |
| Prudential PLC | | 166,480 | 1,546,544 |
| Reckitt Benckiser Group PLC | | 43,117 | 2,861,417 |
| RELX PLC (London Stock Exchange) | | 115,553 | 3,103,811 |
| Rentokil Initial PLC | | 151,528 | 945,551 |
| Rio Tinto PLC | | 67,808 | 3,543,758 |
| Rolls-Royce Holdings PLC (a) | | 519,976 | 466,348 |
| Sage Group PLC | | 61,893 | 515,875 |
| Schroders PLC | | 42,911 | 192,757 |
| Segro PLC | | 74,413 | 669,894 |
| Severn Trent PLC | | 14,544 | 417,477 |
| Shell PLC (London) | | 448,816 | 12,432,925 |
| Smith & Nephew PLC | | 52,962 | 625,847 |
| Smiths Group PLC | | 23,351 | 417,885 |
| Spirax-Sarco Engineering PLC | | 4,505 | 555,381 |
| SSE PLC | | 65,296 | 1,166,897 |
| St. James's Place PLC | | 33,860 | 413,546 |
| Standard Chartered PLC (United Kingdom) | | 152,435 | 909,374 |
| Taylor Wimpey PLC | | 203,827 | 219,210 |
| Tesco PLC | | 457,570 | 1,130,145 |
| Unilever PLC | | 153,985 | 6,999,289 |
| United Utilities Group PLC | | 41,461 | 446,792 |
| Vodafone Group PLC | | 1,481,977 | 1,730,064 |
| Vodafone Group PLC sponsored ADR | | 13,592 | 160,522 |
| Whitbread PLC | | 12,416 | 365,429 |
TOTAL UNITED KINGDOM | | | 113,034,605 |
| United States of America - 0.2% | | | |
| 360 DigiTech, Inc. ADR | | 6,415 | 65,176 |
| Coca-Cola European Partners PLC | | 12,564 | 591,136 |
| Legend Biotech Corp. ADR (a) | | 2,754 | 137,204 |
| Li Auto, Inc. ADR (a) | | 32,701 | 445,388 |
| NICE Ltd. sponsored ADR (a) | | 278 | 52,789 |
| Southern Copper Corp. | | 5,011 | 235,367 |
| Yum China Holdings, Inc. | | 25,919 | 1,071,751 |
TOTAL UNITED STATES OF AMERICA | | | 2,598,811 |
| TOTAL COMMON STOCKS (Cost $1,435,345,055) | | | 1,204,088,723 |
| | | | |
| Nonconvertible Preferred Stocks - 1.0% |
| | | Shares | Value ($) |
| Brazil - 0.5% | | | |
| Banco Bradesco SA (PN) | | 318,095 | 1,222,992 |
| Braskem SA Class A | | 11,600 | 75,701 |
| Centrais Eletricas Brasileiras SA (Electrobras) (PN-B) | | 16,055 | 165,725 |
| Companhia Energetica de Minas Gerais (CEMIG) (PN) | | 86,120 | 189,562 |
| Gerdau SA | | 67,100 | 334,493 |
| Itau Unibanco Holding SA | | 295,550 | 1,739,371 |
| Itausa-Investimentos Itau SA (PN) | | 274,574 | 570,889 |
| Petroleo Brasileiro SA - Petrobras (PN) (non-vtg.) | | 282,800 | 1,632,033 |
TOTAL BRAZIL | | | 5,930,766 |
| Chile - 0.0% | | | |
| Sociedad Quimica y Minera de Chile SA (PN-B) | | 8,540 | 812,816 |
| Colombia - 0.0% | | | |
| Bancolombia SA (PN) | | 25,820 | 163,376 |
| Germany - 0.3% | | | |
| Bayerische Motoren Werke AG (BMW) (non-vtg.) | | 4,406 | 325,261 |
| Dr. Ing. h.c. F. Porsche AG Series F (a) | | 6,877 | 703,406 |
| Henkel AG & Co. KGaA | | 10,682 | 672,951 |
| Porsche Automobil Holding SE (Germany) | | 9,116 | 509,332 |
| Sartorius AG (non-vtg.) | | 1,476 | 520,886 |
| Volkswagen AG | | 11,257 | 1,440,912 |
TOTAL GERMANY | | | 4,172,748 |
| Korea (South) - 0.2% | | | |
| AMOREPACIFIC Corp. | | 450 | 11,602 |
| Hyundai Motor Co. | | 1,106 | 60,751 |
| Hyundai Motor Co. Series 2 | | 2,956 | 165,267 |
| LG Chemical Ltd. | | 716 | 144,974 |
| LG H & H Co. Ltd. | | 149 | 29,282 |
| Samsung Electronics Co. Ltd. | | 49,749 | 1,857,763 |
TOTAL KOREA (SOUTH) | | | 2,269,639 |
| Russia - 0.0% | | | |
| Surgutneftegas OJSC (c) | | 352,900 | 9,207 |
| TOTAL NONCONVERTIBLE PREFERRED STOCKS (Cost $15,258,676) | | | 13,358,552 |
| | | | |
| Government Obligations - 0.4% |
| | | Principal Amount (e) | Value ($) |
| United States of America - 0.4% | | | |
U.S. Treasury Bills, yield at date of purchase 1.23% 1/26/23 (f) (Cost $4,885,784) | | 4,900,000 | 4,853,324 |
| | | | |
| Money Market Funds - 4.6% |
| | | Shares | Value ($) |
| Fidelity Cash Central Fund 3.10% (g) | | 47,486,913 | 47,496,410 |
| Fidelity Securities Lending Cash Central Fund 3.10% (g)(h) | | 11,110,689 | 11,111,800 |
| TOTAL MONEY MARKET FUNDS (Cost $58,608,210) | | | 58,608,210 |
| | | | |
| TOTAL INVESTMENT IN SECURITIES - 100.4% (Cost $1,514,097,725) | 1,280,908,809 |
NET OTHER ASSETS (LIABILITIES) - (0.4)% | (5,101,030) |
| NET ASSETS - 100.0% | 1,275,807,779 |
| | |
| Futures Contracts |
| | Number of contracts | Expiration Date | Notional Amount ($) | Value ($) | Unrealized Appreciation/ (Depreciation) ($) |
| Purchased | | | | | |
| | | | | | |
| Equity Index Contracts | | | | | |
| ICE E-mini MSCI EAFE Index Contracts (United States) | 428 | Dec 2022 | 37,576,260 | 252,413 | 252,413 |
| ICE E-mini MSCI Emerging Markets Index Contracts (United States) | 376 | Dec 2022 | 16,047,680 | (1,053,084) | (1,053,084) |
| TME S&P/TSX 60 Index Contracts (Canada) | 28 | Dec 2022 | 4,840,577 | 97,997 | 97,997 |
| | | | | | |
| TOTAL FUTURES CONTRACTS | | | | | (702,674) |
| The notional amount of futures purchased as a percentage of Net Assets is 4.6% |
Categorizations in the Schedule of Investments are based on country or territory of incorporation.
Legend
| (b) | Security exempt from registration under Rule 144A of the Securities Act of 1933. These securities may be resold in transactions exempt from registration, normally to qualified institutional buyers. At the end of the period, the value of these securities amounted to $28,459,066 or 2.2% of net assets. |
| (d) | Security or a portion of the security is on loan at period end. |
| (e) | Amount is stated in United States dollars unless otherwise noted. |
| (f) | Security or a portion of the security was pledged to cover margin requirements for futures contracts. At period end, the value of securities pledged amounted to $3,023,918. |
| (g) | Affiliated fund that is generally available only to investment companies and other accounts managed by Fidelity Investments. The rate quoted is the annualized seven-day yield of the fund at period end. A complete unaudited listing of the fund's holdings as of its most recent quarter end is available upon request. In addition, each Fidelity Central Fund's financial statements, which are not covered by the Fund's Report of Independent Registered Public Accounting Firm, are available on the SEC's website or upon request. |
| (h) | Investment made with cash collateral received from securities on loan. |
Affiliated Central Funds
Fiscal year to date information regarding the Fund's investments in Fidelity Central Funds, including the ownership percentage, is presented below.
| Affiliate | Value, beginning of period ($) | Purchases ($) | Sales Proceeds ($) | Dividend Income ($) | Realized Gain (loss) ($) | Change in Unrealized appreciation (depreciation) ($) | Value, end of period ($) | % ownership, end of period |
| Fidelity Cash Central Fund 3.10% | 35,973,953 | 355,604,810 | 344,082,353 | 388,789 | - | - | 47,496,410 | 0.1% |
| Fidelity Securities Lending Cash Central Fund 3.10% | 6,771,783 | 67,184,295 | 62,844,278 | 47,501 | - | - | 11,111,800 | 0.0% |
| Total | 42,745,736 | 422,789,105 | 406,926,631 | 436,290 | - | - | 58,608,210 | |
| | | | | | | | | |
Amounts in the income column in the above table include any capital gain distributions from underlying funds, which are presented in the corresponding line item in the Statement of Operations, if applicable.
Amount for Fidelity Securities Lending Cash Central Fund represents the income earned on investing cash collateral, less rebates paid to borrowers and any lending agent fees associated with the loan, plus any premium payments received for lending certain types of securities.
Investment Valuation
The following is a summary of the inputs used, as of October 31, 2022, involving the Fund's assets and liabilities carried at fair value. The inputs or methodology used for valuing securities may not be an indication of the risk associated with investing in those securities. For more information on valuation inputs, and their aggregation into the levels used below, please refer to the Investment Valuation section in the accompanying Notes to Financial Statements.
| Valuation Inputs at Reporting Date: |
| Description | Total ($) | Level 1 ($) | Level 2 ($) | Level 3 ($) |
Investments in Securities: | | | | |
|
| Equities: | | | | |
Communication Services | 69,110,724 | 28,000,617 | 40,999,653 | 110,454 |
Consumer Discretionary | 130,365,276 | 56,081,839 | 74,275,895 | 7,542 |
Consumer Staples | 110,354,284 | 48,073,883 | 62,275,634 | 4,767 |
Energy | 80,648,147 | 45,287,141 | 35,212,753 | 148,253 |
Financials | 254,836,061 | 165,464,296 | 89,325,116 | 46,649 |
Health Care | 121,573,824 | 39,523,338 | 82,050,486 | - |
Industrials | 151,928,567 | 86,274,475 | 65,654,092 | - |
Information Technology | 132,441,542 | 73,463,471 | 58,978,071 | - |
Materials | 98,897,016 | 63,707,567 | 35,096,153 | 93,296 |
Real Estate | 26,643,887 | 22,201,617 | 4,426,515 | 15,755 |
Utilities | 40,647,947 | 23,715,178 | 16,918,248 | 14,521 |
|
| Government Obligations | 4,853,324 | - | 4,853,324 | - |
|
| Money Market Funds | 58,608,210 | 58,608,210 | - | - |
| Total Investments in Securities: | 1,280,908,809 | 710,401,632 | 570,065,940 | 441,237 |
Derivative Instruments: | | | | |
|
| Assets | | | | |
Futures Contracts | 350,410 | 350,410 | - | - |
| Total Assets | 350,410 | 350,410 | - | - |
|
| Liabilities | | | | |
Futures Contracts | (1,053,084) | (1,053,084) | - | - |
| Total Liabilities | (1,053,084) | (1,053,084) | - | - |
| Total Derivative Instruments: | (702,674) | (702,674) | - | - |
The following is a reconciliation of Investments in Securities for which Level 3 inputs were used in determining value:
| |
| Investments in Securities: | |
| Beginning Balance | $ | 128,262 | |
| Net Realized Gain (Loss) on Investment Securities | | (162,456) | |
| Net Unrealized Gain (Loss) on Investment Securities | | (15,312,421) | |
| Cost of Purchases | | 1,640,657 | |
| Proceeds of Sales | | (189,463) | |
| Amortization/Accretion | | - | |
| Transfers into Level 3 | | 14,431,782 | |
| Transfers out of Level 3 | | (95,124) | |
| Ending Balance | $ | 441,237 | |
| The change in unrealized gain (loss) for the period attributable to Level 3 securities held at October 31, 2022 | $ | (15,333,239) | |
| The information used in the above reconciliation represents fiscal year to date activity for any Investments in Securities identified as using Level 3 inputs at either the beginning or the end of the current fiscal period. Cost of purchases and proceeds of sales may include securities received and/or delivered through in-kind transactions. Transfers into Level 3 were attributable to a lack of observable market data resulting from decreases in market activity, decreases in liquidity, security restructurings or corporate actions. Transfers out of Level 3 were attributable to observable market data becoming available for those securities. Transfers in or out of Level 3 represent the beginning value of any Security or Instrument where a change in the pricing level occurred from the beginning to the end of the period. The cost of purchases and the proceeds of sales may include securities received or delivered through corporate actions or exchanges. Realized and unrealized gains (losses) disclosed in the reconciliation are included in Net Gain (Loss) on the Fund's Statement of Operations. | |
Value of Derivative Instruments
The following table is a summary of the Fund's value of derivative instruments by primary risk exposure as of October 31, 2022. For additional information on derivative instruments, please refer to the Derivative Instruments section in the accompanying Notes to Financial Statements.
Primary Risk Exposure / Derivative Type | Value |
| Asset ($) | Liability ($) |
| Equity Risk | | |
Futures Contracts (a) | 350,410 | (1,053,084) |
| Total Equity Risk | 350,410 | (1,053,084) |
| Total Value of Derivatives | 350,410 | (1,053,084) |
(a)Reflects gross cumulative appreciation (depreciation) on futures contracts as presented in the Schedule of Investments. In the Statement of Assets and Liabilities, the period end daily variation margin is included in receivable or payable for daily variation margin on futures contracts, and the net cumulative appreciation (depreciation) is included in Total accumulated earnings (loss).
| Statement of Assets and Liabilities |
| | | | October 31, 2022 |
| | | | | |
| Assets | | | | |
| Investment in securities, at value (including securities loaned of $10,581,560) - See accompanying schedule: | | | | |
Unaffiliated issuers (cost $1,455,489,515) | | $1,222,300,599 | | |
Fidelity Central Funds (cost $58,608,210) | | 58,608,210 | | |
| | | | | |
| Total Investment in Securities (cost $1,514,097,725) | | | $ | 1,280,908,809 |
| Foreign currency held at value (cost $2,268,418) | | | | 2,215,744 |
| Receivable for investments sold | | | | 192,117 |
| Receivable for fund shares sold | | | | 2,374,119 |
| Dividends receivable | | | | 2,415,406 |
| Reclaims receivable | | | | 1,762,463 |
| Distributions receivable from Fidelity Central Funds | | | | 110,517 |
Total assets | | | | 1,289,979,175 |
| Liabilities | | | | |
| Payable for investments purchased | | $1,306 | | |
| Payable for fund shares redeemed | | 1,284,151 | | |
| Payable for daily variation margin on futures contracts | | 389,645 | | |
| Deferred taxes | | 1,384,688 | | |
| Other payables and accrued expenses | | 47 | | |
| Collateral on securities loaned | | 11,111,559 | | |
| Total Liabilities | | | | 14,171,396 |
| Net Assets | | | $ | 1,275,807,779 |
| Net Assets consist of: | | | | |
| Paid in capital | | | $ | 1,526,568,846 |
| Total accumulated earnings (loss) | | | | (250,761,067) |
| Net Assets | | | $ | 1,275,807,779 |
Net Asset Value , offering price and redemption price per share ($1,275,807,779 ÷ 123,131,598 shares) | | | $ | 10.36 |
| | | | | |
| Statement of Operations |
| | | | Year ended October 31, 2022 |
| Investment Income | | | | |
| Dividends | | | $ | 41,540,238 |
| Non-Cash dividends | | | | 2,831,647 |
| Interest | | | | 30,412 |
| Income from Fidelity Central Funds (including $47,501 from security lending) | | | | 436,290 |
| Income before foreign taxes withheld | | | | 44,838,587 |
| Less foreign taxes withheld | | | | (4,095,874) |
| Total Income | | | | 40,742,713 |
| Expenses | | | | |
| Independent trustees' fees and expenses | | 4,283 | | |
| Total expenses before reductions | | 4,283 | | |
| Expense reductions | | (63) | | |
| Total expenses after reductions | | | | 4,220 |
| Net Investment income (loss) | | | | 40,738,493 |
| Realized and Unrealized Gain (Loss) | | | | |
| Net realized gain (loss) on: | | | | |
| Investment Securities: | | | | |
| Unaffiliated issuers(net of foreign taxes of $63,589) | | (19,442,702) | | |
| Foreign currency transactions | | (525,304) | | |
| Futures contracts | | (11,861,291) | | |
| Total net realized gain (loss) | | | | (31,829,297) |
| Change in net unrealized appreciation (depreciation) on: | | | | |
| Investment Securities: | | | | |
| Unaffiliated issuers (net of decrease in deferred foreign taxes of $139,893) | | (379,349,969) | | |
| Assets and liabilities in foreign currencies | | (263,279) | | |
| Futures contracts | | (1,516,777) | | |
| Total change in net unrealized appreciation (depreciation) | | | | (381,130,025) |
| Net gain (loss) | | | | (412,959,322) |
| Net increase (decrease) in net assets resulting from operations | | | $ | (372,220,829) |
| Statement of Changes in Net Assets |
| |
| | Year ended October 31, 2022 | | Year ended October 31, 2021 |
| Increase (Decrease) in Net Assets | | | | |
| Operations | | | | |
| Net investment income (loss) | $ | 40,738,493 | $ | 24,595,144 |
| Net realized gain (loss) | | (31,829,297) | | (4,206,679) |
| Change in net unrealized appreciation (depreciation) | | (381,130,025) | | 160,024,832 |
| Net increase (decrease) in net assets resulting from operations | | (372,220,829) | | 180,413,297 |
| Distributions to shareholders | | (29,150,134) | | (10,454,288) |
| Share transactions | | | | |
| Proceeds from sales of shares | | 735,487,480 | | 773,112,753 |
| Reinvestment of distributions | | 19,695,566 | | 7,447,910 |
| Cost of shares redeemed | | (350,156,302) | | (253,488,031) |
Net increase (decrease) in net assets resulting from share transactions | | 405,026,744 | | 527,072,632 |
| Total increase (decrease) in net assets | | 3,655,781 | | 697,031,641 |
| | | | | |
| Net Assets | | | | |
| Beginning of period | | 1,272,151,998 | | 575,120,357 |
| End of period | $ | 1,275,807,779 | $ | 1,272,151,998 |
| | | | | |
| Other Information | | | | |
| Shares | | | | |
| Sold | | 60,059,205 | | 56,476,027 |
| Issued in reinvestment of distributions | | 1,491,705 | | 587,374 |
| Redeemed | | (28,896,363) | | (18,694,973) |
| Net increase (decrease) | | 32,654,547 | | 38,368,428 |
| | | | | |
Financial Highlights
| Fidelity Flex® International Index Fund |
| |
| Years ended October 31, | | 2022 | | 2021 | | 2020 | | 2019 | | 2018 |
Selected Per-Share Data | | | | | | | | | | |
| Net asset value, beginning of period | $ | 14.06 | $ | 11.04 | $ | 11.59 | $ | 10.60 | $ | 11.79 |
| Income from Investment Operations | | | | | | | | | | |
Net investment income (loss) A,B | | .37 | | .35 | | .27 | | .37 | | .36 |
| Net realized and unrealized gain (loss) | | (3.76) | | 2.87 | | (.52) | | .81 | | (1.35) |
| Total from investment operations | | (3.39) | | 3.22 | | (.25) | | 1.18 | | (.99) |
| Distributions from net investment income | | (.31) | | (.20) | | (.30) | | (.19) | | (.15) |
| Distributions from net realized gain | | - | | - | | - | | - | | (.05) |
| Total distributions | | (.31) | | (.20) | | (.30) | | (.19) | | (.20) |
| Net asset value, end of period | $ | 10.36 | $ | 14.06 | $ | 11.04 | $ | 11.59 | $ | 10.60 |
Total Return C | | (24.60)% | | 29.31% | | (2.24)% | | 11.40% | | (8.53)% |
Ratios to Average Net Assets B,D,E | | | | | | | | | | |
Expenses before reductions F | | -% | | -% | | -% | | -% | | -% |
Expenses net of fee waivers, if any F | | -% | | -% | | -% | | -% | | -% |
Expenses net of all reductions F | | -% | | -% | | -% | | -% | | -% |
| Net investment income (loss) | | 3.10% | | 2.56% | | 2.46% | | 3.35% | | 3.13% |
| Supplemental Data | | | | | | | | | | |
| Net assets, end of period (000 omitted) | $ | 1,275,808 | $ | 1,272,152 | $ | 575,120 | $ | 378,587 | $ | 244,871 |
Portfolio turnover rate G | | 4% | | 5% | | 4% | | 4% | | 4% H |
A Calculated based on average shares outstanding during the period.
B Net investment income (loss) is affected by the timing of the declaration of dividends by any underlying mutual funds or exchange-traded funds (ETFs). Net investment income (loss) of any mutual funds or ETFs is not included in the Fund's net investment income (loss) ratio.
C Total returns would have been lower if certain expenses had not been reduced during the applicable periods shown.
D Fees and expenses of any underlying mutual funds or exchange-traded funds (ETFs) are not included in the Fund's expense ratio. The Fund indirectly bears its proportionate share of these expenses. For additional expense information related to investments in Fidelity Central Funds, please refer to the "Investments in Fidelity Central Funds" note found in the Notes to Financial Statements section of the most recent Annual or Semi-Annual report.
E Expense ratios reflect operating expenses of the class. Expenses before reductions do not reflect amounts reimbursed, waived, or reduced through arrangements with the investment adviser, brokerage services, or other offset arrangements, if applicable, and do not represent the amount paid by the class during periods when reimbursements, waivers or reductions occur.
F Amount represents less than .005%.
G Amount does not include the portfolio activity of any underlying mutual funds or exchange-traded funds (ETFs).
H Portfolio turnover rate excludes securities received or delivered in-kind.
For the period ended October 31, 2022
1. Organization.
Fidelity Flex International Index Fund (the Fund) is a fund of Fidelity Salem Street Trust (the Trust) and is authorized to issue an unlimited number of shares. Share transactions on the Statement of Changes in Net Assets may contain exchanges between affiliated funds. The Trust is registered under the Investment Company Act of 1940, as amended (the 1940 Act), as an open-end management investment company organized as a Massachusetts business trust. The Fund is available only to certain fee-based accounts and advisory programs offered by Fidelity. The Fund's investments in emerging markets can be subject to social, economic, regulatory, and political uncertainties and can be extremely volatile.
2. Investments in Fidelity Central Funds.
Funds may invest in Fidelity Central Funds, which are open-end investment companies generally available only to other investment companies and accounts managed by the investment adviser and its affiliates. The Schedule of Investments lists any Fidelity Central Funds held as an investment as of period end, but does not include the underlying holdings of each Fidelity Central Fund. An investing fund indirectly bears its proportionate share of the expenses of the underlying Fidelity Central Funds.
Based on its investment objective, each Fidelity Central Fund may invest or participate in various investment vehicles or strategies that are similar to those of the investing fund. These strategies are consistent with the investment objectives of the investing fund and may involve certain economic risks which may cause a decline in value of each of the Fidelity Central Funds and thus a decline in the value of the investing fund.
| Fidelity Central Fund | Investment Manager | Investment Objective | Investment Practices | Expense Ratio A |
| Fidelity Money Market Central Funds | Fidelity Management & Research Company LLC (FMR) | Each fund seeks to obtain a high level of current income consistent with the preservation of capital and liquidity. | Short-term Investments | Less than .005% |
A Expenses expressed as a percentage of average net assets and are as of each underlying Central Fund's most recent annual or semi-annual shareholder report.
A complete unaudited list of holdings for each Fidelity Central Fund is available upon request or at the Securities and Exchange Commission website at www.sec.gov. In addition, the financial statements of the Fidelity Central Funds which contain the significant accounting policies (including investment valuation policies) of those funds, and are not covered by the Report of Independent Registered Public Accounting Firm, are available on the Securities and Exchange Commission website or upon request.
3. Significant Accounting Policies.
The Fund is an investment company and applies the accounting and reporting guidance of the Financial Accounting Standards Board (FASB) Accounting Standards Codification Topic 946 Financial Services - Investment Companies . The financial statements have been prepared in conformity with accounting principles generally accepted in the United States of America (GAAP), which require management to make certain estimates and assumptions at the date of the financial statements. Actual results could differ from those estimates. Subsequent events, if any, through the date that the financial statements were issued have been evaluated in the preparation of the financial statements. The Fund's Schedule of Investments lists any underlying mutual funds or exchange-traded funds (ETFs) but does not include the underlying holdings of these funds. The following summarizes the significant accounting policies of the Fund:
Investment Valuation. Investments are valued as of 4:00 p.m. Eastern time on the last calendar day of the period. The Board of Trustees (the Board) has designated the Fund's investment adviser as the valuation designee responsible for the fair valuation function and performing fair value determinations as needed. The investment adviser has established a Fair Value Committee (the Committee) to carry out the day-to-day fair valuation responsibilities and has adopted policies and procedures to govern the fair valuation process and the activities of the Committee. In accordance with these fair valuation policies and procedures, which have been approved by the Board, the Fund attempts to obtain prices from one or more third party pricing services or brokers to value its investments. When current market prices, quotations or currency exchange rates are not readily available or reliable, investments will be fair valued in good faith by the Committee, in accordance with the policies and procedures. Factors used in determining fair value vary by investment type and may include market or investment specific events, transaction data, estimated cash flows, and market observations of comparable investments. The frequency that the fair valuation procedures are used cannot be predicted and they may be utilized to a significant extent. The Committee manages the Fund's fair valuation practices and maintains the fair valuation policies and procedures. The Fund's investment adviser reports to the Board information regarding the fair valuation process and related material matters.
The Fund categorizes the inputs to valuation techniques used to value its investments into a disclosure hierarchy consisting of three levels as shown below:
Level 1 - unadjusted quoted prices in active markets for identical investments
Level 2 - other significant observable inputs (including quoted prices for similar investments, interest rates, prepayment speeds, etc.)
Level 3 - unobservable inputs (including the Fund's own assumptions based on the best information available)
Valuation techniques used to value the Fund's investments by major category are as follows:
Equity securities, including restricted securities, for which market quotations are readily available, are valued at the last reported sale price or official closing price as reported by a third party pricing service on the primary market or exchange on which they are traded and are categorized as Level 1 in the hierarchy. In the event there were no sales during the day or closing prices are not available, securities are valued at the last quoted bid price or may be valued using the last available price and are generally categorized as Level 2 in the hierarchy. For foreign equity securities, when market or security specific events arise, comparisons to the valuation of American Depositary Receipts (ADRs), futures contracts, Exchange-Traded Funds (ETFs) and certain indexes as well as quoted prices for similar securities may be used and would be categorized as Level 2 in the hierarchy. For equity securities, including restricted securities, where observable inputs are limited, assumptions about market activity and risk are used and these securities may be categorized as Level 3 in the hierarchy.
Debt securities, including restricted securities, are valued based on evaluated prices received from third party pricing services or from brokers who make markets in such securities. U.S. government and government agency obligations are valued by pricing services who utilize matrix pricing which considers yield or price of bonds of comparable quality, coupon, maturity and type or by broker-supplied prices. When independent prices are unavailable or unreliable, debt securities may be valued utilizing pricing methodologies which consider similar factors that would be used by third party pricing services. Debt securities are generally categorized as Level 2 in the hierarchy but may be Level 3 depending on the circumstances.
Futures contracts are valued at the settlement price established each day by the board of trade or exchange on which they are traded and are categorized as Level 1 in the hierarchy. Investments in open-end mutual funds, including the Fidelity Central Funds, are valued at their closing net asset value (NAV) each business day and are categorized as Level 1 in the hierarchy.
Changes in valuation techniques may result in transfers in or out of an assigned level within the disclosure hierarchy. The aggregate value of investments by input level as of October 31, 2022, as well as a roll forward of Level 3 investments, is included at the end of the Fund's Schedule of Investments.
Foreign Currency. Certain Funds may use foreign currency contracts to facilitate transactions in foreign-denominated securities. Gains and losses from these transactions may arise from changes in the value of the foreign currency or if the counterparties do not perform under the contracts' terms.
Foreign-denominated assets, including investment securities, and liabilities are translated into U.S. dollars at the exchange rates at period end. Purchases and sales of investment securities, income and dividends received, and expenses denominated in foreign currencies are translated into U.S. dollars at the exchange rate in effect on the transaction date.
The effects of exchange rate fluctuations on investments are included with the net realized and unrealized gain (loss) on investment securities. Other foreign currency transactions resulting in realized and unrealized gain (loss) are disclosed separately.
Investment Transactions and Income. For financial reporting purposes, the Fund's investment holdings and NAV include trades executed through the end of the last business day of the period. The NAV per share for processing shareholder transactions is calculated as of the close of business of the New York Stock Exchange (NYSE), normally 4:00 p.m. Eastern time and includes trades executed through the end of the prior business day. Gains and losses on securities sold are determined on the basis of identified cost. Commissions paid to certain brokers with whom the investment adviser, or its affiliates, places trades on behalf of a fund include an amount in addition to trade execution, which may be rebated back to a fund. Any such rebates are included in net realized gain (loss) on investments in the Statement of Operations. Dividend income is recorded on the ex-dividend date, except for certain dividends from foreign securities where the ex-dividend date may have passed, which are recorded as soon as the Fund is informed of the ex-dividend date. Non-cash dividends included in dividend income, if any, are recorded at the fair market value of the securities received. Income and capital gain distributions from Fidelity Central Funds, if any, are recorded on the ex-dividend date. Certain distributions received by the Fund represent a return of capital or capital gain. The Fund determines the components of these distributions subsequent to the ex-dividend date, based upon receipt of tax filings or other correspondence relating to the underlying investment. These distributions are recorded as a reduction of cost of investments and/or as a realized gain. Interest income is accrued as earned and includes coupon interest and amortization of premium and accretion of discount on debt securities as applicable. Investment income is recorded net of foreign taxes withheld where recovery of such taxes is uncertain. Funds may file withholding tax reclaims in certain jurisdictions to recover a portion of amounts previously withheld. Any withholding tax reclaims income is included in the Statement of Operations in foreign taxes withheld. Any receivables for withholding tax reclaims are included in the Statement of Assets and Liabilities in reclaims receivable.
Expenses. Expenses directly attributable to a fund are charged to that fund. Expenses attributable to more than one fund are allocated among the respective funds on the basis of relative net assets or other appropriate methods. Expenses included in the accompanying financial statements reflect the expenses of that fund and do not include any expenses associated with any underlying mutual funds or exchange-traded funds. Although not included in a fund's expenses, a fund indirectly bears its proportionate share of these expenses through the net asset value of each underlying mutual fund or exchange-traded fund. Expense estimates are accrued in the period to which they relate and adjustments are made when actual amounts are known.
Income Tax Information and Distributions to Shareholders. Each year, the Fund intends to qualify as a regulated investment company under Subchapter M of the Internal Revenue Code, including distributing substantially all of its taxable income and realized gains. As a result, no provision for U.S. Federal income taxes is required. As of October 31, 2022, the Fund did not have any unrecognized tax benefits in the financial statements; nor is the Fund aware of any tax positions for which it is reasonably possible that the total amounts of unrecognized tax benefits will significantly change in the next twelve months. The Fund files a U.S. federal tax return, in addition to state and local tax returns as required. The Fund's federal income tax returns are subject to examination by the Internal Revenue Service (IRS) for a period of three fiscal years after they are filed. State and local tax returns may be subject to examination for an additional fiscal year depending on the jurisdiction. Foreign taxes are provided for based on the Fund's understanding of the tax rules and rates that exist in the foreign markets in which it invests. The Fund is subject to a tax imposed on capital gains by certain countries in which it invests. An estimated deferred tax liability for net unrealized appreciation on the applicable securities is included in Deferred taxes on the Statement of Assets & Liabilities.
Distributions are declared and recorded on the ex-dividend date. Income and capital gain distributions are determined in accordance with income tax regulations, which may differ from GAAP. In addition, the Fund claimed a portion of the payment made to redeeming shareholders as a distribution for income tax purposes.
Capital accounts within the financial statements are adjusted for permanent book-tax differences. These adjustments have no impact on net assets or the results of operations. Capital accounts are not adjusted for temporary book-tax differences which will reverse in a subsequent period.
Book-tax differences are primarily due to futures contracts, foreign currency transactions, certain foreign taxes, passive foreign investment companies (PFIC), capital loss carryforwards, partnerships and losses deferred due to wash sales.
As of period end, the cost and unrealized appreciation (depreciation) in securities, and derivatives if applicable, for federal income tax purposes were as follows:
| Gross unrealized appreciation | $94,882,136 |
| Gross unrealized depreciation | (338,490,606) |
| Net unrealized appreciation (depreciation) | $(243,608,470) |
| Tax Cost | $1,524,615,276 |
The tax-based components of distributable earnings as of period end were as follows:
| Undistributed ordinary income | $30,272,081 |
| Capital loss carryforward | $(35,768,547) |
| Net unrealized appreciation (depreciation) on securities and other investments | $(243,879,914) |
Capital loss carryforwards are only available to offset future capital gains of the Fund to the extent provided by regulations and may be limited. The capital loss carryforward information presented below, including any applicable limitation, is estimated as of fiscal period end and is subject to adjustment.
Short-term | $(11,746,000) |
Long-term | (24,022,547) |
| Total capital loss carryforward | $(35,768,547) |
The tax character of distributions paid was as follows:
| | October 31, 2022 | October 31, 2021 |
| Ordinary Income | $29,150,134 | $10,454,288 |
Restricted Securities (including Private Placements). Funds may invest in securities that are subject to legal or contractual restrictions on resale. These securities generally may be resold in transactions exempt from registration or to the public if the securities are registered. Disposal of these securities may involve time-consuming negotiations and expense, and prompt sale at an acceptable price may be difficult. Information regarding restricted securities held at period end is included at the end of the Schedule of Investments, if applicable.
4. Derivative Instruments.
Risk Exposures and the Use of Derivative Instruments. The Fund's investment objectives allow for various types of derivative instruments, including futures contracts. Derivatives are investments whose value is primarily derived from underlying assets, indices or reference rates and may be transacted on an exchange or over-the-counter (OTC). Derivatives may involve a future commitment to buy or sell a specified asset based on specified terms, to exchange future cash flows at periodic intervals based on a notional principal amount, or for one party to make one or more payments upon the occurrence of specified events in exchange for periodic payments from the other party.
Derivatives were used to increase returns and to manage exposure to certain risks as defined below. The success of any strategy involving derivatives depends on analysis of numerous economic factors, and if the strategies for investment do not work as intended, the objectives may not be achieved.
Derivatives were used to increase or decrease exposure to the following risk(s):
| | |
| Equity Risk | Equity risk relates to the fluctuations in the value of financial instruments as a result of changes in market prices (other than those arising from interest rate risk or foreign exchange risk), whether caused by factors specific to an individual investment, its issuer, or all factors affecting all instruments traded in a market or market segment. |
Funds are also exposed to additional risks from investing in derivatives, such as liquidity risk and counterparty credit risk. Liquidity risk is the risk that a fund will be unable to close out the derivative in the open market in a timely manner. Counterparty credit risk is the risk that the counterparty will not be able to fulfill its obligation to a fund. Counterparty credit risk related to exchange-traded contracts may be mitigated by the protection provided by the exchange on which they trade.
Investing in derivatives may involve greater risks than investing in the underlying assets directly and, to varying degrees, may involve risk of loss in excess of any initial investment and collateral received and amounts recognized in the Statement of Assets and Liabilities. In addition, there may be the risk that the change in value of the derivative contract does not correspond to the change in value of the underlying instrument.
Futures Contracts. A futures contract is an agreement between two parties to buy or sell a specified underlying instrument for a fixed price at a specified future date. Futures contracts were used to manage exposure to the stock market.
Upon entering into a futures contract, a fund is required to deposit either cash or securities (initial margin) with a clearing broker in an amount equal to a certain percentage of the face value of the contract. Futures contracts are marked-to-market daily and subsequent daily payments are made or received by a fund depending on the daily fluctuations in the value of the futures contracts and are recorded as unrealized appreciation or (depreciation). This receivable and/or payable, if any, is included in daily variation margin on futures contracts in the Statement of Assets and Liabilities. Realized gain or (loss) is recorded upon the expiration or closing of a futures contract. The net realized gain (loss) and change in net unrealized appreciation (depreciation) on futures contracts during the period is presented in the Statement of Operations.
Any open futures contracts at period end are presented in the Schedule of Investments under the caption "Futures Contracts". The notional amount at value reflects each contract's exposure to the underlying instrument or index at period end, and is representative of volume of activity during the period unless an average notional amount is presented. Any securities deposited to meet initial margin requirements are identified in the Schedule of Investments. Any cash deposited to meet initial margin requirements is presented as segregated cash with brokers for derivative instruments in the Statement of Assets and Liabilities.
5. Purchases and Sales of Investments.
Purchases and sales of securities, other than short-term securities and in-kind transactions, as applicable, are noted in the table below.
| | Purchases ($) | Sales ($) |
| Fidelity Flex International Index Fund | 436,770,833 | 51,874,692 |
6. Fees and Other Transactions with Affiliates.
Management Fee. Fidelity Management & Research Company LLC (the investment adviser) and its affiliates provide the Fund with investment management related services and the Fund does not pay any fees for these services. Under the management contract, the investment adviser or an affiliate pays all other expenses of the Fund, excluding fees and expenses of the independent Trustees, and certain miscellaneous expenses such as proxy and shareholder meeting expenses.
Sub-Adviser. Geode Capital Management, LLC (Geode), serves as sub-adviser for the Fund. Geode provides discretionary investment advisory services to the Fund and is paid by the investment adviser for providing these services.
Interfund Trades. Funds may purchase from or sell securities to other Fidelity Funds under procedures adopted by the Board. The procedures have been designed to ensure these interfund trades are executed in accordance with Rule 17a-7 of the 1940 Act. Any interfund trades are included within the respective purchases and sales amounts shown in the Purchases and Sales of Investments note. During the period, there were no interfund trades.
7. Committed Line of Credit.
Certain Funds participate with other funds managed by the investment adviser or an affiliate in a $4.25 billion credit facility (the "line of credit") to be utilized for temporary or emergency purposes to fund shareholder redemptions or for other short-term liquidity purposes. The commitment fees on the pro-rata portion of the line of credit are borne by the investment adviser. During the period, there were no borrowings on this line of credit.
8. Security Lending.
Funds lend portfolio securities through a lending agent from time to time in order to earn additional income. A fund may lend securities to certain qualified borrowers, including NFS. On the settlement date of the loan, a fund receives collateral (in the form of U.S. Treasury obligations, letters of credit and/or cash) against the loaned securities and maintains collateral in an amount not less than 100% of the market value of the loaned securities during the period of the loan. The market value of the loaned securities is determined at the close of business of a fund and any additional required collateral is delivered to a fund on the next business day. The Fund or borrower may terminate the loan at any time, and if the borrower defaults on its obligation to return the securities loaned because of insolvency or other reasons, a fund may apply collateral received from the borrower against the obligation. A fund may experience delays and costs in recovering the securities loaned. Any cash collateral received is invested in the Fidelity Securities Lending Cash Central Fund. Any loaned securities are identified as such in the Schedule of Investments, and the value of loaned securities and cash collateral at period end, as applicable, are presented in the Statement of Assets and Liabilities. Security lending income represents the income earned on investing cash collateral, less rebates paid to borrowers and any lending agent fees associated with the loan, plus any premium payments received for lending certain types of securities. Security lending income is presented in the Statement of Operations as a component of income from Fidelity Central Funds.
| | Security Lending Income From Securities Loaned to NFS | Value of Securities Loaned to NFS at Period End |
| Fidelity Flex International Index Fund | $- | $- |
| | | |
9. Expense Reductions.
Through arrangements with the Fund's custodian, credits realized as a result of certain uninvested cash balances were used to reduce the Fund's expenses by $63.
10. Other.
A fund's organizational documents provide former and current trustees and officers with a limited indemnification against liabilities arising in connection with the performance of their duties to the fund. In the normal course of business, a fund may also enter into contracts that provide general indemnifications. A fund's maximum exposure under these arrangements is unknown as this would be dependent on future claims that may be made against a fund. The risk of material loss from such claims is considered remote.
11. Risk and Uncertainties.
Many factors affect a fund's performance. Developments that disrupt global economies and financial markets, such as pandemics, epidemics, outbreaks of infectious diseases, war, terrorism, and environmental disasters, may significantly affect a fund's investment performance. The effects of these developments to a fund will be impacted by the types of securities in which a fund invests, the financial condition, industry, economic sector, and geographic location of an issuer, and a fund's level of investment in the securities of that issuer.
To the Board of Trustees of Fidelity Salem Street Trust and the Shareholders of Fidelity Flex International Index Fund
Opinion on the Financial Statements and Financial Highlights
We have audited the accompanying statement of assets and liabilities of Fidelity Flex International Index Fund (the "Fund"), a fund of Fidelity Salem Street Trust, including the schedule of investments, as of October 31, 2022, the related statement of operations for the year then ended, the statement of changes in net assets for each of the two years in the period then ended, the financial highlights for each of the five years in the period then ended, and the related notes. In our opinion, the financial statements and financial highlights present fairly, in all material respects, the financial position of the Fund as of October 31, 2022, and the results of its operations for the year then ended, the changes in its net assets for each of the two years in the period then ended, and the financial highlights for each of the five years in the period then ended in conformity with accounting principles generally accepted in the United States of America.
Basis for Opinion
These financial statements and financial highlights are the responsibility of the Fund's management. Our responsibility is to express an opinion on the Fund's financial statements and financial highlights based on our audits. We are a public accounting firm registered with the Public Company Accounting Oversight Board (United States) (PCAOB) and are required to be independent with respect to the Fund in accordance with the U.S. federal securities laws and the applicable rules and regulations of the Securities and Exchange Commission and the PCAOB.
We conducted our audits in accordance with the standards of the PCAOB. Those standards require that we plan and perform the audit to obtain reasonable assurance about whether the financial statements and financial highlights are free of material misstatement, whether due to error or fraud. The Fund is not required to have, nor were we engaged to perform, an audit of its internal control over financial reporting. As part of our audits we are required to obtain an understanding of internal control over financial reporting but not for the purpose of expressing an opinion on the effectiveness of the Fund's internal control over financial reporting. Accordingly, we express no such opinion.
Our audits included performing procedures to assess the risks of material misstatement of the financial statements and financial highlights, whether due to error or fraud, and performing procedures that respond to those risks. Such procedures included examining, on a test basis, evidence regarding the amounts and disclosures in the financial statements and financial highlights. Our audits also included evaluating the accounting principles used and significant estimates made by management, as well as evaluating the overall presentation of the financial statements and financial highlights. Our procedures included confirmation of securities owned as of October 31, 2022, by correspondence with the custodian and brokers; when replies were not received from brokers, we performed other auditing procedures. We believe that our audits provide a reasonable basis for our opinion.
/s/ Deloitte & Touche LLP
Boston, Massachusetts
December 14, 2022
We have served as the auditor of one or more of the Fidelity investment companies since 1999.
The Trustees, Members of the Advisory Board (if any), and officers of the trust and fund, as applicable, are listed below. The Board of Trustees governs the fund and is responsible for protecting the interests of shareholders. The Trustees are experienced executives who meet periodically throughout the year to oversee the fund's activities, review contractual arrangements with companies that provide services to the fund, oversee management of the risks associated with such activities and contractual arrangements, and review the fund's performance. Except for Jonathan Chiel, each of the Trustees oversees 293 funds. Mr. Chiel oversees 184 funds.
The Trustees hold office without limit in time except that (a) any Trustee may resign; (b) any Trustee may be removed by written instrument, signed by at least two-thirds of the number of Trustees prior to such removal; (c) any Trustee who requests to be retired or who has become incapacitated by illness or injury may be retired by written instrument signed by a majority of the other Trustees; and (d) any Trustee may be removed at any special meeting of shareholders by a two-thirds vote of the outstanding voting securities of the trust. Each Trustee who is not an interested person (as defined in the 1940 Act) of the trust and the fund is referred to herein as an Independent Trustee. Each Independent Trustee shall retire not later than the last day of the calendar year in which his or her 75th birthday occurs. The Independent Trustees may waive this mandatory retirement age policy with respect to individual Trustees. Officers and Advisory Board Members hold office without limit in time, except that any officer or Advisory Board Member may resign or may be removed by a vote of a majority of the Trustees at any regular meeting or any special meeting of the Trustees. Except as indicated, each individual has held the office shown or other offices in the same company for the past five years.
The fund's Statement of Additional Information (SAI) includes more information about the Trustees. To request a free copy, call Fidelity at 1-800-544-3455 (for managed account clients) or 1-800-835-5092 (for retirement plan participants).
Experience, Skills, Attributes, and Qualifications of the Trustees. The Governance and Nominating Committee has adopted a statement of policy that describes the experience, qualifications, attributes, and skills that are necessary and desirable for potential Independent Trustee candidates (Statement of Policy). The Board believes that each Trustee satisfied at the time he or she was initially elected or appointed a Trustee, and continues to satisfy, the standards contemplated by the Statement of Policy. The Governance and Nominating Committee also engages professional search firms to help identify potential Independent Trustee candidates who have the experience, qualifications, attributes, and skills consistent with the Statement of Policy. From time to time, additional criteria based on the composition and skills of the current Independent Trustees, as well as experience or skills that may be appropriate in light of future changes to board composition, business conditions, and regulatory or other developments, have also been considered by the professional search firms and the Governance and Nominating Committee. In addition, the Board takes into account the Trustees' commitment and participation in Board and committee meetings, as well as their leadership of standing and ad hoc committees throughout their tenure.
In determining that a particular Trustee was and continues to be qualified to serve as a Trustee, the Board has considered a variety of criteria, none of which, in isolation, was controlling. The Board believes that, collectively, the Trustees have balanced and diverse experience, qualifications, attributes, and skills, which allow the Board to operate effectively in governing the fund and protecting the interests of shareholders. Information about the specific experience, skills, attributes, and qualifications of each Trustee, which in each case led to the Board's conclusion that the Trustee should serve (or continue to serve) as a trustee of the fund, is provided below.
Board Structure and Oversight Function. Abigail P. Johnson is an interested person and currently serves as Chairman. The Trustees have determined that an interested Chairman is appropriate and benefits shareholders because an interested Chairman has a personal and professional stake in the quality and continuity of services provided to the fund. Independent Trustees exercise their informed business judgment to appoint an individual of their choosing to serve as Chairman, regardless of whether the Trustee happens to be independent or a member of management. The Independent Trustees have determined that they can act independently and effectively without having an Independent Trustee serve as Chairman and that a key structural component for assuring that they are in a position to do so is for the Independent Trustees to constitute a substantial majority for the Board. The Independent Trustees also regularly meet in executive session. Michael E. Kenneally serves as Chairman of the Independent Trustees and as such (i) acts as a liaison between the Independent Trustees and management with respect to matters important to the Independent Trustees and (ii) with management prepares agendas for Board meetings.
Fidelity ® funds are overseen by different Boards of Trustees. The fund's Board oversees Fidelity's investment-grade bond, money market, asset allocation and certain equity funds, and other Boards oversee Fidelity's high income and other equity funds. The asset allocation funds may invest in Fidelity ® funds that are overseen by such other Boards. The use of separate Boards, each with its own committee structure, allows the Trustees of each group of Fidelity ® funds to focus on the unique issues of the funds they oversee, including common research, investment, and operational issues. On occasion, the separate Boards establish joint committees to address issues of overlapping consequences for the Fidelity ® funds overseen by each Board.
The Trustees operate using a system of committees to facilitate the timely and efficient consideration of all matters of importance to the Trustees, the fund, and fund shareholders and to facilitate compliance with legal and regulatory requirements and oversight of the fund's activities and associated risks. The Board, acting through its committees, has charged FMR and its affiliates with (i) identifying events or circumstances the occurrence of which could have demonstrably adverse effects on the fund's business and/or reputation; (ii) implementing processes and controls to lessen the possibility that such events or circumstances occur or to mitigate the effects of such events or circumstances if they do occur; and (iii) creating and maintaining a system designed to evaluate continuously business and market conditions in order to facilitate the identification and implementation processes described in (i) and (ii) above. Because the day-to-day operations and activities of the fund are carried out by or through FMR, its affiliates, and other service providers, the fund's exposure to risks is mitigated but not eliminated by the processes overseen by the Trustees. While each of the Board's committees has responsibility for overseeing different aspects of the fund's activities, oversight is exercised primarily through the Operations and Audit Committees. In addition, an ad hoc Board committee of Independent Trustees has worked with FMR to enhance the Board's oversight of investment and financial risks, legal and regulatory risks, technology risks, and operational risks, including the development of additional risk reporting to the Board. Appropriate personnel, including but not limited to the fund's Chief Compliance Officer (CCO), FMR's internal auditor, the independent accountants, the fund's Treasurer and portfolio management personnel, make periodic reports to the Board's committees, as appropriate, including an annual review of Fidelity's risk management program for the Fidelity ® funds. The responsibilities of each standing committee, including their oversight responsibilities, are described further under "Standing Committees of the Trustees."
Interested Trustees*:
Correspondence intended for a Trustee who is an interested person may be sent to Fidelity Investments, 245 Summer Street, Boston, Massachusetts 02210.
Name, Year of Birth; Principal Occupations and Other Relevant Experience+
Jonathan Chiel (1957)
Year of Election or Appointment: 2016
Trustee
Mr. Chiel also serves as Trustee of other Fidelity ® funds. Mr. Chiel is Executive Vice President and General Counsel for FMR LLC (diversified financial services company, 2012-present). Previously, Mr. Chiel served as general counsel (2004-2012) and senior vice president and deputy general counsel (2000-2004) for John Hancock Financial Services; a partner with Choate, Hall & Stewart (1996-2000) (law firm); and an Assistant United States Attorney for the United States Attorney's Office of the District of Massachusetts (1986-95), including Chief of the Criminal Division (1993-1995). Mr. Chiel is a director on the boards of the Boston Bar Foundation and the Maimonides School.
Abigail P. Johnson (1961)
Year of Election or Appointment: 2009
Trustee
Chairman of the Board of Trustees
Ms. Johnson also serves as Trustee of other Fidelity ® funds. Ms. Johnson serves as Chairman (2016-present), Chief Executive Officer (2014-present), and Director (2007-present) of FMR LLC (diversified financial services company), President of Fidelity Financial Services (2012-present) and President of Personal, Workplace and Institutional Services (2005-present). Ms. Johnson is Chairman and Director of Fidelity Management & Research Company LLC (investment adviser firm, 2011-present). Previously, Ms. Johnson served as Chairman and Director of FMR Co., Inc. (investment adviser firm, 2011-2019), Vice Chairman (2007-2016) and President (2013-2016) of FMR LLC, President and a Director of Fidelity Management & Research Company (2001-2005), a Trustee of other investment companies advised by Fidelity Management & Research Company, Fidelity Investments Money Management, Inc. (investment adviser firm), and FMR Co., Inc. (2001-2005), Senior Vice President of the Fidelity ® funds (2001-2005), and managed a number of Fidelity ® funds. Ms. Abigail P. Johnson and Mr. Arthur E. Johnson are not related.
Jennifer Toolin McAuliffe (1959)
Year of Election or Appointment: 2016
Trustee
Ms. McAuliffe also serves as Trustee of other Fidelity ® funds and as Trustee of Fidelity Charitable (2020-present). Previously, Ms. McAuliffe served as Co-Head of Fixed Income of Fidelity Investments Limited (now known as FIL Limited (FIL)) (diversified financial services company), Director of Research for FIL's credit and quantitative teams in London, Hong Kong and Tokyo and Director of Research for taxable and municipal bonds at Fidelity Investments Money Management, Inc. Ms. McAuliffe previously served as a member of the Advisory Board of certain Fidelity ® funds (2016). Ms. McAuliffe was previously a lawyer at Ropes & Gray LLP and currently serves as director or trustee of several not-for-profit entities.
* Determined to be an "Interested Trustee" by virtue of, among other things, his or her affiliation with the trust or various entities under common control with FMR.
+ The information includes the Trustee's principal occupation during the last five years and other information relating to the experience, attributes, and skills relevant to the Trustee's qualifications to serve as a Trustee, which led to the conclusion that the Trustee should serve as a Trustee for the fund.
Independent Trustees:
Correspondence intended for an Independent Trustee may be sent to Fidelity Investments, P.O. Box 55235, Boston, Massachusetts 02205-5235.
Name, Year of Birth; Principal Occupations and Other Relevant Experience+
Elizabeth S. Acton (1951)
Year of Election or Appointment: 2013
Trustee
Ms. Acton also serves as Trustee of other Fidelity ® funds. Prior to her retirement, Ms. Acton served as Executive Vice President, Finance (2011-2012), Executive Vice President, Chief Financial Officer (2002-2011) and Treasurer (2004-2005) of Comerica Incorporated (financial services). Prior to joining Comerica, Ms. Acton held a variety of positions at Ford Motor Company (1983-2002), including Vice President and Treasurer (2000-2002) and Executive Vice President and Chief Financial Officer of Ford Motor Credit Company (1998-2000). Ms. Acton currently serves as a member of the Board and Audit and Finance Committees of Beazer Homes USA, Inc. (homebuilding, 2012-present). Ms. Acton previously served as a member of the Advisory Board of certain Fidelity ® funds (2013-2016).
Ann E. Dunwoody (1953)
Year of Election or Appointment: 2018
Trustee
General Dunwoody also serves as Trustee of other Fidelity ® funds. General Dunwoody (United States Army, Retired) was the first woman in U.S. military history to achieve the rank of four-star general and prior to her retirement in 2012 held a variety of positions within the U.S. Army, including Commanding General, U.S. Army Material Command (2008-2012). General Dunwoody currently serves as President of First to Four LLC (leadership and mentoring services, 2012-present), a member of the Board and Nomination and Corporate Governance Committees of Kforce Inc. (professional staffing services, 2016-present) and a member of the Board of Automattic Inc. (software engineering, 2018-present). Previously, General Dunwoody served as a member of the Advisory Board and Nominating and Corporate Governance Committee of L3 Technologies, Inc. (communication, electronic, sensor and aerospace systems, 2013-2019) and a member of the Board and Audit and Sustainability and Corporate Responsibility Committees of Republic Services, Inc. (waste collection, disposal and recycling, 2013-2016). Ms. Dunwoody also serves on several boards for non-profit organizations, including as a member of the Board, Chair of the Nomination and Governance Committee and a member of the Audit Committee of Logistics Management Institute (consulting non-profit, 2012-present), a member of the Council of Trustees for the Association of the United States Army (advocacy non-profit, 2013-present), a member of the Board of Florida Institute of Technology (2015-present) and a member of the Board of ThanksUSA (military family education non-profit, 2014-present). General Dunwoody previously served as a member of the Advisory Board of certain Fidelity ® funds (2018).
John Engler (1948)
Year of Election or Appointment: 2014
Trustee
Mr. Engler also serves as Trustee of other Fidelity ® funds. Previously, Mr. Engler served as Governor of Michigan (1991-2003), President of the Business Roundtable (2011-2017) and interim President of Michigan State University (2018-2019). Mr. Engler currently serves as a member of the Board of Stride, Inc. (formerly K12 Inc.) (technology-based education company, 2012-present). Previously, Mr. Engler served as a member of the Board of Universal Forest Products (manufacturer and distributor of wood and wood-alternative products, 2003-2019) and Trustee of The Munder Funds (2003-2014). Mr. Engler previously served as a member of the Advisory Board of certain Fidelity ® funds (2014-2016).
Robert F. Gartland (1951)
Year of Election or Appointment: 2010
Trustee
Mr. Gartland also serves as Trustee of other Fidelity ® funds. Prior to his retirement, Mr. Gartland held a variety of positions at Morgan Stanley (financial services, 1979-2007), including Managing Director (1987-2007) and Chase Manhattan Bank (1975-1978). Mr. Gartland previously served as Chairman and an investor in Gartland & Mellina Group Corp. (consulting, 2009-2019), as a member of the Board of National Securities Clearing Corporation (1993-1996) and as Chairman of TradeWeb (2003-2004).
Arthur E. Johnson (1947)
Year of Election or Appointment: 2008
Trustee
Mr. Johnson also serves as Trustee of other Fidelity ® funds. Prior to his retirement, Mr. Johnson served as Senior Vice President of Corporate Strategic Development of Lockheed Martin Corporation (defense contractor, 1999-2009). Mr. Johnson currently serves as a member of the Board of Booz Allen Hamilton (management consulting, 2011-present). Mr. Johnson previously served as a member of the Board of Eaton Corporation plc (diversified power management, 2009-2019) and a member of the Board of AGL Resources, Inc. (holding company, 2002-2016). Mr. Johnson previously served as Chairman (2018-2021) and Vice Chairman (2015-2018) of the Independent Trustees of certain Fidelity® funds. Mr. Arthur E. Johnson is not related to Ms. Abigail P. Johnson.
Michael E. Kenneally (1954)
Year of Election or Appointment: 2009
Trustee
Chairman of the Independent Trustees
Mr. Kenneally also serves as Trustee of other Fidelity ® funds and was Vice Chairman (2018-2021) of the Independent Trustees of certain Fidelity ® funds. Prior to retirement in 2005, he was Chairman and Global Chief Executive Officer of Credit Suisse Asset Management, the worldwide fund management and institutional investment business of Credit Suisse Group. Previously, Mr. Kenneally was an Executive Vice President and the Chief Investment Officer for Bank of America. In this role, he was responsible for the investment management, strategy and products delivered to the bank's institutional, high-net-worth and retail clients. Earlier, Mr. Kenneally directed the organization's equity and quantitative research groups. He began his career as a research analyst and then spent more than a dozen years as a portfolio manager for endowments, pension plans and mutual funds. He earned the Chartered Financial Analyst (CFA) designation in 1991.
Marie L. Knowles (1946)
Year of Election or Appointment: 2001
Trustee
Ms. Knowles also serves as Trustee of other Fidelity ® funds. Prior to her retirement, Ms. Knowles held several positions at Atlantic Richfield Company (diversified energy), including Executive Vice President and Chief Financial Officer (1996-2000), Senior Vice President (1993-1996) and President of ARCO Transportation Company (pipeline and tanker operations, 1993-1996). Ms. Knowles currently serves as a member of the Board of the Santa Catalina Island Company (real estate, 2009-present), a member of the Investment Company Institute Board of Governors and a member of the Governing Council of the Independent Directors Council (2014-present). Ms. Knowles also serves as a member of the Advisory Board for the School of Engineering of the University of Southern California. Ms. Knowles previously served as a member of the Board of McKesson Corporation (healthcare service, 2002-2021). In addition, Ms. Knowles previously served as Chairman (2015-2018) and Vice Chairman (2012-2015) of the Independent Trustees of certain Fidelity ® funds.
Mark A. Murray (1954)
Year of Election or Appointment: 2016
Trustee
Mr. Murray also serves as Trustee of other Fidelity ® funds. Previously, Mr. Murray served as Co-Chief Executive Officer (2013-2016), President (2006-2013) and Vice Chairman (2013-2020) of Meijer, Inc. Mr. Murray serves as a member of the Board (2009-present) and Public Policy and Responsibility Committee (2009-present) and Chair of the Nuclear Review Committee (2019-present) of DTE Energy Company (diversified energy company). Mr. Murray previously served as a member of the Board of Spectrum Health (not-for-profit health system, 2015-2019) and as a member of the Board and Audit Committee and Chairman of the Nominating and Corporate Governance Committee of Universal Forest Products, Inc. (manufacturer and distributor of wood and wood-alternative products, 2004-2016). Mr. Murray also serves as a member of the Board of many community and professional organizations. Mr. Murray previously served as a member of the Advisory Board of certain Fidelity ® funds (2016).
+ The information includes the Trustee's principal occupation during the last five years and other information relating to the experience, attributes, and skills relevant to the Trustee's qualifications to serve as a Trustee, which led to the conclusion that the Trustee should serve as a Trustee for the fund.
Advisory Board Members and Officers:
Correspondence intended for a Member of the Advisory Board (if any) may be sent to Fidelity Investments, P.O. Box 55235, Boston, Massachusetts 02205-5235. Correspondence intended for an officer may be sent to Fidelity Investments, 245 Summer Street, Boston, Massachusetts 02210. Officers appear below in alphabetical order.
Name, Year of Birth; Principal Occupation
Laura M. Bishop (1961)
Year of Election or Appointment: 2022
Member of the Advisory Board
Ms. Bishop also serves as a Member of the Advisory Board of other funds. Prior to her retirement, Ms. Bishop held a variety of positions at United Services Automobile Association (2001-2020), including Executive Vice President and Chief Financial Officer (2014-2020) and Senior Vice President and Deputy Chief Financial Officer (2012-2014). Ms. Bishop currently serves as a member of the Audit Committee and Compensation and Personnel Committee (2021-present) of the Board of Directors of Korn Ferry (global organizational consulting).
Robert W. Helm (1957)
Year of Election or Appointment: 2021
Member of the Advisory Board
Mr. Helm also serves as a Member of the Advisory Board of other Fidelity® funds. Mr. Helm was formerly Deputy Chairman (2003-2020), partner (1991-2020) and an associate (1984-1991) of Dechert LLP (formerly Dechert Price & Rhoads). Mr. Helm currently serves on boards and committees of several not-for-profit organizations.
Craig S. Brown (1977)
Year of Election or Appointment: 2019
Assistant Treasurer
Mr. Brown also serves as an officer of other funds. Mr. Brown serves as Assistant Treasurer of FIMM, LLC (2021-present) and is an employee of Fidelity Investments (2013-present). Previously, Mr. Brown served as Assistant Treasurer of certain Fidelity ® funds (2019-2022).
John J. Burke III (1964)
Year of Election or Appointment: 2018
Chief Financial Officer
Mr. Burke also serves as Chief Financial Officer of other funds. Mr. Burke serves as Head of Investment Operations for Fidelity Fund and Investment Operations (2018-present) and is an employee of Fidelity Investments (1998-present). Previously Mr. Burke served as head of Asset Management Investment Operations (2012-2018).
David J. Carter (1973)
Year of Election or Appointment: 2020
Assistant Secretary
Mr. Carter also serves as Assistant Secretary of other funds. Mr. Carter serves as Senior Vice President, Deputy General Counsel (2022-present) and is an employee of Fidelity Investments (2005-present).
Jonathan Davis (1968)
Year of Election or Appointment: 2010
Assistant Treasurer
Mr. Davis also serves as an officer of other funds. Mr. Davis serves as Assistant Treasurer of FIMM, LLC (2021-present), FMR Capital, Inc. (2017-present), FD Funds GP LLC (2021-present), FD Funds Holding LLC (2021-present), and FD Funds Management LLC (2021-present); and is an employee of Fidelity Investments. Previously, Mr. Davis served as Vice President and Associate General Counsel of FMR LLC (diversified financial services company, 2003-2010).
Laura M. Del Prato (1964)
Year of Election or Appointment: 2018
President and Treasurer
Ms. Del Prato also serves as an officer of other funds. Ms. Del Prato serves as Assistant Treasurer of FIMM, LLC (2021-present) and is an employee of Fidelity Investments (2017-present). Previously, Ms. Del Prato served as President and Treasurer of The North Carolina Capital Management Trust: Cash Portfolio and Term Portfolio (2018-2020). Prior to joining Fidelity Investments, Ms. Del Prato served as a Managing Director and Treasurer of the JPMorgan Mutual Funds (2014-2017). Prior to JPMorgan, Ms. Del Prato served as a partner at Cohen Fund Audit Services (accounting firm, 2012-2013) and KPMG LLP (accounting firm, 2004-2012).
Colm A. Hogan (1973)
Year of Election or Appointment: 2016
Assistant Treasurer
Mr. Hogan also serves as an officer of other funds. Mr. Hogan serves as Assistant Treasurer of FIMM, LLC (2021-present) and FMR Capital, Inc. (2017-present) and is an employee of Fidelity Investments (2005-present). Previously, Mr. Hogan served as Deputy Treasurer of certain Fidelity ® funds (2016-2020) and Assistant Treasurer of certain Fidelity ® funds (2016-2018).
Cynthia Lo Bessette (1969)
Year of Election or Appointment: 2019
Secretary and Chief Legal Officer (CLO)
Ms. Lo Bessette also serves as an officer of other funds. Ms. Lo Bessette serves as CLO, Secretary, and Senior Vice President of Fidelity Management & Research Company LLC (investment adviser firm, 2019-present); CLO of Fidelity Management & Research (Hong Kong) Limited, FMR Investment Management (UK) Limited, and Fidelity Management & Research (Japan) Limited (investment adviser firms, 2019-present); Secretary of FD Funds GP LLC (2021-present), FD Funds Holding LLC (2021-present), FD Funds Management LLC (2021-present), and Fidelity Diversifying Solutions LLC (investment adviser firm, 2022-present); and Assistant Secretary of FIMM, LLC (2019-present). She is a Senior Vice President and Deputy General Counsel of FMR LLC (diversified financial services company, 2019-present), and is an employee of Fidelity Investments. Previously, Ms. Lo Bessette served as CLO, Secretary, and Senior Vice President of FMR Co., Inc. (investment adviser firm, 2019); Secretary of Fidelity SelectCo, LLC and Fidelity Investments Money Management, Inc. (investment adviser firms, 2019). Prior to joining Fidelity Investments, Ms. Lo Bessette was Executive Vice President, General Counsel (2016-2019) and Senior Vice President, Deputy General Counsel (2015-2016) of OppenheimerFunds (investment management company) and Deputy Chief Legal Officer (2013-2015) of Jennison Associates LLC (investment adviser firm).
Chris Maher (1972)
Year of Election or Appointment: 2013
Assistant Treasurer
Mr. Maher also serves as an officer of other funds. Mr. Maher serves as Assistant Treasurer of FIMM, LLC (2021-present) and FMR Capital, Inc. (2017-present), and is an employee of Fidelity Investments (2008-present). Previously, Mr. Maher served as Assistant Treasurer of certain funds (2013-2020); Vice President of Asset Management Compliance (2013), Vice President of the Program Management Group of FMR (investment adviser firm, 2010-2013), and Vice President of Valuation Oversight (2008-2010).
Jamie Pagliocco (1964)
Year of Election or Appointment: 2020
Vice President
Mr. Pagliocco also serves as Vice President of other funds. Mr. Pagliocco serves as President of Fixed Income (2020-present), and is an employee of Fidelity Investments (2001-present). Previously, Mr. Pagliocco served as Co-Chief Investment Officer - Bond (2017-2020), Global Head of Bond Trading (2016-2019), and as a portfolio manager.
Kenneth B. Robins (1969)
Year of Election or Appointment: 2020
Chief Compliance Officer
Mr. Robins also serves as an officer of other funds. Mr. Robins serves as Compliance Officer of Fidelity Management & Research Company LLC (investment adviser firm, 2016-present) and is an employee of Fidelity Investments (2004-present). Previously, Mr. Robins served as Compliance Officer of FMR Co., Inc. (investment adviser firm, 2016-2019), as Executive Vice President of Fidelity Investments Money Management, Inc. (investment adviser firm, 2013-2016) and served in other fund officer roles.
Brett Segaloff (1972)
Year of Election or Appointment: 2021
Anti-Money Laundering (AML) Officer
Mr. Segaloff also serves as an AML Officer of other funds and other related entities. He is Director, Anti-Money Laundering (2007-present) of FMR LLC (diversified financial services company) and is an employee of Fidelity Investments (1996-present).
Stacie M. Smith (1974)
Year of Election or Appointment: 2013
Assistant Treasurer
Ms. Smith also serves as an officer of other funds. Ms. Smith serves as Assistant Treasurer of FIMM, LLC (2021-present) and FMR Capital, Inc. (2017-present), is an employee of Fidelity Investments (2009-present), and has served in other fund officer roles. Prior to joining Fidelity Investments, Ms. Smith served as Senior Audit Manager of Ernst & Young LLP (accounting firm, 1996-2009). Previously, Ms. Smith served as Assistant Treasurer (2013-2019) and Deputy Treasurer (2013-2016) of certain Fidelity ® funds.
Jim Wegmann (1979)
Year of Election or Appointment: 2021
Deputy Treasurer
Mr. Wegmann also serves as an officer of other funds. Mr. Wegmann serves as Assistant Treasurer of FIMM, LLC (2021-present) and is an employee of Fidelity Investments (2011-present). Previously, Mr. Wegmann served as Assistant Treasurer of certain Fidelity ® funds (2019-2021).
As a shareholder, you incur two types of costs: (1) transaction costs, which may include sales charges (loads) on purchase payments or redemption proceeds, as applicable and (2) ongoing costs, which generally include management fees, distribution and/or service (12b-1) fees and other Fund expenses. This Example is intended to help you understand your ongoing costs (in dollars) of investing in a fund and to compare these costs with the ongoing costs of investing in other mutual funds.
| The Example is based on an investment of $1,000 invested at the beginning of the period and held for the entire period (May 1, 2022 to October 31, 2022). |
Actual Expenses
The first line of the accompanying table provides information about actual account values and actual expenses. You may use the information in this line, together with the amount you invested, to estimate the expenses that you paid over the period. Simply divide your account value by $1,000.00 (for example, an $8,600 account value divided by $1,000.00 = 8.6), then multiply the result by the number in the first line for a class/Fund under the heading entitled "Expenses Paid During Period" to estimate the expenses you paid on your account during this period. If any fund is a shareholder of any underlying mutual funds or exchange-traded funds (ETFs) (the Underlying Funds), such fund indirectly bears its proportional share of the expenses of the Underlying Funds in addition to the direct expenses incurred presented in the table. These fees and expenses are not included in the annualized expense ratio used to calculate the expense estimate in the table below.
Hypothetical Example for Comparison Purposes
The second line of the accompanying table provides information about hypothetical account values and hypothetical expenses based on the actual expense ratio and an assumed rate of return of 5% per year before expenses, which is not the actual return. The hypothetical account values and expenses may not be used to estimate the actual ending account balance or expenses you paid for the period. You may use this information to compare the ongoing costs of investing in the Fund and other funds. To do so, compare this 5% hypothetical example with the 5% hypothetical examples that appear in the shareholder reports of the other funds. If any fund is a shareholder of any Underlying Funds, such fund indirectly bears its proportional share of the expenses of the Underlying Funds in addition to the direct expenses as presented in the table. These fees and expenses are not included in the annualized expense ratio used to calculate the expense estimate in the table below.
Please note that the expenses shown in the table are meant to highlight your ongoing costs only and do not reflect any transaction costs. Therefore, the second line of the table is useful in comparing ongoing costs only, and will not help you determine the relative total costs of owning different funds. In addition, if these transactional costs were included, your costs would have been higher.
| | | | | Annualized Expense Ratio- A | | Beginning Account Value May 1, 2022 | | Ending Account Value October 31, 2022 | | Expenses Paid During Period- C May 1, 2022 to October 31, 2022 |
| | | | | | | | | | |
| Fidelity Flex® International Index Fund | | | | -%- D | | | | | | |
| Actual | | | | | | $ 1,000 | | $ 862.60 | | $- E |
Hypothetical- B | | | | | | $ 1,000 | | $ 1,025.21 | | $- E |
| |
A Annualized expense ratio reflects expenses net of applicable fee waivers.
B 5% return per year before expenses
C Expenses are equal to the annualized expense ratio, multiplied by the average account value over the period, multiplied by 184/ 365 (to reflect the one-half year period). The fees and expenses of any Underlying Funds are not included in each annualized expense ratio.
D Amount represents less than .005%.
E Amount represents less than $.005.
The dividend and capital gains distributions for the fund(s) are available on Fidelity.com or Institutional.Fidelity.com.
The fund designates 73% and 75% of the dividends distributed on December 3, 2021 and December 28, 2021, respectively, during the fiscal year as amounts which may be taken into account as a dividend for purposes of the maximum rate under section 1(h)(11) of the Internal Revenue Code.
The amounts per share which represent income derived from sources within, and taxes paid to, foreign countries or possessions of the United States are $0.3255 and $0.0283 for the dividend paid December 6, 2021.
The fund will notify shareholders in January 2023 of amounts for use in preparing 2022 income tax returns.
Fidelity Flex International Index Fund
Each year, the Board of Trustees, including the Independent Trustees (together, the Board), votes on the renewal of the management contract with Fidelity Management & Research Company LLC (FMR) and the sub-advisory agreement (Sub-Advisory Agreement) for the fund with Geode Capital Management, LLC (Geode) (together, the Advisory Contracts). FMR and Geode are referred to herein as the Investment Advisers. The Board, assisted by the advice of fund counsel and Independent Trustees' counsel, requests and considers a broad range of information relevant to the renewal of the Advisory Contracts throughout the year.
The Board meets regularly and, at each of its meetings, covers an extensive agenda of topics and materials and considers factors that are relevant to its annual consideration of the renewal of the fund's Advisory Contracts, including the services and support provided to the fund and its shareholders. The Board has established four standing committees (Committees) - Operations, Audit, Fair Valuation, and Governance and Nominating - each composed of and chaired by Independent Trustees with varying backgrounds, to which the Board has assigned specific subject matter responsibilities in order to enhance effective decision-making by the Board. The Operations Committee, of which all the Independent Trustees are members, meets regularly throughout the year and requests, receives and considers, among other matters, information related to the annual consideration of the renewal of the fund's Advisory Contracts before making its recommendation to the Board. The Board also meets as needed to review matters specifically related to the Board's annual consideration of the renewal of the Advisory Contracts. Members of the Board may also meet from time to time with trustees of other Fidelity funds through joint ad hoc committees to discuss certain matters relevant to all of the Fidelity funds.
At its September 2022 meeting, the Board unanimously determined to renew the fund's Advisory Contracts. In considering whether to renew the Advisory Contracts for the fund, the Board considered all factors it believed relevant and reached a determination, with the assistance of fund counsel and Independent Trustees' counsel and through the exercise of its business judgment, that the renewal of the Advisory Contracts was in the best interests of the fund and its shareholders and the fact that no fee is payable under the management contract was fair and reasonable.
Nature, Extent, and Quality of Services Provided . The Board considered staffing as it relates to the fund, including the backgrounds of investment personnel of Fidelity and Geode, and also considered the fund's investment objective, strategies, and related investment philosophy. The Independent Trustees also had discussions with senior management of Fidelity's investment operations and investment groups and with senior management of Geode. The Board considered the structure of the investment personnel compensation programs and whether the structures provide appropriate incentives to act in the best interests of the fund. The Board also considered the steps Fidelity had taken to ensure the continued provision of high quality services to the Fidelity funds throughout the COVID-19 pandemic, including the expansion of staff in client facing positions to maintain service levels in periods of high volumes and volatility.
The Trustees also discussed with representatives of Fidelity, at meetings throughout the year, Fidelity's role in, among other things, overseeing compliance with federal securities laws and other applicable requirements by Geode with respect to the fund and monitoring and overseeing the performance and investment capabilities of Geode. The Trustees considered that the Board had received from Fidelity periodic reports about its oversight and due diligence processes, as well as periodic reports regarding the performance of Geode.
The Board also considered the nature, extent and quality of services provided by Geode. The Trustees noted that under the Sub-Advisory Agreement, subject to oversight by Fidelity, Geode is responsible for, among other things, identifying investments and arranging for execution of portfolio transactions to implement the fund's investment strategy. In addition, the Trustees noted that Geode is responsible for providing such reporting as may be requested by Fidelity to fulfill its oversight responsibilities discussed above.
Resources Dedicated to Investment Management and Support Services . The Board reviewed the general qualifications and capabilities of Fidelity's and Geode's investment staffs, including their size, education, experience, and resources, as well as Fidelity's and Geode's approach to recruiting, training, managing, and compensating investment personnel. The Board considered that Fidelity's and Geode's investment professionals have extensive resources, tools and capabilities so as to provide competitive investment results over time, and that those professionals also have access to sophisticated tools that permit them to assess portfolio construction and risk and performance attribution characteristics continuously. Additionally, in its deliberations, the Board considered Fidelity's and Geode's trading, risk management, compliance, cybersecurity, and technology and operations capabilities and resources, which are integral parts of the investment management process.
Shareholder and Administrative Services . The Board considered (i) the nature, extent, quality, and cost of advisory, administrative, and shareholder services performed by the Investment Advisers and their affiliates under the Advisory Contracts and by FMR's affiliates under separate agreements covering transfer agency, pricing and bookkeeping, and securities lending services for the fund; (ii) the nature and extent of the supervision of third party service providers, principally custodians, subcustodians, and pricing vendors; and (iii) the resources devoted to, and the record of compliance with, the fund's compliance policies and procedures. The Board also reviewed the allocation of fund brokerage, including allocations to brokers affiliated with the Investment Advisers.
The Board noted that the growth of fund assets over time across the complex allows Fidelity to reinvest in the development of services designed to enhance the value and convenience of the Fidelity funds as investment vehicles. These services include 24-hour access to account information and market information over the Internet and through telephone representatives, investor education materials and asset allocation tools. The Board also considered that it reviews customer service metrics such as telephone response times, continuity of services on the website and metrics addressing services at Fidelity Investor Centers.
Investment in a Large Fund Family . The Board considered the benefits to shareholders of investing in a Fidelity fund, including the benefits of investing in a fund that is part of a large family of funds offering a variety of investment disciplines and providing a large variety of mutual fund investor services. The Board noted that Fidelity had taken, or had made recommendations to the Board that resulted in the Fidelity funds taking, a number of actions over the previous year that benefited particular funds, including: (i) continuing to dedicate additional resources to Fidelity's investment research process, which includes meetings with management of issuers of securities in which the funds invest; (ii) continuing efforts to enhance Fidelity's global research capabilities; (iii) launching new funds, ETFs, and share classes with innovative structures, strategies and pricing and making other enhancements to meet investor needs; (iv) broadening eligibility requirements for certain funds and share classes; (v) reducing management fees and total expenses for certain funds and classes; (vi) lowering expenses for certain existing funds and classes by implementing or lowering expense caps; (vii) rationalizing product lines and gaining increased efficiencies from fund mergers and liquidations; (viii) continuing to develop, acquire and implement systems and technology to improve services to the funds and shareholders, strengthen information security, and increase efficiency; and (ix) continuing to implement enhancements to further strengthen Fidelity's product line to increase investors' probability of success in achieving their investment goals, including their retirement income goals.
Investment Performance . The Board considered whether the fund has operated in accordance with its investment objective, as well as its record of compliance with its investment restrictions. The Board reviewed the fund's absolute investment performance, as well as the fund's relative investment performance. The Board did not consider performance to be a material factor in its decision to renew the fund's Advisory Contracts as the fund is not publicly offered as a stand-alone investment product. In this regard, the Board noted that the fund is available exclusively to certain fee-based accounts and advisor programs offered by Fidelity, including certain employer-sponsored plans and discretionary investment programs.
Based on its review, the Board concluded that the nature, extent, and quality of services provided to the fund under the Advisory Contracts should continue to benefit the shareholders of the fund.
Competitiveness of Management Fee and Total Expense Ratio . The Board noted that the fund is available exclusively through certain Fidelity fee-based accounts and advisory programs. The Board considered that the fund does not pay FMR a management fee for investment advisory services, but that FMR is indirectly compensated for its services out of Fidelity fee-based account and advisory program fees. The Board also noted that FMR or an affiliate undertakes to pay all operating expenses of the fund, except Independent Trustee fees and expenses, proxy and shareholder meeting expenses, interest, taxes, and extraordinary expenses (such as litigation expenses). The Board further noted that the fund pays its non-operating expenses, including brokerage commissions and fees and expenses associated with the fund's securities lending program, if applicable.
At its September 2022 meeting, the Board also approved an amendment to the fund's sub-advisory agreement with Geode (effective October 1, 2022) that reduced the sub-advisory fee rate that FMR pays to Geode.
Based on its review, the Board considered that the fund does not pay a management fee and concluded that the fund's total expense ratio was reasonable in light of the services that the fund and its shareholders receive and the other factors considered.
Costs of the Services and Profitability . The Board considered the level of Fidelity's profits in respect of all the Fidelity funds.
A public accounting firm has been engaged annually by the Board as part of the Board's assessment of Fidelity's profitability analysis. The engagement includes the review and assessment of the methodologies used by Fidelity in determining the revenues and expenses attributable to Fidelity's mutual fund business, and completion of agreed-upon procedures in respect of the mathematical accuracy of certain fund profitability information and its conformity to established allocation methodologies. After considering the reports issued under the engagement and information provided by Fidelity, the Board concluded that while other allocation methods may also be reasonable, Fidelity's profitability methodologies are reasonable in all material respects.
The Board also reviewed Fidelity's and Geode's non-fund businesses and potential indirect benefits such businesses may have received as a result of their association with Fidelity's mutual fund business (i.e., fall-out benefits) as well as cases where Fidelity's and Geode's affiliates may benefit from the funds' business. The Board considered areas where potential indirect benefits to the Fidelity funds from their relationships with Fidelity may exist. The Board's consideration of these matters was informed by the findings of a joint ad hoc committee created by it and the boards of other Fidelity funds to evaluate potential fall-out benefits.
The Board concluded that the costs of the services provided by and the profits realized by Fidelity in connection with the operation of the fund were not relevant to the renewal of the Advisory Contracts because the fund pays no advisory fees and FMR or an affiliate bears all expenses of the fund, with limited exceptions.
The Board also considered information regarding the profitability of Geode's relationship with the fund.
Economies of Scale. The Board concluded that because the fund pays no advisory fees and FMR or an affiliate bears all expenses of the fund with certain limited exceptions, the realization of economies of scale was not a material factor in the Board's decision to renew the fund's Advisory Contracts.
Additional Information Requested by the Board . In order to develop fully the factual basis for consideration of the Fidelity funds' advisory contracts, the Board requested and received additional information on certain topics, including: (i) Fidelity's fund profitability methodology, profitability trends for certain funds, the allocation of various costs to different funds, and the impact of certain factors on fund profitability results; (ii) portfolio manager changes that have occurred during the past year and the amount of the investment that each portfolio manager has made in the Fidelity fund(s) that he or she manages; (iii) the extent to which current market conditions have affected retention and recruitment of personnel; (iv) the arrangements with and compensation paid to certain fund sub-advisers on behalf of the Fidelity funds and the treatment of such compensation within Fidelity's fund profitability methodology; (v) the terms of the funds' various management fee structures, including the basic group fee and the terms of Fidelity's voluntary expense limitation arrangements; (vi) Fidelity's transfer agent, pricing and bookkeeping fees, expense and service structures for different funds and classes relative to competitive trends; (vii) the impact on fund profitability of recent industry trends, such as the growth in passively managed funds and the changes in flows for different types of funds; (viii) the types of management fee and total expense comparisons provided, and the challenges and limitations associated with such information; and (ix) explanations regarding the relative total expense ratios and management fees of certain funds and classes, total expense and management fee competitive trends, and methodologies for total expense and management fee competitive comparisons. In addition, the Board considered its discussions with Fidelity regarding Fidelity's efforts to maintain the continuous investment and shareholder services necessary for the funds during the current pandemic and economic circumstances.
Based on its evaluation of all of the conclusions noted above, and after considering all factors it believed relevant, the Board concluded that the advisory and sub-advisory fee arrangements are fair and reasonable, and that the fund's Advisory Contracts should be renewed.
1.9881635.105
ZEI-ANN-1222
Fidelity® SAI Emerging Markets Index Fund
Annual Report
October 31, 2022
Offered exclusively to certain clients of the Adviser, or its affiliates, including Strategic Advisers LLC (Strategic Advisers) - not available for sale to the general public. Fidelity ® SAI is a product name of Fidelity ® funds dedicated to certain programs affiliated with Strategic Advisers.
Contents
To view a fund's proxy voting guidelines and proxy voting record for the 12-month period ended June 30, visit http://www.fidelity.com/proxyvotingresults or visit the Securities and Exchange Commission's (SEC) web site at http://www.sec.gov.
You may also call 1-800-544-3455 to request a free copy of the proxy voting guidelines.
The funds or securities referred to herein are not sponsored, endorsed, or promoted by MSCI, and MSCI bears no liability with respect to any such funds or securities or any index on which such funds or securities are based. The prospectus contains a more detailed description of the limited relationship MSCI has with Fidelity and any related funds.
Standard & Poor's, S&P and S&P 500 are registered service marks of The McGraw-Hill Companies, Inc. and have been licensed for use by Fidelity Distributors Corporation.
Other third-party marks appearing herein are the property of their respective owners.
All other marks appearing herein are registered or unregistered trademarks or service marks of FMR LLC or an affiliated company. © 2022 FMR LLC. All rights reserved.
This report and the financial statements contained herein are submitted for the general information of the shareholders of the Fund. This report is not authorized for distribution to prospective investors in the Fund unless preceded or accompanied by an effective prospectus.
A fund files its complete schedule of portfolio holdings with the SEC for the first and third quarters of each fiscal year on Form N-PORT. Forms N-PORT are available on the SEC's web site at http://www.sec.gov. A fund's Forms N-PORT may be reviewed and copied at the SEC's Public Reference Room in Washington, DC. Information regarding the operation of the SEC's Public Reference Room may be obtained by calling 1-800-SEC-0330.
For a complete list of a fund's portfolio holdings, view the most recent holdings listing, semiannual report, or annual report on Fidelity's web site at http://www.fidelity.com, http://www.institutional.fidelity.com, or http://www.401k.com, as applicable.
NOT FDIC INSURED •MAY LOSE VALUE •NO BANK GUARANTEE
Neither the Fund nor Fidelity Distributors Corporation is a bank.
Average annual total return reflects the change in the value of an investment, assuming reinvestment of distributions from dividend income and capital gains (the profits earned upon the sale of securities that have grown in value, if any) and assuming a constant rate of performance each year. The hypothetical investment and the average annual total returns do not reflect the deduction of taxes that a shareholder would pay on fund distributions or the redemption of fund shares. During periods of reimbursement by Fidelity, a fund's total return will be greater than it would be had the reimbursement not occurred. How a fund did yesterday is no guarantee of how it will do tomorrow.
| Average Annual Total Returns |
| | | | |
Periods ended October 31, 2022 | Past 1 year | Past 5 years | Life of Fund A |
| Fidelity® SAI Emerging Markets Index Fund | -30.89% | -3.34% | 3.59% |
A From January 05, 2016
| $10,000 Over Life of Fund |
| |
Let's say hypothetically that $10,000 was invested in Fidelity® SAI Emerging Markets Index Fund, on January 05, 2016, when the fund started. The chart shows how the value of your investment would have changed, and also shows how the MSCI Emerging Markets Index performed over the same period. |
|
|
Market Recap:
International equities returned -24.61% for the 12 months ending October 31, 2022, according to the MSCI ACWI (All Country World Index) ex USA Index. After gaining 7.98% in 2021, non-U.S. stocks retreated in the new year, as a multitude of risk factors challenged the global economy and financial markets. Persistently high inflation in some markets, exacerbated by energy price shocks from the Russia-Ukraine conflict, spurred the U.S. Federal Reserve and other central banks to aggressively tighten monetary policy, and market interest rates eclipsed their highest level in roughly a decade, stoking recession fears and sending stocks into bear market territory. Other factors influencing equities abroad included surging global commodity prices, rising sovereign bond yields in some markets, ongoing global supply-chain disruption, a broadly strong U.S. dollar and the potential for variants of the coronavirus to upend global economic growth. Against this backdrop, the index returned -24.20% year to date through October. For the full 12 months, emerging markets (-31%) and Europe ex U.K. (-25%) notably lagged. Conversely, Canada (-13%) and the U.K. (-12%) held up best. Among the 11 sectors, information technology and consumer discretionary (-37% each) fared worst. Communication services (-34%) also trailed the broader market. In contrast, energy gained 2% amid high prices for oil and natural gas. The defensive-oriented utilities (-16%) sector also outperformed, as did financials and consumer staples (-18% each).
Comments from the Geode Capital Management, LLC, passive equity index team:
For the fiscal year ending October 31, 2022, the fund returned -30.89%, roughly in line with the -31.01% result of the benchmark MSCI Emerging Markets (Net MA) index. (The fund's relative performance was affected by differing methodologies (fund versus index) for valuing certain foreign stocks and for incorporating foreign exchange rates, as well as by required local capital gains tax.) By sector, stocks in the consumer discretionary sector returned roughly -47% and detracted most, followed by information technology, which returned -35%. Communication services returned roughly -46%, hampered by the media & entertainment industry (-58%). Financials detracted -14%, especially in the banks industry (-9%). Materials (-22%) and health care (-37%), especially in the pharmaceuticals, biotechnology & life sciences industry (-41%), hampered results. Consumer staples detracted about -21%, hurt by the food, beverage & tobacco industry (-22%). The energy sector (-18%) also detracted. Industrials (-17%) real estate (-40%), and utilities (-5%) also hurt. Turning to individual stocks, the biggest individual detractor was Taiwan Semiconductor (-42%), from the semiconductors & semiconductor equipment category. In retailing, Alibaba Group Holding (-63%) and Meituan (-54%) hurt. Tencent Holdings, within the media & entertainment group, returned approximately -56% and hindered the fund. Another detractor was Samsung Electronics (-29%), a stock in the technology hardware & equipment segment. Conversely, the biggest individual contributor was Petroleo Brasileiro (+101%), also known as Petrobras, from the energy sector. In materials, Saudi Arabian Mining Company (+105%) and Vale (+12%) helped. Itau Unibanco Holding, within the banks industry, advanced about 46% and lifted the fund. Another contributor was Adani Total Gas (+127%), a stock in the utilities sector.
The views expressed above reflect those of the portfolio manager(s) only through the end of the period as stated on the cover of this report and do not necessarily represent the views of Fidelity or any other person in the Fidelity organization. Any such views are subject to change at any time based upon market or other conditions and Fidelity disclaims any responsibility to update such views. These views may not be relied on as investment advice and, because investment decisions for a Fidelity fund are based on numerous factors, may not be relied on as an indication of trading intent on behalf of any Fidelity fund.
Top Holdings (% of Fund's net assets) |
| |
| Taiwan Semiconductor Manufacturing Co. Ltd. (Taiwan, Semiconductors & Semiconductor Equipment) | 5.3 | |
| Samsung Electronics Co. Ltd. (Korea (South), Technology Hardware, Storage & Peripherals) | 3.6 | |
| Tencent Holdings Ltd. (Cayman Islands, Interactive Media & Services) | 2.9 | |
| Alibaba Group Holding Ltd. (Cayman Islands, Internet & Direct Marketing Retail) | 2.1 | |
| Reliance Industries Ltd. (India, Oil, Gas & Consumable Fuels) | 1.7 | |
| Meituan Class B (Cayman Islands, Internet & Direct Marketing Retail) | 1.3 | |
| Infosys Ltd. (India, IT Services) | 1.1 | |
| ICICI Bank Ltd. (India, Banks) | 1.0 | |
| Vale SA (Brazil, Metals & Mining) | 0.9 | |
| Housing Development Finance Corp. Ltd. (India, Diversified Financial Services) | 0.9 | |
| | 20.8 | |
| |
| Market Sectors (% of Fund's net assets) |
| |
| Financials | 23.8 | |
| Information Technology | 18.5 | |
| Consumer Discretionary | 12.0 | |
| Materials | 8.5 | |
| Communication Services | 8.3 | |
| Consumer Staples | 7.2 | |
| Industrials | 6.1 | |
| Energy | 6.1 | |
| Health Care | 4.0 | |
| Utilities | 3.5 | |
| Real Estate | 1.6 | |
| |
Asset Allocation (% of Fund's net assets) |
|
Foreign investments - 99% |
|
Geographic Diversification (% of Fund's net assets) |
|
* Includes Short-Term investments and Net Other Assets (Liabilities). Percentages are based on country or territory of incorporation and are adjusted for the effect of futures contracts, if applicable. |
| |
Showing Percentage of Net Assets
| Common Stocks - 96.9% |
| | | Shares | Value ($) |
| Bermuda - 0.5% | | | |
| Alibaba Health Information Technology Ltd. (a) | | 2,499,000 | 1,056,949 |
| Alibaba Pictures Group Ltd. (a) | | 6,450,000 | 238,291 |
| Beijing Enterprises Water Group Ltd. | | 2,132,000 | 448,147 |
| China Gas Holdings Ltd. | | 1,576,500 | 1,397,825 |
| China Resource Gas Group Ltd. | | 485,200 | 1,242,415 |
| China Ruyi Holdings Ltd. (a) | | 2,456,000 | 384,843 |
| Cosco Shipping Ports Ltd. | | 970,473 | 478,458 |
| Credicorp Ltd. (United States) | | 37,869 | 5,542,507 |
| Hopson Development Holdings Ltd. | | 412,100 | 330,745 |
| Kunlun Energy Co. Ltd. | | 2,051,000 | 1,225,429 |
| Nine Dragons Paper (Holdings) Ltd. | | 852,000 | 504,710 |
| Orient Overseas International Ltd. | | 70,000 | 1,022,848 |
| Shenzhen International Holdings Ltd. | | 637,019 | 428,485 |
TOTAL BERMUDA | | | 14,301,652 |
| Brazil - 4.7% | | | |
| Ambev SA | | 2,491,798 | 7,718,279 |
| Americanas SA | | 335,746 | 1,010,065 |
| Atacadao SA | | 257,900 | 971,587 |
| B3 SA - Brasil Bolsa Balcao | | 3,222,540 | 9,382,829 |
| Banco Bradesco SA | | 837,712 | 2,698,582 |
| Banco BTG Pactual SA unit | | 624,700 | 3,499,916 |
| Banco do Brasil SA | | 456,805 | 3,273,821 |
| Banco Santander SA (Brasil) unit | | 200,800 | 1,157,647 |
| BB Seguridade Participacoes SA | | 370,958 | 2,132,174 |
| BRF SA (a) | | 316,050 | 768,481 |
| CCR SA | | 652,812 | 1,637,875 |
| Centrais Eletricas Brasileiras SA (Electrobras) | | 562,397 | 5,424,183 |
| Companhia de Saneamento Basico do Estado de Sao Paulo (SABESP) | | 180,400 | 2,098,933 |
| Companhia Siderurgica Nacional SA (CSN) | | 352,800 | 838,715 |
| Cosan SA | | 646,824 | 2,111,209 |
| CPFL Energia SA | | 122,900 | 842,729 |
| Energisa SA unit | | 103,600 | 972,522 |
| ENGIE Brasil Energia SA | | 104,120 | 810,707 |
| Equatorial Energia SA | | 536,000 | 3,116,074 |
| Hapvida Participacoes e Investimentos SA (b) | | 2,454,443 | 3,706,254 |
| Hypera SA | | 217,900 | 2,143,355 |
| JBS SA | | 414,500 | 2,002,888 |
| Klabin SA unit | | 402,500 | 1,684,648 |
| Localiza Rent a Car SA | | 1,224 | 16,715 |
| Localiza Rent a Car SA | | 391,376 | 5,344,626 |
| Lojas Renner SA | | 520,101 | 3,111,242 |
| Magazine Luiza SA | | 1,601,708 | 1,386,049 |
| Natura & Co. Holding SA (a) | | 474,526 | 1,373,374 |
| Petro Rio SA (a) | | 371,800 | 2,547,285 |
| Petroleo Brasileiro SA - Petrobras (ON) | | 2,009,308 | 12,937,680 |
| Raia Drogasil SA | | 563,600 | 2,870,645 |
| Rede D'Oregon Sao Luiz SA (b) | | 214,300 | 1,334,630 |
| Rumo SA | | 685,600 | 2,938,570 |
| Suzano Papel e Celulose SA | | 398,312 | 4,102,255 |
| Telefonica Brasil SA | | 264,600 | 2,116,083 |
| TIM SA | | 442,500 | 1,130,771 |
| Totvs SA | | 278,100 | 1,785,267 |
| Ultrapar Participacoes SA | | 386,438 | 1,003,220 |
| Vale SA | | 2,114,173 | 27,475,449 |
| Vibra Energia SA | | 614,249 | 2,170,176 |
| Weg SA | | 884,580 | 6,897,857 |
TOTAL BRAZIL | | | 140,545,367 |
| British Virgin Islands - 0.0% | | | |
| VK Co. Ltd. unit (a)(c) | | 41,654 | 18,557 |
| Cayman Islands - 13.8% | | | |
| 3SBio, Inc. (b) | | 741,000 | 522,971 |
| AAC Technology Holdings, Inc. (a) | | 378,133 | 692,657 |
| Airtac International Group | | 73,926 | 1,696,076 |
| Alibaba Group Holding Ltd. (a) | | 8,026,216 | 62,403,081 |
| Anta Sports Products Ltd. | | 644,600 | 5,666,163 |
| Autohome, Inc. ADR Class A | | 39,725 | 1,037,617 |
| Baidu, Inc. Class A (a) | | 1,165,474 | 11,173,404 |
| BeiGene Ltd. ADR (a)(d) | | 24,898 | 4,205,023 |
| Bilibili, Inc. Class Z (a) | | 97,441 | 868,335 |
| Bosideng International Holdings Ltd. | | 1,698,000 | 733,309 |
| Chailease Holding Co. Ltd. | | 726,078 | 3,354,177 |
| China Conch Venture Holdings Ltd. | | 869,600 | 1,282,856 |
| China Feihe Ltd. (b) | | 1,868,000 | 1,075,635 |
| China Hongqiao Group Ltd. | | 1,212,200 | 860,160 |
| China Huishan Dairy Holdings Co. Ltd. (a)(c) | | 2,302,000 | 3 |
| China Liansu Group Holdings Ltd. | | 575,000 | 466,613 |
| China Literature Ltd. (a)(b) | | 216,100 | 582,257 |
| China Medical System Holdings Ltd. | | 704,000 | 768,605 |
| China Meidong Auto Holding Ltd. | | 296,000 | 389,154 |
| China Mengniu Dairy Co. Ltd. | | 1,669,000 | 5,347,417 |
| China Overseas Property Holdings Ltd. | | 690,000 | 434,236 |
| China Resources Cement Holdings Ltd. | | 1,274,000 | 460,933 |
| China Resources Land Ltd. | | 1,696,812 | 5,317,635 |
| China Resources Microelectronics Ltd. (A Shares) | | 36,146 | 250,744 |
| China Resources Mixc Lifestyle Services Ltd. (b) | | 361,600 | 1,059,512 |
| China State Construction International Holdings Ltd. | | 1,059,500 | 952,918 |
| ChinaSoft International Ltd. | | 1,450,000 | 960,552 |
| CIFI Holdings Group Co. Ltd. (c)(d) | | 2,190,446 | 145,106 |
| Country Garden Holdings Co. Ltd. | | 4,298,662 | 553,101 |
| Country Garden Services Holdings Co. Ltd. | | 1,069,000 | 934,225 |
| Dali Foods Group Co. Ltd. (b) | | 1,025,300 | 421,894 |
| Daqo New Energy Corp. ADR (a) | | 31,389 | 1,380,802 |
| Dongyue Group Co. Ltd. | | 763,000 | 662,916 |
| ENN Energy Holdings Ltd. | | 417,543 | 4,151,680 |
| GDS Holdings Ltd. Class A (a) | | 463,752 | 517,617 |
| Geely Automobile Holdings Ltd. | | 3,177,517 | 3,416,489 |
| Genscript Biotech Corp. (a) | | 606,000 | 1,531,666 |
| Greentown China Holdings Ltd. | | 463,500 | 441,083 |
| Greentown Service Group Co. Ltd. | | 766,000 | 314,220 |
| H World Group Ltd. ADR | | 101,925 | 2,760,129 |
| Haidilao International Holding Ltd. (a)(b)(d) | | 587,000 | 871,940 |
| Haitian International Holdings Ltd. | | 332,000 | 664,876 |
| Hansoh Pharmaceutical Group Co. Ltd. (b) | | 622,000 | 960,379 |
| Hengan International Group Co. Ltd. | | 331,900 | 1,287,491 |
| HUTCHMED China Ltd. sponsored ADR (a)(d) | | 45,554 | 402,697 |
| Hygeia Healthcare Holdings Co. (a)(b) | | 177,800 | 770,124 |
| Innovent Biologics, Inc. (a)(b) | | 541,000 | 1,915,984 |
| iQIYI, Inc. ADR (a)(d) | | 180,440 | 364,489 |
| JD Health International, Inc. (a)(b) | | 590,050 | 3,236,024 |
| JD.com, Inc. Class A | | 1,140,200 | 20,763,635 |
| Jinxin Fertility Group Ltd. (b) | | 777,500 | 383,320 |
| Jiumaojiu International Holdings Ltd. (b)(d) | | 381,000 | 597,978 |
| JOYY, Inc. ADR | | 24,561 | 619,674 |
| Kanzhun Ltd. ADR (a) | | 96,311 | 1,052,679 |
| KE Holdings, Inc. ADR (a) | | 352,178 | 3,585,172 |
| Kingboard Chemical Holdings Ltd. | | 351,400 | 866,676 |
| Kingboard Laminates Holdings Ltd. | | 488,500 | 390,195 |
| Kingdee International Software Group Co. Ltd. (a) | | 1,377,000 | 2,252,416 |
| Kingsoft Corp. Ltd. | | 506,200 | 1,531,565 |
| Kuaishou Technology Class B (a)(b) | | 923,900 | 3,801,694 |
| Li Ning Co. Ltd. | | 1,243,500 | 6,431,637 |
| Longfor Properties Co. Ltd. (b) | | 964,700 | 1,228,972 |
| Lufax Holding Ltd. ADR | | 363,417 | 577,833 |
| Meituan Class B (a)(b) | | 2,328,500 | 37,280,556 |
| Microport Scientific Corp. (a)(d) | | 334,700 | 706,952 |
| Ming Yuan Cloud Group Holdings Ltd. | | 365,000 | 167,861 |
| Minth Group Ltd. | | 400,000 | 789,844 |
| NetEase, Inc. | | 1,095,820 | 12,158,401 |
| New Oriental Education & Technology Group, Inc. (a) | | 804,010 | 1,882,710 |
| NIO, Inc. sponsored ADR (a) | | 723,964 | 7,000,732 |
| Parade Technologies Ltd. | | 41,000 | 774,137 |
| Pinduoduo, Inc. ADR (a) | | 267,383 | 14,660,610 |
| Ping An Healthcare and Technology Co. Ltd. (a)(b)(d) | | 266,100 | 490,866 |
| Pop Mart International Group Ltd. (b)(d) | | 293,800 | 380,273 |
| RLX Technology, Inc. ADR (a)(d) | | 249,572 | 311,965 |
| Sany Heavy Equipment International Holdings Co. Ltd. | | 550,000 | 451,230 |
| Seazen Group Ltd. (a) | | 1,050,000 | 168,543 |
| Shenzhou International Group Holdings Ltd. | | 436,200 | 3,028,538 |
| Silergy Corp. | | 170,000 | 1,971,228 |
| Sino Biopharmaceutical Ltd. | | 5,439,750 | 2,640,302 |
| Smoore International Holdings Ltd. (b)(d) | | 952,000 | 1,012,682 |
| Sunny Optical Technology Group Co. Ltd. | | 376,500 | 3,263,945 |
| TAL Education Group ADR (a) | | 238,745 | 1,124,489 |
| Tencent Holdings Ltd. | | 3,302,600 | 86,781,740 |
| Tencent Music Entertainment Group ADR (a) | | 376,532 | 1,359,281 |
| Tingyi (Cayman Islands) Holding Corp. | | 1,031,000 | 1,612,897 |
| Tongcheng Travel Holdings Ltd. (a) | | 637,200 | 993,589 |
| Topsports International Holdings Ltd. (b) | | 953,000 | 480,770 |
| Trip.com Group Ltd. ADR (a) | | 288,093 | 6,519,545 |
| Uni-President China Holdings Ltd. | | 657,000 | 485,448 |
| Vinda International Holdings Ltd. | | 187,000 | 350,670 |
| Vipshop Holdings Ltd. ADR (a) | | 229,538 | 1,599,880 |
| Want Want China Holdings Ltd. | | 2,492,418 | 1,638,401 |
| Weibo Corp. sponsored ADR (a) | | 37,421 | 423,606 |
| Wuxi Biologics (Cayman), Inc. (a)(b) | | 1,894,000 | 8,522,323 |
| Xiaomi Corp. Class B (a)(b) | | 8,069,800 | 9,057,084 |
| Xinyi Solar Holdings Ltd. | | 2,575,538 | 2,555,966 |
| XPeng, Inc. ADR (a)(d) | | 223,615 | 1,480,331 |
| XTEP International Holdings Ltd. | | 689,500 | 632,436 |
| Yadea Group Holdings Ltd. (b) | | 642,000 | 979,809 |
| Yihai International Holding Ltd. | | 246,000 | 404,900 |
| Zai Lab Ltd. ADR (a) | | 46,501 | 1,036,042 |
| Zhen Ding Technology Holding Ltd. | | 353,000 | 1,160,104 |
| Zhongsheng Group Holdings Ltd. Class H | | 315,100 | 1,196,229 |
| ZTO Express, Inc. sponsored ADR | | 222,548 | 3,758,836 |
TOTAL CAYMAN ISLANDS | | | 407,646,172 |
| Chile - 0.4% | | | |
| Banco de Chile | | 24,227,778 | 2,215,808 |
| Banco de Credito e Inversiones | | 29,210 | 813,917 |
| Banco Santander Chile | | 35,251,821 | 1,262,863 |
| Cencosud SA | | 746,665 | 1,005,050 |
| Compania Cervecerias Unidas SA | | 67,880 | 372,315 |
| Compania Sud Americana de Vapores SA | | 8,194,487 | 568,881 |
| Empresas CMPC SA | | 604,526 | 959,168 |
| Empresas COPEC SA | | 208,746 | 1,438,544 |
| Enel Americas SA | | 11,395,904 | 1,129,082 |
| Enel Chile SA | | 14,942,235 | 525,789 |
| Falabella SA | | 401,422 | 784,890 |
TOTAL CHILE | | | 11,076,307 |
| China - 11.3% | | | |
| 360 Security Technology, Inc. (A Shares) | | 247,800 | 240,237 |
| 37 Interactive Entertainment Network Technology Group Co. Ltd. (A Shares) | | 73,800 | 146,430 |
| A-Living Smart City Services C (H Shares) (b) | | 340,500 | 193,031 |
| Advanced Micro-Fabrication Equipment, Inc., China (A Shares) (a) | | 19,979 | 303,642 |
| AECC Aero-Engine Control Co. Ltd. (A Shares) | | 45,300 | 186,090 |
| AECC Aviation Power Co. Ltd. | | 88,000 | 586,112 |
| Agricultural Bank of China Ltd.: | | | |
| (A Shares) | | 1,571,500 | 593,920 |
| (H Shares) | | 16,955,297 | 4,839,610 |
| Aier Eye Hospital Group Co. Ltd. (A Shares) | | 230,031 | 778,015 |
| Air China Ltd.: | | | |
| (A Shares) (a) | | 199,600 | 264,297 |
| (H Shares) (a) | | 978,000 | 680,270 |
| Aluminum Corp. of China Ltd.: | | | |
| (A shares) | | 332,300 | 175,640 |
| (H Shares) | | 2,118,000 | 603,803 |
| Amlogic Shanghai Co. Ltd. (A Shares) (a) | | 13,375 | 105,053 |
| Angel Yeast Co. Ltd. (A Shares) | | 26,600 | 131,782 |
| Anhui Conch Cement Co. Ltd.: | | | |
| (A Shares) | | 159,100 | 528,961 |
| (H Shares) | | 592,900 | 1,525,747 |
| Anhui Gujing Distillery Co. Ltd.: | | | |
| (A Shares) | | 17,200 | 464,121 |
| (B Shares) | | 28,657 | 337,803 |
| Anhui Honglu Steel Construction Group Co. Ltd. | | 21,190 | 98,886 |
| Anhui Kouzi Distillery Co. Ltd. (A Shares) | | 19,100 | 105,924 |
| Anhui Yingjia Distillery Co. Ltd. (A Shares) | | 21,500 | 138,664 |
| Anjoy Foods Group Co. Ltd. (A Shares) | | 10,000 | 183,941 |
| Apeloa Pharmaceutical Co. Ltd. A Shares | | 40,200 | 114,607 |
| Asia - Potash International Investment Guangzhou Co. Ltd. (A Shares) (a) | | 20,700 | 72,280 |
| Asymchem Laboratories Tianjin Co. Ltd. (A Shares) | | 11,360 | 222,739 |
| Avary Holding Shenzhen Co. Ltd. (A Shares) | | 63,700 | 259,496 |
| AVIC Capital Co. Ltd. (A Shares) | | 335,900 | 139,366 |
| AVIC Electromechanical Systems Co. Ltd. (A Shares) | | 134,200 | 215,002 |
| AviChina Industry & Technology Co. Ltd. (H Shares) | | 1,266,000 | 554,807 |
| Avicopter PLC (A Shares) | | 20,400 | 122,631 |
| Bank of Beijing Co. Ltd. (A Shares) | | 732,425 | 405,181 |
| Bank of Changsha Co. Ltd. (A Shares) | | 121,900 | 107,496 |
| Bank of Chengdu Co. Ltd. (A Shares) | | 115,700 | 215,782 |
| Bank of China Ltd. (H Shares) | | 43,461,464 | 13,997,957 |
| Bank of Communications Co. Ltd.: | | | |
| (A Shares) | | 947,800 | 577,539 |
| (H Shares) | | 4,951,176 | 2,415,777 |
| Bank of Hangzhou Co. Ltd. (A Shares) | | 200,200 | 331,981 |
| Bank of Jiangsu Co. Ltd. (A Shares) | | 498,343 | 472,214 |
| Bank of Nanjing Co. Ltd. (A Shares) | | 347,100 | 490,500 |
| Bank of Ningbo Co. Ltd. (A Shares) | | 218,420 | 710,630 |
| Bank of Shanghai Co. Ltd. (A Shares) | | 510,980 | 390,430 |
| Baoshan Iron & Steel Co. Ltd. (A Shares) | | 754,500 | 496,946 |
| BBMG Corp. (A Shares) | | 263,000 | 83,911 |
| Beijing Capital International Airport Co. Ltd. (H Shares) (a) | | 987,000 | 534,387 |
| Beijing Dabeinong Technology Group Co. Ltd. (A Shares) (a) | | 134,600 | 168,828 |
| Beijing Easpring Material Technology Co. Ltd. (A Shares) | | 16,700 | 134,896 |
| Beijing Enlight Media Co. Ltd. (A Shares) | | 93,800 | 86,442 |
| Beijing Kingsoft Office Software, Inc. (A Shares) | | 15,256 | 607,365 |
| Beijing New Building Materials PLC (A Shares) | | 58,700 | 159,392 |
| Beijing Originwater Technology Co. Ltd. (A Shares) | | 146,000 | 94,163 |
| Beijing Roborock Technology Co. Ltd. (A Shares) | | 3,042 | 97,897 |
| Beijing Shiji Information Technology Co. Ltd. (A Shares) | | 45,416 | 78,607 |
| Beijing Shunxin Agriculture Co. Ltd. | | 23,500 | 65,838 |
| Beijing Sinnet Technology Co. Ltd. (A Shares) | | 56,800 | 67,355 |
| Beijing Tiantan Biological Products Corp. Ltd. (A Shares) | | 52,488 | 148,561 |
| Beijing Tongrentang Co. Ltd. (A Shares) | | 45,700 | 305,067 |
| Beijing United Information Technology Co. Ltd. (A Shares) | | 16,510 | 280,332 |
| Beijing Wantai Biological Pharmacy Enterprise Co. Ltd. (A Shares) | | 19,880 | 341,691 |
| Beijing Yuanliu Hongyuan Electronic Technology Co. Ltd. (A Shares) | | 7,400 | 116,347 |
| Beijing-Shanghai High Speed Railway Co. Ltd. (A Shares) | | 1,356,400 | 828,376 |
| Betta Pharmaceuticals Co. Ltd. (A Shares) | | 13,600 | 85,125 |
| BGI Genomics Co. Ltd. | | 14,300 | 108,617 |
| Bloomage Biotechnology Corp. Ltd. (A Shares) | | 10,559 | 153,247 |
| BOC International China Co. Ltd. | | 83,900 | 120,745 |
| BOE Technology Group Co. Ltd. (A Shares) | | 1,225,200 | 560,348 |
| BTG Hotels Group Co. Ltd. | | 36,100 | 107,417 |
| By-Health Co. Ltd. (A Shares) | | 67,800 | 162,655 |
| BYD Co. Ltd.: | | | |
| (A Shares) | | 57,700 | 1,948,932 |
| (H Shares) | | 434,300 | 9,721,008 |
| Caitong Securities Co. Ltd. | | 149,600 | 146,468 |
| CanSino Biologics, Inc.: | | | |
| (A Shares) | | 7,445 | 193,340 |
| (H Shares) (b)(d) | | 30,800 | 286,433 |
| CECEP Solar Energy Co. Ltd. (A Shares) | | 118,600 | 109,783 |
| CECEP Wind-Power Corp. (A Shares) | | 179,000 | 104,906 |
| CGN Power Co. Ltd. (H Shares) (b) | | 5,179,447 | 1,049,132 |
| Chacha Food Co. Ltd. (A Shares) | | 9,700 | 58,682 |
| Changchun High & New Technology Industry Group, Inc. (A Shares) | | 13,200 | 292,634 |
| Changjiang Securities Co. Ltd. (A Shares) | | 217,600 | 155,239 |
| Changzhou Xingyu Automotive Lighting Systems Co. Ltd. (A Shares) | | 9,600 | 160,953 |
| Chaozhou Three-Circle Group Co. (A Shares) | | 63,700 | 247,721 |
| Chengtun Mining Group Co. Ltd. (A Shares) | | 87,400 | 66,302 |
| Chengxin Lithium Group Co. Ltd. (A Shares) | | 28,000 | 165,710 |
| Chifeng Jilong Gold Mining Co. Ltd. (A Shares) (a) | | 54,700 | 140,965 |
| China Baoan Group Co. Ltd. (A Shares) | | 84,100 | 133,125 |
| China Cinda Asset Management Co. Ltd. (H Shares) | | 4,403,000 | 409,469 |
| China CITIC Bank Corp. Ltd. (H Shares) | | 4,644,051 | 1,751,211 |
| China Coal Energy Co. Ltd. (H Shares) | | 1,072,000 | 789,355 |
| China Communications Services Corp. Ltd. (H Shares) | | 1,220,000 | 340,372 |
| China Construction Bank Corp. (H Shares) | | 51,183,000 | 27,162,227 |
| China CSSC Holdings Ltd. (A Shares) | | 147,500 | 535,637 |
| China Eastern Airlines Corp. Ltd. (A Shares) (a) | | 330,800 | 217,426 |
| China Energy Engineering Corp. Ltd. (A Shares) | | 1,160,600 | 363,934 |
| China Everbright Bank Co. Ltd.: | | | |
| (A Shares) | | 1,598,300 | 595,294 |
| (H Shares) | | 1,084,000 | 280,334 |
| China Galaxy Securities Co. Ltd.: | | | |
| (A Shares) | | 84,200 | 103,882 |
| (H Shares) | | 1,910,000 | 715,369 |
| China Great Wall Securities Co. Ltd. (A Shares) | | 117,000 | 129,450 |
| China Greatwall Technology Group Co. Ltd. (A Shares) | | 107,100 | 163,519 |
| China International Capital Corp. Ltd. | | 61,100 | 289,817 |
| China International Capital Corp. Ltd. (H Shares) (b) | | 690,200 | 960,168 |
| China Jushi Co. Ltd. (A Shares) | | 132,814 | 212,782 |
| China Life Insurance Co. Ltd.: | | | |
| (A Shares) | | 109,000 | 397,020 |
| (H Shares) | | 3,839,747 | 4,187,082 |
| China Longyuan Power Grid Corp. Ltd. (H Shares) | | 1,751,000 | 2,000,913 |
| China Meheco Co. Ltd. (A Shares) | | 45,000 | 77,764 |
| China Merchants Bank Co. Ltd.: | | | |
| (A Shares) | | 571,000 | 2,097,005 |
| (H Shares) | | 2,145,421 | 7,051,507 |
| China Merchants Energy Shipping Co. Ltd. (A Shares) | | 267,800 | 255,592 |
| China Merchants Securities Co. Ltd. (A Shares) | | 249,650 | 427,313 |
| China Merchants Shekou Industrial Zone Holdings Co. Ltd. (A Shares) | | 260,000 | 466,746 |
| China Minmetals Rare Earth Co. Ltd. (A Shares) (a) | | 31,500 | 124,397 |
| China Minsheng Banking Corp. Ltd.: | | | |
| (A Shares) | | 1,192,400 | 538,816 |
| (H Shares) | | 3,122,561 | 906,975 |
| China National Building Materials Co. Ltd. (H Shares) | | 2,042,000 | 1,186,234 |
| China National Chemical Engineering Co. Ltd. (A Shares) | | 198,108 | 191,790 |
| China National Nuclear Power Co. Ltd. (A Shares) | | 615,000 | 507,805 |
| China Northern Rare Earth Group High-Tech Co. Ltd. | | 118,800 | 393,674 |
| China Oilfield Services Ltd. (H Shares) | | 940,000 | 1,058,595 |
| China Pacific Insurance (Group) Co. Ltd. | | 113,200 | 294,978 |
| China Pacific Insurance (Group) Co. Ltd. (H Shares) | | 1,537,828 | 2,480,226 |
| China Petroleum & Chemical Corp.: | | | |
| (A Shares) | | 1,042,900 | 581,222 |
| (H Shares) | | 13,376,704 | 5,301,542 |
| China Railway Group Ltd.: | | | |
| (A Shares) | | 692,500 | 473,178 |
| (H Shares) | | 2,132,000 | 926,171 |
| China Railway Signal & Communications Corp. (A Shares) | | 265,870 | 164,920 |
| China Resources Sanjiu Medical & Pharmaceutical Co. Ltd. (A Shares) | | 30,200 | 225,542 |
| China Shenhua Energy Co. Ltd.: | | | |
| (A Shares) | | 226,285 | 868,527 |
| (H Shares) | | 1,752,202 | 4,609,501 |
| China Southern Airlines Ltd.: | | | |
| (A Shares) (a) | | 429,200 | 379,662 |
| (H Shares) (a) | | 788,000 | 406,566 |
| China State Construction Engineering Corp. Ltd. (A Shares) | | 1,380,340 | 897,810 |
| China Suntien Green Energy Corp. Ltd. (H Shares) | | 901,000 | 342,051 |
| China Three Gorges Renewables Group Co. Ltd. (A Shares) | | 960,600 | 732,660 |
| China Tourism Group Duty Free Corp. Ltd. (A Shares) | | 63,600 | 1,396,554 |
| China Tower Corp. Ltd. (H Shares) (b) | | 23,157,000 | 2,094,548 |
| China United Network Communications Ltd. (A Shares) | | 1,062,300 | 488,755 |
| China Vanke Co. Ltd.: | | | |
| (A Shares) | | 361,000 | 668,326 |
| (H Shares) | | 824,300 | 1,058,511 |
| China Yangtze Power Co. Ltd. (A Shares) | | 742,200 | 2,059,041 |
| China Zhenhua (Group) Science & Technology Co. Ltd. (A Shares) | | 17,100 | 315,756 |
| China Zheshang Bank Co. Ltd. (a) | | 619,500 | 234,129 |
| Chongqing Brewery Co. Ltd. (A Shares) | | 16,100 | 192,726 |
| Chongqing Changan Automobile Co. Ltd. (A Shares) | | 271,474 | 419,688 |
| Chongqing Fuling Zhacai Group Co. Ltd. Group (A Shares) | | 27,200 | 83,840 |
| Chongqing Rural Commercial Bank Co. Ltd. (A Shares) | | 355,500 | 169,891 |
| Chongqing Zhifei Biological Products Co. Ltd. (A Shares) | | 52,300 | 611,595 |
| CITIC Securities Co. Ltd.: | | | |
| (A Shares) | | 359,700 | 847,668 |
| (H Shares) | | 1,119,590 | 1,674,468 |
| Cmoc Group Ltd.: | | | |
| (A Shares) | | 598,400 | 340,051 |
| (H Shares) | | 1,750,000 | 564,038 |
| CNGR Advanced Material Co. Ltd. | | 13,600 | 134,326 |
| CNNC Hua Yuan Titanium Dioxide Co. Ltd. (A Shares) | | 95,990 | 87,803 |
| Contemporary Amperex Technology Co. Ltd. | | 75,500 | 3,854,967 |
| COSCO Shipping Development Co. Ltd. (A Shares) | | 309,600 | 103,442 |
| COSCO Shipping Energy Transportation Co. Ltd. (A Shares) (a) | | 114,000 | 263,969 |
| COSCO SHIPPING Holdings Co. Ltd.: | | | |
| (A Shares) | | 384,420 | 591,140 |
| (H Shares) | | 1,683,800 | 1,816,869 |
| CRRC Corp. Ltd.: | | | |
| (A Shares) | | 916,900 | 596,376 |
| (H Shares) | | 1,807,000 | 547,879 |
| CSC Financial Co. Ltd. (A Shares) | | 142,800 | 461,667 |
| Daan Gene Co. Ltd. | | 47,468 | 116,218 |
| Daqin Railway Co. Ltd. (A Shares) | | 497,000 | 436,234 |
| DaShenLin Pharmaceutical Group Co. Ltd. | | 30,528 | 152,370 |
| DHC Software Co. Ltd. (A Shares) | | 101,700 | 85,923 |
| Do-Fluoride New Materials Co. Ltd. (A Shares) | | 24,900 | 106,209 |
| Dong-E-E-Jiao Co. Ltd. (A Shares) | | 21,000 | 107,949 |
| Dongfang Electric Corp. Ltd. (A Shares) | | 90,400 | 287,308 |
| Dongfeng Motor Group Co. Ltd. (H Shares) | | 1,455,000 | 658,023 |
| Dongxing Securities Co. Ltd. (A Shares) | | 101,500 | 107,992 |
| East Money Information Co. Ltd. (A Shares) | | 429,440 | 917,931 |
| Ecovacs Robotics Co. Ltd. Class A | | 18,400 | 146,890 |
| ENN Natural Gas Co. Ltd. (A Shares) | | 82,000 | 173,816 |
| Eve Energy Co. Ltd. (A shares) | | 61,874 | 703,558 |
| Everbright Securities Co. Ltd. (A Shares) | | 127,858 | 245,460 |
| Fangda Carbon New Material Co. Ltd. (A Shares) (a) | | 148,448 | 122,167 |
| FAW Jiefang Group Co. Ltd. (A Shares) | | 96,100 | 91,588 |
| Fiberhome Telecommunication Technologies Co. Ltd. (A Shares) | | 32,900 | 62,080 |
| First Capital Securities Co. Ltd. (A Shares) | | 140,500 | 106,776 |
| Flat Glass Group Co. Ltd. | | 224,000 | 524,497 |
| Flat Glass Group Co. Ltd. (A Shares) (a) | | 53,600 | 251,747 |
| Focus Media Information Technology Co. Ltd. (A Shares) | | 493,040 | 302,458 |
| Foshan Haitian Flavouring & Food Co. Ltd. (A Shares) | | 126,864 | 1,036,745 |
| Founder Securities Co. Ltd. (A Shares) | | 283,100 | 245,385 |
| Foxconn Industrial Internet Co. Ltd. (A Shares) | | 333,097 | 374,015 |
| Fujian Sunner Development Co. Ltd. A Shares | | 38,000 | 114,267 |
| Fuyao Glass Industries Group Co. Ltd.: | | | |
| (A Shares) | | 52,300 | 239,410 |
| (H Shares) (b) | | 329,600 | 1,181,994 |
| G-bits Network Technology Xiamen Co. Ltd. (A Shares) | | 2,300 | 80,200 |
| Ganfeng Lithium Group Co. Ltd. (A Shares) | | 60,440 | 653,983 |
| GCL System Integration Technology Co. Ltd. (a) | | 166,200 | 74,419 |
| GD Power Development Co. Ltd. (A Shares) (a) | | 595,700 | 356,462 |
| GEM Co. Ltd. (A Shares) | | 153,300 | 156,178 |
| Gemdale Corp. (A Shares) | | 150,900 | 161,585 |
| GF Securities Co. Ltd.: | | | |
| (A Shares) | | 249,400 | 465,476 |
| (H Shares) | | 434,628 | 442,399 |
| Giant Network Group Co. Ltd. (A Shares) | | 69,800 | 73,978 |
| Gigadevice Semiconductor Beijing, Inc. (A Shares) | | 21,560 | 242,882 |
| Ginlong Technologies Co. Ltd. (A Shares) | | 12,100 | 309,504 |
| GoerTek, Inc. (A Shares) | | 111,500 | 331,008 |
| Gotion High-tech Co. Ltd. (A Shares) | | 55,000 | 226,314 |
| Great Wall Motor Co. Ltd.: | | | |
| (A Shares) | | 103,700 | 414,067 |
| (H Shares) | | 1,534,500 | 1,675,319 |
| Gree Electric Appliances, Inc. of Zhuhai (A Shares) | | 96,000 | 376,880 |
| GRG Banking Equipment Co. Ltd. (A Shares) | | 78,900 | 101,773 |
| Guangdong Haid Group Co. Ltd. (A Shares) | | 55,300 | 437,302 |
| Guangdong Kinlong Hardware Products Co. Ltd. (A Shares) | | 10,500 | 113,901 |
| Guanghui Energy Co. Ltd. (A Shares) | | 213,600 | 300,676 |
| Guangzhou Automobile Group Co. Ltd. | | 190,400 | 295,394 |
| Guangzhou Automobile Group Co. Ltd. (H Shares) | | 1,454,200 | 885,527 |
| Guangzhou Baiyunshan Pharma Health (A Shares) | | 52,400 | 193,660 |
| Guangzhou Haige Communications Group (A Shares) | | 70,200 | 81,227 |
| Guangzhou Kingmed Diagnostics Group Co. Ltd. (A Shares) | | 14,900 | 154,164 |
| Guangzhou Shiyuan Electronic Technology Co. Ltd. (A Shares) | | 23,700 | 211,138 |
| Guangzhou Tinci Materials Technology Co. Ltd. (A Shares) | | 63,200 | 367,799 |
| Guangzhou Yuexiu Financial Holdings Group Co. Ltd. (A Shares) | | 129,431 | 98,718 |
| Guolian Securities Co. Ltd. | | 80,900 | 103,577 |
| Guosen Securities Co. Ltd. (A Shares) | | 226,400 | 267,232 |
| Guotai Junan Securities Co. Ltd. (A Shares) | | 257,000 | 465,232 |
| Guoyuan Securities Co. Ltd. (A Shares) | | 143,970 | 123,213 |
| Haier Smart Home Co. Ltd. | | 1,267,600 | 3,171,564 |
| Haier Smart Home Co. Ltd. (A Shares) | | 144,700 | 412,132 |
| Haitong Securities Co. Ltd.: | | | |
| (A Shares) | | 353,900 | 409,004 |
| (H Shares) | | 1,340,800 | 655,911 |
| Hangzhou First Applied Material Co. Ltd. (A Shares) | | 43,652 | 382,909 |
| Hangzhou Lion Electronics Co. Ltd. (A Shares) | | 22,100 | 129,582 |
| Hangzhou Oxygen Plant Group Co. Ltd. (A Shares) | | 33,500 | 193,076 |
| Hangzhou Robam Appliances Co. Ltd. (A Shares) | | 34,400 | 96,564 |
| Hangzhou Silan Microelectronics Co. Ltd. (A Shares) | | 45,700 | 196,495 |
| Hangzhou Tigermed Consulting Co. Ltd.: | | | |
| (A Shares) | | 18,000 | 205,439 |
| (H Shares) (b) | | 50,100 | 340,504 |
| Heilongjiang Agriculture Co. Ltd. (A Shares) | | 54,200 | 102,420 |
| Henan Shenhuo Coal & Power Co. Ltd. (A Shares) | �� | 73,200 | 140,629 |
| Henan Shuanghui Investment & Development Co. Ltd. (A Shares) | | 117,300 | 365,895 |
| Hengli Petrochemical Co. Ltd. (A Shares) | | 195,220 | 410,067 |
| Hengtong Optic-electric Co. Ltd. (A Shares) | | 77,400 | 206,141 |
| Hengyi Petrochemical Co. Ltd. (A Shares) | | 120,280 | 110,350 |
| Hesteel Co. Ltd. (A Shares) | | 355,500 | 105,634 |
| Hithink RoyalFlush Information Network Co. Ltd. (A Shares) | | 17,900 | 208,489 |
| Hongfa Technology Co. Ltd. (A Shares) | | 35,880 | 168,569 |
| Hoshine Silicon Industry Co. Ltd. (A Shares) | | 16,000 | 209,670 |
| Huadian Power International Corp. Ltd. (A Shares) | | 277,200 | 206,109 |
| Huadong Medicine Co. Ltd. (A Shares) | | 58,900 | 330,112 |
| Huafon Chemical Co. Ltd. (A Shares) | | 186,900 | 170,447 |
| Huagong Tech Co. Ltd. (A Shares) | | 32,800 | 75,320 |
| Huaibei Mining Holdings Co. Ltd. (A Shares) | | 82,100 | 146,485 |
| Hualan Biological Engineer, Inc. (A Shares) | | 61,070 | 148,266 |
| Huaneng Power International, Inc.: | | | |
| (A Shares) (a) | | 286,000 | 262,389 |
| (H Shares) (a) | | 2,100,186 | 751,820 |
| Huatai Securities Co. Ltd.: | | | |
| (A Shares) | | 148,000 | 242,583 |
| (H Shares) (b) | | 892,200 | 874,054 |
| HUAXI Securities Co. Ltd. | | 80,700 | 81,110 |
| Huaxia Bank Co. Ltd. (A Shares) | | 463,058 | 303,722 |
| Huaxin Cement Co. Ltd. (A Shares) | | 51,900 | 95,373 |
| Huayu Automotive Systems Co. Ltd. (A Shares) | | 107,800 | 247,546 |
| Hubei Xingfa Chemicals Group Co. Ltd. (A Shares) | | 36,400 | 140,907 |
| Huizhou Desay SV Automotive Co. Ltd. | | 18,100 | 256,769 |
| Humanwell Healthcare Group Co. Ltd. (A Shares) | | 52,500 | 143,994 |
| Hunan Valin Steel Co. Ltd. (A Shares) | | 221,600 | 121,376 |
| Hundsun Technologies, Inc. (A Shares) | | 63,419 | 361,953 |
| iFlytek Co. Ltd. (A Shares) | | 76,900 | 368,868 |
| IMEIK Technology Development Co. Ltd. (A Shares) | | 5,900 | 340,125 |
| Industrial & Commercial Bank of China Ltd.: | | | |
| (A Shares) | | 468,200 | 266,063 |
| (H Shares) | | 31,803,000 | 13,807,764 |
| Industrial Bank Co. Ltd. (A Shares) | | 683,000 | 1,405,673 |
| Industrial Securities Co. Ltd. (A Shares) (a) | | 233,870 | 174,532 |
| Ingenic Semiconductor Co. Ltd. (A Shares) | | 15,800 | 147,033 |
| Inner Mongoli Yili Industries Co. Ltd. (A Shares) | | 210,900 | 728,904 |
| Inner Mongolia Baotou Steel Union Co. Ltd. (A Shares) | | 1,503,100 | 362,247 |
| Inner Mongolia Dian Tou Energy Corp. Ltd. | | 64,000 | 108,231 |
| Inner Mongolia Eerduosi Resourses Co. Ltd. (A Shares) | | 38,500 | 73,385 |
| Inner Mongolia Junzheng Energy & Chemical Industry Group Co. Ltd. (A Shares) | | 273,200 | 145,150 |
| Inner Mongolia Yitai Coal Co. Ltd. (B Shares) | | 452,390 | 639,679 |
| Inner Mongolia Yuan Xing Energy Co. Ltd. (A Shares) | | 114,700 | 101,304 |
| Inspur Electronic Information Industry Co. Ltd. (A Shares) | | 46,072 | 145,227 |
| Intco Medical Technology Co. Ltd. (A Shares) | | 23,080 | 67,379 |
| JA Solar Technology Co. Ltd. (A Shares) | | 76,860 | 657,787 |
| Jafron Biomedical Co. Ltd. (A Shares) | | 25,740 | 111,660 |
| Jason Furniture Hangzhou Co. Ltd. (A Shares) | | 26,520 | 109,306 |
| JCET Group Co. Ltd. (A Shares) | | 57,900 | 190,915 |
| Jiangsu Eastern Shenghong Co. Ltd. | | 130,700 | 219,059 |
| Jiangsu Expressway Co. Ltd. (H Shares) | | 552,000 | 388,878 |
| Jiangsu Hengli Hydraulic Co. Ltd. | | 44,476 | 335,995 |
| Jiangsu Hengrui Medicine Co. Ltd. (A Shares) | | 209,658 | 1,154,097 |
| Jiangsu King's Luck Brewery JSC Ltd. (A Shares) | | 43,000 | 220,096 |
| Jiangsu Yanghe Brewery JSC Ltd. (A Shares) | | 49,600 | 887,352 |
| Jiangsu Yangnong Chemical Co. Ltd. (A Shares) | | 9,900 | 125,246 |
| Jiangsu Yoke Technology Co. Ltd. (A Shares) | | 15,000 | 120,774 |
| Jiangsu Yuyue Medical Equipment & Supply Co. Ltd. (A Shares) | | 35,000 | 156,000 |
| Jiangsu Zhongtian Technology Co. Ltd. (A Shares) | | 112,500 | 338,444 |
| Jiangxi Copper Co. Ltd.: | | | |
| (A Shares) | | 43,300 | 91,309 |
| (H Shares) | | 582,000 | 636,151 |
| Jiangxi Special Electric Motor Co. Ltd. (A Shares) (a) | | 56,200 | 146,832 |
| Jiangxi Zhengbang Technology Co. Ltd. (A Shares) (a) | | 102,100 | 48,933 |
| Jinke Properties Group Co. Ltd. (A Shares) (a) | | 177,100 | 42,924 |
| JiuGui Liquor Co. Ltd. (A Shares) | | 11,000 | 153,713 |
| Jizhong Energy Resources Co. Ltd. (A Shares) | | 119,100 | 99,156 |
| Joincare Pharmaceutical Group Industry Co. Ltd. (A Shares) | | 56,200 | 89,961 |
| Joinn Laboratories China Co. Ltd. (A Shares) | | 15,296 | 119,785 |
| Jointown Pharmaceutical Group (A Shares) | | 56,600 | 97,344 |
| Jonjee Hi-Tech Industrial & Commercial Holding Co. Ltd. (A Shares) | | 25,700 | 95,369 |
| Juewei Food Co. Ltd. | | 19,600 | 127,135 |
| Kangmei Pharmaceutical Co. Ltd. rights (a)(c) | | 18,271 | 0 |
| Keda Industrial Group Co. Ltd. | | 63,200 | 134,744 |
| Kingfa Sci & Tech Co. Ltd. (A Shares) | | 83,000 | 110,017 |
| Kuang-Chi Technologies Co. Ltd. (A Shares) (a) | | 71,800 | 170,089 |
| Kunlun Tech Co. Ltd. (A Shares) | | 39,600 | 70,547 |
| Kweichow Moutai Co. Ltd. (A Shares) | | 40,700 | 7,488,654 |
| Lb Group Co. Ltd. (A Shares) | | 81,900 | 172,370 |
| Lens Technology Co. Ltd. (A Shares) | | 164,700 | 224,625 |
| Lepu Medical Technology Beijing Co. Ltd. (A Shares) | | 63,700 | 220,594 |
| Liaoning Port Co. Ltd. (A Shares) | | 718,900 | 156,520 |
| Lingyi iTech Guangdong Co. (A Shares) (a) | | 234,200 | 151,689 |
| Livzon Pharmaceutical Group, Inc. (A Shares) | | 18,200 | 88,048 |
| LONGi Green Energy Technology Co. Ltd. | | 245,599 | 1,613,584 |
| Luoyang Xinqianglian Slewing Bearing Co. Ltd. (A Shares) | | 11,050 | 105,644 |
| Luxi Chemical Group Co. Ltd. | | 61,500 | 95,666 |
| Luxshare Precision Industry Co. Ltd. (A Shares) | | 230,424 | 899,243 |
| Luzhou Laojiao Co. Ltd. (A Shares) | | 47,900 | 1,025,506 |
| Maanshan Iron & Steel Co. Ltd. (A Shares) | | 196,400 | 67,771 |
| Mango Excellent Media Co. Ltd. (A Shares) | | 61,770 | 185,490 |
| Maxscend Microelectronics Co. Ltd. (A Shares) | | 17,728 | 224,207 |
| Meinian Onehealth Healthcare Holdings Co. Ltd. (A Shares) (a) | | 122,888 | 71,853 |
| Metallurgical Corp. China Ltd. (A Shares) | | 630,200 | 248,528 |
| Ming Yang Smart Energy Group Ltd. (A Shares) | | 68,900 | 234,922 |
| Montage Technology Co. Ltd. (A Shares) | | 37,056 | 287,907 |
| Muyuan Foodstuff Co. Ltd. (A Shares) | | 173,354 | 1,110,449 |
| Nanjing King-Friend Biochemical Pharmaceutical Co. Ltd. | | 50,653 | 112,849 |
| Nanjing Securities Co. Ltd. (A Shares) | | 123,700 | 134,153 |
| NARI Technology Co. Ltd. (A Shares) | | 219,196 | 732,364 |
| National Silicon Industry Group Co. Ltd. (A Shares) (a) | | 84,729 | 235,639 |
| NAURA Technology Group Co. Ltd. | | 17,100 | 622,146 |
| NavInfo Co. Ltd. (A Shares) | | 78,100 | 126,835 |
| New China Life Insurance Co. Ltd. | | 10,100 | 32,321 |
| New China Life Insurance Co. Ltd. (H Shares) | | 566,200 | 898,747 |
| New Hope Liuhe Co. Ltd. (A Shares) (a) | | 150,100 | 264,934 |
| Ninestar Corp. (A Shares) | | 47,300 | 369,895 |
| Ningbo Deye Technology Co. Ltd. (A Shares) | | 6,500 | 291,200 |
| Ningbo Joyson Electronic Corp. (A shares) (a) | | 44,000 | 92,484 |
| Ningbo Orient Wires & Cables Co. Ltd. (A Shares) | | 23,300 | 245,670 |
| Ningbo Ronbay New Energy Technology Co. Ltd. (A Shares) | | 14,798 | 158,681 |
| Ningbo Shanshan Co. Ltd. (A Shares) | | 71,300 | 175,543 |
| Ningbo Tuopu Group Co. Ltd. (A Shares) | | 35,900 | 318,547 |
| Ningxia Baofeng Energy Group Co. Ltd. | | 203,500 | 319,619 |
| Nongfu Spring Co. Ltd. (H Shares) (b) | | 921,600 | 4,631,687 |
| North Industries Group Red Arrow Co. Ltd. (A Shares) | | 45,900 | 129,160 |
| Northeast Securities Co. Ltd. (A Shares) | | 71,700 | 62,246 |
| Offshore Oil Enginering Co. Ltd. (A Shares) | | 141,600 | 91,131 |
| OFILM Group Co. Ltd. (A Shares) (a) | | 103,300 | 66,199 |
| Oppein Home Group, Inc. (A Shares) | | 17,180 | 191,540 |
| Orient Securities Co. Ltd. (A Shares) | | 258,339 | 274,509 |
| Ovctek China, Inc. (A Shares) | | 28,289 | 115,125 |
| Pangang Group Vanadium Titanium & Resources Co. Ltd. (A Shares) (a) | | 275,700 | 171,017 |
| People's Insurance Co. of China Group Ltd.: | | | |
| (A Shares) | | 368,800 | 244,927 |
| (H Shares) | | 3,890,552 | 1,075,525 |
| Perfect World Co. Ltd. (A Shares) | | 64,400 | 100,442 |
| PetroChina Co. Ltd.: | | | |
| (A Shares) | | 612,700 | 401,872 |
| (H Shares) | | 11,225,790 | 4,290,302 |
| Pharmaron Beijing Co. Ltd.: | | | |
| (A Shares) | | 35,200 | 250,640 |
| (H Shares) (b) | | 95,250 | 320,345 |
| PICC Property & Casualty Co. Ltd. (H Shares) | | 3,627,568 | 3,345,830 |
| Ping An Bank Co. Ltd. (A Shares) | | 637,700 | 902,904 |
| Ping An Insurance Group Co. of China Ltd.: | | | |
| (A Shares) | | 268,196 | 1,327,594 |
| (H Shares) | | 3,432,641 | 13,742,202 |
| Pingdingshan Tianan Coal Mining Co. Ltd. A Shares | | 76,200 | 114,985 |
| Poly Developments & Holdings (A Shares) | | 391,500 | 739,802 |
| Postal Savings Bank of China Co. Ltd. | | 830,500 | 441,241 |
| Postal Savings Bank of China Co. Ltd. (H Shares) (b) | | 4,133,000 | 1,916,534 |
| Power Construction Corp. of China Ltd. (A Shares) | | 502,400 | 484,314 |
| Proya Cosmetics Co. Ltd. (A Shares) | | 5,000 | 114,441 |
| Pylon Technologies Co. Ltd. (Series A) | | 5,062 | 213,837 |
| Qingdao Rural Commercial Bank Corp. (A Shares) | | 135,800 | 51,509 |
| Qinghai Salt Lake Potash Co. Ltd. Class A (a) | | 178,200 | 524,871 |
| Raytron Technology Co. Ltd. (A Shares) | | 14,486 | 94,320 |
| Riyue Heavy Industry Co. Ltd. (A Shares) | | 31,700 | 95,887 |
| Rongsheng Petrochemical Co. Ltd. (A Shares) | | 335,600 | 491,712 |
| SAIC Motor Corp. Ltd. (A Shares) | | 265,800 | 500,452 |
| Sailun Group Co. Ltd. A Shares | | 99,600 | 118,518 |
| Sangfor Technologies, Inc. | | 14,300 | 246,724 |
| Sany Heavy Industry Co. Ltd. (A Shares) | | 280,400 | 518,342 |
| Satellite Chemical Co. Ltd. (A Shares) | | 112,030 | 190,222 |
| SDIC Power Holdings Co. Ltd. (A Shares) | | 264,200 | 365,392 |
| Sealand Securities Co. Ltd. (A Shares) | | 208,550 | 92,811 |
| Seazen Holdings Co. Ltd. (A Shares) (a) | | 77,600 | 140,156 |
| SF Holding Co. Ltd. (A Shares) | | 159,500 | 1,054,029 |
| SG Micro Corp. (A Shares) | | 11,625 | 238,234 |
| Shaanxi Coal Industry Co. Ltd. (A Shares) | | 317,200 | 862,615 |
| Shan Xi Hua Yang Group New Energy Co. Ltd. | | 79,400 | 183,635 |
| Shandong Buchang Pharmaceuticals Co. Ltd. (A Shares) | | 34,788 | 91,366 |
| Shandong Gold Mining Co. Ltd.: | | | |
| (A Shares) | | 161,544 | 382,685 |
| (H Shares) (b) | | 281,750 | 448,667 |
| Shandong Hualu Hengsheng Chemical Co. Ltd. (A Shares) | | 72,500 | 259,904 |
| Shandong Linglong Tyre Co. Ltd. (A Shares) | | 44,700 | 100,198 |
| Shandong Nanshan Aluminum Co. Ltd. (A Shares) | | 412,800 | 174,099 |
| Shandong Sun Paper Industry JSC Ltd. (A Shares) | | 89,100 | 127,985 |
| Shandong Weigao Medical Polymer Co. Ltd. (H Shares) | | 1,300,800 | 1,793,030 |
| Shanghai Bairun Investment Holding Group Co. Ltd. (A Shares) | | 34,160 | 142,667 |
| Shanghai Baosight Software Co. Ltd. | | 109,273 | 329,240 |
| Shanghai Baosight Software Co. Ltd. (A Shares) | | 75,124 | 435,340 |
| Shanghai Construction Group Co. Ltd. (A Shares) | | 273,294 | 96,176 |
| Shanghai Electric Group Co. Ltd. (A Shares) (a) | | 441,500 | 234,567 |
| Shanghai Fosun Pharmaceutical (Group) Co. Ltd.: | | | |
| (A Shares) | | 84,700 | 383,086 |
| (H Shares) | | 227,500 | 574,427 |
| Shanghai Friendess Electronic Technology Corp. Ltd. (A Shares) | | 5,048 | 142,380 |
| Shanghai International Airport Co. Ltd. (A Shares) (a) | | 32,800 | 239,749 |
| Shanghai International Port Group Co. Ltd. (A Shares) | | 324,843 | 229,969 |
| Shanghai Jinjiang International Hotels Co. Ltd. (A Shares) | | 31,400 | 234,246 |
| Shanghai Junshi Biosciences Co. Ltd. (A Shares) (a) | | 23,008 | 223,877 |
| Shanghai Lingang Holdings Corp. Ltd. (A Shares) | | 91,200 | 143,364 |
| Shanghai M&G Stationery, Inc. (A Shares) | | 32,800 | 181,002 |
| Shanghai Medicilon, Inc. (A Shares) | | 2,613 | 79,286 |
| Shanghai Pharmaceuticals Holding Co. Ltd.: | | | |
| (A Shares) | | 170,900 | 411,401 |
| (H Shares) | | 247,409 | 335,357 |
| Shanghai Pudong Development Bank Co. Ltd. (A Shares) | | 930,709 | 846,227 |
| Shanghai Putailai New Energy Technology Co. Ltd. | | 46,124 | 315,224 |
| Shanghai RAAS Blood Products Co. Ltd. (A Shares) | | 214,200 | 159,560 |
| Shanghai Yuyuan Tourist Mart Group Co. Ltd. | | 116,900 | 100,366 |
| Shanghai Zhangjiang High Ltd. (A Shares) | | 44,000 | 67,781 |
| Shanxi Lu'an Environmental Energy Development Co. Ltd. (A Shares) | | 98,500 | 226,460 |
| Shanxi Meijin Energy Co. Ltd. (A Shares) | | 144,700 | 173,571 |
| Shanxi Securities Co. Ltd. (A Shares) | | 104,760 | 73,877 |
| Shanxi Taigang Stainless Steel Co. Ltd. (A Shares) | | 183,800 | 99,917 |
| Shanxi Xinghuacun Fen Wine Factory Co. Ltd. (A Shares) | | 39,660 | 1,261,991 |
| Shanxi Xishan Coal & Electricity Power Co. Ltd. (A Shares) | | 132,990 | 207,418 |
| Shenghe Resources Holding Co. Ltd. (A Shares) | | 53,800 | 98,422 |
| Shengyi Technology Co. Ltd. | | 74,500 | 141,494 |
| Shennan Circuits Co. Ltd. (A Shares) | | 17,240 | 177,218 |
| Shenwan Hongyuan Group Co. Ltd. (A Shares) | | 779,800 | 415,372 |
| Shenzhen Capchem Technology Co. Ltd. (A Shares) | | 24,120 | 119,462 |
| Shenzhen Dynanonic Co. Ltd. (A Shares) | | 5,700 | 201,372 |
| Shenzhen Energy Group Co. Ltd. (A Shares) | | 191,960 | 149,827 |
| Shenzhen Inovance Technology Co. Ltd. (A Shares) | | 87,200 | 796,429 |
| Shenzhen Kangtai Biological Products Co. Ltd. | | 37,720 | 160,737 |
| Shenzhen Kedali Industry Co. Ltd. | | 7,900 | 99,143 |
| Shenzhen Mindray Bio-Medical Electronics Co. Ltd. (A Shares) | | 39,500 | 1,760,243 |
| Shenzhen New Industries Biomedical Engineering Co. Ltd. | | 27,000 | 213,437 |
| Shenzhen Overseas Chinese Town Co. Ltd. (A Shares) | | 288,000 | 165,633 |
| Shenzhen Salubris Pharmaceuticals Co. Ltd. (A Shares) | | 35,900 | 152,392 |
| Shenzhen SC New Energy Technology Corp. (A Shares) | | 11,100 | 206,317 |
| Shenzhen Senior Technology Material Co. Ltd. (A Shares) | | 43,158 | 109,270 |
| Shenzhen Sunlord Electronics Co. Ltd. (A Shares) | | 24,800 | 72,673 |
| Shenzhen Transsion Holdings Co. Ltd. (A Shares) | | 22,403 | 190,595 |
| Shijiazhuang Yiling Pharmaceutical Co. Ltd. (A Shares) | | 54,860 | 228,968 |
| Sichuan Chuantou Energy Co. Ltd. (A Shares) | | 121,100 | 183,236 |
| Sichuan Hebang Biotechnology Co. Ltd. (A Shares) | | 286,600 | 113,417 |
| Sichuan Kelun Pharmaceutical Co. Ltd. (A Shares) | | 44,100 | 149,760 |
| Sichuan New Energy Power Co. Ltd. (A Shares) (a) | | 50,700 | 130,726 |
| Sichuan Road & Bridge (Group) Co. Ltd. (A Shares) | | 154,600 | 238,159 |
| Sichuan Swellfun Co. Ltd. (A Shares) | | 16,900 | 130,935 |
| Sichuan Yahua Industrial Group Co. Ltd. (A Shares) | | 37,200 | 136,261 |
| Sieyuan Electric Co. Ltd. (A Shares) | | 23,600 | 108,097 |
| Sinolink Securities Co. Ltd. (A Shares) | | 134,800 | 145,637 |
| Sinoma Science & Technology Co. Ltd. (A Shares) | | 54,100 | 132,678 |
| Sinomine Resource Group Co. Ltd. (A Shares) | | 15,680 | 193,238 |
| Sinopec Shanghai Petrochemical Co. Ltd. (A Shares) | | 311,800 | 131,075 |
| Sinopharm Group Co. Ltd. (H Shares) | | 700,200 | 1,334,453 |
| Sinotrans Ltd. | | 128,600 | 62,514 |
| SKSHU Paint Co. Ltd. (A Shares) (a) | | 12,320 | 146,600 |
| Songcheng Performance Development Co. Ltd. (A Shares) | | 94,960 | 149,795 |
| Soochow Securities Co. Ltd. (A Shares) | | 184,960 | 165,891 |
| Southwest Securities Co. Ltd. (A Shares) | | 253,700 | 128,537 |
| StarPower Semiconductor Ltd. (A Shares) | | 5,500 | 280,690 |
| Sungrow Power Supply Co. Ltd. (A Shares) | | 48,200 | 860,060 |
| Sunwoda Electronic Co. Ltd. (A Shares) | | 57,400 | 183,135 |
| Suzhou Dongshan Precision Manufacturing Co. Ltd. (A Shares) | | 55,300 | 191,353 |
| Suzhou Maxwell Technologies Co. Ltd. (A Shares) | | 5,700 | 372,694 |
| Suzhou TA&A Ultra Clean Technology Co. Ltd. (A Shares) | | 19,400 | 164,303 |
| Tangshan Jidong Cement Co. Ltd. A Shares | | 84,900 | 88,238 |
| TBEA Co. Ltd. (A Shares) | | 124,800 | 348,789 |
| TCL Technology Group Corp. (A Shares) | | 461,500 | 247,089 |
| TCL Zhonghuan Renewable Energy Technology Co. Ltd. (A Shares) | | 104,500 | 565,221 |
| Thunder Software Technology Co. Ltd. (A Shares) | | 14,000 | 189,289 |
| Tianjin 712 Communication & Broadcasting Co. Ltd. | | 24,300 | 131,068 |
| Tianma Microelectronics Co. Ltd. (A Shares) | | 75,400 | 91,270 |
| Tianqi Lithium Corp. (A Shares) (a) | | 48,200 | 630,641 |
| Tianshan Aluminum Group Co. Ltd. | | 128,400 | 109,712 |
| Tianshui Huatian Technology Co. Ltd. (A Shares) | | 103,800 | 125,363 |
| Tibet Summit Industrial Co. Ltd. (A Shares) (a) | | 28,700 | 82,332 |
| Titan Wind Energy Suzhou Co. Ltd. (A Shares) | | 55,300 | 88,899 |
| Toly Bread Co. Ltd. | | 41,748 | 64,369 |
| TongFu Microelectronics Co. Ltd. (A Shares) (a) | | 39,100 | 100,817 |
| Tongkun Group Co. Ltd. (A Shares) | | 79,300 | 131,390 |
| Tongling Nonferrous Metals Group Co. Ltd. (A Shares) | | 339,300 | 117,082 |
| Tongwei Co. Ltd. (A Shares) | | 146,400 | 872,037 |
| Topchoice Medical Corp. (a) | | 10,900 | 182,465 |
| Transfar Zhilian Co. Ltd. | | 91,200 | 61,567 |
| TravelSky Technology Ltd. (H Shares) | | 484,000 | 702,910 |
| Trina Solar Co. Ltd. (A Shares) | | 70,446 | 640,804 |
| Tsingtao Brewery Co. Ltd.: | | | |
| (A Shares) | | 12,000 | 134,412 |
| (H Shares) | | 342,000 | 2,396,285 |
| Unigroup Guoxin Microelectronics Co. Ltd. | | 27,739 | 623,348 |
| Unisplendour Corp. Ltd. (A Shares) | | 98,110 | 230,400 |
| Walvax Biotechnology Co. Ltd. (A Shares) | | 53,200 | 280,100 |
| Wanhua Chemical Group Co. Ltd. (A Shares) | | 102,800 | 1,131,196 |
| Weichai Power Co. Ltd.: | | | |
| (A Shares) | | 172,100 | 213,979 |
| (H Shares) | | 1,057,000 | 1,012,611 |
| Weihai Guangwei Composites Co. Ltd. (A Shares) | | 16,700 | 177,453 |
| Wens Foodstuffs Group Co. Ltd. (A Shares) (a) | | 210,500 | 515,953 |
| Western Mining Co. Ltd. (A Shares) | | 78,200 | 101,405 |
| Western Securities Co. Ltd. (A Shares) | | 139,500 | 114,039 |
| Western Superconducting Technologies Co. Ltd. (A Shares) | | 15,473 | 247,173 |
| Westone Information Industry, Inc. (A Shares) | | 27,600 | 137,265 |
| Will Semiconductor Ltd. | | 38,430 | 386,094 |
| Wingtech Technology Co. Ltd. (A Shares) | | 40,700 | 266,841 |
| Winning Health Technology Group Co. Ltd. (A Shares) | | 78,630 | 104,224 |
| Wuchan Zhongda Group Co. Ltd. | | 168,600 | 96,272 |
| Wuhan Guide Infrared Co. Ltd. (A Shares) | | 108,360 | 172,269 |
| Wuliangye Yibin Co. Ltd. (A Shares) | | 126,200 | 2,306,988 |
| WUS Printed Circuit Kunshan Co. Ltd. (A Shares) | | 59,860 | 89,263 |
| WuXi AppTec Co. Ltd. | | 99,884 | 1,044,946 |
| WuXi AppTec Co. Ltd. (H Shares) (b) | | 156,968 | 1,257,800 |
| Wuxi Shangji Automation Co. Ltd. (A Shares) | | 12,600 | 211,320 |
| XCMG Construction Machinery Co. Ltd. (A Shares) | | 258,500 | 163,888 |
| Xiamen C&D, Inc. (A Shares) | | 99,925 | 164,058 |
| Xiamen Faratronic Co. Ltd. (A Shares) | | 7,300 | 177,040 |
| Xiamen Intretech, Inc. | | 28,910 | 68,169 |
| Xiamen Tungsten Co. Ltd. (A Shares) | | 43,200 | 118,782 |
| Xinjiang Goldwind Science & Technology Co. Ltd.: | | | |
| (A Shares) | | 155,600 | 222,654 |
| (H Shares) | | 315,964 | 274,116 |
| Xinjiang Zhongtai Chemical Co. Ltd. (A Shares) | | 79,600 | 64,091 |
| Yangzhou Yangjie Electronic Technology Co. Ltd. (A Shares) | | 17,100 | 120,308 |
| Yankuang Energy Group Co. Ltd.: | | | |
| (A Shares) | | 115,300 | 641,003 |
| (H Shares) | | 738,000 | 2,077,774 |
| Yantai Jereh Oilfield Services (A Shares) | | 35,100 | 144,478 |
| Yealink Network Technology Corp. Ltd. | | 30,250 | 285,314 |
| Yifeng Pharmacy Chain Co. Ltd. | | 23,050 | 177,194 |
| Yihai Kerry Arawana Holdings Co. Ltd. (A Shares) | | 49,500 | 259,263 |
| Yintai Gold Co. Ltd. (A Shares) | | 89,880 | 175,750 |
| YongXing Special Materials Technology Co. Ltd. (A Shares) | | 13,300 | 212,115 |
| Yonyou Network Technology Co. Ltd. (A Shares) | | 114,220 | 382,250 |
| Youngor Group Co. Ltd. (A Shares) | | 147,687 | 120,934 |
| Youngy Co. Ltd. (A Shares) (a) | | 8,800 | 132,779 |
| YTO Express Group Co. Ltd. (A Shares) | | 111,300 | 287,436 |
| Yuan Longping High-tech Agriculture Co. Ltd. (A Shares) (a) | | 41,300 | 82,115 |
| Yunda Holding Co. Ltd. (A Shares) | | 95,960 | 173,185 |
| Yunnan Aluminium Co. Ltd. (A Shares) | | 114,600 | 143,899 |
| Yunnan Baiyao Group Co. Ltd. (A Shares) | | 60,960 | 455,432 |
| Yunnan Botanee Bio-Technology Group Co., Ltd. (A Shares) | | 9,500 | 186,022 |
| Yunnan Energy New Material Co. Ltd. | | 29,200 | 591,925 |
| Yunnan Tin Co. Ltd. (A Shares) | | 56,200 | 87,806 |
| Yunnan Yuntianhua Co. Ltd. (Series A) (a) | | 60,400 | 166,737 |
| Zangge Mining Co. Ltd. (Series A) | | 53,000 | 197,038 |
| Zhangzhou Pientzehuang Pharmaceutical Co. Ltd. (A Shares) | | 20,100 | 627,532 |
| Zhaojin Mining Industry Co. Ltd. (H Shares) (a) | | 602,500 | 497,372 |
| Zhefu Holding Group Co. Ltd. (A Shares) | | 178,300 | 95,462 |
| Zhejiang Century Huatong Group Co. Ltd. (A Shares) (a) | | 249,110 | 125,870 |
| Zhejiang China Commodities City Group Co. Ltd. (A Shares) | | 196,700 | 112,856 |
| Zhejiang Chint Electric Co. Ltd. (A Shares) | | 71,300 | 247,986 |
| Zhejiang Dahua Technology Co. Ltd. (A Shares) | | 93,000 | 147,467 |
| Zhejiang Dingli Machinery Co. Ltd. (A Shares) | | 15,740 | 96,838 |
| Zhejiang Expressway Co. Ltd. (H Shares) | | 684,000 | 424,360 |
| Zhejiang HangKe Technology, Inc. Co. (A Shares) | | 13,047 | 89,417 |
| Zhejiang Huahai Pharmaceutical Co. Ltd. (A Shares) | | 46,090 | 126,603 |
| Zhejiang Huayou Cobalt Co. Ltd. (A Shares) | | 51,815 | 386,543 |
| Zhejiang Jingsheng Mechanical & Electrical Co. Ltd. (A Shares) | | 41,900 | 408,850 |
| Zhejiang Jiuzhou Pharmaceutical Co. Ltd. (A Shares) | | 26,700 | 129,864 |
| Zhejiang Juhua Co. Ltd. (A Shares) | | 91,500 | 196,459 |
| Zhejiang NHU Co. Ltd. (A Shares) | | 102,236 | 250,869 |
| Zhejiang Orient Gene Biotech Co. Ltd. (A Shares) | | 5,663 | 64,052 |
| Zhejiang Semir Garment Co. Ltd. (A Shares) | | 81,000 | 49,690 |
| Zhejiang Supor Cookware Co. Ltd. | | 16,400 | 89,850 |
| Zhejiang Weiming Enviroment Protection Co. Ltd. (A Shares) | | 52,130 | 135,127 |
| Zhejiang Weixing New Building Materials Co. Ltd. (A Shares) | | 56,700 | 135,094 |
| Zhejiang Wolwo Bio-Pharmaceutical Co. Ltd. | | 15,000 | 96,537 |
| Zhejiang Yongtai Technology Co. Ltd. (A Shares) | | 28,400 | 84,855 |
| Zheshang Securities Co. Ltd. | | 123,600 | 172,125 |
| ZhongAn Online P & C Insurance Co. Ltd. (H Shares) (a)(b) | | 372,100 | 693,038 |
| Zhongji Innolight Co. Ltd. (A Shares) | | 25,200 | 101,036 |
| Zhongtai Securities Co. Ltd. (A Shares) | | 207,000 | 180,274 |
| Zhuzhou CRRC Times Electric Co. Ltd.: | | | |
| (A Shares) | | 25,206 | 216,686 |
| (H Shares) | | 275,827 | 1,196,475 |
| Zhuzhou Hongda Electronics Corp. Ltd. (A Shares) | | 12,800 | 77,734 |
| Zhuzhou Kibing Group Co. Ltd. (A Shares) | | 91,600 | 98,462 |
| Zibo Qixiang Tengda Chemical Co. Ltd. (A Shares) (a) | | 91,600 | 85,041 |
| Zijin Mining Group Co. Ltd.: | | | |
| (A Shares) | | 507,100 | 549,950 |
| (H Shares) | | 3,160,000 | 3,019,243 |
| Zoomlion Heavy Industry Science and Technology Co. Ltd.: | | | |
| (A Shares) | | 108,800 | 79,705 |
| (H Shares) | | 843,000 | 271,705 |
| ZTE Corp.: | | | |
| (A Shares) | | 158,600 | 481,475 |
| (H Shares) | | 334,000 | 595,695 |
TOTAL CHINA | | | 335,277,218 |
| Colombia - 0.1% | | | |
| Bancolombia SA | | 130,474 | 937,854 |
| Ecopetrol SA | | 2,612,624 | 1,296,063 |
| Interconexion Electrica SA ESP | | 234,047 | 913,204 |
TOTAL COLOMBIA | | | 3,147,121 |
| Cyprus - 0.0% | | | |
| Galaxy Cosmos Mezz PLC (a) | | 44,689 | 7,216 |
| Ozon Holdings PLC ADR (a)(c) | | 28,218 | 88,651 |
| TCS Group Holding PLC unit (a)(c) | | 64,541 | 123,242 |
TOTAL CYPRUS | | | 219,109 |
| Czech Republic - 0.1% | | | |
| CEZ A/S (d) | | 85,254 | 2,788,103 |
| Komercni Banka A/S | | 39,877 | 1,143,920 |
| MONETA Money Bank A/S (b) | | 174,151 | 508,362 |
TOTAL CZECH REPUBLIC | | | 4,440,385 |
| Egypt - 0.1% | | | |
| Commercial International Bank SAE | | 1,318,697 | 1,767,354 |
| Eastern Co. SAE | | 520,507 | 256,001 |
| EFG-Hermes Holding SAE | | 378,806 | 209,969 |
TOTAL EGYPT | | | 2,233,324 |
| Greece - 0.3% | | | |
| Alpha Bank SA (a) | | 1,206,617 | 1,118,508 |
| Eurobank Ergasias Services and Holdings SA (a) | | 1,385,986 | 1,369,701 |
| Ff Group (a)(c) | | 1,944 | 2,305 |
| Hellenic Telecommunications Organization SA | | 106,082 | 1,666,885 |
| Jumbo SA | | 60,872 | 865,656 |
| Mytilineos SA | | 52,963 | 888,745 |
| National Bank of Greece SA (a) | | 295,820 | 1,072,903 |
| OPAP SA | | 103,023 | 1,262,475 |
| Public Power Corp. of Greece (a) | | 113,896 | 719,244 |
TOTAL GREECE | | | 8,966,422 |
| Hong Kong - 1.1% | | | |
| Beijing Enterprises Holdings Ltd. | | 266,927 | 677,379 |
| BYD Electronic International Co. Ltd. | | 355,500 | 1,032,581 |
| China Everbright International Ltd. | | 1,941,814 | 645,651 |
| China Jinmao Holdings Group Ltd. | | 3,042,000 | 403,035 |
| China Merchants Holdings International Co. Ltd. | | 693,036 | 812,257 |
| China Overseas Land and Investment Ltd. | | 2,026,702 | 3,867,688 |
| China Power International Development Ltd. | | 2,844,619 | 822,621 |
| China Resources Beer Holdings Co. Ltd. | | 852,144 | 4,016,654 |
| China Resources Power Holdings Co. Ltd. | | 1,008,940 | 1,467,848 |
| China Taiping Insurance Group Ltd. | | 696,255 | 482,522 |
| China Traditional Chinese Medicine Holdings Co. Ltd. | | 1,452,000 | 627,070 |
| CITIC Pacific Ltd. | | 3,057,941 | 2,738,635 |
| CSPC Pharmaceutical Group Ltd. | | 4,707,608 | 4,835,476 |
| Far East Horizon Ltd. | | 760,000 | 586,727 |
| Fosun International Ltd. | | 1,311,454 | 801,944 |
| Ganfeng Lithium Group Co. Ltd. (H Shares) (b) | | 173,120 | 1,171,093 |
| Guangdong Investment Ltd. | | 1,533,126 | 966,791 |
| Hua Hong Semiconductor Ltd. (a)(b) | | 305,000 | 714,159 |
| Lenovo Group Ltd. | | 3,787,000 | 3,029,735 |
| MMG Ltd. (a) | | 1,620,000 | 319,887 |
| Sinotruk Hong Kong Ltd. | | 357,500 | 318,804 |
| Wharf Holdings Ltd. | | 652,000 | 1,864,720 |
| Yuexiu Property Co. Ltd. | | 724,600 | 618,476 |
TOTAL HONG KONG | | | 32,821,753 |
| Hungary - 0.2% | | | |
| MOL Hungarian Oil and Gas PLC Series A (For. Reg.) | | 218,831 | 1,312,138 |
| OTP Bank PLC | | 119,097 | 2,596,017 |
| Richter Gedeon PLC | | 74,338 | 1,467,855 |
TOTAL HUNGARY | | | 5,376,010 |
| India - 16.1% | | | |
| ACC Ltd. | | 38,806 | 1,120,536 |
| Adani Enterprises Ltd. | | 150,805 | 6,098,239 |
| Adani Green Energy Ltd. (a) | | 167,460 | 4,254,067 |
| Adani Ports & Special Economic Zone Ltd. | | 280,940 | 2,794,976 |
| Adani Power Ltd. (a) | | 407,769 | 1,649,696 |
| Adani Total Gas Ltd. | | 145,553 | 6,334,931 |
| Adani Transmissions Ltd. (a) | | 147,623 | 5,971,794 |
| Ambuja Cements Ltd. | | 311,442 | 2,005,110 |
| Apollo Hospitals Enterprise Ltd. | | 53,258 | 2,906,415 |
| Asian Paints Ltd. | | 202,572 | 7,604,893 |
| AU Small Finance Bank Ltd. (b) | | 87,964 | 626,470 |
| Aurobindo Pharma Ltd. | | 139,824 | 908,991 |
| Avenue Supermarts Ltd. (a)(b) | | 85,328 | 4,453,899 |
| Axis Bank Ltd. | | 1,201,974 | 13,155,212 |
| Bajaj Auto Ltd. | | 36,988 | 1,640,667 |
| Bajaj Finance Ltd. | | 144,069 | 12,433,478 |
| Bajaj Finserv Ltd. | | 202,011 | 4,118,067 |
| Balkrishna Industries Ltd. | | 41,333 | 980,024 |
| Bandhan Bank Ltd. (a)(b) | | 340,764 | 981,991 |
| Berger Paints India Ltd. | | 127,462 | 901,996 |
| Bharat Electronics Ltd. | | 1,924,728 | 2,484,383 |
| Bharat Forge Ltd. | | 137,096 | 1,381,559 |
| Bharat Petroleum Corp. Ltd. | | 461,178 | 1,691,673 |
| Bharti Airtel Ltd. | | 1,159,729 | 11,656,131 |
| Biocon Ltd. | | 219,132 | 714,336 |
| Britannia Industries Ltd. | | 57,328 | 2,608,466 |
| Cholamandalam Investment and Finance Co. Ltd. | | 218,726 | 1,874,285 |
| Cipla Ltd./India | | 255,386 | 3,601,566 |
| Coal India Ltd. | | 815,243 | 2,422,192 |
| Colgate-Palmolive Ltd. | | 63,638 | 1,254,425 |
| Container Corp. of India Ltd. | | 143,617 | 1,384,469 |
| Dabur India Ltd. | | 324,937 | 2,177,368 |
| Divi's Laboratories Ltd. | | 69,795 | 3,042,802 |
| DLF Ltd. | | 334,640 | 1,558,392 |
| Dr. Reddy's Laboratories Ltd. | | 61,593 | 3,315,250 |
| Eicher Motors Ltd. | | 72,375 | 3,366,469 |
| GAIL India Ltd. | | 1,250,488 | 1,379,192 |
| Godrej Consumer Products Ltd. (a) | | 215,657 | 2,160,478 |
| Godrej Properties Ltd. (a) | | 67,569 | 1,030,921 |
| Grasim Industries Ltd. | | 138,567 | 2,881,986 |
| Havells India Ltd. | | 130,414 | 1,916,194 |
| HCL Technologies Ltd. | | 574,026 | 7,219,705 |
| HDFC Standard Life Insurance Co. Ltd. (b) | | 502,629 | 3,281,540 |
| Hero Motocorp Ltd. | | 58,379 | 1,887,797 |
| Hindalco Industries Ltd. | | 712,678 | 3,492,363 |
| Hindustan Petroleum Corp. Ltd. | | 339,995 | 878,327 |
| Hindustan Unilever Ltd. | | 434,170 | 13,378,079 |
| Housing Development Finance Corp. Ltd. | | 911,466 | 27,194,234 |
| ICICI Bank Ltd. | | 2,720,638 | 29,913,465 |
| ICICI Lombard General Insurance Co. Ltd. (b) | | 127,188 | 1,797,579 |
| ICICI Prudential Life Insurance Co. Ltd. (b) | | 190,458 | 1,167,757 |
| Indian Oil Corp. Ltd. | | 1,511,922 | 1,246,541 |
| Indian Railway Catering & Tourism Corp. Ltd. | | 126,383 | 1,131,615 |
| Indraprastha Gas Ltd. | | 167,378 | 865,905 |
| Indus Towers Ltd. | | 354,987 | 795,483 |
| Info Edge India Ltd. | | 37,622 | 1,782,341 |
| Infosys Ltd. | | 1,779,672 | 33,057,655 |
| InterGlobe Aviation Ltd. (a)(b) | | 52,154 | 1,122,527 |
| ITC Ltd. | | 1,574,037 | 6,630,426 |
| Jindal Steel & Power Ltd. | | 215,582 | 1,197,577 |
| JSW Steel Ltd. (a) | | 382,723 | 3,115,924 |
| Jubilant Foodworks Ltd. | | 208,972 | 1,539,774 |
| Kotak Mahindra Bank Ltd. | | 294,220 | 6,759,987 |
| Larsen & Toubro Infotech Ltd. (b) | | 27,845 | 1,594,360 |
| Larsen & Toubro Ltd. | | 364,918 | 8,918,405 |
| Lupin Ltd. | | 108,010 | 912,044 |
| Mahindra & Mahindra Ltd. | | 461,750 | 7,522,542 |
| Marico Ltd. | | 272,300 | 1,725,477 |
| Maruti Suzuki India Ltd. | | 63,996 | 7,365,647 |
| MindTree Consulting Ltd. | | 30,507 | 1,254,388 |
| Mphasis BFL Ltd. | | 44,905 | 1,073,261 |
| MRF Ltd. | | 1,015 | 1,112,932 |
| Muthoot Finance Ltd. | | 64,238 | 809,726 |
| Nestle India Ltd. | | 17,811 | 4,381,403 |
| NTPC Ltd. | | 2,045,078 | 4,276,432 |
| Oil & Natural Gas Corp. Ltd. | | 1,334,154 | 2,160,466 |
| Page Industries Ltd. | | 3,238 | 1,946,737 |
| Petronet LNG Ltd. | | 398,451 | 989,389 |
| PI Industries Ltd. | | 39,889 | 1,562,191 |
| Pidilite Industries Ltd. | | 80,224 | 2,504,601 |
| Piramal Pharma Ltd. (a) | | 255,972 | 509,903 |
| Power Grid Corp. of India Ltd. | | 1,663,845 | 4,585,724 |
| Reliance Industries Ltd. | | 1,609,624 | 49,575,953 |
| Samvardhana Motherson International Ltd. | | 1,100,049 | 857,129 |
| SBI Cards & Payment Services Ltd. | | 125,454 | 1,252,797 |
| SBI Life Insurance Co. Ltd. (b) | | 238,279 | 3,643,988 |
| Shree Cement Ltd. | | 5,676 | 1,559,254 |
| Shriram Transport Finance Co. Ltd. | | 101,042 | 1,500,311 |
| Siemens Ltd. | | 37,396 | 1,321,645 |
| SRF Ltd. | | 78,164 | 2,415,974 |
| State Bank of India | | 945,400 | 6,553,159 |
| Sun Pharmaceutical Industries Ltd. | | 507,076 | 6,229,108 |
| Tata Consultancy Services Ltd. | | 483,725 | 18,659,175 |
| Tata Consumer Products Ltd. | | 291,960 | 2,716,272 |
| Tata Elxsi Ltd. | | 18,141 | 1,533,121 |
| Tata Motors Ltd. (a) | | 884,011 | 4,425,972 |
| Tata Power Co. Ltd./The | | 762,705 | 2,082,282 |
| Tata Steel Ltd. | | 3,879,317 | 4,758,935 |
| Tech Mahindra Ltd. | | 308,601 | 3,964,319 |
| Titan Co. Ltd. | | 188,160 | 6,276,925 |
| Torrent Pharmaceuticals Ltd. | | 53,891 | 1,074,174 |
| Trent Ltd. | | 95,684 | 1,766,074 |
| Ultratech Cement Ltd. | | 53,254 | 4,319,859 |
| United Spirits Ltd. (a) | | 151,978 | 1,645,633 |
| UPL Ltd. | | 257,900 | 2,274,928 |
| Vedanta Ltd. | | 393,226 | 1,333,871 |
| Wipro Ltd. | | 723,677 | 3,386,309 |
| Yes Bank Ltd. (a) | | 5,969,348 | 1,121,326 |
| Zomato Ltd. (a) | | 1,251,176 | 953,723 |
TOTAL INDIA | | | 476,708,434 |
| Indonesia - 2.3% | | | |
| PT Adaro Energy Tbk | | 7,583,800 | 1,935,151 |
| PT Adaro Minerals Indonesia Tbk | | 4,297,400 | 476,647 |
| PT Aneka Tambang Tbk | | 4,394,800 | 519,853 |
| PT Astra International Tbk | | 10,713,759 | 4,567,815 |
| PT Bank Central Asia Tbk | | 29,300,050 | 16,530,883 |
| PT Bank Jago Tbk (a) | | 2,200,300 | 719,444 |
| PT Bank Mandiri (Persero) Tbk | | 9,856,798 | 6,667,044 |
| PT Bank Negara Indonesia (Persero) Tbk | | 3,930,300 | 2,368,637 |
| PT Bank Rakyat Indonesia (Persero) Tbk | | 36,031,527 | 10,741,888 |
| PT Barito Pacific Tbk | | 14,878,900 | 786,991 |
| PT Charoen Pokphand Indonesia Tbk | | 3,899,400 | 1,393,759 |
| PT Gudang Garam Tbk | | 261,100 | 403,431 |
| PT Indah Kiat Pulp & Paper Tbk | | 1,459,500 | 898,298 |
| PT Indofood CBP Sukses Makmur Tbk | | 1,236,400 | 770,892 |
| PT Indofood Sukses Makmur Tbk | | 2,336,900 | 966,373 |
| PT Kalbe Farma Tbk | | 11,035,300 | 1,450,384 |
| PT Merdeka Copper Gold Tbk (a) | | 6,366,886 | 1,538,911 |
| PT Sarana Menara Nusantara Tbk | | 12,123,600 | 897,757 |
| PT Semen Indonesia (Persero) Tbk | | 1,540,148 | 785,009 |
| PT Sumber Alfaria Trijaya Tbk | | 8,663,600 | 1,566,363 |
| PT Telkom Indonesia Persero Tbk | | 26,123,165 | 7,336,715 |
| PT Tower Bersama Infrastructure Tbk | | 2,361,310 | 372,420 |
| PT Unilever Indonesia Tbk | | 4,030,995 | 1,199,155 |
| PT United Tractors Tbk | | 884,300 | 1,831,248 |
| PT Vale Indonesia Tbk (a) | | 1,297,600 | 540,753 |
TOTAL INDONESIA | | | 67,265,821 |
| Korea (South) - 11.2% | | | |
| Alteogen, Inc. | | 17,425 | 448,041 |
| AMOREPACIFIC Corp. | | 15,379 | 998,818 |
| AMOREPACIFIC Group, Inc. | | 15,247 | 263,852 |
| BGF Retail Co. Ltd. | | 3,959 | 517,301 |
| Celltrion Healthcare Co. Ltd. | | 45,828 | 2,231,487 |
| Celltrion Pharm, Inc. | | 8,978 | 426,469 |
| Celltrion, Inc. | | 52,022 | 6,997,887 |
| Cheil Worldwide, Inc. | | 36,349 | 622,659 |
| CJ CheilJedang Corp. | | 4,370 | 1,267,536 |
| CJ Corp. | | 7,831 | 393,931 |
| CJ ENM Co. Ltd. | | 5,869 | 301,814 |
| CJ Logistics Corp. (a) | | 4,812 | 296,342 |
| Coway Co. Ltd. | | 29,255 | 1,133,454 |
| Db Insurance Co. Ltd. | | 24,380 | 961,658 |
| Doosan Bobcat, Inc. | | 26,787 | 628,706 |
| Doosan Heavy Industries & Construction Co. Ltd. (a) | | 215,857 | 2,003,829 |
| E-Mart, Inc. | | 11,095 | 657,622 |
| Ecopro BM Co. Ltd. | | 25,439 | 2,051,417 |
| F&F Co. Ltd. | | 9,091 | 926,730 |
| Green Cross Corp. | | 3,078 | 274,952 |
| GS Engineering & Construction Corp. | | 34,473 | 524,104 |
| GS Holdings Corp. | | 25,146 | 810,411 |
| Hana Financial Group, Inc. | | 156,965 | 4,536,338 |
| Hankook Tire Co. Ltd. | | 39,690 | 1,016,359 |
| Hanmi Pharm Co. Ltd. | | 3,606 | 639,183 |
| Hanon Systems | | 100,544 | 549,452 |
| Hanwha Solutions Corp. (a) | | 60,506 | 2,000,871 |
| HD Hyundai Co. Ltd. | | 25,304 | 1,079,655 |
| HLB, Inc. (a) | | 50,704 | 1,438,719 |
| HLB, Inc. rights 12/2/22 (a) | | 4,540 | 31,172 |
| HMM Co. Ltd. | | 141,777 | 1,897,220 |
| Hotel Shilla Co. | | 16,062 | 731,462 |
| HYBE Co. Ltd. (a) | | 9,892 | 838,587 |
| Hyundai Engineering & Construction Co. Ltd. | | 41,186 | 1,007,056 |
| Hyundai Glovis Co. Ltd. | | 9,814 | 1,196,393 |
| Hyundai Heavy Industries Co. Ltd. (a) | | 9,400 | 717,849 |
| Hyundai Mobis | | 32,602 | 5,002,269 |
| Hyundai Motor Co. | | 75,400 | 8,689,922 |
| Hyundai Steel Co. | | 46,581 | 917,052 |
| Iljin Materials Co. Ltd. | | 12,203 | 518,105 |
| Industrial Bank of Korea | | 140,603 | 1,029,413 |
| Kakao Corp. | | 164,386 | 5,839,174 |
| Kakao Games Corp. (a) | | 18,825 | 521,627 |
| KakaoBank Corp. (a) | | 63,092 | 755,873 |
| Kangwon Land, Inc. (a) | | 50,199 | 808,913 |
| KB Financial Group, Inc. | | 207,698 | 6,974,792 |
| Kia Corp. | | 139,551 | 6,482,240 |
| Korea Aerospace Industries Ltd. | | 38,383 | 1,273,320 |
| Korea Electric Power Corp. (a) | | 136,889 | 1,602,001 |
| Korea Investment Holdings Co. Ltd. | | 22,485 | 780,576 |
| Korea Shipbuilding & Offshore Engineering Co. Ltd. (a) | | 22,593 | 1,150,766 |
| Korea Zinc Co. Ltd. | | 4,592 | 2,059,020 |
| Korean Air Lines Co. Ltd. (a) | | 93,521 | 1,513,560 |
| KRAFTON, Inc. (a) | | 12,991 | 1,615,547 |
| KT&G Corp. | | 58,248 | 3,905,455 |
| Kumho Petro Chemical Co. Ltd. | | 9,612 | 882,193 |
| L&F Co. Ltd. (a) | | 12,338 | 1,944,939 |
| LG Chemical Ltd. | | 26,189 | 11,486,082 |
| LG Corp. | | 49,742 | 2,760,114 |
| LG Display Co. Ltd. | | 125,471 | 1,117,489 |
| LG Electronics, Inc. | | 56,438 | 3,226,565 |
| LG Energy Solution (a) | | 12,309 | 4,553,395 |
| LG H & H Co. Ltd. | | 5,030 | 1,797,284 |
| LG Innotek Co. Ltd. | | 7,482 | 1,554,251 |
| LG Uplus Corp. | | 111,833 | 897,127 |
| Lotte Chemical Corp. | | 9,123 | 945,971 |
| Lotte Shopping Co. Ltd. | | 6,146 | 376,342 |
| Meritz Financial Holdings Co. | | 17,809 | 270,756 |
| Meritz Fire & Marine Insurance Co. Ltd. | | 19,334 | 426,011 |
| Meritz Securities Co. Ltd. | | 142,812 | 370,207 |
| Mirae Asset Securities Co. Ltd. | | 149,039 | 663,059 |
| NAVER Corp. | | 69,420 | 8,243,905 |
| NCSOFT Corp. | | 8,729 | 2,385,106 |
| Netmarble Corp. (b) | | 11,610 | 362,782 |
| NH Investment & Securities Co. Ltd. | | 78,883 | 495,741 |
| Orion Corp./Republic of Korea | | 12,435 | 884,281 |
| Pan Ocean Co., Ltd. (Korea) | | 139,028 | 418,841 |
| Pearl Abyss Corp. (a) | | 15,393 | 448,637 |
| POSCO | | 41,573 | 7,231,222 |
| POSCO Chemtech Co. Ltd. | | 14,269 | 1,994,413 |
| S-Oil Corp. | | 23,898 | 1,446,618 |
| S1 Corp. | | 8,617 | 376,721 |
| Samsung Biologics Co. Ltd. (a)(b) | | 9,373 | 5,759,130 |
| Samsung C&T Corp. | | 44,376 | 3,684,217 |
| Samsung Electro-Mechanics Co. Ltd. | | 29,582 | 2,507,792 |
| Samsung Electronics Co. Ltd. | | 2,525,151 | 105,087,836 |
| Samsung Engineering Co. Ltd. (a) | | 82,215 | 1,373,783 |
| Samsung Fire & Marine Insurance Co. Ltd. | | 16,273 | 2,280,217 |
| Samsung Heavy Industries Co. Ltd. (a) | | 325,169 | 1,173,262 |
| Samsung Life Insurance Co. Ltd. | | 42,400 | 2,002,186 |
| Samsung SDI Co. Ltd. | | 29,080 | 15,015,526 |
| Samsung SDS Co. Ltd. | | 18,313 | 1,603,792 |
| Samsung Securities Co. Ltd. | | 33,602 | 747,459 |
| SD Biosensor, Inc. | | 19,055 | 394,498 |
| Seegene, Inc. | | 19,170 | 385,463 |
| Shinhan Financial Group Co. Ltd. | | 244,542 | 6,202,917 |
| SK Biopharmaceuticals Co. Ltd. (a) | | 16,550 | 673,679 |
| SK Bioscience Co. Ltd. (a) | | 12,130 | 642,482 |
| SK Chemicals Co. Ltd. | | 5,481 | 339,462 |
| SK Hynix, Inc. | | 288,569 | 16,719,906 |
| SK IE Technology Co. Ltd. (a)(b) | | 13,178 | 480,100 |
| SK Innovation Co., Ltd. | | 29,375 | 3,560,431 |
| SK Square Co. Ltd. (a) | | 52,224 | 1,351,958 |
| SK, Inc. | | 19,690 | 2,952,148 |
| SKC Co. Ltd. | | 10,999 | 797,576 |
| Woori Financial Group, Inc. | | 290,773 | 2,393,705 |
| Yuhan Corp. | | 26,560 | 1,112,776 |
TOTAL KOREA (SOUTH) | | | 330,661,314 |
| Kuwait - 1.0% | | | |
| Agility Public Warehousing Co. KSC | | 781,881 | 1,978,360 |
| Boubyan Bank KSC | | 694,971 | 1,848,172 |
| Gulf Bank | | 853,646 | 944,975 |
| Kuwait Finance House KSCP | | 3,905,139 | 10,208,690 |
| Mabanee Co. SAKC | | 332,421 | 935,521 |
| Mobile Telecommunication Co. | | 1,138,823 | 2,201,565 |
| National Bank of Kuwait | | 3,797,456 | 13,211,740 |
TOTAL KUWAIT | | | 31,329,023 |
| Luxembourg - 0.1% | | | |
| Allegro.eu SA (a)(b) | | 195,802 | 951,511 |
| Reinet Investments SCA | | 72,069 | 1,157,969 |
TOTAL LUXEMBOURG | | | 2,109,480 |
| Malaysia - 1.6% | | | |
| AMMB Holdings Bhd | | 965,300 | 835,042 |
| Axiata Group Bhd | | 1,454,498 | 876,760 |
| CIMB Group Holdings Bhd | | 3,679,731 | 4,296,133 |
| Dialog Group Bhd | | 1,948,165 | 848,820 |
| DiGi.com Bhd | | 1,637,300 | 1,312,472 |
| Genting Bhd | | 1,138,000 | 1,068,680 |
| Genting Malaysia Bhd | | 1,581,340 | 916,428 |
| Hap Seng Consolidated Bhd | | 332,700 | 452,466 |
| Hartalega Holdings Bhd | | 905,100 | 413,497 |
| Hong Leong Bank Bhd | | 339,600 | 1,519,868 |
| Hong Leong Credit Bhd | | 121,900 | 491,931 |
| IHH Healthcare Bhd | | 934,987 | 1,176,644 |
| Inari Amertron Bhd | | 1,451,800 | 764,590 |
| IOI Corp. Bhd | | 1,332,600 | 1,149,959 |
| Kuala Lumpur Kepong Bhd | | 231,128 | 1,059,826 |
| Malayan Banking Bhd | | 2,545,397 | 4,624,569 |
| Malaysia Airports Holdings Bhd (a) | | 364,200 | 460,642 |
| Maxis Bhd | | 1,231,900 | 1,003,133 |
| MISC Bhd | | 698,000 | 1,067,373 |
| MR DIY Group M Sdn Bhd (b) | | 1,226,950 | 524,205 |
| Nestle (Malaysia) Bhd | | 36,900 | 1,038,008 |
| Petronas Chemicals Group Bhd | | 1,259,800 | 2,323,489 |
| Petronas Dagangan Bhd | | 157,026 | 720,035 |
| Petronas Gas Bhd | | 422,100 | 1,526,631 |
| PPB Group Bhd | | 338,540 | 1,195,774 |
| Press Metal Bhd | | 1,962,800 | 1,805,876 |
| Public Bank Bhd | | 7,692,285 | 7,272,528 |
| QL Resources Bhd | | 574,700 | 622,349 |
| RHB Bank Bhd | | 763,343 | 923,503 |
| Sime Darby Bhd | | 1,431,749 | 681,353 |
| Sime Darby Plantation Bhd | | 1,101,496 | 1,025,081 |
| Telekom Malaysia Bhd | | 597,747 | 702,934 |
| Tenaga Nasional Bhd | | 1,368,072 | 2,436,372 |
| Top Glove Corp. Bhd | | 2,801,300 | 471,031 |
TOTAL MALAYSIA | | | 47,608,002 |
| Mexico - 2.6% | | | |
| Alfa SA de CV Series A | | 1,537,000 | 1,020,116 |
| America Movil S.A.B. de CV Series L | | 14,743,047 | 13,952,058 |
| Arca Continental S.A.B. de CV | | 227,400 | 1,862,653 |
| CEMEX S.A.B. de CV unit (a) | | 7,996,286 | 3,107,626 |
| Coca-Cola FEMSA S.A.B. de CV unit | | 276,814 | 1,743,762 |
| Fibra Uno Administracion SA de CV | | 1,610,783 | 1,879,640 |
| Fomento Economico Mexicano S.A.B. de CV unit | | 1,025,791 | 7,363,764 |
| Gruma S.A.B. de CV Series B | | 108,545 | 1,259,118 |
| Grupo Aeroportuario del Pacifico S.A.B. de CV Series B | | 191,827 | 2,971,368 |
| Grupo Aeroportuario del Sureste S.A.B. de CV Series B | | 102,510 | 2,399,126 |
| Grupo Bimbo S.A.B. de CV Series A | | 705,370 | 2,730,981 |
| Grupo Carso SA de CV Series A1 | | 234,400 | 944,556 |
| Grupo Financiero Banorte S.A.B. de CV Series O | | 1,371,381 | 11,147,273 |
| Grupo Financiero Inbursa S.A.B. de CV Series O (a) | | 1,138,600 | 2,101,580 |
| Grupo Mexico SA de CV Series B | | 1,645,454 | 5,965,425 |
| Grupo Televisa SA de CV | | 1,286,693 | 1,365,078 |
| Industrias Penoles SA de CV (d) | | 73,320 | 831,747 |
| Kimberly-Clark de Mexico SA de CV Series A | | 808,727 | 1,275,971 |
| Operadora de Sites Mexicanos, SA de CV | | 686,500 | 747,032 |
| Orbia Advance Corp. S.A.B. de CV | | 531,220 | 896,851 |
| Promotora y Operadora de Infraestructura S.A.B. de CV | | 121,100 | 910,955 |
| Sitios Latinoamerica S.A.B. de CV (a) | | 737,237 | 215,072 |
| Wal-Mart de Mexico SA de CV Series V | | 2,760,256 | 10,661,807 |
TOTAL MEXICO | | | 77,353,559 |
| Netherlands - 0.1% | | | |
| NEPI Rockcastle PLC | | 237,384 | 1,195,401 |
| X5 Retail Group NV GDR (c) | | 66,442 | 23,506 |
| Yandex NV Class A (a)(c) | | 158,365 | 886,640 |
TOTAL NETHERLANDS | | | 2,105,547 |
| Peru - 0.0% | | | |
| Compania de Minas Buenaventura SAA sponsored ADR (d) | | 113,500 | 787,690 |
| Philippines - 0.8% | | | |
| Aboitiz Equity Ventures, Inc. | | 893,620 | 875,628 |
| ACEN Corp. | | 4,047,618 | 438,790 |
| Ayala Corp. | | 131,166 | 1,517,573 |
| Ayala Land, Inc. | | 3,952,413 | 1,748,759 |
| Bank of the Philippine Islands (BPI) | | 947,778 | 1,571,470 |
| BDO Unibank, Inc. | | 1,042,651 | 2,297,723 |
| Converge ICT Solutions, Inc. (a) | | 1,135,700 | 242,510 |
| Globe Telecom, Inc. | | 15,262 | 613,442 |
| GT Capital Holdings, Inc. | | 46,417 | 330,883 |
| International Container Terminal Services, Inc. | | 541,070 | 1,617,066 |
| JG Summit Holdings, Inc. | | 1,596,413 | 1,191,435 |
| Jollibee Food Corp. | | 232,393 | 929,397 |
| Manila Electric Co. | | 118,340 | 615,155 |
| Metro Pacific Investments Corp. | | 5,588,200 | 352,504 |
| Metropolitan Bank & Trust Co. | | 948,612 | 849,082 |
| Monde Nissin Corp. (b) | | 3,321,000 | 671,209 |
| PLDT, Inc. | | 45,395 | 1,276,282 |
| SM Investments Corp. | | 127,210 | 1,807,585 |
| SM Prime Holdings, Inc. | | 6,133,900 | 3,339,779 |
| Universal Robina Corp. | | 460,318 | 970,912 |
TOTAL PHILIPPINES | | | 23,257,184 |
| Poland - 0.6% | | | |
| Bank Polska Kasa Opieki SA | | 96,360 | 1,583,226 |
| CD Projekt RED SA (d) | | 34,248 | 911,778 |
| Cyfrowy Polsat SA | | 138,161 | 518,021 |
| Dino Polska SA (a)(b) | | 25,632 | 1,676,192 |
| KGHM Polska Miedz SA (Bearer) | | 73,742 | 1,477,589 |
| LPP SA | | 586 | 1,017,561 |
| mBank SA (a) | | 7,850 | 440,012 |
| Orange Polska SA | | 337,136 | 425,966 |
| PGE Polska Grupa Energetyczna SA (a) | | 477,634 | 545,256 |
| Polski Koncern Naftowy Orlen SA | | 215,613 | 2,480,356 |
| Polskie Gornictwo Naftowe i Gazownictwo SA (a) | | 917,349 | 976,147 |
| Powszechna Kasa Oszczednosci Bank SA | | 460,715 | 2,515,833 |
| Powszechny Zaklad Ubezpieczen SA | | 317,188 | 1,780,574 |
| Santander Bank Polska SA | | 18,670 | 994,096 |
TOTAL POLAND | | | 17,342,607 |
| Qatar - 1.3% | | | |
| Barwa Real Estate Co. (a) | | 1,026,288 | 958,160 |
| Industries Qatar QSC (a) | | 793,191 | 3,434,783 |
| Masraf al Rayan | | 2,939,055 | 3,096,630 |
| Mesaieed Petrochemical Holding Co. (a) | | 2,277,586 | 1,419,680 |
| Ooredoo QSC | | 411,354 | 1,103,571 |
| Qatar Electricity & Water Co. (a) | | 233,799 | 1,187,693 |
| Qatar Fuel Co. (a) | | 252,437 | 1,322,578 |
| Qatar Gas Transport Co. Ltd. (Nakilat) (a) | | 1,307,447 | 1,471,966 |
| Qatar International Islamic Bank QSC (a) | | 386,614 | 1,228,290 |
| Qatar Islamic Bank (a) | | 872,121 | 5,840,882 |
| Qatar National Bank SAQ (a) | | 2,437,873 | 13,348,304 |
| The Commercial Bank of Qatar (a) | | 1,703,913 | 2,944,856 |
TOTAL QATAR | | | 37,357,393 |
| Russia - 0.1% | | | |
| Alrosa Co. Ltd. (c) | | 1,399,461 | 349,132 |
| Gazprom OAO (c) | | 6,384,126 | 1,001,770 |
| Inter Rao Ues JSC (c) | | 20,040,158 | 165,683 |
| LUKOIL PJSC (c) | | 224,329 | 104,123 |
| Magnit OJSC GDR (Reg. S) (c) | | 193,190 | 941 |
| MMC Norilsk Nickel PJSC (c) | | 34,221 | 341,288 |
| Mobile TeleSystems OJSC sponsored ADR (c) | | 247,296 | 246,304 |
| Moscow Exchange MICEX-RTS OAO (a)(c) | | 808,717 | 233,122 |
| Novatek PJSC GDR (Reg. S) (c) | | 49,200 | 12,569 |
| Novolipetsk Steel OJSC (c) | | 812,466 | 11,697 |
| PhosAgro PJSC: | | | |
| GDR (c) | | 472 | 10 |
| GDR (Reg. S) (c) | | 73,324 | 1,504 |
| Polyus PJSC (c) | | 18,462 | 65,105 |
| Rosneft Oil Co. OJSC (c) | | 635,841 | 159,461 |
| Sberbank of Russia (a)(c) | | 5,823,145 | 53,689 |
| Severstal PAO (c) | | 113,908 | 3,814 |
| Surgutneftegas OJSC (c) | | 4,033,562 | 74,014 |
| Tatneft PAO (c) | | 770,244 | 143,662 |
| United Co. RUSAL International PJSC (c) | | 1,646,280 | 297,524 |
| VTB Bank OJSC (a)(c) | | 1,801,039,946 | 103,186 |
TOTAL RUSSIA | | | 3,368,598 |
| Saudi Arabia - 5.1% | | | |
| ACWA Power Co. | | 42,371 | 1,962,064 |
| Advanced Polypropylene Co. | | 67,166 | 791,860 |
| Al Rajhi Bank | | 1,036,315 | 23,497,768 |
| Alinma Bank | | 517,982 | 5,169,412 |
| Almarai Co. Ltd. | | 132,572 | 1,986,348 |
| Arab National Bank | | 317,306 | 2,723,349 |
| Bank Al-Jazira | | 212,393 | 1,321,539 |
| Bank Albilad | | 259,070 | 3,495,589 |
| Banque Saudi Fransi | | 313,038 | 3,598,952 |
| Bupa Arabia for Cooperative Insurance Co. | | 31,699 | 1,628,164 |
| Dar Al Arkan Real Estate Development Co. (a) | | 280,078 | 1,000,292 |
| Dr Sulaiman Al Habib Medical Services Group Co. | | 46,202 | 2,786,223 |
| Elm Co. | | 12,677 | 1,116,708 |
| Emaar The Economic City (a) | | 216,839 | 553,415 |
| Etihad Etisalat Co. | | 199,046 | 1,938,786 |
| Jarir Marketing Co. | | 30,923 | 1,349,649 |
| Mobile Telecommunications Co. Saudi Arabia (a) | | 229,603 | 793,136 |
| Mouwasat Medical Services Co. | | 26,001 | 1,515,407 |
| National Industrialization Co. (a) | | 174,285 | 620,599 |
| Rabigh Refining & Petrochemical Co. (a) | | 221,996 | 805,851 |
| Riyad Bank | | 714,127 | 6,832,342 |
| Sabic Agriculture-Nutrients Co. | | 113,178 | 4,789,105 |
| Sahara International Petrochemical Co. | | 190,226 | 2,052,844 |
| Saudi Arabian Mining Co. | | 455,570 | 10,147,891 |
| Saudi Arabian Oil Co. (b) | | 1,280,613 | 11,894,291 |
| Saudi Basic Industries Corp. | | 475,937 | 11,196,879 |
| Saudi Electricity Co. | | 443,295 | 3,185,311 |
| Saudi Industrial Investment Group | | 195,072 | 1,167,042 |
| Saudi Investment Bank/The | | 260,497 | 1,257,579 |
| Saudi Kayan Petrochemical Co. (a) | | 389,808 | 1,365,218 |
| Saudi Research & Marketing Group (a) | | 19,170 | 1,027,488 |
| Saudi Tadawul Group Holding Co. | | 19,022 | 1,099,541 |
| Saudi Telecom Co. | | 791,758 | 8,512,734 |
| The Saudi British Bank | | 489,000 | 5,661,003 |
| The Saudi National Bank | | 1,160,412 | 18,343,994 |
| The Savola Group | | 139,723 | 1,089,509 |
| Yanbu National Petrochemical Co. | | 133,459 | 1,587,635 |
TOTAL SAUDI ARABIA | | | 149,865,517 |
| Singapore - 0.0% | | | |
| BOC Aviation Ltd. Class A (b) | | 111,700 | 747,783 |
| South Africa - 3.5% | | | |
| Absa Group Ltd. | | 449,087 | 4,883,328 |
| African Rainbow Minerals Ltd. | | 58,977 | 830,486 |
| Anglo American Platinum Ltd. | | 28,002 | 2,227,385 |
| AngloGold Ashanti Ltd. | | 220,849 | 2,884,225 |
| Aspen Pharmacare Holdings Ltd. | | 202,484 | 1,667,382 |
| Bid Corp. Ltd. | | 176,428 | 2,838,792 |
| Bidvest Group Ltd./The | | 153,660 | 1,777,458 |
| Capitec Bank Holdings Ltd. | | 46,087 | 4,768,510 |
| Clicks Group Ltd. | | 127,387 | 2,158,514 |
| Discovery Ltd. (a) | | 265,693 | 1,738,911 |
| Exxaro Resources Ltd. | | 129,457 | 1,441,391 |
| FirstRand Ltd. | | 2,672,029 | 9,360,739 |
| Foschini Group Ltd./The | | 174,778 | 1,093,365 |
| Gold Fields Ltd. | | 470,534 | 3,769,354 |
| Growthpoint Properties Ltd. (d) | | 1,856,577 | 1,308,890 |
| Harmony Gold Mining Co. Ltd. | | 291,052 | 806,081 |
| Impala Platinum Holdings Ltd. | | 449,309 | 4,600,325 |
| Kumba Iron Ore Ltd. | | 33,960 | 639,664 |
| Mr Price Group Ltd. | | 135,062 | 1,300,272 |
| MTN Group Ltd. | | 896,323 | 6,335,683 |
| MultiChoice Group Ltd. | | 201,576 | 1,317,192 |
| Naspers Ltd. Class N | | 115,206 | 11,875,650 |
| Nedbank Group Ltd. | | 244,842 | 2,899,916 |
| Northam Platinum Holdings Ltd. (a) | | 178,179 | 1,672,106 |
| Old Mutual Ltd. | | 2,506,335 | 1,424,492 |
| Pepkor Holdings Ltd. (b) | | 872,260 | 1,076,510 |
| Remgro Ltd. | | 281,288 | 2,093,495 |
| Sanlam Ltd. | | 945,528 | 2,750,814 |
| Sasol Ltd. | | 299,660 | 5,037,302 |
| Shoprite Holdings Ltd. | | 264,312 | 3,365,639 |
| Sibanye-Stillwater Ltd. | | 1,494,764 | 3,501,072 |
| Spar Group Ltd./The | | 100,587 | 852,885 |
| Standard Bank Group Ltd. | | 711,375 | 6,647,568 |
| Vodacom Group Ltd. | | 338,627 | 2,310,084 |
| Woolworths Holdings Ltd. | | 525,716 | 1,805,644 |
TOTAL SOUTH AFRICA | | | 105,061,124 |
| Taiwan - 13.1% | | | |
| Accton Technology Corp. | | 267,000 | 2,011,564 |
| Acer, Inc. | | 1,526,000 | 1,045,594 |
| Advantech Co. Ltd. | | 225,066 | 2,044,532 |
| ASE Technology Holding Co. Ltd. | | 1,730,592 | 4,268,919 |
| Asia Cement Corp. | | 1,216,000 | 1,406,238 |
| ASMedia Technology, Inc. | | 14,000 | 252,620 |
| ASUSTeK Computer, Inc. | | 374,502 | 2,740,202 |
| AUO Corp. | | 3,528,800 | 1,848,971 |
| Catcher Technology Co. Ltd. | | 349,095 | 1,834,551 |
| Cathay Financial Holding Co. Ltd. | | 4,193,809 | 4,914,925 |
| Chang Hwa Commercial Bank | | 2,525,959 | 1,300,022 |
| Cheng Shin Rubber Industry Co. Ltd. | | 957,000 | 958,365 |
| China Airlines Ltd. | | 1,523,000 | 800,361 |
| China Development Financial Ho | | 8,237,624 | 3,000,933 |
| China Steel Corp. | | 6,250,289 | 5,203,084 |
| Chunghwa Telecom Co. Ltd. | | 2,003,129 | 6,899,876 |
| Compal Electronics, Inc. | | 2,226,000 | 1,456,210 |
| CTBC Financial Holding Co. Ltd. | | 9,301,778 | 5,883,186 |
| Delta Electronics, Inc. | | 1,029,717 | 8,220,752 |
| E Ink Holdings, Inc. | | 452,000 | 2,879,829 |
| E.SUN Financial Holdings Co. Ltd. | | 6,785,733 | 4,880,914 |
| ECLAT Textile Co. Ltd. | | 101,129 | 1,330,975 |
| eMemory Technology, Inc. | | 34,000 | 1,133,193 |
| EVA Airways Corp. | | 1,350,000 | 979,413 |
| Evergreen Marine Corp. (Taiwan) | | 535,494 | 2,282,831 |
| Far Eastern New Century Corp. | | 1,703,000 | 1,697,509 |
| Far EasTone Telecommunications Co. Ltd. | | 840,348 | 1,842,023 |
| Feng Tay Enterprise Co. Ltd. | | 233,390 | 1,161,378 |
| First Financial Holding Co. Ltd. | | 5,597,251 | 4,295,032 |
| Formosa Chemicals & Fibre Corp. | | 1,854,149 | 3,995,267 |
| Formosa Petrochemical Corp. | | 603,347 | 1,552,607 |
| Formosa Plastics Corp. | | 2,185,085 | 5,629,707 |
| Fubon Financial Holding Co. Ltd. | | 3,944,713 | 6,237,377 |
| Giant Manufacturing Co. Ltd. | | 161,000 | 1,025,780 |
| GlobalWafers Co. Ltd. | | 116,000 | 1,289,328 |
| Hon Hai Precision Industry Co. Ltd. (Foxconn) | | 6,605,465 | 20,991,510 |
| Hotai Motor Co. Ltd. | | 159,000 | 2,878,899 |
| Hua Nan Financial Holdings Co. Ltd. | | 4,695,379 | 3,064,356 |
| Innolux Corp. | | 4,883,380 | 1,794,136 |
| Inventec Corp. | | 1,327,000 | 1,003,869 |
| Largan Precision Co. Ltd. | | 53,451 | 3,065,801 |
| Lite-On Technology Corp. | | 1,055,044 | 2,093,471 |
| MediaTek, Inc. | | 802,615 | 14,681,678 |
| Mega Financial Holding Co. Ltd. | | 5,910,446 | 5,479,083 |
| Micro-Star International Co. Ltd. | | 356,000 | 1,208,594 |
| momo.com, Inc. | | 35,200 | 526,570 |
| Nan Ya Plastics Corp. | | 2,514,358 | 5,324,321 |
| Nan Ya Printed Circuit Board Corp. | | 119,000 | 780,322 |
| Nanya Technology Corp. | | 653,000 | 1,103,383 |
| Nien Made Enterprise Co. Ltd. | | 94,000 | 725,677 |
| Novatek Microelectronics Corp. | | 305,000 | 2,278,942 |
| Pegatron Corp. | | 1,063,000 | 1,944,472 |
| Pou Chen Corp. | | 1,197,391 | 1,011,624 |
| Powerchip Semiconductor Manufacturing Corp. | | 1,556,933 | 1,486,747 |
| President Chain Store Corp. | | 300,000 | 2,492,714 |
| Quanta Computer, Inc. | | 1,432,000 | 3,036,795 |
| Realtek Semiconductor Corp. | | 243,000 | 1,921,157 |
| Ruentex Development Co. Ltd. | | 931,440 | 1,143,580 |
| Shin Kong Financial Holding Co. Ltd. | | 6,995,732 | 1,735,160 |
| Sinopac Financial Holdings Co. | | 5,426,535 | 2,708,725 |
| Synnex Technology International Corp. | | 713,700 | 1,163,906 |
| Taishin Financial Holdings Co. Ltd. | | 5,731,194 | 2,354,385 |
| Taiwan Cement Corp. | | 3,204,354 | 3,005,262 |
| Taiwan Cooperative Financial Holding Co. Ltd. | | 5,191,516 | 4,023,932 |
| Taiwan High Speed Rail Corp. | | 1,064,000 | 926,967 |
| Taiwan Mobile Co. Ltd. | | 906,000 | 2,671,315 |
| Taiwan Semiconductor Manufacturing Co. Ltd. | | 13,023,740 | 156,421,205 |
| The Shanghai Commercial & Savings Bank Ltd. | | 1,896,420 | 2,728,154 |
| The Shanghai Commercial & Savings Bank Ltd. rights (a) | | 139,019 | 40,515 |
| Uni-President Enterprises Corp. | | 2,553,332 | 5,185,194 |
| Unimicron Technology Corp. | | 662,000 | 2,555,311 |
| United Microelectronics Corp. | | 6,269,000 | 7,530,867 |
| Vanguard International Semiconductor Corp. | | 474,000 | 975,805 |
| Voltronic Power Technology Corp. | | 34,000 | 1,380,914 |
| Walsin Lihwa Corp. | | 1,350,779 | 1,497,189 |
| Wan Hai Lines Ltd. | | 369,415 | 775,389 |
| Win Semiconductors Corp. | | 180,000 | 680,846 |
| Winbond Electronics Corp. | | 1,583,000 | 957,044 |
| Wiwynn Corp. | | 45,629 | 1,024,226 |
| WPG Holding Co. Ltd. | | 858,880 | 1,170,329 |
| Yageo Corp. | | 184,114 | 2,094,929 |
| Yang Ming Marine Transport Corp. | | 918,000 | 1,713,387 |
| Yuanta Financial Holding Co. Ltd. | | 5,299,141 | 3,236,593 |
TOTAL TAIWAN | | | 386,899,318 |
| Thailand - 2.2% | | | |
| Advanced Information Service PCL NVDR | | 629,900 | 3,162,331 |
| Airports of Thailand PCL NVDR (a) | | 2,314,900 | 4,502,631 |
| Asset World Corp. PCL NVDR | | 4,376,900 | 701,777 |
| B. Grimm Power PCL: | | | |
| (For. Reg.) | | 70,900 | 62,896 |
| NVDR | | 353,400 | 313,504 |
| Bangkok Commercial Asset Management PCL: | | | |
| (For. Reg.) | | 66,700 | 26,824 |
| NVDR | | 859,200 | 345,532 |
| Bangkok Dusit Medical Services PCL: | | | |
| (For. Reg.) | | 47,900 | 37,142 |
| NVDR | | 5,400,200 | 4,187,302 |
| Bangkok Expressway and Metro PCL NVDR | | 4,068,000 | 1,005,104 |
| Berli Jucker PCL unit | | 656,600 | 591,104 |
| BTS Group Holdings PCL NVDR | | 4,317,900 | 942,005 |
| Bumrungrad Hospital PCL: | | | |
| NVDR | | 302,500 | 1,804,902 |
| (For. Reg.) | | 8,200 | 48,926 |
| Carabao Group PCL NVDR | | 166,200 | 394,258 |
| Central Pattana PCL: | | | |
| (For. Reg.) | | 449,000 | 811,375 |
| NVDR | | 626,900 | 1,132,853 |
| Central Retail Corp. PCL: | | | |
| (For. Reg.) | | 217,424 | 240,026 |
| NVDR | | 727,300 | 802,907 |
| Charoen Pokphand Foods PCL: | | | |
| (For. Reg.) | | 1,700 | 1,128 |
| (NVDR) | | 2,060,600 | 1,367,595 |
| CP ALL PCL NVDR | | 3,080,100 | 4,857,563 |
| Delta Electronics PCL NVDR | | 164,600 | 2,509,344 |
| Electricity Generating PCL: | | | |
| (For. Reg.) | | 5,400 | 24,200 |
| NVDR | | 127,100 | 569,603 |
| Energy Absolute PCL NVDR | | 882,600 | 2,238,688 |
| Global Power Synergy Public Co. Ltd.: | | | |
| (For. Reg.) | | 600 | 978 |
| NVDR | | 354,700 | 578,037 |
| Gulf Energy Development PCL: | | | |
| (For. Reg.) | | 46,100 | 61,192 |
| NVDR | | 1,486,500 | 1,973,144 |
| Home Product Center PCL NVDR | | 3,189,800 | 1,224,105 |
| Indorama Ventures PCL NVDR | | 898,200 | 991,573 |
| Intouch Holdings PCL NVDR | | 602,300 | 1,139,850 |
| JMT Network Services PCL NVDR | | 332,500 | 568,077 |
| Kasikornbank PCL NVDR | | 313,000 | 1,201,157 |
| Krung Thai Bank PCL: | | | |
| (For. Reg.) | | 553,800 | 254,738 |
| NVDR | | 1,288,400 | 592,640 |
| Krungthai Card PCL: | | | |
| (For. Reg.) | | 142,000 | 212,748 |
| NVDR | | 323,200 | 484,227 |
| Land & House PCL: | | | |
| NVDR | | 4,284,800 | 1,036,146 |
| (For. Reg.) | | 217,100 | 52,499 |
| Minor International PCL: | | | |
| unit (a) | | 1,549,300 | 1,150,420 |
| (For. Reg.) (a) | | 127,526 | 94,693 |
| Muangthai Leasing PCL: | | | |
| (For. Reg.) | | 4,001 | 3,812 |
| NVDR | | 390,400 | 371,981 |
| Osotspa PCL NVDR | | 790,200 | 550,409 |
| PTT Exploration and Production PCL: | | | |
| (For. Reg.) | | 29,800 | 142,166 |
| NVDR | | 702,600 | 3,351,870 |
| PTT Global Chemical PCL NVDR | | 1,220,300 | 1,395,270 |
| PTT Oil & Retail Business PCL NVDR | | 1,618,700 | 1,025,382 |
| PTT PCL NVDR | | 5,398,300 | 5,108,130 |
| Ratch Group PCL unit | | 576,100 | 620,846 |
| Robinsons Department Store PCL (For. Reg.) (a) | �� | 55,100 | 96,309 |
| SCB X PCL: | | | |
| (For. Reg.) | | 184,500 | 514,049 |
| NVDR unit | | 179,200 | 499,282 |
| SCG Packaging PCL NVDR | | 695,300 | 950,338 |
| Siam Cement PCL: | | | |
| (For. Reg.) | | 18,200 | 154,995 |
| NVDR | | 392,100 | 3,339,214 |
| Siam Commercial Bank PCL (For. Reg.) | | 204,200 | 472,618 |
| Srisawad Corp. PCL: | | | |
| warrants 8/29/25 (a) | | 16,016 | 1,364 |
| NVDR | | 364,700 | 393,027 |
| Thai Oil PCL NVDR | | 663,121 | 949,930 |
| Thai Union Frozen Products PCL: | | | |
| (For. Reg.) | | 100 | 47 |
| NVDR | | 1,500,500 | 709,922 |
| rights (a)(c) | | 42,547 | 19,689 |
| rights (a)(c) | | 2 | 1 |
| True Corp. PCL NVDR | | 6,130,400 | 799,232 |
TOTAL THAILAND | | | 65,767,627 |
| Turkey - 0.5% | | | |
| Akbank TAS | | 1,653,546 | 1,298,728 |
| Aselsan A/S | | 352,673 | 610,453 |
| Bim Birlesik Magazalar A/S JSC | | 237,777 | 1,711,706 |
| Eregli Demir ve Celik Fabrikalari T.A.S. | | 736,030 | 1,174,374 |
| Ford Otomotiv Sanayi A/S | | 37,772 | 736,599 |
| Haci Omer Sabanci Holding A/S | | 539,363 | 971,849 |
| Koc Holding A/S | | 401,160 | 1,198,248 |
| Turk Hava Yollari AO (a) | | 292,858 | 1,593,753 |
| Turk Sise ve Cam Fabrikalari A/S | | 720,133 | 1,285,188 |
| Turkcell Iletisim Hizmet A/S | | 634,616 | 874,145 |
| Turkiye Is Bankasi A/S Series C | | 1,851,485 | 927,023 |
| Turkiye Petrol Rafinerileri A/S (a) | | 65,825 | 1,340,246 |
TOTAL TURKEY | | | 13,722,312 |
| United Arab Emirates - 1.5% | | | |
| Abu Dhabi Commercial Bank PJSC | | 1,474,128 | 3,792,576 |
| Abu Dhabi Islamic Bank | | 767,598 | 1,985,293 |
| Abu Dhabi National Oil Co. for Distribution PJSC | | 1,644,030 | 2,018,615 |
| Aldar Properties PJSC | | 2,061,304 | 2,424,337 |
| Dubai Islamic Bank Pakistan Ltd. | | 1,535,713 | 2,433,326 |
| Emaar Properties PJSC (a) | | 2,138,074 | 3,527,464 |
| Emirates NBD Bank PJSC | | 1,003,817 | 3,621,076 |
| Emirates Telecommunications Corp. | | 1,837,718 | 12,908,204 |
| First Abu Dhabi Bank PJSC | | 2,337,675 | 11,392,116 |
TOTAL UNITED ARAB EMIRATES | | | 44,103,007 |
| United States of America - 0.6% | | | |
| 360 DigiTech, Inc. ADR | | 57,026 | 579,384 |
| Legend Biotech Corp. ADR (a) | | 25,379 | 1,264,382 |
| Li Auto, Inc. ADR (a) | | 288,827 | 3,933,824 |
| Southern Copper Corp. | | 45,049 | 2,115,952 |
| Yum China Holdings, Inc. | | 222,359 | 9,194,545 |
TOTAL UNITED STATES OF AMERICA | | | 17,088,087 |
| TOTAL COMMON STOCKS (Cost $2,799,982,977) | | | 2,866,578,824 |
| | | | |
| Nonconvertible Preferred Stocks - 2.7% |
| | | Shares | Value ($) |
| Brazil - 1.8% | | | |
| Banco Bradesco SA (PN) | | 2,828,288 | 10,874,030 |
| Braskem SA Class A | | 101,900 | 664,998 |
| Centrais Eletricas Brasileiras SA (Electrobras) (PN-B) | | 128,505 | 1,326,471 |
| Companhia Energetica de Minas Gerais (CEMIG) (PN) | | 737,060 | 1,622,374 |
| Gerdau SA | | 606,400 | 3,022,902 |
| Itau Unibanco Holding SA | | 2,562,771 | 15,082,420 |
| Itausa-Investimentos Itau SA (PN) | | 2,449,012 | 5,091,935 |
| Petroleo Brasileiro SA - Petrobras (PN) (non-vtg.) | | 2,472,100 | 14,266,441 |
TOTAL BRAZIL | | | 51,951,571 |
| Chile - 0.2% | | | |
| Sociedad Quimica y Minera de Chile SA (PN-B) | | 75,478 | 7,183,810 |
| Colombia - 0.1% | | | |
| Bancolombia SA (PN) | | 244,933 | 1,549,817 |
| Korea (South) - 0.6% | | | |
| Hyundai Motor Co. | | 10,549 | 579,437 |
| Hyundai Motor Co. Series 2 | | 17,174 | 960,181 |
| LG Chemical Ltd. | | 3,892 | 788,042 |
| LG H & H Co. Ltd. | | 910 | 178,835 |
| Samsung Electronics Co. Ltd. | | 434,401 | 16,221,712 |
TOTAL KOREA (SOUTH) | | | 18,728,207 |
| Russia - 0.0% | | | |
| Surgutneftegas OJSC (c) | | 3,570,022 | 93,142 |
| TOTAL NONCONVERTIBLE PREFERRED STOCKS (Cost $59,143,019) | | | 79,506,547 |
| | | | |
| Government Obligations - 0.5% |
| | | Principal Amount (e) | Value ($) |
| United States of America - 0.5% | | | |
U.S. Treasury Bills, yield at date of purchase 1.15% 1/26/23 (f) (Cost $14,959,168) | | 15,000,000 | 14,857,115 |
| | | | |
| Money Market Funds - 0.7% |
| | | Shares | Value ($) |
| Fidelity Cash Central Fund 3.10% (g) | | 3,463,651 | 3,464,344 |
| Fidelity Securities Lending Cash Central Fund 3.10% (g)(h) | | 16,507,890 | 16,509,541 |
| TOTAL MONEY MARKET FUNDS (Cost $19,973,885) | | | 19,973,885 |
| | | | |
| TOTAL INVESTMENT IN SECURITIES - 100.8% (Cost $2,894,059,049) | 2,980,916,371 |
NET OTHER ASSETS (LIABILITIES) - (0.8)% | (24,823,935) |
| NET ASSETS - 100.0% | 2,956,092,436 |
| | |
| Futures Contracts |
| | Number of contracts | Expiration Date | Notional Amount ($) | Value ($) | Unrealized Appreciation/ (Depreciation) ($) |
| Purchased | | | | | |
| | | | | | |
| Equity Index Contracts | | | | | |
| ICE E-mini MSCI Emerging Markets Index Contracts (United States) | 248 | Dec 2022 | 10,584,640 | (394,271) | (394,271) |
| | | | | | |
| The notional amount of futures purchased as a percentage of Net Assets is 0.4% |
Categorizations in the Schedule of Investments are based on country or territory of incorporation.
Legend
| (b) | Security exempt from registration under Rule 144A of the Securities Act of 1933. These securities may be resold in transactions exempt from registration, normally to qualified institutional buyers. At the end of the period, the value of these securities amounted to $142,129,304 or 4.8% of net assets. |
| (d) | Security or a portion of the security is on loan at period end. |
| (e) | Amount is stated in United States dollars unless otherwise noted. |
| (f) | Security or a portion of the security was pledged to cover margin requirements for futures contracts. At period end, the value of securities pledged amounted to $782,475. |
| (g) | Affiliated fund that is generally available only to investment companies and other accounts managed by Fidelity Investments. The rate quoted is the annualized seven-day yield of the fund at period end. A complete unaudited listing of the fund's holdings as of its most recent quarter end is available upon request. In addition, each Fidelity Central Fund's financial statements, which are not covered by the Fund's Report of Independent Registered Public Accounting Firm, are available on the SEC's website or upon request. |
| (h) | Investment made with cash collateral received from securities on loan. |
Affiliated Central Funds
Fiscal year to date information regarding the Fund's investments in Fidelity Central Funds, including the ownership percentage, is presented below.
| Affiliate | Value, beginning of period ($) | Purchases ($) | Sales Proceeds ($) | Dividend Income ($) | Realized Gain (loss) ($) | Change in Unrealized appreciation (depreciation) ($) | Value, end of period ($) | % ownership, end of period |
| Fidelity Cash Central Fund 3.10% | 90,704,884 | 1,831,193,158 | 1,918,433,698 | 460,608 | - | - | 3,464,344 | 0.0% |
| Fidelity Securities Lending Cash Central Fund 3.10% | 31,019,879 | 190,371,277 | 204,881,615 | 286,718 | - | - | 16,509,541 | 0.0% |
| Total | 121,724,763 | 2,021,564,435 | 2,123,315,313 | 747,326 | - | - | 19,973,885 | |
| | | | | | | | | |
Amounts in the income column in the above table include any capital gain distributions from underlying funds, which are presented in the corresponding line item in the Statement of Operations, if applicable.
Amount for Fidelity Securities Lending Cash Central Fund represents the income earned on investing cash collateral, less rebates paid to borrowers and any lending agent fees associated with the loan, plus any premium payments received for lending certain types of securities.
Investment Valuation
The following is a summary of the inputs used, as of October 31, 2022, involving the Fund's assets and liabilities carried at fair value. The inputs or methodology used for valuing securities may not be an indication of the risk associated with investing in those securities. For more information on valuation inputs, and their aggregation into the levels used below, please refer to the Investment Valuation section in the accompanying Notes to Financial Statements.
| Valuation Inputs at Reporting Date: |
| Description | Total ($) | Level 1 ($) | Level 2 ($) | Level 3 ($) |
Investments in Securities: | | | | |
|
| Equities: | | | | |
Communication Services | 257,115,841 | 128,613,635 | 127,350,705 | 1,151,501 |
Consumer Discretionary | 360,554,963 | 217,843,296 | 142,620,711 | 90,956 |
Consumer Staples | 191,443,597 | 189,757,336 | 1,642,121 | 44,140 |
Energy | 166,185,118 | 159,294,835 | 5,301,542 | 1,588,741 |
Financials | 696,153,110 | 569,227,943 | 126,411,928 | 513,239 |
Health Care | 120,100,014 | 103,426,965 | 16,673,049 | - |
Industrials | 179,749,472 | 172,409,302 | 7,340,170 | - |
Information Technology | 558,822,820 | 384,887,757 | 173,935,063 | - |
Materials | 269,929,619 | 240,426,161 | 28,433,384 | 1,070,074 |
Real Estate | 50,819,909 | 45,586,265 | 5,088,538 | 145,106 |
Utilities | 95,210,908 | 92,389,279 | 2,655,946 | 165,683 |
|
| Government Obligations | 14,857,115 | - | 14,857,115 | - |
|
| Money Market Funds | 19,973,885 | 19,973,885 | - | - |
| Total Investments in Securities: | 2,980,916,371 | 2,323,836,659 | 652,310,272 | 4,769,440 |
Derivative Instruments: | | | | |
|
| Liabilities | | | | |
Futures Contracts | (394,271) | (394,271) | - | - |
| Total Liabilities | (394,271) | (394,271) | - | - |
| Total Derivative Instruments: | (394,271) | (394,271) | - | - |
The following is a reconciliation of Investments in Securities for which Level 3 inputs were used in determining value:
| |
| Investments in Securities: | |
| Energy | | | |
| Beginning Balance | $ | 43 | |
| Net Realized Gain (Loss) on Investment Securities | | (62,666) | |
| Net Unrealized Gain (Loss) on Investment Securities | | (79,578,044) | |
| Cost of Purchases | | 10,797,960 | |
| Proceeds of Sales | | (667,017) | |
| Amortization/Accretion | | - | |
| Transfers into Level 3 | | 71,098,465 | |
| Transfers out of Level 3 | | - | |
| Ending Balance | $ | 1,588,741 | |
| The change in unrealized gain (loss) for the period attributable to Level 3 securities held at October 31, 2022 | $ | (79,578,000) | |
| Financials | | | |
| Beginning Balance | $ | 594,787 | |
| Net Realized Gain (Loss) on Investment Securities | | (711,901) | |
| Net Unrealized Gain (Loss) on Investment Securities | | (37,475,118) | |
| Cost of Purchases | | 4,635,618 | |
| Proceeds of Sales | | (576,004) | |
| Amortization/Accretion | | - | |
| Transfers into Level 3 | | 34,045,857 | |
| Transfers out of Level 3 | | - | |
| Ending Balance | $ | 513,239 | |
| The change in unrealized gain (loss) for the period attributable to Level 3 securities held at October 31, 2022 | $ | (37,800,475) | |
| Other Investments in Securities | | | |
| Beginning Balance | $ | 1,103,079 | |
| Net Realized Gain (Loss) on Investment Securities | | (823,780) | |
| Net Unrealized Gain (Loss) on Investment Securities | | (47,514,619) | |
| Cost of Purchases | | 9,659,917 | |
| Proceeds of Sales | | (2,743,884) | |
| Amortization/Accretion | | - | |
| Transfers into Level 3 | | 42,986,747 | |
| Transfers out of Level 3 | | - | |
| Ending Balance | $ | 2,667,460 | |
| The change in unrealized gain (loss) for the period attributable to Level 3 securities held at October 31, 2022 | $ | (47,266,929) | |
| The information used in the above reconciliation represents fiscal year to date activity for any Investments in Securities identified as using Level 3 inputs at either the beginning or the end of the current fiscal period. Cost of purchases and proceeds of sales may include securities received and/or delivered through in-kind transactions. Transfers into Level 3 were attributable to a lack of observable market data resulting from decreases in market activity, decreases in liquidity, security restructurings or corporate actions. Transfers out of Level 3 were attributable to observable market data becoming available for those securities. Transfers in or out of Level 3 represent the beginning value of any Security or Instrument where a change in the pricing level occurred from the beginning to the end of the period. The cost of purchases and the proceeds of sales may include securities received or delivered through corporate actions or exchanges. Realized and unrealized gains (losses) disclosed in the reconciliation are included in Net Gain (Loss) on the Fund's Statement of Operations. | |
Value of Derivative Instruments
The following table is a summary of the Fund's value of derivative instruments by primary risk exposure as of October 31, 2022. For additional information on derivative instruments, please refer to the Derivative Instruments section in the accompanying Notes to Financial Statements.
Primary Risk Exposure / Derivative Type | Value |
| Asset ($) | Liability ($) |
| Equity Risk | | |
Futures Contracts (a) | 0 | (394,271) |
| Total Equity Risk | 0 | (394,271) |
| Total Value of Derivatives | 0 | (394,271) |
(a)Reflects gross cumulative appreciation (depreciation) on futures contracts as presented in the Schedule of Investments. In the Statement of Assets and Liabilities, the period end daily variation margin is included in receivable or payable for daily variation margin on futures contracts, and the net cumulative appreciation (depreciation) is included in Total accumulated earnings (loss).
| Statement of Assets and Liabilities |
| | | | October 31, 2022 |
| | | | | |
| Assets | | | | |
| Investment in securities, at value (including securities loaned of $14,296,237) - See accompanying schedule: | | | | |
Unaffiliated issuers (cost $2,874,085,164) | | $2,960,942,486 | | |
Fidelity Central Funds (cost $19,973,885) | | 19,973,885 | | |
| | | | | |
| Total Investment in Securities (cost $2,894,059,049) | | | $ | 2,980,916,371 |
| Foreign currency held at value (cost $3,014,284) | | | | 2,890,369 |
| Receivable for fund shares sold | | | | 1,454,451 |
| Dividends receivable | | | | 2,534,871 |
| Distributions receivable from Fidelity Central Funds | | | | 27,771 |
| Prepaid expenses | | | | 5,185 |
| Receivable from investment adviser for expense reductions | | | | 92,095 |
Total assets | | | | 2,987,921,113 |
| Liabilities | | | | |
| Payable for investments purchased | | $11,957 | | |
| Payable for fund shares redeemed | | 1,276,612 | | |
| Accrued management fee | | 190,872 | | |
| Payable for daily variation margin on futures contracts | | 33,338 | | |
| Deferred taxes | | 13,166,390 | | |
| Other payables and accrued expenses | | 628,714 | | |
| Collateral on securities loaned | | 16,520,794 | | |
| Total Liabilities | | | | 31,828,677 |
| Net Assets | | | $ | 2,956,092,436 |
| Net Assets consist of: | | | | |
| Paid in capital | | | $ | 3,499,056,036 |
| Total accumulated earnings (loss) | | | | (542,963,600) |
| Net Assets | | | $ | 2,956,092,436 |
Net Asset Value , offering price and redemption price per share ($2,956,092,436 ÷ 267,030,184 shares) | | | $ | 11.07 |
| | | | | |
| Statement of Operations |
| | | | Year ended October 31, 2022 |
| Investment Income | | | | |
| Dividends | | | $ | 123,692,667 |
| Non-Cash dividends | | | | 8,243,914 |
| Interest | | | | 107,831 |
| Income from Fidelity Central Funds (including $286,718 from security lending) | | | | 747,326 |
| Income before foreign taxes withheld | | | | 132,791,738 |
| Less foreign taxes withheld | | | | (14,175,373) |
| Total Income | | | | 118,616,365 |
| Expenses | | | | |
| Management fee | $ | 2,938,191 | | |
| Custodian fees and expenses | | 2,605,456 | | |
| Independent trustees' fees and expenses | | 12,998 | | |
| Registration fees | | 74,955 | | |
| Audit | | 61,562 | | |
| Legal | | 6,431 | | |
| Interest | | 67,387 | | |
| Miscellaneous | | 16,896 | | |
| Total expenses before reductions | | 5,783,876 | | |
| Expense reductions | | (2,817,391) | | |
| Total expenses after reductions | | | | 2,966,485 |
| Net Investment income (loss) | | | | 115,649,880 |
| Realized and Unrealized Gain (Loss) | | | | |
| Net realized gain (loss) on: | | | | |
| Investment Securities: | | | | |
| Unaffiliated issuers(net of foreign taxes of $6,067,387) | | (245,079,130) | | |
| Foreign currency transactions | | (3,408,409) | | |
| Futures contracts | | (67,959,180) | | |
| Total net realized gain (loss) | | | | (316,446,719) |
| Change in net unrealized appreciation (depreciation) on: | | | | |
| Investment Securities: | | | | |
| Unaffiliated issuers (net of decrease in deferred foreign taxes of $5,904,131) | | (1,204,488,023) | | |
| Assets and liabilities in foreign currencies | | 84,358 | | |
| Futures contracts | | 686,411 | | |
| Total change in net unrealized appreciation (depreciation) | | | | (1,203,717,254) |
| Net gain (loss) | | | | (1,520,163,973) |
| Net increase (decrease) in net assets resulting from operations | | | $ | (1,404,514,093) |
| Statement of Changes in Net Assets |
| |
| | Year ended October 31, 2022 | | Year ended October 31, 2021 |
| Increase (Decrease) in Net Assets | | | | |
| Operations | | | | |
| Net investment income (loss) | $ | 115,649,880 | $ | 81,878,413 |
| Net realized gain (loss) | | (316,446,719) | | 138,277,121 |
| Change in net unrealized appreciation (depreciation) | | (1,203,717,254) | | 391,718,795 |
| Net increase (decrease) in net assets resulting from operations | | (1,404,514,093) | | 611,874,329 |
| Distributions to shareholders | | (108,921,064) | | (61,451,040) |
| Share transactions | | | | |
| Proceeds from sales of shares | | 1,927,174,410 | | 904,679,177 |
| Reinvestment of distributions | | 106,410,044 | | 59,925,572 |
| Cost of shares redeemed | | (1,370,213,430) | | (1,273,280,123) |
Net increase (decrease) in net assets resulting from share transactions | | 663,371,024 | | (308,675,374) |
| Total increase (decrease) in net assets | | (850,064,133) | | 241,747,915 |
| | | | | |
| Net Assets | | | | |
| Beginning of period | | 3,806,156,569 | | 3,564,408,654 |
| End of period | $ | 2,956,092,436 | $ | 3,806,156,569 |
| | | | | |
| Other Information | | | | |
| Shares | | | | |
| Sold | | 132,184,146 | | 53,294,459 |
| Issued in reinvestment of distributions | | 6,895,296 | | 3,717,467 |
| Redeemed | | (102,830,412) | | (72,956,690) |
| Net increase (decrease) | | 36,249,030 | | (15,944,764) |
| | | | | |
Financial Highlights
| Fidelity® SAI Emerging Markets Index Fund |
| |
| Years ended October 31, | | 2022 | | 2021 | | 2020 | | 2019 | | 2018 |
Selected Per-Share Data | | | | | | | | | | |
| Net asset value, beginning of period | $ | 16.49 | $ | 14.45 | $ | 13.71 | $ | 12.62 | $ | 14.80 |
| Income from Investment Operations | | | | | | | | | | |
Net investment income (loss) A,B | | .41 | | .36 | | .30 | | .42 C | | .36 |
| Net realized and unrealized gain (loss) | | (5.38) | | 1.93 | | .80 | | .99 | | (2.18) |
| Total from investment operations | | (4.97) | | 2.29 | | 1.10 | | 1.41 | | (1.82) |
| Distributions from net investment income | | (.45) | | (.25) | | (.36) | | (.32) | | (.27) |
| Distributions from net realized gain | | - | | - | | - | | - | | (.09) |
| Total distributions | | (.45) | | (.25) | | (.36) | | (.32) | | (.36) |
| Net asset value, end of period | $ | 11.07 | $ | 16.49 | $ | 14.45 | $ | 13.71 | $ | 12.62 |
Total Return D | | (30.89)% | | 15.87% | | 8.19% | | 11.44% | | (12.61)% |
Ratios to Average Net Assets B,E,F | | | | | | | | | | |
| Expenses before reductions | | .15% | | .13% | | .14% | | .16% | | .17% |
| Expenses net of fee waivers, if any | | .08% | | .08% | | .08% | | .08% | | .08% |
| Expenses net of all reductions | | .08% | | .08% | | .08% | | .08% | | .08% |
| Net investment income (loss) | | 2.95% | | 2.10% | | 2.21% | | 3.12% C | | 2.48% |
| Supplemental Data | | | | | | | | | | |
| Net assets, end of period (000 omitted) | $ | 2,956,092 | $ | 3,806,157 | $ | 3,564,409 | $ | 3,840,772 | $ | 4,257,694 |
Portfolio turnover rate G | | 30% | | 16% | | 38% | | 22% | | 3% |
A Calculated based on average shares outstanding during the period.
B Net investment income (loss) is affected by the timing of the declaration of dividends by any underlying mutual funds or exchange-traded funds (ETFs). Net investment income (loss) of any mutual funds or ETFs is not included in the Fund's net investment income (loss) ratio.
C Net investment income per share reflects one or more large, non-recurring dividend(s) which amounted to $.08 per share. Excluding such non-recurring dividend(s), the ratio of net investment income (loss) to average net assets would have been 2.51%.
D Total returns would have been lower if certain expenses had not been reduced during the applicable periods shown.
E Fees and expenses of any underlying mutual funds or exchange-traded funds (ETFs) are not included in the Fund's expense ratio. The Fund indirectly bears its proportionate share of these expenses. For additional expense information related to investments in Fidelity Central Funds, please refer to the "Investments in Fidelity Central Funds" note found in the Notes to Financial Statements section of the most recent Annual or Semi-Annual report.
F Expense ratios reflect operating expenses of the class. Expenses before reductions do not reflect amounts reimbursed, waived, or reduced through arrangements with the investment adviser, brokerage services, or other offset arrangements, if applicable, and do not represent the amount paid by the class during periods when reimbursements, waivers or reductions occur.
G Amount does not include the portfolio activity of any underlying mutual funds or exchange-traded funds (ETFs).
For the period ended October 31, 2022
1. Organization.
Fidelity SAI Emerging Markets Index Fund (the Fund) is a fund of Fidelity Salem Street Trust (the Trust) and is authorized to issue an unlimited number of shares. Shares are offered exclusively to certain clients of Fidelity Management & Research Company LLC (FMR) or its affiliates. The Trust is registered under the Investment Company Act of 1940, as amended (the 1940 Act), as an open-end management investment company organized as a Massachusetts business trust. The Fund's investments in emerging markets can be subject to social, economic, regulatory, and political uncertainties and can be extremely volatile.
2. Investments in Fidelity Central Funds.
Funds may invest in Fidelity Central Funds, which are open-end investment companies generally available only to other investment companies and accounts managed by the investment adviser and its affiliates. The Schedule of Investments lists any Fidelity Central Funds held as an investment as of period end, but does not include the underlying holdings of each Fidelity Central Fund. An investing fund indirectly bears its proportionate share of the expenses of the underlying Fidelity Central Funds.
Based on its investment objective, each Fidelity Central Fund may invest or participate in various investment vehicles or strategies that are similar to those of the investing fund. These strategies are consistent with the investment objectives of the investing fund and may involve certain economic risks which may cause a decline in value of each of the Fidelity Central Funds and thus a decline in the value of the investing fund.
| Fidelity Central Fund | Investment Manager | Investment Objective | Investment Practices | Expense Ratio A |
| Fidelity Money Market Central Funds | Fidelity Management & Research Company LLC (FMR) | Each fund seeks to obtain a high level of current income consistent with the preservation of capital and liquidity. | Short-term Investments | Less than .005% |
A Expenses expressed as a percentage of average net assets and are as of each underlying Central Fund's most recent annual or semi-annual shareholder report.
A complete unaudited list of holdings for each Fidelity Central Fund is available upon request or at the Securities and Exchange Commission website at www.sec.gov. In addition, the financial statements of the Fidelity Central Funds which contain the significant accounting policies (including investment valuation policies) of those funds, and are not covered by the Report of Independent Registered Public Accounting Firm, are available on the Securities and Exchange Commission website or upon request.
3. Significant Accounting Policies.
The Fund is an investment company and applies the accounting and reporting guidance of the Financial Accounting Standards Board (FASB) Accounting Standards Codification Topic 946 Financial Services - Investment Companies . The financial statements have been prepared in conformity with accounting principles generally accepted in the United States of America (GAAP), which require management to make certain estimates and assumptions at the date of the financial statements. Actual results could differ from those estimates. Subsequent events, if any, through the date that the financial statements were issued have been evaluated in the preparation of the financial statements. The Fund's Schedule of Investments lists any underlying mutual funds or exchange-traded funds (ETFs) but does not include the underlying holdings of these funds. The following summarizes the significant accounting policies of the Fund:
Investment Valuation. Investments are valued as of 4:00 p.m. Eastern time on the last calendar day of the period. The Board of Trustees (the Board) has designated the Fund's investment adviser as the valuation designee responsible for the fair valuation function and performing fair value determinations as needed. The investment adviser has established a Fair Value Committee (the Committee) to carry out the day-to-day fair valuation responsibilities and has adopted policies and procedures to govern the fair valuation process and the activities of the Committee. In accordance with these fair valuation policies and procedures, which have been approved by the Board, the Fund attempts to obtain prices from one or more third party pricing services or brokers to value its investments. When current market prices, quotations or currency exchange rates are not readily available or reliable, investments will be fair valued in good faith by the Committee, in accordance with the policies and procedures. Factors used in determining fair value vary by investment type and may include market or investment specific events, transaction data, estimated cash flows, and market observations of comparable investments. The frequency that the fair valuation procedures are used cannot be predicted and they may be utilized to a significant extent. The Committee manages the Fund's fair valuation practices and maintains the fair valuation policies and procedures. The Fund's investment adviser reports to the Board information regarding the fair valuation process and related material matters.
The Fund categorizes the inputs to valuation techniques used to value its investments into a disclosure hierarchy consisting of three levels as shown below:
Level 1 - unadjusted quoted prices in active markets for identical investments
Level 2 - other significant observable inputs (including quoted prices for similar investments, interest rates, prepayment speeds, etc.)
Level 3 - unobservable inputs (including the Fund's own assumptions based on the best information available)
Valuation techniques used to value the Fund's investments by major category are as follows:
Equity securities, including restricted securities, for which market quotations are readily available, are valued at the last reported sale price or official closing price as reported by a third party pricing service on the primary market or exchange on which they are traded and are categorized as Level 1 in the hierarchy. In the event there were no sales during the day or closing prices are not available, securities are valued at the last quoted bid price or may be valued using the last available price and are generally categorized as Level 2 in the hierarchy. For foreign equity securities, when market or security specific events arise, comparisons to the valuation of American Depositary Receipts (ADRs), futures contracts, Exchange-Traded Funds (ETFs) and certain indexes as well as quoted prices for similar securities may be used and would be categorized as Level 2 in the hierarchy. For equity securities, including restricted securities, where observable inputs are limited, assumptions about market activity and risk are used and these securities may be categorized as Level 3 in the hierarchy.
Debt securities, including restricted securities, are valued based on evaluated prices received from third party pricing services or from brokers who make markets in such securities. U.S. government and government agency obligations are valued by pricing services who utilize matrix pricing which considers yield or price of bonds of comparable quality, coupon, maturity and type or by broker-supplied prices. When independent prices are unavailable or unreliable, debt securities may be valued utilizing pricing methodologies which consider similar factors that would be used by third party pricing services. Debt securities are generally categorized as Level 2 in the hierarchy but may be Level 3 depending on the circumstances.
Futures contracts are valued at the settlement price established each day by the board of trade or exchange on which they are traded and are categorized as Level 1 in the hierarchy. Investments in open-end mutual funds, including the Fidelity Central Funds, are valued at their closing net asset value (NAV) each business day and are categorized as Level 1 in the hierarchy.
Changes in valuation techniques may result in transfers in or out of an assigned level within the disclosure hierarchy. The aggregate value of investments by input level as of October 31, 2022, as well as a roll forward of Level 3 investments, is included at the end of the Fund's Schedule of Investments.
Foreign Currency. Certain Funds may use foreign currency contracts to facilitate transactions in foreign-denominated securities. Gains and losses from these transactions may arise from changes in the value of the foreign currency or if the counterparties do not perform under the contracts' terms.
Foreign-denominated assets, including investment securities, and liabilities are translated into U.S. dollars at the exchange rates at period end. Purchases and sales of investment securities, income and dividends received, and expenses denominated in foreign currencies are translated into U.S. dollars at the exchange rate in effect on the transaction date.
The effects of exchange rate fluctuations on investments are included with the net realized and unrealized gain (loss) on investment securities. Other foreign currency transactions resulting in realized and unrealized gain (loss) are disclosed separately.
Investment Transactions and Income. For financial reporting purposes, the Fund's investment holdings and NAV include trades executed through the end of the last business day of the period. The NAV per share for processing shareholder transactions is calculated as of the close of business of the New York Stock Exchange (NYSE), normally 4:00 p.m. Eastern time and includes trades executed through the end of the prior business day. Gains and losses on securities sold are determined on the basis of identified cost and include proceeds received from litigation. Commissions paid to certain brokers with whom the investment adviser, or its affiliates, places trades on behalf of a fund include an amount in addition to trade execution, which may be rebated back to a fund. Any such rebates are included in net realized gain (loss) on investments in the Statement of Operations. Dividend income is recorded on the ex-dividend date, except for certain dividends from foreign securities where the ex-dividend date may have passed, which are recorded as soon as the Fund is informed of the ex-dividend date. Non-cash dividends included in dividend income, if any, are recorded at the fair market value of the securities received. Income and capital gain distributions from Fidelity Central Funds, if any, are recorded on the ex-dividend date. Interest income is accrued as earned and includes coupon interest and amortization of premium and accretion of discount on debt securities as applicable. Investment income is recorded net of foreign taxes withheld where recovery of such taxes is uncertain. Funds may file withholding tax reclaims in certain jurisdictions to recover a portion of amounts previously withheld. Any withholding tax reclaims income is included in the Statement of Operations in foreign taxes withheld. Any receivables for withholding tax reclaims are included in the Statement of Assets and Liabilities in dividends receivable.
Expenses. Expenses directly attributable to a fund are charged to that fund. Expenses attributable to more than one fund are allocated among the respective funds on the basis of relative net assets or other appropriate methods. Expenses included in the accompanying financial statements reflect the expenses of that fund and do not include any expenses associated with any underlying mutual funds or exchange-traded funds. Although not included in a fund's expenses, a fund indirectly bears its proportionate share of these expenses through the net asset value of each underlying mutual fund or exchange-traded fund. Expense estimates are accrued in the period to which they relate and adjustments are made when actual amounts are known.
Income Tax Information and Distributions to Shareholders. Each year, the Fund intends to qualify as a regulated investment company under Subchapter M of the Internal Revenue Code, including distributing substantially all of its taxable income and realized gains. As a result, no provision for U.S. Federal income taxes is required. As of October 31, 2022, the Fund did not have any unrecognized tax benefits in the financial statements; nor is the Fund aware of any tax positions for which it is reasonably possible that the total amounts of unrecognized tax benefits will significantly change in the next twelve months. The Fund files a U.S. federal tax return, in addition to state and local tax returns as required. The Fund's federal income tax returns are subject to examination by the Internal Revenue Service (IRS) for a period of three fiscal years after they are filed. State and local tax returns may be subject to examination for an additional fiscal year depending on the jurisdiction. Foreign taxes are provided for based on the Fund's understanding of the tax rules and rates that exist in the foreign markets in which it invests. The Fund is subject to a tax imposed on capital gains by certain countries in which it invests. An estimated deferred tax liability for net unrealized appreciation on the applicable securities is included in Deferred taxes on the Statement of Assets & Liabilities.
Distributions are declared and recorded on the ex-dividend date. Income and capital gain distributions are determined in accordance with income tax regulations, which may differ from GAAP. In addition, the Fund claimed a portion of the payment made to redeeming shareholders as a distribution for income tax purposes.
Capital accounts within the financial statements are adjusted for permanent book-tax differences. These adjustments have no impact on net assets or the results of operations. Capital accounts are not adjusted for temporary book-tax differences which will reverse in a subsequent period.
Book-tax differences are primarily due to futures contracts, foreign currency transactions, certain foreign taxes, passive foreign investment companies (PFIC), capital loss carryforwards and losses deferred due to wash sales.
As of period end, the cost and unrealized appreciation (depreciation) in securities, and derivatives if applicable, for federal income tax purposes were as follows:
| Gross unrealized appreciation | $679,288,768 |
| Gross unrealized depreciation | (691,494,218) |
| Net unrealized appreciation (depreciation) | $(12,205,450) |
| Tax Cost | $2,993,121,821 |
The tax-based components of distributable earnings as of period end were as follows:
| Undistributed ordinary income | $70,157,788 |
| Capital loss carryforward | $(587,626,215) |
| Net unrealized appreciation (depreciation) on securities and other investments | $(12,328,785) |
Capital loss carryforwards are only available to offset future capital gains of the Fund to the extent provided by regulations and may be limited. The capital loss carryforward information presented below, including any applicable limitation, is estimated as of fiscal period end and is subject to adjustment.
Short-term | $(387,599,592) |
Long-term | (200,026,623) |
| Total capital loss carryforward | $(587,626,215) |
The tax character of distributions paid was as follows:
| | October 31, 2022 | October 31, 2021 |
| Ordinary Income | $ 108,921,064 | $ 61,451,040 |
Restricted Securities (including Private Placements). Funds may invest in securities that are subject to legal or contractual restrictions on resale. These securities generally may be resold in transactions exempt from registration or to the public if the securities are registered. Disposal of these securities may involve time-consuming negotiations and expense, and prompt sale at an acceptable price may be difficult. Information regarding restricted securities held at period end is included at the end of the Schedule of Investments, if applicable.
4. Derivative Instruments.
Risk Exposures and the Use of Derivative Instruments. The Fund's investment objectives allow for various types of derivative instruments, including futures contracts. Derivatives are investments whose value is primarily derived from underlying assets, indices or reference rates and may be transacted on an exchange or over-the-counter (OTC). Derivatives may involve a future commitment to buy or sell a specified asset based on specified terms, to exchange future cash flows at periodic intervals based on a notional principal amount, or for one party to make one or more payments upon the occurrence of specified events in exchange for periodic payments from the other party.
Derivatives were used to increase returns and to manage exposure to certain risks as defined below. The success of any strategy involving derivatives depends on analysis of numerous economic factors, and if the strategies for investment do not work as intended, the objectives may not be achieved.
Derivatives were used to increase or decrease exposure to the following risk(s):
| | |
| Equity Risk | Equity risk relates to the fluctuations in the value of financial instruments as a result of changes in market prices (other than those arising from interest rate risk or foreign exchange risk), whether caused by factors specific to an individual investment, its issuer, or all factors affecting all instruments traded in a market or market segment. |
Funds are also exposed to additional risks from investing in derivatives, such as liquidity risk and counterparty credit risk. Liquidity risk is the risk that a fund will be unable to close out the derivative in the open market in a timely manner. Counterparty credit risk is the risk that the counterparty will not be able to fulfill its obligation to a fund. Counterparty credit risk related to exchange-traded contracts may be mitigated by the protection provided by the exchange on which they trade.
Investing in derivatives may involve greater risks than investing in the underlying assets directly and, to varying degrees, may involve risk of loss in excess of any initial investment and collateral received and amounts recognized in the Statement of Assets and Liabilities. In addition, there may be the risk that the change in value of the derivative contract does not correspond to the change in value of the underlying instrument.
Futures Contracts. A futures contract is an agreement between two parties to buy or sell a specified underlying instrument for a fixed price at a specified future date. Futures contracts were used to manage exposure to the stock market.
Upon entering into a futures contract, a fund is required to deposit either cash or securities (initial margin) with a clearing broker in an amount equal to a certain percentage of the face value of the contract. Futures contracts are marked-to-market daily and subsequent daily payments are made or received by a fund depending on the daily fluctuations in the value of the futures contracts and are recorded as unrealized appreciation or (depreciation). This receivable and/or payable, if any, is included in daily variation margin on futures contracts in the Statement of Assets and Liabilities. Realized gain or (loss) is recorded upon the expiration or closing of a futures contract. The net realized gain (loss) and change in net unrealized appreciation (depreciation) on futures contracts during the period is presented in the Statement of Operations.
Any open futures contracts at period end are presented in the Schedule of Investments under the caption "Futures Contracts". The notional amount at value reflects each contract's exposure to the underlying instrument or index at period end, and is representative of volume of activity during the period unless an average notional amount is presented. Any securities deposited to meet initial margin requirements are identified in the Schedule of Investments. Any cash deposited to meet initial margin requirements is presented as segregated cash with brokers for derivative instruments in the Statement of Assets and Liabilities.
5. Purchases and Sales of Investments.
Purchases and sales of securities, other than short-term securities and in-kind transactions, as applicable, are noted in the table below.
| | Purchases ($) | Sales ($) |
| Fidelity SAI Emerging Markets Index Fund | 1,824,575,067 | 1,137,327,650 |
6. Fees and Other Transactions with Affiliates.
Management Fee. Fidelity Management & Research Company LLC (the investment adviser) and its affiliates provide the Fund with investment management related services for which the Fund pays a monthly management fee that is based on an annual rate of .075% of the Fund's average net assets.
Sub-Adviser. Geode Capital Management, LLC (Geode), serves as sub-adviser for the Fund. Geode provides discretionary investment advisory services to the Fund and is paid by the investment adviser for providing these services.
Interfund Lending Program. Pursuant to an Exemptive Order issued by the Securities and Exchange Commission (the SEC), the Fund, along with other registered investment companies having management contracts with Fidelity Management & Research Company LLC (FMR), or other affiliated entities of FMR, may participate in an interfund lending program. This program provides an alternative credit facility allowing the Fund to borrow from, or lend money to, other participating affiliated funds. At period end, there were no interfund loans outstanding. Activity in this program during the period for which loans were outstanding was as follows:
| | Borrower or Lender | Average Loan Balance | Weighted Average Interest Rate | Interest Expense |
Fidelity SAI Emerging Markets Index Fund | Borrower | $ 26,280,744 | 2.02% | $63,477 |
Interfund Trades. Funds may purchase from or sell securities to other Fidelity Funds under procedures adopted by the Board. The procedures have been designed to ensure these interfund trades are executed in accordance with Rule 17a-7 of the 1940 Act. Any interfund trades are included within the respective purchases and sales amounts shown in the Purchases and Sales of Investments note. During the period, there were no interfund trades.
7. Committed Line of Credit.
Certain Funds participate with other funds managed by the investment adviser or an affiliate in a $4.25 billion credit facility (the "line of credit") to be utilized for temporary or emergency purposes to fund shareholder redemptions or for other short-term liquidity purposes. The participating funds have agreed to pay commitment fees on their pro-rata portion of the line of credit, which are reflected in Miscellaneous expenses on the Statement of Operations, and are listed below. During the period, there were no borrowings on this line of credit.
| | Amount |
| Fidelity SAI Emerging Markets Index Fund | $6,800 |
8. Security Lending.
Funds lend portfolio securities from time to time in order to earn additional income. Lending agents are used, including National Financial Services (NFS), an affiliate of the investment adviser. Pursuant to a securities lending agreement, NFS will receive a fee, which is capped at 9.9% of a fund's daily lending revenue, for its services as lending agent. A fund may lend securities to certain qualified borrowers, including NFS. On the settlement date of the loan, a fund receives collateral (in the form of U.S. Treasury obligations, letters of credit and/or cash) against the loaned securities and maintains collateral in an amount not less than 100% of the market value of the loaned securities during the period of the loan. The market value of the loaned securities is determined at the close of business of a fund and any additional required collateral is delivered to a fund on the next business day. A fund or borrower may terminate the loan at any time, and if the borrower defaults on its obligation to return the securities loaned because of insolvency or other reasons, a fund may apply collateral received from the borrower against the obligation. A fund may experience delays and costs in recovering the securities loaned. Any cash collateral received is invested in the Fidelity Securities Lending Cash Central Fund. Any loaned securities are identified as such in the Schedule of Investments, and the value of loaned securities and cash collateral at period end, as applicable, are presented in the Statement of Assets and Liabilities. Security lending income represents the income earned on investing cash collateral, less rebates paid to borrowers and any lending agent fees associated with the loan, plus any premium payments received for lending certain types of securities. Security lending income is presented in the Statement of Operations as a component of income from Fidelity Central Funds. Affiliated security lending activity, if any, was as follows:
| | Total Security Lending Fees Paid to NFS | Security Lending Income From Securities Loaned to NFS | Value of Securities Loaned to NFS at Period End |
| Fidelity SAI Emerging Markets Index Fund | $30,155 | $13 | $- |
9. Bank Borrowings.
The Fund is permitted to have bank borrowings for temporary or emergency purposes to fund shareholder redemptions or for other short-term liquidity requirements. The Fund has established borrowing arrangements with certain banks. The interest rate on the borrowings is the bank's base rate, as revised from time to time. Any open loans, including accrued interest, at period end are presented under the caption "Notes payable" in the Statement of Assets and Liabilities, if applicable. Activity in this program during the period for which loans were outstanding was as follows:
| | Average Loan Balance | Weighted Average Interest Rate | Interest Expense |
| Fidelity SAI Emerging Markets Index Fund | $ 4,692,900 | 2.00% | $ 3,910 |
10. Expense Reductions.
The investment adviser contractually agreed to reimburse the Fund to the extent annual operating expenses exceeded .075% of average net assets. This reimbursement will remain in place through February 29, 2024. Some expenses, for example the compensation of the independent Trustees, and certain miscellaneous expenses such as proxy and shareholder meeting expenses, are excluded from this reimbursement. During the period this reimbursement reduced the Fund's expenses by $2,765,137.
Through arrangements with the Fund's custodian, credits realized as a result of certain uninvested cash balances were used to reduce the Fund's expenses by $52,254.
11. Other.
A fund's organizational documents provide former and current trustees and officers with a limited indemnification against liabilities arising in connection with the performance of their duties to the fund. In the normal course of business, a fund may also enter into contracts that provide general indemnifications. A fund's maximum exposure under these arrangements is unknown as this would be dependent on future claims that may be made against a fund. The risk of material loss from such claims is considered remote.
At the end of the period, the following mutual funds managed by the investment adviser or its affiliates were the owners of record of 10% or more of the total outstanding shares.
| | Strategic Advisers Fidelity Emerging Markets Fund |
| Fidelity SAI Emerging Markets Index Fund | 19% |
Mutual funds managed by the investment adviser or its affiliates, in aggregate, were the owners of record of more than 20% of the total outstanding shares.
| Fund | % of shares held |
| Fidelity SAI Emerging Markets Index Fund | 22% |
12. Risk and Uncertainties.
Many factors affect a fund's performance. Developments that disrupt global economies and financial markets, such as pandemics, epidemics, outbreaks of infectious diseases, war, terrorism, and environmental disasters, may significantly affect a fund's investment performance. The effects of these developments to a fund will be impacted by the types of securities in which a fund invests, the financial condition, industry, economic sector, and geographic location of an issuer, and a fund's level of investment in the securities of that issuer.
To the Board of Trustees of Fidelity Salem Street Trust and Shareholders of Fidelity SAI Emerging Markets Index Fund
Opinion on the Financial Statements
We have audited the accompanying statement of assets and liabilities, including the schedule of investments, of Fidelity SAI Emerging Markets Index Fund (one of the funds constituting Fidelity Salem Street Trust, referred to hereafter as the "Fund") as of October 31, 2022, the related statement of operations for the year ended October 31, 2022, the statement of changes in net assets for each of the two years in the period ended October 31, 2022, including the related notes, and the financial highlights for each of the five years in the period ended October 31, 2022 (collectively referred to as the "financial statements"). In our opinion, the financial statements present fairly, in all material respects, the financial position of the Fund as of October 31, 2022, the results of its operations for the year then ended, the changes in its net assets for each of the two years in the period ended October 31, 2022 and the financial highlights for each of the five years in the period ended October 31, 2022 in conformity with accounting principles generally accepted in the United States of America.
Basis for Opinion
These financial statements are the responsibility of the Fund's management. Our responsibility is to express an opinion on the Fund's financial statements based on our audits. We are a public accounting firm registered with the Public Company Accounting Oversight Board (United States) (PCAOB) and are required to be independent with respect to the Fund in accordance with the U.S. federal securities laws and the applicable rules and regulations of the Securities and Exchange Commission and the PCAOB.
We conducted our audits of these financial statements in accordance with the standards of the PCAOB. Those standards require that we plan and perform the audit to obtain reasonable assurance about whether the financial statements are free of material misstatement, whether due to error or fraud.
Our audits included performing procedures to assess the risks of material misstatement of the financial statements, whether due to error or fraud, and performing procedures that respond to those risks. Such procedures included examining, on a test basis, evidence regarding the amounts and disclosures in the financial statements. Our audits also included evaluating the accounting principles used and significant estimates made by management, as well as evaluating the overall presentation of the financial statements. Our procedures included confirmation of securities owned as of October 31, 2022 by correspondence with the custodian and brokers; when replies were not received from brokers, we performed other auditing procedures. We believe that our audits provide a reasonable basis for our opinion.
/s/ PricewaterhouseCoopers LLP
Boston, Massachusetts
December 15, 2022
We have served as the auditor of one or more investment companies in the Fidelity group of funds since 1932.
The Trustees, Members of the Advisory Board (if any), and officers of the trust and fund, as applicable, are listed below. The Board of Trustees governs the fund and is responsible for protecting the interests of shareholders. The Trustees are experienced executives who meet periodically throughout the year to oversee the fund's activities, review contractual arrangements with companies that provide services to the fund, oversee management of the risks associated with such activities and contractual arrangements, and review the fund's performance. Except for Jonathan Chiel, each of the Trustees oversees 293 funds. Mr. Chiel oversees 184 funds.
The Trustees hold office without limit in time except that (a) any Trustee may resign; (b) any Trustee may be removed by written instrument, signed by at least two-thirds of the number of Trustees prior to such removal; (c) any Trustee who requests to be retired or who has become incapacitated by illness or injury may be retired by written instrument signed by a majority of the other Trustees; and (d) any Trustee may be removed at any special meeting of shareholders by a two-thirds vote of the outstanding voting securities of the trust. Each Trustee who is not an interested person (as defined in the 1940 Act) of the trust and the fund is referred to herein as an Independent Trustee. Each Independent Trustee shall retire not later than the last day of the calendar year in which his or her 75th birthday occurs. The Independent Trustees may waive this mandatory retirement age policy with respect to individual Trustees. Officers and Advisory Board Members hold office without limit in time, except that any officer or Advisory Board Member may resign or may be removed by a vote of a majority of the Trustees at any regular meeting or any special meeting of the Trustees. Except as indicated, each individual has held the office shown or other offices in the same company for the past five years.
The fund's Statement of Additional Information (SAI) includes more information about the Trustees. To request a free copy, call Fidelity at 1-800-544-3455.
Experience, Skills, Attributes, and Qualifications of the Trustees. The Governance and Nominating Committee has adopted a statement of policy that describes the experience, qualifications, attributes, and skills that are necessary and desirable for potential Independent Trustee candidates (Statement of Policy). The Board believes that each Trustee satisfied at the time he or she was initially elected or appointed a Trustee, and continues to satisfy, the standards contemplated by the Statement of Policy. The Governance and Nominating Committee also engages professional search firms to help identify potential Independent Trustee candidates who have the experience, qualifications, attributes, and skills consistent with the Statement of Policy. From time to time, additional criteria based on the composition and skills of the current Independent Trustees, as well as experience or skills that may be appropriate in light of future changes to board composition, business conditions, and regulatory or other developments, have also been considered by the professional search firms and the Governance and Nominating Committee. In addition, the Board takes into account the Trustees' commitment and participation in Board and committee meetings, as well as their leadership of standing and ad hoc committees throughout their tenure.
In determining that a particular Trustee was and continues to be qualified to serve as a Trustee, the Board has considered a variety of criteria, none of which, in isolation, was controlling. The Board believes that, collectively, the Trustees have balanced and diverse experience, qualifications, attributes, and skills, which allow the Board to operate effectively in governing the fund and protecting the interests of shareholders. Information about the specific experience, skills, attributes, and qualifications of each Trustee, which in each case led to the Board's conclusion that the Trustee should serve (or continue to serve) as a trustee of the fund, is provided below.
Board Structure and Oversight Function. Abigail P. Johnson is an interested person and currently serves as Chairman. The Trustees have determined that an interested Chairman is appropriate and benefits shareholders because an interested Chairman has a personal and professional stake in the quality and continuity of services provided to the fund. Independent Trustees exercise their informed business judgment to appoint an individual of their choosing to serve as Chairman, regardless of whether the Trustee happens to be independent or a member of management. The Independent Trustees have determined that they can act independently and effectively without having an Independent Trustee serve as Chairman and that a key structural component for assuring that they are in a position to do so is for the Independent Trustees to constitute a substantial majority for the Board. The Independent Trustees also regularly meet in executive session. Michael E. Kenneally serves as Chairman of the Independent Trustees and as such (i) acts as a liaison between the Independent Trustees and management with respect to matters important to the Independent Trustees and (ii) with management prepares agendas for Board meetings.
Fidelity ® funds are overseen by different Boards of Trustees. The fund's Board oversees Fidelity's investment-grade bond, money market, asset allocation and certain equity funds, and other Boards oversee Fidelity's high income and other equity funds. The asset allocation funds may invest in Fidelity ® funds that are overseen by such other Boards. The use of separate Boards, each with its own committee structure, allows the Trustees of each group of Fidelity ® funds to focus on the unique issues of the funds they oversee, including common research, investment, and operational issues. On occasion, the separate Boards establish joint committees to address issues of overlapping consequences for the Fidelity ® funds overseen by each Board.
The Trustees operate using a system of committees to facilitate the timely and efficient consideration of all matters of importance to the Trustees, the fund, and fund shareholders and to facilitate compliance with legal and regulatory requirements and oversight of the fund's activities and associated risks. The Board, acting through its committees, has charged FMR and its affiliates with (i) identifying events or circumstances the occurrence of which could have demonstrably adverse effects on the fund's business and/or reputation; (ii) implementing processes and controls to lessen the possibility that such events or circumstances occur or to mitigate the effects of such events or circumstances if they do occur; and (iii) creating and maintaining a system designed to evaluate continuously business and market conditions in order to facilitate the identification and implementation processes described in (i) and (ii) above. Because the day-to-day operations and activities of the fund are carried out by or through FMR, its affiliates, and other service providers, the fund's exposure to risks is mitigated but not eliminated by the processes overseen by the Trustees. While each of the Board's committees has responsibility for overseeing different aspects of the fund's activities, oversight is exercised primarily through the Operations and Audit Committees. In addition, an ad hoc Board committee of Independent Trustees has worked with FMR to enhance the Board's oversight of investment and financial risks, legal and regulatory risks, technology risks, and operational risks, including the development of additional risk reporting to the Board. Appropriate personnel, including but not limited to the fund's Chief Compliance Officer (CCO), FMR's internal auditor, the independent accountants, the fund's Treasurer and portfolio management personnel, make periodic reports to the Board's committees, as appropriate, including an annual review of Fidelity's risk management program for the Fidelity ® funds. The responsibilities of each standing committee, including their oversight responsibilities, are described further under "Standing Committees of the Trustees."
Interested Trustees*:
Correspondence intended for a Trustee who is an interested person may be sent to Fidelity Investments, 245 Summer Street, Boston, Massachusetts 02210.
Name, Year of Birth; Principal Occupations and Other Relevant Experience+
Jonathan Chiel (1957)
Year of Election or Appointment: 2016
Trustee
Mr. Chiel also serves as Trustee of other Fidelity ® funds. Mr. Chiel is Executive Vice President and General Counsel for FMR LLC (diversified financial services company, 2012-present). Previously, Mr. Chiel served as general counsel (2004-2012) and senior vice president and deputy general counsel (2000-2004) for John Hancock Financial Services; a partner with Choate, Hall & Stewart (1996-2000) (law firm); and an Assistant United States Attorney for the United States Attorney's Office of the District of Massachusetts (1986-95), including Chief of the Criminal Division (1993-1995). Mr. Chiel is a director on the boards of the Boston Bar Foundation and the Maimonides School.
Abigail P. Johnson (1961)
Year of Election or Appointment: 2009
Trustee
Chairman of the Board of Trustees
Ms. Johnson also serves as Trustee of other Fidelity ® funds. Ms. Johnson serves as Chairman (2016-present), Chief Executive Officer (2014-present), and Director (2007-present) of FMR LLC (diversified financial services company), President of Fidelity Financial Services (2012-present) and President of Personal, Workplace and Institutional Services (2005-present). Ms. Johnson is Chairman and Director of Fidelity Management & Research Company LLC (investment adviser firm, 2011-present). Previously, Ms. Johnson served as Chairman and Director of FMR Co., Inc. (investment adviser firm, 2011-2019), Vice Chairman (2007-2016) and President (2013-2016) of FMR LLC, President and a Director of Fidelity Management & Research Company (2001-2005), a Trustee of other investment companies advised by Fidelity Management & Research Company, Fidelity Investments Money Management, Inc. (investment adviser firm), and FMR Co., Inc. (2001-2005), Senior Vice President of the Fidelity ® funds (2001-2005), and managed a number of Fidelity ® funds. Ms. Abigail P. Johnson and Mr. Arthur E. Johnson are not related.
Jennifer Toolin McAuliffe (1959)
Year of Election or Appointment: 2016
Trustee
Ms. McAuliffe also serves as Trustee of other Fidelity ® funds and as Trustee of Fidelity Charitable (2020-present). Previously, Ms. McAuliffe served as Co-Head of Fixed Income of Fidelity Investments Limited (now known as FIL Limited (FIL)) (diversified financial services company), Director of Research for FIL's credit and quantitative teams in London, Hong Kong and Tokyo and Director of Research for taxable and municipal bonds at Fidelity Investments Money Management, Inc. Ms. McAuliffe previously served as a member of the Advisory Board of certain Fidelity ® funds (2016). Ms. McAuliffe was previously a lawyer at Ropes & Gray LLP and currently serves as director or trustee of several not-for-profit entities.
* Determined to be an "Interested Trustee" by virtue of, among other things, his or her affiliation with the trust or various entities under common control with FMR.
+ The information includes the Trustee's principal occupation during the last five years and other information relating to the experience, attributes, and skills relevant to the Trustee's qualifications to serve as a Trustee, which led to the conclusion that the Trustee should serve as a Trustee for the fund.
Independent Trustees:
Correspondence intended for an Independent Trustee may be sent to Fidelity Investments, P.O. Box 55235, Boston, Massachusetts 02205-5235.
Name, Year of Birth; Principal Occupations and Other Relevant Experience+
Elizabeth S. Acton (1951)
Year of Election or Appointment: 2013
Trustee
Ms. Acton also serves as Trustee of other Fidelity ® funds. Prior to her retirement, Ms. Acton served as Executive Vice President, Finance (2011-2012), Executive Vice President, Chief Financial Officer (2002-2011) and Treasurer (2004-2005) of Comerica Incorporated (financial services). Prior to joining Comerica, Ms. Acton held a variety of positions at Ford Motor Company (1983-2002), including Vice President and Treasurer (2000-2002) and Executive Vice President and Chief Financial Officer of Ford Motor Credit Company (1998-2000). Ms. Acton currently serves as a member of the Board and Audit and Finance Committees of Beazer Homes USA, Inc. (homebuilding, 2012-present). Ms. Acton previously served as a member of the Advisory Board of certain Fidelity ® funds (2013-2016).
Ann E. Dunwoody (1953)
Year of Election or Appointment: 2018
Trustee
General Dunwoody also serves as Trustee of other Fidelity ® funds. General Dunwoody (United States Army, Retired) was the first woman in U.S. military history to achieve the rank of four-star general and prior to her retirement in 2012 held a variety of positions within the U.S. Army, including Commanding General, U.S. Army Material Command (2008-2012). General Dunwoody currently serves as President of First to Four LLC (leadership and mentoring services, 2012-present), a member of the Board and Nomination and Corporate Governance Committees of Kforce Inc. (professional staffing services, 2016-present) and a member of the Board of Automattic Inc. (software engineering, 2018-present). Previously, General Dunwoody served as a member of the Advisory Board and Nominating and Corporate Governance Committee of L3 Technologies, Inc. (communication, electronic, sensor and aerospace systems, 2013-2019) and a member of the Board and Audit and Sustainability and Corporate Responsibility Committees of Republic Services, Inc. (waste collection, disposal and recycling, 2013-2016). Ms. Dunwoody also serves on several boards for non-profit organizations, including as a member of the Board, Chair of the Nomination and Governance Committee and a member of the Audit Committee of Logistics Management Institute (consulting non-profit, 2012-present), a member of the Council of Trustees for the Association of the United States Army (advocacy non-profit, 2013-present), a member of the Board of Florida Institute of Technology (2015-present) and a member of the Board of ThanksUSA (military family education non-profit, 2014-present). General Dunwoody previously served as a member of the Advisory Board of certain Fidelity ® funds (2018).
John Engler (1948)
Year of Election or Appointment: 2014
Trustee
Mr. Engler also serves as Trustee of other Fidelity ® funds. Previously, Mr. Engler served as Governor of Michigan (1991-2003), President of the Business Roundtable (2011-2017) and interim President of Michigan State University (2018-2019). Mr. Engler currently serves as a member of the Board of Stride, Inc. (formerly K12 Inc.) (technology-based education company, 2012-present). Previously, Mr. Engler served as a member of the Board of Universal Forest Products (manufacturer and distributor of wood and wood-alternative products, 2003-2019) and Trustee of The Munder Funds (2003-2014). Mr. Engler previously served as a member of the Advisory Board of certain Fidelity ® funds (2014-2016).
Robert F. Gartland (1951)
Year of Election or Appointment: 2010
Trustee
Mr. Gartland also serves as Trustee of other Fidelity ® funds. Prior to his retirement, Mr. Gartland held a variety of positions at Morgan Stanley (financial services, 1979-2007), including Managing Director (1987-2007) and Chase Manhattan Bank (1975-1978). Mr. Gartland previously served as Chairman and an investor in Gartland & Mellina Group Corp. (consulting, 2009-2019), as a member of the Board of National Securities Clearing Corporation (1993-1996) and as Chairman of TradeWeb (2003-2004).
Arthur E. Johnson (1947)
Year of Election or Appointment: 2008
Trustee
Mr. Johnson also serves as Trustee of other Fidelity ® funds. Prior to his retirement, Mr. Johnson served as Senior Vice President of Corporate Strategic Development of Lockheed Martin Corporation (defense contractor, 1999-2009). Mr. Johnson currently serves as a member of the Board of Booz Allen Hamilton (management consulting, 2011-present). Mr. Johnson previously served as a member of the Board of Eaton Corporation plc (diversified power management, 2009-2019) and a member of the Board of AGL Resources, Inc. (holding company, 2002-2016). Mr. Johnson previously served as Chairman (2018-2021) and Vice Chairman (2015-2018) of the Independent Trustees of certain Fidelity® funds. Mr. Arthur E. Johnson is not related to Ms. Abigail P. Johnson.
Michael E. Kenneally (1954)
Year of Election or Appointment: 2009
Trustee
Chairman of the Independent Trustees
Mr. Kenneally also serves as Trustee of other Fidelity ® funds and was Vice Chairman (2018-2021) of the Independent Trustees of certain Fidelity ® funds. Prior to retirement in 2005, he was Chairman and Global Chief Executive Officer of Credit Suisse Asset Management, the worldwide fund management and institutional investment business of Credit Suisse Group. Previously, Mr. Kenneally was an Executive Vice President and the Chief Investment Officer for Bank of America. In this role, he was responsible for the investment management, strategy and products delivered to the bank's institutional, high-net-worth and retail clients. Earlier, Mr. Kenneally directed the organization's equity and quantitative research groups. He began his career as a research analyst and then spent more than a dozen years as a portfolio manager for endowments, pension plans and mutual funds. He earned the Chartered Financial Analyst (CFA) designation in 1991.
Marie L. Knowles (1946)
Year of Election or Appointment: 2001
Trustee
Ms. Knowles also serves as Trustee of other Fidelity ® funds. Prior to her retirement, Ms. Knowles held several positions at Atlantic Richfield Company (diversified energy), including Executive Vice President and Chief Financial Officer (1996-2000), Senior Vice President (1993-1996) and President of ARCO Transportation Company (pipeline and tanker operations, 1993-1996). Ms. Knowles currently serves as a member of the Board of the Santa Catalina Island Company (real estate, 2009-present), a member of the Investment Company Institute Board of Governors and a member of the Governing Council of the Independent Directors Council (2014-present). Ms. Knowles also serves as a member of the Advisory Board for the School of Engineering of the University of Southern California. Ms. Knowles previously served as a member of the Board of McKesson Corporation (healthcare service, 2002-2021). In addition, Ms. Knowles previously served as Chairman (2015-2018) and Vice Chairman (2012-2015) of the Independent Trustees of certain Fidelity ® funds.
Mark A. Murray (1954)
Year of Election or Appointment: 2016
Trustee
Mr. Murray also serves as Trustee of other Fidelity ® funds. Previously, Mr. Murray served as Co-Chief Executive Officer (2013-2016), President (2006-2013) and Vice Chairman (2013-2020) of Meijer, Inc. Mr. Murray serves as a member of the Board (2009-present) and Public Policy and Responsibility Committee (2009-present) and Chair of the Nuclear Review Committee (2019-present) of DTE Energy Company (diversified energy company). Mr. Murray previously served as a member of the Board of Spectrum Health (not-for-profit health system, 2015-2019) and as a member of the Board and Audit Committee and Chairman of the Nominating and Corporate Governance Committee of Universal Forest Products, Inc. (manufacturer and distributor of wood and wood-alternative products, 2004-2016). Mr. Murray also serves as a member of the Board of many community and professional organizations. Mr. Murray previously served as a member of the Advisory Board of certain Fidelity ® funds (2016).
+ The information includes the Trustee's principal occupation during the last five years and other information relating to the experience, attributes, and skills relevant to the Trustee's qualifications to serve as a Trustee, which led to the conclusion that the Trustee should serve as a Trustee for the fund.
Advisory Board Members and Officers:
Correspondence intended for a Member of the Advisory Board (if any) may be sent to Fidelity Investments, P.O. Box 55235, Boston, Massachusetts 02205-5235. Correspondence intended for an officer may be sent to Fidelity Investments, 245 Summer Street, Boston, Massachusetts 02210. Officers appear below in alphabetical order.
Name, Year of Birth; Principal Occupation
Laura M. Bishop (1961)
Year of Election or Appointment: 2022
Member of the Advisory Board
Ms. Bishop also serves as a Member of the Advisory Board of other funds. Prior to her retirement, Ms. Bishop held a variety of positions at United Services Automobile Association (2001-2020), including Executive Vice President and Chief Financial Officer (2014-2020) and Senior Vice President and Deputy Chief Financial Officer (2012-2014). Ms. Bishop currently serves as a member of the Audit Committee and Compensation and Personnel Committee (2021-present) of the Board of Directors of Korn Ferry (global organizational consulting).
Robert W. Helm (1957)
Year of Election or Appointment: 2021
Member of the Advisory Board
Mr. Helm also serves as a Member of the Advisory Board of other Fidelity® funds. Mr. Helm was formerly Deputy Chairman (2003-2020), partner (1991-2020) and an associate (1984-1991) of Dechert LLP (formerly Dechert Price & Rhoads). Mr. Helm currently serves on boards and committees of several not-for-profit organizations.
Craig S. Brown (1977)
Year of Election or Appointment: 2019
Assistant Treasurer
Mr. Brown also serves as an officer of other funds. Mr. Brown serves as Assistant Treasurer of FIMM, LLC (2021-present) and is an employee of Fidelity Investments (2013-present). Previously, Mr. Brown served as Assistant Treasurer of certain Fidelity ® funds (2019-2022).
John J. Burke III (1964)
Year of Election or Appointment: 2018
Chief Financial Officer
Mr. Burke also serves as Chief Financial Officer of other funds. Mr. Burke serves as Head of Investment Operations for Fidelity Fund and Investment Operations (2018-present) and is an employee of Fidelity Investments (1998-present). Previously Mr. Burke served as head of Asset Management Investment Operations (2012-2018).
David J. Carter (1973)
Year of Election or Appointment: 2020
Assistant Secretary
Mr. Carter also serves as Assistant Secretary of other funds. Mr. Carter serves as Senior Vice President, Deputy General Counsel (2022-present) and is an employee of Fidelity Investments (2005-present).
Jonathan Davis (1968)
Year of Election or Appointment: 2010
Assistant Treasurer
Mr. Davis also serves as an officer of other funds. Mr. Davis serves as Assistant Treasurer of FIMM, LLC (2021-present), FMR Capital, Inc. (2017-present), FD Funds GP LLC (2021-present), FD Funds Holding LLC (2021-present), and FD Funds Management LLC (2021-present); and is an employee of Fidelity Investments. Previously, Mr. Davis served as Vice President and Associate General Counsel of FMR LLC (diversified financial services company, 2003-2010).
Laura M. Del Prato (1964)
Year of Election or Appointment: 2018
President and Treasurer
Ms. Del Prato also serves as an officer of other funds. Ms. Del Prato serves as Assistant Treasurer of FIMM, LLC (2021-present) and is an employee of Fidelity Investments (2017-present). Previously, Ms. Del Prato served as President and Treasurer of The North Carolina Capital Management Trust: Cash Portfolio and Term Portfolio (2018-2020). Prior to joining Fidelity Investments, Ms. Del Prato served as a Managing Director and Treasurer of the JPMorgan Mutual Funds (2014-2017). Prior to JPMorgan, Ms. Del Prato served as a partner at Cohen Fund Audit Services (accounting firm, 2012-2013) and KPMG LLP (accounting firm, 2004-2012).
Colm A. Hogan (1973)
Year of Election or Appointment: 2016
Assistant Treasurer
Mr. Hogan also serves as an officer of other funds. Mr. Hogan serves as Assistant Treasurer of FIMM, LLC (2021-present) and FMR Capital, Inc. (2017-present) and is an employee of Fidelity Investments (2005-present). Previously, Mr. Hogan served as Deputy Treasurer of certain Fidelity ® funds (2016-2020) and Assistant Treasurer of certain Fidelity ® funds (2016-2018).
Cynthia Lo Bessette (1969)
Year of Election or Appointment: 2019
Secretary and Chief Legal Officer (CLO)
Ms. Lo Bessette also serves as an officer of other funds. Ms. Lo Bessette serves as CLO, Secretary, and Senior Vice President of Fidelity Management & Research Company LLC (investment adviser firm, 2019-present); CLO of Fidelity Management & Research (Hong Kong) Limited, FMR Investment Management (UK) Limited, and Fidelity Management & Research (Japan) Limited (investment adviser firms, 2019-present); Secretary of FD Funds GP LLC (2021-present), FD Funds Holding LLC (2021-present), FD Funds Management LLC (2021-present), and Fidelity Diversifying Solutions LLC (investment adviser firm, 2022-present); and Assistant Secretary of FIMM, LLC (2019-present). She is a Senior Vice President and Deputy General Counsel of FMR LLC (diversified financial services company, 2019-present), and is an employee of Fidelity Investments. Previously, Ms. Lo Bessette served as CLO, Secretary, and Senior Vice President of FMR Co., Inc. (investment adviser firm, 2019); Secretary of Fidelity SelectCo, LLC and Fidelity Investments Money Management, Inc. (investment adviser firms, 2019). Prior to joining Fidelity Investments, Ms. Lo Bessette was Executive Vice President, General Counsel (2016-2019) and Senior Vice President, Deputy General Counsel (2015-2016) of OppenheimerFunds (investment management company) and Deputy Chief Legal Officer (2013-2015) of Jennison Associates LLC (investment adviser firm).
Chris Maher (1972)
Year of Election or Appointment: 2013
Assistant Treasurer
Mr. Maher also serves as an officer of other funds. Mr. Maher serves as Assistant Treasurer of FIMM, LLC (2021-present) and FMR Capital, Inc. (2017-present), and is an employee of Fidelity Investments (2008-present). Previously, Mr. Maher served as Assistant Treasurer of certain funds (2013-2020); Vice President of Asset Management Compliance (2013), Vice President of the Program Management Group of FMR (investment adviser firm, 2010-2013), and Vice President of Valuation Oversight (2008-2010).
Jamie Pagliocco (1964)
Year of Election or Appointment: 2020
Vice President
Mr. Pagliocco also serves as Vice President of other funds. Mr. Pagliocco serves as President of Fixed Income (2020-present), and is an employee of Fidelity Investments (2001-present). Previously, Mr. Pagliocco served as Co-Chief Investment Officer - Bond (2017-2020), Global Head of Bond Trading (2016-2019), and as a portfolio manager.
Kenneth B. Robins (1969)
Year of Election or Appointment: 2020
Chief Compliance Officer
Mr. Robins also serves as an officer of other funds. Mr. Robins serves as Compliance Officer of Fidelity Management & Research Company LLC (investment adviser firm, 2016-present) and is an employee of Fidelity Investments (2004-present). Previously, Mr. Robins served as Compliance Officer of FMR Co., Inc. (investment adviser firm, 2016-2019), as Executive Vice President of Fidelity Investments Money Management, Inc. (investment adviser firm, 2013-2016) and served in other fund officer roles.
Brett Segaloff (1972)
Year of Election or Appointment: 2021
Anti-Money Laundering (AML) Officer
Mr. Segaloff also serves as an AML Officer of other funds and other related entities. He is Director, Anti-Money Laundering (2007-present) of FMR LLC (diversified financial services company) and is an employee of Fidelity Investments (1996-present).
Stacie M. Smith (1974)
Year of Election or Appointment: 2013
Assistant Treasurer
Ms. Smith also serves as an officer of other funds. Ms. Smith serves as Assistant Treasurer of FIMM, LLC (2021-present) and FMR Capital, Inc. (2017-present), is an employee of Fidelity Investments (2009-present), and has served in other fund officer roles. Prior to joining Fidelity Investments, Ms. Smith served as Senior Audit Manager of Ernst & Young LLP (accounting firm, 1996-2009). Previously, Ms. Smith served as Assistant Treasurer (2013-2019) and Deputy Treasurer (2013-2016) of certain Fidelity ® funds.
Jim Wegmann (1979)
Year of Election or Appointment: 2021
Deputy Treasurer
Mr. Wegmann also serves as an officer of other funds. Mr. Wegmann serves as Assistant Treasurer of FIMM, LLC (2021-present) and is an employee of Fidelity Investments (2011-present). Previously, Mr. Wegmann served as Assistant Treasurer of certain Fidelity ® funds (2019-2021).
As a shareholder, you incur two types of costs: (1) transaction costs, which may include sales charges (loads) on purchase payments or redemption proceeds, as applicable and (2) ongoing costs, which generally include management fees, distribution and/or service (12b-1) fees and other Fund expenses. This Example is intended to help you understand your ongoing costs (in dollars) of investing in a fund and to compare these costs with the ongoing costs of investing in other mutual funds.
| The Example is based on an investment of $1,000 invested at the beginning of the period and held for the entire period (May 1, 2022 to October 31, 2022). |
Actual Expenses
The first line of the accompanying table provides information about actual account values and actual expenses. You may use the information in this line, together with the amount you invested, to estimate the expenses that you paid over the period. Simply divide your account value by $1,000.00 (for example, an $8,600 account value divided by $1,000.00 = 8.6), then multiply the result by the number in the first line for a class/Fund under the heading entitled "Expenses Paid During Period" to estimate the expenses you paid on your account during this period. If any fund is a shareholder of any underlying mutual funds or exchange-traded funds (ETFs) (the Underlying Funds), such fund indirectly bears its proportional share of the expenses of the Underlying Funds in addition to the direct expenses incurred presented in the table. These fees and expenses are not included in the annualized expense ratio used to calculate the expense estimate in the table below.
Hypothetical Example for Comparison Purposes
The second line of the accompanying table provides information about hypothetical account values and hypothetical expenses based on the actual expense ratio and an assumed rate of return of 5% per year before expenses, which is not the actual return. The hypothetical account values and expenses may not be used to estimate the actual ending account balance or expenses you paid for the period. You may use this information to compare the ongoing costs of investing in the Fund and other funds. To do so, compare this 5% hypothetical example with the 5% hypothetical examples that appear in the shareholder reports of the other funds. If any fund is a shareholder of any Underlying Funds, such fund indirectly bears its proportional share of the expenses of the Underlying Funds in addition to the direct expenses as presented in the table. These fees and expenses are not included in the annualized expense ratio used to calculate the expense estimate in the table below.
Please note that the expenses shown in the table are meant to highlight your ongoing costs only and do not reflect any transaction costs. Therefore, the second line of the table is useful in comparing ongoing costs only, and will not help you determine the relative total costs of owning different funds. In addition, if these transactional costs were included, your costs would have been higher.
| | | | | Annualized Expense Ratio- A | | Beginning Account Value May 1, 2022 | | Ending Account Value October 31, 2022 | | Expenses Paid During Period- C May 1, 2022 to October 31, 2022 |
| | | | | | | | | | |
| Fidelity® SAI Emerging Markets Index Fund | | | | .08% | | | | | | |
| Actual | | | | | | $ 1,000 | | $ 812.20 | | $ .37 |
Hypothetical- B | | | | | | $ 1,000 | | $ 1,024.80 | | $ .41 |
| |
A Annualized expense ratio reflects expenses net of applicable fee waivers.
B 5% return per year before expenses
C Expenses are equal to the annualized expense ratio, multiplied by the average account value over the period, multiplied by 184/ 365 (to reflect the one-half year period). The fees and expenses of any Underlying Funds are not included in each annualized expense ratio.
The dividend and capital gains distributions for the fund(s) are available on Fidelity.com or Institutional.Fidelity.com .
The fund designates 41% and 56% of the dividends distributed on December 6, 2021, and December 29, 2021, respectively during the fiscal year as amounts which may be taken into account as a dividend for the purposes of the maximum rate under section 1(h)(11) of the Internal Revenue Code.
The amounts per share which represent income derived from sources within, and taxes paid to, foreign countries or possessions of the United States are as follows:
| Pay Date | Income | Taxes |
| | | |
| 12/06/21 | $0.4956 | $0.0466 |
| 12/29/21 | $0.0023 | $0.0000 |
| | | |
The fund will notify shareholders in January 2023 of amounts for use in preparing 2022 income tax returns.
Fidelity SAI Emerging Markets Index Fund
Each year, the Board of Trustees, including the Independent Trustees (together, the Board), votes on the renewal of the management contract with Fidelity Management & Research Company LLC (FMR) and the sub-advisory agreement (Sub-Advisory Agreement) for the fund with Geode Capital Management, LLC (Geode) (together, the Advisory Contracts). FMR and Geode are referred to herein as the Investment Advisers. The Board, assisted by the advice of fund counsel and Independent Trustees' counsel, requests and considers a broad range of information relevant to the renewal of the Advisory Contracts throughout the year.
The Board meets regularly and, at each of its meetings, covers an extensive agenda of topics and materials and considers factors that are relevant to its annual consideration of the renewal of the fund's Advisory Contracts, including the services and support provided to the fund and its shareholders. The Board has established four standing committees (Committees) - Operations, Audit, Fair Valuation, and Governance and Nominating - each composed of and chaired by Independent Trustees with varying backgrounds, to which the Board has assigned specific subject matter responsibilities in order to enhance effective decision-making by the Board. The Operations Committee, of which all the Independent Trustees are members, meets regularly throughout the year and requests, receives and considers, among other matters, information related to the annual consideration of the renewal of the fund's Advisory Contracts before making its recommendation to the Board. The Board also meets as needed to review matters specifically related to the Board's annual consideration of the renewal of the Advisory Contracts. Members of the Board may also meet from time to time with trustees of other Fidelity funds through joint ad hoc committees to discuss certain matters relevant to all of the Fidelity funds.
At its September 2022 meeting, the Board unanimously determined to renew the fund's Advisory Contracts. In reaching its determination, the Board considered all factors it believed relevant, including (i) the nature, extent, and quality of the services provided to the fund and its shareholders (including the investment performance of the fund); (ii) the competitiveness relative to peer funds of the fund's management fee and total expense ratio; (iii) the total costs of the services provided by and the profits realized by Fidelity and Geode from their respective relationships with the fund; and (iv) the extent to which, if any, economies of scale exist and are realized as the fund grows, and whether any economies of scale are appropriately shared with fund shareholders.
In considering whether to renew the Advisory Contracts for the fund, the Board reached a determination, with the assistance of fund counsel and Independent Trustees' counsel and through the exercise of its business judgment, that the renewal of the Advisory Contracts was in the best interests of the fund and its shareholders and that the compensation payable under the Advisory Contracts was fair and reasonable. The Board's decision to renew the Advisory Contracts was not based on any single factor, but rather was based on a comprehensive consideration of all the information provided to the Board at its meetings throughout the year. The Board, in reaching its determination to renew the Advisory Contracts, was aware that shareholders of the fund have a broad range of investment choices available to them, including a wide choice among funds offered by Fidelity's competitors, and that the fund's shareholders, who have the opportunity to review and weigh the disclosure provided by the fund in its prospectus and other public disclosures, have chosen to invest in this fund, which is part of the Fidelity family of funds.
Nature, Extent, and Quality of Services Provided . The Board considered staffing as it relates to the fund, including the backgrounds of investment personnel of Fidelity and Geode, and also considered the fund's investment objective, strategies, and related investment philosophy. The Independent Trustees also had discussions with senior management of Fidelity's investment operations and investment groups and with senior management of Geode. The Board considered the structure of the investment personnel compensation programs and whether the structures provide appropriate incentives to act in the best interests of the fund. The Board also considered the steps Fidelity and Geode had taken to ensure the continued provision of high quality services to the Fidelity funds throughout the COVID-19 pandemic, including the expansion of staff in client facing positions to maintain service levels in periods of high volumes and volatility.
The Trustees also discussed with representatives of Fidelity, at meetings throughout the year, Fidelity's role in, among other things, overseeing compliance with federal securities laws and other applicable requirements by Geode with respect to the fund and monitoring and overseeing the performance and investment capabilities of Geode. The Trustees considered that the Board had received from Fidelity periodic reports about its oversight and due diligence processes, as well as periodic reports regarding the performance of Geode.
The Board also considered the nature, extent and quality of services provided by Geode. The Trustees noted that under the Sub-Advisory Agreement, subject to oversight by Fidelity, Geode is responsible for, among other things, identifying investments and arranging for execution of portfolio transactions to implement the fund's investment strategy. In addition, the Trustees noted that Geode is responsible for providing such reporting as may be requested by Fidelity to fulfill its oversight responsibilities discussed above.
Resources Dedicated to Investment Management and Support Services . The Board reviewed the general qualifications and capabilities of Fidelity's and Geode's investment staffs, including their size, education, experience, and resources, as well as Fidelity's and Geode's approach to recruiting, managing, training, and compensating investment personnel. The Board noted the resources devoted to Fidelity's global investment organization and that Fidelity's and Geode's analysts have extensive resources, tools and capabilities that allow them to conduct quantitative and fundamental analysis, as well as credit analysis of issuers, counterparties, and guarantors. Further, the Board considered that Fidelity's and Geode's investment professionals have sufficient access to information and data so as to provide competitive investment results over time, and that those professionals also have access to sophisticated tools that permit them to assess portfolio construction and risk and performance attribution characteristics continuously. Additionally, in its deliberations, the Board considered Fidelity's and Geode's trading, risk management, compliance, cybersecurity, and technology and operations capabilities and resources, which are integral parts of the investment management process.
Shareholder and Administrative Services . The Board considered (i) the nature, extent, quality, and cost of advisory, administrative, and shareholder services performed by the Investment Advisers and their affiliates under the Advisory Contracts and by FMR's affiliates under separate agreements covering transfer agency, pricing and bookkeeping, and securities lending services for the fund; (ii) the nature and extent of the supervision of third party service providers, principally custodians, subcustodians, and pricing vendors; and (iii) the resources devoted to, and the record of compliance with, the fund's compliance policies and procedures. The Board also reviewed the allocation of fund brokerage, including allocations to brokers affiliated with the Investment Advisers.
The Board noted that the growth of fund assets over time across the complex allows Fidelity to reinvest in the development of services designed to enhance the value and convenience of the Fidelity funds as investment vehicles. These services include 24-hour access to account information and market information over the Internet and through telephone representatives, investor education materials and asset allocation tools. The Board also considered that it reviews customer service metrics such as telephone response times, continuity of services on the website and metrics addressing services at Fidelity Investor Centers.
Investment in a Large Fund Family . The Board considered the benefits to shareholders of investing in a Fidelity fund, including the benefits of investing in a fund that is part of a large family of funds offering a variety of investment disciplines and providing a large variety of mutual fund investor services. The Board noted that Fidelity had taken, or had made recommendations to the Board that resulted in the Fidelity funds taking, a number of actions over the previous year that benefited particular funds, including: (i) continuing to dedicate additional resources to Fidelity's investment research process, which includes meetings with management of issuers of securities in which the funds invest; (ii) continuing efforts to enhance Fidelity's global research capabilities; (iii) launching new funds, ETFs, and share classes with innovative structures, strategies and pricing and making other enhancements to meet investor needs; (iv) broadening eligibility requirements for certain funds and share classes; (v) reducing management fees and total expenses for certain funds and classes; (vi) lowering expenses for certain existing funds and classes by implementing or lowering expense caps; (vii) rationalizing product lines and gaining increased efficiencies from fund mergers and liquidations; (viii) continuing to develop, acquire and implement systems and technology to improve services to the funds and shareholders, strengthen information security, and increase efficiency; and (ix) continuing to implement enhancements to further strengthen Fidelity's product line to increase investors' probability of success in achieving their investment goals, including their retirement income goals.
Investment Performance . The Board considered whether the fund has operated in accordance with its investment objective, as well as its record of compliance with its investment restrictions and its performance history.
The Board took into account discussions that occur at Board meetings throughout the year with representatives of the Investment Advisers about fund investment performance. In this regard the Board noted that as part of regularly scheduled fund reviews and other reports to the Board on fund performance, the Board considers annualized return information for the fund for different time periods, measured against the securities market index the fund seeks to track. The Board also periodically considers the fund's tracking error versus its benchmark index.
In addition to reviewing absolute and relative fund performance, the Independent Trustees periodically consider the appropriateness of fund performance metrics in evaluating the results achieved. In general, the Independent Trustees believe that an index fund's performance should be evaluated based on gross performance (before fees and expenses but after transaction costs) compared to the fund's benchmark index, over appropriate time periods, taking into account relevant factors including the following: general market conditions; the characteristics of the fund's benchmark index; the extent to which statistical sampling is employed; any securities lending revenues; and fund cash flows and other factors. The Independent Trustees generally give greater weight to fund performance over longer time periods than over shorter time periods. Depending on the circumstances, the Independent Trustees may be satisfied with a fund's performance notwithstanding that it lags its benchmark index for certain periods.
The Independent Trustees recognize that shareholders evaluate performance on a net basis (after fees and expenses) over their own holding periods, for which one-, three-, and five-year periods are often used as a proxy. For this reason, the performance information reviewed by the Board also included net cumulative calendar year total return information for the fund and its benchmark index for the most recent one-, three, and five-year periods. No performance peer group information was considered by the Board as Fidelity advised the Board that the peer group, which is created by a third-party provider, includes a number of actively-managed funds. The Independent Trustees recognize that shareholders who are not investing through a tax-advantaged retirement account also consider tax consequences in evaluating performance.
Based on its review, the Board concluded that the nature, extent, and quality of services provided to the fund under the Advisory Contracts should continue to benefit the shareholders of the fund.
Competitiveness of Management Fee and Total Expense Ratio . The Board considered the fund's management fee and total expense ratio compared to selected groups of competitive funds and classes (referred to as "mapped groups" below) for the purpose of facilitating the Trustees' competitive analysis of management fees and total expenses. Fidelity creates "mapped groups" by combining similar investment objective categories (as classified by Lipper) that have comparable investment mandates. Combining funds with similar investment objective categories aids the Board's comparison of management fees and total expense ratios by broadening the competitive group used for such comparison.
Management Fee . The Board considered two proprietary management fee comparisons for the 12-month periods shown in basis points (BP) in the chart below. The group of Lipper funds used by the Board for management fee comparisons is referred to below as the "Total Mapped Group." The Total Mapped Group comparison focuses on a fund's standing in terms of gross management fees before expense reimbursements or caps relative to the total universe of funds with comparable investment mandates, regardless of whether their management fee structures also are comparable. Funds with comparable investment mandates offer exposure to similar types of securities. Funds with comparable management fee structures have similar management fee contractual arrangements (e.g., flat rate charged for advisory services, all-inclusive fee rate, etc.). "TMG %" represents the percentage of funds in the Total Mapped Group that had management fees that were lower than the fund's. For example, a hypothetical TMG % of 20% would mean that 80% of the funds in the Total Mapped Group had higher, and 20% had lower, management fees than the fund. The fund's actual TMG %s and the number of funds in the Total Mapped Group are in the chart below. The "Asset-Sized Peer Group" (ASPG) comparison focuses on a fund's standing relative to a subset of non-Fidelity funds within the Total Mapped Group that are similar in size and management fee structure. For example, if a fund is in the first quartile of the ASPG, the fund's management fee ranks in the least expensive or lowest 25% of funds in the ASPG. The ASPG represents at least 15% of the funds in the Total Mapped Group with comparable asset size and management fee structures, subject to a minimum of 50 funds (or all funds in the Total Mapped Group if fewer than 50). Additional information, such as the ASPG quartile in which the fund's management fee rate ranked, is also included in the chart and was considered by the Board.
The Board considered that, effective August 1, 2019, the fund's management fee rate was reduced from 0.09% to 0.075%. The Board considered that the chart below reflects the fund's lower management fee rate for 2019 as if the lower fee rate were in effect for the entire period.
The Board noted that the fund's management fee rate ranked below the median of its Total Mapped Group and below the median of its ASPG for 2021.
Based on its review, the Board concluded that the fund's management fee is fair and reasonable in light of the services that the fund receives and the other factors considered.
Total Expense Ratio . In its review of the fund's total expense ratio, the Board considered the fund's management fee rate as well as other fund expenses, such as custodial, legal, and audit fees. The Board also noted that Fidelity may agree to waive fees or reimburse expenses from time to time, and the extent to which, if any, it has done so for the fund. The fund is compared to those funds and classes in the Total Mapped Group (used by the Board for management fee comparisons) that have a similar sales load structure. The Board also considered a total expense ASPG comparison, which focuses on the total expenses of the fund relative to a subset of non-Fidelity funds within the similar sales load structure group that are similar in size and management fee structure. The total expense ASPG is limited to 15 larger and 15 smaller classes of different funds, where possible. The total expense ASPG comparison excludes performance adjustments and fund-paid 12b-1 fees to eliminate variability in expenses relating to these items.
The Board noted that the fund's total net expense ratio ranked below the similar sales load structure group competitive median for 2021 and below the ASPG competitive median for 2021.
The Board further considered that FMR has contractually agreed to reimburse the fund to the extent that total operating expenses, with certain exceptions, as a percentage of its average net assets, exceed 0.075% through February 28, 2023.
Fees Charged to Other Clients . The Board also considered fee structures and other information with respect to clients of Fidelity and Geode, such as other funds advised or subadvised by Fidelity or Geode, pension plan clients, and other institutional clients with similar mandates. The Board noted that a joint ad hoc committee created by it and the boards of other Fidelity funds periodically reviews and compares Fidelity's institutional investment advisory business with its business of providing services to the Fidelity funds and also noted the most recent findings of the committee. The Board noted that the committee's review included a consideration of the differences in services provided, fees charged, and costs incurred, as well as competition in the markets serving the different categories of clients.
Based on its review of total expense ratios and fees charged to other Fidelity clients, the Board concluded that the fund's total expense ratio was reasonable in light of the services that the fund and its shareholders receive and the other factors considered.
Costs of the Services and Profitability . The Board considered the revenues earned and the expenses incurred by Fidelity in conducting the business of developing, marketing, distributing, managing, administering and servicing the fund and servicing the fund's shareholders. The Board also considered the level of Fidelity's profits in respect of all the Fidelity funds.
On an annual basis, Fidelity presents to the Board information about the profitability of its relationships with the fund. Fidelity calculates profitability information for each fund, as well as aggregate profitability information for groups of Fidelity funds and all Fidelity funds, using a series of detailed revenue and cost allocation methodologies which originate with the books and records of Fidelity on which Fidelity's audited financial statements are based. The Audit Committee of the Board reviews any significant changes from the prior year's methodologies and the full Board approves such changes.
A public accounting firm has been engaged annually by the Board as part of the Board's assessment of Fidelity's profitability analysis. The engagement includes the review and assessment of the methodologies used by Fidelity in determining the revenues and expenses attributable to Fidelity's mutual fund business, and completion of agreed-upon procedures in respect of the mathematical accuracy of certain fund profitability information and its conformity to established allocation methodologies. After considering the reports issued under the engagement and information provided by Fidelity, the Board concluded that while other allocation methods may also be reasonable, Fidelity's profitability methodologies are reasonable in all material respects.
The Board also reviewed Fidelity's and Geode's non-fund businesses and potential indirect benefits such businesses may have received as a result of their association with Fidelity's mutual fund business (i.e., fall-out benefits) as well as cases where Fidelity's and Geode's affiliates may benefit from the funds' business. The Board considered areas where potential indirect benefits to the Fidelity funds from their relationships with Fidelity may exist. The Board's consideration of these matters was informed by the findings of a joint ad hoc committee created by it and the boards of other Fidelity funds to evaluate potential fall-out benefits.
The Board considered the costs of the services provided by and the profits realized by Fidelity in connection with the operation of the fund and was satisfied that the profitability was not excessive.
The Board also considered information regarding the profitability of Geode's relationship with the fund.
Economies of Scale . The Board considered whether there have been economies of scale in respect of the management of the Fidelity funds, whether the Fidelity funds (including the fund) have appropriately benefited from any such economies of scale, and whether there is potential for realization of any further economies of scale. The Board considered the extent to which the fund will benefit from economies of scale as assets grow through increased services to the fund, through waivers or reimbursements, or through fee or expense ratio reductions. The Board also noted that a committee (the Economies of Scale Committee) created by it and the boards of other Fidelity funds periodically analyzes whether Fidelity attains economies of scale in respect of the management and servicing of the Fidelity funds, whether the Fidelity funds have appropriately benefited from such economies of scale, and whether there is potential for realization of any further economies of scale.
The Board concluded, taking into account the analysis of the Economies of Scale Committee, that economies of scale, if any, are being appropriately shared between fund shareholders and Fidelity.
Additional Information Requested by the Board . In order to develop fully the factual basis for consideration of the Fidelity funds' advisory contracts, the Board requested and received additional information on certain topics, including: (i) Fidelity's fund profitability methodology, profitability trends for certain funds, the allocation of various costs to different funds, and the impact of certain factors on fund profitability results; (ii) portfolio manager changes that have occurred during the past year and the amount of the investment that each portfolio manager has made in the Fidelity fund(s) that he or she manages; (iii) the extent to which current market conditions have affected retention and recruitment of personnel; (iv) the arrangements with and compensation paid to certain fund sub-advisers on behalf of the Fidelity funds and the treatment of such compensation within Fidelity's fund profitability methodology; (v) the terms of the funds' various management fee structures, including the basic group fee and the terms of Fidelity's voluntary expense limitation arrangements; (vi) Fidelity's transfer agent, pricing and bookkeeping fees, expense and service structures for different funds and classes relative to competitive trends; (vii) the impact on fund profitability of recent industry trends, such as the growth in passively managed funds and the changes in flows for different types of funds; (viii) the types of management fee and total expense comparisons provided, and the challenges and limitations associated with such information; and (ix) explanations regarding the relative total expense ratios and management fees of certain funds and classes, total expense and management fee competitive trends, and methodologies for total expense and management fee competitive comparisons. In addition, the Board considered its discussions with Fidelity regarding Fidelity's efforts to maintain the continuous investment and shareholder services necessary for the funds during the current pandemic and economic circumstances.
Based on its evaluation of all of the conclusions noted above, and after considering all factors it believed relevant, the Board concluded that the advisory and sub-advisory fee arrangements are fair and reasonable and that the fund's Advisory Contracts should be renewed.
1.9879600.106
SV6-ANN-1222
Fidelity® Emerging Markets Index Fund
Fidelity® Global ex U.S. Index Fund
Annual Report
October 31, 2022
Contents
To view a fund's proxy voting guidelines and proxy voting record for the 12-month period ended June 30, visit http://www.fidelity.com/proxyvotingresults or visit the Securities and Exchange Commission's (SEC) web site at http://www.sec.gov.
You may also call 1-800-544-8544 to request a free copy of the proxy voting guidelines.
The funds or securities referred to herein are not sponsored, endorsed, or promoted by MSCI, and MSCI bears no liability with respect to any such funds or securities or any index on which such funds or securities are based. The prospectus contains a more detailed description of the limited relationship MSCI has with Fidelity and any related funds.
Standard & Poor's, S&P and S&P 500 are registered service marks of The McGraw-Hill Companies, Inc. and have been licensed for use by Fidelity Distributors Corporation.
Other third-party marks appearing herein are the property of their respective owners.
All other marks appearing herein are registered or unregistered trademarks or service marks of FMR LLC or an affiliated company. © 2022 FMR LLC. All rights reserved.
This report and the financial statements contained herein are submitted for the general information of the shareholders of the Funds. This report is not authorized for distribution to prospective investors in the Funds unless preceded or accompanied by an effective prospectus.
A fund files its complete schedule of portfolio holdings with the SEC for the first and third quarters of each fiscal year on Form N-PORT. Forms N-PORT are available on the SEC's web site at http://www.sec.gov. A fund's Forms N-PORT may be reviewed and copied at the SEC's Public Reference Room in Washington, DC. Information regarding the operation of the SEC's Public Reference Room may be obtained by calling 1-800-SEC-0330.
For a complete list of a fund's portfolio holdings, view the most recent holdings listing, semiannual report, or annual report on Fidelity's web site at http://www.fidelity.com, http://www.institutional.fidelity.com, or http://www.401k.com, as applicable.
NOT FDIC INSURED •MAY LOSE VALUE •NO BANK GUARANTEE
Neither the Funds nor Fidelity Distributors Corporation is a bank.
Average annual total return reflects the change in the value of an investment, assuming reinvestment of distributions from dividend income and capital gains (the profits earned upon the sale of securities that have grown in value, if any) and assuming a constant rate of performance each year. The hypothetical investment and the average annual total returns do not reflect the deduction of taxes that a shareholder would pay on fund distributions or the redemption of fund shares. During periods of reimbursement by Fidelity, a fund's total return will be greater than it would be had the reimbursement not occurred. How a fund did yesterday is no guarantee of how it will do tomorrow.
| Average Annual Total Returns |
| | | | |
Periods ended October 31, 2022 | Past 1 year | Past 5 years | Past 10 years |
| Fidelity® Emerging Markets Index Fund | -30.81% | -3.27% | 0.76% |
| $10,000 Over 10 Years |
| |
Let's say hypothetically that $10,000 was invested in Fidelity® Emerging Markets Index Fund on October 31, 2012. The chart shows how the value of your investment would have changed, and also shows how the MSCI Emerging Markets Index performed over the same period. |
|
|
Fidelity® Emerging Markets Index Fund
Market Recap:
International equities returned -24.61% for the 12 months ending October 31, 2022, according to the MSCI ACWI (All Country World Index) ex USA Index. After gaining 7.98% in 2021, non-U.S. stocks retreated in the new year, as a multitude of risk factors challenged the global economy and financial markets. Persistently high inflation in some markets, exacerbated by energy price shocks from the Russia-Ukraine conflict, spurred the U.S. Federal Reserve and other central banks to aggressively tighten monetary policy, and market interest rates eclipsed their highest level in roughly a decade, stoking recession fears and sending stocks into bear market territory. Other factors influencing equities abroad included surging global commodity prices, rising sovereign bond yields in some markets, ongoing global supply-chain disruption, a broadly strong U.S. dollar and the potential for variants of the coronavirus to upend global economic growth. Against this backdrop, the index returned -24.20% year to date through October. For the full 12 months, emerging markets (-31%) and Europe ex U.K. (-25%) notably lagged. Conversely, Canada (-13%) and the U.K. (-12%) held up best. Among the 11 sectors, information technology and consumer discretionary (-37% each) fared worst. Communication services (-34%) also trailed the broader market. In contrast, energy gained 2% amid high prices for oil and natural gas. The defensive-oriented utilities (-16%) sector also outperformed, as did financials and consumer staples (-18% each).
Comments from the Geode Capital Management, LLC, passive equity index team:
For the fiscal year ending October 31, 2022, the fund returned -30.81%, compared with the -31.01% result of the benchmark MSCI Emerging Markets (Net MA) index . (The fund's relative performance was affected by differing methodologies (fund versus index) for valuing certain foreign stocks and for incorporating foreign exchange rates, as well as by required local capital gains tax.) By region, Emerging Asia returned -34.38% and detracted most, followed by Emerging Europe. By sector, stocks in the consumer discretionary sector returned -47% and detracted most, followed by information technology, which returned -35%. Communication services returned about -46% and financials detracted -14%, especially in the banks industry (-9%). Materials (-22%) and health care (-37%) hampered results. Other notable detractors included the consumer staples (-21%) and energy (-18%) sectors. Industrials (-17%), real estate (-40%), and utilities (-5%) also hurt. In contrast, Latin America gained 18% and contributed most, followed by the Middle East (+4%). Turning to individual stocks, the biggest individual detractor was Taiwan Semiconductor (-42%), from the semiconductors & semiconductor equipment industry. Tencent Holdings, within the media & entertainment group, returned -56% and hindered the fund. In retailing, Alibaba Group Holding (-63%) and Meituan (-54%) hurt. Another detractor was Samsung Electronics (-29%), a stock in the technology hardware & equipment segment. In contrast, the biggest individual contributor was Petroleo Brasileiro (+101%), also known as Petrobras, from the energy sector. In materials, Saudi Arabian Mining Company (+105%) and Vale (+12%) helped. Itau Unibanco Holding, within the banks category, advanced roughly 47% and lifted the fund. Another contributor was Adani Total Gas (+127%), a stock in the utilities sector.
The views expressed above reflect those of the portfolio manager(s) only through the end of the period as stated on the cover of this report and do not necessarily represent the views of Fidelity or any other person in the Fidelity organization. Any such views are subject to change at any time based upon market or other conditions and Fidelity disclaims any responsibility to update such views. These views may not be relied on as investment advice and, because investment decisions for a Fidelity fund are based on numerous factors, may not be relied on as an indication of trading intent on behalf of any Fidelity fund.
Fidelity® Emerging Markets Index Fund
Top Holdings (% of Fund's net assets) |
| |
| Taiwan Semiconductor Manufacturing Co. Ltd. (Taiwan, Semiconductors & Semiconductor Equipment) | 5.2 | |
| Samsung Electronics Co. Ltd. (Korea (South), Technology Hardware, Storage & Peripherals) | 3.5 | |
| Tencent Holdings Ltd. (Cayman Islands, Interactive Media & Services) | 2.9 | |
| Alibaba Group Holding Ltd. (Cayman Islands, Internet & Direct Marketing Retail) | 2.1 | |
| Reliance Industries Ltd. (India, Oil, Gas & Consumable Fuels) | 1.6 | |
| Meituan Class B (Cayman Islands, Internet & Direct Marketing Retail) | 1.2 | |
| Infosys Ltd. (India, IT Services) | 1.1 | |
| ICICI Bank Ltd. (India, Banks) | 1.0 | |
| Vale SA (Brazil, Metals & Mining) | 0.9 | |
| Housing Development Finance Corp. Ltd. (India, Diversified Financial Services) | 0.9 | |
| | 20.4 | |
| |
| Market Sectors (% of Fund's net assets) |
| |
| Financials | 23.7 | |
| Information Technology | 18.3 | |
| Consumer Discretionary | 11.6 | |
| Materials | 8.5 | |
| Communication Services | 8.1 | |
| Consumer Staples | 6.9 | |
| Energy | 6.0 | |
| Industrials | 5.7 | |
| Health Care | 3.9 | |
| Utilities | 3.3 | |
| Real Estate | 1.5 | |
| |
Asset Allocation (% of Fund's net assets) |
|
Foreign investments - 96.9% |
|
Geographic Diversification (% of Fund's net assets) |
|
* Includes Short-Term investments and Net Other Assets (Liabilities). Percentages are based on country or territory of incorporation and are adjusted for the effect of futures contracts, if applicable. |
| |
Fidelity® Emerging Markets Index Fund
Showing Percentage of Net Assets
| Common Stocks - 94.9% |
| | | Shares | Value ($) |
| Bermuda - 0.5% | | | |
| Alibaba Health Information Technology Ltd. (a) | | 4,346,000 | 1,838,135 |
| Alibaba Pictures Group Ltd. (a) | | 11,450,000 | 423,012 |
| Beijing Enterprises Water Group Ltd. | | 3,844,000 | 808,011 |
| China Gas Holdings Ltd. | | 2,740,000 | 2,429,459 |
| China Resource Gas Group Ltd. | | 845,300 | 2,164,495 |
| China Ruyi Holdings Ltd. (a) | | 4,424,000 | 693,218 |
| Cosco Shipping Ports Ltd. | | 1,780,977 | 878,049 |
| Credicorp Ltd. | | 5,134 | 748,537 |
| Credicorp Ltd. (United States) | | 60,633 | 8,874,246 |
| Hopson Development Holdings Ltd. | | 736,452 | 591,064 |
| Kunlun Energy Co. Ltd. | | 3,576,000 | 2,136,584 |
| Nine Dragons Paper (Holdings) Ltd. | | 1,547,000 | 916,417 |
| Orient Overseas International Ltd. | | 120,500 | 1,760,760 |
| Shenzhen International Holdings Ltd. | | 1,105,336 | 743,495 |
TOTAL BERMUDA | | | 25,005,482 |
| Brazil - 4.6% | | | |
| Ambev SA | | 4,292,300 | 13,295,286 |
| Americanas SA | | 581,011 | 1,747,926 |
| Atacadao SA | | 441,000 | 1,661,380 |
| B3 SA - Brasil Bolsa Balcao | | 5,577,542 | 16,239,712 |
| Banco Bradesco SA | | 1,454,780 | 4,686,388 |
| Banco BTG Pactual SA unit | | 1,087,200 | 6,091,098 |
| Banco do Brasil SA | | 792,700 | 5,681,106 |
| Banco Santander SA (Brasil) unit | | 345,300 | 1,990,714 |
| BB Seguridade Participacoes SA | | 644,200 | 3,702,700 |
| BRF SA (a) | | 562,736 | 1,368,302 |
| CCR SA | | 1,150,200 | 2,885,798 |
| Centrais Eletricas Brasileiras SA (Electrobras) | | 989,265 | 9,541,222 |
| Companhia de Saneamento Basico do Estado de Sao Paulo (SABESP) | | 312,200 | 3,632,411 |
| Companhia Siderurgica Nacional SA (CSN) | | 604,800 | 1,437,798 |
| Cosan SA | | 1,126,996 | 3,678,473 |
| CPFL Energia SA | | 217,700 | 1,492,776 |
| Energisa SA unit | | 186,900 | 1,754,483 |
| ENGIE Brasil Energia SA | | 178,150 | 1,387,125 |
| Equatorial Energia SA | | 930,200 | 5,407,784 |
| Hapvida Participacoes e Investimentos SA (b) | | 4,247,344 | 6,413,568 |
| Hypera SA | | 380,000 | 3,737,838 |
| Itausa-Investimentos Itau SA | | 41,542 | 87,017 |
| JBS SA | | 718,500 | 3,471,834 |
| Klabin SA unit | | 688,600 | 2,882,109 |
| Localiza Rent a Car SA | | 2,087 | 28,500 |
| Localiza Rent a Car SA | | 680,342 | 9,290,741 |
| Lojas Renner SA | | 894,698 | 5,352,080 |
| Magazine Luiza SA | | 2,758,524 | 2,387,107 |
| Natura & Co. Holding SA (a) | | 816,490 | 2,363,087 |
| Petro Rio SA (a) | | 646,200 | 4,427,261 |
| Petroleo Brasileiro SA - Petrobras (ON) | | 3,319,297 | 21,372,533 |
| Raia Drogasil SA | | 967,000 | 4,925,326 |
| Rede D'Oregon Sao Luiz SA (b) | | 369,400 | 2,300,571 |
| Rumo SA | | 1,189,800 | 5,099,636 |
| Suzano Papel e Celulose SA | | 692,317 | 7,130,242 |
| Telefonica Brasil SA | | 456,400 | 3,649,963 |
| TIM SA | | 761,600 | 1,946,205 |
| Totvs SA | | 481,800 | 3,092,922 |
| Ultrapar Participacoes SA | | 682,300 | 1,771,299 |
| Vale SA | | 3,661,107 | 47,579,153 |
| Vibra Energia SA | | 1,056,091 | 3,731,228 |
| Weg SA | | 1,524,864 | 11,890,722 |
TOTAL BRAZIL | | | 242,613,424 |
| British Virgin Islands - 0.0% | | | |
| Tianhe Chemicals Group Ltd. (a)(c) | | 376,000 | 0 |
| VK Co. Ltd. unit (a)(c) | | 100,000 | 44,550 |
TOTAL BRITISH VIRGIN ISLANDS | | | 44,550 |
| Cayman Islands - 13.5% | | | |
| 3SBio, Inc. (b) | | 1,272,500 | 898,085 |
| AAC Technology Holdings, Inc. (a) | | 679,000 | 1,243,779 |
| Airtac International Group | | 128,551 | 2,949,332 |
| Alibaba Group Holding Ltd. (a) | | 13,901,940 | 108,086,287 |
| Anta Sports Products Ltd. | | 1,115,800 | 9,808,106 |
| Autohome, Inc. ADR Class A | | 68,531 | 1,790,030 |
| Baidu, Inc. Class A (a) | | 2,018,152 | 19,348,031 |
| BeiGene Ltd. ADR (a)(d) | | 43,010 | 7,263,959 |
| Bilibili, Inc. Class Z (a) | | 168,532 | 1,501,855 |
| Bosideng International Holdings Ltd. | | 2,926,000 | 1,263,641 |
| Chailease Holding Co. Ltd. | | 1,257,102 | 5,807,286 |
| China Conch Venture Holdings Ltd. | | 1,497,500 | 2,209,149 |
| China Feihe Ltd. (b) | | 3,204,000 | 1,844,933 |
| China Hongqiao Group Ltd. | | 2,102,500 | 1,491,904 |
| China Huishan Dairy Holdings Co. Ltd. (a)(c) | | 888,000 | 1 |
| China Liansu Group Holdings Ltd. | | 1,020,000 | 827,731 |
| China Literature Ltd. (a)(b) | | 385,200 | 1,037,878 |
| China Medical System Holdings Ltd. | | 1,214,000 | 1,325,407 |
| China Meidong Auto Holding Ltd. | | 500,000 | 657,354 |
| China Mengniu Dairy Co. Ltd. | | 2,890,000 | 9,259,457 |
| China Overseas Property Holdings Ltd. | | 1,230,000 | 774,073 |
| China Resources Cement Holdings Ltd. | | 2,146,000 | 776,422 |
| China Resources Land Ltd. | | 2,938,744 | 9,209,723 |
| China Resources Microelectronics Ltd. (A Shares) | | 62,086 | 430,689 |
| China Resources Mixc Lifestyle Services Ltd. (b) | | 618,800 | 1,813,125 |
| China State Construction International Holdings Ltd. | | 1,845,000 | 1,659,399 |
| ChinaSoft International Ltd. | | 2,492,000 | 1,650,825 |
| CIFI Holdings Group Co. Ltd. (c) | | 3,886,485 | 257,460 |
| Country Garden Holdings Co. Ltd. | | 7,414,958 | 954,069 |
| Country Garden Services Holdings Co. Ltd. | | 1,858,000 | 1,623,751 |
| Dali Foods Group Co. Ltd. (b) | | 1,799,000 | 740,258 |
| Daqo New Energy Corp. ADR (a) | | 54,975 | 2,418,350 |
| Dongyue Group Co. Ltd. | | 1,311,000 | 1,139,034 |
| ENN Energy Holdings Ltd. | | 723,700 | 7,195,835 |
| GDS Holdings Ltd. Class A (a) | | 799,792 | 892,689 |
| Geely Automobile Holdings Ltd. | | 5,502,000 | 5,915,790 |
| Genscript Biotech Corp. (a) | | 1,054,000 | 2,663,986 |
| Greentown China Holdings Ltd. | | 802,000 | 763,211 |
| Greentown Service Group Co. Ltd. | | 1,292,000 | 529,991 |
| H World Group Ltd. ADR | | 176,124 | 4,769,438 |
| Haidilao International Holding Ltd. (a)(b)(d) | | 1,011,000 | 1,501,756 |
| Haitian International Holdings Ltd. | | 574,000 | 1,149,514 |
| Hansoh Pharmaceutical Group Co. Ltd. (b) | | 1,068,000 | 1,649,011 |
| Hengan International Group Co. Ltd. | | 575,500 | 2,232,453 |
| HUTCHMED China Ltd. sponsored ADR (a)(d) | | 80,514 | 711,744 |
| Hygeia Healthcare Holdings Co. (a)(b) | | 306,400 | 1,327,142 |
| Innovent Biologics, Inc. (a)(b) | | 939,000 | 3,325,524 |
| iQIYI, Inc. ADR (a)(d) | | 322,810 | 652,076 |
| JD Health International, Inc. (a)(b) | | 1,024,450 | 5,618,413 |
| JD.com, Inc. Class A | | 1,975,457 | 35,974,099 |
| Jinxin Fertility Group Ltd. (b) | | 1,409,000 | 694,659 |
| Jiumaojiu International Holdings Ltd. (b)(d) | | 655,000 | 1,028,020 |
| JOYY, Inc. ADR | | 43,781 | 1,104,595 |
| Kanzhun Ltd. ADR (a) | | 168,113 | 1,837,475 |
| KE Holdings, Inc. ADR (a) | | 609,305 | 6,202,725 |
| Kingboard Chemical Holdings Ltd. | | 610,500 | 1,505,708 |
| Kingboard Laminates Holdings Ltd. | | 880,000 | 702,910 |
| Kingdee International Software Group Co. Ltd. (a) | | 2,398,000 | 3,922,509 |
| Kingsoft Corp. Ltd. | | 876,000 | 2,650,437 |
| Kuaishou Technology Class B (a)(b) | | 1,599,500 | 6,581,676 |
| Li Ning Co. Ltd. | | 2,152,500 | 11,133,172 |
| Longfor Properties Co. Ltd. (b) | | 1,681,000 | 2,141,497 |
| Lufax Holding Ltd. ADR | | 627,439 | 997,628 |
| Meituan Class B (a)(b) | | 4,033,600 | 64,580,138 |
| Microport Scientific Corp. (a) | | 572,400 | 1,209,021 |
| Ming Yuan Cloud Group Holdings Ltd. | | 644,000 | 296,171 |
| Minth Group Ltd. | | 686,000 | 1,354,583 |
| NetEase, Inc. | | 1,898,450 | 21,063,784 |
| New Oriental Education & Technology Group, Inc. (a) | | 1,407,510 | 3,295,896 |
| NIO, Inc. sponsored ADR (a) | | 1,253,696 | 12,123,240 |
| Parade Technologies Ltd. | | 69,000 | 1,302,815 |
| Pinduoduo, Inc. ADR (a) | | 463,095 | 25,391,499 |
| Ping An Healthcare and Technology Co. Ltd. (a)(b)(d) | | 473,200 | 872,897 |
| Pop Mart International Group Ltd. (b)(d) | | 501,400 | 648,975 |
| RLX Technology, Inc. ADR (a)(d) | | 436,045 | 545,056 |
| Sany Heavy Equipment International Holdings Co. Ltd. | | 960,000 | 787,602 |
| Seazen Group Ltd. (a) | | 1,830,000 | 293,746 |
| Shenzhou International Group Holdings Ltd. | | 754,500 | 5,238,496 |
| Silergy Corp. | | 294,000 | 3,409,066 |
| Sino Biopharmaceutical Ltd. | | 9,497,000 | 4,609,578 |
| Smoore International Holdings Ltd. (b) | | 1,697,000 | 1,805,170 |
| Sunny Optical Technology Group Co. Ltd. | | 651,300 | 5,646,235 |
| TAL Education Group ADR (a) | | 413,189 | 1,946,120 |
| Tencent Holdings Ltd. | | 5,720,100 | 150,305,889 |
| Tencent Music Entertainment Group ADR (a) | | 649,730 | 2,345,525 |
| Tingyi (Cayman Islands) Holding Corp. | | 1,804,000 | 2,822,179 |
| Tongcheng Travel Holdings Ltd. (a) | | 1,090,800 | 1,700,890 |
| Topsports International Holdings Ltd. (b) | | 1,649,000 | 831,889 |
| Trip.com Group Ltd. ADR (a) | | 498,495 | 11,280,942 |
| Uni-President China Holdings Ltd. | | 1,132,000 | 836,419 |
| Vinda International Holdings Ltd. | | 340,000 | 637,583 |
| Vipshop Holdings Ltd. ADR (a) | | 400,025 | 2,788,174 |
| Want Want China Holdings Ltd. | | 4,370,000 | 2,872,638 |
| Weibo Corp. sponsored ADR (a) | | 67,012 | 758,576 |
| Wuxi Biologics (Cayman), Inc. (a)(b) | | 3,277,500 | 14,747,578 |
| Xiaomi Corp. Class B (a)(b) | | 13,960,800 | 15,668,807 |
| Xinyi Solar Holdings Ltd. | | 4,461,498 | 4,427,595 |
| XPeng, Inc. ADR (a)(d) | | 386,976 | 2,561,781 |
| XTEP International Holdings Ltd. | | 1,191,500 | 1,092,889 |
| Yadea Group Holdings Ltd. (b) | | 1,118,000 | 1,706,272 |
| Yihai International Holding Ltd. | | 420,000 | 691,292 |
| Zai Lab Ltd. ADR (a) | | 81,156 | 1,808,156 |
| Zhen Ding Technology Holding Ltd. | | 626,000 | 2,057,295 |
| Zhongsheng Group Holdings Ltd. Class H | | 544,000 | 2,065,213 |
| ZTO Express, Inc. sponsored ADR | | 385,021 | 6,503,005 |
TOTAL CAYMAN ISLANDS | | | 706,367,741 |
| Chile - 0.4% | | | |
| Banco de Chile | | 42,068,389 | 3,847,463 |
| Banco de Credito e Inversiones | | 51,705 | 1,440,725 |
| Banco Santander Chile | | 60,527,382 | 2,168,337 |
| Cencosud SA | | 1,266,356 | 1,704,581 |
| Compania Cervecerias Unidas SA | | 109,094 | 598,369 |
| Compania Sud Americana de Vapores SA | | 14,564,732 | 1,011,118 |
| Empresas CMPC SA | | 1,059,270 | 1,680,686 |
| Empresas COPEC SA | | 367,389 | 2,531,811 |
| Enel Americas SA | | 19,848,074 | 1,966,506 |
| Enel Chile SA | | 26,168,411 | 920,817 |
| Falabella SA | | 710,721 | 1,389,654 |
TOTAL CHILE | | | 19,260,067 |
| China - 11.1% | | | |
| 360 Security Technology, Inc. (A Shares) | | 412,800 | 400,200 |
| 37 Interactive Entertainment Network Technology Group Co. Ltd. (A Shares) | | 123,000 | 244,050 |
| A-Living Smart City Services C (H Shares) (b) | | 599,000 | 339,576 |
| Advanced Micro-Fabrication Equipment, Inc., China (A Shares) (a) | | 35,037 | 532,495 |
| AECC Aero-Engine Control Co. Ltd. (A Shares) | | 76,100 | 312,616 |
| AECC Aviation Power Co. Ltd. | | 151,800 | 1,011,044 |
| Agricultural Bank of China Ltd.: | | | |
| (A Shares) | | 5,390,700 | 2,037,318 |
| (H Shares) | | 25,770,000 | 7,355,621 |
| Aier Eye Hospital Group Co. Ltd. (A Shares) | | 397,857 | 1,345,639 |
| Air China Ltd.: | | | |
| (A Shares) (a) | | 192,000 | 254,233 |
| (H Shares) (a) | | 1,950,000 | 1,356,366 |
| Aluminum Corp. of China Ltd.: | | | |
| (A shares) | | 912,000 | 482,044 |
| (H Shares) | | 3,104,000 | 884,894 |
| Amlogic Shanghai Co. Ltd. (A Shares) (a) | | 23,243 | 182,560 |
| Angel Yeast Co. Ltd. (A Shares) | | 45,600 | 225,911 |
| Anhui Conch Cement Co. Ltd.: | | | |
| (A Shares) | | 273,300 | 908,642 |
| (H Shares) | | 1,019,000 | 2,622,257 |
| Anhui Gujing Distillery Co. Ltd.: | | | |
| (A Shares) | | 18,900 | 509,994 |
| (B Shares) | | 97,000 | 1,143,415 |
| Anhui Honglu Steel Construction Group Co. Ltd. | | 38,910 | 181,579 |
| Anhui Kouzi Distillery Co. Ltd. (A Shares) | | 32,700 | 181,346 |
| Anhui Yingjia Distillery Co. Ltd. (A Shares) | | 38,400 | 247,661 |
| Anjoy Foods Group Co. Ltd. (A Shares) | | 16,700 | 307,181 |
| Apeloa Pharmaceutical Co. Ltd. A Shares | | 63,400 | 180,748 |
| Asia - Potash International Investment Guangzhou Co. Ltd. (A Shares) (a) | | 52,400 | 182,968 |
| Asymchem Laboratories Tianjin Co. Ltd. (A Shares) | | 19,140 | 375,283 |
| Avary Holding Shenzhen Co. Ltd. (A Shares) | | 107,800 | 439,147 |
| AVIC Capital Co. Ltd. (A Shares) | | 479,100 | 198,780 |
| AVIC Electromechanical Systems Co. Ltd. (A Shares) | | 221,100 | 354,225 |
| AviChina Industry & Technology Co. Ltd. (H Shares) | | 2,143,000 | 939,140 |
| Avicopter PLC (A Shares) | | 34,000 | 204,385 |
| Bank of Beijing Co. Ltd. (A Shares) | | 1,208,380 | 668,482 |
| Bank of Changsha Co. Ltd. (A Shares) | | 238,800 | 210,584 |
| Bank of Chengdu Co. Ltd. (A Shares) | | 208,300 | 388,482 |
| Bank of China Ltd.: | | | |
| (A Shares) | | 2,434,600 | 1,003,457 |
| (H Shares) | | 72,199,000 | 23,253,668 |
| Bank of Communications Co. Ltd.: | | | |
| (A Shares) | | 2,292,700 | 1,397,050 |
| (H Shares) | | 7,909,000 | 3,858,958 |
| Bank of Hangzhou Co. Ltd. (A Shares) | | 339,020 | 562,178 |
| Bank of Jiangsu Co. Ltd. (A Shares) | | 825,700 | 782,408 |
| Bank of Nanjing Co. Ltd. (A Shares) | | 585,200 | 826,968 |
| Bank of Ningbo Co. Ltd. (A Shares) | | 371,980 | 1,210,238 |
| Bank of Shanghai Co. Ltd. (A Shares) | | 815,377 | 623,013 |
| Baoshan Iron & Steel Co. Ltd. (A Shares) | | 1,265,600 | 833,578 |
| BBMG Corp.: | | | |
| (A Shares) | | 438,700 | 139,968 |
| (H Shares) | | 129,000 | 13,311 |
| Beijing Capital International Airport Co. Ltd. (H Shares) (a) | | 1,760,000 | 952,909 |
| Beijing Dabeinong Technology Group Co. Ltd. (A Shares) (a) | | 232,300 | 291,373 |
| Beijing Easpring Material Technology Co. Ltd. (A Shares) | | 27,700 | 223,750 |
| Beijing Enlight Media Co. Ltd. (A Shares) | | 167,700 | 154,544 |
| Beijing Kingsoft Office Software, Inc. (A Shares) | | 26,219 | 1,043,820 |
| Beijing New Building Materials PLC (A Shares) | | 91,600 | 248,727 |
| Beijing Originwater Technology Co. Ltd. (A Shares) | | 196,700 | 126,862 |
| Beijing Roborock Technology Co. Ltd. (A Shares) | | 5,210 | 167,667 |
| Beijing Shiji Information Technology Co. Ltd. (A Shares) | | 101,920 | 176,405 |
| Beijing Shunxin Agriculture Co. Ltd. | | 39,900 | 111,785 |
| Beijing Sinnet Technology Co. Ltd. (A Shares) | | 96,400 | 114,314 |
| Beijing Tiantan Biological Products Corp. Ltd. (A Shares) | | 91,740 | 259,659 |
| Beijing Tongrentang Co. Ltd. (A Shares) | | 78,300 | 522,686 |
| Beijing United Information Technology Co. Ltd. (A Shares) | | 27,535 | 467,532 |
| Beijing Wantai Biological Pharmacy Enterprise Co. Ltd. (A Shares) | | 34,605 | 594,780 |
| Beijing Yuanliu Hongyuan Electronic Technology Co. Ltd. (A Shares) | | 13,300 | 209,110 |
| Beijing-Shanghai High Speed Railway Co. Ltd. (A Shares) | | 2,324,600 | 1,419,671 |
| Betta Pharmaceuticals Co. Ltd. (A Shares) | | 22,000 | 137,701 |
| BGI Genomics Co. Ltd. | | 22,100 | 167,863 |
| Bloomage Biotechnology Corp. Ltd. (A Shares) | | 17,713 | 257,076 |
| BOC International China Co. Ltd. | | 160,000 | 230,265 |
| BOE Technology Group Co. Ltd. (A Shares) | | 2,121,300 | 970,182 |
| BTG Hotels Group Co. Ltd. | | 62,300 | 185,376 |
| By-Health Co. Ltd. (A Shares) | | 90,900 | 218,073 |
| BYD Co. Ltd.: | | | |
| (A Shares) | | 104,800 | 3,539,829 |
| (H Shares) | | 746,500 | 16,709,032 |
| Caitong Securities Co. Ltd. | | 249,990 | 244,756 |
| CanSino Biologics, Inc.: | | | |
| (A Shares) | | 9,667 | 251,044 |
| (H Shares) (b)(d) | | 65,400 | 608,205 |
| CECEP Solar Energy Co. Ltd. (A Shares) | | 232,900 | 215,586 |
| CECEP Wind-Power Corp. (A Shares) | | 282,700 | 165,682 |
| CGN Power Co. Ltd. (H Shares) (b) | | 8,886,000 | 1,799,920 |
| Chacha Food Co. Ltd. (A Shares) | | 15,100 | 91,350 |
| Changchun High & New Technology Industry Group, Inc. (A Shares) | | 22,800 | 505,459 |
| Changjiang Securities Co. Ltd. (A Shares) | | 299,000 | 213,311 |
| Changzhou Xingyu Automotive Lighting Systems Co. Ltd. (A Shares) | | 15,800 | 264,902 |
| Chaozhou Three-Circle Group Co. (A Shares) | | 108,700 | 422,720 |
| Chengtun Mining Group Co. Ltd. (A Shares) | | 186,600 | 141,555 |
| Chengxin Lithium Group Co. Ltd. (A Shares) | | 47,700 | 282,298 |
| Chifeng Jilong Gold Mining Co. Ltd. (A Shares) (a) | | 91,900 | 236,832 |
| China Baoan Group Co. Ltd. (A Shares) | | 139,700 | 221,136 |
| China Cinda Asset Management Co. Ltd. (H Shares) | | 8,339,000 | 775,508 |
| China CITIC Bank Corp. Ltd.: | | | |
| (A Shares) | | 74,600 | 44,231 |
| (H Shares) | | 8,085,000 | 3,048,747 |
| China Coal Energy Co. Ltd. (H Shares) | | 1,864,000 | 1,372,535 |
| China Communications Services Corp. Ltd. (H Shares) | | 2,088,000 | 582,538 |
| China Construction Bank Corp.: | | | |
| (A Shares) | | 954,700 | 698,092 |
| (H Shares) | | 87,560,000 | 46,467,081 |
| China CSSC Holdings Ltd. (A Shares) | | 251,400 | 912,943 |
| China Eastern Airlines Corp. Ltd. (A Shares) (a) | | 526,100 | 345,791 |
| China Energy Engineering Corp. Ltd. (A Shares) | | 1,859,400 | 583,060 |
| China Everbright Bank Co. Ltd.: | | | |
| (A Shares) | | 2,206,400 | 821,784 |
| (H Shares) | | 2,924,000 | 756,176 |
| China Galaxy Securities Co. Ltd.: | | | |
| (A Shares) | | 154,700 | 190,862 |
| (H Shares) | | 3,387,000 | 1,268,564 |
| China Great Wall Securities Co. Ltd. (A Shares) | | 195,000 | 215,750 |
| China Greatwall Technology Group Co. Ltd. (A Shares) | | 186,200 | 284,288 |
| China International Capital Corp. Ltd. | | 69,800 | 331,084 |
| China International Capital Corp. Ltd. (H Shares) (b) | | 1,366,400 | 1,900,860 |
| China Jushi Co. Ltd. (A Shares) | | 231,404 | 370,733 |
| China Life Insurance Co. Ltd.: | | | |
| (A Shares) | | 124,700 | 454,206 |
| (H Shares) | | 6,881,000 | 7,503,439 |
| China Longyuan Power Grid Corp. Ltd. (H Shares) | | 3,051,000 | 3,486,457 |
| China Meheco Co. Ltd. (A Shares) | | 79,760 | 137,832 |
| China Merchants Bank Co. Ltd.: | | | |
| (A Shares) | | 1,035,000 | 3,801,052 |
| (H Shares) | | 3,658,846 | 12,025,788 |
| China Merchants Energy Shipping Co. Ltd. (A Shares) | | 459,100 | 438,172 |
| China Merchants Securities Co. Ltd. (A Shares) | | 418,600 | 716,496 |
| China Merchants Shekou Industrial Zone Holdings Co. Ltd. (A Shares) | | 450,000 | 807,830 |
| China Minmetals Rare Earth Co. Ltd. (A Shares) (a) | | 58,200 | 229,839 |
| China Minsheng Banking Corp. Ltd.: | | | |
| (A Shares) | | 2,498,800 | 1,129,146 |
| (H Shares) | | 4,549,040 | 1,321,309 |
| China National Building Materials Co. Ltd. (H Shares) | | 3,566,000 | 2,071,552 |
| China National Chemical Engineering Co. Ltd. (A Shares) | | 346,900 | 335,837 |
| China National Nuclear Power Co. Ltd. (A Shares) | | 1,083,200 | 894,398 |
| China Northern Rare Earth Group High-Tech Co. Ltd. | | 207,400 | 687,272 |
| China Oilfield Services Ltd. (H Shares) | | 1,616,000 | 1,819,882 |
| China Pacific Insurance (Group) Co. Ltd. | | 286,000 | 745,263 |
| China Pacific Insurance (Group) Co. Ltd. (H Shares) | | 2,514,600 | 4,055,574 |
| China Petroleum & Chemical Corp.: | | | |
| (A Shares) | | 2,981,800 | 1,661,795 |
| (H Shares) | | 21,635,000 | 8,574,523 |
| China Railway Group Ltd.: | | | |
| (A Shares) | | 1,028,200 | 702,559 |
| (H Shares) | | 3,997,000 | 1,736,354 |
| China Railway Signal & Communications Corp. (A Shares) | | 393,289 | 243,958 |
| China Resources Sanjiu Medical & Pharmaceutical Co. Ltd. (A Shares) | | 55,800 | 416,729 |
| China Shenhua Energy Co. Ltd.: | | | |
| (A Shares) | | 377,100 | 1,447,386 |
| (H Shares) | | 3,066,000 | 8,065,697 |
| China Southern Airlines Ltd.: | | | |
| (A Shares) (a) | | 327,100 | 289,346 |
| (H Shares) (a) | | 2,142,000 | 1,105,158 |
| China State Construction Engineering Corp. Ltd. (A Shares) | | 2,378,380 | 1,546,961 |
| China Suntien Green Energy Corp. Ltd. (H Shares) | | 1,649,000 | 626,018 |
| China Three Gorges Renewables Group Co. Ltd. (A Shares) | | 1,625,300 | 1,239,634 |
| China Tourism Group Duty Free Corp. Ltd. (A Shares) | | 110,800 | 2,432,991 |
| China Tower Corp. Ltd. (H Shares) (b) | | 40,184,000 | 3,634,638 |
| China United Network Communications Ltd. (A Shares) | | 1,789,100 | 823,149 |
| China Vanke Co. Ltd.: | | | |
| (A Shares) | | 610,900 | 1,130,971 |
| (H Shares) | | 1,457,800 | 1,872,010 |
| China Yangtze Power Co. Ltd. (A Shares) | | 1,294,600 | 3,591,532 |
| China Zhenhua (Group) Science & Technology Co. Ltd. (A Shares) | | 29,500 | 544,725 |
| China Zheshang Bank Co. Ltd. (a) | | 961,500 | 363,382 |
| Chongqing Brewery Co. Ltd. (A Shares) | | 27,800 | 332,782 |
| Chongqing Changan Automobile Co. Ltd. (A Shares) | | 468,876 | 724,864 |
| Chongqing Fuling Zhacai Group Co. Ltd. Group (A Shares) | | 47,300 | 145,795 |
| Chongqing Rural Commercial Bank Co. Ltd.: | | | |
| (A Shares) | | 186,800 | 89,270 |
| (H Shares) | | 151,000 | 45,783 |
| Chongqing Zhifei Biological Products Co. Ltd. (A Shares) | | 89,900 | 1,051,289 |
| CITIC Securities Co. Ltd.: | | | |
| (A Shares) | | 797,195 | 1,878,668 |
| (H Shares) | | 1,724,925 | 2,579,812 |
| Cmoc Group Ltd.: | | | |
| (A Shares) | | 707,700 | 402,163 |
| (H Shares) | | 3,612,000 | 1,164,174 |
| CNGR Advanced Material Co. Ltd. | | 22,500 | 222,230 |
| CNNC Hua Yuan Titanium Dioxide Co. Ltd. (A Shares) | | 160,620 | 146,920 |
| Contemporary Amperex Technology Co. Ltd. | | 132,100 | 6,744,916 |
| COSCO Shipping Development Co. Ltd. (A Shares) | | 568,000 | 189,777 |
| COSCO Shipping Energy Transportation Co. Ltd.: | | | |
| (A Shares) (a) | | 95,800 | 221,827 |
| (H Shares) (a) | | 324,000 | 236,097 |
| COSCO SHIPPING Holdings Co. Ltd.: | | | |
| (A Shares) | | 577,110 | 887,448 |
| (H Shares) | | 3,026,050 | 3,265,196 |
| CRRC Corp. Ltd.: | | | |
| (A Shares) | | 1,304,500 | 848,481 |
| (H Shares) | | 3,907,000 | 1,184,595 |
| CSC Financial Co. Ltd. (A Shares) | | 246,100 | 795,632 |
| Daan Gene Co. Ltd. | | 83,796 | 205,161 |
| Daqin Railway Co. Ltd. (A Shares) | | 841,600 | 738,701 |
| DaShenLin Pharmaceutical Group Co. Ltd. | | 54,356 | 271,300 |
| DHC Software Co. Ltd. (A Shares) | | 185,700 | 156,892 |
| Do-Fluoride New Materials Co. Ltd. (A Shares) | | 42,300 | 180,428 |
| Dong-E-E-Jiao Co. Ltd. (A Shares) | | 38,900 | 199,962 |
| Dongfang Electric Corp. Ltd. (A Shares) | | 157,400 | 500,247 |
| Dongfeng Motor Group Co. Ltd. (H Shares) | | 2,700,000 | 1,221,074 |
| Dongxing Securities Co. Ltd. (A Shares) | | 175,700 | 186,938 |
| East Money Information Co. Ltd. (A Shares) | | 753,098 | 1,609,752 |
| Ecovacs Robotics Co. Ltd. Class A | | 32,900 | 262,645 |
| ENN Natural Gas Co. Ltd. (A Shares) | | 132,900 | 281,709 |
| Eve Energy Co. Ltd. (A shares) | | 107,755 | 1,225,263 |
| Everbright Securities Co. Ltd. (A Shares) | | 223,100 | 428,304 |
| Fangda Carbon New Material Co. Ltd. (A Shares) (a) | | 229,581 | 188,936 |
| FAW Jiefang Group Co. Ltd. (A Shares) | | 177,500 | 169,166 |
| Fiberhome Telecommunication Technologies Co. Ltd. (A Shares) | | 62,500 | 117,933 |
| First Capital Securities Co. Ltd. (A Shares) | | 228,500 | 173,654 |
| Flat Glass Group Co. Ltd. | | 255,000 | 597,084 |
| Flat Glass Group Co. Ltd. (A Shares) (a) | | 161,000 | 756,179 |
| Focus Media Information Technology Co. Ltd. (A Shares) | | 826,220 | 506,849 |
| Foshan Haitian Flavouring & Food Co. Ltd. (A Shares) | | 219,364 | 1,792,664 |
| Founder Securities Co. Ltd. (A Shares) | | 470,300 | 407,646 |
| Foxconn Industrial Internet Co. Ltd. (A Shares) | | 554,696 | 622,836 |
| Fujian Sunner Development Co. Ltd. A Shares | | 68,700 | 206,583 |
| Fuyao Glass Industries Group Co. Ltd.: | | | |
| (A Shares) | | 171,100 | 783,233 |
| (H Shares) (b) | | 475,600 | 1,705,572 |
| G-bits Network Technology Xiamen Co. Ltd. (A Shares) | | 3,900 | 135,992 |
| Ganfeng Lithium Group Co. Ltd. (A Shares) | | 119,100 | 1,288,705 |
| GCL System Integration Technology Co. Ltd. (a) | | 338,600 | 151,614 |
| GD Power Development Co. Ltd. (A Shares) (a) | | 1,025,400 | 613,592 |
| GEM Co. Ltd. (A Shares) | | 277,600 | 282,811 |
| Gemdale Corp. (A Shares) | | 251,800 | 269,629 |
| GF Securities Co. Ltd.: | | | |
| (A Shares) | | 238,600 | 445,319 |
| (H Shares) | | 1,169,600 | 1,190,512 |
| Giant Network Group Co. Ltd. (A Shares) | | 120,600 | 127,818 |
| Gigadevice Semiconductor Beijing, Inc. (A Shares) | | 38,184 | 430,158 |
| Ginlong Technologies Co. Ltd. (A Shares) | | 21,050 | 538,435 |
| GoerTek, Inc. (A Shares) | | 192,300 | 570,878 |
| Gotion High-tech Co. Ltd. (A Shares) | | 95,400 | 392,552 |
| Great Wall Motor Co. Ltd.: | | | |
| (A Shares) | | 139,600 | 557,414 |
| (H Shares) | | 2,844,500 | 3,105,535 |
| Gree Electric Appliances, Inc. of Zhuhai (A Shares) | | 161,100 | 632,452 |
| GRG Banking Equipment Co. Ltd. (A Shares) | | 148,100 | 191,034 |
| Guangdong Haid Group Co. Ltd. (A Shares) | | 94,400 | 746,498 |
| Guangdong Kinlong Hardware Products Co. Ltd. (A Shares) | | 18,300 | 198,514 |
| Guanghui Energy Co. Ltd. (A Shares) | | 371,200 | 522,523 |
| Guangzhou Automobile Group Co. Ltd. | | 362,400 | 562,241 |
| Guangzhou Automobile Group Co. Ltd. (H Shares) | | 2,448,000 | 1,490,696 |
| Guangzhou Baiyunshan Pharma Health (A Shares) | | 82,400 | 304,533 |
| Guangzhou Haige Communications Group (A Shares) | | 121,300 | 140,353 |
| Guangzhou Kingmed Diagnostics Group Co. Ltd. (A Shares) | | 27,300 | 282,461 |
| Guangzhou Shiyuan Electronic Technology Co. Ltd. (A Shares) | | 35,800 | 318,935 |
| Guangzhou Tinci Materials Technology Co. Ltd. (A Shares) | | 109,500 | 637,247 |
| Guangzhou Yuexiu Financial Holdings Group Co. Ltd. (A Shares) | | 225,717 | 172,157 |
| Guolian Securities Co. Ltd. | | 127,900 | 163,752 |
| Guosen Securities Co. Ltd. (A Shares) | | 364,900 | 430,711 |
| Guotai Junan Securities Co. Ltd. (A Shares) | | 429,600 | 777,679 |
| Guoyuan Securities Co. Ltd. (A Shares) | | 234,910 | 201,042 |
| Haier Smart Home Co. Ltd. | | 2,174,800 | 5,441,398 |
| Haier Smart Home Co. Ltd. (A Shares) | | 271,600 | 773,567 |
| Haitong Securities Co. Ltd.: | | | |
| (A Shares) | | 326,300 | 377,107 |
| (H Shares) | | 3,072,400 | 1,502,999 |
| Hanergy Mobile Energy Holding (a)(c) | | 1,618,000 | 2 |
| Hangzhou First Applied Material Co. Ltd. (A Shares) | | 75,560 | 662,802 |
| Hangzhou Lion Electronics Co. Ltd. (A Shares) | | 38,700 | 226,915 |
| Hangzhou Oxygen Plant Group Co. Ltd. (A Shares) | | 53,800 | 310,074 |
| Hangzhou Robam Appliances Co. Ltd. (A Shares) | | 52,000 | 145,969 |
| Hangzhou Silan Microelectronics Co. Ltd. (A Shares) | | 80,800 | 347,413 |
| Hangzhou Tigermed Consulting Co. Ltd.: | | | |
| (A Shares) | | 30,000 | 342,398 |
| (H Shares) (b) | | 88,100 | 598,770 |
| Heilongjiang Agriculture Co. Ltd. (A Shares) | | 98,900 | 186,887 |
| Henan Shenhuo Coal & Power Co. Ltd. (A Shares) | | 127,500 | 244,947 |
| Henan Shuanghui Investment & Development Co. Ltd. (A Shares) | | 194,523 | 606,777 |
| Hengli Petrochemical Co. Ltd. (A Shares) | | 332,840 | 699,142 |
| Hengtong Optic-electric Co. Ltd. (A Shares) | | 130,600 | 347,830 |
| Hengyi Petrochemical Co. Ltd. (A Shares) | | 207,120 | 190,021 |
| Hesteel Co. Ltd. (A Shares) | | 613,100 | 182,178 |
| Hithink RoyalFlush Information Network Co. Ltd. (A Shares) | | 31,100 | 362,235 |
| Hongfa Technology Co. Ltd. (A Shares) | | 58,640 | 275,499 |
| Hoshine Silicon Industry Co. Ltd. (A Shares) | | 28,400 | 372,164 |
| Huadian Power International Corp. Ltd. (A Shares) | | 468,500 | 348,349 |
| Huadong Medicine Co. Ltd. (A Shares) | | 100,280 | 562,032 |
| Huafon Chemical Co. Ltd. (A Shares) | | 267,400 | 243,860 |
| Huagong Tech Co. Ltd. (A Shares) | | 54,300 | 124,692 |
| Huaibei Mining Holdings Co. Ltd. (A Shares) | | 140,000 | 249,791 |
| Hualan Biological Engineer, Inc. (A Shares) | | 100,160 | 243,169 |
| Huaneng Power International, Inc.: | | | |
| (A Shares) (a) | | 436,600 | 400,556 |
| (H Shares) (a) | | 3,802,000 | 1,361,031 |
| Huatai Securities Co. Ltd.: | | | |
| (A Shares) | | 228,600 | 374,693 |
| (H Shares) (b) | | 1,648,800 | 1,615,266 |
| HUAXI Securities Co. Ltd. | | 141,700 | 142,420 |
| Huaxia Bank Co. Ltd. (A Shares) | | 729,700 | 478,613 |
| Huaxin Cement Co. Ltd. (A Shares) | | 72,300 | 132,860 |
| Huayu Automotive Systems Co. Ltd. (A Shares) | | 181,700 | 417,246 |
| Hubei Xingfa Chemicals Group Co. Ltd. (A Shares) | | 63,300 | 245,038 |
| Huizhou Desay SV Automotive Co. Ltd. | | 31,400 | 445,445 |
| Humanwell Healthcare Group Co. Ltd. (A Shares) | | 93,600 | 256,721 |
| Hunan Valin Steel Co. Ltd. (A Shares) | | 395,300 | 216,517 |
| Hundsun Technologies, Inc. (A Shares) | | 106,652 | 608,697 |
| iFlytek Co. Ltd. (A Shares) | | 133,200 | 638,924 |
| IMEIK Technology Development Co. Ltd. (A Shares) | | 10,100 | 582,248 |
| Industrial & Commercial Bank of China Ltd.: | | | |
| (A Shares) | | 4,398,700 | 2,499,638 |
| (H Shares) | | 50,438,000 | 21,898,436 |
| Industrial Bank Co. Ltd. (A Shares) | | 1,187,300 | 2,443,566 |
| Industrial Securities Co. Ltd. (A Shares) (a) | | 392,510 | 292,922 |
| Ingenic Semiconductor Co. Ltd. (A Shares) | | 27,700 | 257,773 |
| Inner Mongoli Yili Industries Co. Ltd. (A Shares) | | 364,500 | 1,259,771 |
| Inner Mongolia Baotou Steel Union Co. Ltd. (A Shares) | | 2,596,900 | 625,853 |
| Inner Mongolia Dian Tou Energy Corp. Ltd. | | 104,200 | 176,214 |
| Inner Mongolia Eerduosi Resourses Co. Ltd. (A Shares) | | 67,600 | 128,852 |
| Inner Mongolia Junzheng Energy & Chemical Industry Group Co. Ltd. (A Shares) | | 476,300 | 253,056 |
| Inner Mongolia Yitai Coal Co. Ltd. (B Shares) | | 512,404 | 724,539 |
| Inner Mongolia Yuan Xing Energy Co. Ltd. (A Shares) | | 208,000 | 183,708 |
| Inspur Electronic Information Industry Co. Ltd. (A Shares) | | 85,996 | 271,074 |
| Intco Medical Technology Co. Ltd. (A Shares) | | 38,660 | 112,864 |
| JA Solar Technology Co. Ltd. (A Shares) | | 133,280 | 1,140,643 |
| Jafron Biomedical Co. Ltd. (A Shares) | | 45,890 | 199,071 |
| Jason Furniture Hangzhou Co. Ltd. (A Shares) | | 45,810 | 188,813 |
| JCET Group Co. Ltd. (A Shares) | | 101,900 | 335,997 |
| Jiangsu Eastern Shenghong Co. Ltd. | | 224,100 | 375,602 |
| Jiangsu Expressway Co. Ltd. (H Shares) | | 1,118,000 | 787,620 |
| Jiangsu Hengli Hydraulic Co. Ltd. | | 72,276 | 546,011 |
| Jiangsu Hengrui Medicine Co. Ltd. (A Shares) | | 360,275 | 1,983,192 |
| Jiangsu King's Luck Brewery JSC Ltd. (A Shares) | | 72,000 | 368,533 |
| Jiangsu Yanghe Brewery JSC Ltd. (A Shares) | | 85,600 | 1,531,397 |
| Jiangsu Yangnong Chemical Co. Ltd. (A Shares) | | 17,200 | 217,600 |
| Jiangsu Yoke Technology Co. Ltd. (A Shares) | | 25,100 | 202,095 |
| Jiangsu Yuyue Medical Equipment & Supply Co. Ltd. (A Shares) | | 57,900 | 258,068 |
| Jiangsu Zhongtian Technology Co. Ltd. (A Shares) | | 196,500 | 591,149 |
| Jiangxi Copper Co. Ltd.: | | | |
| (A Shares) | | 144,100 | 303,871 |
| (H Shares) | | 890,000 | 972,808 |
| Jiangxi Special Electric Motor Co. Ltd. (A Shares) (a) | | 99,100 | 258,915 |
| Jiangxi Zhengbang Technology Co. Ltd. (A Shares) (a) | | 168,700 | 80,851 |
| Jinke Properties Group Co. Ltd. (A Shares) (a) | | 289,200 | 70,093 |
| JiuGui Liquor Co. Ltd. (A Shares) | | 18,800 | 262,709 |
| Jizhong Energy Resources Co. Ltd. (A Shares) | | 199,900 | 166,426 |
| Joincare Pharmaceutical Group Industry Co. Ltd. (A Shares) | | 113,900 | 182,324 |
| Joinn Laboratories China Co. Ltd. (A Shares) | | 25,376 | 198,723 |
| Jointown Pharmaceutical Group (A Shares) | | 105,300 | 181,102 |
| Jonjee Hi-Tech Industrial & Commercial Holding Co. Ltd. (A Shares) | | 42,600 | 158,082 |
| Juewei Food Co. Ltd. | | 35,800 | 232,215 |
| Kangmei Pharmaceutical Co. Ltd. rights (a)(c) | | 10,350 | 0 |
| Keda Industrial Group Co. Ltd. | | 108,300 | 230,899 |
| Kingfa Sci & Tech Co. Ltd. (A Shares) | | 146,200 | 193,788 |
| Kuang-Chi Technologies Co. Ltd. (A Shares) (a) | | 126,600 | 299,906 |
| Kunlun Tech Co. Ltd. (A Shares) | | 71,600 | 127,554 |
| Kweichow Moutai Co. Ltd. (A Shares) | | 71,200 | 13,100,544 |
| Lb Group Co. Ltd. (A Shares) | | 129,873 | 273,336 |
| Lens Technology Co. Ltd. (A Shares) | | 283,500 | 386,649 |
| Lepu Medical Technology Beijing Co. Ltd. (A Shares) | | 103,500 | 358,421 |
| Liaoning Port Co. Ltd. (A Shares) | | 1,155,500 | 251,577 |
| Lingyi iTech Guangdong Co. (A Shares) (a) | | 404,300 | 261,860 |
| Livzon Pharmaceutical Group, Inc. (A Shares) | | 34,300 | 165,937 |
| LONGi Green Energy Technology Co. Ltd. | | 430,348 | 2,827,383 |
| Luoyang Xinqianglian Slewing Bearing Co. Ltd. (A Shares) | | 18,340 | 175,341 |
| Luxi Chemical Group Co. Ltd. | | 108,700 | 169,088 |
| Luxshare Precision Industry Co. Ltd. (A Shares) | | 399,728 | 1,559,962 |
| Luzhou Laojiao Co. Ltd. (A Shares) | | 83,600 | 1,789,818 |
| Maanshan Iron & Steel Co. Ltd. (A Shares) | | 347,000 | 119,739 |
| Mango Excellent Media Co. Ltd. (A Shares) | | 104,707 | 314,426 |
| Maxscend Microelectronics Co. Ltd. (A Shares) | | 30,476 | 385,431 |
| Meinian Onehealth Healthcare Holdings Co. Ltd. (A Shares) (a) | | 217,060 | 126,915 |
| Metallurgical Corp. China Ltd. (A Shares) | | 1,018,500 | 401,660 |
| Ming Yang Smart Energy Group Ltd. (A Shares) | | 119,200 | 406,425 |
| Montage Technology Co. Ltd. (A Shares) | | 64,432 | 500,605 |
| Muyuan Foodstuff Co. Ltd. (A Shares) | | 302,040 | 1,934,770 |
| Nanjing King-Friend Biochemical Pharmaceutical Co. Ltd. | | 89,535 | 199,473 |
| Nanjing Securities Co. Ltd. (A Shares) | | 198,300 | 215,056 |
| NARI Technology Co. Ltd. (A Shares) | | 380,412 | 1,271,009 |
| National Silicon Industry Group Co. Ltd. (A Shares) (a) | | 154,732 | 430,323 |
| NAURA Technology Group Co. Ltd. | | 30,000 | 1,091,484 |
| NavInfo Co. Ltd. (A Shares) | | 137,000 | 222,490 |
| New China Life Insurance Co. Ltd. | | 78,400 | 250,888 |
| New China Life Insurance Co. Ltd. (H Shares) | | 856,300 | 1,359,232 |
| New Hope Liuhe Co. Ltd. (A Shares) (a) | | 259,500 | 458,031 |
| Ninestar Corp. (A Shares) | | 80,500 | 629,525 |
| Ningbo Deye Technology Co. Ltd. (A Shares) | | 11,300 | 506,240 |
| Ningbo Joyson Electronic Corp. (A shares) (a) | | 78,000 | 163,949 |
| Ningbo Orient Wires & Cables Co. Ltd. (A Shares) | | 39,600 | 417,533 |
| Ningbo Ronbay New Energy Technology Co. Ltd. (A Shares) | | 24,867 | 266,652 |
| Ningbo Shanshan Co. Ltd. (A Shares) | | 119,300 | 293,721 |
| Ningbo Tuopu Group Co. Ltd. (A Shares) | | 62,700 | 556,349 |
| Ningxia Baofeng Energy Group Co. Ltd. | | 345,000 | 541,860 |
| Nongfu Spring Co. Ltd. (H Shares) (b) | | 1,596,200 | 8,022,025 |
| North Industries Group Red Arrow Co. Ltd. (A Shares) | | 79,700 | 224,272 |
| Northeast Securities Co. Ltd. (A Shares) | | 127,100 | 110,342 |
| Offshore Oil Enginering Co. Ltd. (A Shares) | | 231,900 | 149,246 |
| OFILM Group Co. Ltd. (A Shares) (a) | | 188,900 | 121,055 |
| Oppein Home Group, Inc. (A Shares) | | 28,660 | 319,530 |
| Orient Securities Co. Ltd. (A Shares) | | 430,808 | 457,773 |
| Ovctek China, Inc. (A Shares) | | 48,820 | 198,679 |
| Pangang Group Vanadium Titanium & Resources Co. Ltd. (A Shares) (a) | | 490,900 | 304,506 |
| People's Insurance Co. of China Group Ltd.: | | | |
| (A Shares) | | 212,200 | 140,926 |
| (H Shares) | | 7,896,000 | 2,182,813 |
| Perfect World Co. Ltd. (A Shares) | | 103,900 | 162,048 |
| PetroChina Co. Ltd.: | | | |
| (A Shares) | | 1,579,300 | 1,035,869 |
| (H Shares) | | 18,612,000 | 7,113,183 |
| Pharmaron Beijing Co. Ltd.: | | | |
| (A Shares) | | 45,350 | 322,913 |
| (H Shares) (b) | | 187,550 | 630,770 |
| PICC Property & Casualty Co. Ltd. (H Shares) | | 6,295,840 | 5,806,868 |
| Ping An Bank Co. Ltd. (A Shares) | | 1,097,800 | 1,554,349 |
| Ping An Insurance Group Co. of China Ltd.: | | | |
| (A Shares) | | 566,194 | 2,802,710 |
| (H Shares) | | 5,820,500 | 23,301,734 |
| Pingdingshan Tianan Coal Mining Co. Ltd. A Shares | | 130,300 | 196,621 |
| Poly Developments & Holdings (A Shares) | | 680,300 | 1,285,536 |
| Postal Savings Bank of China Co. Ltd. | | 1,272,300 | 675,968 |
| Postal Savings Bank of China Co. Ltd. (H Shares) (b) | | 7,382,000 | 3,423,144 |
| Power Construction Corp. of China Ltd. (A Shares) | | 868,900 | 837,620 |
| Proya Cosmetics Co. Ltd. (A Shares) | | 8,160 | 186,767 |
| Pylon Technologies Co. Ltd. (Series A) | | 8,800 | 371,743 |
| Qingdao Rural Commercial Bank Corp. (A Shares) | | 303,100 | 114,966 |
| Qinghai Salt Lake Potash Co. Ltd. Class A (a) | | 308,400 | 908,363 |
| Raytron Technology Co. Ltd. (A Shares) | | 24,210 | 157,634 |
| Riyue Heavy Industry Co. Ltd. (A Shares) | | 52,200 | 157,896 |
| Rongsheng Petrochemical Co. Ltd. (A Shares) | | 574,500 | 841,741 |
| SAIC Motor Corp. Ltd. (A Shares) | | 442,700 | 833,522 |
| Sailun Group Co. Ltd. A Shares | | 173,300 | 206,216 |
| Sangfor Technologies, Inc. | | 23,500 | 405,455 |
| Sany Heavy Industry Co. Ltd. (A Shares) | | 476,100 | 880,109 |
| Satellite Chemical Co. Ltd. (A Shares) | | 191,356 | 324,914 |
| SDIC Power Holdings Co. Ltd. (A Shares) | | 432,600 | 598,291 |
| Sealand Securities Co. Ltd. (A Shares) | | 296,200 | 131,818 |
| Seazen Holdings Co. Ltd. (A Shares) (a) | | 124,800 | 225,405 |
| SF Holding Co. Ltd. (A Shares) | | 277,200 | 1,831,830 |
| SG Micro Corp. (A Shares) | | 20,150 | 412,939 |
| Shaanxi Coal Industry Co. Ltd. (A Shares) | | 547,900 | 1,489,996 |
| Shan Xi Hua Yang Group New Energy Co. Ltd. | | 137,000 | 316,851 |
| Shandong Buchang Pharmaceuticals Co. Ltd. (A Shares) | | 62,243 | 163,472 |
| Shandong Gold Mining Co. Ltd.: | | | |
| (A Shares) | | 382,784 | 906,785 |
| (H Shares) (b) | | 368,500 | 586,810 |
| Shandong Hualu Hengsheng Chemical Co. Ltd. (A Shares) | | 116,420 | 417,351 |
| Shandong Linglong Tyre Co. Ltd. (A Shares) | | 83,400 | 186,947 |
| Shandong Nanshan Aluminum Co. Ltd. (A Shares) | | 689,400 | 290,755 |
| Shandong Sun Paper Industry JSC Ltd. (A Shares) | | 143,700 | 206,413 |
| Shandong Weigao Medical Polymer Co. Ltd. (H Shares) | | 2,256,800 | 3,110,785 |
| Shanghai Bairun Investment Holding Group Co. Ltd. (A Shares) | | 61,140 | 255,347 |
| Shanghai Baosight Software Co. Ltd. | | 266,037 | 801,569 |
| Shanghai Baosight Software Co. Ltd. (A Shares) | | 82,540 | 478,316 |
| Shanghai Construction Group Co. Ltd. (A Shares) | | 512,300 | 180,286 |
| Shanghai Electric Group Co. Ltd. (A Shares) (a) | | 726,000 | 385,721 |
| Shanghai Fosun Pharmaceutical (Group) Co. Ltd.: | | �� | |
| (A Shares) | | 104,800 | 473,996 |
| (H Shares) | | 471,000 | 1,189,253 |
| Shanghai Friendess Electronic Technology Corp. Ltd. (A Shares) | | 8,312 | 234,442 |
| Shanghai International Airport Co. Ltd. (A Shares) (a) | | 55,800 | 407,866 |
| Shanghai International Port Group Co. Ltd. (A Shares) | | 536,800 | 380,021 |
| Shanghai Jinjiang International Hotels Co. Ltd. (A Shares) | | 52,600 | 392,399 |
| Shanghai Junshi Biosciences Co. Ltd. (A Shares) (a) | | 38,637 | 375,953 |
| Shanghai Lingang Holdings Corp. Ltd. (A Shares) | | 128,060 | 201,308 |
| Shanghai Lujiazui Finance Trust Ltd. (B Shares) | | 995,203 | 738,441 |
| Shanghai M&G Stationery, Inc. (A Shares) | | 53,200 | 293,577 |
| Shanghai Medicilon, Inc. (A Shares) | | 4,952 | 150,257 |
| Shanghai Pharmaceuticals Holding Co. Ltd.: | | | |
| (A Shares) | | 151,500 | 364,700 |
| (H Shares) | | 697,400 | 945,308 |
| Shanghai Pudong Development Bank Co. Ltd. (A Shares) | | 1,666,100 | 1,514,865 |
| Shanghai Putailai New Energy Technology Co. Ltd. | | 77,924 | 532,554 |
| Shanghai RAAS Blood Products Co. Ltd. (A Shares) | | 384,400 | 286,343 |
| Shanghai Yuyuan Tourist Mart Group Co. Ltd. | | 224,200 | 192,490 |
| Shanghai Zhangjiang High Ltd. (A Shares) | | 84,400 | 130,017 |
| Shanxi Lu'an Environmental Energy Development Co. Ltd. (A Shares) | | 165,500 | 380,499 |
| Shanxi Meijin Energy Co. Ltd. (A Shares) | | 246,900 | 296,162 |
| Shanxi Securities Co. Ltd. (A Shares) | | 194,830 | 137,394 |
| Shanxi Taigang Stainless Steel Co. Ltd. (A Shares) | | 326,200 | 177,329 |
| Shanxi Xinghuacun Fen Wine Factory Co. Ltd. (A Shares) | | 69,340 | 2,206,415 |
| Shanxi Xishan Coal & Electricity Power Co. Ltd. (A Shares) | | 229,260 | 357,566 |
| Shenghe Resources Holding Co. Ltd. (A Shares) | | 99,300 | 181,660 |
| Shengyi Technology Co. Ltd. | | 120,300 | 228,479 |
| Shennan Circuits Co. Ltd. (A Shares) | | 27,540 | 283,097 |
| Shenwan Hongyuan Group Co. Ltd. (A Shares) | | 1,282,500 | 683,143 |
| Shenzhen Capchem Technology Co. Ltd. (A Shares) | | 42,580 | 210,891 |
| Shenzhen Dynanonic Co. Ltd. (A Shares) | | 9,900 | 349,751 |
| Shenzhen Energy Group Co. Ltd. (A Shares) | | 271,760 | 212,112 |
| Shenzhen Inovance Technology Co. Ltd. (A Shares) | | 150,050 | 1,370,460 |
| Shenzhen Kangtai Biological Products Co. Ltd. | | 64,900 | 276,560 |
| Shenzhen Kedali Industry Co. Ltd. | | 13,200 | 165,657 |
| Shenzhen Mindray Bio-Medical Electronics Co. Ltd. (A Shares) | | 68,800 | 3,065,943 |
| Shenzhen New Industries Biomedical Engineering Co. Ltd. | | 45,300 | 358,100 |
| Shenzhen Overseas Chinese Town Co. Ltd. (A Shares) | | 471,200 | 270,994 |
| Shenzhen Salubris Pharmaceuticals Co. Ltd. (A Shares) | | 65,100 | 276,342 |
| Shenzhen SC New Energy Technology Corp. (A Shares) | | 19,800 | 368,025 |
| Shenzhen Senior Technology Material Co. Ltd. (A Shares) | | 73,338 | 185,682 |
| Shenzhen Sunlord Electronics Co. Ltd. (A Shares) | | 42,400 | 124,247 |
| Shenzhen Transsion Holdings Co. Ltd. (A Shares) | | 38,021 | 323,467 |
| Shijiazhuang Yiling Pharmaceutical Co. Ltd. (A Shares) | | 93,160 | 388,820 |
| Sichuan Chuantou Energy Co. Ltd. (A Shares) | | 214,100 | 323,954 |
| Sichuan Hebang Biotechnology Co. Ltd. (A Shares) | | 506,700 | 200,518 |
| Sichuan Kelun Pharmaceutical Co. Ltd. (A Shares) | | 78,200 | 265,560 |
| Sichuan New Energy Power Co. Ltd. (A Shares) (a) | | 83,500 | 215,299 |
| Sichuan Road & Bridge (Group) Co. Ltd. (A Shares) | | 273,200 | 420,860 |
| Sichuan Swellfun Co. Ltd. (A Shares) | | 28,300 | 219,257 |
| Sichuan Yahua Industrial Group Co. Ltd. (A Shares) | | 63,100 | 231,131 |
| Sieyuan Electric Co. Ltd. (A Shares) | | 43,600 | 199,704 |
| Sinolink Securities Co. Ltd. (A Shares) | | 200,300 | 216,403 |
| Sinoma Science & Technology Co. Ltd. (A Shares) | | 92,400 | 226,606 |
| Sinomine Resource Group Co. Ltd. (A Shares) | | 26,000 | 320,421 |
| Sinopec Shanghai Petrochemical Co. Ltd. (A Shares) | | 402,300 | 169,119 |
| Sinopharm Group Co. Ltd. (H Shares) | | 1,197,200 | 2,281,645 |
| Sinotrans Ltd. | | 96,000 | 46,666 |
| Sinotrans Ltd. (H Shares) | | 51,000 | 12,409 |
| SKSHU Paint Co. Ltd. (A Shares) (a) | | 20,380 | 242,509 |
| Songcheng Performance Development Co. Ltd. (A Shares) | | 143,480 | 226,333 |
| Soochow Securities Co. Ltd. (A Shares) | | 269,145 | 241,397 |
| Southwest Securities Co. Ltd. (A Shares) | | 360,400 | 182,596 |
| StarPower Semiconductor Ltd. (A Shares) | | 9,700 | 495,035 |
| Sungrow Power Supply Co. Ltd. (A Shares) | | 84,300 | 1,504,212 |
| Sunwoda Electronic Co. Ltd. (A Shares) | | 95,800 | 305,651 |
| Suzhou Dongshan Precision Manufacturing Co. Ltd. (A Shares) | | 97,500 | 337,376 |
| Suzhou Maxwell Technologies Co. Ltd. (A Shares) | | 9,740 | 636,850 |
| Suzhou TA&A Ultra Clean Technology Co. Ltd. (A Shares) | | 32,200 | 272,709 |
| Tangshan Jidong Cement Co. Ltd. A Shares | | 140,100 | 145,608 |
| TBEA Co. Ltd. (A Shares) | | 217,000 | 606,467 |
| TCL Technology Group Corp. (A Shares) | | 803,700 | 430,304 |
| TCL Zhonghuan Renewable Energy Technology Co. Ltd. (A Shares) | | 183,500 | 992,517 |
| Thunder Software Technology Co. Ltd. (A Shares) | | 23,900 | 323,144 |
| Tianjin 712 Communication & Broadcasting Co. Ltd. | | 40,800 | 220,065 |
| Tianma Microelectronics Co. Ltd. (A Shares) | | 136,500 | 165,230 |
| Tianqi Lithium Corp. (A Shares) (a) | | 83,800 | 1,096,426 |
| Tianshan Aluminum Group Co. Ltd. | | 221,200 | 189,005 |
| Tianshui Huatian Technology Co. Ltd. (A Shares) | | 183,300 | 221,379 |
| Tibet Summit Industrial Co. Ltd. (A Shares) (a) | | 52,500 | 150,608 |
| Titan Wind Energy Suzhou Co. Ltd. (A Shares) | | 102,500 | 164,777 |
| Toly Bread Co. Ltd. | | 71,252 | 109,860 |
| TongFu Microelectronics Co. Ltd. (A Shares) (a) | | 75,500 | 194,671 |
| Tongkun Group Co. Ltd. (A Shares) | | 135,800 | 225,004 |
| Tongling Nonferrous Metals Group Co. Ltd. (A Shares) | | 617,300 | 213,011 |
| Tongwei Co. Ltd. (A Shares) | | 255,800 | 1,523,682 |
| Topchoice Medical Corp. (a) | | 18,800 | 314,711 |
| Transfar Zhilian Co. Ltd. | | 160,100 | 108,079 |
| TravelSky Technology Ltd. (H Shares) | | 832,000 | 1,208,309 |
| Trina Solar Co. Ltd. (A Shares) | | 123,035 | 1,119,174 |
| Tsingtao Brewery Co. Ltd.: | | | |
| (A Shares) | | 55,300 | 619,417 |
| (H Shares) | | 540,000 | 3,783,608 |
| Unigroup Guoxin Microelectronics Co. Ltd. | | 48,119 | 1,081,325 |
| Unisplendour Corp. Ltd. (A Shares) | | 156,903 | 368,468 |
| Walvax Biotechnology Co. Ltd. (A Shares) | | 92,000 | 484,383 |
| Wanhua Chemical Group Co. Ltd. (A Shares) | | 177,400 | 1,952,083 |
| Weichai Power Co. Ltd.: | | | |
| (A Shares) | | 310,600 | 386,182 |
| (H Shares) | | 1,828,200 | 1,751,424 |
| Weihai Guangwei Composites Co. Ltd. (A Shares) | | 29,600 | 314,527 |
| Wens Foodstuffs Group Co. Ltd. (A Shares) (a) | | 366,680 | 898,762 |
| Western Mining Co. Ltd. (A Shares) | | 140,300 | 181,933 |
| Western Securities Co. Ltd. (A Shares) | | 241,700 | 197,586 |
| Western Superconducting Technologies Co. Ltd. (A Shares) | | 26,441 | 422,381 |
| Westone Information Industry, Inc. (A Shares) | | 46,600 | 231,759 |
| Will Semiconductor Ltd. | | 67,335 | 676,494 |
| Wingtech Technology Co. Ltd. (A Shares) | | 69,000 | 452,385 |
| Winning Health Technology Group Co. Ltd. (A Shares) | | 113,180 | 150,020 |
| Wuchan Zhongda Group Co. Ltd. | | 278,300 | 158,911 |
| Wuhan Guide Infrared Co. Ltd. (A Shares) | | 187,130 | 297,495 |
| Wuliangye Yibin Co. Ltd. (A Shares) | | 220,300 | 4,027,174 |
| WUS Printed Circuit Kunshan Co. Ltd. (A Shares) | | 100,690 | 150,148 |
| WuXi AppTec Co. Ltd. | | 147,244 | 1,540,407 |
| WuXi AppTec Co. Ltd. (H Shares) (b) | | 304,422 | 2,439,363 |
| Wuxi Shangji Automation Co. Ltd. (A Shares) | | 21,440 | 359,579 |
| XCMG Construction Machinery Co. Ltd. (A Shares) | | 444,200 | 281,620 |
| Xiamen C&D, Inc. (A Shares) | | 169,800 | 278,780 |
| Xiamen Faratronic Co. Ltd. (A Shares) | | 12,400 | 300,725 |
| Xiamen Intretech, Inc. | | 44,430 | 104,764 |
| Xiamen Tungsten Co. Ltd. (A Shares) | | 81,300 | 223,542 |
| Xinjiang Goldwind Science & Technology Co. Ltd.: | | | |
| (A Shares) | | 176,900 | 253,133 |
| (H Shares) | | 673,210 | 584,046 |
| Xinjiang Zhongtai Chemical Co. Ltd. (A Shares) | | 148,000 | 119,164 |
| Yangzhou Yangjie Electronic Technology Co. Ltd. (A Shares) | | 29,500 | 207,549 |
| Yankuang Energy Group Co. Ltd.: | | | |
| (A Shares) | | 171,500 | 953,443 |
| (H Shares) | | 1,334,000 | 3,755,760 |
| Yantai Jereh Oilfield Services (A Shares) | | 58,100 | 239,150 |
| Yealink Network Technology Corp. Ltd. | | 50,150 | 473,008 |
| Yifeng Pharmacy Chain Co. Ltd. | | 40,918 | 314,551 |
| Yihai Kerry Arawana Holdings Co. Ltd. (A Shares) | | 82,100 | 430,011 |
| Yintai Gold Co. Ltd. (A Shares) | | 159,780 | 312,432 |
| YongXing Special Materials Technology Co. Ltd. (A Shares) | | 23,000 | 366,815 |
| Yonyou Network Technology Co. Ltd. (A Shares) | | 196,338 | 657,068 |
| Youngor Group Co. Ltd. (A Shares) | | 274,789 | 225,012 |
| Youngy Co. Ltd. (A Shares) (a) | | 14,800 | 223,310 |
| YTO Express Group Co. Ltd. (A Shares) | | 194,600 | 502,561 |
| Yuan Longping High-tech Agriculture Co. Ltd. (A Shares) (a) | | 73,400 | 145,938 |
| Yunda Holding Co. Ltd. (A Shares) | | 164,590 | 297,046 |
| Yunnan Aluminium Co. Ltd. (A Shares) | | 197,300 | 247,743 |
| Yunnan Baiyao Group Co. Ltd. (A Shares) | | 102,700 | 767,272 |
| Yunnan Botanee Bio-Technology Group Co., Ltd. (A Shares) | | 15,500 | 303,510 |
| Yunnan Energy New Material Co. Ltd. | | 50,600 | 1,025,733 |
| Yunnan Tin Co. Ltd. (A Shares) | | 97,000 | 151,552 |
| Yunnan Yuntianhua Co. Ltd. (Series A) (a) | | 104,300 | 287,925 |
| Zangge Mining Co. Ltd. (Series A) | | 90,000 | 334,593 |
| Zhangzhou Pientzehuang Pharmaceutical Co. Ltd. (A Shares) | | 34,400 | 1,073,984 |
| Zhaojin Mining Industry Co. Ltd. (H Shares) (a) | | 1,113,000 | 918,798 |
| Zhefu Holding Group Co. Ltd. (A Shares) | | 291,000 | 155,802 |
| Zhejiang Century Huatong Group Co. Ltd. (A Shares) (a) | | 423,397 | 213,934 |
| Zhejiang China Commodities City Group Co. Ltd. (A Shares) | | 303,500 | 174,132 |
| Zhejiang Chint Electric Co. Ltd. (A Shares) | | 122,600 | 426,411 |
| Zhejiang Dahua Technology Co. Ltd. (A Shares) | | 158,300 | 251,012 |
| Zhejiang Dingli Machinery Co. Ltd. (A Shares) | | 26,060 | 160,330 |
| Zhejiang Expressway Co. Ltd. (H Shares) | | 1,194,000 | 740,769 |
| Zhejiang HangKe Technology, Inc. Co. (A Shares) | | 22,844 | 156,560 |
| Zhejiang Huahai Pharmaceutical Co. Ltd. (A Shares) | | 83,820 | 230,241 |
| Zhejiang Huayou Cobalt Co. Ltd. (A Shares) | | 90,350 | 674,016 |
| Zhejiang Jingsheng Mechanical & Electrical Co. Ltd. (A Shares) | | 73,000 | 712,317 |
| Zhejiang Jiuzhou Pharmaceutical Co. Ltd. (A Shares) | | 46,100 | 224,222 |
| Zhejiang Juhua Co. Ltd. (A Shares) | | 150,500 | 323,137 |
| Zhejiang NHU Co. Ltd. (A Shares) | | 175,328 | 430,223 |
| Zhejiang Orient Gene Biotech Co. Ltd. (A Shares) | | 9,259 | 104,725 |
| Zhejiang Semir Garment Co. Ltd. (A Shares) | | 158,900 | 97,478 |
| Zhejiang Supor Cookware Co. Ltd. | | 31,600 | 173,125 |
| Zhejiang Weiming Enviroment Protection Co. Ltd. (A Shares) | | 96,490 | 250,114 |
| Zhejiang Weixing New Building Materials Co. Ltd. (A Shares) | | 84,300 | 200,854 |
| Zhejiang Wolwo Bio-Pharmaceutical Co. Ltd. | | 27,700 | 178,272 |
| Zhejiang Yongtai Technology Co. Ltd. (A Shares) | | 48,600 | 145,210 |
| Zheshang Securities Co. Ltd. | | 224,200 | 312,220 |
| ZhongAn Online P & C Insurance Co. Ltd. (H Shares) (a)(b) | | 642,100 | 1,195,913 |
| Zhongji Innolight Co. Ltd. (A Shares) | | 47,500 | 190,445 |
| Zhongtai Securities Co. Ltd. (A Shares) | | 334,100 | 290,963 |
| Zhuzhou CRRC Times Electric Co. Ltd.: | | | |
| (A Shares) | | 24,959 | 214,562 |
| (H Shares) | | 514,900 | 2,233,519 |
| Zhuzhou Hongda Electronics Corp. Ltd. (A Shares) | | 21,700 | 131,783 |
| Zhuzhou Kibing Group Co. Ltd. (A Shares) | | 154,400 | 165,967 |
| Zibo Qixiang Tengda Chemical Co. Ltd. (A Shares) (a) | | 160,200 | 148,729 |
| Zijin Mining Group Co. Ltd.: | | | |
| (A Shares) | | 1,107,100 | 1,200,651 |
| (H Shares) | | 5,228,000 | 4,995,127 |
| Zoomlion Heavy Industry Science and Technology Co. Ltd.: | | | |
| (A Shares) | | 633,700 | 464,240 |
| (H Shares) | | 642,800 | 207,179 |
| ZTE Corp.: | | | |
| (A Shares) | | 147,600 | 448,081 |
| (H Shares) | | 790,880 | 1,410,550 |
TOTAL CHINA | | | 580,997,918 |
| Colombia - 0.1% | | | |
| Bancolombia SA | | 205,496 | 1,477,116 |
| Bancolombia SA sponsored ADR | | 9,406 | 238,630 |
| Ecopetrol SA | | 4,497,467 | 2,231,090 |
| Interconexion Electrica SA ESP | | 408,500 | 1,593,884 |
TOTAL COLOMBIA | | | 5,540,720 |
| Cyprus - 0.0% | | | |
| Galaxy Cosmos Mezz PLC (a) | | 77,843 | 12,570 |
| Ozon Holdings PLC ADR (a)(c) | | 40,002 | 125,673 |
| TCS Group Holding PLC unit (a)(c) | | 103,050 | 196,776 |
TOTAL CYPRUS | | | 335,019 |
| Czech Republic - 0.1% | | | |
| CEZ A/S | | 147,546 | 4,825,269 |
| Komercni Banka A/S | | 68,033 | 1,951,609 |
| MONETA Money Bank A/S (b) | | 294,104 | 858,516 |
TOTAL CZECH REPUBLIC | | | 7,635,394 |
| Egypt - 0.1% | | | |
| Commercial International Bank SAE | | 2,216,642 | 2,970,805 |
| Eastern Co. SAE | | 950,750 | 467,608 |
| EFG-Hermes Holding SAE | | 591,192 | 327,693 |
TOTAL EGYPT | | | 3,766,106 |
| Greece - 0.3% | | | |
| Alpha Bank SA (a) | | 2,101,784 | 1,948,309 |
| Eurobank Ergasias Services and Holdings SA (a) | | 2,448,474 | 2,419,704 |
| Ff Group (a)(c) | | 1,035 | 1,227 |
| Hellenic Telecommunications Organization SA | | 182,726 | 2,871,206 |
| Jumbo SA | | 103,984 | 1,478,748 |
| Mytilineos SA | | 94,076 | 1,578,641 |
| National Bank of Greece SA (a) | | 516,714 | 1,874,058 |
| OPAP SA | | 183,360 | 2,246,948 |
| Public Power Corp. of Greece (a) | | 198,044 | 1,250,632 |
TOTAL GREECE | | | 15,669,473 |
| Hong Kong - 1.1% | | | |
| Beijing Enterprises Holdings Ltd. | | 478,500 | 1,214,286 |
| BYD Electronic International Co. Ltd. | | 613,500 | 1,781,965 |
| China Everbright International Ltd. | | 3,479,333 | 1,156,874 |
| China Jinmao Holdings Group Ltd. | | 5,382,000 | 713,061 |
| China Merchants Holdings International Co. Ltd. | | 1,202,126 | 1,408,924 |
| China Overseas Land and Investment Ltd. | | 3,512,000 | 6,702,179 |
| China Power International Development Ltd. | | 4,951,563 | 1,431,917 |
| China Resources Beer Holdings Co. Ltd. | | 1,470,878 | 6,933,110 |
| China Resources Power Holdings Co. Ltd. | | 1,753,691 | 2,551,343 |
| China Taiping Insurance Group Ltd. | | 1,209,777 | 838,405 |
| China Traditional Chinese Medicine Holdings Co. Ltd. | | 2,622,000 | 1,132,354 |
| CITIC Pacific Ltd. | | 5,329,000 | 4,772,553 |
| CSPC Pharmaceutical Group Ltd. | | 8,139,840 | 8,360,935 |
| Far East Horizon Ltd. | | 1,435,000 | 1,107,833 |
| Fosun International Ltd. | | 2,356,000 | 1,440,676 |
| Ganfeng Lithium Group Co. Ltd. (H Shares) (b) | | 279,440 | 1,890,309 |
| Guangdong Investment Ltd. | | 2,630,000 | 1,658,482 |
| Hua Hong Semiconductor Ltd. (a)(b) | | 529,000 | 1,238,657 |
| Lenovo Group Ltd. | | 6,552,000 | 5,241,834 |
| MMG Ltd. (a) | | 2,848,000 | 562,369 |
| Sinotruk Hong Kong Ltd. | | 652,000 | 581,427 |
| Wharf Holdings Ltd. | | 1,127,000 | 3,223,220 |
| Yuexiu Property Co. Ltd. | | 1,320,400 | 1,127,016 |
TOTAL HONG KONG | | | 57,069,729 |
| Hungary - 0.2% | | | |
| MOL Hungarian Oil and Gas PLC Series A (For. Reg.) | | 386,843 | 2,319,558 |
| OTP Bank PLC | | 206,139 | 4,493,315 |
| Richter Gedeon PLC | | 129,107 | 2,549,306 |
TOTAL HUNGARY | | | 9,362,179 |
| India - 15.8% | | | |
| ACC Ltd. | | 64,895 | 1,873,865 |
| Adani Enterprises Ltd. | | 262,066 | 10,597,401 |
| Adani Green Energy Ltd. (a) | | 290,043 | 7,368,101 |
| Adani Ports & Special Economic Zone Ltd. | | 490,217 | 4,877,002 |
| Adani Power Ltd. (a) | | 714,656 | 2,891,257 |
| Adani Total Gas Ltd. | | 252,606 | 10,994,220 |
| Adani Transmissions Ltd. (a) | | 256,096 | 10,359,854 |
| Ambuja Cements Ltd. | | 532,707 | 3,429,647 |
| Apollo Hospitals Enterprise Ltd. | | 92,348 | 5,039,648 |
| Asian Paints Ltd. | | 351,026 | 13,178,105 |
| AU Small Finance Bank Ltd. (b) | | 150,332 | 1,070,648 |
| Aurobindo Pharma Ltd. | | 240,617 | 1,564,243 |
| Avenue Supermarts Ltd. (a)(b) | | 146,856 | 7,665,500 |
| Axis Bank Ltd. | | 2,078,376 | 22,747,145 |
| Bajaj Auto Ltd. | | 64,224 | 2,848,767 |
| Bajaj Finance Ltd. | | 249,416 | 21,525,161 |
| Bajaj Finserv Ltd. | | 349,797 | 7,130,737 |
| Balkrishna Industries Ltd. | | 73,151 | 1,734,442 |
| Bandhan Bank Ltd. (a)(b) | | 584,778 | 1,685,175 |
| Berger Paints India Ltd. | | 225,969 | 1,599,090 |
| Bharat Electronics Ltd. | | 3,370,052 | 4,349,964 |
| Bharat Forge Ltd. | | 235,363 | 2,371,827 |
| Bharat Petroleum Corp. Ltd. | | 798,824 | 2,930,212 |
| Bharti Airtel Ltd. | | 2,008,561 | 20,187,518 |
| Biocon Ltd. | | 374,584 | 1,221,086 |
| Britannia Industries Ltd. | | 99,620 | 4,532,782 |
| Cholamandalam Investment and Finance Co. Ltd. | | 377,961 | 3,238,785 |
| Cipla Ltd./India | | 442,417 | 6,239,159 |
| Coal India Ltd. | | 1,428,809 | 4,245,175 |
| Colgate-Palmolive Ltd. | | 109,215 | 2,152,834 |
| Container Corp. of India Ltd. | | 247,583 | 2,386,703 |
| Dabur India Ltd. | | 555,264 | 3,720,765 |
| Divi's Laboratories Ltd. | | 119,938 | 5,228,851 |
| DLF Ltd. | | 571,788 | 2,662,772 |
| Dr. Reddy's Laboratories Ltd. | | 106,575 | 5,736,412 |
| Eicher Motors Ltd. | | 126,369 | 5,877,960 |
| GAIL India Ltd. | | 2,208,201 | 2,435,477 |
| Godrej Consumer Products Ltd. (a) | | 373,905 | 3,745,825 |
| Godrej Properties Ltd. (a) | | 117,974 | 1,799,966 |
| Grasim Industries Ltd. | | 236,184 | 4,912,273 |
| Havells India Ltd. | | 221,958 | 3,261,265 |
| HCL Technologies Ltd. | | 992,982 | 12,489,046 |
| HDFC Standard Life Insurance Co. Ltd. (b) | | 866,817 | 5,659,232 |
| Hero Motocorp Ltd. | | 101,833 | 3,292,965 |
| Hindalco Industries Ltd. | | 1,230,593 | 6,030,322 |
| Hindustan Petroleum Corp. Ltd. | | 601,722 | 1,554,461 |
| Hindustan Unilever Ltd. | | 750,838 | 23,135,570 |
| Housing Development Finance Corp. Ltd. | | 1,579,448 | 47,123,951 |
| ICICI Bank Ltd. | | 4,710,283 | 51,789,649 |
| ICICI Lombard General Insurance Co. Ltd. (b) | | 220,369 | 3,114,529 |
| ICICI Prudential Life Insurance Co. Ltd. (b) | | 327,068 | 2,005,356 |
| Indian Oil Corp. Ltd. | | 2,558,013 | 2,109,017 |
| Indian Railway Catering & Tourism Corp. Ltd. | | 215,234 | 1,927,174 |
| Indraprastha Gas Ltd. | | 294,589 | 1,524,012 |
| Indus Towers Ltd. | | 609,127 | 1,364,980 |
| Info Edge India Ltd. | | 64,805 | 3,070,135 |
| Infosys Ltd. | | 3,081,361 | 57,236,709 |
| InterGlobe Aviation Ltd. (a)(b) | | 91,104 | 1,960,860 |
| ITC Ltd. | | 2,762,279 | 11,635,742 |
| Jindal Steel & Power Ltd. | | 371,663 | 2,064,620 |
| JSW Steel Ltd. (a) | | 663,734 | 5,403,763 |
| Jubilant Foodworks Ltd. | | 360,075 | 2,653,150 |
| Kotak Mahindra Bank Ltd. | | 508,381 | 11,680,542 |
| Larsen & Toubro Infotech Ltd. (b) | | 47,714 | 2,732,027 |
| Larsen & Toubro Ltd. | | 632,211 | 15,450,907 |
| Lupin Ltd. | | 186,189 | 1,572,193 |
| Mahindra & Mahindra Ltd. | | 803,774 | 13,094,583 |
| Marico Ltd. | | 470,955 | 2,984,289 |
| Maruti Suzuki India Ltd. | | 111,139 | 12,791,591 |
| MindTree Consulting Ltd. | | 52,142 | 2,143,976 |
| Mphasis BFL Ltd. | | 76,473 | 1,827,758 |
| MRF Ltd. | | 1,801 | 1,974,769 |
| Muthoot Finance Ltd. | | 108,087 | 1,362,447 |
| Nestle India Ltd. | | 30,852 | 7,589,413 |
| NTPC Ltd. | | 3,525,188 | 7,371,467 |
| Oil & Natural Gas Corp. Ltd. | | 2,314,483 | 3,747,964 |
| Page Industries Ltd. | | 5,671 | 3,409,495 |
| Petronet LNG Ltd. | | 673,329 | 1,671,935 |
| PI Industries Ltd. | | 68,948 | 2,700,241 |
| Pidilite Industries Ltd. | | 139,497 | 4,355,111 |
| Piramal Pharma Ltd. (a) | | 427,928 | 852,444 |
| Power Grid Corp. of India Ltd. | | 2,892,511 | 7,972,051 |
| Reliance Industries Ltd. | | 2,788,090 | 85,872,364 |
| Samvardhana Motherson International Ltd. | | 1,920,726 | 1,496,579 |
| SBI Cards & Payment Services Ltd. | | 215,667 | 2,153,674 |
| SBI Life Insurance Co. Ltd. (b) | | 412,482 | 6,308,065 |
| Shree Cement Ltd. | | 9,608 | 2,639,414 |
| Shriram Transport Finance Co. Ltd. | | 173,110 | 2,570,405 |
| Siemens Ltd. | | 65,050 | 2,298,989 |
| SRF Ltd. | | 136,342 | 4,214,200 |
| State Bank of India | | 1,632,604 | 11,316,600 |
| Sun Pharmaceutical Industries Ltd. | | 877,927 | 10,784,779 |
| Tata Consultancy Services Ltd. | | 837,677 | 32,312,495 |
| Tata Consumer Products Ltd. | | 505,082 | 4,699,069 |
| Tata Elxsi Ltd. | | 31,786 | 2,686,278 |
| Tata Motors Ltd. (a) | | 1,538,936 | 7,704,981 |
| Tata Power Co. Ltd./The | | 1,329,170 | 3,628,804 |
| Tata Steel Ltd. | | 6,716,995 | 8,240,044 |
| Tech Mahindra Ltd. | | 532,824 | 6,844,709 |
| Titan Co. Ltd. | | 326,412 | 10,888,943 |
| Torrent Pharmaceuticals Ltd. | | 92,805 | 1,849,822 |
| Trent Ltd. | | 168,260 | 3,105,635 |
| Ultratech Cement Ltd. | | 91,263 | 7,403,074 |
| United Spirits Ltd. (a) | | 262,280 | 2,839,994 |
| UPL Ltd. | | 449,696 | 3,966,755 |
| Vedanta Ltd. | | 678,761 | 2,302,441 |
| Wipro Ltd. | | 1,249,540 | 5,846,985 |
| Yes Bank Ltd. (a) | | 10,320,394 | 1,938,658 |
| Zomato Ltd. (a) | | 2,164,707 | 1,650,073 |
TOTAL INDIA | | | 825,411,894 |
| Indonesia - 2.2% | | | |
| PT Adaro Energy Tbk | | 13,251,200 | 3,381,297 |
| PT Adaro Minerals Indonesia Tbk | | 7,761,900 | 860,913 |
| PT Aneka Tambang Tbk | | 7,364,000 | 871,074 |
| PT Astra International Tbk | | 18,594,200 | 7,927,644 |
| PT Bank Central Asia Tbk | | 50,686,800 | 28,597,137 |
| PT Bank Jago Tbk (a) | | 3,777,700 | 1,235,215 |
| PT Bank Mandiri (Persero) Tbk | | 17,045,100 | 11,529,143 |
| PT Bank Negara Indonesia (Persero) Tbk | | 6,775,400 | 4,083,267 |
| PT Bank Rakyat Indonesia (Persero) Tbk | | 62,325,285 | 18,580,707 |
| PT Barito Pacific Tbk | | 25,521,600 | 1,349,916 |
| PT Charoen Pokphand Indonesia Tbk | | 6,715,100 | 2,400,172 |
| PT Gudang Garam Tbk | | 412,900 | 637,980 |
| PT Indah Kiat Pulp & Paper Tbk | | 2,566,100 | 1,579,392 |
| PT Indofood CBP Sukses Makmur Tbk | | 2,114,600 | 1,318,448 |
| PT Indofood Sukses Makmur Tbk | | 3,900,500 | 1,612,965 |
| PT Kalbe Farma Tbk | | 19,174,800 | 2,520,169 |
| PT Merdeka Copper Gold Tbk (a) | | 11,088,196 | 2,680,077 |
| PT Sarana Menara Nusantara Tbk | | 20,864,400 | 1,545,016 |
| PT Semen Indonesia (Persero) Tbk | | 2,583,100 | 1,316,598 |
| PT Sumber Alfaria Trijaya Tbk | | 14,839,400 | 2,682,937 |
| PT Telkom Indonesia Persero Tbk | | 45,166,600 | 12,685,081 |
| PT Tower Bersama Infrastructure Tbk | | 4,037,860 | 636,842 |
| PT Unilever Indonesia Tbk | | 6,990,400 | 2,079,529 |
| PT United Tractors Tbk | | 1,538,600 | 3,186,202 |
| PT Vale Indonesia Tbk (a) | | 2,208,600 | 920,398 |
TOTAL INDONESIA | | | 116,218,119 |
| Korea (South) - 11.0% | | | |
| Alteogen, Inc. | | 31,681 | 814,598 |
| AMOREPACIFIC Corp. | | 26,275 | 1,706,480 |
| AMOREPACIFIC Group, Inc. | | 26,566 | 459,729 |
| BGF Retail Co. Ltd. | | 6,861 | 896,489 |
| Celltrion Healthcare Co. Ltd. | | 79,158 | 3,854,413 |
| Celltrion Pharm, Inc. | | 16,118 | 765,631 |
| Celltrion, Inc. | | 89,969 | 12,102,435 |
| Cheil Worldwide, Inc. | | 65,598 | 1,123,694 |
| CJ CheilJedang Corp. | | 7,590 | 2,201,511 |
| CJ Corp. | | 13,881 | 698,271 |
| CJ ENM Co. Ltd. | | 10,214 | 525,255 |
| CJ Logistics Corp. (a) | | 8,606 | 529,991 |
| Coway Co. Ltd. | | 50,420 | 1,953,469 |
| Db Insurance Co. Ltd. | | 41,972 | 1,655,567 |
| Doosan Bobcat, Inc. | | 47,173 | 1,107,177 |
| Doosan Heavy Industries & Construction Co. Ltd. (a) | | 371,647 | 3,450,048 |
| E-Mart, Inc. | | 18,061 | 1,070,510 |
| Ecopro BM Co. Ltd. | | 43,779 | 3,530,367 |
| F&F Co. Ltd. | | 15,592 | 1,589,438 |
| Green Cross Corp. | | 5,490 | 490,412 |
| GS Engineering & Construction Corp. | | 61,014 | 927,615 |
| GS Holdings Corp. | | 43,705 | 1,408,535 |
| Hana Financial Group, Inc. | | 273,409 | 7,901,607 |
| Hankook Tire Co. Ltd. | | 70,062 | 1,794,108 |
| Hanmi Pharm Co. Ltd. | | 6,429 | 1,139,574 |
| Hanon Systems | | 176,067 | 962,169 |
| Hanwha Solutions Corp. (a) | | 105,768 | 3,497,639 |
| HD Hyundai Co. Ltd. | | 42,849 | 1,828,254 |
| HLB, Inc. (a) | | 87,707 | 2,488,674 |
| HLB, Inc. rights 12/2/22 (a) | | 7,854 | 53,926 |
| HMM Co. Ltd. | | 242,922 | 3,250,715 |
| Hotel Shilla Co. | | 26,890 | 1,224,568 |
| HYBE Co. Ltd. (a) | | 17,597 | 1,491,773 |
| Hyundai Engineering & Construction Co. Ltd. | | 70,560 | 1,725,292 |
| Hyundai Glovis Co. Ltd. | | 16,897 | 2,059,859 |
| Hyundai Heavy Industries Co. Ltd. (a) | | 16,750 | 1,279,146 |
| Hyundai Mobis | | 56,684 | 8,697,276 |
| Hyundai Motor Co. | | 130,370 | 15,025,268 |
| Hyundai Steel Co. | | 81,828 | 1,610,968 |
| Iljin Materials Co. Ltd. | | 21,667 | 919,920 |
| Industrial Bank of Korea | | 238,098 | 1,743,214 |
| Kakao Corp. | | 284,043 | 10,089,524 |
| Kakao Games Corp. (a) | | 33,321 | 923,301 |
| KakaoBank Corp. (a) | | 106,786 | 1,279,349 |
| Kangwon Land, Inc. (a) | | 86,557 | 1,394,790 |
| KB Financial Group, Inc. | | 359,416 | 12,069,697 |
| Kia Corp. | | 242,368 | 11,258,161 |
| Korea Aerospace Industries Ltd. | | 66,513 | 2,206,506 |
| Korea Electric Power Corp. (a) | | 238,663 | 2,793,054 |
| Korea Investment Holdings Co. Ltd. | | 39,620 | 1,375,425 |
| Korea Shipbuilding & Offshore Engineering Co. Ltd. (a) | | 39,053 | 1,989,150 |
| Korea Zinc Co. Ltd. | | 8,011 | 3,592,075 |
| Korean Air Lines Co. Ltd. (a) | | 164,731 | 2,666,036 |
| KRAFTON, Inc. (a) | | 22,522 | 2,800,812 |
| KT&G Corp. | | 102,307 | 6,859,555 |
| Kumho Petro Chemical Co. Ltd. | | 17,093 | 1,568,802 |
| L&F Co. Ltd. (a) | | 21,517 | 3,391,899 |
| LG Chemical Ltd. | | 45,330 | 19,881,022 |
| LG Corp. | | 85,610 | 4,750,380 |
| LG Display Co. Ltd. | | 219,348 | 1,953,591 |
| LG Electronics, Inc. | | 99,029 | 5,661,496 |
| LG Energy Solution (a) | | 21,217 | 7,848,679 |
| LG H & H Co. Ltd. | | 8,818 | 3,150,786 |
| LG Innotek Co. Ltd. | | 13,069 | 2,714,849 |
| LG Uplus Corp. | | 191,744 | 1,538,176 |
| Lotte Chemical Corp. | | 16,128 | 1,672,326 |
| Lotte Shopping Co. Ltd. | | 9,696 | 593,721 |
| Meritz Financial Holdings Co. | | 30,860 | 469,174 |
| Meritz Fire & Marine Insurance Co. Ltd. | | 34,345 | 756,768 |
| Meritz Securities Co. Ltd. | | 248,977 | 645,416 |
| Mirae Asset Securities Co. Ltd. | | 261,366 | 1,162,790 |
| NAVER Corp. | | 120,110 | 14,263,546 |
| NCSOFT Corp. | | 15,134 | 4,135,204 |
| Netmarble Corp. (b) | | 20,391 | 637,165 |
| NH Investment & Securities Co. Ltd. | | 141,110 | 886,807 |
| Orion Corp./Republic of Korea | | 21,314 | 1,515,687 |
| Pan Ocean Co., Ltd. (Korea) | | 232,156 | 699,402 |
| Pearl Abyss Corp. (a) | | 27,348 | 797,072 |
| POSCO | | 72,022 | 12,527,532 |
| POSCO Chemtech Co. Ltd. | | 24,809 | 3,467,614 |
| S-Oil Corp. | | 41,388 | 2,505,341 |
| S1 Corp. | | 14,394 | 629,281 |
| Samsung Biologics Co. Ltd. (a)(b) | | 16,160 | 9,929,322 |
| Samsung C&T Corp. | | 76,511 | 6,352,152 |
| Samsung Electro-Mechanics Co. Ltd. | | 51,240 | 4,343,833 |
| Samsung Electronics Co. Ltd. | | 4,405,424 | 183,338,134 |
| Samsung Engineering Co. Ltd. (a) | | 141,171 | 2,358,916 |
| Samsung Fire & Marine Insurance Co. Ltd. | | 28,140 | 3,943,054 |
| Samsung Heavy Industries Co. Ltd. (a) | | 562,112 | 2,028,190 |
| Samsung Life Insurance Co. Ltd. | | 73,217 | 3,457,407 |
| Samsung SDI Co. Ltd. | | 50,298 | 25,971,489 |
| Samsung SDS Co. Ltd. | | 31,460 | 2,755,164 |
| Samsung Securities Co. Ltd. | | 59,193 | 1,316,718 |
| SD Biosensor, Inc. | | 34,300 | 710,118 |
| Seegene, Inc. | | 34,320 | 690,093 |
| Shinhan Financial Group Co. Ltd. | | 423,196 | 10,734,556 |
| SK Biopharmaceuticals Co. Ltd. (a) | | 27,808 | 1,131,943 |
| SK Bioscience Co. Ltd. (a) | | 20,740 | 1,098,523 |
| SK Chemicals Co. Ltd. | | 9,371 | 580,386 |
| SK Hynix, Inc. | | 499,924 | 28,965,975 |
| SK IE Technology Co. Ltd. (a)(b) | | 23,562 | 858,409 |
| SK Innovation Co., Ltd. | | 50,791 | 6,156,183 |
| SK Square Co. Ltd. (a) | | 89,899 | 2,327,276 |
| SK, Inc. | | 33,902 | 5,082,972 |
| SKC Co. Ltd. | | 19,691 | 1,427,864 |
| Woori Financial Group, Inc. | | 503,011 | 4,140,893 |
| Yuhan Corp. | | 44,944 | 1,883,005 |
TOTAL KOREA (SOUTH) | | | 574,260,121 |
| Kuwait - 1.0% | | | |
| Agility Public Warehousing Co. KSC | | 1,359,205 | 3,439,137 |
| Boubyan Bank KSC | | 1,205,344 | 3,205,433 |
| Gulf Bank | | 1,501,009 | 1,661,598 |
| Kuwait Finance House KSCP | | 6,778,395 | 17,719,864 |
| Mabanee Co. SAKC | | 590,903 | 1,662,958 |
| Mobile Telecommunication Co. | | 1,941,172 | 3,752,661 |
| National Bank of Kuwait | | 6,604,576 | 22,977,999 |
TOTAL KUWAIT | | | 54,419,650 |
| Luxembourg - 0.1% | | | |
| Allegro.eu SA (a)(b) | | 337,588 | 1,640,527 |
| Reinet Investments SCA | | 123,427 | 1,983,164 |
TOTAL LUXEMBOURG | | | 3,623,691 |
| Malaysia - 1.6% | | | |
| AMMB Holdings Bhd | | 1,646,200 | 1,424,060 |
| Axiata Group Bhd | | 2,487,041 | 1,499,168 |
| CIMB Group Holdings Bhd | | 6,339,820 | 7,401,820 |
| Dialog Group Bhd | | 3,423,700 | 1,491,714 |
| DiGi.com Bhd | | 2,845,100 | 2,280,653 |
| Genting Bhd | | 2,015,800 | 1,893,010 |
| Genting Malaysia Bhd | | 2,794,400 | 1,619,428 |
| Hap Seng Consolidated Bhd | | 588,500 | 800,350 |
| Hartalega Holdings Bhd | | 1,626,900 | 743,254 |
| Hong Leong Bank Bhd | | 583,700 | 2,612,329 |
| Hong Leong Credit Bhd | | 218,300 | 880,957 |
| IHH Healthcare Bhd | | 1,569,800 | 1,975,531 |
| Inari Amertron Bhd | | 2,441,800 | 1,285,973 |
| IOI Corp. Bhd | | 2,371,700 | 2,046,645 |
| Kuala Lumpur Kepong Bhd | | 407,947 | 1,870,620 |
| Malayan Banking Bhd | | 4,407,581 | 8,007,851 |
| Malaysia Airports Holdings Bhd (a) | | 642,006 | 812,013 |
| Maxis Bhd | | 2,149,700 | 1,750,496 |
| MISC Bhd | | 1,210,600 | 1,851,235 |
| MR DIY Group M Sdn Bhd (b) | | 2,201,150 | 940,424 |
| Nestle (Malaysia) Bhd | | 63,300 | 1,780,647 |
| Petronas Chemicals Group Bhd | | 2,187,300 | 4,034,107 |
| Petronas Dagangan Bhd | | 278,400 | 1,276,589 |
| Petronas Gas Bhd | | 744,530 | 2,692,780 |
| PPB Group Bhd | | 580,820 | 2,051,543 |
| Press Metal Bhd | | 3,369,300 | 3,099,927 |
| Public Bank Bhd | | 13,290,400 | 12,565,162 |
| QL Resources Bhd | | 1,036,050 | 1,121,949 |
| RHB Bank Bhd | | 1,297,676 | 1,569,946 |
| Sime Darby Bhd | | 2,566,749 | 1,221,486 |
| Sime Darby Plantation Bhd | | 1,959,356 | 1,823,428 |
| Telekom Malaysia Bhd | | 1,011,193 | 1,189,136 |
| Tenaga Nasional Bhd | | 2,360,400 | 4,203,589 |
| Top Glove Corp. Bhd | | 5,046,800 | 848,605 |
TOTAL MALAYSIA | | | 82,666,425 |
| Mexico - 2.5% | | | |
| Alfa SA de CV Series A | | 2,627,600 | 1,743,953 |
| America Movil S.A.B. de CV Series L | | 25,501,500 | 24,133,303 |
| Arca Continental S.A.B. de CV | | 385,400 | 3,156,845 |
| CEMEX S.A.B. de CV unit (a) | | 13,686,318 | 5,318,965 |
| Coca-Cola FEMSA S.A.B. de CV unit | | 482,395 | 3,038,799 |
| Fibra Uno Administracion SA de CV | | 2,768,000 | 3,230,009 |
| Fomento Economico Mexicano S.A.B. de CV unit | | 1,768,300 | 12,693,954 |
| Gruma S.A.B. de CV Series B | | 187,120 | 2,170,584 |
| Grupo Aeroportuario del Pacifico S.A.B. de CV Series B | | 334,600 | 5,182,897 |
| Grupo Aeroportuario del Sureste S.A.B. de CV Series B | | 177,690 | 4,158,626 |
| Grupo Bimbo S.A.B. de CV Series A | | 1,222,100 | 4,731,605 |
| Grupo Carso SA de CV Series A1 | | 402,500 | 1,621,945 |
| Grupo Financiero Banorte S.A.B. de CV Series O | | 2,370,800 | 19,271,051 |
| Grupo Financiero Inbursa S.A.B. de CV Series O (a) | | 1,961,400 | 3,620,269 |
| Grupo Mexico SA de CV Series B | | 2,845,707 | 10,316,819 |
| Grupo Televisa SA de CV | | 2,206,900 | 2,341,343 |
| Industrias Penoles SA de CV (d) | | 125,620 | 1,425,042 |
| Kimberly-Clark de Mexico SA de CV Series A | | 1,436,100 | 2,265,810 |
| Operadora de Sites Mexicanos, SA de CV (d) | | 1,183,300 | 1,287,637 |
| Orbia Advance Corp. S.A.B. de CV | | 947,055 | 1,598,899 |
| Promotora y Operadora de Infraestructura S.A.B. de CV | | 203,305 | 1,529,328 |
| Sitios Latinoamerica S.A.B. de CV (a)(d) | | 1,319,175 | 384,840 |
| Wal-Mart de Mexico SA de CV Series V | | 4,757,100 | 18,374,848 |
TOTAL MEXICO | | | 133,597,371 |
| Netherlands - 0.1% | | | |
| NEPI Rockcastle PLC | | 384,050 | 1,933,971 |
| X5 Retail Group NV: | | | |
| GDR (c) | | 102,956 | 36,424 |
| GDR (Reg. S) (c) | | 4,876 | 1,018 |
| Yandex NV Class A (a)(c) | | 261,431 | 1,463,677 |
TOTAL NETHERLANDS | | | 3,435,090 |
| Peru - 0.0% | | | |
| Compania de Minas Buenaventura SAA | | 1,294 | 8,980 |
| Compania de Minas Buenaventura SAA sponsored ADR (d) | | 193,704 | 1,344,306 |
TOTAL PERU | | | 1,353,286 |
| Philippines - 0.8% | | | |
| Aboitiz Equity Ventures, Inc. | | 1,539,210 | 1,508,220 |
| ACEN Corp. | | 6,687,995 | 725,026 |
| Ayala Corp. | | 223,685 | 2,588,006 |
| Ayala Land, Inc. | | 6,782,540 | 3,000,959 |
| Bank of the Philippine Islands (BPI) | | 1,640,997 | 2,720,867 |
| BDO Unibank, Inc. | | 1,800,356 | 3,967,501 |
| Converge ICT Solutions, Inc. (a) | | 2,062,900 | 440,498 |
| Globe Telecom, Inc. | | 27,141 | 1,090,907 |
| GT Capital Holdings, Inc. | | 80,904 | 576,723 |
| International Container Terminal Services, Inc. | | 942,880 | 2,817,932 |
| JG Summit Holdings, Inc. | | 2,768,446 | 2,066,148 |
| Jollibee Food Corp. | | 396,850 | 1,587,101 |
| Manila Electric Co. | | 213,800 | 1,111,374 |
| Metro Pacific Investments Corp. | | 9,080,500 | 572,799 |
| Metropolitan Bank & Trust Co. | | 1,614,227 | 1,444,860 |
| Monde Nissin Corp. (b) | | 5,934,900 | 1,199,505 |
| PLDT, Inc. | | 77,900 | 2,190,162 |
| SM Investments Corp. | | 216,630 | 3,078,195 |
| SM Prime Holdings, Inc. | | 10,626,700 | 5,786,013 |
| Universal Robina Corp. | | 794,990 | 1,676,809 |
TOTAL PHILIPPINES | | | 40,149,605 |
| Poland - 0.6% | | | |
| Bank Polska Kasa Opieki SA | | 165,261 | 2,715,291 |
| CD Projekt RED SA (d) | | 58,791 | 1,565,182 |
| Cyfrowy Polsat SA | | 240,760 | 902,705 |
| Dino Polska SA (a)(b) | | 43,783 | 2,863,168 |
| KGHM Polska Miedz SA (Bearer) | | 126,688 | 2,538,484 |
| LPP SA | | 1,009 | 1,752,081 |
| mBank SA (a) | | 14,008 | 785,183 |
| Orange Polska SA | | 560,278 | 707,902 |
| PGE Polska Grupa Energetyczna SA (a) | | 851,699 | 972,280 |
| Polski Koncern Naftowy Orlen SA | | 374,224 | 4,304,975 |
| Polskie Gornictwo Naftowe i Gazownictwo SA (a) | | 1,574,286 | 1,675,191 |
| Powszechna Kasa Oszczednosci Bank SA | | 793,302 | 4,331,996 |
| Powszechny Zaklad Ubezpieczen SA | | 546,962 | 3,070,439 |
| Santander Bank Polska SA | | 31,007 | 1,650,988 |
TOTAL POLAND | | | 29,835,865 |
| Qatar - 1.2% | | | |
| Barwa Real Estate Co. (a) | | 1,649,159 | 1,539,683 |
| Industries Qatar QSC (a) | | 1,363,770 | 5,905,582 |
| Masraf al Rayan | | 5,061,531 | 5,332,902 |
| Mesaieed Petrochemical Holding Co. (a) | | 3,903,353 | 2,433,064 |
| Ooredoo QSC | | 704,627 | 1,890,357 |
| Qatar Electricity & Water Co. (a) | | 415,784 | 2,112,172 |
| Qatar Fuel Co. (a) | | 435,532 | 2,281,856 |
| Qatar Gas Transport Co. Ltd. (Nakilat) (a) | | 2,234,423 | 2,515,586 |
| Qatar International Islamic Bank QSC (a) | | 659,408 | 2,094,968 |
| Qatar Islamic Bank (a) | | 1,506,852 | 10,091,884 |
| Qatar National Bank SAQ (a) | | 4,211,414 | 23,059,132 |
| The Commercial Bank of Qatar (a) | | 2,938,908 | 5,079,285 |
TOTAL QATAR | | | 64,336,471 |
| Russia - 0.1% | | | |
| Alrosa Co. Ltd. (c) | | 2,234,923 | 557,560 |
| Gazprom OAO (c) | | 8,473,436 | 1,329,616 |
| Gazprom OAO sponsored ADR (Reg. S) (a)(c) | | 863,533 | 197,265 |
| Inter Rao Ues JSC (c) | | 31,187,844 | 257,846 |
| LUKOIL PJSC (c) | | 334,533 | 155,274 |
| LUKOIL PJSC sponsored ADR (c) | | 22,773 | 6,442 |
| Magnit OJSC GDR (Reg. S) (c) | | 305,795 | 1,489 |
| MMC Norilsk Nickel PJSC (c) | | 48,442 | 483,115 |
| MMC Norilsk Nickel PJSC sponsored ADR (c) | | 59,247 | 43,996 |
| Mobile TeleSystems OJSC sponsored ADR (c) | | 396,417 | 394,827 |
| Moscow Exchange MICEX-RTS OAO (a)(c) | | 1,311,841 | 378,153 |
| Novatek PJSC GDR (Reg. S) (c) | | 78,382 | 20,024 |
| Novolipetsk Steel OJSC (c) | | 1,258,902 | 18,124 |
| Novolipetsk Steel OJSC GDR (Reg. S) (c) | | 3,783 | 470 |
| PhosAgro PJSC: | | | |
| GDR (c) | | 749 | 15 |
| GDR (Reg. S) (c) | | 116,446 | 2,388 |
| Polyus PJSC (c) | | 26,742 | 94,304 |
| Polyus PJSC unit (c) | | 5,226 | 8,008 |
| Rosneft Oil Co. OJSC (c) | | 857,494 | 215,048 |
| Rosneft Oil Co. OJSC GDR (Reg. S) (c) | | 150,200 | 35,515 |
| Sberbank of Russia (a)(c) | | 9,313,306 | 85,868 |
| Severstal PAO (c) | | 155,372 | 5,202 |
| Severstal PAO GDR (Reg. S) (c) | | 26,165 | 618 |
| Surgutneftegas OJSC (c) | | 5,613,549 | 103,006 |
| Surgutneftegas OJSC sponsored ADR (a)(c) | | 73,333 | 13,542 |
| Tatneft PAO (c) | | 1,103,564 | 205,832 |
| Tatneft PAO sponsored ADR (c) | | 18,698 | 17,264 |
| United Co. RUSAL International PJSC (c) | | 2,596,470 | 469,248 |
| VTB Bank OJSC (a)(c) | | 2,380,815,800 | 136,403 |
| VTB Bank OJSC sponsored GDR (Reg. S) (a)(c) | | 221,738 | 37,021 |
TOTAL RUSSIA | | | 5,273,483 |
| Saudi Arabia - 4.9% | | | |
| ACWA Power Co. | | 74,380 | 3,444,297 |
| Advanced Polypropylene Co. | | 119,748 | 1,411,781 |
| Al Rajhi Bank | | 1,793,475 | 40,665,878 |
| Alinma Bank | | 896,373 | 8,945,719 |
| Almarai Co. Ltd. | | 229,598 | 3,440,105 |
| Arab National Bank | | 554,174 | 4,756,320 |
| Bank Al-Jazira | | 365,129 | 2,271,884 |
| Bank Albilad | | 447,785 | 6,041,889 |
| Banque Saudi Fransi | | 541,239 | 6,222,545 |
| Bupa Arabia for Cooperative Insurance Co. | | 54,682 | 2,808,646 |
| Dar Al Arkan Real Estate Development Co. (a) | | 484,672 | 1,730,994 |
| Dr Sulaiman Al Habib Medical Services Group Co. | | 80,191 | 4,835,938 |
| Elm Co. | | 22,118 | 1,948,359 |
| Emaar The Economic City (a) | | 375,831 | 959,194 |
| Etihad Etisalat Co. | | 343,761 | 3,348,366 |
| Jarir Marketing Co. | | 53,879 | 2,351,574 |
| Mobile Telecommunications Co. Saudi Arabia (a) | | 387,908 | 1,339,981 |
| Mouwasat Medical Services Co. | | 44,989 | 2,622,078 |
| National Industrialization Co. (a) | | 309,170 | 1,100,902 |
| Rabigh Refining & Petrochemical Co. (a) | | 393,017 | 1,426,661 |
| Riyad Bank | | 1,235,713 | 11,822,566 |
| Sabic Agriculture-Nutrients Co. | | 195,753 | 8,283,250 |
| Sahara International Petrochemical Co. | | 329,070 | 3,551,194 |
| Saudi Arabian Mining Co. | | 789,033 | 17,575,831 |
| Saudi Arabian Oil Co. (b) | | 2,222,053 | 20,638,355 |
| Saudi Basic Industries Corp. | | 824,262 | 19,391,561 |
| Saudi Electricity Co. | | 776,603 | 5,580,307 |
| Saudi Industrial Investment Group | | 334,636 | 2,002,001 |
| Saudi Investment Bank/The | | 452,273 | 2,183,399 |
| Saudi Kayan Petrochemical Co. (a) | | 675,246 | 2,364,902 |
| Saudi Research & Marketing Group (a) | | 33,979 | 1,821,232 |
| Saudi Tadawul Group Holding Co. | | 33,075 | 1,911,855 |
| Saudi Telecom Co. | | 1,368,635 | 14,715,135 |
| The Saudi British Bank | | 846,810 | 9,803,259 |
| The Saudi National Bank | | 2,009,309 | 31,763,504 |
| The Savola Group | | 247,258 | 1,928,027 |
| Yanbu National Petrochemical Co. | | 229,201 | 2,726,586 |
TOTAL SAUDI ARABIA | | | 259,736,075 |
| Singapore - 0.0% | | | |
| BOC Aviation Ltd. Class A (b) | | 196,500 | 1,315,482 |
| South Africa - 3.5% | | | |
| Absa Group Ltd. | | 781,862 | 8,501,891 |
| African Rainbow Minerals Ltd. | | 102,066 | 1,437,245 |
| Anglo American Platinum Ltd. | | 48,427 | 3,852,067 |
| AngloGold Ashanti Ltd. | | 384,774 | 5,025,039 |
| Aspen Pharmacare Holdings Ltd. | | 350,181 | 2,883,614 |
| Bid Corp. Ltd. | | 301,950 | 4,858,487 |
| Bidvest Group Ltd./The | | 273,247 | 3,160,777 |
| Capitec Bank Holdings Ltd. | | 79,719 | 8,248,332 |
| Clicks Group Ltd. | | 220,675 | 3,739,236 |
| Discovery Ltd. (a) | | 457,969 | 2,997,321 |
| Exxaro Resources Ltd. | | 230,301 | 2,564,201 |
| FirstRand Ltd. | | 4,643,500 | 16,267,260 |
| Foschini Group Ltd./The | | 302,595 | 1,892,954 |
| Gold Fields Ltd. | | 814,875 | 6,527,802 |
| Growthpoint Properties Ltd. (d) | | 3,058,935 | 2,156,554 |
| Harmony Gold Mining Co. Ltd. | | 498,605 | 1,380,908 |
| Impala Platinum Holdings Ltd. | | 777,374 | 7,959,273 |
| Kumba Iron Ore Ltd. | | 58,496 | 1,101,819 |
| Mr Price Group Ltd. | | 228,961 | 2,204,258 |
| MTN Group Ltd. | | 1,551,379 | 10,965,964 |
| MultiChoice Group Ltd. | | 355,723 | 2,324,460 |
| Naspers Ltd. Class N | | 199,689 | 20,584,316 |
| Nedbank Group Ltd. | | 426,327 | 5,049,429 |
| Northam Platinum Holdings Ltd. (a) | | 307,482 | 2,885,539 |
| Old Mutual Ltd. | | 4,341,376 | 2,467,450 |
| Pepkor Holdings Ltd. (b) | | 1,492,260 | 1,841,690 |
| Remgro Ltd. | | 499,203 | 3,715,334 |
| Sanlam Ltd. | | 1,638,223 | 4,766,064 |
| Sasol Ltd. | | 520,541 | 8,750,325 |
| Shoprite Holdings Ltd. | | 456,410 | 5,811,735 |
| Sibanye-Stillwater Ltd. | | 2,586,063 | 6,057,139 |
| Spar Group Ltd./The | | 165,832 | 1,406,102 |
| Standard Bank Group Ltd. | | 1,232,907 | 11,521,115 |
| Vodacom Group Ltd. | | 586,691 | 4,002,355 |
| Woolworths Holdings Ltd. | | 914,064 | 3,139,479 |
TOTAL SOUTH AFRICA | | | 182,047,534 |
| Taiwan - 12.8% | | | |
| Accton Technology Corp. | | 465,000 | 3,503,286 |
| Acer, Inc. | | 2,570,994 | 1,761,610 |
| Advantech Co. Ltd. | | 389,681 | 3,539,919 |
| ASE Technology Holding Co. Ltd. | | 2,995,927 | 7,390,171 |
| Asia Cement Corp. | | 2,034,153 | 2,352,388 |
| ASMedia Technology, Inc. | | 26,000 | 469,151 |
| ASUSTeK Computer, Inc. | | 648,000 | 4,741,365 |
| AUO Corp. | | 6,018,400 | 3,153,437 |
| Catcher Technology Co. Ltd. | | 603,000 | 3,168,863 |
| Cathay Financial Holding Co. Ltd. | | 7,239,832 | 8,484,704 |
| Chang Hwa Commercial Bank | | 4,247,840 | 2,186,214 |
| Cheng Shin Rubber Industry Co. Ltd. | | 1,681,937 | 1,684,336 |
| China Airlines Ltd. | | 2,703,000 | 1,420,470 |
| China Development Financial Ho | | 14,265,648 | 5,196,917 |
| China Steel Corp. | | 10,809,204 | 8,998,175 |
| Chunghwa Telecom Co. Ltd. | | 3,464,000 | 11,931,918 |
| Compal Electronics, Inc. | | 3,865,000 | 2,528,415 |
| CTBC Financial Holding Co. Ltd. | | 16,060,826 | 10,158,146 |
| Delta Electronics, Inc. | | 1,781,381 | 14,221,666 |
| E Ink Holdings, Inc. | | 784,000 | 4,995,101 |
| E.SUN Financial Holdings Co. Ltd. | | 11,734,684 | 8,440,648 |
| ECLAT Textile Co. Ltd. | | 174,613 | 2,298,109 |
| eMemory Technology, Inc. | | 59,000 | 1,966,423 |
| EVA Airways Corp. | | 2,406,000 | 1,745,532 |
| Evergreen Marine Corp. (Taiwan) | | 920,363 | 3,923,542 |
| Far Eastern New Century Corp. | | 2,950,705 | 2,941,191 |
| Far EasTone Telecommunications Co. Ltd. | | 1,466,000 | 3,213,437 |
| Feng Tay Enterprise Co. Ltd. | | 400,686 | 1,993,864 |
| First Financial Holding Co. Ltd. | | 9,673,107 | 7,422,627 |
| Formosa Chemicals & Fibre Corp. | | 3,216,760 | 6,931,383 |
| Formosa Petrochemical Corp. | | 1,043,000 | 2,683,977 |
| Formosa Plastics Corp. | | 3,787,520 | 9,758,260 |
| Fubon Financial Holding Co. Ltd. | | 6,813,530 | 10,773,548 |
| Giant Manufacturing Co. Ltd. | | 274,000 | 1,745,737 |
| GlobalWafers Co. Ltd. | | 199,000 | 2,211,865 |
| Hon Hai Precision Industry Co. Ltd. (Foxconn) | | 11,441,869 | 36,361,120 |
| Hotai Motor Co. Ltd. | | 276,000 | 4,997,334 |
| Hua Nan Financial Holdings Co. Ltd. | | 8,101,032 | 5,286,995 |
| Innolux Corp. | | 8,561,614 | 3,145,505 |
| Inventec Corp. | | 2,287,865 | 1,730,759 |
| Largan Precision Co. Ltd. | | 92,000 | 5,276,865 |
| Lite-On Technology Corp. | | 1,836,279 | 3,643,637 |
| MediaTek, Inc. | | 1,390,292 | 25,431,645 |
| Mega Financial Holding Co. Ltd. | | 10,218,123 | 9,472,372 |
| Micro-Star International Co. Ltd. | | 611,000 | 2,074,301 |
| momo.com, Inc. | | 61,800 | 924,490 |
| Nan Ya Plastics Corp. | | 4,358,860 | 9,230,177 |
| Nan Ya Printed Circuit Board Corp. | | 203,000 | 1,331,137 |
| Nanya Technology Corp. | | 1,122,000 | 1,895,858 |
| Nien Made Enterprise Co. Ltd. | | 166,000 | 1,281,515 |
| Novatek Microelectronics Corp. | | 531,000 | 3,967,601 |
| Pegatron Corp. | | 1,844,000 | 3,373,101 |
| Pou Chen Corp. | | 2,078,000 | 1,755,612 |
| Powerchip Semiconductor Manufacturing Corp. | | 2,680,294 | 2,559,467 |
| President Chain Store Corp. | | 516,000 | 4,287,468 |
| Quanta Computer, Inc. | | 2,482,000 | 5,263,496 |
| Realtek Semiconductor Corp. | | 423,401 | 3,347,407 |
| Ruentex Development Co. Ltd. | | 1,642,062 | 2,016,049 |
| Shin Kong Financial Holding Co. Ltd. | | 11,977,127 | 2,970,702 |
| Sinopac Financial Holdings Co. | | 9,358,866 | 4,671,599 |
| Synnex Technology International Corp. | | 1,257,500 | 2,050,738 |
| Taishin Financial Holdings Co. Ltd. | | 9,936,191 | 4,081,805 |
| Taiwan Cement Corp. | | 5,537,730 | 5,193,661 |
| Taiwan Cooperative Financial Holding Co. Ltd. | | 8,971,018 | 6,953,415 |
| Taiwan High Speed Rail Corp. | | 1,740,000 | 1,515,905 |
| Taiwan Mobile Co. Ltd. | | 1,567,900 | 4,622,908 |
| Taiwan Semiconductor Manufacturing Co. Ltd. | | 22,555,000 | 270,896,102 |
| The Shanghai Commercial & Savings Bank Ltd. | | 3,265,246 | 4,697,322 |
| The Shanghai Commercial & Savings Bank Ltd. rights (a) | | 239,363 | 69,759 |
| Uni-President Enterprises Corp. | | 4,437,983 | 9,012,460 |
| Unimicron Technology Corp. | | 1,157,000 | 4,466,004 |
| United Microelectronics Corp. | | 10,837,000 | 13,018,345 |
| Vanguard International Semiconductor Corp. | | 808,000 | 1,663,397 |
| Voltronic Power Technology Corp. | | 60,000 | 2,436,907 |
| Walsin Lihwa Corp. | | 2,368,526 | 2,625,250 |
| Wan Hai Lines Ltd. | | 623,950 | 1,309,649 |
| Win Semiconductors Corp. | | 320,000 | 1,210,393 |
| Winbond Electronics Corp. | | 2,715,000 | 1,641,424 |
| Wiwynn Corp. | | 79,756 | 1,790,269 |
| WPG Holding Co. Ltd. | | 1,503,200 | 2,048,293 |
| Yageo Corp. | | 316,845 | 3,605,200 |
| Yang Ming Marine Transport Corp. | | 1,592,000 | 2,971,365 |
| Yuanta Financial Holding Co. Ltd. | | 9,163,592 | 5,596,911 |
TOTAL TAIWAN | | | 669,710,089 |
| Thailand - 2.2% | | | |
| Advanced Info Service PCL (For. Reg.) | | 1,072,700 | 5,385,352 |
| Airports of Thailand PCL (For. Reg.) (a) | | 3,817,300 | 7,424,897 |
| Asset World Corp. PCL (For. Reg.) | | 10,557,900 | 1,692,816 |
| B. Grimm Power PCL (For. Reg.) | | 512,800 | 454,909 |
| Bangkok Commercial Asset Management PCL (For. Reg.) | | 1,458,600 | 586,584 |
| Bangkok Dusit Medical Services PCL (For. Reg.) | | 9,705,500 | 7,525,621 |
| Bangkok Expressway and Metro PCL (For. Reg.) | | 6,885,900 | 1,701,339 |
| Berli Jucker PCL (For. Reg.) | | 1,115,700 | 1,004,409 |
| BTS Group Holdings PCL (For. Reg.) | | 7,574,000 | 1,652,364 |
| Bumrungrad Hospital PCL: | | | |
| NVDR | | 48,700 | 290,574 |
| (For. Reg.) | | 440,200 | 2,626,505 |
| Carabao Group PCL (For. Reg.) | | 220,100 | 522,119 |
| Central Pattana PCL (For. Reg.) | | 1,901,200 | 3,435,603 |
| Central Retail Corp. PCL (For. Reg.) | | 1,664,716 | 1,837,773 |
| Charoen Pokphand Foods PCL (For. Reg.) | | 3,632,320 | 2,410,726 |
| CP ALL PCL (For. Reg.) | | 5,383,300 | 8,489,894 |
| Delta Electronics PCL (For. Reg.) | | 313,500 | 4,779,340 |
| Electricity Generating PCL (For. Reg.) | | 239,900 | 1,075,120 |
| Energy Absolute PCL (For. Reg.) | | 1,527,300 | 3,873,951 |
| Global Power Synergy Public Co. Ltd. (For. Reg.) | | 620,500 | 1,011,197 |
| Gulf Energy Development PCL (For. Reg.) | | 2,654,200 | 3,523,120 |
| Home Product Center PCL (For. Reg.) | | 5,651,806 | 2,168,915 |
| Indorama Ventures PCL (For. Reg.) | | 1,954,200 | 2,157,351 |
| Intouch Holdings PCL (For. Reg.) | | 950,000 | 1,797,871 |
| JMT Network Services PCL (For. Reg.) | | 489,400 | 836,141 |
| Kasikornbank PCL: | | | |
| NVDR | | 2,200 | 8,443 |
| (For. Reg.) | | 554,400 | 2,127,544 |
| Krung Thai Bank PCL (For. Reg.) | | 3,301,270 | 1,518,523 |
| Krungthai Card PCL (For. Reg.) | | 824,600 | 1,235,437 |
| Land & House PCL (For. Reg.) | | 8,223,200 | 1,988,525 |
| Minor International PCL (For. Reg.) (a) | | 2,983,632 | 2,215,471 |
| Muangthai Leasing PCL (For. Reg.) | | 701,300 | 668,212 |
| Osotspa PCL (For. Reg.) | | 955,400 | 665,478 |
| PTT Exploration and Production PCL (For. Reg.) | | 1,291,339 | 6,160,547 |
| PTT Global Chemical PCL (For. Reg.) | | 2,166,539 | 2,477,184 |
| PTT Oil & Retail Business PCL: | | | |
| (For. Reg.) | | 918,600 | 581,897 |
| NVDR | | 1,777,700 | 1,126,103 |
| PTT PCL (For. Reg.) | | 9,210,000 | 8,714,943 |
| Ratch Group PCL (For. Reg.) | | 779,000 | 839,506 |
| SCB X PCL (For. Reg.) | | 677,200 | 1,886,797 |
| SCG Packaging PCL (For. Reg.) | | 1,464,300 | 2,001,409 |
| Siam Cement PCL (For. Reg.) | | 748,750 | 6,376,528 |
| Siam Commercial Bank PCL (For. Reg.) | | 385,900 | 893,160 |
| Srisawad Corp. PCL: | | | |
| warrants 8/29/25 (a) | | 14,528 | 1,237 |
| (For. Reg.) | | 644,900 | 694,990 |
| Thai Oil PCL (For. Reg.) | | 1,248,614 | 1,788,657 |
| Thai Union Frozen Products PCL: | | | |
| (For. Reg.) | | 2,810,920 | 1,329,914 |
| rights (a)(c) | | 79,705 | 36,884 |
| True Corp. PCL (For. Reg.) | | 10,668,919 | 1,390,928 |
TOTAL THAILAND | | | 114,992,808 |
| Turkey - 0.4% | | | |
| Akbank TAS | | 2,858,504 | 2,245,126 |
| Aselsan A/S | | 600,017 | 1,038,589 |
| Bim Birlesik Magazalar A/S JSC | | 406,892 | 2,929,128 |
| Eregli Demir ve Celik Fabrikalari T.A.S. | | 1,271,145 | 2,028,178 |
| Ford Otomotiv Sanayi A/S | | 66,133 | 1,289,672 |
| Haci Omer Sabanci Holding A/S | | 930,961 | 1,677,448 |
| Koc Holding A/S | | 693,175 | 2,070,485 |
| Turk Hava Yollari AO (a) | | 509,052 | 2,770,295 |
| Turk Sise ve Cam Fabrikalari A/S | | 1,241,681 | 2,215,971 |
| Turkcell Iletisim Hizmet A/S | | 1,086,837 | 1,497,052 |
| Turkiye Is Bankasi A/S Series C | | 3,171,990 | 1,588,189 |
| Turkiye Petrol Rafinerileri A/S (a) | | 114,308 | 2,327,396 |
TOTAL TURKEY | | | 23,677,529 |
| United Arab Emirates - 1.5% | | | |
| Abu Dhabi Commercial Bank PJSC | | 2,574,395 | 6,623,297 |
| Abu Dhabi Islamic Bank | | 1,350,168 | 3,492,036 |
| Abu Dhabi National Oil Co. for Distribution PJSC | | 2,870,091 | 3,524,029 |
| Aldar Properties PJSC | | 3,583,710 | 4,214,867 |
| Dubai Islamic Bank Pakistan Ltd. | | 2,687,509 | 4,258,338 |
| Emaar Properties PJSC (a) | | 3,721,356 | 6,139,614 |
| Emirates NBD Bank PJSC | | 1,740,254 | 6,277,631 |
| Emirates Telecommunications Corp. | | 3,179,324 | 22,331,698 |
| First Abu Dhabi Bank PJSC | | 4,052,138 | 19,747,154 |
TOTAL UNITED ARAB EMIRATES | | | 76,608,664 |
| United States of America - 0.6% | | | |
| 360 DigiTech, Inc. ADR | | 97,828 | 993,932 |
| Legend Biotech Corp. ADR (a) | | 43,040 | 2,144,253 |
| Li Auto, Inc. ADR (a) | | 500,174 | 6,812,370 |
| Southern Copper Corp. | | 77,860 | 3,657,084 |
| Yum China Holdings, Inc. | | 384,538 | 15,900,646 |
TOTAL UNITED STATES OF AMERICA | | | 29,508,285 |
| TOTAL COMMON STOCKS (Cost $6,186,692,254) | | | 4,965,845,339 |
| | | | |
| Nonconvertible Preferred Stocks - 2.6% |
| | | Shares | Value ($) |
| Brazil - 1.7% | | | |
| Banco Bradesco SA (PN) | | 4,895,204 | 18,820,782 |
| Braskem SA Class A | | 179,000 | 1,168,152 |
| Centrais Eletricas Brasileiras SA (Electrobras) (PN-B) | | 210,206 | 2,169,816 |
| Companhia Energetica de Minas Gerais (CEMIG) (PN) | | 1,281,280 | 2,820,279 |
| Gerdau SA | | 1,049,900 | 5,233,748 |
| Itau Unibanco Holding SA | | 4,440,131 | 26,131,058 |
| Itausa-Investimentos Itau SA (PN) | | 4,182,139 | 8,695,416 |
| Petroleo Brasileiro SA - Petrobras (PN) (non-vtg.) | | 4,467,400 | 25,781,278 |
TOTAL BRAZIL | | | 90,820,529 |
| Chile - 0.2% | | | |
| Sociedad Quimica y Minera de Chile SA (PN-B) | | 130,827 | 12,451,791 |
| Colombia - 0.1% | | | |
| Bancolombia SA (PN) | | 407,608 | 2,579,145 |
| Korea (South) - 0.6% | | | |
| Hyundai Motor Co. | | 20,026 | 1,099,990 |
| Hyundai Motor Co. Series 2 | | 29,477 | 1,648,029 |
| LG Chemical Ltd. | | 6,753 | 1,367,330 |
| LG H & H Co. Ltd. | | 1,155 | 226,983 |
| Samsung Electronics Co. Ltd. | | 715,971 | 26,736,299 |
TOTAL KOREA (SOUTH) | | | 31,078,631 |
| Russia - 0.0% | | | |
| Surgutneftegas OJSC (c) | | 5,794,540 | 151,180 |
| TOTAL NONCONVERTIBLE PREFERRED STOCKS (Cost $143,113,764) | | | 137,081,276 |
| | | | |
| Nonconvertible Bonds - 0.0% |
| | | Principal Amount (e) | Value ($) |
| India - 0.0% | | | |
NTPC Ltd. 8.49% 3/25/25 (Cost $52,909) | INR | 264,162 | 42,632 |
| | | | |
| Government Obligations - 0.3% |
| | | Principal Amount (e) | Value ($) |
| United States of America - 0.3% | | | |
U.S. Treasury Bills, yield at date of purchase 1.15% 1/26/23 (f) (Cost $14,959,168) | | 15,000,000 | 14,857,115 |
| | | | |
| Money Market Funds - 1.6% |
| | | Shares | Value ($) |
| Fidelity Cash Central Fund 3.10% (g) | | 62,320,151 | 62,332,615 |
| Fidelity Securities Lending Cash Central Fund 3.10% (g)(h) | | 20,630,344 | 20,632,407 |
| TOTAL MONEY MARKET FUNDS (Cost $82,965,022) | | | 82,965,022 |
| | | | |
| TOTAL INVESTMENT IN SECURITIES - 99.4% (Cost $6,427,783,117) | 5,200,791,384 |
NET OTHER ASSETS (LIABILITIES) - 0.6% | 33,852,908 |
| NET ASSETS - 100.0% | 5,234,644,292 |
| | |
| Futures Contracts |
| | Number of contracts | Expiration Date | Notional Amount ($) | Value ($) | Unrealized Appreciation/ (Depreciation) ($) |
| Purchased | | | | | |
| | | | | | |
| Equity Index Contracts | | | | | |
| ICE E-mini MSCI Emerging Markets Index Contracts (United States) | 3,081 | Dec 2022 | 131,497,080 | (848,260) | (848,260) |
| | | | | | |
| The notional amount of futures purchased as a percentage of Net Assets is 2.5% |
Currency Abbreviations
Categorizations in the Schedule of Investments are based on country or territory of incorporation.
Legend
| (b) | Security exempt from registration under Rule 144A of the Securities Act of 1933. These securities may be resold in transactions exempt from registration, normally to qualified institutional buyers. At the end of the period, the value of these securities amounted to $246,331,595 or 4.7% of net assets. |
| (d) | Security or a portion of the security is on loan at period end. |
| (e) | Amount is stated in United States dollars unless otherwise noted. |
| (f) | Security or a portion of the security was pledged to cover margin requirements for futures contracts. At period end, the value of securities pledged amounted to $4,406,620. |
| (g) | Affiliated fund that is generally available only to investment companies and other accounts managed by Fidelity Investments. The rate quoted is the annualized seven-day yield of the fund at period end. A complete unaudited listing of the fund's holdings as of its most recent quarter end is available upon request. In addition, each Fidelity Central Fund's financial statements, which are not covered by the Fund's Report of Independent Registered Public Accounting Firm, are available on the SEC's website or upon request. |
| (h) | Investment made with cash collateral received from securities on loan. |
Affiliated Central Funds
Fiscal year to date information regarding the Fund's investments in Fidelity Central Funds, including the ownership percentage, is presented below.
| Affiliate | Value, beginning of period ($) | Purchases ($) | Sales Proceeds ($) | Dividend Income ($) | Realized Gain (loss) ($) | Change in Unrealized appreciation (depreciation) ($) | Value, end of period ($) | % ownership, end of period |
| Fidelity Cash Central Fund 3.10% | 150,494,987 | 2,257,314,675 | 2,345,477,047 | 1,481,014 | - | - | 62,332,615 | 0.1% |
| Fidelity Securities Lending Cash Central Fund 3.10% | 46,844,807 | 312,522,864 | 338,735,264 | 536,172 | - | - | 20,632,407 | 0.1% |
| Total | 197,339,794 | 2,569,837,539 | 2,684,212,311 | 2,017,186 | - | - | 82,965,022 | |
| | | | | | | | | |
Amounts in the income column in the above table include any capital gain distributions from underlying funds, which are presented in the corresponding line item in the Statement of Operations, if applicable.
Amount for Fidelity Securities Lending Cash Central Fund represents the income earned on investing cash collateral, less rebates paid to borrowers and any lending agent fees associated with the loan, plus any premium payments received for lending certain types of securities.
Investment Valuation
The following is a summary of the inputs used, as of October 31, 2022, involving the Fund's assets and liabilities carried at fair value. The inputs or methodology used for valuing securities may not be an indication of the risk associated with investing in those securities. For more information on valuation inputs, and their aggregation into the levels used below, please refer to the Investment Valuation section in the accompanying Notes to Financial Statements.
| Valuation Inputs at Reporting Date: |
| Description | Total ($) | Level 1 ($) | Level 2 ($) | Level 3 ($) |
Investments in Securities: | | | | |
|
| Equities: | | | | |
Communication Services | 444,820,188 | 222,359,009 | 220,558,125 | 1,903,054 |
Consumer Discretionary | 625,486,809 | 378,254,669 | 247,105,240 | 126,900 |
Consumer Staples | 331,216,148 | 328,264,018 | 2,876,314 | 75,816 |
Energy | 287,644,182 | 276,619,651 | 8,574,523 | 2,450,008 |
Financials | 1,205,067,497 | 990,190,449 | 214,042,827 | 834,221 |
Health Care | 207,724,196 | 178,879,271 | 28,844,925 | - |
Industrials | 310,909,823 | 298,274,599 | 12,635,224 | - |
Information Technology | 968,058,770 | 666,817,108 | 301,241,662 | - |
Materials | 468,249,408 | 417,453,448 | 49,112,912 | 1,683,048 |
Real Estate | 88,647,602 | 79,603,170 | 8,786,972 | 257,460 |
Utilities | 165,101,992 | 160,214,690 | 4,629,454 | 257,848 |
|
| Corporate Bonds | 42,632 | - | 42,632 | - |
|
| Government Obligations | 14,857,115 | - | 14,857,115 | - |
|
| Money Market Funds | 82,965,022 | 82,965,022 | - | - |
| Total Investments in Securities: | 5,200,791,384 | 4,079,895,104 | 1,113,307,925 | 7,588,355 |
Derivative Instruments: | | | | |
|
| Liabilities | | | | |
Futures Contracts | (848,260) | (848,260) | - | - |
| Total Liabilities | (848,260) | (848,260) | - | - |
| Total Derivative Instruments: | (848,260) | (848,260) | - | - |
The following is a reconciliation of Investments in Securities for which Level 3 inputs were used in determining value:
| |
| Investments in Securities: | |
| Energy | | | |
| Beginning Balance | $ | 68 | |
| Net Realized Gain (Loss) on Investment Securities | | 4,373 | |
| Net Unrealized Gain (Loss) on Investment Securities | | (127,237,495) | |
| Cost of Purchases | | 17,026,346 | |
| Proceeds of Sales | | (82,151) | |
| Amortization/Accretion | | - | |
| Transfers into Level 3 | | 112,738,867 | |
| Transfers out of Level 3 | | - | |
| Ending Balance | $ | 2,450,008 | |
| The change in unrealized gain (loss) for the period attributable to Level 3 securities held at October 31, 2022 | $ | (127,237,425) | |
| Financials | | | |
| Beginning Balance | $ | 873,237 | |
| Net Realized Gain (Loss) on Investment Securities | | (1,323,641) | |
| Net Unrealized Gain (Loss) on Investment Securities | | (60,154,400) | |
| Cost of Purchases | | 8,058,740 | |
| Proceeds of Sales | | (348,712) | |
| Amortization/Accretion | | - | |
| Transfers into Level 3 | | 53,728,997 | |
| Transfers out of Level 3 | | - | |
| Ending Balance | $ | 834,221 | |
| The change in unrealized gain (loss) for the period attributable to Level 3 securities held at October 31, 2022 | $ | (60,953,517) | |
| Other Investments in Securities | | | |
| Beginning Balance | $ | 1,685,472 | |
| Net Realized Gain (Loss) on Investment Securities | | (1,699,975) | |
| Net Unrealized Gain (Loss) on Investment Securities | | (76,514,113) | |
| Cost of Purchases | | 16,203,167 | |
| Proceeds of Sales | | (3,595,121) | |
| Amortization/Accretion | | - | |
| Transfers into Level 3 | | 68,224,696 | |
| Transfers out of Level 3 | | - | |
| Ending Balance | $ | 4,304,126 | |
| The change in unrealized gain (loss) for the period attributable to Level 3 securities held at October 31, 2022 | $ | (76,166,175) | |
| The information used in the above reconciliation represents fiscal year to date activity for any Investments in Securities identified as using Level 3 inputs at either the beginning or the end of the current fiscal period. Cost of purchases and proceeds of sales may include securities received and/or delivered through in-kind transactions. Transfers into Level 3 were attributable to a lack of observable market data resulting from decreases in market activity, decreases in liquidity, security restructurings or corporate actions. Transfers out of Level 3 were attributable to observable market data becoming available for those securities. Transfers in or out of Level 3 represent the beginning value of any Security or Instrument where a change in the pricing level occurred from the beginning to the end of the period. The cost of purchases and the proceeds of sales may include securities received or delivered through corporate actions or exchanges. Realized and unrealized gains (losses) disclosed in the reconciliation are included in Net Gain (Loss) on the Fund's Statement of Operations. | |
Value of Derivative Instruments
The following table is a summary of the Fund's value of derivative instruments by primary risk exposure as of October 31, 2022. For additional information on derivative instruments, please refer to the Derivative Instruments section in the accompanying Notes to Financial Statements.
Primary Risk Exposure / Derivative Type | Value |
| Asset ($) | Liability ($) |
| Equity Risk | | |
Futures Contracts (a) | 0 | (848,260) |
| Total Equity Risk | 0 | (848,260) |
| Total Value of Derivatives | 0 | (848,260) |
(a)Reflects gross cumulative appreciation (depreciation) on futures contracts as presented in the Schedule of Investments. In the Statement of Assets and Liabilities, the period end daily variation margin is included in receivable or payable for daily variation margin on futures contracts, and the net cumulative appreciation (depreciation) is included in Total accumulated earnings (loss).
Fidelity® Emerging Markets Index Fund
| Statement of Assets and Liabilities |
| | | | October 31, 2022 |
| | | | | |
| Assets | | | | |
| Investment in securities, at value (including securities loaned of $18,456,366) - See accompanying schedule: | | | | |
Unaffiliated issuers (cost $6,344,818,095) | | $5,117,826,362 | | |
Fidelity Central Funds (cost $82,965,022) | | 82,965,022 | | |
| | | | | |
| Total Investment in Securities (cost $6,427,783,117) | | | $ | 5,200,791,384 |
| Foreign currency held at value (cost $21,699,789) | | | | 21,372,138 |
| Receivable for fund shares sold | | | | 60,058,978 |
| Dividends receivable | | | | 4,263,584 |
| Interest receivable | | | | 244 |
| Distributions receivable from Fidelity Central Funds | | | | 102,853 |
| Other receivables | | | | 46,050 |
Total assets | | | | 5,286,635,231 |
| Liabilities | | | | |
| Payable for investments purchased | | $20,345 | | |
| Payable for fund shares redeemed | | 8,195,859 | | |
| Accrued management fee | | 333,146 | | |
| Payable for daily variation margin on futures contracts | | 180,931 | | |
| Other payables and accrued expenses | | 22,631,733 | | |
| Collateral on securities loaned | | 20,628,925 | | |
| Total Liabilities | | | | 51,990,939 |
| Net Assets | | | $ | 5,234,644,292 |
| Net Assets consist of: | | | | |
| Paid in capital | | | $ | 6,952,911,805 |
| Total accumulated earnings (loss) | | | | (1,718,267,513) |
| Net Assets | | | $ | 5,234,644,292 |
Net Asset Value , offering price and redemption price per share ($5,234,644,292 ÷ 611,594,762 shares) | | | $ | 8.56 |
| | | | | |
| Statement of Operations |
| | | | Year ended October 31, 2022 |
| Investment Income | | | | |
| Dividends | | | $ | 197,913,449 |
| Non-Cash dividends | | | | 13,296,373 |
| Interest | | | | 116,337 |
| Income from Fidelity Central Funds (including $536,172 from security lending) | | | | 2,017,186 |
| Income before foreign taxes withheld | | | | 213,343,345 |
| Less foreign taxes withheld | | | | (22,834,108) |
| Total Income | | | | 190,509,237 |
| Expenses | | | | |
| Management fee | $ | 4,672,725 | | |
| Independent trustees' fees and expenses | | 20,609 | | |
| Total expenses before reductions | | 4,693,334 | | |
| Expense reductions | | (102,851) | | |
| Total expenses after reductions | | | | 4,590,483 |
| Net Investment income (loss) | | | | 185,918,754 |
| Realized and Unrealized Gain (Loss) | | | | |
| Net realized gain (loss) on: | | | | |
| Investment Securities: | | | | |
| Unaffiliated issuers(net of foreign taxes of $744,641) | | (252,159,696) | | |
| Foreign currency transactions | | (4,150,165) | | |
| Futures contracts | | (32,564,871) | | |
| Total net realized gain (loss) | | | | (288,874,732) |
| Change in net unrealized appreciation (depreciation) on: | | | | |
| Investment Securities: | | | | |
| Unaffiliated issuers (net of decrease in deferred foreign taxes of $2,884,802) | | (2,124,245,229) | | |
| Assets and liabilities in foreign currencies | | (229,426) | | |
| Futures contracts | | (783,987) | | |
| Total change in net unrealized appreciation (depreciation) | | | | (2,125,258,642) |
| Net gain (loss) | | | | (2,414,133,374) |
| Net increase (decrease) in net assets resulting from operations | | | $ | (2,228,214,620) |
| Statement of Changes in Net Assets |
| |
| | Year ended October 31, 2022 | | Year ended October 31, 2021 |
| Increase (Decrease) in Net Assets | | | | |
| Operations | | | | |
| Net investment income (loss) | $ | 185,918,754 | $ | 113,950,572 |
| Net realized gain (loss) | | (288,874,732) | | (33,717,915) |
| Change in net unrealized appreciation (depreciation) | | (2,125,258,642) | | 382,072,849 |
| Net increase (decrease) in net assets resulting from operations | | (2,228,214,620) | | 462,305,506 |
| Distributions to shareholders | | (141,768,973) | | (60,657,681) |
| Share transactions | | | | |
| Proceeds from sales of shares | | 4,848,475,063 | | 4,030,141,535 |
| Reinvestment of distributions | | 111,740,080 | | 45,982,262 |
| Cost of shares redeemed | | (3,797,103,742) | | (1,437,019,718) |
Net increase (decrease) in net assets resulting from share transactions | | 1,163,111,401 | | 2,639,104,079 |
| Total increase (decrease) in net assets | | (1,206,872,192) | | 3,040,751,904 |
| | | | | |
| Net Assets | | | | |
| Beginning of period | | 6,441,516,484 | | 3,400,764,580 |
| End of period | $ | 5,234,644,292 | $ | 6,441,516,484 |
| | | | | |
| Other Information | | | | |
| Shares | | | | |
| Sold | | 456,938,763 | | 309,586,290 |
| Issued in reinvestment of distributions | | 9,382,039 | | 3,723,260 |
| Redeemed | | (364,529,607) | | (110,589,949) |
| Net increase (decrease) | | 101,791,195 | | 202,719,601 |
| | | | | |
Financial Highlights
| Fidelity® Emerging Markets Index Fund |
| |
| Years ended October 31, | | 2022 | | 2021 | | 2020 | | 2019 | | 2018 |
Selected Per-Share Data | | | | | | | | | | |
| Net asset value, beginning of period | $ | 12.64 | $ | 11.07 | $ | 10.48 | $ | 9.62 | $ | 11.23 |
| Income from Investment Operations | | | | | | | | | | |
Net investment income (loss) A,B | | .32 | | .28 | | .22 | | .35 C | | .27 |
| Net realized and unrealized gain (loss) | | (4.14) | | 1.48 | | .65 | | .72 | | (1.66) |
| Total from investment operations | | (3.82) | | 1.76 | | .87 | | 1.07 | | (1.39) |
| Distributions from net investment income | | (.26) | | (.19) | | (.28) | | (.21) | | (.20) |
| Distributions from net realized gain | | - | | - | | - | | - | | (.01) |
| Total distributions | | (.26) | | (.19) | | (.28) | | (.21) | | (.22) D |
Redemption fees added to paid in capital A | | - | | - | | - | | - | | - E |
| Net asset value, end of period | $ | 8.56 | $ | 12.64 | $ | 11.07 | $ | 10.48 | $ | 9.62 |
Total Return F | | (30.81)% | | 15.95% | | 8.54% | | 11.33% | | (12.65)% |
Ratios to Average Net Assets B,G,H | | | | | | | | | | |
| Expenses before reductions | | .08% | | .07% I | | .08% | | .08% | | .08% |
| Expenses net of fee waivers, if any | | .08% | | .07% I | | .08% | | .08% | | .08% |
| Expenses net of all reductions | | .07% | | .07% I | | .07% | | .08% | | .08% |
| Net investment income (loss) | | 2.97% | | 2.17% | | 2.20% | | 3.40% C | | 2.46% |
| Supplemental Data | | | | | | | | | | |
| Net assets, end of period (000 omitted) | $ | 5,234,644 | $ | 6,441,516 | $ | 3,400,765 | $ | 2,938,021 | $ | 593,466 |
Portfolio turnover rate J | | 8% | | 5% | | 10% | | 3% | | 4% |
A Calculated based on average shares outstanding during the period.
B Net investment income (loss) is affected by the timing of the declaration of dividends by any underlying mutual funds or exchange-traded funds (ETFs). Net investment income (loss) of any mutual funds or ETFs is not included in the Fund's net investment income (loss) ratio.
C Net investment income per share reflects one or more large, non-recurring dividend(s) which amounted to $.08 per share. Excluding such non-recurring dividend(s), the ratio of net investment income (loss) to average net assets would have been 2.66%.
D Total distributions per share do not sum due to rounding.
E Amount represents less than $.005 per share.
F Total returns would have been lower if certain expenses had not been reduced during the applicable periods shown.
G Fees and expenses of any underlying mutual funds or exchange-traded funds (ETFs) are not included in the Fund's expense ratio. The Fund indirectly bears its proportionate share of these expenses. For additional expense information related to investments in Fidelity Central Funds, please refer to the "Investments in Fidelity Central Funds" note found in the Notes to Financial Statements section of the most recent Annual or Semi-Annual report.
H Expense ratios reflect operating expenses of the class. Expenses before reductions do not reflect amounts reimbursed, waived, or reduced through arrangements with the investment adviser, brokerage services, or other offset arrangements, if applicable, and do not represent the amount paid by the class during periods when reimbursements, waivers or reductions occur.
I The size and fluctuation of net assets and expense amounts may cause ratios to differ from contractual rates.
J Amount does not include the portfolio activity of any underlying mutual funds or exchange-traded funds (ETFs).
Average annual total return reflects the change in the value of an investment, assuming reinvestment of distributions from dividend income and capital gains (the profits earned upon the sale of securities that have grown in value, if any) and assuming a constant rate of performance each year. The hypothetical investment and the average annual total returns do not reflect the deduction of taxes that a shareholder would pay on fund distributions or the redemption of fund shares. During periods of reimbursement by Fidelity, a fund's total return will be greater than it would be had the reimbursement not occurred. How a fund did yesterday is no guarantee of how it will do tomorrow.
| Average Annual Total Returns |
| | | | |
Periods ended October 31, 2022 | Past 1 year | Past 5 years | Past 10 years |
| Fidelity® Global ex U.S. Index Fund | -24.56% | -0.59% | 3.28% |
| $10,000 Over 10 Years |
| |
Let's say hypothetically that $10,000 was invested in Fidelity® Global ex U.S. Index Fund on October 31, 2012. The chart shows how the value of your investment would have changed, and also shows how the MSCI ACWI (All Country World Index) ex USA Index performed over the same period. |
|
|
Fidelity® Global ex U.S. Index Fund
Market Recap:
International equities returned -24.61% for the 12 months ending October 31, 2022, according to the MSCI ACWI (All Country World Index) ex USA Index. After gaining 7.98% in 2021, non-U.S. stocks retreated in the new year, as a multitude of risk factors challenged the global economy and financial markets. Persistently high inflation in some markets, exacerbated by energy price shocks from the Russia-Ukraine conflict, spurred the U.S. Federal Reserve and other central banks to aggressively tighten monetary policy, and market interest rates eclipsed their highest level in roughly a decade, stoking recession fears and sending stocks into bear market territory. Other factors influencing equities abroad included surging global commodity prices, rising sovereign bond yields in some markets, ongoing global supply-chain disruption, a broadly strong U.S. dollar and the potential for variants of the coronavirus to upend global economic growth. Against this backdrop, the index returned -24.20% year to date through October. For the full 12 months, emerging markets (-31%) and Europe ex U.K. (-25%) notably lagged. Conversely, Canada (-13%) and the U.K. (-12%) held up best. Among the 11 sectors, information technology and consumer discretionary (-37% each) fared worst. Communication services (-34%) also trailed the broader market. In contrast, energy gained 2% amid high prices for oil and natural gas. The defensive-oriented utilities (-16%) sector also outperformed, as did financials and consumer staples (-18% each).
Comments from the Geode Capital Management, LLC, passive equity index team :
For the fiscal year ending October 31, 2022, the fund returned -24.56%, roughly in line with the -24.61% result of the benchmark MSCI All Country World ex US Index (Net MA). (The fund's relative performance was affected by differing methodologies (fund versus index) for valuing certain foreign stocks and for incorporating foreign exchange rates, as well as by required local capital gains tax.) By region, emerging markets, returned -29.80% and detracted most, followed by Europe ex U.K. (-25.44%). By sector, stocks in the information technology sector returned -37% and detracted most, followed by consumer discretionary, which returned roughly -37%, hampered by the retailing industry (-49%). Financials returned about -18%, hampered by the banks industry (-13%). Industrials detracted -25%, especially in the capital goods industry (-26%). Communication services returned approximately -34%, hampered by the media & entertainment industry (-51%). Health care returned -20%, especially in the pharmaceuticals, biotechnology & life sciences industry (-15%). Consumer staples detracted -18%, hampered by the food, beverage & tobacco industry (-16%). The materials sector (-19%) also detracted, while real estate (-33%) and utilities (-16%) also hurt. From a sector standpoint, energy gained roughly 5% and contributed most. Turning to individual stocks, the biggest individual detractor was Taiwan Semiconductor (-42%), from the semiconductors & semiconductor equipment group, followed by Tencent Holdings (-56%), which is in the media & entertainment category. Within retailing, Alibaba Group Holding returned about -63% and hurt. Other detractors were ASML Holding (-41%), a stock in the semiconductors & semiconductor equipment segment, and Shopify (-76%), from the software & services industry. Conversely, the biggest individual contributor was Shell (+24%), from the energy sector. In energy, Petroleo Brasileiro (+101%), also known as Petrobras; Canadian National Resources (+49%); BP (+20%); and TotalEnergies (+14%) all benefited the fund.
The views expressed above reflect those of the portfolio manager(s) only through the end of the period as stated on the cover of this report and do not necessarily represent the views of Fidelity or any other person in the Fidelity organization. Any such views are subject to change at any time based upon market or other conditions and Fidelity disclaims any responsibility to update such views. These views may not be relied on as investment advice and, because investment decisions for a Fidelity fund are based on numerous factors, may not be relied on as an indication of trading intent on behalf of any Fidelity fund.
Fidelity® Global ex U.S. Index Fund
Top Holdings (% of Fund's net assets) |
| |
| Nestle SA (Reg. S) (Switzerland, Food Products) | 1.5 | |
| Taiwan Semiconductor Manufacturing Co. Ltd. (Taiwan, Semiconductors & Semiconductor Equipment) | 1.5 | |
| Roche Holding AG (participation certificate) (Switzerland, Pharmaceuticals) | 1.1 | |
| Shell PLC (London) (United Kingdom, Oil, Gas & Consumable Fuels) | 1.0 | |
| Samsung Electronics Co. Ltd. (Korea (South), Technology Hardware, Storage & Peripherals) | 1.0 | |
| ASML Holding NV (Netherlands) (Netherlands, Semiconductors & Semiconductor Equipment) | 0.9 | |
| AstraZeneca PLC (United Kingdom) (United Kingdom, Pharmaceuticals) | 0.9 | |
| Novo Nordisk A/S Series B (Denmark, Pharmaceuticals) | 0.9 | |
| LVMH Moet Hennessy Louis Vuitton SE (France, Textiles, Apparel & Luxury Goods) | 0.9 | |
| Novartis AG (Switzerland, Pharmaceuticals) | 0.9 | |
| | 10.6 | |
| |
| Market Sectors (% of Fund's net assets) |
| |
| Financials | 23.0 | |
| Industrials | 10.8 | |
| Information Technology | 10.6 | |
| Health Care | 10.2 | |
| Consumer Discretionary | 9.5 | |
| Consumer Staples | 9.1 | |
| Materials | 7.7 | |
| Energy | 6.8 | |
| Communication Services | 5.6 | |
| Utilities | 3.0 | |
| Real Estate | 1.6 | |
| |
Asset Allocation (% of Fund's net assets) |
|
Short-Term Investments and Net Other Assets (Liabilities) - (0.1)%* |
Foreign investments - 97.9% |
*Short-Term Investments and Net Other Assets (Liabilities) are not available in the pie chart. |
|
Geographic Diversification (% of Fund's net assets) |
|
* Includes Short-Term investments and Net Other Assets (Liabilities). Percentages are based on country or territory of incorporation and are adjusted for the effect of futures contracts, if applicable. |
| |
Fidelity® Global ex U.S. Index Fund
Showing Percentage of Net Assets
| Common Stocks - 96.8% |
| | | Shares | Value ($) |
| Australia - 4.9% | | | |
| Ampol Ltd. | | 85,941 | 1,496,892 |
| APA Group unit | | 423,347 | 2,846,044 |
| Aristocrat Leisure Ltd. | | 216,671 | 5,137,665 |
| ASX Ltd. | | 71,090 | 3,078,503 |
| Aurizon Holdings Ltd. | | 661,762 | 1,532,332 |
| Australia & New Zealand Banking Group Ltd. | | 1,080,382 | 17,700,696 |
| BHP Group Ltd. | | 1,836,137 | 43,878,761 |
| BlueScope Steel Ltd. | | 184,109 | 1,852,449 |
| Brambles Ltd. | | 514,102 | 3,840,914 |
| Cochlear Ltd. | | 24,229 | 3,095,122 |
| Coles Group Ltd. | | 487,686 | 5,094,117 |
| Commonwealth Bank of Australia | | 618,305 | 41,400,814 |
| Computershare Ltd. | | 194,676 | 3,146,734 |
| CSL Ltd. | | 174,907 | 31,379,896 |
| Dexus unit | | 387,896 | 1,925,393 |
| Dominos Pizza Enterprises Ltd. | | 20,637 | 841,529 |
| Endeavour Group Ltd. | | 493,973 | 2,259,184 |
| Evolution Mining Ltd. | | 625,482 | 832,186 |
| Fortescue Metals Group Ltd. | | 615,883 | 5,802,237 |
| Goodman Group unit | | 618,826 | 6,729,145 |
| IDP Education Ltd. | | 76,447 | 1,446,931 |
| Insurance Australia Group Ltd. | | 886,736 | 2,779,283 |
| Lendlease Group unit | | 247,662 | 1,376,644 |
| Macquarie Group Ltd. | | 132,624 | 14,379,184 |
| Medibank Private Ltd. | | 986,674 | 1,773,464 |
| Mineral Resources Ltd. | | 61,439 | 2,873,969 |
| Mirvac Group unit | | 1,435,599 | 1,900,841 |
| National Australia Bank Ltd. | | 1,163,167 | 24,161,360 |
| Newcrest Mining Ltd. | | 321,398 | 3,559,573 |
| Northern Star Resources Ltd. | | 421,151 | 2,354,462 |
| Orica Ltd. | | 162,005 | 1,438,336 |
| Origin Energy Ltd. | | 634,451 | 2,260,454 |
| Qantas Airways Ltd. (a) | | 346,490 | 1,294,333 |
| QBE Insurance Group Ltd. | | 541,842 | 4,242,252 |
| Ramsay Health Care Ltd. | | 65,547 | 2,455,673 |
| REA Group Ltd. | | 19,282 | 1,499,658 |
| Reece Ltd. | | 76,999 | 764,890 |
| Rio Tinto Ltd. | | 135,140 | 7,624,211 |
| Santos Ltd. | | 1,175,282 | 5,737,326 |
| Scentre Group unit | | 1,910,605 | 3,544,144 |
| SEEK Ltd. | | 123,768 | 1,709,241 |
| Sonic Healthcare Ltd. | | 167,690 | 3,515,006 |
| South32 Ltd. | | 1,669,433 | 3,830,129 |
| Stockland Corp. Ltd. unit | | 859,711 | 1,979,691 |
| Suncorp Group Ltd. | | 452,966 | 3,305,930 |
| Telstra Group Ltd. | | 1,489,378 | 3,734,508 |
| The GPT Group unit | | 697,789 | 1,923,729 |
| The Lottery Corp. Ltd. (a) | | 805,776 | 2,211,129 |
| Transurban Group unit | | 1,117,158 | 9,475,465 |
| Treasury Wine Estates Ltd. | | 261,565 | 2,166,665 |
| Vicinity Centres unit | | 1,393,265 | 1,733,388 |
| Washington H. Soul Pattinson & Co. Ltd. | | 77,726 | 1,389,105 |
| Wesfarmers Ltd. | | 412,065 | 11,957,734 |
| Westpac Banking Corp. | | 1,268,729 | 19,566,290 |
| WiseTech Global Ltd. | | 52,849 | 1,966,091 |
| Woodside Energy Group Ltd. | | 689,353 | 15,865,188 |
| Woolworths Group Ltd. | | 441,366 | 9,322,199 |
TOTAL AUSTRALIA | | | 366,989,089 |
| Austria - 0.1% | | | |
| Erste Group Bank AG | | 124,421 | 3,066,349 |
| OMV AG | | 53,310 | 2,457,163 |
| Verbund AG | | 24,485 | 1,917,636 |
| Voestalpine AG | | 39,684 | 862,005 |
TOTAL AUSTRIA | | | 8,303,153 |
| Bailiwick of Jersey - 0.6% | | | |
| Experian PLC | | 334,928 | 10,679,272 |
| Ferguson PLC | | 77,723 | 8,476,523 |
| Glencore PLC | | 3,578,579 | 20,516,257 |
| WPP PLC | | 405,462 | 3,568,127 |
TOTAL BAILIWICK OF JERSEY | | | 43,240,179 |
| Belgium - 0.5% | | | |
| Ageas | | 58,450 | 2,023,445 |
| Anheuser-Busch InBev SA NV | | 314,160 | 15,714,413 |
| D'ieteren Group | | 8,956 | 1,489,584 |
| ELIA GROUP SA/NV | | 11,933 | 1,508,298 |
| Groupe Bruxelles Lambert SA | | 36,716 | 2,706,830 |
| KBC Group NV | | 91,466 | 4,583,888 |
| Proximus | | 51,970 | 544,923 |
| Sofina SA | | 5,886 | 1,148,826 |
| Solvay SA Class A | | 27,069 | 2,440,756 |
| UCB SA | | 46,215 | 3,485,685 |
| Umicore SA | | 75,694 | 2,495,322 |
| Warehouses de Pauw | | 58,621 | 1,505,079 |
TOTAL BELGIUM | | | 39,647,049 |
| Bermuda - 0.2% | | | |
| Alibaba Health Information Technology Ltd. (a) | | 1,636,000 | 691,944 |
| Alibaba Pictures Group Ltd. (a) | | 4,160,000 | 153,688 |
| Beijing Enterprises Water Group Ltd. | | 1,398,000 | 293,860 |
| China Gas Holdings Ltd. | | 1,136,000 | 1,007,250 |
| China Oriental Group Co. Ltd. (H Shares) | | 107 | 15 |
| China Resource Gas Group Ltd. | | 360,000 | 921,825 |
| China Ruyi Holdings Ltd. (a)(b) | | 1,624,000 | 254,472 |
| CK Infrastructure Holdings Ltd. | | 229,136 | 1,088,809 |
| Cosco Shipping Ports Ltd. | | 648,344 | 319,644 |
| Credicorp Ltd. (United States) | | 25,501 | 3,732,326 |
| Hongkong Land Holdings Ltd. | | 407,167 | 1,567,593 |
| Hopson Development Holdings Ltd. | | 269,250 | 216,096 |
| Jardine Matheson Holdings Ltd. | | 58,219 | 2,679,238 |
| Kunlun Energy Co. Ltd. | | 1,514,000 | 904,583 |
| Nine Dragons Paper (Holdings) Ltd. | | 574,000 | 340,028 |
| Orient Overseas International Ltd. | | 49,500 | 723,300 |
| Shenzhen International Holdings Ltd. | | 433,597 | 291,655 |
TOTAL BERMUDA | | | 15,186,326 |
| Brazil - 1.3% | | | |
| Ambev SA | | 1,735,900 | 5,376,904 |
| Americanas SA | | 222,649 | 669,822 |
| Atacadao SA | | 169,400 | 638,181 |
| B3 SA - Brasil Bolsa Balcao | | 2,245,498 | 6,538,049 |
| Banco Bradesco SA | | 588,115 | 1,894,538 |
| Banco BTG Pactual SA unit | | 426,600 | 2,390,050 |
| Banco do Brasil SA | | 310,900 | 2,228,152 |
| Banco Santander SA (Brasil) unit | | 126,200 | 727,565 |
| BB Seguridade Participacoes SA | | 251,200 | 1,443,835 |
| BRF SA (a) | | 206,161 | 501,284 |
| CCR SA | | 414,300 | 1,039,459 |
| Centrais Eletricas Brasileiras SA (Electrobras) | | 384,680 | 3,710,146 |
| Companhia de Saneamento Basico do Estado de Sao Paulo (SABESP) | | 124,600 | 1,449,707 |
| Companhia Siderurgica Nacional SA (CSN) | | 236,800 | 562,947 |
| Cosan SA | | 441,064 | 1,439,617 |
| CPFL Energia SA | | 76,500 | 524,563 |
| Energisa SA unit | | 67,600 | 634,580 |
| ENGIE Brasil Energia SA | | 69,650 | 542,314 |
| Equatorial Energia SA | | 374,800 | 2,178,926 |
| Hapvida Participacoes e Investimentos SA (c) | | 1,674,855 | 2,529,062 |
| Hypera SA | | 153,000 | 1,504,971 |
| JBS SA | | 282,700 | 1,366,023 |
| Klabin SA unit | | 258,800 | 1,083,197 |
| Localiza Rent a Car SA | | 821 | 11,212 |
| Localiza Rent a Car SA | | 267,695 | 3,655,639 |
| Lojas Renner SA | | 366,222 | 2,190,739 |
| Magazine Luiza SA | | 1,055,252 | 913,169 |
| Natura & Co. Holding SA (a) | | 311,903 | 902,710 |
| Petro Rio SA (a) | | 259,300 | 1,776,523 |
| Petroleo Brasileiro SA - Petrobras (ON) | | 1,366,709 | 8,800,066 |
| Raia Drogasil SA | | 392,600 | 1,999,672 |
| Rede D'Oregon Sao Luiz SA (c) | | 137,200 | 854,462 |
| Rumo SA | | 470,400 | 2,016,195 |
| Suzano Papel e Celulose SA | | 270,438 | 2,785,268 |
| Telefonica Brasil SA | | 184,300 | 1,473,900 |
| TIM SA | | 287,200 | 733,915 |
| Totvs SA | | 204,000 | 1,309,581 |
| Ultrapar Participacoes SA | | 243,200 | 631,364 |
| Vale SA | | 1,453,986 | 18,895,766 |
| Vibra Energia SA | | 437,351 | 1,545,186 |
| Weg SA | | 617,500 | 4,815,197 |
TOTAL BRAZIL | | | 96,284,456 |
| British Virgin Islands - 0.0% | | | |
| VK Co. Ltd. unit (a)(d) | | 38,348 | 17,084 |
| Canada - 8.4% | | | |
| Agnico Eagle Mines Ltd. (Canada) | | 166,181 | 7,310,329 |
| Air Canada (a) | | 73,613 | 1,059,604 |
| Algonquin Power & Utilities Corp. | | 239,151 | 2,647,188 |
| Alimentation Couche-Tard, Inc. Class A (multi-vtg.) | | 300,808 | 13,468,850 |
| AltaGas Ltd. | | 102,035 | 1,840,203 |
| ARC Resources Ltd. | | 249,995 | 3,519,583 |
| Bank of Montreal | | 243,338 | 22,414,567 |
| Bank of Nova Scotia | | 433,772 | 20,966,628 |
| Barrick Gold Corp. (Canada) | | 647,557 | 9,739,379 |
| Bausch Health Cos., Inc. (Canada) (a) | | 94,535 | 614,805 |
| BCE, Inc. | | 26,943 | 1,215,288 |
| BlackBerry Ltd. (a) | | 213,979 | 994,228 |
| Brookfield Asset Management, Inc. (Canada) Class A | | 511,594 | 20,259,475 |
| Brookfield Renewable Corp. | | 47,989 | 1,491,081 |
| BRP, Inc. | | 14,590 | 975,523 |
| CAE, Inc. (a) | | 114,922 | 2,193,248 |
| Cameco Corp. | | 157,456 | 3,734,285 |
| Canadian Apartment Properties (REIT) unit | | 36,571 | 1,132,551 |
| Canadian Imperial Bank of Commerce | | 327,327 | 14,865,285 |
| Canadian National Railway Co. | | 212,657 | 25,193,849 |
| Canadian Natural Resources Ltd. | | 419,557 | 25,163,873 |
| Canadian Pacific Railway Ltd. | | 337,048 | 25,126,139 |
| Canadian Tire Ltd. Class A (non-vtg.) | | 20,551 | 2,303,323 |
| Canadian Utilities Ltd. Class A (non-vtg.) | | 45,634 | 1,214,249 |
| CCL Industries, Inc. Class B | | 54,350 | 2,553,235 |
| Cenovus Energy, Inc. (Canada) | | 505,094 | 10,210,510 |
| CGI, Inc. Class A (sub. vtg.) (a) | | 78,943 | 6,359,016 |
| Constellation Software, Inc. | | 7,317 | 10,580,016 |
| Dollarama, Inc. | | 100,454 | 5,968,915 |
| Emera, Inc. | | 95,066 | 3,523,237 |
| Empire Co. Ltd. Class A (non-vtg.) | | 61,067 | 1,568,866 |
| Enbridge, Inc. | | 733,600 | 28,582,587 |
| Fairfax Financial Holdings Ltd. (sub. vtg.) | | 8,264 | 4,058,693 |
| First Quantum Minerals Ltd. | | 211,434 | 3,729,408 |
| FirstService Corp. | | 14,551 | 1,819,049 |
| Fortis, Inc. | | 173,624 | 6,773,675 |
| Franco-Nevada Corp. | | 69,479 | 8,584,725 |
| George Weston Ltd. | | 26,746 | 2,943,856 |
| GFL Environmental, Inc. | | 66,086 | 1,783,670 |
| Gildan Activewear, Inc. | | 68,532 | 2,162,580 |
| Great-West Lifeco, Inc. | | 100,056 | 2,316,414 |
| Hydro One Ltd. (c) | | 117,403 | 2,943,800 |
| iA Financial Corp, Inc. | | 38,997 | 2,170,333 |
| IGM Financial, Inc. | | 28,748 | 769,582 |
| Imperial Oil Ltd. | | 85,991 | 4,677,794 |
| Intact Financial Corp. | | 63,612 | 9,665,886 |
| Ivanhoe Mines Ltd. (a) | | 221,907 | 1,539,268 |
| Keyera Corp. | | 81,169 | 1,739,740 |
| Kinross Gold Corp. | | 480,995 | 1,744,130 |
| Lightspeed Commerce, Inc. (Canada) (a) | | 46,329 | 887,914 |
| Loblaw Companies Ltd. | | 60,542 | 4,960,324 |
| Lundin Mining Corp. | | 247,447 | 1,296,856 |
| Magna International, Inc. Class A (sub. vtg.) | | 101,171 | 5,637,980 |
| Manulife Financial Corp. | | 698,515 | 11,577,398 |
| Metro, Inc. | | 87,105 | 4,563,206 |
| National Bank of Canada | | 122,535 | 8,343,191 |
| Northland Power, Inc. | | 84,468 | 2,457,747 |
| Nutrien Ltd. | | 200,162 | 16,912,429 |
| Nuvei Corp. (a)(c) | | 22,739 | 684,331 |
| Onex Corp. (sub. vtg.) | | 29,091 | 1,464,212 |
| Open Text Corp. | | 97,565 | 2,825,937 |
| Pan American Silver Corp. | | 79,241 | 1,266,271 |
| Parkland Corp. | | 57,178 | 1,155,857 |
| Pembina Pipeline Corp. | | 197,074 | 6,506,690 |
| Power Corp. of Canada (sub. vtg.) | | 203,005 | 5,041,039 |
| Quebecor, Inc. Class B (sub. vtg.) | | 55,240 | 1,041,262 |
| Restaurant Brands International, Inc. | | 100,849 | 5,992,386 |
| Restaurant Brands International, Inc. | | 6,344 | 376,707 |
| RioCan (REIT) | | 51,889 | 739,285 |
| Ritchie Bros. Auctioneers, Inc. | | 39,916 | 2,607,644 |
| Rogers Communications, Inc. Class B (non-vtg.) | | 130,005 | 5,411,666 |
| Royal Bank of Canada | | 513,267 | 47,489,489 |
| Saputo, Inc. | | 90,572 | 2,204,549 |
| Shaw Communications, Inc. Class B | | 174,912 | 4,492,363 |
| Shopify, Inc. Class A (a) | | 415,153 | 14,234,078 |
| Sun Life Financial, Inc. | | 213,088 | 9,050,003 |
| Suncor Energy, Inc. | | 522,606 | 17,975,790 |
| TC Energy Corp. | | 356,104 | 15,641,548 |
| Teck Resources Ltd. Class B (sub. vtg.) | | 172,125 | 5,239,493 |
| TELUS Corp. | | 168,418 | 3,517,079 |
| TFI International, Inc. (Canada) | | 29,708 | 2,704,216 |
| The Toronto-Dominion Bank | | 658,506 | 42,144,191 |
| Thomson Reuters Corp. | | 61,308 | 6,520,289 |
| TMX Group Ltd. | | 20,151 | 1,937,371 |
| Toromont Industries Ltd. | | 29,931 | 2,300,272 |
| Tourmaline Oil Corp. | | 115,880 | 6,529,122 |
| West Fraser Timber Co. Ltd. | | 22,079 | 1,657,769 |
| Wheaton Precious Metals Corp. | | 163,104 | 5,336,034 |
| WSP Global, Inc. | | 45,322 | 5,570,313 |
TOTAL CANADA | | | 624,506,819 |
| Cayman Islands - 4.1% | | | |
| 3SBio, Inc. (c) | | 515,500 | 363,821 |
| AAC Technology Holdings, Inc. (a) | | 250,500 | 458,861 |
| Airtac International Group | | 53,043 | 1,216,960 |
| Alibaba Group Holding Ltd. (a) | | 5,509,912 | 42,839,052 |
| Anta Sports Products Ltd. | | 442,400 | 3,888,785 |
| Autohome, Inc. ADR Class A | | 26,083 | 681,288 |
| Baidu, Inc. Class A (a) | | 804,444 | 7,712,208 |
| BeiGene Ltd. ADR (a)(b) | | 17,162 | 2,898,490 |
| Bilibili, Inc. Class Z (a) | | 65,231 | 581,299 |
| Bosideng International Holdings Ltd. | | 1,122,000 | 484,554 |
| Budweiser Brewing Co. APAC Ltd. (c) | | 630,393 | 1,326,695 |
| Chailease Holding Co. Ltd. | | 508,693 | 2,349,949 |
| China Conch Venture Holdings Ltd. | | 566,000 | 834,977 |
| China Feihe Ltd. (c) | | 1,383,000 | 796,362 |
| China Hongqiao Group Ltd. | | 785,500 | 557,380 |
| China Huishan Dairy Holdings Co. Ltd. (a)(d) | | 397,000 | 1 |
| China Liansu Group Holdings Ltd. | | 372,000 | 301,878 |
| China Literature Ltd. (a)(c) | | 142,600 | 384,220 |
| China Medical System Holdings Ltd. | | 464,000 | 506,581 |
| China Meidong Auto Holding Ltd. | | 198,000 | 260,312 |
| China Mengniu Dairy Co. Ltd. | | 1,154,000 | 3,697,375 |
| China Overseas Property Holdings Ltd. | | 455,000 | 286,344 |
| China Resources Cement Holdings Ltd. | | 844,000 | 305,359 |
| China Resources Land Ltd. | | 1,188,634 | 3,725,057 |
| China Resources Microelectronics Ltd. (A Shares) | | 17,743 | 123,083 |
| China Resources Mixc Lifestyle Services Ltd. (c) | | 272,600 | 798,736 |
| China State Construction International Holdings Ltd. | | 691,250 | 621,712 |
| ChinaSoft International Ltd. | | 954,000 | 631,977 |
| Chow Tai Fook Jewellery Group Ltd. | | 777,000 | 1,330,363 |
| CIFI Holdings Group Co. Ltd. (d) | | 1,438,803 | 95,313 |
| CK Asset Holdings Ltd. | | 717,471 | 3,966,832 |
| CK Hutchison Holdings Ltd. | | 966,893 | 4,813,033 |
| Country Garden Holdings Co. Ltd. | | 2,813,517 | 362,010 |
| Country Garden Services Holdings Co. Ltd. | | 752,000 | 657,191 |
| Dali Foods Group Co. Ltd. (c) | | 722,000 | 297,091 |
| Daqo New Energy Corp. ADR (a) | | 22,160 | 974,818 |
| Dongyue Group Co. Ltd. | | 503,000 | 437,021 |
| ENN Energy Holdings Ltd. | | 286,100 | 2,844,726 |
| ESR Group Ltd. (c) | | 744,459 | 1,270,853 |
| Futu Holdings Ltd. ADR (a) | | 20,526 | 695,010 |
| GDS Holdings Ltd. Class A (a) | | 309,800 | 345,784 |
| Geely Automobile Holdings Ltd. | | 2,175,000 | 2,338,576 |
| Genscript Biotech Corp. (a) | | 448,000 | 1,132,321 |
| Grab Holdings Ltd. (a) | | 477,266 | 1,240,892 |
| Greentown China Holdings Ltd. | | 300,000 | 285,490 |
| Greentown Service Group Co. Ltd. | | 504,000 | 206,746 |
| H World Group Ltd. ADR | | 70,264 | 1,902,749 |
| Haidilao International Holding Ltd. (a)(b)(c) | | 388,000 | 576,342 |
| Haitian International Holdings Ltd. | | 221,000 | 442,583 |
| Hansoh Pharmaceutical Group Co. Ltd. (c) | | 406,000 | 626,871 |
| Hengan International Group Co. Ltd. | | 255,500 | 991,124 |
| HUTCHMED China Ltd. sponsored ADR (a)(b) | | 30,204 | 267,003 |
| Hygeia Healthcare Holdings Co. (a)(c) | | 116,400 | 504,175 |
| Innovent Biologics, Inc. (a)(c) | | 389,000 | 1,377,667 |
| iQIYI, Inc. ADR (a)(b) | | 119,588 | 241,568 |
| JD Health International, Inc. (a)(c) | | 405,100 | 2,221,698 |
| JD.com, Inc. Class A | | 783,967 | 14,276,447 |
| Jinxin Fertility Group Ltd. (c) | | 518,500 | 255,629 |
| Jiumaojiu International Holdings Ltd. (c) | | 254,000 | 398,652 |
| JOYY, Inc. ADR | | 17,048 | 430,121 |
| Kanzhun Ltd. ADR (a) | | 67,708 | 740,048 |
| KE Holdings, Inc. ADR (a) | | 239,636 | 2,439,494 |
| Kingboard Chemical Holdings Ltd. | | 229,000 | 564,795 |
| Kingboard Laminates Holdings Ltd. | | 323,000 | 258,000 |
| Kingdee International Software Group Co. Ltd. (a) | | 956,000 | 1,563,769 |
| Kingsoft Corp. Ltd. | | 331,200 | 1,002,083 |
| Kuaishou Technology Class B (a)(c) | | 631,400 | 2,598,106 |
| Li Ning Co. Ltd. | | 850,000 | 4,396,374 |
| Longfor Properties Co. Ltd. (c) | | 663,000 | 844,624 |
| Lufax Holding Ltd. ADR | | 244,399 | 388,594 |
| Meituan Class B (a)(c) | | 1,599,800 | 25,613,671 |
| Microport Scientific Corp. (a) | | 222,000 | 468,908 |
| Ming Yuan Cloud Group Holdings Ltd. | | 248,000 | 114,053 |
| Minth Group Ltd. | | 258,000 | 509,449 |
| NetEase, Inc. | | 755,695 | 8,384,628 |
| New Oriental Education & Technology Group, Inc. (a) | | 535,110 | 1,253,040 |
| NIO, Inc. sponsored ADR (a) | | 499,313 | 4,828,357 |
| Parade Technologies Ltd. | | 26,000 | 490,916 |
| Pinduoduo, Inc. ADR (a) | | 183,810 | 10,078,302 |
| Ping An Healthcare and Technology Co. Ltd. (a)(b)(c) | | 175,100 | 323,001 |
| Pop Mart International Group Ltd. (b)(c) | | 196,000 | 253,688 |
| RLX Technology, Inc. ADR (a)(b) | | 169,239 | 211,549 |
| Sands China Ltd. (a) | | 881,587 | 1,538,634 |
| Sany Heavy Equipment International Holdings Co. Ltd. | | 388,000 | 318,322 |
| Sea Ltd. ADR (a) | | 131,783 | 6,546,979 |
| Seazen Group Ltd. (a) | | 686,000 | 110,114 |
| Shenzhou International Group Holdings Ltd. | | 302,500 | 2,100,258 |
| Silergy Corp. | | 118,000 | 1,368,264 |
| Sino Biopharmaceutical Ltd. | | 3,945,250 | 1,914,914 |
| SITC International Holdings Co. Ltd. | | 523,000 | 856,825 |
| Smoore International Holdings Ltd. (b)(c) | | 622,000 | 661,647 |
| Sunny Optical Technology Group Co. Ltd. | | 258,300 | 2,239,248 |
| TAL Education Group ADR (a) | | 157,373 | 741,227 |
| Tencent Holdings Ltd. | | 2,268,600 | 59,611,535 |
| Tencent Music Entertainment Group ADR (a) | | 247,420 | 893,186 |
| Tingyi (Cayman Islands) Holding Corp. | | 752,000 | 1,176,430 |
| Tongcheng Travel Holdings Ltd. (a) | | 421,600 | 657,403 |
| Topsports International Holdings Ltd. (c) | | 638,000 | 321,859 |
| Trip.com Group Ltd. ADR (a) | | 196,756 | 4,452,588 |
| Uni-President China Holdings Ltd. | | 559,000 | 413,038 |
| Vinda International Holdings Ltd. | | 125,000 | 234,405 |
| Vipshop Holdings Ltd. ADR (a) | | 153,892 | 1,072,627 |
| Want Want China Holdings Ltd. | | 1,817,000 | 1,194,412 |
| Weibo Corp. sponsored ADR (a) | | 24,467 | 276,966 |
| WH Group Ltd. (c) | | 3,075,946 | 1,555,675 |
| Wharf Real Estate Investment Co. Ltd. | | 604,654 | 2,384,061 |
| Wuxi Biologics (Cayman), Inc. (a)(c) | | 1,306,500 | 5,878,783 |
| Xiaomi Corp. Class B (a)(c) | | 5,534,800 | 6,211,944 |
| Xinyi Glass Holdings Ltd. | | 669,793 | 861,810 |
| Xinyi Solar Holdings Ltd. | | 1,785,446 | 1,771,878 |
| XPeng, Inc. ADR (a)(b) | | 156,806 | 1,038,056 |
| XTEP International Holdings Ltd. | | 453,000 | 415,509 |
| Yadea Group Holdings Ltd. (c) | | 476,000 | 726,463 |
| Yihai International Holding Ltd. | | 161,000 | 264,995 |
| Zai Lab Ltd. ADR (a) | | 32,673 | 727,954 |
| Zhen Ding Technology Holding Ltd. | | 227,302 | 747,009 |
| Zhongsheng Group Holdings Ltd. Class H | | 240,500 | 913,022 |
| ZTO Express, Inc. sponsored ADR | | 153,029 | 2,584,660 |
TOTAL CAYMAN ISLANDS | | | 308,548,164 |
| Chile - 0.1% | | | |
| Banco de Chile | | 17,332,073 | 1,585,145 |
| Banco de Credito e Inversiones | | 20,000 | 557,287 |
| Banco Santander Chile | | 22,381,910 | 801,811 |
| Cencosud SA | | 481,632 | 648,302 |
| Compania Cervecerias Unidas SA | | 43,595 | 239,114 |
| Compania Sud Americana de Vapores SA | | 5,280,824 | 366,607 |
| Empresas CMPC SA | | 381,728 | 605,667 |
| Empresas COPEC SA | | 145,804 | 1,004,788 |
| Enel Americas SA | | 7,335,583 | 726,794 |
| Enel Chile SA | | 9,911,147 | 348,755 |
| Falabella SA | | 254,488 | 497,593 |
| Itau CorpBanca SA | | 1 | 0 |
TOTAL CHILE | | | 7,381,863 |
| China - 3.1% | | | |
| 360 Security Technology, Inc. (A Shares) | | 155,900 | 151,142 |
| 37 Interactive Entertainment Network Technology Group Co. Ltd. (A Shares) | | 48,200 | 95,636 |
| A-Living Smart City Services C (H Shares) (c) | | 361,500 | 204,936 |
| Advanced Micro-Fabrication Equipment, Inc., China (A Shares) (a) | | 11,853 | 180,143 |
| AECC Aero-Engine Control Co. Ltd. (A Shares) | | 27,900 | 114,612 |
| AECC Aviation Power Co. Ltd. | | 55,500 | 369,650 |
| Agricultural Bank of China Ltd.: | | | |
| (A Shares) | | 2,154,700 | 814,330 |
| (H Shares) | | 10,184,000 | 2,906,855 |
| Aier Eye Hospital Group Co. Ltd. (A Shares) | | 145,156 | 490,949 |
| Air China Ltd.: | | | |
| (A Shares) (a) | | 184,500 | 244,302 |
| (H Shares) (a) | | 556,000 | 386,738 |
| Aluminum Corp. of China Ltd.: | | | |
| (A shares) | | 542,000 | 286,478 |
| (H Shares) | | 844,000 | 240,609 |
| Amlogic Shanghai Co. Ltd. (A Shares) (a) | | 8,978 | 70,517 |
| Angel Yeast Co. Ltd. (A Shares) | | 16,600 | 82,240 |
| Anhui Conch Cement Co. Ltd.: | | | |
| (A Shares) | | 32,800 | 109,050 |
| (H Shares) | | 526,000 | 1,353,589 |
| Anhui Gujing Distillery Co. Ltd. (B Shares) | | 62,902 | 741,475 |
| Anhui Honglu Steel Construction Group Co. Ltd. | | 14,950 | 69,766 |
| Anhui Kouzi Distillery Co. Ltd. (A Shares) | | 11,500 | 63,776 |
| Anhui Yingjia Distillery Co. Ltd. (A Shares) | | 14,800 | 95,452 |
| Anjoy Foods Group Co. Ltd. (A Shares) | | 5,900 | 108,525 |
| Apeloa Pharmaceutical Co. Ltd. A Shares | | 27,200 | 77,545 |
| Asia - Potash International Investment Guangzhou Co. Ltd. (A Shares) (a) | | 19,000 | 66,344 |
| Asymchem Laboratories Tianjin Co. Ltd. (A Shares) | | 6,860 | 134,506 |
| Avary Holding Shenzhen Co. Ltd. (A Shares) | | 37,000 | 150,728 |
| AVIC Capital Co. Ltd. (A Shares) | | 141,000 | 58,501 |
| AVIC Electromechanical Systems Co. Ltd. (A Shares) | | 82,700 | 132,494 |
| AviChina Industry & Technology Co. Ltd. (H Shares) | | 871,000 | 381,704 |
| Avicopter PLC (A Shares) | | 13,700 | 82,355 |
| Bank of Beijing Co. Ltd. (A Shares) | | 471,716 | 260,956 |
| Bank of Changsha Co. Ltd. (A Shares) | | 104,200 | 91,888 |
| Bank of Chengdu Co. Ltd. (A Shares) | | 64,200 | 119,734 |
| Bank of China Ltd.: | | | |
| (A Shares) | | 1,027,200 | 423,376 |
| (H Shares) | | 28,520,000 | 9,185,648 |
| Bank of Communications Co. Ltd.: | | | |
| (A Shares) | | 730,700 | 445,250 |
| (H Shares) | | 3,407,000 | 1,662,343 |
| Bank of Hangzhou Co. Ltd. (A Shares) | | 102,780 | 170,434 |
| Bank of Jiangsu Co. Ltd. (A Shares) | | 314,230 | 297,755 |
| Bank of Nanjing Co. Ltd. (A Shares) | | 211,900 | 299,444 |
| Bank of Ningbo Co. Ltd. (A Shares) | | 138,740 | 451,391 |
| Bank of Shanghai Co. Ltd. (A Shares) | | 209,320 | 159,937 |
| Baoshan Iron & Steel Co. Ltd. (A Shares) | | 413,800 | 272,546 |
| BBMG Corp. (H Shares) | | 513,000 | 52,936 |
| Beijing Capital International Airport Co. Ltd. (H Shares) (a) | | 666,000 | 360,589 |
| Beijing Dabeinong Technology Group Co. Ltd. (A Shares) (a) | | 88,700 | 111,256 |
| Beijing Easpring Material Technology Co. Ltd. (A Shares) | | 10,900 | 88,046 |
| Beijing Enlight Media Co. Ltd. (A Shares) | | 63,600 | 58,611 |
| Beijing Kingsoft Office Software, Inc. (A Shares) | | 9,091 | 361,927 |
| Beijing New Building Materials PLC (A Shares) | | 33,900 | 92,051 |
| Beijing Originwater Technology Co. Ltd. (A Shares) | | 69,500 | 44,824 |
| Beijing Roborock Technology Co. Ltd. (A Shares) | | 1,849 | 59,504 |
| Beijing Shiji Information Technology Co. Ltd. (A Shares) | | 31,164 | 53,939 |
| Beijing Shunxin Agriculture Co. Ltd. | | 17,100 | 47,908 |
| Beijing Sinnet Technology Co. Ltd. (A Shares) | | 35,500 | 42,097 |
| Beijing Tiantan Biological Products Corp. Ltd. (A Shares) | | 33,064 | 93,584 |
| Beijing Tongrentang Co. Ltd. (A Shares) | | 25,900 | 172,894 |
| Beijing United Information Technology Co. Ltd. (A Shares) | | 11,190 | 190,001 |
| Beijing Wantai Biological Pharmacy Enterprise Co. Ltd. (A Shares) | | 11,890 | 204,362 |
| Beijing Yuanliu Hongyuan Electronic Technology Co. Ltd. (A Shares) | | 5,400 | 84,902 |
| Beijing-Shanghai High Speed Railway Co. Ltd. (A Shares) | | 856,200 | 522,895 |
| Betta Pharmaceuticals Co. Ltd. (A Shares) | | 8,800 | 55,081 |
| BGI Genomics Co. Ltd. | | 8,300 | 63,044 |
| Bloomage Biotechnology Corp. Ltd. (A Shares) | | 6,845 | 99,344 |
| BOC International China Co. Ltd. | | 54,800 | 78,866 |
| BOE Technology Group Co. Ltd. (A Shares) | | 730,900 | 334,279 |
| BTG Hotels Group Co. Ltd. | | 29,700 | 88,373 |
| By-Health Co. Ltd. (A Shares) | | 30,700 | 73,651 |
| BYD Co. Ltd.: | | | |
| (A Shares) | | 37,500 | 1,266,637 |
| (H Shares) | | 303,500 | 6,793,290 |
| Caitong Securities Co. Ltd. | | 85,670 | 83,876 |
| CanSino Biologics, Inc.: | | | |
| (A Shares) | | 3,817 | 99,124 |
| (H Shares) (b)(c) | | 28,000 | 260,394 |
| CECEP Solar Energy Co. Ltd. (A Shares) | | 84,900 | 78,589 |
| CECEP Wind-Power Corp. (A Shares) | | 120,500 | 70,621 |
| CGN Power Co. Ltd. (H Shares) (c) | | 4,597,000 | 931,154 |
| Chacha Food Co. Ltd. (A Shares) | | 9,000 | 54,447 |
| Changchun High & New Technology Industry Group, Inc. (A Shares) | | 8,300 | 184,005 |
| Changjiang Securities Co. Ltd. (A Shares) | | 101,100 | 72,126 |
| Changzhou Xingyu Automotive Lighting Systems Co. Ltd. (A Shares) | | 6,100 | 102,272 |
| Chaozhou Three-Circle Group Co. (A Shares) | | 41,300 | 160,610 |
| Chengtun Mining Group Co. Ltd. (A Shares) | | 63,700 | 48,323 |
| Chengxin Lithium Group Co. Ltd. (A Shares) | | 18,200 | 107,711 |
| Chifeng Jilong Gold Mining Co. Ltd. (A Shares) (a) | | 33,000 | 85,043 |
| China Baoan Group Co. Ltd. (A Shares) | | 56,600 | 89,594 |
| China Cinda Asset Management Co. Ltd. (H Shares) | | 2,914,000 | 270,996 |
| China CITIC Bank Corp. Ltd.: | | | |
| (A Shares) | | 111,700 | 66,229 |
| (H Shares) | | 3,242,000 | 1,222,516 |
| China Coal Energy Co. Ltd. (H Shares) | | 706,000 | 519,855 |
| China Communications Services Corp. Ltd. (H Shares) | | 828,000 | 231,006 |
| China Construction Bank Corp.: | | | |
| (A Shares) | | 676,442 | 494,625 |
| (H Shares) | | 34,388,000 | 18,249,315 |
| China CSSC Holdings Ltd. (A Shares) | | 89,200 | 323,924 |
| China Eastern Airlines Corp. Ltd. (A Shares) (a) | | 194,600 | 127,905 |
| China Energy Engineering Corp. Ltd. (A Shares) | | 648,100 | 203,227 |
| China Everbright Bank Co. Ltd.: | | | |
| (A Shares) | | 324,600 | 120,899 |
| (H Shares) | | 1,935,000 | 500,411 |
| China Galaxy Securities Co. Ltd. (H Shares) | | 1,469,500 | 550,385 |
| China Great Wall Securities Co. Ltd. (A Shares) | | 68,600 | 75,900 |
| China Greatwall Technology Group Co. Ltd. (A Shares) | | 64,400 | 98,325 |
| China International Capital Corp. Ltd. | | 11,400 | 54,074 |
| China International Capital Corp. Ltd. (H Shares) (c) | | 579,600 | 806,308 |
| China Jushi Co. Ltd. (A Shares) | | 65,722 | 105,293 |
| China Life Insurance Co. Ltd.: | | | |
| (A Shares) | | 31,100 | 113,278 |
| (H Shares) | | 2,808,000 | 3,062,005 |
| China Longyuan Power Grid Corp. Ltd. (H Shares) | | 1,234,000 | 1,410,124 |
| China Meheco Co. Ltd. (A Shares) | | 33,180 | 57,338 |
| China Merchants Bank Co. Ltd.: | | | |
| (A Shares) | | 345,400 | 1,268,486 |
| (H Shares) | | 1,518,251 | 4,990,143 |
| China Merchants Energy Shipping Co. Ltd. (A Shares) | | 170,000 | 162,251 |
| China Merchants Securities Co. Ltd. (A Shares) | | 156,930 | 268,609 |
| China Merchants Shekou Industrial Zone Holdings Co. Ltd. (A Shares) | | 165,900 | 297,820 |
| China Minmetals Rare Earth Co. Ltd. (A Shares) (a) | | 22,700 | 89,645 |
| China Minsheng Banking Corp. Ltd.: | | | |
| (A Shares) | | 801,300 | 362,088 |
| (H Shares) | | 2,041,800 | 593,059 |
| China National Building Materials Co. Ltd. (H Shares) | | 1,469,000 | 853,368 |
| China National Chemical Engineering Co. Ltd. (A Shares) | | 115,600 | 111,913 |
| China National Nuclear Power Co. Ltd. (A Shares) | | 383,300 | 316,491 |
| China Northern Rare Earth Group High-Tech Co. Ltd. | | 72,300 | 239,584 |
| China Oilfield Services Ltd. (H Shares) | | 622,000 | 700,475 |
| China Pacific Insurance (Group) Co. Ltd. | | 60,500 | 157,652 |
| China Pacific Insurance (Group) Co. Ltd. (H Shares) | | 1,181,400 | 1,905,375 |
| China Petroleum & Chemical Corp.: | | | |
| (A Shares) | | 896,400 | 499,575 |
| (H Shares) | | 8,940,000 | 3,543,158 |
| China Railway Group Ltd.: | | | |
| (A Shares) | | 665,000 | 454,388 |
| (H Shares) | | 1,336,000 | 580,377 |
| China Railway Signal & Communications Corp. (A Shares) | | 163,929 | 101,685 |
| China Resources Sanjiu Medical & Pharmaceutical Co. Ltd. (A Shares) | | 20,500 | 153,099 |
| China Shenhua Energy Co. Ltd.: | | | |
| (A Shares) | | 135,500 | 520,076 |
| (H Shares) | | 1,231,500 | 3,239,695 |
| China Southern Airlines Ltd.: | | | |
| (A Shares) (a) | | 280,800 | 248,390 |
| (H Shares) (a) | | 572,000 | 295,121 |
| China State Construction Engineering Corp. Ltd. (A Shares) | | 870,760 | 566,365 |
| China Suntien Green Energy Corp. Ltd. (H Shares) | | 594,000 | 225,503 |
| China Three Gorges Renewables Group Co. Ltd. (A Shares) | | 544,300 | 415,143 |
| China Tourism Group Duty Free Corp. Ltd. (A Shares) | | 40,100 | 880,532 |
| China Tower Corp. Ltd. (H Shares) (c) | | 16,756,000 | 1,515,578 |
| China United Network Communications Ltd. (A Shares) | | 694,400 | 319,487 |
| China Vanke Co. Ltd.: | | | |
| (A Shares) | | 139,600 | 258,444 |
| (H Shares) | | 750,600 | 963,871 |
| China Yangtze Power Co. Ltd. (A Shares) | | 568,330 | 1,576,684 |
| China Zhenhua (Group) Science & Technology Co. Ltd. (A Shares) | | 11,100 | 204,964 |
| China Zheshang Bank Co. Ltd. (a) | | 391,500 | 147,960 |
| Chongqing Brewery Co. Ltd. (A Shares) | | 9,400 | 112,524 |
| Chongqing Changan Automobile Co. Ltd. (A Shares) | | 170,390 | 263,416 |
| Chongqing Fuling Zhacai Group Co. Ltd. Group (A Shares) | | 17,800 | 54,866 |
| Chongqing Rural Commercial Bank Co. Ltd. (A Shares) | | 232,300 | 111,014 |
| Chongqing Zhifei Biological Products Co. Ltd. (A Shares) | | 33,000 | 385,901 |
| CITIC Securities Co. Ltd.: | | | |
| (A Shares) | | 204,630 | 482,231 |
| (H Shares) | | 969,175 | 1,449,506 |
| Cmoc Group Ltd.: | | | |
| (A Shares) | | 278,300 | 158,149 |
| (H Shares) | | 1,665,000 | 536,642 |
| CNGR Advanced Material Co. Ltd. | | 8,400 | 82,966 |
| CNNC Hua Yuan Titanium Dioxide Co. Ltd. (A Shares) | | 62,975 | 57,604 |
| Contemporary Amperex Technology Co. Ltd. | | 51,700 | 2,639,759 |
| COSCO Shipping Development Co. Ltd. (A Shares) | | 174,000 | 58,136 |
| COSCO Shipping Energy Transportation Co. Ltd. (A Shares) (a) | | 73,900 | 171,117 |
| COSCO SHIPPING Holdings Co. Ltd.: | | | |
| (A Shares) | | 392,320 | 603,288 |
| (H Shares) | | 1,077,150 | 1,162,276 |
| CRRC Corp. Ltd.: | | | |
| (A Shares) | | 1,230,600 | 800,415 |
| (H Shares) | | 243,000 | 73,677 |
| CSC Financial Co. Ltd. (A Shares) | | 85,000 | 274,802 |
| Daan Gene Co. Ltd. | | 27,900 | 68,309 |
| Daqin Railway Co. Ltd. (A Shares) | | 322,100 | 282,718 |
| DaShenLin Pharmaceutical Group Co. Ltd. | | 18,792 | 93,794 |
| DHC Software Co. Ltd. (A Shares) | | 48,700 | 41,145 |
| Do-Fluoride New Materials Co. Ltd. (A Shares) | | 16,700 | 71,233 |
| Dong-E-E-Jiao Co. Ltd. (A Shares) | | 13,300 | 68,368 |
| Dongfang Electric Corp. Ltd. (A Shares) | | 58,000 | 184,335 |
| Dongfeng Motor Group Co. Ltd. (H Shares) | | 990,000 | 447,727 |
| Dongxing Securities Co. Ltd. (A Shares) | | 57,200 | 60,859 |
| East Money Information Co. Ltd. (A Shares) | | 275,608 | 589,114 |
| Ecovacs Robotics Co. Ltd. Class A | | 11,100 | 88,613 |
| ENN Natural Gas Co. Ltd. (A Shares) | | 45,100 | 95,599 |
| Eve Energy Co. Ltd. (A shares) | | 39,124 | 444,872 |
| Everbright Securities Co. Ltd. (A Shares) | | 81,200 | 155,887 |
| Fangda Carbon New Material Co. Ltd. (A Shares) (a) | | 75,600 | 62,216 |
| FAW Jiefang Group Co. Ltd. (A Shares) | | 49,800 | 47,462 |
| Fiberhome Telecommunication Technologies Co. Ltd. (A Shares) | | 20,100 | 37,927 |
| First Capital Securities Co. Ltd. (A Shares) | | 70,800 | 53,806 |
| Flat Glass Group Co. Ltd. | | 41,000 | 96,002 |
| Flat Glass Group Co. Ltd. (A Shares) (a) | | 100,500 | 472,025 |
| Focus Media Information Technology Co. Ltd. (A Shares) | | 289,240 | 177,436 |
| Foshan Haitian Flavouring & Food Co. Ltd. (A Shares) | | 80,148 | 654,977 |
| Founder Securities Co. Ltd. (A Shares) | | 171,700 | 148,826 |
| Foxconn Industrial Internet Co. Ltd. (A Shares) | | 628,996 | 706,263 |
| Fujian Sunner Development Co. Ltd. A Shares | | 24,200 | 72,770 |
| Fuyao Glass Industries Group Co. Ltd.: | | | |
| (A Shares) | | 90,600 | 414,734 |
| (H Shares) (c) | | 180,800 | 648,375 |
| G-bits Network Technology Xiamen Co. Ltd. (A Shares) | | 1,400 | 48,818 |
| Ganfeng Lithium Group Co. Ltd. (A Shares) | | 81,620 | 883,158 |
| GCL System Integration Technology Co. Ltd. (a) | | 123,500 | 55,299 |
| GD Power Development Co. Ltd. (A Shares) (a) | | 390,100 | 233,433 |
| GEM Co. Ltd. (A Shares) | | 97,200 | 99,025 |
| Gemdale Corp. (A Shares) | | 96,300 | 103,119 |
| GF Securities Co. Ltd.: | | | |
| (A Shares) | | 231,600 | 432,254 |
| (H Shares) | | 185,800 | 189,122 |
| Giant Network Group Co. Ltd. (A Shares) | | 48,200 | 51,085 |
| Gigadevice Semiconductor Beijing, Inc. (A Shares) | | 12,784 | 144,017 |
| Ginlong Technologies Co. Ltd. (A Shares) | | 7,700 | 196,957 |
| GoerTek, Inc. (A Shares) | | 69,000 | 204,839 |
| Gotion High-tech Co. Ltd. (A Shares) | | 34,600 | 142,372 |
| Great Wall Motor Co. Ltd.: | | | |
| (A Shares) | | 48,100 | 192,060 |
| (H Shares) | | 1,152,000 | 1,257,717 |
| Gree Electric Appliances, Inc. of Zhuhai (A Shares) | | 62,200 | 244,187 |
| GRG Banking Equipment Co. Ltd. (A Shares) | | 26,300 | 33,924 |
| Guangdong Haid Group Co. Ltd. (A Shares) | | 32,700 | 258,586 |
| Guangdong Kinlong Hardware Products Co. Ltd. (A Shares) | | 6,700 | 72,680 |
| Guanghui Energy Co. Ltd. (A Shares) | | 138,300 | 194,679 |
| Guangzhou Automobile Group Co. Ltd. | | 166,700 | 258,625 |
| Guangzhou Automobile Group Co. Ltd. (H Shares) | | 992,000 | 604,073 |
| Guangzhou Baiyunshan Pharma Health (A Shares) | | 30,200 | 111,613 |
| Guangzhou Haige Communications Group (A Shares) | | 36,400 | 42,118 |
| Guangzhou Kingmed Diagnostics Group Co. Ltd. (A Shares) | | 8,200 | 84,842 |
| Guangzhou Shiyuan Electronic Technology Co. Ltd. (A Shares) | | 11,000 | 97,997 |
| Guangzhou Tinci Materials Technology Co. Ltd. (A Shares) | | 39,620 | 230,573 |
| Guangzhou Yuexiu Financial Holdings Group Co. Ltd. (A Shares) | | 69,604 | 53,088 |
| Guolian Securities Co. Ltd. | | 45,900 | 58,766 |
| Guosen Securities Co. Ltd. (A Shares) | | 151,000 | 178,233 |
| Guotai Junan Securities Co. Ltd.: | | | |
| (A Shares) | | 43,000 | 77,840 |
| (H Shares) (c) | | 228,600 | 230,940 |
| Guoyuan Securities Co. Ltd. (A Shares) | | 91,900 | 78,650 |
| Haier Smart Home Co. Ltd. | | 817,600 | 2,045,654 |
| Haier Smart Home Co. Ltd. (A Shares) | | 141,229 | 402,246 |
| Haitong Securities Co. Ltd.: | | | |
| (A Shares) | | 114,700 | 132,559 |
| (H Shares) | | 1,228,000 | 600,730 |
| Hanergy Mobile Energy Holding (a)(d) | | 576,000 | 1 |
| Hangzhou First Applied Material Co. Ltd. (A Shares) | | 26,180 | 229,647 |
| Hangzhou Lion Electronics Co. Ltd. (A Shares) | | 14,900 | 87,365 |
| Hangzhou Oxygen Plant Group Co. Ltd. (A Shares) | | 21,100 | 121,609 |
| Hangzhou Robam Appliances Co. Ltd. (A Shares) | | 18,900 | 53,054 |
| Hangzhou Silan Microelectronics Co. Ltd. (A Shares) | | 27,000 | 116,091 |
| Hangzhou Tigermed Consulting Co. Ltd.: | | | |
| (A Shares) | | 29,600 | 337,833 |
| (H Shares) (c) | | 10,000 | 67,965 |
| Heilongjiang Agriculture Co. Ltd. (A Shares) | | 32,100 | 60,658 |
| Henan Shenhuo Coal & Power Co. Ltd. (A Shares) | | 51,300 | 98,555 |
| Henan Shuanghui Investment & Development Co. Ltd. (A Shares) | | 66,100 | 206,186 |
| Hengli Petrochemical Co. Ltd. (A Shares) | | 114,800 | 241,141 |
| Hengtong Optic-electric Co. Ltd. (A Shares) | | 52,300 | 139,292 |
| Hengyi Petrochemical Co. Ltd. (A Shares) | | 73,630 | 67,551 |
| Hesteel Co. Ltd. (A Shares) | | 237,700 | 70,631 |
| Hithink RoyalFlush Information Network Co. Ltd. (A Shares) | | 10,200 | 118,804 |
| Hongfa Technology Co. Ltd. (A Shares) | | 20,820 | 97,815 |
| Hoshine Silicon Industry Co. Ltd. (A Shares) | | 10,400 | 136,286 |
| Huadian Power International Corp. Ltd.: | | | |
| (A Shares) | | 21,700 | 16,135 |
| (H Shares) | | 518,000 | 155,737 |
| Huadong Medicine Co. Ltd. (A Shares) | | 34,560 | 193,696 |
| Huafon Chemical Co. Ltd. (A Shares) | | 94,500 | 86,181 |
| Huagong Tech Co. Ltd. (A Shares) | | 26,200 | 60,164 |
| Huaibei Mining Holdings Co. Ltd. (A Shares) | | 55,500 | 99,024 |
| Hualan Biological Engineer, Inc. (A Shares) | | 38,250 | 92,863 |
| Huaneng Power International, Inc.: | | | |
| (A Shares) (a) | | 191,800 | 175,966 |
| (H Shares) (a) | | 1,386,000 | 496,157 |
| Huatai Securities Co. Ltd.: | | | |
| (A Shares) | | 71,000 | 116,374 |
| (H Shares) (c) | | 663,000 | 649,516 |
| HUAXI Securities Co. Ltd. | | 51,000 | 51,259 |
| Huaxia Bank Co. Ltd. (A Shares) | | 192,800 | 126,458 |
| Huaxin Cement Co. Ltd. (A Shares) | | 21,900 | 40,244 |
| Huayu Automotive Systems Co. Ltd. (A Shares) | | 67,031 | 153,927 |
| Hubei Xingfa Chemicals Group Co. Ltd. (A Shares) | | 24,300 | 94,067 |
| Huizhou Desay SV Automotive Co. Ltd. | | 11,100 | 157,466 |
| Humanwell Healthcare Group Co. Ltd. (A Shares) | | 35,400 | 97,093 |
| Hunan Valin Steel Co. Ltd. (A Shares) | | 127,200 | 69,671 |
| Hundsun Technologies, Inc. (A Shares) | | 37,677 | 215,035 |
| iFlytek Co. Ltd. (A Shares) | | 47,000 | 225,446 |
| IMEIK Technology Development Co. Ltd. (A Shares) | | 3,800 | 219,064 |
| Industrial & Commercial Bank of China Ltd.: | | | |
| (A Shares) | | 1,311,300 | 745,169 |
| (H Shares) | | 20,537,000 | 8,916,456 |
| Industrial Bank Co. Ltd. (A Shares) | | 432,700 | 890,534 |
| Industrial Securities Co. Ltd. (A Shares) (a) | | 158,340 | 118,166 |
| Ingenic Semiconductor Co. Ltd. (A Shares) | | 9,000 | 83,753 |
| Inner Mongoli Yili Industries Co. Ltd. (A Shares) | | 137,500 | 475,222 |
| Inner Mongolia Baotou Steel Union Co. Ltd. (A Shares) | | 900,600 | 217,045 |
| Inner Mongolia Dian Tou Energy Corp. Ltd. | | 46,800 | 79,144 |
| Inner Mongolia Eerduosi Resourses Co. Ltd. (A Shares) | | 26,880 | 51,236 |
| Inner Mongolia Junzheng Energy & Chemical Industry Group Co. Ltd. (A Shares) | | 147,700 | 78,472 |
| Inner Mongolia Yitai Coal Co. Ltd. (B Shares) | | 496,700 | 702,334 |
| Inner Mongolia Yuan Xing Energy Co. Ltd. (A Shares) | | 71,300 | 62,973 |
| Inspur Electronic Information Industry Co. Ltd. (A Shares) | | 27,512 | 86,723 |
| Intco Medical Technology Co. Ltd. (A Shares) | | 13,560 | 39,587 |
| JA Solar Technology Co. Ltd. (A Shares) | | 46,540 | 398,301 |
| Jafron Biomedical Co. Ltd. (A Shares) | | 13,740 | 59,604 |
| Jason Furniture Hangzhou Co. Ltd. (A Shares) | | 18,020 | 74,272 |
| JCET Group Co. Ltd. (A Shares) | | 34,900 | 115,076 |
| Jiangsu Eastern Shenghong Co. Ltd. | | 82,100 | 137,603 |
| Jiangsu Expressway Co. Ltd. (H Shares) | | 414,000 | 291,659 |
| Jiangsu Hengli Hydraulic Co. Ltd. | | 25,472 | 192,429 |
| Jiangsu Hengrui Medicine Co. Ltd. (A Shares) | | 132,048 | 726,880 |
| Jiangsu King's Luck Brewery JSC Ltd. (A Shares) | | 22,000 | 112,607 |
| Jiangsu Yanghe Brewery JSC Ltd. (A Shares) | | 31,300 | 559,962 |
| Jiangsu Yangnong Chemical Co. Ltd. (A Shares) | | 6,000 | 75,907 |
| Jiangsu Yoke Technology Co. Ltd. (A Shares) | | 10,300 | 82,931 |
| Jiangsu Yuyue Medical Equipment & Supply Co. Ltd. (A Shares) | | 17,200 | 76,663 |
| Jiangsu Zhongtian Technology Co. Ltd. (A Shares) | | 69,200 | 208,181 |
| Jiangxi Copper Co. Ltd.: | | | |
| (A Shares) | | 30,000 | 63,263 |
| (H Shares) | | 423,000 | 462,357 |
| Jiangxi Special Electric Motor Co. Ltd. (A Shares) (a) | | 35,600 | 93,011 |
| Jiangxi Zhengbang Technology Co. Ltd. (A Shares) (a) | | 71,800 | 34,411 |
| Jinke Properties Group Co. Ltd. (A Shares) (a) | | 127,300 | 30,854 |
| JiuGui Liquor Co. Ltd. (A Shares) | | 6,400 | 89,433 |
| Jizhong Energy Resources Co. Ltd. (A Shares) | | 75,000 | 62,441 |
| Joincare Pharmaceutical Group Industry Co. Ltd. (A Shares) | | 30,000 | 48,022 |
| Joinn Laboratories China Co. Ltd. (A Shares) | | 9,788 | 76,651 |
| Jointown Pharmaceutical Group (A Shares) | | 31,800 | 54,692 |
| Jonjee Hi-Tech Industrial & Commercial Holding Co. Ltd. (A Shares) | | 16,700 | 61,971 |
| Juewei Food Co. Ltd. | | 12,400 | 80,432 |
| Kangmei Pharmaceutical Co. Ltd. rights (a)(d) | | 3,087 | 0 |
| Keda Industrial Group Co. Ltd. | | 40,500 | 86,347 |
| Kingfa Sci & Tech Co. Ltd. (A Shares) | | 56,600 | 75,023 |
| Kuang-Chi Technologies Co. Ltd. (A Shares) (a) | | 45,500 | 107,786 |
| Kunlun Tech Co. Ltd. (A Shares) | | 25,800 | 45,962 |
| Kweichow Moutai Co. Ltd. (A Shares) | | 28,500 | 5,243,898 |
| Lb Group Co. Ltd. (A Shares) | | 45,500 | 95,761 |
| Lens Technology Co. Ltd. (A Shares) | | 100,600 | 137,202 |
| Lepu Medical Technology Beijing Co. Ltd. (A Shares) | | 37,400 | 129,516 |
| Liaoning Port Co. Ltd. (A Shares) | | 390,600 | 85,042 |
| Lingyi iTech Guangdong Co. (A Shares) (a) | | 150,800 | 97,671 |
| Livzon Pharmaceutical Group, Inc. (A Shares) | | 14,900 | 72,083 |
| LONGi Green Energy Technology Co. Ltd. | | 156,368 | 1,027,337 |
| Luoyang Xinqianglian Slewing Bearing Co. Ltd. (A Shares) | | 6,800 | 65,012 |
| Luxi Chemical Group Co. Ltd. | | 42,500 | 66,111 |
| Luxshare Precision Industry Co. Ltd. (A Shares) | | 146,247 | 570,738 |
| Luzhou Laojiao Co. Ltd. (A Shares) | | 30,400 | 650,843 |
| Maanshan Iron & Steel Co. Ltd. (A Shares) | | 130,400 | 44,997 |
| Mango Excellent Media Co. Ltd. (A Shares) | | 37,800 | 113,510 |
| Maxscend Microelectronics Co. Ltd. (A Shares) | | 10,752 | 135,981 |
| Meinian Onehealth Healthcare Holdings Co. Ltd. (A Shares) (a) | | 72,264 | 42,253 |
| Metallurgical Corp. China Ltd. (H Shares) | | 920,000 | 146,503 |
| Ming Yang Smart Energy Group Ltd. (A Shares) | | 44,800 | 152,750 |
| Montage Technology Co. Ltd. (A Shares) | | 21,515 | 167,161 |
| Muyuan Foodstuff Co. Ltd. (A Shares) | | 108,640 | 695,912 |
| Nanjing King-Friend Biochemical Pharmaceutical Co. Ltd. | | 35,293 | 78,629 |
| Nanjing Securities Co. Ltd. (A Shares) | | 73,200 | 79,385 |
| NARI Technology Co. Ltd. (A Shares) | | 138,688 | 463,376 |
| National Silicon Industry Group Co. Ltd. (A Shares) (a) | | 45,898 | 127,646 |
| NAURA Technology Group Co. Ltd. | | 10,900 | 396,573 |
| NavInfo Co. Ltd. (A Shares) | | 52,300 | 84,936 |
| New China Life Insurance Co. Ltd. | | 13,900 | 44,481 |
| New China Life Insurance Co. Ltd. (H Shares) | | 424,400 | 673,664 |
| New Hope Liuhe Co. Ltd. (A Shares) (a) | | 96,000 | 169,445 |
| Ninestar Corp. (A Shares) | | 27,300 | 213,491 |
| Ningbo Deye Technology Co. Ltd. (A Shares) | | 4,100 | 183,680 |
| Ningbo Joyson Electronic Corp. (A shares) (a) | | 29,500 | 62,006 |
| Ningbo Orient Wires & Cables Co. Ltd. (A Shares) | | 14,500 | 152,884 |
| Ningbo Ronbay New Energy Technology Co. Ltd. (A Shares) | | 9,354 | 100,304 |
| Ningbo Shanshan Co. Ltd. (A Shares) | | 44,500 | 109,561 |
| Ningbo Tuopu Group Co. Ltd. (A Shares) | | 22,900 | 203,196 |
| Ningxia Baofeng Energy Group Co. Ltd. | | 119,200 | 187,217 |
| Nongfu Spring Co. Ltd. (H Shares) (c) | | 648,800 | 3,260,675 |
| North Industries Group Red Arrow Co. Ltd. (A Shares) | | 29,900 | 84,137 |
| Northeast Securities Co. Ltd. (A Shares) | | 57,700 | 50,092 |
| Offshore Oil Enginering Co. Ltd. (A Shares) | | 63,300 | 40,739 |
| OFILM Group Co. Ltd. (A Shares) (a) | | 74,700 | 47,871 |
| Oppein Home Group, Inc. (A Shares) | | 10,760 | 119,963 |
| Orient Securities Co. Ltd. (A Shares) | | 135,808 | 144,308 |
| Ovctek China, Inc. (A Shares) | | 17,420 | 70,893 |
| Pangang Group Vanadium Titanium & Resources Co. Ltd. (A Shares) (a) | | 179,600 | 111,406 |
| People's Insurance Co. of China Group Ltd.: | | | |
| (A Shares) | | 140,700 | 93,442 |
| (H Shares) | | 3,307,000 | 914,205 |
| Perfect World Co. Ltd. (A Shares) | | 42,950 | 66,987 |
| PetroChina Co. Ltd.: | | | |
| (A Shares) | | 525,000 | 344,350 |
| (H Shares) | | 7,560,000 | 2,889,301 |
| Pharmaron Beijing Co. Ltd.: | | | |
| (A Shares) | | 18,000 | 128,168 |
| (H Shares) (c) | | 72,600 | 244,169 |
| PICC Property & Casualty Co. Ltd. (H Shares) | | 2,542,933 | 2,345,434 |
| Ping An Bank Co. Ltd. (A Shares) | | 407,700 | 577,253 |
| Ping An Insurance Group Co. of China Ltd.: | | | |
| (A Shares) | | 253,892 | 1,256,788 |
| (H Shares) | | 2,298,000 | 9,199,791 |
| Pingdingshan Tianan Coal Mining Co. Ltd. A Shares | | 52,600 | 79,373 |
| Poly Developments & Holdings (A Shares) | | 245,200 | 463,345 |
| Postal Savings Bank of China Co. Ltd. | | 332,900 | 176,868 |
| Postal Savings Bank of China Co. Ltd. (H Shares) (c) | | 3,304,000 | 1,532,114 |
| Power Construction Corp. of China Ltd. (A Shares) | | 305,600 | 294,599 |
| Proya Cosmetics Co. Ltd. (A Shares) | | 3,240 | 74,158 |
| Pylon Technologies Co. Ltd. (Series A) | | 3,234 | 136,615 |
| Qingdao Rural Commercial Bank Corp. (A Shares) | | 57,000 | 21,620 |
| Qinghai Salt Lake Potash Co. Ltd. Class A (a) | | 107,800 | 317,515 |
| Raytron Technology Co. Ltd. (A Shares) | | 9,121 | 59,388 |
| Riyue Heavy Industry Co. Ltd. (A Shares) | | 22,600 | 68,361 |
| Rongsheng Petrochemical Co. Ltd. (A Shares) | | 210,550 | 308,492 |
| SAIC Motor Corp. Ltd. (A Shares) | | 164,000 | 308,781 |
| Sailun Group Co. Ltd. A Shares | | 66,900 | 79,607 |
| Sangfor Technologies, Inc. | | 8,200 | 141,478 |
| Sany Heavy Industry Co. Ltd. (A Shares) | | 178,400 | 329,787 |
| Satellite Chemical Co. Ltd. (A Shares) | | 72,399 | 122,930 |
| SDIC Power Holdings Co. Ltd. (A Shares) | | 139,000 | 192,239 |
| Sealand Securities Co. Ltd. (A Shares) | | 114,180 | 50,813 |
| Seazen Holdings Co. Ltd. (A Shares) (a) | | 48,200 | 87,056 |
| SF Holding Co. Ltd. (A Shares) | | 101,400 | 670,085 |
| SG Micro Corp. (A Shares) | | 7,575 | 155,236 |
| Shaanxi Coal Industry Co. Ltd. (A Shares) | | 200,900 | 546,341 |
| Shan Xi Hua Yang Group New Energy Co. Ltd. | | 50,800 | 117,489 |
| Shandong Buchang Pharmaceuticals Co. Ltd. (A Shares) | | 24,010 | 63,059 |
| Shandong Gold Mining Co. Ltd.: | | | |
| (A Shares) | | 89,232 | 211,384 |
| (H Shares) (c) | | 234,000 | 372,628 |
| Shandong Hualu Hengsheng Chemical Co. Ltd. (A Shares) | | 39,520 | 141,674 |
| Shandong Linglong Tyre Co. Ltd. (A Shares) | | 30,400 | 68,144 |
| Shandong Nanshan Aluminum Co. Ltd. (A Shares) | | 237,000 | 99,955 |
| Shandong Sun Paper Industry JSC Ltd. (A Shares) | | 41,600 | 59,755 |
| Shandong Weigao Medical Polymer Co. Ltd. (H Shares) | | 955,200 | 1,316,653 |
| Shanghai Bairun Investment Holding Group Co. Ltd. (A Shares) | | 20,580 | 85,951 |
| Shanghai Baosight Software Co. Ltd. | | 305,610 | 920,803 |
| Shanghai Baosight Software Co. Ltd. (A Shares) | | 9,460 | 54,820 |
| Shanghai Construction Group Co. Ltd. (A Shares) | | 168,300 | 59,227 |
| Shanghai Electric Group Co. Ltd. (A Shares) (a) | | 265,500 | 141,059 |
| Shanghai Fosun Pharmaceutical (Group) Co. Ltd.: | | | |
| (A Shares) | | 30,400 | 137,495 |
| (H Shares) | | 199,500 | 503,728 |
| Shanghai Friendess Electronic Technology Corp. Ltd. (A Shares) | | 3,050 | 86,026 |
| Shanghai International Airport Co. Ltd. (A Shares) (a) | | 19,600 | 143,265 |
| Shanghai International Port Group Co. Ltd. (A Shares) | | 205,500 | 145,481 |
| Shanghai Jinjiang International Hotels Co. Ltd. (A Shares) | | 19,600 | 146,217 |
| Shanghai Junshi Biosciences Co. Ltd. (A Shares) (a) | | 14,382 | 139,942 |
| Shanghai Lingang Holdings Corp. Ltd. (A Shares) | | 56,280 | 88,471 |
| Shanghai Lujiazui Finance Trust Ltd. (B Shares) | | 405,171 | 300,637 |
| Shanghai M&G Stationery, Inc. (A Shares) | | 15,700 | 86,638 |
| Shanghai Medicilon, Inc. (A Shares) | | 1,840 | 55,831 |
| Shanghai Pharmaceuticals Holding Co. Ltd.: | | | |
| (A Shares) | | 96,900 | 233,264 |
| (H Shares) | | 191,700 | 259,844 |
| Shanghai Pudong Development Bank Co. Ltd. (A Shares) | | 623,200 | 566,631 |
| Shanghai Putailai New Energy Technology Co. Ltd. | | 27,928 | 190,868 |
| Shanghai RAAS Blood Products Co. Ltd. (A Shares) | | 153,600 | 114,418 |
| Shanghai Yuyuan Tourist Mart Group Co. Ltd. | | 65,400 | 56,150 |
| Shanghai Zhangjiang High Ltd. (A Shares) | | 33,300 | 51,298 |
| Shanxi Lu'an Environmental Energy Development Co. Ltd. (A Shares) | | 64,300 | 147,831 |
| Shanxi Meijin Energy Co. Ltd. (A Shares) | | 82,700 | 99,201 |
| Shanxi Securities Co. Ltd. (A Shares) | | 59,350 | 41,854 |
| Shanxi Taigang Stainless Steel Co. Ltd. (A Shares) | | 116,400 | 63,277 |
| Shanxi Xinghuacun Fen Wine Factory Co. Ltd. (A Shares) | | 25,120 | 799,324 |
| Shanxi Xishan Coal & Electricity Power Co. Ltd. (A Shares) | | 88,270 | 137,671 |
| Shenghe Resources Holding Co. Ltd. (A Shares) | | 36,000 | 65,859 |
| Shengyi Technology Co. Ltd. | | 38,700 | 73,501 |
| Shennan Circuits Co. Ltd. (A Shares) | | 8,600 | 88,404 |
| Shenwan Hongyuan Group Co. Ltd. (A Shares) | | 1,443,000 | 768,636 |
| Shenzhen Capchem Technology Co. Ltd. (A Shares) | | 15,700 | 77,759 |
| Shenzhen Dynanonic Co. Ltd. (A Shares) | | 3,600 | 127,182 |
| Shenzhen Energy Group Co. Ltd. (A Shares) | | 69,720 | 54,417 |
| Shenzhen Inovance Technology Co. Ltd. (A Shares) | | 55,050 | 502,791 |
| Shenzhen Kangtai Biological Products Co. Ltd. | | 24,060 | 102,527 |
| Shenzhen Kedali Industry Co. Ltd. | | 4,900 | 61,494 |
| Shenzhen Mindray Bio-Medical Electronics Co. Ltd. (A Shares) | | 25,100 | 1,118,534 |
| Shenzhen New Industries Biomedical Engineering Co. Ltd. | | 14,600 | 115,414 |
| Shenzhen Overseas Chinese Town Co. Ltd. (A Shares) | | 182,400 | 104,901 |
| Shenzhen Salubris Pharmaceuticals Co. Ltd. (A Shares) | | 19,900 | 84,473 |
| Shenzhen SC New Energy Technology Corp. (A Shares) | | 7,200 | 133,827 |
| Shenzhen Senior Technology Material Co. Ltd. (A Shares) | | 27,217 | 68,910 |
| Shenzhen Sunlord Electronics Co. Ltd. (A Shares) | | 18,700 | 54,797 |
| Shenzhen Transsion Holdings Co. Ltd. (A Shares) | | 14,131 | 120,221 |
| Shijiazhuang Yiling Pharmaceutical Co. Ltd. (A Shares) | | 35,860 | 149,668 |
| Sichuan Chuantou Energy Co. Ltd. (A Shares) | | 82,836 | 125,339 |
| Sichuan Hebang Biotechnology Co. Ltd. (A Shares) | | 172,200 | 68,145 |
| Sichuan Kelun Pharmaceutical Co. Ltd. (A Shares) | | 29,900 | 101,538 |
| Sichuan New Energy Power Co. Ltd. (A Shares) (a) | | 31,500 | 81,220 |
| Sichuan Road & Bridge (Group) Co. Ltd. (A Shares) | | 106,600 | 164,216 |
| Sichuan Swellfun Co. Ltd. (A Shares) | | 9,200 | 71,278 |
| Sichuan Yahua Industrial Group Co. Ltd. (A Shares) | | 25,200 | 92,306 |
| Sieyuan Electric Co. Ltd. (A Shares) | | 16,900 | 77,408 |
| Sinolink Securities Co. Ltd. (A Shares) | | 57,100 | 61,690 |
| Sinoma Science & Technology Co. Ltd. (A Shares) | | 36,000 | 88,288 |
| Sinomine Resource Group Co. Ltd. (A Shares) | | 9,940 | 122,499 |
| Sinopec Shanghai Petrochemical Co. Ltd. (A Shares) | | 111,300 | 46,788 |
| Sinopharm Group Co. Ltd. (H Shares) | | 464,400 | 885,062 |
| Sinotrans Ltd. | | 81,000 | 39,375 |
| SKSHU Paint Co. Ltd. (A Shares) (a) | | 7,560 | 89,959 |
| Songcheng Performance Development Co. Ltd. (A Shares) | | 60,860 | 96,004 |
| Soochow Securities Co. Ltd. (A Shares) | | 76,349 | 68,478 |
| Southwest Securities Co. Ltd. (A Shares) | | 114,400 | 57,961 |
| StarPower Semiconductor Ltd. (A Shares) | | 3,300 | 168,414 |
| Sungrow Power Supply Co. Ltd. (A Shares) | | 30,900 | 551,366 |
| Sunwoda Electronic Co. Ltd. (A Shares) | | 36,300 | 115,816 |
| Suzhou Dongshan Precision Manufacturing Co. Ltd. (A Shares) | | 35,500 | 122,840 |
| Suzhou Maxwell Technologies Co. Ltd. (A Shares) | | 3,460 | 226,232 |
| Suzhou TA&A Ultra Clean Technology Co. Ltd. (A Shares) | | 12,100 | 102,478 |
| Tangshan Jidong Cement Co. Ltd. A Shares | | 68,000 | 70,673 |
| TBEA Co. Ltd. (A Shares) | | 75,800 | 211,844 |
| TCL Technology Group Corp. (A Shares) | | 272,800 | 146,058 |
| TCL Zhonghuan Renewable Energy Technology Co. Ltd. (A Shares) | | 67,500 | 365,095 |
| Thunder Software Technology Co. Ltd. (A Shares) | | 8,900 | 120,334 |
| Tianjin 712 Communication & Broadcasting Co. Ltd. | | 14,700 | 79,288 |
| Tianma Microelectronics Co. Ltd. (A Shares) | | 41,400 | 50,114 |
| Tianqi Lithium Corp. (A Shares) (a) | | 30,700 | 401,674 |
| Tianshan Aluminum Group Co. Ltd. | | 86,000 | 73,483 |
| Tianshui Huatian Technology Co. Ltd. (A Shares) | | 53,100 | 64,131 |
| Tibet Summit Industrial Co. Ltd. (A Shares) (a) | | 18,800 | 53,932 |
| Titan Wind Energy Suzhou Co. Ltd. (A Shares) | | 38,500 | 61,892 |
| Toly Bread Co. Ltd. | | 24,308 | 37,479 |
| TongFu Microelectronics Co. Ltd. (A Shares) (a) | | 26,600 | 68,586 |
| Tongkun Group Co. Ltd. (A Shares) | | 49,100 | 81,353 |
| Tongling Nonferrous Metals Group Co. Ltd. (A Shares) | | 217,300 | 74,983 |
| Tongwei Co. Ltd. (A Shares) | | 93,300 | 555,745 |
| Topchoice Medical Corp. (a) | | 6,600 | 110,484 |
| Transfar Zhilian Co. Ltd. | | 71,100 | 47,998 |
| TravelSky Technology Ltd. (H Shares) | | 320,000 | 464,734 |
| Trina Solar Co. Ltd. (A Shares) | | 44,714 | 406,736 |
| Tsingtao Brewery Co. Ltd.: | | | |
| (A Shares) | | 32,300 | 361,793 |
| (H Shares) | | 202,000 | 1,415,350 |
| Unigroup Guoxin Microelectronics Co. Ltd. | | 17,779 | 399,528 |
| Unisplendour Corp. Ltd. (A Shares) | | 46,620 | 109,482 |
| Walvax Biotechnology Co. Ltd. (A Shares) | | 33,000 | 173,746 |
| Wanhua Chemical Group Co. Ltd. (A Shares) | | 65,700 | 722,953 |
| Weichai Power Co. Ltd.: | | | |
| (A Shares) | | 88,600 | 110,160 |
| (H Shares) | | 736,600 | 705,666 |
| Weihai Guangwei Composites Co. Ltd. (A Shares) | | 10,200 | 108,384 |
| Wens Foodstuffs Group Co. Ltd. (A Shares) (a) | | 131,600 | 322,562 |
| Western Mining Co. Ltd. (A Shares) | | 57,100 | 74,044 |
| Western Securities Co. Ltd. (A Shares) | | 67,600 | 55,262 |
| Western Superconducting Technologies Co. Ltd. (A Shares) | | 9,909 | 158,291 |
| Westone Information Industry, Inc. (A Shares) | | 18,900 | 93,997 |
| Will Semiconductor Ltd. | | 23,750 | 238,609 |
| Wingtech Technology Co. Ltd. (A Shares) | | 25,500 | 167,186 |
| Winning Health Technology Group Co. Ltd. (A Shares) | | 54,820 | 72,664 |
| Wuchan Zhongda Group Co. Ltd. | | 106,200 | 60,641 |
| Wuhan Guide Infrared Co. Ltd. (A Shares) | | 63,880 | 101,555 |
| Wuliangye Yibin Co. Ltd. (A Shares) | | 95,900 | 1,753,091 |
| WUS Printed Circuit Kunshan Co. Ltd. (A Shares) | | 38,930 | 58,052 |
| WuXi AppTec Co. Ltd. | | 50,348 | 526,721 |
| WuXi AppTec Co. Ltd. (H Shares) (c) | | 138,300 | 1,108,211 |
| Wuxi Shangji Automation Co. Ltd. (A Shares) | | 8,200 | 137,526 |
| XCMG Construction Machinery Co. Ltd. (A Shares) | | 142,700 | 90,471 |
| Xiamen C&D, Inc. (A Shares) | | 65,100 | 106,882 |
| Xiamen Faratronic Co. Ltd. (A Shares) | | 4,800 | 116,410 |
| Xiamen Intretech, Inc. | | 16,730 | 39,449 |
| Xiamen Tungsten Co. Ltd. (A Shares) | | 29,300 | 80,563 |
| Xinjiang Goldwind Science & Technology Co. Ltd.: | | | |
| (A Shares) | | 192,182 | 275,001 |
| (H Shares) | | 140,452 | 121,850 |
| Xinjiang Zhongtai Chemical Co. Ltd. (A Shares) | | 44,700 | 35,991 |
| Yangzhou Yangjie Electronic Technology Co. Ltd. (A Shares) | | 11,600 | 81,613 |
| Yankuang Energy Group Co. Ltd.: | | | |
| (A Shares) | | 77,500 | 430,856 |
| (H Shares) | | 514,000 | 1,447,122 |
| Yantai Jereh Oilfield Services (A Shares) | | 19,800 | 81,500 |
| Yealink Network Technology Corp. Ltd. | | 19,400 | 182,978 |
| Yifeng Pharmacy Chain Co. Ltd. | | 14,014 | 107,731 |
| Yihai Kerry Arawana Holdings Co. Ltd. (A Shares) | | 25,200 | 131,989 |
| Yintai Gold Co. Ltd. (A Shares) | | 54,940 | 107,429 |
| YongXing Special Materials Technology Co. Ltd. (A Shares) | | 8,500 | 135,562 |
| Yonyou Network Technology Co. Ltd. (A Shares) | | 70,030 | 234,364 |
| Youngor Group Co. Ltd. (A Shares) | | 97,993 | 80,242 |
| Youngy Co. Ltd. (A Shares) (a) | | 5,500 | 82,987 |
| YTO Express Group Co. Ltd. (A Shares) | | 65,800 | 169,931 |
| Yuan Longping High-tech Agriculture Co. Ltd. (A Shares) (a) | | 34,000 | 67,601 |
| Yunda Holding Co. Ltd. (A Shares) | | 57,120 | 103,088 |
| Yunnan Aluminium Co. Ltd. (A Shares) | | 69,900 | 87,771 |
| Yunnan Baiyao Group Co. Ltd. (A Shares) | | 38,080 | 284,496 |
| Yunnan Botanee Bio-Technology Group Co., Ltd. (A Shares) | | 5,800 | 113,571 |
| Yunnan Energy New Material Co. Ltd. | | 18,400 | 372,994 |
| Yunnan Tin Co. Ltd. (A Shares) | | 30,600 | 47,809 |
| Yunnan Yuntianhua Co. Ltd. (Series A) (a) | | 38,600 | 106,557 |
| Zangge Mining Co. Ltd. (Series A) | | 30,700 | 114,133 |
| Zhangzhou Pientzehuang Pharmaceutical Co. Ltd. (A Shares) | | 12,898 | 402,682 |
| Zhaojin Mining Industry Co. Ltd. (H Shares) (a) | | 411,000 | 339,286 |
| Zhefu Holding Group Co. Ltd. (A Shares) | | 130,200 | 69,710 |
| Zhejiang Century Huatong Group Co. Ltd. (A Shares) (a) | | 167,966 | 84,870 |
| Zhejiang China Commodities City Group Co. Ltd. (A Shares) | | 125,300 | 71,890 |
| Zhejiang Chint Electric Co. Ltd. (A Shares) | | 44,300 | 154,079 |
| Zhejiang Dahua Technology Co. Ltd. (A Shares) | | 48,900 | 77,539 |
| Zhejiang Dingli Machinery Co. Ltd. (A Shares) | | 8,900 | 54,756 |
| Zhejiang Expressway Co. Ltd. (H Shares) | | 476,000 | 295,315 |
| Zhejiang HangKe Technology, Inc. Co. (A Shares) | | 8,227 | 56,383 |
| Zhejiang Huahai Pharmaceutical Co. Ltd. (A Shares) | | 30,460 | 83,669 |
| Zhejiang Huayou Cobalt Co. Ltd. (A Shares) | | 32,910 | 245,510 |
| Zhejiang Jingsheng Mechanical & Electrical Co. Ltd. (A Shares) | | 24,900 | 242,968 |
| Zhejiang Jiuzhou Pharmaceutical Co. Ltd. (A Shares) | | 18,000 | 87,549 |
| Zhejiang Juhua Co. Ltd. (A Shares) | | 57,500 | 123,458 |
| Zhejiang NHU Co. Ltd. (A Shares) | | 60,380 | 148,162 |
| Zhejiang Orient Gene Biotech Co. Ltd. (A Shares) | | 3,858 | 43,636 |
| Zhejiang Semir Garment Co. Ltd. (A Shares) | | 22,600 | 13,864 |
| Zhejiang Supor Cookware Co. Ltd. | | 8,500 | 46,568 |
| Zhejiang Weiming Enviroment Protection Co. Ltd. (A Shares) | | 35,600 | 92,280 |
| Zhejiang Weixing New Building Materials Co. Ltd. (A Shares) | | 30,400 | 72,432 |
| Zhejiang Wolwo Bio-Pharmaceutical Co. Ltd. | | 11,500 | 74,012 |
| Zhejiang Yongtai Technology Co. Ltd. (A Shares) | | 19,600 | 58,562 |
| Zheshang Securities Co. Ltd. | | 76,900 | 107,091 |
| ZhongAn Online P & C Insurance Co. Ltd. (H Shares) (a)(c) | | 243,300 | 453,147 |
| Zhongji Innolight Co. Ltd. (A Shares) | | 15,200 | 60,942 |
| Zhongtai Securities Co. Ltd. (A Shares) | | 121,000 | 105,377 |
| Zhuzhou CRRC Times Electric Co. Ltd.: | | | |
| (A Shares) | | 14,039 | 120,687 |
| (H Shares) | | 186,100 | 807,260 |
| Zhuzhou Hongda Electronics Corp. Ltd. (A Shares) | | 9,700 | 58,907 |
| Zhuzhou Kibing Group Co. Ltd. (A Shares) | | 55,400 | 59,550 |
| Zibo Qixiang Tengda Chemical Co. Ltd. (A Shares) (a) | | 51,700 | 47,998 |
| Zijin Mining Group Co. Ltd. (H Shares) | | 2,714,000 | 2,593,109 |
| Zoomlion Heavy Industry Science and Technology Co. Ltd. (A Shares) | | 434,100 | 318,015 |
| ZTE Corp.: | | | |
| (A Shares) | | 30,600 | 92,895 |
| (H Shares) | | 351,680 | 627,228 |
TOTAL CHINA | | | 228,278,475 |
| Colombia - 0.0% | | | |
| Bancolombia SA | | 89,720 | 644,912 |
| Ecopetrol SA | | 1,674,242 | 830,553 |
| Interconexion Electrica SA ESP | | 156,495 | 610,612 |
TOTAL COLOMBIA | | | 2,086,077 |
| Cyprus - 0.0% | | | |
| Galaxy Cosmos Mezz PLC (a) | | 28,113 | 4,540 |
| Ozon Holdings PLC ADR (a)(d) | | 15,142 | 47,571 |
| TCS Group Holding PLC unit (a)(d) | | 40,237 | 76,833 |
TOTAL CYPRUS | | | 128,944 |
| Czech Republic - 0.0% | | | |
| CEZ A/S | | 58,549 | 1,914,757 |
| Komercni Banka A/S | | 25,975 | 745,124 |
| MONETA Money Bank A/S (c) | | 114,231 | 333,450 |
TOTAL CZECH REPUBLIC | | | 2,993,331 |
| Denmark - 1.7% | | | |
| A.P. Moller - Maersk A/S: | | | |
| Series A | | 1,152 | 2,305,743 |
| Series B | | 1,802 | 3,764,689 |
| Carlsberg A/S Series B | | 35,067 | 4,128,989 |
| Chr. Hansen Holding A/S | | 37,805 | 2,099,730 |
| Coloplast A/S Series B | | 43,264 | 4,822,646 |
| Danske Bank A/S | | 251,100 | 4,052,634 |
| Demant A/S (a) | | 32,702 | 893,692 |
| DSV A/S | | 68,258 | 9,240,827 |
| Genmab A/S (a) | | 24,024 | 9,254,231 |
| GN Store Nord A/S | | 44,755 | 951,615 |
| Novo Nordisk A/S Series B | | 600,112 | 65,250,934 |
| Novozymes A/S Series B | | 74,613 | 3,918,661 |
| ORSTED A/S (c) | | 68,919 | 5,686,214 |
| Pandora A/S | | 32,240 | 1,699,229 |
| Rockwool International A/S Series B | | 3,042 | 605,630 |
| Tryg A/S | | 126,211 | 2,731,336 |
| Vestas Wind Systems A/S | | 367,591 | 7,246,566 |
TOTAL DENMARK | | | 128,653,366 |
| Egypt - 0.0% | | | |
| Commercial International Bank SAE | | 942,144 | 1,262,687 |
| Eastern Co. SAE | | 357,323 | 175,742 |
| EFG-Hermes Holding SAE | | 274,121 | 151,943 |
TOTAL EGYPT | | | 1,590,372 |
| Finland - 0.8% | | | |
| Elisa Corp. (A Shares) | | 52,509 | 2,538,039 |
| Fortum Corp. | | 161,040 | 2,267,060 |
| Kesko Oyj | | 101,522 | 1,976,484 |
| Kone OYJ (B Shares) | | 123,897 | 5,073,062 |
| Neste OYJ | | 153,408 | 6,722,186 |
| Nokia Corp. | | 1,963,013 | 8,723,469 |
| Nordea Bank ABP | | 1,234,348 | 11,796,580 |
| Orion Oyj (B Shares) | | 38,779 | 1,783,952 |
| Sampo Oyj (A Shares) | | 172,429 | 7,886,249 |
| Stora Enso Oyj (R Shares) | | 202,186 | 2,635,498 |
| UPM-Kymmene Corp. | | 193,010 | 6,468,066 |
| Wartsila Corp. | | 174,670 | 1,191,062 |
TOTAL FINLAND | | | 59,061,707 |
| France - 6.8% | | | |
| Accor SA (a) | | 62,696 | 1,502,288 |
| Aeroports de Paris SA (a) | | 10,809 | 1,463,967 |
| Air Liquide SA | | 180,852 | 23,657,931 |
| Alstom SA | | 114,631 | 2,359,249 |
| Amundi SA (c) | | 20,821 | 983,138 |
| Arkema SA | | 21,656 | 1,714,692 |
| AXA SA | | 676,737 | 16,711,958 |
| bioMerieux SA | | 15,087 | 1,335,017 |
| BNP Paribas SA | | 403,341 | 18,914,241 |
| Bollore SA | | 322,725 | 1,615,396 |
| Bouygues SA | | 82,125 | 2,343,123 |
| Bureau Veritas SA | | 104,535 | 2,589,899 |
| Capgemini SA | | 59,625 | 9,771,992 |
| Carrefour SA | | 216,394 | 3,482,960 |
| Compagnie de St. Gobain | | 182,811 | 7,473,491 |
| Compagnie Generale des Etablissements Michelin SCA Series B | | 247,678 | 6,311,842 |
| Covivio | | 16,096 | 862,152 |
| Credit Agricole SA | | 443,399 | 4,023,253 |
| Danone SA | | 232,789 | 11,569,501 |
| Dassault Aviation SA | | 9,587 | 1,424,943 |
| Dassault Systemes SA | | 242,225 | 8,119,086 |
| Edenred SA | | 90,826 | 4,663,867 |
| Eiffage SA | | 29,933 | 2,707,871 |
| Electricite de France SA (a) | | 5,248 | 61,977 |
| Electricite de France SA | | 200,376 | 2,366,358 |
| Engie SA | | 663,191 | 8,617,083 |
| EssilorLuxottica SA | | 104,246 | 16,519,435 |
| Eurazeo SA | | 18,043 | 1,030,632 |
| Gecina SA | | 16,739 | 1,492,944 |
| Getlink SE | | 158,714 | 2,514,291 |
| Hermes International SCA | | 11,479 | 14,866,472 |
| Ipsen SA | | 13,659 | 1,403,845 |
| Kering SA | | 27,162 | 12,439,145 |
| Klepierre SA | | 77,835 | 1,565,331 |
| L'Oreal SA (a) | | 4,395 | 1,380,049 |
| L'Oreal SA | | 83,035 | 26,073,355 |
| La Francaise des Jeux SAEM (c) | | 40,143 | 1,309,154 |
| Legrand SA | | 98,253 | 7,487,341 |
| LVMH Moet Hennessy Louis Vuitton SE | | 100,469 | 63,395,426 |
| Orange SA | | 727,174 | 6,928,452 |
| Pernod Ricard SA | | 75,723 | 13,297,869 |
| Publicis Groupe SA | | 84,363 | 4,724,699 |
| Remy Cointreau SA | | 8,384 | 1,285,079 |
| Renault SA (a) | | 69,483 | 2,140,337 |
| Safran SA | | 124,683 | 13,885,944 |
| Sanofi SA | | 412,985 | 35,540,607 |
| Sartorius Stedim Biotech | | 9,917 | 3,147,913 |
| Schneider Electric SA | | 197,050 | 24,918,237 |
| SEB SA | | 8,470 | 551,614 |
| Societe Generale Series A | | 290,354 | 6,659,861 |
| Sodexo SA (a) | | 2,224 | 197,237 |
| Sodexo SA | | 29,701 | 2,634,050 |
| Teleperformance | | 21,480 | 5,759,051 |
| Thales SA | | 38,394 | 4,881,350 |
| TotalEnergies SE | | 899,286 | 49,059,079 |
| Ubisoft Entertainment SA (a) | | 33,732 | 925,731 |
| Valeo SA | | 75,288 | 1,241,792 |
| Veolia Environnement SA | | 238,113 | 5,313,735 |
| VINCI SA | | 193,399 | 17,799,868 |
| Vivendi SA | | 261,680 | 2,141,846 |
| Wendel SA | | 11,341 | 888,774 |
| Worldline SA (a)(c) | | 85,702 | 3,740,592 |
TOTAL FRANCE | | | 505,788,412 |
| Germany - 4.6% | | | |
| adidas AG | | 63,464 | 6,195,046 |
| Allianz SE | | 147,944 | 26,615,794 |
| BASF AG | | 335,108 | 15,036,523 |
| Bayer AG | | 356,916 | 18,767,027 |
| Bayerische Motoren Werke AG (BMW) | | 119,386 | 9,370,839 |
| Bechtle AG | | 31,457 | 1,088,058 |
| Beiersdorf AG | | 36,468 | 3,500,754 |
| Brenntag SE | | 56,730 | 3,442,170 |
| Carl Zeiss Meditec AG | | 14,607 | 1,769,054 |
| Commerzbank AG (a) | | 383,607 | 3,069,191 |
| Continental AG | | 40,142 | 2,079,183 |
| Covestro AG (c) | | 71,311 | 2,420,726 |
| Daimler Truck Holding AG (a) | | 162,337 | 4,331,598 |
| Delivery Hero AG (a)(c) | | 58,724 | 1,932,544 |
| Deutsche Bank AG | | 754,836 | 7,206,038 |
| Deutsche Borse AG | | 68,817 | 11,191,005 |
| Deutsche Lufthansa AG (a) | | 225,102 | 1,539,025 |
| Deutsche Post AG | | 362,560 | 12,816,434 |
| Deutsche Telekom AG | | 1,174,858 | 22,176,031 |
| E.ON SE | | 819,867 | 6,865,561 |
| Evonik Industries AG | | 78,167 | 1,441,071 |
| Fresenius Medical Care AG & Co. KGaA | | 73,759 | 2,040,218 |
| Fresenius SE & Co. KGaA | | 150,782 | 3,469,971 |
| GEA Group AG | | 56,352 | 1,971,421 |
| Hannover Reuck SE | | 21,966 | 3,577,462 |
| HeidelbergCement AG | | 51,865 | 2,385,105 |
| HelloFresh AG (a) | | 59,887 | 1,199,054 |
| Henkel AG & Co. KGaA | | 37,408 | 2,196,041 |
| Infineon Technologies AG | | 475,877 | 11,547,385 |
| KION Group AG | | 24,592 | 545,212 |
| Knorr-Bremse AG | | 26,476 | 1,191,970 |
| LEG Immobilien AG | | 26,351 | 1,721,856 |
| Mercedes-Benz Group AG (Germany) | | 291,887 | 16,894,884 |
| Merck KGaA | | 46,989 | 7,657,569 |
| MTU Aero Engines AG | | 19,268 | 3,451,290 |
| Muenchener Rueckversicherungs-Gesellschaft AG in Muenchen | | 50,757 | 13,398,633 |
| Nemetschek SE | | 21,025 | 1,004,822 |
| Puma AG | | 38,911 | 1,723,115 |
| Rational AG | | 1,987 | 1,121,246 |
| Rheinmetall AG | | 15,709 | 2,553,767 |
| RWE AG | | 233,355 | 8,991,604 |
| SAP SE | | 378,624 | 36,443,650 |
| Scout24 AG (c) | | 29,282 | 1,501,300 |
| Siemens AG | | 278,195 | 30,381,407 |
| Siemens Energy AG | | 155,008 | 1,809,900 |
| Siemens Healthineers AG (c) | | 103,083 | 4,722,498 |
| Symrise AG | | 48,503 | 4,950,825 |
| Telefonica Deutschland Holding AG | | 400,051 | 872,143 |
| Uniper SE (b) | | 31,161 | 93,370 |
| United Internet AG | | 33,039 | 617,916 |
| Volkswagen AG | | 11,157 | 1,907,088 |
| Vonovia SE | | 257,025 | 5,682,981 |
| Zalando SE (a)(c) | | 80,776 | 1,861,741 |
TOTAL GERMANY | | | 342,341,116 |
| Greece - 0.1% | | | |
| Alpha Bank SA (a) | | 759,078 | 703,649 |
| Eurobank Ergasias Services and Holdings SA (a) | | 887,021 | 876,599 |
| Ff Group (a)(d) | | 5,453 | 6,467 |
| Hellenic Telecommunications Organization SA | | 68,752 | 1,080,312 |
| Jumbo SA | | 39,440 | 560,873 |
| Mytilineos SA | | 33,722 | 565,872 |
| National Bank of Greece SA (a) | | 186,604 | 676,790 |
| OPAP SA | | 66,226 | 811,553 |
| Public Power Corp. of Greece (a) | | 68,974 | 435,565 |
TOTAL GREECE | | | 5,717,680 |
| Hong Kong - 1.5% | | | |
| AIA Group Ltd. | | 4,372,495 | 33,120,749 |
| Beijing Enterprises Holdings Ltd. | | 173,500 | 440,290 |
| BOC Hong Kong (Holdings) Ltd. | | 1,345,649 | 4,182,841 |
| BYD Electronic International Co. Ltd. | | 231,500 | 672,412 |
| China Everbright International Ltd. | | 1,270,481 | 422,434 |
| China Jinmao Holdings Group Ltd. | | 1,954,000 | 258,885 |
| China Merchants Holdings International Co. Ltd. | | 456,392 | 534,904 |
| China Overseas Land and Investment Ltd. | | 1,412,000 | 2,694,612 |
| China Power International Development Ltd. | | 1,877,248 | 542,872 |
| China Resources Beer Holdings Co. Ltd. | | 595,162 | 2,805,347 |
| China Resources Power Holdings Co. Ltd. | | 730,523 | 1,062,796 |
| China Taiping Insurance Group Ltd. | | 500,177 | 346,635 |
| China Traditional Chinese Medicine Holdings Co. Ltd. | | 944,000 | 407,682 |
| CITIC Pacific Ltd. | | 2,160,000 | 1,934,456 |
| CLP Holdings Ltd. | | 590,108 | 3,960,691 |
| CSPC Pharmaceutical Group Ltd. | | 3,360,640 | 3,451,922 |
| Far East Horizon Ltd. | | 526,000 | 406,077 |
| Fosun International Ltd. | | 843,500 | 515,794 |
| Galaxy Entertainment Group Ltd. | | 801,136 | 3,658,854 |
| Ganfeng Lithium Group Co. Ltd. (H Shares) (c) | | 66,740 | 451,472 |
| Guangdong Investment Ltd. | | 1,008,000 | 635,646 |
| Hang Lung Properties Ltd. | | 784,998 | 987,499 |
| Hang Seng Bank Ltd. | | 275,050 | 3,872,097 |
| Henderson Land Development Co. Ltd. | | 532,059 | 1,302,619 |
| Hong Kong & China Gas Co. Ltd. | | 3,948,468 | 3,043,360 |
| Hong Kong Exchanges and Clearing Ltd. | | 438,602 | 11,642,084 |
| Hua Hong Semiconductor Ltd. (a)(c) | | 202,000 | 472,984 |
| Jinmao Property Services Co. Ltd. (a) | | 316 | 97 |
| Lenovo Group Ltd. | | 2,710,000 | 2,168,097 |
| Link (REIT) | | 783,995 | 4,634,266 |
| MMG Ltd. (a) | | 1,016,000 | 200,620 |
| MTR Corp. Ltd. | | 549,898 | 2,420,360 |
| New World Development Co. Ltd. | | 559,090 | 1,143,871 |
| Power Assets Holdings Ltd. | | 493,354 | 2,360,034 |
| Sino Land Ltd. | | 1,269,819 | 1,357,230 |
| Sinotruk Hong Kong Ltd. | | 221,000 | 197,079 |
| Sun Hung Kai Properties Ltd. | | 517,562 | 5,561,888 |
| Swire Pacific Ltd. (A Shares) | | 183,004 | 1,211,144 |
| Swire Properties Ltd. | | 397,555 | 763,745 |
| Techtronic Industries Co. Ltd. | | 494,347 | 4,680,857 |
| Wharf Holdings Ltd. | | 443,000 | 1,266,980 |
| Yuexiu Property Co. Ltd. | | 470,400 | 401,506 |
TOTAL HONG KONG | | | 112,195,788 |
| Hungary - 0.0% | | | |
| MOL Hungarian Oil and Gas PLC Series A (For. Reg.) | | 140,780 | 844,134 |
| OTP Bank PLC | | 82,056 | 1,788,616 |
| Richter Gedeon PLC | | 47,652 | 940,921 |
TOTAL HUNGARY | | | 3,573,671 |
| India - 4.4% | | | |
| ACC Ltd. | | 29,607 | 854,912 |
| Adani Enterprises Ltd. | | 102,304 | 4,136,960 |
| Adani Green Energy Ltd. (a) | | 113,477 | 2,882,711 |
| Adani Ports & Special Economic Zone Ltd. | | 194,040 | 1,930,438 |
| Adani Power Ltd. (a) | | 282,497 | 1,142,888 |
| Adani Total Gas Ltd. | | 98,504 | 4,287,209 |
| Adani Transmissions Ltd. (a) | | 101,453 | 4,104,079 |
| Ambuja Cements Ltd. | | 221,908 | 1,428,677 |
| Apollo Hospitals Enterprise Ltd. | | 36,758 | 2,005,971 |
| Asian Paints Ltd. | | 139,655 | 5,242,883 |
| AU Small Finance Bank Ltd. (c) | | 53,793 | 383,108 |
| Aurobindo Pharma Ltd. | | 89,984 | 584,983 |
| Avenue Supermarts Ltd. (a)(c) | | 59,249 | 3,092,643 |
| Axis Bank Ltd. | | 830,370 | 9,088,128 |
| Bajaj Auto Ltd. | | 24,773 | 1,098,849 |
| Bajaj Finance Ltd. | | 99,279 | 8,568,001 |
| Bajaj Finserv Ltd. | | 138,120 | 2,815,626 |
| Balkrishna Industries Ltd. | | 26,349 | 624,746 |
| Bandhan Bank Ltd. (a)(c) | | 219,728 | 633,198 |
| Berger Paints India Ltd. | | 83,179 | 588,624 |
| Bharat Electronics Ltd. | | 1,350,273 | 1,742,893 |
| Bharat Forge Ltd. | | 87,545 | 882,218 |
| Bharat Petroleum Corp. Ltd. | | 315,855 | 1,158,606 |
| Bharti Airtel Ltd. | | 790,891 | 7,949,037 |
| Biocon Ltd. | | 144,134 | 469,855 |
| Britannia Industries Ltd. | | 39,749 | 1,808,608 |
| Cholamandalam Investment and Finance Co. Ltd. | | 150,327 | 1,288,167 |
| Cipla Ltd./India | | 178,324 | 2,514,804 |
| Coal India Ltd. | | 557,016 | 1,654,966 |
| Colgate-Palmolive Ltd. | | 49,016 | 966,198 |
| Container Corp. of India Ltd. | | 105,014 | 1,012,336 |
| Dabur India Ltd. | | 233,189 | 1,562,575 |
| Divi's Laboratories Ltd. | | 47,763 | 2,082,289 |
| DLF Ltd. | | 210,480 | 980,189 |
| Dr. Reddy's Laboratories Ltd. | | 42,626 | 2,294,349 |
| Eicher Motors Ltd. | | 49,678 | 2,310,735 |
| GAIL India Ltd. | | 791,982 | 873,495 |
| Godrej Consumer Products Ltd. (a) | | 151,014 | 1,512,876 |
| Godrej Properties Ltd. (a) | | 42,528 | 648,863 |
| Grasim Industries Ltd. | | 96,208 | 2,000,982 |
| Havells India Ltd. | | 92,403 | 1,357,692 |
| HCL Technologies Ltd. | | 397,928 | 5,004,865 |
| HDFC Standard Life Insurance Co. Ltd. (c) | | 344,207 | 2,247,242 |
| Hero Motocorp Ltd. | | 39,878 | 1,289,532 |
| Hindalco Industries Ltd. | | 487,929 | 2,391,017 |
| Hindustan Petroleum Corp. Ltd. | | 217,047 | 560,709 |
| Hindustan Unilever Ltd. | | 299,061 | 9,214,966 |
| Housing Development Finance Corp. Ltd. | | 627,262 | 18,714,807 |
| ICICI Bank Ltd. | | 1,867,248 | 20,530,427 |
| ICICI Lombard General Insurance Co. Ltd. (c) | | 87,990 | 1,243,584 |
| ICICI Prudential Life Insurance Co. Ltd. (c) | | 122,502 | 751,098 |
| Indian Oil Corp. Ltd. | | 956,610 | 788,701 |
| Indian Railway Catering & Tourism Corp. Ltd. | | 81,941 | 733,688 |
| Indraprastha Gas Ltd. | | 107,169 | 554,423 |
| Indus Towers Ltd. | | 229,332 | 513,905 |
| Info Edge India Ltd. | | 26,180 | 1,240,277 |
| Infosys Ltd. | | 1,214,341 | 22,556,553 |
| Infosys Ltd. sponsored ADR | | 8,891 | 166,528 |
| InterGlobe Aviation Ltd. (a)(c) | | 33,326 | 717,286 |
| ITC Ltd. | | 1,062,302 | 4,474,809 |
| Jindal Steel & Power Ltd. | | 138,503 | 769,396 |
| JSW Steel Ltd. (a) | | 260,252 | 2,118,831 |
| Jubilant Foodworks Ltd. | | 137,067 | 1,009,954 |
| Kotak Mahindra Bank Ltd. | | 199,709 | 4,588,506 |
| Larsen & Toubro Infotech Ltd. (c) | | 19,967 | 1,143,278 |
| Larsen & Toubro Ltd. | | 252,059 | 6,160,190 |
| Lupin Ltd. | | 69,539 | 587,192 |
| Mahindra & Mahindra Ltd. | | 312,214 | 5,086,395 |
| Marico Ltd. | | 196,518 | 1,245,271 |
| Maruti Suzuki India Ltd. | | 43,938 | 5,057,063 |
| MindTree Consulting Ltd. | | 22,050 | 906,652 |
| Mphasis BFL Ltd. | | 28,686 | 685,616 |
| MRF Ltd. | | 654 | 717,101 |
| Muthoot Finance Ltd. | | 40,573 | 511,427 |
| Nestle India Ltd. | | 12,213 | 3,004,327 |
| NTPC Ltd. | | 1,414,424 | 2,957,681 |
| Oil & Natural Gas Corp. Ltd. | | 906,653 | 1,468,191 |
| Page Industries Ltd. | | 2,248 | 1,351,533 |
| Petronet LNG Ltd. | | 253,959 | 630,602 |
| PI Industries Ltd. | | 29,273 | 1,146,432 |
| Pidilite Industries Ltd. | | 55,443 | 1,730,936 |
| Piramal Pharma Ltd. (a) | | 161,640 | 321,991 |
| Power Grid Corp. of India Ltd. | | 1,130,644 | 3,116,169 |
| Reliance Industries Ltd. | | 1,103,912 | 34,000,170 |
| Samvardhana Motherson International Ltd. | | 768,949 | 599,145 |
| SBI Cards & Payment Services Ltd. | | 92,121 | 919,930 |
| SBI Life Insurance Co. Ltd. (c) | | 162,322 | 2,482,381 |
| Shree Cement Ltd. | | 4,123 | 1,132,630 |
| Shriram Transport Finance Co. Ltd. | | 69,917 | 1,038,155 |
| Siemens Ltd. | | 24,354 | 860,716 |
| SRF Ltd. | | 54,156 | 1,673,910 |
| State Bank of India | | 639,786 | 4,434,757 |
| Sun Pharmaceutical Industries Ltd. | | 351,465 | 4,317,525 |
| Tata Consultancy Services Ltd. | | 332,211 | 12,814,684 |
| Tata Consumer Products Ltd. | | 205,225 | 1,909,326 |
| Tata Elxsi Ltd. | | 12,684 | 1,071,942 |
| Tata Motors Ltd. (a) | | 596,437 | 2,986,177 |
| Tata Power Co. Ltd./The | | 527,853 | 1,441,106 |
| Tata Steel Ltd. | | 2,692,577 | 3,303,107 |
| Tech Mahindra Ltd. | | 211,768 | 2,720,393 |
| Titan Co. Ltd. | | 129,703 | 4,326,828 |
| Torrent Pharmaceuticals Ltd. | | 34,647 | 690,596 |
| Trent Ltd. | | 69,906 | 1,290,280 |
| Ultratech Cement Ltd. | | 36,648 | 2,972,813 |
| United Spirits Ltd. (a) | | 109,899 | 1,189,997 |
| UPL Ltd. | | 187,633 | 1,655,105 |
| Vedanta Ltd. | | 277,767 | 942,220 |
| Wipro Ltd. | | 495,965 | 2,320,774 |
| Yes Bank Ltd. (a) | | 3,852,181 | 723,622 |
| Zomato Ltd. (a) | | 823,314 | 627,581 |
TOTAL INDIA | | | 327,021,388 |
| Indonesia - 0.6% | | | |
| PT Adaro Energy Tbk | | 5,270,100 | 1,344,767 |
| PT Adaro Minerals Indonesia Tbk | | 2,784,300 | 308,821 |
| PT Aneka Tambang Tbk | | 2,884,200 | 341,167 |
| PT Astra International Tbk | | 7,438,600 | 3,171,450 |
| PT Bank Central Asia Tbk | | 20,210,700 | 11,402,735 |
| PT Bank Jago Tbk (a) | | 1,431,900 | 468,196 |
| PT Bank Mandiri (Persero) Tbk | | 6,743,000 | 4,560,901 |
| PT Bank Negara Indonesia (Persero) Tbk | | 2,745,000 | 1,654,304 |
| PT Bank Rakyat Indonesia (Persero) Tbk | | 24,918,654 | 7,428,866 |
| PT Barito Pacific Tbk | | 9,593,200 | 507,414 |
| PT Charoen Pokphand Indonesia Tbk | | 2,838,600 | 1,014,598 |
| PT Gudang Garam Tbk | | 147,900 | 228,523 |
| PT Indah Kiat Pulp & Paper Tbk | | 922,300 | 567,660 |
| PT Indofood CBP Sukses Makmur Tbk | | 793,800 | 494,932 |
| PT Indofood Sukses Makmur Tbk | | 1,500,100 | 620,333 |
| PT Kalbe Farma Tbk | | 8,292,200 | 1,089,855 |
| PT Merdeka Copper Gold Tbk (a) | | 4,425,195 | 1,069,594 |
| PT Sarana Menara Nusantara Tbk | | 7,826,200 | 579,533 |
| PT Semen Indonesia (Persero) Tbk | | 1,010,300 | 514,947 |
| PT Sumber Alfaria Trijaya Tbk | | 6,251,000 | 1,130,170 |
| PT Surya Citra Media Tbk | | 20 | 0 |
| PT Telkom Indonesia Persero Tbk | | 17,943,600 | 5,039,476 |
| PT Tower Bersama Infrastructure Tbk | | 1,980,170 | 312,308 |
| PT Unilever Indonesia Tbk | | 2,596,400 | 772,386 |
| PT United Tractors Tbk | | 616,200 | 1,276,055 |
| PT Vale Indonesia Tbk (a) | | 855,100 | 356,349 |
TOTAL INDONESIA | | | 46,255,340 |
| Ireland - 0.5% | | | |
| CRH PLC | | 259,919 | 9,361,726 |
| CRH PLC sponsored ADR | | 17,336 | 627,737 |
| DCC PLC (United Kingdom) | | 35,620 | 1,977,092 |
| Flutter Entertainment PLC (a) | | 14,275 | 1,895,712 |
| Flutter Entertainment PLC (Ireland) (a) | | 46,904 | 6,206,650 |
| James Hardie Industries PLC CDI | | 163,683 | 3,573,688 |
| Kerry Group PLC Class A | | 56,978 | 4,955,149 |
| Kingspan Group PLC (Ireland) | | 55,661 | 2,810,857 |
| Smurfit Kappa Group PLC | | 89,074 | 2,951,558 |
TOTAL IRELAND | | | 34,360,169 |
| Isle of Man - 0.0% | | | |
| Entain PLC | | 218,142 | 3,155,769 |
| Israel - 0.5% | | | |
| Azrieli Group | | 14,964 | 1,109,950 |
| Bank Hapoalim BM (Reg.) | | 466,077 | 4,497,807 |
| Bank Leumi le-Israel BM | | 564,681 | 5,393,438 |
| Bezeq The Israel Telecommunication Corp. Ltd. | | 755,141 | 1,337,372 |
| Check Point Software Technologies Ltd. (a) | | 37,530 | 4,850,002 |
| CyberArk Software Ltd. (a) | | 14,877 | 2,334,350 |
| Elbit Systems Ltd. (Israel) | | 9,563 | 1,935,577 |
| Icl Group Ltd. | | 253,142 | 2,286,735 |
| Israel Discount Bank Ltd. (Class A) | | 440,442 | 2,507,873 |
| Mizrahi Tefahot Bank Ltd. | | 54,718 | 2,070,382 |
| NICE Ltd. (a) | | 21,242 | 4,026,515 |
| Teva Pharmaceutical Industries Ltd. sponsored ADR (a) | | 398,245 | 3,552,345 |
| Tower Semiconductor Ltd. (a) | | 38,672 | 1,654,768 |
| Wix.com Ltd. (a) | | 21,384 | 1,798,394 |
| ZIM Integrated Shipping Services Ltd. (b) | | 29,047 | 682,314 |
TOTAL ISRAEL | | | 40,037,822 |
| Italy - 1.1% | | | |
| Amplifon SpA | | 45,255 | 1,124,343 |
| Assicurazioni Generali SpA | | 411,716 | 6,178,670 |
| Atlantia SpA | | 178,813 | 3,990,156 |
| DiaSorin SpA | | 9,135 | 1,194,360 |
| Enel SpA | | 2,975,650 | 13,293,268 |
| Eni SpA | | 922,946 | 12,121,728 |
| FinecoBank SpA | | 226,584 | 3,054,291 |
| Infrastrutture Wireless Italiane SpA (c) | | 134,185 | 1,184,458 |
| Intesa Sanpaolo SpA | | 6,059,794 | 11,553,182 |
| Mediobanca SpA | | 234,971 | 2,129,831 |
| Moncler SpA | | 76,189 | 3,289,585 |
| Nexi SpA (a)(c) | | 189,321 | 1,640,836 |
| Poste Italiane SpA (c) | | 210,450 | 1,834,359 |
| Prysmian SpA | | 95,562 | 3,115,547 |
| Recordati SpA | | 37,998 | 1,428,084 |
| Snam SpA | | 746,964 | 3,321,386 |
| Telecom Italia SpA (a) | | 1,638,386 | 320,538 |
| Telecom Italia SpA (Risparmio Shares) (a) | | 1,892,894 | 361,971 |
| Terna - Rete Elettrica Nazionale | | 526,012 | 3,487,029 |
| UniCredit SpA | | 756,869 | 9,386,141 |
TOTAL ITALY | | | 84,009,763 |
| Japan - 13.8% | | | |
| Advantest Corp. | | 68,437 | 3,617,572 |
| AEON Co. Ltd. | | 238,642 | 4,456,031 |
| AGC, Inc. | | 69,573 | 2,182,710 |
| Aisin Seiki Co. Ltd. | | 52,662 | 1,351,125 |
| Ajinomoto Co., Inc. | | 163,861 | 4,513,767 |
| Ana Holdings, Inc. (a) | | 61,456 | 1,194,857 |
| Asahi Group Holdings | | 166,449 | 4,661,176 |
| ASAHI INTECC Co. Ltd. | | 78,992 | 1,346,150 |
| Asahi Kasei Corp. | | 460,030 | 2,949,674 |
| Astellas Pharma, Inc. | | 667,930 | 9,216,222 |
| Azbil Corp. | | 43,322 | 1,178,503 |
| Bandai Namco Holdings, Inc. | | 71,798 | 4,752,251 |
| Bridgestone Corp. | | 207,220 | 7,494,412 |
| Brother Industries Ltd. | | 85,921 | 1,462,497 |
| Canon, Inc. | | 362,483 | 7,683,729 |
| Capcom Co. Ltd. | | 63,374 | 1,766,604 |
| Central Japan Railway Co. | | 52,442 | 6,071,554 |
| Chiba Bank Ltd. | | 197,832 | 1,081,660 |
| Chubu Electric Power Co., Inc. | | 231,444 | 1,884,923 |
| Chugai Pharmaceutical Co. Ltd. | | 244,460 | 5,664,594 |
| Concordia Financial Group Ltd. | | 396,215 | 1,207,071 |
| CyberAgent, Inc. | | 161,200 | 1,326,936 |
| Dai Nippon Printing Co. Ltd. | | 79,938 | 1,603,652 |
| Dai-ichi Mutual Life Insurance Co. | | 356,965 | 5,659,538 |
| Daifuku Co. Ltd. | | 36,701 | 1,683,317 |
| Daiichi Sankyo Kabushiki Kaisha | | 636,173 | 20,364,385 |
| Daikin Industries Ltd. | | 90,446 | 13,547,651 |
| Daito Trust Construction Co. Ltd. | | 22,365 | 2,212,510 |
| Daiwa House Industry Co. Ltd. | | 220,659 | 4,445,691 |
| Daiwa House REIT Investment Corp. | | 799 | 1,612,025 |
| Daiwa Securities Group, Inc. | | 478,644 | 1,867,000 |
| DENSO Corp. | | 157,725 | 7,825,672 |
| Dentsu Group, Inc. | | 78,814 | 2,456,726 |
| Disco Corp. | | 10,529 | 2,527,895 |
| East Japan Railway Co. | | 109,995 | 5,861,126 |
| Eisai Co. Ltd. | | 93,248 | 5,627,678 |
| ENEOS Holdings, Inc. | | 1,098,105 | 3,617,148 |
| FANUC Corp. | | 69,690 | 9,119,050 |
| Fast Retailing Co. Ltd. | | 21,158 | 11,808,752 |
| Fuji Electric Co. Ltd. | | 46,325 | 1,794,492 |
| FUJIFILM Holdings Corp. | | 131,353 | 6,023,714 |
| Fujitsu Ltd. | | 71,594 | 8,237,501 |
| GLP J-REIT | | 1,532 | 1,587,688 |
| GMO Payment Gateway, Inc. | | 15,841 | 1,143,105 |
| Hakuhodo DY Holdings, Inc. | | 79,524 | 671,725 |
| Hamamatsu Photonics K.K. | | 50,642 | 2,295,485 |
| Hankyu Hanshin Holdings, Inc. | | 83,421 | 2,476,907 |
| Hikari Tsushin, Inc. | | 7,822 | 945,300 |
| Hirose Electric Co. Ltd. | | 10,515 | 1,365,511 |
| Hitachi Construction Machinery Co. Ltd. | | 36,609 | 717,433 |
| Hitachi Ltd. | | 351,656 | 15,987,051 |
| Honda Motor Co. Ltd. | | 591,109 | 13,478,749 |
| Hoshizaki Corp. | | 40,900 | 1,173,130 |
| Hoya Corp. | | 133,070 | 12,417,003 |
| Hulic Co. Ltd. | | 129,994 | 944,171 |
| Ibiden Co. Ltd. | | 42,205 | 1,427,695 |
| Idemitsu Kosan Co. Ltd. | | 75,185 | 1,643,305 |
| Iida Group Holdings Co. Ltd. | | 50,040 | 695,266 |
| INPEX Corp. | | 373,606 | 3,770,580 |
| Isuzu Motors Ltd. | | 209,245 | 2,454,173 |
| ITO EN Ltd. | | 18,253 | 644,462 |
| Itochu Corp. | | 430,322 | 11,138,972 |
| ITOCHU Techno-Solutions Corp. | | 36,098 | 837,541 |
| Japan Airlines Co. Ltd. (a) | | 56,540 | 1,055,170 |
| Japan Exchange Group, Inc. | | 180,808 | 2,376,140 |
| Japan Post Bank Co. Ltd. | | 141,290 | 940,698 |
| Japan Post Holdings Co. Ltd. | | 850,230 | 5,715,659 |
| Japan Post Insurance Co. Ltd. | | 74,316 | 1,098,035 |
| Japan Real Estate Investment Corp. | | 443 | 1,856,075 |
| Japan Retail Fund Investment Corp. | | 2,509 | 1,847,645 |
| Japan Tobacco, Inc. | | 433,981 | 7,268,069 |
| JFE Holdings, Inc. | | 178,842 | 1,639,340 |
| JSR Corp. | | 65,701 | 1,252,205 |
| Kajima Corp. | | 153,644 | 1,447,629 |
| Kakaku.com, Inc. | | 51,033 | 865,222 |
| Kansai Electric Power Co., Inc. | | 253,094 | 1,918,269 |
| Kao Corp. | | 173,105 | 6,465,808 |
| KDDI Corp. | | 584,187 | 17,266,799 |
| Keio Corp. | | 37,402 | 1,313,013 |
| Keisei Electric Railway Co. | | 46,830 | 1,244,013 |
| Keyence Corp. | | 70,620 | 26,748,165 |
| Kikkoman Corp. | | 53,173 | 2,889,390 |
| Kintetsu Group Holdings Co. Ltd. | | 61,670 | 2,086,150 |
| Kirin Holdings Co. Ltd. | | 298,808 | 4,399,880 |
| Kobayashi Pharmaceutical Co. Ltd. | | 20,048 | 1,065,128 |
| Kobe Bussan Co. Ltd. | | 54,721 | 1,190,507 |
| Koei Tecmo Holdings Co. Ltd. | | 40,076 | 605,877 |
| Koito Manufacturing Co. Ltd. | | 76,404 | 1,086,237 |
| Komatsu Ltd. | | 335,763 | 6,577,663 |
| Konami Group Corp. | | 33,592 | 1,475,206 |
| Kose Corp. | | 12,434 | 1,243,442 |
| Kubota Corp. | | 366,025 | 5,111,476 |
| Kurita Water Industries Ltd. | | 38,198 | 1,402,610 |
| Kyocera Corp. | | 115,717 | 5,790,714 |
| Kyowa Hakko Kirin Co., Ltd. | | 98,763 | 2,328,016 |
| Lasertec Corp. | | 27,174 | 3,818,244 |
| LIXIL Group Corp. | | 107,361 | 1,625,271 |
| M3, Inc. | | 158,534 | 4,740,187 |
| Makita Corp. | | 81,620 | 1,491,484 |
| Marubeni Corp. | | 561,529 | 4,920,625 |
| Mazda Motor Corp. | | 205,472 | 1,383,435 |
| McDonald's Holdings Co. (Japan) Ltd. | | 30,968 | 1,074,649 |
| Meiji Holdings Co. Ltd. | | 41,213 | 1,696,248 |
| Minebea Mitsumi, Inc. | | 132,260 | 1,960,396 |
| Misumi Group, Inc. | | 102,775 | 2,197,952 |
| Mitsubishi Chemical Holdings Corp. | | 462,462 | 2,090,324 |
| Mitsubishi Corp. | | 457,614 | 12,405,542 |
| Mitsubishi Electric Corp. | | 702,896 | 6,184,510 |
| Mitsubishi Estate Co. Ltd. | | 431,067 | 5,420,796 |
| Mitsubishi Heavy Industries Ltd. | | 115,501 | 3,977,034 |
| Mitsubishi UFJ Financial Group, Inc. | | 4,328,657 | 20,447,930 |
| Mitsubishi UFJ Lease & Finance Co. Ltd. | | 250,699 | 1,075,665 |
| Mitsui & Co. Ltd. | | 506,504 | 11,217,039 |
| Mitsui Chemicals, Inc. | | 68,343 | 1,266,249 |
| Mitsui Fudosan Co. Ltd. | | 330,506 | 6,333,615 |
| Mitsui OSK Lines Ltd. | | 127,400 | 2,528,380 |
| Mizuho Financial Group, Inc. | | 867,314 | 9,367,539 |
| MonotaRO Co. Ltd. | | 90,350 | 1,378,081 |
| MS&AD Insurance Group Holdings, Inc. | | 161,537 | 4,277,694 |
| Murata Manufacturing Co. Ltd. | | 208,166 | 9,854,463 |
| NEC Corp. | | 88,456 | 2,929,795 |
| Nexon Co. Ltd. | | 177,279 | 2,977,004 |
| NGK Insulators Ltd. | | 89,860 | 1,049,711 |
| Nidec Corp. | | 162,841 | 8,953,652 |
| Nihon M&A Center Holdings, Inc. | | 110,494 | 1,250,623 |
| Nintendo Co. Ltd. | | 394,710 | 16,024,869 |
| Nippon Building Fund, Inc. | | 576 | 2,560,516 |
| Nippon Express Holdings, Inc. | | 28,073 | 1,410,305 |
| Nippon Paint Holdings Co. Ltd. | | 299,010 | 1,910,350 |
| Nippon Prologis REIT, Inc. | | 763 | 1,598,403 |
| Nippon Sanso Holdings Corp. | | 65,247 | 1,040,828 |
| Nippon Shinyaku Co. Ltd. | | 18,445 | 1,022,138 |
| Nippon Steel & Sumitomo Metal Corp. | | 289,924 | 3,982,446 |
| Nippon Telegraph & Telephone Corp. | | 432,561 | 11,930,338 |
| Nippon Yusen KK | | 175,653 | 3,181,862 |
| Nissan Chemical Corp. | | 46,222 | 2,082,702 |
| Nissan Motor Co. Ltd. | | 832,971 | 2,654,932 |
| Nisshin Seifun Group, Inc. | | 67,384 | 728,696 |
| Nissin Food Holdings Co. Ltd. | | 22,863 | 1,480,687 |
| Nitori Holdings Co. Ltd. | | 29,780 | 2,698,577 |
| Nitto Denko Corp. | | 52,555 | 2,767,448 |
| Nomura Holdings, Inc. | | 1,065,206 | 3,446,964 |
| Nomura Real Estate Holdings, Inc. | | 40,314 | 912,315 |
| Nomura Real Estate Master Fund, Inc. | | 1,519 | 1,731,534 |
| Nomura Research Institute Ltd. | | 120,424 | 2,676,629 |
| NTT Data Corp. | | 225,615 | 3,272,817 |
| Obayashi Corp. | | 234,443 | 1,505,720 |
| OBIC Co. Ltd. | | 24,969 | 3,756,391 |
| Odakyu Electric Railway Co. Ltd. | | 106,690 | 1,269,273 |
| Oji Holdings Corp. | | 293,056 | 1,016,960 |
| Olympus Corp. | | 448,748 | 9,476,235 |
| OMRON Corp. | | 68,484 | 3,203,704 |
| Ono Pharmaceutical Co. Ltd. | | 130,765 | 3,074,444 |
| Open House Group Co. Ltd. | | 31,300 | 1,115,639 |
| Oracle Corp. Japan | | 13,038 | 696,202 |
| Oriental Land Co. Ltd. | | 72,697 | 9,753,557 |
| ORIX Corp. | | 437,996 | 6,436,136 |
| Osaka Gas Co. Ltd. | | 135,275 | 2,003,265 |
| Otsuka Corp. | | 41,204 | 1,301,004 |
| Otsuka Holdings Co. Ltd. | | 142,785 | 4,576,904 |
| Pan Pacific International Holdings Ltd. | | 137,008 | 2,249,144 |
| Panasonic Holdings Corp. | | 790,680 | 5,631,709 |
| Persol Holdings Co. Ltd. | | 64,377 | 1,292,779 |
| Rakuten Group, Inc. | | 318,250 | 1,420,785 |
| Recruit Holdings Co. Ltd. | | 524,036 | 16,125,200 |
| Renesas Electronics Corp. (a) | | 419,467 | 3,509,157 |
| Resona Holdings, Inc. | | 774,343 | 2,914,690 |
| Ricoh Co. Ltd. | | 208,662 | 1,529,585 |
| ROHM Co. Ltd. | | 32,087 | 2,259,329 |
| SBI Holdings, Inc. Japan | | 89,164 | 1,611,842 |
| SCSK Corp. | | 60,356 | 891,773 |
| Secom Co. Ltd. | | 76,206 | 4,341,494 |
| Seiko Epson Corp. | | 101,362 | 1,381,078 |
| Sekisui Chemical Co. Ltd. | | 139,852 | 1,749,384 |
| Sekisui House Ltd. | | 225,208 | 3,748,544 |
| Seven & i Holdings Co. Ltd. | | 273,240 | 10,199,605 |
| SG Holdings Co. Ltd. | | 103,816 | 1,376,813 |
| Sharp Corp. | | 83,313 | 499,718 |
| Shimadzu Corp. | | 85,221 | 2,249,520 |
| SHIMANO, Inc. | | 26,174 | 4,050,251 |
| SHIMIZU Corp. | | 214,243 | 1,070,531 |
| Shin-Etsu Chemical Co. Ltd. | | 136,149 | 14,149,960 |
| Shionogi & Co. Ltd. | | 95,360 | 4,428,256 |
| Shiseido Co. Ltd. | | 144,394 | 5,005,892 |
| Shizuoka Financial Group | | 151,412 | 955,139 |
| SMC Corp. | | 20,857 | 8,372,047 |
| SoftBank Corp. | | 1,036,229 | 10,221,765 |
| SoftBank Group Corp. | | 438,542 | 18,824,951 |
| Sompo Holdings, Inc. | | 113,579 | 4,730,453 |
| Sony Group Corp. | | 457,742 | 30,867,677 |
| Square Enix Holdings Co. Ltd. | | 30,992 | 1,383,953 |
| Subaru Corp. | | 224,105 | 3,489,795 |
| Sumco Corp. | | 129,464 | 1,644,692 |
| Sumitomo Chemical Co. Ltd. | | 538,085 | 1,812,977 |
| Sumitomo Corp. | | 409,061 | 5,200,707 |
| Sumitomo Electric Industries Ltd. | | 261,832 | 2,736,386 |
| Sumitomo Metal Mining Co. Ltd. | | 89,328 | 2,503,940 |
| Sumitomo Mitsui Financial Group, Inc. | | 470,585 | 13,214,764 |
| Sumitomo Mitsui Trust Holdings, Inc. | | 122,827 | 3,533,613 |
| Sumitomo Realty & Development Co. Ltd. | | 111,208 | 2,554,056 |
| Suntory Beverage & Food Ltd. | | 49,937 | 1,672,459 |
| Suzuki Motor Corp. | | 133,864 | 4,519,300 |
| Sysmex Corp. | | 60,265 | 3,253,690 |
| T&D Holdings, Inc. | | 191,927 | 1,893,520 |
| Taisei Corp. | | 64,587 | 1,761,325 |
| Takeda Pharmaceutical Co. Ltd. | | 544,846 | 14,388,839 |
| TDK Corp. | | 141,584 | 4,432,385 |
| Terumo Corp. | | 235,935 | 7,178,250 |
| TIS, Inc. | | 81,320 | 2,195,769 |
| Tobu Railway Co. Ltd. | | 67,786 | 1,568,202 |
| Toho Co. Ltd. | | 41,413 | 1,476,101 |
| Tokio Marine Holdings, Inc. | | 659,463 | 11,934,597 |
| Tokyo Electric Power Co., Inc. (a) | | 551,166 | 1,797,744 |
| Tokyo Electron Ltd. | | 54,248 | 14,272,465 |
| Tokyo Gas Co. Ltd. | | 143,062 | 2,556,345 |
| Tokyu Corp. | | 189,681 | 2,188,995 |
| Toppan, Inc. | | 94,558 | 1,411,105 |
| Toray Industries, Inc. | | 499,653 | 2,434,504 |
| Toshiba Corp. | | 141,479 | 4,929,572 |
| Tosoh Corp. | | 94,951 | 1,033,832 |
| Toto Ltd. | | 51,339 | 1,467,371 |
| Toyota Industries Corp. | | 52,542 | 2,706,693 |
| Toyota Motor Corp. | | 3,840,865 | 53,290,510 |
| Toyota Tsusho Corp. | | 76,711 | 2,579,475 |
| Trend Micro, Inc. | | 48,030 | 2,425,807 |
| Unicharm Corp. | | 144,497 | 4,391,471 |
| USS Co. Ltd. | | 80,617 | 1,218,241 |
| Welcia Holdings Co. Ltd. | | 36,092 | 754,875 |
| West Japan Railway Co. | | 78,759 | 3,125,572 |
| Yakult Honsha Co. Ltd. | | 46,127 | 2,556,148 |
| Yamaha Corp. | | 51,532 | 1,947,677 |
| Yamaha Motor Co. Ltd. | | 107,278 | 2,214,893 |
| Yamato Holdings Co. Ltd. | | 105,302 | 1,560,816 |
| Yaskawa Electric Corp. | | 86,935 | 2,414,618 |
| Yokogawa Electric Corp. | | 82,423 | 1,380,784 |
| Z Holdings Corp. | | 978,796 | 2,526,037 |
| ZOZO, Inc. | | 46,307 | 985,653 |
TOTAL JAPAN | | | 1,030,719,564 |
| Korea (South) - 3.0% | | | |
| Alteogen, Inc. | | 11,652 | 299,602 |
| AMOREPACIFIC Corp. | | 11,942 | 775,596 |
| AMOREPACIFIC Group, Inc. | | 9,744 | 168,621 |
| BGF Retail Co. Ltd. | | 2,656 | 347,045 |
| Celltrion Healthcare Co. Ltd. | | 31,917 | 1,554,123 |
| Celltrion Pharm, Inc. | | 5,641 | 267,957 |
| Celltrion, Inc. | | 35,570 | 4,784,799 |
| Cheil Worldwide, Inc. | | 23,604 | 404,337 |
| CJ CheilJedang Corp. | | 2,824 | 819,113 |
| CJ Corp. | | 5,012 | 252,124 |
| CJ ENM Co. Ltd. | | 3,673 | 188,884 |
| CJ Logistics Corp. (a) | | 3,129 | 192,696 |
| Coway Co. Ltd. | | 18,912 | 732,725 |
| Db Insurance Co. Ltd. | | 15,671 | 618,136 |
| Doosan Bobcat, Inc. | | 16,751 | 393,155 |
| Doosan Heavy Industries & Construction Co. Ltd. (a) | | 150,881 | 1,400,648 |
| E-Mart, Inc. | | 7,123 | 422,194 |
| Ecopro BM Co. Ltd. | | 18,288 | 1,474,756 |
| F&F Co. Ltd. | | 5,874 | 598,791 |
| Green Cross Corp. | | 2,016 | 180,086 |
| GS Engineering & Construction Corp. | | 21,899 | 332,937 |
| GS Holdings Corp. | | 15,723 | 506,724 |
| Hana Financial Group, Inc. | | 108,983 | 3,149,643 |
| Hankook Tire Co. Ltd. | | 25,277 | 647,279 |
| Hanmi Pharm Co. Ltd. | | 2,311 | 409,637 |
| Hanon Systems | | 63,505 | 347,041 |
| Hanwha Solutions Corp. (a) | | 43,209 | 1,428,877 |
| HD Hyundai Co. Ltd. | | 16,067 | 685,537 |
| HLB, Inc. (a) | | 33,329 | 945,706 |
| HLB, Inc. rights 12/2/22 (a) | | 2,984 | 20,488 |
| HMM Co. Ltd. | | 101,560 | 1,359,048 |
| Hotel Shilla Co. | | 10,758 | 489,918 |
| HYBE Co. Ltd. (a) | | 6,465 | 548,066 |
| Hyundai Engineering & Construction Co. Ltd. | | 26,526 | 648,598 |
| Hyundai Glovis Co. Ltd. | | 6,402 | 780,447 |
| Hyundai Heavy Industries Co. Ltd. (a) | | 6,022 | 459,881 |
| Hyundai Mobis | | 21,986 | 3,373,409 |
| Hyundai Motor Co. | | 50,532 | 5,823,862 |
| Hyundai Steel Co. | | 29,458 | 579,947 |
| Iljin Materials Co. Ltd. | | 7,899 | 335,369 |
| Industrial Bank of Korea | | 87,519 | 640,763 |
| Kakao Corp. | | 112,827 | 4,007,741 |
| Kakao Games Corp. (a) | | 12,227 | 338,801 |
| KakaoBank Corp. (a) | | 40,528 | 485,546 |
| Kangwon Land, Inc. (a) | | 32,763 | 527,947 |
| KB Financial Group, Inc. | | 147,297 | 4,946,441 |
| Kia Corp. | | 94,765 | 4,401,900 |
| Korea Aerospace Industries Ltd. | | 25,437 | 843,849 |
| Korea Electric Power Corp. (a) | | 94,705 | 1,108,325 |
| Korea Investment Holdings Co. Ltd. | | 14,326 | 497,333 |
| Korea Shipbuilding & Offshore Engineering Co. Ltd. (a) | | 14,452 | 736,107 |
| Korea Zinc Co. Ltd. | | 3,380 | 1,515,568 |
| Korean Air Lines Co. Ltd. (a) | | 59,644 | 965,289 |
| KRAFTON, Inc. (a) | | 8,985 | 1,117,365 |
| KT&G Corp. | | 40,166 | 2,693,079 |
| Kumho Petro Chemical Co. Ltd. | | 6,188 | 567,937 |
| L&F Co. Ltd. (a) | | 8,871 | 1,398,408 |
| LG Chemical Ltd. | | 17,826 | 7,818,202 |
| LG Corp. | | 35,162 | 1,951,090 |
| LG Display Co. Ltd. | | 79,479 | 707,868 |
| LG Electronics, Inc. | | 39,308 | 2,247,242 |
| LG Energy Solution (a) | | 8,458 | 3,128,818 |
| LG H & H Co. Ltd. | | 3,505 | 1,252,382 |
| LG Innotek Co. Ltd. | | 5,296 | 1,100,149 |
| LG Uplus Corp. | | 72,903 | 584,830 |
| Lotte Chemical Corp. | | 5,827 | 604,206 |
| Lotte Shopping Co. Ltd. | | 3,801 | 232,749 |
| Meritz Financial Holdings Co. | | 11,627 | 176,769 |
| Meritz Fire & Marine Insurance Co. Ltd. | | 12,317 | 271,397 |
| Meritz Securities Co. Ltd. | | 92,437 | 239,622 |
| Mirae Asset Securities Co. Ltd. | | 93,777 | 417,204 |
| NAVER Corp. | | 47,501 | 5,640,935 |
| NCSOFT Corp. | | 6,097 | 1,665,940 |
| Netmarble Corp. (c) | | 7,307 | 228,325 |
| NH Investment & Securities Co. Ltd. | | 50,861 | 319,636 |
| Orion Corp./Republic of Korea | | 8,102 | 576,152 |
| Pan Ocean Co., Ltd. (Korea) | | 90,744 | 273,379 |
| Pearl Abyss Corp. (a) | | 10,135 | 295,390 |
| POSCO | | 29,318 | 5,099,583 |
| POSCO Chemtech Co. Ltd. | | 10,308 | 1,440,774 |
| S-Oil Corp. | | 16,714 | 1,011,749 |
| S1 Corp. | | 5,842 | 255,402 |
| Samsung Biologics Co. Ltd. (a)(c) | | 6,395 | 3,929,333 |
| Samsung C&T Corp. | | 30,710 | 2,549,628 |
| Samsung Electro-Mechanics Co. Ltd. | | 20,955 | 1,776,445 |
| Samsung Electronics Co. Ltd. | | 1,725,402 | 71,805,116 |
| Samsung Engineering Co. Ltd. (a) | | 62,384 | 1,042,414 |
| Samsung Fire & Marine Insurance Co. Ltd. | | 11,300 | 1,583,387 |
| Samsung Heavy Industries Co. Ltd. (a) | | 209,969 | 757,602 |
| Samsung Life Insurance Co. Ltd. | | 29,838 | 1,408,991 |
| Samsung SDI Co. Ltd. | | 20,154 | 10,406,565 |
| Samsung SDS Co. Ltd. | | 11,848 | 1,037,609 |
| Samsung Securities Co. Ltd. | | 21,480 | 477,812 |
| SD Biosensor, Inc. | | 12,373 | 256,160 |
| Seegene, Inc. | | 13,028 | 261,962 |
| Shinhan Financial Group Co. Ltd. | | 165,454 | 4,196,815 |
| SK Biopharmaceuticals Co. Ltd. (a) | | 10,659 | 433,882 |
| SK Bioscience Co. Ltd. (a) | | 7,991 | 423,254 |
| SK Chemicals Co. Ltd. | | 3,921 | 242,844 |
| SK Hynix, Inc. | | 199,862 | 11,580,155 |
| SK IE Technology Co. Ltd. (a)(c) | | 8,521 | 310,436 |
| SK Innovation Co., Ltd. | | 20,163 | 2,443,880 |
| SK Square Co. Ltd. (a) | | 33,854 | 876,401 |
| SK, Inc. | | 13,930 | 2,088,544 |
| SKC Co. Ltd. | | 7,107 | 515,354 |
| Woori Financial Group, Inc. | | 202,567 | 1,667,574 |
| Yuhan Corp. | | 17,560 | 735,706 |
TOTAL KOREA (SOUTH) | | | 225,887,863 |
| Kuwait - 0.3% | | | |
| Agility Public Warehousing Co. KSC | | 537,919 | 1,361,073 |
| Boubyan Bank KSC | | 476,438 | 1,267,016 |
| Gulf Bank | | 546,195 | 604,631 |
| Kuwait Finance House KSCP | | 2,679,339 | 7,004,243 |
| Mabanee Co. SAKC | | 212,028 | 596,703 |
| Mobile Telecommunication Co. | | 803,442 | 1,553,209 |
| National Bank of Kuwait | | 2,613,089 | 9,091,205 |
TOTAL KUWAIT | | | 21,478,080 |
| Luxembourg - 0.2% | | | |
| Allegro.eu SA (a)(c) | | 127,048 | 617,397 |
| ArcelorMittal SA (Netherlands) | | 189,231 | 4,236,656 |
| Aroundtown SA | | 339,253 | 673,216 |
| Eurofins Scientific SA | | 48,264 | 3,089,805 |
| Reinet Investments SCA | | 46,790 | 751,799 |
| Tenaris SA | | 176,607 | 2,764,104 |
TOTAL LUXEMBOURG | | | 12,132,977 |
| Malaysia - 0.4% | | | |
| AMMB Holdings Bhd | | 622,400 | 538,413 |
| Axiata Group Bhd | | 939,434 | 566,283 |
| CIMB Group Holdings Bhd | | 2,578,311 | 3,010,211 |
| Dialog Group Bhd | | 1,276,322 | 556,096 |
| DiGi.com Bhd | | 1,063,000 | 852,109 |
| Genting Bhd | | 724,300 | 680,180 |
| Genting Malaysia Bhd | | 1,012,700 | 586,886 |
| Hap Seng Consolidated Bhd | | 212,900 | 289,540 |
| Hartalega Holdings Bhd | | 610,900 | 279,091 |
| Hong Leong Bank Bhd | | 222,300 | 994,896 |
| Hong Leong Credit Bhd | | 78,500 | 316,789 |
| IHH Healthcare Bhd | | 606,300 | 763,004 |
| Inari Amertron Bhd | | 954,500 | 502,687 |
| IOI Corp. Bhd | | 860,500 | 742,563 |
| IOI Properties Group Bhd | | 30 | 7 |
| Kuala Lumpur Kepong Bhd | | 147,641 | 677,000 |
| Malayan Banking Bhd | | 1,709,707 | 3,106,257 |
| Malaysia Airports Holdings Bhd (a) | | 234,802 | 296,979 |
| Maxis Bhd | | 804,300 | 654,940 |
| MISC Bhd | | 456,200 | 697,615 |
| MR DIY Group M Sdn Bhd (c) | | 779,050 | 332,843 |
| Nestle (Malaysia) Bhd | | 24,200 | 680,753 |
| Petronas Chemicals Group Bhd | | 912,000 | 1,682,030 |
| Petronas Dagangan Bhd | | 101,400 | 464,964 |
| Petronas Gas Bhd | | 270,100 | 976,885 |
| PPB Group Bhd | | 219,180 | 774,176 |
| Press Metal Bhd | | 1,388,600 | 1,277,582 |
| Public Bank Bhd | | 5,444,200 | 5,147,118 |
| QL Resources Bhd | | 377,250 | 408,528 |
| RHB Bank Bhd | | 496,056 | 600,135 |
| Sime Darby Bhd | | 892,285 | 424,628 |
| Sime Darby Plantation Bhd | | 710,640 | 661,340 |
| Sime Darby Property Bhd | | 10 | 1 |
| SP Setia Bhd | | 13 | 1 |
| Telekom Malaysia Bhd | | 395,497 | 465,094 |
| Tenaga Nasional Bhd | | 981,200 | 1,747,399 |
| Top Glove Corp. Bhd | | 1,847,500 | 310,652 |
TOTAL MALAYSIA | | | 32,065,675 |
| Mexico - 0.7% | | | |
| Alfa SA de CV Series A | | 1,003,700 | 666,161 |
| America Movil S.A.B. de CV Series L | | 10,222,200 | 9,673,762 |
| Arca Continental S.A.B. de CV | | 169,300 | 1,386,751 |
| CEMEX S.A.B. de CV unit (a) | | 5,548,494 | 2,156,332 |
| Coca-Cola FEMSA S.A.B. de CV unit | | 196,980 | 1,240,856 |
| Fibra Uno Administracion SA de CV | | 1,077,200 | 1,256,996 |
| Fomento Economico Mexicano S.A.B. de CV unit | | 719,100 | 5,162,146 |
| Gruma S.A.B. de CV Series B | | 71,020 | 823,829 |
| Grupo Aeroportuario del Pacifico S.A.B. de CV Series B | | 133,500 | 2,067,892 |
| Grupo Aeroportuario del Sureste S.A.B. de CV Series B | | 72,730 | 1,702,160 |
| Grupo Bimbo S.A.B. de CV Series A | | 484,400 | 1,875,452 |
| Grupo Carso SA de CV Series A1 | | 153,900 | 620,167 |
| Grupo Financiero Banorte S.A.B. de CV Series O | | 949,700 | 7,719,638 |
| Grupo Financiero Inbursa S.A.B. de CV Series O (a) | | 786,400 | 1,451,504 |
| Grupo Mexico SA de CV Series B | | 1,119,824 | 4,059,807 |
| Grupo Televisa SA de CV | | 819,000 | 868,893 |
| Industrias Penoles SA de CV | | 47,410 | 537,822 |
| Kimberly-Clark de Mexico SA de CV Series A | | 520,000 | 820,431 |
| Operadora de Sites Mexicanos, SA de CV | | 448,200 | 487,720 |
| Orbia Advance Corp. S.A.B. de CV | | 343,037 | 579,144 |
| Promotora y Operadora de Infraestructura S.A.B. de CV | | 77,780 | 585,087 |
| Sitios Latinoamerica S.A.B. de CV (a) | | 501,950 | 146,433 |
| Wal-Mart de Mexico SA de CV Series V | | 1,914,800 | 7,396,136 |
TOTAL MEXICO | | | 53,285,119 |
| Multi-National - 0.1% | | | |
| HK Electric Investments & HK Electric Investments Ltd. unit | | 911,000 | 579,120 |
| HKT Trust/HKT Ltd. unit | | 1,404,557 | 1,587,131 |
| Unibail-Rodamco SE & WFD Unibail-Rodamco NV unit (a) | | 42,740 | 2,022,346 |
TOTAL MULTI-NATIONAL | | | 4,188,597 |
| Netherlands - 3.5% | | | |
| ABN AMRO Bank NV GDR (c) | | 152,855 | 1,503,943 |
| Adyen BV (a)(c) | | 7,894 | 11,269,470 |
| AEGON NV | | 643,447 | 2,978,621 |
| AerCap Holdings NV (a)(b) | | 48,794 | 2,606,088 |
| Airbus Group NV | | 214,891 | 23,252,018 |
| Akzo Nobel NV | | 67,006 | 4,136,647 |
| Argenx SE (a) | | 20,060 | 7,788,307 |
| ASM International NV (Netherlands) | | 16,832 | 3,739,374 |
| ASML Holding NV (Netherlands) | | 147,419 | 69,152,360 |
| CNH Industrial NV | | 378,629 | 4,903,630 |
| Davide Campari Milano NV | | 202,262 | 1,817,758 |
| Euronext NV (c) | | 30,711 | 1,951,514 |
| EXOR NV | | 41,310 | 2,776,073 |
| Ferrari NV (Italy) | | 45,809 | 9,031,514 |
| Heineken Holding NV | | 35,954 | 2,455,229 |
| Heineken NV (Bearer) | | 93,401 | 7,808,879 |
| IMCD NV | | 20,574 | 2,669,625 |
| ING Groep NV (Certificaten Van Aandelen) | | 1,421,382 | 13,985,822 |
| JDE Peet's BV | | 36,388 | 1,042,134 |
| Just Eat Takeaway.com NV (a)(c) | | 63,259 | 1,085,531 |
| Koninklijke Ahold Delhaize NV | | 379,338 | 10,579,091 |
| Koninklijke DSM NV | | 63,806 | 7,505,525 |
| Koninklijke KPN NV | | 1,186,038 | 3,317,474 |
| Koninklijke Philips Electronics NV | | 324,071 | 4,110,806 |
| NEPI Rockcastle PLC | | 181,673 | 914,856 |
| NN Group NV | | 101,487 | 4,297,621 |
| OCI NV | | 37,968 | 1,452,847 |
| Prosus NV | | 300,916 | 13,012,118 |
| QIAGEN NV (Germany) (a) | | 84,402 | 3,645,029 |
| Randstad NV | | 43,248 | 2,155,797 |
| Stellantis NV (Italy) | | 800,169 | 10,801,877 |
| STMicroelectronics NV (France) | | 248,204 | 7,717,643 |
| Universal Music Group NV | | 260,576 | 5,116,529 |
| Wolters Kluwer NV | | 94,946 | 10,091,458 |
| X5 Retail Group NV GDR (d) | | 41,220 | 14,583 |
| Yandex NV Class A (a)(d) | | 102,848 | 575,816 |
TOTAL NETHERLANDS | | | 261,263,607 |
| New Zealand - 0.1% | | | |
| Auckland International Airport Ltd. (a) | | 463,871 | 2,076,648 |
| Fisher & Paykel Healthcare Corp. | | 209,102 | 2,380,378 |
| Mercury Nz Ltd. | | 237,344 | 803,112 |
| Meridian Energy Ltd. | | 473,533 | 1,343,523 |
| Spark New Zealand Ltd. | | 695,869 | 2,071,441 |
| Xero Ltd. (a) | | 48,406 | 2,417,273 |
TOTAL NEW ZEALAND | | | 11,092,375 |
| Norway - 0.5% | | | |
| Adevinta ASA Class B (a) | | 100,301 | 686,930 |
| Aker BP ASA | | 116,195 | 3,703,970 |
| DNB Bank ASA | | 338,068 | 5,979,369 |
| Equinor ASA | | 354,627 | 12,920,382 |
| Gjensidige Forsikring ASA | | 70,990 | 1,296,730 |
| Kongsberg Gruppen ASA | | 33,447 | 1,198,747 |
| Mowi ASA | | 149,273 | 2,226,284 |
| Norsk Hydro ASA | | 483,096 | 3,065,882 |
| Orkla ASA | | 268,415 | 1,810,502 |
| Salmar ASA | | 21,395 | 724,818 |
| Telenor ASA | | 252,826 | 2,297,649 |
| Yara International ASA | | 59,599 | 2,660,017 |
TOTAL NORWAY | | | 38,571,280 |
| Peru - 0.0% | | | |
| Compania de Minas Buenaventura SAA sponsored ADR (b) | | 73,763 | 511,915 |
| Philippines - 0.2% | | | |
| Aboitiz Equity Ventures, Inc. | | 577,750 | 566,118 |
| ACEN Corp. | | 2,623,120 | 284,365 |
| Altus Property Ventures, Inc. (a) | | 7 | 1 |
| Ayala Corp. | | 97,730 | 1,130,723 |
| Ayala Land, Inc. | | 2,557,100 | 1,131,398 |
| Bank of the Philippine Islands (BPI) | | 700,056 | 1,160,733 |
| BDO Unibank, Inc. | | 739,934 | 1,630,616 |
| Converge ICT Solutions, Inc. (a) | | 774,000 | 165,275 |
| DMCI Holdings, Inc. | | 4 | 1 |
| Globe Telecom, Inc. | | 12,517 | 503,109 |
| GT Capital Holdings, Inc. | | 29,421 | 209,727 |
| International Container Terminal Services, Inc. | | 353,060 | 1,055,171 |
| JG Summit Holdings, Inc. | | 1,025,736 | 765,528 |
| Jollibee Food Corp. | | 151,870 | 607,365 |
| Manila Electric Co. | | 76,990 | 400,209 |
| Metro Pacific Investments Corp. | | 3,630,200 | 228,993 |
| Metropolitan Bank & Trust Co. | | 613,771 | 549,373 |
| Monde Nissin Corp. (c) | | 2,146,200 | 433,769 |
| PLDT, Inc. | | 29,540 | 830,518 |
| SM Investments Corp. | | 93,183 | 1,324,080 |
| SM Prime Holdings, Inc. | | 4,205,300 | 2,289,697 |
| Universal Robina Corp. | | 299,920 | 632,597 |
TOTAL PHILIPPINES | | | 15,899,366 |
| Poland - 0.2% | | | |
| Bank Polska Kasa Opieki SA | | 72,278 | 1,187,551 |
| CD Projekt RED SA (b) | | 22,953 | 611,074 |
| Cyfrowy Polsat SA | | 87,993 | 329,921 |
| Dino Polska SA (a)(c) | | 18,043 | 1,179,913 |
| KGHM Polska Miedz SA (Bearer) | | 48,236 | 966,518 |
| LPP SA | | 384 | 666,798 |
| mBank SA (a) | | 5,075 | 284,466 |
| Orange Polska SA | | 221,350 | 279,672 |
| PGE Polska Grupa Energetyczna SA (a) | | 305,466 | 348,713 |
| Polski Koncern Naftowy Orlen SA | | 150,006 | 1,725,630 |
| Polskie Gornictwo Naftowe i Gazownictwo SA (a) | | 589,981 | 627,796 |
| Powszechna Kasa Oszczednosci Bank SA | | 329,671 | 1,800,239 |
| Powszechny Zaklad Ubezpieczen SA | | 238,237 | 1,337,373 |
| Santander Bank Polska SA | | 12,263 | 652,951 |
TOTAL POLAND | | | 11,998,615 |
| Portugal - 0.1% | | | |
| Banco Espirito Santo SA (Reg.) (a)(d) | | 82,039 | 1 |
| Energias de Portugal SA | | 1,005,027 | 4,394,989 |
| Galp Energia SGPS SA Class B | | 180,456 | 1,832,188 |
| Jeronimo Martins SGPS SA | | 102,155 | 2,118,029 |
TOTAL PORTUGAL | | | 8,345,207 |
| Qatar - 0.4% | | | |
| Barwa Real Estate Co. (a) | | 649,882 | 606,741 |
| Industries Qatar QSC (a) | | 543,208 | 2,352,273 |
| Masraf al Rayan | | 2,001,052 | 2,108,337 |
| Mesaieed Petrochemical Holding Co. (a) | | 1,730,679 | 1,078,778 |
| Ooredoo QSC | | 328,076 | 880,154 |
| Qatar Electricity & Water Co. (a) | | 150,248 | 763,256 |
| Qatar Fuel Co. (a) | | 185,536 | 972,068 |
| Qatar Gas Transport Co. Ltd. (Nakilat) (a) | | 937,838 | 1,055,848 |
| Qatar International Islamic Bank QSC (a) | | 288,287 | 915,900 |
| Qatar Islamic Bank (a) | | 608,477 | 4,075,171 |
| Qatar National Bank SAQ (a) | | 1,672,028 | 9,155,005 |
| The Commercial Bank of Qatar (a) | | 1,217,379 | 2,103,984 |
TOTAL QATAR | | | 26,067,515 |
| Russia - 0.0% | | | |
| Alrosa Co. Ltd. (d) | | 846,411 | 211,159 |
| Gazprom OAO (d) | | 3,422,762 | 537,086 |
| Gazprom OAO sponsored ADR (Reg. S) (a)(d) | | 266,976 | 60,988 |
| Inter Rao Ues JSC (d) | | 12,405,200 | 102,560 |
| LUKOIL PJSC (d) | | 135,807 | 63,035 |
| LUKOIL PJSC sponsored ADR (d) | | 3,670 | 1,038 |
| Magnit OJSC GDR (Reg. S) (d) | | 122,013 | 594 |
| MMC Norilsk Nickel PJSC (d) | | 18,102 | 180,532 |
| MMC Norilsk Nickel PJSC sponsored ADR (d) | | 27,948 | 20,754 |
| Mobile TeleSystems OJSC sponsored ADR (d) | | 145,706 | 145,122 |
| Moscow Exchange MICEX-RTS OAO (a)(d) | | 524,685 | 151,246 |
| Novatek PJSC GDR (Reg. S) (d) | | 30,578 | 7,812 |
| Novolipetsk Steel OJSC (d) | | 477,930 | 6,881 |
| PhosAgro PJSC: | | | |
| GDR (d) | | 300 | 6 |
| GDR (Reg. S) (d) | | 46,691 | 958 |
| Polyus PJSC (d) | | 11,075 | 39,055 |
| Rosneft Oil Co. OJSC (d) | | 322,313 | 80,832 |
| Rosneft Oil Co. OJSC GDR (Reg. S) (d) | | 56,929 | 13,461 |
| Sberbank of Russia (a)(d) | | 3,621,326 | 33,389 |
| Severstal PAO (d) | | 60,348 | 2,021 |
| Severstal PAO GDR (Reg. S) (d) | | 9,813 | 232 |
| Surgutneftegas OJSC (d) | | 1,105,600 | 20,287 |
| Surgutneftegas OJSC sponsored ADR (a)(d) | | 71,885 | 13,275 |
| Tatneft PAO (d) | | 446,514 | 83,282 |
| Tatneft PAO sponsored ADR (d) | | 5,142 | 4,748 |
| United Co. RUSAL International PJSC (d) | | 1,020,580 | 184,445 |
| VTB Bank OJSC (a)(d) | | 1,160,850,350 | 66,508 |
TOTAL RUSSIA | | | 2,031,306 |
| Saudi Arabia - 1.4% | | | |
| ACWA Power Co. | | 29,075 | 1,346,369 |
| Advanced Polypropylene Co. | | 42,963 | 506,516 |
| Al Rajhi Bank | | 714,214 | 16,194,337 |
| Alinma Bank | | 363,416 | 3,626,858 |
| Almarai Co. Ltd. | | 94,440 | 1,415,010 |
| Arab National Bank | | 217,970 | 1,870,776 |
| Bank Al-Jazira | | 137,078 | 852,918 |
| Bank Albilad | | 177,692 | 2,397,569 |
| Banque Saudi Fransi | | 213,852 | 2,458,625 |
| Bupa Arabia for Cooperative Insurance Co. | | 22,948 | 1,178,684 |
| Dar Al Arkan Real Estate Development Co. (a) | | 184,871 | 660,262 |
| Dr Sulaiman Al Habib Medical Services Group Co. | | 31,853 | 1,920,903 |
| Elm Co. | | 8,191 | 721,540 |
| Emaar The Economic City (a) | | 132,855 | 339,072 |
| Etihad Etisalat Co. | | 139,367 | 1,357,489 |
| Jarir Marketing Co. | | 20,045 | 874,873 |
| Mobile Telecommunications Co. Saudi Arabia (a) | | 150,783 | 520,862 |
| Mouwasat Medical Services Co. | | 16,750 | 976,235 |
| National Industrialization Co. (a) | | 112,329 | 399,985 |
| Rabigh Refining & Petrochemical Co. (a) | | 144,248 | 523,624 |
| Riyad Bank | | 486,046 | 4,650,199 |
| Sabic Agriculture-Nutrients Co. | | 79,197 | 3,351,206 |
| Sahara International Petrochemical Co. | | 132,177 | 1,426,402 |
| Saudi Arabian Mining Co. | | 314,670 | 7,009,322 |
| Saudi Arabian Oil Co. (c) | | 878,123 | 8,155,977 |
| Saudi Basic Industries Corp. | | 323,391 | 7,608,086 |
| Saudi Electricity Co. | | 301,274 | 2,164,814 |
| Saudi Industrial Investment Group | | 126,012 | 753,882 |
| Saudi Investment Bank/The | | 166,834 | 805,410 |
| Saudi Kayan Petrochemical Co. (a) | | 250,713 | 878,068 |
| Saudi Research & Marketing Group (a) | | 12,451 | 667,358 |
| Saudi Tadawul Group Holding Co. | | 12,262 | 708,788 |
| Saudi Telecom Co. | | 541,768 | 5,824,920 |
| The Saudi British Bank | | 332,648 | 3,850,964 |
| The Saudi National Bank | | 799,239 | 12,634,508 |
| The Savola Group | | 89,174 | 695,346 |
| Yanbu National Petrochemical Co. | | 96,753 | 1,150,978 |
TOTAL SAUDI ARABIA | | | 102,478,735 |
| Singapore - 0.8% | | | |
| BOC Aviation Ltd. Class A (c) | | 71,000 | 475,314 |
| CapitaLand Ascendas REIT | | 1,222,754 | 2,263,080 |
| CapitaLand Investment Ltd. | | 939,071 | 1,996,753 |
| CapitaMall Trust | | 1,920,248 | 2,550,202 |
| City Developments Ltd. | | 139,352 | 751,099 |
| DBS Group Holdings Ltd. | | 656,200 | 15,853,377 |
| Genting Singapore Ltd. | | 2,348,213 | 1,335,343 |
| Keppel Corp. Ltd. | | 529,120 | 2,605,232 |
| Mapletree Logistics Trust (REIT) | | 1,214,466 | 1,304,032 |
| Mapletree Pan Asia Commercial | | 804,743 | 903,886 |
| Oversea-Chinese Banking Corp. Ltd. | | 1,223,151 | 10,480,942 |
| Singapore Airlines Ltd. | | 494,968 | 1,839,172 |
| Singapore Exchange Ltd. | | 309,717 | 1,842,199 |
| Singapore Technologies Engineering Ltd. | | 594,124 | 1,385,002 |
| Singapore Telecommunications Ltd. | | 3,037,169 | 5,363,749 |
| United Overseas Bank Ltd. | | 428,109 | 8,395,243 |
| UOL Group Ltd. | | 157,315 | 687,892 |
| Venture Corp. Ltd. | | 96,269 | 1,083,332 |
| Wilmar International Ltd. | | 706,793 | 1,937,240 |
TOTAL SINGAPORE | | | 63,053,089 |
| South Africa - 1.0% | | | |
| Absa Group Ltd. | | 306,525 | 3,333,123 |
| African Rainbow Minerals Ltd. | | 38,257 | 538,717 |
| Anglo American Platinum Ltd. | | 19,234 | 1,529,945 |
| AngloGold Ashanti Ltd. | | 151,113 | 1,973,493 |
| Aspen Pharmacare Holdings Ltd. | | 132,102 | 1,087,812 |
| Bid Corp. Ltd. | | 122,266 | 1,967,305 |
| Bidvest Group Ltd./The | | 107,487 | 1,243,353 |
| Capitec Bank Holdings Ltd. | | 31,872 | 3,297,719 |
| Clicks Group Ltd. | | 89,287 | 1,512,927 |
| Discovery Ltd. (a) | | 182,608 | 1,195,135 |
| Exxaro Resources Ltd. | | 92,380 | 1,028,571 |
| FirstRand Ltd. | | 1,865,540 | 6,535,420 |
| Foschini Group Ltd./The | | 112,971 | 706,716 |
| Gold Fields Ltd. | | 320,183 | 2,564,922 |
| Growthpoint Properties Ltd. | | 1,166,794 | 822,592 |
| Harmony Gold Mining Co. Ltd. | | 189,185 | 523,956 |
| Impala Platinum Holdings Ltd. | | 305,600 | 3,128,936 |
| Kumba Iron Ore Ltd. | | 21,938 | 413,220 |
| Mr Price Group Ltd. | | 87,612 | 843,460 |
| MTN Group Ltd. | | 624,844 | 4,416,727 |
| MultiChoice Group Ltd. | | 128,026 | 836,582 |
| Naspers Ltd. Class N | | 79,132 | 8,157,075 |
| Nedbank Group Ltd. | | 167,634 | 1,985,462 |
| Northam Platinum Holdings Ltd. (a) | | 128,324 | 1,204,246 |
| Old Mutual Ltd. | | 1,596,936 | 907,629 |
| Pepkor Holdings Ltd. (c) | | 566,924 | 699,676 |
| Remgro Ltd. | | 195,834 | 1,457,501 |
| Sanlam Ltd. | | 646,256 | 1,880,145 |
| Sasol Ltd. | | 208,777 | 3,509,554 |
| Shoprite Holdings Ltd. | | 182,370 | 2,322,224 |
| Sibanye-Stillwater Ltd. | | 1,020,255 | 2,389,666 |
| Spar Group Ltd./The | | 65,962 | 559,297 |
| Standard Bank Group Ltd. | | 480,894 | 4,493,798 |
| Vodacom Group Ltd. | | 235,282 | 1,605,073 |
| Woolworths Holdings Ltd. | | 367,337 | 1,261,669 |
TOTAL SOUTH AFRICA | | | 71,933,646 |
| Spain - 1.6% | | | |
| Acciona SA | | 8,918 | 1,604,886 |
| ACS Actividades de Construccion y Servicios SA | | 85,946 | 2,204,093 |
| Aena SME SA (a)(c) | | 27,069 | 3,181,461 |
| Amadeus IT Holding SA Class A (a) | | 164,241 | 8,566,039 |
| Banco Bilbao Vizcaya Argentaria SA | | 2,421,106 | 12,489,987 |
| Banco Santander SA (Spain) | | 6,207,730 | 16,085,417 |
| CaixaBank SA | | 1,610,772 | 5,341,393 |
| Cellnex Telecom SA (c) | | 198,356 | 6,492,243 |
| EDP Renovaveis SA | | 104,312 | 2,196,770 |
| Enagas SA | | 90,746 | 1,473,162 |
| Endesa SA | | 112,974 | 1,885,152 |
| Ferrovial SA | | 175,926 | 4,296,053 |
| Grifols SA (a) | | 109,180 | 928,563 |
| Iberdrola SA | | 2,155,054 | 21,915,347 |
| Industria de Diseno Textil SA | | 397,360 | 9,008,332 |
| Naturgy Energy Group SA | | 51,943 | 1,332,596 |
| Red Electrica Corporacion SA | | 145,566 | 2,354,635 |
| Repsol SA | | 528,412 | 7,188,770 |
| Siemens Gamesa Renewable Energy SA (a) | | 84,028 | 1,491,410 |
| Telefonica SA | | 1,909,084 | 6,580,989 |
TOTAL SPAIN | | | 116,617,298 |
| Sweden - 2.0% | | | |
| Alfa Laval AB | | 103,759 | 2,557,043 |
| ASSA ABLOY AB (B Shares) | | 364,148 | 7,352,906 |
| Atlas Copco AB: | | | |
| (A Shares) | | 975,930 | 10,416,349 |
| (B Shares) | | 565,427 | 5,468,336 |
| Boliden AB | | 100,228 | 2,919,368 |
| Electrolux AB (B Shares) (b) | | 77,195 | 952,667 |
| Embracer Group AB (a)(b) | | 241,153 | 1,161,296 |
| Epiroc AB: | | | |
| (A Shares) | | 234,304 | 3,586,833 |
| (B Shares) | | 148,750 | 1,998,611 |
| EQT AB | | 107,280 | 2,114,275 |
| Ericsson (B Shares) | | 1,058,640 | 5,885,345 |
| Essity AB (B Shares) | | 217,842 | 4,604,963 |
| Evolution AB (c) | | 66,595 | 6,212,162 |
| Fastighets AB Balder (a) | | 230,169 | 865,020 |
| Getinge AB (B Shares) | | 82,486 | 1,675,688 |
| H&M Hennes & Mauritz AB (B Shares) (b) | | 271,753 | 2,737,140 |
| Hexagon AB (B Shares) | | 707,333 | 6,992,621 |
| Holmen AB (B Shares) | | 33,929 | 1,231,022 |
| Husqvarna AB (B Shares) | | 142,939 | 848,651 |
| Industrivarden AB: | | | |
| (A Shares) | | 49,625 | 1,124,531 |
| (C Shares) | | 53,723 | 1,207,176 |
| Indutrade AB | | 98,918 | 1,732,221 |
| Investment AB Latour (B Shares) | | 50,418 | 852,766 |
| Investor AB: | | | |
| (A Shares) | | 184,414 | 3,138,372 |
| (B Shares) | | 658,052 | 10,749,399 |
| Kinnevik AB (B Shares) (a) | | 88,766 | 1,097,395 |
| L E Lundbergforetagen AB | | 29,763 | 1,175,834 |
| Lifco AB | | 85,543 | 1,236,132 |
| Nibe Industrier AB (B Shares) | | 551,918 | 4,403,867 |
| Sagax AB | | 68,907 | 1,270,647 |
| Sandvik AB | | 382,001 | 5,969,434 |
| Securitas AB (B Shares) (b) | | 182,864 | 1,496,208 |
| Skandinaviska Enskilda Banken AB (A Shares) | | 590,304 | 6,228,527 |
| Skanska AB (B Shares) | | 123,632 | 1,923,702 |
| SKF AB (B Shares) | | 138,730 | 2,008,203 |
| Svenska Cellulosa AB SCA (B Shares) | | 217,180 | 2,562,996 |
| Svenska Handelsbanken AB (A Shares) | | 528,718 | 4,912,337 |
| Swedbank AB (A Shares) | | 328,448 | 4,896,519 |
| Swedish Match Co. AB | | 551,453 | 5,671,636 |
| Swedish Orphan Biovitrum AB (a) | | 61,985 | 1,141,321 |
| Tele2 AB (B Shares) | | 204,865 | 1,679,562 |
| Telia Co. AB | | 970,925 | 2,572,724 |
| Volvo AB: | | | |
| (A Shares) | | 76,651 | 1,309,312 |
| (B Shares) | | 539,745 | 8,833,972 |
| Volvo Car AB | | 213,349 | 906,055 |
TOTAL SWEDEN | | | 149,681,144 |
| Switzerland - 6.6% | | | |
| ABB Ltd. (Reg.) | | 597,452 | 16,591,422 |
| Accelleron Industries Ltd. (a) | | 1,494 | 25,334 |
| Adecco SA (Reg.) | | 59,008 | 1,846,712 |
| Alcon, Inc. (Switzerland) | | 181,777 | 11,062,556 |
| Bachem Holding AG (B Shares) | | 12,302 | 882,707 |
| Baloise Holdings AG | | 16,465 | 2,249,375 |
| Barry Callebaut AG | | 1,322 | 2,500,492 |
| Clariant AG (Reg.) | | 79,728 | 1,282,686 |
| Coca-Cola HBC AG | | 72,704 | 1,586,246 |
| Compagnie Financiere Richemont SA Series A | | 189,582 | 18,528,523 |
| Credit Suisse Group AG (b) | | 957,126 | 3,964,860 |
| Ems-Chemie Holding AG | | 2,549 | 1,602,432 |
| Geberit AG (Reg.) | | 12,951 | 5,759,305 |
| Givaudan SA | | 3,367 | 10,053,757 |
| Holcim AG | | 201,551 | 9,156,935 |
| Julius Baer Group Ltd. | | 81,507 | 3,910,614 |
| Kuehne & Nagel International AG | | 19,624 | 4,182,116 |
| Lindt & Spruengli AG | | 39 | 3,789,584 |
| Lindt & Spruengli AG (participation certificate) | | 398 | 3,815,649 |
| Logitech International SA (Reg.) | | 65,081 | 3,239,914 |
| Lonza Group AG | | 27,200 | 14,002,130 |
| Nestle SA (Reg. S) | | 1,020,134 | 111,050,558 |
| Novartis AG | | 783,635 | 63,388,835 |
| Partners Group Holding AG | | 8,325 | 7,477,411 |
| Roche Holding AG: | | | |
| (Bearer) | | 10,838 | 4,396,460 |
| (participation certificate) | | 253,299 | 84,044,149 |
| Schindler Holding AG: | | | |
| (participation certificate) | | 14,144 | 2,305,895 |
| (Reg.) | | 9,509 | 1,496,598 |
| SGS SA (Reg.) | | 2,349 | 5,178,398 |
| Sig Group AG | | 110,211 | 2,117,601 |
| Sika AG | | 53,410 | 12,042,664 |
| Sonova Holding AG | | 19,635 | 4,641,339 |
| Straumann Holding AG | | 40,142 | 3,820,368 |
| Swatch Group AG (Bearer) | | 11,076 | 2,488,882 |
| Swatch Group AG (Bearer) (Reg.) | | 17,057 | 712,703 |
| Swiss Life Holding AG | | 11,488 | 5,563,021 |
| Swiss Prime Site AG | | 27,482 | 2,217,552 |
| Swiss Re Ltd. | | 109,612 | 8,142,504 |
| Swisscom AG | | 9,361 | 4,620,904 |
| Temenos Group AG | | 22,984 | 1,370,295 |
| UBS Group AG | | 1,278,127 | 20,282,057 |
| VAT Group AG (c) | | 9,842 | 2,248,814 |
| Zurich Insurance Group Ltd. | | 54,424 | 23,194,092 |
TOTAL SWITZERLAND | | | 492,834,449 |
| Taiwan - 3.6% | | | |
| Accton Technology Corp. | | 183,000 | 1,378,713 |
| Acer, Inc. | | 995,288 | 681,958 |
| Advantech Co. Ltd. | | 156,937 | 1,425,638 |
| ASE Technology Holding Co. Ltd. | | 1,206,840 | 2,976,960 |
| Asia Cement Corp. | | 906,466 | 1,048,279 |
| ASMedia Technology, Inc. | | 9,000 | 162,398 |
| ASUSTeK Computer, Inc. | | 259,000 | 1,895,083 |
| AUO Corp. | | 2,400,000 | 1,257,518 |
| Catcher Technology Co. Ltd. | | 235,000 | 1,234,963 |
| Cathay Financial Holding Co. Ltd. | | 2,915,879 | 3,417,258 |
| Chang Hwa Commercial Bank | | 1,615,297 | 831,337 |
| Cheng Shin Rubber Industry Co. Ltd. | | 605,899 | 606,763 |
| China Airlines Ltd. | | 967,490 | 508,432 |
| China Development Financial Ho | | 5,672,405 | 2,066,434 |
| China Steel Corp. | | 4,345,426 | 3,617,371 |
| Chunghwa Telecom Co. Ltd. | | 1,371,000 | 4,722,477 |
| Compal Electronics, Inc. | | 1,432,000 | 936,789 |
| CTBC Financial Holding Co. Ltd. | | 6,469,579 | 4,091,877 |
| Delta Electronics, Inc. | | 699,621 | 5,585,428 |
| E Ink Holdings, Inc. | | 309,000 | 1,968,733 |
| E.SUN Financial Holdings Co. Ltd. | | 4,624,516 | 3,326,371 |
| ECLAT Textile Co. Ltd. | | 65,941 | 867,860 |
| eMemory Technology, Inc. | | 25,000 | 833,230 |
| EVA Airways Corp. | | 872,000 | 632,629 |
| Evergreen Marine Corp. (Taiwan) | | 359,248 | 1,531,488 |
| Far Eastern New Century Corp. | | 1,251,664 | 1,247,628 |
| Far EasTone Telecommunications Co. Ltd. | | 590,000 | 1,293,266 |
| Feng Tay Enterprise Co. Ltd. | | 171,254 | 852,182 |
| First Financial Holding Co. Ltd. | | 3,894,531 | 2,988,455 |
| Formosa Chemicals & Fibre Corp. | | 1,275,590 | 2,748,605 |
| Formosa Petrochemical Corp. | | 427,000 | 1,098,809 |
| Formosa Plastics Corp. | | 1,486,480 | 3,829,804 |
| Fubon Financial Holding Co. Ltd. | | 2,681,000 | 4,239,195 |
| Giant Manufacturing Co. Ltd. | | 102,000 | 649,873 |
| GlobalWafers Co. Ltd. | | 86,000 | 955,881 |
| Hon Hai Precision Industry Co. Ltd. (Foxconn) | | 4,531,990 | 14,402,213 |
| Hotai Motor Co. Ltd. | | 111,000 | 2,009,797 |
| Hua Nan Financial Holdings Co. Ltd. | | 3,212,423 | 2,096,531 |
| Innolux Corp. | | 3,366,986 | 1,237,018 |
| Inventec Corp. | | 862,280 | 652,311 |
| Largan Precision Co. Ltd. | | 36,000 | 2,064,860 |
| Lite-On Technology Corp. | | 734,910 | 1,458,245 |
| MediaTek, Inc. | | 552,970 | 10,115,096 |
| Mega Financial Holding Co. Ltd. | | 4,024,802 | 3,731,059 |
| Micro-Star International Co. Ltd. | | 265,000 | 899,656 |
| momo.com, Inc. | | 22,800 | 341,074 |
| Nan Ya Plastics Corp. | | 1,759,780 | 3,726,452 |
| Nan Ya Printed Circuit Board Corp. | | 78,000 | 511,471 |
| Nanya Technology Corp. | | 423,000 | 714,749 |
| Nien Made Enterprise Co. Ltd. | | 60,000 | 463,198 |
| Novatek Microelectronics Corp. | | 215,000 | 1,606,467 |
| Pegatron Corp. | | 753,000 | 1,377,411 |
| Pou Chen Corp. | | 751,000 | 634,487 |
| Powerchip Semiconductor Manufacturing Corp. | | 1,129,044 | 1,078,147 |
| President Chain Store Corp. | | 209,000 | 1,736,591 |
| Quanta Computer, Inc. | | 983,000 | 2,084,616 |
| Realtek Semiconductor Corp. | | 171,090 | 1,352,637 |
| Ruentex Development Co. Ltd. | | 591,835 | 726,628 |
| Shin Kong Financial Holding Co. Ltd. | | 4,876,475 | 1,209,518 |
| Sinopac Financial Holdings Co. | | 3,795,827 | 1,894,736 |
| Synnex Technology International Corp. | | 459,500 | 749,355 |
| Taishin Financial Holdings Co. Ltd. | | 3,980,507 | 1,635,199 |
| Taiwan Cement Corp. | | 2,168,612 | 2,033,872 |
| Taiwan Cooperative Financial Holding Co. Ltd. | | 3,605,742 | 2,794,802 |
| Taiwan High Speed Rail Corp. | | 669,000 | 582,839 |
| Taiwan Mobile Co. Ltd. | | 635,600 | 1,874,048 |
| Taiwan Semiconductor Manufacturing Co. Ltd. | | 8,935,000 | 107,313,532 |
| The Shanghai Commercial & Savings Bank Ltd. | | 1,315,616 | 1,892,621 |
| The Shanghai Commercial & Savings Bank Ltd. rights (a) | | 96,443 | 28,107 |
| Uni-President Enterprises Corp. | | 1,729,080 | 3,511,339 |
| Unimicron Technology Corp. | | 457,000 | 1,764,014 |
| United Microelectronics Corp. | | 4,304,000 | 5,170,339 |
| Vanguard International Semiconductor Corp. | | 309,000 | 636,126 |
| Voltronic Power Technology Corp. | | 24,000 | 974,763 |
| Walsin Lihwa Corp. | | 952,312 | 1,055,533 |
| Wan Hai Lines Ltd. | | 238,360 | 500,309 |
| Win Semiconductors Corp. | | 116,000 | 438,767 |
| Winbond Electronics Corp. | | 1,021,000 | 617,272 |
| Wiwynn Corp. | | 30,000 | 673,405 |
| WPG Holding Co. Ltd. | | 545,320 | 743,065 |
| Yageo Corp. | | 129,352 | 1,471,823 |
| Yang Ming Marine Transport Corp. | | 653,000 | 1,218,782 |
| Yuanta Financial Holding Co. Ltd. | | 3,682,281 | 2,249,052 |
TOTAL TAIWAN | | | 265,563,617 |
| Thailand - 0.6% | | | |
| Advanced Info Service PCL (For. Reg.) | | 259,300 | 1,301,782 |
| Advanced Information Service PCL NVDR | | 172,800 | 867,520 |
| Airports of Thailand PCL: | | | |
| (For. Reg.) (a) | | 931,300 | 1,811,439 |
| NVDR (a) | | 560,500 | 1,090,209 |
| Asset World Corp. PCL: | | | |
| (For. Reg.) | | 2,621,000 | 420,242 |
| NVDR | | 1,431,700 | 229,554 |
| B. Grimm Power PCL (For. Reg.) | | 222,000 | 196,938 |
| Bangkok Commercial Asset Management PCL NVDR | | 637,400 | 256,334 |
| Bangkok Dusit Medical Services PCL: | | | |
| (For. Reg.) | | 2,030,000 | 1,574,057 |
| NVDR | | 1,814,100 | 1,406,649 |
| Bangkok Expressway and Metro PCL: | | | |
| (For. Reg.) | | 1,674,400 | 413,704 |
| NVDR | | 971,100 | 239,935 |
| Berli Jucker PCL: | | | |
| unit | | 104,700 | 94,256 |
| (For. Reg.) | | 308,300 | 277,547 |
| BTS Group Holdings PCL: | | | |
| (For. Reg.) | | 1,613,500 | 352,006 |
| NVDR | | 1,314,100 | 286,688 |
| Bumrungrad Hospital PCL: | | | |
| NVDR | | 105,400 | 628,882 |
| (For. Reg.) | | 104,400 | 622,915 |
| Carabao Group PCL NVDR | | 109,400 | 259,518 |
| Central Pattana PCL: | | | |
| (For. Reg.) | | 540,000 | 975,818 |
| NVDR | | 156,200 | 282,264 |
| Central Retail Corp. PCL: | | | |
| (For. Reg.) | | 273,766 | 302,226 |
| NVDR | | 345,800 | 381,748 |
| Charoen Pokphand Foods PCL: | | | |
| (For. Reg.) | | 706,700 | 469,028 |
| (NVDR) | | 648,200 | 430,202 |
| CP ALL PCL: | | | |
| (For. Reg.) | | 1,219,200 | 1,922,776 |
| NVDR | | 893,500 | 1,409,121 |
| Delta Electronics PCL NVDR | | 114,200 | 1,740,991 |
| Electricity Generating PCL: | | | |
| (For. Reg.) | | 38,400 | 172,091 |
| NVDR | | 55,800 | 250,070 |
| Energy Absolute PCL: | | | |
| (For. Reg.) | | 281,900 | 715,031 |
| NVDR | | 344,500 | 873,814 |
| Global Power Synergy Public Co. Ltd. (For. Reg.) | | 214,300 | 349,234 |
| Gulf Energy Development PCL: | | | |
| (For. Reg.) | | 350,400 | 465,112 |
| NVDR | | 729,700 | 968,586 |
| Home Product Center PCL: | | | |
| (For. Reg.) | | 1,346,367 | 516,677 |
| NVDR | | 719,100 | 275,959 |
| Indorama Ventures PCL NVDR | | 585,000 | 645,814 |
| Intouch Holdings PCL: | | | |
| (For. Reg.) | | 291,300 | 551,284 |
| NVDR | | 201,000 | 380,392 |
| JMT Network Services PCL NVDR | | 218,800 | 373,820 |
| Kasikornbank PCL NVDR | | 217,200 | 833,518 |
| Krung Thai Bank PCL: | | | |
| (For. Reg.) | | 788,655 | 362,767 |
| NVDR | | 429,500 | 197,562 |
| Krungthai Card PCL: | | | |
| (For. Reg.) | | 150,000 | 224,734 |
| NVDR | | 167,900 | 251,552 |
| Land & House PCL: | | | |
| NVDR | | 1,568,000 | 379,172 |
| (For. Reg.) | | 2,392,000 | 578,431 |
| Minor International PCL: | | | |
| unit (a) | | 184,200 | 136,776 |
| (For. Reg.) (a) | | 1,019,598 | 757,094 |
| Muangthai Leasing PCL: | | | |
| (For. Reg.) | | 145,909 | 139,025 |
| NVDR | | 118,600 | 113,004 |
| Osotspa PCL: | | | |
| (For. Reg.) | | 123,400 | 85,953 |
| NVDR | | 388,800 | 270,816 |
| PTT Exploration and Production PCL: | | | |
| (For. Reg.) | | 377,644 | 1,801,614 |
| NVDR | | 136,000 | 648,811 |
| PTT Global Chemical PCL: | | | |
| (For. Reg.) | | 584,939 | 668,809 |
| NVDR | | 210,800 | 241,025 |
| PTT Oil & Retail Business PCL NVDR | | 1,048,200 | 663,993 |
| PTT PCL: | | | |
| (For. Reg.) | | 2,630,500 | 2,489,105 |
| NVDR | | 1,062,400 | 1,005,294 |
| Ratch Group PCL: | | | |
| unit | | 264,200 | 284,721 |
| (For. Reg.) | | 98,200 | 105,827 |
| SCB X PCL: | | | |
| (For. Reg.) | | 94,050 | 262,040 |
| NVDR unit | | 155,500 | 433,250 |
| SCG Packaging PCL NVDR | | 446,900 | 610,824 |
| Siam Cement PCL: | | | |
| (For. Reg.) | | 169,400 | 1,442,649 |
| NVDR | | 123,300 | 1,050,051 |
| Siam Commercial Bank PCL (For. Reg.) | | 76,350 | 176,711 |
| Srisawad Corp. PCL: | | | |
| warrants 8/29/25 (a) | | 7,244 | 617 |
| (For. Reg.) | | 22,000 | 23,709 |
| NVDR | | 227,600 | 245,278 |
| Thai Oil PCL: | | | |
| (For. Reg.) | | 321,912 | 461,143 |
| NVDR | | 127,810 | 183,090 |
| Thai Union Frozen Products PCL: | | | |
| (For. Reg.) | | 828,700 | 392,078 |
| NVDR | | 379,300 | 179,456 |
| rights (a)(d) | | 10,755 | 4,977 |
| rights (a)(d) | | 23,498 | 10,874 |
| True Corp. PCL: | | | |
| (For. Reg.) | | 2,418,912 | 315,358 |
| NVDR | | 1,614,300 | 210,459 |
TOTAL THAILAND | | | 45,024,400 |
| Turkey - 0.1% | | | |
| Akbank TAS | | 1,078,164 | 846,811 |
| Aselsan A/S | | 234,956 | 406,693 |
| Bim Birlesik Magazalar A/S JSC | | 175,968 | 1,266,756 |
| Eregli Demir ve Celik Fabrikalari T.A.S. | | 551,413 | 879,808 |
| Ford Otomotiv Sanayi A/S | | 23,877 | 465,630 |
| Haci Omer Sabanci Holding A/S | | 346,549 | 624,428 |
| Koc Holding A/S | | 260,305 | 777,520 |
| Turk Hava Yollari AO (a) | | 193,209 | 1,051,456 |
| Turk Sise ve Cam Fabrikalari A/S | | 566,186 | 1,010,446 |
| Turkcell Iletisim Hizmet A/S | | 418,075 | 575,873 |
| Turkiye Is Bankasi A/S Series C | | 1,182,563 | 592,099 |
| Turkiye Petrol Rafinerileri A/S (a) | | 43,201 | 879,605 |
TOTAL TURKEY | | | 9,377,125 |
| United Arab Emirates - 0.4% | | | |
| Abu Dhabi Commercial Bank PJSC | | 1,008,460 | 2,594,524 |
| Abu Dhabi Islamic Bank | | 532,055 | 1,376,092 |
| Abu Dhabi National Oil Co. for Distribution PJSC | | 1,071,143 | 1,315,198 |
| Aldar Properties PJSC | | 1,405,271 | 1,652,765 |
| Dubai Islamic Bank Pakistan Ltd. | | 1,065,413 | 1,688,139 |
| Emaar Properties PJSC (a) | | 1,458,794 | 2,406,766 |
| Emirates NBD Bank PJSC | | 685,313 | 2,472,135 |
| Emirates Telecommunications Corp. | | 1,250,433 | 8,783,091 |
| First Abu Dhabi Bank PJSC | | 1,618,884 | 7,889,255 |
TOTAL UNITED ARAB EMIRATES | | | 30,177,965 |
| United Kingdom - 9.1% | | | |
| 3i Group PLC | | 354,920 | 4,726,959 |
| Abrdn PLC | | 810,284 | 1,477,482 |
| Admiral Group PLC | | 64,751 | 1,497,753 |
| Anglo American PLC (United Kingdom) | | 461,526 | 13,824,650 |
| Antofagasta PLC | | 142,300 | 1,918,294 |
| Ashtead Group PLC | | 161,608 | 8,432,608 |
| Associated British Foods PLC | | 128,503 | 1,991,705 |
| AstraZeneca PLC (United Kingdom) | | 561,890 | 65,927,785 |
| Auto Trader Group PLC (c) | | 336,430 | 2,013,797 |
| Aveva Group PLC | | 43,368 | 1,551,714 |
| Aviva PLC | | 1,030,492 | 4,942,887 |
| BAE Systems PLC | | 1,146,093 | 10,720,061 |
| Barclays PLC | | 6,090,225 | 10,348,839 |
| Barratt Developments PLC | | 374,142 | 1,613,709 |
| Berkeley Group Holdings PLC | | 40,872 | 1,626,927 |
| BP PLC | | 6,931,864 | 38,351,288 |
| BP PLC sponsored ADR | | 11,803 | 392,804 |
| British American Tobacco PLC (United Kingdom) | | 779,944 | 30,802,697 |
| British Land Co. PLC | | 319,674 | 1,341,397 |
| BT Group PLC | | 2,496,057 | 3,715,497 |
| Bunzl PLC | | 122,631 | 3,995,390 |
| Burberry Group PLC | | 141,468 | 2,944,574 |
| Compass Group PLC | | 647,638 | 13,640,439 |
| Croda International PLC | | 51,156 | 3,965,801 |
| Diageo PLC | | 827,065 | 34,035,806 |
| GSK PLC | | 1,475,843 | 24,175,930 |
| Haleon PLC (a) | | 1,848,643 | 5,681,664 |
| Halma PLC | | 139,047 | 3,372,560 |
| Hargreaves Lansdown PLC | | 129,850 | 1,136,496 |
| Hikma Pharmaceuticals PLC | | 59,209 | 848,082 |
| HSBC Holdings PLC (United Kingdom) | | 7,282,803 | 37,375,734 |
| Imperial Brands PLC | | 326,437 | 7,951,711 |
| Informa PLC | | 549,599 | 3,501,836 |
| InterContinental Hotel Group PLC | | 66,618 | 3,579,435 |
| Intertek Group PLC | | 57,543 | 2,411,286 |
| J Sainsbury PLC | | 636,213 | 1,418,178 |
| JD Sports Fashion PLC | | 945,758 | 1,056,830 |
| Johnson Matthey PLC | | 68,054 | 1,509,768 |
| Kingfisher PLC | | 737,955 | 1,854,064 |
| Land Securities Group PLC | | 255,513 | 1,671,399 |
| Legal & General Group PLC | | 2,186,552 | 5,849,601 |
| Lloyds Banking Group PLC | | 25,267,573 | 12,135,206 |
| London Stock Exchange Group PLC | | 119,376 | 10,347,756 |
| M&G PLC | | 930,701 | 1,869,958 |
| Melrose Industries PLC | | 1,570,876 | 2,105,931 |
| Mondi PLC | | 153,647 | 2,576,960 |
| Mondi PLC | | 21,440 | 366,781 |
| National Grid PLC | | 1,323,950 | 14,424,603 |
| NatWest Group PLC | | 1,945,571 | 5,238,813 |
| Next PLC | | 46,862 | 2,648,911 |
| NMC Health PLC (a) | | 30,958 | 619 |
| Ocado Group PLC (a) | | 208,823 | 1,132,092 |
| Pearson PLC | | 241,382 | 2,668,025 |
| Persimmon PLC | | 116,074 | 1,737,133 |
| Phoenix Group Holdings PLC | | 268,017 | 1,667,131 |
| Prudential PLC | | 1,000,018 | 9,289,838 |
| Reckitt Benckiser Group PLC | | 259,323 | 17,209,716 |
| RELX PLC (London Stock Exchange) | | 695,382 | 18,678,304 |
| Rentokil Initial PLC | | 910,533 | 5,681,827 |
| Rio Tinto PLC | | 407,822 | 21,313,452 |
| Rolls-Royce Holdings PLC (a) | | 3,022,330 | 2,710,618 |
| Sage Group PLC | | 375,358 | 3,128,587 |
| Schroders PLC | | 266,576 | 1,197,464 |
| Segro PLC | | 432,106 | 3,889,982 |
| Severn Trent PLC | | 88,703 | 2,546,167 |
| Shell PLC (London) | | 2,694,948 | 74,654,392 |
| Smith & Nephew PLC | | 312,852 | 3,696,945 |
| Smiths Group PLC | | 137,471 | 2,460,155 |
| Spirax-Sarco Engineering PLC | | 27,146 | 3,346,586 |
| SSE PLC | | 395,049 | 7,059,875 |
| St. James's Place PLC | | 197,477 | 2,411,870 |
| Standard Chartered PLC (United Kingdom) | | 916,200 | 5,465,732 |
| Taylor Wimpey PLC | | 1,244,960 | 1,338,916 |
| Tesco PLC | | 2,754,075 | 6,802,247 |
| Unilever PLC | | 924,489 | 42,022,055 |
| United Utilities Group PLC | | 241,577 | 2,603,282 |
| Vodafone Group PLC | | 9,434,254 | 11,013,573 |
| Vodafone Group PLC sponsored ADR | | 27,565 | 325,543 |
| Whitbread PLC | | 74,733 | 2,199,550 |
TOTAL UNITED KINGDOM | | | 679,162,032 |
| United States of America - 0.2% | | | |
| 360 DigiTech, Inc. ADR | | 37,586 | 381,874 |
| Coca-Cola European Partners PLC | | 73,903 | 3,477,136 |
| Legend Biotech Corp. ADR (a) | | 18,994 | 946,281 |
| Li Auto, Inc. ADR (a) | | 196,610 | 2,677,828 |
| NICE Ltd. sponsored ADR (a) | | 1,402 | 266,226 |
| Southern Copper Corp. | | 31,754 | 1,491,485 |
| Yum China Holdings, Inc. | | 152,245 | 6,295,331 |
TOTAL UNITED STATES OF AMERICA | | | 15,536,161 |
| TOTAL COMMON STOCKS (Cost $8,304,512,715) | | | 7,234,332,094 |
| | | | |
| Nonconvertible Preferred Stocks - 1.1% |
| | | Shares | Value ($) |
| Brazil - 0.5% | | | |
| Banco Bradesco SA (PN) | | 1,962,844 | 7,546,623 |
| Braskem SA Class A | | 63,600 | 415,053 |
| Centrais Eletricas Brasileiras SA (Electrobras) (PN-B) | | 84,407 | 871,277 |
| Companhia Energetica de Minas Gerais (CEMIG) (PN) | | 475,805 | 1,047,314 |
| Gerdau SA | | 420,800 | 2,097,687 |
| Itau Unibanco Holding SA | | 1,777,821 | 10,462,832 |
| Itausa-Investimentos Itau SA (PN) | | 1,676,037 | 3,484,781 |
| Petroleo Brasileiro SA - Petrobras (PN) (non-vtg.) | | 1,714,200 | 9,892,615 |
TOTAL BRAZIL | | | 35,818,182 |
| Chile - 0.1% | | | |
| Sociedad Quimica y Minera de Chile SA (PN-B) | | 51,538 | 4,905,260 |
| Colombia - 0.0% | | | |
| Bancolombia SA (PN) | | 163,190 | 1,032,587 |
| France - 0.0% | | | |
| Air Liquide SA (a) | | 8,637 | 1,129,838 |
| Germany - 0.3% | | | |
| Bayerische Motoren Werke AG (BMW) (non-vtg.) | | 22,474 | 1,659,082 |
| Dr. Ing. h.c. F. Porsche AG Series F (a) | | 41,324 | 4,226,779 |
| Henkel AG & Co. KGaA | | 63,755 | 4,016,477 |
| Porsche Automobil Holding SE (Germany) | | 55,111 | 3,079,178 |
| Sartorius AG (non-vtg.) | | 8,736 | 3,082,970 |
| Volkswagen AG | | 67,069 | 8,584,928 |
TOTAL GERMANY | | | 24,649,414 |
| Korea (South) - 0.2% | | | |
| Hyundai Motor Co. | | 8,912 | 489,519 |
| Hyundai Motor Co. Series 2 | | 14,147 | 790,944 |
| LG Chemical Ltd. | | 3,500 | 708,671 |
| LG H & H Co. Ltd. | | 694 | 136,386 |
| Samsung Electronics Co. Ltd. | | 310,324 | 11,588,340 |
TOTAL KOREA (SOUTH) | | | 13,713,860 |
| Russia - 0.0% | | | |
| Surgutneftegas OJSC (d) | | 2,913,333 | 76,009 |
| TOTAL NONCONVERTIBLE PREFERRED STOCKS (Cost $86,712,145) | | | 81,325,150 |
| | | | |
| Nonconvertible Bonds - 0.0% |
| | | Principal Amount (e) | Value ($) |
| India - 0.0% | | | |
NTPC Ltd. 8.49% 3/25/25 (Cost $13,959) | INR | 69,696 | 11,248 |
| | | | |
| Government Obligations - 0.1% |
| | | Principal Amount (e) | Value ($) |
| United States of America - 0.1% | | | |
U.S. Treasury Bills, yield at date of purchase 1.15% 1/26/23 (f) (Cost $9,972,779) | | 10,000,000 | 9,904,743 |
| | | | |
| Money Market Funds - 1.9% |
| | | Shares | Value ($) |
| Fidelity Cash Central Fund 3.10% (g) | | 122,707,689 | 122,732,231 |
| Fidelity Securities Lending Cash Central Fund 3.10% (g)(h) | | 17,458,093 | 17,459,839 |
| TOTAL MONEY MARKET FUNDS (Cost $140,191,435) | | | 140,192,070 |
| | | | |
| TOTAL INVESTMENT IN SECURITIES - 99.9% (Cost $8,541,403,033) | 7,465,765,305 |
NET OTHER ASSETS (LIABILITIES) - 0.1% | 8,017,253 |
| NET ASSETS - 100.0% | 7,473,782,558 |
| | |
| Futures Contracts |
| | Number of contracts | Expiration Date | Notional Amount ($) | Value ($) | Unrealized Appreciation/ (Depreciation) ($) |
| Purchased | | | | | |
| | | | | | |
| Equity Index Contracts | | | | | |
| ICE E-mini MSCI EAFE Index Contracts (United States) | 1,155 | Dec 2022 | 101,403,225 | 1,040,867 | 1,040,867 |
| ICE E-mini MSCI Emerging Markets Index Contracts (United States) | 1,016 | Dec 2022 | 43,362,880 | (2,506,039) | (2,506,039) |
| TME S&P/TSX 60 Index Contracts (Canada) | 79 | Dec 2022 | 13,657,342 | 337,572 | 337,572 |
| | | | | | |
| TOTAL FUTURES CONTRACTS | | | | | (1,127,600) |
| The notional amount of futures purchased as a percentage of Net Assets is 2.2% |
Currency Abbreviations
Categorizations in the Schedule of Investments are based on country or territory of incorporation.
Legend
| (b) | Security or a portion of the security is on loan at period end. |
| (c) | Security exempt from registration under Rule 144A of the Securities Act of 1933. These securities may be resold in transactions exempt from registration, normally to qualified institutional buyers. At the end of the period, the value of these securities amounted to $170,577,240 or 2.3% of net assets. |
| (e) | Amount is stated in United States dollars unless otherwise noted. |
| (f) | Security or a portion of the security was pledged to cover margin requirements for futures contracts. At period end, the value of securities pledged amounted to $9,730,420. |
| (g) | Affiliated fund that is generally available only to investment companies and other accounts managed by Fidelity Investments. The rate quoted is the annualized seven-day yield of the fund at period end. A complete unaudited listing of the fund's holdings as of its most recent quarter end is available upon request. In addition, each Fidelity Central Fund's financial statements, which are not covered by the Fund's Report of Independent Registered Public Accounting Firm, are available on the SEC's website or upon request. |
| (h) | Investment made with cash collateral received from securities on loan. |
Affiliated Central Funds
Fiscal year to date information regarding the Fund's investments in Fidelity Central Funds, including the ownership percentage, is presented below.
| Affiliate | Value, beginning of period ($) | Purchases ($) | Sales Proceeds ($) | Dividend Income ($) | Realized Gain (loss) ($) | Change in Unrealized appreciation (depreciation) ($) | Value, end of period ($) | % ownership, end of period |
| Fidelity Cash Central Fund 3.10% | 154,057,509 | 1,842,172,834 | 1,873,498,113 | 2,023,004 | - | 1 | 122,732,231 | 0.2% |
| Fidelity Securities Lending Cash Central Fund 3.10% | 35,881,913 | 332,578,045 | 351,000,119 | 590,267 | - | - | 17,459,839 | 0.0% |
| Total | 189,939,422 | 2,174,750,879 | 2,224,498,232 | 2,613,271 | - | 1 | 140,192,070 | |
| | | | | | | | | |
Amounts in the income column in the above table include any capital gain distributions from underlying funds, which are presented in the corresponding line item in the Statement of Operations, if applicable.
Amount for Fidelity Securities Lending Cash Central Fund represents the income earned on investing cash collateral, less rebates paid to borrowers and any lending agent fees associated with the loan, plus any premium payments received for lending certain types of securities.
Investment Valuation
The following is a summary of the inputs used, as of October 31, 2022, involving the Fund's assets and liabilities carried at fair value. The inputs or methodology used for valuing securities may not be an indication of the risk associated with investing in those securities. For more information on valuation inputs, and their aggregation into the levels used below, please refer to the Investment Valuation section in the accompanying Notes to Financial Statements.
| Valuation Inputs at Reporting Date: |
| Description | Total ($) | Level 1 ($) | Level 2 ($) | Level 3 ($) |
Investments in Securities: | | | | |
|
| Equities: | | | | |
Communication Services | 415,291,413 | 168,275,411 | 246,277,980 | 738,022 |
Consumer Discretionary | 783,598,046 | 336,774,820 | 446,769,188 | 54,038 |
Consumer Staples | 663,513,353 | 289,550,472 | 373,931,852 | 31,029 |
Energy | 484,891,344 | 271,986,496 | 211,942,995 | 961,853 |
Financials | 1,531,128,495 | 990,942,228 | 539,858,290 | 327,977 |
Health Care | 730,794,605 | 238,049,395 | 492,745,210 | - |
Industrials | 912,162,624 | 517,316,821 | 394,845,803 | - |
Information Technology | 796,175,732 | 441,576,403 | 354,599,329 | - |
Materials | 594,383,851 | 382,838,150 | 210,899,658 | 646,043 |
Real Estate | 159,821,798 | 132,903,915 | 26,822,570 | 95,313 |
Utilities | 243,895,983 | 142,068,321 | 101,725,101 | 102,561 |
|
| Corporate Bonds | 11,248 | - | 11,248 | - |
|
| Government Obligations | 9,904,743 | - | 9,904,743 | - |
|
| Money Market Funds | 140,192,070 | 140,192,070 | - | - |
| Total Investments in Securities: | 7,465,765,305 | 4,052,474,502 | 3,410,333,967 | 2,956,836 |
Derivative Instruments: | | | | |
|
| Assets | | | | |
Futures Contracts | 1,378,439 | 1,378,439 | - | - |
| Total Assets | 1,378,439 | 1,378,439 | - | - |
|
| Liabilities | | | | |
Futures Contracts | (2,506,039) | (2,506,039) | - | - |
| Total Liabilities | (2,506,039) | (2,506,039) | - | - |
| Total Derivative Instruments: | (1,127,600) | (1,127,600) | - | - |
The following is a reconciliation of Investments in Securities for which Level 3 inputs were used in determining value:
| |
| Investments in Securities: | |
| Beginning Balance | $ | 1,149,714 | |
| Net Realized Gain (Loss) on Investment Securities | | (1,384,995) | |
| Net Unrealized Gain (Loss) on Investment Securities | | (103,152,210) | |
| Cost of Purchases | | 4,772,944 | |
| Proceeds of Sales | | (1,890,912) | |
| Amortization/Accretion | | - | |
| Transfers into Level 3 | | 103,462,295 | |
| Transfers out of Level 3 | | - | |
| Ending Balance | $ | 2,956,836 | |
| The change in unrealized gain (loss) for the period attributable to Level 3 securities held at October 31, 2022 | $ | (103,593,894) | |
| The information used in the above reconciliation represents fiscal year to date activity for any Investments in Securities identified as using Level 3 inputs at either the beginning or the end of the current fiscal period. Cost of purchases and proceeds of sales may include securities received and/or delivered through in-kind transactions. Transfers into Level 3 were attributable to a lack of observable market data resulting from decreases in market activity, decreases in liquidity, security restructurings or corporate actions. Transfers out of Level 3 were attributable to observable market data becoming available for those securities. Transfers in or out of Level 3 represent the beginning value of any Security or Instrument where a change in the pricing level occurred from the beginning to the end of the period. The cost of purchases and the proceeds of sales may include securities received or delivered through corporate actions or exchanges. Realized and unrealized gains (losses) disclosed in the reconciliation are included in Net Gain (Loss) on the Fund's Statement of Operations. | |
Value of Derivative Instruments
The following table is a summary of the Fund's value of derivative instruments by primary risk exposure as of October 31, 2022. For additional information on derivative instruments, please refer to the Derivative Instruments section in the accompanying Notes to Financial Statements.
Primary Risk Exposure / Derivative Type | Value |
| Asset ($) | Liability ($) |
| Equity Risk | | |
Futures Contracts (a) | 1,378,439 | (2,506,039) |
| Total Equity Risk | 1,378,439 | (2,506,039) |
| Total Value of Derivatives | 1,378,439 | (2,506,039) |
(a)Reflects gross cumulative appreciation (depreciation) on futures contracts as presented in the Schedule of Investments. In the Statement of Assets and Liabilities, the period end daily variation margin is included in receivable or payable for daily variation margin on futures contracts, and the net cumulative appreciation (depreciation) is included in Total accumulated earnings (loss).
Fidelity® Global ex U.S. Index Fund
| Statement of Assets and Liabilities |
| | | | October 31, 2022 |
| | | | | |
| Assets | | | | |
| Investment in securities, at value (including securities loaned of $16,124,708) - See accompanying schedule: | | | | |
Unaffiliated issuers (cost $8,401,211,598) | | $7,325,573,235 | | |
Fidelity Central Funds (cost $140,191,435) | | 140,192,070 | | |
| | | | | |
| Total Investment in Securities (cost $8,541,403,033) | | | $ | 7,465,765,305 |
| Segregated cash with brokers for derivative instruments | | | | 90 |
| Foreign currency held at value (cost $11,037,116) | | | | 10,933,878 |
| Receivable for investments sold | | | | 1,160,446 |
| Receivable for fund shares sold | | | | 7,964,495 |
| Dividends receivable | | | | 14,629,341 |
| Reclaims receivable | | | | 16,279,408 |
| Interest receivable | | | | 43 |
| Distributions receivable from Fidelity Central Funds | | | | 327,574 |
| Other receivables | | | | 16,545 |
Total assets | | | | 7,517,077,125 |
| Liabilities | | | | |
| Payable for investments purchased | | 18,282 | | |
| Payable for fund shares redeemed | | 13,987,538 | | |
| Accrued management fee | | 338,181 | | |
| Payable for daily variation margin on futures contracts | | 1,107,434 | | |
| Other payables and accrued expenses | | 10,384,696 | | |
| Collateral on securities loaned | | 17,458,436 | | |
| Total Liabilities | | | | 43,294,567 |
| Net Assets | | | $ | 7,473,782,558 |
| Net Assets consist of: | | | | |
| Paid in capital | | | $ | 8,876,341,526 |
| Total accumulated earnings (loss) | | | | (1,402,558,968) |
| Net Assets | | | $ | 7,473,782,558 |
Net Asset Value , offering price and redemption price per share ($7,473,782,558 ÷ 644,453,048 shares) | | | $ | 11.60 |
| | | | | |
| Statement of Operations |
| | | | Year ended October 31, 2022 |
| Investment Income | | | | |
| Dividends | | | $ | 269,917,552 |
| Non-Cash dividends | | | | 18,846,609 |
| Interest | | | | 86,293 |
| Income from Fidelity Central Funds (including $590,267 from security lending) | | | | 2,613,271 |
| Income before foreign taxes withheld | | | | 291,463,725 |
| Less foreign taxes withheld | | | | (25,558,877) |
| Total Income | | | | 265,904,848 |
| Expenses | | | | |
| Management fee | $ | 4,674,737 | | |
| Independent trustees' fees and expenses | | 28,359 | | |
| Total expenses before reductions | | 4,703,096 | | |
| Expense reductions | | (935) | | |
| Total expenses after reductions | | | | 4,702,161 |
| Net Investment income (loss) | | | | 261,202,687 |
| Realized and Unrealized Gain (Loss) | | | | |
| Net realized gain (loss) on: | | | | |
| Investment Securities: | | | | |
| Unaffiliated issuers(net of foreign taxes of $794,127) | | 33,157,913 | | |
| Foreign currency transactions | | (3,940,160) | | |
| Futures contracts | | (71,227,493) | | |
| Total net realized gain (loss) | | | | (42,009,740) |
| Change in net unrealized appreciation (depreciation) on: | | | | |
| Investment Securities: | | | | |
| Unaffiliated issuers (net of decrease in deferred foreign taxes of $1,202,494) | | (2,575,410,085) | | |
| Fidelity Central Funds | | 1 | | |
| Assets and liabilities in foreign currencies | | (2,517,992) | | |
| Futures contracts | | (2,526,756) | | |
| Total change in net unrealized appreciation (depreciation) | | | | (2,580,454,832) |
| Net gain (loss) | | | | (2,622,464,572) |
| Net increase (decrease) in net assets resulting from operations | | | $ | (2,361,261,885) |
| Statement of Changes in Net Assets |
| |
| | Year ended October 31, 2022 | | Year ended October 31, 2021 |
| Increase (Decrease) in Net Assets | | | | |
| Operations | | | | |
| Net investment income (loss) | $ | 261,202,687 | $ | 195,437,644 |
| Net realized gain (loss) | | (42,009,740) | | (26,281,392) |
| Change in net unrealized appreciation (depreciation) | | (2,580,454,832) | | 1,519,342,124 |
| Net increase (decrease) in net assets resulting from operations | | (2,361,261,885) | | 1,688,498,376 |
| Distributions to shareholders | | (232,318,373) | | (113,745,928) |
| Share transactions | | | | |
| Proceeds from sales of shares | | 3,351,217,856 | | 3,700,740,156 |
| Reinvestment of distributions | | 222,581,907 | | 108,447,495 |
| Cost of shares redeemed | | (2,638,924,650) | | (1,873,018,145) |
Net increase (decrease) in net assets resulting from share transactions | | 934,875,113 | | 1,936,169,506 |
| Total increase (decrease) in net assets | | (1,658,705,145) | | 3,510,921,954 |
| | | | | |
| Net Assets | | | | |
| Beginning of period | | 9,132,487,703 | | 5,621,565,749 |
| End of period | $ | 7,473,782,558 | $ | 9,132,487,703 |
| | | | | |
| Other Information | | | | |
| Shares | | | | |
| Sold | | 247,319,236 | | 240,549,523 |
| Issued in reinvestment of distributions | | 15,064,264 | | 7,610,351 |
| Redeemed | | (196,149,020) | | (122,263,327) |
| Net increase (decrease) | | 66,234,480 | | 125,896,547 |
| | | | | |
Financial Highlights
| Fidelity® Global ex U.S. Index Fund |
| |
| Years ended October 31, | | 2022 | | 2021 | | 2020 | | 2019 | | 2018 |
Selected Per-Share Data | | | | | | | | | | |
| Net asset value, beginning of period | $ | 15.79 | $ | 12.43 | $ | 13.09 | $ | 12.07 | $ | 13.50 |
| Income from Investment Operations | | | | | | | | | | |
Net investment income (loss) A,B | | .42 | | .38 | | .29 | | .41 | | .38 |
| Net realized and unrealized gain (loss) | | (4.21) | | 3.23 | | (.57) | | .91 | | (1.50) |
| Total from investment operations | | (3.79) | | 3.61 | | (.28) | | 1.32 | | (1.12) |
| Distributions from net investment income | | (.40) | | (.25) | | (.38) | | (.30) | | (.28) |
| Distributions from net realized gain | | - | | - | | - | | - | | (.03) |
| Total distributions | | (.40) | | (.25) | | (.38) | | (.30) | | (.31) |
| Net asset value, end of period | $ | 11.60 | $ | 15.79 | $ | 12.43 | $ | 13.09 | $ | 12.07 |
Total Return C | | (24.56)% | | 29.25% | | (2.25)% | | 11.28% | | (8.47)% |
Ratios to Average Net Assets B,D,E | | | | | | | | | | |
| Expenses before reductions | | .06% | | .05% F | | .06% | | .06% | | .06% |
| Expenses net of fee waivers, if any | | .06% | | .05% F | | .06% | | .06% | | .06% |
| Expenses net of all reductions | | .06% | | .05% F | | .06% | | .06% | | .06% |
| Net investment income (loss) | | 3.06% | | 2.46% | | 2.37% | | 3.32% | | 2.91% |
| Supplemental Data | | | | | | | | | | |
| Net assets, end of period (000 omitted) | $ | 7,473,783 | $ | 9,132,488 | $ | 5,621,566 | $ | 5,343,395 | $ | 2,879,110 |
Portfolio turnover rate G | | 5% H | | 5% H | | 5% | | 5% H | | 19% H |
A Calculated based on average shares outstanding during the period.
B Net investment income (loss) is affected by the timing of the declaration of dividends by any underlying mutual funds or exchange-traded funds (ETFs). Net investment income (loss) of any mutual funds or ETFs is not included in the Fund's net investment income (loss) ratio.
C Total returns would have been lower if certain expenses had not been reduced during the applicable periods shown.
D Fees and expenses of any underlying mutual funds or exchange-traded funds (ETFs) are not included in the Fund's expense ratio. The Fund indirectly bears its proportionate share of these expenses. For additional expense information related to investments in Fidelity Central Funds, please refer to the "Investments in Fidelity Central Funds" note found in the Notes to Financial Statements section of the most recent Annual or Semi-Annual report.
E Expense ratios reflect operating expenses of the class. Expenses before reductions do not reflect amounts reimbursed, waived, or reduced through arrangements with the investment adviser, brokerage services, or other offset arrangements, if applicable, and do not represent the amount paid by the class during periods when reimbursements, waivers or reductions occur.
F The size and fluctuation of net assets and expense amounts may cause ratios to differ from contractual rates.
G Amount does not include the portfolio activity of any underlying mutual funds or exchange-traded funds (ETFs).
H Portfolio turnover rate excludes securities received or delivered in-kind.
For the period ended October 31, 2022
1. Organization.
Fidelity Emerging Markets Index Fund and Fidelity Global ex U.S. Index Fund (the Funds) are funds of Fidelity Salem Street Trust (the Trust). Each Fund is authorized to issue an unlimited number of shares. Share transactions on the Statement of Changes in Net Assets may contain exchanges between affiliated funds. The Trust is registered under the Investment Company Act of 1940, as amended (the 1940 Act), as an open-end management investment company organized as a Massachusetts business trust. Investments in emerging markets, if applicable, can be subject to social, economic, regulatory, and political uncertainties and can be extremely volatile.
2. Investments in Fidelity Central Funds.
Funds may invest in Fidelity Central Funds, which are open-end investment companies generally available only to other investment companies and accounts managed by the investment adviser and its affiliates. The Schedule of Investments lists any Fidelity Central Funds held as an investment as of period end, but does not include the underlying holdings of each Fidelity Central Fund. An investing fund indirectly bears its proportionate share of the expenses of the underlying Fidelity Central Funds.
Based on its investment objective, each Fidelity Central Fund may invest or participate in various investment vehicles or strategies that are similar to those of the investing fund. These strategies are consistent with the investment objectives of the investing fund and may involve certain economic risks which may cause a decline in value of each of the Fidelity Central Funds and thus a decline in the value of the investing fund.
| Fidelity Central Fund | Investment Manager | Investment Objective | Investment Practices | Expense Ratio A |
| Fidelity Money Market Central Funds | Fidelity Management & Research Company LLC (FMR) | Each fund seeks to obtain a high level of current income consistent with the preservation of capital and liquidity. | Short-term Investments | Less than .005% |
A Expenses expressed as a percentage of average net assets and are as of each underlying Central Fund's most recent annual or semi-annual shareholder report.
A complete unaudited list of holdings for each Fidelity Central Fund is available upon request or at the Securities and Exchange Commission website at www.sec.gov. In addition, the financial statements of the Fidelity Central Funds which contain the significant accounting policies (including investment valuation policies) of those funds, and are not covered by the Report of Independent Registered Public Accounting Firm, are available on the Securities and Exchange Commission website or upon request.
3. Significant Accounting Policies.
Each Fund is an investment company and applies the accounting and reporting guidance of the Financial Accounting Standards Board (FASB) Accounting Standards Codification Topic 946 Financial Services - Investment Companies . The financial statements have been prepared in conformity with accounting principles generally accepted in the United States of America (GAAP), which require management to make certain estimates and assumptions at the date of the financial statements. Actual results could differ from those estimates. Subsequent events, if any, through the date that the financial statements were issued have been evaluated in the preparation of the financial statements. Each Fund's Schedule of Investments lists any underlying mutual funds or exchange-traded funds (ETFs) but does not include the underlying holdings of these funds. The following summarizes the significant accounting policies of each Fund:
Investment Valuation. Investments are valued as of 4:00 p.m. Eastern time on the last calendar day of the period. The Board of Trustees (the Board) has designated each Fund's investment adviser as the valuation designee responsible for the fair valuation function and performing fair value determinations as needed. The investment adviser has established a Fair Value Committee (the Committee) to carry out the day-to-day fair valuation responsibilities and has adopted policies and procedures to govern the fair valuation process and the activities of the Committee. In accordance with these fair valuation policies and procedures, which have been approved by the Board, each Fund attempts to obtain prices from one or more third party pricing services or brokers to value its investments. When current market prices, quotations or currency exchange rates are not readily available or reliable, investments will be fair valued in good faith by the Committee, in accordance with the policies and procedures. Factors used in determining fair value vary by investment type and may include market or investment specific events, transaction data, estimated cash flows, and market observations of comparable investments. The frequency that the fair valuation procedures are used cannot be predicted and they may be utilized to a significant extent. The Committee manages each Fund's fair valuation practices and maintains the fair valuation policies and procedures. Each Fund's investment adviser reports to the Board information regarding the fair valuation process and related material matters.
Each Fund categorizes the inputs to valuation techniques used to value its investments into a disclosure hierarchy consisting of three levels as shown below:
Level 1 - unadjusted quoted prices in active markets for identical investments
Level 2 - other significant observable inputs (including quoted prices for similar investments, interest rates, prepayment speeds, etc.)
Level 3 - unobservable inputs (including the Fund's own assumptions based on the best information available)
Valuation techniques used to value each Fund's investments by major category are as follows:
Equity securities, including restricted securities, for which market quotations are readily available, are valued at the last reported sale price or official closing price as reported by a third party pricing service on the primary market or exchange on which they are traded and are categorized as Level 1 in the hierarchy. In the event there were no sales during the day or closing prices are not available, securities are valued at the last quoted bid price or may be valued using the last available price and are generally categorized as Level 2 in the hierarchy. For foreign equity securities, when market or security specific events arise, comparisons to the valuation of American Depositary Receipts (ADRs), futures contracts, Exchange-Traded Funds (ETFs) and certain indexes as well as quoted prices for similar securities may be used and would be categorized as Level 2 in the hierarchy. For equity securities, including restricted securities, where observable inputs are limited, assumptions about market activity and risk are used and these securities may be categorized as Level 3 in the hierarchy.
Debt securities, including restricted securities, are valued based on evaluated prices received from third party pricing services or from brokers who make markets in such securities. Corporate bonds and U.S. government and government agency obligations are valued by pricing services who utilize matrix pricing which considers yield or price of bonds of comparable quality, coupon, maturity and type or by broker-supplied prices. When independent prices are unavailable or unreliable, debt securities may be valued utilizing pricing methodologies which consider similar factors that would be used by third party pricing services. Debt securities are generally categorized as Level 2 in the hierarchy but may be Level 3 depending on the circumstances.
Futures contracts are valued at the settlement price established each day by the board of trade or exchange on which they are traded and are categorized as Level 1 in the hierarchy. Investments in open-end mutual funds, including the Fidelity Central Funds, are valued at their closing net asset value (NAV) each business day and are categorized as Level 1 in the hierarchy.
Changes in valuation techniques may result in transfers in or out of an assigned level within the disclosure hierarchy. The aggregate value of investments by input level as of October 31, 2022 is included at the end of each Fund's Schedule of Investments.
Foreign Currency. Certain Funds may use foreign currency contracts to facilitate transactions in foreign-denominated securities. Gains and losses from these transactions may arise from changes in the value of the foreign currency or if the counterparties do not perform under the contracts' terms.
Foreign-denominated assets, including investment securities, and liabilities are translated into U.S. dollars at the exchange rates at period end. Purchases and sales of investment securities, income and dividends received, and expenses denominated in foreign currencies are translated into U.S. dollars at the exchange rate in effect on the transaction date.
The effects of exchange rate fluctuations on investments are included with the net realized and unrealized gain (loss) on investment securities. Other foreign currency transactions resulting in realized and unrealized gain (loss) are disclosed separately.
Investment Transactions and Income. For financial reporting purposes, the Funds' investment holdings and NAV include trades executed through the end of the last business day of the period. The NAV per share for processing shareholder transactions is calculated as of the close of business of the New York Stock Exchange (NYSE), normally 4:00 p.m. Eastern time and includes trades executed through the end of the prior business day. Gains and losses on securities sold are determined on the basis of identified cost and for certain Funds include proceeds received from litigation. Commissions paid to certain brokers with whom the investment adviser, or its affiliates, places trades on behalf of a fund include an amount in addition to trade execution, which may be rebated back to a fund. Any such rebates are included in net realized gain (loss) on investments in the Statement of Operations. Dividend income is recorded on the ex-dividend date, except for certain dividends from foreign securities where the ex-dividend date may have passed, which are recorded as soon as the Funds are informed of the ex-dividend date. Non-cash dividends included in dividend income, if any, are recorded at the fair market value of the securities received. Income and capital gain distributions from Fidelity Central Funds, if any, are recorded on the ex-dividend date. Certain distributions received by the Funds represent a return of capital or capital gain. The Funds determine the components of these distributions subsequent to the ex-dividend date, based upon receipt of tax filings or other correspondence relating to the underlying investment. These distributions are recorded as a reduction of cost of investments and/or as a realized gain. Interest income is accrued as earned and includes coupon interest and amortization of premium and accretion of discount on debt securities as applicable. Investment income is recorded net of foreign taxes withheld where recovery of such taxes is uncertain. Funds may file withholding tax reclaims in certain jurisdictions to recover a portion of amounts previously withheld. Any withholding tax reclaims income is included in the Statement of Operations in foreign taxes withheld. Any receivables for withholding tax reclaims are included in the Statement of Assets and Liabilities in dividends receivable or reclaims receivable, as applicable. Fidelity Global ex U.S. Index Fund has filed tax reclaims for previously withheld taxes on dividends earned in certain European Union (EU) countries. These additional filings are subject to various administrative proceedings by the local jurisdictions' tax authorities within the EU, as well as a number of related judicial proceedings. Income recognized for EU reclaims is included with other reclaims in the Statement of Operations in foreign taxes withheld. These reclaims are recorded when the amount is known and there are no significant uncertainties on collectability.
Expenses. Expenses directly attributable to a fund are charged to that fund. Expenses attributable to more than one fund are allocated among the respective funds on the basis of relative net assets or other appropriate methods. Expenses included in the accompanying financial statements reflect the expenses of that fund and do not include any expenses associated with any underlying mutual funds or exchange-traded funds. Although not included in a fund's expenses, a fund indirectly bears its proportionate share of these expenses through the net asset value of each underlying mutual fund or exchange-traded fund. Expense estimates are accrued in the period to which they relate and adjustments are made when actual amounts are known.
Income Tax Information and Distributions to Shareholders. Each year, each Fund intends to qualify as a regulated investment company under Subchapter M of the Internal Revenue Code, including distributing substantially all of its taxable income and realized gains. As a result, no provision for U.S. Federal income taxes is required. As of October 31, 2022, each Fund did not have any unrecognized tax benefits in the financial statements; nor is each Fund aware of any tax positions for which it is reasonably possible that the total amounts of unrecognized tax benefits will significantly change in the next twelve months. Each Fund files a U.S. federal tax return, in addition to state and local tax returns as required. Each Fund's federal income tax returns are subject to examination by the Internal Revenue Service (IRS) for a period of three fiscal years after they are filed. State and local tax returns may be subject to examination for an additional fiscal year depending on the jurisdiction. Foreign taxes are provided for based on each Fund's understanding of the tax rules and rates that exist in the foreign markets in which it invests. Fidelity Emerging Markets Index Fund and Fidelity Global ex U.S. Index Fund are subject to a tax imposed on capital gains by certain countries in which they invest. An estimated deferred tax liability for net unrealized appreciation on the applicable securities is included in Other payables and accrued expenses on each applicable Fund's Statement of Assets & Liabilities.
Distributions are declared and recorded on the ex-dividend date. Income and capital gain distributions are determined in accordance with income tax regulations, which may differ from GAAP. In addition, the Funds claimed a portion of the payment made to redeeming shareholders as a distribution for income tax purposes.
Capital accounts within the financial statements are adjusted for permanent book-tax differences. These adjustments have no impact on net assets or the results of operations. Capital accounts are not adjusted for temporary book-tax differences which will reverse in a subsequent period.
Book-tax differences are primarily due to futures contracts, foreign currency transactions, certain foreign taxes, passive foreign investment companies (PFIC), redemptions in-kind, partnerships, capital loss carryforwards and losses deferred due to wash sales.
As of period end, the cost and unrealized appreciation (depreciation) in securities, and derivatives if applicable, for federal income tax purposes were as follows for each Fund:
| | Tax cost | Gross unrealized appreciation | Gross unrealized depreciation | Net unrealized appreciation (depreciation) |
Fidelity Emerging Markets Index Fund | $6,529,461,712 | $687,398,725 | $(2,016,069,053) | $(1,328,670,328) |
| Fidelity Global ex U.S. Index Fund | 8,640,290,116 | 789,207,799 | (1,963,395,038) | (1,174,187,239) |
The tax-based components of distributable earnings as of period end were as follows for each Fund:
| | Undistributed ordinary income | Capital loss carryforward | Net unrealized appreciation (depreciation) on securities and other investments |
Fidelity Emerging Markets Index Fund | $115,773,997 | $(482,439,502) | $(1,328,955,716) |
| Fidelity Global ex U.S. Index Fund | 178,852,513 | (394,392,523) | (1,176,634,264) |
Capital loss carryforwards are only available to offset future capital gains of the Funds to the extent provided by regulations and may be limited. The capital loss carryforward information presented below, including any applicable limitation, is estimated as of fiscal period end and is subject to adjustment.
| | Short-term | Long-term | Total capital loss carryforward |
Fidelity Emerging Markets Index Fund | $(132,849,320) | $(349,590,182) | $(482,439,502) |
| Fidelity Global ex U.S. Index Fund | (73,644,327) | (320,748,196) | (394,392,523) |
The tax character of distributions paid was as follows:
| October 31, 2022 | | |
| | Ordinary Income | Total |
Fidelity Emerging Markets Index Fund | $141,768,973 | $141,768,973 |
| Fidelity Global ex U.S. Index Fund | 232,318,373 | 232,318,373 |
| October 31, 2021 | | |
| | Ordinary Income | Total |
Fidelity Emerging Markets Index Fund | $60,657,681 | $60,657,681 |
| Fidelity Global ex U.S. Index Fund | 113,745,928 | 113,745,928 |
Restricted Securities (including Private Placements). Funds may invest in securities that are subject to legal or contractual restrictions on resale. These securities generally may be resold in transactions exempt from registration or to the public if the securities are registered. Disposal of these securities may involve time-consuming negotiations and expense, and prompt sale at an acceptable price may be difficult. Information regarding restricted securities held at period end is included at the end of the Schedule of Investments, if applicable.
4. Derivative Instruments.
Risk Exposures and the Use of Derivative Instruments. Each Fund's investment objectives allow for various types of derivative instruments, including futures contracts. Derivatives are investments whose value is primarily derived from underlying assets, indices or reference rates and may be transacted on an exchange or over-the-counter (OTC). Derivatives may involve a future commitment to buy or sell a specified asset based on specified terms, to exchange future cash flows at periodic intervals based on a notional principal amount, or for one party to make one or more payments upon the occurrence of specified events in exchange for periodic payments from the other party.
Derivatives were used to increase returns and to manage exposure to certain risks as defined below. The success of any strategy involving derivatives depends on analysis of numerous economic factors, and if the strategies for investment do not work as intended, the objectives may not be achieved.
Derivatives were used to increase or decrease exposure to the following risk(s):
| Equity Risk | Equity risk relates to the fluctuations in the value of financial instruments as a result of changes in market prices (other than those arising from interest rate risk or foreign exchange risk), whether caused by factors specific to an individual investment, its issuer, or all factors affecting all instruments traded in a market or market segment. |
Funds are also exposed to additional risks from investing in derivatives, such as liquidity risk and counterparty credit risk. Liquidity risk is the risk that a fund will be unable to close out the derivative in the open market in a timely manner. Counterparty credit risk is the risk that the counterparty will not be able to fulfill its obligation to a fund. Counterparty credit risk related to exchange-traded contracts may be mitigated by the protection provided by the exchange on which they trade.
Investing in derivatives may involve greater risks than investing in the underlying assets directly and, to varying degrees, may involve risk of loss in excess of any initial investment and collateral received and amounts recognized in the Statement of Assets and Liabilities. In addition, there may be the risk that the change in value of the derivative contract does not correspond to the change in value of the underlying instrument.
Futures Contracts. A futures contract is an agreement between two parties to buy or sell a specified underlying instrument for a fixed price at a specified future date. Futures contracts were used to manage exposure to the stock market.
Upon entering into a futures contract, a fund is required to deposit either cash or securities (initial margin) with a clearing broker in an amount equal to a certain percentage of the face value of the contract. Futures contracts are marked-to-market daily and subsequent daily payments are made or received by a fund depending on the daily fluctuations in the value of the futures contracts and are recorded as unrealized appreciation or (depreciation). This receivable and/or payable, if any, is included in daily variation margin on futures contracts in the Statement of Assets and Liabilities. Realized gain or (loss) is recorded upon the expiration or closing of a futures contract. The net realized gain (loss) and change in net unrealized appreciation (depreciation) on futures contracts during the period is presented in the Statement of Operations.
Any open futures contracts at period end are presented in the Schedule of Investments under the caption "Futures Contracts". The notional amount at value reflects each contract's exposure to the underlying instrument or index at period end, and is representative of volume of activity during the period unless an average notional amount is presented. Any securities deposited to meet initial margin requirements are identified in the Schedule of Investments. Any cash deposited to meet initial margin requirements is presented as segregated cash with brokers for derivative instruments in the Statement of Assets and Liabilities.
5. Purchases and Sales of Investments.
Purchases and sales of securities, other than short-term securities and in-kind transactions, as applicable, are noted in the table below.
| | Purchases ($) | Sales ($) |
| Fidelity Emerging Markets Index Fund | 2,129,712,861 | 508,329,060 |
| Fidelity Global ex U.S. Index Fund | 2,026,305,817 | 450,657,992 |
Unaffiliated Redemptions In-Kind. Shares that were redeemed in-kind for investments, including accrued interest and cash, if any, are shown in the table below. The net realized gain or loss on investments delivered through in-kind redemptions is included in the accompanying Statement of Operations. The amount of the in-kind redemptions is included in share transactions in the accompanying Statement of Changes in Net Assets. There was no gain or loss for federal income tax purposes.
| | Shares | Total net realized gain or loss ($) | Total Proceeds ($) |
| Fidelity Global ex U.S. Index Fund | 62,225,242 | 197,626,769 | 805,816,881 |
6. Fees and Other Transactions with Affiliates.
Management Fee and Expense Contract. Fidelity Management & Research Company LLC (the investment adviser) and its affiliates provide the Funds with investment management related services for which the Funds pay a monthly management fee. The management fee is based on an annual rate of .075% and .055% of average net assets for Fidelity Emerging Markets Index Fund and Fidelity Global ex U.S. Index Fund, respectively. The management fee is reduced by an amount equal to the fees and expenses paid by each Fund to the independent Trustees. Under the management contract, the investment adviser pays all other operating expenses, except the compensation of the independent Trustees and certain other expenses such as interest expense.
Under the expense contract, the investment adviser pays all other operating expenses, except the compensation of the independent Trustees, as necessary so that the total expenses do not exceed .075%, and .055% of average net assets for Fidelity Emerging Markets Index Fund and Fidelity Global Ex-U.S. Index Fund, respectively. These expense contracts will remain in place through December 31, 2023.
Sub-Adviser. Geode Capital Management, LLC (Geode), serves as sub-adviser for the Funds. Geode provides discretionary investment advisory services to the Funds and is paid by the investment adviser for providing these services.
Interfund Lending Program. Pursuant to an Exemptive Order issued by the Securities and Exchange Commission (the SEC), each Fund, along with other registered investment companies having management contracts with Fidelity Management & Research Company LLC (FMR), or other affiliated entities of FMR, may participate in an interfund lending program. This program provides an alternative credit facility allowing each Fund to borrow from, or lend money to, other participating affiliated funds. At period end, there were no interfund loans outstanding. Activity in this program during the period for which loans were outstanding is presented in the table below. Interest expense on borrowings is paid by the investment adviser under the Expense Contract.
| | Borrower or Lender | Average Loan Balance | Weighted Average Interest Rate | Interest Expense |
Fidelity Emerging Markets Index Fund | Borrower | $21,143,350 | 2.67% | $31,400 |
Interfund Trades. Funds may purchase from or sell securities to other Fidelity Funds under procedures adopted by the Board. The procedures have been designed to ensure these interfund trades are executed in accordance with Rule 17a-7 of the 1940 Act. Any interfund trades are included within the respective purchases and sales amounts shown in the Purchases and Sales of Investments note. During the period, there were no interfund trades.
Prior Fiscal Year Affiliated Exchanges In-Kind. Shares that were exchanged for investments, including accrued interest and cash, if any, are shown in the table below. The amount of in-kind exchanges is included in share transactions in the accompanying Statement of Changes in Net Assets.
| | Shares | Total Proceeds ($) |
| Fidelity Global ex U.S. Index Fund | 1,703,066 | 26,142,058 |
7. Committed Line of Credit.
Certain Funds participate with other funds managed by the investment adviser or an affiliate in a $4.25 billion credit facility (the "line of credit") to be utilized for temporary or emergency purposes to fund shareholder redemptions or for other short-term liquidity purposes. The commitment fees on the pro-rata portion of the line of credit are borne by the investment adviser. During the period, there were no borrowings on this line of credit.
8. Security Lending.
Funds lend portfolio securities from time to time in order to earn additional income. Lending agents are used, including National Financial Services (NFS), an affiliate of the investment adviser. Pursuant to a securities lending agreement, NFS will receive a fee, which is capped at 9.9% of a fund's daily lending revenue, for its services as lending agent. A fund may lend securities to certain qualified borrowers, including NFS. On the settlement date of the loan, a fund receives collateral (in the form of U.S. Treasury obligations, letters of credit and/or cash) against the loaned securities and maintains collateral in an amount not less than 100% of the market value of the loaned securities during the period of the loan. The market value of the loaned securities is determined at the close of business of a fund and any additional required collateral is delivered to a fund on the next business day. A fund or borrower may terminate the loan at any time, and if the borrower defaults on its obligation to return the securities loaned because of insolvency or other reasons, a fund may apply collateral received from the borrower against the obligation. A fund may experience delays and costs in recovering the securities loaned. Any cash collateral received is invested in the Fidelity Securities Lending Cash Central Fund. Any loaned securities are identified as such in the Schedule of Investments, and the value of loaned securities and cash collateral at period end, as applicable, are presented in the Statement of Assets and Liabilities. Security lending income represents the income earned on investing cash collateral, less rebates paid to borrowers and any lending agent fees associated with the loan, plus any premium payments received for lending certain types of securities. Security lending income is presented in the Statement of Operations as a component of income from Fidelity Central Funds. Affiliated security lending activity, if any, was as follows:
| | Total Security Lending Fees Paid to NFS | Security Lending Income From Securities Loaned to NFS | Value of Securities Loaned to NFS at Period End |
| Fidelity Emerging Markets Index Fund | $56,314 | $- | $- |
| Fidelity Global ex U.S. Index Fund | $62,191 | $1 | $- |
9. Expense Reductions.
Through arrangements with each applicable Fund's custodian, credits realized as a result of certain uninvested cash balances were used to reduce each applicable Fund's expenses. All of the applicable expense reductions are noted in the table below.
| | Custodian credits |
Fidelity Emerging Markets Index Fund | $102,851 |
| Fidelity Global ex U.S. Index Fund | 935 |
10. Other.
A fund's organizational documents provide former and current trustees and officers with a limited indemnification against liabilities arising in connection with the performance of their duties to the fund. In the normal course of business, a fund may also enter into contracts that provide general indemnifications. A fund's maximum exposure under these arrangements is unknown as this would be dependent on future claims that may be made against a fund. The risk of material loss from such claims is considered remote.
At the end of the period, the following mutual funds managed by the investment adviser or its affiliates were the owners of record of 10% or more of the total outstanding shares.
| | Fidelity Multi-Asset Index Fund |
| Fidelity Emerging Markets Index Fund | 13% |
11. Risk and Uncertainties.
Many factors affect a fund's performance. Developments that disrupt global economies and financial markets, such as pandemics, epidemics, outbreaks of infectious diseases, war, terrorism, and environmental disasters, may significantly affect a fund's investment performance. The effects of these developments to a fund will be impacted by the types of securities in which a fund invests, the financial condition, industry, economic sector, and geographic location of an issuer, and a fund's level of investment in the securities of that issuer.
To the Board of Trustees of Fidelity Salem Street Trust and Shareholders of Fidelity Emerging Markets Index Fund and Fidelity Global ex U.S. Index Fund:
Opinion on the Financial Statements and Financial Highlights
We have audited the accompanying statements of assets and liabilities of Fidelity Emerging Markets Index Fund and Fidelity Global ex U.S. Index Fund (the "Funds"), each a fund of Fidelity Salem Street Trust, including the schedules of investments, as of October 31, 2022, the related statements of operations for the year then ended, the statements of changes in net assets for each of the two years in the period then ended, the financial highlights for each of the five years in the period then ended, and the related notes. In our opinion, the financial statements and financial highlights present fairly, in all material respects, the financial position of each of the Funds as of October 31, 2022, and the results of their operations for the year then ended, the changes in their net assets for each of the two years in the period then ended, and the financial highlights for each of the five years in the period then ended in conformity with accounting principles generally accepted in the United States of America.
Basis for Opinion
These financial statements and financial highlights are the responsibility of the Funds' management. Our responsibility is to express an opinion on the Funds' financial statements and financial highlights based on our audits. We are a public accounting firm registered with the Public Company Accounting Oversight Board (United States) (PCAOB) and are required to be independent with respect to the Funds in accordance with the U.S. federal securities laws and the applicable rules and regulations of the Securities and Exchange Commission and the PCAOB.
We conducted our audits in accordance with the standards of the PCAOB. Those standards require that we plan and perform the audit to obtain reasonable assurance about whether the financial statements and financial highlights are free of material misstatement, whether due to error or fraud. The Funds are not required to have, nor were we engaged to perform, an audit of their internal control over financial reporting. As part of our audits we are required to obtain an understanding of internal control over financial reporting but not for the purpose of expressing an opinion on the effectiveness of the Funds' internal control over financial reporting. Accordingly, we express no such opinion.
Our audits included performing procedures to assess the risks of material misstatement of the financial statements and financial highlights, whether due to error or fraud, and performing procedures that respond to those risks. Such procedures included examining, on a test basis, evidence regarding the amounts and disclosures in the financial statements and financial highlights. Our audits also included evaluating the accounting principles used and significant estimates made by management, as well as evaluating the overall presentation of the financial statements and financial highlights. Our procedures included confirmation of securities owned as of October 31, 2022, by correspondence with the custodian and brokers; when replies were not received from brokers, we performed other auditing procedures. We believe that our audits provide a reasonable basis for our opinion.
/s/ Deloitte & Touche LLP
Boston, Massachusetts
December 14, 2022
We have served as the auditor of one or more of the Fidelity investment companies since 1999.
The Trustees, Members of the Advisory Board (if any), and officers of the trust and funds, as applicable, are listed below. The Board of Trustees governs each fund and is responsible for protecting the interests of shareholders. The Trustees are experienced executives who meet periodically throughout the year to oversee each fund's activities, review contractual arrangements with companies that provide services to each fund, oversee management of the risks associated with such activities and contractual arrangements, and review each fund's performance. Except for Jonathan Chiel, each of the Trustees oversees 293 funds. Mr. Chiel oversees 184 funds.
The Trustees hold office without limit in time except that (a) any Trustee may resign; (b) any Trustee may be removed by written instrument, signed by at least two-thirds of the number of Trustees prior to such removal; (c) any Trustee who requests to be retired or who has become incapacitated by illness or injury may be retired by written instrument signed by a majority of the other Trustees; and (d) any Trustee may be removed at any special meeting of shareholders by a two-thirds vote of the outstanding voting securities of the trust. Each Trustee who is not an interested person (as defined in the 1940 Act) of the trust and the funds is referred to herein as an Independent Trustee. Each Independent Trustee shall retire not later than the last day of the calendar year in which his or her 75th birthday occurs. The Independent Trustees may waive this mandatory retirement age policy with respect to individual Trustees. Officers and Advisory Board Members hold office without limit in time, except that any officer or Advisory Board Member may resign or may be removed by a vote of a majority of the Trustees at any regular meeting or any special meeting of the Trustees. Except as indicated, each individual has held the office shown or other offices in the same company for the past five years.
The funds' Statement of Additional Information (SAI) includes more information about the Trustees. To request a free copy, call Fidelity at 1-800-544-8544.
Experience, Skills, Attributes, and Qualifications of the Trustees. The Governance and Nominating Committee has adopted a statement of policy that describes the experience, qualifications, attributes, and skills that are necessary and desirable for potential Independent Trustee candidates (Statement of Policy). The Board believes that each Trustee satisfied at the time he or she was initially elected or appointed a Trustee, and continues to satisfy, the standards contemplated by the Statement of Policy. The Governance and Nominating Committee also engages professional search firms to help identify potential Independent Trustee candidates who have the experience, qualifications, attributes, and skills consistent with the Statement of Policy. From time to time, additional criteria based on the composition and skills of the current Independent Trustees, as well as experience or skills that may be appropriate in light of future changes to board composition, business conditions, and regulatory or other developments, have also been considered by the professional search firms and the Governance and Nominating Committee. In addition, the Board takes into account the Trustees' commitment and participation in Board and committee meetings, as well as their leadership of standing and ad hoc committees throughout their tenure.
In determining that a particular Trustee was and continues to be qualified to serve as a Trustee, the Board has considered a variety of criteria, none of which, in isolation, was controlling. The Board believes that, collectively, the Trustees have balanced and diverse experience, qualifications, attributes, and skills, which allow the Board to operate effectively in governing each fund and protecting the interests of shareholders. Information about the specific experience, skills, attributes, and qualifications of each Trustee, which in each case led to the Board's conclusion that the Trustee should serve (or continue to serve) as a trustee of the funds, is provided below.
Board Structure and Oversight Function. Abigail P. Johnson is an interested person and currently serves as Chairman. The Trustees have determined that an interested Chairman is appropriate and benefits shareholders because an interested Chairman has a personal and professional stake in the quality and continuity of services provided to the funds. Independent Trustees exercise their informed business judgment to appoint an individual of their choosing to serve as Chairman, regardless of whether the Trustee happens to be independent or a member of management. The Independent Trustees have determined that they can act independently and effectively without having an Independent Trustee serve as Chairman and that a key structural component for assuring that they are in a position to do so is for the Independent Trustees to constitute a substantial majority for the Board. The Independent Trustees also regularly meet in executive session. Michael E. Kenneally serves as Chairman of the Independent Trustees and as such (i) acts as a liaison between the Independent Trustees and management with respect to matters important to the Independent Trustees and (ii) with management prepares agendas for Board meetings.
Fidelity ® funds are overseen by different Boards of Trustees. The funds' Board oversees Fidelity's investment-grade bond, money market, asset allocation and certain equity funds, and other Boards oversee Fidelity's high income and other equity funds. The asset allocation funds may invest in Fidelity ® funds that are overseen by such other Boards. The use of separate Boards, each with its own committee structure, allows the Trustees of each group of Fidelity ® funds to focus on the unique issues of the funds they oversee, including common research, investment, and operational issues. On occasion, the separate Boards establish joint committees to address issues of overlapping consequences for the Fidelity ® funds overseen by each Board.
The Trustees operate using a system of committees to facilitate the timely and efficient consideration of all matters of importance to the Trustees, each fund, and fund shareholders and to facilitate compliance with legal and regulatory requirements and oversight of the funds' activities and associated risks. The Board, acting through its committees, has charged FMR and its affiliates with (i) identifying events or circumstances the occurrence of which could have demonstrably adverse effects on the funds' business and/or reputation; (ii) implementing processes and controls to lessen the possibility that such events or circumstances occur or to mitigate the effects of such events or circumstances if they do occur; and (iii) creating and maintaining a system designed to evaluate continuously business and market conditions in order to facilitate the identification and implementation processes described in (i) and (ii) above. Because the day-to-day operations and activities of the funds are carried out by or through FMR, its affiliates, and other service providers, the funds' exposure to risks is mitigated but not eliminated by the processes overseen by the Trustees. While each of the Board's committees has responsibility for overseeing different aspects of the funds' activities, oversight is exercised primarily through the Operations and Audit Committees. In addition, an ad hoc Board committee of Independent Trustees has worked with FMR to enhance the Board's oversight of investment and financial risks, legal and regulatory risks, technology risks, and operational risks, including the development of additional risk reporting to the Board. Appropriate personnel, including but not limited to the funds' Chief Compliance Officer (CCO), FMR's internal auditor, the independent accountants, the funds' Treasurer and portfolio management personnel, make periodic reports to the Board's committees, as appropriate, including an annual review of Fidelity's risk management program for the Fidelity ® funds. The responsibilities of each standing committee, including their oversight responsibilities, are described further under "Standing Committees of the Trustees."
Interested Trustees*:
Correspondence intended for a Trustee who is an interested person may be sent to Fidelity Investments, 245 Summer Street, Boston, Massachusetts 02210.
Name, Year of Birth; Principal Occupations and Other Relevant Experience+
Jonathan Chiel (1957)
Year of Election or Appointment: 2016
Trustee
Mr. Chiel also serves as Trustee of other Fidelity ® funds. Mr. Chiel is Executive Vice President and General Counsel for FMR LLC (diversified financial services company, 2012-present). Previously, Mr. Chiel served as general counsel (2004-2012) and senior vice president and deputy general counsel (2000-2004) for John Hancock Financial Services; a partner with Choate, Hall & Stewart (1996-2000) (law firm); and an Assistant United States Attorney for the United States Attorney's Office of the District of Massachusetts (1986-95), including Chief of the Criminal Division (1993-1995). Mr. Chiel is a director on the boards of the Boston Bar Foundation and the Maimonides School.
Abigail P. Johnson (1961)
Year of Election or Appointment: 2009
Trustee
Chairman of the Board of Trustees
Ms. Johnson also serves as Trustee of other Fidelity ® funds. Ms. Johnson serves as Chairman (2016-present), Chief Executive Officer (2014-present), and Director (2007-present) of FMR LLC (diversified financial services company), President of Fidelity Financial Services (2012-present) and President of Personal, Workplace and Institutional Services (2005-present). Ms. Johnson is Chairman and Director of Fidelity Management & Research Company LLC (investment adviser firm, 2011-present). Previously, Ms. Johnson served as Chairman and Director of FMR Co., Inc. (investment adviser firm, 2011-2019), Vice Chairman (2007-2016) and President (2013-2016) of FMR LLC, President and a Director of Fidelity Management & Research Company (2001-2005), a Trustee of other investment companies advised by Fidelity Management & Research Company, Fidelity Investments Money Management, Inc. (investment adviser firm), and FMR Co., Inc. (2001-2005), Senior Vice President of the Fidelity ® funds (2001-2005), and managed a number of Fidelity ® funds. Ms. Abigail P. Johnson and Mr. Arthur E. Johnson are not related.
Jennifer Toolin McAuliffe (1959)
Year of Election or Appointment: 2016
Trustee
Ms. McAuliffe also serves as Trustee of other Fidelity ® funds and as Trustee of Fidelity Charitable (2020-present). Previously, Ms. McAuliffe served as Co-Head of Fixed Income of Fidelity Investments Limited (now known as FIL Limited (FIL)) (diversified financial services company), Director of Research for FIL's credit and quantitative teams in London, Hong Kong and Tokyo and Director of Research for taxable and municipal bonds at Fidelity Investments Money Management, Inc. Ms. McAuliffe previously served as a member of the Advisory Board of certain Fidelity ® funds (2016). Ms. McAuliffe was previously a lawyer at Ropes & Gray LLP and currently serves as director or trustee of several not-for-profit entities.
* Determined to be an "Interested Trustee" by virtue of, among other things, his or her affiliation with the trust or various entities under common control with FMR.
+ The information includes the Trustee's principal occupation during the last five years and other information relating to the experience, attributes, and skills relevant to the Trustee's qualifications to serve as a Trustee, which led to the conclusion that the Trustee should serve as a Trustee for each fund.
Independent Trustees:
Correspondence intended for an Independent Trustee may be sent to Fidelity Investments, P.O. Box 55235, Boston, Massachusetts 02205-5235.
Name, Year of Birth; Principal Occupations and Other Relevant Experience+
Elizabeth S. Acton (1951)
Year of Election or Appointment: 2013
Trustee
Ms. Acton also serves as Trustee of other Fidelity ® funds. Prior to her retirement, Ms. Acton served as Executive Vice President, Finance (2011-2012), Executive Vice President, Chief Financial Officer (2002-2011) and Treasurer (2004-2005) of Comerica Incorporated (financial services). Prior to joining Comerica, Ms. Acton held a variety of positions at Ford Motor Company (1983-2002), including Vice President and Treasurer (2000-2002) and Executive Vice President and Chief Financial Officer of Ford Motor Credit Company (1998-2000). Ms. Acton currently serves as a member of the Board and Audit and Finance Committees of Beazer Homes USA, Inc. (homebuilding, 2012-present). Ms. Acton previously served as a member of the Advisory Board of certain Fidelity ® funds (2013-2016).
Ann E. Dunwoody (1953)
Year of Election or Appointment: 2018
Trustee
General Dunwoody also serves as Trustee of other Fidelity ® funds. General Dunwoody (United States Army, Retired) was the first woman in U.S. military history to achieve the rank of four-star general and prior to her retirement in 2012 held a variety of positions within the U.S. Army, including Commanding General, U.S. Army Material Command (2008-2012). General Dunwoody currently serves as President of First to Four LLC (leadership and mentoring services, 2012-present), a member of the Board and Nomination and Corporate Governance Committees of Kforce Inc. (professional staffing services, 2016-present) and a member of the Board of Automattic Inc. (software engineering, 2018-present). Previously, General Dunwoody served as a member of the Advisory Board and Nominating and Corporate Governance Committee of L3 Technologies, Inc. (communication, electronic, sensor and aerospace systems, 2013-2019) and a member of the Board and Audit and Sustainability and Corporate Responsibility Committees of Republic Services, Inc. (waste collection, disposal and recycling, 2013-2016). Ms. Dunwoody also serves on several boards for non-profit organizations, including as a member of the Board, Chair of the Nomination and Governance Committee and a member of the Audit Committee of Logistics Management Institute (consulting non-profit, 2012-present), a member of the Council of Trustees for the Association of the United States Army (advocacy non-profit, 2013-present), a member of the Board of Florida Institute of Technology (2015-present) and a member of the Board of ThanksUSA (military family education non-profit, 2014-present). General Dunwoody previously served as a member of the Advisory Board of certain Fidelity ® funds (2018).
John Engler (1948)
Year of Election or Appointment: 2014
Trustee
Mr. Engler also serves as Trustee of other Fidelity ® funds. Previously, Mr. Engler served as Governor of Michigan (1991-2003), President of the Business Roundtable (2011-2017) and interim President of Michigan State University (2018-2019). Mr. Engler currently serves as a member of the Board of Stride, Inc. (formerly K12 Inc.) (technology-based education company, 2012-present). Previously, Mr. Engler served as a member of the Board of Universal Forest Products (manufacturer and distributor of wood and wood-alternative products, 2003-2019) and Trustee of The Munder Funds (2003-2014). Mr. Engler previously served as a member of the Advisory Board of certain Fidelity ® funds (2014-2016).
Robert F. Gartland (1951)
Year of Election or Appointment: 2010
Trustee
Mr. Gartland also serves as Trustee of other Fidelity ® funds. Prior to his retirement, Mr. Gartland held a variety of positions at Morgan Stanley (financial services, 1979-2007), including Managing Director (1987-2007) and Chase Manhattan Bank (1975-1978). Mr. Gartland previously served as Chairman and an investor in Gartland & Mellina Group Corp. (consulting, 2009-2019), as a member of the Board of National Securities Clearing Corporation (1993-1996) and as Chairman of TradeWeb (2003-2004).
Arthur E. Johnson (1947)
Year of Election or Appointment: 2008
Trustee
Mr. Johnson also serves as Trustee of other Fidelity ® funds. Prior to his retirement, Mr. Johnson served as Senior Vice President of Corporate Strategic Development of Lockheed Martin Corporation (defense contractor, 1999-2009). Mr. Johnson currently serves as a member of the Board of Booz Allen Hamilton (management consulting, 2011-present). Mr. Johnson previously served as a member of the Board of Eaton Corporation plc (diversified power management, 2009-2019) and a member of the Board of AGL Resources, Inc. (holding company, 2002-2016). Mr. Johnson previously served as Chairman (2018-2021) and Vice Chairman (2015-2018) of the Independent Trustees of certain Fidelity® funds. Mr. Arthur E. Johnson is not related to Ms. Abigail P. Johnson.
Michael E. Kenneally (1954)
Year of Election or Appointment: 2009
Trustee
Chairman of the Independent Trustees
Mr. Kenneally also serves as Trustee of other Fidelity ® funds and was Vice Chairman (2018-2021) of the Independent Trustees of certain Fidelity ® funds. Prior to retirement in 2005, he was Chairman and Global Chief Executive Officer of Credit Suisse Asset Management, the worldwide fund management and institutional investment business of Credit Suisse Group. Previously, Mr. Kenneally was an Executive Vice President and the Chief Investment Officer for Bank of America. In this role, he was responsible for the investment management, strategy and products delivered to the bank's institutional, high-net-worth and retail clients. Earlier, Mr. Kenneally directed the organization's equity and quantitative research groups. He began his career as a research analyst and then spent more than a dozen years as a portfolio manager for endowments, pension plans and mutual funds. He earned the Chartered Financial Analyst (CFA) designation in 1991.
Marie L. Knowles (1946)
Year of Election or Appointment: 2001
Trustee
Ms. Knowles also serves as Trustee of other Fidelity ® funds. Prior to her retirement, Ms. Knowles held several positions at Atlantic Richfield Company (diversified energy), including Executive Vice President and Chief Financial Officer (1996-2000), Senior Vice President (1993-1996) and President of ARCO Transportation Company (pipeline and tanker operations, 1993-1996). Ms. Knowles currently serves as a member of the Board of the Santa Catalina Island Company (real estate, 2009-present), a member of the Investment Company Institute Board of Governors and a member of the Governing Council of the Independent Directors Council (2014-present). Ms. Knowles also serves as a member of the Advisory Board for the School of Engineering of the University of Southern California. Ms. Knowles previously served as a member of the Board of McKesson Corporation (healthcare service, 2002-2021). In addition, Ms. Knowles previously served as Chairman (2015-2018) and Vice Chairman (2012-2015) of the Independent Trustees of certain Fidelity ® funds.
Mark A. Murray (1954)
Year of Election or Appointment: 2016
Trustee
Mr. Murray also serves as Trustee of other Fidelity ® funds. Previously, Mr. Murray served as Co-Chief Executive Officer (2013-2016), President (2006-2013) and Vice Chairman (2013-2020) of Meijer, Inc. Mr. Murray serves as a member of the Board (2009-present) and Public Policy and Responsibility Committee (2009-present) and Chair of the Nuclear Review Committee (2019-present) of DTE Energy Company (diversified energy company). Mr. Murray previously served as a member of the Board of Spectrum Health (not-for-profit health system, 2015-2019) and as a member of the Board and Audit Committee and Chairman of the Nominating and Corporate Governance Committee of Universal Forest Products, Inc. (manufacturer and distributor of wood and wood-alternative products, 2004-2016). Mr. Murray also serves as a member of the Board of many community and professional organizations. Mr. Murray previously served as a member of the Advisory Board of certain Fidelity ® funds (2016).
+ The information includes the Trustee's principal occupation during the last five years and other information relating to the experience, attributes, and skills relevant to the Trustee's qualifications to serve as a Trustee, which led to the conclusion that the Trustee should serve as a Trustee for each fund.
Advisory Board Members and Officers:
Correspondence intended for a Member of the Advisory Board (if any) may be sent to Fidelity Investments, P.O. Box 55235, Boston, Massachusetts 02205-5235. Correspondence intended for an officer may be sent to Fidelity Investments, 245 Summer Street, Boston, Massachusetts 02210. Officers appear below in alphabetical order.
Name, Year of Birth; Principal Occupation
Laura M. Bishop (1961)
Year of Election or Appointment: 2022
Member of the Advisory Board
Ms. Bishop also serves as a Member of the Advisory Board of other funds. Prior to her retirement, Ms. Bishop held a variety of positions at United Services Automobile Association (2001-2020), including Executive Vice President and Chief Financial Officer (2014-2020) and Senior Vice President and Deputy Chief Financial Officer (2012-2014). Ms. Bishop currently serves as a member of the Audit Committee and Compensation and Personnel Committee (2021-present) of the Board of Directors of Korn Ferry (global organizational consulting).
Robert W. Helm (1957)
Year of Election or Appointment: 2021
Member of the Advisory Board
Mr. Helm also serves as a Member of the Advisory Board of other Fidelity® funds. Mr. Helm was formerly Deputy Chairman (2003-2020), partner (1991-2020) and an associate (1984-1991) of Dechert LLP (formerly Dechert Price & Rhoads). Mr. Helm currently serves on boards and committees of several not-for-profit organizations.
Craig S. Brown (1977)
Year of Election or Appointment: 2019
Assistant Treasurer
Mr. Brown also serves as an officer of other funds. Mr. Brown serves as Assistant Treasurer of FIMM, LLC (2021-present) and is an employee of Fidelity Investments (2013-present). Previously, Mr. Brown served as Assistant Treasurer of certain Fidelity ® funds (2019-2022).
John J. Burke III (1964)
Year of Election or Appointment: 2018
Chief Financial Officer
Mr. Burke also serves as Chief Financial Officer of other funds. Mr. Burke serves as Head of Investment Operations for Fidelity Fund and Investment Operations (2018-present) and is an employee of Fidelity Investments (1998-present). Previously Mr. Burke served as head of Asset Management Investment Operations (2012-2018).
David J. Carter (1973)
Year of Election or Appointment: 2020
Assistant Secretary
Mr. Carter also serves as Assistant Secretary of other funds. Mr. Carter serves as Senior Vice President, Deputy General Counsel (2022-present) and is an employee of Fidelity Investments (2005-present).
Jonathan Davis (1968)
Year of Election or Appointment: 2010
Assistant Treasurer
Mr. Davis also serves as an officer of other funds. Mr. Davis serves as Assistant Treasurer of FIMM, LLC (2021-present), FMR Capital, Inc. (2017-present), FD Funds GP LLC (2021-present), FD Funds Holding LLC (2021-present), and FD Funds Management LLC (2021-present); and is an employee of Fidelity Investments. Previously, Mr. Davis served as Vice President and Associate General Counsel of FMR LLC (diversified financial services company, 2003-2010).
Laura M. Del Prato (1964)
Year of Election or Appointment: 2018
President and Treasurer
Ms. Del Prato also serves as an officer of other funds. Ms. Del Prato serves as Assistant Treasurer of FIMM, LLC (2021-present) and is an employee of Fidelity Investments (2017-present). Previously, Ms. Del Prato served as President and Treasurer of The North Carolina Capital Management Trust: Cash Portfolio and Term Portfolio (2018-2020). Prior to joining Fidelity Investments, Ms. Del Prato served as a Managing Director and Treasurer of the JPMorgan Mutual Funds (2014-2017). Prior to JPMorgan, Ms. Del Prato served as a partner at Cohen Fund Audit Services (accounting firm, 2012-2013) and KPMG LLP (accounting firm, 2004-2012).
Colm A. Hogan (1973)
Year of Election or Appointment: 2016
Assistant Treasurer
Mr. Hogan also serves as an officer of other funds. Mr. Hogan serves as Assistant Treasurer of FIMM, LLC (2021-present) and FMR Capital, Inc. (2017-present) and is an employee of Fidelity Investments (2005-present). Previously, Mr. Hogan served as Deputy Treasurer of certain Fidelity ® funds (2016-2020) and Assistant Treasurer of certain Fidelity ® funds (2016-2018).
Cynthia Lo Bessette (1969)
Year of Election or Appointment: 2019
Secretary and Chief Legal Officer (CLO)
Ms. Lo Bessette also serves as an officer of other funds. Ms. Lo Bessette serves as CLO, Secretary, and Senior Vice President of Fidelity Management & Research Company LLC (investment adviser firm, 2019-present); CLO of Fidelity Management & Research (Hong Kong) Limited, FMR Investment Management (UK) Limited, and Fidelity Management & Research (Japan) Limited (investment adviser firms, 2019-present); Secretary of FD Funds GP LLC (2021-present), FD Funds Holding LLC (2021-present), FD Funds Management LLC (2021-present), and Fidelity Diversifying Solutions LLC (investment adviser firm, 2022-present); and Assistant Secretary of FIMM, LLC (2019-present). She is a Senior Vice President and Deputy General Counsel of FMR LLC (diversified financial services company, 2019-present), and is an employee of Fidelity Investments. Previously, Ms. Lo Bessette served as CLO, Secretary, and Senior Vice President of FMR Co., Inc. (investment adviser firm, 2019); Secretary of Fidelity SelectCo, LLC and Fidelity Investments Money Management, Inc. (investment adviser firms, 2019). Prior to joining Fidelity Investments, Ms. Lo Bessette was Executive Vice President, General Counsel (2016-2019) and Senior Vice President, Deputy General Counsel (2015-2016) of OppenheimerFunds (investment management company) and Deputy Chief Legal Officer (2013-2015) of Jennison Associates LLC (investment adviser firm).
Chris Maher (1972)
Year of Election or Appointment: 2013
Assistant Treasurer
Mr. Maher also serves as an officer of other funds. Mr. Maher serves as Assistant Treasurer of FIMM, LLC (2021-present) and FMR Capital, Inc. (2017-present), and is an employee of Fidelity Investments (2008-present). Previously, Mr. Maher served as Assistant Treasurer of certain funds (2013-2020); Vice President of Asset Management Compliance (2013), Vice President of the Program Management Group of FMR (investment adviser firm, 2010-2013), and Vice President of Valuation Oversight (2008-2010).
Jamie Pagliocco (1964)
Year of Election or Appointment: 2020
Vice President
Mr. Pagliocco also serves as Vice President of other funds. Mr. Pagliocco serves as President of Fixed Income (2020-present), and is an employee of Fidelity Investments (2001-present). Previously, Mr. Pagliocco served as Co-Chief Investment Officer - Bond (2017-2020), Global Head of Bond Trading (2016-2019), and as a portfolio manager.
Kenneth B. Robins (1969)
Year of Election or Appointment: 2020
Chief Compliance Officer
Mr. Robins also serves as an officer of other funds. Mr. Robins serves as Compliance Officer of Fidelity Management & Research Company LLC (investment adviser firm, 2016-present) and is an employee of Fidelity Investments (2004-present). Previously, Mr. Robins served as Compliance Officer of FMR Co., Inc. (investment adviser firm, 2016-2019), as Executive Vice President of Fidelity Investments Money Management, Inc. (investment adviser firm, 2013-2016) and served in other fund officer roles.
Brett Segaloff (1972)
Year of Election or Appointment: 2021
Anti-Money Laundering (AML) Officer
Mr. Segaloff also serves as an AML Officer of other funds and other related entities. He is Director, Anti-Money Laundering (2007-present) of FMR LLC (diversified financial services company) and is an employee of Fidelity Investments (1996-present).
Stacie M. Smith (1974)
Year of Election or Appointment: 2013
Assistant Treasurer
Ms. Smith also serves as an officer of other funds. Ms. Smith serves as Assistant Treasurer of FIMM, LLC (2021-present) and FMR Capital, Inc. (2017-present), is an employee of Fidelity Investments (2009-present), and has served in other fund officer roles. Prior to joining Fidelity Investments, Ms. Smith served as Senior Audit Manager of Ernst & Young LLP (accounting firm, 1996-2009). Previously, Ms. Smith served as Assistant Treasurer (2013-2019) and Deputy Treasurer (2013-2016) of certain Fidelity ® funds.
Jim Wegmann (1979)
Year of Election or Appointment: 2021
Deputy Treasurer
Mr. Wegmann also serves as an officer of other funds. Mr. Wegmann serves as Assistant Treasurer of FIMM, LLC (2021-present) and is an employee of Fidelity Investments (2011-present). Previously, Mr. Wegmann served as Assistant Treasurer of certain Fidelity ® funds (2019-2021).
As a shareholder, you incur two types of costs: (1) transaction costs, which may include sales charges (loads) on purchase payments or redemption proceeds, as applicable and (2) ongoing costs, which generally include management fees, distribution and/or service (12b-1) fees and other Fund expenses. This Example is intended to help you understand your ongoing costs (in dollars) of investing in a fund and to compare these costs with the ongoing costs of investing in other mutual funds.
| The Example is based on an investment of $1,000 invested at the beginning of the period and held for the entire period (May 1, 2022 to October 31, 2022). |
Actual Expenses
The first line of the accompanying table provides information about actual account values and actual expenses. You may use the information in this line, together with the amount you invested, to estimate the expenses that you paid over the period. Simply divide your account value by $1,000.00 (for example, an $8,600 account value divided by $1,000.00 = 8.6), then multiply the result by the number in the first line for a class/Fund under the heading entitled "Expenses Paid During Period" to estimate the expenses you paid on your account during this period. If any fund is a shareholder of any underlying mutual funds or exchange-traded funds (ETFs) (the Underlying Funds), such fund indirectly bears its proportional share of the expenses of the Underlying Funds in addition to the direct expenses incurred presented in the table. These fees and expenses are not included in the annualized expense ratio used to calculate the expense estimate in the table below.
Hypothetical Example for Comparison Purposes
The second line of the accompanying table provides information about hypothetical account values and hypothetical expenses based on the actual expense ratio and an assumed rate of return of 5% per year before expenses, which is not the actual return. The hypothetical account values and expenses may not be used to estimate the actual ending account balance or expenses you paid for the period. You may use this information to compare the ongoing costs of investing in the Fund and other funds. To do so, compare this 5% hypothetical example with the 5% hypothetical examples that appear in the shareholder reports of the other funds. If any fund is a shareholder of any Underlying Funds, such fund indirectly bears its proportional share of the expenses of the Underlying Funds in addition to the direct expenses as presented in the table. These fees and expenses are not included in the annualized expense ratio used to calculate the expense estimate in the table below.
Please note that the expenses shown in the table are meant to highlight your ongoing costs only and do not reflect any transaction costs. Therefore, the second line of the table is useful in comparing ongoing costs only, and will not help you determine the relative total costs of owning different funds. In addition, if these transactional costs were included, your costs would have been higher.
| | | | | Annualized Expense Ratio- A | | Beginning Account Value May 1, 2022 | | Ending Account Value October 31, 2022 | | Expenses Paid During Period- C May 1, 2022 to October 31, 2022 |
| | | | | | | | | | |
| Fidelity® Emerging Markets Index Fund | | | | .07% | | | | | | |
| Actual | | | | | | $ 1,000 | | $ 812.90 | | $ .32 |
Hypothetical- B | | | | | | $ 1,000 | | $ 1,024.85 | | $ .36 |
| | | | | | | | | | |
| Fidelity® Global ex U.S. Index Fund | | | | .05% | | | | | | |
| Actual | | | | | | $ 1,000 | | $ 863.70 | | $ .23 |
Hypothetical- B | | | | | | $ 1,000 | | $ 1,024.95 | | $ .26 |
| |
A Annualized expense ratio reflects expenses net of applicable fee waivers.
B 5% return per year before expenses
C Expenses are equal to the annualized expense ratio, multiplied by the average account value over the period, multiplied by 184/ 365 (to reflect the one-half year period). The fees and expenses of any Underlying Funds are not included in each annualized expense ratio.
The dividend and capital gains distributions for the fund(s) are available on Fidelity.com or Institutional.Fidelity.com.
A percentage of the dividends distributed during the fiscal year for the following funds may be taken into account as a dividend for purposes of the maximum rate under section 1(h)(11) of the Internal Revenue Code.
| Fidelity Emerging Markets Index Fund | |
| December, 2021 | 45% |
| Fidelity Global ex U.S. Index Fund | |
| December 6, 2021 | 74% |
| December 29, 2021 | 77% |
The amounts per share which represent income derived from sources within, and taxes paid to, foreign countries or possessions of the United States are as follows:
| | Pay Date | Income | Taxes |
| Fidelity Emerging Markets Index Fund | 12/06/2021 | $0.2813 | $0.0259 |
| Fidelity Global ex U.S. Index Fund | 12/06/2021 | $0.4278 | $0.0428 |
| Fidelity Global ex U.S. Index Fund | 12/29/2021 | $0.0081 | $0.0000 |
The funds will notify shareholders in January 2023 of amounts for use in preparing 2022 income tax returns.
Fidelity Emerging Markets Index Fund
Fidelity Global ex U.S. Index Fund
Each year, the Board of Trustees, including the Independent Trustees (together, the Board), votes on the renewal of the management contract with Fidelity Management & Research Company LLC (FMR) and the sub-advisory agreement (Sub-Advisory Agreement) for each fund with Geode Capital Management, LLC (Geode) (together, the Advisory Contracts). FMR and Geode are referred to herein as the Investment Advisers. The Board, assisted by the advice of fund counsel and Independent Trustees' counsel, requests and considers a broad range of information relevant to the renewal of the Advisory Contracts throughout the year.
The Board meets regularly and, at each of its meetings, covers an extensive agenda of topics and materials and considers factors that are relevant to its annual consideration of the renewal of each fund's Advisory Contracts, including the services and support provided to each fund and its shareholders. The Board has established four standing committees (Committees) - Operations, Audit, Fair Valuation, and Governance and Nominating - each composed of and chaired by Independent Trustees with varying backgrounds, to which the Board has assigned specific subject matter responsibilities in order to enhance effective decision-making by the Board. The Operations Committee, of which all the Independent Trustees are members, meets regularly throughout the year and requests, receives and considers, among other matters, information related to the annual consideration of the renewal of each fund's Advisory Contracts before making its recommendation to the Board. The Board also meets as needed to review matters specifically related to the Board's annual consideration of the renewal of the Advisory Contracts. Members of the Board may also meet from time to time with trustees of other Fidelity funds through joint ad hoc committees to discuss certain matters relevant to all of the Fidelity funds.
At its September 2022 meeting, the Board unanimously determined to renew each fund's Advisory Contracts. In reaching its determination, the Board considered all factors it believed relevant, including (i) the nature, extent, and quality of the services provided to each fund and its shareholders (including the investment performance of each fund); (ii) the competitiveness relative to peer funds of each fund's management fee and total expense ratio; (iii) the total costs of the services provided by and the profits realized by Fidelity and Geode from their respective relationships with each fund; and (iv) the extent to which, if any, economies of scale exist and are realized as each fund grows, and whether any economies of scale are appropriately shared with fund shareholders.
In considering whether to renew the Advisory Contracts for each fund, the Board reached a determination, with the assistance of fund counsel and Independent Trustees' counsel and through the exercise of its business judgment, that the renewal of the Advisory Contracts was in the best interests of each fund and its shareholders and that the compensation payable under the Advisory Contracts was fair and reasonable. The Board's decision to renew the Advisory Contracts was not based on any single factor, but rather was based on a comprehensive consideration of all the information provided to the Board at its meetings throughout the year. The Board, in reaching its determination to renew the Advisory Contracts, was aware that shareholders of each fund have a broad range of investment choices available to them, including a wide choice among funds offered by Fidelity's competitors, and that each fund's shareholders, who have the opportunity to review and weigh the disclosure provided by the fund in its prospectus and other public disclosures, have chosen to invest in that fund, which is part of the Fidelity family of funds.
Nature, Extent, and Quality of Services Provided . The Board considered staffing as it relates to the funds, including the backgrounds of investment personnel of Fidelity and Geode, and also considered the funds' investment objectives, strategies, and related investment philosophies. The Independent Trustees also had discussions with senior management of Fidelity's investment operations and investment groups and with senior management of Geode. The Board considered the structure of the investment personnel compensation programs and whether the structures provide appropriate incentives to act in the best interests of each fund. The Board also considered the steps Fidelity and Geode had taken to ensure the continued provision of high quality services to the Fidelity funds throughout the COVID-19 pandemic, including the expansion of staff in client facing positions to maintain service levels in periods of high volumes and volatility.
The Trustees also discussed with representatives of Fidelity, at meetings throughout the year, Fidelity's role in, among other things, overseeing compliance with federal securities laws and other applicable requirements by Geode with respect to the funds and monitoring and overseeing the performance and investment capabilities of Geode. The Trustees considered that the Board had received from Fidelity periodic reports about its oversight and due diligence processes, as well as periodic reports regarding the performance of Geode.
The Board also considered the nature, extent and quality of services provided by Geode. The Trustees noted that under the Sub-Advisory Agreement, subject to oversight by Fidelity, Geode is responsible for, among other things, identifying investments and arranging for execution of portfolio transactions to implement each fund's investment strategy. In addition, the Trustees noted that Geode is responsible for providing such reporting as may be requested by Fidelity to fulfill its oversight responsibilities discussed above.
Resources Dedicated to Investment Management and Support Services . The Board reviewed the general qualifications and capabilities of Fidelity's and Geode's investment staffs, including their size, education, experience, and resources, as well as Fidelity's and Geode's approach to recruiting, training, managing, and compensating investment personnel. The Board noted the resources devoted to Fidelity's global investment organization and that Fidelity's and Geode's analysts have extensive resources, tools and capabilities that allow them to conduct quantitative and fundamental analysis, as well as credit analysis of issuers, counterparties, and guarantors. Further, the Board considered that Fidelity's and Geode's investment professionals have sufficient access to information and data so as to provide competitive investment results over time, and that those professionals also have access to sophisticated tools that permit them to assess portfolio construction and risk and performance attribution characteristics continuously. Additionally, in its deliberations, the Board considered Fidelity's and Geode's trading, risk management, compliance, cybersecurity, and technology and operations capabilities and resources, which are integral parts of the investment management process.
Shareholder and Administrative Services . The Board considered (i) the nature, extent, quality, and cost of advisory, administrative, and shareholder services performed by the Investment Advisers and their affiliates under the Advisory Contracts and by FMR's affiliates under separate agreements covering transfer agency, pricing and bookkeeping, and securities lending services for each fund; (ii) the nature and extent of the supervision of third party service providers, principally custodians, subcustodians, and pricing vendors; and (iii) the resources devoted to, and the record of compliance with, each fund's compliance policies and procedures. The Board also reviewed the allocation of fund brokerage, including allocations to brokers affiliated with the Investment Advisers.
The Board noted that the growth of fund assets over time across the complex allows Fidelity to reinvest in the development of services designed to enhance the value and convenience of the Fidelity funds as investment vehicles. These services include 24-hour access to account information and market information over the Internet and through telephone representatives, investor education materials and asset allocation tools. The Board also considered that it reviews customer service metrics such as telephone response times, continuity of services on the website and metrics addressing services at Fidelity Investor Centers.
Investment in a Large Fund Family . The Board considered the benefits to shareholders of investing in a Fidelity fund, including the benefits of investing in a fund that is part of a large family of funds offering a variety of investment disciplines and providing a large variety of mutual fund investor services. The Board noted that Fidelity had taken, or had made recommendations to the Board that resulted in the Fidelity funds taking, a number of actions over the previous year that benefited particular funds, including: (i) continuing to dedicate additional resources to Fidelity's investment research process, which includes meetings with management of issuers of securities in which the funds invest; (ii) continuing efforts to enhance Fidelity's global research capabilities; (iii) launching new funds, ETFs, and share classes with innovative structures, strategies and pricing and making other enhancements to meet investor needs; (iv) broadening eligibility requirements for certain funds and share classes; (v) reducing management fees and total expenses for certain funds and classes; (vi) lowering expenses for certain existing funds and classes by implementing or lowering expense caps; (vii) rationalizing product lines and gaining increased efficiencies from fund mergers and liquidations; (viii) continuing to develop, acquire and implement systems and technology to improve services to the funds and shareholders, strengthen information security, and increase efficiency; and (ix) continuing to implement enhancements to further strengthen Fidelity's product line to increase investors' probability of success in achieving their investment goals, including their retirement income goals.
Investment Performance . The Board considered whether each fund has operated in accordance with its investment objective, as well as its record of compliance with its investment restrictions and its performance history.
The Board took into account discussions that occur at Board meetings throughout the year with representatives of the Investment Advisers about fund investment performance. In this regard the Board noted that as part of regularly scheduled fund reviews and other reports to the Board on fund performance, the Board considers annualized return information for each fund for different time periods, measured against the securities market index the fund seeks to track. The Board also periodically considers each fund's tracking error versus its benchmark index.
In addition to reviewing absolute and relative fund performance, the Independent Trustees periodically consider the appropriateness of fund performance metrics in evaluating the results achieved. In general, the Independent Trustees believe that an index fund's performance should be evaluated based on gross performance (before fees and expenses but after transaction costs) compared to a fund's benchmark index, over appropriate time periods, taking into account relevant factors including the following: general market conditions; the characteristics of the fund's benchmark index; the extent to which statistical sampling is employed; any securities lending revenues; and fund cash flows and other factors. The Independent Trustees generally give greater weight to fund performance over longer time periods than over shorter time periods. Depending on the circumstances, the Independent Trustees may be satisfied with a fund's performance notwithstanding that it lags its benchmark index for certain periods.
The Independent Trustees recognize that shareholders evaluate performance on a net basis (after fees and expenses) over their own holding periods, for which one-, three-, and five-year periods are often used as a proxy. For this reason, the performance information reviewed by the Board also included net cumulative calendar year total return information for each fund and its benchmark index for the most recent one-, three-, and five-year periods. No performance peer group information was considered by the Board as Fidelity advised the Board that the peer groups, which are created by a third-party provider, include a number of actively-managed funds. The Independent Trustees recognize that shareholders who are not investing through a tax-advantaged retirement account also consider tax consequences in evaluating performance.
Based on its review, the Board concluded that the nature, extent, and quality of services provided to each fund under the Advisory Contracts should continue to benefit the shareholders of each fund.
Competitiveness of Management Fee and Total Expense Ratio . The Board considered each fund's management fee and total expense ratio compared to selected groups of competitive funds and classes (referred to as "mapped groups" below) for the purpose of facilitating the Trustees' competitive analysis of management fees and total expenses. Fidelity creates "mapped groups" by combining similar investment objective categories (as classified by Lipper) that have comparable investment mandates. Combining funds with similar investment objective categories aids the Board's comparisons of management fees and total expense ratios by broadening the competitive group used for such comparisons.
Management Fee . The Board considered two proprietary management fee comparisons for the 12-month periods shown in basis points (BP) in the charts below. The group of Lipper funds used by the Board for management fee comparisons is referred to below as the "Total Mapped Group." The Total Mapped Group comparison focuses on a fund's standing in terms of gross management fees before expense reimbursements or caps relative to the total universe of funds with comparable investment mandates, regardless of whether their management fee structures also are comparable. Funds with comparable investment mandates offer exposure to similar types of securities. Funds with comparable management fee structures have similar management fee contractual arrangements (e.g., flat rate charged for advisory services, all-inclusive fee rate, etc.). "TMG %" represents the percentage of funds in the Total Mapped Group that had management fees that were lower than a fund's. For example, a hypothetical TMG % of 20% would mean that 80% of the funds in the Total Mapped Group had higher, and 20% had lower, management fees than a fund. The funds' actual TMG %s and the number of funds in the Total Mapped Group are in the charts below. The "Asset-Sized Peer Group" (ASPG) comparison focuses on a fund's standing relative to a subset of non-Fidelity funds within the Total Mapped Group that are similar in size and management fee structure. For example, if a fund is in the first quartile of the ASPG, the fund's management fee ranks in the least expensive or lowest 25% of funds in the ASPG. The ASPG represents at least 15% of the funds in the Total Mapped Group with comparable asset size and management fee structures, subject to a minimum of 50 funds (or all funds in the Total Mapped Group if fewer than 50). Additional information, such as the ASPG quartile in which a fund's management fee rate ranked, is also included in the charts and was considered by the Board.
Fidelity Emerging Markets Index Fund
The Board considered that (i) effective August 1, 2017, the fund's management fee rate was reduced from 0.09% to 0.08%, and (ii) effective August 1, 2019, the fund's management fee rate was further reduced from 0.08% to 0.075%. The Board considered that the chart below reflects the fund's lower management fee rates for 2017 and 2019 (as well as the 2019 reduction in 2018), as if the lower fee rates were in effect for the entire year.
The Board noted that the fund's management fee rate ranked below the median of its Total Mapped Group and below the median of its ASPG for 2021.
Fidelity Global ex U.S. Index Fund
The Board considered that, effective August 1, 2019, the fund's management fee rate was reduced from 0.06% to 0.055%. The Board considered that the chart below reflects the fund's lower management fee rate for 2019 (as well as the 2019 reduction in 2018), as if the lower fee rate were in effect for the entire year.
The Board noted that the fund's management fee rate ranked below the median of its Total Mapped Group and below the median of its ASPG for 2021.
At its September 2022 meeting, the Board also approved an amendment to the Global ex U.S. Index Fund's sub-advisory agreement with Geode (effective October 1, 2022) that reduced the sub-advisory fee rate that FMR pays to Geode.
Based on its review, the Board concluded that each fund's management fee is fair and reasonable in light of the services that the fund receives and the other factors considered.
Total Expense Ratio . In its review of each fund's total expense ratio, the Board considered the fund's unitary (subject to certain limited exceptions) fee rate as well as fund expenses paid by FMR under the fund's management contract, such as transfer agent fees, pricing and bookkeeping fees, and custodial, legal, and audit fees. The Board also noted that Fidelity may agree to waive fees or reimburse expenses from time to time, and the extent to which, if any, it has done so for each fund. Each fund is compared to those funds and classes in the Total Mapped Group (used by the Board for management fee comparisons) that have a similar sales load structure. The Board also considered a total expense ASPG comparison, which focuses on the total expenses of each fund relative to a subset of non-Fidelity funds within the similar sales load structure group that are similar in size and management fee structure. The total expense ASPG is limited to 15 larger and 15 smaller classes of different funds, where possible. The total expense ASPG comparison excludes performance adjustments and fund-paid 12b-1 fees to eliminate variability in expenses relating to these items.
The Board noted that each fund's total net expense ratio ranked below the similar sales load structure group competitive median and below the ASPG competitive median for 2021.
The Board considered that current contractual arrangements for the funds oblige FMR to pay all expenses of each fund to the extent necessary to limit total operating expenses, with certain exceptions, to 0.075% for Fidelity Emerging Markets Index Fund and 0.055% for Fidelity Global ex U.S. Index Fund. These contractual arrangements terminate on December 31, 2023 and may not be amended to increase the fees or expenses payable except by a vote of a majority of the Board.
Fees Charged to Other Clients . The Board also considered fee structures and other information with respect to clients of Fidelity and Geode, such as other funds advised or subadvised by Fidelity or Geode, pension plan clients, and other institutional clients with similar mandates. The Board noted that a joint ad hoc committee created by it and the boards of other Fidelity funds periodically reviews and compares Fidelity's institutional investment advisory business with its business of providing services to the Fidelity funds and also noted the most recent findings of the committee. The Board noted that the committee's review included a consideration of the differences in services provided, fees charged, and costs incurred, as well as competition in the markets serving the different categories of clients.
Based on its review of total expense ratios and fees charged to other Fidelity clients, the Board concluded that each fund's total expense ratio was reasonable in light of the services that the fund and its shareholders receive and the other factors considered.
Costs of the Services and Profitability . The Board considered the revenues earned and the expenses incurred by Fidelity in conducting the business of developing, marketing, distributing, managing, administering and servicing each fund and servicing each fund's shareholders. The Board also considered the level of Fidelity's profits in respect of all the Fidelity funds.
On an annual basis, Fidelity presents to the Board information about the profitability of its relationships with each fund. Fidelity calculates profitability information for each fund, as well as aggregate profitability information for groups of Fidelity funds and all Fidelity funds, using a series of detailed revenue and cost allocation methodologies which originate with the books and records of Fidelity on which Fidelity's audited financial statements are based. The Audit Committee of the Board reviews any significant changes from the prior year's methodologies and the full Board approves such changes.
A public accounting firm has been engaged annually by the Board as part of the Board's assessment of Fidelity's profitability analysis. The engagement includes the review and assessment of the methodologies used by Fidelity in determining the revenues and expenses attributable to Fidelity's mutual fund business, and completion of agreed-upon procedures in respect of the mathematical accuracy of certain fund profitability information and its conformity to established allocation methodologies. After considering the reports issued under the engagement and information provided by Fidelity, the Board concluded that while other allocation methods may also be reasonable, Fidelity's profitability methodologies are reasonable in all material respects.
The Board also reviewed Fidelity's and Geode's non-fund businesses and potential indirect benefits such businesses may have received as a result of their association with Fidelity's mutual fund business (i.e., fall-out benefits) as well as cases where Fidelity's and Geode's affiliates may benefit from the funds' business. The Board considered areas where potential indirect benefits to the Fidelity funds from their relationships with Fidelity may exist. The Board's consideration of these matters was informed by the findings of a joint ad hoc committee created by it and the boards of other Fidelity funds to evaluate potential fall-out benefits.
The Board considered the costs of the services provided by and the profits realized by Fidelity in connection with the operation of each fund and was satisfied that the profitability was not excessive.
The Board also considered information regarding the profitability of Geode's relationship with each fund.
Economies of Scale . The Board considered whether there have been economies of scale in respect of the management of the Fidelity funds, whether the Fidelity funds (including each fund) have appropriately benefited from any such economies of scale, and whether there is potential for realization of any further economies of scale. The Board considered the extent to which each fund will benefit from economies of scale as assets grow through increased services to the fund, through waivers or reimbursements, or through fee or expense ratio reductions. The Board recognized that, due to each fund's current contractual arrangements, its expense ratio will not decline if the fund's operating costs decrease as assets grow, or rise as assets decrease. The Board also noted that a committee (the Economies of Scale Committee) created by it and the boards of other Fidelity funds periodically analyzes whether Fidelity attains economies of scale in respect of the management and servicing of the Fidelity funds, whether the Fidelity funds have appropriately benefited from such economies of scale, and whether there is potential for realization of any further economies of scale.
The Board concluded, taking into account the analysis of the Economies of Scale Committee, that economies of scale, if any, are being appropriately shared between fund shareholders and Fidelity.
Additional Information Requested by the Board . In order to develop fully the factual basis for consideration of the Fidelity funds' advisory contracts, the Board requested and received additional information on certain topics, including: (i) Fidelity's fund profitability methodology, profitability trends for certain funds, the allocation of various costs to different funds, and the impact of certain factors on fund profitability results; (ii) portfolio manager changes that have occurred during the past year and the amount of the investment that each portfolio manager has made in the Fidelity fund(s) that he or she manages; (iii) the extent to which current market conditions have affected retention and recruitment of personnel; (iv) the arrangements with and compensation paid to certain fund sub-advisers on behalf of the Fidelity funds and the treatment of such compensation within Fidelity's fund profitability methodology; (v) the terms of the funds' various management fee structures, including the basic group fee and the terms of Fidelity's voluntary expense limitation arrangements; (vi) Fidelity's transfer agent, pricing and bookkeeping fees, expense and service structures for different funds and classes relative to competitive trends; (vii) the impact on fund profitability of recent industry trends, such as the growth in passively managed funds and the changes in flows for different types of funds; (viii) the types of management fee and total expense comparisons provided, and the challenges and limitations associated with such information; and (ix) explanations regarding the relative total expense ratios and management fees of certain funds and classes, total expense and management fee competitive trends, and methodologies for total expense and management fee competitive comparisons. In addition, the Board considered its discussions with Fidelity regarding Fidelity's efforts to maintain the continuous investment and shareholder services necessary for the funds during the current pandemic and economic circumstances.
Based on its evaluation of all of the conclusions noted above, and after considering all factors it believed relevant, the Board concluded that the advisory and sub-advisory fee arrangements are fair and reasonable and that each fund's Advisory Contracts should be renewed.
1.929368.111
EMX-I-GUX-I-ANN-1222
Fidelity® SAI International Index Fund
Annual Report
October 31, 2022
Offered exclusively to certain clients of the Adviser, or its affiliates, including Strategic Advisers LLC (Strategic Advisers) - not available for sale to the general public. Fidelity ® SAI is a product name of Fidelity ® funds dedicated to certain programs affiliated with Strategic Advisers.
Contents
To view a fund's proxy voting guidelines and proxy voting record for the 12-month period ended June 30, visit http://www.fidelity.com/proxyvotingresults or visit the Securities and Exchange Commission's (SEC) web site at http://www.sec.gov.
You may also call 1-800-544-3455 to request a free copy of the proxy voting guidelines.
The funds or securities referred to herein are not sponsored, endorsed, or promoted by MSCI, and MSCI bears no liability with respect to any such funds or securities or any index on which such funds or securities are based. The prospectus contains a more detailed description of the limited relationship MSCI has with Fidelity and any related funds.
Standard & Poor's, S&P and S&P 500 are registered service marks of The McGraw-Hill Companies, Inc. and have been licensed for use by Fidelity Distributors Corporation.
Other third-party marks appearing herein are the property of their respective owners.
All other marks appearing herein are registered or unregistered trademarks or service marks of FMR LLC or an affiliated company. © 2022 FMR LLC. All rights reserved.
This report and the financial statements contained herein are submitted for the general information of the shareholders of the Fund. This report is not authorized for distribution to prospective investors in the Fund unless preceded or accompanied by an effective prospectus.
A fund files its complete schedule of portfolio holdings with the SEC for the first and third quarters of each fiscal year on Form N-PORT. Forms N-PORT are available on the SEC's web site at http://www.sec.gov. A fund's Forms N-PORT may be reviewed and copied at the SEC's Public Reference Room in Washington, DC. Information regarding the operation of the SEC's Public Reference Room may be obtained by calling 1-800-SEC-0330.
For a complete list of a fund's portfolio holdings, view the most recent holdings listing, semiannual report, or annual report on Fidelity's web site at http://www.fidelity.com, http://www.institutional.fidelity.com, or http://www.401k.com, as applicable.
NOT FDIC INSURED •MAY LOSE VALUE •NO BANK GUARANTEE
Neither the Fund nor Fidelity Distributors Corporation is a bank.
Average annual total return reflects the change in the value of an investment, assuming reinvestment of distributions from dividend income and capital gains (the profits earned upon the sale of securities that have grown in value, if any) and assuming a constant rate of performance each year. The hypothetical investment and the average annual total returns do not reflect the deduction of taxes that a shareholder would pay on fund distributions or the redemption of fund shares. During periods of reimbursement by Fidelity, a fund's total return will be greater than it would be had the reimbursement not occurred. How a fund did yesterday is no guarantee of how it will do tomorrow.
| Average Annual Total Returns |
| | | | |
Periods ended October 31, 2022 | Past 1 year | Past 5 years | Life of Fund A |
| Fidelity® SAI International Index Fund | -23.00% | -0.04% | 3.39% |
A From January 05, 2016
| $10,000 Over Life of Fund |
| |
Let's say hypothetically that $10,000 was invested in Fidelity® SAI International Index Fund, on January 05, 2016, when the fund started. The chart shows how the value of your investment would have changed, and also shows how the MSCI EAFE Index performed over the same period. |
|
|
Market Recap:
International equities returned -24.61% for the 12 months ending October 31, 2022, according to the MSCI ACWI (All Country World Index) ex USA Index. After gaining 7.98% in 2021, non-U.S. stocks retreated in the new year, as a multitude of risk factors challenged the global economy and financial markets. Persistently high inflation in some markets, exacerbated by energy price shocks from the Russia-Ukraine conflict, spurred the U.S. Federal Reserve and other central banks to aggressively tighten monetary policy, and market interest rates eclipsed their highest level in roughly a decade, stoking recession fears and sending stocks into bear market territory. Other factors influencing equities abroad included surging global commodity prices, rising sovereign bond yields in some markets, ongoing global supply-chain disruption, a broadly strong U.S. dollar and the potential for variants of the coronavirus to upend global economic growth. Against this backdrop, the index returned -24.20% year to date through October. For the full 12 months, emerging markets (-31%) and Europe ex U.K. (-25%) notably lagged. Conversely, Canada (-13%) and the U.K. (-12%) held up best. Among the 11 sectors, information technology and consumer discretionary (-37% each) fared worst. Communication services (-34%) also trailed the broader market. In contrast, energy gained 2% amid high prices for oil and natural gas. The defensive-oriented utilities (-16%) sector also outperformed, as did financials and consumer staples (-18% each).
Comments from the Geode Capital Management, LLC, passive equity index team:
For the fiscal year ending October 31, 2022, the fund returned -23.00%, roughly in line with the -22.84% result of the benchmark MSCI EAFE Index (Net MA). (The fund's relative performance was affected by differing methodologies (fund versus index) for valuing certain foreign stocks and for incorporating foreign exchange rates, which differ from those used by the index, as well as by local tax laws or regulations, which vary by country.) By region, Europe ex U.K. returned -25.71% and detracted most, followed by Japan (-24.43%). By sector, stocks in the industrials sector returned -27% and detracted most, followed by consumer discretionary, which returned -31%. Financials returned -20% and information technology detracted -36%. Health care (-17%) and consumer staples (-19%) hampered results. Other notable detractors included the materials (-20%) and communication services (-23%) sectors. Real estate (-31%) and utilities (-21%) also hurt. In contrast, energy gained 16% and contributed most. Turning to individual stocks, the biggest individual detractor was ASML Holding (-41%), from the semiconductors & semiconductor equipment group, followed by Sony (-41%), which is in the consumer durables & apparel category. Within food, beverage & tobacco, Nestle returned -16% and hurt. Other detractors were Sea (-85%), a stock in the media & entertainment industry, and Recruit Holdings (-53%), from the commercial & professional services segment. Conversely, the biggest individual contributor was Shell (+25%), from the energy sector. Also in energy, BP (+20%) and TotalEnergies (+14%) helped. British American Tobacco, within the food, beverage & tobacco group, advanced 21% and lifted the fund. Another contributor was Daiichi (+28%), a stock in the pharmaceuticals, biotechnology & life sciences segment.
The views expressed above reflect those of the portfolio manager(s) only through the end of the period as stated on the cover of this report and do not necessarily represent the views of Fidelity or any other person in the Fidelity organization. Any such views are subject to change at any time based upon market or other conditions and Fidelity disclaims any responsibility to update such views. These views may not be relied on as investment advice and, because investment decisions for a Fidelity fund are based on numerous factors, may not be relied on as an indication of trading intent on behalf of any Fidelity fund.
Top Holdings (% of Fund's net assets) |
| |
| Nestle SA (Reg. S) (Switzerland, Food Products) | 2.3 | |
| Roche Holding AG (participation certificate) (Switzerland, Pharmaceuticals) | 1.8 | |
| Shell PLC (London) (United Kingdom, Oil, Gas & Consumable Fuels) | 1.6 | |
| ASML Holding NV (Netherlands) (Netherlands, Semiconductors & Semiconductor Equipment) | 1.5 | |
| AstraZeneca PLC (United Kingdom) (United Kingdom, Pharmaceuticals) | 1.4 | |
| Novo Nordisk A/S Series B (Denmark, Pharmaceuticals) | 1.4 | |
| LVMH Moet Hennessy Louis Vuitton SE (France, Textiles, Apparel & Luxury Goods) | 1.3 | |
| Novartis AG (Switzerland, Pharmaceuticals) | 1.3 | |
| Toyota Motor Corp. (Japan, Automobiles) | 1.1 | |
| TotalEnergies SE (France, Oil, Gas & Consumable Fuels) | 1.0 | |
| | 14.7 | |
| |
| Market Sectors (% of Fund's net assets) |
| |
| Financials | 17.2 | |
| Industrials | 14.9 | |
| Health Care | 14.1 | |
| Consumer Discretionary | 10.9 | |
| Consumer Staples | 10.3 | |
| Information Technology | 8.3 | |
| Materials | 7.7 | |
| Energy | 5.1 | |
| Communication Services | 4.5 | |
| Utilities | 3.5 | |
| Real Estate | 1.8 | |
| |
Asset Allocation (% of Fund's net assets) |
|
Foreign investments - 98.2% |
|
Geographic Diversification (% of Fund's net assets) |
|
* Includes Short-Term investments and Net Other Assets (Liabilities). Percentages are based on country or territory of incorporation and are adjusted for the effect of futures contracts, if applicable. |
| |
Showing Percentage of Net Assets
| Common Stocks - 97.8% |
| | | Shares | Value ($) |
| Australia - 7.7% | | | |
| Ampol Ltd. | | 57,382 | 999,461 |
| APA Group unit | | 284,909 | 1,915,364 |
| Aristocrat Leisure Ltd. | | 145,615 | 3,452,797 |
| ASX Ltd. | | 46,721 | 2,023,220 |
| Aurizon Holdings Ltd. | | 443,148 | 1,026,124 |
| Australia & New Zealand Banking Group Ltd. | | 720,594 | 11,806,024 |
| BHP Group Ltd. | | 1,224,495 | 29,262,154 |
| BlueScope Steel Ltd. | | 113,969 | 1,146,721 |
| Brambles Ltd. | | 350,831 | 2,621,098 |
| Cochlear Ltd. | | 15,855 | 2,025,389 |
| Coles Group Ltd. | | 323,066 | 3,374,581 |
| Commonwealth Bank of Australia | | 412,810 | 27,641,164 |
| Computershare Ltd. | | 132,785 | 2,146,331 |
| CSL Ltd. | | 116,557 | 20,911,379 |
| Dexus unit | | 258,397 | 1,282,601 |
| Dominos Pizza Enterprises Ltd. | | 14,436 | 588,667 |
| Endeavour Group Ltd. | | 327,604 | 1,498,296 |
| Evolution Mining Ltd. | | 447,056 | 594,795 |
| Fortescue Metals Group Ltd. | | 409,123 | 3,854,350 |
| Goodman Group unit | | 406,377 | 4,418,964 |
| IDP Education Ltd. | | 50,913 | 963,643 |
| Insurance Australia Group Ltd. | | 595,136 | 1,865,326 |
| Lendlease Group unit | | 166,379 | 924,827 |
| Macquarie Group Ltd. | | 88,099 | 9,551,753 |
| Medibank Private Ltd. | | 671,680 | 1,207,289 |
| Mineral Resources Ltd. | | 41,617 | 1,946,744 |
| Mirvac Group unit | | 948,519 | 1,255,911 |
| National Australia Bank Ltd. | | 776,372 | 16,126,836 |
| Newcrest Mining Ltd. | | 218,319 | 2,417,944 |
| Northern Star Resources Ltd. | | 284,165 | 1,588,636 |
| Orica Ltd. | | 108,328 | 961,773 |
| Origin Energy Ltd. | | 424,564 | 1,512,658 |
| Qantas Airways Ltd. (a) | | 225,396 | 841,979 |
| QBE Insurance Group Ltd. | | 358,337 | 2,805,534 |
| Ramsay Health Care Ltd. | | 44,741 | 1,676,190 |
| REA Group Ltd. | | 12,698 | 987,588 |
| Reece Ltd. | | 55,143 | 547,778 |
| Rio Tinto Ltd. | | 89,603 | 5,055,144 |
| Santos Ltd. | | 777,297 | 3,794,499 |
| Scentre Group unit | | 1,251,710 | 2,321,903 |
| SEEK Ltd. | | 80,343 | 1,109,540 |
| Sonic Healthcare Ltd. | | 110,092 | 2,307,675 |
| South32 Ltd. | | 1,134,081 | 2,601,887 |
| Stockland Corp. Ltd. unit | | 575,702 | 1,325,692 |
| Suncorp Group Ltd. | | 304,641 | 2,223,394 |
| Telstra Group Ltd. | | 992,480 | 2,488,572 |
| The GPT Group unit | | 460,481 | 1,269,496 |
| The Lottery Corp. Ltd. (a) | | 537,522 | 1,475,013 |
| Transurban Group unit | | 742,899 | 6,301,090 |
| Treasury Wine Estates Ltd. | | 173,697 | 1,438,813 |
| Vicinity Centres unit | | 943,723 | 1,174,104 |
| Washington H. Soul Pattinson & Co. Ltd. | | 52,367 | 935,894 |
| Wesfarmers Ltd. | | 273,770 | 7,944,544 |
| Westpac Banking Corp. | | 846,805 | 13,059,394 |
| WiseTech Global Ltd. | | 35,815 | 1,332,391 |
| Woodside Energy Group Ltd. | | 459,194 | 10,568,169 |
| Woolworths Group Ltd. | | 293,750 | 6,204,365 |
TOTAL AUSTRALIA | | | 244,703,468 |
| Austria - 0.2% | | | |
| Erste Group Bank AG | | 82,888 | 2,042,770 |
| OMV AG | | 35,546 | 1,638,386 |
| Verbund AG | | 16,460 | 1,289,128 |
| Voestalpine AG | | 27,657 | 600,758 |
TOTAL AUSTRIA | | | 5,571,042 |
| Bailiwick of Jersey - 0.9% | | | |
| Experian PLC | | 222,724 | 7,101,616 |
| Ferguson PLC | | 51,786 | 5,647,816 |
| Glencore PLC | | 2,383,432 | 13,664,391 |
| WPP PLC | | 262,754 | 2,312,275 |
TOTAL BAILIWICK OF JERSEY | | | 28,726,098 |
| Belgium - 0.8% | | | |
| Ageas | | 38,840 | 1,344,579 |
| Anheuser-Busch InBev SA NV | | 210,202 | 10,514,391 |
| D'ieteren Group | | 6,007 | 999,099 |
| ELIA GROUP SA/NV | | 7,987 | 1,009,534 |
| Groupe Bruxelles Lambert SA | | 23,942 | 1,765,087 |
| KBC Group NV | | 60,319 | 3,022,932 |
| Proximus | | 36,130 | 378,835 |
| Sofina SA | | 3,704 | 722,944 |
| Solvay SA Class A | | 17,823 | 1,607,063 |
| UCB SA | | 30,575 | 2,306,066 |
| Umicore SA | | 50,553 | 1,666,526 |
| Warehouses de Pauw | | 39,072 | 1,003,163 |
TOTAL BELGIUM | | | 26,340,219 |
| Bermuda - 0.1% | | | |
| CK Infrastructure Holdings Ltd. | | 153,500 | 729,402 |
| Hongkong Land Holdings Ltd. | | 272,920 | 1,050,742 |
| Jardine Matheson Holdings Ltd. | | 38,461 | 1,769,975 |
TOTAL BERMUDA | | | 3,550,119 |
| Cayman Islands - 0.6% | | | |
| Budweiser Brewing Co. APAC Ltd. (b) | | 419,900 | 883,702 |
| Chow Tai Fook Jewellery Group Ltd. | | 487,800 | 835,201 |
| CK Asset Holdings Ltd. | | 484,925 | 2,681,106 |
| CK Hutchison Holdings Ltd. | | 647,500 | 3,223,147 |
| ESR Group Ltd. (b) | | 484,000 | 826,228 |
| Futu Holdings Ltd. ADR (a) | | 14,305 | 484,367 |
| Grab Holdings Ltd. (a) | | 317,331 | 825,061 |
| Sands China Ltd. (a) | | 592,000 | 1,033,218 |
| Sea Ltd. ADR (a) | | 87,257 | 4,334,928 |
| SITC International Holdings Co. Ltd. | | 327,000 | 535,721 |
| WH Group Ltd. (b) | | 1,997,500 | 1,010,246 |
| Wharf Real Estate Investment Co. Ltd. | | 403,000 | 1,588,969 |
| Xinyi Glass Holdings Ltd. | | 436,000 | 560,993 |
TOTAL CAYMAN ISLANDS | | | 18,822,887 |
| Denmark - 2.7% | | | |
| A.P. Moller - Maersk A/S: | | | |
| Series A | | 742 | 1,485,123 |
| Series B | | 1,224 | 2,557,147 |
| Carlsberg A/S Series B | | 23,567 | 2,774,913 |
| Chr. Hansen Holding A/S | | 25,505 | 1,416,575 |
| Coloplast A/S Series B | | 28,718 | 3,201,201 |
| Danske Bank A/S | | 166,400 | 2,685,616 |
| Demant A/S (a) | | 22,115 | 604,367 |
| DSV A/S | | 45,281 | 6,130,181 |
| Genmab A/S (a) | | 15,902 | 6,125,573 |
| GN Store Nord A/S | | 31,193 | 663,249 |
| Novo Nordisk A/S Series B | | 400,550 | 43,552,306 |
| Novozymes A/S Series B | | 49,454 | 2,597,315 |
| ORSTED A/S (b) | | 45,750 | 3,774,638 |
| Pandora A/S | | 21,778 | 1,147,823 |
| Rockwool International A/S Series B | | 2,112 | 420,477 |
| Tryg A/S | | 87,922 | 1,902,723 |
| Vestas Wind Systems A/S | | 244,114 | 4,812,382 |
TOTAL DENMARK | | | 85,851,609 |
| Finland - 1.2% | | | |
| Elisa Corp. (A Shares) | | 34,382 | 1,661,865 |
| Fortum Corp. | | 108,324 | 1,524,944 |
| Kesko Oyj | | 65,792 | 1,280,873 |
| Kone OYJ (B Shares) | | 83,073 | 3,401,491 |
| Neste OYJ | | 102,358 | 4,485,226 |
| Nokia Corp. | | 1,308,664 | 5,815,596 |
| Nordea Bank ABP | | 825,117 | 7,885,587 |
| Orion Oyj (B Shares) | | 25,760 | 1,185,038 |
| Sampo Oyj (A Shares) | | 115,973 | 5,304,166 |
| Stora Enso Oyj (R Shares) | | 132,999 | 1,733,644 |
| UPM-Kymmene Corp. | | 129,122 | 4,327,079 |
| Wartsila Corp. | | 112,813 | 769,263 |
TOTAL FINLAND | | | 39,374,772 |
| France - 10.7% | | | |
| Accor SA (a) | | 41,512 | 994,688 |
| Aeroports de Paris SA (a) | | 7,144 | 967,581 |
| Air Liquide SA | | 126,543 | 16,553,566 |
| Alstom SA | | 76,328 | 1,570,925 |
| Amundi SA (b) | | 14,508 | 685,047 |
| Arkema SA | | 14,277 | 1,130,433 |
| AXA SA | | 452,018 | 11,162,543 |
| bioMerieux SA | | 10,096 | 893,374 |
| BNP Paribas SA | | 268,490 | 12,590,549 |
| Bollore SA | | 212,766 | 1,064,997 |
| Bouygues SA | | 55,974 | 1,597,004 |
| Bureau Veritas SA | | 71,216 | 1,764,407 |
| Capgemini SA | | 39,582 | 6,487,128 |
| Carrefour SA | | 147,508 | 2,374,208 |
| Compagnie de St. Gobain | | 120,183 | 4,913,198 |
| Compagnie Generale des Etablissements Michelin SCA Series B | | 163,783 | 4,173,856 |
| Covivio | | 11,296 | 605,049 |
| Credit Agricole SA | | 295,794 | 2,683,935 |
| Danone SA | | 155,314 | 7,719,031 |
| Dassault Aviation SA | | 5,999 | 891,648 |
| Dassault Systemes SA | | 161,012 | 5,396,925 |
| Edenred SA | | 60,335 | 3,098,170 |
| Eiffage SA | | 20,139 | 1,821,863 |
| Electricite de France SA | | 136,711 | 1,614,501 |
| Engie SA | | 441,899 | 5,741,755 |
| EssilorLuxottica SA | | 69,562 | 11,023,204 |
| Eurazeo SA | | 10,374 | 592,572 |
| Gecina SA | | 11,024 | 983,226 |
| Getlink SE | | 106,011 | 1,679,389 |
| Hermes International SCA | | 7,662 | 9,923,069 |
| Ipsen SA | | 9,109 | 936,205 |
| Kering SA | | 18,096 | 8,287,268 |
| Klepierre SA | | 52,472 | 1,055,258 |
| L'Oreal SA | | 58,396 | 18,336,601 |
| La Francaise des Jeux SAEM (b) | | 25,330 | 826,068 |
| Legrand SA | | 64,557 | 4,919,547 |
| LVMH Moet Hennessy Louis Vuitton SE | | 67,182 | 42,391,499 |
| Orange SA | | 482,342 | 4,595,714 |
| Pernod Ricard SA | | 50,698 | 8,903,178 |
| Publicis Groupe SA | | 54,967 | 3,078,394 |
| Remy Cointreau SA | | 5,539 | 849,004 |
| Renault SA (a) | | 46,881 | 1,444,111 |
| Safran SA | | 82,628 | 9,202,279 |
| Sanofi SA | | 275,506 | 23,709,458 |
| Sartorius Stedim Biotech | | 6,683 | 2,121,357 |
| Schneider Electric SA | | 131,204 | 16,591,588 |
| SEB SA | | 5,978 | 389,321 |
| Societe Generale Series A | | 194,327 | 4,457,286 |
| Sodexo SA | | 21,353 | 1,893,703 |
| Teleperformance | | 14,203 | 3,807,998 |
| Thales SA | | 25,748 | 3,273,559 |
| TotalEnergies SE | | 599,695 | 32,715,381 |
| Ubisoft Entertainment SA (a) | | 22,897 | 628,378 |
| Valeo SA | | 50,288 | 829,445 |
| Veolia Environnement SA | | 160,635 | 3,584,734 |
| VINCI SA | | 129,238 | 11,894,681 |
| Vivendi SA | | 175,740 | 1,438,429 |
| Wendel SA | | 6,303 | 493,955 |
| Worldline SA (a)(b) | | 57,641 | 2,515,828 |
TOTAL FRANCE | | | 337,868,068 |
| Germany - 7.2% | | | |
| adidas AG | | 41,714 | 4,071,917 |
| Allianz SE | | 98,815 | 17,777,265 |
| BASF AG | | 221,927 | 9,958,015 |
| Bayer AG | | 237,611 | 12,493,842 |
| Bayerische Motoren Werke AG (BMW) | | 80,183 | 6,293,719 |
| Bechtle AG | | 19,573 | 677,006 |
| Beiersdorf AG | | 24,632 | 2,364,554 |
| Brenntag SE | | 37,231 | 2,259,041 |
| Carl Zeiss Meditec AG | | 9,689 | 1,173,435 |
| Commerzbank AG (a) | | 259,624 | 2,077,218 |
| Continental AG | | 26,829 | 1,389,627 |
| Covestro AG (b) | | 47,120 | 1,599,537 |
| Daimler Truck Holding AG (a) | | 109,190 | 2,913,489 |
| Delivery Hero AG (a)(b) | | 39,899 | 1,313,033 |
| Deutsche Bank AG | | 505,000 | 4,820,980 |
| Deutsche Borse AG | | 45,970 | 7,475,631 |
| Deutsche Lufthansa AG (a) | | 145,785 | 996,734 |
| Deutsche Post AG | | 239,536 | 8,467,556 |
| Deutsche Telekom AG | | 784,268 | 14,803,450 |
| E.ON SE | | 543,108 | 4,547,983 |
| Evonik Industries AG | | 51,144 | 942,881 |
| Fresenius Medical Care AG & Co. KGaA | | 50,023 | 1,383,666 |
| Fresenius SE & Co. KGaA | | 101,132 | 2,327,367 |
| GEA Group AG | | 36,101 | 1,262,959 |
| Hannover Reuck SE | | 14,576 | 2,373,900 |
| HeidelbergCement AG | | 35,320 | 1,624,254 |
| HelloFresh AG (a) | | 40,302 | 806,924 |
| Henkel AG & Co. KGaA | | 25,025 | 1,469,095 |
| Infineon Technologies AG | | 315,686 | 7,660,273 |
| KION Group AG | | 17,141 | 380,021 |
| Knorr-Bremse AG | | 17,420 | 784,262 |
| LEG Immobilien AG | | 17,765 | 1,160,820 |
| Mercedes-Benz Group AG (Germany) | | 193,846 | 11,220,115 |
| Merck KGaA | | 31,272 | 5,096,246 |
| MTU Aero Engines AG | | 12,844 | 2,300,621 |
| Muenchener Rueckversicherungs-Gesellschaft AG in Muenchen | | 33,881 | 8,943,773 |
| Nemetschek SE | | 13,817 | 660,339 |
| Puma AG | | 25,749 | 1,140,255 |
| Rational AG | | 1,248 | 704,235 |
| Rheinmetall AG | | 10,624 | 1,727,113 |
| RWE AG | | 155,274 | 5,982,997 |
| SAP SE | | 252,471 | 24,301,060 |
| Scout24 AG (b) | | 19,227 | 985,776 |
| Siemens AG | | 184,981 | 20,201,596 |
| Siemens Energy AG (c) | | 106,334 | 1,241,574 |
| Siemens Healthineers AG (b) | | 68,154 | 3,122,311 |
| Symrise AG | | 32,083 | 3,274,794 |
| Telefonica Deutschland Holding AG | | 253,914 | 553,553 |
| Uniper SE (c) | | 21,551 | 64,575 |
| United Internet AG | | 22,832 | 427,018 |
| Volkswagen AG | | 6,638 | 1,134,647 |
| Vonovia SE | | 172,993 | 3,824,982 |
| Zalando SE (a)(b) | | 54,321 | 1,252,001 |
TOTAL GERMANY | | | 227,810,035 |
| Hong Kong - 1.9% | | | |
| AIA Group Ltd. | | 2,913,600 | 22,069,920 |
| BOC Hong Kong (Holdings) Ltd. | | 893,000 | 2,775,818 |
| CLP Holdings Ltd. | | 397,500 | 2,667,943 |
| Galaxy Entertainment Group Ltd. | | 532,000 | 2,429,688 |
| Hang Lung Properties Ltd. | | 487,000 | 612,628 |
| Hang Seng Bank Ltd. | | 184,500 | 2,597,353 |
| Henderson Land Development Co. Ltd. | | 351,021 | 859,391 |
| Hong Kong & China Gas Co. Ltd. | | 2,705,074 | 2,084,989 |
| Hong Kong Exchanges and Clearing Ltd. | | 291,160 | 7,728,440 |
| Link (REIT) | | 509,639 | 3,012,523 |
| MTR Corp. Ltd. | | 375,935 | 1,654,667 |
| New World Development Co. Ltd. | | 362,845 | 742,363 |
| Power Assets Holdings Ltd. | | 335,500 | 1,604,916 |
| Sino Land Ltd. | | 837,080 | 894,702 |
| Sun Hung Kai Properties Ltd. | | 351,000 | 3,771,959 |
| Swire Pacific Ltd. (A Shares) | | 121,500 | 804,103 |
| Swire Properties Ltd. | | 285,400 | 548,283 |
| Techtronic Industries Co. Ltd. | | 336,000 | 3,181,506 |
TOTAL HONG KONG | | | 60,041,192 |
| Ireland - 0.7% | | | |
| CRH PLC | | 184,442 | 6,643,206 |
| DCC PLC (United Kingdom) | | 23,700 | 1,315,471 |
| Flutter Entertainment PLC (Ireland) (a) | | 40,358 | 5,340,440 |
| James Hardie Industries PLC CDI | | 107,552 | 2,348,181 |
| Kerry Group PLC Class A | | 38,503 | 3,348,452 |
| Kingspan Group PLC (Ireland) | | 37,257 | 1,881,463 |
| Smurfit Kappa Group PLC | | 59,604 | 1,975,039 |
TOTAL IRELAND | | | 22,852,252 |
| Isle of Man - 0.1% | | | |
| Entain PLC | | 141,718 | 2,050,175 |
| Israel - 0.8% | | | |
| Azrieli Group | | 10,351 | 767,782 |
| Bank Hapoalim BM (Reg.) | | 306,245 | 2,955,372 |
| Bank Leumi le-Israel BM | | 372,507 | 3,557,927 |
| Bezeq The Israel Telecommunication Corp. Ltd. | | 494,584 | 875,920 |
| Check Point Software Technologies Ltd. (a) | | 25,044 | 3,236,436 |
| CyberArk Software Ltd. (a) | | 9,954 | 1,561,882 |
| Elbit Systems Ltd. (Israel) | | 6,406 | 1,296,592 |
| Icl Group Ltd. | | 172,964 | 1,562,454 |
| Israel Discount Bank Ltd. (Class A) | | 296,914 | 1,690,625 |
| Mizrahi Tefahot Bank Ltd. | | 37,013 | 1,400,472 |
| NICE Ltd. (a) | | 15,309 | 2,901,889 |
| Teva Pharmaceutical Industries Ltd. sponsored ADR (a) | | 271,303 | 2,420,023 |
| Tower Semiconductor Ltd. (a) | | 26,388 | 1,129,138 |
| Wix.com Ltd. (a) | | 13,732 | 1,154,861 |
| ZIM Integrated Shipping Services Ltd. (c) | | 20,132 | 472,901 |
TOTAL ISRAEL | | | 26,984,274 |
| Italy - 1.7% | | | |
| Amplifon SpA | | 30,368 | 754,481 |
| Assicurazioni Generali SpA | | 268,039 | 4,022,492 |
| Atlantia SpA | | 121,027 | 2,700,679 |
| DiaSorin SpA | | 6,140 | 802,777 |
| Enel SpA | | 1,966,886 | 8,786,767 |
| Eni SpA | | 609,842 | 8,009,503 |
| FinecoBank SpA | | 146,660 | 1,976,937 |
| Infrastrutture Wireless Italiane SpA (b) | | 80,759 | 712,864 |
| Intesa Sanpaolo SpA | | 3,980,941 | 7,589,785 |
| Mediobanca SpA | | 147,625 | 1,338,107 |
| Moncler SpA | | 49,485 | 2,136,596 |
| Nexi SpA (a)(b) | | 127,818 | 1,107,793 |
| Poste Italiane SpA (b) | | 127,420 | 1,110,639 |
| Prysmian SpA | | 61,285 | 1,998,036 |
| Recordati SpA | | 25,235 | 948,411 |
| Snam SpA | | 487,126 | 2,166,013 |
| Telecom Italia SpA (a) | | 2,341,868 | 458,170 |
| Terna - Rete Elettrica Nazionale | | 339,858 | 2,252,980 |
| UniCredit SpA | | 507,053 | 6,288,104 |
TOTAL ITALY | | | 55,161,134 |
| Japan - 21.7% | | | |
| Advantest Corp. | | 46,300 | 2,447,412 |
| AEON Co. Ltd. | | 157,700 | 2,944,645 |
| AGC, Inc. | | 47,230 | 1,481,744 |
| Aisin Seiki Co. Ltd. | | 35,990 | 923,379 |
| Ajinomoto Co., Inc. | | 111,500 | 3,071,415 |
| Ana Holdings, Inc. (a) | | 39,000 | 758,257 |
| Asahi Group Holdings | | 110,000 | 3,080,399 |
| ASAHI INTECC Co. Ltd. | | 53,000 | 903,205 |
| Asahi Kasei Corp. | | 306,800 | 1,967,176 |
| Astellas Pharma, Inc. | | 443,300 | 6,116,736 |
| Azbil Corp. | | 27,400 | 745,371 |
| Bandai Namco Holdings, Inc. | | 48,000 | 3,177,081 |
| Bridgestone Corp. | | 139,500 | 5,045,220 |
| Brother Industries Ltd. | | 56,500 | 961,710 |
| Canon, Inc. | | 241,800 | 5,125,552 |
| Capcom Co. Ltd. | | 43,000 | 1,198,662 |
| Central Japan Railway Co. | | 35,200 | 4,075,335 |
| Chiba Bank Ltd. | | 129,300 | 706,957 |
| Chubu Electric Power Co., Inc. | | 157,160 | 1,279,941 |
| Chugai Pharmaceutical Co. Ltd. | | 162,200 | 3,758,476 |
| Concordia Financial Group Ltd. | | 258,400 | 787,217 |
| CyberAgent, Inc. | | 104,800 | 862,673 |
| Dai Nippon Printing Co. Ltd. | | 54,120 | 1,085,712 |
| Dai-ichi Mutual Life Insurance Co. | | 236,300 | 3,746,442 |
| Daifuku Co. Ltd. | | 24,200 | 1,109,950 |
| Daiichi Sankyo Kabushiki Kaisha | | 423,800 | 13,566,163 |
| Daikin Industries Ltd. | | 60,200 | 9,017,188 |
| Daito Trust Construction Co. Ltd. | | 14,900 | 1,474,017 |
| Daiwa House Industry Co. Ltd. | | 144,700 | 2,915,319 |
| Daiwa House REIT Investment Corp. | | 530 | 1,069,303 |
| Daiwa Securities Group, Inc. | | 316,900 | 1,236,101 |
| DENSO Corp. | | 104,500 | 5,184,864 |
| Dentsu Group, Inc. | | 52,800 | 1,645,839 |
| Disco Corp. | | 6,900 | 1,656,613 |
| East Japan Railway Co. | | 73,900 | 3,937,790 |
| Eisai Co. Ltd. | | 61,700 | 3,723,702 |
| ENEOS Holdings, Inc. | | 739,000 | 2,434,259 |
| FANUC Corp. | | 46,300 | 6,058,430 |
| Fast Retailing Co. Ltd. | | 14,100 | 7,869,525 |
| Fuji Electric Co. Ltd. | | 30,300 | 1,173,731 |
| FUJIFILM Holdings Corp. | | 87,000 | 3,989,731 |
| Fujitsu Ltd. | | 47,500 | 5,465,280 |
| GLP J-REIT | | 1,040 | 1,077,804 |
| GMO Payment Gateway, Inc. | | 10,100 | 728,827 |
| Hakuhodo DY Holdings, Inc. | | 54,100 | 456,973 |
| Hamamatsu Photonics K.K. | | 33,500 | 1,518,477 |
| Hankyu Hanshin Holdings, Inc. | | 54,900 | 1,630,072 |
| Hikari Tsushin, Inc. | | 5,000 | 604,257 |
| Hirose Electric Co. Ltd. | | 7,130 | 925,924 |
| Hitachi Construction Machinery Co. Ltd. | | 25,400 | 497,768 |
| Hitachi Ltd. | | 234,000 | 10,638,152 |
| Honda Motor Co. Ltd. | | 393,500 | 8,972,774 |
| Hoshizaki Corp. | | 25,700 | 737,150 |
| Hoya Corp. | | 88,300 | 8,239,433 |
| Hulic Co. Ltd. | | 93,600 | 679,835 |
| Ibiden Co. Ltd. | | 26,800 | 906,581 |
| Idemitsu Kosan Co. Ltd. | | 51,023 | 1,115,201 |
| Iida Group Holdings Co. Ltd. | | 35,900 | 498,802 |
| INPEX Corp. | | 250,700 | 2,530,164 |
| Isuzu Motors Ltd. | | 142,500 | 1,671,341 |
| ITO EN Ltd. | | 12,700 | 448,401 |
| Itochu Corp. | | 287,100 | 7,431,641 |
| ITOCHU Techno-Solutions Corp. | | 23,400 | 542,923 |
| Japan Airlines Co. Ltd. (a) | | 33,400 | 623,323 |
| Japan Exchange Group, Inc. | | 120,600 | 1,584,900 |
| Japan Post Bank Co. Ltd. | | 100,600 | 669,787 |
| Japan Post Holdings Co. Ltd. | | 580,800 | 3,904,420 |
| Japan Post Insurance Co. Ltd. | | 48,700 | 719,553 |
| Japan Real Estate Investment Corp. | | 304 | 1,273,694 |
| Japan Retail Fund Investment Corp. | | 1,705 | 1,255,573 |
| Japan Tobacco, Inc. | | 293,200 | 4,910,348 |
| JFE Holdings, Inc. | | 116,500 | 1,067,887 |
| JSR Corp. | | 44,100 | 840,508 |
| Kajima Corp. | | 103,200 | 972,347 |
| Kakaku.com, Inc. | | 32,500 | 551,010 |
| Kansai Electric Power Co., Inc. | | 171,700 | 1,301,361 |
| Kao Corp. | | 114,500 | 4,276,798 |
| KDDI Corp. | | 390,000 | 11,527,219 |
| Keio Corp. | | 24,600 | 863,593 |
| Keisei Electric Railway Co. | | 30,800 | 818,185 |
| Keyence Corp. | | 47,000 | 17,801,809 |
| Kikkoman Corp. | | 35,500 | 1,929,049 |
| Kintetsu Group Holdings Co. Ltd. | | 41,000 | 1,386,933 |
| Kirin Holdings Co. Ltd. | | 198,000 | 2,915,505 |
| Kobayashi Pharmaceutical Co. Ltd. | | 12,660 | 672,612 |
| Kobe Bussan Co. Ltd. | | 36,700 | 798,443 |
| Koei Tecmo Holdings Co. Ltd. | | 28,660 | 433,287 |
| Koito Manufacturing Co. Ltd. | | 49,700 | 706,586 |
| Komatsu Ltd. | | 223,000 | 4,368,613 |
| Konami Group Corp. | | 22,300 | 979,313 |
| Kose Corp. | | 8,000 | 800,027 |
| Kubota Corp. | | 245,700 | 3,431,158 |
| Kurita Water Industries Ltd. | | 25,000 | 917,986 |
| Kyocera Corp. | | 77,300 | 3,868,249 |
| Kyowa Hakko Kirin Co., Ltd. | | 64,800 | 1,527,449 |
| Lasertec Corp. | | 18,400 | 2,585,401 |
| LIXIL Group Corp. | | 72,600 | 1,099,046 |
| M3, Inc. | | 107,800 | 3,223,234 |
| Makita Corp. | | 54,620 | 998,099 |
| Marubeni Corp. | | 377,700 | 3,309,749 |
| Mazda Motor Corp. | | 135,600 | 912,990 |
| McDonald's Holdings Co. (Japan) Ltd. | | 21,100 | 732,210 |
| Meiji Holdings Co. Ltd. | | 26,600 | 1,094,805 |
| Minebea Mitsumi, Inc. | | 86,610 | 1,283,758 |
| Misumi Group, Inc. | | 68,350 | 1,461,737 |
| Mitsubishi Chemical Holdings Corp. | | 312,300 | 1,411,593 |
| Mitsubishi Corp. | | 305,200 | 8,273,723 |
| Mitsubishi Electric Corp. | | 466,600 | 4,105,433 |
| Mitsubishi Estate Co. Ltd. | | 285,800 | 3,594,020 |
| Mitsubishi Heavy Industries Ltd. | | 78,300 | 2,696,096 |
| Mitsubishi UFJ Financial Group, Inc. | | 2,887,200 | 13,638,702 |
| Mitsubishi UFJ Lease & Finance Co. Ltd. | | 161,000 | 690,797 |
| Mitsui & Co. Ltd. | | 341,100 | 7,554,002 |
| Mitsui Chemicals, Inc. | | 43,800 | 811,520 |
| Mitsui Fudosan Co. Ltd. | | 218,800 | 4,192,949 |
| Mitsui OSK Lines Ltd. | | 81,900 | 1,625,387 |
| Mizuho Financial Group, Inc. | | 589,320 | 6,365,029 |
| MonotaRO Co. Ltd. | | 61,100 | 931,940 |
| MS&AD Insurance Group Holdings, Inc. | | 107,400 | 2,844,081 |
| Murata Manufacturing Co. Ltd. | | 138,800 | 6,570,715 |
| NEC Corp. | | 60,000 | 1,987,289 |
| Nexon Co. Ltd. | | 119,210 | 2,001,865 |
| NGK Insulators Ltd. | | 55,600 | 649,499 |
| Nidec Corp. | | 109,300 | 6,009,753 |
| Nihon M&A Center Holdings, Inc. | | 73,900 | 836,435 |
| Nintendo Co. Ltd. | | 266,700 | 10,827,779 |
| Nippon Building Fund, Inc. | | 369 | 1,640,331 |
| Nippon Express Holdings, Inc. | | 18,800 | 944,457 |
| Nippon Paint Holdings Co. Ltd. | | 202,400 | 1,293,117 |
| Nippon Prologis REIT, Inc. | | 521 | 1,091,439 |
| Nippon Sanso Holdings Corp. | | 41,500 | 662,013 |
| Nippon Shinyaku Co. Ltd. | | 11,800 | 653,902 |
| Nippon Steel & Sumitomo Metal Corp. | | 197,400 | 2,711,520 |
| Nippon Telegraph & Telephone Corp. | | 289,000 | 7,970,825 |
| Nippon Yusen KK | | 116,200 | 2,104,902 |
| Nissan Chemical Corp. | | 30,700 | 1,383,301 |
| Nissan Motor Co. Ltd. | | 555,300 | 1,769,910 |
| Nisshin Seifun Group, Inc. | | 46,100 | 498,529 |
| Nissin Food Holdings Co. Ltd. | | 15,000 | 971,452 |
| Nitori Holdings Co. Ltd. | | 19,200 | 1,739,848 |
| Nitto Denko Corp. | | 34,800 | 1,832,503 |
| Nomura Holdings, Inc. | | 711,300 | 2,301,738 |
| Nomura Real Estate Holdings, Inc. | | 28,900 | 654,013 |
| Nomura Real Estate Master Fund, Inc. | | 1,035 | 1,179,814 |
| Nomura Research Institute Ltd. | | 82,120 | 1,825,257 |
| NTT Data Corp. | | 154,200 | 2,236,857 |
| Obayashi Corp. | | 158,400 | 1,017,331 |
| OBIC Co. Ltd. | | 16,800 | 2,527,429 |
| Odakyu Electric Railway Co. Ltd. | | 71,900 | 855,382 |
| Oji Holdings Corp. | | 197,900 | 686,751 |
| Olympus Corp. | | 298,200 | 6,297,105 |
| OMRON Corp. | | 45,300 | 2,119,149 |
| Ono Pharmaceutical Co. Ltd. | | 87,300 | 2,052,529 |
| Open House Group Co. Ltd. | | 20,000 | 712,869 |
| Oracle Corp. Japan | | 9,400 | 501,940 |
| Oriental Land Co. Ltd. | | 48,300 | 6,480,278 |
| ORIX Corp. | | 287,900 | 4,230,549 |
| Osaka Gas Co. Ltd. | | 90,130 | 1,334,720 |
| Otsuka Corp. | | 27,800 | 877,777 |
| Otsuka Holdings Co. Ltd. | | 94,200 | 3,019,535 |
| Pan Pacific International Holdings Ltd. | | 93,000 | 1,526,702 |
| Panasonic Holdings Corp. | | 532,200 | 3,790,656 |
| Persol Holdings Co. Ltd. | | 43,300 | 869,524 |
| Rakuten Group, Inc. | | 206,600 | 922,338 |
| Recruit Holdings Co. Ltd. | | 348,500 | 10,723,752 |
| Renesas Electronics Corp. (a) | | 285,000 | 2,384,239 |
| Resona Holdings, Inc. | | 528,220 | 1,988,263 |
| Ricoh Co. Ltd. | | 137,400 | 1,007,203 |
| ROHM Co. Ltd. | | 20,900 | 1,471,623 |
| SBI Holdings, Inc. Japan | | 58,400 | 1,055,713 |
| SCSK Corp. | | 38,100 | 562,936 |
| Secom Co. Ltd. | | 50,700 | 2,888,404 |
| Seiko Epson Corp. | | 68,200 | 929,239 |
| Sekisui Chemical Co. Ltd. | | 88,800 | 1,110,784 |
| Sekisui House Ltd. | | 150,600 | 2,506,708 |
| Seven & i Holdings Co. Ltd. | | 182,000 | 6,793,764 |
| SG Holdings Co. Ltd. | | 70,300 | 932,322 |
| Sharp Corp. | | 57,600 | 345,490 |
| Shimadzu Corp. | | 56,900 | 1,501,950 |
| SHIMANO, Inc. | | 17,800 | 2,754,430 |
| SHIMIZU Corp. | | 134,600 | 672,570 |
| Shin-Etsu Chemical Co. Ltd. | | 90,600 | 9,416,054 |
| Shionogi & Co. Ltd. | | 64,700 | 3,004,490 |
| Shiseido Co. Ltd. | | 97,800 | 3,390,558 |
| Shizuoka Financial Group | | 108,900 | 686,965 |
| SMC Corp. | | 14,000 | 5,619,632 |
| SoftBank Corp. | | 694,300 | 6,848,845 |
| SoftBank Group Corp. | | 291,400 | 12,508,701 |
| Sompo Holdings, Inc. | | 75,400 | 3,140,336 |
| Sony Group Corp. | | 305,000 | 20,567,572 |
| Square Enix Holdings Co. Ltd. | | 20,900 | 933,293 |
| Subaru Corp. | | 150,400 | 2,342,051 |
| Sumco Corp. | | 82,700 | 1,050,609 |
| Sumitomo Chemical Co. Ltd. | | 363,400 | 1,224,408 |
| Sumitomo Corp. | | 275,200 | 3,498,829 |
| Sumitomo Electric Industries Ltd. | | 171,000 | 1,787,108 |
| Sumitomo Metal Mining Co. Ltd. | | 60,330 | 1,691,101 |
| Sumitomo Mitsui Financial Group, Inc. | | 314,600 | 8,834,461 |
| Sumitomo Mitsui Trust Holdings, Inc. | | 82,500 | 2,373,445 |
| Sumitomo Realty & Development Co. Ltd. | | 74,500 | 1,711,002 |
| Suntory Beverage & Food Ltd. | | 33,900 | 1,135,358 |
| Suzuki Motor Corp. | | 90,000 | 3,038,434 |
| Sysmex Corp. | | 41,000 | 2,213,578 |
| T&D Holdings, Inc. | | 129,300 | 1,275,652 |
| Taisei Corp. | | 43,400 | 1,183,544 |
| Takeda Pharmaceutical Co. Ltd. | | 363,203 | 9,591,828 |
| TDK Corp. | | 95,000 | 2,974,041 |
| Terumo Corp. | | 155,600 | 4,734,083 |
| TIS, Inc. | | 54,400 | 1,468,886 |
| Tobu Railway Co. Ltd. | | 44,800 | 1,036,430 |
| Toho Co. Ltd. | | 26,770 | 954,175 |
| Tokio Marine Holdings, Inc. | | 443,600 | 8,028,028 |
| Tokyo Electric Power Co., Inc. (a) | | 372,300 | 1,214,335 |
| Tokyo Electron Ltd. | | 36,100 | 9,497,788 |
| Tokyo Gas Co. Ltd. | | 95,500 | 1,706,470 |
| Tokyu Corp. | | 127,300 | 1,469,093 |
| Toppan, Inc. | | 64,000 | 955,083 |
| Toray Industries, Inc. | | 339,000 | 1,651,740 |
| Toshiba Corp. | | 94,000 | 3,275,255 |
| Tosoh Corp. | | 61,290 | 667,329 |
| Toto Ltd. | | 33,900 | 968,930 |
| Toyota Industries Corp. | | 35,770 | 1,842,686 |
| Toyota Motor Corp. | | 2,564,750 | 35,584,910 |
| Toyota Tsusho Corp. | | 50,740 | 1,706,177 |
| Trend Micro, Inc. | | 32,700 | 1,651,548 |
| Unicharm Corp. | | 97,500 | 2,963,165 |
| USS Co. Ltd. | | 52,400 | 791,841 |
| Welcia Holdings Co. Ltd. | | 23,000 | 481,052 |
| West Japan Railway Co. | | 53,600 | 2,127,130 |
| Yakult Honsha Co. Ltd. | | 31,300 | 1,734,504 |
| Yamaha Corp. | | 33,500 | 1,266,149 |
| Yamaha Motor Co. Ltd. | | 72,600 | 1,498,921 |
| Yamato Holdings Co. Ltd. | | 71,100 | 1,053,865 |
| Yaskawa Electric Corp. | | 57,400 | 1,594,284 |
| Yokogawa Electric Corp. | | 54,700 | 916,357 |
| Z Holdings Corp. | | 650,100 | 1,677,752 |
| ZOZO, Inc. | | 29,600 | 630,041 |
TOTAL JAPAN | | | 687,755,767 |
| Luxembourg - 0.2% | | | |
| ArcelorMittal SA (Netherlands) | | 126,854 | 2,840,109 |
| Aroundtown SA | | 243,665 | 483,530 |
| Eurofins Scientific SA | | 32,508 | 2,081,124 |
| Tenaris SA | | 115,169 | 1,802,528 |
TOTAL LUXEMBOURG | | | 7,207,291 |
| Multi-National - 0.1% | | | |
| HK Electric Investments & HK Electric Investments Ltd. unit | | 640,500 | 407,164 |
| HKT Trust/HKT Ltd. unit | | 915,000 | 1,033,938 |
| Unibail-Rodamco SE & WFD Unibail-Rodamco NV unit (a) | | 28,244 | 1,336,433 |
TOTAL MULTI-NATIONAL | | | 2,777,535 |
| Netherlands - 5.5% | | | |
| ABN AMRO Bank NV GDR (b) | | 103,166 | 1,015,052 |
| Adyen BV (a)(b) | | 5,239 | 7,479,194 |
| AEGON NV | | 430,659 | 1,993,590 |
| AerCap Holdings NV (a) | | 32,997 | 1,762,370 |
| Airbus Group NV | | 142,947 | 15,467,405 |
| Akzo Nobel NV | | 43,732 | 2,699,815 |
| Argenx SE (a) | | 13,304 | 5,165,286 |
| ASM International NV (Netherlands) | | 11,443 | 2,542,161 |
| ASML Holding NV (Netherlands) | | 98,330 | 46,125,341 |
| CNH Industrial NV | | 246,667 | 3,194,588 |
| Davide Campari Milano NV | | 125,570 | 1,128,516 |
| Euronext NV (b) | | 20,634 | 1,311,177 |
| EXOR NV | | 26,126 | 1,755,693 |
| Ferrari NV (Italy) | | 30,474 | 6,008,128 |
| Heineken Holding NV | | 24,306 | 1,659,810 |
| Heineken NV (Bearer) | | 62,684 | 5,240,755 |
| IMCD NV | | 13,657 | 1,772,094 |
| ING Groep NV (Certificaten Van Aandelen) | | 943,180 | 9,280,508 |
| JDE Peet's BV | | 24,521 | 702,269 |
| Just Eat Takeaway.com NV (a)(b) | | 44,564 | 764,723 |
| Koninklijke Ahold Delhaize NV | | 252,771 | 7,049,353 |
| Koninklijke DSM NV | | 42,213 | 4,965,532 |
| Koninklijke KPN NV | | 796,654 | 2,228,326 |
| Koninklijke Philips Electronics NV | | 216,019 | 2,740,178 |
| NN Group NV | | 67,285 | 2,849,285 |
| OCI NV | | 25,696 | 983,258 |
| Prosus NV | | 200,527 | 8,671,128 |
| QIAGEN NV (Germany) (a) | | 54,878 | 2,369,990 |
| Randstad NV | | 29,163 | 1,453,698 |
| Stellantis NV (Italy) | | 531,098 | 7,169,555 |
| STMicroelectronics NV (France) | | 165,222 | 5,137,405 |
| Universal Music Group NV | | 175,145 | 3,439,052 |
| Wolters Kluwer NV | | 63,528 | 6,752,155 |
TOTAL NETHERLANDS | | | 172,877,390 |
| New Zealand - 0.2% | | | |
| Auckland International Airport Ltd. (a) | | 300,613 | 1,345,778 |
| Fisher & Paykel Healthcare Corp. | | 138,917 | 1,581,405 |
| Mercury Nz Ltd. | | 166,385 | 563,005 |
| Meridian Energy Ltd. | | 313,040 | 888,167 |
| Spark New Zealand Ltd. | | 450,129 | 1,339,930 |
| Xero Ltd. (a) | | 32,413 | 1,618,623 |
TOTAL NEW ZEALAND | | | 7,336,908 |
| Norway - 0.8% | | | |
| Adevinta ASA Class B (a) | | 69,983 | 479,292 |
| Aker BP ASA | | 76,242 | 2,430,380 |
| DNB Bank ASA | | 224,749 | 3,975,109 |
| Equinor ASA | | 236,335 | 8,610,564 |
| Gjensidige Forsikring ASA | | 48,484 | 885,627 |
| Kongsberg Gruppen ASA | | 21,520 | 771,281 |
| Mowi ASA | | 101,161 | 1,508,733 |
| Norsk Hydro ASA | | 323,794 | 2,054,900 |
| Orkla ASA | | 183,181 | 1,235,585 |
| Salmar ASA | | 14,365 | 486,656 |
| Telenor ASA | | 168,878 | 1,534,741 |
| Yara International ASA | | 40,382 | 1,802,326 |
TOTAL NORWAY | | | 25,775,194 |
| Portugal - 0.2% | | | |
| Energias de Portugal SA | | 670,711 | 2,933,023 |
| Galp Energia SGPS SA Class B | | 122,254 | 1,241,257 |
| Jeronimo Martins SGPS SA | | 68,259 | 1,415,247 |
TOTAL PORTUGAL | | | 5,589,527 |
| Singapore - 1.3% | | | |
| CapitaLand Ascendas REIT | | 819,089 | 1,515,974 |
| CapitaLand Investment Ltd. | | 634,465 | 1,349,067 |
| CapitaMall Trust | | 1,278,827 | 1,698,357 |
| City Developments Ltd. | | 99,800 | 537,916 |
| DBS Group Holdings Ltd. | | 437,805 | 10,577,092 |
| Genting Singapore Ltd. | | 1,442,900 | 820,525 |
| Keppel Corp. Ltd. | | 350,500 | 1,725,759 |
| Mapletree Logistics Trust (REIT) | | 798,412 | 857,295 |
| Mapletree Pan Asia Commercial | | 560,900 | 630,002 |
| Oversea-Chinese Banking Corp. Ltd. | | 818,164 | 7,010,688 |
| Singapore Airlines Ltd. | | 326,790 | 1,214,266 |
| Singapore Exchange Ltd. | | 206,900 | 1,230,643 |
| Singapore Technologies Engineering Ltd. | | 373,500 | 870,691 |
| Singapore Telecommunications Ltd. | | 1,992,600 | 3,519,003 |
| United Overseas Bank Ltd. | | 284,972 | 5,588,318 |
| UOL Group Ltd. | | 111,691 | 488,392 |
| Venture Corp. Ltd. | | 66,400 | 747,211 |
| Wilmar International Ltd. | | 468,500 | 1,284,106 |
TOTAL SINGAPORE | | | 41,665,305 |
| Spain - 2.5% | | | |
| Acciona SA | | 6,021 | 1,083,541 |
| ACS Actividades de Construccion y Servicios SA | | 55,316 | 1,418,584 |
| Aena SME SA (a)(b) | | 18,068 | 2,123,560 |
| Amadeus IT Holding SA Class A (a) | | 108,783 | 5,673,610 |
| Banco Bilbao Vizcaya Argentaria SA | | 1,629,104 | 8,404,212 |
| Banco Santander SA (Spain) | | 4,125,048 | 10,688,789 |
| CaixaBank SA | | 1,083,193 | 3,591,917 |
| Cellnex Telecom SA (b) | | 131,284 | 4,296,959 |
| EDP Renovaveis SA | | 69,672 | 1,467,265 |
| Enagas SA | | 59,463 | 965,317 |
| Endesa SA | | 77,466 | 1,292,644 |
| Ferrovial SA | | 116,628 | 2,848,016 |
| Grifols SA (a) | | 72,751 | 618,738 |
| Iberdrola SA | | 1,440,945 | 14,653,373 |
| Industria de Diseno Textil SA | | 263,469 | 5,972,962 |
| Naturgy Energy Group SA | | 35,472 | 910,033 |
| Red Electrica Corporacion SA | | 97,912 | 1,583,797 |
| Repsol SA | | 350,286 | 4,765,458 |
| Siemens Gamesa Renewable Energy SA (a) | | 58,144 | 1,031,996 |
| Telefonica SA | | 1,265,083 | 4,360,991 |
TOTAL SPAIN | | | 77,751,762 |
| Sweden - 3.2% | | | |
| Alfa Laval AB | | 69,936 | 1,723,507 |
| ASSA ABLOY AB (B Shares) | | 242,760 | 4,901,830 |
| Atlas Copco AB: | | | |
| (A Shares) | | 646,612 | 6,901,454 |
| (B Shares) | | 380,649 | 3,681,318 |
| Boliden AB | | 65,837 | 1,917,652 |
| Electrolux AB (B Shares) (c) | | 51,957 | 641,204 |
| Embracer Group AB (a)(c) | | 161,331 | 776,906 |
| Epiroc AB: | | | |
| (A Shares) | | 158,259 | 2,422,701 |
| (B Shares) | | 95,102 | 1,277,794 |
| EQT AB | | 72,886 | 1,436,437 |
| Ericsson (B Shares) | | 706,505 | 3,927,705 |
| Essity AB (B Shares) | | 147,385 | 3,115,572 |
| Evolution AB (b) | | 44,689 | 4,168,711 |
| Fastighets AB Balder (a) | | 153,890 | 578,349 |
| Getinge AB (B Shares) | | 55,787 | 1,133,303 |
| H&M Hennes & Mauritz AB (B Shares) (c) | | 178,572 | 1,798,606 |
| Hexagon AB (B Shares) | | 470,893 | 4,655,199 |
| Holmen AB (B Shares) | | 22,880 | 830,139 |
| Husqvarna AB (B Shares) | | 99,420 | 590,272 |
| Industrivarden AB: | | | |
| (A Shares) | | 30,831 | 698,648 |
| (C Shares) | | 37,631 | 845,583 |
| Indutrade AB | | 65,603 | 1,148,819 |
| Investment AB Latour (B Shares) | | 35,426 | 599,193 |
| Investor AB: | | | |
| (A Shares) | | 117,369 | 1,997,395 |
| (B Shares) | | 444,205 | 7,256,169 |
| Kinnevik AB (B Shares) (a) | | 58,161 | 719,032 |
| L E Lundbergforetagen AB | | 18,204 | 719,178 |
| Lifco AB | | 55,856 | 807,143 |
| Nibe Industrier AB (B Shares) | | 366,495 | 2,924,339 |
| Sagax AB | | 45,888 | 846,176 |
| Sandvik AB | | 257,380 | 4,022,012 |
| Securitas AB (B Shares) (c) | | 118,372 | 968,529 |
| Skandinaviska Enskilda Banken AB (A Shares) | | 393,450 | 4,151,444 |
| Skanska AB (B Shares) | | 82,002 | 1,275,943 |
| SKF AB (B Shares) | | 92,090 | 1,333,060 |
| Svenska Cellulosa AB SCA (B Shares) | | 146,543 | 1,729,391 |
| Svenska Handelsbanken AB (A Shares) | | 352,487 | 3,274,969 |
| Swedbank AB (A Shares) | | 221,328 | 3,299,569 |
| Swedish Match Co. AB | | 369,126 | 3,796,422 |
| Swedish Orphan Biovitrum AB (a) | | 40,760 | 750,508 |
| Tele2 AB (B Shares) | | 138,439 | 1,134,976 |
| Telia Co. AB | | 649,714 | 1,721,590 |
| Volvo AB: | | | |
| (A Shares) | | 48,820 | 833,918 |
| (B Shares) | | 364,343 | 5,963,179 |
| Volvo Car AB | | 145,337 | 617,220 |
TOTAL SWEDEN | | | 99,913,064 |
| Switzerland - 10.4% | | | |
| ABB Ltd. (Reg.) | | 396,626 | 11,014,424 |
| Accelleron Industries Ltd. (a) | | 1,003 | 17,008 |
| Adecco SA (Reg.) | | 38,534 | 1,205,959 |
| Alcon, Inc. (Switzerland) | | 120,720 | 7,346,759 |
| Bachem Holding AG (B Shares) (c) | | 7,944 | 570,007 |
| Baloise Holdings AG | | 10,984 | 1,500,585 |
| Barry Callebaut AG | | 854 | 1,615,295 |
| Clariant AG (Reg.) | | 51,514 | 828,772 |
| Coca-Cola HBC AG | | 48,445 | 1,056,967 |
| Compagnie Financiere Richemont SA Series A | | 126,204 | 12,334,366 |
| Credit Suisse Group AG (c) | | 648,003 | 2,684,329 |
| Ems-Chemie Holding AG | | 1,671 | 1,050,476 |
| Geberit AG (Reg.) | | 8,620 | 3,833,311 |
| Givaudan SA | | 2,230 | 6,658,711 |
| Holcim AG | | 133,912 | 6,083,936 |
| Julius Baer Group Ltd. | | 53,227 | 2,553,771 |
| Kuehne & Nagel International AG | | 13,277 | 2,829,492 |
| Lindt & Spruengli AG | | 26 | 2,526,389 |
| Lindt & Spruengli AG (participation certificate) | | 261 | 2,502,222 |
| Logitech International SA (Reg.) | | 41,457 | 2,063,845 |
| Lonza Group AG | | 17,991 | 9,261,483 |
| Nestle SA (Reg. S) | | 681,046 | 74,137,854 |
| Novartis AG | | 523,387 | 42,337,175 |
| Partners Group Holding AG | | 5,473 | 4,915,780 |
| Roche Holding AG: | | | |
| (Bearer) (c) | | 6,575 | 2,667,164 |
| (participation certificate) | | 169,814 | 56,343,978 |
| Schindler Holding AG: | | | |
| (participation certificate) | | 9,931 | 1,619,050 |
| (Reg.) | | 5,481 | 862,641 |
| SGS SA (Reg.) | | 1,557 | 3,432,425 |
| Sig Group AG | | 73,842 | 1,418,805 |
| Sika AG | | 35,253 | 7,948,699 |
| Sonova Holding AG | | 13,119 | 3,101,081 |
| Straumann Holding AG | | 27,277 | 2,595,989 |
| Swatch Group AG (Bearer) | | 6,912 | 1,553,192 |
| Swatch Group AG (Bearer) (Reg.) | | 12,832 | 536,167 |
| Swiss Life Holding AG | | 7,597 | 3,678,819 |
| Swiss Prime Site AG | | 18,472 | 1,490,525 |
| Swiss Re Ltd. | | 72,802 | 5,408,081 |
| Swisscom AG | | 6,230 | 3,075,337 |
| Temenos Group AG | | 15,241 | 908,661 |
| UBS Group AG | | 849,968 | 13,487,783 |
| VAT Group AG (b) | | 6,465 | 1,477,198 |
| Zurich Insurance Group Ltd. | | 36,376 | 15,502,504 |
TOTAL SWITZERLAND | | | 328,037,015 |
| United Kingdom - 14.3% | | | |
| 3i Group PLC | | 234,988 | 3,129,659 |
| Abrdn PLC | | 531,863 | 969,805 |
| Admiral Group PLC | | 43,971 | 1,017,091 |
| Anglo American PLC (United Kingdom) | | 307,209 | 9,202,205 |
| Antofagasta PLC | | 96,177 | 1,296,527 |
| Ashtead Group PLC | | 106,958 | 5,581,004 |
| Associated British Foods PLC | | 86,887 | 1,346,687 |
| AstraZeneca PLC (United Kingdom) | | 374,860 | 43,983,145 |
| Auto Trader Group PLC (b) | | 225,996 | 1,352,763 |
| Aveva Group PLC | | 29,416 | 1,052,509 |
| Aviva PLC | | 683,053 | 3,276,351 |
| BAE Systems PLC | | 762,739 | 7,134,333 |
| Barclays PLC | | 4,041,550 | 6,867,620 |
| Barratt Developments PLC | | 243,834 | 1,051,678 |
| Berkeley Group Holdings PLC | | 26,541 | 1,056,476 |
| BP PLC | | 4,673,476 | 25,856,512 |
| British American Tobacco PLC (United Kingdom) | | 520,726 | 20,565,278 |
| British Land Co. PLC | | 214,747 | 901,109 |
| BT Group PLC | | 1,676,825 | 2,496,032 |
| Bunzl PLC | | 81,393 | 2,651,832 |
| Burberry Group PLC | | 96,976 | 2,018,499 |
| Compass Group PLC | | 431,408 | 9,086,240 |
| Croda International PLC | | 33,660 | 2,609,447 |
| Diageo PLC | | 553,535 | 22,779,358 |
| GSK PLC | | 983,874 | 16,116,937 |
| Haleon PLC (a) | | 1,240,982 | 3,814,064 |
| Halma PLC | | 91,577 | 2,221,184 |
| Hargreaves Lansdown PLC | | 86,762 | 759,374 |
| Hikma Pharmaceuticals PLC | | 39,763 | 569,547 |
| HSBC Holdings PLC (United Kingdom) | | 4,862,304 | 24,953,604 |
| Imperial Brands PLC | | 220,541 | 5,372,180 |
| Informa PLC | | 351,419 | 2,239,109 |
| InterContinental Hotel Group PLC | | 44,215 | 2,375,705 |
| Intertek Group PLC | | 39,038 | 1,635,851 |
| J Sainsbury PLC | | 419,424 | 934,935 |
| JD Sports Fashion PLC | | 629,014 | 702,887 |
| Johnson Matthey PLC | | 44,219 | 980,992 |
| Kingfisher PLC | | 482,995 | 1,213,493 |
| Land Securities Group PLC | | 171,800 | 1,123,803 |
| Legal & General Group PLC | | 1,440,749 | 3,854,382 |
| Lloyds Banking Group PLC | | 16,809,788 | 8,073,203 |
| London Stock Exchange Group PLC | | 79,722 | 6,910,466 |
| M&G PLC | | 616,448 | 1,238,563 |
| Melrose Industries PLC | | 1,066,401 | 1,429,627 |
| Mondi PLC | | 117,084 | 1,963,727 |
| National Grid PLC | | 882,352 | 9,613,337 |
| NatWest Group PLC | | 1,310,000 | 3,527,419 |
| Next PLC | | 31,877 | 1,801,872 |
| NMC Health PLC (a) | | 55,366 | 1,107 |
| Ocado Group PLC (a) | | 140,732 | 762,950 |
| Pearson PLC | | 163,760 | 1,810,060 |
| Persimmon PLC | | 77,855 | 1,165,158 |
| Phoenix Group Holdings PLC | | 182,835 | 1,137,278 |
| Prudential PLC | | 664,569 | 6,173,627 |
| Reckitt Benckiser Group PLC | | 172,963 | 11,478,520 |
| RELX PLC (London Stock Exchange) | | 466,343 | 12,526,204 |
| Rentokil Initial PLC | | 612,937 | 3,824,795 |
| Rio Tinto PLC | | 271,828 | 14,206,181 |
| Rolls-Royce Holdings PLC (a) | | 2,045,406 | 1,834,450 |
| Sage Group PLC | | 244,086 | 2,034,443 |
| Schroders PLC | | 178,347 | 801,138 |
| Segro PLC | | 291,620 | 2,625,274 |
| Severn Trent PLC | | 61,159 | 1,755,533 |
| Shell PLC (London) | | 1,799,700 | 49,854,583 |
| Smith & Nephew PLC | | 213,153 | 2,518,811 |
| Smiths Group PLC | | 89,716 | 1,605,541 |
| Spirax-Sarco Engineering PLC | | 17,763 | 2,189,840 |
| SSE PLC | | 257,926 | 4,609,366 |
| St. James's Place PLC | | 130,201 | 1,590,200 |
| Standard Chartered PLC (United Kingdom) | | 616,290 | 3,676,573 |
| Taylor Wimpey PLC | | 849,755 | 913,885 |
| Tesco PLC | | 1,843,923 | 4,554,277 |
| Unilever PLC | | 617,417 | 28,064,294 |
| United Utilities Group PLC | | 166,587 | 1,795,175 |
| Vodafone Group PLC | | 6,455,915 | 7,536,652 |
| Whitbread PLC | | 49,266 | 1,450,002 |
TOTAL UNITED KINGDOM | | | 453,204,338 |
| United States of America - 0.1% | | | |
| Coca-Cola European Partners PLC | | 50,248 | 2,364,168 |
| TOTAL COMMON STOCKS (Cost $2,714,519,863) | | | 3,097,962,608 |
| | | | |
| Nonconvertible Preferred Stocks - 0.5% |
| | | Shares | Value ($) |
| Germany - 0.5% | | | |
| Bayerische Motoren Werke AG (BMW) (non-vtg.) | | 14,103 | 1,041,116 |
| Dr. Ing. h.c. F. Porsche AG Series F (a) | | 27,545 | 2,817,409 |
| Henkel AG & Co. KGaA | | 43,298 | 2,727,714 |
| Porsche Automobil Holding SE (Germany) | | 37,430 | 2,091,300 |
| Sartorius AG (non-vtg.) | | 5,947 | 2,098,721 |
| Volkswagen AG | | 45,362 | 5,806,401 |
| | | | |
| TOTAL NONCONVERTIBLE PREFERRED STOCKS (Cost $17,037,944) | | | 16,582,661 |
| | | | |
| Government Obligations - 0.0% |
| | | Principal Amount (d) | Value ($) |
| United States of America - 0.0% | | | |
U.S. Treasury Bills, yield at date of purchase 1.23% 1/26/23 (Cost $1,595,358) | | 1,600,000 | 1,584,759 |
| | | | |
| Money Market Funds - 0.8% |
| | | Shares | Value ($) |
| Fidelity Cash Central Fund 3.10% (e) | | 13,898,365 | 13,901,145 |
| Fidelity Securities Lending Cash Central Fund 3.10% (e)(f) | | 11,417,855 | 11,418,997 |
| TOTAL MONEY MARKET FUNDS (Cost $25,320,142) | | | 25,320,142 |
| | | | |
| TOTAL INVESTMENT IN SECURITIES - 99.1% (Cost $2,758,473,307) | 3,141,450,170 |
NET OTHER ASSETS (LIABILITIES) - 0.9% | 27,476,028 |
| NET ASSETS - 100.0% | 3,168,926,198 |
| | |
| Futures Contracts |
| | Number of contracts | Expiration Date | Notional Amount ($) | Value ($) | Unrealized Appreciation/ (Depreciation) ($) |
| Purchased | | | | | |
| | | | | | |
| Equity Index Contracts | | | | | |
| ICE E-mini MSCI EAFE Index Contracts (United States) | 550 | Dec 2022 | 48,287,250 | 1,504,021 | 1,504,021 |
| | | | | | |
| The notional amount of futures purchased as a percentage of Net Assets is 1.5% |
Categorizations in the Schedule of Investments are based on country or territory of incorporation.
Legend
| (b) | Security exempt from registration under Rule 144A of the Securities Act of 1933. These securities may be resold in transactions exempt from registration, normally to qualified institutional buyers. At the end of the period, the value of these securities amounted to $45,715,048 or 1.4% of net assets. |
| (c) | Security or a portion of the security is on loan at period end. |
| (d) | Amount is stated in United States dollars unless otherwise noted. |
| (e) | Affiliated fund that is generally available only to investment companies and other accounts managed by Fidelity Investments. The rate quoted is the annualized seven-day yield of the fund at period end. A complete unaudited listing of the fund's holdings as of its most recent quarter end is available upon request. In addition, each Fidelity Central Fund's financial statements, which are not covered by the Fund's Report of Independent Registered Public Accounting Firm, are available on the SEC's website or upon request. |
| (f) | Investment made with cash collateral received from securities on loan. |
Affiliated Central Funds
Fiscal year to date information regarding the Fund's investments in Fidelity Central Funds, including the ownership percentage, is presented below.
| Affiliate | Value, beginning of period ($) | Purchases ($) | Sales Proceeds ($) | Dividend Income ($) | Realized Gain (loss) ($) | Change in Unrealized appreciation (depreciation) ($) | Value, end of period ($) | % ownership, end of period |
| Fidelity Cash Central Fund 3.10% | - | 1,448,086,963 | 1,434,185,818 | 263,735 | - | - | 13,901,145 | 0.0% |
| Fidelity Securities Lending Cash Central Fund 3.10% | 4,060,855 | 172,843,114 | 165,484,972 | 292,412 | - | - | 11,418,997 | 0.0% |
| Total | 4,060,855 | 1,620,930,077 | 1,599,670,790 | 556,147 | - | - | 25,320,142 | |
| | | | | | | | | |
Amounts in the income column in the above table include any capital gain distributions from underlying funds, which are presented in the corresponding line item in the Statement of Operations, if applicable.
Amount for Fidelity Securities Lending Cash Central Fund represents the income earned on investing cash collateral, less rebates paid to borrowers and any lending agent fees associated with the loan, plus any premium payments received for lending certain types of securities.
Investment Valuation
The following is a summary of the inputs used, as of October 31, 2022, involving the Fund's assets and liabilities carried at fair value. The inputs or methodology used for valuing securities may not be an indication of the risk associated with investing in those securities. For more information on valuation inputs, and their aggregation into the levels used below, please refer to the Investment Valuation section in the accompanying Notes to Financial Statements.
| Valuation Inputs at Reporting Date: |
| Description | Total ($) | Level 1 ($) | Level 2 ($) | Level 3 ($) |
Investments in Securities: | | | | |
|
| Equities: | | | | |
Communication Services | 148,650,134 | 42,321,447 | 106,328,687 | - |
Consumer Discretionary | 342,479,923 | 110,006,287 | 232,473,636 | - |
Consumer Staples | 335,288,232 | 85,985,957 | 249,302,275 | - |
Energy | 163,787,425 | 24,606,976 | 139,180,449 | - |
Financials | 551,760,615 | 248,590,179 | 303,170,436 | - |
Health Care | 432,342,474 | 111,210,294 | 321,132,180 | - |
Industrials | 476,236,179 | 216,394,917 | 259,841,262 | - |
Information Technology | 250,702,829 | 93,898,590 | 156,804,239 | - |
Materials | 228,045,980 | 100,187,155 | 127,858,825 | - |
Real Estate | 81,038,090 | 65,459,791 | 15,578,299 | - |
Utilities | 104,213,388 | 37,638,201 | 66,575,187 | - |
|
| Government Obligations | 1,584,759 | - | 1,584,759 | - |
|
| Money Market Funds | 25,320,142 | 25,320,142 | - | - |
| Total Investments in Securities: | 3,141,450,170 | 1,161,619,936 | 1,979,830,234 | - |
Derivative Instruments: | | | | |
|
| Assets | | | | |
Futures Contracts | 1,504,021 | 1,504,021 | - | - |
| Total Assets | 1,504,021 | 1,504,021 | - | - |
| Total Derivative Instruments: | 1,504,021 | 1,504,021 | - | - |
Value of Derivative Instruments
The following table is a summary of the Fund's value of derivative instruments by primary risk exposure as of October 31, 2022. For additional information on derivative instruments, please refer to the Derivative Instruments section in the accompanying Notes to Financial Statements.
Primary Risk Exposure / Derivative Type | Value |
| Asset ($) | Liability ($) |
| Equity Risk | | |
Futures Contracts (a) | 1,504,021 | 0 |
| Total Equity Risk | 1,504,021 | 0 |
| Total Value of Derivatives | 1,504,021 | 0 |
(a)Reflects gross cumulative appreciation (depreciation) on futures contracts as presented in the Schedule of Investments. In the Statement of Assets and Liabilities, the period end daily variation margin is included in receivable or payable for daily variation margin on futures contracts, and the net cumulative appreciation (depreciation) is included in Total accumulated earnings (loss).
| Statement of Assets and Liabilities |
| | | | October 31, 2022 |
| | | | | |
| Assets | | | | |
| Investment in securities, at value (including securities loaned of $10,824,884) - See accompanying schedule: | | | | |
Unaffiliated issuers (cost $2,733,153,165) | | $3,116,130,028 | | |
Fidelity Central Funds (cost $25,320,142) | | 25,320,142 | | |
| | | | | |
| Total Investment in Securities (cost $2,758,473,307) | | | $ | 3,141,450,170 |
| Segregated cash with brokers for derivative instruments | | | | 2,566,459 |
| Foreign currency held at value (cost $1,455,588) | | | | 1,474,792 |
| Receivable for investments sold | | | | 745,115 |
| Receivable for fund shares sold | | | | 696,641 |
| Dividends receivable | | | | 8,061,368 |
| Reclaims receivable | | | | 27,491,555 |
| Distributions receivable from Fidelity Central Funds | | | | 50,884 |
| Prepaid expenses | | | | 5,691 |
| Receivable from investment adviser for expense reductions | | | | 34,967 |
Total assets | | | | 3,182,577,642 |
| Liabilities | | | | |
| Payable for fund shares redeemed | | $1,518,818 | | |
| Accrued management fee | | 90,180 | | |
| Payable for daily variation margin on futures contracts | | 446,001 | | |
| Other payables and accrued expenses | | 177,448 | | |
| Collateral on securities loaned | | 11,418,997 | | |
| Total Liabilities | | | | 13,651,444 |
| Net Assets | | | $ | 3,168,926,198 |
| Net Assets consist of: | | | | |
| Paid in capital | | | $ | 3,778,564,688 |
| Total accumulated earnings (loss) | | | | (609,638,490) |
| Net Assets | | | $ | 3,168,926,198 |
Net Asset Value , offering price and redemption price per share ($3,168,926,198 ÷ 291,190,431 shares) | | | $ | 10.88 |
| | | | | |
| Statement of Operations |
| | | | Year ended October 31, 2022 |
| Investment Income | | | | |
| Dividends | | | $ | 158,511,319 |
| Non-Cash dividends | | | | 14,048,652 |
| Foreign Tax Reclaims | | | | 18,373,901 |
| Interest | | | | 40,470 |
| Income from Fidelity Central Funds (including $292,412 from security lending) | | | | 556,147 |
| Income before foreign taxes withheld | | | | 191,530,489 |
| Less foreign taxes withheld | | | | (26,251,243) |
| Total Income | | | | 165,279,246 |
| Expenses | | | | |
| Management fee | $ | 1,745,577 | | |
| Custodian fees and expenses | | 550,465 | | |
| Independent trustees' fees and expenses | | 17,095 | | |
| Registration fees | | 38,703 | | |
| Audit | | 56,388 | | |
| Legal | | 7,626 | | |
| Interest | | 149,464 | | |
| Miscellaneous | | 21,388 | | |
| Total expenses before reductions | | 2,586,706 | | |
| Expense reductions | | (675,219) | | |
| Total expenses after reductions | | | | 1,911,487 |
| Net Investment income (loss) | | | | 163,367,759 |
| Realized and Unrealized Gain (Loss) | | | | |
| Net realized gain (loss) on: | | | | |
| Investment Securities: | | | | |
| Unaffiliated issuers | | (436,035,420) | | |
| Foreign currency transactions | | (1,793,930) | | |
| Futures contracts | | (38,480,165) | | |
| Total net realized gain (loss) | | | | (476,309,515) |
| Change in net unrealized appreciation (depreciation) on: | | | | |
| Investment Securities: | | | | |
| Unaffiliated issuers | | (935,650,006) | | |
| Assets and liabilities in foreign currencies | | (3,328,241) | | |
| Futures contracts | | 1,181,068 | | |
| Total change in net unrealized appreciation (depreciation) | | | | (937,797,179) |
| Net gain (loss) | | | | (1,414,106,694) |
| Net increase (decrease) in net assets resulting from operations | | | $ | (1,250,738,935) |
| Statement of Changes in Net Assets |
| |
| | Year ended October 31, 2022 | | Year ended October 31, 2021 |
| Increase (Decrease) in Net Assets | | | | |
| Operations | | | | |
| Net investment income (loss) | $ | 163,367,759 | $ | 130,014,915 |
| Net realized gain (loss) | | (476,309,515) | | 61,887,202 |
| Change in net unrealized appreciation (depreciation) | | (937,797,179) | | 1,021,443,608 |
| Net increase (decrease) in net assets resulting from operations | | (1,250,738,935) | | 1,213,345,725 |
| Distributions to shareholders | | (164,779,160) | | (79,662,707) |
| Share transactions | | | | |
| Proceeds from sales of shares | | 1,319,237,205 | | 2,374,722,124 |
| Reinvestment of distributions | | 164,400,475 | | 79,438,628 |
| Cost of shares redeemed | | (3,151,339,963) | | (993,618,213) |
Net increase (decrease) in net assets resulting from share transactions | | (1,667,702,283) | | 1,460,542,539 |
| Total increase (decrease) in net assets | | (3,083,220,378) | | 2,594,225,557 |
| | | | | |
| Net Assets | | | | |
| Beginning of period | | 6,252,146,576 | | 3,657,921,019 |
| End of period | $ | 3,168,926,198 | $ | 6,252,146,576 |
| | | | | |
| Other Information | | | | |
| Shares | | | | |
| Sold | | 104,093,787 | | 166,626,703 |
| Issued in reinvestment of distributions | | 12,109,857 | | 6,210,995 |
| Redeemed | | (255,655,639) | | (73,639,882) |
| Net increase (decrease) | | (139,451,995) | | 99,197,816 |
| | | | | |
Financial Highlights
| Fidelity® SAI International Index Fund |
| |
| Years ended October 31, | | 2022 | | 2021 | | 2020 | | 2019 | | 2018 |
Selected Per-Share Data | | | | | | | | | | |
| Net asset value, beginning of period | $ | 14.52 | $ | 11.04 | $ | 12.19 | $ | 11.27 | $ | 12.40 |
| Income from Investment Operations | | | | | | | | | | |
Net investment income (loss) A,B | | .42 | | .37 | | .28 | | .38 | | .37 |
| Net realized and unrealized gain (loss) | | (3.68) | | 3.36 | | (1.04) | | .85 | | (1.24) |
| Total from investment operations | | (3.26) | | 3.73 | | (.76) | | 1.23 | | (.87) |
| Distributions from net investment income | | (.38) | | (.25) | | (.39) | | (.31) | | (.20) |
| Distributions from net realized gain | | - | | - | | - | | - | | (.06) |
| Total distributions | | (.38) | | (.25) | | (.39) | | (.31) | | (.26) |
| Net asset value, end of period | $ | 10.88 | $ | 14.52 | $ | 11.04 | $ | 12.19 | $ | 11.27 |
Total Return C | | (23.00)% | | 34.09% | | (6.51)% | | 11.36% | | (7.14)% |
Ratios to Average Net Assets B,D,E | | | | | | | | | | |
| Expenses before reductions | | .05% | | .05% | | .05% | | .11% | | .13% |
| Expenses net of fee waivers, if any | | .04% | | .04% | | .04% | | .05% | | .05% |
| Expenses net of all reductions | | .04% | | .04% | | .04% | | .05% | | .05% |
| Net investment income (loss) | | 3.28% | | 2.66% | | 2.51% | | 3.35% | | 2.98% |
| Supplemental Data | | | | | | | | | | |
| Net assets, end of period (000 omitted) | $ | 3,168,926 | $ | 6,252,147 | $ | 3,657,921 | $ | 6,490,033 | $ | 7,884,495 |
Portfolio turnover rate F | | 20% | | 10% | | 16% | | 4% | | 7% |
A Calculated based on average shares outstanding during the period.
B Net investment income (loss) is affected by the timing of the declaration of dividends by any underlying mutual funds or exchange-traded funds (ETFs). Net investment income (loss) of any mutual funds or ETFs is not included in the Fund's net investment income (loss) ratio.
C Total returns would have been lower if certain expenses had not been reduced during the applicable periods shown.
D Fees and expenses of any underlying mutual funds or exchange-traded funds (ETFs) are not included in the Fund's expense ratio. The Fund indirectly bears its proportionate share of these expenses. For additional expense information related to investments in Fidelity Central Funds, please refer to the "Investments in Fidelity Central Funds" note found in the Notes to Financial Statements section of the most recent Annual or Semi-Annual report.
E Expense ratios reflect operating expenses of the class. Expenses before reductions do not reflect amounts reimbursed, waived, or reduced through arrangements with the investment adviser, brokerage services, or other offset arrangements, if applicable, and do not represent the amount paid by the class during periods when reimbursements, waivers or reductions occur.
F Amount does not include the portfolio activity of any underlying mutual funds or exchange-traded funds (ETFs).
For the period ended October 31, 2022
1. Organization.
Fidelity SAI International Index Fund (the Fund) is a fund of Fidelity Salem Street Trust (the Trust) and is authorized to issue an unlimited number of shares. Shares are offered exclusively to certain clients of Fidelity Management & Research Company LLC (FMR) or its affiliates. The Trust is registered under the Investment Company Act of 1940, as amended (the 1940 Act), as an open-end management investment company organized as a Massachusetts business trust.
2. Investments in Fidelity Central Funds.
Funds may invest in Fidelity Central Funds, which are open-end investment companies generally available only to other investment companies and accounts managed by the investment adviser and its affiliates. The Schedule of Investments lists any Fidelity Central Funds held as an investment as of period end, but does not include the underlying holdings of each Fidelity Central Fund. An investing fund indirectly bears its proportionate share of the expenses of the underlying Fidelity Central Funds.
Based on its investment objective, each Fidelity Central Fund may invest or participate in various investment vehicles or strategies that are similar to those of the investing fund. These strategies are consistent with the investment objectives of the investing fund and may involve certain economic risks which may cause a decline in value of each of the Fidelity Central Funds and thus a decline in the value of the investing fund.
| Fidelity Central Fund | Investment Manager | Investment Objective | Investment Practices | Expense Ratio A |
| Fidelity Money Market Central Funds | Fidelity Management & Research Company LLC (FMR) | Each fund seeks to obtain a high level of current income consistent with the preservation of capital and liquidity. | Short-term Investments | Less than .005% |
A Expenses expressed as a percentage of average net assets and are as of each underlying Central Fund's most recent annual or semi-annual shareholder report.
A complete unaudited list of holdings for each Fidelity Central Fund is available upon request or at the Securities and Exchange Commission website at www.sec.gov. In addition, the financial statements of the Fidelity Central Funds which contain the significant accounting policies (including investment valuation policies) of those funds, and are not covered by the Report of Independent Registered Public Accounting Firm, are available on the Securities and Exchange Commission website or upon request.
3. Significant Accounting Policies.
The Fund is an investment company and applies the accounting and reporting guidance of the Financial Accounting Standards Board (FASB) Accounting Standards Codification Topic 946 Financial Services - Investment Companies . The financial statements have been prepared in conformity with accounting principles generally accepted in the United States of America (GAAP), which require management to make certain estimates and assumptions at the date of the financial statements. Actual results could differ from those estimates. Subsequent events, if any, through the date that the financial statements were issued have been evaluated in the preparation of the financial statements. The Fund's Schedule of Investments lists any underlying mutual funds or exchange-traded funds (ETFs) but does not include the underlying holdings of these funds. The following summarizes the significant accounting policies of the Fund:
Investment Valuation. Investments are valued as of 4:00 p.m. Eastern time on the last calendar day of the period. The Board of Trustees (the Board) has designated the Fund's investment adviser as the valuation designee responsible for the fair valuation function and performing fair value determinations as needed. The investment adviser has established a Fair Value Committee (the Committee) to carry out the day-to-day fair valuation responsibilities and has adopted policies and procedures to govern the fair valuation process and the activities of the Committee. In accordance with these fair valuation policies and procedures, which have been approved by the Board, the Fund attempts to obtain prices from one or more third party pricing services or brokers to value its investments. When current market prices, quotations or currency exchange rates are not readily available or reliable, investments will be fair valued in good faith by the Committee, in accordance with the policies and procedures. Factors used in determining fair value vary by investment type and may include market or investment specific events, transaction data, estimated cash flows, and market observations of comparable investments. The frequency that the fair valuation procedures are used cannot be predicted and they may be utilized to a significant extent. The Committee manages the Fund's fair valuation practices and maintains the fair valuation policies and procedures. The Fund's investment adviser reports to the Board information regarding the fair valuation process and related material matters.
The Fund categorizes the inputs to valuation techniques used to value its investments into a disclosure hierarchy consisting of three levels as shown below:
Level 1 - unadjusted quoted prices in active markets for identical investments
Level 2 - other significant observable inputs (including quoted prices for similar investments, interest rates, prepayment speeds, etc.)
Level 3 - unobservable inputs (including the Fund's own assumptions based on the best information available)
Valuation techniques used to value the Fund's investments by major category are as follows:
Equity securities, including restricted securities, for which market quotations are readily available, are valued at the last reported sale price or official closing price as reported by a third party pricing service on the primary market or exchange on which they are traded and are categorized as Level 1 in the hierarchy. In the event there were no sales during the day or closing prices are not available, securities are valued at the last quoted bid price or may be valued using the last available price and are generally categorized as Level 2 in the hierarchy. For foreign equity securities, when market or security specific events arise, comparisons to the valuation of American Depositary Receipts (ADRs), futures contracts, ETFs and certain indexes as well as quoted prices for similar securities may be used and would be categorized as Level 2 in the hierarchy. For equity securities, including restricted securities, where observable inputs are limited, assumptions about market activity and risk are used and these securities may be categorized as Level 3 in the hierarchy.
Debt securities, including restricted securities, are valued based on evaluated prices received from third party pricing services or from brokers who make markets in such securities. U.S. government and government agency obligations are valued by pricing services who utilize matrix pricing which considers yield or price of bonds of comparable quality, coupon, maturity and type or by broker-supplied prices. When independent prices are unavailable or unreliable, debt securities may be valued utilizing pricing methodologies which consider similar factors that would be used by third party pricing services. Debt securities are generally categorized as Level 2 in the hierarchy but may be Level 3 depending on the circumstances.
Futures contracts are valued at the settlement price established each day by the board of trade or exchange on which they are traded and are categorized as Level 1 in the hierarchy. Investments in open-end mutual funds, including the Fidelity Central Funds, are valued at their closing net asset value (NAV) each business day and are categorized as Level 1 in the hierarchy.
Changes in valuation techniques may result in transfers in or out of an assigned level within the disclosure hierarchy. The aggregate value of investments by input level as of October 31, 2022 is included at the end of the Fund's Schedule of Investments.
Foreign Currency. Certain Funds may use foreign currency contracts to facilitate transactions in foreign-denominated securities. Gains and losses from these transactions may arise from changes in the value of the foreign currency or if the counterparties do not perform under the contracts' terms.
Foreign-denominated assets, including investment securities, and liabilities are translated into U.S. dollars at the exchange rates at period end. Purchases and sales of investment securities, income and dividends received, and expenses denominated in foreign currencies are translated into U.S. dollars at the exchange rate in effect on the transaction date.
The effects of exchange rate fluctuations on investments are included with the net realized and unrealized gain (loss) on investment securities. Other foreign currency transactions resulting in realized and unrealized gain (loss) are disclosed separately.
Investment Transactions and Income. For financial reporting purposes, the Fund's investment holdings and NAV include trades executed through the end of the last business day of the period. The NAV per share for processing shareholder transactions is calculated as of the close of business of the New York Stock Exchange (NYSE), normally 4:00 p.m. Eastern time and includes trades executed through the end of the prior business day. Gains and losses on securities sold are determined on the basis of identified cost. Commissions paid to certain brokers with whom the investment adviser, or its affiliates, places trades on behalf of a fund include an amount in addition to trade execution, which may be rebated back to a fund. Any such rebates are included in net realized gain (loss) on investments in the Statement of Operations. Dividend income is recorded on the ex-dividend date, except for certain dividends from foreign securities where the ex-dividend date may have passed, which are recorded as soon as the Fund is informed of the ex-dividend date. Non-cash dividends included in dividend income, if any, are recorded at the fair market value of the securities received. Income and capital gain distributions from Fidelity Central Funds, if any, are recorded on the ex-dividend date. Certain distributions received by the Fund represent a return of capital or capital gain. The Fund determines the components of these distributions subsequent to the ex-dividend date, based upon receipt of tax filings or other correspondence relating to the underlying investment. These distributions are recorded as a reduction of cost of investments and/or as a realized gain. Investment income is recorded net of foreign taxes withheld where recovery of such taxes is uncertain. Funds may file withholding tax reclaims in certain jurisdictions to recover a portion of amounts previously withheld. Any withholding tax reclaims income is included in the Statement of Operations in foreign tax reclaims. Any receivables for withholding tax reclaims are included in the Statement of Assets and Liabilities in reclaims receivable. The Fund has filed tax reclaims for previously withheld taxes on dividends earned in certain European Union (EU) countries. These additional filings are subject to various administrative proceedings by the local jurisdictions' tax authorities within the EU, as well as a number of related judicial proceedings. Income recognized for EU reclaims is included with other reclaims in the Statement of Operations in foreign tax reclaims. These reclaims are recorded when the amount is known and there are no significant uncertainties on collectability.
Expenses. Expenses directly attributable to a fund are charged to that fund. Expenses attributable to more than one fund are allocated among the respective funds on the basis of relative net assets or other appropriate methods. Expenses included in the accompanying financial statements reflect the expenses of that fund and do not include any expenses associated with any underlying mutual funds or exchange-traded funds. Although not included in a fund's expenses, a fund indirectly bears its proportionate share of these expenses through the net asset value of each underlying mutual fund or exchange-traded fund. Expense estimates are accrued in the period to which they relate and adjustments are made when actual amounts are known.
Income Tax Information and Distributions to Shareholders. Each year, the Fund intends to qualify as a regulated investment company under Subchapter M of the Internal Revenue Code, including distributing substantially all of its taxable income and realized gains. As a result, no provision for U.S. Federal income taxes is required. As of October 31, 2022, the Fund did not have any unrecognized tax benefits in the financial statements; nor is the Fund aware of any tax positions for which it is reasonably possible that the total amounts of unrecognized tax benefits will significantly change in the next twelve months. The Fund files a U.S. federal tax return, in addition to state and local tax returns as required. The Fund's federal income tax returns are subject to examination by the Internal Revenue Service (IRS) for a period of three fiscal years after they are filed. State and local tax returns may be subject to examination for an additional fiscal year depending on the jurisdiction. Foreign taxes are provided for based on the Fund's understanding of the tax rules and rates that exist in the foreign markets in which it invests.
Distributions are declared and recorded on the ex-dividend date. Income and capital gain distributions are determined in accordance with income tax regulations, which may differ from GAAP. In addition, the Fund claimed a portion of the payment made to redeeming shareholders as a distribution for income tax purposes.
Capital accounts within the financial statements are adjusted for permanent book-tax differences. These adjustments have no impact on net assets or the results of operations. Capital accounts are not adjusted for temporary book-tax differences which will reverse in a subsequent period.
Book-tax differences are primarily due to partnerships, futures contracts, foreign currency transactions, passive foreign investment companies (PFIC), capital loss carryforwards and losses deferred due to wash sales.
As of period end, the cost and unrealized appreciation (depreciation) in securities, and derivatives if applicable, for federal income tax purposes were as follows:
| Gross unrealized appreciation | $ 696,554,729 |
| Gross unrealized depreciation | (342,358,714) |
| Net unrealized appreciation (depreciation) | $354,196,015 |
| Tax Cost | $2,787,254,155 |
The tax-based components of distributable earnings as of period end were as follows:
| Undistributed ordinary income | $89,739,734 |
| Capital loss carryforward | $(1,050,854,629) |
| Net unrealized appreciation (depreciation) on securities and other investments | $351,476,405 |
Capital loss carryforwards are only available to offset future capital gains of the Fund to the extent provided by regulations and may be limited. The capital loss carryforward information presented below, including any applicable limitation, is estimated as of fiscal period end and is subject to adjustment.
| Short-term | $(445,039,676) |
| Long-term | (605,814,953) |
| Total capital loss carryforward | $(1,050,854,629) |
The tax character of distributions paid was as follows:
| | October 31, 2022 | October 31, 2021 |
| Ordinary Income | $164,779,160 | $ 79,662,707 |
Restricted Securities (including Private Placements). Funds may invest in securities that are subject to legal or contractual restrictions on resale. These securities generally may be resold in transactions exempt from registration or to the public if the securities are registered. Disposal of these securities may involve time-consuming negotiations and expense, and prompt sale at an acceptable price may be difficult. Information regarding restricted securities held at period end is included at the end of the Schedule of Investments, if applicable.
4. Derivative Instruments.
Risk Exposures and the Use of Derivative Instruments. The Fund's investment objectives allow for various types of derivative instruments, including futures contracts. Derivatives are investments whose value is primarily derived from underlying assets, indices or reference rates and may be transacted on an exchange or over-the-counter (OTC). Derivatives may involve a future commitment to buy or sell a specified asset based on specified terms, to exchange future cash flows at periodic intervals based on a notional principal amount, or for one party to make one or more payments upon the occurrence of specified events in exchange for periodic payments from the other party.
Derivatives were used to increase returns and to manage exposure to certain risks as defined below. The success of any strategy involving derivatives depends on analysis of numerous economic factors, and if the strategies for investment do not work as intended, the objectives may not be achieved.
Derivatives were used to increase or decrease exposure to the following risk(s):
| | |
| Equity Risk | Equity risk relates to the fluctuations in the value of financial instruments as a result of changes in market prices (other than those arising from interest rate risk or foreign exchange risk), whether caused by factors specific to an individual investment, its issuer, or all factors affecting all instruments traded in a market or market segment. |
Funds are also exposed to additional risks from investing in derivatives, such as liquidity risk and counterparty credit risk. Liquidity risk is the risk that a fund will be unable to close out the derivative in the open market in a timely manner. Counterparty credit risk is the risk that the counterparty will not be able to fulfill its obligation to a fund. Counterparty credit risk related to exchange-traded contracts may be mitigated by the protection provided by the exchange on which they trade.
Investing in derivatives may involve greater risks than investing in the underlying assets directly and, to varying degrees, may involve risk of loss in excess of any initial investment and collateral received and amounts recognized in the Statement of Assets and Liabilities. In addition, there may be the risk that the change in value of the derivative contract does not correspond to the change in value of the underlying instrument.
Futures Contracts. A futures contract is an agreement between two parties to buy or sell a specified underlying instrument for a fixed price at a specified future date. Futures contracts were used to manage exposure to the stock market.
Upon entering into a futures contract, a fund is required to deposit either cash or securities (initial margin) with a clearing broker in an amount equal to a certain percentage of the face value of the contract. Futures contracts are marked-to-market daily and subsequent daily payments are made or received by a fund depending on the daily fluctuations in the value of the futures contracts and are recorded as unrealized appreciation or (depreciation). This receivable and/or payable, if any, is included in daily variation margin on futures contracts in the Statement of Assets and Liabilities. Realized gain or (loss) is recorded upon the expiration or closing of a futures contract. The net realized gain (loss) and change in net unrealized appreciation (depreciation) on futures contracts during the period is presented in the Statement of Operations.
Any open futures contracts at period end are presented in the Schedule of Investments under the caption "Futures Contracts". The notional amount at value reflects each contract's exposure to the underlying instrument or index at period end, and is representative of volume of activity during the period unless an average notional amount is presented. Any securities deposited to meet initial margin requirements are identified in the Schedule of Investments. Any cash deposited to meet initial margin requirements is presented as segregated cash with brokers for derivative instruments in the Statement of Assets and Liabilities.
5. Purchases and Sales of Investments.
Purchases and sales of securities, other than short-term securities and in-kind transactions, as applicable, are noted in the table below.
| | Purchases ($) | Sales ($) |
| Fidelity SAI International Index Fund | 961,330,086 | 2,667,926,615 |
6. Fees and Other Transactions with Affiliates.
Management Fee. Fidelity Management & Research Company LLC (the investment adviser) and its affiliates provide the Fund with investment management related services for which the Fund pays a monthly management fee that is based on an annual rate of .035% of the Fund's average net assets.
Sub-Adviser. Geode Capital Management, LLC (Geode), serves as sub-adviser for the Fund. Geode provides discretionary investment advisory services to the Fund and is paid by the investment adviser for providing these services.
Interfund Lending Program. Pursuant to an Exemptive Order issued by the Securities and Exchange Commission (the SEC), the Fund, along with other registered investment companies having management contracts with Fidelity Management & Research Company LLC (FMR), or other affiliated entities of FMR, may participate in an interfund lending program. This program provides an alternative credit facility allowing the Fund to borrow from, or lend money to, other participating affiliated funds. At period end, there were no interfund loans outstanding. Activity in this program during the period for which loans were outstanding was as follows:
| | Borrower or Lender | Average Loan Balance | Weighted Average Interest Rate | Interest Expense |
| Fidelity SAI International Index Fund | Borrower | $33,631,942 | 1.76% | $141,159 |
Interfund Trades. Funds may purchase from or sell securities to other Fidelity Funds under procedures adopted by the Board. The procedures have been designed to ensure these interfund trades are executed in accordance with Rule 17a-7 of the 1940 Act. Any interfund trades are included within the respective purchases and sales amounts shown in the Purchases and Sales of Investments note. During the period, there were no interfund trades.
7. Committed Line of Credit.
Certain Funds participate with other funds managed by the investment adviser or an affiliate in a $4.25 billion credit facility (the "line of credit") to be utilized for temporary or emergency purposes to fund shareholder redemptions or for other short-term liquidity purposes. The participating funds have agreed to pay commitment fees on their pro-rata portion of the line of credit, which are reflected in Miscellaneous expenses on the Statement of Operations, and are listed below. During the period, there were no borrowings on this line of credit.
| | Amount |
| Fidelity SAI International Index Fund | $8,936 |
8. Security Lending.
Funds lend portfolio securities from time to time in order to earn additional income. Lending agents are used, including National Financial Services (NFS), an affiliate of the investment adviser. Pursuant to a securities lending agreement, NFS will receive a fee, which is capped at 9.9% of a fund's daily lending revenue, for its services as lending agent. A fund may lend securities to certain qualified borrowers, including NFS. On the settlement date of the loan, a fund receives collateral (in the form of U.S. Treasury obligations, letters of credit and/or cash) against the loaned securities and maintains collateral in an amount not less than 100% of the market value of the loaned securities during the period of the loan. The market value of the loaned securities is determined at the close of business of a fund and any additional required collateral is delivered to a fund on the next business day. A fund or borrower may terminate the loan at any time, and if the borrower defaults on its obligation to return the securities loaned because of insolvency or other reasons, a fund may apply collateral received from the borrower against the obligation. A fund may experience delays and costs in recovering the securities loaned. Any cash collateral received is invested in the Fidelity Securities Lending Cash Central Fund. Any loaned securities are identified as such in the Schedule of Investments, and the value of loaned securities and cash collateral at period end, as applicable, are presented in the Statement of Assets and Liabilities. Security lending income represents the income earned on investing cash collateral, less rebates paid to borrowers and any lending agent fees associated with the loan, plus any premium payments received for lending certain types of securities. Security lending income is presented in the Statement of Operations as a component of income from Fidelity Central Funds. Affiliated security lending activity, if any, was as follows:
| | Total Security Lending Fees Paid to NFS | Security Lending Income From Securities Loaned to NFS | Value of Securities Loaned to NFS at Period End |
| Fidelity SAI International Index Fund | $31,484 | $- | $- |
9. Bank Borrowings.
The Fund is permitted to have bank borrowings for temporary or emergency purposes to fund shareholder redemptions or for other short-term liquidity requirements. The Fund has established borrowing arrangements with certain banks. The interest rate on the borrowings is the bank's base rate, as revised from time to time. Any open loans, including accrued interest, at period end are presented under the caption "Notes payable" in the Statement of Assets and Liabilities, if applicable. Activity in this program during the period for which loans were outstanding was as follows:
| | Average Loan Balance | Weighted Average Interest Rate | Interest Expense |
| Fidelity SAI International Index Fund | $4,881,567 | 2.04% | $8,305 |
10. Expense Reductions.
The investment adviser contractually agreed to reimburse the Fund to the extent annual operating expenses exceeded .035% of average net assets. This reimbursement will remain in place through February 29, 2024. Some expenses, for example the compensation of the independent Trustees, and certain miscellaneous expenses such as proxy and shareholder meeting expenses, are excluded from this reimbursement. During the period this reimbursement reduced the Fund's expenses by $675,212.
Through arrangements with the Fund's custodian, credits realized as a result of certain uninvested cash balances were used to reduce the Fund's expenses by $7.
11. Other.
A fund's organizational documents provide former and current trustees and officers with a limited indemnification against liabilities arising in connection with the performance of their duties to the fund. In the normal course of business, a fund may also enter into contracts that provide general indemnifications. A fund's maximum exposure under these arrangements is unknown as this would be dependent on future claims that may be made against a fund. The risk of material loss from such claims is considered remote.
12. Risk and Uncertainties.
Many factors affect a fund's performance. Developments that disrupt global economies and financial markets, such as pandemics, epidemics, outbreaks of infectious diseases, war, terrorism, and environmental disasters, may significantly affect a fund's investment performance. The effects of these developments to a fund will be impacted by the types of securities in which a fund invests, the financial condition, industry, economic sector, and geographic location of an issuer, and a fund's level of investment in the securities of that issuer.
To the Board of Trustees of Fidelity Salem Street Trust and Shareholders of Fidelity SAI International Index Fund
Opinion on the Financial Statements
We have audited the accompanying statement of assets and liabilities, including the schedule of investments, of Fidelity SAI International Index Fund (one of the funds constituting Fidelity Salem Street Trust, referred to hereafter as the "Fund") as of October 31, 2022, the related statement of operations for the year ended October 31, 2022, the statement of changes in net assets for each of the two years in the period ended October 31, 2022, including the related notes, and the financial highlights for each of the five years in the period ended October 31, 2022 (collectively referred to as the "financial statements"). In our opinion, the financial statements present fairly, in all material respects, the financial position of the Fund as of October 31, 2022, the results of its operations for the year then ended, the changes in its net assets for each of the two years in the period ended October 31, 2022 and the financial highlights for each of the five years in the period ended October 31, 2022 in conformity with accounting principles generally accepted in the United States of America.
Basis for Opinion
These financial statements are the responsibility of the Fund's management. Our responsibility is to express an opinion on the Fund's financial statements based on our audits. We are a public accounting firm registered with the Public Company Accounting Oversight Board (United States) (PCAOB) and are required to be independent with respect to the Fund in accordance with the U.S. federal securities laws and the applicable rules and regulations of the Securities and Exchange Commission and the PCAOB.
We conducted our audits of these financial statements in accordance with the standards of the PCAOB. Those standards require that we plan and perform the audit to obtain reasonable assurance about whether the financial statements are free of material misstatement, whether due to error or fraud.
Our audits included performing procedures to assess the risks of material misstatement of the financial statements, whether due to error or fraud, and performing procedures that respond to those risks. Such procedures included examining, on a test basis, evidence regarding the amounts and disclosures in the financial statements. Our audits also included evaluating the accounting principles used and significant estimates made by management, as well as evaluating the overall presentation of the financial statements. Our procedures included confirmation of securities owned as of October 31, 2022 by correspondence with the custodian and brokers. We believe that our audits provide a reasonable basis for our opinion.
/s/ PricewaterhouseCoopers LLP
Boston, Massachusetts
December 15, 2022
We have served as the auditor of one or more investment companies in the Fidelity group of funds since 1932.
The Trustees, Members of the Advisory Board (if any), and officers of the trust and fund, as applicable, are listed below. The Board of Trustees governs the fund and is responsible for protecting the interests of shareholders. The Trustees are experienced executives who meet periodically throughout the year to oversee the fund's activities, review contractual arrangements with companies that provide services to the fund, oversee management of the risks associated with such activities and contractual arrangements, and review the fund's performance. Except for Jonathan Chiel, each of the Trustees oversees 293 funds. Mr. Chiel oversees 184 funds.
The Trustees hold office without limit in time except that (a) any Trustee may resign; (b) any Trustee may be removed by written instrument, signed by at least two-thirds of the number of Trustees prior to such removal; (c) any Trustee who requests to be retired or who has become incapacitated by illness or injury may be retired by written instrument signed by a majority of the other Trustees; and (d) any Trustee may be removed at any special meeting of shareholders by a two-thirds vote of the outstanding voting securities of the trust. Each Trustee who is not an interested person (as defined in the 1940 Act) of the trust and the fund is referred to herein as an Independent Trustee. Each Independent Trustee shall retire not later than the last day of the calendar year in which his or her 75th birthday occurs. The Independent Trustees may waive this mandatory retirement age policy with respect to individual Trustees. Officers and Advisory Board Members hold office without limit in time, except that any officer or Advisory Board Member may resign or may be removed by a vote of a majority of the Trustees at any regular meeting or any special meeting of the Trustees. Except as indicated, each individual has held the office shown or other offices in the same company for the past five years.
The fund's Statement of Additional Information (SAI) includes more information about the Trustees. To request a free copy, call Fidelity at 1-800-544-3455.
Experience, Skills, Attributes, and Qualifications of the Trustees. The Governance and Nominating Committee has adopted a statement of policy that describes the experience, qualifications, attributes, and skills that are necessary and desirable for potential Independent Trustee candidates (Statement of Policy). The Board believes that each Trustee satisfied at the time he or she was initially elected or appointed a Trustee, and continues to satisfy, the standards contemplated by the Statement of Policy. The Governance and Nominating Committee also engages professional search firms to help identify potential Independent Trustee candidates who have the experience, qualifications, attributes, and skills consistent with the Statement of Policy. From time to time, additional criteria based on the composition and skills of the current Independent Trustees, as well as experience or skills that may be appropriate in light of future changes to board composition, business conditions, and regulatory or other developments, have also been considered by the professional search firms and the Governance and Nominating Committee. In addition, the Board takes into account the Trustees' commitment and participation in Board and committee meetings, as well as their leadership of standing and ad hoc committees throughout their tenure.
In determining that a particular Trustee was and continues to be qualified to serve as a Trustee, the Board has considered a variety of criteria, none of which, in isolation, was controlling. The Board believes that, collectively, the Trustees have balanced and diverse experience, qualifications, attributes, and skills, which allow the Board to operate effectively in governing the fund and protecting the interests of shareholders. Information about the specific experience, skills, attributes, and qualifications of each Trustee, which in each case led to the Board's conclusion that the Trustee should serve (or continue to serve) as a trustee of the fund, is provided below.
Board Structure and Oversight Function. Abigail P. Johnson is an interested person and currently serves as Chairman. The Trustees have determined that an interested Chairman is appropriate and benefits shareholders because an interested Chairman has a personal and professional stake in the quality and continuity of services provided to the fund. Independent Trustees exercise their informed business judgment to appoint an individual of their choosing to serve as Chairman, regardless of whether the Trustee happens to be independent or a member of management. The Independent Trustees have determined that they can act independently and effectively without having an Independent Trustee serve as Chairman and that a key structural component for assuring that they are in a position to do so is for the Independent Trustees to constitute a substantial majority for the Board. The Independent Trustees also regularly meet in executive session. Michael E. Kenneally serves as Chairman of the Independent Trustees and as such (i) acts as a liaison between the Independent Trustees and management with respect to matters important to the Independent Trustees and (ii) with management prepares agendas for Board meetings.
Fidelity ® funds are overseen by different Boards of Trustees. The fund's Board oversees Fidelity's investment-grade bond, money market, asset allocation and certain equity funds, and other Boards oversee Fidelity's high income and other equity funds. The asset allocation funds may invest in Fidelity ® funds that are overseen by such other Boards. The use of separate Boards, each with its own committee structure, allows the Trustees of each group of Fidelity ® funds to focus on the unique issues of the funds they oversee, including common research, investment, and operational issues. On occasion, the separate Boards establish joint committees to address issues of overlapping consequences for the Fidelity ® funds overseen by each Board.
The Trustees operate using a system of committees to facilitate the timely and efficient consideration of all matters of importance to the Trustees, the fund, and fund shareholders and to facilitate compliance with legal and regulatory requirements and oversight of the fund's activities and associated risks. The Board, acting through its committees, has charged FMR and its affiliates with (i) identifying events or circumstances the occurrence of which could have demonstrably adverse effects on the fund's business and/or reputation; (ii) implementing processes and controls to lessen the possibility that such events or circumstances occur or to mitigate the effects of such events or circumstances if they do occur; and (iii) creating and maintaining a system designed to evaluate continuously business and market conditions in order to facilitate the identification and implementation processes described in (i) and (ii) above. Because the day-to-day operations and activities of the fund are carried out by or through FMR, its affiliates, and other service providers, the fund's exposure to risks is mitigated but not eliminated by the processes overseen by the Trustees. While each of the Board's committees has responsibility for overseeing different aspects of the fund's activities, oversight is exercised primarily through the Operations and Audit Committees. In addition, an ad hoc Board committee of Independent Trustees has worked with FMR to enhance the Board's oversight of investment and financial risks, legal and regulatory risks, technology risks, and operational risks, including the development of additional risk reporting to the Board. Appropriate personnel, including but not limited to the fund's Chief Compliance Officer (CCO), FMR's internal auditor, the independent accountants, the fund's Treasurer and portfolio management personnel, make periodic reports to the Board's committees, as appropriate, including an annual review of Fidelity's risk management program for the Fidelity ® funds. The responsibilities of each standing committee, including their oversight responsibilities, are described further under "Standing Committees of the Trustees."
Interested Trustees*:
Correspondence intended for a Trustee who is an interested person may be sent to Fidelity Investments, 245 Summer Street, Boston, Massachusetts 02210.
Name, Year of Birth; Principal Occupations and Other Relevant Experience+
Jonathan Chiel (1957)
Year of Election or Appointment: 2016
Trustee
Mr. Chiel also serves as Trustee of other Fidelity ® funds. Mr. Chiel is Executive Vice President and General Counsel for FMR LLC (diversified financial services company, 2012-present). Previously, Mr. Chiel served as general counsel (2004-2012) and senior vice president and deputy general counsel (2000-2004) for John Hancock Financial Services; a partner with Choate, Hall & Stewart (1996-2000) (law firm); and an Assistant United States Attorney for the United States Attorney's Office of the District of Massachusetts (1986-95), including Chief of the Criminal Division (1993-1995). Mr. Chiel is a director on the boards of the Boston Bar Foundation and the Maimonides School.
Abigail P. Johnson (1961)
Year of Election or Appointment: 2009
Trustee
Chairman of the Board of Trustees
Ms. Johnson also serves as Trustee of other Fidelity ® funds. Ms. Johnson serves as Chairman (2016-present), Chief Executive Officer (2014-present), and Director (2007-present) of FMR LLC (diversified financial services company), President of Fidelity Financial Services (2012-present) and President of Personal, Workplace and Institutional Services (2005-present). Ms. Johnson is Chairman and Director of Fidelity Management & Research Company LLC (investment adviser firm, 2011-present). Previously, Ms. Johnson served as Chairman and Director of FMR Co., Inc. (investment adviser firm, 2011-2019), Vice Chairman (2007-2016) and President (2013-2016) of FMR LLC, President and a Director of Fidelity Management & Research Company (2001-2005), a Trustee of other investment companies advised by Fidelity Management & Research Company, Fidelity Investments Money Management, Inc. (investment adviser firm), and FMR Co., Inc. (2001-2005), Senior Vice President of the Fidelity ® funds (2001-2005), and managed a number of Fidelity ® funds. Ms. Abigail P. Johnson and Mr. Arthur E. Johnson are not related.
Jennifer Toolin McAuliffe (1959)
Year of Election or Appointment: 2016
Trustee
Ms. McAuliffe also serves as Trustee of other Fidelity ® funds and as Trustee of Fidelity Charitable (2020-present). Previously, Ms. McAuliffe served as Co-Head of Fixed Income of Fidelity Investments Limited (now known as FIL Limited (FIL)) (diversified financial services company), Director of Research for FIL's credit and quantitative teams in London, Hong Kong and Tokyo and Director of Research for taxable and municipal bonds at Fidelity Investments Money Management, Inc. Ms. McAuliffe previously served as a member of the Advisory Board of certain Fidelity ® funds (2016). Ms. McAuliffe was previously a lawyer at Ropes & Gray LLP and currently serves as director or trustee of several not-for-profit entities.
* Determined to be an "Interested Trustee" by virtue of, among other things, his or her affiliation with the trust or various entities under common control with FMR.
+ The information includes the Trustee's principal occupation during the last five years and other information relating to the experience, attributes, and skills relevant to the Trustee's qualifications to serve as a Trustee, which led to the conclusion that the Trustee should serve as a Trustee for the fund.
Independent Trustees:
Correspondence intended for an Independent Trustee may be sent to Fidelity Investments, P.O. Box 55235, Boston, Massachusetts 02205-5235.
Name, Year of Birth; Principal Occupations and Other Relevant Experience+
Elizabeth S. Acton (1951)
Year of Election or Appointment: 2013
Trustee
Ms. Acton also serves as Trustee of other Fidelity ® funds. Prior to her retirement, Ms. Acton served as Executive Vice President, Finance (2011-2012), Executive Vice President, Chief Financial Officer (2002-2011) and Treasurer (2004-2005) of Comerica Incorporated (financial services). Prior to joining Comerica, Ms. Acton held a variety of positions at Ford Motor Company (1983-2002), including Vice President and Treasurer (2000-2002) and Executive Vice President and Chief Financial Officer of Ford Motor Credit Company (1998-2000). Ms. Acton currently serves as a member of the Board and Audit and Finance Committees of Beazer Homes USA, Inc. (homebuilding, 2012-present). Ms. Acton previously served as a member of the Advisory Board of certain Fidelity ® funds (2013-2016).
Ann E. Dunwoody (1953)
Year of Election or Appointment: 2018
Trustee
General Dunwoody also serves as Trustee of other Fidelity ® funds. General Dunwoody (United States Army, Retired) was the first woman in U.S. military history to achieve the rank of four-star general and prior to her retirement in 2012 held a variety of positions within the U.S. Army, including Commanding General, U.S. Army Material Command (2008-2012). General Dunwoody currently serves as President of First to Four LLC (leadership and mentoring services, 2012-present), a member of the Board and Nomination and Corporate Governance Committees of Kforce Inc. (professional staffing services, 2016-present) and a member of the Board of Automattic Inc. (software engineering, 2018-present). Previously, General Dunwoody served as a member of the Advisory Board and Nominating and Corporate Governance Committee of L3 Technologies, Inc. (communication, electronic, sensor and aerospace systems, 2013-2019) and a member of the Board and Audit and Sustainability and Corporate Responsibility Committees of Republic Services, Inc. (waste collection, disposal and recycling, 2013-2016). Ms. Dunwoody also serves on several boards for non-profit organizations, including as a member of the Board, Chair of the Nomination and Governance Committee and a member of the Audit Committee of Logistics Management Institute (consulting non-profit, 2012-present), a member of the Council of Trustees for the Association of the United States Army (advocacy non-profit, 2013-present), a member of the Board of Florida Institute of Technology (2015-present) and a member of the Board of ThanksUSA (military family education non-profit, 2014-present). General Dunwoody previously served as a member of the Advisory Board of certain Fidelity ® funds (2018).
John Engler (1948)
Year of Election or Appointment: 2014
Trustee
Mr. Engler also serves as Trustee of other Fidelity ® funds. Previously, Mr. Engler served as Governor of Michigan (1991-2003), President of the Business Roundtable (2011-2017) and interim President of Michigan State University (2018-2019). Mr. Engler currently serves as a member of the Board of Stride, Inc. (formerly K12 Inc.) (technology-based education company, 2012-present). Previously, Mr. Engler served as a member of the Board of Universal Forest Products (manufacturer and distributor of wood and wood-alternative products, 2003-2019) and Trustee of The Munder Funds (2003-2014). Mr. Engler previously served as a member of the Advisory Board of certain Fidelity ® funds (2014-2016).
Robert F. Gartland (1951)
Year of Election or Appointment: 2010
Trustee
Mr. Gartland also serves as Trustee of other Fidelity ® funds. Prior to his retirement, Mr. Gartland held a variety of positions at Morgan Stanley (financial services, 1979-2007), including Managing Director (1987-2007) and Chase Manhattan Bank (1975-1978). Mr. Gartland previously served as Chairman and an investor in Gartland & Mellina Group Corp. (consulting, 2009-2019), as a member of the Board of National Securities Clearing Corporation (1993-1996) and as Chairman of TradeWeb (2003-2004).
Arthur E. Johnson (1947)
Year of Election or Appointment: 2008
Trustee
Mr. Johnson also serves as Trustee of other Fidelity ® funds. Prior to his retirement, Mr. Johnson served as Senior Vice President of Corporate Strategic Development of Lockheed Martin Corporation (defense contractor, 1999-2009). Mr. Johnson currently serves as a member of the Board of Booz Allen Hamilton (management consulting, 2011-present). Mr. Johnson previously served as a member of the Board of Eaton Corporation plc (diversified power management, 2009-2019) and a member of the Board of AGL Resources, Inc. (holding company, 2002-2016). Mr. Johnson previously served as Chairman (2018-2021) and Vice Chairman (2015-2018) of the Independent Trustees of certain Fidelity® funds. Mr. Arthur E. Johnson is not related to Ms. Abigail P. Johnson.
Michael E. Kenneally (1954)
Year of Election or Appointment: 2009
Trustee
Chairman of the Independent Trustees
Mr. Kenneally also serves as Trustee of other Fidelity ® funds and was Vice Chairman (2018-2021) of the Independent Trustees of certain Fidelity ® funds. Prior to retirement in 2005, he was Chairman and Global Chief Executive Officer of Credit Suisse Asset Management, the worldwide fund management and institutional investment business of Credit Suisse Group. Previously, Mr. Kenneally was an Executive Vice President and the Chief Investment Officer for Bank of America. In this role, he was responsible for the investment management, strategy and products delivered to the bank's institutional, high-net-worth and retail clients. Earlier, Mr. Kenneally directed the organization's equity and quantitative research groups. He began his career as a research analyst and then spent more than a dozen years as a portfolio manager for endowments, pension plans and mutual funds. He earned the Chartered Financial Analyst (CFA) designation in 1991.
Marie L. Knowles (1946)
Year of Election or Appointment: 2001
Trustee
Ms. Knowles also serves as Trustee of other Fidelity ® funds. Prior to her retirement, Ms. Knowles held several positions at Atlantic Richfield Company (diversified energy), including Executive Vice President and Chief Financial Officer (1996-2000), Senior Vice President (1993-1996) and President of ARCO Transportation Company (pipeline and tanker operations, 1993-1996). Ms. Knowles currently serves as a member of the Board of the Santa Catalina Island Company (real estate, 2009-present), a member of the Investment Company Institute Board of Governors and a member of the Governing Council of the Independent Directors Council (2014-present). Ms. Knowles also serves as a member of the Advisory Board for the School of Engineering of the University of Southern California. Ms. Knowles previously served as a member of the Board of McKesson Corporation (healthcare service, 2002-2021). In addition, Ms. Knowles previously served as Chairman (2015-2018) and Vice Chairman (2012-2015) of the Independent Trustees of certain Fidelity ® funds.
Mark A. Murray (1954)
Year of Election or Appointment: 2016
Trustee
Mr. Murray also serves as Trustee of other Fidelity ® funds. Previously, Mr. Murray served as Co-Chief Executive Officer (2013-2016), President (2006-2013) and Vice Chairman (2013-2020) of Meijer, Inc. Mr. Murray serves as a member of the Board (2009-present) and Public Policy and Responsibility Committee (2009-present) and Chair of the Nuclear Review Committee (2019-present) of DTE Energy Company (diversified energy company). Mr. Murray previously served as a member of the Board of Spectrum Health (not-for-profit health system, 2015-2019) and as a member of the Board and Audit Committee and Chairman of the Nominating and Corporate Governance Committee of Universal Forest Products, Inc. (manufacturer and distributor of wood and wood-alternative products, 2004-2016). Mr. Murray also serves as a member of the Board of many community and professional organizations. Mr. Murray previously served as a member of the Advisory Board of certain Fidelity ® funds (2016).
+ The information includes the Trustee's principal occupation during the last five years and other information relating to the experience, attributes, and skills relevant to the Trustee's qualifications to serve as a Trustee, which led to the conclusion that the Trustee should serve as a Trustee for the fund.
Advisory Board Members and Officers:
Correspondence intended for a Member of the Advisory Board (if any) may be sent to Fidelity Investments, P.O. Box 55235, Boston, Massachusetts 02205-5235. Correspondence intended for an officer may be sent to Fidelity Investments, 245 Summer Street, Boston, Massachusetts 02210. Officers appear below in alphabetical order.
Name, Year of Birth; Principal Occupation
Laura M. Bishop (1961)
Year of Election or Appointment: 2022
Member of the Advisory Board
Ms. Bishop also serves as a Member of the Advisory Board of other funds. Prior to her retirement, Ms. Bishop held a variety of positions at United Services Automobile Association (2001-2020), including Executive Vice President and Chief Financial Officer (2014-2020) and Senior Vice President and Deputy Chief Financial Officer (2012-2014). Ms. Bishop currently serves as a member of the Audit Committee and Compensation and Personnel Committee (2021-present) of the Board of Directors of Korn Ferry (global organizational consulting).
Robert W. Helm (1957)
Year of Election or Appointment: 2021
Member of the Advisory Board
Mr. Helm also serves as a Member of the Advisory Board of other Fidelity® funds. Mr. Helm was formerly Deputy Chairman (2003-2020), partner (1991-2020) and an associate (1984-1991) of Dechert LLP (formerly Dechert Price & Rhoads). Mr. Helm currently serves on boards and committees of several not-for-profit organizations.
Craig S. Brown (1977)
Year of Election or Appointment: 2019
Assistant Treasurer
Mr. Brown also serves as an officer of other funds. Mr. Brown serves as Assistant Treasurer of FIMM, LLC (2021-present) and is an employee of Fidelity Investments (2013-present). Previously, Mr. Brown served as Assistant Treasurer of certain Fidelity ® funds (2019-2022).
John J. Burke III (1964)
Year of Election or Appointment: 2018
Chief Financial Officer
Mr. Burke also serves as Chief Financial Officer of other funds. Mr. Burke serves as Head of Investment Operations for Fidelity Fund and Investment Operations (2018-present) and is an employee of Fidelity Investments (1998-present). Previously Mr. Burke served as head of Asset Management Investment Operations (2012-2018).
David J. Carter (1973)
Year of Election or Appointment: 2020
Assistant Secretary
Mr. Carter also serves as Assistant Secretary of other funds. Mr. Carter serves as Senior Vice President, Deputy General Counsel (2022-present) and is an employee of Fidelity Investments (2005-present).
Jonathan Davis (1968)
Year of Election or Appointment: 2010
Assistant Treasurer
Mr. Davis also serves as an officer of other funds. Mr. Davis serves as Assistant Treasurer of FIMM, LLC (2021-present), FMR Capital, Inc. (2017-present), FD Funds GP LLC (2021-present), FD Funds Holding LLC (2021-present), and FD Funds Management LLC (2021-present); and is an employee of Fidelity Investments. Previously, Mr. Davis served as Vice President and Associate General Counsel of FMR LLC (diversified financial services company, 2003-2010).
Laura M. Del Prato (1964)
Year of Election or Appointment: 2018
President and Treasurer
Ms. Del Prato also serves as an officer of other funds. Ms. Del Prato serves as Assistant Treasurer of FIMM, LLC (2021-present) and is an employee of Fidelity Investments (2017-present). Previously, Ms. Del Prato served as President and Treasurer of The North Carolina Capital Management Trust: Cash Portfolio and Term Portfolio (2018-2020). Prior to joining Fidelity Investments, Ms. Del Prato served as a Managing Director and Treasurer of the JPMorgan Mutual Funds (2014-2017). Prior to JPMorgan, Ms. Del Prato served as a partner at Cohen Fund Audit Services (accounting firm, 2012-2013) and KPMG LLP (accounting firm, 2004-2012).
Colm A. Hogan (1973)
Year of Election or Appointment: 2016
Assistant Treasurer
Mr. Hogan also serves as an officer of other funds. Mr. Hogan serves as Assistant Treasurer of FIMM, LLC (2021-present) and FMR Capital, Inc. (2017-present) and is an employee of Fidelity Investments (2005-present). Previously, Mr. Hogan served as Deputy Treasurer of certain Fidelity ® funds (2016-2020) and Assistant Treasurer of certain Fidelity ® funds (2016-2018).
Cynthia Lo Bessette (1969)
Year of Election or Appointment: 2019
Secretary and Chief Legal Officer (CLO)
Ms. Lo Bessette also serves as an officer of other funds. Ms. Lo Bessette serves as CLO, Secretary, and Senior Vice President of Fidelity Management & Research Company LLC (investment adviser firm, 2019-present); CLO of Fidelity Management & Research (Hong Kong) Limited, FMR Investment Management (UK) Limited, and Fidelity Management & Research (Japan) Limited (investment adviser firms, 2019-present); Secretary of FD Funds GP LLC (2021-present), FD Funds Holding LLC (2021-present), FD Funds Management LLC (2021-present), and Fidelity Diversifying Solutions LLC (investment adviser firm, 2022-present); and Assistant Secretary of FIMM, LLC (2019-present). She is a Senior Vice President and Deputy General Counsel of FMR LLC (diversified financial services company, 2019-present), and is an employee of Fidelity Investments. Previously, Ms. Lo Bessette served as CLO, Secretary, and Senior Vice President of FMR Co., Inc. (investment adviser firm, 2019); Secretary of Fidelity SelectCo, LLC and Fidelity Investments Money Management, Inc. (investment adviser firms, 2019). Prior to joining Fidelity Investments, Ms. Lo Bessette was Executive Vice President, General Counsel (2016-2019) and Senior Vice President, Deputy General Counsel (2015-2016) of OppenheimerFunds (investment management company) and Deputy Chief Legal Officer (2013-2015) of Jennison Associates LLC (investment adviser firm).
Chris Maher (1972)
Year of Election or Appointment: 2013
Assistant Treasurer
Mr. Maher also serves as an officer of other funds. Mr. Maher serves as Assistant Treasurer of FIMM, LLC (2021-present) and FMR Capital, Inc. (2017-present), and is an employee of Fidelity Investments (2008-present). Previously, Mr. Maher served as Assistant Treasurer of certain funds (2013-2020); Vice President of Asset Management Compliance (2013), Vice President of the Program Management Group of FMR (investment adviser firm, 2010-2013), and Vice President of Valuation Oversight (2008-2010).
Jamie Pagliocco (1964)
Year of Election or Appointment: 2020
Vice President
Mr. Pagliocco also serves as Vice President of other funds. Mr. Pagliocco serves as President of Fixed Income (2020-present), and is an employee of Fidelity Investments (2001-present). Previously, Mr. Pagliocco served as Co-Chief Investment Officer - Bond (2017-2020), Global Head of Bond Trading (2016-2019), and as a portfolio manager.
Kenneth B. Robins (1969)
Year of Election or Appointment: 2020
Chief Compliance Officer
Mr. Robins also serves as an officer of other funds. Mr. Robins serves as Compliance Officer of Fidelity Management & Research Company LLC (investment adviser firm, 2016-present) and is an employee of Fidelity Investments (2004-present). Previously, Mr. Robins served as Compliance Officer of FMR Co., Inc. (investment adviser firm, 2016-2019), as Executive Vice President of Fidelity Investments Money Management, Inc. (investment adviser firm, 2013-2016) and served in other fund officer roles.
Brett Segaloff (1972)
Year of Election or Appointment: 2021
Anti-Money Laundering (AML) Officer
Mr. Segaloff also serves as an AML Officer of other funds and other related entities. He is Director, Anti-Money Laundering (2007-present) of FMR LLC (diversified financial services company) and is an employee of Fidelity Investments (1996-present).
Stacie M. Smith (1974)
Year of Election or Appointment: 2013
Assistant Treasurer
Ms. Smith also serves as an officer of other funds. Ms. Smith serves as Assistant Treasurer of FIMM, LLC (2021-present) and FMR Capital, Inc. (2017-present), is an employee of Fidelity Investments (2009-present), and has served in other fund officer roles. Prior to joining Fidelity Investments, Ms. Smith served as Senior Audit Manager of Ernst & Young LLP (accounting firm, 1996-2009). Previously, Ms. Smith served as Assistant Treasurer (2013-2019) and Deputy Treasurer (2013-2016) of certain Fidelity ® funds.
Jim Wegmann (1979)
Year of Election or Appointment: 2021
Deputy Treasurer
Mr. Wegmann also serves as an officer of other funds. Mr. Wegmann serves as Assistant Treasurer of FIMM, LLC (2021-present) and is an employee of Fidelity Investments (2011-present). Previously, Mr. Wegmann served as Assistant Treasurer of certain Fidelity ® funds (2019-2021).
As a shareholder, you incur two types of costs: (1) transaction costs, which may include sales charges (loads) on purchase payments or redemption proceeds, as applicable and (2) ongoing costs, which generally include management fees, distribution and/or service (12b-1) fees and other Fund expenses. This Example is intended to help you understand your ongoing costs (in dollars) of investing in a fund and to compare these costs with the ongoing costs of investing in other mutual funds.
| The Example is based on an investment of $1,000 invested at the beginning of the period and held for the entire period (May 1, 2022 to October 31, 2022). |
Actual Expenses
The first line of the accompanying table provides information about actual account values and actual expenses. You may use the information in this line, together with the amount you invested, to estimate the expenses that you paid over the period. Simply divide your account value by $1,000.00 (for example, an $8,600 account value divided by $1,000.00 = 8.6), then multiply the result by the number in the first line for a class/Fund under the heading entitled "Expenses Paid During Period" to estimate the expenses you paid on your account during this period. If any fund is a shareholder of any underlying mutual funds or exchange-traded funds (ETFs) (the Underlying Funds), such fund indirectly bears its proportional share of the expenses of the Underlying Funds in addition to the direct expenses incurred presented in the table. These fees and expenses are not included in the annualized expense ratio used to calculate the expense estimate in the table below.
Hypothetical Example for Comparison Purposes
The second line of the accompanying table provides information about hypothetical account values and hypothetical expenses based on the actual expense ratio and an assumed rate of return of 5% per year before expenses, which is not the actual return. The hypothetical account values and expenses may not be used to estimate the actual ending account balance or expenses you paid for the period. You may use this information to compare the ongoing costs of investing in the Fund and other funds. To do so, compare this 5% hypothetical example with the 5% hypothetical examples that appear in the shareholder reports of the other funds. If any fund is a shareholder of any Underlying Funds, such fund indirectly bears its proportional share of the expenses of the Underlying Funds in addition to the direct expenses as presented in the table. These fees and expenses are not included in the annualized expense ratio used to calculate the expense estimate in the table below.
Please note that the expenses shown in the table are meant to highlight your ongoing costs only and do not reflect any transaction costs. Therefore, the second line of the table is useful in comparing ongoing costs only, and will not help you determine the relative total costs of owning different funds. In addition, if these transactional costs were included, your costs would have been higher.
| | | | | Annualized Expense Ratio- A | | Beginning Account Value May 1, 2022 | | Ending Account Value October 31, 2022 | | Expenses Paid During Period- C May 1, 2022 to October 31, 2022 |
| | | | | | | | | | |
| Fidelity® SAI International Index Fund | | | | .04% | | | | | | |
| Actual | | | | | | $ 1,000 | | $ 882.40 | | $ .19 |
Hypothetical- B | | | | | | $ 1,000 | | $ 1,025.00 | | $ .20 |
| |
A Annualized expense ratio reflects expenses net of applicable fee waivers.
B 5% return per year before expenses
C Expenses are equal to the annualized expense ratio, multiplied by the average account value over the period, multiplied by 184/ 365 (to reflect the one-half year period). The fees and expenses of any Underlying Funds are not included in each annualized expense ratio.
The dividend and capital gains distributions for the fund(s) are available on Fidelity.com or Institutional.Fidelity.com .
The fund designates 80% and 88% of the dividends distributed December 3, 2021 and December 28, 2021, respectively during the fiscal year as amounts which may be taken into account as a dividend for the purposes of the maximum rate under section 1(h)(11) of the Internal Revenue Code.
The amounts per share which represent income derived from sources within, and taxes paid to, foreign countries or possessions of the United States are $0.3853 and $0.0325 for the dividend paid December 6, 2021.
The fund will notify shareholders in January 2023 of amounts for use in preparing 2022 income tax returns.
Fidelity SAI International Index Fund
Each year, the Board of Trustees, including the Independent Trustees (together, the Board), votes on the renewal of the management contract with Fidelity Management & Research Company LLC (FMR) and the sub-advisory agreement (Sub-Advisory Agreement) for the fund with Geode Capital Management, LLC (Geode) (together, the Advisory Contracts). FMR and Geode are referred to herein as the Investment Advisers. The Board, assisted by the advice of fund counsel and Independent Trustees' counsel, requests and considers a broad range of information relevant to the renewal of the Advisory Contracts throughout the year.
The Board meets regularly and, at each of its meetings, covers an extensive agenda of topics and materials and considers factors that are relevant to its annual consideration of the renewal of the fund's Advisory Contracts, including the services and support provided to the fund and its shareholders. The Board has established four standing committees (Committees) - Operations, Audit, Fair Valuation, and Governance and Nominating - each composed of and chaired by Independent Trustees with varying backgrounds, to which the Board has assigned specific subject matter responsibilities in order to enhance effective decision-making by the Board. The Operations Committee, of which all the Independent Trustees are members, meets regularly throughout the year and requests, receives and considers, among other matters, information related to the annual consideration of the renewal of the fund's Advisory Contracts before making its recommendation to the Board. The Board also meets as needed to review matters specifically related to the Board's annual consideration of the renewal of the Advisory Contracts. Members of the Board may also meet from time to time with trustees of other Fidelity funds through joint ad hoc committees to discuss certain matters relevant to all of the Fidelity funds.
At its September 2022 meeting, the Board unanimously determined to renew the fund's Advisory Contracts. In reaching its determination, the Board considered all factors it believed relevant, including (i) the nature, extent, and quality of the services provided to the fund and its shareholders (including the investment performance of the fund); (ii) the competitiveness relative to peer funds of the fund's management fee and total expense ratio; (iii) the total costs of the services provided by and the profits realized by Fidelity and Geode from their respective relationships with the fund; and (iv) the extent to which, if any, economies of scale exist and are realized as the fund grows, and whether any economies of scale are appropriately shared with fund shareholders.
In considering whether to renew the Advisory Contracts for the fund, the Board reached a determination, with the assistance of fund counsel and Independent Trustees' counsel and through the exercise of its business judgment, that the renewal of the Advisory Contracts was in the best interests of the fund and its shareholders and that the compensation payable under the Advisory Contracts was fair and reasonable. The Board's decision to renew the Advisory Contracts was not based on any single factor, but rather was based on a comprehensive consideration of all the information provided to the Board at its meetings throughout the year. The Board, in reaching its determination to renew the Advisory Contracts, was aware that shareholders of the fund have a broad range of investment choices available to them, including a wide choice among funds offered by Fidelity's competitors, and that the fund's shareholders, who have the opportunity to review and weigh the disclosure provided by the fund in its prospectus and other public disclosures, have chosen to invest in this fund, which is part of the Fidelity family of funds.
Nature, Extent, and Quality of Services Provided . The Board considered staffing as it relates to the fund, including the backgrounds of investment personnel of Fidelity and Geode, and also considered the fund's investment objective, strategies, and related investment philosophy. The Independent Trustees also had discussions with senior management of Fidelity's investment operations and investment groups and with senior management of Geode. The Board considered the structure of the investment personnel compensation programs and whether the structures provide appropriate incentives to act in the best interests of the fund. The Board also considered the steps Fidelity and Geode had taken to ensure the continued provision of high quality services to the Fidelity funds throughout the COVID-19 pandemic, including the expansion of staff in client facing positions to maintain service levels in periods of high volumes and volatility.
The Trustees also discussed with representatives of Fidelity, at meetings throughout the year, Fidelity's role in, among other things, overseeing compliance with federal securities laws and other applicable requirements by Geode with respect to the fund and monitoring and overseeing the performance and investment capabilities of Geode. The Trustees considered that the Board had received from Fidelity periodic reports about its oversight and due diligence processes, as well as periodic reports regarding the performance of Geode.
The Board also considered the nature, extent and quality of services provided by Geode. The Trustees noted that under the Sub-Advisory Agreement, subject to oversight by Fidelity, Geode is responsible for, among other things, identifying investments and arranging for execution of portfolio transactions to implement the fund's investment strategy. In addition, the Trustees noted that Geode is responsible for providing such reporting as may be requested by Fidelity to fulfill its oversight responsibilities discussed above.
Resources Dedicated to Investment Management and Support Services . The Board reviewed the general qualifications and capabilities of Fidelity's and Geode's investment staffs, including their size, education, experience, and resources, as well as Fidelity's and Geode's approach to recruiting, managing, training, and compensating investment personnel. The Board noted the resources devoted to Fidelity's global investment organization and that Fidelity's and Geode's analysts have extensive resources, tools and capabilities that allow them to conduct quantitative and fundamental analysis, as well as credit analysis of issuers, counterparties, and guarantors. Further, the Board considered that Fidelity's and Geode's investment professionals have sufficient access to information and data so as to provide competitive investment results over time, and that those professionals also have access to sophisticated tools that permit them to assess portfolio construction and risk and performance attribution characteristics continuously. Additionally, in its deliberations, the Board considered Fidelity's and Geode's trading, risk management, compliance, cybersecurity, and technology and operations capabilities and resources, which are integral parts of the investment management process.
Shareholder and Administrative Services . The Board considered (i) the nature, extent, quality, and cost of advisory, administrative, and shareholder services performed by the Investment Advisers and their affiliates under the Advisory Contracts and by FMR's affiliates under separate agreements covering transfer agency, pricing and bookkeeping, and securities lending services for the fund; (ii) the nature and extent of the supervision of third party service providers, principally custodians, subcustodians, and pricing vendors; and (iii) the resources devoted to, and the record of compliance with, the fund's compliance policies and procedures. The Board also reviewed the allocation of fund brokerage, including allocations to brokers affiliated with the Investment Advisers.
The Board noted that the growth of fund assets over time across the complex allows Fidelity to reinvest in the development of services designed to enhance the value and convenience of the Fidelity funds as investment vehicles. These services include 24-hour access to account information and market information over the Internet and through telephone representatives, investor education materials and asset allocation tools. The Board also considered that it reviews customer service metrics such as telephone response times, continuity of services on the website and metrics addressing services at Fidelity Investor Centers.
Investment in a Large Fund Family . The Board considered the benefits to shareholders of investing in a Fidelity fund, including the benefits of investing in a fund that is part of a large family of funds offering a variety of investment disciplines and providing a large variety of mutual fund investor services. The Board noted that Fidelity had taken, or had made recommendations to the Board that resulted in the Fidelity funds taking, a number of actions over the previous year that benefited particular funds, including: (i) continuing to dedicate additional resources to Fidelity's investment research process, which includes meetings with management of issuers of securities in which the funds invest; (ii) continuing efforts to enhance Fidelity's global research capabilities; (iii) launching new funds, ETFs, and share classes with innovative structures, strategies and pricing and making other enhancements to meet investor needs; (iv) broadening eligibility requirements for certain funds and share classes; (v) reducing management fees and total expenses for certain funds and classes; (vi) lowering expenses for certain existing funds and classes by implementing or lowering expense caps; (vii) rationalizing product lines and gaining increased efficiencies from fund mergers and liquidations; (viii) continuing to develop, acquire and implement systems and technology to improve services to the funds and shareholders, strengthen information security, and increase efficiency; and (ix) continuing to implement enhancements to further strengthen Fidelity's product line to increase investors' probability of success in achieving their investment goals, including their retirement income goals.
Investment Performance . The Board considered whether the fund has operated in accordance with its investment objective, as well as its record of compliance with its investment restrictions and its performance history.
The Board took into account discussions that occur at Board meetings throughout the year with representatives of the Investment Advisers about fund investment performance. In this regard the Board noted that as part of regularly scheduled fund reviews and other reports to the Board on fund performance, the Board considers annualized return information for the fund for different time periods, measured against the securities market index the fund seeks to track. The Board also periodically considers the fund's tracking error versus its benchmark index.
In addition to reviewing absolute and relative fund performance, the Independent Trustees periodically consider the appropriateness of fund performance metrics in evaluating the results achieved. In general, the Independent Trustees believe that an index fund's performance should be evaluated based on gross performance (before fees and expenses but after transaction costs) compared to the fund's benchmark index, over appropriate time periods, taking into account relevant factors including the following: general market conditions; the characteristics of the fund's benchmark index; the extent to which statistical sampling is employed; any securities lending revenues; and fund cash flows and other factors. The Independent Trustees generally give greater weight to fund performance over longer time periods than over shorter time periods. Depending on the circumstances, the Independent Trustees may be satisfied with a fund's performance notwithstanding that it lags its benchmark index for certain periods.
The Independent Trustees recognize that shareholders evaluate performance on a net basis (after fees and expenses) over their own holding periods, for which one-, three-, and five-year periods are often used as a proxy. For this reason, the performance information reviewed by the Board also included net cumulative calendar year total return information for the fund and its benchmark index for the most recent one-, three-, and five-year periods. No performance peer group information was considered by the Board as Fidelity advised the Board that the peer group, which is created by a third-party provider, includes a number of actively-managed funds. The Independent Trustees recognize that shareholders who are not investing through a tax-advantaged retirement account also consider tax consequences in evaluating performance.
Based on its review, the Board concluded that the nature, extent, and quality of services provided to the fund under the Advisory Contracts should continue to benefit the shareholders of the fund.
Competitiveness of Management Fee and Total Expense Ratio . The Board considered the fund's management fee and total expense ratio compared to selected groups of competitive funds and classes (referred to as "mapped groups" below) for the purpose of facilitating the Trustees' competitive analysis of management fees and total expenses. Fidelity creates "mapped groups" by combining similar investment objective categories (as classified by Lipper) that have comparable investment mandates. Combining funds with similar investment objective categories aids the Board's comparison of management fees and total expense ratios by broadening the competitive group used for such comparison.
Management Fee . The Board considered two proprietary management fee comparisons for the 12-month periods shown in basis points (BP) in the chart below. The group of Lipper funds used by the Board for management fee comparisons is referred to below as the "Total Mapped Group." The Total Mapped Group comparison focuses on a fund's standing in terms of gross management fees before expense reimbursements or caps relative to the total universe of funds with comparable investment mandates, regardless of whether their management fee structures also are comparable. Funds with comparable investment mandates offer exposure to similar types of securities. Funds with comparable management fee structures have similar management fee contractual arrangements (e.g., flat rate charged for advisory services, all-inclusive fee rate, etc.). "TMG %" represents the percentage of funds in the Total Mapped Group that had management fees that were lower than the fund's. For example, a hypothetical TMG % of 20% would mean that 80% of the funds in the Total Mapped Group had higher, and 20% had lower, management fees than the fund. The fund's actual TMG %s and the number of funds in the Total Mapped Group are in the chart below. The "Asset-Sized Peer Group" (ASPG) comparison focuses on a fund's standing relative to a subset of non-Fidelity funds within the Total Mapped Group that are similar in size and management fee structure. For example, if a fund is in the first quartile of the ASPG, the fund's management fee ranks in the least expensive or lowest 25% of funds in the ASPG. The ASPG represents at least 15% of the funds in the Total Mapped Group with comparable asset size and management fee structures, subject to a minimum of 50 funds (or all funds in the Total Mapped Group if fewer than 50). Additional information, such as the ASPG quartile in which the fund's management fee rate ranked, is also included in the chart and was considered by the Board.
The Board considered that effective August 1, 2019, the fund's management fee rate was reduced from 0.05% to 0.035%. The Board considered that the chart below reflects the fund's lower management fee rate for 2019, as if the lower fee rate were in effect for the entire period.
The Board noted that the fund's management fee rate ranked below the median of its Total Mapped Group and below the median of its ASPG for 2021.
At its September 2022 meeting, the Board also approved an amendment to the fund's sub-advisory agreement with Geode (effective October 1, 2022) that reduced the sub-advisory fee rate that FMR pays to Geode.
Based on its review, the Board concluded that the fund's management fee is fair and reasonable in light of the services that the fund receives and the other factors considered.
Total Expense Ratio . In its review of the fund's total expense ratio, the Board considered the fund's management fee rate as well as other fund expenses, such as custodial, legal, and audit fees. The Board also noted that Fidelity may agree to waive fees or reimburse expenses from time to time, and the extent to which, if any, it has done so for the fund. The fund is compared to those funds and classes in the Total Mapped Group (used by the Board for management fee comparisons) that have a similar sales load structure. The Board also considered a total expense ASPG comparison, which focuses on the total expenses of the fund relative to a subset of non-Fidelity funds within the similar sales load structure group that are similar in size and management fee structure. The total expense ASPG is limited to 15 larger and 15 smaller classes of different funds, where possible. The total expense ASPG comparison excludes performance adjustments and fund-paid 12b-1 fees to eliminate variability in expenses relating to these items.
The Board noted that the fund's total net expense ratio ranked below the similar sales load structure group competitive median for 2021 and below the ASPG competitive median for 2021.
The Board further considered that FMR has contractually agreed to reimburse the fund to the extent that total operating expenses, with certain exceptions, as a percentage of its average net assets, exceed 0.035% through February 28, 2023.
Fees Charged to Other Clients . The Board also considered fee structures and other information with respect to clients of Fidelity and Geode, such as other funds advised or subadvised by Fidelity or Geode, pension plan clients, and other institutional clients with similar mandates. The Board noted that a joint ad hoc committee created by it and the boards of other Fidelity funds periodically reviews and compares Fidelity's institutional investment advisory business with its business of providing services to the Fidelity funds and also noted the most recent findings of the committee. The Board noted that the committee's review included a consideration of the differences in services provided, fees charged, and costs incurred, as well as competition in the markets serving the different categories of clients.
Based on its review of total expense ratios and fees charged to other Fidelity clients, the Board concluded that the fund's total expense ratio was reasonable in light of the services that the fund and its shareholders receive and the other factors considered.
Costs of the Services and Profitability . The Board considered the revenues earned and the expenses incurred by Fidelity in conducting the business of developing, marketing, distributing, managing, administering and servicing the fund and servicing the fund's shareholders. The Board also considered the level of Fidelity's profits in respect of all the Fidelity funds.
On an annual basis, Fidelity presents to the Board information about the profitability of its relationships with the fund. Fidelity calculates profitability information for each fund, as well as aggregate profitability information for groups of Fidelity funds and all Fidelity funds, using a series of detailed revenue and cost allocation methodologies which originate with the books and records of Fidelity on which Fidelity's audited financial statements are based. The Audit Committee of the Board reviews any significant changes from the prior year's methodologies and the full Board approves such changes.
A public accounting firm has been engaged annually by the Board as part of the Board's assessment of Fidelity's profitability analysis. The engagement includes the review and assessment of the methodologies used by Fidelity in determining the revenues and expenses attributable to Fidelity's mutual fund business, and completion of agreed-upon procedures in respect of the mathematical accuracy of certain fund profitability information and its conformity to established allocation methodologies. After considering the reports issued under the engagement and information provided by Fidelity, the Board concluded that while other allocation methods may also be reasonable, Fidelity's profitability methodologies are reasonable in all material respects.
The Board also reviewed Fidelity's and Geode's non-fund businesses and potential indirect benefits such businesses may have received as a result of their association with Fidelity's mutual fund business (i.e., fall-out benefits) as well as cases where Fidelity's and Geode's affiliates may benefit from the funds' business. The Board considered areas where potential indirect benefits to the Fidelity funds from their relationships with Fidelity may exist. The Board's consideration of these matters was informed by the findings of a joint ad hoc committee created by it and the boards of other Fidelity funds to evaluate potential fall-out benefits.
The Board considered the costs of the services provided by and the profits realized by Fidelity in connection with the operation of the fund and was satisfied that the profitability was not excessive.
The Board also considered information regarding the profitability of Geode's relationship with the fund.
Economies of Scale . The Board considered whether there have been economies of scale in respect of the management of the Fidelity funds, whether the Fidelity funds (including the fund) have appropriately benefited from any such economies of scale, and whether there is potential for realization of any further economies of scale. The Board considered the extent to which the fund will benefit from economies of scale as assets grow through increased services to the fund, through waivers or reimbursements, or through fee or expense ratio reductions. The Board also noted that a committee (the Economies of Scale Committee) created by it and the boards of other Fidelity funds periodically analyzes whether Fidelity attains economies of scale in respect of the management and servicing of the Fidelity funds, whether the Fidelity funds have appropriately benefited from such economies of scale, and whether there is potential for realization of any further economies of scale.
The Board concluded, taking into account the analysis of the Economies of Scale Committee, that economies of scale, if any, are being appropriately shared between fund shareholders and Fidelity.
Additional Information Requested by the Board . In order to develop fully the factual basis for consideration of the Fidelity funds' advisory contracts, the Board requested and received additional information on certain topics, including: (i) Fidelity's fund profitability methodology, profitability trends for certain funds, the allocation of various costs to different funds, and the impact of certain factors on fund profitability results; (ii) portfolio manager changes that have occurred during the past year and the amount of the investment that each portfolio manager has made in the Fidelity fund(s) that he or she manages; (iii) the extent to which current market conditions have affected retention and recruitment of personnel; (iv) the arrangements with and compensation paid to certain fund sub-advisers on behalf of the Fidelity funds and the treatment of such compensation within Fidelity's fund profitability methodology; (v) the terms of the funds' various management fee structures, including the basic group fee and the terms of Fidelity's voluntary expense limitation arrangements; (vi) Fidelity's transfer agent, pricing and bookkeeping fees, expense and service structures for different funds and classes relative to competitive trends; (vii) the impact on fund profitability of recent industry trends, such as the growth in passively managed funds and the changes in flows for different types of funds; (viii) the types of management fee and total expense comparisons provided, and the challenges and limitations associated with such information; and (ix) explanations regarding the relative total expense ratios and management fees of certain funds and classes, total expense and management fee competitive trends, and methodologies for total expense and management fee competitive comparisons. In addition, the Board considered its discussions with Fidelity regarding Fidelity's efforts to maintain the continuous investment and shareholder services necessary for the funds during the current pandemic and economic circumstances.
Based on its evaluation of all of the conclusions noted above, and after considering all factors it believed relevant, the Board concluded that the advisory and sub-advisory fee arrangements are fair and reasonable and that the fund's Advisory Contracts should be renewed.
1.9879602.106
SV7-ANN-1222
Fidelity® SAI Emerging Markets Low Volatility Index Fund
Fidelity® SAI International Low Volatility Index Fund
Fidelity® SAI U.S. Low Volatility Index Fund
Annual Report
October 31, 2022
Offered exclusively to certain clients of the Adviser, or its affiliates, including Strategic Advisers LLC (Strategic Advisers) - not available for sale to the general public. Fidelity ® SAI is a product name of Fidelity ® funds dedicated to certain programs affiliated with Strategic Advisers.
Contents
To view a fund's proxy voting guidelines and proxy voting record for the 12-month period ended June 30, visit http://www.fidelity.com/proxyvotingresults or visit the Securities and Exchange Commission's (SEC) web site at http://www.sec.gov.
You may also call 1-800-544-3455 to request a free copy of the proxy voting guidelines.
The funds or securities referred to herein are not sponsored, endorsed, or promoted by Fidelity Product Services LLC (FPS), and FPS bears no liability with respect to any such funds or securities or any index on which such funds or securities are based. The prospectus contains a more detailed description of the relationship between FPS and any related funds.
Standard & Poor's, S&P and S&P 500 are registered service marks of The McGraw-Hill Companies, Inc. and have been licensed for use by Fidelity Distributors Corporation.
Other third-party marks appearing herein are the property of their respective owners.
All other marks appearing herein are registered or unregistered trademarks or service marks of FMR LLC or an affiliated company. © 2022 FMR LLC. All rights reserved.
This report and the financial statements contained herein are submitted for the general information of the shareholders of the Funds. This report is not authorized for distribution to prospective investors in the Funds unless preceded or accompanied by an effective prospectus.
A fund files its complete schedule of portfolio holdings with the SEC for the first and third quarters of each fiscal year on Form N-PORT. Forms N-PORT are available on the SEC's web site at http://www.sec.gov. A fund's Forms N-PORT may be reviewed and copied at the SEC's Public Reference Room in Washington, DC. Information regarding the operation of the SEC's Public Reference Room may be obtained by calling 1-800-SEC-0330.
For a complete list of a fund's portfolio holdings, view the most recent holdings listing, semiannual report, or annual report on Fidelity's web site at http://www.fidelity.com, http://www.institutional.fidelity.com, or http://www.401k.com, as applicable.
NOT FDIC INSURED •MAY LOSE VALUE •NO BANK GUARANTEE
Neither the Funds nor Fidelity Distributors Corporation is a bank.
Average annual total return reflects the change in the value of an investment, assuming reinvestment of distributions from dividend income and capital gains (the profits earned upon the sale of securities that have grown in value, if any) and assuming a constant rate of performance each year. The hypothetical investment and the average annual total returns do not reflect the deduction of taxes that a shareholder would pay on fund distributions or the redemption of fund shares. During periods of reimbursement by Fidelity, a fund's total return will be greater than it would be had the reimbursement not occurred. How a fund did yesterday is no guarantee of how it will do tomorrow.
| Average Annual Total Returns |
| | | | |
Periods ended October 31, 2022 | Past 1 year | Life of Fund A |
| Fidelity® SAI Emerging Markets Low Volatility Index Fund | -16.88% | -0.34% |
A From January 30, 2019
| $10,000 Over Life of Fund |
| |
Let's say hypothetically that $10,000 was invested in Fidelity® SAI Emerging Markets Low Volatility Index Fund on January 30, 2019, when the fund started. The chart shows how the value of your investment would have changed, and also shows how the Fidelity Emerging Markets Low Volatility Focus Index℠ and MSCI ACWI (All Country World Index) ex USA Index performed over the same period. |
|
|
Fidelity® SAI Emerging Markets Low Volatility Index Fund
Market Recap:
International equities returned -24.61% for the 12 months ending October 31, 2022, according to the MSCI ACWI (All Country World Index) ex USA Index. After gaining 7.98% in 2021, non-U.S. stocks retreated in the new year, as a multitude of risk factors challenged the global economy and financial markets. Persistently high inflation in some markets, exacerbated by energy price shocks from the Russia-Ukraine conflict, spurred the U.S. Federal Reserve and other central banks to aggressively tighten monetary policy, and market interest rates eclipsed their highest level in roughly a decade, stoking recession fears and sending stocks into bear market territory. Other factors influencing equities abroad included surging global commodity prices, rising sovereign bond yields in some markets, ongoing global supply-chain disruption, a broadly strong U.S. dollar and the potential for variants of the coronavirus to upend global economic growth. Against this backdrop, the index returned -24.20% year to date through October. For the full 12 months, emerging markets (-31%) and Europe ex U.K. (-25%) notably lagged. Conversely, Canada (-13%) and the U.K. (-12%) held up best. Among the 11 sectors, information technology and consumer discretionary (-37% each) fared worst. Communication services (-34%) also trailed the broader market. In contrast, energy gained 2% amid high prices for oil and natural gas. The defensive-oriented utilities (-16%) sector also outperformed, as did financials and consumer staples (-18% each).
Comments from the Geode Capital Management, LLC, passive equity index team:
For the fiscal year, the fund returned -16.88%, roughly in line with the -16.56% result of the benchmark, the Fidelity Emerging Markets Low Volatility Focus Index. (The fund's relative performance was affected by differing methodologies (fund versus index) for valuing certain foreign stocks and for incorporating foreign exchange rates, as well as by required local capital gains tax.) By sector, stocks in consumer discretionary returned about -37% and hurt most, followed by information technology, which returned -25%. Communication services (-13%) and utilities (-22%) also detracted, as did materials (-32%) and industrials (-37%). Other notable detractors included the energy (-19%), consumer staples (-7%), health care (-9%) and real estate (-10%) sectors. In contrast, financials returned roughly 0% and contributed, driven by the banks industry (+2%). Turning to individual stocks, the biggest individual detractor was Shenzhou International (-67%), from the consumer durables & apparel segment, followed by Li Ning (-53%), which is in the consumer durables & apparel category. Within materials, PhosAgro returned approximately -99% and hurt. Other detractors were NCSoft (-48%), a stock in the media & entertainment industry, and Wipro (-46%), from the software & services group. Conversely, the biggest individual contributor was Alinma Bank (+51%), from the banks industry. Also in banks, Qatar Islamic Bank (+36%) and National Bank of Kuwait (+15%) helped. Power Grid, within the utilities sector, advanced 18% and lifted the fund. Another contributor was Emirates Telecom Group (+4%), a stock in the telecommunication services segment.
The views expressed above reflect those of the portfolio manager(s) only through the end of the period as stated on the cover of this report and do not necessarily represent the views of Fidelity or any other person in the Fidelity organization. Any such views are subject to change at any time based upon market or other conditions and Fidelity disclaims any responsibility to update such views. These views may not be relied on as investment advice and, because investment decisions for a Fidelity fund are based on numerous factors, may not be relied on as an indication of trading intent on behalf of any Fidelity fund.
Fidelity® SAI Emerging Markets Low Volatility Index Fund
Top Holdings (% of Fund's net assets) |
| |
| KT&G Corp. (Korea (South), Tobacco) | 1.8 | |
| PT Bank Central Asia Tbk (Indonesia, Banks) | 1.8 | |
| Dr. Reddy's Laboratories Ltd. (India, Pharmaceuticals) | 1.7 | |
| National Bank of Kuwait (Kuwait, Banks) | 1.6 | |
| Power Grid Corp. of India Ltd. (India, Electric Utilities) | 1.6 | |
| Saudi Telecom Co. (Saudi Arabia, Diversified Telecommunication Services) | 1.6 | |
| Nestle India Ltd. (India, Food Products) | 1.6 | |
| Alinma Bank (Saudi Arabia, Banks) | 1.6 | |
| China Shenhua Energy Co. Ltd. (H Shares) (China, Oil, Gas & Consumable Fuels) | 1.5 | |
| Qatar Islamic Bank (Qatar, Banks) | 1.5 | |
| | 16.3 | |
| |
| Market Sectors (% of Fund's net assets) |
| |
| Financials | 24.6 | |
| Communication Services | 14.8 | |
| Information Technology | 14.7 | |
| Consumer Staples | 10.8 | |
| Consumer Discretionary | 8.6 | |
| Utilities | 7.5 | |
| Health Care | 7.4 | |
| Energy | 4.1 | |
| Materials | 3.7 | |
| Industrials | 1.5 | |
| Real Estate | 0.5 | |
| |
Asset Allocation (% of Fund's net assets) |
|
Foreign investments - 97% |
|
Geographic Diversification (% of Fund's net assets) |
|
* Includes Short-Term investments and Net Other Assets (Liabilities). Percentages are based on country or territory of incorporation and are adjusted for the effect of futures contracts, if applicable. |
| |
Fidelity® SAI Emerging Markets Low Volatility Index Fund
Showing Percentage of Net Assets
| Common Stocks - 98.2% |
| | | Shares | Value ($) |
| Bailiwick of Jersey - 0.9% | | | |
| WNS Holdings Ltd. sponsored ADR (a) | | 206,798 | 17,801,172 |
| Bermuda - 0.6% | | | |
| China Gas Holdings Ltd. | | 531,400 | 471,173 |
| China Resource Gas Group Ltd. | | 5,040,300 | 12,906,312 |
TOTAL BERMUDA | | | 13,377,485 |
| Brazil - 0.8% | | | |
| Telefonica Brasil SA | | 2,172,100 | 17,370,913 |
| Cayman Islands - 6.1% | | | |
| Anta Sports Products Ltd. | | 1,651,000 | 14,512,622 |
| Hansoh Pharmaceutical Group Co. Ltd. (b) | | 4,854,000 | 7,494,663 |
| Hengan International Group Co. Ltd. | | 3,198,000 | 12,405,534 |
| JD.com, Inc. sponsored ADR | | 361,487 | 13,479,850 |
| Kingdee International Software Group Co. Ltd. (a) | | 1,264,000 | 2,067,578 |
| Li Ning Co. Ltd. | | 3,247,500 | 16,796,736 |
| Shenzhou International Group Holdings Ltd. | | 1,621,100 | 11,255,302 |
| Tencent Holdings Ltd. | | 310,000 | 8,145,806 |
| Want Want China Holdings Ltd. | | 27,740,000 | 18,235,004 |
| ZTO Express, Inc. sponsored ADR | | 1,270,397 | 21,457,005 |
TOTAL CAYMAN ISLANDS | | | 125,850,100 |
| Chile - 0.7% | | | |
| Banco de Chile | | 167,966,619 | 15,361,780 |
| China - 9.7% | | | |
| Bank of China Ltd. (H Shares) | | 96,820,000 | 31,183,537 |
| Bank of Communications Co. Ltd. (H Shares) | | 55,590,000 | 27,123,464 |
| CGN Power Co. Ltd. (H Shares) (b) | | 56,801,000 | 11,505,429 |
| China Minsheng Banking Corp. Ltd. (H Shares) (c) | | 35,050,000 | 10,180,581 |
| China Railway Group Ltd. (H Shares) | | 22,121,000 | 9,609,678 |
| China Shenhua Energy Co. Ltd. (H Shares) | | 12,216,000 | 32,136,516 |
| China Tower Corp. Ltd. (H Shares) (b) | | 140,102,000 | 12,672,211 |
| PetroChina Co. Ltd. (H Shares) | | 71,808,000 | 27,443,771 |
| Postal Savings Bank of China Co. Ltd. (H Shares) (b) | | 39,877,000 | 18,491,561 |
| Shandong Weigao Medical Polymer Co. Ltd. (H Shares) | | 10,708,800 | 14,761,068 |
| Sinopharm Group Co. Ltd. (H Shares) | | 3,168,000 | 6,037,630 |
TOTAL CHINA | | | 201,145,446 |
| Hong Kong - 1.1% | | | |
| China Resources Power Holdings Co. Ltd. | | 8,107,000 | 11,794,404 |
| Guangdong Investment Ltd. | | 16,090,000 | 10,146,376 |
TOTAL HONG KONG | | | 21,940,780 |
| India - 15.7% | | | |
| Cipla Ltd./India | | 1,680,422 | 23,698,051 |
| Dr. Reddy's Laboratories Ltd. | | 638,066 | 34,343,978 |
| HCL Technologies Ltd. | | 2,383,454 | 29,977,448 |
| Hindustan Unilever Ltd. | | 1,023,802 | 31,546,409 |
| Infosys Ltd. | | 1,681,971 | 31,242,845 |
| Lupin Ltd. | | 1,095,302 | 9,248,805 |
| MRF Ltd. | | 11,556 | 12,670,977 |
| Nestle India Ltd. | | 135,672 | 33,374,525 |
| Power Grid Corp. of India Ltd. | | 12,193,277 | 33,605,897 |
| Sun Pharmaceutical Industries Ltd. | | 928,091 | 11,401,012 |
| Tata Consultancy Services Ltd. | | 801,636 | 30,922,252 |
| Tech Mahindra Ltd. | | 1,873,055 | 24,061,448 |
| Wipro Ltd. | | 4,318,829 | 20,209,138 |
TOTAL INDIA | | | 326,302,785 |
| Indonesia - 3.3% | | | |
| PT Bank Central Asia Tbk | | 64,957,800 | 36,648,735 |
| PT Telkom Indonesia Persero Tbk | | 111,265,000 | 31,248,876 |
TOTAL INDONESIA | | | 67,897,611 |
| Korea (South) - 7.7% | | | |
| Coway Co. Ltd. | | 251,533 | 9,745,379 |
| Db Insurance Co. Ltd. | | 204,711 | 8,074,734 |
| Hankook Tire Co. Ltd. | | 361,107 | 9,247,023 |
| Hyundai Fire & Marine Insurance Co. Ltd. | | 303,503 | 7,080,858 |
| Hyundai Mobis | | 116,367 | 17,854,702 |
| Kangwon Land, Inc. (a) | | 517,905 | 8,345,581 |
| Korea Electric Power Corp. (a) | | 1,071,785 | 12,543,013 |
| KT&G Corp. | | 549,950 | 36,873,450 |
| NCSOFT Corp. | | 89,318 | 24,405,193 |
| Samsung Electronics Co. Ltd. | | 502,899 | 20,928,874 |
| Samsung SDS Co. Ltd. | | 15,831 | 1,386,427 |
| SK Hynix, Inc. | | 44,885 | 2,600,671 |
TOTAL KOREA (SOUTH) | | | 159,085,905 |
| Kuwait - 3.1% | | | |
| Boubyan Bank KSC | | 4,471,075 | 11,890,159 |
| Mobile Telecommunication Co. | | 9,948,671 | 19,232,706 |
| National Bank of Kuwait | | 9,752,508 | 33,929,978 |
TOTAL KUWAIT | | | 65,052,843 |
| Malaysia - 5.3% | | | |
| Dialog Group Bhd | | 14,535,300 | 6,333,062 |
| DiGi.com Bhd | | 15,551,200 | 12,465,958 |
| IHH Healthcare Bhd | | 12,160,400 | 15,303,380 |
| Malayan Banking Bhd | | 6,008,116 | 10,915,761 |
| Nestle (Malaysia) Bhd | | 165,000 | 4,641,497 |
| Petronas Gas Bhd | | 2,060,100 | 7,450,869 |
| PPB Group Bhd | | 2,450,800 | 8,656,591 |
| Public Bank Bhd | | 22,708,800 | 21,469,614 |
| Tenaga Nasional Bhd | | 12,541,000 | 22,334,014 |
TOTAL MALAYSIA | | | 109,570,746 |
| Mexico - 0.5% | | | |
| Gruma S.A.B. de CV Series B | | 113,455 | 1,316,073 |
| Kimberly-Clark de Mexico SA de CV Series A | | 5,136,200 | 8,103,650 |
TOTAL MEXICO | | | 9,419,723 |
| Philippines - 2.4% | | | |
| Bank of the Philippine Islands (BPI) | | 7,275,310 | 12,062,880 |
| BDO Unibank, Inc. | | 7,831,270 | 17,258,015 |
| Manila Electric Co. | | 1,106,920 | 5,753,988 |
| PLDT, Inc. | | 440,605 | 12,387,629 |
| SM Prime Holdings, Inc. | | 5,071,400 | 2,761,270 |
TOTAL PHILIPPINES | | | 50,223,782 |
| Qatar - 4.0% | | | |
| Barwa Real Estate Co. (a) | | 7,993,431 | 7,462,804 |
| Masraf al Rayan | | 2,785,751 | 2,935,107 |
| Qatar Islamic Bank (a) | | 4,748,104 | 31,799,617 |
| Qatar National Bank SAQ (a) | | 4,858,088 | 26,599,924 |
| The Commercial Bank of Qatar (a) | | 7,720,494 | 13,343,252 |
TOTAL QATAR | | | 82,140,704 |
| Russia - 0.0% | | | |
| PhosAgro PJSC (d) | | 1,400 | 129 |
| PhosAgro PJSC: | | | |
| GDR (d) | | 3,774 | 77 |
| GDR (Reg. S) (d) | | 586,072 | 12,020 |
TOTAL RUSSIA | | | 12,226 |
| Saudi Arabia - 9.5% | | | |
| Advanced Polypropylene Co. | | 712,555 | 8,400,736 |
| Alinma Bank | | 3,306,461 | 32,998,174 |
| Almarai Co. Ltd. | | 1,355,500 | 20,309,683 |
| Jarir Marketing Co. | | 327,888 | 14,310,823 |
| Mouwasat Medical Services Co. | | 261,475 | 15,239,458 |
| Sabic Agriculture-Nutrients Co. | | 559,958 | 23,694,514 |
| Saudi Basic Industries Corp. | | 1,047,607 | 24,645,968 |
| Saudi Electricity Co. | | 3,436,027 | 24,689,686 |
| Saudi Telecom Co. | | 3,106,615 | 33,401,351 |
| The Savola Group | | 11,729 | 91,458 |
TOTAL SAUDI ARABIA | | | 197,781,851 |
| Taiwan - 19.0% | | | |
| ASUSTeK Computer, Inc. | | 2,583,000 | 18,899,609 |
| Chang Hwa Commercial Bank | | 28,964,287 | 14,906,900 |
| Chicony Electronics Co. Ltd. | | 3,687,000 | 9,156,343 |
| Chunghwa Telecom Co. Ltd. | | 8,440,000 | 29,071,995 |
| Compal Electronics, Inc. | | 23,063,000 | 15,087,409 |
| Far EasTone Telecommunications Co. Ltd. | | 8,896,000 | 19,499,820 |
| Formosa Petrochemical Corp. | | 7,631,000 | 19,637,037 |
| Formosa Plastics Corp. | | 7,712,000 | 19,869,387 |
| Inventec Corp. | | 17,394,000 | 13,158,480 |
| Lite-On Technology Corp. | | 8,903,000 | 17,665,778 |
| Mega Financial Holding Co. Ltd. | | 27,730,075 | 25,706,246 |
| Pou Chen Corp. | | 4,865,000 | 4,110,227 |
| President Chain Store Corp. | | 2,954,000 | 24,544,925 |
| Quanta Computer, Inc. | | 12,976,000 | 27,517,778 |
| Sinopac Financial Holdings Co. | | 36,999,870 | 18,468,962 |
| Synnex Technology International Corp. | | 7,421,000 | 12,102,207 |
| Taiwan Cooperative Financial Holding Co. Ltd. | | 31,831,594 | 24,672,594 |
| Taiwan Mobile Co. Ltd. | | 9,221,000 | 27,187,856 |
| The Shanghai Commercial & Savings Bank Ltd. | | 13,165,000 | 18,938,922 |
| The Shanghai Commercial & Savings Bank Ltd. rights (a) | | 965,080 | 281,260 |
| Uni-President Enterprises Corp. | | 10,916,000 | 22,167,731 |
| WPG Holding Co. Ltd. | | 7,935,000 | 10,812,403 |
TOTAL TAIWAN | | | 393,463,869 |
| Thailand - 2.5% | | | |
| Advanced Info Service PCL (For. Reg.) | | 5,833,400 | 29,285,830 |
| Advanced Information Service PCL NVDR | | 217,600 | 1,092,433 |
| Bangkok Bank PCL: | | | |
| (For. Reg.) | | 2,028,000 | 7,755,921 |
| NVDR | | 78,200 | 299,070 |
| Bangkok Dusit Medical Services PCL: | | | |
| (For. Reg.) | | 18,183,900 | 14,099,752 |
| NVDR | | 114,800 | 89,016 |
TOTAL THAILAND | | | 52,622,022 |
| United Arab Emirates - 4.1% | | | |
| Abu Dhabi National Oil Co. for Distribution PJSC | | 15,995,893 | 19,640,488 |
| Dubai Islamic Bank Pakistan Ltd. | | 16,136,608 | 25,568,337 |
| Emirates Telecommunications Corp. | | 4,428,174 | 31,103,670 |
| First Abu Dhabi Bank PJSC | | 1,721,397 | 8,388,829 |
TOTAL UNITED ARAB EMIRATES | | | 84,701,324 |
| United States of America - 1.2% | | | |
| Yum China Holdings, Inc. | | 591,406 | 24,454,638 |
| TOTAL COMMON STOCKS (Cost $2,197,866,755) | | | 2,035,577,705 |
| | | | |
| Government Obligations - 0.1% |
| | | Principal Amount (e) | Value ($) |
| United States of America - 0.1% | | | |
U.S. Treasury Bills, yield at date of purchase 1.23% 1/26/23 (f) (Cost $1,794,778) | | 1,800,000 | 1,782,854 |
| | | | |
| Money Market Funds - 2.1% |
| | | Shares | Value ($) |
| Fidelity Cash Central Fund 3.10% (g) | | 30,180,080 | 30,186,116 |
| Fidelity Securities Lending Cash Central Fund 3.10% (g)(h) | | 12,498,750 | 12,500,000 |
| TOTAL MONEY MARKET FUNDS (Cost $42,686,116) | | | 42,686,116 |
| | | | |
| TOTAL INVESTMENT IN SECURITIES - 100.4% (Cost $2,242,347,649) | 2,080,046,675 |
NET OTHER ASSETS (LIABILITIES) - (0.4)% | (8,093,923) |
| NET ASSETS - 100.0% | 2,071,952,752 |
| | |
| Futures Contracts |
| | Number of contracts | Expiration Date | Notional Amount ($) | Value ($) | Unrealized Appreciation/ (Depreciation) ($) |
| Purchased | | | | | |
| | | | | | |
| Equity Index Contracts | | | | | |
| ICE E-mini MSCI Emerging Markets Index Contracts (United States) | 858 | Dec 2022 | 36,619,440 | (1,341,259) | (1,341,259) |
| | | | | | |
| The notional amount of futures purchased as a percentage of Net Assets is 1.8% |
Categorizations in the Schedule of Investments are based on country or territory of incorporation.
Legend
| (b) | Security exempt from registration under Rule 144A of the Securities Act of 1933. These securities may be resold in transactions exempt from registration, normally to qualified institutional buyers. At the end of the period, the value of these securities amounted to $50,163,864 or 2.4% of net assets. |
| (c) | Security or a portion of the security is on loan at period end. |
| (e) | Amount is stated in United States dollars unless otherwise noted. |
| (f) | Security or a portion of the security was pledged to cover margin requirements for futures contracts. At period end, the value of securities pledged amounted to $1,782,854. |
| (g) | Affiliated fund that is generally available only to investment companies and other accounts managed by Fidelity Investments. The rate quoted is the annualized seven-day yield of the fund at period end. A complete unaudited listing of the fund's holdings as of its most recent quarter end is available upon request. In addition, each Fidelity Central Fund's financial statements, which are not covered by the Fund's Report of Independent Registered Public Accounting Firm, are available on the SEC's website or upon request. |
| (h) | Investment made with cash collateral received from securities on loan. |
Affiliated Central Funds
Fiscal year to date information regarding the Fund's investments in Fidelity Central Funds, including the ownership percentage, is presented below.
| Affiliate | Value, beginning of period ($) | Purchases ($) | Sales Proceeds ($) | Dividend Income ($) | Realized Gain (loss) ($) | Change in Unrealized appreciation (depreciation) ($) | Value, end of period ($) | % ownership, end of period |
| Fidelity Cash Central Fund 3.10% | 20,125,016 | 450,749,312 | 440,688,212 | 200,798 | - | - | 30,186,116 | 0.1% |
| Fidelity Securities Lending Cash Central Fund 3.10% | 21,000,909 | 56,448,522 | 64,949,431 | 4,774 | - | - | 12,500,000 | 0.0% |
| Total | 41,125,925 | 507,197,834 | 505,637,643 | 205,572 | - | - | 42,686,116 | |
| | | | | | | | | |
Amounts in the income column in the above table include any capital gain distributions from underlying funds, which are presented in the corresponding line item in the Statement of Operations, if applicable.
Amount for Fidelity Securities Lending Cash Central Fund represents the income earned on investing cash collateral, less rebates paid to borrowers and any lending agent fees associated with the loan, plus any premium payments received for lending certain types of securities.
Investment Valuation
The following is a summary of the inputs used, as of October 31, 2022, involving the Fund's assets and liabilities carried at fair value. The inputs or methodology used for valuing securities may not be an indication of the risk associated with investing in those securities. For more information on valuation inputs, and their aggregation into the levels used below, please refer to the Investment Valuation section in the accompanying Notes to Financial Statements.
| Valuation Inputs at Reporting Date: |
| Description | Total ($) | Level 1 ($) | Level 2 ($) | Level 3 ($) |
Investments in Securities: | | | | |
|
| Equities: | | | | |
Communication Services | 308,572,247 | 227,717,941 | 80,854,306 | - |
Consumer Discretionary | 176,424,348 | 165,169,046 | 11,255,302 | - |
Consumer Staples | 222,266,530 | 222,266,530 | - | - |
Energy | 85,550,386 | 85,550,386 | - | - |
Financials | 514,334,772 | 453,549,080 | 60,785,692 | - |
Health Care | 151,716,813 | 117,372,835 | 34,343,978 | - |
Industrials | 31,066,683 | 31,066,683 | - | - |
Information Technology | 305,597,860 | 285,388,722 | 20,209,138 | - |
Materials | 76,622,831 | 76,610,605 | - | 12,226 |
Real Estate | 10,224,074 | 7,462,804 | 2,761,270 | - |
Utilities | 153,201,161 | 134,904,160 | 18,297,001 | - |
|
| Government Obligations | 1,782,854 | - | 1,782,854 | - |
|
| Money Market Funds | 42,686,116 | 42,686,116 | - | - |
| Total Investments in Securities: | 2,080,046,675 | 1,849,744,908 | 230,289,541 | 12,226 |
Derivative Instruments: | | | | |
|
| Liabilities | | | | |
Futures Contracts | (1,341,259) | (1,341,259) | - | - |
| Total Liabilities | (1,341,259) | (1,341,259) | - | - |
| Total Derivative Instruments: | (1,341,259) | (1,341,259) | - | - |
Value of Derivative Instruments
The following table is a summary of the Fund's value of derivative instruments by primary risk exposure as of October 31, 2022. For additional information on derivative instruments, please refer to the Derivative Instruments section in the accompanying Notes to Financial Statements.
Primary Risk Exposure / Derivative Type | Value |
| Asset ($) | Liability ($) |
| Equity Risk | | |
Futures Contracts (a) | 0 | (1,341,259) |
| Total Equity Risk | 0 | (1,341,259) |
| Total Value of Derivatives | 0 | (1,341,259) |
(a)Reflects gross cumulative appreciation (depreciation) on futures contracts as presented in the Schedule of Investments. In the Statement of Assets and Liabilities, the period end daily variation margin is included in receivable or payable for daily variation margin on futures contracts, and the net cumulative appreciation (depreciation) is included in Total accumulated earnings (loss).
Fidelity® SAI Emerging Markets Low Volatility Index Fund
| Statement of Assets and Liabilities |
| | | | October 31, 2022 |
| | | | | |
| Assets | | | | |
| Investment in securities, at value (including securities loaned of $7,261,703) - See accompanying schedule: | | | | |
Unaffiliated issuers (cost $2,199,661,533) | | $2,037,360,559 | | |
Fidelity Central Funds (cost $42,686,116) | | 42,686,116 | | |
| | | | | |
| Total Investment in Securities (cost $2,242,347,649) | | | $ | 2,080,046,675 |
| Segregated cash with brokers for derivative instruments | | | | 49,056 |
| Cash | | | | 11 |
| Foreign currency held at value (cost $9,697,634) | | | | 9,618,347 |
| Receivable for fund shares sold | | | | 1,534,684 |
| Dividends receivable | | | | 1,377,491 |
| Distributions receivable from Fidelity Central Funds | | | | 82,691 |
| Prepaid expenses | | | | 2,541 |
| Other receivables | | | | 133,186 |
Total assets | | | | 2,092,844,682 |
| Liabilities | | | | |
| Payable for fund shares redeemed | | $532,976 | | |
| Accrued management fee | | 266,628 | | |
| Payable for daily variation margin on futures contracts | | 108,425 | | |
| Deferred taxes | | 6,914,515 | | |
| Other payables and accrued expenses | | 569,386 | | |
| Collateral on securities loaned | | 12,500,000 | | |
| Total Liabilities | | | | 20,891,930 |
| Net Assets | | | $ | 2,071,952,752 |
| Net Assets consist of: | | | | |
| Paid in capital | | | $ | 2,235,362,257 |
| Total accumulated earnings (loss) | | | | (163,409,505) |
| Net Assets | | | $ | 2,071,952,752 |
Net Asset Value , offering price and redemption price per share ($2,071,952,752 ÷ 222,999,112 shares) | | | $ | 9.29 |
| | | | | |
| Statement of Operations |
| | | | Year ended October 31, 2022 |
| Investment Income | | | | |
| Dividends | | | $ | 74,614,905 |
| Interest | | | | 5,854 |
| Income from Fidelity Central Funds (including $4,774 from security lending) | | | | 205,572 |
| Income before foreign taxes withheld | | | | 74,826,331 |
| Less foreign taxes withheld | | | | (10,078,518) |
| Total Income | | | | 64,747,813 |
| Expenses | | | | |
| Management fee | $ | 2,903,473 | | |
| Custodian fees and expenses | | 1,886,227 | | |
| Independent trustees' fees and expenses | | 6,241 | | |
| Registration fees | | 121,230 | | |
| Audit | | 60,213 | | |
| Legal | | 1,890 | | |
| Interest | | 40,681 | | |
| Miscellaneous | | 7,823 | | |
| Total expenses before reductions | | 5,027,778 | | |
| Expense reductions | | (143,808) | | |
| Total expenses after reductions | | | | 4,883,970 |
| Net Investment income (loss) | | | | 59,863,843 |
| Realized and Unrealized Gain (Loss) | | | | |
| Net realized gain (loss) on: | | | | |
| Investment Securities: | | | | |
| Unaffiliated issuers(net of foreign taxes of $2,601,153) | | (1,923,123) | | |
| Foreign currency transactions | | (1,955,205) | | |
| Futures contracts | | (2,290,600) | | |
| Total net realized gain (loss) | | | | (6,168,928) |
| Change in net unrealized appreciation (depreciation) on: | | | | |
| Investment Securities: | | | | |
| Unaffiliated issuers (net of decrease in deferred foreign taxes of $4,933,884) | | (411,180,313) | | |
| Assets and liabilities in foreign currencies | | (41,880) | | |
| Futures contracts | | (1,285,078) | | |
| Total change in net unrealized appreciation (depreciation) | | | | (412,507,271) |
| Net gain (loss) | | | | (418,676,199) |
| Net increase (decrease) in net assets resulting from operations | | | $ | (358,812,356) |
| Statement of Changes in Net Assets |
| |
| | Year ended October 31, 2022 | | Year ended October 31, 2021 |
| Increase (Decrease) in Net Assets | | | | |
| Operations | | | | |
| Net investment income (loss) | $ | 59,863,843 | $ | 38,325,535 |
| Net realized gain (loss) | | (6,168,928) | | 13,133,681 |
| Change in net unrealized appreciation (depreciation) | | (412,507,271) | | 248,534,401 |
| Net increase (decrease) in net assets resulting from operations | | (358,812,356) | | 299,993,617 |
| Distributions to shareholders | | (41,568,890) | | (24,528,630) |
| Share transactions | | | | |
| Proceeds from sales of shares | | 901,012,848 | | 431,880,407 |
| Reinvestment of distributions | | 41,085,516 | | 24,269,809 |
| Cost of shares redeemed | | (262,187,253) | | (198,597,781) |
Net increase (decrease) in net assets resulting from share transactions | | 679,911,111 | | 257,552,435 |
| Total increase (decrease) in net assets | | 279,529,865 | | 533,017,422 |
| | | | | |
| Net Assets | | | | |
| Beginning of period | | 1,792,422,887 | | 1,259,405,465 |
| End of period | $ | 2,071,952,752 | $ | 1,792,422,887 |
| | | | | |
| Other Information | | | | |
| Shares | | | | |
| Sold | | 87,667,616 | | 38,702,331 |
| Issued in reinvestment of distributions | | 3,675,772 | | 2,367,786 |
| Redeemed | | (25,061,997) | | (18,195,718) |
| Net increase (decrease) | | 66,281,391 | | 22,874,399 |
| | | | | |
Financial Highlights
| Fidelity® SAI Emerging Markets Low Volatility Index Fund |
| |
| Years ended October 31, | | 2022 | | 2021 | | 2020 | | 2019 A |
Selected Per-Share Data | | | | | | | | |
| Net asset value, beginning of period | $ | 11.44 | $ | 9.41 | $ | 10.11 | $ | 10.00 |
| Income from Investment Operations | | | | | | | | |
Net investment income (loss) B,C | | .33 | | .27 | | .24 | | .22 |
| Net realized and unrealized gain (loss) | | (2.22) | | 1.95 | | (.75) | | (.11) |
| Total from investment operations | | (1.89) | | 2.22 | | (.51) | | .11 |
| Distributions from net investment income | | (.26) | | (.19) | | (.19) | | - |
| Total distributions | | (.26) | | (.19) | | (.19) | | - |
| Net asset value, end of period | $ | 9.29 | $ | 11.44 | $ | 9.41 | $ | 10.11 |
Total Return D,E | | (16.88)% | | 23.79% | | (5.10)% | | 1.10% |
Ratios to Average Net Assets C,F,G | | | | | | | | |
| Expenses before reductions | | .26% | | .23% | | .24% | | .35% H |
| Expenses net of fee waivers, if any | | .25% | | .23% | | .24% | | .26% H |
| Expenses net of all reductions | | .25% | | .23% | | .24% | | .26% H |
| Net investment income (loss) | | 3.09% | | 2.44% | | 2.59% | | 2.90% H |
| Supplemental Data | | | | | | | | |
| Net assets, end of period (000 omitted) | $ | 2,071,953 | $ | 1,792,423 | $ | 1,259,405 | $ | 644,085 |
Portfolio turnover rate I | | 21% | | 28% | | 30% | | 75% H |
A For the period January 30, 2019 (commencement of operations) through October 31, 2019.
B Calculated based on average shares outstanding during the period.
C Net investment income (loss) is affected by the timing of the declaration of dividends by any underlying mutual funds or exchange-traded funds (ETFs). Net investment income (loss) of any mutual funds or ETFs is not included in the Fund's net investment income (loss) ratio.
D Total returns for periods of less than one year are not annualized.
E Total returns would have been lower if certain expenses had not been reduced during the applicable periods shown.
F Fees and expenses of any underlying mutual funds or exchange-traded funds (ETFs) are not included in the Fund's expense ratio. The Fund indirectly bears its proportionate share of these expenses. For additional expense information related to investments in Fidelity Central Funds, please refer to the "Investments in Fidelity Central Funds" note found in the Notes to Financial Statements section of the most recent Annual or Semi-Annual report.
G Expense ratios reflect operating expenses of the class. Expenses before reductions do not reflect amounts reimbursed, waived, or reduced through arrangements with the investment adviser, brokerage services, or other offset arrangements, if applicable, and do not represent the amount paid by the class during periods when reimbursements, waivers or reductions occur.
H Annualized.
I Amount does not include the portfolio activity of any underlying mutual funds or exchange-traded funds (ETFs).
Average annual total return reflects the change in the value of an investment, assuming reinvestment of distributions from dividend income and capital gains (the profits earned upon the sale of securities that have grown in value, if any) and assuming a constant rate of performance each year. The hypothetical investment and the average annual total returns do not reflect the deduction of taxes that a shareholder would pay on fund distributions or the redemption of fund shares. During periods of reimbursement by Fidelity, a fund's total return will be greater than it would be had the reimbursement not occurred. How a fund did yesterday is no guarantee of how it will do tomorrow.
| Average Annual Total Returns |
| | | | |
Periods ended October 31, 2022 | Past 1 year | Past 5 years | Life of Fund A |
| Fidelity® SAI International Low Volatility Index Fund | -19.80% | -0.59% | 1.22% |
A From May 29, 2015
| $10,000 Over Life of Fund |
| |
Let's say hypothetically that $10,000 was invested in Fidelity® SAI International Low Volatility Index Fund on May 29, 2015, when the fund started. The chart shows how the value of your investment would have changed, and also shows how the Fidelity International Low Volatility Focus Index℠, Fidelity SAI International Low Volatility Index Fund Linked Index and MSCI ACWI (All Country World Index) ex USA Index performed over the same period. |
|
|
Fidelity® SAI International Low Volatility Index Fund
Market Recap:
International equities returned -24.61% for the 12 months ending October 31, 2022, according to the MSCI ACWI (All Country World Index) ex USA Index. After gaining 7.98% in 2021, non-U.S. stocks retreated in the new year, as a multitude of risk factors challenged the global economy and financial markets. Persistently high inflation in some markets, exacerbated by energy price shocks from the Russia-Ukraine conflict, spurred the U.S. Federal Reserve and other central banks to aggressively tighten monetary policy, and market interest rates eclipsed their highest level in roughly a decade, stoking recession fears and sending stocks into bear market territory. Other factors influencing equities abroad included surging global commodity prices, rising sovereign bond yields in some markets, ongoing global supply-chain disruption, a broadly strong U.S. dollar and the potential for variants of the coronavirus to upend global economic growth. Against this backdrop, the index returned -24.20% year to date through October. For the full 12 months, emerging markets (-31%) and Europe ex U.K. (-25%) notably lagged. Conversely, Canada (-13%) and the U.K. (-12%) held up best. Among the 11 sectors, information technology and consumer discretionary (-37% each) fared worst. Communication services (-34%) also trailed the broader market. In contrast, energy gained 2% amid high prices for oil and natural gas. The defensive-oriented utilities (-16%) sector also outperformed, as did financials and consumer staples (-18% each).
Comments from the Geode Capital Management, LLC, passive equity index team:
For the fiscal year, the fund returned -19.80%, roughly in line with the -19.44% result of the benchmark, the Fidelity International Low Volatility Focus Index. (The fund's relative performance can be affected by Fidelity's methodologies for valuing certain foreign stocks and for incorporating foreign exchange rates, which differ from those used by the index, as well as by local tax laws or regulations, which vary by country.) By region, Europe ex U.K. returned -20% and detracted most, followed by Japan (-18%). By sector, stocks in health care returned about -19% and detracted most, followed by real estate, which returned roughly -28%. Consumer discretionary returned approximately -32%, hampered by the retailing industry (-40%). Industrials (-15%) detracted, especially in the commercial & professional services industry (-16%). Consumer staples returned roughly -15%, held back by the food, beverage & tobacco industry (-15%). Consumer staples returned -16%, hampered by the household & personal products industry (-21%). Other notable detractors included the utilities (-21%) and information technology (-31%) sectors. Materials (-31%) and communication services (-10%) also hurt. Turning to individual stocks, the biggest detractor was Prosus (-51%), from the retailing group, followed by Fujifilm Holdings (-40%), which is in the technology hardware & equipment category. Within consumer durables & apparel, Shimano returned approximately -43% and hurt. Other noteworthy detractors were Hong Kong & China Gas (-48%), a stock in the utilities sector, and Givaudan (-36%), from the materials sector. Conversely, the top contributor was Deutsche Telekom (+7%), from the telecommunication services industry. In utilities, Tokyo Gas (+6%) was helpful, and NTT Data (-9%), from the software & services segment, also contributed. ICA Gruppen, within the food & staples retailing industry, rose roughly 14% and Kintetsu, within the transportation category, gained about 9% and boosted the fund.
The views expressed above reflect those of the portfolio manager(s) only through the end of the period as stated on the cover of this report and do not necessarily represent the views of Fidelity or any other person in the Fidelity organization. Any such views are subject to change at any time based upon market or other conditions and Fidelity disclaims any responsibility to update such views. These views may not be relied on as investment advice and, because investment decisions for a Fidelity fund are based on numerous factors, may not be relied on as an indication of trading intent on behalf of any Fidelity fund.
Fidelity® SAI International Low Volatility Index Fund
Top Holdings (% of Fund's net assets) |
| |
| Novo Nordisk A/S Series B (Denmark, Pharmaceuticals) | 2.3 | |
| Roche Holding AG (participation certificate) (Switzerland, Pharmaceuticals) | 2.2 | |
| Novartis AG (Switzerland, Pharmaceuticals) | 2.1 | |
| AstraZeneca PLC (United Kingdom) (United Kingdom, Pharmaceuticals) | 2.0 | |
| Nestle SA (Reg. S) (Switzerland, Food Products) | 2.0 | |
| Sanofi SA (France, Pharmaceuticals) | 1.9 | |
| RELX PLC (London Stock Exchange) (United Kingdom, Professional Services) | 1.9 | |
| Diageo PLC (United Kingdom, Beverages) | 1.9 | |
| Nippon Telegraph & Telephone Corp. (Japan, Diversified Telecommunication Services) | 1.9 | |
| Wolters Kluwer NV (Netherlands, Professional Services) | 1.8 | |
| | 20.0 | |
| |
| Market Sectors (% of Fund's net assets) |
| |
| Health Care | 17.3 | |
| Consumer Staples | 15.8 | |
| Industrials | 14.9 | |
| Financials | 12.3 | |
| Communication Services | 10.0 | |
| Utilities | 7.5 | |
| Real Estate | 7.3 | |
| Consumer Discretionary | 6.2 | |
| Materials | 4.3 | |
| Information Technology | 3.6 | |
| |
Asset Allocation (% of Fund's net assets) |
|
Foreign investments - 99.2% |
|
Geographic Diversification (% of Fund's net assets) |
|
* Includes Short-Term investments and Net Other Assets (Liabilities). Percentages are based on country or territory of incorporation and are adjusted for the effect of futures contracts, if applicable. |
| |
Fidelity® SAI International Low Volatility Index Fund
Showing Percentage of Net Assets
| Common Stocks - 99.2% |
| | | Shares | Value ($) |
| Australia - 2.0% | | | |
| ASX Ltd. | | 1,167,631 | 50,563,449 |
| CSL Ltd. | | 174,005 | 31,218,069 |
| Medibank Private Ltd. | | 15,030,670 | 27,016,374 |
TOTAL AUSTRALIA | | | 108,797,892 |
| Bailiwick of Jersey - 1.5% | | | |
| Experian PLC | | 2,656,255 | 84,695,424 |
| Belgium - 0.9% | | | |
| Cofinimmo SA | | 55,215 | 4,580,835 |
| ELIA GROUP SA/NV (a) | | 202,456 | 25,589,867 |
| Warehouses de Pauw | | 797,396 | 20,472,931 |
TOTAL BELGIUM | | | 50,643,633 |
| Bermuda - 1.3% | | | |
| Jardine Matheson Holdings Ltd. | | 1,518,176 | 69,866,460 |
| Cayman Islands - 0.0% | | | |
| China Huishan Dairy Holdings Co. Ltd. (b)(c) | | 5,145,000 | 7 |
| Denmark - 5.8% | | | |
| Chr. Hansen Holding A/S | | 620,245 | 34,449,072 |
| Coloplast A/S Series B | | 716,409 | 79,858,243 |
| Novo Nordisk A/S Series B | | 1,149,305 | 124,965,380 |
| Novozymes A/S Series B | | 609,002 | 31,984,669 |
| Tryg A/S | | 2,170,667 | 46,975,466 |
TOTAL DENMARK | | | 318,232,830 |
| Finland - 0.8% | | | |
| Elisa Corp. (A Shares) | | 908,215 | 43,898,851 |
| France - 5.6% | | | |
| Air Liquide SA | | 31,985 | 4,184,078 |
| Hermes International SCA | | 15,684 | 20,312,374 |
| L'Oreal SA | | 259,910 | 81,612,882 |
| Orange SA | | 9,845,030 | 93,802,611 |
| Sanofi SA | | 1,248,967 | 107,483,432 |
TOTAL FRANCE | | | 307,395,377 |
| Germany - 6.3% | | | |
| Beiersdorf AG | | 564,263 | 54,166,549 |
| Deutsche Borse AG | | 593,480 | 96,511,580 |
| Deutsche Telekom AG | | 3,612,272 | 68,183,437 |
| Hannover Reuck SE | | 322,646 | 52,547,289 |
| Symrise AG | | 738,428 | 75,373,236 |
TOTAL GERMANY | | | 346,782,091 |
| Hong Kong - 5.7% | | | |
| CLP Holdings Ltd. | | 10,057,000 | 67,500,640 |
| Hang Seng Bank Ltd. | | 4,382,300 | 61,693,105 |
| Hong Kong & China Gas Co. Ltd. | | 62,187,015 | 47,931,868 |
| Link (REIT) | | 9,170,353 | 54,206,796 |
| MTR Corp. Ltd. | | 9,343,871 | 41,126,769 |
| Power Assets Holdings Ltd. | | 8,241,500 | 39,424,474 |
TOTAL HONG KONG | | | 311,883,652 |
| Ireland - 0.3% | | | |
| Kerry Group PLC Class A | | 169,478 | 14,738,824 |
| Israel - 1.3% | | | |
| Bank Hapoalim BM (Reg.) | | 5,587,227 | 53,918,705 |
| Mizrahi Tefahot Bank Ltd. | | 501,531 | 18,976,580 |
TOTAL ISRAEL | | | 72,895,285 |
| Italy - 0.4% | | | |
| Recordati SpA | | 605,578 | 22,759,527 |
| Japan - 29.5% | | | |
| Advance Residence Investment Corp. | | 7,960 | 18,522,210 |
| Ajinomoto Co., Inc. | | 3,152,500 | 86,839,773 |
| Canon, Inc. | | 2,123,800 | 45,019,223 |
| Central Japan Railway Co. | | 591,980 | 68,537,402 |
| Chubu Electric Power Co., Inc. | | 4,313,300 | 35,128,325 |
| Daiwa House REIT Investment Corp. | | 12,141 | 24,495,107 |
| FUJIFILM Holdings Corp. | | 1,788,410 | 82,014,646 |
| Hankyu Hanshin Holdings, Inc. | | 1,386,240 | 41,159,754 |
| Industrial & Infrastructure Fund Investment Corp. | | 11,882 | 12,545,640 |
| Japan Post Holdings Co. Ltd. | | 7,263,300 | 48,827,430 |
| Japan Real Estate Investment Corp. | | 7,945 | 33,287,838 |
| Kansai Electric Power Co., Inc. | | 4,464,600 | 33,838,422 |
| KDDI Corp. | | 971,700 | 28,720,510 |
| Kintetsu Group Holdings Co. Ltd. | | 1,149,700 | 38,891,631 |
| Kyushu Railway Co. | | 948,500 | 19,838,159 |
| McDonald's Holdings Co. (Japan) Ltd. | | 448,800 | 15,574,216 |
| Medipal Holdings Corp. | | 1,268,000 | 15,733,280 |
| Nagoya Railroad Co. Ltd. | | 1,186,500 | 18,177,121 |
| Nippon Building Fund, Inc. | | 9,483 | 42,155,170 |
| Nippon Prologis REIT, Inc. | | 14,818 | 31,042,113 |
| Nippon Telegraph & Telephone Corp. | | 3,675,696 | 101,378,297 |
| Oriental Land Co. Ltd. | | 668,500 | 89,690,810 |
| Osaka Gas Co. Ltd. | | 2,391,260 | 35,411,779 |
| Otsuka Holdings Co. Ltd. | | 1,029,560 | 33,002,046 |
| Pan Pacific International Holdings Ltd. | | 3,057,700 | 50,195,674 |
| Secom Co. Ltd. | | 1,294,270 | 73,735,211 |
| Sega Sammy Holdings, Inc. | | 608,600 | 7,797,054 |
| Sekisui House Ltd. | | 1,310,600 | 21,814,688 |
| Seven & i Holdings Co. Ltd. | | 2,290,800 | 85,511,840 |
| SHIMANO, Inc. | | 406,200 | 62,856,721 |
| Skylark Holdings Co. Ltd. | | 1,372,400 | 14,647,425 |
| SoftBank Corp. | | 8,730,500 | 86,121,044 |
| Suntory Beverage & Food Ltd. | | 201,900 | 6,761,909 |
| Tobu Railway Co. Ltd. | | 1,265,200 | 29,269,901 |
| Tokio Marine Holdings, Inc. | | 5,172,600 | 93,610,858 |
| Tokyo Gas Co. Ltd. | | 1,439,900 | 25,729,273 |
| Toyo Suisan Kaisha Ltd. | | 586,180 | 21,997,272 |
| Toyota Motor Corp. | | 23,600 | 327,441 |
| Trend Micro, Inc. | | 807,800 | 40,798,803 |
TOTAL JAPAN | | | 1,621,006,016 |
| Netherlands - 4.8% | | | |
| ASML Holding NV (Netherlands) | | 6,814 | 3,196,360 |
| Koninklijke Ahold Delhaize NV | | 3,514,702 | 98,019,051 |
| Prosus NV | | 1,420,971 | 61,445,197 |
| Wolters Kluwer NV | | 950,782 | 101,055,089 |
TOTAL NETHERLANDS | | | 263,715,697 |
| Norway - 0.5% | | | |
| Orkla ASA | | 2,268,266 | 15,299,813 |
| Telenor ASA | | 1,284,754 | 11,675,675 |
TOTAL NORWAY | | | 26,975,488 |
| Singapore - 2.0% | | | |
| CapitaLand Ascendas REIT | | 20,249,799 | 37,478,436 |
| CapitaMall Trust | | 18,507,900 | 24,579,579 |
| Mapletree Industrial (REIT) | | 11,788,821 | 18,321,140 |
| Singapore Exchange Ltd. | | 4,960,000 | 29,502,119 |
TOTAL SINGAPORE | | | 109,881,274 |
| Spain - 0.6% | | | |
| Grifols SA (a)(b) | | 1,687,824 | 14,354,740 |
| Red Electrica Corporacion SA | | 1,036,097 | 16,759,613 |
TOTAL SPAIN | | | 31,114,353 |
| Sweden - 1.5% | | | |
| Axfood AB | | 608,922 | 15,078,006 |
| Ericsson (B Shares) | | 5,468,792 | 30,402,903 |
| Telia Co. AB (a) | | 15,041,417 | 39,856,239 |
TOTAL SWEDEN | | | 85,337,148 |
| Switzerland - 14.3% | | | |
| Allreal Holding AG | | 91,344 | 13,081,070 |
| Banque Cantonale Vaudoise | | 171,546 | 15,264,142 |
| Galenica AG (d) | | 301,928 | 21,679,356 |
| Givaudan SA | | 29,302 | 87,494,862 |
| Lindt & Spruengli AG | | 777 | 75,500,175 |
| Nestle SA (Reg. S) | | 996,790 | 108,509,365 |
| Novartis AG | | 1,446,349 | 116,996,278 |
| PSP Swiss Property AG | | 276,865 | 29,584,616 |
| Roche Holding AG (participation certificate) | | 371,375 | 123,221,552 |
| SGS SA (Reg.) | | 26,053 | 57,434,141 |
| Swiss Prime Site AG | | 436,435 | 35,216,406 |
| Swisscom AG | | 153,269 | 75,658,727 |
| Zurich Insurance Group Ltd. | | 63,947 | 27,252,546 |
TOTAL SWITZERLAND | | | 786,893,236 |
| United Kingdom - 14.1% | | | |
| Admiral Group PLC | | 1,645,729 | 38,067,285 |
| AstraZeneca PLC (United Kingdom) | | 946,335 | 111,035,560 |
| Bunzl PLC | | 1,935,758 | 63,068,134 |
| Diageo PLC | | 2,571,407 | 105,819,867 |
| Direct Line Insurance Group PLC | | 7,721,391 | 17,869,170 |
| GSK PLC | | 6,117,252 | 100,207,308 |
| National Grid PLC | | 8,238,978 | 89,764,711 |
| RELX PLC (London Stock Exchange) | | 3,942,271 | 105,891,349 |
| Smith & Nephew PLC | | 4,714,603 | 55,712,062 |
| Unilever PLC | | 1,913,097 | 86,958,598 |
TOTAL UNITED KINGDOM | | | 774,394,044 |
| TOTAL COMMON STOCKS (Cost $6,142,379,716) | | | 5,451,907,109 |
| | | | |
| Government Obligations - 0.1% |
| | | Principal Amount (e) | Value ($) |
| United States of America - 0.1% | | | |
U.S. Treasury Bills, yield at date of purchase 1.23% 1/26/23 (f) (Cost $2,891,586) | | 2,900,000 | 2,872,376 |
| | | | |
| Money Market Funds - 0.9% |
| | | Shares | Value ($) |
Fidelity Securities Lending Cash Central Fund 3.10% (g)(h) (Cost $50,539,138) | | 50,534,085 | 50,539,138 |
| | | | |
| TOTAL INVESTMENT IN SECURITIES - 100.2% (Cost $6,195,810,440) | 5,505,318,623 |
NET OTHER ASSETS (LIABILITIES) - (0.2)% | (10,499,062) |
| NET ASSETS - 100.0% | 5,494,819,561 |
| | |
| Futures Contracts |
| | Number of contracts | Expiration Date | Notional Amount ($) | Value ($) | Unrealized Appreciation/ (Depreciation) ($) |
| Purchased | | | | | |
| | | | | | |
| Equity Index Contracts | | | | | |
| ICE E-mini MSCI EAFE Index Contracts (United States) | 492 | Dec 2022 | 43,195,140 | 2,432,661 | 2,432,661 |
| | | | | | |
| The notional amount of futures purchased as a percentage of Net Assets is 0.8% |
Categorizations in the Schedule of Investments are based on country or territory of incorporation.
Legend
| (a) | Security or a portion of the security is on loan at period end. |
| (d) | Security exempt from registration under Rule 144A of the Securities Act of 1933. These securities may be resold in transactions exempt from registration, normally to qualified institutional buyers. At the end of the period, the value of these securities amounted to $21,679,356 or 0.4% of net assets. |
| (e) | Amount is stated in United States dollars unless otherwise noted. |
| (f) | Security or a portion of the security was pledged to cover margin requirements for futures contracts. At period end, the value of securities pledged amounted to $2,333,557. |
| (g) | Affiliated fund that is generally available only to investment companies and other accounts managed by Fidelity Investments. The rate quoted is the annualized seven-day yield of the fund at period end. A complete unaudited listing of the fund's holdings as of its most recent quarter end is available upon request. In addition, each Fidelity Central Fund's financial statements, which are not covered by the Fund's Report of Independent Registered Public Accounting Firm, are available on the SEC's website or upon request. |
| (h) | Investment made with cash collateral received from securities on loan. |
Affiliated Central Funds
Fiscal year to date information regarding the Fund's investments in Fidelity Central Funds, including the ownership percentage, is presented below.
| Affiliate | Value, beginning of period ($) | Purchases ($) | Sales Proceeds ($) | Dividend Income ($) | Realized Gain (loss) ($) | Change in Unrealized appreciation (depreciation) ($) | Value, end of period ($) | % ownership, end of period |
| Fidelity Cash Central Fund 3.10% | 22,539,668 | 820,336,757 | 842,876,425 | 280,754 | - | - | - | 0.0% |
| Fidelity Securities Lending Cash Central Fund 3.10% | - | 325,675,287 | 275,136,149 | 514,791 | - | - | 50,539,138 | 0.1% |
| Total | 22,539,668 | 1,146,012,044 | 1,118,012,574 | 795,545 | - | - | 50,539,138 | |
| | | | | | | | | |
Amounts in the income column in the above table include any capital gain distributions from underlying funds, which are presented in the corresponding line item in the Statement of Operations, if applicable.
Amount for Fidelity Securities Lending Cash Central Fund represents the income earned on investing cash collateral, less rebates paid to borrowers and any lending agent fees associated with the loan, plus any premium payments received for lending certain types of securities.
Investment Valuation
The following is a summary of the inputs used, as of October 31, 2022, involving the Fund's assets and liabilities carried at fair value. The inputs or methodology used for valuing securities may not be an indication of the risk associated with investing in those securities. For more information on valuation inputs, and their aggregation into the levels used below, please refer to the Investment Valuation section in the accompanying Notes to Financial Statements.
| Valuation Inputs at Reporting Date: |
| Description | Total ($) | Level 1 ($) | Level 2 ($) | Level 3 ($) |
Investments in Securities: | | | | |
|
| Equities: | | | | |
Communication Services | 549,295,391 | 119,557,578 | 429,737,813 | - |
Consumer Discretionary | 344,661,600 | 220,032,241 | 124,629,359 | - |
Consumer Staples | 856,813,931 | 220,915,959 | 635,897,965 | 7 |
Financials | 678,596,098 | 493,138,867 | 185,457,231 | - |
Health Care | 958,226,833 | 105,744,972 | 852,481,861 | - |
Industrials | 812,746,545 | 422,453,018 | 390,293,527 | - |
Information Technology | 201,431,935 | 122,813,449 | 78,618,486 | - |
Materials | 233,485,917 | 119,479,531 | 114,006,386 | - |
Real Estate | 399,569,887 | 399,569,887 | - | - |
Utilities | 417,078,972 | 195,122,140 | 221,956,832 | - |
|
| Government Obligations | 2,872,376 | - | 2,872,376 | - |
|
| Money Market Funds | 50,539,138 | 50,539,138 | - | - |
| Total Investments in Securities: | 5,505,318,623 | 2,469,366,780 | 3,035,951,836 | 7 |
Derivative Instruments: | | | | |
|
| Assets | | | | |
Futures Contracts | 2,432,661 | 2,432,661 | - | - |
| Total Assets | 2,432,661 | 2,432,661 | - | - |
| Total Derivative Instruments: | 2,432,661 | 2,432,661 | - | - |
Value of Derivative Instruments
The following table is a summary of the Fund's value of derivative instruments by primary risk exposure as of October 31, 2022. For additional information on derivative instruments, please refer to the Derivative Instruments section in the accompanying Notes to Financial Statements.
Primary Risk Exposure / Derivative Type | Value |
| Asset ($) | Liability ($) |
| Equity Risk | | |
Futures Contracts (a) | 2,432,661 | 0 |
| Total Equity Risk | 2,432,661 | 0 |
| Total Value of Derivatives | 2,432,661 | 0 |
(a)Reflects gross cumulative appreciation (depreciation) on futures contracts as presented in the Schedule of Investments. In the Statement of Assets and Liabilities, the period end daily variation margin is included in receivable or payable for daily variation margin on futures contracts, and the net cumulative appreciation (depreciation) is included in Total accumulated earnings (loss).
Fidelity® SAI International Low Volatility Index Fund
| Statement of Assets and Liabilities |
| | | | October 31, 2022 |
| | | | | |
| Assets | | | | |
| Investment in securities, at value (including securities loaned of $43,363,945) - See accompanying schedule: | | | | |
Unaffiliated issuers (cost $6,145,271,302) | | $5,454,779,485 | | |
Fidelity Central Funds (cost $50,539,138) | | 50,539,138 | | |
| | | | | |
| Total Investment in Securities (cost $6,195,810,440) | | | $ | 5,505,318,623 |
| Foreign currency held at value (cost $8,393,312) | | | | 8,397,344 |
| Receivable for fund shares sold | | | | 4,439,184 |
| Dividends receivable | | | | 13,640,764 |
| Reclaims receivable | | | | 20,761,717 |
| Interest receivable | | | | 223 |
| Distributions receivable from Fidelity Central Funds | | | | 120,082 |
| Prepaid expenses | | | | 7,523 |
| Other receivables | | | | 27 |
Total assets | | | | 5,552,685,487 |
| Liabilities | | | | |
| Payable to custodian bank | | 2,913,512 | | |
| Payable for fund shares redeemed | | 3,092,149 | | |
| Accrued management fee | | 679,657 | | |
| Payable for daily variation margin on futures contracts | | 383,681 | | |
| Other payables and accrued expenses | | 257,789 | | |
| Collateral on securities loaned | | 50,539,138 | | |
| Total Liabilities | | | | 57,865,926 |
| Net Assets | | | $ | 5,494,819,561 |
| Net Assets consist of: | | | | |
| Paid in capital | | | $ | 6,211,157,978 |
| Total accumulated earnings (loss) | | | | (716,338,417) |
| Net Assets | | | $ | 5,494,819,561 |
Net Asset Value , offering price and redemption price per share ($5,494,819,561 ÷ 602,080,621 shares) | | | $ | 9.13 |
| | | | | |
| Statement of Operations |
| | | | Year ended October 31, 2022 |
| Investment Income | | | | |
| Dividends | | | $ | 160,656,773 |
| Foreign Tax Reclaims | | | | 11,752,665 |
| Interest | | | | 36,020 |
| Income from Fidelity Central Funds (including $514,791 from security lending) | | | | 795,545 |
| Income before foreign taxes withheld | | | | 173,241,003 |
| Less foreign taxes withheld | | | | (24,196,449) |
| Total Income | | | | 149,044,554 |
| Expenses | | | | |
| Management fee | $ | 8,511,049 | | |
| Custodian fees and expenses | | 599,143 | | |
| Independent trustees' fees and expenses | | 18,662 | | |
| Registration fees | | 317,375 | | |
| Audit | | 55,715 | | |
| Legal | | 6,195 | | |
| Interest | | 49,384 | | |
| Miscellaneous | | 23,983 | | |
| Total Expenses | | | | 9,581,506 |
| Net Investment income (loss) | | | | 139,463,048 |
| Realized and Unrealized Gain (Loss) | | | | |
| Net realized gain (loss) on: | | | | |
| Investment Securities: | | | | |
| Unaffiliated issuers | | (43,408,094) | | |
| Foreign currency transactions | | (6,290,470) | | |
| Futures contracts | | (11,748,572) | | |
| Total net realized gain (loss) | | | | (61,447,136) |
| Change in net unrealized appreciation (depreciation) on: | | | | |
| Investment Securities: | | | | |
| Unaffiliated issuers | | (1,300,961,852) | | |
| Assets and liabilities in foreign currencies | | (3,110,571) | | |
| Futures contracts | | 1,035,605 | | |
| Total change in net unrealized appreciation (depreciation) | | | | (1,303,036,818) |
| Net gain (loss) | | | | (1,364,483,954) |
| Net increase (decrease) in net assets resulting from operations | | | $ | (1,225,020,906) |
| Statement of Changes in Net Assets |
| |
| | Year ended October 31, 2022 | | Year ended October 31, 2021 |
| Increase (Decrease) in Net Assets | | | | |
| Operations | | | | |
| Net investment income (loss) | $ | 139,463,048 | $ | 128,397,656 |
| Net realized gain (loss) | | (61,447,136) | | 14,167,979 |
| Change in net unrealized appreciation (depreciation) | | (1,303,036,818) | | 892,934,603 |
| Net increase (decrease) in net assets resulting from operations | | (1,225,020,906) | | 1,035,500,238 |
| Distributions to shareholders | | (141,537,086) | | (67,692,252) |
| Share transactions | | | | |
| Proceeds from sales of shares | | 2,573,305,678 | | 1,656,234,854 |
| Reinvestment of distributions | | 136,529,604 | | 65,190,425 |
| Cost of shares redeemed | | (1,787,195,386) | | (1,354,456,288) |
Net increase (decrease) in net assets resulting from share transactions | | 922,639,896 | | 366,968,991 |
| Total increase (decrease) in net assets | | (443,918,096) | | 1,334,776,977 |
| | | | | |
| Net Assets | | | | |
| Beginning of period | | 5,938,737,657 | | 4,603,960,680 |
| End of period | $ | 5,494,819,561 | $ | 5,938,737,657 |
| | | | | |
| Other Information | | | | |
| Shares | | | | |
| Sold | | 254,202,230 | | 147,014,322 |
| Issued in reinvestment of distributions | | 12,222,883 | | 6,126,920 |
| Redeemed | | (173,081,629) | | (121,900,067) |
| Net increase (decrease) | | 93,343,484 | | 31,241,175 |
| | | | | |
Financial Highlights
| Fidelity® SAI International Low Volatility Index Fund |
| |
| Years ended October 31, | | 2022 | | 2021 | | 2020 | | 2019 | | 2018 |
Selected Per-Share Data | | | | | | | | | | |
| Net asset value, beginning of period | $ | 11.67 | $ | 9.64 | $ | 11.54 | $ | 10.49 | $ | 10.83 |
| Income from Investment Operations | | | | | | | | | | |
Net investment income (loss) A,B | | .26 | | .27 | | .24 | | .28 | | .27 |
| Net realized and unrealized gain (loss) | | (2.52) | | 1.90 | | (1.46) | | 1.04 | | (.42) |
| Total from investment operations | | (2.26) | | 2.17 | | (1.22) | | 1.32 | | (.15) |
| Distributions from net investment income | | (.28) | | (.14) | | (.22) | | (.24) | | (.19) |
| Distributions from net realized gain | | - | | - | | (.46) | | (.03) | | - |
| Total distributions | | (.28) | | (.14) | | (.68) | | (.27) | | (.19) |
| Net asset value, end of period | $ | 9.13 | $ | 11.67 | $ | 9.64 | $ | 11.54 | $ | 10.49 |
Total Return C | | (19.80)% | | 22.69% | | (11.31)% | | 12.89% | | (1.47)% |
Ratios to Average Net Assets B,D,E | | | | | | | | | | |
| Expenses before reductions | | .17% | | .17% | | .18% | | .25% | | .30% |
| Expenses net of fee waivers, if any | | .17% | | .17% | | .18% | | .20% | | .20% |
| Expenses net of all reductions | | .17% | | .17% | | .18% | | .20% | | .20% |
| Net investment income (loss) | | 2.46% | | 2.37% | | 2.39% | | 2.59% | | 2.49% |
| Supplemental Data | | | | | | | | | | |
| Net assets, end of period (000 omitted) | $ | 5,494,820 | $ | 5,938,738 | $ | 4,603,961 | $ | 2,548,056 | $ | 1,536,470 |
Portfolio turnover rate F | | 26% | | 26% | | 20% | | 93% | | 43% |
A Calculated based on average shares outstanding during the period.
B Net investment income (loss) is affected by the timing of the declaration of dividends by any underlying mutual funds or exchange-traded funds (ETFs). Net investment income (loss) of any mutual funds or ETFs is not included in the Fund's net investment income (loss) ratio.
C Total returns would have been lower if certain expenses had not been reduced during the applicable periods shown.
D Fees and expenses of any underlying mutual funds or exchange-traded funds (ETFs) are not included in the Fund's expense ratio. The Fund indirectly bears its proportionate share of these expenses. For additional expense information related to investments in Fidelity Central Funds, please refer to the "Investments in Fidelity Central Funds" note found in the Notes to Financial Statements section of the most recent Annual or Semi-Annual report.
E Expense ratios reflect operating expenses of the class. Expenses before reductions do not reflect amounts reimbursed, waived, or reduced through arrangements with the investment adviser, brokerage services, or other offset arrangements, if applicable, and do not represent the amount paid by the class during periods when reimbursements, waivers or reductions occur.
F Amount does not include the portfolio activity of any underlying mutual funds or exchange-traded funds (ETFs).
Average annual total return reflects the change in the value of an investment, assuming reinvestment of distributions from dividend income and capital gains (the profits earned upon the sale of securities that have grown in value, if any) and assuming a constant rate of performance each year. The hypothetical investment and the average annual total returns do not reflect the deduction of taxes that a shareholder would pay on fund distributions or the redemption of fund shares. During periods of reimbursement by Fidelity, a fund's total return will be greater than it would be had the reimbursement not occurred. How a fund did yesterday is no guarantee of how it will do tomorrow.
| Average Annual Total Returns |
| | | | |
Periods ended October 31, 2022 | Past 1 year | Past 5 years | Life of Fund A |
| Fidelity® SAI U.S. Low Volatility Index Fund | -8.39% | 9.47% | 10.16% |
A From May 29, 2015
| $10,000 Over Life of Fund |
| |
Let's say hypothetically that $10,000 was invested in Fidelity® SAI U.S. Low Volatility Index Fund on May 29, 2015, when the fund started. The chart shows how the value of your investment would have changed, and also shows how the Fidelity U.S. Low Volatility Focus Index℠, Fidelity SAI U.S. Low Volatility Index Fund Linked Index and S&P 500 ® Index performed over the same period. |
|
|
Fidelity® SAI U.S. Low Volatility Index Fund
Market Recap:
U.S. equities returned -14.61% for the 12 months ending October 31, 2022, according to the S&P 500® index, as a multitude of risk factors challenged the global economy and financial markets. Persistently high inflation prompted the Federal Reserve to aggressively tighten monetary policy, and market interest rates eclipsed their highest level in roughly a decade, stoking recession fears and sending stocks into bear market territory. In late 2021, the Fed shifted to a more "hawkish" (restrictive) policy stance and proceeded to hike its benchmark rate five times, by a total of 3%, between March and September - the fastest-ever pace of monetary tightening - while taking substantive steps to shrink its massive asset portfolio. Against this hostile backdrop for risk assets, the S&P 500® posted its worst year-to-date result (-23.87%) in 20 years through September, a seasonally weak month for stocks that stayed true to form, and then some, with volatility spiking due to growing certainty the Fed would persist in its effort to cool inflation, even at the expense of economic growth. Three of the index's worst monthly returns ever were recorded this period, with the S&P 500® shedding 8% to 9% in April, June and September. Gains of similar proportion were made in July and October, amid optimism on inflation and policy easing. For the full 12 months, the growth-oriented communication services (-41%) and consumer discretionary (-29%) sectors lagged most. In sharp contrast, energy (+65%) had a strong run, followed by consumer staples (+5%).
Comments from the Geode Capital Management, LLC, passive equity index team:
For the fiscal year, the fund returned -8.39%, roughly in line with the -8.31% result of the benchmark, the Fidelity U.S. Low Volatility Focus Index. By sector, information technology returned -17% and detracted most, followed by consumer discretionary, which returned approximately -16%, hurt by the consumer durables & apparel industry (-42%). Communication services (-16%) hurt, with the media & entertainment industry returning (-29%). Real estate (-22%) also hurt, as did materials (-14%) and financials (-6%). Other notable detractors included the utilities (-2%) and consumer staples (0%) sectors. In contrast, health care gained about 8% and contributed most, driven by the pharmaceuticals, biotechnology & life sciences industry (+14%). Energy stocks also helped, gaining 30%. The industrials sector rose 3%, boosted by the capital goods industry (+6%). Turning to individual stocks, the biggest individual detractor was Microsoft (-29%), from the software & services group, followed by Intel (-40%), which is in the semiconductors & semiconductor equipment category. Within consumer durables & apparel, Nike returned roughly -43% and hurt. Other noteworthy detractors were Alphabet (-36%), a stock in the media & entertainment segment, and Verizon Communications (-26%), from the telecommunication services industry. In contrast, the biggest individual contributor was Eli Lilly (+44%), from the pharmaceuticals, biotechnology & life sciences category. UnitedHealth Group, within the health care equipment & services industry, advanced roughly 22% and lifted the fund. In capital goods, Lockheed Martin (+51%) and Northrop Grumman (+56%) helped. Another notable contributor was Merck (+19%), a stock in the pharmaceuticals, biotechnology & life sciences segment.
The views expressed above reflect those of the portfolio manager(s) only through the end of the period as stated on the cover of this report and do not necessarily represent the views of Fidelity or any other person in the Fidelity organization. Any such views are subject to change at any time based upon market or other conditions and Fidelity disclaims any responsibility to update such views. These views may not be relied on as investment advice and, because investment decisions for a Fidelity fund are based on numerous factors, may not be relied on as an indication of trading intent on behalf of any Fidelity fund.
Fidelity® SAI U.S. Low Volatility Index Fund
Top Holdings (% of Fund's net assets) |
| |
| Microsoft Corp. | 6.3 | |
| Apple, Inc. | 4.4 | |
| Johnson & Johnson | 3.4 | |
| Eli Lilly & Co. | 3.2 | |
| Merck & Co., Inc. | 3.1 | |
| UnitedHealth Group, Inc. | 3.1 | |
| Visa, Inc. Class A | 2.9 | |
| The Home Depot, Inc. | 2.8 | |
| Procter & Gamble Co. | 2.8 | |
| McDonald's Corp. | 2.7 | |
| | 34.7 | |
| |
| Market Sectors (% of Fund's net assets) |
| |
| Information Technology | 24.2 | |
| Health Care | 17.6 | |
| Consumer Discretionary | 9.6 | |
| Financials | 9.4 | |
| Consumer Staples | 8.3 | |
| Industrials | 8.2 | |
| Communication Services | 7.2 | |
| Utilities | 4.5 | |
| Real Estate | 4.5 | |
| Materials | 4.0 | |
| Energy | 2.3 | |
| |
Asset Allocation (% of Fund's net assets) |
|
Short-Term Investments and Net Other Assets (Liabilities) - (0.1)%* |
Foreign investments - 5.7% |
*Short-Term Investments and Net Other Assets (Liabilities) are not available in the pie chart. |
|
Fidelity® SAI U.S. Low Volatility Index Fund
Showing Percentage of Net Assets
| Common Stocks - 99.8% |
| | | Shares | Value ($) |
| COMMUNICATION SERVICES - 7.2% | | | |
| Diversified Telecommunication Services - 3.8% | | | |
| AT&T, Inc. | | 7,361,586 | 134,201,713 |
| Verizon Communications, Inc. | | 4,318,486 | 161,381,822 |
| | | | 295,583,535 |
| Entertainment - 0.7% | | | |
| Activision Blizzard, Inc. | | 733,628 | 53,408,118 |
| Interactive Media & Services - 1.2% | | | |
| Alphabet, Inc. Class A (a) | | 1,011,432 | 95,590,438 |
| Media - 0.3% | | | |
| Cable One, Inc. (b) | | 4,858 | 4,175,111 |
| Omnicom Group, Inc. | | 208,308 | 15,154,407 |
| | | | 19,329,518 |
| Wireless Telecommunication Services - 1.2% | | | |
| T-Mobile U.S., Inc. (a) | | 605,858 | 91,823,838 |
TOTAL COMMUNICATION SERVICES | | | 555,735,447 |
| CONSUMER DISCRETIONARY - 9.6% | | | |
| Auto Components - 0.1% | | | |
| Gentex Corp. | | 241,094 | 6,386,580 |
| Distributors - 0.1% | | | |
| Pool Corp. | | 37,828 | 11,508,412 |
| Diversified Consumer Services - 0.1% | | | |
| Service Corp. International (b) | | 163,228 | 9,893,249 |
| Hotels, Restaurants & Leisure - 3.1% | | | |
| Domino's Pizza, Inc. | | 37,065 | 12,314,476 |
| McDonald's Corp. | | 760,475 | 207,351,114 |
| Yum China Holdings, Inc. | | 433,356 | 17,919,271 |
| Yum! Brands, Inc. | | 41,273 | 4,880,532 |
| | | | 242,465,393 |
| Household Durables - 0.2% | | | |
| Garmin Ltd. | | 156,886 | 13,812,243 |
| Internet & Direct Marketing Retail - 0.9% | | | |
| Amazon.com, Inc. (a) | | 666,701 | 68,296,850 |
| Multiline Retail - 0.8% | | | |
| Dollar General Corp. | | 235,259 | 60,002,808 |
| Specialty Retail - 3.9% | | | |
| AutoZone, Inc. (a) | | 20,411 | 51,698,614 |
| The Home Depot, Inc. | | 738,308 | 218,635,148 |
| TJX Companies, Inc. | | 374,853 | 27,026,901 |
| | | | 297,360,663 |
| Textiles, Apparel & Luxury Goods - 0.4% | | | |
| NIKE, Inc. Class B | | 348,751 | 32,322,243 |
TOTAL CONSUMER DISCRETIONARY | | | 742,048,441 |
| CONSUMER STAPLES - 8.3% | | | |
| Beverages - 0.9% | | | |
| PepsiCo, Inc. | | 397,653 | 72,205,832 |
| Food & Staples Retailing - 0.6% | | | |
| Walmart, Inc. | | 325,220 | 46,288,563 |
| Food Products - 2.1% | | | |
| Flowers Foods, Inc. | | 204,950 | 5,884,115 |
| General Mills, Inc. | | 619,254 | 50,518,741 |
| Hormel Foods Corp. | | 291,419 | 13,536,413 |
| Kellogg Co. | | 260,576 | 20,017,448 |
| McCormick & Co., Inc. (non-vtg.) | | 235,071 | 18,485,983 |
| The Hershey Co. | | 150,122 | 35,844,630 |
| The J.M. Smucker Co. | | 111,527 | 16,802,658 |
| | | | 161,089,988 |
| Household Products - 4.7% | | | |
| Church & Dwight Co., Inc. | | 249,641 | 18,505,887 |
| Colgate-Palmolive Co. | | 861,654 | 63,624,531 |
| Kimberly-Clark Corp. | | 346,459 | 43,120,287 |
| Procter & Gamble Co. | | 1,609,967 | 216,814,256 |
| The Clorox Co. | | 126,563 | 18,483,261 |
| | | | 360,548,222 |
TOTAL CONSUMER STAPLES | | | 640,132,605 |
| ENERGY - 2.3% | | | |
| Oil, Gas & Consumable Fuels - 2.3% | | | |
| Chesapeake Energy Corp. | | 106,433 | 10,884,903 |
| Chevron Corp. | | 321,871 | 58,226,464 |
| Coterra Energy, Inc. | | 828,608 | 25,794,567 |
| DT Midstream, Inc. | | 99,471 | 5,938,419 |
| Kinder Morgan, Inc. | | 2,005,209 | 36,334,387 |
| The Williams Companies, Inc. | | 1,240,773 | 40,610,500 |
| | | | 177,789,240 |
| FINANCIALS - 9.4% | | | |
| Banks - 0.9% | | | |
| Commerce Bancshares, Inc. (b) | | 112,977 | 8,003,291 |
| First Financial Bankshares, Inc. | | 125,661 | 4,836,692 |
| U.S. Bancorp | | 1,272,715 | 54,026,752 |
| | | | 66,866,735 |
| Capital Markets - 2.7% | | | |
| Cboe Global Markets, Inc. | | 108,902 | 13,558,299 |
| CME Group, Inc. | | 369,589 | 64,049,774 |
| FactSet Research Systems, Inc. | | 38,969 | 16,580,920 |
| Houlihan Lokey | | 51,266 | 4,579,079 |
| Intercontinental Exchange, Inc. | | 552,137 | 52,767,733 |
| MarketAxess Holdings, Inc. | | 37,265 | 9,094,151 |
| NASDAQ, Inc. | | 344,143 | 21,419,460 |
| S&P Global, Inc. | | 92,209 | 29,622,141 |
| | | | 211,671,557 |
| Insurance - 5.8% | | | |
| Allstate Corp. | | 278,922 | 35,213,903 |
| Arthur J. Gallagher & Co. | | 216,012 | 40,411,525 |
| Assurant, Inc. | | 55,615 | 7,555,854 |
| Brown & Brown, Inc. | | 240,916 | 14,163,452 |
| Chubb Ltd. | | 413,872 | 88,936,954 |
| Erie Indemnity Co. Class A | | 25,648 | 6,591,792 |
| Marsh & McLennan Companies, Inc. | | 494,798 | 79,904,929 |
| Progressive Corp. | | 601,428 | 77,223,355 |
| RLI Corp. | | 41,007 | 5,333,780 |
| Selective Insurance Group, Inc. | | 62,061 | 6,086,943 |
| The Travelers Companies, Inc. | | 246,751 | 45,515,689 |
| W.R. Berkley Corp. | | 215,431 | 16,023,758 |
| Willis Towers Watson PLC | | 114,643 | 25,016,249 |
| | | | 447,978,183 |
TOTAL FINANCIALS | | | 726,516,475 |
| HEALTH CARE - 17.6% | | | |
| Biotechnology - 1.3% | | | |
| Amgen, Inc. | | 363,155 | 98,178,954 |
| Health Care Equipment & Supplies - 2.4% | | | |
| Baxter International, Inc. | | 517,778 | 28,141,234 |
| Medtronic PLC | | 1,267,732 | 110,723,713 |
| ResMed, Inc. | | 142,809 | 31,944,945 |
| STERIS PLC | | 98,023 | 16,916,809 |
| | | | 187,726,701 |
| Health Care Providers & Services - 3.2% | | | |
| Chemed Corp. | | 15,391 | 7,185,596 |
| UnitedHealth Group, Inc. | | 430,884 | 239,205,253 |
| | | | 246,390,849 |
| Pharmaceuticals - 10.7% | | | |
| Eli Lilly & Co. | | 690,349 | 249,968,469 |
| Johnson & Johnson | | 1,481,309 | 257,703,327 |
| Merck & Co., Inc. | | 2,380,311 | 240,887,473 |
| Zoetis, Inc. Class A | | 483,947 | 72,969,529 |
| | | | 821,528,798 |
TOTAL HEALTH CARE | | | 1,353,825,302 |
| INDUSTRIALS - 8.2% | | | |
| Aerospace & Defense - 3.2% | | | |
| General Dynamics Corp. | | 2,470 | 617,006 |
| L3Harris Technologies, Inc. | | 197,264 | 48,619,658 |
| Lockheed Martin Corp. | | 243,537 | 118,524,587 |
| Northrop Grumman Corp. | | 150,253 | 82,490,400 |
| | | | 250,251,651 |
| Air Freight & Logistics - 0.3% | | | |
| C.H. Robinson Worldwide, Inc. | | 130,867 | 12,788,323 |
| Expeditors International of Washington, Inc. | | 120,723 | 11,812,746 |
| | | | 24,601,069 |
| Building Products - 0.1% | | | |
| Lennox International, Inc. | | 32,989 | 7,705,241 |
| Commercial Services & Supplies - 1.3% | | | |
| Republic Services, Inc. | | 214,388 | 28,432,137 |
| Rollins, Inc. | | 232,942 | 9,802,199 |
| Waste Management, Inc. | | 392,800 | 62,207,736 |
| | | | 100,442,072 |
| Construction & Engineering - 0.1% | | | |
| MDU Resources Group, Inc. | | 209,106 | 5,955,339 |
| Industrial Conglomerates - 1.0% | | | |
| 3M Co. | | 583,200 | 73,360,728 |
| Machinery - 1.1% | | | |
| Graco, Inc. | | 174,016 | 12,108,033 |
| Otis Worldwide Corp. | | 434,758 | 30,711,305 |
| PACCAR, Inc. | | 340,234 | 32,944,858 |
| Toro Co. (b) | | 107,496 | 11,333,303 |
| | | | 87,097,499 |
| Professional Services - 1.0% | | | |
| Booz Allen Hamilton Holding Corp. Class A | | 137,029 | 14,915,607 |
| Exponent, Inc. | | 53,288 | 5,076,215 |
| FTI Consulting, Inc. (a)(b) | | 35,445 | 5,516,305 |
| Leidos Holdings, Inc. | | 140,529 | 14,276,341 |
| Science Applications International Corp. (b) | | 57,399 | 6,218,608 |
| Verisk Analytics, Inc. | | 157,938 | 28,875,805 |
| | | | 74,878,881 |
| Road & Rail - 0.1% | | | |
| Landstar System, Inc. | | 36,106 | 5,640,479 |
TOTAL INDUSTRIALS | | | 629,932,959 |
| INFORMATION TECHNOLOGY - 24.2% | | | |
| IT Services - 7.8% | | | |
| Accenture PLC Class A | | 142,018 | 40,318,910 |
| Akamai Technologies, Inc. (a) | | 164,841 | 14,560,406 |
| Amdocs Ltd. | | 128,148 | 11,060,454 |
| Automatic Data Processing, Inc. | | 429,568 | 103,826,586 |
| Broadridge Financial Solutions, Inc. | | 120,544 | 18,088,833 |
| Concentrix Corp. | | 42,044 | 5,139,038 |
| Fiserv, Inc. (a) | | 598,217 | 61,460,815 |
| IBM Corp. | | 40,536 | 5,605,723 |
| Jack Henry & Associates, Inc. | | 74,924 | 14,914,371 |
| MasterCard, Inc. Class A | | 113,019 | 37,090,575 |
| Maximus, Inc. | | 63,151 | 3,894,522 |
| Paychex, Inc. | | 330,397 | 39,089,269 |
| VeriSign, Inc. (a) | | 98,001 | 19,645,280 |
| Visa, Inc. Class A (b) | | 1,095,032 | 226,846,829 |
| | | | 601,541,611 |
| Semiconductors & Semiconductor Equipment - 3.5% | | | |
| Intel Corp. | | 4,204,711 | 119,539,934 |
| Texas Instruments, Inc. | | 948,229 | 152,314,024 |
| | | | 271,853,958 |
| Software - 8.5% | | | |
| Black Knight, Inc. (a) | | 160,379 | 9,698,118 |
| Check Point Software Technologies Ltd. (a) | | 102,757 | 13,279,287 |
| Microsoft Corp. | | 2,107,519 | 489,218,385 |
| Oracle Corp. | | 1,618,760 | 126,376,593 |
| Tyler Technologies, Inc. (a) | | 42,648 | 13,789,378 |
| UiPath, Inc. Class A (a)(b) | | 285,298 | 3,609,020 |
| | | | 655,970,781 |
| Technology Hardware, Storage & Peripherals - 4.4% | | | |
| Apple, Inc. | | 2,188,164 | 335,533,068 |
TOTAL INFORMATION TECHNOLOGY | | | 1,864,899,418 |
| MATERIALS - 4.0% | | | |
| Chemicals - 3.2% | | | |
| Air Products & Chemicals, Inc. | | 228,049 | 57,103,470 |
| Balchem Corp. | | 33,025 | 4,616,895 |
| Ecolab, Inc. | | 234,788 | 36,878,151 |
| Linde PLC | | 502,305 | 149,360,392 |
| | | | 247,958,908 |
| Construction Materials - 0.3% | | | |
| Vulcan Materials Co. | | 135,517 | 22,184,133 |
| Containers & Packaging - 0.5% | | | |
| Aptargroup, Inc. | | 67,429 | 6,685,585 |
| Ball Corp. | | 328,838 | 16,241,309 |
| Packaging Corp. of America | | 96,352 | 11,582,474 |
| | | | 34,509,368 |
TOTAL MATERIALS | | | 304,652,409 |
| REAL ESTATE - 4.5% | | | |
| Equity Real Estate Investment Trusts (REITs) - 4.5% | | | |
| Agree Realty Corp. | | 77,301 | 5,310,579 |
| American Tower Corp. | | 477,847 | 99,005,120 |
| Crown Castle International Corp. | | 423,559 | 56,443,472 |
| CubeSmart | | 230,789 | 9,663,135 |
| Digital Realty Trust, Inc. | | 278,112 | 27,880,728 |
| Equinix, Inc. | | 93,598 | 53,017,651 |
| Equity Lifestyle Properties, Inc. | | 177,886 | 11,377,589 |
| Essex Property Trust, Inc. | | 6,985 | 1,552,346 |
| Extra Space Storage, Inc. | | 136,729 | 24,261,194 |
| Mid-America Apartment Communities, Inc. | | 24,580 | 3,870,121 |
| Public Storage | | 157,032 | 48,640,662 |
| Realty Income Corp. | | 105,897 | 6,594,206 |
| | | | 347,616,803 |
| UTILITIES - 4.5% | | | |
| Electric Utilities - 2.9% | | | |
| Alliant Energy Corp. | | 257,911 | 13,455,217 |
| American Electric Power Co., Inc. | | 528,076 | 46,428,442 |
| Duke Energy Corp. | | 791,687 | 73,769,395 |
| Evergy, Inc. | | 205,455 | 12,559,464 |
| Eversource Energy | | 354,637 | 27,051,710 |
| Hawaiian Electric Industries, Inc. | | 112,528 | 4,280,565 |
| IDACORP, Inc. | | 47,653 | 4,989,269 |
| Pinnacle West Capital Corp. | | 116,199 | 7,809,735 |
| Xcel Energy, Inc. | | 560,066 | 36,465,897 |
| | | | 226,809,694 |
| Gas Utilities - 0.2% | | | |
| Atmos Energy Corp. | | 130,501 | 13,904,882 |
| Southwest Gas Corp. | | 68,744 | 5,023,124 |
| | | | 18,928,006 |
| Multi-Utilities - 1.3% | | | |
| Ameren Corp. | | 265,534 | 21,646,332 |
| CMS Energy Corp. | | 298,339 | 17,020,240 |
| Consolidated Edison, Inc. | | 364,321 | 32,045,675 |
| WEC Energy Group, Inc. | | 324,361 | 29,623,890 |
| | | | 100,336,137 |
| Water Utilities - 0.1% | | | |
| American Water Works Co., Inc. | | 25,847 | 3,756,603 |
TOTAL UTILITIES | | | 349,830,440 |
| TOTAL COMMON STOCKS (Cost $6,562,352,332) | | | 7,692,979,539 |
| | | | |
| U.S. Treasury Obligations - 0.0% |
| | | Principal Amount (c) | Value ($) |
U.S. Treasury Bills, yield at date of purchase 1.23% 1/26/23 (d) (Cost $697,969) | | 700,000 | 693,332 |
| | | | |
| Money Market Funds - 3.4% |
| | | Shares | Value ($) |
| Fidelity Cash Central Fund 3.10% (e) | | 17,175,368 | 17,178,803 |
| Fidelity Securities Lending Cash Central Fund 3.10% (e)(f) | | 246,522,501 | 246,547,154 |
| TOTAL MONEY MARKET FUNDS (Cost $263,725,957) | | | 263,725,957 |
| | | | |
| TOTAL INVESTMENT IN SECURITIES - 103.2% (Cost $6,826,776,258) | 7,957,398,828 |
NET OTHER ASSETS (LIABILITIES) - (3.2)% | (245,123,230) |
| NET ASSETS - 100.0% | 7,712,275,598 |
| | |
| Futures Contracts |
| | Number of contracts | Expiration Date | Notional Amount ($) | Value ($) | Unrealized Appreciation/ (Depreciation) ($) |
| Purchased | | | | | |
| | | | | | |
| Equity Index Contracts | | | | | |
| CME E-mini S&P 500 Index Contracts (United States) | 75 | Dec 2022 | 14,561,250 | 876,245 | 876,245 |
| CME E-mini S&P MidCap 400 Index Contracts (United States) | 20 | Dec 2022 | 4,879,200 | 364,122 | 364,122 |
| | | | | | |
| TOTAL FUTURES CONTRACTS | | | | | 1,240,367 |
| The notional amount of futures purchased as a percentage of Net Assets is 0.3% |
Legend
| (b) | Security or a portion of the security is on loan at period end. |
| (c) | Amount is stated in United States dollars unless otherwise noted. |
| (d) | Security or a portion of the security was pledged to cover margin requirements for futures contracts. At period end, the value of securities pledged amounted to $693,332. |
| (e) | Affiliated fund that is generally available only to investment companies and other accounts managed by Fidelity Investments. The rate quoted is the annualized seven-day yield of the fund at period end. A complete unaudited listing of the fund's holdings as of its most recent quarter end is available upon request. In addition, each Fidelity Central Fund's financial statements, which are not covered by the Fund's Report of Independent Registered Public Accounting Firm, are available on the SEC's website or upon request. |
| (f) | Investment made with cash collateral received from securities on loan. |
Affiliated Central Funds
Fiscal year to date information regarding the Fund's investments in Fidelity Central Funds, including the ownership percentage, is presented below.
| Affiliate | Value, beginning of period ($) | Purchases ($) | Sales Proceeds ($) | Dividend Income ($) | Realized Gain (loss) ($) | Change in Unrealized appreciation (depreciation) ($) | Value, end of period ($) | % ownership, end of period |
| Fidelity Cash Central Fund 3.10% | 15,252,945 | 1,520,440,730 | 1,518,514,872 | 240,903 | - | - | 17,178,803 | 0.0% |
| Fidelity Securities Lending Cash Central Fund 3.10% | 127,461,306 | 1,826,372,210 | 1,707,286,362 | 283,855 | - | - | 246,547,154 | 0.7% |
| Total | 142,714,251 | 3,346,812,940 | 3,225,801,234 | 524,758 | - | - | 263,725,957 | |
| | | | | | | | | |
Amounts in the income column in the above table include any capital gain distributions from underlying funds, which are presented in the corresponding line item in the Statement of Operations, if applicable.
Amount for Fidelity Securities Lending Cash Central Fund represents the income earned on investing cash collateral, less rebates paid to borrowers and any lending agent fees associated with the loan, plus any premium payments received for lending certain types of securities.
Investment Valuation
The following is a summary of the inputs used, as of October 31, 2022, involving the Fund's assets and liabilities carried at fair value. The inputs or methodology used for valuing securities may not be an indication of the risk associated with investing in those securities. For more information on valuation inputs, and their aggregation into the levels used below, please refer to the Investment Valuation section in the accompanying Notes to Financial Statements.
| Valuation Inputs at Reporting Date: |
| Description | Total ($) | Level 1 ($) | Level 2 ($) | Level 3 ($) |
Investments in Securities: | | | | |
|
| Equities: | | | | |
Communication Services | 555,735,447 | 555,735,447 | - | - |
Consumer Discretionary | 742,048,441 | 742,048,441 | - | - |
Consumer Staples | 640,132,605 | 640,132,605 | - | - |
Energy | 177,789,240 | 177,789,240 | - | - |
Financials | 726,516,475 | 726,516,475 | - | - |
Health Care | 1,353,825,302 | 1,353,825,302 | - | - |
Industrials | 629,932,959 | 629,932,959 | - | - |
Information Technology | 1,864,899,418 | 1,864,899,418 | - | - |
Materials | 304,652,409 | 304,652,409 | - | - |
Real Estate | 347,616,803 | 347,616,803 | - | - |
Utilities | 349,830,440 | 349,830,440 | - | - |
|
| U.S. Government and Government Agency Obligations | 693,332 | - | 693,332 | - |
|
| Money Market Funds | 263,725,957 | 263,725,957 | - | - |
| Total Investments in Securities: | 7,957,398,828 | 7,956,705,496 | 693,332 | - |
Derivative Instruments: | | | | |
|
| Assets | | | | |
Futures Contracts | 1,240,367 | 1,240,367 | - | - |
| Total Assets | 1,240,367 | 1,240,367 | - | - |
| Total Derivative Instruments: | 1,240,367 | 1,240,367 | - | - |
Value of Derivative Instruments
The following table is a summary of the Fund's value of derivative instruments by primary risk exposure as of October 31, 2022. For additional information on derivative instruments, please refer to the Derivative Instruments section in the accompanying Notes to Financial Statements.
Primary Risk Exposure / Derivative Type | Value |
| Asset ($) | Liability ($) |
| Equity Risk | | |
Futures Contracts (a) | 1,240,367 | 0 |
| Total Equity Risk | 1,240,367 | 0 |
| Total Value of Derivatives | 1,240,367 | 0 |
(a)Reflects gross cumulative appreciation (depreciation) on futures contracts as presented in the Schedule of Investments. In the Statement of Assets and Liabilities, the period end daily variation margin is included in receivable or payable for daily variation margin on futures contracts, and the net cumulative appreciation (depreciation) is included in Total accumulated earnings (loss).
Fidelity® SAI U.S. Low Volatility Index Fund
| Statement of Assets and Liabilities |
| | | | October 31, 2022 |
| | | | | |
| Assets | | | | |
| Investment in securities, at value (including securities loaned of $238,970,979) - See accompanying schedule: | | | | |
Unaffiliated issuers (cost $6,563,050,301) | | $7,693,672,871 | | |
Fidelity Central Funds (cost $263,725,957) | | 263,725,957 | | |
| | | | | |
| Total Investment in Securities (cost $6,826,776,258) | | | $ | 7,957,398,828 |
| Segregated cash with brokers for derivative instruments | | | | 236,723 |
| Receivable for fund shares sold | | | | 4,660,045 |
| Dividends receivable | | | | 10,347,109 |
| Distributions receivable from Fidelity Central Funds | | | | 53,626 |
| Prepaid expenses | | | | 11,118 |
| Other receivables | | | | 35 |
Total assets | | | | 7,972,707,484 |
| Liabilities | | | | |
| Payable for investments purchased | | 10,276,688 | | |
| Payable for fund shares redeemed | | 2,753,682 | | |
| Accrued management fee | | 610,297 | | |
| Payable for daily variation margin on futures contracts | | 100,021 | | |
| Other payables and accrued expenses | | 147,973 | | |
| Collateral on securities loaned | | 246,543,225 | | |
| Total Liabilities | | | | 260,431,886 |
| Net Assets | | | $ | 7,712,275,598 |
| Net Assets consist of: | | | | |
| Paid in capital | | | $ | 6,363,224,163 |
| Total accumulated earnings (loss) | | | | 1,349,051,435 |
| Net Assets | | | $ | 7,712,275,598 |
Net Asset Value , offering price and redemption price per share ($7,712,275,598 ÷ 453,468,440 shares) | | | $ | 17.01 |
| | | | | |
| Statement of Operations |
| | | | Year ended October 31, 2022 |
| Investment Income | | | | |
| Dividends | | | $ | 152,186,130 |
| Interest | | | | 11,305 |
| Income from Fidelity Central Funds (including $283,855 from security lending) | | | | 524,758 |
| Total Income | | | | 152,722,193 |
| Expenses | | | | |
| Management fee | $ | 7,780,714 | | |
| Custodian fees and expenses | | 95,264 | | |
| Independent trustees' fees and expenses | | 25,654 | | |
| Registration fees | | 285,044 | | |
| Audit | | 46,200 | | |
| Legal | | 11,874 | | |
| Interest | | 81,489 | | |
| Miscellaneous | | 34,063 | | |
| Total expenses before reductions | | 8,360,302 | | |
| Expense reductions | | (434) | | |
| Total expenses after reductions | | | | 8,359,868 |
| Net Investment income (loss) | | | | 144,362,325 |
| Realized and Unrealized Gain (Loss) | | | | |
| Net realized gain (loss) on: | | | | |
| Investment Securities: | | | | |
| Unaffiliated issuers | | 183,040,028 | | |
| Futures contracts | | (4,299,206) | | |
| Total net realized gain (loss) | | | | 178,740,822 |
| Change in net unrealized appreciation (depreciation) on: | | | | |
| Investment Securities: | | | | |
| Unaffiliated issuers | | (1,000,513,793) | | |
| Futures contracts | | 364,749 | | |
| Total change in net unrealized appreciation (depreciation) | | | | (1,000,149,044) |
| Net gain (loss) | | | | (821,408,222) |
| Net increase (decrease) in net assets resulting from operations | | | $ | (677,045,897) |
| Statement of Changes in Net Assets |
| |
| | Year ended October 31, 2022 | | Year ended October 31, 2021 |
| Increase (Decrease) in Net Assets | | | | |
| Operations | | | | |
| Net investment income (loss) | $ | 144,362,325 | $ | 130,710,189 |
| Net realized gain (loss) | | 178,740,822 | | 222,765,290 |
| Change in net unrealized appreciation (depreciation) | | (1,000,149,044) | | 1,521,115,853 |
| Net increase (decrease) in net assets resulting from operations | | (677,045,897) | | 1,874,591,332 |
| Distributions to shareholders | | (268,770,756) | | (80,110,109) |
| Share transactions | | | | |
| Proceeds from sales of shares | | 3,039,157,235 | | 3,501,165,873 |
| Reinvestment of distributions | | 267,624,606 | | 79,731,236 |
| Cost of shares redeemed | | (2,464,734,875) | | (2,803,328,859) |
Net increase (decrease) in net assets resulting from share transactions | | 842,046,966 | | 777,568,250 |
| Total increase (decrease) in net assets | | (103,769,687) | | 2,572,049,473 |
| | | | | |
| Net Assets | | | | |
| Beginning of period | | 7,816,045,285 | | 5,243,995,812 |
| End of period | $ | 7,712,275,598 | $ | 7,816,045,285 |
| | | | | |
| Other Information | | | | |
| Shares | | | | |
| Sold | | 172,683,980 | | 206,459,886 |
| Issued in reinvestment of distributions | | 14,640,296 | | 4,912,584 |
| Redeemed | | (139,598,293) | | (158,169,542) |
| Net increase (decrease) | | 47,725,983 | | 53,202,928 |
| | | | | |
Financial Highlights
| Fidelity® SAI U.S. Low Volatility Index Fund |
| |
| Years ended October 31, | | 2022 | | 2021 | | 2020 | | 2019 | | 2018 |
Selected Per-Share Data | | | | | | | | | | |
| Net asset value, beginning of period | $ | 19.26 | $ | 14.87 | $ | 15.12 | $ | 13.18 | $ | 12.60 |
| Income from Investment Operations | | | | | | | | | | |
Net investment income (loss) A,B | | .33 | | .31 | | .30 | | .29 | | .26 |
| Net realized and unrealized gain (loss) | | (1.90) | | 4.30 | | .03 | | 1.98 | | .82 |
| Total from investment operations | | (1.57) | | 4.61 | | .33 | | 2.27 | | 1.08 |
| Distributions from net investment income | | (.34) | | (.22) | | (.24) | | (.20) | | (.14) |
| Distributions from net realized gain | | (.35) | | - | | (.34) | | (.13) | | (.37) |
| Total distributions | | (.68) C | | (.22) | | (.58) | | (.33) | | (.50) C |
| Net asset value, end of period | $ | 17.01 | $ | 19.26 | $ | 14.87 | $ | 15.12 | $ | 13.18 |
Total Return D | | (8.39)% | | 31.25% | | 2.16% | | 17.62% | | 8.79% |
Ratios to Average Net Assets B,E,F | | | | | | | | | | |
| Expenses before reductions | | .11% | | .11% | | .12% | | .19% | | .23% |
| Expenses net of fee waivers, if any | | .11% | | .11% | | .12% | | .15% | | .15% |
| Expenses net of all reductions | | .11% | | .11% | | .12% | | .15% | | .15% |
| Net investment income (loss) | | 1.85% | | 1.76% | | 2.06% | | 2.05% | | 2.00% |
| Supplemental Data | | | | | | | | | | |
| Net assets, end of period (000 omitted) | $ | 7,712,276 | $ | 7,816,045 | $ | 5,243,996 | $ | 4,120,541 | $ | 1,979,673 |
Portfolio turnover rate G | | 41% | | 44% | | 49% | | 72% | | 39% |
A Calculated based on average shares outstanding during the period.
B Net investment income (loss) is affected by the timing of the declaration of dividends by any underlying mutual funds or exchange-traded funds (ETFs). Net investment income (loss) of any mutual funds or ETFs is not included in the Fund's net investment income (loss) ratio.
C Total distributions per share do not sum due to rounding.
D Total returns would have been lower if certain expenses had not been reduced during the applicable periods shown.
E Fees and expenses of any underlying mutual funds or exchange-traded funds (ETFs) are not included in the Fund's expense ratio. The Fund indirectly bears its proportionate share of these expenses. For additional expense information related to investments in Fidelity Central Funds, please refer to the "Investments in Fidelity Central Funds" note found in the Notes to Financial Statements section of the most recent Annual or Semi-Annual report.
F Expense ratios reflect operating expenses of the class. Expenses before reductions do not reflect amounts reimbursed, waived, or reduced through arrangements with the investment adviser, brokerage services, or other offset arrangements, if applicable, and do not represent the amount paid by the class during periods when reimbursements, waivers or reductions occur.
G Amount does not include the portfolio activity of any underlying mutual funds or exchange-traded funds (ETFs).
For the period ended October 31, 2022
1. Organization.
Fidelity SAI Emerging Markets Low Volatility Index Fund, Fidelity SAI International Low Volatility Index Fund and Fidelity SAI U.S. Low Volatility Index Fund (the Funds) are funds of Fidelity Salem Street Trust (the Trust). Each Fund is authorized to issue an unlimited number of shares. Shares are offered only to certain clients of Fidelity Management & Research Company (FMR) or its affiliates. The Trust is registered under the Investment Company Act of 1940, as amended (the 1940 Act), as an open-end management investment company organized as a Massachusetts business trust. Investments in emerging markets, if applicable, can be subject to social, economic, regulatory, and political uncertainties and can be extremely volatile.
2. Investments in Fidelity Central Funds.
Funds may invest in Fidelity Central Funds, which are open-end investment companies generally available only to other investment companies and accounts managed by the investment adviser and its affiliates. The Schedule of Investments lists any Fidelity Central Funds held as an investment as of period end, but does not include the underlying holdings of each Fidelity Central Fund. An investing fund indirectly bears its proportionate share of the expenses of the underlying Fidelity Central Funds.
Based on its investment objective, each Fidelity Central Fund may invest or participate in various investment vehicles or strategies that are similar to those of the investing fund. These strategies are consistent with the investment objectives of the investing fund and may involve certain economic risks which may cause a decline in value of each of the Fidelity Central Funds and thus a decline in the value of the investing fund.
| Fidelity Central Fund | Investment Manager | Investment Objective | Investment Practices | Expense Ratio A |
| Fidelity Money Market Central Funds | Fidelity Management & Research Company LLC (FMR) | Each fund seeks to obtain a high level of current income consistent with the preservation of capital and liquidity. | Short-term Investments | Less than .005% |
A Expenses expressed as a percentage of average net assets and are as of each underlying Central Fund's most recent annual or semi-annual shareholder report.
A complete unaudited list of holdings for each Fidelity Central Fund is available upon request or at the Securities and Exchange Commission website at www.sec.gov. In addition, the financial statements of the Fidelity Central Funds which contain the significant accounting policies (including investment valuation policies) of those funds, and are not covered by the Report of Independent Registered Public Accounting Firm, are available on the Securities and Exchange Commission website or upon request.
3. Significant Accounting Policies.
Each Fund is an investment company and applies the accounting and reporting guidance of the Financial Accounting Standards Board (FASB) Accounting Standards Codification Topic 946 Financial Services - Investment Companies . The financial statements have been prepared in conformity with accounting principles generally accepted in the United States of America (GAAP), which require management to make certain estimates and assumptions at the date of the financial statements. Actual results could differ from those estimates. Subsequent events, if any, through the date that the financial statements were issued have been evaluated in the preparation of the financial statements. Each Fund's Schedule of Investments lists any underlying mutual funds or exchange-traded funds (ETFs) but does not include the underlying holdings of these funds. The following summarizes the significant accounting policies of each Fund:
Investment Valuation. Investments are valued as of 4:00 p.m. Eastern time on the last calendar day of the period. The Board of Trustees (the Board) has designated each Fund's investment adviser as the valuation designee responsible for the fair valuation function and performing fair value determinations as needed. The investment adviser has established a Fair Value Committee (the Committee) to carry out the day-to-day fair valuation responsibilities and has adopted policies and procedures to govern the fair valuation process and the activities of the Committee. In accordance with these fair valuation policies and procedures, which have been approved by the Board, each Fund attempts to obtain prices from one or more third party pricing services or brokers to value its investments. When current market prices, quotations or currency exchange rates are not readily available or reliable, investments will be fair valued in good faith by the Committee, in accordance with the policies and procedures. Factors used in determining fair value vary by investment type and may include market or investment specific events, transaction data, estimated cash flows, and market observations of comparable investments. The frequency that the fair valuation procedures are used cannot be predicted and they may be utilized to a significant extent. The Committee manages each Fund's fair valuation practices and maintains the fair valuation policies and procedures. Each Fund's investment adviser reports to the Board information regarding the fair valuation process and related material matters.
Each Fund categorizes the inputs to valuation techniques used to value its investments into a disclosure hierarchy consisting of three levels as shown below:
Level 1 - unadjusted quoted prices in active markets for identical investments
Level 2 - other significant observable inputs (including quoted prices for similar investments, interest rates, prepayment speeds, etc.)
Level 3 - unobservable inputs (including the Fund's own assumptions based on the best information available)
Valuation techniques used to value each Fund's investments by major category are as follows:
Equity securities, including restricted securities, for which market quotations are readily available, are valued at the last reported sale price or official closing price as reported by a third party pricing service on the primary market or exchange on which they are traded and are categorized as Level 1 in the hierarchy. In the event there were no sales during the day or closing prices are not available, securities are valued at the last quoted bid price or may be valued using the last available price and are generally categorized as Level 2 in the hierarchy. For foreign equity securities, when market or security specific events arise, comparisons to the valuation of American Depositary Receipts (ADRs), futures contracts, Exchange-Traded Funds (ETFs) and certain indexes as well as quoted prices for similar securities may be used and would be categorized as Level 2 in the hierarchy. For equity securities, including restricted securities, where observable inputs are limited, assumptions about market activity and risk are used and these securities may be categorized as Level 3 in the hierarchy.
Debt securities, including restricted securities, are valued based on evaluated prices received from third party pricing services or from brokers who make markets in such securities. U.S. government and government agency obligations are valued by pricing services who utilize matrix pricing which considers yield or price of bonds of comparable quality, coupon, maturity and type or by broker-supplied prices. When independent prices are unavailable or unreliable, debt securities may be valued utilizing pricing methodologies which consider similar factors that would be used by third party pricing services. Debt securities are generally categorized as Level 2 in the hierarchy but may be Level 3 depending on the circumstances.
Futures contracts are valued at the settlement price established each day by the board of trade or exchange on which they are traded and are categorized as Level 1 in the hierarchy. Investments in open-end mutual funds, including the Fidelity Central Funds, are valued at their closing net asset value (NAV) each business day and are categorized as Level 1 in the hierarchy.
Changes in valuation techniques may result in transfers in or out of an assigned level within the disclosure hierarchy. The aggregate value of investments by input level as of October 31, 2022 is included at the end of each Fund's Schedule of Investments.
Foreign Currency. Certain Funds may use foreign currency contracts to facilitate transactions in foreign-denominated securities. Gains and losses from these transactions may arise from changes in the value of the foreign currency or if the counterparties do not perform under the contracts' terms.
Foreign-denominated assets, including investment securities, and liabilities are translated into U.S. dollars at the exchange rates at period end. Purchases and sales of investment securities, income and dividends received, and expenses denominated in foreign currencies are translated into U.S. dollars at the exchange rate in effect on the transaction date.
The effects of exchange rate fluctuations on investments are included with the net realized and unrealized gain (loss) on investment securities. Other foreign currency transactions resulting in realized and unrealized gain (loss) are disclosed separately.
Investment Transactions and Income. For financial reporting purposes, the Funds' investment holdings and NAV include trades executed through the end of the last business day of the period. The NAV per share for processing shareholder transactions is calculated as of the close of business of the New York Stock Exchange (NYSE), normally 4:00 p.m. Eastern time and includes trades executed through the end of the prior business day. Gains and losses on securities sold are determined on the basis of identified cost and for certain Funds include proceeds received from litigation. Commissions paid to certain brokers with whom the investment adviser, or its affiliates, places trades on behalf of a fund include an amount in addition to trade execution, which may be rebated back to a fund. Any such rebates are included in net realized gain (loss) on investments in the Statement of Operations. Dividend income is recorded on the ex-dividend date, except for certain dividends from foreign securities where the ex-dividend date may have passed, which are recorded as soon as the Funds are informed of the ex-dividend date. Non-cash dividends included in dividend income, if any, are recorded at the fair market value of the securities received. Income and capital gain distributions from Fidelity Central Funds, if any, are recorded on the ex-dividend date. Certain distributions received by the Funds represent a return of capital or capital gain. The Funds determine the components of these distributions subsequent to the ex-dividend date, based upon receipt of tax filings or other correspondence relating to the underlying investment. These distributions are recorded as a reduction of cost of investments and/or as a realized gain. Interest income is accrued as earned and includes coupon interest and amortization of premium and accretion of discount on debt securities as applicable. Investment income is recorded net of foreign taxes withheld where recovery of such taxes is uncertain. Funds may file withholding tax reclaims in certain jurisdictions to recover a portion of amounts previously withheld. Any withholding tax reclaims income is included in the Statement of Operations in dividends, foreign taxes withheld or foreign tax reclaims, as applicable. Any receivables for withholding tax reclaims are included in the Statement of Assets and Liabilities in dividends receivable or reclaims receivable, as applicable. Fidelity SAI International Low Volatility Index Fund has filed tax reclaims for previously withheld taxes on dividends earned in certain European Union (EU) countries. These additional filings are subject to various administrative proceedings by the local jurisdictions' tax authorities within the EU, as well as a number of related judicial proceedings. Income recognized for EU reclaims is included with other reclaims in the Statement of Operations in foreign tax reclaims. These reclaims are recorded when the amount is known and there are no significant uncertainties on collectability.
Expenses. Expenses directly attributable to a fund are charged to that fund. Expenses attributable to more than one fund are allocated among the respective funds on the basis of relative net assets or other appropriate methods. Expenses included in the accompanying financial statements reflect the expenses of that fund and do not include any expenses associated with any underlying mutual funds or exchange-traded funds. Although not included in a fund's expenses, a fund indirectly bears its proportionate share of these expenses through the net asset value of each underlying mutual fund or exchange-traded fund. Expense estimates are accrued in the period to which they relate and adjustments are made when actual amounts are known.
Income Tax Information and Distributions to Shareholders. Each year, each Fund intends to qualify as a regulated investment company under Subchapter M of the Internal Revenue Code, including distributing substantially all of its taxable income and realized gains. As a result, no provision for U.S. Federal income taxes is required. As of October 31, 2022, each Fund did not have any unrecognized tax benefits in the financial statements; nor is each Fund aware of any tax positions for which it is reasonably possible that the total amounts of unrecognized tax benefits will significantly change in the next twelve months. Each Fund files a U.S. federal tax return, in addition to state and local tax returns as required. Each Fund's federal income tax returns are subject to examination by the Internal Revenue Service (IRS) for a period of three fiscal years after they are filed. State and local tax returns may be subject to examination for an additional fiscal year depending on the jurisdiction. Foreign taxes are provided for based on each Fund's understanding of the tax rules and rates that exist in the foreign markets in which it invests. An estimated deferred tax liability for net unrealized appreciation on the applicable securities is included in Deferred taxes on each applicable Fund's Statement of Assets & Liabilities.
Distributions are declared and recorded on the ex-dividend date. Income and capital gain distributions are determined in accordance with income tax regulations, which may differ from GAAP. In addition, the Funds claimed a portion of the payment made to redeeming shareholders as a distribution for income tax purposes.
Capital accounts within the financial statements are adjusted for permanent book-tax differences. These adjustments have no impact on net assets or the results of operations. Capital accounts are not adjusted for temporary book-tax differences which will reverse in a subsequent period.
Book-tax differences are primarily due to partnerships, futures contracts, foreign currency transactions, certain foreign taxes, passive foreign investment companies (PFIC), capital loss carryforwards and losses deferred due to wash sales.
As of period end, the cost and unrealized appreciation (depreciation) in securities, and derivatives if applicable, for federal income tax purposes were as follows for each Fund:
| | Tax cost | Gross unrealized appreciation | Gross unrealized depreciation | Net unrealized appreciation (depreciation) |
| Fidelity SAI Emerging Markets Low Volatility Index Fund | $2,255,443,799 | $155,830,766 | $(331,227,890) | $(175,397,124) |
| Fidelity SAI International Low Volatility Index Fund | 6,217,231,770 | 250,177,547 | (962,090,694) | (711,913,147) |
| Fidelity SAI U.S. Low Volatility Index Fund | 6,877,863,987 | 1,598,958,038 | (519,423,197) | 1,079,534,841 |
The tax-based components of distributable earnings as of period end were as follows for each Fund:
| | Undistributed ordinary income | Undistributed long-term capital gain | Capital loss carryforward | Net unrealized appreciation (depreciation) on securities and other investments |
| Fidelity SAI Emerging Markets Low Volatility Index Fund | $43,891,851 | $- | $(24,897,305) | $(175,489,538) |
| Fidelity SAI International Low Volatility Index Fund | 89,797,371 | - | (91,200,408) | (714,936,030) |
| Fidelity SAI U.S. Low Volatility Index Fund | 120,676,718 | 148,839,876 | - | 1,079,534,841 |
Capital loss carryforwards are only available to offset future capital gains of the Funds to the extent provided by regulations and may be limited. The capital loss carryforward information presented below, including any applicable limitation, is estimated as of fiscal period end and is subject to adjustment.
| | Short-term | Long-term | Total capital loss carryforward |
| Fidelity SAI Emerging Markets Low Volatility Index Fund | $(24,897,305) | $- | $(24,897,305) |
| Fidelity SAI International Low Volatility Index Fund | (33,020,130) | (58,180,278) | (91,200,408) |
The tax character of distributions paid was as follows:
| October 31, 2022 | | | |
| | Ordinary Income | Long-term Capital Gains | Total |
| Fidelity SAI Emerging Markets Low Volatility Index Fund | $41,568,890 | $- | $41,568,890 |
| Fidelity SAI International Low Volatility Index Fund | 141,537,086 | - | 141,537,086 |
| Fidelity SAI U.S. Low Volatility Index Fund | 159,841,640 | 108,929,116 | 268,770,756 |
| October 31, 2021 | |
| | Ordinary Income |
| Fidelity SAI Emerging Markets Low Volatility Index Fund | $24,528,630 |
| Fidelity SAI International Low Volatility Index Fund | 67,692,252 |
| Fidelity SAI U.S. Low Volatility Index Fund | 80,110,109 |
Restricted Securities (including Private Placements). Funds may invest in securities that are subject to legal or contractual restrictions on resale. These securities generally may be resold in transactions exempt from registration or to the public if the securities are registered. Disposal of these securities may involve time-consuming negotiations and expense, and prompt sale at an acceptable price may be difficult. Information regarding restricted securities held at period end is included at the end of the Schedule of Investments, if applicable.
4. Derivative Instruments.
Risk Exposures and the Use of Derivative Instruments. Each Fund's investment objectives allow for various types of derivative instruments, including futures contracts. Derivatives are investments whose value is primarily derived from underlying assets, indices or reference rates and may be transacted on an exchange or over-the-counter (OTC). Derivatives may involve a future commitment to buy or sell a specified asset based on specified terms, to exchange future cash flows at periodic intervals based on a notional principal amount, or for one party to make one or more payments upon the occurrence of specified events in exchange for periodic payments from the other party.
Derivatives were used to increase returns and to manage exposure to certain risks as defined below. The success of any strategy involving derivatives depends on analysis of numerous economic factors, and if the strategies for investment do not work as intended, the objectives may not be achieved.
Derivatives were used to increase or decrease exposure to the following risk(s):
| | |
| Equity Risk | Equity risk relates to the fluctuations in the value of financial instruments as a result of changes in market prices (other than those arising from interest rate risk or foreign exchange risk), whether caused by factors specific to an individual investment, its issuer, or all factors affecting all instruments traded in a market or market segment. |
Funds are also exposed to additional risks from investing in derivatives, such as liquidity risk and counterparty credit risk. Liquidity risk is the risk that a fund will be unable to close out the derivative in the open market in a timely manner. Counterparty credit risk is the risk that the counterparty will not be able to fulfill its obligation to a fund. Counterparty credit risk related to exchange-traded contracts may be mitigated by the protection provided by the exchange on which they trade.
Investing in derivatives may involve greater risks than investing in the underlying assets directly and, to varying degrees, may involve risk of loss in excess of any initial investment and collateral received and amounts recognized in the Statement of Assets and Liabilities. In addition, there may be the risk that the change in value of the derivative contract does not correspond to the change in value of the underlying instrument.
Futures Contracts. A futures contract is an agreement between two parties to buy or sell a specified underlying instrument for a fixed price at a specified future date. Futures contracts were used to manage exposure to the stock market.
Upon entering into a futures contract, a fund is required to deposit either cash or securities (initial margin) with a clearing broker in an amount equal to a certain percentage of the face value of the contract. Futures contracts are marked-to-market daily and subsequent daily payments are made or received by a fund depending on the daily fluctuations in the value of the futures contracts and are recorded as unrealized appreciation or (depreciation). This receivable and/or payable, if any, is included in daily variation margin on futures contracts in the Statement of Assets and Liabilities. Realized gain or (loss) is recorded upon the expiration or closing of a futures contract. The net realized gain (loss) and change in net unrealized appreciation (depreciation) on futures contracts during the period is presented in the Statement of Operations.
Any open futures contracts at period end are presented in the Schedule of Investments under the caption "Futures Contracts". The notional amount at value reflects each contract's exposure to the underlying instrument or index at period end, and is representative of volume of activity during the period unless an average notional amount is presented. Any securities deposited to meet initial margin requirements are identified in the Schedule of Investments. Any cash deposited to meet initial margin requirements is presented as segregated cash with brokers for derivative instruments in the Statement of Assets and Liabilities.
5. Purchases and Sales of Investments.
Purchases and sales of securities, other than short-term securities and in-kind transactions, as applicable, are noted in the table below.
| | Purchases ($) | Sales ($) |
| Fidelity SAI Emerging Markets Low Volatility Index Fund | 1,086,751,263 | 412,871,174 |
| Fidelity SAI International Low Volatility Index Fund | 2,375,577,298 | 1,444,105,911 |
| Fidelity SAI U.S. Low Volatility Index Fund | 3,907,033,711 | 3,164,499,653 |
6. Fees and Other Transactions with Affiliates.
Management Fee. Fidelity Management & Research Company LLC (the investment adviser) and its affiliates provide the Funds with investment management related services for which the Funds pay a monthly management fee. Each Fund's management fee is equal to the following annual rate of average net assets:
| Fidelity SAI Emerging Markets Low Volatility Index Fund | .15% |
| Fidelity SAI International Low Volatility Index Fund | .15% |
| Fidelity SAI U.S. Low Volatility Index Fund | .10% |
Sub-Adviser. Geode Capital Management, LLC (Geode), serves as sub-adviser for the Funds. Geode provides discretionary investment advisory services to the Funds and is paid by the investment adviser for providing these services.
Interfund Lending Program. Pursuant to an Exemptive Order issued by the Securities and Exchange Commission (the SEC), each Fund, along with other registered investment companies having management contracts with Fidelity Management & Research Company LLC (FMR), or other affiliated entities of FMR, may participate in an interfund lending program. This program provides an alternative credit facility allowing each Fund to borrow from, or lend money to, other participating affiliated funds. At period end, there were no interfund loans outstanding. Activity in this program during the period for which loans were outstanding was as follows:
| | Borrower or Lender | Average Loan Balance | Weighted Average Interest Rate | Interest Expense |
| Fidelity SAI Emerging Markets Low Volatility Index Fund | Borrower | $9,665,213 | 1.50% | $24,554 |
| Fidelity SAI International Low Volatility Index Fund | Borrower | $22,816,500 | 1.16% | $38,088 |
| Fidelity SAI U.S. Low Volatility Index Fund | Borrower | $59,305,062 | 1.55% | $81,489 |
Interfund Trades. Funds may purchase from or sell securities to other Fidelity Funds under procedures adopted by the Board. The procedures have been designed to ensure these interfund trades are executed in accordance with Rule 17a-7 of the 1940 Act. Any interfund trades are included within the respective purchases and sales amounts shown in the Purchases and Sales of Investments note. During the period, there were no interfund trades.
7. Committed Line of Credit.
Certain Funds participate with other funds managed by the investment adviser or an affiliate in a $4.25 billion credit facility (the "line of credit") to be utilized for temporary or emergency purposes to fund shareholder redemptions or for other short-term liquidity purposes. The participating funds have agreed to pay commitment fees on their pro-rata portion of the line of credit, which are reflected in Miscellaneous expenses on the Statement of Operations, and are listed below. During the period, there were no borrowings on this line of credit.
| | Amount |
| Fidelity SAI Emerging Markets Low Volatility Index Fund | $3,252 |
| Fidelity SAI International Low Volatility Index Fund | 9,762 |
| Fidelity SAI U.S. Low Volatility Index Fund | 13,342 |
8. Security Lending.
Funds lend portfolio securities from time to time in order to earn additional income. Lending agents are used, including National Financial Services (NFS), an affiliate of the investment adviser. Pursuant to a securities lending agreement, NFS will receive a fee, which is capped at 9.9% of a fund's daily lending revenue, for its services as lending agent. A fund may lend securities to certain qualified borrowers, including NFS. On the settlement date of the loan, a fund receives collateral (in the form of U.S. Treasury obligations, letters of credit and/or cash) against the loaned securities and maintains collateral in an amount not less than 100% of the market value of the loaned securities during the period of the loan. The market value of the loaned securities is determined at the close of business of a fund and any additional required collateral is delivered to a fund on the next business day. A fund or borrower may terminate the loan at any time, and if the borrower defaults on its obligation to return the securities loaned because of insolvency or other reasons, a fund may apply collateral received from the borrower against the obligation. A fund may experience delays and costs in recovering the securities loaned. Any cash collateral received is invested in the Fidelity Securities Lending Cash Central Fund. Any loaned securities are identified as such in the Schedule of Investments, and the value of loaned securities and cash collateral at period end, as applicable, are presented in the Statement of Assets and Liabilities. Security lending income represents the income earned on investing cash collateral, less rebates paid to borrowers and any lending agent fees associated with the loan, plus any premium payments received for lending certain types of securities. Security lending income is presented in the Statement of Operations as a component of income from Fidelity Central Funds. Affiliated security lending activity, if any, was as follows:
| | Total Security Lending Fees Paid to NFS | Security Lending Income From Securities Loaned to NFS | Value of Securities Loaned to NFS at Period End |
| Fidelity SAI Emerging Markets Low Volatility Index Fund | $444 | $5 | $- |
| Fidelity SAI International Low Volatility Index Fund | $55,307 | $- | $- |
| Fidelity SAI U.S. Low Volatility Index Fund | $28,838 | $3 | $- |
9. Bank Borrowings.
Each Fund is permitted to have bank borrowings for temporary or emergency purposes to fund shareholder redemptions or for other short-term liquidity requirements. Each Fund has established borrowing arrangements with certain banks. The interest rate on the borrowings is the bank's base rate, as revised from time to time. Any open loans, including accrued interest, at period end are presented under the caption "Notes payable" in the Statement of Assets and Liabilities, if applicable. Activity in this program during the period for which loans were outstanding was as follows:
| | Average Loan Balance | Weighted Average Interest Rate | Interest Expense |
| Fidelity SAI Emerging Markets Low Volatility Index Fund | $9,333,375 | 1.56% | $16,127 |
| Fidelity SAI International Low Volatility Index Fund | $14,912,103 | .94% | $11,296 |
10. Expense Reductions.
The investment adviser contractually agreed to reimburse expenses of Fidelity SAI Emerging Markets Low Volatility Index Fund to the extent annual operating expenses exceeded certain levels of average net assets as noted in the table below. This reimbursement will remain in place through February 29, 2024. Some expenses, for example the compensation of the independent Trustees, and certain miscellaneous expenses such as proxy and shareholder meeting expenses, are excluded from this reimbursement.
The following Fund was in reimbursement during the period:
| | Expense Limitations | Reimbursement |
| Fidelity SAI Emerging Markets Low Volatility Index Fund | .25% | $143,808 |
Through arrangements with each applicable Fund's custodian, credits realized as a result of certain uninvested cash balances were used to reduce each applicable Fund's expenses. All of the applicable expense reductions are noted in the table below.
| | Custodian credits | Transfer Agent credits |
| Fidelity SAI U.S. Low Volatility Index Fund | $420 | $14 |
11. Other.
A fund's organizational documents provide former and current trustees and officers with a limited indemnification against liabilities arising in connection with the performance of their duties to the fund. In the normal course of business, a fund may also enter into contracts that provide general indemnifications. A fund's maximum exposure under these arrangements is unknown as this would be dependent on future claims that may be made against a fund. The risk of material loss from such claims is considered remote.
In addition, at the end of the period, the following mutual funds managed by the investment adviser or its affiliates were the owners of record of 10% or more of the total outstanding shares.
| | Strategic Advisers Emerging Markets Fund | Strategic Advisers Fidelity Emerging Markets Fund | Strategic Advisers Fidelity International Fund | Strategic Advisers Fidelity U.S. Total Stock Fund | Strategic Advisers Large Cap Fund |
| Fidelity SAI Emerging Markets Low Volatility Index Fund | 27% | 28% | - | - | - |
| Fidelity SAI International Low Volatility Index Fund | - | - | 20% | - | - |
| Fidelity SAI U.S. Low Volatility Index Fund | - | - | - | 34% | 12% |
Mutual funds managed by the investment adviser or its affiliates, in aggregate, were the owners of record of more than 20% of the total outstanding shares.
| Fund | % of shares held |
| Fidelity SAI Emerging Markets Low Volatility Index Fund | 55% |
| Fidelity SAI International Low Volatility Index Fund | 30% |
| Fidelity SAI U.S. Low Volatility Index Fund | 46% |
12. Risk and Uncertainties.
Many factors affect a fund's performance. Developments that disrupt global economies and financial markets, such as pandemics, epidemics, outbreaks of infectious diseases, war, terrorism, and environmental disasters, may significantly affect a fund's investment performance. The effects of these developments to a fund will be impacted by the types of securities in which a fund invests, the financial condition, industry, economic sector, and geographic location of an issuer, and a fund's level of investment in the securities of that issuer.
To the Board of Trustees of Fidelity Salem Street Trust and the Shareholders of Fidelity SAI Emerging Markets Low Volatility Index Fund, Fidelity SAI International Low Volatility Index Fund and Fidelity SAI U.S. Low Volatility Index Fund
Opinions on the Financial Statements
We have audited the accompanying statements of assets and liabilities, including the schedules of investments, of Fidelity SAI Emerging Markets Low Volatility Index Fund, Fidelity SAI International Low Volatility Index Fund and Fidelity SAI U.S. Low Volatility Index Fund (three of the funds constituting Fidelity Salem Street Trust, hereafter collectively referred to as the "Funds") as of October 31, 2022, the related statements of operations for the year ended October 31, 2022, the statements of changes in net assets for each of the two years in the period ended October 31, 2022, including the related notes, and the financial highlights for each of the periods indicated therein (collectively referred to as the "financial statements"). In our opinion, the financial statements present fairly, in all material respects, the financial position of each of the Funds as of October 31, 2022, the results of each of their operations for the year then ended, the changes in each of their net assets for each of the two years in the period ended October 31, 2022, and each of the financial highlights for each of the periods indicated therein in conformity with accounting principles generally accepted in the United States of America.
Basis for Opinions
These financial statements are the responsibility of the Funds' management. Our responsibility is to express an opinion on the Funds' financial statements based on our audits. We are a public accounting firm registered with the Public Company Accounting Oversight Board (United States) (PCAOB) and are required to be independent with respect to the Funds in accordance with the U.S. federal securities laws and the applicable rules and regulations of the Securities and Exchange Commission and the PCAOB.
We conducted our audits of these financial statements in accordance with the standards of the PCAOB. Those standards require that we plan and perform the audit to obtain reasonable assurance about whether the financial statements are free of material misstatement, whether due to error or fraud.
Our audits included performing procedures to assess the risks of material misstatement of the financial statements, whether due to error or fraud, and performing procedures that respond to those risks. Such procedures included examining, on a test basis, evidence regarding the amounts and disclosures in the financial statements. Our audits also included evaluating the accounting principles used and significant estimates made by management, as well as evaluating the overall presentation of the financial statements. Our procedures included confirmation of securities owned as of October 31, 2022 by correspondence with the custodian and brokers. We believe that our audits provide a reasonable basis for our opinion.
/s/ PricewaterhouseCoopers LLP
Boston, Massachusetts
December 16, 2022
We have served as the auditor of one or more investment companies in the Fidelity group of funds since 1932.
The Trustees, Members of the Advisory Board (if any), and officers of the trust and funds, as applicable, are listed below. The Board of Trustees governs each fund and is responsible for protecting the interests of shareholders. The Trustees are experienced executives who meet periodically throughout the year to oversee each fund's activities, review contractual arrangements with companies that provide services to each fund, oversee management of the risks associated with such activities and contractual arrangements, and review each fund's performance. Except for Jonathan Chiel, each of the Trustees oversees 293 funds. Mr. Chiel oversees 184 funds.
The Trustees hold office without limit in time except that (a) any Trustee may resign; (b) any Trustee may be removed by written instrument, signed by at least two-thirds of the number of Trustees prior to such removal; (c) any Trustee who requests to be retired or who has become incapacitated by illness or injury may be retired by written instrument signed by a majority of the other Trustees; and (d) any Trustee may be removed at any special meeting of shareholders by a two-thirds vote of the outstanding voting securities of the trust. Each Trustee who is not an interested person (as defined in the 1940 Act) of the trust and the funds is referred to herein as an Independent Trustee. Each Independent Trustee shall retire not later than the last day of the calendar year in which his or her 75th birthday occurs. The Independent Trustees may waive this mandatory retirement age policy with respect to individual Trustees. Officers and Advisory Board Members hold office without limit in time, except that any officer or Advisory Board Member may resign or may be removed by a vote of a majority of the Trustees at any regular meeting or any special meeting of the Trustees. Except as indicated, each individual has held the office shown or other offices in the same company for the past five years.
The funds' Statement of Additional Information (SAI) includes more information about the Trustees. To request a free copy, call Fidelity at 1-800-544-3455.
Experience, Skills, Attributes, and Qualifications of the Trustees. The Governance and Nominating Committee has adopted a statement of policy that describes the experience, qualifications, attributes, and skills that are necessary and desirable for potential Independent Trustee candidates (Statement of Policy). The Board believes that each Trustee satisfied at the time he or she was initially elected or appointed a Trustee, and continues to satisfy, the standards contemplated by the Statement of Policy. The Governance and Nominating Committee also engages professional search firms to help identify potential Independent Trustee candidates who have the experience, qualifications, attributes, and skills consistent with the Statement of Policy. From time to time, additional criteria based on the composition and skills of the current Independent Trustees, as well as experience or skills that may be appropriate in light of future changes to board composition, business conditions, and regulatory or other developments, have also been considered by the professional search firms and the Governance and Nominating Committee. In addition, the Board takes into account the Trustees' commitment and participation in Board and committee meetings, as well as their leadership of standing and ad hoc committees throughout their tenure.
In determining that a particular Trustee was and continues to be qualified to serve as a Trustee, the Board has considered a variety of criteria, none of which, in isolation, was controlling. The Board believes that, collectively, the Trustees have balanced and diverse experience, qualifications, attributes, and skills, which allow the Board to operate effectively in governing each fund and protecting the interests of shareholders. Information about the specific experience, skills, attributes, and qualifications of each Trustee, which in each case led to the Board's conclusion that the Trustee should serve (or continue to serve) as a trustee of the funds, is provided below.
Board Structure and Oversight Function. Abigail P. Johnson is an interested person and currently serves as Chairman. The Trustees have determined that an interested Chairman is appropriate and benefits shareholders because an interested Chairman has a personal and professional stake in the quality and continuity of services provided to the funds. Independent Trustees exercise their informed business judgment to appoint an individual of their choosing to serve as Chairman, regardless of whether the Trustee happens to be independent or a member of management. The Independent Trustees have determined that they can act independently and effectively without having an Independent Trustee serve as Chairman and that a key structural component for assuring that they are in a position to do so is for the Independent Trustees to constitute a substantial majority for the Board. The Independent Trustees also regularly meet in executive session. Michael E. Kenneally serves as Chairman of the Independent Trustees and as such (i) acts as a liaison between the Independent Trustees and management with respect to matters important to the Independent Trustees and (ii) with management prepares agendas for Board meetings.
Fidelity ® funds are overseen by different Boards of Trustees. The funds' Board oversees Fidelity's investment-grade bond, money market, asset allocation and certain equity funds, and other Boards oversee Fidelity's high income and other equity funds. The asset allocation funds may invest in Fidelity ® funds that are overseen by such other Boards. The use of separate Boards, each with its own committee structure, allows the Trustees of each group of Fidelity ® funds to focus on the unique issues of the funds they oversee, including common research, investment, and operational issues. On occasion, the separate Boards establish joint committees to address issues of overlapping consequences for the Fidelity ® funds overseen by each Board.
The Trustees operate using a system of committees to facilitate the timely and efficient consideration of all matters of importance to the Trustees, each fund, and fund shareholders and to facilitate compliance with legal and regulatory requirements and oversight of the funds' activities and associated risks. The Board, acting through its committees, has charged FMR and its affiliates with (i) identifying events or circumstances the occurrence of which could have demonstrably adverse effects on the funds' business and/or reputation; (ii) implementing processes and controls to lessen the possibility that such events or circumstances occur or to mitigate the effects of such events or circumstances if they do occur; and (iii) creating and maintaining a system designed to evaluate continuously business and market conditions in order to facilitate the identification and implementation processes described in (i) and (ii) above. Because the day-to-day operations and activities of the funds are carried out by or through FMR, its affiliates, and other service providers, the funds' exposure to risks is mitigated but not eliminated by the processes overseen by the Trustees. While each of the Board's committees has responsibility for overseeing different aspects of the funds' activities, oversight is exercised primarily through the Operations and Audit Committees. In addition, an ad hoc Board committee of Independent Trustees has worked with FMR to enhance the Board's oversight of investment and financial risks, legal and regulatory risks, technology risks, and operational risks, including the development of additional risk reporting to the Board. Appropriate personnel, including but not limited to the funds' Chief Compliance Officer (CCO), FMR's internal auditor, the independent accountants, the funds' Treasurer and portfolio management personnel, make periodic reports to the Board's committees, as appropriate, including an annual review of Fidelity's risk management program for the Fidelity ® funds. The responsibilities of each standing committee, including their oversight responsibilities, are described further under "Standing Committees of the Trustees."
Interested Trustees*:
Correspondence intended for a Trustee who is an interested person may be sent to Fidelity Investments, 245 Summer Street, Boston, Massachusetts 02210.
Name, Year of Birth; Principal Occupations and Other Relevant Experience+
Jonathan Chiel (1957)
Year of Election or Appointment: 2016
Trustee
Mr. Chiel also serves as Trustee of other Fidelity ® funds. Mr. Chiel is Executive Vice President and General Counsel for FMR LLC (diversified financial services company, 2012-present). Previously, Mr. Chiel served as general counsel (2004-2012) and senior vice president and deputy general counsel (2000-2004) for John Hancock Financial Services; a partner with Choate, Hall & Stewart (1996-2000) (law firm); and an Assistant United States Attorney for the United States Attorney's Office of the District of Massachusetts (1986-95), including Chief of the Criminal Division (1993-1995). Mr. Chiel is a director on the boards of the Boston Bar Foundation and the Maimonides School.
Abigail P. Johnson (1961)
Year of Election or Appointment: 2009
Trustee
Chairman of the Board of Trustees
Ms. Johnson also serves as Trustee of other Fidelity ® funds. Ms. Johnson serves as Chairman (2016-present), Chief Executive Officer (2014-present), and Director (2007-present) of FMR LLC (diversified financial services company), President of Fidelity Financial Services (2012-present) and President of Personal, Workplace and Institutional Services (2005-present). Ms. Johnson is Chairman and Director of Fidelity Management & Research Company LLC (investment adviser firm, 2011-present). Previously, Ms. Johnson served as Chairman and Director of FMR Co., Inc. (investment adviser firm, 2011-2019), Vice Chairman (2007-2016) and President (2013-2016) of FMR LLC, President and a Director of Fidelity Management & Research Company (2001-2005), a Trustee of other investment companies advised by Fidelity Management & Research Company, Fidelity Investments Money Management, Inc. (investment adviser firm), and FMR Co., Inc. (2001-2005), Senior Vice President of the Fidelity ® funds (2001-2005), and managed a number of Fidelity ® funds. Ms. Abigail P. Johnson and Mr. Arthur E. Johnson are not related.
Jennifer Toolin McAuliffe (1959)
Year of Election or Appointment: 2016
Trustee
Ms. McAuliffe also serves as Trustee of other Fidelity ® funds and as Trustee of Fidelity Charitable (2020-present). Previously, Ms. McAuliffe served as Co-Head of Fixed Income of Fidelity Investments Limited (now known as FIL Limited (FIL)) (diversified financial services company), Director of Research for FIL's credit and quantitative teams in London, Hong Kong and Tokyo and Director of Research for taxable and municipal bonds at Fidelity Investments Money Management, Inc. Ms. McAuliffe previously served as a member of the Advisory Board of certain Fidelity ® funds (2016). Ms. McAuliffe was previously a lawyer at Ropes & Gray LLP and currently serves as director or trustee of several not-for-profit entities.
* Determined to be an "Interested Trustee" by virtue of, among other things, his or her affiliation with the trust or various entities under common control with FMR.
+ The information includes the Trustee's principal occupation during the last five years and other information relating to the experience, attributes, and skills relevant to the Trustee's qualifications to serve as a Trustee, which led to the conclusion that the Trustee should serve as a Trustee for each fund.
Independent Trustees:
Correspondence intended for an Independent Trustee may be sent to Fidelity Investments, P.O. Box 55235, Boston, Massachusetts 02205-5235.
Name, Year of Birth; Principal Occupations and Other Relevant Experience+
Elizabeth S. Acton (1951)
Year of Election or Appointment: 2013
Trustee
Ms. Acton also serves as Trustee of other Fidelity ® funds. Prior to her retirement, Ms. Acton served as Executive Vice President, Finance (2011-2012), Executive Vice President, Chief Financial Officer (2002-2011) and Treasurer (2004-2005) of Comerica Incorporated (financial services). Prior to joining Comerica, Ms. Acton held a variety of positions at Ford Motor Company (1983-2002), including Vice President and Treasurer (2000-2002) and Executive Vice President and Chief Financial Officer of Ford Motor Credit Company (1998-2000). Ms. Acton currently serves as a member of the Board and Audit and Finance Committees of Beazer Homes USA, Inc. (homebuilding, 2012-present). Ms. Acton previously served as a member of the Advisory Board of certain Fidelity ® funds (2013-2016).
Ann E. Dunwoody (1953)
Year of Election or Appointment: 2018
Trustee
General Dunwoody also serves as Trustee of other Fidelity ® funds. General Dunwoody (United States Army, Retired) was the first woman in U.S. military history to achieve the rank of four-star general and prior to her retirement in 2012 held a variety of positions within the U.S. Army, including Commanding General, U.S. Army Material Command (2008-2012). General Dunwoody currently serves as President of First to Four LLC (leadership and mentoring services, 2012-present), a member of the Board and Nomination and Corporate Governance Committees of Kforce Inc. (professional staffing services, 2016-present) and a member of the Board of Automattic Inc. (software engineering, 2018-present). Previously, General Dunwoody served as a member of the Advisory Board and Nominating and Corporate Governance Committee of L3 Technologies, Inc. (communication, electronic, sensor and aerospace systems, 2013-2019) and a member of the Board and Audit and Sustainability and Corporate Responsibility Committees of Republic Services, Inc. (waste collection, disposal and recycling, 2013-2016). Ms. Dunwoody also serves on several boards for non-profit organizations, including as a member of the Board, Chair of the Nomination and Governance Committee and a member of the Audit Committee of Logistics Management Institute (consulting non-profit, 2012-present), a member of the Council of Trustees for the Association of the United States Army (advocacy non-profit, 2013-present), a member of the Board of Florida Institute of Technology (2015-present) and a member of the Board of ThanksUSA (military family education non-profit, 2014-present). General Dunwoody previously served as a member of the Advisory Board of certain Fidelity ® funds (2018).
John Engler (1948)
Year of Election or Appointment: 2014
Trustee
Mr. Engler also serves as Trustee of other Fidelity ® funds. Previously, Mr. Engler served as Governor of Michigan (1991-2003), President of the Business Roundtable (2011-2017) and interim President of Michigan State University (2018-2019). Mr. Engler currently serves as a member of the Board of Stride, Inc. (formerly K12 Inc.) (technology-based education company, 2012-present). Previously, Mr. Engler served as a member of the Board of Universal Forest Products (manufacturer and distributor of wood and wood-alternative products, 2003-2019) and Trustee of The Munder Funds (2003-2014). Mr. Engler previously served as a member of the Advisory Board of certain Fidelity ® funds (2014-2016).
Robert F. Gartland (1951)
Year of Election or Appointment: 2010
Trustee
Mr. Gartland also serves as Trustee of other Fidelity ® funds. Prior to his retirement, Mr. Gartland held a variety of positions at Morgan Stanley (financial services, 1979-2007), including Managing Director (1987-2007) and Chase Manhattan Bank (1975-1978). Mr. Gartland previously served as Chairman and an investor in Gartland & Mellina Group Corp. (consulting, 2009-2019), as a member of the Board of National Securities Clearing Corporation (1993-1996) and as Chairman of TradeWeb (2003-2004).
Arthur E. Johnson (1947)
Year of Election or Appointment: 2008
Trustee
Mr. Johnson also serves as Trustee of other Fidelity ® funds. Prior to his retirement, Mr. Johnson served as Senior Vice President of Corporate Strategic Development of Lockheed Martin Corporation (defense contractor, 1999-2009). Mr. Johnson currently serves as a member of the Board of Booz Allen Hamilton (management consulting, 2011-present). Mr. Johnson previously served as a member of the Board of Eaton Corporation plc (diversified power management, 2009-2019) and a member of the Board of AGL Resources, Inc. (holding company, 2002-2016). Mr. Johnson previously served as Chairman (2018-2021) and Vice Chairman (2015-2018) of the Independent Trustees of certain Fidelity® funds. Mr. Arthur E. Johnson is not related to Ms. Abigail P. Johnson.
Michael E. Kenneally (1954)
Year of Election or Appointment: 2009
Trustee
Chairman of the Independent Trustees
Mr. Kenneally also serves as Trustee of other Fidelity ® funds and was Vice Chairman (2018-2021) of the Independent Trustees of certain Fidelity ® funds. Prior to retirement in 2005, he was Chairman and Global Chief Executive Officer of Credit Suisse Asset Management, the worldwide fund management and institutional investment business of Credit Suisse Group. Previously, Mr. Kenneally was an Executive Vice President and the Chief Investment Officer for Bank of America. In this role, he was responsible for the investment management, strategy and products delivered to the bank's institutional, high-net-worth and retail clients. Earlier, Mr. Kenneally directed the organization's equity and quantitative research groups. He began his career as a research analyst and then spent more than a dozen years as a portfolio manager for endowments, pension plans and mutual funds. He earned the Chartered Financial Analyst (CFA) designation in 1991.
Marie L. Knowles (1946)
Year of Election or Appointment: 2001
Trustee
Ms. Knowles also serves as Trustee of other Fidelity ® funds. Prior to her retirement, Ms. Knowles held several positions at Atlantic Richfield Company (diversified energy), including Executive Vice President and Chief Financial Officer (1996-2000), Senior Vice President (1993-1996) and President of ARCO Transportation Company (pipeline and tanker operations, 1993-1996). Ms. Knowles currently serves as a member of the Board of the Santa Catalina Island Company (real estate, 2009-present), a member of the Investment Company Institute Board of Governors and a member of the Governing Council of the Independent Directors Council (2014-present). Ms. Knowles also serves as a member of the Advisory Board for the School of Engineering of the University of Southern California. Ms. Knowles previously served as a member of the Board of McKesson Corporation (healthcare service, 2002-2021). In addition, Ms. Knowles previously served as Chairman (2015-2018) and Vice Chairman (2012-2015) of the Independent Trustees of certain Fidelity ® funds.
Mark A. Murray (1954)
Year of Election or Appointment: 2016
Trustee
Mr. Murray also serves as Trustee of other Fidelity ® funds. Previously, Mr. Murray served as Co-Chief Executive Officer (2013-2016), President (2006-2013) and Vice Chairman (2013-2020) of Meijer, Inc. Mr. Murray serves as a member of the Board (2009-present) and Public Policy and Responsibility Committee (2009-present) and Chair of the Nuclear Review Committee (2019-present) of DTE Energy Company (diversified energy company). Mr. Murray previously served as a member of the Board of Spectrum Health (not-for-profit health system, 2015-2019) and as a member of the Board and Audit Committee and Chairman of the Nominating and Corporate Governance Committee of Universal Forest Products, Inc. (manufacturer and distributor of wood and wood-alternative products, 2004-2016). Mr. Murray also serves as a member of the Board of many community and professional organizations. Mr. Murray previously served as a member of the Advisory Board of certain Fidelity ® funds (2016).
+ The information includes the Trustee's principal occupation during the last five years and other information relating to the experience, attributes, and skills relevant to the Trustee's qualifications to serve as a Trustee, which led to the conclusion that the Trustee should serve as a Trustee for each fund.
Advisory Board Members and Officers:
Correspondence intended for a Member of the Advisory Board (if any) may be sent to Fidelity Investments, P.O. Box 55235, Boston, Massachusetts 02205-5235. Correspondence intended for an officer may be sent to Fidelity Investments, 245 Summer Street, Boston, Massachusetts 02210. Officers appear below in alphabetical order.
Name, Year of Birth; Principal Occupation
Laura M. Bishop (1961)
Year of Election or Appointment: 2022
Member of the Advisory Board
Ms. Bishop also serves as a Member of the Advisory Board of other funds. Prior to her retirement, Ms. Bishop held a variety of positions at United Services Automobile Association (2001-2020), including Executive Vice President and Chief Financial Officer (2014-2020) and Senior Vice President and Deputy Chief Financial Officer (2012-2014). Ms. Bishop currently serves as a member of the Audit Committee and Compensation and Personnel Committee (2021-present) of the Board of Directors of Korn Ferry (global organizational consulting).
Robert W. Helm (1957)
Year of Election or Appointment: 2021
Member of the Advisory Board
Mr. Helm also serves as a Member of the Advisory Board of other Fidelity® funds. Mr. Helm was formerly Deputy Chairman (2003-2020), partner (1991-2020) and an associate (1984-1991) of Dechert LLP (formerly Dechert Price & Rhoads). Mr. Helm currently serves on boards and committees of several not-for-profit organizations.
Craig S. Brown (1977)
Year of Election or Appointment: 2019
Assistant Treasurer
Mr. Brown also serves as an officer of other funds. Mr. Brown serves as Assistant Treasurer of FIMM, LLC (2021-present) and is an employee of Fidelity Investments (2013-present). Previously, Mr. Brown served as Assistant Treasurer of certain Fidelity ® funds (2019-2022).
John J. Burke III (1964)
Year of Election or Appointment: 2018
Chief Financial Officer
Mr. Burke also serves as Chief Financial Officer of other funds. Mr. Burke serves as Head of Investment Operations for Fidelity Fund and Investment Operations (2018-present) and is an employee of Fidelity Investments (1998-present). Previously Mr. Burke served as head of Asset Management Investment Operations (2012-2018).
David J. Carter (1973)
Year of Election or Appointment: 2020
Assistant Secretary
Mr. Carter also serves as Assistant Secretary of other funds. Mr. Carter serves as Senior Vice President, Deputy General Counsel (2022-present) and is an employee of Fidelity Investments (2005-present).
Jonathan Davis (1968)
Year of Election or Appointment: 2010
Assistant Treasurer
Mr. Davis also serves as an officer of other funds. Mr. Davis serves as Assistant Treasurer of FIMM, LLC (2021-present), FMR Capital, Inc. (2017-present), FD Funds GP LLC (2021-present), FD Funds Holding LLC (2021-present), and FD Funds Management LLC (2021-present); and is an employee of Fidelity Investments. Previously, Mr. Davis served as Vice President and Associate General Counsel of FMR LLC (diversified financial services company, 2003-2010).
Laura M. Del Prato (1964)
Year of Election or Appointment: 2018
President and Treasurer
Ms. Del Prato also serves as an officer of other funds. Ms. Del Prato serves as Assistant Treasurer of FIMM, LLC (2021-present) and is an employee of Fidelity Investments (2017-present). Previously, Ms. Del Prato served as President and Treasurer of The North Carolina Capital Management Trust: Cash Portfolio and Term Portfolio (2018-2020). Prior to joining Fidelity Investments, Ms. Del Prato served as a Managing Director and Treasurer of the JPMorgan Mutual Funds (2014-2017). Prior to JPMorgan, Ms. Del Prato served as a partner at Cohen Fund Audit Services (accounting firm, 2012-2013) and KPMG LLP (accounting firm, 2004-2012).
Colm A. Hogan (1973)
Year of Election or Appointment: 2016
Assistant Treasurer
Mr. Hogan also serves as an officer of other funds. Mr. Hogan serves as Assistant Treasurer of FIMM, LLC (2021-present) and FMR Capital, Inc. (2017-present) and is an employee of Fidelity Investments (2005-present). Previously, Mr. Hogan served as Deputy Treasurer of certain Fidelity ® funds (2016-2020) and Assistant Treasurer of certain Fidelity ® funds (2016-2018).
Cynthia Lo Bessette (1969)
Year of Election or Appointment: 2019
Secretary and Chief Legal Officer (CLO)
Ms. Lo Bessette also serves as an officer of other funds. Ms. Lo Bessette serves as CLO, Secretary, and Senior Vice President of Fidelity Management & Research Company LLC (investment adviser firm, 2019-present); CLO of Fidelity Management & Research (Hong Kong) Limited, FMR Investment Management (UK) Limited, and Fidelity Management & Research (Japan) Limited (investment adviser firms, 2019-present); Secretary of FD Funds GP LLC (2021-present), FD Funds Holding LLC (2021-present), FD Funds Management LLC (2021-present), and Fidelity Diversifying Solutions LLC (investment adviser firm, 2022-present); and Assistant Secretary of FIMM, LLC (2019-present). She is a Senior Vice President and Deputy General Counsel of FMR LLC (diversified financial services company, 2019-present), and is an employee of Fidelity Investments. Previously, Ms. Lo Bessette served as CLO, Secretary, and Senior Vice President of FMR Co., Inc. (investment adviser firm, 2019); Secretary of Fidelity SelectCo, LLC and Fidelity Investments Money Management, Inc. (investment adviser firms, 2019). Prior to joining Fidelity Investments, Ms. Lo Bessette was Executive Vice President, General Counsel (2016-2019) and Senior Vice President, Deputy General Counsel (2015-2016) of OppenheimerFunds (investment management company) and Deputy Chief Legal Officer (2013-2015) of Jennison Associates LLC (investment adviser firm).
Chris Maher (1972)
Year of Election or Appointment: 2013
Assistant Treasurer
Mr. Maher also serves as an officer of other funds. Mr. Maher serves as Assistant Treasurer of FIMM, LLC (2021-present) and FMR Capital, Inc. (2017-present), and is an employee of Fidelity Investments (2008-present). Previously, Mr. Maher served as Assistant Treasurer of certain funds (2013-2020); Vice President of Asset Management Compliance (2013), Vice President of the Program Management Group of FMR (investment adviser firm, 2010-2013), and Vice President of Valuation Oversight (2008-2010).
Jamie Pagliocco (1964)
Year of Election or Appointment: 2020
Vice President
Mr. Pagliocco also serves as Vice President of other funds. Mr. Pagliocco serves as President of Fixed Income (2020-present), and is an employee of Fidelity Investments (2001-present). Previously, Mr. Pagliocco served as Co-Chief Investment Officer - Bond (2017-2020), Global Head of Bond Trading (2016-2019), and as a portfolio manager.
Kenneth B. Robins (1969)
Year of Election or Appointment: 2020
Chief Compliance Officer
Mr. Robins also serves as an officer of other funds. Mr. Robins serves as Compliance Officer of Fidelity Management & Research Company LLC (investment adviser firm, 2016-present) and is an employee of Fidelity Investments (2004-present). Previously, Mr. Robins served as Compliance Officer of FMR Co., Inc. (investment adviser firm, 2016-2019), as Executive Vice President of Fidelity Investments Money Management, Inc. (investment adviser firm, 2013-2016) and served in other fund officer roles.
Brett Segaloff (1972)
Year of Election or Appointment: 2021
Anti-Money Laundering (AML) Officer
Mr. Segaloff also serves as an AML Officer of other funds and other related entities. He is Director, Anti-Money Laundering (2007-present) of FMR LLC (diversified financial services company) and is an employee of Fidelity Investments (1996-present).
Stacie M. Smith (1974)
Year of Election or Appointment: 2013
Assistant Treasurer
Ms. Smith also serves as an officer of other funds. Ms. Smith serves as Assistant Treasurer of FIMM, LLC (2021-present) and FMR Capital, Inc. (2017-present), is an employee of Fidelity Investments (2009-present), and has served in other fund officer roles. Prior to joining Fidelity Investments, Ms. Smith served as Senior Audit Manager of Ernst & Young LLP (accounting firm, 1996-2009). Previously, Ms. Smith served as Assistant Treasurer (2013-2019) and Deputy Treasurer (2013-2016) of certain Fidelity ® funds.
Jim Wegmann (1979)
Year of Election or Appointment: 2021
Deputy Treasurer
Mr. Wegmann also serves as an officer of other funds. Mr. Wegmann serves as Assistant Treasurer of FIMM, LLC (2021-present) and is an employee of Fidelity Investments (2011-present). Previously, Mr. Wegmann served as Assistant Treasurer of certain Fidelity ® funds (2019-2021).
As a shareholder, you incur two types of costs: (1) transaction costs, which may include sales charges (loads) on purchase payments or redemption proceeds, as applicable and (2) ongoing costs, which generally include management fees, distribution and/or service (12b-1) fees and other Fund expenses. This Example is intended to help you understand your ongoing costs (in dollars) of investing in a fund and to compare these costs with the ongoing costs of investing in other mutual funds.
| The Example is based on an investment of $1,000 invested at the beginning of the period and held for the entire period (May 1, 2022 to October 31, 2022). |
Actual Expenses
The first line of the accompanying table provides information about actual account values and actual expenses. You may use the information in this line, together with the amount you invested, to estimate the expenses that you paid over the period. Simply divide your account value by $1,000.00 (for example, an $8,600 account value divided by $1,000.00 = 8.6), then multiply the result by the number in the first line for a class/Fund under the heading entitled "Expenses Paid During Period" to estimate the expenses you paid on your account during this period. If any fund is a shareholder of any underlying mutual funds or exchange-traded funds (ETFs) (the Underlying Funds), such fund indirectly bears its proportional share of the expenses of the Underlying Funds in addition to the direct expenses incurred presented in the table. These fees and expenses are not included in the annualized expense ratio used to calculate the expense estimate in the table below.
Hypothetical Example for Comparison Purposes
The second line of the accompanying table provides information about hypothetical account values and hypothetical expenses based on the actual expense ratio and an assumed rate of return of 5% per year before expenses, which is not the actual return. The hypothetical account values and expenses may not be used to estimate the actual ending account balance or expenses you paid for the period. You may use this information to compare the ongoing costs of investing in the Fund and other funds. To do so, compare this 5% hypothetical example with the 5% hypothetical examples that appear in the shareholder reports of the other funds. If any fund is a shareholder of any Underlying Funds, such fund indirectly bears its proportional share of the expenses of the Underlying Funds in addition to the direct expenses as presented in the table. These fees and expenses are not included in the annualized expense ratio used to calculate the expense estimate in the table below.
Please note that the expenses shown in the table are meant to highlight your ongoing costs only and do not reflect any transaction costs. Therefore, the second line of the table is useful in comparing ongoing costs only, and will not help you determine the relative total costs of owning different funds. In addition, if these transactional costs were included, your costs would have been higher.
| | | | | Annualized Expense Ratio- A | | Beginning Account Value May 1, 2022 | | Ending Account Value October 31, 2022 | | Expenses Paid During Period- C May 1, 2022 to October 31, 2022 |
| | | | | | | | | | |
| Fidelity® SAI Emerging Markets Low Volatility Index Fund | | | | .25% | | | | | | |
| Actual | | | | | | $ 1,000 | | $ 850.00 | | $ 1.17 |
Hypothetical- B | | | | | | $ 1,000 | | $ 1,023.95 | | $ 1.28 |
| | | | | | | | | | |
| Fidelity® SAI International Low Volatility Index Fund | | | | .17% | | | | | | |
| Actual | | | | | | $ 1,000 | | $ 867.00 | | $ .80 |
Hypothetical- B | | | | | | $ 1,000 | | $ 1,024.35 | | $ .87 |
| | | | | | | | | | |
| Fidelity® SAI U.S. Low Volatility Index Fund | | | | .11% | | | | | | |
| Actual | | | | | | $ 1,000 | | $ 962.60 | | $ .54 |
Hypothetical- B | | | | | | $ 1,000 | | $ 1,024.65 | | $ .56 |
| |
A Annualized expense ratio reflects expenses net of applicable fee waivers.
B 5% return per year before expenses
C Expenses are equal to the annualized expense ratio, multiplied by the average account value over the period, multiplied by 184/ 365 (to reflect the one-half year period). The fees and expenses of any Underlying Funds are not included in each annualized expense ratio.
The dividend and capital gains distributions for the fund(s) are available on Fidelity.com or Institutional.Fidelity.com.
The funds hereby designate as capital gain dividend the amounts noted below for the taxable year ended October 31, 2022, or, if subsequently determined to be different, the net capital gain of such year.
| Fidelity SAI U.S. Low Volatility Index Fund | $207,595,602 |
A percentage of the dividends distributed during the fiscal year for the following funds qualify for the dividends-received deduction for corporate shareholders:
| | |
| Fidelity SAI Emerging Markets Low Volatility Index Fund | |
| December,2021 | 1% |
| Fidelity SAI U.S. Low Volatility Index Fund | |
| December, 2021 | 75% |
| | |
A percentage of the dividends distributed during the fiscal year for the following funds may be taken into account as a dividend for purposes of the maximum rate under section 1(h)(11) of the Internal Revenue Code.
| | |
| Fidelity SAI Emerging Markets Low Volatility Index Fund | |
| December 3, 2021 | 42% |
| December 28, 2021 | 83% |
| Fidelity SAI International Low Volatility Index Fund | |
| December, 2021 | 78% |
| Fidelity SAI U.S. Low Volatility Index Fund | |
| December, 2021 | 82% |
| | |
A percentage of the dividends distributed during the fiscal year for the following funds qualify as a section 199A dividend:
| Fidelity® SAI U.S. Low Volatility Index Fund | |
| December, 2021 | 4% |
The amounts per share which represent income derived from sources within, and taxes paid to, foreign countries or possessions of the United States are as follows:
| | Pay Date | Income | Taxes |
| Fidelity SAI Emerging Markets Low Volatility Index Fund | | | |
| | 12/06/2021 | $0.3068 | $0.0518 |
| | 12/29/2021 | $0.0014 | $0.0000 |
| Fidelity® SAI International Low Volatility Index Fund | | | |
| | 12/06/2021 | $0.3111 | $0.0311 |
| | | | |
The funds will notify shareholders in January 2023 of amounts for use in preparing 2022 income tax returns.
Fidelity SAI Emerging Markets Low Volatility Index Fund
Fidelity SAI International Low Volatility Index Fund
Fidelity SAI U.S. Low Volatility Index Fund
Each year, the Board of Trustees, including the Independent Trustees (together, the Board), votes on the renewal of the management contract with Fidelity Management & Research Company LLC (FMR) and the sub-advisory agreement (Sub-Advisory Agreement) for each fund with Geode Capital Management, LLC (Geode) (together, the Advisory Contracts). FMR and Geode are referred to herein as the Investment Advisers. The Board, assisted by the advice of fund counsel and Independent Trustees' counsel, requests and considers a broad range of information relevant to the renewal of the Advisory Contracts throughout the year.
The Board meets regularly and, at each of its meetings, covers an extensive agenda of topics and materials and considers factors that are relevant to its annual consideration of the renewal of each fund's Advisory Contracts, including the services and support provided to each fund and its shareholders. The Board has established four standing committees (Committees) - Operations, Audit, Fair Valuation, and Governance and Nominating - each composed of and chaired by Independent Trustees with varying backgrounds, to which the Board has assigned specific subject matter responsibilities in order to enhance effective decision-making by the Board. The Operations Committee, of which all the Independent Trustees are members, meets regularly throughout the year and requests, receives and considers, among other matters, information related to the annual consideration of the renewal of each fund's Advisory Contracts before making its recommendation to the Board. The Board also meets as needed to review matters specifically related to the Board's annual consideration of the renewal of the Advisory Contracts. Members of the Board may also meet from time to time with trustees of other Fidelity funds through joint ad hoc committees to discuss certain matters relevant to all of the Fidelity funds.
At its September 2022 meeting, the Board unanimously determined to renew each fund's Advisory Contracts. In reaching its determination, the Board considered all factors it believed relevant, including (i) the nature, extent, and quality of the services provided to each fund and its shareholders (including the investment performance of each fund); (ii) the competitiveness relative to peer funds of each fund's management fee and total expense ratio; (iii) the total costs of the services provided by and the profits realized by Fidelity and Geode from their respective relationships with each fund; and (iv) the extent to which, if any, economies of scale exist and are realized as each fund grows, and whether any economies of scale are appropriately shared with fund shareholders.
In considering whether to renew the Advisory Contracts for each fund, the Board reached a determination, with the assistance of fund counsel and Independent Trustees' counsel and through the exercise of its business judgment, that the renewal of the Advisory Contracts was in the best interests of each fund and its shareholders and that the compensation payable under the Advisory Contracts was fair and reasonable. The Board's decision to renew the Advisory Contracts was not based on any single factor, but rather was based on a comprehensive consideration of all the information provided to the Board at its meetings throughout the year. The Board, in reaching its determination to renew the Advisory Contracts, was aware that shareholders of each fund have a broad range of investment choices available to them, including a wide choice among funds offered by Fidelity's competitors, and that each fund's shareholders, who have the opportunity to review and weigh the disclosure provided by the fund in its prospectus and other public disclosures, have chosen to invest in that fund, which is part of the Fidelity family of funds.
Nature, Extent, and Quality of Services Provided. The Board considered staffing as it relates to the funds, including the backgrounds of investment personnel of Fidelity and Geode, and also considered the funds' investment objectives, strategies, and related investment philosophies. The Independent Trustees also had discussions with senior management of Fidelity's investment operations and investment groups and with senior management of Geode. The Board considered the structure of the investment personnel compensation programs and whether the structures provide appropriate incentives to act in the best interests of each fund. The Board also considered the steps Fidelity and Geode had taken to ensure the continued provision of high quality services to the Fidelity funds throughout the COVID-19 pandemic, including the expansion of staff in client facing positions to maintain service levels in periods of high volumes and volatility.
The Trustees also discussed with representatives of Fidelity, at meetings throughout the year, Fidelity's role in, among other things, overseeing compliance with federal securities laws and other applicable requirements by Geode with respect to the funds and monitoring and overseeing the performance and investment capabilities of Geode. The Trustees considered that the Board had received from Fidelity periodic reports about its oversight and due diligence processes, as well as periodic reports regarding the performance of Geode.
The Board also considered the nature, extent and quality of services provided by Geode. The Trustees noted that under the Sub-Advisory Agreement, subject to oversight by Fidelity, Geode is responsible for, among other things, identifying investments and arranging for execution of portfolio transactions to implement each fund's investment strategy. In addition, the Trustees noted that Geode is responsible for providing such reporting as may be requested by Fidelity to fulfill its oversight responsibilities discussed above.
Resources Dedicated to Investment Management and Support Services. The Board reviewed the general qualifications and capabilities of Fidelity's and Geode's investment staffs, including their size, education, experience, and resources, as well as Fidelity's and Geode's approach to recruiting, managing, training, and compensating investment personnel. The Board noted the resources devoted to Fidelity's global investment organization and that Fidelity's and Geode's analysts have extensive resources, tools and capabilities that allow them to conduct quantitative and fundamental analysis, as well as credit analysis of issuers, counterparties and guarantors. Further, the Board considered that Fidelity's and Geode's investment professionals have sufficient access to information and data so as to provide competitive investment results over time, and that those professionals also have access to sophisticated tools that permit them to assess portfolio construction and risk and performance attribution characteristics continuously. Additionally, in its deliberations, the Board considered Fidelity's and Geode's trading, risk management, compliance, cybersecurity, and technology and operations capabilities and resources, which are integral parts of the investment management process.
Shareholder and Administrative Services. The Board considered (i) the nature, extent, quality, and cost of advisory, administrative, and shareholder services performed by the Investment Advisers and their affiliates under the Advisory Contracts and by FMR's affiliates under separate agreements covering transfer agency, pricing and bookkeeping, and securities lending services for each fund; (ii) the nature and extent of the supervision of third party service providers, principally custodians, subcustodians, and pricing vendors; and (iii) the resources devoted to, and the record of compliance with, each fund's compliance policies and procedures. The Board also reviewed the allocation of fund brokerage, including allocations to brokers affiliated with the Investment Advisers.
The Board noted that the growth of fund assets over time across the complex allows Fidelity to reinvest in the development of services designed to enhance the value and convenience of the Fidelity funds as investment vehicles. These services include 24-hour access to account information and market information over the Internet and through telephone representatives, investor education materials and asset allocation tools. The Board also considered that it reviews customer service metrics such as telephone response times, continuity of services on the website and metrics addressing services at Fidelity Investor Centers.
Investment in a Large Fund Family. The Board considered the benefits to shareholders of investing in a Fidelity fund, including the benefits of investing in a fund that is part of a large family of funds offering a variety of investment disciplines and providing a large variety of mutual fund investor services. The Board noted that Fidelity had taken, or had made recommendations to the Board that resulted in the Fidelity funds taking, a number of actions over the previous year that benefited particular funds, including: (i) continuing to dedicate additional resources to Fidelity's investment research process, which includes meetings with management of issuers of securities in which the funds invest; (ii) continuing efforts to enhance Fidelity's global research capabilities; (iii) launching new funds, ETFs, and share classes with innovative structures, strategies and pricing and making other enhancements to meet investor needs; (iv) broadening eligibility requirements for certain funds and share classes; (v) reducing management fees and total expenses for certain funds and classes; (vi) lowering expenses for certain existing funds and classes by implementing or lowering expense caps; (vii) rationalizing product lines and gaining increased efficiencies from fund mergers and liquidations; (viii) continuing to develop, acquire and implement systems and technology to improve services to the funds and shareholders, strengthen information security, and increase efficiency; and (ix) continuing to implement enhancements to further strengthen Fidelity's product line to increase investors' probability of success in achieving their investment goals, including their retirement income goals.
Investment Performance . The Board considered whether each fund has operated in accordance with its investment objective, as well as its record of compliance with its investment restrictions and its performance history.
The Board took into account discussions that occur at Board meetings throughout the year with representatives of the Investment Advisers about fund investment performance. In this regard the Board noted that as part of regularly scheduled fund reviews and other reports to the Board on fund performance, the Board considers annualized return information for each fund for different time periods, measured against the securities market index the fund seeks to track. The Board also periodically considers each fund's tracking error versus its benchmark index.
In addition to reviewing absolute and relative fund performance, the Independent Trustees periodically consider the appropriateness of fund performance metrics in evaluating the results achieved. In general, the Independent Trustees believe that an index fund's performance should be evaluated based on gross performance (before fees and expenses but after transaction costs) compared to a fund's benchmark index, over appropriate time periods, taking into account relevant factors including the following: general market conditions; the characteristics of the fund's benchmark index; the extent to which statistical sampling is employed; any securities lending revenues; and fund cash flows and other factors. The Independent Trustees generally give greater weight to fund performance over longer time periods than over shorter time periods. Depending on the circumstances, the Independent Trustees may be satisfied with a fund's performance notwithstanding that it lags its benchmark index for certain periods.
The Independent Trustees recognize that shareholders evaluate performance on a net basis (after fees and expenses) over their own holding periods, for which one-, three-, and five-year periods are often used as a proxy. For this reason, the performance information reviewed by the Board also included net cumulative calendar year total return information for each fund and its benchmark index for the most recent one-, three- and five-year periods (one-year period for Fidelity SAI Emerging Markets Low Volatility Index Fund). No performance peer group information was considered by the Board as Fidelity advised the Board that the peer groups, which are created by a third-party provider, include a number of actively-managed funds. The Independent Trustees recognize that shareholders who are not investing through a tax-advantaged retirement account also consider tax consequences in evaluating performance.
Based on its review, the Board concluded that the nature, extent, and quality of services provided to each fund under the Advisory Contracts should continue to benefit the shareholders of each fund.
Competitiveness of Management Fee and Total Expense Ratio. The Board considered each fund's management fee and total expense ratio compared to selected groups of competitive funds and classes (referred to as "mapped groups" below) for the purpose of facilitating the Trustees' competitive analysis of management fees and total expenses. Fidelity creates "mapped groups" by combining similar investment objective categories (as classified by Lipper) that have comparable investment mandates. Combining funds with similar investment objective categories aids the Board's comparisons of management fees and total expense ratios by broadening the competitive group used for such comparisons.
Management Fee. The Board considered two proprietary management fee comparisons for the 12-month (or shorter) periods shown in basis points (BP) in the charts below. The group of Lipper funds used by the Board for management fee comparisons is referred to below as the "Total Mapped Group." The Total Mapped Group comparison focuses on a fund's standing in terms of gross management fees before expense reimbursements or caps relative to the total universe of funds with comparable investment mandates, regardless of whether their management fee structures also are comparable. Funds with comparable investment mandates offer exposure to similar types of securities. Funds with comparable management fee structures have similar management fee contractual arrangements (e.g., flat rate charged for advisory services, all-inclusive fee rate, etc.). "TMG %" represents the percentage of funds in the Total Mapped Group that had management fees that were lower than a fund's. For example, a hypothetical TMG % of 20% would mean that 80% of the funds in the Total Mapped Group had higher, and 20% had lower, management fees than a fund. The funds' actual TMG %s and the number of funds in the Total Mapped Group are in the charts below. The "Asset-Sized Peer Group" (ASPG) comparison focuses on a fund's standing relative to a subset of non-Fidelity funds within the Total Mapped Group that are similar in size and management fee structure. For example, if a fund is in the first quartile of the ASPG, the fund's management fee ranks in the least expensive or lowest 25% of funds in the ASPG. The ASPG represents at least 15% of the funds in the Total Mapped Group with comparable asset size and management fee structures, subject to a minimum of 50 funds (or all funds in the Total Mapped Group if fewer than 50). Additional information, such as the ASPG quartile in which a fund's management fee rate ranked, is also included in the charts and was considered by the Board.
Fidelity SAI Emerging Markets Low Volatility Index Fund
The Board noted that the fund's management fee rate ranked equal to the median of its Total Mapped Group and equal to the median of its ASPG for 2021.
Fidelity SAI International Low Volatility Index Fund
The Board noted that the fund's management fee rate ranked equal to the median of its Total Mapped Group and equal to the median of its ASPG for 2021.
Fi delity SAI U.S. Low Volatility Index Fund
The Board noted that the fund's management fee rate ranked below the median of its Total Mapped Group and below the median of its ASPG for 2021.
Based on its review, the Board concluded that each fund's management fee is fair and reasonable in light of the services that the fund receives and the other factors considered.
Total Expense Ratio. In its review of each fund's total expense ratio, the Board considered the fund's management fee rate as well as other fund expenses, such as custodial, legal, and audit fees. The Board also noted that Fidelity may agree to waive fees or reimburse expenses from time to time, and the extent to which, if any, it has done so for each fund. Each fund is compared to those funds and classes in the Total Mapped Group (used by the Board for management fee comparisons) that have a similar sales load structure. The Board also considered a total expense ASPG comparison, which focuses on the total expenses of each fund relative to a subset of non-Fidelity funds within the similar sales load structure group that are similar in size and management fee structure. The total expense ASPG is limited to 15 larger and 15 smaller classes of different funds, where possible. The total expense ASPG comparison excludes performance adjustments and fund-paid 12b-1 fees to eliminate variability in expenses relating to these items.
The Board noted that Fidelity SAI International Low Volatility Index Fund and Fidelity SAI U.S. Low Volatility Index Fund's total net expense ratio ranked below the sales load structure group competitive median for 2021 and Fidelity SAI Emerging Markets Low Volatility Index Fund's total net expense ratio ranked above the sales load structure group competitive median for 2021. The Board also noted that each fund's total net expense ratio ranked above the ASPG competitive median for 2021. The Board considered that if funds in a fund complex with a unique at-cost service model were excluded from the ASPGs, each fund would not have been above the competitive median for 2021.
The Board further considered that FMR has contractually agreed to reimburse each fund to the extent that total operating expenses, with certain exceptions, as a percentage of its average net assets, exceed 0.25% for Fidelity SAI Emerging Markets Low Volatility Index Fund, 0.20% for Fidelity SAI International Low Volatility Index Fund, and 0.15% for Fidelity SAI U.S. Low Volatility Index Fund through February 28, 2023.
Fees Charged to Other Clients . The Board also considered fee structures and other information with respect to clients of Fidelity and Geode, such as other funds advised or subadvised by Fidelity or Geode, pension plan clients, and other institutional clients with similar mandates. The Board noted that a joint ad hoc committee created by it and the boards of other Fidelity funds periodically reviews and compares Fidelity's institutional investment advisory business with its business of providing services to the Fidelity funds and also noted the most recent findings of the committee. The Board noted that the committee's review included a consideration of the differences in services provided, fees charged, and costs incurred, as well as competition in the markets serving the different categories of clients.
Based on its review of total expense ratios and fees charged to other Fidelity clients, the Board concluded that each fund's total expense ratio was reasonable in light of the services that the fund and its shareholders receive and the other factors considered.
Costs of the Services and Profitability. The Board considered the revenues earned and the expenses incurred by Fidelity in conducting the business of developing, marketing, distributing, managing, administering and servicing each fund and servicing each fund's shareholders. The Board also considered the level of Fidelity's profits in respect of all the Fidelity funds.
On an annual basis, Fidelity presents to the Board information about the profitability of its relationships with each fund. Fidelity calculates profitability information for each fund, as well as aggregate profitability information for groups of Fidelity funds and all Fidelity funds, using a series of detailed revenue and cost allocation methodologies which originate with the books and records of Fidelity on which Fidelity's audited financial statements are based. The Audit Committee of the Board reviews any significant changes from the prior year's methodologies and the full Board approves such changes.
A public accounting firm has been engaged annually by the Board as part of the Board's assessment of Fidelity's profitability analysis. The engagement includes the review and assessment of the methodologies used by Fidelity in determining the revenues and expenses attributable to Fidelity's mutual fund business, and completion of agreed-upon procedures in respect of the mathematical accuracy of certain fund profitability information and its conformity to established allocation methodologies. After considering the reports issued under the engagement and information provided by Fidelity, the Board concluded that while other allocation methods may also be reasonable, Fidelity's profitability methodologies are reasonable in all material respects.
The Board also reviewed Fidelity's and Geode's non-fund businesses and potential indirect benefits such businesses may have received as a result of their association with Fidelity's mutual fund business (i.e., fall-out benefits) as well as cases where Fidelity's and Geode's affiliates may benefit from the funds' business. The Board considered areas where potential indirect benefits to the Fidelity funds from their relationships with Fidelity may exist. The Board's consideration of these matters was informed by the findings of a joint ad hoc committee created by it and the boards of other Fidelity funds to evaluate potential fall-out benefits.
The Board considered the costs of the services provided by and the profits realized by Fidelity in connection with the operation of each fund and was satisfied that the profitability was not excessive.
The Board also considered information regarding the profitability of Geode's relationship with each fund.
Economies of Scale . The Board considered whether there have been economies of scale in respect of the management of the Fidelity funds, whether the Fidelity funds (including each fund) have appropriately benefited from any such economies of scale, and whether there is potential for realization of any further economies of scale. The Board considered the extent to which each fund will benefit from economies of scale as assets grow through increased services to the fund, through waivers or reimbursements, or through fee or expense ratio reductions. The Board also noted that a committee (the Economies of Scale Committee) created by it and the boards of other Fidelity funds periodically analyzes whether Fidelity attains economies of scale in respect of the management and servicing of the Fidelity funds, whether the Fidelity funds have appropriately benefited from such economies of scale, and whether there is potential for realization of any further economies of scale.
The Board concluded, taking into account the analysis of the Economies of Scale Committee, that economies of scale, if any, are being appropriately shared between fund shareholders and Fidelity.
Additional Information Requested by the Board . In order to develop fully the factual basis for consideration of the Fidelity funds' advisory contracts, the Board requested and received additional information on certain topics, including: (i) Fidelity's fund profitability methodology, profitability trends for certain funds, the allocation of various costs to different funds, and the impact of certain factors on fund profitability results; (ii) portfolio manager changes that have occurred during the past year and the amount of the investment that each portfolio manager has made in the Fidelity fund(s) that he or she manages; (iii) the extent to which current market conditions have affected retention and recruitment of personnel; (iv) the arrangements with and compensation paid to certain fund sub-advisers on behalf of the Fidelity funds and the treatment of such compensation within Fidelity's fund profitability methodology; (v) the terms of the funds' various management fee structures, including the basic group fee and the terms of Fidelity's voluntary expense limitation arrangements; (vi) Fidelity's transfer agent, pricing and bookkeeping fees, expense and service structures for different funds and classes relative to competitive trends; (vii) the impact on fund profitability of recent industry trends, such as the growth in passively managed funds and the changes in flows for different types of funds; (viii) the types of management fee and total expense comparisons provided, and the challenges and limitations associated with such information; and (ix) explanations regarding the relative total expense ratios and management fees of certain funds and classes, total expense and management fee competitive trends, and methodologies for total expense and management fee competitive comparisons. In addition, the Board considered its discussions with Fidelity regarding Fidelity's efforts to maintain the continuous investment and shareholder services necessary for the funds during the current pandemic and economic circumstances.
Based on its evaluation of all of the conclusions noted above, and after considering all factors it believed relevant, the Board concluded that the advisory and sub-advisory fee arrangements are fair and reasonable and that each fund's Advisory Contracts should be renewed.
1.9867660.107
SV1-SV2-ANN-1222
Fidelity® SAI Emerging Markets Value Index Fund
Annual Report
October 31, 2022
Offered exclusively to certain clients of the Adviser, or its affiliates, including Strategic Advisers LLC (Strategic Advisers) - not available for sale to the general public. Fidelity ® SAI is a product name of Fidelity ® funds dedicated to certain programs affiliated with Strategic Advisers.
Contents
To view a fund's proxy voting guidelines and proxy voting record for the 12-month period ended June 30, visit http://www.fidelity.com/proxyvotingresults or visit the Securities and Exchange Commission's (SEC) web site at http://www.sec.gov.
You may also call 1-800-544-3455 to request a free copy of the proxy voting guidelines.
The funds or securities referred to herein are not sponsored, endorsed, or promoted by Fidelity Product Services LLC (FPS), and FPS bears no liability with respect to any such funds or securities or any index on which such funds or securities are based. The prospectus contains a more detailed description of the relationship between FPS and any related funds.
Standard & Poor's, S&P and S&P 500 are registered service marks of The McGraw-Hill Companies, Inc. and have been licensed for use by Fidelity Distributors Corporation.
Other third-party marks appearing herein are the property of their respective owners.
All other marks appearing herein are registered or unregistered trademarks or service marks of FMR LLC or an affiliated company. © 2022 FMR LLC. All rights reserved.
This report and the financial statements contained herein are submitted for the general information of the shareholders of the Fund. This report is not authorized for distribution to prospective investors in the Fund unless preceded or accompanied by an effective prospectus.
A fund files its complete schedule of portfolio holdings with the SEC for the first and third quarters of each fiscal year on Form N-PORT. Forms N-PORT are available on the SEC's web site at http://www.sec.gov. A fund's Forms N-PORT may be reviewed and copied at the SEC's Public Reference Room in Washington, DC. Information regarding the operation of the SEC's Public Reference Room may be obtained by calling 1-800-SEC-0330.
For a complete list of a fund's portfolio holdings, view the most recent holdings listing, semiannual report, or annual report on Fidelity's web site at http://www.fidelity.com, http://www.institutional.fidelity.com, or http://www.401k.com, as applicable.
NOT FDIC INSURED •MAY LOSE VALUE •NO BANK GUARANTEE
Neither the Fund nor Fidelity Distributors Corporation is a bank.
Average annual total return reflects the change in the value of an investment, assuming reinvestment of distributions from dividend income and capital gains (the profits earned upon the sale of securities that have grown in value, if any) and assuming a constant rate of performance each year. The hypothetical investment and the average annual total returns do not reflect the deduction of taxes that a shareholder would pay on fund distributions or the redemption of fund shares. During periods of reimbursement by Fidelity, a fund's total return will be greater than it would be had the reimbursement not occurred. How a fund did yesterday is no guarantee of how it will do tomorrow.
| Average Annual Total Returns |
| | | | |
Periods ended October 31, 2022 | Past 1 year | Life of Fund A |
| Fidelity® SAI Emerging Markets Value Index Fund | -25.19% | 3.43% |
A From May 12, 2020
| $10,000 Over Life of Fund |
| |
Let's say hypothetically that $10,000 was invested in Fidelity® SAI Emerging Markets Value Index Fund on May 12, 2020, when the fund started. The chart shows how the value of your investment would have changed, and also shows how the Fidelity Emerging Markets Value Focus Index℠ and MSCI ACWI (All Country World Index) ex USA Index performed over the same period. |
|
|
Market Recap:
International equities returned -24.61% for the 12 months ending October 31, 2022, according to the MSCI ACWI (All Country World Index) ex USA Index. After gaining 7.98% in 2021, non-U.S. stocks retreated in the new year, as a multitude of risk factors challenged the global economy and financial markets. Persistently high inflation in some markets, exacerbated by energy price shocks from the Russia-Ukraine conflict, spurred the U.S. Federal Reserve and other central banks to aggressively tighten monetary policy, and market interest rates eclipsed their highest level in roughly a decade, stoking recession fears and sending stocks into bear market territory. Other factors influencing equities abroad included surging global commodity prices, rising sovereign bond yields in some markets, ongoing global supply-chain disruption, a broadly strong U.S. dollar and the potential for variants of the coronavirus to upend global economic growth. Against this backdrop, the index returned -24.20% year to date through October. For the full 12 months, emerging markets (-31%) and Europe ex U.K. (-25%) notably lagged. Conversely, Canada (-13%) and the U.K. (-12%) held up best. Among the 11 sectors, information technology and consumer discretionary (-37% each) fared worst. Communication services (-34%) also trailed the broader market. In contrast, energy gained 2% amid high prices for oil and natural gas. The defensive-oriented utilities (-16%) sector also outperformed, as did financials and consumer staples (-18% each).
Comments from the Geode Capital Management, LLC, passive equity index team:
For the fiscal year, the fund returned -25.19%, roughly in line with the -25.34% result of the benchmark, the Fidelity Emerging Markets Value Focus Index. (The fund's relative performance was affected by differing methodologies (fund versus index) for valuing certain foreign stocks and for incorporating foreign exchange rates, as well as by required local capital gains tax.) By sector, stocks in information technology returned -29% and hurt most, followed by consumer discretionary, which returned about -34%. Financials (-15%) and communication services (-28%) also detracted, as did materials (-23%) and industrials (-24%). Other notable detractors included the energy (-17%), real estate (-45%), consumer staples (-15%), health care (-14%) and utilities (-3%) sectors. Turning to individual stocks, the biggest individual detractor was Alibaba Group Holding (-61%), from the retailing segment, followed by Tencent Holdings (-56%), which is in the media & entertainment industry. Within semiconductors & semiconductor equipment, Taiwan Semiconductor returned -42% and hurt. Other detractors were Gazprom (-61%), a stock in the energy sector, and Samsung Electronics (-29%), from the technology hardware & equipment group. In contrast, the biggest individual contributor was Petrobras (+95%), from the energy sector. Mahindra & Mahindra, within the automobiles & components category, advanced roughly 39% and lifted the fund. In banks, Banco do Brasil (+54%) and Riyad Bank (+25%) helped. Another contributor was ITC (+46%), a stock in the food, beverage & tobacco group.
The views expressed above reflect those of the portfolio manager(s) only through the end of the period as stated on the cover of this report and do not necessarily represent the views of Fidelity or any other person in the Fidelity organization. Any such views are subject to change at any time based upon market or other conditions and Fidelity disclaims any responsibility to update such views. These views may not be relied on as investment advice and, because investment decisions for a Fidelity fund are based on numerous factors, may not be relied on as an indication of trading intent on behalf of any Fidelity fund.
Top Holdings (% of Fund's net assets) |
| |
| Samsung Electronics Co. Ltd. (Korea (South), Technology Hardware, Storage & Peripherals) | 3.6 | |
| Taiwan Semiconductor Manufacturing Co. Ltd. (Taiwan, Semiconductors & Semiconductor Equipment) | 3.4 | |
| Alibaba Group Holding Ltd. sponsored ADR (Cayman Islands, Internet & Direct Marketing Retail) | 2.6 | |
| Tencent Holdings Ltd. (Cayman Islands, Interactive Media & Services) | 2.2 | |
| Vale SA (Brazil, Metals & Mining) | 2.1 | |
| China Construction Bank Corp. (H Shares) (China, Banks) | 2.0 | |
| Petroleo Brasileiro SA - Petrobras (PN) (non-vtg.) (Brazil, Oil, Gas & Consumable Fuels) | 2.0 | |
| Infosys Ltd. (India, IT Services) | 1.5 | |
| Bank of China Ltd. (H Shares) (China, Banks) | 1.5 | |
| Industrial & Commercial Bank of China Ltd. (H Shares) (China, Banks) | 1.5 | |
| | 22.4 | |
| |
| Market Sectors (% of Fund's net assets) |
| |
| Financials | 22.9 | |
| Information Technology | 18.9 | |
| Consumer Discretionary | 13.6 | |
| Communication Services | 9.9 | |
| Materials | 8.9 | |
| Consumer Staples | 5.4 | |
| Energy | 5.3 | |
| Industrials | 5.2 | |
| Health Care | 4.2 | |
| Utilities | 3.2 | |
| Real Estate | 1.7 | |
| |
Asset Allocation (% of Fund's net assets) |
|
Foreign investments - 99.1% |
|
Geographic Diversification (% of Fund's net assets) |
|
* Includes Short-Term investments and Net Other Assets (Liabilities). Percentages are based on country or territory of incorporation and are adjusted for the effect of futures contracts, if applicable. |
| |
Showing Percentage of Net Assets
| Common Stocks - 96.6% |
| | | Shares | Value ($) |
| Bermuda - 0.4% | | | |
| Credicorp Ltd. (United States) | | 28,231 | 4,131,889 |
| Kunlun Energy Co. Ltd. | | 8,888,000 | 5,310,392 |
TOTAL BERMUDA | | | 9,442,281 |
| Brazil - 3.7% | | | |
| Banco do Brasil SA | | 2,802,000 | 20,081,316 |
| Companhia Siderurgica Nacional SA (CSN) | | 1,455,600 | 3,460,414 |
| JBS SA | | 1,485,400 | 7,177,540 |
| Vale SA | | 3,931,800 | 51,097,035 |
| Vibra Energia SA | | 2,389,400 | 8,441,884 |
TOTAL BRAZIL | | | 90,258,189 |
| British Virgin Islands - 0.0% | | | |
| VK Co. Ltd. GDR (Reg. S) (a)(b) | | 217,763 | 73,240 |
| Cayman Islands - 7.6% | | | |
| Alibaba Group Holding Ltd. sponsored ADR (a) | | 988,774 | 62,866,251 |
| China Conch Venture Holdings Ltd. | | 2,907,000 | 4,288,479 |
| China Feihe Ltd. (c) | | 6,558,000 | 3,776,240 |
| China Hongqiao Group Ltd. | | 4,959,000 | 3,518,836 |
| Country Garden Holdings Co. Ltd. (d) | | 16,534,000 | 2,127,399 |
| Daqo New Energy Corp. ADR (a) | | 134,726 | 5,926,597 |
| Hengan International Group Co. Ltd. | | 1,479,000 | 5,737,269 |
| JD.com, Inc. sponsored ADR | | 36,925 | 1,376,933 |
| Kingboard Chemical Holdings Ltd. | | 1,485,000 | 3,662,533 |
| Lufax Holding Ltd. ADR | | 1,209,328 | 1,922,832 |
| Meituan Class B (a)(c) | | 691,200 | 11,066,489 |
| TAL Education Group ADR (a) | | 1,112,255 | 5,238,721 |
| Tencent Holdings Ltd. | | 2,049,400 | 53,851,662 |
| Tencent Music Entertainment Group ADR (a) | | 1,346,012 | 4,859,103 |
| Vipshop Holdings Ltd. ADR (a) | | 787,479 | 5,488,729 |
| WH Group Ltd. (c) | | 17,469,500 | 8,835,288 |
TOTAL CAYMAN ISLANDS | | | 184,543,361 |
| Chile - 0.6% | | | |
| Cencosud SA | | 3,005,062 | 4,044,970 |
| Empresas CMPC SA | | 2,456,895 | 3,898,221 |
| Enel Americas SA | | 21,877,216 | 2,167,549 |
| Falabella SA | | 1,624,684 | 3,176,701 |
TOTAL CHILE | | | 13,287,441 |
| China - 12.8% | | | |
| Agricultural Bank of China Ltd. (H Shares) | | 68,637,000 | 19,591,299 |
| Anhui Conch Cement Co. Ltd. (H Shares) | | 2,639,500 | 6,792,392 |
| Bank of China Ltd. (H Shares) | | 111,920,000 | 36,046,906 |
| Bank of Communications Co. Ltd. (H Shares) | | 47,691,000 | 23,269,385 |
| China CITIC Bank Corp. Ltd. (H Shares) | | 20,274,000 | 7,645,059 |
| China Coal Energy Co. Ltd. (H Shares) | | 4,676,000 | 3,443,119 |
| China Construction Bank Corp. (H Shares) | | 90,120,000 | 47,825,644 |
| China Galaxy Securities Co. Ltd. (H Shares) | | 7,739,000 | 2,898,557 |
| China Life Insurance Co. Ltd. (H Shares) | | 16,612,000 | 18,114,683 |
| China Minsheng Banking Corp. Ltd. (H Shares) | | 13,949,500 | 4,051,755 |
| China National Building Materials Co. Ltd. (H Shares) | | 10,176,000 | 5,911,418 |
| China Petroleum & Chemical Corp. (H Shares) | | 55,938,000 | 22,169,709 |
| China Railway Group Ltd. (H Shares) | | 9,394,000 | 4,080,888 |
| China Tower Corp. Ltd. (H Shares) (c) | | 96,870,000 | 8,761,881 |
| COSCO SHIPPING Holdings Co. Ltd. (H Shares) | | 7,489,300 | 8,081,172 |
| CRRC Corp. Ltd. (H Shares) | | 9,760,000 | 2,959,215 |
| Dongfeng Motor Group Co. Ltd. (H Shares) | | 5,484,000 | 2,480,136 |
| Great Wall Motor Co. Ltd. (H Shares) | | 6,918,500 | 7,553,400 |
| Guangzhou Automobile Group Co. Ltd. (H Shares) | | 6,294,000 | 3,832,696 |
| Haitong Securities Co. Ltd. (H Shares) | | 6,159,600 | 3,013,238 |
| Industrial & Commercial Bank of China Ltd. (H Shares) | | 82,974,000 | 36,024,443 |
| New China Life Insurance Co. Ltd. (H Shares) | | 1,730,400 | 2,746,719 |
| People's Insurance Co. of China Group Ltd. (H Shares) | | 18,313,000 | 5,062,545 |
| PICC Property & Casualty Co. Ltd. (H Shares) | | 14,036,000 | 12,945,882 |
| Postal Savings Bank of China Co. Ltd. (H Shares) (c) | | 20,834,000 | 9,661,037 |
| Sinopharm Group Co. Ltd. (H Shares) | | 2,994,400 | 5,706,780 |
TOTAL CHINA | | | 310,669,958 |
| Czech Republic - 0.1% | | | |
| CEZ A/S | | 91,745 | 3,000,382 |
| Egypt - 0.1% | | | |
| Commercial International Bank SAE | | 1,225,572 | 1,642,545 |
| Greece - 0.3% | | | |
| Jumbo SA | | 202,238 | 2,876,010 |
| National Bank of Greece SA (a) | | 1,225,942 | 4,446,341 |
TOTAL GREECE | | | 7,322,351 |
| Hong Kong - 1.8% | | | |
| China Merchants Holdings International Co. Ltd. | | 3,042,823 | 3,566,270 |
| China Overseas Land and Investment Ltd. | | 8,308,000 | 15,854,699 |
| CITIC Pacific Ltd. | | 14,290,000 | 12,797,857 |
| Lenovo Group Ltd. | | 15,590,000 | 12,472,556 |
TOTAL HONG KONG | | | 44,691,382 |
| Hungary - 0.2% | | | |
| MOL Hungarian Oil and Gas PLC Series A (For. Reg.) | | 731,624 | 4,386,907 |
| India - 19.8% | | | |
| Aurobindo Pharma Ltd. | | 627,677 | 4,080,507 |
| Bajaj Auto Ltd. | | 155,048 | 6,877,422 |
| Bank of Baroda | | 2,309,815 | 4,121,281 |
| Cipla Ltd./India | | 1,134,792 | 16,003,336 |
| Divi's Laboratories Ltd. | | 200,810 | 8,754,569 |
| Dr. Reddy's Laboratories Ltd. | | 271,202 | 14,597,480 |
| GAIL India Ltd. | | 6,093,099 | 6,720,222 |
| HCL Technologies Ltd. | | 2,423,188 | 30,477,195 |
| Hero Motocorp Ltd. | | 289,978 | 9,376,995 |
| Indian Oil Corp. Ltd. | | 8,513,295 | 7,018,995 |
| Indus Towers Ltd. | | 1,803,751 | 4,041,989 |
| Infosys Ltd. | | 2,020,247 | 37,526,369 |
| ITC Ltd. | | 6,603,994 | 27,818,467 |
| Jindal Steel & Power Ltd. | | 888,220 | 4,934,138 |
| Lupin Ltd. | | 537,704 | 4,540,409 |
| Mahindra & Mahindra Ltd. | | 2,083,442 | 33,942,134 |
| Maruti Suzuki India Ltd. | | 296,745 | 34,153,994 |
| MRF Ltd. | | 4,641 | 5,088,785 |
| NTPC Ltd. | | 10,599,831 | 22,165,146 |
| Oil & Natural Gas Corp. Ltd. | | 8,145,197 | 13,189,945 |
| Power Finance Corp. Ltd. | | 2,597,827 | 3,616,810 |
| Power Grid Corp. of India Ltd. | | 5,219,971 | 14,386,765 |
| REC Ltd. | | 2,767,984 | 3,429,050 |
| Reliance Industries Ltd. | | 719,318 | 22,154,786 |
| State Bank of India | | 3,801,320 | 26,349,329 |
| Sun Pharmaceutical Industries Ltd. | | 2,410,392 | 29,610,143 |
| Tata Motors Ltd. (a) | | 4,449,006 | 22,274,811 |
| Tata Steel Ltd. | | 17,709,694 | 21,725,289 |
| Tech Mahindra Ltd. | | 1,388,612 | 17,838,246 |
| Vedanta Ltd. | | 2,904,810 | 9,853,475 |
| Wipro Ltd. | | 3,303,988 | 15,460,383 |
TOTAL INDIA | | | 482,128,465 |
| Indonesia - 2.0% | | | |
| PT Astra International Tbk | | 45,188,200 | 19,266,006 |
| PT Indofood Sukses Makmur Tbk | | 9,800,100 | 4,052,614 |
| PT Telkom Indonesia Persero Tbk | | 88,061,700 | 24,732,208 |
TOTAL INDONESIA | | | 48,050,828 |
| Korea (South) - 12.5% | | | |
| GS Engineering & Construction Corp. | | 175,625 | 2,670,083 |
| GS Holdings Corp. | | 207,501 | 6,687,390 |
| Hana Financial Group, Inc. | | 670,311 | 19,372,200 |
| Hankook Tire Co. Ltd. | | 177,017 | 4,532,951 |
| HMM Co. Ltd. | | 818,759 | 10,956,406 |
| Hyundai Mobis | | 147,795 | 22,676,838 |
| Hyundai Steel Co. | | 190,724 | 3,754,830 |
| Industrial Bank of Korea | | 615,344 | 4,505,188 |
| KB Financial Group, Inc. | | 844,074 | 28,345,197 |
| Kia Corp. | | 570,886 | 26,518,049 |
| Korea Investment Holdings Co. Ltd. | | 104,560 | 3,629,843 |
| Kumho Petro Chemical Co. Ltd. | | 44,045 | 4,042,468 |
| LG Corp. | | 272,109 | 15,098,950 |
| LG Display Co. Ltd. | | 495,178 | 4,410,230 |
| POSCO | | 169,346 | 29,456,102 |
| Samsung Electronics Co. Ltd. | | 2,082,077 | 86,648,666 |
| Shinhan Financial Group Co. Ltd. | | 815,255 | 20,679,308 |
| Woori Financial Group, Inc. | | 1,267,896 | 10,437,588 |
TOTAL KOREA (SOUTH) | | | 304,422,287 |
| Kuwait - 1.0% | | | |
| Agility Public Warehousing Co. KSC | | 3,525,016 | 8,919,195 |
| Mobile Telecommunication Co. | | 4,732,297 | 9,148,446 |
| National Bank of Kuwait | | 965,713 | 3,359,815 |
| National Industries Group Holding SAK | | 4,391,289 | 3,316,320 |
TOTAL KUWAIT | | | 24,743,776 |
| Luxembourg - 0.1% | | | |
| Ternium SA sponsored ADR | | 109,543 | 3,153,743 |
| Malaysia - 1.8% | | | |
| Axiata Group Bhd | | 10,288,700 | 6,201,945 |
| IHH Healthcare Bhd | | 7,073,200 | 8,901,341 |
| Kuala Lumpur Kepong Bhd | | 1,279,500 | 5,867,081 |
| PPB Group Bhd | | 1,588,000 | 5,609,052 |
| Sime Darby Plantation Bhd | | 5,867,200 | 5,460,169 |
| Tenaga Nasional Bhd | | 6,138,800 | 10,932,465 |
TOTAL MALAYSIA | | | 42,972,053 |
| Mexico - 2.1% | | | |
| Alfa SA de CV Series A | | 6,315,700 | 4,191,766 |
| America Movil S.A.B. de CV Series L | | 36,395,500 | 34,442,822 |
| Arca Continental S.A.B. de CV | | 650,000 | 5,324,206 |
| Fibra Uno Administracion SA de CV | | 6,366,500 | 7,429,136 |
| Sitios Latinoamerica S.A.B. de CV (a) | | 1,818,265 | 530,438 |
TOTAL MEXICO | | | 51,918,368 |
| Philippines - 0.8% | | | |
| Aboitiz Equity Ventures, Inc. | | 5,012,380 | 4,911,461 |
| ACEN Corp. | | 1,474,290 | 159,823 |
| Ayala Corp. | | 551,710 | 6,383,212 |
| Metropolitan Bank & Trust Co. | | 3,987,430 | 3,569,063 |
| PLDT, Inc. | | 173,935 | 4,890,190 |
TOTAL PHILIPPINES | | | 19,913,749 |
| Poland - 0.5% | | | |
| KGHM Polska Miedz SA (Bearer) | | 223,414 | 4,476,610 |
| Polski Koncern Naftowy Orlen SA | | 663,055 | 7,627,612 |
TOTAL POLAND | | | 12,104,222 |
| Qatar - 1.4% | | | |
| Barwa Real Estate Co. (a) | | 4,252,783 | 3,970,471 |
| Ooredoo QSC | | 1,714,980 | 4,600,907 |
| Qatar National Bank SAQ (a) | | 4,741,440 | 25,961,231 |
TOTAL QATAR | | | 34,532,609 |
| Russia - 0.2% | | | |
| Gazprom OAO (b) | | 9,889,350 | 1,551,796 |
| Inter Rao Ues JSC (b) | | 63,735,100 | 526,932 |
| Magnit OJSC (b) | | 135,409 | 4,172 |
| Mobile TeleSystems OJSC sponsored ADR (b) | | 753,517 | 750,495 |
| Sberbank of Russia (a)(b) | | 440,500 | 4,061 |
| Surgutneftegas OJSC (b) | | 29,672,400 | 544,474 |
| VTB Bank OJSC (a)(b) | | 9,075,720,096 | 519,971 |
TOTAL RUSSIA | | | 3,901,901 |
| Saudi Arabia - 4.6% | | | |
| Almarai Co. Ltd. | | 558,192 | 8,363,484 |
| Banque Saudi Fransi | | 949,344 | 10,914,468 |
| Etihad Etisalat Co. | | 842,396 | 8,205,265 |
| Jarir Marketing Co. | | 131,279 | 5,729,732 |
| Riyad Bank | | 3,013,969 | 28,835,860 |
| Saudi Electricity Co. | | 1,766,508 | 12,693,302 |
| Saudi Telecom Co. | | 3,122,079 | 33,567,615 |
| The Savola Group | | 584,174 | 4,555,175 |
TOTAL SAUDI ARABIA | | | 112,864,901 |
| Singapore - 0.2% | | | |
| Yangzijiang Shipbuilding Holdings Ltd. | | 6,028,700 | 5,110,511 |
| South Africa - 4.2% | | | |
| Anglo American Platinum Ltd. | | 116,770 | 9,288,328 |
| Aspen Pharmacare Holdings Ltd. | | 835,539 | 6,880,361 |
| Foschini Group Ltd./The | | 739,199 | 4,624,232 |
| Impala Platinum Holdings Ltd. | | 1,897,675 | 19,429,661 |
| MTN Group Ltd. | | 3,762,608 | 26,596,095 |
| MultiChoice Group Ltd. (d) | | 908,621 | 5,937,354 |
| Pepkor Holdings Ltd. (c) | | 2,815,749 | 3,475,088 |
| Sibanye-Stillwater Ltd. | | 6,001,409 | 14,056,644 |
| Tiger Brands Ltd. | | 389,616 | 3,945,846 |
| Woolworths Holdings Ltd. | | 2,349,382 | 8,069,276 |
TOTAL SOUTH AFRICA | | | 102,302,885 |
| Taiwan - 13.8% | | | |
| Acer, Inc. | | 6,806,000 | 4,663,378 |
| ASE Technology Holding Co. Ltd. | | 7,588,000 | 18,717,617 |
| ASUSTeK Computer, Inc. | | 1,559,000 | 11,407,081 |
| AUO Corp. | | 15,986,200 | 8,376,226 |
| Catcher Technology Co. Ltd. | | 1,630,000 | 8,565,914 |
| Cathay Financial Holding Co. Ltd. | | 10,727,000 | 12,571,483 |
| Evergreen Marine Corp. (Taiwan) | | 2,268,300 | 9,669,847 |
| Foxconn Technology Co. Ltd. | | 2,367,000 | 3,317,058 |
| Fubon Financial Holding Co. Ltd. | | 16,196,215 | 25,609,443 |
| Hon Hai Precision Industry Co. Ltd. (Foxconn) | | 10,644,000 | 33,825,572 |
| Innolux Corp. | | 21,335,040 | 7,838,415 |
| Macronix International Co. Ltd. | | 4,144,000 | 3,828,710 |
| Nanya Technology Corp. | | 2,627,000 | 4,438,876 |
| Novatek Microelectronics Corp. | | 1,263,000 | 9,437,062 |
| Pegatron Corp. | | 4,708,000 | 8,612,017 |
| Pou Chen Corp. | | 5,659,000 | 4,781,043 |
| Powertech Technology, Inc. | | 1,594,000 | 3,686,749 |
| Radiant Opto-Electronics Corp. | | 1,039,000 | 3,169,765 |
| Shin Kong Financial Holding Co. Ltd. | | 31,580,309 | 7,832,904 |
| Simplo Technology Co. Ltd. | | 392,000 | 3,117,381 |
| Sino-American Silicon Products, Inc. | | 1,243,000 | 4,778,694 |
| Taiwan Semiconductor Manufacturing Co. Ltd. | | 6,808,000 | 81,767,266 |
| Uni-President Enterprises Corp. | | 9,959,000 | 20,224,298 |
| United Microelectronics Corp. | | 20,562,000 | 24,700,860 |
| Winbond Electronics Corp. | | 6,218,000 | 3,759,255 |
| Yang Ming Marine Transport Corp. | | 3,898,000 | 7,275,364 |
TOTAL TAIWAN | | | 335,972,278 |
| Thailand - 1.8% | | | |
| Bangkok Bank PCL: | | | |
| (For. Reg.) | | 9,200 | 35,185 |
| NVDR | | 1,270,100 | 4,857,394 |
| Bank of Ayudhya PCL | | 79,200 | 66,095 |
| Bank of Ayudhya PCL NVDR | | 3,696,300 | 3,084,703 |
| Charoen Pokphand Foods PCL: | | | |
| (For. Reg.) | | 83,100 | 55,152 |
| (NVDR) | | 7,608,700 | 5,049,801 |
| Kasikornbank PCL: | | | |
| NVDR | | 2,605,800 | 9,999,916 |
| (For. Reg.) | | 12,500 | 47,970 |
| PTT Global Chemical PCL: | | | |
| (For. Reg.) | | 78,100 | 89,298 |
| NVDR | | 3,648,400 | 4,171,518 |
| PTT Oil & Retail Business PCL NVDR | | 5,700,900 | 3,611,294 |
| SCB X PCL NVDR unit | | 1,892,700 | 5,273,392 |
| Thai Beverage PCL | | 19,066,900 | 7,744,750 |
TOTAL THAILAND | | | 44,086,468 |
| Turkey - 0.5% | | | |
| Akbank TAS | | 6,534,513 | 5,132,336 |
| Koc Holding A/S | | 2,207,910 | 6,594,936 |
TOTAL TURKEY | | | 11,727,272 |
| United Arab Emirates - 1.6% | | | |
| Emaar Properties PJSC (a) | | 6,599,664 | 10,888,341 |
| Emirates NBD Bank PJSC | | 5,499,713 | 19,839,154 |
| Emirates Telecommunications Corp. | | 1,063,058 | 7,466,962 |
TOTAL UNITED ARAB EMIRATES | | | 38,194,457 |
| United States of America - 0.1% | | | |
| 360 DigiTech, Inc. ADR | | 229,611 | 2,332,848 |
| TOTAL COMMON STOCKS (Cost $2,958,453,999) | | | 2,349,751,658 |
| | | | |
| Nonconvertible Preferred Stocks - 2.6% |
| | | Shares | Value ($) |
| Brazil - 2.5% | | | |
| Gerdau SA | | 2,558,800 | 12,755,609 |
| Petroleo Brasileiro SA - Petrobras (PN) (non-vtg.) | | 8,162,400 | 47,105,052 |
TOTAL BRAZIL | | | 59,860,661 |
| Colombia - 0.1% | | | |
| Bancolombia SA (PN) | | 463,194 | 2,930,866 |
| Russia - 0.0% | | | |
| AK Transneft OAO (b) | | 2,792 | 1,214,891 |
| TOTAL NONCONVERTIBLE PREFERRED STOCKS (Cost $61,671,874) | | | 64,006,418 |
| | | | |
| Government Obligations - 0.1% |
| | | Principal Amount (e) | Value ($) |
| United States of America - 0.1% | | | |
U.S. Treasury Bills, yield at date of purchase 1.23% 1/26/23 (f) (Cost $1,894,488) | | 1,900,000 | 1,881,901 |
| | | | |
| Money Market Funds - 0.9% |
| | | Shares | Value ($) |
| Fidelity Cash Central Fund 3.10% (g) | | 19,451,280 | 19,455,170 |
| Fidelity Securities Lending Cash Central Fund 3.10% (g)(h) | | 1,612,236 | 1,612,397 |
| TOTAL MONEY MARKET FUNDS (Cost $21,067,567) | | | 21,067,567 |
| | | | |
| TOTAL INVESTMENT IN SECURITIES - 100.2% (Cost $3,043,087,928) | 2,436,707,544 |
NET OTHER ASSETS (LIABILITIES) - (0.2)% | (3,802,645) |
| NET ASSETS - 100.0% | 2,432,904,899 |
| | |
| Futures Contracts |
| | Number of contracts | Expiration Date | Notional Amount ($) | Value ($) | Unrealized Appreciation/ (Depreciation) ($) |
| Purchased | | | | | |
| | | | | | |
| Equity Index Contracts | | | | | |
| ICE E-mini MSCI Emerging Markets Index Contracts (United States) | 460 | Dec 2022 | 19,632,800 | (182,137) | (182,137) |
| | | | | | |
| The notional amount of futures purchased as a percentage of Net Assets is 0.8% |
Categorizations in the Schedule of Investments are based on country or territory of incorporation.
Legend
| (c) | Security exempt from registration under Rule 144A of the Securities Act of 1933. These securities may be resold in transactions exempt from registration, normally to qualified institutional buyers. At the end of the period, the value of these securities amounted to $45,576,023 or 1.9% of net assets. |
| (d) | Security or a portion of the security is on loan at period end. |
| (e) | Amount is stated in United States dollars unless otherwise noted. |
| (f) | Security or a portion of the security was pledged to cover margin requirements for futures contracts. At period end, the value of securities pledged amounted to $1,058,817. |
| (g) | Affiliated fund that is generally available only to investment companies and other accounts managed by Fidelity Investments. The rate quoted is the annualized seven-day yield of the fund at period end. A complete unaudited listing of the fund's holdings as of its most recent quarter end is available upon request. In addition, each Fidelity Central Fund's financial statements, which are not covered by the Fund's Report of Independent Registered Public Accounting Firm, are available on the SEC's website or upon request. |
| (h) | Investment made with cash collateral received from securities on loan. |
Affiliated Central Funds
Fiscal year to date information regarding the Fund's investments in Fidelity Central Funds, including the ownership percentage, is presented below.
| Affiliate | Value, beginning of period ($) | Purchases ($) | Sales Proceeds ($) | Dividend Income ($) | Realized Gain (loss) ($) | Change in Unrealized appreciation (depreciation) ($) | Value, end of period ($) | % ownership, end of period |
| Fidelity Cash Central Fund 3.10% | 20,250,590 | 923,585,592 | 924,381,012 | 407,960 | - | - | 19,455,170 | 0.0% |
| Fidelity Securities Lending Cash Central Fund 3.10% | 6,606,250 | 221,712,137 | 226,705,990 | 158,955 | - | - | 1,612,397 | 0.0% |
| Total | 26,856,840 | 1,145,297,729 | 1,151,087,002 | 566,915 | - | - | 21,067,567 | |
| | | | | | | | | |
Amounts in the income column in the above table include any capital gain distributions from underlying funds, which are presented in the corresponding line item in the Statement of Operations, if applicable.
Amount for Fidelity Securities Lending Cash Central Fund represents the income earned on investing cash collateral, less rebates paid to borrowers and any lending agent fees associated with the loan, plus any premium payments received for lending certain types of securities.
Investment Valuation
The following is a summary of the inputs used, as of October 31, 2022, involving the Fund's assets and liabilities carried at fair value. The inputs or methodology used for valuing securities may not be an indication of the risk associated with investing in those securities. For more information on valuation inputs, and their aggregation into the levels used below, please refer to the Investment Valuation section in the accompanying Notes to Financial Statements.
| Valuation Inputs at Reporting Date: |
| Description | Total ($) | Level 1 ($) | Level 2 ($) | Level 3 ($) |
Investments in Securities: | | | | |
|
| Equities: | | | | |
Communication Services | 238,658,617 | 154,360,822 | 83,474,060 | 823,735 |
Consumer Discretionary | 329,396,600 | 296,055,300 | 33,341,300 | - |
Consumer Staples | 133,645,574 | 133,641,402 | - | 4,172 |
Energy | 130,407,286 | 104,926,416 | 22,169,709 | 3,311,161 |
Financials | 558,386,027 | 347,665,452 | 210,196,543 | 524,032 |
Health Care | 99,074,926 | 84,477,446 | 14,597,480 | - |
Industrials | 127,559,322 | 116,264,649 | 11,294,673 | - |
Information Technology | 462,430,671 | 317,374,315 | 145,056,356 | - |
Materials | 215,866,029 | 152,923,622 | 62,942,407 | - |
Real Estate | 40,270,046 | 40,270,046 | - | - |
Utilities | 78,062,978 | 77,376,223 | 159,823 | 526,932 |
|
| Government Obligations | 1,881,901 | - | 1,881,901 | - |
|
| Money Market Funds | 21,067,567 | 21,067,567 | - | - |
| Total Investments in Securities: | 2,436,707,544 | 1,846,403,260 | 585,114,252 | 5,190,032 |
Derivative Instruments: | | | | |
|
| Liabilities | | | | |
Futures Contracts | (182,137) | (182,137) | - | - |
| Total Liabilities | (182,137) | (182,137) | - | - |
| Total Derivative Instruments: | (182,137) | (182,137) | - | - |
The following is a reconciliation of Investments in Securities for which Level 3 inputs were used in determining value:
| |
| Investments in Securities: | |
| Energy | | | |
| Beginning Balance | $ | - | |
| Net Realized Gain (Loss) on Investment Securities | | (651,526) | |
| Net Unrealized Gain (Loss) on Investment Securities | | (64,619,935) | |
| Cost of Purchases | | 18,685,572 | |
| Proceeds of Sales | | (4,756,982) | |
| Amortization/Accretion | | - | |
| Transfers into Level 3 | | 54,654,032 | |
| Transfers out of Level 3 | | - | |
| Ending Balance | $ | 3,311,161 | |
| The change in unrealized gain (loss) for the period attributable to Level 3 securities held at October 31, 2022 | $ | (64,619,935) | |
| Other Investments in Securities | | | |
| Beginning Balance | $ | - | |
| Net Realized Gain (Loss) on Investment Securities | | (81,914) | |
| Net Unrealized Gain (Loss) on Investment Securities | | (31,879,961) | |
| Cost of Purchases | | 10,951,382 | |
| Proceeds of Sales | | (389,309) | |
| Amortization/Accretion | | - | |
| Transfers into Level 3 | | 23,278,673 | |
| Transfers out of Level 3 | | - | |
| Ending Balance | $ | 1,878,871 | |
| The change in unrealized gain (loss) for the period attributable to Level 3 securities held at October 31, 2022 | $ | (31,879,961) | |
| The information used in the above reconciliation represents fiscal year to date activity for any Investments in Securities identified as using Level 3 inputs at either the beginning or the end of the current fiscal period. Cost of purchases and proceeds of sales may include securities received and/or delivered through in-kind transactions. Transfers into Level 3 were attributable to a lack of observable market data resulting from decreases in market activity, decreases in liquidity, security restructurings or corporate actions. Transfers out of Level 3 were attributable to observable market data becoming available for those securities. Transfers in or out of Level 3 represent the beginning value of any Security or Instrument where a change in the pricing level occurred from the beginning to the end of the period. The cost of purchases and the proceeds of sales may include securities received or delivered through corporate actions or exchanges. Realized and unrealized gains (losses) disclosed in the reconciliation are included in Net Gain (Loss) on the Fund's Statement of Operations. | |
Value of Derivative Instruments
The following table is a summary of the Fund's value of derivative instruments by primary risk exposure as of October 31, 2022. For additional information on derivative instruments, please refer to the Derivative Instruments section in the accompanying Notes to Financial Statements.
Primary Risk Exposure / Derivative Type | Value |
| Asset ($) | Liability ($) |
| Equity Risk | | |
Futures Contracts (a) | 0 | (182,137) |
| Total Equity Risk | 0 | (182,137) |
| Total Value of Derivatives | 0 | (182,137) |
(a)Reflects gross cumulative appreciation (depreciation) on futures contracts as presented in the Schedule of Investments. In the Statement of Assets and Liabilities, the period end daily variation margin is included in receivable or payable for daily variation margin on futures contracts, and the net cumulative appreciation (depreciation) is included in Total accumulated earnings (loss).
| Statement of Assets and Liabilities |
| | | | October 31, 2022 |
| | | | | |
| Assets | | | | |
| Investment in securities, at value (including securities loaned of $981,496) - See accompanying schedule: | | | | |
Unaffiliated issuers (cost $3,022,020,361) | | $2,415,639,977 | | |
Fidelity Central Funds (cost $21,067,567) | | 21,067,567 | | |
| | | | | |
| Total Investment in Securities (cost $3,043,087,928) | | | $ | 2,436,707,544 |
| Foreign currency held at value (cost $1,991,567) | | | | 1,978,550 |
| Receivable for fund shares sold | | | | 5,551,917 |
| Dividends receivable | | | | 2,978,423 |
| Distributions receivable from Fidelity Central Funds | | | | 120,554 |
| Prepaid expenses | | | | 3,456 |
| Other receivables | | | | 4,123 |
Total assets | | | | 2,447,344,567 |
| Liabilities | | | | |
| Payable for investments purchased | | $612,755 | | |
| Payable for fund shares redeemed | | 5,239,003 | | |
| Accrued management fee | | 306,643 | | |
| Payable for daily variation margin on futures contracts | | 60,046 | | |
| Deferred taxes | | 6,054,685 | | |
| Other payables and accrued expenses | | 554,139 | | |
| Collateral on securities loaned | | 1,612,397 | | |
| Total Liabilities | | | | 14,439,668 |
| Net Assets | | | $ | 2,432,904,899 |
| Net Assets consist of: | | | | |
| Paid in capital | | | $ | 3,105,475,059 |
| Total accumulated earnings (loss) | | | | (672,570,160) |
| Net Assets | | | $ | 2,432,904,899 |
Net Asset Value , offering price and redemption price per share ($2,432,904,899 ÷ 238,405,794 shares) | | | $ | 10.20 |
| | | | | |
| Statement of Operations |
| | | | Year ended October 31, 2022 |
| Investment Income | | | | |
| Dividends | | | $ | 148,040,880 |
| Interest | | | | 26,054 |
| Income from Fidelity Central Funds (including $158,955 from security lending) | | | | 566,915 |
| Income before foreign taxes withheld | | | | 148,633,849 |
| Less foreign taxes withheld | | | | (16,513,679) |
| Total Income | | | | 132,120,170 |
| Expenses | | | | |
| Management fee | $ | 3,833,657 | | |
| Custodian fees and expenses | | 1,573,036 | | |
| Independent trustees' fees and expenses | | 8,188 | | |
| Registration fees | | 170,110 | | |
| Audit | | 75,470 | | |
| Legal | | 2,336 | | |
| Interest | | 6,921 | | |
| Miscellaneous | | 9,120 | | |
| Total Expenses | | | | 5,678,838 |
| Net Investment income (loss) | | | | 126,441,332 |
| Realized and Unrealized Gain (Loss) | | | | |
| Net realized gain (loss) on: | | | | |
| Investment Securities: | | | | |
| Unaffiliated issuers(net of foreign taxes of $1,574,974) | | (147,287,075) | | |
| Foreign currency transactions | | (3,185,384) | | |
| Futures contracts | | (9,590,754) | | |
| Total net realized gain (loss) | | | | (160,063,213) |
| Change in net unrealized appreciation (depreciation) on: | | | | |
| Investment Securities: | | | | |
| Unaffiliated issuers (net of decrease in deferred foreign taxes of $2,358,105) | | (723,993,382) | | |
| Assets and liabilities in foreign currencies | | (3,419) | | |
| Futures contracts | | (14,320) | | |
| Total change in net unrealized appreciation (depreciation) | | | | (724,011,121) |
| Net gain (loss) | | | | (884,074,334) |
| Net increase (decrease) in net assets resulting from operations | | | $ | (757,633,002) |
| Statement of Changes in Net Assets |
| |
| | Year ended October 31, 2022 | | Year ended October 31, 2021 |
| Increase (Decrease) in Net Assets | | | | |
| Operations | | | | |
| Net investment income (loss) | $ | 126,441,332 | $ | 50,228,082 |
| Net realized gain (loss) | | (160,063,213) | | 49,414,723 |
| Change in net unrealized appreciation (depreciation) | | (724,011,121) | | 83,259,274 |
| Net increase (decrease) in net assets resulting from operations | | (757,633,002) | | 182,902,079 |
| Distributions to shareholders | | (110,523,013) | | (13,732,853) |
| Share transactions | | | | |
| Proceeds from sales of shares | | 1,475,059,590 | | 949,000,000 |
| Reinvestment of distributions | | 110,523,013 | | 13,732,853 |
| Cost of shares redeemed | | (254,572,119) | | (28) |
Net increase (decrease) in net assets resulting from share transactions | | 1,331,010,484 | | 962,732,825 |
| Total increase (decrease) in net assets | | 462,854,469 | | 1,131,902,051 |
| | | | | |
| Net Assets | | | | |
| Beginning of period | | 1,970,050,430 | | 838,148,379 |
| End of period | $ | 2,432,904,899 | $ | 1,970,050,430 |
| | | | | |
| Other Information | | | | |
| Shares | | | | |
| Sold | | 116,250,779 | | 65,341,811 |
| Issued in reinvestment of distributions | | 8,108,805 | | 1,030,995 |
| Redeemed | | (23,481,271) | | (2) |
| Net increase (decrease) | | 100,878,313 | | 66,372,804 |
| | | | | |
Financial Highlights
| Fidelity® SAI Emerging Markets Value Index Fund |
| |
| Years ended October 31, | | 2022 | | 2021 | | 2020 A |
Selected Per-Share Data | | | | | | |
| Net asset value, beginning of period | $ | 14.32 | $ | 11.78 | $ | 10.00 |
| Income from Investment Operations | | | | | | |
Net investment income (loss) B,C | | .61 | | .51 | | .19 |
| Net realized and unrealized gain (loss) | | (4.04) | | 2.22 | | 1.59 |
| Total from investment operations | | (3.43) | | 2.73 | | 1.78 |
| Distributions from net investment income | | (.37) | | (.17) | | - |
| Distributions from net realized gain | | (.32) | | (.02) | | - |
| Total distributions | | (.69) | | (.19) | | - |
| Net asset value, end of period | $ | 10.20 | $ | 14.32 | $ | 11.78 |
Total Return D,E | | (25.19)% | | 23.32% | | 17.80% |
Ratios to Average Net Assets C,F,G | | | | | | |
| Expenses before reductions | | .22% | | .22% | | .27% H,I |
| Expenses net of fee waivers, if any | | .22% | | .22% | | .25% I |
| Expenses net of all reductions | | .22% | | .22% | | .25% I |
| Net investment income (loss) | | 4.95% | | 3.53% | | 3.43% I |
| Supplemental Data | | | | | | |
| Net assets, end of period (000 omitted) | $ | 2,432,905 | $ | 1,970,050 | $ | 838,148 |
Portfolio turnover rate J | | 30% | | 33% | | 17% K |
A For the period May 12, 2020 (commencement of operations) through October 31, 2020.
B Calculated based on average shares outstanding during the period.
C Net investment income (loss) is affected by the timing of the declaration of dividends by any underlying mutual funds or exchange-traded funds (ETFs). Net investment income (loss) of any mutual funds or ETFs is not included in the Fund's net investment income (loss) ratio.
D Total returns for periods of less than one year are not annualized.
E Total returns would have been lower if certain expenses had not been reduced during the applicable periods shown.
F Fees and expenses of any underlying mutual funds or exchange-traded funds (ETFs) are not included in the Fund's expense ratio. The Fund indirectly bears its proportionate share of these expenses. For additional expense information related to investments in Fidelity Central Funds, please refer to the "Investments in Fidelity Central Funds" note found in the Notes to Financial Statements section of the most recent Annual or Semi-Annual report.
G Expense ratios reflect operating expenses of the class. Expenses before reductions do not reflect amounts reimbursed, waived, or reduced through arrangements with the investment adviser, brokerage services, or other offset arrangements, if applicable, and do not represent the amount paid by the class during periods when reimbursements, waivers or reductions occur.
H Audit fees are not annualized.
I Annualized.
J Amount does not include the portfolio activity of any underlying mutual funds or exchange-traded funds (ETFs).
K Amount not annualized.
For the period ended October 31, 2022
1. Organization.
Fidelity SAI Emerging Markets Value Index Fund (the Fund) is a fund of Fidelity Salem Street Trust (the Trust) and is authorized to issue an unlimited number of shares. Shares are offered exclusively to certain clients of Fidelity Management & Research Company LLC (FMR) or its affiliates. The Trust is registered under the Investment Company Act of 1940, as amended (the 1940 Act), as an open-end management investment company organized as a Massachusetts business trust. The Fund's investments in emerging markets can be subject to social, economic, regulatory, and political uncertainties and can be extremely volatile.
2. Investments in Fidelity Central Funds.
Funds may invest in Fidelity Central Funds, which are open-end investment companies generally available only to other investment companies and accounts managed by the investment adviser and its affiliates. The Schedule of Investments lists any Fidelity Central Funds held as an investment as of period end, but does not include the underlying holdings of each Fidelity Central Fund. An investing fund indirectly bears its proportionate share of the expenses of the underlying Fidelity Central Funds.
Based on its investment objective, each Fidelity Central Fund may invest or participate in various investment vehicles or strategies that are similar to those of the investing fund. These strategies are consistent with the investment objectives of the investing fund and may involve certain economic risks which may cause a decline in value of each of the Fidelity Central Funds and thus a decline in the value of the investing fund.
| Fidelity Central Fund | Investment Manager | Investment Objective | Investment Practices | Expense Ratio A |
| Fidelity Money Market Central Funds | Fidelity Management & Research Company LLC (FMR) | Each fund seeks to obtain a high level of current income consistent with the preservation of capital and liquidity. | Short-term Investments | Less than .005% |
A Expenses expressed as a percentage of average net assets and are as of each underlying Central Fund's most recent annual or semi-annual shareholder report.
A complete unaudited list of holdings for each Fidelity Central Fund is available upon request or at the Securities and Exchange Commission website at www.sec.gov. In addition, the financial statements of the Fidelity Central Funds which contain the significant accounting policies (including investment valuation policies) of those funds, and are not covered by the Report of Independent Registered Public Accounting Firm, are available on the Securities and Exchange Commission website or upon request.
3. Significant Accounting Policies.
The Fund is an investment company and applies the accounting and reporting guidance of the Financial Accounting Standards Board (FASB) Accounting Standards Codification Topic 946 Financial Services - Investment Companies . The financial statements have been prepared in conformity with accounting principles generally accepted in the United States of America (GAAP), which require management to make certain estimates and assumptions at the date of the financial statements. Actual results could differ from those estimates. Subsequent events, if any, through the date that the financial statements were issued have been evaluated in the preparation of the financial statements. The Fund's Schedule of Investments lists any underlying mutual funds or exchange-traded funds (ETFs) but does not include the underlying holdings of these funds. The following summarizes the significant accounting policies of the Fund:
Investment Valuation. Investments are valued as of 4:00 p.m. Eastern time on the last calendar day of the period. The Board of Trustees (the Board) has designated the Fund's investment adviser as the valuation designee responsible for the fair valuation function and performing fair value determinations as needed. The investment adviser has established a Fair Value Committee (the Committee) to carry out the day-to-day fair valuation responsibilities and has adopted policies and procedures to govern the fair valuation process and the activities of the Committee. In accordance with these fair valuation policies and procedures, which have been approved by the Board, the Fund attempts to obtain prices from one or more third party pricing services or brokers to value its investments. When current market prices, quotations or currency exchange rates are not readily available or reliable, investments will be fair valued in good faith by the Committee, in accordance with the policies and procedures. Factors used in determining fair value vary by investment type and may include market or investment specific events, transaction data, estimated cash flows, and market observations of comparable investments. The frequency that the fair valuation procedures are used cannot be predicted and they may be utilized to a significant extent. The Committee manages the Fund's fair valuation practices and maintains the fair valuation policies and procedures. The Fund's investment adviser reports to the Board information regarding the fair valuation process and related material matters.
The Fund categorizes the inputs to valuation techniques used to value its investments into a disclosure hierarchy consisting of three levels as shown below:
Level 1 - unadjusted quoted prices in active markets for identical investments
Level 2 - other significant observable inputs (including quoted prices for similar investments, interest rates, prepayment speeds, etc.)
Level 3 - unobservable inputs (including the Fund's own assumptions based on the best information available)
Valuation techniques used to value the Fund's investments by major category are as follows:
Equity securities, including restricted securities, for which market quotations are readily available, are valued at the last reported sale price or official closing price as reported by a third party pricing service on the primary market or exchange on which they are traded and are categorized as Level 1 in the hierarchy. In the event there were no sales during the day or closing prices are not available, securities are valued at the last quoted bid price or may be valued using the last available price and are generally categorized as Level 2 in the hierarchy. For foreign equity securities, when market or security specific events arise, comparisons to the valuation of American Depositary Receipts (ADRs), futures contracts, ETFs and certain indexes as well as quoted prices for similar securities may be used and would be categorized as Level 2 in the hierarchy. For equity securities, including restricted securities, where observable inputs are limited, assumptions about market activity and risk are used and these securities may be categorized as Level 3 in the hierarchy.
Debt securities, including restricted securities, are valued based on evaluated prices received from third party pricing services or from brokers who make markets in such securities. U.S. government and government agency obligations are valued by pricing services who utilize matrix pricing which considers yield or price of bonds of comparable quality, coupon, maturity and type or by broker-supplied prices. When independent prices are unavailable or unreliable, debt securities may be valued utilizing pricing methodologies which consider similar factors that would be used by third party pricing services. Debt securities are generally categorized as Level 2 in the hierarchy but may be Level 3 depending on the circumstances.
Futures contracts are valued at the settlement price established each day by the board of trade or exchange on which they are traded and are categorized as Level 1 in the hierarchy. Investments in open-end mutual funds, including the Fidelity Central Funds, are valued at their closing net asset value (NAV) each business day and are categorized as Level 1 in the hierarchy.
Changes in valuation techniques may result in transfers in or out of an assigned level within the disclosure hierarchy. The aggregate value of investments by input level as of October 31, 2022, as well as a roll forward of Level 3 investments, is included at the end of the Fund's Schedule of Investments.
Foreign Currency. Certain Funds may use foreign currency contracts to facilitate transactions in foreign-denominated securities. Gains and losses from these transactions may arise from changes in the value of the foreign currency or if the counterparties do not perform under the contracts' terms.
Foreign-denominated assets, including investment securities, and liabilities are translated into U.S. dollars at the exchange rates at period end. Purchases and sales of investment securities, income and dividends received, and expenses denominated in foreign currencies are translated into U.S. dollars at the exchange rate in effect on the transaction date.
The effects of exchange rate fluctuations on investments are included with the net realized and unrealized gain (loss) on investment securities. Other foreign currency transactions resulting in realized and unrealized gain (loss) are disclosed separately.
Investment Transactions and Income. For financial reporting purposes, the Fund's investment holdings and NAV include trades executed through the end of the last business day of the period. The NAV per share for processing shareholder transactions is calculated as of the close of business of the New York Stock Exchange (NYSE), normally 4:00 p.m. Eastern time and includes trades executed through the end of the prior business day. Gains and losses on securities sold are determined on the basis of identified cost. Commissions paid to certain brokers with whom the investment adviser, or its affiliates, places trades on behalf of a fund include an amount in addition to trade execution, which may be rebated back to a fund. Any such rebates are included in net realized gain (loss) on investments in the Statement of Operations. Dividend income is recorded on the ex-dividend date, except for certain dividends from foreign securities where the ex-dividend date may have passed, which are recorded as soon as the Fund is informed of the ex-dividend date. Non-cash dividends included in dividend income, if any, are recorded at the fair market value of the securities received. Income and capital gain distributions from Fidelity Central Funds, if any, are recorded on the ex-dividend date. Interest income is accrued as earned and includes coupon interest and amortization of premium and accretion of discount on debt securities as applicable. Investment income is recorded net of foreign taxes withheld where recovery of such taxes is uncertain. Funds may file withholding tax reclaims in certain jurisdictions to recover a portion of amounts previously withheld. Any withholding tax reclaims income is included in the Statement of Operations in foreign taxes withheld. Any receivables for withholding tax reclaims are included in the Statement of Assets and Liabilities in dividends receivable.
Expenses. Expenses directly attributable to a fund are charged to that fund. Expenses attributable to more than one fund are allocated among the respective funds on the basis of relative net assets or other appropriate methods. Expenses included in the accompanying financial statements reflect the expenses of that fund and do not include any expenses associated with any underlying mutual funds or exchange-traded funds. Although not included in a fund's expenses, a fund indirectly bears its proportionate share of these expenses through the net asset value of each underlying mutual fund or exchange-traded fund. Expense estimates are accrued in the period to which they relate and adjustments are made when actual amounts are known.
Income Tax Information and Distributions to Shareholders. Each year, the Fund intends to qualify as a regulated investment company under Subchapter M of the Internal Revenue Code, including distributing substantially all of its taxable income and realized gains. As a result, no provision for U.S. Federal income taxes is required. As of October 31, 2022, the Fund did not have any unrecognized tax benefits in the financial statements; nor is the Fund aware of any tax positions for which it is reasonably possible that the total amounts of unrecognized tax benefits will significantly change in the next twelve months. The Fund files a U.S. federal tax return, in addition to state and local tax returns as required. The Fund's federal income tax returns are subject to examination by the Internal Revenue Service (IRS) for a period of three fiscal years after they are filed. State and local tax returns may be subject to examination for an additional fiscal year depending on the jurisdiction. Foreign taxes are provided for based on the Fund's understanding of the tax rules and rates that exist in the foreign markets in which it invests. The Fund is subject to a tax imposed on capital gains by certain countries in which it invests. An estimated deferred tax liability for net unrealized appreciation on the applicable securities is included in Deferred taxes on the Statement of Assets & Liabilities.
Distributions are declared and recorded on the ex-dividend date. Income and capital gain distributions are determined in accordance with income tax regulations, which may differ from GAAP. In addition, the Fund claimed a portion of the payment made to redeeming shareholders as a distribution for income tax purposes.
Capital accounts within the financial statements are adjusted for permanent book-tax differences. These adjustments have no impact on net assets or the results of operations. Capital accounts are not adjusted for temporary book-tax differences which will reverse in a subsequent period.
Book-tax differences are primarily due to, futures contracts, foreign currency transactions, certain foreign taxes, passive foreign investment companies (PFIC), capital loss carryforwards and losses deferred due to wash sales.
As of period end, the cost and unrealized appreciation (depreciation) in securities, and derivatives if applicable, for federal income tax purposes were as follows:
| Gross unrealized appreciation | $141,283,952 |
| Gross unrealized depreciation | (774,573,163) |
| Net unrealized appreciation (depreciation) | $(633,289,211) |
| Tax Cost | $3,069,996,755 |
The tax-based components of distributable earnings as of period end were as follows:
| Undistributed ordinary income | $100,201,121 |
| Capital loss carryforward | $(133,416,706) |
| Net unrealized appreciation (depreciation) on securities and other investments | $(633,299,890) |
Capital loss carryforwards are only available to offset future capital gains of the Fund to the extent provided by regulations and may be limited. The capital loss carryforward information presented below, including any applicable limitation, is estimated as of fiscal period end and is subject to adjustment.
| Short-term | $(102,356,221) |
| Long-term | $(31,060,485) |
| Total capital loss carryforward | $(133,416,706) |
The tax character of distributions paid was as follows:
| | October 31, 2022 | October 31, 2021 |
| Ordinary Income | $96,324,436 | $13,163,616 |
| Long-term Capital Gains | 14,198,577 | 569,237 |
| Total | $110,523,013 | $13,732,853 |
Restricted Securities (including Private Placements). Funds may invest in securities that are subject to legal or contractual restrictions on resale. These securities generally may be resold in transactions exempt from registration or to the public if the securities are registered. Disposal of these securities may involve time-consuming negotiations and expense, and prompt sale at an acceptable price may be difficult. Information regarding restricted securities held at period end is included at the end of the Schedule of Investments, if applicable.
4. Derivative Instruments.
Risk Exposures and the Use of Derivative Instruments. The Fund's investment objectives allow for various types of derivative instruments, including futures contracts. Derivatives are investments whose value is primarily derived from underlying assets, indices or reference rates and may be transacted on an exchange or over-the-counter (OTC). Derivatives may involve a future commitment to buy or sell a specified asset based on specified terms, to exchange future cash flows at periodic intervals based on a notional principal amount, or for one party to make one or more payments upon the occurrence of specified events in exchange for periodic payments from the other party.
Derivatives were used to increase returns and to manage exposure to certain risks as defined below. The success of any strategy involving derivatives depends on analysis of numerous economic factors, and if the strategies for investment do not work as intended, the objectives may not be achieved.
Derivatives were used to increase or decrease exposure to the following risk(s):
| Equity Risk | Equity risk relates to the fluctuations in the value of financial instruments as a result of changes in market prices (other than those arising from interest rate risk or foreign exchange risk), whether caused by factors specific to an individual investment, its issuer, or all factors affecting all instruments traded in a market or market segment. |
Funds are also exposed to additional risks from investing in derivatives, such as liquidity risk and counterparty credit risk. Liquidity risk is the risk that a fund will be unable to close out the derivative in the open market in a timely manner. Counterparty credit risk is the risk that the counterparty will not be able to fulfill its obligation to a fund. Counterparty credit risk related to exchange-traded contracts may be mitigated by the protection provided by the exchange on which they trade.
Investing in derivatives may involve greater risks than investing in the underlying assets directly and, to varying degrees, may involve risk of loss in excess of any initial investment and collateral received and amounts recognized in the Statement of Assets and Liabilities. In addition, there may be the risk that the change in value of the derivative contract does not correspond to the change in value of the underlying instrument.
Futures Contracts. A futures contract is an agreement between two parties to buy or sell a specified underlying instrument for a fixed price at a specified future date. Futures contracts were used to manage exposure to the stock market.
Upon entering into a futures contract, a fund is required to deposit either cash or securities (initial margin) with a clearing broker in an amount equal to a certain percentage of the face value of the contract. Futures contracts are marked-to-market daily and subsequent daily payments are made or received by a fund depending on the daily fluctuations in the value of the futures contracts and are recorded as unrealized appreciation or (depreciation). This receivable and/or payable, if any, is included in daily variation margin on futures contracts in the Statement of Assets and Liabilities. Realized gain or (loss) is recorded upon the expiration or closing of a futures contract. The net realized gain (loss) and change in net unrealized appreciation (depreciation) on futures contracts during the period is presented in the Statement of Operations.
Any open futures contracts at period end are presented in the Schedule of Investments under the caption "Futures Contracts". The notional amount at value reflects each contract's exposure to the underlying instrument or index at period end, and is representative of volume of activity during the period unless an average notional amount is presented. Any securities deposited to meet initial margin requirements are identified in the Schedule of Investments. Any cash deposited to meet initial margin requirements is presented as segregated cash with brokers for derivative instruments in the Statement of Assets and Liabilities.
5. Purchases and Sales of Investments.
Purchases and sales of securities, other than short-term securities, U.S. government securities and in-kind transactions, as applicable, are noted in the table below.
| | Purchases ($) | Sales ($) |
| Fidelity SAI Emerging Markets Value Index Fund | 2,073,407,751 | 741,508,042 |
6. Fees and Other Transactions with Affiliates.
Management Fee. Fidelity Management & Research Company LLC (the investment adviser) and its affiliates provide the Fund with investment management related services for which the Fund pays a monthly management fee that is based on an annual rate of .15% of the Fund's average net assets.
Sub-Adviser. Geode Capital Management, LLC (Geode), serves as sub-adviser for the Fund. Geode provides discretionary investment advisory services to the Fund and is paid by the investment adviser for providing these services.
Interfund Lending Program. Pursuant to an Exemptive Order issued by the Securities and Exchange Commission (the SEC), the Fund, along with other registered investment companies having management contracts with Fidelity Management & Research Company LLC (FMR), or other affiliated entities of FMR, may participate in an interfund lending program. This program provides an alternative credit facility allowing the Fund to borrow from, or lend money to, other participating affiliated funds. At period end, there were no interfund loans outstanding. Activity in this program during the period for which loans were outstanding was as follows:
| | Borrower or Lender | Average Loan Balance | Weighted Average Interest Rate | Interest Expense |
Fidelity SAI Emerging Markets Value Index Fund | Borrower | $18,748,542 | .53% | $6,668 |
Interfund Trades. Funds may purchase from or sell securities to other Fidelity Funds under procedures adopted by the Board. The procedures have been designed to ensure these interfund trades are executed in accordance with Rule 17a-7 of the 1940 Act. Any interfund trades are included within the respective purchases and sales amounts shown in the Purchases and Sales of Investments note. During the period, there were no interfund trades.
7. Committed Line of Credit.
Certain Funds participate with other funds managed by the investment adviser or an affiliate in a $4.25 billion credit facility (the "line of credit") to be utilized for temporary or emergency purposes to fund shareholder redemptions or for other short-term liquidity purposes. The participating funds have agreed to pay commitment fees on their pro-rata portion of the line of credit, which are reflected in Miscellaneous expenses on the Statement of Operations, and are listed below. During the period, there were no borrowings on this line of credit.
| | Amount |
| Fidelity SAI Emerging Markets Value Index Fund | $4,242 |
8. Security Lending.
Funds lend portfolio securities from time to time in order to earn additional income. Lending agents are used, including National Financial Services (NFS), an affiliate of the investment adviser. Pursuant to a securities lending agreement, NFS will receive a fee, which is capped at 9.9% of a fund's daily lending revenue, for its services as lending agent. A fund may lend securities to certain qualified borrowers, including NFS. On the settlement date of the loan, a fund receives collateral (in the form of U.S. Treasury obligations, letters of credit and/or cash) against the loaned securities and maintains collateral in an amount not less than 100% of the market value of the loaned securities during the period of the loan. The market value of the loaned securities is determined at the close of business of a fund and any additional required collateral is delivered to a fund on the next business day. A fund or borrower may terminate the loan at any time, and if the borrower defaults on its obligation to return the securities loaned because of insolvency or other reasons, a fund may apply collateral received from the borrower against the obligation. A fund may experience delays and costs in recovering the securities loaned. Any cash collateral received is invested in the Fidelity Securities Lending Cash Central Fund. Any loaned securities are identified as such in the Schedule of Investments, and the value of loaned securities and cash collateral at period end, as applicable, are presented in the Statement of Assets and Liabilities. Security lending income represents the income earned on investing cash collateral, less rebates paid to borrowers and any lending agent fees associated with the loan, plus any premium payments received for lending certain types of securities. Security lending income is presented in the Statement of Operations as a component of income from Fidelity Central Funds. Affiliated security lending activity, if any, was as follows:
| | Total Security Lending Fees Paid to NFS | Security Lending Income From Securities Loaned to NFS | Value of Securities Loaned to NFS at Period End |
| Fidelity SAI Emerging Markets Value Index Fund | $16,566 | $- | $- |
9. Bank Borrowings.
The Fund is permitted to have bank borrowings for temporary or emergency purposes to fund shareholder redemptions or for other short-term liquidity requirements. The Fund has established borrowing arrangements with certain banks. The interest rate on the borrowings is the bank's base rate, as revised from time to time. Any open loans, including accrued interest, at period end are presented under the caption "Notes payable" in the Statement of Assets and Liabilities, if applicable. Activity in this program during the period for which loans were outstanding was as follows:
| | Average Loan Balance | Weighted Average Interest Rate | Interest Expense |
| Fidelity SAI Emerging Markets Value Index Fund | $2,259,600 | .81% | $253 |
10. Other.
A fund's organizational documents provide former and current trustees and officers with a limited indemnification against liabilities arising in connection with the performance of their duties to the fund. In the normal course of business, a fund may also enter into contracts that provide general indemnifications. A fund's maximum exposure under these arrangements is unknown as this would be dependent on future claims that may be made against a fund. The risk of material loss from such claims is considered remote.
At the end of the period, the following mutual funds managed by the investment adviser or its affiliates were the owners of record of 10% or more of the total outstanding shares.
| | Strategic Advisers Emerging Markets Fund | Strategic Advisers Fidelity Emerging Markets Fund |
| Fidelity SAI Emerging Markets Value Index Fund | 31% | 60% |
Mutual funds managed by the investment adviser or its affiliates, in aggregate, were the owners of record of more than 20% of the total outstanding shares.
| Fund | % of shares held |
| Fidelity SAI Emerging Markets Value Index Fund | 91% |
11. Risk and Uncertainties.
Many factors affect a fund's performance. Developments that disrupt global economies and financial markets, such as pandemics, epidemics, outbreaks of infectious diseases, war, terrorism, and environmental disasters, may significantly affect a fund's investment performance. The effects of these developments to a fund will be impacted by the types of securities in which a fund invests, the financial condition, industry, economic sector, and geographic location of an issuer, and a fund's level of investment in the securities of that issuer.
To the Board of Trustees of Fidelity Salem Street Trust and Shareholders of Fidelity SAI Emerging Markets Value Index Fund
Opinion on the Financial Statements
We have audited the accompanying statement of assets and liabilities, including the schedule of investments, of Fidelity SAI Emerging Markets Value Index Fund (one of the funds constituting Fidelity Salem Street Trust, referred to hereafter as the "Fund") as of October 31, 2022, the related statement of operations for the year ended October 31, 2022, the statement of changes in net assets for each of the two years in the period ended October 31, 2022, including the related notes, and the financial highlights for each of the two years in the period ended October 31, 2022 and for the period May 12, 2020 (commencement of operations) through October 31, 2020 (collectively referred to as the "financial statements"). In our opinion, the financial statements present fairly, in all material respects, the financial position of the Fund as of October 31, 2022, the results of its operations for the year then ended, the changes in its net assets for each of the two years in the period ended October 31, 2022 and the financial highlights for each of the two years in the period ended October 31, 2022 and for the period May 12, 2020 (commencement of operations) through October 31, 2020 in conformity with accounting principles generally accepted in the United States of America.
Basis for Opinion
These financial statements are the responsibility of the Fund's management. Our responsibility is to express an opinion on the Fund's financial statements based on our audits. We are a public accounting firm registered with the Public Company Accounting Oversight Board (United States) (PCAOB) and are required to be independent with respect to the Fund in accordance with the U.S. federal securities laws and the applicable rules and regulations of the Securities and Exchange Commission and the PCAOB.
We conducted our audits of these financial statements in accordance with the standards of the PCAOB. Those standards require that we plan and perform the audit to obtain reasonable assurance about whether the financial statements are free of material misstatement, whether due to error or fraud.
Our audits included performing procedures to assess the risks of material misstatement of the financial statements, whether due to error or fraud, and performing procedures that respond to those risks. Such procedures included examining, on a test basis, evidence regarding the amounts and disclosures in the financial statements. Our audits also included evaluating the accounting principles used and significant estimates made by management, as well as evaluating the overall presentation of the financial statements. Our procedures included confirmation of securities owned as of October 31, 2022 by correspondence with the custodian and brokers; when replies were not received from brokers, we performed other auditing procedures. We believe that our audits provide a reasonable basis for our opinion.
/s/ PricewaterhouseCoopers LLP
Boston, Massachusetts
December 15, 2022
We have served as the auditor of one or more investment companies in the Fidelity group of funds since 1932.
The Trustees, Members of the Advisory Board (if any), and officers of the trust and fund, as applicable, are listed below. The Board of Trustees governs the fund and is responsible for protecting the interests of shareholders. The Trustees are experienced executives who meet periodically throughout the year to oversee the fund's activities, review contractual arrangements with companies that provide services to the fund, oversee management of the risks associated with such activities and contractual arrangements, and review the fund's performance. Except for Jonathan Chiel, each of the Trustees oversees 293 funds. Mr. Chiel oversees 184 funds.
The Trustees hold office without limit in time except that (a) any Trustee may resign; (b) any Trustee may be removed by written instrument, signed by at least two-thirds of the number of Trustees prior to such removal; (c) any Trustee who requests to be retired or who has become incapacitated by illness or injury may be retired by written instrument signed by a majority of the other Trustees; and (d) any Trustee may be removed at any special meeting of shareholders by a two-thirds vote of the outstanding voting securities of the trust. Each Trustee who is not an interested person (as defined in the 1940 Act) of the trust and the fund is referred to herein as an Independent Trustee. Each Independent Trustee shall retire not later than the last day of the calendar year in which his or her 75th birthday occurs. The Independent Trustees may waive this mandatory retirement age policy with respect to individual Trustees. Officers and Advisory Board Members hold office without limit in time, except that any officer or Advisory Board Member may resign or may be removed by a vote of a majority of the Trustees at any regular meeting or any special meeting of the Trustees. Except as indicated, each individual has held the office shown or other offices in the same company for the past five years.
The fund's Statement of Additional Information (SAI) includes more information about the Trustees. To request a free copy, call Fidelity at 1-800-544-3455.
Experience, Skills, Attributes, and Qualifications of the Trustees. The Governance and Nominating Committee has adopted a statement of policy that describes the experience, qualifications, attributes, and skills that are necessary and desirable for potential Independent Trustee candidates (Statement of Policy). The Board believes that each Trustee satisfied at the time he or she was initially elected or appointed a Trustee, and continues to satisfy, the standards contemplated by the Statement of Policy. The Governance and Nominating Committee also engages professional search firms to help identify potential Independent Trustee candidates who have the experience, qualifications, attributes, and skills consistent with the Statement of Policy. From time to time, additional criteria based on the composition and skills of the current Independent Trustees, as well as experience or skills that may be appropriate in light of future changes to board composition, business conditions, and regulatory or other developments, have also been considered by the professional search firms and the Governance and Nominating Committee. In addition, the Board takes into account the Trustees' commitment and participation in Board and committee meetings, as well as their leadership of standing and ad hoc committees throughout their tenure.
In determining that a particular Trustee was and continues to be qualified to serve as a Trustee, the Board has considered a variety of criteria, none of which, in isolation, was controlling. The Board believes that, collectively, the Trustees have balanced and diverse experience, qualifications, attributes, and skills, which allow the Board to operate effectively in governing the fund and protecting the interests of shareholders. Information about the specific experience, skills, attributes, and qualifications of each Trustee, which in each case led to the Board's conclusion that the Trustee should serve (or continue to serve) as a trustee of the fund, is provided below.
Board Structure and Oversight Function. Abigail P. Johnson is an interested person and currently serves as Chairman. The Trustees have determined that an interested Chairman is appropriate and benefits shareholders because an interested Chairman has a personal and professional stake in the quality and continuity of services provided to the fund. Independent Trustees exercise their informed business judgment to appoint an individual of their choosing to serve as Chairman, regardless of whether the Trustee happens to be independent or a member of management. The Independent Trustees have determined that they can act independently and effectively without having an Independent Trustee serve as Chairman and that a key structural component for assuring that they are in a position to do so is for the Independent Trustees to constitute a substantial majority for the Board. The Independent Trustees also regularly meet in executive session. Michael E. Kenneally serves as Chairman of the Independent Trustees and as such (i) acts as a liaison between the Independent Trustees and management with respect to matters important to the Independent Trustees and (ii) with management prepares agendas for Board meetings.
Fidelity ® funds are overseen by different Boards of Trustees. The fund's Board oversees Fidelity's investment-grade bond, money market, asset allocation and certain equity funds, and other Boards oversee Fidelity's high income and other equity funds. The asset allocation funds may invest in Fidelity ® funds that are overseen by such other Boards. The use of separate Boards, each with its own committee structure, allows the Trustees of each group of Fidelity ® funds to focus on the unique issues of the funds they oversee, including common research, investment, and operational issues. On occasion, the separate Boards establish joint committees to address issues of overlapping consequences for the Fidelity ® funds overseen by each Board.
The Trustees operate using a system of committees to facilitate the timely and efficient consideration of all matters of importance to the Trustees, the fund, and fund shareholders and to facilitate compliance with legal and regulatory requirements and oversight of the fund's activities and associated risks. The Board, acting through its committees, has charged FMR and its affiliates with (i) identifying events or circumstances the occurrence of which could have demonstrably adverse effects on the fund's business and/or reputation; (ii) implementing processes and controls to lessen the possibility that such events or circumstances occur or to mitigate the effects of such events or circumstances if they do occur; and (iii) creating and maintaining a system designed to evaluate continuously business and market conditions in order to facilitate the identification and implementation processes described in (i) and (ii) above. Because the day-to-day operations and activities of the fund are carried out by or through FMR, its affiliates, and other service providers, the fund's exposure to risks is mitigated but not eliminated by the processes overseen by the Trustees. While each of the Board's committees has responsibility for overseeing different aspects of the fund's activities, oversight is exercised primarily through the Operations and Audit Committees. In addition, an ad hoc Board committee of Independent Trustees has worked with FMR to enhance the Board's oversight of investment and financial risks, legal and regulatory risks, technology risks, and operational risks, including the development of additional risk reporting to the Board. Appropriate personnel, including but not limited to the fund's Chief Compliance Officer (CCO), FMR's internal auditor, the independent accountants, the fund's Treasurer and portfolio management personnel, make periodic reports to the Board's committees, as appropriate, including an annual review of Fidelity's risk management program for the Fidelity ® funds. The responsibilities of each standing committee, including their oversight responsibilities, are described further under "Standing Committees of the Trustees."
Interested Trustees*:
Correspondence intended for a Trustee who is an interested person may be sent to Fidelity Investments, 245 Summer Street, Boston, Massachusetts 02210.
Name, Year of Birth; Principal Occupations and Other Relevant Experience+
Jonathan Chiel (1957)
Year of Election or Appointment: 2016
Trustee
Mr. Chiel also serves as Trustee of other Fidelity ® funds. Mr. Chiel is Executive Vice President and General Counsel for FMR LLC (diversified financial services company, 2012-present). Previously, Mr. Chiel served as general counsel (2004-2012) and senior vice president and deputy general counsel (2000-2004) for John Hancock Financial Services; a partner with Choate, Hall & Stewart (1996-2000) (law firm); and an Assistant United States Attorney for the United States Attorney's Office of the District of Massachusetts (1986-95), including Chief of the Criminal Division (1993-1995). Mr. Chiel is a director on the boards of the Boston Bar Foundation and the Maimonides School.
Abigail P. Johnson (1961)
Year of Election or Appointment: 2009
Trustee
Chairman of the Board of Trustees
Ms. Johnson also serves as Trustee of other Fidelity ® funds. Ms. Johnson serves as Chairman (2016-present), Chief Executive Officer (2014-present), and Director (2007-present) of FMR LLC (diversified financial services company), President of Fidelity Financial Services (2012-present) and President of Personal, Workplace and Institutional Services (2005-present). Ms. Johnson is Chairman and Director of Fidelity Management & Research Company LLC (investment adviser firm, 2011-present). Previously, Ms. Johnson served as Chairman and Director of FMR Co., Inc. (investment adviser firm, 2011-2019), Vice Chairman (2007-2016) and President (2013-2016) of FMR LLC, President and a Director of Fidelity Management & Research Company (2001-2005), a Trustee of other investment companies advised by Fidelity Management & Research Company, Fidelity Investments Money Management, Inc. (investment adviser firm), and FMR Co., Inc. (2001-2005), Senior Vice President of the Fidelity ® funds (2001-2005), and managed a number of Fidelity ® funds. Ms. Abigail P. Johnson and Mr. Arthur E. Johnson are not related.
Jennifer Toolin McAuliffe (1959)
Year of Election or Appointment: 2016
Trustee
Ms. McAuliffe also serves as Trustee of other Fidelity ® funds and as Trustee of Fidelity Charitable (2020-present). Previously, Ms. McAuliffe served as Co-Head of Fixed Income of Fidelity Investments Limited (now known as FIL Limited (FIL)) (diversified financial services company), Director of Research for FIL's credit and quantitative teams in London, Hong Kong and Tokyo and Director of Research for taxable and municipal bonds at Fidelity Investments Money Management, Inc. Ms. McAuliffe previously served as a member of the Advisory Board of certain Fidelity ® funds (2016). Ms. McAuliffe was previously a lawyer at Ropes & Gray LLP and currently serves as director or trustee of several not-for-profit entities.
* Determined to be an "Interested Trustee" by virtue of, among other things, his or her affiliation with the trust or various entities under common control with FMR.
+ The information includes the Trustee's principal occupation during the last five years and other information relating to the experience, attributes, and skills relevant to the Trustee's qualifications to serve as a Trustee, which led to the conclusion that the Trustee should serve as a Trustee for the fund.
Independent Trustees:
Correspondence intended for an Independent Trustee may be sent to Fidelity Investments, P.O. Box 55235, Boston, Massachusetts 02205-5235.
Name, Year of Birth; Principal Occupations and Other Relevant Experience+
Elizabeth S. Acton (1951)
Year of Election or Appointment: 2013
Trustee
Ms. Acton also serves as Trustee of other Fidelity ® funds. Prior to her retirement, Ms. Acton served as Executive Vice President, Finance (2011-2012), Executive Vice President, Chief Financial Officer (2002-2011) and Treasurer (2004-2005) of Comerica Incorporated (financial services). Prior to joining Comerica, Ms. Acton held a variety of positions at Ford Motor Company (1983-2002), including Vice President and Treasurer (2000-2002) and Executive Vice President and Chief Financial Officer of Ford Motor Credit Company (1998-2000). Ms. Acton currently serves as a member of the Board and Audit and Finance Committees of Beazer Homes USA, Inc. (homebuilding, 2012-present). Ms. Acton previously served as a member of the Advisory Board of certain Fidelity ® funds (2013-2016).
Ann E. Dunwoody (1953)
Year of Election or Appointment: 2018
Trustee
General Dunwoody also serves as Trustee of other Fidelity ® funds. General Dunwoody (United States Army, Retired) was the first woman in U.S. military history to achieve the rank of four-star general and prior to her retirement in 2012 held a variety of positions within the U.S. Army, including Commanding General, U.S. Army Material Command (2008-2012). General Dunwoody currently serves as President of First to Four LLC (leadership and mentoring services, 2012-present), a member of the Board and Nomination and Corporate Governance Committees of Kforce Inc. (professional staffing services, 2016-present) and a member of the Board of Automattic Inc. (software engineering, 2018-present). Previously, General Dunwoody served as a member of the Advisory Board and Nominating and Corporate Governance Committee of L3 Technologies, Inc. (communication, electronic, sensor and aerospace systems, 2013-2019) and a member of the Board and Audit and Sustainability and Corporate Responsibility Committees of Republic Services, Inc. (waste collection, disposal and recycling, 2013-2016). Ms. Dunwoody also serves on several boards for non-profit organizations, including as a member of the Board, Chair of the Nomination and Governance Committee and a member of the Audit Committee of Logistics Management Institute (consulting non-profit, 2012-present), a member of the Council of Trustees for the Association of the United States Army (advocacy non-profit, 2013-present), a member of the Board of Florida Institute of Technology (2015-present) and a member of the Board of ThanksUSA (military family education non-profit, 2014-present). General Dunwoody previously served as a member of the Advisory Board of certain Fidelity ® funds (2018).
John Engler (1948)
Year of Election or Appointment: 2014
Trustee
Mr. Engler also serves as Trustee of other Fidelity ® funds. Previously, Mr. Engler served as Governor of Michigan (1991-2003), President of the Business Roundtable (2011-2017) and interim President of Michigan State University (2018-2019). Mr. Engler currently serves as a member of the Board of Stride, Inc. (formerly K12 Inc.) (technology-based education company, 2012-present). Previously, Mr. Engler served as a member of the Board of Universal Forest Products (manufacturer and distributor of wood and wood-alternative products, 2003-2019) and Trustee of The Munder Funds (2003-2014). Mr. Engler previously served as a member of the Advisory Board of certain Fidelity ® funds (2014-2016).
Robert F. Gartland (1951)
Year of Election or Appointment: 2010
Trustee
Mr. Gartland also serves as Trustee of other Fidelity ® funds. Prior to his retirement, Mr. Gartland held a variety of positions at Morgan Stanley (financial services, 1979-2007), including Managing Director (1987-2007) and Chase Manhattan Bank (1975-1978). Mr. Gartland previously served as Chairman and an investor in Gartland & Mellina Group Corp. (consulting, 2009-2019), as a member of the Board of National Securities Clearing Corporation (1993-1996) and as Chairman of TradeWeb (2003-2004).
Arthur E. Johnson (1947)
Year of Election or Appointment: 2008
Trustee
Mr. Johnson also serves as Trustee of other Fidelity ® funds. Prior to his retirement, Mr. Johnson served as Senior Vice President of Corporate Strategic Development of Lockheed Martin Corporation (defense contractor, 1999-2009). Mr. Johnson currently serves as a member of the Board of Booz Allen Hamilton (management consulting, 2011-present). Mr. Johnson previously served as a member of the Board of Eaton Corporation plc (diversified power management, 2009-2019) and a member of the Board of AGL Resources, Inc. (holding company, 2002-2016). Mr. Johnson previously served as Chairman (2018-2021) and Vice Chairman (2015-2018) of the Independent Trustees of certain Fidelity® funds. Mr. Arthur E. Johnson is not related to Ms. Abigail P. Johnson.
Michael E. Kenneally (1954)
Year of Election or Appointment: 2009
Trustee
Chairman of the Independent Trustees
Mr. Kenneally also serves as Trustee of other Fidelity ® funds and was Vice Chairman (2018-2021) of the Independent Trustees of certain Fidelity ® funds. Prior to retirement in 2005, he was Chairman and Global Chief Executive Officer of Credit Suisse Asset Management, the worldwide fund management and institutional investment business of Credit Suisse Group. Previously, Mr. Kenneally was an Executive Vice President and the Chief Investment Officer for Bank of America. In this role, he was responsible for the investment management, strategy and products delivered to the bank's institutional, high-net-worth and retail clients. Earlier, Mr. Kenneally directed the organization's equity and quantitative research groups. He began his career as a research analyst and then spent more than a dozen years as a portfolio manager for endowments, pension plans and mutual funds. He earned the Chartered Financial Analyst (CFA) designation in 1991.
Marie L. Knowles (1946)
Year of Election or Appointment: 2001
Trustee
Ms. Knowles also serves as Trustee of other Fidelity ® funds. Prior to her retirement, Ms. Knowles held several positions at Atlantic Richfield Company (diversified energy), including Executive Vice President and Chief Financial Officer (1996-2000), Senior Vice President (1993-1996) and President of ARCO Transportation Company (pipeline and tanker operations, 1993-1996). Ms. Knowles currently serves as a member of the Board of the Santa Catalina Island Company (real estate, 2009-present), a member of the Investment Company Institute Board of Governors and a member of the Governing Council of the Independent Directors Council (2014-present). Ms. Knowles also serves as a member of the Advisory Board for the School of Engineering of the University of Southern California. Ms. Knowles previously served as a member of the Board of McKesson Corporation (healthcare service, 2002-2021). In addition, Ms. Knowles previously served as Chairman (2015-2018) and Vice Chairman (2012-2015) of the Independent Trustees of certain Fidelity ® funds.
Mark A. Murray (1954)
Year of Election or Appointment: 2016
Trustee
Mr. Murray also serves as Trustee of other Fidelity ® funds. Previously, Mr. Murray served as Co-Chief Executive Officer (2013-2016), President (2006-2013) and Vice Chairman (2013-2020) of Meijer, Inc. Mr. Murray serves as a member of the Board (2009-present) and Public Policy and Responsibility Committee (2009-present) and Chair of the Nuclear Review Committee (2019-present) of DTE Energy Company (diversified energy company). Mr. Murray previously served as a member of the Board of Spectrum Health (not-for-profit health system, 2015-2019) and as a member of the Board and Audit Committee and Chairman of the Nominating and Corporate Governance Committee of Universal Forest Products, Inc. (manufacturer and distributor of wood and wood-alternative products, 2004-2016). Mr. Murray also serves as a member of the Board of many community and professional organizations. Mr. Murray previously served as a member of the Advisory Board of certain Fidelity ® funds (2016).
+ The information includes the Trustee's principal occupation during the last five years and other information relating to the experience, attributes, and skills relevant to the Trustee's qualifications to serve as a Trustee, which led to the conclusion that the Trustee should serve as a Trustee for the fund.
Advisory Board Members and Officers:
Correspondence intended for a Member of the Advisory Board (if any) may be sent to Fidelity Investments, P.O. Box 55235, Boston, Massachusetts 02205-5235. Correspondence intended for an officer may be sent to Fidelity Investments, 245 Summer Street, Boston, Massachusetts 02210. Officers appear below in alphabetical order.
Name, Year of Birth; Principal Occupation
Laura M. Bishop (1961)
Year of Election or Appointment: 2022
Member of the Advisory Board
Ms. Bishop also serves as a Member of the Advisory Board of other funds. Prior to her retirement, Ms. Bishop held a variety of positions at United Services Automobile Association (2001-2020), including Executive Vice President and Chief Financial Officer (2014-2020) and Senior Vice President and Deputy Chief Financial Officer (2012-2014). Ms. Bishop currently serves as a member of the Audit Committee and Compensation and Personnel Committee (2021-present) of the Board of Directors of Korn Ferry (global organizational consulting).
Robert W. Helm (1957)
Year of Election or Appointment: 2021
Member of the Advisory Board
Mr. Helm also serves as a Member of the Advisory Board of other Fidelity® funds. Mr. Helm was formerly Deputy Chairman (2003-2020), partner (1991-2020) and an associate (1984-1991) of Dechert LLP (formerly Dechert Price & Rhoads). Mr. Helm currently serves on boards and committees of several not-for-profit organizations.
Craig S. Brown (1977)
Year of Election or Appointment: 2019
Assistant Treasurer
Mr. Brown also serves as an officer of other funds. Mr. Brown serves as Assistant Treasurer of FIMM, LLC (2021-present) and is an employee of Fidelity Investments (2013-present). Previously, Mr. Brown served as Assistant Treasurer of certain Fidelity ® funds (2019-2022).
John J. Burke III (1964)
Year of Election or Appointment: 2018
Chief Financial Officer
Mr. Burke also serves as Chief Financial Officer of other funds. Mr. Burke serves as Head of Investment Operations for Fidelity Fund and Investment Operations (2018-present) and is an employee of Fidelity Investments (1998-present). Previously Mr. Burke served as head of Asset Management Investment Operations (2012-2018).
David J. Carter (1973)
Year of Election or Appointment: 2020
Assistant Secretary
Mr. Carter also serves as Assistant Secretary of other funds. Mr. Carter serves as Senior Vice President, Deputy General Counsel (2022-present) and is an employee of Fidelity Investments (2005-present).
Jonathan Davis (1968)
Year of Election or Appointment: 2010
Assistant Treasurer
Mr. Davis also serves as an officer of other funds. Mr. Davis serves as Assistant Treasurer of FIMM, LLC (2021-present), FMR Capital, Inc. (2017-present), FD Funds GP LLC (2021-present), FD Funds Holding LLC (2021-present), and FD Funds Management LLC (2021-present); and is an employee of Fidelity Investments. Previously, Mr. Davis served as Vice President and Associate General Counsel of FMR LLC (diversified financial services company, 2003-2010).
Laura M. Del Prato (1964)
Year of Election or Appointment: 2018
President and Treasurer
Ms. Del Prato also serves as an officer of other funds. Ms. Del Prato serves as Assistant Treasurer of FIMM, LLC (2021-present) and is an employee of Fidelity Investments (2017-present). Previously, Ms. Del Prato served as President and Treasurer of The North Carolina Capital Management Trust: Cash Portfolio and Term Portfolio (2018-2020). Prior to joining Fidelity Investments, Ms. Del Prato served as a Managing Director and Treasurer of the JPMorgan Mutual Funds (2014-2017). Prior to JPMorgan, Ms. Del Prato served as a partner at Cohen Fund Audit Services (accounting firm, 2012-2013) and KPMG LLP (accounting firm, 2004-2012).
Colm A. Hogan (1973)
Year of Election or Appointment: 2016
Assistant Treasurer
Mr. Hogan also serves as an officer of other funds. Mr. Hogan serves as Assistant Treasurer of FIMM, LLC (2021-present) and FMR Capital, Inc. (2017-present) and is an employee of Fidelity Investments (2005-present). Previously, Mr. Hogan served as Deputy Treasurer of certain Fidelity ® funds (2016-2020) and Assistant Treasurer of certain Fidelity ® funds (2016-2018).
Cynthia Lo Bessette (1969)
Year of Election or Appointment: 2019
Secretary and Chief Legal Officer (CLO)
Ms. Lo Bessette also serves as an officer of other funds. Ms. Lo Bessette serves as CLO, Secretary, and Senior Vice President of Fidelity Management & Research Company LLC (investment adviser firm, 2019-present); CLO of Fidelity Management & Research (Hong Kong) Limited, FMR Investment Management (UK) Limited, and Fidelity Management & Research (Japan) Limited (investment adviser firms, 2019-present); Secretary of FD Funds GP LLC (2021-present), FD Funds Holding LLC (2021-present), FD Funds Management LLC (2021-present), and Fidelity Diversifying Solutions LLC (investment adviser firm, 2022-present); and Assistant Secretary of FIMM, LLC (2019-present). She is a Senior Vice President and Deputy General Counsel of FMR LLC (diversified financial services company, 2019-present), and is an employee of Fidelity Investments. Previously, Ms. Lo Bessette served as CLO, Secretary, and Senior Vice President of FMR Co., Inc. (investment adviser firm, 2019); Secretary of Fidelity SelectCo, LLC and Fidelity Investments Money Management, Inc. (investment adviser firms, 2019). Prior to joining Fidelity Investments, Ms. Lo Bessette was Executive Vice President, General Counsel (2016-2019) and Senior Vice President, Deputy General Counsel (2015-2016) of OppenheimerFunds (investment management company) and Deputy Chief Legal Officer (2013-2015) of Jennison Associates LLC (investment adviser firm).
Chris Maher (1972)
Year of Election or Appointment: 2013
Assistant Treasurer
Mr. Maher also serves as an officer of other funds. Mr. Maher serves as Assistant Treasurer of FIMM, LLC (2021-present) and FMR Capital, Inc. (2017-present), and is an employee of Fidelity Investments (2008-present). Previously, Mr. Maher served as Assistant Treasurer of certain funds (2013-2020); Vice President of Asset Management Compliance (2013), Vice President of the Program Management Group of FMR (investment adviser firm, 2010-2013), and Vice President of Valuation Oversight (2008-2010).
Jamie Pagliocco (1964)
Year of Election or Appointment: 2020
Vice President
Mr. Pagliocco also serves as Vice President of other funds. Mr. Pagliocco serves as President of Fixed Income (2020-present), and is an employee of Fidelity Investments (2001-present). Previously, Mr. Pagliocco served as Co-Chief Investment Officer - Bond (2017-2020), Global Head of Bond Trading (2016-2019), and as a portfolio manager.
Kenneth B. Robins (1969)
Year of Election or Appointment: 2020
Chief Compliance Officer
Mr. Robins also serves as an officer of other funds. Mr. Robins serves as Compliance Officer of Fidelity Management & Research Company LLC (investment adviser firm, 2016-present) and is an employee of Fidelity Investments (2004-present). Previously, Mr. Robins served as Compliance Officer of FMR Co., Inc. (investment adviser firm, 2016-2019), as Executive Vice President of Fidelity Investments Money Management, Inc. (investment adviser firm, 2013-2016) and served in other fund officer roles.
Brett Segaloff (1972)
Year of Election or Appointment: 2021
Anti-Money Laundering (AML) Officer
Mr. Segaloff also serves as an AML Officer of other funds and other related entities. He is Director, Anti-Money Laundering (2007-present) of FMR LLC (diversified financial services company) and is an employee of Fidelity Investments (1996-present).
Stacie M. Smith (1974)
Year of Election or Appointment: 2013
Assistant Treasurer
Ms. Smith also serves as an officer of other funds. Ms. Smith serves as Assistant Treasurer of FIMM, LLC (2021-present) and FMR Capital, Inc. (2017-present), is an employee of Fidelity Investments (2009-present), and has served in other fund officer roles. Prior to joining Fidelity Investments, Ms. Smith served as Senior Audit Manager of Ernst & Young LLP (accounting firm, 1996-2009). Previously, Ms. Smith served as Assistant Treasurer (2013-2019) and Deputy Treasurer (2013-2016) of certain Fidelity ® funds.
Jim Wegmann (1979)
Year of Election or Appointment: 2021
Deputy Treasurer
Mr. Wegmann also serves as an officer of other funds. Mr. Wegmann serves as Assistant Treasurer of FIMM, LLC (2021-present) and is an employee of Fidelity Investments (2011-present). Previously, Mr. Wegmann served as Assistant Treasurer of certain Fidelity ® funds (2019-2021).
As a shareholder, you incur two types of costs: (1) transaction costs, which may include sales charges (loads) on purchase payments or redemption proceeds, as applicable and (2) ongoing costs, which generally include management fees, distribution and/or service (12b-1) fees and other Fund expenses. This Example is intended to help you understand your ongoing costs (in dollars) of investing in a fund and to compare these costs with the ongoing costs of investing in other mutual funds.
| The Example is based on an investment of $1,000 invested at the beginning of the period and held for the entire period (May 1, 2022 to October 31, 2022). |
Actual Expenses
The first line of the accompanying table provides information about actual account values and actual expenses. You may use the information in this line, together with the amount you invested, to estimate the expenses that you paid over the period. Simply divide your account value by $1,000.00 (for example, an $8,600 account value divided by $1,000.00 = 8.6), then multiply the result by the number in the first line for a class/Fund under the heading entitled "Expenses Paid During Period" to estimate the expenses you paid on your account during this period. If any fund is a shareholder of any underlying mutual funds or exchange-traded funds (ETFs) (the Underlying Funds), such fund indirectly bears its proportional share of the expenses of the Underlying Funds in addition to the direct expenses incurred presented in the table. These fees and expenses are not included in the annualized expense ratio used to calculate the expense estimate in the table below.
Hypothetical Example for Comparison Purposes
The second line of the accompanying table provides information about hypothetical account values and hypothetical expenses based on the actual expense ratio and an assumed rate of return of 5% per year before expenses, which is not the actual return. The hypothetical account values and expenses may not be used to estimate the actual ending account balance or expenses you paid for the period. You may use this information to compare the ongoing costs of investing in the Fund and other funds. To do so, compare this 5% hypothetical example with the 5% hypothetical examples that appear in the shareholder reports of the other funds. If any fund is a shareholder of any Underlying Funds, such fund indirectly bears its proportional share of the expenses of the Underlying Funds in addition to the direct expenses as presented in the table. These fees and expenses are not included in the annualized expense ratio used to calculate the expense estimate in the table below.
Please note that the expenses shown in the table are meant to highlight your ongoing costs only and do not reflect any transaction costs. Therefore, the second line of the table is useful in comparing ongoing costs only, and will not help you determine the relative total costs of owning different funds. In addition, if these transactional costs were included, your costs would have been higher.
| | | | | Annualized Expense Ratio- A | | Beginning Account Value May 1, 2022 | | Ending Account Value October 31, 2022 | | Expenses Paid During Period- C May 1, 2022 to October 31, 2022 |
| | | | | | | | | | |
| Fidelity® SAI Emerging Markets Value Index Fund | | | | .22% | | | | | | |
| Actual | | | | | | $ 1,000 | | $ 818.60 | | $ 1.01 |
Hypothetical- B | | | | | | $ 1,000 | | $ 1,024.10 | | $ 1.12 |
| |
A Annualized expense ratio reflects expenses net of applicable fee waivers.
B 5% return per year before expenses
C Expenses are equal to the annualized expense ratio, multiplied by the average account value over the period, multiplied by 184/ 365 (to reflect the one-half year period). The fees and expenses of any Underlying Funds are not included in each annualized expense ratio.
The dividend and capital gains distributions for the fund(s) are available on Fidelity.com or Institutional.Fidelity.com.
The fund designates 34% of the dividend distributed in December, during the fiscal year as amounts which may be taken into account as a dividend for the purposes of the maximum rate under section 1(h)(11) of the Internal Revenue Code.
The amounts per share which represent income derived from sources within, and taxes paid to, foreign countries or possessions of the United States are $0.3723 and $0.0546 for the dividend paid December 13, 2021.
The fund will notify shareholders in January 2023 of amounts for use in preparing 2022 income tax returns.
Fidelity SAI Emerging Markets Value Index Fund
Each year, the Board of Trustees, including the Independent Trustees (together, the Board), votes on the renewal of the management contract with Fidelity Management & Research Company LLC (FMR) and the sub-advisory agreement (Sub-Advisory Agreement) for the fund with Geode Capital Management, LLC (Geode) (together, the Advisory Contracts). FMR and Geode are referred to herein as the Investment Advisers. The Board, assisted by the advice of fund counsel and Independent Trustees' counsel, requests and considers a broad range of information relevant to the renewal of the Advisory Contracts throughout the year.
The Board meets regularly and, at each of its meetings, covers an extensive agenda of topics and materials and considers factors that are relevant to its annual consideration of the renewal of the fund's Advisory Contracts, including the services and support provided to the fund and its shareholders. The Board has established four standing committees (Committees) - Operations, Audit, Fair Valuation, and Governance and Nominating - each composed of and chaired by Independent Trustees with varying backgrounds, to which the Board has assigned specific subject matter responsibilities in order to enhance effective decision-making by the Board. The Operations Committee, of which all the Independent Trustees are members, meets regularly throughout the year and requests, receives and considers, among other matters, information related to the annual consideration of the renewal of the fund's Advisory Contracts before making its recommendation to the Board. The Board also meets as needed to review matters specifically related to the Board's annual consideration of the renewal of the Advisory Contracts. Members of the Board may also meet from time to time with trustees of other Fidelity funds through joint ad hoc committees to discuss certain matters relevant to all of the Fidelity funds.
At its September 2022 meeting, the Board unanimously determined to renew the fund's Advisory Contracts. In reaching its determination, the Board considered all factors it believed relevant, including (i) the nature, extent, and quality of the services provided to the fund and its shareholders (including the investment performance of the fund); (ii) the competitiveness relative to peer funds of the fund's management fee and total expense ratio; (iii) the total costs of the services provided by and the profits realized by Fidelity and Geode from their respective relationships with the fund; and (iv) the extent to which, if any, economies of scale exist and are realized as the fund grows, and whether any economies of scale are appropriately shared with fund shareholders.
In considering whether to renew the Advisory Contracts for the fund, the Board reached a determination, with the assistance of fund counsel and Independent Trustees' counsel and through the exercise of its business judgment, that the renewal of the Advisory Contracts was in the best interests of the fund and its shareholders and that the compensation payable under the Advisory Contracts was fair and reasonable. The Board's decision to renew the Advisory Contracts was not based on any single factor, but rather was based on a comprehensive consideration of all the information provided to the Board at its meetings throughout the year. The Board, in reaching its determination to renew the Advisory Contracts, was aware that shareholders of the fund have a broad range of investment choices available to them, including a wide choice among funds offered by Fidelity's competitors, and that the fund's shareholders, who have the opportunity to review and weigh the disclosure provided by the fund in its prospectus and other public disclosures, have chosen to invest in this fund, which is part of the Fidelity family of funds.
Nature, Extent, and Quality of Services Provided . The Board considered staffing as it relates to the fund, including the backgrounds of investment personnel of Fidelity and Geode, and also considered the fund's investment objective, strategies, and related investment philosophy. The Independent Trustees also had discussions with senior management of Fidelity's investment operations and investment groups and with senior management of Geode. The Board considered the structure of the investment personnel compensation programs and whether the structures provide appropriate incentives to act in the best interests of the fund. The Board also considered the steps Fidelity and Geode had taken to ensure the continued provision of high quality services to the Fidelity funds throughout the COVID-19 pandemic, including the expansion of staff in client facing positions to maintain service levels in periods of high volumes and volatility.
The Trustees also discussed with representatives of Fidelity, at meetings throughout the year, Fidelity's role in, among other things, overseeing compliance with federal securities laws and other applicable requirements by Geode with respect to the fund and monitoring and overseeing the performance and investment capabilities of Geode. The Trustees considered that the Board had received from Fidelity periodic reports about its oversight and due diligence processes, as well as periodic reports regarding the performance of Geode.
The Board also considered the nature, extent and quality of services provided by Geode. The Trustees noted that under the Sub-Advisory Agreement, subject to oversight by Fidelity, Geode is responsible for, among other things, identifying investments and arranging for execution of portfolio transactions to implement the fund's investment strategy. In addition, the Trustees noted that Geode is responsible for providing such reporting as may be requested by Fidelity to fulfill its oversight responsibilities discussed above.
Resources Dedicated to Investment Management and Support Services . The Board reviewed the general qualifications and capabilities of Fidelity's and Geode's investment staffs, including their size, education, experience, and resources, as well as Fidelity's and Geode's approach to recruiting, managing, training, and compensating investment personnel. The Board noted the resources devoted to Fidelity's global investment organization and that Fidelity's and Geode's analysts have extensive resources, tools and capabilities that allow them to conduct quantitative and fundamental analysis, as well as credit analysis of issuers, counterparties, and guarantors. Further, the Board considered that Fidelity's and Geode's investment professionals have sufficient access to information and data so as to provide competitive investment results over time, and that those professionals also have access to sophisticated tools that permit them to assess portfolio construction and risk and performance attribution characteristics continuously. Additionally, in its deliberations, the Board considered Fidelity's and Geode's trading, risk management, compliance, cybersecurity, and technology and operations capabilities and resources, which are integral parts of the investment management process.
Shareholder and Administrative Services . The Board considered (i) the nature, extent, quality, and cost of advisory, administrative, and shareholder services performed by the Investment Advisers and their affiliates under the Advisory Contracts and by FMR's affiliates under separate agreements covering transfer agency, pricing and bookkeeping, and securities lending services for the fund; (ii) the nature and extent of the supervision of third party service providers, principally custodians, subcustodians, and pricing vendors; and (iii) the resources devoted to, and the record of compliance with, the fund's compliance policies and procedures. The Board also reviewed the allocation of fund brokerage, including allocations to brokers affiliated with the Investment Advisers.
The Board noted that the growth of fund assets over time across the complex allows Fidelity to reinvest in the development of services designed to enhance the value and convenience of the Fidelity funds as investment vehicles. These services include 24-hour access to account information and market information over the Internet and through telephone representatives, investor education materials and asset allocation tools. The Board also considered that it reviews customer service metrics such as telephone response times, continuity of services on the website and metrics addressing services at Fidelity Investor Centers.
Investment in a Large Fund Family . The Board considered the benefits to shareholders of investing in a Fidelity fund, including the benefits of investing in a fund that is part of a large family of funds offering a variety of investment disciplines and providing a large variety of mutual fund investor services. The Board noted that Fidelity had taken, or had made recommendations to the Board that resulted in the Fidelity funds taking, a number of actions over the previous year that benefited particular funds, including: (i) continuing to dedicate additional resources to Fidelity's investment research process, which includes meetings with management of issuers of securities in which the funds invest; (ii) continuing efforts to enhance Fidelity's global research capabilities; (iii) launching new funds, ETFs, and share classes with innovative structures, strategies and pricing and making other enhancements to meet investor needs; (iv) broadening eligibility requirements for certain funds and share classes; (v) reducing management fees and total expenses for certain funds and classes; (vi) lowering expenses for certain existing funds and classes by implementing or lowering expense caps; (vii) rationalizing product lines and gaining increased efficiencies from fund mergers and liquidations; (viii) continuing to develop, acquire and implement systems and technology to improve services to the funds and shareholders, strengthen information security, and increase efficiency; and (ix) continuing to implement enhancements to further strengthen Fidelity's product line to increase investors' probability of success in achieving their investment goals, including their retirement income goals.
Investment Performance . The Board considered whether the fund has operated in accordance with its investment objective, as well as its record of compliance with its investment restrictions and its performance history.
The Board took into account discussions that occur at Board meetings throughout the year with representatives of the Investment Advisers about fund investment performance. In this regard the Board noted that as part of regularly scheduled fund reviews and other reports to the Board on fund performance, the Board considers annualized return information for the fund for different time periods, measured against the securities market index the fund seeks to track. The Board also periodically considers the fund's tracking error versus its benchmark index.
In addition to reviewing absolute and relative fund performance, the Independent Trustees periodically consider the appropriateness of fund performance metrics in evaluating the results achieved. In general, the Independent Trustees believe that an index fund's performance should be evaluated based on gross performance (before fees and expenses but after transaction costs) compared to the fund's benchmark index, over appropriate time periods, taking into account relevant factors including the following: general market conditions; the characteristics of the fund's benchmark index; the extent to which statistical sampling is employed; any securities lending revenues; and fund cash flows and other factors. The Independent Trustees generally give greater weight to fund performance over longer time periods than over shorter time periods. Depending on the circumstances, the Independent Trustees may be satisfied with a fund's performance notwithstanding that it lags its benchmark index for certain periods.
The Independent Trustees recognize that shareholders evaluate performance on a net basis (after fees and expenses) over their own holding periods, for which one-, three-, and five-year periods are often used as a proxy. For this reason, the performance information reviewed by the Board also included net calendar year total return information for the fund and its benchmark index for the most recent one-year period. No performance peer group information was considered by the Board as Fidelity advised the Board that the peer group, which is created by a third-party provider, includes a number of actively-managed funds. The Independent Trustees recognize that shareholders who are not investing through a tax-advantaged retirement account also consider tax consequences in evaluating performance.
Based on its review, the Board concluded that the nature, extent, and quality of services provided to the fund under the Advisory Contracts should continue to benefit the shareholders of the fund.
Competitiveness of Management Fee and Total Expense Ratio . The Board considered the fund's management fee and total expense ratio compared to selected groups of competitive funds and classes (referred to as "mapped groups" below) for the purpose of facilitating the Trustees' competitive analysis of management fees and total expenses. Fidelity creates "mapped groups" by combining similar investment objective categories (as classified by Lipper) that have comparable investment mandates. Combining funds with similar investment objective categories aids the Board's comparison of management fees and total expense ratios by broadening the competitive group used for such comparison.
Management Fee . The Board considered two proprietary management fee comparisons for the 12-month (or shorter) periods shown in basis points (BP) in the chart below. The group of Lipper funds used by the Board for management fee comparisons is referred to below as the "Total Mapped Group." The Total Mapped Group comparison focuses on a fund's standing in terms of gross management fees before expense reimbursements or caps relative to the total universe of funds with comparable investment mandates, regardless of whether their management fee structures also are comparable. Funds with comparable investment mandates offer exposure to similar types of securities. Funds with comparable management fee structures have similar management fee contractual arrangements (e.g., flat rate charged for advisory services, all-inclusive fee rate, etc.). "TMG %" represents the percentage of funds in the Total Mapped Group that had management fees that were lower than the fund's. For example, a hypothetical TMG % of 20% would mean that 80% of the funds in the Total Mapped Group had higher, and 20% had lower, management fees than the fund. The fund's actual TMG %s and the number of funds in the Total Mapped Group are in the chart below. The "Asset-Sized Peer Group" (ASPG) comparison focuses on a fund's standing relative to a subset of non-Fidelity funds within the Total Mapped Group that are similar in size and management fee structure. For example, if a fund is in the first quartile of the ASPG, the fund's management fee ranks in the least expensive or lowest 25% of funds in the ASPG. The ASPG represents at least 15% of the funds in the Total Mapped Group with comparable asset size and management fee structures, subject to a minimum of 50 funds (or all funds in the Total Mapped Group if fewer than 50). Additional information, such as the ASPG quartile in which the fund's management fee rate ranked, is also included in the chart and was considered by the Board.
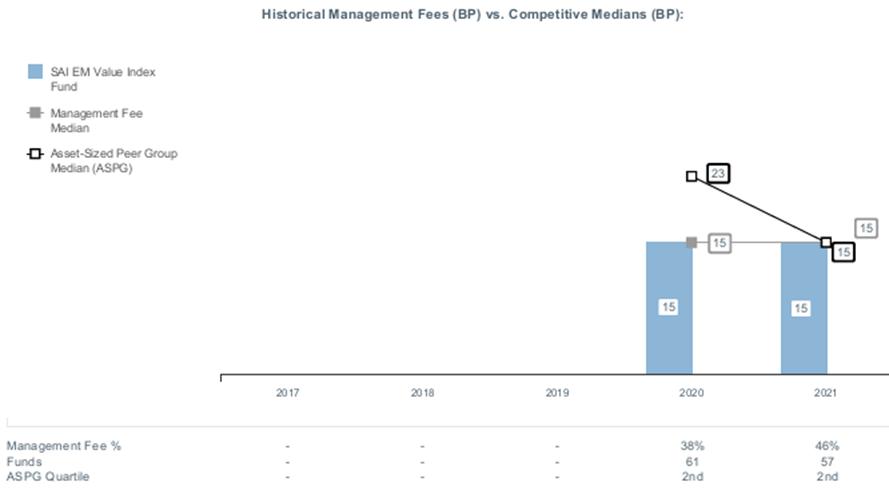
The Board noted that the fund's management fee rate ranked equal to the median of its Total Mapped Group and equal to the median of its ASPG for 2021.
Based on its review, the Board concluded that the fund's management fee is fair and reasonable in light of the services that the fund receives and the other factors considered.
Total Expense Ratio . In its review of the fund's total expense ratio, the Board considered the fund's management fee rate as well as other fund expenses, such as custodial, legal, and audit fees. The Board also noted that Fidelity may agree to waive fees or reimburse expenses from time to time, and the extent to which, if any, it has done so for the fund. The fund is compared to those funds and classes in the Total Mapped Group (used by the Board for management fee comparisons) that have a similar sales load structure. The Board also considered a total expense ASPG comparison, which focuses on the total expenses of the fund relative to a subset of non-Fidelity funds within the similar sales load structure group that are similar in size and management fee structure. The total expense ASPG is limited to 15 larger and 15 smaller classes of different funds, where possible. The total expense ASPG comparison excludes performance adjustments and fund-paid 12b-1 fees to eliminate variability in expenses relating to these items.
The Board noted that the fund's total net expense ratio ranked above the similar sales load structure group competitive median for 2021 and above the ASPG competitive median for 2021. The Board considered that, when compared to a subset of each group that excludes funds in a fund complex with a unique at-cost service model, the fund would not be above the competitive median for 2021.
The Board further considered that FMR has contractually agreed to reimburse the fund to the extent that total operating expenses, with certain exceptions, as a percentage of its average net assets, exceed 0.25% through February 28, 2023.
Fees Charged to Other Clients . The Board also considered fee structures and other information with respect to clients of Fidelity and Geode, such as other funds advised or subadvised by Fidelity or Geode, pension plan clients, and other institutional clients with similar mandates. The Board noted that a joint ad hoc committee created by it and the boards of other Fidelity funds periodically reviews and compares Fidelity's institutional investment advisory business with its business of providing services to the Fidelity funds and also noted the most recent findings of the committee. The Board noted that the committee's review included a consideration of the differences in services provided, fees charged, and costs incurred, as well as competition in the markets serving the different categories of clients.
Based on its review of total expense ratios and fees charged to other Fidelity clients, the Board concluded that the fund's total expense ratio was reasonable in light of the services that the fund and its shareholders receive and the other factors considered.
Costs of the Services and Profitability . The Board considered the revenues earned and the expenses incurred by Fidelity in conducting the business of developing, marketing, distributing, managing, administering and servicing the fund and servicing the fund's shareholders. The Board also considered the level of Fidelity's profits in respect of all the Fidelity funds.
On an annual basis, Fidelity presents to the Board information about the profitability of its relationships with the fund. Fidelity calculates profitability information for each fund, as well as aggregate profitability information for groups of Fidelity funds and all Fidelity funds, using a series of detailed revenue and cost allocation methodologies which originate with the books and records of Fidelity on which Fidelity's audited financial statements are based. The Audit Committee of the Board reviews any significant changes from the prior year's methodologies and the full Board approves such changes.
A public accounting firm has been engaged annually by the Board as part of the Board's assessment of Fidelity's profitability analysis. The engagement includes the review and assessment of the methodologies used by Fidelity in determining the revenues and expenses attributable to Fidelity's mutual fund business, and completion of agreed-upon procedures in respect of the mathematical accuracy of certain fund profitability information and its conformity to established allocation methodologies. After considering the reports issued under the engagement and information provided by Fidelity, the Board concluded that while other allocation methods may also be reasonable, Fidelity's profitability methodologies are reasonable in all material respects.
The Board also reviewed Fidelity's and Geode's non-fund businesses and potential indirect benefits such businesses may have received as a result of their association with Fidelity's mutual fund business (i.e., fall-out benefits) as well as cases where Fidelity's and Geode's affiliates may benefit from the funds' business. The Board considered areas where potential indirect benefits to the Fidelity funds from their relationships with Fidelity may exist. The Board's consideration of these matters was informed by the findings of a joint ad hoc committee created by it and the boards of other Fidelity funds to evaluate potential fall-out benefits.
The Board considered the costs of the services provided by and the profits realized by Fidelity in connection with the operation of the fund and was satisfied that the profitability was not excessive.
The Board also considered information regarding the profitability of Geode's relationship with the fund.
Economies of Scale . The Board considered whether there have been economies of scale in respect of the management of the Fidelity funds, whether the Fidelity funds (including the fund) have appropriately benefited from any such economies of scale, and whether there is potential for realization of any further economies of scale. The Board considered the extent to which the fund will benefit from economies of scale as assets grow through increased services to the fund, through waivers or reimbursements, or through fee or expense ratio reductions. The Board also noted that a committee (the Economies of Scale Committee) created by it and the boards of other Fidelity funds periodically analyzes whether Fidelity attains economies of scale in respect of the management and servicing of the Fidelity funds, whether the Fidelity funds have appropriately benefited from such economies of scale, and whether there is potential for realization of any further economies of scale.
The Board concluded, taking into account the analysis of the Economies of Scale Committee, that economies of scale, if any, are being appropriately shared between fund shareholders and Fidelity.
Additional Information Requested by the Board . In order to develop fully the factual basis for consideration of the Fidelity funds' advisory contracts, the Board requested and received additional information on certain topics, including: (i) Fidelity's fund profitability methodology, profitability trends for certain funds, the allocation of various costs to different funds, and the impact of certain factors on fund profitability results; (ii) portfolio manager changes that have occurred during the past year and the amount of the investment that each portfolio manager has made in the Fidelity fund(s) that he or she manages; (iii) the extent to which current market conditions have affected retention and recruitment of personnel; (iv) the arrangements with and compensation paid to certain fund sub-advisers on behalf of the Fidelity funds and the treatment of such compensation within Fidelity's fund profitability methodology; (v) the terms of the funds' various management fee structures, including the basic group fee and the terms of Fidelity's voluntary expense limitation arrangements; (vi) Fidelity's transfer agent, pricing and bookkeeping fees, expense and service structures for different funds and classes relative to competitive trends; (vii) the impact on fund profitability of recent industry trends, such as the growth in passively managed funds and the changes in flows for different types of funds; (viii) the types of management fee and total expense comparisons provided, and the challenges and limitations associated with such information; and (ix) explanations regarding the relative total expense ratios and management fees of certain funds and classes, total expense and management fee competitive trends, and methodologies for total expense and management fee competitive comparisons. In addition, the Board considered its discussions with Fidelity regarding Fidelity's efforts to maintain the continuous investment and shareholder services necessary for the funds during the current pandemic and economic circumstances.
Based on its evaluation of all of the conclusions noted above, and after considering all factors it believed relevant, the Board concluded that the advisory and sub-advisory fee arrangements are fair and reasonable and that the fund's Advisory Contracts should be renewed.
1.9900583.102
EMV-ANN-1222
Fidelity® SAI International Quality Index Fund
Annual Report
October 31, 2022
Offered exclusively to certain clients of the Adviser, or its affiliates, including Strategic Advisers LLC (Strategic Advisers) - not available for sale to the general public. Fidelity ® SAI is a product name of Fidelity ® funds dedicated to certain programs affiliated with Strategic Advisers.
Contents
To view a fund's proxy voting guidelines and proxy voting record for the 12-month period ended June 30, visit http://www.fidelity.com/proxyvotingresults or visit the Securities and Exchange Commission's (SEC) web site at http://www.sec.gov.
You may also call 1-800-544-3455 to request a free copy of the proxy voting guidelines.
The funds or securities referred to herein are not sponsored, endorsed, or promoted by Fidelity Product Services LLC (FPS), and FPS bears no liability with respect to any such funds or securities or any index on which such funds or securities are based. The prospectus contains a more detailed description of the relationship between FPS and any related funds.
Standard & Poor's, S&P and S&P 500 are registered service marks of The McGraw-Hill Companies, Inc. and have been licensed for use by Fidelity Distributors Corporation.
Other third-party marks appearing herein are the property of their respective owners.
All other marks appearing herein are registered or unregistered trademarks or service marks of FMR LLC or an affiliated company. © 2022 FMR LLC. All rights reserved.
This report and the financial statements contained herein are submitted for the general information of the shareholders of the Fund. This report is not authorized for distribution to prospective investors in the Fund unless preceded or accompanied by an effective prospectus.
A fund files its complete schedule of portfolio holdings with the SEC for the first and third quarters of each fiscal year on Form N-PORT. Forms N-PORT are available on the SEC's web site at http://www.sec.gov. A fund's Forms N-PORT may be reviewed and copied at the SEC's Public Reference Room in Washington, DC. Information regarding the operation of the SEC's Public Reference Room may be obtained by calling 1-800-SEC-0330.
For a complete list of a fund's portfolio holdings, view the most recent holdings listing, semiannual report, or annual report on Fidelity's web site at http://www.fidelity.com, http://www.institutional.fidelity.com, or http://www.401k.com, as applicable.
NOT FDIC INSURED •MAY LOSE VALUE •NO BANK GUARANTEE
Neither the Fund nor Fidelity Distributors Corporation is a bank.
Average annual total return reflects the change in the value of an investment, assuming reinvestment of distributions from dividend income and capital gains (the profits earned upon the sale of securities that have grown in value, if any) and assuming a constant rate of performance each year. The hypothetical investment and the average annual total returns do not reflect the deduction of taxes that a shareholder would pay on fund distributions or the redemption of fund shares. During periods of reimbursement by Fidelity, a fund's total return will be greater than it would be had the reimbursement not occurred. How a fund did yesterday is no guarantee of how it will do tomorrow.
| Average Annual Total Returns |
| | | | |
Periods ended October 31, 2022 | Past 1 year | Life of Fund A |
| Fidelity® SAI International Quality Index Fund | -23.94% | 4.46% |
A From May 12, 2020
| $10,000 Over Life of Fund |
| |
Let's say hypothetically that $10,000 was invested in Fidelity® SAI International Quality Index Fund on May 12, 2020, when the fund started. The chart shows how the value of your investment would have changed, and also shows how the Fidelity International Quality Focus Index℠ and MSCI ACWI (All Country World Index) ex USA Index performed over the same period. |
|
|
Market Recap:
International equities returned -24.61% for the 12 months ending October 31, 2022, according to the MSCI ACWI (All Country World Index) ex USA Index. After gaining 7.98% in 2021, non-U.S. stocks retreated in the new year, as a multitude of risk factors challenged the global economy and financial markets. Persistently high inflation in some markets, exacerbated by energy price shocks from the Russia-Ukraine conflict, spurred the U.S. Federal Reserve and other central banks to aggressively tighten monetary policy, and market interest rates eclipsed their highest level in roughly a decade, stoking recession fears and sending stocks into bear market territory. Other factors influencing equities abroad included surging global commodity prices, rising sovereign bond yields in some markets, ongoing global supply-chain disruption, a broadly strong U.S. dollar and the potential for variants of the coronavirus to upend global economic growth. Against this backdrop, the index returned -24.20% year to date through October. For the full 12 months, emerging markets (-31%) and Europe ex U.K. (-25%) notably lagged. Conversely, Canada (-13%) and the U.K. (-12%) held up best. Among the 11 sectors, information technology and consumer discretionary (-37% each) fared worst. Communication services (-34%) also trailed the broader market. In contrast, energy gained 2% amid high prices for oil and natural gas. The defensive-oriented utilities (-16%) sector also outperformed, as did financials and consumer staples (-18% each).
Comments from the Geode Capital Management, LLC, passive equity index team:
For the fiscal year, the fund returned -23.94%, roughly in line with the -23.62% result of the benchmark, the Fidelity International Quality Focus Index. (The fund's relative performance can be affected by Fidelity's methodologies for valuing certain foreign stocks and for incorporating foreign exchange rates, which differ from those used by the index, as well as by local tax laws or regulations, which vary by country.) By region, Europe ex U.K. returned -24% and detracted most, followed by Japan (-23%). By sector, stocks in information technology returned -36% and detracted most, followed by industrials, which returned -30%. Health care (-17%) and financials (-28%) also hurt. Consumer discretionary (-28%) and consumer staples (-17%) detracted, with the latter hurt by the household & personal products industry (-30%). Other notable detractors included the real estate (-46%), communication services (-11%), materials (-5%) and utilities (-18%) sectors. In contrast, energy gained 9% and contributed. Turning to individual stocks, the biggest individual detractor was ASML Holding (-41%), from the semiconductors & semiconductor equipment category. In software & services, Adyen (-52%) and SAP (-31%) hurt. Hong Kong Exchanges and Clearing, within the diversified financials industry, returned -55% and hindered the fund. Another noteworthy detractor was Keyence (-37%), a stock in the technology hardware & equipment segment. Conversely, the top contributor was BHP (+2%), from the materials sector. In materials, Fortescue Metals (+27%) was helpful and Lasertec (+25%), from the semiconductors & semiconductor equipment group, also contributed. Imperial Brands, within the food, beverage & tobacco industry, rose about 21% and Zurich Insurance, within the insurance category, gained 5% and boosted the fund.
The views expressed above reflect those of the portfolio manager(s) only through the end of the period as stated on the cover of this report and do not necessarily represent the views of Fidelity or any other person in the Fidelity organization. Any such views are subject to change at any time based upon market or other conditions and Fidelity disclaims any responsibility to update such views. These views may not be relied on as investment advice and, because investment decisions for a Fidelity fund are based on numerous factors, may not be relied on as an indication of trading intent on behalf of any Fidelity fund.
Top Holdings (% of Fund's net assets) |
| |
| Roche Holding AG (participation certificate) (Switzerland, Pharmaceuticals) | 3.9 | |
| Novartis AG (Switzerland, Pharmaceuticals) | 3.4 | |
| Novo Nordisk A/S Series B (Denmark, Pharmaceuticals) | 3.4 | |
| ASML Holding NV (Netherlands) (Netherlands, Semiconductors & Semiconductor Equipment) | 3.4 | |
| LVMH Moet Hennessy Louis Vuitton SE (France, Textiles, Apparel & Luxury Goods) | 3.2 | |
| SAP SE (Germany, Software) | 2.9 | |
| BHP Group Ltd. (Australia, Metals & Mining) | 2.6 | |
| Diageo PLC (United Kingdom, Beverages) | 2.6 | |
| Keyence Corp. (Japan, Electronic Equipment & Components) | 2.6 | |
| L'Oreal SA (France, Personal Products) | 2.4 | |
| | 30.4 | |
| |
| Market Sectors (% of Fund's net assets) |
| |
| Health Care | 21.9 | |
| Information Technology | 14.2 | |
| Industrials | 13.9 | |
| Financials | 10.3 | |
| Materials | 9.1 | |
| Consumer Discretionary | 8.8 | |
| Consumer Staples | 8.1 | |
| Communication Services | 7.5 | |
| Energy | 2.1 | |
| Real Estate | 1.4 | |
| Utilities | 1.0 | |
| |
Asset Allocation (% of Fund's net assets) |
|
|
Geographic Diversification (% of Fund's net assets) |
|
* Includes Short-Term investments and Net Other Assets (Liabilities). Percentages are based on country or territory of incorporation and are adjusted for the effect of futures contracts, if applicable. |
| |
Showing Percentage of Net Assets
| Common Stocks - 98.3% |
| | | Shares | Value ($) |
| Australia - 5.6% | | | |
| ASX Ltd. | | 21,816 | 944,727 |
| Aurizon Holdings Ltd. | | 207,336 | 480,093 |
| BHP Group Ltd. | | 349,180 | 8,344,468 |
| JB Hi-Fi Ltd. | | 12,319 | 338,124 |
| Medibank Private Ltd. | | 310,377 | 557,877 |
| NIB Holdings Ltd. | | 51,677 | 220,478 |
| REA Group Ltd. | | 5,798 | 450,940 |
| Rio Tinto Ltd. | | 41,874 | 2,362,411 |
| SEEK Ltd. | | 39,810 | 549,778 |
| Sonic Healthcare Ltd. | | 54,138 | 1,134,805 |
| Telstra Group Ltd. | | 457,397 | 1,146,890 |
| Whitehaven Coal Ltd. | | 106,525 | 615,293 |
| WiseTech Global Ltd. | | 18,374 | 683,550 |
TOTAL AUSTRALIA | | | 17,829,434 |
| Bailiwick of Jersey - 1.2% | | | |
| Experian PLC | | 109,372 | 3,487,356 |
| Man Group PLC | | 166,154 | 412,912 |
TOTAL BAILIWICK OF JERSEY | | | 3,900,268 |
| Belgium - 0.6% | | | |
| Sofina SA | | 1,776 | 346,639 |
| UCB SA | | 14,261 | 1,075,611 |
| Warehouses de Pauw | | 15,937 | 409,178 |
TOTAL BELGIUM | | | 1,831,428 |
| Bermuda - 0.2% | | | |
| CK Infrastructure Holdings Ltd. | | 65,000 | 308,867 |
| Orient Overseas International Ltd. | | 19,500 | 284,936 |
TOTAL BERMUDA | | | 593,803 |
| Denmark - 5.7% | | | |
| Coloplast A/S Series B | | 13,399 | 1,493,589 |
| Demant A/S (a) | | 10,901 | 297,906 |
| Genmab A/S (a) | | 7,411 | 2,854,775 |
| Novo Nordisk A/S Series B | | 97,601 | 10,612,280 |
| Novozymes A/S Series B | | 23,585 | 1,238,680 |
| Pandora A/S | | 10,756 | 566,902 |
| Ringkjoebing Landbobank A/S | | 3,202 | 348,492 |
| Royal Unibrew A/S | | 4,677 | 267,113 |
| SimCorp A/S | | 4,496 | 268,532 |
TOTAL DENMARK | | | 17,948,269 |
| Finland - 1.2% | | | |
| Elisa Corp. (A Shares) | | 17,013 | 822,329 |
| Kojamo OYJ | | 17,015 | 221,455 |
| Kone OYJ (B Shares) | | 45,509 | 1,863,403 |
| Orion Oyj (B Shares) | | 12,042 | 553,969 |
| Valmet Corp. | | 18,773 | 427,262 |
TOTAL FINLAND | | | 3,888,418 |
| France - 9.8% | | | |
| bioMerieux SA | | 5,345 | 472,968 |
| Edenred SA | | 28,157 | 1,445,847 |
| Gaztransport et Technigaz SA | | 2,889 | 336,040 |
| Hermes International SCA | | 3,930 | 5,089,749 |
| Ipsen SA | | 4,540 | 466,612 |
| Kering SA | | 8,298 | 3,800,163 |
| L'Oreal SA | | 24,273 | 7,621,829 |
| La Francaise des Jeux SAEM (b) | | 14,043 | 457,974 |
| LVMH Moet Hennessy Louis Vuitton SE | | 16,079 | 10,145,767 |
| Remy Cointreau SA | | 2,656 | 407,105 |
| Sartorius Stedim Biotech | | 2,705 | 858,637 |
TOTAL FRANCE | | | 31,102,691 |
| Germany - 4.6% | | | |
| Beiersdorf AG | | 3,714 | 356,526 |
| Deutsche Borse AG | | 21,439 | 3,486,405 |
| Encavis AG | | 13,054 | 243,177 |
| LEG Immobilien AG | | 8,220 | 537,120 |
| Nemetschek SE | | 6,235 | 297,982 |
| Rational AG | | 577 | 325,596 |
| SAP SE | | 94,654 | 9,110,720 |
| Vantage Towers AG | | 10,852 | 305,433 |
TOTAL GERMANY | | | 14,662,959 |
| Hong Kong - 1.4% | | | |
| Hong Kong Exchanges and Clearing Ltd. | | 134,400 | 3,567,462 |
| Power Assets Holdings Ltd. | | 154,000 | 736,683 |
TOTAL HONG KONG | | | 4,304,145 |
| Israel - 0.4% | | | |
| NICE Ltd. (a) | | 7,350 | 1,393,225 |
| Italy - 0.6% | | | |
| FinecoBank SpA | | 68,822 | 927,702 |
| Italgas SpA | | 54,111 | 278,873 |
| Recordati SpA | | 11,326 | 425,667 |
| Reply SpA | | 2,527 | 274,954 |
TOTAL ITALY | | | 1,907,196 |
| Japan - 24.5% | | | |
| Astellas Pharma, Inc. | | 206,700 | 2,852,085 |
| Bandai Namco Holdings, Inc. | | 25,000 | 1,654,729 |
| BayCurrent Consulting, Inc. | | 16,000 | 450,856 |
| Capcom Co. Ltd. | | 18,300 | 510,128 |
| Chugai Pharmaceutical Co. Ltd. | | 72,000 | 1,668,374 |
| CyberAgent, Inc. | | 46,200 | 380,301 |
| Daito Trust Construction Co. Ltd. | | 7,800 | 771,633 |
| Disco Corp. | | 3,300 | 792,293 |
| Hamamatsu Photonics K.K. | | 16,600 | 752,440 |
| Hirose Electric Co. Ltd. | | 3,700 | 480,494 |
| Hoya Corp. | | 41,300 | 3,853,778 |
| Japan Exchange Group, Inc. | | 59,600 | 783,251 |
| Japan Tobacco, Inc. | | 124,100 | 2,078,357 |
| Kakaku.com, Inc. | | 14,600 | 247,531 |
| KDDI Corp. | | 184,700 | 5,459,173 |
| Keyence Corp. | | 21,500 | 8,143,381 |
| Kobayashi Pharmaceutical Co. Ltd. | | 6,600 | 350,651 |
| Konami Group Corp. | | 11,300 | 496,244 |
| M3, Inc. | | 48,200 | 1,441,186 |
| MS&AD Insurance Group Holdings, Inc. | | 52,900 | 1,400,856 |
| Nabtesco Corp. | | 13,700 | 291,607 |
| Nexon Co. Ltd. | | 52,800 | 886,658 |
| Nihon M&A Center Holdings, Inc. | | 33,800 | 382,564 |
| Nintendo Co. Ltd. | | 131,800 | 5,350,961 |
| Nippon Shinyaku Co. Ltd. | | 6,900 | 382,367 |
| Nippon Telegraph & Telephone Corp. | | 134,800 | 3,717,879 |
| Nissan Chemical Corp. | | 16,000 | 720,939 |
| NOF Corp. | | 9,200 | 316,783 |
| OBIC Co. Ltd. | | 7,500 | 1,128,316 |
| Ono Pharmaceutical Co. Ltd. | | 54,900 | 1,290,766 |
| Otsuka Holdings Co. Ltd. | | 62,100 | 1,990,585 |
| Recruit Holdings Co. Ltd. | | 191,300 | 5,886,525 |
| Shimadzu Corp. | | 31,100 | 820,925 |
| SHIMANO, Inc. | | 9,400 | 1,454,587 |
| Shin-Etsu Chemical Co. Ltd. | | 38,600 | 4,011,696 |
| Shionogi & Co. Ltd. | | 32,000 | 1,485,992 |
| SMC Corp. | | 6,900 | 2,769,676 |
| Sompo Holdings, Inc. | | 39,200 | 1,632,641 |
| Square Enix Holdings Co. Ltd. | | 9,900 | 442,086 |
| Sysmex Corp. | | 19,100 | 1,031,203 |
| TechnoPro Holdings, Inc. | | 12,200 | 292,682 |
| Tokio Marine Holdings, Inc. | | 230,100 | 4,164,223 |
| Trend Micro, Inc. | | 15,900 | 803,047 |
| USS Co. Ltd. | | 25,100 | 379,298 |
| Yakult Honsha Co. Ltd. | | 18,100 | 1,003,020 |
| ZOZO, Inc. | | 12,600 | 268,193 |
TOTAL JAPAN | | | 77,472,960 |
| Luxembourg - 0.1% | | | |
| SES SA (France) (depositary receipt) | | 43,156 | 306,134 |
| Netherlands - 7.1% | | | |
| Adyen BV (a)(b) | | 3,492 | 4,985,177 |
| Arcadis NV | | 8,360 | 284,040 |
| ASML Holding NV (Netherlands) | | 22,591 | 10,597,148 |
| BE Semiconductor Industries NV | | 8,510 | 434,966 |
| Ferrari NV (Italy) | | 14,434 | 2,845,748 |
| Wolters Kluwer NV | | 29,615 | 3,147,668 |
TOTAL NETHERLANDS | | | 22,294,747 |
| New Zealand - 0.3% | | | |
| Fisher & Paykel Healthcare Corp. | | 65,022 | 740,198 |
| Ryman Healthcare Ltd. | | 47,295 | 230,427 |
TOTAL NEW ZEALAND | | | 970,625 |
| Norway - 1.9% | | | |
| Aker BP ASA | | 34,892 | 1,112,259 |
| Equinor ASA | | 121,229 | 4,416,824 |
| Gjensidige Forsikring ASA | | 21,375 | 390,444 |
TOTAL NORWAY | | | 5,919,527 |
| Singapore - 0.2% | | | |
| Singapore Exchange Ltd. | | 92,300 | 549,001 |
| Spain - 0.4% | | | |
| Enagas SA (c) | | 28,087 | 455,962 |
| Red Electrica Corporacion SA | | 48,887 | 790,782 |
TOTAL SPAIN | | | 1,246,744 |
| Sweden - 2.8% | | | |
| Atlas Copco AB (A Shares) | | 449,590 | 4,798,588 |
| Epiroc AB (A Shares) | | 109,759 | 1,680,241 |
| Fastighets AB Balder (a) | | 71,121 | 267,287 |
| Sagax AB | | 20,337 | 375,015 |
| Swedish Match Co. AB | | 172,041 | 1,769,423 |
TOTAL SWEDEN | | | 8,890,554 |
| Switzerland - 15.7% | | | |
| ABB Ltd. (Reg.) | | 144,042 | 4,000,090 |
| Accelleron Industries Ltd. (a) | | 7,188 | 121,888 |
| Belimo Holding AG (Reg.) | | 1,110 | 452,269 |
| Bucher Industries AG | | 750 | 252,709 |
| Ems-Chemie Holding AG | | 763 | 479,661 |
| Geberit AG (Reg.) | | 4,048 | 1,800,144 |
| Kuehne & Nagel International AG | | 5,722 | 1,219,429 |
| Nestle SA (Reg. S) | | 7,792 | 848,228 |
| Novartis AG | | 134,884 | 10,910,870 |
| Partners Group Holding AG | | 2,559 | 2,298,462 |
| Roche Holding AG (participation certificate) | | 36,800 | 12,210,168 |
| Schindler Holding AG (participation certificate) | | 6,728 | 1,096,865 |
| SGS SA (Reg.) | | 684 | 1,507,886 |
| Sonova Holding AG | | 5,984 | 1,414,503 |
| Straumann Holding AG | | 12,924 | 1,229,995 |
| Swisscom AG | | 2,862 | 1,412,779 |
| Temenos Group AG | | 7,573 | 451,499 |
| VAT Group AG (b) | | 3,043 | 695,300 |
| Zurich Insurance Group Ltd. | | 16,972 | 7,233,024 |
TOTAL SWITZERLAND | | | 49,635,769 |
| United Kingdom - 14.0% | | | |
| 3i Group PLC | | 109,777 | 1,462,052 |
| Admiral Group PLC | | 30,785 | 712,086 |
| Anglo American PLC (United Kingdom) | | 150,898 | 4,520,031 |
| Antofagasta PLC | | 38,948 | 525,044 |
| Auto Trader Group PLC (b) | | 109,262 | 654,018 |
| Big Yellow Group PLC | | 19,548 | 252,423 |
| Computacenter PLC | | 10,051 | 208,629 |
| Diageo PLC | | 201,934 | 8,310,092 |
| Games Workshop Group PLC | | 3,703 | 271,782 |
| GSK PLC | | 355,609 | 5,825,266 |
| Hargreaves Lansdown PLC | | 40,093 | 350,909 |
| IG Group Holdings PLC | | 48,699 | 444,271 |
| Imperial Brands PLC | | 107,113 | 2,609,176 |
| Indivior PLC (a) | | 15,852 | 301,591 |
| Persimmon PLC | | 36,022 | 539,096 |
| RELX PLC (London Stock Exchange) | | 223,669 | 6,007,860 |
| Rightmove PLC | | 98,716 | 555,889 |
| Rio Tinto PLC | | 119,691 | 6,255,250 |
| Rotork PLC | | 97,189 | 285,551 |
| Safestore Holdings PLC | | 23,800 | 246,600 |
| Sage Group PLC | | 123,804 | 1,031,899 |
| Schroders PLC | | 80,936 | 363,566 |
| Segro PLC | | 135,645 | 1,221,128 |
| St. James's Place PLC | | 60,917 | 744,005 |
| Tritax Big Box REIT PLC | | 210,802 | 339,172 |
| Wise PLC (a) | | 47,362 | 361,193 |
TOTAL UNITED KINGDOM | | | 44,398,579 |
| TOTAL COMMON STOCKS (Cost $329,610,459) | | | 311,046,476 |
| | | | |
| Government Obligations - 0.1% |
| | | Principal Amount (d) | Value ($) |
| United States of America - 0.1% | | | |
U.S. Treasury Bills, yield at date of purchase 1.23% 1/26/23 (e) (Cost $299,130) | | 300,000 | 297,142 |
| | | | |
| Money Market Funds - 1.2% |
| | | Shares | Value ($) |
| Fidelity Cash Central Fund 3.10% (f) | | 3,033,504 | 3,034,111 |
| Fidelity Securities Lending Cash Central Fund 3.10% (f)(g) | | 650,885 | 650,950 |
| TOTAL MONEY MARKET FUNDS (Cost $3,685,061) | | | 3,685,061 |
| | | | |
| TOTAL INVESTMENT IN SECURITIES - 99.6% (Cost $333,594,650) | 315,028,679 |
NET OTHER ASSETS (LIABILITIES) - 0.4% | 1,261,865 |
| NET ASSETS - 100.0% | 316,290,544 |
| | |
| Futures Contracts |
| | Number of contracts | Expiration Date | Notional Amount ($) | Value ($) | Unrealized Appreciation/ (Depreciation) ($) |
| Purchased | | | | | |
| | | | | | |
| Equity Index Contracts | | | | | |
| ICE E-mini MSCI EAFE Index Contracts (United States) | 60 | Dec 2022 | 5,267,700 | 228,491 | 228,491 |
| | | | | | |
| The notional amount of futures purchased as a percentage of Net Assets is 1.7% |
Categorizations in the Schedule of Investments are based on country or territory of incorporation.
Legend
| (b) | Security exempt from registration under Rule 144A of the Securities Act of 1933. These securities may be resold in transactions exempt from registration, normally to qualified institutional buyers. At the end of the period, the value of these securities amounted to $6,792,469 or 2.1% of net assets. |
| (c) | Security or a portion of the security is on loan at period end. |
| (d) | Amount is stated in United States dollars unless otherwise noted. |
| (e) | Security or a portion of the security was pledged to cover margin requirements for futures contracts. At period end, the value of securities pledged amounted to $297,142. |
| (f) | Affiliated fund that is generally available only to investment companies and other accounts managed by Fidelity Investments. The rate quoted is the annualized seven-day yield of the fund at period end. A complete unaudited listing of the fund's holdings as of its most recent quarter end is available upon request. In addition, each Fidelity Central Fund's financial statements, which are not covered by the Fund's Report of Independent Registered Public Accounting Firm, are available on the SEC's website or upon request. |
| (g) | Investment made with cash collateral received from securities on loan. |
Affiliated Central Funds
Fiscal year to date information regarding the Fund's investments in Fidelity Central Funds, including the ownership percentage, is presented below.
| Affiliate | Value, beginning of period ($) | Purchases ($) | Sales Proceeds ($) | Dividend Income ($) | Realized Gain (loss) ($) | Change in Unrealized appreciation (depreciation) ($) | Value, end of period ($) | % ownership, end of period |
| Fidelity Cash Central Fund 3.10% | 6,762,264 | 84,759,761 | 88,487,914 | 22,562 | - | - | 3,034,111 | 0.0% |
| Fidelity Securities Lending Cash Central Fund 3.10% | - | 27,023,406 | 26,372,456 | 18,772 | - | - | 650,950 | 0.0% |
| Total | 6,762,264 | 111,783,167 | 114,860,370 | 41,334 | - | - | 3,685,061 | |
| | | | | | | | | |
Amounts in the income column in the above table include any capital gain distributions from underlying funds, which are presented in the corresponding line item in the Statement of Operations, if applicable.
Amount for Fidelity Securities Lending Cash Central Fund represents the income earned on investing cash collateral, less rebates paid to borrowers and any lending agent fees associated with the loan, plus any premium payments received for lending certain types of securities.
Investment Valuation
The following is a summary of the inputs used, as of October 31, 2022, involving the Fund's assets and liabilities carried at fair value. The inputs or methodology used for valuing securities may not be an indication of the risk associated with investing in those securities. For more information on valuation inputs, and their aggregation into the levels used below, please refer to the Investment Valuation section in the accompanying Notes to Financial Statements.
| Valuation Inputs at Reporting Date: |
| Description | Total ($) | Level 1 ($) | Level 2 ($) | Level 3 ($) |
Investments in Securities: | | | | |
|
| Equities: | | | | |
Communication Services | 23,695,151 | 7,957,231 | 15,737,920 | - |
Consumer Discretionary | 27,812,112 | 12,411,595 | 15,400,517 | - |
Consumer Staples | 25,621,520 | 2,027,889 | 23,593,631 | - |
Energy | 6,480,416 | 2,063,592 | 4,416,824 | - |
Financials | 33,341,485 | 15,408,435 | 17,933,050 | - |
Health Care | 69,106,173 | 15,972,194 | 53,133,979 | - |
Industrials | 44,293,084 | 11,998,777 | 32,294,307 | - |
Information Technology | 44,466,217 | 19,773,172 | 24,693,045 | - |
Materials | 28,774,963 | 13,987,986 | 14,786,977 | - |
Real Estate | 4,641,011 | 4,641,011 | - | - |
Utilities | 2,814,344 | 1,567,600 | 1,246,744 | - |
|
| Government Obligations | 297,142 | - | 297,142 | - |
|
| Money Market Funds | 3,685,061 | 3,685,061 | - | - |
| Total Investments in Securities: | 315,028,679 | 111,494,543 | 203,534,136 | - |
Derivative Instruments: | | | | |
|
| Assets | | | | |
Futures Contracts | 228,491 | 228,491 | - | - |
| Total Assets | 228,491 | 228,491 | - | - |
| Total Derivative Instruments: | 228,491 | 228,491 | - | - |
Value of Derivative Instruments
The following table is a summary of the Fund's value of derivative instruments by primary risk exposure as of October 31, 2022. For additional information on derivative instruments, please refer to the Derivative Instruments section in the accompanying Notes to Financial Statements.
Primary Risk Exposure / Derivative Type | Value |
| Asset ($) | Liability ($) |
| Equity Risk | | |
Futures Contracts (a) | 228,491 | 0 |
| Total Equity Risk | 228,491 | 0 |
| Total Value of Derivatives | 228,491 | 0 |
(a)Reflects gross cumulative appreciation (depreciation) on futures contracts as presented in the Schedule of Investments. In the Statement of Assets and Liabilities, the period end daily variation margin is included in receivable or payable for daily variation margin on futures contracts, and the net cumulative appreciation (depreciation) is included in Total accumulated earnings (loss).
| Statement of Assets and Liabilities |
| | | | October 31, 2022 |
| | | | | |
| Assets | | | | |
| Investment in securities, at value (including securities loaned of $449,672) - See accompanying schedule: | | | | |
Unaffiliated issuers (cost $329,909,589) | | $311,343,618 | | |
Fidelity Central Funds (cost $3,685,061) | | 3,685,061 | | |
| | | | | |
| Total Investment in Securities (cost $333,594,650) | | | $ | 315,028,679 |
| Foreign currency held at value (cost $313,306) | | | | 316,058 |
| Receivable for fund shares sold | | | | 56,411 |
| Dividends receivable | | | | 594,586 |
| Reclaims receivable | | | | 1,199,074 |
| Distributions receivable from Fidelity Central Funds | | | | 4,230 |
| Prepaid expenses | | | | 487 |
Total assets | | | | 317,199,525 |
| Liabilities | | | | |
| Payable for fund shares redeemed | | $112,106 | | |
| Accrued management fee | | 38,893 | | |
| Payable for daily variation margin on futures contracts | | 48,000 | | |
| Other payables and accrued expenses | | 59,032 | | |
| Collateral on securities loaned | | 650,950 | | |
| Total Liabilities | | | | 908,981 |
| Net Assets | | | $ | 316,290,544 |
| Net Assets consist of: | | | | |
| Paid in capital | | | $ | 358,825,363 |
| Total accumulated earnings (loss) | | | | (42,534,819) |
| Net Assets | | | $ | 316,290,544 |
Net Asset Value , offering price and redemption price per share ($316,290,544 ÷ 31,897,369 shares) | | | $ | 9.92 |
| | | | | |
| Statement of Operations |
| | | | Year ended October 31, 2022 |
| Investment Income | | | | |
| Dividends | | | $ | 14,462,059 |
| Foreign Tax Reclaims | | | | 801,029 |
| Income from Fidelity Central Funds (including $18,772 from security lending) | | | | 41,334 |
| Income before foreign taxes withheld | | | | 15,304,422 |
| Less foreign taxes withheld | | | | (1,922,520) |
| Total Income | | | | 13,381,902 |
| Expenses | | | | |
| Management fee | $ | 696,500 | | |
| Custodian fees and expenses | | 84,252 | | |
| Independent trustees' fees and expenses | | 1,580 | | |
| Registration fees | | 23,821 | | |
| Audit | | 46,539 | | |
| Legal | | 561 | | |
| Interest | | 6,316 | | |
| Miscellaneous | | 1,963 | | |
| Total Expenses | | | | 861,532 |
| Net Investment income (loss) | | | | 12,520,370 |
| Realized and Unrealized Gain (Loss) | | | | |
| Net realized gain (loss) on: | | | | |
| Investment Securities: | | | | |
| Unaffiliated issuers | | (29,802,098) | | |
| Foreign currency transactions | | (423,184) | | |
| Futures contracts | | (1,109,626) | | |
| Total net realized gain (loss) | | | | (31,334,908) |
| Change in net unrealized appreciation (depreciation) on: | | | | |
| Investment Securities: | | | | |
| Unaffiliated issuers | | (106,016,210) | | |
| Assets and liabilities in foreign currencies | | (124,584) | | |
| Futures contracts | | 83,982 | | |
| Total change in net unrealized appreciation (depreciation) | | | | (106,056,812) |
| Net gain (loss) | | | | (137,391,720) |
| Net increase (decrease) in net assets resulting from operations | | | $ | (124,871,350) |
| Statement of Changes in Net Assets |
| |
| | Year ended October 31, 2022 | | Year ended October 31, 2021 |
| Increase (Decrease) in Net Assets | | | | |
| Operations | | | | |
| Net investment income (loss) | $ | 12,520,370 | $ | 8,838,979 |
| Net realized gain (loss) | | (31,334,908) | | 56,989,236 |
| Change in net unrealized appreciation (depreciation) | | (106,056,812) | | 67,282,760 |
| Net increase (decrease) in net assets resulting from operations | | (124,871,350) | | 133,110,975 |
| Distributions to shareholders | | (57,966,562) | | (4,741,796) |
| Share transactions | | | | |
| Proceeds from sales of shares | | 58,623,756 | | 211,498,578 |
| Reinvestment of distributions | | 57,912,763 | | 4,739,668 |
| Cost of shares redeemed | | (205,609,251) | | (229,953,190) |
Net increase (decrease) in net assets resulting from share transactions | | (89,072,732) | | (13,714,944) |
| Total increase (decrease) in net assets | | (271,910,644) | | 114,654,235 |
| | | | | |
| Net Assets | | | | |
| Beginning of period | | 588,201,188 | | 473,546,953 |
| End of period | $ | 316,290,544 | $ | 588,201,188 |
| | | | | |
| Other Information | | | | |
| Shares | | | | |
| Sold | | 4,925,582 | | 14,999,451 |
| Issued in reinvestment of distributions | | 4,434,362 | | 379,477 |
| Redeemed | | (18,012,279) | | (17,607,218) |
| Net increase (decrease) | | (8,652,335) | | (2,228,290) |
| | | | | |
Financial Highlights
| Fidelity® SAI International Quality Index Fund |
| |
| Years ended October 31, | | 2022 | | 2021 | | 2020 A |
Selected Per-Share Data | | | | | | |
| Net asset value, beginning of period | $ | 14.51 | $ | 11.07 | $ | 10.00 |
| Income from Investment Operations | | | | | | |
Net investment income (loss) B,C | | .32 | | .24 | | .08 |
| Net realized and unrealized gain (loss) | | (3.44) | | 3.32 | | .99 |
| Total from investment operations | | (3.12) | | 3.56 | | 1.07 |
| Distributions from net investment income | | (.24) | | (.10) | | - |
| Distributions from net realized gain | | (1.24) | | (.02) | | - |
| Total distributions | | (1.47) D | | (.12) | | - |
| Net asset value, end of period | $ | 9.92 | $ | 14.51 | $ | 11.07 |
Total Return E,F | | (23.94)% | | 32.28% | | 10.70% |
Ratios to Average Net Assets C,G,H | | | | | | |
| Expenses before reductions | | .19% | | .19% | | .23% I,J |
| Expenses net of fee waivers, if any | | .19% | | .19% | | .20% J |
| Expenses net of all reductions | | .19% | | .19% | | .20% J |
| Net investment income (loss) | | 2.70% | | 1.78% | | 1.55% J |
| Supplemental Data | | | | | | |
| Net assets, end of period (000 omitted) | $ | 316,291 | $ | 588,201 | $ | 473,547 |
Portfolio turnover rate K | | 47% | | 78% | | 30% L |
A For the period May 12, 2020 (commencement of operations) through October 31, 2020.
B Calculated based on average shares outstanding during the period.
C Net investment income (loss) is affected by the timing of the declaration of dividends by any underlying mutual funds or exchange-traded funds (ETFs). Net investment income (loss) of any mutual funds or ETFs is not included in the Fund's net investment income (loss) ratio.
D Total distributions per share do not sum due to rounding.
E Total returns for periods of less than one year are not annualized.
F Total returns would have been lower if certain expenses had not been reduced during the applicable periods shown.
G Fees and expenses of any underlying mutual funds or exchange-traded funds (ETFs) are not included in the Fund's expense ratio. The Fund indirectly bears its proportionate share of these expenses. For additional expense information related to investments in Fidelity Central Funds, please refer to the "Investments in Fidelity Central Funds" note found in the Notes to Financial Statements section of the most recent Annual or Semi-Annual report.
H Expense ratios reflect operating expenses of the class. Expenses before reductions do not reflect amounts reimbursed, waived, or reduced through arrangements with the investment adviser, brokerage services, or other offset arrangements, if applicable, and do not represent the amount paid by the class during periods when reimbursements, waivers or reductions occur.
I Audit fees are not annualized.
J Annualized.
K Amount does not include the portfolio activity of any underlying mutual funds or exchange-traded funds (ETFs).
L Amount not annualized.
For the period ended October 31, 2022
1. Organization.
Fidelity SAI International Quality Index Fund (the Fund) is a fund of Fidelity Salem Street Trust (the Trust) and is authorized to issue an unlimited number of shares. Shares are offered exclusively to certain clients of Fidelity Management & Research Company LLC (FMR) or its affiliates. The Trust is registered under the Investment Company Act of 1940, as amended (the 1940 Act), as an open-end management investment company organized as a Massachusetts business trust.
2. Investments in Fidelity Central Funds.
Funds may invest in Fidelity Central Funds, which are open-end investment companies generally available only to other investment companies and accounts managed by the investment adviser and its affiliates. The Schedule of Investments lists any Fidelity Central Funds held as an investment as of period end, but does not include the underlying holdings of each Fidelity Central Fund. An investing fund indirectly bears its proportionate share of the expenses of the underlying Fidelity Central Funds.
Based on its investment objective, each Fidelity Central Fund may invest or participate in various investment vehicles or strategies that are similar to those of the investing fund. These strategies are consistent with the investment objectives of the investing fund and may involve certain economic risks which may cause a decline in value of each of the Fidelity Central Funds and thus a decline in the value of the investing fund.
| Fidelity Central Fund | Investment Manager | Investment Objective | Investment Practices | Expense Ratio A |
| Fidelity Money Market Central Funds | Fidelity Management & Research Company LLC (FMR) | Each fund seeks to obtain a high level of current income consistent with the preservation of capital and liquidity. | Short-term Investments | Less than .005% |
A Expenses expressed as a percentage of average net assets and are as of each underlying Central Fund's most recent annual or semi-annual shareholder report.
A complete unaudited list of holdings for each Fidelity Central Fund is available upon request or at the Securities and Exchange Commission website at www.sec.gov. In addition, the financial statements of the Fidelity Central Funds which contain the significant accounting policies (including investment valuation policies) of those funds, and are not covered by the Report of Independent Registered Public Accounting Firm, are available on the Securities and Exchange Commission website or upon request.
3. Significant Accounting Policies.
The Fund is an investment company and applies the accounting and reporting guidance of the Financial Accounting Standards Board (FASB) Accounting Standards Codification Topic 946 Financial Services - Investment Companies . The financial statements have been prepared in conformity with accounting principles generally accepted in the United States of America (GAAP), which require management to make certain estimates and assumptions at the date of the financial statements. Actual results could differ from those estimates. Subsequent events, if any, through the date that the financial statements were issued have been evaluated in the preparation of the financial statements. The Fund's Schedule of Investments lists any underlying mutual funds or exchange-traded funds (ETFs) but does not include the underlying holdings of these funds. The following summarizes the significant accounting policies of the Fund:
Investment Valuation. Investments are valued as of 4:00 p.m. Eastern time on the last calendar day of the period. The Board of Trustees (the Board) has designated the Fund's investment adviser as the valuation designee responsible for the fair valuation function and performing fair value determinations as needed. The investment adviser has established a Fair Value Committee (the Committee) to carry out the day-to-day fair valuation responsibilities and has adopted policies and procedures to govern the fair valuation process and the activities of the Committee. In accordance with these fair valuation policies and procedures, which have been approved by the Board, the Fund attempts to obtain prices from one or more third party pricing services or brokers to value its investments. When current market prices, quotations or currency exchange rates are not readily available or reliable, investments will be fair valued in good faith by the Committee, in accordance with the policies and procedures. Factors used in determining fair value vary by investment type and may include market or investment specific events, transaction data, estimated cash flows, and market observations of comparable investments. The frequency that the fair valuation procedures are used cannot be predicted and they may be utilized to a significant extent. The Committee manages the Fund's fair valuation practices and maintains the fair valuation policies and procedures. The Fund's investment adviser reports to the Board information regarding the fair valuation process and related material matters.
The Fund categorizes the inputs to valuation techniques used to value its investments into a disclosure hierarchy consisting of three levels as shown below:
Level 1 - unadjusted quoted prices in active markets for identical investments
Level 2 - other significant observable inputs (including quoted prices for similar investments, interest rates, prepayment speeds, etc.)
Level 3 - unobservable inputs (including the Fund's own assumptions based on the best information available)
Valuation techniques used to value the Fund's investments by major category are as follows:
Equity securities, including restricted securities, for which market quotations are readily available, are valued at the last reported sale price or official closing price as reported by a third party pricing service on the primary market or exchange on which they are traded and are categorized as Level 1 in the hierarchy. In the event there were no sales during the day or closing prices are not available, securities are valued at the last quoted bid price or may be valued using the last available price and are generally categorized as Level 2 in the hierarchy. For foreign equity securities, when market or security specific events arise, comparisons to the valuation of American Depositary Receipts (ADRs), futures contracts, ETFs and certain indexes as well as quoted prices for similar securities may be used and would be categorized as Level 2 in the hierarchy. For equity securities, including restricted securities, where observable inputs are limited, assumptions about market activity and risk are used and these securities may be categorized as Level 3 in the hierarchy.
Debt securities, including restricted securities, are valued based on evaluated prices received from third party pricing services or from brokers who make markets in such securities. U.S. government and government agency obligations are valued by pricing services who utilize matrix pricing which considers prepayment speed assumptions, attributes of the collateral, yield or price of bonds of comparable quality, coupon, maturity and type or by broker-supplied prices. When independent prices are unavailable or unreliable, debt securities may be valued utilizing pricing methodologies which consider similar factors that would be used by third party pricing services. Debt securities are generally categorized as Level 2 in the hierarchy but may be Level 3 depending on the circumstances.
Futures contracts are valued at the settlement price or official closing price established each day by the board of trade or exchange on which they are traded and are categorized as Level 1 in the hierarchy. Investments in open-end mutual funds, including the Fidelity Central Funds, are valued at their closing net asset value (NAV) each business day and are categorized as Level 1 in the hierarchy.
Changes in valuation techniques may result in transfers in or out of an assigned level within the disclosure hierarchy. The aggregate value of investments by input level as of October 31, 2022 is included at the end of the Fund's Schedule of Investments.
Foreign Currency. Certain Funds may use foreign currency contracts to facilitate transactions in foreign-denominated securities. Gains and losses from these transactions may arise from changes in the value of the foreign currency or if the counterparties do not perform under the contracts' terms.
Foreign-denominated assets, including investment securities, and liabilities are translated into U.S. dollars at the exchange rates at period end. Purchases and sales of investment securities, income and dividends received, and expenses denominated in foreign currencies are translated into U.S. dollars at the exchange rate in effect on the transaction date.
The effects of exchange rate fluctuations on investments are included with the net realized and unrealized gain (loss) on investment securities. Other foreign currency transactions resulting in realized and unrealized gain (loss) are disclosed separately.
Investment Transactions and Income. For financial reporting purposes, the Fund's investment holdings and NAV include trades executed through the end of the last business day of the period. The NAV per share for processing shareholder transactions is calculated as of the close of business of the New York Stock Exchange (NYSE), normally 4:00 p.m. Eastern time and includes trades executed through the end of the prior business day. Gains and losses on securities sold are determined on the basis of identified cost. Commissions paid to certain brokers with whom the investment adviser, or its affiliates, places trades on behalf of a fund include an amount in addition to trade execution, which may be rebated back to a fund. Any such rebates are included in net realized gain (loss) on investments in the Statement of Operations. Dividend income is recorded on the ex-dividend date, except for certain dividends from foreign securities where the ex-dividend date may have passed, which are recorded as soon as the Fund is informed of the ex-dividend date. Non-cash dividends included in dividend income, if any, are recorded at the fair market value of the securities received. Income and capital gain distributions from Fidelity Central Funds, if any, are recorded on the ex-dividend date. Investment income is recorded net of foreign taxes withheld where recovery of such taxes is uncertain. Funds may file withholding tax reclaims in certain jurisdictions to recover a portion of amounts previously withheld. Any withholding tax reclaims income is included in the Statement of Operations in foreign tax reclaims. Any receivables for withholding tax reclaims are included in the Statement of Assets and Liabilities in reclaims receivable.
Expenses. Expenses directly attributable to a fund are charged to that fund. Expenses attributable to more than one fund are allocated among the respective funds on the basis of relative net assets or other appropriate methods. Expenses included in the accompanying financial statements reflect the expenses of that fund and do not include any expenses associated with any underlying mutual funds or exchange-traded funds. Although not included in a fund's expenses, a fund indirectly bears its proportionate share of these expenses through the net asset value of each underlying mutual fund or exchange-traded fund. Expense estimates are accrued in the period to which they relate and adjustments are made when actual amounts are known.
Income Tax Information and Distributions to Shareholders. Each year, the Fund intends to qualify as a regulated investment company under Subchapter M of the Internal Revenue Code, including distributing substantially all of its taxable income and realized gains. As a result, no provision for U.S. Federal income taxes is required. As of October 31, 2022, the Fund did not have any unrecognized tax benefits in the financial statements; nor is the Fund aware of any tax positions for which it is reasonably possible that the total amounts of unrecognized tax benefits will significantly change in the next twelve months. The Fund files a U.S. federal tax return, in addition to state and local tax returns as required. The Fund's federal income tax returns are subject to examination by the Internal Revenue Service (IRS) for a period of three fiscal years after they are filed. State and local tax returns may be subject to examination for an additional fiscal year depending on the jurisdiction. Foreign taxes are provided for based on the Fund's understanding of the tax rules and rates that exist in the foreign markets in which it invests.
Distributions are declared and recorded on the ex-dividend date. Income and capital gain distributions are determined in accordance with income tax regulations, which may differ from GAAP. In addition, the Fund claimed a portion of the payment made to redeeming shareholders as a distribution for income tax purposes.
Capital accounts within the financial statements are adjusted for permanent book-tax differences. These adjustments have no impact on net assets or the results of operations. Capital accounts are not adjusted for temporary book-tax differences which will reverse in a subsequent period.
Book-tax differences are primarily due to futures contracts, foreign currency transactions, passive foreign investment companies (PFIC), certain corporate actions, capital loss carryforwards and losses deferred due to wash sales.
As of period end, the cost and unrealized appreciation (depreciation) in securities, and derivatives if applicable, for federal income tax purposes were as follows:
| Gross unrealized appreciation | $ 21,708,565 |
| Gross unrealized depreciation | (42,363,696) |
| Net unrealized appreciation (depreciation) | $(20,655,131) |
| Tax Cost | $335,683,810 |
The tax-based components of distributable earnings as of period end were as follows:
| Undistributed ordinary income | $9,673,810 |
| Capital loss carryforward | $(31,419,962) |
| Net unrealized appreciation (depreciation) on securities and other investments | $(20,788,665) |
Capital loss carryforwards are only available to offset future capital gains of the Fund to the extent provided by regulations and may be limited. The capital loss carryforward information presented below, including any applicable limitation, is estimated as of fiscal period end and is subject to adjustment.
The tax character of distributions paid was as follows:
| | October 31, 2022 | October 31, 2021 |
| Ordinary Income | $ 45,978,919 | $ 4,741,796 |
| Long-term Capital Gains | 11,987,643 | - |
| Total | $57,966,562 | $4,741,796 |
Restricted Securities (including Private Placements). Funds may invest in securities that are subject to legal or contractual restrictions on resale. These securities generally may be resold in transactions exempt from registration or to the public if the securities are registered. Disposal of these securities may involve time-consuming negotiations and expense, and prompt sale at an acceptable price may be difficult. Information regarding restricted securities held at period end is included at the end of the Schedule of Investments, if applicable.
4. Derivative Instruments.
Risk Exposures and the Use of Derivative Instruments. The Fund's investment objectives allow for various types of derivative instruments, including futures contracts. Derivatives are investments whose value is primarily derived from underlying assets, indices or reference rates and may be transacted on an exchange or over-the-counter (OTC). Derivatives may involve a future commitment to buy or sell a specified asset based on specified terms, to exchange future cash flows at periodic intervals based on a notional principal amount, or for one party to make one or more payments upon the occurrence of specified events in exchange for periodic payments from the other party.
Derivatives were used to increase returns and to manage exposure to certain risks as defined below. The success of any strategy involving derivatives depends on analysis of numerous economic factors, and if the strategies for investment do not work as intended, the objectives may not be achieved.
Derivatives were used to increase or decrease exposure to the following risk(s):
| | |
| Equity Risk | Equity risk relates to the fluctuations in the value of financial instruments as a result of changes in market prices (other than those arising from interest rate risk or foreign exchange risk), whether caused by factors specific to an individual investment, its issuer, or all factors affecting all instruments traded in a market or market segment. |
Funds are also exposed to additional risks from investing in derivatives, such as liquidity risk and counterparty credit risk. Liquidity risk is the risk that a fund will be unable to close out the derivative in the open market in a timely manner. Counterparty credit risk is the risk that the counterparty will not be able to fulfill its obligation to a fund. Counterparty credit risk related to exchange-traded contracts may be mitigated by the protection provided by the exchange on which they trade.
Investing in derivatives may involve greater risks than investing in the underlying assets directly and, to varying degrees, may involve risk of loss in excess of any initial investment and collateral received and amounts recognized in the Statement of Assets and Liabilities. In addition, there may be the risk that the change in value of the derivative contract does not correspond to the change in value of the underlying instrument.
Futures Contracts. A futures contract is an agreement between two parties to buy or sell a specified underlying instrument for a fixed price at a specified future date. Futures contracts were used to manage exposure to the stock market.
Upon entering into a futures contract, a fund is required to deposit either cash or securities (initial margin) with a clearing broker in an amount equal to a certain percentage of the face value of the contract. Futures contracts are marked-to-market daily and subsequent daily payments are made or received by a fund depending on the daily fluctuations in the value of the futures contracts and are recorded as unrealized appreciation or (depreciation). This receivable and/or payable, if any, is included in daily variation margin on futures contracts in the Statement of Assets and Liabilities. Realized gain or (loss) is recorded upon the expiration or closing of a futures contract. The net realized gain (loss) and change in net unrealized appreciation (depreciation) on futures contracts during the period is presented in the Statement of Operations.
Any open futures contracts at period end are presented in the Schedule of Investments under the caption "Futures Contracts". The notional amount at value reflects each contract's exposure to the underlying instrument or index at period end, and is representative of volume of activity during the period unless an average notional amount is presented. Any securities deposited to meet initial margin requirements are identified in the Schedule of Investments. Any cash deposited to meet initial margin requirements is presented as segregated cash with brokers for derivative instruments in the Statement of Assets and Liabilities.
5. Purchases and Sales of Investments.
Purchases and sales of securities, other than short-term securities, U.S. government securities and in-kind transactions, as applicable, are noted in the table below.
| | Purchases ($) | Sales ($) |
| Fidelity SAI International Quality Index Fund | 217,377,526 | 348,293,935 |
6. Fees and Other Transactions with Affiliates.
Management Fee. Fidelity Management & Research Company LLC (the investment adviser) and its affiliates provide the Fund with investment management related services for which the Fund pays a monthly management fee that is based on an annual rate of .15% of the Fund's average net assets.
Sub-Adviser. Geode Capital Management, LLC (Geode), serves as sub-adviser for the Fund. Geode provides discretionary investment advisory services to the Fund and is paid by the investment adviser for providing these services.
Interfund Lending Program. Pursuant to an Exemptive Order issued by the Securities and Exchange Commission (the SEC), the Fund, along with other registered investment companies having management contracts with Fidelity Management & Research Company LLC (FMR), or other affiliated entities of FMR, may participate in an interfund lending program. This program provides an alternative credit facility allowing the Fund to borrow from, or lend money to, other participating affiliated funds. Activity in this program during the period for which loans were outstanding was as follows:
| | Borrower or Lender | Average Loan Balance | Weighted Average Interest Rate | Interest Expense |
Fidelity SAI International Quality Index Fund | Borrower | $ 10,321,444 | 1.22% | $6,316 |
Interfund Trades. Funds may purchase from or sell securities to other Fidelity Funds under procedures adopted by the Board. The procedures have been designed to ensure these interfund trades are executed in accordance with Rule 17a-7 of the 1940 Act. Any interfund trades are included within the respective purchases and sales amounts shown in the Purchases and Sales of Investments note. During the period, there were no interfund trades.
7. Committed Line of Credit.
Certain Funds participate with other funds managed by the investment adviser or an affiliate in a $4.25 billion credit facility (the "line of credit") to be utilized for temporary or emergency purposes to fund shareholder redemptions or for other short-term liquidity purposes. The participating funds have agreed to pay commitment fees on their pro-rata portion of the line of credit, which are reflected in Miscellaneous expenses on the Statement of Operations, and are listed below. During the period, there were no borrowings on this line of credit.
| | Amount |
| Fidelity SAI International Quality Index Fund | $830 |
8. Security Lending.
Funds lend portfolio securities from time to time in order to earn additional income. Lending agents are used, including National Financial Services (NFS), an affiliate of the investment adviser. Pursuant to a securities lending agreement, NFS will receive a fee, which is capped at 9.9% of a fund's daily lending revenue, for its services as lending agent. A fund may lend securities to certain qualified borrowers, including NFS. On the settlement date of the loan, a fund receives collateral (in the form of U.S. Treasury obligations, letters of credit and/or cash) against the loaned securities and maintains collateral in an amount not less than 100% of the market value of the loaned securities during the period of the loan. The market value of the loaned securities is determined at the close of business of a fund and any additional required collateral is delivered to a fund on the next business day. A fund or borrower may terminate the loan at any time, and if the borrower defaults on its obligation to return the securities loaned because of insolvency or other reasons, a fund may apply collateral received from the borrower against the obligation. A fund may experience delays and costs in recovering the securities loaned. Any cash collateral received is invested in the Fidelity Securities Lending Cash Central Fund. Any loaned securities are identified as such in the Schedule of Investments, and the value of loaned securities and cash collateral at period end, as applicable, are presented in the Statement of Assets and Liabilities. Security lending income represents the income earned on investing cash collateral, less rebates paid to borrowers and any lending agent fees associated with the loan, plus any premium payments received for lending certain types of securities. Security lending income is presented in the Statement of Operations as a component of income from Fidelity Central Funds. Affiliated security lending activity, if any, was as follows:
| | Total Security Lending Fees Paid to NFS | Security Lending Income From Securities Loaned to NFS | Value of Securities Loaned to NFS at Period End |
| Fidelity SAI International Quality Index Fund | $1,978 | $- | $- |
9. Other.
A fund's organizational documents provide former and current trustees and officers with a limited indemnification against liabilities arising in connection with the performance of their duties to the fund. In the normal course of business, a fund may also enter into contracts that provide general indemnifications. A fund's maximum exposure under these arrangements is unknown as this would be dependent on future claims that may be made against a fund. The risk of material loss from such claims is considered remote.
At the end of the period, the following mutual funds managed by the investment adviser or its affiliates were the owners of record of 10% or more of the total outstanding shares.
| | Strategic Advisers Fidelity International Fund |
| Fidelity SAI International Quality Index Fund | 29% |
Mutual funds managed by the investment adviser or its affiliates, in aggregate, were the owners of record of more than 20% of the total outstanding shares.
| Fund | % of shares held |
| Fidelity SAI International Quality Index Fund | 29% |
10. Risk and Uncertainties.
Many factors affect a fund's performance. Developments that disrupt global economies and financial markets, such as pandemics, epidemics, outbreaks of infectious diseases, war, terrorism, and environmental disasters, may significantly affect a fund's investment performance. The effects of these developments to a fund will be impacted by the types of securities in which a fund invests, the financial condition, industry, economic sector, and geographic location of an issuer, and a fund's level of investment in the securities of that issuer.
To the Board of Trustees of Fidelity Salem Street Trust and Shareholders of Fidelity SAI International Quality Index Fund
Opinion on the Financial Statements
We have audited the accompanying statement of assets and liabilities, including the schedule of investments, of Fidelity SAI International Quality Index Fund (one of the funds constituting Fidelity Salem Street Trust, referred to hereafter as the "Fund") as of October 31, 2022, the related statement of operations for the year ended October 31, 2022, the statement of changes in net assets for each of the two years in the period ended October 31, 2022, including the related notes, and the financial highlights for each of the two years in the period ended October 31, 2022 and for the period May 12, 2020 (commencement of operations) through October 31, 2020 (collectively referred to as the "financial statements"). In our opinion, the financial statements present fairly, in all material respects, the financial position of the Fund as of October 31, 2022, the results of its operations for the year then ended, the changes in its net assets for each of the two years in the period ended October 31, 2022 and the financial highlights for each of the two years in the period ended October 31, 2022 and for the period May 12, 2020 (commencement of operations) through October 31, 2020 in conformity with accounting principles generally accepted in the United States of America.
Basis for Opinion
These financial statements are the responsibility of the Fund's management. Our responsibility is to express an opinion on the Fund's financial statements based on our audits. We are a public accounting firm registered with the Public Company Accounting Oversight Board (United States) (PCAOB) and are required to be independent with respect to the Fund in accordance with the U.S. federal securities laws and the applicable rules and regulations of the Securities and Exchange Commission and the PCAOB.
We conducted our audits of these financial statements in accordance with the standards of the PCAOB. Those standards require that we plan and perform the audit to obtain reasonable assurance about whether the financial statements are free of material misstatement, whether due to error or fraud.
Our audits included performing procedures to assess the risks of material misstatement of the financial statements, whether due to error or fraud, and performing procedures that respond to those risks. Such procedures included examining, on a test basis, evidence regarding the amounts and disclosures in the financial statements. Our audits also included evaluating the accounting principles used and significant estimates made by management, as well as evaluating the overall presentation of the financial statements. Our procedures included confirmation of securities owned as of October 31, 2022 by correspondence with the custodian and brokers. We believe that our audits provide a reasonable basis for our opinion.
/s/ PricewaterhouseCoopers LLP
Boston, Massachusetts
December 15, 2022
We have served as the auditor of one or more investment companies in the Fidelity group of funds since 1932.
The Trustees, Members of the Advisory Board (if any), and officers of the trust and fund, as applicable, are listed below. The Board of Trustees governs the fund and is responsible for protecting the interests of shareholders. The Trustees are experienced executives who meet periodically throughout the year to oversee the fund's activities, review contractual arrangements with companies that provide services to the fund, oversee management of the risks associated with such activities and contractual arrangements, and review the fund's performance. Except for Jonathan Chiel, each of the Trustees oversees 293 funds. Mr. Chiel oversees 184 funds.
The Trustees hold office without limit in time except that (a) any Trustee may resign; (b) any Trustee may be removed by written instrument, signed by at least two-thirds of the number of Trustees prior to such removal; (c) any Trustee who requests to be retired or who has become incapacitated by illness or injury may be retired by written instrument signed by a majority of the other Trustees; and (d) any Trustee may be removed at any special meeting of shareholders by a two-thirds vote of the outstanding voting securities of the trust. Each Trustee who is not an interested person (as defined in the 1940 Act) of the trust and the fund is referred to herein as an Independent Trustee. Each Independent Trustee shall retire not later than the last day of the calendar year in which his or her 75th birthday occurs. The Independent Trustees may waive this mandatory retirement age policy with respect to individual Trustees. Officers and Advisory Board Members hold office without limit in time, except that any officer or Advisory Board Member may resign or may be removed by a vote of a majority of the Trustees at any regular meeting or any special meeting of the Trustees. Except as indicated, each individual has held the office shown or other offices in the same company for the past five years.
The fund's Statement of Additional Information (SAI) includes more information about the Trustees. To request a free copy, call Fidelity at 1-800-544-3455.
Experience, Skills, Attributes, and Qualifications of the Trustees. The Governance and Nominating Committee has adopted a statement of policy that describes the experience, qualifications, attributes, and skills that are necessary and desirable for potential Independent Trustee candidates (Statement of Policy). The Board believes that each Trustee satisfied at the time he or she was initially elected or appointed a Trustee, and continues to satisfy, the standards contemplated by the Statement of Policy. The Governance and Nominating Committee also engages professional search firms to help identify potential Independent Trustee candidates who have the experience, qualifications, attributes, and skills consistent with the Statement of Policy. From time to time, additional criteria based on the composition and skills of the current Independent Trustees, as well as experience or skills that may be appropriate in light of future changes to board composition, business conditions, and regulatory or other developments, have also been considered by the professional search firms and the Governance and Nominating Committee. In addition, the Board takes into account the Trustees' commitment and participation in Board and committee meetings, as well as their leadership of standing and ad hoc committees throughout their tenure.
In determining that a particular Trustee was and continues to be qualified to serve as a Trustee, the Board has considered a variety of criteria, none of which, in isolation, was controlling. The Board believes that, collectively, the Trustees have balanced and diverse experience, qualifications, attributes, and skills, which allow the Board to operate effectively in governing the fund and protecting the interests of shareholders. Information about the specific experience, skills, attributes, and qualifications of each Trustee, which in each case led to the Board's conclusion that the Trustee should serve (or continue to serve) as a trustee of the fund, is provided below.
Board Structure and Oversight Function. Abigail P. Johnson is an interested person and currently serves as Chairman. The Trustees have determined that an interested Chairman is appropriate and benefits shareholders because an interested Chairman has a personal and professional stake in the quality and continuity of services provided to the fund. Independent Trustees exercise their informed business judgment to appoint an individual of their choosing to serve as Chairman, regardless of whether the Trustee happens to be independent or a member of management. The Independent Trustees have determined that they can act independently and effectively without having an Independent Trustee serve as Chairman and that a key structural component for assuring that they are in a position to do so is for the Independent Trustees to constitute a substantial majority for the Board. The Independent Trustees also regularly meet in executive session. Michael E. Kenneally serves as Chairman of the Independent Trustees and as such (i) acts as a liaison between the Independent Trustees and management with respect to matters important to the Independent Trustees and (ii) with management prepares agendas for Board meetings.
Fidelity ® funds are overseen by different Boards of Trustees. The fund's Board oversees Fidelity's investment-grade bond, money market, asset allocation and certain equity funds, and other Boards oversee Fidelity's high income and other equity funds. The asset allocation funds may invest in Fidelity ® funds that are overseen by such other Boards. The use of separate Boards, each with its own committee structure, allows the Trustees of each group of Fidelity ® funds to focus on the unique issues of the funds they oversee, including common research, investment, and operational issues. On occasion, the separate Boards establish joint committees to address issues of overlapping consequences for the Fidelity ® funds overseen by each Board.
The Trustees operate using a system of committees to facilitate the timely and efficient consideration of all matters of importance to the Trustees, the fund, and fund shareholders and to facilitate compliance with legal and regulatory requirements and oversight of the fund's activities and associated risks. The Board, acting through its committees, has charged FMR and its affiliates with (i) identifying events or circumstances the occurrence of which could have demonstrably adverse effects on the fund's business and/or reputation; (ii) implementing processes and controls to lessen the possibility that such events or circumstances occur or to mitigate the effects of such events or circumstances if they do occur; and (iii) creating and maintaining a system designed to evaluate continuously business and market conditions in order to facilitate the identification and implementation processes described in (i) and (ii) above. Because the day-to-day operations and activities of the fund are carried out by or through FMR, its affiliates, and other service providers, the fund's exposure to risks is mitigated but not eliminated by the processes overseen by the Trustees. While each of the Board's committees has responsibility for overseeing different aspects of the fund's activities, oversight is exercised primarily through the Operations and Audit Committees. In addition, an ad hoc Board committee of Independent Trustees has worked with FMR to enhance the Board's oversight of investment and financial risks, legal and regulatory risks, technology risks, and operational risks, including the development of additional risk reporting to the Board. Appropriate personnel, including but not limited to the fund's Chief Compliance Officer (CCO), FMR's internal auditor, the independent accountants, the fund's Treasurer and portfolio management personnel, make periodic reports to the Board's committees, as appropriate, including an annual review of Fidelity's risk management program for the Fidelity ® funds. The responsibilities of each standing committee, including their oversight responsibilities, are described further under "Standing Committees of the Trustees."
Interested Trustees*:
Correspondence intended for a Trustee who is an interested person may be sent to Fidelity Investments, 245 Summer Street, Boston, Massachusetts 02210.
Name, Year of Birth; Principal Occupations and Other Relevant Experience+
Jonathan Chiel (1957)
Year of Election or Appointment: 2016
Trustee
Mr. Chiel also serves as Trustee of other Fidelity ® funds. Mr. Chiel is Executive Vice President and General Counsel for FMR LLC (diversified financial services company, 2012-present). Previously, Mr. Chiel served as general counsel (2004-2012) and senior vice president and deputy general counsel (2000-2004) for John Hancock Financial Services; a partner with Choate, Hall & Stewart (1996-2000) (law firm); and an Assistant United States Attorney for the United States Attorney's Office of the District of Massachusetts (1986-95), including Chief of the Criminal Division (1993-1995). Mr. Chiel is a director on the boards of the Boston Bar Foundation and the Maimonides School.
Abigail P. Johnson (1961)
Year of Election or Appointment: 2009
Trustee
Chairman of the Board of Trustees
Ms. Johnson also serves as Trustee of other Fidelity ® funds. Ms. Johnson serves as Chairman (2016-present), Chief Executive Officer (2014-present), and Director (2007-present) of FMR LLC (diversified financial services company), President of Fidelity Financial Services (2012-present) and President of Personal, Workplace and Institutional Services (2005-present). Ms. Johnson is Chairman and Director of Fidelity Management & Research Company LLC (investment adviser firm, 2011-present). Previously, Ms. Johnson served as Chairman and Director of FMR Co., Inc. (investment adviser firm, 2011-2019), Vice Chairman (2007-2016) and President (2013-2016) of FMR LLC, President and a Director of Fidelity Management & Research Company (2001-2005), a Trustee of other investment companies advised by Fidelity Management & Research Company, Fidelity Investments Money Management, Inc. (investment adviser firm), and FMR Co., Inc. (2001-2005), Senior Vice President of the Fidelity ® funds (2001-2005), and managed a number of Fidelity ® funds. Ms. Abigail P. Johnson and Mr. Arthur E. Johnson are not related.
Jennifer Toolin McAuliffe (1959)
Year of Election or Appointment: 2016
Trustee
Ms. McAuliffe also serves as Trustee of other Fidelity ® funds and as Trustee of Fidelity Charitable (2020-present). Previously, Ms. McAuliffe served as Co-Head of Fixed Income of Fidelity Investments Limited (now known as FIL Limited (FIL)) (diversified financial services company), Director of Research for FIL's credit and quantitative teams in London, Hong Kong and Tokyo and Director of Research for taxable and municipal bonds at Fidelity Investments Money Management, Inc. Ms. McAuliffe previously served as a member of the Advisory Board of certain Fidelity ® funds (2016). Ms. McAuliffe was previously a lawyer at Ropes & Gray LLP and currently serves as director or trustee of several not-for-profit entities.
* Determined to be an "Interested Trustee" by virtue of, among other things, his or her affiliation with the trust or various entities under common control with FMR.
+ The information includes the Trustee's principal occupation during the last five years and other information relating to the experience, attributes, and skills relevant to the Trustee's qualifications to serve as a Trustee, which led to the conclusion that the Trustee should serve as a Trustee for the fund.
Independent Trustees:
Correspondence intended for an Independent Trustee may be sent to Fidelity Investments, P.O. Box 55235, Boston, Massachusetts 02205-5235.
Name, Year of Birth; Principal Occupations and Other Relevant Experience+
Elizabeth S. Acton (1951)
Year of Election or Appointment: 2013
Trustee
Ms. Acton also serves as Trustee of other Fidelity ® funds. Prior to her retirement, Ms. Acton served as Executive Vice President, Finance (2011-2012), Executive Vice President, Chief Financial Officer (2002-2011) and Treasurer (2004-2005) of Comerica Incorporated (financial services). Prior to joining Comerica, Ms. Acton held a variety of positions at Ford Motor Company (1983-2002), including Vice President and Treasurer (2000-2002) and Executive Vice President and Chief Financial Officer of Ford Motor Credit Company (1998-2000). Ms. Acton currently serves as a member of the Board and Audit and Finance Committees of Beazer Homes USA, Inc. (homebuilding, 2012-present). Ms. Acton previously served as a member of the Advisory Board of certain Fidelity ® funds (2013-2016).
Ann E. Dunwoody (1953)
Year of Election or Appointment: 2018
Trustee
General Dunwoody also serves as Trustee of other Fidelity ® funds. General Dunwoody (United States Army, Retired) was the first woman in U.S. military history to achieve the rank of four-star general and prior to her retirement in 2012 held a variety of positions within the U.S. Army, including Commanding General, U.S. Army Material Command (2008-2012). General Dunwoody currently serves as President of First to Four LLC (leadership and mentoring services, 2012-present), a member of the Board and Nomination and Corporate Governance Committees of Kforce Inc. (professional staffing services, 2016-present) and a member of the Board of Automattic Inc. (software engineering, 2018-present). Previously, General Dunwoody served as a member of the Advisory Board and Nominating and Corporate Governance Committee of L3 Technologies, Inc. (communication, electronic, sensor and aerospace systems, 2013-2019) and a member of the Board and Audit and Sustainability and Corporate Responsibility Committees of Republic Services, Inc. (waste collection, disposal and recycling, 2013-2016). Ms. Dunwoody also serves on several boards for non-profit organizations, including as a member of the Board, Chair of the Nomination and Governance Committee and a member of the Audit Committee of Logistics Management Institute (consulting non-profit, 2012-present), a member of the Council of Trustees for the Association of the United States Army (advocacy non-profit, 2013-present), a member of the Board of Florida Institute of Technology (2015-present) and a member of the Board of ThanksUSA (military family education non-profit, 2014-present). General Dunwoody previously served as a member of the Advisory Board of certain Fidelity ® funds (2018).
John Engler (1948)
Year of Election or Appointment: 2014
Trustee
Mr. Engler also serves as Trustee of other Fidelity ® funds. Previously, Mr. Engler served as Governor of Michigan (1991-2003), President of the Business Roundtable (2011-2017) and interim President of Michigan State University (2018-2019). Mr. Engler currently serves as a member of the Board of Stride, Inc. (formerly K12 Inc.) (technology-based education company, 2012-present). Previously, Mr. Engler served as a member of the Board of Universal Forest Products (manufacturer and distributor of wood and wood-alternative products, 2003-2019) and Trustee of The Munder Funds (2003-2014). Mr. Engler previously served as a member of the Advisory Board of certain Fidelity ® funds (2014-2016).
Robert F. Gartland (1951)
Year of Election or Appointment: 2010
Trustee
Mr. Gartland also serves as Trustee of other Fidelity ® funds. Prior to his retirement, Mr. Gartland held a variety of positions at Morgan Stanley (financial services, 1979-2007), including Managing Director (1987-2007) and Chase Manhattan Bank (1975-1978). Mr. Gartland previously served as Chairman and an investor in Gartland & Mellina Group Corp. (consulting, 2009-2019), as a member of the Board of National Securities Clearing Corporation (1993-1996) and as Chairman of TradeWeb (2003-2004).
Arthur E. Johnson (1947)
Year of Election or Appointment: 2008
Trustee
Mr. Johnson also serves as Trustee of other Fidelity ® funds. Prior to his retirement, Mr. Johnson served as Senior Vice President of Corporate Strategic Development of Lockheed Martin Corporation (defense contractor, 1999-2009). Mr. Johnson currently serves as a member of the Board of Booz Allen Hamilton (management consulting, 2011-present). Mr. Johnson previously served as a member of the Board of Eaton Corporation plc (diversified power management, 2009-2019) and a member of the Board of AGL Resources, Inc. (holding company, 2002-2016). Mr. Johnson previously served as Chairman (2018-2021) and Vice Chairman (2015-2018) of the Independent Trustees of certain Fidelity® funds. Mr. Arthur E. Johnson is not related to Ms. Abigail P. Johnson.
Michael E. Kenneally (1954)
Year of Election or Appointment: 2009
Trustee
Chairman of the Independent Trustees
Mr. Kenneally also serves as Trustee of other Fidelity ® funds and was Vice Chairman (2018-2021) of the Independent Trustees of certain Fidelity ® funds. Prior to retirement in 2005, he was Chairman and Global Chief Executive Officer of Credit Suisse Asset Management, the worldwide fund management and institutional investment business of Credit Suisse Group. Previously, Mr. Kenneally was an Executive Vice President and the Chief Investment Officer for Bank of America. In this role, he was responsible for the investment management, strategy and products delivered to the bank's institutional, high-net-worth and retail clients. Earlier, Mr. Kenneally directed the organization's equity and quantitative research groups. He began his career as a research analyst and then spent more than a dozen years as a portfolio manager for endowments, pension plans and mutual funds. He earned the Chartered Financial Analyst (CFA) designation in 1991.
Marie L. Knowles (1946)
Year of Election or Appointment: 2001
Trustee
Ms. Knowles also serves as Trustee of other Fidelity ® funds. Prior to her retirement, Ms. Knowles held several positions at Atlantic Richfield Company (diversified energy), including Executive Vice President and Chief Financial Officer (1996-2000), Senior Vice President (1993-1996) and President of ARCO Transportation Company (pipeline and tanker operations, 1993-1996). Ms. Knowles currently serves as a member of the Board of the Santa Catalina Island Company (real estate, 2009-present), a member of the Investment Company Institute Board of Governors and a member of the Governing Council of the Independent Directors Council (2014-present). Ms. Knowles also serves as a member of the Advisory Board for the School of Engineering of the University of Southern California. Ms. Knowles previously served as a member of the Board of McKesson Corporation (healthcare service, 2002-2021). In addition, Ms. Knowles previously served as Chairman (2015-2018) and Vice Chairman (2012-2015) of the Independent Trustees of certain Fidelity ® funds.
Mark A. Murray (1954)
Year of Election or Appointment: 2016
Trustee
Mr. Murray also serves as Trustee of other Fidelity ® funds. Previously, Mr. Murray served as Co-Chief Executive Officer (2013-2016), President (2006-2013) and Vice Chairman (2013-2020) of Meijer, Inc. Mr. Murray serves as a member of the Board (2009-present) and Public Policy and Responsibility Committee (2009-present) and Chair of the Nuclear Review Committee (2019-present) of DTE Energy Company (diversified energy company). Mr. Murray previously served as a member of the Board of Spectrum Health (not-for-profit health system, 2015-2019) and as a member of the Board and Audit Committee and Chairman of the Nominating and Corporate Governance Committee of Universal Forest Products, Inc. (manufacturer and distributor of wood and wood-alternative products, 2004-2016). Mr. Murray also serves as a member of the Board of many community and professional organizations. Mr. Murray previously served as a member of the Advisory Board of certain Fidelity ® funds (2016).
+ The information includes the Trustee's principal occupation during the last five years and other information relating to the experience, attributes, and skills relevant to the Trustee's qualifications to serve as a Trustee, which led to the conclusion that the Trustee should serve as a Trustee for the fund.
Advisory Board Members and Officers:
Correspondence intended for a Member of the Advisory Board (if any) may be sent to Fidelity Investments, P.O. Box 55235, Boston, Massachusetts 02205-5235. Correspondence intended for an officer may be sent to Fidelity Investments, 245 Summer Street, Boston, Massachusetts 02210. Officers appear below in alphabetical order.
Name, Year of Birth; Principal Occupation
Laura M. Bishop (1961)
Year of Election or Appointment: 2022
Member of the Advisory Board
Ms. Bishop also serves as a Member of the Advisory Board of other funds. Prior to her retirement, Ms. Bishop held a variety of positions at United Services Automobile Association (2001-2020), including Executive Vice President and Chief Financial Officer (2014-2020) and Senior Vice President and Deputy Chief Financial Officer (2012-2014). Ms. Bishop currently serves as a member of the Audit Committee and Compensation and Personnel Committee (2021-present) of the Board of Directors of Korn Ferry (global organizational consulting).
Robert W. Helm (1957)
Year of Election or Appointment: 2021
Member of the Advisory Board
Mr. Helm also serves as a Member of the Advisory Board of other Fidelity® funds. Mr. Helm was formerly Deputy Chairman (2003-2020), partner (1991-2020) and an associate (1984-1991) of Dechert LLP (formerly Dechert Price & Rhoads). Mr. Helm currently serves on boards and committees of several not-for-profit organizations.
Craig S. Brown (1977)
Year of Election or Appointment: 2019
Assistant Treasurer
Mr. Brown also serves as an officer of other funds. Mr. Brown serves as Assistant Treasurer of FIMM, LLC (2021-present) and is an employee of Fidelity Investments (2013-present). Previously, Mr. Brown served as Assistant Treasurer of certain Fidelity ® funds (2019-2022).
John J. Burke III (1964)
Year of Election or Appointment: 2018
Chief Financial Officer
Mr. Burke also serves as Chief Financial Officer of other funds. Mr. Burke serves as Head of Investment Operations for Fidelity Fund and Investment Operations (2018-present) and is an employee of Fidelity Investments (1998-present). Previously Mr. Burke served as head of Asset Management Investment Operations (2012-2018).
David J. Carter (1973)
Year of Election or Appointment: 2020
Assistant Secretary
Mr. Carter also serves as Assistant Secretary of other funds. Mr. Carter serves as Senior Vice President, Deputy General Counsel (2022-present) and is an employee of Fidelity Investments (2005-present).
Jonathan Davis (1968)
Year of Election or Appointment: 2010
Assistant Treasurer
Mr. Davis also serves as an officer of other funds. Mr. Davis serves as Assistant Treasurer of FIMM, LLC (2021-present), FMR Capital, Inc. (2017-present), FD Funds GP LLC (2021-present), FD Funds Holding LLC (2021-present), and FD Funds Management LLC (2021-present); and is an employee of Fidelity Investments. Previously, Mr. Davis served as Vice President and Associate General Counsel of FMR LLC (diversified financial services company, 2003-2010).
Laura M. Del Prato (1964)
Year of Election or Appointment: 2018
President and Treasurer
Ms. Del Prato also serves as an officer of other funds. Ms. Del Prato serves as Assistant Treasurer of FIMM, LLC (2021-present) and is an employee of Fidelity Investments (2017-present). Previously, Ms. Del Prato served as President and Treasurer of The North Carolina Capital Management Trust: Cash Portfolio and Term Portfolio (2018-2020). Prior to joining Fidelity Investments, Ms. Del Prato served as a Managing Director and Treasurer of the JPMorgan Mutual Funds (2014-2017). Prior to JPMorgan, Ms. Del Prato served as a partner at Cohen Fund Audit Services (accounting firm, 2012-2013) and KPMG LLP (accounting firm, 2004-2012).
Colm A. Hogan (1973)
Year of Election or Appointment: 2016
Assistant Treasurer
Mr. Hogan also serves as an officer of other funds. Mr. Hogan serves as Assistant Treasurer of FIMM, LLC (2021-present) and FMR Capital, Inc. (2017-present) and is an employee of Fidelity Investments (2005-present). Previously, Mr. Hogan served as Deputy Treasurer of certain Fidelity ® funds (2016-2020) and Assistant Treasurer of certain Fidelity ® funds (2016-2018).
Cynthia Lo Bessette (1969)
Year of Election or Appointment: 2019
Secretary and Chief Legal Officer (CLO)
Ms. Lo Bessette also serves as an officer of other funds. Ms. Lo Bessette serves as CLO, Secretary, and Senior Vice President of Fidelity Management & Research Company LLC (investment adviser firm, 2019-present); CLO of Fidelity Management & Research (Hong Kong) Limited, FMR Investment Management (UK) Limited, and Fidelity Management & Research (Japan) Limited (investment adviser firms, 2019-present); Secretary of FD Funds GP LLC (2021-present), FD Funds Holding LLC (2021-present), FD Funds Management LLC (2021-present), and Fidelity Diversifying Solutions LLC (investment adviser firm, 2022-present); and Assistant Secretary of FIMM, LLC (2019-present). She is a Senior Vice President and Deputy General Counsel of FMR LLC (diversified financial services company, 2019-present), and is an employee of Fidelity Investments. Previously, Ms. Lo Bessette served as CLO, Secretary, and Senior Vice President of FMR Co., Inc. (investment adviser firm, 2019); Secretary of Fidelity SelectCo, LLC and Fidelity Investments Money Management, Inc. (investment adviser firms, 2019). Prior to joining Fidelity Investments, Ms. Lo Bessette was Executive Vice President, General Counsel (2016-2019) and Senior Vice President, Deputy General Counsel (2015-2016) of OppenheimerFunds (investment management company) and Deputy Chief Legal Officer (2013-2015) of Jennison Associates LLC (investment adviser firm).
Chris Maher (1972)
Year of Election or Appointment: 2013
Assistant Treasurer
Mr. Maher also serves as an officer of other funds. Mr. Maher serves as Assistant Treasurer of FIMM, LLC (2021-present) and FMR Capital, Inc. (2017-present), and is an employee of Fidelity Investments (2008-present). Previously, Mr. Maher served as Assistant Treasurer of certain funds (2013-2020); Vice President of Asset Management Compliance (2013), Vice President of the Program Management Group of FMR (investment adviser firm, 2010-2013), and Vice President of Valuation Oversight (2008-2010).
Jamie Pagliocco (1964)
Year of Election or Appointment: 2020
Vice President
Mr. Pagliocco also serves as Vice President of other funds. Mr. Pagliocco serves as President of Fixed Income (2020-present), and is an employee of Fidelity Investments (2001-present). Previously, Mr. Pagliocco served as Co-Chief Investment Officer - Bond (2017-2020), Global Head of Bond Trading (2016-2019), and as a portfolio manager.
Kenneth B. Robins (1969)
Year of Election or Appointment: 2020
Chief Compliance Officer
Mr. Robins also serves as an officer of other funds. Mr. Robins serves as Compliance Officer of Fidelity Management & Research Company LLC (investment adviser firm, 2016-present) and is an employee of Fidelity Investments (2004-present). Previously, Mr. Robins served as Compliance Officer of FMR Co., Inc. (investment adviser firm, 2016-2019), as Executive Vice President of Fidelity Investments Money Management, Inc. (investment adviser firm, 2013-2016) and served in other fund officer roles.
Brett Segaloff (1972)
Year of Election or Appointment: 2021
Anti-Money Laundering (AML) Officer
Mr. Segaloff also serves as an AML Officer of other funds and other related entities. He is Director, Anti-Money Laundering (2007-present) of FMR LLC (diversified financial services company) and is an employee of Fidelity Investments (1996-present).
Stacie M. Smith (1974)
Year of Election or Appointment: 2013
Assistant Treasurer
Ms. Smith also serves as an officer of other funds. Ms. Smith serves as Assistant Treasurer of FIMM, LLC (2021-present) and FMR Capital, Inc. (2017-present), is an employee of Fidelity Investments (2009-present), and has served in other fund officer roles. Prior to joining Fidelity Investments, Ms. Smith served as Senior Audit Manager of Ernst & Young LLP (accounting firm, 1996-2009). Previously, Ms. Smith served as Assistant Treasurer (2013-2019) and Deputy Treasurer (2013-2016) of certain Fidelity ® funds.
Jim Wegmann (1979)
Year of Election or Appointment: 2021
Deputy Treasurer
Mr. Wegmann also serves as an officer of other funds. Mr. Wegmann serves as Assistant Treasurer of FIMM, LLC (2021-present) and is an employee of Fidelity Investments (2011-present). Previously, Mr. Wegmann served as Assistant Treasurer of certain Fidelity ® funds (2019-2021).
As a shareholder, you incur two types of costs: (1) transaction costs, which may include sales charges (loads) on purchase payments or redemption proceeds, as applicable and (2) ongoing costs, which generally include management fees, distribution and/or service (12b-1) fees and other Fund expenses. This Example is intended to help you understand your ongoing costs (in dollars) of investing in a fund and to compare these costs with the ongoing costs of investing in other mutual funds.
| The Example is based on an investment of $1,000 invested at the beginning of the period and held for the entire period (May 1, 2022 to October 31, 2022). |
Actual Expenses
The first line of the accompanying table provides information about actual account values and actual expenses. You may use the information in this line, together with the amount you invested, to estimate the expenses that you paid over the period. Simply divide your account value by $1,000.00 (for example, an $8,600 account value divided by $1,000.00 = 8.6), then multiply the result by the number in the first line for a class/Fund under the heading entitled "Expenses Paid During Period" to estimate the expenses you paid on your account during this period. If any fund is a shareholder of any underlying mutual funds or exchange-traded funds (ETFs) (the Underlying Funds), such fund indirectly bears its proportional share of the expenses of the Underlying Funds in addition to the direct expenses incurred presented in the table. These fees and expenses are not included in the annualized expense ratio used to calculate the expense estimate in the table below.
Hypothetical Example for Comparison Purposes
The second line of the accompanying table provides information about hypothetical account values and hypothetical expenses based on the actual expense ratio and an assumed rate of return of 5% per year before expenses, which is not the actual return. The hypothetical account values and expenses may not be used to estimate the actual ending account balance or expenses you paid for the period. You may use this information to compare the ongoing costs of investing in the Fund and other funds. To do so, compare this 5% hypothetical example with the 5% hypothetical examples that appear in the shareholder reports of the other funds. If any fund is a shareholder of any Underlying Funds, such fund indirectly bears its proportional share of the expenses of the Underlying Funds in addition to the direct expenses as presented in the table. These fees and expenses are not included in the annualized expense ratio used to calculate the expense estimate in the table below.
Please note that the expenses shown in the table are meant to highlight your ongoing costs only and do not reflect any transaction costs. Therefore, the second line of the table is useful in comparing ongoing costs only, and will not help you determine the relative total costs of owning different funds. In addition, if these transactional costs were included, your costs would have been higher.
| | | | | Annualized Expense Ratio- A | | Beginning Account Value May 1, 2022 | | Ending Account Value October 31, 2022 | | Expenses Paid During Period- C May 1, 2022 to October 31, 2022 |
| | | | | | | | | | |
| Fidelity® SAI International Quality Index Fund | | | | .19% | | | | | | |
| Actual | | | | | | $ 1,000 | | $ 870.90 | | $ .90 |
Hypothetical- B | | | | | | $ 1,000 | | $ 1,024.25 | | $ .97 |
| |
A Annualized expense ratio reflects expenses net of applicable fee waivers.
B 5% return per year before expenses
C Expenses are equal to the annualized expense ratio, multiplied by the average account value over the period, multiplied by 184/ 365 (to reflect the one-half year period). The fees and expenses of any Underlying Funds are not included in each annualized expense ratio.
The dividend and capital gains distributions for the fund(s) are available on Fidelity.com or Institutional.Fidelity.com.
The fund designates 22% of the dividend distributed during the fiscal year as amounts which may be taken into account as a dividend for the purposes of the maximum rate under section 1(h)(11) of the Internal Revenue Code.
The amounts per share which represent income derived from sources within, and taxes paid to, foreign countries or possessions of the United States are $0.2799 and $0.0268 for the dividend paid December 13, 2021.
The fund will notify shareholders in January 2023 of amounts for use in preparing 2022 income tax returns.
Fidelity SAI International Quality Index Fund
Each year, the Board of Trustees, including the Independent Trustees (together, the Board), votes on the renewal of the management contract with Fidelity Management & Research Company LLC (FMR) and the sub-advisory agreement (Sub-Advisory Agreement) for the fund with Geode Capital Management, LLC (Geode) (together, the Advisory Contracts). FMR and Geode are referred to herein as the Investment Advisers. The Board, assisted by the advice of fund counsel and Independent Trustees' counsel, requests and considers a broad range of information relevant to the renewal of the Advisory Contracts throughout the year.
The Board meets regularly and, at each of its meetings, covers an extensive agenda of topics and materials and considers factors that are relevant to its annual consideration of the renewal of the fund's Advisory Contracts, including the services and support provided to the fund and its shareholders. The Board has established four standing committees (Committees) - Operations, Audit, Fair Valuation, and Governance and Nominating - each composed of and chaired by Independent Trustees with varying backgrounds, to which the Board has assigned specific subject matter responsibilities in order to enhance effective decision-making by the Board. The Operations Committee, of which all the Independent Trustees are members, meets regularly throughout the year and requests, receives and considers, among other matters, information related to the annual consideration of the renewal of the fund's Advisory Contracts before making its recommendation to the Board. The Board also meets as needed to review matters specifically related to the Board's annual consideration of the renewal of the Advisory Contracts. Members of the Board may also meet from time to time with trustees of other Fidelity funds through joint ad hoc committees to discuss certain matters relevant to all of the Fidelity funds.
At its September 2022 meeting, the Board unanimously determined to renew the fund's Advisory Contracts. In reaching its determination, the Board considered all factors it believed relevant, including (i) the nature, extent, and quality of the services provided to the fund and its shareholders (including the investment performance of the fund); (ii) the competitiveness relative to peer funds of the fund's management fee and total expense ratio; (iii) the total costs of the services provided by and the profits realized by Fidelity and Geode from their respective relationships with the fund; and (iv) the extent to which, if any, economies of scale exist and are realized as the fund grows, and whether any economies of scale are appropriately shared with fund shareholders.
In considering whether to renew the Advisory Contracts for the fund, the Board reached a determination, with the assistance of fund counsel and Independent Trustees' counsel and through the exercise of its business judgment, that the renewal of the Advisory Contracts was in the best interests of the fund and its shareholders and that the compensation payable under the Advisory Contracts was fair and reasonable. The Board's decision to renew the Advisory Contracts was not based on any single factor, but rather was based on a comprehensive consideration of all the information provided to the Board at its meetings throughout the year. The Board, in reaching its determination to renew the Advisory Contracts, was aware that shareholders of the fund have a broad range of investment choices available to them, including a wide choice among funds offered by Fidelity's competitors, and that the fund's shareholders, who have the opportunity to review and weigh the disclosure provided by the fund in its prospectus and other public disclosures, have chosen to invest in this fund, which is part of the Fidelity family of funds.
Nature, Extent, and Quality of Services Provided . The Board considered staffing as it relates to the fund, including the backgrounds of investment personnel of Fidelity and Geode, and also considered the fund's investment objective, strategies, and related investment philosophy. The Independent Trustees also had discussions with senior management of Fidelity's investment operations and investment groups and with senior management of Geode. The Board considered the structure of the investment personnel compensation programs and whether the structures provide appropriate incentives to act in the best interests of the fund. The Board also considered the steps Fidelity and Geode had taken to ensure the continued provision of high quality services to the Fidelity funds throughout the COVID-19 pandemic, including the expansion of staff in client facing positions to maintain service levels in periods of high volumes and volatility.
The Trustees also discussed with representatives of Fidelity, at meetings throughout the year, Fidelity's role in, among other things, overseeing compliance with federal securities laws and other applicable requirements by Geode with respect to the fund and monitoring and overseeing the performance and investment capabilities of Geode. The Trustees considered that the Board had received from Fidelity periodic reports about its oversight and due diligence processes, as well as periodic reports regarding the performance of Geode.
The Board also considered the nature, extent and quality of services provided by Geode. The Trustees noted that under the Sub-Advisory Agreement, subject to oversight by Fidelity, Geode is responsible for, among other things, identifying investments and arranging for execution of portfolio transactions to implement the fund's investment strategy. In addition, the Trustees noted that Geode is responsible for providing such reporting as may be requested by Fidelity to fulfill its oversight responsibilities discussed above.
Resources Dedicated to Investment Management and Support Services . The Board reviewed the general qualifications and capabilities of Fidelity's and Geode's investment staffs, including their size, education, experience, and resources, as well as Fidelity's and Geode's approach to recruiting, managing, training, and compensating investment personnel. The Board noted the resources devoted to Fidelity's global investment organization and that Fidelity's and Geode's analysts have extensive resources, tools and capabilities that allow them to conduct quantitative and fundamental analysis, as well as credit analysis of issuers, counterparties, and guarantors. Further, the Board considered that Fidelity's and Geode's investment professionals have sufficient access to information and data so as to provide competitive investment results over time, and that those professionals also have access to sophisticated tools that permit them to assess portfolio construction and risk and performance attribution characteristics continuously. Additionally, in its deliberations, the Board considered Fidelity's and Geode's trading, risk management, compliance, cybersecurity, and technology and operations capabilities and resources, which are integral parts of the investment management process.
Shareholder and Administrative Services . The Board considered (i) the nature, extent, quality, and cost of advisory, administrative, and shareholder services performed by the Investment Advisers and their affiliates under the Advisory Contracts and by FMR's affiliates under separate agreements covering transfer agency, pricing and bookkeeping, and securities lending services for the fund; (ii) the nature and extent of the supervision of third party service providers, principally custodians, subcustodians, and pricing vendors; and (iii) the resources devoted to, and the record of compliance with, the fund's compliance policies and procedures. The Board also reviewed the allocation of fund brokerage, including allocations to brokers affiliated with the Investment Advisers.
The Board noted that the growth of fund assets over time across the complex allows Fidelity to reinvest in the development of services designed to enhance the value and convenience of the Fidelity funds as investment vehicles. These services include 24-hour access to account information and market information over the Internet and through telephone representatives, investor education materials and asset allocation tools. The Board also considered that it reviews customer service metrics such as telephone response times, continuity of services on the website and metrics addressing services at Fidelity Investor Centers.
Investment in a Large Fund Family . The Board considered the benefits to shareholders of investing in a Fidelity fund, including the benefits of investing in a fund that is part of a large family of funds offering a variety of investment disciplines and providing a large variety of mutual fund investor services. The Board noted that Fidelity had taken, or had made recommendations to the Board that resulted in the Fidelity funds taking, a number of actions over the previous year that benefited particular funds, including: (i) continuing to dedicate additional resources to Fidelity's investment research process, which includes meetings with management of issuers of securities in which the funds invest; (ii) continuing efforts to enhance Fidelity's global research capabilities; (iii) launching new funds, ETFs, and share classes with innovative structures, strategies and pricing and making other enhancements to meet investor needs; (iv) broadening eligibility requirements for certain funds and share classes; (v) reducing management fees and total expenses for certain funds and classes; (vi) lowering expenses for certain existing funds and classes by implementing or lowering expense caps; (vii) rationalizing product lines and gaining increased efficiencies from fund mergers and liquidations; (viii) continuing to develop, acquire and implement systems and technology to improve services to the funds and shareholders, strengthen information security, and increase efficiency; and (ix) continuing to implement enhancements to further strengthen Fidelity's product line to increase investors' probability of success in achieving their investment goals, including their retirement income goals.
Investment Performance . The Board considered whether the fund has operated in accordance with its investment objective, as well as its record of compliance with its investment restrictions and its performance history.
The Board took into account discussions that occur at Board meetings throughout the year with representatives of the Investment Advisers about fund investment performance. In this regard the Board noted that as part of regularly scheduled fund reviews and other reports to the Board on fund performance, the Board considers annualized return information for the fund for different time periods, measured against the securities market index the fund seeks to track. The Board also periodically considers the fund's tracking error versus its benchmark index.
In addition to reviewing absolute and relative fund performance, the Independent Trustees periodically consider the appropriateness of fund performance metrics in evaluating the results achieved. In general, the Independent Trustees believe that an index fund's performance should be evaluated based on gross performance (before fees and expenses but after transaction costs) compared to the fund's benchmark index, over appropriate time periods, taking into account relevant factors including the following: general market conditions; the characteristics of the fund's benchmark index; the extent to which statistical sampling is employed; any securities lending revenues; and fund cash flows and other factors. The Independent Trustees generally give greater weight to fund performance over longer time periods than over shorter time periods. Depending on the circumstances, the Independent Trustees may be satisfied with a fund's performance notwithstanding that it lags its benchmark index for certain periods.
The Independent Trustees recognize that shareholders evaluate performance on a net basis (after fees and expenses) over their own holding periods, for which one-, three-, and five-year periods are often used as a proxy. For this reason, the performance information reviewed by the Board also included net calendar year total return information for the fund and its benchmark index for the most recent one-year period. No performance peer group information was considered by the Board as Fidelity advised the Board that the peer group, which is created by a third-party provider, includes a number of actively-managed funds. The Independent Trustees recognize that shareholders who are not investing through a tax-advantaged retirement account also consider tax consequences in evaluating performance.
Based on its review, the Board concluded that the nature, extent, and quality of services provided to the fund under the Advisory Contracts should continue to benefit the shareholders of the fund.
Competitiveness of Management Fee and Total Expense Ratio . The Board considered the fund's management fee and total expense ratio compared to selected groups of competitive funds and classes (referred to as "mapped groups" below) for the purpose of facilitating the Trustees' competitive analysis of management fees and total expenses. Fidelity creates "mapped groups" by combining similar investment objective categories (as classified by Lipper) that have comparable investment mandates. Combining funds with similar investment objective categories aids the Board's comparison of management fees and total expense ratios by broadening the competitive group used for such comparison.
Management Fee . The Board considered two proprietary management fee comparisons for the 12-month (or shorter) periods
shown in basis points (BP) in the chart below. The group of Lipper funds used by the Board for management fee comparisons is referred to below as the "Total Mapped Group." The Total Mapped Group comparison focuses on a fund's standing in terms of gross management fees before expense reimbursements or caps relative to the total universe of funds with comparable investment mandates, regardless of whether their management fee structures also are comparable. Funds with comparable investment mandates offer exposure to similar types of securities. Funds with comparable management fee structures have similar management fee contractual arrangements (e.g., flat rate charged for advisory services, all-inclusive fee rate, etc.). "TMG %" represents the percentage of funds in the Total Mapped Group that had management fees that were lower than the fund's. For example, a hypothetical TMG % of 20% would mean that 80% of the funds in the Total Mapped Group had higher, and 20% had lower, management fees than the fund. The fund's actual TMG %s and the number of funds in the Total Mapped Group are in the chart below. The "Asset-Sized Peer Group" (ASPG) comparison focuses on a fund's standing relative to a subset of non-Fidelity funds within the Total Mapped Group that are similar in size and management fee structure. For example, if a fund is in the first quartile of the ASPG, the fund's management fee ranks in the least expensive or lowest 25% of funds in the ASPG. The ASPG represents at least 15% of the funds in the Total Mapped Group with comparable asset size and management fee structures, subject to a minimum of 50 funds (or all funds in the Total Mapped Group if fewer than 50). Additional information, such as the ASPG quartile in which the fund's management fee rate ranked, is also included in the chart and was considered by the Board.

The Board noted that the fund's management fee rate ranked equal to the median of its Total Mapped Group and equal to the median of its ASPG for 2021.
Based on its review, the Board concluded that the fund's management fee is fair and reasonable in light of the services that the fund receives and the other factors considered.
Total Expense Ratio . In its review of the fund's total expense ratio, the Board considered the fund's management fee rate as well as other fund expenses, such as custodial, legal, and audit fees. The Board also noted that Fidelity may agree to waive fees or reimburse expenses from time to time, and the extent to which, if any, it has done so for the fund. The fund is compared to those funds and classes in the Total Mapped Group (used by the Board for management fee comparisons) that have a similar sales load structure. The Board also considered a total expense ASPG comparison, which focuses on the total expenses of the fund relative to a subset of non-Fidelity funds within the similar sales load structure group that are similar in size and management fee structure. The total expense ASPG is limited to 15 larger and 15 smaller classes of different funds, where possible. The total expense ASPG comparison excludes performance adjustments and fund-paid 12b-1 fees to eliminate variability in expenses relating to these items.
The Board noted that the fund's total net expense ratio ranked equal to the similar sales load structure group competitive median for 2021 and below the ASPG competitive median for 2021.
The Board further considered that FMR has contractually agreed to reimburse the fund to the extent that total operating expenses, with certain exceptions, as a percentage of its average net assets, exceed 0.20% through February 28, 2023.
Fees Charged to Other Clients . The Board also considered fee structures and other information with respect to clients of Fidelity and Geode, such as other funds advised or subadvised by Fidelity or Geode, pension plan clients, and other institutional clients with similar mandates. The Board noted that a joint ad hoc committee created by it and the boards of other Fidelity funds periodically reviews and compares Fidelity's institutional investment advisory business with its business of providing services to the Fidelity funds and also noted the most recent findings of the committee. The Board noted that the committee's review included a consideration of the differences in services provided, fees charged, and costs incurred, as well as competition in the markets serving the different categories of clients.
Based on its review of total expense ratios and fees charged to other Fidelity clients, the Board concluded that the fund's total expense ratio was reasonable in light of the services that the fund and its shareholders receive and the other factors considered.
Costs of the Services and Profitability . The Board considered the revenues earned and the expenses incurred by Fidelity in conducting the business of developing, marketing, distributing, managing, administering and servicing the fund and servicing the fund's shareholders. The Board also considered the level of Fidelity's profits in respect of all the Fidelity funds.
On an annual basis, Fidelity presents to the Board information about the profitability of its relationships with the fund. Fidelity calculates profitability information for each fund, as well as aggregate profitability information for groups of Fidelity funds and all Fidelity funds, using a series of detailed revenue and cost allocation methodologies which originate with the books and records of Fidelity on which Fidelity's audited financial statements are based. The Audit Committee of the Board reviews any significant changes from the prior year's methodologies and the full Board approves such changes.
A public accounting firm has been engaged annually by the Board as part of the Board's assessment of Fidelity's profitability analysis. The engagement includes the review and assessment of the methodologies used by Fidelity in determining the revenues and expenses attributable to Fidelity's mutual fund business, and completion of agreed-upon procedures in respect of the mathematical accuracy of certain fund profitability information and its conformity to established allocation methodologies. After considering the reports issued under the engagement and information provided by Fidelity, the Board concluded that while other allocation methods may also be reasonable, Fidelity's profitability methodologies are reasonable in all material respects.
The Board also reviewed Fidelity's and Geode's non-fund businesses and potential indirect benefits such businesses may have received as a result of their association with Fidelity's mutual fund business (i.e., fall-out benefits) as well as cases where Fidelity's and Geode's affiliates may benefit from the funds' business. The Board considered areas where potential indirect benefits to the Fidelity funds from their relationships with Fidelity may exist. The Board's consideration of these matters was informed by the findings of a joint ad hoc committee created by it and the boards of other Fidelity funds to evaluate potential fall-out benefits.
The Board considered the costs of the services provided by and the profits realized by Fidelity in connection with the operation of the fund and was satisfied that the profitability was not excessive.
The Board also considered information regarding the profitability of Geode's relationship with the fund.
Economies of Scale . The Board considered whether there have been economies of scale in respect of the management of the Fidelity funds, whether the Fidelity funds (including the fund) have appropriately benefited from any such economies of scale, and whether there is potential for realization of any further economies of scale. The Board considered the extent to which the fund will benefit from economies of scale as assets grow through increased services to the fund, through waivers or reimbursements, or through fee or expense ratio reductions. The Board also noted that a committee (the Economies of Scale Committee) created by it and the boards of other Fidelity funds periodically analyzes whether Fidelity attains economies of scale in respect of the management and servicing of the Fidelity funds, whether the Fidelity funds have appropriately benefited from such economies of scale, and whether there is potential for realization of any further economies of scale.
The Board concluded, taking into account the analysis of the Economies of Scale Committee, that economies of scale, if any, are being appropriately shared between fund shareholders and Fidelity.
Additional Information Requested by the Board . In order to develop fully the factual basis for consideration of the Fidelity funds' advisory contracts, the Board requested and received additional information on certain topics, including: (i) Fidelity's fund profitability methodology, profitability trends for certain funds, the allocation of various costs to different funds, and the impact of certain factors on fund profitability results; (ii) portfolio manager changes that have occurred during the past year and the amount of the investment that each portfolio manager has made in the Fidelity fund(s) that he or she manages; (iii) the extent to which current market conditions have affected retention and recruitment of personnel; (iv) the arrangements with and compensation paid to certain fund sub-advisers on behalf of the Fidelity funds and the treatment of such compensation within Fidelity's fund profitability methodology; (v) the terms of the funds' various management fee structures, including the basic group fee and the terms of Fidelity's voluntary expense limitation arrangements; (vi) Fidelity's transfer agent, pricing and bookkeeping fees, expense and service structures for different funds and classes relative to competitive trends; (vii) the impact on fund profitability of recent industry trends, such as the growth in passively managed funds and the changes in flows for different types of funds; (viii) the types of management fee and total expense comparisons provided, and the challenges and limitations associated with such information; and (ix) explanations regarding the relative total expense ratios and management fees of certain funds and classes, total expense and management fee competitive trends, and methodologies for total expense and management fee competitive comparisons. In addition, the Board considered its discussions with Fidelity regarding Fidelity's efforts to maintain the continuous investment and shareholder services necessary for the funds during the current pandemic and economic circumstances.
Based on its evaluation of all of the conclusions noted above, and after considering all factors it believed relevant, the Board concluded that the advisory and sub-advisory fee arrangements are fair and reasonable and that the fund's Advisory Contracts should be renewed.
1.9900585.102
IQI-ANN-1222
Fidelity® Series Global ex U.S. Index Fund
Annual Report
October 31, 2022
Contents
To view a fund's proxy voting guidelines and proxy voting record for the 12-month period ended June 30, visit http://www.fidelity.com/proxyvotingresults or visit the Securities and Exchange Commission's (SEC) web site at http://www.sec.gov.
You may also call 1-800-544-8544 to request a free copy of the proxy voting guidelines.
The funds or securities referred to herein are not sponsored, endorsed, or promoted by MSCI, and MSCI bears no liability with respect to any such funds or securities or any index on which such funds or securities are based. The prospectus contains a more detailed description of the limited relationship MSCI has with Fidelity and any related funds.
Standard & Poor's, S&P and S&P 500 are registered service marks of The McGraw-Hill Companies, Inc. and have been licensed for use by Fidelity Distributors Corporation.
Other third-party marks appearing herein are the property of their respective owners.
All other marks appearing herein are registered or unregistered trademarks or service marks of FMR LLC or an affiliated company. © 2022 FMR LLC. All rights reserved.
This report and the financial statements contained herein are submitted for the general information of the shareholders of the Fund. This report is not authorized for distribution to prospective investors in the Fund unless preceded or accompanied by an effective prospectus.
A fund files its complete schedule of portfolio holdings with the SEC for the first and third quarters of each fiscal year on Form N-PORT. Forms N-PORT are available on the SEC's web site at http://www.sec.gov. A fund's Forms N-PORT may be reviewed and copied at the SEC's Public Reference Room in Washington, DC. Information regarding the operation of the SEC's Public Reference Room may be obtained by calling 1-800-SEC-0330.
For a complete list of a fund's portfolio holdings, view the most recent holdings listing, semiannual report, or annual report on Fidelity's web site at http://www.fidelity.com, http://www.institutional.fidelity.com, or http://www.401k.com, as applicable.
NOT FDIC INSURED •MAY LOSE VALUE •NO BANK GUARANTEE
Neither the Fund nor Fidelity Distributors Corporation is a bank.
Average annual total return reflects the change in the value of an investment, assuming reinvestment of distributions from dividend income and capital gains (the profits earned upon the sale of securities that have grown in value, if any) and assuming a constant rate of performance each year. The hypothetical investment and the average annual total returns do not reflect the deduction of taxes that a shareholder would pay on fund distributions or the redemption of fund shares. During periods of reimbursement by Fidelity, a fund's total return will be greater than it would be had the reimbursement not occurred. How a fund did yesterday is no guarantee of how it will do tomorrow.
| Average Annual Total Returns |
| | | | |
Periods ended October 31, 2022 | Past 1 year | Past 5 years | Past 10 years |
| Fidelity® Series Global ex U.S. Index Fund | -24.57% | -0.57% | 3.28% |
| $10,000 Over 10 Years |
| |
Let's say hypothetically that $10,000 was invested in Fidelity® Series Global ex U.S. Index Fund on October 31, 2012. The chart shows how the value of your investment would have changed, and also shows how the MSCI ACWI (All Country World Index) ex USA Index performed over the same period. |
|
|
Market Recap:
International equities returned -24.61% for the 12 months ending October 31, 2022, according to the MSCI ACWI (All Country World Index) ex USA Index. After gaining 7.98% in 2021, non-U.S. stocks retreated in the new year, as a multitude of risk factors challenged the global economy and financial markets. Persistently high inflation in some markets, exacerbated by energy price shocks from the Russia-Ukraine conflict, spurred the U.S. Federal Reserve and other central banks to aggressively tighten monetary policy, and market interest rates eclipsed their highest level in roughly a decade, stoking recession fears and sending stocks into bear market territory. Other factors influencing equities abroad included surging global commodity prices, rising sovereign bond yields in some markets, ongoing global supply-chain disruption, a broadly strong U.S. dollar and the potential for variants of the coronavirus to upend global economic growth. Against this backdrop, the index returned -24.20% year to date through October. For the full 12 months, emerging markets (-31%) and Europe ex U.K. (-25%) notably lagged. Conversely, Canada (-13%) and the U.K. (-12%) held up best. Among the 11 sectors, information technology and consumer discretionary (-37% each) fared worst. Communication services (-34%) also trailed the broader market. In contrast, energy gained 2% amid high prices for oil and natural gas. The defensive-oriented utilities (-16%) sector also outperformed, as did financials and consumer staples (-18% each).
Comments from the Geode Capital Management, LLC, passive equity index team :
For the fiscal year ending October 31, 2022, the fund returned -24.57%, roughly in line with the -24.61% result of the benchmark MSCI All Country World ex US Index (Net MA). (The fund's relative performance can be affected by Fidelity's methodologies for valuing certain foreign stocks and for incorporating foreign exchange rates, which differ from those used by the index, as well as by local tax laws or regulations, which vary by country.) By region, emerging markets returned -29.84% and detracted most, followed by Europe ex U.K. (-25.44%). By sector, stocks in the information technology sector returned roughly -37% and detracted most, followed by consumer discretionary, which returned roughly -37%, hampered by the retailing industry (-49%). Financials returned about -18% and industrials detracted -25%. Communication services returned -34%, hurt by the media & entertainment industry (-51%). Health care returned -20%, especially in the pharmaceuticals, biotechnology & life sciences industry (-15%). Consumer staples detracted, returning -18%, hampered by the food, beverage & tobacco industry (-16%). The materials sector (-19%) also detracted. Real estate (-33%) and utilities (-16%) also hurt. From a sector standpoint, energy gained approximately 4% and contributed most. Turning to individual stocks, the biggest individual detractor was Taiwan Semiconductor (-42%), from the semiconductors & semiconductor equipment industry, followed by Tencent Holdings (-56%), which is in the media & entertainment category. Within retailing, Alibaba Group Holding returned roughly -63% and hurt. Other detractors were ASML Holding (-41%), a stock in the semiconductors & semiconductor equipment group, and Shopify (-77%), from the software & services segment. Conversely, the biggest individual contributor was Shell (+24%), from the energy sector. In energy, Petroleo Brasileiro, also known as Petrobras (+100%); Canadian National Resources (+49%); BP (+20%); and TotalEnergies (+14%) all benefited the fund.
The views expressed above reflect those of the portfolio manager(s) only through the end of the period as stated on the cover of this report and do not necessarily represent the views of Fidelity or any other person in the Fidelity organization. Any such views are subject to change at any time based upon market or other conditions and Fidelity disclaims any responsibility to update such views. These views may not be relied on as investment advice and, because investment decisions for a Fidelity fund are based on numerous factors, may not be relied on as an indication of trading intent on behalf of any Fidelity fund.
Top Holdings (% of Fund's net assets) |
| |
| Nestle SA (Reg. S) (Switzerland, Food Products) | 1.5 | |
| Taiwan Semiconductor Manufacturing Co. Ltd. (Taiwan, Semiconductors & Semiconductor Equipment) | 1.4 | |
| Roche Holding AG (participation certificate) (Switzerland, Pharmaceuticals) | 1.1 | |
| Shell PLC (London) (United Kingdom, Oil, Gas & Consumable Fuels) | 1.0 | |
| Samsung Electronics Co. Ltd. (Korea (South), Technology Hardware, Storage & Peripherals) | 1.0 | |
| ASML Holding NV (Netherlands) (Netherlands, Semiconductors & Semiconductor Equipment) | 0.9 | |
| AstraZeneca PLC (United Kingdom) (United Kingdom, Pharmaceuticals) | 0.9 | |
| Novo Nordisk A/S Series B (Denmark, Pharmaceuticals) | 0.9 | |
| Novartis AG (Switzerland, Pharmaceuticals) | 0.8 | |
| LVMH Moet Hennessy Louis Vuitton SE (France, Textiles, Apparel & Luxury Goods) | 0.9 | |
| | 10.4 | |
| |
| Market Sectors (% of Fund's net assets) |
| |
| Financials | 22.7 | |
| Industrials | 12.1 | |
| Information Technology | 10.6 | |
| Consumer Discretionary | 10.4 | |
| Health Care | 10.2 | |
| Consumer Staples | 9.1 | |
| Materials | 7.7 | |
| Energy | 7.0 | |
| Communication Services | 5.6 | |
| Utilities | 2.8 | |
| Real Estate | 1.6 | |
| |
Asset Allocation (% of Fund's net assets) |
|
Foreign investments - 96.9% |
|
Geographic Diversification (% of Fund's net assets) |
|
* Includes Short-Term investments and Net Other Assets (Liabilities). Percentages are based on country or territory of incorporation and are adjusted for the effect of futures contracts, if applicable. |
| |
Showing Percentage of Net Assets
| Common Stocks - 96.0% |
| | | Shares | Value ($) |
| Australia - 4.9% | | | |
| Ampol Ltd. | | 337,473 | 5,877,993 |
| APA Group unit | | 1,682,260 | 11,309,365 |
| Aristocrat Leisure Ltd. | | 868,178 | 20,586,085 |
| ASX Ltd. | | 280,988 | 12,167,990 |
| Aurizon Holdings Ltd. | | 2,635,813 | 6,103,312 |
| Australia & New Zealand Banking Group Ltd. | | 4,291,271 | 70,307,063 |
| BHP Group Ltd. | | 7,286,064 | 174,117,432 |
| BlueScope Steel Ltd. | | 701,728 | 7,060,573 |
| Brambles Ltd. | | 2,055,251 | 15,355,010 |
| Cochlear Ltd. | | 95,533 | 12,203,815 |
| Coles Group Ltd. | | 1,933,608 | 20,197,472 |
| Commonwealth Bank of Australia | | 2,455,748 | 164,433,355 |
| Computershare Ltd. | | 774,737 | 12,522,814 |
| CSL Ltd. | | 694,897 | 124,670,798 |
| Dexus unit | | 1,579,200 | 7,838,650 |
| Dominos Pizza Enterprises Ltd. | | 90,235 | 3,679,575 |
| Endeavour Group Ltd. | | 1,962,614 | 8,976,010 |
| Evolution Mining Ltd. | | 2,675,993 | 3,560,334 |
| Fortescue Metals Group Ltd. | | 2,436,721 | 22,956,362 |
| Goodman Group unit | | 2,420,605 | 26,321,780 |
| IDP Education Ltd. | | 288,560 | 5,461,645 |
| Insurance Australia Group Ltd. | | 3,563,820 | 11,170,028 |
| Lendlease Group unit | | 962,618 | 5,350,768 |
| Macquarie Group Ltd. | | 524,041 | 56,816,879 |
| Medibank Private Ltd. | | 4,015,399 | 7,217,344 |
| Mineral Resources Ltd. | | 245,236 | 11,471,553 |
| Mirvac Group unit | | 5,585,285 | 7,395,339 |
| National Australia Bank Ltd. | | 4,616,158 | 95,887,052 |
| Newcrest Mining Ltd. | | 1,284,971 | 14,231,415 |
| Northern Star Resources Ltd. | | 1,694,120 | 9,471,047 |
| Orica Ltd. | | 657,803 | 5,840,200 |
| Origin Energy Ltd. | | 2,493,817 | 8,885,097 |
| Qantas Airways Ltd. (a) | | 1,295,925 | 4,841,000 |
| QBE Insurance Group Ltd. | | 2,133,646 | 16,704,989 |
| Ramsay Health Care Ltd. | | 263,657 | 9,877,725 |
| REA Group Ltd. | | 75,051 | 5,837,095 |
| Reece Ltd. | | 332,257 | 3,300,563 |
| Rio Tinto Ltd. | | 533,139 | 30,078,172 |
| Santos Ltd. | | 4,646,339 | 22,681,842 |
| Scentre Group unit | | 7,511,976 | 13,934,603 |
| SEEK Ltd. | | 490,553 | 6,774,558 |
| Sonic Healthcare Ltd. | | 655,150 | 13,732,816 |
| South32 Ltd. | | 6,652,964 | 15,263,692 |
| Stockland Corp. Ltd. unit | | 3,487,964 | 8,031,874 |
| Suncorp Group Ltd. | | 1,821,086 | 13,291,026 |
| Telstra Group Ltd. | | 5,872,066 | 14,723,783 |
| The GPT Group unit | | 2,713,853 | 7,481,798 |
| The Lottery Corp. Ltd. (a) | | 3,266,315 | 8,963,090 |
| Transurban Group unit | | 4,389,079 | 37,227,110 |
| Treasury Wine Estates Ltd. | | 1,084,754 | 8,985,525 |
| Vicinity Centres unit | | 5,602,127 | 6,969,714 |
| Washington H. Soul Pattinson & Co. Ltd. | | 315,693 | 5,642,009 |
| Wesfarmers Ltd. | | 1,625,124 | 47,159,549 |
| Westpac Banking Corp. | | 5,038,929 | 77,710,169 |
| WiseTech Global Ltd. | | 205,528 | 7,646,062 |
| Woodside Energy Group Ltd. | | 2,734,285 | 62,928,495 |
| Woolworths Group Ltd. | | 1,757,328 | 37,116,952 |
TOTAL AUSTRALIA | | | 1,456,348,366 |
| Austria - 0.1% | | | |
| Erste Group Bank AG | | 501,772 | 12,366,144 |
| OMV AG | | 210,055 | 9,681,851 |
| Verbund AG | | 98,624 | 7,724,115 |
| Voestalpine AG | | 170,478 | 3,703,078 |
TOTAL AUSTRIA | | | 33,475,188 |
| Bailiwick of Jersey - 0.6% | | | |
| Experian PLC | | 1,331,544 | 42,456,648 |
| Ferguson PLC | | 311,613 | 33,984,726 |
| Glencore PLC | | 14,204,241 | 81,433,961 |
| WPP PLC | | 1,575,402 | 13,863,775 |
TOTAL BAILIWICK OF JERSEY | | | 171,739,110 |
| Belgium - 0.5% | | | |
| Ageas | | 235,248 | 8,143,909 |
| Anheuser-Busch InBev SA NV | | 1,258,477 | 62,949,538 |
| D'ieteren Group | | 35,932 | 5,976,299 |
| ELIA GROUP SA/NV | | 46,408 | 5,865,840 |
| Groupe Bruxelles Lambert SA | | 143,628 | 10,588,752 |
| KBC Group NV | | 360,288 | 18,056,107 |
| Proximus | | 221,367 | 2,321,107 |
| Sofina SA (b) | | 22,034 | 4,300,582 |
| Solvay SA Class A | | 107,904 | 9,729,480 |
| UCB SA | | 181,295 | 13,673,856 |
| Umicore SA | | 305,281 | 10,063,868 |
| Warehouses de Pauw | | 230,410 | 5,915,716 |
TOTAL BELGIUM | | | 157,585,054 |
| Bermuda - 0.2% | | | |
| Alibaba Health Information Technology Ltd. (a) | | 6,308,000 | 2,667,961 |
| Alibaba Pictures Group Ltd. (a) | | 14,390,000 | 531,629 |
| Beijing Enterprises Water Group Ltd. | | 6,350,000 | 1,334,773 |
| China Gas Holdings Ltd. | | 4,165,200 | 3,693,132 |
| China Resource Gas Group Ltd. | | 1,365,000 | 3,495,251 |
| China Ruyi Holdings Ltd. (a)(b) | | 6,848,000 | 1,073,047 |
| CK Infrastructure Holdings Ltd. | | 889,131 | 4,224,976 |
| Cosco Shipping Ports Ltd. | | 2,234,345 | 1,101,567 |
| Credicorp Ltd. (United States) | | 103,324 | 15,122,501 |
| Hongkong Land Holdings Ltd. | | 1,582,345 | 6,092,028 |
| Hopson Development Holdings Ltd. | | 1,081,872 | 868,293 |
| Jardine Matheson Holdings Ltd. | | 228,864 | 10,532,321 |
| Kunlun Energy Co. Ltd. | | 5,794,000 | 3,461,793 |
| Nine Dragons Paper (Holdings) Ltd. | | 2,092,000 | 1,239,265 |
| Orient Overseas International Ltd. | | 195,000 | 2,849,363 |
| Shenzhen International Holdings Ltd. | | 1,789,236 | 1,203,514 |
TOTAL BERMUDA | | | 59,491,414 |
| Brazil - 1.2% | | | |
| Ambev SA | | 6,347,730 | 19,661,926 |
| Americanas SA | | 890,295 | 2,678,382 |
| Atacadao SA | | 737,600 | 2,778,762 |
| B3 SA - Brasil Bolsa Balcao | | 8,743,775 | 25,458,596 |
| Banco Bradesco SA | | 516,238 | 1,662,995 |
| Banco BTG Pactual SA unit | | 1,696,700 | 9,505,856 |
| Banco do Brasil SA | | 1,233,800 | 8,842,373 |
| Banco Santander SA (Brasil) unit | | 526,800 | 3,037,093 |
| BB Seguridade Participacoes SA | | 1,012,600 | 5,820,171 |
| BRF SA (a) | | 850,691 | 2,068,469 |
| CCR SA | | 1,601,900 | 4,019,093 |
| Centrais Eletricas Brasileiras SA (Electrobras) | | 1,528,430 | 14,741,338 |
| Companhia de Saneamento Basico do Estado de Sao Paulo (SABESP) | | 494,600 | 5,754,614 |
| Companhia Siderurgica Nacional SA (CSN) | | 940,600 | 2,236,099 |
| Cosan SA | | 1,718,432 | 5,608,898 |
| CPFL Energia SA | | 327,700 | 2,247,049 |
| Energisa SA unit | | 277,300 | 2,603,093 |
| ENGIE Brasil Energia SA | | 355,450 | 2,767,631 |
| Equatorial Energia SA | | 1,476,700 | 8,584,900 |
| Hapvida Participacoes e Investimentos SA (c) | | 6,713,644 | 10,137,726 |
| Hypera SA | | 571,400 | 5,620,527 |
| JBS SA | | 1,106,100 | 5,344,740 |
| Klabin SA unit | | 1,067,200 | 4,466,724 |
| Localiza Rent a Car SA | | 3,193 | 43,604 |
| Localiza Rent a Car SA | | 1,068,076 | 14,585,632 |
| Lojas Renner SA | | 1,466,909 | 8,775,044 |
| Magazine Luiza SA | | 4,266,532 | 3,692,072 |
| Natura & Co. Holding SA (a) | | 1,322,019 | 3,826,190 |
| Petro Rio SA (a) | | 1,004,200 | 6,880,000 |
| Petroleo Brasileiro SA - Petrobras (ON) | | 4,465,111 | 28,750,284 |
| Raia Drogasil SA | | 1,595,600 | 8,127,042 |
| Rede D'Oregon Sao Luiz SA (c) | | 562,500 | 3,503,170 |
| Rumo SA | | 1,882,000 | 8,066,495 |
| Suzano Papel e Celulose SA | | 1,063,795 | 10,956,131 |
| Telefonica Brasil SA | | 722,140 | 5,775,163 |
| TIM SA | | 1,335,603 | 3,413,021 |
| Totvs SA | | 728,200 | 4,674,690 |
| Ultrapar Participacoes SA | | 1,070,100 | 2,778,055 |
| Vale SA | | 5,161,147 | 67,073,429 |
| Vale SA sponsored ADR | | 620,044 | 8,023,369 |
| Vibra Energia SA | | 1,737,150 | 6,137,448 |
| Weg SA | | 2,421,632 | 18,883,620 |
TOTAL BRAZIL | | | 369,611,514 |
| British Virgin Islands - 0.0% | | | |
| VK Co. Ltd. unit (a)(d) | | 120,267 | 53,579 |
| Canada - 8.3% | | | |
| Agnico Eagle Mines Ltd. (Canada) | | 658,154 | 28,952,302 |
| Air Canada (a) | | 254,672 | 3,665,811 |
| Algonquin Power & Utilities Corp. (b) | | 922,721 | 10,213,699 |
| Alimentation Couche-Tard, Inc. Class A (multi-vtg.) (b) | | 1,196,718 | 53,583,733 |
| AltaGas Ltd. (b) | | 392,292 | 7,074,991 |
| ARC Resources Ltd. | | 974,395 | 13,718,131 |
| Bank of Montreal (b) | | 967,408 | 89,110,750 |
| Bank of Nova Scotia | | 1,723,551 | 83,308,866 |
| Barrick Gold Corp. (Canada) | | 2,570,525 | 38,661,179 |
| Bausch Health Cos., Inc. (Canada) (a) | | 378,494 | 2,461,524 |
| BCE, Inc. | | 105,554 | 4,761,106 |
| BlackBerry Ltd. (a)(b) | | 798,335 | 3,709,370 |
| Brookfield Asset Management, Inc. (Canada) Class A | | 2,025,850 | 80,225,058 |
| Brookfield Renewable Corp. (b) | | 196,759 | 6,113,560 |
| BRP, Inc. | | 53,728 | 3,592,383 |
| CAE, Inc. (a) | | 458,172 | 8,744,061 |
| Cameco Corp. (b) | | 618,890 | 14,677,826 |
| Canadian Apartment Properties (REIT) unit (b) | | 116,516 | 3,608,331 |
| Canadian Imperial Bank of Commerce (b) | | 1,300,261 | 59,050,279 |
| Canadian National Railway Co. | | 844,059 | 99,997,154 |
| Canadian Natural Resources Ltd. | | 1,663,495 | 99,771,848 |
| Canadian Pacific Railway Ltd. (b) | | 1,336,933 | 99,665,222 |
| Canadian Tire Ltd. Class A (non-vtg.) (b) | | 80,136 | 8,981,514 |
| Canadian Utilities Ltd. Class A (non-vtg.) | | 173,629 | 4,619,996 |
| CCL Industries, Inc. Class B | | 222,414 | 10,448,487 |
| Cenovus Energy, Inc. (Canada) | | 2,000,492 | 40,440,085 |
| CGI, Inc. Class A (sub. vtg.) (a) | | 308,152 | 24,822,256 |
| Constellation Software, Inc. | | 28,885 | 41,766,266 |
| Dollarama, Inc. (b) | | 395,271 | 23,486,760 |
| Emera, Inc. (b) | | 379,051 | 14,047,994 |
| Empire Co. Ltd. Class A (non-vtg.) | | 249,493 | 6,409,700 |
| Enbridge, Inc. | | 2,918,714 | 113,719,190 |
| Fairfax Financial Holdings Ltd. (sub. vtg.) | | 32,896 | 16,156,189 |
| First Quantum Minerals Ltd. | | 841,320 | 14,839,740 |
| FirstService Corp. (b) | | 57,253 | 7,157,308 |
| Fortis, Inc. | | 681,292 | 26,579,565 |
| Franco-Nevada Corp. | | 276,637 | 34,180,869 |
| George Weston Ltd. | | 107,828 | 11,868,322 |
| GFL Environmental, Inc. | | 253,538 | 6,843,023 |
| Gildan Activewear, Inc. (b) | | 269,043 | 8,489,858 |
| Great-West Lifeco, Inc. | | 413,591 | 9,575,117 |
| Hydro One Ltd. (c) | | 468,302 | 11,742,354 |
| iA Financial Corp, Inc. | | 155,620 | 8,660,850 |
| IGM Financial, Inc. | | 111,051 | 2,972,826 |
| Imperial Oil Ltd. | | 335,050 | 18,226,267 |
| Intact Financial Corp. (b) | | 253,506 | 38,520,407 |
| Ivanhoe Mines Ltd. (a)(b) | | 861,359 | 5,974,854 |
| Keyera Corp. (b) | | 321,628 | 6,893,631 |
| Kinross Gold Corp. | | 1,901,584 | 6,895,310 |
| Lightspeed Commerce, Inc. (Canada) (a) | | 193,756 | 3,713,414 |
| Loblaw Companies Ltd. (b) | | 241,910 | 19,820,159 |
| Lundin Mining Corp. | | 952,893 | 4,994,059 |
| Magna International, Inc. Class A (sub. vtg.) | | 404,422 | 22,537,320 |
| Manulife Financial Corp. (b) | | 2,775,826 | 46,007,378 |
| Metro, Inc. (b) | | 355,591 | 18,628,495 |
| National Bank of Canada | | 487,429 | 33,188,178 |
| Northland Power, Inc. (b) | | 349,670 | 10,174,272 |
| Nutrien Ltd. | | 794,127 | 67,098,733 |
| Nuvei Corp. (a)(c) | | 100,208 | 3,015,765 |
| Onex Corp. (sub. vtg.) | | 108,203 | 5,446,089 |
| Open Text Corp. | | 387,158 | 11,213,899 |
| Pan American Silver Corp. | | 306,598 | 4,899,435 |
| Parkland Corp. (b) | | 222,578 | 4,499,430 |
| Pembina Pipeline Corp. (b) | | 799,592 | 26,399,712 |
| Power Corp. of Canada (sub. vtg.) (b) | | 810,512 | 20,126,708 |
| Quebecor, Inc. Class B (sub. vtg.) | | 226,488 | 4,269,249 |
| Restaurant Brands International, Inc. | | 304,188 | 18,074,664 |
| Restaurant Brands International, Inc. (b) | | 113,857 | 6,760,829 |
| RioCan (REIT) (b) | | 230,372 | 3,282,211 |
| Ritchie Bros. Auctioneers, Inc. (b) | | 159,347 | 10,409,868 |
| Rogers Communications, Inc. Class B (non-vtg.) (b) | | 510,664 | 21,257,207 |
| Royal Bank of Canada (b) | | 2,040,101 | 188,758,198 |
| Saputo, Inc. (b) | | 360,133 | 8,765,743 |
| Shaw Communications, Inc. Class B | | 675,357 | 17,345,573 |
| Shopify, Inc. Class A (a) | | 1,646,010 | 56,435,664 |
| Sun Life Financial, Inc. | | 852,174 | 36,192,452 |
| Suncor Energy, Inc. | | 2,071,821 | 71,263,282 |
| TC Energy Corp. | | 1,414,504 | 62,130,818 |
| Teck Resources Ltd. Class B (sub. vtg.) | | 690,802 | 21,028,046 |
| TELUS Corp. | | 670,375 | 13,999,463 |
| TFI International, Inc. (Canada) | | 118,696 | 10,804,486 |
| The Toronto-Dominion Bank | | 2,618,085 | 167,556,671 |
| Thomson Reuters Corp. | | 245,634 | 26,123,911 |
| TMX Group Ltd. | | 80,648 | 7,753,716 |
| Toromont Industries Ltd. | | 118,431 | 9,101,718 |
| Tourmaline Oil Corp. | | 459,430 | 25,886,040 |
| West Fraser Timber Co. Ltd. | | 84,913 | 6,375,565 |
| Wheaton Precious Metals Corp. | | 654,516 | 21,412,837 |
| WSP Global, Inc. (b) | | 177,850 | 21,858,703 |
TOTAL CANADA | | | 2,477,595,882 |
| Cayman Islands - 4.1% | | | |
| 3SBio, Inc. (c) | | 2,282,000 | 1,610,553 |
| AAC Technology Holdings, Inc. (a)(b) | | 1,139,500 | 2,087,315 |
| Airtac International Group | | 201,456 | 4,621,983 |
| Alibaba Group Holding Ltd. (a) | | 21,859,124 | 169,952,650 |
| Anta Sports Products Ltd. | | 1,760,200 | 15,472,512 |
| Autohome, Inc. ADR Class A | | 111,645 | 2,916,167 |
| Baidu, Inc. Class A (a) | | 3,194,198 | 30,622,788 |
| BeiGene Ltd. ADR (a)(b) | | 68,821 | 11,623,179 |
| Bilibili, Inc. Class Z (a) | | 262,184 | 2,336,425 |
| Bosideng International Holdings Ltd. | | 5,252,000 | 2,268,162 |
| Budweiser Brewing Co. APAC Ltd. (c) | | 2,643,058 | 5,562,454 |
| Chailease Holding Co. Ltd. | | 1,925,243 | 8,893,818 |
| China Conch Venture Holdings Ltd. | | 2,332,500 | 3,440,962 |
| China Feihe Ltd. (c) | | 5,487,000 | 3,159,535 |
| China Hongqiao Group Ltd. | | 3,614,500 | 2,564,798 |
| China Huishan Dairy Holdings Co. Ltd. (a)(d) | | 958,000 | 1 |
| China Liansu Group Holdings Ltd. | | 1,380,000 | 1,119,872 |
| China Literature Ltd. (a)(c) | | 614,400 | 1,655,432 |
| China Medical System Holdings Ltd. | | 1,986,000 | 2,168,252 |
| China Meidong Auto Holding Ltd. | | 794,000 | 1,043,878 |
| China Mengniu Dairy Co. Ltd. | | 4,585,000 | 14,690,177 |
| China Overseas Property Holdings Ltd. | | 1,950,000 | 1,227,188 |
| China Resources Cement Holdings Ltd. | | 3,592,000 | 1,299,584 |
| China Resources Land Ltd. | | 4,644,465 | 14,555,278 |
| China Resources Microelectronics Ltd. (A Shares) | | 85,320 | 591,862 |
| China Resources Mixc Lifestyle Services Ltd. (c) | | 1,031,800 | 3,023,243 |
| China State Construction International Holdings Ltd. | | 3,051,750 | 2,744,754 |
| ChinaSoft International Ltd. | | 4,268,000 | 2,827,336 |
| Chow Tai Fook Jewellery Group Ltd. | | 2,931,600 | 5,019,422 |
| CIFI Holdings Group Co. Ltd. (b)(d) | | 5,274,679 | 349,421 |
| CK Asset Holdings Ltd. | | 2,863,639 | 15,832,799 |
| CK Hutchison Holdings Ltd. | | 3,892,223 | 19,374,839 |
| Country Garden Holdings Co. Ltd. | | 11,562,866 | 1,487,773 |
| Country Garden Services Holdings Co. Ltd. | | 2,823,000 | 2,467,088 |
| Dali Foods Group Co. Ltd. (c) | | 2,386,500 | 982,005 |
| Daqo New Energy Corp. ADR (a) | | 87,563 | 3,851,896 |
| Dongyue Group Co. Ltd. | | 2,041,000 | 1,773,279 |
| ENN Energy Holdings Ltd. | | 1,138,900 | 11,324,218 |
| ESR Group Ltd. (c) | | 2,838,791 | 4,846,050 |
| Futu Holdings Ltd. ADR (a) | | 88,056 | 2,981,576 |
| GDS Holdings Ltd. Class A (a) | | 1,204,620 | 1,344,538 |
| Geely Automobile Holdings Ltd. | | 8,784,000 | 9,444,620 |
| Genscript Biotech Corp. (a) | | 1,774,000 | 4,483,787 |
| Grab Holdings Ltd. (a) | | 1,878,203 | 4,883,328 |
| Greentown China Holdings Ltd. | | 1,192,000 | 1,134,349 |
| Greentown Service Group Co. Ltd. | | 2,078,000 | 852,415 |
| H World Group Ltd. ADR | | 274,655 | 7,437,657 |
| Haidilao International Holding Ltd. (a)(b)(c) | | 1,683,000 | 2,499,956 |
| Haitian International Holdings Ltd. | | 896,000 | 1,794,363 |
| Hansoh Pharmaceutical Group Co. Ltd. (c) | | 1,754,000 | 2,708,207 |
| Hengan International Group Co. Ltd. | | 956,500 | 3,710,411 |
| HUTCHMED China Ltd. sponsored ADR (a)(b) | | 119,954 | 1,060,393 |
| Hygeia Healthcare Holdings Co. (a)(c) | | 511,400 | 2,215,080 |
| Innovent Biologics, Inc. (a)(c) | | 1,474,000 | 5,220,258 |
| Inter & Co., Inc. unit | | 1 | 3 |
| iQIYI, Inc. ADR (a)(b) | | 466,290 | 941,906 |
| JD Health International, Inc. (a)(c) | | 1,609,450 | 8,826,740 |
| JD.com, Inc. Class A | | 3,105,249 | 56,548,199 |
| Jinxin Fertility Group Ltd. (c) | | 2,110,000 | 1,040,263 |
| Jiumaojiu International Holdings Ltd. (b)(c) | | 1,046,000 | 1,641,694 |
| JOYY, Inc. ADR | | 66,473 | 1,677,114 |
| Kanzhun Ltd. ADR (a) | | 254,227 | 2,778,701 |
| KE Holdings, Inc. ADR (a) | | 956,113 | 9,733,230 |
| Kingboard Chemical Holdings Ltd. | | 907,500 | 2,238,214 |
| Kingboard Laminates Holdings Ltd. | | 1,246,000 | 995,257 |
| Kingdee International Software Group Co. Ltd. (a) | | 3,717,000 | 6,080,052 |
| Kingsoft Corp. Ltd. | | 1,422,800 | 4,304,842 |
| Kuaishou Technology Class B (a)(c) | | 2,526,900 | 10,397,772 |
| Li Ning Co. Ltd. | | 3,388,500 | 17,526,017 |
| Longfor Properties Co. Ltd. (c) | | 2,642,500 | 3,366,392 |
| Lufax Holding Ltd. ADR | | 945,129 | 1,502,755 |
| Meituan Class B (a)(c) | | 6,341,390 | 101,529,116 |
| Microport Scientific Corp. (a)(b) | | 873,300 | 1,844,581 |
| Ming Yuan Cloud Group Holdings Ltd. | | 835,000 | 384,011 |
| Minth Group Ltd. | | 1,066,000 | 2,104,935 |
| NetEase, Inc. | | 2,969,235 | 32,944,415 |
| New Oriental Education & Technology Group, Inc. (a) | | 2,204,230 | 5,161,535 |
| NIO, Inc. sponsored ADR (a) | | 1,981,559 | 19,161,676 |
| Parade Technologies Ltd. | | 116,000 | 2,190,240 |
| Pinduoduo, Inc. ADR (a) | | 728,464 | 39,941,681 |
| Ping An Healthcare and Technology Co. Ltd. (a)(b)(c) | | 750,800 | 1,384,977 |
| Pop Mart International Group Ltd. (b)(c) | | 778,800 | 1,008,020 |
| RLX Technology, Inc. ADR (a)(b) | | 595,818 | 744,773 |
| Sands China Ltd. (a) | | 3,422,465 | 5,973,231 |
| Sany Heavy Equipment International Holdings Co. Ltd. | | 1,388,000 | 1,138,741 |
| Sea Ltd. ADR (a) | | 520,834 | 25,875,033 |
| Seazen Group Ltd. (a) | | 2,464,000 | 395,513 |
| Shenzhou International Group Holdings Ltd. | | 1,177,100 | 8,172,609 |
| Silergy Corp. | | 457,000 | 5,299,126 |
| Sino Biopharmaceutical Ltd. | | 14,934,000 | 7,248,545 |
| SITC International Holdings Co. Ltd. | | 1,994,000 | 3,266,749 |
| Smoore International Holdings Ltd. (b)(c) | | 2,459,000 | 2,615,741 |
| Sunny Optical Technology Group Co. Ltd. | | 1,041,500 | 9,028,947 |
| TAL Education Group ADR (a) | | 629,441 | 2,964,667 |
| Tencent Holdings Ltd. | | 9,009,600 | 236,743,403 |
| Tencent Music Entertainment Group ADR (a) | | 1,019,953 | 3,682,030 |
| Tingyi (Cayman Islands) Holding Corp. | | 2,972,000 | 4,649,400 |
| Tongcheng Travel Holdings Ltd. (a) | | 1,865,600 | 2,909,040 |
| Topsports International Holdings Ltd. (c) | | 2,839,000 | 1,432,222 |
| Trip.com Group Ltd. ADR (a) | | 784,464 | 17,752,420 |
| Uni-President China Holdings Ltd. | | 1,822,000 | 1,346,251 |
| Vinda International Holdings Ltd. | | 534,000 | 1,001,380 |
| Vipshop Holdings Ltd. ADR (a) | | 596,310 | 4,156,281 |
| Want Want China Holdings Ltd. | | 7,030,000 | 4,621,200 |
| Weibo Corp. sponsored ADR (a) | | 97,242 | 1,100,779 |
| WH Group Ltd. (c) | | 11,934,743 | 6,036,056 |
| Wharf Real Estate Investment Co. Ltd. | | 2,406,349 | 9,487,875 |
| Wuxi Biologics (Cayman), Inc. (a)(c) | | 5,194,500 | 23,373,393 |
| Xiaomi Corp. Class B (a)(c) | | 22,098,400 | 24,801,985 |
| Xinyi Glass Holdings Ltd. | | 2,567,467 | 3,303,512 |
| Xinyi Solar Holdings Ltd. | | 7,143,450 | 7,089,166 |
| XPeng, Inc. ADR (a)(b) | | 599,883 | 3,971,225 |
| XTEP International Holdings Ltd. | | 1,817,000 | 1,666,622 |
| Yadea Group Holdings Ltd. (c) | | 1,854,000 | 2,829,543 |
| Yihai International Holding Ltd. | | 658,000 | 1,083,024 |
| Zai Lab Ltd. ADR (a) | | 122,928 | 2,738,836 |
| Zhen Ding Technology Holding Ltd. | | 893,230 | 2,935,524 |
| Zhongsheng Group Holdings Ltd. Class H | | 906,500 | 3,441,389 |
| ZTO Express, Inc. sponsored ADR | | 612,392 | 10,343,301 |
TOTAL CAYMAN ISLANDS | | | 1,225,633,756 |
| Chile - 0.1% | | | |
| Banco de Chile | | 63,271,730 | 5,786,664 |
| Banco de Credito e Inversiones | | 75,417 | 2,101,445 |
| Banco Santander Chile | | 92,084,682 | 3,298,847 |
| Cencosud SA | | 2,048,633 | 2,757,566 |
| Compania Cervecerias Unidas SA | | 171,887 | 942,782 |
| Compania Sud Americana de Vapores SA | | 21,100,968 | 1,464,879 |
| Empresas CMPC SA | | 1,436,384 | 2,279,032 |
| Empresas COPEC SA | | 553,603 | 3,815,079 |
| Enel Americas SA | | 30,558,774 | 3,027,699 |
| Enel Chile SA | | 40,992,693 | 1,442,456 |
| Falabella SA | | 1,021,353 | 1,997,024 |
TOTAL CHILE | | | 28,913,473 |
| China - 3.0% | | | |
| 360 Security Technology, Inc. (A Shares) | | 788,800 | 764,724 |
| 37 Interactive Entertainment Network Technology Group Co. Ltd. (A Shares) | | 245,200 | 486,512 |
| A-Living Smart City Services C (H Shares) (c) | | 1,230,000 | 697,292 |
| Advanced Micro-Fabrication Equipment, Inc., China (A Shares) (a) | | 44,288 | 673,092 |
| AECC Aero-Engine Control Co. Ltd. (A Shares) | | 93,600 | 384,505 |
| AECC Aviation Power Co. Ltd. | | 210,452 | 1,401,688 |
| Agricultural Bank of China Ltd.: | | | |
| (A Shares) | | 7,033,200 | 2,658,072 |
| (H Shares) | | 43,592,000 | 12,442,617 |
| Aier Eye Hospital Group Co. Ltd. (A Shares) | | 544,219 | 1,840,667 |
| Air China Ltd.: | | | |
| (A Shares) (a) | | 1,259,700 | 1,668,008 |
| (H Shares) (a) | | 1,500,000 | 1,043,359 |
| Aluminum Corp. of China Ltd.: | | | |
| (A shares) | | 950,100 | 502,182 |
| (H Shares) | | 7,618,000 | 2,171,754 |
| Amlogic Shanghai Co. Ltd. (A Shares) (a) | | 32,787 | 257,523 |
| Angel Yeast Co. Ltd. (A Shares) | | 62,600 | 310,133 |
| Anhui Conch Cement Co. Ltd.: | | | |
| (A Shares) | | 254,100 | 844,808 |
| (H Shares) | | 2,079,500 | 5,351,309 |
| Anhui Gujing Distillery Co. Ltd.: | | | |
| (A Shares) | | 26,500 | 715,071 |
| (B Shares) | | 158,900 | 1,873,079 |
| Anhui Honglu Steel Construction Group Co. Ltd. | | 48,100 | 224,465 |
| Anhui Kouzi Distillery Co. Ltd. (A Shares) | | 31,400 | 174,136 |
| Anhui Yingjia Distillery Co. Ltd. (A Shares) | | 55,900 | 360,527 |
| Anjoy Foods Group Co. Ltd. (A Shares) | | 25,400 | 467,209 |
| Apeloa Pharmaceutical Co. Ltd. A Shares | | 82,100 | 234,061 |
| Asia - Potash International Investment Guangzhou Co. Ltd. (A Shares) (a) | | 71,600 | 250,010 |
| Asymchem Laboratories Tianjin Co. Ltd. (A Shares) | | 28,000 | 549,004 |
| Avary Holding Shenzhen Co. Ltd. (A Shares) | | 140,500 | 572,358 |
| AVIC Capital Co. Ltd. (A Shares) | | 584,900 | 242,677 |
| AVIC Electromechanical Systems Co. Ltd. (A Shares) | | 261,500 | 418,950 |
| AviChina Industry & Technology Co. Ltd. (H Shares) | | 3,945,000 | 1,728,841 |
| Avicopter PLC (A Shares) | | 44,100 | 265,099 |
| Bank of Beijing Co. Ltd. (A Shares) | | 1,592,200 | 880,813 |
| Bank of Changsha Co. Ltd. (A Shares) | | 913,500 | 805,562 |
| Bank of Chengdu Co. Ltd. (A Shares) | | 282,000 | 525,934 |
| Bank of China Ltd.: | | | |
| (A Shares) | | 4,596,600 | 1,894,558 |
| (H Shares) | | 113,402,024 | 36,524,232 |
| Bank of Communications Co. Ltd.: | | | |
| (A Shares) | | 753,200 | 458,960 |
| (H Shares) | | 16,182,200 | 7,895,616 |
| Bank of Hangzhou Co. Ltd. (A Shares) | | 550,431 | 912,750 |
| Bank of Jiangsu Co. Ltd. (A Shares) | | 1,168,460 | 1,107,196 |
| Bank of Nanjing Co. Ltd. (A Shares) | | 813,800 | 1,150,011 |
| Bank of Ningbo Co. Ltd. (A Shares) | | 517,910 | 1,685,021 |
| Bank of Shanghai Co. Ltd. (A Shares) | | 1,062,500 | 811,835 |
| Baoshan Iron & Steel Co. Ltd. (A Shares) | | 1,730,800 | 1,139,978 |
| BBMG Corp. (A Shares) | | 647,300 | 206,522 |
| Beijing Capital International Airport Co. Ltd. (H Shares) (a) | | 2,426,000 | 1,313,498 |
| Beijing Dabeinong Technology Group Co. Ltd. (A Shares) (a) | | 343,300 | 430,600 |
| Beijing Easpring Material Technology Co. Ltd. (A Shares) | | 36,400 | 294,025 |
| Beijing Enlight Media Co. Ltd. (A Shares) | | 320,100 | 294,989 |
| Beijing Kingsoft Office Software, Inc. (A Shares) | | 35,642 | 1,418,964 |
| Beijing New Building Materials PLC (A Shares) | | 140,800 | 382,323 |
| Beijing Originwater Technology Co. Ltd. (A Shares) | | 317,500 | 204,771 |
| Beijing Roborock Technology Co. Ltd. (A Shares) | | 7,058 | 227,139 |
| Beijing Shiji Information Technology Co. Ltd. (A Shares) | | 120,652 | 208,827 |
| Beijing Shunxin Agriculture Co. Ltd. | | 56,300 | 157,732 |
| Beijing Sinnet Technology Co. Ltd. (A Shares) | | 89,100 | 105,657 |
| Beijing Tiantan Biological Products Corp. Ltd. (A Shares) | | 130,336 | 368,901 |
| Beijing Tongrentang Co. Ltd. (A Shares) | | 98,400 | 656,862 |
| Beijing United Information Technology Co. Ltd. (A Shares) | | 44,080 | 748,459 |
| Beijing Wantai Biological Pharmacy Enterprise Co. Ltd. (A Shares) | | 45,385 | 780,063 |
| Beijing Yuanliu Hongyuan Electronic Technology Co. Ltd. (A Shares) | | 18,400 | 289,294 |
| Beijing-Shanghai High Speed Railway Co. Ltd. (A Shares) | | 3,385,800 | 2,067,763 |
| Betta Pharmaceuticals Co. Ltd. (A Shares) | | 24,800 | 155,227 |
| BGI Genomics Co. Ltd. | | 27,800 | 211,158 |
| Bloomage Biotechnology Corp. Ltd. (A Shares) | | 28,949 | 420,149 |
| BOC International China Co. Ltd. | | 219,400 | 315,750 |
| BOE Technology Group Co. Ltd. (A Shares) | | 3,560,100 | 1,628,221 |
| BTG Hotels Group Co. Ltd. | | 106,500 | 316,894 |
| By-Health Co. Ltd. (A Shares) | | 80,300 | 192,643 |
| BYD Co. Ltd.: | | | |
| (A Shares) | | 115,300 | 3,894,487 |
| (H Shares) | | 1,257,000 | 28,135,637 |
| Caitong Securities Co. Ltd. | | 377,560 | 369,655 |
| CanSino Biologics, Inc.: | | | |
| (A Shares) | | 20,069 | 521,175 |
| (H Shares) (b)(c) | | 133,600 | 1,242,450 |
| CECEP Solar Energy Co. Ltd. (A Shares) | | 288,800 | 267,331 |
| CECEP Wind-Power Corp. (A Shares) | | 460,100 | 269,650 |
| CGN Power Co. Ltd. (H Shares) (c) | | 19,827,000 | 4,016,094 |
| Chacha Food Co. Ltd. (A Shares) | | 27,900 | 168,785 |
| Changchun High & New Technology Industry Group, Inc. (A Shares) | | 30,200 | 669,512 |
| Changjiang Securities Co. Ltd. (A Shares) | | 330,800 | 235,998 |
| Changzhou Xingyu Automotive Lighting Systems Co. Ltd. (A Shares) | | 21,800 | 365,498 |
| Chaozhou Three-Circle Group Co. (A Shares) | | 157,900 | 614,052 |
| Chengtun Mining Group Co. Ltd. (A Shares) | | 267,800 | 203,154 |
| Chengxin Lithium Group Co. Ltd. (A Shares) | | 69,300 | 410,131 |
| Chifeng Jilong Gold Mining Co. Ltd. (A Shares) (a) | | 124,100 | 319,813 |
| China Baoan Group Co. Ltd. (A Shares) | | 225,800 | 357,426 |
| China Cinda Asset Management Co. Ltd. (H Shares) | | 12,363,000 | 1,149,732 |
| China CITIC Bank Corp. Ltd.: | | | |
| (A Shares) | | 308,300 | 182,796 |
| (H Shares) | | 12,822,293 | 4,835,118 |
| China Coal Energy Co. Ltd. (H Shares) | | 2,871,000 | 2,114,028 |
| China Communications Services Corp. Ltd. (H Shares) | | 2,958,000 | 825,262 |
| China Construction Bank Corp.: | | | |
| (A Shares) | | 4,020,200 | 2,939,636 |
| (H Shares) | | 135,462,649 | 71,888,464 |
| China CSSC Holdings Ltd. (A Shares) | | 351,900 | 1,277,902 |
| China Eastern Airlines Corp. Ltd. (A Shares) (a) | | 920,600 | 605,086 |
| China Energy Engineering Corp. Ltd. (A Shares) | | 2,557,000 | 801,809 |
| China Everbright Bank Co. Ltd.: | | | |
| (A Shares) | | 4,317,300 | 1,607,999 |
| (H Shares) | | 2,628,000 | 679,628 |
| China Galaxy Securities Co. Ltd. (H Shares) | | 6,703,000 | 2,510,535 |
| China Great Wall Securities Co. Ltd. (A Shares) | | 296,800 | 328,382 |
| China Greatwall Technology Group Co. Ltd. (A Shares) | | 235,100 | 358,949 |
| China International Capital Corp. Ltd. | | 179,500 | 851,426 |
| China International Capital Corp. Ltd. (H Shares) (c) | | 2,045,200 | 2,845,169 |
| China Jushi Co. Ltd. (A Shares) | | 360,740 | 577,943 |
| China Life Insurance Co. Ltd.: | | | |
| (A Shares) | | 318,500 | 1,160,101 |
| (H Shares) | | 10,515,000 | 11,466,162 |
| China Longyuan Power Grid Corp. Ltd. (H Shares) | | 4,855,000 | 5,547,935 |
| China Meheco Co. Ltd. (A Shares) | | 116,620 | 201,529 |
| China Merchants Bank Co. Ltd.: | | | |
| (A Shares) | | 716,800 | 2,632,458 |
| (H Shares) | | 6,752,691 | 22,194,547 |
| China Merchants Energy Shipping Co. Ltd. (A Shares) | | 685,000 | 653,775 |
| China Merchants Securities Co. Ltd. (A Shares) | | 539,200 | 922,921 |
| China Merchants Shekou Industrial Zone Holdings Co. Ltd. (A Shares) | | 672,000 | 1,206,359 |
| China Minmetals Rare Earth Co. Ltd. (A Shares) (a) | | 78,500 | 310,006 |
| China Minsheng Banking Corp. Ltd.: | | | |
| (A Shares) | | 1,905,200 | 860,913 |
| (H Shares) | | 11,564,832 | 3,359,107 |
| China National Building Materials Co. Ltd. (H Shares) | | 5,718,000 | 3,321,687 |
| China National Chemical Engineering Co. Ltd. (A Shares) | | 500,000 | 484,054 |
| China National Nuclear Power Co. Ltd. (A Shares) | | 1,311,500 | 1,082,905 |
| China Northern Rare Earth Group High-Tech Co. Ltd. | | 271,200 | 898,690 |
| China Oilfield Services Ltd. (H Shares) | | 2,852,000 | 3,211,822 |
| China Pacific Insurance (Group) Co. Ltd. | | 109,600 | 285,597 |
| China Pacific Insurance (Group) Co. Ltd. (H Shares) | | 4,858,400 | 7,835,680 |
| China Petroleum & Chemical Corp.: | | | |
| (A Shares) | | 3,312,500 | 1,846,099 |
| (H Shares) | | 36,009,800 | 14,271,636 |
| China Railway Group Ltd.: | | | |
| (A Shares) | | 2,481,900 | 1,695,858 |
| (H Shares) | | 5,686,000 | 2,470,080 |
| China Railway Signal & Communications Corp. (A Shares) | | 645,958 | 400,689 |
| China Resources Sanjiu Medical & Pharmaceutical Co. Ltd. (A Shares) | | 79,400 | 592,980 |
| China Shenhua Energy Co. Ltd.: | | | |
| (A Shares) | | 215,300 | 826,365 |
| (H Shares) | | 5,380,000 | 14,153,115 |
| China Southern Airlines Ltd.: | | | |
| (A Shares) (a) | | 1,705,500 | 1,508,651 |
| (H Shares) (a) | | 1,256,000 | 648,029 |
| China State Construction Engineering Corp. Ltd. (A Shares) | | 3,265,840 | 2,124,189 |
| China Suntien Green Energy Corp. Ltd. (H Shares) | | 3,012,000 | 1,143,460 |
| China Three Gorges Renewables Group Co. Ltd. (A Shares) | | 2,089,600 | 1,593,760 |
| China Tourism Group Duty Free Corp. Ltd. (A Shares) | | 153,200 | 3,364,027 |
| China Tower Corp. Ltd. (H Shares) (c) | | 63,984,000 | 5,787,346 |
| China United Network Communications Ltd. (A Shares) | | 3,229,800 | 1,486,003 |
| China Vanke Co. Ltd.: | | | |
| (A Shares) | | 599,400 | 1,109,681 |
| (H Shares) | | 2,744,400 | 3,524,176 |
| China Yangtze Power Co. Ltd. (A Shares) | | 1,760,400 | 4,883,773 |
| China Zhenhua (Group) Science & Technology Co. Ltd. (A Shares) | | 41,200 | 760,769 |
| China Zheshang Bank Co. Ltd. (a) | | 1,543,400 | 583,300 |
| Chongqing Brewery Co. Ltd. (A Shares) | | 41,600 | 497,976 |
| Chongqing Changan Automobile Co. Ltd. (A Shares) | | 667,164 | 1,031,410 |
| Chongqing Fuling Zhacai Group Co. Ltd. Group (A Shares) | | 50,600 | 155,966 |
| Chongqing Rural Commercial Bank Co. Ltd.: | | | |
| (A Shares) | | 198,300 | 94,766 |
| (H Shares) | | 354,000 | 107,332 |
| Chongqing Zhifei Biological Products Co. Ltd. (A Shares) | | 126,000 | 1,473,442 |
| CITIC Securities Co. Ltd.: | | | |
| (A Shares) | | 410,405 | 967,160 |
| (H Shares) | | 4,405,275 | 6,588,565 |
| Cmoc Group Ltd.: | | | |
| (A Shares) | | 384,300 | 218,385 |
| (H Shares) | | 7,611,000 | 2,453,081 |
| CNGR Advanced Material Co. Ltd. | | 32,400 | 320,012 |
| CNNC Hua Yuan Titanium Dioxide Co. Ltd. (A Shares) | | 303,775 | 277,865 |
| Contemporary Amperex Technology Co. Ltd. | | 188,600 | 9,629,759 |
| COSCO Shipping Development Co. Ltd. (A Shares) | | 962,000 | 321,418 |
| COSCO Shipping Energy Transportation Co. Ltd. (A Shares) (a) | | 331,800 | 768,289 |
| COSCO SHIPPING Holdings Co. Ltd.: | | | |
| (A Shares) | | 634,170 | 975,192 |
| (H Shares) | | 5,273,100 | 5,689,828 |
| CRRC Corp. Ltd.: | | | |
| (A Shares) | | 5,254,900 | 3,417,926 |
| (H Shares) | | 409,000 | 124,008 |
| CSC Financial Co. Ltd. (A Shares) | | 347,500 | 1,123,454 |
| Daan Gene Co. Ltd. | | 79,840 | 195,476 |
| Daqin Railway Co. Ltd. (A Shares) | | 1,014,000 | 890,022 |
| DaShenLin Pharmaceutical Group Co. Ltd. | | 64,980 | 324,326 |
| DHC Software Co. Ltd. (A Shares) | | 423,600 | 357,887 |
| Do-Fluoride New Materials Co. Ltd. (A Shares) | | 70,000 | 298,580 |
| Dong-E-E-Jiao Co. Ltd. (A Shares) | | 53,400 | 274,499 |
| Dongfang Electric Corp. Ltd. (A Shares) | | 234,924 | 746,633 |
| Dongfeng Motor Group Co. Ltd. (H Shares) | | 3,948,000 | 1,785,481 |
| Dongxing Securities Co. Ltd. (A Shares) | | 241,600 | 257,053 |
| East Money Information Co. Ltd. (A Shares) | | 1,030,317 | 2,202,310 |
| Ecovacs Robotics Co. Ltd. Class A | | 39,000 | 311,342 |
| ENN Natural Gas Co. Ltd. (A Shares) | | 198,700 | 421,186 |
| Eve Energy Co. Ltd. (A shares) | | 154,929 | 1,761,671 |
| Everbright Securities Co. Ltd. (A Shares) | | 327,700 | 629,114 |
| Fangda Carbon New Material Co. Ltd. (A Shares) (a) | | 224,487 | 184,744 |
| FAW Jiefang Group Co. Ltd. (A Shares) | | 197,100 | 187,845 |
| Fiberhome Telecommunication Technologies Co. Ltd. (A Shares) | | 89,200 | 168,313 |
| First Capital Securities Co. Ltd. (A Shares) | | 329,900 | 250,715 |
| Flat Glass Group Co. Ltd. | | 119,000 | 278,639 |
| Flat Glass Group Co. Ltd. (A Shares) (a) | | 402,900 | 1,892,326 |
| Focus Media Information Technology Co. Ltd. (A Shares) | | 1,281,840 | 786,351 |
| Foshan Haitian Flavouring & Food Co. Ltd. (A Shares) | | 283,386 | 2,315,858 |
| Founder Securities Co. Ltd. (A Shares) | | 658,900 | 571,121 |
| Foxconn Industrial Internet Co. Ltd. (A Shares) | | 607,594 | 682,232 |
| Fujian Sunner Development Co. Ltd. A Shares | | 99,100 | 297,996 |
| Fuyao Glass Industries Group Co. Ltd.: | | | |
| (A Shares) | | 124,600 | 570,373 |
| (H Shares) (c) | | 959,200 | 3,439,832 |
| G-bits Network Technology Xiamen Co. Ltd. (A Shares) | | 8,100 | 282,445 |
| Ganfeng Lithium Group Co. Ltd. (A Shares) | | 266,160 | 2,879,947 |
| GCL System Integration Technology Co. Ltd. (a) | | 431,700 | 193,301 |
| GD Power Development Co. Ltd. (A Shares) (a) | | 1,884,200 | 1,127,491 |
| GEM Co. Ltd. (A Shares) | | 320,500 | 326,517 |
| Gemdale Corp. (A Shares) | | 395,000 | 422,969 |
| GF Securities Co. Ltd.: | | | |
| (A Shares) | | 70,600 | 131,767 |
| (H Shares) | | 2,468,000 | 2,512,127 |
| Giant Network Group Co. Ltd. (A Shares) | | 218,200 | 231,260 |
| Gigadevice Semiconductor Beijing, Inc. (A Shares) | | 47,384 | 533,799 |
| Ginlong Technologies Co. Ltd. (A Shares) | | 30,650 | 783,993 |
| GoerTek, Inc. (A Shares) | | 269,000 | 798,576 |
| Gotion High-tech Co. Ltd. (A Shares) | | 141,600 | 582,656 |
| Great Wall Motor Co. Ltd.: | | | |
| (A Shares) | | 160,400 | 640,467 |
| (H Shares) | | 4,776,000 | 5,214,286 |
| Gree Electric Appliances, Inc. of Zhuhai (A Shares) | | 229,700 | 901,765 |
| GRG Banking Equipment Co. Ltd. (A Shares) | | 127,700 | 164,720 |
| Guangdong Haid Group Co. Ltd. (A Shares) | | 133,400 | 1,054,903 |
| Guangdong Kinlong Hardware Products Co. Ltd. (A Shares) | | 27,500 | 298,313 |
| Guanghui Energy Co. Ltd. (A Shares) | | 564,800 | 795,046 |
| Guangzhou Automobile Group Co. Ltd. | | 400,600 | 621,506 |
| Guangzhou Automobile Group Co. Ltd. (H Shares) | | 4,541,526 | 2,765,537 |
| Guangzhou Baiyunshan Pharma Health (A Shares) | | 79,500 | 293,815 |
| Guangzhou Haige Communications Group (A Shares) | | 113,500 | 131,328 |
| Guangzhou Kingmed Diagnostics Group Co. Ltd. (A Shares) | | 24,900 | 257,630 |
| Guangzhou Shiyuan Electronic Technology Co. Ltd. (A Shares) | | 33,100 | 294,881 |
| Guangzhou Tinci Materials Technology Co. Ltd. (A Shares) | | 152,040 | 884,813 |
| Guangzhou Yuexiu Financial Holdings Group Co. Ltd. (A Shares) | | 383,716 | 292,664 |
| Guolian Securities Co. Ltd. | | 235,800 | 301,898 |
| Guosen Securities Co. Ltd. (A Shares) | | 542,800 | 640,696 |
| Guotai Junan Securities Co. Ltd. (A Shares) | | 649,900 | 1,176,475 |
| Guoyuan Securities Co. Ltd. (A Shares) | | 410,900 | 351,658 |
| Haier Smart Home Co. Ltd. | | 3,520,000 | 8,807,119 |
| Haier Smart Home Co. Ltd. (A Shares) | | 369,300 | 1,051,834 |
| Haitong Securities Co. Ltd.: | | | |
| (A Shares) | | 65,000 | 75,121 |
| (H Shares) | | 6,476,400 | 3,168,215 |
| Hanergy Mobile Energy Holding (a)(d) | | 1,902,000 | 2 |
| Hangzhou First Applied Material Co. Ltd. (A Shares) | | 102,300 | 897,361 |
| Hangzhou Lion Electronics Co. Ltd. (A Shares) | | 57,500 | 337,147 |
| Hangzhou Oxygen Plant Group Co. Ltd. (A Shares) | | 77,000 | 443,787 |
| Hangzhou Robam Appliances Co. Ltd. (A Shares) | | 60,000 | 168,426 |
| Hangzhou Silan Microelectronics Co. Ltd. (A Shares) | | 116,100 | 499,191 |
| Hangzhou Tigermed Consulting Co. Ltd.: | | | |
| (A Shares) | | 123,207 | 1,406,195 |
| (H Shares) (c) | | 17,200 | 116,899 |
| Heilongjiang Agriculture Co. Ltd. (A Shares) | | 97,800 | 184,809 |
| Henan Shenhuo Coal & Power Co. Ltd. (A Shares) | | 194,800 | 374,241 |
| Henan Shuanghui Investment & Development Co. Ltd. (A Shares) | | 278,200 | 867,792 |
| Hengli Petrochemical Co. Ltd. (A Shares) | | 457,560 | 961,121 |
| Hengtong Optic-electric Co. Ltd. (A Shares) | | 265,400 | 706,847 |
| Hengyi Petrochemical Co. Ltd. (A Shares) | | 307,010 | 281,664 |
| Hesteel Co. Ltd. (A Shares) | | 773,200 | 229,750 |
| Hithink RoyalFlush Information Network Co. Ltd. (A Shares) | | 34,200 | 398,342 |
| Hongfa Technology Co. Ltd. (A Shares) | | 80,020 | 375,945 |
| Hoshine Silicon Industry Co. Ltd. (A Shares) | | 42,000 | 550,384 |
| Huadian Power International Corp. Ltd. (A Shares) | | 733,000 | 545,015 |
| Huadong Medicine Co. Ltd. (A Shares) | | 147,160 | 824,776 |
| Huafon Chemical Co. Ltd. (A Shares) | | 302,200 | 275,596 |
| Huagong Tech Co. Ltd. (A Shares) | | 79,200 | 181,871 |
| Huaibei Mining Holdings Co. Ltd. (A Shares) | | 207,400 | 370,048 |
| Hualan Biological Engineer, Inc. (A Shares) | | 139,050 | 337,586 |
| Huaneng Power International, Inc.: | | | |
| (A Shares) (a) | | 1,038,600 | 952,857 |
| (H Shares) (a) | | 5,480,000 | 1,961,718 |
| Huatai Securities Co. Ltd.: | | | |
| (A Shares) | | 246,600 | 404,196 |
| (H Shares) (c) | | 2,628,400 | 2,574,942 |
| HUAXI Securities Co. Ltd. | | 261,200 | 262,527 |
| Huaxia Bank Co. Ltd. (A Shares) | | 1,436,764 | 942,379 |
| Huaxin Cement Co. Ltd. (A Shares) | | 72,800 | 133,779 |
| Huayu Automotive Systems Co. Ltd. (A Shares) | | 273,200 | 627,362 |
| Hubei Xingfa Chemicals Group Co. Ltd. (A Shares) | | 94,200 | 364,654 |
| Huizhou Desay SV Automotive Co. Ltd. | | 43,300 | 614,260 |
| Humanwell Healthcare Group Co. Ltd. (A Shares) | | 139,700 | 383,162 |
| Hunan Valin Steel Co. Ltd. (A Shares) | | 314,400 | 172,206 |
| Hundsun Technologies, Inc. (A Shares) | | 189,868 | 1,083,638 |
| iFlytek Co. Ltd. (A Shares) | | 199,200 | 955,508 |
| IMEIK Technology Development Co. Ltd. (A Shares) | | 17,600 | 1,014,611 |
| Industrial & Commercial Bank of China Ltd.: | | | |
| (A Shares) | | 3,444,700 | 1,957,511 |
| (H Shares) | | 84,554,008 | 36,710,428 |
| Industrial Bank Co. Ltd. (A Shares) | | 1,609,400 | 3,312,284 |
| Industrial Securities Co. Ltd. (A Shares) (a) | | 773,370 | 577,150 |
| Ingenic Semiconductor Co. Ltd. (A Shares) | | 32,500 | 302,442 |
| Inner Mongoli Yili Industries Co. Ltd. (A Shares) | | 525,700 | 1,816,904 |
| Inner Mongolia Baotou Steel Union Co. Ltd. (A Shares) | | 3,410,100 | 821,835 |
| Inner Mongolia Dian Tou Energy Corp. Ltd. | | 172,700 | 292,055 |
| Inner Mongolia Eerduosi Resourses Co. Ltd. (A Shares) | | 98,840 | 188,398 |
| Inner Mongolia Junzheng Energy & Chemical Industry Group Co. Ltd. (A Shares) | | 544,200 | 289,131 |
| Inner Mongolia Yitai Coal Co. Ltd. (B Shares) | | 3,184,830 | 4,503,350 |
| Inner Mongolia Yuan Xing Energy Co. Ltd. (A Shares) | | 323,600 | 285,807 |
| Inspur Electronic Information Industry Co. Ltd. (A Shares) | | 78,934 | 248,814 |
| Intco Medical Technology Co. Ltd. (A Shares) | | 31,680 | 92,486 |
| JA Solar Technology Co. Ltd. (A Shares) | | 177,740 | 1,521,142 |
| Jafron Biomedical Co. Ltd. (A Shares) | | 55,300 | 239,892 |
| Jason Furniture Hangzhou Co. Ltd. (A Shares) | | 61,230 | 252,369 |
| JCET Group Co. Ltd. (A Shares) | | 123,800 | 408,208 |
| Jiangsu Eastern Shenghong Co. Ltd. | | 330,100 | 553,263 |
| Jiangsu Expressway Co. Ltd. (H Shares) | | 1,174,000 | 827,071 |
| Jiangsu Hengli Hydraulic Co. Ltd. | | 102,432 | 773,826 |
| Jiangsu Hengrui Medicine Co. Ltd. (A Shares) | | 492,466 | 2,710,859 |
| Jiangsu King's Luck Brewery JSC Ltd. (A Shares) | | 106,200 | 543,586 |
| Jiangsu Yanghe Brewery JSC Ltd. (A Shares) | | 115,200 | 2,060,946 |
| Jiangsu Yangnong Chemical Co. Ltd. (A Shares) | | 18,800 | 237,841 |
| Jiangsu Yoke Technology Co. Ltd. (A Shares) | | 43,700 | 351,855 |
| Jiangsu Yuyue Medical Equipment & Supply Co. Ltd. (A Shares) | | 73,500 | 327,599 |
| Jiangsu Zhongtian Technology Co. Ltd. (A Shares) | | 279,500 | 840,846 |
| Jiangxi Copper Co. Ltd. (H Shares) | | 2,175,000 | 2,377,367 |
| Jiangxi Special Electric Motor Co. Ltd. (A Shares) (a) | | 139,500 | 364,466 |
| Jiangxi Zhengbang Technology Co. Ltd. (A Shares) (a) | | 272,900 | 130,791 |
| Jinke Properties Group Co. Ltd. (A Shares) (a) | | 528,300 | 128,044 |
| JiuGui Liquor Co. Ltd. (A Shares) | | 21,500 | 300,439 |
| Jizhong Energy Resources Co. Ltd. (A Shares) | | 312,500 | 260,171 |
| Joincare Pharmaceutical Group Industry Co. Ltd. (A Shares) | | 132,100 | 211,457 |
| Joinn Laboratories China Co. Ltd. (A Shares) | | 33,320 | 260,933 |
| Jointown Pharmaceutical Group (A Shares) | | 111,500 | 191,765 |
| Jonjee Hi-Tech Industrial & Commercial Holding Co. Ltd. (A Shares) | | 58,600 | 217,456 |
| Juewei Food Co. Ltd. | | 36,600 | 237,405 |
| Kangmei Pharmaceutical Co. Ltd. rights (a)(d) | | 10,730 | 0 |
| Keda Industrial Group Co. Ltd. | | 162,400 | 346,242 |
| Kingfa Sci & Tech Co. Ltd. (A Shares) | | 232,600 | 308,311 |
| Kuang-Chi Technologies Co. Ltd. (A Shares) (a) | | 142,800 | 338,282 |
| Kunlun Tech Co. Ltd. (A Shares) | | 174,800 | 311,403 |
| Kweichow Moutai Co. Ltd. (A Shares) | | 99,600 | 18,326,042 |
| Lb Group Co. Ltd. (A Shares) | | 154,800 | 325,799 |
| Lens Technology Co. Ltd. (A Shares) | | 380,100 | 518,396 |
| Lepu Medical Technology Beijing Co. Ltd. (A Shares) | | 128,900 | 446,382 |
| Liaoning Port Co. Ltd. (A Shares) | | 1,825,800 | 397,516 |
| Lingyi iTech Guangdong Co. (A Shares) (a) | | 525,400 | 340,295 |
| Livzon Pharmaceutical Group, Inc. (A Shares) | | 44,700 | 216,250 |
| LONGi Green Energy Technology Co. Ltd. | | 587,966 | 3,862,932 |
| Luoyang Xinqianglian Slewing Bearing Co. Ltd. (A Shares) | | 23,970 | 229,167 |
| Luxi Chemical Group Co. Ltd. | | 137,600 | 214,043 |
| Luxshare Precision Industry Co. Ltd. (A Shares) | | 572,282 | 2,233,364 |
| Luzhou Laojiao Co. Ltd. (A Shares) | | 113,700 | 2,434,238 |
| Maanshan Iron & Steel Co. Ltd. (A Shares) | | 511,400 | 176,468 |
| Mango Excellent Media Co. Ltd. (A Shares) | | 152,494 | 457,927 |
| Maxscend Microelectronics Co. Ltd. (A Shares) | | 38,916 | 492,172 |
| Meinian Onehealth Healthcare Holdings Co. Ltd. (A Shares) (a) | | 207,764 | 121,479 |
| Metallurgical Corp. China Ltd. (A Shares) | | 1,480,200 | 583,737 |
| Ming Yang Smart Energy Group Ltd. (A Shares) | | 156,800 | 534,626 |
| Montage Technology Co. Ltd. (A Shares) | | 88,054 | 684,137 |
| Muyuan Foodstuff Co. Ltd. (A Shares) | | 418,570 | 2,681,223 |
| Nanjing King-Friend Biochemical Pharmaceutical Co. Ltd. | | 161,458 | 359,709 |
| Nanjing Securities Co. Ltd. (A Shares) | | 319,200 | 346,173 |
| NARI Technology Co. Ltd. (A Shares) | | 516,684 | 1,726,313 |
| National Silicon Industry Group Co. Ltd. (A Shares) (a) | | 164,661 | 457,937 |
| NAURA Technology Group Co. Ltd. | | 41,400 | 1,506,248 |
| NavInfo Co. Ltd. (A Shares) | | 190,000 | 308,562 |
| New China Life Insurance Co. Ltd. | | 69,700 | 223,047 |
| New China Life Insurance Co. Ltd. (H Shares) | | 1,559,800 | 2,475,920 |
| New Hope Liuhe Co. Ltd. (A Shares) (a) | | 431,900 | 762,326 |
| Ninestar Corp. (A Shares) | | 114,100 | 892,283 |
| Ningbo Deye Technology Co. Ltd. (A Shares) | | 16,200 | 725,760 |
| Ningbo Joyson Electronic Corp. (A shares) (a) | | 107,500 | 225,955 |
| Ningbo Orient Wires & Cables Co. Ltd. (A Shares) | | 55,700 | 587,287 |
| Ningbo Ronbay New Energy Technology Co. Ltd. (A Shares) | | 36,112 | 387,234 |
| Ningbo Shanshan Co. Ltd. (A Shares) | | 172,800 | 425,440 |
| Ningbo Tuopu Group Co. Ltd. (A Shares) | | 86,600 | 768,418 |
| Ningxia Baofeng Energy Group Co. Ltd. | | 483,800 | 759,861 |
| Nongfu Spring Co. Ltd. (H Shares) (c) | | 2,584,400 | 12,988,424 |
| North Industries Group Red Arrow Co. Ltd. (A Shares) | | 113,800 | 320,228 |
| Northeast Securities Co. Ltd. (A Shares) | | 234,800 | 203,841 |
| Offshore Oil Enginering Co. Ltd. (A Shares) | | 236,000 | 151,885 |
| OFILM Group Co. Ltd. (A Shares) (a) | | 252,200 | 161,620 |
| Oppein Home Group, Inc. (A Shares) | | 39,600 | 441,500 |
| Orient Securities Co. Ltd. (A Shares) | | 684,072 | 726,889 |
| Ovctek China, Inc. (A Shares) | | 66,029 | 268,713 |
| Pangang Group Vanadium Titanium & Resources Co. Ltd. (A Shares) (a) | | 674,900 | 418,642 |
| People's Insurance Co. of China Group Ltd.: | | | |
| (A Shares) | | 3,070,700 | 2,039,312 |
| (H Shares) | | 6,868,000 | 1,898,627 |
| Perfect World Co. Ltd. (A Shares) | | 260,250 | 405,900 |
| PetroChina Co. Ltd.: | | | |
| (A Shares) | | 934,500 | 612,942 |
| (H Shares) | | 32,056,000 | 12,251,247 |
| Pharmaron Beijing Co. Ltd.: | | | |
| (A Shares) | | 60,150 | 428,296 |
| (H Shares) (c) | | 377,300 | 1,268,938 |
| PICC Property & Casualty Co. Ltd. (H Shares) | | 10,110,001 | 9,324,799 |
| Ping An Bank Co. Ltd. (A Shares) | | 1,510,300 | 2,138,397 |
| Ping An Insurance Group Co. of China Ltd.: | | | |
| (A Shares) | | 1,336,377 | 6,615,184 |
| (H Shares) | | 8,786,500 | 35,175,791 |
| Pingdingshan Tianan Coal Mining Co. Ltd. A Shares | | 198,700 | 299,836 |
| Poly Developments & Holdings (A Shares) | | 983,600 | 1,858,670 |
| Postal Savings Bank of China Co. Ltd. | | 2,355,900 | 1,251,680 |
| Postal Savings Bank of China Co. Ltd. (H Shares) (c) | | 11,572,000 | 5,366,109 |
| Power Construction Corp. of China Ltd. (A Shares) | | 1,197,039 | 1,153,946 |
| Proya Cosmetics Co. Ltd. (A Shares) | | 16,380 | 374,908 |
| Pylon Technologies Co. Ltd. (Series A) | | 12,829 | 541,942 |
| Qingdao Rural Commercial Bank Corp. (A Shares) | | 280,900 | 106,546 |
| Qinghai Salt Lake Potash Co. Ltd. Class A (a) | | 424,200 | 1,249,441 |
| Raytron Technology Co. Ltd. (A Shares) | | 35,170 | 228,996 |
| Riyue Heavy Industry Co. Ltd. (A Shares) | | 77,400 | 234,122 |
| Rongsheng Petrochemical Co. Ltd. (A Shares) | | 804,350 | 1,178,511 |
| SAIC Motor Corp. Ltd. (A Shares) | | 559,700 | 1,053,811 |
| Sailun Group Co. Ltd. A Shares | | 252,800 | 300,816 |
| Sangfor Technologies, Inc. | | 30,500 | 526,229 |
| Sany Heavy Industry Co. Ltd. (A Shares) | | 675,600 | 1,248,901 |
| Satellite Chemical Co. Ltd. (A Shares) | | 278,601 | 473,052 |
| SDIC Power Holdings Co. Ltd. (A Shares) | | 647,700 | 895,777 |
| Sealand Securities Co. Ltd. (A Shares) | | 393,590 | 175,159 |
| Seazen Holdings Co. Ltd. (A Shares) (a) | | 191,000 | 344,971 |
| SF Holding Co. Ltd. (A Shares) | | 375,500 | 2,481,429 |
| SG Micro Corp. (A Shares) | | 27,975 | 573,298 |
| Shaanxi Coal Industry Co. Ltd. (A Shares) | | 785,500 | 2,136,142 |
| Shan Xi Hua Yang Group New Energy Co. Ltd. | | 205,100 | 474,351 |
| Shandong Buchang Pharmaceuticals Co. Ltd. (A Shares) | | 100,770 | 264,658 |
| Shandong Gold Mining Co. Ltd.: | | | |
| (A Shares) | | 568,823 | 1,347,497 |
| (H Shares) (c) | | 821,750 | 1,308,577 |
| Shandong Hualu Hengsheng Chemical Co. Ltd. (A Shares) | | 174,100 | 624,127 |
| Shandong Linglong Tyre Co. Ltd. (A Shares) | | 108,700 | 243,659 |
| Shandong Nanshan Aluminum Co. Ltd. (A Shares) | | 751,200 | 316,819 |
| Shandong Sun Paper Industry JSC Ltd. (A Shares) | | 141,300 | 202,966 |
| Shandong Weigao Medical Polymer Co. Ltd. (H Shares) | | 3,654,400 | 5,037,245 |
| Shanghai Bairun Investment Holding Group Co. Ltd. (A Shares) | | 65,744 | 274,575 |
| Shanghai Baosight Software Co. Ltd. | | 1,222,513 | 3,683,432 |
| Shanghai Baosight Software Co. Ltd. (A Shares) | | 77,402 | 448,541 |
| Shanghai Construction Group Co. Ltd. (A Shares) | | 1,042,233 | 366,777 |
| Shanghai Electric Group Co. Ltd. (A Shares) (a) | | 810,800 | 430,775 |
| Shanghai Fosun Pharmaceutical (Group) Co. Ltd.: | | | |
| (A Shares) | | 58,600 | 265,040 |
| (H Shares) | | 1,020,500 | 2,576,715 |
| Shanghai Friendess Electronic Technology Corp. Ltd. (A Shares) | | 11,481 | 323,824 |
| Shanghai International Airport Co. Ltd. (A Shares) (a) | | 89,572 | 654,720 |
| Shanghai International Port Group Co. Ltd. (A Shares) | | 568,400 | 402,392 |
| Shanghai Jinjiang International Hotels Co. Ltd. (A Shares) | | 78,000 | 581,884 |
| Shanghai Junshi Biosciences Co. Ltd. (A Shares) (a) | | 54,678 | 532,038 |
| Shanghai Lingang Holdings Corp. Ltd. (A Shares) | | 224,360 | 352,689 |
| Shanghai Lujiazui Finance Trust Ltd. (B Shares) | | 1,421,043 | 1,054,414 |
| Shanghai M&G Stationery, Inc. (A Shares) | | 58,700 | 323,927 |
| Shanghai Medicilon, Inc. (A Shares) | | 7,088 | 215,069 |
| Shanghai Pharmaceuticals Holding Co. Ltd.: | | | |
| (A Shares) | | 800,800 | 1,927,736 |
| (H Shares) | | 251,200 | 340,495 |
| Shanghai Pudong Development Bank Co. Ltd. (A Shares) | | 2,378,800 | 2,162,871 |
| Shanghai Putailai New Energy Technology Co. Ltd. | | 108,080 | 738,648 |
| Shanghai RAAS Blood Products Co. Ltd. (A Shares) | | 658,400 | 490,448 |
| Shanghai Yuyuan Tourist Mart Group Co. Ltd. | | 353,800 | 303,760 |
| Shanghai Zhangjiang High Ltd. (A Shares) | | 172,200 | 265,271 |
| Shanxi Lu'an Environmental Energy Development Co. Ltd. (A Shares) | | 255,900 | 588,336 |
| Shanxi Meijin Energy Co. Ltd. (A Shares) | | 286,600 | 343,783 |
| Shanxi Securities Co. Ltd. (A Shares) | | 332,800 | 234,690 |
| Shanxi Taigang Stainless Steel Co. Ltd. (A Shares) | | 381,000 | 207,119 |
| Shanxi Xinghuacun Fen Wine Factory Co. Ltd. (A Shares) | | 95,460 | 3,037,560 |
| Shanxi Xishan Coal & Electricity Power Co. Ltd. (A Shares) | | 343,480 | 535,710 |
| Shenghe Resources Holding Co. Ltd. (A Shares) | | 116,700 | 213,492 |
| Shengyi Technology Co. Ltd. | | 181,700 | 345,093 |
| Shennan Circuits Co. Ltd. (A Shares) | | 24,640 | 253,286 |
| Shenwan Hongyuan Group Co. Ltd. (A Shares) | | 1,996,815 | 1,063,634 |
| Shenzhen Capchem Technology Co. Ltd. (A Shares) | | 58,220 | 288,354 |
| Shenzhen Dynanonic Co. Ltd. (A Shares) | | 13,700 | 484,000 |
| Shenzhen Energy Group Co. Ltd. (A Shares) | | 359,498 | 280,592 |
| Shenzhen Inovance Technology Co. Ltd. (A Shares) | | 204,300 | 1,865,945 |
| Shenzhen Kangtai Biological Products Co. Ltd. | | 89,280 | 380,451 |
| Shenzhen Kedali Industry Co. Ltd. | | 18,900 | 237,191 |
| Shenzhen Mindray Bio-Medical Electronics Co. Ltd. (A Shares) | | 96,100 | 4,282,516 |
| Shenzhen New Industries Biomedical Engineering Co. Ltd. | | 75,100 | 593,671 |
| Shenzhen Overseas Chinese Town Co. Ltd. (A Shares) | | 612,600 | 352,315 |
| Shenzhen Salubris Pharmaceuticals Co. Ltd. (A Shares) | | 66,500 | 282,285 |
| Shenzhen SC New Energy Technology Corp. (A Shares) | | 27,500 | 511,146 |
| Shenzhen Senior Technology Material Co. Ltd. (A Shares) | | 99,940 | 253,035 |
| Shenzhen Sunlord Electronics Co. Ltd. (A Shares) | | 78,600 | 230,325 |
| Shenzhen Transsion Holdings Co. Ltd. (A Shares) | | 52,337 | 445,261 |
| Shijiazhuang Yiling Pharmaceutical Co. Ltd. (A Shares) | | 127,060 | 530,308 |
| Sichuan Chuantou Energy Co. Ltd. (A Shares) | | 288,100 | 435,923 |
| Sichuan Hebang Biotechnology Co. Ltd. (A Shares) | | 784,000 | 310,255 |
| Sichuan Kelun Pharmaceutical Co. Ltd. (A Shares) | | 99,500 | 337,893 |
| Sichuan New Energy Power Co. Ltd. (A Shares) (a) | | 118,700 | 306,059 |
| Sichuan Road & Bridge (Group) Co. Ltd. (A Shares) | | 350,400 | 539,786 |
| Sichuan Swellfun Co. Ltd. (A Shares) | | 28,000 | 216,933 |
| Sichuan Yahua Industrial Group Co. Ltd. (A Shares) | | 100,400 | 367,758 |
| Sieyuan Electric Co. Ltd. (A Shares) | | 73,300 | 335,741 |
| Sinolink Securities Co. Ltd. (A Shares) | | 284,300 | 307,156 |
| Sinoma Science & Technology Co. Ltd. (A Shares) | | 126,000 | 309,009 |
| Sinomine Resource Group Co. Ltd. (A Shares) | | 36,120 | 445,138 |
| Sinopec Shanghai Petrochemical Co. Ltd. (A Shares) | | 366,600 | 154,112 |
| Sinopharm Group Co. Ltd. (H Shares) | | 2,055,600 | 3,917,598 |
| Sinotrans Ltd. | | 436,105 | 211,994 |
| SKSHU Paint Co. Ltd. (A Shares) (a) | | 29,680 | 353,174 |
| Songcheng Performance Development Co. Ltd. (A Shares) | | 197,952 | 312,260 |
| Soochow Securities Co. Ltd. (A Shares) | | 378,625 | 339,590 |
| Southwest Securities Co. Ltd. (A Shares) | | 497,500 | 252,057 |
| StarPower Semiconductor Ltd. (A Shares) | | 12,400 | 632,828 |
| Sungrow Power Supply Co. Ltd. (A Shares) | | 120,800 | 2,155,502 |
| Sunwoda Electronic Co. Ltd. (A Shares) | | 144,700 | 461,667 |
| Suzhou Dongshan Precision Manufacturing Co. Ltd. (A Shares) | | 139,800 | 483,746 |
| Suzhou Maxwell Technologies Co. Ltd. (A Shares) | | 13,680 | 894,467 |
| Suzhou TA&A Ultra Clean Technology Co. Ltd. (A Shares) | | 47,300 | 400,595 |
| Tangshan Jidong Cement Co. Ltd. A Shares | | 264,300 | 274,690 |
| TBEA Co. Ltd. (A Shares) | | 337,500 | 943,238 |
| TCL Technology Group Corp. (A Shares) | | 1,091,300 | 584,286 |
| TCL Zhonghuan Renewable Energy Technology Co. Ltd. (A Shares) | | 250,000 | 1,352,203 |
| Thunder Software Technology Co. Ltd. (A Shares) | | 42,600 | 575,980 |
| Tianjin 712 Communication & Broadcasting Co. Ltd. | | 46,900 | 252,967 |
| Tianma Microelectronics Co. Ltd. (A Shares) | | 100,300 | 121,411 |
| Tianqi Lithium Corp. (A Shares) (a) | | 120,900 | 1,581,837 |
| Tianshan Aluminum Group Co. Ltd. | | 459,000 | 392,195 |
| Tianshui Huatian Technology Co. Ltd. (A Shares) | | 178,800 | 215,944 |
| Tibet Summit Industrial Co. Ltd. (A Shares) (a) | | 74,100 | 212,572 |
| Titan Wind Energy Suzhou Co. Ltd. (A Shares) | | 159,500 | 256,409 |
| Toly Bread Co. Ltd. | | 52,724 | 81,293 |
| TongFu Microelectronics Co. Ltd. (A Shares) (a) | | 103,200 | 266,094 |
| Tongkun Group Co. Ltd. (A Shares) | | 229,300 | 379,922 |
| Tongling Nonferrous Metals Group Co. Ltd. (A Shares) | | 891,600 | 307,663 |
| Tongwei Co. Ltd. (A Shares) | | 359,900 | 2,143,758 |
| Topchoice Medical Corp. (a) | | 20,800 | 348,190 |
| Transfar Zhilian Co. Ltd. | | 267,738 | 180,743 |
| TravelSky Technology Ltd. (H Shares) | | 1,338,000 | 1,943,169 |
| Trina Solar Co. Ltd. (A Shares) | | 171,946 | 1,564,087 |
| Tsingtao Brewery Co. Ltd.: | | | |
| (A Shares) | | 52,600 | 589,174 |
| (H Shares) | | 948,000 | 6,642,334 |
| Unigroup Guoxin Microelectronics Co. Ltd. | | 65,559 | 1,473,235 |
| Unisplendour Corp. Ltd. (A Shares) | | 238,980 | 561,216 |
| Walvax Biotechnology Co. Ltd. (A Shares) | | 123,500 | 650,231 |
| Wanhua Chemical Group Co. Ltd. (A Shares) | | 247,800 | 2,726,753 |
| Weichai Power Co. Ltd.: | | | |
| (A Shares) | | 218,900 | 272,168 |
| (H Shares) | | 3,788,800 | 3,629,687 |
| Weihai Guangwei Composites Co. Ltd. (A Shares) | | 38,000 | 403,785 |
| Wens Foodstuffs Group Co. Ltd. (A Shares) (a) | | 525,620 | 1,288,337 |
| Western Mining Co. Ltd. (A Shares) | | 210,600 | 273,095 |
| Western Securities Co. Ltd. (A Shares) | | 269,800 | 220,557 |
| Western Superconducting Technologies Co. Ltd. (A Shares) | | 41,028 | 655,401 |
| Westone Information Industry, Inc. (A Shares) | | 66,200 | 329,237 |
| Will Semiconductor Ltd. | | 87,615 | 880,241 |
| Wingtech Technology Co. Ltd. (A Shares) | | 95,800 | 628,094 |
| Winning Health Technology Group Co. Ltd. (A Shares) | | 117,490 | 155,733 |
| Wuchan Zhongda Group Co. Ltd. | | 299,300 | 170,902 |
| Wuhan Guide Infrared Co. Ltd. (A Shares) | | 240,872 | 382,933 |
| Wuliangye Yibin Co. Ltd. (A Shares) | | 300,100 | 5,485,951 |
| WUS Printed Circuit Kunshan Co. Ltd. (A Shares) | | 141,740 | 211,361 |
| WuXi AppTec Co. Ltd. | | 151,696 | 1,586,982 |
| WuXi AppTec Co. Ltd. (H Shares) (c) | | 636,274 | 5,098,525 |
| Wuxi Shangji Automation Co. Ltd. (A Shares) | | 29,646 | 497,206 |
| XCMG Construction Machinery Co. Ltd. (A Shares) | | 500,000 | 316,997 |
| Xiamen C&D, Inc. (A Shares) | | 232,600 | 381,886 |
| Xiamen Faratronic Co. Ltd. (A Shares) | | 17,900 | 434,111 |
| Xiamen Intretech, Inc. | | 58,630 | 138,248 |
| Xiamen Tungsten Co. Ltd. (A Shares) | | 116,200 | 319,503 |
| Xinjiang Goldwind Science & Technology Co. Ltd.: | | | |
| (A Shares) | | 98,100 | 140,375 |
| (H Shares) | | 1,711,964 | 1,485,222 |
| Xinjiang Zhongtai Chemical Co. Ltd. (A Shares) | | 243,400 | 195,976 |
| Yangzhou Yangjie Electronic Technology Co. Ltd. (A Shares) | | 41,700 | 293,383 |
| Yankuang Energy Group Co. Ltd.: | | | |
| (A Shares) | | 52,600 | 292,426 |
| (H Shares) | | 2,496,000 | 7,027,269 |
| Yantai Jereh Oilfield Services (A Shares) | | 84,600 | 348,228 |
| Yealink Network Technology Corp. Ltd. | | 64,550 | 608,827 |
| Yifeng Pharmacy Chain Co. Ltd. | | 50,600 | 388,980 |
| Yihai Kerry Arawana Holdings Co. Ltd. (A Shares) | | 133,500 | 699,226 |
| Yintai Gold Co. Ltd. (A Shares) | | 203,080 | 397,100 |
| YongXing Special Materials Technology Co. Ltd. (A Shares) | | 30,900 | 492,807 |
| Yonyou Network Technology Co. Ltd. (A Shares) | | 326,920 | 1,094,076 |
| Youngor Group Co. Ltd. (A Shares) | | 821,377 | 672,587 |
| Youngy Co. Ltd. (A Shares) (a) | | 21,800 | 328,930 |
| YTO Express Group Co. Ltd. (A Shares) | | 310,700 | 802,394 |
| Yuan Longping High-tech Agriculture Co. Ltd. (A Shares) (a) | | 92,300 | 183,516 |
| Yunda Holding Co. Ltd. (A Shares) | | 252,250 | 455,251 |
| Yunnan Aluminium Co. Ltd. (A Shares) | | 246,500 | 309,522 |
| Yunnan Baiyao Group Co. Ltd. (A Shares) | | 147,520 | 1,102,123 |
| Yunnan Botanee Bio-Technology Group Co., Ltd. (A Shares) | | 22,400 | 438,620 |
| Yunnan Energy New Material Co. Ltd. | | 70,000 | 1,418,998 |
| Yunnan Tin Co. Ltd. (A Shares) | | 157,100 | 245,452 |
| Yunnan Yuntianhua Co. Ltd. (Series A) (a) | | 154,300 | 425,952 |
| Zangge Mining Co. Ltd. (Series A) | | 119,700 | 445,009 |
| Zhangzhou Pientzehuang Pharmaceutical Co. Ltd. (A Shares) | | 45,000 | 1,404,921 |
| Zhaojin Mining Industry Co. Ltd. (H Shares) (a) | | 1,658,000 | 1,368,703 |
| Zhefu Holding Group Co. Ltd. (A Shares) | | 486,000 | 260,206 |
| Zhejiang Century Huatong Group Co. Ltd. (A Shares) (a) | | 927,500 | 468,646 |
| Zhejiang China Commodities City Group Co. Ltd. (A Shares) | | 608,400 | 349,066 |
| Zhejiang Chint Electric Co. Ltd. (A Shares) | | 168,000 | 584,316 |
| Zhejiang Dahua Technology Co. Ltd. (A Shares) | | 166,000 | 263,221 |
| Zhejiang Dingli Machinery Co. Ltd. (A Shares) | | 25,440 | 156,516 |
| Zhejiang Expressway Co. Ltd. (H Shares) | | 1,794,000 | 1,113,015 |
| Zhejiang HangKe Technology, Inc. Co. (A Shares) | | 29,688 | 203,465 |
| Zhejiang Huahai Pharmaceutical Co. Ltd. (A Shares) | | 111,980 | 307,593 |
| Zhejiang Huayou Cobalt Co. Ltd. (A Shares) | | 125,200 | 933,998 |
| Zhejiang Jingsheng Mechanical & Electrical Co. Ltd. (A Shares) | | 102,000 | 995,292 |
| Zhejiang Jiuzhou Pharmaceutical Co. Ltd. (A Shares) | | 63,700 | 309,825 |
| Zhejiang Juhua Co. Ltd. (A Shares) | | 207,800 | 446,166 |
| Zhejiang NHU Co. Ltd. (A Shares) | | 256,508 | 629,424 |
| Zhejiang Orient Gene Biotech Co. Ltd. (A Shares) | | 13,598 | 153,801 |
| Zhejiang Semir Garment Co. Ltd. (A Shares) | | 115,500 | 70,854 |
| Zhejiang Supor Cookware Co. Ltd. | | 24,800 | 135,870 |
| Zhejiang Weiming Enviroment Protection Co. Ltd. (A Shares) | | 208,520 | 540,509 |
| Zhejiang Weixing New Building Materials Co. Ltd. (A Shares) | | 115,300 | 274,716 |
| Zhejiang Wolwo Bio-Pharmaceutical Co. Ltd. | | 34,200 | 220,104 |
| Zhejiang Yongtai Technology Co. Ltd. (A Shares) | | 73,500 | 219,607 |
| Zheshang Securities Co. Ltd. | | 325,800 | 453,708 |
| ZhongAn Online P & C Insurance Co. Ltd. (H Shares) (a)(c) | | 989,700 | 1,843,320 |
| Zhongji Innolight Co. Ltd. (A Shares) | | 42,100 | 168,794 |
| Zhongtai Securities Co. Ltd. (A Shares) | | 523,200 | 455,648 |
| Zhuzhou CRRC Times Electric Co. Ltd. (H Shares) | | 908,100 | 3,939,132 |
| Zhuzhou Hongda Electronics Corp. Ltd. (A Shares) | | 37,800 | 229,557 |
| Zhuzhou Kibing Group Co. Ltd. (A Shares) | | 205,100 | 220,465 |
| Zibo Qixiang Tengda Chemical Co. Ltd. (A Shares) (a) | | 301,000 | 279,448 |
| Zijin Mining Group Co. Ltd.: | | | |
| (A Shares) | | 568,800 | 616,864 |
| (H Shares) | | 9,989,000 | 9,544,056 |
| Zoomlion Heavy Industry Science and Technology Co. Ltd.: | | | |
| (A Shares) | | 1,019,000 | 746,505 |
| (H Shares) | | 1,173,600 | 378,260 |
| ZTE Corp.: | | | |
| (A Shares) | | 45,300 | 137,521 |
| (H Shares) | | 1,508,336 | 2,690,146 |
TOTAL CHINA | | | 898,493,349 |
| Colombia - 0.0% | | | |
| Bancolombia SA | | 276,393 | 1,986,728 |
| Ecopetrol SA | | 7,444,699 | 3,693,144 |
| Interconexion Electrica SA ESP | | 548,359 | 2,139,586 |
TOTAL COLOMBIA | | | 7,819,458 |
| Cyprus - 0.0% | | | |
| Galaxy Cosmos Mezz PLC (a) | | 110,235 | 17,801 |
| Ozon Holdings PLC ADR (a)(d) | | 62,559 | 196,539 |
| TCS Group Holding PLC unit (a)(d) | | 142,667 | 272,425 |
TOTAL CYPRUS | | | 486,765 |
| Czech Republic - 0.0% | | | |
| CEZ A/S | | 231,642 | 7,575,501 |
| Komercni Banka A/S | | 111,764 | 3,206,085 |
| MONETA Money Bank A/S (c) | | 467,815 | 1,365,594 |
TOTAL CZECH REPUBLIC | | | 12,147,180 |
| Denmark - 1.7% | | | |
| A.P. Moller - Maersk A/S: | | | |
| Series A | | 4,478 | 8,962,776 |
| Series B | | 7,284 | 15,217,535 |
| Carlsberg A/S Series B | | 141,023 | 16,604,852 |
| Chr. Hansen Holding A/S (b) | | 151,733 | 8,427,413 |
| Coloplast A/S Series B | | 171,182 | 19,081,689 |
| Danske Bank A/S | | 974,742 | 15,731,870 |
| Demant A/S (a) | | 129,089 | 3,527,790 |
| DSV A/S | | 269,259 | 36,452,515 |
| Genmab A/S (a) | | 95,157 | 36,655,213 |
| GN Store Nord A/S | | 184,477 | 3,922,490 |
| Novo Nordisk A/S Series B | | 2,381,826 | 258,978,944 |
| Novozymes A/S Series B | | 293,621 | 15,420,919 |
| ORSTED A/S (c) | | 269,726 | 22,253,946 |
| Pandora A/S | | 130,513 | 6,878,769 |
| Rockwool International A/S Series B | | 12,776 | 2,543,567 |
| Tryg A/S | | 507,723 | 10,987,648 |
| Vestas Wind Systems A/S | | 1,457,762 | 28,737,834 |
TOTAL DENMARK | | | 510,385,770 |
| Egypt - 0.0% | | | |
| Commercial International Bank SAE | | 4,093,470 | 5,486,181 |
| Eastern Co. SAE | | 971,292 | 477,711 |
| EFG-Hermes Holding SAE | | 1,101,107 | 610,334 |
TOTAL EGYPT | | | 6,574,226 |
| Finland - 0.8% | | | |
| Elisa Corp. (A Shares) | | 213,162 | 10,303,251 |
| Fortum Corp. | | 642,787 | 9,048,912 |
| Kesko Oyj | | 423,837 | 8,251,481 |
| Kone OYJ (B Shares) | | 493,571 | 20,209,661 |
| Neste OYJ | | 613,625 | 26,888,437 |
| Nokia Corp. (b) | | 7,789,836 | 34,617,395 |
| Nordea Bank ABP | | 4,913,095 | 46,954,116 |
| Orion Oyj (B Shares) | | 155,127 | 7,136,313 |
| Sampo Oyj (A Shares) | | 699,519 | 31,993,348 |
| Stora Enso Oyj (R Shares) | | 794,281 | 10,353,467 |
| UPM-Kymmene Corp. | | 766,956 | 25,701,890 |
| Wartsila Corp. (b) | | 686,826 | 4,683,415 |
TOTAL FINLAND | | | 236,141,686 |
| France - 6.7% | | | |
| Accor SA (a) | | 243,036 | 5,823,498 |
| Aeroports de Paris SA (a) | | 41,261 | 5,588,376 |
| Air Liquide SA | | 706,830 | 92,463,093 |
| Alstom SA (b) | | 459,438 | 9,455,806 |
| Amundi SA (c) | | 85,789 | 4,050,835 |
| Arkema SA | | 86,129 | 6,819,573 |
| AXA SA | | 2,691,440 | 66,464,862 |
| bioMerieux SA | | 60,738 | 5,374,578 |
| BNP Paribas SA | | 1,599,641 | 75,013,439 |
| Bollore SA (b) | | 1,217,843 | 6,095,896 |
| Bouygues SA | | 335,756 | 9,579,515 |
| Bureau Veritas SA | | 420,678 | 10,422,477 |
| Capgemini SA | | 235,768 | 38,640,218 |
| Carrefour SA (b) | | 879,941 | 14,163,051 |
| Compagnie de St. Gobain | | 711,525 | 29,087,833 |
| Compagnie Generale des Etablissements Michelin SCA Series B | | 976,317 | 24,880,523 |
| Covivio | | 68,789 | 3,684,556 |
| Credit Agricole SA | | 1,729,238 | 15,690,521 |
| Danone SA | | 921,604 | 45,803,274 |
| Dassault Aviation SA | | 36,079 | 5,362,523 |
| Dassault Systemes SA | | 954,156 | 31,982,143 |
| Edenred SA | | 358,423 | 18,404,831 |
| Eiffage SA | | 120,904 | 10,937,508 |
| Electricite de France SA (b) | | 803,062 | 9,483,831 |
| Electricite de France SA (a) | | 23,260 | 274,691 |
| Engie SA | | 2,610,100 | 33,913,984 |
| EssilorLuxottica SA (b) | | 414,984 | 65,760,808 |
| Eurazeo SA | | 60,805 | 3,473,233 |
| Gecina SA | | 64,872 | 5,785,905 |
| Getlink SE | | 611,321 | 9,684,332 |
| Hermes International SCA | | 45,561 | 59,006,125 |
| Ipsen SA | | 54,667 | 5,618,565 |
| Kering SA | | 107,613 | 49,282,591 |
| Klepierre SA | | 312,642 | 6,287,508 |
| L'Oreal SA (a) | | 23,733 | 7,452,266 |
| L'Oreal SA | | 324,483 | 101,889,088 |
| La Francaise des Jeux SAEM (c) | | 154,296 | 5,031,940 |
| Legrand SA | | 391,376 | 29,824,693 |
| LVMH Moet Hennessy Louis Vuitton SE | | 399,138 | 251,854,040 |
| Orange SA | | 2,898,409 | 27,615,795 |
| Pernod Ricard SA | | 303,630 | 53,321,079 |
| Publicis Groupe SA | | 325,280 | 18,217,110 |
| Remy Cointreau SA | | 34,508 | 5,289,303 |
| Renault SA (a) | | 275,281 | 8,479,688 |
| Safran SA | | 491,815 | 54,773,430 |
| Sanofi SA | | 1,639,510 | 141,092,728 |
| Sartorius Stedim Biotech | | 39,974 | 12,688,783 |
| Schneider Electric SA | | 783,692 | 99,102,884 |
| SEB SA (b) | | 32,276 | 2,101,996 |
| Societe Generale Series A | | 1,146,416 | 26,295,390 |
| Sodexo SA (a) | | 8,142 | 722,078 |
| Sodexo SA | | 120,911 | 10,723,059 |
| Teleperformance | | 84,833 | 22,744,764 |
| Thales SA | | 150,676 | 19,156,700 |
| TotalEnergies SE | | 3,570,052 | 194,758,357 |
| Ubisoft Entertainment SA (a) | | 135,299 | 3,713,106 |
| Valeo SA | | 293,574 | 4,842,178 |
| Veolia Environnement SA | | 951,466 | 21,232,936 |
| VINCI SA | | 767,449 | 70,633,720 |
| Vivendi SA | | 1,023,287 | 8,375,584 |
| Wendel SA | | 36,388 | 2,851,663 |
| Worldline SA (a)(c) | | 341,145 | 14,889,783 |
TOTAL FRANCE | | | 2,004,034,643 |
| Germany - 4.5% | | | |
| adidas AG | | 250,290 | 24,432,089 |
| Allianz SE | | 589,974 | 106,138,987 |
| BASF AG | | 1,326,789 | 59,533,922 |
| Bayer AG | | 1,416,015 | 74,455,591 |
| Bayerische Motoren Werke AG (BMW) | | 455,907 | 35,785,026 |
| Bechtle AG | | 117,452 | 4,062,518 |
| Beiersdorf AG | | 149,304 | 14,332,470 |
| Brenntag SE | | 223,723 | 13,574,696 |
| Carl Zeiss Meditec AG | | 60,082 | 7,276,533 |
| Commerzbank AG (a) | | 1,523,620 | 12,190,289 |
| Continental AG | | 156,976 | 8,130,681 |
| Covestro AG (c) | | 283,829 | 9,634,869 |
| Daimler Truck Holding AG (a) | | 652,495 | 17,410,361 |
| Delivery Hero AG (a)(c) | | 233,558 | 7,686,143 |
| Deutsche Bank AG | | 2,983,482 | 28,481,796 |
| Deutsche Borse AG | | 273,875 | 44,537,489 |
| Deutsche Lufthansa AG (a) | | 844,697 | 5,775,202 |
| Deutsche Post AG | | 1,435,595 | 50,748,036 |
| Deutsche Telekom AG | | 4,683,805 | 88,409,158 |
| E.ON SE | | 3,213,639 | 26,910,993 |
| Evonik Industries AG | | 309,325 | 5,702,655 |
| Fresenius Medical Care AG & Co. KGaA | | 239,746 | 6,631,519 |
| Fresenius Medical Care AG & Co. KGaA sponsored ADR | | 112,708 | 1,563,260 |
| Fresenius SE & Co. KGaA | | 605,924 | 13,944,229 |
| GEA Group AG | | 222,364 | 7,779,193 |
| Hannover Reuck SE | | 88,000 | 14,331,997 |
| HeidelbergCement AG | | 210,957 | 9,701,238 |
| HelloFresh AG (a) | | 242,480 | 4,854,921 |
| Henkel AG & Co. KGaA | | 143,975 | 8,452,069 |
| Infineon Technologies AG | | 1,883,470 | 45,703,308 |
| KION Group AG | | 106,132 | 2,352,978 |
| Knorr-Bremse AG | | 103,395 | 4,654,922 |
| LEG Immobilien AG | | 102,227 | 6,679,828 |
| Mercedes-Benz Group AG (Germany) | | 1,152,690 | 66,719,531 |
| Merck KGaA | | 186,891 | 30,456,718 |
| MTU Aero Engines AG | | 77,494 | 13,880,750 |
| Muenchener Rueckversicherungs-Gesellschaft AG in Muenchen | | 202,391 | 53,426,379 |
| Nemetschek SE | | 81,468 | 3,893,500 |
| Puma AG | | 156,231 | 6,918,453 |
| Rational AG | | 7,369 | 4,158,259 |
| Rheinmetall AG | | 62,814 | 10,211,491 |
| RWE AG | | 931,666 | 35,898,831 |
| SAP SE | | 1,501,989 | 144,570,764 |
| Scout24 AG (c) | | 118,847 | 6,093,334 |
| Siemens AG | | 1,104,130 | 120,580,972 |
| Siemens Energy AG | | 653,046 | 7,625,079 |
| Siemens Healthineers AG (c) | | 409,615 | 18,765,520 |
| Symrise AG | | 193,135 | 19,713,784 |
| Telefonica Deutschland Holding AG | | 1,517,593 | 3,308,473 |
| Uniper SE (b) | | 117,682 | 352,619 |
| United Internet AG | | 145,787 | 2,726,601 |
| Volkswagen AG | | 41,423 | 7,080,517 |
| Vonovia SE | | 1,034,201 | 22,866,822 |
| Zalando SE (a)(c) | | 315,971 | 7,282,560 |
TOTAL GERMANY | | | 1,358,389,923 |
| Greece - 0.1% | | | |
| Alpha Bank SA (a) | | 2,976,369 | 2,759,030 |
| Eurobank Ergasias Services and Holdings SA (a) | | 3,302,560 | 3,263,755 |
| Ff Group (a)(d) | | 7,962 | 9,442 |
| Hellenic Telecommunications Organization SA | | 274,062 | 4,306,384 |
| Jumbo SA | | 145,272 | 2,065,901 |
| Mytilineos SA | | 121,544 | 2,039,567 |
| National Bank of Greece SA (a) | | 662,061 | 2,401,214 |
| OPAP SA | | 256,066 | 3,137,910 |
| Public Power Corp. of Greece (a) | | 261,984 | 1,654,407 |
TOTAL GREECE | | | 21,637,610 |
| Hong Kong - 1.5% | | | |
| AIA Group Ltd. | | 17,377,609 | 131,631,810 |
| Beijing Enterprises Holdings Ltd. | | 689,000 | 1,748,470 |
| BOC Hong Kong (Holdings) Ltd. | | 5,332,951 | 16,577,045 |
| BYD Electronic International Co. Ltd. | | 967,000 | 2,808,737 |
| China Everbright International Ltd. | | 5,206,629 | 1,731,198 |
| China Jinmao Holdings Group Ltd. | | 8,286,000 | 1,097,812 |
| China Merchants Holdings International Co. Ltd. | | 1,885,182 | 2,209,484 |
| China Overseas Land and Investment Ltd. | | 5,540,500 | 10,573,298 |
| China Power International Development Ltd. | | 8,139,699 | 2,353,878 |
| China Resources Beer Holdings Co. Ltd. | | 2,368,989 | 11,166,433 |
| China Resources Power Holdings Co. Ltd. | | 2,897,780 | 4,215,812 |
| China Taiping Insurance Group Ltd. | | 2,234,265 | 1,548,400 |
| China Traditional Chinese Medicine Holdings Co. Ltd. | | 4,010,000 | 1,731,784 |
| CITIC Pacific Ltd. | | 8,421,000 | 7,541,690 |
| CLP Holdings Ltd. | | 2,366,476 | 15,883,330 |
| CSPC Pharmaceutical Group Ltd. | | 13,190,800 | 13,549,090 |
| Far East Horizon Ltd. | | 2,093,000 | 1,615,815 |
| Fosun International Ltd. | | 3,987,500 | 2,438,325 |
| Galaxy Entertainment Group Ltd. | | 3,164,239 | 14,451,341 |
| Ganfeng Lithium Group Co. Ltd. (H Shares) (c) | | 319,920 | 2,164,141 |
| Guangdong Investment Ltd. | | 4,446,000 | 2,803,654 |
| Hang Lung Properties Ltd. | | 2,819,125 | 3,546,355 |
| Hang Seng Bank Ltd. | | 1,109,053 | 15,613,017 |
| Henderson Land Development Co. Ltd. | | 2,013,869 | 4,930,475 |
| Hong Kong & China Gas Co. Ltd. | | 15,839,350 | 12,208,491 |
| Hong Kong Exchanges and Clearing Ltd. | | 1,742,684 | 46,257,140 |
| Hua Hong Semiconductor Ltd. (a)(c) | | 821,000 | 1,922,376 |
| Lenovo Group Ltd. | | 10,952,000 | 8,761,991 |
| Link (REIT) | | 3,077,539 | 18,191,615 |
| MMG Ltd. (a) | | 3,840,000 | 758,250 |
| MTR Corp. Ltd. | | 2,301,825 | 10,131,414 |
| New World Development Co. Ltd. | | 2,155,491 | 4,410,029 |
| Power Assets Holdings Ltd. | | 2,075,426 | 9,928,117 |
| Sino Land Ltd. | | 4,892,991 | 5,229,812 |
| Sinotruk Hong Kong Ltd. | | 1,149,500 | 1,025,078 |
| Sun Hung Kai Properties Ltd. | | 2,073,422 | 22,281,661 |
| Swire Pacific Ltd. (A Shares) | | 698,060 | 4,619,851 |
| Swire Properties Ltd. | | 1,715,520 | 3,295,694 |
| Techtronic Industries Co. Ltd. | | 1,970,370 | 18,656,978 |
| Wharf Holdings Ltd. | | 1,697,000 | 4,853,420 |
| Yuexiu Property Co. Ltd. | | 1,992,400 | 1,700,596 |
TOTAL HONG KONG | | | 448,163,907 |
| Hungary - 0.1% | | | |
| MOL Hungarian Oil and Gas PLC Series A (For. Reg.) | | 573,192 | 3,436,930 |
| OTP Bank PLC | | 323,632 | 7,054,368 |
| Richter Gedeon PLC | | 193,255 | 3,815,953 |
TOTAL HUNGARY | | | 14,307,251 |
| India - 4.3% | | | |
| ACC Ltd. | | 127,155 | 3,671,643 |
| Adani Enterprises Ltd. | | 405,044 | 16,379,132 |
| Adani Green Energy Ltd. (a) | | 453,609 | 11,523,247 |
| Adani Ports & Special Economic Zone Ltd. | | 742,371 | 7,385,596 |
| Adani Power Ltd. (a) | | 1,073,899 | 4,344,634 |
| Adani Total Gas Ltd. | | 390,801 | 17,008,908 |
| Adani Transmissions Ltd. (a) | | 397,767 | 16,090,872 |
| Ambuja Cements Ltd. | | 872,673 | 5,618,399 |
| Apollo Hospitals Enterprise Ltd. | | 146,421 | 7,990,540 |
| Asian Paints Ltd. | | 555,608 | 20,858,456 |
| AU Small Finance Bank Ltd. (c) | | 258,793 | 1,843,095 |
| Aurobindo Pharma Ltd. | | 365,483 | 2,375,993 |
| Avenue Supermarts Ltd. (a)(c) | | 233,973 | 12,212,780 |
| Axis Bank Ltd. | | 3,283,086 | 35,932,301 |
| Bajaj Auto Ltd. | | 97,803 | 4,338,221 |
| Bajaj Finance Ltd. | | 394,197 | 34,020,087 |
| Bajaj Finserv Ltd. | | 551,007 | 11,232,475 |
| Balkrishna Industries Ltd. | | 108,891 | 2,581,853 |
| Bandhan Bank Ltd. (a)(c) | | 965,153 | 2,781,315 |
| Berger Paints India Ltd. | | 334,030 | 2,363,793 |
| Bharat Electronics Ltd. | | 5,551,577 | 7,165,813 |
| Bharat Forge Ltd. | | 368,730 | 3,715,808 |
| Bharat Petroleum Corp. Ltd. | | 1,245,381 | 4,568,252 |
| Bharti Airtel Ltd. | | 3,155,693 | 31,717,040 |
| Biocon Ltd. | | 629,497 | 2,052,063 |
| Britannia Industries Ltd. | | 153,846 | 7,000,105 |
| Cholamandalam Investment and Finance Co. Ltd. | | 597,386 | 5,119,060 |
| Cipla Ltd./India | | 697,623 | 9,838,187 |
| Coal India Ltd. | | 2,190,069 | 6,506,976 |
| Colgate-Palmolive Ltd. | | 187,002 | 3,686,162 |
| Container Corp. of India Ltd. | | 404,288 | 3,897,340 |
| Dabur India Ltd. | | 917,058 | 6,145,108 |
| Divi's Laboratories Ltd. | | 193,043 | 8,415,957 |
| DLF Ltd. | | 836,328 | 3,894,714 |
| Dr. Reddy's Laboratories Ltd. | | 168,020 | 9,043,696 |
| Eicher Motors Ltd. | | 196,718 | 9,150,191 |
| GAIL India Ltd. | | 3,356,010 | 3,701,422 |
| Godrej Consumer Products Ltd. (a) | | 585,462 | 5,865,229 |
| Godrej Properties Ltd. (a) | | 189,290 | 2,888,056 |
| Grasim Industries Ltd. | | 381,513 | 7,934,899 |
| Havells India Ltd. | | 369,898 | 5,434,971 |
| HCL Technologies Ltd. | | 1,552,239 | 19,522,996 |
| HDFC Standard Life Insurance Co. Ltd. (c) | | 1,404,944 | 9,172,529 |
| Hero Motocorp Ltd. | | 155,982 | 5,043,977 |
| Hindalco Industries Ltd. | | 1,935,717 | 9,485,668 |
| Hindustan Petroleum Corp. Ltd. | | 919,631 | 2,375,732 |
| Hindustan Unilever Ltd. | | 1,193,176 | 36,765,330 |
| Housing Development Finance Corp. Ltd. | | 2,482,143 | 74,056,497 |
| ICICI Bank Ltd. | | 7,419,717 | 81,579,927 |
| ICICI Lombard General Insurance Co. Ltd. (c) | | 344,572 | 4,869,920 |
| ICICI Prudential Life Insurance Co. Ltd. (c) | | 536,500 | 3,289,449 |
| Indian Oil Corp. Ltd. | | 4,082,651 | 3,366,042 |
| Indian Railway Catering & Tourism Corp. Ltd. | | 363,343 | 3,253,320 |
| Indraprastha Gas Ltd. | | 423,649 | 2,191,685 |
| Indus Towers Ltd. | | 929,513 | 2,082,927 |
| Info Edge India Ltd. | | 101,799 | 4,822,725 |
| Infosys Ltd. | | 4,269,172 | 79,300,463 |
| Infosys Ltd. sponsored ADR | | 570,216 | 10,680,146 |
| InterGlobe Aviation Ltd. (a)(c) | | 124,076 | 2,670,527 |
| ITC Ltd. | | 4,224,348 | 17,794,517 |
| Jindal Steel & Power Ltd. | | 597,563 | 3,319,514 |
| JSW Steel Ltd. (a) | | 1,021,028 | 8,312,658 |
| Jubilant Foodworks Ltd. | | 588,953 | 4,339,598 |
| Kotak Mahindra Bank Ltd. | | 797,714 | 18,328,245 |
| Larsen & Toubro Infotech Ltd. (c) | | 76,422 | 4,375,801 |
| Larsen & Toubro Ltd. | | 986,542 | 24,110,572 |
| Lupin Ltd. | | 306,457 | 2,587,744 |
| Mahindra & Mahindra Ltd. | | 1,244,651 | 20,277,076 |
| Marico Ltd. | | 765,395 | 4,850,060 |
| Maruti Suzuki India Ltd. | | 173,553 | 19,975,158 |
| MindTree Consulting Ltd. | | 88,533 | 3,640,302 |
| Mphasis BFL Ltd. | | 120,902 | 2,889,643 |
| MRF Ltd. | | 2,618 | 2,870,597 |
| Muthoot Finance Ltd. | | 176,887 | 2,229,678 |
| Nestle India Ltd. | | 48,582 | 11,950,890 |
| NTPC Ltd. | | 5,681,075 | 11,879,610 |
| Oil & Natural Gas Corp. Ltd. | | 3,525,744 | 5,709,422 |
| Page Industries Ltd. | | 8,627 | 5,186,689 |
| Petronet LNG Ltd. | | 1,033,366 | 2,565,938 |
| PI Industries Ltd. | | 112,083 | 4,389,556 |
| Pidilite Industries Ltd. | | 216,083 | 6,746,133 |
| Piramal Pharma Ltd. (a) | | 619,272 | 1,233,607 |
| Power Grid Corp. of India Ltd. | | 4,498,570 | 12,398,511 |
| Reliance Industries Ltd. | | 4,385,919 | 135,085,034 |
| Samvardhana Motherson International Ltd. | | 3,479,031 | 2,710,770 |
| SBI Cards & Payment Services Ltd. | | 355,228 | 3,547,345 |
| SBI Life Insurance Co. Ltd. (c) | | 656,989 | 10,047,297 |
| Shree Cement Ltd. | | 16,455 | 4,520,354 |
| Shriram Transport Finance Co. Ltd. | | 278,483 | 4,135,025 |
| Siemens Ltd. | | 106,377 | 3,759,562 |
| SRF Ltd. | | 209,518 | 6,475,999 |
| State Bank of India | | 2,551,344 | 17,684,962 |
| Sun Pharmaceutical Industries Ltd. | | 1,375,486 | 16,896,976 |
| Tata Consultancy Services Ltd. | | 1,318,340 | 50,853,556 |
| Tata Consumer Products Ltd. | | 793,315 | 7,380,666 |
| Tata Elxsi Ltd. | | 47,249 | 3,993,077 |
| Tata Motors Ltd. (a) | | 2,388,381 | 11,957,893 |
| Tata Power Co. Ltd./The | | 2,021,974 | 5,520,248 |
| Tata Steel Ltd. | | 10,500,025 | 12,880,859 |
| Tech Mahindra Ltd. | | 839,705 | 10,786,933 |
| Titan Co. Ltd. | | 506,396 | 16,893,121 |
| Torrent Pharmaceuticals Ltd. | | 141,031 | 2,811,079 |
| Trent Ltd. | | 257,903 | 4,760,208 |
| Ultratech Cement Ltd. | | 147,839 | 11,992,408 |
| United Spirits Ltd. (a) | | 424,621 | 4,597,838 |
| UPL Ltd. | | 715,235 | 6,309,067 |
| Vedanta Ltd. | | 1,060,108 | 3,596,017 |
| Wipro Ltd. | | 1,964,824 | 9,194,020 |
| Yes Bank Ltd. (a) | | 16,691,511 | 3,135,455 |
| Zomato Ltd. (a) | | 3,204,560 | 2,442,712 |
TOTAL INDIA | | | 1,298,754,249 |
| Indonesia - 0.6% | | | |
| PT Adaro Energy Tbk | | 20,604,500 | 5,257,632 |
| PT Adaro Minerals Indonesia Tbk | | 11,830,100 | 1,312,138 |
| PT Aneka Tambang Tbk | | 14,170,100 | 1,676,155 |
| PT Astra International Tbk | | 29,453,100 | 12,557,340 |
| PT Bank Central Asia Tbk | | 80,664,000 | 45,510,063 |
| PT Bank Jago Tbk (a) | | 5,757,100 | 1,882,431 |
| PT Bank Mandiri (Persero) Tbk | | 27,041,900 | 18,290,883 |
| PT Bank Negara Indonesia (Persero) Tbk | | 11,462,189 | 6,907,811 |
| PT Bank Rakyat Indonesia (Persero) Tbk | | 98,501,800 | 29,365,820 |
| PT Barito Pacific Tbk | | 42,261,000 | 2,235,315 |
| PT Charoen Pokphand Indonesia Tbk | | 10,004,200 | 3,575,792 |
| PT Gudang Garam Tbk | | 549,500 | 849,043 |
| PT Indah Kiat Pulp & Paper Tbk | | 3,995,000 | 2,458,856 |
| PT Indofood CBP Sukses Makmur Tbk | | 3,222,100 | 2,008,971 |
| PT Indofood Sukses Makmur Tbk | | 6,489,700 | 2,683,671 |
| PT Kalbe Farma Tbk | | 30,482,500 | 4,006,355 |
| PT Merdeka Copper Gold Tbk (a) | | 17,040,990 | 4,118,899 |
| PT Sarana Menara Nusantara Tbk | | 32,839,500 | 2,431,776 |
| PT Semen Indonesia (Persero) Tbk | | 4,859,600 | 2,476,924 |
| PT Sumber Alfaria Trijaya Tbk | | 24,225,200 | 4,379,873 |
| PT Surya Citra Media Tbk | | 35 | 1 |
| PT Telkom Indonesia Persero Tbk | | 72,109,100 | 20,251,906 |
| PT Tower Bersama Infrastructure Tbk | | 8,374,270 | 1,320,770 |
| PT Unilever Indonesia Tbk | | 10,695,500 | 3,181,736 |
| PT United Tractors Tbk | | 2,427,812 | 5,027,622 |
| PT Vale Indonesia Tbk (a) | | 3,515,500 | 1,465,026 |
TOTAL INDONESIA | | | 185,232,809 |
| Ireland - 0.5% | | | |
| CRH PLC | | 843,715 | 30,388,807 |
| CRH PLC sponsored ADR (b) | | 246,023 | 8,908,493 |
| DCC PLC (United Kingdom) | | 146,665 | 8,140,658 |
| Flutter Entertainment PLC (a) | | 84,526 | 11,225,005 |
| Flutter Entertainment PLC (Ireland) (a) | | 156,171 | 20,665,589 |
| James Hardie Industries PLC CDI | | 645,908 | 14,102,098 |
| Kerry Group PLC Class A | | 226,448 | 19,693,277 |
| Kingspan Group PLC (Ireland) | | 221,048 | 11,162,830 |
| Smurfit Kappa Group PLC | | 353,731 | 11,721,238 |
TOTAL IRELAND | | | 136,007,995 |
| Isle of Man - 0.0% | | | |
| Entain PLC | | 860,853 | 12,453,601 |
| Israel - 0.5% | | | |
| Azrieli Group | | 57,454 | 4,261,633 |
| Bank Hapoalim BM (Reg.) | | 1,827,123 | 17,632,379 |
| Bank Leumi le-Israel BM | | 2,219,475 | 21,198,874 |
| Bezeq The Israel Telecommunication Corp. Ltd. | | 3,012,131 | 5,334,555 |
| Check Point Software Technologies Ltd. (a) | | 145,740 | 18,833,980 |
| CyberArk Software Ltd. (a) | | 59,669 | 9,362,663 |
| Elbit Systems Ltd. (Israel) | | 37,498 | 7,589,696 |
| Icl Group Ltd. | | 1,010,533 | 9,128,557 |
| Israel Discount Bank Ltd. (Class A) | | 1,785,509 | 10,166,671 |
| Mizrahi Tefahot Bank Ltd. | | 217,535 | 8,230,938 |
| NICE Ltd. (a) | | 68,694 | 13,021,251 |
| Teva Pharmaceutical Industries Ltd. sponsored ADR (a) | | 1,585,512 | 14,142,767 |
| Tower Semiconductor Ltd. (a) | | 155,809 | 6,667,040 |
| Wix.com Ltd. (a) | | 84,134 | 7,075,669 |
| ZIM Integrated Shipping Services Ltd. (b) | | 124,842 | 2,932,539 |
TOTAL ISRAEL | | | 155,579,212 |
| Italy - 1.1% | | | |
| Amplifon SpA | | 179,472 | 4,458,911 |
| Assicurazioni Generali SpA | | 1,598,427 | 23,987,780 |
| Atlantia SpA | | 698,887 | 15,595,443 |
| DiaSorin SpA (b) | | 35,824 | 4,683,826 |
| Enel SpA | | 11,698,614 | 52,261,794 |
| Eni SpA | | 3,631,243 | 47,691,781 |
| FinecoBank SpA | | 877,464 | 11,827,978 |
| Infrastrutture Wireless Italiane SpA (c) | | 492,504 | 4,347,357 |
| Intesa Sanpaolo SpA | | 23,758,092 | 45,295,525 |
| Mediobanca SpA | | 862,479 | 7,817,707 |
| Moncler SpA | | 293,064 | 12,653,520 |
| Nexi SpA (a)(c) | | 753,925 | 6,534,232 |
| Poste Italiane SpA (c) | | 726,255 | 6,330,304 |
| Prysmian SpA | | 373,889 | 12,189,667 |
| Recordati SpA | | 146,277 | 5,497,550 |
| Snam SpA | | 2,831,846 | 12,591,845 |
| Telecom Italia SpA (a) | | 5,958,305 | 1,165,699 |
| Telecom Italia SpA (Risparmio Shares) (a) | | 7,564,311 | 1,446,496 |
| Terna - Rete Elettrica Nazionale | | 1,974,441 | 13,088,927 |
| UniCredit SpA | | 2,987,068 | 37,043,453 |
TOTAL ITALY | | | 326,509,795 |
| Japan - 13.7% | | | |
| Advantest Corp. | | 276,082 | 14,593,662 |
| AEON Co. Ltd. | | 947,978 | 17,701,072 |
| AGC, Inc. | | 269,496 | 8,454,883 |
| Aisin Seiki Co. Ltd. | | 212,801 | 5,459,738 |
| Ajinomoto Co., Inc. | | 653,015 | 17,988,160 |
| Ana Holdings, Inc. (a)(b) | | 234,351 | 4,556,365 |
| Asahi Group Holdings | | 662,817 | 18,561,283 |
| ASAHI INTECC Co. Ltd. | | 316,549 | 5,394,500 |
| Asahi Kasei Corp. | | 1,812,725 | 11,623,040 |
| Astellas Pharma, Inc. | | 2,663,065 | 36,745,466 |
| Azbil Corp. | | 164,082 | 4,463,578 |
| Bandai Namco Holdings, Inc. | | 289,098 | 19,135,159 |
| Bridgestone Corp. | | 821,895 | 29,725,027 |
| Brother Industries Ltd. | | 349,975 | 5,957,071 |
| Canon, Inc. | | 1,347,028 | 28,553,608 |
| Canon, Inc. sponsored ADR (b) | | 103,588 | 2,197,101 |
| Capcom Co. Ltd. | | 252,500 | 7,038,653 |
| Central Japan Railway Co. | | 206,438 | 23,900,680 |
| Chiba Bank Ltd. | | 778,094 | 4,254,282 |
| Chubu Electric Power Co., Inc. | | 913,095 | 7,436,417 |
| Chugai Pharmaceutical Co. Ltd. | | 975,524 | 22,604,709 |
| Concordia Financial Group Ltd. | | 1,552,588 | 4,729,966 |
| CyberAgent, Inc. | | 607,396 | 4,999,850 |
| Dai Nippon Printing Co. Ltd. | | 325,221 | 6,524,323 |
| Dai-ichi Mutual Life Insurance Co. | | 1,404,191 | 22,262,889 |
| Daifuku Co. Ltd. | | 143,409 | 6,577,554 |
| Daiichi Sankyo Kabushiki Kaisha | | 2,524,796 | 80,820,655 |
| Daikin Industries Ltd. | | 358,482 | 53,696,008 |
| Daito Trust Construction Co. Ltd. | | 89,221 | 8,826,396 |
| Daiwa House Industry Co. Ltd. | | 856,208 | 17,250,310 |
| Daiwa House REIT Investment Corp. | | 3,137 | 6,329,063 |
| Daiwa Securities Group, Inc. | | 1,871,351 | 7,299,395 |
| DENSO Corp. | | 624,825 | 31,001,271 |
| Dentsu Group, Inc. | | 311,122 | 9,698,043 |
| Disco Corp. | | 41,629 | 9,994,656 |
| East Japan Railway Co. | | 433,081 | 23,076,888 |
| Eisai Co. Ltd. | | 364,297 | 21,985,953 |
| ENEOS Holdings, Inc. | | 4,365,564 | 14,380,129 |
| FANUC Corp. | | 276,725 | 36,209,917 |
| Fast Retailing Co. Ltd. | | 84,163 | 46,973,250 |
| Fuji Electric Co. Ltd. | | 193,104 | 7,480,272 |
| FUJIFILM Holdings Corp. | | 523,848 | 24,023,131 |
| Fujitsu Ltd. | | 283,958 | 32,671,791 |
| GLP J-REIT | | 6,379 | 6,610,874 |
| GMO Payment Gateway, Inc. | | 59,728 | 4,310,040 |
| Hakuhodo DY Holdings, Inc. | | 334,007 | 2,821,297 |
| Hamamatsu Photonics K.K. | | 202,246 | 9,167,343 |
| Hankyu Hanshin Holdings, Inc. | | 329,580 | 9,785,774 |
| Hikari Tsushin, Inc. | | 29,670 | 3,585,661 |
| Hirose Electric Co. Ltd. | | 41,668 | 5,411,137 |
| Hitachi Construction Machinery Co. Ltd. | | 152,071 | 2,980,160 |
| Hitachi Ltd. | | 1,400,709 | 63,679,295 |
| Hitachi Metals Ltd. (a) | | 9,800 | 143,149 |
| Honda Motor Co. Ltd. | | 2,334,186 | 53,225,220 |
| Hoshizaki Corp. | | 155,706 | 4,466,096 |
| Hoya Corp. | | 529,182 | 49,378,932 |
| Hulic Co. Ltd. | | 513,972 | 3,733,076 |
| Ibiden Co. Ltd. | | 165,240 | 5,589,678 |
| Idemitsu Kosan Co. Ltd. | | 294,427 | 6,435,238 |
| Iida Group Holdings Co. Ltd. | | 204,978 | 2,848,008 |
| INPEX Corp. | | 1,484,112 | 14,978,248 |
| Isuzu Motors Ltd. | | 834,192 | 9,783,993 |
| ITO EN Ltd. | | 85,625 | 3,023,177 |
| Itochu Corp. | | 1,708,071 | 44,213,762 |
| ITOCHU Techno-Solutions Corp. | | 136,885 | 3,175,986 |
| Japan Airlines Co. Ltd. (a) | | 215,726 | 4,025,957 |
| Japan Exchange Group, Inc. | | 741,494 | 9,744,557 |
| Japan Post Bank Co. Ltd. | | 579,940 | 3,861,196 |
| Japan Post Holdings Co. Ltd. | | 3,418,146 | 22,978,437 |
| Japan Post Insurance Co. Ltd. | | 281,542 | 4,159,842 |
| Japan Real Estate Investment Corp. | | 1,870 | 7,834,897 |
| Japan Retail Fund Investment Corp. | | 9,921 | 7,305,891 |
| Japan Tobacco, Inc. | | 1,715,526 | 28,730,663 |
| JFE Holdings, Inc. | | 704,890 | 6,461,314 |
| JSR Corp. | | 267,621 | 5,100,628 |
| Kajima Corp. | | 608,378 | 5,732,120 |
| Kakaku.com, Inc. | | 191,065 | 3,239,348 |
| Kansai Electric Power Co., Inc. | | 1,017,899 | 7,714,934 |
| Kao Corp. | | 688,126 | 25,702,844 |
| KDDI Corp. | | 2,330,307 | 68,876,821 |
| Keio Corp. | | 143,820 | 5,048,861 |
| Keisei Electric Railway Co. | | 182,342 | 4,843,814 |
| Keyence Corp. | | 280,129 | 106,102,191 |
| Kikkoman Corp. | | 212,148 | 11,527,999 |
| Kintetsu Group Holdings Co. Ltd. | | 247,264 | 8,364,356 |
| Kirin Holdings Co. Ltd. | | 1,224,220 | 18,026,361 |
| Kobayashi Pharmaceutical Co. Ltd. | | 85,787 | 4,557,768 |
| Kobe Bussan Co. Ltd. | | 228,072 | 4,961,922 |
| Koei Tecmo Holdings Co. Ltd. (b) | | 163,718 | 2,475,121 |
| Koito Manufacturing Co. Ltd. | | 299,630 | 4,259,846 |
| Komatsu Ltd. | | 1,331,264 | 26,079,721 |
| Konami Group Corp. | | 130,736 | 5,741,323 |
| Kose Corp. | | 48,068 | 4,806,962 |
| Kubota Corp. | | 1,458,067 | 20,361,654 |
| Kurita Water Industries Ltd. | | 147,684 | 5,422,877 |
| Kyocera Corp. | | 454,956 | 22,766,923 |
| Kyowa Hakko Kirin Co., Ltd. | | 392,821 | 9,259,475 |
| Lasertec Corp. | | 109,195 | 15,343,092 |
| LIXIL Group Corp. | | 418,403 | 6,333,940 |
| M3, Inc. | | 628,002 | 18,777,342 |
| Makita Corp. | | 317,168 | 5,795,772 |
| Marubeni Corp. | | 2,199,645 | 19,275,278 |
| Mazda Motor Corp. | | 819,409 | 5,517,050 |
| McDonald's Holdings Co. (Japan) Ltd. | | 136,545 | 4,738,372 |
| Meiji Holdings Co. Ltd. | | 162,706 | 6,696,666 |
| Minebea Mitsumi, Inc. | | 508,800 | 7,541,580 |
| Misumi Group, Inc. | | 410,614 | 8,781,415 |
| Mitsubishi Chemical Holdings Corp. | | 1,831,584 | 8,278,742 |
| Mitsubishi Corp. | | 1,814,201 | 49,181,507 |
| Mitsubishi Electric Corp. | | 2,821,797 | 24,827,901 |
| Mitsubishi Estate Co. Ltd. | | 1,681,812 | 21,149,289 |
| Mitsubishi Heavy Industries Ltd. | | 456,928 | 15,733,356 |
| Mitsubishi UFJ Financial Group, Inc. | | 17,215,318 | 81,322,594 |
| Mitsubishi UFJ Lease & Finance Co. Ltd. | | 901,016 | 3,865,955 |
| Mitsui & Co. Ltd. | | 2,004,946 | 44,401,541 |
| Mitsui Chemicals, Inc. | | 264,471 | 4,900,081 |
| Mitsui Fudosan Co. Ltd. | | 1,289,610 | 24,713,297 |
| Mitsui OSK Lines Ltd. | | 502,300 | 9,968,643 |
| Mizuho Financial Group, Inc. | | 3,474,232 | 37,523,902 |
| MonotaRO Co. Ltd. | | 352,708 | 5,379,749 |
| MS&AD Insurance Group Holdings, Inc. | | 637,915 | 16,892,757 |
| Murata Manufacturing Co. Ltd. | | 826,261 | 39,114,738 |
| NEC Corp. | | 352,163 | 11,664,163 |
| Nexon Co. Ltd. | | 706,359 | 11,861,720 |
| NGK Insulators Ltd. | | 338,995 | 3,960,014 |
| Nidec Corp. | | 648,256 | 35,643,719 |
| Nihon M&A Center Holdings, Inc. | | 449,960 | 5,092,859 |
| Nintendo Co. Ltd. | | 1,587,490 | 64,450,660 |
| Nippon Building Fund, Inc. | | 2,250 | 10,002,018 |
| Nippon Express Holdings, Inc. | | 112,785 | 5,665,987 |
| Nippon Paint Holdings Co. Ltd. | | 1,207,530 | 7,714,809 |
| Nippon Prologis REIT, Inc. | | 3,194 | 6,691,086 |
| Nippon Sanso Holdings Corp. | | 249,986 | 3,987,806 |
| Nippon Shinyaku Co. Ltd. | | 72,055 | 3,992,960 |
| Nippon Steel & Sumitomo Metal Corp. | | 1,151,199 | 15,813,067 |
| Nippon Telegraph & Telephone Corp. | | 1,727,571 | 47,647,631 |
| Nippon Yusen KK | | 702,633 | 12,727,826 |
| Nissan Chemical Corp. | | 185,584 | 8,362,170 |
| Nissan Motor Co. Ltd. | | 3,249,125 | 10,355,950 |
| Nisshin Seifun Group, Inc. | | 304,962 | 3,297,884 |
| Nissin Food Holdings Co. Ltd. | | 92,205 | 5,971,513 |
| Nitori Holdings Co. Ltd. | | 117,742 | 10,669,436 |
| Nitto Denko Corp. | | 211,450 | 11,134,561 |
| Nomura Holdings, Inc. | | 4,152,665 | 13,437,856 |
| Nomura Real Estate Holdings, Inc. | | 166,718 | 3,772,864 |
| Nomura Real Estate Master Fund, Inc. | | 6,276 | 7,154,121 |
| Nomura Research Institute Ltd. | | 480,580 | 10,681,710 |
| NTT Data Corp. | | 903,056 | 13,099,915 |
| Obayashi Corp. | | 982,685 | 6,311,336 |
| OBIC Co. Ltd. | | 100,052 | 15,052,041 |
| Odakyu Electric Railway Co. Ltd. | | 420,539 | 5,003,083 |
| Oji Holdings Corp. | | 1,127,102 | 3,911,259 |
| Olympus Corp. | | 1,782,663 | 37,644,587 |
| OMRON Corp. | | 267,577 | 12,517,338 |
| Ono Pharmaceutical Co. Ltd. | | 518,945 | 12,201,027 |
| Open House Group Co. Ltd. | | 116,600 | 4,156,024 |
| Oracle Corp. Japan | | 55,403 | 2,958,404 |
| Oriental Land Co. Ltd. | | 289,288 | 38,812,977 |
| ORIX Corp. | | 1,702,354 | 25,015,256 |
| Osaka Gas Co. Ltd. | | 524,718 | 7,770,463 |
| Otsuka Corp. | | 164,532 | 5,195,049 |
| Otsuka Holdings Co. Ltd. | | 560,503 | 17,966,651 |
| Pan Pacific International Holdings Ltd. | | 543,991 | 8,930,240 |
| Panasonic Holdings Corp. | | 3,123,093 | 22,244,589 |
| Persol Holdings Co. Ltd. | | 261,626 | 5,253,810 |
| Rakuten Group, Inc. | | 1,203,360 | 5,372,242 |
| Recruit Holdings Co. Ltd. | | 2,080,883 | 64,031,203 |
| Renesas Electronics Corp. (a) | | 1,673,083 | 13,996,598 |
| Resona Holdings, Inc. | | 3,107,789 | 11,697,969 |
| Ricoh Co. Ltd. | | 840,138 | 6,158,582 |
| ROHM Co. Ltd. | | 127,795 | 8,998,377 |
| SBI Holdings, Inc. Japan | | 342,465 | 6,190,833 |
| SCSK Corp. | | 214,233 | 3,165,338 |
| Secom Co. Ltd. | | 301,959 | 17,202,756 |
| Seiko Epson Corp. | | 396,909 | 5,407,967 |
| Sekisui Chemical Co. Ltd. | | 520,239 | 6,507,580 |
| Sekisui House Ltd. | | 867,603 | 14,441,087 |
| Seven & i Holdings Co. Ltd. | | 1,091,872 | 40,757,807 |
| SG Holdings Co. Ltd. | | 428,149 | 5,678,132 |
| Sharp Corp. | | 342,811 | 2,056,210 |
| Shimadzu Corp. | | 339,977 | 8,974,140 |
| SHIMANO, Inc. | | 104,090 | 16,107,228 |
| SHIMIZU Corp. | | 792,681 | 3,960,873 |
| Shin-Etsu Chemical Co. Ltd. | | 542,017 | 56,331,803 |
| Shionogi & Co. Ltd. | | 380,694 | 17,678,383 |
| Shiseido Co. Ltd. | | 580,975 | 20,141,404 |
| Shizuoka Financial Group | | 659,518 | 4,160,381 |
| SMC Corp. | | 82,655 | 33,177,905 |
| SoftBank Corp. | | 4,173,427 | 41,168,305 |
| SoftBank Group Corp. | | 1,740,844 | 74,727,856 |
| Sompo Holdings, Inc. | | 454,054 | 18,910,901 |
| Sony Group Corp. | | 1,814,720 | 122,375,028 |
| Square Enix Holdings Co. Ltd. | | 123,138 | 5,498,748 |
| Subaru Corp. | | 884,878 | 13,779,448 |
| Sumco Corp. | | 523,229 | 6,647,026 |
| Sumitomo Chemical Co. Ltd. | | 2,151,181 | 7,248,002 |
| Sumitomo Corp. | | 1,601,069 | 20,355,619 |
| Sumitomo Electric Industries Ltd. | | 1,032,303 | 10,788,519 |
| Sumitomo Metal Mining Co. Ltd. | | 355,132 | 9,954,653 |
| Sumitomo Mitsui Financial Group, Inc. | | 1,880,372 | 52,803,791 |
| Sumitomo Mitsui Trust Holdings, Inc. | | 484,157 | 13,928,726 |
| Sumitomo Realty & Development Co. Ltd. | | 442,579 | 10,164,480 |
| Suntory Beverage & Food Ltd. | | 211,103 | 7,070,130 |
| Suzuki Motor Corp. | | 529,532 | 17,877,203 |
| Sysmex Corp. | | 241,529 | 13,040,081 |
| T&D Holdings, Inc. | | 779,153 | 7,686,993 |
| Taisei Corp. | | 263,402 | 7,183,127 |
| Takeda Pharmaceutical Co. Ltd. | | 2,167,720 | 57,247,320 |
| TDK Corp. | | 554,487 | 17,358,600 |
| Terumo Corp. | | 939,524 | 28,584,731 |
| TIS, Inc. | | 323,867 | 8,744,921 |
| Tobu Railway Co. Ltd. | | 263,693 | 6,100,433 |
| Toho Co. Ltd. | | 157,105 | 5,599,761 |
| Tokio Marine Holdings, Inc. | | 2,647,824 | 47,918,857 |
| Tokyo Electric Power Co., Inc. (a) | | 2,207,226 | 7,199,332 |
| Tokyo Electron Ltd. | | 215,486 | 56,693,638 |
| Tokyo Gas Co. Ltd. | | 569,639 | 10,178,761 |
| Tokyu Corp. | | 771,375 | 8,901,977 |
| Toppan, Inc. | | 382,477 | 5,707,767 |
| Toray Industries, Inc. | | 1,997,519 | 9,732,691 |
| Toshiba Corp. | | 566,315 | 19,732,190 |
| Tosoh Corp. | | 370,325 | 4,032,121 |
| Toto Ltd. | | 205,617 | 5,876,944 |
| Toyota Industries Corp. | | 209,443 | 10,789,424 |
| Toyota Motor Corp. | | 15,237,730 | 211,417,587 |
| Toyota Tsusho Corp. | | 297,095 | 9,990,080 |
| Trend Micro, Inc. | | 191,345 | 9,664,084 |
| Unicharm Corp. | | 575,897 | 17,502,334 |
| USS Co. Ltd. | | 331,546 | 5,010,147 |
| Welcia Holdings Co. Ltd. | | 141,537 | 2,960,288 |
| West Japan Railway Co. | | 318,580 | 12,642,931 |
| Yakult Honsha Co. Ltd. | | 185,818 | 10,297,188 |
| Yamaha Corp. | | 201,761 | 7,625,655 |
| Yamaha Motor Co. Ltd. | | 425,839 | 8,791,995 |
| Yamato Holdings Co. Ltd. | | 430,729 | 6,384,389 |
| Yaskawa Electric Corp. | | 349,989 | 9,720,936 |
| Yokogawa Electric Corp. | | 321,100 | 5,379,200 |
| Z Holdings Corp. | | 3,818,749 | 9,855,274 |
| ZOZO, Inc. | | 171,163 | 3,643,235 |
TOTAL JAPAN | | | 4,095,120,154 |
| Korea (South) - 3.0% | | | |
| Alteogen, Inc. | | 50,276 | 1,292,723 |
| AMOREPACIFIC Corp. | | 45,960 | 2,984,959 |
| AMOREPACIFIC Group, Inc. | | 37,383 | 646,919 |
| BGF Retail Co. Ltd. | | 13,197 | 1,724,379 |
| Celltrion Healthcare Co. Ltd. | | 124,359 | 6,055,370 |
| Celltrion Pharm, Inc. | | 24,834 | 1,179,655 |
| Celltrion, Inc. | | 142,136 | 19,119,827 |
| Cheil Worldwide, Inc. | | 96,330 | 1,650,133 |
| CJ CheilJedang Corp. | | 11,295 | 3,276,161 |
| CJ Corp. | | 18,038 | 907,385 |
| CJ ENM Co. Ltd. | | 13,209 | 679,273 |
| CJ Logistics Corp. (a) | | 10,778 | 663,752 |
| Coway Co. Ltd. | | 80,195 | 3,107,070 |
| Db Insurance Co. Ltd. | | 62,355 | 2,459,565 |
| Doosan Bobcat, Inc. | | 69,800 | 1,638,245 |
| Doosan Heavy Industries & Construction Co. Ltd. (a) | | 612,278 | 5,683,858 |
| E-Mart, Inc. | | 29,731 | 1,762,214 |
| Ecopro BM Co. Ltd. | | 71,450 | 5,761,774 |
| EUSU Holdings Co. Ltd. | | 6 | 29 |
| F&F Co. Ltd. | | 24,976 | 2,546,036 |
| Green Cross Corp. | | 8,441 | 754,020 |
| GS Engineering & Construction Corp. | | 92,735 | 1,409,880 |
| GS Holdings Corp. | | 64,497 | 2,078,624 |
| Hana Financial Group, Inc. | | 421,362 | 12,177,495 |
| Hanjin Shipping Co. Ltd. (a)(d) | | 12 | 0 |
| Hankook Tire Co. Ltd. | | 105,623 | 2,704,734 |
| Hanmi Pharm Co. Ltd. | | 10,613 | 1,881,210 |
| Hanon Systems | | 277,185 | 1,514,757 |
| Hanwha Solutions Corp. (a) | | 167,415 | 5,536,241 |
| HD Hyundai Co. Ltd. | | 65,222 | 2,782,852 |
| HLB, Inc. (a) | | 151,783 | 4,306,821 |
| HLB, Inc. rights 12/2/22 (a) | | 12,168 | 83,546 |
| HMM Co. Ltd. | | 390,167 | 5,221,106 |
| Hotel Shilla Co. | | 46,802 | 2,131,358 |
| HYBE Co. Ltd. (a) | | 26,452 | 2,242,449 |
| Hyundai Engineering & Construction Co. Ltd. | | 116,450 | 2,847,368 |
| Hyundai Glovis Co. Ltd. | | 27,037 | 3,295,994 |
| Hyundai Heavy Industries Co. Ltd. (a) | | 23,479 | 1,793,018 |
| Hyundai Mobis | | 87,602 | 13,441,161 |
| Hyundai Motor Co. | | 197,517 | 22,764,024 |
| Hyundai Steel Co. | | 133,886 | 2,635,847 |
| Iljin Materials Co. Ltd. | | 31,425 | 1,334,217 |
| Industrial Bank of Korea | | 376,255 | 2,754,718 |
| Kakao Corp. | | 453,528 | 16,109,821 |
| Kakao Games Corp. (a) | | 47,694 | 1,321,566 |
| KakaoBank Corp. (a) | | 160,424 | 1,921,959 |
| Kangwon Land, Inc. (a) | | 139,111 | 2,241,651 |
| KB Financial Group, Inc. | | 569,452 | 19,123,003 |
| Kia Corp. | | 379,947 | 17,648,801 |
| Korea Aerospace Industries Ltd. | | 106,538 | 3,534,298 |
| Korea Electric Power Corp. (a) | | 364,951 | 4,270,992 |
| Korea Investment Holdings Co. Ltd. | | 50,723 | 1,760,870 |
| Korea Shipbuilding & Offshore Engineering Co. Ltd. (a) | | 58,298 | 2,969,386 |
| Korea Zinc Co. Ltd. | | 12,730 | 5,708,040 |
| Korean Air Lines Co. Ltd. (a) | | 260,501 | 4,215,994 |
| KRAFTON, Inc. (a) | | 34,923 | 4,342,987 |
| KT&G Corp. | | 153,520 | 10,293,322 |
| Kumho Petro Chemical Co. Ltd. | | 24,893 | 2,284,689 |
| L&F Co. Ltd. (a) | | 32,540 | 5,129,543 |
| LG Chemical Ltd. | | 71,638 | 31,419,295 |
| LG Corp. | | 141,984 | 7,878,495 |
| LG Display Co. Ltd. | | 334,812 | 2,981,954 |
| LG Electronics, Inc. | | 151,255 | 8,647,261 |
| LG Energy Solution (a) | | 33,996 | 12,575,938 |
| LG H & H Co. Ltd. | | 14,326 | 5,118,866 |
| LG Innotek Co. Ltd. | | 20,749 | 4,310,231 |
| LG Uplus Corp. | | 298,036 | 2,390,853 |
| Lotte Chemical Corp. | | 23,244 | 2,410,190 |
| Lotte Shopping Co. Ltd. | | 14,375 | 880,234 |
| Meritz Financial Holdings Co. | | 41,555 | 631,774 |
| Meritz Fire & Marine Insurance Co. Ltd. | | 45,133 | 994,474 |
| Meritz Securities Co. Ltd. | | 343,624 | 890,766 |
| Mirae Asset Securities Co. Ltd. | | 385,670 | 1,715,806 |
| NAVER Corp. | | 190,319 | 22,601,148 |
| NCSOFT Corp. | | 23,547 | 6,433,967 |
| Netmarble Corp. (c) | | 27,534 | 860,365 |
| NH Investment & Securities Co. Ltd. | | 172,685 | 1,085,240 |
| Orion Corp./Republic of Korea | | 33,786 | 2,402,600 |
| Pan Ocean Co., Ltd. (Korea) | | 429,953 | 1,295,293 |
| Pearl Abyss Corp. (a) | | 36,526 | 1,064,570 |
| POSCO | | 113,099 | 19,672,479 |
| POSCO Chemtech Co. Ltd. | | 40,001 | 5,591,037 |
| S-Oil Corp. | | 66,673 | 4,035,919 |
| S1 Corp. | | 24,076 | 1,052,562 |
| Samsung Biologics Co. Ltd. (a)(c) | | 25,777 | 15,838,375 |
| Samsung C&T Corp. | | 124,674 | 10,350,776 |
| Samsung Electro-Mechanics Co. Ltd. | | 82,319 | 6,978,532 |
| Samsung Electronics Co. Ltd. | | 6,908,111 | 287,491,098 |
| Samsung Engineering Co. Ltd. (a) | | 223,998 | 3,742,925 |
| Samsung Fire & Marine Insurance Co. Ltd. | | 44,212 | 6,195,107 |
| Samsung Heavy Industries Co. Ltd. (a) | | 923,119 | 3,330,762 |
| Samsung Life Insurance Co. Ltd. | | 118,818 | 5,610,748 |
| Samsung SDI Co. Ltd. | | 78,791 | 40,683,916 |
| Samsung SDS Co. Ltd. | | 52,006 | 4,554,515 |
| Samsung Securities Co. Ltd. | | 86,405 | 1,922,035 |
| SD Biosensor, Inc. | | 46,082 | 954,042 |
| Seegene, Inc. | | 54,201 | 1,089,853 |
| Shinhan Financial Group Co. Ltd. | | 654,199 | 16,594,051 |
| SK Biopharmaceuticals Co. Ltd. (a) | | 43,048 | 1,752,297 |
| SK Bioscience Co. Ltd. (a) | | 31,738 | 1,681,048 |
| SK Chemicals Co. Ltd. | | 14,691 | 909,876 |
| SK Hynix, Inc. | | 787,015 | 45,600,244 |
| SK IE Technology Co. Ltd. (a)(c) | | 32,003 | 1,165,931 |
| SK Innovation Co., Ltd. | | 80,571 | 9,765,703 |
| SK Square Co. Ltd. (a) | | 149,983 | 3,882,712 |
| SK, Inc. | | 53,572 | 8,032,122 |
| SKC Co. Ltd. | | 28,280 | 2,050,682 |
| Woori Financial Group, Inc. | | 774,070 | 6,372,308 |
| Yuhan Corp. | | 72,426 | 3,034,411 |
TOTAL KOREA (SOUTH) | | | 900,233,075 |
| Kuwait - 0.3% | | | |
| Agility Public Warehousing Co. KSC | | 2,158,306 | 5,461,068 |
| Boubyan Bank KSC | | 1,776,362 | 4,723,971 |
| Gulf Bank | | 2,123,925 | 2,351,158 |
| Kuwait Finance House KSCP | | 10,565,054 | 27,618,828 |
| Mabanee Co. SAKC | | 812,094 | 2,285,448 |
| Mobile Telecommunication Co. | | 3,080,497 | 5,955,197 |
| National Bank of Kuwait | | 10,288,407 | 35,794,426 |
TOTAL KUWAIT | | | 84,190,096 |
| Luxembourg - 0.2% | | | |
| Allegro.eu SA (a)(c) | | 517,232 | 2,513,517 |
| ArcelorMittal SA (Netherlands) | | 760,927 | 17,036,245 |
| Aroundtown SA | | 1,342,917 | 2,664,893 |
| Eurofins Scientific SA | | 194,823 | 12,472,342 |
| Reinet Investments SCA | | 196,553 | 3,158,117 |
| Tenaris SA | | 683,908 | 10,703,951 |
TOTAL LUXEMBOURG | | | 48,549,065 |
| Malaysia - 0.4% | | | |
| AMMB Holdings Bhd | | 2,720,200 | 2,353,134 |
| Axiata Group Bhd | | 3,306,115 | 1,992,899 |
| CIMB Group Holdings Bhd | | 10,370,688 | 12,107,910 |
| Dialog Group Bhd | | 5,149,622 | 2,243,702 |
| DiGi.com Bhd | | 3,816,900 | 3,059,655 |
| Genting Bhd | | 3,257,300 | 3,058,886 |
| Genting Malaysia Bhd | | 4,256,100 | 2,466,522 |
| Hap Seng Consolidated Bhd | | 689,500 | 937,708 |
| Hartalega Holdings Bhd | | 2,650,300 | 1,210,797 |
| Hong Leong Bank Bhd | | 985,400 | 4,410,124 |
| Hong Leong Credit Bhd | | 256,800 | 1,036,325 |
| IHH Healthcare Bhd | | 2,698,300 | 3,395,703 |
| Inari Amertron Bhd | | 4,041,200 | 2,128,297 |
| IOI Corp. Bhd | | 3,179,100 | 2,743,386 |
| IOI Properties Group Bhd | | 11 | 2 |
| Kuala Lumpur Kepong Bhd | | 614,813 | 2,819,193 |
| Malayan Banking Bhd | | 7,001,668 | 12,720,882 |
| Malaysia Airports Holdings Bhd (a) | | 918,498 | 1,161,721 |
| Maxis Bhd | | 2,693,300 | 2,193,148 |
| MISC Bhd | | 1,738,700 | 2,658,799 |
| MR DIY Group M Sdn Bhd (c) | | 2,872,950 | 1,227,445 |
| Nestle (Malaysia) Bhd | | 83,500 | 2,348,879 |
| Petronas Chemicals Group Bhd | | 3,740,500 | 6,898,723 |
| Petronas Dagangan Bhd | | 349,700 | 1,603,531 |
| Petronas Gas Bhd | | 1,021,800 | 3,695,596 |
| PPB Group Bhd | | 797,420 | 2,816,606 |
| Press Metal Bhd | | 5,489,200 | 5,050,343 |
| Public Bank Bhd | | 21,089,100 | 19,938,299 |
| QL Resources Bhd | | 1,355,700 | 1,468,102 |
| RHB Bank Bhd | | 2,264,763 | 2,739,942 |
| Sime Darby Bhd | | 3,983,207 | 1,895,562 |
| Sime Darby Plantation Bhd | | 2,869,924 | 2,670,826 |
| Sime Darby Property Bhd | | 15 | 1 |
| SP Setia Bhd | | 14 | 1 |
| Telekom Malaysia Bhd | | 1,627,099 | 1,913,424 |
| Tenaga Nasional Bhd | | 3,762,425 | 6,700,427 |
| Top Glove Corp. Bhd | | 8,478,000 | 1,425,552 |
TOTAL MALAYSIA | | | 127,092,052 |
| Mexico - 0.7% | | | |
| Alfa SA de CV Series A | | 4,254,100 | 2,823,470 |
| America Movil S.A.B. de CV Series L | | 40,141,446 | 37,987,791 |
| Arca Continental S.A.B. de CV | | 711,262 | 5,826,009 |
| CEMEX S.A.B. de CV unit (a) | | 22,491,840 | 8,741,088 |
| Coca-Cola FEMSA S.A.B. de CV unit | | 780,440 | 4,916,303 |
| Fibra Uno Administracion SA de CV | | 4,298,100 | 5,015,499 |
| Fomento Economico Mexicano S.A.B. de CV unit | | 2,836,000 | 20,358,567 |
| Gruma S.A.B. de CV Series B | | 285,995 | 3,317,530 |
| Grupo Aeroportuario del Pacifico S.A.B. de CV Series B | | 517,800 | 8,020,634 |
| Grupo Aeroportuario del Sureste S.A.B. de CV Series B | | 291,985 | 6,833,566 |
| Grupo Bimbo S.A.B. de CV Series A | | 1,884,700 | 7,296,994 |
| Grupo Carso SA de CV Series A1 | | 565,500 | 2,278,783 |
| Grupo Financiero Banorte S.A.B. de CV Series O | | 3,754,700 | 30,520,085 |
| Grupo Financiero Inbursa S.A.B. de CV Series O (a) | | 3,117,500 | 5,754,150 |
| Grupo Mexico SA de CV Series B | | 4,473,923 | 16,219,749 |
| Grupo Televisa SA de CV | | 3,395,100 | 3,601,928 |
| Industrias Penoles SA de CV | | 204,640 | 2,321,450 |
| Kimberly-Clark de Mexico SA de CV Series A | | 2,253,600 | 3,555,622 |
| Operadora de Sites Mexicanos, SA de CV (b) | | 1,731,300 | 1,883,956 |
| Orbia Advance Corp. S.A.B. de CV | | 1,498,116 | 2,529,247 |
| Promotora y Operadora de Infraestructura S.A.B. de CV | | 313,890 | 2,361,185 |
| Sitios Latinoamerica S.A.B. de CV (a) | | 1,971,532 | 575,150 |
| Wal-Mart de Mexico SA de CV Series V | | 7,633,700 | 29,486,048 |
TOTAL MEXICO | | | 212,224,804 |
| Multi-National - 0.1% | | | |
| HK Electric Investments & HK Electric Investments Ltd. unit | | 3,459,676 | 2,199,306 |
| HKT Trust/HKT Ltd. unit | | 5,489,479 | 6,203,038 |
| Unibail-Rodamco SE & WFD Unibail-Rodamco NV unit (a)(b) | | 171,051 | 8,093,690 |
TOTAL MULTI-NATIONAL | | | 16,496,034 |
| Netherlands - 3.5% | | | |
| ABN AMRO Bank NV GDR (c) | | 591,036 | 5,815,213 |
| Adyen BV (a)(c) | | 31,220 | 44,569,656 |
| AEGON NV | | 2,558,043 | 11,841,596 |
| AerCap Holdings NV (a) | | 192,511 | 10,282,013 |
| Airbus Group NV | | 850,531 | 92,030,666 |
| Akzo Nobel NV (b) | | 260,802 | 16,100,734 |
| Argenx SE (a) | | 79,506 | 30,868,252 |
| ASM International NV (Netherlands) | | 67,014 | 14,887,736 |
| ASML Holding NV (Netherlands) | | 585,074 | 274,450,703 |
| CNH Industrial NV | | 1,451,663 | 18,800,511 |
| Davide Campari Milano NV | | 783,895 | 7,044,978 |
| Euronext NV (c) | | 123,138 | 7,824,740 |
| EXOR NV | | 152,730 | 10,263,609 |
| Ferrari NV (Italy) | | 180,243 | 35,535,967 |
| Heineken Holding NV | | 146,498 | 10,004,066 |
| Heineken NV (Bearer) | | 374,605 | 31,319,207 |
| IMCD NV | | 81,497 | 10,574,825 |
| ING Groep NV (Certificaten Van Aandelen) | | 5,622,136 | 55,319,537 |
| JDE Peet's BV | | 140,922 | 4,035,934 |
| Just Eat Takeaway.com NV (a)(c) | | 259,642 | 4,455,482 |
| Koninklijke Ahold Delhaize NV | | 1,508,140 | 42,059,455 |
| Koninklijke DSM NV | | 252,093 | 29,653,799 |
| Koninklijke KPN NV | | 4,721,343 | 13,206,098 |
| Koninklijke Philips Electronics NV | | 1,269,986 | 16,109,636 |
| NEPI Rockcastle PLC (b) | | 741,848 | 3,735,744 |
| NN Group NV | | 397,265 | 16,822,787 |
| OCI NV | | 150,880 | 5,773,429 |
| Prosus NV | | 1,190,136 | 51,463,500 |
| QIAGEN NV (Germany) (a) | | 344,043 | 14,858,022 |
| Randstad NV | | 169,930 | 8,470,557 |
| Stellantis NV (Italy) | | 3,145,918 | 42,468,304 |
| STMicroelectronics NV (France) | | 983,104 | 30,568,588 |
| Universal Music Group NV | | 1,042,446 | 20,468,903 |
| Wolters Kluwer NV | | 376,455 | 40,012,005 |
| X5 Retail Group NV GDR (d) | | 152,037 | 53,788 |
| Yandex NV Class A (a)(d) | | 371,380 | 2,079,249 |
TOTAL NETHERLANDS | | | 1,033,829,289 |
| New Zealand - 0.2% | | | |
| Auckland International Airport Ltd. (a) | | 1,785,302 | 7,992,404 |
| Fisher & Paykel Healthcare Corp. | | 844,185 | 9,610,043 |
| Mercury Nz Ltd. | | 898,581 | 3,040,572 |
| Meridian Energy Ltd. | | 1,981,549 | 5,622,114 |
| Spark New Zealand Ltd. | | 2,778,553 | 8,271,108 |
| Xero Ltd. (a) | | 193,648 | 9,670,292 |
TOTAL NEW ZEALAND | | | 44,206,533 |
| Norway - 0.5% | | | |
| Adevinta ASA Class B (a) | | 420,467 | 2,879,648 |
| Aker BP ASA | | 450,411 | 14,357,835 |
| DNB Bank ASA | | 1,327,487 | 23,479,105 |
| Equinor ASA | | 1,283,585 | 46,765,780 |
| Equinor ASA sponsored ADR | | 116,214 | 4,216,244 |
| Gjensidige Forsikring ASA | | 283,709 | 5,182,336 |
| Kongsberg Gruppen ASA | | 127,416 | 4,566,614 |
| Mowi ASA | | 595,136 | 8,875,962 |
| Norsk Hydro ASA | | 1,919,535 | 12,181,983 |
| Orkla ASA | | 1,029,488 | 6,944,060 |
| Salmar ASA | | 81,397 | 2,757,562 |
| Telenor ASA | | 1,006,354 | 9,145,613 |
| Yara International ASA | | 234,569 | 10,469,262 |
TOTAL NORWAY | | | 151,822,004 |
| Peru - 0.0% | | | |
| Compania de Minas Buenaventura SAA sponsored ADR | | 328,850 | 2,282,219 |
| Philippines - 0.2% | | | |
| Aboitiz Equity Ventures, Inc. | | 2,135,920 | 2,092,916 |
| ACEN Corp. | | 10,831,225 | 1,174,181 |
| Ayala Corp. | | 383,045 | 4,431,780 |
| Ayala Land, Inc. | | 11,166,070 | 4,940,468 |
| Bank of the Philippine Islands (BPI) | | 2,381,603 | 3,948,834 |
| BDO Unibank, Inc. | | 2,981,908 | 6,571,324 |
| Converge ICT Solutions, Inc. (a) | | 3,169,800 | 676,858 |
| Globe Telecom, Inc. | | 40,108 | 1,612,104 |
| GT Capital Holdings, Inc. | | 98,639 | 703,147 |
| International Container Terminal Services, Inc. | | 1,574,350 | 4,705,171 |
| JG Summit Holdings, Inc. | | 3,730,975 | 2,784,502 |
| Jollibee Food Corp. | | 505,500 | 2,021,619 |
| Manila Electric Co. | | 252,850 | 1,314,364 |
| Metro Pacific Investments Corp. | | 11,439,700 | 721,617 |
| Metropolitan Bank & Trust Co. | | 2,539,341 | 2,272,910 |
| Monde Nissin Corp. (c) | | 7,850,500 | 1,586,668 |
| PLDT, Inc. | | 106,345 | 2,989,894 |
| SM Investments Corp. | | 385,685 | 5,480,375 |
| SM Prime Holdings, Inc. | | 17,267,475 | 9,401,775 |
| Universal Robina Corp. | | 1,277,960 | 2,695,500 |
TOTAL PHILIPPINES | | | 62,126,007 |
| Poland - 0.2% | | | |
| Bank Polska Kasa Opieki SA | | 274,248 | 4,505,983 |
| CD Projekt RED SA | | 95,646 | 2,546,366 |
| Cyfrowy Polsat SA | | 342,607 | 1,284,570 |
| Dino Polska SA (a)(c) | | 71,217 | 4,657,202 |
| KGHM Polska Miedz SA (Bearer) | | 205,137 | 4,110,388 |
| LPP SA | | 1,627 | 2,825,209 |
| mBank SA (a) | | 21,514 | 1,205,912 |
| Orange Polska SA | | 973,980 | 1,230,608 |
| PGE Polska Grupa Energetyczna SA (a) | | 1,179,648 | 1,346,658 |
| Polski Koncern Naftowy Orlen SA | | 585,828 | 6,739,212 |
| Polskie Gornictwo Naftowe i Gazownictwo SA (a) | | 2,455,675 | 2,613,074 |
| Powszechna Kasa Oszczednosci Bank SA | | 1,303,291 | 7,116,901 |
| Powszechny Zaklad Ubezpieczen SA | | 920,661 | 5,168,244 |
| Santander Bank Polska SA | | 52,660 | 2,803,915 |
TOTAL POLAND | | | 48,154,242 |
| Portugal - 0.1% | | | |
| Banco Espirito Santo SA (Reg.) (a)(d) | | 319,729 | 3 |
| Energias de Portugal SA | | 3,864,345 | 16,898,805 |
| Galp Energia SGPS SA Class B (b) | | 701,333 | 7,120,706 |
| Jeronimo Martins SGPS SA | | 411,406 | 8,529,880 |
TOTAL PORTUGAL | | | 32,549,394 |
| Qatar - 0.4% | | | |
| Barwa Real Estate Co. (a) | | 2,918,811 | 2,725,052 |
| Industries Qatar QSC (a) | | 2,307,375 | 9,991,708 |
| Masraf al Rayan | | 8,460,233 | 8,913,823 |
| Mesaieed Petrochemical Holding Co. (a) | | 6,857,410 | 4,274,407 |
| Ooredoo QSC | | 1,268,319 | 3,402,616 |
| Qatar Electricity & Water Co. (a) | | 545,531 | 2,771,284 |
| Qatar Fuel Co. (a) | | 743,739 | 3,896,627 |
| Qatar Gas Transport Co. Ltd. (Nakilat) (a) | | 3,749,526 | 4,221,338 |
| Qatar International Islamic Bank QSC (a) | | 1,149,170 | 3,650,964 |
| Qatar Islamic Bank (a) | | 2,412,328 | 16,156,156 |
| Qatar National Bank SAQ (a) | | 6,773,950 | 37,090,015 |
| The Commercial Bank of Qatar (a) | | 4,820,530 | 8,331,274 |
TOTAL QATAR | | | 105,425,264 |
| Russia - 0.0% | | | |
| Alrosa Co. Ltd. (d) | | 3,102,770 | 774,067 |
| Gazprom OAO (d) | | 12,146,244 | 1,905,938 |
| Gazprom OAO sponsored ADR (Reg. S) (a)(d) | | 1,078,053 | 246,270 |
| Inter Rao Ues JSC (d) | | 42,112,900 | 348,170 |
| LUKOIL PJSC (d) | | 451,803 | 209,705 |
| LUKOIL PJSC sponsored ADR (d) | | 52,271 | 14,787 |
| Magnit OJSC GDR (Reg. S) (d) | | 428,621 | 2,087 |
| MMC Norilsk Nickel PJSC (d) | | 66,556 | 663,767 |
| MMC Norilsk Nickel PJSC sponsored ADR (d) | | 85,403 | 63,419 |
| Mobile TeleSystems OJSC sponsored ADR (d) | | 504,110 | 502,089 |
| Moscow Exchange MICEX-RTS OAO (a)(d) | | 1,699,470 | 489,891 |
| Novatek PJSC GDR (Reg. S) (d) | | 110,438 | 28,214 |
| Novolipetsk Steel OJSC (d) | | 1,805,640 | 25,995 |
| PhosAgro PJSC: | | | |
| GDR (d) | | 1,019 | 21 |
| GDR (Reg. S) (d) | | 158,247 | 3,246 |
| Polyus PJSC (d) | | 41,353 | 145,829 |
| Rosneft Oil Co. OJSC (d) | | 1,187,356 | 297,773 |
| Rosneft Oil Co. OJSC GDR (Reg. S) (d) | | 214,392 | 50,693 |
| Sberbank of Russia (a)(d) | | 13,066,303 | 120,471 |
| Severstal PAO (d) | | 245,384 | 8,216 |
| Severstal PAO GDR (Reg. S) (d) | | 10,278 | 243 |
| Surgutneftegas OJSC (d) | | 6,111,900 | 112,150 |
| Surgutneftegas OJSC sponsored ADR (a)(d) | | 214,357 | 39,585 |
| Tatneft PAO (d) | | 1,520,327 | 283,564 |
| Tatneft PAO sponsored ADR (d) | | 24,387 | 22,517 |
| United Co. RUSAL International PJSC (d) | | 3,455,150 | 624,433 |
| VTB Bank OJSC (a)(d) | | 4,133,678,016 | 236,829 |
TOTAL RUSSIA | | | 7,219,969 |
| Saudi Arabia - 1.4% | | | |
| ACWA Power Co. | | 116,630 | 5,400,758 |
| Advanced Polypropylene Co. | | 184,348 | 2,173,389 |
| Al Rajhi Bank | | 2,823,633 | 64,024,040 |
| Alinma Bank | | 1,412,401 | 14,095,631 |
| Almarai Co. Ltd. | | 347,487 | 5,206,456 |
| Arab National Bank | | 852,374 | 7,315,687 |
| Bank Al-Jazira | | 558,397 | 3,474,424 |
| Bank Albilad | | 701,421 | 9,464,157 |
| Banque Saudi Fransi | | 854,956 | 9,829,303 |
| Bupa Arabia for Cooperative Insurance Co. | | 83,684 | 4,298,283 |
| Dar Al Arkan Real Estate Development Co. (a) | | 763,442 | 2,726,615 |
| Dr Sulaiman Al Habib Medical Services Group Co. | | 125,190 | 7,549,615 |
| Elm Co. | | 32,026 | 2,821,148 |
| Emaar The Economic City (a) | | 553,239 | 1,411,974 |
| Etihad Etisalat Co. | | 535,201 | 5,213,066 |
| Jarir Marketing Co. | | 84,269 | 3,677,959 |
| Mobile Telecommunications Co. Saudi Arabia (a) | | 682,727 | 2,358,397 |
| Mouwasat Medical Services Co. | | 71,036 | 4,140,167 |
| National Industrialization Co. (a) | | 416,590 | 1,483,407 |
| Rabigh Refining & Petrochemical Co. (a) | | 645,790 | 2,344,234 |
| Riyad Bank | | 1,929,906 | 18,464,191 |
| Sabic Agriculture-Nutrients Co. | | 307,072 | 12,993,692 |
| Sahara International Petrochemical Co. | | 501,787 | 5,415,088 |
| Saudi Arabian Mining Co. | | 1,239,411 | 27,608,069 |
| Saudi Arabian Oil Co. (c) | | 3,470,070 | 32,229,895 |
| Saudi Basic Industries Corp. | | 1,285,997 | 30,254,324 |
| Saudi Electricity Co. | | 1,195,290 | 8,588,796 |
| Saudi Industrial Investment Group | | 553,593 | 3,311,937 |
| Saudi Investment Bank/The | | 672,279 | 3,245,503 |
| Saudi Kayan Petrochemical Co. (a) | | 1,075,752 | 3,767,587 |
| Saudi Research & Marketing Group (a) | | 50,303 | 2,696,178 |
| Saudi Tadawul Group Holding Co. | | 51,758 | 2,991,800 |
| Saudi Telecom Co. | | 2,152,035 | 23,138,006 |
| The Saudi British Bank | | 1,322,304 | 15,307,906 |
| The Saudi National Bank | | 3,159,828 | 49,951,107 |
| The Savola Group | | 350,386 | 2,732,182 |
| Yanbu National Petrochemical Co. | | 368,972 | 4,389,309 |
TOTAL SAUDI ARABIA | | | 406,094,280 |
| Singapore - 0.8% | | | |
| BOC Aviation Ltd. Class A (c) | | 294,100 | 1,968,872 |
| CapitaLand Ascendas REIT | | 4,862,815 | 9,000,124 |
| CapitaLand Investment Ltd. | | 3,573,499 | 7,598,355 |
| CapitaMall Trust | | 7,660,539 | 10,173,646 |
| City Developments Ltd. | | 520,645 | 2,806,246 |
| DBS Group Holdings Ltd. | | 2,603,383 | 62,896,085 |
| Genting Singapore Ltd. | | 9,187,023 | 5,224,324 |
| Keppel Corp. Ltd. | | 2,018,057 | 9,936,322 |
| Mapletree Logistics Trust (REIT) | | 4,671,533 | 5,016,057 |
| Mapletree Pan Asia Commercial | | 3,393,089 | 3,811,113 |
| Oversea-Chinese Banking Corp. Ltd. | | 4,859,091 | 41,636,602 |
| Singapore Airlines Ltd. | | 1,807,539 | 6,716,343 |
| Singapore Exchange Ltd. | | 1,215,990 | 7,232,718 |
| Singapore Technologies Engineering Ltd. | | 2,422,997 | 5,648,411 |
| Singapore Telecommunications Ltd. | | 12,021,418 | 21,230,252 |
| United Overseas Bank Ltd. | | 1,695,615 | 33,251,111 |
| UOL Group Ltd. | | 552,249 | 2,414,822 |
| Venture Corp. Ltd. | | 393,770 | 4,431,164 |
| Wilmar International Ltd. | | 2,695,980 | 7,389,377 |
TOTAL SINGAPORE | | | 248,381,944 |
| South Africa - 1.0% | | | |
| Absa Group Ltd. | | 1,207,146 | 13,126,388 |
| African Rainbow Minerals Ltd. | | 168,071 | 2,366,696 |
| Anglo American Platinum Ltd. | | 75,085 | 5,972,546 |
| AngloGold Ashanti Ltd. | | 591,295 | 7,722,145 |
| Aspen Pharmacare Holdings Ltd. | | 533,004 | 4,389,095 |
| Bid Corp. Ltd. | | 491,578 | 7,909,672 |
| Bidvest Group Ltd./The | | 402,690 | 4,658,105 |
| Capitec Bank Holdings Ltd. | | 124,377 | 12,868,986 |
| Clicks Group Ltd. | | 361,883 | 6,131,941 |
| Discovery Ltd. (a) | | 706,853 | 4,626,219 |
| Exxaro Resources Ltd. | | 347,081 | 3,864,444 |
| FirstRand Ltd. (b) | | 7,186,198 | 25,174,922 |
| Foschini Group Ltd./The | | 498,147 | 3,116,275 |
| Gold Fields Ltd. | | 1,286,446 | 10,305,463 |
| Growthpoint Properties Ltd. (b) | | 4,825,438 | 3,401,942 |
| Harmony Gold Mining Co. Ltd. | | 803,883 | 2,226,389 |
| Impala Platinum Holdings Ltd. | | 1,215,718 | 12,447,331 |
| Kumba Iron Ore Ltd. | | 85,547 | 1,611,346 |
| Mr Price Group Ltd. | | 395,697 | 3,809,462 |
| MTN Group Ltd. | | 2,439,981 | 17,247,071 |
| MultiChoice Group Ltd. | | 530,248 | 3,464,888 |
| Naspers Ltd. Class N | | 312,286 | 32,191,026 |
| Nedbank Group Ltd. | | 656,431 | 7,774,788 |
| Northam Platinum Holdings Ltd. (a) | | 478,613 | 4,491,504 |
| Old Mutual Ltd. | | 6,506,289 | 3,697,892 |
| Pepkor Holdings Ltd. (c) | | 2,598,634 | 3,207,133 |
| Remgro Ltd. | | 738,536 | 5,496,577 |
| Sanlam Ltd. | | 2,568,726 | 7,473,166 |
| Sasol Ltd. | | 807,320 | 13,571,096 |
| Shoprite Holdings Ltd. | | 729,030 | 9,283,164 |
| Sibanye-Stillwater Ltd. | | 4,044,938 | 9,474,151 |
| Spar Group Ltd./The | | 274,045 | 2,323,648 |
| Standard Bank Group Ltd. | | 1,926,981 | 18,007,011 |
| Thungela Resources Ltd. | | 1 | 15 |
| Vodacom Group Ltd. | | 917,444 | 6,258,722 |
| Woolworths Holdings Ltd. | | 1,410,723 | 4,845,322 |
TOTAL SOUTH AFRICA | | | 284,536,541 |
| Spain - 1.5% | | | |
| Acciona SA (b) | | 35,567 | 6,400,649 |
| ACS Actividades de Construccion y Servicios SA | | 330,927 | 8,486,652 |
| Aena SME SA (a)(c) | | 104,761 | 12,312,721 |
| Amadeus IT Holding SA Class A (a) | | 642,883 | 33,529,758 |
| Banco Bilbao Vizcaya Argentaria SA | | 9,612,726 | 49,590,074 |
| Banco Santander SA (Spain) (b) | | 24,553,115 | 63,621,823 |
| Banco Santander SA (Spain) sponsored ADR | | 58,075 | 151,576 |
| CaixaBank SA | | 6,373,857 | 21,135,997 |
| Cellnex Telecom SA (c) | | 779,285 | 25,506,201 |
| EDP Renovaveis SA | | 427,860 | 9,010,564 |
| Enagas SA | | 327,846 | 5,322,222 |
| Endesa SA (b) | | 452,741 | 7,554,709 |
| Ferrovial SA | | 691,135 | 16,877,280 |
| Grifols SA (a) | | 422,162 | 3,590,437 |
| Iberdrola SA | | 8,557,927 | 87,027,955 |
| Industria de Diseno Textil SA (b) | | 1,579,444 | 35,806,714 |
| Naturgy Energy Group SA (b) | | 191,841 | 4,921,675 |
| Red Electrica Corporacion SA | | 583,974 | 9,446,199 |
| Repsol SA | | 2,071,282 | 28,178,712 |
| Siemens Gamesa Renewable Energy SA (a) | | 349,420 | 6,201,845 |
| Telefonica SA | | 7,488,224 | 25,813,386 |
TOTAL SPAIN | | | 460,487,149 |
| Sweden - 2.0% | | | |
| Alfa Laval AB | | 415,884 | 10,249,070 |
| ASSA ABLOY AB (B Shares) | | 1,430,798 | 28,890,789 |
| Atlas Copco AB: | | | |
| (A Shares) | | 3,759,551 | 40,126,642 |
| (B Shares) | | 2,368,981 | 22,910,800 |
| Boliden AB | | 393,728 | 11,468,221 |
| Electrolux AB (B Shares) (b) | | 308,289 | 3,804,610 |
| Embracer Group AB (a)(b) | | 930,237 | 4,479,649 |
| Epiroc AB: | | | |
| (A Shares) | | 971,663 | 14,874,662 |
| (B Shares) | | 530,766 | 7,131,393 |
| EQT AB | | 433,579 | 8,544,976 |
| Ericsson (B Shares) (b) | | 4,164,889 | 23,154,056 |
| Essity AB (B Shares) | | 870,371 | 18,398,778 |
| Evolution AB (c) | | 262,680 | 24,503,502 |
| Fastighets AB Balder (a) | | 884,881 | 3,325,557 |
| Getinge AB (B Shares) | | 334,391 | 6,793,093 |
| H&M Hennes & Mauritz AB (B Shares) (b) | | 1,073,736 | 10,814,843 |
| Hexagon AB (B Shares) | | 2,781,410 | 27,496,731 |
| Holmen AB (B Shares) | | 126,924 | 4,605,093 |
| Husqvarna AB (B Shares) (b) | | 630,809 | 3,745,209 |
| Industrivarden AB: | | | |
| (A Shares) | | 186,202 | 4,219,445 |
| (C Shares) | | 212,539 | 4,775,833 |
| Indutrade AB | | 385,940 | 6,758,459 |
| Investment AB Latour (B Shares) | | 210,366 | 3,558,114 |
| Investor AB: | | | |
| (A Shares) (b) | | 778,877 | 13,254,989 |
| (B Shares) | | 2,551,957 | 41,686,679 |
| Kinnevik AB (B Shares) (a) | | 343,292 | 4,244,046 |
| L E Lundbergforetagen AB | | 107,315 | 4,239,648 |
| Lifco AB | | 354,551 | 5,123,412 |
| Nibe Industrier AB (B Shares) | | 2,167,925 | 17,298,318 |
| Sagax AB | | 266,931 | 4,922,214 |
| Sandvik AB | | 1,529,204 | 23,896,486 |
| Securitas AB (B Shares) | | 888,955 | 7,273,502 |
| Skandinaviska Enskilda Banken AB (A Shares) | | 2,354,268 | 24,840,798 |
| Skanska AB (B Shares) | | 510,335 | 7,940,763 |
| SKF AB (B Shares) | | 541,091 | 7,832,630 |
| Svenska Cellulosa AB SCA (B Shares) | | 844,012 | 9,960,400 |
| Svenska Handelsbanken AB (A Shares) | | 2,085,995 | 19,381,052 |
| Swedbank AB (A Shares) | | 1,297,860 | 19,348,560 |
| Swedish Match Co. AB | | 2,185,687 | 22,479,559 |
| Swedish Orphan Biovitrum AB (a) | | 240,917 | 4,435,969 |
| Tele2 AB (B Shares) | | 848,405 | 6,955,550 |
| Telia Co. AB (b) | | 3,862,739 | 10,235,355 |
| Volvo AB: | | | |
| (A Shares) | | 334,450 | 5,712,900 |
| (B Shares) | | 2,123,366 | 34,752,995 |
| Volvo Car AB (b) | | 856,185 | 3,636,064 |
TOTAL SWEDEN | | | 594,081,414 |
| Switzerland - 6.6% | | | |
| ABB Ltd. (Reg.) (b) | | 2,393,635 | 66,471,967 |
| Accelleron Industries Ltd. (a) | | 5,825 | 98,775 |
| Adecco SA (Reg.) | | 241,324 | 7,552,467 |
| Alcon, Inc. (Switzerland) | | 723,334 | 44,020,546 |
| Bachem Holding AG (B Shares) (b) | | 48,337 | 3,468,331 |
| Baloise Holdings AG | | 67,626 | 9,238,764 |
| Barry Callebaut AG | | 5,093 | 9,633,137 |
| Clariant AG (Reg.) | | 311,349 | 5,009,070 |
| Coca-Cola HBC AG | | 305,811 | 6,672,145 |
| Compagnie Financiere Richemont SA Series A | | 752,021 | 73,497,687 |
| Credit Suisse Group AG (b) | | 3,629,302 | 15,034,252 |
| Credit Suisse Group AG sponsored ADR (b) | | 194,628 | 801,867 |
| Ems-Chemie Holding AG | | 10,702 | 6,727,826 |
| Geberit AG (Reg.) | | 52,001 | 23,124,827 |
| Givaudan SA | | 13,365 | 39,907,475 |
| Holcim AG | | 804,484 | 36,549,596 |
| Julius Baer Group Ltd. | | 321,419 | 15,421,321 |
| Kuehne & Nagel International AG | | 79,438 | 16,929,215 |
| Lindt & Spruengli AG | | 154 | 14,963,999 |
| Lindt & Spruengli AG (participation certificate) | | 1,562 | 14,974,984 |
| Logitech International SA (Reg.) (b) | | 253,783 | 12,634,027 |
| Lonza Group AG | | 108,156 | 55,677,001 |
| Nestle SA (Reg. S) | | 4,051,849 | 441,079,426 |
| Novartis AG | | 3,115,588 | 252,022,299 |
| Partners Group Holding AG | | 32,652 | 29,327,617 |
| Roche Holding AG: | | | |
| (Bearer) (b) | | 36,620 | 14,854,990 |
| (participation certificate) | | 1,014,097 | 336,475,547 |
| Schindler Holding AG: | | | |
| (participation certificate) | | 57,985 | 9,453,289 |
| (Reg.) | | 34,441 | 5,420,584 |
| SGS SA (Reg.) | | 9,236 | 20,360,869 |
| Sig Group AG | | 435,325 | 8,364,361 |
| Sika AG | | 211,230 | 47,627,259 |
| Sonova Holding AG | | 77,226 | 18,254,750 |
| Straumann Holding AG | | 161,363 | 15,357,135 |
| Swatch Group AG (Bearer) | | 47,558 | 10,686,734 |
| Swatch Group AG (Bearer) (Reg.) | | 48,249 | 2,016,017 |
| Swiss Life Holding AG | | 45,956 | 22,254,021 |
| Swiss Prime Site AG | | 111,488 | 8,996,086 |
| Swiss Re Ltd. | | 437,608 | 32,507,616 |
| Swisscom AG | | 38,133 | 18,823,730 |
| Temenos Group AG | | 92,082 | 5,489,884 |
| UBS Group AG | | 4,872,455 | 77,318,929 |
| UBS Group AG | | 194,394 | 3,083,089 |
| VAT Group AG (c) | | 38,554 | 8,809,263 |
| Zurich Insurance Group Ltd. | | 217,303 | 92,608,880 |
TOTAL SWITZERLAND | | | 1,959,601,654 |
| Taiwan - 3.5% | | | |
| Accton Technology Corp. | | 701,000 | 5,281,298 |
| Acer, Inc. | | 4,180,060 | 2,864,120 |
| Advantech Co. Ltd. | | 640,076 | 5,814,543 |
| ASE Technology Holding Co. Ltd. | | 4,743,943 | 11,702,070 |
| Asia Cement Corp. | | 3,649,785 | 4,220,778 |
| ASMedia Technology, Inc. | | 36,000 | 649,594 |
| ASUSTeK Computer, Inc. | | 1,035,422 | 7,576,102 |
| AUO Corp. | | 11,751,600 | 6,157,439 |
| Catcher Technology Co. Ltd. | | 936,000 | 4,918,832 |
| Cathay Financial Holding Co. Ltd. | | 11,418,332 | 13,381,688 |
| Chang Hwa Commercial Bank | | 6,959,610 | 3,581,867 |
| Cheng Shin Rubber Industry Co. Ltd. | | 2,713,513 | 2,717,383 |
| China Airlines Ltd. | | 4,061,000 | 2,134,121 |
| China Development Financial Ho | | 22,796,457 | 8,304,656 |
| China Steel Corp. | | 17,240,421 | 14,351,873 |
| Chunghwa Picture Tubes, Ltd. (a)(d) | | 551 | 0 |
| Chunghwa Telecom Co. Ltd. | | 5,490,400 | 18,911,953 |
| Compal Electronics, Inc. | | 6,323,394 | 4,136,653 |
| CTBC Financial Holding Co. Ltd. | | 25,348,255 | 16,032,257 |
| Delta Electronics, Inc. | | 2,782,383 | 22,213,171 |
| E Ink Holdings, Inc. | | 1,203,000 | 7,664,677 |
| E.SUN Financial Holdings Co. Ltd. | | 18,481,314 | 13,293,436 |
| ECLAT Textile Co. Ltd. | | 275,420 | 3,624,846 |
| eMemory Technology, Inc. | | 94,000 | 3,132,945 |
| EVA Airways Corp. | | 3,398,000 | 2,465,220 |
| Evergreen Marine Corp. (Taiwan) | | 1,529,221 | 6,519,126 |
| Far Eastern New Century Corp. | | 4,714,032 | 4,698,832 |
| Far EasTone Telecommunications Co. Ltd. | | 2,317,000 | 5,078,809 |
| Feng Tay Enterprise Co. Ltd. | | 647,563 | 3,222,356 |
| First Financial Holding Co. Ltd. | | 15,309,378 | 11,747,600 |
| Formosa Chemicals & Fibre Corp. | | 5,018,620 | 10,813,979 |
| Formosa Petrochemical Corp. | | 1,636,000 | 4,209,958 |
| Formosa Plastics Corp. | | 5,947,640 | 15,323,646 |
| Fubon Financial Holding Co. Ltd. | | 10,708,201 | 16,931,799 |
| Giant Manufacturing Co. Ltd. | | 420,042 | 2,676,215 |
| GlobalWafers Co. Ltd. | | 316,000 | 3,512,309 |
| Hon Hai Precision Industry Co. Ltd. (Foxconn) | | 17,967,593 | 57,099,221 |
| Hotai Motor Co. Ltd. | | 431,000 | 7,803,807 |
| Hua Nan Financial Holdings Co. Ltd. | | 12,606,634 | 8,227,496 |
| Innolux Corp. | | 14,460,576 | 5,312,762 |
| Inventec Corp. | | 3,527,209 | 2,668,317 |
| Largan Precision Co. Ltd. | | 142,000 | 8,144,726 |
| Lite-On Technology Corp. | | 2,854,053 | 5,663,155 |
| MediaTek, Inc. | | 2,193,989 | 40,133,116 |
| Mega Financial Holding Co. Ltd. | | 16,069,578 | 14,896,769 |
| Micro-Star International Co. Ltd. | | 1,029,000 | 3,493,381 |
| momo.com, Inc. | | 81,600 | 1,220,686 |
| Nan Ya Plastics Corp. | | 6,863,980 | 14,534,936 |
| Nan Ya Printed Circuit Board Corp. | | 316,000 | 2,072,115 |
| Nanya Technology Corp. | | 1,889,000 | 3,191,868 |
| Nien Made Enterprise Co. Ltd. | | 229,000 | 1,767,874 |
| Novatek Microelectronics Corp. | | 828,000 | 6,186,768 |
| Pegatron Corp. | | 2,906,652 | 5,316,936 |
| Pou Chen Corp. | | 3,126,240 | 2,641,224 |
| Powerchip Semiconductor Manufacturing Corp. | | 4,247,554 | 4,056,076 |
| President Chain Store Corp. | | 823,000 | 6,838,346 |
| Quanta Computer, Inc. | | 3,906,000 | 8,283,326 |
| Realtek Semiconductor Corp. | | 652,744 | 5,160,592 |
| Ruentex Development Co. Ltd. | | 2,475,735 | 3,039,595 |
| Shin Kong Financial Holding Co. Ltd. | | 18,917,616 | 4,692,160 |
| Sinopac Financial Holdings Co. | | 14,710,682 | 7,343,027 |
| Synnex Technology International Corp. | | 1,892,920 | 3,086,984 |
| Taishin Financial Holdings Co. Ltd. | | 15,424,842 | 6,336,552 |
| Taiwan Cement Corp. | | 8,763,302 | 8,218,822 |
| Taiwan Cooperative Financial Holding Co. Ltd. | | 14,164,852 | 10,979,144 |
| Taiwan High Speed Rail Corp. | | 2,484,000 | 2,164,085 |
| Taiwan Mobile Co. Ltd. | | 2,512,400 | 7,407,740 |
| Taiwan Semiconductor Manufacturing Co. Ltd. | | 35,476,000 | 426,083,363 |
| The Shanghai Commercial & Savings Bank Ltd. | | 5,101,815 | 7,339,375 |
| The Shanghai Commercial & Savings Bank Ltd. rights (a) | | 373,996 | 108,996 |
| Uni-President Enterprises Corp. | | 7,044,620 | 14,305,903 |
| Unimicron Technology Corp. | | 1,807,000 | 6,974,995 |
| United Microelectronics Corp. | | 17,065,000 | 20,499,960 |
| Vanguard International Semiconductor Corp. | | 1,395,000 | 2,871,830 |
| Voltronic Power Technology Corp. | | 94,000 | 3,817,821 |
| Walsin Lihwa Corp. | | 3,846,600 | 4,263,532 |
| Wan Hai Lines Ltd. | | 1,091,050 | 2,290,075 |
| Win Semiconductors Corp. | | 470,000 | 1,777,764 |
| Winbond Electronics Corp. | | 4,623,000 | 2,794,956 |
| Wiwynn Corp. | | 129,000 | 2,895,641 |
| WPG Holding Co. Ltd. | | 2,222,378 | 3,028,260 |
| Yageo Corp. | | 492,909 | 5,608,532 |
| Yang Ming Marine Transport Corp. | | 2,527,000 | 4,716,482 |
| Yuanta Financial Holding Co. Ltd. | | 14,467,365 | 8,836,333 |
TOTAL TAIWAN | | | 1,056,061,575 |
| Thailand - 0.6% | | | |
| Advanced Info Service PCL (For. Reg.) | | 894,500 | 4,490,722 |
| Advanced Information Service PCL NVDR | | 859,100 | 4,313,000 |
| Airports of Thailand PCL: | | | |
| (For. Reg.) (a) | | 2,920,100 | 5,679,784 |
| NVDR (a) | | 2,943,100 | 5,724,521 |
| Asset World Corp. PCL: | | | |
| (For. Reg.) | | 8,077,300 | 1,295,086 |
| NVDR | | 6,977,600 | 1,118,764 |
| B. Grimm Power PCL (For. Reg.) | | 794,300 | 704,629 |
| Bangkok Commercial Asset Management PCL: | | | |
| (For. Reg.) | | 259,500 | 104,359 |
| NVDR | | 2,181,100 | 877,141 |
| Bangkok Dusit Medical Services PCL: | | | |
| (For. Reg.) | | 8,284,500 | 6,423,781 |
| NVDR | | 6,471,000 | 5,017,598 |
| Bangkok Expressway and Metro PCL: | | | |
| (For. Reg.) | | 5,848,100 | 1,444,924 |
| NVDR | | 4,958,000 | 1,225,002 |
| Berli Jucker PCL: | | | |
| unit | | 1,135,000 | 1,021,783 |
| (For. Reg.) | | 600,400 | 540,510 |
| BTS Group Holdings PCL: | | | |
| (For. Reg.) | | 3,939,900 | 859,539 |
| NVDR | | 6,906,300 | 1,506,697 |
| Bumrungrad Hospital PCL: | | | |
| NVDR | | 439,500 | 2,622,329 |
| (For. Reg.) | | 333,600 | 1,990,464 |
| Carabao Group PCL NVDR | | 462,500 | 1,097,138 |
| Central Pattana PCL: | | | |
| (For. Reg.) | | 1,878,700 | 3,394,943 |
| NVDR | | 854,500 | 1,544,142 |
| Central Retail Corp. PCL: | | | |
| (For. Reg.) | | 1,222,150 | 1,349,200 |
| NVDR | | 1,396,000 | 1,541,122 |
| Charoen Pokphand Foods PCL: | | | |
| (For. Reg.) | | 3,517,640 | 2,334,615 |
| (NVDR) | | 2,051,700 | 1,361,688 |
| CP ALL PCL: | | | |
| (For. Reg.) | | 4,617,300 | 7,281,850 |
| NVDR | | 3,782,600 | 5,965,462 |
| Delta Electronics PCL: | | | |
| (For. Reg.) | | 273,200 | 4,164,963 |
| NVDR | | 209,200 | 3,189,276 |
| Electricity Generating PCL: | | | |
| (For. Reg.) | | 240,100 | 1,076,017 |
| NVDR | | 202,800 | 908,855 |
| Energy Absolute PCL: | | | |
| (For. Reg.) | | 1,281,300 | 3,249,979 |
| NVDR | | 1,119,000 | 2,838,310 |
| Global Power Synergy Public Co. Ltd.: | | | |
| (For. Reg.) | | 488,700 | 796,410 |
| NVDR | | 703,700 | 1,146,784 |
| Gulf Energy Development PCL: | | | |
| (For. Reg.) | | 1,475,300 | 1,958,277 |
| NVDR | | 2,935,800 | 3,896,909 |
| Home Product Center PCL: | | | |
| (For. Reg.) | | 5,041,347 | 1,934,648 |
| NVDR | | 3,966,500 | 1,522,168 |
| Indorama Ventures PCL NVDR | | 2,353,300 | 2,597,939 |
| Intouch Holdings PCL: | | | |
| (For. Reg.) | | 1,148,900 | 2,174,288 |
| NVDR | | 530,100 | 1,003,212 |
| JMT Network Services PCL NVDR | | 1,017,000 | 1,737,548 |
| Kasikornbank PCL NVDR | | 876,500 | 3,363,622 |
| Krung Thai Bank PCL: | | | |
| (For. Reg.) | | 1,971,475 | 906,842 |
| NVDR | | 3,089,700 | 1,421,205 |
| Krungthai Card PCL: | | | |
| (For. Reg.) | | 502,900 | 753,458 |
| NVDR | | 892,700 | 1,337,466 |
| Land & House PCL: | | | |
| NVDR | | 3,732,600 | 902,613 |
| (For. Reg.) | | 7,055,500 | 1,706,153 |
| Minor International PCL: | | | |
| unit (a) | | 2,210,382 | 1,641,301 |
| warrants 2/15/24 (a) | | 12,037 | 949 |
| (For. Reg.) (a) | | 2,339,241 | 1,736,984 |
| Muangthai Leasing PCL: | | | |
| (For. Reg.) | | 569,191 | 542,336 |
| NVDR | | 394,600 | 375,982 |
| Osotspa PCL: | | | |
| (For. Reg.) | | 630,600 | 439,240 |
| NVDR | | 1,455,100 | 1,013,541 |
| PTT Exploration and Production PCL: | | | |
| (For. Reg.) | | 1,224,151 | 5,840,016 |
| NVDR | | 769,000 | 3,668,642 |
| PTT Global Chemical PCL: | | | |
| (For. Reg.) | | 2,006,886 | 2,294,639 |
| NVDR | | 1,222,000 | 1,397,214 |
| PTT Oil & Retail Business PCL NVDR | | 4,540,300 | 2,876,100 |
| PTT PCL: | | | |
| (For. Reg.) | | 7,683,000 | 7,270,022 |
| NVDR | | 6,460,400 | 6,113,140 |
| Ratch Group PCL: | | | |
| unit | | 972,900 | 1,048,466 |
| (For. Reg.) | | 514,200 | 554,139 |
| SCB X PCL: | | | |
| (For. Reg.) | | 344,200 | 959,001 |
| NVDR unit | | 897,200 | 2,499,756 |
| SCG Packaging PCL NVDR | | 1,775,700 | 2,427,031 |
| Siam Cement PCL: | | | |
| (For. Reg.) | | 581,550 | 4,952,614 |
| NVDR | | 542,800 | 4,622,610 |
| Siam Commercial Bank PCL (For. Reg.) | | 269,700 | 624,216 |
| Srisawad Corp. PCL: | | | |
| warrants 8/29/25 (a) | | 22,064 | 1,879 |
| (For. Reg.) | | 677,100 | 729,691 |
| NVDR | | 585,900 | 631,408 |
| Thai Oil PCL: | | | |
| (For. Reg.) | | 1,142,045 | 1,635,996 |
| NVDR | | 800,054 | 1,146,089 |
| Thai Union Frozen Products PCL: | | | |
| (For. Reg.) | | 2,880,000 | 1,362,597 |
| NVDR | | 1,455,500 | 688,632 |
| rights (a)(d) | | 41,271 | 19,098 |
| rights (a)(d) | | 81,664 | 37,791 |
| True Corp. PCL: | | | |
| (For. Reg.) | | 6,974,635 | 909,297 |
| NVDR | | 9,513,100 | 1,240,241 |
TOTAL THAILAND | | | 178,718,393 |
| Turkey - 0.1% | | | |
| Akbank TAS | | 4,761,832 | 3,740,037 |
| Aselsan A/S | | 1,063,371 | 1,840,623 |
| Bim Birlesik Magazalar A/S JSC | | 679,791 | 4,893,670 |
| Eregli Demir ve Celik Fabrikalari T.A.S. | | 2,063,723 | 3,292,777 |
| Ford Otomotiv Sanayi A/S | | 89,616 | 1,747,619 |
| Haci Omer Sabanci Holding A/S | | 1,430,561 | 2,577,650 |
| Koc Holding A/S | | 1,130,138 | 3,375,676 |
| Turk Hava Yollari AO (a) | | 800,029 | 4,353,812 |
| Turk Sise ve Cam Fabrikalari A/S | | 2,050,761 | 3,659,899 |
| Turkcell Iletisim Hizmet A/S | | 1,683,080 | 2,318,341 |
| Turkiye Is Bankasi A/S Series C | | 4,837,100 | 2,421,896 |
| Turkiye Petrol Rafinerileri A/S (a) | | 183,008 | 3,726,179 |
TOTAL TURKEY | | | 37,948,179 |
| United Arab Emirates - 0.4% | | | |
| Abu Dhabi Commercial Bank PJSC | | 3,985,366 | 10,253,385 |
| Abu Dhabi Islamic Bank | | 2,067,341 | 5,346,911 |
| Abu Dhabi National Oil Co. for Distribution PJSC | | 4,518,145 | 5,547,585 |
| Aldar Properties PJSC | | 5,455,232 | 6,415,998 |
| Dubai Islamic Bank Pakistan Ltd. | | 4,177,251 | 6,618,824 |
| Emaar Properties PJSC (a) | | 5,752,103 | 9,490,007 |
| Emirates NBD Bank PJSC | | 2,710,439 | 9,777,386 |
| Emirates Telecommunications Corp. | | 5,032,734 | 35,350,123 |
| First Abu Dhabi Bank PJSC | | 6,360,817 | 30,997,965 |
TOTAL UNITED ARAB EMIRATES | | | 119,798,184 |
| United Kingdom - 9.0% | | | |
| 3i Group PLC | | 1,395,102 | 18,580,498 |
| Abrdn PLC | | 3,141,712 | 5,728,635 |
| Admiral Group PLC | | 262,476 | 6,071,321 |
| Anglo American PLC (United Kingdom) | | 1,832,542 | 54,892,360 |
| Antofagasta PLC | | 578,015 | 7,792,009 |
| Ashtead Group PLC | | 638,779 | 33,331,105 |
| Associated British Foods PLC | | 522,767 | 8,102,517 |
| AstraZeneca PLC (United Kingdom) | | 2,231,439 | 261,819,629 |
| Auto Trader Group PLC (c) | | 1,386,640 | 8,300,124 |
| Aveva Group PLC | | 173,793 | 6,218,341 |
| Aviva PLC | | 4,103,317 | 19,682,086 |
| BAE Systems PLC | | 4,520,044 | 42,278,548 |
| Barclays PLC | | 24,143,963 | 41,026,724 |
| Barratt Developments PLC | | 1,487,688 | 6,416,534 |
| Berkeley Group Holdings PLC | | 161,514 | 6,429,134 |
| BP PLC | | 22,948,667 | 126,965,983 |
| BP PLC sponsored ADR | | 794,478 | 26,440,228 |
| British American Tobacco PLC (United Kingdom) | | 3,088,919 | 121,992,138 |
| British Land Co. PLC | | 1,273,622 | 5,344,298 |
| BT Group PLC | | 10,018,524 | 14,913,038 |
| Bunzl PLC | | 482,873 | 15,732,286 |
| Burberry Group PLC | | 570,784 | 11,880,538 |
| Compass Group PLC | | 2,578,347 | 54,304,697 |
| Croda International PLC | | 201,725 | 15,638,464 |
| Diageo PLC | | 3,303,646 | 135,953,344 |
| GSK PLC | | 5,858,619 | 95,970,615 |
| Haleon PLC (a) | | 7,356,491 | 22,609,616 |
| Halma PLC | | 545,753 | 13,237,141 |
| Hargreaves Lansdown PLC | | 509,289 | 4,457,490 |
| Hikma Pharmaceuticals PLC | | 239,714 | 3,433,551 |
| HSBC Holdings PLC (United Kingdom) | | 28,941,549 | 148,529,577 |
| Imperial Brands PLC | | 1,290,474 | 31,434,784 |
| Informa PLC | | 2,114,963 | 13,475,742 |
| InterContinental Hotel Group PLC | | 271,040 | 14,563,182 |
| Intertek Group PLC | | 236,133 | 9,894,934 |
| J Sainsbury PLC | | 2,713,118 | 6,047,795 |
| JD Sports Fashion PLC | | 3,702,747 | 4,137,605 |
| Johnson Matthey PLC | | 271,963 | 6,033,457 |
| Kingfisher PLC | | 2,911,132 | 7,314,029 |
| Land Securities Group PLC | | 1,011,303 | 6,615,284 |
| Legal & General Group PLC | | 8,602,092 | 23,012,854 |
| Lloyds Banking Group PLC | | 100,535,818 | 48,284,132 |
| London Stock Exchange Group PLC | | 475,089 | 41,181,687 |
| M&G PLC | | 3,758,425 | 7,551,403 |
| Melrose Industries PLC | | 6,381,417 | 8,554,986 |
| Mondi PLC | | 441,331 | 7,401,981 |
| Mondi PLC | | 253,585 | 4,338,159 |
| National Grid PLC | | 5,213,022 | 56,796,536 |
| NatWest Group PLC | | 7,735,504 | 20,829,286 |
| Next PLC | | 188,809 | 10,672,574 |
| NMC Health PLC (a) | | 75,611 | 1,512 |
| Ocado Group PLC (a) | | 820,644 | 4,448,955 |
| Pearson PLC | | 633,762 | 7,005,050 |
| Pearson PLC sponsored ADR | | 327,892 | 3,646,159 |
| Persimmon PLC | | 451,827 | 6,761,925 |
| Phoenix Group Holdings PLC | | 1,131,347 | 7,037,253 |
| Prudential PLC | | 3,972,273 | 36,901,110 |
| Reckitt Benckiser Group PLC | | 1,027,898 | 68,215,442 |
| RELX PLC (London Stock Exchange) | | 2,774,800 | 74,532,500 |
| Rentokil Initial PLC | | 3,619,635 | 22,586,923 |
| Rio Tinto PLC | | 1,620,192 | 84,673,912 |
| Rolls-Royce Holdings PLC (a) | | 12,169,412 | 10,914,303 |
| Sage Group PLC | | 1,462,381 | 12,188,861 |
| Schroders PLC | | 1,060,938 | 4,765,750 |
| Segro PLC | | 1,746,999 | 15,727,149 |
| Severn Trent PLC | | 366,402 | 10,517,351 |
| Shell PLC (London) | | 10,711,909 | 296,737,099 |
| Smith & Nephew PLC | | 1,257,162 | 14,855,776 |
| Smiths Group PLC | | 557,527 | 9,977,399 |
| Spirax-Sarco Engineering PLC | | 106,387 | 13,115,496 |
| SSE PLC | | 1,543,383 | 27,581,620 |
| St. James's Place PLC | | 801,285 | 9,786,430 |
| Standard Chartered PLC (United Kingdom) | | 3,636,290 | 21,692,847 |
| Taylor Wimpey PLC | | 5,187,876 | 5,579,400 |
| Tesco PLC | | 11,017,912 | 27,212,971 |
| Unilever PLC | | 3,678,284 | 167,194,041 |
| United Utilities Group PLC | | 995,074 | 10,723,118 |
| Vodafone Group PLC | | 30,454,745 | 35,552,951 |
| Vodafone Group PLC sponsored ADR | | 806,369 | 9,523,218 |
| Whitbread PLC | | 302,837 | 8,913,131 |
TOTAL UNITED KINGDOM | | | 2,700,582,631 |
| United States of America - 0.2% | | | |
| 360 DigiTech, Inc. ADR | | 155,705 | 1,581,963 |
| Coca-Cola European Partners PLC | | 296,647 | 13,957,241 |
| Legend Biotech Corp. ADR (a) | | 75,620 | 3,767,388 |
| Li Auto, Inc. ADR (a) | | 792,237 | 10,790,268 |
| NICE Ltd. sponsored ADR (a)(b) | | 22,281 | 4,230,939 |
| Southern Copper Corp. (b) | | 122,741 | 5,765,145 |
| Yum China Holdings, Inc. | | 608,102 | 25,145,018 |
TOTAL UNITED STATES OF AMERICA | | | 65,237,962 |
| TOTAL COMMON STOCKS (Cost $32,281,766,728) | | | 28,696,616,872 |
| | | | |
| Nonconvertible Preferred Stocks - 1.1% |
| | | Shares | Value ($) |
| Brazil - 0.5% | | | |
| Ambev SA sponsored ADR | | 491,407 | 1,493,877 |
| Banco Bradesco SA: | | | |
| (PN) | | 7,823,934 | 30,080,985 |
| (PN) sponsored ADR | | 1,392,823 | 5,278,799 |
| Braskem SA Class A | | 273,800 | 1,786,816 |
| Centrais Eletricas Brasileiras SA (Electrobras) (PN-B) | | 350,342 | 3,616,346 |
| Companhia Energetica de Minas Gerais (CEMIG) (PN) | | 2,079,554 | 4,577,394 |
| Gerdau SA | | 1,666,750 | 8,308,743 |
| Itau Unibanco Holding SA | | 5,918,961 | 34,834,269 |
| Itau Unibanco Holding SA sponsored ADR | | 1,038,799 | 6,045,810 |
| Itausa-Investimentos Itau SA (PN) | | 6,747,362 | 14,028,975 |
| Petroleo Brasileiro SA - Petrobras: | | | |
| (PN) (non-vtg.) | | 5,226,940 | 30,164,569 |
| (PN) sponsored ADR (non-vtg.) | | 905,983 | 10,427,864 |
| sponsored ADR | | 315,461 | 4,044,210 |
TOTAL BRAZIL | | | 154,688,657 |
| Chile - 0.1% | | | |
| Sociedad Quimica y Minera de Chile SA (PN-B) | | 205,118 | 19,522,625 |
| Colombia - 0.0% | | | |
| Bancolombia SA (PN) | | 682,954 | 4,321,400 |
| France - 0.0% | | | |
| Air Liquide SA (a) | | 46,389 | 6,068,320 |
| Germany - 0.3% | | | |
| Bayerische Motoren Werke AG (BMW) (non-vtg.) | | 103,408 | 7,633,814 |
| Dr. Ing. h.c. F. Porsche AG Series F (a) | | 163,808 | 16,754,917 |
| Henkel AG & Co. KGaA | | 262,048 | 16,508,661 |
| Porsche Automobil Holding SE (Germany) | | 220,417 | 12,315,204 |
| Sartorius AG (non-vtg.) | | 34,975 | 12,342,820 |
| Volkswagen AG | | 267,555 | 34,247,422 |
TOTAL GERMANY | | | 99,802,838 |
| Korea (South) - 0.2% | | | |
| AMOREPACIFIC Corp. | | 1 | 26 |
| Hyundai Motor Co. | | 33,896 | 1,861,843 |
| Hyundai Motor Co. Series 2 | | 56,952 | 3,184,128 |
| LG Chemical Ltd. | | 9,326 | 1,888,304 |
| LG H & H Co. Ltd. | | 1,381 | 271,397 |
| Samsung Electronics Co. Ltd. | | 1,157,107 | 43,209,514 |
TOTAL KOREA (SOUTH) | | | 50,415,212 |
| Russia - 0.0% | | | |
| Surgutneftegas OJSC (d) | | 8,898,217 | 232,156 |
| TOTAL NONCONVERTIBLE PREFERRED STOCKS (Cost $362,840,324) | | | 335,051,208 |
| | | | |
| Nonconvertible Bonds - 0.0% |
| | | Principal Amount (e) | Value ($) |
| India - 0.0% | | | |
NTPC Ltd. 8.49% 3/25/25 (Cost $46,681) | INR | 233,068 | 37,613 |
| | | | |
| U.S. Government and Government Agency Obligations - 0.2% |
| | | Principal Amount (e) | Value ($) |
| U.S. Treasury Obligations - 0.2% | | | |
U.S. Treasury Bills, yield at date of purchase 1.15% 1/26/23 (f) (Cost $39,891,114) | | 40,000,000 | 39,618,972 |
| | | | |
| Money Market Funds - 3.9% |
| | | Shares | Value ($) |
| Fidelity Cash Central Fund 3.10% (g) | | 397,580,632 | 397,660,148 |
| Fidelity Securities Lending Cash Central Fund 3.10% (g)(h) | | 772,551,646 | 772,628,901 |
| TOTAL MONEY MARKET FUNDS (Cost $1,170,288,641) | | | 1,170,289,049 |
| | | | |
| TOTAL INVESTMENT IN SECURITIES - 101.2% (Cost $33,854,833,488) | 30,241,613,714 |
NET OTHER ASSETS (LIABILITIES) - (1.2)% | (355,133,790) |
| NET ASSETS - 100.0% | 29,886,479,924 |
| | |
| Futures Contracts |
| | Number of contracts | Expiration Date | Notional Amount ($) | Value ($) | Unrealized Appreciation/ (Depreciation) ($) |
| Purchased | | | | | |
| | | | | | |
| Equity Index Contracts | | | | | |
| ICE E-mini MSCI EAFE Index Contracts (United States) | 6,360 | Dec 2022 | 558,376,200 | 16,505,520 | 16,505,520 |
| ICE E-mini MSCI Emerging Markets Index Contracts (United States) | 5,630 | Dec 2022 | 240,288,400 | (1,916,194) | (1,916,194) |
| TME S&P/TSX 60 Index Contracts (Canada) | 431 | Dec 2022 | 74,510,309 | 2,191,263 | 2,191,263 |
| | | | | | |
| TOTAL FUTURES CONTRACTS | | | | | 16,780,589 |
| The notional amount of futures purchased as a percentage of Net Assets is 2.9% |
Currency Abbreviations
Categorizations in the Schedule of Investments are based on country or territory of incorporation.
Legend
| (b) | Security or a portion of the security is on loan at period end. |
| (c) | Security exempt from registration under Rule 144A of the Securities Act of 1933. These securities may be resold in transactions exempt from registration, normally to qualified institutional buyers. At the end of the period, the value of these securities amounted to $677,727,571 or 2.3% of net assets. |
| (e) | Amount is stated in United States dollars unless otherwise noted. |
| (f) | Security or a portion of the security was pledged to cover margin requirements for futures contracts. At period end, the value of securities pledged amounted to $29,492,363. |
| (g) | Affiliated fund that is generally available only to investment companies and other accounts managed by Fidelity Investments. The rate quoted is the annualized seven-day yield of the fund at period end. A complete unaudited listing of the fund's holdings as of its most recent quarter end is available upon request. In addition, each Fidelity Central Fund's financial statements, which are not covered by the Fund's Report of Independent Registered Public Accounting Firm, are available on the SEC's website or upon request. |
| (h) | Investment made with cash collateral received from securities on loan. |
Affiliated Central Funds
Fiscal year to date information regarding the Fund's investments in Fidelity Central Funds, including the ownership percentage, is presented below.
| Affiliate | Value, beginning of period ($) | Purchases ($) | Sales Proceeds ($) | Dividend Income ($) | Realized Gain (loss) ($) | Change in Unrealized appreciation (depreciation) ($) | Value, end of period ($) | % ownership, end of period |
| Fidelity Cash Central Fund 3.10% | 489,430,157 | 8,487,387,283 | 8,579,157,292 | 8,245,718 | - | - | 397,660,148 | 0.8% |
| Fidelity Securities Lending Cash Central Fund 3.10% | 703,170,009 | 7,357,778,469 | 7,288,319,577 | 6,110,549 | - | - | 772,628,901 | 2.2% |
| Total | 1,192,600,166 | 15,845,165,752 | 15,867,476,869 | 14,356,267 | - | - | 1,170,289,049 | |
| | | | | | | | | |
Amounts in the income column in the above table include any capital gain distributions from underlying funds, which are presented in the corresponding line item in the Statement of Operations, if applicable.
Amount for Fidelity Securities Lending Cash Central Fund represents the income earned on investing cash collateral, less rebates paid to borrowers and any lending agent fees associated with the loan, plus any premium payments received for lending certain types of securities.
Investment Valuation
The following is a summary of the inputs used, as of October 31, 2022, involving the Fund's assets and liabilities carried at fair value. The inputs or methodology used for valuing securities may not be an indication of the risk associated with investing in those securities. For more information on valuation inputs, and their aggregation into the levels used below, please refer to the Investment Valuation section in the accompanying Notes to Financial Statements.
| Valuation Inputs at Reporting Date: |
| Description | Total ($) | Level 1 ($) | Level 2 ($) | Level 3 ($) |
Investments in Securities: | | | | |
|
| Equities: | | | | |
Communication Services | 1,649,154,800 | 679,822,788 | 966,697,095 | 2,634,917 |
Consumer Discretionary | 3,108,476,200 | 1,338,518,892 | 1,769,751,327 | 205,981 |
Consumer Staples | 2,637,091,462 | 1,148,683,125 | 1,488,295,572 | 112,765 |
Energy | 1,924,070,384 | 1,109,772,937 | 810,854,095 | 3,443,352 |
Financials | 6,074,798,646 | 3,932,917,358 | 2,140,761,669 | 1,119,619 |
Health Care | 2,904,367,697 | 946,120,293 | 1,958,247,404 | - |
Industrials | 3,620,704,739 | 2,052,911,574 | 1,567,793,165 | - |
Information Technology | 3,155,802,597 | 1,751,362,809 | 1,404,439,788 | - |
Materials | 2,359,777,016 | 1,526,304,991 | 831,162,789 | 2,309,236 |
Real Estate | 632,258,024 | 525,541,448 | 106,367,155 | 349,421 |
Utilities | 965,166,515 | 563,903,837 | 400,914,506 | 348,172 |
|
| Corporate Bonds | 37,613 | - | 37,613 | - |
|
| U.S. Government and Government Agency Obligations | 39,618,972 | - | 39,618,972 | - |
|
| Money Market Funds | 1,170,289,049 | 1,170,289,049 | - | - |
| Total Investments in Securities: | 30,241,613,714 | 16,746,149,101 | 13,484,941,150 | 10,523,463 |
Derivative Instruments: | | | | |
|
| Assets | | | | |
Futures Contracts | 18,696,783 | 18,696,783 | - | - |
| Total Assets | 18,696,783 | 18,696,783 | - | - |
|
| Liabilities | | | | |
Futures Contracts | (1,916,194) | (1,916,194) | - | - |
| Total Liabilities | (1,916,194) | (1,916,194) | - | - |
| Total Derivative Instruments: | 16,780,589 | 16,780,589 | - | - |
The following is a reconciliation of Investments in Securities for which Level 3 inputs were used in determining value:
| |
| Investments in Securities: | |
| Beginning Balance | $ | 3,859,727 | |
| Net Realized Gain (Loss) on Investment Securities | | (3,616,698) | |
| Net Unrealized Gain (Loss) on Investment Securities | | (370,795,871) | |
| Cost of Purchases | | 40,336,531 | |
| Proceeds of Sales | | (7,099,120) | |
| Amortization/Accretion | | - | |
| Transfers into Level 3 | | 347,838,894 | |
| Transfers out of Level 3 | | - | |
| Ending Balance | $ | 10,523,463 | |
| The change in unrealized gain (loss) for the period attributable to Level 3 securities held at October 31, 2022 | $ | (371,053,752) | |
| The information used in the above reconciliation represents fiscal year to date activity for any Investments in Securities identified as using Level 3 inputs at either the beginning or the end of the current fiscal period. Cost of purchases and proceeds of sales may include securities received and/or delivered through in-kind transactions. Transfers into Level 3 were attributable to a lack of observable market data resulting from decreases in market activity, decreases in liquidity, security restructurings or corporate actions. Transfers out of Level 3 were attributable to observable market data becoming available for those securities. Transfers in or out of Level 3 represent the beginning value of any Security or Instrument where a change in the pricing level occurred from the beginning to the end of the period. The cost of purchases and the proceeds of sales may include securities received or delivered through corporate actions or exchanges. Realized and unrealized gains (losses) disclosed in the reconciliation are included in Net Gain (Loss) on the Fund's Statement of Operations. | |
Value of Derivative Instruments
The following table is a summary of the Fund's value of derivative instruments by primary risk exposure as of October 31, 2022. For additional information on derivative instruments, please refer to the Derivative Instruments section in the accompanying Notes to Financial Statements.
Primary Risk Exposure / Derivative Type | Value |
| Asset ($) | Liability ($) |
| Equity Risk | | |
Futures Contracts (a) | 18,696,783 | (1,916,194) |
| Total Equity Risk | 18,696,783 | (1,916,194) |
| Total Value of Derivatives | 18,696,783 | (1,916,194) |
(a)Reflects gross cumulative appreciation (depreciation) on futures contracts as presented in the Schedule of Investments. In the Statement of Assets and Liabilities, the period end daily variation margin is included in receivable or payable for daily variation margin on futures contracts, and the net cumulative appreciation (depreciation) is included in Total accumulated earnings (loss).
| Statement of Assets and Liabilities |
| | | | October 31, 2022 |
| | | | | |
| Assets | | | | |
| Investment in securities, at value (including securities loaned of $713,180,728) - See accompanying schedule: | | | | |
Unaffiliated issuers (cost $32,684,544,847) | | $29,071,324,665 | | |
Fidelity Central Funds (cost $1,170,288,641) | | 1,170,289,049 | | |
| | | | | |
| Total Investment in Securities (cost $33,854,833,488) | | | $ | 30,241,613,714 |
| Cash | | | | 942,036 |
| Foreign currency held at value (cost $25,958,016) | | | | 25,836,665 |
| Receivable for investments sold | | | | 4,608,958 |
| Receivable for fund shares sold | | | | 377,796,566 |
| Dividends receivable | | | | 55,899,933 |
| Reclaims receivable | | | | 32,310,865 |
| Interest receivable | | | | 145 |
| Distributions receivable from Fidelity Central Funds | | | | 2,123,508 |
| Receivable from investment adviser for expense reductions | | | | 101,114 |
| Other receivables | | | | 28,342 |
Total assets | | | | 30,741,261,846 |
| Liabilities | | | | |
| Payable for investments purchased | | $14,288,366 | | |
| Payable for fund shares redeemed | | 27,244,632 | | |
| Payable for daily variation margin on futures contracts | | 3,416,432 | | |
| Other payables and accrued expenses | | 37,183,711 | | |
| Collateral on securities loaned | | 772,648,781 | | |
| Total Liabilities | | | | 854,781,922 |
| Net Assets | | | $ | 29,886,479,924 |
| Net Assets consist of: | | | | |
| Paid in capital | | | $ | 33,892,385,789 |
| Total accumulated earnings (loss) | | | | (4,005,905,865) |
| Net Assets | | | $ | 29,886,479,924 |
Net Asset Value , offering price and redemption price per share ($29,886,479,924 ÷ 2,615,765,749 shares) | | | $ | 11.43 |
| | | | | |
| Statement of Operations |
| | | | Year ended October 31, 2022 |
| Investment Income | | | | |
| Dividends | | | $ | 975,535,263 |
| Non-Cash dividends | | | | 68,134,114 |
| Interest | | | | 267,001 |
| Income from Fidelity Central Funds (including $6,110,549 from security lending) | | | | 14,356,267 |
| Income before foreign taxes withheld | | | | 1,058,292,645 |
| Less foreign taxes withheld | | | | (94,260,029) |
| Total Income | | | | 964,032,616 |
| Expenses | | | | |
| Custodian fees and expenses | | 5,146,195 | | |
| Independent trustees' fees and expenses | | 101,161 | | |
| Total expenses before reductions | | 5,247,356 | | |
| Expense reductions | | (1,133,095) | | |
| Total expenses after reductions | | | | 4,114,261 |
| Net Investment income (loss) | | | | 959,918,355 |
| Realized and Unrealized Gain (Loss) | | | | |
| Net realized gain (loss) on: | | | | |
| Investment Securities: | | | | |
| Unaffiliated issuers(net of foreign taxes of $751,471) | | (411,922,316) | | |
| Foreign currency transactions | | (14,079,020) | | |
| Futures contracts | | (203,943,600) | | |
| Total net realized gain (loss) | | | | (629,944,936) |
| Change in net unrealized appreciation (depreciation) on: | | | | |
| Investment Securities: | | | | |
| Unaffiliated issuers (net of decrease in deferred foreign taxes of $2,966,037) | | (8,939,001,403) | | |
| Assets and liabilities in foreign currencies | | (3,684,528) | | |
| Futures contracts | | 9,925,609 | | |
| Total change in net unrealized appreciation (depreciation) | | | | (8,932,760,322) |
| Net gain (loss) | | | | (9,562,705,258) |
| Net increase (decrease) in net assets resulting from operations | | | $ | (8,602,786,903) |
| Statement of Changes in Net Assets |
| |
| | Year ended October 31, 2022 | | Year ended October 31, 2021 |
| Increase (Decrease) in Net Assets | | | | |
| Operations | | | | |
| Net investment income (loss) | $ | 959,918,355 | $ | 657,103,626 |
| Net realized gain (loss) | | (629,944,936) | | 10,580,928 |
| Change in net unrealized appreciation (depreciation) | | (8,932,760,322) | | 4,801,097,013 |
| Net increase (decrease) in net assets resulting from operations | | (8,602,786,903) | | 5,468,781,567 |
| Distributions to shareholders | | (836,166,076) | | (362,237,580) |
| Share transactions | | | | |
| Proceeds from sales of shares | | 10,356,317,960 | | 10,518,243,482 |
| Reinvestment of distributions | | 836,166,076 | | 362,237,580 |
| Cost of shares redeemed | | (2,731,913,098) | | (3,299,611,978) |
Net increase (decrease) in net assets resulting from share transactions | | 8,460,570,938 | | 7,580,869,084 |
| Total increase (decrease) in net assets | | (978,382,041) | | 12,687,413,071 |
| | | | | |
| Net Assets | | | | |
| Beginning of period | | 30,864,861,965 | | 18,177,448,894 |
| End of period | $ | 29,886,479,924 | $ | 30,864,861,965 |
| | | | | |
| Other Information | | | | |
| Shares | | | | |
| Sold | | 773,245,005 | | 695,122,777 |
| Issued in reinvestment of distributions | | 56,080,892 | | 25,892,608 |
| Redeemed | | (198,646,544) | | (222,365,668) |
| Net increase (decrease) | | 630,679,353 | | 498,649,717 |
| | | | | |
Financial Highlights
| Fidelity® Series Global ex U.S. Index Fund |
| |
| Years ended October 31, | | 2022 | | 2021 | | 2020 | | 2019 | | 2018 |
Selected Per-Share Data | | | | | | | | | | |
| Net asset value, beginning of period | $ | 15.55 | $ | 12.23 | $ | 12.78 | $ | 11.80 | $ | 13.22 |
| Income from Investment Operations | | | | | | | | | | |
Net investment income (loss) A,B | | .42 | | .38 | | .29 | | .40 | | .37 |
| Net realized and unrealized gain (loss) | | (4.15) | | 3.18 | | (.56) | | .90 | | (1.46) |
| Total from investment operations | | (3.73) | | 3.56 | | (.27) | | 1.30 | | (1.09) |
| Distributions from net investment income | | (.39) | | (.24) | | (.26) | | (.32) | | (.31) |
| Distributions from net realized gain | | - | | - | | (.01) | | - | | (.02) |
| Total distributions | | (.39) | | (.24) | | (.28) C | | (.32) | | (.33) |
| Net asset value, end of period | $ | 11.43 | $ | 15.55 | $ | 12.23 | $ | 12.78 | $ | 11.80 |
Total Return D | | (24.57)% | | 29.34% | | (2.27)% | | 11.36% | | (8.48)% |
Ratios to Average Net Assets B,E,F | | | | | | | | | | |
| Expenses before reductions | | .02% | | .02% | | .02% | | .04% | | .06% |
| Expenses net of fee waivers, if any | | .01% | | .01% | | .01% | | .04% | | .06% |
| Expenses net of all reductions | | .01% | | .01% | | .01% | | .04% | | .06% |
| Net investment income (loss) | | 3.11% | | 2.52% | | 2.42% | | 3.27% | | 2.82% |
| Supplemental Data | | | | | | | | | | |
| Net assets, end of period (000 omitted) | $ | 29,886,480 | $ | 30,864,862 | $ | 18,177,449 | $ | 12,066,585 | $ | 5,946,725 |
Portfolio turnover rate G | | 4% | | 5% H | | 5% | | 3% H | | 2% |
A Calculated based on average shares outstanding during the period.
B Net investment income (loss) is affected by the timing of the declaration of dividends by any underlying mutual funds or exchange-traded funds (ETFs). Net investment income (loss) of any mutual funds or ETFs is not included in the Fund's net investment income (loss) ratio.
C Total distributions per share do not sum due to rounding.
D Total returns would have been lower if certain expenses had not been reduced during the applicable periods shown.
E Fees and expenses of any underlying mutual funds or exchange-traded funds (ETFs) are not included in the Fund's expense ratio. The Fund indirectly bears its proportionate share of these expenses. For additional expense information related to investments in Fidelity Central Funds, please refer to the "Investments in Fidelity Central Funds" note found in the Notes to Financial Statements section of the most recent Annual or Semi-Annual report.
F Expense ratios reflect operating expenses of the class. Expenses before reductions do not reflect amounts reimbursed, waived, or reduced through arrangements with the investment adviser, brokerage services, or other offset arrangements, if applicable, and do not represent the amount paid by the class during periods when reimbursements, waivers or reductions occur.
G Amount does not include the portfolio activity of any underlying mutual funds or exchange-traded funds (ETFs).
H Portfolio turnover rate excludes securities received or delivered in-kind.
For the period ended October 31, 2022
1. Organization.
Fidelity Series Global ex U.S. Index Fund (the Fund) is a fund of Fidelity Salem Street Trust (the Trust) and is authorized to issue an unlimited number of shares. Shares are offered only to certain other Fidelity funds, Fidelity managed 529 plans, and Fidelity managed collective investment trusts. The Trust is registered under the Investment Company Act of 1940, as amended (the 1940 Act), as an open-end management investment company organized as a Massachusetts business trust.
2. Investments in Fidelity Central Funds.
Funds may invest in Fidelity Central Funds, which are open-end investment companies generally available only to other investment companies and accounts managed by the investment adviser and its affiliates. The Schedule of Investments lists any Fidelity Central Funds held as an investment as of period end, but does not include the underlying holdings of each Fidelity Central Fund. An investing fund indirectly bears its proportionate share of the expenses of the underlying Fidelity Central Funds.
Based on its investment objective, each Fidelity Central Fund may invest or participate in various investment vehicles or strategies that are similar to those of the investing fund. These strategies are consistent with the investment objectives of the investing fund and may involve certain economic risks which may cause a decline in value of each of the Fidelity Central Funds and thus a decline in the value of the investing fund.
| Fidelity Central Fund | Investment Manager | Investment Objective | Investment Practices | Expense Ratio A |
| Fidelity Money Market Central Funds | Fidelity Management & Research Company LLC (FMR) | Each fund seeks to obtain a high level of current income consistent with the preservation of capital and liquidity. | Short-term Investments | Less than .005% |
A Expenses expressed as a percentage of average net assets and are as of each underlying Central Fund's most recent annual or semi-annual shareholder report.
A complete unaudited list of holdings for each Fidelity Central Fund is available upon request or at the Securities and Exchange Commission website at www.sec.gov. In addition, the financial statements of the Fidelity Central Funds which contain the significant accounting policies (including investment valuation policies) of those funds, and are not covered by the Report of Independent Registered Public Accounting Firm, are available on the Securities and Exchange Commission website or upon request.
3. Significant Accounting Policies.
The Fund is an investment company and applies the accounting and reporting guidance of the Financial Accounting Standards Board (FASB) Accounting Standards Codification Topic 946 Financial Services - Investment Companies . The financial statements have been prepared in conformity with accounting principles generally accepted in the United States of America (GAAP), which require management to make certain estimates and assumptions at the date of the financial statements. Actual results could differ from those estimates. Subsequent events, if any, through the date that the financial statements were issued have been evaluated in the preparation of the financial statements. The Fund's Schedule of Investments lists any underlying mutual funds or exchange-traded funds (ETFs) but does not include the underlying holdings of these funds. The following summarizes the significant accounting policies of the Fund:
Investment Valuation. Investments are valued as of 4:00 p.m. Eastern time on the last calendar day of the period. The Board of Trustees (the Board) has designated the Fund's investment adviser as the valuation designee responsible for the fair valuation function and performing fair value determinations as needed. The investment adviser has established a Fair Value Committee (the Committee) to carry out the day-to-day fair valuation responsibilities and has adopted policies and procedures to govern the fair valuation process and the activities of the Committee. In accordance with these fair valuation policies and procedures, which have been approved by the Board, the Fund attempts to obtain prices from one or more third party pricing services or brokers to value its investments. When current market prices, quotations or currency exchange rates are not readily available or reliable, investments will be fair valued in good faith by the Committee, in accordance with the policies and procedures. Factors used in determining fair value vary by investment type and may include market or investment specific events, transaction data, estimated cash flows, and market observations of comparable investments. The frequency that the fair valuation procedures are used cannot be predicted and they may be utilized to a significant extent. The Committee manages the Fund's fair valuation practices and maintains the fair valuation policies and procedures. The Fund's investment adviser reports to the Board information regarding the fair valuation process and related material matters.
The Fund categorizes the inputs to valuation techniques used to value its investments into a disclosure hierarchy consisting of three levels as shown below:
Level 1 - unadjusted quoted prices in active markets for identical investments
Level 2 - other significant observable inputs (including quoted prices for similar investments, interest rates, prepayment speeds, etc.)
Level 3 - unobservable inputs (including the Fund's own assumptions based on the best information available)
Valuation techniques used to value the Fund's investments by major category are as follows:
Equity securities, including restricted securities, for which market quotations are readily available, are valued at the last reported sale price or official closing price as reported by a third party pricing service on the primary market or exchange on which they are traded and are categorized as Level 1 in the hierarchy. In the event there were no sales during the day or closing prices are not available, securities are valued at the last quoted bid price or may be valued using the last available price and are generally categorized as Level 2 in the hierarchy. For foreign equity securities, when market or security specific events arise, comparisons to the valuation of American Depositary Receipts (ADRs), futures contracts, ETFs and certain indexes as well as quoted prices for similar securities may be used and would be categorized as Level 2 in the hierarchy. For equity securities, including restricted securities, where observable inputs are limited, assumptions about market activity and risk are used and these securities may be categorized as Level 3 in the hierarchy.
Debt securities, including restricted securities, are valued based on evaluated prices received from third party pricing services or from brokers who make markets in such securities. Corporate bonds and U.S. government and government agency obligations are valued by pricing services who utilize matrix pricing which considers yield or price of bonds of comparable quality, coupon, maturity and type or by broker-supplied prices. When independent prices are unavailable or unreliable, debt securities may be valued utilizing pricing methodologies which consider similar factors that would be used by third party pricing services. Debt securities are generally categorized as Level 2 in the hierarchy but may be Level 3 depending on the circumstances.
Futures contracts are valued at the settlement price established each day by the board of trade or exchange on which they are traded and are categorized as Level 1 in the hierarchy.
Investments in open-end mutual funds, including the Fidelity Central Funds, are valued at their closing net asset value (NAV) each business day and are categorized as Level 1 in the hierarchy.
Changes in valuation techniques may result in transfers in or out of an assigned level within the disclosure hierarchy. The aggregate value of investments by input level as of October 31, 2022 is included at the end of the Fund's Schedule of Investments.
Foreign Currency. Certain Funds may use foreign currency contracts to facilitate transactions in foreign-denominated securities. Gains and losses from these transactions may arise from changes in the value of the foreign currency or if the counterparties do not perform under the contracts' terms.
Foreign-denominated assets, including investment securities, and liabilities are translated into U.S. dollars at the exchange rates at period end. Purchases and sales of investment securities, income and dividends received, and expenses denominated in foreign currencies are translated into U.S. dollars at the exchange rate in effect on the transaction date.
The effects of exchange rate fluctuations on investments are included with the net realized and unrealized gain (loss) on investment securities. Other foreign currency transactions resulting in realized and unrealized gain (loss) are disclosed separately.
Investment Transactions and Income. For financial reporting purposes, the Fund's investment holdings and NAV include trades executed through the end of the last business day of the period. The NAV per share for processing shareholder transactions is calculated as of the close of business of the New York Stock Exchange (NYSE), normally 4:00 p.m. Eastern time and includes trades executed through the end of the prior business day. Gains and losses on securities sold are determined on the basis of identified cost and include proceeds received from litigation. Commissions paid to certain brokers with whom the investment adviser, or its affiliates, places trades on behalf of a fund include an amount in addition to trade execution, which may be rebated back to a fund. Any such rebates are included in net realized gain (loss) on investments in the Statement of Operations. Dividend income is recorded on the ex-dividend date, except for certain dividends from foreign securities where the ex-dividend date may have passed, which are recorded as soon as the Fund is informed of the ex-dividend date. Non-cash dividends included in dividend income, if any, are recorded at the fair market value of the securities received. Income and capital gain distributions from Fidelity Central Funds, if any, are recorded on the ex-dividend date. Certain distributions received by the Fund represent a return of capital or capital gain. The Fund determines the components of these distributions subsequent to the ex-dividend date, based upon receipt of tax filings or other correspondence relating to the underlying investment. These distributions are recorded as a reduction of cost of investments and/or as a realized gain. Interest income is accrued as earned and includes coupon interest and amortization of premium and accretion of discount on debt securities as applicable. Investment income is recorded net of foreign taxes withheld where recovery of such taxes is uncertain. Funds may file withholding tax reclaims in certain jurisdictions to recover a portion of amounts previously withheld. Any withholding tax reclaims income is included in the Statement of Operations in foreign taxes withheld. Any receivables for withholding tax reclaims are included in the Statement of Assets and Liabilities in reclaims receivable. The Fund has filed tax reclaims for previously withheld taxes on dividends earned in certain European Union (EU) countries. These additional filings are subject to various administrative proceedings by the local jurisdictions' tax authorities within the EU, as well as a number of related judicial proceedings. Income recognized for EU reclaims is included with other reclaims in the Statement of Operations in foreign taxes withheld. These reclaims are recorded when the amount is known and there are no significant uncertainties on collectability.
Expenses. Expenses directly attributable to a fund are charged to that fund. Expenses attributable to more than one fund are allocated among the respective funds on the basis of relative net assets or other appropriate methods. Expenses included in the accompanying financial statements reflect the expenses of that fund and do not include any expenses associated with any underlying mutual funds or exchange-traded funds. Although not included in a fund's expenses, a fund indirectly bears its proportionate share of these expenses through the net asset value of each underlying mutual fund or exchange-traded fund. Expense estimates are accrued in the period to which they relate and adjustments are made when actual amounts are known.
Income Tax Information and Distributions to Shareholders. Each year, the Fund intends to qualify as a regulated investment company under Subchapter M of the Internal Revenue Code, including distributing substantially all of its taxable income and realized gains. As a result, no provision for U.S. Federal income taxes is required. As of October 31, 2022, the Fund did not have any unrecognized tax benefits in the financial statements; nor is the Fund aware of any tax positions for which it is reasonably possible that the total amounts of unrecognized tax benefits will significantly change in the next twelve months. The Fund files a U.S. federal tax return, in addition to state and local tax returns as required. The Fund's federal income tax returns are subject to examination by the Internal Revenue Service (IRS) for a period of three fiscal years after they are filed. State and local tax returns may be subject to examination for an additional fiscal year depending on the jurisdiction. Foreign taxes are provided for based on the Fund's understanding of the tax rules and rates that exist in the foreign markets in which it invests. The Fund is subject to a tax imposed on capital gains by certain countries in which it invests. An estimated deferred tax liability for net unrealized appreciation on the applicable securities is included in Other payables and accrued expenses on the Statement of Assets & Liabilities.
Distributions are declared and recorded on the ex-dividend date. Income and capital gain distributions are determined in accordance with income tax regulations, which may differ from GAAP. In addition, the Fund claimed a portion of the payment made to redeeming shareholders as a distribution for income tax purposes.
Capital accounts within the financial statements are adjusted for permanent book-tax differences. These adjustments have no impact on net assets or the results of operations. Capital accounts are not adjusted for temporary book-tax differences which will reverse in a subsequent period.
Book-tax differences are primarily due to futures contracts, foreign currency transactions, certain foreign taxes, passive foreign investment companies (PFIC), partnerships, capital loss carryforwards and losses deferred due to wash sales.
As of period end, the cost and unrealized appreciation (depreciation) in securities, and derivatives if applicable, for federal income tax purposes were as follows:
| Gross unrealized appreciation | $3,110,224,333 |
| Gross unrealized depreciation | (7,044,239,407) |
| Net unrealized appreciation (depreciation) | $(3,934,015,074) |
| Tax Cost | $34,177,820,051 |
The tax-based components of distributable earnings as of period end were as follows:
| Undistributed ordinary income | $737,966,437 |
| Capital loss carryforward | $(769,677,049) |
| Net unrealized appreciation (depreciation) on securities and other investments | $(3,938,187,976) |
Capital loss carryforwards are only available to offset future capital gains of the Fund to the extent provided by regulations and may be limited. The capital loss carryforward information presented below, including any applicable limitation, is estimated as of fiscal period end and is subject to adjustment.
Short-term | $(202,229,866) |
Long-term | (567,447,183) |
| Total capital loss carryforward | $(769,677,049) |
The tax character of distributions paid was as follows:
| | October 31, 2022 | October 31, 2021 |
| Ordinary Income | $836,166,076 | $362,237,580 |
| | | |
Restricted Securities (including Private Placements). Funds may invest in securities that are subject to legal or contractual restrictions on resale. These securities generally may be resold in transactions exempt from registration or to the public if the securities are registered. Disposal of these securities may involve time-consuming negotiations and expense, and prompt sale at an acceptable price may be difficult. Information regarding restricted securities held at period end is included at the end of the Schedule of Investments, if applicable.
4. Derivative Instruments.
Risk Exposures and the Use of Derivative Instruments. The Fund's investment objectives allow for various types of derivative instruments, including futures contracts. Derivatives are investments whose value is primarily derived from underlying assets, indices or reference rates and may be transacted on an exchange or over-the-counter (OTC). Derivatives may involve a future commitment to buy or sell a specified asset based on specified terms, to exchange future cash flows at periodic intervals based on a notional principal amount, or for one party to make one or more payments upon the occurrence of specified events in exchange for periodic payments from the other party.
Derivatives were used to increase returns and to manage exposure to certain risks as defined below. The success of any strategy involving derivatives depends on analysis of numerous economic factors, and if the strategies for investment do not work as intended, the objectives may not be achieved.
Derivatives were used to increase or decrease exposure to the following risk(s):
| | |
| Equity Risk | Equity risk relates to the fluctuations in the value of financial instruments as a result of changes in market prices (other than those arising from interest rate risk or foreign exchange risk), whether caused by factors specific to an individual investment, its issuer, or all factors affecting all instruments traded in a market or market segment. |
Funds are also exposed to additional risks from investing in derivatives, such as liquidity risk and counterparty credit risk. Liquidity risk is the risk that a fund will be unable to close out the derivative in the open market in a timely manner. Counterparty credit risk is the risk that the counterparty will not be able to fulfill its obligation to a fund. Counterparty credit risk related to exchange-traded contracts may be mitigated by the protection provided by the exchange on which they trade.
Investing in derivatives may involve greater risks than investing in the underlying assets directly and, to varying degrees, may involve risk of loss in excess of any initial investment and collateral received and amounts recognized in the Statement of Assets and Liabilities. In addition, there may be the risk that the change in value of the derivative contract does not correspond to the change in value of the underlying instrument.
Futures Contracts. A futures contract is an agreement between two parties to buy or sell a specified underlying instrument for a fixed price at a specified future date. Futures contracts were used to manage exposure to the stock market.
Upon entering into a futures contract, a fund is required to deposit either cash or securities (initial margin) with a clearing broker in an amount equal to a certain percentage of the face value of the contract. Futures contracts are marked-to-market daily and subsequent daily payments are made or received by a fund depending on the daily fluctuations in the value of the futures contracts and are recorded as unrealized appreciation or (depreciation). This receivable and/or payable, if any, is included in daily variation margin on futures contracts in the Statement of Assets and Liabilities. Realized gain or (loss) is recorded upon the expiration or closing of a futures contract. The net realized gain (loss) and change in net unrealized appreciation (depreciation) on futures contracts during the period is presented in the Statement of Operations.
Any open futures contracts at period end are presented in the Schedule of Investments under the caption "Futures Contracts". The notional amount at value reflects each contract's exposure to the underlying instrument or index at period end, and is representative of volume of activity during the period unless an average notional amount is presented. Any securities deposited to meet initial margin requirements are identified in the Schedule of Investments. Any cash deposited to meet initial margin requirements is presented as segregated cash with brokers for derivative instruments in the Statement of Assets and Liabilities.
5. Purchases and Sales of Investments.
Purchases and sales of securities, other than short-term securities and in-kind transactions, as applicable, are noted in the table below.
| | Purchases ($) | Sales ($) |
| Fidelity Series Global ex U.S. Index Fund | 9,502,533,743 | 1,095,320,248 |
6. Fees and Other Transactions with Affiliates.
Management Fee. Fidelity Management & Research Company LLC (the investment adviser) and its affiliates provide the Fund with investment management related services for which the Fund does not pay a management fee. Under the management contract, the investment adviser or an affiliate pays all ordinary operating expenses of the Fund, except custody fees, fees and expenses of the independent Trustees, and certain miscellaneous expenses such as proxy and shareholder meeting expenses.
Sub-Adviser. Geode Capital Management, LLC (Geode), serves as sub-adviser for the Fund. Geode provides discretionary investment advisory services to the Fund and is paid by the investment adviser for providing these services.
Interfund Trades. Funds may purchase from or sell securities to other Fidelity Funds under procedures adopted by the Board. The procedures have been designed to ensure these interfund trades are executed in accordance with Rule 17a-7 of the 1940 Act. Any interfund trades are included within the respective purchases and sales amounts shown in the Purchases and Sales of Investments note. During the period, there were no interfund trades.
Prior Fiscal Year Affiliated Exchanges In-Kind. Shares that were exchanged for investments, including accrued interest and cash, if any, are shown in the table below. The amount of in-kind exchanges is included in share transactions in the accompanying Statement of Changes in Net Assets.
| | Shares | Total Proceeds ($) |
| Fidelity Series Global ex U.S. Index Fund | 13,852,005 | 209,303,799 |
7. Committed Line of Credit.
Certain Funds participate with other funds managed by the investment adviser or an affiliate in a $4.25 billion credit facility (the "line of credit") to be utilized for temporary or emergency purposes to fund shareholder redemptions or for other short-term liquidity purposes. The commitment fees on the pro-rata portion of the line of credit are borne by the investment adviser. During the period, there were no borrowings on this line of credit.
8. Security Lending.
Funds lend portfolio securities from time to time in order to earn additional income. Lending agents are used, including National Financial Services (NFS), an affiliate of the investment adviser. Pursuant to a securities lending agreement, NFS will receive a fee, which is capped at 9.9% of a fund's daily lending revenue, for its services as lending agent. A fund may lend securities to certain qualified borrowers, including NFS. On the settlement date of the loan, a fund receives collateral (in the form of U.S. Treasury obligations, letters of credit and/or cash) against the loaned securities and maintains collateral in an amount not less than 100% of the market value of the loaned securities during the period of the loan. The market value of the loaned securities is determined at the close of business of a fund and any additional required collateral is delivered to a fund on the next business day. A fund or borrower may terminate the loan at any time, and if the borrower defaults on its obligation to return the securities loaned because of insolvency or other reasons, a fund may apply collateral received from the borrower against the obligation. A fund may experience delays and costs in recovering the securities loaned. Any cash collateral received is invested in the Fidelity Securities Lending Cash Central Fund. Any loaned securities are identified as such in the Schedule of Investments, and the value of loaned securities and cash collateral at period end, as applicable, are presented in the Statement of Assets and Liabilities. Security lending income represents the income earned on investing cash collateral, less rebates paid to borrowers and any lending agent fees associated with the loan, plus any premium payments received for lending certain types of securities. Security lending income is presented in the Statement of Operations as a component of income from Fidelity Central Funds. Affiliated security lending activity, if any, was as follows:
| | Total Security Lending Fees Paid to NFS | Security Lending Income From Securities Loaned to NFS | Value of Securities Loaned to NFS at Period End |
| Fidelity Series Global ex U.S. Index Fund | $652,930 | $14 | $- |
9. Expense Reductions.
The investment adviser contractually agreed to reimburse the Fund to the extent annual operating expenses exceeded .013% of average net assets. This reimbursement will remain in place through February 28, 2026. Some expenses, for example the compensation of the independent Trustees, and certain other expenses such as interest expense, are excluded from this reimbursement. During the period this reimbursement reduced the Fund's expenses by $1,132,815.
Through arrangements with the Fund's custodian, credits realized as a result of certain uninvested cash balances were used to reduce the Fund's expenses by $280.
10. Other.
A fund's organizational documents provide former and current trustees and officers with a limited indemnification against liabilities arising in connection with the performance of their duties to the fund. In the normal course of business, a fund may also enter into contracts that provide general indemnifications. A fund's maximum exposure under these arrangements is unknown as this would be dependent on future claims that may be made against a fund. The risk of material loss from such claims is considered remote.
At the end of the period, mutual funds and accounts managed by the investment adviser or its affiliates were the owners of record of all of the outstanding shares of the Fund.
11. Risk and Uncertainties.
Many factors affect a fund's performance. Developments that disrupt global economies and financial markets, such as pandemics, epidemics, outbreaks of infectious diseases, war, terrorism, and environmental disasters, may significantly affect a fund's investment performance. The effects of these developments to a fund will be impacted by the types of securities in which a fund invests, the financial condition, industry, economic sector, and geographic location of an issuer, and a fund's level of investment in the securities of that issuer.
To the Board of Trustees of Fidelity Salem Street Trust and the Shareholders of Fidelity Series Global ex U.S. Index Fund:
Opinion on the Financial Statements and Financial Highlights
We have audited the accompanying statement of assets and liabilities of Fidelity Series Global ex U.S. Index Fund (the "Fund"), a fund of Fidelity Salem Street Trust, including the schedule of investments, as of October 31, 2022, the related statement of operations for the year then ended, the statement of changes in net assets for each of the two years in the period then ended, the financial highlights for each of the five years in the period then ended, and the related notes. In our opinion, the financial statements and financial highlights present fairly, in all material respects, the financial position of the Fund as of October 31, 2022, and the results of its operations for the year then ended, the changes in its net assets for each of the two years in the period then ended, and the financial highlights for each of the five years in the period then ended in conformity with accounting principles generally accepted in the United States of America.
Basis for Opinion
These financial statements and financial highlights are the responsibility of the Fund's management. Our responsibility is to express an opinion on the Fund's financial statements and financial highlights based on our audits. We are a public accounting firm registered with the Public Company Accounting Oversight Board (United States) (PCAOB) and are required to be independent with respect to the Fund in accordance with the U.S. federal securities laws and the applicable rules and regulations of the Securities and Exchange Commission and the PCAOB.
We conducted our audits in accordance with the standards of the PCAOB. Those standards require that we plan and perform the audit to obtain reasonable assurance about whether the financial statements and financial highlights are free of material misstatement, whether due to error or fraud. The Fund is not required to have, nor were we engaged to perform, an audit of its internal control over financial reporting. As part of our audits we are required to obtain an understanding of internal control over financial reporting but not for the purpose of expressing an opinion on the effectiveness of the Fund's internal control over financial reporting. Accordingly, we express no such opinion.
Our audits included performing procedures to assess the risks of material misstatement of the financial statements and financial highlights, whether due to error or fraud, and performing procedures that respond to those risks. Such procedures included examining, on a test basis, evidence regarding the amounts and disclosures in the financial statements and financial highlights. Our audits also included evaluating the accounting principles used and significant estimates made by management, as well as evaluating the overall presentation of the financial statements and financial highlights. Our procedures included confirmation of securities owned as of October 31, 2022, by correspondence with the custodian and brokers; when replies were not received from brokers, we performed other auditing procedures. We believe that our audits provide a reasonable basis for our opinion.
/s/ Deloitte & Touche LLP
Boston, Massachusetts
December 19, 2022
We have served as the auditor of one or more of the Fidelity investment companies since 1999.
The Trustees, Members of the Advisory Board (if any), and officers of the trust and fund, as applicable, are listed below. The Board of Trustees governs the fund and is responsible for protecting the interests of shareholders. The Trustees are experienced executives who meet periodically throughout the year to oversee the fund's activities, review contractual arrangements with companies that provide services to the fund, oversee management of the risks associated with such activities and contractual arrangements, and review the fund's performance. Except for Jonathan Chiel, each of the Trustees oversees 293 funds. Mr. Chiel oversees 184 funds.
The Trustees hold office without limit in time except that (a) any Trustee may resign; (b) any Trustee may be removed by written instrument, signed by at least two-thirds of the number of Trustees prior to such removal; (c) any Trustee who requests to be retired or who has become incapacitated by illness or injury may be retired by written instrument signed by a majority of the other Trustees; and (d) any Trustee may be removed at any special meeting of shareholders by a two-thirds vote of the outstanding voting securities of the trust. Each Trustee who is not an interested person (as defined in the 1940 Act) of the trust and the fund is referred to herein as an Independent Trustee. Each Independent Trustee shall retire not later than the last day of the calendar year in which his or her 75th birthday occurs. The Independent Trustees may waive this mandatory retirement age policy with respect to individual Trustees. Officers and Advisory Board Members hold office without limit in time, except that any officer or Advisory Board Member may resign or may be removed by a vote of a majority of the Trustees at any regular meeting or any special meeting of the Trustees. Except as indicated, each individual has held the office shown or other offices in the same company for the past five years.
The fund's Statement of Additional Information (SAI) includes more information about the Trustees. To request a free copy, call Fidelity at 1-800-544-8544.
Experience, Skills, Attributes, and Qualifications of the Trustees. The Governance and Nominating Committee has adopted a statement of policy that describes the experience, qualifications, attributes, and skills that are necessary and desirable for potential Independent Trustee candidates (Statement of Policy). The Board believes that each Trustee satisfied at the time he or she was initially elected or appointed a Trustee, and continues to satisfy, the standards contemplated by the Statement of Policy. The Governance and Nominating Committee also engages professional search firms to help identify potential Independent Trustee candidates who have the experience, qualifications, attributes, and skills consistent with the Statement of Policy. From time to time, additional criteria based on the composition and skills of the current Independent Trustees, as well as experience or skills that may be appropriate in light of future changes to board composition, business conditions, and regulatory or other developments, have also been considered by the professional search firms and the Governance and Nominating Committee. In addition, the Board takes into account the Trustees' commitment and participation in Board and committee meetings, as well as their leadership of standing and ad hoc committees throughout their tenure.
In determining that a particular Trustee was and continues to be qualified to serve as a Trustee, the Board has considered a variety of criteria, none of which, in isolation, was controlling. The Board believes that, collectively, the Trustees have balanced and diverse experience, qualifications, attributes, and skills, which allow the Board to operate effectively in governing the fund and protecting the interests of shareholders. Information about the specific experience, skills, attributes, and qualifications of each Trustee, which in each case led to the Board's conclusion that the Trustee should serve (or continue to serve) as a trustee of the fund, is provided below.
Board Structure and Oversight Function. Abigail P. Johnson is an interested person and currently serves as Chairman. The Trustees have determined that an interested Chairman is appropriate and benefits shareholders because an interested Chairman has a personal and professional stake in the quality and continuity of services provided to the fund. Independent Trustees exercise their informed business judgment to appoint an individual of their choosing to serve as Chairman, regardless of whether the Trustee happens to be independent or a member of management. The Independent Trustees have determined that they can act independently and effectively without having an Independent Trustee serve as Chairman and that a key structural component for assuring that they are in a position to do so is for the Independent Trustees to constitute a substantial majority for the Board. The Independent Trustees also regularly meet in executive session. Michael E. Kenneally serves as Chairman of the Independent Trustees and as such (i) acts as a liaison between the Independent Trustees and management with respect to matters important to the Independent Trustees and (ii) with management prepares agendas for Board meetings.
Fidelity ® funds are overseen by different Boards of Trustees. The fund's Board oversees Fidelity's investment-grade bond, money market, asset allocation and certain equity funds, and other Boards oversee Fidelity's high income and other equity funds. The asset allocation funds may invest in Fidelity ® funds that are overseen by such other Boards. The use of separate Boards, each with its own committee structure, allows the Trustees of each group of Fidelity ® funds to focus on the unique issues of the funds they oversee, including common research, investment, and operational issues. On occasion, the separate Boards establish joint committees to address issues of overlapping consequences for the Fidelity ® funds overseen by each Board.
The Trustees operate using a system of committees to facilitate the timely and efficient consideration of all matters of importance to the Trustees, the fund, and fund shareholders and to facilitate compliance with legal and regulatory requirements and oversight of the fund's activities and associated risks. The Board, acting through its committees, has charged FMR and its affiliates with (i) identifying events or circumstances the occurrence of which could have demonstrably adverse effects on the fund's business and/or reputation; (ii) implementing processes and controls to lessen the possibility that such events or circumstances occur or to mitigate the effects of such events or circumstances if they do occur; and (iii) creating and maintaining a system designed to evaluate continuously business and market conditions in order to facilitate the identification and implementation processes described in (i) and (ii) above. Because the day-to-day operations and activities of the fund are carried out by or through FMR, its affiliates, and other service providers, the fund's exposure to risks is mitigated but not eliminated by the processes overseen by the Trustees. While each of the Board's committees has responsibility for overseeing different aspects of the fund's activities, oversight is exercised primarily through the Operations and Audit Committees. In addition, an ad hoc Board committee of Independent Trustees has worked with FMR to enhance the Board's oversight of investment and financial risks, legal and regulatory risks, technology risks, and operational risks, including the development of additional risk reporting to the Board. Appropriate personnel, including but not limited to the fund's Chief Compliance Officer (CCO), FMR's internal auditor, the independent accountants, the fund's Treasurer and portfolio management personnel, make periodic reports to the Board's committees, as appropriate, including an annual review of Fidelity's risk management program for the Fidelity ® funds. The responsibilities of each standing committee, including their oversight responsibilities, are described further under "Standing Committees of the Trustees."
Interested Trustees*:
Correspondence intended for a Trustee who is an interested person may be sent to Fidelity Investments, 245 Summer Street, Boston, Massachusetts 02210.
Name, Year of Birth; Principal Occupations and Other Relevant Experience+
Jonathan Chiel (1957)
Year of Election or Appointment: 2016
Trustee
Mr. Chiel also serves as Trustee of other Fidelity ® funds. Mr. Chiel is Executive Vice President and General Counsel for FMR LLC (diversified financial services company, 2012-present). Previously, Mr. Chiel served as general counsel (2004-2012) and senior vice president and deputy general counsel (2000-2004) for John Hancock Financial Services; a partner with Choate, Hall & Stewart (1996-2000) (law firm); and an Assistant United States Attorney for the United States Attorney's Office of the District of Massachusetts (1986-95), including Chief of the Criminal Division (1993-1995). Mr. Chiel is a director on the boards of the Boston Bar Foundation and the Maimonides School.
Abigail P. Johnson (1961)
Year of Election or Appointment: 2009
Trustee
Chairman of the Board of Trustees
Ms. Johnson also serves as Trustee of other Fidelity ® funds. Ms. Johnson serves as Chairman (2016-present), Chief Executive Officer (2014-present), and Director (2007-present) of FMR LLC (diversified financial services company), President of Fidelity Financial Services (2012-present) and President of Personal, Workplace and Institutional Services (2005-present). Ms. Johnson is Chairman and Director of Fidelity Management & Research Company LLC (investment adviser firm, 2011-present). Previously, Ms. Johnson served as Chairman and Director of FMR Co., Inc. (investment adviser firm, 2011-2019), Vice Chairman (2007-2016) and President (2013-2016) of FMR LLC, President and a Director of Fidelity Management & Research Company (2001-2005), a Trustee of other investment companies advised by Fidelity Management & Research Company, Fidelity Investments Money Management, Inc. (investment adviser firm), and FMR Co., Inc. (2001-2005), Senior Vice President of the Fidelity ® funds (2001-2005), and managed a number of Fidelity ® funds. Ms. Abigail P. Johnson and Mr. Arthur E. Johnson are not related.
Jennifer Toolin McAuliffe (1959)
Year of Election or Appointment: 2016
Trustee
Ms. McAuliffe also serves as Trustee of other Fidelity ® funds and as Trustee of Fidelity Charitable (2020-present). Previously, Ms. McAuliffe served as Co-Head of Fixed Income of Fidelity Investments Limited (now known as FIL Limited (FIL)) (diversified financial services company), Director of Research for FIL's credit and quantitative teams in London, Hong Kong and Tokyo and Director of Research for taxable and municipal bonds at Fidelity Investments Money Management, Inc. Ms. McAuliffe previously served as a member of the Advisory Board of certain Fidelity ® funds (2016). Ms. McAuliffe was previously a lawyer at Ropes & Gray LLP and currently serves as director or trustee of several not-for-profit entities.
* Determined to be an "Interested Trustee" by virtue of, among other things, his or her affiliation with the trust or various entities under common control with FMR.
+ The information includes the Trustee's principal occupation during the last five years and other information relating to the experience, attributes, and skills relevant to the Trustee's qualifications to serve as a Trustee, which led to the conclusion that the Trustee should serve as a Trustee for the fund.
Independent Trustees:
Correspondence intended for an Independent Trustee may be sent to Fidelity Investments, P.O. Box 55235, Boston, Massachusetts 02205-5235.
Name, Year of Birth; Principal Occupations and Other Relevant Experience+
Elizabeth S. Acton (1951)
Year of Election or Appointment: 2013
Trustee
Ms. Acton also serves as Trustee of other Fidelity ® funds. Prior to her retirement, Ms. Acton served as Executive Vice President, Finance (2011-2012), Executive Vice President, Chief Financial Officer (2002-2011) and Treasurer (2004-2005) of Comerica Incorporated (financial services). Prior to joining Comerica, Ms. Acton held a variety of positions at Ford Motor Company (1983-2002), including Vice President and Treasurer (2000-2002) and Executive Vice President and Chief Financial Officer of Ford Motor Credit Company (1998-2000). Ms. Acton currently serves as a member of the Board and Audit and Finance Committees of Beazer Homes USA, Inc. (homebuilding, 2012-present). Ms. Acton previously served as a member of the Advisory Board of certain Fidelity ® funds (2013-2016).
Ann E. Dunwoody (1953)
Year of Election or Appointment: 2018
Trustee
General Dunwoody also serves as Trustee of other Fidelity ® funds. General Dunwoody (United States Army, Retired) was the first woman in U.S. military history to achieve the rank of four-star general and prior to her retirement in 2012 held a variety of positions within the U.S. Army, including Commanding General, U.S. Army Material Command (2008-2012). General Dunwoody currently serves as President of First to Four LLC (leadership and mentoring services, 2012-present), a member of the Board and Nomination and Corporate Governance Committees of Kforce Inc. (professional staffing services, 2016-present) and a member of the Board of Automattic Inc. (software engineering, 2018-present). Previously, General Dunwoody served as a member of the Advisory Board and Nominating and Corporate Governance Committee of L3 Technologies, Inc. (communication, electronic, sensor and aerospace systems, 2013-2019) and a member of the Board and Audit and Sustainability and Corporate Responsibility Committees of Republic Services, Inc. (waste collection, disposal and recycling, 2013-2016). Ms. Dunwoody also serves on several boards for non-profit organizations, including as a member of the Board, Chair of the Nomination and Governance Committee and a member of the Audit Committee of Logistics Management Institute (consulting non-profit, 2012-present), a member of the Council of Trustees for the Association of the United States Army (advocacy non-profit, 2013-present), a member of the Board of Florida Institute of Technology (2015-present) and a member of the Board of ThanksUSA (military family education non-profit, 2014-present). General Dunwoody previously served as a member of the Advisory Board of certain Fidelity ® funds (2018).
John Engler (1948)
Year of Election or Appointment: 2014
Trustee
Mr. Engler also serves as Trustee of other Fidelity ® funds. Previously, Mr. Engler served as Governor of Michigan (1991-2003), President of the Business Roundtable (2011-2017) and interim President of Michigan State University (2018-2019). Mr. Engler currently serves as a member of the Board of Stride, Inc. (formerly K12 Inc.) (technology-based education company, 2012-present). Previously, Mr. Engler served as a member of the Board of Universal Forest Products (manufacturer and distributor of wood and wood-alternative products, 2003-2019) and Trustee of The Munder Funds (2003-2014). Mr. Engler previously served as a member of the Advisory Board of certain Fidelity ® funds (2014-2016).
Robert F. Gartland (1951)
Year of Election or Appointment: 2010
Trustee
Mr. Gartland also serves as Trustee of other Fidelity ® funds. Prior to his retirement, Mr. Gartland held a variety of positions at Morgan Stanley (financial services, 1979-2007), including Managing Director (1987-2007) and Chase Manhattan Bank (1975-1978). Mr. Gartland previously served as Chairman and an investor in Gartland & Mellina Group Corp. (consulting, 2009-2019), as a member of the Board of National Securities Clearing Corporation (1993-1996) and as Chairman of TradeWeb (2003-2004).
Arthur E. Johnson (1947)
Year of Election or Appointment: 2008
Trustee
Mr. Johnson also serves as Trustee of other Fidelity ® funds. Prior to his retirement, Mr. Johnson served as Senior Vice President of Corporate Strategic Development of Lockheed Martin Corporation (defense contractor, 1999-2009). Mr. Johnson currently serves as a member of the Board of Booz Allen Hamilton (management consulting, 2011-present). Mr. Johnson previously served as a member of the Board of Eaton Corporation plc (diversified power management, 2009-2019) and a member of the Board of AGL Resources, Inc. (holding company, 2002-2016). Mr. Johnson previously served as Chairman (2018-2021) and Vice Chairman (2015-2018) of the Independent Trustees of certain Fidelity® funds. Mr. Arthur E. Johnson is not related to Ms. Abigail P. Johnson.
Michael E. Kenneally (1954)
Year of Election or Appointment: 2009
Trustee
Chairman of the Independent Trustees
Mr. Kenneally also serves as Trustee of other Fidelity ® funds and was Vice Chairman (2018-2021) of the Independent Trustees of certain Fidelity ® funds. Prior to retirement in 2005, he was Chairman and Global Chief Executive Officer of Credit Suisse Asset Management, the worldwide fund management and institutional investment business of Credit Suisse Group. Previously, Mr. Kenneally was an Executive Vice President and the Chief Investment Officer for Bank of America. In this role, he was responsible for the investment management, strategy and products delivered to the bank's institutional, high-net-worth and retail clients. Earlier, Mr. Kenneally directed the organization's equity and quantitative research groups. He began his career as a research analyst and then spent more than a dozen years as a portfolio manager for endowments, pension plans and mutual funds. He earned the Chartered Financial Analyst (CFA) designation in 1991.
Marie L. Knowles (1946)
Year of Election or Appointment: 2001
Trustee
Ms. Knowles also serves as Trustee of other Fidelity ® funds. Prior to her retirement, Ms. Knowles held several positions at Atlantic Richfield Company (diversified energy), including Executive Vice President and Chief Financial Officer (1996-2000), Senior Vice President (1993-1996) and President of ARCO Transportation Company (pipeline and tanker operations, 1993-1996). Ms. Knowles currently serves as a member of the Board of the Santa Catalina Island Company (real estate, 2009-present), a member of the Investment Company Institute Board of Governors and a member of the Governing Council of the Independent Directors Council (2014-present). Ms. Knowles also serves as a member of the Advisory Board for the School of Engineering of the University of Southern California. Ms. Knowles previously served as a member of the Board of McKesson Corporation (healthcare service, 2002-2021). In addition, Ms. Knowles previously served as Chairman (2015-2018) and Vice Chairman (2012-2015) of the Independent Trustees of certain Fidelity ® funds.
Mark A. Murray (1954)
Year of Election or Appointment: 2016
Trustee
Mr. Murray also serves as Trustee of other Fidelity ® funds. Previously, Mr. Murray served as Co-Chief Executive Officer (2013-2016), President (2006-2013) and Vice Chairman (2013-2020) of Meijer, Inc. Mr. Murray serves as a member of the Board (2009-present) and Public Policy and Responsibility Committee (2009-present) and Chair of the Nuclear Review Committee (2019-present) of DTE Energy Company (diversified energy company). Mr. Murray previously served as a member of the Board of Spectrum Health (not-for-profit health system, 2015-2019) and as a member of the Board and Audit Committee and Chairman of the Nominating and Corporate Governance Committee of Universal Forest Products, Inc. (manufacturer and distributor of wood and wood-alternative products, 2004-2016). Mr. Murray also serves as a member of the Board of many community and professional organizations. Mr. Murray previously served as a member of the Advisory Board of certain Fidelity ® funds (2016).
+ The information includes the Trustee's principal occupation during the last five years and other information relating to the experience, attributes, and skills relevant to the Trustee's qualifications to serve as a Trustee, which led to the conclusion that the Trustee should serve as a Trustee for the fund.
Advisory Board Members and Officers:
Correspondence intended for a Member of the Advisory Board (if any) may be sent to Fidelity Investments, P.O. Box 55235, Boston, Massachusetts 02205-5235. Correspondence intended for an officer may be sent to Fidelity Investments, 245 Summer Street, Boston, Massachusetts 02210. Officers appear below in alphabetical order.
Name, Year of Birth; Principal Occupation
Laura M. Bishop (1961)
Year of Election or Appointment: 2022
Member of the Advisory Board
Ms. Bishop also serves as a Member of the Advisory Board of other funds. Prior to her retirement, Ms. Bishop held a variety of positions at United Services Automobile Association (2001-2020), including Executive Vice President and Chief Financial Officer (2014-2020) and Senior Vice President and Deputy Chief Financial Officer (2012-2014). Ms. Bishop currently serves as a member of the Audit Committee and Compensation and Personnel Committee (2021-present) of the Board of Directors of Korn Ferry (global organizational consulting).
Robert W. Helm (1957)
Year of Election or Appointment: 2021
Member of the Advisory Board
Mr. Helm also serves as a Member of the Advisory Board of other Fidelity® funds. Mr. Helm was formerly Deputy Chairman (2003-2020), partner (1991-2020) and an associate (1984-1991) of Dechert LLP (formerly Dechert Price & Rhoads). Mr. Helm currently serves on boards and committees of several not-for-profit organizations.
Craig S. Brown (1977)
Year of Election or Appointment: 2019
Assistant Treasurer
Mr. Brown also serves as an officer of other funds. Mr. Brown serves as Assistant Treasurer of FIMM, LLC (2021-present) and is an employee of Fidelity Investments (2013-present). Previously, Mr. Brown served as Assistant Treasurer of certain Fidelity ® funds (2019-2022).
John J. Burke III (1964)
Year of Election or Appointment: 2018
Chief Financial Officer
Mr. Burke also serves as Chief Financial Officer of other funds. Mr. Burke serves as Head of Investment Operations for Fidelity Fund and Investment Operations (2018-present) and is an employee of Fidelity Investments (1998-present). Previously Mr. Burke served as head of Asset Management Investment Operations (2012-2018).
David J. Carter (1973)
Year of Election or Appointment: 2020
Assistant Secretary
Mr. Carter also serves as Assistant Secretary of other funds. Mr. Carter serves as Senior Vice President, Deputy General Counsel (2022-present) and is an employee of Fidelity Investments (2005-present).
Jonathan Davis (1968)
Year of Election or Appointment: 2010
Assistant Treasurer
Mr. Davis also serves as an officer of other funds. Mr. Davis serves as Assistant Treasurer of FIMM, LLC (2021-present), FMR Capital, Inc. (2017-present), FD Funds GP LLC (2021-present), FD Funds Holding LLC (2021-present), and FD Funds Management LLC (2021-present); and is an employee of Fidelity Investments. Previously, Mr. Davis served as Vice President and Associate General Counsel of FMR LLC (diversified financial services company, 2003-2010).
Laura M. Del Prato (1964)
Year of Election or Appointment: 2018
President and Treasurer
Ms. Del Prato also serves as an officer of other funds. Ms. Del Prato serves as Assistant Treasurer of FIMM, LLC (2021-present) and is an employee of Fidelity Investments (2017-present). Previously, Ms. Del Prato served as President and Treasurer of The North Carolina Capital Management Trust: Cash Portfolio and Term Portfolio (2018-2020). Prior to joining Fidelity Investments, Ms. Del Prato served as a Managing Director and Treasurer of the JPMorgan Mutual Funds (2014-2017). Prior to JPMorgan, Ms. Del Prato served as a partner at Cohen Fund Audit Services (accounting firm, 2012-2013) and KPMG LLP (accounting firm, 2004-2012).
Colm A. Hogan (1973)
Year of Election or Appointment: 2016
Assistant Treasurer
Mr. Hogan also serves as an officer of other funds. Mr. Hogan serves as Assistant Treasurer of FIMM, LLC (2021-present) and FMR Capital, Inc. (2017-present) and is an employee of Fidelity Investments (2005-present). Previously, Mr. Hogan served as Deputy Treasurer of certain Fidelity ® funds (2016-2020) and Assistant Treasurer of certain Fidelity ® funds (2016-2018).
Cynthia Lo Bessette (1969)
Year of Election or Appointment: 2019
Secretary and Chief Legal Officer (CLO)
Ms. Lo Bessette also serves as an officer of other funds. Ms. Lo Bessette serves as CLO, Secretary, and Senior Vice President of Fidelity Management & Research Company LLC (investment adviser firm, 2019-present); CLO of Fidelity Management & Research (Hong Kong) Limited, FMR Investment Management (UK) Limited, and Fidelity Management & Research (Japan) Limited (investment adviser firms, 2019-present); Secretary of FD Funds GP LLC (2021-present), FD Funds Holding LLC (2021-present), FD Funds Management LLC (2021-present), and Fidelity Diversifying Solutions LLC (investment adviser firm, 2022-present); and Assistant Secretary of FIMM, LLC (2019-present). She is a Senior Vice President and Deputy General Counsel of FMR LLC (diversified financial services company, 2019-present), and is an employee of Fidelity Investments. Previously, Ms. Lo Bessette served as CLO, Secretary, and Senior Vice President of FMR Co., Inc. (investment adviser firm, 2019); Secretary of Fidelity SelectCo, LLC and Fidelity Investments Money Management, Inc. (investment adviser firms, 2019). Prior to joining Fidelity Investments, Ms. Lo Bessette was Executive Vice President, General Counsel (2016-2019) and Senior Vice President, Deputy General Counsel (2015-2016) of OppenheimerFunds (investment management company) and Deputy Chief Legal Officer (2013-2015) of Jennison Associates LLC (investment adviser firm).
Chris Maher (1972)
Year of Election or Appointment: 2013
Assistant Treasurer
Mr. Maher also serves as an officer of other funds. Mr. Maher serves as Assistant Treasurer of FIMM, LLC (2021-present) and FMR Capital, Inc. (2017-present), and is an employee of Fidelity Investments (2008-present). Previously, Mr. Maher served as Assistant Treasurer of certain funds (2013-2020); Vice President of Asset Management Compliance (2013), Vice President of the Program Management Group of FMR (investment adviser firm, 2010-2013), and Vice President of Valuation Oversight (2008-2010).
Jamie Pagliocco (1964)
Year of Election or Appointment: 2020
Vice President
Mr. Pagliocco also serves as Vice President of other funds. Mr. Pagliocco serves as President of Fixed Income (2020-present), and is an employee of Fidelity Investments (2001-present). Previously, Mr. Pagliocco served as Co-Chief Investment Officer - Bond (2017-2020), Global Head of Bond Trading (2016-2019), and as a portfolio manager.
Kenneth B. Robins (1969)
Year of Election or Appointment: 2020
Chief Compliance Officer
Mr. Robins also serves as an officer of other funds. Mr. Robins serves as Compliance Officer of Fidelity Management & Research Company LLC (investment adviser firm, 2016-present) and is an employee of Fidelity Investments (2004-present). Previously, Mr. Robins served as Compliance Officer of FMR Co., Inc. (investment adviser firm, 2016-2019), as Executive Vice President of Fidelity Investments Money Management, Inc. (investment adviser firm, 2013-2016) and served in other fund officer roles.
Brett Segaloff (1972)
Year of Election or Appointment: 2021
Anti-Money Laundering (AML) Officer
Mr. Segaloff also serves as an AML Officer of other funds and other related entities. He is Director, Anti-Money Laundering (2007-present) of FMR LLC (diversified financial services company) and is an employee of Fidelity Investments (1996-present).
Stacie M. Smith (1974)
Year of Election or Appointment: 2013
Assistant Treasurer
Ms. Smith also serves as an officer of other funds. Ms. Smith serves as Assistant Treasurer of FIMM, LLC (2021-present) and FMR Capital, Inc. (2017-present), is an employee of Fidelity Investments (2009-present), and has served in other fund officer roles. Prior to joining Fidelity Investments, Ms. Smith served as Senior Audit Manager of Ernst & Young LLP (accounting firm, 1996-2009). Previously, Ms. Smith served as Assistant Treasurer (2013-2019) and Deputy Treasurer (2013-2016) of certain Fidelity ® funds.
Jim Wegmann (1979)
Year of Election or Appointment: 2021
Deputy Treasurer
Mr. Wegmann also serves as an officer of other funds. Mr. Wegmann serves as Assistant Treasurer of FIMM, LLC (2021-present) and is an employee of Fidelity Investments (2011-present). Previously, Mr. Wegmann served as Assistant Treasurer of certain Fidelity ® funds (2019-2021).
As a shareholder, you incur two types of costs: (1) transaction costs, which may include sales charges (loads) on purchase payments or redemption proceeds, as applicable and (2) ongoing costs, which generally include management fees, distribution and/or service (12b-1) fees and other Fund expenses. This Example is intended to help you understand your ongoing costs (in dollars) of investing in a fund and to compare these costs with the ongoing costs of investing in other mutual funds.
| The Example is based on an investment of $1,000 invested at the beginning of the period and held for the entire period (May 1, 2022 to October 31, 2022). |
Actual Expenses
The first line of the accompanying table provides information about actual account values and actual expenses. You may use the information in this line, together with the amount you invested, to estimate the expenses that you paid over the period. Simply divide your account value by $1,000.00 (for example, an $8,600 account value divided by $1,000.00 = 8.6), then multiply the result by the number in the first line for a class/Fund under the heading entitled "Expenses Paid During Period" to estimate the expenses you paid on your account during this period. If any fund is a shareholder of any underlying mutual funds or exchange-traded funds (ETFs) (the Underlying Funds), such fund indirectly bears its proportional share of the expenses of the Underlying Funds in addition to the direct expenses incurred presented in the table. These fees and expenses are not included in the annualized expense ratio used to calculate the expense estimate in the table below.
Hypothetical Example for Comparison Purposes
The second line of the accompanying table provides information about hypothetical account values and hypothetical expenses based on the actual expense ratio and an assumed rate of return of 5% per year before expenses, which is not the actual return. The hypothetical account values and expenses may not be used to estimate the actual ending account balance or expenses you paid for the period. You may use this information to compare the ongoing costs of investing in the Fund and other funds. To do so, compare this 5% hypothetical example with the 5% hypothetical examples that appear in the shareholder reports of the other funds. If any fund is a shareholder of any Underlying Funds, such fund indirectly bears its proportional share of the expenses of the Underlying Funds in addition to the direct expenses as presented in the table. These fees and expenses are not included in the annualized expense ratio used to calculate the expense estimate in the table below.
Please note that the expenses shown in the table are meant to highlight your ongoing costs only and do not reflect any transaction costs. Therefore, the second line of the table is useful in comparing ongoing costs only, and will not help you determine the relative total costs of owning different funds. In addition, if these transactional costs were included, your costs would have been higher.
| | | | | Annualized Expense Ratio- A | | Beginning Account Value May 1, 2022 | | Ending Account Value October 31, 2022 | | Expenses Paid During Period- C May 1, 2022 to October 31, 2022 |
| | | | | | | | | | |
| Fidelity® Series Global ex U.S. Index Fund | | | | .01% | | | | | | |
| Actual | | | | | | $ 1,000 | | $ 863.30 | | $ .05 |
Hypothetical- B | | | | | | $ 1,000 | | $ 1,025.16 | | $ .05 |
| |
A Annualized expense ratio reflects expenses net of applicable fee waivers.
B 5% return per year before expenses
C Expenses are equal to the annualized expense ratio, multiplied by the average account value over the period, multiplied by 184/ 365 (to reflect the one-half year period). The fees and expenses of any Underlying Funds are not included in each annualized expense ratio.
The dividend and capital gains distributions for the fund(s) are available on Fidelity.com or Institutional.Fidelity.com .
The fund designates 59% of the dividend distributed in December during the fiscal year as amounts which may be taken into account as a dividend for the purposes of the maximum rate under section 1(h)(11) of the Internal Revenue Code.
The fund will notify shareholders in January 2023 of amounts for use in preparing 2022 income tax returns.
Fidelity Series Global ex U.S. Index Fund
Each year, the Board of Trustees, including the Independent Trustees (together, the Board), votes on the renewal of the management contract with Fidelity Management & Research Company LLC (FMR) and the sub-advisory agreement (Sub-Advisory Agreement) for the fund with Geode Capital Management, LLC (Geode) (together, the Advisory Contracts). FMR and Geode are referred to herein as the Investment Advisers. The Board, assisted by the advice of fund counsel and Independent Trustees' counsel, requests and considers a broad range of information relevant to the renewal of the Advisory Contracts throughout the year.
The Board meets regularly and, at each of its meetings, covers an extensive agenda of topics and materials and considers factors that are relevant to its annual consideration of the renewal of the fund's Advisory Contracts, including the services and support provided to the fund and its shareholders. The Board has established four standing committees (Committees) - Operations, Audit, Fair Valuation, and Governance and Nominating - each composed of and chaired by Independent Trustees with varying backgrounds, to which the Board has assigned specific subject matter responsibilities in order to enhance effective decision-making by the Board. The Operations Committee, of which all the Independent Trustees are members, meets regularly throughout the year and requests, receives and considers, among other matters, information related to the annual consideration of the renewal of the fund's Advisory Contracts before making its recommendation to the Board. The Board also meets as needed to review matters specifically related to the Board's annual consideration of the renewal of the Advisory Contracts. Members of the Board may also meet from time to tmie with trustees of other Fidelity funds through joint ad hoc committees to discuss certain matters relevant to all of the Fidelity funds.
At its September 2022 meeting, the Board unanimously determined to renew the fund's Advisory Contracts. In considering whether to renew the Advisory Contracts for the fund, the Board considered all factors it believed relevant and reached a determination, with the assistance of fund counsel and Independent Trustees' counsel and through the exercise of its business judgment, that the renewal of the Advisory Contracts was in the best interests of the fund and its shareholders and the fact that no fee is payable under the management contract was fair and reasonable.
Nature, Extent, and Quality of Services Provided . The Board considered staffing as it relates to the fund, including the backgrounds of investment personnel of Fidelity and Geode, and also considered the fund's investment objective, strategies, and related investment philosophy. The Independent Trustees also had discussions with senior management of Fidelity's investment operations and investment groups and with senior management of Geode. The Board considered the structure of the investment personnel compensation programs and whether the structures provide appropriate incentives to act in the best interests of the fund. The Board also considered the steps Fidelity had taken to ensure the continued provision of high quality services to the Fidelity funds throughout the COVID-19 pandemic, including the expansion of staff in client facing positions to maintain service levels in periods of high volumes and volatility.
The Trustees also discussed with representatives of Fidelity, at meetings throughout the year, Fidelity's role in, among other things, overseeing compliance with federal securities laws and other applicable requirements by Geode with respect to the fund and monitoring and overseeing the performance and investment capabilities of Geode. The Trustees considered that the Board had received from Fidelity periodic reports about its oversight and due diligence processes, as well as periodic reports regarding the performance of Geode.
The Board also considered the nature, extent and quality of services provided by Geode. The Trustees noted that under the Sub-Advisory Agreement, subject to oversight by Fidelity, Geode is responsible for, among other things, identifying investments and arranging for execution of portfolio transactions to implement the fund's investment strategy. In addition, the Trustees noted that Geode is responsible for providing such reporting as may be requested by Fidelity to fulfill its oversight responsibilities discussed above.
Resources Dedicated to Investment Management and Support Services . The Board reviewed the general qualifications and capabilities of Fidelity's and Geode's investment staffs, including their size, education, experience, and resources, as well as Fidelity's and Geode's approach to recruiting, training, managing, and compensating investment personnel. The Board considered that Fidelity's and Geode's investment professionals have extensive resources, tools and capabilities so as to provide competitive investment results over time, and that those professionals also have access to sophisticated tools that permit them to assess portfolio construction and risk and performance attribution characteristics continuously. Additionally, in its deliberations, the Board considered Fidelity's and Geode's trading, risk management, compliance, cybersecurity, and technology and operations capabilities and resources, which are integral parts of the investment management process.
Administrative Services . The Board considered (i) the nature, extent, quality, and cost of advisory and administrative services performed by the Investment Advisers and their affiliates under the Advisory Contracts and by FMR's affiliates under separate agreements covering transfer agency, pricing and bookkeeping, and securities lending services for the fund; (ii) the nature and extent of the supervision of third party service providers, principally custodians, subcustodians, and pricing vendors; and (iii) the resources devoted to, and the record of compliance with, the fund's compliance policies and procedures. The Board also reviewed the allocation of fund brokerage, including allocations to brokers affiliated with the Investment Advisers.
Investment Performance . The Board considered whether the fund has operated in accordance with its investment objective, as well as its record of compliance with its investment restrictions. The Board reviewed the fund's absolute investment performance, as well as the fund's relative investment performance. In this regard, the Board noted that the fund is designed to offer an investment option for other investment companies, collective investment trusts, and 529 plans managed by Fidelity and ultimately to enhance the performance of those investment companies, collective investment trusts, and 529 plans.
Based on its review, the Board concluded that the nature, extent, and quality of services provided to the fund under the Advisory Contracts should continue to benefit the shareholders of the fund.
Competitiveness of Management Fee and Total Expense Ratio . The Board considered that the fund does not pay FMR a management fee for investment advisory services, but that FMR receives fees for providing services to funds, collective investment trusts, and 529 plans that invest in the fund. The Board also noted that FMR or an affiliate undertakes to pay all operating expenses of the fund, except transfer agent fees, 12b-1 fees, Independent Trustee fees and expenses, custodian fees and expenses, proxy and shareholder meeting expenses, interest, taxes, and extraordinary expenses (such as litigation expenses). The Board further noted that the fund pays its non-operating expenses, including brokerage commissions and fees and expenses associated with the fund's securities lending program, if applicable.
The Board further considered that FMR has contractually agreed to reimburse the fund to the extent that total operating expenses, with certain exceptions, as a percentage of its average net assets, exceed 0.013% through February 28, 2025.
At its September 2022 meeting, the Board also approved an amendment to the fund's sub-advisory agreement with Geode (effective October 1, 2022) that reduced the sub-advisory fee rate that FMR pays to Geode.
Based on its review, the Board considered that the fund does not pay a management fee and concluded that the fund's total expense ratio was reasonable in light of the services that the fund and its shareholders receive and the other factors considered.
Costs of the Services and Profitability . The Board considered the level of Fidelity's profits in respect of all the Fidelity funds.
A public accounting firm has been engaged annually by the Board as part of the Board's assessment of Fidelity's profitability analysis. The engagement includes the review and assessment of the methodologies used by Fidelity in determining the revenues and expenses attributable to Fidelity's mutual fund business, and completion of agreed-upon procedures in respect of the mathematical accuracy of certain fund profitability information and its conformity to established allocation methodologies.
After considering the reports issued under the engagement and information provided by Fidelity, the Board concluded that while other allocation methods may also be reasonable, Fidelity's profitability methodologies are reasonable in all material respects.
The Board also reviewed Fidelity's and Geode's non-fund businesses and potential indirect benefits such businesses may have received as a result of their association with Fidelity's mutual fund business (i.e., fall-out benefits) as well as cases where Fidelity's and Geode's affiliates may benefit from the funds' business. The Board considered areas where potential indirect benefits to the Fidelity funds from their relationships with Fidelity may exist. The Board's consideration of these matters was informed by the findings of a joint ad hoc committee created by it and the boards of other Fidelity funds to evaluate potential fall-out benefits.
The Board concluded that the costs of the services provided by and the profits realized by Fidelity in connection with the operation of the fund were not relevant to the renewal of the Advisory Contracts because the fund pays no advisory fees and FMR or an affiliate bears all expenses of the fund, with limited exceptions.
The Board also considered information regarding the profitability of Geode's relationship with the fund.
Economies of Scale . The Board concluded that because the fund pays no advisory fees and FMR or an affiliate bears all expenses of the fund with certain limited exceptions, the realization of economies of scale was not a material factor in the Board's decision to renew the fund's Advisory Contracts.
Additional Information Requested by the Board . In order to develop fully the factual basis for consideration of the Fidelity funds' advisory contracts, the Board requested and received additional information on certain topics, including: (i) Fidelity's fund profitability methodology, profitability trends for certain funds, the allocation of various costs to different funds, and the impact of certain factors on fund profitability results; (ii) portfolio manager changes that have occurred during the past year and the amount of the investment that each portfolio manager has made in the Fidelity fund(s) that he or she manages; (iii) the extent to which current market conditions have affected retention and recruitment of personnel; (iv) the arrangements with and compensation paid to certain fund sub-advisers on behalf of the Fidelity funds and the treatment of such compensation within Fidelity's fund profitability methodology; (v) the terms of the funds' various management fee structures, including the basic group fee and the terms of Fidelity's voluntary expense limitation arrangements; (vi) Fidelity's transfer agent, pricing and bookkeeping fees, expense and service structures for different funds and classes relative to competitive trends; (vii) the impact on fund profitability of recent industry trends, such as the growth in passively managed funds and the changes in flows for different types of funds; (viii) the types of management fee and total expense comparisons provided, and the challenges and limitations associated with such information; and (ix) explanations regarding the relative total expense ratios and management fees of certain funds and classes, total expense and management fee competitive trends, and methodologies for total expense and management fee competitive comparisons. In addition, the Board considered its discussions with Fidelity regarding Fidelity's efforts to maintain the continuous investment and shareholder services necessary for the funds during the current pandemic and economic circumstances.
Based on its evaluation of all of the conclusions noted above, and after considering all factors it believed relevant, the Board concluded that the advisory and sub-advisory fee arrangements are fair and reasonable and that the fund's Advisory Contracts should be renewed.
1.899279.113
SGX-ANN-1222
Fidelity® International Sustainability Index Fund
Annual Report
October 31, 2022
Contents
To view a fund's proxy voting guidelines and proxy voting record for the 12-month period ended June 30, visit http://www.fidelity.com/proxyvotingresults or visit the Securities and Exchange Commission's (SEC) web site at http://www.sec.gov.
You may also call 1-800-544-8544 to request a free copy of the proxy voting guidelines.
The funds or securities referred to herein are not sponsored, endorsed, or promoted by MSCI, and MSCI bears no liability with respect to any such funds or securities or any index on which such funds or securities are based. The prospectus contains a more detailed description of the limited relationship MSCI has with Fidelity and any related funds.
Standard & Poor's, S&P and S&P 500 are registered service marks of The McGraw-Hill Companies, Inc. and have been licensed for use by Fidelity Distributors Corporation.
Other third-party marks appearing herein are the property of their respective owners.
All other marks appearing herein are registered or unregistered trademarks or service marks of FMR LLC or an affiliated company. © 2022 FMR LLC. All rights reserved.
This report and the financial statements contained herein are submitted for the general information of the shareholders of the Fund. This report is not authorized for distribution to prospective investors in the Fund unless preceded or accompanied by an effective prospectus.
A fund files its complete schedule of portfolio holdings with the SEC for the first and third quarters of each fiscal year on Form N-PORT. Forms N-PORT are available on the SEC's web site at http://www.sec.gov. A fund's Forms N-PORT may be reviewed and copied at the SEC's Public Reference Room in Washington, DC. Information regarding the operation of the SEC's Public Reference Room may be obtained by calling 1-800-SEC-0330.
For a complete list of a fund's portfolio holdings, view the most recent holdings listing, semiannual report, or annual report on Fidelity's web site at http://www.fidelity.com, http://www.institutional.fidelity.com, or http://www.401k.com, as applicable.
NOT FDIC INSURED •MAY LOSE VALUE •NO BANK GUARANTEE
Neither the Fund nor Fidelity Distributors Corporation is a bank.
Average annual total return reflects the change in the value of an investment, assuming reinvestment of distributions from dividend income and capital gains (the profits earned upon the sale of securities that have grown in value, if any) and assuming a constant rate of performance each year. The hypothetical investment and the average annual total returns do not reflect the deduction of taxes that a shareholder would pay on fund distributions or the redemption of fund shares. During periods of reimbursement by Fidelity, a fund's total return will be greater than it would be had the reimbursement not occurred. How a fund did yesterday is no guarantee of how it will do tomorrow.
| Average Annual Total Returns |
| | | | |
Periods ended October 31, 2022 | Past 1 year | Past 5 years | Life of Fund A |
| Fidelity® International Sustainability Index Fund | -28.11% | -0.91% | 0.85% |
A From May 09, 2017
| $10,000 Over Life of Fund |
| |
Let's say hypothetically that $10,000 was invested in Fidelity® International Sustainability Index Fund on May 09, 2017, when the fund started. The chart shows how the value of your investment would have changed, and also shows how the MSCI ACWI (All Country World Index) ex USA ESG Leaders Index (net) and the MSCI ACWI (All Country World Index) ex USA ESG Leaders Index (gross) performed over the same period. |
|
|
Effective April 1, 2022, the fund's benchmark changed from the MSCI ACWI (All Country World Index) ex USA ESG Leaders Index (gross) to the MSCI ACWI (All Country World Index) ex USA ESG Leaders Index (net).
Market Recap:
International equities returned -24.61% for the 12 months ending October 31, 2022, according to the MSCI ACWI (All Country World Index) ex USA Index. After gaining 7.98% in 2021, non-U.S. stocks retreated in the new year, as a multitude of risk factors challenged the global economy and financial markets. Persistently high inflation in some markets, exacerbated by energy price shocks from the Russia-Ukraine conflict, spurred the U.S. Federal Reserve and other central banks to aggressively tighten monetary policy, and market interest rates eclipsed their highest level in roughly a decade, stoking recession fears and sending stocks into bear market territory. Other factors influencing equities abroad included surging global commodity prices, rising sovereign bond yields in some markets, ongoing global supply-chain disruption, a broadly strong U.S. dollar and the potential for variants of the coronavirus to upend global economic growth. Against this backdrop, the index returned -24.20% year to date through October. For the full 12 months, emerging markets (-31%) and Europe ex U.K. (-25%) notably lagged. Conversely, Canada (-13%) and the U.K. (-12%) held up best. Among the 11 sectors, information technology and consumer discretionary (-37% each) fared worst. Communication services (-34%) also trailed the broader market. In contrast, energy gained 2% amid high prices for oil and natural gas. The defensive-oriented utilities (-16%) sector also outperformed, as did financials and consumer staples (-18% each).
Comments from the Geode Capital Management, LLC, passive equity index team:
For the fiscal year ending October 31, 2022, the fund returned -28.11%, roughly in line with the -28.07% result of the benchmark MSCI ACWI (All Country World Index) EX USA ESG Leaders Index (Net). (The fund's relative performance can be affected by Fidelity's methodologies for valuing certain foreign stocks and for incorporating foreign exchange rates, which differ from those used by the index, as well as by local tax laws or regulations, which vary by country.) By region, emerging markets returned -34% and detracted the most from the fund's result, followed by Europe ex U.K. (-26%). None of the fund's industry sectors posted a positive return for the period. Stocks in the consumer discretionary sector returned -43% and hurt performance the most, followed by information technology, which returned -40%, hampered by holdings in the semiconductors & semiconductor equipment industry (-41%). Financials returned -19%, while industrials returned roughly -27%, hurt especially by stocks in the capital goods industry (-29%). Communication services (-36%) and materials (-26%) further hampered results. Health care (-19%), consumer staples (-21%), real estate (-32%), energy (-11%), and utilities (-18%) all detracted as well. Turning to individual stocks, the biggest individual detractor was Taiwan Semiconductor (-42%), followed by Tencent Holdings (-56%), which is in the media & entertainment category. Within retailing, Alibaba Group returned about -63%, while ASML Holding (-41%), a stock in the semiconductors & semiconductor equipment industry, and Shopify (-76%), from the software & services group, also hurt the fund's result. Conversely, the biggest individual contributor was TotalEnergies (+14%), from the energy sector; within the sector, Equinor (+48%) and Woodside Energy (+45%) also helped. Nutrien, in the materials group, advanced roughly 24% and lifted performance, as did Daiichi (+21%), a stock in the pharmaceuticals, biotechnology & life sciences industry.
Note to Shareholders:
On April 1, 2022, the fund's benchmark was changed to the MSCI ACWI (All Country World Index) ex USA ESG Leaders Index (net).
The views expressed above reflect those of the portfolio manager(s) only through the end of the period as stated on the cover of this report and do not necessarily represent the views of Fidelity or any other person in the Fidelity organization. Any such views are subject to change at any time based upon market or other conditions and Fidelity disclaims any responsibility to update such views. These views may not be relied on as investment advice and, because investment decisions for a Fidelity fund are based on numerous factors, may not be relied on as an indication of trading intent on behalf of any Fidelity fund.
Top Holdings (% of Fund's net assets) |
| |
| Taiwan Semiconductor Manufacturing Co. Ltd. (Taiwan, Semiconductors & Semiconductor Equipment) | 2.8 | |
| Roche Holding AG (participation certificate) (Switzerland, Pharmaceuticals) | 2.2 | |
| ASML Holding NV (Netherlands) (Netherlands, Semiconductors & Semiconductor Equipment) | 1.8 | |
| AstraZeneca PLC (United Kingdom) (United Kingdom, Pharmaceuticals) | 1.7 | |
| Novo Nordisk A/S Series B (Denmark, Pharmaceuticals) | 1.7 | |
| Tencent Holdings Ltd. (Cayman Islands, Interactive Media & Services) | 1.6 | |
| TotalEnergies SE (France, Oil, Gas & Consumable Fuels) | 1.3 | |
| Alibaba Group Holding Ltd. (Cayman Islands, Internet & Direct Marketing Retail) | 1.1 | |
| The Toronto-Dominion Bank (Canada, Banks) | 1.1 | |
| Unilever PLC (United Kingdom, Personal Products) | 1.1 | |
| | 16.4 | |
| |
| Market Sectors (% of Fund's net assets) |
| |
| Financials | 21.4 | |
| Industrials | 11.6 | |
| Health Care | 10.9 | |
| Information Technology | 10.5 | |
| Consumer Discretionary | 9.4 | |
| Materials | 7.9 | |
| Consumer Staples | 7.7 | |
| Communication Services | 6.3 | |
| Energy | 5.6 | |
| Utilities | 3.2 | |
| Real Estate | 1.8 | |
| |
Asset Allocation (% of Fund's net assets) |
|
Foreign investments - 96% |
|
Geographic Diversification (% of Fund's net assets) |
|
* Includes Short-Term investments and Net Other Assets (Liabilities). Percentages are based on country or territory of incorporation and are adjusted for the effect of futures contracts, if applicable. |
| |
Showing Percentage of Net Assets
| Common Stocks - 95.4% |
| | | Shares | Value ($) |
| Australia - 5.1% | | | |
| APA Group unit | | 37,422 | 251,578 |
| Aristocrat Leisure Ltd. | | 18,812 | 446,067 |
| ASX Ltd. | | 6,093 | 263,853 |
| Aurizon Holdings Ltd. | | 59,773 | 138,406 |
| Australia & New Zealand Banking Group Ltd. | | 93,868 | 1,537,909 |
| BlueScope Steel Ltd. | | 13,940 | 140,260 |
| Brambles Ltd. | | 45,559 | 340,376 |
| Cochlear Ltd. | | 2,035 | 259,960 |
| Coles Group Ltd. | | 41,830 | 436,935 |
| Commonwealth Bank of Australia | | 53,862 | 3,606,522 |
| Computershare Ltd. | | 17,090 | 276,242 |
| Dexus unit | | 33,904 | 168,289 |
| Dominos Pizza Enterprises Ltd. | | 1,948 | 79,435 |
| Endeavour Group Ltd. | | 43,454 | 198,737 |
| Evolution Mining Ltd. | | 59,531 | 79,204 |
| Fortescue Metals Group Ltd. | | 53,725 | 506,144 |
| Goodman Group unit | | 53,320 | 579,804 |
| IDP Education Ltd. | | 6,931 | 131,185 |
| Lendlease Group unit | | 20,596 | 114,484 |
| Macquarie Group Ltd. | | 11,431 | 1,239,357 |
| Mineral Resources Ltd. | | 5,400 | 252,599 |
| Mirvac Group unit | | 129,375 | 171,302 |
| Newcrest Mining Ltd. | | 27,556 | 305,190 |
| Northern Star Resources Ltd. | | 37,110 | 207,465 |
| Orica Ltd. | | 14,641 | 129,988 |
| QBE Insurance Group Ltd. | | 47,193 | 369,489 |
| Ramsay Health Care Ltd. | | 5,745 | 215,232 |
| REA Group Ltd. | | 1,624 | 126,307 |
| Santos Ltd. | | 103,062 | 503,114 |
| Scentre Group unit | | 156,706 | 290,687 |
| SEEK Ltd. | | 10,461 | 144,467 |
| Sonic Healthcare Ltd. | | 14,722 | 308,593 |
| Stockland Corp. Ltd. unit | | 78,398 | 180,530 |
| Suncorp Group Ltd. | | 39,216 | 286,214 |
| Telstra Group Ltd. | | 129,598 | 324,958 |
| The GPT Group unit | | 62,721 | 172,915 |
| Transurban Group unit | | 97,917 | 830,508 |
| Vicinity Centres unit | | 126,442 | 157,309 |
| Woodside Energy Group Ltd. | | 59,809 | 1,376,481 |
TOTAL AUSTRALIA | | | 17,148,095 |
| Austria - 0.1% | | | |
| OMV AG | | 4,488 | 206,861 |
| Verbund AG | | 2,142 | 167,759 |
| Voestalpine AG | | 3,720 | 80,805 |
TOTAL AUSTRIA | | | 455,425 |
| Bailiwick of Jersey - 0.3% | | | |
| Ferguson PLC | | 6,745 | 735,614 |
| WPP PLC | | 34,132 | 300,367 |
TOTAL BAILIWICK OF JERSEY | | | 1,035,981 |
| Belgium - 0.3% | | | |
| D'ieteren Group | | 826 | 137,382 |
| KBC Group NV | | 7,840 | 392,908 |
| Solvay SA Class A | | 2,270 | 204,681 |
| Umicore SA | | 6,521 | 214,971 |
TOTAL BELGIUM | | | 949,942 |
| Bermuda - 0.3% | | | |
| Alibaba Health Information Technology Ltd. (a) | | 148,000 | 62,596 |
| Beijing Enterprises Water Group Ltd. | | 132,000 | 27,746 |
| China Gas Holdings Ltd. | | 101,400 | 89,908 |
| China Resource Gas Group Ltd. | | 27,000 | 69,137 |
| China Ruyi Holdings Ltd. (a) | | 160,000 | 25,071 |
| CK Infrastructure Holdings Ltd. | | 21,500 | 102,164 |
| Credicorp Ltd. (United States) | | 2,222 | 325,212 |
| Hopson Development Holdings Ltd. | | 27,489 | 22,062 |
| Kunlun Energy Co. Ltd. | | 126,000 | 75,282 |
| Shenzhen International Holdings Ltd. | | 26,823 | 18,042 |
TOTAL BERMUDA | | | 817,220 |
| Brazil - 1.0% | | | |
| Americanas SA | | 20,991 | 63,150 |
| Atacadao SA | | 17,100 | 64,421 |
| Banco Bradesco SA | | 58,410 | 188,160 |
| Banco Santander SA (Brasil) unit | | 12,900 | 74,371 |
| CCR SA | | 38,300 | 96,093 |
| Companhia de Saneamento Basico do Estado de Sao Paulo (SABESP) | | 9,900 | 115,185 |
| Cosan SA | | 37,444 | 122,216 |
| Energisa SA unit | | 6,400 | 60,079 |
| Equatorial Energia SA | | 29,700 | 172,663 |
| Hapvida Participacoes e Investimentos SA (b) | | 152,700 | 230,580 |
| Hypera SA | | 12,700 | 124,922 |
| Klabin SA unit | | 24,000 | 100,451 |
| Localiza Rent a Car SA | | 73 | 997 |
| Localiza Rent a Car SA | | 23,854 | 325,750 |
| Lojas Renner SA | | 32,965 | 197,197 |
| Natura & Co. Holding SA (a) | | 29,913 | 86,574 |
| Petro Rio SA (a) | | 23,100 | 158,263 |
| Raia Drogasil SA | | 32,000 | 162,989 |
| Rede D'Oregon Sao Luiz SA (b) | | 12,900 | 80,339 |
| Rumo SA | | 42,300 | 181,303 |
| Telefonica Brasil SA | | 14,800 | 118,360 |
| TIM SA | | 28,400 | 72,574 |
| Totvs SA | | 18,300 | 117,477 |
| Ultrapar Participacoes SA | | 24,400 | 63,344 |
| Weg SA | | 51,380 | 400,656 |
TOTAL BRAZIL | | | 3,378,114 |
| Canada - 8.1% | | | |
| Agnico Eagle Mines Ltd. (Canada) | | 14,620 | 643,136 |
| Alimentation Couche-Tard, Inc. Class A (multi-vtg.) | | 26,094 | 1,168,374 |
| Bank of Montreal | | 21,244 | 1,956,846 |
| Bank of Nova Scotia | | 37,822 | 1,828,149 |
| Brookfield Asset Management, Inc. (Canada) Class A | | 44,364 | 1,756,845 |
| CAE, Inc. (a) | | 10,433 | 199,110 |
| Cameco Corp. | | 13,714 | 325,246 |
| Canadian Apartment Properties (REIT) unit | | 2,767 | 85,690 |
| Canadian National Railway Co. | | 18,550 | 2,197,651 |
| Canadian Tire Ltd. Class A (non-vtg.) | | 1,805 | 202,302 |
| Enbridge, Inc. | | 63,905 | 2,489,872 |
| FirstService Corp. | | 1,315 | 164,391 |
| Fortis, Inc. | | 14,997 | 585,085 |
| Gildan Activewear, Inc. | | 5,745 | 181,288 |
| Hydro One Ltd. (b) | | 9,865 | 247,358 |
| Intact Financial Corp. | | 5,551 | 843,478 |
| Ivanhoe Mines Ltd. (a) | | 20,159 | 139,834 |
| Keyera Corp. | | 6,293 | 134,881 |
| Kinross Gold Corp. | | 42,510 | 154,145 |
| Lundin Mining Corp. | | 22,322 | 116,988 |
| Magna International, Inc. Class A (sub. vtg.) | | 8,747 | 487,446 |
| Metro, Inc. | | 7,540 | 395,001 |
| National Bank of Canada | | 10,707 | 729,021 |
| Northland Power, Inc. | | 7,301 | 212,436 |
| Nutrien Ltd. | | 17,382 | 1,468,670 |
| Open Text Corp. | | 8,468 | 245,273 |
| Parkland Corp. | | 5,283 | 106,796 |
| Pembina Pipeline Corp. | | 17,003 | 561,379 |
| Power Corp. of Canada (sub. vtg.) | | 17,405 | 432,203 |
| Ritchie Bros. Auctioneers, Inc. | | 3,506 | 229,041 |
| Rogers Communications, Inc. Class B (non-vtg.) | | 11,065 | 460,598 |
| Shopify, Inc. Class A (a) | | 35,989 | 1,233,931 |
| TELUS Corp. | | 14,131 | 295,098 |
| The Toronto-Dominion Bank | | 57,477 | 3,678,511 |
| Thomson Reuters Corp. | | 5,377 | 571,860 |
| Toromont Industries Ltd. | | 2,561 | 196,819 |
| Wheaton Precious Metals Corp. | | 13,918 | 455,335 |
TOTAL CANADA | | | 27,180,087 |
| Cayman Islands - 4.8% | | | |
| 3SBio, Inc. (b) | | 37,000 | 26,113 |
| AAC Technology Holdings, Inc. (a)(c) | | 22,000 | 40,299 |
| Airtac International Group | | 4,000 | 91,772 |
| Alibaba Group Holding Ltd. (a) | | 479,000 | 3,724,180 |
| Baidu, Inc. sponsored ADR (a) | | 8,714 | 667,231 |
| Chailease Holding Co. Ltd. | | 42,461 | 196,152 |
| China Conch Venture Holdings Ltd. | | 52,500 | 77,449 |
| China Feihe Ltd. (b) | | 113,000 | 65,068 |
| China Liansu Group Holdings Ltd. | | 38,000 | 30,837 |
| China Medical System Holdings Ltd. | | 45,000 | 49,130 |
| China Mengniu Dairy Co. Ltd. | | 101,000 | 323,600 |
| China Resources Cement Holdings Ltd. | | 60,000 | 21,708 |
| China Resources Mixc Lifestyle Services Ltd. (b) | | 23,600 | 69,150 |
| Chow Tai Fook Jewellery Group Ltd. | | 67,400 | 115,401 |
| CIFI Holdings Group Co. Ltd. (d) | | 130,720 | 8,660 |
| Country Garden Services Holdings Co. Ltd. | | 65,000 | 56,805 |
| Dali Foods Group Co. Ltd. (b) | | 75,500 | 31,067 |
| ENN Energy Holdings Ltd. | | 24,700 | 245,595 |
| Genscript Biotech Corp. (a) | | 38,000 | 96,045 |
| Grab Holdings Ltd. (a) | | 42,017 | 109,244 |
| Greentown Service Group Co. Ltd. | | 42,000 | 17,229 |
| Hansoh Pharmaceutical Group Co. Ltd. (b) | | 36,000 | 55,585 |
| Jinxin Fertility Group Ltd. (b) | | 45,500 | 22,432 |
| Kingdee International Software Group Co. Ltd. (a) | | 84,000 | 137,402 |
| Longfor Properties Co. Ltd. (b) | | 60,000 | 76,437 |
| Meituan Class B (a)(b) | | 138,900 | 2,223,865 |
| Microport Scientific Corp. (a) | | 21,300 | 44,990 |
| NetEase, Inc. | | 65,200 | 723,411 |
| Ping An Healthcare and Technology Co. Ltd. (a)(b) | | 17,700 | 32,651 |
| Pop Mart International Group Ltd. (b)(c) | | 18,600 | 24,074 |
| Sino Biopharmaceutical Ltd. | | 301,750 | 146,461 |
| Tencent Holdings Ltd. | | 197,100 | 5,179,156 |
| Tongcheng Travel Holdings Ltd. (a) | | 37,200 | 58,006 |
| Uni-President China Holdings Ltd. | | 38,000 | 28,078 |
| Vinda International Holdings Ltd. | | 11,000 | 20,628 |
| Vipshop Holdings Ltd. ADR (a) | | 14,330 | 99,880 |
| Want Want China Holdings Ltd. | | 153,000 | 100,575 |
| WH Group Ltd. (b) | | 249,000 | 125,933 |
| Wuxi Biologics (Cayman), Inc. (a)(b) | | 113,000 | 508,460 |
| Xinyi Solar Holdings Ltd. | | 151,494 | 150,343 |
| XPeng, Inc. ADR (a) | | 13,158 | 87,106 |
| Yadea Group Holdings Ltd. (b) | | 42,000 | 64,100 |
| Yihai International Holding Ltd. | | 16,000 | 26,335 |
TOTAL CAYMAN ISLANDS | | | 15,998,643 |
| Chile - 0.1% | | | |
| Cencosud SA | | 45,907 | 61,793 |
| Empresas CMPC SA | | 32,914 | 52,223 |
| Empresas COPEC SA | | 12,956 | 89,284 |
| Enel Americas SA | | 740,774 | 73,394 |
| Falabella SA | | 24,579 | 48,059 |
TOTAL CHILE | | | 324,753 |
| China - 1.6% | | | |
| 37 Interactive Entertainment Network Technology Group Co. Ltd. (A Shares) | | 3,600 | 7,143 |
| A-Living Smart City Services C (H Shares) (b) | | 17,500 | 9,921 |
| Air China Ltd.: | | | |
| (A Shares) (a) | | 29,500 | 39,062 |
| (H Shares) (a) | | 26,000 | 18,085 |
| Angel Yeast Co. Ltd. (A Shares) | | 2,600 | 12,881 |
| Anjoy Foods Group Co. Ltd. (A Shares) | | 400 | 7,358 |
| Baoshan Iron & Steel Co. Ltd. (A Shares) | | 65,900 | 43,405 |
| BBMG Corp. (A Shares) | | 23,600 | 7,530 |
| Beijing Capital International Airport Co. Ltd. (H Shares) (a) | | 70,000 | 37,900 |
| Beijing Easpring Material Technology Co. Ltd. (A Shares) | | 900 | 7,270 |
| By-Health Co. Ltd. (A Shares) | | 3,800 | 9,116 |
| BYD Co. Ltd.: | | | |
| (A Shares) | | 1,200 | 40,532 |
| (H Shares) | | 29,000 | 649,112 |
| CanSino Biologics, Inc.: | | | |
| (A Shares) | | 274 | 7,116 |
| (H Shares) (b)(c) | | 2,400 | 22,319 |
| CECEP Solar Energy Co. Ltd. (A Shares) | | 5,500 | 5,091 |
| CECEP Wind-Power Corp. (A Shares) | | 5,400 | 3,165 |
| Chengtun Mining Group Co. Ltd. (A Shares) | | 1,800 | 1,365 |
| Chengxin Lithium Group Co. Ltd. (A Shares) | | 1,500 | 8,877 |
| China Baoan Group Co. Ltd. (A Shares) | | 4,400 | 6,965 |
| China Communications Services Corp. Ltd. (H Shares) | | 70,000 | 19,530 |
| China Construction Bank Corp.: | | | |
| (A Shares) | | 81,800 | 59,814 |
| (H Shares) | | 2,916,000 | 1,547,488 |
| China Eastern Airlines Corp. Ltd.: | | | |
| (A Shares) (a) | | 10,900 | 7,164 |
| (H Shares) (a) | | 6,000 | 1,980 |
| China Jushi Co. Ltd. (A Shares) | | 5,457 | 8,743 |
| China Merchants Bank Co. Ltd.: | | | |
| (A Shares) | | 36,300 | 133,312 |
| (H Shares) | | 123,500 | 405,916 |
| China Resources Sanjiu Medical & Pharmaceutical Co. Ltd. (A Shares) | | 2,400 | 17,924 |
| China Southern Airlines Ltd. (A Shares) (a) | | 66,300 | 58,648 |
| China Suntien Green Energy Corp. Ltd. (H Shares) | | 65,000 | 24,676 |
| China Three Gorges Renewables Group Co. Ltd. (A Shares) | | 67,000 | 51,102 |
| China Vanke Co. Ltd.: | | | |
| (A Shares) | | 7,300 | 13,515 |
| (H Shares) | | 68,900 | 88,477 |
| Cmoc Group Ltd.: | | | |
| (A Shares) | | 20,600 | 11,706 |
| (H Shares) | | 132,000 | 42,545 |
| Contemporary Amperex Technology Co. Ltd. | | 4,700 | 239,978 |
| ENN Natural Gas Co. Ltd. (A Shares) | | 4,000 | 8,479 |
| Eve Energy Co. Ltd. (A shares) | | 3,640 | 41,390 |
| Ganfeng Lithium Group Co. Ltd. (A Shares) | | 1,820 | 19,693 |
| GEM Co. Ltd. (A Shares) | | 8,600 | 8,761 |
| Gotion High-tech Co. Ltd. (A Shares) | | 3,000 | 12,344 |
| Guangzhou Baiyunshan Pharma Health (A Shares) | | 3,600 | 13,305 |
| Guangzhou Kingmed Diagnostics Group Co. Ltd. (A Shares) | | 600 | 6,208 |
| Henan Shuanghui Investment & Development Co. Ltd. (A Shares) | | 9,100 | 28,386 |
| Huadong Medicine Co. Ltd. (A Shares) | | 2,800 | 15,693 |
| Huatai Securities Co. Ltd. (A Shares) | | 62,700 | 102,770 |
| Huaxin Cement Co. Ltd. (A Shares) | | 800 | 1,470 |
| Inner Mongoli Yili Industries Co. Ltd. (A Shares) | | 11,600 | 40,091 |
| Jafron Biomedical Co. Ltd. (A Shares) | | 1,800 | 7,808 |
| Jiangsu Eastern Shenghong Co. Ltd. | | 7,300 | 12,235 |
| Jiangsu Zhongtian Technology Co. Ltd. (A Shares) | | 6,100 | 18,351 |
| Jinke Properties Group Co. Ltd. (A Shares) (a) | | 7,300 | 1,769 |
| Jonjee Hi-Tech Industrial & Commercial Holding Co. Ltd. (A Shares) | | 900 | 3,340 |
| Keda Industrial Group Co. Ltd. | | 3,000 | 6,396 |
| Kingfa Sci & Tech Co. Ltd. (A Shares) | | 3,400 | 4,507 |
| Ming Yang Smart Energy Group Ltd. (A Shares) | | 3,900 | 13,297 |
| Orient Securities Co. Ltd. (A Shares) | | 26,000 | 27,627 |
| Ovctek China, Inc. (A Shares) | | 1,640 | 6,674 |
| Pharmaron Beijing Co. Ltd.: | | | |
| (A Shares) | | 2,700 | 19,225 |
| (H Shares) (b) | | 5,400 | 18,161 |
| Postal Savings Bank of China Co. Ltd. (H Shares) (b) | | 292,000 | 135,405 |
| SF Holding Co. Ltd. (A Shares) | | 10,800 | 71,370 |
| Shandong Nanshan Aluminum Co. Ltd. (A Shares) | | 9,200 | 3,880 |
| Shandong Weigao Medical Polymer Co. Ltd. (H Shares) | | 84,000 | 115,786 |
| Shanghai Electric Group Co. Ltd. (A Shares) (a) | | 13,400 | 7,119 |
| Shanghai Fosun Pharmaceutical (Group) Co. Ltd.: | | | |
| (A Shares) | | 3,700 | 16,735 |
| (H Shares) | | 17,000 | 42,924 |
| Shanghai M&G Stationery, Inc. (A Shares) | | 1,200 | 6,622 |
| Shanghai Pharmaceuticals Holding Co. Ltd.: | | | |
| (A Shares) | | 1,900 | 4,574 |
| (H Shares) | | 31,800 | 43,104 |
| Shanghai Putailai New Energy Technology Co. Ltd. | | 3,300 | 22,553 |
| Shenzhen Inovance Technology Co. Ltd. (A Shares) | | 4,600 | 42,013 |
| Shenzhen Mindray Bio-Medical Electronics Co. Ltd. (A Shares) | | 2,600 | 115,864 |
| Sichuan Yahua Industrial Group Co. Ltd. (A Shares) | | 1,400 | 5,128 |
| Sinopharm Group Co. Ltd. (H Shares) | | 36,800 | 70,134 |
| Sinotrans Ltd. | | 5,400 | 2,625 |
| SKSHU Paint Co. Ltd. (A Shares) (a) | | 620 | 7,378 |
| Sungrow Power Supply Co. Ltd. (A Shares) | | 2,900 | 51,746 |
| Suzhou TA&A Ultra Clean Technology Co. Ltd. (A Shares) | | 1,000 | 8,469 |
| Titan Wind Energy Suzhou Co. Ltd. (A Shares) | | 3,100 | 4,984 |
| Topchoice Medical Corp. (a) | | 500 | 8,370 |
| Transfar Zhilian Co. Ltd. | | 4,400 | 2,970 |
| Unisplendour Corp. Ltd. (A Shares) | | 5,200 | 12,212 |
| WuXi AppTec Co. Ltd. | | 3,776 | 39,503 |
| WuXi AppTec Co. Ltd. (H Shares) (b) | | 12,980 | 104,010 |
| Xinjiang Goldwind Science & Technology Co. Ltd. (H Shares) | | 36,618 | 31,768 |
| Youngy Co. Ltd. (A Shares) (a) | | 400 | 6,035 |
| Yunnan Baiyao Group Co. Ltd. (A Shares) | | 2,520 | 18,827 |
| Yunnan Energy New Material Co. Ltd. | | 2,000 | 40,543 |
| Zhejiang Chint Electric Co. Ltd. (A Shares) | | 3,900 | 13,564 |
| Zhejiang Expressway Co. Ltd. (H Shares) | | 48,000 | 29,780 |
| Zhejiang Huayou Cobalt Co. Ltd. (A Shares) | | 2,958 | 22,067 |
| Zhejiang Jiuzhou Pharmaceutical Co. Ltd. (A Shares) | | 2,600 | 12,646 |
| Zhejiang Weixing New Building Materials Co. Ltd. (A Shares) | | 2,100 | 5,003 |
| Zhejiang Yongtai Technology Co. Ltd. (A Shares) | | 1,300 | 3,884 |
| Zoomlion Heavy Industry Science and Technology Co. Ltd.: | | | |
| (A Shares) | | 22,800 | 16,703 |
| (H Shares) | | 43,000 | 13,859 |
TOTAL CHINA | | | 5,274,868 |
| Colombia - 0.0% | | | |
| Bancolombia SA | | 4,385 | 31,520 |
| Interconexion Electrica SA ESP | | 15,655 | 61,083 |
TOTAL COLOMBIA | | | 92,603 |
| Cyprus - 0.0% | | | |
| Galaxy Cosmos Mezz PLC (a) | | 2,525 | 408 |
| Czech Republic - 0.0% | | | |
| Komercni Banka A/S | | 2,594 | 74,412 |
| MONETA Money Bank A/S (b) | | 7,833 | 22,865 |
TOTAL CZECH REPUBLIC | | | 97,277 |
| Denmark - 2.8% | | | |
| A.P. Moller - Maersk A/S: | | | |
| Series A | | 1 | 2,002 |
| Series B | | 254 | 530,650 |
| Chr. Hansen Holding A/S | | 3,280 | 182,175 |
| Coloplast A/S Series B | | 3,742 | 417,121 |
| Demant A/S (a) | | 2,847 | 77,804 |
| Genmab A/S (a) | | 2,105 | 810,862 |
| GN Store Nord A/S | | 4,073 | 86,603 |
| Novo Nordisk A/S Series B | | 52,275 | 5,683,927 |
| Novozymes A/S Series B | | 6,473 | 339,961 |
| ORSTED A/S (b) | | 5,961 | 491,817 |
| Pandora A/S | | 2,818 | 148,524 |
| Vestas Wind Systems A/S | | 31,821 | 627,309 |
TOTAL DENMARK | | | 9,398,755 |
| Egypt - 0.0% | | | |
| Commercial International Bank SAE | | 69,994 | 93,808 |
| Commercial International Bank SAE sponsored GDR | | 17,516 | 22,245 |
TOTAL EGYPT | | | 116,053 |
| Finland - 1.1% | | | |
| Elisa Corp. (A Shares) | | 4,560 | 220,409 |
| Kesko Oyj | | 8,474 | 164,976 |
| Neste OYJ | | 13,300 | 582,793 |
| Nordea Bank ABP | | 108,073 | 1,032,846 |
| Orion Oyj (B Shares) | | 3,415 | 157,100 |
| Sampo Oyj (A Shares) | | 15,147 | 692,766 |
| Stora Enso Oyj (R Shares) | | 17,148 | 223,524 |
| UPM-Kymmene Corp. | | 17,025 | 570,534 |
| Wartsila Corp. | | 15,299 | 104,323 |
TOTAL FINLAND | | | 3,749,271 |
| France - 6.8% | | | |
| Accor SA (a) | | 5,232 | 125,366 |
| Air Liquide SA | | 16,520 | 2,161,043 |
| Alstom SA | | 9,957 | 204,927 |
| AXA SA | | 59,046 | 1,458,136 |
| bioMerieux SA | | 1,328 | 117,512 |
| BNP Paribas SA | | 35,088 | 1,645,414 |
| Bouygues SA | | 7,489 | 213,670 |
| Bureau Veritas SA | | 9,260 | 229,420 |
| Carrefour SA | | 19,339 | 311,270 |
| Compagnie Generale des Etablissements Michelin SCA Series B | | 21,357 | 544,263 |
| Covivio | | 1,618 | 86,665 |
| Danone SA | | 20,247 | 1,006,266 |
| Eiffage SA | | 2,672 | 241,721 |
| EssilorLuxottica SA | | 9,089 | 1,440,296 |
| Gecina SA | | 1,457 | 129,949 |
| Kering SA | | 2,364 | 1,082,621 |
| Klepierre SA | | 6,963 | 140,032 |
| L'Oreal SA | | 7,614 | 2,390,829 |
| Orange SA | | 63,064 | 600,868 |
| Publicis Groupe SA | | 7,164 | 401,216 |
| Schneider Electric SA | | 17,120 | 2,164,934 |
| SEB SA | | 878 | 57,180 |
| Societe Generale Series A | | 25,055 | 574,688 |
| Teleperformance | | 1,851 | 496,276 |
| TotalEnergies SE (c) | | 78,196 | 4,265,855 |
| Valeo SA | | 6,522 | 107,573 |
| Vivendi SA | | 22,284 | 182,394 |
| Worldline SA (a)(b) | | 7,558 | 329,880 |
TOTAL FRANCE | | | 22,710,264 |
| Germany - 3.5% | | | |
| adidas AG | | 5,425 | 529,562 |
| Allianz SE | | 12,929 | 2,325,985 |
| Bayerische Motoren Werke AG (BMW) | | 10,263 | 805,563 |
| Beiersdorf AG | | 3,248 | 311,792 |
| Brenntag SE | | 4,739 | 287,545 |
| Carl Zeiss Meditec AG | | 1,308 | 158,412 |
| Commerzbank AG (a) | | 33,421 | 267,397 |
| Delivery Hero AG (a)(b) | | 5,103 | 167,934 |
| Deutsche Borse AG | | 6,003 | 976,206 |
| Evonik Industries AG | | 6,754 | 124,515 |
| GEA Group AG | | 4,722 | 165,195 |
| HeidelbergCement AG | | 4,738 | 217,885 |
| HelloFresh AG (a) | | 5,438 | 108,879 |
| Henkel AG & Co. KGaA | | 3,053 | 179,227 |
| LEG Immobilien AG | | 2,235 | 146,042 |
| Merck KGaA | | 4,065 | 662,453 |
| MTU Aero Engines AG | | 1,647 | 295,011 |
| Puma AG | | 3,245 | 143,700 |
| SAP SE | | 32,988 | 3,175,190 |
| Symrise AG | | 4,237 | 432,481 |
| Telefonica Deutschland Holding AG | | 34,973 | 76,244 |
| Zalando SE (a)(b) | | 7,380 | 170,096 |
TOTAL GERMANY | | | 11,727,314 |
| Greece - 0.1% | | | |
| Alpha Bank SA (a) | | 68,202 | 63,222 |
| Eurobank Ergasias Services and Holdings SA (a) | | 82,010 | 81,046 |
| Mytilineos SA | | 2,799 | 46,969 |
| Public Power Corp. of Greece (a) | | 6,322 | 39,923 |
TOTAL GREECE | | | 231,160 |
| Hong Kong - 1.7% | | | |
| AIA Group Ltd. | | 379,400 | 2,873,877 |
| BOC Hong Kong (Holdings) Ltd. | | 119,500 | 371,456 |
| China Everbright International Ltd. | | 131,962 | 43,877 |
| China Overseas Land and Investment Ltd. | | 122,000 | 232,821 |
| CITIC Pacific Ltd. | | 175,000 | 156,727 |
| CSPC Pharmaceutical Group Ltd. | | 279,280 | 286,866 |
| Far East Horizon Ltd. | | 31,000 | 23,932 |
| Fosun International Ltd. | | 91,000 | 55,646 |
| Ganfeng Lithium Group Co. Ltd. (H Shares) (b) | | 13,440 | 90,917 |
| Hang Seng Bank Ltd. | | 24,600 | 346,314 |
| Hong Kong & China Gas Co. Ltd. | | 348,356 | 268,502 |
| Lenovo Group Ltd. | | 216,000 | 172,808 |
| MTR Corp. Ltd. | | 50,048 | 220,285 |
| Sino Land Ltd. | | 94,000 | 100,471 |
| Sinotruk Hong Kong Ltd. | | 22,000 | 19,619 |
| Swire Pacific Ltd. (A Shares) | | 17,000 | 112,508 |
| Swire Properties Ltd. | | 38,400 | 73,770 |
| Wharf Holdings Ltd. | | 41,000 | 117,260 |
TOTAL HONG KONG | | | 5,567,656 |
| Hungary - 0.1% | | | |
| MOL Hungarian Oil and Gas PLC Series A (For. Reg.) | | 13,913 | 83,424 |
| OTP Bank PLC | | 7,276 | 158,599 |
TOTAL HUNGARY | | | 242,023 |
| India - 4.4% | | | |
| Adani Green Energy Ltd. (a) | | 9,979 | 253,501 |
| Adani Total Gas Ltd. | | 8,661 | 376,954 |
| Asian Paints Ltd. | | 12,129 | 455,343 |
| Axis Bank Ltd. | | 71,116 | 778,341 |
| Berger Paints India Ltd. | | 7,942 | 56,202 |
| Britannia Industries Ltd. | | 3,296 | 149,970 |
| Colgate-Palmolive Ltd. | | 4,188 | 82,553 |
| Dabur India Ltd. | | 18,158 | 121,675 |
| Eicher Motors Ltd. | | 4,207 | 195,685 |
| GAIL India Ltd. | | 77,032 | 84,960 |
| Grasim Industries Ltd. | | 8,051 | 167,449 |
| Havells India Ltd. | | 7,518 | 110,463 |
| HCL Technologies Ltd. | | 33,866 | 425,943 |
| Hero Motocorp Ltd. | | 3,618 | 116,995 |
| Hindalco Industries Ltd. | | 41,067 | 201,242 |
| Hindustan Unilever Ltd. | | 26,075 | 803,449 |
| Housing Development Finance Corp. Ltd. | | 54,203 | 1,617,185 |
| ICICI Prudential Life Insurance Co. Ltd. (b) | | 11,483 | 70,406 |
| Indraprastha Gas Ltd. | | 8,679 | 44,900 |
| Info Edge India Ltd. | | 2,166 | 102,614 |
| Infosys Ltd. | | 106,105 | 1,970,915 |
| Kotak Mahindra Bank Ltd. | | 17,419 | 400,218 |
| Lupin Ltd. | | 7,189 | 60,704 |
| Mahindra & Mahindra Ltd. | | 27,584 | 449,381 |
| Marico Ltd. | | 16,681 | 105,702 |
| Nestle India Ltd. | | 1,100 | 270,594 |
| PI Industries Ltd. | | 2,569 | 100,611 |
| Piramal Pharma Ltd. (a) | | 15,820 | 31,514 |
| Reliance Industries Ltd. | | 96,046 | 2,958,189 |
| Shree Cement Ltd. | | 357 | 98,072 |
| Shriram Transport Finance Co. Ltd. | | 6,268 | 93,070 |
| Siemens Ltd. | | 2,387 | 84,361 |
| State Bank of India | | 56,700 | 393,023 |
| Tata Consultancy Services Ltd. | | 28,789 | 1,110,505 |
| UPL Ltd. | | 16,274 | 143,552 |
| Zomato Ltd. (a) | | 76,887 | 58,608 |
TOTAL INDIA | | | 14,544,849 |
| Indonesia - 0.6% | | | |
| PT Aneka Tambang Tbk | | 290,000 | 34,304 |
| PT Bank Central Asia Tbk | | 1,741,100 | 982,316 |
| PT Bank Negara Indonesia (Persero) Tbk | | 229,800 | 138,491 |
| PT Barito Pacific Tbk | | 969,000 | 51,253 |
| PT Indah Kiat Pulp & Paper Tbk | | 98,300 | 60,502 |
| PT Kalbe Farma Tbk | | 732,600 | 96,287 |
| PT Merdeka Copper Gold Tbk (a) | | 398,118 | 96,227 |
| PT Telkom Indonesia Persero Tbk | | 1,541,900 | 433,044 |
| PT Tower Bersama Infrastructure Tbk | | 165,220 | 26,058 |
| PT Unilever Indonesia Tbk | | 235,700 | 70,117 |
TOTAL INDONESIA | | | 1,988,599 |
| Ireland - 0.7% | | | |
| CRH PLC | | 24,042 | 865,941 |
| DCC PLC (United Kingdom) | | 3,226 | 179,060 |
| James Hardie Industries PLC CDI | | 14,032 | 306,360 |
| Kerry Group PLC Class A | | 5,014 | 436,048 |
| Kingspan Group PLC (Ireland) | | 4,818 | 243,307 |
| Smurfit Kappa Group PLC | | 7,695 | 254,982 |
TOTAL IRELAND | | | 2,285,698 |
| Israel - 0.1% | | | |
| Bank Leumi le-Israel BM | | 49,224 | 470,153 |
| Italy - 0.8% | | | |
| Amplifon SpA | | 4,245 | 105,465 |
| Enel SpA | | 255,852 | 1,142,980 |
| Intesa Sanpaolo SpA | | 519,750 | 990,919 |
| Nexi SpA (a)(b) | | 16,691 | 144,660 |
| Prysmian SpA | | 7,929 | 258,504 |
TOTAL ITALY | | | 2,642,528 |
| Japan - 13.8% | | | |
| AEON Co. Ltd. | | 21,000 | 392,121 |
| Ajinomoto Co., Inc. | | 14,700 | 404,931 |
| Ana Holdings, Inc. (a)(c) | | 5,600 | 108,878 |
| Asahi Kasei Corp. | | 39,500 | 253,271 |
| Astellas Pharma, Inc. | | 57,700 | 796,155 |
| Azbil Corp. | | 3,500 | 95,212 |
| Bridgestone Corp. | | 18,100 | 654,613 |
| Chugai Pharmaceutical Co. Ltd. | | 21,500 | 498,195 |
| Dai Nippon Printing Co. Ltd. | | 7,200 | 144,441 |
| Dai-ichi Mutual Life Insurance Co. | | 31,400 | 497,834 |
| Daifuku Co. Ltd. | | 3,200 | 146,770 |
| Daiichi Sankyo Kabushiki Kaisha | | 55,300 | 1,770,195 |
| Daikin Industries Ltd. | | 7,900 | 1,183,319 |
| Daiwa House Industry Co. Ltd. | | 18,600 | 374,740 |
| DENSO Corp. | | 13,700 | 679,738 |
| Eisai Co. Ltd. | | 7,800 | 470,743 |
| FANUC Corp. | | 6,000 | 785,110 |
| Fast Retailing Co. Ltd. | | 1,800 | 1,004,620 |
| FUJIFILM Holdings Corp. | | 11,400 | 522,792 |
| Fujitsu Ltd. | | 6,200 | 713,363 |
| Hankyu Hanshin Holdings, Inc. | | 7,200 | 213,780 |
| Hikari Tsushin, Inc. | | 700 | 84,596 |
| Hirose Electric Co. Ltd. | | 1,000 | 129,863 |
| Hitachi Construction Machinery Co. Ltd. | | 3,500 | 68,590 |
| Hoshizaki Corp. | | 3,400 | 97,522 |
| Hoya Corp. | | 11,500 | 1,073,086 |
| Hulic Co. Ltd. | | 12,200 | 88,611 |
| Ibiden Co. Ltd. | | 3,400 | 115,014 |
| INPEX Corp. | | 32,700 | 330,021 |
| Isuzu Motors Ltd. | | 18,600 | 218,154 |
| ITO EN Ltd. | | 1,600 | 56,491 |
| Itochu Corp. | | 37,500 | 970,695 |
| Japan Real Estate Investment Corp. | | 41 | 171,781 |
| JFE Holdings, Inc. | | 16,000 | 146,663 |
| JSR Corp. | | 5,900 | 112,449 |
| Kajima Corp. | | 13,200 | 124,370 |
| Kao Corp. | | 14,900 | 556,544 |
| KDDI Corp. | | 50,900 | 1,504,450 |
| Keio Corp. | | 3,300 | 115,848 |
| Kikkoman Corp. | | 4,600 | 249,961 |
| Komatsu Ltd. | | 29,500 | 577,911 |
| Kubota Corp. | | 32,000 | 446,874 |
| Kurita Water Industries Ltd. | | 3,100 | 113,830 |
| LIXIL Group Corp. | | 9,400 | 142,301 |
| Marubeni Corp. | | 49,000 | 429,382 |
| Mazda Motor Corp. | | 17,800 | 119,847 |
| McDonald's Holdings Co. (Japan) Ltd. | | 2,300 | 79,814 |
| Meiji Holdings Co. Ltd. | | 3,600 | 148,169 |
| Mitsubishi Chemical Holdings Corp. | | 42,000 | 189,840 |
| Mitsubishi Estate Co. Ltd. | | 37,600 | 472,831 |
| Mitsui & Co. Ltd. | | 44,000 | 974,424 |
| Mitsui Chemicals, Inc. | | 5,500 | 101,903 |
| MS&AD Insurance Group Holdings, Inc. | | 14,100 | 373,385 |
| Murata Manufacturing Co. Ltd. | | 18,100 | 856,844 |
| Nintendo Co. Ltd. | | 34,990 | 1,420,562 |
| Nippon Building Fund, Inc. | | 50 | 222,267 |
| Nippon Express Holdings, Inc. | | 2,500 | 125,593 |
| Nippon Paint Holdings Co. Ltd. | | 25,800 | 164,834 |
| Nippon Prologis REIT, Inc. | | 70 | 146,642 |
| Nippon Steel & Sumitomo Metal Corp. | | 25,100 | 344,778 |
| Nippon Yusen KK | | 15,000 | 271,717 |
| Nissin Food Holdings Co. Ltd. | | 2,100 | 136,003 |
| Nitori Holdings Co. Ltd. | | 2,500 | 226,543 |
| Nitto Denko Corp. | | 4,500 | 236,962 |
| Nomura Holdings, Inc. | | 91,300 | 295,443 |
| Nomura Real Estate Holdings, Inc. | | 3,900 | 88,258 |
| Nomura Research Institute Ltd. | | 10,600 | 235,603 |
| NTT Data Corp. | | 20,100 | 291,575 |
| Obayashi Corp. | | 20,700 | 132,947 |
| Odakyu Electric Railway Co. Ltd. | | 9,400 | 111,830 |
| OMRON Corp. | | 5,900 | 276,004 |
| Open House Group Co. Ltd. | | 2,700 | 96,237 |
| Oriental Land Co. Ltd. | | 6,300 | 845,254 |
| ORIX Corp. | | 38,000 | 558,391 |
| Osaka Gas Co. Ltd. | | 11,700 | 173,263 |
| Pan Pacific International Holdings Ltd. | | 11,900 | 195,352 |
| Panasonic Holdings Corp. | | 69,300 | 493,597 |
| Rakuten Group, Inc. | | 27,600 | 123,217 |
| Recruit Holdings Co. Ltd. | | 45,400 | 1,397,011 |
| ROHM Co. Ltd. | | 2,700 | 190,114 |
| SCSK Corp. | | 4,900 | 72,399 |
| Sekisui Chemical Co. Ltd. | | 11,500 | 143,852 |
| Sekisui House Ltd. | | 19,900 | 331,232 |
| Seven & i Holdings Co. Ltd. | | 23,800 | 888,415 |
| SG Holdings Co. Ltd. | | 8,600 | 114,054 |
| Sharp Corp. | | 6,300 | 37,788 |
| Shimadzu Corp. | | 7,400 | 195,333 |
| SHIMIZU Corp. | | 17,100 | 85,445 |
| Shin-Etsu Chemical Co. Ltd. | | 11,800 | 1,226,373 |
| Shionogi & Co. Ltd. | | 8,500 | 394,717 |
| SoftBank Corp. | | 91,000 | 897,659 |
| Sompo Holdings, Inc. | | 9,900 | 412,325 |
| Sony Group Corp. | | 39,800 | 2,683,900 |
| Sumitomo Chemical Co. Ltd. | | 46,500 | 156,673 |
| Sumitomo Electric Industries Ltd. | | 22,500 | 235,146 |
| Sumitomo Metal Mining Co. Ltd. | | 7,600 | 213,034 |
| Sumitomo Mitsui Trust Holdings, Inc. | | 10,700 | 307,829 |
| Sumitomo Realty & Development Co. Ltd. | | 10,000 | 229,665 |
| Suntory Beverage & Food Ltd. | | 4,400 | 147,362 |
| Sysmex Corp. | | 5,300 | 286,145 |
| Taisei Corp. | | 5,700 | 155,442 |
| TDK Corp. | | 12,500 | 391,321 |
| Terumo Corp. | | 20,300 | 617,621 |
| Tobu Railway Co. Ltd. | | 5,900 | 136,494 |
| Tokyo Electron Ltd. | | 4,700 | 1,236,554 |
| Tokyo Gas Co. Ltd. | | 12,500 | 223,360 |
| Tokyu Corp. | | 16,100 | 185,800 |
| Toray Industries, Inc. | | 45,000 | 219,258 |
| Tosoh Corp. | | 8,400 | 91,460 |
| Toto Ltd. | | 4,600 | 131,477 |
| Unicharm Corp. | | 12,700 | 385,971 |
| USS Co. Ltd. | | 6,900 | 104,269 |
| West Japan Railway Co. | | 6,900 | 273,828 |
| Yamaha Corp. | | 4,300 | 162,521 |
| Yamaha Motor Co. Ltd. | | 9,700 | 200,269 |
| Yaskawa Electric Corp. | | 7,500 | 208,312 |
| Yokogawa Electric Corp. | | 7,300 | 122,293 |
| Z Holdings Corp. | | 83,800 | 216,268 |
| ZOZO, Inc. | | 3,900 | 83,012 |
TOTAL JAPAN | | | 45,957,758 |
| Korea (South) - 2.0% | | | |
| AMOREPACIFIC Corp. | | 970 | 62,998 |
| AMOREPACIFIC Group, Inc. | | 1,135 | 19,641 |
| BGF Retail Co. Ltd. | | 270 | 35,279 |
| Celltrion Healthcare Co. Ltd. | | 2,802 | 136,437 |
| CJ CheilJedang Corp. | | 276 | 80,055 |
| CJ Corp. | | 465 | 23,391 |
| CJ Logistics Corp. (a) | | 296 | 18,229 |
| Coway Co. Ltd. | | 1,778 | 68,887 |
| Doosan Bobcat, Inc. | | 1,486 | 34,877 |
| GS Engineering & Construction Corp. | | 2,181 | 33,158 |
| Hana Financial Group, Inc. | | 9,190 | 265,594 |
| Hanwha Solutions Corp. (a) | | 3,811 | 126,026 |
| HMM Co. Ltd. | | 8,873 | 118,736 |
| Hyundai Engineering & Construction Co. Ltd. | | 2,492 | 60,933 |
| Hyundai Glovis Co. Ltd. | | 643 | 78,386 |
| Kakao Corp. | | 9,657 | 343,027 |
| KB Financial Group, Inc. | | 12,369 | 415,369 |
| Korea Zinc Co. Ltd. | | 255 | 114,340 |
| Korean Air Lines Co. Ltd. (a) | | 5,297 | 85,728 |
| LG Chemical Ltd. | | 1,568 | 687,700 |
| LG Corp. | | 2,894 | 160,584 |
| LG Display Co. Ltd. | | 7,392 | 65,836 |
| LG Electronics, Inc. | | 3,261 | 186,432 |
| LG H & H Co. Ltd. | | 294 | 105,050 |
| Lotte Chemical Corp. | | 521 | 54,023 |
| NAVER Corp. | | 4,091 | 485,823 |
| NCSOFT Corp. | | 495 | 135,253 |
| Netmarble Corp. (b) | | 698 | 21,811 |
| POSCO Chemtech Co. Ltd. | | 917 | 128,171 |
| S1 Corp. | | 770 | 33,663 |
| Samsung Engineering Co. Ltd. (a) | | 5,459 | 91,218 |
| Samsung Life Insurance Co. Ltd. | | 2,735 | 129,150 |
| Samsung SDI Co. Ltd. | | 1,720 | 888,126 |
| Samsung SDS Co. Ltd. | | 1,121 | 98,174 |
| Samsung Securities Co. Ltd. | | 2,120 | 47,158 |
| Shinhan Financial Group Co. Ltd. | | 14,468 | 366,987 |
| SK Biopharmaceuticals Co. Ltd. (a) | | 830 | 33,786 |
| SK Chemicals Co. Ltd. | | 451 | 27,932 |
| SK IE Technology Co. Ltd. (a)(b) | | 867 | 31,586 |
| SK Innovation Co., Ltd. | | 1,697 | 205,687 |
| SK, Inc. | | 1,076 | 161,326 |
| SKC Co. Ltd. | | 737 | 53,442 |
| Woori Financial Group, Inc. | | 17,313 | 142,524 |
| Yuhan Corp. | | 1,726 | 72,314 |
TOTAL KOREA (SOUTH) | | | 6,534,847 |
| Kuwait - 0.2% | | | |
| Kuwait Finance House KSCP | | 233,260 | 609,781 |
| Luxembourg - 0.1% | | | |
| Tenaris SA | | 14,934 | 233,734 |
| Malaysia - 0.6% | | | |
| AMMB Holdings Bhd | | 61,600 | 53,288 |
| Axiata Group Bhd | | 93,904 | 56,605 |
| CIMB Group Holdings Bhd | | 222,505 | 259,777 |
| DiGi.com Bhd | | 93,200 | 74,710 |
| Hap Seng Consolidated Bhd | | 21,700 | 29,512 |
| Hartalega Holdings Bhd | | 49,800 | 22,751 |
| IHH Healthcare Bhd | | 55,400 | 69,719 |
| Kuala Lumpur Kepong Bhd | | 13,800 | 63,279 |
| Malayan Banking Bhd | | 154,740 | 281,137 |
| Malaysia Airports Holdings Bhd (a) | | 10,900 | 13,786 |
| Maxis Bhd | | 78,300 | 63,760 |
| MISC Bhd | | 45,700 | 69,884 |
| Nestle (Malaysia) Bhd | | 2,300 | 64,700 |
| Petronas Dagangan Bhd | | 9,600 | 44,020 |
| Petronas Gas Bhd | | 24,800 | 89,695 |
| PPB Group Bhd | | 21,100 | 74,528 |
| Press Metal Bhd | | 125,000 | 115,006 |
| Public Bank Bhd | | 455,400 | 430,549 |
| QL Resources Bhd | | 30,200 | 32,704 |
| RHB Bank Bhd | | 42,244 | 51,107 |
| Sime Darby Bhd | | 81,000 | 38,547 |
| Telekom Malaysia Bhd | | 30,295 | 35,626 |
| Top Glove Corp. Bhd | | 172,200 | 28,955 |
TOTAL MALAYSIA | | | 2,063,645 |
| Mexico - 0.6% | | | |
| Arca Continental S.A.B. de CV | | 14,400 | 117,952 |
| CEMEX S.A.B. de CV unit (a) | | 468,400 | 182,036 |
| Coca-Cola FEMSA S.A.B. de CV unit | | 17,480 | 110,114 |
| Fomento Economico Mexicano S.A.B. de CV unit | | 59,400 | 426,410 |
| Gruma S.A.B. de CV Series B | | 7,065 | 81,954 |
| Grupo Aeroportuario del Sureste S.A.B. de CV Series B | | 6,435 | 150,604 |
| Grupo Bimbo S.A.B. de CV Series A | | 44,400 | 171,904 |
| Grupo Financiero Banorte S.A.B. de CV Series O | | 83,300 | 677,104 |
| Grupo Televisa SA de CV | | 78,300 | 83,070 |
| Industrias Penoles SA de CV | | 4,310 | 48,893 |
| Kimberly-Clark de Mexico SA de CV Series A | | 51,500 | 81,254 |
TOTAL MEXICO | | | 2,131,295 |
| Multi-National - 0.1% | | | |
| HKT Trust/HKT Ltd. unit | | 113,000 | 127,689 |
| Unibail-Rodamco SE & WFD Unibail-Rodamco NV unit (a) | | 3,697 | 174,932 |
TOTAL MULTI-NATIONAL | | | 302,621 |
| Netherlands - 3.8% | | | |
| Akzo Nobel NV | | 5,869 | 362,325 |
| ASML Holding NV (Netherlands) | | 12,835 | 6,020,734 |
| CNH Industrial NV | | 32,081 | 415,482 |
| IMCD NV | | 1,777 | 230,579 |
| ING Groep NV (Certificaten Van Aandelen) | | 123,199 | 1,212,228 |
| JDE Peet's BV | | 3,116 | 89,241 |
| Koninklijke Ahold Delhaize NV | | 32,990 | 920,035 |
| Koninklijke DSM NV | | 5,497 | 646,614 |
| Koninklijke KPN NV | | 106,721 | 298,510 |
| NEPI Rockcastle PLC | | 13,700 | 68,989 |
| NN Group NV | | 8,838 | 374,258 |
| Prosus NV | | 26,160 | 1,131,203 |
| Randstad NV | | 3,692 | 184,036 |
| Wolters Kluwer NV | | 8,301 | 882,282 |
TOTAL NETHERLANDS | | | 12,836,516 |
| New Zealand - 0.3% | | | |
| Auckland International Airport Ltd. (a) | | 37,740 | 168,954 |
| Fisher & Paykel Healthcare Corp. | | 17,910 | 203,884 |
| Mercury Nz Ltd. | | 23,100 | 78,165 |
| Meridian Energy Ltd. | | 39,601 | 112,357 |
| Spark New Zealand Ltd. | | 56,293 | 167,571 |
| Xero Ltd. (a) | | 4,189 | 209,188 |
TOTAL NEW ZEALAND | | | 940,119 |
| Norway - 0.9% | | | |
| Aker BP ASA | | 10,080 | 321,322 |
| DNB Bank ASA | | 29,519 | 522,099 |
| Equinor ASA | | 30,778 | 1,121,357 |
| Gjensidige Forsikring ASA | | 6,528 | 119,243 |
| Mowi ASA | | 12,910 | 192,542 |
| Norsk Hydro ASA | | 41,660 | 264,388 |
| Orkla ASA | | 23,648 | 159,510 |
| Salmar ASA | | 1,989 | 67,383 |
| Telenor ASA | | 21,803 | 198,143 |
TOTAL NORWAY | | | 2,965,987 |
| Philippines - 0.2% | | | |
| Globe Telecom, Inc. | | 989 | 39,752 |
| GT Capital Holdings, Inc. | | 3,170 | 22,597 |
| JG Summit Holdings, Inc. | | 95,813 | 71,507 |
| Monde Nissin Corp. (b) | | 214,300 | 43,312 |
| SM Investments Corp. | | 7,805 | 110,905 |
| SM Prime Holdings, Inc. | | 367,000 | 199,824 |
| Universal Robina Corp. | | 29,280 | 61,758 |
TOTAL PHILIPPINES | | | 549,655 |
| Poland - 0.2% | | | |
| Bank Polska Kasa Opieki SA | | 5,871 | 96,462 |
| CD Projekt RED SA | | 2,318 | 61,712 |
| KGHM Polska Miedz SA (Bearer) | | 4,676 | 93,694 |
| Polski Koncern Naftowy Orlen SA | | 13,252 | 152,448 |
| Polskie Gornictwo Naftowe i Gazownictwo SA (a) | | 60,283 | 64,147 |
| Powszechna Kasa Oszczednosci Bank SA | | 28,830 | 157,432 |
| Powszechny Zaklad Ubezpieczen SA | | 17,002 | 95,443 |
| Santander Bank Polska SA | | 1,242 | 66,131 |
TOTAL POLAND | | | 787,469 |
| Portugal - 0.1% | | | |
| Galp Energia SGPS SA Class B | | 16,410 | 166,612 |
| Jeronimo Martins SGPS SA | | 9,005 | 186,705 |
TOTAL PORTUGAL | | | 353,317 |
| Qatar - 0.3% | | | |
| Qatar Fuel Co. (a) | | 16,336 | 85,588 |
| Qatar Gas Transport Co. Ltd. (Nakilat) (a) | | 84,301 | 94,909 |
| Qatar National Bank SAQ (a) | | 145,018 | 794,030 |
| The Commercial Bank of Qatar (a) | | 100,940 | 174,454 |
TOTAL QATAR | | | 1,148,981 |
| Russia - 0.0% | | | |
| Gazprom OAO (d) | | 372,050 | 58,381 |
| LUKOIL PJSC (d) | | 13,192 | 6,123 |
| Mobile TeleSystems OJSC sponsored ADR (d) | | 14,384 | 14,326 |
| Moscow Exchange MICEX-RTS OAO (a)(d) | | 49,350 | 14,226 |
| Novatek PJSC GDR (Reg. S) (d) | | 2,894 | 739 |
| Novolipetsk Steel OJSC (d) | | 47,040 | 677 |
| PhosAgro PJSC: | | | |
| GDR (d) | | 26 | 1 |
| GDR (Reg. S) (d) | | 4,171 | 86 |
| Polyus PJSC (d) | | 1,031 | 3,636 |
TOTAL RUSSIA | | | 98,195 |
| Saudi Arabia - 0.6% | | | |
| ACWA Power Co. | | 2,562 | 118,638 |
| Bank Albilad | | 15,354 | 207,169 |
| Dr Sulaiman Al Habib Medical Services Group Co. | | 2,742 | 165,357 |
| Saudi Arabian Oil Co. (b) | | 76,260 | 708,300 |
| Saudi Basic Industries Corp. | | 28,220 | 663,903 |
| Saudi Electricity Co. | | 26,306 | 189,023 |
TOTAL SAUDI ARABIA | | | 2,052,390 |
| Singapore - 0.6% | | | |
| BOC Aviation Ltd. Class A (b) | | 7,100 | 47,531 |
| CapitaLand Investment Ltd. | | 85,401 | 181,589 |
| CapitaMall Trust | | 157,509 | 209,181 |
| City Developments Ltd. | | 13,600 | 73,303 |
| Keppel Corp. Ltd. | | 44,500 | 219,105 |
| Singapore Airlines Ltd. | | 43,100 | 160,148 |
| Singapore Exchange Ltd. | | 27,100 | 161,191 |
| United Overseas Bank Ltd. | | 37,700 | 739,299 |
| UOL Group Ltd. | | 16,700 | 73,024 |
TOTAL SINGAPORE | | | 1,864,371 |
| South Africa - 1.6% | | | |
| Absa Group Ltd. | | 25,214 | 274,175 |
| Anglo American Platinum Ltd. | | 1,783 | 141,827 |
| Aspen Pharmacare Holdings Ltd. | | 12,644 | 104,119 |
| Bid Corp. Ltd. | | 11,061 | 177,976 |
| Bidvest Group Ltd./The | | 9,351 | 108,167 |
| Capitec Bank Holdings Ltd. | | 2,774 | 287,019 |
| Clicks Group Ltd. | | 6,837 | 115,850 |
| Discovery Ltd. (a) | | 16,496 | 107,963 |
| FirstRand Ltd. | | 161,395 | 565,404 |
| Gold Fields Ltd. | | 27,529 | 220,529 |
| Growthpoint Properties Ltd. | | 107,074 | 75,487 |
| Impala Platinum Holdings Ltd. | | 27,403 | 280,570 |
| Kumba Iron Ore Ltd. | | 2,103 | 39,612 |
| Mr Price Group Ltd. | | 8,489 | 81,725 |
| MTN Group Ltd. | | 52,482 | 370,970 |
| MultiChoice Group Ltd. | | 11,581 | 75,676 |
| Naspers Ltd. Class N | | 6,854 | 706,523 |
| Nedbank Group Ltd. | | 14,691 | 174,001 |
| Northam Platinum Holdings Ltd. (a) | | 10,974 | 102,985 |
| Old Mutual Ltd. | | 152,050 | 86,419 |
| Remgro Ltd. | | 18,028 | 134,174 |
| Sanlam Ltd. | | 52,869 | 153,811 |
| Sasol Ltd. | | 17,572 | 295,386 |
| Shoprite Holdings Ltd. | | 14,952 | 190,393 |
| Spar Group Ltd./The | | 6,264 | 53,113 |
| Standard Bank Group Ltd. | | 42,630 | 398,364 |
| Vodacom Group Ltd. | | 20,365 | 138,928 |
TOTAL SOUTH AFRICA | | | 5,461,166 |
| Spain - 1.4% | | | |
| Banco Bilbao Vizcaya Argentaria SA | | 210,361 | 1,085,209 |
| Iberdrola SA | | 188,087 | 1,912,709 |
| Industria de Diseno Textil SA | | 34,281 | 777,166 |
| Naturgy Energy Group SA | | 4,642 | 119,090 |
| Red Electrica Corporacion SA | | 12,794 | 206,952 |
| Repsol SA | | 45,462 | 618,487 |
TOTAL SPAIN | | | 4,719,613 |
| Sweden - 1.9% | | | |
| Alfa Laval AB | | 9,240 | 227,711 |
| ASSA ABLOY AB (B Shares) | | 31,713 | 640,351 |
| Atlas Copco AB: | | | |
| (A Shares) | | 84,859 | 905,722 |
| (B Shares) | | 49,167 | 475,502 |
| Boliden AB | | 8,494 | 247,407 |
| Electrolux AB (B Shares) | | 7,428 | 91,669 |
| Epiroc AB: | | | |
| (A Shares) | | 19,722 | 301,913 |
| (B Shares) | | 13,788 | 185,256 |
| EQT AB | | 9,276 | 182,811 |
| Ericsson (B Shares) | | 92,152 | 512,305 |
| Essity AB (B Shares) | | 19,205 | 405,975 |
| H&M Hennes & Mauritz AB (B Shares) | | 22,764 | 229,283 |
| Holmen AB (B Shares) | | 2,906 | 105,436 |
| Husqvarna AB (B Shares) | | 13,341 | 79,208 |
| Nibe Industrier AB (B Shares) | | 47,591 | 379,738 |
| Sandvik AB | | 33,610 | 525,215 |
| SKF AB (B Shares) | | 11,698 | 169,336 |
| Svenska Cellulosa AB SCA (B Shares) | | 19,043 | 224,731 |
| Tele2 AB (B Shares) | | 17,440 | 142,980 |
| Telia Co. AB | | 85,365 | 226,197 |
TOTAL SWEDEN | | | 6,258,746 |
| Switzerland - 5.4% | | | |
| ABB Ltd. (Reg.) | | 51,694 | 1,435,558 |
| Accelleron Industries Ltd. (a) | | 129 | 2,187 |
| Adecco SA (Reg.) | | 5,242 | 164,053 |
| Clariant AG (Reg.) | | 7,167 | 115,305 |
| Coca-Cola HBC AG | | 6,766 | 147,620 |
| Compagnie Financiere Richemont SA Series A | | 16,473 | 1,609,965 |
| Geberit AG (Reg.) | | 1,116 | 496,285 |
| Givaudan SA | | 290 | 865,931 |
| Kuehne & Nagel International AG | | 1,731 | 368,897 |
| Lindt & Spruengli AG | | 3 | 291,506 |
| Lindt & Spruengli AG (participation certificate) | | 39 | 373,895 |
| Lonza Group AG | | 2,344 | 1,206,654 |
| Roche Holding AG (participation certificate) | | 22,179 | 7,358,952 |
| SGS SA (Reg.) | | 199 | 438,698 |
| Sika AG | | 4,582 | 1,033,130 |
| Sonova Holding AG | | 1,726 | 407,993 |
| Straumann Holding AG | | 3,490 | 332,148 |
| Swiss Life Holding AG | | 1,004 | 486,183 |
| Swiss Re Ltd. | | 9,494 | 705,260 |
| Temenos Group AG | | 1,973 | 117,629 |
TOTAL SWITZERLAND | | | 17,957,849 |
| Taiwan - 5.1% | | | |
| Acer, Inc. | | 102,000 | 69,889 |
| AUO Corp. | | 218,400 | 114,434 |
| Cathay Financial Holding Co. Ltd. | | 247,547 | 290,112 |
| China Airlines Ltd. | | 91,000 | 47,822 |
| China Steel Corp. | | 360,000 | 299,684 |
| Chunghwa Telecom Co. Ltd. | | 119,000 | 409,901 |
| CTBC Financial Holding Co. Ltd. | | 551,000 | 348,496 |
| Delta Electronics, Inc. | | 61,000 | 486,994 |
| E.SUN Financial Holdings Co. Ltd. | | 405,042 | 291,343 |
| EVA Airways Corp. | | 85,000 | 61,667 |
| Evergreen Marine Corp. (Taiwan) | | 33,157 | 141,350 |
| Far Eastern New Century Corp. | | 94,000 | 93,697 |
| Far EasTone Telecommunications Co. Ltd. | | 53,000 | 116,175 |
| First Financial Holding Co. Ltd. | | 330,465 | 253,581 |
| Fubon Financial Holding Co. Ltd. | | 232,843 | 368,171 |
| Hotai Motor Co. Ltd. | | 9,000 | 162,957 |
| Hua Nan Financial Holdings Co. Ltd. | | 279,357 | 182,317 |
| MediaTek, Inc. | | 48,000 | 878,031 |
| Mega Financial Holding Co. Ltd. | | 351,100 | 325,476 |
| momo.com, Inc. | | 2,400 | 35,903 |
| Nan Ya Plastics Corp. | | 149,000 | 315,517 |
| President Chain Store Corp. | | 19,000 | 157,872 |
| Sinopac Financial Holdings Co. | | 283,527 | 141,526 |
| Taishin Financial Holdings Co. Ltd. | | 335,625 | 137,875 |
| Taiwan Cement Corp. | | 196,887 | 184,654 |
| Taiwan Cooperative Financial Holding Co. Ltd. | | 317,240 | 245,892 |
| Taiwan High Speed Rail Corp. | | 56,000 | 48,788 |
| Taiwan Mobile Co. Ltd. | | 54,000 | 159,217 |
| Taiwan Semiconductor Manufacturing Co. Ltd. | | 778,000 | 9,344,157 |
| The Shanghai Commercial & Savings Bank Ltd. | | 113,000 | 162,560 |
| The Shanghai Commercial & Savings Bank Ltd. rights (a) | | 8,283 | 2,414 |
| Uni-President Enterprises Corp. | | 150,000 | 304,613 |
| United Microelectronics Corp. | | 374,000 | 449,281 |
| Voltronic Power Technology Corp. | | 2,000 | 81,230 |
| Wan Hai Lines Ltd. | | 22,460 | 47,143 |
| Yang Ming Marine Transport Corp. | | 56,000 | 104,520 |
TOTAL TAIWAN | | | 16,865,259 |
| Thailand - 0.8% | | | |
| Advanced Info Service PCL (For. Reg.) | | 13,300 | 66,771 |
| Advanced Information Service PCL NVDR | | 23,400 | 117,477 |
| Airports of Thailand PCL: | | | |
| (For. Reg.) (a) | | 33,200 | 64,576 |
| NVDR (a) | | 92,700 | 180,308 |
| Asset World Corp. PCL NVDR | | 247,500 | 39,683 |
| B. Grimm Power PCL: | | | |
| (For. Reg.) | | 13,000 | 11,532 |
| NVDR | | 7,400 | 6,565 |
| Bangkok Dusit Medical Services PCL: | | | |
| (For. Reg.) | | 106,700 | 82,735 |
| NVDR | | 216,700 | 168,029 |
| Berli Jucker PCL unit | | 39,900 | 35,920 |
| BTS Group Holdings PCL: | | | |
| (For. Reg.) | | 90,133 | 19,664 |
| NVDR | | 155,100 | 33,837 |
| Bumrungrad Hospital PCL: | | | |
| NVDR | | 10,700 | 63,843 |
| (For. Reg.) | | 6,200 | 36,993 |
| Central Pattana PCL: | | | |
| (For. Reg.) | | 31,400 | 56,742 |
| NVDR | | 37,600 | 67,946 |
| Charoen Pokphand Foods PCL: | | | |
| (For. Reg.) | | 53,600 | 35,574 |
| (NVDR) | | 74,000 | 49,113 |
| CP ALL PCL: | | | |
| (For. Reg.) | | 61,000 | 96,202 |
| NVDR | | 128,500 | 202,655 |
| Energy Absolute PCL: | | | |
| (For. Reg.) | | 20,900 | 53,012 |
| NVDR | | 30,000 | 76,094 |
| Home Product Center PCL: | | | |
| (For. Reg.) | | 78,800 | 30,240 |
| NVDR | | 140,600 | 53,956 |
| Indorama Ventures PCL: | | | |
| (For. Reg.) | | 25,100 | 27,709 |
| NVDR | | 35,400 | 39,080 |
| Intouch Holdings PCL: | | | |
| (For. Reg.) | | 6,200 | 11,733 |
| NVDR | | 28,300 | 53,558 |
| Krungthai Card PCL NVDR | | 31,900 | 47,793 |
| Minor International PCL: | | | |
| unit (a) | | 47,868 | 35,544 |
| warrants 2/15/24 (a) | | 878 | 69 |
| (For. Reg.) (a) | | 48,599 | 36,087 |
| Osotspa PCL NVDR | | 44,600 | 31,066 |
| PTT Exploration and Production PCL: | | | |
| (For. Reg.) | | 20,200 | 96,367 |
| NVDR | | 25,000 | 119,267 |
| PTT Global Chemical PCL: | | | |
| (For. Reg.) | | 11,900 | 13,606 |
| NVDR | | 53,700 | 61,400 |
| PTT Oil & Retail Business PCL NVDR | | 102,300 | 64,803 |
| SCB X PCL: | | | |
| (For. Reg.) | | 5,700 | 15,881 |
| NVDR unit | | 18,100 | 50,430 |
| SCG Packaging PCL NVDR | | 45,700 | 62,463 |
| Siam Cement PCL: | | | |
| (For. Reg.) | | 7,000 | 59,614 |
| NVDR | | 17,900 | 152,441 |
| Siam Commercial Bank PCL (For. Reg.) | | 5,700 | 13,193 |
| Thai Union Frozen Products PCL: | | | |
| (For. Reg.) | | 27,600 | 13,058 |
| NVDR | | 64,800 | 30,658 |
| rights (a)(d) | | 1,837 | 850 |
| rights (a)(d) | | 782 | 362 |
| True Corp. PCL: | | | |
| (For. Reg.) | | 156,800 | 20,442 |
| NVDR | | 202,100 | 26,348 |
TOTAL THAILAND | | | 2,733,289 |
| Turkey - 0.1% | | | |
| Koc Holding A/S | | 25,804 | 77,075 |
| Turk Hava Yollari AO (a) | | 17,803 | 96,885 |
| Turk Sise ve Cam Fabrikalari A/S | | 45,981 | 82,060 |
| Turkiye Is Bankasi A/S Series C | | 115,692 | 57,926 |
| Turkiye Petrol Rafinerileri A/S (a) | | 4,295 | 87,449 |
TOTAL TURKEY | | | 401,395 |
| United Arab Emirates - 0.6% | | | |
| Abu Dhabi Commercial Bank PJSC | | 85,061 | 218,841 |
| Abu Dhabi Islamic Bank | | 46,846 | 121,161 |
| Aldar Properties PJSC | | 114,801 | 135,020 |
| Emirates NBD Bank PJSC | | 61,920 | 223,364 |
| Emirates Telecommunications Corp. | | 108,793 | 764,166 |
| First Abu Dhabi Bank PJSC | | 141,018 | 687,218 |
TOTAL UNITED ARAB EMIRATES | | | 2,149,770 |
| United Kingdom - 9.4% | | | |
| Abrdn PLC | | 63,343 | 115,500 |
| Antofagasta PLC | | 13,106 | 176,677 |
| Ashtead Group PLC | | 14,099 | 735,677 |
| Associated British Foods PLC | | 10,876 | 168,570 |
| AstraZeneca PLC (United Kingdom) | | 48,911 | 5,738,835 |
| Barratt Developments PLC | | 33,606 | 144,946 |
| Berkeley Group Holdings PLC | | 3,377 | 134,423 |
| British Land Co. PLC | | 28,831 | 120,979 |
| BT Group PLC | | 221,935 | 330,361 |
| Bunzl PLC | | 10,639 | 346,625 |
| Burberry Group PLC | | 12,630 | 262,886 |
| Compass Group PLC | | 56,270 | 1,185,149 |
| Croda International PLC | | 4,334 | 335,988 |
| GSK PLC | | 128,340 | 2,102,350 |
| HSBC Holdings PLC (United Kingdom) | | 635,074 | 3,259,234 |
| Informa PLC | | 45,874 | 292,292 |
| InterContinental Hotel Group PLC | | 5,920 | 318,086 |
| Intertek Group PLC | | 5,240 | 219,577 |
| J Sainsbury PLC | | 58,453 | 130,297 |
| Johnson Matthey PLC | | 6,071 | 134,684 |
| Kingfisher PLC | | 66,353 | 166,708 |
| Land Securities Group PLC | | 20,883 | 136,603 |
| Legal & General Group PLC | | 187,118 | 500,590 |
| Lloyds Banking Group PLC | | 2,201,085 | 1,057,111 |
| Mondi PLC | | 8,889 | 149,086 |
| Mondi PLC | | 7,068 | 120,915 |
| National Grid PLC | | 114,990 | 1,252,831 |
| Next PLC | | 4,025 | 227,516 |
| NMC Health PLC (a) | | 987 | 20 |
| Ocado Group PLC (a) | | 18,951 | 102,739 |
| Pearson PLC | | 21,104 | 233,265 |
| Persimmon PLC | | 10,581 | 158,352 |
| Prudential PLC | | 86,434 | 802,943 |
| Reckitt Benckiser Group PLC | | 22,547 | 1,496,310 |
| RELX PLC (London Stock Exchange) | | 60,815 | 1,633,521 |
| Rentokil Initial PLC | | 79,266 | 494,629 |
| Schroders PLC | | 21,635 | 97,185 |
| Segro PLC | | 38,074 | 342,757 |
| Spirax-Sarco Engineering PLC | | 2,298 | 283,300 |
| St. James's Place PLC | | 17,674 | 215,860 |
| Taylor Wimpey PLC | | 106,482 | 114,518 |
| Tesco PLC | | 238,190 | 588,302 |
| Unilever PLC | | 80,558 | 3,661,712 |
| Vodafone Group PLC | | 843,077 | 984,210 |
| Whitbread PLC | | 6,083 | 179,036 |
TOTAL UNITED KINGDOM | | | 31,253,155 |
| United States of America - 0.3% | | | |
| Coca-Cola European Partners PLC | | 6,439 | 302,955 |
| Li Auto, Inc. ADR (a) | | 17,165 | 233,787 |
| Yum China Holdings, Inc. | | 13,196 | 545,655 |
TOTAL UNITED STATES OF AMERICA | | | 1,082,397 |
| TOTAL COMMON STOCKS (Cost $396,459,707) | | | 318,741,059 |
| | | | |
| Nonconvertible Preferred Stocks - 0.9% |
| | | Shares | Value ($) |
| Brazil - 0.5% | | | |
| Banco Bradesco SA (PN) | | 157,255 | 604,604 |
| Companhia Energetica de Minas Gerais (CEMIG) (PN) | | 45,568 | 100,302 |
| Gerdau SA | | 37,300 | 185,940 |
| Itau Unibanco Holding SA | | 150,500 | 885,723 |
TOTAL BRAZIL | | | 1,776,569 |
| Chile - 0.1% | | | |
| Sociedad Quimica y Minera de Chile SA (PN-B) | | 4,452 | 423,730 |
| Colombia - 0.1% | | | |
| Bancolombia SA (PN) | | 17,257 | 109,194 |
| Germany - 0.2% | | | |
| Bayerische Motoren Werke AG (BMW) (non-vtg.) | | 2,037 | 150,376 |
| Henkel AG & Co. KGaA | | 5,771 | 363,565 |
TOTAL GERMANY | | | 513,941 |
| Korea (South) - 0.0% | | | |
| AMOREPACIFIC Corp. | | 111 | 2,862 |
| LG Chemical Ltd. | | 199 | 40,293 |
| LG H & H Co. Ltd. | | 60 | 11,791 |
TOTAL KOREA (SOUTH) | | | 54,946 |
| TOTAL NONCONVERTIBLE PREFERRED STOCKS (Cost $2,862,399) | | | 2,878,380 |
| | | | |
| Government Obligations - 0.1% |
| | | Principal Amount (e) | Value ($) |
| United States of America - 0.1% | | | |
U.S. Treasury Bills, yield at date of purchase 1.23% 1/26/23 (f) (Cost $199,420) | | 200,000 | 198,095 |
| | | | |
| Money Market Funds - 4.4% |
| | | Shares | Value ($) |
| Fidelity Cash Central Fund 3.10% (g) | | 10,181,043 | 10,183,079 |
| Fidelity Securities Lending Cash Central Fund 3.10% (g)(h) | | 4,676,468 | 4,676,936 |
| TOTAL MONEY MARKET FUNDS (Cost $14,860,015) | | | 14,860,015 |
| | | | |
| TOTAL INVESTMENT IN SECURITIES - 100.8% (Cost $414,381,541) | 336,677,549 |
NET OTHER ASSETS (LIABILITIES) - (0.8)% | (2,592,042) |
| NET ASSETS - 100.0% | 334,085,507 |
| | |
| Futures Contracts |
| | Number of contracts | Expiration Date | Notional Amount ($) | Value ($) | Unrealized Appreciation/ (Depreciation) ($) |
| Purchased | | | | | |
| | | | | | |
| Equity Index Contracts | | | | | |
| ICE E-mini MSCI EAFE Index Contracts (United States) | 91 | Dec 2022 | 7,989,345 | (38,952) | (38,952) |
| ICE E-mini MSCI Emerging Markets Index Contracts (United States) | 80 | Dec 2022 | 3,414,400 | (161,816) | (161,816) |
| TME S&P/TSX 60 Index Contracts (Canada) | 6 | Dec 2022 | 1,037,266 | 16,688 | 16,688 |
| | | | | | |
| TOTAL FUTURES CONTRACTS | | | | | (184,080) |
| The notional amount of futures purchased as a percentage of Net Assets is 3.7% |
Categorizations in the Schedule of Investments are based on country or territory of incorporation.
Legend
| (b) | Security exempt from registration under Rule 144A of the Securities Act of 1933. These securities may be resold in transactions exempt from registration, normally to qualified institutional buyers. At the end of the period, the value of these securities amounted to $6,514,143 or 1.9% of net assets. |
| (c) | Security or a portion of the security is on loan at period end. |
| (e) | Amount is stated in United States dollars unless otherwise noted. |
| (f) | Security or a portion of the security was pledged to cover margin requirements for futures contracts. At period end, the value of securities pledged amounted to $198,095. |
| (g) | Affiliated fund that is generally available only to investment companies and other accounts managed by Fidelity Investments. The rate quoted is the annualized seven-day yield of the fund at period end. A complete unaudited listing of the fund's holdings as of its most recent quarter end is available upon request. In addition, each Fidelity Central Fund's financial statements, which are not covered by the Fund's Report of Independent Registered Public Accounting Firm, are available on the SEC's website or upon request. |
| (h) | Investment made with cash collateral received from securities on loan. |
Affiliated Central Funds
Fiscal year to date information regarding the Fund's investments in Fidelity Central Funds, including the ownership percentage, is presented below.
| Affiliate | Value, beginning of period ($) | Purchases ($) | Sales Proceeds ($) | Dividend Income ($) | Realized Gain (loss) ($) | Change in Unrealized appreciation (depreciation) ($) | Value, end of period ($) | % ownership, end of period |
| Fidelity Cash Central Fund 3.10% | 10,908,961 | 134,015,024 | 134,740,906 | 74,802 | - | - | 10,183,079 | 0.0% |
| Fidelity Securities Lending Cash Central Fund 3.10% | 154,910 | 25,340,221 | 20,818,195 | 33,343 | - | - | 4,676,936 | 0.0% |
| Total | 11,063,871 | 159,355,245 | 155,559,101 | 108,145 | - | - | 14,860,015 | |
| | | | | | | | | |
Amounts in the income column in the above table include any capital gain distributions from underlying funds, which are presented in the corresponding line item in the Statement of Operations, if applicable.
Amount for Fidelity Securities Lending Cash Central Fund represents the income earned on investing cash collateral, less rebates paid to borrowers and any lending agent fees associated with the loan, plus any premium payments received for lending certain types of securities.
Investment Valuation
The following is a summary of the inputs used, as of October 31, 2022, involving the Fund's assets and liabilities carried at fair value. The inputs or methodology used for valuing securities may not be an indication of the risk associated with investing in those securities. For more information on valuation inputs, and their aggregation into the levels used below, please refer to the Investment Valuation section in the accompanying Notes to Financial Statements.
| Valuation Inputs at Reporting Date: |
| Description | Total ($) | Level 1 ($) | Level 2 ($) | Level 3 ($) |
Investments in Securities: | | | | |
|
| Equities: | | | | |
Communication Services | 21,274,582 | 7,010,883 | 14,249,373 | 14,326 |
Consumer Discretionary | 31,825,169 | 11,761,577 | 20,063,592 | - |
Consumer Staples | 26,068,277 | 12,340,641 | 13,726,424 | 1,212 |
Energy | 18,567,632 | 11,263,209 | 7,239,180 | 65,243 |
Financials | 68,571,500 | 42,968,136 | 25,589,138 | 14,226 |
Health Care | 37,331,409 | 8,763,519 | 28,567,890 | - |
Industrials | 40,066,276 | 24,353,458 | 15,712,818 | - |
Information Technology | 34,242,142 | 11,497,699 | 22,744,443 | - |
Materials | 26,320,923 | 16,328,713 | 9,987,810 | 4,400 |
Real Estate | 7,300,115 | 6,244,060 | 1,047,395 | 8,660 |
Utilities | 10,051,414 | 4,775,623 | 5,275,791 | - |
|
| Government Obligations | 198,095 | - | 198,095 | - |
|
| Money Market Funds | 14,860,015 | 14,860,015 | - | - |
| Total Investments in Securities: | 336,677,549 | 172,167,533 | 164,401,949 | 108,067 |
Derivative Instruments: | | | | |
|
| Assets | | | | |
Futures Contracts | 16,688 | 16,688 | - | - |
| Total Assets | 16,688 | 16,688 | - | - |
|
| Liabilities | | | | |
Futures Contracts | (200,768) | (200,768) | - | - |
| Total Liabilities | (200,768) | (200,768) | - | - |
| Total Derivative Instruments: | (184,080) | (184,080) | - | - |
The following is a reconciliation of Investments in Securities for which Level 3 inputs were used in determining value:
| |
| Investments in Securities: | |
| Beginning Balance | $ | 66,404 | |
| Net Realized Gain (Loss) on Investment Securities | | (25,145) | |
| Net Unrealized Gain (Loss) on Investment Securities | | (4,517,423) | |
| Cost of Purchases | | 723,985 | |
| Proceeds of Sales | | (137,321) | |
| Amortization/Accretion | | - | |
| Transfers into Level 3 | | 3,997,567 | |
| Transfers out of Level 3 | | - | |
| Ending Balance | $ | 108,067 | |
| The change in unrealized gain (loss) for the period attributable to Level 3 securities held at October 31, 2022 | $ | (4,501,696) | |
| The information used in the above reconciliation represents fiscal year to date activity for any Investments in Securities identified as using Level 3 inputs at either the beginning or the end of the current fiscal period. Cost of purchases and proceeds of sales may include securities received and/or delivered through in-kind transactions. Transfers into Level 3 were attributable to a lack of observable market data resulting from decreases in market activity, decreases in liquidity, security restructurings or corporate actions. Transfers out of Level 3 were attributable to observable market data becoming available for those securities. Transfers in or out of Level 3 represent the beginning value of any Security or Instrument where a change in the pricing level occurred from the beginning to the end of the period. The cost of purchases and the proceeds of sales may include securities received or delivered through corporate actions or exchanges. Realized and unrealized gains (losses) disclosed in the reconciliation are included in Net Gain (Loss) on the Fund's Statement of Operations. | |
Value of Derivative Instruments
The following table is a summary of the Fund's value of derivative instruments by primary risk exposure as of October 31, 2022. For additional information on derivative instruments, please refer to the Derivative Instruments section in the accompanying Notes to Financial Statements.
Primary Risk Exposure / Derivative Type | Value |
| Asset ($) | Liability ($) |
| Equity Risk | | |
Futures Contracts (a) | 16,688 | (200,768) |
| Total Equity Risk | 16,688 | (200,768) |
| Total Value of Derivatives | 16,688 | (200,768) |
(a)Reflects gross cumulative appreciation (depreciation) on futures contracts as presented in the Schedule of Investments. In the Statement of Assets and Liabilities, the period end daily variation margin is included in receivable or payable for daily variation margin on futures contracts, and the net cumulative appreciation (depreciation) is included in Total accumulated earnings (loss).
| Statement of Assets and Liabilities |
| | | | October 31, 2022 |
| | | | | |
| Assets | | | | |
| Investment in securities, at value (including securities loaned of $4,434,482) - See accompanying schedule: | | | | |
Unaffiliated issuers (cost $399,521,526) | | $321,817,534 | | |
Fidelity Central Funds (cost $14,860,015) | | 14,860,015 | | |
| | | | | |
| Total Investment in Securities (cost $414,381,541) | | | $ | 336,677,549 |
| Segregated cash with brokers for derivative instruments | | | | 467,408 |
| Foreign currency held at value (cost $1,012,502) | | | | 991,666 |
| Receivable for investments sold | | | | 101,207 |
| Receivable for fund shares sold | | | | 205,485 |
| Dividends receivable | | | | 649,367 |
| Reclaims receivable | | | | 491,162 |
| Distributions receivable from Fidelity Central Funds | | | | 24,249 |
| Other receivables | | | | 334 |
Total assets | | | | 339,608,427 |
| Liabilities | | | | |
| Payable for investments purchased | | $712 | | |
| Payable for fund shares redeemed | | 454,759 | | |
| Accrued management fee | | 54,983 | | |
| Payable for daily variation margin on futures contracts | | 88,413 | | |
| Other payables and accrued expenses | | 247,117 | | |
| Collateral on securities loaned | | 4,676,936 | | |
| Total Liabilities | | | | 5,522,920 |
| Net Assets | | | $ | 334,085,507 |
| Net Assets consist of: | | | | |
| Paid in capital | | | $ | 428,500,385 |
| Total accumulated earnings (loss) | | | | (94,414,878) |
| Net Assets | | | $ | 334,085,507 |
Net Asset Value , offering price and redemption price per share ($334,085,507 ÷ 34,828,805 shares) | | | $ | 9.59 |
| | | | | |
| Statement of Operations |
| | | | Year ended October 31, 2022 |
| Investment Income | | | | |
| Dividends | | | $ | 11,991,235 |
| Interest | | | | 2,391 |
| Income from Fidelity Central Funds (including $33,343 from security lending) | | | | 108,145 |
| Income before foreign taxes withheld | | | | 12,101,771 |
| Less foreign taxes withheld | | | | (1,293,880) |
| Total Income | | | | 10,807,891 |
| Expenses | | | | |
| Management fee | $ | 794,462 | | |
| Independent trustees' fees and expenses | | 1,309 | | |
| Interest | | 1,308 | | |
| Total expenses before reductions | | 797,079 | | |
| Expense reductions | | (5) | | |
| Total expenses after reductions | | | | 797,074 |
| Net Investment income (loss) | | | | 10,010,817 |
| Realized and Unrealized Gain (Loss) | | | | |
| Net realized gain (loss) on: | | | | |
| Investment Securities: | | | | |
| Unaffiliated issuers(net of foreign taxes of $102,975) | | (19,149,013) | | |
| Foreign currency transactions | | (248,927) | | |
| Futures contracts | | (2,110,154) | | |
| Total net realized gain (loss) | | | | (21,508,094) |
| Change in net unrealized appreciation (depreciation) on: | | | | |
| Investment Securities: | | | | |
| Unaffiliated issuers (net of decrease in deferred foreign taxes of $194,713) | | (120,249,093) | | |
| Assets and liabilities in foreign currencies | | (69,768) | | |
| Futures contracts | | (342,459) | | |
| Total change in net unrealized appreciation (depreciation) | | | | (120,661,320) |
| Net gain (loss) | | | | (142,169,414) |
| Net increase (decrease) in net assets resulting from operations | | | $ | (132,158,597) |
| Statement of Changes in Net Assets |
| |
| | Year ended October 31, 2022 | | Year ended October 31, 2021 |
| Increase (Decrease) in Net Assets | | | | |
| Operations | | | | |
| Net investment income (loss) | $ | 10,010,817 | $ | 7,014,168 |
| Net realized gain (loss) | | (21,508,094) | | 2,636,263 |
| Change in net unrealized appreciation (depreciation) | | (120,661,320) | | 39,595,390 |
| Net increase (decrease) in net assets resulting from operations | | (132,158,597) | | 49,245,821 |
| Distributions to shareholders | | (7,834,340) | | (2,202,031) |
| Share transactions | | | | |
| Proceeds from sales of shares | | 188,182,342 | | 254,390,236 |
| Reinvestment of distributions | | 7,154,872 | | 1,989,394 |
| Cost of shares redeemed | | (125,866,856) | | (48,683,263) |
Net increase (decrease) in net assets resulting from share transactions | | 69,470,358 | | 207,696,367 |
| Total increase (decrease) in net assets | | (70,522,579) | | 254,740,157 |
| | | | | |
| Net Assets | | | | |
| Beginning of period | | 404,608,086 | | 149,867,929 |
| End of period | $ | 334,085,507 | $ | 404,608,086 |
| | | | | |
| Other Information | | | | |
| Shares | | | | |
| Sold | | 15,579,977 | | 19,388,313 |
| Issued in reinvestment of distributions | | 546,174 | | 162,399 |
| Redeemed | | (11,037,382) | | (3,675,014) |
| Net increase (decrease) | | 5,088,769 | | 15,875,698 |
| | | | | |
Financial Highlights
| Fidelity® International Sustainability Index Fund |
| |
| Years ended October 31, | | 2022 | | 2021 | | 2020 | | 2019 | | 2018 |
Selected Per-Share Data | | | | | | | | | | |
| Net asset value, beginning of period | $ | 13.60 | $ | 10.81 | $ | 10.89 | $ | 9.87 | $ | 10.96 |
| Income from Investment Operations | | | | | | | | | | |
Net investment income (loss) A,B | | .29 | | .30 | | .24 | | .32 C | | .29 |
| Net realized and unrealized gain (loss) | | (4.04) | | 2.63 | | (.08) | | .91 | | (1.24) |
| Total from investment operations | | (3.75) | | 2.93 | | .16 | | 1.23 | | (.95) |
| Distributions from net investment income | | (.26) | | (.14) | | (.24) | | (.21) | | (.09) |
| Distributions from net realized gain | | - | | - | | - | | - | | (.05) |
| Total distributions | | (.26) | | (.14) | | (.24) | | (.21) | | (.14) |
| Net asset value, end of period | $ | 9.59 | $ | 13.60 | $ | 10.81 | $ | 10.89 | $ | 9.87 |
Total Return D | | (28.11)% | | 27.27% | | 1.48% | | 12.81% | | (8.77)% |
Ratios to Average Net Assets B,E,F | | | | | | | | | | |
| Expenses before reductions | | .20% | | .20% | | .20% | | .20% | | .20% |
| Expenses net of fee waivers, if any | | .20% | | .20% | | .20% | | .20% | | .20% |
| Expenses net of all reductions | | .20% | | .20% | | .20% | | .20% | | .20% |
| Net investment income (loss) | | 2.52% | | 2.28% | | 2.25% | | 3.14% C | | 2.70% |
| Supplemental Data | | | | | | | | | | |
| Net assets, end of period (000 omitted) | $ | 334,086 | $ | 404,608 | $ | 149,868 | $ | 71,875 | $ | 3,810 |
Portfolio turnover rate G | | 23% | | 19% | | 11% | | 17% | | 10% |
A Calculated based on average shares outstanding during the period.
B Net investment income (loss) is affected by the timing of the declaration of dividends by any underlying mutual funds or exchange-traded funds (ETFs). Net investment income (loss) of any mutual funds or ETFs is not included in the Fund's net investment income (loss) ratio.
C Net investment income per share reflects one or more large, non-recurring dividend(s) which amounted to $.04 per share. Excluding such non-recurring dividend(s), the ratio of net investment income (loss) to average net assets would have been 2.73%.
D Total returns would have been lower if certain expenses had not been reduced during the applicable periods shown.
E Fees and expenses of any underlying mutual funds or exchange-traded funds (ETFs) are not included in the Fund's expense ratio. The Fund indirectly bears its proportionate share of these expenses. For additional expense information related to investments in Fidelity Central Funds, please refer to the "Investments in Fidelity Central Funds" note found in the Notes to Financial Statements section of the most recent Annual or Semi-Annual report.
F Expense ratios reflect operating expenses of the class. Expenses before reductions do not reflect amounts reimbursed, waived, or reduced through arrangements with the investment adviser, brokerage services, or other offset arrangements, if applicable, and do not represent the amount paid by the class during periods when reimbursements, waivers or reductions occur.
G Amount does not include the portfolio activity of any underlying mutual funds or exchange-traded funds (ETFs).
For the period ended October 31, 2022
1. Organization.
Fidelity International Sustainability Index Fund (the Fund) is a fund of Fidelity Salem Street Trust (the Trust) and is authorized to issue an unlimited number of shares. Share transactions on the Statement of Changes in Net Assets may contain exchanges between affiliated funds. The Trust is registered under the Investment Company Act of 1940, as amended (the 1940 Act), as an open-end management investment company organized as a Massachusetts business trust. The Fund's investments in emerging markets can be subject to social, economic, regulatory, and political uncertainties and can be extremely volatile.
2. Investments in Fidelity Central Funds.
Funds may invest in Fidelity Central Funds, which are open-end investment companies generally available only to other investment companies and accounts managed by the investment adviser and its affiliates. The Schedule of Investments lists any Fidelity Central Funds held as an investment as of period end, but does not include the underlying holdings of each Fidelity Central Fund. An investing fund indirectly bears its proportionate share of the expenses of the underlying Fidelity Central Funds.
Based on its investment objective, each Fidelity Central Fund may invest or participate in various investment vehicles or strategies that are similar to those of the investing fund. These strategies are consistent with the investment objectives of the investing fund and may involve certain economic risks which may cause a decline in value of each of the Fidelity Central Funds and thus a decline in the value of the investing fund.
| Fidelity Central Fund | Investment Manager | Investment Objective | Investment Practices | Expense Ratio A |
| Fidelity Money Market Central Funds | Fidelity Management & Research Company LLC (FMR) | Each fund seeks to obtain a high level of current income consistent with the preservation of capital and liquidity. | Short-term Investments | Less than .005% |
A Expenses expressed as a percentage of average net assets and are as of each underlying Central Fund's most recent annual or semi-annual shareholder report.
A complete unaudited list of holdings for each Fidelity Central Fund is available upon request or at the Securities and Exchange Commission website at www.sec.gov. In addition, the financial statements of the Fidelity Central Funds which contain the significant accounting policies (including investment valuation policies) of those funds, and are not covered by the Report of Independent Registered Public Accounting Firm, are available on the Securities and Exchange Commission website or upon request.
3. Significant Accounting Policies.
The Fund is an investment company and applies the accounting and reporting guidance of the Financial Accounting Standards Board (FASB) Accounting Standards Codification Topic 946 Financial Services - Investment Companies . The financial statements have been prepared in conformity with accounting principles generally accepted in the United States of America (GAAP), which require management to make certain estimates and assumptions at the date of the financial statements. Actual results could differ from those estimates. Subsequent events, if any, through the date that the financial statements were issued have been evaluated in the preparation of the financial statements. The Fund's Schedule of Investments lists any underlying mutual funds or exchange-traded funds (ETFs) but does not include the underlying holdings of these funds. The following summarizes the significant accounting policies of the Fund:
Investment Valuation. Investments are valued as of 4:00 p.m. Eastern time on the last calendar day of the period. The Board of Trustees (the Board) has designated the Fund's investment adviser as the valuation designee responsible for the fair valuation function and performing fair value determinations as needed. The investment adviser has established a Fair Value Committee (the Committee) to carry out the day-to-day fair valuation responsibilities and has adopted policies and procedures to govern the fair valuation process and the activities of the Committee. In accordance with these fair valuation policies and procedures, which have been approved by the Board, the Fund attempts to obtain prices from one or more third party pricing services or brokers to value its investments. When current market prices, quotations or currency exchange rates are not readily available or reliable, investments will be fair valued in good faith by the Committee, in accordance with the policies and procedures. Factors used in determining fair value vary by investment type and may include market or investment specific events, transaction data, estimated cash flows, and market observations of comparable investments. The frequency that the fair valuation procedures are used cannot be predicted and they may be utilized to a significant extent. The Committee manages the Fund's fair valuation practices and maintains the fair valuation policies and procedures. The Fund's investment adviser reports to the Board information regarding the fair valuation process and related material matters.
The Fund categorizes the inputs to valuation techniques used to value its investments into a disclosure hierarchy consisting of three levels as shown below:
Level 1 - unadjusted quoted prices in active markets for identical investments
Level 2 - other significant observable inputs (including quoted prices for similar investments, interest rates, prepayment speeds, etc.)
Level 3 - unobservable inputs (including the Fund's own assumptions based on the best information available)
Valuation techniques used to value the Fund's investments by major category are as follows:
Equity securities, including restricted securities, for which market quotations are readily available, are valued at the last reported sale price or official closing price as reported by a third party pricing service on the primary market or exchange on which they are traded and are categorized as Level 1 in the hierarchy. In the event there were no sales during the day or closing prices are not available, securities are valued at the last quoted bid price or may be valued using the last available price and are generally categorized as Level 2 in the hierarchy. For foreign equity securities, when market or security specific events arise, comparisons to the valuation of American Depositary Receipts (ADRs), futures contracts, ETFs and certain indexes as well as quoted prices for similar securities may be used and would be categorized as Level 2 in the hierarchy. For equity securities, including restricted securities, where observable inputs are limited, assumptions about market activity and risk are used and these securities may be categorized as Level 3 in the hierarchy.
Debt securities, including restricted securities, are valued based on evaluated prices received from third party pricing services or from brokers who make markets in such securities. Preferred securities and U.S. government and government agency obligations are valued by pricing services who utilize matrix pricing which considers yield or price of bonds of comparable quality, coupon, maturity and type or by broker-supplied prices.
Futures contracts are valued at the settlement price established each day by the board of trade or exchange on which they are traded and are categorized as Level 1 in the hierarchy.
Investments in open-end mutual funds, including the Fidelity Central Funds, are valued at their closing net asset value (NAV) each business day and are categorized as Level 1 in the hierarchy.
Changes in valuation techniques may result in transfers in or out of an assigned level within the disclosure hierarchy. The aggregate value of investments by input level as of October 31, 2022 is included at the end of the Fund's Schedule of Investments.
Foreign Currency. Certain Funds may use foreign currency contracts to facilitate transactions in foreign-denominated securities. Gains and losses from these transactions may arise from changes in the value of the foreign currency or if the counterparties do not perform under the contracts' terms.
Foreign-denominated assets, including investment securities, and liabilities are translated into U.S. dollars at the exchange rates at period end. Purchases and sales of investment securities, income and dividends received, and expenses denominated in foreign currencies are translated into U.S. dollars at the exchange rate in effect on the transaction date.
The effects of exchange rate fluctuations on investments are included with the net realized and unrealized gain (loss) on investment securities. Other foreign currency transactions resulting in realized and unrealized gain (loss) are disclosed separately.
Investment Transactions and Income. For financial reporting purposes, the Fund's investment holdings and NAV include trades executed through the end of the last business day of the period. The NAV per share for processing shareholder transactions is calculated as of the close of business of the New York Stock Exchange (NYSE), normally 4:00 p.m. Eastern time and includes trades executed through the end of the prior business day. Gains and losses on securities sold are determined on the basis of identified cost. Commissions paid to certain brokers with whom the investment adviser, or its affiliates, places trades on behalf of a fund include an amount in addition to trade execution, which may be rebated back to a fund. Any such rebates are included in net realized gain (loss) on investments in the Statement of Operations. Dividend income is recorded on the ex-dividend date, except for certain dividends from foreign securities where the ex-dividend date may have passed, which are recorded as soon as the Fund is informed of the ex-dividend date. Non-cash dividends included in dividend income, if any, are recorded at the fair market value of the securities received. Income and capital gain distributions from Fidelity Central Funds, if any, are recorded on the ex-dividend date. Interest income is accrued as earned and includes coupon interest and amortization of premium and accretion of discount on debt securities as applicable. Investment income is recorded net of foreign taxes withheld where recovery of such taxes is uncertain. Funds may file withholding tax reclaims in certain jurisdictions to recover a portion of amounts previously withheld. Any withholding tax reclaims income is included in the Statement of Operations in foreign taxes withheld. Any receivables for withholding tax reclaims are included in the Statement of Assets and Liabilities in reclaims receivable.
Expenses. Expenses directly attributable to a fund are charged to that fund. Expenses attributable to more than one fund are allocated among the respective funds on the basis of relative net assets or other appropriate methods. Expenses included in the accompanying financial statements reflect the expenses of that fund and do not include any expenses associated with any underlying mutual funds or exchange-traded funds. Although not included in a fund's expenses, a fund indirectly bears its proportionate share of these expenses through the net asset value of each underlying mutual fund or exchange-traded fund. Expense estimates are accrued in the period to which they relate and adjustments are made when actual amounts are known.
Income Tax Information and Distributions to Shareholders. Each year, the Fund intends to qualify as a regulated investment company under Subchapter M of the Internal Revenue Code, including distributing substantially all of its taxable income and realized gains. As a result, no provision for U.S. Federal income taxes is required. As of October 31, 2022, the Fund did not have any unrecognized tax benefits in the financial statements; nor is the Fund aware of any tax positions for which it is reasonably possible that the total amounts of unrecognized tax benefits will significantly change in the next twelve months. The Fund files a U.S. federal tax return, in addition to state and local tax returns as required. The Fund's federal income tax returns are subject to examination by the Internal Revenue Service (IRS) for a period of three fiscal years after they are filed. State and local tax returns may be subject to examination for an additional fiscal year depending on the jurisdiction. Foreign taxes are provided for based on the Fund's understanding of the tax rules and rates that exist in the foreign markets in which it invests. The Fund is subject to a tax imposed on capital gains by certain countries in which it invests. An estimated deferred tax liability for net unrealized appreciation on the applicable securities is included in Other payables and accrued expenses on the Statement of Assets & Liabilities.
Distributions are declared and recorded on the ex-dividend date. Income and capital gain distributions are determined in accordance with income tax regulations, which may differ from GAAP. In addition, the Fund claimed a portion of the payment made to redeeming shareholders as a distribution for income tax purposes.
Capital accounts within the financial statements are adjusted for permanent book-tax differences. These adjustments have no impact on net assets or the results of operations. Capital accounts are not adjusted for temporary book-tax differences which will reverse in a subsequent period.
Book-tax differences are primarily due to futures contracts, foreign currency transactions, certain foreign taxes, passive foreign investment companies (PFIC), capital loss carryforwards and losses deferred due to wash sales.
As of period end, the cost and unrealized appreciation (depreciation) in securities, and derivatives if applicable, for federal income tax purposes were as follows:
| Gross unrealized appreciation | $20,134,582 |
| Gross unrealized depreciation | (99,650,912) |
| Net unrealized appreciation (depreciation) | $(79,516,330) |
| Tax Cost | $416,210,567 |
The tax-based components of distributable earnings as of period end were as follows:
| Undistributed ordinary income | $7,256,625 |
| Capital loss carryforward | $(21,825,453) |
| Net unrealized appreciation (depreciation) on securities and other investments | $(79,598,938) |
Capital loss carryforwards are only available to offset future capital gains of the Fund to the extent provided by regulations and may be limited. The capital loss carryforward information presented below, including any applicable limitation, is estimated as of fiscal period end and is subject to adjustment.
Short-term | $(11,497,395) |
Long-term | (10,328,058) |
| Total capital loss carryforward | $(21,825,453) |
The tax character of distributions paid was as follows:
| | October 31, 2022 | October 31, 2021 |
| Ordinary Income | $7,834,340 | $2,202,031 |
Restricted Securities (including Private Placements). Funds may invest in securities that are subject to legal or contractual restrictions on resale. These securities generally may be resold in transactions exempt from registration or to the public if the securities are registered. Disposal of these securities may involve time-consuming negotiations and expense, and prompt sale at an acceptable price may be difficult. Information regarding restricted securities held at period end is included at the end of the Schedule of Investments, if applicable.
4. Derivative Instruments.
Risk Exposures and the Use of Derivative Instruments. The Fund's investment objectives allow for various types of derivative instruments, including futures contracts. Derivatives are investments whose value is primarily derived from underlying assets, indices or reference rates and may be transacted on an exchange or over-the-counter (OTC). Derivatives may involve a future commitment to buy or sell a specified asset based on specified terms, to exchange future cash flows at periodic intervals based on a notional principal amount, or for one party to make one or more payments upon the occurrence of specified events in exchange for periodic payments from the other party.
Derivatives were used to increase returns and to manage exposure to certain risks as defined below. The success of any strategy involving derivatives depends on analysis of numerous economic factors, and if the strategies for investment do not work as intended, the objectives may not be achieved.
Derivatives were used to increase or decrease exposure to the following risk(s):
| | |
| Equity Risk | Equity risk relates to the fluctuations in the value of financial instruments as a result of changes in market prices (other than those arising from interest rate risk or foreign exchange risk), whether caused by factors specific to an individual investment, its issuer, or all factors affecting all instruments traded in a market or market segment. |
Funds are also exposed to additional risks from investing in derivatives, such as liquidity risk and counterparty credit risk. Liquidity risk is the risk that a fund will be unable to close out the derivative in the open market in a timely manner. Counterparty credit risk is the risk that the counterparty will not be able to fulfill its obligation to a fund. Counterparty credit risk related to exchange-traded contracts may be mitigated by the protection provided by the exchange on which they trade.
Investing in derivatives may involve greater risks than investing in the underlying assets directly and, to varying degrees, may involve risk of loss in excess of any initial investment and collateral received and amounts recognized in the Statement of Assets and Liabilities. In addition, there may be the risk that the change in value of the derivative contract does not correspond to the change in value of the underlying instrument.
Futures Contracts. A futures contract is an agreement between two parties to buy or sell a specified underlying instrument for a fixed price at a specified future date. Futures contracts were used to manage exposure to the stock market.
Upon entering into a futures contract, a fund is required to deposit either cash or securities (initial margin) with a clearing broker in an amount equal to a certain percentage of the face value of the contract. Futures contracts are marked-to-market daily and subsequent daily payments are made or received by a fund depending on the daily fluctuations in the value of the futures contracts and are recorded as unrealized appreciation or (depreciation). This receivable and/or payable, if any, is included in daily variation margin on futures contracts in the Statement of Assets and Liabilities. Realized gain or (loss) is recorded upon the expiration or closing of a futures contract. The net realized gain (loss) and change in net unrealized appreciation (depreciation) on futures contracts during the period is presented in the Statement of Operations.
Any open futures contracts at period end are presented in the Schedule of Investments under the caption "Futures Contracts". The notional amount at value reflects each contract's exposure to the underlying instrument or index at period end, and is representative of volume of activity during the period unless an average notional amount is presented. Any securities deposited to meet initial margin requirements are identified in the Schedule of Investments. Any cash deposited to meet initial margin requirements is presented as segregated cash with brokers for derivative instruments in the Statement of Assets and Liabilities.
5. Purchases and Sales of Investments.
Purchases and sales of securities, other than short-term securities, U.S. government securities and in-kind transactions, as applicable, are noted in the table below.
| | Purchases ($) | Sales ($) |
| Fidelity International Sustainability Index Fund | 163,664,193 | 90,103,588 |
6. Fees and Other Transactions with Affiliates.
Management Fee. Fidelity Management & Research Company LLC (the investment adviser) and its affiliates provide the Fund with investment management related services for which the Fund pays a monthly management fee. The management fee is based on an annual rate of .20% of the Fund's average net assets. Under the management contract, the investment adviser pays all other operating expenses, except the compensation of the independent Trustees and certain miscellaneous expenses such as proxy and shareholder meeting expenses.
Sub-Adviser. Geode Capital Management, LLC (Geode), serves as sub-adviser for the Fund. Geode provides discretionary investment advisory services to the Fund and is paid by the investment adviser for providing these services.
Interfund Lending Program. Pursuant to an Exemptive Order issued by the Securities and Exchange Commission (the SEC), the Fund, along with other registered investment companies having management contracts with Fidelity Management & Research Company LLC (FMR), or other affiliated entities of FMR, may participate in an interfund lending program. This program provides an alternative credit facility allowing the Fund to borrow from, or lend money to, other participating affiliated funds. At period end, there were no interfund loans outstanding. Activity in this program during the period for which loans were outstanding was as follows:
| | Borrower or Lender | Average Loan Balance | Weighted Average Interest Rate | Interest Expense |
Fidelity International Sustainability Index Fund | Borrower | $7,238,250 | 1.63% | $1,308 |
Interfund Trades. Funds may purchase from or sell securities to other Fidelity Funds under procedures adopted by the Board. The procedures have been designed to ensure these interfund trades are executed in accordance with Rule 17a-7 of the 1940 Act. Any interfund trades are included within the respective purchases and sales amounts shown in the Purchases and Sales of Investments note. During the period, there were no interfund trades.
7. Committed Line of Credit.
Certain Funds participate with other funds managed by the investment adviser or an affiliate in a $4.25 billion credit facility (the "line of credit") to be utilized for temporary or emergency purposes to fund shareholder redemptions or for other short-term liquidity purposes. The commitment fees on the pro-rata portion of the line of credit are borne by the investment adviser. During the period, there were no borrowings on this line of credit.
8. Security Lending.
Funds lend portfolio securities from time to time in order to earn additional income. Lending agents are used, including National Financial Services (NFS), an affiliate of the investment adviser. Pursuant to a securities lending agreement, NFS will receive a fee, which is capped at 9.9% of a fund's daily lending revenue, for its services as lending agent. A fund may lend securities to certain qualified borrowers, including NFS. On the settlement date of the loan, a fund receives collateral (in the form of U.S. Treasury obligations, letters of credit and/or cash) against the loaned securities and maintains collateral in an amount not less than 100% of the market value of the loaned securities during the period of the loan. The market value of the loaned securities is determined at the close of business of a fund and any additional required collateral is delivered to a fund on the next business day. A fund or borrower may terminate the loan at any time, and if the borrower defaults on its obligation to return the securities loaned because of insolvency or other reasons, a fund may apply collateral received from the borrower against the obligation. A fund may experience delays and costs in recovering the securities loaned. Any cash collateral received is invested in the Fidelity Securities Lending Cash Central Fund. Any loaned securities are identified as such in the Schedule of Investments, and the value of loaned securities and cash collateral at period end, as applicable, are presented in the Statement of Assets and Liabilities. Security lending income represents the income earned on investing cash collateral, less rebates paid to borrowers and any lending agent fees associated with the loan, plus any premium payments received for lending certain types of securities. Security lending income is presented in the Statement of Operations as a component of income from Fidelity Central Funds. Affiliated security lending activity, if any, was as follows:
| | Total Security Lending Fees Paid to NFS | Security Lending Income From Securities Loaned to NFS | Value of Securities Loaned to NFS at Period End |
| Fidelity International Sustainability Index Fund | $3,581 | $- | $- |
9. Expense Reductions.
Through arrangements with the Fund's custodian, credits realized as a result of certain uninvested cash balances were used to reduce the Fund's expenses by $5.
10. Other.
A fund's organizational documents provide former and current trustees and officers with a limited indemnification against liabilities arising in connection with the performance of their duties to the fund. In the normal course of business, a fund may also enter into contracts that provide general indemnifications. A fund's maximum exposure under these arrangements is unknown as this would be dependent on future claims that may be made against a fund. The risk of material loss from such claims is considered remote.
11. Risk and Uncertainties.
Many factors affect a fund's performance. Developments that disrupt global economies and financial markets, such as pandemics, epidemics, outbreaks of infectious diseases, war, terrorism, and environmental disasters, may significantly affect a fund's investment performance. The effects of these developments to a fund will be impacted by the types of securities in which a fund invests, the financial condition, industry, economic sector, and geographic location of an issuer, and a fund's level of investment in the securities of that issuer.
To the Board of Trustees of Fidelity Salem Street Trust and Shareholders of Fidelity International Sustainability Index Fund:
Opinion on the Financial Statements and Financial Highlights
We have audited the accompanying statement of assets and liabilities of Fidelity International Sustainability Index Fund (the "Fund"), a fund of Fidelity Salem Street Trust, including the schedule of investments, as of October 31, 2022, the related statement of operations for the year then ended, the statement of changes in net assets for each of the two years in the period then ended, the financial highlights for each of the five years in the period then ended, and the related notes. In our opinion, the financial statements and financial highlights present fairly, in all material respects, the financial position of the Fund as of October 31, 2022, and the results of its operations for the year then ended, the changes in its net assets for each of the two years in the period then ended, and the financial highlights for each of the five years in the period then ended in conformity with accounting principles generally accepted in the United States of America.
Basis for Opinion
These financial statements and financial highlights are the responsibility of the Fund's management. Our responsibility is to express an opinion on the Fund's financial statements and financial highlights based on our audits. We are a public accounting firm registered with the Public Company Accounting Oversight Board (United States) (PCAOB) and are required to be independent with respect to the Fund in accordance with the U.S. federal securities laws and the applicable rules and regulations of the Securities and Exchange Commission and the PCAOB.
We conducted our audits in accordance with the standards of the PCAOB. Those standards require that we plan and perform the audit to obtain reasonable assurance about whether the financial statements and financial highlights are free of material misstatement, whether due to error or fraud. The Fund is not required to have, nor were we engaged to perform, an audit of its internal control over financial reporting. As part of our audits we are required to obtain an understanding of internal control over financial reporting but not for the purpose of expressing an opinion on the effectiveness of the Fund's internal control over financial reporting. Accordingly, we express no such opinion.
Our audits included performing procedures to assess the risks of material misstatement of the financial statements and financial highlights, whether due to error or fraud, and performing procedures that respond to those risks. Such procedures included examining, on a test basis, evidence regarding the amounts and disclosures in the financial statements and financial highlights. Our audits also included evaluating the accounting principles used and significant estimates made by management, as well as evaluating the overall presentation of the financial statements and financial highlights. Our procedures included confirmation of securities owned as of October 31, 2022, by correspondence with the custodian and brokers; when replies were not received from brokers, we performed other auditing procedures. We believe that our audits provide a reasonable basis for our opinion.
/s/ Deloitte & Touche LLP
Boston, Massachusetts
December 15, 2022
We have served as the auditor of one or more of the Fidelity investment companies since 1999.
The Trustees, Members of the Advisory Board (if any), and officers of the trust and fund, as applicable, are listed below. The Board of Trustees governs the fund and is responsible for protecting the interests of shareholders. The Trustees are experienced executives who meet periodically throughout the year to oversee the fund's activities, review contractual arrangements with companies that provide services to the fund, oversee management of the risks associated with such activities and contractual arrangements, and review the fund's performance. Except for Jonathan Chiel, each of the Trustees oversees 293 funds. Mr. Chiel oversees 184 funds.
The Trustees hold office without limit in time except that (a) any Trustee may resign; (b) any Trustee may be removed by written instrument, signed by at least two-thirds of the number of Trustees prior to such removal; (c) any Trustee who requests to be retired or who has become incapacitated by illness or injury may be retired by written instrument signed by a majority of the other Trustees; and (d) any Trustee may be removed at any special meeting of shareholders by a two-thirds vote of the outstanding voting securities of the trust. Each Trustee who is not an interested person (as defined in the 1940 Act) of the trust and the fund is referred to herein as an Independent Trustee. Each Independent Trustee shall retire not later than the last day of the calendar year in which his or her 75th birthday occurs. The Independent Trustees may waive this mandatory retirement age policy with respect to individual Trustees. Officers and Advisory Board Members hold office without limit in time, except that any officer or Advisory Board Member may resign or may be removed by a vote of a majority of the Trustees at any regular meeting or any special meeting of the Trustees. Except as indicated, each individual has held the office shown or other offices in the same company for the past five years.
The fund's Statement of Additional Information (SAI) includes more information about the Trustees. To request a free copy, call Fidelity at 1-800-544-8544.
Experience, Skills, Attributes, and Qualifications of the Trustees. The Governance and Nominating Committee has adopted a statement of policy that describes the experience, qualifications, attributes, and skills that are necessary and desirable for potential Independent Trustee candidates (Statement of Policy). The Board believes that each Trustee satisfied at the time he or she was initially elected or appointed a Trustee, and continues to satisfy, the standards contemplated by the Statement of Policy. The Governance and Nominating Committee also engages professional search firms to help identify potential Independent Trustee candidates who have the experience, qualifications, attributes, and skills consistent with the Statement of Policy. From time to time, additional criteria based on the composition and skills of the current Independent Trustees, as well as experience or skills that may be appropriate in light of future changes to board composition, business conditions, and regulatory or other developments, have also been considered by the professional search firms and the Governance and Nominating Committee. In addition, the Board takes into account the Trustees' commitment and participation in Board and committee meetings, as well as their leadership of standing and ad hoc committees throughout their tenure.
In determining that a particular Trustee was and continues to be qualified to serve as a Trustee, the Board has considered a variety of criteria, none of which, in isolation, was controlling. The Board believes that, collectively, the Trustees have balanced and diverse experience, qualifications, attributes, and skills, which allow the Board to operate effectively in governing the fund and protecting the interests of shareholders. Information about the specific experience, skills, attributes, and qualifications of each Trustee, which in each case led to the Board's conclusion that the Trustee should serve (or continue to serve) as a trustee of the fund, is provided below.
Board Structure and Oversight Function. Abigail P. Johnson is an interested person and currently serves as Chairman. The Trustees have determined that an interested Chairman is appropriate and benefits shareholders because an interested Chairman has a personal and professional stake in the quality and continuity of services provided to the fund. Independent Trustees exercise their informed business judgment to appoint an individual of their choosing to serve as Chairman, regardless of whether the Trustee happens to be independent or a member of management. The Independent Trustees have determined that they can act independently and effectively without having an Independent Trustee serve as Chairman and that a key structural component for assuring that they are in a position to do so is for the Independent Trustees to constitute a substantial majority for the Board. The Independent Trustees also regularly meet in executive session. Michael E. Kenneally serves as Chairman of the Independent Trustees and as such (i) acts as a liaison between the Independent Trustees and management with respect to matters important to the Independent Trustees and (ii) with management prepares agendas for Board meetings.
Fidelity ® funds are overseen by different Boards of Trustees. The fund's Board oversees Fidelity's investment-grade bond, money market, asset allocation and certain equity funds, and other Boards oversee Fidelity's high income and other equity funds. The asset allocation funds may invest in Fidelity ® funds that are overseen by such other Boards. The use of separate Boards, each with its own committee structure, allows the Trustees of each group of Fidelity ® funds to focus on the unique issues of the funds they oversee, including common research, investment, and operational issues. On occasion, the separate Boards establish joint committees to address issues of overlapping consequences for the Fidelity ® funds overseen by each Board.
The Trustees operate using a system of committees to facilitate the timely and efficient consideration of all matters of importance to the Trustees, the fund, and fund shareholders and to facilitate compliance with legal and regulatory requirements and oversight of the fund's activities and associated risks. The Board, acting through its committees, has charged FMR and its affiliates with (i) identifying events or circumstances the occurrence of which could have demonstrably adverse effects on the fund's business and/or reputation; (ii) implementing processes and controls to lessen the possibility that such events or circumstances occur or to mitigate the effects of such events or circumstances if they do occur; and (iii) creating and maintaining a system designed to evaluate continuously business and market conditions in order to facilitate the identification and implementation processes described in (i) and (ii) above. Because the day-to-day operations and activities of the fund are carried out by or through FMR, its affiliates, and other service providers, the fund's exposure to risks is mitigated but not eliminated by the processes overseen by the Trustees. While each of the Board's committees has responsibility for overseeing different aspects of the fund's activities, oversight is exercised primarily through the Operations and Audit Committees. In addition, an ad hoc Board committee of Independent Trustees has worked with FMR to enhance the Board's oversight of investment and financial risks, legal and regulatory risks, technology risks, and operational risks, including the development of additional risk reporting to the Board. Appropriate personnel, including but not limited to the fund's Chief Compliance Officer (CCO), FMR's internal auditor, the independent accountants, the fund's Treasurer and portfolio management personnel, make periodic reports to the Board's committees, as appropriate, including an annual review of Fidelity's risk management program for the Fidelity ® funds. The responsibilities of each standing committee, including their oversight responsibilities, are described further under "Standing Committees of the Trustees."
Interested Trustees*:
Correspondence intended for a Trustee who is an interested person may be sent to Fidelity Investments, 245 Summer Street, Boston, Massachusetts 02210.
Name, Year of Birth; Principal Occupations and Other Relevant Experience+
Jonathan Chiel (1957)
Year of Election or Appointment: 2016
Trustee
Mr. Chiel also serves as Trustee of other Fidelity ® funds. Mr. Chiel is Executive Vice President and General Counsel for FMR LLC (diversified financial services company, 2012-present). Previously, Mr. Chiel served as general counsel (2004-2012) and senior vice president and deputy general counsel (2000-2004) for John Hancock Financial Services; a partner with Choate, Hall & Stewart (1996-2000) (law firm); and an Assistant United States Attorney for the United States Attorney's Office of the District of Massachusetts (1986-95), including Chief of the Criminal Division (1993-1995). Mr. Chiel is a director on the boards of the Boston Bar Foundation and the Maimonides School.
Abigail P. Johnson (1961)
Year of Election or Appointment: 2009
Trustee
Chairman of the Board of Trustees
Ms. Johnson also serves as Trustee of other Fidelity ® funds. Ms. Johnson serves as Chairman (2016-present), Chief Executive Officer (2014-present), and Director (2007-present) of FMR LLC (diversified financial services company), President of Fidelity Financial Services (2012-present) and President of Personal, Workplace and Institutional Services (2005-present). Ms. Johnson is Chairman and Director of Fidelity Management & Research Company LLC (investment adviser firm, 2011-present). Previously, Ms. Johnson served as Chairman and Director of FMR Co., Inc. (investment adviser firm, 2011-2019), Vice Chairman (2007-2016) and President (2013-2016) of FMR LLC, President and a Director of Fidelity Management & Research Company (2001-2005), a Trustee of other investment companies advised by Fidelity Management & Research Company, Fidelity Investments Money Management, Inc. (investment adviser firm), and FMR Co., Inc. (2001-2005), Senior Vice President of the Fidelity ® funds (2001-2005), and managed a number of Fidelity ® funds. Ms. Abigail P. Johnson and Mr. Arthur E. Johnson are not related.
Jennifer Toolin McAuliffe (1959)
Year of Election or Appointment: 2016
Trustee
Ms. McAuliffe also serves as Trustee of other Fidelity ® funds and as Trustee of Fidelity Charitable (2020-present). Previously, Ms. McAuliffe served as Co-Head of Fixed Income of Fidelity Investments Limited (now known as FIL Limited (FIL)) (diversified financial services company), Director of Research for FIL's credit and quantitative teams in London, Hong Kong and Tokyo and Director of Research for taxable and municipal bonds at Fidelity Investments Money Management, Inc. Ms. McAuliffe previously served as a member of the Advisory Board of certain Fidelity ® funds (2016). Ms. McAuliffe was previously a lawyer at Ropes & Gray LLP and currently serves as director or trustee of several not-for-profit entities.
* Determined to be an "Interested Trustee" by virtue of, among other things, his or her affiliation with the trust or various entities under common control with FMR.
+ The information includes the Trustee's principal occupation during the last five years and other information relating to the experience, attributes, and skills relevant to the Trustee's qualifications to serve as a Trustee, which led to the conclusion that the Trustee should serve as a Trustee for the fund.
Independent Trustees:
Correspondence intended for an Independent Trustee may be sent to Fidelity Investments, P.O. Box 55235, Boston, Massachusetts 02205-5235.
Name, Year of Birth; Principal Occupations and Other Relevant Experience+
Elizabeth S. Acton (1951)
Year of Election or Appointment: 2013
Trustee
Ms. Acton also serves as Trustee of other Fidelity ® funds. Prior to her retirement, Ms. Acton served as Executive Vice President, Finance (2011-2012), Executive Vice President, Chief Financial Officer (2002-2011) and Treasurer (2004-2005) of Comerica Incorporated (financial services). Prior to joining Comerica, Ms. Acton held a variety of positions at Ford Motor Company (1983-2002), including Vice President and Treasurer (2000-2002) and Executive Vice President and Chief Financial Officer of Ford Motor Credit Company (1998-2000). Ms. Acton currently serves as a member of the Board and Audit and Finance Committees of Beazer Homes USA, Inc. (homebuilding, 2012-present). Ms. Acton previously served as a member of the Advisory Board of certain Fidelity ® funds (2013-2016).
Ann E. Dunwoody (1953)
Year of Election or Appointment: 2018
Trustee
General Dunwoody also serves as Trustee of other Fidelity ® funds. General Dunwoody (United States Army, Retired) was the first woman in U.S. military history to achieve the rank of four-star general and prior to her retirement in 2012 held a variety of positions within the U.S. Army, including Commanding General, U.S. Army Material Command (2008-2012). General Dunwoody currently serves as President of First to Four LLC (leadership and mentoring services, 2012-present), a member of the Board and Nomination and Corporate Governance Committees of Kforce Inc. (professional staffing services, 2016-present) and a member of the Board of Automattic Inc. (software engineering, 2018-present). Previously, General Dunwoody served as a member of the Advisory Board and Nominating and Corporate Governance Committee of L3 Technologies, Inc. (communication, electronic, sensor and aerospace systems, 2013-2019) and a member of the Board and Audit and Sustainability and Corporate Responsibility Committees of Republic Services, Inc. (waste collection, disposal and recycling, 2013-2016). Ms. Dunwoody also serves on several boards for non-profit organizations, including as a member of the Board, Chair of the Nomination and Governance Committee and a member of the Audit Committee of Logistics Management Institute (consulting non-profit, 2012-present), a member of the Council of Trustees for the Association of the United States Army (advocacy non-profit, 2013-present), a member of the Board of Florida Institute of Technology (2015-present) and a member of the Board of ThanksUSA (military family education non-profit, 2014-present). General Dunwoody previously served as a member of the Advisory Board of certain Fidelity ® funds (2018).
John Engler (1948)
Year of Election or Appointment: 2014
Trustee
Mr. Engler also serves as Trustee of other Fidelity ® funds. Previously, Mr. Engler served as Governor of Michigan (1991-2003), President of the Business Roundtable (2011-2017) and interim President of Michigan State University (2018-2019). Mr. Engler currently serves as a member of the Board of Stride, Inc. (formerly K12 Inc.) (technology-based education company, 2012-present). Previously, Mr. Engler served as a member of the Board of Universal Forest Products (manufacturer and distributor of wood and wood-alternative products, 2003-2019) and Trustee of The Munder Funds (2003-2014). Mr. Engler previously served as a member of the Advisory Board of certain Fidelity ® funds (2014-2016).
Robert F. Gartland (1951)
Year of Election or Appointment: 2010
Trustee
Mr. Gartland also serves as Trustee of other Fidelity ® funds. Prior to his retirement, Mr. Gartland held a variety of positions at Morgan Stanley (financial services, 1979-2007), including Managing Director (1987-2007) and Chase Manhattan Bank (1975-1978). Mr. Gartland previously served as Chairman and an investor in Gartland & Mellina Group Corp. (consulting, 2009-2019), as a member of the Board of National Securities Clearing Corporation (1993-1996) and as Chairman of TradeWeb (2003-2004).
Arthur E. Johnson (1947)
Year of Election or Appointment: 2008
Trustee
Mr. Johnson also serves as Trustee of other Fidelity ® funds. Prior to his retirement, Mr. Johnson served as Senior Vice President of Corporate Strategic Development of Lockheed Martin Corporation (defense contractor, 1999-2009). Mr. Johnson currently serves as a member of the Board of Booz Allen Hamilton (management consulting, 2011-present). Mr. Johnson previously served as a member of the Board of Eaton Corporation plc (diversified power management, 2009-2019) and a member of the Board of AGL Resources, Inc. (holding company, 2002-2016). Mr. Johnson previously served as Chairman (2018-2021) and Vice Chairman (2015-2018) of the Independent Trustees of certain Fidelity® funds. Mr. Arthur E. Johnson is not related to Ms. Abigail P. Johnson.
Michael E. Kenneally (1954)
Year of Election or Appointment: 2009
Trustee
Chairman of the Independent Trustees
Mr. Kenneally also serves as Trustee of other Fidelity ® funds and was Vice Chairman (2018-2021) of the Independent Trustees of certain Fidelity ® funds. Prior to retirement in 2005, he was Chairman and Global Chief Executive Officer of Credit Suisse Asset Management, the worldwide fund management and institutional investment business of Credit Suisse Group. Previously, Mr. Kenneally was an Executive Vice President and the Chief Investment Officer for Bank of America. In this role, he was responsible for the investment management, strategy and products delivered to the bank's institutional, high-net-worth and retail clients. Earlier, Mr. Kenneally directed the organization's equity and quantitative research groups. He began his career as a research analyst and then spent more than a dozen years as a portfolio manager for endowments, pension plans and mutual funds. He earned the Chartered Financial Analyst (CFA) designation in 1991.
Marie L. Knowles (1946)
Year of Election or Appointment: 2001
Trustee
Ms. Knowles also serves as Trustee of other Fidelity ® funds. Prior to her retirement, Ms. Knowles held several positions at Atlantic Richfield Company (diversified energy), including Executive Vice President and Chief Financial Officer (1996-2000), Senior Vice President (1993-1996) and President of ARCO Transportation Company (pipeline and tanker operations, 1993-1996). Ms. Knowles currently serves as a member of the Board of the Santa Catalina Island Company (real estate, 2009-present), a member of the Investment Company Institute Board of Governors and a member of the Governing Council of the Independent Directors Council (2014-present). Ms. Knowles also serves as a member of the Advisory Board for the School of Engineering of the University of Southern California. Ms. Knowles previously served as a member of the Board of McKesson Corporation (healthcare service, 2002-2021). In addition, Ms. Knowles previously served as Chairman (2015-2018) and Vice Chairman (2012-2015) of the Independent Trustees of certain Fidelity ® funds.
Mark A. Murray (1954)
Year of Election or Appointment: 2016
Trustee
Mr. Murray also serves as Trustee of other Fidelity ® funds. Previously, Mr. Murray served as Co-Chief Executive Officer (2013-2016), President (2006-2013) and Vice Chairman (2013-2020) of Meijer, Inc. Mr. Murray serves as a member of the Board (2009-present) and Public Policy and Responsibility Committee (2009-present) and Chair of the Nuclear Review Committee (2019-present) of DTE Energy Company (diversified energy company). Mr. Murray previously served as a member of the Board of Spectrum Health (not-for-profit health system, 2015-2019) and as a member of the Board and Audit Committee and Chairman of the Nominating and Corporate Governance Committee of Universal Forest Products, Inc. (manufacturer and distributor of wood and wood-alternative products, 2004-2016). Mr. Murray also serves as a member of the Board of many community and professional organizations. Mr. Murray previously served as a member of the Advisory Board of certain Fidelity ® funds (2016).
+ The information includes the Trustee's principal occupation during the last five years and other information relating to the experience, attributes, and skills relevant to the Trustee's qualifications to serve as a Trustee, which led to the conclusion that the Trustee should serve as a Trustee for the fund.
Advisory Board Members and Officers:
Correspondence intended for a Member of the Advisory Board (if any) may be sent to Fidelity Investments, P.O. Box 55235, Boston, Massachusetts 02205-5235. Correspondence intended for an officer may be sent to Fidelity Investments, 245 Summer Street, Boston, Massachusetts 02210. Officers appear below in alphabetical order.
Name, Year of Birth; Principal Occupation
Laura M. Bishop (1961)
Year of Election or Appointment: 2022
Member of the Advisory Board
Ms. Bishop also serves as a Member of the Advisory Board of other funds. Prior to her retirement, Ms. Bishop held a variety of positions at United Services Automobile Association (2001-2020), including Executive Vice President and Chief Financial Officer (2014-2020) and Senior Vice President and Deputy Chief Financial Officer (2012-2014). Ms. Bishop currently serves as a member of the Audit Committee and Compensation and Personnel Committee (2021-present) of the Board of Directors of Korn Ferry (global organizational consulting).
Robert W. Helm (1957)
Year of Election or Appointment: 2021
Member of the Advisory Board
Mr. Helm also serves as a Member of the Advisory Board of other Fidelity® funds. Mr. Helm was formerly Deputy Chairman (2003-2020), partner (1991-2020) and an associate (1984-1991) of Dechert LLP (formerly Dechert Price & Rhoads). Mr. Helm currently serves on boards and committees of several not-for-profit organizations.
Craig S. Brown (1977)
Year of Election or Appointment: 2019
Assistant Treasurer
Mr. Brown also serves as an officer of other funds. Mr. Brown serves as Assistant Treasurer of FIMM, LLC (2021-present) and is an employee of Fidelity Investments (2013-present). Previously, Mr. Brown served as Assistant Treasurer of certain Fidelity ® funds (2019-2022).
John J. Burke III (1964)
Year of Election or Appointment: 2018
Chief Financial Officer
Mr. Burke also serves as Chief Financial Officer of other funds. Mr. Burke serves as Head of Investment Operations for Fidelity Fund and Investment Operations (2018-present) and is an employee of Fidelity Investments (1998-present). Previously Mr. Burke served as head of Asset Management Investment Operations (2012-2018).
David J. Carter (1973)
Year of Election or Appointment: 2020
Assistant Secretary
Mr. Carter also serves as Assistant Secretary of other funds. Mr. Carter serves as Senior Vice President, Deputy General Counsel (2022-present) and is an employee of Fidelity Investments (2005-present).
Jonathan Davis (1968)
Year of Election or Appointment: 2010
Assistant Treasurer
Mr. Davis also serves as an officer of other funds. Mr. Davis serves as Assistant Treasurer of FIMM, LLC (2021-present), FMR Capital, Inc. (2017-present), FD Funds GP LLC (2021-present), FD Funds Holding LLC (2021-present), and FD Funds Management LLC (2021-present); and is an employee of Fidelity Investments. Previously, Mr. Davis served as Vice President and Associate General Counsel of FMR LLC (diversified financial services company, 2003-2010).
Laura M. Del Prato (1964)
Year of Election or Appointment: 2018
President and Treasurer
Ms. Del Prato also serves as an officer of other funds. Ms. Del Prato serves as Assistant Treasurer of FIMM, LLC (2021-present) and is an employee of Fidelity Investments (2017-present). Previously, Ms. Del Prato served as President and Treasurer of The North Carolina Capital Management Trust: Cash Portfolio and Term Portfolio (2018-2020). Prior to joining Fidelity Investments, Ms. Del Prato served as a Managing Director and Treasurer of the JPMorgan Mutual Funds (2014-2017). Prior to JPMorgan, Ms. Del Prato served as a partner at Cohen Fund Audit Services (accounting firm, 2012-2013) and KPMG LLP (accounting firm, 2004-2012).
Colm A. Hogan (1973)
Year of Election or Appointment: 2016
Assistant Treasurer
Mr. Hogan also serves as an officer of other funds. Mr. Hogan serves as Assistant Treasurer of FIMM, LLC (2021-present) and FMR Capital, Inc. (2017-present) and is an employee of Fidelity Investments (2005-present). Previously, Mr. Hogan served as Deputy Treasurer of certain Fidelity ® funds (2016-2020) and Assistant Treasurer of certain Fidelity ® funds (2016-2018).
Cynthia Lo Bessette (1969)
Year of Election or Appointment: 2019
Secretary and Chief Legal Officer (CLO)
Ms. Lo Bessette also serves as an officer of other funds. Ms. Lo Bessette serves as CLO, Secretary, and Senior Vice President of Fidelity Management & Research Company LLC (investment adviser firm, 2019-present); CLO of Fidelity Management & Research (Hong Kong) Limited, FMR Investment Management (UK) Limited, and Fidelity Management & Research (Japan) Limited (investment adviser firms, 2019-present); Secretary of FD Funds GP LLC (2021-present), FD Funds Holding LLC (2021-present), FD Funds Management LLC (2021-present), and Fidelity Diversifying Solutions LLC (investment adviser firm, 2022-present); and Assistant Secretary of FIMM, LLC (2019-present). She is a Senior Vice President and Deputy General Counsel of FMR LLC (diversified financial services company, 2019-present), and is an employee of Fidelity Investments. Previously, Ms. Lo Bessette served as CLO, Secretary, and Senior Vice President of FMR Co., Inc. (investment adviser firm, 2019); Secretary of Fidelity SelectCo, LLC and Fidelity Investments Money Management, Inc. (investment adviser firms, 2019). Prior to joining Fidelity Investments, Ms. Lo Bessette was Executive Vice President, General Counsel (2016-2019) and Senior Vice President, Deputy General Counsel (2015-2016) of OppenheimerFunds (investment management company) and Deputy Chief Legal Officer (2013-2015) of Jennison Associates LLC (investment adviser firm).
Chris Maher (1972)
Year of Election or Appointment: 2013
Assistant Treasurer
Mr. Maher also serves as an officer of other funds. Mr. Maher serves as Assistant Treasurer of FIMM, LLC (2021-present) and FMR Capital, Inc. (2017-present), and is an employee of Fidelity Investments (2008-present). Previously, Mr. Maher served as Assistant Treasurer of certain funds (2013-2020); Vice President of Asset Management Compliance (2013), Vice President of the Program Management Group of FMR (investment adviser firm, 2010-2013), and Vice President of Valuation Oversight (2008-2010).
Jamie Pagliocco (1964)
Year of Election or Appointment: 2020
Vice President
Mr. Pagliocco also serves as Vice President of other funds. Mr. Pagliocco serves as President of Fixed Income (2020-present), and is an employee of Fidelity Investments (2001-present). Previously, Mr. Pagliocco served as Co-Chief Investment Officer - Bond (2017-2020), Global Head of Bond Trading (2016-2019), and as a portfolio manager.
Kenneth B. Robins (1969)
Year of Election or Appointment: 2020
Chief Compliance Officer
Mr. Robins also serves as an officer of other funds. Mr. Robins serves as Compliance Officer of Fidelity Management & Research Company LLC (investment adviser firm, 2016-present) and is an employee of Fidelity Investments (2004-present). Previously, Mr. Robins served as Compliance Officer of FMR Co., Inc. (investment adviser firm, 2016-2019), as Executive Vice President of Fidelity Investments Money Management, Inc. (investment adviser firm, 2013-2016) and served in other fund officer roles.
Brett Segaloff (1972)
Year of Election or Appointment: 2021
Anti-Money Laundering (AML) Officer
Mr. Segaloff also serves as an AML Officer of other funds and other related entities. He is Director, Anti-Money Laundering (2007-present) of FMR LLC (diversified financial services company) and is an employee of Fidelity Investments (1996-present).
Stacie M. Smith (1974)
Year of Election or Appointment: 2013
Assistant Treasurer
Ms. Smith also serves as an officer of other funds. Ms. Smith serves as Assistant Treasurer of FIMM, LLC (2021-present) and FMR Capital, Inc. (2017-present), is an employee of Fidelity Investments (2009-present), and has served in other fund officer roles. Prior to joining Fidelity Investments, Ms. Smith served as Senior Audit Manager of Ernst & Young LLP (accounting firm, 1996-2009). Previously, Ms. Smith served as Assistant Treasurer (2013-2019) and Deputy Treasurer (2013-2016) of certain Fidelity ® funds.
Jim Wegmann (1979)
Year of Election or Appointment: 2021
Deputy Treasurer
Mr. Wegmann also serves as an officer of other funds. Mr. Wegmann serves as Assistant Treasurer of FIMM, LLC (2021-present) and is an employee of Fidelity Investments (2011-present). Previously, Mr. Wegmann served as Assistant Treasurer of certain Fidelity ® funds (2019-2021).
As a shareholder, you incur two types of costs: (1) transaction costs, which may include sales charges (loads) on purchase payments or redemption proceeds, as applicable and (2) ongoing costs, which generally include management fees, distribution and/or service (12b-1) fees and other Fund expenses. This Example is intended to help you understand your ongoing costs (in dollars) of investing in a fund and to compare these costs with the ongoing costs of investing in other mutual funds.
| The Example is based on an investment of $1,000 invested at the beginning of the period and held for the entire period (May 1, 2022 to October 31, 2022). |
Actual Expenses
The first line of the accompanying table provides information about actual account values and actual expenses. You may use the information in this line, together with the amount you invested, to estimate the expenses that you paid over the period. Simply divide your account value by $1,000.00 (for example, an $8,600 account value divided by $1,000.00 = 8.6), then multiply the result by the number in the first line for a class/Fund under the heading entitled "Expenses Paid During Period" to estimate the expenses you paid on your account during this period. If any fund is a shareholder of any underlying mutual funds or exchange-traded funds (ETFs) (the Underlying Funds), such fund indirectly bears its proportional share of the expenses of the Underlying Funds in addition to the direct expenses incurred presented in the table. These fees and expenses are not included in the annualized expense ratio used to calculate the expense estimate in the table below.
Hypothetical Example for Comparison Purposes
The second line of the accompanying table provides information about hypothetical account values and hypothetical expenses based on the actual expense ratio and an assumed rate of return of 5% per year before expenses, which is not the actual return. The hypothetical account values and expenses may not be used to estimate the actual ending account balance or expenses you paid for the period. You may use this information to compare the ongoing costs of investing in the Fund and other funds. To do so, compare this 5% hypothetical example with the 5% hypothetical examples that appear in the shareholder reports of the other funds. If any fund is a shareholder of any Underlying Funds, such fund indirectly bears its proportional share of the expenses of the Underlying Funds in addition to the direct expenses as presented in the table. These fees and expenses are not included in the annualized expense ratio used to calculate the expense estimate in the table below.
Please note that the expenses shown in the table are meant to highlight your ongoing costs only and do not reflect any transaction costs. Therefore, the second line of the table is useful in comparing ongoing costs only, and will not help you determine the relative total costs of owning different funds. In addition, if these transactional costs were included, your costs would have been higher.
| | | | | Annualized Expense Ratio- A | | Beginning Account Value May 1, 2022 | | Ending Account Value October 31, 2022 | | Expenses Paid During Period- C May 1, 2022 to October 31, 2022 |
| | | | | | | | | | |
| Fidelity® International Sustainability Index Fund | | | | .20% | | | | | | |
| Actual | | | | | | $ 1,000 | | $ 842.00 | | $ .93 |
Hypothetical- B | | | | | | $ 1,000 | | $ 1,024.20 | | $ 1.02 |
| |
A Annualized expense ratio reflects expenses net of applicable fee waivers.
B 5% return per year before expenses
C Expenses are equal to the annualized expense ratio, multiplied by the average account value over the period, multiplied by 184/ 365 (to reflect the one-half year period). The fees and expenses of any Underlying Funds are not included in each annualized expense ratio.
The dividend and capital gains distributions for the fund(s) are available on Fidelity.com or Institutional.Fidelity.com .
The fund designates 81% of the dividend distributed during the fiscal year as amounts which may be taken into account as a dividend for the purposes of the maximum rate under section 1(h)(11) of the Internal Revenue Code.
The amounts per share which represent income derived from sources within, and taxes paid to, foreign countries or possessions of the United States are $0.2843 and $0.0293 for the dividend paid December 13, 2021.
The fund will notify shareholders in January 2023 of amounts for use in preparing 2022 income tax returns.
Fidelity International Sustainability Index Fund
Each year, the Board of Trustees, including the Independent Trustees (together, the Board), votes on the renewal of the management contract with Fidelity Management & Research Company LLC (FMR) and the sub-advisory agreement (Sub-Advisory Agreement) for the fund with Geode Capital Management, LLC (Geode) (together, the Advisory Contracts). FMR and Geode are referred to herein as the Investment Advisers. The Board, assisted by the advice of fund counsel and Independent Trustees' counsel, requests and considers a broad range of information relevant to the renewal of the Advisory Contracts throughout the year.
The Board meets regularly and, at each of its meetings, covers an extensive agenda of topics and materials and considers factors that are relevant to its annual consideration of the renewal of the fund's Advisory Contracts, including the services and support provided to the fund and its shareholders. The Board has established four standing committees (Committees) - Operations, Audit, Fair Valuation, and Governance and Nominating - each composed of and chaired by Independent Trustees with varying backgrounds, to which the Board has assigned specific subject matter responsibilities in order to enhance effective decision-making by the Board. The Operations Committee, of which all the Independent Trustees are members, meets regularly throughout the year and requests, receives and considers, among other matters, information related to the annual consideration of the renewal of the fund's Advisory Contracts before making its recommendation to the Board. The Board also meets as needed to review matters specifically related to the Board's annual consideration of the renewal of the Advisory Contracts. Members of the Board may also meet from time to time with trustees of other Fidelity funds through joint ad hoc committees to discuss certain matters relevant to all of the Fidelity funds.
At its September 2022 meeting, the Board unanimously determined to renew the fund's Advisory Contracts. In reaching its determination, the Board considered all factors it believed relevant, including (i) the nature, extent, and quality of the services provided to the fund and its shareholders (including the investment performance of the fund); (ii) the competitiveness relative to peer funds of the fund's management fee and total expense ratio; (iii) the total costs of the services provided by and the profits realized by Fidelity and Geode from their respective relationships with the fund; and (iv) the extent to which, if any, economies of scale exist and are realized as the fund grows, and whether any economies of scale are appropriately shared with fund shareholders.
In considering whether to renew the Advisory Contracts for the fund, the Board reached a determination, with the assistance of fund counsel and Independent Trustees' counsel and through the exercise of its business judgment, that the renewal of the Advisory Contracts was in the best interests of the fund and its shareholders and that the compensation payable under the Advisory Contracts was fair and reasonable. The Board's decision to renew the Advisory Contracts was not based on any single factor, but rather was based on a comprehensive consideration of all the information provided to the Board at its meetings throughout the year. The Board, in reaching its determination to renew the Advisory Contracts, was aware that shareholders of the fund have a broad range of investment choices available to them, including a wide choice among funds offered by Fidelity's competitors, and that the fund's shareholders, who have the opportunity to review and weigh the disclosure provided by the fund in its prospectus and other public disclosures, have chosen to invest in this fund, which is part of the Fidelity family of funds.
Nature, Extent, and Quality of Services Provided . The Board considered staffing as it relates to the fund, including the backgrounds of investment personnel of Fidelity and Geode, and also considered the fund's investment objective, strategies, and related investment philosophy. The Independent Trustees also had discussions with senior management of Fidelity's investment operations and investment groups and with senior management of Geode. The Board considered the structure of the investment personnel compensation programs and whether the structures provide appropriate incentives to act in the best interests of the fund. The Board also considered the steps Fidelity and Geode had taken to ensure the continued provision of high quality services to the Fidelity funds throughout the COVID-19 pandemic, including the expansion of staff in client facing positions to maintain service levels in periods of high volumes and volatility.
The Trustees also discussed with representatives of Fidelity, at meetings throughout the year, Fidelity's role in, among other things, overseeing compliance with federal securities laws and other applicable requirements by Geode with respect to the fund and monitoring and overseeing the performance and investment capabilities of Geode. The Trustees considered that the Board had received from Fidelity periodic reports about its oversight and due diligence processes, as well as periodic reports regarding the performance of Geode.
The Board also considered the nature, extent and quality of services provided by Geode. The Trustees noted that under the Sub-Advisory Agreement, subject to oversight by Fidelity, Geode is responsible for, among other things, identifying investments and arranging for execution of portfolio transactions to implement the fund's investment strategy. In addition, the Trustees noted that Geode is responsible for providing such reporting as may be requested by Fidelity to fulfill its oversight responsibilities discussed above.
Resources Dedicated to Investment Management and Support Services . The Board reviewed the general qualifications and capabilities of Fidelity's and Geode's investment staffs, including their size, education, experience, and resources, as well as Fidelity's and Geode's approach to recruiting, training, managing, and compensating investment personnel. The Board noted the resources devoted to Fidelity's global investment organization and that Fidelity's and Geode's analysts have extensive resources, tools and capabilities that allow them to conduct quantitative and fundamental analysis, as well as credit analysis of issuers, counterparties, and guarantors. Further, the Board considered that Fidelity's and Geode's investment professionals have sufficient access to information and data so as to provide competitive investment results over time, and that those professionals also have access to sophisticated tools that permit them to assess portfolio construction and risk and performance attribution characteristics continuously. Additionally, in its deliberations, the Board considered Fidelity's and Geode's trading, risk management, compliance, cybersecurity, and technology and operations capabilities and resources, which are integral parts of the investment management process.
Shareholder and Administrative Services . The Board considered (i) the nature, extent, quality, and cost of advisory, administrative, and shareholder services performed by the Investment Advisers and their affiliates under the Advisory Contracts and by FMR's affiliates under separate agreements covering transfer agency, pricing and bookkeeping, and securities lending services for the fund; (ii) the nature and extent of the supervision of third party service providers, principally custodians, subcustodians, and pricing vendors; and (iii) the resources devoted to, and the record of compliance with, the fund's compliance policies and procedures. The Board also reviewed the allocation of fund brokerage, including allocations to brokers affiliated with the Investment Advisers.
The Board noted that the growth of fund assets over time across the complex allows Fidelity to reinvest in the development of services designed to enhance the value and convenience of the Fidelity funds as investment vehicles. These services include 24-hour access to account information and market information over the Internet and through telephone representatives, investor education materials and asset allocation tools. The Board also considered that it reviews customer service metrics such as telephone response times, continuity of services on the website and metrics addressing services at Fidelity Investor Centers.
Investment in a Large Fund Family . The Board considered the benefits to shareholders of investing in a Fidelity fund, including the benefits of investing in a fund that is part of a large family of funds offering a variety of investment disciplines and providing a large variety of mutual fund investor services. The Board noted that Fidelity had taken, or had made recommendations to the Board that resulted in the Fidelity funds taking, a number of actions over the previous year that benefited particular funds, including: (i) continuing to dedicate additional resources to Fidelity's investment research process, which includes meetings with management of issuers of securities in which the funds invest; (ii) continuing efforts to enhance Fidelity's global research capabilities; (iii) launching new funds, ETFs, and share classes with innovative structures, strategies and pricing and making other enhancements to meet investor needs; (iv) broadening eligibility requirements for certain funds and share classes; (v) reducing management fees and total expenses for certain funds and classes; (vi) lowering expenses for certain existing funds and classes by implementing or lowering expense caps; (vii) rationalizing product lines and gaining increased efficiencies from fund mergers and liquidations; (viii) continuing to develop, acquire and implement systems and technology to improve services to the funds and shareholders, strengthen information security, and increase efficiency; and (ix) continuing to implement enhancements to further strengthen Fidelity's product line to increase investors' probability of success in achieving their investment goals, including their retirement income goals.
Investment Performance . The Board considered whether the fund has operated in accordance with its investment objective, as well as its record of compliance with its investment restrictions and its performance history.
The Board took into account discussions that occur at Board meetings throughout the year with representatives of the Investment Advisers about fund investment performance. In this regard the Board noted that as part of regularly scheduled fund reviews and other reports to the Board on fund performance, the Board considers annualized return information for the fund for different time periods, measured against the securities market index the fund seeks to track. The Board also periodically considers the fund's tracking error versus its benchmark index.
In addition to reviewing absolute and relative fund performance, the Independent Trustees periodically consider the appropriateness of fund performance metrics in evaluating the results achieved. In general, the Independent Trustees believe that an index fund's performance should be evaluated based on gross performance (before fees and expenses but after transaction costs) compared to the fund's benchmark index, over appropriate time periods, taking into account relevant factors including the following: general market conditions; the characteristics of the fund's benchmark index; the extent to which statistical sampling is employed; any securities lending revenues; and fund cash flows and other factors. The Independent Trustees generally give greater weight to fund performance over longer time periods than over shorter time periods. Depending on the circumstances, the Independent Trustees may be satisfied with a fund's performance notwithstanding that it lags its benchmark index for certain periods.
The Independent Trustees recognize that shareholders evaluate performance on a net basis (after fees and expenses) over their own holding periods, for which one-, three-, and five-year periods are often used as a proxy. For this reason, the performance information reviewed by the Board also included net cumulative calendar year total return information for the fund and its benchmark index for the most recent one- and three-year periods. No performance peer group information was considered by the Board as Fidelity advised the Board that the peer group, which is created by a third-party provider, includes a number of actively-managed funds. The Independent Trustees recognize that shareholders who are not investing through a tax-advantaged retirement account also consider tax consequences in evaluating performance.
Based on its review, the Board concluded that the nature, extent, and quality of services provided to the fund under the Advisory Contracts should continue to benefit the shareholders of the fund.
Competitiveness of Management Fee and Total Expense Ratio . The Board considered the fund's management fee and total expense ratio compared to selected groups of competitive funds and classes (referred to as "mapped groups" below) for the purpose of facilitating the Trustees' competitive analysis of management fees and total expenses. Fidelity creates "mapped groups" by combining similar investment objective categories (as classified by Lipper) that have comparable investment mandates. Combining funds with similar investment objective categories aids the Board's comparison of management fees and total expense ratios by broadening the competitive group used for such comparison.
Management Fee . The Board considered two proprietary management fee comparisons for the 12-month (or shorter) periods shown in basis points (BP) in the chart below. The group of Lipper funds used by the Board for management fee comparisons is referred to below as the "Total Mapped Group." The Total Mapped Group comparison focuses on a fund's standing in terms of gross management fees before expense reimbursements or caps relative to the total universe of funds with comparable investment mandates, regardless of whether their management fee structures also are comparable. Funds with comparable investment mandates offer exposure to similar types of securities. Funds with comparable management fee structures have similar management fee contractual arrangements (e.g., flat rate charged for advisory services, all-inclusive fee rate, etc.). "TMG %" represents the percentage of funds in the Total Mapped Group that had management fees that were lower than the fund's. For example, a hypothetical TMG % of 20% would mean that 80% of the funds in the Total Mapped Group had higher, and 20% had lower, management fees than the fund. The fund's actual TMG %s and the number of funds in the Total Mapped Group are in the chart below. The "Asset-Sized Peer Group" (ASPG) comparison focuses on a fund's standing relative to a subset of non-Fidelity funds within the Total Mapped Group that are similar in size and management fee structure. For example, if a fund is in the first quartile of the ASPG, the fund's management fee ranks in the least expensive or lowest 25% of funds in the ASPG. The ASPG represents at least 15% of the funds in the Total Mapped Group with comparable asset size and management fee structures, subject to a minimum of 50 funds (or all funds in the Total Mapped Group if fewer than 50). Additional information, such as the ASPG quartile in which the fund's management fee rate ranked, is also included in the chart and was considered by the Board.
The Board considered that effective August 1, 2019, the fund's management fee rate was increased from 0.17% to 0.20%, but that the fund no longer paid operating expenses under separate agreements. The Board considered that the chart below reflects the fund's higher management fee rate for 2019, as if the higher fee rate were in effect for the entire year.
The Board noted that the fund's management fee rate ranked above the median of its Total Mapped Group and above the median of its ASPG for 2021. The Board considered that the fund has a unitary fee that covers expenses beyond portfolio management, whereas the majority of funds within this group do not have unitary or all-inclusive fees. The Board further considered that the fund's total net expense ratio ranked below the competitive medians.
Based on its review, the Board concluded that the fund's management fee is fair and reasonable in light of the services that the fund receives and the other factors considered.
Total Expense Ratio . In its review of the fund's total expense ratio, the Board considered the fund's unitary (subject to certain limited exceptions) fee rate as well as fund expenses paid by FMR under the fund's management contract, such as transfer agent fees, pricing and bookkeeping fees, and custodial, legal, and audit fees. The Board also noted that Fidelity may agree to waive fees or reimburse expenses from time to time, and the extent to which, if any, it has done so for the fund. The fund is compared to those funds and classes in the Total Mapped Group (used by the Board for management fee comparisons) that have a similar sales load structure. The Board also considered a total expense ASPG comparison, which focuses on the total expenses of the fund relative to a subset of non-Fidelity funds within the similar sales load structure group that are similar in size and management fee structure. The total expense ASPG is limited to 15 larger and 15 smaller classes of different funds, where possible. The total expense ASPG comparison excludes performance adjustments and fund-paid 12b-1 fees to eliminate variability in expenses relating to these items.
The Board noted that the fund's total net expense ratio ranked below the similar sales load structure group competitive median and below the ASPG competitive median for 2021.
Fees Charged to Other Clients . The Board also considered fee structures and other information with respect to clients of Fidelity and Geode, such as other funds advised or subadvised by Fidelity or Geode, pension plan clients, and other institutional clients with similar mandates. The Board noted that a joint ad hoc committee created by it and the boards of other Fidelity funds periodically reviews and compares Fidelity's institutional investment advisory business with its business of providing services to the Fidelity funds and also noted the most recent findings of the committee. The Board noted that the committee's review included a consideration of the differences in services provided, fees charged, and costs incurred, as well as competition in the markets serving the different categories of clients.
Based on its review of total expense ratios and fees charged to other Fidelity clients, the Board concluded that the fund's total expense ratio was reasonable in light of the services that the fund and its shareholders receive and the other factors considered.
Costs of the Services and Profitability . The Board considered the revenues earned and the expenses incurred by Fidelity in conducting the business of developing, marketing, distributing, managing, administering and servicing the fund and servicing the fund's shareholders. The Board also considered the level of Fidelity's profits in respect of all the Fidelity funds.
On an annual basis, Fidelity presents to the Board information about the profitability of its relationships with the fund. Fidelity calculates profitability information for each fund, as well as aggregate profitability information for groups of Fidelity funds and all Fidelity funds, using a series of detailed revenue and cost allocation methodologies which originate with the books and records of Fidelity on which Fidelity's audited financial statements are based. The Audit Committee of the Board reviews any significant changes from the prior year's methodologies and the full Board approves such changes.
A public accounting firm has been engaged annually by the Board as part of the Board's assessment of Fidelity's profitability analysis. The engagement includes the review and assessment of the methodologies used by Fidelity in determining the revenues and expenses attributable to Fidelity's mutual fund business, and completion of agreed-upon procedures in respect of the mathematical accuracy of certain fund profitability information and its conformity to established allocation methodologies. After considering the reports issued under the engagement and information provided by Fidelity, the Board concluded that while other allocation methods may also be reasonable, Fidelity's profitability methodologies are reasonable in all material respects.
The Board also reviewed Fidelity's and Geode's non-fund businesses and potential indirect benefits such businesses may have received as a result of their association with Fidelity's mutual fund business (i.e., fall-out benefits) as well as cases where Fidelity's and Geode's affiliates may benefit from the funds' business. The Board considered areas where potential indirect benefits to the Fidelity funds from their relationships with Fidelity may exist. The Board's consideration of these matters was informed by the findings of a joint ad hoc committee created by it and the boards of other Fidelity funds to evaluate potential fall-out benefits.
The Board considered the costs of the services provided by and the profits realized by Fidelity in connection with the operation of the fund and was satisfied that the profitability was not excessive.
The Board also considered information regarding the profitability of Geode's relationship with the fund.
Economies of Scale . The Board considered whether there have been economies of scale in respect of the management of the Fidelity funds, whether the Fidelity funds (including the fund) have appropriately benefited from any such economies of scale, and whether there is potential for realization of any further economies of scale. The Board considered the extent to which the fund will benefit from economies of scale as assets grow through increased services to the fund, through waivers or reimbursements, or through fee or expense ratio reductions. The Board recognized that, due to the fund's current contractual arrangements, its expense ratio will not decline if the fund's operating costs decrease as assets grow, or rise as assets decrease. The Board also noted that a committee (the Economies of Scale Committee) created by it and the boards of other Fidelity funds periodically analyzes whether Fidelity attains economies of scale in respect of the management and servicing of the Fidelity funds, whether the Fidelity funds have appropriately benefited from such economies of scale, and whether there is potential for realization of any further economies of scale.
The Board concluded, taking into account the analysis of the Economies of Scale Committee, that economies of scale, if any, are being appropriately shared between fund shareholders and Fidelity.
Additional Information Requested by the Board . In order to develop fully the factual basis for consideration of the Fidelity funds' advisory contracts, the Board requested and received additional information on certain topics, including: (i) Fidelity's fund profitability methodology, profitability trends for certain funds, the allocation of various costs to different funds, and the impact of certain factors on fund profitability results; (ii) portfolio manager changes that have occurred during the past year and the amount of the investment that each portfolio manager has made in the Fidelity fund(s) that he or she manages; (iii) the extent to which current market conditions have affected retention and recruitment of personnel; (iv) the arrangements with and compensation paid to certain fund sub-advisers on behalf of the Fidelity funds and the treatment of such compensation within Fidelity's fund profitability methodology; (v) the terms of the funds' various management fee structures, including the basic group fee and the terms of Fidelity's voluntary expense limitation arrangements; (vi) Fidelity's transfer agent, pricing and bookkeeping fees, expense and service structures for different funds and classes relative to competitive trends; (vii) the impact on fund profitability of recent industry trends, such as the growth in passively managed funds and the changes in flows for different types of funds; (viii) the types of management fee and total expense comparisons provided, and the challenges and limitations associated with such information; and (ix) explanations regarding the relative total expense ratios and management fees of certain funds and classes, total expense and management fee competitive trends, and methodologies for total expense and management fee competitive comparisons. In addition, the Board considered its discussions with Fidelity regarding Fidelity's efforts to maintain the continuous investment and shareholder services necessary for the funds during the current pandemic and economic circumstances.
Based on its evaluation of all of the conclusions noted above, and after considering all factors it believed relevant, the Board concluded that the advisory and sub-advisory fee arrangements are fair and reasonable and that the fund's Advisory Contracts should be renewed.
1.9883818.105
ISY-ANN-1222
Item 2.
Code of Ethics
As of the end of the period, October 31, 2022, Fidelity Salem Street Trust (the trust) has adopted a code of ethics, as defined in Item 2 of Form N-CSR, that applies to its President and Treasurer and its Chief Financial Officer. A copy of the code of ethics is filed as an exhibit to this Form N-CSR.
Item 3.
Audit Committee Financial Expert
The Board of Trustees of the trust has determined that Elizabeth S. Acton is an audit committee financial expert, as defined in Item 3 of Form N-CSR. Ms. Acton is independent for purposes of Item 3 of Form N-CSR.
Item 4.
Principal Accountant Fees and Services
Fees and Services
The following table presents fees billed by Deloitte & Touche LLP, the member firms of Deloitte Touche Tohmatsu, and their respective affiliates (collectively, “Deloitte Entities ”) in each of the last two fiscal years for services rendered to Fidelity Emerging Markets Index Fund, Fidelity Flex International Index Fund, Fidelity Global ex U.S. Index Fund, Fidelity International Sustainability Index Fund and Fidelity Series Global ex U.S. Index Fund (the “Fund(s) ”):
Services Billed by Deloitte Entities
October 31, 2022 Fees A
| | | | |
| Audit Fees | Audit-Related Fees | Tax Fees | All Other Fees |
Fidelity Emerging Markets Index Fund | $46,700 | $- | $11,200 | $1,100 |
Fidelity Flex International Index Fund | $48,800 | $- | $9,100 | $1,100 |
Fidelity Global ex U.S. Index Fund | $53,000 | $- | $9,100 | $1,200 |
Fidelity International Sustainability Index Fund | $35,900 | $- | $9,100 | $900 |
Fidelity Series Global ex U.S. Index Fund | $57,500 | $- | $9,100 | $1,300 |
| | | | |
| Audit Fees | Audit-Related Fees | Tax Fees | All Other Fees |
Fidelity Emerging Markets Index Fund | $45,100 | $- | $11,100 | $1,100 |
Fidelity Flex International Index Fund | $47,300 | $- | $9,100 | $1,100 |
Fidelity Global ex U.S. Index Fund | $50,100 | $- | $9,100 | $1,200 |
Fidelity International Sustainability Index Fund | $34,700 | $- | $9,100 | $900 |
Fidelity Series Global ex U.S. Index Fund | $54,500 | $- | $9,100 | $1,300 |
A Amounts may reflect rounding.
The following table presents fees billed by PricewaterhouseCoopers LLP ( “PwC ”) in each of the last two fiscal years for services rendered to Fidelity SAI Emerging Markets Index Fund, Fidelity SAI Emerging Markets Low Volatility Index Fund, Fidelity SAI Emerging Markets Value Index Fund, Fidelity SAI International Index Fund, Fidelity SAI International Low Volatility Index Fund, Fidelity SAI International Momentum Index Fund, Fidelity SAI International Quality Index Fund, Fidelity SAI International Value Index Fund, Fidelity SAI U.S. Low Volatility Index Fund, Fidelity Total International Index Fund and Fidelity U.S. Sustainability Index Fund (the “Fund(s) ”):
Services Billed by PwC
October 31, 2022 Fees A
| | | | |
| Audit Fees | Audit-Related Fees | Tax Fees | All Other Fees |
Fidelity SAI Emerging Markets Index Fund | $38,900 | $3,600 | $9,900 | $1,600 |
Fidelity SAI Emerging Markets Low Volatility Index Fund | $34,400 | $3,200 | $10,900 | $1,400 |
Fidelity SAI Emerging Markets Value Index Fund | $36,400 | $3,300 | $9,500 | $1,500 |
Fidelity SAI International Index Fund | $45,000 | $3,600 | $9,900 | $1,600 |
Fidelity SAI International Low Volatility Index Fund | $34,500 | $3,200 | $15,500 | $1,400 |
Fidelity SAI International Momentum Index Fund | $36,400 | $3,300 | $9,500 | $1,500 |
Fidelity SAI International Quality Index Fund | $36,400 | $3,300 | $9,500 | $1,500 |
Fidelity SAI International Value Index Fund | $37,300 | $3,400 | $13,300 | $1,500 |
Fidelity SAI U.S. Low Volatility Index Fund | $35,200 | $3,200 | $11,300 | $1,400 |
Fidelity Total International Index Fund | $62,200 | $5,700 | $30,900 | $2,500 |
Fidelity U.S. Sustainability Index Fund | $30,100 | $2,700 | $6,300 | $1,200 |
| | | | |
| Audit Fees | Audit-Related Fees | Tax Fees | All Other Fees |
Fidelity SAI Emerging Markets Index Fund | $37,900 | $3,800 | $9,600 | $1,700 |
Fidelity SAI Emerging Markets Low Volatility Index Fund | $33,500 | $3,400 | $10,000 | $1,500 |
Fidelity SAI Emerging Markets Value Index Fund | $35,500 | $3,500 | $9,200 | $1,600 |
Fidelity SAI International Index Fund | $37,900 | $3,800 | $10,200 | $1,700 |
Fidelity SAI International Low Volatility Index Fund | $33,500 | $3,400 | $9,000 | $1,500 |
Fidelity SAI International Momentum Index Fund | $35,500 | $3,500 | $9,200 | $1,600 |
Fidelity SAI International Quality Index Fund | $35,500 | $3,500 | $9,200 | $1,600 |
Fidelity International Value Index Fund | $36,300 | $3,600 | $9,000 | $1,600 |
Fidelity SAI U.S. Low Volatility Index Fund | $34,200 | $3,400 | $9,000 | $1,500 |
Fidelity Total International Index Fund | $60,500 | $6,000 | $16,000 | $2,700 |
Fidelity U.S. Sustainability Index Fund | $29,200 | $2,800 | $6,100 | $1,300 |
A Amounts may reflect rounding.
The following table(s) present(s) fees billed by Deloitte Entities and PwC that were required to be approved by the Audit Committee for services that relate directly to the operations and financial reporting of the Fund(s) and that are rendered on behalf of Fidelity Management & Research Company LLC ("FMR") and entities controlling, controlled by, or under common control with FMR (not including any sub-adviser whose role is primarily portfolio management and is subcontracted with or overseen by another
investment adviser) that provide ongoing services to the Fund(s) ( “Fund Service Providers ”):
Services Billed by Deloitte Entities
| | |
| October 31, 2022 A | October 31, 2021 A |
Audit-Related Fees | $- | $- |
Tax Fees | $- | $- |
All Other Fees | $- | $- |
A Amounts may reflect rounding.
Services Billed by PwC
| | | |
| October 31, 2022 A | October 31, 2021 A |
Audit-Related Fees | $7,914,600 | $8,830,600 | |
Tax Fees | $1,000 | $354,200 | |
All Other Fees | $- | $- | |
A Amounts may reflect rounding.
“Audit-Related Fees ” represent fees billed for assurance and related services that are reasonably related to the performance of the fund audit or the review of the fund's financial statements and that are not reported under Audit Fees.
“Tax Fees ” represent fees billed for tax compliance, tax advice or tax planning that relate directly to the operations and financial reporting of the fund.
“All Other Fees ” represent fees billed for services provided to the fund or Fund Service Provider, a significant portion of which are assurance related, that relate directly to the operations and financial reporting of the fund, excluding those services that are reported under Audit Fees, Audit-Related Fees or Tax Fees.
Assurance services must be performed by an independent public accountant.
* * *
The aggregate non-audit fees billed by Deloitte Entities and PwC for services rendered to the Fund(s), FMR (not including any sub-adviser whose role is primarily portfolio management and is subcontracted with or overseen by another investment adviser), and any Fund Service Provider for each of the last two fiscal years of the Fund(s) are as follows:
| | |
Billed By | October 31, 2022 A | October 31, 2021 A |
Deloitte Entities | $510,800 | $574,700 |
PwC | $13,075,100 | $14,653,000 |
A Amounts may reflect rounding.
The trust's Audit Committee has considered non-audit services that were not pre-approved that were provided by Deloitte Entities and PwC to Fund Service Providers to be compatible with maintaining the independence of Deloitte Entities and PwC in its(their) audit of the Fund(s), taking into account representations from Deloitte Entities and PwC, in accordance with Public Company Accounting Oversight Board rules, regarding its independence from the Fund(s) and its(their) related entities and FMR ’s review of the appropriateness and permissibility under applicable law of such non-audit services prior to their provision to the Fund(s) Service Providers.
Audit Committee Pre-Approval Policies and Procedures
The trust ’s Audit Committee must pre-approve all audit and non-audit services provided by a fund ’s independent registered public accounting firm relating to the operations or financial reporting of the fund. Prior to the commencement of any audit or non-audit services to a fund, the Audit Committee reviews the services to determine whether they are appropriate and permissible under applicable law.
The Audit Committee has adopted policies and procedures to, among other purposes, provide a framework for the Committee ’s consideration of non-audit services by the audit firms that audit the Fidelity funds. The policies and procedures require that any non-audit service provided by a fund audit firm to a Fidelity fund and any non-audit service provided by a fund auditor to a Fund Service Provider that relates directly to the operations and financial reporting of a Fidelity fund ( “Covered Service ”) are subject to approval by the Audit Committee before such service is provided.
All Covered Services must be approved in advance of provision of the service either: (i) by formal resolution of the Audit Committee, or (ii) by oral or written approval of the service by the Chair of the Audit Committee (or if the Chair is unavailable, such other member of the Audit Committee as may be designated by the Chair to act in the Chair ’s absence). The approval contemplated by (ii) above is permitted where the Treasurer determines that action on such an engagement is necessary before the next meeting of the Audit Committee.
Non-audit services provided by a fund audit firm to a Fund Service Provider that do not relate directly to the operations and financial reporting of a Fidelity fund are reported to the Audit Committee periodically.
Non-Audit Services Approved Pursuant to Rule 2-01(c)(7)(i)(C) and (ii) of Regulation S-X ( “De Minimis Exception ”)
There were no non-audit services approved or required to be approved by the Audit Committee pursuant to the De Minimis Exception during the Fund ’s(s ’) last two fiscal years relating to services provided to (i) the Fund(s) or (ii) any Fund Service Provider that relate directly to the operations and financial reporting of the Fund(s).
Item 5.
Audit Committee of Listed Registrants
Not applicable.
Item 6.
Investments
(a)
Not applicable.
(b)
Not applicable.
Item 7.
Disclosure of Proxy Voting Policies and Procedures for Closed-End Management Investment Companies
Not applicable.
Item 8.
Portfolio Managers of Closed-End Management Investment Companies
Not applicable.
Item 9.
Purchase of Equity Securities by Closed-End Management Investment Company and Affiliated Purchasers
Not applicable.
Item 10.
Submission of Matters to a Vote of Security Holders
There were no material changes to the procedures by which shareholders may recommend nominees to the trust ’s Board of Trustees.
Item 11.
Controls and Procedures
(a)(i) The President and Treasurer and the Chief Financial Officer have concluded that the trust ’s disclosure controls and procedures (as defined in Rule 30a-3(c) under the Investment Company Act) provide reasonable assurances that material information relating to the trust is made known to them by the appropriate persons, based on their evaluation of these controls and procedures as of a date within 90 days of the filing date of this report.
(a)(ii) There was no change in the trust ’s internal control over financial reporting (as defined in Rule 30a-3(d) under the Investment Company Act) that occurred during the period covered by this report that has materially affected, or is reasonably likely to materially affect, the trust ’s internal control over financial reporting.
Item 12.
Disclosure of Securities Lending Activities for Closed-End Management
Investment Companies
Not applicable.
Item 13.
Exhibits
SIGNATURES
Pursuant to the requirements of the Securities Exchange Act of 1934 and the Investment Company Act of 1940, the registrant has duly caused this report to be signed on its behalf by the undersigned, thereunto duly authorized.
Fidelity Salem Street Trust
| |
By: | /s/Laura M. Del Prato |
| Laura M. Del Prato |
| President and Treasurer |
|
|
Date: | December 21, 2022 |
Pursuant to the requirements of the Securities Exchange Act of 1934 and the Investment Company Act of 1940, this report has been signed below by the following persons on behalf of the registrant and in the capacities and on the dates indicated.
| |
By: | /s/Laura M. Del Prato |
| Laura M. Del Prato |
| President and Treasurer |
|
|
Date: | December 21, 2022 |
| |
By: | /s/John J. Burke III |
| John J. Burke III |
| Chief Financial Officer |
|
|
Date: | December 21, 2022 |