UNITED STATES
SECURITIES AND EXCHANGE COMMISSION
Washington, D.C. 20549
FORM N-CSR
CERTIFIED SHAREHOLDER REPORT OF REGISTERED
MANAGEMENT INVESTMENT COMPANIES
Investment Company Act file number 811-02105
Fidelity Salem Street Trust
(Exact name of registrant as specified in charter)
245 Summer St., Boston, Massachusetts 02210
(Address of principal executive offices) (Zip code)
Cynthia Lo Bessette, Secretary
245 Summer St.
Boston, Massachusetts 02210
(Name and address of agent for service)
Registrant's telephone number, including area code:
617-563-7000
| |
Date of fiscal year end: | January 31 |
|
|
Date of reporting period: | January 31, 2023 |
Item 1.
Reports to Stockholders
Fidelity® Tax-Free Bond Fund
Annual Report
January 31, 2023
Contents
To view a fund's proxy voting guidelines and proxy voting record for the 12-month period ended June 30, visit http://www.fidelity.com/proxyvotingresults or visit the Securities and Exchange Commission's (SEC) web site at http://www.sec.gov.
You may also call 1-800-544-8544 to request a free copy of the proxy voting guidelines.
Standard & Poor's, S&P and S&P 500 are registered service marks of The McGraw-Hill Companies, Inc. and have been licensed for use by Fidelity Distributors Corporation.
Other third-party marks appearing herein are the property of their respective owners.
All other marks appearing herein are registered or unregistered trademarks or service marks of FMR LLC or an affiliated company. © 2023 FMR LLC. All rights reserved.
This report and the financial statements contained herein are submitted for the general information of the shareholders of the Fund. This report is not authorized for distribution to prospective investors in the Fund unless preceded or accompanied by an effective prospectus.
A fund files its complete schedule of portfolio holdings with the SEC for the first and third quarters of each fiscal year on Form N-PORT. Forms N-PORT are available on the SEC's web site at http://www.sec.gov. A fund's Forms N-PORT may be reviewed and copied at the SEC's Public Reference Room in Washington, DC. Information regarding the operation of the SEC's Public Reference Room may be obtained by calling 1-800-SEC-0330.
For a complete list of a fund's portfolio holdings, view the most recent holdings listing, semiannual report, or annual report on Fidelity's web site at http://www.fidelity.com, http://www.institutional.fidelity.com, or http://www.401k.com, as applicable.
NOT FDIC INSURED •MAY LOSE VALUE •NO BANK GUARANTEE
Neither the Fund nor Fidelity Distributors Corporation is a bank.
Average annual total return reflects the change in the value of an investment, assuming reinvestment of distributions from dividend income and capital gains (the profits earned upon the sale of securities that have grown in value, if any) and assuming a constant rate of performance each year. The hypothetical investment and the average annual total returns do not reflect the deduction of taxes that a shareholder would pay on fund distributions or the redemption of fund shares. During periods of reimbursement by Fidelity, a fund's total return will be greater than it would be had the reimbursement not occurred. How a fund did yesterday is no guarantee of how it will do tomorrow.
| Average Annual Total Returns |
| | | | |
Periods ended January 31, 2023 | Past 1 year | Past 5 years | Past 10 years |
| Fidelity® Tax-Free Bond Fund | -4.38% | 2.16% | 2.63% |
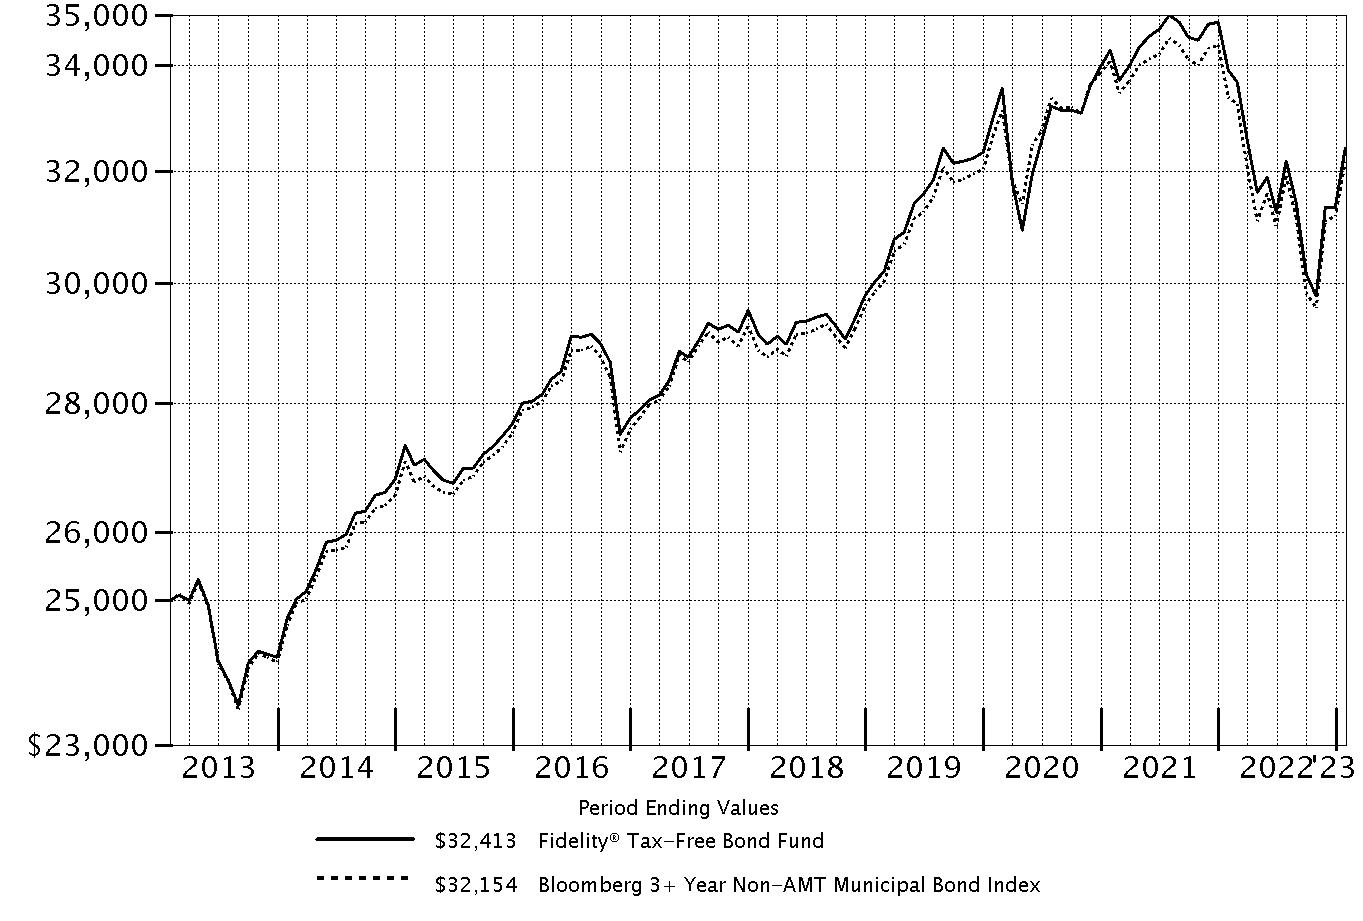
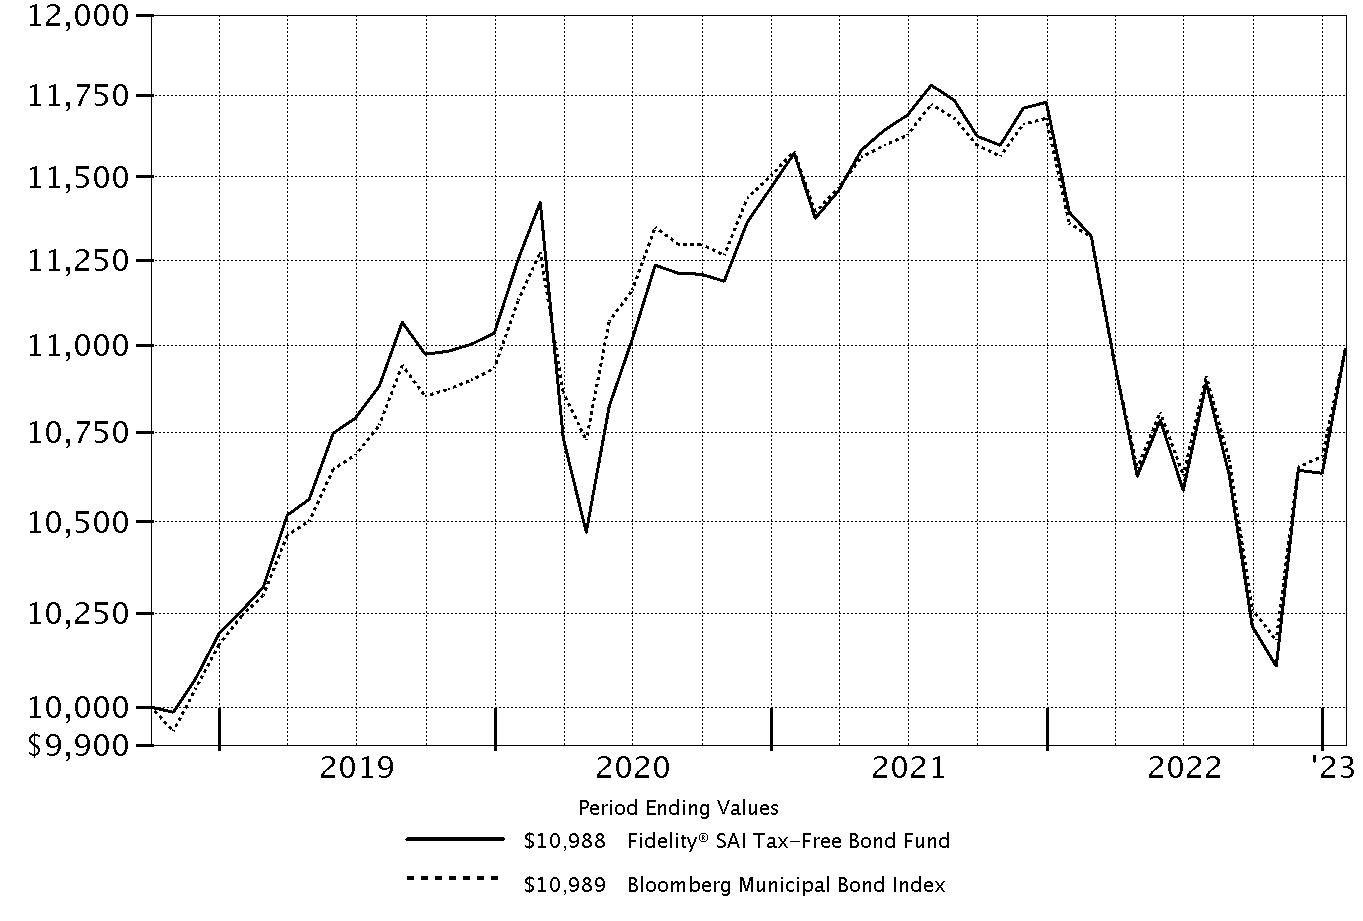
| $25,000 Over 10 Years |
| |
Let's say hypothetically that $25,000 was invested in Fidelity® Tax-Free Bond Fund on January 31, 2013. The chart shows how the value of your investment would have changed, and also shows how the Bloomberg 3+ Year Non-AMT Municipal Bond Index performed over the same period. |
Market Recap:
Tax-exempt municipal bonds declined for the 12 months ending January 31, 2023, with a late-period rally partially offsetting a steep fall earlier on. The Bloomberg Municipal Bond Index returned -3.25% for the period. By early 2022, the Federal Reserve had begun its pivot from monetary easing to monetary tightening, tapering the large-scale asset purchases it restarted in 2020 amid the COVID-19 pandemic. In March, the Fed, faced with persistent inflationary pressure, began implementing an aggressive series of rate hikes, eventually raising its benchmark interest rate seven times, by a total of 4.25 percentage points, through mid-December. This helped push municipal bond yields to their highest level in more than a decade. Muni bond prices, which move inversely to yields, fell sharply. Credit spreads significantly widened, as investors demanded more yield for lower-quality munis as recession risk increased. In November, December and January, the tax-exempt market reversed course and rallied strongly (+7.99%) - including a gain of 2.87% in January - amid market expectations for the Fed to pause monetary policy tightening in 2023. Muni yields declined and prices rebounded. Favorable supply and demand was helpful; issuance remained subdued, while net inflows into munis turned positive. Muni tax-backed credit fundamentals were solid throughout the period and, for the most part, the risk of credit-rating downgrades appeared low. Shorter-duration (lower sensitivity to changes in interest rates) and higher-credit-quality munis led the way for the year.
Comments from Co-Portfolio Managers Michael Maka, Cormac Cullen and Elizah McLaughlin:
For the fiscal year ending January 31, 2023, the fund returned -4.38%, lagging the -3.66% result of the supplemental index, the Bloomberg Municipal Bond 3+ Year Index, as well as the -3.25% result of the benchmark, the broad-based Bloomberg Municipal Bond Index. The past 12 months, we continued to focus on longer-term objectives and sought to generate attractive tax-exempt income and a competitive risk-adjusted return. Versus the supplemental index, the fund's underweight exposure to high-quality AAA-rated securities - which outpaced lower-quality securities as credit spreads widened - detracted from relative performance. An overweight to hospitals, a segment that lagged the index, also hurt. A larger-than-index stake in bonds backed by the state of Illinois further crimped the relative result. Pricing-related factors significantly detracted as well. Fund holdings are priced by a third-party pricing service and validated daily by Fidelity Management & Research's fair-value processes. Securities within the index, however, are priced by the index provider. In contrast, duration (interest rate) positioning contributed to performance versus the supplemental index. The fund had less sensitivity to interest rates, as measured by its shorter duration, during periods when interest rates rose and therefore was hurt less. A higher-than-average yield on the fund's underlying holdings provided another boost to the relative result.
The views expressed above reflect those of the portfolio manager(s) only through the end of the period as stated on the cover of this report and do not necessarily represent the views of Fidelity or any other person in the Fidelity organization. Any such views are subject to change at any time based upon market or other conditions and Fidelity disclaims any responsibility to update such views. These views may not be relied on as investment advice and, because investment decisions for a Fidelity fund are based on numerous factors, may not be relied on as an indication of trading intent on behalf of any Fidelity fund.
| Top Five States (% of Fund's net assets) |
| | |
| Illinois | 14.9 |
| New York | 6.5 |
| Texas | 6.5 |
| Pennsylvania | 6.3 |
| Florida | 6.1 |
| | |
| Revenue Sources (% of Fund's net assets) |
| Health Care | 25.6% | |
| General Obligations | 20.4% | |
| Transportation | 17.1% | |
| Education | 9.2% | |
| Special Tax | 7.5% | |
| State G.O. | 5.3% | |
| Others* (Individually Less Than 5%) | 14.9% | |
| | 100.0% | |
| |
| *Includes net other assets | | |
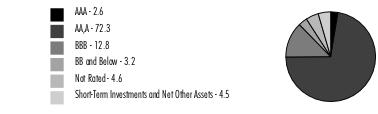
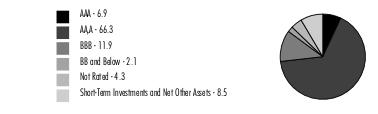
Quality Diversification (% of Fund's net assets) |
|
| |
| We have used ratings from Moody's Investors Service, Inc. Where Moody's® ratings are not available, we have used S&P® ratings. All ratings are as of the date indicated and do not reflect subsequent changes. |
Showing Percentage of Net Assets
| Municipal Bonds - 95.5% |
| | | Principal Amount (a) | Value ($) |
| Alabama - 2.1% | | | |
| Auburn Univ. Gen. Fee Rev. Series 2018 A, 5% 6/1/43 | | 1,700,000 | 1,838,965 |
| Homewood Edl. Bldg. Auth. Rev. Series 2019 A: | | | |
| 4% 12/1/33 | | 270,000 | 280,715 |
| 4% 12/1/35 | | 880,000 | 896,581 |
| 4% 12/1/37 | | 1,180,000 | 1,185,842 |
| 4% 12/1/38 | | 225,000 | 225,305 |
| 4% 12/1/39 | | 1,605,000 | 1,595,562 |
| 4% 12/1/41 | | 3,845,000 | 3,751,550 |
| 4% 12/1/44 | | 2,265,000 | 2,172,320 |
| 4% 12/1/49 | | 530,000 | 494,941 |
| Lower Alabama Gas District Bonds (No. 2 Proj.) Series 2020, 4%, tender 12/1/25 (b) | | 23,020,000 | 23,124,198 |
| Montgomery Med. Clinic Facilities Series 2015: | | | |
| 5% 3/1/26 | | 55,000 | 55,906 |
| 5% 3/1/27 | | 110,000 | 111,393 |
| 5% 3/1/28 | | 120,000 | 121,383 |
| 5% 3/1/29 | | 100,000 | 100,986 |
| 5% 3/1/30 | | 120,000 | 120,949 |
| 5% 3/1/36 | | 2,315,000 | 2,230,720 |
| Southeast Energy Auth. Rev. Bonds: | | | |
| (Proj. No. 2) Series 2021 B1: | | | |
4% 6/1/29 | | 1,260,000 | 1,295,720 |
4% 6/1/30 | | 955,000 | 978,708 |
4% 6/1/31 | | 825,000 | 838,358 |
| Bonds (Proj. No. 2) Series 2021 B1, 4%, tender 12/1/31 (b) | | 20,155,000 | 20,089,805 |
TOTAL ALABAMA | | | 61,509,907 |
| Alaska - 0.1% | | | |
| Alaska Int'l. Arpts. Revs. Series 2016 B: | | | |
| 5% 10/1/31 | | 1,590,000 | 1,699,056 |
| 5% 10/1/33 | | 2,075,000 | 2,204,233 |
TOTAL ALASKA | | | 3,903,289 |
| Arizona - 2.3% | | | |
| Arizona Board of Regents Ctfs. of Prtn. (Univ. of Arizona Univ. Revs.) Series 2018 B: | | | |
| 5% 6/1/27 | | 470,000 | 520,770 |
| 5% 6/1/30 | | 1,390,000 | 1,562,305 |
| Arizona Health Facilities Auth. Rev. (Banner Health Sys. Proj.) Series 2007 B, 3 month U.S. LIBOR + 0.810% 3.995%, tender 1/1/37 (b)(c) | | 945,000 | 885,143 |
| Arizona Indl. Dev. Auth. Hosp. Rev. Series 2021 A: | | | |
| 4% 2/1/38 | | 1,415,000 | 1,432,476 |
| 4% 2/1/39 | | 1,415,000 | 1,424,778 |
| Arizona Indl. Dev. Auth. Lease Rev. Series 2020 A: | | | |
| 4% 9/1/37 | | 385,000 | 393,329 |
| 4% 9/1/38 | | 420,000 | 425,854 |
| 4% 9/1/39 | | 380,000 | 384,252 |
| 4% 9/1/40 | | 410,000 | 413,279 |
| 4% 9/1/46 | | 945,000 | 943,779 |
| 5% 9/1/31 | | 185,000 | 209,427 |
| 5% 9/1/32 | | 285,000 | 320,524 |
| 5% 9/1/33 | | 390,000 | 435,797 |
| 5% 9/1/34 | | 330,000 | 366,329 |
| Arizona Indl. Dev. Auth. Rev. (Provident Group-Eastern Michigan Univ. Parking Proj.) Series 2018: | | | |
| 5% 5/1/37 | | 1,030,000 | 798,980 |
| 5% 5/1/43 | | 945,000 | 678,538 |
| Arizona State Univ. Revs. Series 2021 C: | | | |
| 5% 7/1/32 | | 1,150,000 | 1,375,350 |
| 5% 7/1/34 | | 1,180,000 | 1,397,560 |
| 5% 7/1/35 | | 945,000 | 1,107,411 |
| Glendale Indl. Dev. Auth. (Terraces of Phoenix Proj.) Series 2018 A: | | | |
| 5% 7/1/38 | | 145,000 | 130,003 |
| 5% 7/1/48 | | 190,000 | 159,309 |
| Maricopa County Indl. Dev. Auth. (Creighton Univ. Proj.) Series 2020, 5% 7/1/47 | | 1,890,000 | 2,022,441 |
| Maricopa County Indl. Dev. Auth. Sr. Living Facilities Series 2016: | | | |
| 5.75% 1/1/36 (d) | | 1,735,000 | 1,375,484 |
| 6% 1/1/48 (d) | | 3,290,000 | 2,378,133 |
| Maricopa County Rev.: | | | |
| Series 2017 D, 3% 1/1/48 | | 4,000,000 | 3,150,545 |
| Series 2019 E, 3% 1/1/49 | | 2,375,000 | 1,852,614 |
| Maricopa County Unified School District #48 Scottsdale Series 2017 B: | | | |
| 5% 7/1/31 | | 755,000 | 841,443 |
| 5% 7/1/32 | | 3,070,000 | 3,417,398 |
| Phoenix Civic Impt. Board Arpt. Rev.: | | | |
| Series 2017 B: | | | |
5% 7/1/30 | | 2,475,000 | 2,752,671 |
5% 7/1/34 | | 1,890,000 | 2,087,015 |
5% 7/1/35 | | 1,890,000 | 2,070,326 |
| Series 2019 A, 5% 7/1/44 | | 5,300,000 | 5,743,454 |
| Phoenix Civic Impt. Corp. Series 2019 A: | | | |
| 5% 7/1/30 | | 1,040,000 | 1,182,525 |
| 5% 7/1/32 | | 335,000 | 378,145 |
| 5% 7/1/36 | | 560,000 | 613,565 |
| 5% 7/1/37 | | 490,000 | 533,660 |
| 5% 7/1/38 | | 785,000 | 851,801 |
| 5% 7/1/45 | | 6,800,000 | 7,240,969 |
| Phoenix Civic Impt. Corp. District Rev. (Plaza Expansion Proj.) Series 2005 B, 5.5% 7/1/38 (Nat'l. Pub. Fin. Guarantee Corp. Insured) | | 4,720,000 | 5,962,372 |
| Phoenix IDA Student Hsg. Rev. (Downtown Phoenix Student Hsg. II LLC Arizona State Univ. Proj.) Series 2019 A: | | | |
| 5% 7/1/49 | | 1,060,000 | 1,065,149 |
| 5% 7/1/54 | | 3,335,000 | 3,343,924 |
| Salt Verde Finl. Corp. Sr. Gas Rev. Series 2007, 5.25% 12/1/23 | | 2,360,000 | 2,389,027 |
TOTAL ARIZONA | | | 66,617,854 |
| California - 2.9% | | | |
| California Gen. Oblig. Series 2004: | | | |
| 5.25% 12/1/33 | | 35,000 | 35,078 |
| 5.5% 4/1/30 | | 5,000 | 5,013 |
| California Hsg. Fin. Agcy. Series 2021 1, 3.5% 11/20/35 | | 1,690,335 | 1,637,767 |
| California Muni. Fin. Auth. Student Hsg. (CHF-Davis I, LLC - West Village Student Hsg. Proj.) Series 2018: | | | |
| 5% 5/15/35 | | 2,020,000 | 2,119,045 |
| 5% 5/15/38 | | 2,830,000 | 2,936,216 |
| 5% 5/15/43 | | 3,775,000 | 3,859,959 |
| California Pub. Fin. Auth. Univ. Hsg. Rev.: | | | |
| (Claremont Colleges Proj.) Series 2017 A, 5% 7/1/27 (d) | | 340,000 | 331,875 |
| (NCCD - Claremont Properties LLC - Claremont Colleges Proj.) Series 2017 A, 5% 7/1/47 (d) | | 280,000 | 277,324 |
| California Pub. Works Board Lease Rev. (Various Cap. Projs.) Series 2022 C, 5% 8/1/32 | | 2,190,000 | 2,673,172 |
| California Statewide Cmntys. Dev. Auth. Series 2016: | | | |
| 5% 5/15/25 | | 945,000 | 980,050 |
| 5% 5/15/26 | | 945,000 | 993,692 |
| 5% 5/15/27 | | 945,000 | 993,091 |
| 5% 5/15/28 | | 945,000 | 990,389 |
| 5% 5/15/32 | | 1,180,000 | 1,224,369 |
| 5% 5/15/33 | | 1,415,000 | 1,465,141 |
| 5% 5/15/40 | | 945,000 | 963,843 |
| California Statewide Cmntys. Dev. Auth. Rev. Series 2015, 5% 2/1/45 | | 2,150,000 | 1,799,544 |
| Mount Diablo Unified School District Series 2022 B: | | | |
| 4% 8/1/29 | | 1,800,000 | 1,998,829 |
| 4% 8/1/32 | | 1,100,000 | 1,237,046 |
| 4% 8/1/33 | | 1,425,000 | 1,584,311 |
| Poway Unified School District: | | | |
| (District #2007-1 School Facilities Proj.) Series 2008 A, 0% 8/1/32 | | 1,225,000 | 926,207 |
| Series B: | | | |
0% 8/1/33 | | 4,105,000 | 2,982,881 |
0% 8/1/37 | | 7,555,000 | 4,430,913 |
0% 8/1/38 | | 3,990,000 | 2,227,710 |
0% 8/1/39 | | 6,815,000 | 3,610,493 |
0% 8/1/41 | | 4,625,000 | 2,208,007 |
| Poway Unified School District Pub. Fing. Series 2015 A: | | | |
| 5% 9/1/27 | | 990,000 | 1,042,384 |
| 5% 9/1/30 | | 1,295,000 | 1,350,891 |
| Sacramento City Fing. Auth. Rev. Series A, 0% 12/1/26 (Nat'l. Pub. Fin. Guarantee Corp. Insured) | | 1,510,000 | 1,356,930 |
| San Diego Cmnty. College District Series 2011, 0% 8/1/35 | | 2,830,000 | 1,872,610 |
| San Diego Unified School District: | | | |
| Series 2008 C: | | | |
0% 7/1/34 | | 1,225,000 | 857,875 |
0% 7/1/37 | | 4,820,000 | 2,867,624 |
| Series 2008 E, 0% 7/1/47 (e) | | 2,455,000 | 1,882,338 |
| San Francisco City & County Arpts. Commission Int'l. Arpt. Rev.: | | | |
| Series 2019 B, 5% 5/1/49 | | 2,765,000 | 2,975,970 |
| Series 2022 B, 5% 5/1/52 | | 14,945,000 | 16,489,457 |
| San Marcos Unified School District Series 2010 B, 0% 8/1/47 | | 3,495,000 | 1,287,788 |
| Santa Rosa Wastewtr. Rev. Series 2002 B, 0% 9/1/25 (AMBAC Insured) | | 1,605,000 | 1,511,798 |
| Tobacco Securitization Auth. Southern California Tobacco Settlement Series 2019 A1: | | | |
| 5% 6/1/27 | | 945,000 | 1,018,747 |
| 5% 6/1/28 | | 1,425,000 | 1,558,409 |
| 5% 6/1/29 | | 945,000 | 1,045,443 |
| Univ. of California Revs. Series 2017 AV, 5% 5/15/36 | | 1,520,000 | 1,674,164 |
TOTAL CALIFORNIA | | | 83,284,393 |
| Colorado - 0.8% | | | |
| Arkansas River Pwr. Auth. Rev. Series 2018 A: | | | |
| 5% 10/1/38 | | 1,370,000 | 1,404,769 |
| 5% 10/1/43 | | 5,485,000 | 5,540,245 |
| Colorado Health Facilities Auth. Rev. Bonds: | | | |
| (Parkview Episcopal Med. Ctr., Co. Proj.) Series 2017: | | | |
5% 9/1/23 | | 255,000 | 258,008 |
5% 9/1/24 | | 210,000 | 215,968 |
5% 9/1/25 | | 245,000 | 256,182 |
5% 9/1/28 | | 2,075,000 | 2,236,891 |
| (Parkview Med. Ctr., Inc. Proj.) Series 2016, 5% 9/1/46 | | 3,495,000 | 3,569,641 |
| Series 2019 A, 4% 11/1/39 | | 2,815,000 | 2,820,123 |
| Series 2019 A2: | | | |
3.25% 8/1/49 | | 2,700,000 | 2,048,344 |
4% 8/1/49 | | 4,390,000 | 4,127,843 |
| Series 2020 A, 4% 9/1/50 | | 1,020,000 | 883,557 |
| Colorado Hsg. & Fin. Auth. Series 2019 H, 4.25% 11/1/49 | | 825,000 | 842,088 |
TOTAL COLORADO | | | 24,203,659 |
| Connecticut - 2.5% | | | |
| Connecticut Gen. Oblig.: | | | |
| Series 2018 F, 5% 9/15/27 | | 945,000 | 1,060,291 |
| Series 2020 A: | | | |
4% 1/15/34 | | 6,615,000 | 7,170,916 |
5% 1/15/40 | | 2,610,000 | 2,862,065 |
| Series 2021 A: | | | |
3% 1/15/35 | | 1,000,000 | 977,749 |
3% 1/15/39 | | 960,000 | 866,031 |
3% 1/15/40 | | 1,230,000 | 1,087,129 |
| Series 2021 B, 3% 6/1/40 | | 1,000,000 | 882,583 |
| Series 2022 B, 3% 1/15/40 | | 2,625,000 | 2,320,092 |
| Connecticut Health & Edl. Facilities Auth. Rev.: | | | |
| (Sacred Heart Univ., CT. Proj.) Series 2017 I-1: | | | |
5% 7/1/34 | | 990,000 | 1,069,519 |
5% 7/1/35 | | 1,135,000 | 1,216,399 |
5% 7/1/36 | | 380,000 | 404,219 |
5% 7/1/37 | | 1,470,000 | 1,556,975 |
5% 7/1/42 | | 3,570,000 | 3,728,566 |
| Bonds Series 2020 B, 5%, tender 1/1/27 (b) | | 4,445,000 | 4,792,022 |
| Series 2016 K, 4% 7/1/46 | | 4,215,000 | 3,855,573 |
| Series 2019 A: | | | |
5% 7/1/34 (d) | | 1,325,000 | 1,297,774 |
5% 7/1/49 (d) | | 1,925,000 | 1,689,065 |
| Series 2020 A, 4% 7/1/39 | | 2,830,000 | 2,831,929 |
| Series 2020 C, 4% 7/1/45 | | 3,985,000 | 3,881,873 |
| Series 2020 K: | | | |
5% 7/1/37 | | 945,000 | 1,034,925 |
5% 7/1/38 | | 1,415,000 | 1,543,206 |
5% 7/1/39 | | 1,465,000 | 1,590,608 |
5% 7/1/44 (d) | | 1,295,000 | 1,269,879 |
| Series 2021 S, 4% 6/1/51 | | 1,120,000 | 1,057,623 |
| Series 2022 M: | | | |
4% 7/1/37 | | 3,305,000 | 3,241,148 |
4% 7/1/52 | | 1,680,000 | 1,614,947 |
| Series G, 5% 7/1/50 (d) | | 1,100,000 | 1,060,508 |
| Series K1: | | | |
5% 7/1/31 | | 1,415,000 | 1,466,282 |
5% 7/1/35 | | 1,210,000 | 1,236,267 |
| Series N: | | | |
4% 7/1/39 | | 1,165,000 | 1,040,591 |
4% 7/1/49 | | 1,395,000 | 1,126,298 |
5% 7/1/32 | | 520,000 | 544,874 |
5% 7/1/33 | | 470,000 | 490,388 |
5% 7/1/34 | | 235,000 | 243,581 |
| Connecticut Hsg. Fin. Auth. Series 2019 B1, 4% 5/15/49 | | 1,040,000 | 1,059,476 |
| Connecticut State Revolving Fund Gen. Rev. Series 2017 A, 5% 5/1/35 | | 2,195,000 | 2,414,421 |
| Hbr. Point Infrastructure Impt. District Series 2017: | | | |
| 5% 4/1/30 (d) | | 2,295,000 | 2,334,504 |
| 5% 4/1/39 (d) | | 2,950,000 | 2,950,128 |
| New Haven Gen. Oblig. Series 2016 A, 5% 8/15/25 (Assured Guaranty Muni. Corp. Insured) | | 540,000 | 572,298 |
TOTAL CONNECTICUT | | | 71,442,722 |
| District Of Columbia - 0.9% | | | |
| District of Columbia Gen. Oblig. Series 2017 A, 5% 6/1/33 | | 2,170,000 | 2,415,293 |
| District of Columbia Hosp. Rev. Series 2015: | | | |
| 5% 7/15/29 | | 3,775,000 | 4,014,404 |
| 5% 7/15/30 | | 6,130,000 | 6,502,150 |
| Metropolitan Washington Arpts. Auth. Dulles Toll Road Rev. (Dulles Metrorail and Cap. Impt. Projs.): | | | |
| Series 2019 A: | | | |
5% 10/1/33 | | 1,180,000 | 1,314,077 |
5% 10/1/34 | | 1,890,000 | 2,099,541 |
5% 10/1/36 | | 1,890,000 | 2,061,473 |
| Series 2019 B, 3% 10/1/50 (Assured Guaranty Muni. Corp. Insured) | | 4,210,000 | 3,248,675 |
| Washington D.C. Metropolitan Transit Auth. Rev. Series 2017 B, 5% 7/1/33 | | 4,290,000 | 4,686,613 |
TOTAL DISTRICT OF COLUMBIA | | | 26,342,226 |
| Florida - 6.1% | | | |
| Brevard County Health Facilities Auth. Rev. Series 2023 A, 5% 4/1/32 (f)(g) | | 2,220,000 | 2,502,275 |
| Broward County School Board Ctfs. of Prtn.: | | | |
| (Broward County School District Proj.) Series 2016 A, 5% 7/1/28 | | 1,505,000 | 1,638,957 |
| Series 2016, 5% 7/1/32 | | 965,000 | 1,038,375 |
| Cap. Projs. Fin. Auth. Student Hsg. Rev. (Cap. Projs. Ln. Prog. - Florida Univs.) Series 2020 A, 5% 10/1/29 | | 1,650,000 | 1,707,511 |
| Central Florida Expressway Auth. Sr. Lien Rev. Series 2021: | | | |
| 4% 7/1/34 (Assured Guaranty Muni. Corp. Insured) | | 4,015,000 | 4,338,687 |
| 4% 7/1/35 (Assured Guaranty Muni. Corp. Insured) | | 3,890,000 | 4,167,961 |
| 4% 7/1/37 (Assured Guaranty Muni. Corp. Insured) | | 4,320,000 | 4,505,169 |
| 4% 7/1/38 (Assured Guaranty Muni. Corp. Insured) | | 2,700,000 | 2,803,890 |
| 4% 7/1/39 (Assured Guaranty Muni. Corp. Insured) | | 2,175,000 | 2,240,791 |
| Duval County School Board Ctfs. of Prtn. Series 2015 B, 5% 7/1/29 | | 6,025,000 | 6,370,573 |
| Escambia County Health Facilities Auth. Health Facilities Rev. Series 2020 A, 4% 8/15/45 | | 2,255,000 | 2,142,708 |
| Florida Higher Edl. Facilities Fing. Auth.: | | | |
| (St. Leo Univ. Proj.) Series 2019, 5% 3/1/49 | | 4,530,000 | 4,084,906 |
| Series 2019, 5% 10/1/27 | | 615,000 | 654,720 |
| Florida Hsg. Fin. Corp. Rev. Series 2019 1, 4% 7/1/50 | | 3,140,000 | 3,179,434 |
| Florida Mid-Bay Bridge Auth. Rev.: | | | |
| Series 2015 A, 5% 10/1/35 | | 2,455,000 | 2,532,250 |
| Series 2015 C, 5% 10/1/35 | | 1,890,000 | 1,941,741 |
| Florida Muni. Pwr. Agcy. Rev.: | | | |
| (Pwr. Supply Proj.) Series 2017 A, 5% 10/1/28 | | 380,000 | 430,358 |
| (Requirements Pwr. Supply Proj.) Series 2016 A: | | | |
5% 10/1/30 | | 930,000 | 1,008,495 |
5% 10/1/31 | | 1,015,000 | 1,097,343 |
| Series 2015 B, 5% 10/1/29 | | 1,180,000 | 1,255,737 |
| Gainesville Utils. Sys. Rev. Series 2017 A, 5% 10/1/35 | | 4,720,000 | 5,191,305 |
| Halifax Hosp. Med. Ctr. Rev. Series 2015: | | | |
| 5% 6/1/24 | | 790,000 | 811,034 |
| 5% 6/1/28 (Pre-Refunded to 6/1/25 @ 100) | | 620,000 | 657,975 |
| Hillsborough County School Board Ctfs. of Prtn. Series 2015 A, 5% 7/1/26 | | 7,555,000 | 7,973,778 |
| Jacksonville Health Care Facilities (Baptist Med. Ctr. Proj.) Series 2017: | | | |
| 5% 8/15/26 | | 1,890,000 | 2,053,442 |
| 5% 8/15/34 | | 2,595,000 | 2,836,853 |
| Miami Beach Health Facilities Auth. Hosp. Rev. Series 2014 A, 5% 11/15/39 | | 1,445,000 | 1,467,884 |
| Miami-Dade County Aviation Rev. Series 2020 A: | | | |
| 4% 10/1/35 | | 1,510,000 | 1,566,919 |
| 4% 10/1/41 | | 1,135,000 | 1,132,360 |
| 5% 10/1/31 | | 2,020,000 | 2,342,905 |
| Miami-Dade County Expressway Auth.: | | | |
| Series 2010 A, 5% 7/1/40 | | 3,115,000 | 3,118,804 |
| Series 2014 A: | | | |
5% 7/1/25 | | 1,350,000 | 1,386,600 |
5% 7/1/27 | | 945,000 | 971,017 |
5% 7/1/28 | | 2,100,000 | 2,157,521 |
5% 7/1/29 | | 955,000 | 981,025 |
5% 7/1/44 | | 15,860,000 | 16,109,259 |
| Series 2014 B, 5% 7/1/30 | | 2,360,000 | 2,423,982 |
| Miami-Dade County Gen. Oblig. Series 2020, 2.25% 7/1/38 | | 1,000,000 | 792,420 |
| Miami-Dade County School Board Ctfs. of Prtn.: | | | |
| Series 2015 A, 5% 5/1/29 | | 11,680,000 | 12,294,076 |
| Series 2016 A, 5% 5/1/32 | | 9,440,000 | 10,044,355 |
| Series 2016 B, 5% 8/1/26 | | 4,255,000 | 4,616,038 |
| Palm Beach County School Board Ctfs. of Prtn.: | | | |
| Series 2015 D, 5% 8/1/28 | | 1,870,000 | 1,981,836 |
| Series 2018 A, 5% 8/1/24 | | 720,000 | 746,528 |
| Pinellas County Idr (Drs. Kiran & Pallavi Patel 2017 Foundation for Global Understanding, Inc. Proj.) Series 2019: | | | |
| 5% 7/1/29 | | 200,000 | 204,158 |
| 5% 7/1/39 | | 400,000 | 398,471 |
| Saint Lucie County School Board Ctfs. of Prtn. Series 2013 A, 5% 7/1/26 | | 2,375,000 | 2,397,473 |
| South Florida Wtr. Mgmt. District Ctfs. of Prtn. Series 2015: | | | |
| 5% 10/1/27 | | 470,000 | 509,706 |
| 5% 10/1/28 | | 3,775,000 | 4,093,912 |
| 5% 10/1/30 | | 1,890,000 | 2,045,449 |
| 5% 10/1/32 | | 3,125,000 | 3,363,184 |
| South Miami Health Facilities Auth. Hosp. Rev. (Baptist Med. Ctr., FL. Proj.) Series 2017: | | | |
| 5% 8/15/29 | | 1,395,000 | 1,532,334 |
| 5% 8/15/32 | | 3,700,000 | 4,030,064 |
| 5% 8/15/35 | | 665,000 | 712,436 |
| 5% 8/15/37 | | 4,720,000 | 4,990,698 |
| 5% 8/15/42 | | 3,210,000 | 3,321,152 |
| 5% 8/15/47 | | 4,910,000 | 5,051,023 |
| Tallahassee Health Facilities Rev.: | | | |
| (Tallahassee Memorial Healthcare, Inc. Proj.) Series 2016 A: | | | |
5% 12/1/29 | | 1,345,000 | 1,405,648 |
5% 12/1/36 | | 1,040,000 | 1,066,445 |
| Series 2015 A, 5% 12/1/40 | | 945,000 | 960,161 |
| Volusia County Edl. Facilities Auth. Rev. (Embry-Riddle Aeronautical Univ., Inc. Proj.) Series 2020 A: | | | |
| 5% 10/15/44 | | 720,000 | 765,395 |
| 5% 10/15/49 | | 1,340,000 | 1,416,958 |
| Volusia County School Board Ctfs. of Prtn. (Florida Master Lease Prog.) Series 2016 A: | | | |
| 5% 8/1/30 (Build America Mutual Assurance Insured) | | 1,095,000 | 1,173,505 |
| 5% 8/1/31 (Build America Mutual Assurance Insured) | | 2,090,000 | 2,236,717 |
TOTAL FLORIDA | | | 174,974,686 |
| Georgia - 3.9% | | | |
| Brookhaven Dev. Auth. Rev. Series 2019 A, 5% 7/1/36 | | 1,435,000 | 1,604,760 |
| Burke County Indl. Dev. Auth. Poll. Cont. Rev.: | | | |
| (Georgia Transmission Corp. Proj.) Series 2012, 2.75% 1/1/52 (b) | | 2,900,000 | 2,031,350 |
| Bonds (Georgia Pwr. Co. Plant Vogtle Proj.) Series 2013 1st, 2.925%, tender 3/12/24 (b) | | 9,065,000 | 8,990,963 |
| Coweta County Dev. Auth. Rev. (Piedmont Healthcare, Inc. Proj.) Series 2019 A, 5% 7/1/44 | | 6,080,000 | 6,399,590 |
| DeKalb Private Hosp. Auth. Rev. Series 2019 B, 5% 7/1/35 | | 1,285,000 | 1,451,309 |
| Fulton County Dev. Auth. Rev.: | | | |
| Series 2019 C, 5% 7/1/38 | | 1,160,000 | 1,279,018 |
| Series 2019, 4% 6/15/49 | | 1,115,000 | 1,104,225 |
| Gainesville & Hall County Hosp. Auth. Rev. Series 2020 A, 3% 2/15/47 | | 9,015,000 | 7,107,647 |
| Georgia Muni. Elec. Auth. Pwr. Rev. Series 2019 A: | | | |
| 4% 1/1/49 | | 5,760,000 | 5,479,961 |
| 5% 1/1/30 | | 390,000 | 436,278 |
| 5% 1/1/32 | | 885,000 | 986,136 |
| 5% 1/1/34 | | 1,815,000 | 2,007,263 |
| 5% 1/1/35 | | 875,000 | 958,804 |
| 5% 1/1/36 | | 1,075,000 | 1,161,671 |
| 5% 1/1/37 | | 1,055,000 | 1,131,522 |
| 5% 1/1/38 | | 1,085,000 | 1,156,520 |
| 5% 1/1/44 | | 2,825,000 | 2,937,626 |
| Hosp. Auth. of Savannah Auth. Rev. Series 2019 A: | | | |
| 4% 7/1/35 | | 4,620,000 | 4,726,922 |
| 4% 7/1/39 | | 2,360,000 | 2,370,797 |
| 4% 7/1/43 | | 2,470,000 | 2,428,106 |
| Main Street Natural Gas, Inc. Bonds: | | | |
| Series 2019 B, 4%, tender 12/2/24 (b) | | 5,705,000 | 5,742,513 |
| Series 2021 A, 4%, tender 9/1/27 (b) | | 21,715,000 | 22,132,371 |
| Series 2021 C, 4%, tender 12/1/28 (b) | | 20,380,000 | 20,419,937 |
| Private Colleges & Univs. Auth. Rev.: | | | |
| (The Savannah College of Art & Design Projs.) Series 2021: | | | |
4% 4/1/38 | | 500,000 | 505,667 |
4% 4/1/40 | | 1,320,000 | 1,325,718 |
5% 4/1/36 | | 1,060,000 | 1,175,311 |
| Series 2020 B: | | | |
5% 9/1/31 | | 1,060,000 | 1,263,189 |
5% 9/1/33 | | 2,360,000 | 2,790,096 |
TOTAL GEORGIA | | | 111,105,270 |
| Hawaii - 0.1% | | | |
| Hawaii Gen. Oblig. Series 2020 C: | | | |
| 4% 7/1/37 | | 1,040,000 | 1,079,917 |
| 4% 7/1/38 | | 1,180,000 | 1,218,326 |
TOTAL HAWAII | | | 2,298,243 |
| Idaho - 0.2% | | | |
| Idaho Health Facilities Auth. Rev. Series 2015 ID: | | | |
| 5% 12/1/24 | | 470,000 | 491,309 |
| 5.5% 12/1/27 | | 3,070,000 | 3,293,432 |
| Idaho Hsg. & Fin. Assoc. Single Family Mtg.: | | | |
| (Idaho St Garvee Proj.) Series 2017 A: | | | |
5% 7/15/24 | | 665,000 | 689,615 |
5% 7/15/25 | | 665,000 | 706,764 |
5% 7/15/26 | | 470,000 | 511,817 |
| Series 2019 A, 4% 1/1/50 | | 375,000 | 380,319 |
TOTAL IDAHO | | | 6,073,256 |
| Illinois - 14.9% | | | |
| Chicago Board of Ed.: | | | |
| Series 2012 A, 5% 12/1/42 | | 2,660,000 | 2,654,508 |
| Series 2015 C, 5.25% 12/1/39 | | 755,000 | 758,600 |
| Series 2016 B, 6.5% 12/1/46 | | 400,000 | 425,784 |
| Series 2017 A, 7% 12/1/46 (d) | | 1,400,000 | 1,534,967 |
| Series 2017 C: | | | |
5% 12/1/24 | | 1,735,000 | 1,773,861 |
5% 12/1/25 | | 2,670,000 | 2,754,355 |
5% 12/1/26 | | 500,000 | 519,910 |
| Series 2017 D: | | | |
5% 12/1/24 | | 1,705,000 | 1,743,189 |
5% 12/1/31 | | 1,845,000 | 1,914,094 |
| Series 2017 H, 5% 12/1/36 | | 440,000 | 448,786 |
| Series 2018 A: | | | |
5% 12/1/24 | | 1,590,000 | 1,625,613 |
5% 12/1/29 | | 4,195,000 | 4,392,220 |
5% 12/1/31 | | 850,000 | 888,865 |
| Series 2018 C, 5% 12/1/46 | | 8,210,000 | 8,178,163 |
| Series 2019 A: | | | |
5% 12/1/25 | | 2,360,000 | 2,434,561 |
5% 12/1/26 | | 1,985,000 | 2,064,042 |
5% 12/1/29 | | 2,920,000 | 3,101,831 |
5% 12/1/30 | | 3,820,000 | 4,022,092 |
5% 12/1/32 | | 1,700,000 | 1,784,142 |
| Chicago Gen. Oblig.: | | | |
| Series 2020 A: | | | |
5% 1/1/26 | | 1,565,000 | 1,620,193 |
5% 1/1/27 | | 7,225,000 | 7,555,409 |
5% 1/1/29 | | 3,645,000 | 3,879,396 |
5% 1/1/30 | | 7,320,000 | 7,856,884 |
| Series 2021 A, 5% 1/1/32 | | 4,405,000 | 4,741,931 |
| Chicago Midway Arpt. Rev. Series 2016 B: | | | |
| 4% 1/1/35 | | 770,000 | 779,098 |
| 5% 1/1/36 | | 4,250,000 | 4,427,501 |
| 5% 1/1/37 | | 5,005,000 | 5,200,456 |
| Chicago O'Hare Int'l. Arpt. Rev.: | | | |
| Series 2016 B, 5% 1/1/34 | | 2,675,000 | 2,843,949 |
| Series 2016 C: | | | |
5% 1/1/32 | | 4,485,000 | 4,780,687 |
5% 1/1/33 | | 1,230,000 | 1,309,714 |
5% 1/1/34 | | 1,425,000 | 1,515,001 |
| Series 2017 B: | | | |
5% 1/1/34 | | 1,430,000 | 1,549,715 |
5% 1/1/35 | | 2,400,000 | 2,588,977 |
5% 1/1/36 | | 1,560,000 | 1,669,647 |
5% 1/1/37 | | 6,045,000 | 6,436,251 |
5% 1/1/38 | | 2,125,000 | 2,252,846 |
| Series 2018 B: | | | |
4% 1/1/44 | | 2,510,000 | 2,488,753 |
5% 1/1/48 | | 1,055,000 | 1,112,997 |
5% 1/1/53 | | 1,060,000 | 1,113,628 |
| Series 2020 A, 4% 1/1/37 | | 6,305,000 | 6,467,443 |
| Chicago Transit Auth. Series 2017, 5% 12/1/46 | | 1,795,000 | 1,851,095 |
| Chicago Transit Auth. Cap. Grant Receipts Rev. Series 2017: | | | |
| 5% 6/1/23 | | 830,000 | 835,950 |
| 5% 6/1/25 | | 705,000 | 737,213 |
| 5% 6/1/26 | | 1,505,000 | 1,606,255 |
| Chicago Wtr. Rev. Series 2017, 5.25% 11/1/33 (Assured Guaranty Muni. Corp. Insured) | | 420,000 | 424,332 |
| Cook County Ccsd 034 Glenview Series 2021 A, 2% 12/1/37 | | 2,010,000 | 1,544,215 |
| Cook County Gen. Oblig. Series 2016 A, 5% 11/15/29 | | 5,770,000 | 6,251,244 |
| Grundy & Will Counties Cmnty. School Gen. Oblig. Series 2018, 5% 2/1/29 | | 635,000 | 700,385 |
| Illinois Fin. Auth.: | | | |
| Series 2020 A: | | | |
3% 5/15/50 | | 7,190,000 | 5,229,401 |
3% 5/15/50 (Build America Mutual Assurance Insured) | | 3,390,000 | 2,567,943 |
3.25% 8/15/49 | | 1,340,000 | 1,085,222 |
| Series 2020, 5% 7/1/36 | | 4,150,000 | 4,777,789 |
| Illinois Fin. Auth. Academic Facilities (Provident Group UIUC Properties LLC Univ. of Illinois at Urbana-Champaign Proj.) Series 2019 A: | | | |
| 5% 10/1/31 | | 190,000 | 214,278 |
| 5% 10/1/32 | | 275,000 | 307,942 |
| 5% 10/1/33 | | 470,000 | 521,434 |
| 5% 10/1/35 | | 285,000 | 310,452 |
| 5% 10/1/36 | | 285,000 | 307,506 |
| 5% 10/1/37 | | 330,000 | 354,200 |
| 5% 10/1/38 | | 355,000 | 379,716 |
| 5% 10/1/39 | | 610,000 | 649,817 |
| Illinois Fin. Auth. Rev.: | | | |
| (Bradley Univ. Proj.) Series 2017 C, 5% 8/1/31 | | 2,230,000 | 2,352,426 |
| (Depaul Univ. Proj.) Series 2016 A: | | | |
4% 10/1/31 | | 1,395,000 | 1,431,866 |
5% 10/1/33 | | 1,415,000 | 1,511,181 |
| (Northwestern Memorial Hosp.,IL. Proj.) Series 2017 A: | | | |
5% 7/15/25 | | 750,000 | 794,707 |
5% 7/15/27 | | 1,225,000 | 1,356,603 |
5% 7/15/30 | | 1,405,000 | 1,573,815 |
| (OSF Healthcare Sys.) Series 2018 A: | | | |
4.125% 5/15/47 | | 10,465,000 | 10,058,897 |
5% 5/15/43 | | 9,440,000 | 9,733,975 |
| (Presence Health Proj.) Series 2016 C: | | | |
5% 2/15/29 | | 3,260,000 | 3,570,951 |
5% 2/15/36 | | 2,255,000 | 2,380,616 |
| (Rosalind Franklin Univ. Research Bldg. Proj.) Series 2017 C, 5% 8/1/49 | | 465,000 | 468,287 |
| (Rush Univ. Med. Ctr. Proj.) Series 2015 A, 5% 11/15/34 | | 1,135,000 | 1,173,508 |
| Series 2015 A, 5% 11/15/31 | | 3,305,000 | 3,465,714 |
| Series 2015 C: | | | |
5% 8/15/35 | | 3,155,000 | 3,248,451 |
5% 8/15/44 | | 15,205,000 | 15,269,215 |
| Series 2016 A: | | | |
5% 7/1/33 (Pre-Refunded to 7/1/26 @ 100) | | 1,745,000 | 1,902,120 |
5% 7/1/34 (Pre-Refunded to 7/1/26 @ 100) | | 945,000 | 1,030,088 |
5% 7/1/36 (Pre-Refunded to 7/1/26 @ 100) | | 1,445,000 | 1,575,108 |
5.25% 8/15/29 (Pre-Refunded to 8/15/26 @ 100) | | 960,000 | 1,055,871 |
| Series 2016 B: | | | |
5% 8/15/30 | | 2,830,000 | 3,071,449 |
5% 8/15/33 | | 4,330,000 | 4,647,037 |
5% 8/15/34 | | 2,280,000 | 2,439,768 |
| Series 2016 C: | | | |
3.75% 2/15/34 | | 685,000 | 700,178 |
4% 2/15/36 | | 2,915,000 | 2,975,180 |
4% 2/15/41 | | 8,645,000 | 8,655,271 |
4% 2/15/41 (Pre-Refunded to 2/15/27 @ 100) | | 395,000 | 419,413 |
5% 2/15/31 | | 1,965,000 | 2,145,768 |
| Series 2016: | | | |
4% 2/15/41 (Pre-Refunded to 2/15/27 @ 100) | | 20,000 | 21,236 |
5% 12/1/29 | | 970,000 | 1,027,658 |
5% 12/1/46 | | 2,510,000 | 2,539,874 |
| Series 2017 A, 5% 8/1/47 | | 405,000 | 408,307 |
| Series 2017: | | | |
5% 7/1/33 | | 3,175,000 | 3,469,098 |
5% 7/1/34 | | 2,610,000 | 2,837,463 |
5% 7/1/35 | | 530,000 | 575,544 |
| Series 2019: | | | |
4% 9/1/37 | | 380,000 | 332,713 |
4% 9/1/39 | | 945,000 | 813,537 |
5% 9/1/30 | | 180,000 | 185,671 |
5% 9/1/38 | | 850,000 | 835,848 |
| Illinois Gen. Oblig.: | | | |
| Series 2006, 5.5% 1/1/31 | | 1,835,000 | 2,082,394 |
| Series 2013 A, 5% 4/1/35 | | 850,000 | 851,482 |
| Series 2013, 5.5% 7/1/38 | | 1,890,000 | 1,901,737 |
| Series 2014: | | | |
5% 2/1/25 | | 2,120,000 | 2,164,271 |
5% 2/1/27 | | 1,155,000 | 1,175,973 |
5% 4/1/28 | | 550,000 | 560,766 |
5% 5/1/28 | | 3,140,000 | 3,205,409 |
5% 5/1/32 | | 1,320,000 | 1,341,940 |
5% 5/1/33 | | 1,510,000 | 1,533,872 |
5.25% 2/1/29 | | 2,830,000 | 2,882,003 |
5.25% 2/1/30 | | 2,550,000 | 2,594,393 |
5.25% 2/1/31 | | 1,230,000 | 1,250,449 |
| Series 2016: | | | |
5% 2/1/26 | | 945,000 | 998,049 |
5% 6/1/26 | | 575,000 | 609,985 |
5% 2/1/27 | | 3,535,000 | 3,780,719 |
5% 2/1/28 | | 3,300,000 | 3,514,853 |
5% 2/1/29 | | 3,100,000 | 3,288,598 |
| Series 2017 A, 5% 12/1/26 | | 3,165,000 | 3,378,382 |
| Series 2018 A: | | | |
5% 10/1/26 | | 1,415,000 | 1,507,399 |
5% 10/1/28 | | 3,305,000 | 3,588,718 |
| Series 2020 B, 4% 10/1/32 | | 5,055,000 | 5,173,234 |
| Series 2021 A: | | | |
5% 3/1/32 | | 100,000 | 109,666 |
5% 3/1/35 | | 710,000 | 765,973 |
5% 3/1/36 | | 565,000 | 604,869 |
5% 3/1/37 | | 710,000 | 754,137 |
5% 3/1/46 | | 2,830,000 | 2,909,418 |
| Series 2021 B, 4% 12/1/34 | | 3,355,000 | 3,382,723 |
| Series 2022 A: | | | |
5% 3/1/32 | | 1,755,000 | 1,942,421 |
5% 3/1/36 | | 7,365,000 | 7,938,310 |
5.25% 3/1/37 | | 1,605,000 | 1,748,466 |
| Series 2022 B: | | | |
5% 3/1/29 | | 3,495,000 | 3,805,363 |
5% 3/1/32 | | 1,550,000 | 1,715,503 |
| Illinois Hsg. Dev. Auth. Series 2021, 3% 4/1/51 | | 6,620,000 | 6,516,713 |
| Illinois Hsg. Dev. Auth. Multi-family Hsg. Rev. Series 2019, 2.9% 7/1/35 | | 4,527,862 | 4,203,383 |
| Illinois Muni. Elec. Agcy. Pwr. Supply Series 2015 A, 5% 2/1/31 | | 1,785,000 | 1,878,898 |
| Illinois Toll Hwy. Auth. Toll Hwy. Rev.: | | | |
| Series 2016 A, 5% 12/1/31 | | 890,000 | 951,824 |
| Series 2019 A, 5% 1/1/44 | | 1,060,000 | 1,145,532 |
| Kane, McHenry, Cook & DeKalb Counties Unit School District #300: | | | |
| Series 2015 5% 1/1/28 | | 2,625,000 | 2,707,856 |
| Series 2017, 5% 1/1/29 | | 970,000 | 1,067,786 |
| Kendall, Kane & Will Counties Cmnty. Unit School District #308 Series 2016, 5% 2/1/33 | | 10,270,000 | 10,966,431 |
| Lake County Cmnty. Consolidated School District #73 Gen. Oblig. Series 2021, 2.25% 1/1/40 | | 1,245,000 | 958,917 |
| McHenry County Cmnty. School District #200 Series 2006 B: | | | |
| 0% 1/15/24 | | 2,165,000 | 2,101,653 |
| 0% 1/15/25 | | 4,190,000 | 3,942,679 |
| 0% 1/15/26 | | 3,150,000 | 2,883,402 |
| Metropolitan Pier & Exposition: | | | |
| (McCormick Place Expansion Proj.): | | | |
Series 2010 B1: | | | |
0% 6/15/43 (Assured Guaranty Muni. Corp. Insured) | | 30,875,000 | 12,315,195 |
0% 6/15/45 (Assured Guaranty Muni. Corp. Insured) | | 11,465,000 | 4,110,250 |
0% 6/15/47 (Assured Guaranty Muni. Corp. Insured) | | 10,015,000 | 3,231,473 |
Series 2012 B, 0% 12/15/51 | | 5,570,000 | 1,246,535 |
| Series 2002 A, 0% 6/15/35 (Nat'l. Pub. Fin. Guarantee Corp. Insured) | | 1,310,000 | 782,918 |
| Series 2002, 0% 12/15/36 (Nat'l. Pub. Fin. Guarantee Corp. Insured) | | 12,285,000 | 6,725,114 |
| Series 2017 B: | | | |
5% 12/15/28 | | 1,890,000 | 1,985,426 |
5% 12/15/32 | | 850,000 | 890,173 |
| Series 2020 A, 5% 6/15/50 | | 21,945,000 | 22,274,129 |
| Series 2022 A, 4% 12/15/42 | | 5,405,000 | 5,055,506 |
| Univ. of Illinois Rev.: | | | |
| Series 2013: | | | |
6% 10/1/42 | | 1,825,000 | 1,861,191 |
6.25% 10/1/38 | | 1,795,000 | 1,834,812 |
| Series 2018 A, 5% 4/1/29 | | 3,720,000 | 4,150,043 |
| Will County Cmnty. Unit School District #365-U Series 2007 B, 0% 11/1/26 (Assured Guaranty Muni. Corp. Insured) | | 3,000,000 | 2,686,337 |
TOTAL ILLINOIS | | | 429,456,511 |
| Indiana - 1.4% | | | |
| Beech Grove School Bldg. Corp. Series 1996, 5.625% 7/5/24 (Escrowed to Maturity) | | 475,000 | 486,427 |
| Indiana Fin. Auth. Hosp. Rev. (Parkview Health Sys. Proj.) Series 2017 A: | | | |
| 5% 11/1/28 | | 425,000 | 482,808 |
| 5% 11/1/29 | | 1,320,000 | 1,526,823 |
| 5% 11/1/30 | | 295,000 | 347,260 |
| Indiana Fin. Auth. Rev.: | | | |
| (Butler Univ. Proj.) Series 2019, 4% 2/1/44 | | 2,450,000 | 2,405,484 |
| Series 2015 A, 5.25% 2/1/32 | | 2,775,000 | 2,933,467 |
| Series 2015, 5% 3/1/36 | | 4,250,000 | 4,392,194 |
| Series 2016: | | | |
5% 9/1/27 | | 1,745,000 | 1,892,405 |
5% 9/1/31 | | 1,735,000 | 1,860,681 |
| Indiana Hsg. & Cmnty. Dev. Auth.: | | | |
| (Glasswater Creek of Whitestown Proj.) Series 2020, 5.375% 10/1/40 (d) | | 1,660,000 | 1,385,828 |
| Series 2021 B, 3% 7/1/50 | | 1,085,000 | 1,068,885 |
| Indiana Muni. Pwr. Agcy. Pwr. Supply Sys. Rev. Series 2017 A: | | | |
| 5% 1/1/32 | | 3,775,000 | 4,239,635 |
| 5% 1/1/34 | | 1,890,000 | 2,113,708 |
| Indianapolis Local Pub. Impt. (Courthouse and Jail Proj.) Series 2019 A, 5% 2/1/49 | | 3,090,000 | 3,303,730 |
| Indianapolis Wtr. Sys. Rev. Series 2018 A, 5% 10/1/32 | | 2,830,000 | 3,188,251 |
| Saint Joseph County Econ. Dev. Auth. Rev. (St. Mary's College Proj.): | | | |
| Series 2019: | | | |
4% 4/1/39 | | 945,000 | 940,709 |
4% 4/1/46 | | 2,115,000 | 2,047,055 |
5% 4/1/40 | | 2,115,000 | 2,251,945 |
| Series 2020: | | | |
4% 4/1/37 | | 1,565,000 | 1,571,880 |
5% 4/1/29 | | 970,000 | 1,084,595 |
TOTAL INDIANA | | | 39,523,770 |
| Iowa - 0.3% | | | |
| Iowa Fin. Auth. Rev.: | | | |
| Series 2018 B, 5% 2/15/48 | | 2,360,000 | 2,463,805 |
| Series A: | | | |
5% 5/15/43 | | 775,000 | 684,696 |
5% 5/15/48 | | 1,355,000 | 1,157,814 |
| Tobacco Settlement Auth. Tobacco Settlement Rev.: | | | |
| Series 2021 A2, 4% 6/1/49 | | 2,645,000 | 2,411,572 |
| Series 2021 B1, 4% 6/1/49 | | 3,215,000 | 3,214,858 |
TOTAL IOWA | | | 9,932,745 |
| Kentucky - 3.3% | | | |
| Ashland Med. Ctr. Rev.: | | | |
| (Ashland Hosp. Corp. d/b/a King's Daughters Med. Ctr. Proj.) Series 2016 A, 5% 2/1/40 | | 1,135,000 | 1,157,860 |
| Series 2019: | | | |
3% 2/1/40 (Assured Guaranty Muni. Corp. Insured) | | 1,665,000 | 1,396,774 |
5% 2/1/28 | | 45,000 | 48,795 |
5% 2/1/32 | | 60,000 | 65,365 |
| Boyle County Edl. Facilities Rev. Series 2017, 5% 6/1/37 | | 1,585,000 | 1,671,591 |
| Kenton County Arpt. Board Arpt. Rev.: | | | |
| Series 2016: | | | |
5% 1/1/24 | | 755,000 | 772,189 |
5% 1/1/27 | | 1,415,000 | 1,523,881 |
5% 1/1/33 | | 1,225,000 | 1,309,721 |
| Series 2019, 5% 1/1/44 | | 2,120,000 | 2,279,077 |
| Kentucky Econ. Dev. Fin. Auth.: | | | |
| Series 2019 A1: | | | |
5% 8/1/33 | | 945,000 | 1,037,959 |
5% 8/1/44 | | 945,000 | 983,768 |
| Series 2019 A2, 5% 8/1/49 | | 2,360,000 | 2,430,765 |
| Kentucky Econ. Dev. Fin. Auth. Hosp. Rev.: | | | |
| Series 2015 A: | | | |
5% 6/1/25 | | 45,000 | 47,025 |
5% 6/1/26 | | 50,000 | 52,237 |
5% 6/1/27 | | 50,000 | 52,140 |
5% 6/1/28 | | 55,000 | 57,236 |
5% 6/1/29 | | 60,000 | 62,355 |
5% 6/1/30 | | 60,000 | 62,335 |
| Series 2017 B: | | | |
5% 8/15/32 | | 2,530,000 | 2,725,553 |
5% 8/15/33 | | 1,250,000 | 1,343,874 |
5% 8/15/35 | | 1,415,000 | 1,505,502 |
| Kentucky State Property & Buildings Commission Rev.: | | | |
| (Proj. No. 119) Series 2018: | | | |
5% 5/1/29 | | 1,760,000 | 1,970,954 |
5% 5/1/30 | | 1,180,000 | 1,320,452 |
5% 5/1/31 | | 505,000 | 567,782 |
5% 5/1/32 | | 265,000 | 296,194 |
5% 5/1/33 | | 595,000 | 664,582 |
5% 5/1/34 | | 680,000 | 754,663 |
5% 5/1/35 | | 400,000 | 438,894 |
5% 5/1/36 | | 340,000 | 369,571 |
| Series A: | | | |
4% 11/1/38 | | 600,000 | 608,427 |
5% 11/1/29 | | 3,625,000 | 4,095,920 |
5% 11/1/30 | | 2,030,000 | 2,292,767 |
| Kentucky, Inc. Pub. Energy Bonds Series A, 4%, tender 6/1/26 (b) | | 29,720,000 | 29,775,559 |
| Louisville & Jefferson County: | | | |
| Bonds: | | | |
Series 2020 C, 5%, tender 10/1/26 (b) | | 1,360,000 | 1,448,286 |
Series 2020 D, 5%, tender 10/1/29 (b) | | 1,635,000 | 1,820,372 |
| Series 2013 A, 5.5% 10/1/33 | | 1,205,000 | 1,225,629 |
| Series 2016 A: | | | |
5% 10/1/31 | | 6,045,000 | 6,446,490 |
5% 10/1/32 | | 7,310,000 | 7,778,776 |
5% 10/1/33 | | 4,155,000 | 4,409,253 |
| Series 2020 A: | | | |
3% 10/1/43 | | 5,505,000 | 4,531,526 |
4% 10/1/40 | | 1,090,000 | 1,059,398 |
5% 10/1/37 | | 2,715,000 | 2,876,311 |
TOTAL KENTUCKY | | | 95,337,808 |
| Louisiana - 0.2% | | | |
| Louisiana Pub. Facilities Auth. Hosp. Rev. (Franciscan Missionaries of Our Lady Health Sys. Proj.) Series 2017 A, 5% 7/1/47 | | 1,605,000 | 1,642,807 |
| Louisiana Pub. Facilities Auth. Rev. (Tulane Univ. of Louisiana Proj.) Series 2016 A: | | | |
| 5% 12/15/25 | | 420,000 | 451,454 |
| 5% 12/15/27 | | 1,890,000 | 2,071,674 |
| 5% 12/15/29 | | 1,135,000 | 1,234,321 |
TOTAL LOUISIANA | | | 5,400,256 |
| Maine - 1.0% | | | |
| Maine Health & Higher Edl. Facilities Auth. Rev.: | | | |
| Series 2016 A: | | | |
4% 7/1/41 | | 1,120,000 | 1,055,598 |
4% 7/1/46 | | 1,665,000 | 1,516,364 |
5% 7/1/41 | | 455,000 | 456,430 |
5% 7/1/46 | | 310,000 | 293,683 |
| Series 2018 A: | | | |
5% 7/1/30 | | 1,120,000 | 1,227,547 |
5% 7/1/31 | | 1,040,000 | 1,136,518 |
5% 7/1/34 | | 1,890,000 | 2,035,331 |
5% 7/1/35 | | 2,590,000 | 2,769,163 |
5% 7/1/36 | | 3,070,000 | 3,260,855 |
5% 7/1/37 | | 2,830,000 | 2,994,744 |
5% 7/1/38 | | 2,150,000 | 2,271,189 |
5% 7/1/43 | | 4,250,000 | 4,426,859 |
| Maine Tpk. Auth. Tpk. Rev. Series 2018: | | | |
| 5% 7/1/33 | | 660,000 | 744,822 |
| 5% 7/1/34 | | 945,000 | 1,061,826 |
| 5% 7/1/35 | | 1,040,000 | 1,160,131 |
| 5% 7/1/36 | | 1,890,000 | 2,089,399 |
TOTAL MAINE | | | 28,500,459 |
| Maryland - 1.0% | | | |
| Baltimore Gen. Oblig. Series 2022 A, 5% 10/15/37 | | 735,000 | 865,513 |
| City of Westminster Series 2016, 5% 11/1/31 | | 1,865,000 | 1,984,591 |
| Maryland Cmnty. Dev. Admin Dept. Hsg. & Cmnty. Dev.: | | | |
| Series 2019 B, 4% 9/1/49 | | 1,590,000 | 1,608,103 |
| Series 2019 C, 3.5% 3/1/50 | | 1,755,000 | 1,754,778 |
| Maryland Dept. of Trans. Series 2022 B, 5% 12/1/23 | | 995,000 | 1,016,732 |
| Maryland Health & Higher Edl. Series 2021 A, 3% 7/1/51 | | 4,320,000 | 3,251,369 |
| Maryland Health & Higher Edl. Facilities Auth. Rev.: | | | |
| Series 2015, 5% 7/1/40 | | 1,890,000 | 1,921,830 |
| Series 2016 A: | | | |
4% 7/1/42 | | 735,000 | 682,214 |
5% 7/1/35 | | 1,940,000 | 2,018,714 |
5% 7/1/38 | | 1,060,000 | 1,088,491 |
| Maryland Stadium Auth. Built to Learn Rev.: | | | |
| Series 2021, 4% 6/1/46 | | 850,000 | 842,528 |
| Series 2022 A: | | | |
4% 6/1/37 | | 2,240,000 | 2,327,648 |
4% 6/1/38 | | 2,455,000 | 2,542,717 |
| Washington Metropolitan Area Transit Auth. Series 2020 A, 5% 7/15/38 | | 7,100,000 | 7,973,181 |
TOTAL MARYLAND | | | 29,878,409 |
| Massachusetts - 2.1% | | | |
| Massachusetts Dev. Fin. Agcy. Rev.: | | | |
| (Lesley Univ. Proj.) Series 2016, 5% 7/1/39 | | 960,000 | 974,142 |
| (Univ. of Massachusetts Health Cr., Inc. Proj.) Series 2017 L, 4% 7/1/44 | | 9,440,000 | 8,969,458 |
| (Wentworth Institute of Technology Proj.) Series 2017: | | | |
5% 10/1/30 | | 1,100,000 | 1,166,239 |
5% 10/1/33 | | 1,280,000 | 1,346,105 |
| Series 2015 D, 5% 7/1/44 | | 2,430,000 | 2,467,946 |
| Series 2016 A, 5% 1/1/47 | | 6,610,000 | 6,713,878 |
| Series 2019, 5% 9/1/59 | | 11,260,000 | 11,786,483 |
| Series 2020 A, 4% 7/1/45 | | 9,790,000 | 9,026,636 |
| Series J2, 5% 7/1/53 | | 2,360,000 | 2,402,506 |
| Series M: | | | |
4% 10/1/50 | | 9,975,000 | 8,888,246 |
5% 10/1/45 | | 7,515,000 | 7,805,815 |
TOTAL MASSACHUSETTS | | | 61,547,454 |
| Michigan - 2.0% | | | |
| Detroit Downtown Dev. Auth. Tax Series A, 5% 7/1/37 (Assured Guaranty Muni. Corp. Insured) | | 975,000 | 993,152 |
| Detroit Gen. Oblig. Series 2021 A, 5% 4/1/46 | | 1,840,000 | 1,822,844 |
| Grand Traverse County Hosp. Fin. Auth. Series 2021, 3% 7/1/51 | | 1,860,000 | 1,407,985 |
| Great Lakes Wtr. Auth. Sew Disp. Sys. Series 2018 A: | | | |
| 5% 7/1/43 | | 1,415,000 | 1,512,081 |
| 5% 7/1/48 | | 6,135,000 | 6,449,703 |
| Jackson County Series 2019: | | | |
| 4% 5/1/32 (Build America Mutual Assurance Insured) | | 2,050,000 | 2,224,848 |
| 4% 5/1/33 (Build America Mutual Assurance Insured) | | 2,110,000 | 2,276,353 |
| Kalamazoo Hosp. Fin. Auth. Hosp. Facilities Rev. Series 2016: | | | |
| 5% 5/15/28 | | 1,365,000 | 1,453,531 |
| 5% 5/15/28 (Pre-Refunded to 5/15/26 @ 100) | | 10,000 | 10,834 |
| Michigan Fin. Auth. Rev.: | | | |
| (Charter County of Wayne Criminal Justice Ctr. Proj.) Series 2018, 5% 11/1/43 | | 1,740,000 | 1,859,440 |
| Series 2016, 5% 11/15/32 | | 4,545,000 | 4,871,634 |
| Series 2019 A: | | | |
3% 12/1/49 | | 2,645,000 | 2,057,521 |
5% 11/15/48 | | 1,555,000 | 1,610,900 |
| Series 2020 A, 4% 6/1/49 | | 2,070,000 | 1,869,706 |
| Michigan Hosp. Fin. Auth. Rev. Series 2008 C: | | | |
| 5% 12/1/32 | | 290,000 | 322,101 |
| 5% 12/1/32 (Pre-Refunded to 12/1/27 @ 100) | | 40,000 | 45,057 |
| Portage Pub. Schools Series 2016: | | | |
| 5% 11/1/33 | | 945,000 | 1,011,864 |
| 5% 11/1/36 | | 1,180,000 | 1,256,676 |
| 5% 11/1/37 | | 945,000 | 1,005,802 |
| Warren Consolidated School District Series 2016: | | | |
| 5% 5/1/28 | | 3,870,000 | 4,182,666 |
| 5% 5/1/29 | | 3,995,000 | 4,311,267 |
| Wayne County Arpt. Auth. Rev.: | | | |
| Series 2015 D: | | | |
5% 12/1/30 | | 1,225,000 | 1,309,427 |
5% 12/1/31 | | 2,170,000 | 2,318,392 |
| Series 2015 G: | | | |
5% 12/1/31 | | 1,415,000 | 1,511,763 |
5% 12/1/32 | | 1,415,000 | 1,510,276 |
5% 12/1/33 | | 1,890,000 | 2,014,296 |
| Series 2015, 5% 12/1/29 | | 1,510,000 | 1,614,364 |
| Series 2017 A: | | | |
5% 12/1/28 | | 565,000 | 630,558 |
5% 12/1/29 | | 520,000 | 577,635 |
5% 12/1/30 | | 660,000 | 732,617 |
5% 12/1/33 | | 330,000 | 366,124 |
5% 12/1/37 | | 470,000 | 510,065 |
5% 12/1/37 | | 255,000 | 272,484 |
| Series 2017 C, 5% 12/1/28 | | 1,040,000 | 1,163,189 |
TOTAL MICHIGAN | | | 57,087,155 |
| Minnesota - 1.6% | | | |
| Duluth Econ. Dev. Auth. Health Care Facilities Rev. Series 2018 A: | | | |
| 5% 2/15/48 | | 6,685,000 | 6,901,502 |
| 5% 2/15/58 | | 11,185,000 | 11,480,265 |
| Maple Grove Health Care Sys. Rev.: | | | |
| Series 2015, 5% 9/1/27 | | 1,215,000 | 1,271,261 |
| Series 2017: | | | |
5% 5/1/23 | | 470,000 | 472,508 |
5% 5/1/24 | | 1,135,000 | 1,164,803 |
| Minneapolis & Saint Paul Hsg. & Redev. Auth. Health Care Sys. Rev. (Allina Health Sys. Proj.) Series 2017 A, 5% 11/15/25 | | 1,290,000 | 1,377,382 |
| Minnesota Higher Ed. Facilities Auth. Rev. Series 2018 A: | | | |
| 5% 10/1/29 | | 945,000 | 1,036,397 |
| 5% 10/1/32 | | 675,000 | 734,812 |
| 5% 10/1/33 | | 825,000 | 894,443 |
| 5% 10/1/45 | | 975,000 | 1,011,970 |
| Minnesota Hsg. Fin. Agcy.: | | | |
| Series B, 4% 8/1/41 | | 1,270,000 | 1,287,471 |
| Series D: | | | |
4% 8/1/38 | | 2,265,000 | 2,329,114 |
4% 8/1/40 | | 2,455,000 | 2,500,124 |
4% 8/1/41 | | 1,610,000 | 1,632,148 |
4% 8/1/43 | | 1,820,000 | 1,828,966 |
| Saint Cloud Health Care Rev. Series 2019: | | | |
| 4% 5/1/49 | | 3,265,000 | 3,165,002 |
| 5% 5/1/48 | | 4,085,000 | 4,254,033 |
| Shakopee Sr. Hsg. Rev. Bonds Series 2018, 5.85%, tender 11/1/25 (b)(d) | | 3,150,000 | 3,123,750 |
TOTAL MINNESOTA | | | 46,465,951 |
| Mississippi - 0.1% | | | |
| Mississippi Home Corp. Series 2021 B: | | | |
| 3% 6/1/51 | | 2,890,000 | 2,846,210 |
| 5% 6/1/28 | | 705,000 | 789,256 |
TOTAL MISSISSIPPI | | | 3,635,466 |
| Missouri - 1.0% | | | |
| Cape Girardeau County Indl. Dev. Auth. Series 2017 A: | | | |
| 5% 3/1/27 | | 30,000 | 31,880 |
| 5% 3/1/29 | | 1,390,000 | 1,469,620 |
| Kansas City San. Swr. Sys. Rev. Series 2018 B: | | | |
| 5% 1/1/26 | | 225,000 | 242,999 |
| 5% 1/1/28 | | 470,000 | 532,997 |
| 5% 1/1/33 | | 450,000 | 506,753 |
| Kansas City Wtr. Rev. Series 2020 A, 4% 12/1/39 | | 1,190,000 | 1,227,257 |
| Missouri Health & Edl. Facilities Rev.: | | | |
| Series 2015 B: | | | |
3.125% 2/1/27 | | 380,000 | 384,042 |
3.25% 2/1/28 | | 380,000 | 384,799 |
5% 2/1/34 | | 2,940,000 | 3,057,100 |
5% 2/1/36 | | 1,135,000 | 1,173,077 |
| Series 2019 A: | | | |
4% 10/1/48 | | 2,030,000 | 2,011,324 |
5% 10/1/46 | | 3,990,000 | 4,335,581 |
| Missouri Hsg. Dev. Commission Single Family Mtg. Rev. Series 2019, 4% 5/1/50 | | 480,000 | 486,507 |
| Saint Louis Arpt. Rev.: | | | |
| Series 2019 A: | | | |
5% 7/1/44 | | 1,320,000 | 1,414,785 |
5% 7/1/49 | | 1,085,000 | 1,152,543 |
| Series A, 5.25% 7/1/26 (Assured Guaranty Muni. Corp. Insured) | | 2,830,000 | 3,100,120 |
| Saint Louis County Indl. Dev. Auth. Sr. Living Facilities Rev. Series 2018 A, 5.125% 9/1/48 | | 2,510,000 | 2,313,639 |
| The Indl. Dev. Auth. of Hannibal (Hannibal Reg'l. Healthcare Sys. Proj.) Series 2017: | | | |
| 5% 10/1/42 | | 3,235,000 | 3,338,676 |
| 5% 10/1/47 | | 2,005,000 | 2,058,856 |
TOTAL MISSOURI | | | 29,222,555 |
| Montana - 0.1% | | | |
| Montana Board Hsg. Single Family Series 2019 B, 4% 6/1/50 | | 265,000 | 269,802 |
| Montana Facility Fin. Auth. Series 2021 A, 3% 6/1/50 | | 2,665,000 | 1,972,664 |
TOTAL MONTANA | | | 2,242,466 |
| Nebraska - 1.1% | | | |
| Central Plains Energy Proj. Gas Supply Bonds Series 2019, 4%, tender 8/1/25 (b) | | 13,495,000 | 13,666,859 |
| Douglas County Neb Edl. Facilities Rev. (Creighton Univ. Projs.): | | | |
| Series 2017, 4% 7/1/33 | | 730,000 | 756,884 |
| Series 2021 A, 3% 7/1/51 | | 1,190,000 | 873,729 |
| Lincoln Elec. Sys. Rev. Series 2018: | | | |
| 5% 9/1/31 | | 1,890,000 | 2,091,015 |
| 5% 9/1/32 | | 3,525,000 | 3,895,189 |
| 5% 9/1/33 | | 2,115,000 | 2,331,825 |
| Nebraska Invt. Fin. Auth. Single Family Hsg. Rev. Series 2020 A, 3.5% 9/1/50 | | 1,190,000 | 1,191,356 |
| Nebraska Pub. Pwr. District Rev.: | | | |
| Series 2016 A: | | | |
5% 1/1/32 | | 1,575,000 | 1,674,806 |
5% 1/1/34 | | 945,000 | 1,001,341 |
| Series 2016 B, 5% 1/1/32 | | 4,720,000 | 5,019,100 |
TOTAL NEBRASKA | | | 32,502,104 |
| Nevada - 0.6% | | | |
| Carson City Hosp. Rev. (Carson Tahoe Hosp. Proj.) Series 2017: | | | |
| 5% 9/1/37 | | 2,555,000 | 2,645,731 |
| 5% 9/1/42 | | 6,295,000 | 6,490,964 |
| Clark County School District Series 2020 B, 3% 6/15/39 | | 2,630,000 | 2,270,140 |
| Las Vegas Valley Wtr. District Wtr. Impt. Gen. Oblig. Series 2016 B, 5% 6/1/36 | | 2,550,000 | 2,728,267 |
| Nevada Hsg. Division Single Family Mtg. Rev. Series 2019 B, 4% 10/1/49 | | 775,000 | 784,444 |
| Tahoe-Douglas Visitors Auth. Series 2020, 5% 7/1/51 | | 2,830,000 | 2,853,717 |
TOTAL NEVADA | | | 17,773,263 |
| New Hampshire - 1.3% | | | |
| Nat'l. Fin. Auth. Hosp. Rev. (St. Luke's Univ. Health Network Proj.) Series 2021 B, 3% 8/15/51 (Assured Guaranty Muni. Corp. Insured) | | 2,300,000 | 1,748,627 |
| Nat'l. Finnance Auth. Series 2020 1, 4.125% 1/20/34 | | 4,700,434 | 4,748,745 |
| New Hampshire Health & Ed. Facilities Auth.: | | | |
| (Dartmouth-Hitchcock Oblgtd Grp Proj.): | | | |
Series 2018 A: | | | |
5% 8/1/31 | | 1,225,000 | 1,348,379 |
5% 8/1/32 | | 235,000 | 258,312 |
5% 8/1/34 | | 2,830,000 | 3,086,430 |
5% 8/1/36 | | 1,890,000 | 2,019,984 |
5% 8/1/37 | | 2,265,000 | 2,401,952 |
Series 2018, 5% 8/1/35 | | 2,595,000 | 2,802,063 |
| (Partners Healthcare Sys., Inc. Proj.) Series 2017, 5% 7/1/41 | | 1,985,000 | 2,080,136 |
| Series 2017: | | | |
5% 7/1/36 | | 1,135,000 | 1,169,772 |
5% 7/1/44 | | 1,790,000 | 1,771,303 |
| New Hampshire Health & Ed. Facilities Auth. Rev.: | | | |
| Series 2012: | | | |
4% 7/1/23 | | 945,000 | 945,700 |
4% 7/1/32 | | 850,000 | 850,284 |
| Series 2016: | | | |
4% 10/1/38 | | 1,100,000 | 1,084,031 |
5% 10/1/28 | | 2,830,000 | 3,018,080 |
5% 10/1/32 | | 4,870,000 | 5,156,325 |
5% 10/1/38 | | 3,555,000 | 3,646,034 |
TOTAL NEW HAMPSHIRE | | | 38,136,157 |
| New Jersey - 5.6% | | | |
| New Jersey Econ. Dev. Auth.: | | | |
| (White Horse HMT Urban Renewal LLC Proj.) Series 2020, 5% 1/1/40 (d) | | 855,000 | 654,688 |
| Series A, 5% 11/1/36 | | 4,895,000 | 5,307,888 |
| Series QQQ: | | | |
4% 6/15/34 | | 755,000 | 789,459 |
4% 6/15/36 | | 1,040,000 | 1,060,588 |
4% 6/15/39 | | 945,000 | 946,982 |
4% 6/15/41 | | 945,000 | 934,354 |
4% 6/15/46 | | 1,415,000 | 1,359,138 |
4% 6/15/50 | | 1,890,000 | 1,796,837 |
5% 6/15/31 | | 1,040,000 | 1,199,605 |
5% 6/15/33 | | 190,000 | 216,056 |
| New Jersey Econ. Dev. Auth. Rev.: | | | |
| (Black Horse EHT Urban Renewal LLC Proj.) Series 2019 A, 5% 10/1/39 (d) | | 750,000 | 576,771 |
| (Provident Montclair Proj.) Series 2017: | | | |
5% 6/1/27 (Assured Guaranty Muni. Corp. Insured) | | 40,000 | 43,666 |
5% 6/1/28 (Assured Guaranty Muni. Corp. Insured) | | 55,000 | 59,819 |
5% 6/1/29 (Assured Guaranty Muni. Corp. Insured) | | 40,000 | 43,400 |
| Series 2014 PP, 5% 6/15/26 | | 5,665,000 | 5,840,731 |
| Series 2016 AAA, 5% 6/15/41 | | 2,370,000 | 2,449,135 |
| Series LLL, 4% 6/15/49 | | 2,655,000 | 2,528,685 |
| Series MMM, 4% 6/15/36 | | 755,000 | 768,275 |
| New Jersey Edl. Facility Series 2016 A, 5% 7/1/29 | | 2,480,000 | 2,625,037 |
| New Jersey Gen. Oblig. Series 2020 A, 5% 6/1/29 | | 3,000,000 | 3,482,961 |
| New Jersey Health Care Facilities Fing. Auth. Rev.: | | | |
| Series 2016 A: | | | |
5% 7/1/25 (Escrowed to Maturity) | | 995,000 | 1,055,915 |
5% 7/1/25 (Escrowed to Maturity) | | 465,000 | 492,905 |
5% 7/1/26 (Escrowed to Maturity) | | 145,000 | 157,558 |
5% 7/1/27 (Pre-Refunded to 7/1/26 @ 100) | | 220,000 | 239,053 |
5% 7/1/28 (Pre-Refunded to 7/1/26 @ 100) | | 35,000 | 38,091 |
5% 7/1/28 (Pre-Refunded to 7/1/26 @ 100) | | 645,000 | 700,860 |
5% 7/1/30 | | 945,000 | 1,024,691 |
| Series 2016: | | | |
4% 7/1/48 | | 1,700,000 | 1,423,573 |
5% 7/1/41 | | 2,070,000 | 2,060,665 |
| New Jersey Higher Ed. Student Assistance Auth. Student Ln. Rev. Series 2019 A: | | | |
| 5% 12/1/24 | | 550,000 | 572,924 |
| 5% 12/1/25 | | 1,005,000 | 1,072,287 |
| New Jersey Tpk. Auth. Tpk. Rev. Series 2022 B: | | | |
| 4.25% 1/1/43 | | 6,000,000 | 6,172,020 |
| 5% 1/1/46 | | 8,000,000 | 8,808,590 |
| New Jersey Trans. Trust Fund Auth.: | | | |
| (Trans. Prog.) Series 2019 AA, 5.25% 6/15/43 | | 15,160,000 | 16,065,816 |
| Series 2006 C: | | | |
0% 12/15/31 (FGIC Insured) | | 5,300,000 | 3,918,904 |
0% 12/15/36 (AMBAC Insured) | | 10,000,000 | 5,663,285 |
| Series 2010 A, 0% 12/15/27 | | 6,980,000 | 6,004,960 |
| Series 2014 BB2, 5% 6/15/34 | | 5,370,000 | 6,085,009 |
| Series 2016 A: | | | |
5% 6/15/27 | | 890,000 | 959,652 |
5% 6/15/29 | | 3,350,000 | 3,603,514 |
| Series 2018 A: | | | |
5% 12/15/32 | | 3,025,000 | 3,361,901 |
5% 12/15/34 | | 945,000 | 1,033,072 |
| Series 2019 BB, 4% 6/15/50 | | 1,770,000 | 1,682,752 |
| Series 2021 A: | | | |
4% 6/15/38 | | 510,000 | 513,698 |
5% 6/15/32 | | 3,360,000 | 3,880,693 |
5% 6/15/33 | | 945,000 | 1,081,843 |
| Series 2022 A: | | | |
4% 6/15/41 | | 4,625,000 | 4,572,899 |
4% 6/15/42 | | 3,105,000 | 3,041,612 |
| Series 2022 AA: | | | |
5% 6/15/29 | | 7,555,000 | 8,557,306 |
5% 6/15/35 | | 590,000 | 668,972 |
5% 6/15/36 | | 6,915,000 | 7,709,647 |
5% 6/15/37 | | 3,195,000 | 3,522,041 |
| Series A: | | | |
4% 12/15/39 | | 945,000 | 946,758 |
4.25% 12/15/38 | | 2,345,000 | 2,386,811 |
| Series AA: | | | |
4% 6/15/38 | | 2,660,000 | 2,676,635 |
4% 6/15/45 | | 6,365,000 | 6,137,579 |
4% 6/15/50 | | 895,000 | 850,883 |
5% 6/15/37 | | 2,830,000 | 3,079,702 |
5% 6/15/50 | | 3,160,000 | 3,321,677 |
| South Jersey Trans. Auth. Trans. Sys. Rev. Series 2022 A: | | | |
| 4.5% 11/1/42 | | 1,500,000 | 1,519,516 |
| 4.625% 11/1/47 | | 2,500,000 | 2,542,862 |
TOTAL NEW JERSEY | | | 161,893,206 |
| New Mexico - 0.1% | | | |
| New Mexico Mtg. Fin. Auth. Series 2019 D, 3.75% 1/1/50 | | 1,035,000 | 1,042,791 |
| Santa Fe Retirement Fac. Series 2019 A: | | | |
| 5% 5/15/34 | | 215,000 | 206,206 |
| 5% 5/15/39 | | 160,000 | 145,985 |
| 5% 5/15/44 | | 170,000 | 148,043 |
| 5% 5/15/49 | | 335,000 | 283,537 |
TOTAL NEW MEXICO | | | 1,826,562 |
| New York - 6.5% | | | |
| Dorm. Auth. New York Univ. Rev.: | | | |
| (Memorial Sloan-Kettring Cancer Ctr.) Series 2017 1, 5% 7/1/42 | | 1,470,000 | 1,556,689 |
| Series 2016 A: | | | |
5% 7/1/23 | | 30,000 | 30,304 |
5% 7/1/25 | | 65,000 | 68,385 |
5% 7/1/32 | | 2,360,000 | 2,520,202 |
| Hempstead Local Dev. Corp. Rev. (Hofstra Univ. Proj.) Series 2021 A, 3% 7/1/51 | | 2,285,000 | 1,770,367 |
| Hudson Yards Infrastructure Corp. New York Rev. Series 2017 A, 5% 2/15/33 | | 3,395,000 | 3,736,924 |
| Long Island Pwr. Auth. Elec. Sys. Rev. Series 2017: | | | |
| 5% 9/1/33 | | 470,000 | 521,621 |
| 5% 9/1/35 | | 1,890,000 | 2,071,693 |
| 5% 9/1/36 | | 1,070,000 | 1,168,310 |
| MTA Hudson Rail Yards Trust Oblig. Series 2016 A, 5% 11/15/56 | | 16,100,000 | 15,944,888 |
| New York City Edl. Construction Fund Series 2021 B, 5% 4/1/46 | | 4,505,000 | 4,885,006 |
| New York City Gen. Oblig.: | | | |
| Series 2021 A1, 5% 8/1/31 | | 6,010,000 | 7,169,639 |
| Series 2022 B1, 5% 8/1/32 | | 1,000,000 | 1,233,420 |
| New York City Transitional Fin. Auth. Rev.: | | | |
| Series 2016 A, 5% 5/1/40 | | 1,840,000 | 1,955,448 |
| Series 2017 B, 5% 8/1/40 | | 1,890,000 | 2,017,633 |
| Series 2019 B1, 5% 8/1/34 | | 1,890,000 | 2,127,949 |
| New York Convention Ctr. Dev. Corp. Rev. Series 2015: | | | |
| 5% 11/15/28 | | 6,805,000 | 7,214,920 |
| 5% 11/15/29 | | 4,720,000 | 4,990,358 |
| New York Dorm. Auth. Rev. Series 2022 A: | | | |
| 5% 7/1/33 | | 660,000 | 773,435 |
| 5% 7/1/34 | | 1,370,000 | 1,588,246 |
| 5% 7/15/37 | | 570,000 | 602,888 |
| 5% 7/1/38 | | 1,785,000 | 1,968,535 |
| 5% 7/1/42 | | 1,180,000 | 1,265,627 |
| 5% 7/15/42 | | 1,605,000 | 1,659,431 |
| 5% 7/15/50 | | 4,150,000 | 4,222,432 |
| New York Dorm. Auth. Sales Tax Rev.: | | | |
| Series 2016 A, 5% 3/15/32 | | 1,835,000 | 2,005,331 |
| Series 2018 C, 5% 3/15/38 | | 7,820,000 | 8,519,508 |
| New York Metropolitan Trans. Auth. Rev.: | | | |
| Series 2016 C1, 5% 11/15/56 | | 1,890,000 | 1,902,158 |
| Series 2017 C-2: | | | |
0% 11/15/29 | | 2,150,000 | 1,694,947 |
0% 11/15/33 | | 5,285,000 | 3,498,239 |
| Series 2017 D, 5% 11/15/30 | | 4,720,000 | 5,006,036 |
| Series 2020 D: | | | |
4% 11/15/46 | | 31,520,000 | 28,540,925 |
4% 11/15/47 | | 2,205,000 | 1,983,198 |
| New York State Dorm. Auth.: | | | |
| Series 2019 D, 3% 2/15/49 | | 5,070,000 | 4,065,763 |
| Series 2021 E, 3% 3/15/50 | | 5,030,000 | 3,966,602 |
| New York State Urban Dev. Corp. Series 2020 E: | | | |
| 4% 3/15/44 | | 22,920,000 | 22,756,745 |
| 4% 3/15/45 | | 18,600,000 | 18,387,173 |
| New York Urban Dev. Corp. Rev.: | | | |
| (New York State Gen. Oblig. Proj.) Series 2017 A, 5% 3/15/34 | | 3,495,000 | 3,828,975 |
| Gen. Oblig. (New York State Gen. Oblig. Proj.) Series 2017 A, 5% 3/15/32 | | 2,955,000 | 3,260,594 |
| Oneida County Local Dev. Corp. Rev. (Mohawk Valley Health Sys. Proj.) Series 2019 A: | | | |
| 4% 12/1/32 (Assured Guaranty Muni. Corp. Insured) | | 945,000 | 982,240 |
| 5% 12/1/25 (Assured Guaranty Muni. Corp. Insured) | | 595,000 | 606,822 |
| 5% 12/1/30 (Assured Guaranty Muni. Corp. Insured) | | 1,415,000 | 1,612,637 |
| Suffolk County Econ. Dev. Corp. Rev. Series 2021: | | | |
| 5.125% 11/1/41 (d) | | 600,000 | 482,397 |
| 5.375% 11/1/54 (d) | | 1,020,000 | 787,678 |
TOTAL NEW YORK | | | 186,952,318 |
| North Carolina - 1.5% | | | |
| Charlotte Ctfs. of Prtn. (Convention Facility Projs.) Series 2019 A, 5% 6/1/46 | | 2,245,000 | 2,450,832 |
| Charlotte Int'l. Arpt. Rev.: | | | |
| Series 2017 A: | | | |
5% 7/1/35 | | 1,890,000 | 2,062,919 |
5% 7/1/42 | | 2,715,000 | 2,872,834 |
| Series 2017 C: | | | |
4% 7/1/36 | | 1,415,000 | 1,447,692 |
4% 7/1/37 | | 1,415,000 | 1,437,323 |
| New Hanover County Hosp. Rev. Series 2017, 5% 10/1/27 (Escrowed to Maturity) | | 210,000 | 235,166 |
| North Carolina Med. Care Commission Health Care Facilities Rev.: | | | |
| Series 2019 A: | | | |
5% 12/1/29 | | 1,310,000 | 1,457,573 |
5% 12/1/30 | | 1,360,000 | 1,512,674 |
5% 12/1/32 | | 1,035,000 | 1,144,980 |
5% 12/1/33 | | 755,000 | 830,750 |
| Series 2020 A, 3% 7/1/45 | | 1,730,000 | 1,386,495 |
| Series 2021 A: | | | |
4% 3/1/36 | | 850,000 | 724,326 |
4% 3/1/51 | | 1,790,000 | 1,304,787 |
| North Carolina Muni. Pwr. Agcy. #1 Catawba Elec. Rev. Series 2015 C, 5% 1/1/29 | | 7,555,000 | 8,106,918 |
| North Carolina Tpk. Auth. Triangle Expressway Sys. Series 2019: | | | |
| 4% 1/1/55 | | 3,045,000 | 2,852,314 |
| 5% 1/1/43 | | 4,250,000 | 4,471,966 |
| 5% 1/1/44 | | 5,295,000 | 5,559,602 |
| 5% 1/1/49 | | 1,890,000 | 1,967,964 |
TOTAL NORTH CAROLINA | | | 41,827,115 |
| North Dakota - 0.1% | | | |
| Univ. of North Dakota Series 2021 A, 3% 6/1/61 (Assured Guaranty Muni. Corp. Insured) | | 3,620,000 | 2,588,667 |
| Ohio - 2.7% | | | |
| Akron Bath Copley Hosp. District Rev. Series 2016, 5.25% 11/15/46 | | 3,965,000 | 4,056,329 |
| American Muni. Pwr., Inc. (Solar Electricity Prepayment Proj.) Series 2019 A: | | | |
| 5% 2/15/38 | | 1,415,000 | 1,525,867 |
| 5% 2/15/39 | | 945,000 | 1,015,758 |
| 5% 2/15/44 | | 2,975,000 | 3,152,694 |
| American Muni. Pwr., Inc. Rev. (Greenup Hydroelectric Proj.): | | | |
| Series 2016 A, 5% 2/15/41 | | 3,775,000 | 3,915,602 |
| Series 2016, 5% 2/15/46 | | 1,210,000 | 1,247,346 |
| Buckeye Tobacco Settlement Fing. Auth.: | | | |
| Series 2020 A2: | | | |
3% 6/1/48 | | 2,570,000 | 1,955,278 |
4% 6/1/48 | | 850,000 | 781,282 |
5% 6/1/27 | | 2,125,000 | 2,270,517 |
5% 6/1/29 | | 3,870,000 | 4,235,250 |
5% 6/1/34 | | 1,140,000 | 1,242,009 |
| Series 2020 B2, 5% 6/1/55 | | 7,105,000 | 6,774,741 |
| Cleveland Arpt. Sys. Rev. Series 2016 A: | | | |
| 5% 1/1/26 (Assured Guaranty Muni. Corp. Insured) | | 470,000 | 492,966 |
| 5% 1/1/27 (Assured Guaranty Muni. Corp. Insured) | | 2,055,000 | 2,156,452 |
| 5% 1/1/31 (Assured Guaranty Muni. Corp. Insured) | | 945,000 | 989,525 |
| Cleveland Income Tax Rev. Series 2018 A: | | | |
| 5% 10/1/35 | | 1,890,000 | 2,089,911 |
| 5% 10/1/37 | | 1,180,000 | 1,292,346 |
| 5% 10/1/38 | | 1,415,000 | 1,545,402 |
| Columbus City School District Series 2016 A, 5% 12/1/32 | | 945,000 | 1,019,504 |
| Fairfield County Hosp. Facilities Rev. (Fairfield Med. Ctr. Proj.) Series 2013: | | | |
| 5% 6/15/25 | | 65,000 | 65,235 |
| 5% 6/15/26 | | 70,000 | 70,260 |
| 5% 6/15/27 | | 75,000 | 75,269 |
| 5% 6/15/28 | | 80,000 | 80,273 |
| 5.25% 6/15/43 | | 4,720,000 | 4,665,307 |
| Lake County Hosp. Facilities Rev. Series 2015, 5% 8/15/27 (Pre-Refunded to 8/15/25 @ 100) | | 60,000 | 63,718 |
| Lancaster Port Auth. Gas Rev. Bonds Series 2019, 5%, tender 2/1/25 (b) | | 10,450,000 | 10,757,324 |
| Muskingum County Hosp. Facilities (Genesis Healthcare Sys. Obligated Group Proj.) Series 2013, 5% 2/15/27 | | 160,000 | 160,104 |
| Ohio Higher Edl. Facility Commission Rev. Series 2019, 4% 10/1/44 | | 1,675,000 | 1,611,360 |
| Ohio Hosp. Facilities Rev. Series 2017 A, 5% 1/1/31 | | 130,000 | 146,196 |
| Ohio Hosp. Rev. Series 2020 A, 4% 1/15/50 | | 780,000 | 720,796 |
| Ohio Hsg. Fin. Agcy. Residential Mtg. Rev. (Mtg. Backed Securities Prog.) Series 2019 B, 4.5% 3/1/50 | | 375,000 | 383,766 |
| Ohio Tpk. Commission Tpk. Rev. (Infrastructure Proj.) Series 2005 A, 0% 2/15/42 | | 5,475,000 | 2,461,380 |
| Scioto County Hosp. Facilities Rev.: | | | |
| Series 2016, 5% 2/15/29 | | 1,195,000 | 1,254,612 |
| Series 2019, 5% 2/15/29 | | 2,530,000 | 2,674,935 |
| Univ. of Akron Gen. Receipts Series 2019 A: | | | |
| 4% 1/1/28 | | 3,495,000 | 3,706,023 |
| 5% 1/1/30 | | 1,700,000 | 1,937,257 |
| Washington County Hosp. Rev. Series 2022: | | | |
| 6% 12/1/28 | | 1,075,000 | 1,116,683 |
| 6% 12/1/29 | | 1,140,000 | 1,190,699 |
| 6% 12/1/30 | | 1,205,000 | 1,262,861 |
| 6% 12/1/31 | | 1,280,000 | 1,344,083 |
TOTAL OHIO | | | 77,506,920 |
| Oklahoma - 0.1% | | | |
| Oklahoma City Pub. Property Auth. Hotel Tax Rev. Series 2015: | | | |
| 5% 10/1/24 | | 1,045,000 | 1,088,779 |
| 5% 10/1/32 | | 1,040,000 | 1,106,474 |
| Oklahoma Dev. Fin. Auth. Rev. (Oklahoma City Univ. Proj.) Series 2019, 5% 8/1/44 | | 1,590,000 | 1,600,491 |
TOTAL OKLAHOMA | | | 3,795,744 |
| Oregon - 0.7% | | | |
| Oregon State Hsg. & Cmnty. Svcs. Dept. Series 2019 A, 4% 7/1/50 | | 4,385,000 | 4,436,888 |
| Polk Marion & Benton School District # 13J Series B, 0% 12/15/38 | | 1,995,000 | 1,089,853 |
| Salem Hosp. Facility Auth. Rev. (Salem Health Projs.) Series 2019 A, 3% 5/15/49 | | 3,960,000 | 3,034,479 |
| Washington, Multnomah & Yamhill County School District #1J Series 2017: | | | |
| 5% 6/15/33 | | 1,020,000 | 1,131,596 |
| 5% 6/15/35 | | 2,960,000 | 3,256,692 |
| 5% 6/15/36 | | 2,830,000 | 3,092,829 |
| 5% 6/15/38 | | 2,830,000 | 3,074,583 |
TOTAL OREGON | | | 19,116,920 |
| Pennsylvania - 6.3% | | | |
| Allegheny County Arpt. Auth. Rev. Series 2021 B: | | | |
| 5% 1/1/51 | | 5,350,000 | 5,712,188 |
| 5% 1/1/56 | | 11,795,000 | 12,522,780 |
| Allegheny County Hosp. Dev. Auth. Rev. Series 2019 A, 4% 7/15/36 | | 2,360,000 | 2,392,894 |
| Allegheny County Indl. Dev. Auth. Rev. Series 2021: | | | |
| 3.5% 12/1/31 | | 1,265,000 | 1,070,769 |
| 4% 12/1/41 | | 2,135,000 | 1,621,127 |
| 4.25% 12/1/50 | | 2,375,000 | 1,712,759 |
| Bucks County Indl. Dev. Auth. Hosp. Rev. Series 2021: | | | |
| 5% 7/1/37 | | 1,390,000 | 1,389,984 |
| 5% 7/1/39 | | 2,765,000 | 2,701,887 |
| Cap. Region Wtr. Wtr. Rev. Series 2018: | | | |
| 5% 7/15/26 | | 945,000 | 1,025,804 |
| 5% 7/15/38 | | 945,000 | 1,040,085 |
| Coatesville Area School District Series 2017, 5% 8/1/23 (Assured Guaranty Muni. Corp. Insured) | | 425,000 | 430,168 |
| Dauphin County Gen. Auth. (Pinnacle Health Sys. Proj.) Series 2016 A, 5% 6/1/29 | | 1,255,000 | 1,332,868 |
| Delaware County Auth. Rev. Series 2017, 5% 7/1/26 | | 1,115,000 | 1,150,040 |
| Doylestown Hosp. Auth. Hosp. Rev. Series 2016 A, 5% 7/1/46 | | 785,000 | 657,469 |
| Lancaster County Hosp. Auth. Health Ctr. Rev. Series 2021, 5% 11/1/51 | | 3,110,000 | 3,237,361 |
| Lehigh County Gen. Purp. Hosp. Rev. Series 2019 A: | | | |
| 4% 7/1/37 | | 1,890,000 | 1,893,181 |
| 4% 7/1/38 | | 2,060,000 | 2,060,362 |
| 4% 7/1/39 | | 2,360,000 | 2,352,010 |
| 5% 7/1/44 | | 2,360,000 | 2,474,542 |
| Monroeville Fin. Auth. UPMC Rev. Series 2012, 5% 2/15/26 | | 1,605,000 | 1,722,991 |
| Montgomery County Higher Ed. & Health Auth. Rev.: | | | |
| Series 2014 A, 5% 10/1/23 | | 2,225,000 | 2,238,855 |
| Series 2016 A: | | | |
5% 10/1/28 | | 40,000 | 41,078 |
5% 10/1/29 | | 40,000 | 41,056 |
5% 10/1/30 | | 4,105,000 | 4,210,682 |
5% 10/1/32 | | 130,000 | 133,125 |
5% 10/1/36 | | 4,395,000 | 4,419,047 |
5% 10/1/40 | | 2,405,000 | 2,334,318 |
| Series 2019, 4% 9/1/44 | | 4,875,000 | 4,757,518 |
| Northampton County Gen. Purp. Auth. Hosp. Rev. (St. Luke's Univ. Health Network Proj.) Series 2018 A, 4% 8/15/48 | | 6,835,000 | 6,470,299 |
| Pennsylvania Ctfs. Prtn. Series 2018 A: | | | |
| 5% 7/1/35 | | 710,000 | 784,691 |
| 5% 7/1/36 | | 945,000 | 1,037,535 |
| 5% 7/1/37 | | 755,000 | 826,038 |
| 5% 7/1/38 | | 710,000 | 773,127 |
| 5% 7/1/43 | | 1,890,000 | 2,011,433 |
| Pennsylvania Higher Edl. Facilities Auth. Rev.: | | | |
| (Drexel Univ. Proj.) Series 2016, 5% 5/1/35 | | 1,495,000 | 1,572,420 |
| Series 2016: | | | |
5% 5/1/29 | | 945,000 | 1,007,713 |
5% 5/1/31 | | 945,000 | 1,003,644 |
| Pennsylvania Pub. School Bldg. Auth. School Rev. (The School District of The City of Harrisburg Proj.) Series 2016 A: | | | |
| 5% 12/1/29 | | 4,595,000 | 4,913,443 |
| 5% 12/1/29 (Pre-Refunded to 12/1/26 @ 100) | | 720,000 | 792,607 |
| Pennsylvania State Univ. Series 2020 A, 4% 9/1/50 | | 2,050,000 | 2,060,234 |
| Pennsylvania Tpk. Commission Tpk. Rev. Series 2021 A, 4% 12/1/50 | | 16,995,000 | 16,097,000 |
| Philadelphia Arpt. Rev. Series 2017 A: | | | |
| 5% 7/1/28 | | 470,000 | 520,144 |
| 5% 7/1/29 | | 470,000 | 518,022 |
| 5% 7/1/30 | | 520,000 | 572,597 |
| 5% 7/1/31 | | 565,000 | 620,621 |
| 5% 7/1/32 | | 520,000 | 570,520 |
| 5% 7/1/33 | | 565,000 | 617,480 |
| 5% 7/1/42 | | 2,255,000 | 2,367,288 |
| Philadelphia Auth. for Indl. Dev. Series 2017, 5% 11/1/47 | | 10,470,000 | 10,683,438 |
| Philadelphia Gas Works Rev.: | | | |
| Series 16 A, 4% 8/1/45 (Assured Guaranty Muni. Corp. Insured) | | 2,185,000 | 2,192,392 |
| Series 2015: | | | |
5% 8/1/26 | | 945,000 | 998,223 |
5% 8/1/27 | | 945,000 | 998,223 |
5% 8/1/28 | | 1,890,000 | 1,995,978 |
| Philadelphia Gen. Oblig. Series 2019 B: | | | |
| 5% 2/1/33 | | 1,510,000 | 1,691,248 |
| 5% 2/1/36 | | 1,400,000 | 1,536,141 |
| 5% 2/1/37 | | 1,810,000 | 1,970,612 |
| Philadelphia School District: | | | |
| Series 2016 F, 5% 9/1/29 | | 3,280,000 | 3,536,703 |
| Series 2018 A: | | | |
5% 9/1/34 | | 1,370,000 | 1,513,245 |
5% 9/1/35 | | 945,000 | 1,035,765 |
| Series 2018 B, 5% 9/1/43 | | 1,315,000 | 1,404,991 |
| Series 2019 A: | | | |
4% 9/1/35 | | 2,175,000 | 2,261,162 |
4% 9/1/36 | | 1,890,000 | 1,945,887 |
5% 9/1/31 | | 1,100,000 | 1,246,858 |
5% 9/1/33 | | 1,945,000 | 2,206,728 |
5% 9/1/33 | | 6,485,000 | 7,316,066 |
| Pittsburgh & Allegheny County Parking Sys. Series 2017: | | | |
| 5% 12/15/35 | | 1,060,000 | 1,152,750 |
| 5% 12/15/37 | | 470,000 | 508,763 |
| Pittsburgh Wtr. & Swr. Auth. Wtr. & Swr. Sys. Rev. Series 2019 B, 5% 9/1/32 (Assured Guaranty Muni. Corp. Insured) | | 1,890,000 | 2,301,249 |
| Pocono Mountains Indl. Park Auth. (St. Luke's Hosp. - Monroe Proj.) Series 2015 A, 5% 8/15/40 | | 1,695,000 | 1,724,919 |
| Southcentral Pennsylvania Gen. Auth. Rev. Series 2019 A: | | | |
| 4% 6/1/44 | | 1,405,000 | 1,398,895 |
| 4% 6/1/49 | | 3,345,000 | 3,185,962 |
| 5% 6/1/44 | | 2,450,000 | 2,581,456 |
| 5% 6/1/49 | | 3,915,000 | 4,099,884 |
| State Pub. School Bldg. Auth. Lease Rev. (The School District of Philadelphia Proj.) Series 2015 A, 5% 6/1/26 | | 695,000 | 728,999 |
| Union County Hosp. Auth. Rev. Series 2018 B: | | | |
| 5% 8/1/33 | | 945,000 | 1,011,367 |
| 5% 8/1/38 | | 3,025,000 | 3,191,510 |
| 5% 8/1/48 | | 2,690,000 | 2,754,067 |
TOTAL PENNSYLVANIA | | | 180,987,285 |
| Puerto Rico - 1.0% | | | |
| Puerto Rico Commonwealth Aqueduct & Swr. Auth.: | | | |
| Series 2021 B: | | | |
4% 7/1/42 (d) | | 2,165,000 | 1,932,638 |
5% 7/1/33 (d) | | 1,030,000 | 1,056,845 |
5% 7/1/37 (d) | | 4,335,000 | 4,400,194 |
| Series 2022 A, 4% 7/1/42 (d) | | 2,165,000 | 1,932,638 |
| Puerto Rico Commonwealth Pub. Impt. Gen. Oblig. Series 2021 A1: | | | |
| 0% 7/1/33 | | 10,912,493 | 6,319,863 |
| 4% 7/1/33 | | 8,345,792 | 7,803,317 |
| 4% 7/1/35 | | 3,005,000 | 2,729,450 |
| 5.625% 7/1/27 | | 1,085,763 | 1,137,219 |
| 5.625% 7/1/29 | | 1,260,915 | 1,340,575 |
TOTAL PUERTO RICO | | | 28,652,739 |
| Rhode Island - 0.5% | | | |
| Rhode Island Health & Edl. Bldg. Corp. Higher Ed. Facilities Rev.: | | | |
| Series 2016 B: | | | |
5% 9/1/31 | | 4,605,000 | 4,630,791 |
5% 9/1/36 | | 185,000 | 179,391 |
| Series 2016, 5% 5/15/39 | | 3,100,000 | 3,147,771 |
| Rhode Island Hsg. & Mtg. Fin. Corp.: | | | |
| Series 2019 70, 4% 10/1/49 | | 785,000 | 793,578 |
| Series 2021 74, 3% 4/1/49 | | 5,090,000 | 5,019,305 |
TOTAL RHODE ISLAND | | | 13,770,836 |
| South Carolina - 2.0% | | | |
| Charleston County Arpt. District Series 2019: | | | |
| 5% 7/1/43 | | 1,510,000 | 1,639,659 |
| 5% 7/1/48 | | 11,330,000 | 12,198,677 |
| South Carolina Hsg. Fin. & Dev. Auth. Mtg. Rev.: | | | |
| Series 2019 A, 4% 1/1/50 | | 1,270,000 | 1,291,852 |
| Series 2022 A: | | | |
5% 1/1/29 | | 285,000 | 321,449 |
5% 7/1/29 | | 470,000 | 534,510 |
5% 1/1/30 | | 470,000 | 536,229 |
5% 7/1/30 | | 520,000 | 598,306 |
5% 1/1/31 | | 520,000 | 600,553 |
5% 7/1/31 | | 535,000 | 621,676 |
| South Carolina Jobs-Econ. Dev. Auth. Series 2019 C, 5% 7/1/32 | | 4,080,000 | 4,502,083 |
| South Carolina Pub. Svc. Auth. Rev.: | | | |
| Series 2016 B: | | | |
5% 12/1/35 | | 3,425,000 | 3,574,429 |
5% 12/1/36 | | 5,140,000 | 5,345,004 |
| Series 2016 C: | | | |
5% 12/1/24 | | 485,000 | 504,331 |
5% 12/1/25 | | 565,000 | 600,439 |
5% 12/1/26 | | 945,000 | 1,021,860 |
| Spartanburg County Reg'l. Health Series 2017 A: | | | |
| 4% 4/15/43 | | 9,360,000 | 9,064,734 |
| 4% 4/15/48 | | 6,530,000 | 6,183,845 |
| 5% 4/15/48 | | 8,855,000 | 9,170,752 |
TOTAL SOUTH CAROLINA | | | 58,310,388 |
| South Dakota - 0.1% | | | |
| South Dakota Health & Edl. Facilities Auth. Rev.: | | | |
| Series 2017: | | | |
5% 7/1/30 | | 805,000 | 890,678 |
5% 7/1/35 | | 685,000 | 736,169 |
| Series 2020 A, 3% 9/1/45 | | 2,245,000 | 1,792,954 |
TOTAL SOUTH DAKOTA | | | 3,419,801 |
| Tennessee - 0.8% | | | |
| Chattanooga Health Ed. & Hsg. Facility Board Rev.: | | | |
| Series 2019 A1, 4% 8/1/44 | | 1,700,000 | 1,635,791 |
| Series 2019 A2: | | | |
5% 8/1/37 | | 810,000 | 860,952 |
5% 8/1/44 | | 1,125,000 | 1,171,153 |
| Greeneville Health & Edl. Facilities Board Series 2018 A, 5% 7/1/25 | | 945,000 | 951,283 |
| Nashville and Davidson County Metropolitan Govt. Health & Edl. Facilities Board Rev. (Lipscomb Univ. Proj.) Series 2019 A: | | | |
| 4% 10/1/49 | | 2,445,000 | 1,986,841 |
| 5.25% 10/1/58 | | 7,340,000 | 7,293,354 |
| Shelby County Health Edl. & Hsg. Facilities Board Rev. (Methodist Le Bonheur Health Proj.) Series 2017 A: | | | |
| 5% 5/1/25 | | 1,225,000 | 1,285,840 |
| 5% 5/1/27 | | 1,160,000 | 1,270,657 |
| 5% 5/1/29 | | 1,170,000 | 1,279,487 |
| 5% 5/1/30 | | 2,260,000 | 2,465,223 |
| 5% 5/1/31 | | 1,190,000 | 1,294,632 |
TOTAL TENNESSEE | | | 21,495,213 |
| Texas - 6.3% | | | |
| Central Reg'l. Mobility Auth.: | | | |
| Series 2020 A, 5% 1/1/49 | | 3,720,000 | 3,985,978 |
| Series 2020 B, 5% 1/1/45 | | 1,650,000 | 1,777,791 |
| Collin County Series 2022, 4% 2/15/39 | | 1,275,000 | 1,298,425 |
| Dallas Area Rapid Transit Sales Tax Rev. Series 2020 A, 5% 12/1/45 | | 1,355,000 | 1,484,547 |
| Dallas Fort Worth Int'l. Arpt. Rev.: | | | |
| Series 2020 B: | | | |
4% 11/1/34 | | 3,220,000 | 3,398,562 |
4% 11/1/35 | | 2,860,000 | 2,965,960 |
| Series 2021 B, 5% 11/1/43 | | 2,325,000 | 2,552,545 |
| Garland Elec. Util. Sys. Rev. Series 2021 A: | | | |
| 4% 3/1/46 | | 1,700,000 | 1,661,580 |
| 4% 3/1/51 | | 2,125,000 | 2,039,475 |
| Grand Parkway Trans. Corp.: | | | |
| Series 2018 A: | | | |
5% 10/1/36 | | 4,720,000 | 5,155,710 |
5% 10/1/37 | | 9,440,000 | 10,244,639 |
5% 10/1/43 | | 5,195,000 | 5,556,552 |
| Series 2020 C, 4% 10/1/49 | | 2,740,000 | 2,673,031 |
| Greenville Gen. Oblig. Series 2021, 2% 2/15/33 | | 1,055,000 | 922,749 |
| Harris County Toll Road Rev. (Harris County Toll Road Auth. Proj.) Series 2018 A, 5% 8/15/33 | | 1,890,000 | 2,121,062 |
| Houston Arpt. Sys. Rev. Series 2018 D: | | | |
| 5% 7/1/29 | | 1,795,000 | 2,040,554 |
| 5% 7/1/30 | | 2,360,000 | 2,681,124 |
| 5% 7/1/31 | | 2,125,000 | 2,412,796 |
| 5% 7/1/32 | | 1,890,000 | 2,142,933 |
| 5% 7/1/39 | | 6,685,000 | 7,275,791 |
| Houston Util. Sys. Rev. Series 2016 B, 5% 11/15/33 | | 1,320,000 | 1,437,347 |
| Irving Hosp. Auth. Hosp. Rev. Series 2017 A: | | | |
| 5% 10/15/33 | | 995,000 | 1,048,552 |
| 5% 10/15/34 | | 1,575,000 | 1,651,318 |
| 5% 10/15/35 | | 1,145,000 | 1,192,521 |
| 5% 10/15/44 | | 790,000 | 797,846 |
| Lower Colorado River Auth. Rev.: | | | |
| (LCRA Transmission Svcs. Corp. Proj.) Series 2018: | | | |
5% 5/15/33 | | 4,260,000 | 4,754,416 |
5% 5/15/35 | | 2,005,000 | 2,210,886 |
| Series 2015 B: | | | |
5% 5/15/30 | | 4,250,000 | 4,468,929 |
5% 5/15/31 | | 6,800,000 | 7,136,459 |
| New Hope Cultural Ed. Facilities Fin. Corp. (Childrens Med. Ctr. of Dallas) Series 2017 A: | | | |
| 5% 8/15/28 | | 1,415,000 | 1,563,476 |
| 5% 8/15/47 | | 1,140,000 | 1,184,644 |
| Newark Higher Ed. Fin. Corp. (Abilene Christian Univ. Proj.) Series 2016 A, 5% 4/1/29 | | 1,985,000 | 2,114,229 |
| North Texas Tollway Auth. Rev.: | | | |
| (Sr. Lien Proj.) Series 2017 A: | | | |
5% 1/1/30 | | 1,345,000 | 1,437,421 |
5% 1/1/34 | | 945,000 | 1,023,016 |
5% 1/1/35 | | 1,225,000 | 1,320,044 |
5% 1/1/36 | | 1,135,000 | 1,215,641 |
5% 1/1/37 | | 4,440,000 | 4,739,161 |
| (Sub Lien Proj.) Series 2017 B: | | | |
5% 1/1/30 | | 250,000 | 266,453 |
5% 1/1/31 | | 350,000 | 372,775 |
5% 1/1/33 | | 1,415,000 | 1,531,110 |
| Series 2014, 5% 1/1/24 | | 170,000 | 173,777 |
| Series 2015 A, 5% 1/1/32 | | 1,465,000 | 1,528,695 |
| Series 2016 A: | | | |
5% 1/1/32 | | 2,830,000 | 3,015,756 |
5% 1/1/39 | | 945,000 | 990,111 |
| Series 2018, 0% 1/1/29 (Assured Guaranty Corp. Insured) | | 14,265,000 | 12,011,320 |
| Series 2021 B, 3% 1/1/46 | | 4,000,000 | 3,047,650 |
| San Antonio Elec. & Gas Sys. Rev. Series 2017: | | | |
| 5% 2/1/32 | | 1,180,000 | 1,306,563 |
| 5% 2/1/34 | | 1,415,000 | 1,559,229 |
| San Antonio Independent School District Series 2016, 5% 8/15/31 | | 1,900,000 | 2,077,132 |
| Southwest Higher Ed. Auth. Rev. (Southern Methodist Univ., TX. Proj.) Series 2017: | | | |
| 5% 10/1/32 | | 710,000 | 778,394 |
| 5% 10/1/41 | | 1,415,000 | 1,515,131 |
| Tarrant County Cultural Ed. Facilities Fin. Corp. Hosp. Rev. Series 2015, 5% 9/1/30 | | 4,720,000 | 4,870,313 |
| Tarrant County Cultural Ed. Facilities Fin. Corp. Rev.: | | | |
| Series 2016 A, 5% 2/15/41 | | 7,620,000 | 7,899,993 |
| Series 2018 B, 5% 7/1/43 | | 1,320,000 | 1,376,606 |
| Texas Dept. of Hsg. & Cmnty. Affairs Multi-family Hsg. Rev. Series 2019, 2.95% 7/1/36 | | 3,494,405 | 3,259,399 |
| Texas Dept. of Hsg. & Cmnty. Affairs Single Family Mtg. Rev.: | | | |
| Series 2019 A, 4% 3/1/50 | | 2,760,000 | 2,811,086 |
| Series A, 3.5% 3/1/51 | | 2,580,000 | 2,584,982 |
| Texas Private Activity Bond Surface Trans. Corp. (LBJ Infrastructure Group LLC I-635 Managed Lanes Proj.) Series 2020 A: | | | |
| 4% 12/31/36 | | 1,920,000 | 1,902,617 |
| 4% 6/30/37 | | 2,830,000 | 2,784,362 |
| 4% 12/31/37 | | 3,775,000 | 3,711,872 |
| 4% 12/31/38 | | 2,125,000 | 2,069,620 |
| Texas State Univ. Sys. Fing. Rev.: | | | |
| Series 2017 A, 5% 3/15/31 | | 1,890,000 | 2,067,878 |
| Series 2019 A: | | | |
4% 3/15/34 | | 2,125,000 | 2,254,185 |
4% 3/15/35 | | 1,890,000 | 1,983,069 |
| Texas Wtr. Dev. Board Rev.: | | | |
| Series 2018 B, 5% 4/15/49 | | 1,765,000 | 1,900,400 |
| Series 2021, 2.5% 10/15/39 | | 2,000,000 | 1,669,166 |
| Univ. of Houston Univ. Revs. Series 2017 A, 5% 2/15/33 | | 3,305,000 | 3,537,951 |
| Univ. of Texas Permanent Univ. Fund Rev. Series 2016 B, 5% 7/1/29 | | 885,000 | 968,961 |
TOTAL TEXAS | | | 181,514,266 |
| Utah - 1.2% | | | |
| Salt Lake City Arpt. Rev.: | | | |
| Series 2017 B: | | | |
5% 7/1/34 | | 1,550,000 | 1,701,367 |
5% 7/1/35 | | 1,415,000 | 1,543,846 |
5% 7/1/36 | | 1,415,000 | 1,532,310 |
5% 7/1/37 | | 945,000 | 1,018,127 |
| Series 2021 B: | | | |
5% 7/1/46 | | 5,225,000 | 5,673,402 |
5% 7/1/51 | | 21,060,000 | 22,717,868 |
TOTAL UTAH | | | 34,186,920 |
| Vermont - 0.2% | | | |
| Vermont Edl. & Health Bldg. Fin. Agcy. Rev. (Champlain College Proj.) Series 2016 A: | | | |
| 5% 10/15/41 | | 2,265,000 | 2,271,090 |
| 5% 10/15/46 | | 2,645,000 | 2,616,425 |
TOTAL VERMONT | | | 4,887,515 |
| Virginia - 1.1% | | | |
| Chesapeake Gen. Oblig. Series 2020 A: | | | |
| 5% 8/1/34 | | 1,120,000 | 1,320,214 |
| 5% 8/1/35 | | 1,230,000 | 1,435,667 |
| Fredericksburg Econ. Dev. Auth. Rev. Series 2014, 5% 6/15/26 | | 1,850,000 | 1,909,663 |
| Lynchburg Econ. Dev. Series 2021, 3% 1/1/51 | | 2,010,000 | 1,490,357 |
| Stafford County Econ. Dev. Auth. Hosp. Facilities Rev.: | | | |
| (Mary Washington Hosp. Proj.) Series 2016, 3% 6/15/29 | | 350,000 | 351,235 |
| Series 2016: | | | |
4% 6/15/37 | | 325,000 | 325,324 |
5% 6/15/28 | | 945,000 | 1,007,762 |
5% 6/15/33 | | 210,000 | 220,687 |
5% 6/15/36 | | 945,000 | 979,684 |
| Virginia College Bldg. Auth. Edl. Facilities Rev. (21St Century Collage and Equip. Programs) Series 2021 A, 4% 2/1/35 | | 16,100,000 | 17,296,594 |
| Virginia Commonwealth Trans. Board Rev. (Virginia Gen. Oblig. Proj.) Series 2017 A: | | | |
| 5% 5/15/32 | | 450,000 | 505,243 |
| 5% 5/15/33 | | 1,890,000 | 2,119,694 |
| Winchester Econ. Dev. Auth. Series 2015, 5% 1/1/44 | | 2,360,000 | 2,395,000 |
TOTAL VIRGINIA | | | 31,357,124 |
| Washington - 3.0% | | | |
| Chelan County Pub. Util. District #1 Columbia River-Rock Island Hydro-Elec. Sys. Rev. Series A, 0% 6/1/28 (Nat'l. Pub. Fin. Guarantee Corp. Insured) | | 1,395,000 | 1,197,475 |
| Port of Seattle Rev. Series 2016: | | | |
| 5% 2/1/25 | | 1,180,000 | 1,237,445 |
| 5% 2/1/28 | | 1,890,000 | 2,032,304 |
| Tacoma Elec. Sys. Rev. Series 2017: | | | |
| 5% 1/1/37 | | 945,000 | 1,021,323 |
| 5% 1/1/38 | | 945,000 | 1,020,595 |
| Washington Convention Ctr. Pub. Facilities Series 2021, 4% 7/1/31 | | 11,755,000 | 11,022,259 |
| Washington Gen. Oblig.: | | | |
| Series 2015 C, 5% 2/1/34 | | 905,000 | 949,780 |
| Series 2017 D, 5% 2/1/33 | | 1,985,000 | 2,183,418 |
| Series 2021 A, 5% 6/1/35 | | 4,000,000 | 4,614,376 |
| Series R-2017 A: | | | |
5% 8/1/28 | | 890,000 | 973,651 |
5% 8/1/30 | | 890,000 | 971,766 |
| Washington Health Care Facilities Auth. Rev.: | | | |
| (Overlake Hosp. Med. Ctr., WA. Proj.) Series 2017 B: | | | |
5% 7/1/29 | | 380,000 | 412,702 |
5% 7/1/31 | | 810,000 | 874,911 |
5% 7/1/34 | | 2,495,000 | 2,664,753 |
5% 7/1/35 | | 2,220,000 | 2,350,323 |
5% 7/1/36 | | 2,125,000 | 2,236,222 |
5% 7/1/42 | | 8,705,000 | 8,904,586 |
| (Providence Health Systems Proj.) Series 2018 B: | | | |
5% 10/1/30 | | 1,135,000 | 1,274,871 |
5% 10/1/31 | | 1,415,000 | 1,580,218 |
5% 10/1/32 | | 975,000 | 1,081,604 |
5% 10/1/33 | | 2,360,000 | 2,598,282 |
| (Virginia Mason Med. Ctr. Proj.) Series 2017: | | | |
5% 8/15/29 | | 2,125,000 | 2,275,054 |
5% 8/15/30 | | 945,000 | 1,011,259 |
| Series 2017 B, 4% 8/15/41 | | 6,845,000 | 6,611,996 |
| Series 2019 A1: | | | |
5% 8/1/34 | | 1,790,000 | 1,952,194 |
5% 8/1/37 | | 945,000 | 1,004,444 |
| Series 2019 A2: | | | |
5% 8/1/35 | | 2,695,000 | 2,909,124 |
5% 8/1/39 | | 1,055,000 | 1,111,251 |
| Series 2020, 5% 9/1/55 | | 9,515,000 | 9,960,887 |
| Washington Higher Ed. Facilities Auth. Rev.: | | | |
| (Gonzaga Univ. Proj.) Series 2019 A, 3% 4/1/49 | | 3,245,000 | 2,468,666 |
| (Whitworth Univ. Proj.) Series 2016 A: | | | |
5% 10/1/34 | | 1,510,000 | 1,576,360 |
5% 10/1/35 | | 945,000 | 981,568 |
5% 10/1/40 | | 1,535,000 | 1,572,712 |
| Washington Hsg. Fin. Commission Nonprofit Hsg. Rev. (Judson Park Proj.) Series 2018: | | | |
| 4% 7/1/28 (d) | | 100,000 | 93,321 |
| 5% 7/1/33 (d) | | 325,000 | 308,279 |
| 5% 7/1/38 (d) | | 100,000 | 90,496 |
| 5% 7/1/48 (d) | | 300,000 | 254,899 |
TOTAL WASHINGTON | | | 85,385,374 |
| West Virginia - 0.1% | | | |
| West Virginia Hosp. Fin. Auth. Hosp. Rev. Series 2018 A, 5% 1/1/33 | | 1,735,000 | 1,855,430 |
| Wisconsin - 1.7% | | | |
| Blue Ridge Healthcare Pub. Fin. Auth. Series 2020 A, 4% 1/1/45 | | 1,415,000 | 1,349,533 |
| Pub. Fin. Auth. Edl. Facilities Series 2018 A: | | | |
| 5.25% 10/1/43 | | 575,000 | 579,619 |
| 5.25% 10/1/48 | | 575,000 | 575,851 |
| Pub. Fin. Auth. Hosp. Rev.: | | | |
| Series 2019 A, 5% 10/1/44 | | 5,820,000 | 6,028,564 |
| Series 2020 A, 3% 6/1/45 | | 3,000,000 | 2,372,477 |
| Pub. Fin. Auth. Sr. Living Rev. (Mary's Woods At Marylhurst, Inc. Proj.) Series 2017 A: | | | |
| 5% 5/15/25 (d) | | 500,000 | 500,711 |
| 5% 5/15/28 (d) | | 550,000 | 542,933 |
| 5.25% 5/15/37 (d) | | 180,000 | 172,990 |
| 5.25% 5/15/42 (d) | | 220,000 | 206,044 |
| 5.25% 5/15/47 (d) | | 220,000 | 200,854 |
| 5.25% 5/15/52 (d) | | 410,000 | 368,823 |
| Pub. Fin. Auth. Wisconsin Retirement Facility Rev. Series 2018: | | | |
| 5% 10/1/43 (d) | | 485,000 | 431,107 |
| 5% 10/1/48 (d) | | 625,000 | 539,247 |
| 5% 10/1/53 (d) | | 1,615,000 | 1,367,810 |
| Roseman Univ. of Health: | | | |
| Series 2020, 5% 4/1/50 (d) | | 1,085,000 | 1,020,644 |
| Series 2021 A: | | | |
3% 7/1/50 | | 1,740,000 | 1,316,740 |
4.5% 6/1/56 (d) | | 12,205,000 | 9,337,406 |
| Series 2021 B, 6.5% 6/1/56 (d) | | 3,990,000 | 3,304,220 |
| Wisconsin Health & Edl. Facilities: | | | |
| Series 2014: | | | |
4% 5/1/33 | | 1,395,000 | 1,405,579 |
5% 5/1/25 | | 730,000 | 747,300 |
| Series 2015, 5% 12/15/44 | | 7,315,000 | 7,408,260 |
| Series 2017 A: | | | |
5% 9/1/30 (Pre-Refunded to 9/1/27 @ 100) | | 1,200,000 | 1,335,794 |
5% 9/1/32 (Pre-Refunded to 9/1/27 @ 100) | | 1,040,000 | 1,157,688 |
| Series 2019 A, 5% 11/1/39 | | 3,975,000 | 3,531,332 |
| Series 2019 B1, 2.825% 11/1/28 | | 1,125,000 | 1,005,588 |
| Series 2019 B2, 2.55% 11/1/27 | | 610,000 | 578,164 |
| Wisconsin Health & Edl. Facilities Auth. Rev. Series 2012, 5% 6/1/39 | | 1,125,000 | 1,125,536 |
TOTAL WISCONSIN | | | 48,510,814 |
| TOTAL MUNICIPAL BONDS (Cost $2,837,328,818) | | | 2,748,239,191 |
| | | | |
| Municipal Notes - 0.4% |
| | | Principal Amount (a) | Value ($) |
| Arizona - 0.2% | | | |
| Arizona St Indl. Dev. Auth. Multi Participating VRDN Series MIZ 91 18, 1.32% 2/1/23 (Liquidity Facility Mizuho Cap. Markets LLC) (b)(h)(i) | | 6,500,000 | 6,500,000 |
| Texas - 0.2% | | | |
| Gulf Coast Indl. Dev. Auth. TX Rev. (ExxonMobil Proj.) Series 2012, 1.1% 2/1/23, VRDN (b) | | 5,300,000 | 5,300,000 |
| TOTAL MUNICIPAL NOTES (Cost $11,800,000) | | | 11,800,000 |
| | | | |
| Money Market Funds - 3.3% |
| | | Shares | Value ($) |
Fidelity Tax-Free Cash Central Fund 1.39% (j)(k) (Cost $93,598,653) | | 93,571,376 | 93,599,434 |
| | | | |
| TOTAL INVESTMENT IN SECURITIES - 99.2% (Cost $2,942,727,471) | 2,853,638,625 |
NET OTHER ASSETS (LIABILITIES) - 0.8% | 23,737,820 |
| NET ASSETS - 100.0% | 2,877,376,445 |
| | |
Security Type Abbreviations
| VRDN | - | VARIABLE RATE DEMAND NOTE (A debt instrument that is payable upon demand, either daily, weekly or monthly) |
Legend
| (a) | Amount is stated in United States dollars unless otherwise noted. |
| (b) | Coupon rates for floating and adjustable rate securities reflect the rates in effect at period end. |
| (c) | Coupon is indexed to a floating interest rate which may be multiplied by a specified factor and/or subject to caps or floors. |
| (d) | Security exempt from registration under Rule 144A of the Securities Act of 1933. These securities may be resold in transactions exempt from registration, normally to qualified institutional buyers. At the end of the period, the value of these securities amounted to $51,572,852 or 1.8% of net assets. |
| (e) | Security initially issued in zero coupon form which converts to coupon form at a specified rate and date. The rate shown is the rate at period end. |
| (f) | Security or a portion of the security purchased on a delayed delivery or when-issued basis. |
| (g) | A portion of the security sold on a delayed delivery basis. |
| (h) | Provides evidence of ownership in one or more underlying municipal bonds. |
| (i) | Coupon rates are determined by re-marketing agents based on current market conditions. |
| (j) | Information in this report regarding holdings by state and security types does not reflect the holdings of the Fidelity Tax-Free Cash Central Fund. |
| (k) | Affiliated fund that is generally available only to investment companies and other accounts managed by Fidelity Investments. The rate quoted is the annualized seven-day yield of the fund at period end. A complete unaudited listing of the fund's holdings as of its most recent quarter end is available upon request. In addition, each Fidelity Central Fund's financial statements, which are not covered by the Fund's Report of Independent Registered Public Accounting Firm, are available on the SEC's website or upon request. |
Affiliated Central Funds
Fiscal year to date information regarding the Fund's investments in Fidelity Central Funds, including the ownership percentage, is presented below.
| Affiliate | Value, beginning of period ($) | Purchases ($) | Sales Proceeds ($) | Dividend Income ($) | Realized Gain (loss) ($) | Change in Unrealized appreciation (depreciation) ($) | Value, end of period ($) | % ownership, end of period |
| Fidelity Tax-Free Cash Central Fund 1.39% | 70,108,427 | 1,143,144,005 | 1,119,653,000 | 643,162 | 6,212 | (6,210) | 93,599,434 | 9.1% |
| Total | 70,108,427 | 1,143,144,005 | 1,119,653,000 | 643,162 | 6,212 | (6,210) | 93,599,434 | |
| | | | | | | | | |
Amounts in the dividend income column in the above table include any capital gain distributions from underlying funds, which are presented in the corresponding line item in the Statement of Operations, if applicable.
Amounts included in the purchases and sales proceeds columns may include in-kind transactions, if applicable.
Investment Valuation
The following is a summary of the inputs used, as of January 31, 2023, involving the Fund's assets and liabilities carried at fair value. The inputs or methodology used for valuing securities may not be an indication of the risk associated with investing in those securities. For more information on valuation inputs, and their aggregation into the levels used below, please refer to the Investment Valuation section in the accompanying Notes to Financial Statements.
| Valuation Inputs at Reporting Date: |
| Description | Total ($) | Level 1 ($) | Level 2 ($) | Level 3 ($) |
Investments in Securities: | | | | |
|
| Municipal Securities | 2,760,039,191 | - | 2,760,039,191 | - |
|
| Money Market Funds | 93,599,434 | 93,599,434 | - | - |
| Total Investments in Securities: | 2,853,638,625 | 93,599,434 | 2,760,039,191 | - |
| Statement of Assets and Liabilities |
| | | | January 31, 2023 |
| | | | | |
| Assets | | | | |
| Investment in securities, at value - See accompanying schedule: | | | | |
Unaffiliated issuers (cost $2,849,128,818) | $ | 2,760,039,191 | | |
Fidelity Central Funds (cost $93,598,653) | | 93,599,434 | | |
| | | | | |
| | | | | |
| Total Investment in Securities (cost $2,942,727,471) | | | $ | 2,853,638,625 |
| Cash | | | | 107,500 |
| Receivable for securities sold on a delayed delivery basis | | | | 137,019 |
| Receivable for fund shares sold | | | | 2,739,403 |
| Interest receivable | | | | 28,422,164 |
| Distributions receivable from Fidelity Central Funds | | | | 91,972 |
| Prepaid expenses | | | | 2,606 |
| Receivable from investment adviser for expense reductions | | | | 489,355 |
| Other receivables | | | | 1,769 |
Total assets | | | | 2,885,630,413 |
| Liabilities | | | | |
| Payable for investments purchased on a delayed delivery basis | $ | 2,629,627 | | |
| Payable for fund shares redeemed | | 1,764,685 | | |
| Distributions payable | | 2,727,025 | | |
| Accrued management fee | | 819,862 | | |
| Other affiliated payables | | 248,745 | | |
| Other payables and accrued expenses | | 64,024 | | |
| Total Liabilities | | | | 8,253,968 |
| Net Assets | | | $ | 2,877,376,445 |
| Net Assets consist of: | | | | |
| Paid in capital | | | $ | 3,012,354,542 |
| Total accumulated earnings (loss) | | | | (134,978,097) |
| Net Assets | | | $ | 2,877,376,445 |
Net Asset Value , offering price and redemption price per share ($2,877,376,445 ÷ 262,606,809 shares) | | | $ | 10.96 |
| Statement of Operations |
| | | | Year ended January 31, 2023 |
| Investment Income | | | | |
| Interest | | | $ | 97,722,397 |
| Income from Fidelity Central Funds | | | | 642,624 |
| Total Income | | | | 98,365,021 |
| Expenses | | | | |
| Management fee | $ | 11,305,954 | | |
| Transfer agent fees | | 2,920,982 | | |
| Accounting fees and expenses | | 542,589 | | |
| Custodian fees and expenses | | 31,701 | | |
| Independent trustees' fees and expenses | | 11,675 | | |
| Registration fees | | 104,198 | | |
| Audit | | 67,160 | | |
| Legal | | 5,301 | | |
| Miscellaneous | | 16,152 | | |
| Total expenses before reductions | | 15,005,712 | | |
| Expense reductions | | (6,949,862) | | |
| Total expenses after reductions | | | | 8,055,850 |
| Net Investment income (loss) | | | | 90,309,171 |
| Realized and Unrealized Gain (Loss) | | | | |
| Net realized gain (loss) on: | | | | |
| Investment Securities: | | | | |
| Unaffiliated issuers | | (46,200,102) | | |
| Redemptions in-kind | | (10,197,768) | | |
| Fidelity Central Funds | | 6,212 | | |
| Capital gain distributions from Fidelity Central Funds | | 538 | | |
| Total net realized gain (loss) | | | | (56,391,120) |
| Change in net unrealized appreciation (depreciation) on: | | | | |
| Investment Securities: | | | | |
| Unaffiliated issuers | | (252,361,532) | | |
| Fidelity Central Funds | | (6,210) | | |
| Total change in net unrealized appreciation (depreciation) | | | | (252,367,742) |
| Net gain (loss) | | | | (308,758,862) |
| Net increase (decrease) in net assets resulting from operations | | | $ | (218,449,691) |
| Statement of Changes in Net Assets |
| |
| | Year ended January 31, 2023 | | Year ended January 31, 2022 |
| Increase (Decrease) in Net Assets | | | | |
| Operations | | | | |
| Net investment income (loss) | $ | 90,309,171 | $ | 110,582,951 |
| Net realized gain (loss) | | (56,391,120) | | 14,010,485 |
| Change in net unrealized appreciation (depreciation) | | (252,367,742) | | (182,614,888) |
| Net increase (decrease) in net assets resulting from operations | | (218,449,691) | | (58,021,452) |
| Distributions to shareholders | | (90,744,332) | | (123,268,008) |
| Share transactions | | | | |
| Proceeds from sales of shares | | 1,285,693,354 | | 913,491,530 |
| Reinvestment of distributions | | 50,620,037 | | 57,887,688 |
| Cost of shares redeemed | | (2,668,009,654) | | (746,733,438) |
Net increase (decrease) in net assets resulting from share transactions | | (1,331,696,263) | | 224,645,780 |
| Total increase (decrease) in net assets | | (1,640,890,286) | | 43,356,320 |
| | | | | |
| Net Assets | | | | |
| Beginning of period | | 4,518,266,731 | | 4,474,910,411 |
| End of period | $ | 2,877,376,445 | $ | 4,518,266,731 |
| | | | | |
| Other Information | | | | |
| Shares | | | | |
| Sold | | 118,888,176 | | 74,806,481 |
| Issued in reinvestment of distributions | | 4,670,605 | | 4,763,272 |
| Redeemed | | (244,286,870) | | (61,459,051) |
| Net increase (decrease) | | (120,728,089) | | 18,110,702 |
| | | | | |
Financial Highlights
| Fidelity® Tax-Free Bond Fund |
| |
| Years ended January 31, | | 2023 | | 2022 | | 2021 | | 2020 | | 2019 |
Selected Per-Share Data | | | | | | | | | | |
| Net asset value, beginning of period | $ | 11.79 | $ | 12.25 | $ | 12.13 | $ | 11.37 | $ | 11.39 |
| Income from Investment Operations | | | | | | | | | | |
Net investment income (loss) A,B | | .304 | | .291 | | .312 | | .337 | | .340 |
| Net realized and unrealized gain (loss) | | (.828) | | (.427) | | .152 | | .772 | | .003 |
| Total from investment operations | | (.524) | | (.136) | | .464 | | 1.109 | | .343 |
| Distributions from net investment income | | (.304) | | (.291) | | (.312) | | (.337) | | (.340) |
| Distributions from net realized gain | | (.002) | | (.033) | | (.032) | | (.012) | | (.023) |
| Total distributions | | (.306) | | (.324) | | (.344) | | (.349) | | (.363) |
| Net asset value, end of period | $ | 10.96 | $ | 11.79 | $ | 12.25 | $ | 12.13 | $ | 11.37 |
Total Return C | | (4.38)% | | (1.16)% | | 3.94% | | 9.87% | | 3.09% |
Ratios to Average Net Assets B,D,E | | | | | | | | | | |
| Expenses before reductions | | .46% | | .46% | | .46% | | .46% | | .46% |
| Expenses net of fee waivers, if any | | .25% | | .25% | | .25% | | .25% | | .25% |
| Expenses net of all reductions | | .25% | | .25% | | .25% | | .25% | | .25% |
| Net investment income (loss) | | 2.78% | | 2.39% | | 2.62% | | 2.86% | | 3.02% |
| Supplemental Data | | | | | | | | | | |
| Net assets, end of period (000 omitted) | $ | 2,877,376 | $ | 4,518,267 | $ | 4,474,910 | $ | 4,458,835 | $ | 3,611,503 |
Portfolio turnover rate F | | 11% G | | 8% | | 19% | | 8% | | 23% |
A Calculated based on average shares outstanding during the period.
B Net investment income (loss) is affected by the timing of the declaration of dividends by any underlying mutual funds or exchange-traded funds (ETFs). Net investment income (loss) of any mutual funds or ETFs is not included in the Fund's net investment income (loss) ratio.
C Total returns would have been lower if certain expenses had not been reduced during the applicable periods shown.
D Fees and expenses of any underlying mutual funds or exchange-traded funds (ETFs) are not included in the Fund's expense ratio. The Fund indirectly bears its proportionate share of these expenses. For additional expense information related to investments in Fidelity Central Funds, please refer to the "Investments in Fidelity Central Funds" note found in the Notes to Financial Statements section of the most recent Annual or Semi-Annual report.
E Expense ratios reflect operating expenses of the class. Expenses before reductions do not reflect amounts reimbursed, waived, or reduced through arrangements with the investment adviser, brokerage services, or other offset arrangements, if applicable, and do not represent the amount paid by the class during periods when reimbursements, waivers or reductions occur.
F Amount does not include the portfolio activity of any underlying mutual funds or exchange-traded funds (ETFs).
G Portfolio turnover rate excludes securities received or delivered in-kind.
For the period ended January 31, 2023
1. Organization.
Fidelity Tax-Free Bond Fund (the Fund) is a fund of Fidelity Salem Street Trust (the Trust) and is authorized to issue an unlimited number of shares. Share transactions on the Statement of Changes in Net Assets may contain exchanges between affiliated funds. The Trust is registered under the Investment Company Act of 1940, as amended (the 1940 Act), as an open-end management investment company organized as a Massachusetts business trust.
2. Investments in Fidelity Central Funds.
Funds may invest in Fidelity Central Funds, which are open-end investment companies generally available only to other investment companies and accounts managed by the investment adviser and its affiliates. The Schedule of Investments lists any Fidelity Central Funds held as an investment as of period end, but does not include the underlying holdings of each Fidelity Central Fund. An investing fund indirectly bears its proportionate share of the expenses of the underlying Fidelity Central Funds.
Based on its investment objective, each Fidelity Central Fund may invest or participate in various investment vehicles or strategies that are similar to those of the investing fund. These strategies are consistent with the investment objectives of the investing fund and may involve certain economic risks which may cause a decline in value of each of the Fidelity Central Funds and thus a decline in the value of the investing fund.
| Fidelity Central Fund | Investment Manager | Investment Objective | Investment Practices | Expense Ratio A |
| Fidelity Money Market Central Funds | Fidelity Management & Research Company LLC (FMR) | Each fund seeks to obtain a high level of current income consistent with the preservation of capital and liquidity. | Short-term Investments | Less than .005% |
A Expenses expressed as a percentage of average net assets and are as of each underlying Central Fund's most recent annual or semi-annual shareholder report.
A complete unaudited list of holdings for each Fidelity Central Fund is available upon request or at the Securities and Exchange Commission website at www.sec.gov. In addition, the financial statements of the Fidelity Central Funds which contain the significant accounting policies (including investment valuation policies) of those funds, and are not covered by the Report of Independent Registered Public Accounting Firm, are available on the Securities and Exchange Commission website or upon request.
3. Significant Accounting Policies.
The Fund is an investment company and applies the accounting and reporting guidance of the Financial Accounting Standards Board (FASB) Accounting Standards Codification Topic 946 Financial Services - Investment Companies . The financial statements have been prepared in conformity with accounting principles generally accepted in the United States of America (GAAP), which require management to make certain estimates and assumptions at the date of the financial statements. Actual results could differ from those estimates. Subsequent events, if any, through the date that the financial statements were issued have been evaluated in the preparation of the financial statements. The Fund's Schedule of Investments lists any underlying mutual funds or exchange-traded funds (ETFs) but does not include the underlying holdings of these funds. The following summarizes the significant accounting policies of the Fund:
Investment Valuation. Investments are valued as of 4:00 p.m. Eastern time on the last calendar day of the period. The Board of Trustees (the Board) has designated the Fund's investment adviser as the valuation designee responsible for the fair valuation function and performing fair value determinations as needed. The investment adviser has established a Fair Value Committee (the Committee) to carry out the day-to-day fair valuation responsibilities and has adopted policies and procedures to govern the fair valuation process and the activities of the Committee. In accordance with these fair valuation policies and procedures, which have been approved by the Board, the Fund attempts to obtain prices from one or more third party pricing services or brokers to value its investments. When current market prices, quotations or currency exchange rates are not readily available or reliable, investments will be fair valued in good faith by the Committee, in accordance with the policies and procedures. Factors used in determining fair value vary by investment type and may include market or investment specific events, transaction data, estimated cash flows, and market observations of comparable investments. The frequency that the fair valuation procedures are used cannot be predicted and they may be utilized to a significant extent. The Committee manages the Fund's fair valuation practices and maintains the fair valuation policies and procedures. The Fund's investment adviser reports to the Board information regarding the fair valuation process and related material matters.
The Fund categorizes the inputs to valuation techniques used to value its investments into a disclosure hierarchy consisting of three levels as shown below:
Level 1 - unadjusted quoted prices in active markets for identical investments
Level 2 - other significant observable inputs (including quoted prices for similar investments, interest rates, prepayment speeds, etc.)
Level 3 - unobservable inputs (including the Fund's own assumptions based on the best information available)
Valuation techniques used to value the Fund's investments by major category are as follows:
Debt securities, including restricted securities, are valued based on evaluated prices received from third party pricing services or from brokers who make markets in such securities. Municipal securities are valued by pricing services who utilize matrix pricing which considers yield or price of bonds of comparable quality, coupon, maturity and type or by broker-supplied prices. When independent prices are unavailable or unreliable, debt securities may be valued utilizing pricing methodologies which consider similar factors that would be used by third party pricing services. Debt securities are generally categorized as Level 2 in the hierarchy but may be Level 3 depending on the circumstances.
Investments in open-end mutual funds, including the Fidelity Central Funds, are valued at their closing net asset value (NAV) each business day and are categorized as Level 1 in the hierarchy.
Changes in valuation techniques may result in transfers in or out of an assigned level within the disclosure hierarchy. The aggregate value of investments by input level as of January 31, 2023 is included at the end of the Fund's Schedule of Investments.
Investment Transactions and Income. For financial reporting purposes, the Fund's investment holdings and NAV include trades executed through the end of the last business day of the period. The NAV per share for processing shareholder transactions is calculated as of the close of business of the New York Stock Exchange (NYSE), normally 4:00 p.m. Eastern time and includes trades executed through the end of the prior business day. Gains and losses on securities sold are determined on the basis of identified cost. Income and capital gain distributions from Fidelity Central Funds, if any, are recorded on the ex-dividend date. Interest income is accrued as earned and includes coupon interest and amortization of premium and accretion of discount on debt securities as applicable. Debt obligations may be placed on non-accrual status and related interest income may be reduced by ceasing current accruals and writing off interest receivables when the collection of all or a portion of interest has become doubtful based on consistently applied procedures. A debt obligation is removed from non-accrual status when the issuer resumes interest payments or when collectability of interest is reasonably assured.
Expenses. Expenses directly attributable to a fund are charged to that fund. Expenses attributable to more than one fund are allocated among the respective funds on the basis of relative net assets or other appropriate methods. Expenses included in the accompanying financial statements reflect the expenses of that fund and do not include any expenses associated with any underlying mutual funds or exchange-traded funds. Although not included in a fund's expenses, a fund indirectly bears its proportionate share of these expenses through the net asset value of each underlying mutual fund or exchange-traded fund. Expense estimates are accrued in the period to which they relate and adjustments are made when actual amounts are known.
Income Tax Information and Distributions to Shareholders. Each year, the Fund intends to qualify as a regulated investment company under Subchapter M of the Internal Revenue Code, including distributing substantially all of its taxable income and realized gains. As a result, no provision for U.S. Federal income taxes is required. As of January 31, 2023, the Fund did not have any unrecognized tax benefits in the financial statements; nor is the Fund aware of any tax positions for which it is reasonably possible that the total amounts of unrecognized tax benefits will significantly change in the next twelve months. The Fund files a U.S. federal tax return, in addition to state and local tax returns as required. The Fund's federal income tax returns are subject to examination by the Internal Revenue Service (IRS) for a period of three fiscal years after they are filed. State and local tax returns may be subject to examination for an additional fiscal year depending on the jurisdiction.
Distributions are declared and recorded daily and paid monthly from net investment income. Distributions from realized gains, if any, are declared and recorded on the ex-dividend date. Income and capital gain distributions are determined in accordance with income tax regulations, which may differ from GAAP.
Capital accounts within the financial statements are adjusted for permanent book-tax differences. These adjustments have no impact on net assets or the results of operations. Capital accounts are not adjusted for temporary book-tax differences which will reverse in a subsequent period.
Book-tax differences are primarily due to market discount, redemptions in-kind and capital loss carryforwards.
The Fund purchases municipal securities whose interest, in the opinion of the issuer, is free from federal income tax. There is no assurance that the IRS will agree with this opinion. In the event the IRS determines that the issuer does not comply with relevant tax requirements, interest payments from a security could become federally taxable, possibly retroactively to the date the security was issued.
As of period end, the cost and unrealized appreciation (depreciation) in securities, and derivatives if applicable, for federal income tax purposes were as follows:
| Gross unrealized appreciation | $40,316,145 |
| Gross unrealized depreciation | (128,929,534) |
| Net unrealized appreciation (depreciation) | $(88,613,389) |
| Tax Cost | $2,942,252,014 |
The tax-based components of distributable earnings as of period end were as follows:
| Capital loss carryforward | $(46,184,349) |
| Net unrealized appreciation (depreciation) on securities and other investments | $(88,613,389) |
Capital loss carryforwards are only available to offset future capital gains of the Fund to the extent provided by regulations and may be limited. The capital loss carryforward information presented below, including any applicable limitation, is estimated as of fiscal period end and is subject to adjustment.
Short-term | $(35,814,736) |
Long-term | (10,369,613) |
Total capital loss carryforward | $(46,184,349) |
The tax character of distributions paid was as follows:
| | January 31, 2023 | January 31, 2022 |
| Tax-exempt Income | $90,014,082 | $110,516,107 |
| Long-term Capital Gains | 730,250 | 12,751,901 |
| Total | $90,744,332 | $123,268,008 |
Delayed Delivery Transactions and When-Issued Securities. During the period, certain Funds transacted in securities on a delayed delivery or when-issued basis. Payment and delivery may take place after the customary settlement period for that security. The price of the underlying securities and the date when the securities will be delivered and paid for are fixed at the time the transaction is negotiated. Securities purchased on a delayed delivery or when-issued basis are identified as such in the Schedule of Investments. Compensation for interest forgone in the purchase of a delayed delivery or when-issued debt security may be received. With respect to purchase commitments, each applicable Fund identifies securities as segregated in its records with a value at least equal to the amount of the commitment. Payables and receivables associated with the purchases and sales of delayed delivery securities having the same coupon, settlement date and broker are offset. Delayed delivery or when-issued securities that have been purchased from and sold to different brokers are reflected as both payables and receivables in the Statement of Assets and Liabilities under the caption "Delayed delivery", as applicable. Losses may arise due to changes in the value of the underlying securities or if the counterparty does not perform under the contract's terms, or if the issuer does not issue the securities due to political, economic, or other factors.
Restricted Securities (including Private Placements). Funds may invest in securities that are subject to legal or contractual restrictions on resale. These securities generally may be resold in transactions exempt from registration or to the public if the securities are registered. Disposal of these securities may involve time-consuming negotiations and expense, and prompt sale at an acceptable price may be difficult. Information regarding restricted securities held at period end is included at the end of the Schedule of Investments, if applicable.
4. Purchases and Sales of Investments.
Purchases and sales of securities, other than short-term securities and in-kind transactions, as applicable, are noted in the table below.
| | Purchases ($) | Sales ($) |
| Fidelity Tax-Free Bond Fund | 343,243,513 | 1,580,263,175 |
5. Fees and Other Transactions with Affiliates.
Management Fee. Fidelity Management & Research Company LLC (the investment adviser) and its affiliates provide the Fund with investment management related services for which the Fund pays a monthly management fee. The management fee is the sum of an individual fund fee rate that is based on an annual rate of .25% of the Fund's average net assets and an annualized group fee rate that averaged .10% during the period. The group fee rate is based upon the monthly average net assets of a group of registered investment companies with which the investment adviser has management contracts. The group fee rate decreases as assets under management increase and increases as assets under management decrease. For the reporting period, the total annual management fee rate was .35% of the Fund's average net assets.
Transfer Agent Fees. Fidelity Investments Institutional Operations Company LLC (FIIOC), an affiliate of the investment adviser, is the transfer, dividend disbursing and shareholder servicing agent for the Fund. FIIOC receives account fees and asset-based fees that vary according to account size and type of account. FIIOC pays for typesetting, printing and mailing of shareholder reports, except proxy statements. For the period, transfer agent fees were equivalent to an annual rate of .09% of average net assets.
Accounting Fees. Fidelity Service Company, Inc. (FSC), an affiliate of the investment adviser, maintains the Fund's accounting records. The accounting fee is based on the level of average net assets for each month. For the period, the fees were equivalent to the following annual rates:
| | % of Average Net Assets |
| Fidelity Tax-Free Bond Fund | .02 |
Interfund Trades. Funds may purchase from or sell securities to other Fidelity Funds under procedures adopted by the Board. The procedures have been designed to ensure these interfund trades are executed in accordance with Rule 17a-7 of the 1940 Act. Any interfund trades are included within the respective purchases and sales amounts shown in the Purchases and Sales of Investments note. Interfund trades during the period are noted in the table below.
| | Purchases ($) | Sales ($) | Realized Gain (Loss) ($) |
| Fidelity Tax-Free Bond Fund | 1,100,000 | - | - |
Affiliated Redemptions In-Kind. Shares that were redeemed in-kind for investments, including accrued interest and cash, if any, are shown in the table below. The net realized gain or loss on investments delivered through in-kind redemptions is included in the "Net realized gain (loss) on: Redemptions in-kind" line in the accompanying Statement of Operations. The amount of the in-kind redemptions is included in share transactions in the accompanying Statement of Changes in Net Assets. There was no gain or loss for federal income tax purposes.
| | Shares | Total net realized gain or loss ($) | Total Proceeds($) |
| Fidelity Tax-Free Bond Fund | 16,954,008 | (10,197,768) | 180,390,645 |
6. Committed Line of Credit.
Certain Funds participate with other funds managed by the investment adviser or an affiliate in a $4.25 billion credit facility (the "line of credit") to be utilized for temporary or emergency purposes to fund shareholder redemptions or for other short-term liquidity purposes. The participating funds have agreed to pay commitment fees on their pro-rata portion of the line of credit, which are reflected in Miscellaneous expenses on the Statement of Operations, and are listed below. During the period, there were no borrowings on this line of credit.
| | Amount |
| Fidelity Tax-Free Bond Fund | $6,073 |
7. Expense Reductions.
The investment adviser contractually agreed to reimburse the Fund to the extent annual operating expenses exceeded .25% of average net assets. This reimbursement will remain in place through May 31, 2024. Some expenses, for example the compensation of the independent Trustees, and certain miscellaneous expenses such as proxy and shareholder meeting expenses, are excluded from this reimbursement. During the period this reimbursement reduced the Fund's expenses by $6,886,966.
Through arrangements with the Fund's custodian, credits realized as a result of certain uninvested cash balances were used to reduce the Fund's expenses by $2,862.
In addition, during the period the investment adviser or an affiliate reimbursed and/or waived a portion of operating expenses in the amount of $60,034.
8. Other.
A fund's organizational documents provide former and current trustees and officers with a limited indemnification against liabilities arising in connection with the performance of their duties to the fund. In the normal course of business, a fund may also enter into contracts that provide general indemnifications. A fund's maximum exposure under these arrangements is unknown as this would be dependent on future claims that may be made against a fund. The risk of material loss from such claims is considered remote.
9. Risk and Uncertainties.
Many factors affect a fund's performance. Developments that disrupt global economies and financial markets, such as pandemics, epidemics, outbreaks of infectious diseases, war, terrorism, and environmental disasters, may significantly affect a fund's investment performance. The effects of these developments to a fund will be impacted by the types of securities in which a fund invests, the financial condition, industry, economic sector, and geographic location of an issuer, and a fund's level of investment in the securities of that issuer.
To the Board of Trustees of Fidelity Salem Street Trust and the Shareholders of Fidelity Tax-Free Bond Fund:
Opinion on the Financial Statements and Financial Highlights
We have audited the accompanying statement of assets and liabilities of Fidelity Tax-Free Bond Fund (the "Fund"), a fund of Fidelity Salem Street Trust, including the schedule of investments, as of January 31, 2023, the related statement of operations for the year then ended, the statement of changes in net assets for each of the two years in the period then ended, the financial highlights for each of the five years in the period then ended, and the related notes. In our opinion, the financial statements and financial highlights present fairly, in all material respects, the financial position of the Fund as of January 31, 2023, and the results of its operations for the year then ended, the changes in its net assets for each of the two years in the period then ended, and the financial highlights for each of the five years in the period then ended in conformity with accounting principles generally accepted in the United States of America.
Basis for Opinion
These financial statements and financial highlights are the responsibility of the Fund's management. Our responsibility is to express an opinion on the Fund's financial statements and financial highlights based on our audits. We are a public accounting firm registered with the Public Company Accounting Oversight Board (United States) (PCAOB) and are required to be independent with respect to the Fund in accordance with the U.S. federal securities laws and the applicable rules and regulations of the Securities and Exchange Commission and the PCAOB.
We conducted our audits in accordance with the standards of the PCAOB. Those standards require that we plan and perform the audit to obtain reasonable assurance about whether the financial statements and financial highlights are free of material misstatement, whether due to error or fraud. The Fund is not required to have, nor were we engaged to perform, an audit of its internal control over financial reporting. As part of our audits we are required to obtain an understanding of internal control over financial reporting but not for the purpose of expressing an opinion on the effectiveness of the Fund's internal control over financial reporting. Accordingly, we express no such opinion.
Our audits included performing procedures to assess the risks of material misstatement of the financial statements and financial highlights, whether due to error or fraud, and performing procedures that respond to those risks. Such procedures included examining, on a test basis, evidence regarding the amounts and disclosures in the financial statements and financial highlights. Our audits also included evaluating the accounting principles used and significant estimates made by management, as well as evaluating the overall presentation of the financial statements and financial highlights. Our procedures included confirmation of securities owned as of January 31, 2023, by correspondence with the custodian and brokers; when replies were not received from brokers, we performed other auditing procedures. We believe that our audits provide a reasonable basis for our opinion.
/s/ Deloitte & Touche LLP
Boston, Massachusetts
March 14, 2023
We have served as the auditor of one or more of the Fidelity investment companies since 1999.
The Trustees, Members of the Advisory Board (if any), and officers of the trust and fund, as applicable, are listed below. The Board of Trustees governs the fund and is responsible for protecting the interests of shareholders. The Trustees are experienced executives who meet periodically throughout the year to oversee the fund's activities, review contractual arrangements with companies that provide services to the fund, oversee management of the risks associated with such activities and contractual arrangements, and review the fund's performance. Except for Jonathan Chiel, each of the Trustees oversees 291 funds. Mr. Chiel oversees 186 funds.
The Trustees hold office without limit in time except that (a) any Trustee may resign; (b) any Trustee may be removed by written instrument, signed by at least two-thirds of the number of Trustees prior to such removal; (c) any Trustee who requests to be retired or who has become incapacitated by illness or injury may be retired by written instrument signed by a majority of the other Trustees; and (d) any Trustee may be removed at any special meeting of shareholders by a two-thirds vote of the outstanding voting securities of the trust. Each Trustee who is not an interested person (as defined in the 1940 Act) of the trust and the fund is referred to herein as an Independent Trustee. Each Independent Trustee shall retire not later than the last day of the calendar year in which his or her 75th birthday occurs. The Independent Trustees may waive this mandatory retirement age policy with respect to individual Trustees. Officers and Advisory Board Members hold office without limit in time, except that any officer or Advisory Board Member may resign or may be removed by a vote of a majority of the Trustees at any regular meeting or any special meeting of the Trustees. Except as indicated, each individual has held the office shown or other offices in the same company for the past five years.
The fund's Statement of Additional Information (SAI) includes more information about the Trustees. To request a free copy, call Fidelity at 1-800-544-8544.
Experience, Skills, Attributes, and Qualifications of the Trustees. The Governance and Nominating Committee has adopted a statement of policy that describes the experience, qualifications, attributes, and skills that are necessary and desirable for potential Independent Trustee candidates (Statement of Policy). The Board believes that each Trustee satisfied at the time he or she was initially elected or appointed a Trustee, and continues to satisfy, the standards contemplated by the Statement of Policy. The Governance and Nominating Committee also engages professional search firms to help identify potential Independent Trustee candidates who have the experience, qualifications, attributes, and skills consistent with the Statement of Policy. From time to time, additional criteria based on the composition and skills of the current Independent Trustees, as well as experience or skills that may be appropriate in light of future changes to board composition, business conditions, and regulatory or other developments, have also been considered by the professional search firms and the Governance and Nominating Committee. In addition, the Board takes into account the Trustees' commitment and participation in Board and committee meetings, as well as their leadership of standing and ad hoc committees throughout their tenure.
In determining that a particular Trustee was and continues to be qualified to serve as a Trustee, the Board has considered a variety of criteria, none of which, in isolation, was controlling. The Board believes that, collectively, the Trustees have balanced and diverse experience, qualifications, attributes, and skills, which allow the Board to operate effectively in governing the fund and protecting the interests of shareholders. Information about the specific experience, skills, attributes, and qualifications of each Trustee, which in each case led to the Board's conclusion that the Trustee should serve (or continue to serve) as a trustee of the fund, is provided below.
Board Structure and Oversight Function. Abigail P. Johnson is an interested person and currently serves as Chairman. The Trustees have determined that an interested Chairman is appropriate and benefits shareholders because an interested Chairman has a personal and professional stake in the quality and continuity of services provided to the fund. Independent Trustees exercise their informed business judgment to appoint an individual of their choosing to serve as Chairman, regardless of whether the Trustee happens to be independent or a member of management. The Independent Trustees have determined that they can act independently and effectively without having an Independent Trustee serve as Chairman and that a key structural component for assuring that they are in a position to do so is for the Independent Trustees to constitute a substantial majority for the Board. The Independent Trustees also regularly meet in executive session. Michael E. Kenneally serves as Chairman of the Independent Trustees and as such (i) acts as a liaison between the Independent Trustees and management with respect to matters important to the Independent Trustees and (ii) with management prepares agendas for Board meetings.
Fidelity ® funds are overseen by different Boards of Trustees. The fund's Board oversees Fidelity's alternative investment, investment-grade bond, money market, asset allocation and certain equity funds, and other Boards oversee Fidelity's high income and other equity funds. The asset allocation funds may invest in Fidelity ® funds that are overseen by such other Boards. The use of separate Boards, each with its own committee structure, allows the Trustees of each group of Fidelity ® funds to focus on the unique issues of the funds they oversee, including common research, investment, and operational issues. On occasion, the separate Boards establish joint committees to address issues of overlapping consequences for the Fidelity ® funds overseen by each Board.
The Trustees operate using a system of committees to facilitate the timely and efficient consideration of all matters of importance to the Trustees, the fund, and fund shareholders and to facilitate compliance with legal and regulatory requirements and oversight of the fund's activities and associated risks. The Board, acting through its committees, has charged FMR and its affiliates with (i) identifying events or circumstances the occurrence of which could have demonstrably adverse effects on the fund's business and/or reputation; (ii) implementing processes and controls to lessen the possibility that such events or circumstances occur or to mitigate the effects of such events or circumstances if they do occur; and (iii) creating and maintaining a system designed to evaluate continuously business and market conditions in order to facilitate the identification and implementation processes described in (i) and (ii) above. Because the day-to-day operations and activities of the fund are carried out by or through FMR, its affiliates, and other service providers, the fund's exposure to risks is mitigated but not eliminated by the processes overseen by the Trustees. While each of the Board's committees has responsibility for overseeing different aspects of the fund's activities, oversight is exercised primarily through the Operations and Audit Committees. In addition, an ad hoc Board committee of Independent Trustees has worked with FMR to enhance the Board's oversight of investment and financial risks, legal and regulatory risks, technology risks, and operational risks, including the development of additional risk reporting to the Board. Appropriate personnel, including but not limited to the fund's Chief Compliance Officer (CCO), FMR's internal auditor, the independent accountants, the fund's Treasurer and portfolio management personnel, make periodic reports to the Board's committees, as appropriate, including an annual review of Fidelity's risk management program for the Fidelity ® funds. The responsibilities of each standing committee, including their oversight responsibilities, are described further under "Standing Committees of the Trustees."
Interested Trustees*:
Correspondence intended for a Trustee who is an interested person may be sent to Fidelity Investments, 245 Summer Street, Boston, Massachusetts 02210.
Name, Year of Birth; Principal Occupations and Other Relevant Experience+
Jonathan Chiel (1957)
Year of Election or Appointment: 2016
Trustee
Mr. Chiel also serves as Trustee of other Fidelity ® funds. Mr. Chiel is Executive Vice President and General Counsel for FMR LLC (diversified financial services company, 2012-present). Previously, Mr. Chiel served as general counsel (2004-2012) and senior vice president and deputy general counsel (2000-2004) for John Hancock Financial Services; a partner with Choate, Hall & Stewart (1996-2000) (law firm); and an Assistant United States Attorney for the United States Attorney's Office of the District of Massachusetts (1986-95), including Chief of the Criminal Division (1993-1995). Mr. Chiel is a director on the boards of the Boston Bar Foundation and the Maimonides School.
Abigail P. Johnson (1961)
Year of Election or Appointment: 2009
Trustee
Chairman of the Board of Trustees
Ms. Johnson also serves as Trustee of other Fidelity ® funds. Ms. Johnson serves as Chairman (2016-present), Chief Executive Officer (2014-present), and Director (2007-present) of FMR LLC (diversified financial services company), President of Fidelity Financial Services (2012-present) and President of Personal, Workplace and Institutional Services (2005-present). Ms. Johnson is Chairman and Director of Fidelity Management & Research Company LLC (investment adviser firm, 2011-present). Previously, Ms. Johnson served as Chairman and Director of FMR Co., Inc. (investment adviser firm, 2011-2019), Vice Chairman (2007-2016) and President (2013-2016) of FMR LLC, President and a Director of Fidelity Management & Research Company (2001-2005), a Trustee of other investment companies advised by Fidelity Management & Research Company, Fidelity Investments Money Management, Inc. (investment adviser firm), and FMR Co., Inc. (2001-2005), Senior Vice President of the Fidelity ® funds (2001-2005), and managed a number of Fidelity ® funds. Ms. Abigail P. Johnson and Mr. Arthur E. Johnson are not related.
Jennifer Toolin McAuliffe (1959)
Year of Election or Appointment: 2016
Trustee
Ms. McAuliffe also serves as Trustee of other Fidelity ® funds and as Trustee of Fidelity Charitable (2020-present). Previously, Ms. McAuliffe served as Co-Head of Fixed Income of Fidelity Investments Limited (now known as FIL Limited (FIL)) (diversified financial services company), Director of Research for FIL's credit and quantitative teams in London, Hong Kong and Tokyo and Director of Research for taxable and municipal bonds at Fidelity Investments Money Management, Inc. Ms. McAuliffe previously served as a member of the Advisory Board of certain Fidelity ® funds (2016). Ms. McAuliffe was previously a lawyer at Ropes & Gray LLP and currently serves as director or trustee of several not-for-profit entities.
* Determined to be an "Interested Trustee" by virtue of, among other things, his or her affiliation with the trust or various entities under common control with FMR.
+ The information includes the Trustee's principal occupation during the last five years and other information relating to the experience, attributes, and skills relevant to the Trustee's qualifications to serve as a Trustee, which led to the conclusion that the Trustee should serve as a Trustee for the fund.
Independent Trustees:
Correspondence intended for an Independent Trustee may be sent to Fidelity Investments, P.O. Box 55235, Boston, Massachusetts 02205-5235.
Name, Year of Birth; Principal Occupations and Other Relevant Experience+
Elizabeth S. Acton (1951)
Year of Election or Appointment: 2013
Trustee
Ms. Acton also serves as Trustee of other Fidelity ® funds. Prior to her retirement, Ms. Acton served as Executive Vice President, Finance (2011-2012), Executive Vice President, Chief Financial Officer (2002-2011) and Treasurer (2004-2005) of Comerica Incorporated (financial services). Prior to joining Comerica, Ms. Acton held a variety of positions at Ford Motor Company (1983-2002), including Vice President and Treasurer (2000-2002) and Executive Vice President and Chief Financial Officer of Ford Motor Credit Company (1998-2000). Ms. Acton currently serves as a member of the Board and Audit and Finance Committees of Beazer Homes USA, Inc. (homebuilding, 2012-present). Ms. Acton previously served as a member of the Advisory Board of certain Fidelity ® funds (2013-2016).
Ann E. Dunwoody (1953)
Year of Election or Appointment: 2018
Trustee
General Dunwoody also serves as Trustee of other Fidelity ® funds. General Dunwoody (United States Army, Retired) was the first woman in U.S. military history to achieve the rank of four-star general and prior to her retirement in 2012 held a variety of positions within the U.S. Army, including Commanding General, U.S. Army Material Command (2008-2012). General Dunwoody currently serves as President of First to Four LLC (leadership and mentoring services, 2012-present), a member of the Board and Nomination and Corporate Governance Committees of Kforce Inc. (professional staffing services, 2016-present) and a member of the Board of Automattic Inc. (software engineering, 2018-present). Previously, General Dunwoody served as a member of the Advisory Board and Nominating and Corporate Governance Committee of L3 Technologies, Inc. (communication, electronic, sensor and aerospace systems, 2013-2019) and a member of the Board and Audit and Sustainability and Corporate Responsibility Committees of Republic Services, Inc. (waste collection, disposal and recycling, 2013-2016). Ms. Dunwoody also serves on several boards for non-profit organizations, including as a member of the Board, Chair of the Nomination and Governance Committee and a member of the Audit Committee of Logistics Management Institute (consulting non-profit, 2012-present), a member of the Council of Trustees for the Association of the United States Army (advocacy non-profit, 2013-present), a member of the Board of Florida Institute of Technology (2015-present) and a member of the Board of ThanksUSA (military family education non-profit, 2014-present). General Dunwoody previously served as a member of the Advisory Board of certain Fidelity ® funds (2018).
John Engler (1948)
Year of Election or Appointment: 2014
Trustee
Mr. Engler also serves as Trustee of other Fidelity ® funds. Previously, Mr. Engler served as Governor of Michigan (1991-2003), President of the Business Roundtable (2011-2017) and interim President of Michigan State University (2018-2019). Mr. Engler currently serves as a member of the Board of Stride, Inc. (formerly K12 Inc.) (technology-based education company, 2012-present). Previously, Mr. Engler served as a member of the Board of Universal Forest Products (manufacturer and distributor of wood and wood-alternative products, 2003-2019) and Trustee of The Munder Funds (2003-2014). Mr. Engler previously served as a member of the Advisory Board of certain Fidelity ® funds (2014-2016).
Robert F. Gartland (1951)
Year of Election or Appointment: 2010
Trustee
Mr. Gartland also serves as Trustee of other Fidelity ® funds. Prior to his retirement, Mr. Gartland held a variety of positions at Morgan Stanley (financial services, 1979-2007), including Managing Director (1987-2007) and Chase Manhattan Bank (1975-1978). Mr. Gartland previously served as Chairman and an investor in Gartland & Mellina Group Corp. (consulting, 2009-2019), as a member of the Board of National Securities Clearing Corporation (1993-1996) and as Chairman of TradeWeb (2003-2004).
Arthur E. Johnson (1947)
Year of Election or Appointment: 2008
Trustee
Mr. Johnson also serves as Trustee of other Fidelity ® funds. Prior to his retirement, Mr. Johnson served as Senior Vice President of Corporate Strategic Development of Lockheed Martin Corporation (defense contractor, 1999-2009). Mr. Johnson currently serves as a member of the Board of Booz Allen Hamilton (management consulting, 2011-present). Mr. Johnson previously served as a member of the Board of Eaton Corporation plc (diversified power management, 2009-2019) and a member of the Board of AGL Resources, Inc. (holding company, 2002-2016). Mr. Johnson previously served as Chairman (2018-2021) and Vice Chairman (2015-2018) of the Independent Trustees of certain Fidelity® funds. Mr. Arthur E. Johnson is not related to Ms. Abigail P. Johnson.
Michael E. Kenneally (1954)
Year of Election or Appointment: 2009
Trustee
Chairman of the Independent Trustees
Mr. Kenneally also serves as Trustee of other Fidelity ® funds and was Vice Chairman (2018-2021) of the Independent Trustees of certain Fidelity ® funds. Prior to retirement in 2005, he was Chairman and Global Chief Executive Officer of Credit Suisse Asset Management, the worldwide fund management and institutional investment business of Credit Suisse Group. Previously, Mr. Kenneally was an Executive Vice President and the Chief Investment Officer for Bank of America. In this role, he was responsible for the investment management, strategy and products delivered to the bank's institutional, high-net-worth and retail clients. Earlier, Mr. Kenneally directed the organization's equity and quantitative research groups. He began his career as a research analyst and then spent more than a dozen years as a portfolio manager for endowments, pension plans and mutual funds. He earned the Chartered Financial Analyst (CFA) designation in 1991.
Mark A. Murray (1954)
Year of Election or Appointment: 2016
Trustee
Mr. Murray also serves as Trustee of other Fidelity ® funds. Previously, Mr. Murray served as Co-Chief Executive Officer (2013-2016), President (2006-2013) and Vice Chairman (2013-2020) of Meijer, Inc. Mr. Murray serves as a member of the Board (2009-present) and Public Policy and Responsibility Committee (2009-present) and Chair of the Nuclear Review Committee (2019-present) of DTE Energy Company (diversified energy company). Mr. Murray previously served as a member of the Board of Spectrum Health (not-for-profit health system, 2015-2019) and as a member of the Board and Audit Committee and Chairman of the Nominating and Corporate Governance Committee of Universal Forest Products, Inc. (manufacturer and distributor of wood and wood-alternative products, 2004-2016). Mr. Murray also serves as a member of the Board of many community and professional organizations. Mr. Murray previously served as a member of the Advisory Board of certain Fidelity ® funds (2016).
+ The information includes the Trustee's principal occupation during the last five years and other information relating to the experience, attributes, and skills relevant to the Trustee's qualifications to serve as a Trustee, which led to the conclusion that the Trustee should serve as a Trustee for the fund.
Advisory Board Members and Officers:
Correspondence intended for a Member of the Advisory Board (if any) may be sent to Fidelity Investments, P.O. Box 55235, Boston, Massachusetts 02205-5235. Correspondence intended for an officer may be sent to Fidelity Investments, 245 Summer Street, Boston, Massachusetts 02210. Officers appear below in alphabetical order.
Name, Year of Birth; Principal Occupation
Laura M. Bishop (1961)
Year of Election or Appointment: 2022
Member of the Advisory Board
Ms. Bishop also serves as a Member of the Advisory Board of other funds. Prior to her retirement, Ms. Bishop held a variety of positions at United Services Automobile Association (2001-2020), including Executive Vice President and Chief Financial Officer (2014-2020) and Senior Vice President and Deputy Chief Financial Officer (2012-2014). Ms. Bishop currently serves as a member of the Audit Committee and Compensation and Personnel Committee (2021-present) of the Board of Directors of Korn Ferry (global organizational consulting).
Robert W. Helm (1957)
Year of Election or Appointment: 2021
Member of the Advisory Board
Mr. Helm also serves as a Member of the Advisory Board of other Fidelity® funds. Mr. Helm was formerly Deputy Chairman (2003-2020), partner (1991-2020) and an associate (1984-1991) of Dechert LLP (formerly Dechert Price & Rhoads). Mr. Helm currently serves on boards and committees of several not-for-profit organizations.
Carol J. Zierhoffer (1960)
Year of Election or Appointment: 2023
Member of the Advisory Board
Ms. Zierhoffer also serves as a Member of the Advisory Board of other funds. Prior to her retirement, Ms. Zierhoffer held a variety of positions at Bechtel Corporation (engineering company, 2013-2019), including Principal Vice President and Chief Information Officer (2013-2016) and Senior Vice President and Chief Information Officer (2016-2019). Ms. Zierhoffer currently serves as a member of the Board of Directors, Audit Committee and Compensation Committee of Allscripts Healthcare Solutions, Inc. (healthcare technology, 2020-present) and as a member of the Board of Directors, Audit and Finance Committee and Nominating and Governance Committee of Atlas Air Worldwide Holdings, Inc. (aviation operating services, 2021-present). Previously, Ms. Zierhoffer served as a member of the Board of Directors and Audit Committee and as the founding Chair of the Information Technology Committee of MedAssets, Inc. (healthcare technology, 2013-2016).
Craig S. Brown (1977)
Year of Election or Appointment: 2019
Assistant Treasurer
Mr. Brown also serves as an officer of other funds. Mr. Brown serves as Assistant Treasurer of FIMM, LLC (2021-present) and is an employee of Fidelity Investments (2013-present). Previously, Mr. Brown served as Assistant Treasurer of certain Fidelity ® funds (2019-2022).
John J. Burke III (1964)
Year of Election or Appointment: 2018
Chief Financial Officer
Mr. Burke also serves as Chief Financial Officer of other funds. Mr. Burke serves as Head of Investment Operations for Fidelity Fund and Investment Operations (2018-present) and is an employee of Fidelity Investments (1998-present). Previously Mr. Burke served as head of Asset Management Investment Operations (2012-2018).
David J. Carter (1973)
Year of Election or Appointment: 2020
Assistant Secretary
Mr. Carter also serves as Assistant Secretary of other funds. Mr. Carter serves as Senior Vice President, Deputy General Counsel (2022-present) and is an employee of Fidelity Investments (2005-present).
Jonathan Davis (1968)
Year of Election or Appointment: 2010
Assistant Treasurer
Mr. Davis also serves as an officer of other funds. Mr. Davis serves as Assistant Treasurer of FIMM, LLC (2021-present), FMR Capital, Inc. (2017-present), FD Funds GP LLC (2021-present), FD Funds Holding LLC (2021-present), and FD Funds Management LLC (2021-present); and is an employee of Fidelity Investments. Previously, Mr. Davis served as Vice President and Associate General Counsel of FMR LLC (diversified financial services company, 2003-2010).
Laura M. Del Prato (1964)
Year of Election or Appointment: 2018
President and Treasurer
Ms. Del Prato also serves as an officer of other funds. Ms. Del Prato serves as Assistant Treasurer of FIMM, LLC (2021-present) and is an employee of Fidelity Investments (2017-present). Previously, Ms. Del Prato served as President and Treasurer of The North Carolina Capital Management Trust: Cash Portfolio and Term Portfolio (2018-2020). Prior to joining Fidelity Investments, Ms. Del Prato served as a Managing Director and Treasurer of the JPMorgan Mutual Funds (2014-2017). Prior to JPMorgan, Ms. Del Prato served as a partner at Cohen Fund Audit Services (accounting firm, 2012-2013) and KPMG LLP (accounting firm, 2004-2012).
Christopher M. Gouveia (1973)
Year of Election or Appointment: 2023
Chief Compliance Officer
Mr. Gouveia also serves as Chief Compliance Officer of other funds. Mr. Gouveia serves as Senior Vice President of Asset Management Compliance for Fidelity Investments and is an employee of Fidelity Investments. Previously, Mr. Gouveia served as Chief Compliance Officer of the North Carolina Capital Management Trust (2016-2019).
Colm A. Hogan (1973)
Year of Election or Appointment: 2016
Assistant Treasurer
Mr. Hogan also serves as an officer of other funds. Mr. Hogan serves as Assistant Treasurer of FIMM, LLC (2021-present) and FMR Capital, Inc. (2017-present) and is an employee of Fidelity Investments (2005-present). Previously, Mr. Hogan served as Deputy Treasurer of certain Fidelity ® funds (2016-2020) and Assistant Treasurer of certain Fidelity ® funds (2016-2018).
Cynthia Lo Bessette (1969)
Year of Election or Appointment: 2019
Secretary and Chief Legal Officer (CLO)
Ms. Lo Bessette also serves as an officer of other funds. Ms. Lo Bessette serves as CLO, Secretary, and Senior Vice President of Fidelity Management & Research Company LLC (investment adviser firm, 2019-present); CLO of Fidelity Management & Research (Hong Kong) Limited, FMR Investment Management (UK) Limited, and Fidelity Management & Research (Japan) Limited (investment adviser firms, 2019-present); Secretary of FD Funds GP LLC (2021-present), FD Funds Holding LLC (2021-present), FD Funds Management LLC (2021-present), and Fidelity Diversifying Solutions LLC (investment adviser firm, 2022-present); and Assistant Secretary of FIMM, LLC (2019-present). She is a Senior Vice President and Deputy General Counsel of FMR LLC (diversified financial services company, 2019-present), and is an employee of Fidelity Investments. Previously, Ms. Lo Bessette served as CLO, Secretary, and Senior Vice President of FMR Co., Inc. (investment adviser firm, 2019); Secretary of Fidelity SelectCo, LLC and Fidelity Investments Money Management, Inc. (investment adviser firms, 2019). Prior to joining Fidelity Investments, Ms. Lo Bessette was Executive Vice President, General Counsel (2016-2019) and Senior Vice President, Deputy General Counsel (2015-2016) of OppenheimerFunds (investment management company) and Deputy Chief Legal Officer (2013-2015) of Jennison Associates LLC (investment adviser firm).
Chris Maher (1972)
Year of Election or Appointment: 2013
Assistant Treasurer
Mr. Maher also serves as an officer of other funds. Mr. Maher serves as Assistant Treasurer of FIMM, LLC (2021-present) and FMR Capital, Inc. (2017-present), and is an employee of Fidelity Investments (2008-present). Previously, Mr. Maher served as Assistant Treasurer of certain funds (2013-2020); Vice President of Asset Management Compliance (2013), Vice President of the Program Management Group of FMR (investment adviser firm, 2010-2013), and Vice President of Valuation Oversight (2008-2010).
Jamie Pagliocco (1964)
Year of Election or Appointment: 2020
Vice President
Mr. Pagliocco also serves as Vice President of other funds. Mr. Pagliocco serves as President of Fixed Income (2020-present), and is an employee of Fidelity Investments (2001-present). Previously, Mr. Pagliocco served as Co-Chief Investment Officer - Bond (2017-2020), Global Head of Bond Trading (2016-2019), and as a portfolio manager.
Brett Segaloff (1972)
Year of Election or Appointment: 2021
Anti-Money Laundering (AML) Officer
Mr. Segaloff also serves as an AML Officer of other funds and other related entities. He is Director, Anti-Money Laundering (2007-present) of FMR LLC (diversified financial services company) and is an employee of Fidelity Investments (1996-present).
Stacie M. Smith (1974)
Year of Election or Appointment: 2013
Assistant Treasurer
Ms. Smith also serves as an officer of other funds. Ms. Smith serves as Assistant Treasurer of FIMM, LLC (2021-present) and FMR Capital, Inc. (2017-present), is an employee of Fidelity Investments (2009-present), and has served in other fund officer roles. Prior to joining Fidelity Investments, Ms. Smith served as Senior Audit Manager of Ernst & Young LLP (accounting firm, 1996-2009). Previously, Ms. Smith served as Assistant Treasurer (2013-2019) and Deputy Treasurer (2013-2016) of certain Fidelity ® funds.
Jim Wegmann (1979)
Year of Election or Appointment: 2021
Deputy Treasurer
Mr. Wegmann also serves as an officer of other funds. Mr. Wegmann serves as Assistant Treasurer of FIMM, LLC (2021-present) and is an employee of Fidelity Investments (2011-present). Previously, Mr. Wegmann served as Assistant Treasurer of certain Fidelity ® funds (2019-2021).
As a shareholder, you incur two types of costs: (1) transaction costs, which may include sales charges (loads) on purchase payments or redemption proceeds, as applicable and (2) ongoing costs, which generally include management fees, distribution and/or service (12b-1) fees and other Fund expenses. This Example is intended to help you understand your ongoing costs (in dollars) of investing in a fund and to compare these costs with the ongoing costs of investing in other mutual funds.
| The Example is based on an investment of $1,000 invested at the beginning of the period and held for the entire period (August 1, 2022 to January 31, 2023). |
Actual Expenses
The first line of the accompanying table provides information about actual account values and actual expenses. You may use the information in this line, together with the amount you invested, to estimate the expenses that you paid over the period. Simply divide your account value by $1,000.00 (for example, an $8,600 account value divided by $1,000.00 = 8.6), then multiply the result by the number in the first line for a class/Fund under the heading entitled "Expenses Paid During Period" to estimate the expenses you paid on your account during this period. If any fund is a shareholder of any underlying mutual funds or exchange-traded funds (ETFs) (the Underlying Funds), such fund indirectly bears its proportional share of the expenses of the Underlying Funds in addition to the direct expenses incurred presented in the table. These fees and expenses are not included in the annualized expense ratio used to calculate the expense estimate in the table below.
Hypothetical Example for Comparison Purposes
The second line of the accompanying table provides information about hypothetical account values and hypothetical expenses based on the actual expense ratio and an assumed rate of return of 5% per year before expenses, which is not the actual return. The hypothetical account values and expenses may not be used to estimate the actual ending account balance or expenses you paid for the period. You may use this information to compare the ongoing costs of investing in the Fund and other funds. To do so, compare this 5% hypothetical example with the 5% hypothetical examples that appear in the shareholder reports of the other funds. If any fund is a shareholder of any Underlying Funds, such fund indirectly bears its proportional share of the expenses of the Underlying Funds in addition to the direct expenses as presented in the table. These fees and expenses are not included in the annualized expense ratio used to calculate the expense estimate in the table below.
Please note that the expenses shown in the table are meant to highlight your ongoing costs only and do not reflect any transaction costs. Therefore, the second line of the table is useful in comparing ongoing costs only, and will not help you determine the relative total costs of owning different funds. In addition, if these transactional costs were included, your costs would have been higher.
| | | | | Annualized Expense Ratio- A | | Beginning Account Value August 1, 2022 | | Ending Account Value January 31, 2023 | | Expenses Paid During Period- C August 1, 2022 to January 31, 2023 |
| | | | | | | | | | |
| Fidelity® Tax-Free Bond Fund | | | | .25% | | | | | | |
| Actual | | | | | | $ 1,000 | | $ 1,007.50 | | $ 1.27 |
Hypothetical- B | | | | | | $ 1,000 | | $ 1,023.95 | | $ 1.28 |
| |
A Annualized expense ratio reflects expenses net of applicable fee waivers.
B 5% return per year before expenses
C Expenses are equal to the annualized expense ratio, multiplied by the average account value over the period, multiplied by 184/ 365 (to reflect the one-half year period). The fees and expenses of any Underlying Funds are not included in each annualized expense ratio.
The dividend and capital gains distributions for the fund(s) are available on Fidelity.com or Institutional.Fidelity.com .
During fiscal year ended 2023, 100% of the fund's income dividends were free from federal income tax, and 0.00% of the fund's income dividends were subject to the federal alternative minimum tax.
The fund will notify shareholders in January 2024 of amounts for use in preparing 2023 income tax returns.
Board Approval of Investment Advisory Contracts and Management Fees
Fidelity Tax-Free Bond Fund
Each year, the Board of Trustees, including the Independent Trustees (together, the Board), votes on the renewal of the management contract with Fidelity Management & Research Company LLC (FMR) and the sub-advisory agreements (together, the Advisory Contracts) for the fund. FMR and the sub-advisers are referred to herein as the Investment Advisers. The Board, assisted by the advice of fund counsel and Independent Trustees' counsel, requests and considers a broad range of information relevant to the renewal of the Advisory Contracts throughout the year.
The Board meets regularly and, at each of its meetings, covers an extensive agenda of topics and materials and considers factors that are relevant to its annual consideration of the renewal of the fund's Advisory Contracts, including the services and support provided to the fund and its shareholders. The Board has established four standing committees (Committees) - Operations, Audit, Fair Valuation, and Governance and Nominating - each composed of and chaired by Independent Trustees with varying backgrounds, to which the Board has assigned specific subject matter responsibilities in order to enhance effective decision-making by the Board. The Operations Committee, of which all the Independent Trustees are members, meets regularly throughout the year and requests, receives and considers, among other matters, information related to the annual consideration of the renewal of the fund's Advisory Contracts before making its recommendation to the Board. The Board also meets as needed to review matters specifically related to the Board's annual consideration of the renewal of the Advisory Contracts. Members of the Board may also meet from time to time with trustees of other Fidelity funds through joint ad hoc committees to discuss certain matters relevant to all of the Fidelity funds.
At its September 2022 meeting, the Board unanimously determined to renew the fund's Advisory Contracts. In reaching its determination, the Board considered all factors it believed relevant, including (i) the nature, extent, and quality of the services provided to the fund and its shareholders (including the investment performance of the fund); (ii) the competitiveness relative to peer funds of the fund's management fee and the total expense ratio; (iii) the total costs of the services provided by and the profits realized by Fidelity from its relationships with the fund; and (iv) the extent to which, if any, economies of scale exist and are realized as the fund grows, and whether any economies of scale are appropriately shared with fund shareholders.
In considering whether to renew the Advisory Contracts for the fund, the Board reached a determination, with the assistance of fund counsel and Independent Trustees' counsel and through the exercise of its business judgment, that the renewal of the Advisory Contracts was in the best interests of the fund and its shareholders and that the compensation payable under the Advisory Contracts was fair and reasonable. The Board's decision to renew the Advisory Contracts was not based on any single factor, but rather was based on a comprehensive consideration of all the information provided to the Board at its meetings throughout the year. The Board, in reaching its determination to renew the Advisory Contracts, was aware that shareholders of the fund have a broad range of investment choices available to them, including a wide choice among funds offered by Fidelity's competitors, and that the fund's shareholders, who have the opportunity to review and weigh the disclosure provided by the fund in its prospectus and other public disclosures, have chosen to invest in this fund, which is part of the Fidelity family of funds.
Nature, Extent, and Quality of Services Provided. The Board considered Fidelity's staffing as it relates to the fund, including the backgrounds of investment personnel of Fidelity, and also considered the fund's investment objective, strategies, and related investment philosophy. The Independent Trustees also had discussions with senior management of Fidelity's investment operations and investment groups. The Board considered the structure of the investment personnel compensation program and whether this structure provides appropriate incentives to act in the best interests of the fund. Additionally, the Board considered the portfolio managers' investments, if any, in the funds that they manage. The Board also considered the steps Fidelity had taken to ensure the continued provision of high quality services to the Fidelity funds throughout the COVID-19 pandemic, including the expansion of staff in client facing positions to maintain service levels in periods of high volumes and volatility.
Resources Dedicated to Investment Management and Support Services . The Board reviewed the general qualifications and capabilities of Fidelity's investment staff, including its size, education, experience, and resources, as well as Fidelity's approach to recruiting, training, managing, and compensating investment personnel. The Board noted the resources devoted to Fidelity's global investment organization, and that Fidelity's analysts have extensive resources, tools and capabilities that allow them to conduct quantitative and fundamental analysis, as well as credit analysis of issuers, counterparties and guarantors. Further, the Board considered that Fidelity's investment professionals have sufficient access to global information and data so as to provide competitive investment results over time, and that those professionals also have access to sophisticated tools that permit them to assess portfolio construction and risk and performance attribution characteristics continuously, as well as to transmit new information and research conclusions rapidly around the world. Additionally, in its deliberations, the Board considered Fidelity's trading, risk management, compliance, cybersecurity, and technology and operations capabilities and resources, which are integral parts of the investment management process.
Shareholder and Administrative Services . The Board considered (i) the nature, extent, quality, and cost of advisory, administrative, and shareholder services performed by the Investment Advisers and their affiliates under the Advisory Contracts and under separate agreements covering transfer agency and pricing and bookkeeping services for the fund; (ii) the nature and extent of the supervision of third party service providers, principally custodians, subcustodians, and pricing vendors; and (iii) the resources devoted to, and the record of compliance with, the fund's compliance policies and procedures.
The Board noted that the growth of fund assets over time across the complex allows Fidelity to reinvest in the development of services designed to enhance the value and convenience of the Fidelity funds as investment vehicles. These services include 24-hour access to account information and market information over the Internet and through telephone representatives, investor education materials and asset allocation tools. The Board also considered that it reviews customer service metrics such as telephone response times, continuity of services on the website and metrics addressing services at Fidelity Investor Centers.
Investment in a Large Fund Family . The Board considered the benefits to shareholders of investing in a Fidelity fund, including the benefits of investing in a fund that is part of a large family of funds offering a variety of investment disciplines and providing a large variety of mutual fund investor services. The Board noted that Fidelity had taken, or had made recommendations to the Board that resulted in the Fidelity funds taking, a number of actions over the previous year that benefited particular funds, including: (i) continuing to dedicate additional resources to Fidelity's investment research process, which includes meetings with management of issuers of securities in which the funds invest; (ii) continuing efforts to enhance Fidelity's global research capabilities; (iii) launching new funds, ETFs, and share classes with innovative structures, strategies and pricing and making other enhancements to meet investor needs; (iv) broadening eligibility requirements for certain funds and share classes; (v) reducing management fees and total expenses for certain funds and classes; (vi) lowering expenses for certain existing funds and classes by implementing or lowering expense caps; (vii) rationalizing product lines and gaining increased efficiencies from fund mergers and liquidations; (viii) continuing to develop, acquire and implement systems and technology to improve services to the funds and shareholders, strengthen information security, and increase efficiency; and (ix) continuing to implement enhancements to further strengthen Fidelity's product line to increase investors' probability of success in achieving their investment goals, including their retirement income goals.
Investment Performance . The Board considered whether the fund has operated in accordance with its investment objective, as well as its record of compliance with its investment restrictions and its performance history.
The Board took into account discussions that occur at Board meetings throughout the year with representatives of the Investment Advisers about fund investment performance. In this regard the Board noted that as part of regularly scheduled fund reviews and other reports to the Board on fund performance, the Board considers annualized return information for the fund for different time periods, measured against an appropriate securities market index (benchmark index) and an appropriate peer group of funds with similar objectives (peer group). The Board also receives and considers information about performance attribution. In its evaluation of fund investment performance at meetings throughout the year, the Board gave particular attention to information indicating underperformance of certain Fidelity funds for specific time periods and discussed with the Investment Advisers the reasons for such underperformance.
In addition to reviewing absolute and relative fund performance, the Independent Trustees periodically consider the appropriateness of fund performance metrics in evaluating the results achieved. In general, the Independent Trustees believe that fund performance should be evaluated based on gross performance (before fees and expenses but after transaction costs) compared to appropriate benchmark indices, over appropriate time periods that may include full market cycles, and on net performance (after fees and expenses) compared to appropriate peer groups, as applicable, over the same periods, taking into account relevant factors including the following: general market conditions; expectations for interest rate levels and credit conditions; issuer-specific information including credit quality; the potential for incremental return versus the fund's benchmark index weighed against the risks involved in obtaining that incremental return, including the risk of diminished or negative total returns; and fund cash flows and other factors. The Independent Trustees generally give greater weight to fund performance over longer time periods than over shorter time periods. Depending on the circumstances, the Independent Trustees may be satisfied with a fund's performance notwithstanding that it lags its benchmark index or peer group for certain periods.
The Independent Trustees recognize that shareholders evaluate performance on a net basis over their own holding periods, for which one-, three-, and five-year periods are often used as a proxy. For this reason, the performance information reviewed by the Board also included net calendar year total return information for the fund and an appropriate benchmark index and peer group for the most recent one-, three-, and five-year periods.
Based on its review, the Board concluded that the nature, extent, and quality of services provided to the fund under the Advisory Contracts should continue to benefit the shareholders of the fund.
Competitiveness of Management Fee and Total Expense Ratio . The Board considered the fund's management fee and total expense ratio compared to selected groups of competitive funds and classes (referred to as "mapped groups" below) for the purpose of facilitating the Trustees' competitive analysis of management fees and total expenses. Fidelity creates "mapped groups" by combining similar investment objective categories (as classified by Lipper) that have comparable investment mandates. Combining funds with similar investment objective categories aids the Board's comparison of management fees and total expense ratios by broadening the competitive group used for such comparison.
Management Fee . The Board considered two proprietary management fee comparisons for the 12-month periods shown in basis points (BP) in the chart below. The group of Lipper funds used by the Board for management fee comparisons is referred to below as the "Total Mapped Group" and is broader than the Lipper peer group used by the Board for performance comparisons. The Total Mapped Group comparison focuses on a fund's standing in terms of gross management fees before expense reimbursements or caps relative to the total universe of funds with comparable investment mandates, regardless of whether their management fee structures also are comparable. Funds with comparable investment mandates offer exposure to similar types of securities. Funds with comparable management fee structures have similar management fee contractual arrangements (e.g., flat rate charged for advisory services, all-inclusive fee rate, etc.). "TMG %" represents the percentage of funds in the Total Mapped Group that had management fees that were lower than the fund's. For example, a hypothetical TMG % of 20% would mean that 80% of the funds in the Total Mapped Group had higher, and 20% had lower, management fees than the fund. The fund's actual TMG %s and the number of funds in the Total Mapped Group are in the chart below. The "Asset-Sized Peer Group" (ASPG) comparison focuses on a fund's standing relative to a subset of non-Fidelity funds within the Total Mapped Group that are similar in size and management fee structure. For example, if a fund is in the first quartile of the ASPG, the fund's management fee ranks in the least expensive or lowest 25% of funds in the ASPG. The ASPG represents at least 15% of the funds in the Total Mapped Group with comparable asset size and management fee structures, subject to a minimum of 50 funds (or all funds in the Total Mapped Group if fewer than 50). Additional information, such as the ASPG quartile in which the fund's management fee rate ranked, is also included in the chart and was considered by the Board.
The Board noted that the fund's management fee rate ranked below the median of its Total Mapped Group and below the median of its ASPG for 2021.
Based on its review, the Board concluded that the fund's management fee is fair and reasonable in light of the services that the fund receives and the other factors considered.
Total Expense Ratio . In its review of the fund's total expense ratio, the Board considered the fund's management fee rate as well as other fund expenses, such as transfer agent fees, pricing and bookkeeping fees, and custodial, legal, and audit fees. The Board also noted that Fidelity may agree to waive fees or reimburse expenses from time to time, and the extent to which, if any, it has done so for the fund. The fund is compared to those funds and classes in the Total Mapped Group (used by the Board for management fee comparisons) that have a similar sales load structure. The Board also considered a total expense ASPG comparison, which focuses on the total expenses of the fund relative to a subset of non-Fidelity funds within the similar sales load structure group that are similar in size and management fee structure. The total expense ASPG is limited to 15 larger and 15 smaller classes of different funds, where possible. The total expense ASPG comparison excludes performance adjustments and fund-paid 12b-1 fees to eliminate variability in expenses relating to these items.
The Board noted that the fund's total net expense ratio ranked below the similar sales load structure group competitive median for 2021 and below the ASPG competitive median for 2021.
The Board further considered that FMR has contractually agreed to reimburse the fund to the extent that total operating expenses, with certain exceptions, as a percentage of its average net assets, exceed 0.25% through May 31, 2023.
Fees Charged to Other Fidelity Clients . The Board also considered Fidelity fee structures and other information with respect to clients of Fidelity, such as other funds advised or subadvised by Fidelity, pension plan clients, and other institutional clients with similar mandates. The Board noted that a joint ad hoc committee created by it and the boards of other Fidelity funds periodically reviews and compares Fidelity's institutional investment advisory business with its business of providing services to the Fidelity funds and also noted the most recent findings of the committee. The Board noted that the committee's review included a consideration of the differences in services provided, fees charged, and costs incurred, as well as competition in the markets serving the different categories of clients.
Based on its review of total expense ratios and fees charged to other Fidelity clients, the Board concluded that the fund's total expense ratio was reasonable in light of the services that the fund and its shareholders receive and the other factors considered.
Costs of the Services and Profitability . The Board considered the revenues earned and the expenses incurred by Fidelity in conducting the business of developing, marketing, distributing, managing, administering and servicing the fund and servicing the fund's shareholders. The Board also considered the level of Fidelity's profits in respect of all the Fidelity funds.
On an annual basis, Fidelity presents to the Board information about the profitability of its relationships with the fund. Fidelity calculates profitability information for each fund, as well as aggregate profitability information for groups of Fidelity funds and all Fidelity funds, using a series of detailed revenue and cost allocation methodologies which originate with the books and records of Fidelity on which Fidelity's audited financial statements are based. The Audit Committee of the Board reviews any significant changes from the prior year's methodologies and the full Board approves such changes.
A public accounting firm has been engaged annually by the Board as part of the Board's assessment of Fidelity's profitability analysis. The engagement includes the review and assessment of the methodologies used by Fidelity in determining the revenues and expenses attributable to Fidelity's mutual fund business, and completion of agreed-upon procedures in respect of the mathematical accuracy of certain fund profitability information and its conformity to established allocation methodologies. After considering the reports issued under the engagement and information provided by Fidelity, the Board concluded that while other allocation methods may also be reasonable, Fidelity's profitability methodologies are reasonable in all material respects.
The Board also reviewed Fidelity's non-fund businesses and potential indirect benefits such businesses may have received as a result of their association with Fidelity's mutual fund business (i.e., fall-out benefits) as well as cases where Fidelity's affiliates may benefit from the funds' business. The Board considered areas where potential indirect benefits to the Fidelity funds from their relationships with Fidelity may exist. The Board's consideration of these matters was informed by the findings of a joint ad hoc committee created by it and the boards of other Fidelity funds to evaluate potential fall-out benefits.
The Board considered the costs of the services provided by and the profits realized by Fidelity in connection with the operation of the fund and was satisfied that the profitability was not excessive.
Economies of Scale . The Board considered whether there have been economies of scale in respect of the management of the Fidelity funds, whether the Fidelity funds (including the fund) have appropriately benefited from any such economies of scale, and whether there is potential for realization of any further economies of scale. The Board considered the extent to which the fund will benefit from economies of scale as assets grow through increased services to the fund, through waivers or reimbursements, or through fee or expense ratio reductions. The Board also noted that a committee (the Economies of Scale Committee) created by it and the boards of other Fidelity funds periodically analyzes whether Fidelity attains economies of scale in respect of the management and servicing of the Fidelity funds, whether the Fidelity funds have appropriately benefited from such economies of scale, and whether there is potential for realization of any further economies of scale.
The Board recognized that the fund's management contract incorporates a "group fee" structure, which provides for lower group fee rates as total "group assets" increase, and for higher group fee rates as total "group assets" decrease ("group assets" as defined in the management contract). FMR calculates the group fee rates based on a tiered asset "breakpoint" schedule that varies based on asset class. The Board considered that the group fee is designed to deliver the benefits of economies of scale to fund shareholders when total Fidelity fund assets increase, even if assets of any particular fund are unchanged or have declined, because some portion of Fidelity's costs are attributable to services provided to all Fidelity funds, and all funds benefit if those costs can be allocated among more assets. The Board also considered that Fidelity agreed to impose a temporary fee waiver in the form of additional breakpoints to the current breakpoint schedule. The Board concluded that, given the group fee structure, fund shareholders will benefit from lower management fees as "group assets" increase at the fund complex level, regardless of whether Fidelity achieves any such economies of scale.
The Board concluded, taking into account the analysis of the Economies of Scale Committee, that economies of scale, if any, are being appropriately shared between fund shareholders and Fidelity.
Additional Information Requested by the Board . In order to develop fully the factual basis for consideration of the Fidelity funds' advisory contracts, the Board requested and received additional information on certain topics, including: (i) Fidelity's fund profitability methodology, profitability trends for certain funds, the allocation of various costs to different funds, and the impact of certain factors on fund profitability results; (ii) portfolio manager changes that have occurred during the past year and the amount of the investment that each portfolio manager has made in the Fidelity fund(s) that he or she manages; (iii) the extent to which current market conditions have affected retention and recruitment of personnel; (iv) the arrangements with and compensation paid to certain fund sub-advisers on behalf of the Fidelity funds and the treatment of such compensation within Fidelity's fund profitability methodology; (v) the terms of the funds' various management fee structures, including the basic group fee and the terms of Fidelity's voluntary expense limitation arrangements; (vi) Fidelity's transfer agent, pricing and bookkeeping fees, expense and service structures for different funds and classes relative to competitive trends; (vii) the impact on fund profitability of recent industry trends, such as the growth in passively managed funds and the changes in flows for different types of funds; (viii) the types of management fee and total expense comparisons provided, and the challenges and limitations associated with such information; and (ix) explanations regarding the relative total expense ratios and management fees of certain funds and classes, total expense and management fee competitive trends, and methodologies for total expense and management fee competitive comparisons. In addition, the Board considered its discussions with Fidelity regarding Fidelity's efforts to maintain the continuous investment and shareholder services necessary for the funds during the current pandemic and economic circumstances.
Based on its evaluation of all of the conclusions noted above, and after considering all factors it believed relevant, the Board concluded that the advisory fee arrangements are fair and reasonable and that the fund's Advisory Contracts should be renewed.
The Securities and Exchange Commission adopted Rule 22e-4 under the Investment Company Act of 1940 (the Liquidity Rule) to promote effective liquidity risk management throughout the open-end investment company industry, thereby reducing the risk that funds will be unable to meet their redemption obligations and mitigating dilution of the interests of fund shareholders.
The Fund has adopted and implemented a liquidity risk management program (the Program) reasonably designed to assess and manage the Fund's liquidity risk and to comply with the requirements of the Liquidity Rule. The Fund's Board of Trustees (the Board) has designated the Fund's investment adviser as administrator of the Program. The Fidelity advisers have established a Liquidity Risk Management Committee (the LRM Committee) to manage the Program for each of the Fidelity Funds. The LRM Committee monitors the adequacy and effectiveness of implementation of the Program and on a periodic basis assesses each Fund's liquidity risk based on a variety of factors including (1) the Fund's investment strategy, (2) portfolio liquidity and cash flow projections during normal and reasonably foreseeable stressed conditions, (3) shareholder redemptions, (4) borrowings and other funding sources and (5) certain factors specific to ETFs including the effect of the Fund's prices and spreads, market participants, and basket compositions on the overall liquidity of the Fund's portfolio, as applicable.
In accordance with the Program, each of the Fund's portfolio investments is classified into one of four defined liquidity categories based on a determination of a reasonable expectation for how long it would take to convert the investment to cash (or sell or dispose of the investment) without significantly changing its market value.
- Highly liquid investments - cash or convertible to cash within three business days or less
- Moderately liquid investments - convertible to cash in three to seven calendar days
- Less liquid investments - can be sold or disposed of, but not settled, within seven calendar days
- Illiquid investments - cannot be sold or disposed of within seven calendar days
Liquidity classification determinations take into account a variety of factors including various market, trading and investment-specific considerations, as well as market depth, and generally utilize analysis from a third-party liquidity metrics service.
The Liquidity Rule places a 15% limit on a fund's illiquid investments and requires funds that do not primarily hold assets that are highly liquid investments to determine and maintain a minimum percentage of the fund's net assets to be invested in highly liquid investments (highly liquid investment minimum or HLIM). The Program includes provisions reasonably designed to comply with the 15% limit on illiquid investments and for determining, periodically reviewing and complying with the HLIM requirement as applicable.
At a recent meeting of the Fund's Board of Trustees, the LRM Committee provided a written report to the Board pertaining to the operation, adequacy, and effectiveness of the Program for the period December 1, 2021 through November 30, 2022. The report concluded that the Program is operating effectively and is reasonably designed to assess and manage the Fund's liquidity risk.
1.769635.121
SFB-ANN-0423
Fidelity® SAI Sustainable Conservative Income Municipal Bond Fund
Annual Report
January 31, 2023
Offered exclusively to certain clients of the Adviser, or its affiliates, including Strategic Advisers LLC (Strategic Advisers) - not available for sale to the general public. Fidelity ® SAI is a product name of Fidelity ® funds dedicated to certain programs affiliated with Strategic Advisers.
Contents
To view a fund's proxy voting guidelines and proxy voting record for the 12-month period ended June 30, visit http://www.fidelity.com/proxyvotingresults or visit the Securities and Exchange Commission's (SEC) web site at http://www.sec.gov.
You may also call 1-800-544-3455 to request a free copy of the proxy voting guidelines.
Standard & Poor's, S&P and S&P 500 are registered service marks of The McGraw-Hill Companies, Inc. and have been licensed for use by Fidelity Distributors Corporation.
Other third-party marks appearing herein are the property of their respective owners.
All other marks appearing herein are registered or unregistered trademarks or service marks of FMR LLC or an affiliated company. © 2023 FMR LLC. All rights reserved.
This report and the financial statements contained herein are submitted for the general information of the shareholders of the Fund. This report is not authorized for distribution to prospective investors in the Fund unless preceded or accompanied by an effective prospectus.
A fund files its complete schedule of portfolio holdings with the SEC for the first and third quarters of each fiscal year on Form N-PORT. Forms N-PORT are available on the SEC's web site at http://www.sec.gov. A fund's Forms N-PORT may be reviewed and copied at the SEC's Public Reference Room in Washington, DC. Information regarding the operation of the SEC's Public Reference Room may be obtained by calling 1-800-SEC-0330.
For a complete list of a fund's portfolio holdings, view the most recent holdings listing, semiannual report, or annual report on Fidelity's web site at http://www.fidelity.com, http://www.institutional.fidelity.com, or http://www.401k.com, as applicable.
NOT FDIC INSURED •MAY LOSE VALUE •NO BANK GUARANTEE
Neither the Fund nor Fidelity Distributors Corporation is a bank.
Average annual total return reflects the change in the value of an investment, assuming reinvestment of distributions from dividend income and capital gains (the profits earned upon the sale of securities that have grown in value, if any) and assuming a constant rate of performance each year. The hypothetical investment and the average annual total returns do not reflect the deduction of taxes that a shareholder would pay on fund distributions or the redemption of fund shares. During periods of reimbursement by Fidelity, a fund's total return will be greater than it would be had the reimbursement not occurred. How a fund did yesterday is no guarantee of how it will do tomorrow.
Average annual total returns for Fidelity SAI Sustainable Conservative Income Municipal Bond Fund will be reported once the fund is a year old.
| $10,000 Over Life of Fund |
| |
Let's say hypothetically that $10,000 was invested in Fidelity SAI Sustainable Conservative Income Municipal Bond Fund, on June 16, 2022, when the fund started. The chart shows how the value of your investment would have changed, and also shows how the Bloomberg Municipal Bond 1 Year (1-2 Y) Index performed over the same period. |
|
|
Market Recap:
Tax-exempt municipal bonds declined for the 12 months ending January 31, 2023, with a late-period rally partially offsetting a steep fall earlier on. The Bloomberg Municipal Bond Index returned -3.25% for the period. By early 2022, the Federal Reserve had begun its pivot from monetary easing to monetary tightening, tapering the large-scale asset purchases it restarted in 2020 amid the COVID-19 pandemic. In March, the Fed, faced with persistent inflationary pressure, began implementing an aggressive series of rate hikes, eventually raising its benchmark interest rate seven times, by a total of 4.25 percentage points, through mid-December. This helped push municipal bond yields to their highest level in more than a decade. Muni bond prices, which move inversely to yields, fell sharply. Credit spreads significantly widened, as investors demanded more yield for lower-quality munis as recession risk increased. In November, December and January, the tax-exempt market reversed course and rallied strongly (+7.99%) - including a gain of 2.87% in January - amid market expectations for the Fed to pause monetary policy tightening in 2023. Muni yields declined and prices rebounded. Favorable supply and demand was helpful; issuance remained subdued, while net inflows into munis turned positive. Muni tax-backed credit fundamentals were solid throughout the period and, for the most part, the risk of credit-rating downgrades appeared low. Shorter-duration (lower sensitivity to changes in interest rates) and higher-credit-quality munis led the way for the year.
Comments from Co-Portfolio Managers Elizah McLaughlin, Ryan Brogan and Michael Maka:
From its inception on June 16, 2022, through January 31, 2023, the fund returned -1.07%, net of fees, lagging the 1.22% return of both the supplemental index, the Fidelity Sustainable Conservative Income Municipal Bond Composite Index, and the benchmark, the Bloomberg Municipal 1 Year (1-2 Y) Bond Index. During the reporting period, we focused on longer-term objectives and sought to generate attractive tax-exempt income and a competitive risk-adjusted return. Versus the supplemental index, the fund's duration (interest rate) positioning contributed to performance. The fund had less sensitivity to interest rates, as measured by its shorter duration, than the index and therefore was hurt less as interest rates rose. Larger-than-index exposure to bonds with durations of three and four years also proved beneficial, as they outpaced the index. An overweight to variable-rate securities also contributed to relative performance, given that these securities outperformed fixed-rate securities for most of the year amid rising interest rates. In contrast, an overweight in lower-rated, investment-grade bonds was a key detractor, as they lagged the Composite index as credit spreads widened. Larger-than-index exposure to industrial development securities and gas pre-pay bonds detracted as well. Relative performance also was crimped by the fund's exposure to bonds with a mandatory tender structure, which lagged the index. Application of FMR's environmental, social and governance (ESG) ratings process and/or its sustainable investing exclusion criteria may affect the fund's exposure to certain issuers, sectors, regions and countries, and may affect the fund's performance.
The views expressed above reflect those of the portfolio manager(s) only through the end of the period as stated on the cover of this report and do not necessarily represent the views of Fidelity or any other person in the Fidelity organization. Any such views are subject to change at any time based upon market or other conditions and Fidelity disclaims any responsibility to update such views. These views may not be relied on as investment advice and, because investment decisions for a Fidelity fund are based on numerous factors, may not be relied on as an indication of trading intent on behalf of any Fidelity fund.
| Top Five States (% of Fund's net assets) |
| | |
| New York | 16.2 |
| Alabama | 10.0 |
| Texas | 6.2 |
| Georgia | 5.0 |
| Tennessee | 4.7 |
| | |
| Revenue Sources (% of Fund's net assets) |
| Synthetics | 22.7% | |
| General Obligations | 16.3% | |
| Industrial Development | 11.6% | |
| Health Care | 10.1% | |
| Resource Recovery | 9.1% | |
| Electric Utilities | 7.7% | |
| Education | 7.6% | |
| State G.O. | 6.9% | |
| Housing | 5.3% | |
| Others* (Individually Less Than 5%) | 2.7% | |
| | 100.0% | |
| |
| *Includes net other assets | | |
Quality Diversification (% of Fund's net assets) |
|
| |
| We have used ratings from Moody's Investors Service, Inc. Where Moody's® ratings are not available, we have used S&P® ratings. All ratings are as of the date indicated and do not reflect subsequent changes. |
| Maturity Diversification (% of Fund's Investments) |
| Days |
| 1 - 7 | 57.6 | |
| 8 - 30 | 5.6 | |
| 31 - 60 | 0.3 | |
| 61 - 90 | 6.0 | |
| 91 - 180 | 2.7 | |
| > 180 | 27.8 | |
| The date shown for securities represents the date when principal payments must be paid, taking into account any call options exercised by the issuer and any permissible maturity shortening features other than interest rate resets. |
Showing Percentage of Net Assets
| Municipal Bonds - 40.5% |
| | | Principal Amount (a) | Value ($) |
| Alabama - 3.0% | | | |
| Black Belt Energy Gas District: | | | |
| Bonds Series 2018 A, 4%, tender 12/1/23 (b) | | 100,000 | 100,281 |
| Series 2021 C1, 4% 12/1/23 | | 10,000 | 10,038 |
| Series 2022 C1: | | | |
5.25% 12/1/24 | | 5,000 | 5,145 |
5.25% 12/1/25 | | 5,000 | 5,222 |
| Series 2022 E: | | | |
5% 6/1/24 | | 50,000 | 51,121 |
5% 6/1/25 | | 50,000 | 51,987 |
5% 6/1/26 | | 50,000 | 52,810 |
| Southeast Alabama Gas Supply District Bonds (Proj. No. 2) Series 2018 A, 4%, tender 6/1/24 (b) | | 35,000 | 35,078 |
TOTAL ALABAMA | | | 311,682 |
| Arizona - 0.8% | | | |
| Chandler Indl. Dev. Auth. Indl. Dev. Rev. Bonds (Intel Corp. Proj.) Series 2019, 5%, tender 6/3/24 (b)(c) | | 80,000 | 81,213 |
| California - 3.8% | | | |
| California Muni. Fin. Auth. Solid Waste Disp. Rev. Bonds (Republic Svcs., Inc. Proj.): | | | |
| Series 2021 A, 3.875%, tender 4/3/23 (b)(c) | | 50,000 | 50,042 |
| Series 2021 B, 3.6%, tender 7/17/23 (b)(c) | | 100,000 | 100,063 |
| California Poll. Cont. Fing. Auth. Solid Waste Disp. Rev. Bonds (Republic Svcs., Inc. Proj.) Series 2017 A1, 3.45%, tender 4/17/23 (b)(c)(d) | | 200,000 | 200,050 |
| Univ. of California Revs. Bonds Series 2013 AK, 5%, tender 5/15/23 (b) | | 50,000 | 50,372 |
TOTAL CALIFORNIA | | | 400,527 |
| Connecticut - 2.3% | | | |
| Connecticut Gen. Oblig.: | | | |
| Series 2016 B, 5% 5/15/25 | | 10,000 | 10,598 |
| Series 2018 F, 5% 9/15/23 | | 75,000 | 76,203 |
| Connecticut Health & Edl. Facilities Auth. Rev. Bonds: | | | |
| Series 2010 A3, 0.25%, tender 2/9/24 (b) | | 50,000 | 48,412 |
| Series 2014 A, 1.1%, tender 2/7/23 (b) | | 100,000 | 99,967 |
TOTAL CONNECTICUT | | | 235,180 |
| Florida - 2.0% | | | |
| Duval County School Board Ctfs. of Prtn. Series 2022 A, 5% 7/1/26 (Assured Guaranty Muni. Corp. Insured) | | 100,000 | 108,592 |
| Florida Dev. Fin. Corp. Rev. Bonds (Brightline Florida Passenger Rail Expansion Proj.) Series 2021 A, 2.9%, tender 4/4/23 (b)(c) | | 100,000 | 99,940 |
TOTAL FLORIDA | | | 208,532 |
| Georgia - 1.2% | | | |
| Bartow County Dev. Auth. Poll. Cont. Rev. Bonds (Georgia Pwr. Co. Plant Bowen Proj.): | | | |
| Series 2009 1st, 2.75%, tender 3/15/23 (b) | | 30,000 | 29,994 |
| Series 2013, 2.875%, tender 8/19/25 (b) | | 100,000 | 98,279 |
TOTAL GEORGIA | | | 128,273 |
| Hawaii - 0.5% | | | |
| Honolulu City & County Gen. Oblig. Bonds (Honolulu Rail Transit Proj.) Series 2019 E, 5%, tender 9/1/23 (b) | | 55,000 | 55,458 |
| Illinois - 2.0% | | | |
| Illinois Dev. Fin. Auth. Solid Waste Disp. Rev. Bonds (Waste Mgmt., Inc. Proj.) Series 2019, 4.4%, tender 11/1/23 (b)(c) | | 100,000 | 100,787 |
| Illinois Fin. Auth. Series 2022 A, 5% 10/1/24 | | 100,000 | 101,744 |
| Illinois Gen. Oblig. Series 2017 D, 5% 11/1/26 | | 5,000 | 5,332 |
TOTAL ILLINOIS | | | 207,863 |
| Indiana - 0.5% | | | |
| Indiana Dev. Fin. Auth. Solid Waste Disp. Rev. Bonds (Waste Mgmt., Inc. Proj.) Series 2001, 4%, tender 10/2/23 (b)(c) | | 50,000 | 50,220 |
| Kentucky - 0.6% | | | |
| Kentucky State Property & Buildings Commission Rev. Series 2013 A, 5% 10/1/23 | | 50,000 | 50,756 |
| Kentucky, Inc. Pub. Energy Bonds Series 2018 A, 4%, tender 4/1/24 (b) | | 15,000 | 15,032 |
TOTAL KENTUCKY | | | 65,788 |
| Massachusetts - 0.9% | | | |
| Massachusetts Bay Trans. Auth. Sales Tax Rev. Series C, 5.5% 7/1/23 | | 60,000 | 60,758 |
| Massachusetts Gen. Oblig. Bonds Series 2020 A, 5%, tender 6/1/23 (b) | | 30,000 | 30,268 |
TOTAL MASSACHUSETTS | | | 91,026 |
| Michigan - 1.4% | | | |
| Coopersville Area Pub. Schools Series 2022 I: | | | |
| 4% 5/1/26 | | 30,000 | 31,502 |
| 5% 5/1/25 | | 110,000 | 116,303 |
TOTAL MICHIGAN | | | 147,805 |
| Minnesota - 0.2% | | | |
| Minnesota Hsg. Fin. Agcy. Series 2022 A, 5% 8/1/23 | | 25,000 | 25,316 |
| Nebraska - 1.0% | | | |
| Central Plains Energy Proj. Gas Supply Bonds Series 2019, 4%, tender 8/1/25 (b) | | 105,000 | 106,337 |
| Nevada - 2.4% | | | |
| Nevada Dept. of Bus. & Industry Bonds: | | | |
| (Republic Svcs., Inc. Proj.) Series 2001, 3.75%, tender 6/1/23 (b)(c)(d) | | 50,000 | 50,042 |
| Series 2023 A, 3.7%, tender 1/31/24 (b)(c) | | 200,000 | 200,033 |
TOTAL NEVADA | | | 250,075 |
| New Hampshire - 0.9% | | | |
| Nat'l. Fin. Auth. Solid Bonds (Waste Mgmt., Inc. Proj.) Series 2019 A1, 2.15%, tender 7/1/24 (b)(c) | | 100,000 | 97,413 |
| New Jersey - 2.5% | | | |
| New Jersey Econ. Dev. Auth. Rev.: | | | |
| Series 2013, 5% 3/1/25 | | 25,000 | 25,043 |
| Series 2019, 5.25% 9/1/24 (d) | | 100,000 | 103,963 |
| New Jersey Edl. Facility (Stevens Institute of Techonolgy Proj.) Series 2017 A, 5% 7/1/25 | | 75,000 | 78,280 |
| New Jersey Trans. Trust Fund Auth. Series 2010 D, 5.25% 12/15/23 | | 55,000 | 56,184 |
TOTAL NEW JERSEY | | | 263,470 |
| New York - 3.3% | | | |
| New York City Hsg. Dev. Corp. Multifamily Hsg. Bonds Series 2021 K2, 0.9%, tender 1/1/26 (b) | | 165,000 | 152,986 |
| New York Metropolitan Trans. Auth. Rev.: | | | |
| Bonds Series 2020 A2, 5%, tender 5/15/24 (b) | | 100,000 | 102,235 |
| Series 2020 A, 5% 2/1/23 | | 90,000 | 90,000 |
TOTAL NEW YORK | | | 345,221 |
| Oregon - 2.3% | | | |
| Oregon Bus. Dev. Commission Recovery Zone Facility Bonds (Intel Corp. Proj.) Series 232, 2.4%, tender 8/14/23 (b) | | 100,000 | 99,594 |
| Union County Hosp. Facility Auth. Series 2022, 5% 7/1/24 | | 135,000 | 138,170 |
TOTAL OREGON | | | 237,764 |
| Pennsylvania - 1.9% | | | |
| Pennsylvania Econ. Dev. Fing. Auth. Solid Waste Disp. Rev. Bonds: | | | |
| (Republic Svcs., Inc. Proj.) Series 2014, 3.8%, tender 4/3/23 (b)(c) | | 100,000 | 100,078 |
| (Waste Mgmt., Inc. Proj.) Series 2013, 4%, tender 2/1/23 (b)(c) | | 100,000 | 99,999 |
TOTAL PENNSYLVANIA | | | 200,077 |
| Tennessee - 2.8% | | | |
| Tennergy Corp. Gas Rev. Bonds Series 2019 A, 5%, tender 10/1/24 (b) | | 95,000 | 97,329 |
| Tennessee Energy Acquisition Corp. Bonds (Gas Rev. Proj.) Series A, 4%, tender 5/1/23 (b) | | 200,000 | 200,209 |
TOTAL TENNESSEE | | | 297,538 |
| Texas - 1.4% | | | |
| Mission Econ. Dev. Corp. Solid Waste Disp. Rev. Bonds (Waste Mgmt., Inc. Proj.) Series 2020 B, 3.5%, tender 3/1/23 (b)(c) | | 100,000 | 100,009 |
| Pflugerville Independent School District Bonds Series 2019 B, 2.5%, tender 8/15/23 (b) | | 35,000 | 34,826 |
| Tarrant County Cultural Ed. Facilities Fin. Corp. Hosp. Rev. Bonds (Baylor Scott & White Health Proj.) Series 2022 E, 5%, tender 5/15/26 (b) | | 15,000 | 15,992 |
TOTAL TEXAS | | | 150,827 |
| Virginia - 0.8% | | | |
| Louisa Indl. Dev. Auth. Poll. Cont. Rev. Bonds (Virginia Elec. and Pwr. Co. Proj.) Series 2008 B, 0.75%, tender 9/2/25 (b) | | 95,000 | 87,267 |
| Wisconsin - 2.0% | | | |
| Pub. Fin. Auth. Health Care Sys. Rev. Series 2023 A, 5% 10/1/24 (e) | | 200,000 | 208,184 |
| TOTAL MUNICIPAL BONDS (Cost $4,260,573) | | | 4,253,056 |
| | | | |
| Municipal Notes - 62.1% |
| | | Principal Amount (a) | Value ($) |
| Alabama - 7.0% | | | |
| Black Belt Energy Gas District Participating VRDN Series ZL 03 97, 1.96% 2/7/23 (Liquidity Facility Morgan Stanley Bank, West Valley City Utah) (b)(f)(g) | | 330,000 | 330,000 |
| Southeast Energy Auth. Rev. Bonds Participating VRDN Series XG 04 10, 1.96% 2/7/23 (Liquidity Facility Morgan Stanley Bank, West Valley City Utah) (b)(f)(g) | | 300,000 | 300,000 |
| West Jefferson Indl. Dev. Board Solid Waste Disp. Rev. (Alabama Pwr. Co. Miller Plant Proj.) Series 2008, 1.42% 2/1/23, VRDN (b)(c) | | 100,000 | 100,000 |
TOTAL ALABAMA | | | 730,000 |
| Alaska - 1.9% | | | |
| Valdez Marine Term. Rev. (Phillips Trans. Alaska, Inc. Proj.) Series 1994 B, 1.78% 2/7/23, VRDN (b) | | 200,000 | 200,000 |
| Connecticut - 1.9% | | | |
| Connecticut Gen. Oblig. Series 2016 C, 1.68% 2/7/23 (Liquidity Facility Bank of America NA), VRDN (b) | | 200,000 | 200,000 |
| Georgia - 3.8% | | | |
| Bartow County Dev. Auth. (Georgia Pwr. Co. Plant Bowen Proj.) Series 2022, 1.55% 2/1/23, VRDN (b)(c) | | 300,000 | 300,000 |
| Monroe County Dev. Auth. Rev. (Florida Pwr. & Lt. Co. Proj.) Series 2019, 1.35% 2/1/23, VRDN (b)(c) | | 100,000 | 100,000 |
TOTAL GEORGIA | | | 400,000 |
| Indiana - 0.9% | | | |
| Indiana Dev. Fin. Auth. Envir. Rev. (PSI Energy Proj.) Series 2003 A, 2.05% 2/7/23, VRDN (b)(c) | | 100,000 | 100,000 |
| Kentucky - 3.8% | | | |
| Kentucky Tpk. Auth. Econ. Dev. Road Rev. Participating VRDN Series XF 24 84, 1.86% 2/7/23 (Liquidity Facility Morgan Stanley Bank, West Valley City Utah) (b)(f)(g) | | 300,000 | 300,000 |
| Meade County Indl. Bldg. Rev. (Nucor Steel Brandenburg Proj.) Series 2020 A1, 2.11% 2/1/23, VRDN (b)(c) | | 100,000 | 100,000 |
TOTAL KENTUCKY | | | 400,000 |
| Louisiana - 4.1% | | | |
| Saint James Parish Gen. Oblig. (Nucor Steel Louisiana LLC Proj.): | | | |
| Series 2010 A1, 2.13% 2/7/23, VRDN (b) | | 100,000 | 100,000 |
| Series 2010 B1, 2.3% 2/7/23, VRDN (b) | | 330,000 | 330,000 |
TOTAL LOUISIANA | | | 430,000 |
| Minnesota - 3.8% | | | |
| Minnesota Higher Ed. Facilities Auth. Rev. Series 1994 3Z, 1.85% 2/1/23, VRDN (b) | | 400,000 | 400,000 |
| Missouri - 1.9% | | | |
| Missouri Health & Edl. Facilities Auth. Edl. Facilities Rev. Participating VRDN Series XG 01 76, 1.79% 2/7/23 (Liquidity Facility Royal Bank of Canada) (b)(f)(g) | | 200,000 | 200,000 |
| New York - 12.9% | | | |
| New York City Gen. Oblig. Series 2012 2, 1.6% 2/8/23, VRDN (b) | | 500,000 | 499,997 |
| New York City Hsg. Dev. Corp. Multi-family Mtg. Rev. (Ogden Avenue Apts. Proj.) Series A, 1.69% 2/7/23, LOC Fannie Mae, VRDN (b)(c) | | 200,000 | 200,000 |
| New York Dorm. Auth. Rev. Participating VRDN Series XF 13 28, 1.83% 2/7/23 (Liquidity Facility JPMorgan Chase Bank) (b)(f)(g) | | 450,000 | 450,000 |
| New York Metropolitan Trans. Auth. Rev. Participating VRDN Series XF 13 55, 1.84% 2/7/23 (Liquidity Facility JPMorgan Chase Bank) (b)(f)(g) | | 200,000 | 200,000 |
TOTAL NEW YORK | | | 1,349,997 |
| North Carolina - 2.9% | | | |
| Raleigh Ctfs. of Prtn. (Downtown Impt. Proj.) Series 2005 B1, 1.77% 2/7/23 (Liquidity Facility PNC Bank NA), VRDN (b) | | 300,000 | 300,000 |
| Ohio - 3.8% | | | |
| Allen County Hosp. Facilities Rev. Series 2012 B, 2.1% 2/7/23 (Liquidity Facility Ohio Gen. Oblig.), VRDN (b) | | 400,000 | 400,000 |
| South Carolina - 0.9% | | | |
| Greenville Hosp. Sys. Facilities Rev. Participating VRDN Series XF 01 45, 1.86% 2/7/23 (Liquidity Facility Toronto-Dominion Bank) (b)(f)(g) | | 100,000 | 100,000 |
| Tennessee - 1.9% | | | |
| Chattanooga Health Ed. & Hsg. Facility Board Rev. (Catholic Health Initiatives Proj.) Series C, 2.05% 2/7/23, VRDN (b) | | 200,000 | 200,000 |
| Texas - 4.8% | | | |
| Port Arthur Navigation District Indl. Dev. Corp. Exempt Facilities Rev. (Air Products Proj.): | | | |
| Series 2001, 1.74% 2/7/23, VRDN (b)(c) | | 200,000 | 200,000 |
| Series 2002, 1.74% 2/7/23, VRDN (b)(c) | | 100,000 | 100,000 |
| Tarrant County Cultural Ed. Facilities Fin. Corp. Hosp. Rev. Participating VRDN Series E 141, 1.69% 2/7/23 (Liquidity Facility Royal Bank of Canada) (b)(f)(g) | | 200,000 | 200,000 |
TOTAL TEXAS | | | 500,000 |
| Virginia - 2.9% | | | |
| Lynchburg Econ. Dev. Participating VRDN Series XL 00 75, 1.91% 2/7/23 (Liquidity Facility JPMorgan Chase Bank) (b)(f)(g) | | 300,000 | 300,000 |
| Washington - 1.9% | | | |
| Seattle Hsg. Auth. Rev. (Douglas Apts. Proj.) Series 2008, 1.85% 2/7/23, LOC KeyBank NA, VRDN (b) | | 200,000 | 200,000 |
| West Virginia - 1.0% | | | |
| West Virginia Hosp. Fin. Auth. Hosp. Rev. Series 2018 E, 2.18% 2/6/26, VRDN (b) | | 100,000 | 100,000 |
| TOTAL MUNICIPAL NOTES (Cost $6,509,998) | | | 6,509,997 |
| | | | |
| TOTAL INVESTMENT IN SECURITIES - 102.6% (Cost $10,770,571) | 10,763,053 |
NET OTHER ASSETS (LIABILITIES) - (2.6)% | (271,278) |
| NET ASSETS - 100.0% | 10,491,775 |
| | |
Security Type Abbreviations
| VRDN | - | VARIABLE RATE DEMAND NOTE (A debt instrument that is payable upon demand, either daily, weekly or monthly) |
Legend
| (a) | Amount is stated in United States dollars unless otherwise noted. |
| (b) | Coupon rates for floating and adjustable rate securities reflect the rates in effect at period end. |
| (c) | Private activity obligations whose interest is subject to the federal alternative minimum tax for individuals. |
| (d) | Security exempt from registration under Rule 144A of the Securities Act of 1933. These securities may be resold in transactions exempt from registration, normally to qualified institutional buyers. At the end of the period, the value of these securities amounted to $354,055 or 3.4% of net assets. |
| (e) | Security or a portion of the security purchased on a delayed delivery or when-issued basis. |
| (f) | Provides evidence of ownership in one or more underlying municipal bonds. |
| (g) | Coupon rates are determined by re-marketing agents based on current market conditions. |
Affiliated Central Funds
Fiscal year to date information regarding the Fund's investments in Fidelity Central Funds, including the ownership percentage, is presented below.
| Affiliate | Value, beginning of period ($) | Purchases ($) | Sales Proceeds ($) | Dividend Income ($) | Realized Gain (loss) ($) | Change in Unrealized appreciation (depreciation) ($) | Value, end of period ($) | % ownership, end of period |
| Fidelity Municipal Cash Central Fund 1.40% | - | 898,000 | 898,000 | 519 | - | - | - | 0.0% |
| Total | - | 898,000 | 898,000 | 519 | - | - | - | |
| | | | | | | | | |
Amounts in the dividend income column in the above table include any capital gain distributions from underlying funds, which are presented in the corresponding line item in the Statement of Operations, if applicable.
Amounts included in the purchases and sales proceeds columns may include in-kind transactions, if applicable.
Investment Valuation
The following is a summary of the inputs used, as of January 31, 2023, involving the Fund's assets and liabilities carried at fair value. The inputs or methodology used for valuing securities may not be an indication of the risk associated with investing in those securities. For more information on valuation inputs, and their aggregation into the levels used below, please refer to the Investment Valuation section in the accompanying Notes to Financial Statements.
| Valuation Inputs at Reporting Date: |
| Description | Total ($) | Level 1 ($) | Level 2 ($) | Level 3 ($) |
Investments in Securities: | | | | |
|
| Municipal Securities | 10,763,053 | - | 10,763,053 | - |
| Total Investments in Securities: | 10,763,053 | - | 10,763,053 | - |
| Statement of Assets and Liabilities |
| | | | January 31, 2023 |
| | | | | |
| Assets | | | | |
Investment in securities, at value - See accompanying schedule Unaffiliated issuers (cost $10,770,571): | | | $ | 10,763,053 |
| Interest receivable | | | | 58,402 |
| Prepaid expenses | | | | 8,139 |
| Receivable from investment adviser for expense reductions | | | | 8,373 |
| Other receivables | | | | 57 |
Total assets | | | | 10,838,024 |
| Liabilities | | | | |
| Payable to custodian bank | $ | 94,171 | | |
| Payable for investments purchased on a delayed delivery basis | | 208,262 | | |
| Distributions payable | | 587 | | |
| Accrued management fee | | 2,597 | | |
| Audit fee payable | | 40,219 | | |
| Other payables and accrued expenses | | 413 | | |
| Total Liabilities | | | | 346,249 |
| Net Assets | | | $ | 10,491,775 |
| Net Assets consist of: | | | | |
| Paid in capital | | | $ | 10,498,508 |
| Total accumulated earnings (loss) | | | | (6,733) |
| Net Assets | | | $ | 10,491,775 |
Net Asset Value , offering price and redemption price per share ($10,491,775 ÷ 1,049,963 shares) | | | $ | 9.99 |
| Statement of Operations |
| | | | For the period June 16, 2022 (commencement of operations) through January 31, 2023 |
| Investment Income | | | | |
| Interest | | | $ | 133,375 |
| Income from Fidelity Central Funds | | | | 519 |
| Total Income | | | | 133,894 |
| Expenses | | | | |
| Management fee | $ | 18,863 | | |
| Custodian fees and expenses | | 816 | | |
| Independent trustees' fees and expenses | | 20 | | |
| Registration fees | | 16,718 | | |
| Audit | | 45,794 | | |
| Legal | | 3 | | |
| Miscellaneous | | 33 | | |
| Total expenses before reductions | | 82,247 | | |
| Expense reductions | | (66,863) | | |
| Total expenses after reductions | | | | 15,384 |
| Net Investment income (loss) | | | | 118,510 |
| Realized and Unrealized Gain (Loss) | | | | |
| Net realized gain (loss) on: | | | | |
| Investment Securities: | | | | |
| Unaffiliated issuers | | 103 | | |
| Total net realized gain (loss) | | | | 103 |
| Change in net unrealized appreciation (depreciation) on investment securities | | | | (7,518) |
| Net gain (loss) | | | | (7,415) |
| Net increase (decrease) in net assets resulting from operations | | | $ | 111,095 |
| Statement of Changes in Net Assets |
| |
| | For the period June 16, 2022 (commencement of operations) through January 31, 2023 |
| Increase (Decrease) in Net Assets | | |
| Operations | | |
| Net investment income (loss) | $ | 118,510 |
| Net realized gain (loss) | | 103 |
| Change in net unrealized appreciation (depreciation) | | (7,518) |
| Net increase (decrease) in net assets resulting from operations | | 111,095 |
| Distributions to shareholders | | (117,828) |
| Share transactions | | |
| Proceeds from sales of shares | | 10,386,249 |
| Reinvestment of distributions | | 116,752 |
| Cost of shares redeemed | | (4,493) |
Net increase (decrease) in net assets resulting from share transactions | | 10,498,508 |
| Total increase (decrease) in net assets | | 10,491,775 |
| | | |
| Net Assets | | |
| Beginning of period | | - |
| End of period | $ | 10,491,775 |
| | | |
| Other Information | | |
| Shares | | |
| Sold | | 1,038,704 |
| Issued in reinvestment of distributions | | 11,709 |
| Redeemed | | (450) |
| Net increase (decrease) | | 1,049,963 |
| | | |
Financial Highlights
| Fidelity SAI Sustainable Conservative Income Municipal Bond Fund |
| |
| Years ended January 31, | | 2023 A |
Selected Per-Share Data | | |
| Net asset value, beginning of period | $ | 10.00 |
| Income from Investment Operations | | |
Net investment income (loss) B,C | | .117 |
| Net realized and unrealized gain (loss) | | (.011) |
| Total from investment operations | | .106 |
| Distributions from net investment income | | (.116) |
| Total distributions | | (.116) |
| Net asset value, end of period | $ | 9.99 |
Total Return D,E | | 1.07% |
Ratios to Average Net Assets C,F,G | | |
| Expenses before reductions | | 1.03% H,I |
| Expenses net of fee waivers, if any | | .25% H |
| Expenses net of all reductions | | .24% H |
| Net investment income (loss) | | 1.86% H |
| Supplemental Data | | |
| Net assets, end of period (000 omitted) | $ | 10,492 |
Portfolio turnover rate J | | 42% H |
A For the period June 16, 2022 (commencement of operations) through January 31, 2023.
B Calculated based on average shares outstanding during the period.
C Net investment income (loss) is affected by the timing of the declaration of dividends by any underlying mutual funds or exchange-traded funds (ETFs). Net investment income (loss) of any mutual funds or ETFs is not included in the Fund's net investment income (loss) ratio.
D Total returns for periods of less than one year are not annualized.
E Total returns would have been lower if certain expenses had not been reduced during the applicable periods shown.
F Fees and expenses of any underlying mutual funds or exchange-traded funds (ETFs) are not included in the Fund's expense ratio. The Fund indirectly bears its proportionate share of these expenses. For additional expense information related to investments in Fidelity Central Funds, please refer to the "Investments in Fidelity Central Funds" note found in the Notes to Financial Statements section of the most recent Annual or Semi-Annual report.
G Expense ratios reflect operating expenses of the class. Expenses before reductions do not reflect amounts reimbursed, waived, or reduced through arrangements with the investment adviser, brokerage services, or other offset arrangements, if applicable, and do not represent the amount paid by the class during periods when reimbursements, waivers or reductions occur.
H Annualized.
I Audit fees are not annualized.
J Amount does not include the portfolio activity of any underlying mutual funds or exchange-traded funds (ETFs).
For the period ended January 31, 2023
1. Organization.
Fidelity SAI Sustainable Conservative Income Municipal Bond Fund (the Fund) is a fund of Fidelity Salem Street Trust (the Trust) and is authorized to issue an unlimited number of shares. Shares are offered exclusively to certain clients of Fidelity Management & Research Company LLC (FMR) or its affiliates. The Trust is registered under the Investment Company Act of 1940, as amended (the 1940 Act), as an open-end management investment company organized as a Massachusetts business trust.
2. Investments in Fidelity Central Funds.
Funds may invest in Fidelity Central Funds, which are open-end investment companies generally available only to other investment companies and accounts managed by the investment adviser and its affiliates. The Schedule of Investments lists any Fidelity Central Funds held as an investment as of period end, but does not include the underlying holdings of each Fidelity Central Fund. An investing fund indirectly bears its proportionate share of the expenses of the underlying Fidelity Central Funds.
Based on its investment objective, each Fidelity Central Fund may invest or participate in various investment vehicles or strategies that are similar to those of the investing fund. These strategies are consistent with the investment objectives of the investing fund and may involve certain economic risks which may cause a decline in value of each of the Fidelity Central Funds and thus a decline in the value of the investing fund.
| Fidelity Central Fund | Investment Manager | Investment Objective | Investment Practices | Expense Ratio A |
| Fidelity Money Market Central Funds | Fidelity Management & Research Company LLC (FMR) | Each fund seeks to obtain a high level of current income consistent with the preservation of capital and liquidity. | Short-term Investments | Less than .005% |
A Expenses expressed as a percentage of average net assets and are as of each underlying Central Fund's most recent annual or semi-annual shareholder report.
A complete unaudited list of holdings for each Fidelity Central Fund is available upon request or at the Securities and Exchange Commission website at www.sec.gov. In addition, the financial statements of the Fidelity Central Funds which contain the significant accounting policies (including investment valuation policies) of those funds, and are not covered by the Report of Independent Registered Public Accounting Firm, are available on the Securities and Exchange Commission website or upon request.
3. Significant Accounting Policies.
The Fund is an investment company and applies the accounting and reporting guidance of the Financial Accounting Standards Board (FASB) Accounting Standards Codification Topic 946 Financial Services - Investment Companies . The financial statements have been prepared in conformity with accounting principles generally accepted in the United States of America (GAAP), which require management to make certain estimates and assumptions at the date of the financial statements. Actual results could differ from those estimates. Subsequent events, if any, through the date that the financial statements were issued have been evaluated in the preparation of the financial statements. The Fund's Schedule of Investments lists any underlying mutual funds or exchange-traded funds (ETFs) but does not include the underlying holdings of these funds. The following summarizes the significant accounting policies of the Fund:
Investment Valuation. Investments are valued as of 4:00 p.m. Eastern time on the last calendar day of the period. The Board of Trustees (the Board) has designated the Fund's investment adviser as the valuation designee responsible for the fair valuation function and performing fair value determinations as needed. The investment adviser has established a Fair Value Committee (the Committee) to carry out the day-to-day fair valuation responsibilities and has adopted policies and procedures to govern the fair valuation process and the activities of the Committee. In accordance with these fair valuation policies and procedures, which have been approved by the Board, the Fund attempts to obtain prices from one or more third party pricing services or brokers to value its investments. When current market prices, quotations or currency exchange rates are not readily available or reliable, investments will be fair valued in good faith by the Committee, in accordance with the policies and procedures. Factors used in determining fair value vary by investment type and may include market or investment specific events, transaction data, estimated cash flows, and market observations of comparable investments. The frequency that the fair valuation procedures are used cannot be predicted and they may be utilized to a significant extent. The Committee manages the Fund's fair valuation practices and maintains the fair valuation policies and procedures. The Fund's investment adviser reports to the Board information regarding the fair valuation process and related material matters.
The Fund categorizes the inputs to valuation techniques used to value its investments into a disclosure hierarchy consisting of three levels as shown below:
Level 1 - unadjusted quoted prices in active markets for identical investments
Level 2 - other significant observable inputs (including quoted prices for similar investments, interest rates, prepayment speeds, etc.)
Level 3 - unobservable inputs (including the Fund's own assumptions based on the best information available)
Valuation techniques used to value the Fund's investments by major category are as follows:
Debt securities, including restricted securities, are valued based on evaluated prices received from third party pricing services or from brokers who make markets in such securities. Municipal securities are valued by pricing services who utilize matrix pricing which considers yield or price of bonds of comparable quality, coupon, maturity and type or by broker-supplied prices. When independent prices are unavailable or unreliable, debt securities may be valued utilizing pricing methodologies which consider similar factors that would be used by third party pricing services. Debt securities are generally categorized as Level 2 in the hierarchy but may be Level 3 depending on the circumstances.
Investments in open-end mutual funds, including the Fidelity Central Funds, are valued at their closing net asset value (NAV) each business day and are categorized as Level 1 in the hierarchy.
Changes in valuation techniques may result in transfers in or out of an assigned level within the disclosure hierarchy. The aggregate value of investments by input level as of January 31, 2023 is included at the end of the Fund's Schedule of Investments.
Investment Transactions and Income. For financial reporting purposes, the Fund's investment holdings and NAV include trades executed through the end of the last business day of the period. The NAV per share for processing shareholder transactions is calculated as of the close of business of the New York Stock Exchange (NYSE), normally 4:00 p.m. Eastern time and includes trades executed through the end of the prior business day. Gains and losses on securities sold are determined on the basis of identified cost. Income and capital gain distributions from Fidelity Central Funds, if any, are recorded on the ex-dividend date. Interest income is accrued as earned and includes coupon interest and amortization of premium and accretion of discount on debt securities as applicable.
Expenses. Expenses directly attributable to a fund are charged to that fund. Expenses attributable to more than one fund are allocated among the respective funds on the basis of relative net assets or other appropriate methods. Expenses included in the accompanying financial statements reflect the expenses of that fund and do not include any expenses associated with any underlying mutual funds or exchange-traded funds. Although not included in a fund's expenses, a fund indirectly bears its proportionate share of these expenses through the net asset value of each underlying mutual fund or exchange-traded fund. Expense estimates are accrued in the period to which they relate and adjustments are made when actual amounts are known.
Income Tax Information and Distributions to Shareholders. Each year, the Fund intends to qualify as a regulated investment company under Subchapter M of the Internal Revenue Code, including distributing substantially all of its taxable income and realized gains. As a result, no provision for U.S. Federal income taxes is required. As of January 31, 2023, the Fund did not have any unrecognized tax benefits in the financial statements; nor is the Fund aware of any tax positions for which it is reasonably possible that the total amounts of unrecognized tax benefits will significantly change in the next twelve months. The Fund files a U.S. federal tax return, in addition to state and local tax returns as required. The Fund's federal income tax returns are subject to examination by the Internal Revenue Service (IRS) for a period of three fiscal years after they are filed. State and local tax returns may be subject to examination for an additional fiscal year depending on the jurisdiction.
Distributions are declared and recorded daily and paid monthly from net investment income. Distributions from realized gains, if any, are declared and recorded on the ex-dividend date. Income and capital gain distributions are determined in accordance with income tax regulations, which may differ from GAAP.
Capital accounts within the financial statements are adjusted for permanent book-tax differences. These adjustments have no impact on net assets or the results of operations. Capital accounts are not adjusted for temporary book-tax differences which will reverse in a subsequent period.
Book-tax differences are primarily due to market discount.
The Fund purchases municipal securities whose interest, in the opinion of the issuer, is free from federal income tax. There is no assurance that the Internal Revenue Service (IRS) will agree with this opinion. In the event the IRS determines that the issuer does not comply with relevant tax requirements, interest payments from a security could become federally taxable, possibly retroactively to the date the security was issued.
As of period end, the cost and unrealized appreciation (depreciation) in securities, and derivatives if applicable, for federal income tax purposes were as follows:
| Gross unrealized appreciation | $8,362 |
| Gross unrealized depreciation | (15,148) |
| Net unrealized appreciation (depreciation) | $(6,786) |
| Tax Cost | $10,769,839 |
The tax-based components of distributable earnings as of period end were as follows:
| Undistributed ordinary income | $102 |
| Net unrealized appreciation (depreciation) on securities and other investments | $(6,786) |
The tax character of distributions paid was as follows:
| | January 31, 2023 A |
| Tax-exempt Income | $117,828 |
| Total | $117,828 |
A For the period June 16, 2022 (commencement of operations) through January 31, 2023.
Delayed Delivery Transactions and When-Issued Securities. During the period, certain Funds transacted in securities on a delayed delivery or when-issued basis. Payment and delivery may take place after the customary settlement period for that security. The price of the underlying securities and the date when the securities will be delivered and paid for are fixed at the time the transaction is negotiated. Securities purchased on a delayed delivery or when-issued basis are identified as such in the Schedule of Investments. Compensation for interest forgone in the purchase of a delayed delivery or when-issued debt security may be received. With respect to purchase commitments, each applicable Fund identifies securities as segregated in its records with a value at least equal to the amount of the commitment. Payables and receivables associated with the purchases and sales of delayed delivery securities having the same coupon, settlement date and broker are offset. Delayed delivery or when-issued securities that have been purchased from and sold to different brokers are reflected as both payables and receivables in the Statement of Assets and Liabilities under the caption "Delayed delivery", as applicable. Losses may arise due to changes in the value of the underlying securities or if the counterparty does not perform under the contract's terms, or if the issuer does not issue the securities due to political, economic, or other factors.
Restricted Securities (including Private Placements). Funds may invest in securities that are subject to legal or contractual restrictions on resale. These securities generally may be resold in transactions exempt from registration or to the public if the securities are registered. Disposal of these securities may involve time-consuming negotiations and expense, and prompt sale at an acceptable price may be difficult. Information regarding restricted securities held at period end is included at the end of the Schedule of Investments, if applicable.
4. Purchases and Sales of Investments.
Purchases and sales of securities, other than short-term securities and in-kind transactions, as applicable, are noted in the table below.
| | Purchases ($) | Sales ($) |
| Fidelity SAI Sustainable Conservative Income Municipal Bond Fund | 4,980,537 | 815,000 |
5. Fees and Other Transactions with Affiliates.
Management Fee. Fidelity Management & Research Company LLC (the investment adviser) and its affiliates provide the Fund with investment management related services for which the Fund pays a monthly management fee that is based on an annual rate of .30% of the Fund's average net assets.
Interfund Trades. Funds may purchase from or sell securities to other Fidelity Funds under procedures adopted by the Board. The procedures have been designed to ensure these interfund trades are executed in accordance with Rule 17a-7 of the 1940 Act. Any interfund trades are included within the respective purchases and sales amounts shown in the Purchases and Sales of Investments note. Interfund trades during the period are noted in the table below.
| | Purchases ($) | Sales ($) | Realized Gain (Loss) ($) |
| Fidelity SAI Sustainable Conservative Income Municipal Bond Fund | - | 500,000 | - |
6. Expense Reductions.
The investment adviser contractually agreed to reimburse the Fund to the extent annual operating expenses exceeded .25% of average net assets. This reimbursement will remain in place through May 31, 2024. Some expenses, for example the compensation of the independent Trustees, and certain miscellaneous expenses such as proxy and shareholder meeting expenses, are excluded from this reimbursement. During the period this reimbursement reduced the Fund's expenses by $66,327.
Through arrangements with the Fund's custodian and transfer agent, credits realized as a result of certain uninvested cash balances were used to reduce the Fund's expenses by $436 and $100, respectively.
7. Other.
A fund's organizational documents provide former and current trustees and officers with a limited indemnification against liabilities arising in connection with the performance of their duties to the fund. In the normal course of business, a fund may also enter into contracts that provide general indemnifications. A fund's maximum exposure under these arrangements is unknown as this would be dependent on future claims that may be made against a fund. The risk of material loss from such claims is considered remote.
At the end of the period, the investment adviser or its affiliates were owners of record of more than 10% of the outstanding shares as follows:
| Fund | Affiliated % |
Fidelity SAI Sustainable Conservative Income Municipal Bond Fund | 96% |
8. Risk and Uncertainties.
Many factors affect a fund's performance. Developments that disrupt global economies and financial markets, such as pandemics, epidemics, outbreaks of infectious diseases, war, terrorism, and environmental disasters, may significantly affect a fund's investment performance. The effects of these developments to a fund will be impacted by the types of securities in which a fund invests, the financial condition, industry, economic sector, and geographic location of an issuer, and a fund's level of investment in the securities of that issuer.
To the Board of Trustees of Fidelity Salem Street Trust and Shareholders of Fidelity SAI Sustainable Conservative Income Municipal Bond Fund
Opinion on the Financial Statements
We have audited the accompanying statement of assets and liabilities, including the schedule of investments, of Fidelity SAI Sustainable Conservative Income Municipal Bond Fund (one of the funds constituting Fidelity Salem Street Trust, referred to hereafter as the "Fund") as of January 31, 2023, and the related statements of operations and changes in net assets, including the related notes, and the financial highlights for the period June 16, 2022 (commencement of operations) through January 31, 2023 (collectively referred to as the "financial statements"). In our opinion, the financial statements present fairly, in all material respects, the financial position of the Fund as of January 31, 2023, and the results of its operations, changes in its net assets, and the financial highlights for the period June 16, 2022 (commencement of operations) through January 31, 2023 in conformity with accounting principles generally accepted in the United States of America.
Basis for Opinion
These financial statements are the responsibility of the Fund's management. Our responsibility is to express an opinion on the Fund's financial statements based on our audit. We are a public accounting firm registered with the Public Company Accounting Oversight Board (United States) (PCAOB) and are required to be independent with respect to the Fund in accordance with the U.S. federal securities laws and the applicable rules and regulations of the Securities and Exchange Commission and the PCAOB.
We conducted our audit of these financial statements in accordance with the standards of the PCAOB. Those standards require that we plan and perform the audit to obtain reasonable assurance about whether the financial statements are free of material misstatement, whether due to error or fraud.
Our audit included performing procedures to assess the risks of material misstatement of the financial statements, whether due to error or fraud, and performing procedures that respond to those risks. Such procedures included examining, on a test basis, evidence regarding the amounts and disclosures in the financial statements. Our audit also included evaluating the accounting principles used and significant estimates made by management, as well as evaluating the overall presentation of the financial statements. Our procedures included confirmation of securities owned as of January 31, 2023 by correspondence with the custodian and brokers; when replies were not received from brokers, we performed other auditing procedures. We believe that our audit provides a reasonable basis for our opinion.
/s/ PricewaterhouseCoopers LLP
Boston, Massachusetts
March 16, 2023
We have served as the auditor of one or more investment companies in the Fidelity group of funds since 1932.
The Trustees, Members of the Advisory Board (if any), and officers of the trust and fund, as applicable, are listed below. The Board of Trustees governs the fund and is responsible for protecting the interests of shareholders. The Trustees are experienced executives who meet periodically throughout the year to oversee the fund's activities, review contractual arrangements with companies that provide services to the fund, oversee management of the risks associated with such activities and contractual arrangements, and review the fund's performance. Except for Jonathan Chiel, each of the Trustees oversees 291 funds. Mr. Chiel oversees 186 funds.
The Trustees hold office without limit in time except that (a) any Trustee may resign; (b) any Trustee may be removed by written instrument, signed by at least two-thirds of the number of Trustees prior to such removal; (c) any Trustee who requests to be retired or who has become incapacitated by illness or injury may be retired by written instrument signed by a majority of the other Trustees; and (d) any Trustee may be removed at any special meeting of shareholders by a two-thirds vote of the outstanding voting securities of the trust. Each Trustee who is not an interested person (as defined in the 1940 Act) of the trust and the fund is referred to herein as an Independent Trustee. Each Independent Trustee shall retire not later than the last day of the calendar year in which his or her 75th birthday occurs. The Independent Trustees may waive this mandatory retirement age policy with respect to individual Trustees. Officers and Advisory Board Members hold office without limit in time, except that any officer or Advisory Board Member may resign or may be removed by a vote of a majority of the Trustees at any regular meeting or any special meeting of the Trustees. Except as indicated, each individual has held the office shown or other offices in the same company for the past five years.
The fund's Statement of Additional Information (SAI) includes more information about the Trustees. To request a free copy, call Fidelity at 1-800-544-3455.
Experience, Skills, Attributes, and Qualifications of the Trustees. The Governance and Nominating Committee has adopted a statement of policy that describes the experience, qualifications, attributes, and skills that are necessary and desirable for potential Independent Trustee candidates (Statement of Policy). The Board believes that each Trustee satisfied at the time he or she was initially elected or appointed a Trustee, and continues to satisfy, the standards contemplated by the Statement of Policy. The Governance and Nominating Committee also engages professional search firms to help identify potential Independent Trustee candidates who have the experience, qualifications, attributes, and skills consistent with the Statement of Policy. From time to time, additional criteria based on the composition and skills of the current Independent Trustees, as well as experience or skills that may be appropriate in light of future changes to board composition, business conditions, and regulatory or other developments, have also been considered by the professional search firms and the Governance and Nominating Committee. In addition, the Board takes into account the Trustees' commitment and participation in Board and committee meetings, as well as their leadership of standing and ad hoc committees throughout their tenure.
In determining that a particular Trustee was and continues to be qualified to serve as a Trustee, the Board has considered a variety of criteria, none of which, in isolation, was controlling. The Board believes that, collectively, the Trustees have balanced and diverse experience, qualifications, attributes, and skills, which allow the Board to operate effectively in governing the fund and protecting the interests of shareholders. Information about the specific experience, skills, attributes, and qualifications of each Trustee, which in each case led to the Board's conclusion that the Trustee should serve (or continue to serve) as a trustee of the fund, is provided below.
Board Structure and Oversight Function. Abigail P. Johnson is an interested person and currently serves as Chairman. The Trustees have determined that an interested Chairman is appropriate and benefits shareholders because an interested Chairman has a personal and professional stake in the quality and continuity of services provided to the fund. Independent Trustees exercise their informed business judgment to appoint an individual of their choosing to serve as Chairman, regardless of whether the Trustee happens to be independent or a member of management. The Independent Trustees have determined that they can act independently and effectively without having an Independent Trustee serve as Chairman and that a key structural component for assuring that they are in a position to do so is for the Independent Trustees to constitute a substantial majority for the Board. The Independent Trustees also regularly meet in executive session. Michael E. Kenneally serves as Chairman of the Independent Trustees and as such (i) acts as a liaison between the Independent Trustees and management with respect to matters important to the Independent Trustees and (ii) with management prepares agendas for Board meetings.
Fidelity ® funds are overseen by different Boards of Trustees. The fund's Board oversees Fidelity's alternative investment, investment-grade bond, money market, asset allocation and certain equity funds, and other Boards oversee Fidelity's high income and other equity funds. The asset allocation funds may invest in Fidelity ® funds that are overseen by such other Boards. The use of separate Boards, each with its own committee structure, allows the Trustees of each group of Fidelity ® funds to focus on the unique issues of the funds they oversee, including common research, investment, and operational issues. On occasion, the separate Boards establish joint committees to address issues of overlapping consequences for the Fidelity ® funds overseen by each Board.
The Trustees operate using a system of committees to facilitate the timely and efficient consideration of all matters of importance to the Trustees, the fund, and fund shareholders and to facilitate compliance with legal and regulatory requirements and oversight of the fund's activities and associated risks. The Board, acting through its committees, has charged FMR and its affiliates with (i) identifying events or circumstances the occurrence of which could have demonstrably adverse effects on the fund's business and/or reputation; (ii) implementing processes and controls to lessen the possibility that such events or circumstances occur or to mitigate the effects of such events or circumstances if they do occur; and (iii) creating and maintaining a system designed to evaluate continuously business and market conditions in order to facilitate the identification and implementation processes described in (i) and (ii) above. Because the day-to-day operations and activities of the fund are carried out by or through FMR, its affiliates, and other service providers, the fund's exposure to risks is mitigated but not eliminated by the processes overseen by the Trustees. While each of the Board's committees has responsibility for overseeing different aspects of the fund's activities, oversight is exercised primarily through the Operations and Audit Committees. In addition, an ad hoc Board committee of Independent Trustees has worked with FMR to enhance the Board's oversight of investment and financial risks, legal and regulatory risks, technology risks, and operational risks, including the development of additional risk reporting to the Board. Appropriate personnel, including but not limited to the fund's Chief Compliance Officer (CCO), FMR's internal auditor, the independent accountants, the fund's Treasurer and portfolio management personnel, make periodic reports to the Board's committees, as appropriate, including an annual review of Fidelity's risk management program for the Fidelity ® funds. The responsibilities of each standing committee, including their oversight responsibilities, are described further under "Standing Committees of the Trustees."
Interested Trustees*:
Correspondence intended for a Trustee who is an interested person may be sent to Fidelity Investments, 245 Summer Street, Boston, Massachusetts 02210.
Name, Year of Birth; Principal Occupations and Other Relevant Experience+
Jonathan Chiel (1957)
Year of Election or Appointment: 2016
Trustee
Mr. Chiel also serves as Trustee of other Fidelity ® funds. Mr. Chiel is Executive Vice President and General Counsel for FMR LLC (diversified financial services company, 2012-present). Previously, Mr. Chiel served as general counsel (2004-2012) and senior vice president and deputy general counsel (2000-2004) for John Hancock Financial Services; a partner with Choate, Hall & Stewart (1996-2000) (law firm); and an Assistant United States Attorney for the United States Attorney's Office of the District of Massachusetts (1986-95), including Chief of the Criminal Division (1993-1995). Mr. Chiel is a director on the boards of the Boston Bar Foundation and the Maimonides School.
Abigail P. Johnson (1961)
Year of Election or Appointment: 2009
Trustee
Chairman of the Board of Trustees
Ms. Johnson also serves as Trustee of other Fidelity ® funds. Ms. Johnson serves as Chairman (2016-present), Chief Executive Officer (2014-present), and Director (2007-present) of FMR LLC (diversified financial services company), President of Fidelity Financial Services (2012-present) and President of Personal, Workplace and Institutional Services (2005-present). Ms. Johnson is Chairman and Director of Fidelity Management & Research Company LLC (investment adviser firm, 2011-present). Previously, Ms. Johnson served as Chairman and Director of FMR Co., Inc. (investment adviser firm, 2011-2019), Vice Chairman (2007-2016) and President (2013-2016) of FMR LLC, President and a Director of Fidelity Management & Research Company (2001-2005), a Trustee of other investment companies advised by Fidelity Management & Research Company, Fidelity Investments Money Management, Inc. (investment adviser firm), and FMR Co., Inc. (2001-2005), Senior Vice President of the Fidelity ® funds (2001-2005), and managed a number of Fidelity ® funds. Ms. Abigail P. Johnson and Mr. Arthur E. Johnson are not related.
Jennifer Toolin McAuliffe (1959)
Year of Election or Appointment: 2016
Trustee
Ms. McAuliffe also serves as Trustee of other Fidelity ® funds and as Trustee of Fidelity Charitable (2020-present). Previously, Ms. McAuliffe served as Co-Head of Fixed Income of Fidelity Investments Limited (now known as FIL Limited (FIL)) (diversified financial services company), Director of Research for FIL's credit and quantitative teams in London, Hong Kong and Tokyo and Director of Research for taxable and municipal bonds at Fidelity Investments Money Management, Inc. Ms. McAuliffe previously served as a member of the Advisory Board of certain Fidelity ® funds (2016). Ms. McAuliffe was previously a lawyer at Ropes & Gray LLP and currently serves as director or trustee of several not-for-profit entities.
* Determined to be an "Interested Trustee" by virtue of, among other things, his or her affiliation with the trust or various entities under common control with FMR.
+ The information includes the Trustee's principal occupation during the last five years and other information relating to the experience, attributes, and skills relevant to the Trustee's qualifications to serve as a Trustee, which led to the conclusion that the Trustee should serve as a Trustee for the fund.
Independent Trustees:
Correspondence intended for an Independent Trustee may be sent to Fidelity Investments, P.O. Box 55235, Boston, Massachusetts 02205-5235.
Name, Year of Birth; Principal Occupations and Other Relevant Experience+
Elizabeth S. Acton (1951)
Year of Election or Appointment: 2013
Trustee
Ms. Acton also serves as Trustee of other Fidelity ® funds. Prior to her retirement, Ms. Acton served as Executive Vice President, Finance (2011-2012), Executive Vice President, Chief Financial Officer (2002-2011) and Treasurer (2004-2005) of Comerica Incorporated (financial services). Prior to joining Comerica, Ms. Acton held a variety of positions at Ford Motor Company (1983-2002), including Vice President and Treasurer (2000-2002) and Executive Vice President and Chief Financial Officer of Ford Motor Credit Company (1998-2000). Ms. Acton currently serves as a member of the Board and Audit and Finance Committees of Beazer Homes USA, Inc. (homebuilding, 2012-present). Ms. Acton previously served as a member of the Advisory Board of certain Fidelity ® funds (2013-2016).
Ann E. Dunwoody (1953)
Year of Election or Appointment: 2018
Trustee
General Dunwoody also serves as Trustee of other Fidelity ® funds. General Dunwoody (United States Army, Retired) was the first woman in U.S. military history to achieve the rank of four-star general and prior to her retirement in 2012 held a variety of positions within the U.S. Army, including Commanding General, U.S. Army Material Command (2008-2012). General Dunwoody currently serves as President of First to Four LLC (leadership and mentoring services, 2012-present), a member of the Board and Nomination and Corporate Governance Committees of Kforce Inc. (professional staffing services, 2016-present) and a member of the Board of Automattic Inc. (software engineering, 2018-present). Previously, General Dunwoody served as a member of the Advisory Board and Nominating and Corporate Governance Committee of L3 Technologies, Inc. (communication, electronic, sensor and aerospace systems, 2013-2019) and a member of the Board and Audit and Sustainability and Corporate Responsibility Committees of Republic Services, Inc. (waste collection, disposal and recycling, 2013-2016). Ms. Dunwoody also serves on several boards for non-profit organizations, including as a member of the Board, Chair of the Nomination and Governance Committee and a member of the Audit Committee of Logistics Management Institute (consulting non-profit, 2012-present), a member of the Council of Trustees for the Association of the United States Army (advocacy non-profit, 2013-present), a member of the Board of Florida Institute of Technology (2015-present) and a member of the Board of ThanksUSA (military family education non-profit, 2014-present). General Dunwoody previously served as a member of the Advisory Board of certain Fidelity ® funds (2018).
John Engler (1948)
Year of Election or Appointment: 2014
Trustee
Mr. Engler also serves as Trustee of other Fidelity ® funds. Previously, Mr. Engler served as Governor of Michigan (1991-2003), President of the Business Roundtable (2011-2017) and interim President of Michigan State University (2018-2019). Mr. Engler currently serves as a member of the Board of Stride, Inc. (formerly K12 Inc.) (technology-based education company, 2012-present). Previously, Mr. Engler served as a member of the Board of Universal Forest Products (manufacturer and distributor of wood and wood-alternative products, 2003-2019) and Trustee of The Munder Funds (2003-2014). Mr. Engler previously served as a member of the Advisory Board of certain Fidelity ® funds (2014-2016).
Robert F. Gartland (1951)
Year of Election or Appointment: 2010
Trustee
Mr. Gartland also serves as Trustee of other Fidelity ® funds. Prior to his retirement, Mr. Gartland held a variety of positions at Morgan Stanley (financial services, 1979-2007), including Managing Director (1987-2007) and Chase Manhattan Bank (1975-1978). Mr. Gartland previously served as Chairman and an investor in Gartland & Mellina Group Corp. (consulting, 2009-2019), as a member of the Board of National Securities Clearing Corporation (1993-1996) and as Chairman of TradeWeb (2003-2004).
Arthur E. Johnson (1947)
Year of Election or Appointment: 2008
Trustee
Mr. Johnson also serves as Trustee of other Fidelity ® funds. Prior to his retirement, Mr. Johnson served as Senior Vice President of Corporate Strategic Development of Lockheed Martin Corporation (defense contractor, 1999-2009). Mr. Johnson currently serves as a member of the Board of Booz Allen Hamilton (management consulting, 2011-present). Mr. Johnson previously served as a member of the Board of Eaton Corporation plc (diversified power management, 2009-2019) and a member of the Board of AGL Resources, Inc. (holding company, 2002-2016). Mr. Johnson previously served as Chairman (2018-2021) and Vice Chairman (2015-2018) of the Independent Trustees of certain Fidelity® funds. Mr. Arthur E. Johnson is not related to Ms. Abigail P. Johnson.
Michael E. Kenneally (1954)
Year of Election or Appointment: 2009
Trustee
Chairman of the Independent Trustees
Mr. Kenneally also serves as Trustee of other Fidelity ® funds and was Vice Chairman (2018-2021) of the Independent Trustees of certain Fidelity ® funds. Prior to retirement in 2005, he was Chairman and Global Chief Executive Officer of Credit Suisse Asset Management, the worldwide fund management and institutional investment business of Credit Suisse Group. Previously, Mr. Kenneally was an Executive Vice President and the Chief Investment Officer for Bank of America. In this role, he was responsible for the investment management, strategy and products delivered to the bank's institutional, high-net-worth and retail clients. Earlier, Mr. Kenneally directed the organization's equity and quantitative research groups. He began his career as a research analyst and then spent more than a dozen years as a portfolio manager for endowments, pension plans and mutual funds. He earned the Chartered Financial Analyst (CFA) designation in 1991.
Mark A. Murray (1954)
Year of Election or Appointment: 2016
Trustee
Mr. Murray also serves as Trustee of other Fidelity ® funds. Previously, Mr. Murray served as Co-Chief Executive Officer (2013-2016), President (2006-2013) and Vice Chairman (2013-2020) of Meijer, Inc. Mr. Murray serves as a member of the Board (2009-present) and Public Policy and Responsibility Committee (2009-present) and Chair of the Nuclear Review Committee (2019-present) of DTE Energy Company (diversified energy company). Mr. Murray previously served as a member of the Board of Spectrum Health (not-for-profit health system, 2015-2019) and as a member of the Board and Audit Committee and Chairman of the Nominating and Corporate Governance Committee of Universal Forest Products, Inc. (manufacturer and distributor of wood and wood-alternative products, 2004-2016). Mr. Murray also serves as a member of the Board of many community and professional organizations. Mr. Murray previously served as a member of the Advisory Board of certain Fidelity ® funds (2016).
+ The information includes the Trustee's principal occupation during the last five years and other information relating to the experience, attributes, and skills relevant to the Trustee's qualifications to serve as a Trustee, which led to the conclusion that the Trustee should serve as a Trustee for the fund.
Advisory Board Members and Officers:
Correspondence intended for a Member of the Advisory Board (if any) may be sent to Fidelity Investments, P.O. Box 55235, Boston, Massachusetts 02205-5235. Correspondence intended for an officer may be sent to Fidelity Investments, 245 Summer Street, Boston, Massachusetts 02210. Officers appear below in alphabetical order.
Name, Year of Birth; Principal Occupation
Laura M. Bishop (1961)
Year of Election or Appointment: 2022
Member of the Advisory Board
Ms. Bishop also serves as a Member of the Advisory Board of other funds. Prior to her retirement, Ms. Bishop held a variety of positions at United Services Automobile Association (2001-2020), including Executive Vice President and Chief Financial Officer (2014-2020) and Senior Vice President and Deputy Chief Financial Officer (2012-2014). Ms. Bishop currently serves as a member of the Audit Committee and Compensation and Personnel Committee (2021-present) of the Board of Directors of Korn Ferry (global organizational consulting).
Robert W. Helm (1957)
Year of Election or Appointment: 2021
Member of the Advisory Board
Mr. Helm also serves as a Member of the Advisory Board of other Fidelity® funds. Mr. Helm was formerly Deputy Chairman (2003-2020), partner (1991-2020) and an associate (1984-1991) of Dechert LLP (formerly Dechert Price & Rhoads). Mr. Helm currently serves on boards and committees of several not-for-profit organizations.
Carol J. Zierhoffer (1960)
Year of Election or Appointment: 2023
Member of the Advisory Board
Ms. Zierhoffer also serves as a Member of the Advisory Board of other funds. Prior to her retirement, Ms. Zierhoffer held a variety of positions at Bechtel Corporation (engineering company, 2013-2019), including Principal Vice President and Chief Information Officer (2013-2016) and Senior Vice President and Chief Information Officer (2016-2019). Ms. Zierhoffer currently serves as a member of the Board of Directors, Audit Committee and Compensation Committee of Allscripts Healthcare Solutions, Inc. (healthcare technology, 2020-present) and as a member of the Board of Directors, Audit and Finance Committee and Nominating and Governance Committee of Atlas Air Worldwide Holdings, Inc. (aviation operating services, 2021-present). Previously, Ms. Zierhoffer served as a member of the Board of Directors and Audit Committee and as the founding Chair of the Information Technology Committee of MedAssets, Inc. (healthcare technology, 2013-2016).
Craig S. Brown (1977)
Year of Election or Appointment: 2019
Assistant Treasurer
Mr. Brown also serves as an officer of other funds. Mr. Brown serves as Assistant Treasurer of FIMM, LLC (2021-present) and is an employee of Fidelity Investments (2013-present). Previously, Mr. Brown served as Assistant Treasurer of certain Fidelity ® funds (2019-2022).
John J. Burke III (1964)
Year of Election or Appointment: 2018
Chief Financial Officer
Mr. Burke also serves as Chief Financial Officer of other funds. Mr. Burke serves as Head of Investment Operations for Fidelity Fund and Investment Operations (2018-present) and is an employee of Fidelity Investments (1998-present). Previously Mr. Burke served as head of Asset Management Investment Operations (2012-2018).
David J. Carter (1973)
Year of Election or Appointment: 2020
Assistant Secretary
Mr. Carter also serves as Assistant Secretary of other funds. Mr. Carter serves as Senior Vice President, Deputy General Counsel (2022-present) and is an employee of Fidelity Investments (2005-present).
Jonathan Davis (1968)
Year of Election or Appointment: 2010
Assistant Treasurer
Mr. Davis also serves as an officer of other funds. Mr. Davis serves as Assistant Treasurer of FIMM, LLC (2021-present), FMR Capital, Inc. (2017-present), FD Funds GP LLC (2021-present), FD Funds Holding LLC (2021-present), and FD Funds Management LLC (2021-present); and is an employee of Fidelity Investments. Previously, Mr. Davis served as Vice President and Associate General Counsel of FMR LLC (diversified financial services company, 2003-2010).
Laura M. Del Prato (1964)
Year of Election or Appointment: 2018
President and Treasurer
Ms. Del Prato also serves as an officer of other funds. Ms. Del Prato serves as Assistant Treasurer of FIMM, LLC (2021-present) and is an employee of Fidelity Investments (2017-present). Previously, Ms. Del Prato served as President and Treasurer of The North Carolina Capital Management Trust: Cash Portfolio and Term Portfolio (2018-2020). Prior to joining Fidelity Investments, Ms. Del Prato served as a Managing Director and Treasurer of the JPMorgan Mutual Funds (2014-2017). Prior to JPMorgan, Ms. Del Prato served as a partner at Cohen Fund Audit Services (accounting firm, 2012-2013) and KPMG LLP (accounting firm, 2004-2012).
Christopher M. Gouveia (1973)
Year of Election or Appointment: 2023
Chief Compliance Officer
Mr. Gouveia also serves as Chief Compliance Officer of other funds. Mr. Gouveia serves as Senior Vice President of Asset Management Compliance for Fidelity Investments and is an employee of Fidelity Investments. Previously, Mr. Gouveia served as Chief Compliance Officer of the North Carolina Capital Management Trust (2016-2019).
Colm A. Hogan (1973)
Year of Election or Appointment: 2016
Assistant Treasurer
Mr. Hogan also serves as an officer of other funds. Mr. Hogan serves as Assistant Treasurer of FIMM, LLC (2021-present) and FMR Capital, Inc. (2017-present) and is an employee of Fidelity Investments (2005-present). Previously, Mr. Hogan served as Deputy Treasurer of certain Fidelity ® funds (2016-2020) and Assistant Treasurer of certain Fidelity ® funds (2016-2018).
Cynthia Lo Bessette (1969)
Year of Election or Appointment: 2019
Secretary and Chief Legal Officer (CLO)
Ms. Lo Bessette also serves as an officer of other funds. Ms. Lo Bessette serves as CLO, Secretary, and Senior Vice President of Fidelity Management & Research Company LLC (investment adviser firm, 2019-present); CLO of Fidelity Management & Research (Hong Kong) Limited, FMR Investment Management (UK) Limited, and Fidelity Management & Research (Japan) Limited (investment adviser firms, 2019-present); Secretary of FD Funds GP LLC (2021-present), FD Funds Holding LLC (2021-present), FD Funds Management LLC (2021-present), and Fidelity Diversifying Solutions LLC (investment adviser firm, 2022-present); and Assistant Secretary of FIMM, LLC (2019-present). She is a Senior Vice President and Deputy General Counsel of FMR LLC (diversified financial services company, 2019-present), and is an employee of Fidelity Investments. Previously, Ms. Lo Bessette served as CLO, Secretary, and Senior Vice President of FMR Co., Inc. (investment adviser firm, 2019); Secretary of Fidelity SelectCo, LLC and Fidelity Investments Money Management, Inc. (investment adviser firms, 2019). Prior to joining Fidelity Investments, Ms. Lo Bessette was Executive Vice President, General Counsel (2016-2019) and Senior Vice President, Deputy General Counsel (2015-2016) of OppenheimerFunds (investment management company) and Deputy Chief Legal Officer (2013-2015) of Jennison Associates LLC (investment adviser firm).
Chris Maher (1972)
Year of Election or Appointment: 2013
Assistant Treasurer
Mr. Maher also serves as an officer of other funds. Mr. Maher serves as Assistant Treasurer of FIMM, LLC (2021-present) and FMR Capital, Inc. (2017-present), and is an employee of Fidelity Investments (2008-present). Previously, Mr. Maher served as Assistant Treasurer of certain funds (2013-2020); Vice President of Asset Management Compliance (2013), Vice President of the Program Management Group of FMR (investment adviser firm, 2010-2013), and Vice President of Valuation Oversight (2008-2010).
Jamie Pagliocco (1964)
Year of Election or Appointment: 2020
Vice President
Mr. Pagliocco also serves as Vice President of other funds. Mr. Pagliocco serves as President of Fixed Income (2020-present), and is an employee of Fidelity Investments (2001-present). Previously, Mr. Pagliocco served as Co-Chief Investment Officer - Bond (2017-2020), Global Head of Bond Trading (2016-2019), and as a portfolio manager.
Brett Segaloff (1972)
Year of Election or Appointment: 2021
Anti-Money Laundering (AML) Officer
Mr. Segaloff also serves as an AML Officer of other funds and other related entities. He is Director, Anti-Money Laundering (2007-present) of FMR LLC (diversified financial services company) and is an employee of Fidelity Investments (1996-present).
Stacie M. Smith (1974)
Year of Election or Appointment: 2013
Assistant Treasurer
Ms. Smith also serves as an officer of other funds. Ms. Smith serves as Assistant Treasurer of FIMM, LLC (2021-present) and FMR Capital, Inc. (2017-present), is an employee of Fidelity Investments (2009-present), and has served in other fund officer roles. Prior to joining Fidelity Investments, Ms. Smith served as Senior Audit Manager of Ernst & Young LLP (accounting firm, 1996-2009). Previously, Ms. Smith served as Assistant Treasurer (2013-2019) and Deputy Treasurer (2013-2016) of certain Fidelity ® funds.
Jim Wegmann (1979)
Year of Election or Appointment: 2021
Deputy Treasurer
Mr. Wegmann also serves as an officer of other funds. Mr. Wegmann serves as Assistant Treasurer of FIMM, LLC (2021-present) and is an employee of Fidelity Investments (2011-present). Previously, Mr. Wegmann served as Assistant Treasurer of certain Fidelity ® funds (2019-2021).
As a shareholder, you incur two types of costs: (1) transaction costs, which may include sales charges (loads) on purchase payments or redemption proceeds, as applicable and (2) ongoing costs, which generally include management fees, distribution and/or service (12b-1) fees and other Fund expenses. This Example is intended to help you understand your ongoing costs (in dollars) of investing in a fund and to compare these costs with the ongoing costs of investing in other mutual funds.
| The Example is based on an investment of $1,000 invested at the beginning of the period and held for the entire period (August 1, 2022 to January 31, 2023). |
Actual Expenses
The first line of the accompanying table provides information about actual account values and actual expenses. You may use the information in this line, together with the amount you invested, to estimate the expenses that you paid over the period. Simply divide your account value by $1,000.00 (for example, an $8,600 account value divided by $1,000.00 = 8.6), then multiply the result by the number in the first line for a class/Fund under the heading entitled "Expenses Paid During Period" to estimate the expenses you paid on your account during this period. If any fund is a shareholder of any underlying mutual funds or exchange-traded funds (ETFs) (the Underlying Funds), such fund indirectly bears its proportional share of the expenses of the Underlying Funds in addition to the direct expenses incurred presented in the table. These fees and expenses are not included in the annualized expense ratio used to calculate the expense estimate in the table below.
Hypothetical Example for Comparison Purposes
The second line of the accompanying table provides information about hypothetical account values and hypothetical expenses based on the actual expense ratio and an assumed rate of return of 5% per year before expenses, which is not the actual return. The hypothetical account values and expenses may not be used to estimate the actual ending account balance or expenses you paid for the period. You may use this information to compare the ongoing costs of investing in the Fund and other funds. To do so, compare this 5% hypothetical example with the 5% hypothetical examples that appear in the shareholder reports of the other funds. If any fund is a shareholder of any Underlying Funds, such fund indirectly bears its proportional share of the expenses of the Underlying Funds in addition to the direct expenses as presented in the table. These fees and expenses are not included in the annualized expense ratio used to calculate the expense estimate in the table below.
Please note that the expenses shown in the table are meant to highlight your ongoing costs only and do not reflect any transaction costs. Therefore, the second line of the table is useful in comparing ongoing costs only, and will not help you determine the relative total costs of owning different funds. In addition, if these transactional costs were included, your costs would have been higher.
| | | | | Annualized Expense Ratio- A | | Beginning Account Value August 1, 2022 | | Ending Account Value January 31, 2023 | | Expenses Paid During Period- C August 1, 2022 to January 31, 2023 |
| | | | | | | | | | |
| Fidelity® SAI Sustainable Conservative Income Municipal Bond Fund | | | | .25% | | | | | | |
| Actual | | | | | | $ 1,000 | | $ 1,008.70 | | $ 1.27 |
Hypothetical- B | | | | | | $ 1,000 | | $ 1,023.95 | | $ 1.28 |
| |
A Annualized expense ratio reflects expenses net of applicable fee waivers.
B 5% return per year before expenses
C Expenses are equal to the annualized expense ratio, multiplied by the average account value over the period, multiplied by 184/ 365 (to reflect the one-half year period). The fees and expenses of any Underlying Funds are not included in each annualized expense ratio.
The dividend and capital gains distributions for the fund(s) are available on Fidelity.com or Institutional.Fidelity.com .
During fiscal year ended 2023, 100% of the fund's income dividends was free from federal income tax, and 23.94% of the fund's income dividends was subject to the federal alternative minimum tax.
The fund will notify shareholders in January 2024 of amounts for use in preparing 2023 income tax returns.
The Securities and Exchange Commission adopted Rule 22e-4 under the Investment Company Act of 1940 (the Liquidity Rule) to promote effective liquidity risk management throughout the open-end investment company industry, thereby reducing the risk that funds will be unable to meet their redemption obligations and mitigating dilution of the interests of fund shareholders.
The Fund has adopted and implemented a liquidity risk management program (the Program) reasonably designed to assess and manage the Fund's liquidity risk and to comply with the requirements of the Liquidity Rule. The Fund's Board of Trustees (the Board) has designated the Fund's investment adviser as administrator of the Program. The Fidelity advisers have established a Liquidity Risk Management Committee (the LRM Committee) to manage the Program for each of the Fidelity Funds. The LRM Committee monitors the adequacy and effectiveness of implementation of the Program and on a periodic basis assesses each Fund's liquidity risk based on a variety of factors including (1) the Fund's investment strategy, (2) portfolio liquidity and cash flow projections during normal and reasonably foreseeable stressed conditions, (3) shareholder redemptions, (4) borrowings and other funding sources and (5) certain factors specific to ETFs including the effect of the Fund's prices and spreads, market participants, and basket compositions on the overall liquidity of the Fund's portfolio, as applicable.
In accordance with the Program, each of the Fund's portfolio investments is classified into one of four defined liquidity categories based on a determination of a reasonable expectation for how long it would take to convert the investment to cash (or sell or dispose of the investment) without significantly changing its market value.
- Highly liquid investments - cash or convertible to cash within three business days or less
- Moderately liquid investments - convertible to cash in three to seven calendar days
- Less liquid investments - can be sold or disposed of, but not settled, within seven calendar days
- Illiquid investments - cannot be sold or disposed of within seven calendar days
Liquidity classification determinations take into account a variety of factors including various market, trading and investment-specific considerations, as well as market depth, and generally utilize analysis from a third-party liquidity metrics service.
The Liquidity Rule places a 15% limit on a fund's illiquid investments and requires funds that do not primarily hold assets that are highly liquid investments to determine and maintain a minimum percentage of the fund's net assets to be invested in highly liquid investments (highly liquid investment minimum or HLIM). The Program includes provisions reasonably designed to comply with the 15% limit on illiquid investments and for determining, periodically reviewing and complying with the HLIM requirement as applicable.
At a recent meeting of the Fund's Board of Trustees, the LRM Committee provided a written report to the Board pertaining to the operation, adequacy, and effectiveness of the Program for the period December 1, 2021 through November 30, 2022. The report concluded that the Program is operating effectively and is reasonably designed to assess and manage the Fund's liquidity risk.
1.9905582.100
SMB-ANN-0423
Fidelity® Sustainable Intermediate Municipal Income Fund
Annual Report
January 31, 2023
Includes Fidelity and Fidelity Advisor share classes
Contents
To view a fund's proxy voting guidelines and proxy voting record for the 12-month period ended June 30, visit http://www.fidelity.com/proxyvotingresults or visit the Securities and Exchange Commission's (SEC) web site at http://www.sec.gov.
You may also call 1-800-544-8544 if you're an individual investing directly with Fidelity, call 1-800-835-5092 if you're a plan sponsor or participant with Fidelity as your recordkeeper or call 1-877-208-0098 on institutional accounts or if you're an advisor or invest through one to request a free copy of the proxy voting guidelines.
Standard & Poor's, S&P and S&P 500 are registered service marks of The McGraw-Hill Companies, Inc. and have been licensed for use by Fidelity Distributors Corporation.
Other third-party marks appearing herein are the property of their respective owners.
All other marks appearing herein are registered or unregistered trademarks or service marks of FMR LLC or an affiliated company. © 2023 FMR LLC. All rights reserved.
This report and the financial statements contained herein are submitted for the general information of the shareholders of the Fund. This report is not authorized for distribution to prospective investors in the Fund unless preceded or accompanied by an effective prospectus.
A fund files its complete schedule of portfolio holdings with the SEC for the first and third quarters of each fiscal year on Form N-PORT. Forms N-PORT are available on the SEC's web site at http://www.sec.gov. A fund's Forms N-PORT may be reviewed and copied at the SEC's Public Reference Room in Washington, DC. Information regarding the operation of the SEC's Public Reference Room may be obtained by calling 1-800-SEC-0330.
For a complete list of a fund's portfolio holdings, view the most recent holdings listing, semiannual report, or annual report on Fidelity's web site at http://www.fidelity.com, http://www.institutional.fidelity.com, or http://www.401k.com, as applicable.
NOT FDIC INSURED •MAY LOSE VALUE •NO BANK GUARANTEE
Neither the Fund nor Fidelity Distributors Corporation is a bank.
Average annual total return reflects the change in the value of an investment, assuming reinvestment of distributions from dividend income and capital gains (the profits earned upon the sale of securities that have grown in value, if any) and assuming a constant rate of performance each year. The hypothetical investment and the average annual total returns do not reflect the deduction of taxes that a shareholder would pay on fund distributions or the redemption of fund shares. During periods of reimbursement by Fidelity, a fund's total return will be greater than it would be had the reimbursement not occurred. How a fund did yesterday is no guarantee of how it will do tomorrow.
Average annual total returns for Fidelity Sustainable Intermediate Municipal Income Fund will be reported once the fund is a year old.
| $10,000 Over Life of Fund |
| |
Let's say hypothetically that $10,000 was invested in Fidelity Sustainable Intermediate Municipal Income Fund, a class of the fund, on April 13, 2022, when the fund started. The chart shows how the value of your investment would have changed, and also shows how the Bloomberg Municipal Bond Index performed over the same period. |
|
|
Market Recap:
Tax-exempt municipal bonds declined for the 12 months ending January 31, 2023, with a late-period rally partially offsetting a steep fall earlier on. The Bloomberg Municipal Bond Index returned -3.25% for the period. By early 2022, the Federal Reserve had begun its pivot from monetary easing to monetary tightening, tapering the large-scale asset purchases it restarted in 2020 amid the COVID-19 pandemic. In March, the Fed, faced with persistent inflationary pressure, began implementing an aggressive series of rate hikes, eventually raising its benchmark interest rate seven times, by a total of 4.25 percentage points, through mid-December. This helped push municipal bond yields to their highest level in more than a decade. Muni bond prices, which move inversely to yields, fell sharply. Credit spreads significantly widened, as investors demanded more yield for lower-quality munis as recession risk increased. In November, December and January, the tax-exempt market reversed course and rallied strongly (+7.99%) - including a gain of 2.87% in January - amid market expectations for the Fed to pause monetary policy tightening in 2023. Muni yields declined and prices rebounded. Favorable supply and demand was helpful; issuance remained subdued, while net inflows into munis turned positive. Muni tax-backed credit fundamentals were solid throughout the period and, for the most part, the risk of credit-rating downgrades appeared low. Shorter-duration (lower sensitivity to changes in interest rates) and higher-credit-quality munis led the way for the year.
Comments from Co-Portfolio Managers Elizah McLaughlin, Cormac Cullen and Michael Maka:
From its inception on April 13, 2022, through January 31, 2023, the fund's share classes (excluding sales charges, if applicable) posted returns in the range of 2.62% to 3.49%, compared with the 2.76% return of the supplemental index, the Bloomberg 3-15 Year Municipal Bond Index, and the 1.68% result of the benchmark Bloomberg Municipal Bond Index. During the reporting period, we focused on longer-term objectives and sought to generate attractive tax-exempt income and a competitive risk-adjusted return. Versus the supplemental index, yield-curve positioning contributed to relative performance. Specifically, the fund's larger-than-index exposure to bonds with durations of 10 years proved beneficial. In contrast, an overweight in lower-rated, investment-grade bonds was a key detractor, as they lagged the index as credit spreads widened. Larger-than-index exposure to the health care and private college sectors detracted as well. Relative performance also was crimped by the fund's underweight exposure to bonds issued by the state of California, which outpaced the index. Application of FMR's environmental, social and governance (ESG) ratings process and/or its sustainable investing exclusion criteria may affect the fund's exposure to certain issuers, sectors, regions and countries, and may affect the fund's performance.
The views expressed above reflect those of the portfolio manager(s) only through the end of the period as stated on the cover of this report and do not necessarily represent the views of Fidelity or any other person in the Fidelity organization. Any such views are subject to change at any time based upon market or other conditions and Fidelity disclaims any responsibility to update such views. These views may not be relied on as investment advice and, because investment decisions for a Fidelity fund are based on numerous factors, may not be relied on as an indication of trading intent on behalf of any Fidelity fund.
| Top Five States (% of Fund's net assets) |
| | |
| New York | 15.0 |
| California | 8.1 |
| Florida | 8.1 |
| Massachusetts | 6.0 |
| Georgia | 5.1 |
| | |
| Revenue Sources (% of Fund's net assets) |
| General Obligations | 21.5% | |
| Health Care | 15.8% | |
| Education | 13.6% | |
| Electric Utilities | 12.4% | |
| Special Tax | 9.7% | |
| Water & Sewer | 6.6% | |
| Others* (Individually Less Than 5%) | 20.4% | |
| | 100.0% | |
| |
| *Includes net other assets | | |
Quality Diversification (% of Fund's net assets) |
|
| |
| We have used ratings from Moody's Investors Service, Inc. Where Moody's® ratings are not available, we have used S&P® ratings. All ratings are as of the date indicated and do not reflect subsequent changes. |
Showing Percentage of Net Assets
| Municipal Bonds - 92.4% |
| | | Principal Amount (a) | Value ($) |
| Alabama - 1.0% | | | |
| Black Belt Energy Gas District Bonds: | | | |
| Series 2022 D1, 4%, tender 6/1/27 (b) | | 10,000 | 10,182 |
| Series 2022 F, 5.5%, tender 12/1/28 (b) | | 100,000 | 107,404 |
| Southeast Energy Auth. Rev. Bonds Bonds Series 2022 B1, 5%, tender 8/1/28 (b) | | 20,000 | 20,959 |
TOTAL ALABAMA | | | 138,545 |
| Arizona - 4.4% | | | |
| Chandler Indl. Dev. Auth. Indl. Dev. Rev. (Intel Corp. Proj.) Series 2022 2, 5%, tender 9/1/27 (b)(c) | | 50,000 | 52,965 |
| Maricopa County Unified School District #48 Scottsdale Series D, 4% 7/1/24 | | 80,000 | 81,841 |
| Phoenix Civic Impt. Corp. Wastewtr. Sys. Rev. Series 2016, 5% 7/1/30 | | 50,000 | 54,554 |
| Phoenix Civic Impt. Corp. Wtr. Sys. Rev. Series 2021 A, 5% 7/1/35 | | 175,000 | 205,940 |
| Salt Verde Finl. Corp. Sr. Gas Rev. Series 2007 1, 5% 12/1/32 | | 165,000 | 179,988 |
TOTAL ARIZONA | | | 575,288 |
| California - 8.1% | | | |
| California Health Facilities Fing. Auth. Rev. Bonds Series 2019 C, 5%, tender 10/1/25 (b) | | 150,000 | 159,070 |
| California Hsg. Fin. Agcy. Series 2021 1, 3.5% 11/20/35 | | 97,313 | 94,287 |
| California Muni. Fin. Auth. Rev. Series 2018, 5% 10/1/25 | | 15,000 | 15,569 |
| California Poll. Cont. Fing. Auth. Solid Waste Disp. Rev. Bonds (Republic Svcs., Inc. Proj.) Series 2017 A1, 3.45%, tender 4/17/23 (b)(c)(d) | | 200,000 | 200,050 |
| California Statewide Cmntys. Dev. Auth. Rev. Series 2016, 5% 10/1/33 | | 25,000 | 26,415 |
| Los Angeles Dept. of Wtr. & Pwr. Wtrwks. Rev.: | | | |
| Series 2017 A, 5% 7/1/32 | | 15,000 | 16,666 |
| Series 2022 B: | | | |
5% 7/1/31 | | 30,000 | 36,930 |
5% 7/1/32 | | 100,000 | 123,898 |
| Riverside Elec. Rev. Series 2019 A, 5% 10/1/43 | | 5,000 | 5,496 |
| San Francisco Bay Area Rapid Transit District Sales Tax Rev. Series 2015 A, 5% 7/1/27 | | 10,000 | 10,703 |
| San Francisco Bay Area Rapid Transit Fing. Auth. Series 2019 F1, 5% 8/1/23 | | 125,000 | 126,682 |
| Southern California Pub. Pwr. Auth. Transmission Proj. Rev. (Southern Transmission Proj.) Series 2017 A, 5% 7/1/23 | | 250,000 | 252,813 |
TOTAL CALIFORNIA | | | 1,068,579 |
| Colorado - 1.1% | | | |
| Colorado Ctfs. of Prtn. Series 2020 A, 4% 12/15/38 | | 10,000 | 10,242 |
| Colorado Health Facilities Auth. Rev. Bonds Series 2019 A2, 5% 8/1/33 | | 125,000 | 137,296 |
TOTAL COLORADO | | | 147,538 |
| Connecticut - 3.7% | | | |
| Connecticut Gen. Oblig.: | | | |
| Series 2019 A, 5% 4/15/33 | | 25,000 | 28,434 |
| Series 2021 D, 5% 7/15/28 | | 75,000 | 85,462 |
| Connecticut Health & Edl. Facilities Auth. Rev. Series 2016 A, 2%, tender 7/1/26 (b) | | 35,000 | 33,690 |
| Connecticut Hsg. Fin. Auth. Series 2021 D1: | | | |
| 5% 11/15/27 | | 10,000 | 11,057 |
| 5% 11/15/28 | | 25,000 | 28,077 |
| Connecticut Spl. Tax Oblig. Trans. Infrastructure Rev.: | | | |
| Series 2021 A, 4% 5/1/36 | | 130,000 | 137,327 |
| Series A: | | | |
5% 9/1/26 | | 100,000 | 109,618 |
5% 5/1/29 | | 20,000 | 23,258 |
| South Central Reg'l. Wtr. Auth. Wtr. Sys. Rev. Series 32 B, 5% 8/1/32 | | 25,000 | 27,119 |
TOTAL CONNECTICUT | | | 484,042 |
| District Of Columbia - 0.2% | | | |
| District of Columbia Univ. Rev. Series 2017: | | | |
| 5% 4/1/29 | | 20,000 | 21,674 |
| 5% 4/1/33 | | 10,000 | 10,799 |
TOTAL DISTRICT OF COLUMBIA | | | 32,473 |
| Florida - 7.7% | | | |
| Broward County School Board Ctfs. of Prtn.: | | | |
| Series 2015 A, 5% 7/1/26 | | 30,000 | 31,895 |
| Series 2020 A, 5% 7/1/33 | | 25,000 | 29,278 |
| Duval County School Board Ctfs. of Prtn. Series 2022 A, 5% 7/1/34 (Assured Guaranty Muni. Corp. Insured) | | 250,000 | 289,469 |
| Escambia County Health Facilities Auth. Health Facilities Rev. Series 2020 A, 5% 8/15/34 | | 200,000 | 215,619 |
| Florida Hsg. Fin. Corp. Rev. Series 2020 1, 3.5% 7/1/51 | | 80,000 | 80,054 |
| JEA Wtr. & Swr. Sys. Rev. Series 2017 A, 5% 10/1/29 | | 25,000 | 27,941 |
| Miami-Dade County Wtr. & Swr. Rev. Series 2017 B, 5% 10/1/27 | | 60,000 | 67,303 |
| Palm Beach County Health Facilities Auth. Hosp. Rev. (Jupiter Med. Ctr. Proj.) Series 2022, 5% 11/1/35 | | 100,000 | 107,747 |
| Palm Beach County School Board Ctfs. of Prtn.: | | | |
| Series 2018 A, 5% 8/1/24 | | 20,000 | 20,737 |
| Series 2021 A, 5% 8/1/38 | | 125,000 | 141,263 |
TOTAL FLORIDA | | | 1,011,306 |
| Georgia - 3.6% | | | |
| Bartow County Dev. Auth. Poll. Cont. Rev. Bonds (Georgia Pwr. Co. Plant Bowen Proj.) Series 2013, 2.875%, tender 8/19/25 (b) | | 100,000 | 98,279 |
| Fulton County Dev. Auth. Rev. Series 2019, 5% 6/15/44 | | 10,000 | 10,999 |
| Main Street Natural Gas, Inc. Bonds: | | | |
| Series 2019 B, 4%, tender 12/2/24 (b) | | 135,000 | 135,888 |
| Series 2021 A, 4%, tender 9/1/27 (b) | | 100,000 | 101,922 |
| Series 2022 B, 5%, tender 6/1/29 (b) | | 15,000 | 15,854 |
| Private Colleges & Univs. Auth. Rev. Series 2019 A, 5% 9/1/39 | | 100,000 | 111,809 |
TOTAL GEORGIA | | | 474,751 |
| Hawaii - 0.1% | | | |
| Honolulu City & County Gen. Oblig. Series 2019 A, 5% 9/1/27 | | 10,000 | 11,243 |
| Illinois - 3.1% | | | |
| Illinois Fin. Auth. Series 2022 A, 5% 10/1/32 | | 100,000 | 105,300 |
| Illinois Fin. Auth. Academic Facilities (Provident Group UIUC Properties LLC Univ. of Illinois at Urbana-Champaign Proj.) Series 2019 A: | | | |
| 5% 10/1/32 | | 10,000 | 11,198 |
| 5% 10/1/38 | | 100,000 | 106,962 |
| Illinois Fin. Auth. Rev.: | | | |
| (Presence Health Proj.) Series 2016 C, 5% 2/15/36 | | 30,000 | 31,671 |
| Series 2014 A, 5% 10/1/26 | | 40,000 | 41,649 |
| Series 2016 A, 5% 7/1/31 (Pre-Refunded to 7/1/26 @ 100) | | 50,000 | 54,502 |
| Illinois Hsg. Dev. Auth. Rev. Series D, 3.75% 4/1/50 | | 20,000 | 20,164 |
| McHenry County Conservation District Gen. Oblig. Series 2014, 5% 2/1/24 | | 40,000 | 40,995 |
TOTAL ILLINOIS | | | 412,441 |
| Indiana - 1.1% | | | |
| Indiana Dev. Fin. Auth. Envir. Rev. Bonds Series 2022 A1, 4.5%, tender 6/1/32 (b)(c) | | 100,000 | 103,016 |
| Indiana Hsg. & Cmnty. Dev. Auth.: | | | |
| Series 2021 B, Series 2021 B, 5% 1/1/28 | | 15,000 | 16,662 |
| Series A, 5% 7/1/28 | | 25,000 | 28,301 |
TOTAL INDIANA | | | 147,979 |
| Iowa - 0.8% | | | |
| Iowa Student Ln. Liquidity Corp. Student Ln. Rev. Series 2022 B, 5% 12/1/29 (c) | | 100,000 | 111,636 |
| Kentucky - 1.2% | | | |
| Kentucky Bond Dev. Corp. Edl. Facilities Series 2021: | | | |
| 4% 6/1/33 | | 5,000 | 5,258 |
| 4% 6/1/35 | | 15,000 | 15,300 |
| Kentucky State Property & Buildings Commission Rev.: | | | |
| Series A: | | | |
5% 11/1/31 | | 30,000 | 33,819 |
5% 11/1/33 | | 15,000 | 16,833 |
| Series B, 5% 8/1/26 | | 75,000 | 81,285 |
TOTAL KENTUCKY | | | 152,495 |
| Maine - 0.1% | | | |
| Maine Health & Higher Edl. Facilities Auth. Rev. Series 2017 B, 5% 7/1/28 | | 10,000 | 10,914 |
| Maryland - 2.0% | | | |
| Baltimore Proj. Rev. (Wtr. Projs.) Series 2014 A, 5% 7/1/24 | | 150,000 | 155,101 |
| Maryland Dept. of Trans.: | | | |
| Series 2016, 4% 9/1/27 | | 15,000 | 16,179 |
| Series 2021 A, 2% 10/1/34 | | 15,000 | 13,012 |
| Maryland Gen. Oblig. Series A, 5% 8/1/34 | | 15,000 | 17,681 |
| Montgomery County Gen. Oblig. Ctfs. of Prtn. Series 2020 A, 5% 10/1/27 | | 50,000 | 56,441 |
TOTAL MARYLAND | | | 258,414 |
| Massachusetts - 6.0% | | | |
| Arlington Gen. Oblig. Series 2021, 2% 9/15/34 | | 275,000 | 238,832 |
| Massachusetts Bay Trans. Auth. Sales Tax Rev.: | | | |
| Series 2015 B, 5% 7/1/26 (Pre-Refunded to 7/1/25 @ 100) | | 10,000 | 10,649 |
| Series 2016 A, 0% 7/1/29 | | 5,000 | 4,067 |
| Series 2021 A1, 5% 7/1/35 | | 45,000 | 52,956 |
| Massachusetts Commonwealth Trans. Fund Rev. Series 2021 A, 5% 6/1/51 | | 100,000 | 109,462 |
| Massachusetts Dev. Fin. Agcy. Rev.: | | | |
| (Partners Healthcare Sys., Inc. Proj.) Series 2017 S, 5% 7/1/32 | | 15,000 | 16,576 |
| Bonds Series A1, 5%, tender 1/31/30 (b) | | 20,000 | 22,888 |
| Series 2015 O1, 4% 7/1/45 | | 30,000 | 29,611 |
| Series 2018 L, 5% 10/1/33 | | 35,000 | 37,703 |
| Series 2020 A: | | | |
5% 10/15/29 | | 35,000 | 41,402 |
5% 10/15/30 | | 20,000 | 24,148 |
| Series 2021 G, 4% 7/1/46 | | 75,000 | 68,104 |
| Massachusetts Gen. Oblig.: | | | |
| Series 2017 A, 5% 4/1/36 | | 15,000 | 16,332 |
| Series 2017 D, 5% 7/1/27 | | 25,000 | 28,052 |
| Series A, 5% 7/1/31 | | 10,000 | 10,922 |
| Massachusetts School Bldg. Auth. Dedicated Sales Tax Rev. Series A, 5% 8/15/32 | | 10,000 | 11,815 |
| Univ. of Massachusetts Bldg. Auth. Rev. Series 2021 1, 5% 11/1/32 | | 50,000 | 59,320 |
TOTAL MASSACHUSETTS | | | 782,839 |
| Michigan - 1.8% | | | |
| Grand Rapids San. Swr. Sys. Rev.: | | | |
| Series 2018, 5% 1/1/35 | | 5,000 | 5,512 |
| Series 2018, 5% 1/1/29 | | 25,000 | 28,207 |
| Great Lakes Wtr. Auth. Sew Disp. Sys. Series 2018 B, 5% 7/1/29 | | 45,000 | 51,433 |
| Kalamazoo Hosp. Fin. Auth. Hosp. Facilities Rev. Series 2016, 4% 5/15/36 | | 10,000 | 10,009 |
| Lake Orion Cmnty. School District Series 2016, 5% 5/1/25 | | 10,000 | 10,575 |
| Michigan Fin. Auth. Rev.: | | | |
| Bonds Series 2019 B, 5%, tender 11/16/26 (b) | | 10,000 | 10,778 |
| Series 2016: | | | |
5% 11/15/28 | | 15,000 | 16,184 |
5% 11/15/30 | | 35,000 | 37,664 |
5% 11/15/34 | | 15,000 | 15,948 |
| Series 2022, 5% 12/1/32 | | 25,000 | 27,331 |
| Michigan Hosp. Fin. Auth. Rev. Series 2010 F4, 5% 11/15/47 | | 10,000 | 10,449 |
| Univ. of Michigan Rev. Series 2020 A, 5% 4/1/39 | | 10,000 | 11,351 |
TOTAL MICHIGAN | | | 235,441 |
| Minnesota - 3.4% | | | |
| Anoka-Hennepin Independent School District #11 Series 2020 A, 4% 2/1/29 | | 10,000 | 10,813 |
| Hennepin County Sales Tax Rev. (Ballpark Proj.) Series 2017 A, 5% 12/15/24 | | 265,000 | 277,282 |
| Minnesota Gen. Oblig. Series 2019 A, 5% 8/1/30 | | 15,000 | 17,568 |
| Minnesota Hsg. Fin. Agcy.: | | | |
| Series 2022 A, 5% 8/1/32 | | 100,000 | 120,495 |
| Series B, 4% 8/1/36 | | 15,000 | 15,664 |
TOTAL MINNESOTA | | | 441,822 |
| Nebraska - 1.5% | | | |
| Central Plains Energy Proj. Gas Supply Bonds Series 2019, 4%, tender 8/1/25 (b) | | 50,000 | 50,637 |
| Douglas County Hosp. Auth. #2 Health Facilities Rev. Series 2020 A, 5% 11/15/30 | | 125,000 | 144,370 |
TOTAL NEBRASKA | | | 195,007 |
| New Hampshire - 0.9% | | | |
| New Hampshire Health & Ed. Facilities Auth.: | | | |
| (Concord Hosp.) Series 2017, 5% 10/1/42 | | 15,000 | 15,661 |
| (Partners Healthcare Sys., Inc. Proj.) Series 2017, 5% 7/1/25 | | 5,000 | 5,309 |
| New Hampshire Nat'l. Fin. Auth. Series 2022 2, 4% 10/20/36 | | 99,601 | 96,503 |
TOTAL NEW HAMPSHIRE | | | 117,473 |
| New Jersey - 4.5% | | | |
| New Jersey Edl. Facility Series A, 5% 7/1/36 | | 15,000 | 16,092 |
| New Jersey Health Care Facilities Fing. Auth. Rev. Series 2016 A, 5% 7/1/33 | | 10,000 | 10,775 |
| New Jersey Trans. Trust Fund Auth.: | | | |
| Series 2018 A, 5% 12/15/32 | | 100,000 | 111,137 |
| Series 2021 A, 5% 6/15/33 | | 95,000 | 108,757 |
| Series 2022 A, 4% 6/15/39 | | 30,000 | 30,073 |
| Series 2022 BB, 5% 6/15/31 | | 135,000 | 156,887 |
| Series 2022 CC, 5% 6/15/33 | | 100,000 | 116,713 |
| Series A, 0% 12/15/31 | | 50,000 | 36,810 |
TOTAL NEW JERSEY | | | 587,244 |
| New York - 15.0% | | | |
| Dutchess County Local Dev. Corp. Rev. (Vassar College Proj.) Series 2020, 5% 7/1/45 | | 25,000 | 27,092 |
| Long Island Pwr. Auth. Elec. Sys. Rev.: | | | |
| Series 2018, 5% 9/1/27 | | 15,000 | 16,864 |
| Series 2020 A, 5% 9/1/38 | | 165,000 | 185,126 |
| Series 2022 A, 5% 9/1/33 | | 100,000 | 121,655 |
| New York City Transitional Fin. Auth. Bldg. Aid Rev. Series 2017 S1, 5% 7/15/28 | | 50,000 | 55,804 |
| New York Dorm. Auth. Rev.: | | | |
| Series 2013 A, 5% 7/1/23 | | 310,000 | 313,242 |
| Series 2022 A, 5% 7/1/34 | | 200,000 | 222,458 |
| New York Dorm. Auth. Sales Tax Rev. Series 2015 A, 5% 3/15/24 (Escrowed to Maturity) | | 25,000 | 25,726 |
| New York Metropolitan Trans. Auth. Rev.: | | | |
| Series 2017 C1: | | | |
5% 11/15/27 | | 20,000 | 21,533 |
5% 11/15/29 | | 50,000 | 53,079 |
5% 11/15/31 | | 140,000 | 148,277 |
| Series 2019 C, 5% 11/15/39 | | 70,000 | 73,274 |
| New York State Dorm. Auth.: | | | |
| Series 2017 A, 5% 2/15/31 | | 10,000 | 11,049 |
| Series 2019 D, 4% 2/15/36 | | 15,000 | 15,485 |
| New York State Urban Dev. Corp. Series 2020 E, 4% 3/15/35 | | 30,000 | 31,261 |
| New York State Urban Eev Corp. Series 2019 A, 5% 3/15/37 | | 80,000 | 89,891 |
| New York Thruway Auth. Personal Income Tax Rev. Series 2021 A1, 5% 3/15/34 | | 205,000 | 242,587 |
| Saratoga County Cap. Resources Rev. (Skidmore College Proj.) Series 2020 A, 5% 7/1/45 | | 85,000 | 92,688 |
| Suffolk County Gen. Oblig. Series 2017 D, 4% 2/1/28 (Build America Mutual Assurance Insured) | | 100,000 | 108,034 |
| Triborough Bridge & Tunnel Auth. Series 2023 A, 4% 11/15/34 | | 100,000 | 111,684 |
TOTAL NEW YORK | | | 1,966,809 |
| North Carolina - 1.1% | | | |
| Charlotte-Mecklenburg Hosp. Auth. Health Care Sys. Rev. Bonds Series 2021 C, 5%, tender 12/1/28 (b) | | 25,000 | 28,344 |
| Univ. of North Carolina at Chapel Hill Rev. Series 2021 B, 5% 12/1/38 | | 100,000 | 117,476 |
TOTAL NORTH CAROLINA | | | 145,820 |
| Ohio - 2.6% | | | |
| Ohio Air Quality Dev. Auth. Rev. Bonds Series 2022 B, 4.25%, tender 6/1/27 (b)(c) | | 150,000 | 153,566 |
| Ohio Gen. Oblig. Series 2019 A, 5% 5/1/30 | | 20,000 | 22,248 |
| Ohio Higher Edl. Facility Commission Rev. (Univ. of Dayton Proj.) Series 2018 B, 5% 12/1/29 | | 25,000 | 27,606 |
| Ohio Hsg. Fin. Agcy. Residential Mtg. Rev. (Mtg. Backed Securities Prog.) Series 2019 B, 4.5% 3/1/50 | | 100,000 | 102,337 |
| Ohio Spl. Oblig. Series 2021 A, 5% 4/1/41 | | 20,000 | 22,495 |
| Ohio State Univ. Gen. Receipts (Multiyear Debt Issuance Prog.) Series 2020 A, 5% 12/1/29 | | 10,000 | 11,769 |
TOTAL OHIO | | | 340,021 |
| Oklahoma - 0.4% | | | |
| Grand River Dam Auth. Rev. Series 2014 A, 5% 6/1/26 | | 40,000 | 41,330 |
| Oklahoma State Univ. Agricultural And Mechanical College Series 2020 A, 5% 9/1/32 | | 10,000 | 11,778 |
TOTAL OKLAHOMA | | | 53,108 |
| Oregon - 2.1% | | | |
| Gilliam County Solid Waste Disp. Rev. Bonds (Waste Mgmt., Inc. Proj.) Series 2003 A, 3%, tender 5/1/23 (b)(c) | | 50,000 | 49,954 |
| Medford Hosp. Facilities Auth. Rev. (Asante Projs.) Series 2020 A, 5% 8/15/38 | | 10,000 | 10,912 |
| Oregon Facilities Auth. Rev. Series 2022 B, 5% 6/1/30 | | 30,000 | 34,279 |
| Salem Hosp. Facility Auth. Rev. Series 2016 A, 4% 5/15/41 | | 25,000 | 25,047 |
| Union County Hosp. Facility Auth. (Grande Ronde Hosp. Proj.) Series 2022, 5% 7/1/25 | | 150,000 | 155,956 |
TOTAL OREGON | | | 276,148 |
| Pennsylvania - 1.6% | | | |
| Cumberland County Muni. Auth. Rev. (Dickinson Proj.) Series 2017, 5% 5/1/37 | | 5,000 | 5,367 |
| Dubois Hosp. Auth. Hosp. Rev. (Penn Highlands Healthcare Proj.) Series 2018: | | | |
| 5% 7/15/27 | | 50,000 | 53,946 |
| 5% 7/15/28 | | 35,000 | 38,055 |
| Montgomery County Higher Ed. & Health Auth. Rev. Series 2019, 5% 9/1/31 | | 10,000 | 11,138 |
| Pennsylvania Econ. Dev. Fing. Auth. Solid Waste Disp. Rev. Bonds (Republic Svcs., Inc. Proj.) Series 2014, 3.8%, tender 4/3/23 (b)(c) | | 100,000 | 100,078 |
TOTAL PENNSYLVANIA | | | 208,584 |
| Rhode Island - 0.9% | | | |
| Rhode Island Student Ln. Auth. Student Ln. Rev. Series 2021 A, 5% 12/1/30 (c) | | 100,000 | 113,019 |
| Tennessee - 0.6% | | | |
| Knox County Health Edl. & Hsg. Facilities Board Rev. Series 2017, 5% 4/1/27 | | 20,000 | 21,390 |
| Nashville and Davidson County Metropolitan Govt. Gen. Oblig. Series 2021 C, 5% 1/1/28 | | 50,000 | 56,552 |
TOTAL TENNESSEE | | | 77,942 |
| Texas - 3.5% | | | |
| Alvin Independent School District Series 2016 A, 5% 2/15/28 | | 25,000 | 26,944 |
| Cypress-Fairbanks Independent School District Series 2016, 5% 2/15/25 | | 15,000 | 15,804 |
| Georgetown Util. Sys. Rev. Series 2022, 5% 8/15/27 (Assured Guaranty Muni. Corp. Insured) | | 100,000 | 110,757 |
| Harris County Cultural Ed. Facilities Fin. Corp. Rev. Series 2014 A, 5% 12/1/26 | | 90,000 | 94,003 |
| Mission Econ. Dev. Corp. Solid Waste Disp. Rev. Bonds (Waste Mgmt., Inc. Proj.) Series 2020 B, 3.5%, tender 3/1/23 (b)(c) | | 100,000 | 100,009 |
| San Antonio Wtr. Sys. Rev.: | | | |
| Series 2018 A, 5% 5/15/33 | | 5,000 | 5,630 |
| Series 2020 A, 5% 5/15/27 | | 10,000 | 11,121 |
| Tarrant Reg'l. Wtr. District (City of Dallas Proj.) Series 2021 A, 4% 9/1/25 | | 45,000 | 46,982 |
| Wichita Falls Independent School District Series 2021, 4% 2/1/28 | | 50,000 | 53,787 |
TOTAL TEXAS | | | 465,037 |
| Virginia - 3.9% | | | |
| Louisa Indl. Dev. Auth. Poll. Cont. Rev. Bonds (Virginia Elec. and Pwr. Co. Proj.) Series 2008 B, 0.75%, tender 9/2/25 (b) | | 105,000 | 96,453 |
| Virginia College Bldg. Auth. Edl. Facilities Rev.: | | | |
| (21st Century College and Equip. Progs.) Series 2017 E, 5% 2/1/31 | | 10,000 | 11,342 |
| (Virginia Gen. Oblig.) Series 2017 E, 5% 2/1/30 | | 15,000 | 17,016 |
| Virginia Commonwealth Trans. Board Rev.: | | | |
| (Virginia Gen. Oblig. Proj.) Series 2017 A, 5% 5/15/29 | | 60,000 | 67,575 |
| (Virginia Gen. Oblig.) Series 2017 A, 5% 5/15/27 | | 15,000 | 16,766 |
| Virginia Commonwealth Univ. Health Sys. Auth. Series 2017 A, 5% 7/1/28 | | 270,000 | 299,045 |
TOTAL VIRGINIA | | | 508,197 |
| Washington - 4.1% | | | |
| Energy Northwest Elec. Rev. Series 2020 A, 5% 7/1/34 | | 95,000 | 111,394 |
| Washington Gen. Oblig.: | | | |
| Series 2018 A, 5% 8/1/27 | | 50,000 | 56,104 |
| Series 2018 C, 5% 8/1/30 | | 25,000 | 27,984 |
| Series 2018 D, 5% 8/1/33 | | 20,000 | 22,224 |
| Series 2020 A, 5% 8/1/27 | | 65,000 | 72,935 |
| Series 2020 C, 5% 2/1/37 | | 15,000 | 16,999 |
| Series R-2017 A, 5% 8/1/30 | | 10,000 | 10,919 |
| Washington Health Care Facilities Auth. Rev.: | | | |
| (Overlake Hosp. Med. Ctr., WA. Proj.) Series 2017 B, 5% 7/1/27 | | 25,000 | 27,171 |
| (Providence Health Systems Proj.) Series 2018 B, 5% 10/1/33 | | 45,000 | 49,544 |
| Series 2017 A, 4% 7/1/37 | | 125,000 | 126,558 |
| Series 2019 A2, 5% 8/1/33 | | 10,000 | 10,984 |
TOTAL WASHINGTON | | | 532,816 |
| Wisconsin - 0.3% | | | |
| Wisconsin Gen. Oblig. Series 2019 A, 5% 5/1/37 | | 5,000 | 5,335 |
| Wisconsin St Gen. Fund Annual Appropriation Series 2019 A: | | | |
| 5% 5/1/25 (Escrowed to Maturity) | | 10,000 | 10,589 |
| 5% 5/1/26 (Escrowed to Maturity) | | 20,000 | 21,747 |
TOTAL WISCONSIN | | | 37,671 |
| TOTAL MUNICIPAL BONDS (Cost $11,918,318) | | | 12,122,642 |
| | | | |
| Municipal Notes - 4.2% |
| | | Principal Amount (a) | Value ($) |
| Delaware - 0.8% | | | |
| Delaware Econ. Dev. Auth. Rev. (Delmarva Pwr. & Lt. Co. Proj.) Series 1994, 1.54% 2/1/23, VRDN (b)(c) | | 100,000 | 100,000 |
| Florida - 0.4% | | | |
| Broward County Indl. Dev. Rev. (Florida Pwr. & Lt. Co. Proj.) Series 2018 B, 1.45% 2/1/23, VRDN (b)(c) | | 50,000 | 50,000 |
| Georgia - 1.5% | | | |
| Burke County Indl. Dev. Auth. Poll. Cont. Rev. (Georgia Pwr. Co. Plant Vogtle Proj.) Series 2018, 1.75% 2/1/23, VRDN (b) | | 200,000 | 200,000 |
| Louisiana - 1.5% | | | |
| Saint James Parish Gen. Oblig. (Nucor Steel Louisiana LLC Proj.) Series 2010 B1, 2.3% 2/7/23, VRDN (b) | | 200,000 | 200,000 |
| TOTAL MUNICIPAL NOTES (Cost $550,000) | | | 550,000 |
| | | | |
| Money Market Funds - 2.9% |
| | | Shares | Value ($) |
Fidelity Municipal Cash Central Fund 1.40% (e)(f) (Cost $386,003) | | 385,923 | 385,996 |
| | | | |
| TOTAL INVESTMENT IN SECURITIES - 99.5% (Cost $12,854,321) | 13,058,638 |
NET OTHER ASSETS (LIABILITIES) - 0.5% | 67,909 |
| NET ASSETS - 100.0% | 13,126,547 |
| | |
Security Type Abbreviations
| VRDN | - | VARIABLE RATE DEMAND NOTE (A debt instrument that is payable upon demand, either daily, weekly or monthly) |
Legend
| (a) | Amount is stated in United States dollars unless otherwise noted. |
| (b) | Coupon rates for floating and adjustable rate securities reflect the rates in effect at period end. |
| (c) | Private activity obligations whose interest is subject to the federal alternative minimum tax for individuals. |
| (d) | Security exempt from registration under Rule 144A of the Securities Act of 1933. These securities may be resold in transactions exempt from registration, normally to qualified institutional buyers. At the end of the period, the value of these securities amounted to $200,050 or 1.5% of net assets. |
| (e) | Information in this report regarding holdings by state and security types does not reflect the holdings of the Fidelity Municipal Cash Central Fund. |
| (f) | Affiliated fund that is generally available only to investment companies and other accounts managed by Fidelity Investments. The rate quoted is the annualized seven-day yield of the fund at period end. A complete unaudited listing of the fund's holdings as of its most recent quarter end is available upon request. In addition, each Fidelity Central Fund's financial statements, which are not covered by the Fund's Report of Independent Registered Public Accounting Firm, are available on the SEC's website or upon request. |
Affiliated Central Funds
Fiscal year to date information regarding the Fund's investments in Fidelity Central Funds, including the ownership percentage, is presented below.
| Affiliate | Value, beginning of period ($) | Purchases ($) | Sales Proceeds ($) | Dividend Income ($) | Realized Gain (loss) ($) | Change in Unrealized appreciation (depreciation) ($) | Value, end of period ($) | % ownership, end of period |
| Fidelity Municipal Cash Central Fund 1.40% | - | 2,457,996 | 2,072,000 | 3,370 | - | - | 385,996 | 0.0% |
| Total | - | 2,457,996 | 2,072,000 | 3,370 | - | - | 385,996 | |
| | | | | | | | | |
Amounts in the dividend income column in the above table include any capital gain distributions from underlying funds, which are presented in the corresponding line item in the Statement of Operations, if applicable.
Amounts included in the purchases and sales proceeds columns may include in-kind transactions, if applicable.
Investment Valuation
The following is a summary of the inputs used, as of January 31, 2023, involving the Fund's assets and liabilities carried at fair value. The inputs or methodology used for valuing securities may not be an indication of the risk associated with investing in those securities. For more information on valuation inputs, and their aggregation into the levels used below, please refer to the Investment Valuation section in the accompanying Notes to Financial Statements.
| Valuation Inputs at Reporting Date: |
| Description | Total ($) | Level 1 ($) | Level 2 ($) | Level 3 ($) |
Investments in Securities: | | | | |
|
| Municipal Securities | 12,672,642 | - | 12,672,642 | - |
|
| Money Market Funds | 385,996 | 385,996 | - | - |
| Total Investments in Securities: | 13,058,638 | 385,996 | 12,672,642 | - |
| Statement of Assets and Liabilities |
| | | | January 31, 2023 |
| | | | | |
| Assets | | | | |
| Investment in securities, at value - See accompanying schedule: | $ | | | |
Unaffiliated issuers (cost $12,468,318) | | 12,672,642 | | |
Fidelity Central Funds (cost $386,003) | | 385,996 | | |
| | | | | |
| | | | | |
| Total Investment in Securities (cost $12,854,321) | | | $ | 13,058,638 |
| Receivable for fund shares sold | | | | 872 |
| Interest receivable | | | | 123,002 |
| Distributions receivable from Fidelity Central Funds | | | | 705 |
| Prepaid expenses | | | | 20,590 |
| Receivable from investment adviser for expense reductions | | | | 17,233 |
| Other receivables | | | | 17 |
Total assets | | | | 13,221,057 |
| Liabilities | | | | |
| Payable to custodian bank | | $39,814 | | |
| Payable for fund shares redeemed | | 146 | | |
| Distributions payable | | 3,234 | | |
| Accrued management fee | | 3,763 | | |
| Distribution and service plan fees payable | | 1,435 | | |
| Other affiliated payables | | 1,316 | | |
| Audit fee payable | | 44,672 | | |
| Other payables and accrued expenses | | 130 | | |
| Total Liabilities | | | | 94,510 |
| Net Assets | | | $ | 13,126,547 |
| Net Assets consist of: | | | | |
| Paid in capital | | | $ | 12,931,708 |
| Total accumulated earnings (loss) | | | | 194,839 |
| Net Assets | | | $ | 13,126,547 |
| | | | | |
| Net Asset Value and Maximum Offering Price | | | | |
| Class A : | | | | |
Net Asset Value and redemption price per share ($1,563,434 ÷ 154,160 shares) (a) | | | $ | 10.14 |
| Maximum offering price per share (100/96.00 of $10.14) | | | $ | 10.56 |
| Class M : | | | | |
Net Asset Value and redemption price per share ($1,122,043 ÷ 110,637 shares) (a) | | | $ | 10.14 |
| Maximum offering price per share (100/96.00 of $10.14) | | | $ | 10.56 |
| Class C : | | | | |
Net Asset Value and offering price per share ($1,064,872 ÷ 105,631 shares) (a) | | | $ | 10.08 |
| Fidelity Sustainable Intermediate Municipal Income Fund : | | | | |
Net Asset Value , offering price and redemption price per share ($7,306,507 ÷ 720,420 shares) | | | $ | 10.14 |
| Class I : | | | | |
Net Asset Value , offering price and redemption price per share ($1,034,596 ÷ 102,010 shares) | | | $ | 10.14 |
| Class Z : | | | | |
Net Asset Value , offering price and redemption price per share ($1,035,095 ÷ 102,059 shares) | | | $ | 10.14 |
(a)Redemption price per share is equal to net asset value less any applicable contingent deferred sales charge. |
| Statement of Operations |
| | | | For the period April 13, 2022 (commencement of operations) through January 31, 2023 |
| Investment Income | | | | |
| Interest | | | $ | 256,680 |
| Income from Fidelity Central Funds | | | | 3,364 |
| Total Income | | | | 260,044 |
| Expenses | | | | |
| Management fee | $ | 31,292 | | |
| Transfer agent fees | | 7,205 | | |
| Distribution and service plan fees | | 12,331 | | |
| Accounting fees and expenses | | 2,327 | | |
| Custodian fees and expenses | | 735 | | |
| Independent trustees' fees and expenses | | 28 | | |
| Registration fees | | 103,035 | | |
| Audit | | 51,464 | | |
| Legal | | 4 | | |
| Miscellaneous | | 34 | | |
| Total expenses before reductions | | 208,455 | | |
| Expense reductions | | (163,741) | | |
| Total expenses after reductions | | | | 44,714 |
| Net Investment income (loss) | | | | 215,330 |
| Realized and Unrealized Gain (Loss) | | | | |
| Net realized gain (loss) on: | | | | |
| Investment Securities: | | | | |
| Unaffiliated issuers | | (4,499) | | |
| Capital gain distributions from Fidelity Central Funds | | 6 | | |
| Total net realized gain (loss) | | | | (4,493) |
| Change in net unrealized appreciation (depreciation) on: | | | | |
| Investment Securities: | | | | |
| Unaffiliated issuers | | 204,324 | | |
| Fidelity Central Funds | | (7) | | |
| Total change in net unrealized appreciation (depreciation) | | | | 204,317 |
| Net gain (loss) | | | | 199,824 |
| Net increase (decrease) in net assets resulting from operations | | | $ | 415,154 |
| Statement of Changes in Net Assets |
| |
| | For the period April 13, 2022 (commencement of operations) through January 31, 2023 |
| Increase (Decrease) in Net Assets | | |
| Operations | | |
| Net investment income (loss) | $ | 215,330 |
| Net realized gain (loss) | | (4,493) |
| Change in net unrealized appreciation (depreciation) | | 204,317 |
| Net increase (decrease) in net assets resulting from operations | | 415,154 |
| Distributions to shareholders | | (220,316) |
| Share transactions - net increase (decrease) | | 12,931,709 |
| Total increase (decrease) in net assets | | 13,126,547 |
| | | |
| Net Assets | | |
| Beginning of period | | - |
| End of period | $ | 13,126,547 |
| | | |
| | | |
Financial Highlights
| Fidelity Advisor Sustainable Intermediate Municipal Income Fund Class A |
| |
| Years ended January 31, | | 2023 A |
Selected Per-Share Data | | |
| Net asset value, beginning of period | $ | 10.00 |
| Income from Investment Operations | | |
Net investment income (loss) B,C | | .181 |
| Net realized and unrealized gain (loss) | | .137 |
| Total from investment operations | | .318 |
| Distributions from net investment income | | (.178) |
| Total distributions | | (.178) |
| Net asset value, end of period | $ | 10.14 |
Total Return D,E,F | | 3.24% |
Ratios to Average Net Assets C,G,H | | |
| Expenses before reductions | | 2.34% I,J |
| Expenses net of fee waivers, if any | | .62% J |
| Expenses net of all reductions | | .61% J |
| Net investment income (loss) | | 2.26% J |
| Supplemental Data | | |
| Net assets, end of period (000 omitted) | $ | 1,563 |
Portfolio turnover rate K | | 14% J |
A For the period April 13, 2022 (commencement of operations) through January 31, 2023.
B Calculated based on average shares outstanding during the period.
C Net investment income (loss) is affected by the timing of the declaration of dividends by any underlying mutual funds or exchange-traded funds (ETFs). Net investment income (loss) of any mutual funds or ETFs is not included in the Fund's net investment income (loss) ratio.
D Total returns for periods of less than one year are not annualized.
E Total returns would have been lower if certain expenses had not been reduced during the applicable periods shown.
F Total returns do not include the effect of the sales charges.
G Fees and expenses of any underlying mutual funds or exchange-traded funds (ETFs) are not included in the Fund's expense ratio. The Fund indirectly bears its proportionate share of these expenses. For additional expense information related to investments in Fidelity Central Funds, please refer to the "Investments in Fidelity Central Funds" note found in the Notes to Financial Statements section of the most recent Annual or Semi-Annual report.
H Expense ratios reflect operating expenses of the class. Expenses before reductions do not reflect amounts reimbursed, waived, or reduced through arrangements with the investment adviser, brokerage services, or other offset arrangements, if applicable, and do not represent the amount paid by the class during periods when reimbursements, waivers or reductions occur.
I Audit fees are not annualized.
J Annualized.
K Amount does not include the portfolio activity of any underlying mutual funds or exchange-traded funds (ETFs).
| Fidelity Advisor Sustainable Intermediate Municipal Income Fund Class M |
| |
| Years ended January 31, | | 2023 A |
Selected Per-Share Data | | |
| Net asset value, beginning of period | $ | 10.00 |
| Income from Investment Operations | | |
Net investment income (loss) B,C | | .181 |
| Net realized and unrealized gain (loss) | | .137 |
| Total from investment operations | | .318 |
| Distributions from net investment income | | (.178) |
| Total distributions | | (.178) |
| Net asset value, end of period | $ | 10.14 |
Total Return D,E,F | | 3.24% |
Ratios to Average Net Assets C,G,H | | |
| Expenses before reductions | | 2.36% I,J |
| Expenses net of fee waivers, if any | | .62% J |
| Expenses net of all reductions | | .61% J |
| Net investment income (loss) | | 2.26% J |
| Supplemental Data | | |
| Net assets, end of period (000 omitted) | $ | 1,122 |
Portfolio turnover rate K | | 14% J |
A For the period April 13, 2022 (commencement of operations) through January 31, 2023.
B Calculated based on average shares outstanding during the period.
C Net investment income (loss) is affected by the timing of the declaration of dividends by any underlying mutual funds or exchange-traded funds (ETFs). Net investment income (loss) of any mutual funds or ETFs is not included in the Fund's net investment income (loss) ratio.
D Total returns for periods of less than one year are not annualized.
E Total returns would have been lower if certain expenses had not been reduced during the applicable periods shown.
F Total returns do not include the effect of the sales charges.
G Fees and expenses of any underlying mutual funds or exchange-traded funds (ETFs) are not included in the Fund's expense ratio. The Fund indirectly bears its proportionate share of these expenses. For additional expense information related to investments in Fidelity Central Funds, please refer to the "Investments in Fidelity Central Funds" note found in the Notes to Financial Statements section of the most recent Annual or Semi-Annual report.
H Expense ratios reflect operating expenses of the class. Expenses before reductions do not reflect amounts reimbursed, waived, or reduced through arrangements with the investment adviser, brokerage services, or other offset arrangements, if applicable, and do not represent the amount paid by the class during periods when reimbursements, waivers or reductions occur.
I Audit fees are not annualized.
J Annualized.
K Amount does not include the portfolio activity of any underlying mutual funds or exchange-traded funds (ETFs).
| Fidelity Advisor Sustainable Intermediate Municipal Income Fund Class C |
| |
| Years ended January 31, | | 2023 A |
Selected Per-Share Data | | |
| Net asset value, beginning of period | $ | 10.00 |
| Income from Investment Operations | | |
Net investment income (loss) B,C | | .120 |
| Net realized and unrealized gain (loss) | | .137 |
| Total from investment operations | | .257 |
| Distributions from net investment income | | (.177) |
| Total distributions | | (.177) |
| Net asset value, end of period | $ | 10.08 |
Total Return D,E,F | | 2.62% |
Ratios to Average Net Assets C,G,H | | |
| Expenses before reductions | | 3.08% I,J |
| Expenses net of fee waivers, if any | | 1.37% J |
| Expenses net of all reductions | | 1.36% J |
| Net investment income (loss) | | 1.51% J |
| Supplemental Data | | |
| Net assets, end of period (000 omitted) | $ | 1,065 |
Portfolio turnover rate K | | 14% J |
A For the period April 13, 2022 (commencement of operations) through January 31, 2023.
B Calculated based on average shares outstanding during the period.
C Net investment income (loss) is affected by the timing of the declaration of dividends by any underlying mutual funds or exchange-traded funds (ETFs). Net investment income (loss) of any mutual funds or ETFs is not included in the Fund's net investment income (loss) ratio.
D Total returns for periods of less than one year are not annualized.
E Total returns would have been lower if certain expenses had not been reduced during the applicable periods shown.
F Total returns do not include the effect of the contingent deferred sales charge.
G Fees and expenses of any underlying mutual funds or exchange-traded funds (ETFs) are not included in the Fund's expense ratio. The Fund indirectly bears its proportionate share of these expenses. For additional expense information related to investments in Fidelity Central Funds, please refer to the "Investments in Fidelity Central Funds" note found in the Notes to Financial Statements section of the most recent Annual or Semi-Annual report.
H Expense ratios reflect operating expenses of the class. Expenses before reductions do not reflect amounts reimbursed, waived, or reduced through arrangements with the investment adviser, brokerage services, or other offset arrangements, if applicable, and do not represent the amount paid by the class during periods when reimbursements, waivers or reductions occur.
I Audit fees are not annualized.
J Annualized.
K Amount does not include the portfolio activity of any underlying mutual funds or exchange-traded funds (ETFs).
| Fidelity Sustainable Intermediate Municipal Income Fund |
| |
| Years ended January 31, | | 2023 A |
Selected Per-Share Data | | |
| Net asset value, beginning of period | $ | 10.00 |
| Income from Investment Operations | | |
Net investment income (loss) B,C | | .200 |
| Net realized and unrealized gain (loss) | | .138 |
| Total from investment operations | | .338 |
| Distributions from net investment income | | (.198) |
| Total distributions | | (.198) |
| Net asset value, end of period | $ | 10.14 |
Total Return D,E | | 3.44% |
Ratios to Average Net Assets C,F,G | | |
| Expenses before reductions | | 2.03% H,I |
| Expenses net of fee waivers, if any | | .37% I |
| Expenses net of all reductions | | .36% I |
| Net investment income (loss) | | 2.51% I |
| Supplemental Data | | |
| Net assets, end of period (000 omitted) | $ | 7,307 |
Portfolio turnover rate J | | 14% I |
A For the period April 13, 2022 (commencement of operations) through January 31, 2023.
B Calculated based on average shares outstanding during the period.
C Net investment income (loss) is affected by the timing of the declaration of dividends by any underlying mutual funds or exchange-traded funds (ETFs). Net investment income (loss) of any mutual funds or ETFs is not included in the Fund's net investment income (loss) ratio.
D Total returns for periods of less than one year are not annualized.
E Total returns would have been lower if certain expenses had not been reduced during the applicable periods shown.
F Fees and expenses of any underlying mutual funds or exchange-traded funds (ETFs) are not included in the Fund's expense ratio. The Fund indirectly bears its proportionate share of these expenses. For additional expense information related to investments in Fidelity Central Funds, please refer to the "Investments in Fidelity Central Funds" note found in the Notes to Financial Statements section of the most recent Annual or Semi-Annual report.
G Expense ratios reflect operating expenses of the class. Expenses before reductions do not reflect amounts reimbursed, waived, or reduced through arrangements with the investment adviser, brokerage services, or other offset arrangements, if applicable, and do not represent the amount paid by the class during periods when reimbursements, waivers or reductions occur.
H Audit fees are not annualized.
I Annualized.
J Amount does not include the portfolio activity of any underlying mutual funds or exchange-traded funds (ETFs).
| Fidelity Advisor Sustainable Intermediate Municipal Income Fund Class I |
| |
| Years ended January 31, | | 2023 A |
Selected Per-Share Data | | |
| Net asset value, beginning of period | $ | 10.00 |
| Income from Investment Operations | | |
Net investment income (loss) B,C | | .201 |
| Net realized and unrealized gain (loss) | | .137 |
| Total from investment operations | | .338 |
| Distributions from net investment income | | (.198) |
| Total distributions | | (.198) |
| Net asset value, end of period | $ | 10.14 |
Total Return D,E | | 3.44% |
Ratios to Average Net Assets C,F,G | | |
| Expenses before reductions | | 2.12% H,I |
| Expenses net of fee waivers, if any | | .37% I |
| Expenses net of all reductions | | .36% I |
| Net investment income (loss) | | 2.51% I |
| Supplemental Data | | |
| Net assets, end of period (000 omitted) | $ | 1,035 |
Portfolio turnover rate J | | 14% I |
A For the period April 13, 2022 (commencement of operations) through January 31, 2023.
B Calculated based on average shares outstanding during the period.
C Net investment income (loss) is affected by the timing of the declaration of dividends by any underlying mutual funds or exchange-traded funds (ETFs). Net investment income (loss) of any mutual funds or ETFs is not included in the Fund's net investment income (loss) ratio.
D Total returns for periods of less than one year are not annualized.
E Total returns would have been lower if certain expenses had not been reduced during the applicable periods shown.
F Fees and expenses of any underlying mutual funds or exchange-traded funds (ETFs) are not included in the Fund's expense ratio. The Fund indirectly bears its proportionate share of these expenses. For additional expense information related to investments in Fidelity Central Funds, please refer to the "Investments in Fidelity Central Funds" note found in the Notes to Financial Statements section of the most recent Annual or Semi-Annual report.
G Expense ratios reflect operating expenses of the class. Expenses before reductions do not reflect amounts reimbursed, waived, or reduced through arrangements with the investment adviser, brokerage services, or other offset arrangements, if applicable, and do not represent the amount paid by the class during periods when reimbursements, waivers or reductions occur.
H Audit fees are not annualized.
I Annualized.
J Amount does not include the portfolio activity of any underlying mutual funds or exchange-traded funds (ETFs).
| Fidelity Advisor Sustainable Intermediate Municipal Income Fund Class Z |
| |
| Years ended January 31, | | 2023 A |
Selected Per-Share Data | | |
| Net asset value, beginning of period | $ | 10.00 |
| Income from Investment Operations | | |
Net investment income (loss) B,C | | .205 |
| Net realized and unrealized gain (loss) | | .137 |
| Total from investment operations | | .342 |
| Distributions from net investment income | | (.202) |
| Total distributions | | (.202) |
| Net asset value, end of period | $ | 10.14 |
Total Return D,E | | 3.49% |
Ratios to Average Net Assets C,F,G | | |
| Expenses before reductions | | 2.04% H,I |
| Expenses net of fee waivers, if any | | .31% I |
| Expenses net of all reductions | | .30% I |
| Net investment income (loss) | | 2.57% I |
| Supplemental Data | | |
| Net assets, end of period (000 omitted) | $ | 1,035 |
Portfolio turnover rate J | | 14% I |
A For the period April 13, 2022 (commencement of operations) through January 31, 2023.
B Calculated based on average shares outstanding during the period.
C Net investment income (loss) is affected by the timing of the declaration of dividends by any underlying mutual funds or exchange-traded funds (ETFs). Net investment income (loss) of any mutual funds or ETFs is not included in the Fund's net investment income (loss) ratio.
D Total returns for periods of less than one year are not annualized.
E Total returns would have been lower if certain expenses had not been reduced during the applicable periods shown.
F Fees and expenses of any underlying mutual funds or exchange-traded funds (ETFs) are not included in the Fund's expense ratio. The Fund indirectly bears its proportionate share of these expenses. For additional expense information related to investments in Fidelity Central Funds, please refer to the "Investments in Fidelity Central Funds" note found in the Notes to Financial Statements section of the most recent Annual or Semi-Annual report.
G Expense ratios reflect operating expenses of the class. Expenses before reductions do not reflect amounts reimbursed, waived, or reduced through arrangements with the investment adviser, brokerage services, or other offset arrangements, if applicable, and do not represent the amount paid by the class during periods when reimbursements, waivers or reductions occur.
H Audit fees are not annualized.
I Annualized.
J Amount does not include the portfolio activity of any underlying mutual funds or exchange-traded funds (ETFs).
For the period ended January 31, 2023
1. Organization.
Fidelity Sustainable Intermediate Municipal Income Fund (the Fund) is a fund of Fidelity Salem Street Trust (the Trust) and is authorized to issue an unlimited number of shares. The Trust is registered under the Investment Company Act of 1940, as amended (the 1940 Act), as an open-end management investment company organized as a Massachusetts business trust. The Fund offers Class A, Class M, Class C, Fidelity Sustainable Intermediate Municipal Income Fund, Class I and Class Z shares, each of which has equal rights as to assets and voting privileges. Each class has exclusive voting rights with respect to matters that affect that class. Class C shares will automatically convert to Class A shares after a holding period of eight years from the initial date of purchase, with certain exceptions.
2. Investments in Fidelity Central Funds.
Funds may invest in Fidelity Central Funds, which are open-end investment companies generally available only to other investment companies and accounts managed by the investment adviser and its affiliates. The Schedule of Investments lists any Fidelity Central Funds held as an investment as of period end, but does not include the underlying holdings of each Fidelity Central Fund. An investing fund indirectly bears its proportionate share of the expenses of the underlying Fidelity Central Funds.
Based on its investment objective, each Fidelity Central Fund may invest or participate in various investment vehicles or strategies that are similar to those of the investing fund. These strategies are consistent with the investment objectives of the investing fund and may involve certain economic risks which may cause a decline in value of each of the Fidelity Central Funds and thus a decline in the value of the investing fund.
| Fidelity Central Fund | Investment Manager | Investment Objective | Investment Practices | Expense Ratio A |
| Fidelity Money Market Central Funds | Fidelity Management & Research Company LLC (FMR) | Each fund seeks to obtain a high level of current income consistent with the preservation of capital and liquidity. | Short-term Investments | Less than .005% |
A Expenses expressed as a percentage of average net assets and are as of each underlying Central Fund's most recent annual or semi-annual shareholder report.
A complete unaudited list of holdings for each Fidelity Central Fund is available upon request or at the Securities and Exchange Commission website at www.sec.gov. In addition, the financial statements of the Fidelity Central Funds which contain the significant accounting policies (including investment valuation policies) of those funds, and are not covered by the Report of Independent Registered Public Accounting Firm, are available on the Securities and Exchange Commission website or upon request.
3. Significant Accounting Policies.
The Fund is an investment company and applies the accounting and reporting guidance of the Financial Accounting Standards Board (FASB) Accounting Standards Codification Topic 946 Financial Services - Investment Companies . The financial statements have been prepared in conformity with accounting principles generally accepted in the United States of America (GAAP), which require management to make certain estimates and assumptions at the date of the financial statements. Actual results could differ from those estimates. Subsequent events, if any, through the date that the financial statements were issued have been evaluated in the preparation of the financial statements. The Fund's Schedule of Investments lists any underlying mutual funds or exchange-traded funds (ETFs) but does not include the underlying holdings of these funds. The following summarizes the significant accounting policies of the Fund:
Investment Valuation. Investments are valued as of 4:00 p.m. Eastern time on the last calendar day of the period. The Board of Trustees (the Board) has designated the Fund's investment adviser as the valuation designee responsible for the fair valuation function and performing fair value determinations as needed. The investment adviser has established a Fair Value Committee (the Committee) to carry out the day-to-day fair valuation responsibilities and has adopted policies and procedures to govern the fair valuation process and the activities of the Committee. In accordance with these fair valuation policies and procedures, which have been approved by the Board, the Fund attempts to obtain prices from one or more third party pricing services or brokers to value its investments. When current market prices, quotations or currency exchange rates are not readily available or reliable, investments will be fair valued in good faith by the Committee, in accordance with the policies and procedures. Factors used in determining fair value vary by investment type and may include market or investment specific events, transaction data, estimated cash flows, and market observations of comparable investments. The frequency that the fair valuation procedures are used cannot be predicted and they may be utilized to a significant extent. The Committee manages the Fund's fair valuation practices and maintains the fair valuation policies and procedures. The Fund's investment adviser reports to the Board information regarding the fair valuation process and related material matters.
The Fund categorizes the inputs to valuation techniques used to value its investments into a disclosure hierarchy consisting of three levels as shown below:
Level 1 - unadjusted quoted prices in active markets for identical investments
Level 2 - other significant observable inputs (including quoted prices for similar investments, interest rates, prepayment speeds, etc.)
Level 3 - unobservable inputs (including the Fund's own assumptions based on the best information available)
Valuation techniques used to value the Fund's investments by major category are as follows:
Debt securities, including restricted securities, are valued based on evaluated prices received from third party pricing services or from brokers who make markets in such securities. Municipal securities are valued by pricing services who utilize matrix pricing which considers yield or price of bonds of comparable quality, coupon, maturity and type or by broker-supplied prices. When independent prices are unavailable or unreliable, debt securities may be valued utilizing pricing methodologies which consider similar factors that would be used by third party pricing services. Debt securities are generally categorized as Level 2 in the hierarchy but may be Level 3 depending on the circumstances.
Investments in open-end mutual funds, including the Fidelity Central Funds, are valued at their closing net asset value (NAV) each business day and are categorized as Level 1 in the hierarchy.
Changes in valuation techniques may result in transfers in or out of an assigned level within the disclosure hierarchy. The aggregate value of investments by input level as of January 31, 2023 is included at the end of the Fund's Schedule of Investments.
Investment Transactions and Income. For financial reporting purposes, the Fund's investment holdings and NAV include trades executed through the end of the last business day of the period. The NAV per share for processing shareholder transactions is calculated as of the close of business of the New York Stock Exchange (NYSE), normally 4:00 p.m. Eastern time and includes trades executed through the end of the prior business day. Gains and losses on securities sold are determined on the basis of identified cost. Income and capital gain distributions from Fidelity Central Funds, if any, are recorded on the ex-dividend date. Interest income is accrued as earned and includes coupon interest and amortization of premium and accretion of discount on debt securities as applicable.
Class Allocations and Expenses. Investment income, realized and unrealized capital gains and losses, common expenses of a fund, and certain fund-level expense reductions, if any, are allocated daily on a pro-rata basis to each class based on the relative net assets of each class to the total net assets of a fund. Each class differs with respect to transfer agent and distribution and service plan fees incurred, as applicable. Certain expense reductions may also differ by class, if applicable. For the reporting period, the allocated portion of income and expenses to each class as a percent of its average net assets may vary due to the timing of recording these transactions in relation to fluctuating net assets of the classes. Expenses directly attributable to a fund are charged to that fund. Expenses attributable to more than one fund are allocated among the respective funds on the basis of relative net assets or other appropriate methods. Expenses included in the accompanying financial statements reflect the expenses of that fund and do not include any expenses associated with any underlying mutual funds or exchange-traded funds. Although not included in a fund's expenses, a fund indirectly bears its proportionate share of these expenses through the net asset value of each underlying mutual fund or exchange-traded fund. Expense estimates are accrued in the period to which they relate and adjustments are made when actual amounts are known.
Income Tax Information and Distributions to Shareholders. Each year, the Fund intends to qualify as a regulated investment company under Subchapter M of the Internal Revenue Code, including distributing substantially all of its taxable income and realized gains. As a result, no provision for U.S. Federal income taxes is required. As of January 31, 2023, the Fund did not have any unrecognized tax benefits in the financial statements; nor is the Fund aware of any tax positions for which it is reasonably possible that the total amounts of unrecognized tax benefits will significantly change in the next twelve months. The Fund files a U.S. federal tax return, in addition to state and local tax returns as required. The Fund's federal income tax returns are subject to examination by the Internal Revenue Service (IRS) for a period of three fiscal years after they are filed. State and local tax returns may be subject to examination for an additional fiscal year depending on the jurisdiction.
Distributions are declared and recorded daily and paid monthly from net investment income. Distributions from realized gains, if any, are declared and recorded on the ex-dividend date. Income and capital gain distributions are declared separately for each class. Income and capital gain distributions are determined in accordance with income tax regulations, which may differ from GAAP.
Capital accounts within the financial statements are adjusted for permanent book-tax differences. These adjustments have no impact on net assets or the results of operations. Capital accounts are not adjusted for temporary book-tax differences which will reverse in a subsequent period.
Book-tax differences are primarily due to market discount and capital loss carryforwards.
The Fund purchases municipal securities whose interest, in the opinion of the issuer, is free from federal income tax. There is no assurance that the IRS will agree with this opinion. In the event the IRS determines that the issuer does not comply with relevant tax requirements, interest payments from a security could become federally taxable, possibly retroactively to the date the security was issued.
As of period end, the cost and unrealized appreciation (depreciation) in securities, and derivatives if applicable, for federal income tax purposes were as follows:
| Gross unrealized appreciation | $235,435 |
| Gross unrealized depreciation | (29,727) |
| Net unrealized appreciation (depreciation) | $205,708 |
| Tax Cost | $12,852,930 |
The tax-based components of distributable earnings as of period end were as follows:
| Capital loss carryforward | $(4,491) |
| Net unrealized appreciation (depreciation) on securities and other investments | $ 205,708 |
Capital loss carryforwards are only available to offset future capital gains of the Fund to the extent provided by regulations and may be limited. The capital loss carryforward information presented below, including any applicable limitation, is estimated as of fiscal period end and is subject to adjustment.
The tax character of distributions paid was as follows:
| | January 31, 2023 A |
| Tax-exempt Income | $220,316 |
A For the period April 13, 2022 (commencement of operations) through January 31, 2023.
Restricted Securities (including Private Placements). Funds may invest in securities that are subject to legal or contractual restrictions on resale. These securities generally may be resold in transactions exempt from registration or to the public if the securities are registered. Disposal of these securities may involve time-consuming negotiations and expense, and prompt sale at an acceptable price may be difficult. Information regarding restricted securities held at period end is included at the end of the Schedule of Investments, if applicable.
4. Purchases and Sales of Investments.
Purchases and sales of securities, other than short-term securities and in-kind transactions, as applicable, are noted in the table below.
| | Purchases ($) | Sales ($) |
| Fidelity Sustainable Intermediate Municipal Income Fund | 13,132,916 | 1,112,030 |
5. Fees and Other Transactions with Affiliates.
Management Fee. Fidelity Management & Research Company LLC (the investment adviser) and its affiliates provide the Fund with investment management related services for which the Fund pays a monthly management fee. The management fee is the sum of an individual fund fee rate that is based on an annual rate of .25% of the Fund's average net assets and an annualized group fee rate that averaged .10% during the period. The group fee rate is based upon the monthly average net assets of a group of registered investment companies with which the investment adviser has management contracts. The group fee rate decreases as assets under management increase and increases as assets under management decrease. For the reporting period, the total annualized management fee rate was .35% of the Fund's average net assets.
Distribution and Service Plan Fees. In accordance with Rule 12b-1 of the 1940 Act, the Fund has adopted separate Distribution and Service Plans for each class of shares. Certain classes pay Fidelity Distributors Company LLC (FDC), an affiliate of the investment adviser, separate Distribution and Service Fees, each of which is based on an annual percentage of each class' average net assets. In addition, FDC may pay financial intermediaries for selling shares of the Fund and providing shareholder support services. For the period, the Distribution and Service Fee rates, total fees and amounts retained by FDC were as follows:
| | Distribution Fee | Service Fee | Total Fees | Retained by FDC |
| Class A | - % | .25% | $2,261 | $2,005 |
| Class M | - % | .25% | 2,042 | 1,998 |
| Class C | .75% | .25% | 8,028 | 8,024 |
| | | | $12,331 | $12,027 |
Sales Load. FDC may receive a front-end sales charge of up to 4.00% for selling Class A shares and Class M shares, some of which is paid to financial intermediaries for selling shares of the Fund. Depending on the holding period, FDC may receive contingent deferred sales charges levied on Class A, Class M and Class C redemptions. The deferred sales charges are 1.00% for Class C shares, .75% for certain purchases of Class A shares and .25% for certain purchases of Class M shares. For the period, there were no sales charge amounts retained by FDC.
Transfer Agent Fees. Fidelity Investments Institutional Operations Company LLC (FIIOC), an affiliate of the investment adviser, is the transfer, dividend disbursing and shareholder servicing agent for each class of the Fund. FIIOC receives account fees and asset-based fees that vary according to the account size and type of account of the shareholders of the respective classes of the Fund, except for Class Z. FIIOC receives an asset-based fee of Class Z's average net assets. FIIOC pays for typesetting, printing and mailing of shareholder reports, except proxy statements.
For the period, transfer agent fees for each class were as follows:
| | Amount | % of Class-Level Average Net Assets A |
| Class A | $1,101 | .12 |
| Class M | 1,051 | .13 |
| Class C | 834 | .10 |
| Fidelity Sustainable Intermediate Municipal Income Fund | 2,775 | .06 |
| Class I | 1,044 | .13 |
| Class Z | 400 | .05 |
| | $7,205 | |
A Annualized
Accounting Fees. Fidelity Service Company, Inc. (FSC), an affiliate of the investment adviser, maintains the Fund's accounting records. The accounting fee is based on the level of average net assets for each month. For the period, the fees were equivalent to the following annualized rates:
| | % of Average Net Assets |
| Fidelity Sustainable Intermediate Municipal Income Fund | .03 |
Interfund Trades. Funds may purchase from or sell securities to other Fidelity Funds under procedures adopted by the Board. The procedures have been designed to ensure these interfund trades are executed in accordance with Rule 17a-7 of the 1940 Act. Any interfund trades are included within the respective purchases and sales amounts shown in the Purchases and Sales of Investments note. During the period, there were no interfund trades.
6. Expense Reductions.
The investment adviser contractually agreed to reimburse expenses of each class to the extent annual operating expenses exceeded certain levels of class-level average net assets as noted in the table below. This reimbursement will remain in place through May 31, 2024. Some expenses, for example the compensation of the independent Trustees, and certain miscellaneous expenses such as proxy and shareholder meeting expenses, are excluded from this reimbursement.
The following classes were in reimbursement during the period:
| | Expense Limitations | Reimbursement |
| Class A | .62% | $16,718 |
| Class M | .62% | 15,232 |
| Class C | 1.37% | 14,742 |
| Fidelity Sustainable Intermediate Municipal Income Fund | .37% | 86,535 |
| Class I | .37% | 14,965 |
| Class Z | .31% | 14,808 |
| | | $163,000 |
Through arrangements with the Fund's custodian and each class' transfer agent, credits realized as a result of certain uninvested cash balances were used to reduce the Fund's expenses. During the period, custodian credits reduced the Fund's expenses by $406. During the period, transfer agent credits reduced each class' expenses as noted in the table below.
| | Expense reduction |
| Fidelity Sustainable Intermediate Municipal Income Fund | $172 |
In addition, during the period the investment adviser or an affiliate reimbursed and/or waived a portion of fund-level operating expenses in the amount of $163.
7. Distributions to Shareholders.
Distributions to shareholders of each class were as follows:
| | Year ended January 31, 2023 A |
| Fidelity Sustainable Intermediate Municipal Income Fund | |
| Distributions to shareholders | |
| Class A | $20,582 |
| Class M | 18,384 |
| Class C | 17,991 |
| Fidelity Sustainable Intermediate Municipal Income Fund | 123,006 |
| Class I | 19,937 |
| Class Z | 20,416 |
| Total | $220,316 |
A For the period April 13, 2022 (commencement of operations) through January 31, 2023.
8. Share Transactions.
Share transactions for each class were as follows and may contain in-kind transactions, automatic conversions between classes or exchanges between affiliated funds:
| | Shares | Dollars |
| | Year ended January 31, 2023 A | Year ended January 31, 2023 A |
| Fidelity Sustainable Intermediate Municipal Income Fund | | |
| Class A | | |
| Shares sold | 152,415 | $1,510,973 |
| Reinvestment of distributions | 2,073 | 20,582 |
| Shares redeemed | (328) | (3,253) |
| Net increase (decrease) | 154,160 | $1,528,302 |
| Class M | | |
| Shares sold | 108,784 | $1,085,981 |
| Reinvestment of distributions | 1,853 | 18,384 |
| Net increase (decrease) | 110,637 | $1,104,365 |
| Class C | | |
| Shares sold | 104,646 | $1,046,011 |
| Reinvestment of distributions | 1,821 | 17,991 |
| Shares redeemed | (836) | (8,058) |
| Net increase (decrease) | 105,631 | $1,055,944 |
| Fidelity Sustainable Intermediate Municipal Income Fund | | |
| Shares sold | 731,710 | $7,308,238 |
| Reinvestment of distributions | 10,931 | 108,350 |
| Shares redeemed | (22,221) | (213,843) |
| Net increase (decrease) | 720,420 | $7,202,745 |
| Class I | | |
| Shares sold | 100,000 | $1,000,000 |
| Reinvestment of distributions | 2,010 | 19,937 |
| Net increase (decrease) | 102,010 | $1,019,937 |
| Class Z | | |
| Shares sold | 100,000 | $1,000,000 |
| Reinvestment of distributions | 2,059 | 20,416 |
| Net increase (decrease) | 102,059 | $1,020,416 |
A For the period April 13, 2022 (commencement of operations) through January 31, 2023.
9. Other.
A fund's organizational documents provide former and current trustees and officers with a limited indemnification against liabilities arising in connection with the performance of their duties to the fund. In the normal course of business, a fund may also enter into contracts that provide general indemnifications. A fund's maximum exposure under these arrangements is unknown as this would be dependent on future claims that may be made against a fund. The risk of material loss from such claims is considered remote.
At the end of the period, the investment adviser or its affiliates were owners of record of more than 10% of the outstanding shares as follows:
| Fund | Affiliated % |
Fidelity Sustainable Intermediate Municipal Income Fund | 79% |
10. Risk and Uncertainties.
Many factors affect a fund's performance. Developments that disrupt global economies and financial markets, such as pandemics, epidemics, outbreaks of infectious diseases, war, terrorism, and environmental disasters, may significantly affect a fund's investment performance. The effects of these developments to a fund will be impacted by the types of securities in which a fund invests, the financial condition, industry, economic sector, and geographic location of an issuer, and a fund's level of investment in the securities of that issuer.
To the Board of Trustees of Fidelity Salem Street Trust and Shareholders of Fidelity Sustainable Intermediate Municipal Income Fund
Opinion on the Financial Statements
We have audited the accompanying statement of assets and liabilities, including the schedule of investments, of Fidelity Sustainable Intermediate Municipal Income Fund (one of the funds constituting Fidelity Salem Street Trust, referred to hereafter as the "Fund") as of January 31, 2023, and the related statements of operations and changes in net assets, including the related notes, and the financial highlights for the period April 13, 2022 (commencement of operations) through January 31, 2023 (collectively referred to as the "financial statements"). In our opinion, the financial statements present fairly, in all material respects, the financial position of the Fund as of January 31, 2023, and the results of its operations, changes in its net assets, and the financial highlights for the period April 13, 2022 (commencement of operations) through January 31, 2023 in conformity with accounting principles generally accepted in the United States of America.
Basis for Opinion
These financial statements are the responsibility of the Fund's management. Our responsibility is to express an opinion on the Fund's financial statements based on our audit. We are a public accounting firm registered with the Public Company Accounting Oversight Board (United States) (PCAOB) and are required to be independent with respect to the Fund in accordance with the U.S. federal securities laws and the applicable rules and regulations of the Securities and Exchange Commission and the PCAOB.
We conducted our audit of these financial statements in accordance with the standards of the PCAOB. Those standards require that we plan and perform the audit to obtain reasonable assurance about whether the financial statements are free of material misstatement, whether due to error or fraud.
Our audit included performing procedures to assess the risks of material misstatement of the financial statements, whether due to error or fraud, and performing procedures that respond to those risks. Such procedures included examining, on a test basis, evidence regarding the amounts and disclosures in the financial statements. Our audit also included evaluating the accounting principles used and significant estimates made by management, as well as evaluating the overall presentation of the financial statements. Our procedures included confirmation of securities owned as of January 31, 2023 by correspondence with the custodian. We believe that our audit provides a reasonable basis for our opinion.
/s/ PricewaterhouseCoopers LLP
Boston, Massachusetts
March 16, 2023
We have served as the auditor of one or more investment companies in the Fidelity group of funds since 1932.
The Trustees, Members of the Advisory Board (if any), and officers of the trust and fund, as applicable, are listed below. The Board of Trustees governs the fund and is responsible for protecting the interests of shareholders. The Trustees are experienced executives who meet periodically throughout the year to oversee the fund's activities, review contractual arrangements with companies that provide services to the fund, oversee management of the risks associated with such activities and contractual arrangements, and review the fund's performance. Except for Jonathan Chiel, each of the Trustees oversees 291 funds. Mr. Chiel oversees 186 funds.
The Trustees hold office without limit in time except that (a) any Trustee may resign; (b) any Trustee may be removed by written instrument, signed by at least two-thirds of the number of Trustees prior to such removal; (c) any Trustee who requests to be retired or who has become incapacitated by illness or injury may be retired by written instrument signed by a majority of the other Trustees; and (d) any Trustee may be removed at any special meeting of shareholders by a two-thirds vote of the outstanding voting securities of the trust. Each Trustee who is not an interested person (as defined in the 1940 Act) of the trust and the fund is referred to herein as an Independent Trustee. Each Independent Trustee shall retire not later than the last day of the calendar year in which his or her 75th birthday occurs. The Independent Trustees may waive this mandatory retirement age policy with respect to individual Trustees. Officers and Advisory Board Members hold office without limit in time, except that any officer or Advisory Board Member may resign or may be removed by a vote of a majority of the Trustees at any regular meeting or any special meeting of the Trustees. Except as indicated, each individual has held the office shown or other offices in the same company for the past five years.
The fund's Statement of Additional Information (SAI) includes more information about the Trustees. To request a free copy, call Fidelity at 1-800-544-8544 if you're an individual investing directly with Fidelity, call 1-800-835-5092 if you're a plan sponsor or participant with Fidelity as your recordkeeper or call 1-877-208-0098 on institutional accounts or if you're an advisor or invest through one.
Experience, Skills, Attributes, and Qualifications of the Trustees. The Governance and Nominating Committee has adopted a statement of policy that describes the experience, qualifications, attributes, and skills that are necessary and desirable for potential Independent Trustee candidates (Statement of Policy). The Board believes that each Trustee satisfied at the time he or she was initially elected or appointed a Trustee, and continues to satisfy, the standards contemplated by the Statement of Policy. The Governance and Nominating Committee also engages professional search firms to help identify potential Independent Trustee candidates who have the experience, qualifications, attributes, and skills consistent with the Statement of Policy. From time to time, additional criteria based on the composition and skills of the current Independent Trustees, as well as experience or skills that may be appropriate in light of future changes to board composition, business conditions, and regulatory or other developments, have also been considered by the professional search firms and the Governance and Nominating Committee. In addition, the Board takes into account the Trustees' commitment and participation in Board and committee meetings, as well as their leadership of standing and ad hoc committees throughout their tenure.
In determining that a particular Trustee was and continues to be qualified to serve as a Trustee, the Board has considered a variety of criteria, none of which, in isolation, was controlling. The Board believes that, collectively, the Trustees have balanced and diverse experience, qualifications, attributes, and skills, which allow the Board to operate effectively in governing the fund and protecting the interests of shareholders. Information about the specific experience, skills, attributes, and qualifications of each Trustee, which in each case led to the Board's conclusion that the Trustee should serve (or continue to serve) as a trustee of the fund, is provided below.
Board Structure and Oversight Function. Abigail P. Johnson is an interested person and currently serves as Chairman. The Trustees have determined that an interested Chairman is appropriate and benefits shareholders because an interested Chairman has a personal and professional stake in the quality and continuity of services provided to the fund. Independent Trustees exercise their informed business judgment to appoint an individual of their choosing to serve as Chairman, regardless of whether the Trustee happens to be independent or a member of management. The Independent Trustees have determined that they can act independently and effectively without having an Independent Trustee serve as Chairman and that a key structural component for assuring that they are in a position to do so is for the Independent Trustees to constitute a substantial majority for the Board. The Independent Trustees also regularly meet in executive session. Michael E. Kenneally serves as Chairman of the Independent Trustees and as such (i) acts as a liaison between the Independent Trustees and management with respect to matters important to the Independent Trustees and (ii) with management prepares agendas for Board meetings.
Fidelity ® funds are overseen by different Boards of Trustees. The fund's Board oversees Fidelity's alternative investment, investment-grade bond, money market, asset allocation and certain equity funds, and other Boards oversee Fidelity's high income and other equity funds. The asset allocation funds may invest in Fidelity ® funds that are overseen by such other Boards. The use of separate Boards, each with its own committee structure, allows the Trustees of each group of Fidelity ® funds to focus on the unique issues of the funds they oversee, including common research, investment, and operational issues. On occasion, the separate Boards establish joint committees to address issues of overlapping consequences for the Fidelity ® funds overseen by each Board.
The Trustees operate using a system of committees to facilitate the timely and efficient consideration of all matters of importance to the Trustees, the fund, and fund shareholders and to facilitate compliance with legal and regulatory requirements and oversight of the fund's activities and associated risks. The Board, acting through its committees, has charged FMR and its affiliates with (i) identifying events or circumstances the occurrence of which could have demonstrably adverse effects on the fund's business and/or reputation; (ii) implementing processes and controls to lessen the possibility that such events or circumstances occur or to mitigate the effects of such events or circumstances if they do occur; and (iii) creating and maintaining a system designed to evaluate continuously business and market conditions in order to facilitate the identification and implementation processes described in (i) and (ii) above. Because the day-to-day operations and activities of the fund are carried out by or through FMR, its affiliates, and other service providers, the fund's exposure to risks is mitigated but not eliminated by the processes overseen by the Trustees. While each of the Board's committees has responsibility for overseeing different aspects of the fund's activities, oversight is exercised primarily through the Operations and Audit Committees. In addition, an ad hoc Board committee of Independent Trustees has worked with FMR to enhance the Board's oversight of investment and financial risks, legal and regulatory risks, technology risks, and operational risks, including the development of additional risk reporting to the Board. Appropriate personnel, including but not limited to the fund's Chief Compliance Officer (CCO), FMR's internal auditor, the independent accountants, the fund's Treasurer and portfolio management personnel, make periodic reports to the Board's committees, as appropriate, including an annual review of Fidelity's risk management program for the Fidelity ® funds. The responsibilities of each standing committee, including their oversight responsibilities, are described further under "Standing Committees of the Trustees."
Interested Trustees*:
Correspondence intended for a Trustee who is an interested person may be sent to Fidelity Investments, 245 Summer Street, Boston, Massachusetts 02210.
Name, Year of Birth; Principal Occupations and Other Relevant Experience+
Jonathan Chiel (1957)
Year of Election or Appointment: 2016
Trustee
Mr. Chiel also serves as Trustee of other Fidelity ® funds. Mr. Chiel is Executive Vice President and General Counsel for FMR LLC (diversified financial services company, 2012-present). Previously, Mr. Chiel served as general counsel (2004-2012) and senior vice president and deputy general counsel (2000-2004) for John Hancock Financial Services; a partner with Choate, Hall & Stewart (1996-2000) (law firm); and an Assistant United States Attorney for the United States Attorney's Office of the District of Massachusetts (1986-95), including Chief of the Criminal Division (1993-1995). Mr. Chiel is a director on the boards of the Boston Bar Foundation and the Maimonides School.
Abigail P. Johnson (1961)
Year of Election or Appointment: 2009
Trustee
Chairman of the Board of Trustees
Ms. Johnson also serves as Trustee of other Fidelity ® funds. Ms. Johnson serves as Chairman (2016-present), Chief Executive Officer (2014-present), and Director (2007-present) of FMR LLC (diversified financial services company), President of Fidelity Financial Services (2012-present) and President of Personal, Workplace and Institutional Services (2005-present). Ms. Johnson is Chairman and Director of Fidelity Management & Research Company LLC (investment adviser firm, 2011-present). Previously, Ms. Johnson served as Chairman and Director of FMR Co., Inc. (investment adviser firm, 2011-2019), Vice Chairman (2007-2016) and President (2013-2016) of FMR LLC, President and a Director of Fidelity Management & Research Company (2001-2005), a Trustee of other investment companies advised by Fidelity Management & Research Company, Fidelity Investments Money Management, Inc. (investment adviser firm), and FMR Co., Inc. (2001-2005), Senior Vice President of the Fidelity ® funds (2001-2005), and managed a number of Fidelity ® funds. Ms. Abigail P. Johnson and Mr. Arthur E. Johnson are not related.
Jennifer Toolin McAuliffe (1959)
Year of Election or Appointment: 2016
Trustee
Ms. McAuliffe also serves as Trustee of other Fidelity ® funds and as Trustee of Fidelity Charitable (2020-present). Previously, Ms. McAuliffe served as Co-Head of Fixed Income of Fidelity Investments Limited (now known as FIL Limited (FIL)) (diversified financial services company), Director of Research for FIL's credit and quantitative teams in London, Hong Kong and Tokyo and Director of Research for taxable and municipal bonds at Fidelity Investments Money Management, Inc. Ms. McAuliffe previously served as a member of the Advisory Board of certain Fidelity ® funds (2016). Ms. McAuliffe was previously a lawyer at Ropes & Gray LLP and currently serves as director or trustee of several not-for-profit entities.
* Determined to be an "Interested Trustee" by virtue of, among other things, his or her affiliation with the trust or various entities under common control with FMR.
+ The information includes the Trustee's principal occupation during the last five years and other information relating to the experience, attributes, and skills relevant to the Trustee's qualifications to serve as a Trustee, which led to the conclusion that the Trustee should serve as a Trustee for the fund.
Independent Trustees:
Correspondence intended for an Independent Trustee may be sent to Fidelity Investments, P.O. Box 55235, Boston, Massachusetts 02205-5235.
Name, Year of Birth; Principal Occupations and Other Relevant Experience+
Elizabeth S. Acton (1951)
Year of Election or Appointment: 2013
Trustee
Ms. Acton also serves as Trustee of other Fidelity ® funds. Prior to her retirement, Ms. Acton served as Executive Vice President, Finance (2011-2012), Executive Vice President, Chief Financial Officer (2002-2011) and Treasurer (2004-2005) of Comerica Incorporated (financial services). Prior to joining Comerica, Ms. Acton held a variety of positions at Ford Motor Company (1983-2002), including Vice President and Treasurer (2000-2002) and Executive Vice President and Chief Financial Officer of Ford Motor Credit Company (1998-2000). Ms. Acton currently serves as a member of the Board and Audit and Finance Committees of Beazer Homes USA, Inc. (homebuilding, 2012-present). Ms. Acton previously served as a member of the Advisory Board of certain Fidelity ® funds (2013-2016).
Ann E. Dunwoody (1953)
Year of Election or Appointment: 2018
Trustee
General Dunwoody also serves as Trustee of other Fidelity ® funds. General Dunwoody (United States Army, Retired) was the first woman in U.S. military history to achieve the rank of four-star general and prior to her retirement in 2012 held a variety of positions within the U.S. Army, including Commanding General, U.S. Army Material Command (2008-2012). General Dunwoody currently serves as President of First to Four LLC (leadership and mentoring services, 2012-present), a member of the Board and Nomination and Corporate Governance Committees of Kforce Inc. (professional staffing services, 2016-present) and a member of the Board of Automattic Inc. (software engineering, 2018-present). Previously, General Dunwoody served as a member of the Advisory Board and Nominating and Corporate Governance Committee of L3 Technologies, Inc. (communication, electronic, sensor and aerospace systems, 2013-2019) and a member of the Board and Audit and Sustainability and Corporate Responsibility Committees of Republic Services, Inc. (waste collection, disposal and recycling, 2013-2016). Ms. Dunwoody also serves on several boards for non-profit organizations, including as a member of the Board, Chair of the Nomination and Governance Committee and a member of the Audit Committee of Logistics Management Institute (consulting non-profit, 2012-present), a member of the Council of Trustees for the Association of the United States Army (advocacy non-profit, 2013-present), a member of the Board of Florida Institute of Technology (2015-present) and a member of the Board of ThanksUSA (military family education non-profit, 2014-present). General Dunwoody previously served as a member of the Advisory Board of certain Fidelity ® funds (2018).
John Engler (1948)
Year of Election or Appointment: 2014
Trustee
Mr. Engler also serves as Trustee of other Fidelity ® funds. Previously, Mr. Engler served as Governor of Michigan (1991-2003), President of the Business Roundtable (2011-2017) and interim President of Michigan State University (2018-2019). Mr. Engler currently serves as a member of the Board of Stride, Inc. (formerly K12 Inc.) (technology-based education company, 2012-present). Previously, Mr. Engler served as a member of the Board of Universal Forest Products (manufacturer and distributor of wood and wood-alternative products, 2003-2019) and Trustee of The Munder Funds (2003-2014). Mr. Engler previously served as a member of the Advisory Board of certain Fidelity ® funds (2014-2016).
Robert F. Gartland (1951)
Year of Election or Appointment: 2010
Trustee
Mr. Gartland also serves as Trustee of other Fidelity ® funds. Prior to his retirement, Mr. Gartland held a variety of positions at Morgan Stanley (financial services, 1979-2007), including Managing Director (1987-2007) and Chase Manhattan Bank (1975-1978). Mr. Gartland previously served as Chairman and an investor in Gartland & Mellina Group Corp. (consulting, 2009-2019), as a member of the Board of National Securities Clearing Corporation (1993-1996) and as Chairman of TradeWeb (2003-2004).
Arthur E. Johnson (1947)
Year of Election or Appointment: 2008
Trustee
Mr. Johnson also serves as Trustee of other Fidelity ® funds. Prior to his retirement, Mr. Johnson served as Senior Vice President of Corporate Strategic Development of Lockheed Martin Corporation (defense contractor, 1999-2009). Mr. Johnson currently serves as a member of the Board of Booz Allen Hamilton (management consulting, 2011-present). Mr. Johnson previously served as a member of the Board of Eaton Corporation plc (diversified power management, 2009-2019) and a member of the Board of AGL Resources, Inc. (holding company, 2002-2016). Mr. Johnson previously served as Chairman (2018-2021) and Vice Chairman (2015-2018) of the Independent Trustees of certain Fidelity® funds. Mr. Arthur E. Johnson is not related to Ms. Abigail P. Johnson.
Michael E. Kenneally (1954)
Year of Election or Appointment: 2009
Trustee
Chairman of the Independent Trustees
Mr. Kenneally also serves as Trustee of other Fidelity ® funds and was Vice Chairman (2018-2021) of the Independent Trustees of certain Fidelity ® funds. Prior to retirement in 2005, he was Chairman and Global Chief Executive Officer of Credit Suisse Asset Management, the worldwide fund management and institutional investment business of Credit Suisse Group. Previously, Mr. Kenneally was an Executive Vice President and the Chief Investment Officer for Bank of America. In this role, he was responsible for the investment management, strategy and products delivered to the bank's institutional, high-net-worth and retail clients. Earlier, Mr. Kenneally directed the organization's equity and quantitative research groups. He began his career as a research analyst and then spent more than a dozen years as a portfolio manager for endowments, pension plans and mutual funds. He earned the Chartered Financial Analyst (CFA) designation in 1991.
Mark A. Murray (1954)
Year of Election or Appointment: 2016
Trustee
Mr. Murray also serves as Trustee of other Fidelity ® funds. Previously, Mr. Murray served as Co-Chief Executive Officer (2013-2016), President (2006-2013) and Vice Chairman (2013-2020) of Meijer, Inc. Mr. Murray serves as a member of the Board (2009-present) and Public Policy and Responsibility Committee (2009-present) and Chair of the Nuclear Review Committee (2019-present) of DTE Energy Company (diversified energy company). Mr. Murray previously served as a member of the Board of Spectrum Health (not-for-profit health system, 2015-2019) and as a member of the Board and Audit Committee and Chairman of the Nominating and Corporate Governance Committee of Universal Forest Products, Inc. (manufacturer and distributor of wood and wood-alternative products, 2004-2016). Mr. Murray also serves as a member of the Board of many community and professional organizations. Mr. Murray previously served as a member of the Advisory Board of certain Fidelity ® funds (2016).
+ The information includes the Trustee's principal occupation during the last five years and other information relating to the experience, attributes, and skills relevant to the Trustee's qualifications to serve as a Trustee, which led to the conclusion that the Trustee should serve as a Trustee for the fund.
Advisory Board Members and Officers:
Correspondence intended for a Member of the Advisory Board (if any) may be sent to Fidelity Investments, P.O. Box 55235, Boston, Massachusetts 02205-5235. Correspondence intended for an officer may be sent to Fidelity Investments, 245 Summer Street, Boston, Massachusetts 02210. Officers appear below in alphabetical order.
Name, Year of Birth; Principal Occupation
Laura M. Bishop (1961)
Year of Election or Appointment: 2022
Member of the Advisory Board
Ms. Bishop also serves as a Member of the Advisory Board of other funds. Prior to her retirement, Ms. Bishop held a variety of positions at United Services Automobile Association (2001-2020), including Executive Vice President and Chief Financial Officer (2014-2020) and Senior Vice President and Deputy Chief Financial Officer (2012-2014). Ms. Bishop currently serves as a member of the Audit Committee and Compensation and Personnel Committee (2021-present) of the Board of Directors of Korn Ferry (global organizational consulting).
Robert W. Helm (1957)
Year of Election or Appointment: 2021
Member of the Advisory Board
Mr. Helm also serves as a Member of the Advisory Board of other Fidelity® funds. Mr. Helm was formerly Deputy Chairman (2003-2020), partner (1991-2020) and an associate (1984-1991) of Dechert LLP (formerly Dechert Price & Rhoads). Mr. Helm currently serves on boards and committees of several not-for-profit organizations.
Carol J. Zierhoffer (1960)
Year of Election or Appointment: 2023
Member of the Advisory Board
Ms. Zierhoffer also serves as a Member of the Advisory Board of other funds. Prior to her retirement, Ms. Zierhoffer held a variety of positions at Bechtel Corporation (engineering company, 2013-2019), including Principal Vice President and Chief Information Officer (2013-2016) and Senior Vice President and Chief Information Officer (2016-2019). Ms. Zierhoffer currently serves as a member of the Board of Directors, Audit Committee and Compensation Committee of Allscripts Healthcare Solutions, Inc. (healthcare technology, 2020-present) and as a member of the Board of Directors, Audit and Finance Committee and Nominating and Governance Committee of Atlas Air Worldwide Holdings, Inc. (aviation operating services, 2021-present). Previously, Ms. Zierhoffer served as a member of the Board of Directors and Audit Committee and as the founding Chair of the Information Technology Committee of MedAssets, Inc. (healthcare technology, 2013-2016).
Craig S. Brown (1977)
Year of Election or Appointment: 2019
Assistant Treasurer
Mr. Brown also serves as an officer of other funds. Mr. Brown serves as Assistant Treasurer of FIMM, LLC (2021-present) and is an employee of Fidelity Investments (2013-present). Previously, Mr. Brown served as Assistant Treasurer of certain Fidelity ® funds (2019-2022).
John J. Burke III (1964)
Year of Election or Appointment: 2018
Chief Financial Officer
Mr. Burke also serves as Chief Financial Officer of other funds. Mr. Burke serves as Head of Investment Operations for Fidelity Fund and Investment Operations (2018-present) and is an employee of Fidelity Investments (1998-present). Previously Mr. Burke served as head of Asset Management Investment Operations (2012-2018).
David J. Carter (1973)
Year of Election or Appointment: 2020
Assistant Secretary
Mr. Carter also serves as Assistant Secretary of other funds. Mr. Carter serves as Senior Vice President, Deputy General Counsel (2022-present) and is an employee of Fidelity Investments (2005-present).
Jonathan Davis (1968)
Year of Election or Appointment: 2010
Assistant Treasurer
Mr. Davis also serves as an officer of other funds. Mr. Davis serves as Assistant Treasurer of FIMM, LLC (2021-present), FMR Capital, Inc. (2017-present), FD Funds GP LLC (2021-present), FD Funds Holding LLC (2021-present), and FD Funds Management LLC (2021-present); and is an employee of Fidelity Investments. Previously, Mr. Davis served as Vice President and Associate General Counsel of FMR LLC (diversified financial services company, 2003-2010).
Laura M. Del Prato (1964)
Year of Election or Appointment: 2018
President and Treasurer
Ms. Del Prato also serves as an officer of other funds. Ms. Del Prato serves as Assistant Treasurer of FIMM, LLC (2021-present) and is an employee of Fidelity Investments (2017-present). Previously, Ms. Del Prato served as President and Treasurer of The North Carolina Capital Management Trust: Cash Portfolio and Term Portfolio (2018-2020). Prior to joining Fidelity Investments, Ms. Del Prato served as a Managing Director and Treasurer of the JPMorgan Mutual Funds (2014-2017). Prior to JPMorgan, Ms. Del Prato served as a partner at Cohen Fund Audit Services (accounting firm, 2012-2013) and KPMG LLP (accounting firm, 2004-2012).
Christopher M. Gouveia (1973)
Year of Election or Appointment: 2023
Chief Compliance Officer
Mr. Gouveia also serves as Chief Compliance Officer of other funds. Mr. Gouveia serves as Senior Vice President of Asset Management Compliance for Fidelity Investments and is an employee of Fidelity Investments. Previously, Mr. Gouveia served as Chief Compliance Officer of the North Carolina Capital Management Trust (2016-2019).
Colm A. Hogan (1973)
Year of Election or Appointment: 2016
Assistant Treasurer
Mr. Hogan also serves as an officer of other funds. Mr. Hogan serves as Assistant Treasurer of FIMM, LLC (2021-present) and FMR Capital, Inc. (2017-present) and is an employee of Fidelity Investments (2005-present). Previously, Mr. Hogan served as Deputy Treasurer of certain Fidelity ® funds (2016-2020) and Assistant Treasurer of certain Fidelity ® funds (2016-2018).
Cynthia Lo Bessette (1969)
Year of Election or Appointment: 2019
Secretary and Chief Legal Officer (CLO)
Ms. Lo Bessette also serves as an officer of other funds. Ms. Lo Bessette serves as CLO, Secretary, and Senior Vice President of Fidelity Management & Research Company LLC (investment adviser firm, 2019-present); CLO of Fidelity Management & Research (Hong Kong) Limited, FMR Investment Management (UK) Limited, and Fidelity Management & Research (Japan) Limited (investment adviser firms, 2019-present); Secretary of FD Funds GP LLC (2021-present), FD Funds Holding LLC (2021-present), FD Funds Management LLC (2021-present), and Fidelity Diversifying Solutions LLC (investment adviser firm, 2022-present); and Assistant Secretary of FIMM, LLC (2019-present). She is a Senior Vice President and Deputy General Counsel of FMR LLC (diversified financial services company, 2019-present), and is an employee of Fidelity Investments. Previously, Ms. Lo Bessette served as CLO, Secretary, and Senior Vice President of FMR Co., Inc. (investment adviser firm, 2019); Secretary of Fidelity SelectCo, LLC and Fidelity Investments Money Management, Inc. (investment adviser firms, 2019). Prior to joining Fidelity Investments, Ms. Lo Bessette was Executive Vice President, General Counsel (2016-2019) and Senior Vice President, Deputy General Counsel (2015-2016) of OppenheimerFunds (investment management company) and Deputy Chief Legal Officer (2013-2015) of Jennison Associates LLC (investment adviser firm).
Chris Maher (1972)
Year of Election or Appointment: 2013
Assistant Treasurer
Mr. Maher also serves as an officer of other funds. Mr. Maher serves as Assistant Treasurer of FIMM, LLC (2021-present) and FMR Capital, Inc. (2017-present), and is an employee of Fidelity Investments (2008-present). Previously, Mr. Maher served as Assistant Treasurer of certain funds (2013-2020); Vice President of Asset Management Compliance (2013), Vice President of the Program Management Group of FMR (investment adviser firm, 2010-2013), and Vice President of Valuation Oversight (2008-2010).
Jamie Pagliocco (1964)
Year of Election or Appointment: 2020
Vice President
Mr. Pagliocco also serves as Vice President of other funds. Mr. Pagliocco serves as President of Fixed Income (2020-present), and is an employee of Fidelity Investments (2001-present). Previously, Mr. Pagliocco served as Co-Chief Investment Officer - Bond (2017-2020), Global Head of Bond Trading (2016-2019), and as a portfolio manager.
Brett Segaloff (1972)
Year of Election or Appointment: 2021
Anti-Money Laundering (AML) Officer
Mr. Segaloff also serves as an AML Officer of other funds and other related entities. He is Director, Anti-Money Laundering (2007-present) of FMR LLC (diversified financial services company) and is an employee of Fidelity Investments (1996-present).
Stacie M. Smith (1974)
Year of Election or Appointment: 2013
Assistant Treasurer
Ms. Smith also serves as an officer of other funds. Ms. Smith serves as Assistant Treasurer of FIMM, LLC (2021-present) and FMR Capital, Inc. (2017-present), is an employee of Fidelity Investments (2009-present), and has served in other fund officer roles. Prior to joining Fidelity Investments, Ms. Smith served as Senior Audit Manager of Ernst & Young LLP (accounting firm, 1996-2009). Previously, Ms. Smith served as Assistant Treasurer (2013-2019) and Deputy Treasurer (2013-2016) of certain Fidelity ® funds.
Jim Wegmann (1979)
Year of Election or Appointment: 2021
Deputy Treasurer
Mr. Wegmann also serves as an officer of other funds. Mr. Wegmann serves as Assistant Treasurer of FIMM, LLC (2021-present) and is an employee of Fidelity Investments (2011-present). Previously, Mr. Wegmann served as Assistant Treasurer of certain Fidelity ® funds (2019-2021).
As a shareholder, you incur two types of costs: (1) transaction costs, which may include sales charges (loads) on purchase payments or redemption proceeds, as applicable and (2) ongoing costs, which generally include management fees, distribution and/or service (12b-1) fees and other Fund expenses. This Example is intended to help you understand your ongoing costs (in dollars) of investing in a fund and to compare these costs with the ongoing costs of investing in other mutual funds.
| The Example is based on an investment of $1,000 invested at the beginning of the period and held for the entire period (August 1, 2022 to January 31, 2023). |
Actual Expenses
The first line of the accompanying table provides information about actual account values and actual expenses. You may use the information in this line, together with the amount you invested, to estimate the expenses that you paid over the period. Simply divide your account value by $1,000.00 (for example, an $8,600 account value divided by $1,000.00 = 8.6), then multiply the result by the number in the first line for a class/Fund under the heading entitled "Expenses Paid During Period" to estimate the expenses you paid on your account during this period. If any fund is a shareholder of any underlying mutual funds or exchange-traded funds (ETFs) (the Underlying Funds), such fund indirectly bears its proportional share of the expenses of the Underlying Funds in addition to the direct expenses incurred presented in the table. These fees and expenses are not included in the annualized expense ratio used to calculate the expense estimate in the table below.
Hypothetical Example for Comparison Purposes
The second line of the accompanying table provides information about hypothetical account values and hypothetical expenses based on the actual expense ratio and an assumed rate of return of 5% per year before expenses, which is not the actual return. The hypothetical account values and expenses may not be used to estimate the actual ending account balance or expenses you paid for the period. You may use this information to compare the ongoing costs of investing in the Fund and other funds. To do so, compare this 5% hypothetical example with the 5% hypothetical examples that appear in the shareholder reports of the other funds. If any fund is a shareholder of any Underlying Funds, such fund indirectly bears its proportional share of the expenses of the Underlying Funds in addition to the direct expenses as presented in the table. These fees and expenses are not included in the annualized expense ratio used to calculate the expense estimate in the table below.
Please note that the expenses shown in the table are meant to highlight your ongoing costs only and do not reflect any transaction costs. Therefore, the second line of the table is useful in comparing ongoing costs only, and will not help you determine the relative total costs of owning different funds. In addition, if these transactional costs were included, your costs would have been higher.
| | | | | Annualized Expense Ratio- A | | Beginning Account Value August 1, 2022 | | Ending Account Value January 31, 2023 | | Expenses Paid During Period- C August 1, 2022 to January 31, 2023 |
| Fidelity® Sustainable Intermediate Municipal Income Fund | | | | | | | | | | |
| Class A | | | | .62% | | | | | | |
| Actual | | | | | | $ 1,000 | | $ 1,011.40 | | $ 3.14 |
Hypothetical- B | | | | | | $ 1,000 | | $ 1,022.08 | | $ 3.16 |
| Class M | | | | .62% | | | | | | |
| Actual | | | | | | $ 1,000 | | $ 1,011.40 | | $ 3.14 |
Hypothetical- B | | | | | | $ 1,000 | | $ 1,022.08 | | $ 3.16 |
| Class C | | | | 1.37% | | | | | | |
| Actual | | | | | | $ 1,000 | | $ 1,007.30 | | $ 6.93 |
Hypothetical- B | | | | | | $ 1,000 | | $ 1,018.30 | | $ 6.97 |
| Fidelity® Sustainable Intermediate Municipal Income Fund | | | | .37% | | | | | | |
| Actual | | | | | | $ 1,000 | | $ 1,012.70 | | $ 1.88 |
Hypothetical- B | | | | | | $ 1,000 | | $ 1,023.34 | | $ 1.89 |
| Class I | | | | .37% | | | | | | |
| Actual | | | | | | $ 1,000 | | $ 1,012.60 | | $ 1.88 |
Hypothetical- B | | | | | | $ 1,000 | | $ 1,023.34 | | $ 1.89 |
| Class Z | | | | .31% | | | | | | |
| Actual | | | | | | $ 1,000 | | $ 1,012.90 | | $ 1.57 |
Hypothetical- B | | | | | | $ 1,000 | | $ 1,023.64 | | $ 1.58 |
| |
A Annualized expense ratio reflects expenses net of applicable fee waivers.
B 5% return per year before expenses
C Expenses are equal to the annualized expense ratio, multiplied by the average account value over the period, multiplied by 184/ 365 (to reflect the one-half year period). The fees and expenses of any Underlying Funds are not included in each annualized expense ratio.
The dividend and capital gains distributions for the fund(s) are available on Fidelity.com or Institutional.Fidelity.com .
During fiscal year ended 2023, 100% of the fund's income dividends was free from federal income tax, and 8.61% of the fund's income dividends was subject to the federal alternative minimum tax.
The fund will notify shareholders in January 2024 of amounts for use in preparing 2023 income tax returns.
The Securities and Exchange Commission adopted Rule 22e-4 under the Investment Company Act of 1940 (the Liquidity Rule) to promote effective liquidity risk management throughout the open-end investment company industry, thereby reducing the risk that funds will be unable to meet their redemption obligations and mitigating dilution of the interests of fund shareholders.
The Fund has adopted and implemented a liquidity risk management program (the Program) reasonably designed to assess and manage the Fund's liquidity risk and to comply with the requirements of the Liquidity Rule. The Fund's Board of Trustees (the Board) has designated the Fund's investment adviser as administrator of the Program. The Fidelity advisers have established a Liquidity Risk Management Committee (the LRM Committee) to manage the Program for each of the Fidelity Funds. The LRM Committee monitors the adequacy and effectiveness of implementation of the Program and on a periodic basis assesses each Fund's liquidity risk based on a variety of factors including (1) the Fund's investment strategy, (2) portfolio liquidity and cash flow projections during normal and reasonably foreseeable stressed conditions, (3) shareholder redemptions, (4) borrowings and other funding sources and (5) certain factors specific to ETFs including the effect of the Fund's prices and spreads, market participants, and basket compositions on the overall liquidity of the Fund's portfolio, as applicable.
In accordance with the Program, each of the Fund's portfolio investments is classified into one of four defined liquidity categories based on a determination of a reasonable expectation for how long it would take to convert the investment to cash (or sell or dispose of the investment) without significantly changing its market value.
- Highly liquid investments - cash or convertible to cash within three business days or less
- Moderately liquid investments - convertible to cash in three to seven calendar days
- Less liquid investments - can be sold or disposed of, but not settled, within seven calendar days
- Illiquid investments - cannot be sold or disposed of within seven calendar days
Liquidity classification determinations take into account a variety of factors including various market, trading and investment-specific considerations, as well as market depth, and generally utilize analysis from a third-party liquidity metrics service.
The Liquidity Rule places a 15% limit on a fund's illiquid investments and requires funds that do not primarily hold assets that are highly liquid investments to determine and maintain a minimum percentage of the fund's net assets to be invested in highly liquid investments (highly liquid investment minimum or HLIM). The Program includes provisions reasonably designed to comply with the 15% limit on illiquid investments and for determining, periodically reviewing and complying with the HLIM requirement as applicable.
At a recent meeting of the Fund's Board of Trustees, the LRM Committee provided a written report to the Board pertaining to the operation, adequacy, and effectiveness of the Program for the period December 1, 2021 through November 30, 2022. The report concluded that the Program is operating effectively and is reasonably designed to assess and manage the Fund's liquidity risk.
1.9909543.100
SNT-ANN-0423
Fidelity® SAI Sustainable Municipal Income Fund
Annual Report
January 31, 2023
Offered exclusively to certain clients of the Adviser, or its affiliates, including Strategic Advisers LLC (Strategic Advisers) - not available for sale to the general public. Fidelity ® SAI is a product name of Fidelity ® funds dedicated to certain programs affiliated with Strategic Advisers.
Contents
To view a fund's proxy voting guidelines and proxy voting record for the 12-month period ended June 30, visit http://www.fidelity.com/proxyvotingresults or visit the Securities and Exchange Commission's (SEC) web site at http://www.sec.gov.
You may also call 1-800-544-3455 to request a free copy of the proxy voting guidelines.
Standard & Poor's, S&P and S&P 500 are registered service marks of The McGraw-Hill Companies, Inc. and have been licensed for use by Fidelity Distributors Corporation.
Other third-party marks appearing herein are the property of their respective owners.
All other marks appearing herein are registered or unregistered trademarks or service marks of FMR LLC or an affiliated company. © 2023 FMR LLC. All rights reserved.
This report and the financial statements contained herein are submitted for the general information of the shareholders of the Fund. This report is not authorized for distribution to prospective investors in the Fund unless preceded or accompanied by an effective prospectus.
A fund files its complete schedule of portfolio holdings with the SEC for the first and third quarters of each fiscal year on Form N-PORT. Forms N-PORT are available on the SEC's web site at http://www.sec.gov. A fund's Forms N-PORT may be reviewed and copied at the SEC's Public Reference Room in Washington, DC. Information regarding the operation of the SEC's Public Reference Room may be obtained by calling 1-800-SEC-0330.
For a complete list of a fund's portfolio holdings, view the most recent holdings listing, semiannual report, or annual report on Fidelity's web site at http://www.fidelity.com, http://www.institutional.fidelity.com, or http://www.401k.com, as applicable.
NOT FDIC INSURED •MAY LOSE VALUE •NO BANK GUARANTEE
Neither the Fund nor Fidelity Distributors Corporation is a bank.
Average annual total return reflects the change in the value of an investment, assuming reinvestment of distributions from dividend income and capital gains (the profits earned upon the sale of securities that have grown in value, if any) and assuming a constant rate of performance each year. The hypothetical investment and the average annual total returns do not reflect the deduction of taxes that a shareholder would pay on fund distributions or the redemption of fund shares. During periods of reimbursement by Fidelity, a fund's total return will be greater than it would be had the reimbursement not occurred. How a fund did yesterday is no guarantee of how it will do tomorrow.
Average annual total returns for Fidelity SAI Sustainable Municipal Income Fund will be reported once the fund is a year old.
| $10,000 Over Life of Fund |
| |
Let's say hypothetically that $10,000 was invested in Fidelity SAI Sustainable Municipal Income Fund, on April 13, 2022, when the fund started. The chart shows how the value of your investment would have changed, and also shows how the Bloomberg Municipal Bond Index performed over the same period. |
|
|
Market Recap:
Tax-exempt municipal bonds declined for the 12 months ending January 31, 2023, with a late-period rally partially offsetting a steep fall earlier on. The Bloomberg Municipal Bond Index returned -3.25% for the period. By early 2022, the Federal Reserve had begun its pivot from monetary easing to monetary tightening, tapering the large-scale asset purchases it restarted in 2020 amid the COVID-19 pandemic. In March, the Fed, faced with persistent inflationary pressure, began implementing an aggressive series of rate hikes, eventually raising its benchmark interest rate seven times, by a total of 4.25 percentage points, through mid-December. This helped push municipal bond yields to their highest level in more than a decade. Muni bond prices, which move inversely to yields, fell sharply. Credit spreads significantly widened, as investors demanded more yield for lower-quality munis as recession risk increased. In November, December and January, the tax-exempt market reversed course and rallied strongly (+7.99%) - including a gain of 2.87% in January - amid market expectations for the Fed to pause monetary policy tightening in 2023. Muni yields declined and prices rebounded. Favorable supply and demand was helpful; issuance remained subdued, while net inflows into munis turned positive. Muni tax-backed credit fundamentals were solid throughout the period and, for the most part, the risk of credit-rating downgrades appeared low. Shorter-duration (lower sensitivity to changes in interest rates) and higher-credit-quality munis led the way for the year.
Comments from Co-Portfolio Managers Cormac Cullen, Michael Maka and Elizah McLaughlin:
From its inception on April 13, 2022, through January 31, 2023, the fund returned 3.56%, net of fees, notably outpacing the 1.67% result of the supplemental index, the Bloomberg 3+ Year Municipal Bond Index, as well as the 1.68% result of the benchmark, the broad-based Bloomberg Municipal Bond Index. During the period, we continued to focus on longer-term objectives and sought to generate attractive tax-exempt income and a competitive risk-adjusted return. Versus the supplemental index, the fund's duration (interest rate) positioning was by far the biggest contributor to relative performance. The fund had less sensitivity to interest rates, as measured by its shorter duration, during periods when interest rates rose and therefore was hurt less. To a much lesser extent, pricing-related factors contributed as well. Fund holdings are priced by a third-party pricing service and validated daily by Fidelity Management & Research's fair-value processes. Securities within the index, however, are priced by the index provider. In contrast, the fund's overweight to lower-rated bonds in the health care and education sectors detracted from relative performance, as these securities lagged the index as credit spreads widened. Application of FMR's environmental, social and governance (ESG) ratings process and/or its sustainable investing exclusion criteria may affect the fund's exposure to certain issuers, sectors, regions and countries, and may affect the fund's performance.
The views expressed above reflect those of the portfolio manager(s) only through the end of the period as stated on the cover of this report and do not necessarily represent the views of Fidelity or any other person in the Fidelity organization. Any such views are subject to change at any time based upon market or other conditions and Fidelity disclaims any responsibility to update such views. These views may not be relied on as investment advice and, because investment decisions for a Fidelity fund are based on numerous factors, may not be relied on as an indication of trading intent on behalf of any Fidelity fund.
| Top Five States (% of Fund's net assets) |
| | |
| Massachusetts | 13.7 |
| New York | 12.9 |
| Illinois | 12.6 |
| California | 6.3 |
| Florida | 6.0 |
| | |
| Revenue Sources (% of Fund's net assets) |
| Health Care | 25.8% | |
| General Obligations | 24.2% | |
| Education | 13.8% | |
| Water & Sewer | 12.4% | |
| Special Tax | 9.4% | |
| Others* (Individually Less Than 5%) | 14.4% | |
| | 100.0% | |
| |
| *Includes net other assets | | |
Quality Diversification (% of Fund's net assets) |
|
| |
| We have used ratings from Moody's Investors Service, Inc. Where Moody's® ratings are not available, we have used S&P® ratings. All ratings are as of the date indicated and do not reflect subsequent changes. |
Showing Percentage of Net Assets
| Municipal Bonds - 90.4% |
| | | Principal Amount (a) | Value ($) |
| Alabama - 1.9% | | | |
| Black Belt Energy Gas District Bonds Series 2022 F, 5.5%, tender 12/1/28 (b) | | 100,000 | 107,404 |
| Southeast Energy Auth. Rev. Bonds Bonds Series 2022 A1, 5.5%, tender 12/1/29 (b) | | 100,000 | 108,863 |
TOTAL ALABAMA | | | 216,267 |
| Arizona - 3.5% | | | |
| Phoenix Civic Impt. Corp. Wtr. Sys. Rev. Series 2021 A, 5% 7/1/45 | | 195,000 | 219,653 |
| Salt Verde Finl. Corp. Sr. Gas Rev. Series 2007 1, 5% 12/1/32 | | 170,000 | 185,442 |
TOTAL ARIZONA | | | 405,095 |
| California - 6.3% | | | |
| California Edl. Facilities Auth. Rev. Series T1, 5% 3/15/39 | | 30,000 | 36,937 |
| California Infrastructure and Econ. Dev. Bank Rev. Series 2017, 5% 5/15/47 | | 25,000 | 26,812 |
| California Muni. Fin. Auth. Rev.: | | | |
| (Pomona College Proj.) Series 2017, 5% 1/1/33 (Pre-Refunded to 1/1/28 @ 100) | | 25,000 | 28,426 |
| Series 2018: | | | |
5% 10/1/25 | | 15,000 | 15,569 |
5% 10/1/35 | | 5,000 | 5,237 |
| California Statewide Cmntys. Dev. Auth. Rev. Series 2016, 5% 10/1/33 | | 20,000 | 21,132 |
| Los Angeles Dept. of Wtr. & Pwr. Wtrwks. Rev.: | | | |
| Series 2017 A, 5% 7/1/32 | | 10,000 | 11,111 |
| Series 2020 A, 5% 7/1/40 | | 400,000 | 453,758 |
| Series 2020 B, 4% 7/1/29 | | 55,000 | 61,533 |
| San Diego Unified School District: | | | |
| (Convention Ctr. Proj.) Series 2012, 0% 7/1/45 | | 10,000 | 3,996 |
| Series 2010 C, 0% 7/1/44 | | 100,000 | 41,979 |
| Univ. of California Revs. Series 2020 BE, 5% 5/15/42 | | 10,000 | 11,255 |
TOTAL CALIFORNIA | | | 717,745 |
| Colorado - 1.5% | | | |
| Colorado Ctfs. of Prtn. Series 2020 A, 4% 12/15/38 | | 10,000 | 10,242 |
| Colorado Health Facilities Auth. Rev. Bonds: | | | |
| Series 2019 A1, 5% 8/1/36 | | 15,000 | 16,038 |
| Series 2019 A2: | | | |
5% 8/1/33 | | 125,000 | 137,296 |
5% 8/1/39 | | 10,000 | 10,533 |
TOTAL COLORADO | | | 174,109 |
| Connecticut - 3.0% | | | |
| Connecticut Gen. Oblig.: | | | |
| Series 2019 A, 5% 4/15/33 | | 30,000 | 34,121 |
| Series 2021 B, 4% 6/1/34 | | 10,000 | 10,951 |
| Series 2021 D, 5% 7/15/28 | | 75,000 | 85,462 |
| Connecticut Hsg. Fin. Auth. Series 2021 D1, 5% 11/15/28 | | 25,000 | 28,077 |
| Connecticut Spl. Tax Oblig. Trans. Infrastructure Rev.: | | | |
| Series 2021 A, 4% 5/1/36 | | 130,000 | 137,327 |
| Series A, 5% 5/1/29 | | 15,000 | 17,444 |
| South Central Reg'l. Wtr. Auth. Wtr. Sys. Rev. Series 32 B, 5% 8/1/32 | | 25,000 | 27,119 |
TOTAL CONNECTICUT | | | 340,501 |
| District Of Columbia - 0.1% | | | |
| District of Columbia Univ. Rev. Series 2017, 5% 4/1/33 | | 10,000 | 10,799 |
| Florida - 6.0% | | | |
| Broward County School Board Ctfs. of Prtn.: | | | |
| Series 2015 A, 5% 7/1/26 | | 30,000 | 31,895 |
| Series 2020 A, 5% 7/1/33 | | 30,000 | 35,134 |
| Escambia County Health Facilities Auth. Health Facilities Rev. Series 2020 A, 5% 8/15/34 | | 195,000 | 210,229 |
| JEA Wtr. & Swr. Sys. Rev. Series 2017 A, 5% 10/1/29 | | 25,000 | 27,941 |
| Lakeland Hosp. Sys. Rev. Series 2016, 5% 11/15/29 | | 15,000 | 16,057 |
| Miami-Dade County Wtr. & Swr. Rev. Series 2017 B, 5% 10/1/27 | | 55,000 | 61,695 |
| Palm Beach County Health Facilities Auth. Hosp. Rev. (Jupiter Med. Ctr. Proj.) Series 2022, 5% 11/1/35 | | 150,000 | 161,620 |
| Palm Beach County School Board Ctfs. of Prtn. Series 2021 A, 5% 8/1/38 | | 130,000 | 146,914 |
TOTAL FLORIDA | | | 691,485 |
| Georgia - 3.2% | | | |
| Fulton County Dev. Auth. Rev.: | | | |
| Series 2019 A, 3% 7/1/44 | | 175,000 | 142,082 |
| Series 2019, 5% 6/15/44 | | 15,000 | 16,499 |
| Main Street Natural Gas, Inc. Bonds Series 2021 A, 4%, tender 9/1/27 (b) | | 100,000 | 101,922 |
| Private Colleges & Univs. Auth. Rev. Series 2019 A, 5% 9/1/39 | | 100,000 | 111,809 |
TOTAL GEORGIA | | | 372,312 |
| Illinois - 7.4% | | | |
| Illinois Fin. Auth. Series 2022 A, 5% 10/1/35 | | 150,000 | 152,802 |
| Illinois Fin. Auth. Academic Facilities (Provident Group UIUC Properties LLC Univ. of Illinois at Urbana-Champaign Proj.) Series 2019 A: | | | |
| 5% 10/1/32 | | 15,000 | 16,797 |
| 5% 10/1/38 | | 300,000 | 320,887 |
| Illinois Fin. Auth. Health Svcs. Facility Lease Rev. (Provident Group - UIC Surgery Ctr. LLC - Univ. of Illinois Health Svcs. Facility Proj.) Series 2020, 4% 10/1/55 | | 100,000 | 83,840 |
| Illinois Fin. Auth. Rev.: | | | |
| (Presence Health Proj.) Series 2016 C, 5% 2/15/36 | | 30,000 | 31,671 |
| Series 2015 A, 5% 10/1/35 | | 5,000 | 5,294 |
| Series 2016 A, 5% 7/1/31 (Pre-Refunded to 7/1/26 @ 100) | | 50,000 | 54,502 |
| Illinois Gen. Oblig.: | | | |
| Series 2017 C, 5% 11/1/29 | | 125,000 | 133,499 |
| Series 2021 A, 5% 3/1/46 | | 50,000 | 51,403 |
TOTAL ILLINOIS | | | 850,695 |
| Indiana - 0.4% | | | |
| Indiana Hsg. & Cmnty. Dev. Auth.: | | | |
| Series 2021 B, Series 2021 B, 5% 1/1/28 | | 15,000 | 16,662 |
| Series A, 5% 7/1/28 | | 25,000 | 28,301 |
TOTAL INDIANA | | | 44,963 |
| Kentucky - 0.4% | | | |
| Kentucky Bond Dev. Corp. Edl. Facilities Series 2021, 4% 6/1/35 | | 20,000 | 20,400 |
| Kentucky State Property & Buildings Commission Rev. Series A, 5% 11/1/33 | | 20,000 | 22,444 |
TOTAL KENTUCKY | | | 42,844 |
| Maine - 2.8% | | | |
| Maine Health & Higher Edl. Facilities Auth. Rev.: | | | |
| Series 2017 B: | | | |
5% 7/1/28 | | 30,000 | 32,741 |
5% 7/1/29 | | 10,000 | 10,886 |
| Series 2018 A, 5% 7/1/30 | | 250,000 | 274,006 |
TOTAL MAINE | | | 317,633 |
| Maryland - 0.7% | | | |
| Baltimore Proj. Rev. (Wastewtr. Projs.) Series 2017 B, 5% 7/1/32 | | 25,000 | 27,402 |
| Maryland Dept. of Trans.: | | | |
| Series 2016, 4% 9/1/27 | | 10,000 | 10,786 |
| Series 2020, 5% 10/1/33 | | 10,000 | 11,914 |
| Series 2021 A, 2% 10/1/34 | | 10,000 | 8,675 |
| Montgomery County Gen. Oblig. Ctfs. of Prtn. Series 2020 A, 5% 10/1/27 | | 15,000 | 16,932 |
TOTAL MARYLAND | | | 75,709 |
| Massachusetts - 13.7% | | | |
| Massachusetts Bay Trans. Auth. Sales Tax Rev. Series 2021 A1, 5% 7/1/35 | | 45,000 | 52,956 |
| Massachusetts Commonwealth Trans. Fund Rev. (Rail Enhancement & Accelerated Bridge Programs) Series 2019 A, 5% 6/1/49 | | 215,000 | 233,628 |
| Massachusetts Dev. Fin. Agcy. Rev.: | | | |
| (Partners Healthcare Sys., Inc. Proj.) Series 2017 S, 5% 7/1/32 | | 15,000 | 16,576 |
| Bonds Series A1, 5%, tender 1/31/30 (b) | | 20,000 | 22,888 |
| Series 2015 O1, 4% 7/1/45 | | 50,000 | 49,351 |
| Series 2018 L, 5% 10/1/33 | | 35,000 | 37,703 |
| Series 2020 A: | | | |
5% 10/15/29 | | 30,000 | 35,487 |
5% 10/15/30 | | 25,000 | 30,185 |
| Series 2021 G, 4% 7/1/46 | | 75,000 | 68,104 |
| Massachusetts Gen. Oblig.: | | | |
| Series 2017 A, 5% 4/1/36 | | 15,000 | 16,332 |
| Series 2017 D, 5% 7/1/27 | | 25,000 | 28,052 |
| Series 2020 D, 5% 7/1/48 | | 10,000 | 10,980 |
| Series D, 5% 7/1/45 | | 340,000 | 376,109 |
| Series E, 5% 11/1/45 | | 375,000 | 416,387 |
| Massachusetts School Bldg. Auth. Dedicated Sales Tax Rev. Series A: | | | |
| 5% 8/15/34 | | 5,000 | 5,847 |
| 5% 8/15/45 | | 100,000 | 110,916 |
| Univ. of Massachusetts Bldg. Auth. Rev. Series 2021 1, 5% 11/1/32 | | 50,000 | 59,320 |
TOTAL MASSACHUSETTS | | | 1,570,821 |
| Michigan - 5.6% | | | |
| Grand Rapids San. Swr. Sys. Rev.: | | | |
| Series 2018, 5% 1/1/35 | | 15,000 | 16,535 |
| Series 2018, 5% 1/1/29 | | 30,000 | 33,848 |
| Great Lakes Wtr. Auth. Wtr. Supply Sys. Rev. Series 2020 B, 5% 7/1/45 | | 430,000 | 465,686 |
| Michigan Fin. Auth. Rev.: | | | |
| Series 2016: | | | |
5% 11/15/26 | | 20,000 | 21,676 |
5% 11/15/30 | | 30,000 | 32,284 |
5% 11/15/34 | | 15,000 | 15,948 |
| Series 2022, 5% 12/1/32 | | 25,000 | 27,331 |
| Michigan Hosp. Fin. Auth. Rev. Series 2010 F4, 5% 11/15/47 | | 10,000 | 10,449 |
| Univ. of Michigan Rev. Series 2020 A, 5% 4/1/39 | | 15,000 | 17,026 |
TOTAL MICHIGAN | | | 640,783 |
| Minnesota - 0.2% | | | |
| Minnesota Gen. Oblig. Series 2019 A, 5% 8/1/30 | | 10,000 | 11,712 |
| Minnesota Hsg. Fin. Agcy. Series B, 4% 8/1/36 | | 15,000 | 15,664 |
TOTAL MINNESOTA | | | 27,376 |
| Nebraska - 1.7% | | | |
| Central Plains Energy Proj. Gas Supply Bonds Series 2019, 4%, tender 8/1/25 (b) | | 50,000 | 50,637 |
| Douglas County Hosp. Auth. #2 Health Facilities Rev. Series 2020 A, 5% 11/15/30 | | 125,000 | 144,370 |
TOTAL NEBRASKA | | | 195,007 |
| New Jersey - 4.0% | | | |
| New Jersey Trans. Trust Fund Auth.: | | | |
| Series 2018 A, 5% 12/15/32 | | 100,000 | 111,137 |
| Series 2021 A, 5% 6/15/33 | | 95,000 | 108,757 |
| Series 2022 A, 4% 6/15/39 | | 50,000 | 50,122 |
| Series 2022 BB, 5% 6/15/31 | | 130,000 | 151,076 |
| Series A, 0% 12/15/31 | | 50,000 | 36,810 |
TOTAL NEW JERSEY | | | 457,902 |
| New York - 12.9% | | | |
| Dorm. Auth. New York Univ. Rev. Series 2018 A, 5% 7/1/36 | | 10,000 | 11,092 |
| Dutchess County Local Dev. Corp. Rev. (Vassar College Proj.) Series 2020, 5% 7/1/45 | | 60,000 | 65,020 |
| Long Island Pwr. Auth. Elec. Sys. Rev. Series 2020 A: | | | |
| 5% 9/1/35 | | 10,000 | 11,492 |
| 5% 9/1/38 | | 170,000 | 190,736 |
| New York Dorm. Auth. Rev.: | | | |
| Series 2015 A, 3.75% 7/1/46 | | 10,000 | 8,970 |
| Series 2022 A, 5% 7/1/34 | | 200,000 | 222,458 |
| New York Metropolitan Trans. Auth. Rev.: | | | |
| Series 2017 C1: | | | |
5% 11/15/27 | | 20,000 | 21,533 |
5% 11/15/29 | | 50,000 | 53,079 |
5% 11/15/31 | | 135,000 | 142,982 |
| Series 2019 C, 5% 11/15/39 | | 70,000 | 73,274 |
| New York State Dorm. Auth.: | | | |
| Series 2017 A, 5% 2/15/31 | | 15,000 | 16,574 |
| Series 2021 E, 3% 3/15/50 | | 100,000 | 78,859 |
| New York State Urban Dev. Corp. Series 2020 E, 4% 3/15/35 | | 30,000 | 31,261 |
| New York State Urban Eev Corp. Series 2019 A, 5% 3/15/37 | | 85,000 | 95,510 |
| New York Thruway Auth. Personal Income Tax Rev. Series 2021 A1, 5% 3/15/34 | | 210,000 | 248,504 |
| Saratoga County Cap. Resources Rev. (Skidmore College Proj.) Series 2020 A, 5% 7/1/45 | | 90,000 | 98,140 |
| Suffolk County Gen. Oblig. Series 2017 D, 4% 2/1/28 (Build America Mutual Assurance Insured) | | 100,000 | 108,034 |
TOTAL NEW YORK | | | 1,477,518 |
| North Carolina - 1.3% | | | |
| Charlotte-Mecklenburg Hosp. Auth. Health Care Sys. Rev. Bonds Series 2021 C, 5%, tender 12/1/28 (b) | | 25,000 | 28,344 |
| Univ. of North Carolina at Chapel Hill Rev. Series 2021 B, 5% 12/1/38 | | 100,000 | 117,476 |
TOTAL NORTH CAROLINA | | | 145,820 |
| Ohio - 0.7% | | | |
| Allen County Hosp. Facilities Rev. (Mercy Health) Series 2017 A, 5% 8/1/29 | | 10,000 | 11,168 |
| Ohio Gen. Oblig. Series 2019 A, 5% 5/1/30 | | 20,000 | 22,248 |
| Ohio Higher Edl. Facility Commission Rev. (Univ. of Dayton Proj.) Series 2018 B, 5% 12/1/29 | | 25,000 | 27,606 |
| Ohio Hsg. Fin. Agcy. Residential Mtg. Rev. (Mtg.-Backed Securities Prog.) Series 2022 A, 5% 3/1/30 | | 15,000 | 17,199 |
TOTAL OHIO | | | 78,221 |
| Oklahoma - 0.1% | | | |
| Oklahoma State Univ. Agricultural And Mechanical College Series 2020 A, 5% 9/1/32 | | 15,000 | 17,666 |
| Oregon - 2.8% | | | |
| Medford Hosp. Facilities Auth. Rev. (Asante Projs.) Series 2020 A, 5% 8/15/38 | | 15,000 | 16,369 |
| Oregon Facilities Auth. Rev. Series 2022 B, 5% 6/1/30 | | 30,000 | 34,279 |
| Salem Hosp. Facility Auth. Rev. (Salem Health Projs.) Series 2019 A, 3% 5/15/49 | | 350,000 | 268,199 |
TOTAL OREGON | | | 318,847 |
| Pennsylvania - 0.8% | | | |
| Dubois Hosp. Auth. Hosp. Rev. (Penn Highlands Healthcare Proj.) Series 2018: | | | |
| 5% 7/15/27 | | 45,000 | 48,551 |
| 5% 7/15/28 | | 30,000 | 32,619 |
| Montgomery County Higher Ed. & Health Auth. Rev. Series 2019, 5% 9/1/31 | | 10,000 | 11,138 |
TOTAL PENNSYLVANIA | | | 92,308 |
| Tennessee - 0.2% | | | |
| Knox County Health Edl. & Hsg. Facilities Board Rev. Series 2017, 5% 4/1/27 | | 25,000 | 26,738 |
| Texas - 1.3% | | | |
| Alvin Independent School District Series 2016 A, 5% 2/15/28 | | 20,000 | 21,555 |
| Cypress-Fairbanks Independent School District Series 2016, 5% 2/15/25 | | 15,000 | 15,804 |
| San Antonio Wtr. Sys. Rev.: | | | |
| Series 2018 A, 5% 5/15/33 | | 15,000 | 16,891 |
| Series 2020 A, 5% 5/15/27 | | 10,000 | 11,121 |
| Univ. of Houston Univ. Revs. Series 2021 A, 2% 2/15/33 | | 35,000 | 31,360 |
| Wichita Falls Independent School District Series 2021, 4% 2/1/28 | | 50,000 | 53,787 |
TOTAL TEXAS | | | 150,518 |
| Virginia - 2.3% | | | |
| Virginia College Bldg. Auth. Edl. Facilities Rev. (21st Century College and Equip. Progs.) Series 2017 E, 5% 2/1/31 | | 10,000 | 11,342 |
| Virginia Commonwealth Trans. Board Rev.: | | | |
| (Virginia Gen. Oblig. Proj.) Series 2017 A, 5% 5/15/29 | | 60,000 | 67,575 |
| (Virginia Gen. Oblig.) Series 2017 A, 5% 5/15/27 | | 20,000 | 22,355 |
| Virginia Commonwealth Univ. Health Sys. Auth. Series 2017 A, 5% 7/1/28 | | 5,000 | 5,538 |
| Virginia Pub. Bldg. Auth. Pub. Facilities Rev. Series 2019 A, 4% 8/1/36 | | 150,000 | 158,901 |
TOTAL VIRGINIA | | | 265,711 |
| Washington - 5.5% | | | |
| Energy Northwest Elec. Rev. Series 2020 A, 5% 7/1/34 | | 100,000 | 117,257 |
| Washington Gen. Oblig.: | | | |
| Series 2018 A, 5% 8/1/27 | | 50,000 | 56,104 |
| Series 2018 C, 5% 8/1/30 | | 30,000 | 33,580 |
| Series 2020 A, 5% 8/1/27 | | 60,000 | 67,324 |
| Series 2020 C, 5% 2/1/37 | | 10,000 | 11,333 |
| Series 2021 A, 5% 8/1/43 | | 85,000 | 94,567 |
| Series 2022 A, 5% 8/1/42 | | 40,000 | 45,116 |
| Washington Health Care Facilities Auth. Rev.: | | | |
| (Overlake Hosp. Med. Ctr., WA. Proj.) Series 2017 B, 5% 7/1/27 | | 25,000 | 27,171 |
| (Providence Health Systems Proj.) Series 2018 B, 5% 10/1/33 | | 40,000 | 44,039 |
| Series 2017 A, 4% 7/1/37 | | 130,000 | 131,620 |
TOTAL WASHINGTON | | | 628,111 |
| Wisconsin - 0.1% | | | |
| Wisconsin St Gen. Fund Annual Appropriation Series 2019 A, 5% 5/1/26 (Escrowed to Maturity) | | 15,000 | 16,310 |
| TOTAL MUNICIPAL BONDS (Cost $10,216,587) | | | 10,369,814 |
| | | | |
| Municipal Notes - 7.0% |
| | | Principal Amount (a) | Value ($) |
| Illinois - 5.2% | | | |
| Illinois Fin. Auth. Rev.: | | | |
| (The Univ. of Chicago Med. Ctr. Proj.): | | | |
Series 2009 D2, 1.3% 2/1/23, LOC PNC Bank NA, VRDN (b) | | 400,000 | 400,000 |
Series 2010 A, 1.31% 2/1/23, LOC Bank of America NA, VRDN (b) | | 100,000 | 100,000 |
| Series 2011 A, 1.31% 2/1/23, LOC Bank of America NA, VRDN (b) | | 100,000 | 100,000 |
TOTAL ILLINOIS | | | 600,000 |
| Texas - 1.8% | | | |
| Harris County Health Facilities Dev. Corp. Rev. (Methodist Hosp. Proj.) Series A1, 1.25% 2/1/23, VRDN (b) | | 200,000 | 200,000 |
| TOTAL MUNICIPAL NOTES (Cost $800,000) | | | 800,000 |
| | | | |
| Money Market Funds - 2.0% |
| | | Shares | Value ($) |
Fidelity Municipal Cash Central Fund 1.40% (c)(d) (Cost $232,000) | | 231,954 | 232,000 |
| | | | |
| TOTAL INVESTMENT IN SECURITIES - 99.4% (Cost $11,248,587) | 11,401,814 |
NET OTHER ASSETS (LIABILITIES) - 0.6% | 64,265 |
| NET ASSETS - 100.0% | 11,466,079 |
| | |
Security Type Abbreviations
| VRDN | - | VARIABLE RATE DEMAND NOTE (A debt instrument that is payable upon demand, either daily, weekly or monthly) |
Legend
| (a) | Amount is stated in United States dollars unless otherwise noted. |
| (b) | Coupon rates for floating and adjustable rate securities reflect the rates in effect at period end. |
| (c) | Information in this report regarding holdings by state and security types does not reflect the holdings of the Fidelity Municipal Cash Central Fund. |
| (d) | Affiliated fund that is generally available only to investment companies and other accounts managed by Fidelity Investments. The rate quoted is the annualized seven-day yield of the fund at period end. A complete unaudited listing of the fund's holdings as of its most recent quarter end is available upon request. In addition, each Fidelity Central Fund's financial statements, which are not covered by the Fund's Report of Independent Registered Public Accounting Firm, are available on the SEC's website or upon request. |
Affiliated Central Funds
Fiscal year to date information regarding the Fund's investments in Fidelity Central Funds, including the ownership percentage, is presented below.
| Affiliate | Value, beginning of period ($) | Purchases ($) | Sales Proceeds ($) | Dividend Income ($) | Realized Gain (loss) ($) | Change in Unrealized appreciation (depreciation) ($) | Value, end of period ($) | % ownership, end of period |
| Fidelity Municipal Cash Central Fund 1.40% | - | 2,132,000 | 1,900,000 | 3,422 | - | - | 232,000 | 0.0% |
| Total | - | 2,132,000 | 1,900,000 | 3,422 | - | - | 232,000 | |
| | | | | | | | | |
Amounts in the dividend income column in the above table include any capital gain distributions from underlying funds, which are presented in the corresponding line item in the Statement of Operations, if applicable.
Amounts included in the purchases and sales proceeds columns may include in-kind transactions, if applicable.
Investment Valuation
The following is a summary of the inputs used, as of January 31, 2023, involving the Fund's assets and liabilities carried at fair value. The inputs or methodology used for valuing securities may not be an indication of the risk associated with investing in those securities. For more information on valuation inputs, and their aggregation into the levels used below, please refer to the Investment Valuation section in the accompanying Notes to Financial Statements.
| Valuation Inputs at Reporting Date: |
| Description | Total ($) | Level 1 ($) | Level 2 ($) | Level 3 ($) |
Investments in Securities: | | | | |
|
| Municipal Securities | 11,169,814 | - | 11,169,814 | - |
|
| Money Market Funds | 232,000 | 232,000 | - | - |
| Total Investments in Securities: | 11,401,814 | 232,000 | 11,169,814 | - |
| Statement of Assets and Liabilities |
| | | | January 31, 2023 |
| | | | | |
| Assets | | | | |
| Investment in securities, at value - See accompanying schedule: | | | | |
Unaffiliated issuers (cost $11,016,587) | $ | 11,169,814 | | |
Fidelity Central Funds (cost $232,000) | | 232,000 | | |
| | | | | |
| | | | | |
| Total Investment in Securities (cost $11,248,587) | | | $ | 11,401,814 |
| Interest receivable | | | | 109,600 |
| Distributions receivable from Fidelity Central Funds | | | | 120 |
| Prepaid expenses | | | | 4,729 |
| Receivable from investment adviser for expense reductions | | | | 7,412 |
| Other receivables | | | | 26 |
Total assets | | | | 11,523,701 |
| Liabilities | | | | |
| Payable to custodian bank | $ | 8,363 | | |
| Distributions payable | | 2,006 | | |
| Accrued management fee | | 3,216 | | |
| Audit fee payable | | 43,964 | | |
| Other payables and accrued expenses | | 73 | | |
| Total Liabilities | | | | 57,622 |
| Net Assets | | | $ | 11,466,079 |
| Net Assets consist of: | | | | |
| Paid in capital | | | $ | 11,312,447 |
| Total accumulated earnings (loss) | | | | 153,632 |
| Net Assets | | | $ | 11,466,079 |
Net Asset Value , offering price and redemption price per share ($11,466,079 ÷ 1,132,306 shares) | | | $ | 10.13 |
| Statement of Operations |
| | | | For the period April 13, 2022 (commencement of operations) through January 31, 2023 |
| Investment Income | | | | |
| Interest | | | $ | 248,848 |
| Income from Fidelity Central Funds | | | | 3,420 |
| Total Income | | | | 252,268 |
| Expenses | | | | |
| Management fee | $ | 28,164 | | |
| Custodian fees and expenses | | 523 | | |
| Independent trustees' fees and expenses | | 25 | | |
| Registration fees | | 26,448 | | |
| Audit | | 50,699 | | |
| Legal | | 4 | | |
| Miscellaneous | | 33 | | |
| Total expenses before reductions | | 105,896 | | |
| Expense reductions | | (77,169) | | |
| Total expenses after reductions | | | | 28,727 |
| Net Investment income (loss) | | | | 223,541 |
| Realized and Unrealized Gain (Loss) | | | | |
| Net realized gain (loss) on: | | | | |
| Investment Securities: | | | | |
| Unaffiliated issuers | | 137 | | |
| Capital gain distributions from Fidelity Central Funds | | 2 | | |
| Total net realized gain (loss) | | | | 139 |
| Change in net unrealized appreciation (depreciation) on investment securities | | | | 153,227 |
| Net gain (loss) | | | | 153,366 |
| Net increase (decrease) in net assets resulting from operations | | | $ | 376,907 |
| Statement of Changes in Net Assets |
| |
| | For the period April 13, 2022 (commencement of operations) through January 31, 2023 |
| Increase (Decrease) in Net Assets | | |
| Operations | | |
| Net investment income (loss) | $ | 223,541 |
| Net realized gain (loss) | | 139 |
| Change in net unrealized appreciation (depreciation) | | 153,227 |
| Net increase (decrease) in net assets resulting from operations | | 376,907 |
| Distributions to shareholders | | (223,275) |
| Share transactions | | |
| Proceeds from sales of shares | | 11,106,399 |
| Reinvestment of distributions | | 219,718 |
| Cost of shares redeemed | | (13,670) |
Net increase (decrease) in net assets resulting from share transactions | | 11,312,447 |
| Total increase (decrease) in net assets | | 11,466,079 |
| | | |
| Net Assets | | |
| Beginning of period | | - |
| End of period | $ | 11,466,079 |
| | | |
| Other Information | | |
| Shares | | |
| Sold | | 1,111,389 |
| Issued in reinvestment of distributions | | 22,288 |
| Redeemed | | (1,371) |
| Net increase (decrease) | | 1,132,306 |
| | | |
Financial Highlights
| Fidelity SAI Sustainable Municipal Income Fund |
| |
| Years ended January 31, | | 2023 A |
Selected Per-Share Data | | |
| Net asset value, beginning of period | $ | 10.00 |
| Income from Investment Operations | | |
Net investment income (loss) B,C | | .218 |
| Net realized and unrealized gain (loss) | | .130 |
| Total from investment operations | | .348 |
| Distributions from net investment income | | (.218) |
| Total distributions | | (.218) |
| Net asset value, end of period | $ | 10.13 |
Total Return D,E | | 3.56% |
Ratios to Average Net Assets C,F,G | | |
| Expenses before reductions | | 1.18% H,I |
| Expenses net of fee waivers, if any | | .36% I |
| Expenses net of all reductions | | .35% I |
| Net investment income (loss) | | 2.74% I |
| Supplemental Data | | |
| Net assets, end of period (000 omitted) | $ | 11,466 |
Portfolio turnover rate J | | -% I |
A For the period April 13, 2022 (commencement of operations) through January 31, 2023.
B Calculated based on average shares outstanding during the period.
C Net investment income (loss) is affected by the timing of the declaration of dividends by any underlying mutual funds or exchange-traded funds (ETFs). Net investment income (loss) of any mutual funds or ETFs is not included in the Fund's net investment income (loss) ratio.
D Total returns for periods of less than one year are not annualized.
E Total returns would have been lower if certain expenses had not been reduced during the applicable periods shown.
F Fees and expenses of any underlying mutual funds or exchange-traded funds (ETFs) are not included in the Fund's expense ratio. The Fund indirectly bears its proportionate share of these expenses. For additional expense information related to investments in Fidelity Central Funds, please refer to the "Investments in Fidelity Central Funds" note found in the Notes to Financial Statements section of the most recent Annual or Semi-Annual report.
G Expense ratios reflect operating expenses of the class. Expenses before reductions do not reflect amounts reimbursed, waived, or reduced through arrangements with the investment adviser, brokerage services, or other offset arrangements, if applicable, and do not represent the amount paid by the class during periods when reimbursements, waivers or reductions occur.
H Audit fees are not annualized.
I Annualized.
J Amount does not include the portfolio activity of any underlying mutual funds or exchange-traded funds (ETFs).
For the period ended January 31, 2023
1. Organization.
Fidelity SAI Sustainable Municipal Income Fund (the Fund) is a fund of Fidelity Salem Street Trust (the Trust) and is authorized to issue an unlimited number of shares. Shares are offered exclusively to certain clients of Fidelity Management & Research Company LLC (FMR) or its affiliates. The Trust is registered under the Investment Company Act of 1940, as amended (the 1940 Act), as an open-end management investment company organized as a Massachusetts business trust.
2. Investments in Fidelity Central Funds.
Funds may invest in Fidelity Central Funds, which are open-end investment companies generally available only to other investment companies and accounts managed by the investment adviser and its affiliates. The Schedule of Investments lists any Fidelity Central Funds held as an investment as of period end, but does not include the underlying holdings of each Fidelity Central Fund. An investing fund indirectly bears its proportionate share of the expenses of the underlying Fidelity Central Funds.
Based on its investment objective, each Fidelity Central Fund may invest or participate in various investment vehicles or strategies that are similar to those of the investing fund. These strategies are consistent with the investment objectives of the investing fund and may involve certain economic risks which may cause a decline in value of each of the Fidelity Central Funds and thus a decline in the value of the investing fund.
| Fidelity Central Fund | Investment Manager | Investment Objective | Investment Practices | Expense Ratio A |
| | | | | |
| Fidelity Money Market Central Funds | Fidelity Management & Research Company LLC (FMR) | Each fund seeks to obtain a high level of current income consistent with the preservation of capital and liquidity. | Short-term Investments | Less than .005% |
| | | | | |
A Expenses expressed as a percentage of average net assets and are as of each underlying Central Fund's most recent annual or semi-annual shareholder report.
A complete unaudited list of holdings for each Fidelity Central Fund is available upon request or at the Securities and Exchange Commission website at www.sec.gov. In addition, the financial statements of the Fidelity Central Funds which contain the significant accounting policies (including investment valuation policies) of those funds, and are not covered by the Report of Independent Registered Public Accounting Firm, are available on the Securities and Exchange Commission website or upon request.
3. Significant Accounting Policies.
The Fund is an investment company and applies the accounting and reporting guidance of the Financial Accounting Standards Board (FASB) Accounting Standards Codification Topic 946 Financial Services - Investment Companies . The financial statements have been prepared in conformity with accounting principles generally accepted in the United States of America (GAAP), which require management to make certain estimates and assumptions at the date of the financial statements. Actual results could differ from those estimates. Subsequent events, if any, through the date that the financial statements were issued have been evaluated in the preparation of the financial statements. The Fund's Schedule of Investments lists any underlying mutual funds or exchange-traded funds (ETFs) but does not include the underlying holdings of these funds. The following summarizes the significant accounting policies of the Fund:
Investment Valuation. Investments are valued as of 4:00 p.m. Eastern time on the last calendar day of the period. The Board of Trustees (the Board) has designated the Fund's investment adviser as the valuation designee responsible for the fair valuation function and performing fair value determinations as needed. The investment adviser has established a Fair Value Committee (the Committee) to carry out the day-to-day fair valuation responsibilities and has adopted policies and procedures to govern the fair valuation process and the activities of the Committee. In accordance with these fair valuation policies and procedures, which have been approved by the Board, the Fund attempts to obtain prices from one or more third party pricing services or brokers to value its investments. When current market prices, quotations or currency exchange rates are not readily available or reliable, investments will be fair valued in good faith by the Committee, in accordance with the policies and procedures. Factors used in determining fair value vary by investment type and may include market or investment specific events, transaction data, estimated cash flows, and market observations of comparable investments. The frequency that the fair valuation procedures are used cannot be predicted and they may be utilized to a significant extent. The Committee manages the Fund's fair valuation practices and maintains the fair valuation policies and procedures. The Fund's investment adviser reports to the Board information regarding the fair valuation process and related material matters.
The Fund categorizes the inputs to valuation techniques used to value its investments into a disclosure hierarchy consisting of three levels as shown below:
Level 1 - unadjusted quoted prices in active markets for identical investments
Level 2 - other significant observable inputs (including quoted prices for similar investments, interest rates, prepayment speeds, etc.)
Level 3 - unobservable inputs (including the Fund's own assumptions based on the best information available)
Valuation techniques used to value the Fund's investments by major category are as follows:
Debt securities, including restricted securities, are valued based on evaluated prices received from third party pricing services or from brokers who make markets in such securities. Municipal securities are valued by pricing services who utilize matrix pricing which considers yield or price of bonds of comparable quality, coupon, maturity and type or by broker-supplied prices. When independent prices are unavailable or unreliable, debt securities may be valued utilizing pricing methodologies which consider similar factors that would be used by third party pricing services. Debt securities are generally categorized as Level 2 in the hierarchy but may be Level 3 depending on the circumstances.
Investments in open-end mutual funds, including the Fidelity Central Funds, are valued at their closing net asset value (NAV) each business day and are categorized as Level 1 in the hierarchy.
Changes in valuation techniques may result in transfers in or out of an assigned level within the disclosure hierarchy. The aggregate value of investments by input level as of January 31, 2023 is included at the end of the Fund's Schedule of Investments.
Investment Transactions and Income. For financial reporting purposes, the Fund's investment holdings and NAV include trades executed through the end of the last business day of the period. The NAV per share for processing shareholder transactions is calculated as of the close of business of the New York Stock Exchange (NYSE), normally 4:00 p.m. Eastern time and includes trades executed through the end of the prior business day. Gains and losses on securities sold are determined on the basis of identified cost. Income and capital gain distributions from Fidelity Central Funds, if any, are recorded on the ex-dividend date. Interest income is accrued as earned and includes coupon interest and amortization of premium and accretion of discount on debt securities as applicable.
Expenses. Expenses directly attributable to a fund are charged to that fund. Expenses attributable to more than one fund are allocated among the respective funds on the basis of relative net assets or other appropriate methods. Expenses included in the accompanying financial statements reflect the expenses of that fund and do not include any expenses associated with any underlying mutual funds or exchange-traded funds. Although not included in a fund's expenses, a fund indirectly bears its proportionate share of these expenses through the net asset value of each underlying mutual fund or exchange-traded fund. Expense estimates are accrued in the period to which they relate and adjustments are made when actual amounts are known.
Income Tax Information and Distributions to Shareholders. Each year, the Fund intends to qualify as a regulated investment company under Subchapter M of the Internal Revenue Code, including distributing substantially all of its taxable income and realized gains. As a result, no provision for U.S. Federal income taxes is required. As of January 31, 2023, the Fund did not have any unrecognized tax benefits in the financial statements; nor is the Fund aware of any tax positions for which it is reasonably possible that the total amounts of unrecognized tax benefits will significantly change in the next twelve months. The Fund files a U.S. federal tax return, in addition to state and local tax returns as required. The Fund's federal income tax returns are subject to examination by the Internal Revenue Service (IRS) for a period of three fiscal years after they are filed. State and local tax returns may be subject to examination for an additional fiscal year depending on the jurisdiction.
Distributions are declared and recorded daily and paid monthly from net investment income. Distributions from realized gains, if any, are declared and recorded on the ex-dividend date. Income and capital gain distributions are determined in accordance with income tax regulations, which may differ from GAAP.
Capital accounts within the financial statements are adjusted for permanent book-tax differences. These adjustments have no impact on net assets or the results of operations. Capital accounts are not adjusted for temporary book-tax differences which will reverse in a subsequent period.
Book-tax differences are primarily due to market discount.
The Fund purchases municipal securities whose interest, in the opinion of the issuer, is free from federal income tax. There is no assurance that the IRS will agree with this opinion. In the event the IRS determines that the issuer does not comply with relevant tax requirements, interest payments from a security could become federally taxable, possibly retroactively to the date the security was issued.
As of period end, the cost and unrealized appreciation (depreciation) in securities, and derivatives if applicable, for federal income tax purposes were as follows:
| Gross unrealized appreciation | $193,745 |
| Gross unrealized depreciation | (39,785) |
| Net unrealized appreciation (depreciation) | $153,960 |
| Tax Cost | $11,247,854 |
The tax-based components of distributable earnings as of period end were as follows:
| Undistributed long-term capital gain | $2 |
| Net unrealized appreciation (depreciation) on securities and other investments | $153,960 |
The tax character of distributions paid was as follows:
| | January 31, 2023 A |
| Tax-exempt Income | $223,275 |
| Total | $223,275 |
A For the period April 13, 2022 (commencement of operations) through January 31, 2023.
4. Purchases and Sales of Investments.
Purchases and sales of securities, other than short-term securities and in-kind transactions, as applicable, are noted in the table below.
| | Purchases ($) | Sales ($) |
| Fidelity SAI Sustainable Municipal Income Fund | 10,314,228 | 21,988 |
5. Fees and Other Transactions with Affiliates.
Management Fee. Fidelity Management & Research Company LLC (the investment adviser) and its affiliates provide the Fund with investment management related services for which the Fund pays a monthly management fee. The management fee is the sum of an individual fund fee rate that is based on an annual rate of .25% of the Fund's average net assets and an annualized group fee rate that averaged .10% during the period. The group fee rate is based upon the monthly average net assets of a group of registered investment companies with which the investment adviser has management contracts. The group fee rate decreases as assets under management increase and increases as assets under management decrease. For the reporting period, the total annualized management fee rate was .35% of the Fund's average net assets.
Interfund Trades. Funds may purchase from or sell securities to other Fidelity Funds under procedures adopted by the Board. The procedures have been designed to ensure these interfund trades are executed in accordance with Rule 17a-7 of the 1940 Act. Any interfund trades are included within the respective purchases and sales amounts shown in the Purchases and Sales of Investments note. During the period, there were no interfund trades.
6. Expense Reductions.
The investment adviser contractually agreed to reimburse the Fund to the extent annual operating expenses exceeded .36% of average net assets. This reimbursement will remain in place through May 31, 2024. Some expenses, for example the compensation of the independent Trustees, and certain miscellaneous expenses such as proxy and shareholder meeting expenses, are excluded from this reimbursement. During the period this reimbursement reduced the Fund's expenses by $76,545.
Through arrangements with the Fund's custodian and transfer agent, credits realized as a result of certain uninvested cash balances were used to reduce the Fund's expenses by $324 and $157, respectively.
In addition, during the period the investment adviser or an affiliate reimbursed and/or waived a portion of operating expenses in the amount of $143.
7. Other.
A fund's organizational documents provide former and current trustees and officers with a limited indemnification against liabilities arising in connection with the performance of their duties to the fund. In the normal course of business, a fund may also enter into contracts that provide general indemnifications. A fund's maximum exposure under these arrangements is unknown as this would be dependent on future claims that may be made against a fund. The risk of material loss from such claims is considered remote.
At the end of the period, the investment adviser or its affiliates were owners of record of more than 10% of the outstanding shares as follows:
| Fund | Affiliated % |
| Fidelity SAI Sustainable Municipal Income Fund | 90% |
8. Risk and Uncertainties.
Many factors affect a fund's performance. Developments that disrupt global economies and financial markets, such as pandemics, epidemics, outbreaks of infectious diseases, war, terrorism, and environmental disasters, may significantly affect a fund's investment performance. The effects of these developments to a fund will be impacted by the types of securities in which a fund invests, the financial condition, industry, economic sector, and geographic location of an issuer, and a fund's level of investment in the securities of that issuer.
To the Board of Trustees of Fidelity Salem Street Trust and Shareholders of Fidelity SAI Sustainable Municipal Income Fund
Opinion on the Financial Statements
We have audited the accompanying statement of assets and liabilities, including the schedule of investments, of Fidelity SAI Sustainable Municipal Income Fund (one of the funds constituting Fidelity Salem Street Trust, referred to hereafter as the "Fund") as of January 31, 2023, and the related statements of operations and changes in net assets, including the related notes, and the financial highlights for the period April 13, 2022 (commencement of operations) through January 31, 2023 (collectively referred to as the "financial statements"). In our opinion, the financial statements present fairly, in all material respects, the financial position of the Fund as of January 31, 2023, and the results of its operations, changes in its net assets, and the financial highlights for the period April 13, 2022 (commencement of operations) through January 31, 2023 in conformity with accounting principles generally accepted in the United States of America.
Basis for Opinion
These financial statements are the responsibility of the Fund's management. Our responsibility is to express an opinion on the Fund's financial statements based on our audit. We are a public accounting firm registered with the Public Company Accounting Oversight Board (United States) (PCAOB) and are required to be independent with respect to the Fund in accordance with the U.S. federal securities laws and the applicable rules and regulations of the Securities and Exchange Commission and the PCAOB.
We conducted our audit of these financial statements in accordance with the standards of the PCAOB. Those standards require that we plan and perform the audit to obtain reasonable assurance about whether the financial statements are free of material misstatement, whether due to error or fraud.
Our audit included performing procedures to assess the risks of material misstatement of the financial statements, whether due to error or fraud, and performing procedures that respond to those risks. Such procedures included examining, on a test basis, evidence regarding the amounts and disclosures in the financial statements. Our audit also included evaluating the accounting principles used and significant estimates made by management, as well as evaluating the overall presentation of the financial statements. Our procedures included confirmation of securities owned as of January 31, 2023 by correspondence with the custodian. We believe that our audit provides a reasonable basis for our opinion.
/s/ PricewaterhouseCoopers LLP
Boston, Massachusetts
March 16, 2023
We have served as the auditor of one or more investment companies in the Fidelity group of funds since 1932.
The Trustees, Members of the Advisory Board (if any), and officers of the trust and fund, as applicable, are listed below. The Board of Trustees governs the fund and is responsible for protecting the interests of shareholders. The Trustees are experienced executives who meet periodically throughout the year to oversee the fund's activities, review contractual arrangements with companies that provide services to the fund, oversee management of the risks associated with such activities and contractual arrangements, and review the fund's performance. Except for Jonathan Chiel, each of the Trustees oversees 291 funds. Mr. Chiel oversees 186 funds.
The Trustees hold office without limit in time except that (a) any Trustee may resign; (b) any Trustee may be removed by written instrument, signed by at least two-thirds of the number of Trustees prior to such removal; (c) any Trustee who requests to be retired or who has become incapacitated by illness or injury may be retired by written instrument signed by a majority of the other Trustees; and (d) any Trustee may be removed at any special meeting of shareholders by a two-thirds vote of the outstanding voting securities of the trust. Each Trustee who is not an interested person (as defined in the 1940 Act) of the trust and the fund is referred to herein as an Independent Trustee. Each Independent Trustee shall retire not later than the last day of the calendar year in which his or her 75th birthday occurs. The Independent Trustees may waive this mandatory retirement age policy with respect to individual Trustees. Officers and Advisory Board Members hold office without limit in time, except that any officer or Advisory Board Member may resign or may be removed by a vote of a majority of the Trustees at any regular meeting or any special meeting of the Trustees. Except as indicated, each individual has held the office shown or other offices in the same company for the past five years.
The fund's Statement of Additional Information (SAI) includes more information about the Trustees. To request a free copy, call Fidelity at 1-800-544-3455.
Experience, Skills, Attributes, and Qualifications of the Trustees. The Governance and Nominating Committee has adopted a statement of policy that describes the experience, qualifications, attributes, and skills that are necessary and desirable for potential Independent Trustee candidates (Statement of Policy). The Board believes that each Trustee satisfied at the time he or she was initially elected or appointed a Trustee, and continues to satisfy, the standards contemplated by the Statement of Policy. The Governance and Nominating Committee also engages professional search firms to help identify potential Independent Trustee candidates who have the experience, qualifications, attributes, and skills consistent with the Statement of Policy. From time to time, additional criteria based on the composition and skills of the current Independent Trustees, as well as experience or skills that may be appropriate in light of future changes to board composition, business conditions, and regulatory or other developments, have also been considered by the professional search firms and the Governance and Nominating Committee. In addition, the Board takes into account the Trustees' commitment and participation in Board and committee meetings, as well as their leadership of standing and ad hoc committees throughout their tenure.
In determining that a particular Trustee was and continues to be qualified to serve as a Trustee, the Board has considered a variety of criteria, none of which, in isolation, was controlling. The Board believes that, collectively, the Trustees have balanced and diverse experience, qualifications, attributes, and skills, which allow the Board to operate effectively in governing the fund and protecting the interests of shareholders. Information about the specific experience, skills, attributes, and qualifications of each Trustee, which in each case led to the Board's conclusion that the Trustee should serve (or continue to serve) as a trustee of the fund, is provided below.
Board Structure and Oversight Function. Abigail P. Johnson is an interested person and currently serves as Chairman. The Trustees have determined that an interested Chairman is appropriate and benefits shareholders because an interested Chairman has a personal and professional stake in the quality and continuity of services provided to the fund. Independent Trustees exercise their informed business judgment to appoint an individual of their choosing to serve as Chairman, regardless of whether the Trustee happens to be independent or a member of management. The Independent Trustees have determined that they can act independently and effectively without having an Independent Trustee serve as Chairman and that a key structural component for assuring that they are in a position to do so is for the Independent Trustees to constitute a substantial majority for the Board. The Independent Trustees also regularly meet in executive session. Michael E. Kenneally serves as Chairman of the Independent Trustees and as such (i) acts as a liaison between the Independent Trustees and management with respect to matters important to the Independent Trustees and (ii) with management prepares agendas for Board meetings.
Fidelity ® funds are overseen by different Boards of Trustees. The fund's Board oversees Fidelity's alternative investment, investment-grade bond, money market, asset allocation and certain equity funds, and other Boards oversee Fidelity's high income and other equity funds. The asset allocation funds may invest in Fidelity ® funds that are overseen by such other Boards. The use of separate Boards, each with its own committee structure, allows the Trustees of each group of Fidelity ® funds to focus on the unique issues of the funds they oversee, including common research, investment, and operational issues. On occasion, the separate Boards establish joint committees to address issues of overlapping consequences for the Fidelity ® funds overseen by each Board.
The Trustees operate using a system of committees to facilitate the timely and efficient consideration of all matters of importance to the Trustees, the fund, and fund shareholders and to facilitate compliance with legal and regulatory requirements and oversight of the fund's activities and associated risks. The Board, acting through its committees, has charged FMR and its affiliates with (i) identifying events or circumstances the occurrence of which could have demonstrably adverse effects on the fund's business and/or reputation; (ii) implementing processes and controls to lessen the possibility that such events or circumstances occur or to mitigate the effects of such events or circumstances if they do occur; and (iii) creating and maintaining a system designed to evaluate continuously business and market conditions in order to facilitate the identification and implementation processes described in (i) and (ii) above. Because the day-to-day operations and activities of the fund are carried out by or through FMR, its affiliates, and other service providers, the fund's exposure to risks is mitigated but not eliminated by the processes overseen by the Trustees. While each of the Board's committees has responsibility for overseeing different aspects of the fund's activities, oversight is exercised primarily through the Operations and Audit Committees. In addition, an ad hoc Board committee of Independent Trustees has worked with FMR to enhance the Board's oversight of investment and financial risks, legal and regulatory risks, technology risks, and operational risks, including the development of additional risk reporting to the Board. Appropriate personnel, including but not limited to the fund's Chief Compliance Officer (CCO), FMR's internal auditor, the independent accountants, the fund's Treasurer and portfolio management personnel, make periodic reports to the Board's committees, as appropriate, including an annual review of Fidelity's risk management program for the Fidelity ® funds. The responsibilities of each standing committee, including their oversight responsibilities, are described further under "Standing Committees of the Trustees."
Interested Trustees*:
Correspondence intended for a Trustee who is an interested person may be sent to Fidelity Investments, 245 Summer Street, Boston, Massachusetts 02210.
Name, Year of Birth; Principal Occupations and Other Relevant Experience+
Jonathan Chiel (1957)
Year of Election or Appointment: 2016
Trustee
Mr. Chiel also serves as Trustee of other Fidelity ® funds. Mr. Chiel is Executive Vice President and General Counsel for FMR LLC (diversified financial services company, 2012-present). Previously, Mr. Chiel served as general counsel (2004-2012) and senior vice president and deputy general counsel (2000-2004) for John Hancock Financial Services; a partner with Choate, Hall & Stewart (1996-2000) (law firm); and an Assistant United States Attorney for the United States Attorney's Office of the District of Massachusetts (1986-95), including Chief of the Criminal Division (1993-1995). Mr. Chiel is a director on the boards of the Boston Bar Foundation and the Maimonides School.
Abigail P. Johnson (1961)
Year of Election or Appointment: 2009
Trustee
Chairman of the Board of Trustees
Ms. Johnson also serves as Trustee of other Fidelity ® funds. Ms. Johnson serves as Chairman (2016-present), Chief Executive Officer (2014-present), and Director (2007-present) of FMR LLC (diversified financial services company), President of Fidelity Financial Services (2012-present) and President of Personal, Workplace and Institutional Services (2005-present). Ms. Johnson is Chairman and Director of Fidelity Management & Research Company LLC (investment adviser firm, 2011-present). Previously, Ms. Johnson served as Chairman and Director of FMR Co., Inc. (investment adviser firm, 2011-2019), Vice Chairman (2007-2016) and President (2013-2016) of FMR LLC, President and a Director of Fidelity Management & Research Company (2001-2005), a Trustee of other investment companies advised by Fidelity Management & Research Company, Fidelity Investments Money Management, Inc. (investment adviser firm), and FMR Co., Inc. (2001-2005), Senior Vice President of the Fidelity ® funds (2001-2005), and managed a number of Fidelity ® funds. Ms. Abigail P. Johnson and Mr. Arthur E. Johnson are not related.
Jennifer Toolin McAuliffe (1959)
Year of Election or Appointment: 2016
Trustee
Ms. McAuliffe also serves as Trustee of other Fidelity ® funds and as Trustee of Fidelity Charitable (2020-present). Previously, Ms. McAuliffe served as Co-Head of Fixed Income of Fidelity Investments Limited (now known as FIL Limited (FIL)) (diversified financial services company), Director of Research for FIL's credit and quantitative teams in London, Hong Kong and Tokyo and Director of Research for taxable and municipal bonds at Fidelity Investments Money Management, Inc. Ms. McAuliffe previously served as a member of the Advisory Board of certain Fidelity ® funds (2016). Ms. McAuliffe was previously a lawyer at Ropes & Gray LLP and currently serves as director or trustee of several not-for-profit entities.
* Determined to be an "Interested Trustee" by virtue of, among other things, his or her affiliation with the trust or various entities under common control with FMR.
+ The information includes the Trustee's principal occupation during the last five years and other information relating to the experience, attributes, and skills relevant to the Trustee's qualifications to serve as a Trustee, which led to the conclusion that the Trustee should serve as a Trustee for the fund.
Independent Trustees:
Correspondence intended for an Independent Trustee may be sent to Fidelity Investments, P.O. Box 55235, Boston, Massachusetts 02205-5235.
Name, Year of Birth; Principal Occupations and Other Relevant Experience+
Elizabeth S. Acton (1951)
Year of Election or Appointment: 2013
Trustee
Ms. Acton also serves as Trustee of other Fidelity ® funds. Prior to her retirement, Ms. Acton served as Executive Vice President, Finance (2011-2012), Executive Vice President, Chief Financial Officer (2002-2011) and Treasurer (2004-2005) of Comerica Incorporated (financial services). Prior to joining Comerica, Ms. Acton held a variety of positions at Ford Motor Company (1983-2002), including Vice President and Treasurer (2000-2002) and Executive Vice President and Chief Financial Officer of Ford Motor Credit Company (1998-2000). Ms. Acton currently serves as a member of the Board and Audit and Finance Committees of Beazer Homes USA, Inc. (homebuilding, 2012-present). Ms. Acton previously served as a member of the Advisory Board of certain Fidelity ® funds (2013-2016).
Ann E. Dunwoody (1953)
Year of Election or Appointment: 2018
Trustee
General Dunwoody also serves as Trustee of other Fidelity ® funds. General Dunwoody (United States Army, Retired) was the first woman in U.S. military history to achieve the rank of four-star general and prior to her retirement in 2012 held a variety of positions within the U.S. Army, including Commanding General, U.S. Army Material Command (2008-2012). General Dunwoody currently serves as President of First to Four LLC (leadership and mentoring services, 2012-present), a member of the Board and Nomination and Corporate Governance Committees of Kforce Inc. (professional staffing services, 2016-present) and a member of the Board of Automattic Inc. (software engineering, 2018-present). Previously, General Dunwoody served as a member of the Advisory Board and Nominating and Corporate Governance Committee of L3 Technologies, Inc. (communication, electronic, sensor and aerospace systems, 2013-2019) and a member of the Board and Audit and Sustainability and Corporate Responsibility Committees of Republic Services, Inc. (waste collection, disposal and recycling, 2013-2016). Ms. Dunwoody also serves on several boards for non-profit organizations, including as a member of the Board, Chair of the Nomination and Governance Committee and a member of the Audit Committee of Logistics Management Institute (consulting non-profit, 2012-present), a member of the Council of Trustees for the Association of the United States Army (advocacy non-profit, 2013-present), a member of the Board of Florida Institute of Technology (2015-present) and a member of the Board of ThanksUSA (military family education non-profit, 2014-present). General Dunwoody previously served as a member of the Advisory Board of certain Fidelity ® funds (2018).
John Engler (1948)
Year of Election or Appointment: 2014
Trustee
Mr. Engler also serves as Trustee of other Fidelity ® funds. Previously, Mr. Engler served as Governor of Michigan (1991-2003), President of the Business Roundtable (2011-2017) and interim President of Michigan State University (2018-2019). Mr. Engler currently serves as a member of the Board of Stride, Inc. (formerly K12 Inc.) (technology-based education company, 2012-present). Previously, Mr. Engler served as a member of the Board of Universal Forest Products (manufacturer and distributor of wood and wood-alternative products, 2003-2019) and Trustee of The Munder Funds (2003-2014). Mr. Engler previously served as a member of the Advisory Board of certain Fidelity ® funds (2014-2016).
Robert F. Gartland (1951)
Year of Election or Appointment: 2010
Trustee
Mr. Gartland also serves as Trustee of other Fidelity ® funds. Prior to his retirement, Mr. Gartland held a variety of positions at Morgan Stanley (financial services, 1979-2007), including Managing Director (1987-2007) and Chase Manhattan Bank (1975-1978). Mr. Gartland previously served as Chairman and an investor in Gartland & Mellina Group Corp. (consulting, 2009-2019), as a member of the Board of National Securities Clearing Corporation (1993-1996) and as Chairman of TradeWeb (2003-2004).
Arthur E. Johnson (1947)
Year of Election or Appointment: 2008
Trustee
Mr. Johnson also serves as Trustee of other Fidelity ® funds. Prior to his retirement, Mr. Johnson served as Senior Vice President of Corporate Strategic Development of Lockheed Martin Corporation (defense contractor, 1999-2009). Mr. Johnson currently serves as a member of the Board of Booz Allen Hamilton (management consulting, 2011-present). Mr. Johnson previously served as a member of the Board of Eaton Corporation plc (diversified power management, 2009-2019) and a member of the Board of AGL Resources, Inc. (holding company, 2002-2016). Mr. Johnson previously served as Chairman (2018-2021) and Vice Chairman (2015-2018) of the Independent Trustees of certain Fidelity® funds. Mr. Arthur E. Johnson is not related to Ms. Abigail P. Johnson.
Michael E. Kenneally (1954)
Year of Election or Appointment: 2009
Trustee
Chairman of the Independent Trustees
Mr. Kenneally also serves as Trustee of other Fidelity ® funds and was Vice Chairman (2018-2021) of the Independent Trustees of certain Fidelity ® funds. Prior to retirement in 2005, he was Chairman and Global Chief Executive Officer of Credit Suisse Asset Management, the worldwide fund management and institutional investment business of Credit Suisse Group. Previously, Mr. Kenneally was an Executive Vice President and the Chief Investment Officer for Bank of America. In this role, he was responsible for the investment management, strategy and products delivered to the bank's institutional, high-net-worth and retail clients. Earlier, Mr. Kenneally directed the organization's equity and quantitative research groups. He began his career as a research analyst and then spent more than a dozen years as a portfolio manager for endowments, pension plans and mutual funds. He earned the Chartered Financial Analyst (CFA) designation in 1991.
Mark A. Murray (1954)
Year of Election or Appointment: 2016
Trustee
Mr. Murray also serves as Trustee of other Fidelity ® funds. Previously, Mr. Murray served as Co-Chief Executive Officer (2013-2016), President (2006-2013) and Vice Chairman (2013-2020) of Meijer, Inc. Mr. Murray serves as a member of the Board (2009-present) and Public Policy and Responsibility Committee (2009-present) and Chair of the Nuclear Review Committee (2019-present) of DTE Energy Company (diversified energy company). Mr. Murray previously served as a member of the Board of Spectrum Health (not-for-profit health system, 2015-2019) and as a member of the Board and Audit Committee and Chairman of the Nominating and Corporate Governance Committee of Universal Forest Products, Inc. (manufacturer and distributor of wood and wood-alternative products, 2004-2016). Mr. Murray also serves as a member of the Board of many community and professional organizations. Mr. Murray previously served as a member of the Advisory Board of certain Fidelity ® funds (2016).
+ The information includes the Trustee's principal occupation during the last five years and other information relating to the experience, attributes, and skills relevant to the Trustee's qualifications to serve as a Trustee, which led to the conclusion that the Trustee should serve as a Trustee for the fund.
Advisory Board Members and Officers:
Correspondence intended for a Member of the Advisory Board (if any) may be sent to Fidelity Investments, P.O. Box 55235, Boston, Massachusetts 02205-5235. Correspondence intended for an officer may be sent to Fidelity Investments, 245 Summer Street, Boston, Massachusetts 02210. Officers appear below in alphabetical order.
Name, Year of Birth; Principal Occupation
Laura M. Bishop (1961)
Year of Election or Appointment: 2022
Member of the Advisory Board
Ms. Bishop also serves as a Member of the Advisory Board of other funds. Prior to her retirement, Ms. Bishop held a variety of positions at United Services Automobile Association (2001-2020), including Executive Vice President and Chief Financial Officer (2014-2020) and Senior Vice President and Deputy Chief Financial Officer (2012-2014). Ms. Bishop currently serves as a member of the Audit Committee and Compensation and Personnel Committee (2021-present) of the Board of Directors of Korn Ferry (global organizational consulting).
Robert W. Helm (1957)
Year of Election or Appointment: 2021
Member of the Advisory Board
Mr. Helm also serves as a Member of the Advisory Board of other Fidelity® funds. Mr. Helm was formerly Deputy Chairman (2003-2020), partner (1991-2020) and an associate (1984-1991) of Dechert LLP (formerly Dechert Price & Rhoads). Mr. Helm currently serves on boards and committees of several not-for-profit organizations.
Carol J. Zierhoffer (1960)
Year of Election or Appointment: 2023
Member of the Advisory Board
Ms. Zierhoffer also serves as a Member of the Advisory Board of other funds. Prior to her retirement, Ms. Zierhoffer held a variety of positions at Bechtel Corporation (engineering company, 2013-2019), including Principal Vice President and Chief Information Officer (2013-2016) and Senior Vice President and Chief Information Officer (2016-2019). Ms. Zierhoffer currently serves as a member of the Board of Directors, Audit Committee and Compensation Committee of Allscripts Healthcare Solutions, Inc. (healthcare technology, 2020-present) and as a member of the Board of Directors, Audit and Finance Committee and Nominating and Governance Committee of Atlas Air Worldwide Holdings, Inc. (aviation operating services, 2021-present). Previously, Ms. Zierhoffer served as a member of the Board of Directors and Audit Committee and as the founding Chair of the Information Technology Committee of MedAssets, Inc. (healthcare technology, 2013-2016).
Craig S. Brown (1977)
Year of Election or Appointment: 2019
Assistant Treasurer
Mr. Brown also serves as an officer of other funds. Mr. Brown serves as Assistant Treasurer of FIMM, LLC (2021-present) and is an employee of Fidelity Investments (2013-present). Previously, Mr. Brown served as Assistant Treasurer of certain Fidelity ® funds (2019-2022).
John J. Burke III (1964)
Year of Election or Appointment: 2018
Chief Financial Officer
Mr. Burke also serves as Chief Financial Officer of other funds. Mr. Burke serves as Head of Investment Operations for Fidelity Fund and Investment Operations (2018-present) and is an employee of Fidelity Investments (1998-present). Previously Mr. Burke served as head of Asset Management Investment Operations (2012-2018).
David J. Carter (1973)
Year of Election or Appointment: 2020
Assistant Secretary
Mr. Carter also serves as Assistant Secretary of other funds. Mr. Carter serves as Senior Vice President, Deputy General Counsel (2022-present) and is an employee of Fidelity Investments (2005-present).
Jonathan Davis (1968)
Year of Election or Appointment: 2010
Assistant Treasurer
Mr. Davis also serves as an officer of other funds. Mr. Davis serves as Assistant Treasurer of FIMM, LLC (2021-present), FMR Capital, Inc. (2017-present), FD Funds GP LLC (2021-present), FD Funds Holding LLC (2021-present), and FD Funds Management LLC (2021-present); and is an employee of Fidelity Investments. Previously, Mr. Davis served as Vice President and Associate General Counsel of FMR LLC (diversified financial services company, 2003-2010).
Laura M. Del Prato (1964)
Year of Election or Appointment: 2018
President and Treasurer
Ms. Del Prato also serves as an officer of other funds. Ms. Del Prato serves as Assistant Treasurer of FIMM, LLC (2021-present) and is an employee of Fidelity Investments (2017-present). Previously, Ms. Del Prato served as President and Treasurer of The North Carolina Capital Management Trust: Cash Portfolio and Term Portfolio (2018-2020). Prior to joining Fidelity Investments, Ms. Del Prato served as a Managing Director and Treasurer of the JPMorgan Mutual Funds (2014-2017). Prior to JPMorgan, Ms. Del Prato served as a partner at Cohen Fund Audit Services (accounting firm, 2012-2013) and KPMG LLP (accounting firm, 2004-2012).
Christopher M. Gouveia (1973)
Year of Election or Appointment: 2023
Chief Compliance Officer
Mr. Gouveia also serves as Chief Compliance Officer of other funds. Mr. Gouveia serves as Senior Vice President of Asset Management Compliance for Fidelity Investments and is an employee of Fidelity Investments. Previously, Mr. Gouveia served as Chief Compliance Officer of the North Carolina Capital Management Trust (2016-2019).
Colm A. Hogan (1973)
Year of Election or Appointment: 2016
Assistant Treasurer
Mr. Hogan also serves as an officer of other funds. Mr. Hogan serves as Assistant Treasurer of FIMM, LLC (2021-present) and FMR Capital, Inc. (2017-present) and is an employee of Fidelity Investments (2005-present). Previously, Mr. Hogan served as Deputy Treasurer of certain Fidelity ® funds (2016-2020) and Assistant Treasurer of certain Fidelity ® funds (2016-2018).
Cynthia Lo Bessette (1969)
Year of Election or Appointment: 2019
Secretary and Chief Legal Officer (CLO)
Ms. Lo Bessette also serves as an officer of other funds. Ms. Lo Bessette serves as CLO, Secretary, and Senior Vice President of Fidelity Management & Research Company LLC (investment adviser firm, 2019-present); CLO of Fidelity Management & Research (Hong Kong) Limited, FMR Investment Management (UK) Limited, and Fidelity Management & Research (Japan) Limited (investment adviser firms, 2019-present); Secretary of FD Funds GP LLC (2021-present), FD Funds Holding LLC (2021-present), FD Funds Management LLC (2021-present), and Fidelity Diversifying Solutions LLC (investment adviser firm, 2022-present); and Assistant Secretary of FIMM, LLC (2019-present). She is a Senior Vice President and Deputy General Counsel of FMR LLC (diversified financial services company, 2019-present), and is an employee of Fidelity Investments. Previously, Ms. Lo Bessette served as CLO, Secretary, and Senior Vice President of FMR Co., Inc. (investment adviser firm, 2019); Secretary of Fidelity SelectCo, LLC and Fidelity Investments Money Management, Inc. (investment adviser firms, 2019). Prior to joining Fidelity Investments, Ms. Lo Bessette was Executive Vice President, General Counsel (2016-2019) and Senior Vice President, Deputy General Counsel (2015-2016) of OppenheimerFunds (investment management company) and Deputy Chief Legal Officer (2013-2015) of Jennison Associates LLC (investment adviser firm).
Chris Maher (1972)
Year of Election or Appointment: 2013
Assistant Treasurer
Mr. Maher also serves as an officer of other funds. Mr. Maher serves as Assistant Treasurer of FIMM, LLC (2021-present) and FMR Capital, Inc. (2017-present), and is an employee of Fidelity Investments (2008-present). Previously, Mr. Maher served as Assistant Treasurer of certain funds (2013-2020); Vice President of Asset Management Compliance (2013), Vice President of the Program Management Group of FMR (investment adviser firm, 2010-2013), and Vice President of Valuation Oversight (2008-2010).
Jamie Pagliocco (1964)
Year of Election or Appointment: 2020
Vice President
Mr. Pagliocco also serves as Vice President of other funds. Mr. Pagliocco serves as President of Fixed Income (2020-present), and is an employee of Fidelity Investments (2001-present). Previously, Mr. Pagliocco served as Co-Chief Investment Officer - Bond (2017-2020), Global Head of Bond Trading (2016-2019), and as a portfolio manager.
Brett Segaloff (1972)
Year of Election or Appointment: 2021
Anti-Money Laundering (AML) Officer
Mr. Segaloff also serves as an AML Officer of other funds and other related entities. He is Director, Anti-Money Laundering (2007-present) of FMR LLC (diversified financial services company) and is an employee of Fidelity Investments (1996-present).
Stacie M. Smith (1974)
Year of Election or Appointment: 2013
Assistant Treasurer
Ms. Smith also serves as an officer of other funds. Ms. Smith serves as Assistant Treasurer of FIMM, LLC (2021-present) and FMR Capital, Inc. (2017-present), is an employee of Fidelity Investments (2009-present), and has served in other fund officer roles. Prior to joining Fidelity Investments, Ms. Smith served as Senior Audit Manager of Ernst & Young LLP (accounting firm, 1996-2009). Previously, Ms. Smith served as Assistant Treasurer (2013-2019) and Deputy Treasurer (2013-2016) of certain Fidelity ® funds.
Jim Wegmann (1979)
Year of Election or Appointment: 2021
Deputy Treasurer
Mr. Wegmann also serves as an officer of other funds. Mr. Wegmann serves as Assistant Treasurer of FIMM, LLC (2021-present) and is an employee of Fidelity Investments (2011-present). Previously, Mr. Wegmann served as Assistant Treasurer of certain Fidelity ® funds (2019-2021).
As a shareholder, you incur two types of costs: (1) transaction costs, which may include sales charges (loads) on purchase payments or redemption proceeds, as applicable and (2) ongoing costs, which generally include management fees, distribution and/or service (12b-1) fees and other Fund expenses. This Example is intended to help you understand your ongoing costs (in dollars) of investing in a fund and to compare these costs with the ongoing costs of investing in other mutual funds.
| The Example is based on an investment of $1,000 invested at the beginning of the period and held for the entire period (August 1, 2022 to January 31, 2023). |
Actual Expenses
The first line of the accompanying table provides information about actual account values and actual expenses. You may use the information in this line, together with the amount you invested, to estimate the expenses that you paid over the period. Simply divide your account value by $1,000.00 (for example, an $8,600 account value divided by $1,000.00 = 8.6), then multiply the result by the number in the first line for a class/Fund under the heading entitled "Expenses Paid During Period" to estimate the expenses you paid on your account during this period. If any fund is a shareholder of any underlying mutual funds or exchange-traded funds (ETFs) (the Underlying Funds), such fund indirectly bears its proportional share of the expenses of the Underlying Funds in addition to the direct expenses incurred presented in the table. These fees and expenses are not included in the annualized expense ratio used to calculate the expense estimate in the table below.
Hypothetical Example for Comparison Purposes
The second line of the accompanying table provides information about hypothetical account values and hypothetical expenses based on the actual expense ratio and an assumed rate of return of 5% per year before expenses, which is not the actual return. The hypothetical account values and expenses may not be used to estimate the actual ending account balance or expenses you paid for the period. You may use this information to compare the ongoing costs of investing in the Fund and other funds. To do so, compare this 5% hypothetical example with the 5% hypothetical examples that appear in the shareholder reports of the other funds. If any fund is a shareholder of any Underlying Funds, such fund indirectly bears its proportional share of the expenses of the Underlying Funds in addition to the direct expenses as presented in the table. These fees and expenses are not included in the annualized expense ratio used to calculate the expense estimate in the table below.
Please note that the expenses shown in the table are meant to highlight your ongoing costs only and do not reflect any transaction costs. Therefore, the second line of the table is useful in comparing ongoing costs only, and will not help you determine the relative total costs of owning different funds. In addition, if these transactional costs were included, your costs would have been higher.
| | | | | Annualized Expense Ratio- A | | Beginning Account Value August 1, 2022 | | Ending Account Value January 31, 2023 | | Expenses Paid During Period- C August 1, 2022 to January 31, 2023 |
| | | | | | | | | | |
| Fidelity® SAI Sustainable Municipal Income Fund | | | | .36% | | | | | | |
| Actual | | | | | | $ 1,000 | | $ 1,011.00 | | $ 1.82 |
Hypothetical- B | | | | | | $ 1,000 | | $ 1,023.39 | | $ 1.84 |
| |
A Annualized expense ratio reflects expenses net of applicable fee waivers.
B 5% return per year before expenses
C Expenses are equal to the annualized expense ratio, multiplied by the average account value over the period, multiplied by 184/ 365 (to reflect the one-half year period). The fees and expenses of any Underlying Funds are not included in each annualized expense ratio.
The dividend and capital gains distributions for the fund is available on Fidelity.com or Institutional.Fidelity.com .
The fund hereby designates as a capital gain dividend with respect to the taxable year ended January 31, 2023, $2 or, if subsequently determined to be different, the net capital gain of such year.
During fiscal year ended 2023, 100% of the fund's income dividends was free from federal income tax, and 0.64% of the fund's income dividends was subject to the federal alternative minimum tax.
The fund will notify shareholders in January 2024 of amounts for use in preparing 2023 income tax returns.
The Securities and Exchange Commission adopted Rule 22e-4 under the Investment Company Act of 1940 (the Liquidity Rule) to promote effective liquidity risk management throughout the open-end investment company industry, thereby reducing the risk that funds will be unable to meet their redemption obligations and mitigating dilution of the interests of fund shareholders.
The Fund has adopted and implemented a liquidity risk management program (the Program) reasonably designed to assess and manage the Fund's liquidity risk and to comply with the requirements of the Liquidity Rule. The Fund's Board of Trustees (the Board) has designated the Fund's investment adviser as administrator of the Program. The Fidelity advisers have established a Liquidity Risk Management Committee (the LRM Committee) to manage the Program for each of the Fidelity Funds. The LRM Committee monitors the adequacy and effectiveness of implementation of the Program and on a periodic basis assesses each Fund's liquidity risk based on a variety of factors including (1) the Fund's investment strategy, (2) portfolio liquidity and cash flow projections during normal and reasonably foreseeable stressed conditions, (3) shareholder redemptions, (4) borrowings and other funding sources and (5) certain factors specific to ETFs including the effect of the Fund's prices and spreads, market participants, and basket compositions on the overall liquidity of the Fund's portfolio, as applicable.
In accordance with the Program, each of the Fund's portfolio investments is classified into one of four defined liquidity categories based on a determination of a reasonable expectation for how long it would take to convert the investment to cash (or sell or dispose of the investment) without significantly changing its market value.
- Highly liquid investments - cash or convertible to cash within three business days or less
- Moderately liquid investments - convertible to cash in three to seven calendar days
- Less liquid investments - can be sold or disposed of, but not settled, within seven calendar days
- Illiquid investments - cannot be sold or disposed of within seven calendar days
Liquidity classification determinations take into account a variety of factors including various market, trading and investment-specific considerations, as well as market depth, and generally utilize analysis from a third-party liquidity metrics service.
The Liquidity Rule places a 15% limit on a fund's illiquid investments and requires funds that do not primarily hold assets that are highly liquid investments to determine and maintain a minimum percentage of the fund's net assets to be invested in highly liquid investments (highly liquid investment minimum or HLIM). The Program includes provisions reasonably designed to comply with the 15% limit on illiquid investments and for determining, periodically reviewing and complying with the HLIM requirement as applicable.
At a recent meeting of the Fund's Board of Trustees, the LRM Committee provided a written report to the Board pertaining to the operation, adequacy, and effectiveness of the Program for the period December 1, 2021 through November 30, 2022. The report concluded that the Program is operating effectively and is reasonably designed to assess and manage the Fund's liquidity risk.
1.9904935.100
MNI-ANN-0423
Fidelity® Series Large Cap Value Index Fund
Annual Report
January 31, 2023
Contents
To view a fund's proxy voting guidelines and proxy voting record for the 12-month period ended June 30, visit http://www.fidelity.com/proxyvotingresults or visit the Securities and Exchange Commission's (SEC) web site at http://www.sec.gov.
You may also call 1-800-544-8544 to request a free copy of the proxy voting guidelines.
A fund is not in any way connected to or sponsored, endorsed, sold or promoted by the London Stock Exchange Group plc and its group undertakings (collectively, the "LSE Group"). The LSE Group does not accept any liability whatsoever to any person arising out of the use of a fund or the underlying data.
Standard & Poor's, S&P and S&P 500 are registered service marks of The McGraw-Hill Companies, Inc. and have been licensed for use by Fidelity Distributors Corporation.
Other third-party marks appearing herein are the property of their respective owners.
All other marks appearing herein are registered or unregistered trademarks or service marks of FMR LLC or an affiliated company. © 2023 FMR LLC. All rights reserved.
This report and the financial statements contained herein are submitted for the general information of the shareholders of the Fund. This report is not authorized for distribution to prospective investors in the Fund unless preceded or accompanied by an effective prospectus.
A fund files its complete schedule of portfolio holdings with the SEC for the first and third quarters of each fiscal year on Form N-PORT. Forms N-PORT are available on the SEC's web site at http://www.sec.gov. A fund's Forms N-PORT may be reviewed and copied at the SEC's Public Reference Room in Washington, DC. Information regarding the operation of the SEC's Public Reference Room may be obtained by calling 1-800-SEC-0330.
For a complete list of a fund's portfolio holdings, view the most recent holdings listing, semiannual report, or annual report on Fidelity's web site at http://www.fidelity.com, http://www.institutional.fidelity.com, or http://www.401k.com, as applicable.
NOT FDIC INSURED •MAY LOSE VALUE •NO BANK GUARANTEE
Neither the Fund nor Fidelity Distributors Corporation is a bank.
Average annual total return reflects the change in the value of an investment, assuming reinvestment of distributions from dividend income and capital gains (the profits earned upon the sale of securities that have grown in value, if any) and assuming a constant rate of performance each year. The hypothetical investment and the average annual total returns do not reflect the deduction of taxes that a shareholder would pay on fund distributions or the redemption of fund shares. During periods of reimbursement by Fidelity, a fund's total return will be greater than it would be had the reimbursement not occurred. How a fund did yesterday is no guarantee of how it will do tomorrow.
| Average Annual Total Returns |
| | | | |
Periods ended January 31, 2023 | Past 1 year | Past 5 years | Life of Fund A |
| Fidelity® Series Large Cap Value Index Fund | -0.40% | 6.99% | 8.92% |
A From November 07, 2013
| $10,000 Over Life of Fund |
| |
Let's say hypothetically that $10,000 was invested in Fidelity® Series Large Cap Value Index Fund, on November 07, 2013, when the fund started. The chart shows how the value of your investment would have changed, and also shows how the Russell 1000® Value Index performed over the same period. |
|
|
Market Recap:
U.S. equities returned -8.22% for the 12 months ending January 31, 2023, according to the S&P 500 ® index. The new year began with an encouraging upturn in January (+6.28%), but the backdrop remains clouded by the multitude of risk factors that challenged the global economy in 2022, when the index logged its lowest calendar-year return since 2008 and first annual retreat since 2018. High inflation prompted the Federal Reserve to aggressively tighten monetary policy, and market interest rates eclipsed their highest level in a decade, stoking recession fears and sending stocks into bear market territory. Since March 2022, the Fed has hiked its benchmark rate seven times, by 4.25 percentage points - the fastest-ever pace of monetary tightening - while also shrinking its massive portfolio. The latest bump came in mid-December, along with a signal that the central bank plans to lift rates through the spring, though likely in smaller increments, to combat high inflation. Against this backdrop, stocks struggled to gain traction until a strong rally ignited heading into the summer. But in September, the S&P 500 ® returned -9.21%, one of its worst monthly results ever, before advancing 7.56% in Q4 as risky assets regained favor. For the full 12 months, value stocks handily outpaced growth. This headwind was most pronounced in the growth-oriented communication services (-27%), consumer discretionary (-20%) and information technology (-16%) sectors. In contrast, energy (+43%) led by a wide margin, followed by health care (+3%).
Comments from the Geode Capital Management, LLC, passive equity index team:
For the fiscal year ending January 31, 2023, the fund returned -0.40%, roughly in line with the -0.43% result of the benchmark Russell 1000 ® Value Index. By sector, stocks in the information technology sector returned -15% and detracted most. Communication services (-14%), especially in the media & entertainment industry (-20%), and financials (-4%) also hurt. Other notable detractors included the real estate (-12%), consumer discretionary (-5%), and consumer staples (0%) sectors. In contrast, energy advanced 43% and contributed most. Health care stocks also helped, gaining about 4%. The materials sector rose roughly 8%. Other notable contributors included the industrials (+3%) and utilities (+3%) sectors. Turning to individual stocks, the biggest individual detractor was Intel (-40%), from the semiconductors & semiconductor equipment industry. Bank of America, within the banks category, returned roughly -21% and hindered the fund. In media & entertainment, Disney (-24%) and Alphabet (-26%) hurt. Another detractor was Salesforce (-28%), a stock in the software & services segment. In contrast, the biggest individual contributor was Exxon Mobil (+59%), from the energy sector. In energy, Chevron (+37%) and ConocoPhillips (+44%) helped. Merck, within the pharmaceuticals, biotechnology & life sciences group, advanced approximately 35% and lifted the fund. Another contributor was Netflix (+85%), a stock in the media & entertainment industry.
The views expressed above reflect those of the portfolio manager(s) only through the end of the period as stated on the cover of this report and do not necessarily represent the views of Fidelity or any other person in the Fidelity organization. Any such views are subject to change at any time based upon market or other conditions and Fidelity disclaims any responsibility to update such views. These views may not be relied on as investment advice and, because investment decisions for a Fidelity fund are based on numerous factors, may not be relied on as an indication of trading intent on behalf of any Fidelity fund.
Top Holdings (% of Fund's net assets) |
| |
| Berkshire Hathaway, Inc. Class B | 2.9 | |
| Exxon Mobil Corp. | 2.5 | |
| Johnson & Johnson | 2.2 | |
| JPMorgan Chase & Co. | 2.1 | |
| Chevron Corp. | 1.7 | |
| Meta Platforms, Inc. Class A | 1.4 | |
| Pfizer, Inc. | 1.3 | |
| Bank of America Corp. | 1.3 | |
| Walmart, Inc. | 1.1 | |
| Cisco Systems, Inc. | 1.0 | |
| | 17.5 | |
| |
| Market Sectors (% of Fund's net assets) |
| |
| Financials | 20.4 | |
| Health Care | 16.3 | |
| Industrials | 10.3 | |
| Information Technology | 8.6 | |
| Energy | 8.2 | |
| Communication Services | 7.9 | |
| Consumer Staples | 6.9 | |
| Consumer Discretionary | 6.3 | |
| Utilities | 5.4 | |
| Real Estate | 4.7 | |
| Materials | 4.5 | |
| |
Asset Allocation (% of Fund's net assets) |
|
Foreign investments - 4.3% |
Percentages shown as 0.0% may reflect amounts less than 0.05%. |
|
Showing Percentage of Net Assets
| Common Stocks - 99.5% |
| | | Shares | Value ($) |
| COMMUNICATION SERVICES - 7.9% | | | |
| Diversified Telecommunication Services - 1.7% | | | |
| AT&T, Inc. | | 2,090,453 | 42,582,528 |
| Frontier Communications Parent, Inc. (a)(b) | | 71,418 | 2,114,687 |
| Lumen Technologies, Inc. (b) | | 299,618 | 1,572,995 |
| Verizon Communications, Inc. | | 1,227,180 | 51,013,873 |
| | | | 97,284,083 |
| Entertainment - 2.1% | | | |
| Activision Blizzard, Inc. | | 226,737 | 17,361,252 |
| AMC Entertainment Holdings, Inc. Class A (a)(b) | | 150,708 | 806,288 |
| Electronic Arts, Inc. | | 75,831 | 9,757,933 |
| Liberty Media Corp. Liberty Formula One: | | | |
| Class A (a) | | 5,478 | 348,839 |
| Series C (a) | | 51,938 | 3,677,210 |
| Live Nation Entertainment, Inc. (a) | | 22,740 | 1,830,343 |
| Madison Square Garden Sports Corp. | | 2,753 | 500,606 |
| Netflix, Inc. (a) | | 70,170 | 24,830,356 |
| Playtika Holding Corp. (a) | | 2,068 | 21,693 |
| Roku, Inc. Class A (a) | | 25,460 | 1,463,950 |
| Take-Two Interactive Software, Inc. (a) | | 8,193 | 927,693 |
| The Walt Disney Co. (a) | | 496,353 | 53,849,337 |
| Warner Bros Discovery, Inc. (a) | | 183,048 | 2,712,771 |
| | | | 118,088,271 |
| Interactive Media & Services - 2.2% | | | |
| Alphabet, Inc.: | | | |
| Class A (a) | | 228,298 | 22,564,974 |
| Class C (a) | | 202,502 | 20,223,875 |
| IAC, Inc. (a) | | 22,407 | 1,265,996 |
| Match Group, Inc. (a) | | 5,127 | 277,473 |
| Meta Platforms, Inc. Class A (a) | | 516,583 | 76,955,370 |
| Pinterest, Inc. Class A (a) | | 134,008 | 3,523,070 |
| TripAdvisor, Inc. (a)(b) | | 27,366 | 637,628 |
| | | | 125,448,386 |
| Media - 1.4% | | | |
| Altice U.S.A., Inc. Class A (a) | | 61,004 | 298,920 |
| Cable One, Inc. (b) | | 649 | 512,632 |
| Comcast Corp. Class A | | 1,252,541 | 49,287,488 |
| DISH Network Corp. Class A (a) | | 73,069 | 1,051,463 |
| Fox Corp.: | | | |
| Class A | | 86,727 | 2,943,514 |
| Class B | | 41,472 | 1,314,662 |
| Interpublic Group of Companies, Inc. | | 113,173 | 4,126,288 |
| Liberty Broadband Corp.: | | | |
| Class A (a) | | 2,735 | 245,111 |
| Class C (a)(b) | | 18,587 | 1,668,741 |
| Liberty Media Corp. Liberty SiriusXM: | | | |
| Series A (a)(b) | | 15,926 | 646,914 |
| Series C (a) | | 32,464 | 1,308,299 |
| News Corp.: | | | |
| Class A | | 110,682 | 2,242,417 |
| Class B | | 34,605 | 707,326 |
| Nexstar Broadcasting Group, Inc. Class A (b) | | 9,608 | 1,967,430 |
| Omnicom Group, Inc. | | 59,346 | 5,103,163 |
| Paramount Global: | | | |
| Class A (b) | | 3,437 | 91,596 |
| Class B (b) | | 167,324 | 3,875,224 |
| Sirius XM Holdings, Inc. (b) | | 204,657 | 1,184,964 |
| The New York Times Co. Class A | | 47,359 | 1,649,988 |
| | | | 80,226,140 |
| Wireless Telecommunication Services - 0.5% | | | |
| T-Mobile U.S., Inc. (a) | | 173,938 | 25,970,683 |
TOTAL COMMUNICATION SERVICES | | | 447,017,563 |
| CONSUMER DISCRETIONARY - 6.3% | | | |
| Auto Components - 0.3% | | | |
| Aptiv PLC (a) | | 59,069 | 6,680,113 |
| BorgWarner, Inc. | | 68,067 | 3,218,208 |
| Gentex Corp. (b) | | 68,521 | 2,022,055 |
| Lear Corp. | | 17,159 | 2,501,439 |
| QuantumScape Corp. Class A (a)(b) | | 75,159 | 639,603 |
| | | | 15,061,418 |
| Automobiles - 0.7% | | | |
| Ford Motor Co. | | 1,150,540 | 15,543,795 |
| General Motors Co. | | 413,603 | 16,262,870 |
| Harley-Davidson, Inc. (b) | | 39,229 | 1,805,711 |
| Lucid Group, Inc. Class A (a)(b) | | 9,497 | 111,020 |
| Rivian Automotive, Inc. (a) | | 151,555 | 2,940,167 |
| Thor Industries, Inc. (b) | | 15,054 | 1,435,098 |
| | | | 38,098,661 |
| Distributors - 0.2% | | | |
| Genuine Parts Co. | | 37,216 | 6,245,589 |
| LKQ Corp. | | 72,906 | 4,298,538 |
| | | | 10,544,127 |
| Diversified Consumer Services - 0.1% | | | |
| ADT, Inc. | | 60,934 | 535,610 |
| Bright Horizons Family Solutions, Inc. (a)(b) | | 12,039 | 924,354 |
| Grand Canyon Education, Inc. (a) | | 8,938 | 1,041,813 |
| H&R Block, Inc. | | 7,897 | 307,825 |
| Mister Car Wash, Inc. (a)(b) | | 6,381 | 65,533 |
| Service Corp. International | | 43,619 | 3,234,349 |
| | | | 6,109,484 |
| Hotels, Restaurants & Leisure - 2.0% | | | |
| ARAMARK Holdings Corp. | | 67,610 | 3,010,673 |
| Boyd Gaming Corp. | | 22,266 | 1,387,394 |
| Caesars Entertainment, Inc. (a) | | 18,785 | 977,947 |
| Carnival Corp. (a)(b) | | 284,509 | 3,078,387 |
| Darden Restaurants, Inc. | | 9,641 | 1,426,579 |
| Domino's Pizza, Inc. | | 2,767 | 976,751 |
| Hilton Worldwide Holdings, Inc. | | 21,526 | 3,123,207 |
| Hyatt Hotels Corp. Class A (a) | | 13,805 | 1,506,402 |
| Las Vegas Sands Corp. (a) | | 60,492 | 3,569,028 |
| Marriott Vacations Worldwide Corp. (b) | | 10,904 | 1,745,076 |
| McDonald's Corp. | | 163,342 | 43,677,651 |
| MGM Resorts International | | 93,551 | 3,873,947 |
| Norwegian Cruise Line Holdings Ltd. (a)(b) | | 112,928 | 1,717,635 |
| Penn Entertainment, Inc. (a) | | 45,046 | 1,596,881 |
| Planet Fitness, Inc. (a) | | 6,400 | 541,760 |
| Royal Caribbean Cruises Ltd. (a)(b) | | 64,243 | 4,171,940 |
| Six Flags Entertainment Corp. (a) | | 10,834 | 290,893 |
| Starbucks Corp. | | 214,275 | 23,385,974 |
| Travel+Leisure Co. (b) | | 6,570 | 278,371 |
| Vail Resorts, Inc. | | 627 | 164,487 |
| Wyndham Hotels & Resorts, Inc. | | 7,746 | 600,392 |
| Wynn Resorts Ltd. (a) | | 26,566 | 2,753,300 |
| Yum! Brands, Inc. | | 72,804 | 9,501,650 |
| | | | 113,356,325 |
| Household Durables - 0.5% | | | |
| D.R. Horton, Inc. | | 43,809 | 4,323,510 |
| Garmin Ltd. | | 44,965 | 4,446,139 |
| Leggett & Platt, Inc. (b) | | 38,798 | 1,418,455 |
| Lennar Corp.: | | | |
| Class A | | 72,949 | 7,469,978 |
| Class B | | 4,556 | 393,456 |
| Mohawk Industries, Inc. (a) | | 15,337 | 1,841,360 |
| Newell Brands, Inc. | | 110,086 | 1,756,973 |
| NVR, Inc. (a) | | 238 | 1,254,260 |
| PulteGroup, Inc. | | 40,260 | 2,290,391 |
| Tempur Sealy International, Inc. | | 49,002 | 1,996,832 |
| Toll Brothers, Inc. | | 14,924 | 887,829 |
| TopBuild Corp. (a)(b) | | 1,450 | 290,087 |
| Whirlpool Corp. | | 15,552 | 2,419,736 |
| | | | 30,789,006 |
| Internet & Direct Marketing Retail - 0.2% | | | |
| Doordash, Inc. (a)(b) | | 8,381 | 485,428 |
| eBay, Inc. | | 137,797 | 6,820,952 |
| Lyft, Inc. (a) | | 18,607 | 302,364 |
| Uber Technologies, Inc. (a) | | 75,069 | 2,321,884 |
| Wayfair LLC Class A (a)(b) | | 8,393 | 507,777 |
| | | | 10,438,405 |
| Leisure Products - 0.1% | | | |
| Brunswick Corp. (b) | | 17,402 | 1,467,511 |
| Hasbro, Inc. | | 38,316 | 2,267,158 |
| Mattel, Inc. (a) | | 53,099 | 1,086,406 |
| Peloton Interactive, Inc. Class A (a)(b) | | 89,867 | 1,161,980 |
| Polaris, Inc. (b) | | 4,157 | 477,390 |
| | | | 6,460,445 |
| Multiline Retail - 0.4% | | | |
| Dollar Tree, Inc. (a) | | 42,768 | 6,422,898 |
| Kohl's Corp. | | 33,847 | 1,095,627 |
| Macy's, Inc. (b) | | 78,589 | 1,857,058 |
| Nordstrom, Inc. (b) | | 4,767 | 93,147 |
| Ollie's Bargain Outlet Holdings, Inc. (a) | | 17,268 | 945,596 |
| Target Corp. | | 60,710 | 10,450,619 |
| | | | 20,864,945 |
| Specialty Retail - 1.5% | | | |
| Advance Auto Parts, Inc. | | 16,141 | 2,457,951 |
| AutoNation, Inc. (a)(b) | | 9,831 | 1,245,784 |
| AutoZone, Inc. (a) | | 508 | 1,238,936 |
| Bath & Body Works, Inc. | | 66,725 | 3,070,017 |
| Best Buy Co., Inc. | | 40,277 | 3,573,375 |
| Burlington Stores, Inc. (a) | | 1,209 | 277,864 |
| CarMax, Inc. (a)(b) | | 40,704 | 2,867,597 |
| Dick's Sporting Goods, Inc. | | 15,503 | 2,027,172 |
| GameStop Corp. Class A (b) | | 78,287 | 1,712,137 |
| Gap, Inc. (b) | | 56,720 | 769,690 |
| Leslie's, Inc. (a)(b) | | 5,124 | 79,371 |
| Lithia Motors, Inc. Class A (sub. vtg.) (b) | | 7,907 | 2,081,122 |
| Lowe's Companies, Inc. | | 24,840 | 5,172,930 |
| O'Reilly Automotive, Inc. (a) | | 10,709 | 8,485,276 |
| Penske Automotive Group, Inc. (b) | | 7,521 | 961,334 |
| Petco Health & Wellness Co., Inc. (a)(b) | | 23,495 | 274,657 |
| RH (a) | | 3,470 | 1,082,605 |
| Ross Stores, Inc. | | 57,288 | 6,770,869 |
| The Home Depot, Inc. | | 126,709 | 41,075,257 |
| Victoria's Secret & Co. (a) | | 6,739 | 284,049 |
| Williams-Sonoma, Inc. (b) | | 4,038 | 544,888 |
| | | | 86,052,881 |
| Textiles, Apparel & Luxury Goods - 0.3% | | | |
| Capri Holdings Ltd. (a) | | 36,620 | 2,434,864 |
| Carter's, Inc. (b) | | 10,876 | 906,732 |
| Columbia Sportswear Co. | | 10,502 | 1,007,142 |
| Deckers Outdoor Corp. (a) | | 898 | 383,877 |
| Hanesbrands, Inc. (b) | | 101,623 | 857,698 |
| PVH Corp. | | 18,918 | 1,700,728 |
| Ralph Lauren Corp. (b) | | 11,822 | 1,464,155 |
| Skechers U.S.A., Inc. Class A (sub. vtg.) (a) | | 33,122 | 1,594,824 |
| Tapestry, Inc. | | 61,082 | 2,783,507 |
| Under Armour, Inc.: | | | |
| Class A (sub. vtg.) (a)(b) | | 53,945 | 668,379 |
| Class C (non-vtg.) (a)(b) | | 58,767 | 640,560 |
| VF Corp. | | 101,959 | 3,154,611 |
| | | | 17,597,077 |
TOTAL CONSUMER DISCRETIONARY | | | 355,372,774 |
| CONSUMER STAPLES - 6.9% | | | |
| Beverages - 0.9% | | | |
| Boston Beer Co., Inc. Class A (a) | | 144 | 55,960 |
| Brown-Forman Corp.: | | | |
| Class A (b) | | 6,007 | 399,466 |
| Class B (non-vtg.) | | 21,534 | 1,433,734 |
| Constellation Brands, Inc. Class A (sub. vtg.) | | 44,207 | 10,234,805 |
| Keurig Dr. Pepper, Inc. | | 250,183 | 8,826,456 |
| Molson Coors Beverage Co. Class B | | 51,050 | 2,684,209 |
| Monster Beverage Corp. (a) | | 8,010 | 833,681 |
| PepsiCo, Inc. | | 62,563 | 10,699,524 |
| The Coca-Cola Co. | | 285,004 | 17,476,445 |
| | | | 52,644,280 |
| Food & Staples Retailing - 1.5% | | | |
| Albertsons Companies, Inc. | | 49,080 | 1,040,496 |
| BJ's Wholesale Club Holdings, Inc. (a) | | 14,418 | 1,044,872 |
| Casey's General Stores, Inc. | | 10,809 | 2,549,951 |
| Grocery Outlet Holding Corp. (a) | | 23,816 | 723,768 |
| Kroger Co. | | 191,290 | 8,537,273 |
| Performance Food Group Co. (a) | | 30,644 | 1,879,090 |
| U.S. Foods Holding Corp. (a)(b) | | 58,850 | 2,243,951 |
| Walgreens Boots Alliance, Inc. | | 209,304 | 7,714,945 |
| Walmart, Inc. | | 415,013 | 59,707,920 |
| | | | 85,442,266 |
| Food Products - 1.9% | | | |
| Archer Daniels Midland Co. | | 159,562 | 13,219,712 |
| Bunge Ltd. | | 40,345 | 3,998,190 |
| Campbell Soup Co. | | 56,536 | 2,935,914 |
| Conagra Brands, Inc. | | 137,294 | 5,105,964 |
| Darling Ingredients, Inc. (a) | | 43,441 | 2,879,704 |
| Flowers Foods, Inc. | | 54,652 | 1,513,314 |
| Freshpet, Inc. (a)(b) | | 5,844 | 370,101 |
| General Mills, Inc. | | 173,886 | 13,625,707 |
| Hormel Foods Corp. | | 83,616 | 3,788,641 |
| Ingredion, Inc. | | 19,113 | 1,964,816 |
| Kellogg Co. | | 33,612 | 2,305,111 |
| McCormick & Co., Inc. (non-vtg.) | | 73,118 | 5,492,624 |
| Mondelez International, Inc. | | 398,068 | 26,049,570 |
| Pilgrim's Pride Corp. (a) | | 6,548 | 158,985 |
| Post Holdings, Inc. (a) | | 15,950 | 1,514,453 |
| Seaboard Corp. | | 74 | 290,117 |
| The Hershey Co. | | 5,662 | 1,271,685 |
| The J.M. Smucker Co. | | 30,065 | 4,593,932 |
| The Kraft Heinz Co. | | 203,898 | 8,263,986 |
| Tyson Foods, Inc. Class A | | 83,095 | 5,463,496 |
| | | | 104,806,022 |
| Household Products - 1.3% | | | |
| Church & Dwight Co., Inc. | | 38,738 | 3,132,355 |
| Colgate-Palmolive Co. | | 93,055 | 6,935,389 |
| Kimberly-Clark Corp. | | 39,970 | 5,196,500 |
| Procter & Gamble Co. | | 395,612 | 56,327,237 |
| Reynolds Consumer Products, Inc. (b) | | 15,828 | 471,200 |
| Spectrum Brands Holdings, Inc. | | 11,618 | 788,630 |
| The Clorox Co. (b) | | 6,145 | 889,120 |
| | | | 73,740,431 |
| Personal Products - 0.0% | | | |
| Coty, Inc. Class A (a) | | 102,466 | 1,020,561 |
| Tobacco - 1.3% | | | |
| Altria Group, Inc. | | 523,434 | 23,575,467 |
| Philip Morris International, Inc. | | 452,435 | 47,161,824 |
| | | | 70,737,291 |
TOTAL CONSUMER STAPLES | | | 388,390,851 |
| ENERGY - 8.2% | | | |
| Energy Equipment & Services - 0.7% | | | |
| Baker Hughes Co. Class A | | 274,726 | 8,719,803 |
| Halliburton Co. | | 143,367 | 5,909,588 |
| NOV, Inc. | | 114,139 | 2,789,557 |
| Schlumberger Ltd. | | 412,359 | 23,496,216 |
| | | | 40,915,164 |
| Oil, Gas & Consumable Fuels - 7.5% | | | |
| Antero Midstream GP LP (b) | | 98,034 | 1,068,571 |
| Antero Resources Corp. (a)(b) | | 28,862 | 832,380 |
| APA Corp. | | 93,437 | 4,142,062 |
| Cheniere Energy, Inc. | | 30,858 | 4,714,794 |
| Chesapeake Energy Corp. | | 35,319 | 3,062,864 |
| Chevron Corp. | | 564,692 | 98,267,702 |
| ConocoPhillips Co. | | 363,928 | 44,351,905 |
| Coterra Energy, Inc. | | 191,597 | 4,795,673 |
| Devon Energy Corp. | | 96,962 | 6,131,877 |
| Diamondback Energy, Inc. | | 21,972 | 3,210,549 |
| DT Midstream, Inc. | | 28,258 | 1,544,582 |
| EOG Resources, Inc. | | 45,927 | 6,073,846 |
| EQT Corp. | | 107,482 | 3,511,437 |
| Exxon Mobil Corp. | | 1,203,237 | 139,587,524 |
| Hess Corp. | | 17,824 | 2,676,452 |
| HF Sinclair Corp. (b) | | 39,340 | 2,238,446 |
| Kinder Morgan, Inc. | | 579,776 | 10,609,901 |
| Marathon Oil Corp. | | 184,646 | 5,072,226 |
| Marathon Petroleum Corp. | | 136,584 | 17,553,776 |
| Occidental Petroleum Corp. | | 40,311 | 2,611,750 |
| ONEOK, Inc. (b) | | 115,014 | 7,876,159 |
| Ovintiv, Inc. (b) | | 20,906 | 1,029,202 |
| PDC Energy, Inc. | | 11,882 | 804,768 |
| Phillips 66 Co. | | 137,921 | 13,829,339 |
| Pioneer Natural Resources Co. | | 31,215 | 7,190,375 |
| Range Resources Corp. | | 23,347 | 584,142 |
| Southwestern Energy Co. (a)(b) | | 298,102 | 1,645,523 |
| The Williams Companies, Inc. | | 355,339 | 11,456,129 |
| Valero Energy Corp. | | 112,267 | 15,720,748 |
| Vitesse Energy, Inc. (a)(b) | | 7,024 | 112,103 |
| | | | 422,306,805 |
TOTAL ENERGY | | | 463,221,969 |
| FINANCIALS - 20.4% | | | |
| Banks - 7.4% | | | |
| Bank of America Corp. | | 2,050,675 | 72,757,949 |
| Bank of Hawaii Corp. (b) | | 11,529 | 881,853 |
| Bank OZK (b) | | 32,607 | 1,489,162 |
| BOK Financial Corp. | | 8,463 | 850,532 |
| Citigroup, Inc. | | 565,183 | 29,513,856 |
| Citizens Financial Group, Inc. | | 142,421 | 6,169,678 |
| Comerica, Inc. | | 38,096 | 2,792,818 |
| Commerce Bancshares, Inc. | | 33,153 | 2,206,664 |
| Cullen/Frost Bankers, Inc. | | 17,009 | 2,215,933 |
| East West Bancorp, Inc. | | 41,242 | 3,238,322 |
| Fifth Third Bancorp | | 198,739 | 7,212,238 |
| First Citizens Bancshares, Inc. | | 2,412 | 1,875,764 |
| First Hawaiian, Inc. (b) | | 37,242 | 1,021,920 |
| First Horizon National Corp. | | 154,336 | 3,816,729 |
| First Republic Bank | | 53,037 | 7,471,853 |
| FNB Corp., Pennsylvania | | 101,767 | 1,452,215 |
| Huntington Bancshares, Inc. | | 418,603 | 6,350,208 |
| JPMorgan Chase & Co. | | 851,643 | 119,195,954 |
| KeyCorp | | 271,019 | 5,200,855 |
| M&T Bank Corp. | | 50,149 | 7,823,244 |
| PacWest Bancorp | | 33,883 | 937,204 |
| Pinnacle Financial Partners, Inc. | | 21,854 | 1,720,565 |
| PNC Financial Services Group, Inc. | | 117,530 | 19,442,988 |
| Popular, Inc. | | 20,773 | 1,425,859 |
| Prosperity Bancshares, Inc. (b) | | 25,535 | 1,937,085 |
| Regions Financial Corp. | | 272,636 | 6,417,851 |
| Signature Bank | | 17,147 | 2,211,106 |
| SVB Financial Group (a) | | 6,197 | 1,874,221 |
| Synovus Financial Corp. (b) | | 41,983 | 1,761,187 |
| Truist Financial Corp. | | 388,095 | 19,168,012 |
| U.S. Bancorp | | 391,767 | 19,509,997 |
| Umpqua Holdings Corp. | | 63,000 | 1,146,600 |
| Webster Financial Corp. | | 50,398 | 2,653,455 |
| Wells Fargo & Co. | | 1,107,323 | 51,900,229 |
| Western Alliance Bancorp. | | 11,962 | 901,576 |
| Wintrust Financial Corp. | | 17,471 | 1,598,072 |
| Zions Bancorp NA | | 42,933 | 2,282,318 |
| | | | 420,426,072 |
| Capital Markets - 5.0% | | | |
| Affiliated Managers Group, Inc. | | 10,902 | 1,883,211 |
| Ameriprise Financial, Inc. | | 11,225 | 3,930,097 |
| Bank of New York Mellon Corp. | | 214,295 | 10,836,898 |
| BlackRock, Inc. Class A | | 43,811 | 33,261,749 |
| Carlyle Group LP | | 60,377 | 2,171,761 |
| Cboe Global Markets, Inc. | | 30,878 | 3,794,289 |
| Charles Schwab Corp. | | 197,484 | 15,289,211 |
| CME Group, Inc. | | 104,702 | 18,496,655 |
| Coinbase Global, Inc. (a)(b) | | 46,569 | 2,723,355 |
| Evercore, Inc. Class A | | 10,632 | 1,380,140 |
| Franklin Resources, Inc. (b) | | 83,220 | 2,596,464 |
| Goldman Sachs Group, Inc. | | 95,763 | 35,031,063 |
| Interactive Brokers Group, Inc. | | 27,080 | 2,164,775 |
| Intercontinental Exchange, Inc. | | 161,092 | 17,325,445 |
| Invesco Ltd. | | 108,901 | 2,015,758 |
| Janus Henderson Group PLC | | 39,662 | 1,028,039 |
| Jefferies Financial Group, Inc. (b) | | 58,421 | 2,294,777 |
| KKR & Co. LP (b) | | 166,839 | 9,311,285 |
| Lazard Ltd. Class A (b) | | 24,139 | 967,491 |
| Moody's Corp. | | 2,659 | 858,192 |
| Morgan Stanley | | 359,955 | 35,034,420 |
| Morningstar, Inc. | | 677 | 164,430 |
| MSCI, Inc. | | 5,598 | 2,975,673 |
| NASDAQ, Inc. | | 100,289 | 6,036,395 |
| Northern Trust Corp. | | 59,954 | 5,813,739 |
| Raymond James Financial, Inc. | | 52,226 | 5,889,526 |
| Robinhood Markets, Inc. (a)(b) | | 163,889 | 1,706,084 |
| S&P Global, Inc. | | 95,054 | 35,639,547 |
| SEI Investments Co. | | 29,991 | 1,872,338 |
| State Street Corp. | | 107,023 | 9,774,411 |
| Stifel Financial Corp. | | 30,127 | 2,030,861 |
| T. Rowe Price Group, Inc. (b) | | 64,181 | 7,475,161 |
| Tradeweb Markets, Inc. Class A | | 11,556 | 861,384 |
| Virtu Financial, Inc. Class A | | 27,508 | 531,179 |
| | | | 283,165,803 |
| Consumer Finance - 1.1% | | | |
| Ally Financial, Inc. (b) | | 87,024 | 2,827,410 |
| American Express Co. | | 164,705 | 28,811,846 |
| Capital One Financial Corp. | | 111,098 | 13,220,662 |
| Credit Acceptance Corp. (a)(b) | | 1,762 | 815,172 |
| Discover Financial Services | | 79,599 | 9,291,591 |
| OneMain Holdings, Inc. (b) | | 33,473 | 1,444,025 |
| SLM Corp. (b) | | 72,928 | 1,281,345 |
| SoFi Technologies, Inc. (a)(b) | | 234,936 | 1,628,106 |
| Synchrony Financial | | 130,958 | 4,810,087 |
| Upstart Holdings, Inc. (a)(b) | | 16,634 | 310,723 |
| | | | 64,440,967 |
| Diversified Financial Services - 3.1% | | | |
| Apollo Global Management, Inc. | | 33,568 | 2,375,943 |
| Berkshire Hathaway, Inc. Class B (a) | | 526,764 | 164,097,520 |
| Corebridge Financial, Inc. | | 23,383 | 508,814 |
| Equitable Holdings, Inc. | | 107,497 | 3,447,429 |
| Voya Financial, Inc. (b) | | 28,382 | 1,980,212 |
| | | | 172,409,918 |
| Insurance - 3.6% | | | |
| AFLAC, Inc. | | 179,886 | 13,221,621 |
| Allstate Corp. | | 77,110 | 9,906,322 |
| American Financial Group, Inc. | | 19,622 | 2,797,901 |
| American International Group, Inc. | | 216,917 | 13,713,493 |
| Aon PLC | | 3,469 | 1,105,501 |
| Arch Capital Group Ltd. (a) | | 69,733 | 4,487,319 |
| Arthur J. Gallagher & Co. | | 53,774 | 10,524,647 |
| Assurant, Inc. | | 14,570 | 1,931,836 |
| Assured Guaranty Ltd. | | 16,794 | 1,051,304 |
| Axis Capital Holdings Ltd. (b) | | 22,689 | 1,419,651 |
| Brighthouse Financial, Inc. (a) | | 20,010 | 1,125,963 |
| Brown & Brown, Inc. | | 63,705 | 3,730,565 |
| Chubb Ltd. | | 121,338 | 27,603,182 |
| Cincinnati Financial Corp. | | 44,713 | 5,059,276 |
| CNA Financial Corp. | | 7,955 | 346,520 |
| Erie Indemnity Co. Class A | | 1,901 | 464,509 |
| Everest Re Group Ltd. | | 7,843 | 2,742,619 |
| F&G Annuities & Life, Inc. | | 5,274 | 113,180 |
| Fidelity National Financial, Inc. (b) | | 75,754 | 3,335,449 |
| First American Financial Corp. (b) | | 29,418 | 1,820,092 |
| Globe Life, Inc. | | 26,080 | 3,151,768 |
| Hanover Insurance Group, Inc. | | 10,321 | 1,389,000 |
| Hartford Financial Services Group, Inc. | | 92,612 | 7,187,617 |
| Kemper Corp. (b) | | 18,520 | 1,087,680 |
| Lincoln National Corp. | | 39,233 | 1,390,025 |
| Loews Corp. | | 57,301 | 3,522,865 |
| Markel Corp. (a) | | 3,004 | 4,232,576 |
| Marsh & McLennan Companies, Inc. | | 15,474 | 2,706,557 |
| MetLife, Inc. | | 192,835 | 14,080,812 |
| Old Republic International Corp. (b) | | 81,421 | 2,148,700 |
| Primerica, Inc. (b) | | 10,690 | 1,729,108 |
| Principal Financial Group, Inc. | | 70,631 | 6,536,899 |
| Progressive Corp. | | 22,158 | 3,021,243 |
| Prudential Financial, Inc. | | 107,429 | 11,273,599 |
| Reinsurance Group of America, Inc. | | 19,487 | 2,957,542 |
| RenaissanceRe Holdings Ltd. (b) | | 5,687 | 1,112,889 |
| The Travelers Companies, Inc. | | 68,275 | 13,048,718 |
| Unum Group | | 57,788 | 2,428,830 |
| W.R. Berkley Corp. | | 60,041 | 4,211,276 |
| White Mountains Insurance Group Ltd. (b) | | 729 | 1,113,883 |
| Willis Towers Watson PLC | | 31,401 | 7,981,820 |
| | | | 202,814,357 |
| Mortgage Real Estate Investment Trusts - 0.1% | | | |
| AGNC Investment Corp. (b) | | 166,361 | 1,929,788 |
| Annaly Capital Management, Inc. | | 136,318 | 3,199,383 |
| Rithm Capital Corp. | | 126,253 | 1,188,041 |
| Starwood Property Trust, Inc. | | 85,169 | 1,779,180 |
| | | | 8,096,392 |
| Thrifts & Mortgage Finance - 0.1% | | | |
| MGIC Investment Corp. | | 86,128 | 1,216,127 |
| New York Community Bancorp, Inc. (b) | | 195,194 | 1,949,988 |
| Rocket Companies, Inc. (b) | | 14,405 | 135,551 |
| TFS Financial Corp. (b) | | 14,708 | 209,589 |
| UWM Holdings Corp. Class A (b) | | 2,515 | 11,519 |
| | | | 3,522,774 |
TOTAL FINANCIALS | | | 1,154,876,283 |
| HEALTH CARE - 16.3% | | | |
| Biotechnology - 1.8% | | | |
| Amgen, Inc. | | 24,944 | 6,295,866 |
| Biogen, Inc. (a) | | 41,816 | 12,164,274 |
| BioMarin Pharmaceutical, Inc. (a) | | 53,822 | 6,208,368 |
| Exact Sciences Corp. (a)(b) | | 41,753 | 2,819,163 |
| Exelixis, Inc. (a) | | 12,450 | 219,369 |
| Gilead Sciences, Inc. | | 366,507 | 30,764,598 |
| Horizon Therapeutics PLC (a) | | 4,518 | 495,715 |
| Incyte Corp. (a) | | 7,179 | 611,220 |
| Ionis Pharmaceuticals, Inc. (a) | | 3,326 | 132,608 |
| Mirati Therapeutics, Inc. (a)(b) | | 13,012 | 694,971 |
| Moderna, Inc. (a) | | 91,058 | 16,031,671 |
| Natera, Inc. (a) | | 2,048 | 87,921 |
| Regeneron Pharmaceuticals, Inc. (a) | | 25,844 | 19,601,899 |
| Repligen Corp. (a) | | 4,644 | 860,533 |
| Ultragenyx Pharmaceutical, Inc. (a) | | 4,355 | 197,412 |
| United Therapeutics Corp. (a) | | 13,007 | 3,423,052 |
| Vertex Pharmaceuticals, Inc. (a) | | 4,179 | 1,350,235 |
| | | | 101,958,875 |
| Health Care Equipment & Supplies - 3.3% | | | |
| Abbott Laboratories | | 434,577 | 48,042,487 |
| Align Technology, Inc. (a) | | 5,721 | 1,543,125 |
| Baxter International, Inc. | | 123,946 | 5,663,093 |
| Becton, Dickinson & Co. | | 82,897 | 20,908,281 |
| Boston Scientific Corp. (a) | | 416,577 | 19,266,686 |
| Dentsply Sirona, Inc. | | 62,484 | 2,301,286 |
| Enovis Corp. (a)(b) | | 14,760 | 929,142 |
| Envista Holdings Corp. (a) | | 47,461 | 1,850,504 |
| GE HealthCare Technologies, Inc. (a) | | 100,608 | 6,994,268 |
| Globus Medical, Inc. (a) | | 20,778 | 1,568,739 |
| Hologic, Inc. (a) | | 71,748 | 5,838,135 |
| ICU Medical, Inc. (a)(b) | | 4,787 | 924,992 |
| Integra LifeSciences Holdings Corp. (a) | | 21,116 | 1,209,947 |
| Intuitive Surgical, Inc. (a) | | 8,125 | 1,996,231 |
| Masimo Corp. (a) | | 3,250 | 552,760 |
| Medtronic PLC | | 390,246 | 32,659,688 |
| QuidelOrtho Corp. (a) | | 14,216 | 1,217,032 |
| STERIS PLC | | 29,107 | 6,010,887 |
| Stryker Corp. | | 47,697 | 12,105,976 |
| Tandem Diabetes Care, Inc. (a) | | 1,258 | 51,251 |
| Teleflex, Inc. | | 13,684 | 3,330,959 |
| The Cooper Companies, Inc. | | 14,170 | 4,944,338 |
| Zimmer Biomet Holdings, Inc. | | 61,199 | 7,793,081 |
| | | | 187,702,888 |
| Health Care Providers & Services - 3.1% | | | |
| Acadia Healthcare Co., Inc. (a) | | 25,967 | 2,181,747 |
| agilon health, Inc. (a)(b) | | 3,646 | 79,337 |
| Amedisys, Inc. (a) | | 9,323 | 901,161 |
| Cardinal Health, Inc. | | 76,432 | 5,904,372 |
| Centene Corp. (a) | | 165,874 | 12,646,234 |
| Chemed Corp. | | 2,743 | 1,385,599 |
| Cigna Corp. | | 73,497 | 23,274,295 |
| CVS Health Corp. | | 382,728 | 33,764,264 |
| Elevance Health, Inc. | | 48,985 | 24,492,010 |
| Encompass Health Corp. | | 28,555 | 1,783,260 |
| Enhabit Home Health & Hospice (a)(b) | | 14,412 | 221,368 |
| HCA Holdings, Inc. | | 59,144 | 15,085,860 |
| Henry Schein, Inc. (a) | | 39,428 | 3,396,722 |
| Humana, Inc. | | 10,849 | 5,551,433 |
| Laboratory Corp. of America Holdings | | 25,829 | 6,512,007 |
| McKesson Corp. | | 33,296 | 12,608,529 |
| Molina Healthcare, Inc. (a) | | 3,742 | 1,166,868 |
| Oak Street Health, Inc. (a)(b) | | 33,969 | 987,139 |
| Premier, Inc. | | 34,323 | 1,145,015 |
| Quest Diagnostics, Inc. | | 33,106 | 4,915,579 |
| Signify Health, Inc. (a) | | 22,307 | 634,857 |
| Tenet Healthcare Corp. (a) | | 30,996 | 1,700,131 |
| UnitedHealth Group, Inc. | | 24,579 | 12,269,591 |
| Universal Health Services, Inc. Class B | | 18,093 | 2,681,564 |
| | | | 175,288,942 |
| Health Care Technology - 0.1% | | | |
| Certara, Inc. (a) | | 12,076 | 234,274 |
| Definitive Healthcare Corp. (a)(b) | | 5,014 | 62,073 |
| Doximity, Inc. (a)(b) | | 17,397 | 613,592 |
| Teladoc Health, Inc. (a)(b) | | 42,314 | 1,244,032 |
| | | | 2,153,971 |
| Life Sciences Tools & Services - 2.3% | | | |
| 10X Genomics, Inc. (a) | | 2,749 | 128,736 |
| Agilent Technologies, Inc. | | 8,802 | 1,338,608 |
| Avantor, Inc. (a) | | 12,628 | 301,809 |
| Azenta, Inc. (a) | | 21,596 | 1,207,216 |
| Bio-Rad Laboratories, Inc. Class A (a) | | 6,235 | 2,914,613 |
| Charles River Laboratories International, Inc. (a) | | 989 | 240,574 |
| Danaher Corp. | | 176,155 | 46,571,859 |
| Illumina, Inc. (a) | | 45,858 | 9,822,784 |
| PerkinElmer, Inc. | | 36,789 | 5,059,591 |
| QIAGEN NV (a) | | 66,156 | 3,241,644 |
| Syneos Health, Inc. (a) | | 24,651 | 885,464 |
| Thermo Fisher Scientific, Inc. | | 100,305 | 57,206,951 |
| | | | 128,919,849 |
| Pharmaceuticals - 5.7% | | | |
| Bristol-Myers Squibb Co. | | 621,821 | 45,175,296 |
| Catalent, Inc. (a) | | 35,539 | 1,903,113 |
| Elanco Animal Health, Inc. (a)(b) | | 129,846 | 1,782,786 |
| Eli Lilly & Co. | | 45,759 | 15,747,960 |
| Jazz Pharmaceuticals PLC (a) | | 17,953 | 2,812,517 |
| Johnson & Johnson | | 768,421 | 125,575,360 |
| Merck & Co., Inc. | | 429,136 | 46,093,498 |
| Organon & Co. | | 74,106 | 2,232,814 |
| Perrigo Co. PLC | | 39,159 | 1,465,330 |
| Pfizer, Inc. | | 1,650,240 | 72,874,598 |
| Royalty Pharma PLC | | 108,475 | 4,251,135 |
| Viatris, Inc. | | 353,420 | 4,297,587 |
| | | | 324,211,994 |
TOTAL HEALTH CARE | | | 920,236,519 |
| INDUSTRIALS - 10.3% | | | |
| Aerospace & Defense - 2.4% | | | |
| Axon Enterprise, Inc. (a) | | 4,452 | 870,099 |
| BWX Technologies, Inc. | | 16,240 | 988,366 |
| Curtiss-Wright Corp. (b) | | 11,166 | 1,851,323 |
| General Dynamics Corp. | | 71,014 | 16,550,523 |
| HEICO Corp. (b) | | 570 | 97,442 |
| HEICO Corp. Class A | | 1,783 | 238,351 |
| Hexcel Corp. (b) | | 24,435 | 1,724,622 |
| Howmet Aerospace, Inc. | | 97,627 | 3,972,443 |
| Huntington Ingalls Industries, Inc. | | 8,953 | 1,974,495 |
| L3Harris Technologies, Inc. | | 55,441 | 11,909,836 |
| Mercury Systems, Inc. (a) | | 14,342 | 716,885 |
| Northrop Grumman Corp. | | 37,739 | 16,908,582 |
| Raytheon Technologies Corp. | | 429,166 | 42,852,225 |
| Spirit AeroSystems Holdings, Inc. Class A (b) | | 1,570 | 56,756 |
| Textron, Inc. | | 60,818 | 4,430,591 |
| The Boeing Co. (a) | | 110,235 | 23,480,055 |
| TransDigm Group, Inc. | | 9,183 | 6,591,098 |
| Woodward, Inc. | | 17,163 | 1,755,088 |
| | | | 136,968,780 |
| Air Freight & Logistics - 0.4% | | | |
| C.H. Robinson Worldwide, Inc. | | 24,744 | 2,478,606 |
| Expeditors International of Washington, Inc. | | 31,972 | 3,457,772 |
| FedEx Corp. | | 70,079 | 13,585,515 |
| GXO Logistics, Inc. (a) | | 27,443 | 1,436,092 |
| United Parcel Service, Inc. Class B | | 23,181 | 4,293,817 |
| | | | 25,251,802 |
| Airlines - 0.3% | | | |
| Alaska Air Group, Inc. (a) | | 36,078 | 1,852,245 |
| American Airlines Group, Inc. (a) | | 188,358 | 3,040,098 |
| Copa Holdings SA Class A (a)(b) | | 8,366 | 770,341 |
| JetBlue Airways Corp. (a) | | 93,516 | 748,128 |
| Southwest Airlines Co. | | 172,746 | 6,179,124 |
| United Airlines Holdings, Inc. (a) | | 95,136 | 4,657,859 |
| | | | 17,247,795 |
| Building Products - 0.9% | | | |
| A.O. Smith Corp. (b) | | 27,690 | 1,874,613 |
| Allegion PLC | | 5,314 | 624,661 |
| Armstrong World Industries, Inc. | | 5,572 | 431,329 |
| Builders FirstSource, Inc. (a)(b) | | 42,412 | 3,380,236 |
| Carlisle Companies, Inc. | | 2,354 | 590,524 |
| Carrier Global Corp. | | 243,817 | 11,100,988 |
| Fortune Brands Home & Security, Inc. (b) | | 24,658 | 1,590,688 |
| Hayward Holdings, Inc. (a)(b) | | 19,640 | 264,944 |
| Johnson Controls International PLC | | 200,960 | 13,980,787 |
| Lennox International, Inc. (b) | | 9,316 | 2,427,936 |
| Masco Corp. | | 62,289 | 3,313,775 |
| MasterBrand, Inc. (a) | | 24,930 | 229,356 |
| Owens Corning | | 27,204 | 2,629,267 |
| The AZEK Co., Inc. (a)(b) | | 32,431 | 782,560 |
| Trane Technologies PLC | | 28,086 | 5,030,764 |
| | | | 48,252,428 |
| Commercial Services & Supplies - 0.3% | | | |
| Cintas Corp. | | 1,693 | 751,252 |
| Clean Harbors, Inc. (a)(b) | | 14,865 | 1,936,910 |
| Driven Brands Holdings, Inc. (a) | | 17,083 | 498,653 |
| IAA, Inc. (a) | | 6,675 | 278,548 |
| MSA Safety, Inc. | | 6,610 | 901,538 |
| Republic Services, Inc. | | 56,313 | 7,028,989 |
| Rollins, Inc. | | 4,932 | 179,525 |
| Stericycle, Inc. (a) | | 26,728 | 1,438,234 |
| Tetra Tech, Inc. | | 9,032 | 1,404,657 |
| Waste Management, Inc. | | 7,547 | 1,167,747 |
| | | | 15,586,053 |
| Construction & Engineering - 0.2% | | | |
| AECOM | | 36,062 | 3,147,131 |
| MasTec, Inc. (a) | | 17,776 | 1,746,136 |
| MDU Resources Group, Inc. | | 58,906 | 1,820,784 |
| Quanta Services, Inc. | | 18,842 | 2,867,564 |
| Valmont Industries, Inc. | | 5,275 | 1,739,326 |
| Willscot Mobile Mini Holdings (a) | | 27,756 | 1,345,056 |
| | | | 12,665,997 |
| Electrical Equipment - 1.0% | | | |
| Acuity Brands, Inc. | | 9,348 | 1,762,285 |
| AMETEK, Inc. | | 67,215 | 9,740,798 |
| Eaton Corp. PLC | | 116,525 | 18,901,520 |
| Emerson Electric Co. | | 117,383 | 10,590,294 |
| Hubbell, Inc. Class B | | 15,617 | 3,574,887 |
| nVent Electric PLC | | 48,173 | 1,914,877 |
| Plug Power, Inc. (a)(b) | | 76,185 | 1,296,669 |
| Regal Rexnord Corp. | | 19,294 | 2,685,725 |
| Rockwell Automation, Inc. | | 10,889 | 3,071,025 |
| Sensata Technologies, Inc. PLC | | 44,095 | 2,242,231 |
| Sunrun, Inc. (a) | | 60,737 | 1,596,168 |
| Vertiv Holdings Co. (b) | | 74,534 | 1,059,873 |
| | | | 58,436,352 |
| Industrial Conglomerates - 1.3% | | | |
| 3M Co. | | 160,945 | 18,521,551 |
| General Electric Co. | | 301,824 | 24,290,796 |
| Honeywell International, Inc. | | 138,922 | 28,962,459 |
| | | | 71,774,806 |
| Machinery - 2.0% | | | |
| AGCO Corp. | | 15,712 | 2,170,299 |
| Allison Transmission Holdings, Inc. | | 5,615 | 253,124 |
| Caterpillar, Inc. | | 19,600 | 4,944,884 |
| Crane Holdings Co. (b) | | 13,717 | 1,589,937 |
| Cummins, Inc. | | 41,116 | 10,260,087 |
| Donaldson Co., Inc. (b) | | 29,928 | 1,866,011 |
| Dover Corp. | | 40,857 | 6,203,318 |
| ESAB Corp. (b) | | 14,780 | 854,432 |
| Flowserve Corp. | | 37,968 | 1,306,859 |
| Fortive Corp. | | 103,288 | 7,026,683 |
| Gates Industrial Corp. PLC (a) | | 31,453 | 415,494 |
| Graco, Inc. | | 15,370 | 1,050,078 |
| IDEX Corp. | | 18,213 | 4,365,292 |
| Illinois Tool Works, Inc. | | 9,012 | 2,127,192 |
| Ingersoll Rand, Inc. | | 118,488 | 6,635,328 |
| ITT, Inc. | | 24,343 | 2,229,575 |
| Middleby Corp. (a) | | 14,517 | 2,256,668 |
| Nordson Corp. | | 12,778 | 3,108,887 |
| Oshkosh Corp. (b) | | 19,149 | 1,929,836 |
| Otis Worldwide Corp. | | 106,789 | 8,781,259 |
| PACCAR, Inc. | | 99,532 | 10,879,843 |
| Parker Hannifin Corp. | | 28,861 | 9,408,686 |
| Pentair PLC (b) | | 47,983 | 2,657,299 |
| Snap-On, Inc. | | 15,336 | 3,814,523 |
| Stanley Black & Decker, Inc. | | 43,068 | 3,846,403 |
| Timken Co. (b) | | 17,834 | 1,468,630 |
| Westinghouse Air Brake Tech Co. | | 52,799 | 5,481,064 |
| Xylem, Inc. | | 44,932 | 4,673,377 |
| | | | 111,605,068 |
| Marine - 0.0% | | | |
| Kirby Corp. (a) | | 17,406 | 1,231,997 |
| Professional Services - 0.6% | | | |
| CACI International, Inc. Class A (a) | | 6,756 | 2,081,456 |
| Clarivate Analytics PLC (a)(b) | | 137,640 | 1,530,557 |
| CoStar Group, Inc. (a) | | 100,830 | 7,854,657 |
| Dun & Bradstreet Holdings, Inc. | | 73,313 | 1,074,035 |
| Equifax, Inc. (b) | | 17,727 | 3,938,939 |
| FTI Consulting, Inc. (a)(b) | | 5,700 | 909,264 |
| Jacobs Solutions, Inc. | | 37,278 | 4,605,697 |
| KBR, Inc. | | 13,988 | 716,605 |
| Leidos Holdings, Inc. | | 39,729 | 3,926,814 |
| Manpower, Inc. | | 14,654 | 1,277,243 |
| Robert Half International, Inc. | | 3,637 | 305,363 |
| Science Applications International Corp. (b) | | 16,031 | 1,663,697 |
| TransUnion Holding Co., Inc. (b) | | 14,985 | 1,075,174 |
| | | | 30,959,501 |
| Road & Rail - 0.7% | | | |
| Avis Budget Group, Inc. (a) | | 7,447 | 1,489,698 |
| CSX Corp. | | 458,660 | 14,181,767 |
| Hertz Global Holdings, Inc. (a) | | 55,057 | 992,127 |
| J.B. Hunt Transport Services, Inc. | | 2,619 | 495,122 |
| Knight-Swift Transportation Holdings, Inc. Class A | | 45,495 | 2,688,755 |
| Landstar System, Inc. | | 1,134 | 195,989 |
| Norfolk Southern Corp. | | 67,437 | 16,576,689 |
| RXO, Inc. (a) | | 27,579 | 505,247 |
| Ryder System, Inc. | | 14,167 | 1,337,506 |
| Schneider National, Inc. Class B | | 15,748 | 417,322 |
| U-Haul Holding Co. (b) | | 2,682 | 179,774 |
| U-Haul Holding Co. (non-vtg.) (b) | | 23,548 | 1,455,031 |
| XPO, Inc. (a)(b) | | 27,582 | 1,099,419 |
| | | | 41,614,446 |
| Trading Companies & Distributors - 0.2% | | | |
| Air Lease Corp. Class A (b) | | 30,295 | 1,362,366 |
| Core & Main, Inc. (a)(b) | | 13,670 | 301,697 |
| MSC Industrial Direct Co., Inc. Class A (b) | | 13,475 | 1,114,383 |
| SiteOne Landscape Supply, Inc. (a)(b) | | 5,085 | 770,428 |
| United Rentals, Inc. | | 11,020 | 4,859,269 |
| Univar Solutions, Inc. (a) | | 46,888 | 1,616,698 |
| Watsco, Inc. (b) | | 4,525 | 1,300,349 |
| WESCO International, Inc. (a) | | 6,118 | 911,643 |
| | | | 12,236,833 |
TOTAL INDUSTRIALS | | | 583,831,858 |
| INFORMATION TECHNOLOGY - 8.6% | | | |
| Communications Equipment - 1.4% | | | |
| Ciena Corp. (a) | | 42,964 | 2,234,987 |
| Cisco Systems, Inc. | | 1,199,882 | 58,398,257 |
| F5, Inc. (a) | | 17,362 | 2,563,673 |
| Juniper Networks, Inc. | | 93,191 | 3,010,069 |
| Lumentum Holdings, Inc. (a) | | 19,858 | 1,195,054 |
| Motorola Solutions, Inc. | | 48,033 | 12,344,961 |
| Ubiquiti, Inc. | | 869 | 253,887 |
| ViaSat, Inc. (a)(b) | | 20,949 | 721,693 |
| | | | 80,722,581 |
| Electronic Equipment & Components - 0.6% | | | |
| Amphenol Corp. Class A | | 42,031 | 3,352,813 |
| Arrow Electronics, Inc. (a) | | 16,973 | 1,994,158 |
| Avnet, Inc. | | 26,521 | 1,216,783 |
| Cognex Corp. | | 3,459 | 189,346 |
| Coherent Corp. (a) | | 29,133 | 1,264,372 |
| Corning, Inc. | | 207,263 | 7,173,372 |
| IPG Photonics Corp. (a) | | 9,508 | 1,065,847 |
| Jabil, Inc. | | 7,054 | 554,656 |
| Keysight Technologies, Inc. (a) | | 3,869 | 693,905 |
| Littelfuse, Inc. | | 7,049 | 1,809,408 |
| National Instruments Corp. | | 33,177 | 1,791,558 |
| TD SYNNEX Corp. | | 13,616 | 1,390,874 |
| Teledyne Technologies, Inc. (a) | | 13,507 | 5,730,480 |
| Trimble, Inc. (a) | | 71,805 | 4,168,998 |
| Vontier Corp. | | 17,353 | 399,640 |
| Zebra Technologies Corp. Class A (a) | | 8,880 | 2,807,678 |
| | | | 35,603,888 |
| IT Services - 2.3% | | | |
| Affirm Holdings, Inc. (a)(b) | | 63,437 | 1,027,045 |
| Akamai Technologies, Inc. (a) | | 45,179 | 4,018,672 |
| Amdocs Ltd. | | 35,231 | 3,238,786 |
| Automatic Data Processing, Inc. | | 9,997 | 2,257,423 |
| Block, Inc. Class A (a) | | 156,415 | 12,782,234 |
| Broadridge Financial Solutions, Inc. | | 3,130 | 470,627 |
| Cognizant Technology Solutions Corp. Class A | | 149,719 | 9,993,743 |
| Concentrix Corp. | | 12,396 | 1,757,877 |
| DXC Technology Co. (a) | | 67,084 | 1,927,323 |
| Euronet Worldwide, Inc. (a) | | 3,415 | 384,802 |
| Fidelity National Information Services, Inc. | | 173,006 | 12,982,370 |
| Fiserv, Inc. (a) | | 156,229 | 16,666,510 |
| Genpact Ltd. (b) | | 24,849 | 1,174,861 |
| Global Payments, Inc. | | 78,284 | 8,824,172 |
| GoDaddy, Inc. (a) | | 39,338 | 3,230,830 |
| IBM Corp. | | 87,236 | 11,753,306 |
| Kyndryl Holdings, Inc. (a)(b) | | 59,591 | 797,923 |
| Okta, Inc. (a) | | 38,118 | 2,805,866 |
| PayPal Holdings, Inc. (a) | | 230,271 | 18,764,784 |
| Snowflake, Inc. (a) | | 5,726 | 895,775 |
| SS&C Technologies Holdings, Inc. | | 64,348 | 3,883,402 |
| The Western Union Co. (b) | | 74,515 | 1,055,878 |
| Twilio, Inc. Class A (a) | | 31,598 | 1,890,824 |
| VeriSign, Inc. (a) | | 24,168 | 5,269,832 |
| WEX, Inc. (a) | | 3,502 | 647,765 |
| Wix.com Ltd. (a)(b) | | 3,577 | 311,127 |
| | | | 128,813,757 |
| Semiconductors & Semiconductor Equipment - 2.3% | | | |
| Advanced Micro Devices, Inc. (a) | | 99,976 | 7,513,196 |
| Analog Devices, Inc. | | 119,685 | 20,522,387 |
| Cirrus Logic, Inc. (a)(b) | | 15,978 | 1,444,251 |
| First Solar, Inc. (a) | | 30,983 | 5,502,581 |
| GlobalFoundries, Inc. (a)(b) | | 14,016 | 830,868 |
| Intel Corp. | | 1,194,826 | 33,765,783 |
| Marvell Technology, Inc. | | 247,581 | 10,683,120 |
| Microchip Technology, Inc. | | 22,672 | 1,759,801 |
| Micron Technology, Inc. | | 257,087 | 15,502,346 |
| MKS Instruments, Inc. | | 16,709 | 1,709,665 |
| onsemi (a) | | 47,586 | 3,495,192 |
| Qorvo, Inc. (a) | | 29,490 | 3,204,383 |
| Skyworks Solutions, Inc. | | 46,906 | 5,144,181 |
| Teradyne, Inc. | | 4,248 | 432,022 |
| Texas Instruments, Inc. | | 83,464 | 14,790,655 |
| Wolfspeed, Inc. (a)(b) | | 35,910 | 2,765,429 |
| | | | 129,065,860 |
| Software - 1.7% | | | |
| ANSYS, Inc. (a) | | 11,999 | 3,196,054 |
| Bill.Com Holdings, Inc. (a) | | 28,839 | 3,334,365 |
| Black Knight, Inc. (a) | | 40,878 | 2,476,798 |
| CCC Intelligent Solutions Holdings, Inc. Class A (a) | | 30,674 | 283,735 |
| Ceridian HCM Holding, Inc. (a) | | 32,323 | 2,336,306 |
| Coupa Software, Inc. (a) | | 9,741 | 778,501 |
| Dolby Laboratories, Inc. Class A | | 17,792 | 1,415,532 |
| DoubleVerify Holdings, Inc. (a) | | 2,872 | 78,090 |
| Dropbox, Inc. Class A (a) | | 5,382 | 125,024 |
| Gen Digital, Inc. | | 104,732 | 2,409,883 |
| Guidewire Software, Inc. (a) | | 23,896 | 1,750,143 |
| Informatica, Inc. (a)(b) | | 8,995 | 160,111 |
| Jamf Holding Corp. (a) | | 2,736 | 54,364 |
| Manhattan Associates, Inc. (a) | | 6,928 | 903,134 |
| nCino, Inc. (a)(b) | | 16,279 | 465,579 |
| NCR Corp. (a)(b) | | 35,137 | 963,457 |
| Nutanix, Inc. Class A (a) | | 32,074 | 893,902 |
| Oracle Corp. | | 139,692 | 12,357,154 |
| Paycor HCM, Inc. (a)(b) | | 15,959 | 400,730 |
| Procore Technologies, Inc. (a)(b) | | 5,812 | 325,181 |
| Roper Technologies, Inc. | | 30,812 | 13,149,021 |
| Salesforce.com, Inc. (a) | | 220,861 | 37,098,022 |
| SentinelOne, Inc. (a)(b) | | 16,526 | 249,377 |
| Teradata Corp. (a)(b) | | 13,659 | 476,426 |
| Tyler Technologies, Inc. (a) | | 1,523 | 491,579 |
| UiPath, Inc. Class A (a) | | 99,808 | 1,533,051 |
| Unity Software, Inc. (a)(b) | | 23,662 | 840,474 |
| VMware, Inc. Class A (a) | | 31,642 | 3,875,196 |
| Zoom Video Communications, Inc. Class A (a) | | 36,535 | 2,740,125 |
| | | | 95,161,314 |
| Technology Hardware, Storage & Peripherals - 0.3% | | | |
| Dell Technologies, Inc. | | 62,413 | 2,535,216 |
| Hewlett Packard Enterprise Co. | | 374,946 | 6,047,879 |
| HP, Inc. | | 158,835 | 4,628,452 |
| Western Digital Corp. (a) | | 92,708 | 4,074,517 |
| | | | 17,286,064 |
TOTAL INFORMATION TECHNOLOGY | | | 486,653,464 |
| MATERIALS - 4.5% | | | |
| Chemicals - 2.7% | | | |
| Air Products & Chemicals, Inc. | | 64,636 | 20,716,484 |
| Albemarle Corp. | | 16,558 | 4,660,249 |
| Ashland, Inc. | | 14,770 | 1,613,918 |
| Axalta Coating Systems Ltd. (a)(b) | | 48,740 | 1,467,074 |
| Celanese Corp. Class A | | 31,585 | 3,891,272 |
| Corteva, Inc. | | 208,708 | 13,451,231 |
| Dow, Inc. | | 205,488 | 12,195,713 |
| DuPont de Nemours, Inc. | | 146,298 | 10,818,737 |
| Eastman Chemical Co. | | 34,879 | 3,075,281 |
| Ecolab, Inc. | | 8,469 | 1,311,255 |
| Element Solutions, Inc. | | 65,737 | 1,346,294 |
| FMC Corp. | | 24,173 | 3,218,151 |
| Ginkgo Bioworks Holdings, Inc. Class A (a)(b) | | 206,207 | 402,104 |
| Huntsman Corp. (b) | | 53,166 | 1,684,831 |
| International Flavors & Fragrances, Inc. | | 74,344 | 8,360,726 |
| Linde PLC | | 113,961 | 37,714,253 |
| LyondellBasell Industries NV Class A | | 74,963 | 7,248,172 |
| NewMarket Corp. | | 1,699 | 585,322 |
| Olin Corp. | | 36,807 | 2,377,364 |
| PPG Industries, Inc. | | 32,239 | 4,202,031 |
| RPM International, Inc. (b) | | 35,322 | 3,175,801 |
| The Chemours Co. LLC (b) | | 17,347 | 631,257 |
| The Mosaic Co. | | 86,991 | 4,309,534 |
| The Scotts Miracle-Gro Co. Class A (b) | | 7,742 | 558,895 |
| Westlake Corp. (b) | | 9,625 | 1,181,469 |
| | | | 150,197,418 |
| Construction Materials - 0.2% | | | |
| Eagle Materials, Inc. | | 1,813 | 264,843 |
| Martin Marietta Materials, Inc. | | 16,544 | 5,949,884 |
| Vulcan Materials Co. | | 19,772 | 3,624,801 |
| | | | 9,839,528 |
| Containers & Packaging - 0.5% | | | |
| Amcor PLC | | 437,511 | 5,276,383 |
| Aptargroup, Inc. (b) | | 19,096 | 2,208,261 |
| Ardagh Group SA (a) | | 5,448 | 58,457 |
| Ardagh Metal Packaging SA (b) | | 29,006 | 163,014 |
| Avery Dennison Corp. | | 9,143 | 1,732,050 |
| Ball Corp. | | 54,150 | 3,153,696 |
| Berry Global Group, Inc. | | 18,882 | 1,165,586 |
| Crown Holdings, Inc. | | 3,995 | 352,199 |
| Graphic Packaging Holding Co. | | 20,427 | 492,086 |
| International Paper Co. | | 103,599 | 4,332,510 |
| Packaging Corp. of America | | 26,616 | 3,798,103 |
| Silgan Holdings, Inc. | | 24,524 | 1,321,598 |
| Sonoco Products Co. | | 28,381 | 1,734,363 |
| WestRock Co. | | 73,920 | 2,900,621 |
| | | | 28,688,927 |
| Metals & Mining - 1.1% | | | |
| Alcoa Corp. | | 51,555 | 2,693,233 |
| Cleveland-Cliffs, Inc. (a) | | 149,027 | 3,181,726 |
| Freeport-McMoRan, Inc. | | 416,065 | 18,564,820 |
| Newmont Corp. | | 231,872 | 12,272,985 |
| Nucor Corp. (b) | | 74,800 | 12,642,696 |
| Reliance Steel & Aluminum Co. | | 17,031 | 3,873,701 |
| Royal Gold, Inc. (b) | | 17,869 | 2,269,899 |
| Southern Copper Corp. (b) | | 8,519 | 640,714 |
| SSR Mining, Inc. (b) | | 60,071 | 1,017,603 |
| Steel Dynamics, Inc. (b) | | 48,556 | 5,857,796 |
| United States Steel Corp. | | 67,697 | 1,928,688 |
| | | | 64,943,861 |
| Paper & Forest Products - 0.0% | | | |
| Louisiana-Pacific Corp. | | 18,716 | 1,274,372 |
TOTAL MATERIALS | | | 254,944,106 |
| REAL ESTATE - 4.7% | | | |
| Equity Real Estate Investment Trusts (REITs) - 4.5% | | | |
| Alexandria Real Estate Equities, Inc. | | 47,253 | 7,595,447 |
| American Homes 4 Rent Class A (b) | | 89,764 | 3,078,008 |
| American Tower Corp. | | 31,564 | 7,051,082 |
| Americold Realty Trust | | 78,383 | 2,462,010 |
| Apartment Income (REIT) Corp. | | 40,123 | 1,535,106 |
| AvalonBay Communities, Inc. | | 40,744 | 7,229,615 |
| Boston Properties, Inc. | | 45,709 | 3,407,149 |
| Brixmor Property Group, Inc. | | 86,982 | 2,046,686 |
| Camden Property Trust (SBI) | | 27,695 | 3,412,301 |
| Cousins Properties, Inc. (b) | | 44,037 | 1,207,495 |
| CubeSmart | | 65,187 | 2,984,913 |
| Digital Realty Trust, Inc. | | 83,690 | 9,592,548 |
| Douglas Emmett, Inc. | | 49,283 | 825,490 |
| EastGroup Properties, Inc. | | 11,995 | 2,018,159 |
| EPR Properties | | 21,587 | 917,016 |
| Equinix, Inc. | | 6,632 | 4,895,278 |
| Equity Lifestyle Properties, Inc. | | 20,045 | 1,438,830 |
| Equity Residential (SBI) | | 108,023 | 6,875,664 |
| Essex Property Trust, Inc. | | 18,956 | 4,285,383 |
| Extra Space Storage, Inc. | | 34,049 | 5,373,954 |
| Federal Realty Investment Trust (SBI) | | 23,407 | 2,610,583 |
| First Industrial Realty Trust, Inc. | | 38,415 | 2,049,440 |
| Gaming & Leisure Properties | | 71,211 | 3,814,061 |
| Healthcare Trust of America, Inc. | | 110,572 | 2,380,615 |
| Healthpeak Properties, Inc. | | 157,282 | 4,322,109 |
| Highwoods Properties, Inc. (SBI) | | 30,288 | 919,847 |
| Host Hotels & Resorts, Inc. | | 206,466 | 3,891,884 |
| Hudson Pacific Properties, Inc. | | 40,117 | 456,933 |
| Invitation Homes, Inc. | | 177,998 | 5,784,935 |
| Iron Mountain, Inc. | | 21,132 | 1,153,385 |
| JBG SMITH Properties | | 31,147 | 627,301 |
| Kilroy Realty Corp. | | 33,891 | 1,390,887 |
| Kimco Realty Corp. | | 176,154 | 3,956,419 |
| Lamar Advertising Co. Class A | | 3,026 | 322,390 |
| Life Storage, Inc. | | 24,533 | 2,650,545 |
| Medical Properties Trust, Inc. (b) | | 173,202 | 2,242,966 |
| Mid-America Apartment Communities, Inc. | | 33,486 | 5,582,786 |
| National Retail Properties, Inc. | | 51,990 | 2,461,727 |
| National Storage Affiliates Trust | | 24,750 | 1,009,800 |
| Omega Healthcare Investors, Inc. | | 68,537 | 2,017,729 |
| Park Hotels & Resorts, Inc. | | 64,991 | 956,018 |
| Prologis (REIT), Inc. | | 268,768 | 34,746,327 |
| Public Storage | | 9,397 | 2,859,883 |
| Rayonier, Inc. | | 42,488 | 1,546,138 |
| Realty Income Corp. | | 183,089 | 12,418,927 |
| Regency Centers Corp. | | 49,976 | 3,329,901 |
| Rexford Industrial Realty, Inc. | | 53,560 | 3,399,453 |
| SBA Communications Corp. Class A | | 24,016 | 7,145,480 |
| Simon Property Group, Inc. | | 49,009 | 6,295,696 |
| SL Green Realty Corp. (b) | | 18,665 | 768,065 |
| Spirit Realty Capital, Inc. | | 40,583 | 1,780,782 |
| Store Capital Corp. | | 74,097 | 2,386,664 |
| Sun Communities, Inc. | | 35,483 | 5,565,863 |
| UDR, Inc. | | 94,430 | 4,021,774 |
| Ventas, Inc. | | 116,454 | 6,033,482 |
| VICI Properties, Inc. | | 280,611 | 9,591,284 |
| Vornado Realty Trust | | 51,454 | 1,254,963 |
| Welltower, Inc. | | 138,003 | 10,355,745 |
| Weyerhaeuser Co. | | 214,655 | 7,390,572 |
| WP Carey, Inc. | | 60,140 | 5,143,774 |
| | | | 254,869,267 |
| Real Estate Management & Development - 0.2% | | | |
| CBRE Group, Inc. (a) | | 47,069 | 4,024,870 |
| Howard Hughes Corp. (a) | | 10,677 | 912,777 |
| Jones Lang LaSalle, Inc. (a) | | 13,919 | 2,573,206 |
| Opendoor Technologies, Inc. (a)(b) | | 99,071 | 216,965 |
| WeWork, Inc. (a)(b) | | 63,570 | 101,076 |
| Zillow Group, Inc.: | | | |
| Class A (a) | | 15,650 | 672,324 |
| Class C (a) | | 43,006 | 1,901,295 |
| | | | 10,402,513 |
TOTAL REAL ESTATE | | | 265,271,780 |
| UTILITIES - 5.4% | | | |
| Electric Utilities - 3.4% | | | |
| Alliant Energy Corp. | | 73,111 | 3,950,187 |
| American Electric Power Co., Inc. | | 150,073 | 14,100,859 |
| Avangrid, Inc. (b) | | 20,672 | 871,738 |
| Constellation Energy Corp. | | 95,262 | 8,131,564 |
| Duke Energy Corp. | | 224,801 | 23,030,862 |
| Edison International | | 109,677 | 7,556,745 |
| Entergy Corp. | | 59,218 | 6,412,125 |
| Evergy, Inc. | | 64,841 | 4,062,289 |
| Eversource Energy | | 100,531 | 8,276,717 |
| Exelon Corp. | | 289,797 | 12,226,535 |
| FirstEnergy Corp. (b) | | 158,407 | 6,486,767 |
| Hawaiian Electric Industries, Inc. | | 31,718 | 1,340,720 |
| IDACORP, Inc. (b) | | 14,674 | 1,552,656 |
| NextEra Energy, Inc. | | 579,850 | 43,274,206 |
| NRG Energy, Inc. (b) | | 66,819 | 2,286,546 |
| OGE Energy Corp. | | 58,236 | 2,289,840 |
| PG&E Corp. (a) | | 480,283 | 7,636,500 |
| Pinnacle West Capital Corp. | | 32,924 | 2,454,484 |
| PPL Corp. | | 214,985 | 6,363,556 |
| Southern Co. | | 317,474 | 21,486,640 |
| Xcel Energy, Inc. | | 159,102 | 10,941,445 |
| | | | 194,732,981 |
| Gas Utilities - 0.2% | | | |
| Atmos Energy Corp. | | 40,251 | 4,731,103 |
| National Fuel Gas Co. (b) | | 23,491 | 1,363,887 |
| UGI Corp. | | 61,057 | 2,431,900 |
| | | | 8,526,890 |
| Independent Power and Renewable Electricity Producers - 0.1% | | | |
| Brookfield Renewable Corp. (b) | | 37,238 | 1,173,742 |
| The AES Corp. | | 159,564 | 4,373,649 |
| Vistra Corp. | | 48,463 | 1,117,557 |
| | | | 6,664,948 |
| Multi-Utilities - 1.5% | | | |
| Ameren Corp. | | 75,077 | 6,521,939 |
| CenterPoint Energy, Inc. | | 183,809 | 5,536,327 |
| CMS Energy Corp. | | 84,449 | 5,336,332 |
| Consolidated Edison, Inc. | | 103,535 | 9,867,921 |
| Dominion Energy, Inc. | | 242,956 | 15,461,720 |
| DTE Energy Co. | | 56,276 | 6,548,838 |
| NiSource, Inc. | | 118,428 | 3,286,377 |
| Public Service Enterprise Group, Inc. (b) | | 145,262 | 8,996,076 |
| Sempra Energy | | 91,822 | 14,721,821 |
| WEC Energy Group, Inc. | | 92,063 | 8,653,001 |
| | | | 84,930,352 |
| Water Utilities - 0.2% | | | |
| American Water Works Co., Inc. | | 53,074 | 8,305,550 |
| Essential Utilities, Inc. (b) | | 67,488 | 3,153,714 |
| | | | 11,459,264 |
TOTAL UTILITIES | | | 306,314,435 |
| TOTAL COMMON STOCKS (Cost $4,118,343,522) | | | 5,626,131,602 |
| | | | |
| U.S. Treasury Obligations - 0.0% |
| | | Principal Amount (c) | Value ($) |
U.S. Treasury Bills, yield at date of purchase 4.65% 6/29/23 (d) (Cost $981,243) | | 1,000,000 | 981,226 |
| | | | |
| Money Market Funds - 3.3% |
| | | Shares | Value ($) |
| Fidelity Cash Central Fund 4.38% (e) | | 26,163,425 | 26,168,658 |
| Fidelity Securities Lending Cash Central Fund 4.38% (e)(f) | | 159,853,316 | 159,869,302 |
| TOTAL MONEY MARKET FUNDS (Cost $186,037,583) | | | 186,037,960 |
| | | | |
| TOTAL INVESTMENT IN SECURITIES - 102.8% (Cost $4,305,362,348) | 5,813,150,788 |
NET OTHER ASSETS (LIABILITIES) - (2.8)% | (156,617,537) |
| NET ASSETS - 100.0% | 5,656,533,251 |
| | |
| Futures Contracts |
| | Number of contracts | Expiration Date | Notional Amount ($) | Value ($) | Unrealized Appreciation/ (Depreciation) ($) |
| Purchased | | | | | |
| | | | | | |
| Equity Index Contracts | | | | | |
| CME E-mini S&P 500 Index Contracts (United States) | 80 | Mar 2023 | 16,360,000 | 737,370 | 737,370 |
| CME E-mini S&P MidCap 400 Index Contracts (United States) | 68 | Mar 2023 | 18,107,720 | 1,176,609 | 1,176,609 |
| | | | | | |
| TOTAL FUTURES CONTRACTS | | | | | 1,913,979 |
| The notional amount of futures purchased as a percentage of Net Assets is 0.6% |
For the period, the average monthly notional amount at value for futures contracts in the aggregate was $19,461,692.
Legend
| (b) | Security or a portion of the security is on loan at period end. |
| (c) | Amount is stated in United States dollars unless otherwise noted. |
| (d) | Security or a portion of the security was pledged to cover margin requirements for futures contracts. At period end, the value of securities pledged amounted to $981,226. |
| (e) | Affiliated fund that is generally available only to investment companies and other accounts managed by Fidelity Investments. The rate quoted is the annualized seven-day yield of the fund at period end. A complete unaudited listing of the fund's holdings as of its most recent quarter end is available upon request. In addition, each Fidelity Central Fund's financial statements, which are not covered by the Fund's Report of Independent Registered Public Accounting Firm, are available on the SEC's website or upon request. |
| (f) | Investment made with cash collateral received from securities on loan. |
Affiliated Central Funds
Fiscal year to date information regarding the Fund's investments in Fidelity Central Funds, including the ownership percentage, is presented below.
| Affiliate | Value, beginning of period ($) | Purchases ($) | Sales Proceeds ($) | Dividend Income ($) | Realized Gain (loss) ($) | Change in Unrealized appreciation (depreciation) ($) | Value, end of period ($) | % ownership, end of period |
| Fidelity Cash Central Fund 4.38% | 16,406,949 | 703,853,630 | 694,091,921 | 331,766 | - | - | 26,168,658 | 0.1% |
| Fidelity Securities Lending Cash Central Fund 4.38% | 69,339,940 | 1,010,971,381 | 920,442,019 | 682,647 | - | - | 159,869,302 | 0.5% |
| Total | 85,746,889 | 1,714,825,011 | 1,614,533,940 | 1,014,413 | - | - | 186,037,960 | |
| | | | | | | | | |
Amounts in the dividend income column in the above table include any capital gain distributions from underlying funds, which are presented in the corresponding line item in the Statement of Operations, if applicable.
Amount for Fidelity Securities Lending Cash Central Fund represents the income earned on investing cash collateral, less rebates paid to borrowers and any lending agent fees associated with the loan, plus any premium payments received for lending certain types of securities.
Amounts included in the purchases and sales proceeds columns may include in-kind transactions, if applicable.
Investment Valuation
The following is a summary of the inputs used, as of January 31, 2023, involving the Fund's assets and liabilities carried at fair value. The inputs or methodology used for valuing securities may not be an indication of the risk associated with investing in those securities. For more information on valuation inputs, and their aggregation into the levels used below, please refer to the Investment Valuation section in the accompanying Notes to Financial Statements.
| Valuation Inputs at Reporting Date: |
| Description | Total ($) | Level 1 ($) | Level 2 ($) | Level 3 ($) |
Investments in Securities: | | | | |
|
| Equities: | | | | |
Communication Services | 447,017,563 | 447,017,563 | - | - |
Consumer Discretionary | 355,372,774 | 355,372,774 | - | - |
Consumer Staples | 388,390,851 | 388,390,851 | - | - |
Energy | 463,221,969 | 463,221,969 | - | - |
Financials | 1,154,876,283 | 1,154,876,283 | - | - |
Health Care | 920,236,519 | 920,236,519 | - | - |
Industrials | 583,831,858 | 583,831,858 | - | - |
Information Technology | 486,653,464 | 486,653,464 | - | - |
Materials | 254,944,106 | 254,944,106 | - | - |
Real Estate | 265,271,780 | 265,271,780 | - | - |
Utilities | 306,314,435 | 306,314,435 | - | - |
|
| U.S. Government and Government Agency Obligations | 981,226 | - | 981,226 | - |
|
| Money Market Funds | 186,037,960 | 186,037,960 | - | - |
| Total Investments in Securities: | 5,813,150,788 | 5,812,169,562 | 981,226 | - |
Derivative Instruments: | | | | |
|
| Assets | | | | |
Futures Contracts | 1,913,979 | 1,913,979 | - | - |
| Total Assets | 1,913,979 | 1,913,979 | - | - |
| Total Derivative Instruments: | 1,913,979 | 1,913,979 | - | - |
Value of Derivative Instruments
The following table is a summary of the Fund's value of derivative instruments by primary risk exposure as of January 31, 2023. For additional information on derivative instruments, please refer to the Derivative Instruments section in the accompanying Notes to Financial Statements.
Primary Risk Exposure / Derivative Type | Value |
| Asset ($) | Liability ($) |
| Equity Risk | | |
Futures Contracts (a) | 1,913,979 | 0 |
| Total Equity Risk | 1,913,979 | 0 |
| Total Value of Derivatives | 1,913,979 | 0 |
(a)Reflects gross cumulative appreciation (depreciation) on futures contracts as presented in the Schedule of Investments. In the Statement of Assets and Liabilities, the period end daily variation margin is included in receivable or payable for daily variation margin on futures contracts, and the net cumulative appreciation (depreciation) is included in Total accumulated earnings (loss).
| Statement of Assets and Liabilities |
| | | | January 31, 2023 |
| | | | | |
| Assets | | | | |
| Investment in securities, at value (including securities loaned of $160,015,990) - See accompanying schedule: | | | | |
Unaffiliated issuers (cost $4,119,324,765) | $ | 5,627,112,828 | | |
Fidelity Central Funds (cost $186,037,583) | | 186,037,960 | | |
| | | | | |
| | | | | |
| Total Investment in Securities (cost $4,305,362,348) | | | $ | 5,813,150,788 |
| Segregated cash with brokers for derivative instruments | | | | 629,010 |
| Cash | | | | 6 |
| Receivable for fund shares sold | | | | 111,153,549 |
| Dividends receivable | | | | 5,376,997 |
| Distributions receivable from Fidelity Central Funds | | | | 180,753 |
| Receivable for daily variation margin on futures contracts | | | | 628,371 |
| Other receivables | | | | 1,048 |
Total assets | | | | 5,931,120,522 |
| Liabilities | | | | |
| Payable for investments purchased | $ | 111,676,686 | | |
| Payable for fund shares redeemed | | 3,023,171 | | |
| Other payables and accrued expenses | | 28,918 | | |
| Collateral on securities loaned | | 159,858,496 | | |
| Total Liabilities | | | | 274,587,271 |
| Net Assets | | | $ | 5,656,533,251 |
| Net Assets consist of: | | | | |
| Paid in capital | | | $ | 4,181,557,026 |
| Total accumulated earnings (loss) | | | | 1,474,976,225 |
| Net Assets | | | $ | 5,656,533,251 |
Net Asset Value , offering price and redemption price per share ($5,656,533,251 ÷ 389,963,408 shares) | | | $ | 14.51 |
| Statement of Operations |
| | | | Year ended January 31, 2023 |
| Investment Income | | | | |
| Dividends | | | $ | 120,434,259 |
| Interest | | | | 14,476 |
| Income from Fidelity Central Funds (including $682,647 from security lending) | | | | 1,014,413 |
| Total Income | | | | 121,463,148 |
| Expenses | | | | |
| Custodian fees and expenses | $ | 119,159 | | |
| Independent trustees' fees and expenses | | 19,075 | | |
| Legal | | 2,347 | | |
| Interest | | 21,206 | | |
| Total Expenses | | | | 161,787 |
| Net Investment income (loss) | | | | 121,301,361 |
| Realized and Unrealized Gain (Loss) | | | | |
| Net realized gain (loss) on: | | | | |
| Investment Securities: | | | | |
| Unaffiliated issuers | | 137,060,259 | | |
| Futures contracts | | (2,517,347) | | |
| Total net realized gain (loss) | | | | 134,542,912 |
| Change in net unrealized appreciation (depreciation) on: | | | | |
| Investment Securities: | | | | |
| Unaffiliated issuers | | (294,327,199) | | |
| Futures contracts | | 1,486,218 | | |
| Total change in net unrealized appreciation (depreciation) | | | | (292,840,981) |
| Net gain (loss) | | | | (158,298,069) |
| Net increase (decrease) in net assets resulting from operations | | | $ | (36,996,708) |
| Statement of Changes in Net Assets |
| |
| | Year ended January 31, 2023 | | Year ended January 31, 2022 |
| Increase (Decrease) in Net Assets | | | | |
| Operations | | | | |
| Net investment income (loss) | $ | 121,301,361 | $ | 115,929,176 |
| Net realized gain (loss) | | 134,542,912 | | 384,078,320 |
| Change in net unrealized appreciation (depreciation) | | (292,840,981) | | 720,443,956 |
| Net increase (decrease) in net assets resulting from operations | | (36,996,708) | | 1,220,451,452 |
| Distributions to shareholders | | (223,483,250) | | (364,290,801) |
| Share transactions | | | | |
| Proceeds from sales of shares | | 1,009,067,447 | | 1,026,004,449 |
| Reinvestment of distributions | | 223,483,250 | | 364,290,801 |
| Cost of shares redeemed | | (1,275,321,799) | | (1,630,942,547) |
Net increase (decrease) in net assets resulting from share transactions | | (42,771,102) | | (240,647,297) |
| Total increase (decrease) in net assets | | (303,251,060) | | 615,513,354 |
| | | | | |
| Net Assets | | | | |
| Beginning of period | | 5,959,784,311 | | 5,344,270,957 |
| End of period | $ | 5,656,533,251 | $ | 5,959,784,311 |
| | | | | |
| Other Information | | | | |
| Shares | | | | |
| Sold | | 71,082,789 | | 67,912,369 |
| Issued in reinvestment of distributions | | 15,931,648 | | 23,989,840 |
| Redeemed | | (89,125,886) | | (108,015,406) |
| Net increase (decrease) | | (2,111,449) | | (16,113,197) |
| | | | | |
Financial Highlights
| Fidelity® Series Large Cap Value Index Fund |
| |
| Years ended January 31, | | 2023 | | 2022 | | 2021 | | 2020 | | 2019 |
Selected Per-Share Data | | | | | | | | | | |
| Net asset value, beginning of period | $ | 15.20 | $ | 13.09 | $ | 12.91 | $ | 12.02 | $ | 13.22 |
| Income from Investment Operations | | | | | | | | | | |
Net investment income (loss) A,B | | .32 | | .30 | | .29 | | .33 | | .32 |
| Net realized and unrealized gain (loss) | | (.40) | | 2.76 | | .23 | | 1.46 | | (.96) |
| Total from investment operations | | (.08) | | 3.06 | | .52 | | 1.79 | | (.64) |
| Distributions from net investment income | | (.33) | | (.30) | | (.29) | | (.34) | | (.33) |
| Distributions from net realized gain | | (.28) | | (.65) | | (.05) | | (.57) | | (.22) |
| Total distributions | | (.61) | | (.95) | | (.34) | | (.90) C | | (.56) C |
| Net asset value, end of period | $ | 14.51 | $ | 15.20 | $ | 13.09 | $ | 12.91 | $ | 12.02 |
Total Return D | | (.40)% | | 23.41% | | 4.14% | | 14.94% | | (4.73)% |
Ratios to Average Net Assets B,E,F | | | | | | | | | | |
Expenses before reductions G | | -% | | -% | | -% | | -% | | -% |
Expenses net of fee waivers, if any G | | -% | | -% | | -% | | -% | | -% |
Expenses net of all reductions G | | -% | | -% | | -% | | -% | | -% |
| Net investment income (loss) | | 2.21% | | 1.93% | | 2.49% | | 2.58% | | 2.52% |
| Supplemental Data | | | | | | | | | | |
| Net assets, end of period (000 omitted) | $ | 5,656,533 | $ | 5,959,784 | $ | 5,344,271 | $ | 4,036,878 | $ | 3,698,418 |
Portfolio turnover rate H | | 24% | | 27% | | 21% | | 31% | | 19% |
A Calculated based on average shares outstanding during the period.
B Net investment income (loss) is affected by the timing of the declaration of dividends by any underlying mutual funds or exchange-traded funds (ETFs). Net investment income (loss) of any mutual funds or ETFs is not included in the Fund's net investment income (loss) ratio.
C Total distributions per share do not sum due to rounding.
D Total returns would have been lower if certain expenses had not been reduced during the applicable periods shown.
E Fees and expenses of any underlying mutual funds or exchange-traded funds (ETFs) are not included in the Fund's expense ratio. The Fund indirectly bears its proportionate share of these expenses. For additional expense information related to investments in Fidelity Central Funds, please refer to the "Investments in Fidelity Central Funds" note found in the Notes to Financial Statements section of the most recent Annual or Semi-Annual report.
F Expense ratios reflect operating expenses of the class. Expenses before reductions do not reflect amounts reimbursed, waived, or reduced through arrangements with the investment adviser, brokerage services, or other offset arrangements, if applicable, and do not represent the amount paid by the class during periods when reimbursements, waivers or reductions occur.
G Amount represents less than .005%.
H Amount does not include the portfolio activity of any underlying mutual funds or exchange-traded funds (ETFs).
For the period ended January 31, 2023
1. Organization.
Fidelity Series Large Cap Value Index Fund (the Fund) is a fund of Fidelity Salem Street Trust (the Trust) and is authorized to issue an unlimited number of shares. Shares are offered only to certain other Fidelity funds, Fidelity managed 529 plans, and Fidelity managed collective investment trusts. The Trust is registered under the Investment Company Act of 1940, as amended (the 1940 Act), as an open-end management investment company organized as a Massachusetts business trust.
2. Investments in Fidelity Central Funds.
Funds may invest in Fidelity Central Funds, which are open-end investment companies generally available only to other investment companies and accounts managed by the investment adviser and its affiliates. The Schedule of Investments lists any Fidelity Central Funds held as an investment as of period end, but does not include the underlying holdings of each Fidelity Central Fund. An investing fund indirectly bears its proportionate share of the expenses of the underlying Fidelity Central Funds.
Based on its investment objective, each Fidelity Central Fund may invest or participate in various investment vehicles or strategies that are similar to those of the investing fund. These strategies are consistent with the investment objectives of the investing fund and may involve certain economic risks which may cause a decline in value of each of the Fidelity Central Funds and thus a decline in the value of the investing fund.
| Fidelity Central Fund | Investment Manager | Investment Objective | Investment Practices | Expense Ratio A |
| Fidelity Money Market Central Funds | Fidelity Management & Research Company LLC (FMR) | Each fund seeks to obtain a high level of current income consistent with the preservation of capital and liquidity. | Short-term Investments | Less than .005% |
A Expenses expressed as a percentage of average net assets and are as of each underlying Central Fund's most recent annual or semi-annual shareholder report.
A complete unaudited list of holdings for each Fidelity Central Fund is available upon request or at the Securities and Exchange Commission website at www.sec.gov. In addition, the financial statements of the Fidelity Central Funds which contain the significant accounting policies (including investment valuation policies) of those funds, and are not covered by the Report of Independent Registered Public Accounting Firm, are available on the Securities and Exchange Commission website or upon request.
3. Significant Accounting Policies.
The Fund is an investment company and applies the accounting and reporting guidance of the Financial Accounting Standards Board (FASB) Accounting Standards Codification Topic 946 Financial Services - Investment Companies . The financial statements have been prepared in conformity with accounting principles generally accepted in the United States of America (GAAP), which require management to make certain estimates and assumptions at the date of the financial statements. Actual results could differ from those estimates. Subsequent events, if any, through the date that the financial statements were issued have been evaluated in the preparation of the financial statements. The Fund's Schedule of Investments lists any underlying mutual funds or exchange-traded funds (ETFs) but does not include the underlying holdings of these funds. The following summarizes the significant accounting policies of the Fund:
Investment Valuation. Investments are valued as of 4:00 p.m. Eastern time on the last calendar day of the period. The Board of Trustees (the Board) has designated the Fund's investment adviser as the valuation designee responsible for the fair valuation function and performing fair value determinations as needed. The investment adviser has established a Fair Value Committee (the Committee) to carry out the day-to-day fair valuation responsibilities and has adopted policies and procedures to govern the fair valuation process and the activities of the Committee. In accordance with these fair valuation policies and procedures, which have been approved by the Board, the Fund attempts to obtain prices from one or more third party pricing services or brokers to value its investments. When current market prices, quotations or currency exchange rates are not readily available or reliable, investments will be fair valued in good faith by the Committee, in accordance with the policies and procedures. Factors used in determining fair value vary by investment type and may include market or investment specific events, transaction data, estimated cash flows, and market observations of comparable investments. The frequency that the fair valuation procedures are used cannot be predicted and they may be utilized to a significant extent. The Committee manages the Fund's fair valuation practices and maintains the fair valuation policies and procedures. The Fund's investment adviser reports to the Board information regarding the fair valuation process and related material matters.
The Fund categorizes the inputs to valuation techniques used to value its investments into a disclosure hierarchy consisting of three levels as shown below:
Level 1 - unadjusted quoted prices in active markets for identical investments
Level 2 - other significant observable inputs (including quoted prices for similar investments, interest rates, prepayment speeds, etc.)
Level 3 - unobservable inputs (including the Fund's own assumptions based on the best information available)
Valuation techniques used to value the Fund's investments by major category are as follows:
Equity securities, including restricted securities, for which market quotations are readily available, are valued at the last reported sale price or official closing price as reported by a third party pricing service on the primary market or exchange on which they are traded and are categorized as Level 1 in the hierarchy. In the event there were no sales during the day or closing prices are not available, securities are valued at the last quoted bid price or may be valued using the last available price and are generally categorized as Level 2 in the hierarchy. For foreign equity securities, when market or security specific events arise, comparisons to the valuation of American Depositary Receipts (ADRs), futures contracts, ETFs and certain indexes as well as quoted prices for similar securities may be used and would be categorized as Level 2 in the hierarchy. For equity securities, including restricted securities, where observable inputs are limited, assumptions about market activity and risk are used and these securities may be categorized as Level 3 in the hierarchy.
Debt securities, including restricted securities, are valued based on evaluated prices received from third party pricing services or from brokers who make markets in such securities. U.S. government and government agency obligations are valued by pricing services who utilize matrix pricing which considers prepayment speed assumptions, attributes of the collateral, yield or price of bonds of comparable quality, coupon, maturity and type or by broker-supplied prices. When independent prices are unavailable or unreliable, debt securities may be valued utilizing pricing methodologies which consider similar factors that would be used by third party pricing services. Debt securities are generally categorized as Level 2 in the hierarchy but may be Level 3 depending on the circumstances.
Futures contracts are valued at the settlement price established each day by the board of trade or exchange on which they are traded and are categorized as Level 1 in the hierarchy. Investments in open-end mutual funds, including the Fidelity Central Funds, are valued at their closing net asset value (NAV) each business day and are categorized as Level 1 in the hierarchy.
Changes in valuation techniques may result in transfers in or out of an assigned level within the disclosure hierarchy. The aggregate value of investments by input level as of January 31, 2023 is included at the end of the Fund's Schedule of Investments.
Investment Transactions and Income. For financial reporting purposes, the Fund's investment holdings and NAV include trades executed through the end of the last business day of the period. The NAV per share for processing shareholder transactions is calculated as of the close of business of the New York Stock Exchange (NYSE), normally 4:00 p.m. Eastern time and includes trades executed through the end of the prior business day. Gains and losses on securities sold are determined on the basis of identified cost and include proceeds received from litigation. Commissions paid to certain brokers with whom the investment adviser, or its affiliates, places trades on behalf of a fund include an amount in addition to trade execution, which may be rebated back to a fund. Any such rebates are included in net realized gain (loss) on investments in the Statement of Operations. Dividend income is recorded on the ex-dividend date, except for certain dividends from foreign securities where the ex-dividend date may have passed, which are recorded as soon as the Fund is informed of the ex-dividend date. Non-cash dividends included in dividend income, if any, are recorded at the fair market value of the securities received. Income and capital gain distributions from Fidelity Central Funds, if any, are recorded on the ex-dividend date. Certain distributions received by the Fund represent a return of capital or capital gain. The Fund determines the components of these distributions subsequent to the ex-dividend date, based upon receipt of tax filings or other correspondence relating to the underlying investment. These distributions are recorded as a reduction of cost of investments and/or as a realized gain. Interest income is accrued as earned and includes coupon interest and amortization of premium and accretion of discount on debt securities as applicable.
Expenses. Expenses directly attributable to a fund are charged to that fund. Expenses attributable to more than one fund are allocated among the respective funds on the basis of relative net assets or other appropriate methods. Expenses included in the accompanying financial statements reflect the expenses of that fund and do not include any expenses associated with any underlying mutual funds or exchange-traded funds. Although not included in a fund's expenses, a fund indirectly bears its proportionate share of these expenses through the net asset value of each underlying mutual fund or exchange-traded fund. Expense estimates are accrued in the period to which they relate and adjustments are made when actual amounts are known.
Income Tax Information and Distributions to Shareholders. Each year, the Fund intends to qualify as a regulated investment company under Subchapter M of the Internal Revenue Code, including distributing substantially all of its taxable income and realized gains. As a result, no provision for U.S. Federal income taxes is required. As of January 31, 2023, the Fund did not have any unrecognized tax benefits in the financial statements; nor is the Fund aware of any tax positions for which it is reasonably possible that the total amounts of unrecognized tax benefits will significantly change in the next twelve months. The Fund files a U.S. federal tax return, in addition to state and local tax returns as required. The Fund's federal income tax returns are subject to examination by the Internal Revenue Service (IRS) for a period of three fiscal years after they are filed. State and local tax returns may be subject to examination for an additional fiscal year depending on the jurisdiction.
Distributions are declared and recorded on the ex-dividend date. Income and capital gain distributions are determined in accordance with income tax regulations, which may differ from GAAP. In addition, the Fund claimed a portion of the payment made to redeeming shareholders as a distribution for income tax purposes.
Capital accounts within the financial statements are adjusted for permanent book-tax differences. These adjustments have no impact on net assets or the results of operations. Capital accounts are not adjusted for temporary book-tax differences which will reverse in a subsequent period.
Book-tax differences are primarily due to certain deemed distributions, futures contracts, passive foreign investment companies (PFIC), partnerships and losses deferred due to wash sales.
As of period end, the cost and unrealized appreciation (depreciation) in securities, and derivatives if applicable, for federal income tax purposes were as follows:
| Gross unrealized appreciation | $1,733,757,703 |
| Gross unrealized depreciation | (271,219,575) |
| Net unrealized appreciation (depreciation) | $1,462,538,128 |
| Tax Cost | $4,350,612,660 |
The tax-based components of distributable earnings as of period end were as follows:
| Undistributed ordinary income | $5,386,942 |
| Undistributed long-term capital gain | $7,065,042 |
| Net unrealized appreciation (depreciation) on securities and other investments | $1,462,538,128 |
The tax character of distributions paid was as follows:
| | January 31, 2023 | January 31, 2022 |
| Ordinary Income | $124,055,936 | $ 229,846,073 |
| Long-term Capital Gains | 99,427,314 | 134,444,728 |
| Total | $223,483,250 | $ 364,290,801 |
4. Derivative Instruments.
Risk Exposures and the Use of Derivative Instruments. The Fund's investment objectives allow for various types of derivative instruments, including futures contracts. Derivatives are investments whose value is primarily derived from underlying assets, indices or reference rates and may be transacted on an exchange or over-the-counter (OTC). Derivatives may involve a future commitment to buy or sell a specified asset based on specified terms, to exchange future cash flows at periodic intervals based on a notional principal amount, or for one party to make one or more payments upon the occurrence of specified events in exchange for periodic payments from the other party.
Derivatives were used to increase returns and to manage exposure to certain risks as defined below. The success of any strategy involving derivatives depends on analysis of numerous economic factors, and if the strategies for investment do not work as intended, the objectives may not be achieved.
Derivatives were used to increase or decrease exposure to the following risk(s):
| | |
| Equity Risk | Equity risk relates to the fluctuations in the value of financial instruments as a result of changes in market prices (other than those arising from interest rate risk or foreign exchange risk), whether caused by factors specific to an individual investment, its issuer, or all factors affecting all instruments traded in a market or market segment. |
Funds are also exposed to additional risks from investing in derivatives, such as liquidity risk and counterparty credit risk. Liquidity risk is the risk that a fund will be unable to close out the derivative in the open market in a timely manner. Counterparty credit risk is the risk that the counterparty will not be able to fulfill its obligation to a fund. Counterparty credit risk related to exchange-traded contracts may be mitigated by the protection provided by the exchange on which they trade.
Investing in derivatives may involve greater risks than investing in the underlying assets directly and, to varying degrees, may involve risk of loss in excess of any initial investment and collateral received and amounts recognized in the Statement of Assets and Liabilities. In addition, there may be the risk that the change in value of the derivative contract does not correspond to the change in value of the underlying instrument.
Futures Contracts. A futures contract is an agreement between two parties to buy or sell a specified underlying instrument for a fixed price at a specified future date. Futures contracts were used to manage exposure to the stock market.
Upon entering into a futures contract, a fund is required to deposit either cash or securities (initial margin) with a clearing broker in an amount equal to a certain percentage of the face value of the contract. Futures contracts are marked-to-market daily and subsequent daily payments are made or received by a fund depending on the daily fluctuations in the value of the futures contracts and are recorded as unrealized appreciation or (depreciation). This receivable and/or payable, if any, is included in daily variation margin on futures contracts in the Statement of Assets and Liabilities. Realized gain or (loss) is recorded upon the expiration or closing of a futures contract. The net realized gain (loss) and change in net unrealized appreciation (depreciation) on futures contracts during the period is presented in the Statement of Operations.
Any open futures contracts at period end are presented in the Schedule of Investments under the caption "Futures Contracts". The notional amount at value reflects each contract's exposure to the underlying instrument or index at period end, and is representative of volume of activity during the period unless an average notional amount is presented. Any securities deposited to meet initial margin requirements are identified in the Schedule of Investments. Any cash deposited to meet initial margin requirements is presented as segregated cash with brokers for derivative instruments in the Statement of Assets and Liabilities.
5. Purchases and Sales of Investments.
Purchases and sales of securities, other than short-term securities and in-kind transactions, as applicable, are noted in the table below.
| | Purchases ($) | Sales ($) |
| Fidelity Series Large Cap Value Index Fund | 1,330,883,691 | 1,459,625,010 |
6. Fees and Other Transactions with Affiliates.
Management Fee. Fidelity Management & Research Company LLC (the investment adviser) and its affiliates provide the Fund with investment management related services for which the Fund does not pay a management fee. Under the management contract, the investment adviser or an affiliate pays all ordinary operating expenses of the Fund, except custody fees, fees and expenses of the independent Trustees, and certain miscellaneous expenses such as proxy and shareholder meeting expenses.
Sub-Adviser. Geode Capital Management, LLC (Geode), serves as sub-adviser for the Fund. Geode provides discretionary investment advisory services to the Fund and is paid by the investment adviser for providing these services.
Interfund Lending Program. Pursuant to an Exemptive Order issued by the Securities and Exchange Commission (the SEC), the Fund, along with other registered investment companies having management contracts with Fidelity Management & Research Company LLC (FMR), or other affiliated entities of FMR, may participate in an interfund lending program. This program provides an alternative credit facility allowing the Fund to borrow from, or lend money to, other participating affiliated funds. At period end, there were no interfund loans outstanding. Activity in this program during the period for which loans were outstanding was as follows:
| | Borrower or Lender | Average Loan Balance | Weighted Average Interest Rate | Interest Expense |
| Fidelity Series Large Cap Value Index Fund | Borrower | $60,499,615 | .97% | $21,206 |
Interfund Trades. Funds may purchase from or sell securities to other Fidelity Funds under procedures adopted by the Board. The procedures have been designed to ensure these interfund trades are executed in accordance with Rule 17a-7 of the 1940 Act. Any interfund trades are included within the respective purchases and sales amounts shown in the Purchases and Sales of Investments note. During the period, there were no interfund trades.
7. Committed Line of Credit.
Certain Funds participate with other funds managed by the investment adviser or an affiliate in a $4.25 billion credit facility (the "line of credit") to be utilized for temporary or emergency purposes to fund shareholder redemptions or for other short-term liquidity purposes. The commitment fees on the pro-rata portion of the line of credit are borne by the investment adviser. During the period, there were no borrowings on this line of credit.
8. Security Lending.
Funds lend portfolio securities from time to time in order to earn additional income. Lending agents are used, including National Financial Services (NFS), an affiliate of the investment adviser. Pursuant to a securities lending agreement, NFS will receive a fee, which is capped at 9.9% of a fund's daily lending revenue, for its services as lending agent. A fund may lend securities to certain qualified borrowers, including NFS. On the settlement date of the loan, a fund receives collateral (in the form of U.S. Treasury obligations, letters of credit and/or cash) against the loaned securities and maintains collateral in an amount not less than 100% of the market value of the loaned securities during the period of the loan. The market value of the loaned securities is determined at the close of business of a fund and any additional required collateral is delivered to a fund on the next business day. A fund or borrower may terminate the loan at any time, and if the borrower defaults on its obligation to return the securities loaned because of insolvency or other reasons, a fund may apply collateral received from the borrower against the obligation. A fund may experience delays and costs in recovering the securities loaned. Any cash collateral received is invested in the Fidelity Securities Lending Cash Central Fund. Any loaned securities are identified as such in the Schedule of Investments, and the value of loaned securities and cash collateral at period end, as applicable, are presented in the Statement of Assets and Liabilities. Security lending income represents the income earned on investing cash collateral, less rebates paid to borrowers and any lending agent fees associated with the loan, plus any premium payments received for lending certain types of securities. Security lending income is presented in the Statement of Operations as a component of income from Fidelity Central Funds. Affiliated security lending activity, if any, was as follows:
| | Total Security Lending Fees Paid to NFS | Security Lending Income From Securities Loaned to NFS | Value of Securities Loaned to NFS at Period End |
| Fidelity Series Large Cap Value Index Fund | $72,681 | $25,594 | $- |
9. Other.
A fund's organizational documents provide former and current trustees and officers with a limited indemnification against liabilities arising in connection with the performance of their duties to the fund. In the normal course of business, a fund may also enter into contracts that provide general indemnifications. A fund's maximum exposure under these arrangements is unknown as this would be dependent on future claims that may be made against a fund. The risk of material loss from such claims is considered remote.
At the end of the period, mutual funds and accounts managed by the investment adviser or its affiliates were the owners of record of all of the outstanding shares of the Fund.
10. Risk and Uncertainties.
Many factors affect a fund's performance. Developments that disrupt global economies and financial markets, such as pandemics, epidemics, outbreaks of infectious diseases, war, terrorism, and environmental disasters, may significantly affect a fund's investment performance. The effects of these developments to a fund will be impacted by the types of securities in which a fund invests, the financial condition, industry, economic sector, and geographic location of an issuer, and a fund's level of investment in the securities of that issuer.
To the Board of Trustees of Fidelity Salem Street Trust and Shareholders of Fidelity Series Large Cap Value Index Fund:
Opinion on the Financial Statements and Financial Highlights
We have audited the accompanying statement of assets and liabilities of Fidelity Series Large Cap Value Index Fund (the "Fund"), a fund of Fidelity Salem Street Trust, including the schedule of investments, as of January 31, 2023, the related statement of operations for the year then ended, the statement of changes in net assets for each of the two years in the period then ended, the financial highlights for each of the five years in the period then ended, and the related notes. In our opinion, the financial statements and financial highlights present fairly, in all material respects, the financial position of the Fund as of January 31, 2023, and the results of its operations for the year then ended, the changes in its net assets for each of the two years in the period then ended, and the financial highlights for each of the five years in the period then ended in conformity with accounting principles generally accepted in the United States of America.
Basis for Opinion
These financial statements and financial highlights are the responsibility of the Fund's management. Our responsibility is to express an opinion on the Fund's financial statements and financial highlights based on our audits. We are a public accounting firm registered with the Public Company Accounting Oversight Board (United States) (PCAOB) and are required to be independent with respect to the Fund in accordance with the U.S. federal securities laws and the applicable rules and regulations of the Securities and Exchange Commission and the PCAOB.
We conducted our audits in accordance with the standards of the PCAOB. Those standards require that we plan and perform the audit to obtain reasonable assurance about whether the financial statements and financial highlights are free of material misstatement, whether due to error or fraud. The Fund is not required to have, nor were we engaged to perform, an audit of its internal control over financial reporting. As part of our audits we are required to obtain an understanding of internal control over financial reporting but not for the purpose of expressing an opinion on the effectiveness of the Fund's internal control over financial reporting. Accordingly, we express no such opinion.
Our audits included performing procedures to assess the risks of material misstatement of the financial statements and financial highlights, whether due to error or fraud, and performing procedures that respond to those risks. Such procedures included examining, on a test basis, evidence regarding the amounts and disclosures in the financial statements and financial highlights. Our audits also included evaluating the accounting principles used and significant estimates made by management, as well as evaluating the overall presentation of the financial statements and financial highlights. Our procedures included confirmation of securities owned as of January 31, 2023, by correspondence with the custodian and brokers; when replies were not received from brokers, we performed other auditing procedures. We believe that our audits provide a reasonable basis for our opinion.
/s/ Deloitte & Touche LLP
Boston, Massachusetts
March 16, 2023
We have served as the auditor of one or more of the Fidelity investment companies since 1999.
The Trustees, Members of the Advisory Board (if any), and officers of the trust and fund, as applicable, are listed below. The Board of Trustees governs the fund and is responsible for protecting the interests of shareholders. The Trustees are experienced executives who meet periodically throughout the year to oversee the fund's activities, review contractual arrangements with companies that provide services to the fund, oversee management of the risks associated with such activities and contractual arrangements, and review the fund's performance. Except for Jonathan Chiel, each of the Trustees oversees 291 funds. Mr. Chiel oversees 186 funds.
The Trustees hold office without limit in time except that (a) any Trustee may resign; (b) any Trustee may be removed by written instrument, signed by at least two-thirds of the number of Trustees prior to such removal; (c) any Trustee who requests to be retired or who has become incapacitated by illness or injury may be retired by written instrument signed by a majority of the other Trustees; and (d) any Trustee may be removed at any special meeting of shareholders by a two-thirds vote of the outstanding voting securities of the trust. Each Trustee who is not an interested person (as defined in the 1940 Act) of the trust and the fund is referred to herein as an Independent Trustee. Each Independent Trustee shall retire not later than the last day of the calendar year in which his or her 75th birthday occurs. The Independent Trustees may waive this mandatory retirement age policy with respect to individual Trustees. Officers and Advisory Board Members hold office without limit in time, except that any officer or Advisory Board Member may resign or may be removed by a vote of a majority of the Trustees at any regular meeting or any special meeting of the Trustees. Except as indicated, each individual has held the office shown or other offices in the same company for the past five years.
The fund's Statement of Additional Information (SAI) includes more information about the Trustees. To request a free copy, call Fidelity at 1-800-544-8544.
Experience, Skills, Attributes, and Qualifications of the Trustees. The Governance and Nominating Committee has adopted a statement of policy that describes the experience, qualifications, attributes, and skills that are necessary and desirable for potential Independent Trustee candidates (Statement of Policy). The Board believes that each Trustee satisfied at the time he or she was initially elected or appointed a Trustee, and continues to satisfy, the standards contemplated by the Statement of Policy. The Governance and Nominating Committee also engages professional search firms to help identify potential Independent Trustee candidates who have the experience, qualifications, attributes, and skills consistent with the Statement of Policy. From time to time, additional criteria based on the composition and skills of the current Independent Trustees, as well as experience or skills that may be appropriate in light of future changes to board composition, business conditions, and regulatory or other developments, have also been considered by the professional search firms and the Governance and Nominating Committee. In addition, the Board takes into account the Trustees' commitment and participation in Board and committee meetings, as well as their leadership of standing and ad hoc committees throughout their tenure.
In determining that a particular Trustee was and continues to be qualified to serve as a Trustee, the Board has considered a variety of criteria, none of which, in isolation, was controlling. The Board believes that, collectively, the Trustees have balanced and diverse experience, qualifications, attributes, and skills, which allow the Board to operate effectively in governing the fund and protecting the interests of shareholders. Information about the specific experience, skills, attributes, and qualifications of each Trustee, which in each case led to the Board's conclusion that the Trustee should serve (or continue to serve) as a trustee of the fund, is provided below.
Board Structure and Oversight Function. Abigail P. Johnson is an interested person and currently serves as Chairman. The Trustees have determined that an interested Chairman is appropriate and benefits shareholders because an interested Chairman has a personal and professional stake in the quality and continuity of services provided to the fund. Independent Trustees exercise their informed business judgment to appoint an individual of their choosing to serve as Chairman, regardless of whether the Trustee happens to be independent or a member of management. The Independent Trustees have determined that they can act independently and effectively without having an Independent Trustee serve as Chairman and that a key structural component for assuring that they are in a position to do so is for the Independent Trustees to constitute a substantial majority for the Board. The Independent Trustees also regularly meet in executive session. Michael E. Kenneally serves as Chairman of the Independent Trustees and as such (i) acts as a liaison between the Independent Trustees and management with respect to matters important to the Independent Trustees and (ii) with management prepares agendas for Board meetings.
Fidelity ® funds are overseen by different Boards of Trustees. The fund's Board oversees Fidelity's alternative investment, investment-grade bond, money market, asset allocation and certain equity funds, and other Boards oversee Fidelity's high income and other equity funds. The asset allocation funds may invest in Fidelity ® funds that are overseen by such other Boards. The use of separate Boards, each with its own committee structure, allows the Trustees of each group of Fidelity ® funds to focus on the unique issues of the funds they oversee, including common research, investment, and operational issues. On occasion, the separate Boards establish joint committees to address issues of overlapping consequences for the Fidelity ® funds overseen by each Board.
The Trustees operate using a system of committees to facilitate the timely and efficient consideration of all matters of importance to the Trustees, the fund, and fund shareholders and to facilitate compliance with legal and regulatory requirements and oversight of the fund's activities and associated risks. The Board, acting through its committees, has charged FMR and its affiliates with (i) identifying events or circumstances the occurrence of which could have demonstrably adverse effects on the fund's business and/or reputation; (ii) implementing processes and controls to lessen the possibility that such events or circumstances occur or to mitigate the effects of such events or circumstances if they do occur; and (iii) creating and maintaining a system designed to evaluate continuously business and market conditions in order to facilitate the identification and implementation processes described in (i) and (ii) above. Because the day-to-day operations and activities of the fund are carried out by or through FMR, its affiliates, and other service providers, the fund's exposure to risks is mitigated but not eliminated by the processes overseen by the Trustees. While each of the Board's committees has responsibility for overseeing different aspects of the fund's activities, oversight is exercised primarily through the Operations and Audit Committees. In addition, an ad hoc Board committee of Independent Trustees has worked with FMR to enhance the Board's oversight of investment and financial risks, legal and regulatory risks, technology risks, and operational risks, including the development of additional risk reporting to the Board. Appropriate personnel, including but not limited to the fund's Chief Compliance Officer (CCO), FMR's internal auditor, the independent accountants, the fund's Treasurer and portfolio management personnel, make periodic reports to the Board's committees, as appropriate, including an annual review of Fidelity's risk management program for the Fidelity ® funds. The responsibilities of each standing committee, including their oversight responsibilities, are described further under "Standing Committees of the Trustees."
Interested Trustees*:
Correspondence intended for a Trustee who is an interested person may be sent to Fidelity Investments, 245 Summer Street, Boston, Massachusetts 02210.
Name, Year of Birth; Principal Occupations and Other Relevant Experience+
Jonathan Chiel (1957)
Year of Election or Appointment: 2016
Trustee
Mr. Chiel also serves as Trustee of other Fidelity ® funds. Mr. Chiel is Executive Vice President and General Counsel for FMR LLC (diversified financial services company, 2012-present). Previously, Mr. Chiel served as general counsel (2004-2012) and senior vice president and deputy general counsel (2000-2004) for John Hancock Financial Services; a partner with Choate, Hall & Stewart (1996-2000) (law firm); and an Assistant United States Attorney for the United States Attorney's Office of the District of Massachusetts (1986-95), including Chief of the Criminal Division (1993-1995). Mr. Chiel is a director on the boards of the Boston Bar Foundation and the Maimonides School.
Abigail P. Johnson (1961)
Year of Election or Appointment: 2009
Trustee
Chairman of the Board of Trustees
Ms. Johnson also serves as Trustee of other Fidelity ® funds. Ms. Johnson serves as Chairman (2016-present), Chief Executive Officer (2014-present), and Director (2007-present) of FMR LLC (diversified financial services company), President of Fidelity Financial Services (2012-present) and President of Personal, Workplace and Institutional Services (2005-present). Ms. Johnson is Chairman and Director of Fidelity Management & Research Company LLC (investment adviser firm, 2011-present). Previously, Ms. Johnson served as Chairman and Director of FMR Co., Inc. (investment adviser firm, 2011-2019), Vice Chairman (2007-2016) and President (2013-2016) of FMR LLC, President and a Director of Fidelity Management & Research Company (2001-2005), a Trustee of other investment companies advised by Fidelity Management & Research Company, Fidelity Investments Money Management, Inc. (investment adviser firm), and FMR Co., Inc. (2001-2005), Senior Vice President of the Fidelity ® funds (2001-2005), and managed a number of Fidelity ® funds. Ms. Abigail P. Johnson and Mr. Arthur E. Johnson are not related.
Jennifer Toolin McAuliffe (1959)
Year of Election or Appointment: 2016
Trustee
Ms. McAuliffe also serves as Trustee of other Fidelity ® funds and as Trustee of Fidelity Charitable (2020-present). Previously, Ms. McAuliffe served as Co-Head of Fixed Income of Fidelity Investments Limited (now known as FIL Limited (FIL)) (diversified financial services company), Director of Research for FIL's credit and quantitative teams in London, Hong Kong and Tokyo and Director of Research for taxable and municipal bonds at Fidelity Investments Money Management, Inc. Ms. McAuliffe previously served as a member of the Advisory Board of certain Fidelity ® funds (2016). Ms. McAuliffe was previously a lawyer at Ropes & Gray LLP and currently serves as director or trustee of several not-for-profit entities.
* Determined to be an "Interested Trustee" by virtue of, among other things, his or her affiliation with the trust or various entities under common control with FMR.
+ The information includes the Trustee's principal occupation during the last five years and other information relating to the experience, attributes, and skills relevant to the Trustee's qualifications to serve as a Trustee, which led to the conclusion that the Trustee should serve as a Trustee for the fund.
Independent Trustees:
Correspondence intended for an Independent Trustee may be sent to Fidelity Investments, P.O. Box 55235, Boston, Massachusetts 02205-5235.
Name, Year of Birth; Principal Occupations and Other Relevant Experience+
Elizabeth S. Acton (1951)
Year of Election or Appointment: 2013
Trustee
Ms. Acton also serves as Trustee of other Fidelity ® funds. Prior to her retirement, Ms. Acton served as Executive Vice President, Finance (2011-2012), Executive Vice President, Chief Financial Officer (2002-2011) and Treasurer (2004-2005) of Comerica Incorporated (financial services). Prior to joining Comerica, Ms. Acton held a variety of positions at Ford Motor Company (1983-2002), including Vice President and Treasurer (2000-2002) and Executive Vice President and Chief Financial Officer of Ford Motor Credit Company (1998-2000). Ms. Acton currently serves as a member of the Board and Audit and Finance Committees of Beazer Homes USA, Inc. (homebuilding, 2012-present). Ms. Acton previously served as a member of the Advisory Board of certain Fidelity ® funds (2013-2016).
Ann E. Dunwoody (1953)
Year of Election or Appointment: 2018
Trustee
General Dunwoody also serves as Trustee of other Fidelity ® funds. General Dunwoody (United States Army, Retired) was the first woman in U.S. military history to achieve the rank of four-star general and prior to her retirement in 2012 held a variety of positions within the U.S. Army, including Commanding General, U.S. Army Material Command (2008-2012). General Dunwoody currently serves as President of First to Four LLC (leadership and mentoring services, 2012-present), a member of the Board and Nomination and Corporate Governance Committees of Kforce Inc. (professional staffing services, 2016-present) and a member of the Board of Automattic Inc. (software engineering, 2018-present). Previously, General Dunwoody served as a member of the Advisory Board and Nominating and Corporate Governance Committee of L3 Technologies, Inc. (communication, electronic, sensor and aerospace systems, 2013-2019) and a member of the Board and Audit and Sustainability and Corporate Responsibility Committees of Republic Services, Inc. (waste collection, disposal and recycling, 2013-2016). Ms. Dunwoody also serves on several boards for non-profit organizations, including as a member of the Board, Chair of the Nomination and Governance Committee and a member of the Audit Committee of Logistics Management Institute (consulting non-profit, 2012-present), a member of the Council of Trustees for the Association of the United States Army (advocacy non-profit, 2013-present), a member of the Board of Florida Institute of Technology (2015-present) and a member of the Board of ThanksUSA (military family education non-profit, 2014-present). General Dunwoody previously served as a member of the Advisory Board of certain Fidelity ® funds (2018).
John Engler (1948)
Year of Election or Appointment: 2014
Trustee
Mr. Engler also serves as Trustee of other Fidelity ® funds. Previously, Mr. Engler served as Governor of Michigan (1991-2003), President of the Business Roundtable (2011-2017) and interim President of Michigan State University (2018-2019). Mr. Engler currently serves as a member of the Board of Stride, Inc. (formerly K12 Inc.) (technology-based education company, 2012-present). Previously, Mr. Engler served as a member of the Board of Universal Forest Products (manufacturer and distributor of wood and wood-alternative products, 2003-2019) and Trustee of The Munder Funds (2003-2014). Mr. Engler previously served as a member of the Advisory Board of certain Fidelity ® funds (2014-2016).
Robert F. Gartland (1951)
Year of Election or Appointment: 2010
Trustee
Mr. Gartland also serves as Trustee of other Fidelity ® funds. Prior to his retirement, Mr. Gartland held a variety of positions at Morgan Stanley (financial services, 1979-2007), including Managing Director (1987-2007) and Chase Manhattan Bank (1975-1978). Mr. Gartland previously served as Chairman and an investor in Gartland & Mellina Group Corp. (consulting, 2009-2019), as a member of the Board of National Securities Clearing Corporation (1993-1996) and as Chairman of TradeWeb (2003-2004).
Arthur E. Johnson (1947)
Year of Election or Appointment: 2008
Trustee
Mr. Johnson also serves as Trustee of other Fidelity ® funds. Prior to his retirement, Mr. Johnson served as Senior Vice President of Corporate Strategic Development of Lockheed Martin Corporation (defense contractor, 1999-2009). Mr. Johnson currently serves as a member of the Board of Booz Allen Hamilton (management consulting, 2011-present). Mr. Johnson previously served as a member of the Board of Eaton Corporation plc (diversified power management, 2009-2019) and a member of the Board of AGL Resources, Inc. (holding company, 2002-2016). Mr. Johnson previously served as Chairman (2018-2021) and Vice Chairman (2015-2018) of the Independent Trustees of certain Fidelity® funds. Mr. Arthur E. Johnson is not related to Ms. Abigail P. Johnson.
Michael E. Kenneally (1954)
Year of Election or Appointment: 2009
Trustee
Chairman of the Independent Trustees
Mr. Kenneally also serves as Trustee of other Fidelity ® funds and was Vice Chairman (2018-2021) of the Independent Trustees of certain Fidelity ® funds. Prior to retirement in 2005, he was Chairman and Global Chief Executive Officer of Credit Suisse Asset Management, the worldwide fund management and institutional investment business of Credit Suisse Group. Previously, Mr. Kenneally was an Executive Vice President and the Chief Investment Officer for Bank of America. In this role, he was responsible for the investment management, strategy and products delivered to the bank's institutional, high-net-worth and retail clients. Earlier, Mr. Kenneally directed the organization's equity and quantitative research groups. He began his career as a research analyst and then spent more than a dozen years as a portfolio manager for endowments, pension plans and mutual funds. He earned the Chartered Financial Analyst (CFA) designation in 1991.
Mark A. Murray (1954)
Year of Election or Appointment: 2016
Trustee
Mr. Murray also serves as Trustee of other Fidelity ® funds. Previously, Mr. Murray served as Co-Chief Executive Officer (2013-2016), President (2006-2013) and Vice Chairman (2013-2020) of Meijer, Inc. Mr. Murray serves as a member of the Board (2009-present) and Public Policy and Responsibility Committee (2009-present) and Chair of the Nuclear Review Committee (2019-present) of DTE Energy Company (diversified energy company). Mr. Murray previously served as a member of the Board of Spectrum Health (not-for-profit health system, 2015-2019) and as a member of the Board and Audit Committee and Chairman of the Nominating and Corporate Governance Committee of Universal Forest Products, Inc. (manufacturer and distributor of wood and wood-alternative products, 2004-2016). Mr. Murray also serves as a member of the Board of many community and professional organizations. Mr. Murray previously served as a member of the Advisory Board of certain Fidelity ® funds (2016).
+ The information includes the Trustee's principal occupation during the last five years and other information relating to the experience, attributes, and skills relevant to the Trustee's qualifications to serve as a Trustee, which led to the conclusion that the Trustee should serve as a Trustee for the fund.
Advisory Board Members and Officers:
Correspondence intended for a Member of the Advisory Board (if any) may be sent to Fidelity Investments, P.O. Box 55235, Boston, Massachusetts 02205-5235. Correspondence intended for an officer may be sent to Fidelity Investments, 245 Summer Street, Boston, Massachusetts 02210. Officers appear below in alphabetical order.
Name, Year of Birth; Principal Occupation
Laura M. Bishop (1961)
Year of Election or Appointment: 2022
Member of the Advisory Board
Ms. Bishop also serves as a Member of the Advisory Board of other funds. Prior to her retirement, Ms. Bishop held a variety of positions at United Services Automobile Association (2001-2020), including Executive Vice President and Chief Financial Officer (2014-2020) and Senior Vice President and Deputy Chief Financial Officer (2012-2014). Ms. Bishop currently serves as a member of the Audit Committee and Compensation and Personnel Committee (2021-present) of the Board of Directors of Korn Ferry (global organizational consulting).
Robert W. Helm (1957)
Year of Election or Appointment: 2021
Member of the Advisory Board
Mr. Helm also serves as a Member of the Advisory Board of other Fidelity® funds. Mr. Helm was formerly Deputy Chairman (2003-2020), partner (1991-2020) and an associate (1984-1991) of Dechert LLP (formerly Dechert Price & Rhoads). Mr. Helm currently serves on boards and committees of several not-for-profit organizations.
Carol J. Zierhoffer (1960)
Year of Election or Appointment: 2023
Member of the Advisory Board
Ms. Zierhoffer also serves as a Member of the Advisory Board of other funds. Prior to her retirement, Ms. Zierhoffer held a variety of positions at Bechtel Corporation (engineering company, 2013-2019), including Principal Vice President and Chief Information Officer (2013-2016) and Senior Vice President and Chief Information Officer (2016-2019). Ms. Zierhoffer currently serves as a member of the Board of Directors, Audit Committee and Compensation Committee of Allscripts Healthcare Solutions, Inc. (healthcare technology, 2020-present) and as a member of the Board of Directors, Audit and Finance Committee and Nominating and Governance Committee of Atlas Air Worldwide Holdings, Inc. (aviation operating services, 2021-present). Previously, Ms. Zierhoffer served as a member of the Board of Directors and Audit Committee and as the founding Chair of the Information Technology Committee of MedAssets, Inc. (healthcare technology, 2013-2016).
Craig S. Brown (1977)
Year of Election or Appointment: 2019
Assistant Treasurer
Mr. Brown also serves as an officer of other funds. Mr. Brown serves as Assistant Treasurer of FIMM, LLC (2021-present) and is an employee of Fidelity Investments (2013-present). Previously, Mr. Brown served as Assistant Treasurer of certain Fidelity ® funds (2019-2022).
John J. Burke III (1964)
Year of Election or Appointment: 2018
Chief Financial Officer
Mr. Burke also serves as Chief Financial Officer of other funds. Mr. Burke serves as Head of Investment Operations for Fidelity Fund and Investment Operations (2018-present) and is an employee of Fidelity Investments (1998-present). Previously Mr. Burke served as head of Asset Management Investment Operations (2012-2018).
David J. Carter (1973)
Year of Election or Appointment: 2020
Assistant Secretary
Mr. Carter also serves as Assistant Secretary of other funds. Mr. Carter serves as Senior Vice President, Deputy General Counsel (2022-present) and is an employee of Fidelity Investments (2005-present).
Jonathan Davis (1968)
Year of Election or Appointment: 2010
Assistant Treasurer
Mr. Davis also serves as an officer of other funds. Mr. Davis serves as Assistant Treasurer of FIMM, LLC (2021-present), FMR Capital, Inc. (2017-present), FD Funds GP LLC (2021-present), FD Funds Holding LLC (2021-present), and FD Funds Management LLC (2021-present); and is an employee of Fidelity Investments. Previously, Mr. Davis served as Vice President and Associate General Counsel of FMR LLC (diversified financial services company, 2003-2010).
Laura M. Del Prato (1964)
Year of Election or Appointment: 2018
President and Treasurer
Ms. Del Prato also serves as an officer of other funds. Ms. Del Prato serves as Assistant Treasurer of FIMM, LLC (2021-present) and is an employee of Fidelity Investments (2017-present). Previously, Ms. Del Prato served as President and Treasurer of The North Carolina Capital Management Trust: Cash Portfolio and Term Portfolio (2018-2020). Prior to joining Fidelity Investments, Ms. Del Prato served as a Managing Director and Treasurer of the JPMorgan Mutual Funds (2014-2017). Prior to JPMorgan, Ms. Del Prato served as a partner at Cohen Fund Audit Services (accounting firm, 2012-2013) and KPMG LLP (accounting firm, 2004-2012).
Christopher M. Gouveia (1973)
Year of Election or Appointment: 2023
Chief Compliance Officer
Mr. Gouveia also serves as Chief Compliance Officer of other funds. Mr. Gouveia serves as Senior Vice President of Asset Management Compliance for Fidelity Investments and is an employee of Fidelity Investments. Previously, Mr. Gouveia served as Chief Compliance Officer of the North Carolina Capital Management Trust (2016-2019).
Colm A. Hogan (1973)
Year of Election or Appointment: 2016
Assistant Treasurer
Mr. Hogan also serves as an officer of other funds. Mr. Hogan serves as Assistant Treasurer of FIMM, LLC (2021-present) and FMR Capital, Inc. (2017-present) and is an employee of Fidelity Investments (2005-present). Previously, Mr. Hogan served as Deputy Treasurer of certain Fidelity ® funds (2016-2020) and Assistant Treasurer of certain Fidelity ® funds (2016-2018).
Cynthia Lo Bessette (1969)
Year of Election or Appointment: 2019
Secretary and Chief Legal Officer (CLO)
Ms. Lo Bessette also serves as an officer of other funds. Ms. Lo Bessette serves as CLO, Secretary, and Senior Vice President of Fidelity Management & Research Company LLC (investment adviser firm, 2019-present); CLO of Fidelity Management & Research (Hong Kong) Limited, FMR Investment Management (UK) Limited, and Fidelity Management & Research (Japan) Limited (investment adviser firms, 2019-present); Secretary of FD Funds GP LLC (2021-present), FD Funds Holding LLC (2021-present), FD Funds Management LLC (2021-present), and Fidelity Diversifying Solutions LLC (investment adviser firm, 2022-present); and Assistant Secretary of FIMM, LLC (2019-present). She is a Senior Vice President and Deputy General Counsel of FMR LLC (diversified financial services company, 2019-present), and is an employee of Fidelity Investments. Previously, Ms. Lo Bessette served as CLO, Secretary, and Senior Vice President of FMR Co., Inc. (investment adviser firm, 2019); Secretary of Fidelity SelectCo, LLC and Fidelity Investments Money Management, Inc. (investment adviser firms, 2019). Prior to joining Fidelity Investments, Ms. Lo Bessette was Executive Vice President, General Counsel (2016-2019) and Senior Vice President, Deputy General Counsel (2015-2016) of OppenheimerFunds (investment management company) and Deputy Chief Legal Officer (2013-2015) of Jennison Associates LLC (investment adviser firm).
Chris Maher (1972)
Year of Election or Appointment: 2013
Assistant Treasurer
Mr. Maher also serves as an officer of other funds. Mr. Maher serves as Assistant Treasurer of FIMM, LLC (2021-present) and FMR Capital, Inc. (2017-present), and is an employee of Fidelity Investments (2008-present). Previously, Mr. Maher served as Assistant Treasurer of certain funds (2013-2020); Vice President of Asset Management Compliance (2013), Vice President of the Program Management Group of FMR (investment adviser firm, 2010-2013), and Vice President of Valuation Oversight (2008-2010).
Jamie Pagliocco (1964)
Year of Election or Appointment: 2020
Vice President
Mr. Pagliocco also serves as Vice President of other funds. Mr. Pagliocco serves as President of Fixed Income (2020-present), and is an employee of Fidelity Investments (2001-present). Previously, Mr. Pagliocco served as Co-Chief Investment Officer - Bond (2017-2020), Global Head of Bond Trading (2016-2019), and as a portfolio manager.
Brett Segaloff (1972)
Year of Election or Appointment: 2021
Anti-Money Laundering (AML) Officer
Mr. Segaloff also serves as an AML Officer of other funds and other related entities. He is Director, Anti-Money Laundering (2007-present) of FMR LLC (diversified financial services company) and is an employee of Fidelity Investments (1996-present).
Stacie M. Smith (1974)
Year of Election or Appointment: 2013
Assistant Treasurer
Ms. Smith also serves as an officer of other funds. Ms. Smith serves as Assistant Treasurer of FIMM, LLC (2021-present) and FMR Capital, Inc. (2017-present), is an employee of Fidelity Investments (2009-present), and has served in other fund officer roles. Prior to joining Fidelity Investments, Ms. Smith served as Senior Audit Manager of Ernst & Young LLP (accounting firm, 1996-2009). Previously, Ms. Smith served as Assistant Treasurer (2013-2019) and Deputy Treasurer (2013-2016) of certain Fidelity ® funds.
Jim Wegmann (1979)
Year of Election or Appointment: 2021
Deputy Treasurer
Mr. Wegmann also serves as an officer of other funds. Mr. Wegmann serves as Assistant Treasurer of FIMM, LLC (2021-present) and is an employee of Fidelity Investments (2011-present). Previously, Mr. Wegmann served as Assistant Treasurer of certain Fidelity ® funds (2019-2021).
As a shareholder, you incur two types of costs: (1) transaction costs, which may include sales charges (loads) on purchase payments or redemption proceeds, as applicable and (2) ongoing costs, which generally include management fees, distribution and/or service (12b-1) fees and other Fund expenses. This Example is intended to help you understand your ongoing costs (in dollars) of investing in a fund and to compare these costs with the ongoing costs of investing in other mutual funds.
| The Example is based on an investment of $1,000 invested at the beginning of the period and held for the entire period (August 1, 2022 to January 31, 2023). |
Actual Expenses
The first line of the accompanying table provides information about actual account values and actual expenses. You may use the information in this line, together with the amount you invested, to estimate the expenses that you paid over the period. Simply divide your account value by $1,000.00 (for example, an $8,600 account value divided by $1,000.00 = 8.6), then multiply the result by the number in the first line for a class/Fund under the heading entitled "Expenses Paid During Period" to estimate the expenses you paid on your account during this period. If any fund is a shareholder of any underlying mutual funds or exchange-traded funds (ETFs) (the Underlying Funds), such fund indirectly bears its proportional share of the expenses of the Underlying Funds in addition to the direct expenses incurred presented in the table. These fees and expenses are not included in the annualized expense ratio used to calculate the expense estimate in the table below.
Hypothetical Example for Comparison Purposes
The second line of the accompanying table provides information about hypothetical account values and hypothetical expenses based on the actual expense ratio and an assumed rate of return of 5% per year before expenses, which is not the actual return. The hypothetical account values and expenses may not be used to estimate the actual ending account balance or expenses you paid for the period. You may use this information to compare the ongoing costs of investing in the Fund and other funds. To do so, compare this 5% hypothetical example with the 5% hypothetical examples that appear in the shareholder reports of the other funds. If any fund is a shareholder of any Underlying Funds, such fund indirectly bears its proportional share of the expenses of the Underlying Funds in addition to the direct expenses as presented in the table. These fees and expenses are not included in the annualized expense ratio used to calculate the expense estimate in the table below.
Please note that the expenses shown in the table are meant to highlight your ongoing costs only and do not reflect any transaction costs. Therefore, the second line of the table is useful in comparing ongoing costs only, and will not help you determine the relative total costs of owning different funds. In addition, if these transactional costs were included, your costs would have been higher.
| | | | | Annualized Expense Ratio- A | | Beginning Account Value August 1, 2022 | | Ending Account Value January 31, 2023 | | Expenses Paid During Period- C August 1, 2022 to January 31, 2023 |
| | | | | | | | | | |
| Fidelity® Series Large Cap Value Index Fund | | | | -%- D | | | | | | |
| Actual | | | | | | $ 1,000 | | $ 1,046.60 | | $- E |
Hypothetical- B | | | | | | $ 1,000 | | $ 1,025.21 | | $- E |
| |
A Annualized expense ratio reflects expenses net of applicable fee waivers.
B 5% return per year before expenses
C Expenses are equal to the annualized expense ratio, multiplied by the average account value over the period, multiplied by 184/ 365 (to reflect the one-half year period). The fees and expenses of any Underlying Funds are not included in each annualized expense ratio.
D Amount represents less than .005%.
E Amount represents less than $.005.
The dividend and capital gains distributions for the fund(s) are available on Fidelity.com or Institutional.Fidelity.com .
The fund hereby designates as a capital gain dividend with respect to the taxable year ended January 31,2023, $84,220,296, or, if subsequently determined to be different, the net capital gain of such year.
The fund designates $357,267 of distributions paid during the fiscal year ended 2023 as qualifying to be taxed as section 163(j) interest dividends.
The fund designates 85% and 84% of the dividends distributed in March and December, respectively during the fiscal year as qualifying for the dividends-received deduction for corporate shareholders.
The fund designates 98.84% and 87.58% of the dividends distributed in March and December, respectively during the fiscal year as amounts which may be taken into account as a dividend for the purposes of the maximum rate under section 1(h)(11) of the Internal Revenue Code.
The fund designates 0.32% and 7.21% of the dividends distributed in March and December, respectively during the fiscal year as a section 199A dividend.
The fund will notify shareholders in January 2024 of amounts for use in preparing 2023 income tax returns.
Board Approval of Investment Advisory Contracts and Management Fees
Fidelity Series Large Cap Value Index Fund
Each year, the Board of Trustees, including the Independent Trustees (together, the Board), votes on the renewal of the management contract with Fidelity Management & Research Company LLC (FMR) and the sub-advisory agreement (Sub-Advisory Agreement) for the fund with Geode Capital Management, LLC (Geode) (together, the Advisory Contracts). FMR and Geode are referred to herein as the Investment Advisers. The Board, assisted by the advice of fund counsel and Independent Trustees' counsel, requests and considers a broad range of information relevant to the renewal of the Advisory Contracts throughout the year.
The Board meets regularly and, at each of its meetings, covers an extensive agenda of topics and materials and considers factors that are relevant to its annual consideration of the renewal of the fund's Advisory Contracts, including the services and support provided to the fund and its shareholders. The Board has established four standing committees (Committees) - Operations, Audit, Fair Valuation, and Governance and Nominating - each composed of and chaired by Independent Trustees with varying backgrounds, to which the Board has assigned specific subject matter responsibilities in order to enhance effective decision-making by the Board. The Operations Committee, of which all the Independent Trustees are members, meets regularly throughout the year and requests, receives and considers, among other matters, information related to the annual consideration of the renewal of the fund's Advisory Contracts before making its recommendation to the Board. The Board also meets as needed to review matters specifically related to the Board's annual consideration of the renewal of the Advisory Contracts. Members of the Board may also meet from time to time with trustees of other Fidelity funds through joint ad hoc committees to discuss certain matters relevant to all of the Fidelity funds.
At its September 2022 meeting, the Board unanimously determined to renew the fund's Advisory Contracts. In considering whether to renew the Advisory Contracts for the fund, the Board considered all factors it believed relevant and reached a determination, with the assistance of fund counsel and Independent Trustees' counsel and through the exercise of its business judgment, that the renewal of the Advisory Contracts was in the best interests of the fund and its shareholders and the fact that no fee is payable under the management contract was fair and reasonable.
Nature, Extent, and Quality of Services Provided. The Board considered staffing as it relates to the fund, including the backgrounds of investment personnel of Fidelity and Geode, and also considered the fund's investment objective, strategies, and related investment philosophy. The Independent Trustees also had discussions with senior management of Fidelity's investment operations and investment groups and with senior management of Geode. The Board considered the structure of the investment personnel compensation programs and whether the structures provide appropriate incentives to act in the best interests of the fund. The Board also considered the steps Fidelity had taken to ensure the continued provision of high quality services to the Fidelity funds throughout the COVID-19 pandemic, including the expansion of staff in client facing positions to maintain service levels in periods of high volumes and volatility.
The Trustees also discussed with representatives of Fidelity, at meetings throughout the year, Fidelity's role in, among other things, overseeing compliance with federal securities laws and other applicable requirements by Geode with respect to the fund and monitoring and overseeing the performance and investment capabilities of Geode. The Trustees considered that the Board had received from Fidelity periodic reports about its oversight and due diligence processes, as well as periodic reports regarding the performance of Geode.
The Board also considered the nature, extent and quality of services provided by Geode. The Trustees noted that under the Sub-Advisory Agreement, subject to oversight by Fidelity, Geode is responsible for, among other things, identifying investments and arranging for execution of portfolio transactions to implement the fund's investment strategy. In addition, the Trustees noted that Geode is responsible for providing such reporting as may be requested by Fidelity to fulfill its oversight responsibilities discussed above.
Resources Dedicated to Investment Management and Support Services. The Board reviewed the general qualifications and capabilities of Fidelity's and Geode's investment staffs, including their size, education, experience, and resources, as well as Fidelity's and Geode's approach to recruiting, training, managing, and compensating investment personnel. The Board considered that Fidelity's and Geode's investment professionals have extensive resources, tools and capabilities so as to provide competitive investment results over time, and that those professionals also have access to sophisticated tools that permit them to assess portfolio construction and risk and performance attribution characteristics continuously. Additionally, in its deliberations, the Board considered Fidelity's and Geode's trading, risk management, compliance, cybersecurity, and technology and operations capabilities and resources, which are integral parts of the investment management process.
Administrative Services. The Board considered (i) the nature, extent, quality, and cost of advisory and administrative services performed by the Investment Advisers and their affiliates under the Advisory Contracts and by FMR's affiliates under separate agreements covering transfer agency, pricing and bookkeeping, and securities lending services for the fund; (ii) the nature and extent of the supervision of third party service providers, principally custodians, subcustodians, and pricing vendors; and (iii) the resources devoted to, and the record of compliance with, the fund's compliance policies and procedures. The Board also reviewed the allocation of fund brokerage, including allocations to brokers affiliated with the Investment Advisers.
Investment Performance. The Board considered whether the fund has operated in accordance with its investment objective, as well as its record of compliance with its investment restrictions. The Board reviewed the fund's absolute investment performance, as well as the fund's relative investment performance. In this regard, the Board noted that the fund is designed to offer an investment option for other investment companies, collective investment trusts, and 529 plans managed by Fidelity and ultimately to enhance the performance of those investment companies, collective investment trusts, and 529 plans.
Based on its review, the Board concluded that the nature, extent, and quality of services provided to the fund under the Advisory Contracts should continue to benefit the shareholders of the fund.
Competitiveness of Management Fee and Total Expense Ratio. The Board considered that the fund does not pay FMR a management fee for investment advisory services, but that FMR receives fees for providing services to funds, collective investment trusts, and 529 plans that invest in the fund. The Board also noted that FMR or an affiliate undertakes to pay all operating expenses of the fund, except transfer agent fees, 12b-1 fees, Independent Trustee fees and expenses, custodian fees and expenses, proxy and shareholder meeting expenses, interest, taxes, and extraordinary expenses (such as litigation expenses). The Board further noted that the fund pays its non-operating expenses, including brokerage commissions and fees and expenses associated with the fund's securities lending program, if applicable.
The Board further considered that FMR has contractually agreed to reimburse the fund to the extent that total operating expenses, with certain exceptions, as a percentage of its average net assets, exceed 0.003% through May 31, 2025.
Based on its review, the Board considered that the fund does not pay a management fee and concluded that the fund's total expense ratio was reasonable in light of the services that the fund and its shareholders receive and the other factors considered.
Costs of the Services and Profitability. The Board considered the level of Fidelity's profits in respect of all the Fidelity funds.
A public accounting firm has been engaged annually by the Board as part of the Board's assessment of Fidelity's profitability analysis. The engagement includes the review and assessment of the methodologies used by Fidelity in determining the revenues and expenses attributable to Fidelity's mutual fund business, and completion of agreed-upon procedures in respect of the mathematical accuracy of certain fund profitability information and its conformity to established allocation methodologies. After considering the reports issued under the engagement and information provided by Fidelity, the Board concluded that while other allocation methods may also be reasonable, Fidelity's profitability methodologies are reasonable in all material respects.
The Board also reviewed Fidelity's and Geode's non-fund businesses and potential indirect benefits such businesses may have received as a result of their association with Fidelity's mutual fund business (i.e., fall-out benefits) as well as cases where Fidelity's and Geode's affiliates may benefit from the funds' business. The Board considered areas where potential indirect benefits to the Fidelity funds from their relationships with Fidelity may exist. The Board's consideration of these matters was informed by the findings of a joint ad hoc committee created by it and the boards of other Fidelity funds to evaluate potential fall-out benefits.
The Board concluded that the costs of the services provided by and the profits realized by Fidelity in connection with the operation of the fund were not relevant to the renewal of the Advisory Contracts because the fund pays no advisory fees and FMR or an affiliate bears all expenses of the fund, with limited exceptions.
The Board also considered information regarding the profitability of Geode's relationship with the fund.
Economies of Scale. The Board concluded that because the fund pays no advisory fees and FMR or an affiliate bears all expenses of the fund with certain limited exceptions, the realization of economies of scale was not a material factor in the Board's decision to renew the fund's Advisory Contracts.
Additional Information Requested by the Board. In order to develop fully the factual basis for consideration of the Fidelity funds' advisory contracts, the Board requested and received additional information on certain topics, including: (i) Fidelity's fund profitability methodology, profitability trends for certain funds, the allocation of various costs to different funds, and the impact of certain factors on fund profitability results; (ii) portfolio manager changes that have occurred during the past year and the amount of the investment that each portfolio manager has made in the Fidelity fund(s) that he or she manages; (iii) the extent to which current market conditions have affected retention and recruitment of personnel; (iv) the arrangements with and compensation paid to certain fund sub-advisers on behalf of the Fidelity funds and the treatment of such compensation within Fidelity's fund profitability methodology; (v) the terms of the funds' various management fee structures, including the basic group fee and the terms of Fidelity's voluntary expense limitation arrangements; (vi) Fidelity's transfer agent, pricing and bookkeeping fees, expense and service structures for different funds and classes relative to competitive trends; (vii) the impact on fund profitability of recent industry trends, such as the growth in passively managed funds and the changes in flows for different types of funds; (viii) the types of management fee and total expense comparisons provided, and the challenges and limitations associated with such information; and (ix) explanations regarding the relative total expense ratios and management fees of certain funds and classes, total expense and management fee competitive trends, and methodologies for total expense and management fee competitive comparisons. In addition, the Board considered its discussions with Fidelity regarding Fidelity's efforts to maintain the continuous investment and shareholder services necessary for the funds during the current pandemic and economic circumstances.
Based on its evaluation of all of the conclusions noted above, and after considering all factors it believed relevant, the Board concluded that the advisory and sub-advisory fee arrangements are fair and reasonable and that the fund's Advisory Contracts should be renewed.
The Securities and Exchange Commission adopted Rule 22e-4 under the Investment Company Act of 1940 (the Liquidity Rule) to promote effective liquidity risk management throughout the open-end investment company industry, thereby reducing the risk that funds will be unable to meet their redemption obligations and mitigating dilution of the interests of fund shareholders.
The Fund has adopted and implemented a liquidity risk management program (the Program) reasonably designed to assess and manage the Fund's liquidity risk and to comply with the requirements of the Liquidity Rule. The Fund's Board of Trustees (the Board) has designated the Fund's investment adviser as administrator of the Program. The Fidelity advisers have established a Liquidity Risk Management Committee (the LRM Committee) to manage the Program for each of the Fidelity Funds. The LRM Committee monitors the adequacy and effectiveness of implementation of the Program and on a periodic basis assesses each Fund's liquidity risk based on a variety of factors including (1) the Fund's investment strategy, (2) portfolio liquidity and cash flow projections during normal and reasonably foreseeable stressed conditions, (3) shareholder redemptions, (4) borrowings and other funding sources and (5) certain factors specific to ETFs including the effect of the Fund's prices and spreads, market participants, and basket compositions on the overall liquidity of the Fund's portfolio, as applicable.
In accordance with the Program, each of the Fund's portfolio investments is classified into one of four defined liquidity categories based on a determination of a reasonable expectation for how long it would take to convert the investment to cash (or sell or dispose of the investment) without significantly changing its market value.
- Highly liquid investments - cash or convertible to cash within three business days or less
- Moderately liquid investments - convertible to cash in three to seven calendar days
- Less liquid investments - can be sold or disposed of, but not settled, within seven calendar days
- Illiquid investments - cannot be sold or disposed of within seven calendar days
Liquidity classification determinations take into account a variety of factors including various market, trading and investment-specific considerations, as well as market depth, and generally utilize analysis from a third-party liquidity metrics service.
The Liquidity Rule places a 15% limit on a fund's illiquid investments and requires funds that do not primarily hold assets that are highly liquid investments to determine and maintain a minimum percentage of the fund's net assets to be invested in highly liquid investments (highly liquid investment minimum or HLIM). The Program includes provisions reasonably designed to comply with the 15% limit on illiquid investments and for determining, periodically reviewing and complying with the HLIM requirement as applicable.
At a recent meeting of the Fund's Board of Trustees, the LRM Committee provided a written report to the Board pertaining to the operation, adequacy, and effectiveness of the Program for the period December 1, 2021 through November 30, 2022. The report concluded that the Program is operating effectively and is reasonably designed to assess and manage the Fund's liquidity risk.
1.967963.109
XS6-ANN-0423
Fidelity® SAI Tax-Free Bond Fund
Annual Report
January 31, 2023
Offered exclusively to certain clients of the Adviser, or its affiliates, including Strategic Advisers LLC (Strategic Advisers) - not available for sale to the general public. Fidelity ® SAI is a product name of Fidelity ® funds dedicated to certain programs affiliated with Strategic Advisers.
Contents
To view a fund's proxy voting guidelines and proxy voting record for the 12-month period ended June 30, visit http://www.fidelity.com/proxyvotingresults or visit the Securities and Exchange Commission's (SEC) web site at http://www.sec.gov.
You may also call 1-800-544-3455 to request a free copy of the proxy voting guidelines.
Standard & Poor's, S&P and S&P 500 are registered service marks of The McGraw-Hill Companies, Inc. and have been licensed for use by Fidelity Distributors Corporation.
Other third-party marks appearing herein are the property of their respective owners.
All other marks appearing herein are registered or unregistered trademarks or service marks of FMR LLC or an affiliated company. © 2023 FMR LLC. All rights reserved.
This report and the financial statements contained herein are submitted for the general information of the shareholders of the Fund. This report is not authorized for distribution to prospective investors in the Fund unless preceded or accompanied by an effective prospectus.
A fund files its complete schedule of portfolio holdings with the SEC for the first and third quarters of each fiscal year on Form N-PORT. Forms N-PORT are available on the SEC's web site at http://www.sec.gov. A fund's Forms N-PORT may be reviewed and copied at the SEC's Public Reference Room in Washington, DC. Information regarding the operation of the SEC's Public Reference Room may be obtained by calling 1-800-SEC-0330.
For a complete list of a fund's portfolio holdings, view the most recent holdings listing, semiannual report, or annual report on Fidelity's web site at http://www.fidelity.com, http://www.institutional.fidelity.com, or http://www.401k.com, as applicable.
NOT FDIC INSURED •MAY LOSE VALUE •NO BANK GUARANTEE
Neither the Fund nor Fidelity Distributors Corporation is a bank.
Average annual total return reflects the change in the value of an investment, assuming reinvestment of distributions from dividend income and capital gains (the profits earned upon the sale of securities that have grown in value, if any) and assuming a constant rate of performance each year. The hypothetical investment and the average annual total returns do not reflect the deduction of taxes that a shareholder would pay on fund distributions or the redemption of fund shares. During periods of reimbursement by Fidelity, a fund's total return will be greater than it would be had the reimbursement not occurred. How a fund did yesterday is no guarantee of how it will do tomorrow.
| Average Annual Total Returns |
| | | | |
Periods ended January 31, 2023 | Past 1 year | Life of Fund A |
| Fidelity® SAI Tax-Free Bond Fund | -3.55% | 2.20% |
A From October 02, 2018
| $10,000 Over Life of Fund |
| |
Let's say hypothetically that $10,000 was invested in Fidelity® SAI Tax-Free Bond Fund, on October 02, 2018, when the fund started. The chart shows how the value of your investment would have changed, and also shows how the Bloomberg Municipal Bond Index performed over the same period. |
|
|
Market Recap:
Tax-exempt municipal bonds declined for the 12 months ending January 31, 2023, with a late-period rally partially offsetting a steep fall earlier on. The Bloomberg Municipal Bond Index returned -3.25% for the period. By early 2022, the Federal Reserve had begun its pivot from monetary easing to monetary tightening, tapering the large-scale asset purchases it restarted in 2020 amid the COVID-19 pandemic. In March, the Fed, faced with persistent inflationary pressure, began implementing an aggressive series of rate hikes, eventually raising its benchmark interest rate seven times, by a total of 4.25 percentage points, through mid-December. This helped push municipal bond yields to their highest level in more than a decade. Muni bond prices, which move inversely to yields, fell sharply. Credit spreads significantly widened, as investors demanded more yield for lower-quality munis as recession risk increased. In November, December and January, the tax-exempt market reversed course and rallied strongly (+7.99%) - including a gain of 2.87% in January - amid market expectations for the Fed to pause monetary policy tightening in 2023. Muni yields declined and prices rebounded. Favorable supply and demand was helpful; issuance remained subdued, while net inflows into munis turned positive. Muni tax-backed credit fundamentals were solid throughout the period and, for the most part, the risk of credit-rating downgrades appeared low. Shorter-duration (lower sensitivity to changes in interest rates) and higher-credit-quality munis led the way for the year.
Comments from Co-Portfolio Managers Michael Maka, Cormac Cullen and Elizah McLaughlin:
For the fiscal year ending January 31, 2023, the fund returned -3.55%, net of fees, roughly in line with the -3.66% result of the supplemental index, the Bloomberg 3+ Year Non-AMT Municipal Bond Index, as well as the -3.25% result of the benchmark, the broad-based Bloomberg Municipal Bond Index. The past 12 months, we continued to focus on longer-term objectives and sought to generate attractive tax-exempt income and a competitive risk-adjusted return. Versus the supplemental index, the fund's duration (interest rate) positioning contributed to performance. The fund had less sensitivity to interest rates, as measured by its shorter duration, during periods when interest rates rose and therefore was hurt less. A higher-than-average yield on the fund's underlying holdings provided another modest boost to the relative result. In contrast, the fund's underweight exposure to high-quality AAA-rated securities - which outpaced lower-quality securities as credit spreads widened - detracted from relative performance. An overweight to the bonds of hospitals, a segment that lagged the index, also hurt. A larger-than-index stake in bonds backed by the state of Illinois further crimped the relative result. Pricing-related factors slightly detracted as well. Fund holdings are priced by a third-party pricing service and validated daily by Fidelity Management & Research's fair-value processes. Securities within the index, however, are priced by the index provider.
The views expressed above reflect those of the portfolio manager(s) only through the end of the period as stated on the cover of this report and do not necessarily represent the views of Fidelity or any other person in the Fidelity organization. Any such views are subject to change at any time based upon market or other conditions and Fidelity disclaims any responsibility to update such views. These views may not be relied on as investment advice and, because investment decisions for a Fidelity fund are based on numerous factors, may not be relied on as an indication of trading intent on behalf of any Fidelity fund.
| Top Five States (% of Fund's net assets) |
| | |
| New York | 12.5 |
| Illinois | 12.4 |
| Other | 8.2 |
| Texas | 5.4 |
| California | 5.0 |
| | |
| Revenue Sources (% of Fund's net assets) |
| General Obligations | 24.8% | |
| Health Care | 14.8% | |
| Transportation | 12.4% | |
| Education | 10.8% | |
| Special Tax | 9.6% | |
| Other* | 8.0% | |
| State G.O. | 5.3% | |
| Others(Individually Less Than 5%) | 14.3% | |
| | 100.0% | |
| |
| *Includes net other assets | | |
Quality Diversification (% of Fund's net assets) |
|
| |
| We have used ratings from Moody's Investors Service, Inc. Where Moody's® ratings are not available, we have used S&P® ratings. All ratings are as of the date indicated and do not reflect subsequent changes. |
Showing Percentage of Net Assets
| Municipal Bonds - 91.6% |
| | | Principal Amount (a) | Value ($) |
| Alabama - 1.4% | | | |
| Black Belt Energy Gas District Bonds Series 2022 E, 5%, tender 6/1/28 (b) | | 10,000,000 | 10,683,403 |
| Homewood Edl. Bldg. Auth. Rev. Series 2019 A: | | | |
| 4% 12/1/36 | | 960,000 | 969,214 |
| 4% 12/1/38 | | 1,595,000 | 1,597,165 |
| 4% 12/1/41 | | 1,260,000 | 1,229,377 |
| 4% 12/1/44 | | 1,125,000 | 1,078,967 |
| 4% 12/1/49 | | 1,355,000 | 1,265,369 |
| Infirmary Health Systems Spl. Care Facilities Fing. Auth. Rev. Series 2021 A, 3% 2/1/46 | | 2,865,000 | 2,165,415 |
| Lower Alabama Gas District Bonds (No. 2 Proj.) Series 2020, 4%, tender 12/1/25 (b) | | 7,960,000 | 7,996,030 |
| Mobile Indl. Dev. Board Poll. Cont. Rev. Bonds (Alabama Pwr. Co. Barry Plant Proj.) Series 2008, 2.9%, tender 12/12/23 (b) | | 3,745,000 | 3,739,402 |
| Montgomery Med. Clinic Facilities Series 2015: | | | |
| 5% 3/1/25 | | 1,310,000 | 1,324,483 |
| 5% 3/1/36 | | 1,310,000 | 1,262,308 |
TOTAL ALABAMA | | | 33,311,133 |
| Alaska - 0.3% | | | |
| Alaska Hsg. Fin. Corp. Series 2021 A: | | | |
| 4% 6/1/30 | | 1,030,000 | 1,121,280 |
| 5% 6/1/27 | | 700,000 | 773,184 |
| 5% 12/1/27 | | 935,000 | 1,043,668 |
| 5% 6/1/28 | | 1,230,000 | 1,383,522 |
| Alaska Hsg. Fin. Corp. Mtg. Rev. Series 2022 A, 3% 6/1/51 | | 670,000 | 659,073 |
| Alaska Int'l. Arpts. Revs. Series 2016 A, 5% 10/1/26 | | 1,325,000 | 1,418,293 |
TOTAL ALASKA | | | 6,399,020 |
| Arizona - 1.0% | | | |
| Arizona Health Facilities Auth. Rev. (Scottsdale Lincoln Hospitals Proj.) Series 2014 A, 5% 12/1/39 | | 620,000 | 632,915 |
| Arizona State Univ. Revs. Series 2021 C, 5% 7/1/40 | | 1,445,000 | 1,640,419 |
| Chandler Indl. Dev. Auth. Indl. Dev. Rev. Bonds (Intel Corp. Proj.) Series 2005, 2.4%, tender 8/14/23 (b) | | 250,000 | 248,985 |
| Maricopa County Indl. Dev. Auth.: | | | |
| (Creighton Univ. Proj.) Series 2020, 5% 7/1/47 | | 560,000 | 599,242 |
| Bonds Series 2019 B, 5%, tender 9/1/24 (b) | | 610,000 | 630,009 |
| Maricopa County Indl. Dev. Auth. Sr. Living Facilities: | | | |
| (Christian Care Mesa II, Inc.) Series 2014 A, 4.5% 1/1/39 (Pre-Refunded to 1/1/24 @ 100) | | 420,000 | 427,294 |
| Series 2016: | | | |
5.75% 1/1/36 (c) | | 910,000 | 721,435 |
6% 1/1/48 (c) | | 1,250,000 | 903,546 |
| Maricopa County Rev.: | | | |
| Series 2017 D, 3% 1/1/48 | | 3,090,000 | 2,433,796 |
| Series 2019 E, 3% 1/1/49 | | 1,835,000 | 1,431,388 |
| Maricopa County Spl. Health Care District Gen. Oblig. Series 2018 C, 5% 7/1/36 | | 2,150,000 | 2,348,642 |
| Mesa Util. Sys. Rev. Series 2021, 4% 7/1/35 | | 3,665,000 | 3,893,277 |
| Phoenix Civic Impt. Board Arpt. Rev. Series 2019 A, 5% 7/1/44 | | 1,590,000 | 1,723,036 |
| Phoenix Civic Impt. Corp. Series 2019 A: | | | |
| 5% 7/1/32 | | 810,000 | 914,321 |
| 5% 7/1/39 | | 470,000 | 507,983 |
| 5% 7/1/45 | | 2,400,000 | 2,555,636 |
| Phoenix IDA Student Hsg. Rev. (Downtown Phoenix Student Hsg. II LLC Arizona State Univ. Proj.) Series 2019 A, 5% 7/1/59 | | 1,000,000 | 999,956 |
| Tempe Indl. Dev. Auth. Rev. (Friendship Village of Tempe Proj.) Series 2021 A, 4% 12/1/46 | | 2,020,000 | 1,525,756 |
TOTAL ARIZONA | | | 24,137,636 |
| California - 5.0% | | | |
| Bay Area Toll Auth. San Francisco Bay Toll Bridge Rev. Bonds Series 2021 A, 2%, tender 4/1/28 (b) | | 1,635,000 | 1,547,983 |
| California Edl. Facilities Auth. Rev. Series 2018 A, 5% 10/1/42 | | 1,255,000 | 1,333,388 |
| California Gen. Oblig.: | | | |
| Series 2021: | | | |
5% 12/1/35 | | 3,630,000 | 4,267,469 |
5% 12/1/36 | | 3,600,000 | 4,189,541 |
| Series 2022, 5% 4/1/42 | | 12,055,000 | 13,061,532 |
| California Hsg. Fin. Agcy. Series 2021 1, 3.5% 11/20/35 | | 2,111,702 | 2,046,030 |
| California Muni. Fin. Auth. Rev. Series 2017 A: | | | |
| 5% 7/1/42 | | 935,000 | 965,420 |
| 5.25% 11/1/36 | | 480,000 | 489,752 |
| California Muni. Fin. Auth. Student Hsg. (CHF-Davis I, LLC - West Village Student Hsg. Proj.) Series 2018: | | | |
| 5% 5/15/34 | | 2,465,000 | 2,600,177 |
| 5% 5/15/39 | | 1,100,000 | 1,137,864 |
| California Pub. Fin. Auth. Univ. Hsg. Rev.: | | | |
| (Claremont Colleges Proj.) Series 2017 A, 5% 7/1/27 (c) | | 100,000 | 97,610 |
| (NCCD - Claremont Properties LLC - Claremont Colleges Proj.) Series 2017 A, 5% 7/1/47 (c) | | 100,000 | 99,044 |
| California Pub. Works Board Lease Rev. (Various Cap. Projs.) Series 2022 C: | | | |
| 5% 8/1/30 | | 520,000 | 624,438 |
| 5% 8/1/33 | | 965,000 | 1,172,940 |
| California Statewide Cmntys. Dev. Auth. Rev. Series 2015, 5% 2/1/45 | | 750,000 | 627,748 |
| Golden State Tobacco Securitization Corp. Tobacco Settlement Rev. Series 2017 A1, 5% 6/1/28 (Pre-Refunded to 6/1/27 @ 100) | | 935,000 | 1,048,284 |
| Long Beach Arpt. Rev.: | | | |
| Series 2022 A: | | | |
5% 6/1/33 | | 470,000 | 565,262 |
5% 6/1/34 | | 375,000 | 448,108 |
5% 6/1/35 | | 280,000 | 330,822 |
5% 6/1/36 | | 750,000 | 869,710 |
5% 6/1/37 | | 655,000 | 749,756 |
5% 6/1/38 | | 935,000 | 1,060,401 |
5% 6/1/39 | | 470,000 | 531,353 |
| Series 2022 B: | | | |
5% 6/1/33 | | 420,000 | 505,128 |
5% 6/1/34 | | 375,000 | 448,108 |
5% 6/1/35 | | 280,000 | 330,822 |
5% 6/1/36 | | 280,000 | 324,692 |
5% 6/1/37 | | 470,000 | 537,993 |
5% 6/1/38 | | 280,000 | 317,553 |
5% 6/1/39 | | 530,000 | 599,185 |
| Los Angeles Dept. Arpt. Rev. Series B, 5% 5/15/45 | | 8,425,000 | 9,443,380 |
| Los Angeles Dept. of Wtr. & Pwr. Rev.: | | | |
| Series 2021 C, 5% 7/1/40 | | 3,695,000 | 4,238,811 |
| Series 2022 C: | | | |
5% 7/1/38 | | 2,350,000 | 2,747,940 |
5% 7/1/39 | | 2,100,000 | 2,440,916 |
5% 7/1/40 | | 10,400,000 | 11,992,478 |
5% 7/1/41 | | 5,000,000 | 5,727,488 |
| Middle Fork Proj. Fin. Auth. Series 2020: | | | |
| 5% 4/1/24 | | 2,570,000 | 2,623,052 |
| 5% 4/1/25 | | 2,700,000 | 2,805,558 |
| 5% 4/1/26 | | 1,900,000 | 2,012,084 |
| Mount Diablo Unified School District Series 2022 B: | | | |
| 4% 8/1/31 | | 785,000 | 884,475 |
| 4% 8/1/32 | | 1,105,000 | 1,242,669 |
| Sacramento City Unified School District Series 2022 A: | | | |
| 5% 8/1/35 | | 1,000,000 | 1,153,926 |
| 5% 8/1/39 | | 2,090,000 | 2,355,600 |
| 5% 8/1/40 | | 3,000,000 | 3,370,854 |
| San Diego Assoc. of Governments (Mid-Coast Corridor Transit Proj.) Series 2019 A: | | | |
| 5% 11/15/25 | | 1,870,000 | 1,958,676 |
| 5% 11/15/26 | | 1,870,000 | 2,008,683 |
| San Diego County Reg'l. Arpt. Auth. Arpt. Rev. Series 2019 A, 5% 7/1/49 | | 2,665,000 | 2,835,568 |
| San Diego County Wtr. Auth. Fing. Agcy. Wtr. Rev. Series 2022 A: | | | |
| 5% 5/1/47 | | 2,050,000 | 2,324,653 |
| 5% 5/1/52 | | 3,480,000 | 3,909,292 |
| San Francisco City & County Arpts. Commission Int'l. Arpt. Rev.: | | | |
| Series 2019 B, 5% 5/1/49 | | 435,000 | 468,191 |
| Series 2022 B, 5% 5/1/52 | | 6,820,000 | 7,524,797 |
| Univ. of California Revs. Series 2023 BM, 5% 5/15/36 (d) | | 670,000 | 813,636 |
| Washington Township Health Care District Rev.: | | | |
| Series 2017 A, 5% 7/1/35 | | 750,000 | 778,437 |
| Series 2017 B: | | | |
5% 7/1/29 | | 455,000 | 480,619 |
5% 7/1/30 | | 910,000 | 960,729 |
TOTAL CALIFORNIA | | | 120,030,625 |
| Colorado - 2.9% | | | |
| Colorado Health Facilities Auth. Rev. Bonds: | | | |
| Bonds: | | | |
Series 2018 B, 5%, tender 11/20/25 (b) | | 935,000 | 992,425 |
Series 2019 B, 5%, tender 8/1/26 (b) | | 705,000 | 744,461 |
Series 2022 C, 5%, tender 8/15/28 (b) | | 2,425,000 | 2,736,289 |
| Series 2018 A, 4% 11/15/48 | | 900,000 | 862,469 |
| Series 2019 A: | | | |
4% 11/1/39 | | 845,000 | 846,538 |
5% 11/1/26 | | 1,400,000 | 1,519,754 |
5% 11/15/39 | | 1,170,000 | 1,285,650 |
| Series 2019 A1, 4% 8/1/44 | | 13,820,000 | 13,298,021 |
| Series 2019 A2: | | | |
3.25% 8/1/49 | | 2,195,000 | 1,665,228 |
4% 8/1/49 | | 3,360,000 | 3,159,352 |
| Series 2019 B, 4% 1/1/40 | | 1,560,000 | 1,585,724 |
| Series 2020 A, 4% 9/1/50 | | 805,000 | 697,317 |
| Series 2022 A, 5% 5/15/47 | | 6,000,000 | 6,565,520 |
| Colorado Hsg. & Fin. Auth.: | | | |
| Series 2019 F, 4.25% 11/1/49 | | 275,000 | 280,380 |
| Series 2019 H, 4.25% 11/1/49 | | 160,000 | 163,314 |
| Series 2022 F, 5.25% 11/1/52 | | 1,805,000 | 1,932,180 |
| Colorado Reg'l. Trans. District Sales Tax Rev. (Fastracks Proj.) Series 2021 B, 5% 11/1/28 | | 3,535,000 | 4,069,025 |
| Colorado State Bldg. Excellent Schools Today Ctfs. of Prtn. Series 2018 N: | | | |
| 5% 3/15/37 | | 1,870,000 | 2,028,554 |
| 5% 3/15/38 | | 1,870,000 | 2,018,882 |
| Denver City & County Board Wtr. Rev. Series 2020 A: | | | |
| 5% 9/15/45 | | 5,070,000 | 5,664,849 |
| 5% 9/15/46 | | 7,770,000 | 8,665,209 |
| Univ. of Colorado Enterprise Sys. Rev. Bonds: | | | |
| Series 2019 C, 2%, tender 10/15/24 (b) | | 6,295,000 | 6,199,288 |
| Series 2021 C3A, 2%, tender 10/15/25 (b) | | 830,000 | 813,276 |
| Series 2021 C3B, 2%, tender 10/15/26 (b) | | 700,000 | 681,633 |
| Vauxmont Metropolitan District: | | | |
| Series 2019, 5% 12/15/26 (Assured Guaranty Muni. Corp. Insured) | | 126,000 | 135,779 |
| Series 2020, 5% 12/1/50 (Assured Guaranty Muni. Corp. Insured) | | 1,404,000 | 1,466,783 |
TOTAL COLORADO | | | 70,077,900 |
| Connecticut - 3.5% | | | |
| Bridgeport Gen. Oblig. Series 2019 A: | | | |
| 5% 2/1/23 (Build America Mutual Assurance Insured) | | 590,000 | 590,000 |
| 5% 2/1/25 (Build America Mutual Assurance Insured) | | 625,000 | 655,551 |
| Connecticut Gen. Oblig.: | | | |
| Series 2015 B, 5% 6/15/32 | | 250,000 | 264,695 |
| Series 2016 B: | | | |
5% 5/15/25 | | 935,000 | 990,872 |
5% 5/15/26 | | 510,000 | 554,895 |
| Series 2017 A, 5% 4/15/33 | | 230,000 | 253,104 |
| Series 2018 A, 5% 4/15/38 | | 935,000 | 1,013,800 |
| Series 2019 A, 5% 4/15/26 | | 615,000 | 667,784 |
| Series 2020 A: | | | |
4% 1/15/34 | | 2,105,000 | 2,281,901 |
5% 1/15/40 | | 1,870,000 | 2,050,598 |
| Series 2021 A: | | | |
3% 1/15/39 | | 785,000 | 708,161 |
3% 1/15/40 | | 950,000 | 839,652 |
| Series 2022 B, 4% 1/15/37 | | 9,400,000 | 9,863,512 |
| Connecticut Health & Edl. Facilities Auth. Rev.: | | | |
| (Sacred Heart Univ., CT. Proj.) Series 2017 I-1, 5% 7/1/42 | | 3,120,000 | 3,258,579 |
| Bonds: | | | |
Series 2017 C2, 2.8%, tender 2/3/26 (b)(d) | | 8,750,000 | 8,740,158 |
Series 2020 B: | | | |
5%, tender 1/1/25 (b) | | 2,250,000 | 2,345,273 |
5%, tender 1/1/27 (b) | | 1,665,000 | 1,794,987 |
| Series 2019 A: | | | |
4% 7/1/49 | | 1,635,000 | 1,442,579 |
5% 7/1/27 (c) | | 555,000 | 553,251 |
5% 7/1/34 (c) | | 685,000 | 670,924 |
| Series 2019 Q-1: | | | |
5% 11/1/24 | | 430,000 | 448,948 |
5% 11/1/26 | | 470,000 | 515,314 |
| Series 2020 K: | | | |
4% 7/1/45 | | 2,680,000 | 2,618,278 |
5% 7/1/40 | | 985,000 | 1,064,892 |
| Series 2021 G: | | | |
4% 3/1/46 | | 865,000 | 858,148 |
4% 3/1/51 | | 1,390,000 | 1,363,140 |
| Series 2021 S, 4% 6/1/51 | | 855,000 | 807,382 |
| Series 2022 M: | | | |
4% 7/1/39 | | 1,040,000 | 1,038,958 |
4% 7/1/40 | | 1,075,000 | 1,064,744 |
4% 7/1/52 | | 5,490,000 | 5,277,417 |
5% 7/1/32 | | 1,485,000 | 1,700,434 |
| Series A, 5% 7/1/26 | | 935,000 | 966,133 |
| Series K1: | | | |
5% 7/1/32 | | 985,000 | 1,018,796 |
5% 7/1/33 | | 765,000 | 789,835 |
5% 7/1/35 | | 1,030,000 | 1,052,360 |
| Series K3, 5% 7/1/43 | | 330,000 | 328,169 |
| Series R: | | | |
4% 7/1/36 | | 935,000 | 945,889 |
5% 6/1/32 | | 515,000 | 593,315 |
5% 6/1/33 | | 350,000 | 400,811 |
5% 6/1/34 | | 540,000 | 615,159 |
5% 6/1/35 | | 815,000 | 917,070 |
| Connecticut Hsg. Fin. Auth. Series 2021 B1, 3% 11/15/49 | | 1,370,000 | 1,348,949 |
| Connecticut Spl. Tax Oblig. Trans. Infrastructure Rev.: | | | |
| Series 2020 A, 5% 5/1/40 | | 8,000,000 | 8,948,169 |
| Series A, 5% 9/1/33 | | 4,680,000 | 4,863,076 |
| Stratford Gen. Oblig. Series 2019, 5% 1/1/28 | | 3,640,000 | 3,973,882 |
| Univ. of Connecticut Gen. Oblig. Series 2019 A, 5% 11/1/25 | | 465,000 | 498,827 |
TOTAL CONNECTICUT | | | 83,558,371 |
| District Of Columbia - 1.4% | | | |
| District of Columbia Gen. Oblig. Series 2017 D, 5% 6/1/42 | | 470,000 | 505,034 |
| District of Columbia Rev. Series 2018: | | | |
| 5% 10/1/23 | | 330,000 | 335,099 |
| 5% 10/1/25 | | 465,000 | 490,535 |
| 5% 10/1/26 | | 775,000 | 832,821 |
| 5% 10/1/27 | | 845,000 | 924,695 |
| 5% 10/1/43 | | 2,880,000 | 2,994,389 |
| District of Columbia Wtr. & Swr. Auth. Pub. Util. Rev. Bonds Series 2019 C, 1.75%, tender 10/1/24 (b) | | 3,020,000 | 2,942,187 |
| Metropolitan Washington Arpts. Auth. Dulles Toll Road Rev.: | | | |
| (Dulles Metrorail and Cap. Impt. Projs.): | | | |
Series 2019 A: | | | |
5% 10/1/38 | | 1,405,000 | 1,514,134 |
5% 10/1/44 | | 7,485,000 | 7,957,981 |
Series 2019 B: | | | |
3% 10/1/50 (Assured Guaranty Muni. Corp. Insured) | | 6,425,000 | 4,957,894 |
5% 10/1/47 | | 7,020,000 | 7,390,653 |
| Series 2009 B, 0% 10/1/32 (Assured Guaranty Corp. Insured) | | 1,665,000 | 1,210,924 |
| Metropolitan Washington DC Arpts. Auth. Sys. Rev. Series 2019 B, 5% 10/1/25 | | 1,500,000 | 1,606,702 |
TOTAL DISTRICT OF COLUMBIA | | | 33,663,048 |
| Florida - 3.5% | | | |
| Atlantic Beach Health Care Facilities Series A, 5% 11/15/43 | | 790,000 | 775,914 |
| Broward County School Board Ctfs. of Prtn. Series 2016, 5% 7/1/26 | | 1,375,000 | 1,497,386 |
| Cap. Projs. Fin. Auth. Student Hsg. Rev. (Cap. Projs. Ln. Prog. - Florida Univs.) Series 2020 A, 5% 10/1/30 | | 750,000 | 776,002 |
| Central Florida Expressway Auth. Sr. Lien Rev.: | | | |
| Orlando & Orange County Expressway Auth. Rev. Series 2017, 5% 7/1/39 | | 1,870,000 | 1,998,886 |
| Series 2021: | | | |
4% 7/1/38 (Assured Guaranty Muni. Corp. Insured) | | 1,065,000 | 1,105,979 |
4% 7/1/39 (Assured Guaranty Muni. Corp. Insured) | | 930,000 | 958,131 |
5% 7/1/32 (Assured Guaranty Muni. Corp. Insured) | | 2,810,000 | 3,379,607 |
5% 7/1/33 (Assured Guaranty Muni. Corp. Insured) | | 2,490,000 | 2,984,672 |
| Escambia County Health Facilities Auth. Health Facilities Rev. Series 2020 A: | | | |
| 3% 8/15/50 (Assured Guaranty Muni. Corp. Insured) | | 1,805,000 | 1,370,219 |
| 4% 8/15/45 | | 765,000 | 726,905 |
| Florida Higher Edl. Facilities Fing. Auth.: | | | |
| (St. Leo Univ. Proj.) Series 2019: | | | |
5% 3/1/23 | | 375,000 | 375,233 |
5% 3/1/24 | | 235,000 | 236,686 |
5% 3/1/25 | | 625,000 | 632,231 |
| Series 2019, 5% 10/1/23 | | 235,000 | 237,543 |
| Florida Hsg. Fin. Corp. Rev. Series 2019 1, 4% 7/1/50 | | 6,460,000 | 6,541,129 |
| Florida Mid-Bay Bridge Auth. Rev. Series 2015 A: | | | |
| 5% 10/1/29 | | 2,315,000 | 2,411,898 |
| 5% 10/1/35 | | 935,000 | 964,421 |
| Hillsborough County Aviation Auth. Rev. Series 2018 F: | | | |
| 5% 10/1/37 | | 1,415,000 | 1,560,154 |
| 5% 10/1/43 | | 1,870,000 | 2,013,546 |
| Hillsborough County School Board Ctfs. of Prtn. Series 2020 A, 5% 7/1/27 | | 4,680,000 | 5,174,343 |
| Jacksonville Spl. Rev. Series 2022 A: | | | |
| 5% 10/1/23 | | 205,000 | 208,345 |
| 5% 10/1/24 | | 465,000 | 484,325 |
| 5% 10/1/25 | | 360,000 | 384,740 |
| 5% 10/1/26 | | 255,000 | 278,954 |
| 5% 10/1/27 | | 205,000 | 229,374 |
| 5% 10/1/28 | | 405,000 | 462,812 |
| 5% 10/1/29 | | 350,000 | 407,763 |
| 5% 10/1/30 | | 330,000 | 391,699 |
| 5% 10/1/32 | | 305,000 | 373,837 |
| Lee County School Board Ctfs. Series 2019 A: | | | |
| 5% 8/1/27 | | 3,750,000 | 4,136,620 |
| 5% 8/1/28 | | 1,890,000 | 2,116,229 |
| Lee Memorial Health Sys. Hosp. Rev. Series 2019 A1: | | | |
| 5% 4/1/26 | | 935,000 | 1,001,252 |
| 5% 4/1/44 | | 3,030,000 | 3,163,574 |
| Manatee County School District Series 2017, 5% 10/1/28 (Assured Guaranty Muni. Corp. Insured) | | 2,340,000 | 2,569,198 |
| Miami-Dade County Aviation Rev. Series 2020 A, 4% 10/1/37 | | 1,870,000 | 1,897,650 |
| Miami-Dade County School Board Ctfs. of Prtn. Series 2015 B, 5% 5/1/28 | | 1,605,000 | 1,690,103 |
| Miami-Dade County School District Series 2015, 5% 3/15/26 | | 1,445,000 | 1,518,746 |
| Miami-Dade County Wtr. & Swr. Rev. Series 2019 B, 4% 10/1/49 | | 3,745,000 | 3,646,072 |
| Orange County Health Facilities Auth. Series 2022, 4% 10/1/52 | | 1,365,000 | 1,285,494 |
| Orange County School Board Ctfs. of Prtn. Series 2015 D, 5% 8/1/30 (Pre-Refunded to 8/1/25 @ 100) | | 820,000 | 873,142 |
| Palm Beach County Health Facilities Auth. Hosp. Rev. (Jupiter Med. Ctr. Proj.) Series 2022, 5% 11/1/52 | | 2,850,000 | 2,933,757 |
| Pasco County School Board Ctfs. of Prtn. Series 2018 A, 5% 8/1/35 (Build America Mutual Assurance Insured) | | 1,870,000 | 2,086,657 |
| Pinellas County Hsg. Fin. Auth. Bonds Series 2021 B, 0.65%, tender 7/1/24 (b) | | 1,165,000 | 1,112,862 |
| South Miami Health Facilities Auth. Hosp. Rev. (Baptist Med. Ctr., FL. Proj.) Series 2017, 5% 8/15/28 | | 1,450,000 | 1,596,920 |
| St. Johns County School Board (School Board of St. Johns County, Florida Master Lease Prog.) Series 2019 A: | | | |
| 5% 7/1/24 | | 750,000 | 777,308 |
| 5% 7/1/25 | | 1,360,000 | 1,441,616 |
| Tallahassee Health Facilities Rev.: | | | |
| (Tallahassee Memorial Healthcare, Inc. Proj.) Series 2016 A, 5% 12/1/55 | | 955,000 | 967,516 |
| Series 2015 A, 5% 12/1/40 | | 1,570,000 | 1,595,188 |
| Tampa Hosp. Rev. (H. Lee Moffitt Cancer Ctr. Proj.): | | | |
| Series 2016 B, 5% 7/1/37 | | 900,000 | 934,551 |
| Series 2020 B: | | | |
4% 7/1/45 | | 2,810,000 | 2,721,365 |
5% 7/1/40 | | 655,000 | 692,473 |
| Tampa Tax Allocation (H. Lee Moffitt Cancer Ctr. Proj.) Series 2020 A: | | | |
| 0% 9/1/38 | | 935,000 | 500,893 |
| 0% 9/1/39 | | 795,000 | 401,805 |
| 0% 9/1/40 | | 935,000 | 444,337 |
| 0% 9/1/41 | | 935,000 | 416,681 |
| 0% 9/1/42 | | 935,000 | 390,129 |
| 0% 9/1/45 | | 1,730,000 | 598,188 |
| Volusia County Edl. Facilities Auth. Rev. (Embry-Riddle Aeronautical Univ., Inc. Proj.) Series 2020 A: | | | |
| 5% 10/15/44 | | 230,000 | 244,501 |
| 5% 10/15/49 | | 425,000 | 449,408 |
TOTAL FLORIDA | | | 83,146,969 |
| Georgia - 4.9% | | | |
| Brookhaven Dev. Auth. Rev. Series 2019 A, 5% 7/1/36 | | 935,000 | 1,045,610 |
| Burke County Indl. Dev. Auth. Poll. Cont. Rev.: | | | |
| (Georgia Transmission Corp. Proj.) Series 2012, 2.75% 1/1/52 (b) | | 2,230,000 | 1,562,038 |
| Bonds (Georgia Pwr. Co. Plant Vogtle Proj.): | | | |
Series 1994: | | | |
2.15%, tender 6/13/24 (b) | | 5,950,000 | 5,830,732 |
2.25%, tender 5/25/23 (b) | | 1,720,000 | 1,716,572 |
Series 2013 1st, 2.925%, tender 3/12/24 (b) | | 2,170,000 | 2,152,277 |
| Coweta County Dev. Auth. Rev. (Piedmont Healthcare, Inc. Proj.) Series 2019 A, 5% 7/1/44 | | 4,680,000 | 4,926,000 |
| Fayette County Hosp. Auth. Rev. Bonds (Piedmont Healthcare, Inc. Proj.) Series 2019 A, 5%, tender 7/1/24 (b) | | 750,000 | 764,065 |
| Fulton County Dev. Auth. Rev.: | | | |
| Series 2019 C, 5% 7/1/28 | | 1,265,000 | 1,440,985 |
| Series 2019, 4% 6/15/49 | | 180,000 | 178,261 |
| Gainesville & Hall County Hosp. Auth. Rev. Series 2020 A, 3% 2/15/47 | | 6,980,000 | 5,503,203 |
| Georgia Muni. Elec. Auth. Pwr. Rev. Series 2019 A: | | | |
| 4% 1/1/49 | | 1,735,000 | 1,650,648 |
| 5% 1/1/26 | | 1,145,000 | 1,217,557 |
| 5% 1/1/30 | | 385,000 | 430,685 |
| 5% 1/1/39 | | 1,135,000 | 1,202,909 |
| 5% 1/1/44 | | 1,490,000 | 1,549,403 |
| Hosp. Auth. of Savannah Auth. Rev. Series 2019 A: | | | |
| 4% 7/1/36 | | 1,385,000 | 1,406,052 |
| 4% 7/1/43 | | 1,445,000 | 1,420,491 |
| Main Street Natural Gas, Inc. Bonds: | | | |
| Series 2019 B, 4%, tender 12/2/24 (b) | | 2,470,000 | 2,486,241 |
| Series 2021 A, 4%, tender 9/1/27 (b) | | 37,435,000 | 38,154,516 |
| Series 2022 B, 5%, tender 6/1/29 (b) | | 5,210,000 | 5,506,516 |
| Series 2022 E, 4%, tender 12/1/29 (b) | | 12,405,000 | 12,425,661 |
| Series 2023 A, 5%, tender 6/1/30 (b)(d) | | 13,445,000 | 14,270,050 |
| Monroe County Dev. Auth. Poll. Cont. Rev. (Georgia Pwr. Co. Plant Scherer Proj.) Series 1995, 2.25% 7/1/25 | | 1,040,000 | 1,002,800 |
| Paulding County Hosp. Auth. Rev. Series 2022 A: | | | |
| 5% 4/1/26 | | 200,000 | 214,109 |
| 5% 4/1/27 | | 165,000 | 179,897 |
| 5% 4/1/28 | | 375,000 | 415,658 |
| 5% 4/1/29 | | 325,000 | 365,347 |
| 5% 4/1/30 | | 235,000 | 267,356 |
| 5% 4/1/31 | | 280,000 | 322,077 |
| 5% 4/1/32 | | 185,000 | 215,374 |
| Private Colleges & Univs. Auth. Rev.: | | | |
| (The Savannah College of Art & Design Projs.) Series 2021: | | | |
4% 4/1/38 | | 815,000 | 824,238 |
5% 4/1/27 | | 375,000 | 407,468 |
5% 4/1/31 | | 560,000 | 646,794 |
5% 4/1/36 | | 450,000 | 498,953 |
| Series 2020 B: | | | |
4% 9/1/38 | | 2,810,000 | 2,899,813 |
4% 9/1/39 | | 1,370,000 | 1,410,746 |
5% 9/1/31 | | 1,295,000 | 1,543,236 |
| Series A: | | | |
5% 6/1/23 | | 395,000 | 398,029 |
5% 6/1/24 | | 650,000 | 669,457 |
TOTAL GEORGIA | | | 119,121,824 |
| Hawaii - 0.2% | | | |
| Hawaii Gen. Oblig.: | | | |
| Series 2020 C, 4% 7/1/40 | | 870,000 | 882,145 |
| Series FG, 5% 10/1/27 | | 935,000 | 1,027,324 |
| Honolulu City & County Gen. Oblig.: | | | |
| Series 2018 A, 5% 9/1/41 | | 1,870,000 | 2,056,027 |
| Series 2019 A, 5% 9/1/24 | | 715,000 | 744,772 |
| Honolulu City and County Wastewtr. Sys. Series 2015 A, 5% 7/1/40 (Pre-Refunded to 7/1/25 @ 100) | | 830,000 | 880,814 |
TOTAL HAWAII | | | 5,591,082 |
| Idaho - 0.3% | | | |
| Idaho Hsg. & Fin. Assoc. Single Family Mtg.: | | | |
| Series 2019 A, 4% 1/1/50 | | 75,000 | 76,064 |
| Series 2021 A: | | | |
5% 7/15/29 | | 2,810,000 | 3,244,547 |
5% 7/15/30 | | 935,000 | 1,095,708 |
5% 7/15/31 | | 600,000 | 714,966 |
5% 7/15/32 | | 1,170,000 | 1,386,318 |
TOTAL IDAHO | | | 6,517,603 |
| Illinois - 12.4% | | | |
| Champaign County Cmnty. Unit: | | | |
| Series 2019: | | | |
4% 6/1/26 | | 95,000 | 100,033 |
4% 6/1/27 | | 775,000 | 825,830 |
4% 6/1/28 | | 585,000 | 632,210 |
4% 6/1/29 | | 1,450,000 | 1,586,859 |
4% 6/1/30 | | 935,000 | 1,020,001 |
4% 6/1/31 | | 1,170,000 | 1,272,689 |
4% 6/1/34 | | 935,000 | 1,001,334 |
4% 6/1/35 | | 1,205,000 | 1,280,856 |
4% 6/1/36 | | 1,475,000 | 1,544,660 |
| Series 2020 A: | | | |
5% 1/1/29 | | 630,000 | 708,940 |
5% 1/1/30 | | 585,000 | 655,444 |
5% 1/1/31 | | 795,000 | 888,557 |
5% 1/1/33 | | 1,545,000 | 1,717,805 |
| Chicago Board of Ed.: | | | |
| Series 2012 A, 5% 12/1/42 | | 50,000 | 49,897 |
| Series 2015 C: | | | |
5.25% 12/1/35 | | 1,870,000 | 1,881,357 |
5.25% 12/1/39 | | 40,000 | 40,191 |
| Series 2016 A, 7% 12/1/44 | | 2,995,000 | 3,192,795 |
| Series 2017 C, 5% 12/1/25 | | 290,000 | 299,162 |
| Series 2017 D, 5% 12/1/31 | | 865,000 | 897,394 |
| Series 2017 H, 5% 12/1/36 | | 650,000 | 662,980 |
| Series 2018 A, 5% 12/1/27 | | 185,000 | 193,788 |
| Series 2018 C: | | | |
5% 12/1/24 | | 100,000 | 102,240 |
5% 12/1/25 | | 505,000 | 520,955 |
5% 12/1/27 | | 505,000 | 528,990 |
5% 12/1/46 | | 4,695,000 | 4,676,794 |
| Series 2019 A: | | | |
5% 12/1/23 | | 2,010,000 | 2,030,748 |
5% 12/1/28 | | 240,000 | 253,253 |
5% 12/1/29 | | 750,000 | 796,703 |
5% 12/1/30 | | 575,000 | 605,420 |
5% 12/1/31 | | 600,000 | 631,050 |
| Series 2021 A, 5% 12/1/38 | | 1,200,000 | 1,232,614 |
| Series 2021 B, 5% 12/1/31 | | 1,250,000 | 1,330,638 |
| Series 2022 A, 5% 12/1/47 | | 2,085,000 | 2,096,922 |
| Series 2022 B: | | | |
4% 12/1/35 | | 1,760,000 | 1,674,746 |
4% 12/1/36 | | 2,915,000 | 2,749,065 |
| Chicago Gen. Oblig.: | | | |
| Series 2003 B, 5.5% 1/1/30 | | 1,685,000 | 1,733,568 |
| Series 2019 A: | | | |
5% 1/1/28 | | 1,250,000 | 1,319,339 |
5% 1/1/40 | | 2,200,000 | 2,229,098 |
| Series 2020 A: | | | |
5% 1/1/26 | | 1,955,000 | 2,023,947 |
5% 1/1/27 | | 1,425,000 | 1,490,167 |
5% 1/1/30 | | 1,860,000 | 1,996,421 |
5% 1/1/32 | | 1,215,000 | 1,298,403 |
| Series 2021 A: | | | |
5% 1/1/31 | | 1,400,000 | 1,513,223 |
5% 1/1/32 | | 4,485,000 | 4,828,050 |
5% 1/1/34 | | 795,000 | 850,667 |
| Series 2021 B: | | | |
4% 1/1/32 | | 1,193,000 | 1,191,356 |
4% 1/1/38 | | 2,890,000 | 2,711,920 |
| Chicago Midway Arpt. Rev. Series 2013 B, 5% 1/1/25 | | 580,000 | 581,081 |
| Chicago O'Hare Int'l. Arpt. Rev.: | | | |
| Series 2015 B, 5% 1/1/32 | | 935,000 | 976,008 |
| Series 2018 B: | | | |
4% 1/1/44 | | 1,990,000 | 1,973,155 |
5% 1/1/36 | | 2,105,000 | 2,322,022 |
5% 1/1/37 | | 3,040,000 | 3,328,220 |
5% 1/1/48 | | 9,830,000 | 10,370,386 |
5% 1/1/53 | | 360,000 | 378,213 |
| Series 2020 A: | | | |
4% 1/1/37 | | 3,105,000 | 3,184,998 |
4% 1/1/38 | | 655,000 | 662,231 |
| Series 2022 D: | | | |
5% 1/1/36 | | 2,000,000 | 2,297,409 |
5% 1/1/37 | | 2,400,000 | 2,727,547 |
| Cook County Cmnty. Consolidated School District No. 59 Series 2020: | | | |
| 4% 3/1/24 | | 840,000 | 854,306 |
| 5% 3/1/25 | | 795,000 | 838,250 |
| 5% 3/1/26 | | 1,155,000 | 1,251,487 |
| 5% 3/1/27 | | 1,165,000 | 1,295,306 |
| 5% 3/1/28 | | 1,265,000 | 1,436,114 |
| Cook County Gen. Oblig.: | | | |
| Series 2021 A: | | | |
5% 11/15/31 | | 3,415,000 | 3,949,831 |
5% 11/15/32 | | 2,245,000 | 2,588,710 |
5% 11/15/33 | | 2,200,000 | 2,522,773 |
| Series 2021 B: | | | |
4% 11/15/25 | | 580,000 | 602,993 |
4% 11/15/26 | | 295,000 | 311,181 |
4% 11/15/27 | | 300,000 | 319,547 |
4% 11/15/28 | | 150,000 | 161,113 |
| Series 2022 A, 5% 11/15/29 | | 940,000 | 1,071,618 |
| Cook County Sales Tax Rev. Series 2022 A, 5% 11/15/42 | | 10,000,000 | 10,900,654 |
| DuPage & Cook Counties Cmnty. Unit School District #205 Series 2022, 4% 9/15/42 | | 7,900,000 | 8,010,061 |
| Illinois Fin. Auth.: | | | |
| (Bradley Univ. Proj.) Series 2021 A, 4% 8/1/38 | | 1,125,000 | 1,054,776 |
| Bonds Series 2022 B1, 5%, tender 8/15/25 (b) | | 6,035,000 | 6,344,573 |
| Series 2020 A: | | | |
3% 5/15/50 | | 5,655,000 | 4,112,971 |
3% 5/15/50 (Build America Mutual Assurance Insured) | | 2,620,000 | 1,984,664 |
3.25% 8/15/49 | | 1,025,000 | 830,114 |
| Series 2022 A: | | | |
5.25% 10/1/52 | | 4,525,000 | 4,430,610 |
5.5% 10/1/47 | | 1,010,000 | 1,026,117 |
| Illinois Fin. Auth. Academic Facilities (Provident Group UIUC Properties LLC Univ. of Illinois at Urbana-Champaign Proj.) Series 2019 A: | | | |
| 5% 10/1/27 | | 225,000 | 247,668 |
| 5% 10/1/28 | | 185,000 | 207,335 |
| 5% 10/1/44 | | 935,000 | 982,458 |
| 5% 10/1/49 | | 1,170,000 | 1,222,243 |
| 5% 10/1/51 | | 935,000 | 974,539 |
| Illinois Fin. Auth. Rev.: | | | |
| (Bradley Univ. Proj.) Series 2017 C, 5% 8/1/31 | | 200,000 | 210,980 |
| (Northwestern Memorial Hosp.,IL. Proj.) Series 2017 A, 5% 7/15/25 | | 280,000 | 296,691 |
| (OSF Healthcare Sys.) Series 2018 A: | | | |
4.125% 5/15/47 | | 4,820,000 | 4,632,956 |
5% 5/15/43 | | 45,000 | 46,401 |
| (Presence Health Proj.) Series 2016 C, 5% 2/15/36 | | 935,000 | 987,085 |
| Series 2015 A: | | | |
4.125% 11/15/37 | | 635,000 | 641,662 |
5% 11/15/45 | | 9,360,000 | 9,441,898 |
| Series 2016 A: | | | |
3% 10/1/37 | | 1,455,000 | 1,256,250 |
5% 2/15/24 | | 795,000 | 814,243 |
5% 8/15/25 | | 1,100,000 | 1,166,350 |
| Series 2016 C, 5% 2/15/31 | | 2,340,000 | 2,555,265 |
| Series 2016: | | | |
4% 12/1/35 | | 335,000 | 337,535 |
5% 12/1/40 | | 2,010,000 | 2,057,695 |
5% 12/1/46 | | 11,605,000 | 11,743,120 |
| Series 2018 A, 5% 10/1/41 | | 2,810,000 | 3,040,386 |
| Series 2019, 4% 9/1/35 | | 420,000 | 379,969 |
| Illinois Gen. Oblig.: | | | |
| Series 2006, 5.5% 1/1/28 | | 4,680,000 | 5,156,673 |
| Series 2014, 5% 2/1/26 | | 515,000 | 524,909 |
| Series 2016: | | | |
4% 2/1/30 (Assured Guaranty Muni. Corp. Insured) | | 2,590,000 | 2,693,939 |
5% 2/1/26 | | 4,930,000 | 5,206,755 |
5% 2/1/27 | | 575,000 | 614,968 |
| Series 2017 C, 5% 11/1/29 | | 2,440,000 | 2,605,908 |
| Series 2017 D: | | | |
5% 11/1/25 | | 1,110,000 | 1,168,143 |
5% 11/1/27 | | 2,835,000 | 3,055,178 |
| Series 2018 A: | | | |
5% 10/1/24 | | 470,000 | 486,035 |
5% 10/1/28 | | 935,000 | 1,015,265 |
5% 10/1/29 | | 1,495,000 | 1,615,135 |
| Series 2018 B, 5% 10/1/26 | | 935,000 | 996,055 |
| Series 2019 B, 5% 9/1/24 | | 470,000 | 485,307 |
| Series 2020 B: | | | |
4% 10/1/32 | | 2,570,000 | 2,630,111 |
5% 10/1/28 | | 4,060,000 | 4,408,531 |
| Series 2020, 5.5% 5/1/39 | | 5,925,000 | 6,432,855 |
| Series 2021 A: | | | |
5% 3/1/28 | | 4,000,000 | 4,323,516 |
5% 3/1/32 | | 180,000 | 197,398 |
5% 3/1/33 | | 935,000 | 1,020,959 |
5% 3/1/34 | | 935,000 | 1,015,705 |
5% 3/1/46 | | 1,870,000 | 1,922,478 |
| Series 2021 B, 4% 12/1/34 | | 1,655,000 | 1,668,676 |
| Series 2022 A: | | | |
5% 3/1/29 | | 2,060,000 | 2,243,299 |
5% 3/1/32 | | 1,000,000 | 1,106,793 |
5% 3/1/34 | | 3,640,000 | 3,986,924 |
5.25% 3/1/37 | | 1,600,000 | 1,743,019 |
| Series 2022 B, 5% 3/1/32 | | 2,060,000 | 2,279,959 |
| Illinois Toll Hwy. Auth. Toll Hwy. Rev.: | | | |
| Series 2019 A, 5% 1/1/44 | | 460,000 | 497,117 |
| Series A: | | | |
5% 1/1/38 | | 945,000 | 1,057,714 |
5% 1/1/41 | | 205,000 | 225,383 |
| Kane & DeKalb Counties Cmnty. Unit School District #302 Series 2018, 5% 2/1/26 | | 1,880,000 | 2,019,857 |
| Kane County School District No. 131 Series 2020 A: | | | |
| 4% 12/1/30 (Assured Guaranty Muni. Corp. Insured) | | 430,000 | 467,502 |
| 4% 12/1/31 (Assured Guaranty Muni. Corp. Insured) | | 575,000 | 624,126 |
| 4% 12/1/33 (Assured Guaranty Muni. Corp. Insured) | | 240,000 | 257,276 |
| 4% 12/1/35 (Assured Guaranty Muni. Corp. Insured) | | 255,000 | 267,303 |
| 4% 12/1/36 (Assured Guaranty Muni. Corp. Insured) | | 235,000 | 243,400 |
| 4% 12/1/38 (Assured Guaranty Muni. Corp. Insured) | | 545,000 | 557,077 |
| Metropolitan Pier & Exposition: | | | |
| (McCormick Place Expansion Proj.) Series 2010 B1: | | | |
0% 6/15/43 (Assured Guaranty Muni. Corp. Insured) | | 2,995,000 | 1,194,624 |
0% 6/15/46 (Assured Guaranty Muni. Corp. Insured) | | 7,485,000 | 2,545,871 |
0% 6/15/47 (Assured Guaranty Muni. Corp. Insured) | | 2,365,000 | 763,099 |
| Series 2002 A, 0% 6/15/35 (Nat'l. Pub. Fin. Guarantee Corp. Insured) | | 750,000 | 448,235 |
| Series 2002, 0% 12/15/36 (Nat'l. Pub. Fin. Guarantee Corp. Insured) | | 7,050,000 | 3,859,345 |
| Series 2010 B1, 0% 6/15/26 (Assured Guaranty Muni. Corp. Insured) | | 1,055,000 | 949,058 |
| Series 2017 A, 5% 6/15/57 | | 6,200,000 | 6,231,516 |
| Series 2020 A: | | | |
4% 6/15/50 | | 8,380,000 | 7,468,888 |
5% 6/15/50 | | 6,840,000 | 6,942,586 |
| Series 2020 B, 5% 6/15/42 | | 2,520,000 | 2,598,510 |
| Series 2022 A: | | | |
0% 12/15/35 | | 730,000 | 410,074 |
0% 12/15/36 | | 970,000 | 513,995 |
0% 12/15/37 | | 1,175,000 | 589,019 |
0% 6/15/40 | | 985,000 | 427,998 |
0% 6/15/41 | | 1,355,000 | 551,144 |
| Northern Illinois Univ. Revs. Series 2020 B: | | | |
| 4% 4/1/36 (Build America Mutual Assurance Insured) | | 1,215,000 | 1,229,421 |
| 4% 4/1/38 (Build America Mutual Assurance Insured) | | 1,215,000 | 1,212,705 |
| 4% 4/1/40 (Build America Mutual Assurance Insured) | | 815,000 | 795,478 |
| Railsplitter Tobacco Settlement Auth. Rev. Series 2017, 5% 6/1/27 | | 1,125,000 | 1,213,539 |
| Univ. of Illinois Board of Trustees Ctfs. of Prtn. Series 2014 C, 5% 3/15/23 | | 200,000 | 200,513 |
| Univ. of Illinois Rev. Series 2018 A, 5% 4/1/29 | | 95,000 | 105,982 |
TOTAL ILLINOIS | | | 297,883,695 |
| Indiana - 0.3% | | | |
| Indiana Fin. Auth. Health Sys. Rev. Bonds Series 2019 B, 2.25%, tender 7/1/25 (b) | | 545,000 | 536,176 |
| Indiana Health Facility Fing. Auth. Rev. Bonds Series 2001 A2, 2%, tender 2/1/23 (b) | | 320,000 | 320,000 |
| Indiana Hsg. & Cmnty. Dev. Auth.: | | | |
| (Glasswater Creek of Whitestown Proj.) Series 2020, 5.375% 10/1/40 (c) | | 695,000 | 580,211 |
| Series 2019 B, 3.5% 1/1/49 | | 465,000 | 465,132 |
| Series 2021 C1, 3% 1/1/52 | | 530,000 | 520,542 |
| Series A: | | | |
3.75% 1/1/49 | | 2,330,000 | 2,347,232 |
5% 1/1/28 | | 305,000 | 341,794 |
5% 7/1/28 | | 305,000 | 345,270 |
5% 1/1/29 | | 305,000 | 345,971 |
5% 7/1/29 | | 255,000 | 290,969 |
| Saint Joseph County Econ. Dev. Auth. Rev. (St. Mary's College Proj.): | | | |
| Series 2019, 5% 4/1/43 | | 1,455,000 | 1,536,380 |
| Series 2020, 5% 4/1/32 | | 715,000 | 797,453 |
TOTAL INDIANA | | | 8,427,130 |
| Iowa - 0.6% | | | |
| Iowa Fin. Auth. Rev.: | | | |
| Series 2018 B, 5% 2/15/48 | | 935,000 | 976,126 |
| Series 2019 A1, 5% 5/15/55 | | 3,635,000 | 3,016,009 |
| Series A, 5% 5/15/48 | | 2,505,000 | 2,140,460 |
| Iowa Higher Ed. Ln. Auth. Rev. (Grinnell College Proj.) Series 2017, 5% 12/1/46 | | 5,545,000 | 5,914,803 |
| Tobacco Settlement Auth. Tobacco Settlement Rev.: | | | |
| Series 2021 A2, 4% 6/1/49 | | 1,125,000 | 1,025,716 |
| Series 2021 B1, 4% 6/1/49 | | 1,370,000 | 1,369,939 |
TOTAL IOWA | | | 14,443,053 |
| Kentucky - 2.6% | | | |
| Ashland Med. Ctr. Rev. Series 2019: | | | |
| 3% 2/1/40 (Assured Guaranty Muni. Corp. Insured) | | 1,350,000 | 1,132,519 |
| 4% 2/1/36 | | 710,000 | 700,540 |
| 4% 2/1/37 | | 540,000 | 526,252 |
| 5% 2/1/24 | | 1,105,000 | 1,126,559 |
| 5% 2/1/25 | | 885,000 | 914,259 |
| Boyle County Edl. Facilities Rev. Series 2017, 5% 6/1/37 | | 300,000 | 316,390 |
| Carroll County Poll. Ctlr Rev. Bonds (Kentucky Utils. Co. Proj.) Series 2016 A, 1.55%, tender 9/1/26 (b) | | 6,250,000 | 5,801,410 |
| Kenton County Arpt. Board Arpt. Rev. Series 2019: | | | |
| 5% 1/1/38 | | 685,000 | 754,957 |
| 5% 1/1/39 | | 645,000 | 706,790 |
| 5% 1/1/49 | | 2,340,000 | 2,492,092 |
| Kentucky Econ. Dev. Fin. Auth. Series 2019 A2, 5% 8/1/49 | | 3,180,000 | 3,275,353 |
| Kentucky State Property & Buildings Commission Rev.: | | | |
| (Proj. No. 112) Series 2016 B, 5% 11/1/27 | | 1,025,000 | 1,114,589 |
| (Proj. No. 119) Series 2018: | | | |
5% 5/1/28 | | 935,000 | 1,047,573 |
5% 5/1/38 | | 3,745,000 | 4,010,772 |
| Series 2017: | | | |
5% 4/1/25 | | 3,205,000 | 3,373,646 |
5% 4/1/26 | | 3,245,000 | 3,501,582 |
| Series A: | | | |
4% 11/1/34 | | 1,170,000 | 1,234,361 |
4% 11/1/35 | | 375,000 | 390,024 |
4% 11/1/36 | | 935,000 | 963,749 |
4% 11/1/37 | | 1,170,000 | 1,194,967 |
5% 8/1/27 | | 375,000 | 397,146 |
5% 11/1/29 | | 1,035,000 | 1,169,456 |
| Series B: | | | |
5% 8/1/25 | | 2,775,000 | 2,945,808 |
5% 8/1/26 | | 1,785,000 | 1,934,586 |
5% 5/1/27 | | 1,870,000 | 2,054,707 |
| Kentucky, Inc. Pub. Energy: | | | |
| Bonds: | | | |
Series A, 4%, tender 6/1/26 (b) | | 10,775,000 | 10,795,143 |
Series C1, 4%, tender 6/1/25 (b) | | 1,870,000 | 1,875,154 |
| Series A: | | | |
4% 6/1/23 | | 545,000 | 545,798 |
4% 12/1/24 | | 470,000 | 473,364 |
4% 6/1/25 | | 545,000 | 549,629 |
| Louisville & Jefferson County: | | | |
| Bonds: | | | |
Series 2020 C, 5%, tender 10/1/26 (b) | | 490,000 | 521,809 |
Series 2020 D, 5%, tender 10/1/29 (b) | | 590,000 | 656,892 |
| Series 2016 A, 5% 10/1/31 | | 90,000 | 95,978 |
| Series 2020 A: | | | |
3% 10/1/43 | | 4,225,000 | 3,477,874 |
4% 10/1/39 | | 1,405,000 | 1,381,734 |
TOTAL KENTUCKY | | | 63,453,462 |
| Louisiana - 0.5% | | | |
| Calcasieu Parish Memorial Hosp. (Lake Charles Memorial Hosp. Proj.) Series 2019: | | | |
| 4% 12/1/23 | | 1,135,000 | 1,140,065 |
| 4% 12/1/24 | | 1,145,000 | 1,153,195 |
| Louisiana Pub. Facilities Auth. Hosp. Rev. (Franciscan Missionaries of Our Lady Health Sys. Proj.) Series 2017 A, 5% 7/1/47 | | 1,890,000 | 1,934,520 |
| Louisiana Pub. Facilities Auth. Rev.: | | | |
| (Ochsner Clinic Foundation Proj.) Series 2017, 5% 5/15/27 | | 830,000 | 900,054 |
| Series 2018 E: | | | |
5% 7/1/32 | | 1,375,000 | 1,522,783 |
5% 7/1/33 | | 1,120,000 | 1,234,133 |
5% 7/1/34 | | 1,295,000 | 1,417,393 |
| St. John Baptist Parish Rev.: | | | |
| (Marathon Oil Corp.) Series 2017, 2.2% 6/1/37 (b) | | 1,400,000 | 1,319,023 |
| Bonds (Marathon Oil Corp.) Series 2017: | | | |
2%, tender 4/1/23 (b) | | 1,320,000 | 1,317,609 |
2.1%, tender 7/1/24 (b) | | 635,000 | 621,804 |
TOTAL LOUISIANA | | | 12,560,579 |
| Maine - 0.3% | | | |
| Maine Health & Higher Edl. Facilities Auth. Rev.: | | | |
| (Eastern Maine Healthcare Systems Proj.) Series 2013, 5% 7/1/43 (Pre-Refunded to 7/1/23 @ 100) | | 95,000 | 95,942 |
| Series 2017 B, 5% 7/1/33 | | 260,000 | 281,003 |
| Series 2021 A, 4% 7/1/46 | | 2,865,000 | 2,743,607 |
| Maine Hsg. Auth. Mtg.: | | | |
| Series 2022 E, 5% 11/15/52 | | 1,125,000 | 1,198,590 |
| Series C, 3.5% 11/15/46 | | 1,430,000 | 1,428,257 |
| Maine Tpk. Auth. Tpk. Rev. Series 2018, 5% 7/1/47 | | 470,000 | 502,188 |
TOTAL MAINE | | | 6,249,587 |
| Maryland - 2.8% | | | |
| Baltimore County Gen. Oblig. Series 2021, 5% 3/1/34 | | 6,895,000 | 8,262,839 |
| Hsg. Opportunities Commission of Montgomery County Series 2021 C, 0.8% 7/1/25 | | 375,000 | 354,798 |
| Maryland Cmnty. Dev. Admin Dept. Hsg. & Cmnty. Dev.: | | | |
| Series 2019 B, 4% 9/1/49 | | 310,000 | 313,530 |
| Series 2019 C: | | | |
5% 9/1/27 | | 680,000 | 750,420 |
5% 9/1/28 | | 110,000 | 123,407 |
| Maryland Econ. Dev. Auth. Rev. (Ports America Chesapeake LLC. Proj.) Series 2017 A, 5% 6/1/24 | | 935,000 | 961,749 |
| Maryland Gen. Oblig. Series 2022 A: | | | |
| 5% 6/1/35 | | 15,000,000 | 18,064,542 |
| 5% 6/1/36 | | 3,895,000 | 4,631,738 |
| 5% 6/1/37 | | 10,000,000 | 11,818,332 |
| Maryland Health & Higher Edl. Series 2021 A: | | | |
| 3% 7/1/51 | | 3,325,000 | 2,502,500 |
| 4% 6/1/55 | | 585,000 | 521,757 |
| 5% 6/1/31 | | 330,000 | 370,528 |
| Maryland Health & Higher Edl. Facilities Auth. Rev. Series 2020 B: | | | |
| 5% 4/15/24 | | 660,000 | 678,199 |
| 5% 4/15/25 | | 860,000 | 905,383 |
| Maryland Stadium Auth. Series 2022 A: | | | |
| 5% 6/1/47 | | 5,725,000 | 6,439,229 |
| 5% 6/1/52 | | 1,350,000 | 1,508,673 |
| Maryland Stadium Auth. Built to Learn Rev.: | | | |
| Series 2021, 4% 6/1/46 | | 675,000 | 669,066 |
| Series 2022 A, 4% 6/1/35 | | 2,340,000 | 2,474,812 |
| Maryland Trans. Auth. Trans. Facility Projs. Rev. Series 2020, 5% 7/1/40 | | 4,615,000 | 5,182,982 |
TOTAL MARYLAND | | | 66,534,484 |
| Massachusetts - 2.0% | | | |
| Massachusetts Commonwealth Trans. Fund Rev. (Rail Enhancement Prog.) Series 2021 B, 5% 6/1/37 | | 4,170,000 | 4,618,095 |
| Massachusetts Dev. Fin. Agcy. Rev.: | | | |
| Caregroup, Inc. Series 2015 H-1, 5% 7/1/25 | | 1,285,000 | 1,353,759 |
| Series 2016, 5% 10/1/41 | | 1,000,000 | 1,002,918 |
| Series 2017 A, 5% 1/1/36 | | 2,260,000 | 2,364,020 |
| Series 2017, 5% 7/1/47 | | 885,000 | 896,423 |
| Series 2018, 5% 1/1/43 | | 1,250,000 | 1,281,467 |
| Series 2019 A, 5% 7/1/26 | | 1,640,000 | 1,742,086 |
| Series 2019 K: | | | |
5% 7/1/25 | | 770,000 | 811,202 |
5% 7/1/26 | | 1,015,000 | 1,091,489 |
5% 7/1/27 | | 1,220,000 | 1,338,153 |
| Series 2019: | | | |
5% 7/1/25 | | 615,000 | 643,208 |
5% 7/1/26 | | 345,000 | 366,591 |
5% 7/1/28 | | 515,000 | 561,656 |
5% 7/1/29 | | 470,000 | 518,180 |
5% 9/1/59 | | 3,490,000 | 3,653,182 |
| Series 2020 A, 4% 7/1/45 | | 3,425,000 | 3,157,939 |
| Series 2021 V, 5% 7/1/55 | | 4,980,000 | 6,004,395 |
| Series J2, 5% 7/1/53 | | 3,535,000 | 3,598,669 |
| Series M: | | | |
4% 10/1/50 | | 3,485,000 | 3,105,317 |
5% 10/1/45 | | 2,625,000 | 2,726,582 |
| Massachusetts Gen. Oblig.: | | | |
| Series 2019 C, 5% 5/1/49 | | 1,525,000 | 1,648,442 |
| Series E, 5% 11/1/50 | | 3,175,000 | 3,480,178 |
| Massachusetts Hsg. Fin. Auth. Series 2021 223, 3% 6/1/47 | | 2,270,000 | 2,235,449 |
TOTAL MASSACHUSETTS | | | 48,199,400 |
| Michigan - 1.9% | | | |
| Detroit Downtown Dev. Auth. Tax Series A, 5% 7/1/37 (Assured Guaranty Muni. Corp. Insured) | | 140,000 | 142,606 |
| Detroit Gen. Oblig. Series 2021 A, 5% 4/1/50 | | 800,000 | 782,710 |
| Flint Hosp. Bldg. Auth. Rev. Series 2020: | | | |
| 4% 7/1/41 | | 990,000 | 866,464 |
| 5% 7/1/25 | | 435,000 | 450,634 |
| 5% 7/1/26 | | 400,000 | 421,049 |
| 5% 7/1/27 | | 620,000 | 661,910 |
| 5% 7/1/28 | | 865,000 | 935,757 |
| Grand Rapids Pub. Schools Series 2019, 5% 11/1/26 (Assured Guaranty Muni. Corp. Insured) | | 860,000 | 937,420 |
| Grand Traverse County Hosp. Fin. Auth. Series 2021, 3% 7/1/51 | | 1,020,000 | 772,121 |
| Great Lakes Wtr. Auth. Sew Disp. Sys. Series 2022 A: | | | |
| 5% 7/1/37 | | 3,175,000 | 3,589,552 |
| 5% 7/1/38 | | 1,325,000 | 1,492,666 |
| Great Lakes Wtr. Auth. Wtr. Supply Sys. Rev. Series 2022 A: | | | |
| 5% 7/1/37 | | 750,000 | 849,219 |
| 5% 7/1/38 | | 1,000,000 | 1,126,540 |
| Lake Orion Cmnty. School District Series 2019, 5% 5/1/24 | | 470,000 | 484,565 |
| Lansing Cmnty. College Series 2019, 5% 5/1/44 | | 4,745,000 | 5,160,405 |
| Michigan Fin. Auth. Rev.: | | | |
| (Henry Ford Health Sys. Proj.) Series 2016, 5% 11/15/25 | | 3,950,000 | 4,194,523 |
| (Trinity Health Proj.) Series 2017, 5% 12/1/37 | | 935,000 | 1,011,650 |
| Bonds: | | | |
Series 2019 B, 5%, tender 11/16/26 (b) | | 1,235,000 | 1,331,141 |
Series 2019 MI2, 5%, tender 2/1/25 (b) | | 695,000 | 727,587 |
| Series 2015, 5% 11/15/28 | | 1,315,000 | 1,365,891 |
| Series 2016, 5% 11/15/26 | | 795,000 | 861,605 |
| Series 2019 A: | | | |
3% 12/1/49 | | 2,045,000 | 1,590,787 |
4% 12/1/49 | | 745,000 | 721,911 |
5% 11/15/48 | | 270,000 | 279,706 |
| Series 2020 A, 4% 6/1/49 | | 810,000 | 731,624 |
| Series 2020, 5% 6/1/40 | | 470,000 | 488,166 |
| Oakland Univ. Rev.: | | | |
| Series 2016, 5% 3/1/41 | | 760,000 | 795,696 |
| Series 2019 A, 5% 3/1/31 | | 545,000 | 617,603 |
| Series 2019: | | | |
5% 3/1/32 | | 610,000 | 688,577 |
5% 3/1/33 | | 585,000 | 655,417 |
5% 3/1/34 | | 655,000 | 729,386 |
5% 3/1/35 | | 655,000 | 724,067 |
5% 3/1/36 | | 750,000 | 821,826 |
5% 3/1/37 | | 840,000 | 913,324 |
5% 3/1/38 | | 1,240,000 | 1,339,187 |
5% 3/1/39 | | 840,000 | 903,773 |
| Royal Oak Hosp. Fin. Auth. Hosp. Rev. Series 2014 D, 5% 9/1/23 (Escrowed to Maturity) | | 490,000 | 497,258 |
| Univ. of Michigan Rev. Series 2020 A, 5% 4/1/50 | | 3,745,000 | 4,166,222 |
TOTAL MICHIGAN | | | 44,830,545 |
| Minnesota - 0.4% | | | |
| City of White Bear Lake (YMCA of Greater Twin Cities Proj.) Series 2018: | | | |
| 5% 6/1/23 | | 480,000 | 482,723 |
| 5% 6/1/27 | | 470,000 | 503,143 |
| Duluth Econ. Dev. Auth. Health Care Facilities Rev. Series 2018 A, 5% 2/15/43 | | 470,000 | 487,472 |
| Hennepin County Reg'l. Railroad Auth. Series 2019, 5% 12/1/28 | | 1,985,000 | 2,307,772 |
| Minnesota Higher Ed. Facilities Auth. Rev.: | | | |
| Series 2016 A, 5% 5/1/46 | | 1,365,000 | 1,284,469 |
| Series 2018 A, 5% 10/1/45 | | 5,000 | 5,190 |
| Saint Cloud Health Care Rev. Series 2019: | | | |
| 4% 5/1/49 | | 505,000 | 489,533 |
| 5% 5/1/48 | | 630,000 | 656,069 |
| Shakopee Sr. Hsg. Rev. Bonds Series 2018, 5.85%, tender 11/1/25 (b)(c) | | 1,340,000 | 1,328,833 |
| St. Paul Hsg. & Redev. Auth. Health Care Facilities Rev. Series 2015 A, 5% 7/1/29 | | 2,095,000 | 2,193,912 |
TOTAL MINNESOTA | | | 9,739,116 |
| Mississippi - 0.1% | | | |
| Mississippi Hosp. Equip. & Facilities Auth.: | | | |
| Bonds Series II, 5%, tender 3/1/27 (b) | | 565,000 | 600,162 |
| Series I: | | | |
5% 10/1/23 | | 515,000 | 522,274 |
5% 10/1/24 | | 500,000 | 517,213 |
5% 10/1/26 | | 610,000 | 655,951 |
5% 10/1/28 | | 935,000 | 1,036,987 |
TOTAL MISSISSIPPI | | | 3,332,587 |
| Missouri - 1.1% | | | |
| Kansas City Wtr. Rev. Series 2020 A: | | | |
| 4% 12/1/32 | | 630,000 | 689,808 |
| 4% 12/1/34 | | 375,000 | 405,686 |
| 4% 12/1/36 | | 655,000 | 691,102 |
| 4% 12/1/37 | | 470,000 | 491,995 |
| 4% 12/1/40 | | 470,000 | 482,490 |
| 5% 12/1/28 | | 545,000 | 630,697 |
| 5% 12/1/29 | | 330,000 | 388,382 |
| 5% 12/1/30 | | 620,000 | 743,585 |
| 5% 12/1/35 | | 560,000 | 655,305 |
| Missouri Health & Edl. Facilities Rev.: | | | |
| Series 2017 A, 5% 10/1/42 | | 2,200,000 | 2,344,811 |
| Series 2019 A: | | | |
4% 10/1/48 | | 4,480,000 | 4,438,784 |
5% 10/1/46 | | 430,000 | 467,243 |
| Missouri Hsg. Dev. Commission Single Family Mtg. Rev.: | | | |
| Series 2019, 4% 5/1/50 | | 125,000 | 126,694 |
| Series 2021 A, 3% 5/1/52 | | 2,450,000 | 2,412,590 |
| Saint Louis Arpt. Rev.: | | | |
| Series 2019 C: | | | |
5% 7/1/26 | | 1,350,000 | 1,465,528 |
5% 7/1/27 | | 2,275,000 | 2,525,366 |
| Series A, 5.25% 7/1/26 (Assured Guaranty Muni. Corp. Insured) | | 2,610,000 | 2,859,121 |
| Saint Louis County Indl. Dev. Auth. Sr. Living Facilities Rev. Series 2018 A: | | | |
| 5.125% 9/1/48 | | 55,000 | 50,697 |
| 5.25% 9/1/53 | | 3,910,000 | 3,608,795 |
TOTAL MISSOURI | | | 25,478,679 |
| Montana - 0.1% | | | |
| Montana Board Hsg. Single Family Series 2019 B, 4% 6/1/50 | | 60,000 | 61,087 |
| Montana Facility Fin. Auth. Series 2021 A, 3% 6/1/50 | | 2,055,000 | 1,521,135 |
TOTAL MONTANA | | | 1,582,222 |
| Nebraska - 0.6% | | | |
| Central Plains Energy Proj. Gas Supply Bonds Series 2019, 4%, tender 8/1/25 (b) | | 12,540,000 | 12,699,697 |
| Douglas County Neb Edl. Facilities Rev. (Creighton Univ. Projs.) Series 2021 A, 3% 7/1/51 | | 940,000 | 690,172 |
TOTAL NEBRASKA | | | 13,389,869 |
| Nevada - 1.1% | | | |
| Clark County Arpt. Rev.: | | | |
| Series 2014 A2, 5% 7/1/30 | | 395,000 | 409,682 |
| Series 2019 A, 5% 7/1/26 | | 1,175,000 | 1,282,416 |
| Clark County School District: | | | |
| Series 2015 C, 5% 6/15/26 | | 2,810,000 | 3,018,818 |
| Series 2016 B, 5% 6/15/26 | | 1,570,000 | 1,707,408 |
| Series 2017 A: | | | |
5% 6/15/24 | | 235,000 | 243,053 |
5% 6/15/25 | | 5,565,000 | 5,900,191 |
5% 6/15/26 | | 200,000 | 217,504 |
| Series A, 5% 6/15/27 | | 1,220,000 | 1,359,385 |
| Las Vegas Valley Wtr. District Wtr. Impt. Gen. Oblig. Series 2022 A, 4% 6/1/40 | | 1,245,000 | 1,282,639 |
| Nevada Hsg. Division Single Family Mtg. Rev.: | | | |
| Series 2019 A, 4% 4/1/49 | | 1,695,000 | 1,715,413 |
| Series 2019 B, 4% 10/1/49 | | 180,000 | 182,193 |
| Series 2021 B, 3% 10/1/51 | | 6,770,000 | 6,649,476 |
| Nevada Hwy. Impt. Rev. Series 2020 A, 2% 12/1/32 | | 3,020,000 | 2,733,365 |
TOTAL NEVADA | | | 26,701,543 |
| New Hampshire - 0.6% | | | |
| Nat'l. Fin. Auth. Hosp. Rev. (St. Luke's Univ. Health Network Proj.) Series 2021 B, 3% 8/15/51 (Assured Guaranty Muni. Corp. Insured) | | 1,755,000 | 1,334,278 |
| Nat'l. Finnance Auth.: | | | |
| Series 2020 1, 4.125% 1/20/34 | | 1,625,160 | 1,641,864 |
| Series 2022 1, 4.375% 9/20/36 | | 2,283,417 | 2,288,915 |
| New Hampshire Health & Ed. Facilities Auth.: | | | |
| (Dartmouth-Hitchcock Oblgtd Grp Proj.) Series 2018 A, 5% 8/1/34 | | 295,000 | 321,730 |
| Series 2017, 5% 7/1/44 | | 2,185,000 | 2,162,177 |
| New Hampshire Health & Ed. Facilities Auth. Rev. Series 2016, 5% 10/1/23 | | 160,000 | 162,260 |
| New Hampshire Nat'l. Fin. Auth. Series 2022 2, 4% 10/20/36 | | 7,709,136 | 7,469,356 |
TOTAL NEW HAMPSHIRE | | | 15,380,580 |
| New Jersey - 4.9% | | | |
| Camden County Impt. Auth. Health Care Redev. Rev. Series 2014 A, 5% 2/15/26 | | 935,000 | 949,027 |
| New Jersey Econ. Dev. Auth.: | | | |
| (White Horse HMT Urban Renewal LLC Proj.) Series 2020, 5% 1/1/40 (c) | | 310,000 | 237,372 |
| Series 2013, 5% 3/1/27 | | 45,000 | 45,081 |
| Series A, 5% 11/1/31 | | 2,560,000 | 2,900,573 |
| Series QQQ, 4% 6/15/46 | | 740,000 | 710,786 |
| New Jersey Econ. Dev. Auth. Lease Rev. (State House Proj.) Series 2017 B: | | | |
| 5% 6/15/26 | | 935,000 | 1,006,117 |
| 5% 6/15/35 | | 545,000 | 593,289 |
| New Jersey Econ. Dev. Auth. Rev.: | | | |
| (Black Horse EHT Urban Renewal LLC Proj.) Series 2019 A, 5% 10/1/39 (c) | | 220,000 | 169,186 |
| (Provident Montclair Proj.) Series 2017, 5% 6/1/25 (Assured Guaranty Muni. Corp. Insured) | | 970,000 | 1,021,270 |
| Series 2014 PP, 5% 6/15/26 | | 935,000 | 964,004 |
| Series 2014 RR, 5% 6/15/32 (Pre-Refunded to 6/15/24 @ 100) | | 195,000 | 201,967 |
| Series 2014 UU, 5% 6/15/30 (Pre-Refunded to 6/15/24 @ 100) | | 245,000 | 253,754 |
| Series 2016 A, 5% 7/15/27 | | 935,000 | 1,008,347 |
| Series 2018 EEE: | | | |
5% 6/15/28 | | 550,000 | 614,126 |
5% 6/15/34 (Pre-Refunded to 12/15/28 @ 100) | | 1,405,000 | 1,626,476 |
| Series LLL: | | | |
4% 6/15/44 | | 2,745,000 | 2,664,085 |
4% 6/15/49 | | 2,515,000 | 2,395,345 |
| Series MMM: | | | |
4% 6/15/35 | | 1,085,000 | 1,116,158 |
4% 6/15/36 | | 420,000 | 427,385 |
| New Jersey Edl. Facility Series A: | | | |
| 5% 7/1/38 | | 1,980,000 | 2,099,835 |
| 5% 7/1/39 | | 2,080,000 | 2,196,095 |
| New Jersey Gen. Oblig. Series 2020 A: | | | |
| 5% 6/1/28 | | 935,000 | 1,063,714 |
| 5% 6/1/29 | | 1,120,000 | 1,300,306 |
| New Jersey Health Care Facilities Fing. Auth. Rev.: | | | |
| Bonds: | | | |
Series 2019 B2, 5%, tender 7/1/25 (b) | | 1,560,000 | 1,646,847 |
Series 2019 B3, 5%, tender 7/1/26 (b) | | 1,585,000 | 1,704,981 |
| Series 2016: | | | |
4% 7/1/48 | | 3,355,000 | 2,809,463 |
5% 7/1/28 | | 1,095,000 | 1,147,194 |
5% 7/1/41 | | 85,000 | 84,617 |
| Series 2021, 3% 7/1/39 | | 1,910,000 | 1,683,080 |
| New Jersey Higher Ed. Student Assistance Auth. Student Ln. Rev. Series 2019 A: | | | |
| 5% 12/1/23 | | 185,000 | 188,733 |
| 5% 12/1/24 | | 110,000 | 114,585 |
| 5% 12/1/25 | | 200,000 | 213,390 |
| New Jersey Tobacco Settlement Fing. Corp. Series 2018 A, 5% 6/1/28 | | 935,000 | 1,011,227 |
| New Jersey Tpk. Auth. Tpk. Rev.: | | | |
| Series 2015 E, 5% 1/1/34 | | 630,000 | 658,886 |
| Series 2022 B, 5% 1/1/46 | | 11,000,000 | 12,111,811 |
| Series D, 5% 1/1/28 | | 1,000,000 | 1,082,716 |
| New Jersey Trans. Trust Fund Auth.: | | | |
| (Trans. Prog.) Series 2019 AA, 5.25% 6/15/43 | | 1,820,000 | 1,928,746 |
| Series 2006 C: | | | |
0% 12/15/25 | | 5,025,000 | 4,620,312 |
0% 12/15/31 (FGIC Insured) | | 5,400,000 | 3,992,845 |
| Series 2010 A: | | | |
0% 12/15/27 | | 1,130,000 | 972,150 |
0% 12/15/30 | | 1,000,000 | 767,962 |
| Series 2018 A: | | | |
5% 12/15/32 | | 630,000 | 700,165 |
5% 12/15/34 | | 1,915,000 | 2,093,475 |
| Series 2019 BB, 4% 6/15/50 | | 1,360,000 | 1,292,962 |
| Series 2021 A: | | | |
4% 6/15/34 | | 550,000 | 576,489 |
4% 6/15/38 | | 750,000 | 755,438 |
5% 6/15/32 | | 1,095,000 | 1,264,690 |
5% 6/15/33 | | 4,230,000 | 4,842,535 |
| Series 2022 A, 4% 6/15/40 | | 3,125,000 | 3,114,480 |
| Series 2022 AA: | | | |
5% 6/15/30 | | 1,845,000 | 2,117,360 |
5% 6/15/31 | | 4,485,000 | 5,212,137 |
5% 6/15/33 | | 1,250,000 | 1,449,752 |
| Series 2022 BB: | | | |
4% 6/15/46 | | 5,350,000 | 5,138,791 |
4% 6/15/50 | | 3,600,000 | 3,422,547 |
| Series A: | | | |
0% 12/15/31 | | 1,615,000 | 1,188,962 |
4% 12/15/39 | | 935,000 | 936,740 |
4.25% 12/15/38 | | 2,355,000 | 2,396,989 |
| Series AA: | | | |
4% 6/15/39 | | 975,000 | 977,044 |
4% 6/15/45 | | 5,915,000 | 5,703,657 |
4% 6/15/50 | | 6,105,000 | 5,804,069 |
5% 6/15/36 | | 1,075,000 | 1,181,382 |
5% 6/15/50 | | 470,000 | 494,047 |
| Series BB, 4% 6/15/44 | | 1,215,000 | 1,179,185 |
| Newark Port Auth. Hsg. Auth. Rev. Series 2007, 5.25% 1/1/26 (Nat'l. Pub. Fin. Guarantee Corp. Insured) | | 935,000 | 989,707 |
| Ocean City Gen. Oblig. Series 2020 B, 2% 10/15/30 | | 635,000 | 592,070 |
| Rutgers State Univ. Rev. Series Q, 5% 5/1/23 | | 200,000 | 201,237 |
| South Jersey Trans. Auth. Trans. Sys. Rev. Series 2022 A: | | | |
| 5% 11/1/38 | | 1,000,000 | 1,074,454 |
| 5% 11/1/40 | | 1,350,000 | 1,434,814 |
TOTAL NEW JERSEY | | | 118,439,021 |
| New Mexico - 0.4% | | | |
| Albuquerque Wtr. Util. Auth. Series 2018, 5% 7/1/28 | | 935,000 | 1,020,153 |
| New Mexico Hosp. Equip. Ln. Council Rev. Bonds Series 2019 B, 5%, tender 8/1/25 (b) | | 1,365,000 | 1,438,155 |
| New Mexico Mtg. Fin. Auth.: | | | |
| Series 2019 C, 4% 1/1/50 | | 670,000 | 679,052 |
| Series 2019 D, 3.75% 1/1/50 | | 245,000 | 246,844 |
| New Mexico Muni. Energy Acquisition Auth. Gas Supply Rev.: | | | |
| Bonds Series 2019 A, 5%, tender 5/1/25 (b) | | 4,680,000 | 4,849,887 |
| Series 2019 A: | | | |
4% 5/1/23 | | 550,000 | 551,484 |
4% 11/1/23 | | 185,000 | 186,352 |
4% 5/1/24 | | 630,000 | 636,871 |
| Santa Fe Retirement Fac. Series 2019 A: | | | |
| 5% 5/15/34 | | 65,000 | 62,341 |
| 5% 5/15/39 | | 45,000 | 41,058 |
| 5% 5/15/44 | | 45,000 | 39,188 |
| 5% 5/15/49 | | 100,000 | 84,638 |
TOTAL NEW MEXICO | | | 9,836,023 |
| New York - 12.5% | | | |
| Dorm. Auth. New York Univ. Rev. Series 2017 A, 5% 7/1/46 (Pre-Refunded to 7/1/27 @ 100) | | 1,185,000 | 1,325,435 |
| Hudson Yards Infrastructure Corp. New York Rev. Series 2017 A, 5% 2/15/42 | | 3,465,000 | 3,704,211 |
| Long Island Pwr. Auth. Elec. Sys. Rev.: | | | |
| Bonds Series 2019 B, 1.65%, tender 9/1/24 (b) | | 2,435,000 | 2,372,095 |
| Series 2018, 5% 9/1/36 | | 235,000 | 259,796 |
| MTA Hudson Rail Yards Trust Oblig. Series 2016 A, 5% 11/15/56 | | 280,000 | 277,302 |
| New York City Edl. Construction Fund Series 2021 B, 5% 4/1/46 | | 2,055,000 | 2,228,344 |
| New York City Gen. Oblig.: | | | |
| Series 2021 A1, 5% 8/1/31 | | 3,990,000 | 4,759,877 |
| Series 2021 F1, 5% 3/1/50 | | 3,080,000 | 3,357,784 |
| Series 2022 A1: | | | |
5% 9/1/39 | | 9,105,000 | 10,465,596 |
5% 8/1/47 | | 3,645,000 | 4,000,070 |
| Series B: | | | |
5% 10/1/42 | | 1,870,000 | 2,044,168 |
5% 10/1/43 | | 2,540,000 | 2,771,931 |
| New York City Hsg. Dev. Corp. Multifamily Hsg.: | | | |
| Bonds: | | | |
Series 2021 C2, 0.7%, tender 7/1/25 (b) | | 1,185,000 | 1,110,542 |
Series 2021 K2, 0.9%, tender 1/1/26 (b) | | 6,590,000 | 6,110,164 |
Series 2021, 0.6%, tender 7/1/25 (b) | | 1,570,000 | 1,467,398 |
Series 2022 F 2B, 3.4%, tender 12/22/26 (b) | | 8,400,000 | 8,471,064 |
| Series 2021 C1, 2.5% 11/1/51 | | 4,155,000 | 2,799,819 |
| New York City Muni. Wtr. Fin. Auth. Series 2022 CC1, 5% 6/15/52 | | 15,440,000 | 17,005,137 |
| New York City Transitional Fin. Auth. Bldg. Aid Rev.: | | | |
| (New York State Gen. Oblig. Proj.) Series 2015 S-1, 5% 7/15/35 | | 6,550,000 | 6,855,006 |
| Series 2018 S2, 5% 7/15/35 | | 1,005,000 | 1,105,371 |
| New York City Transitional Fin. Auth. Rev.: | | | |
| Series 2018 A2, 5% 8/1/39 | | 1,685,000 | 1,821,506 |
| Series 2018 B, 5% 8/1/45 | | 6,690,000 | 7,136,134 |
| Series 2022 B1, 5.25% 11/1/37 | | 5,880,000 | 6,973,912 |
| New York City Trust Cultural Resources Rev. Series 2021, 5% 7/1/31 | | 3,370,000 | 4,096,045 |
| New York Dorm. Auth. Rev.: | | | |
| Bonds: | | | |
Series 2019 B2, 5%, tender 5/1/24 (b) | | 825,000 | 838,241 |
Series 2019 B3, 5%, tender 5/1/26 (b) | | 595,000 | 629,307 |
| Series 2022 A: | | | |
5% 7/1/36 | | 750,000 | 846,548 |
5% 7/15/37 | | 380,000 | 401,925 |
5% 7/1/40 | | 935,000 | 1,013,302 |
5% 7/1/41 | | 935,000 | 1,007,906 |
5% 7/15/42 | | 1,075,000 | 1,111,457 |
5% 7/15/50 | | 2,775,000 | 2,823,433 |
| Series 2022: | | | |
5% 7/1/30 | | 1,540,000 | 1,684,261 |
5% 7/1/31 | | 1,615,000 | 1,767,648 |
5% 7/1/38 | | 780,000 | 814,113 |
5% 7/1/39 | | 1,225,000 | 1,271,712 |
5% 7/1/40 | | 2,760,000 | 2,850,545 |
5% 7/1/41 | | 2,900,000 | 2,979,341 |
5% 7/1/42 | | 1,520,000 | 1,558,475 |
5% 7/1/57 | | 6,385,000 | 6,389,792 |
| New York Metropolitan Trans. Auth. Dedicated Tax Fund Rev. Series 2012 A, 0% 11/15/32 | | 5,160,000 | 3,682,349 |
| New York Metropolitan Trans. Auth. Rev.: | | | |
| Series 2015 A1, 5% 11/15/29 | | 400,000 | 409,910 |
| Series 2015 D1, 5% 11/15/28 | | 2,310,000 | 2,379,669 |
| Series 2017 C1, 5% 11/15/34 | | 2,230,000 | 2,348,727 |
| Series 2017 D: | | | |
5% 11/15/30 | | 8,760,000 | 9,290,863 |
5% 11/15/35 | | 1,870,000 | 1,962,842 |
| Series 2020 A, 5% 2/1/23 | | 2,825,000 | 2,825,000 |
| Series 2020 D, 4% 11/15/46 | | 12,660,000 | 11,463,455 |
| New York State Dorm. Auth.: | | | |
| Series 2017 A, 5% 2/15/31 | | 935,000 | 1,033,104 |
| Series 2019 D, 3% 2/15/49 | | 3,920,000 | 3,143,549 |
| Series 2021 A, 4% 3/15/38 | | 4,000,000 | 4,075,945 |
| Series 2021 E: | | | |
3% 3/15/50 | | 2,340,000 | 1,845,298 |
4% 3/15/39 | | 4,000,000 | 4,064,693 |
4% 3/15/45 | | 5,435,000 | 5,380,630 |
4% 3/15/47 | | 3,830,000 | 3,768,116 |
| Series 2022 A, 5% 3/15/41 | | 12,850,000 | 14,431,312 |
| New York State Hsg. Fin. Agcy. Rev. Bonds Series 2021 J2: | | | |
| 1%, tender 11/1/26 (b) | | 960,000 | 882,155 |
| 1.1%, tender 5/1/27 (b) | | 3,545,000 | 3,226,149 |
| New York State Mtg. Agcy. Homeowner Mtg. Series 2020 225, 2.45% 10/1/45 | | 10,000,000 | 6,983,423 |
| New York State Urban Dev. Corp.: | | | |
| Series 2020 A: | | | |
4% 3/15/45 | | 1,170,000 | 1,156,613 |
4% 3/15/49 | | 7,380,000 | 7,189,009 |
5% 3/15/37 | | 11,380,000 | 12,860,941 |
| Series 2020 C: | | | |
4% 3/15/39 | | 3,315,000 | 3,356,606 |
5% 3/15/43 | | 4,680,000 | 5,144,621 |
5% 3/15/47 | | 9,360,000 | 10,202,680 |
| Series 2020 E: | | | |
3% 3/15/50 | | 1,525,000 | 1,202,598 |
4% 3/15/44 | | 8,705,000 | 8,642,996 |
4% 3/15/45 | | 7,020,000 | 6,939,675 |
| New York State Urban Eev Corp. Series 2019 A, 5% 3/15/37 | | 3,540,000 | 3,977,693 |
| Niagara Area Dev. Corp. Rev. (Catholic Health Sys., Inc. Proj.) Series 2022, 4.5% 7/1/52 | | 1,775,000 | 1,326,814 |
| Oneida County Local Dev. Corp. Rev. (Mohawk Valley Health Sys. Proj.) Series 2019 A, 5% 12/1/26 (Assured Guaranty Muni. Corp. Insured) | | 1,520,000 | 1,550,645 |
| Suffolk County Econ. Dev. Corp. Rev. Series 2021: | | | |
| 4.625% 11/1/31 (c) | | 250,000 | 216,055 |
| 5.375% 11/1/54 (c) | | 935,000 | 722,039 |
| Triborough Bridge & Tunnel Auth.: | | | |
| Series 2021 B, 4% 5/15/56 | | 1,645,000 | 1,592,148 |
| Series 2022 A, 5% 5/15/57 | | 8,425,000 | 9,196,060 |
| Triborough Bridge & Tunnel Auth. Revs.: | | | |
| Series 2018 A, 5% 11/15/44 | | 3,745,000 | 4,026,816 |
| Series 2021 A, 5% 11/15/51 | | 3,135,000 | 3,422,617 |
| Series 2022 A: | | | |
5% 11/15/40 | | 2,280,000 | 2,604,499 |
5% 11/15/41 | | 1,750,000 | 1,984,853 |
TOTAL NEW YORK | | | 301,019,880 |
| New York And New Jersey - 0.2% | | | |
| Port Auth. of New York & New Jersey: | | | |
| (H. Lee Moffitt Cancer Ctr. Proj.) Series 2016, 5% 11/15/41 | | 4,680,000 | 4,974,792 |
| Series 194, 5.25% 10/15/55 | | 935,000 | 974,629 |
TOTAL NEW YORK AND NEW JERSEY | | | 5,949,421 |
| North Carolina - 0.7% | | | |
| Charlotte Ctfs. of Prtn. (Convention Facility Projs.) Series 2019 A, 4% 6/1/39 | | 820,000 | 842,686 |
| New Hanover County Hosp. Rev. Series 2017: | | | |
| 5% 10/1/27 (Escrowed to Maturity) | | 50,000 | 55,992 |
| 5% 10/1/42 (Pre-Refunded to 10/1/27 @ 100) | | 435,000 | 487,129 |
| North Carolina Med. Care Commission Health Care Facilities Rev.: | | | |
| Bonds Series 2019 C, 2.55%, tender 6/1/26 (b) | | 1,260,000 | 1,249,775 |
| Series 2020 A, 3% 7/1/45 | | 1,335,000 | 1,069,925 |
| North Carolina Tpk. Auth. Triangle Expressway Sys. Series 2019, 5% 1/1/49 | | 13,100,000 | 13,640,385 |
TOTAL NORTH CAROLINA | | | 17,345,892 |
| North Dakota - 0.3% | | | |
| North Dakota Hsg. Fin. Agcy.: | | | |
| Series 2021 A, 3% 1/1/52 | | 795,000 | 782,984 |
| Series 2021 B, 3% 7/1/52 | | 2,115,000 | 2,076,663 |
| Series 2022, 5% 1/1/53 | | 2,755,000 | 2,935,110 |
| Univ. of North Dakota Series 2021 A, 3% 6/1/61 (Assured Guaranty Muni. Corp. Insured) | | 2,865,000 | 2,048,766 |
TOTAL NORTH DAKOTA | | | 7,843,523 |
| Ohio - 2.8% | | | |
| Akron Bath Copley Hosp. District Rev.: | | | |
| Series 2016, 5.25% 11/15/46 | | 3,495,000 | 3,575,503 |
| Series 2020, 5% 11/15/31 | | 360,000 | 400,628 |
| American Muni. Pwr., Inc. Rev. (Greenup Hydroelectric Proj.): | | | |
| Series 2016 A, 5% 2/15/41 | | 935,000 | 969,825 |
| Series 2016, 5% 2/15/46 | | 1,625,000 | 1,675,154 |
| Buckeye Tobacco Settlement Fing. Auth.: | | | |
| Series 2020 A2: | | | |
3% 6/1/48 | | 2,030,000 | 1,544,442 |
4% 6/1/48 | | 660,000 | 606,643 |
| Series 2020 B2, 5% 6/1/55 | | 5,530,000 | 5,272,951 |
| Chillicothe Hosp. Facilities Rev. (Adena Health Sys. Oblig. Group Proj.) Series 2017, 5% 12/1/47 | | 935,000 | 941,876 |
| Cleveland Arpt. Sys. Rev. Series 2016 A, 5% 1/1/25 (Assured Guaranty Muni. Corp. Insured) | | 685,000 | 715,572 |
| Cleveland-Cuyahoga County Port Auth. Rev. (Euclid Avenue Dev. Corp. Proj.) Series 2022 A: | | | |
| 5% 8/1/39 | | 1,250,000 | 1,348,155 |
| 5.25% 8/1/40 | | 1,320,000 | 1,444,202 |
| 5.25% 8/1/41 | | 1,390,000 | 1,518,419 |
| 5.25% 8/1/42 | | 1,465,000 | 1,594,728 |
| Columbus Gen. Oblig. Series 2016 2, 5% 7/1/25 | | 1,780,000 | 1,897,184 |
| Fairfield County Hosp. Facilities Rev. (Fairfield Med. Ctr. Proj.) Series 2013, 4.25% 6/15/24 | | 360,000 | 360,314 |
| Franklin County Hosp. Facilities Rev. Bonds (U.S. Health Corp. of Columbus Proj.) Series 2011 B, 5%, tender 5/15/23 (b) | | 175,000 | 176,098 |
| Hamilton County Healthcare Rev. (Life Enriching Cmntys. Proj.) Series 2016, 5% 1/1/51 | | 935,000 | 857,447 |
| Hamilton County Hosp. Facilities Rev. (Trihealth, Inc. Obligated Group Proj.) Series 2017 A, 5% 8/15/33 | | 770,000 | 826,817 |
| Lancaster Port Auth. Gas Rev. Bonds Series 2019, 5%, tender 2/1/25 (b) | | 4,130,000 | 4,251,459 |
| Miami County Hosp. Facilities Rev. (Kettering Health Network Obligated Group Proj.) Series 2019: | | | |
| 5% 8/1/23 | | 405,000 | 409,302 |
| 5% 8/1/45 | | 3,320,000 | 3,457,643 |
| Middleburg Heights Hosp. Rev. Series 2021 A, 4% 8/1/41 | | 1,590,000 | 1,563,952 |
| Muskingum County Hosp. Facilities (Genesis Healthcare Sys. Obligated Group Proj.) Series 2013, 4% 2/15/23 | | 1,005,000 | 1,005,159 |
| Ohio Higher Edl. Facility Commission Rev.: | | | |
| (Kenyon College 2020 Proj.) Series 2020: | | | |
4% 7/1/40 | | 685,000 | 685,555 |
5% 7/1/35 | | 2,455,000 | 2,728,730 |
5% 7/1/42 | | 4,235,000 | 4,562,196 |
| (Kenyon College, Oh. Proj.) Series 2017, 5% 7/1/42 | | 1,590,000 | 1,674,463 |
| Ohio Hosp. Rev. Series 2020 A, 4% 1/15/50 | | 265,000 | 244,886 |
| Ohio Hsg. Fin. Agcy. Residential Mtg. Rev. (Mtg. Backed Securities Prog.) Series 2019 B, 4.5% 3/1/50 | | 85,000 | 86,987 |
| Ohio Major New State Infrastructure Rev. Series 2021 1A: | | | |
| 5% 12/15/31 | | 1,310,000 | 1,588,436 |
| 5% 12/15/32 | | 1,625,000 | 2,007,018 |
| Ohio Spl. Oblig. Series 2020 A, 5% 2/1/26 | | 1,070,000 | 1,156,046 |
| Ohio Tpk. Commission Tpk. Rev. (Infrastructure Projs.) Series 2022 A, 5% 2/15/39 | | 590,000 | 688,364 |
| Ross County Hosp. Facilities Rev. (Adena Health Sys. Obligated Group Proj.) Series 2019: | | | |
| 5% 12/1/23 | | 470,000 | 478,313 |
| 5% 12/1/24 | | 490,000 | 508,639 |
| 5% 12/1/25 | | 430,000 | 456,367 |
| 5% 12/1/26 | | 560,000 | 606,608 |
| Scioto County Hosp. Facilities Rev.: | | | |
| Series 2016: | | | |
5% 2/15/26 | | 1,815,000 | 1,921,660 |
5% 2/15/27 | | 1,510,000 | 1,597,270 |
| Series 2019, 5% 2/15/29 | | 605,000 | 639,658 |
| Univ. of Akron Gen. Receipts Series 2019 A, 5% 1/1/26 | | 1,685,000 | 1,791,776 |
| Univ. of Cincinnati Gen. Receipts Series 2016 C, 5% 6/1/41 | | 4,680,000 | 4,964,262 |
| Washington County Hosp. Rev. Series 2022: | | | |
| 6% 12/1/28 | | 830,000 | 862,183 |
| 6% 12/1/29 | | 880,000 | 919,136 |
| 6% 12/1/30 | | 930,000 | 974,657 |
| 6% 12/1/31 | | 995,000 | 1,044,814 |
TOTAL OHIO | | | 68,601,497 |
| Oklahoma - 0.0% | | | |
| Oklahoma Dev. Fin. Auth. Rev. (Oklahoma City Univ. Proj.) Series 2019: | | | |
| 5% 8/1/26 | | 335,000 | 346,569 |
| 5% 8/1/44 | | 620,000 | 624,091 |
TOTAL OKLAHOMA | | | 970,660 |
| Oregon - 0.7% | | | |
| Medford Hosp. Facilities Auth. Rev. (Asante Projs.) Series 2020 A: | | | |
| 5% 8/15/36 | | 1,215,000 | 1,339,705 |
| 5% 8/15/38 | | 3,465,000 | 3,781,128 |
| Oregon Gen. Oblig. Series 2022 A, 5% 12/1/52 | | 1,935,000 | 2,060,205 |
| Oregon State Hsg. & Cmnty. Svcs. Dept. Series 2019 A, 4% 7/1/50 | | 7,470,000 | 7,558,393 |
| Salem Hosp. Facility Auth. Rev. (Salem Health Projs.) Series 2019 A, 3% 5/15/49 | | 3,125,000 | 2,394,633 |
TOTAL OREGON | | | 17,134,064 |
| Pennsylvania - 3.8% | | | |
| Allegheny County Arpt. Auth. Rev. Series 2021 B, 5% 1/1/51 | | 7,525,000 | 8,034,432 |
| Allegheny County Indl. Dev. Auth. Rev. Series 2021: | | | |
| 3.5% 12/1/31 | | 545,000 | 461,320 |
| 4% 12/1/41 | | 995,000 | 755,514 |
| 4.25% 12/1/50 | | 1,110,000 | 800,489 |
| Bucks County Indl. Dev. Auth. Hosp. Rev. Series 2021: | | | |
| 5% 7/1/36 | | 565,000 | 569,187 |
| 5% 7/1/38 | | 1,130,000 | 1,117,231 |
| Commonwealth Fing. Auth. Rev.: | | | |
| Series 2019 B, 5% 6/1/26 | | 635,000 | 686,332 |
| Series 2020 A: | | | |
5% 6/1/29 | | 1,640,000 | 1,880,049 |
5% 6/1/32 | | 2,810,000 | 3,227,240 |
| Dauphin County Gen. Auth. (Pinnacle Health Sys. Proj.) Series 2016 A, 5% 6/1/34 | | 1,065,000 | 1,121,281 |
| Delaware County Auth. Rev.: | | | |
| (Cabrini College) Series 2017, 5% 7/1/47 | | 1,640,000 | 1,629,420 |
| Series 2017, 5% 7/1/30 | | 1,345,000 | 1,397,710 |
| Doylestown Hosp. Auth. Hosp. Rev. Series 2019, 5% 7/1/49 | | 955,000 | 786,082 |
| Lehigh County Gen. Purp. Hosp. Rev. Series 2019 A: | | | |
| 5% 7/1/23 | | 840,000 | 847,426 |
| 5% 7/1/24 | | 1,590,000 | 1,638,686 |
| 5% 7/1/26 | | 1,780,000 | 1,909,324 |
| 5% 7/1/27 | | 1,870,000 | 2,038,076 |
| 5% 7/1/28 | | 1,945,000 | 2,153,846 |
| Montgomery County Higher Ed. & Health Auth. Rev.: | | | |
| Series 2016 A, 5% 10/1/40 | | 2,515,000 | 2,441,085 |
| Series 2019: | | | |
4% 9/1/36 | | 700,000 | 704,180 |
4% 9/1/37 | | 700,000 | 702,391 |
4% 9/1/38 | | 1,590,000 | 1,588,792 |
4% 9/1/39 | | 1,030,000 | 1,028,962 |
4% 9/1/44 | | 235,000 | 229,337 |
5% 9/1/23 | | 470,000 | 475,816 |
5% 9/1/24 | | 630,000 | 650,369 |
| Series 2020: | | | |
5% 4/1/23 | | 335,000 | 335,792 |
5% 4/1/24 | | 340,000 | 345,924 |
5% 4/1/25 | | 260,000 | 268,126 |
5% 4/1/26 | | 310,000 | 324,373 |
5% 4/1/27 | | 590,000 | 625,573 |
| Montgomery County Indl. Dev. Auth. Series 2015 A, 5.25% 1/15/36 (Pre-Refunded to 1/15/25 @ 100) | | 990,000 | 1,041,882 |
| Pennsylvania Econ. Dev. Fing. Auth. Series 2020 A: | | | |
| 5% 4/15/24 | | 515,000 | 529,201 |
| 5% 4/15/25 | | 700,000 | 736,939 |
| 5% 4/15/26 | | 2,340,000 | 2,521,257 |
| Pennsylvania Higher Edl. Facilities Auth. Rev.: | | | |
| Series 2012, 5% 11/1/42 | | 1,280,000 | 1,280,666 |
| Series 2016, 5% 5/1/34 | | 1,495,000 | 1,579,265 |
| Pennsylvania Hsg. Fin. Agcy. Series 2021 137, 3% 10/1/51 | | 3,060,000 | 2,982,720 |
| Pennsylvania State Univ. Series 2020 A, 4% 9/1/50 | | 1,385,000 | 1,391,914 |
| Pennsylvania Tpk. Commission Tpk. Rev.: | | | |
| Series 2016, 5% 6/1/36 | | 1,870,000 | 1,960,769 |
| Series 2021 A: | | | |
4% 12/1/43 | | 2,810,000 | 2,792,775 |
4% 12/1/46 | | 4,680,000 | 4,575,336 |
4% 12/1/50 | | 935,000 | 885,595 |
| Philadelphia Auth. for Indl. Dev.: | | | |
| Series 2015 1, 5% 4/1/33 | | 495,000 | 514,563 |
| Series 2017, 5% 11/1/47 | | 975,000 | 994,876 |
| Philadelphia Gen. Oblig.: | | | |
| Series 2019 A, 5% 8/1/26 | | 1,090,000 | 1,185,541 |
| Series 2019 B: | | | |
5% 2/1/34 | | 2,105,000 | 2,349,925 |
5% 2/1/35 | | 2,575,000 | 2,852,939 |
5% 2/1/36 | | 2,260,000 | 2,479,770 |
| Philadelphia School District: | | | |
| Series 2018 A, 5% 9/1/26 | | 1,310,000 | 1,414,851 |
| Series 2019 A: | | | |
4% 9/1/35 | | 1,170,000 | 1,216,349 |
5% 9/1/23 | | 620,000 | 628,211 |
5% 9/1/26 | | 1,870,000 | 2,017,679 |
5% 9/1/30 | | 1,250,000 | 1,418,057 |
5% 9/1/32 | | 935,000 | 1,057,873 |
5% 9/1/34 | | 580,000 | 649,741 |
5% 9/1/44 | | 1,355,000 | 1,461,094 |
| Series 2019 B: | | | |
5% 9/1/25 | | 1,275,000 | 1,350,748 |
5% 9/1/26 | | 1,035,000 | 1,117,840 |
| Philadelphia Wtr. & Wastewtr. Rev. Series 2022 C: | | | |
| 5% 6/1/33 | | 650,000 | 785,948 |
| 5% 6/1/34 | | 800,000 | 961,097 |
| Pittsburgh Wtr. & Swr. Auth. Wtr. & Swr. Sys. Rev. Series 2019 A, 5% 9/1/44 (Assured Guaranty Muni. Corp. Insured) | | 420,000 | 453,906 |
| Southcentral Pennsylvania Gen. Auth. Rev. Series 2019 A: | | | |
| 4% 6/1/44 | | 220,000 | 219,044 |
| 4% 6/1/49 | | 520,000 | 495,277 |
| 5% 6/1/44 | | 380,000 | 400,389 |
| 5% 6/1/49 | | 605,000 | 633,571 |
| State Pub. School Bldg. Auth. Lease Rev. (The School District of Philadelphia Proj.) Series 2016 A, 5% 6/1/32 (Assured Guaranty Muni. Corp. Insured) | | 830,000 | 888,141 |
| Union County Hosp. Auth. Rev. Series 2018 B, 5% 8/1/48 | | 1,340,000 | 1,371,914 |
TOTAL PENNSYLVANIA | | | 91,972,028 |
| Puerto Rico - 1.0% | | | |
| Puerto Rico Commonwealth Aqueduct & Swr. Auth.: | | | |
| Series 2021 B: | | | |
4% 7/1/42 (c) | | 1,750,000 | 1,562,179 |
5% 7/1/33 (c) | | 835,000 | 856,763 |
5% 7/1/37 (c) | | 3,500,000 | 3,552,637 |
| Series 2022 A, 4% 7/1/42 (c) | | 1,750,000 | 1,562,179 |
| Puerto Rico Commonwealth Pub. Impt. Gen. Oblig. Series 2021 A1: | | | |
| 0% 7/1/33 | | 8,638,773 | 5,003,061 |
| 4% 7/1/33 | | 5,651,810 | 5,284,443 |
| 4% 7/1/35 | | 2,035,000 | 1,848,396 |
| 5.625% 7/1/27 | | 589,592 | 617,534 |
| 5.625% 7/1/29 | | 4,000,136 | 4,252,851 |
TOTAL PUERTO RICO | | | 24,540,043 |
| Rhode Island - 0.0% | | | |
| Rhode Island Health & Edl. Bldg. Corp. Higher Ed. Facilities Rev. Series 2016 B, 5% 9/1/31 | | 855,000 | 859,789 |
| Rhode Island Hsg. & Mtg. Fin. Corp. Series 2019 70, 4% 10/1/49 | | 150,000 | 151,639 |
TOTAL RHODE ISLAND | | | 1,011,428 |
| South Carolina - 0.5% | | | |
| Charleston County Arpt. District Series 2019, 5% 7/1/48 | | 1,755,000 | 1,889,557 |
| Patriots Energy Group Fing. Agcy. Bonds Series 2018 A, 4%, tender 2/1/24 (b) | | 505,000 | 508,252 |
| South Carolina Hsg. Fin. & Dev. Auth. Mtg. Rev. Series 2019 A, 4% 1/1/50 | | 245,000 | 249,216 |
| South Carolina Jobs-Econ. Dev. Auth. Series 2019 C, 5% 7/1/33 | | 1,220,000 | 1,342,656 |
| South Carolina Jobs-Econ. Dev. Auth. Econ. Dev. Rev. Series 2022 A, 4% 4/1/52 | | 2,900,000 | 2,761,624 |
| South Carolina Pub. Svc. Auth. Rev.: | | | |
| Series 2014 C, 5% 12/1/26 | | 95,000 | 98,791 |
| Series 2016 A, 5% 12/1/33 | | 205,000 | 215,074 |
| Series A, 5% 12/1/23 (Escrowed to Maturity) | | 740,000 | 755,361 |
| Series B, 5% 12/1/24 | | 2,360,000 | 2,454,065 |
| Spartanburg County Reg'l. Health Series 2017 A, 5% 4/15/48 | | 2,310,000 | 2,392,370 |
TOTAL SOUTH CAROLINA | | | 12,666,966 |
| South Dakota - 0.1% | | | |
| South Dakota Health & Edl. Facilities Auth. Rev.: | | | |
| Bonds Series 2019 A, 5%, tender 7/1/24 (b) | | 1,495,000 | 1,534,334 |
| Series 2020 A, 3% 9/1/45 | | 1,730,000 | 1,381,653 |
TOTAL SOUTH DAKOTA | | | 2,915,987 |
| Tennessee - 0.8% | | | |
| Chattanooga Health Ed. & Hsg. Facility Board Rev.: | | | |
| Series 2019 A1: | | | |
4% 8/1/44 | | 7,770,000 | 7,476,529 |
5% 8/1/25 | | 575,000 | 602,978 |
| Series 2019 A2, 5% 8/1/44 | | 2,105,000 | 2,191,357 |
| Jackson Hosp. Rev. Series 2018 A: | | | |
| 5% 4/1/27 | | 560,000 | 607,567 |
| 5% 4/1/27 (Escrowed to Maturity) | | 30,000 | 33,157 |
| 5% 4/1/28 | | 375,000 | 412,243 |
| 5% 4/1/28 (Escrowed to Maturity) | | 20,000 | 22,590 |
| 5% 4/1/41 | | 445,000 | 452,041 |
| 5% 4/1/41 (Pre-Refunded to 10/1/28 @ 100) | | 25,000 | 28,526 |
| Nashville and Davidson County Metropolitan Govt. Health & Edl. Facilities Board Rev. (Lipscomb Univ. Proj.) Series 2019 A: | | | |
| 4% 10/1/49 | | 2,150,000 | 1,747,120 |
| 5.25% 10/1/58 | | 1,145,000 | 1,137,724 |
| Tennergy Corp. Gas Rev. Bonds Series 2019 A, 5%, tender 10/1/24 (b) | | 1,895,000 | 1,941,453 |
| Tennessee Energy Acquisition Corp. Bonds (Gas Rev. Proj.) Series A, 4%, tender 5/1/23 (b) | | 95,000 | 95,099 |
| Tennessee Hsg. Dev. Agcy. Residential: | | | |
| Series 2021 1, 3% 7/1/51 | | 2,715,000 | 2,675,885 |
| Series 2021 3A, 3% 1/1/52 | | 875,000 | 860,322 |
TOTAL TENNESSEE | | | 20,284,591 |
| Texas - 5.2% | | | |
| Austin Wtr. & Wastewtr. Sys. Rev. Series 2016, 5% 11/15/33 | | 1,870,000 | 2,043,319 |
| Central Reg'l. Mobility Auth.: | | | |
| Series 2018, 5% 1/1/25 | | 935,000 | 973,168 |
| Series 2020 B: | | | |
4% 1/1/34 | | 260,000 | 273,306 |
4% 1/1/35 | | 210,000 | 219,036 |
4% 1/1/36 | | 230,000 | 237,441 |
4% 1/1/37 | | 330,000 | 338,502 |
4% 1/1/38 | | 435,000 | 444,048 |
4% 1/1/39 | | 560,000 | 568,847 |
4% 1/1/40 | | 215,000 | 217,237 |
5% 1/1/27 | | 185,000 | 201,159 |
5% 1/1/28 | | 215,000 | 237,469 |
5% 1/1/29 | | 795,000 | 892,046 |
5% 1/1/30 | | 375,000 | 426,830 |
5% 1/1/31 | | 185,000 | 210,251 |
5% 1/1/32 | | 185,000 | 209,873 |
5% 1/1/33 | | 280,000 | 316,544 |
| Series 2021 B: | | | |
5% 1/1/30 | | 935,000 | 1,064,230 |
5% 1/1/32 | | 1,195,000 | 1,376,416 |
5% 1/1/39 | | 1,215,000 | 1,339,275 |
5% 1/1/46 | | 3,275,000 | 3,558,044 |
| Series 2021 C, 5% 1/1/27 | | 3,525,000 | 3,748,000 |
| Collin County Series 2019, 5% 2/15/26 | | 2,165,000 | 2,341,320 |
| Dallas Fort Worth Int'l. Arpt. Rev.: | | | |
| Series 2020 B: | | | |
4% 11/1/34 | | 1,320,000 | 1,393,199 |
4% 11/1/35 | | 1,175,000 | 1,218,532 |
| Series 2021 B, 5% 11/1/43 | | 975,000 | 1,070,422 |
| Dallas Independent School District Series 2019: | | | |
| 5% 2/15/24 | | 655,000 | 672,211 |
| 5% 2/15/25 | | 935,000 | 983,575 |
| Dallas Wtrwks. & Swr. Sys. Rev. Series 2017, 5% 10/1/46 | | 470,000 | 502,613 |
| Denton County Gen. Oblig. Series 2020, 4% 5/15/27 | | 1,810,000 | 1,934,783 |
| Denton Independent School District Bonds Series 2014 B: | | | |
| 2%, tender 8/1/24 (b) | | 85,000 | 84,617 |
| 2%, tender 8/1/24 (b) | | 545,000 | 537,016 |
| Fort Worth Gen. Oblig. Series 2016: | | | |
| 5% 3/1/25 | | 935,000 | 986,062 |
| 5% 3/1/27 | | 935,000 | 1,010,124 |
| Harris County Toll Road Rev. Series 2018 A, 5% 8/15/43 | | 470,000 | 502,657 |
| Hays Consolidated Independent School District Series 2022: | | | |
| 4% 2/15/38 | | 1,000,000 | 1,034,911 |
| 4% 2/15/39 | | 2,000,000 | 2,061,218 |
| 4% 2/15/40 | | 2,000,000 | 2,051,142 |
| 4% 2/15/41 | | 2,000,000 | 2,042,517 |
| 5% 2/15/33 | | 1,300,000 | 1,545,842 |
| Houston Arpt. Sys. Rev. Series 2018 D, 5% 7/1/39 | | 2,035,000 | 2,214,844 |
| Houston Convention and Entertainment Facilities Dept. Hotel Occupancy Tax and Spl. Rev. Series 2019, 5% 9/1/33 | | 715,000 | 792,999 |
| Houston Gen. Oblig. Series 2017 A, 5% 3/1/31 | | 1,170,000 | 1,288,239 |
| Houston Util. Sys. Rev.: | | | |
| Series 2017 B, 5% 11/15/35 | | 935,000 | 1,019,603 |
| Series 2020 C, 5% 11/15/28 | | 2,245,000 | 2,566,578 |
| Series 2021 A: | | | |
5% 11/15/26 | | 355,000 | 390,933 |
5% 11/15/28 | | 1,480,000 | 1,698,040 |
| Irving Hosp. Auth. Hosp. Rev. Series 2017 A, 5% 10/15/35 | | 385,000 | 400,979 |
| Lower Colorado River Auth. Rev. (LCRA Transmission Svcs. Corp. Proj.): | | | |
| Series 2018: | | | |
5% 5/15/43 | | 1,405,000 | 1,491,648 |
5% 5/15/48 | | 1,590,000 | 1,677,552 |
| Series 2020, 5% 5/15/28 | | 2,105,000 | 2,386,913 |
| Midlothian Independent School District Bonds Series 2013 C, 2%, tender 8/1/24 (b) | | 530,000 | 521,094 |
| Newark Higher Ed. Fin. Corp. (Abilene Christian Univ. Proj.) Series 2016 A, 5% 4/1/28 | | 1,450,000 | 1,544,818 |
| North East Texas Independent School District Bonds Series 2019, 2.2%, tender 8/1/24 (b) | | 325,000 | 321,559 |
| North Texas Tollway Auth. Rev.: | | | |
| Series 2016 A, 5% 1/1/30 | | 700,000 | 748,100 |
| Series 2017 A, 5% 1/1/39 | | 3,745,000 | 4,026,560 |
| Series 2018: | | | |
4% 1/1/38 | | 1,715,000 | 1,723,359 |
5% 1/1/35 | | 470,000 | 513,570 |
| Series 2019 A, 5% 1/1/38 | | 4,680,000 | 5,123,526 |
| Series 2019 B, 5% 1/1/25 | | 605,000 | 635,131 |
| Series 2021 B, 4% 1/1/33 | | 1,870,000 | 2,022,322 |
| Northside Independent School District Bonds Series 2020, 0.7%, tender 6/1/25 (b) | | 1,510,000 | 1,425,701 |
| Pasadena Independent School District Bonds Series 2015 B, 1.5%, tender 8/15/24 (b) | | 2,175,000 | 2,142,591 |
| San Antonio Elec. & Gas Sys. Rev. Bonds Series 2020, 1.75%, tender 12/1/25 (b) | | 10,060,000 | 9,683,235 |
| Tarrant County Series 2022, 5% 7/15/35 | | 1,640,000 | 1,928,858 |
| Tarrant County Cultural Ed. Facilities Fin. Corp. Hosp. Rev.: | | | |
| Series 2020, 5% 12/1/24 | | 515,000 | 538,066 |
| Series 2022: | | | |
4% 10/1/42 | | 1,185,000 | 1,188,186 |
4% 10/1/47 | | 1,265,000 | 1,238,514 |
4% 10/1/52 | | 2,810,000 | 2,728,443 |
5% 10/1/36 | | 515,000 | 582,279 |
5% 10/1/40 | | 1,870,000 | 2,039,647 |
| Tarrant County Cultural Ed. Facilities Fin. Corp. Retirement Facility Rev. (Buckner Retirement Svcs., Inc.) Series 2016 B, 5% 11/15/40 | | 890,000 | 912,222 |
| Tarrant County Cultural Ed. Facilities Fin. Corp. Rev. Series 2016 A, 5% 2/15/47 | | 7,485,000 | 7,700,578 |
| Texas Dept. of Hsg. & Cmnty. Affairs Multi-family Hsg. Rev. Series 2019, 2.95% 7/1/36 | | 709,355 | 661,649 |
| Texas Dept. of Hsg. & Cmnty. Affairs Single Family Mtg. Rev. Series 2019 A, 4% 3/1/50 | | 655,000 | 667,124 |
| Texas Private Activity Bond Surface Trans. Corp. (LBJ Infrastructure Group LLC I-635 Managed Lanes Proj.) Series 2020 A: | | | |
| 4% 6/30/36 | | 770,000 | 766,744 |
| 4% 6/30/38 | | 1,965,000 | 1,914,938 |
| 4% 12/31/39 | | 1,640,000 | 1,585,434 |
| Texas Pub. Fin. Auth. Lease Rev. Series 2019, 5% 2/1/25 | | 1,075,000 | 1,131,420 |
| Texas State Univ. Sys. Fing. Rev. Series 2019 A, 5% 3/15/25 | | 1,405,000 | 1,482,373 |
| Texas Trans. Commission Series 2019 A, 0% 8/1/41 | | 1,405,000 | 550,762 |
| Texas Trans. Commission Hwy. Impt. Gen. Oblig. Bonds Series 2014 B, 0.65%, tender 4/1/26 (b) | | 8,695,000 | 7,946,769 |
| Texas Wtr. Dev. Board Rev.: | | | |
| Series 2018 A, 5% 10/15/43 | | 935,000 | 1,010,675 |
| Series 2018 B, 5% 4/15/49 | | 935,000 | 1,006,727 |
TOTAL TEXAS | | | 124,809,104 |
| Utah - 0.6% | | | |
| Salt Lake City Arpt. Rev. Series 2021 B: | | | |
| 5% 7/1/46 | | 2,305,000 | 2,502,812 |
| 5% 7/1/51 | | 9,285,000 | 10,015,926 |
| Utah Gen. Oblig. Series 2020, 5% 7/1/26 | | 935,000 | 1,024,028 |
TOTAL UTAH | | | 13,542,766 |
| Vermont - 0.1% | | | |
| Vermont Hsg. Fin. Agcy.: | | | |
| Series 2021 B, 3% 11/1/51 | | 1,021,000 | 1,001,272 |
| Series 2022 A, 5.25% 11/1/52 | | 1,000,000 | 1,083,375 |
| Series A, 3.75% 11/1/50 | | 1,401,000 | 1,410,506 |
TOTAL VERMONT | | | 3,495,153 |
| Virginia - 0.3% | | | |
| Lynchburg Econ. Dev. Series 2021, 3% 1/1/51 | | 1,550,000 | 1,149,280 |
| Roanoke Econ. Dev. Auth. Edl. Facilities Series 2018 A, 5% 9/1/27 | | 470,000 | 503,543 |
| Salem Econ. Dev. Auth. Series 2020: | | | |
| 4% 4/1/38 | | 260,000 | 248,669 |
| 4% 4/1/39 | | 235,000 | 222,420 |
| 4% 4/1/40 | | 260,000 | 243,467 |
| 4% 4/1/45 | | 700,000 | 629,483 |
| 5% 4/1/24 | | 280,000 | 285,683 |
| 5% 4/1/26 | | 330,000 | 346,919 |
| 5% 4/1/27 | | 330,000 | 351,479 |
| 5% 4/1/28 | | 410,000 | 441,743 |
| 5% 4/1/29 | | 540,000 | 587,253 |
| 5% 4/1/49 | | 935,000 | 953,932 |
| York County Econ. Dev. Auth. Poll. Cont. Rev. Bonds (Virginia Elec. and Pwr. Co. Proj.) Series 2009 A, 1.9%, tender 6/1/23 (b) | | 280,000 | 278,363 |
TOTAL VIRGINIA | | | 6,242,234 |
| Washington - 2.9% | | | |
| King County Gen. Oblig. Series 2021 A, 2% 1/1/36 | | 1,700,000 | 1,395,056 |
| King County Hsg. Auth. Rev. Series 2021, 4% 12/1/29 | | 675,000 | 713,984 |
| King County Swr. Rev. Bonds Series 2020 B, 0.875%, tender 1/1/26 (b) | | 2,150,000 | 1,997,628 |
| Port of Seattle Rev. Series 2015 B, 5% 3/1/25 | | 235,000 | 244,189 |
| Spokane Pub. Facilities District Hotel/Motel Tax & Sales/Use Tax Rev. Series 2017, 5% 12/1/38 | | 1,100,000 | 1,161,620 |
| Washington Convention Ctr. Pub. Facilities Series 2021, 4% 7/1/31 | | 9,195,000 | 8,621,835 |
| Washington Gen. Oblig.: | | | |
| Series 2016 C, 5% 2/1/39 | | 2,395,000 | 2,537,522 |
| Series 2017 D, 5% 2/1/35 | | 470,000 | 513,226 |
| Series 2018 C, 5% 2/1/41 | | 935,000 | 1,014,515 |
| Series 2021 A, 5% 8/1/43 | | 840,000 | 934,544 |
| Series 2021 E, 5% 6/1/37 | | 4,780,000 | 5,497,267 |
| Series 2022 A, 5% 8/1/35 | | 8,445,000 | 9,906,241 |
| Series 2023 A, 5% 8/1/41 | | 6,875,000 | 7,883,126 |
| Washington Health Care Facilities Auth. Rev.: | | | |
| (Overlake Hosp. Med. Ctr., WA. Proj.) Series 2017 B: | | | |
5% 7/1/31 | | 40,000 | 43,205 |
5% 7/1/42 | | 525,000 | 537,037 |
| (Virginia Mason Med. Ctr. Proj.) Series 2017: | | | |
5% 8/15/25 | | 230,000 | 239,440 |
5% 8/15/26 | | 210,000 | 222,305 |
| Series 2017 A, 4% 7/1/42 | | 5,410,000 | 5,413,638 |
| Series 2017: | | | |
4% 8/15/42 | | 6,550,000 | 6,059,554 |
5% 8/15/36 | | 470,000 | 482,602 |
| Series 2020: | | | |
5% 9/1/38 | | 1,870,000 | 2,008,085 |
5% 9/1/45 | | 2,105,000 | 2,224,664 |
5% 9/1/50 | | 2,340,000 | 2,465,330 |
| Washington Higher Ed. Facilities Auth. Rev.: | | | |
| (Gonzaga Univ. Proj.) Series 2019 A, 3% 4/1/49 | | 2,625,000 | 1,996,995 |
| (Whitworth Univ. Proj.): | | | |
Series 2016 A: | | | |
5% 10/1/25 | | 400,000 | 418,402 |
5% 10/1/26 | | 1,880,000 | 1,998,689 |
5% 10/1/34 | | 1,415,000 | 1,477,185 |
Series 2019, 4% 10/1/49 | | 1,515,000 | 1,339,272 |
TOTAL WASHINGTON | | | 69,347,156 |
| Wisconsin - 1.9% | | | |
| Pub. Fin. Auth. Edl. Facilities: | | | |
| Series 2018 A: | | | |
5.25% 10/1/43 | | 495,000 | 498,976 |
5.25% 10/1/48 | | 495,000 | 495,733 |
| Series 2022 A: | | | |
5.25% 3/1/42 | | 935,000 | 965,347 |
5.25% 3/1/47 | | 6,175,000 | 6,328,919 |
| Pub. Fin. Auth. Hosp. Rev. Series 2019 A, 5% 10/1/44 | | 1,350,000 | 1,398,378 |
| Pub. Fin. Auth. Sr. Living Rev. (Mary's Woods At Marylhurst, Inc. Proj.) Series 2017 A: | | | |
| 5.25% 5/15/42 (c) | | 840,000 | 786,712 |
| 5.25% 5/15/47 (c) | | 1,225,000 | 1,118,393 |
| Roseman Univ. of Health: | | | |
| Series 2020, 5% 4/1/50 (c) | | 395,000 | 371,571 |
| Series 2021 A: | | | |
3% 7/1/50 | | 1,385,000 | 1,048,094 |
4.5% 6/1/56 (c) | | 5,360,000 | 4,100,655 |
| Series 2021 B, 6.5% 6/1/56 (c) | | 1,815,000 | 1,503,047 |
| Wisconsin Gen. Oblig.: | | | |
| Series 2014 4, 5% 5/1/25 | | 1,160,000 | 1,213,558 |
| Series 2021 A: | | | |
5% 5/1/33 | | 475,000 | 536,768 |
5% 5/1/36 | | 5,320,000 | 5,885,617 |
| Series 2022 A, 5% 5/1/34 | | 3,745,000 | 4,445,324 |
| Wisconsin Health & Edl. Facilities: | | | |
| Series 2018, 5% 4/1/34 | | 1,870,000 | 2,090,552 |
| Series 2019 A: | | | |
5% 11/1/25 | | 225,000 | 221,363 |
5% 11/1/29 | | 160,000 | 153,525 |
5% 12/1/30 | | 280,000 | 312,638 |
5% 12/1/31 | | 280,000 | 312,292 |
5% 12/1/32 | | 330,000 | 367,261 |
5% 12/1/33 | | 330,000 | 366,073 |
5% 12/1/34 | | 330,000 | 363,465 |
5% 12/1/35 | | 420,000 | 458,100 |
5% 7/1/44 | | 470,000 | 481,371 |
5% 11/1/46 | | 1,350,000 | 1,135,157 |
5% 7/1/49 | | 1,870,000 | 1,904,351 |
| Series 2019 B, 5% 7/1/38 | | 330,000 | 341,419 |
| Series 2019 B1, 2.825% 11/1/28 | | 340,000 | 303,911 |
| Series 2019 B2, 2.55% 11/1/27 | | 185,000 | 175,345 |
| Series 2019: | | | |
5% 10/1/24 | | 255,000 | 265,004 |
5% 10/1/26 | | 515,000 | 560,728 |
| Wisconsin Health & Edl. Facilities Auth. Rev. Series 2021, 3% 10/15/37 | | 1,545,000 | 1,385,312 |
| Wisconsin Hsg. & Econ. Dev. Auth.: | | | |
| Series 2021 A, 3% 3/1/52 | | 805,000 | 792,531 |
| Series 2021 C, 3% 9/1/52 | | 1,190,000 | 1,170,784 |
| Wisconsin Hsg. & Econ. Dev. Auth. Hsg. Rev. Bonds Series 2021 C: | | | |
| 0.61%, tender 5/1/24 (b) | | 215,000 | 206,346 |
| 0.81%, tender 5/1/25 (b) | | 715,000 | 680,983 |
TOTAL WISCONSIN | | | 44,745,603 |
| Wyoming - 0.1% | | | |
| Wyoming Cmnty. Dev. Auth. Hsg. Rev. Series 2019 3, 3.75% 12/1/49 | | 2,025,000 | 2,031,474 |
| TOTAL MUNICIPAL BONDS (Cost $2,281,554,851) | | | 2,208,486,256 |
| | | | |
| Municipal Notes - 0.4% |
| | | Principal Amount (a) | Value ($) |
| Arizona - 0.2% | | | |
| Arizona St Indl. Dev. Auth. Multi Participating VRDN Series MIZ 91 18, 1.32% 2/1/23 (Liquidity Facility Mizuho Cap. Markets LLC) (b)(e)(f) | | 4,450,000 | 4,450,000 |
| Texas - 0.2% | | | |
| Lower Neches Valley Auth. Indl. Dev. Corp. Rev. (ExxonMobil Proj.) Series 2012, 1.12% 2/1/23, VRDN (b) | | 4,535,000 | 4,535,000 |
| TOTAL MUNICIPAL NOTES (Cost $8,985,000) | | | 8,985,000 |
| | | | |
| Money Market Funds - 8.2% |
| | | Shares | Value ($) |
Fidelity Tax-Free Cash Central Fund 1.39% (g)(h) (Cost $198,071,424) | | 198,014,056 | 198,073,458 |
| | | | |
| TOTAL INVESTMENT IN SECURITIES - 100.2% (Cost $2,488,611,275) | 2,415,544,714 |
NET OTHER ASSETS (LIABILITIES) - (0.2)% | (5,419,251) |
| NET ASSETS - 100.0% | 2,410,125,463 |
| | |
Security Type Abbreviations
| VRDN | - | VARIABLE RATE DEMAND NOTE (A debt instrument that is payable upon demand, either daily, weekly or monthly) |
Legend
| (a) | Amount is stated in United States dollars unless otherwise noted. |
| (b) | Coupon rates for floating and adjustable rate securities reflect the rates in effect at period end. |
| (c) | Security exempt from registration under Rule 144A of the Securities Act of 1933. These securities may be resold in transactions exempt from registration, normally to qualified institutional buyers. At the end of the period, the value of these securities amounted to $21,713,642 or 0.9% of net assets. |
| (d) | Security or a portion of the security purchased on a delayed delivery or when-issued basis. |
| (e) | Provides evidence of ownership in one or more underlying municipal bonds. |
| (f) | Coupon rates are determined by re-marketing agents based on current market conditions. |
| (g) | Information in this report regarding holdings by state and security types does not reflect the holdings of the Fidelity Tax-Free Cash Central Fund. |
| (h) | Affiliated fund that is generally available only to investment companies and other accounts managed by Fidelity Investments. The rate quoted is the annualized seven-day yield of the fund at period end. A complete unaudited listing of the fund's holdings as of its most recent quarter end is available upon request. In addition, each Fidelity Central Fund's financial statements, which are not covered by the Fund's Report of Independent Registered Public Accounting Firm, are available on the SEC's website or upon request. |
Affiliated Central Funds
Fiscal year to date information regarding the Fund's investments in Fidelity Central Funds, including the ownership percentage, is presented below.
| Affiliate | Value, beginning of period ($) | Purchases ($) | Sales Proceeds ($) | Dividend Income ($) | Realized Gain (loss) ($) | Change in Unrealized appreciation (depreciation) ($) | Value, end of period ($) | % ownership, end of period |
| Fidelity Tax-Free Cash Central Fund 1.39% | 132,221,448 | 971,501,006 | 905,649,000 | 1,447,212 | 1,281 | (1,277) | 198,073,458 | 19.4% |
| Total | 132,221,448 | 971,501,006 | 905,649,000 | 1,447,212 | 1,281 | (1,277) | 198,073,458 | |
| | | | | | | | | |
Amounts in the dividend income column in the above table include any capital gain distributions from underlying funds, which are presented in the corresponding line item in the Statement of Operations, if applicable.
Amounts included in the purchases and sales proceeds columns may include in-kind transactions, if applicable.
Investment Valuation
The following is a summary of the inputs used, as of January 31, 2023, involving the Fund's assets and liabilities carried at fair value. The inputs or methodology used for valuing securities may not be an indication of the risk associated with investing in those securities. For more information on valuation inputs, and their aggregation into the levels used below, please refer to the Investment Valuation section in the accompanying Notes to Financial Statements.
| Valuation Inputs at Reporting Date: |
| Description | Total ($) | Level 1 ($) | Level 2 ($) | Level 3 ($) |
Investments in Securities: | | | | |
|
| Municipal Securities | 2,217,471,256 | - | 2,217,471,256 | - |
|
| Money Market Funds | 198,073,458 | 198,073,458 | - | - |
| Total Investments in Securities: | 2,415,544,714 | 198,073,458 | 2,217,471,256 | - |
| Statement of Assets and Liabilities |
| | | | January 31, 2023 |
| | | | | |
| Assets | | | | |
| Investment in securities, at value - See accompanying schedule: | $ | | | |
Unaffiliated issuers (cost $2,290,539,851) | | 2,217,471,256 | | |
Fidelity Central Funds (cost $198,071,424) | | 198,073,458 | | |
| | | | | |
| | | | | |
| Total Investment in Securities (cost $2,488,611,275) | | | $ | 2,415,544,714 |
| Cash | | | | 1,849,053 |
| Receivable for fund shares sold | | | | 5,098,884 |
| Interest receivable | | | | 22,498,052 |
| Distributions receivable from Fidelity Central Funds | | | | 280,483 |
| Prepaid expenses | | | | 1,768 |
| Receivable from investment adviser for expense reductions | | | | 196,418 |
| Other receivables | | | | 1,849 |
Total assets | | | | 2,445,471,221 |
| Liabilities | | | | |
| Payable for investments purchased | | | | |
Regular delivery | | $4,629,194 | | |
Delayed delivery | | 23,676,390 | | |
| Payable for fund shares redeemed | | 1,114,025 | | |
| Distributions payable | | 5,182,590 | | |
| Accrued management fee | | 682,611 | | |
| Other payables and accrued expenses | | 60,948 | | |
| Total Liabilities | | | | 35,345,758 |
| Net Assets | | | $ | 2,410,125,463 |
| Net Assets consist of: | | | | |
| Paid in capital | | | $ | 2,512,927,907 |
| Total accumulated earnings (loss) | | | | (102,802,444) |
| Net Assets | | | $ | 2,410,125,463 |
Net Asset Value , offering price and redemption price per share ($2,410,125,463 ÷ 241,004,635 shares) | | | $ | 10.00 |
| | | | | |
| Statement of Operations |
| | | | Year ended January 31, 2023 |
| Investment Income | | | | |
| Interest | | | $ | 54,520,437 |
| Income from Fidelity Central Funds | | | | 1,445,089 |
| Total Income | | | | 55,965,526 |
| Expenses | | | | |
| Management fee | $ | 7,553,707 | | |
| Custodian fees and expenses | | 22,130 | | |
| Independent trustees' fees and expenses | | 7,434 | | |
| Registration fees | | 669,009 | | |
| Audit | | 65,924 | | |
| Legal | | 2,987 | | |
| Miscellaneous | | 9,205 | | |
| Total expenses before reductions | | 8,330,396 | | |
| Expense reductions | | (2,939,399) | | |
| Total expenses after reductions | | | | 5,390,997 |
| Net Investment income (loss) | | | | 50,574,529 |
| Realized and Unrealized Gain (Loss) | | | | |
| Net realized gain (loss) on: | | | | |
| Investment Securities: | | | | |
| Unaffiliated issuers | | (29,878,438) | | |
| Redemptions in-kind | | (10,160,414) | | |
| Fidelity Central Funds | | 1,281 | | |
| Capital gain distributions from Fidelity Central Funds | | 2,123 | | |
| Total net realized gain (loss) | | | | (40,035,448) |
| Change in net unrealized appreciation (depreciation) on: | | | | |
| Investment Securities: | | | | |
| Unaffiliated issuers | | (91,701,326) | | |
| Fidelity Central Funds | | (1,277) | | |
| Total change in net unrealized appreciation (depreciation) | | | | (91,702,603) |
| Net gain (loss) | | | | (131,738,051) |
| Net increase (decrease) in net assets resulting from operations | | | $ | (81,163,522) |
| Statement of Changes in Net Assets |
| |
| | Year ended January 31, 2023 | | Year ended January 31, 2022 |
| Increase (Decrease) in Net Assets | | | | |
| Operations | | | | |
| Net investment income (loss) | $ | 50,574,529 | $ | 36,279,553 |
| Net realized gain (loss) | | (40,035,448) | | 1,260,034 |
| Change in net unrealized appreciation (depreciation) | | (91,702,603) | | (71,420,547) |
| Net increase (decrease) in net assets resulting from operations | | (81,163,522) | | (33,880,960) |
| Distributions to shareholders | | (50,249,974) | | (36,466,591) |
| Share transactions | | | | |
| Proceeds from sales of shares | | 7,092,031,431 | | 2,075,633,983 |
| Reinvestment of distributions | | 1,421,586 | | 1,779,197 |
| Cost of shares redeemed | | (6,717,430,416) | | (1,639,170,620) |
Net increase (decrease) in net assets resulting from share transactions | | 376,022,601 | | 438,242,560 |
| Total increase (decrease) in net assets | | 244,609,105 | | 367,895,009 |
| | | | | |
| Net Assets | | | | |
| Beginning of period | | 2,165,516,358 | | 1,797,621,349 |
| End of period | $ | 2,410,125,463 | $ | 2,165,516,358 |
| | | | | |
| Other Information | | | | |
| Shares | | | | |
| Sold | | 715,122,762 | | 190,831,072 |
| Issued in reinvestment of distributions | | 141,280 | | 163,167 |
| Redeemed | | (678,388,942) | | (150,683,639) |
| Net increase (decrease) | | 36,875,100 | | 40,310,600 |
| | | | | |
Financial Highlights
| Fidelity® SAI Tax-Free Bond Fund |
| |
| Years ended January 31, | | 2023 | | 2022 | | 2021 | | 2020 | | 2019 A |
Selected Per-Share Data | | | | | | | | | | |
| Net asset value, beginning of period | $ | 10.61 | $ | 10.97 | $ | 10.89 | $ | 10.19 | $ | 10.00 |
| Income from Investment Operations | | | | | | | | | | |
Net investment income (loss) B,C | | .230 | | .194 | | .215 | | .241 | | .081 |
| Net realized and unrealized gain (loss) | | (.613) | | (.359) | | .085 | | .735 | | .176 |
| Total from investment operations | | (.383) | | (.165) | | .300 | | .976 | | .257 |
| Distributions from net investment income | | (.227) | | (.194) | | (.216) | | (.248) | | (.067) |
| Distributions from net realized gain | | - | | (.001) | | (.004) | | (.028) | | - |
| Total distributions | | (.227) | | (.195) | | (.220) | | (.276) | | (.067) |
| Net asset value, end of period | $ | 10.00 | $ | 10.61 | $ | 10.97 | $ | 10.89 | $ | 10.19 |
Total Return D,E | | (3.55)% | | (1.53)% | | 2.83% | | 9.68% | | 2.58% |
Ratios to Average Net Assets C,F,G | | | | | | | | | | |
| Expenses before reductions | | .38% | | .36% | | .36% | | .43% | | .60% H,I |
| Expenses net of fee waivers, if any | | .25% | | .25% | | .25% | | .25% | | .25% I |
| Expenses net of all reductions | | .25% | | .25% | | .25% | | .25% | | .25% I |
| Net investment income (loss) | | 2.33% | | 1.78% | | 2.02% | | 2.28% | | 2.38% I |
| Supplemental Data | | | | | | | | | | |
| Net assets, end of period (000 omitted) | $ | 2,410,125 | $ | 2,165,516 | $ | 1,797,621 | $ | 1,603,522 | $ | 489,517 |
Portfolio turnover rate J | | 23% K | | 6% | | 32% | | 12% | | 2% L |
A For the period October 2, 2018 (commencement of operations) through January 31, 2019.
B Calculated based on average shares outstanding during the period.
C Net investment income (loss) is affected by the timing of the declaration of dividends by any underlying mutual funds or exchange-traded funds (ETFs). Net investment income (loss) of any mutual funds or ETFs is not included in the Fund's net investment income (loss) ratio.
D Total returns for periods of less than one year are not annualized.
E Total returns would have been lower if certain expenses had not been reduced during the applicable periods shown.
F Fees and expenses of any underlying mutual funds or exchange-traded funds (ETFs) are not included in the Fund's expense ratio. The Fund indirectly bears its proportionate share of these expenses. For additional expense information related to investments in Fidelity Central Funds, please refer to the "Investments in Fidelity Central Funds" note found in the Notes to Financial Statements section of the most recent Annual or Semi-Annual report.
G Expense ratios reflect operating expenses of the class. Expenses before reductions do not reflect amounts reimbursed, waived, or reduced through arrangements with the investment adviser, brokerage services, or other offset arrangements, if applicable, and do not represent the amount paid by the class during periods when reimbursements, waivers or reductions occur.
H Audit fees are not annualized.
I Annualized.
J Amount does not include the portfolio activity of any underlying mutual funds or exchange-traded funds (ETFs).
K Portfolio turnover rate excludes securities received or delivered in-kind.
L Amount not annualized.
For the period ended January 31, 2023
1. Organization.
Fidelity SAI Tax-Free Bond Fund (the Fund) is a fund of Fidelity Salem Street Trust (the Trust) and is authorized to issue an unlimited number of shares. Shares are offered exclusively to certain clients of Fidelity Management & Research Company LLC (FMR) or its affiliates. The Trust is registered under the Investment Company Act of 1940, as amended (the 1940 Act), as an open-end management investment company organized as a Massachusetts business trust.
2. Investments in Fidelity Central Funds.
Funds may invest in Fidelity Central Funds, which are open-end investment companies generally available only to other investment companies and accounts managed by the investment adviser and its affiliates. The Schedule of Investments lists any Fidelity Central Funds held as an investment as of period end, but does not include the underlying holdings of each Fidelity Central Fund. An investing fund indirectly bears its proportionate share of the expenses of the underlying Fidelity Central Funds.
Based on its investment objective, each Fidelity Central Fund may invest or participate in various investment vehicles or strategies that are similar to those of the investing fund. These strategies are consistent with the investment objectives of the investing fund and may involve certain economic risks which may cause a decline in value of each of the Fidelity Central Funds and thus a decline in the value of the investing fund.
| Fidelity Central Fund | Investment Manager | Investment Objective | Investment Practices | Expense Ratio A |
| Fidelity Money Market Central Funds | Fidelity Management & Research Company LLC (FMR) | Each fund seeks to obtain a high level of current income consistent with the preservation of capital and liquidity. | Short-term Investments | Less than .005% |
A Expenses expressed as a percentage of average net assets and are as of each underlying Central Fund's most recent annual or semi-annual shareholder report.
A complete unaudited list of holdings for each Fidelity Central Fund is available upon request or at the Securities and Exchange Commission website at www.sec.gov. In addition, the financial statements of the Fidelity Central Funds which contain the significant accounting policies (including investment valuation policies) of those funds, and are not covered by the Report of Independent Registered Public Accounting Firm, are available on the Securities and Exchange Commission website or upon request.
3. Significant Accounting Policies.
The Fund is an investment company and applies the accounting and reporting guidance of the Financial Accounting Standards Board (FASB) Accounting Standards Codification Topic 946 Financial Services - Investment Companies . The financial statements have been prepared in conformity with accounting principles generally accepted in the United States of America (GAAP), which require management to make certain estimates and assumptions at the date of the financial statements. Actual results could differ from those estimates. Subsequent events, if any, through the date that the financial statements were issued have been evaluated in the preparation of the financial statements. The Fund's Schedule of Investments lists any underlying mutual funds or exchange-traded funds (ETFs) but does not include the underlying holdings of these funds. The following summarizes the significant accounting policies of the Fund:
Investment Valuation. Investments are valued as of 4:00 p.m. Eastern time on the last calendar day of the period. The Board of Trustees (the Board) has designated the Fund's investment adviser as the valuation designee responsible for the fair valuation function and performing fair value determinations as needed. The investment adviser has established a Fair Value Committee (the Committee) to carry out the day-to-day fair valuation responsibilities and has adopted policies and procedures to govern the fair valuation process and the activities of the Committee. In accordance with these fair valuation policies and procedures, which have been approved by the Board, the Fund attempts to obtain prices from one or more third party pricing services or brokers to value its investments. When current market prices, quotations or currency exchange rates are not readily available or reliable, investments will be fair valued in good faith by the Committee, in accordance with the policies and procedures. Factors used in determining fair value vary by investment type and may include market or investment specific events, transaction data, estimated cash flows, and market observations of comparable investments. The frequency that the fair valuation procedures are used cannot be predicted and they may be utilized to a significant extent. The Committee manages the Fund's fair valuation practices and maintains the fair valuation policies and procedures. The Fund's investment adviser reports to the Board information regarding the fair valuation process and related material matters.
The Fund categorizes the inputs to valuation techniques used to value its investments into a disclosure hierarchy consisting of three levels as shown below:
Level 1 - unadjusted quoted prices in active markets for identical investments
Level 2 - other significant observable inputs (including quoted prices for similar investments, interest rates, prepayment speeds, etc.)
Level 3 - unobservable inputs (including the Fund's own assumptions based on the best information available)
Valuation techniques used to value the Fund's investments by major category are as follows:
Debt securities, including restricted securities, are valued based on evaluated prices received from third party pricing services or from brokers who make markets in such securities. Municipal securities are valued by pricing services who utilize matrix pricing which considers yield or price of bonds of comparable quality, coupon, maturity and type or by broker-supplied prices. When independent prices are unavailable or unreliable, debt securities may be valued utilizing pricing methodologies which consider similar factors that would be used by third party pricing services. Debt securities are generally categorized as Level 2 in the hierarchy but may be Level 3 depending on the circumstances.
Investments in open-end mutual funds, including the Fidelity Central Funds, are valued at their closing net asset value (NAV) each business day and are categorized as Level 1 in the hierarchy.
Changes in valuation techniques may result in transfers in or out of an assigned level within the disclosure hierarchy. The aggregate value of investments by input level as of January 31, 2023 is included at the end of the Fund's Schedule of Investments.
Investment Transactions and Income. For financial reporting purposes, the Fund's investment holdings and NAV include trades executed through the end of the last business day of the period. The NAV per share for processing shareholder transactions is calculated as of the close of business of the New York Stock Exchange (NYSE), normally 4:00 p.m. Eastern time and includes trades executed through the end of the prior business day. Gains and losses on securities sold are determined on the basis of identified cost. Income and capital gain distributions from Fidelity Central Funds, if any, are recorded on the ex-dividend date. Interest income is accrued as earned and includes coupon interest and amortization of premium and accretion of discount on debt securities as applicable. Debt obligations may be placed on non-accrual status and related interest income may be reduced by ceasing current accruals and writing off interest receivables when the collection of all or a portion of interest has become doubtful based on consistently applied procedures. A debt obligation is removed from non-accrual status when the issuer resumes interest payments or when collectability of interest is reasonably assured.
Expenses. Expenses directly attributable to a fund are charged to that fund. Expenses attributable to more than one fund are allocated among the respective funds on the basis of relative net assets or other appropriate methods. Expenses included in the accompanying financial statements reflect the expenses of that fund and do not include any expenses associated with any underlying mutual funds or exchange-traded funds. Although not included in a fund's expenses, a fund indirectly bears its proportionate share of these expenses through the net asset value of each underlying mutual fund or exchange-traded fund. Expense estimates are accrued in the period to which they relate and adjustments are made when actual amounts are known.
Income Tax Information and Distributions to Shareholders. Each year, the Fund intends to qualify as a regulated investment company under Subchapter M of the Internal Revenue Code, including distributing substantially all of its taxable income and realized gains. As a result, no provision for U.S. Federal income taxes is required. As of January 31, 2023, the Fund did not have any unrecognized tax benefits in the financial statements; nor is the Fund aware of any tax positions for which it is reasonably possible that the total amounts of unrecognized tax benefits will significantly change in the next twelve months. The Fund files a U.S. federal tax return, in addition to state and local tax returns as required. The Fund's federal income tax returns are subject to examination by the Internal Revenue Service (IRS) for a period of three fiscal years after they are filed. State and local tax returns may be subject to examination for an additional fiscal year depending on the jurisdiction.
Distributions are declared and recorded daily and paid monthly from net investment income. Distributions from realized gains, if any, are declared and recorded on the ex-dividend date. Income and capital gain distributions are determined in accordance with income tax regulations, which may differ from GAAP.
Capital accounts within the financial statements are adjusted for permanent book-tax differences. These adjustments have no impact on net assets or the results of operations. Capital accounts are not adjusted for temporary book-tax differences which will reverse in a subsequent period.
Book-tax differences are primarily due to redemptions in-kind, market discount, capital loss carryforwards and losses deferred due to excise tax regulations.
As of period end, the cost and unrealized appreciation (depreciation) in securities, and derivatives if applicable, for federal income tax purposes were as follows:
| Gross unrealized appreciation | $30,942,429 |
| Gross unrealized depreciation | (103,671,895) |
| Net unrealized appreciation (depreciation) | $(72,729,466) |
| Tax Cost | $2,488,274,180 |
The tax-based components of distributable earnings as of period end were as follows:
| Capital loss carryforward | $(30,011,766) |
| Net unrealized appreciation (depreciation) on securities and other investments | $(72,729,466) |
Capital loss carryforwards are only available to offset future capital gains of the Fund to the extent provided by regulations and may be limited. The capital loss carryforward information presented below, including any applicable limitation, is estimated as of fiscal period end and is subject to adjustment.
| Short-term | $(8,864,320) |
| Long-term | (21,147,446) |
| Total capital loss carryforward | $(30,011,766) |
The tax character of distributions paid was as follows:
| | January 31, 2023 | January 31, 2022 |
| Tax-exempt Income | $50,249,974 | $36,271,346 |
| Long-term Capital Gains | - | 195,245 |
| Total | $50,249,974 | $36,466,591 |
Delayed Delivery Transactions and When-Issued Securities. During the period, certain Funds transacted in securities on a delayed delivery or when-issued basis. Payment and delivery may take place after the customary settlement period for that security. The price of the underlying securities and the date when the securities will be delivered and paid for are fixed at the time the transaction is negotiated. Securities purchased on a delayed delivery or when-issued basis are identified as such in the Schedule of Investments. Compensation for interest forgone in the purchase of a delayed delivery or when-issued debt security may be received. With respect to purchase commitments, each applicable Fund identifies securities as segregated in its records with a value at least equal to the amount of the commitment. Payables and receivables associated with the purchases and sales of delayed delivery securities having the same coupon, settlement date and broker are offset. Delayed delivery or when-issued securities that have been purchased from and sold to different brokers are reflected as both payables and receivables in the Statement of Assets and Liabilities under the caption "Delayed delivery", as applicable. Losses may arise due to changes in the value of the underlying securities or if the counterparty does not perform under the contract's terms, or if the issuer does not issue the securities due to political, economic, or other factors.
Restricted Securities (including Private Placements). Funds may invest in securities that are subject to legal or contractual restrictions on resale. These securities generally may be resold in transactions exempt from registration or to the public if the securities are registered. Disposal of these securities may involve time-consuming negotiations and expense, and prompt sale at an acceptable price may be difficult. Information regarding restricted securities held at period end is included at the end of the Schedule of Investments, if applicable.
4. Purchases and Sales of Investments.
Purchases and sales of securities, other than short-term securities and in-kind transactions, as applicable, are noted in the table below.
| | Purchases ($) | Sales ($) |
| Fidelity SAI Tax-Free Bond Fund | 920,820,482 | 473,521,929 |
5. Fees and Other Transactions with Affiliates.
Management Fee. Fidelity Management & Research Company LLC (the investment adviser) and its affiliates provide the Fund with investment management related services for which the Fund pays a monthly management fee. The management fee is the sum of an individual fund fee rate that is based on an annual rate of .25% of the Fund's average net assets and an annualized group fee rate that averaged .10% during the period. The group fee rate is based upon the monthly average net assets of a group of registered investment companies with which the investment adviser has management contracts. The group fee rate decreases as assets under management increase and increases as assets under management decrease. For the reporting period, the total annual management fee rate was .35% of the Fund's average net assets.
Interfund Trades. Funds may purchase from or sell securities to other Fidelity Funds under procedures adopted by the Board. The procedures have been designed to ensure these interfund trades are executed in accordance with Rule 17a-7 of the 1940 Act. Any interfund trades are included within the respective purchases and sales amounts shown in the Purchases and Sales of Investments note. Interfund trades during the period are noted in the table below.
| | Purchases ($) | Sales ($) | Realized Gain (Loss) ($) |
| Fidelity SAI Tax-Free Bond Fund | - | 7,232,365 | 2,259 |
Affiliated Redemptions In-Kind. Shares that were redeemed in-kind for investments, including accrued interest and cash, if any, are shown in the table below. The net realized gain or loss on investments delivered through in-kind redemptions is included in the "Net realized gain (loss) on: Redemptions in-kind" line in the accompanying Statement of Operations. The amount of the in-kind redemptions is included in share transactions in the accompanying Statement of Changes in Net Assets. There was no gain or loss for federal income tax purposes.
| | Shares | Total net realized gain or loss ($) | Total Proceeds ($) |
| Fidelity SAI Tax-Free Bond Fund | 13,577,568 | (10,160,414) | 131,430,855 |
6. Committed Line of Credit.
Certain Funds participate with other funds managed by the investment adviser or an affiliate in a $4.25 billion credit facility (the "line of credit") to be utilized for temporary or emergency purposes to fund shareholder redemptions or for other short-term liquidity purposes. The participating funds have agreed to pay commitment fees on their pro-rata portion of the line of credit, which are reflected in Miscellaneous expenses on the Statement of Operations, and are listed below. During the period, there were no borrowings on this line of credit.
| | Amount |
| Fidelity SAI Tax-Free Bond Fund | $3,831 |
7. Expense Reductions.
The investment adviser contractually agreed to reimburse the Fund to the extent annual operating expenses exceeded .25% of average net assets. This reimbursement will remain in place through May 31, 2024. Some expenses, for example the compensation of the independent Trustees, and certain miscellaneous expenses such as proxy and shareholder meeting expenses, are excluded from this reimbursement. During the period this reimbursement reduced the Fund's expenses by $2,894,435.
Through arrangements with the Fund's custodian, credits realized as a result of certain uninvested cash balances were used to reduce the Fund's expenses by $4,223.
In addition, during the period the investment adviser or an affiliate reimbursed and/or waived a portion of operating expenses in the amount of $40,741.
8. Other.
A fund's organizational documents provide former and current trustees and officers with a limited indemnification against liabilities arising in connection with the performance of their duties to the fund. In the normal course of business, a fund may also enter into contracts that provide general indemnifications. A fund's maximum exposure under these arrangements is unknown as this would be dependent on future claims that may be made against a fund. The risk of material loss from such claims is considered remote.
9. Risk and Uncertainties.
Many factors affect a fund's performance. Developments that disrupt global economies and financial markets, such as pandemics, epidemics, outbreaks of infectious diseases, war, terrorism, and environmental disasters, may significantly affect a fund's investment performance. The effects of these developments to a fund will be impacted by the types of securities in which a fund invests, the financial condition, industry, economic sector, and geographic location of an issuer, and a fund's level of investment in the securities of that issuer.
To the Board of Trustees of Fidelity Salem Street Trust and the Shareholders of Fidelity SAI Tax-Free Bond Fund:
Opinion on the Financial Statements and Financial Highlights
We have audited the accompanying statement of assets and liabilities of Fidelity SAI Tax-Free Bond Fund (the "Fund"), a fund of Fidelity Salem Street Trust, including the schedule of investments, as of January 31, 2023, the related statement of operations for the year then ended, the statement of changes in net assets for each of the two years in the period then ended, the financial highlights for each of the four years in the period then ended and for the period from October 2, 2018 (commencement of operations) through January 31, 2019, and the related notes. In our opinion, the financial statements and financial highlights present fairly, in all material respects, the financial position of the Fund as of January 31, 2023, and the results of its operations for the year then ended, the changes in its net assets for each of the two years in the period then ended, and the financial highlights for each of the four years in the period then ended and for the period from October 2, 2018 (commencement of operations) through January 31, 2019 in conformity with accounting principles generally accepted in the United States of America.
Basis for Opinion
These financial statements and financial highlights are the responsibility of the Fund's management. Our responsibility is to express an opinion on the Fund's financial statements and financial highlights based on our audits. We are a public accounting firm registered with the Public Company Accounting Oversight Board (United States) (PCAOB) and are required to be independent with respect to the Fund in accordance with the U.S. federal securities laws and the applicable rules and regulations of the Securities and Exchange Commission and the PCAOB.
We conducted our audits in accordance with the standards of the PCAOB. Those standards require that we plan and perform the audit to obtain reasonable assurance about whether the financial statements and financial highlights are free of material misstatement, whether due to error or fraud. The Fund is not required to have, nor were we engaged to perform, an audit of its internal control over financial reporting. As part of our audits we are required to obtain an understanding of internal control over financial reporting but not for the purpose of expressing an opinion on the effectiveness of the Fund's internal control over financial reporting. Accordingly, we express no such opinion.
Our audits included performing procedures to assess the risks of material misstatement of the financial statements and financial highlights, whether due to error or fraud, and performing procedures that respond to those risks. Such procedures included examining, on a test basis, evidence regarding the amounts and disclosures in the financial statements and financial highlights. Our audits also included evaluating the accounting principles used and significant estimates made by management, as well as evaluating the overall presentation of the financial statements and financial highlights. Our procedures included confirmation of securities owned as of January 31, 2023, by correspondence with the custodian and brokers; when replies were not received from brokers, we performed other auditing procedures. We believe that our audits provide a reasonable basis for our opinion.
/s/ Deloitte & Touche LLP
Boston, Massachusetts
March 14, 2023
We have served as the auditor of one or more of the Fidelity investment companies since 1999.
The Trustees, Members of the Advisory Board (if any), and officers of the trust and fund, as applicable, are listed below. The Board of Trustees governs the fund and is responsible for protecting the interests of shareholders. The Trustees are experienced executives who meet periodically throughout the year to oversee the fund's activities, review contractual arrangements with companies that provide services to the fund, oversee management of the risks associated with such activities and contractual arrangements, and review the fund's performance. Except for Jonathan Chiel, each of the Trustees oversees 291 funds. Mr. Chiel oversees 186 funds.
The Trustees hold office without limit in time except that (a) any Trustee may resign; (b) any Trustee may be removed by written instrument, signed by at least two-thirds of the number of Trustees prior to such removal; (c) any Trustee who requests to be retired or who has become incapacitated by illness or injury may be retired by written instrument signed by a majority of the other Trustees; and (d) any Trustee may be removed at any special meeting of shareholders by a two-thirds vote of the outstanding voting securities of the trust. Each Trustee who is not an interested person (as defined in the 1940 Act) of the trust and the fund is referred to herein as an Independent Trustee. Each Independent Trustee shall retire not later than the last day of the calendar year in which his or her 75th birthday occurs. The Independent Trustees may waive this mandatory retirement age policy with respect to individual Trustees. Officers and Advisory Board Members hold office without limit in time, except that any officer or Advisory Board Member may resign or may be removed by a vote of a majority of the Trustees at any regular meeting or any special meeting of the Trustees. Except as indicated, each individual has held the office shown or other offices in the same company for the past five years.
The fund's Statement of Additional Information (SAI) includes more information about the Trustees. To request a free copy, call Fidelity at 1-800-544-3455.
Experience, Skills, Attributes, and Qualifications of the Trustees. The Governance and Nominating Committee has adopted a statement of policy that describes the experience, qualifications, attributes, and skills that are necessary and desirable for potential Independent Trustee candidates (Statement of Policy). The Board believes that each Trustee satisfied at the time he or she was initially elected or appointed a Trustee, and continues to satisfy, the standards contemplated by the Statement of Policy. The Governance and Nominating Committee also engages professional search firms to help identify potential Independent Trustee candidates who have the experience, qualifications, attributes, and skills consistent with the Statement of Policy. From time to time, additional criteria based on the composition and skills of the current Independent Trustees, as well as experience or skills that may be appropriate in light of future changes to board composition, business conditions, and regulatory or other developments, have also been considered by the professional search firms and the Governance and Nominating Committee. In addition, the Board takes into account the Trustees' commitment and participation in Board and committee meetings, as well as their leadership of standing and ad hoc committees throughout their tenure.
In determining that a particular Trustee was and continues to be qualified to serve as a Trustee, the Board has considered a variety of criteria, none of which, in isolation, was controlling. The Board believes that, collectively, the Trustees have balanced and diverse experience, qualifications, attributes, and skills, which allow the Board to operate effectively in governing the fund and protecting the interests of shareholders. Information about the specific experience, skills, attributes, and qualifications of each Trustee, which in each case led to the Board's conclusion that the Trustee should serve (or continue to serve) as a trustee of the fund, is provided below.
Board Structure and Oversight Function. Abigail P. Johnson is an interested person and currently serves as Chairman. The Trustees have determined that an interested Chairman is appropriate and benefits shareholders because an interested Chairman has a personal and professional stake in the quality and continuity of services provided to the fund. Independent Trustees exercise their informed business judgment to appoint an individual of their choosing to serve as Chairman, regardless of whether the Trustee happens to be independent or a member of management. The Independent Trustees have determined that they can act independently and effectively without having an Independent Trustee serve as Chairman and that a key structural component for assuring that they are in a position to do so is for the Independent Trustees to constitute a substantial majority for the Board. The Independent Trustees also regularly meet in executive session. Michael E. Kenneally serves as Chairman of the Independent Trustees and as such (i) acts as a liaison between the Independent Trustees and management with respect to matters important to the Independent Trustees and (ii) with management prepares agendas for Board meetings.
Fidelity ® funds are overseen by different Boards of Trustees. The fund's Board oversees Fidelity's alternative investment, investment-grade bond, money market, asset allocation and certain equity funds, and other Boards oversee Fidelity's high income and other equity funds. The asset allocation funds may invest in Fidelity ® funds that are overseen by such other Boards. The use of separate Boards, each with its own committee structure, allows the Trustees of each group of Fidelity ® funds to focus on the unique issues of the funds they oversee, including common research, investment, and operational issues. On occasion, the separate Boards establish joint committees to address issues of overlapping consequences for the Fidelity ® funds overseen by each Board.
The Trustees operate using a system of committees to facilitate the timely and efficient consideration of all matters of importance to the Trustees, the fund, and fund shareholders and to facilitate compliance with legal and regulatory requirements and oversight of the fund's activities and associated risks. The Board, acting through its committees, has charged FMR and its affiliates with (i) identifying events or circumstances the occurrence of which could have demonstrably adverse effects on the fund's business and/or reputation; (ii) implementing processes and controls to lessen the possibility that such events or circumstances occur or to mitigate the effects of such events or circumstances if they do occur; and (iii) creating and maintaining a system designed to evaluate continuously business and market conditions in order to facilitate the identification and implementation processes described in (i) and (ii) above. Because the day-to-day operations and activities of the fund are carried out by or through FMR, its affiliates, and other service providers, the fund's exposure to risks is mitigated but not eliminated by the processes overseen by the Trustees. While each of the Board's committees has responsibility for overseeing different aspects of the fund's activities, oversight is exercised primarily through the Operations and Audit Committees. In addition, an ad hoc Board committee of Independent Trustees has worked with FMR to enhance the Board's oversight of investment and financial risks, legal and regulatory risks, technology risks, and operational risks, including the development of additional risk reporting to the Board. Appropriate personnel, including but not limited to the fund's Chief Compliance Officer (CCO), FMR's internal auditor, the independent accountants, the fund's Treasurer and portfolio management personnel, make periodic reports to the Board's committees, as appropriate, including an annual review of Fidelity's risk management program for the Fidelity ® funds. The responsibilities of each standing committee, including their oversight responsibilities, are described further under "Standing Committees of the Trustees."
Interested Trustees*:
Correspondence intended for a Trustee who is an interested person may be sent to Fidelity Investments, 245 Summer Street, Boston, Massachusetts 02210.
Name, Year of Birth; Principal Occupations and Other Relevant Experience+
Jonathan Chiel (1957)
Year of Election or Appointment: 2016
Trustee
Mr. Chiel also serves as Trustee of other Fidelity ® funds. Mr. Chiel is Executive Vice President and General Counsel for FMR LLC (diversified financial services company, 2012-present). Previously, Mr. Chiel served as general counsel (2004-2012) and senior vice president and deputy general counsel (2000-2004) for John Hancock Financial Services; a partner with Choate, Hall & Stewart (1996-2000) (law firm); and an Assistant United States Attorney for the United States Attorney's Office of the District of Massachusetts (1986-95), including Chief of the Criminal Division (1993-1995). Mr. Chiel is a director on the boards of the Boston Bar Foundation and the Maimonides School.
Abigail P. Johnson (1961)
Year of Election or Appointment: 2009
Trustee
Chairman of the Board of Trustees
Ms. Johnson also serves as Trustee of other Fidelity ® funds. Ms. Johnson serves as Chairman (2016-present), Chief Executive Officer (2014-present), and Director (2007-present) of FMR LLC (diversified financial services company), President of Fidelity Financial Services (2012-present) and President of Personal, Workplace and Institutional Services (2005-present). Ms. Johnson is Chairman and Director of Fidelity Management & Research Company LLC (investment adviser firm, 2011-present). Previously, Ms. Johnson served as Chairman and Director of FMR Co., Inc. (investment adviser firm, 2011-2019), Vice Chairman (2007-2016) and President (2013-2016) of FMR LLC, President and a Director of Fidelity Management & Research Company (2001-2005), a Trustee of other investment companies advised by Fidelity Management & Research Company, Fidelity Investments Money Management, Inc. (investment adviser firm), and FMR Co., Inc. (2001-2005), Senior Vice President of the Fidelity ® funds (2001-2005), and managed a number of Fidelity ® funds. Ms. Abigail P. Johnson and Mr. Arthur E. Johnson are not related.
Jennifer Toolin McAuliffe (1959)
Year of Election or Appointment: 2016
Trustee
Ms. McAuliffe also serves as Trustee of other Fidelity ® funds and as Trustee of Fidelity Charitable (2020-present). Previously, Ms. McAuliffe served as Co-Head of Fixed Income of Fidelity Investments Limited (now known as FIL Limited (FIL)) (diversified financial services company), Director of Research for FIL's credit and quantitative teams in London, Hong Kong and Tokyo and Director of Research for taxable and municipal bonds at Fidelity Investments Money Management, Inc. Ms. McAuliffe previously served as a member of the Advisory Board of certain Fidelity ® funds (2016). Ms. McAuliffe was previously a lawyer at Ropes & Gray LLP and currently serves as director or trustee of several not-for-profit entities.
* Determined to be an "Interested Trustee" by virtue of, among other things, his or her affiliation with the trust or various entities under common control with FMR.
+ The information includes the Trustee's principal occupation during the last five years and other information relating to the experience, attributes, and skills relevant to the Trustee's qualifications to serve as a Trustee, which led to the conclusion that the Trustee should serve as a Trustee for the fund.
Independent Trustees:
Correspondence intended for an Independent Trustee may be sent to Fidelity Investments, P.O. Box 55235, Boston, Massachusetts 02205-5235.
Name, Year of Birth; Principal Occupations and Other Relevant Experience+
Elizabeth S. Acton (1951)
Year of Election or Appointment: 2013
Trustee
Ms. Acton also serves as Trustee of other Fidelity ® funds. Prior to her retirement, Ms. Acton served as Executive Vice President, Finance (2011-2012), Executive Vice President, Chief Financial Officer (2002-2011) and Treasurer (2004-2005) of Comerica Incorporated (financial services). Prior to joining Comerica, Ms. Acton held a variety of positions at Ford Motor Company (1983-2002), including Vice President and Treasurer (2000-2002) and Executive Vice President and Chief Financial Officer of Ford Motor Credit Company (1998-2000). Ms. Acton currently serves as a member of the Board and Audit and Finance Committees of Beazer Homes USA, Inc. (homebuilding, 2012-present). Ms. Acton previously served as a member of the Advisory Board of certain Fidelity ® funds (2013-2016).
Ann E. Dunwoody (1953)
Year of Election or Appointment: 2018
Trustee
General Dunwoody also serves as Trustee of other Fidelity ® funds. General Dunwoody (United States Army, Retired) was the first woman in U.S. military history to achieve the rank of four-star general and prior to her retirement in 2012 held a variety of positions within the U.S. Army, including Commanding General, U.S. Army Material Command (2008-2012). General Dunwoody currently serves as President of First to Four LLC (leadership and mentoring services, 2012-present), a member of the Board and Nomination and Corporate Governance Committees of Kforce Inc. (professional staffing services, 2016-present) and a member of the Board of Automattic Inc. (software engineering, 2018-present). Previously, General Dunwoody served as a member of the Advisory Board and Nominating and Corporate Governance Committee of L3 Technologies, Inc. (communication, electronic, sensor and aerospace systems, 2013-2019) and a member of the Board and Audit and Sustainability and Corporate Responsibility Committees of Republic Services, Inc. (waste collection, disposal and recycling, 2013-2016). Ms. Dunwoody also serves on several boards for non-profit organizations, including as a member of the Board, Chair of the Nomination and Governance Committee and a member of the Audit Committee of Logistics Management Institute (consulting non-profit, 2012-present), a member of the Council of Trustees for the Association of the United States Army (advocacy non-profit, 2013-present), a member of the Board of Florida Institute of Technology (2015-present) and a member of the Board of ThanksUSA (military family education non-profit, 2014-present). General Dunwoody previously served as a member of the Advisory Board of certain Fidelity ® funds (2018).
John Engler (1948)
Year of Election or Appointment: 2014
Trustee
Mr. Engler also serves as Trustee of other Fidelity ® funds. Previously, Mr. Engler served as Governor of Michigan (1991-2003), President of the Business Roundtable (2011-2017) and interim President of Michigan State University (2018-2019). Mr. Engler currently serves as a member of the Board of Stride, Inc. (formerly K12 Inc.) (technology-based education company, 2012-present). Previously, Mr. Engler served as a member of the Board of Universal Forest Products (manufacturer and distributor of wood and wood-alternative products, 2003-2019) and Trustee of The Munder Funds (2003-2014). Mr. Engler previously served as a member of the Advisory Board of certain Fidelity ® funds (2014-2016).
Robert F. Gartland (1951)
Year of Election or Appointment: 2010
Trustee
Mr. Gartland also serves as Trustee of other Fidelity ® funds. Prior to his retirement, Mr. Gartland held a variety of positions at Morgan Stanley (financial services, 1979-2007), including Managing Director (1987-2007) and Chase Manhattan Bank (1975-1978). Mr. Gartland previously served as Chairman and an investor in Gartland & Mellina Group Corp. (consulting, 2009-2019), as a member of the Board of National Securities Clearing Corporation (1993-1996) and as Chairman of TradeWeb (2003-2004).
Arthur E. Johnson (1947)
Year of Election or Appointment: 2008
Trustee
Mr. Johnson also serves as Trustee of other Fidelity ® funds. Prior to his retirement, Mr. Johnson served as Senior Vice President of Corporate Strategic Development of Lockheed Martin Corporation (defense contractor, 1999-2009). Mr. Johnson currently serves as a member of the Board of Booz Allen Hamilton (management consulting, 2011-present). Mr. Johnson previously served as a member of the Board of Eaton Corporation plc (diversified power management, 2009-2019) and a member of the Board of AGL Resources, Inc. (holding company, 2002-2016). Mr. Johnson previously served as Chairman (2018-2021) and Vice Chairman (2015-2018) of the Independent Trustees of certain Fidelity® funds. Mr. Arthur E. Johnson is not related to Ms. Abigail P. Johnson.
Michael E. Kenneally (1954)
Year of Election or Appointment: 2009
Trustee
Chairman of the Independent Trustees
Mr. Kenneally also serves as Trustee of other Fidelity ® funds and was Vice Chairman (2018-2021) of the Independent Trustees of certain Fidelity ® funds. Prior to retirement in 2005, he was Chairman and Global Chief Executive Officer of Credit Suisse Asset Management, the worldwide fund management and institutional investment business of Credit Suisse Group. Previously, Mr. Kenneally was an Executive Vice President and the Chief Investment Officer for Bank of America. In this role, he was responsible for the investment management, strategy and products delivered to the bank's institutional, high-net-worth and retail clients. Earlier, Mr. Kenneally directed the organization's equity and quantitative research groups. He began his career as a research analyst and then spent more than a dozen years as a portfolio manager for endowments, pension plans and mutual funds. He earned the Chartered Financial Analyst (CFA) designation in 1991.
Mark A. Murray (1954)
Year of Election or Appointment: 2016
Trustee
Mr. Murray also serves as Trustee of other Fidelity ® funds. Previously, Mr. Murray served as Co-Chief Executive Officer (2013-2016), President (2006-2013) and Vice Chairman (2013-2020) of Meijer, Inc. Mr. Murray serves as a member of the Board (2009-present) and Public Policy and Responsibility Committee (2009-present) and Chair of the Nuclear Review Committee (2019-present) of DTE Energy Company (diversified energy company). Mr. Murray previously served as a member of the Board of Spectrum Health (not-for-profit health system, 2015-2019) and as a member of the Board and Audit Committee and Chairman of the Nominating and Corporate Governance Committee of Universal Forest Products, Inc. (manufacturer and distributor of wood and wood-alternative products, 2004-2016). Mr. Murray also serves as a member of the Board of many community and professional organizations. Mr. Murray previously served as a member of the Advisory Board of certain Fidelity ® funds (2016).
+ The information includes the Trustee's principal occupation during the last five years and other information relating to the experience, attributes, and skills relevant to the Trustee's qualifications to serve as a Trustee, which led to the conclusion that the Trustee should serve as a Trustee for the fund.
Advisory Board Members and Officers:
Correspondence intended for a Member of the Advisory Board (if any) may be sent to Fidelity Investments, P.O. Box 55235, Boston, Massachusetts 02205-5235. Correspondence intended for an officer may be sent to Fidelity Investments, 245 Summer Street, Boston, Massachusetts 02210. Officers appear below in alphabetical order.
Name, Year of Birth; Principal Occupation
Laura M. Bishop (1961)
Year of Election or Appointment: 2022
Member of the Advisory Board
Ms. Bishop also serves as a Member of the Advisory Board of other funds. Prior to her retirement, Ms. Bishop held a variety of positions at United Services Automobile Association (2001-2020), including Executive Vice President and Chief Financial Officer (2014-2020) and Senior Vice President and Deputy Chief Financial Officer (2012-2014). Ms. Bishop currently serves as a member of the Audit Committee and Compensation and Personnel Committee (2021-present) of the Board of Directors of Korn Ferry (global organizational consulting).
Robert W. Helm (1957)
Year of Election or Appointment: 2021
Member of the Advisory Board
Mr. Helm also serves as a Member of the Advisory Board of other Fidelity® funds. Mr. Helm was formerly Deputy Chairman (2003-2020), partner (1991-2020) and an associate (1984-1991) of Dechert LLP (formerly Dechert Price & Rhoads). Mr. Helm currently serves on boards and committees of several not-for-profit organizations.
Carol J. Zierhoffer (1960)
Year of Election or Appointment: 2023
Member of the Advisory Board
Ms. Zierhoffer also serves as a Member of the Advisory Board of other funds. Prior to her retirement, Ms. Zierhoffer held a variety of positions at Bechtel Corporation (engineering company, 2013-2019), including Principal Vice President and Chief Information Officer (2013-2016) and Senior Vice President and Chief Information Officer (2016-2019). Ms. Zierhoffer currently serves as a member of the Board of Directors, Audit Committee and Compensation Committee of Allscripts Healthcare Solutions, Inc. (healthcare technology, 2020-present) and as a member of the Board of Directors, Audit and Finance Committee and Nominating and Governance Committee of Atlas Air Worldwide Holdings, Inc. (aviation operating services, 2021-present). Previously, Ms. Zierhoffer served as a member of the Board of Directors and Audit Committee and as the founding Chair of the Information Technology Committee of MedAssets, Inc. (healthcare technology, 2013-2016).
Craig S. Brown (1977)
Year of Election or Appointment: 2019
Assistant Treasurer
Mr. Brown also serves as an officer of other funds. Mr. Brown serves as Assistant Treasurer of FIMM, LLC (2021-present) and is an employee of Fidelity Investments (2013-present). Previously, Mr. Brown served as Assistant Treasurer of certain Fidelity ® funds (2019-2022).
John J. Burke III (1964)
Year of Election or Appointment: 2018
Chief Financial Officer
Mr. Burke also serves as Chief Financial Officer of other funds. Mr. Burke serves as Head of Investment Operations for Fidelity Fund and Investment Operations (2018-present) and is an employee of Fidelity Investments (1998-present). Previously Mr. Burke served as head of Asset Management Investment Operations (2012-2018).
David J. Carter (1973)
Year of Election or Appointment: 2020
Assistant Secretary
Mr. Carter also serves as Assistant Secretary of other funds. Mr. Carter serves as Senior Vice President, Deputy General Counsel (2022-present) and is an employee of Fidelity Investments (2005-present).
Jonathan Davis (1968)
Year of Election or Appointment: 2010
Assistant Treasurer
Mr. Davis also serves as an officer of other funds. Mr. Davis serves as Assistant Treasurer of FIMM, LLC (2021-present), FMR Capital, Inc. (2017-present), FD Funds GP LLC (2021-present), FD Funds Holding LLC (2021-present), and FD Funds Management LLC (2021-present); and is an employee of Fidelity Investments. Previously, Mr. Davis served as Vice President and Associate General Counsel of FMR LLC (diversified financial services company, 2003-2010).
Laura M. Del Prato (1964)
Year of Election or Appointment: 2018
President and Treasurer
Ms. Del Prato also serves as an officer of other funds. Ms. Del Prato serves as Assistant Treasurer of FIMM, LLC (2021-present) and is an employee of Fidelity Investments (2017-present). Previously, Ms. Del Prato served as President and Treasurer of The North Carolina Capital Management Trust: Cash Portfolio and Term Portfolio (2018-2020). Prior to joining Fidelity Investments, Ms. Del Prato served as a Managing Director and Treasurer of the JPMorgan Mutual Funds (2014-2017). Prior to JPMorgan, Ms. Del Prato served as a partner at Cohen Fund Audit Services (accounting firm, 2012-2013) and KPMG LLP (accounting firm, 2004-2012).
Christopher M. Gouveia (1973)
Year of Election or Appointment: 2023
Chief Compliance Officer
Mr. Gouveia also serves as Chief Compliance Officer of other funds. Mr. Gouveia serves as Senior Vice President of Asset Management Compliance for Fidelity Investments and is an employee of Fidelity Investments. Previously, Mr. Gouveia served as Chief Compliance Officer of the North Carolina Capital Management Trust (2016-2019).
Colm A. Hogan (1973)
Year of Election or Appointment: 2016
Assistant Treasurer
Mr. Hogan also serves as an officer of other funds. Mr. Hogan serves as Assistant Treasurer of FIMM, LLC (2021-present) and FMR Capital, Inc. (2017-present) and is an employee of Fidelity Investments (2005-present). Previously, Mr. Hogan served as Deputy Treasurer of certain Fidelity ® funds (2016-2020) and Assistant Treasurer of certain Fidelity ® funds (2016-2018).
Cynthia Lo Bessette (1969)
Year of Election or Appointment: 2019
Secretary and Chief Legal Officer (CLO)
Ms. Lo Bessette also serves as an officer of other funds. Ms. Lo Bessette serves as CLO, Secretary, and Senior Vice President of Fidelity Management & Research Company LLC (investment adviser firm, 2019-present); CLO of Fidelity Management & Research (Hong Kong) Limited, FMR Investment Management (UK) Limited, and Fidelity Management & Research (Japan) Limited (investment adviser firms, 2019-present); Secretary of FD Funds GP LLC (2021-present), FD Funds Holding LLC (2021-present), FD Funds Management LLC (2021-present), and Fidelity Diversifying Solutions LLC (investment adviser firm, 2022-present); and Assistant Secretary of FIMM, LLC (2019-present). She is a Senior Vice President and Deputy General Counsel of FMR LLC (diversified financial services company, 2019-present), and is an employee of Fidelity Investments. Previously, Ms. Lo Bessette served as CLO, Secretary, and Senior Vice President of FMR Co., Inc. (investment adviser firm, 2019); Secretary of Fidelity SelectCo, LLC and Fidelity Investments Money Management, Inc. (investment adviser firms, 2019). Prior to joining Fidelity Investments, Ms. Lo Bessette was Executive Vice President, General Counsel (2016-2019) and Senior Vice President, Deputy General Counsel (2015-2016) of OppenheimerFunds (investment management company) and Deputy Chief Legal Officer (2013-2015) of Jennison Associates LLC (investment adviser firm).
Chris Maher (1972)
Year of Election or Appointment: 2013
Assistant Treasurer
Mr. Maher also serves as an officer of other funds. Mr. Maher serves as Assistant Treasurer of FIMM, LLC (2021-present) and FMR Capital, Inc. (2017-present), and is an employee of Fidelity Investments (2008-present). Previously, Mr. Maher served as Assistant Treasurer of certain funds (2013-2020); Vice President of Asset Management Compliance (2013), Vice President of the Program Management Group of FMR (investment adviser firm, 2010-2013), and Vice President of Valuation Oversight (2008-2010).
Jamie Pagliocco (1964)
Year of Election or Appointment: 2020
Vice President
Mr. Pagliocco also serves as Vice President of other funds. Mr. Pagliocco serves as President of Fixed Income (2020-present), and is an employee of Fidelity Investments (2001-present). Previously, Mr. Pagliocco served as Co-Chief Investment Officer - Bond (2017-2020), Global Head of Bond Trading (2016-2019), and as a portfolio manager.
Brett Segaloff (1972)
Year of Election or Appointment: 2021
Anti-Money Laundering (AML) Officer
Mr. Segaloff also serves as an AML Officer of other funds and other related entities. He is Director, Anti-Money Laundering (2007-present) of FMR LLC (diversified financial services company) and is an employee of Fidelity Investments (1996-present).
Stacie M. Smith (1974)
Year of Election or Appointment: 2013
Assistant Treasurer
Ms. Smith also serves as an officer of other funds. Ms. Smith serves as Assistant Treasurer of FIMM, LLC (2021-present) and FMR Capital, Inc. (2017-present), is an employee of Fidelity Investments (2009-present), and has served in other fund officer roles. Prior to joining Fidelity Investments, Ms. Smith served as Senior Audit Manager of Ernst & Young LLP (accounting firm, 1996-2009). Previously, Ms. Smith served as Assistant Treasurer (2013-2019) and Deputy Treasurer (2013-2016) of certain Fidelity ® funds.
Jim Wegmann (1979)
Year of Election or Appointment: 2021
Deputy Treasurer
Mr. Wegmann also serves as an officer of other funds. Mr. Wegmann serves as Assistant Treasurer of FIMM, LLC (2021-present) and is an employee of Fidelity Investments (2011-present). Previously, Mr. Wegmann served as Assistant Treasurer of certain Fidelity ® funds (2019-2021).
As a shareholder, you incur two types of costs: (1) transaction costs, which may include sales charges (loads) on purchase payments or redemption proceeds, as applicable and (2) ongoing costs, which generally include management fees, distribution and/or service (12b-1) fees and other Fund expenses. This Example is intended to help you understand your ongoing costs (in dollars) of investing in a fund and to compare these costs with the ongoing costs of investing in other mutual funds.
| The Example is based on an investment of $1,000 invested at the beginning of the period and held for the entire period (August 1, 2022 to January 31, 2023). |
Actual Expenses
The first line of the accompanying table provides information about actual account values and actual expenses. You may use the information in this line, together with the amount you invested, to estimate the expenses that you paid over the period. Simply divide your account value by $1,000.00 (for example, an $8,600 account value divided by $1,000.00 = 8.6), then multiply the result by the number in the first line for a class/Fund under the heading entitled "Expenses Paid During Period" to estimate the expenses you paid on your account during this period. If any fund is a shareholder of any underlying mutual funds or exchange-traded funds (ETFs) (the Underlying Funds), such fund indirectly bears its proportional share of the expenses of the Underlying Funds in addition to the direct expenses incurred presented in the table. These fees and expenses are not included in the annualized expense ratio used to calculate the expense estimate in the table below.
Hypothetical Example for Comparison Purposes
The second line of the accompanying table provides information about hypothetical account values and hypothetical expenses based on the actual expense ratio and an assumed rate of return of 5% per year before expenses, which is not the actual return. The hypothetical account values and expenses may not be used to estimate the actual ending account balance or expenses you paid for the period. You may use this information to compare the ongoing costs of investing in the Fund and other funds. To do so, compare this 5% hypothetical example with the 5% hypothetical examples that appear in the shareholder reports of the other funds. If any fund is a shareholder of any Underlying Funds, such fund indirectly bears its proportional share of the expenses of the Underlying Funds in addition to the direct expenses as presented in the table. These fees and expenses are not included in the annualized expense ratio used to calculate the expense estimate in the table below.
Please note that the expenses shown in the table are meant to highlight your ongoing costs only and do not reflect any transaction costs. Therefore, the second line of the table is useful in comparing ongoing costs only, and will not help you determine the relative total costs of owning different funds. In addition, if these transactional costs were included, your costs would have been higher.
| | | | | Annualized Expense Ratio- A | | Beginning Account Value August 1, 2022 | | Ending Account Value January 31, 2023 | | Expenses Paid During Period- C August 1, 2022 to January 31, 2023 |
| | | | | | | | | | |
| Fidelity® SAI Tax-Free Bond Fund | | | | .25% | | | | | | |
| Actual | | | | | | $ 1,000 | | $ 1,009.00 | | $ 1.27 |
Hypothetical- B | | | | | | $ 1,000 | | $ 1,023.95 | | $ 1.28 |
| |
A Annualized expense ratio reflects expenses net of applicable fee waivers.
B 5% return per year before expenses
C Expenses are equal to the annualized expense ratio, multiplied by the average account value over the period, multiplied by 184/ 365 (to reflect the one-half year period). The fees and expenses of any Underlying Funds are not included in each annualized expense ratio.
The dividend and capital gains distributions for the fund(s) are available on Fidelity.com or Institutional.Fidelity.com .
During fiscal year ended 2023, 100% of the fund's income dividends was free from federal income tax, and 0% of the fund's income dividends was subject to the federal alternative minimum tax.
The fund will notify shareholders in January 2024 of amounts for use in preparing 2023 income tax returns.
Board Approval of Investment Advisory Contracts and Management Fees
Fidelity SAI Tax-Free Bond Fund
Each year, the Board of Trustees, including the Independent Trustees (together, the Board), votes on the renewal of the management contract with Fidelity Management & Research Company LLC (FMR) and the sub-advisory agreements (together, the Advisory Contracts) for the fund. FMR and the sub-advisers are referred to herein as the Investment Advisers. The Board, assisted by the advice of fund counsel and Independent Trustees' counsel, requests and considers a broad range of information relevant to the renewal of the Advisory Contracts throughout the year.
The Board meets regularly and, at each of its meetings, covers an extensive agenda of topics and materials and considers factors that are relevant to its annual consideration of the renewal of the fund's Advisory Contracts, including the services and support provided to the fund and its shareholders. The Board has established four standing committees (Committees) - Operations, Audit, Fair Valuation, and Governance and Nominating - each composed of and chaired by Independent Trustees with varying backgrounds, to which the Board has assigned specific subject matter responsibilities in order to enhance effective decision-making by the Board. The Operations Committee, of which all the Independent Trustees are members, meets regularly throughout the year and requests, receives and considers, among other matters, information related to the annual consideration of the renewal of the fund's Advisory Contracts before making its recommendation to the Board. The Board also meets as needed to review matters specifically related to the Board's annual consideration of the renewal of the Advisory Contracts. Members of the Board may also meet from time to time with trustees of other Fidelity funds through joint ad hoc committees to discuss certain matters relevant to all of the Fidelity funds.
At its September 2022 meeting, the Board unanimously determined to renew the fund's Advisory Contracts. In reaching its determination, the Board considered all factors it believed relevant, including (i) the nature, extent, and quality of the services provided to the fund and its shareholders (including the investment performance of the fund); (ii) the competitiveness relative to peer funds of the fund's management fee and the total expense ratio; (iii) the total costs of the services provided by and the profits realized by Fidelity from its relationships with the fund; and (iv) the extent to which, if any, economies of scale exist and are realized as the fund grows, and whether any economies of scale are appropriately shared with fund shareholders.
In considering whether to renew the Advisory Contracts for the fund, the Board reached a determination, with the assistance of fund counsel and Independent Trustees' counsel and through the exercise of its business judgment, that the renewal of the Advisory Contracts was in the best interests of the fund and its shareholders and that the compensation payable under the Advisory Contracts was fair and reasonable. The Board's decision to renew the Advisory Contracts was not based on any single factor, but rather was based on a comprehensive consideration of all the information provided to the Board at its meetings throughout the year. The Board, in reaching its determination to renew the Advisory Contracts, was aware that shareholders of the fund have a broad range of investment choices available to them, including a wide choice among funds offered by Fidelity's competitors, and that the fund's shareholders, who have the opportunity to review and weigh the disclosure provided by the fund in its prospectus and other public disclosures, have chosen to invest in this fund, which is part of the Fidelity family of funds.
Nature, Extent, and Quality of Services Provided. The Board considered Fidelity's staffing as it relates to the fund, including the backgrounds of investment personnel of Fidelity, and also considered the fund's investment objective, strategies, and related investment philosophy. The Independent Trustees also had discussions with senior management of Fidelity's investment operations and investment groups. The Board considered the structure of the investment personnel compensation program and whether this structure provides appropriate incentives to act in the best interests of the fund. Additionally, the Board considered the portfolio managers' investments, if any, in the funds that they manage. The Board also considered the steps Fidelity had taken to ensure the continued provision of high quality services to the Fidelity funds throughout the COVID-19 pandemic, including the expansion of staff in client facing positions to maintain service levels in periods of high volumes and volatility.
Resources Dedicated to Investment Management and Support Services . The Board reviewed the general qualifications and capabilities of Fidelity's investment staff, including its size, education, experience, and resources, as well as Fidelity's approach to recruiting, managing, training, and compensating investment personnel. The Board noted the resources devoted to Fidelity's global investment organization, and that Fidelity's analysts have extensive resources, tools and capabilities that allow them to conduct quantitative and fundamental analysis, as well as credit analysis of issuers, counterparties and guarantors. Further, the Board considered that Fidelity's investment professionals have sufficient access to global information and data so as to provide competitive investment results over time, and that those professionals also have access to sophisticated tools that permit them to assess portfolio construction and risk and performance attribution characteristics continuously, as well as to transmit new information and research conclusions rapidly around the world. Additionally, in its deliberations, the Board considered Fidelity's trading, risk management, compliance, cybersecurity, and technology and operations capabilities and resources, which are integral parts of the investment management process.
Shareholder and Administrative Services . The Board considered (i) the nature, extent, quality, and cost of advisory, administrative, and shareholder services performed by the Investment Advisers and their affiliates under the Advisory Contracts and under separate agreements covering transfer agency and pricing and bookkeeping services for the fund; (ii) the nature and extent of the supervision of third party service providers, principally custodians, subcustodians, and pricing vendors; and (iii) the resources devoted to, and the record of compliance with, the fund's compliance policies and procedures.
The Board noted that the growth of fund assets over time across the complex allows Fidelity to reinvest in the development of services designed to enhance the value and convenience of the Fidelity funds as investment vehicles. These services include 24-hour access to account information and market information over the Internet and through telephone representatives, investor education materials and asset allocation tools. The Board also considered that it reviews customer service metrics such as telephone response times, continuity of services on the website and metrics addressing services at Fidelity Investor Centers.
Investment in a Large Fund Family . The Board considered the benefits to shareholders of investing in a Fidelity fund, including the benefits of investing in a fund that is part of a large family of funds offering a variety of investment disciplines and providing a large variety of mutual fund investor services. The Board noted that Fidelity had taken, or had made recommendations to the Board that resulted in the Fidelity funds taking, a number of actions over the previous year that benefited particular funds, including: (i) continuing to dedicate additional resources to Fidelity's investment research process, which includes meetings with management of issuers of securities in which the funds invest; (ii) continuing efforts to enhance Fidelity's global research capabilities; (iii) launching new funds, ETFs, and share classes with innovative structures, strategies and pricing and making other enhancements to meet investor needs; (iv) broadening eligibility requirements for certain funds and share classes; (v) reducing management fees and total expenses for certain funds and classes; (vi) lowering expenses for certain existing funds and classes by implementing or lowering expense caps; (vii) rationalizing product lines and gaining increased efficiencies from fund mergers and liquidations; (viii) continuing to develop, acquire and implement systems and technology to improve services to the funds and shareholders, strengthen information security, and increase efficiency; and (ix) continuing to implement enhancements to further strengthen Fidelity's product line to increase investors' probability of success in achieving their investment goals, including their retirement income goals.
Investment Performance . The Board considered whether the fund has operated in accordance with its investment objective, as well as its record of compliance with its investment restrictions and its performance history.
The Board took into account discussions that occur at Board meetings throughout the year with representatives of the Investment Advisers about fund investment performance. In this regard the Board noted that as part of regularly scheduled fund reviews and other reports to the Board on fund performance, the Board considers annualized return information for the fund for different time periods, measured against an appropriate securities market index (benchmark index) and an appropriate peer group of funds with similar objectives (peer group). The Board also receives and considers information about performance attribution. In its evaluation of fund investment performance at meetings throughout the year, the Board gave particular attention to information indicating underperformance of certain Fidelity funds for specific time periods and discussed with the Investment Advisers the reasons for such underperformance.
In addition to reviewing absolute and relative fund performance, the Independent Trustees periodically consider the appropriateness of fund performance metrics in evaluating the results achieved. In general, the Independent Trustees believe that fund performance should be evaluated based on gross performance (before fees and expenses but after transaction costs) compared to appropriate benchmark indices, over appropriate time periods that may include full market cycles, and on net performance (after fees and expenses) compared to appropriate peer groups, as applicable, over the same periods, taking into account relevant factors including the following: general market conditions; expectations for interest rate levels and credit conditions; issuer-specific information including credit quality; the potential for incremental return versus the fund's benchmark index weighed against the risks involved in obtaining that incremental return, including the risk of diminished or negative total returns; and fund cash flows and other factors. The Independent Trustees generally give greater weight to fund performance over longer time periods than over shorter time periods. Depending on the circumstances, the Independent Trustees may be satisfied with a fund's performance notwithstanding that it lags its benchmark index or peer group for certain periods.
The Independent Trustees recognize that shareholders evaluate performance on a net basis over their own holding periods, for which one-, three-, and five-year periods are often used as a proxy. For this reason, the performance information reviewed by the Board also included net calendar year total return information for the fund and an appropriate benchmark index and peer group for the most recent one- and three-year periods.
Based on its review, the Board concluded that the nature, extent, and quality of services provided to the fund under the Advisory Contracts should continue to benefit the shareholders of the fund.
Competitiveness of Management Fee and Total Expense Ratio . The Board considered the fund's management fee and total expense ratio compared to selected groups of competitive funds and classes (referred to as "mapped groups" below) for the purpose of facilitating the Trustees' competitive analysis of management fees and total expenses. Fidelity creates "mapped groups" by combining similar investment objective categories (as classified by Lipper) that have comparable investment mandates. Combining funds with similar investment objective categories aids the Board's comparison of management fees and total expense ratios by broadening the competitive group used for such comparison.
Management Fee . The Board considered two proprietary management fee comparisons for the 12-month (or shorter) periods shown in basis points (BP) in the chart below. The group of Lipper funds used by the Board for management fee comparisons is referred to below as the "Total Mapped Group" and is broader than the Lipper peer group used by the Board for performance comparisons. The Total Mapped Group comparison focuses on a fund's standing in terms of gross management fees before expense reimbursements or caps relative to the total universe of funds with comparable investment mandates, regardless of whether their management fee structures also are comparable. Funds with comparable investment mandates offer exposure to similar types of securities. Funds with comparable management fee structures have similar management fee contractual arrangements (e.g., flat rate charged for advisory services, all-inclusive fee rate, etc.). "TMG %" represents the percentage of funds in the Total Mapped Group that had management fees that were lower than the fund's. For example, a hypothetical TMG % of 20% would mean that 80% of the funds in the Total Mapped Group had higher, and 20% had lower, management fees than the fund. The fund's actual TMG %s and the number of funds in the Total Mapped Group are in the chart below. The "Asset-Sized Peer Group" (ASPG) comparison focuses on a fund's standing relative to a subset of non-Fidelity funds within the Total Mapped Group that are similar in size and management fee structure. For example, if a fund is in the first quartile of the ASPG, the fund's management fee ranks in the least expensive or lowest 25% of funds in the ASPG. The ASPG represents at least 15% of the funds in the Total Mapped Group with comparable asset size and management fee structures, subject to a minimum of 50 funds (or all funds in the Total Mapped Group if fewer than 50). Additional information, such as the ASPG quartile in which the fund's management fee rate ranked, is also included in the chart and was considered by the Board.
The Board noted that the fund's management fee rate ranked below the median of its Total Mapped Group and below the median of its ASPG for 2021.
Based on its review, the Board concluded that the fund's management fee is fair and reasonable in light of the services that the fund receives and the other factors considered.
Total Expense Ratio . In its review of the fund's total expense ratio, the Board considered the fund's management fee rate as well as other fund expenses, such as custodial, legal, and audit fees. The Board also noted that Fidelity may agree to waive fees or reimburse expenses from time to time, and the extent to which, if any, it has done so for the fund. The fund is compared to those funds and classes in the Total Mapped Group (used by the Board for management fee comparisons) that have a similar sales load structure. The Board also considered a total expense ASPG comparison, which focuses on the total expenses of the fund relative to a subset of non-Fidelity funds within the similar sales load structure group that are similar in size and management fee structure. The total expense ASPG is limited to 15 larger and 15 smaller classes of different funds, where possible. The total expense ASPG comparison excludes performance adjustments and fund-paid 12b-1 fees to eliminate variability in expenses relating to these items.
The Board noted that the fund's total net expense ratio ranked below the similar sales load structure group competitive median for 2021 and below the ASPG competitive median for 2021.
The Board further considered that FMR has contractually agreed to reimburse the fund to the extent that total operating expenses, with certain exceptions, as a percentage of its average net assets, exceed 0.25% through May 31, 2023.
Fees Charged to Other Fidelity Clients . The Board also considered Fidelity fee structures and other information with respect to clients of Fidelity, such as other funds advised or subadvised by Fidelity, pension plan clients, and other institutional clients with similar mandates. The Board noted that a joint ad hoc committee created by it and the boards of other Fidelity funds periodically reviews and compares Fidelity's institutional investment advisory business with its business of providing services to the Fidelity funds and also noted the most recent findings of the committee. The Board noted that the committee's review included a consideration of the differences in services provided, fees charged, and costs incurred, as well as competition in the markets serving the different categories of clients.
Based on its review of total expense ratios and fees charged to other Fidelity clients, the Board concluded that the fund's total expense ratio was reasonable in light of the services that the fund and its shareholders receive and the other factors considered.
Costs of the Services and Profitability . The Board considered the revenues earned and the expenses incurred by Fidelity in conducting the business of developing, marketing, distributing, managing, administering and servicing the fund and servicing the fund's shareholders. The Board also considered the level of Fidelity's profits in respect of all the Fidelity funds.
On an annual basis, Fidelity presents to the Board information about the profitability of its relationships with the fund. Fidelity calculates profitability information for each fund, as well as aggregate profitability information for groups of Fidelity funds and all Fidelity funds, using a series of detailed revenue and cost allocation methodologies which originate with the books and records of Fidelity on which Fidelity's audited financial statements are based. The Audit Committee of the Board reviews any significant changes from the prior year's methodologies and the full Board approves such changes.
A public accounting firm has been engaged annually by the Board as part of the Board's assessment of Fidelity's profitability analysis. The engagement includes the review and assessment of the methodologies used by Fidelity in determining the revenues and expenses attributable to Fidelity's mutual fund business, and completion of agreed-upon procedures in respect of the mathematical accuracy of certain fund profitability information and its conformity to established allocation methodologies. After considering the reports issued under the engagement and information provided by Fidelity, the Board concluded that while other allocation methods may also be reasonable, Fidelity's profitability methodologies are reasonable in all material respects.
The Board also reviewed Fidelity's non-fund businesses and potential indirect benefits such businesses may have received as a result of their association with Fidelity's mutual fund business (i.e., fall-out benefits) as well as cases where Fidelity's affiliates may benefit from the funds' business. The Board considered areas where potential indirect benefits to the Fidelity funds from their relationships with Fidelity may exist. The Board's consideration of these matters was informed by the findings of a joint ad hoc committee created by it and the boards of other Fidelity funds to evaluate potential fall-out benefits.
The Board considered the costs of the services provided by and the profits realized by Fidelity in connection with the operation of the fund and was satisfied that the profitability was not excessive.
Economies of Scale . The Board considered whether there have been economies of scale in respect of the management of the Fidelity funds, whether the Fidelity funds (including the fund) have appropriately benefited from any such economies of scale, and whether there is potential for realization of any further economies of scale. The Board considered the extent to which the fund will benefit from economies of scale as assets grow through increased services to the fund, through waivers or reimbursements, or through fee or expense ratio reductions. The Board also noted that a committee (the Economies of Scale Committee) created by it and the boards of other Fidelity funds periodically analyzes whether Fidelity attains economies of scale in respect of the management and servicing of the Fidelity funds, whether the Fidelity funds have appropriately benefited from such economies of scale, and whether there is potential for realization of any further economies of scale.
The Board recognized that the fund's management contract incorporates a "group fee" structure, which provides for lower group fee rates as total "group assets" increase, and for higher group fee rates as total "group assets" decrease ("group assets" as defined in the management contract). FMR calculates the group fee rates based on a tiered asset "breakpoint" schedule that varies based on asset class. The Board considered that the group fee is designed to deliver the benefits of economies of scale to fund shareholders when total Fidelity fund assets increase, even if assets of any particular fund are unchanged or have declined, because some portion of Fidelity's costs are attributable to services provided to all Fidelity funds, and all funds benefit if those costs can be allocated among more assets. The Board also considered that Fidelity agreed to impose a temporary fee waiver in the form of additional breakpoints to the current breakpoint schedule. The Board concluded that, given the group fee structure, fund shareholders will benefit from lower management fees as "group assets" increase at the fund complex level, regardless of whether Fidelity achieves any such economies of scale.
The Board concluded, taking into account the analysis of the Economies of Scale Committee, that economies of scale, if any, are being appropriately shared between fund shareholders and Fidelity.
Additional Information Requested by the Board . In order to develop fully the factual basis for consideration of the Fidelity funds' advisory contracts, the Board requested and received additional information on certain topics, including: (i) Fidelity's fund profitability methodology, profitability trends for certain funds, the allocation of various costs to different funds, and the impact of certain factors on fund profitability results; (ii) portfolio manager changes that have occurred during the past year and the amount of the investment that each portfolio manager has made in the Fidelity fund(s) that he or she manages; (iii) the extent to which current market conditions have affected retention and recruitment of personnel; (iv) the arrangements with and compensation paid to certain fund sub-advisers on behalf of the Fidelity funds and the treatment of such compensation within Fidelity's fund profitability methodology; (v) the terms of the funds' various management fee structures, including the basic group fee and the terms of Fidelity's voluntary expense limitation arrangements; (vi) Fidelity's transfer agent, pricing and bookkeeping fees, expense and service structures for different funds and classes relative to competitive trends; (vii) the impact on fund profitability of recent industry trends, such as the growth in passively managed funds and the changes in flows for different types of funds; (viii) the types of management fee and total expense comparisons provided, and the challenges and limitations associated with such information; and (ix) explanations regarding the relative total expense ratios and management fees of certain funds and classes, total expense and management fee competitive trends, and methodologies for total expense and management fee competitive comparisons. In addition, the Board considered its discussions with Fidelity regarding Fidelity's efforts to maintain the continuous investment and shareholder services necessary for the funds during the current pandemic and economic circumstances.
Based on its evaluation of all of the conclusions noted above, and after considering all factors it believed relevant, the Board concluded that the advisory fee arrangements are fair and reasonable and that the fund's Advisory Contracts should be renewed.
The Securities and Exchange Commission adopted Rule 22e-4 under the Investment Company Act of 1940 (the Liquidity Rule) to promote effective liquidity risk management throughout the open-end investment company industry, thereby reducing the risk that funds will be unable to meet their redemption obligations and mitigating dilution of the interests of fund shareholders.
The Fund has adopted and implemented a liquidity risk management program (the Program) reasonably designed to assess and manage the Fund's liquidity risk and to comply with the requirements of the Liquidity Rule. The Fund's Board of Trustees (the Board) has designated the Fund's investment adviser as administrator of the Program. The Fidelity advisers have established a Liquidity Risk Management Committee (the LRM Committee) to manage the Program for each of the Fidelity Funds. The LRM Committee monitors the adequacy and effectiveness of implementation of the Program and on a periodic basis assesses each Fund's liquidity risk based on a variety of factors including (1) the Fund's investment strategy, (2) portfolio liquidity and cash flow projections during normal and reasonably foreseeable stressed conditions, (3) shareholder redemptions, (4) borrowings and other funding sources and (5) certain factors specific to ETFs including the effect of the Fund's prices and spreads, market participants, and basket compositions on the overall liquidity of the Fund's portfolio, as applicable.
In accordance with the Program, each of the Fund's portfolio investments is classified into one of four defined liquidity categories based on a determination of a reasonable expectation for how long it would take to convert the investment to cash (or sell or dispose of the investment) without significantly changing its market value.
- Highly liquid investments - cash or convertible to cash within three business days or less
- Moderately liquid investments - convertible to cash in three to seven calendar days
- Less liquid investments - can be sold or disposed of, but not settled, within seven calendar days
- Illiquid investments - cannot be sold or disposed of within seven calendar days
Liquidity classification determinations take into account a variety of factors including various market, trading and investment-specific considerations, as well as market depth, and generally utilize analysis from a third-party liquidity metrics service.
The Liquidity Rule places a 15% limit on a fund's illiquid investments and requires funds that do not primarily hold assets that are highly liquid investments to determine and maintain a minimum percentage of the fund's net assets to be invested in highly liquid investments (highly liquid investment minimum or HLIM). The Program includes provisions reasonably designed to comply with the 15% limit on illiquid investments and for determining, periodically reviewing and complying with the HLIM requirement as applicable.
At a recent meeting of the Fund's Board of Trustees, the LRM Committee provided a written report to the Board pertaining to the operation, adequacy, and effectiveness of the Program for the period December 1, 2021 through November 30, 2022. The report concluded that the Program is operating effectively and is reasonably designed to assess and manage the Fund's liquidity risk.
1.9887620.104
STF-ANN-0423
Item 2.
Code of Ethics
As of the end of the period, January 31, 2023, Fidelity Salem Street Trust (the trust) has adopted a code of ethics, as defined in Item 2 of Form N-CSR, that applies to its President and Treasurer and its Chief Financial Officer. A copy of the code of ethics is filed as an exhibit to this Form N-CSR.
Item 3.
Audit Committee Financial Expert
The Board of Trustees of the trust has determined that Elizabeth S. Acton is an audit committee financial expert, as defined in Item 3 of Form N-CSR. Ms. Acton is independent for purposes of Item 3 of Form N-CSR.
Item 4.
Principal Accountant Fees and Services
Fees and Services
The following table presents fees billed by Deloitte & Touche LLP, the member firms of Deloitte Touche Tohmatsu, and their respective affiliates (collectively, “Deloitte Entities”) in each of the last two fiscal years for services rendered to Fidelity SAI Tax-Free Bond Fund, Fidelity Series Large Cap Value Index Fund, and Fidelity Tax-Free Bond Fund (the “Funds”):
Services Billed by Deloitte Entities
January 31, 2023 FeesA
| | | | |
| Audit Fees | Audit-Related Fees | Tax Fees | All Other Fees |
Fidelity SAI Tax-Free Bond Fund | $48,800 | $- | $9,600 | $1,100 |
Fidelity Series Large Cap Value Index Fund | $44,500 | $- | $9,700 | $1,100 |
Fidelity Tax-Free Bond Fund | $50,200 | $- | $9,200 | $1,100 |
| | | | |
| Audit Fees | Audit-Related Fees | Tax Fees | All Other Fees |
Fidelity SAI Tax-Free Bond Fund | $48,400 | $- | $7,500 | $1,100 |
Fidelity Series Large Cap Value Index Fund | $44,100 | $- | $9,300 | $1,000 |
Fidelity Tax-Free Bond Fund | $49,800 | $- | $7,200 | $1,100 |
|
|
|
|
|
A Amounts may reflect rounding.
The following table presents fees billed by PricewaterhouseCoopers LLP (“PwC”) in each of the last two fiscal years for services rendered to Fidelity SAI Sustainable Conservative Income Municipal Bond Fund, Fidelity SAI Sustainable Municipal Income Fund, and Fidelity Sustainable Intermediate Municipal Income Fund (the “Funds”):
Services Billed by PwC
January 31, 2023 FeesA,B
| | | | |
| Audit Fees | Audit-Related Fees | Tax Fees | All Other Fees |
Fidelity SAI Sustainable Conservative Income Municipal Bond Fund | $39,500 | $1,800 | $5,400 | $800 |
Fidelity SAI Sustainable Municipal Income Fund | $43,400 | $2,500 | $5,400 | $1,100 |
Fidelity Sustainable Intermediate Municipal Income Fund | $42,200 | $2,600 | $5,400 | $1,100 |
| | | | |
| Audit Fees | Audit-Related Fees | Tax Fees | All Other Fees |
Fidelity SAI Sustainable Conservative Income Municipal Bond Fund | $- | $- | $- | $- |
Fidelity SAI Sustainable Municipal Income Fund | $- | $- | $- | $- |
Fidelity Sustainable Intermediate Municipal Income Fund | $- | $- | $- | $- |
A Amounts may reflect rounding.
B Fidelity SAI Sustainable Municipal Income Fund, and Fidelity Sustainable Intermediate
Municipal Income Fund commenced operations on April 13, 2022. Fidelity SAI Sustainable Conservative Income Municipal Bond Fund commenced operations on June 16, 2022.
The following table(s) present(s) fees billed by Deloitte Entities and PwC that were required to be approved by the Audit Committee for services that relate directly to the operations and financial reporting of the Fund(s) and that are rendered on behalf of Fidelity Management & Research Company LLC ("FMR") and entities controlling, controlled by, or under common control with FMR (not including any sub-adviser whose role is primarily portfolio management and is subcontracted with or overseen by another investment adviser) that provide ongoing services to the Fund(s) (“Fund Service Providers”):
Services Billed by Deloitte Entities
| | |
| January 31, 2023A | January 31, 2022A |
Audit-Related Fees | $- | $- |
Tax Fees | $- | $- |
All Other Fees | $- | $- |
A Amounts may reflect rounding.
Services Billed by PwC
| | |
| January 31, 2023A,B | January 31, 2022A,B |
Audit-Related Fees | $7,914,600 | $8,239,800 |
Tax Fees | $1,000 | $354,200 |
All Other Fees | $- | $- |
A Amounts may reflect rounding.
B May include amounts billed prior to the Fidelity SAI Sustainable Conservative Income Municipal Bond Fund, Fidelity SAI Sustainable Municipal Income Fund, and Fidelity Sustainable Intermediate Municipal Income Fund’s commencement of operations.
“Audit-Related Fees” represent fees billed for assurance and related services that are reasonably related to the performance of the fund audit or the review of the fund's financial statements and that are not reported under Audit Fees.
“Tax Fees” represent fees billed for tax compliance, tax advice or tax planning that relate directly to the operations and financial reporting of the fund.
“All Other Fees” represent fees billed for services provided to the fund or Fund Service Provider, a significant portion of which are assurance related, that relate directly to the operations and financial reporting of the fund, excluding those services that are reported under Audit Fees, Audit-Related Fees or Tax Fees.
Assurance services must be performed by an independent public accountant.
* * *
The aggregate non-audit fees billed by Deloitte Entities and PwC for services rendered to the Fund(s), FMR (not including any sub-adviser whose role is primarily portfolio management and is subcontracted with or overseen by another investment adviser), and any Fund Service Provider for each of the last two fiscal years of the Fund(s) are as follows:
| | |
Billed By | January 31, 2023A,B | January 31, 2022A,B |
Deloitte Entities | $489,400 | $548,800 |
PwC | $12,909,100 | $13,836,700 |
A Amounts may reflect rounding.
B May include amounts billed prior to the Fidelity SAI Sustainable Conservative Income Municipal Bond Fund, Fidelity SAI Sustainable Intermediate Municipal Income Fund, and Fidelity Sustainable Intermediate Municipal Income Fund’s commencement of operations.
The trust's Audit Committee has considered non-audit services that were not pre-approved that were provided by Deloitte Entities and PwC to Fund Service Providers to be compatible with maintaining the independence of Deloitte Entities and PwC in its(their) audit of the Fund(s), taking into account representations from Deloitte Entities and PwC, in accordance with Public Company Accounting Oversight Board rules, regarding its independence from the Fund(s) and its(their) related entities and FMR’s review of the appropriateness and permissibility under applicable law of such non-audit services prior to their provision to the Fund(s) Service Providers.
Audit Committee Pre-Approval Policies and Procedures
The trust’s Audit Committee must pre-approve all audit and non-audit services provided by a fund’s independent registered public accounting firm relating to the operations or financial reporting of the fund. Prior to the commencement of any audit or non-audit services to a fund, the Audit Committee reviews the services to determine whether they are appropriate and permissible under applicable law.
The Audit Committee has adopted policies and procedures to, among other purposes, provide a framework for the Committee’s consideration of non-audit services by the audit firms that audit the Fidelity funds. The policies and procedures require that any non-audit service provided by a fund audit firm to a Fidelity fund and any non-audit service
provided by a fund auditor to a Fund Service Provider that relates directly to the operations and financial reporting of a Fidelity fund (“Covered Service”) are subject to approval by the Audit Committee before such service is provided.
All Covered Services must be approved in advance of provision of the service either: (i) by formal resolution of the Audit Committee, or (ii) by oral or written approval of the service by the Chair of the Audit Committee (or if the Chair is unavailable, such other member of the Audit Committee as may be designated by the Chair to act in the Chair’s absence). The approval contemplated by (ii) above is permitted where the Treasurer determines that action on such an engagement is necessary before the next meeting of the Audit Committee.
Non-audit services provided by a fund audit firm to a Fund Service Provider that do not relate directly to the operations and financial reporting of a Fidelity fund are reported to the Audit Committee periodically.
Non-Audit Services Approved Pursuant to Rule 2-01(c)(7)(i)(C) and (ii) of Regulation S-X (“De Minimis Exception”)
There were no non-audit services approved or required to be approved by the Audit Committee pursuant to the De Minimis Exception during the Fund’s(s’) last two fiscal years relating to services provided to (i) the Fund(s) or (ii) any Fund Service Provider that relate directly to the operations and financial reporting of the Fund(s).
Item 5.
Audit Committee of Listed Registrants
Not applicable.
Item 6.
Investments
(a)
Not applicable.
(b)
Not applicable.
Item 7.
Disclosure of Proxy Voting Policies and Procedures for Closed-End Management Investment Companies
Not applicable.
Item 8.
Portfolio Managers of Closed-End Management Investment Companies
Not applicable.
Item 9.
Purchase of Equity Securities by Closed-End Management Investment Company and Affiliated Purchasers
Not applicable.
Item 10.
Submission of Matters to a Vote of Security Holders
There were no material changes to the procedures by which shareholders may recommend nominees to the trust’s Board of Trustees.
Item 11.
Controls and Procedures
(a)(i) The President and Treasurer and the Chief Financial Officer have concluded that the trust’s disclosure controls and procedures (as defined in Rule 30a-3(c) under the Investment Company Act) provide reasonable assurances that material information relating to the trust is made known to them by the appropriate persons, based on their evaluation of these controls and procedures as of a date within 90 days of the filing date of this report.
(a)(ii) There was no change in the trust’s internal control over financial reporting (as defined in Rule 30a-3(d) under the Investment Company Act) that occurred during the period covered by this report that has materially affected, or is reasonably likely to materially affect, the trust’s internal control over financial reporting.
Item 12.
Disclosure of Securities Lending Activities for Closed-End Management
Investment Companies
Not applicable.
Item 13.
Exhibits
SIGNATURES
Pursuant to the requirements of the Securities Exchange Act of 1934 and the Investment Company Act of 1940, the registrant has duly caused this report to be signed on its behalf by the undersigned, thereunto duly authorized.
Fidelity Salem Street Trust
| |
By: | /s/Laura M. Del Prato |
| Laura M. Del Prato |
| President and Treasurer |
|
|
Date: | March 23, 2023 |
Pursuant to the requirements of the Securities Exchange Act of 1934 and the Investment Company Act of 1940, this report has been signed below by the following persons on behalf of the registrant and in the capacities and on the dates indicated.
| |
By: | /s/Laura M. Del Prato |
| Laura M. Del Prato |
| President and Treasurer |
|
|
Date: | March 23, 2023 |
| |
By: | /s/John J. Burke III |
| John J. Burke III |
| Chief Financial Officer |
|
|
Date: | March 23, 2023 |