UNITED STATES
SECURITIES AND EXCHANGE COMMISSION
Washington, D.C. 20549
FORM N-CSR
CERTIFIED SHAREHOLDER REPORT OF REGISTERED
MANAGEMENT INVESTMENT COMPANIES
Investment Company Act file number 811-02105
Fidelity Salem Street Trust
(Exact name of registrant as specified in charter)
245 Summer St., Boston, Massachusetts 02210
(Address of principal executive offices) (Zip code)
Margaret Carey, Secretary
245 Summer St.
Boston, Massachusetts 02210
(Name and address of agent for service)
Registrant's telephone number, including area code:
617-563-7000
Date of fiscal year end: | June 30 |
Date of reporting period: | June 30, 2023 |
Item 1.
Reports to Stockholders


Contents
| Average Annual Total Returns | |||
Periods ended June 30, 2023 | Past 1 year | Past 5 years | Past 10 years |
| Class A (incl.2.75% sales charge) | -1.98% | 1.00% | 2.10% |
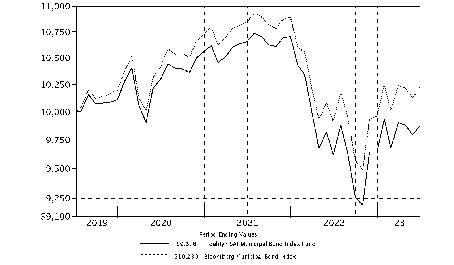
| Fidelity® Municipal Income 2023 Fund | 1.05% | 1.82% | 2.64% |
| Class I | 1.05% | 1.82% | 2.64% |
| $10,000 Over 10 Years |
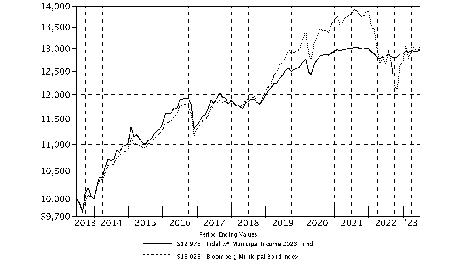
Let's say hypothetically that $10,000 was invested in Fidelity® Municipal Income 2023 Fund, a class of the fund, on June 30, 2013. The chart shows how the value of your investment would have changed, and also shows how the Bloomberg Municipal Bond Index performed over the same period. |
 |
| Average Annual Total Returns | |||
Periods ended June 30, 2023 | Past 1 year | Past 5 years | Life of Fund A |
| Class A (incl.2.75% sales charge) | -2.35% | 1.04% | 0.74% |
| Fidelity® Municipal Income 2025 Fund | 0.66% | 1.86% | 1.45% |
| Class I | 0.66% | 1.86% | 1.45% |
| $10,000 Over Life of Fund |
Let's say hypothetically that $10,000 was invested in Fidelity® Municipal Income 2025 Fund, a class of the fund, on May 25, 2017, when the fund started. The chart shows how the value of your investment would have changed, and also shows how the Bloomberg Municipal Bond Index performed over the same period. |
 |
| Top Five States (% of Fund's net assets) | |
| Arizona | 9.7 |
| New Jersey | 6.4 |
| Florida | 6.3 |
| Massachusetts | 4.6 |
| California | 4.2 |
| Revenue Sources (% of Fund's net assets) | ||
| Health Care | 16.4 | |
| General Obligations | 14.7 | |
| Transportation | 12.8 | |
| Special Tax | 5.8 | |
| Others* | 50.3 | |
| 100.0 | ||
| *Includes net other assets | ||
Quality Diversification (% of Fund's net assets) |
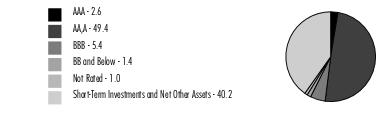 |
| We have used ratings from Moody's Investors Service, Inc. Where Moody's® ratings are not available, we have used S&P® ratings. All ratings are as of the date indicated and do not reflect subsequent changes. |
| Municipal Bonds - 59.8% | |||
Principal Amount (a) | Value ($) | ||
| Alabama - 1.2% | |||
| Birmingham Arpt. Auth. Series 2020, 5% 7/1/23 (Build America Mutual Assurance Insured) | 325,000 | 325,000 | |
| Arizona - 9.7% | |||
| Bullhead City Excise Taxes Series 2021 2, 0.4% 7/1/23 | 250,000 | 250,000 | |
| Glendale Trans. Excise Tax Rev. Series 2015, 5% 7/1/23 (Assured Guaranty Muni. Corp. Insured) | 300,000 | 300,000 | |
| Phoenix Civic Impt. Board Arpt. Rev.: | |||
| Series 2013, 5% 7/1/23 (Escrowed to Maturity) (b) | 380,000 | 380,000 | |
| Series 2017 A, 5% 7/1/23 (b) | 1,000,000 | 1,000,000 | |
| Pima County Swr. Sys. Rev. Series 2020 A, 5% 7/1/23 | 100,000 | 100,000 | |
| Tucson Ctfs. of Prtn.: | |||
| Series 2012, 5% 7/1/23 (Assured Guaranty Muni. Corp. Insured) | 450,000 | 450,000 | |
| Series 2015, 5% 7/1/23 (Assured Guaranty Muni. Corp. Insured) | 250,000 | 250,000 | |
TOTAL ARIZONA | 2,730,000 | ||
| California - 4.2% | |||
| Los Angeles Unified School District: | |||
| Series 2020 C, 5% 7/1/23 | 300,000 | 300,000 | |
| Series A, 5% 7/1/23 | 670,000 | 670,000 | |
| Washington Township Health Care District Rev. Series 2017 B, 5% 7/1/23 | 200,000 | 200,000 | |
TOTAL CALIFORNIA | 1,170,000 | ||
| Connecticut - 2.4% | |||
| Connecticut Health & Edl. Facilities Auth. Rev.: | |||
| Series 2022 L, 5% 7/1/23 | 175,000 | 175,000 | |
| Series K1, 5% 7/1/23 | 500,000 | 500,000 | |
TOTAL CONNECTICUT | 675,000 | ||
| Florida - 6.3% | |||
| Broward County School Board Ctfs. of Prtn.: | |||
| Series 2015 A, 5% 7/1/23 | 250,000 | 250,000 | |
| Series 2015 B, 5% 7/1/23 | 45,000 | 45,000 | |
| Duval County School Board Ctfs. of Prtn. Series 2015 B, 5% 7/1/23 | 500,000 | 500,000 | |
| Florida Board of Ed. Lottery Rev. Series 2016 A, 5% 7/1/23 | 530,000 | 530,000 | |
| Miami-Dade County Expressway Auth.: | |||
| Series 2014 A, 4% 7/1/23 | 200,000 | 200,000 | |
| Series 2014 B, 5% 7/1/23 | 90,000 | 90,000 | |
| Seminole County School Board Ctfs. of Prtn. Series 2012 A, 5% 7/1/23 | 145,000 | 145,000 | |
TOTAL FLORIDA | 1,760,000 | ||
| Illinois - 1.8% | |||
| Illinois Gen. Oblig. Series 2013, 5% 7/1/23 | 295,000 | 295,000 | |
| Illinois Reg'l. Trans. Auth. Series 2003 A, 5.5% 7/1/23 (Nat'l. Pub. Fin. Guarantee Corp. Insured) | 205,000 | 205,000 | |
TOTAL ILLINOIS | 500,000 | ||
| Indiana - 2.1% | |||
| Indiana Hsg. & Cmnty. Dev. Auth. Series A, 5% 7/1/23 | 580,000 | 580,000 | |
| Kentucky - 1.0% | |||
| Kentucky Tpk. Auth. Econ. Dev. Road Rev. (Revitalization Projs.) Series B, 4% 7/1/23 | 275,000 | 275,000 | |
| Maine - 0.7% | |||
| Maine Health & Higher Edl. Facilities Auth. Rev. Series 2013, 3% 7/1/23 (Escrowed to Maturity) | 200,000 | 200,000 | |
| Maryland - 1.8% | |||
| Maryland Trans. Auth. Trans. Facility Projs. Rev. Series 2021 A, 5% 7/1/23 | 500,000 | 500,000 | |
| Massachusetts - 4.6% | |||
| Massachusetts Bay Trans. Auth. Sales Tax Rev.: | |||
| Series 2003 C, 5.25% 7/1/23 | 125,000 | 125,000 | |
| Series 2005 B, 5.5% 7/1/23 | 50,000 | 50,000 | |
| Massachusetts Dev. Fin. Agcy. Rev.: | |||
| Series 2016, 5% 7/1/23 | 230,000 | 230,000 | |
| Series 2019 A, 5% 7/1/23 | 200,000 | 200,000 | |
| Massachusetts Edl. Fing. Auth. Rev. Series 2018 B, 5% 7/1/23 (b) | 135,000 | 135,000 | |
| Massachusetts Port Auth. Rev. Series 2017 A, 5% 7/1/23 (b) | 545,000 | 545,000 | |
TOTAL MASSACHUSETTS | 1,285,000 | ||
| Michigan - 2.6% | |||
| Detroit Swr. Disp. Rev. Series 2004 A, 5.25% 7/1/23 (Assured Guaranty Muni. Corp. Insured) | 50,000 | 50,000 | |
| Flint Hosp. Bldg. Auth. Rev. Series 2020, 5% 7/1/23 | 195,000 | 195,000 | |
| Grand Traverse County Hosp. Fin. Auth. Series 2014 C, 5% 7/1/23 | 390,000 | 390,000 | |
| Saginaw Hosp. Fin. Auth. Hosp. Rev. Series 2020 J, 5% 7/1/23 | 100,000 | 100,000 | |
TOTAL MICHIGAN | 735,000 | ||
| New Jersey - 6.4% | |||
| New Jersey Edl. Facilities Auth. Rev. Series 2013 A, 5% 7/1/23 (Escrowed to Maturity) | 100,000 | 100,000 | |
| New Jersey Health Care Facilities Fing. Auth. Rev.: | |||
| Series 2013 A, 5% 7/1/23 | 200,000 | 200,000 | |
| Series 2013, 5% 7/1/23 | 200,000 | 200,000 | |
| Series 2016 A: | |||
5% 7/1/23 | 250,000 | 250,000 | |
5% 7/1/23 (Escrowed to Maturity) | 90,000 | 90,000 | |
| Series 2016, 5% 7/1/23 | 950,000 | 950,000 | |
TOTAL NEW JERSEY | 1,790,000 | ||
| New Mexico - 0.6% | |||
| New Mexico Severance Tax Rev. Series 2015 A, 5% 7/1/23 | 175,000 | 175,000 | |
| New York - 3.7% | |||
| Monroe County Indl. Dev. Corp. Univ. of Rochester, Proj.) Series 2017 A, 5% 7/1/23 | 100,000 | 100,000 | |
| Nassau County Local Econ. Assistance Corp.: | |||
| (Catholic Health Svcs. of Long Island Obligated Group Proj.) Series 2014, 5% 7/1/23 | 350,000 | 350,000 | |
| Series 2014 B, 5% 7/1/23 | 285,000 | 285,000 | |
| Saratoga County Cap. Resources Rev. Series A, 5% 7/1/23 | 300,000 | 300,000 | |
TOTAL NEW YORK | 1,035,000 | ||
| Oregon - 0.9% | |||
| Port of Portland Arpt. Rev. Series 22, 5% 7/1/23 (b) | 250,000 | 250,000 | |
| Pennsylvania - 2.4% | |||
| Lehigh County Gen. Purp. Hosp. Rev. Series 2019 A, 5% 7/1/23 | 100,000 | 100,000 | |
| Pennsylvania Ctfs. Prtn. Series 2018 A, 5% 7/1/23 | 385,000 | 385,000 | |
| Philadelphia Arpt. Rev. Series 2017 B, 5% 7/1/23 | 100,000 | 100,000 | |
| Philadelphia Wtr. & Wastewtr. Rev. Series 2014 A, 5% 7/1/23 | 100,000 | 100,000 | |
TOTAL PENNSYLVANIA | 685,000 | ||
| Puerto Rico - 0.7% | |||
| Puerto Rico Commonwealth Pub. Impt. Gen. Oblig. Series 2021 A1, 5.25% 7/1/23 | 200,000 | 200,000 | |
| South Carolina - 0.4% | |||
| South Carolina Ports Auth. Ports Rev. Series 2019 B, 5% 7/1/23 (b) | 100,000 | 100,000 | |
| South Dakota - 0.5% | |||
| South Dakota Health & Edl. Facilities Auth. Rev. (Avera Health Proj.) Series 2017, 5% 7/1/23 | 150,000 | 150,000 | |
| Tennessee - 0.7% | |||
| Memphis-Shelby County Arpt. Auth. Arpt. Rev. Series 2020 B, 5% 7/1/23 (b) | 200,000 | 200,000 | |
| Washington - 3.3% | |||
| Port of Seattle Rev. Series 2013, 5% 7/1/23 (b) | 250,000 | 250,000 | |
| Washington Ctfs. of Prtn. Series 2013 B, 4% 7/1/23 | 300,000 | 300,000 | |
| Washington Health Care Facilities Auth. Rev. (Overlake Hosp. Med. Ctr., WA. Proj.) Series 2017 B, 5% 7/1/23 | 380,000 | 380,000 | |
TOTAL WASHINGTON | 930,000 | ||
| Wisconsin - 1.8% | |||
| Wisconsin Health & Edl. Facilities (Agnesian Healthcare Proj.) Series 2017, 5% 7/1/23 | 500,000 | 500,000 | |
| TOTAL MUNICIPAL BONDS (Cost $16,750,000) | 16,750,000 | ||
| Money Market Funds - 38.2% | |||
| Shares | Value ($) | ||
Fidelity Municipal Cash Central Fund 4.23% (c)(d) (Cost $10,695,000) | 10,692,861 | 10,695,000 | |
| TOTAL INVESTMENT IN SECURITIES - 98.0% (Cost $27,445,000) | 27,445,000 |
NET OTHER ASSETS (LIABILITIES) - 2.0% | 550,604 |
| NET ASSETS - 100.0% | 27,995,604 |
| (a) | Amount is stated in United States dollars unless otherwise noted. |
| (b) | Private activity obligations whose interest is subject to the federal alternative minimum tax for individuals. |
| (c) | Information in this report regarding holdings by state and security types does not reflect the holdings of the Fidelity Municipal Cash Central Fund. |
| (d) | Affiliated fund that is generally available only to investment companies and other accounts managed by Fidelity Investments. The rate quoted is the annualized seven-day yield of the fund at period end. A complete unaudited listing of the fund's holdings as of its most recent quarter end is available upon request. In addition, each Fidelity Central Fund's financial statements, which are not covered by the Fund's Report of Independent Registered Public Accounting Firm, are available on the SEC's website or upon request. |
| Affiliate | Value, beginning of period ($) | Purchases ($) | Sales Proceeds ($) | Dividend Income ($) | Realized Gain (loss) ($) | Change in Unrealized appreciation (depreciation) ($) | Value, end of period ($) | % ownership, end of period |
| Fidelity Municipal Cash Central Fund 4.23% | 3,553,999 | 30,539,997 | 23,399,000 | 38,708 | - | 4 | 10,695,000 | 0.4% |
| Total | 3,553,999 | 30,539,997 | 23,399,000 | 38,708 | - | 4 | 10,695,000 | |
| Valuation Inputs at Reporting Date: | ||||
| Description | Total ($) | Level 1 ($) | Level 2 ($) | Level 3 ($) |
Investments in Securities: | ||||
| Municipal Securities | 16,750,000 | - | 16,750,000 | - |
| Money Market Funds | 10,695,000 | 10,695,000 | - | - |
| Total Investments in Securities: | 27,445,000 | 10,695,000 | 16,750,000 | - |
| Statement of Assets and Liabilities | ||||
| June 30, 2023 | ||||
| Assets | ||||
| Investment in securities, at value - See accompanying schedule: | ||||
Unaffiliated issuers (cost $16,750,000) | $ | 16,750,000 | ||
Fidelity Central Funds (cost $10,695,000) | 10,695,000 | |||
| Total Investment in Securities (cost $27,445,000) | $ | 27,445,000 | ||
| Receivable for investments sold | 1,010,344 | |||
| Receivable for fund shares sold | 5 | |||
| Interest receivable | 409,332 | |||
| Distributions receivable from Fidelity Central Funds | 5,697 | |||
| Other receivables | 120 | |||
Total assets | 28,870,498 | |||
| Liabilities | ||||
| Payable to custodian bank | $ | 801,976 | ||
| Payable for fund shares redeemed | 40,633 | |||
| Distributions payable | 22,298 | |||
| Accrued management fee | 7,152 | |||
| Distribution and service plan fees payable | 450 | |||
| Other affiliated payables | 2,385 | |||
| Total Liabilities | 874,894 | |||
| Net Assets | $ | 27,995,604 | ||
| Net Assets consist of: | ||||
| Paid in capital | $ | 28,348,664 | ||
| Total accumulated earnings (loss) | (353,060) | |||
| Net Assets | $ | 27,995,604 | ||
| Net Asset Value and Maximum Offering Price | ||||
| Class A : | ||||
Net Asset Value and redemption price per share ($1,989,294 ÷ 197,095 shares) (a) | $ | 10.09 | ||
| Maximum offering price per share (100/97.25 of $10.09) | $ | 10.38 | ||
| Municipal Income 2023 : | ||||
Net Asset Value , offering price and redemption price per share ($20,318,531 ÷ 2,013,231 shares) | $ | 10.09 | ||
| Class I : | ||||
Net Asset Value , offering price and redemption price per share ($5,687,779 ÷ 563,531 shares) | $ | 10.09 | ||
(a)Redemption price per share is equal to net asset value less any applicable contingent deferred sales charge. | ||||
| Statement of Operations | ||||
Year ended June 30, 2023 | ||||
| Investment Income | ||||
| Interest | $ | 846,729 | ||
| Income from Fidelity Central Funds | 38,696 | |||
| Total Income | 885,425 | |||
| Expenses | ||||
| Management fee | $ | 127,869 | ||
| Transfer agent fees | 42,622 | |||
| Distribution and service plan fees | 5,806 | |||
| Independent trustees' fees and expenses | 162 | |||
| Total expenses before reductions | 176,459 | |||
| Expense reductions | (202) | |||
| Total expenses after reductions | 176,257 | |||
| Net Investment income (loss) | 709,168 | |||
| Realized and Unrealized Gain (Loss) | ||||
| Net realized gain (loss) on: | ||||
| Investment Securities: | ||||
| Unaffiliated issuers | (347,707) | |||
| Capital gain distributions from Fidelity Central Funds | 12 | |||
| Total net realized gain (loss) | (347,695) | |||
| Change in net unrealized appreciation (depreciation) on: | ||||
| Investment Securities: | ||||
| Unaffiliated issuers | 54,547 | |||
| Fidelity Central Funds | 4 | |||
| Total change in net unrealized appreciation (depreciation) | 54,551 | |||
| Net gain (loss) | (293,144) | |||
| Net increase (decrease) in net assets resulting from operations | $ | 416,024 | ||
| Statement of Changes in Net Assets | ||||
Year ended June 30, 2023 | Year ended June 30, 2022 | |||
| Increase (Decrease) in Net Assets | ||||
| Operations | ||||
| Net investment income (loss) | $ | 709,168 | $ | 671,199 |
| Net realized gain (loss) | (347,695) | 28,989 | ||
| Change in net unrealized appreciation (depreciation) | 54,551 | (1,246,658) | ||
| Net increase (decrease) in net assets resulting from operations | 416,024 | (546,470) | ||
| Distributions to shareholders | (701,675) | (670,143) | ||
| Share transactions - net increase (decrease) | (30,426,903) | 14,530,478 | ||
| Total increase (decrease) in net assets | (30,712,554) | 13,313,865 | ||
| Net Assets | ||||
| Beginning of period | 58,708,158 | 45,394,293 | ||
| End of period | $ | 27,995,604 | $ | 58,708,158 |
| Fidelity Advisor® Municipal Income 2023 Fund Class A |
| Years ended June 30, | 2023 | 2022 | 2021 | 2020 | 2019 | |||||
Selected Per-Share Data | ||||||||||
| Net asset value, beginning of period | $ | 10.16 | $ | 10.44 | $ | 10.40 | $ | 10.34 | $ | 10.08 |
| Income from Investment Operations | ||||||||||
Net investment income (loss) A,B | .144 | .121 | .146 | .183 | .189 | |||||
| Net realized and unrealized gain (loss) | (.064) | (.280) | .041 | .060 | .259 | |||||
| Total from investment operations | .080 | (.159) | .187 | .243 | .448 | |||||
| Distributions from net investment income | (.150) | (.121) | (.147) | (.183) | (.188) | |||||
| Total distributions | (.150) | (.121) | (.147) | (.183) | (.188) | |||||
| Net asset value, end of period | $ | 10.09 | $ | 10.16 | $ | 10.44 | $ | 10.40 | $ | 10.34 |
Total Return C,D | .80% | (1.53)% | 1.81% | 2.37% | 4.50% | |||||
Ratios to Average Net Assets B,E,F | ||||||||||
| Expenses before reductions | .65% | .65% | .65% | .65% | .65% | |||||
| Expenses net of fee waivers, if any | .65% | .65% | .65% | .65% | .65% | |||||
| Expenses net of all reductions | .65% | .65% | .65% | .65% | .65% | |||||
| Net investment income (loss) | 1.42% | 1.17% | 1.39% | 1.77% | 1.86% | |||||
| Supplemental Data | ||||||||||
| Net assets, end of period (000 omitted) | $ | 1,989 | $ | 2,684 | $ | 3,126 | $ | 2,675 | $ | 2,487 |
Portfolio turnover rate G | -% | 9% | 9% | 10% | 18% |
| Fidelity® Municipal Income 2023 Fund |
| Years ended June 30, | 2023 | 2022 | 2021 | 2020 | 2019 | |||||
Selected Per-Share Data | ||||||||||
| Net asset value, beginning of period | $ | 10.16 | $ | 10.44 | $ | 10.40 | $ | 10.34 | $ | 10.08 |
| Income from Investment Operations | ||||||||||
Net investment income (loss) A,B | .169 | .146 | .171 | .209 | .214 | |||||
| Net realized and unrealized gain (loss) | (.064) | (.279) | .042 | .060 | .260 | |||||
| Total from investment operations | .105 | (.133) | .213 | .269 | .474 | |||||
| Distributions from net investment income | (.175) | (.147) | (.173) | (.209) | (.214) | |||||
| Total distributions | (.175) | (.147) | (.173) | (.209) | (.214) | |||||
| Net asset value, end of period | $ | 10.09 | $ | 10.16 | $ | 10.44 | $ | 10.40 | $ | 10.34 |
Total Return C | 1.05% | (1.29)% | 2.06% | 2.63% | 4.76% | |||||
Ratios to Average Net Assets B,D,E | ||||||||||
| Expenses before reductions | .40% | .40% | .40% | .40% | .40% | |||||
| Expenses net of fee waivers, if any | .40% | .40% | .40% | .40% | .40% | |||||
| Expenses net of all reductions | .40% | .40% | .40% | .40% | .40% | |||||
| Net investment income (loss) | 1.67% | 1.42% | 1.64% | 2.02% | 2.11% | |||||
| Supplemental Data | ||||||||||
| Net assets, end of period (000 omitted) | $ | 20,319 | $ | 31,541 | $ | 32,627 | $ | 25,058 | $ | 23,223 |
Portfolio turnover rate F | -% | 9% | 9% | 10% | 18% |
| Fidelity Advisor® Municipal Income 2023 Fund Class I |
| Years ended June 30, | 2023 | 2022 | 2021 | 2020 | 2019 | |||||
Selected Per-Share Data | ||||||||||
| Net asset value, beginning of period | $ | 10.16 | $ | 10.44 | $ | 10.40 | $ | 10.34 | $ | 10.08 |
| Income from Investment Operations | ||||||||||
Net investment income (loss) A,B | .171 | .145 | .172 | .209 | .213 | |||||
| Net realized and unrealized gain (loss) | (.065) | (.278) | .041 | .060 | .261 | |||||
| Total from investment operations | .106 | (.133) | .213 | .269 | .474 | |||||
| Distributions from net investment income | (.176) | (.147) | (.173) | (.209) | (.214) | |||||
| Total distributions | (.176) | (.147) | (.173) | (.209) | (.214) | |||||
| Net asset value, end of period | $ | 10.09 | $ | 10.16 | $ | 10.44 | $ | 10.40 | $ | 10.34 |
Total Return C | 1.05% | (1.29)% | 2.06% | 2.63% | 4.76% | |||||
Ratios to Average Net Assets B,D,E | ||||||||||
| Expenses before reductions | .40% | .40% | .40% | .40% | .40% | |||||
| Expenses net of fee waivers, if any | .40% | .40% | .40% | .40% | .40% | |||||
| Expenses net of all reductions | .40% | .40% | .40% | .40% | .40% | |||||
| Net investment income (loss) | 1.67% | 1.42% | 1.64% | 2.02% | 2.11% | |||||
| Supplemental Data | ||||||||||
| Net assets, end of period (000 omitted) | $ | 5,688 | $ | 24,482 | $ | 9,641 | $ | 9,716 | $ | 9,384 |
Portfolio turnover rate F | -% | 9% | 9% | 10% | 18% |
| Top Five States (% of Fund's net assets) | |
| Connecticut | 11.2 |
| Pennsylvania | 9.9 |
| Illinois | 8.4 |
| Florida | 6.7 |
| Massachusetts | 5.5 |
| Revenue Sources (% of Fund's net assets) | ||
| Health Care | 25.8 | |
| Education | 20.1 | |
| Transportation | 19.5 | |
| General Obligations | 15.1 | |
| Housing | 5.1 | |
| Others* (Individually Less Than 5%) | 14.4 | |
| 100.0 | ||
| *Includes net other assets | ||
Quality Diversification (% of Fund's net assets) |
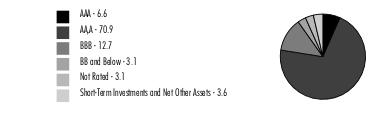 |
| We have used ratings from Moody's Investors Service, Inc. Where Moody's® ratings are not available, we have used S&P® ratings. All ratings are as of the date indicated and do not reflect subsequent changes. |
| Municipal Bonds - 96.4% | |||
Principal Amount (a) | Value ($) | ||
| Alabama - 2.4% | |||
| Black Belt Energy Gas District Series 2022 C1, 5.25% 6/1/25 | 500,000 | 511,279 | |
| Montgomery Med. Clinic Facilities Series 2015, 5% 3/1/25 | 100,000 | 99,676 | |
TOTAL ALABAMA | 610,955 | ||
| Arizona - 2.4% | |||
| Glendale Trans. Excise Tax Rev. Series 2015, 5% 7/1/25 (Assured Guaranty Muni. Corp. Insured) | 75,000 | 77,771 | |
| Phoenix Civic Impt. Board Arpt. Rev.: | |||
| Series 2017 A, 5% 7/1/25 (b) | 250,000 | 257,139 | |
| Series 2017 B, 5% 7/1/25 | 250,000 | 259,382 | |
TOTAL ARIZONA | 594,292 | ||
| California - 3.6% | |||
| Golden State Tobacco Securitization Corp. Tobacco Settlement Rev. Series 2015 A, 5% 6/1/40 (Pre-Refunded to 6/1/25 @ 100) | 365,000 | 379,608 | |
| Poway Unified School District Series 2009, 0% 8/1/25 | 90,000 | 84,185 | |
| San Diego County Reg'l. Arpt. Auth. Arpt. Rev. (Sub Lien Proj.) Series 2017 B, 5% 7/1/25 (b) | 150,000 | 153,471 | |
| Washington Township Health Care District Rev. Series 2017 B, 5% 7/1/25 | 270,000 | 274,487 | |
TOTAL CALIFORNIA | 891,751 | ||
| Colorado - 0.7% | |||
| E-470 Pub. Hwy. Auth. Rev. Series 1997 B, 0% 9/1/25 (Nat'l. Pub. Fin. Guarantee Corp. Insured) | 200,000 | 185,715 | |
| Connecticut - 11.2% | |||
| Connecticut Gen. Oblig.: | |||
| Series 2015 B, 5% 6/15/25 | 175,000 | 181,648 | |
| Series 2016 D, 5% 8/15/25 | 330,000 | 342,888 | |
| Connecticut Health & Edl. Facilities Auth. Rev.: | |||
| (Quinnipiac Univ., Ct. Proj.) Series M, 5% 7/1/25 | 40,000 | 41,150 | |
| (Sacred Heart Univ., CT. Proj.) Series 2017 I-1, 5% 7/1/25 | 400,000 | 412,432 | |
| Series 2022 M, 5% 7/1/25 | 175,000 | 178,679 | |
| Series K1, 5% 7/1/25 | 280,000 | 280,150 | |
| Series K3, 5% 7/1/25 | 200,000 | 200,107 | |
| Series N, 5% 7/1/25 | 50,000 | 50,065 | |
| Connecticut Hsg. Fin. Auth. Series C, 5% 5/15/25 (b) | 935,000 | 956,131 | |
| Hartford Gen. Oblig. Series 2015 C, 5% 7/15/25 (Assured Guaranty Muni. Corp. Insured) | 150,000 | 155,692 | |
TOTAL CONNECTICUT | 2,798,942 | ||
| District Of Columbia - 1.3% | |||
| District of Columbia Rev. Series 2018, 5% 10/1/25 | 75,000 | 77,193 | |
| Washington D.C. Metropolitan Transit Auth. Rev. Series 2017 B, 5% 7/1/25 | 250,000 | 259,284 | |
TOTAL DISTRICT OF COLUMBIA | 336,477 | ||
| Florida - 6.7% | |||
| Broward County Arpt. Sys. Rev. Series 2017, 5% 10/1/25 (b) | 500,000 | 513,426 | |
| Greater Orlando Aviation Auth. Arpt. Facilities Rev. Series 2017 A: | |||
| 5% 10/1/25 (b) | 95,000 | 97,243 | |
| 5% 10/1/25 (Escrowed to Maturity) (b) | 205,000 | 211,038 | |
| Lakeland Hosp. Sys. Rev. Series 2016, 5% 11/15/25 | 430,000 | 442,818 | |
| Palm Beach County School Board Ctfs. of Prtn. Series 2018 A, 5% 8/1/25 | 50,000 | 51,841 | |
| Seminole County School Board Ctfs. of Prtn. Series 2016 C, 5% 7/1/25 | 40,000 | 41,478 | |
| South Miami Health Facilities Auth. Hosp. Rev. (Baptist Med. Ctr., FL. Proj.) Series 2017, 5% 8/15/25 | 200,000 | 206,155 | |
| Tampa Hosp. Rev. (H. Lee Moffitt Cancer Ctr. Proj.) Series 2016 B, 5% 7/1/25 | 100,000 | 102,720 | |
TOTAL FLORIDA | 1,666,719 | ||
| Georgia - 0.2% | |||
| Atlanta Arpt. Rev. Series 2019 B, 5% 7/1/25 (b) | 50,000 | 51,205 | |
| Hawaii - 4.1% | |||
| Hawaii Gen. Oblig. Series 2017 FK, 5% 5/1/25 | 1,000,000 | 1,035,314 | |
| Illinois - 8.4% | |||
| Chicago O'Hare Int'l. Arpt. Rev. Series 2017 D, 5% 1/1/25 (b) | 100,000 | 101,760 | |
| Chicago Transit Auth. Cap. Grant Receipts Rev. Series 2017, 5% 6/1/25 | 250,000 | 256,306 | |
| Illinois Fin. Auth. Rev.: | |||
| (Edward-Elmhurst Healthcare) Series 2017 A, 5% 1/1/25 (Escrowed to Maturity) | 145,000 | 148,802 | |
| (Northwestern Memorial Hosp.,IL. Proj.) Series 2017 A, 5% 7/15/25 | 200,000 | 206,752 | |
| Series 2016, 5% 5/15/25 | 250,000 | 256,421 | |
| Series 2019, 5% 9/1/25 | 200,000 | 199,020 | |
| Illinois Gen. Oblig.: | |||
| Series 2013, 5.5% 7/1/25 | 200,000 | 200,059 | |
| Series 2023 D, 5% 7/1/25 | 200,000 | 205,410 | |
| Illinois Sales Tax Rev. Series 2016 D, 5% 6/15/25 | 100,000 | 102,787 | |
| Kendall, Kane & Will Counties Cmnty. Unit School District #308 Series 2008, 0% 2/1/25 (Assured Guaranty Muni. Corp. Insured) | 185,000 | 174,726 | |
| Metropolitan Pier & Exposition Series 1994 A, 0% 6/15/25 | 270,000 | 250,304 | |
TOTAL ILLINOIS | 2,102,347 | ||
| Indiana - 1.6% | |||
| Indiana Fin. Auth. Health Sys. Rev. Bonds Series 2019 B, 2.25%, tender 7/1/25 (c) | 55,000 | 53,432 | |
| Indiana Fin. Auth. Rev. (Cmnty. Foundation of Northwest Indiana Obligated Group) Series 2016, 5% 9/1/25 | 25,000 | 25,914 | |
| Indiana Hsg. & Cmnty. Dev. Auth. Series A, 5% 7/1/25 | 300,000 | 310,788 | |
TOTAL INDIANA | 390,134 | ||
| Kentucky - 1.7% | |||
| Kentucky State Property & Buildings Commission Rev.: | |||
| (Kentucky St) Series 2016, 5% 10/1/25 | 100,000 | 103,797 | |
| (Proj. No. 118) Series 2018, 5% 4/1/25 | 300,000 | 309,373 | |
TOTAL KENTUCKY | 413,170 | ||
| Louisiana - 0.4% | |||
| New Orleans Aviation Board Rev. (North Term. Proj.) Series 2017 B, 5% 1/1/25 (b) | 100,000 | 101,528 | |
| Maine - 2.3% | |||
| Maine Health & Higher Edl. Facilities Auth. Rev.: | |||
| Series 2017 A, 4% 7/1/25 | 465,000 | 469,687 | |
| Series 2017 B, 4% 7/1/25 | 100,000 | 101,008 | |
TOTAL MAINE | 570,695 | ||
| Maryland - 0.6% | |||
| Maryland Health & Higher Edl. Facilities Auth. Rev. (Lifebridge Health Proj.) Series 2017, 5% 7/1/25 | 150,000 | 154,341 | |
| Massachusetts - 5.5% | |||
| Massachusetts Dev. Fin. Agcy. Rev.: | |||
| (Fisher College) Series 2017, 5% 4/1/25 | 250,000 | 252,689 | |
| Bonds Series 2017 A2, 5%, tender 1/30/25 (c) | 10,000 | 10,244 | |
| Caregroup, Inc. Series 2015 H-1, 5% 7/1/25 | 150,000 | 154,400 | |
| Series 2016 I, 5% 7/1/25 | 50,000 | 50,946 | |
| Series 2019 K, 5% 7/1/25 | 50,000 | 51,467 | |
| Series 2019, 5% 7/1/25 | 170,000 | 172,825 | |
| Series 2022, 5% 7/1/25 | 125,000 | 126,648 | |
| Massachusetts Edl. Fing. Auth. Rev. Series 2017 A, 5% 7/1/25 (b) | 250,000 | 255,256 | |
| Massachusetts Port Auth. Rev. Series 2019 C, 5% 7/1/25 (b) | 300,000 | 307,405 | |
TOTAL MASSACHUSETTS | 1,381,880 | ||
| Michigan - 3.2% | |||
| Flint Hosp. Bldg. Auth. Rev. Series 2020, 5% 7/1/25 | 300,000 | 301,739 | |
| Grand Traverse County Hosp. Fin. Auth. Series 2019 A, 5% 7/1/25 | 150,000 | 154,984 | |
| Saginaw Hosp. Fin. Auth. Hosp. Rev. Series 2020 J, 5% 7/1/25 | 100,000 | 102,199 | |
| Warren Consolidated School District Series 2017, 4% 5/1/25 (Assured Guaranty Muni. Corp. Insured) | 250,000 | 252,921 | |
TOTAL MICHIGAN | 811,843 | ||
| Missouri - 3.7% | |||
| Saint Louis Arpt. Rev.: | |||
| Series 2017 A, 5% 7/1/25 (Assured Guaranty Muni. Corp. Insured) | 370,000 | 382,510 | |
| Series 2017 B, 5% 7/1/25 (Assured Guaranty Muni. Corp. Insured) (b) | 250,000 | 255,785 | |
| Series 2019 C, 5% 7/1/25 | 290,000 | 299,296 | |
TOTAL MISSOURI | 937,591 | ||
| Nebraska - 0.5% | |||
| Central Plains Energy Proj. Gas Supply Bonds Series 2019, 4%, tender 8/1/25 (c) | 125,000 | 125,030 | |
| Nevada - 0.3% | |||
| Clark County School District Series 2017 A, 5% 6/15/25 | 60,000 | 62,026 | |
| New Hampshire - 1.3% | |||
| New Hampshire Health & Ed. Facilities Auth.: | |||
| (Dartmouth-Hitchcock Oblgtd Grp Proj.) Series 2018 A, 5% 8/1/25 | 50,000 | 51,285 | |
| (Partners Healthcare Sys., Inc. Proj.) Series 2017, 5% 7/1/25 | 200,000 | 207,114 | |
| New Hampshire Health & Ed. Facilities Auth. Rev. Series 2016, 5% 10/1/25 | 70,000 | 72,184 | |
TOTAL NEW HAMPSHIRE | 330,583 | ||
| New Jersey - 3.8% | |||
| New Jersey Econ. Dev. Auth. Lease Rev. (Libersty State Park Proj.) Series 2015 A, 5% 6/15/25 | 200,000 | 205,878 | |
| New Jersey Edl. Facility: | |||
| (Stevens Institute of Techonolgy Proj.) Series 2017 A, 5% 7/1/25 | 105,000 | 107,046 | |
| (Stockton Univ. Proj.) Series A, 5% 7/1/25 | 15,000 | 15,408 | |
| Series 2016 E, 5% 7/1/25 | 50,000 | 51,428 | |
| New Jersey Health Care Facilities Fing. Auth. Rev. (St Joseph Hosp. & Med. Ctr., Proj.) Series 2016, 5% 7/1/25 | 400,000 | 405,502 | |
| New Jersey Trans. Trust Fund Auth.: | |||
| Series 2006 C, 0% 12/15/25 | 140,000 | 128,162 | |
| Series 2016 A, 5% 6/15/25 | 40,000 | 41,138 | |
TOTAL NEW JERSEY | 954,562 | ||
| New York - 2.5% | |||
| Dutchess County Local Dev. Corp. Rev. (Health Quest Systems, Inc. Proj.) Series 2016 A, 5% 7/1/25 | 30,000 | 30,282 | |
| New York City Muni. Wtr. Fin. Auth. Wtr. & Swr. Sys. Rev. Series 2015, 5% 6/15/27 (Pre-Refunded to 6/15/25 @ 100) | 200,000 | 207,626 | |
| Niagara Frontier Trans. Auth. Arpt. Rev. Series 2019 A, 5% 4/1/25 (b) | 255,000 | 259,283 | |
| Onondaga Civic Dev. Corp. (Le Moyne College Proj.): | |||
| Series 2015, 5% 7/1/25 | 100,000 | 102,122 | |
| Series 2018, 5% 1/1/25 | 15,000 | 15,166 | |
TOTAL NEW YORK | 614,479 | ||
| Ohio - 4.0% | |||
| Akron Bath Copley Hosp. District Rev. (Summa Health Sys.) Series 2016, 5% 11/15/25 | 150,000 | 153,346 | |
| Hamilton County Hosp. Facilities Rev. (Trihealth, Inc. Obligated Group Proj.) Series 2017 A, 5% 8/15/25 | 140,000 | 144,887 | |
| Lancaster Port Auth. Gas Rev. Series 2019, 5% 2/1/25 | 200,000 | 203,234 | |
| Ohio Higher Edl. Facility Commission Rev.: | |||
| (Kenyon College, Oh. Proj.) Series 2017 5% 7/1/25 | 200,000 | 205,440 | |
| (Xavier Univ. 2015 Proj.) Series 2015 C, 5% 5/1/25 | 190,000 | 194,771 | |
| (Xavier Univ. 2016 Proj.) Series 2016, 5% 5/1/25 | 100,000 | 102,511 | |
TOTAL OHIO | 1,004,189 | ||
| Oregon - 2.5% | |||
| Clackamas County Hosp. Facility Auth. (Williamette View, Inc.) Series 2017 A, 4% 5/15/25 | 200,000 | 197,489 | |
| Port of Portland Arpt. Rev. Series 24B, 5% 7/1/25 (b) | 420,000 | 428,588 | |
TOTAL OREGON | 626,077 | ||
| Pennsylvania - 9.9% | |||
| Allegheny County Hosp. Dev. Auth. Rev. Series 2019 A, 5% 7/15/25 | 600,000 | 618,232 | |
| Butler County Hosp. Auth. Hosp. Rev. Series 2015 A, 5% 7/1/25 | 30,000 | 29,813 | |
| Centre County Pennsylvania Hosp. Auth. Rev. (Mount Nittany Med. Ctr. Proj.) Series 2018 A, 5% 11/15/25 | 100,000 | 103,785 | |
| Delaware County Auth. Rev. Series 2017, 5% 7/1/25 | 125,000 | 125,348 | |
| Doylestown Hosp. Auth. Hosp. Rev. Series 2016 A, 5% 7/1/25 | 125,000 | 122,361 | |
| Dubois Hosp. Auth. Hosp. Rev. (Penn Highlands Healthcare Proj.) Series 2018, 5% 7/15/25 | 110,000 | 112,454 | |
| Monroe County Hosp. Auth. Rev. Series 2016, 5% 7/1/25 | 50,000 | 51,360 | |
| Pennsylvania Higher Edl. Facilities Auth. Rev.: | |||
| (Drexel Univ.) Series 2016, 5% 5/1/25 | 445,000 | 456,412 | |
| Series 2015 AQ, 5% 6/15/25 | 200,000 | 206,449 | |
| Philadelphia Arpt. Rev.: | |||
| Series 2017 A, 5% 7/1/25 | 50,000 | 51,603 | |
| Series 2017 B, 5% 7/1/25 (b) | 210,000 | 214,698 | |
| Philadelphia School District: | |||
| Series 2015 A, 5% 9/1/25 | 20,000 | 20,647 | |
| Series 2018 A, 5% 9/1/25 | 50,000 | 51,618 | |
| Southcentral Pennsylvania Gen. Auth. Rev. Series 2019 A, 5% 6/1/25 | 300,000 | 309,580 | |
TOTAL PENNSYLVANIA | 2,474,360 | ||
| Puerto Rico - 0.4% | |||
| Puerto Rico Commonwealth Pub. Impt. Gen. Oblig. Series 2022 A1, 5.375% 7/1/25 | 100,000 | 102,469 | |
| Tennessee - 2.2% | |||
| Chattanooga Health Ed. & Hsg. Facility Board Rev. Series 2019 A1, 5% 8/1/25 | 250,000 | 255,670 | |
| Knox County Health Edl. & Hsg. Facilities Board Rev.: | |||
| Series 2016, 5% 9/1/25 | 15,000 | 15,325 | |
| Series 2017, 5% 4/1/25 | 265,000 | 269,406 | |
TOTAL TENNESSEE | 540,401 | ||
| Texas - 0.8% | |||
| Houston Arpt. Sys. Rev. Series 2018 C, 5% 7/1/25 (b) | 200,000 | 204,628 | |
| Utah - 0.1% | |||
| Salt Lake City Arpt. Rev. Series 2017 A, 5% 7/1/25 (b) | 30,000 | 30,729 | |
| Vermont - 2.7% | |||
| Vermont Student Assistant Corp. Ed. Ln. Rev.: | |||
| Series 2015 A, 5% 6/15/25 (b) | 300,000 | 303,458 | |
| Series 2019 A, 5% 6/15/25 (b) | 105,000 | 107,192 | |
| Series 2020 A, 5% 6/15/25 (b) | 250,000 | 255,220 | |
TOTAL VERMONT | 665,870 | ||
| Virginia - 0.5% | |||
| Salem Econ. Dev. Auth. Series 2020, 5% 4/1/25 | 125,000 | 126,826 | |
| Washington - 2.5% | |||
| Port of Seattle Rev. Series 2017 C, 5% 5/1/25 (b) | 465,000 | 475,932 | |
| Washington Convention Ctr. Pub. Facilities Series 2018, 5% 7/1/25 | 155,000 | 156,985 | |
TOTAL WASHINGTON | 632,917 | ||
| Wisconsin - 2.4% | |||
| Pub. Fin. Auth. Hosp. Rev. Series 2016, 5% 6/1/25 | 180,000 | 184,007 | |
| Wisconsin Health & Edl. Facilities: | |||
| Bonds Series 2018 B, 5%, tender 1/29/25 (c) | 40,000 | 40,901 | |
| Series 2014, 5% 5/1/25 | 100,000 | 100,972 | |
| Series 2016, 5% 2/15/27 (Pre-Refunded to 8/15/25 @ 100) | 10,000 | 10,367 | |
| Series 2017 A: | |||
5% 4/1/25 | 155,000 | 159,180 | |
5% 9/1/25 (Escrowed to Maturity) | 100,000 | 103,658 | |
TOTAL WISCONSIN | 599,085 | ||
| TOTAL MUNICIPAL BONDS (Cost $24,789,168) | 24,129,130 | ||
| Money Market Funds - 2.0% | |||
| Shares | Value ($) | ||
Fidelity Municipal Cash Central Fund 4.23% (d)(e) (Cost $504,000) | 503,899 | 504,000 | |
| TOTAL INVESTMENT IN SECURITIES - 98.4% (Cost $25,293,168) | 24,633,130 |
NET OTHER ASSETS (LIABILITIES) - 1.6% | 392,064 |
| NET ASSETS - 100.0% | 25,025,194 |
| (a) | Amount is stated in United States dollars unless otherwise noted. |
| (b) | Private activity obligations whose interest is subject to the federal alternative minimum tax for individuals. |
| (c) | Coupon rates for floating and adjustable rate securities reflect the rates in effect at period end. |
| (d) | Information in this report regarding holdings by state and security types does not reflect the holdings of the Fidelity Municipal Cash Central Fund. |
| (e) | Affiliated fund that is generally available only to investment companies and other accounts managed by Fidelity Investments. The rate quoted is the annualized seven-day yield of the fund at period end. A complete unaudited listing of the fund's holdings as of its most recent quarter end is available upon request. In addition, each Fidelity Central Fund's financial statements, which are not covered by the Fund's Report of Independent Registered Public Accounting Firm, are available on the SEC's website or upon request. |
| Affiliate | Value, beginning of period ($) | Purchases ($) | Sales Proceeds ($) | Dividend Income ($) | Realized Gain (loss) ($) | Change in Unrealized appreciation (depreciation) ($) | Value, end of period ($) | % ownership, end of period |
| Fidelity Municipal Cash Central Fund 4.23% | 578,000 | 4,259,000 | 4,333,000 | 11,957 | - | - | 504,000 | 0.0% |
| Total | 578,000 | 4,259,000 | 4,333,000 | 11,957 | - | - | 504,000 | |
| Valuation Inputs at Reporting Date: | ||||
| Description | Total ($) | Level 1 ($) | Level 2 ($) | Level 3 ($) |
Investments in Securities: | ||||
| Municipal Securities | 24,129,130 | - | 24,129,130 | - |
| Money Market Funds | 504,000 | 504,000 | - | - |
| Total Investments in Securities: | 24,633,130 | 504,000 | 24,129,130 | - |
| Statement of Assets and Liabilities | ||||
| June 30, 2023 | ||||
| Assets | ||||
| Investment in securities, at value - See accompanying schedule: | ||||
Unaffiliated issuers (cost $24,789,168) | $ | 24,129,130 | ||
Fidelity Central Funds (cost $504,000) | 504,000 | |||
| Total Investment in Securities (cost $25,293,168) | $ | 24,633,130 | ||
| Cash | 41,348 | |||
| Receivable for fund shares sold | 2,774 | |||
| Interest receivable | 365,935 | |||
| Distributions receivable from Fidelity Central Funds | 1,202 | |||
| Other receivables | 4 | |||
Total assets | 25,044,393 | |||
| Liabilities | ||||
| Payable for fund shares redeemed | $ | 1,252 | ||
| Distributions payable | 8,879 | |||
| Accrued management fee | 6,275 | |||
| Transfer agent fee payable | 2,093 | |||
| Distribution and service plan fees payable | 700 | |||
| Total Liabilities | 19,199 | |||
| Net Assets | $ | 25,025,194 | ||
| Net Assets consist of: | ||||
| Paid in capital | $ | 25,841,886 | ||
| Total accumulated earnings (loss) | (816,692) | |||
| Net Assets | $ | 25,025,194 | ||
| Net Asset Value and Maximum Offering Price | ||||
| Class A : | ||||
Net Asset Value and redemption price per share ($3,367,138 ÷ 343,635 shares) (a) | $ | 9.80 | ||
| Maximum offering price per share (100/97.25 of $9.80) | $ | 10.08 | ||
| Municipal Income 2025 : | ||||
Net Asset Value , offering price and redemption price per share ($16,925,132 ÷ 1,727,253 shares) | $ | 9.80 | ||
| Class I : | ||||
Net Asset Value , offering price and redemption price per share ($4,732,924 ÷ 482,956 shares) | $ | 9.80 | ||
(a)Redemption price per share is equal to net asset value less any applicable contingent deferred sales charge. | ||||
| Statement of Operations | ||||
Year ended June 30, 2023 | ||||
| Investment Income | ||||
| Interest | $ | 544,699 | ||
| Income from Fidelity Central Funds | 11,949 | |||
| Total Income | 556,648 | |||
| Expenses | ||||
| Management fee | $ | 76,836 | ||
| Transfer agent fees | 25,612 | |||
| Distribution and service plan fees | 8,338 | |||
| Independent trustees' fees and expenses | 88 | |||
| Total expenses before reductions | 110,874 | |||
| Expense reductions | (42) | |||
| Total expenses after reductions | 110,832 | |||
| Net Investment income (loss) | 445,816 | |||
| Realized and Unrealized Gain (Loss) | ||||
| Net realized gain (loss) on: | ||||
| Investment Securities: | ||||
| Unaffiliated issuers | (84,715) | |||
| Capital gain distributions from Fidelity Central Funds | 8 | |||
| Total net realized gain (loss) | (84,707) | |||
| Change in net unrealized appreciation (depreciation) on investment securities | (204,924) | |||
| Net gain (loss) | (289,631) | |||
| Net increase (decrease) in net assets resulting from operations | $ | 156,185 | ||
| Statement of Changes in Net Assets | ||||
Year ended June 30, 2023 | Year ended June 30, 2022 | |||
| Increase (Decrease) in Net Assets | ||||
| Operations | ||||
| Net investment income (loss) | $ | 445,816 | $ | 396,741 |
| Net realized gain (loss) | (84,707) | 2,057 | ||
| Change in net unrealized appreciation (depreciation) | (204,924) | (1,724,403) | ||
| Net increase (decrease) in net assets resulting from operations | 156,185 | (1,325,605) | ||
| Distributions to shareholders | (445,770) | (396,732) | ||
| Share transactions - net increase (decrease) | 902,522 | (377,895) | ||
| Total increase (decrease) in net assets | 612,937 | (2,100,232) | ||
| Net Assets | ||||
| Beginning of period | 24,412,257 | 26,512,489 | ||
| End of period | $ | 25,025,194 | $ | 24,412,257 |
| Fidelity Advisor® Municipal Income 2025 Fund Class A |
| Years ended June 30, | 2023 | 2022 | 2021 | 2020 | 2019 | |||||
Selected Per-Share Data | ||||||||||
| Net asset value, beginning of period | $ | 9.91 | $ | 10.59 | $ | 10.35 | $ | 10.29 | $ | 9.77 |
| Income from Investment Operations | ||||||||||
Net investment income (loss) A,B | .150 | .135 | .146 | .166 | .180 | |||||
| Net realized and unrealized gain (loss) | (.110) | (.680) | .241 | .060 | .521 | |||||
| Total from investment operations | .040 | (.545) | .387 | .226 | .701 | |||||
| Distributions from net investment income | (.150) | (.135) | (.147) | (.166) | (.181) | |||||
| Total distributions | (.150) | (.135) | (.147) | (.166) | (.181) | |||||
| Net asset value, end of period | $ | 9.80 | $ | 9.91 | $ | 10.59 | $ | 10.35 | $ | 10.29 |
Total Return C,D | .41% | (5.18)% | 3.75% | 2.21% | 7.25% | |||||
Ratios to Average Net Assets B,E,F | ||||||||||
| Expenses before reductions | .65% | .65% | .65% | .65% | .65% | |||||
| Expenses net of fee waivers, if any | .65% | .65% | .65% | .65% | .65% | |||||
| Expenses net of all reductions | .65% | .65% | .65% | .65% | .65% | |||||
| Net investment income (loss) | 1.52% | 1.31% | 1.39% | 1.61% | 1.81% | |||||
| Supplemental Data | ||||||||||
| Net assets, end of period (000 omitted) | $ | 3,367 | $ | 3,309 | $ | 3,550 | $ | 3,510 | $ | 3,329 |
Portfolio turnover rate G | 6% | 7% | 6% | 23% | 17% |
| Fidelity® Municipal Income 2025 Fund |
| Years ended June 30, | 2023 | 2022 | 2021 | 2020 | 2019 | |||||
Selected Per-Share Data | ||||||||||
| Net asset value, beginning of period | $ | 9.91 | $ | 10.59 | $ | 10.35 | $ | 10.29 | $ | 9.77 |
| Income from Investment Operations | ||||||||||
Net investment income (loss) A,B | .174 | .161 | .173 | .193 | .205 | |||||
| Net realized and unrealized gain (loss) | (.110) | (.680) | .240 | .059 | .521 | |||||
| Total from investment operations | .064 | (.519) | .413 | .252 | .726 | |||||
| Distributions from net investment income | (.174) | (.161) | (.173) | (.192) | (.206) | |||||
| Total distributions | (.174) | (.161) | (.173) | (.192) | (.206) | |||||
| Net asset value, end of period | $ | 9.80 | $ | 9.91 | $ | 10.59 | $ | 10.35 | $ | 10.29 |
Total Return C | .66% | (4.95)% | 4.01% | 2.47% | 7.52% | |||||
Ratios to Average Net Assets B,D,E | ||||||||||
| Expenses before reductions | .40% | .40% | .40% | .40% | .40% | |||||
| Expenses net of fee waivers, if any | .40% | .40% | .40% | .40% | .40% | |||||
| Expenses net of all reductions | .40% | .40% | .40% | .40% | .40% | |||||
| Net investment income (loss) | 1.77% | 1.56% | 1.64% | 1.86% | 2.06% | |||||
| Supplemental Data | ||||||||||
| Net assets, end of period (000 omitted) | $ | 16,925 | $ | 15,820 | $ | 17,136 | $ | 14,596 | $ | 15,780 |
Portfolio turnover rate F | 6% | 7% | 6% | 23% | 17% |
| Fidelity Advisor® Municipal Income 2025 Fund Class I |
| Years ended June 30, | 2023 | 2022 | 2021 | 2020 | 2019 | |||||
Selected Per-Share Data | ||||||||||
| Net asset value, beginning of period | $ | 9.91 | $ | 10.59 | $ | 10.36 | $ | 10.29 | $ | 9.77 |
| Income from Investment Operations | ||||||||||
Net investment income (loss) A,B | .175 | .161 | .173 | .192 | .205 | |||||
| Net realized and unrealized gain (loss) | (.111) | (.680) | .230 | .070 | .521 | |||||
| Total from investment operations | .064 | (.519) | .403 | .262 | .726 | |||||
| Distributions from net investment income | (.174) | (.161) | (.173) | (.192) | (.206) | |||||
| Total distributions | (.174) | (.161) | (.173) | (.192) | (.206) | |||||
| Net asset value, end of period | $ | 9.80 | $ | 9.91 | $ | 10.59 | $ | 10.36 | $ | 10.29 |
Total Return C | .66% | (4.95)% | 3.91% | 2.57% | 7.52% | |||||
Ratios to Average Net Assets B,D,E | ||||||||||
| Expenses before reductions | .40% | .40% | .40% | .40% | .40% | |||||
| Expenses net of fee waivers, if any | .40% | .40% | .40% | .40% | .40% | |||||
| Expenses net of all reductions | .40% | .40% | .40% | .40% | .40% | |||||
| Net investment income (loss) | 1.77% | 1.56% | 1.64% | 1.86% | 2.06% | |||||
| Supplemental Data | ||||||||||
| Net assets, end of period (000 omitted) | $ | 4,733 | $ | 5,284 | $ | 5,827 | $ | 5,512 | $ | 4,727 |
Portfolio turnover rate F | 6% | 7% | 6% | 23% | 17% |
| Fidelity Central Fund | Investment Manager | Investment Objective | Investment Practices | Expense Ratio A |
| Fidelity Money Market Central Funds | Fidelity Management & Research Company LLC (FMR) | Each fund seeks to obtain a high level of current income consistent with the preservation of capital and liquidity. | Short-term Investments | Less than .005% |
| Tax cost | Gross unrealized appreciation | Gross unrealized depreciation | Net unrealized appreciation (depreciation) | |
| Fidelity Municipal Income 2023 Fund | $27,445,000 | $- | $- | $- |
| Fidelity Municipal Income 2025 Fund | 25,293,168 | 2,690 | (662,728) | (660,038) |
| Undistributed tax-exempt income | Undistributed ordinary income | Undistributed long-term capital gain | Capital loss carryforward | Net unrealized appreciation (depreciation) on securities and other investments | |
| Fidelity Municipal Income 2023 Fund | $- | $7,639 | $ - | $(354,599) | $- |
| Fidelity Municipal Income 2025 Fund | 50 | - | - | (156,705) | (660,038) |
| Short-term | Long-term | Total capital loss carryforward | |
| Fidelity Municipal Income 2023 Fund | $ (54,926) | $ (299,673) | $ (354,599) |
| Fidelity Municipal Income 2025 Fund | (71,998) | (84,707) | (156,705) |
| June 30, 2023 | ||
| Tax-Exempt Income | ||
| Fidelity Municipal Income 2023 Fund | $701,675 | |
| Fidelity Municipal Income 2025 Fund | 445,770 | |
| June 30, 2022 | ||
| Tax-Exempt Income | ||
| Fidelity Municipal Income 2023 Fund | $670,143 | |
| Fidelity Municipal Income 2025 Fund | 396,732 | |
| Purchases ($) | Sales ($) | |
| Fidelity Municipal Income 2023 Fund | - | 35,577,809 |
| Fidelity Municipal Income 2025 Fund | 3,096,511 | 1,604,784 |
| Service Fee | Total Fees | Retained by FDC | |
| Fidelity Municipal Income 2023 Fund | |||
Class A | .25% | $5,806 | $15 |
| Fidelity Municipal Income 2025 Fund | |||
Class A | .25% | $8,338 | $6,689 |
| Amount | |
| Fidelity Municipal Income 2023 Fund | |
Class A | $2,322 |
Municipal Income 2023 | 25,019 |
Class I | 15,281 |
| $42,622 | |
| Fidelity Municipal Income 2025 Fund | |
Class A | $3,335 |
Municipal Income 2025 | 17,285 |
Class I | 4,992 |
| $25,612 |
| Purchases ($) | Sales ($) | Realized Gain (Loss) ($) | |
| Fidelity Municipal Income 2023 Fund | 500,000 | 200,000 | - |
| Fidelity Municipal Income 2025 Fund | - | - | - |
| Custodian credits | Transfer Agent credits | |
Fidelity Municipal Income 2023 Fund . | $188 | |
| Class I | $14 | |
Fidelity Municipal Income 2025 Fund . | 30 | |
| Class I | 12 |
Year ended June 30, 2023 | Year ended June 30, 2022 | |
| Fidelity Municipal Income 2023 Fund | ||
| Distributions to shareholders | ||
| Class A | $34,044 | $32,039 |
| Municipal Income 2023 | 423,562 | 451,351 |
| Class I | 244,069 | 186,753 |
Total | $701,675 | $670,143 |
| Fidelity Municipal Income 2025 Fund | ||
| Distributions to shareholders | ||
| Class A | $50,842 | $45,144 |
| Municipal Income 2025 | 306,564 | 264,122 |
| Class I | 88,364 | 87,466 |
Total | $445,770 | $396,732 |
| Shares | Shares | Dollars | Dollars | |
Year ended June 30, 2023 | Year ended June 30, 2022 | Year ended June 30, 2023 | Year ended June 30, 2022 | |
| Fidelity Municipal Income 2023 Fund | ||||
| Class A | ||||
| Shares sold | - | 22,605 | $ - | $229,750 |
| Reinvestment of distributions | 3,016 | 2,832 | 30,506 | 29,184 |
| Shares redeemed | (70,126) | (60,697) | (710,325) | (629,335) |
| Net increase (decrease) | (67,110) | (35,260) | $(679,819) | $(370,401) |
| Municipal Income 2023 | ||||
| Shares sold | - | 680,872 | $- | $6,989,240 |
| Reinvestment of distributions | 25,393 | 29,357 | 256,838 | 302,416 |
| Shares redeemed | (1,116,683) | (731,067) | (11,290,334) | (7,525,006) |
| Net increase (decrease) | (1,091,290) | (20,838) | $(11,033,496) | $(233,350) |
| Class I | ||||
| Shares sold | 3 | 1,729,592 | $27 | $17,640,853 |
| Reinvestment of distributions | 23,439 | 17,265 | 237,157 | 177,025 |
| Shares redeemed | (1,869,536) | (260,718) | (18,950,772) | (2,683,649) |
| Net increase (decrease) | (1,846,094) | 1,486,139 | $(18,713,588) | $15,134,229 |
| Fidelity Municipal Income 2025 Fund | ||||
| Class A | ||||
| Shares sold | 15,519 | 2,990 | $153,021 | $30,464 |
| Reinvestment of distributions | 5,176 | 4,385 | 50,815 | 45,104 |
| Shares redeemed | (11,080) | (8,522) | (108,045) | (88,903) |
| Net increase (decrease) | 9,615 | (1,147) | $95,791 | $(13,335) |
| Municipal Income 2025 | ||||
| Shares sold | 607,812 | 266,749 | $5,979,425 | $2,736,157 |
| Reinvestment of distributions | 21,478 | 20,432 | 210,879 | 210,378 |
| Shares redeemed | (498,993) | (308,148) | (4,892,485) | (3,140,427) |
| Net increase (decrease) | 130,297 | (20,967) | $1,297,819 | $(193,892) |
| Class I | ||||
| Shares sold | 63,655 | 17,070 | $631,309 | $174,223 |
| Reinvestment of distributions | 8,582 | 7,993 | 84,261 | 82,223 |
| Shares redeemed | (122,582) | (41,851) | (1,206,658) | (427,114) |
| Net increase (decrease) | (50,345) | (16,788) | $(491,088) | $(170,668) |
| Fund | Affiliated % |
| Fidelity Municipal Income 2025 Fund. | 43% |
| The Example is based on an investment of $1,000 invested at the beginning of the period and held for the entire period (January 1, 2023 to June 30, 2023). |
Annualized Expense Ratio- A | Beginning Account Value January 1, 2023 | Ending Account Value June 30, 2023 | Expenses Paid During Period- C January 1, 2023 to June 30, 2023 | |||||||
| Fidelity® Municipal Income 2023 Fund | ||||||||||
| Class A | .65% | |||||||||
| Actual | $ 1,000 | $ 1,005.70 | $ 3.23 | |||||||
Hypothetical- B | $ 1,000 | $ 1,021.57 | $ 3.26 | |||||||
| Fidelity® Municipal Income 2023 Fund | .40% | |||||||||
| Actual | $ 1,000 | $ 1,006.90 | $ 1.99 | |||||||
Hypothetical- B | $ 1,000 | $ 1,022.81 | $ 2.01 | |||||||
| Class I | .40% | |||||||||
| Actual | $ 1,000 | $ 1,006.90 | $ 1.99 | |||||||
Hypothetical- B | $ 1,000 | $ 1,022.81 | $ 2.01 | |||||||
| Fidelity® Municipal Income 2025 Fund | ||||||||||
| Class A | .66% | |||||||||
| Actual | $ 1,000 | $ 1,005.90 | $ 3.28 | |||||||
Hypothetical- B | $ 1,000 | $ 1,021.52 | $ 3.31 | |||||||
| Fidelity® Municipal Income 2025 Fund | .40% | |||||||||
| Actual | $ 1,000 | $ 1,007.20 | $ 1.99 | |||||||
Hypothetical- B | $ 1,000 | $ 1,022.81 | $ 2.01 | |||||||
| Class I | .40% | |||||||||
| Actual | $ 1,000 | $ 1,007.20 | $ 1.99 | |||||||
Hypothetical- B | $ 1,000 | $ 1,022.81 | $ 2.01 | |||||||
- Highly liquid investments - cash or convertible to cash within three business days or less
- Moderately liquid investments - convertible to cash in three to seven calendar days
- Less liquid investments - can be sold or disposed of, but not settled, within seven calendar days
- Illiquid investments - cannot be sold or disposed of within seven calendar days
 |


Contents
| Average Annual Total Returns | |||
Periods ended June 30, 2023 | Past 1 year | Life of Fund A |
| Fidelity® SAI Municipal Bond Index Fund | 2.68% | -0.31% |
| $10,000 Over Life of Fund |
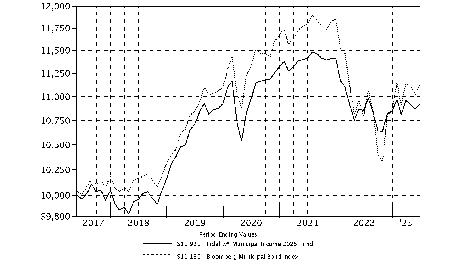
Let's say hypothetically that $10,000 was invested in Fidelity® SAI Municipal Bond Index Fund, on July 11, 2019, when the fund started. The chart shows how the value of your investment would have changed, and also shows how the Bloomberg Municipal Bond Index performed over the same period. |
 |
| Top Five States (% of Fund's net assets) | |
| California | 18.7 |
| New York | 13.7 |
| Texas | 8.6 |
| Illinois | 5.2 |
| Washington | 3.9 |
| Revenue Sources (% of Fund's net assets) | ||
| General Obligations | 33.7 | |
| Transportation | 16.5 | |
| Special Tax | 10.3 | |
| Water & Sewer | 10.3 | |
| Health Care | 8.5 | |
| Electric Utilities | 5.7 | |
| Others* (Individually Less Than 5%) | 15.0 | |
| 100.0 | ||
| *Includes net other assets | ||
Quality Diversification (% of Fund's net assets) |
 |
| We have used ratings from Moody's Investors Service, Inc. Where Moody's® ratings are not available, we have used S&P® ratings. All ratings are as of the date indicated and do not reflect subsequent changes. |
| Municipal Bonds - 98.6% | |||
Principal Amount (a) | Value ($) | ||
| Alabama - 0.7% | |||
| Alabama Fed. Aid Hwy. Fin. Auth.: | |||
| Series 2015, 3.1% 9/1/29 (Pre-Refunded to 9/1/24 @ 100) | 70,000 | 69,814 | |
| Series 2017 A, 4% 6/1/37 (Pre-Refunded to 9/1/27 @ 100) | 25,000 | 26,250 | |
| Birmingham Wtrwks. Board Series 2016, 3% 1/1/43 (Pre-Refunded to 1/1/27 @ 100) | 30,000 | 30,172 | |
| Black Belt Energy Gas District Series 2019 A, 4% 6/1/25 | 180,000 | 180,072 | |
| Decatur Wtr. & Swr. Rev. Series 2021 A, 2.125% 2/15/51 | 90,000 | 52,643 | |
| Infirmary Health Systems Spl. Care Facilities Fing. Auth. Rev. Series 2016 A, 3% 2/1/30 | 60,000 | 57,022 | |
| Tuscaloosa County Board of Ed. Series 2017, 5% 2/1/43 (Pre-Refunded to 2/1/27 @ 100) | 25,000 | 26,869 | |
| UAB Medicine Fin. Auth. Rev.: | |||
| Series 2016 B, 5% 9/1/34 | 50,000 | 52,289 | |
| Series 2017 B1, 3.25% 9/1/31 | 45,000 | 44,163 | |
| Univ. of Alabama Gen. Rev.: | |||
| Series 2012 A, 5% 7/1/24 | 20,000 | 20,025 | |
| Series 2017 B, 3% 7/1/35 | 30,000 | 27,810 | |
TOTAL ALABAMA | 587,129 | ||
| Arizona - 2.0% | |||
| Arizona Health Facilities Auth. Rev. (Scottsdale Lincoln Hospitals Proj.) Series 2014 A, 5% 12/1/26 | 15,000 | 15,310 | |
| Arizona State Univ. Revs. Series 2019 B, 4% 7/1/49 | 70,000 | 67,913 | |
| Bullhead City Excise Taxes Series 2021, 2.7% 7/1/51 | 90,000 | 63,048 | |
| City of Lake Havasu Wastewtr. Sys. Rev. Series 2015 B, 4% 7/1/45 (Assured Guaranty Muni. Corp. Insured) | 60,000 | 57,350 | |
| Glendale Wtr. & Swr. Rev. Series 2015, 5% 7/1/26 | 325,000 | 336,942 | |
| Maricopa County Rev. Series 2016 A, 5% 1/1/38 | 40,000 | 41,520 | |
| McAllister Academic Village LLC Rev. Series 2016, 5% 7/1/39 | 175,000 | 181,199 | |
| Mesa Util. Sys. Rev. Series 2016, 3% 7/1/38 | 125,000 | 111,812 | |
| Phoenix Civic Impt. Board Arpt. Rev.: | |||
| Series 2015 A, 5% 7/1/45 | 95,000 | 96,704 | |
| Series 2017 D, 5% 7/1/25 | 20,000 | 20,723 | |
| Series 2019 B, 5% 7/1/44 (b) | 40,000 | 41,664 | |
| Phoenix Civic Impt. Corp. District Rev. Series 2005 B: | |||
| 5.5% 7/1/36 (Nat'l. Pub. Fin. Guarantee Corp. Insured) | 25,000 | 30,691 | |
| 5.5% 7/1/41 (Nat'l. Pub. Fin. Guarantee Corp. Insured) | 80,000 | 97,675 | |
| Phoenix Civic Impt. Corp. Excise Tax Rev. Series 2015 A, 5% 7/1/31 | 25,000 | 25,924 | |
| Salt River Proj. Agricultural Impt. & Pwr. District Elec. Sys. Rev.: | |||
| (Arizona Salt River Proj.) Series A, 5% 1/1/38 | 145,000 | 152,248 | |
| Series 2015 A, 5% 12/1/32 | 25,000 | 25,836 | |
| Series 2017 A, 5% 1/1/28 | 55,000 | 60,286 | |
| Series 2022 A, 5% 1/1/32 | 145,000 | 170,743 | |
| Salt Verde Finl. Corp. Sr. Gas Rev.: | |||
| Series 2007 1: | |||
5% 12/1/32 | 20,000 | 21,222 | |
5.25% 12/1/24 | 15,000 | 15,180 | |
5.25% 12/1/26 | 15,000 | 15,481 | |
| Series 2007, 5.25% 12/1/23 | 15,000 | 15,052 | |
| Univ. of Arizona Univ. Revs. Series 2016 B, 5% 6/1/42 | 95,000 | 97,676 | |
TOTAL ARIZONA | 1,762,199 | ||
| Arkansas - 0.2% | |||
| Fort Smith Wtr. & Swr. Rev. Series 2018, 5% 10/1/34 | 145,000 | 156,293 | |
| Pulaski County Pub. Facilities Board Series 2014, 5% 12/1/39 (Pre-Refunded to 12/1/24 @ 100) | 35,000 | 35,864 | |
TOTAL ARKANSAS | 192,157 | ||
| California - 18.7% | |||
| Alameda Corridor Trans. Auth. Rev. Series 2016 B, 3% 10/1/34 (Assured Guaranty Muni. Corp. Insured) | 165,000 | 152,607 | |
| Anaheim Pub. Fing. Auth. Lease Rev.: | |||
| (Anaheim Pub. Impts. Proj.) Series 1997 C, 0% 9/1/36 (Escrowed to Maturity) | 90,000 | 57,102 | |
| Series 1997 C, 0% 9/1/35 (Escrowed to Maturity) | 45,000 | 30,010 | |
| Bay Area Toll Auth. San Francisco Bay Toll Bridge Rev.: | |||
| Bonds: | |||
Series 2017 G, 2%, tender 4/1/24 (c) | 50,000 | 49,306 | |
Series 2018 A, 2.625%, tender 4/1/26 (c) | 70,000 | 68,098 | |
| Series 2017 S7: | |||
4% 4/1/34 | 50,000 | 51,563 | |
4% 4/1/42 | 10,000 | 10,017 | |
4% 4/1/47 | 45,000 | 44,277 | |
| Series F1, 5% 4/1/54 (Pre-Refunded to 4/1/24 @ 100) | 10,000 | 10,145 | |
| Series S7, 5% 4/1/24 | 5,000 | 5,070 | |
| Beaumont Calif Pub. Impt. Auth. W Series 2018 A, 5% 9/1/49 (Assured Guaranty Muni. Corp. Insured) | 175,000 | 184,678 | |
| Berkeley Unified School District Gen. Oblig. Series E, 3.5% 8/1/45 | 100,000 | 89,963 | |
| California Dept. of Wtr. Resources: | |||
| Series 2014, 5% 12/1/29 (Pre-Refunded to 12/1/24 @ 100) | 160,000 | 164,640 | |
| Series 2017 AX, 5% 12/1/24 | 160,000 | 164,662 | |
| Series 2019 A, 5% 12/1/34 | 90,000 | 102,143 | |
| Series AV, 4% 12/1/31 | 10,000 | 10,398 | |
| Series BA, 5% 12/1/32 | 5,000 | 5,689 | |
| California Edl. Facilities Auth. Rev.: | |||
| Series 2001 A: | |||
0% 10/1/30 | 15,000 | 11,594 | |
0% 10/1/34 (Nat'l. Pub. Fin. Guarantee Corp. Insured) | 25,000 | 16,088 | |
| Series T1, 5% 3/15/39 | 20,000 | 23,822 | |
| California Gen. Oblig.: | |||
| Series 2007, 5.25% 8/1/32 (Assured Guaranty Muni. Corp. Insured) | 300,000 | 359,033 | |
| Series 2012, 3.5% 9/1/32 | 45,000 | 45,000 | |
| Series 2013: | |||
4% 4/1/43 | 40,000 | 39,999 | |
5% 9/1/27 | 70,000 | 70,195 | |
5% 11/1/30 | 15,000 | 15,083 | |
| Series 2014: | |||
4% 11/1/44 | 10,000 | 10,001 | |
5% 11/1/24 | 100,000 | 102,749 | |
5% 12/1/24 | 15,000 | 15,128 | |
5% 10/1/28 | 10,000 | 10,237 | |
5% 5/1/32 | 105,000 | 106,647 | |
5% 8/1/35 | 20,000 | 20,374 | |
5% 10/1/39 | 25,000 | 25,474 | |
| Series 2015: | |||
3.25% 3/1/32 | 100,000 | 100,053 | |
4% 3/1/45 | 100,000 | 100,003 | |
5% 8/1/23 | 25,000 | 25,035 | |
5% 8/1/26 | 30,000 | 30,965 | |
5% 8/1/26 | 20,000 | 20,842 | |
5% 9/1/26 | 40,000 | 41,759 | |
5% 9/1/28 | 50,000 | 52,304 | |
5% 8/1/29 | 20,000 | 20,908 | |
5% 8/1/30 | 50,000 | 51,581 | |
5% 8/1/45 | 30,000 | 30,993 | |
| Series 2016: | |||
3% 9/1/33 | 30,000 | 29,609 | |
4% 9/1/36 | 100,000 | 101,773 | |
5% 9/1/24 | 55,000 | 56,311 | |
5% 9/1/25 | 25,000 | 26,079 | |
5% 9/1/26 | 15,000 | 15,980 | |
5% 9/1/30 | 20,000 | 21,291 | |
5% 9/1/45 | 10,000 | 10,492 | |
| Series 2017 A, 5% 8/1/26 | 65,000 | 69,121 | |
| Series 2017: | |||
4% 8/1/27 | 55,000 | 56,788 | |
4% 11/1/36 | 20,000 | 20,465 | |
4% 8/1/37 | 25,000 | 25,419 | |
5% 11/1/24 | 95,000 | 97,612 | |
5% 8/1/27 | 30,000 | 32,661 | |
5% 11/1/27 | 150,000 | 164,204 | |
| Series 2018, 5% 10/1/39 | 110,000 | 114,923 | |
| Series 2019: | |||
3% 10/1/36 | 50,000 | 46,180 | |
4% 4/1/25 | 5,000 | 5,096 | |
5% 4/1/25 | 10,000 | 10,364 | |
5% 4/1/27 | 5,000 | 5,402 | |
5% 11/1/27 | 90,000 | 98,522 | |
5% 4/1/28 | 225,000 | 248,592 | |
5% 4/1/35 | 85,000 | 86,117 | |
5% 4/1/37 | 75,000 | 75,903 | |
5% 4/1/45 | 60,000 | 64,991 | |
| Series 2020: | |||
3% 11/1/35 | 220,000 | 209,293 | |
4% 3/1/28 | 60,000 | 62,992 | |
5% 11/1/28 | 140,000 | 156,660 | |
| Series 2021: | |||
4% 10/1/37 | 80,000 | 83,004 | |
5% 10/1/28 | 100,000 | 111,700 | |
| Series 2022, 5% 4/1/32 | 75,000 | 89,149 | |
| California Health Facilities Fing. Auth. Rev.: | |||
| Series 2013 A, 4% 3/1/43 | 40,000 | 36,430 | |
| Series 2016 B: | |||
5% 11/15/46 | 15,000 | 15,458 | |
5% 11/15/46 (Pre-Refunded to 11/15/26 @ 100) | 10,000 | 10,711 | |
| Series 2017 A, 5% 11/1/27 | 30,000 | 32,944 | |
| Series 2018 A: | |||
4% 11/15/42 | 20,000 | 20,001 | |
5% 11/15/24 | 70,000 | 71,869 | |
5% 11/15/33 | 35,000 | 37,761 | |
| Series A: | |||
4% 8/15/50 | 185,000 | 181,565 | |
5% 8/15/47 | 15,000 | 15,047 | |
| California Muni. Fin. Auth. Rev. Series 2018 A, 3.25% 12/31/32 (Assured Guaranty Muni. Corp. Insured) (b) | 30,000 | 28,272 | |
| California State Univ. Rev.: | |||
| Series 2013 A, 5% 11/1/26 (Pre-Refunded to 11/1/23 @ 100) | 40,000 | 40,246 | |
| Series 2014 A: | |||
5% 11/1/30 (Pre-Refunded to 11/1/24 @ 100) | 95,000 | 97,512 | |
5% 11/1/33 (Pre-Refunded to 11/1/24 @ 100) | 100,000 | 102,644 | |
| Series 2015 A, 5% 11/1/26 | 15,000 | 15,737 | |
| Series 2016 A: | |||
3.2% 11/1/37 | 15,000 | 13,991 | |
5% 11/1/26 | 40,000 | 42,496 | |
| Series 2017 A, 5% 11/1/24 | 65,000 | 66,676 | |
| Series 2020 C, 3% 11/1/40 | 50,000 | 43,166 | |
| California Statewide Cmntys. Dev. Auth. Hosp. Rev. Series 2018: | |||
| 4.375% 1/1/48 | 10,000 | 9,382 | |
| 5% 1/1/32 | 30,000 | 31,599 | |
| California Statewide Cmntys. Dev. Auth. Rev.: | |||
| Series 2015, 3% 8/15/29 | 50,000 | 50,187 | |
| Series 2018 A, 3.5% 3/1/38 | 155,000 | 144,540 | |
| Chaffey Unified High School District Series 2019 D, 4% 8/1/49 | 30,000 | 29,491 | |
| Chino Valley Unified School District Series 2017 A, 5.25% 8/1/47 | 25,000 | 26,467 | |
| Coast Cmnty. College District Series 2013 A, 5% 8/1/38 (Pre-Refunded to 8/1/23 @ 100) | 35,000 | 35,048 | |
| Compton Unified School District Series 2019 B, 3% 6/1/49 | 75,000 | 58,552 | |
| Contra Costa Cmnty. College District Series 2014 A, 4% 8/1/39 | 5,000 | 5,000 | |
| Corona-Norco Unified School District Series 2014, 3% 8/1/44 | 125,000 | 104,889 | |
| East Bay Muni. Util. District Wastewtr. Sys. Rev.: | |||
| Series 2015 A, 5% 6/1/37 | 65,000 | 67,335 | |
| Series 2017 B, 5% 6/1/32 | 45,000 | 49,217 | |
| El Camino Cmnty. College District Series 2012 C: | |||
| 0% 8/1/34 | 60,000 | 40,801 | |
| 0% 8/1/38 | 85,000 | 46,091 | |
| Elk Grove Unified School Distr. Ctfs. of Prtn. (Cap. Facilities Proj.) Series 2016, 3% 2/1/35 | 65,000 | 61,251 | |
| Foothill-De Anza Cmnty. College District Series 2003 B: | |||
| 0% 8/1/25 | 75,000 | 70,176 | |
| 0% 8/1/33 | 85,000 | 60,958 | |
| Foothill/Eastern Trans. Corridor Agcy. Toll Road Rev.: | |||
| Series 1995 A, 0% 1/1/29 (Escrowed to Maturity) | 30,000 | 25,822 | |
| Series 2013 A: | |||
0% 1/15/24 (Assured Guaranty Muni. Corp. Insured) | 10,000 | 9,821 | |
6% 1/15/49 (Pre-Refunded to 1/15/24 @ 100) | 20,000 | 20,316 | |
| Series 2013 B1, 3.95% 1/15/53 (c) | 65,000 | 60,598 | |
| Series 2021 A, 4% 1/15/46 | 15,000 | 14,504 | |
| Fremont Union High School District, Santa Clara: | |||
| Series 2015, 4% 8/1/44 | 45,000 | 44,765 | |
| Series 2019 A, 4% 8/1/46 | 30,000 | 29,780 | |
| Fresno Unified School District Series B, 3% 8/1/43 | 110,000 | 91,405 | |
| Golden State Tobacco Securitization Corp. Tobacco Settlement Rev. Series 2015 A: | |||
| 5% 6/1/35 (Pre-Refunded to 6/1/25 @ 100) | 10,000 | 10,400 | |
| 5% 6/1/40 (Pre-Refunded to 6/1/25 @ 100) | 65,000 | 67,601 | |
| 5% 6/1/40 (Pre-Refunded to 6/1/25 @ 100) | 10,000 | 10,400 | |
| 5% 6/1/45 (Pre-Refunded to 6/1/25 @ 100) | 100,000 | 104,002 | |
| Grossmont Union High School District: | |||
| Series 2008, 0% 8/1/30 | 40,000 | 31,434 | |
| Series 2016 B, 3% 8/1/45 | 30,000 | 24,328 | |
| Hayward Unified School District Gen. Oblig. Series 2015, 4% 8/1/40 (Assured Guaranty Muni. Corp. Insured) | 180,000 | 180,115 | |
| Imperial Irrigation District Elec. Rev. Series 2015 C, 5% 11/1/38 | 85,000 | 88,869 | |
| Kaweah Delta Health Care District Series 2015 B, 4% 6/1/45 | 100,000 | 69,473 | |
| Livermore Valley Joint Unified School District Series 2016, 3% 8/1/46 | 50,000 | 39,409 | |
| Long Beach Bond Fin. Auth. Natural Gas Purchase Rev. Series 2007 A: | |||
| 5% 11/15/35 | 25,000 | 26,620 | |
| 5.5% 11/15/37 | 30,000 | 32,975 | |
| Long Beach Unified School District: | |||
| Series 2016, 3% 8/1/32 | 80,000 | 78,712 | |
| Series B, 0% 8/1/35 | 90,000 | 57,431 | |
| Los Angeles Cmnty. College District: | |||
| Series 2015 A, 5% 8/1/24 | 95,000 | 97,110 | |
| Series 2017 J, 5% 8/1/28 | 20,000 | 21,944 | |
| Series A, 5% 8/1/30 (Pre-Refunded to 8/1/24 @ 100) | 20,000 | 20,449 | |
| Series F, 5% 8/1/24 (Pre-Refunded to 8/1/23 @ 100) | 35,000 | 35,047 | |
| Series G, 5% 8/1/27 (Pre-Refunded to 8/1/24 @ 100) | 20,000 | 20,449 | |
| Series K, 4% 8/1/35 | 20,000 | 20,565 | |
| Los Angeles County Metropolitan Trans. Auth. Sales Tax Rev.: | |||
| Series 2019 A, 5% 7/1/44 | 45,000 | 48,328 | |
| Series 2023 A, 5% 7/1/36 | 75,000 | 90,035 | |
| Los Angeles Dept. Arpt. Rev.: | |||
| Series 2018 C, 5% 5/15/36 (b) | 80,000 | 83,818 | |
| Series 2020 A, 5% 5/15/38 | 85,000 | 94,431 | |
| Series 2021 B, 5% 5/15/37 | 50,000 | 56,924 | |
| Series 2022 C, 4% 5/15/41 (b) | 50,000 | 49,281 | |
| Series B, 5% 5/15/48 | 90,000 | 98,769 | |
| Series C, 5% 5/15/33 (b) | 155,000 | 164,235 | |
| Series D, 5% 5/15/26 (b) | 5,000 | 5,200 | |
| Los Angeles Dept. of Wtr. & Pwr. Rev.: | |||
| Series 2014 C, 5% 7/1/29 | 65,000 | 66,248 | |
| Series 2014 D: | |||
5% 7/1/35 | 105,000 | 106,790 | |
5% 7/1/44 | 45,000 | 45,487 | |
| Series 2017 C, 5% 7/1/36 | 50,000 | 53,914 | |
| Series 2018 C, 5% 7/1/25 | 95,000 | 98,808 | |
| Series 2019 B, 5% 7/1/35 | 90,000 | 100,448 | |
| Series 2019 D, 5% 7/1/44 | 50,000 | 54,085 | |
| Series 2022 A, 5% 7/1/40 | 105,000 | 117,388 | |
| Series A, 5% 7/1/31 | 35,000 | 38,628 | |
| Series B: | |||
5% 7/1/30 | 25,000 | 28,164 | |
5% 7/1/30 | 50,000 | 50,000 | |
| Los Angeles Dept. of Wtr. & Pwr. Wtrwks. Rev.: | |||
| Series 2014 A, 5% 7/1/44 | 25,000 | 25,346 | |
| Series 2020 B, 4% 7/1/29 | 115,000 | 123,591 | |
| Series A: | |||
5% 7/1/33 | 55,000 | 59,403 | |
5% 7/1/33 | 5,000 | 5,515 | |
| Series B: | |||
5% 7/1/25 | 20,000 | 20,000 | |
5% 7/1/37 | 100,000 | 109,037 | |
| Los Angeles Muni. Impt. Corp. Lease Rev. Series 2016 B, 4% 11/1/37 | 40,000 | 40,418 | |
| Los Angeles Solid Waste Resources Rev. Series 2018 A: | |||
| 4% 2/1/32 | 35,000 | 36,373 | |
| 5% 2/1/25 | 50,000 | 51,486 | |
| Los Angeles Unified School District: | |||
| Series 2014 C, 5% 7/1/24 | 10,000 | 10,198 | |
| Series 2016 A: | |||
4% 7/1/34 | 100,000 | 101,560 | |
5% 7/1/29 | 80,000 | 83,552 | |
5% 7/1/40 | 75,000 | 77,263 | |
| Series 2018 B1, 5% 7/1/23 | 10,000 | 10,000 | |
| Series 2019 A, 5% 7/1/28 | 20,000 | 22,311 | |
| Series 2021 A, 5% 7/1/25 | 125,000 | 130,207 | |
| Series A: | |||
5% 7/1/29 | 45,000 | 51,270 | |
5% 7/1/30 | 75,000 | 85,027 | |
| Series B, 5% 7/1/25 | 15,000 | 15,625 | |
| Los Angeles Wastewtr. Sys. Rev.: | |||
| Series 2013 A, 5% 6/1/24 | 5,000 | 5,004 | |
| Series 2022 A, 5% 6/1/47 | 85,000 | 94,241 | |
| Marin Healthcare District Series 2017 A, 3% 8/1/37 | 5,000 | 4,499 | |
| Metropolitan Wtr. District of Southern California Wtr. Rev.: | |||
| Series 2017 A, 2.5% 7/1/25 | 50,000 | 49,119 | |
| Series 2020 A, 5% 10/1/36 | 85,000 | 95,638 | |
| Monterey Peninsula Cmnty. College District Series 2016, 0% 8/1/30 | 20,000 | 15,761 | |
| MSR Energy Auth. Gas Rev. Series 2009 B, 6.5% 11/1/39 | 25,000 | 30,035 | |
| Newport Mesa Unified School District: | |||
| Series 2011, 0% 8/1/36 | 70,000 | 43,341 | |
| Series 2017, 0% 8/1/39 | 5,000 | 2,600 | |
| North Orange County Cmnty. College District Rev. Series 2016 A, 3% 8/1/40 | 25,000 | 21,794 | |
| Oakland Unified School District Alameda County: | |||
| Series 2019 A, 3% 8/1/40 (Assured Guaranty Muni. Corp. Insured) | 35,000 | 29,857 | |
| Series 2021 A, 4% 8/1/38 | 150,000 | 156,911 | |
| Palo Alto Unified School District Gen. Oblig. Series 2008 2: | |||
| 0% 8/1/30 | 50,000 | 40,345 | |
| 0% 8/1/32 | 100,000 | 74,786 | |
| 0% 8/1/33 | 15,000 | 10,789 | |
| Palomar Pomerado Health Series 2009 A, 0% 8/1/28 (Assured Guaranty Corp. Insured) | 255,000 | 214,513 | |
| Pasadena Elec. Rev. Series 2013 A, 4.5% 6/1/40 | 15,000 | 15,006 | |
| Peralta Cmnty. College District Gen. Oblig. Series 2016 A, 4% 8/1/39 | 130,000 | 128,808 | |
| Perris Union High School District Series A, 3% 9/1/44 (Assured Guaranty Muni. Corp. Insured) | 25,000 | 20,581 | |
| Port of Oakland Rev. Series 2017 E, 5% 11/1/26 | 30,000 | 31,894 | |
| Poway Unified School District: | |||
| Series 2011 B, 0% 8/1/34 | 50,000 | 33,925 | |
| Series B, 0% 8/1/41 | 190,000 | 88,163 | |
| Pub. Utils. Commission San Francisco City & County Wastewtr. Rev. Series 2021 A: | |||
| 4% 10/1/48 | 100,000 | 98,996 | |
| 4% 10/1/51 | 100,000 | 98,313 | |
| Riverside County Pub. Fing. Auth. Series 2015, 5% 11/1/25 (Escrowed to Maturity) | 255,000 | 267,200 | |
| Riverside Elec. Rev. Series 2019 A, 5% 10/1/26 | 50,000 | 53,463 | |
| Sacramento Muni. Util. District Elec. Rev. Series 2021 I, 5% 8/15/28 | 100,000 | 111,752 | |
| Sacramento TOT Rev. Series A, 5% 6/1/43 | 100,000 | 105,137 | |
| San Bernardino Cmnty. College District Series B, 0% 8/1/48 | 45,000 | 14,561 | |
| San Diego Cmnty. College District: | |||
| Series 2013, 0% 8/1/41 (Pre-Refunded to 8/1/23 @ 57.571) (d) | 20,000 | 11,487 | |
| Series 2016, 5% 8/1/41 (Pre-Refunded to 8/1/26 @ 100) | 5,000 | 5,341 | |
| San Diego County Reg'l. Arpt. Auth. Arpt. Rev.: | |||
| (Sub Lien Proj.) Series 2017 B, 5% 7/1/42 (b) | 175,000 | 179,205 | |
| Series 2019 A, 5% 7/1/34 | 75,000 | 84,068 | |
| San Diego County Wtr. Auth. Fing. Agcy. Wtr. Rev. Series 2022 A, 5% 5/1/47 | 135,000 | 149,558 | |
| San Diego Pub. Facilities Fing. Auth. Swr. Rev. Series 2016 A, 5% 5/15/39 | 100,000 | 105,536 | |
| San Diego Pub. Facilities Fing. Auth. Wtr. Rev. Series 2018 A, 5.25% 8/1/47 | 10,000 | 10,723 | |
| San Diego Redev. Agcy. Series 2016 A, 5% 9/1/23 | 5,000 | 5,013 | |
| San Diego Unified School District: | |||
| Series 1998 G1: | |||
5.25% 7/1/27 | 10,000 | 10,985 | |
5.25% 7/1/28 (Assured Guaranty Muni. Corp. Insured) | 10,000 | 11,262 | |
| Series 2012 I, 5% 7/1/33 | 65,000 | 70,912 | |
| Series 2017 I, 4% 7/1/47 | 15,000 | 14,809 | |
| Series 2017 J, 5% 7/1/30 | 80,000 | 87,559 | |
| Series B, 3.25% 7/1/48 | 80,000 | 67,019 | |
| Series C, 0% 7/1/43 | 40,000 | 17,122 | |
| Series R1, 0% 7/1/30 | 35,000 | 28,034 | |
| San Francisco Bay Area Rapid Transit District Sales Tax Rev. Series 2019 A, 3% 7/1/44 | 50,000 | 40,990 | |
| San Francisco Bay Area Rapid Transit Fing. Auth.: | |||
| Series 2020 C1, 4% 8/1/30 | 125,000 | 134,871 | |
| Series A1, 5% 8/1/47 | 45,000 | 47,673 | |
| San Francisco City & County Arpts. Commission Int'l. Arpt. Rev.: | |||
| Series 2016 A, 5% 5/1/26 | 20,000 | 21,200 | |
| Series 2017 D, 5% 5/1/24 (b) | 35,000 | 35,381 | |
| Series 2019 A, 5% 5/1/49 (b) | 25,000 | 25,779 | |
| Series 2019 E, 5% 5/1/34 (b) | 125,000 | 134,621 | |
| Series 2020 A, 4% 5/1/39 (b) | 35,000 | 34,489 | |
| Series 2020 B, 4% 5/1/39 | 100,000 | 101,692 | |
| San Francisco City & County Ctfs. of Prtn. (49 South Van Ness Proj.) Series 2019 A, 4% 4/1/41 | 35,000 | 35,042 | |
| San Francisco County Trans. Auth. Series 2017, 3% 2/1/33 | 155,000 | 152,098 | |
| San Francisco Pub. Utils. Commission Wtr. Rev.: | |||
| Series 2015 A, 5% 11/1/29 | 20,000 | 20,766 | |
| Series 2016, 5% 11/1/24 | 110,000 | 112,981 | |
| Series 2020 A, 5% 11/1/50 | 30,000 | 32,653 | |
| San Joaquin Hills Trans. Corridor Agcy. Toll Road Rev.: | |||
| Series 1993, 0% 1/1/25 (Escrowed to Maturity) | 100,000 | 95,603 | |
| Series 1997 A: | |||
0% 1/15/25 (Nat'l. Pub. Fin. Guarantee Corp. Insured) | 20,000 | 18,857 | |
0% 1/15/29 (Nat'l. Pub. Fin. Guarantee Corp. Insured) | 50,000 | 40,808 | |
0% 1/15/32 (Nat'l. Pub. Fin. Guarantee Corp. Insured) | 5,000 | 3,593 | |
| Series 2021 A, 4% 1/15/50 | 30,000 | 28,520 | |
| Series A, 0% 1/15/31 (Nat'l. Pub. Fin. Guarantee Corp. Insured) | 90,000 | 67,622 | |
| San Jose Int. Arpt. Rev. Series 2017 B, 5% 3/1/42 | 25,000 | 26,059 | |
| San Mateo County Joint Powers Fing. Auth. (Cap. Projs.) Series 2014 A, 4% 6/15/35 | 95,000 | 95,714 | |
| San Mateo County Trans. District Sales Tax Rev. Series A, 3.25% 6/1/33 | 60,000 | 60,049 | |
| San Mateo Foster City (Clean Wtr. Prog.) Series 2019, 5% 8/1/49 | 45,000 | 48,340 | |
| San Mateo Unified School District Series 2011 A: | |||
| 0% 9/1/33 (d) | 50,000 | 46,310 | |
| 0% 9/1/41 (d) | 10,000 | 9,654 | |
| Santa Clara County Fing. Auth. Lease Rev.: | |||
| Series 2018 A, 3.5% 4/1/39 | 40,000 | 37,452 | |
| Series 2019 A, 3% 5/1/42 | 100,000 | 82,882 | |
| Santa Clara Unified School District Series 2019, 4% 7/1/48 | 35,000 | 34,579 | |
| Sequoia Union High School District Series 2016, 3% 7/1/31 | 55,000 | 55,216 | |
| Silicon Valley Clean Wtr. Series 2019 A, 3% 3/1/24 | 50,000 | 49,985 | |
| Solano Cmnty. College District Series A, 0% 8/1/41 (Pre-Refunded to 8/1/28 @ 100) (d) | 10,000 | 10,938 | |
| Sonoma County Jr. College District Rev. Series B, 3% 8/1/41 | 145,000 | 123,468 | |
| Southern CA Pub. Pwr. Auth. So Series 2023 1, 5% 7/1/35 | 100,000 | 120,803 | |
| Southern California Pub. Pwr. Auth. Rev.: | |||
| Series 2007 A, 5.25% 11/1/25 | 35,000 | 35,917 | |
| Series A, 5.25% 11/1/26 | 30,000 | 31,184 | |
| Univ. of California Revs.: | |||
| Series 2014, 5% 5/15/25 | 75,000 | 76,437 | |
| Series 2015 AO, 5% 5/15/25 | 70,000 | 72,863 | |
| Series 2016, 5% 5/15/35 | 15,000 | 15,946 | |
| Series 2017 AV: | |||
5% 5/15/35 | 50,000 | 54,086 | |
5% 5/15/47 | 110,000 | 116,461 | |
| Series 2017 AY, 5% 5/15/25 | 50,000 | 52,045 | |
| Series 2017 M, 5% 5/15/32 | 35,000 | 38,029 | |
| Series 2020 BE: | |||
4% 5/15/47 | 115,000 | 115,132 | |
5% 5/15/43 | 15,000 | 16,505 | |
| Series 2022 BK, 5% 5/15/32 | 115,000 | 138,663 | |
| Series AM, 5.25% 5/15/37 | 15,000 | 15,254 | |
| Series AY, 5% 5/15/28 | 30,000 | 32,684 | |
| Series I, 5% 5/15/28 | 10,000 | 10,394 | |
| Series M, 5% 5/15/36 | 20,000 | 21,530 | |
| Upland Gen. Oblig. Ctfs. of Prtn. Series 2017, 4% 1/1/42 | 10,000 | 9,011 | |
| West Contra Costa Unified School District Series C1, 0% 8/1/27 (Assured Guaranty Corp. Insured) | 70,000 | 61,071 | |
| West Hollywood Pub. Fing. Auth. Series 2016, 3% 4/1/41 | 75,000 | 64,002 | |
| Westminster Redev. Agcy. Series 2016: | |||
| 3% 11/1/41 | 25,000 | 20,922 | |
| 3% 11/1/45 | 75,000 | 59,426 | |
| William S. Hart Union High School District Series 2005 B, 0% 9/1/28 (Assured Guaranty Muni. Corp. Insured) | 140,000 | 117,844 | |
| Yosemite Cmnty. College District Series 2010 D, 0% 8/1/31 | 100,000 | 76,145 | |
| Yuba Cmnty. College District Series 2016 A: | |||
| 3% 8/1/36 | 150,000 | 136,604 | |
| 3% 8/1/37 | 30,000 | 26,704 | |
TOTAL CALIFORNIA | 16,567,157 | ||
| Colorado - 2.2% | |||
| Colorado Ctfs. of Prtn. Series 2018 A, 3.625% 12/15/36 | 200,000 | 198,217 | |
| Colorado Health Facilities Auth. Rev. Bonds: | |||
| Series 2018 A, 4% 11/15/48 | 5,000 | 4,779 | |
| Series 2019 A, 5% 1/1/30 | 105,000 | 118,260 | |
| Series 2019 A1: | |||
4% 8/1/37 | 90,000 | 88,473 | |
4% 8/1/44 | 10,000 | 9,341 | |
5% 8/1/32 | 120,000 | 129,015 | |
| Series 2021 A, 4% 11/15/46 | 100,000 | 96,473 | |
| Colorado Reg'l. Trans. District Ctfs. of Prtn. Series 2013 A, 5% 6/1/25 | 30,000 | 30,031 | |
| Colorado Springs Utils. Rev.: | |||
| Series 2018 A2, 5% 11/15/48 | 25,000 | 26,670 | |
| Series 2021 B, 4% 11/15/40 | 100,000 | 101,362 | |
| Denver City & County Arpt. Rev.: | |||
| Series 2017 A: | |||
5% 11/15/26 (b) | 55,000 | 57,499 | |
5% 11/15/28 (b) | 30,000 | 31,768 | |
5% 11/15/29 (b) | 20,000 | 21,206 | |
| Series 2018 B, 3.5% 12/1/35 | 10,000 | 9,800 | |
| Series 2019 C, 5% 11/15/31 | 20,000 | 22,536 | |
| Series 2022 A, 5% 11/15/41 (b) | 85,000 | 90,933 | |
| Denver City & County Board Wtr. Rev. Series 2022 A, 5% 12/15/45 | 330,000 | 368,337 | |
| Denver Convention Ctr. Hotel Auth. Series 2016, 5% 12/1/23 | 5,000 | 5,016 | |
| Denver Dedicated Tax Rev. Series 2021 A, 4% 8/1/42 | 100,000 | 100,371 | |
| E-470 Pub. Hwy. Auth. Rev. Series 2000 B: | |||
| 0% 9/1/31 (Nat'l. Pub. Fin. Guarantee Corp. Insured) | 30,000 | 22,435 | |
| 0% 9/1/32 (Nat'l. Pub. Fin. Guarantee Corp. Insured) | 50,000 | 35,866 | |
| East Grand County Co. School District # 2 Series 2022, 4% 12/1/46 | 100,000 | 98,562 | |
| El Paso County Co. Scd # 2 Series 2019, 5% 12/1/37 | 155,000 | 167,909 | |
| Pueblo County Ctfs. of Prtn. (Jail Proj.) Series 2022 A, 5% 7/1/49 | 135,000 | 141,097 | |
| Univ. of Colorado Enterprise Sys. Rev. Series 2016 B1, 2.75% 6/1/30 | 15,000 | 14,770 | |
TOTAL COLORADO | 1,990,726 | ||
| Connecticut - 1.9% | |||
| Connecticut Gen. Oblig.: | |||
| Series 2014 C, 5% 6/15/24 | 60,000 | 61,085 | |
| Series 2015 B: | |||
3.375% 6/15/29 | 25,000 | 25,085 | |
4% 6/15/33 | 110,000 | 111,451 | |
| Series 2016 A, 5% 3/15/26 | 15,000 | 15,770 | |
| Series 2019 A, 5% 4/15/27 | 15,000 | 16,114 | |
| Series 2020 C: | |||
4% 6/1/30 | 120,000 | 128,597 | |
4% 6/1/31 | 25,000 | 26,820 | |
| Series A: | |||
4% 1/15/25 | 60,000 | 60,889 | |
5% 3/15/28 | 15,000 | 15,455 | |
| Series C, 4% 6/15/24 | 25,000 | 25,221 | |
| Series D: | |||
4% 8/15/31 | 45,000 | 46,064 | |
5% 4/15/26 | 25,000 | 26,329 | |
| Series E: | |||
3.375% 10/15/36 | 20,000 | 19,207 | |
5% 9/15/25 | 25,000 | 26,020 | |
5% 10/15/25 | 20,000 | 20,851 | |
| Connecticut Health & Edl. Facilities Auth. Rev.: | |||
| Series 2019 A: | |||
4% 7/1/34 | 45,000 | 44,788 | |
5% 7/1/24 | 230,000 | 231,953 | |
5% 7/1/25 | 100,000 | 101,566 | |
| Series R, 3.375% 7/1/37 | 10,000 | 8,855 | |
| Connecticut Hsg. Fin. Auth.: | |||
| Series 2015 A, 3.75% 11/15/40 | 75,000 | 70,714 | |
| Series 2017 D1, 3.2% 11/15/32 | 10,000 | 9,789 | |
| Series 2020 A1, 3.5% 11/15/45 | 170,000 | 166,067 | |
| Series 2022 A1, 3.5% 11/15/51 | 105,000 | 102,098 | |
| Connecticut Spl. Tax Oblig. Trans. Infrastructure Rev.: | |||
| Series 2015 A: | |||
5% 8/1/28 | 60,000 | 62,250 | |
5% 8/1/33 | 95,000 | 98,304 | |
| Series 2015 B, 5% 8/1/27 | 55,000 | 57,086 | |
| Series 2016 A, 5% 9/1/31 | 25,000 | 26,459 | |
| Series 2018 A, 5% 1/1/27 | 20,000 | 21,386 | |
| Series A, 4% 9/1/35 | 55,000 | 55,811 | |
| Series B, 5% 10/1/33 | 15,000 | 16,484 | |
| Univ. of Connecticut Gen. Oblig. Series 2018 A, 5% 4/15/29 | 25,000 | 27,321 | |
TOTAL CONNECTICUT | 1,725,889 | ||
| Delaware - 0.7% | |||
| Delaware Gen. Oblig.: | |||
| Series 2017, 3.25% 3/1/37 | 6,000 | 5,724 | |
| Series 2020 A, 5% 1/1/30 | 115,000 | 131,647 | |
| Delaware Health Facilities Auth. Rev. Series 2020 A: | |||
| 4% 10/1/49 | 60,000 | 56,941 | |
| 5% 10/1/32 | 65,000 | 72,644 | |
| Delaware River & Bay Auth. Rev. Series 2021, 4% 1/1/46 | 65,000 | 63,930 | |
| Delaware Trans. Auth. Trans. Sys. Rev. Series 2020, 5% 7/1/31 | 210,000 | 241,557 | |
TOTAL DELAWARE | 572,443 | ||
| District Of Columbia - 1.7% | |||
| District of Columbia Gen. Oblig.: | |||
| Series 2014 D, 5% 6/1/31 | 40,000 | 40,695 | |
| Series 2016 A, 5% 6/1/32 | 40,000 | 42,104 | |
| Series 2017 A, 5% 6/1/29 | 10,000 | 10,829 | |
| Series 2019 A, 5% 10/15/28 | 90,000 | 100,145 | |
| Series 2021 D: | |||
4% 2/1/40 | 110,000 | 110,876 | |
5% 2/1/31 | 95,000 | 109,004 | |
| District of Columbia Income Tax Rev.: | |||
| Series 2020 A, 4% 3/1/45 | 50,000 | 49,202 | |
| Series 2020 B, 5% 10/1/31 | 90,000 | 105,295 | |
| District of Columbia Univ. Rev. Series 2017: | |||
| 5% 4/1/31 | 25,000 | 26,561 | |
| 5% 4/1/32 | 120,000 | 127,353 | |
| District of Columbia Wtr. & Swr. Auth. Pub. Util. Rev.: | |||
| Series 2014 C: | |||
5% 10/1/27 | 30,000 | 30,701 | |
5% 10/1/28 | 25,000 | 25,569 | |
| Series 2016 A, 5% 10/1/31 | 50,000 | 52,439 | |
| Series 2019 A, 5% 10/1/44 | 30,000 | 32,280 | |
| Metropolitan Washington Arpts. Auth. Dulles Toll Road Rev.: | |||
| (Dulles Metrorail and Cap. Impt. Proj.) Series 2019 B, 4% 10/1/53 | 95,000 | 87,188 | |
| (Dulles Metrorail and Cap. Impt. Projs.) Series 2019 B, 3% 10/1/50 (Assured Guaranty Muni. Corp. Insured) | 10,000 | 7,505 | |
| Series 2009 B: | |||
0% 10/1/25 (Assured Guaranty Corp. Insured) | 50,000 | 46,145 | |
0% 10/1/30 (Assured Guaranty Corp. Insured) | 65,000 | 50,652 | |
0% 10/1/31 (Assured Guaranty Corp. Insured) | 15,000 | 11,246 | |
0% 10/1/34 (Assured Guaranty Corp. Insured) | 35,000 | 23,142 | |
0% 10/1/36 (Assured Guaranty Corp. Insured) | 5,000 | 2,991 | |
| Metropolitan Washington DC Arpts. Auth. Sys. Rev.: | |||
| Series 2014 A: | |||
5% 10/1/28 (b) | 20,000 | 20,225 | |
5% 10/1/29 (b) | 50,000 | 50,591 | |
5% 10/1/44 (b) | 75,000 | 75,256 | |
| Series 2018 A, 5% 10/1/27 (b) | 40,000 | 42,323 | |
| Series 2019 A, 5% 10/1/39 (b) | 60,000 | 63,023 | |
| Washington D.C. Metropolitan Transit Auth. Rev.: | |||
| Series 2017 A1, 5% 7/1/29 | 40,000 | 43,093 | |
| Series 2017 B: | |||
5% 7/1/26 | 50,000 | 52,866 | |
5% 7/1/42 | 50,000 | 52,112 | |
| Series 2018, 5% 7/1/30 | 35,000 | 37,645 | |
TOTAL DISTRICT OF COLUMBIA | 1,529,056 | ||
| Florida - 3.8% | |||
| Alachua County Health Facilities Auth. Health Facilities Rev. Series 2019 A, 3% 12/1/46 | 15,000 | 10,760 | |
| Broward County Arpt. Sys. Rev.: | |||
| Series 2015 A, 5% 10/1/33 (b) | 35,000 | 35,863 | |
| Series 2017, 5% 10/1/47 (b) | 70,000 | 71,538 | |
| Broward County Port Facilities Rev. Series 2019 B, 4% 9/1/44 (b) | 75,000 | 72,047 | |
| Central Florida Expressway Auth. Sr. Lien Rev.: | |||
| Series 2016 B, 4% 7/1/40 | 5,000 | 4,895 | |
| Series 2017: | |||
3.25% 7/1/39 | 70,000 | 63,308 | |
5% 7/1/42 | 165,000 | 172,778 | |
| Florida Board of Ed. Pub. Ed. Cap. Outlay: | |||
| Series 2017 B, 5% 6/1/30 | 50,000 | 54,123 | |
| Series 2018 A, 4% 6/1/37 | 55,000 | 56,119 | |
| Series 2019 D, 4% 6/1/30 | 65,000 | 69,445 | |
| Series A, 5% 6/1/27 | 100,000 | 103,870 | |
| Series C, 5% 6/1/25 | 15,000 | 15,558 | |
| Series D, 4% 6/1/32 | 50,000 | 51,229 | |
| Florida Dept. of Envir. Protection Rev. Series 2016 A, 2% 7/1/28 | 50,000 | 46,200 | |
| Florida Dept. of Trans. Tpk. Rev.: | |||
| Series 2019 B: | |||
3% 7/1/43 | 30,000 | 24,831 | |
3% 7/1/44 | 200,000 | 163,274 | |
| Series 2020 B, 2% 7/1/37 | 55,000 | 42,284 | |
| Florida Higher Edl. Facilities Fing. Auth.: | |||
| (Nova Southeastern Univ. Proj.) Series 2016, 5% 4/1/35 | 60,000 | 62,030 | |
| (Ringling College Proj.) Series 2017, 4% 3/1/47 | 70,000 | 58,022 | |
| Florida Hsg. Fin. Corp. Rev. Series 2017 1, 3.6% 7/1/37 | 20,000 | 19,694 | |
| Greater Orlando Aviation Auth. Arpt. Facilities Rev.: | |||
| Series 2017 A, 5% 10/1/30 (Pre-Refunded to 10/1/27 @ 100) (b) | 30,000 | 32,170 | |
| Series 2019 A, 5% 10/1/27 (b) | 10,000 | 10,589 | |
| Halifax Hosp. Med. Ctr. Rev.: | |||
| Series 2015, 4% 6/1/38 (Pre-Refunded to 6/1/25 @ 100) | 25,000 | 25,386 | |
| Series 2016, 3.75% 6/1/41 | 5,000 | 4,415 | |
| Hillsborough County Indl. Dev. (Tampa Gen. Hosp. Proj.) Series 2012 A, 3.5% 10/1/28 (Pre-Refunded to 10/1/23 @ 100) | 45,000 | 45,009 | |
| Jacksonville Spl. Rev.: | |||
| Series 2013 A, 5% 10/1/40 | 20,000 | 20,059 | |
| Series 2019 A: | |||
5% 10/1/27 | 20,000 | 21,703 | |
5% 10/1/32 | 10,000 | 11,292 | |
| JEA Wtr. & Swr. Sys. Rev. Series 2014 A, 4% 10/1/40 | 100,000 | 99,658 | |
| Lakeland Hosp. Sys. Rev. Series 2016, 3% 11/15/32 | 30,000 | 28,095 | |
| Miami Beach Series 2019, 3.25% 5/1/49 | 25,000 | 20,265 | |
| Miami Beach Health Facilities Auth. Hosp. Rev. Series 2014 A, 5% 11/15/39 | 15,000 | 15,088 | |
| Miami Beach Wtr. & Swr. Rev. Series 2017, 5% 9/1/47 | 125,000 | 130,105 | |
| Miami-Dade County Aviation Rev.: | |||
| Series 2014 A, 5% 10/1/33 (b) | 85,000 | 85,769 | |
| Series 2020 A, 4% 10/1/39 | 70,000 | 70,057 | |
| Miami-Dade County Cap. Asset Acquisition: | |||
| Series 2009, 0% 10/1/41 | 20,000 | 8,781 | |
| Series 2016: | |||
0% 10/1/31 | 35,000 | 25,654 | |
0% 10/1/32 | 25,000 | 17,460 | |
| Miami-Dade County Edl. Facilities Rev.: | |||
| Series 2015 A, 4% 4/1/45 | 10,000 | 9,481 | |
| Series 2018 A, 4% 4/1/53 | 25,000 | 22,961 | |
| Miami-Dade County Gen. Oblig.: | |||
| (Bldg. Better Cmntys. Prog.): | |||
Series 2013 A, 5% 7/1/26 | 5,000 | 5,186 | |
Series 2015 B, 5% 7/1/27 | 40,000 | 40,807 | |
Series 2016 A, 5% 7/1/29 | 70,000 | 73,787 | |
| (Pub. Health Trust Prog.) Series 2019 A, 5% 7/1/43 | 10,000 | 10,692 | |
| Series 2015 D, 3% 7/1/39 | 5,000 | 4,288 | |
| Miami-Dade County Health Facilities Auth. Hosp. Rev. (Nicklaus Children's Hosp. Proj.) Series 2017, 5% 8/1/47 | 85,000 | 86,582 | |
| Miami-Dade County Pub. Facilities Rev. Series 2015 A, 5% 6/1/28 | 120,000 | 123,627 | |
| Miami-Dade County School Board Ctfs. of Prtn.: | |||
| Series 2015 D, 5% 2/1/30 | 85,000 | 88,280 | |
| Series 2016 C, 5% 2/1/32 | 90,000 | 93,472 | |
| Miami-Dade County Sports Facilities Series C, 0% 10/1/48 (Assured Guaranty Corp. Insured) | 60,000 | 19,053 | |
| Miami-Dade County Transit Sales Surtax Rev. Series 2019, 5% 7/1/31 | 25,000 | 27,952 | |
| Miami-Dade County Wtr. & Swr. Rev.: | |||
| Series 2017 A, 4% 10/1/39 | 35,000 | 35,130 | |
| Series 2017 B, 3.125% 10/1/39 | 20,000 | 17,377 | |
| Series 2019 B, 3% 10/1/49 | 40,000 | 30,845 | |
| North Broward Hosp. District Rev. Series 2017 B, 5% 1/1/32 | 50,000 | 52,601 | |
| Orange County Health Facilities Auth.: | |||
| Series 2016 A, 5% 10/1/44 | 35,000 | 35,990 | |
| Series 2016, 5% 8/1/47 (Pre-Refunded to 8/1/23 @ 103) | 70,000 | 72,149 | |
| Orange County School Board Ctfs. of Prtn. Series 2015 D, 5% 8/1/28 (Pre-Refunded to 8/1/25 @ 100) | 50,000 | 51,902 | |
| Orange County Tourist Dev. Tax Rev.: | |||
| Series 2016 A, 4% 10/1/34 | 20,000 | 20,269 | |
| Series 2017, 5% 10/1/27 | 25,000 | 26,911 | |
| Orlando & Orange County Expressway Auth. Rev. Series 2013 A, 5% 7/1/35 (Pre-Refunded to 7/1/23 @ 100) | 75,000 | 75,000 | |
| Palm Beach County Health Facilities Series 2016, 5% 11/15/32 | 25,000 | 25,314 | |
| Palm Beach County Pub. Impt. Rev. (Professional Sports Franchise Facility Proj.) Series 2015 D, 5% 12/1/40 (Pre-Refunded to 12/1/25 @ 100) | 10,000 | 10,474 | |
| Port Saint Lucie Util. Rev. Series 2007, 5.25% 9/1/26 (Nat'l. Pub. Fin. Guarantee Corp. Insured) | 45,000 | 48,236 | |
| Putnam County Dev. Auth. Poll. Cont. Rev. (Seminole Elec. Coop., Inc. Proj.) Series 2018 A, 5% 3/15/42 | 60,000 | 62,425 | |
| Sarasota County Pub. Hosp. District Hosp. Rev. (Sarasota Memorial Hosp. Proj.) Series 2018, 4% 7/1/48 | 100,000 | 93,725 | |
| South Broward Hosp. District Rev.: | |||
| Series 2016 A, 3.5% 5/1/39 | 15,000 | 13,668 | |
| Series 2021 A, 2.375% 5/1/45 | 130,000 | 86,946 | |
| Tampa Health Sys. Rev. Series 2016 A, 4% 11/15/46 | 125,000 | 118,811 | |
| Tampa Tax Allocation (H. Lee Moffitt Cancer Ctr. Proj.) Series 2020 A, 0% 9/1/53 | 195,000 | 41,592 | |
TOTAL FLORIDA | 3,394,956 | ||
| Georgia - 1.9% | |||
| Atlanta Arpt. Rev. Series 2019 B, 4% 7/1/49 (b) | 50,000 | 47,243 | |
| Atlanta Wtr. & Wastewtr. Rev. Series 2015: | |||
| 5% 11/1/28 | 40,000 | 41,406 | |
| 5% 11/1/32 | 30,000 | 31,058 | |
| 5% 11/1/40 | 20,000 | 20,479 | |
| 5% 11/1/43 (Pre-Refunded to 5/1/25 @ 100) | 50,000 | 51,784 | |
| Brookhaven Dev. Auth. Rev. Series 2019 A, 5% 7/1/26 | 10,000 | 10,567 | |
| Dalton Whitfield County Joint Dev. Auth. Rev. Series 2017, 4% 8/15/48 | 120,000 | 112,273 | |
| Fulton County Dev. Auth. Rev.: | |||
| Series 2019 A, 3% 7/1/44 | 135,000 | 105,761 | |
| Series 2019, 5% 6/15/44 | 30,000 | 32,351 | |
| Fulton County Wtr. & Swr. Rev. Series 2020 A, 3% 1/1/45 | 5,000 | 4,057 | |
| Gainesville & Hall County Hosp. Auth. Rev.: | |||
| (Northeast Georgia Health Sys., Inc. Proj.): | |||
Series 2017 A, 4% 2/15/42 | 20,000 | 19,094 | |
Series 2020 A, 5% 2/15/31 | 40,000 | 44,124 | |
| Series 2020 A, 3% 2/15/47 | 65,000 | 49,094 | |
| Georgia Gen. Oblig.: | |||
| Series 2015 A, 3% 2/1/30 | 55,000 | 54,892 | |
| Series 2017 A: | |||
5% 2/1/25 | 75,000 | 77,311 | |
5% 2/1/27 | 10,000 | 10,762 | |
| Series 2017 C: | |||
5% 7/1/27 | 5,000 | 5,434 | |
5% 7/1/30 | 25,000 | 27,115 | |
| Series 2018 A: | |||
3% 7/1/33 | 25,000 | 24,669 | |
5% 7/1/27 | 20,000 | 21,735 | |
5% 7/1/29 | 50,000 | 55,502 | |
| Series 2020 A, 5% 8/1/31 | 50,000 | 57,904 | |
| Series 2021 A, 5% 7/1/33 | 100,000 | 117,326 | |
| Series 2022 A, 4% 7/1/42 | 100,000 | 101,378 | |
| Georgia Hsg. & Fin. Auth.: | |||
| Series 2017 C, 3.65% 12/1/42 | 15,000 | 13,492 | |
| Series 2020 A, 3.15% 12/1/44 | 15,000 | 12,313 | |
| Georgia Hsg. & Fin. Auth. Rev.: | |||
| Series 2016 A, 3.35% 12/1/41 | 20,000 | 17,739 | |
| Series 2017 A, 3.65% 12/1/32 | 15,000 | 15,117 | |
| Series 2017 B, 3.2% 12/1/32 | 20,000 | 19,419 | |
| Georgia Muni. Elec. Auth. Pwr. Rev.: | |||
| Series 2018 HH, 4.125% 1/1/49 (Assured Guaranty Muni. Corp. Insured) | 110,000 | 107,261 | |
| Series 2021 A, 5% 1/1/56 | 80,000 | 81,598 | |
| Georgia Port Auth. Rev. Series 2021, 2.625% 7/1/51 | 70,000 | 48,296 | |
| Glynn-Brunswick Memorial Hosp. Auth. Rev. (Southeast Georgia Health Sys. Proj.) Series 2015, 5% 8/1/34 | 60,000 | 60,746 | |
| Griffin-Spalding County Hosp. (Wellstar Health Sys., Inc. Proj.) Series 2017 A, 3.75% 4/1/47 | 30,000 | 25,418 | |
| Gwinnett County School District Gen. Oblig. Series 2022 B, 5% 8/1/26 | 55,000 | 58,503 | |
| Hosp. Auth. of Savannah Auth. Rev. Series 2019 A, 3.125% 7/1/44 | 45,000 | 35,455 | |
| Metropolitan Atlanta Rapid Transit Auth. Sales Tax Rev.: | |||
| Series 2017 C, 3.5% 7/1/38 | 30,000 | 28,422 | |
| Series 2019 A, 3.125% 7/1/46 | 5,000 | 4,091 | |
| Series 2021 E2, 5% 7/1/24 | 25,000 | 25,478 | |
| Paulding County Wtr. & Sew Rev. Series 2016, 3% 12/1/48 | 15,000 | 11,673 | |
| Private Colleges & Univs. Auth. Rev. Series 2020 B, 5% 9/1/30 | 5,000 | 5,756 | |
TOTAL GEORGIA | 1,694,096 | ||
| Hawaii - 0.3% | |||
| Hawaii Arpts. Sys. Rev. Series 2020 D, 4% 7/1/39 | 10,000 | 10,020 | |
| Hawaii Dept. of Budget & Fin. Spl. Purp. Rev. Series 2015 A, 4% 7/1/40 | 20,000 | 19,359 | |
| Hawaii Gen. Oblig.: | |||
| Series 2016 FG, 5% 10/1/30 | 30,000 | 31,734 | |
| Series 2018 FT, 5% 1/1/28 | 100,000 | 109,478 | |
| Series FH, 5% 10/1/29 | 25,000 | 26,477 | |
| Series FW, 3.5% 1/1/38 | 5,000 | 4,874 | |
| Honolulu City and County Wastewtr. Sys.: | |||
| Series 2016 B, 4% 7/1/33 | 15,000 | 15,324 | |
| Series 2018 A, 3.375% 7/1/42 | 5,000 | 4,448 | |
TOTAL HAWAII | 221,714 | ||
| Idaho - 0.1% | |||
| Idaho Health Facilities Auth. Rev.: | |||
| (St. Luke's Health Sys. Proj.) Series 2018 A: | |||
5% 3/1/27 | 25,000 | 26,236 | |
5% 3/1/28 | 10,000 | 10,640 | |
| Series 2015 ID, 5.5% 12/1/29 | 25,000 | 25,929 | |
TOTAL IDAHO | 62,805 | ||
| Illinois - 5.2% | |||
| Chicago Gen. Oblig.: | |||
| Series 1999, 0% 1/1/33 | 70,000 | 46,501 | |
| Series 2000, 0% 1/1/29 | 55,000 | 44,298 | |
| Series 2002 B: | |||
5% 1/1/26 | 10,000 | 10,167 | |
5% 1/1/26 (Pre-Refunded to 1/1/25 @ 100) | 20,000 | 20,539 | |
| Series 2007 E, 5.5% 1/1/35 | 20,000 | 20,363 | |
| Series 2014 A: | |||
5.25% 1/1/30 | 95,000 | 95,922 | |
5.25% 1/1/31 (Assured Guaranty Muni. Corp. Insured) | 75,000 | 75,728 | |
| Series 2015 A: | |||
5% 1/1/26 | 5,000 | 5,084 | |
5% 1/1/26 (Escrowed to Maturity) | 10,000 | 10,456 | |
5.5% 1/1/33 | 15,000 | 15,285 | |
5.5% 1/1/39 | 120,000 | 121,983 | |
| Series 2017 A, 5.75% 1/1/33 | 50,000 | 53,375 | |
| Chicago Midway Arpt. Rev.: | |||
| Series 2014 A, 5% 1/1/26 (b) | 60,000 | 60,194 | |
| Series 2014 B, 5% 1/1/27 | 45,000 | 45,299 | |
| Chicago O'Hare Int'l. Arpt. Rev.: | |||
| Series 2015 A, 5% 1/1/28 (b) | 90,000 | 91,273 | |
| Series 2015 B: | |||
5% 1/1/29 | 95,000 | 97,131 | |
5% 1/1/31 | 190,000 | 194,476 | |
| Series 2015 D, 4% 1/1/35 | 85,000 | 85,566 | |
| Series 2017 A, 5% 1/1/27 | 20,000 | 21,298 | |
| Series 2017 B, 5% 1/1/33 | 10,000 | 10,618 | |
| Series 2017 C, 5% 1/1/41 | 100,000 | 103,344 | |
| Series 2017 D, 5% 1/1/42 (b) | 15,000 | 15,270 | |
| Series 2018 B: | |||
5% 1/1/37 | 15,000 | 16,161 | |
5% 1/1/38 | 100,000 | 107,039 | |
| Chicago Transit Auth. Series 2014, 5.25% 12/1/49 | 125,000 | 126,791 | |
| Chicago Transit Auth. Cap. Grant Receipts Rev. Series 2017, 5% 6/1/25 | 20,000 | 20,504 | |
| Chicago Wtr. Rev. Series 2000, 5% 11/1/30 | 35,000 | 36,671 | |
| Cook County Cmnty. College District Series 2013, 5.25% 12/1/30 | 40,000 | 40,078 | |
| Illinois Fin. Auth. Series 2020 A, 4% 4/1/50 | 5,000 | 4,768 | |
| Illinois Fin. Auth. Rev.: | |||
| Series 2015 C, 4.125% 8/15/37 | 65,000 | 61,668 | |
| Series 2016 C, 5% 2/15/34 | 60,000 | 63,327 | |
| Series 2016: | |||
3.25% 11/15/45 | 20,000 | 15,660 | |
4% 1/1/25 | 10,000 | 10,135 | |
4% 12/1/31 | 25,000 | 25,136 | |
4% 12/1/35 | 50,000 | 50,076 | |
| Series 2018 A: | |||
5% 10/1/41 | 10,000 | 10,468 | |
5% 10/1/48 | 30,000 | 31,196 | |
| Series 2019: | |||
5% 7/1/27 | 15,000 | 16,265 | |
5% 1/1/31 | 115,000 | 128,698 | |
| Illinois Gen. Oblig.: | |||
| Series 2012 A, 4.5% 1/1/37 | 65,000 | 65,069 | |
| Series 2013 A, 4% 4/1/31 (Assured Guaranty Muni. Corp. Insured) | 75,000 | 75,046 | |
| Series 2013, 5.25% 7/1/31 | 20,000 | 20,005 | |
| Series 2014, 5% 4/1/27 | 5,000 | 5,049 | |
| Series 2016, 5% 1/1/27 | 185,000 | 191,935 | |
| Series 2017 A, 4.5% 12/1/41 | 15,000 | 15,030 | |
| Series 2017 C, 5% 11/1/29 | 65,000 | 69,334 | |
| Series 2017 D: | |||
3.25% 11/1/26 | 10,000 | 9,762 | |
5% 11/1/28 | 60,000 | 63,867 | |
| Series 2018 A: | |||
5% 10/1/24 | 85,000 | 86,403 | |
5% 10/1/25 | 50,000 | 51,556 | |
| Series 2018 B: | |||
5% 10/1/24 | 30,000 | 30,495 | |
5% 10/1/30 | 100,000 | 108,002 | |
| Series 2019 A, 5% 11/1/25 | 50,000 | 51,622 | |
| Series 2019 B, 5% 9/1/25 | 15,000 | 15,447 | |
| Series 2020 D, 5% 10/1/25 | 5,000 | 5,156 | |
| Series 2022 A, 5.5% 3/1/47 | 200,000 | 216,966 | |
| Series 2022, 5.25% 3/1/38 | 85,000 | 92,947 | |
| Series November 2016, 4.125% 11/1/31 | 10,000 | 10,102 | |
| Illinois Muni. Elec. Agcy. Pwr. Supply Series 2015 A, 4% 2/1/33 | 70,000 | 70,426 | |
| Illinois Sales Tax Rev.: | |||
| Series 2016 A: | |||
3% 6/15/33 | 25,000 | 23,162 | |
3% 6/15/34 | 75,000 | 68,428 | |
| Series 2016 D: | |||
3% 6/15/31 | 15,000 | 14,181 | |
3% 6/15/32 | 20,000 | 18,763 | |
| Illinois Toll Hwy. Auth. Toll Hwy. Rev.: | |||
| Series 2014 B, 5% 1/1/37 | 40,000 | 40,218 | |
| Series 2014 C, 5% 1/1/27 | 130,000 | 133,325 | |
| Series 2015 A, 5% 1/1/40 | 25,000 | 25,503 | |
| Series 2015 B, 5% 1/1/40 | 55,000 | 56,636 | |
| Series 2016 A, 5% 12/1/31 | 60,000 | 62,361 | |
| Series 2017 A, 5% 1/1/42 | 50,000 | 52,460 | |
| Series B: | |||
5% 1/1/27 | 35,000 | 37,342 | |
5% 1/1/30 | 5,000 | 5,622 | |
| Series C, 5% 1/1/30 | 30,000 | 33,735 | |
| Metropolitan Pier & Exposition: | |||
| (McCormick Place Expansion Proj.): | |||
Series 2002 A: | |||
0% 12/15/30 (Nat'l. Pub. Fin. Guarantee Corp. Insured) | 70,000 | 52,529 | |
0% 6/15/36 (Nat'l. Pub. Fin. Guarantee Corp. Insured) | 30,000 | 17,380 | |
Series 2010 B1: | |||
0% 6/15/43 (Assured Guaranty Muni. Corp. Insured) | 70,000 | 27,605 | |
0% 6/15/45 (Assured Guaranty Muni. Corp. Insured) | 345,000 | 122,049 | |
| Series 2002 A: | |||
0% 6/15/32 (Nat'l. Pub. Fin. Guarantee Corp. Insured) | 30,000 | 21,146 | |
0% 12/15/33 (Nat'l. Pub. Fin. Guarantee Corp. Insured) | 50,000 | 33,104 | |
0% 12/15/34 (Nat'l. Pub. Fin. Guarantee Corp. Insured) | 10,000 | 6,305 | |
| Series 2002: | |||
0% 12/15/23 | 20,000 | 19,649 | |
0% 12/15/31 (Nat'l. Pub. Fin. Guarantee Corp. Insured) | 20,000 | 14,386 | |
| Series 2017 B, 0% 12/15/56 (Assured Guaranty Muni. Corp. Insured) | 50,000 | 9,681 | |
| Northern Illinois Muni. Pwr. Agcy. Rev. (Prairie State Proj.) Series 2016 A, 5% 12/1/28 | 25,000 | 26,551 | |
| Rosemont Gen. Oblig. Series 2016 A, 5% 12/1/46 (Assured Guaranty Muni. Corp. Insured) | 335,000 | 346,772 | |
| Sales Tax Securitization Corp. Series 2017 A, 5% 1/1/28 | 50,000 | 53,819 | |
| Springfield Elec. Rev. Series 2015, 4% 3/1/40 (Assured Guaranty Muni. Corp. Insured) | 30,000 | 29,145 | |
TOTAL ILLINOIS | 4,614,887 | ||
| Indiana - 1.0% | |||
| Carmel Local Pub. Impt. Bond Bank Series 2016, 5% 7/15/30 | 10,000 | 10,496 | |
| Indiana Bond Bank Series 2008 B, 0% 6/1/32 (Assured Guaranty Muni. Corp. Insured) | 70,000 | 50,732 | |
| Indiana Fin. Auth. Rev.: | |||
| Series 2019 E, 5% 2/1/36 | 25,000 | 27,637 | |
| Series 2022 B, 5% 2/1/32 | 400,000 | 468,904 | |
| Indiana Fin. Auth. Wastewtr. Util. Rev.: | |||
| (CWA Auth. Proj.) Series 2014 A, 5% 10/1/31 | 50,000 | 51,004 | |
| Series 2021 I, 5% 10/1/27 | 55,000 | 59,684 | |
| Indiana Univ. Lease Purchase Oblig. Series 2020 A, 4% 6/1/45 | 5,000 | 4,934 | |
| Indianapolis Local Pub. Impt.: | |||
| (Courthouse and Jail Proj.) Series 2019 A: | |||
5% 2/1/33 | 15,000 | 16,651 | |
5% 2/1/54 | 25,000 | 26,135 | |
| (Pilot Infrastructure Prog.) Series 2017 C, 5% 1/1/33 | 15,000 | 16,246 | |
| Indianapolis Local Pub. Impt. Bond Bank Series E, 0% 2/1/28 (AMBAC Insured) | 50,000 | 42,887 | |
| Purdue Univ. Rev. Series 2020 EE, 5% 7/1/36 | 80,000 | 89,607 | |
TOTAL INDIANA | 864,917 | ||
| Iowa - 0.2% | |||
| Iowa Fin. Auth. Health Care Facilities Rev. Series 2013, 5% 7/1/33 (Pre-Refunded to 7/1/23 @ 100) | 10,000 | 10,000 | |
| Iowa Fin. Auth. Rev.: | |||
| Series 2016, 5% 8/1/26 | 30,000 | 31,847 | |
| Series 2017, 5% 8/1/37 | 50,000 | 53,547 | |
| Tobacco Settlement Auth. Tobacco Settlement Rev. Series 2021 A2, 4% 6/1/40 | 100,000 | 96,036 | |
TOTAL IOWA | 191,430 | ||
| Kansas - 0.2% | |||
| Johnson & Miami County Unified School District Series 2016 B, 3% 9/1/37 | 20,000 | 17,887 | |
| Kansas Dept. of Trans. Hwy. Rev. Series 2015 A, 3% 9/1/24 | 50,000 | 49,692 | |
| Univ. of Kansas Hosp. Auth. Health Facilities Rev.: | |||
| Series 2017 A, 5% 3/1/47 | 85,000 | 87,034 | |
| Series 2019 A, 4% 9/1/48 | 25,000 | 23,424 | |
TOTAL KANSAS | 178,037 | ||
| Kentucky - 0.9% | |||
| Carroll County Envir. Facilities Rev. Series 2008 A, 2% 2/1/32 (b) | 280,000 | 229,130 | |
| Kentucky Asset/Liability Commission Agcy. Fund Rev.: | |||
| Series 2013 A, 5.25% 9/1/25 | 75,000 | 75,223 | |
| Series 2014 D, 5% 9/1/24 | 155,000 | 157,915 | |
| Kentucky Eco Dev. Fin. Auth. Health Rev. Series 2000 B, 0% 10/1/27 (Nat'l. Pub. Fin. Guarantee Corp. Insured) | 45,000 | 38,328 | |
| Kentucky Econ. Dev. Fin. Auth. Hosp. Rev. Series 2017 A, 5.25% 6/1/41 | 100,000 | 102,316 | |
| Kentucky Muni. Pwr. Agcy. Pwr. Sys. Rev. (Prairie State Proj.) Series 2015 A: | |||
| 4% 9/1/39 | 75,000 | 72,162 | |
| 5% 9/1/23 | 20,000 | 20,043 | |
| 5% 9/1/42 | 25,000 | 25,055 | |
| Kentucky State Property & Buildings Commission Rev. Series B, 5% 11/1/28 | 30,000 | 31,836 | |
| Louisville & Jefferson County Metropolitan Swr. District Swr. & Drain Sys. Rev. Series 2016 A, 3% 5/15/46 | 60,000 | 46,781 | |
| Univ. of Kentucky Gen. Rcpts Series A, 3.5% 10/1/47 | 25,000 | 21,707 | |
TOTAL KENTUCKY | 820,496 | ||
| Louisiana - 0.7% | |||
| Louisiana Gas & Fuel Tax Rev. Series 2017 C, 5% 5/1/45 | 250,000 | 260,608 | |
| Louisiana Gen. Oblig.: | |||
| Series 2014 D1, 3% 12/1/29 | 60,000 | 59,605 | |
| Series 2017 A, 5% 4/1/25 | 25,000 | 25,845 | |
| Series 2021 A, 5% 3/1/41 | 115,000 | 127,272 | |
| Louisiana Pub. Facilities Auth. Hosp. Rev. (Franciscan Missionaries of Our Lady Health Sys. Proj.) Series 2017 A, 3.75% 7/1/47 | 25,000 | 21,092 | |
| Louisiana Pub. Facilities Auth. Lease Rev. (Phase II Proj.) Series 2017, 5% 7/1/57 | 50,000 | 50,431 | |
| Louisiana Pub. Facilities Auth. Rev. Series 2016, 4% 5/15/41 | 20,000 | 19,271 | |
| New Orleans Wtr. Series 2015, 5% 12/1/40 (Pre-Refunded to 12/1/25 @ 100) | 20,000 | 20,877 | |
| Shreveport Wtr. & Swr. Rev. Series 2014 B, 4% 12/1/38 | 25,000 | 24,275 | |
| State of Louisiana Grant Anticipation Rev. Series 2019 A, 5% 9/1/29 | 20,000 | 22,099 | |
TOTAL LOUISIANA | 631,375 | ||
| Maine - 0.1% | |||
| Maine Health & Higher Edl. Facilities Auth. Rev. Series 2021 A, 4% 7/1/50 (Assured Guaranty Muni. Corp. Insured) | 75,000 | 69,061 | |
| Maryland - 2.2% | |||
| Anne Arundel County Gen. Oblig. Series 2021, 5% 4/1/29 | 150,000 | 168,761 | |
| Maryland Cmnty. Dev. Admin Dept. Hsg. & Cmnty. Dev. Series C, 3% 3/1/42 | 20,000 | 17,258 | |
| Maryland Dept. of Trans. Series 2016, 4% 11/1/29 | 85,000 | 86,028 | |
| Maryland Gen. Oblig.: | |||
| Series 2015, 3% 8/1/28 | 30,000 | 29,865 | |
| Series 2019 1, 5% 3/15/31 | 55,000 | 61,809 | |
| Series 2019 A1, 5% 8/1/31 | 100,000 | 111,066 | |
| Series 2019, 5% 3/15/30 | 30,000 | 33,701 | |
| Series 2020 A, 5% 8/1/29 | 150,000 | 169,823 | |
| Series A, 5% 3/15/30 | 30,000 | 33,076 | |
| Maryland Health & Higher Edl. Series 2021 A, 2.5% 7/1/51 | 65,000 | 40,873 | |
| Maryland Health & Higher Edl. Facilities Auth. Rev. Series 2017 A, 4% 5/15/47 | 50,000 | 46,230 | |
| Maryland Stadium Auth. Built to Learn Rev. Series 2021, 2.75% 6/1/51 | 205,000 | 143,075 | |
| Maryland Trans. Auth. Trans. Facility Projs. Rev. Series 2021 A: | |||
| 2.25% 7/1/39 | 185,000 | 140,307 | |
| 4% 7/1/40 | 85,000 | 85,769 | |
| Montgomery County Gen. Oblig. Series 2014 A, 5% 11/1/29 (Pre-Refunded to 11/1/24 @ 100) | 85,000 | 87,080 | |
| Prince Georges County Gen. Oblig. Series 2018 A, 3.25% 7/15/36 | 155,000 | 150,461 | |
| Univ. of Maryland Sys. Auxiliary Facility & Tuition Rev. Series A, 3.25% 4/1/36 | 50,000 | 48,495 | |
| Washington Metropolitan Area Transit Auth. Series 2021 A, 3% 7/15/36 | 150,000 | 140,160 | |
| Washington Suburban San. District: | |||
| Series 2016 2, 5% 6/1/34 | 65,000 | 68,814 | |
| Series 2016, 3% 6/1/46 | 150,000 | 123,098 | |
| Series 2017, 4% 6/15/47 | 125,000 | 123,403 | |
TOTAL MARYLAND | 1,909,152 | ||
| Massachusetts - 2.2% | |||
| Cambridge Gen. Oblig. Series 2021, 5% 2/15/29 | 115,000 | 129,681 | |
| Massachusetts Bay Trans. Auth. Sales Tax Rev.: | |||
| Series 2007, 5.25% 7/1/28 | 10,000 | 11,222 | |
| Series A, 5.25% 7/1/28 | 30,000 | 33,666 | |
| Series B, 5% 7/1/33 | 85,000 | 88,049 | |
| Series C, 5.5% 7/1/23 | 5,000 | 5,000 | |
| Massachusetts Clean Wtr. Trust Series 2020, 5% 8/1/28 | 90,000 | 100,174 | |
| Massachusetts Commonwealth Trans. Fund Rev. (Rail Enhancement & Accelerated Bridge Prog.) Series 2017 A, 5% 6/1/47 | 145,000 | 151,824 | |
| Massachusetts Dev. Fin. Agcy. Rev.: | |||
| Series 2016 I, 3% 7/1/32 | 25,000 | 23,859 | |
| Series BB1, 4% 10/1/46 | 30,000 | 29,637 | |
| Series F, 5% 8/15/24 | 5,000 | 5,072 | |
| Massachusetts Fed. Hwy. (Accelerated Bridge Prog.): | |||
| Series 2016 A, 5% 6/15/27 | 55,000 | 58,384 | |
| Series A, 5% 6/15/25 | 25,000 | 25,421 | |
| Massachusetts Gen. Oblig.: | |||
| Series 2004 C, 5.5% 12/1/24 | 5,000 | 5,171 | |
| Series 2016 B, 4% 7/1/33 | 25,000 | 25,655 | |
| Series 2016 G, 3% 9/1/46 | 40,000 | 31,902 | |
| Series 2017 E, 5% 11/1/24 | 30,000 | 30,770 | |
| Series 2017 F, 5% 11/1/44 | 5,000 | 5,266 | |
| Series 2019 A: | |||
5% 1/1/38 | 60,000 | 65,126 | |
5% 1/1/49 | 70,000 | 74,103 | |
| Series 2019 C: | |||
5% 5/1/31 | 85,000 | 98,877 | |
5% 5/1/41 | 35,000 | 37,734 | |
| Series 2020 D, 5% 7/1/41 | 55,000 | 60,061 | |
| Series 2020 E, 5% 11/1/25 | 75,000 | 78,468 | |
| Series 2021 B, 3% 4/1/47 | 150,000 | 118,376 | |
| Series 2022 C, 5% 10/1/47 | 100,000 | 109,728 | |
| Series A, 5% 7/1/31 | 30,000 | 31,798 | |
| Series B, 5% 7/1/26 | 25,000 | 26,521 | |
| Series C, 5% 5/1/30 | 40,000 | 45,752 | |
| Series D, 5% 7/1/26 | 30,000 | 31,826 | |
| Series E, 5% 11/1/45 | 55,000 | 59,651 | |
| Massachusetts Hsg. Fin. Agcy. Hsg. Rev. Series 2019 B1, 2.75% 12/1/34 | 85,000 | 75,807 | |
| Massachusetts Hsg. Fin. Agcy. Multi-Family Rev. Series A, 4.5% 12/1/48 (b) | 15,000 | 14,201 | |
| Massachusetts Port Auth. Rev. Series 2021 E, 5% 7/1/34 (b) | 70,000 | 77,399 | |
| Massachusetts School Bldg. Auth. Dedicated Sales Tax Rev.: | |||
| Series 2016 B, 5% 11/15/46 | 20,000 | 20,769 | |
| Series 2018 B, 4% 2/15/40 | 85,000 | 84,998 | |
| Series A, 5% 8/15/50 | 10,000 | 10,777 | |
| Series C, 5% 11/15/34 | 20,000 | 21,315 | |
| Massachusetts Spl. Oblig. Dedicated Tax Rev. Series 2005, 5.5% 1/1/30 (Nat'l. Pub. Fin. Guarantee Corp. Insured) | 65,000 | 74,955 | |
TOTAL MASSACHUSETTS | 1,978,995 | ||
| Michigan - 0.9% | |||
| Great Lakes Wtr. Auth. Sew Disp. Sys. Series 2016 C, 5% 7/1/36 | 35,000 | 36,541 | |
| Great Lakes Wtr. Auth. Wtr. Supply Sys. Rev. Series 2018 A, 5% 7/1/27 | 35,000 | 37,312 | |
| Michigan Bldg. Auth. Rev.: | |||
| (Facilities Prog.): | |||
Series 1A: | |||
5% 10/15/33 | 50,000 | 50,289 | |
5.25% 10/15/47 | 10,000 | 10,047 | |
Series I: | |||
5% 4/15/26 | 10,000 | 10,417 | |
5% 10/15/28 | 20,000 | 21,269 | |
5% 10/15/30 | 35,000 | 37,129 | |
| Series I, 5% 4/15/38 | 50,000 | 51,597 | |
| Michigan Fin. Auth. Rev.: | |||
| (Charter County of Wayne Criminal Justice Ctr. Proj.) Series 2018, 5% 11/1/29 | 55,000 | 60,694 | |
| (Detroit Wtr. and Sewerage Dept. Sewage Disp. Sys. Rev. Rfdg. Local Proj.) Series 2014 C, 5% 7/1/28 (Assured Guaranty Muni. Corp. Insured) | 5,000 | 5,077 | |
| (Detroit Wtr. And Sewerage Dept. Wtr. Supply Sys. Rev. Rfdg. Local Proj.) Series 2014 D, 5% 7/1/24 (Assured Guaranty Muni. Corp. Insured) | 35,000 | 35,480 | |
| Series 2016, 3.25% 11/15/42 | 25,000 | 19,993 | |
| Michigan Hosp. Fin. Auth. Rev.: | |||
| (Trinity Health Proj.) Series 2008 C: | |||
5% 12/1/26 | 70,000 | 74,109 | |
5% 12/1/27 | 25,000 | 26,986 | |
| Series 2010 F, 4% 11/15/47 | 20,000 | 18,914 | |
| Michigan Hsg. Dev. Auth. Rental Hsg. Rev. Series 2020 A1, 2.7% 10/1/45 | 40,000 | 29,297 | |
| Michigan Hsg. Dev. Auth. Single Family Mtg. Rev. Series 2016 A, 3.35% 12/1/31 | 10,000 | 9,630 | |
| Michigan State Univ. Revs. Series 2019 B, 4% 2/15/37 | 60,000 | 60,631 | |
| Michigan Strategic Fund Ltd. Oblig. Rev. (I-75 Impt. Proj.) Series 2018: | |||
| 5% 12/31/26 (b) | 50,000 | 51,307 | |
| 5% 6/30/28 (b) | 45,000 | 46,849 | |
| 5% 12/31/31 (b) | 15,000 | 15,732 | |
| Michigan Trunk Line Fund Rev. Series 2020 B, 4% 11/15/37 | 10,000 | 10,236 | |
| Wayne County Arpt. Auth. Rev. Series 2021 B, 5% 12/1/35 (b) | 100,000 | 108,993 | |
TOTAL MICHIGAN | 828,529 | ||
| Minnesota - 1.8% | |||
| Hennepin County Gen. Oblig. Series 2019 B, 5% 12/15/31 | 480,000 | 541,245 | |
| Hennepin County Sales Tax Rev. (Ballpark Proj.) Series 2017 A, 5% 12/15/28 | 20,000 | 20,154 | |
| Minneapolis & Saint Paul Metropolitan Arpts. Commission Arpt. Rev. Series 2019 A, 5% 1/1/49 | 35,000 | 36,778 | |
| Minnesota Gen. Oblig.: | |||
| Series 2016 A, 5% 8/1/25 | 60,000 | 62,491 | |
| Series 2017 A, 5% 10/1/28 | 30,000 | 32,851 | |
| Series 2018 B, 3.25% 8/1/36 | 55,000 | 53,130 | |
| Series 2019 A, 5% 8/1/28 | 70,000 | 77,843 | |
| Series 2022 B, 5% 8/1/32 | 90,000 | 107,109 | |
| Minnesota Hsg. Fin. Agcy.: | |||
| Series 2019 F, 3.75% 1/1/50 | 30,000 | 29,597 | |
| Series 2021 B, 4% 8/1/43 | 75,000 | 72,975 | |
| Series 2021 D, 2.45% 1/1/52 | 100,000 | 73,479 | |
| Minnesota Muni. Gas Agcy. Rev. Bonds Series 2022 A, 4%, tender 12/1/27 (c) | 280,000 | 279,810 | |
| Owatonna Independent School District 761 (Minnesota School District Cr. Enhancement Prog.) Series 2020 A, 2.125% 2/1/40 | 90,000 | 65,238 | |
| Rochester Health Care Facilities Rev. Series 2016 B, 5% 11/15/29 | 25,000 | 28,299 | |
| Saint Cloud Health Care Rev.: | |||
| Series 2016 A, 3.25% 5/1/39 | 15,000 | 12,906 | |
| Series 2019, 5% 5/1/48 | 20,000 | 20,499 | |
| Virginia Independent School District #706 Series 2019 A, 3% 2/1/36 | 85,000 | 79,116 | |
TOTAL MINNESOTA | 1,593,520 | ||
| Mississippi - 0.3% | |||
| Mississippi Dev. Bank Spl. Oblig. (Mississippi Dept. of Corrections Walnut Grove Correctional Facility Rfdg. Bonds Proj.) Series 2016 A, 5% 8/1/26 | 45,000 | 47,122 | |
| Mississippi Gen. Oblig. Series 2016 B: | |||
| 5% 12/1/31 (Pre-Refunded to 12/1/26 @ 100) | 75,000 | 80,304 | |
| 5% 12/1/35 (Pre-Refunded to 12/1/26 @ 100) | 55,000 | 58,890 | |
| Mississippi State Gaming Tax Rev. Series 2019 A, 5% 10/15/28 | 5,000 | 5,395 | |
| West Rankin Util. Auth. Rev. Series 2018, 5% 1/1/48 (Pre-Refunded to 1/1/28 @ 100) | 100,000 | 109,036 | |
TOTAL MISSISSIPPI | 300,747 | ||
| Missouri - 0.8% | |||
| Metropolitan St. Louis Swr. District Wastewtr. Sys. Rev. Series 2015 B, 5% 5/1/45 (Pre-Refunded to 5/1/25 @ 100) | 80,000 | 82,653 | |
| Missouri Board of Pub. Buildings Spl. Oblig. Series 2014 A, 3% 10/1/29 | 15,000 | 15,000 | |
| Missouri Health & Edl. Facilities Auth. Rev. Series 2019 A, 5% 2/1/42 | 125,000 | 116,814 | |
| Missouri Health & Edl. Facilities Rev.: | |||
| Series 2012, 4% 11/15/42 | 85,000 | 83,229 | |
| Series 2014 A: | |||
4% 6/1/32 (Pre-Refunded to 6/1/24 @ 100) | 40,000 | 40,148 | |
5% 6/1/29 (Pre-Refunded to 6/1/24 @ 100) | 55,000 | 55,689 | |
| Series 2014 F, 4.25% 11/15/48 | 15,000 | 15,000 | |
| Series 2016, 5% 11/15/28 | 30,000 | 31,398 | |
| Series 2017 C: | |||
3.625% 11/15/47 | 25,000 | 21,810 | |
4% 11/15/49 | 55,000 | 52,024 | |
| Missouri Joint Muni. Elec. Util. Commission Pwr. Proj. Rev.: | |||
| (IATAN 2 Proj.) Series 2014 A, 5% 1/1/28 | 45,000 | 45,267 | |
| (Prairie State Proj.) Series 2016 A, 5% 12/1/40 | 150,000 | 152,782 | |
| Springfield Pub. Util. Rev. Series 2015, 4% 8/1/31 | 35,000 | 35,568 | |
TOTAL MISSOURI | 747,382 | ||
| Montana - 0.1% | |||
| Montana Facility Fin. Auth. Series 2018 B, 4.125% 7/1/38 | 75,000 | 71,202 | |
| Montana Facility Fin. Auth. Rev. Series 2016, 5% 2/15/28 | 20,000 | 20,822 | |
TOTAL MONTANA | 92,024 | ||
| Nebraska - 0.6% | |||
| Douglas County Hosp. Auth. #2 Health Facilities Rev. Series 2015, 4.25% 11/1/45 | 35,000 | 33,386 | |
| Nebraska Edl. Health Cultural & Social Svcs. Fin. Auth. Rev. Series 2019 A, 4% 1/1/49 | 85,000 | 80,739 | |
| Omaha Pub. Pwr. District Elec. Rev. Series 2015 B, 4% 2/1/39 | 55,000 | 55,113 | |
| Omaha San. Swr. Sys. Rev. Series 2014, 5% 11/15/34 | 315,000 | 321,675 | |
| The Board of Regents of The Univ. of Nebraska Series 2016 A, 3% 7/1/39 (Pre-Refunded to 7/1/26 @ 100) | 5,000 | 5,001 | |
| Univ. of Nebraska Facilities Corp. Series 2021 A, 4% 7/15/62 | 40,000 | 37,240 | |
TOTAL NEBRASKA | 533,154 | ||
| Nevada - 0.7% | |||
| Clark County Fuel Tax: | |||
| Series 2017, 3% 11/1/38 | 15,000 | 13,034 | |
| Series 2018 A, 5% 6/1/43 | 100,000 | 105,917 | |
| Series 2019 A: | |||
5% 12/1/24 | 5,000 | 5,129 | |
5% 12/1/28 | 15,000 | 16,687 | |
| Series 2019, 5% 6/1/25 | 25,000 | 25,883 | |
| Clark County Hwy. Impt. Rev. Series 2017, 5% 7/1/30 | 50,000 | 53,943 | |
| Clark County Poll. Cont. Rev. Series 2010, 2.1% 6/1/31 | 260,000 | 217,133 | |
| Clark County School District Series 2019 A, 3% 6/15/39 (Assured Guaranty Muni. Corp. Insured) | 30,000 | 25,569 | |
| Las Vegas Redev. Agcy., Tax Increment Rev. Series 2016, 5% 6/15/40 | 100,000 | 101,866 | |
| Washoe County School District Series 2017 C, 3.25% 10/1/42 (Assured Guaranty Muni. Corp. Insured) | 50,000 | 43,889 | |
TOTAL NEVADA | 609,050 | ||
| New Jersey - 3.9% | |||
| New Jersey Econ. Dev. Auth.: | |||
| Series A: | |||
4% 11/1/37 | 60,000 | 60,136 | |
5% 11/1/31 | 20,000 | 21,952 | |
| Series UU: | |||
5% 6/15/40 | 30,000 | 30,434 | |
5% 6/15/40 (Pre-Refunded to 6/15/24 @ 100) | 5,000 | 5,072 | |
| New Jersey Econ. Dev. Auth. Lease Rev. (State House Proj.) Series 2017 B, 5% 6/15/26 | 20,000 | 20,908 | |
| New Jersey Econ. Dev. Auth. Natural Gas Facilities Rev. (New Jersey Natural Gas Co. Proj.) Series 2011 C, 3% 8/1/41 (b) | 20,000 | 15,231 | |
| New Jersey Econ. Dev. Auth. Rev.: | |||
| (New Jersey Transit Corp. Projs.) Series 2017, 4% 11/1/25 | 20,000 | 20,165 | |
| Series 2005 N1, 5.5% 9/1/23 | 15,000 | 15,046 | |
| Series 2014 PP: | |||
4% 6/15/30 (Pre-Refunded to 6/15/24 @ 100) | 15,000 | 15,121 | |
5% 6/15/27 (Pre-Refunded to 6/15/24 @ 100) | 65,000 | 66,123 | |
| Series 2014 UU, 5% 6/15/30 (Pre-Refunded to 6/15/24 @ 100) | 10,000 | 10,145 | |
| Series 2015 XX, 4% 6/15/24 | 50,000 | 50,280 | |
| Series 2018 EEE, 5% 6/15/48 | 95,000 | 98,162 | |
| Series 2019 LLL, 5% 6/15/30 | 80,000 | 88,387 | |
| Series B, 5% 11/1/26 | 5,000 | 5,262 | |
| Series UU, 4% 6/15/32 (Pre-Refunded to 6/15/24 @ 100) | 95,000 | 95,500 | |
| Series WW, 5.25% 6/15/28 | 45,000 | 46,506 | |
| Series XX, 4.375% 6/15/27 | 15,000 | 15,189 | |
| New Jersey Econ. Dev. Auth. Wtr. Facilities Rev. Bonds (New Jersey American Wtr. Co., Inc. Proj.) Series 2019 B, 2.05%, tender 12/3/29 (c) | 75,000 | 64,770 | |
| New Jersey Edl. Facility: | |||
| Series 2014 A: | |||
5% 9/1/25 | 10,000 | 10,165 | |
5% 9/1/26 | 100,000 | 101,703 | |
| Series 2014, 5% 6/15/24 | 70,000 | 71,037 | |
| Series 2015 D, 5% 7/1/25 | 65,000 | 67,593 | |
| Series A, 4% 7/1/47 | 40,000 | 35,658 | |
| New Jersey Gen. Oblig.: | |||
| Series 2013, 4% 6/1/27 | 10,000 | 10,006 | |
| Series 2014, 4% 6/1/34 | 15,000 | 15,212 | |
| Series 2016, 5% 6/1/24 | 25,000 | 25,414 | |
| New Jersey Health Care Facilities Fing. Auth. Rev.: | |||
| (Hosp. Asset Transformation Prog.) Series 2017: | |||
5% 10/1/26 | 90,000 | 94,578 | |
5% 10/1/27 | 10,000 | 10,553 | |
| Series 2016, 3% 7/1/32 | 25,000 | 22,242 | |
| Series 2017 A, 4% 7/1/52 | 25,000 | 23,424 | |
| New Jersey Higher Ed. Student Assistance Auth. Student Ln. Rev.: | |||
| Series 2019 A, 5% 12/1/27 | 35,000 | 37,541 | |
| Series 2019 B, 3.25% 12/1/39 (b) | 55,000 | 52,155 | |
| New Jersey Hsg. & Mtg. Fin. Agcy. Rev. Series 2018 A, 3.75% 10/1/35 | 70,000 | 67,589 | |
| New Jersey Sports & Exposition Auth. Contract Rev. Series 2018 A, 5% 9/1/24 | 50,000 | 50,843 | |
| New Jersey Tobacco Settlement Fing. Corp. Series 2018 A, 5% 6/1/29 | 30,000 | 32,183 | |
| New Jersey Tpk. Auth. Tpk. Rev.: | |||
| Series 2004 C2, 5.5% 1/1/25 (AMBAC Insured) | 65,000 | 67,308 | |
| Series 2005 A, 5.25% 1/1/26 (Assured Guaranty Muni. Corp. Insured) | 20,000 | 21,086 | |
| Series 2014 A: | |||
5% 1/1/28 | 90,000 | 91,378 | |
5% 1/1/29 | 5,000 | 5,078 | |
| Series 2015 E: | |||
5% 1/1/32 | 130,000 | 133,432 | |
5% 1/1/45 | 160,000 | 162,958 | |
| Series 2016 A, 5% 1/1/33 | 30,000 | 31,335 | |
| Series 2017 A, 5% 1/1/33 | 70,000 | 74,348 | |
| Series 2017 B, 4% 1/1/35 | 5,000 | 5,134 | |
| Series 2017 E, 5% 1/1/29 | 10,000 | 10,899 | |
| New Jersey Trans. Trust Fund Auth.: | |||
| Series 2006 C: | |||
0% 12/15/25 | 20,000 | 18,309 | |
0% 12/15/29 (Assured Guaranty Muni. Corp. Insured) | 5,000 | 3,982 | |
0% 12/15/32 (Assured Guaranty Muni. Corp. Insured) | 10,000 | 7,069 | |
| Series 2008 A: | |||
0% 12/15/37 | 5,000 | 2,702 | |
0% 12/15/38 | 65,000 | 33,409 | |
| Series 2009 A, 0% 12/15/33 | 90,000 | 60,449 | |
| Series 2010 A: | |||
0% 12/15/25 | 10,000 | 9,148 | |
0% 12/15/27 | 30,000 | 25,674 | |
0% 12/15/32 | 35,000 | 24,490 | |
0% 12/15/33 | 60,000 | 40,299 | |
| Series 2013 AA, 5% 6/15/27 | 190,000 | 190,000 | |
| Series 2015 AA: | |||
5.25% 6/15/29 | 45,000 | 46,506 | |
5.25% 6/15/32 | 5,000 | 5,163 | |
| Series 2016 A, 5% 6/15/30 | 25,000 | 26,142 | |
| Series 2018 A: | |||
5% 12/15/24 | 20,000 | 20,431 | |
5% 6/15/31 | 75,000 | 78,308 | |
| Series 2019 AA, 4.5% 6/15/49 | 5,000 | 5,022 | |
| Series 2019 B, 4% 6/15/37 | 160,000 | 160,315 | |
| Series 2021 A: | |||
5% 6/15/28 | 85,000 | 92,048 | |
5% 6/15/30 | 50,000 | 55,771 | |
| Series A: | |||
0% 12/15/26 | 70,000 | 61,922 | |
0% 12/15/31 | 70,000 | 50,939 | |
4% 12/15/31 | 80,000 | 82,487 | |
4.25% 12/15/38 | 95,000 | 95,889 | |
| Series A1, 4.1% 6/15/31 | 55,000 | 55,929 | |
| Series AA, 5.25% 6/15/27 | 30,000 | 31,059 | |
| Series BB1, 5% 6/15/34 | 85,000 | 91,788 | |
| Series C, 5.25% 6/15/32 | 35,000 | 35,965 | |
TOTAL NEW JERSEY | 3,486,456 | ||
| New Mexico - 0.6% | |||
| New Mexico Hosp. Equip. Ln. Council Rev.: | |||
| Series 2015 A, 4.125% 8/1/44 (Pre-Refunded to 8/1/25 @ 100) | 210,000 | 213,484 | |
| Series 2019 A, 3% 8/1/48 | 10,000 | 7,688 | |
| New Mexico Mtg. Fin. Auth.: | |||
| Series 2021 C, 3% 1/1/52 | 100,000 | 96,032 | |
| Series 2021 D, 3% 7/1/52 | 145,000 | 139,093 | |
| New Mexico Severance Tax Rev. Series 2018A, 5% 7/1/24 | 60,000 | 61,081 | |
TOTAL NEW MEXICO | 517,378 | ||
| New York - 13.7% | |||
| Battery Park City Auth. Rev.: | |||
| Series 2019 A, 5% 11/1/49 | 80,000 | 86,201 | |
| Series 2019 B: | |||
5% 11/1/34 | 190,000 | 215,526 | |
5% 11/1/39 | 60,000 | 66,112 | |
| Brooklyn Arena Local Dev. Corp. Series 2016 A, 3% 7/15/43 (Assured Guaranty Muni. Corp. Insured) | 25,000 | 19,433 | |
| Dorm. Auth. New York Univ. Rev.: | |||
| Series 2016 A: | |||
4% 7/1/43 | 55,000 | 51,442 | |
5% 7/1/26 | 65,000 | 69,071 | |
5% 7/1/37 | 5,000 | 5,164 | |
| Series 2017 1, 5% 7/1/25 | 70,000 | 72,682 | |
| Series 2017 A, 5% 10/1/29 | 35,000 | 37,841 | |
| Series 2018 B, 5% 10/1/38 | 45,000 | 48,582 | |
| Hudson Yards Infrastructure Corp. New York Rev. Series 2017 A, 5% 2/15/39 | 70,000 | 73,880 | |
| Liberty Dev. Corp. Rev. Series 2005, 5.25% 10/1/35 | 75,000 | 85,628 | |
| Long Island Pwr. Auth. Elec. Sys. Rev.: | |||
| Series 1998 A, 0% 12/1/26 (Assured Guaranty Muni. Corp. Insured) | 125,000 | 111,676 | |
| Series 2016 B, 5% 9/1/46 | 10,000 | 10,341 | |
| Series 2017, 5% 9/1/47 | 20,000 | 21,044 | |
| Series 2018, 5% 9/1/35 | 30,000 | 32,934 | |
| Monroe County Indl. Dev. Corp. (Univ. of Rochester Proj.) Series 2020 A, 5% 7/1/25 | 70,000 | 72,668 | |
| Nassau County Gen. Oblig. Series 2016 A, 3.5% 1/1/37 | 130,000 | 127,725 | |
| New York City Gen. Oblig.: | |||
| Series 2008 J, 3% 8/1/26 | 45,000 | 44,992 | |
| Series 2013 F1, 3.5% 3/1/38 | 120,000 | 115,718 | |
| Series 2013 H, 5% 8/1/24 (Pre-Refunded to 8/31/23 @ 100) | 35,000 | 35,087 | |
| Series 2018 1, 5% 8/1/28 | 30,000 | 32,528 | |
| Series 2018 F1, 3.5% 4/1/46 | 135,000 | 121,137 | |
| Series 2019 B1, 5% 10/1/34 | 95,000 | 105,819 | |
| Series 2019 D, 5% 12/1/34 | 25,000 | 27,496 | |
| Series 2019 E, 5% 8/1/34 | 70,000 | 77,270 | |
| Series 2020 A1, 5% 8/1/35 | 150,000 | 165,835 | |
| Series 2020 D, 3% 3/1/45 | 50,000 | 40,434 | |
| Series 2021 A1, 4% 8/1/50 | 140,000 | 136,189 | |
| Series A, 5% 8/1/37 | 140,000 | 146,270 | |
| Series B1, 5% 10/1/32 | 55,000 | 61,568 | |
| Series C, 3% 8/1/29 | 50,000 | 50,091 | |
| Series E, 5% 8/1/26 | 25,000 | 26,532 | |
| Series J, 5% 8/1/24 | 35,000 | 35,688 | |
| New York City Hsg. Dev. Corp.: | |||
| Bonds Series H, 2.95%, tender 2/1/26 (c) | 60,000 | 58,920 | |
| Series 2016 I1A, 3.95% 11/1/36 | 10,000 | 10,017 | |
| Series 2017 C1, 3.65% 11/1/47 | 100,000 | 85,599 | |
| Series 2020 A, 2.55% 8/1/40 | 110,000 | 84,107 | |
| New York City Hsg. Dev. Corp. Multi-family Mtg. Rev. Series 2014, 3% 2/15/48 | 100,000 | 98,022 | |
| New York City Hsg. Dev. Corp. Multifamily Hsg.: | |||
| Bonds Series D2, 0.7%, tender 11/1/24 (c) | 25,000 | 23,743 | |
| Series 2019 E1, 3.25% 11/1/49 | 35,000 | 27,619 | |
| Series 2021 G, 2.15% 11/1/36 | 95,000 | 73,055 | |
| Series 2021 K1, 2.45% 11/1/41 | 130,000 | 95,721 | |
| New York City Indl. Dev. Agcy. Rev.: | |||
| (Queens Baseball Stadium Proj.) Series 2021 A, 3% 1/1/37 (Assured Guaranty Corp. Insured) (Assured Guaranty Muni. Corp. Insured) | 145,000 | 125,387 | |
| Series 2009 A: | |||
0% 3/1/39 (Assured Guaranty Corp. Insured) | 20,000 | 9,879 | |
0% 3/1/44 | 90,000 | 33,944 | |
0% 3/1/45 (Assured Guaranty Corp. Insured) | 15,000 | 5,357 | |
0% 3/1/46 (Assured Guaranty Corp. Insured) | 25,000 | 8,462 | |
| New York City Muni. Wtr. Fin. Auth. Wtr. & Swr. Sys. Rev.: | |||
| Series 2015 FF, 5% 6/15/26 (Pre-Refunded to 6/15/25 @ 100) | 300,000 | 311,439 | |
| Series 2015 HH, 5% 6/15/29 | 5,000 | 5,177 | |
| Series 2016 CC1, 4% 6/15/38 | 25,000 | 25,195 | |
| Series 2017 DD, 5.25% 6/15/47 | 60,000 | 63,036 | |
| Series 2018 AA, 5% 6/15/37 | 25,000 | 26,560 | |
| Series 2018 FF, 5% 6/15/40 | 210,000 | 224,604 | |
| Series 2020 BB, 3% 6/15/49 | 105,000 | 81,340 | |
| Series 2020 GG2, 5% 6/15/29 | 135,000 | 147,008 | |
| Series 2022 EE, 4% 6/15/45 | 120,000 | 118,929 | |
| Series BB, 5% 6/15/49 | 90,000 | 96,085 | |
| Series CC: | |||
4% 6/15/42 | 15,000 | 14,985 | |
5% 6/15/30 | 25,000 | 28,495 | |
| Series DD: | |||
5% 6/15/25 | 60,000 | 60,518 | |
5% 6/15/36 | 55,000 | 55,815 | |
| Series EE, 5% 6/15/34 | 45,000 | 46,849 | |
| New York City Transitional Fin. Auth. Bldg. Aid Rev.: | |||
| Series 2015 S1: | |||
5% 7/15/26 | 100,000 | 102,782 | |
5% 7/15/43 | 75,000 | 76,412 | |
| Series 2015 S2, 5% 7/15/40 | 80,000 | 82,273 | |
| Series 2018 S3, 3.625% 7/15/47 | 60,000 | 55,978 | |
| Series 2018 S4, 5% 7/15/31 | 10,000 | 11,034 | |
| Series 2020 S1, 3% 7/15/49 | 50,000 | 39,368 | |
| Series S1, 5% 7/15/27 | 55,000 | 56,539 | |
| Series S4, 5.25% 7/15/35 | 35,000 | 38,745 | |
| New York City Transitional Fin. Auth. Rev.: | |||
| Series 2014, 5% 11/1/25 | 55,000 | 55,768 | |
| Series 2016 A, 5% 5/1/40 | 105,000 | 108,694 | |
| Series 2016 E, 5% 2/1/37 | 130,000 | 134,562 | |
| Series 2016 E1, 5% 2/1/35 | 120,000 | 124,900 | |
| Series 2016 F3, 3.25% 2/1/42 | 50,000 | 43,664 | |
| Series 2017 B, 4% 8/1/37 | 50,000 | 50,561 | |
| Series 2018 A2, 5% 8/1/39 | 55,000 | 58,263 | |
| Series 2018 B1, 3.375% 8/1/45 | 65,000 | 56,516 | |
| Series 2018 C3, 4% 5/1/44 | 10,000 | 9,878 | |
| Series 2019 A, 5% 8/1/40 | 75,000 | 80,231 | |
| Series 2019 B1, 4% 11/1/43 | 50,000 | 49,447 | |
| Series 2019 C, 4% 11/1/37 | 70,000 | 71,352 | |
| Series 2021 A: | |||
3% 11/1/37 | 115,000 | 102,811 | |
5% 11/1/31 | 80,000 | 91,989 | |
| Series 2022 A1, 5% 11/1/25 | 150,000 | 156,729 | |
| Series 2022 F, 5% 2/1/26 | 50,000 | 52,496 | |
| Series 2023 F1, 5.25% 2/1/47 | 160,000 | 179,641 | |
| Series A, 4% 11/1/35 | 20,000 | 20,914 | |
| Series B, 4% 8/1/39 | 5,000 | 5,033 | |
| Series B1, 5% 11/1/37 | 100,000 | 103,010 | |
| Series C, 3.25% 11/1/43 | 30,000 | 26,049 | |
| Series C1, 4% 5/1/44 | 120,000 | 118,542 | |
| Series E, 5% 2/1/40 | 115,000 | 120,595 | |
| New York City Trust Cultural Resources Rev. Series 2016 1E: | |||
| 4% 4/1/26 | 50,000 | 51,216 | |
| 4% 4/1/28 | 40,000 | 41,373 | |
| New York Convention Ctr. Dev. Corp. Rev. Series 2016 B: | |||
| 0% 11/15/32 | 60,000 | 41,279 | |
| 0% 11/15/38 | 105,000 | 51,543 | |
| 0% 11/15/44 | 25,000 | 8,567 | |
| New York Dorm. Auth. Personal Income Tax Rev. Series 2016 D, 5% 2/15/26 | 40,000 | 42,021 | |
| New York Dorm. Auth. Rev.: | |||
| Series 1: | |||
3% 7/1/34 | 25,000 | 23,650 | |
5% 7/1/30 | 30,000 | 34,047 | |
| Series 2014 A, 5.5% 1/1/39 (Pre-Refunded to 7/1/24 @ 100) | 30,000 | 30,692 | |
| Series 2015 A: | |||
3% 7/1/29 | 50,000 | 50,305 | |
3.75% 7/1/46 | 55,000 | 46,498 | |
5% 5/1/33 | 35,000 | 35,934 | |
| Series 2019 A, 4% 7/1/45 | 30,000 | 29,095 | |
| Series 2019 C, 4% 7/1/49 | 30,000 | 28,888 | |
| Series 2020 A, 4% 7/1/50 | 95,000 | 93,396 | |
| Series 2020 A2, 5% 7/1/31 | 25,000 | 28,757 | |
| Series 2020, 3% 2/1/50 | 100,000 | 74,057 | |
| Series 2021 A, 5% 7/1/26 | 100,000 | 104,711 | |
| New York Dorm. Auth. Sales Tax Rev.: | |||
| Series 2016 A, 5% 3/15/29 | 70,000 | 74,354 | |
| Series 2017 A: | |||
5% 3/15/43 | 75,000 | 78,756 | |
5% 3/15/44 | 15,000 | 15,727 | |
| Series 2018, 5% 3/15/48 | 25,000 | 26,537 | |
| New York Envir. Facilities Corp. Clean Wtr. & Drinking Wtr.: | |||
| (New York City Muni. Wtr. Fin. Auth. Proj.): | |||
Series 2017 A, 3.5% 6/15/36 | 40,000 | 39,909 | |
Series 2018 A, 5% 6/15/30 | 30,000 | 33,413 | |
Series 2019 B, 5% 6/15/31 | 25,000 | 28,429 | |
| Series 2016 A, 4% 6/15/46 | 40,000 | 40,011 | |
| Series 2017 A, 5% 6/15/25 | 70,000 | 72,686 | |
| New York Liberty Dev. Corp. Series 2021 1WTC, 2.75% 2/15/44 | 55,000 | 40,920 | |
| New York Metropolitan Trans. Auth. Dedicated Tax Fund Rev.: | |||
| Series 2012 A, 0% 11/15/32 | 60,000 | 42,942 | |
| Series 2016 A, 5% 11/15/26 | 35,000 | 37,428 | |
| Series 2017 A, 5% 11/15/47 | 165,000 | 172,161 | |
| New York Metropolitan Trans. Auth. Rev.: | |||
| Series 2012 B, 4.25% 11/15/39 | 45,000 | 44,492 | |
| Series 2014 D1, 5% 11/15/33 | 170,000 | 171,806 | |
| Series 2015 B, 4% 11/15/45 | 50,000 | 47,199 | |
| Series 2015 C, 5% 11/15/27 | 100,000 | 103,076 | |
| Series 2015 D1, 5% 11/15/31 | 130,000 | 133,567 | |
| Series 2015 F, 3.25% 11/15/31 | 160,000 | 152,167 | |
| Series 2016 A, 5% 11/15/31 | 235,000 | 241,804 | |
| Series 2016 B, 5% 11/15/29 | 115,000 | 119,511 | |
| Series 2016 C, 4% 11/15/26 | 65,000 | 65,723 | |
| Series 2016 D, 5% 11/15/27 | 30,000 | 31,235 | |
| Series 2017 B: | |||
5% 11/15/23 | 55,000 | 55,235 | |
5% 11/15/26 | 95,000 | 99,094 | |
| Series 2017 C1: | |||
5% 11/15/25 | 15,000 | 15,453 | |
5% 11/15/28 | 35,000 | 37,395 | |
| Series 2017 D: | |||
4% 11/15/42 | 15,000 | 14,393 | |
5% 11/15/27 | 50,000 | 52,861 | |
| Series 2018 B: | |||
5% 11/15/25 | 15,000 | 15,453 | |
5% 11/15/26 | 80,000 | 83,447 | |
5% 11/15/28 | 50,000 | 53,503 | |
| New York State Dorm. Auth.: | |||
| Series 2015 B, 5% 2/15/42 | 35,000 | 35,592 | |
| Series 2017 B, 5% 2/15/39 | 110,000 | 116,452 | |
| Series 2019 A: | |||
5% 3/15/40 | 15,000 | 16,170 | |
5% 3/15/42 | 100,000 | 107,319 | |
| Series 2022 A, 4% 3/15/39 | 280,000 | 281,907 | |
| New York State Envir. Facilities Corp. Rev. Series 2019 A, 5% 2/15/49 | 30,000 | 32,239 | |
| New York State Gen. Oblig. Series 2013 A, 3.5% 3/1/43 | 10,000 | 9,145 | |
| New York State Hsg. Fin. Agcy. Rev.: | |||
| Series 2019 N, 3.05% 11/1/52 | 65,000 | 46,903 | |
| Series 2019 R, 3.15% 11/1/54 | 5,000 | 3,644 | |
| Series 2020 E, 2.2% 11/1/40 | 250,000 | 175,361 | |
| Series L, 3.45% 11/1/42 | 15,000 | 12,933 | |
| New York State Mtg. Agcy. Homeowner Mtg.: | |||
| Series 2019 220, 2.4% 10/1/34 | 75,000 | 64,067 | |
| Series 220, 2.85% 10/1/44 | 15,000 | 11,136 | |
| New York State Mtg. Agcy. Rev. Series 48, 3.45% 10/1/33 | 15,000 | 14,573 | |
| New York State Urban Eev Corp. Series 2021 A, 3% 3/15/41 | 50,000 | 42,092 | |
| New York Thruway Auth. Gen. Rev.: | |||
| Series 2016 A, 5% 1/1/51 | 35,000 | 35,696 | |
| Series 2019 B, 4% 1/1/45 (Assured Guaranty Muni. Corp. Insured) | 125,000 | 123,541 | |
| Series K: | |||
5% 1/1/28 | 40,000 | 41,008 | |
5% 1/1/29 | 50,000 | 51,245 | |
| New York Trans. Dev. Corp.: | |||
| (Delta Air Lines, Inc. LaGuardia Arpt. Terminals C&D Redev. Proj.) Series 2018, 5% 1/1/30 (b) | 15,000 | 15,573 | |
| (LaGuardia Arpt. Term. B Redev. Proj.) Series 2016 A, 4% 1/1/51 (Assured Guaranty Muni. Corp. Insured) (b) | 20,000 | 18,252 | |
| (Term. 4 JFK Int'l. Arpt. Proj.) Series 2020 C, 5% 12/1/30 | 100,000 | 110,432 | |
| (Term. 4 John F. Kennedy Int'l. Arpt. Proj.) Series 2022, 5% 12/1/32 (b) | 80,000 | 87,159 | |
| New York Urban Dev. Corp. Rev.: | |||
| Series 2013 A1, 5% 3/15/29 | 10,000 | 10,011 | |
| Series 2019 A: | |||
5% 3/15/42 | 10,000 | 10,673 | |
5% 3/15/44 | 25,000 | 26,611 | |
| Onondaga County Trust for Cultural Resources Rev. Series 2019: | |||
| 5% 12/1/39 | 75,000 | 82,368 | |
| 5% 12/1/40 | 65,000 | 71,146 | |
| Suffolk County Gen. Oblig. Series 2015 C, 5% 5/1/27 | 10,000 | 10,123 | |
| Suffolk County Wtr. Auth. Wtrwks. Rev. Series 2018 A, 4% 6/1/41 | 45,000 | 45,270 | |
| Triborough Bridge & Tunnel Auth. Series 2021 B, 5% 5/15/56 | 80,000 | 83,823 | |
| Triborough Bridge & Tunnel Auth. Revs.: | |||
| Series 2002 F: | |||
5% 11/1/27 | 65,000 | 70,878 | |
5% 11/1/31 | 75,000 | 88,342 | |
| Series 2008 B3, 5% 11/15/37 | 60,000 | 62,050 | |
| Series 2013 A: | |||
0% 11/15/30 | 85,000 | 65,438 | |
0% 11/15/32 | 90,000 | 63,472 | |
| Series 2016 A: | |||
5% 11/15/41 | 25,000 | 25,656 | |
5% 11/15/46 | 50,000 | 51,013 | |
| Util. Debt Securitization Auth.: | |||
| Series 2015, 3% 12/15/32 | 15,000 | 15,054 | |
| Series 2017, 5% 12/15/41 | 50,000 | 53,820 | |
| Westchester County Gen. Oblig. Series 2021 A, 5% 10/15/29 | 65,000 | 74,395 | |
| Westchester County Local Dev. Co. (Westchester Obligated Group Proj.) Series 2016, 3.75% 11/1/37 | 30,000 | 25,160 | |
TOTAL NEW YORK | 12,205,705 | ||
| New York And New Jersey - 1.1% | |||
| Port Auth. of New York & New Jersey: | |||
| Series 189: | |||
5% 5/1/27 | 60,000 | 62,173 | |
5% 5/1/30 | 80,000 | 82,782 | |
| Series 194, 5% 10/15/30 | 15,000 | 15,665 | |
| Series 198, 5% 11/15/46 | 50,000 | 51,235 | |
| Series 2015 189, 5% 5/1/31 | 50,000 | 51,721 | |
| Series 2015 194, 5% 10/15/34 | 55,000 | 57,241 | |
| Series 2017 205: | |||
5% 11/15/26 | 110,000 | 117,698 | |
5.25% 11/15/57 | 175,000 | 184,382 | |
| Series 2018 209, 5% 7/15/36 | 115,000 | 125,422 | |
| Series 2019 213, 5% 9/1/30 | 70,000 | 79,090 | |
| Series 2019 217, 5% 11/1/32 | 50,000 | 56,533 | |
| Series 202, 5% 10/15/30 (b) | 30,000 | 31,475 | |
| Series 207, 5% 9/15/26 (b) | 5,000 | 5,212 | |
| Series 209, 5% 7/15/31 | 30,000 | 33,264 | |
| Series 211, 4% 9/1/43 | 55,000 | 54,845 | |
TOTAL NEW YORK AND NEW JERSEY | 1,008,738 | ||
| North Carolina - 1.0% | |||
| Charlotte Int'l. Arpt. Rev. Series 2017 A, 5% 7/1/47 | 55,000 | 57,248 | |
| Charlotte Wtr. & Swr. Sys. Rev. Series 2018, 4% 7/1/47 | 25,000 | 24,456 | |
| Mecklenburg County Gen. Oblig. Series 2018, 3.25% 3/1/34 | 65,000 | 64,378 | |
| North Carolina Cap. Facilities Fin. Agcy. Rev. (Duke Univ. Proj.) Series 2015 B, 5% 10/1/41 (Pre-Refunded to 10/1/25 @ 100) | 10,000 | 10,437 | |
| North Carolina Gen. Oblig.: | |||
| Series 2016 A, 5% 6/1/27 | 40,000 | 42,481 | |
| Series 2018 A, 5% 6/1/29 | 75,000 | 83,104 | |
| North Carolina Grant Anticipation Rev.: | |||
| Series 2015, 5% 3/1/27 | 70,000 | 72,019 | |
| Series 2019: | |||
5% 3/1/31 | 5,000 | 5,557 | |
5% 3/1/32 | 30,000 | 33,324 | |
| North Carolina Ltd. Oblig.: | |||
| Series 2019 A, 5% 5/1/25 | 30,000 | 31,049 | |
| Series 2020 B: | |||
5% 5/1/28 | 50,000 | 55,203 | |
5% 5/1/29 | 35,000 | 39,366 | |
| North Carolina Med. Care Commission Health Care Facilities Rev. Series 2012 A, 4% 12/1/45 | 10,000 | 9,880 | |
| North Carolina Tpk. Auth. Triangle Expressway Sys. Series 2018: | |||
| 5% 1/1/28 | 100,000 | 106,260 | |
| 5% 1/1/30 | 55,000 | 59,418 | |
| Union County Enterprise Systems Rev. Series 2021, 3% 6/1/37 | 80,000 | 72,735 | |
| Wake County Series 2021, 5% 3/1/31 | 85,000 | 98,542 | |
TOTAL NORTH CAROLINA | 865,457 | ||
| North Dakota - 0.2% | |||
| Grand Forks Health Care Sys. Rev. Series 2021: | |||
| 4% 12/1/35 | 60,000 | 55,642 | |
| 5% 12/1/27 | 85,000 | 87,367 | |
| North Dakota Hsg. Fin. Agcy.: | |||
| Series 2021 A, 2.25% 7/1/41 | 50,000 | 36,408 | |
| Series C, 3.35% 7/1/42 | 20,000 | 18,064 | |
TOTAL NORTH DAKOTA | 197,481 | ||
| Ohio - 3.0% | |||
| Akron Bath Copley Hosp. District Rev. Series 2020, 4% 11/15/37 | 5,000 | 4,588 | |
| Allen County Hosp. Facilities Rev.: | |||
| (Mercy Health) Series 2017 A, 5% 8/1/27 | 25,000 | 26,798 | |
| Series 2020 A, 5% 12/1/35 | 60,000 | 65,852 | |
| Chillicothe Hosp. Facilities Rev. (Adena Health Sys. Obligated Group Proj.) Series 2017, 4% 12/1/42 | 100,000 | 91,529 | |
| Cleveland Pub. Pwr. Sys. Rev. Series B2, 0% 11/15/38 (Nat'l. Pub. Fin. Guarantee Corp. Insured) | 45,000 | 22,937 | |
| Columbus Gen. Oblig.: | |||
| Series 2016 A, 4% 8/15/27 | 30,000 | 30,552 | |
| Series 2018 A, 5% 4/1/30 | 30,000 | 33,426 | |
| Cuyahoga County Hosp. Rev. Series 2017, 5% 2/15/52 | 5,000 | 4,935 | |
| Franklin County Ohio Sales Tax R Series 2018, 5% 6/1/48 | 30,000 | 31,710 | |
| Franklin County Rev. Series 2017 OH, 5% 12/1/46 | 85,000 | 87,118 | |
| Gahanna-Jefferson School District Series 2021, 2% 12/1/50 (Assured Guaranty Muni. Corp. Insured) | 100,000 | 58,468 | |
| Hamilton County Sales Tax Rev. Series 2016 A, 5% 12/1/27 | 55,000 | 59,700 | |
| Hamilton County Swr. Sys. Rev. Series 2019 A, 5% 12/1/29 | 150,000 | 170,114 | |
| Northeast Ohio Reg'l. Swr. District Wastewtr. Rev. Series 2019, 3% 11/15/40 | 100,000 | 84,306 | |
| Northeastern Local School District of Clark and Champaign Series 2018, 4% 12/1/55 (Assured Guaranty Muni. Corp. Insured) | 100,000 | 93,629 | |
| Ohio Gen. Oblig.: | |||
| Series 2015 A: | |||
5% 9/1/23 | 25,000 | 25,070 | |
5% 9/15/26 | 35,000 | 37,276 | |
| Series 2015 C, 5% 11/1/28 | 25,000 | 25,860 | |
| Series 2017 C, 5% 8/1/26 | 20,000 | 21,244 | |
| Series 2017 C1, 5% 9/1/28 | 60,000 | 66,717 | |
| Series 2018 A, 5% 2/1/29 | 15,000 | 15,741 | |
| Series 2021 A, 4% 3/1/38 | 55,000 | 56,513 | |
| Ohio Hosp. Facilities Rev. Series 2017 A: | |||
| 5% 1/1/28 | 145,000 | 157,339 | |
| 5% 1/1/33 | 40,000 | 43,569 | |
| Ohio Hosp. Rev.: | |||
| Series 2016 A, 5% 1/15/41 | 30,000 | 30,538 | |
| Series 2021 A, 3% 1/15/46 | 50,000 | 37,693 | |
| Ohio Hsg. Fin. Agcy. Residential Mtg. Rev.: | |||
| (Mtg.-Backed Securities Prog.) Series 2022 A, 3.25% 9/1/52 | 115,000 | 111,325 | |
| Series 2019 A: | |||
3.5% 9/1/34 | 5,000 | 4,850 | |
4% 3/1/49 | 10,000 | 9,792 | |
| Ohio Parks & Recreation Cap. Facilities Series 2017 A, 5% 12/1/31 | 40,000 | 43,418 | |
| Ohio Spl. Oblig. (Trans. Bldg. Fund Proj.) Series 2015 A, 5% 4/1/29 | 40,000 | 41,222 | |
| Ohio Tpk. Commission Tpk. Rev. (Infrastructure Proj.): | |||
| Series 2005 A, 0% 2/15/43 | 30,000 | 12,272 | |
| Series 2013 A2, 0% 2/15/37 | 80,000 | 45,695 | |
| Ohio Wtr. Dev. Auth. Wtr. Poll. Cont. Rev.: | |||
| Series 2015 A, 5% 12/1/24 | 235,000 | 241,389 | |
| Series 2015 B, 5% 12/1/26 (Pre-Refunded to 12/1/25 @ 100) | 215,000 | 224,685 | |
| Series 2019 B, 5% 12/1/39 | 275,000 | 302,015 | |
| Series 2020 A, 5% 12/1/38 | 65,000 | 72,084 | |
| Southwest Licking Local School Series 2017 A, 3.375% 11/1/47 | 15,000 | 12,951 | |
| Willoughby-Eastlake City School District Series 2016, 4% 12/1/50 | 160,000 | 152,334 | |
TOTAL OHIO | 2,657,254 | ||
| Oklahoma - 0.5% | |||
| Oklahoma Cap. Imp Auth. St Hwy. Series 2016, 4% 7/1/33 | 40,000 | 40,624 | |
| Oklahoma Dev. Fin. Auth. Lease Series 2016 D, 4% 6/1/36 | 200,000 | 202,671 | |
| Oklahoma Pwr. Auth. Pwr. Supply Sys. Rev. Series 2016 A, 5% 1/1/47 | 10,000 | 10,204 | |
| Oklahoma Tpk. Auth. Tpk. Rev.: | |||
| Series 2017 C: | |||
4% 1/1/42 | 30,000 | 29,828 | |
5% 1/1/47 | 30,000 | 31,172 | |
| Series 2017 D, 5% 1/1/26 | 5,000 | 5,239 | |
| Series 2017 E, 4% 1/1/31 | 100,000 | 102,495 | |
| Univ. of Oklahoma Gen. Rev. Series 2015 C, 5% 7/1/36 | 5,000 | 5,135 | |
TOTAL OKLAHOMA | 427,368 | ||
| Oregon - 0.8% | |||
| Beaverton School District Series 2022 A, 0% 6/15/39 | 200,000 | 97,667 | |
| Clackamas County School District No. 46: | |||
| Series 2009: | |||
0% 6/15/32 | 50,000 | 35,899 | |
0% 6/15/39 | 10,000 | 4,960 | |
| Series B, 0% 6/15/34 | 20,000 | 13,188 | |
| Deschutes & Jefferson Counties School District #2J Redmond Series 2008 B, 0% 6/15/26 | 10,000 | 9,053 | |
| Oregon Facilities Auth. Rev.: | |||
| (Univ. of Portland Proj.) Series 2015 A, 5% 4/1/45 | 35,000 | 35,526 | |
| Series 2022 A, 5% 6/1/52 | 110,000 | 113,618 | |
| Oregon Health and Science Univ. Spl. Rev.: | |||
| Series 2016 B, 5% 7/1/39 | 35,000 | 36,295 | |
| Series 2019 A, 5% 7/1/25 | 215,000 | 222,732 | |
| Salem Hosp. Facility Auth. Rev. (Salem Health Projs.) Series 2019 A, 3% 5/15/49 | 65,000 | 46,289 | |
| Sherwood School District No. 88J Washington, Clackamas, and Yamhill Counties Gen. Oblig. Series 2018 A, 0% 6/15/48 | 255,000 | 76,280 | |
TOTAL OREGON | 691,507 | ||
| Pennsylvania - 3.6% | |||
| Allegheny County Series C77, 5% 11/1/43 | 25,000 | 26,780 | |
| Allegheny County Hosp. Dev. Auth. Rev. Series 2018 A, 4% 4/1/38 | 30,000 | 28,940 | |
| Butler County Hosp. Auth. Hosp. Rev. (Butler Health Sys. Proj.) Series 2015 A, 5% 7/1/35 | 70,000 | 68,949 | |
| Chester County Health & Ed. Facilities Auth. Health Sys. Rev. Series 2020 A, 4% 9/1/50 | 100,000 | 92,143 | |
| Chester County Indl. Dev. Auth. Rev. (Longwood Gardens, Inc. Proj.) Series 2021, 4% 12/1/46 | 110,000 | 108,092 | |
| Commonwealth Fing. Auth. Tobacco Series 2018, 4% 6/1/39 (Assured Guaranty Muni. Corp. Insured) | 15,000 | 14,746 | |
| Delaware River Port Auth. Pennsylvania & New Jersey Rev. Series 2018 A, 5% 1/1/32 | 10,000 | 11,112 | |
| Geisinger Auth. Health Sys. Rev. Series 2017 A2, 4% 2/15/39 | 100,000 | 97,878 | |
| Lancaster County Hosp. Auth. Health Ctr. Rev. Series 2016 A, 5% 8/15/42 | 10,000 | 10,275 | |
| Lehigh County Gen. Purp. Hosp. Rev. Series 2015 A, 4.125% 7/1/40 | 90,000 | 89,215 | |
| Monroeville Fin. Auth. UPMC Rev. Series 2022 B, 4% 2/15/40 | 105,000 | 102,536 | |
| Northampton County Gen. Purp. Auth. Hosp. Rev. (St. Luke's Univ. Health Network Proj.) Series 2016 A, 3.125% 8/15/35 | 10,000 | 9,206 | |
| Pennsylvania Ctfs. Prtn. Series 2018 A, 4% 7/1/46 | 55,000 | 52,318 | |
| Pennsylvania Econ. Dev. Fing. Auth. Series 2017 A, 5% 11/15/28 | 85,000 | 91,327 | |
| Pennsylvania Econ. Dev. Fing. Auth. Indl. Dev. Rev. (The Pennsylvania Rapid Bridge Replacement Proj.) Series 2015: | |||
| 4.125% 12/31/38 (b) | 20,000 | 18,774 | |
| 5% 12/31/28 (b) | 70,000 | 71,909 | |
| Pennsylvania Gen. Oblig.: | |||
| Series 2015 1, 5% 8/15/23 | 5,000 | 5,010 | |
| Series 2015: | |||
4% 8/15/34 | 25,000 | 25,367 | |
5% 3/15/24 | 70,000 | 70,891 | |
5% 8/15/32 | 60,000 | 62,356 | |
| Series 2016 2, 3% 9/15/36 | 15,000 | 13,725 | |
| Series 2016: | |||
5% 9/15/23 | 35,000 | 35,120 | |
5% 9/15/25 | 100,000 | 104,122 | |
5% 9/15/27 | 10,000 | 10,628 | |
| Series 2021, 5% 5/15/31 | 60,000 | 69,518 | |
| Pennsylvania Higher Edl. Facilities Auth. Rev.: | |||
| Series 2015 A: | |||
5% 9/1/39 | 135,000 | 137,056 | |
5% 9/1/45 | 135,000 | 136,505 | |
5.25% 9/1/50 | 50,000 | 50,466 | |
| Series 2016 C: | |||
3% 8/15/41 | 35,000 | 28,873 | |
5% 8/15/25 | 55,000 | 56,999 | |
| Pennsylvania Hsg. Fin. Agcy.: | |||
| Series 2019 129, 3.15% 10/1/39 | 135,000 | 115,754 | |
| Series 2021 134A, 1.85% 4/1/36 | 100,000 | 75,783 | |
| Pennsylvania Hsg. Fin. Agcy. Single Family Mtg. Rev.: | |||
| Series 2017 123B, 3.45% 10/1/32 | 15,000 | 14,719 | |
| Series 2017 125B, 3.65% 10/1/42 | 20,000 | 17,952 | |
| Pennsylvania Pub. School Bldg. Auth. School Rev. Series 2016 A, 5% 12/1/27 | 50,000 | 52,802 | |
| Pennsylvania Tpk. Commission Registration Fee Rev. Series 2005 A, 5.25% 7/15/23 (Assured Guaranty Muni. Corp. Insured) | 35,000 | 35,019 | |
| Pennsylvania Tpk. Commission Tpk. Rev.: | |||
| Series 2013 B, 0% 12/1/41 (d) | 20,000 | 17,871 | |
| Series 2014 A, 0% 12/1/39 (d) | 35,000 | 35,237 | |
| Series 2014 C, 5% 12/1/44 | 50,000 | 50,848 | |
| Series 2016, 5% 6/1/36 | 50,000 | 51,820 | |
| Series 2017 2, 5% 12/1/30 | 10,000 | 10,783 | |
| Series 2017 A2, 5% 12/1/28 | 115,000 | 124,589 | |
| Series 2017, 5% 12/1/40 | 10,000 | 10,434 | |
| Series 2019 A: | |||
4% 12/1/49 | 100,000 | 96,712 | |
4% 12/1/49 (Assured Guaranty Muni. Corp. Insured) | 100,000 | 97,500 | |
5% 12/1/34 | 30,000 | 33,295 | |
5% 12/1/35 | 35,000 | 38,087 | |
| Series 2019, 5% 12/1/32 | 10,000 | 10,977 | |
| Philadelphia Arpt. Rev. Series 2020 A, 4% 7/1/38 | 60,000 | 60,013 | |
| Philadelphia Auth. for Indl. Dev.: | |||
| (The Children's Hosp. of Philadelphia Proj.) Series 2017, 4% 7/1/37 | 45,000 | 45,356 | |
| Series 2017 A, 4% 9/1/42 | 25,000 | 23,413 | |
| Philadelphia Gas Works Rev. Series 2017 15, 5% 8/1/42 | 150,000 | 154,686 | |
| Philadelphia Gen. Oblig.: | |||
| Series 2015 B, 5% 8/1/25 | 15,000 | 15,540 | |
| Series 2017 A, 5% 8/1/23 | 20,000 | 20,021 | |
| Philadelphia School District: | |||
| Series 2007 A, 5% 6/1/27 (FGIC Insured) (Nat'l. Pub. Fin. Guarantee Corp. Insured) | 10,000 | 10,628 | |
| Series 2019 A, 5% 9/1/44 | 25,000 | 26,425 | |
| Pittsburgh Wtr. & Swr. Auth. Wtr. & Swr. Sys. Rev. Series B, 0% 9/1/28 (FGIC Insured) | 15,000 | 12,435 | |
| Pocono Mountains Indl. Park Auth. Series 2015 A, 4% 8/15/45 | 110,000 | 100,586 | |
| State Pub. School Bldg. Auth. Lease Rev. (The School District of Philadelphia Proj.) Series 2016 A, 5% 6/1/33 | 90,000 | 94,275 | |
| Westmoreland County Muni. Auth. Muni. Svc. Rev. Series 2016, 3% 8/15/42 | 50,000 | 41,747 | |
TOTAL PENNSYLVANIA | 3,196,143 | ||
| Pennsylvania, New Jersey - 0.1% | |||
| Delaware River Joint Toll Bridge Commission Pennsylvania-New Jersey Bridge Rev. Series 2017, 5% 7/1/36 | 65,000 | 69,406 | |
| Rhode Island - 0.2% | |||
| Rhode Island & Providence Plantations Series C, 3% 1/15/36 | 95,000 | 88,325 | |
| Rhode Island Gen. Oblig. Series 2021 E: | |||
| 2% 8/1/38 | 70,000 | 51,429 | |
| 2% 8/1/39 | 50,000 | 36,122 | |
| Rhode Island Health & Edl. Bldg. Corp. Higher Ed. Facilities Rev. Series 2016, 5% 5/15/24 | 20,000 | 20,166 | |
TOTAL RHODE ISLAND | 196,042 | ||
| South Carolina - 0.6% | |||
| Brookland-Cayce School District No. 002 Series 2016, 3% 3/1/38 | 20,000 | 17,658 | |
| Lexington County School District #1 Series 2019 B, 2.25% 2/1/34 | 25,000 | 22,011 | |
| South Carolina Jobs-Econ. Dev. Auth. (SPE Fayssoux Properties, LLC Proj.) Series 2016 A, 3% 8/15/38 | 25,000 | 19,283 | |
| South Carolina Pub. Svc. Auth. Rev.: | |||
| Series 2013 A, 5% 12/1/38 | 140,000 | 140,359 | |
| Series 2014 A, 5.5% 12/1/54 | 25,000 | 25,159 | |
| Series 2014 C: | |||
5% 12/1/29 | 25,000 | 25,438 | |
5% 12/1/36 | 25,000 | 25,293 | |
| Series 2015, 5% 12/1/23 (Escrowed to Maturity) | 60,000 | 60,420 | |
| Series 2016 A: | |||
3.25% 12/1/35 | 10,000 | 9,186 | |
5% 12/1/30 | 80,000 | 83,073 | |
| Series A, 3% 12/1/41 | 20,000 | 15,807 | |
| South Carolina Trans. Infrastructure Bank Rev. Series 2017 A, 5% 10/1/38 | 45,000 | 47,679 | |
TOTAL SOUTH CAROLINA | 491,366 | ||
| Tennessee - 0.8% | |||
| Chattanooga Health Ed. & Hsg. Facility Board Rev. Series 2019 A1, 3% 8/1/39 | 20,000 | 15,855 | |
| Greeneville Health & Edl. Facilities Board Series 2018 A, 5% 7/1/33 | 35,000 | 35,000 | |
| Knox County Health Edl. & Hsg. Facilities: | |||
| Series 2012 A, 5% 1/1/25 | 30,000 | 30,029 | |
| Series 2016 A, 4% 1/1/42 | 15,000 | 14,565 | |
| Series 2019, 4% 11/15/43 | 5,000 | 4,713 | |
| Memphis Gen. Oblig. Series 2021: | |||
| 4% 5/1/46 | 50,000 | 49,414 | |
| 5% 5/1/30 | 80,000 | 91,397 | |
| Metropolitan Nashville Arpt. Auth. Rev. Series 2019 A: | |||
| 4% 7/1/54 | 35,000 | 32,926 | |
| 5% 7/1/54 | 140,000 | 148,025 | |
| New Memphis Arena Bldg. Auth. (City of Memphis Proj.) Series 2021, 0% 4/1/43 | 180,000 | 70,436 | |
| Tennessee Energy Acquisition Corp.: | |||
| Series 2006 A, 5.25% 9/1/26 | 20,000 | 20,430 | |
| Series 2006 B, 5.625% 9/1/26 | 50,000 | 51,383 | |
| Series 2006 C: | |||
5% 2/1/24 | 15,000 | 15,055 | |
5% 2/1/27 | 15,000 | 15,119 | |
| Tennessee Gen. Oblig. Series 2016 A, 5% 8/1/35 | 50,000 | 52,747 | |
| Tennessee Hsg. Dev. Agcy. Residential: | |||
| Series 2016 2B, 3.5% 1/1/47 | 35,000 | 34,597 | |
| Series 2020 1A, 2.4% 1/1/44 | 10,000 | 8,269 | |
| Tennessee School Board Auth. Series A, 5% 11/1/42 | 50,000 | 53,028 | |
TOTAL TENNESSEE | 742,988 | ||
| Texas - 8.6% | |||
| Aldine Independent School District Series 2017 A, 5% 2/15/30 | 50,000 | 53,410 | |
| Alvin Independent School District: | |||
| Series 2019, 3.375% 2/15/40 | 15,000 | 14,043 | |
| Series 2020, 4% 2/15/48 | 100,000 | 98,378 | |
| Arlington Higher Ed. Fin. Corp.: | |||
| Series 2018, 4% 8/15/48 | 80,000 | 76,014 | |
| Series 2021 A, 3% 2/15/46 | 270,000 | 205,168 | |
| Austin Elec. Util. Sys. Rev. Series 2015 A, 5% 11/15/45 | 100,000 | 102,155 | |
| Austin Independent School District: | |||
| Series 2017, 4% 8/1/33 | 5,000 | 5,099 | |
| Series 2019, 4% 8/1/35 | 25,000 | 25,846 | |
| Bexar County Hosp. District Series 2020, 3% 2/15/36 | 15,000 | 13,700 | |
| Bexar County Rev. Series 2015, 4% 8/15/51 (Pre-Refunded to 8/15/24 @ 100) | 15,000 | 15,138 | |
| Central Reg'l. Mobility Auth. Series 2016, 3.375% 1/1/41 | 45,000 | 38,601 | |
| City of Denton Series 2017, 4% 2/15/47 | 15,000 | 14,435 | |
| College of the Mainland Series 2019, 3.75% 8/15/49 | 50,000 | 44,528 | |
| Collin County Cmnty. College District Series 2018 A, 3.25% 8/15/33 | 40,000 | 40,181 | |
| Conroe Independent School District Series 2020 A, 2.25% 2/15/46 | 85,000 | 57,225 | |
| Cypress-Fairbanks Independent School District: | |||
| Series 2019, 5% 2/15/30 | 45,000 | 50,225 | |
| Series 2020 A, 3% 2/15/35 | 180,000 | 172,312 | |
| Dallas County Hosp. District Series 2019, 5% 8/15/30 | 75,000 | 81,923 | |
| Dallas Fort Worth Int'l. Arpt. Rev. Series 2014 A, 5.25% 11/1/27 (b) | 10,000 | 10,035 | |
| Dallas Independent School District Series 2019 B, 3% 2/15/37 | 20,000 | 17,901 | |
| Dallas Wtrwks. & Swr. Sys. Rev.: | |||
| Series 2018 C, 4% 10/1/43 | 100,000 | 100,275 | |
| Series 2020 C, 4% 10/1/49 | 75,000 | 74,196 | |
| Del Mar College District Series 2018 B, Series 2018 B, 4% 8/15/48 | 150,000 | 147,595 | |
| Denton Independent School District: | |||
| Series 2014, 5% 8/15/38 (Pre-Refunded to 8/15/24 @ 100) | 60,000 | 61,168 | |
| Series 2015 A, 5% 8/15/45 (Pre-Refunded to 8/15/25 @ 100) | 100,000 | 103,790 | |
| Eagle Mountain & Saginaw Independent School District Series 2019, 4% 8/15/50 | 20,000 | 19,644 | |
| Fort Bend Independent School District Series 2021 A, 2.3% 8/15/46 | 130,000 | 85,687 | |
| Frisco Independent School District: | |||
| Series 2017, 4% 8/15/35 | 30,000 | 30,580 | |
| Series 2019, 4% 8/15/39 | 35,000 | 35,268 | |
| Grand Parkway Trans. Corp.: | |||
| Series 2013: | |||
0% 10/1/32 (d) | 35,000 | 38,323 | |
0% 10/1/48 (d) | 70,000 | 74,526 | |
| Series 2018 A, 5% 10/1/37 | 40,000 | 42,900 | |
| Harris County Cultural Ed. Facilities Fin. Corp. Rev. Series 2019 A, 3% 10/1/39 | 55,000 | 48,341 | |
| Harris County Cultural Ed. Facilities Fin. Corp. Thermal Util. Rev. (TECO Proj.) Series 2017, 4% 11/15/37 | 55,000 | 54,720 | |
| Harris County Flood Cont. District Series 2017 A, 4% 10/1/38 | 200,000 | 200,717 | |
| Harris County Gen. Oblig. Series 2016 A, 5% 8/15/33 | 35,000 | 36,962 | |
| Harris County Hosp. District Rev. Series 2016, 3.25% 2/15/42 | 60,000 | 48,898 | |
| Harris County Toll Road Rev. Series 2021, 5% 8/15/24 | 95,000 | 96,967 | |
| Harris County-Houston Sports Auth. Rev.: | |||
| Series 2001 A, 0% 11/15/34 (Nat'l. Pub. Fin. Guarantee Corp. Insured) | 15,000 | 8,733 | |
| Series 2014: | |||
0% 11/15/48 (Assured Guaranty Muni. Corp. Insured) | 40,000 | 11,468 | |
0% 11/15/49 (Assured Guaranty Muni. Corp. Insured) | 35,000 | 9,505 | |
| Houston Arpt. Sys. Rev.: | |||
| Series 2018 D, 5% 7/1/38 | 20,000 | 21,309 | |
| Series 2021 A, 4% 7/1/41 (b) | 110,000 | 105,573 | |
| Houston Convention and Entertainment Facilities Dept. Hotel Occupancy Tax and Spl. Rev. Series 2001 B: | |||
| 0% 9/1/23 (AMBAC Insured) | 25,000 | 24,846 | |
| 0% 9/1/33 (AMBAC Insured) | 120,000 | 80,393 | |
| Houston Gen. Oblig. Series 2021 A, 3% 3/1/40 | 100,000 | 84,973 | |
| Houston Independent School District: | |||
| Series 2016 A, 5% 2/15/31 | 55,000 | 57,723 | |
| Series 2017, 5% 2/15/27 | 30,000 | 32,208 | |
| Houston Util. Sys. Rev.: | |||
| Series 2014 D, 5% 11/15/27 | 85,000 | 86,756 | |
| Series 2017 B: | |||
5% 11/15/24 | 175,000 | 179,060 | |
5% 11/15/29 | 90,000 | 97,856 | |
| Houston Wtr. & Swr. Sys. Rev. Series 1998 A, 0% 12/1/27 (Escrowed to Maturity) | 50,000 | 43,647 | |
| Humble Independent School District Series 2020 A, 2% 2/15/42 | 100,000 | 65,792 | |
| Katy Independent School District: | |||
| Series 2019, 4% 2/15/40 | 35,000 | 35,151 | |
| Series 2022, 4% 2/15/41 | 125,000 | 126,580 | |
| Keller Independent School District Series 2020, 4% 2/15/44 | 100,000 | 100,634 | |
| Lamar Consolidated Independent School District Series 2018, 4% 2/15/50 | 75,000 | 73,503 | |
| Leander Independent School District: | |||
| Series 2014 D, 0% 8/15/40 (Pre-Refunded to 8/15/24 @ 46.38) | 70,000 | 31,290 | |
| Series 2016 A: | |||
0% 8/16/44 | 130,000 | 50,730 | |
0% 8/16/44 (Pre-Refunded to 8/16/26 @ 48.506) | 10,000 | 4,382 | |
| Lone Star College Sys. Gen. Oblig. Series 2021 A, 4% 2/15/46 | 250,000 | 243,128 | |
| Lower Colorado River Auth. Rev. (LCRA Transmission Svcs. Corp. Proj.): | |||
| Series 2019, 5% 5/15/44 | 260,000 | 269,988 | |
| Series 2020 A, 5% 5/15/50 | 55,000 | 57,952 | |
| Matagorda County Navigation District No. 1 Poll. Cont. Rev.: | |||
| Series 2005 A, 4.4% 5/1/30 (AMBAC Insured) | 10,000 | 10,171 | |
| Series 2005 B, 4.55% 5/1/30 (b)(c) | 50,000 | 50,999 | |
| Midland County Fresh Wtr. Supply District (City of Midland Proj.) Series 2012 A: | |||
| 0% 9/15/33 (Pre-Refunded to 9/15/27 @ 75.851) | 150,000 | 98,130 | |
| 0% 9/15/35 (Pre-Refunded to 9/15/27 @ 68.049) | 50,000 | 29,345 | |
| North East Texas Reg'l. Mobility Auth. Series 2016 B, 5% 1/1/41 | 40,000 | 40,415 | |
| North Texas Tollway Auth. Rev.: | |||
| Series 2008 D: | |||
0% 1/1/34 (Assured Guaranty Corp. Insured) | 10,000 | 6,801 | |
0% 1/1/35 (Assured Guaranty Corp. Insured) | 190,000 | 122,924 | |
0% 1/1/38 (Assured Guaranty Corp. Insured) | 100,000 | 54,247 | |
| Series 2012 A, 0% 1/1/36 (Assured Guaranty Corp. Insured) | 25,000 | 15,295 | |
| Series 2015 A, 5% 1/1/27 | 100,000 | 102,382 | |
| Series 2017 B, 4% 1/1/35 (Assured Guaranty Muni. Corp. Insured) | 105,000 | 106,427 | |
| Series 2018: | |||
4.25% 1/1/49 | 5,000 | 4,949 | |
5% 1/1/48 | 70,000 | 72,335 | |
| Northside Independent School District Series 2019 A, 4% 8/15/36 | 190,000 | 194,449 | |
| Port of Houston Auth. Series 2021, 4% 10/1/39 | 115,000 | 116,499 | |
| San Antonio Elec. & Gas Sys. Rev.: | |||
| Series 2015: | |||
5% 2/1/27 | 30,000 | 31,348 | |
5% 2/1/32 | 45,000 | 46,970 | |
| Series 2019, 4% 2/1/28 | 90,000 | 93,535 | |
| San Antonio Independent School District Series 2019, 5% 8/15/30 | 20,000 | 22,075 | |
| San Jacinto Cmnty. College District Series 2019 A, 5% 2/15/44 | 20,000 | 21,361 | |
| Sherman Independent School District Series 2018 A, 5% 2/15/41 | 50,000 | 53,135 | |
| Texas A&M Univ. Rev.: | |||
| Series 2017 E, 5% 5/15/35 | 50,000 | 53,612 | |
| Series 2021 A, 3% 5/15/37 | 115,000 | 104,218 | |
| Texas Dept. of Hsg. & Cmnty. Affairs Single Family Mtg. Rev. Series 2020 A, 3% 3/1/50 | 35,000 | 25,905 | |
| Texas Gen. Oblig.: | |||
| Series 2014 A, 5% 10/1/23 | 15,000 | 15,064 | |
| Series 2014, 5% 4/1/44 (Pre-Refunded to 4/1/24 @ 100) | 50,000 | 50,672 | |
| Series 2015 A, 5% 10/1/24 | 45,000 | 46,052 | |
| Series 2016 A, 5% 4/1/30 | 50,000 | 52,708 | |
| Series 2017 B, 5% 10/1/33 | 35,000 | 37,726 | |
| Series 2018 A, 5% 10/1/26 | 65,000 | 69,025 | |
| Series 2018 B, 5% 8/1/24 | 30,000 | 30,606 | |
| Texas Private Activity Bond Surface Trans. Corp.: | |||
| (LBJ Infrastructure Group LLC I-635 Managed Lanes Proj.) Series 2020 A, 4% 12/31/31 | 65,000 | 64,997 | |
| (NTE Mobility Partners LLC North Tarrant Express Managed Lanes Proj.) Series 2019 A, 5% 12/31/32 | 55,000 | 58,350 | |
| (NTE Mobility Partners Segments 3 LLC Segment 3C Proj.) Series 2019, 5% 6/30/58 (b) | 105,000 | 104,485 | |
| Texas Tpk. Auth. Central Texas Tpk. Sys. Rev. Series A, 0% 8/15/29 (AMBAC Insured) | 15,000 | 12,134 | |
| Texas Trans. Commission Central Texas Tpk. Sys. Rev. Series 2015 C, 5% 8/15/25 | 65,000 | 65,645 | |
| Texas Wtr. Dev. Board Rev.: | |||
| Series 2017 A, 5% 10/15/47 | 60,000 | 63,168 | |
| Series 2018 A, 4% 10/15/37 | 10,000 | 10,171 | |
| Series 2018 B, 4% 10/15/34 | 5,000 | 5,180 | |
| Series 2019 A, 4% 10/15/49 | 160,000 | 158,337 | |
| Series 2020: | |||
3% 10/15/34 | 10,000 | 9,905 | |
5% 8/1/33 | 55,000 | 62,981 | |
| Series 2022, 5% 10/15/34 | 125,000 | 147,215 | |
| Tomball Independent School District Series 2018, 5% 2/15/41 | 125,000 | 132,347 | |
| Univ. of Houston Univ. Revs. Series 2016 A, 5% 2/15/24 | 50,000 | 50,549 | |
| Univ. of Texas Board of Regents Sys. Rev.: | |||
| Series 2016 A, 4% 8/15/42 | 65,000 | 65,011 | |
| Series 2016 J, 5% 8/15/26 | 20,000 | 21,256 | |
| Series 2017 B, 3.375% 8/15/44 | 15,000 | 13,176 | |
| Series 2019 A, 5% 8/15/31 | 15,000 | 16,865 | |
| Series 2021 A, 5% 8/15/31 | 165,000 | 192,944 | |
| Waco Independent School District Series 2022, 3% 8/15/40 | 235,000 | 203,666 | |
| Waller Independent School District Series 2020, 4% 2/15/50 | 15,000 | 14,682 | |
TOTAL TEXAS | 7,592,498 | ||
| Utah - 0.9% | |||
| Salt Lake City Arpt. Rev. Series 2021 A, 4% 7/1/38 (b) | 90,000 | 87,854 | |
| Salt Lake City Pub. Utils. Rev. Series 2020, 4% 2/1/44 | 100,000 | 99,209 | |
| Univ. of Utah Gen. Revs.: | |||
| Series 2017 A, 5% 8/1/29 | 20,000 | 21,609 | |
| Series 2020 A: | |||
4% 8/1/39 | 65,000 | 65,612 | |
5% 8/1/37 | 60,000 | 66,544 | |
| Series 2021 A1, 4% 8/1/41 | 80,000 | 80,370 | |
| Utah County Hosp. Rev. Series 2018 A, 5% 5/15/41 | 120,000 | 123,391 | |
| Utah Gen. Oblig. Series 2020, 5% 7/1/28 | 150,000 | 166,587 | |
| Utah Transit Auth. Sales Tax Rev.: | |||
| Series 2015 A: | |||
5% 6/15/26 (Pre-Refunded to 6/15/25 @ 100) | 10,000 | 10,364 | |
5% 6/15/29 (Pre-Refunded to 6/15/25 @ 100) | 20,000 | 20,728 | |
| Series 2016, 4% 12/15/29 | 25,000 | 25,592 | |
TOTAL UTAH | 767,860 | ||
| Virginia - 2.1% | |||
| Commonwealth Trans. Board Grant Anticipation Rev.: | |||
| Series 2017 A, 5% 9/15/23 | 10,000 | 10,034 | |
| Series 2017, 5% 3/15/27 | 15,000 | 16,166 | |
| Fairfax County Econ. Dev. Auth.: | |||
| (Route 28 Proj.) Series 2016 A, 2.875% 4/1/35 | 45,000 | 42,486 | |
| Series 2016 A, 3% 4/1/36 | 155,000 | 142,616 | |
| Fairfax County Gen. Oblig. Series 2020 A, 5% 10/1/36 | 270,000 | 303,608 | |
| Fairfax County Indl. Dev. Auth.: | |||
| Series 2018 A, 5% 5/15/24 | 50,000 | 50,738 | |
| Series 2022, 5% 5/15/25 | 55,000 | 56,804 | |
| Henrico County Wtr. & Swr. Rev. Series 2016, 5% 5/1/46 (Pre-Refunded to 5/1/26 @ 100) | 30,000 | 31,707 | |
| Lynchburg Econ. Dev.: | |||
| Series 2017 A, 4% 1/1/47 | 35,000 | 32,316 | |
| Series 2021, 3% 1/1/51 | 50,000 | 35,287 | |
| Richmond Gen. Oblig. Series 2019 A, 3% 7/15/34 | 40,000 | 39,048 | |
| Roanoke Econ. Dev. Authority. Bonds Series 2020 D, 5%, tender 7/1/30 (c) | 30,000 | 33,208 | |
| Univ. of Virginia Gen. Rev. Series 2013 A, 4% 4/1/45 | 55,000 | 54,904 | |
| Virginia College Bldg. Auth. Edl. Facilities Rev.: | |||
| (21st Century College And Equip. Programs) Series 2017 E, 5% 2/1/25 | 125,000 | 128,775 | |
| (21st Century College and Equip. Progs.): | |||
Series 2015 A, 5% 2/1/28 (Pre-Refunded to 2/1/25 @ 100) | 10,000 | 10,310 | |
Series 2017 E, 5% 2/1/24 | 45,000 | 45,482 | |
Series 2019 C, 5% 2/1/30 | 45,000 | 50,412 | |
| Series 2017 A, 5% 2/1/24 | 60,000 | 60,643 | |
| Series 2019 C, 5% 2/1/25 | 65,000 | 66,963 | |
| Series 2022 A, 5% 2/1/26 | 100,000 | 105,042 | |
| Virginia Commonwealth Trans. Board Rev.: | |||
| Series 2014, 5% 5/15/28 | 50,000 | 50,871 | |
| Series 2017, 3% 5/15/36 | 125,000 | 117,810 | |
| Virginia Gen. Oblig. Series 2018 A, 3% 6/1/32 | 5,000 | 4,997 | |
| Virginia Port Auth. Port Facilities Rev. Series 2015 A, 5% 7/1/33 (Pre-Refunded to 7/1/25 @ 100) (b) | 35,000 | 36,170 | |
| Virginia Pub. Bldg. Auth. Pub. Facilities Rev.: | |||
| Series 2013 A, 3% 8/1/30 | 100,000 | 98,953 | |
| Series 2016 A, 3% 8/1/35 | 15,000 | 14,124 | |
| Series 2019 A, 5% 8/1/29 | 60,000 | 67,678 | |
| Virginia Small Bus. Fing. Auth.: | |||
| (Elizabeth River Crossings OPCO, LLC Proj.) Series 2022, 3% 1/1/41 (b) | 50,000 | 38,757 | |
| Series 2014, 4% 10/1/38 | 5,000 | 4,844 | |
| Virginia St Pub. Bldg. Auth. Pubf Series 2022 A, 5% 8/1/31 | 80,000 | 93,369 | |
TOTAL VIRGINIA | 1,844,122 | ||
| Washington - 3.9% | |||
| Central Puget Sound Reg'l. Trans. Auth. Sales & Use Tax Rev. Series 2016 S1: | |||
| 5% 11/1/27 | 45,000 | 47,915 | |
| 5% 11/1/35 | 65,000 | 68,535 | |
| Clark County School District #114, Evergreen Series 2019, 3% 12/1/38 | 20,000 | 17,896 | |
| Energy Northwest Elec. Rev.: | |||
| Series 2015 A, 5% 7/1/28 | 75,000 | 77,712 | |
| Series 2016 A, 5% 7/1/28 | 55,000 | 58,234 | |
| Series 2017 A, 5% 7/1/28 | 95,000 | 102,567 | |
| Series 2018 C, 5% 7/1/33 | 65,000 | 71,534 | |
| King County Gen. Oblig.: | |||
| Series 2015 E, 5% 12/1/29 | 45,000 | 46,910 | |
| Series 2021 A, 4% 1/1/26 | 50,000 | 51,213 | |
| King County Hsg. Auth. Rev. Series 2018, 3.5% 5/1/38 | 35,000 | 32,184 | |
| King County Pub. Hosp. District #2 Series 2020 A, 4% 12/1/45 | 120,000 | 115,596 | |
| King County School District #403 Series 2020 A, 4% 12/1/35 | 100,000 | 104,022 | |
| King County Swr. Rev. Series 2020 A, 4% 1/1/44 | 225,000 | 224,784 | |
| Port of Seattle Rev.: | |||
| Series 2018 B: | |||
5% 5/1/24 (b) | 75,000 | 75,761 | |
5% 5/1/25 (b) | 65,000 | 66,528 | |
| Series 2019, 5% 4/1/34 (b) | 150,000 | 160,301 | |
| Seattle Muni. Lt. & Pwr. Rev.: | |||
| Series 2019 A, 5% 4/1/42 | 100,000 | 107,478 | |
| Series 2020 A, 5% 7/1/27 | 90,000 | 97,416 | |
| Series 2021 A, 4% 7/1/43 | 100,000 | 100,196 | |
| Seattle Wtr. Sys. Rev. Series 2015, 4% 5/1/45 | 50,000 | 49,340 | |
| Thurston & Pierce Counties Cmnty. Schools Series 2019, 4% 12/1/35 | 50,000 | 51,824 | |
| Univ. of Washington Univ. Revs. Series 2012 C, 3.25% 7/1/43 | 135,000 | 114,880 | |
| Washington Gen. Oblig.: | |||
| Series 2014 A, 5% 8/1/26 | 10,000 | 10,012 | |
| Series 2014 B: | |||
5% 8/1/29 | 25,000 | 25,030 | |
5% 8/1/31 | 55,000 | 55,065 | |
| Series 2014 E, 5% 2/1/32 | 90,000 | 90,897 | |
| Series 2015 B, 5% 2/1/28 | 40,000 | 41,171 | |
| Series 2015 G, 5% 7/1/26 | 100,000 | 102,754 | |
| Series 2015 H: | |||
5% 7/1/26 | 25,000 | 25,689 | |
5% 7/1/29 | 15,000 | 15,413 | |
| Series 2016 B, 5% 7/1/32 | 50,000 | 52,417 | |
| Series 2016 C, 5% 2/1/35 | 30,000 | 31,437 | |
| Series 2018 D, 5% 8/1/28 | 30,000 | 32,504 | |
| Series 2020 A, 5% 1/1/26 | 20,000 | 20,976 | |
| Series 2020 E, 5% 6/1/45 | 55,000 | 59,232 | |
| Series 2021 A: | |||
5% 8/1/29 | 75,000 | 84,777 | |
5% 2/1/31 | 100,000 | 116,071 | |
5% 8/1/43 | 175,000 | 191,083 | |
| Series 2021 C, 5% 2/1/28 | 170,000 | 186,289 | |
| Series R 2015 C, 5% 7/1/27 | 25,000 | 25,714 | |
| Washington Health Care Facilities Auth. Rev.: | |||
| Series 2012 A: | |||
4% 10/1/34 | 115,000 | 112,598 | |
5% 10/1/38 | 5,000 | 5,005 | |
| Series 2014 C, 4% 10/1/44 | 55,000 | 49,492 | |
| Series 2015 B, 5% 8/15/24 | 20,000 | 20,346 | |
| Series 2017 B, 3.5% 8/15/38 | 70,000 | 61,660 | |
| Series 2020, 4% 9/1/50 | 115,000 | 105,122 | |
| Washington Higher Ed. Facilities Auth. Rev.: | |||
| (Gonzaga Univ. Proj.) Series 2019 A, 3% 4/1/49 | 40,000 | 30,206 | |
| (Seattle Pacific Univ. Proj.) Series 2020 A, 5% 10/1/42 | 75,000 | 73,386 | |
| Washington State Univ. Hsg. and Dining Sys. Rev. Series 2015, 5% 4/1/40 | 35,000 | 35,647 | |
TOTAL WASHINGTON | 3,502,819 | ||
| West Virginia - 0.2% | |||
| West Virginia Hosp. Fin. Auth. Hosp. Rev. Series 2016 A, 3% 6/1/33 | 20,000 | 18,824 | |
| West Virginia Parkways Auth. Series 2021, 4% 6/1/51 | 145,000 | 139,684 | |
TOTAL WEST VIRGINIA | 158,508 | ||
| Wisconsin - 0.7% | |||
| Milwaukee Gen. Oblig. Series 2016 B3, 3% 3/1/31 | 50,000 | 46,951 | |
| Pub. Fin. Auth. Hosp. Rev. (Renown Reg'l. Med. Ctr. Proj.) Series 2016 A, 3% 6/1/36 | 5,000 | 4,330 | |
| Pub. Fin. Auth. Lease Dev. Rev. (KU Campus Dev. Corp. Central District Dev. Proj.) Series 2016, 5% 3/1/29 | 40,000 | 41,716 | |
| Roseman Univ. of Health (Fargo-Moorhead Metropolitan Area Flood Risk Mgmt. Proj.) Series 2021, 4% 3/31/56 (b) | 5,000 | 3,975 | |
| Wisconsin Envir. Impt. Fund Rev. Series 2017, 5% 6/1/29 | 65,000 | 67,185 | |
| Wisconsin Gen. Oblig.: | |||
| Series 1, 5% 11/1/26 | 40,000 | 42,787 | |
| Series 2015 1, 5% 5/1/25 | 70,000 | 72,434 | |
| Series 2016 2, 5% 11/1/29 | 65,000 | 68,609 | |
| Series 2017 2, 5% 11/1/25 | 65,000 | 68,005 | |
| Series 3, 5% 11/1/31 | 25,000 | 26,982 | |
| Series A, 4% 5/1/27 | 20,000 | 20,562 | |
| Wisconsin Health & Edl. Facilities: | |||
| Series 2014 A, 5% 11/15/25 | 10,000 | 10,168 | |
| Series 2016 A: | |||
3.125% 11/15/36 (Pre-Refunded to 5/15/26 @ 100) | 50,000 | 50,218 | |
3.5% 2/15/46 | 20,000 | 15,514 | |
| Series 2017 A, 5% 4/1/28 | 5,000 | 5,307 | |
| Wisconsin Hsg. & Econ. Dev. Auth. Series 2017 A, 2.69% 7/1/47 | 9,392 | 8,761 | |
| Wisconsin St Gen. Fund Annual Appropriation Series 2017 B, 5% 5/1/36 | 35,000 | 36,895 | |
| Wisconsin Trans. Rev. Series 2017 1, 5% 7/1/28 | 10,000 | 10,707 | |
TOTAL WISCONSIN | 601,106 | ||
| Wyoming - 0.0% | |||
| Campbell County Solid Waste Facilities Rev. Series 2019 A, 3.625% 7/15/39 | 30,000 | 26,441 | |
| TOTAL MUNICIPAL BONDS (Cost $91,472,164) | 87,509,726 | ||
| Money Market Funds - 0.6% | |||
| Shares | Value ($) | ||
Fidelity Municipal Cash Central Fund 4.23% (e)(f) (Cost $554,990) | 554,889 | 554,974 | |
| TOTAL INVESTMENT IN SECURITIES - 99.2% (Cost $92,027,154) | 88,064,700 |
NET OTHER ASSETS (LIABILITIES) - 0.8% | 747,322 |
| NET ASSETS - 100.0% | 88,812,022 |
| (a) | Amount is stated in United States dollars unless otherwise noted. |
| (b) | Private activity obligations whose interest is subject to the federal alternative minimum tax for individuals. |
| (c) | Coupon rates for floating and adjustable rate securities reflect the rates in effect at period end. |
| (d) | Security initially issued in zero coupon form which converts to coupon form at a specified rate and date. The rate shown is the rate at period end. |
| (e) | Information in this report regarding holdings by state and security types does not reflect the holdings of the Fidelity Municipal Cash Central Fund. |
| (f) | Affiliated fund that is generally available only to investment companies and other accounts managed by Fidelity Investments. The rate quoted is the annualized seven-day yield of the fund at period end. A complete unaudited listing of the fund's holdings as of its most recent quarter end is available upon request. In addition, each Fidelity Central Fund's financial statements, which are not covered by the Fund's Report of Independent Registered Public Accounting Firm, are available on the SEC's website or upon request. |
| Affiliate | Value, beginning of period ($) | Purchases ($) | Sales Proceeds ($) | Dividend Income ($) | Realized Gain (loss) ($) | Change in Unrealized appreciation (depreciation) ($) | Value, end of period ($) | % ownership, end of period |
| Fidelity Municipal Cash Central Fund 4.23% | 2,705,986 | 18,635,999 | 20,787,000 | 14,411 | - | (11) | 554,974 | 0.0% |
| Total | 2,705,986 | 18,635,999 | 20,787,000 | 14,411 | - | (11) | 554,974 | |
| Valuation Inputs at Reporting Date: | ||||
| Description | Total ($) | Level 1 ($) | Level 2 ($) | Level 3 ($) |
Investments in Securities: | ||||
| Municipal Securities | 87,509,726 | - | 87,509,726 | - |
| Money Market Funds | 554,974 | 554,974 | - | - |
| Total Investments in Securities: | 88,064,700 | 554,974 | 87,509,726 | - |
| Statement of Assets and Liabilities | ||||
| June 30, 2023 | ||||
| Assets | ||||
| Investment in securities, at value - See accompanying schedule: | ||||
Unaffiliated issuers (cost $91,472,164) | $ | 87,509,726 | ||
Fidelity Central Funds (cost $554,990) | 554,974 | |||
| Total Investment in Securities (cost $92,027,154) | $ | 88,064,700 | ||
| Cash | 223,526 | |||
| Receivable for fund shares sold | 61,431 | |||
| Interest receivable | 1,031,122 | |||
| Distributions receivable from Fidelity Central Funds | 1,878 | |||
| Receivable from investment adviser for expense reductions | 23,026 | |||
| Other receivables | 32 | |||
Total assets | 89,405,715 | |||
| Liabilities | ||||
| Payable for investments purchased | $ | 319,334 | ||
| Payable for fund shares redeemed | 28,936 | |||
| Distributions payable | 187,932 | |||
| Accrued management fee | 3,681 | |||
| Audit fee payable | 53,036 | |||
| Other payables and accrued expenses | 774 | |||
| Total Liabilities | 593,693 | |||
| Net Assets | $ | 88,812,022 | ||
| Net Assets consist of: | ||||
| Paid in capital | $ | 95,017,472 | ||
| Total accumulated earnings (loss) | (6,205,450) | |||
| Net Assets | $ | 88,812,022 | ||
Net Asset Value , offering price and redemption price per share ($88,812,022 ÷ 4,839,560 shares) | $ | 18.35 | ||
| Statement of Operations | ||||
Year ended June 30, 2023 | ||||
| Investment Income | ||||
| Interest | $ | 2,321,887 | ||
| Income from Fidelity Central Funds | 14,399 | |||
| Total Income | 2,336,286 | |||
| Expenses | ||||
| Management fee | $ | 44,233 | ||
| Custodian fees and expenses | 3,530 | |||
| Independent trustees' fees and expenses | 301 | |||
| Registration fees | 45,417 | |||
| Audit | 61,758 | |||
| Legal | 136 | |||
| Miscellaneous | 418 | |||
| Total expenses before reductions | 155,793 | |||
| Expense reductions | (93,747) | |||
| Total expenses after reductions | 62,046 | |||
| Net Investment income (loss) | 2,274,240 | |||
| Realized and Unrealized Gain (Loss) | ||||
| Net realized gain (loss) on: | ||||
| Investment Securities: | ||||
| Unaffiliated issuers | (536,341) | |||
| Capital gain distributions from Fidelity Central Funds | 12 | |||
| Total net realized gain (loss) | (536,329) | |||
| Change in net unrealized appreciation (depreciation) on: | ||||
| Investment Securities: | ||||
| Unaffiliated issuers | 549,465 | |||
| Fidelity Central Funds | (11) | |||
| Total change in net unrealized appreciation (depreciation) | 549,454 | |||
| Net gain (loss) | 13,125 | |||
| Net increase (decrease) in net assets resulting from operations | $ | 2,287,365 | ||
| Statement of Changes in Net Assets | ||||
Year ended June 30, 2023 | Year ended June 30, 2022 | |||
| Increase (Decrease) in Net Assets | ||||
| Operations | ||||
| Net investment income (loss) | $ | 2,274,240 | $ | 1,372,277 |
| Net realized gain (loss) | (536,329) | (1,706,162) | ||
| Change in net unrealized appreciation (depreciation) | 549,454 | (6,693,071) | ||
| Net increase (decrease) in net assets resulting from operations | 2,287,365 | (7,026,956) | ||
| Distributions to shareholders | (2,239,158) | (1,365,882) | ||
| Share transactions | ||||
| Proceeds from sales of shares | 129,072,772 | 198,120,579 | ||
| Reinvestment of distributions | 289 | 6,754 | ||
| Cost of shares redeemed | (126,565,224) | (193,632,934) | ||
Net increase (decrease) in net assets resulting from share transactions | 2,507,837 | 4,494,399 | ||
| Total increase (decrease) in net assets | 2,556,044 | (3,898,439) | ||
| Net Assets | ||||
| Beginning of period | 86,255,978 | 90,154,417 | ||
| End of period | $ | 88,812,022 | $ | 86,255,978 |
| Other Information | ||||
| Shares | ||||
| Sold | 7,250,216 | 10,403,744 | ||
| Issued in reinvestment of distributions | 16 | 327 | ||
| Redeemed | (7,116,407) | (10,063,538) | ||
| Net increase (decrease) | 133,825 | 340,533 | ||
| Fidelity® SAI Municipal Bond Index Fund |
| Years ended June 30, | 2023 | 2022 | 2021 | 2020 A | ||||
Selected Per-Share Data | ||||||||
| Net asset value, beginning of period | $ | 18.33 | $ | 20.65 | $ | 20.26 | $ | 20.00 |
| Income from Investment Operations | ||||||||
Net investment income (loss) B,C | .470 | .330 | .314 | .333 | ||||
| Net realized and unrealized gain (loss) | .012 | (2.320) | .391 | .254 | ||||
| Total from investment operations | .482 | (1.990) | .705 | .587 | ||||
| Distributions from net investment income | (.462) | (.330) | (.315) | (.327) | ||||
| Total distributions | (.462) | (.330) | (.315) | (.327) | ||||
| Net asset value, end of period | $ | 18.35 | $ | 18.33 | $ | 20.65 | $ | 20.26 |
Total Return D,E | 2.68% | (9.74)% | 3.50% | 2.96% | ||||
Ratios to Average Net Assets C,F,G | ||||||||
| Expenses before reductions | .18% | .20% | .17% | .45% H | ||||
| Expenses net of fee waivers, if any | .07% | .07% | .07% | .07% H | ||||
| Expenses net of all reductions | .07% | .07% | .07% | .07% H | ||||
| Net investment income (loss) | 2.57% | 1.65% | 1.53% | 1.72% H | ||||
| Supplemental Data | ||||||||
| Net assets, end of period (000 omitted) | $ | 88,812 | $ | 86,256 | $ | 90,154 | $ | 54,824 |
Portfolio turnover rate I | 17% | 59% | 13% | 8% H |
| Fidelity Central Fund | Investment Manager | Investment Objective | Investment Practices | Expense Ratio A |
| Fidelity Money Market Central Funds | Fidelity Management & Research Company LLC (FMR) | Each fund seeks to obtain a high level of current income consistent with the preservation of capital and liquidity. | Short-term Investments | Less than .005% |
| Gross unrealized appreciation | $355,551 |
| Gross unrealized depreciation | (4,275,293) |
| Net unrealized appreciation (depreciation) | $(3,919,742) |
| Tax Cost | $91,984,442 |
| Capital loss carryforward | $(2,284,670) |
| Net unrealized appreciation (depreciation) on securities and other investments | $(3,919,742) |
| Short-term | $(1,113,841) |
| Long-term | (1,170,829) |
| Total capital loss carryforward | $(2,284,670) |
| June 30, 2023 | June 30, 2022 | |
| Tax-exempt Income | $2,239,158 | $1,365,882 |
| Purchases ($) | Sales ($) | |
| Fidelity SAI Municipal Bond Index Fund | 19,335,077 | 14,854,122 |
| Amount | |
| Fidelity SAI Municipal Bond Index Fund | $156 |
| The Example is based on an investment of $1,000 invested at the beginning of the period and held for the entire period (January 1, 2023 to June 30, 2023). |
Annualized Expense Ratio- A | Beginning Account Value January 1, 2023 | Ending Account Value June 30, 2023 | Expenses Paid During Period- C January 1, 2023 to June 30, 2023 | |||||||
| Fidelity® SAI Municipal Bond Index Fund | .07% | |||||||||
| Actual | $ 1,000 | $ 1,024.00 | $ .35 | |||||||
Hypothetical- B | $ 1,000 | $ 1,024.45 | $ .35 | |||||||
- Highly liquid investments - cash or convertible to cash within three business days or less
- Moderately liquid investments - convertible to cash in three to seven calendar days
- Less liquid investments - can be sold or disposed of, but not settled, within seven calendar days
- Illiquid investments - cannot be sold or disposed of within seven calendar days
 |


Contents
| Average Annual Total Returns | |||
Periods ended June 30, 2023 | Past 1 year | Life of Fund A |
| Fidelity® Municipal Bond Index Fund | 2.64% | -0.52% |
| $10,000 Over Life of Fund |
Let's say hypothetically that $10,000 was invested in Fidelity® Municipal Bond Index Fund, on July 11, 2019, when the fund started. The chart shows how the value of your investment would have changed, and also shows how the Bloomberg Municipal Bond Index performed over the same period. |
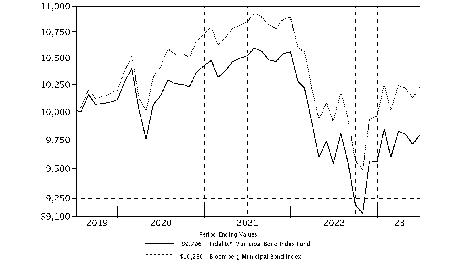 |
| Top Five States (% of Fund's net assets) | |
| California | 19.6 |
| New York | 14.8 |
| Texas | 9.3 |
| Illinois | 4.8 |
| Florida | 4.3 |
| Revenue Sources (% of Fund's net assets) | ||
| General Obligations | 34.4 | |
| Transportation | 15.5 | |
| Special Tax | 10.9 | |
| Health Care | 8.9 | |
| Water & Sewer | 8.1 | |
| Education | 6.0 | |
| Others* (Individually Less Than 5%) | 16.2 | |
| 100.0 | ||
| *Includes net other assets | ||
Quality Diversification (% of Fund's net assets) |
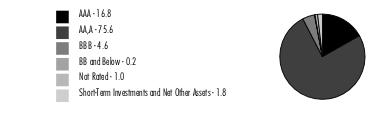 |
| We have used ratings from Moody's Investors Service, Inc. Where Moody's® ratings are not available, we have used S&P® ratings. All ratings are as of the date indicated and do not reflect subsequent changes. |
| Municipal Bonds - 98.2% | |||
Principal Amount (a) | Value ($) | ||
| Alabama - 1.4% | |||
| Alabama Fed. Aid Hwy. Fin. Auth.: | |||
| Series 2015, 3.1% 9/1/29 (Pre-Refunded to 9/1/24 @ 100) | 70,000 | 69,814 | |
| Series 2017 A, 4% 6/1/37 (Pre-Refunded to 9/1/27 @ 100) | 25,000 | 26,250 | |
| Series 2017 B, 5% 9/1/26 (Escrowed to Maturity) | 75,000 | 79,855 | |
| Alabama Pub. School & College Auth. Rev. Series 2020 A: | |||
| 4% 11/1/40 | 100,000 | 100,202 | |
| 5% 11/1/39 | 320,000 | 353,663 | |
| Alabama State Corrections Institution Fin. Auth. Series 2022 A, 5.25% 7/1/47 | 150,000 | 163,166 | |
| Birmingham Jefferson Civic Ctr. Auth. Series 2018 B, 4% 7/1/48 | 30,000 | 27,538 | |
| Birmingham Spl. Care Facilities Fin. Auth. Series 2015, 5% 6/1/25 | 150,000 | 154,594 | |
| Birmingham Wtrwks. Board: | |||
| Series 2016 B, 5% 1/1/30 (Pre-Refunded to 1/1/27 @ 100) | 135,000 | 144,823 | |
| Series 2016, 3% 1/1/43 (Pre-Refunded to 1/1/27 @ 100) | 5,000 | 5,029 | |
| Black Belt Energy Gas District Bonds Series 2019 A, 4%, tender 12/1/25 (b) | 560,000 | 556,730 | |
| Decatur Wtr. & Swr. Rev. Series 2021 A, 2.125% 2/15/51 | 35,000 | 20,472 | |
| Infirmary Health Systems Spl. Care Facilities Fing. Auth. Rev. Series 2016 A, 3% 2/1/30 | 40,000 | 38,015 | |
| Southeast Alabama Gas Supply District Bonds Series 2018 A, 4%, tender 4/1/24 (b) | 50,000 | 49,927 | |
| Tuscaloosa County Board of Ed. Series 2017, 5% 2/1/43 (Pre-Refunded to 2/1/27 @ 100) | 45,000 | 48,365 | |
| UAB Medicine Fin. Auth. Rev.: | |||
| Series 2016 B: | |||
3.625% 9/1/41 | 195,000 | 182,597 | |
5% 9/1/34 | 130,000 | 135,952 | |
| Series 2017 B1, 3.25% 9/1/31 | 5,000 | 4,907 | |
| Univ. of Alabama At Birmingham Series 2019 B, 3% 10/1/41 | 50,000 | 42,587 | |
| Univ. of Alabama Gen. Rev. Series 2017 B, 3% 7/1/35 | 10,000 | 9,270 | |
TOTAL ALABAMA | 2,213,756 | ||
| Alaska - 0.1% | |||
| Alaska Gen. Oblig. Series 2015 B, 5% 8/1/27 | 50,000 | 51,750 | |
| Alaska Hsg. Fin. Corp. Series 2017 A, 5% 12/1/30 | 75,000 | 80,137 | |
TOTAL ALASKA | 131,887 | ||
| Arizona - 1.0% | |||
| Arizona Health Facilities Auth. Rev. (Scottsdale Lincoln Hospitals Proj.) Series 2014 A, 5% 12/1/26 | 35,000 | 35,724 | |
| Arizona Indl. Dev. Auth. Student Hsg. Rev. (North Carolina Central Univ. Proj.) Series 2019 A, 5% 6/1/58 | 65,000 | 69,089 | |
| Arizona State Univ. Revs. Series 2019 B, 4% 7/1/49 | 15,000 | 14,553 | |
| Maricopa County Indl. Dev. Auth. Series 2021 A, 4% 9/1/51 | 135,000 | 123,852 | |
| Maricopa County Rev. Series 2016 A, 5% 1/1/38 | 40,000 | 41,520 | |
| Maricopa County Spl. Health Care District Gen. Oblig. Series 2018 C, 4% 7/1/38 | 55,000 | 55,079 | |
| Mesa Util. Sys. Rev. Series 2020, 4% 7/1/43 | 180,000 | 180,861 | |
| Phoenix Civic Impt. Board Arpt. Rev.: | |||
| Series 2015 A, 5% 7/1/45 | 175,000 | 178,140 | |
| Series 2017 D, 5% 7/1/25 | 15,000 | 15,542 | |
| Phoenix Civic Impt. Corp. District Rev. Series 2005 B, 5.5% 7/1/36 (Nat'l. Pub. Fin. Guarantee Corp. Insured) | 75,000 | 92,073 | |
| Phoenix Civic Impt. Corp. Excise Tax Rev. Series 2015 A, 5% 7/1/31 | 25,000 | 25,924 | |
| Salt River Proj. Agricultural Impt. & Pwr. District Elec. Sys. Rev.: | |||
| (Arizona Salt River Proj.) Series A, 5% 1/1/31 | 45,000 | 48,305 | |
| Series 2016 A, 5% 1/1/27 | 50,000 | 53,604 | |
| Series 2017 A: | |||
5% 1/1/28 | 100,000 | 109,611 | |
5% 1/1/33 | 50,000 | 54,792 | |
| Series 2019 A, 4% 1/1/41 | 175,000 | 176,052 | |
| Series A: | |||
5% 1/1/31 | 40,000 | 43,875 | |
5% 1/1/36 | 40,000 | 42,377 | |
| Salt Verde Finl. Corp. Sr. Gas Rev.: | |||
| Series 2007 1: | |||
5% 12/1/32 | 50,000 | 53,056 | |
5.25% 12/1/24 | 10,000 | 10,120 | |
5.25% 12/1/26 | 15,000 | 15,481 | |
| Series 2007, 5.25% 12/1/23 | 20,000 | 20,069 | |
| Univ. of Arizona Univ. Revs.: | |||
| Series 2016 B, 5% 6/1/42 | 45,000 | 46,268 | |
| Series 2020 A, 4% 8/1/44 | 100,000 | 98,277 | |
TOTAL ARIZONA | 1,604,244 | ||
| Arkansas - 0.1% | |||
| Fort Smith Wtr. & Swr. Rev. Series 2018, 5% 10/1/34 | 110,000 | 118,567 | |
| Pulaski County Pub. Facilities Board Series 2014, 5% 12/1/39 (Pre-Refunded to 12/1/24 @ 100) | 35,000 | 35,864 | |
TOTAL ARKANSAS | 154,431 | ||
| California - 19.6% | |||
| Anaheim Elementary School District Series 2016, 3% 8/1/46 | 50,000 | 39,858 | |
| Anaheim Pub. Fing. Auth. Lease Rev.: | |||
| (Anaheim Pub. Impts. Proj.) Series 1997 C, 0% 9/1/36 (Escrowed to Maturity) | 170,000 | 107,860 | |
| Series 1997 C, 0% 9/1/28 (Assured Guaranty Muni. Corp. Insured) | 95,000 | 79,723 | |
| Antelope Valley Cmnty. College District Series B, 3% 8/1/50 | 55,000 | 42,313 | |
| Bay Area Toll Auth. San Francisco Bay Toll Bridge Rev.: | |||
| Bonds: | |||
Series 2017 G, 2%, tender 4/1/24 (b) | 50,000 | 49,306 | |
Series 2018 A, 2.625%, tender 4/1/26 (b) | 130,000 | 126,467 | |
Series A, 2.95%, tender 4/1/26 (b) | 115,000 | 112,693 | |
| Series 2017 S7: | |||
4% 4/1/34 | 95,000 | 97,969 | |
4% 4/1/38 | 75,000 | 75,934 | |
4% 4/1/47 | 5,000 | 4,920 | |
| Series F1, 5% 4/1/54 (Pre-Refunded to 4/1/24 @ 100) | 70,000 | 71,012 | |
| Brea Redev. Agcy. Series 2003, 0% 8/1/29 (AMBAC Insured) | 105,000 | 84,578 | |
| California Cmnty. Choice Fing. Auth. Clean Energy Proj. Rev. Bonds Series 2022 A1, 4%, tender 8/1/28 (b) | 670,000 | 669,985 | |
| California Dept. of Wtr. Resources: | |||
| Series 2017 AX, 5% 12/1/31 | 200,000 | 221,090 | |
| Series AV, 4% 12/1/31 | 40,000 | 41,592 | |
| Series BA, 5% 12/1/32 | 65,000 | 73,960 | |
| California Edl. Facilities Auth. Rev.: | |||
| (Loyola Marymount Univ. Proj.) Series 2001 A, 0% 10/1/29 (Nat'l. Pub. Fin. Guarantee Corp. Insured) | 165,000 | 132,932 | |
| Series 2001 A: | |||
0% 10/1/30 | 70,000 | 54,106 | |
0% 10/1/34 (Nat'l. Pub. Fin. Guarantee Corp. Insured) | 15,000 | 9,653 | |
| Series 2018 B, 5% 10/1/43 | 100,000 | 104,341 | |
| Series T1, 5% 3/15/39 | 30,000 | 35,734 | |
| Series U6, 5% 5/1/45 | 35,000 | 41,411 | |
| California Gen. Oblig.: | |||
| Series 2012, 4% 9/1/37 | 215,000 | 215,009 | |
| Series 2013: | |||
5% 9/1/26 | 75,000 | 75,210 | |
5% 9/1/27 | 55,000 | 55,153 | |
5% 11/1/30 | 25,000 | 25,139 | |
| Series 2014: | |||
5% 10/1/23 | 35,000 | 35,164 | |
5% 11/1/23 | 50,000 | 50,319 | |
5% 10/1/28 | 30,000 | 30,712 | |
| Series 2015: | |||
5% 8/1/23 | 25,000 | 25,035 | |
5% 8/1/26 | 75,000 | 77,414 | |
5% 8/1/26 | 65,000 | 67,738 | |
5% 9/1/26 | 20,000 | 20,880 | |
5% 9/1/28 | 50,000 | 52,304 | |
5% 8/1/29 | 20,000 | 20,908 | |
5% 8/1/30 | 170,000 | 175,375 | |
5% 8/1/45 | 40,000 | 41,325 | |
5.25% 8/1/30 | 95,000 | 99,445 | |
| Series 2016: | |||
3% 9/1/33 | 120,000 | 118,436 | |
4% 9/1/28 | 110,000 | 113,629 | |
4% 9/1/34 | 300,000 | 308,592 | |
4% 9/1/35 | 50,000 | 51,158 | |
4% 9/1/36 | 200,000 | 203,546 | |
5% 9/1/24 | 45,000 | 46,073 | |
5% 9/1/26 | 160,000 | 170,458 | |
5% 8/1/27 | 45,000 | 47,928 | |
5% 9/1/30 | 15,000 | 15,968 | |
5% 9/1/32 | 50,000 | 53,202 | |
5% 9/1/45 | 10,000 | 10,492 | |
| Series 2017 A, 5% 8/1/26 | 80,000 | 85,072 | |
| Series 2017: | |||
3.5% 8/1/27 | 25,000 | 25,441 | |
4% 8/1/37 | 25,000 | 25,419 | |
5% 11/1/25 | 175,000 | 183,212 | |
5% 11/1/27 | 75,000 | 82,102 | |
5% 11/1/27 | 65,000 | 71,155 | |
5% 11/1/31 | 100,000 | 109,244 | |
5% 8/1/33 | 100,000 | 106,190 | |
| Series 2018, 5% 10/1/48 | 100,000 | 107,281 | |
| Series 2019: | |||
3% 10/1/33 | 70,000 | 69,036 | |
3% 10/1/34 | 50,000 | 48,931 | |
4% 4/1/25 | 45,000 | 45,865 | |
5% 4/1/25 | 105,000 | 108,822 | |
5% 10/1/25 | 175,000 | 182,880 | |
5% 4/1/26 | 295,000 | 311,777 | |
5% 4/1/27 | 10,000 | 10,803 | |
5% 4/1/29 | 140,000 | 157,669 | |
5% 4/1/30 | 100,000 | 112,826 | |
5% 4/1/35 | 5,000 | 5,066 | |
5% 4/1/36 | 75,000 | 75,947 | |
| Series 2020: | |||
2% 11/1/36 | 60,000 | 47,045 | |
3% 3/1/28 | 50,000 | 49,895 | |
3% 11/1/35 | 250,000 | 237,833 | |
4% 3/1/28 | 40,000 | 41,994 | |
4% 3/1/29 | 175,000 | 185,601 | |
4% 3/1/50 | 40,000 | 40,089 | |
5% 11/1/27 | 50,000 | 54,735 | |
5% 3/1/32 | 50,000 | 57,376 | |
5% 3/1/32 | 50,000 | 57,376 | |
5% 3/1/35 | 220,000 | 250,521 | |
| Series 2021: | |||
4% 12/1/24 | 100,000 | 101,533 | |
5% 12/1/26 | 310,000 | 332,132 | |
5% 12/1/31 | 265,000 | 313,414 | |
| California Health Facilities Fing. Auth. Rev.: | |||
| Bonds (Providence St. Jospeh Health) Series 2016 B3, 2%, tender 10/1/25 (b) | 150,000 | 144,453 | |
| Series 2013 A, 4% 3/1/43 | 35,000 | 31,876 | |
| Series 2015, 5% 11/15/26 | 50,000 | 52,351 | |
| Series 2016 A: | |||
3% 10/1/41 | 50,000 | 39,445 | |
3.25% 11/15/36 (Pre-Refunded to 11/15/25 @ 100) | 110,000 | 111,160 | |
| Series 2016 B: | |||
5% 11/15/46 | 15,000 | 15,458 | |
5% 11/15/46 (Pre-Refunded to 11/15/26 @ 100) | 10,000 | 10,711 | |
| Series 2017 A: | |||
5% 11/15/26 | 275,000 | 293,516 | |
5% 11/1/27 | 20,000 | 21,962 | |
| Series 2017 A2, 5% 11/1/47 | 70,000 | 79,706 | |
| Series 2018 A: | |||
4% 11/15/42 | 65,000 | 65,004 | |
5% 11/15/26 | 35,000 | 37,357 | |
5% 11/15/33 | 25,000 | 26,972 | |
| California Infrastructure & Econ. Dev. Bank Rev. Series 2003 A, 5% 7/1/29 (Pre-Refunded to 1/1/28 @ 100) | 165,000 | 181,653 | |
| California Infrastructure and Econ. Dev. Bank Rev.: | |||
| Series 2016: | |||
5% 10/1/26 | 15,000 | 15,913 | |
5% 10/1/29 | 25,000 | 26,590 | |
| Series 2018, 5% 10/1/26 | 25,000 | 26,788 | |
| Series 2020 A1, 5% 4/1/32 | 225,000 | 269,001 | |
| California Muni. Fin. Auth. Rev.: | |||
| (LINXS APM Proj.) Series 2018 A: | |||
5% 12/31/28 (c) | 60,000 | 63,434 | |
5% 12/31/47 (c) | 100,000 | 101,036 | |
| Series 2018 A, 3.25% 12/31/32 (Assured Guaranty Muni. Corp. Insured) (c) | 20,000 | 18,848 | |
| California Pub. Works Board Lease Rev. (Various Cap. Projs.) Series 2020 B, 4% 3/1/45 | 175,000 | 173,597 | |
| California State Univ. Rev.: | |||
| Series 2015 A: | |||
5% 11/1/27 | 20,000 | 21,016 | |
5% 11/1/33 | 105,000 | 109,765 | |
5% 11/1/43 | 40,000 | 41,488 | |
| Series 2016 A: | |||
3.125% 11/1/36 | 155,000 | 145,443 | |
5% 11/1/26 | 45,000 | 47,808 | |
5% 11/1/45 | 125,000 | 130,088 | |
| Series 2017 A, 5% 11/1/25 | 100,000 | 104,669 | |
| California Statewide Cmntys. Dev. Auth. Series 2017, 5% 5/15/42 | 100,000 | 101,749 | |
| California Statewide Cmntys. Dev. Auth. Hosp. Rev. Series 2018: | |||
| 4.375% 1/1/48 | 40,000 | 37,527 | |
| 5% 1/1/32 | 20,000 | 21,066 | |
| California Statewide Cmntys. Dev. Auth. Rev.: | |||
| Bonds Series 2004 J, 5%, tender 11/1/29 (b) | 25,000 | 28,078 | |
| Series 2015, 5% 11/1/43 (Pre-Refunded to 11/1/24 @ 100) | 85,000 | 87,136 | |
| Series 2017 A, 5% 4/1/47 | 55,000 | 55,831 | |
| Series 2018 A, 3.5% 3/1/38 | 125,000 | 116,564 | |
| Carlsbad Unified School District Series 2011 C, 0% 8/1/35 (d) | 180,000 | 196,210 | |
| Cerritos Cmnty. College District Series 2019 C, 3% 8/1/44 | 25,000 | 20,681 | |
| Chaffey Unified High School District Series 2019 D, 4% 8/1/49 | 20,000 | 19,660 | |
| Chino Valley Unified School District Series 2017 A, 5.25% 8/1/47 | 25,000 | 26,467 | |
| Coast Cmnty. College District Series 2013 A, 5% 8/1/38 (Pre-Refunded to 8/1/23 @ 100) | 90,000 | 90,123 | |
| Compton Unified School District Series 2019 B, 3% 6/1/49 | 10,000 | 7,807 | |
| Contra Costa Cmnty. College District Series 2014 A, 4% 8/1/39 | 145,000 | 145,002 | |
| Downey Unified School District Series 2019 B, 3.625% 8/1/42 | 280,000 | 264,383 | |
| East Bay Muni. Util. District Wastewtr. Sys. Rev.: | |||
| Series 2015 A, 5% 6/1/37 | 65,000 | 67,335 | |
| Series 2017 B, 5% 6/1/27 | 5,000 | 5,446 | |
| El Camino Cmnty. College District Series 2012 C: | |||
| 0% 8/1/34 | 165,000 | 112,203 | |
| 0% 8/1/38 | 65,000 | 35,246 | |
| Elk Grove Unified School Distr. Ctfs. of Prtn. (Cap. Facilities Proj.) Series 2016, 3% 2/1/35 | 60,000 | 56,539 | |
| Foothill-De Anza Cmnty. College District Series 2003 B, 0% 8/1/25 | 5,000 | 4,678 | |
| Foothill/Eastern Trans. Corridor Agcy. Toll Road Rev.: | |||
| Series 1995 A: | |||
0% 1/1/24 (Escrowed to Maturity) | 105,000 | 103,406 | |
0% 1/1/27 (Escrowed to Maturity) | 40,000 | 36,157 | |
0% 1/1/29 (Escrowed to Maturity) | 20,000 | 17,214 | |
| Series 2013 A: | |||
0% 1/15/24 (Assured Guaranty Muni. Corp. Insured) | 40,000 | 39,284 | |
5% 1/15/42 (Assured Guaranty Muni. Corp. Insured) | 85,000 | 85,479 | |
6% 1/15/49 (Pre-Refunded to 1/15/24 @ 100) | 40,000 | 40,631 | |
6% 1/15/53 (Pre-Refunded to 1/15/24 @ 100) | 10,000 | 10,158 | |
| Series 2013 B1, 3.95% 1/15/53 (b) | 80,000 | 74,582 | |
| Fremont Union High School District, Santa Clara Series 2019 A, 4% 8/1/46 | 30,000 | 29,780 | |
| Fresno Unified School District Series 2016 A, 4% 8/1/41 | 150,000 | 150,516 | |
| Golden State Tobacco Securitization Corp. Tobacco Settlement Rev. Series 2015 A: | |||
| 4% 6/1/31 (Pre-Refunded to 6/1/25 @ 100) | 100,000 | 102,160 | |
| 5% 6/1/35 (Pre-Refunded to 6/1/25 @ 100) | 20,000 | 20,800 | |
| 5% 6/1/40 (Pre-Refunded to 6/1/25 @ 100) | 10,000 | 10,400 | |
| 5% 6/1/40 (Pre-Refunded to 6/1/25 @ 100) | 10,000 | 10,400 | |
| 5% 6/1/45 (Pre-Refunded to 6/1/25 @ 100) | 140,000 | 145,603 | |
| Grossmont Union High School District: | |||
| Series 2008, 0% 8/1/30 | 10,000 | 7,858 | |
| Series 2016 B, 3% 8/1/45 | 20,000 | 16,218 | |
| Hayward Unified School District Gen. Oblig. Series 2019 A, 4% 8/1/48 | 200,000 | 195,580 | |
| Imperial Irrigation District Elec. Rev. Series 2016 B1, 5% 11/1/46 | 140,000 | 145,905 | |
| Kaweah Delta Health Care District Series 2015 B, 4% 6/1/45 | 155,000 | 107,683 | |
| Livermore Valley Joint Unified School District Series 2019, 4% 8/1/46 | 190,000 | 189,268 | |
| Long Beach Bond Fin. Auth. Natural Gas Purchase Rev. Series 2007 A, 5% 11/15/35 | 25,000 | 26,620 | |
| Long Beach Unified School District: | |||
| Series 2012, 5% 8/1/29 | 105,000 | 105,130 | |
| Series 2016, 3% 8/1/32 | 35,000 | 34,436 | |
| Series B, 0% 8/1/35 | 150,000 | 95,718 | |
| Los Angeles Cmnty. College District: | |||
| Series 2015 A: | |||
5% 8/1/28 (Pre-Refunded to 8/1/24 @ 100) | 170,000 | 173,813 | |
5% 8/1/31 (Pre-Refunded to 8/1/24 @ 100) | 170,000 | 173,813 | |
| Series 2017 J, 5% 8/1/28 | 30,000 | 32,916 | |
| Series A, 5% 8/1/30 (Pre-Refunded to 8/1/24 @ 100) | 30,000 | 30,673 | |
| Series F, 5% 8/1/24 (Pre-Refunded to 8/1/23 @ 100) | 35,000 | 35,047 | |
| Series G, 5% 8/1/27 (Pre-Refunded to 8/1/24 @ 100) | 10,000 | 10,224 | |
| Series K, 4% 8/1/35 | 20,000 | 20,565 | |
| Los Angeles County Metropolitan Trans. Auth. Sales Tax Rev.: | |||
| Series 2019 A, 5% 7/1/44 | 45,000 | 48,328 | |
| Series 2021 A: | |||
5% 6/1/30 | 200,000 | 232,384 | |
5% 7/1/44 | 190,000 | 210,453 | |
| Los Angeles Dept. Arpt. Rev.: | |||
| Series 2015, 5% 5/15/32 | 200,000 | 208,967 | |
| Series 2018 C, 5% 5/15/37 (c) | 75,000 | 78,189 | |
| Series 2018 D: | |||
5% 5/15/31 (c) | 80,000 | 86,559 | |
5% 5/15/34 (c) | 120,000 | 129,477 | |
| Series 2022 I, 5% 5/15/42 | 285,000 | 320,197 | |
| Series A, 5% 5/15/36 (c) | 50,000 | 53,229 | |
| Series B: | |||
5% 5/15/34 (c) | 10,000 | 10,671 | |
5% 5/15/48 | 65,000 | 71,333 | |
| Series C, 5% 5/15/33 (c) | 90,000 | 95,362 | |
| Series D, 5% 5/15/26 (c) | 65,000 | 67,596 | |
| Los Angeles Dept. of Wtr. & Pwr. Rev.: | |||
| Series 2014 C, 5% 7/1/29 | 40,000 | 40,768 | |
| Series 2014 D, 5% 7/1/44 | 45,000 | 45,487 | |
| Series 2015 A, 3.25% 7/1/31 | 100,000 | 100,293 | |
| Series 2016 A: | |||
5% 7/1/40 | 125,000 | 130,167 | |
5% 7/1/46 | 70,000 | 72,517 | |
| Series 2017 A, 5% 7/1/28 | 5,000 | 5,398 | |
| Series 2020 A, 5% 7/1/27 | 135,000 | 146,869 | |
| Series 2022 A, 5% 7/1/40 | 275,000 | 307,446 | |
| Series A, 5% 7/1/31 | 15,000 | 16,555 | |
| Series B: | |||
5% 7/1/29 | 50,000 | 50,471 | |
5% 7/1/30 | 40,000 | 40,000 | |
5% 7/1/30 | 55,000 | 61,962 | |
5% 7/1/40 | 190,000 | 209,922 | |
| Series C, 5% 7/1/37 | 25,000 | 27,716 | |
| Los Angeles Dept. of Wtr. & Pwr. Wtrwks. Rev.: | |||
| Series 2014 A, 5% 7/1/44 | 25,000 | 25,346 | |
| Series 2016 B, 5% 7/1/29 | 50,000 | 52,859 | |
| Series 2022 B: | |||
4% 7/1/49 | 140,000 | 140,507 | |
5% 7/1/28 | 430,000 | 479,040 | |
| Series A: | |||
5% 7/1/33 | 25,000 | 27,576 | |
5% 7/1/33 | 20,000 | 21,601 | |
| Series B, 5% 7/1/25 | 25,000 | 25,000 | |
| Los Angeles Muni. Impt. Corp. Lease Rev. Series 2016 B, 4% 11/1/37 | 490,000 | 495,116 | |
| Los Angeles Solid Waste Resources Rev. Series 2018 A, 5% 2/1/30 | 115,000 | 126,288 | |
| Los Angeles Unified School District: | |||
| Series 2014 C, 5% 7/1/24 | 40,000 | 40,792 | |
| Series 2016 A, 5% 7/1/40 | 30,000 | 30,905 | |
| Series 2017 A, 5% 7/1/26 | 175,000 | 186,374 | |
| Series 2018 B1: | |||
5% 7/1/23 | 95,000 | 95,000 | |
5% 7/1/33 | 125,000 | 137,102 | |
5.25% 7/1/42 | 50,000 | 54,108 | |
| Series 2019 A, 5% 7/1/28 | 130,000 | 145,020 | |
| Series 2020 C, 5% 7/1/30 | 60,000 | 69,704 | |
| Series 2020, 5% 7/1/25 | 10,000 | 10,417 | |
| Series 2021 A, 5% 7/1/25 | 75,000 | 78,124 | |
| Series A: | |||
5% 7/1/24 | 5,000 | 5,099 | |
5% 7/1/29 | 5,000 | 5,697 | |
5% 7/1/30 | 50,000 | 56,685 | |
| Series B, 5% 7/1/25 | 90,000 | 93,749 | |
| Series C, 5% 7/1/28 | 55,000 | 56,034 | |
| Marin Healthcare District Series 2017 A: | |||
| 3% 8/1/37 | 70,000 | 62,986 | |
| 4% 8/1/47 | 135,000 | 133,854 | |
| Metropolitan Wtr. District of Southern California Wtr. Rev. Series 2020 A, 5% 10/1/33 | 55,000 | 62,938 | |
| Montebello Unified School District Series A, 5% 8/1/41 | 50,000 | 52,233 | |
| MSR Energy Auth. Gas Rev.: | |||
| Series 2009 A, 6.125% 11/1/29 | 55,000 | 59,014 | |
| Series 2009 B, 6.5% 11/1/39 | 25,000 | 30,035 | |
| Newport Mesa Unified School District: | |||
| Series 2011, 0% 8/1/36 | 230,000 | 142,406 | |
| Series 2017, 0% 8/1/39 | 495,000 | 257,408 | |
| North Orange County Cmnty. College District Rev. Series 2016 A, 3% 8/1/40 | 15,000 | 13,077 | |
| Norwalk-Mirada Unified School District Series 2005 B, 0% 8/1/28 (Nat'l. Pub. Fin. Guarantee Corp. Insured) | 70,000 | 59,328 | |
| Orange County Wtr. District Rev.: | |||
| Series 2017 A, 5% 8/15/29 | 75,000 | 81,542 | |
| Series 2019 C, 5% 8/15/32 | 150,000 | 171,205 | |
| Orange County Wtr. District Rev. Ctfs. of Prtn. Series 2003 B, 5% 8/15/28 (Escrowed to Maturity) | 120,000 | 127,840 | |
| Palo Alto Unified School District Gen. Oblig. Series 2008 2, 0% 8/1/33 | 35,000 | 25,175 | |
| Palomar Cmnty. College District Series 2010 B, 0% 8/1/45 (d) | 50,000 | 44,009 | |
| Palomar Pomerado Health Series 2009 A, 0% 8/1/28 (Assured Guaranty Corp. Insured) | 200,000 | 168,246 | |
| Port of Oakland Rev. Series 2017 E, 5% 11/1/26 | 30,000 | 31,894 | |
| Poway Unified School District Series 2011, 0% 8/1/46 | 190,000 | 64,386 | |
| Riverside Cmnty. College District Series 2019, 3% 8/1/36 | 200,000 | 187,222 | |
| Riverside County Pub. Fing. Auth. (Cap. Facilities Proj.) Series 2015: | |||
| 4.125% 11/1/40 (Pre-Refunded to 11/1/25 @ 100) | 100,000 | 102,832 | |
| 5.25% 11/1/45 (Pre-Refunded to 11/1/25 @ 100) | 180,000 | 189,616 | |
| Sacramento City Fing. Auth. Rev. Series 2005 A: | |||
| 0% 12/1/29 (Nat'l. Pub. Fin. Guarantee Corp. Insured) | 80,000 | 63,878 | |
| 0% 12/1/34 (FGIC Insured) | 100,000 | 64,308 | |
| Sacramento Muni. Util. District Elec. Rev. Series 2020 H, 5% 8/15/39 | 70,000 | 78,020 | |
| Sacramento TOT Rev. Series A, 5% 6/1/43 | 55,000 | 57,825 | |
| San Bernardino Cmnty. College District: | |||
| Series 2019 A, 3% 8/1/41 (Pre-Refunded to 8/16/27 @ 100) | 375,000 | 380,242 | |
| Series B, 0% 8/1/48 | 5,000 | 1,618 | |
| San Diego Cmnty. College District: | |||
| Series 2013, 0% 8/1/41 (Pre-Refunded to 8/1/23 @ 57.571) (d) | 180,000 | 103,382 | |
| Series 2016, 5% 8/1/41 (Pre-Refunded to 8/1/26 @ 100) | 5,000 | 5,341 | |
| San Diego County Reg'l. Arpt. Auth. Arpt. Rev. Series 2017 A, 5% 7/1/47 | 50,000 | 51,931 | |
| San Diego County Wtr. Auth. Fing. Agcy. Wtr. Rev. Series 2022 A, 5% 5/1/47 | 140,000 | 155,097 | |
| San Diego Pub. Facilities Fing. Auth. Wtr. Rev. Series 2018 A: | |||
| 5% 8/1/33 | 170,000 | 189,443 | |
| 5.25% 8/1/47 | 30,000 | 32,169 | |
| San Diego Redev. Agcy. Series 2016 A, 5% 9/1/23 | 50,000 | 50,130 | |
| San Diego Unified School District: | |||
| (Election of 1998 Proj.) Series 2005 E2, 5.5% 7/1/26 (Assured Guaranty Muni. Corp. Insured) | 80,000 | 86,293 | |
| Series 1998 G1: | |||
5.25% 7/1/27 | 5,000 | 5,493 | |
5.25% 7/1/28 (Assured Guaranty Muni. Corp. Insured) | 25,000 | 28,155 | |
5.25% 7/1/28 (Escrowed to Maturity) | 5,000 | 5,604 | |
| Series 2008 E, 0% 7/1/49 | 125,000 | 39,436 | |
| Series 2009 1, 0% 7/1/30 | 50,000 | 40,215 | |
| Series 2017 K2, 0% 7/1/31 | 430,000 | 326,964 | |
| Series A, 0% 7/1/31 | 15,000 | 11,570 | |
| Series C, 0% 7/1/43 | 10,000 | 4,281 | |
| Series G, 0% 7/1/37 (Pre-Refunded to 1/1/24 @ 47.757) | 130,000 | 61,118 | |
| Series R1, 0% 7/1/30 | 35,000 | 28,034 | |
| Series R4, 5% 7/1/28 | 70,000 | 73,068 | |
| Series R5, 5% 7/1/26 | 50,000 | 53,220 | |
| San Francisco Bay Area Rapid Transit District Sales Tax Rev. Series 2019 A, 3% 7/1/44 | 5,000 | 4,099 | |
| San Francisco Bay Area Rapid Transit Fing. Auth.: | |||
| Series 2017 A1, 4% 8/1/42 | 10,000 | 10,031 | |
| Series 2019 B1, 3% 8/1/49 | 200,000 | 156,063 | |
| Series 2022 D1, 4.125% 8/1/52 | 195,000 | 194,300 | |
| Series A1, 5% 8/1/47 | 80,000 | 84,753 | |
| San Francisco City & County Arpts. Commission Int'l. Arpt. Rev.: | |||
| Series 2016 A, 5% 5/1/26 | 25,000 | 26,500 | |
| Series 2017 A, 5% 5/1/47 (c) | 40,000 | 40,842 | |
| Series 2017 D: | |||
5% 5/1/24 (c) | 35,000 | 35,381 | |
5% 5/1/25 (c) | 105,000 | 107,469 | |
| Series 2019 A, 5% 5/1/49 (c) | 25,000 | 25,779 | |
| Series 2019 D: | |||
5% 5/1/26 | 135,000 | 143,098 | |
5% 5/1/34 | 325,000 | 366,033 | |
5% 5/1/39 | 30,000 | 32,620 | |
| Series 2019 E, 5% 5/1/34 (c) | 175,000 | 188,469 | |
| Series 2020 A, 4% 5/1/39 (c) | 15,000 | 14,781 | |
| San Francisco City & County Ctfs. of Prtn. (49 South Van Ness Proj.) Series 2019 A, 4% 4/1/41 | 30,000 | 30,036 | |
| San Francisco Muni. Trans. Agcy. Series 2017, 4% 3/1/42 | 135,000 | 135,339 | |
| San Francisco Pub. Utils. Commission Wtr. Rev.: | |||
| Series 2015 A, 5% 11/1/29 | 15,000 | 15,574 | |
| Series 2020 A, 5% 11/1/50 | 85,000 | 92,515 | |
| San Joaquin Hills Trans. Corridor Agcy. Toll Road Rev.: | |||
| Series 1993: | |||
0% 1/1/25 (Escrowed to Maturity) | 200,000 | 191,207 | |
0% 1/1/26 (Escrowed to Maturity) | 30,000 | 27,877 | |
0% 1/1/28 (Escrowed to Maturity) | 200,000 | 176,052 | |
0% 1/1/28 (Escrowed to Maturity) | 35,000 | 30,932 | |
| Series 1997 A, 0% 1/15/32 (Nat'l. Pub. Fin. Guarantee Corp. Insured) | 30,000 | 21,561 | |
| Series 2014 A, 5% 1/15/44 (Pre-Refunded to 1/15/25 @ 100) | 95,000 | 98,056 | |
| Series A, 0% 1/15/31 (Nat'l. Pub. Fin. Guarantee Corp. Insured) | 90,000 | 67,622 | |
| San Jose Int. Arpt. Rev. Series 2017 B, 5% 3/1/42 | 20,000 | 20,847 | |
| San Mateo County Cmnty. College District Series 2006 B: | |||
| 0% 9/1/33 (Nat'l. Pub. Fin. Guarantee Corp. Insured) | 130,000 | 93,023 | |
| 0% 9/1/35 (Nat'l. Pub. Fin. Guarantee Corp. Insured) | 200,000 | 130,287 | |
| San Mateo Foster City (Clean Wtr. Prog.) Series 2019, 5% 8/1/49 | 15,000 | 16,113 | |
| San Mateo Unified School District Series 2011 A, 0% 9/1/41 (d) | 50,000 | 48,270 | |
| Santa Clara County Fing. Auth. Lease Rev.: | |||
| (Multiple Facilities Proj.) Series Q, 3% 5/15/37 | 200,000 | 178,367 | |
| Series 2019 A, 3.125% 5/1/47 | 225,000 | 181,452 | |
| Santa Clara Unified School District: | |||
| Series 2019, 4% 7/1/48 | 35,000 | 34,579 | |
| Series 2023, 4% 7/1/40 | 160,000 | 166,016 | |
| Santa Clara Valley Wtr. District Wtr. Util. Rev. Series 2016 A, 5% 6/1/33 | 75,000 | 79,108 | |
| Saugus Union School District Series 2020 C, 2.375% 8/1/44 | 150,000 | 108,874 | |
| Sequoia Union High School District Series 2016, 3% 7/1/31 | 145,000 | 145,569 | |
| Sierra Joint Cmnty. College District Series 2021 B, 2% 8/1/46 | 100,000 | 66,555 | |
| Solano Cmnty. College District Series A, 0% 8/1/41 (Pre-Refunded to 8/1/28 @ 100) (d) | 40,000 | 43,754 | |
| Sonoma County Jr. College District Rev.: | |||
| Series 2019 B, 3% 8/1/36 | 200,000 | 185,427 | |
| Series B, 3% 8/1/41 | 5,000 | 4,258 | |
| Southern California Pub. Pwr. Auth. Rev. Series A, 5.25% 11/1/26 | 30,000 | 31,184 | |
| Southwestern Cmnty. College District Gen. Oblig. Series 2021 C, 2.375% 8/1/46 | 100,000 | 68,142 | |
| Sunnyvale Calif Fin. Auth. Lease (Civic Ctr. Proj.) Series 2020, 4% 4/1/50 | 380,000 | 372,388 | |
| Sweetwater Union High School District Series 2016, 4% 8/1/42 | 350,000 | 343,320 | |
| Turlock Irrigation District Rev. Series 2016, 5% 1/1/46 | 205,000 | 214,748 | |
| Twin Rivers Unified School District Series 2016, 0% 8/1/41 (Assured Guaranty Muni. Corp. Insured) | 135,000 | 58,990 | |
| Univ. of California Revs.: | |||
| Series 2015 AO, 5% 5/15/40 | 125,000 | 128,807 | |
| Series 2016, 5% 5/15/35 | 135,000 | 143,515 | |
| Series 2017 M, 5% 5/15/32 | 75,000 | 81,492 | |
| Series 2018 O: | |||
4% 5/15/48 | 165,000 | 164,748 | |
5% 5/15/58 | 105,000 | 111,546 | |
| Series 2021 Q, 5% 5/15/35 | 250,000 | 292,528 | |
| Series AM, 5.25% 5/15/37 | 10,000 | 10,170 | |
| Series AY, 5% 5/15/28 | 20,000 | 21,790 | |
| Series I: | |||
5% 5/15/25 | 50,000 | 52,045 | |
5% 5/15/28 | 40,000 | 41,575 | |
| Series M, 5% 5/15/36 | 80,000 | 86,119 | |
| Series O, 4% 5/15/29 | 25,000 | 26,545 | |
| Upland Gen. Oblig. Ctfs. of Prtn. Series 2017, 5% 1/1/47 | 80,000 | 81,661 | |
| Upper Santa Clara Valley Joint Powers Auth. Series 2020 A, 4% 8/1/50 | 85,000 | 83,773 | |
| West Contra Costa Unified School District Series C1: | |||
| 0% 8/1/27 (Assured Guaranty Corp. Insured) | 15,000 | 13,087 | |
| 0% 8/1/28 | 60,000 | 50,625 | |
| West Hollywood Pub. Fing. Auth. Series 2016, 3% 4/1/41 | 140,000 | 119,470 | |
| Westminster Redev. Agcy. Series 2016, 3% 11/1/41 | 125,000 | 105,216 | |
| William S. Hart Union High School District Series 2009 A, 0% 8/1/33 | 50,000 | 35,050 | |
| Yuba Cmnty. College District Series 2016 A: | |||
| 3% 8/1/36 | 165,000 | 150,265 | |
| 3% 8/1/37 | 35,000 | 31,154 | |
TOTAL CALIFORNIA | 30,493,188 | ||
| Colorado - 1.8% | |||
| Colorado Ctfs. of Prtn.: | |||
| Series 2020 A, 3% 12/15/36 | 105,000 | 95,068 | |
| Series 2021 A, 4% 12/15/38 | 285,000 | 290,510 | |
| Colorado Health Facilities Auth. Rev. Bonds: | |||
| (Bethesda Proj.) Series 2018 B, 5% 9/15/53 | 90,000 | 73,447 | |
| Series 2016 B, 5% 11/15/30 | 150,000 | 158,439 | |
| Series 2018 A, 4% 11/15/48 | 100,000 | 95,582 | |
| Series 2019 A, 5% 11/1/29 | 35,000 | 38,776 | |
| Series 2019 A1: | |||
4% 8/1/37 | 75,000 | 73,727 | |
4% 8/1/39 | 85,000 | 82,193 | |
4% 8/1/44 | 55,000 | 51,373 | |
5% 8/1/26 | 60,000 | 62,261 | |
| Colorado Reg'l. Trans. District Ctfs. of Prtn. Series 2013 A, 5% 6/1/25 | 25,000 | 25,026 | |
| Colorado Springs Utils. Rev. Series 2018 A2, 5% 11/15/48 | 25,000 | 26,670 | |
| Denver City & County Arpt. Rev.: | |||
| Series 2017 A, 5% 11/15/28 (c) | 30,000 | 31,768 | |
| Series 2018 A: | |||
5% 12/1/25 (c) | 115,000 | 118,373 | |
5% 12/1/36 (c) | 60,000 | 66,969 | |
| Series 2018 B, 3.5% 12/1/35 | 15,000 | 14,699 | |
| Series 2019 C, 5% 11/15/31 | 30,000 | 33,805 | |
| Series 2022 A, 5% 11/15/41 (c) | 245,000 | 262,102 | |
| Series 2022 D, 5% 11/15/42 (c) | 165,000 | 175,814 | |
| Denver City & County Board Wtr. Rev. Series 2022 A, 5% 12/15/45 | 165,000 | 184,169 | |
| Denver Convention Ctr. Hotel Auth.: | |||
| Series 2016, 5% 12/1/23 | 50,000 | 50,160 | |
| Series 2017, 5% 12/1/26 | 50,000 | 51,483 | |
| E-470 Pub. Hwy. Auth. Rev.: | |||
| Series 2000 B: | |||
0% 9/1/30 (Nat'l. Pub. Fin. Guarantee Corp. Insured) | 25,000 | 19,468 | |
0% 9/1/31 (Nat'l. Pub. Fin. Guarantee Corp. Insured) | 20,000 | 14,957 | |
0% 9/1/32 (Nat'l. Pub. Fin. Guarantee Corp. Insured) | 25,000 | 17,933 | |
| Series 2006 B, 0% 9/1/37 (Nat'l. Pub. Fin. Guarantee Corp. Insured) | 100,000 | 50,524 | |
| Metropolitan Wastewtr. Reclamation District Series 2020 A, 2% 4/1/39 | 100,000 | 72,241 | |
| Park Creek Metropolitan District Series 2015 A, 5% 12/1/45 | 445,000 | 447,254 | |
| Univ. of Colorado Enterprise Sys. Rev.: | |||
| Series 2014 A, 5% 6/1/28 (Pre-Refunded to 6/1/24 @ 100) | 5,000 | 5,081 | |
| Series 2016 B1, 2.75% 6/1/30 | 85,000 | 83,694 | |
TOTAL COLORADO | 2,773,566 | ||
| Connecticut - 1.3% | |||
| Connecticut Gen. Oblig.: | |||
| Series 2014 C, 5% 6/15/24 | 15,000 | 15,271 | |
| Series 2015 B, 3.375% 6/15/29 | 25,000 | 25,085 | |
| Series 2016 A, 5% 3/15/26 | 30,000 | 31,539 | |
| Series 2017 A, 5% 4/15/27 | 25,000 | 26,856 | |
| Series 2018 D, 5% 4/15/27 | 105,000 | 112,797 | |
| Series 2019 A, 5% 4/15/27 | 25,000 | 26,856 | |
| Series 2020 C, 4% 6/1/31 | 30,000 | 32,183 | |
| Series 2021 B: | |||
3% 6/1/29 | 90,000 | 89,266 | |
3% 6/1/40 | 100,000 | 84,456 | |
4% 6/1/31 | 65,000 | 70,343 | |
| Series A, 5% 3/15/28 | 35,000 | 36,062 | |
| Series B, 5% 1/15/24 | 50,000 | 50,494 | |
| Series D: | |||
4% 8/15/31 | 15,000 | 15,355 | |
5% 4/15/26 | 25,000 | 26,329 | |
| Series E: | |||
3.375% 10/15/36 | 30,000 | 28,810 | |
5% 9/15/25 | 30,000 | 31,224 | |
5% 10/15/25 | 30,000 | 31,276 | |
| Connecticut Health & Edl. Facilities Auth. Rev.: | |||
| Series 2016 A, 2%, tender 7/1/26 (b) | 225,000 | 213,104 | |
| Series 2019 A: | |||
4% 7/1/34 | 30,000 | 29,859 | |
5% 7/1/33 | 135,000 | 142,085 | |
| Series 2020 A, 5% 7/1/30 | 50,000 | 54,482 | |
| Connecticut Hsg. Fin. Auth.: | |||
| Series 2017 D1, 3.2% 11/15/32 | 15,000 | 14,684 | |
| Series 2018 A, 3.5% 5/15/33 | 5,000 | 4,908 | |
| Series 2020 C1, 2.05% 5/15/37 | 75,000 | 59,356 | |
| Series B1, 3.45% 11/15/41 | 5,000 | 4,352 | |
| Connecticut Spl. Tax Oblig. Trans. Infrastructure Rev.: | |||
| Series 2015 A, 5% 5/1/26 | 150,000 | 158,161 | |
| Series 2015 B, 5% 8/1/26 | 110,000 | 114,340 | |
| Series 2016 A, 5% 9/1/31 | 5,000 | 5,292 | |
| Series 2018 A, 5% 1/1/27 | 35,000 | 37,426 | |
| Series 2018 B, 5% 10/1/28 | 120,000 | 132,862 | |
| Series 2021 A, 4% 5/1/37 | 35,000 | 36,091 | |
| Series A: | |||
4% 9/1/35 | 145,000 | 147,138 | |
5% 9/1/30 | 60,000 | 63,612 | |
| Series B: | |||
5% 10/1/33 | 10,000 | 10,989 | |
5% 10/1/36 | 85,000 | 91,857 | |
| Univ. of Connecticut Gen. Oblig. Series 2018 A, 5% 4/15/29 | 25,000 | 27,321 | |
TOTAL CONNECTICUT | 2,082,121 | ||
| Delaware - 0.3% | |||
| Delaware Gen. Oblig.: | |||
| Series 2009 C, 5% 10/1/25 | 225,000 | 234,783 | |
| Series 2017, 3.25% 3/1/37 | 4,000 | 3,816 | |
| Delaware Health Facilities Auth. Rev. Series 2020 A: | |||
| 4% 10/1/49 | 155,000 | 147,099 | |
| 5% 10/1/32 | 15,000 | 16,764 | |
| Delaware Trans. Auth. Series 2015, 4% 6/1/45 | 50,000 | 49,918 | |
TOTAL DELAWARE | 452,380 | ||
| District Of Columbia - 1.8% | |||
| District of Columbia Gen. Oblig.: | |||
| Series 2016 A: | |||
4% 6/1/36 | 400,000 | 405,066 | |
5% 6/1/32 | 40,000 | 42,104 | |
| Series 2017 A, 5% 6/1/29 | 45,000 | 48,730 | |
| Series 2017 D: | |||
5% 6/1/28 | 100,000 | 108,285 | |
5% 6/1/42 | 35,000 | 36,747 | |
| Series 2019 A: | |||
5% 10/15/31 | 80,000 | 89,158 | |
5% 10/15/40 | 295,000 | 320,244 | |
5% 10/15/44 | 15,000 | 16,129 | |
| Series 2021 D, 5% 2/1/31 | 60,000 | 68,844 | |
| District of Columbia Hosp. Rev. Series 2015, 5% 7/15/24 | 115,000 | 116,525 | |
| District of Columbia Income Tax Rev. Series 2019 C: | |||
| 5% 10/1/29 | 180,000 | 203,860 | |
| 5% 10/1/33 | 205,000 | 231,678 | |
| District of Columbia Rev. Series 2020, 5% 12/1/27 | 180,000 | 195,614 | |
| District of Columbia Univ. Rev. Series 2017, 5% 4/1/31 | 25,000 | 26,561 | |
| District of Columbia Wtr. & Swr. Auth. Pub. Util. Rev.: | |||
| Series 2014 C: | |||
5% 10/1/27 | 20,000 | 20,468 | |
5% 10/1/28 | 50,000 | 51,138 | |
| Series 2019 A, 5% 10/1/44 | 130,000 | 139,880 | |
| Metropolitan Washington Arpts. Auth. Dulles Toll Road Rev.: | |||
| (Dulles Metrorail and Cap. Impt. Proj.) Series 2019 B, 4% 10/1/53 | 45,000 | 41,300 | |
| (Dulles Metrorail and Cap. Impt. Projs.) Series 2019 B, 3% 10/1/50 (Assured Guaranty Muni. Corp. Insured) | 20,000 | 15,010 | |
| Series 2009 B: | |||
0% 10/1/25 (Assured Guaranty Corp. Insured) | 5,000 | 4,615 | |
0% 10/1/31 (Assured Guaranty Corp. Insured) | 35,000 | 26,242 | |
0% 10/1/34 (Assured Guaranty Corp. Insured) | 70,000 | 46,285 | |
0% 10/1/36 (Assured Guaranty Corp. Insured) | 20,000 | 11,964 | |
| Series 2019 218, 4% 10/1/44 | 100,000 | 95,752 | |
| Metropolitan Washington DC Arpts. Auth. Sys. Rev.: | |||
| Series 2014 A: | |||
5% 10/1/28 (c) | 40,000 | 40,449 | |
5% 10/1/44 (c) | 105,000 | 105,359 | |
| Series 2018 A, 5% 10/1/27 (c) | 65,000 | 68,776 | |
| Series 2021 A, 4% 10/1/41 (c) | 205,000 | 199,951 | |
| Washington D.C. Metropolitan Transit Auth. Rev.: | |||
| Series 2017 A1, 5% 7/1/29 | 10,000 | 10,773 | |
| Series 2017 B, 5% 7/1/42 | 70,000 | 72,957 | |
TOTAL DISTRICT OF COLUMBIA | 2,860,464 | ||
| Florida - 4.3% | |||
| Brevard County Health Facilities Auth. Health Care Facilities Rev. (Health First, Inc. Proj.) Series 2014, 4% 4/1/36 | 180,000 | 179,719 | |
| Broward County Arpt. Sys. Rev.: | |||
| Series 2015 A, 5% 10/1/33 (c) | 35,000 | 35,863 | |
| Series 2019 A, 5% 10/1/49 (c) | 100,000 | 103,310 | |
| Broward County Port Facilities Rev. Series 2019 B, 4% 9/1/38 (c) | 75,000 | 73,637 | |
| Broward County Wtr. & Swr. Util. Rev. Series 2019 A, 4% 10/1/43 | 200,000 | 199,433 | |
| Central Florida Expressway Auth. Sr. Lien Rev.: | |||
| Series 2016 B: | |||
3% 7/1/37 (Assured Guaranty Muni. Corp. Insured) | 50,000 | 44,904 | |
4% 7/1/40 | 20,000 | 19,582 | |
| Series 2017, 3.375% 7/1/42 | 70,000 | 61,581 | |
| Series 2019 B, 5% 7/1/44 | 125,000 | 133,126 | |
| Series 2021, 5% 7/1/26 (Assured Guaranty Muni. Corp. Insured) | 265,000 | 280,347 | |
| County of Broward Tourist Dev. Tax Rev. (Convention Ctr. Expansion Proj.) Series 2021, 4% 9/1/51 | 225,000 | 213,694 | |
| Florida Board of Ed. Lottery Rev. Series 2016 B, 5% 7/1/26 | 65,000 | 68,726 | |
| Florida Board of Ed. Pub. Ed. Cap. Outlay: | |||
| Series 2015 E, 5% 6/1/24 | 20,000 | 20,346 | |
| Series 2018 A, 4% 6/1/37 | 55,000 | 56,119 | |
| Series 2018 B, 4% 6/1/48 | 160,000 | 159,566 | |
| Series 2019 D, 4% 6/1/30 | 35,000 | 37,393 | |
| Series C, 5% 6/1/25 | 90,000 | 93,347 | |
| Series D, 4% 6/1/32 | 25,000 | 25,614 | |
| Florida Dept. of Trans. Tpk. Rev.: | |||
| Series 2016 B, 2.625% 7/1/27 | 60,000 | 58,308 | |
| Series 2021 B, 2% 7/1/43 | 155,000 | 105,270 | |
| Series 2021 C, 3% 7/1/51 | 185,000 | 141,563 | |
| Florida Dev. Fin. Corp. Healthcare Facility Rev. Series 2021, 5% 11/15/26 | 100,000 | 104,608 | |
| Florida Higher Edl. Facilities Fing. Auth. (Nova Southeastern Univ. Proj.) Series 2016, 5% 4/1/35 | 40,000 | 41,353 | |
| Gainesville Utils. Sys. Rev. Series 2021 A1, 5% 10/1/46 | 100,000 | 107,981 | |
| Greater Orlando Aviation Auth. Arpt. Facilities Rev. Series 2017 A, 5% 10/1/30 (Pre-Refunded to 10/1/27 @ 100) (c) | 30,000 | 32,170 | |
| Hillsborough County Cap. Impt. Series 2019: | |||
| 3.125% 8/1/46 | 50,000 | 40,875 | |
| 3.25% 8/1/49 | 10,000 | 8,175 | |
| Hillsborough County Indl. Dev. (Tampa Gen. Hosp. Proj.) Series 2012 A: | |||
| 3.5% 10/1/28 (Pre-Refunded to 10/1/23 @ 100) | 50,000 | 50,010 | |
| 5% 10/1/28 (Pre-Refunded to 10/1/23 @ 100) | 25,000 | 25,095 | |
| Hillsborough County School Board Ctfs. of Prtn. Series 2020 A, 5% 7/1/29 | 75,000 | 82,468 | |
| Jacksonville Elec. Auth. Elec. Sys. Rev. Series 2017 B3, 5% 10/1/27 | 125,000 | 135,540 | |
| Jacksonville Spl. Rev.: | |||
| Series 2013 A, 5% 10/1/40 | 75,000 | 75,220 | |
| Series 2013 C, 5.25% 10/1/30 | 150,000 | 150,806 | |
| Series 2014, 5% 10/1/28 | 65,000 | 66,368 | |
| Series 2019 A: | |||
5% 10/1/24 | 85,000 | 86,852 | |
5% 10/1/27 | 80,000 | 86,812 | |
5% 10/1/29 | 25,000 | 28,054 | |
5% 10/1/32 | 60,000 | 67,750 | |
5% 10/1/34 | 100,000 | 111,630 | |
| Jacksonville Trans. Auth. Series 2015, 5% 8/1/35 | 150,000 | 153,763 | |
| JEA Wtr. & Swr. Sys. Rev. Series 2017 A, 4% 10/1/34 | 15,000 | 15,439 | |
| Lakeland Hosp. Sys. Rev. Series 2016, 3% 11/15/32 | 10,000 | 9,365 | |
| Miami Beach Health Facilities Auth. Hosp. Rev. Series 2014 A, 5% 11/15/39 | 25,000 | 25,147 | |
| Miami Beach Wtr. & Swr. Rev. Series 2017, 5% 9/1/47 | 115,000 | 119,696 | |
| Miami-Dade County Series 2021 B2, 4% 10/1/43 | 345,000 | 344,338 | |
| Miami-Dade County Aviation Rev.: | |||
| Series 2016 A, 5% 10/1/41 | 20,000 | 20,531 | |
| Series 2020 A, 4% 10/1/39 | 130,000 | 130,105 | |
| Miami-Dade County Cap. Asset Acquisition: | |||
| Series 2009: | |||
0% 10/1/44 | 155,000 | 58,064 | |
0% 10/1/46 | 10,000 | 3,367 | |
0% 10/1/47 | 50,000 | 15,972 | |
| Series 2016: | |||
0% 10/1/31 | 5,000 | 3,665 | |
0% 10/1/32 | 15,000 | 10,476 | |
5% 10/1/26 | 145,000 | 154,025 | |
| Miami-Dade County Edl. Facilities Rev. Series 2015 A, 4% 4/1/45 | 100,000 | 94,813 | |
| Miami-Dade County Gen. Oblig.: | |||
| (Bldg. Better Cmntys. Prog.): | |||
Series 2013 A, 5% 7/1/26 | 55,000 | 57,042 | |
Series 2015 B, 5% 7/1/27 | 40,000 | 40,807 | |
| Series 2015 D, 3% 7/1/39 | 10,000 | 8,576 | |
| Miami-Dade County School Board Ctfs. of Prtn. Series 2015 A, 5% 5/1/26 | 100,000 | 102,547 | |
| Miami-Dade County Sports Facilities Series C, 0% 10/1/48 (Assured Guaranty Corp. Insured) | 15,000 | 4,763 | |
| Miami-Dade County Transit Sales Surtax Rev. Series 2019, 5% 7/1/31 | 20,000 | 22,361 | |
| Miami-Dade County Wtr. & Swr. Rev.: | |||
| Series 2017 A, 4% 10/1/39 | 75,000 | 75,279 | |
| Series 2017 B, 3.125% 10/1/39 | 5,000 | 4,344 | |
| Series 2019 B, 3% 10/1/49 | 10,000 | 7,711 | |
| Series 2019, 5% 10/1/46 | 165,000 | 173,683 | |
| North Broward Hosp. District Rev. Series 2017 B, 5% 1/1/32 | 10,000 | 10,520 | |
| North Miami Beach Wtr. Rev. Series 2020 A, 5% 8/1/44 | 60,000 | 65,019 | |
| Orange County Health Facilities Auth. Series 2016, 4% 10/1/45 | 65,000 | 61,849 | |
| Orange County Tourist Dev. Tax Rev.: | |||
| Series 2016 A, 4% 10/1/34 | 20,000 | 20,269 | |
| Series 2016 B, 4% 10/1/36 | 30,000 | 29,940 | |
| Orlando Utils. Commission Util. Sys. Rev. Series 2018 A, 5% 10/1/34 | 5,000 | 5,438 | |
| Palm Beach County Health Facilities Series 2016, 5% 11/15/32 | 25,000 | 25,314 | |
| Palm Beach County Pub. Impt. Rev. (Professional Sports Franchise Facility Proj.) Series 2015 D: | |||
| 5% 12/1/40 (Pre-Refunded to 12/1/25 @ 100) | 40,000 | 41,897 | |
| 5% 12/1/45 (Pre-Refunded to 12/1/25 @ 100) | 100,000 | 104,742 | |
| Putnam County Dev. Auth. Poll. Cont. Rev. (Seminole Elec. Coop., Inc. Proj.) Series 2018 A, 5% 3/15/42 | 90,000 | 93,637 | |
| South Broward Hosp. District Rev.: | |||
| Series 2017, 5% 5/1/28 | 55,000 | 58,708 | |
| Series 2021 A, 2.375% 5/1/45 | 375,000 | 250,806 | |
| South Miami Health Facilities Auth. Hosp. Rev. Series 2017, 5% 8/15/23 | 75,000 | 75,135 | |
| Tampa Bay Wtr. Reg'l. Wtr. Supply Auth. Util. Sys. Rev. Series 2020 A: | |||
| 4% 10/1/38 | 100,000 | 102,935 | |
| 5% 10/1/54 | 260,000 | 277,872 | |
| Tampa Health Sys. Rev. Series 2016 A, 4% 11/15/46 | 140,000 | 133,068 | |
| Tampa Tax Allocation (H. Lee Moffitt Cancer Ctr. Proj.) Series 2020 A, 0% 9/1/53 | 5,000 | 1,066 | |
| Volusia County Edl. Facilities Auth. Rev. (Stetson Univ., Inc. Proj.) Series 2015, 5% 6/1/45 | 305,000 | 309,179 | |
TOTAL FLORIDA | 6,736,488 | ||
| Georgia - 1.9% | |||
| Atlanta Arpt. Rev. Series 2019 B, 4% 7/1/49 (c) | 125,000 | 118,107 | |
| Atlanta Wtr. & Wastewtr. Rev.: | |||
| Series 2013 B, 5.25% 11/1/30 (Pre-Refunded to 11/1/23 @ 100) | 100,000 | 100,663 | |
| Series 2015: | |||
5% 11/1/28 | 25,000 | 25,879 | |
5% 11/1/29 | 5,000 | 5,177 | |
5% 11/1/35 (Pre-Refunded to 5/1/25 @ 100) | 30,000 | 31,070 | |
5% 11/1/40 | 40,000 | 40,958 | |
5% 11/1/43 (Pre-Refunded to 5/1/25 @ 100) | 25,000 | 25,892 | |
| Series 2018 C, 4% 11/1/37 | 15,000 | 15,173 | |
| Brookhaven Dev. Auth. Rev. Series 2019 A: | |||
| 4% 7/1/49 | 105,000 | 101,431 | |
| 5% 7/1/26 | 20,000 | 21,135 | |
| Burke County Indl. Dev. Auth. Poll. Cont. Rev. (Oglethorpe Pwr. Corp. Vogtle Proj.) Series 2017 D, 4.125% 11/1/45 | 20,000 | 17,980 | |
| Fulton County Dev. Auth. Rev. Series 2019, 5% 6/15/44 | 20,000 | 21,567 | |
| Gainesville & Hall County Hosp. Auth. Rev.: | |||
| (Northeast Georgia Health Sys., Inc. Proj.): | |||
Series 2017 A, 5% 2/15/45 | 255,000 | 260,457 | |
Series 2020 A, 5% 2/15/31 | 50,000 | 55,155 | |
| (Northeast Georgia Healthcare Sys., Inc. Proj.) Series 2014 A, 4% 8/15/46 (Pre-Refunded to 2/15/25 @ 100) | 55,000 | 55,747 | |
| Georgia Gen. Oblig.: | |||
| Series 2015 A, 3% 2/1/30 | 20,000 | 19,961 | |
| Series 2016 F, 5% 1/1/26 | 25,000 | 26,257 | |
| Series 2017 A, 5% 2/1/25 | 190,000 | 195,856 | |
| Series 2018 A: | |||
3% 7/1/33 | 25,000 | 24,669 | |
4% 7/1/34 | 155,000 | 161,961 | |
5% 7/1/27 | 5,000 | 5,434 | |
| Series 2021 A, 4% 7/1/35 | 105,000 | 112,106 | |
| Series 2022 C, 5% 7/1/31 | 205,000 | 241,224 | |
| Georgia Hsg. & Fin. Auth.: | |||
| Series 2015 A, 3.95% 12/1/43 | 50,000 | 49,326 | |
| Series 2017 C, 3.75% 6/1/48 | 110,000 | 107,485 | |
| Georgia Muni. Elec. Auth. Pwr. Rev. Series 2018 HH, 4.125% 1/1/49 (Assured Guaranty Muni. Corp. Insured) | 65,000 | 63,381 | |
| Griffin-Spalding County Hosp. (Wellstar Health Sys., Inc. Proj.) Series 2017 A, 3.75% 4/1/47 | 275,000 | 232,995 | |
| Gwinnett County School District Gen. Oblig. Series 2019, 5% 2/1/39 | 100,000 | 109,138 | |
| Hosp. Auth. of Savannah Auth. Rev. Series 2019 A, 3.125% 7/1/44 | 110,000 | 86,669 | |
| Main Street Natural Gas, Inc. Series 2019 A, 4% 5/15/39 | 100,000 | 91,014 | |
| Metropolitan Atlanta Rapid Transit Auth. Sales Tax Rev.: | |||
| Series 2007 A, 5.25% 7/1/27 | 65,000 | 70,888 | |
| Series 2019 A, 3.125% 7/1/46 | 25,000 | 20,455 | |
| Paulding County Wtr. & Sew Rev. Series 2016, 3% 12/1/48 | 20,000 | 15,564 | |
| Private Colleges & Univs. Auth. Rev. Series 2020 B: | |||
| 4% 9/1/41 | 195,000 | 197,120 | |
| 5% 9/1/30 | 100,000 | 115,112 | |
| Richmond County Hosp. Auth.: | |||
| (Univ. Health Svcs., Inc. Projs.) Series 2016, 5% 1/1/27 | 105,000 | 109,352 | |
| (Univ. Health Svcs., Inc. Proj.) Series 2016, 4% 1/1/35 | 70,000 | 70,714 | |
TOTAL GEORGIA | 3,023,072 | ||
| Hawaii - 0.7% | |||
| Hawaii Arpts. Sys. Rev.: | |||
| Series 2020 A, 4% 7/1/35 (c) | 80,000 | 80,244 | |
| Series 2020 D, 4% 7/1/39 | 100,000 | 100,204 | |
| Hawaii Dept. of Budget & Fin. Spl. Purp. Rev. Series 2015 A, 4% 7/1/40 | 35,000 | 33,878 | |
| Hawaii Gen. Oblig.: | |||
| Series 2015 EY, 5% 10/1/26 | 130,000 | 135,480 | |
| Series 2016 FG, 5% 10/1/30 | 30,000 | 31,734 | |
| Series FT: | |||
5% 1/1/27 | 50,000 | 53,552 | |
5% 1/1/32 | 65,000 | 70,991 | |
| Series FW, 3.5% 1/1/38 | 35,000 | 34,120 | |
| Honolulu City & County Gen. Oblig.: | |||
| Series 2015 C, 3% 10/1/28 | 135,000 | 135,415 | |
| Series A, 5% 10/1/39 | 100,000 | 102,253 | |
| Honolulu City and County Wastewtr. Sys.: | |||
| Series 2016 B, 4% 7/1/33 | 235,000 | 240,075 | |
| Series 2018 A, 3.375% 7/1/42 | 40,000 | 35,588 | |
| Series 2019 A, 4% 7/1/37 | 100,000 | 102,386 | |
TOTAL HAWAII | 1,155,920 | ||
| Idaho - 0.1% | |||
| Idaho Health Facilities Auth. Rev.: | |||
| (St. Luke's Health Sys. Proj.) Series 2018 A, 5% 3/1/27 | 25,000 | 26,236 | |
| Series 2015 ID: | |||
5.5% 12/1/27 | 60,000 | 62,182 | |
5.5% 12/1/29 | 20,000 | 20,743 | |
| Idaho Hsg. & Fin. Assoc. Single Family Mtg. Series 2021 A, 4% 7/15/38 | 105,000 | 104,536 | |
TOTAL IDAHO | 213,697 | ||
| Illinois - 4.8% | |||
| Chicago Board of Ed.: | |||
| Series 2016, 5.75% 4/1/35 | 100,000 | 106,607 | |
| Series 2023, 5.25% 4/1/39 | 200,000 | 214,754 | |
| Chicago Gen. Oblig.: | |||
| Series 1999: | |||
0% 1/1/31 | 40,000 | 29,442 | |
0% 1/1/33 | 50,000 | 33,215 | |
| Series 2002 B: | |||
5% 1/1/26 | 5,000 | 5,084 | |
5% 1/1/26 (Pre-Refunded to 1/1/25 @ 100) | 10,000 | 10,270 | |
| Series 2007 E, 5.5% 1/1/35 | 45,000 | 45,816 | |
| Series 2008 C: | |||
0% 1/1/26 (Escrowed to Maturity) | 85,000 | 78,329 | |
0% 1/1/30 | 85,000 | 65,137 | |
| Series 2014 A, 5.25% 1/1/30 | 30,000 | 30,291 | |
| Series 2015 A: | |||
5% 1/1/26 | 10,000 | 10,167 | |
5% 1/1/26 (Escrowed to Maturity) | 5,000 | 5,228 | |
5.5% 1/1/33 | 20,000 | 20,380 | |
| Series 2015 C, 5% 1/1/27 | 195,000 | 200,040 | |
| Series 2019 A, 5% 1/1/40 | 15,000 | 15,443 | |
| Chicago Midway Arpt. Rev.: | |||
| Series 2014 A, 5% 1/1/26 (c) | 65,000 | 65,211 | |
| Series 2014 B, 5% 1/1/27 | 5,000 | 5,033 | |
| Chicago O'Hare Int'l. Arpt. Rev.: | |||
| Series 2015 B: | |||
5% 1/1/28 | 45,000 | 46,003 | |
5% 1/1/33 | 105,000 | 107,438 | |
| Series 2015 D, 5% 1/1/46 | 110,000 | 111,147 | |
| Series 2016 C, 5% 1/1/37 | 100,000 | 103,086 | |
| Series 2016 D, 5.25% 1/1/42 | 250,000 | 260,351 | |
| Series 2016 G, 5% 1/1/37 (c) | 225,000 | 232,326 | |
| Series 2017 A, 5% 1/1/30 | 125,000 | 132,778 | |
| Series 2017 B, 5% 1/1/33 | 30,000 | 31,853 | |
| Series 2018 B: | |||
5% 1/1/37 | 45,000 | 48,482 | |
5% 1/1/38 | 20,000 | 21,408 | |
5% 1/1/48 | 10,000 | 10,480 | |
| Series 2020 B, 5% 1/1/29 | 60,000 | 66,219 | |
| Chicago Transit Auth. Cap. Grant Receipts Rev. Series 2017, 5% 6/1/25 | 30,000 | 30,757 | |
| Chicago Wtr. Rev. Series 2000, 5% 11/1/30 | 15,000 | 15,716 | |
| Cook County Cmnty. College District Series 2013, 5.25% 12/1/30 | 40,000 | 40,078 | |
| Cook County Gen. Oblig. Series 2018, 5% 11/15/34 | 100,000 | 102,565 | |
| Illinois Fin. Auth.: | |||
| (Bradley Univ. Proj.) Series 2021 A, 4% 8/1/43 | 80,000 | 68,389 | |
| Series 2015, 4.125% 5/1/45 | 125,000 | 117,170 | |
| Series 2020 A, 3% 5/15/50 | 80,000 | 55,032 | |
| Illinois Fin. Auth. Rev.: | |||
| Series 2014 A, 5% 10/1/30 | 105,000 | 107,095 | |
| Series 2015 A, 4% 11/15/39 | 250,000 | 244,805 | |
| Series 2016: | |||
3.25% 5/15/39 | 160,000 | 132,737 | |
3.25% 11/15/45 | 15,000 | 11,745 | |
4% 1/1/25 | 145,000 | 146,963 | |
4% 7/1/30 | 60,000 | 61,637 | |
4% 12/1/31 | 25,000 | 25,136 | |
4% 12/1/40 | 210,000 | 193,144 | |
| Series 2017 A, 5% 8/1/42 | 105,000 | 104,902 | |
| Series 2017, 5% 8/15/26 | 135,000 | 142,363 | |
| Series 2018 A: | |||
5% 10/1/41 | 25,000 | 26,169 | |
5% 10/1/48 | 20,000 | 20,797 | |
| Illinois Gen. Oblig.: | |||
| Series 2012 A: | |||
4% 1/1/29 | 70,000 | 70,043 | |
4% 1/1/30 | 35,000 | 35,021 | |
| Series 2013: | |||
5% 7/1/23 | 15,000 | 15,000 | |
5.25% 7/1/31 | 85,000 | 85,022 | |
| Series 2014, 5% 4/1/27 | 55,000 | 55,537 | |
| Series 2016 June: | |||
3.5% 6/1/30 | 210,000 | 201,784 | |
3.5% 6/1/31 | 70,000 | 66,838 | |
| Series 2016: | |||
4% 1/1/31 | 70,000 | 70,466 | |
5% 2/1/27 | 140,000 | 147,483 | |
5% 11/1/36 | 100,000 | 102,199 | |
| Series 2017 A, 4.5% 12/1/41 | 35,000 | 35,071 | |
| Series 2017 B, 5% 12/1/24 | 65,000 | 66,231 | |
| Series 2017 C, 5% 11/1/29 | 10,000 | 10,667 | |
| Series 2017 D: | |||
3.25% 11/1/26 | 40,000 | 39,046 | |
5% 11/1/26 | 190,000 | 199,328 | |
5% 11/1/28 | 140,000 | 149,022 | |
| Series 2018 B, 5% 10/1/24 | 20,000 | 20,330 | |
| Series 2019 B, 5% 9/1/25 | 30,000 | 30,894 | |
| Series 2020 D, 5% 10/1/25 | 50,000 | 51,556 | |
| Series 2021 A: | |||
5% 3/1/27 | 50,000 | 52,745 | |
5% 3/1/30 | 160,000 | 176,546 | |
| Series November 2016, 4.125% 11/1/31 | 40,000 | 40,407 | |
| 5% 7/1/32 | 160,000 | 180,875 | |
| Illinois Hsg. Dev. Auth. Rev. Series 2018 A, 4.125% 10/1/38 | 15,000 | 14,756 | |
| Illinois Sales Tax Rev.: | |||
| Series 2013: | |||
5% 6/15/24 | 20,000 | 20,016 | |
5% 6/15/25 | 5,000 | 5,005 | |
| Series 2016 A, 3% 6/15/33 | 25,000 | 23,162 | |
| Series 2016 D, 3% 6/15/31 | 35,000 | 33,089 | |
| Series 2021 A, 4% 6/15/30 | 60,000 | 61,288 | |
| Illinois Toll Hwy. Auth. Toll Hwy. Rev.: | |||
| Series 2014 B, 5% 1/1/37 | 25,000 | 25,136 | |
| Series 2014 C, 5% 1/1/30 | 100,000 | 102,678 | |
| Series 2015 A, 5% 1/1/40 | 25,000 | 25,503 | |
| Series 2016 A, 5% 12/1/31 | 50,000 | 51,967 | |
| Series 2017 A, 5% 1/1/36 | 50,000 | 53,815 | |
| Series 2019 C, 5% 1/1/31 | 120,000 | 135,078 | |
| Series A, 5% 1/1/45 | 145,000 | 154,673 | |
| Series B: | |||
5% 1/1/27 | 25,000 | 26,673 | |
5% 1/1/30 | 50,000 | 56,225 | |
| Series C, 5% 1/1/30 | 95,000 | 106,827 | |
| Kendall, Kane & Will Counties Cmnty. Unit School District #308 Series 2016, 5% 2/1/31 | 65,000 | 67,801 | |
| Metropolitan Pier & Exposition: | |||
| (McCormick Place Expansion Proj.): | |||
Series 2002 A, 0% 6/15/36 (Nat'l. Pub. Fin. Guarantee Corp. Insured) | 35,000 | 20,277 | |
Series 2010 B1, 0% 6/15/47 (Assured Guaranty Muni. Corp. Insured) | 600,000 | 190,736 | |
Series A: | |||
0% 6/15/37 (Nat'l. Pub. Fin. Guarantee Corp. Insured) | 170,000 | 92,794 | |
0% 6/15/38 (Nat'l. Pub. Fin. Guarantee Corp. Insured) | 90,000 | 46,512 | |
0% 12/15/38 (Nat'l. Pub. Fin. Guarantee Corp. Insured) | 10,000 | 5,055 | |
| Series 1998 A, 5.5% 12/15/23 | 15,000 | 15,097 | |
| Series 2002 A: | |||
0% 12/15/26 | 95,000 | 83,301 | |
0% 6/15/32 (Nat'l. Pub. Fin. Guarantee Corp. Insured) | 20,000 | 14,097 | |
0% 12/15/34 (Nat'l. Pub. Fin. Guarantee Corp. Insured) | 20,000 | 12,610 | |
| Series 2002: | |||
0% 12/15/23 | 30,000 | 29,474 | |
0% 12/15/31 (Nat'l. Pub. Fin. Guarantee Corp. Insured) | 30,000 | 21,579 | |
| Series 2017 B, 0% 12/15/56 (Assured Guaranty Muni. Corp. Insured) | 15,000 | 2,904 | |
| Northern Illinois Muni. Pwr. Agcy. Rev. (Prairie State Proj.) Series 2016 A, 5% 12/1/29 | 45,000 | 47,552 | |
| Sales Tax Securitization Corp. Series 2017 A, 5% 1/1/28 | 50,000 | 53,819 | |
| Springfield Elec. Rev. Series 2015: | |||
| 4% 3/1/40 (Assured Guaranty Muni. Corp. Insured) | 35,000 | 34,002 | |
| 5% 3/1/31 | 60,000 | 61,275 | |
| 5% 3/1/32 | 115,000 | 117,370 | |
TOTAL ILLINOIS | 7,473,475 | ||
| Indiana - 0.9% | |||
| Carmel Local Pub. Impt. Bond Bank Series 2016, 5% 7/15/30 | 45,000 | 47,232 | |
| Hanover Middle School Bldg. Corp. Series 2020, 2% 7/15/34 | 200,000 | 170,032 | |
| Indiana Bond Bank Series 2008 B, 0% 6/1/32 (Assured Guaranty Muni. Corp. Insured) | 70,000 | 50,732 | |
| Indiana Fin. Auth. Health Sys. Rev. Series 2017, 5% 11/1/32 | 70,000 | 75,090 | |
| Indiana Fin. Auth. Hwy. Rev. Series 2016 C, 5% 12/1/25 | 35,000 | 36,535 | |
| Indiana Fin. Auth. Rev.: | |||
| Series 2019 E: | |||
5% 2/1/36 | 25,000 | 27,637 | |
5% 2/1/40 | 65,000 | 70,384 | |
| Series 2021 B, 5% 2/1/41 | 150,000 | 165,330 | |
| Indiana Fin. Auth. Wastewtr. Util. Rev. (CWA Auth. Proj.) Series 2021 A, 3% 10/1/40 | 45,000 | 38,786 | |
| Indiana Health & Edl. Facilities Fing. Auth. Rev. Series 2006 B, 5% 11/15/46 | 100,000 | 101,916 | |
| Indiana Muni. Pwr. Agcy. Pwr. Supply Sys. Rev.: | |||
| Series 2014 A: | |||
5% 1/1/30 | 100,000 | 102,066 | |
5% 1/1/31 | 65,000 | 66,305 | |
| Series 2016 C, 5% 1/1/39 | 230,000 | 236,086 | |
| Indianapolis Local Pub. Impt.: | |||
| (Courthouse and Jail Proj.) Series 2019 A: | |||
5% 2/1/33 | 100,000 | 111,010 | |
5% 2/1/54 | 25,000 | 26,135 | |
| (Pilot Infrastructure Prog.) Series 2017 C, 5% 1/1/33 | 40,000 | 43,323 | |
| Indianapolis Local Pub. Impt. Bond Bank Series E, 0% 2/1/28 (AMBAC Insured) | 5,000 | 4,289 | |
| Indianapolis Wtr. Sys. Rev. Series 2018 A, 5% 10/1/30 | 55,000 | 60,700 | |
TOTAL INDIANA | 1,433,588 | ||
| Iowa - 0.4% | |||
| Iowa Fin. Auth. Health Care Facilities Rev. Series 2013, 5% 7/1/33 (Pre-Refunded to 7/1/23 @ 100) | 55,000 | 55,000 | |
| Iowa Fin. Auth. Rev.: | |||
| Series 2017, 5% 8/1/37 | 115,000 | 123,158 | |
| Series 2020 A, 5% 8/1/36 | 105,000 | 118,734 | |
| Iowa Fin. Auth. Single Family Mtg. (Mtg.-Backed Securities Prog.) Series 2019 A, 4% 7/1/47 | 75,000 | 74,478 | |
| Iowa Spl. Oblig. Series 2019, 5% 6/1/33 | 30,000 | 33,527 | |
| Tobacco Settlement Auth. Tobacco Settlement Rev. Series 2021 A2, 4% 6/1/40 | 215,000 | 206,477 | |
TOTAL IOWA | 611,374 | ||
| Kansas - 0.1% | |||
| Johnson & Miami County Unified School District Series 2016 B, 3% 9/1/37 | 30,000 | 26,830 | |
| Univ. of Kansas Hosp. Auth. Health Facilities Rev. Series 2019 A, 4% 9/1/48 | 50,000 | 46,849 | |
TOTAL KANSAS | 73,679 | ||
| Kentucky - 0.7% | |||
| Carroll County Envir. Facilities Rev. Series 2008 A, 2% 2/1/32 (c) | 365,000 | 298,687 | |
| Econ. Dev. Fin. Auth. Lousiville Arena Proj. Rev. Series A2, 0% 12/1/23 (Escrowed to Maturity) | 60,000 | 59,197 | |
| Kentucky Eco Dev. Fin. Auth. Health Rev. Series 2000 B, 0% 10/1/26 (Nat'l. Pub. Fin. Guarantee Corp. Insured) | 100,000 | 88,273 | |
| Kentucky Muni. Pwr. Agcy. Pwr. Sys. Rev. (Prairie State Proj.) Series 2015 A: | |||
| 4% 9/1/39 | 160,000 | 153,945 | |
| 5% 9/1/23 | 5,000 | 5,011 | |
| 5% 9/1/26 | 190,000 | 194,755 | |
| 5% 9/1/42 | 5,000 | 5,011 | |
| Kentucky State Property & Buildings Commission Rev. Series B, 5% 11/1/28 | 30,000 | 31,836 | |
| Kentucky, Inc. Pub. Energy Series 2019 C, 4% 8/1/27 | 50,000 | 49,636 | |
| Louisville & Jefferson County Series 2016 A, 3% 10/1/37 | 95,000 | 80,263 | |
| Louisville & Jefferson County Metropolitan Swr. District Swr. & Drain Sys. Rev. Series 2017 A, 3.25% 5/15/46 | 100,000 | 82,117 | |
TOTAL KENTUCKY | 1,048,731 | ||
| Louisiana - 0.4% | |||
| Jefferson Sales Tax District Series 2019 B, 4% 12/1/42 (Assured Guaranty Muni. Corp. Insured) | 5,000 | 4,966 | |
| Louisiana Gen. Oblig.: | |||
| Series 2014 D1, 3% 12/1/29 | 40,000 | 39,736 | |
| Series 2017 A, 5% 4/1/25 | 25,000 | 25,845 | |
| Louisiana Local Govt. Envir. Facilities and Cmnty. Dev. Auth. (Woman's Hosp. Foundation Proj.) Series 2017 A, 4% 10/1/41 | 50,000 | 47,161 | |
| Louisiana Pub. Facilities Auth. Hosp. Rev. (Franciscan Missionaries of Our Lady Health Sys. Proj.) Series 2017 A, 3.75% 7/1/47 | 30,000 | 25,311 | |
| Louisiana Pub. Facilities Auth. Rev.: | |||
| (Hurricane Recovery Prog.) Series 2014, 5% 6/1/24 | 50,000 | 50,788 | |
| (Loyola Univ. Proj.) Series 2017, 0% 10/1/46 (d) | 35,000 | 34,597 | |
| Louisiana Stadium and Exposition District Series 2013 A, 5% 7/1/27 | 100,000 | 100,000 | |
| New Orleans Aviation Board Series 2018 A, 4% 10/1/43 (Assured Guaranty Muni. Corp. Insured) | 150,000 | 145,659 | |
| New Orleans Wtr. Series 2015, 5% 12/1/40 (Pre-Refunded to 12/1/25 @ 100) | 25,000 | 26,097 | |
| State of Louisiana Grant Anticipation Rev.: | |||
| Series 2019 A, 5% 9/1/29 | 30,000 | 33,148 | |
| Series 2021, 5% 9/1/33 | 100,000 | 113,385 | |
TOTAL LOUISIANA | 646,693 | ||
| Maryland - 1.7% | |||
| Baltimore County Gen. Oblig. Series 2019, 4% 3/1/35 | 40,000 | 41,837 | |
| Maryland Dept. of Trans.: | |||
| Series 2016, 4% 11/1/29 | 85,000 | 86,028 | |
| Series 2018, 3% 5/1/31 | 40,000 | 39,551 | |
| Series 2021 B, 4% 8/1/51 (c) | 100,000 | 92,355 | |
| Maryland Gen. Oblig.: | |||
| Series 2017 B, 5% 8/1/25 | 30,000 | 31,221 | |
| Series 2019 1, 5% 3/15/31 | 70,000 | 78,666 | |
| Series 2019, 5% 3/15/30 | 50,000 | 56,168 | |
| Series 2020 A: | |||
5% 8/1/29 | 150,000 | 169,823 | |
5% 8/1/35 | 55,000 | 62,637 | |
| Series 2021 2A, 5% 8/1/28 | 120,000 | 133,144 | |
| Series 2021 A, 5% 8/1/32 | 75,000 | 88,025 | |
| Series A, 5% 3/15/30 | 30,000 | 33,076 | |
| Series C, 5% 8/1/24 | 5,000 | 5,100 | |
| Maryland Health & Higher Edl. Series 2021 A, 2.5% 7/1/51 | 90,000 | 56,593 | |
| Maryland Health & Higher Edl. Facilities Auth. Rev.: | |||
| Series 2015, 4% 7/1/35 (Pre-Refunded to 7/1/25 @ 100) | 100,000 | 101,915 | |
| Series 2017 A, 4% 5/15/47 | 55,000 | 50,853 | |
| Series 2017 MD, 4% 12/1/46 | 15,000 | 14,342 | |
| Maryland Stadium Auth. Built to Learn Rev. Series 2021: | |||
| 2.75% 6/1/51 | 190,000 | 132,606 | |
| 4% 6/1/37 | 115,000 | 116,760 | |
| Maryland Trans. Auth. Passenger Facility Charge Rev. Series 2012 B, 2.625% 6/1/27 (c) | 40,000 | 37,594 | |
| Maryland Trans. Auth. Trans. Facility Projs. Rev. Series 2021 A: | |||
| 2.25% 7/1/39 | 65,000 | 49,297 | |
| 3% 7/1/47 | 145,000 | 112,653 | |
| 4% 7/1/40 | 180,000 | 181,628 | |
| Montgomery County Gen. Oblig.: | |||
| Series 2014 A, 5% 11/1/29 (Pre-Refunded to 11/1/24 @ 100) | 85,000 | 87,080 | |
| Series 2015 B, 3% 12/1/29 | 70,000 | 69,815 | |
| Series 2020 B, 4% 11/1/31 | 100,000 | 109,490 | |
| Univ. of Maryland Sys. Auxiliary Facility & Tuition Rev. Series 2021 A, 4% 4/1/47 | 290,000 | 283,715 | |
| Washington Metropolitan Area Transit Auth. Series 2021 A, 5% 7/15/46 | 150,000 | 163,881 | |
| Washington Suburban San. District Series 2016 2: | |||
| 4% 6/1/42 | 10,000 | 9,938 | |
| 5% 6/1/34 | 65,000 | 68,814 | |
TOTAL MARYLAND | 2,564,605 | ||
| Massachusetts - 2.9% | |||
| Boston Gen. Oblig. Series A, 5% 4/1/26 | 40,000 | 42,286 | |
| Massachusetts Bay Trans. Auth. Sales Tax Rev.: | |||
| Series 2005 A, 5% 7/1/25 | 55,000 | 57,140 | |
| Series 2007, 5.25% 7/1/28 | 40,000 | 44,888 | |
| Series A, 5.25% 7/1/28 | 20,000 | 22,444 | |
| Series B, 5% 7/1/33 | 5,000 | 5,179 | |
| Series C, 5.5% 7/1/23 | 65,000 | 65,000 | |
| Massachusetts Commonwealth Trans. Fund Rev.: | |||
| (Rail Enhancement & Accelerated Bridge Prog.): | |||
Series 2017 A, 5% 6/1/47 | 20,000 | 20,941 | |
Series 2018 A, 5% 6/1/48 | 130,000 | 137,292 | |
| (Rail Enhancement Prog.) Series 2021 A, 3% 6/1/50 | 185,000 | 142,818 | |
| Series 2015 A, 3.25% 6/1/35 | 150,000 | 147,247 | |
| Massachusetts Dev. Fin. Agcy. Rev.: | |||
| Series 2016 I, 3% 7/1/32 | 25,000 | 23,859 | |
| Series 2018 L, 4% 7/1/44 | 165,000 | 163,451 | |
| Series BB1, 4% 10/1/46 | 25,000 | 24,697 | |
| Series C, 3% 10/1/45 (Assured Guaranty Muni. Corp. Insured) | 10,000 | 7,864 | |
| Series D, 4% 7/1/45 | 25,000 | 22,080 | |
| Series F, 5% 8/15/24 | 110,000 | 111,579 | |
| Massachusetts Edl. Fing. Auth. Rev. Series 2015 A, 5% 1/1/26 (c) | 60,000 | 61,108 | |
| Massachusetts Fed. Hwy. (Accelerated Bridge Prog.) Series A, 5% 6/15/25 | 5,000 | 5,084 | |
| Massachusetts Gen. Oblig.: | |||
| Series 2004 C, 5.5% 12/1/24 | 130,000 | 134,440 | |
| Series 2015 A, 5% 7/1/26 | 130,000 | 137,912 | |
| Series 2016 B: | |||
4% 7/1/33 | 75,000 | 76,965 | |
5% 7/1/27 | 5,000 | 5,426 | |
| Series 2016 G: | |||
3% 9/1/46 | 10,000 | 7,976 | |
4% 9/1/32 | 75,000 | 77,441 | |
| Series 2017 A: | |||
5% 4/1/35 | 100,000 | 107,137 | |
5% 4/1/47 | 155,000 | 161,615 | |
| Series 2017 E, 5% 11/1/24 | 60,000 | 61,539 | |
| Series 2017 F: | |||
5% 11/1/41 | 200,000 | 211,564 | |
5% 11/1/44 | 20,000 | 21,064 | |
| Series 2018 C, 5% 9/1/30 | 150,000 | 172,562 | |
| Series 2018 E, 5% 9/1/25 | 100,000 | 104,252 | |
| Series 2019 A, 5% 1/1/49 | 70,000 | 74,103 | |
| Series 2019 C, 5% 5/1/41 | 25,000 | 26,953 | |
| Series 2019 G: | |||
5% 9/1/29 | 150,000 | 169,719 | |
5% 9/1/32 | 75,000 | 76,558 | |
| Series 2021 B, 3% 4/1/47 | 140,000 | 110,484 | |
| Series 2021 C, 5% 9/1/29 | 50,000 | 56,573 | |
| Series A: | |||
5% 3/1/29 | 175,000 | 196,057 | |
5% 7/1/29 | 70,000 | 74,155 | |
5% 7/1/31 | 45,000 | 47,697 | |
| Series B: | |||
2% 3/1/34 | 170,000 | 142,533 | |
5% 7/1/26 | 40,000 | 42,434 | |
5% 7/1/27 | 20,000 | 21,703 | |
| Series C, 5% 5/1/30 | 35,000 | 40,033 | |
| Series D, 5% 7/1/26 | 40,000 | 42,434 | |
| Series E: | |||
5% 11/1/23 | 60,000 | 60,358 | |
5% 11/1/26 | 20,000 | 21,374 | |
| Series F, 5% 11/1/40 | 15,000 | 15,896 | |
| Series G, 5% 9/1/33 | 55,000 | 56,129 | |
| Massachusetts Health & Edl. Facilities Auth. Rev. Series 2008 M2, 5.5% 6/1/35 | 65,000 | 78,841 | |
| Massachusetts Hsg. Fin. Agcy. Multi-Family Rev. Series A, 4.5% 12/1/48 (c) | 20,000 | 18,935 | |
| Massachusetts Port Auth. Rev. Series 2019 B, 3% 7/1/49 | 70,000 | 54,502 | |
| Massachusetts School Bldg. Auth. Dedicated Sales Tax Rev.: | |||
| Series 2015 D, 4.75% 8/15/32 (Pre-Refunded to 8/15/25 @ 100) | 185,000 | 191,227 | |
| Series 2016 B, 5% 11/15/46 | 30,000 | 31,154 | |
| Series A, 5% 8/15/45 | 50,000 | 54,252 | |
| Series C, 5% 11/15/34 | 35,000 | 37,301 | |
| Massachusetts Spl. Oblig. Dedicated Tax Rev. Series 2005, 5.5% 1/1/30 (Nat'l. Pub. Fin. Guarantee Corp. Insured) | 10,000 | 11,532 | |
| Massachusetts Wtr. Resources Auth. Wtr. & Swr. Rev.: | |||
| Series 2007 B, 5.25% 8/1/30 (Assured Guaranty Muni. Corp. Insured) | 145,000 | 169,306 | |
| Series 2020 B, 5% 8/1/43 | 140,000 | 153,050 | |
TOTAL MASSACHUSETTS | 4,460,143 | ||
| Michigan - 1.8% | |||
| Detroit School District School Bldg. and Site Impt. Series 2005 A, 5.25% 5/1/29 (Assured Guaranty Muni. Corp. Insured) | 180,000 | 203,310 | |
| Great Lakes Wtr. Auth. Sew Disp. Sys. Series 2016 C, 5% 7/1/36 | 15,000 | 15,660 | |
| Great Lakes Wtr. Auth. Wtr. Supply Sys. Rev.: | |||
| Series 2016 C, 5% 7/1/33 | 50,000 | 52,349 | |
| Series 2018 A, 5% 7/1/27 | 65,000 | 69,293 | |
| Lincoln Consolidated School District Series 2016 A, 5% 5/1/40 (Assured Guaranty Muni. Corp. Insured) | 330,000 | 338,846 | |
| Michigan Bldg. Auth. Rev.: | |||
| (Facilities Prog.): | |||
Series 1A, 5.25% 10/15/47 | 15,000 | 15,070 | |
Series I: | |||
5% 4/15/26 | 40,000 | 41,666 | |
5% 10/15/28 | 25,000 | 26,586 | |
5% 10/15/30 | 15,000 | 15,912 | |
| Series 2016 I, 5% 4/15/36 | 115,000 | 122,048 | |
| Michigan Fin. Auth. Rev.: | |||
| (Charter County of Wayne Criminal Justice Ctr. Proj.) Series 2018, 4% 11/1/48 | 10,000 | 9,474 | |
| (Detroit Wtr. and Sewerage Dept. Sewage Disp. Sys. Rev. Rfdg. Local Proj.) Series 2014 C, 5% 7/1/28 (Assured Guaranty Muni. Corp. Insured) | 20,000 | 20,310 | |
| (Detroit Wtr. And Sewerage Dept. Wtr. Supply Sys. Rev. Rfdg. Local Proj.) Series 2014 D, 5% 7/1/24 (Assured Guaranty Muni. Corp. Insured) | 20,000 | 20,275 | |
| Series 2014 C3, 5% 7/1/29 (Assured Guaranty Muni. Corp. Insured) | 70,000 | 71,104 | |
| Series 2014 D2, 5% 7/1/28 (Assured Guaranty Muni. Corp. Insured) | 175,000 | 177,709 | |
| Series 2014, 5% 7/1/26 (Assured Guaranty Muni. Corp. Insured) | 30,000 | 30,464 | |
| Series 2016: | |||
3% 11/15/33 | 240,000 | 220,051 | |
3.25% 11/15/42 | 25,000 | 19,993 | |
4% 11/15/46 | 50,000 | 46,619 | |
5% 11/15/23 | 55,000 | 55,264 | |
| Series 2018 B, 5% 10/1/28 | 130,000 | 144,268 | |
| Series 2019 A: | |||
4% 2/15/47 | 40,000 | 37,697 | |
5% 2/15/34 | 55,000 | 59,673 | |
| Michigan Hosp. Fin. Auth. Rev. (Trinity Health Proj.) Series 2008 C, 5% 12/1/27 | 35,000 | 37,780 | |
| Michigan Hsg. Dev. Auth. Rental Hsg. Rev.: | |||
| Series 2018 A, 4.05% 10/1/48 | 100,000 | 91,732 | |
| Series 2020 A1, 2.7% 10/1/45 | 160,000 | 117,186 | |
| Michigan Hsg. Dev. Auth. Single Family Mtg. Rev.: | |||
| Series 2019 B, 3.1% 12/1/44 | 210,000 | 165,994 | |
| Series B, 3.1% 12/1/31 | 50,000 | 47,677 | |
| Michigan Strategic Fund Ltd. Oblig. Rev. (I-75 Impt. Proj.) Series 2018: | |||
| 5% 12/31/26 (c) | 35,000 | 35,915 | |
| 5% 6/30/28 (c) | 15,000 | 15,616 | |
| 5% 12/31/28 (c) | 55,000 | 57,545 | |
| 5% 6/30/29 (c) | 60,000 | 62,804 | |
| 5% 6/30/31 (c) | 70,000 | 73,447 | |
| 5% 12/31/31 (c) | 20,000 | 20,976 | |
| Michigan Trunk Line Fund Rev. Series 2020 B, 4% 11/15/37 | 25,000 | 25,590 | |
| Muskegon City Pub. Schools Series 2021 II, 5% 5/1/51 | 60,000 | 63,781 | |
| Univ. of Michigan Rev. Series 2015, 5% 4/1/32 (Pre-Refunded to 4/1/26 @ 100) | 125,000 | 132,075 | |
| Wayne County Arpt. Auth. Rev.: | |||
| Series 2018 A, 5% 12/1/34 | 50,000 | 54,315 | |
| Series 2021 B, 5% 12/1/35 (c) | 50,000 | 54,496 | |
TOTAL MICHIGAN | 2,870,570 | ||
| Minnesota - 1.3% | |||
| Apple Valley Sr. Living (Minnesota Sr. Living LLC Proj.) Series 2016 A, 4.25% 1/1/37 | 30,000 | 24,020 | |
| Forest Lake Independent School District No. 831 Gen. Oblig. (MN School District Cr. Enhancement Prog.) Series 2016 A, 3.25% 2/1/46 | 200,000 | 169,474 | |
| Hennepin County Gen. Oblig.: | |||
| Series 2019 B, 5% 12/15/29 | 120,000 | 135,084 | |
| Series 2020 C, 5% 12/15/35 | 250,000 | 281,157 | |
| Minneapolis & Saint Paul Metropolitan Arpts. Commission Arpt. Rev. Series 2019 A, 5% 1/1/49 | 35,000 | 36,778 | |
| Minnesota Gen. Oblig.: | |||
| Series 2015 A, 5% 8/1/28 | 110,000 | 114,568 | |
| Series 2015 B, 2.95% 8/1/27 | 40,000 | 39,703 | |
| Series 2017 A, 5% 10/1/28 | 25,000 | 27,376 | |
| Series 2018 B, 3.25% 8/1/36 | 5,000 | 4,830 | |
| Series 2019 B, 5% 8/1/27 | 100,000 | 108,790 | |
| Series 2020 A, 5% 8/1/33 | 100,000 | 114,788 | |
| Series 2021 A: | |||
4% 9/1/39 | 455,000 | 471,126 | |
5% 9/1/29 | 125,000 | 142,193 | |
| Minnesota Hsg. Fin. Agcy.: | |||
| Series 2019 F, 3.75% 1/1/50 | 105,000 | 103,590 | |
| Series 2021 F, 3% 7/1/52 | 190,000 | 182,675 | |
| Owatonna Independent School District 761 (Minnesota School District Cr. Enhancement Prog.) Series 2020 A, 2.125% 2/1/40 | 145,000 | 105,106 | |
| Saint Cloud Health Care Rev. Series 2019, 5% 5/1/48 | 15,000 | 15,374 | |
TOTAL MINNESOTA | 2,076,632 | ||
| Mississippi - 0.3% | |||
| Mississippi Dev. Bank Spl. Oblig.: | |||
| (Madison County, Mississippi Hwy. Rfdg. Proj.) Series 2013 C, 5% 1/1/27 | 15,000 | 15,825 | |
| (Mississippi Dept. of Corrections Walnut Grove Correctional Facility Rfdg. Bonds Proj.) Series 2016 A: | |||
5% 8/1/26 | 65,000 | 68,066 | |
5% 8/1/27 | 50,000 | 53,320 | |
| Mississippi Gen. Oblig. Series 2017 A, 5% 10/1/30 | 65,000 | 70,417 | |
| Mississippi State Gaming Tax Rev. Series 2019 A: | |||
| 5% 10/15/23 | 150,000 | 150,616 | |
| 5% 10/15/28 | 25,000 | 26,974 | |
TOTAL MISSISSIPPI | 385,218 | ||
| Missouri - 0.5% | |||
| Bi-State Dev. Agcy. Series 2019, 4% 10/1/48 | 180,000 | 176,244 | |
| Kansas City Indl. Dev. Auth. (Kansas City Int'l. Arpt. Term. Modernization Proj.) Series 2020 A, 5% 3/1/57 (Assured Guaranty Muni. Corp. Insured) (c) | 65,000 | 66,772 | |
| Missouri Board of Pub. Buildings Spl. Oblig. Series 2014 A, 3% 10/1/29 | 30,000 | 30,000 | |
| Missouri Envir. Impt. & Energy Resources Auth. Wtr. Poll. Cont. & Drinking Wtr. Rev. Series 2013 A, 5% 7/1/23 | 35,000 | 35,000 | |
| Missouri Health & Edl. Facilities Rev.: | |||
| Series 2014 A, 5% 6/1/29 (Pre-Refunded to 6/1/24 @ 100) | 55,000 | 55,689 | |
| Series 2016, 5% 11/15/28 | 10,000 | 10,466 | |
| Series 2017 C, 3.625% 11/15/47 | 25,000 | 21,810 | |
| Series 2019 A, 4% 2/15/49 | 140,000 | 130,697 | |
| Missouri Hsg. Dev. Commission Single Family Mtg. Rev. (First Place Homeownership Ln. Prog.) Series B, 3.35% 11/1/49 | 30,000 | 27,787 | |
| Missouri Joint Muni. Elec. Util. Commission Pwr. Proj. Rev.: | |||
| (IATAN 2 Proj.) Series 2014 A, 5% 1/1/28 | 45,000 | 45,267 | |
| (Prairie State Proj.) Series 2016 A, 4% 12/1/36 | 40,000 | 40,354 | |
| Saint Louis Arpt. Rev. Series 2017 A, 5% 7/1/23 (Assured Guaranty Muni. Corp. Insured) | 50,000 | 50,000 | |
| Springfield Pub. Util. Rev. Series 2015, 4% 8/1/31 | 50,000 | 50,812 | |
TOTAL MISSOURI | 740,898 | ||
| Montana - 0.2% | |||
| Montana Facility Fin. Auth. Rev.: | |||
| Series 2016, 5% 2/15/28 | 65,000 | 67,670 | |
| Series 2019 A: | |||
4% 1/1/36 | 110,000 | 112,121 | |
5% 1/1/30 | 150,000 | 168,943 | |
TOTAL MONTANA | 348,734 | ||
| Nebraska - 0.3% | |||
| Central Plains Energy Proj. Rev. Series 2017 A, 5% 9/1/36 | 225,000 | 237,707 | |
| Sarpy County Hosp. Auth. #1 Health Facilities Rev. Series 2016, 4% 5/15/51 | 140,000 | 134,286 | |
| The Board of Regents of The Univ. of Nebraska Series 2016 A, 3% 7/1/39 (Pre-Refunded to 7/1/26 @ 100) | 45,000 | 45,012 | |
| Univ. of Nebraska Facilities Corp. Series 2021 A, 4% 7/15/62 | 85,000 | 79,135 | |
TOTAL NEBRASKA | 496,140 | ||
| Nevada - 0.5% | |||
| Clark County Arpt. Rev. Series 2019 B, 5% 7/1/42 | 40,000 | 42,688 | |
| Clark County Fuel Tax: | |||
| Series 2016 A, 5% 11/1/25 | 130,000 | 135,713 | |
| Series 2016 B, 5% 11/1/27 | 50,000 | 53,157 | |
| Series 2019 A: | |||
5% 12/1/24 | 45,000 | 46,161 | |
5% 12/1/28 | 40,000 | 44,499 | |
| Series 2019: | |||
3% 6/1/38 | 65,000 | 56,312 | |
5% 6/1/25 | 25,000 | 25,883 | |
| Clark County Hwy. Impt. Rev. Series 2017, 5% 7/1/30 | 10,000 | 10,789 | |
| Clark County McCarran Int'l. Arpt. Passenger Facility Charge Rev. Series 2019 E, 5% 7/1/24 | 140,000 | 142,427 | |
| Clark County School District Series 2019 A, 3% 6/15/39 (Assured Guaranty Muni. Corp. Insured) | 20,000 | 17,046 | |
| Clark County Wtr. Reclamation District Series 2016, 3% 7/1/30 | 75,000 | 74,083 | |
| Las Vegas Convention & Visitors Auth.: | |||
| Series 2018 B, 4% 7/1/49 | 45,000 | 42,634 | |
| Series 2018 C, 4% 7/1/48 | 50,000 | 47,851 | |
| Washoe County School District Series 2017 C, 3.125% 10/1/40 (Assured Guaranty Muni. Corp. Insured) | 50,000 | 44,322 | |
TOTAL NEVADA | 783,565 | ||
| New Jersey - 3.7% | |||
| Edison Township Gen. Oblig. Series 2021, 2% 3/15/37 | 100,000 | 75,849 | |
| New Jersey Bldg. Auth. State Bldg. Rev. Series 2016 A, 5% 6/15/29 (Pre-Refunded to 6/15/26 @ 100) | 225,000 | 238,092 | |
| New Jersey Econ. Dev. Auth.: | |||
| Series A: | |||
4% 11/1/37 | 40,000 | 40,091 | |
5% 11/1/31 | 35,000 | 38,415 | |
| Series UU: | |||
5% 6/15/40 | 10,000 | 10,145 | |
5% 6/15/40 (Pre-Refunded to 6/15/24 @ 100) | 5,000 | 5,072 | |
| New Jersey Econ. Dev. Auth. Lease Rev. (State House Proj.) Series 2017 B, 5% 6/15/26 | 15,000 | 15,681 | |
| New Jersey Econ. Dev. Auth. Natural Gas Facilities Rev. (New Jersey Natural Gas Co. Proj.) Series 2011 C, 3% 8/1/41 (c) | 110,000 | 83,768 | |
| New Jersey Econ. Dev. Auth. Rev.: | |||
| (New Jersey Transit Corp. Projs.) Series 2017, 4% 11/1/25 | 30,000 | 30,248 | |
| Series 2005 N1, 5.5% 9/1/23 | 35,000 | 35,107 | |
| Series 2014 PP, 4% 6/15/30 (Pre-Refunded to 6/15/24 @ 100) | 20,000 | 20,161 | |
| Series 2014 UU, 5% 6/15/30 (Pre-Refunded to 6/15/24 @ 100) | 40,000 | 40,579 | |
| Series 2015 XX, 4% 6/15/24 | 10,000 | 10,056 | |
| Series 2016 AAA, 5% 6/15/41 (Pre-Refunded to 12/15/26 @ 100) | 55,000 | 58,932 | |
| Series 2018 EE, 5% 6/15/33 | 80,000 | 89,359 | |
| Series PP, 5% 6/15/30 (Pre-Refunded to 6/15/24 @ 100) | 5,000 | 5,086 | |
| Series UU, 4% 6/15/32 (Pre-Refunded to 6/15/24 @ 100) | 5,000 | 5,026 | |
| Series WW: | |||
5% 6/15/37 (Pre-Refunded to 6/15/25 @ 100) | 30,000 | 31,179 | |
5.25% 6/15/28 | 30,000 | 31,004 | |
| Series XX, 4.375% 6/15/27 | 60,000 | 60,755 | |
| New Jersey Econ. Dev. Auth. Wtr. Facilities Rev. Bonds (New Jersey American Wtr. Co., Inc. Proj.) Series 2019 B, 2.05%, tender 12/3/29 (b) | 75,000 | 64,770 | |
| New Jersey Edl. Facility: | |||
| Series 2014 A: | |||
5% 9/1/25 | 45,000 | 45,742 | |
5% 9/1/26 | 135,000 | 137,299 | |
| Series 2014: | |||
5% 6/15/24 | 5,000 | 5,074 | |
5% 6/15/28 | 50,000 | 50,711 | |
| Series A, 4% 7/1/47 | 40,000 | 35,658 | |
| New Jersey Gen. Oblig.: | |||
| Series 2013, 4% 6/1/27 | 20,000 | 20,012 | |
| Series 2014, 4% 6/1/34 | 10,000 | 10,142 | |
| Series 2016, 5% 6/1/24 | 25,000 | 25,414 | |
| Series 2020 A, 3% 6/1/32 | 90,000 | 85,872 | |
| Series 2021, 2% 6/1/37 | 105,000 | 78,993 | |
| New Jersey Health Care Facilities Fing. Auth. Rev.: | |||
| (Hosp. Asset Transformation Prog.) Series 2017: | |||
5% 10/1/23 | 5,000 | 5,018 | |
5% 10/1/26 | 135,000 | 141,867 | |
5% 10/1/27 | 15,000 | 15,829 | |
| (Inspira Health Proj.) Series 2017 A, 5% 7/1/42 | 40,000 | 41,094 | |
| Series 2016: | |||
3% 7/1/32 | 25,000 | 22,242 | |
3.125% 7/1/33 | 150,000 | 133,655 | |
| Series 2017 A, 4% 7/1/52 | 125,000 | 117,122 | |
| New Jersey Higher Ed. Student Assistance Auth. Student Ln. Rev.: | |||
| Series 2014 1B, 5% 12/1/44 (c) | 50,000 | 48,672 | |
| Series 2019 A, 5% 12/1/27 | 35,000 | 37,541 | |
| Series 2019 B, 3.25% 12/1/39 (c) | 65,000 | 61,638 | |
| New Jersey Tobacco Settlement Fing. Corp. Series 2018 A: | |||
| 4% 6/1/37 | 30,000 | 30,172 | |
| 5% 6/1/29 | 130,000 | 139,461 | |
| New Jersey Tpk. Auth. Tpk. Rev.: | |||
| Series 2004 C2, 5.5% 1/1/25 (AMBAC Insured) | 25,000 | 25,888 | |
| Series 2005 A, 5.25% 1/1/26 (Assured Guaranty Muni. Corp. Insured) | 30,000 | 31,629 | |
| Series 2014 A: | |||
4% 1/1/35 | 110,000 | 110,262 | |
5% 1/1/27 | 50,000 | 50,763 | |
5% 1/1/29 | 45,000 | 45,698 | |
| Series 2015 E, 5% 1/1/45 | 240,000 | 244,437 | |
| Series 2016 A, 5% 1/1/33 | 50,000 | 52,225 | |
| Series 2017 A, 5% 1/1/35 | 110,000 | 116,314 | |
| Series 2017 B, 4% 1/1/35 | 30,000 | 30,804 | |
| Series 2017 E: | |||
5% 1/1/29 | 15,000 | 16,349 | |
5% 1/1/31 | 155,000 | 168,783 | |
| New Jersey Trans. Trust Fund Auth.: | |||
| Series 2006 C: | |||
0% 12/15/24 (AMBAC Insured) | 30,000 | 28,475 | |
0% 12/15/25 | 60,000 | 54,927 | |
0% 12/15/29 (Assured Guaranty Muni. Corp. Insured) | 45,000 | 35,836 | |
0% 12/15/32 (Assured Guaranty Muni. Corp. Insured) | 40,000 | 28,276 | |
| Series 2008 A: | |||
0% 12/15/23 | 45,000 | 44,273 | |
0% 12/15/37 | 45,000 | 24,315 | |
0% 12/15/38 | 35,000 | 17,989 | |
| Series 2010 A: | |||
0% 12/15/25 | 40,000 | 36,591 | |
0% 12/15/27 | 30,000 | 25,674 | |
0% 12/15/29 | 20,000 | 15,837 | |
0% 12/15/32 | 65,000 | 45,482 | |
0% 12/15/33 | 15,000 | 10,075 | |
| Series 2010 A3, 0% 12/15/34 | 140,000 | 89,468 | |
| Series 2010 D, 5% 12/15/24 | 135,000 | 137,911 | |
| Series 2013 AA, 5% 6/15/27 | 30,000 | 30,000 | |
| Series 2015 AA: | |||
4.625% 6/15/30 | 165,000 | 168,030 | |
5.25% 6/15/31 | 135,000 | 139,498 | |
5.25% 6/15/32 | 70,000 | 72,284 | |
| Series 2016 A, 5% 6/15/30 | 25,000 | 26,142 | |
| Series 2018 A: | |||
5% 12/15/24 | 55,000 | 56,186 | |
5% 12/15/34 | 250,000 | 269,196 | |
| Series 2021 A, 5% 6/15/30 | 305,000 | 340,202 | |
| Series 2022 CC, 5% 6/15/48 | 230,000 | 245,936 | |
| Series A: | |||
0% 12/15/26 | 90,000 | 79,613 | |
0% 12/15/31 | 30,000 | 21,831 | |
5% 6/15/30 | 50,000 | 52,284 | |
| Series A1, 4.1% 6/15/31 | 15,000 | 15,253 | |
| Series AA: | |||
4% 6/15/36 | 20,000 | 20,183 | |
5% 6/15/44 | 10,000 | 10,000 | |
5.25% 6/15/27 | 20,000 | 20,706 | |
| Series BB, 5% 6/15/33 | 75,000 | 81,092 | |
| Series C, 5.25% 6/15/32 | 65,000 | 66,792 | |
| South Jersey Port Corp. Rev. (New Jersey Gen. Oblig. Proj.) Series 2017 B, 5% 1/1/37 (c) | 25,000 | 25,553 | |
| South Jersey Trans. Auth. Trans. Sys. Rev. Series 2014 A, 5% 11/1/39 | 230,000 | 230,870 | |
TOTAL NEW JERSEY | 5,738,535 | ||
| New Mexico - 0.5% | |||
| New Mexico Hosp. Equip. Ln. Council Rev. Series 2015 A, 4.125% 8/1/44 (Pre-Refunded to 8/1/25 @ 100) | 40,000 | 40,664 | |
| New Mexico Mtg. Fin. Auth.: | |||
| Series 2019 F: | |||
3.05% 7/1/44 | 100,000 | 87,762 | |
3.5% 7/1/50 | 60,000 | 58,756 | |
| Series 2021 C, 3% 1/1/52 | 350,000 | 336,111 | |
| New Mexico Severance Tax Rev.: | |||
| Series 2018 A: | |||
5% 7/1/23 | 30,000 | 30,000 | |
5% 7/1/25 | 65,000 | 67,376 | |
| Series 2022 B, 5% 7/1/31 | 135,000 | 156,737 | |
TOTAL NEW MEXICO | 777,406 | ||
| New York - 14.8% | |||
| Battery Park City Auth. Rev. Series 2019 A, 5% 11/1/49 | 190,000 | 204,728 | |
| Brookhaven Gen. Oblig. Series 2020 C, 5% 1/15/27 | 115,000 | 124,079 | |
| Brooklyn Arena Local Dev. Corp. Series 2016 A, 3% 7/15/43 (Assured Guaranty Muni. Corp. Insured) | 25,000 | 19,433 | |
| Dorm. Auth. New York Univ. Rev.: | |||
| Series 2016 A: | |||
4% 7/1/43 | 100,000 | 97,839 | |
4% 7/1/43 | 165,000 | 154,327 | |
5% 7/1/29 | 60,000 | 63,334 | |
5% 7/1/37 | 100,000 | 103,278 | |
| Series 2017 A: | |||
5% 7/1/24 | 30,000 | 30,573 | |
5% 10/1/29 | 15,000 | 16,217 | |
5% 10/1/47 | 30,000 | 35,541 | |
| Series 2018 B, 5% 10/1/38 | 45,000 | 48,582 | |
| Dutchess County Local Dev. Corp. Rev. Series 2016 B: | |||
| 3% 7/1/29 | 150,000 | 136,517 | |
| 4% 7/1/41 | 40,000 | 36,200 | |
| Hudson Yards Infrastructure Corp. New York Rev. Series 2017 A: | |||
| 4% 2/15/36 | 120,000 | 122,140 | |
| 4% 2/15/44 | 35,000 | 34,530 | |
| 5% 2/15/30 | 55,000 | 58,966 | |
| 5% 2/15/39 | 40,000 | 42,217 | |
| Liberty Dev. Corp. Rev.: | |||
| Series 2005, 5.25% 10/1/35 | 115,000 | 131,297 | |
| Series 2007, 5.5% 10/1/37 | 25,000 | 28,651 | |
| Long Island Pwr. Auth. Elec. Sys. Rev.: | |||
| Series 2000, 0% 6/1/29 (Assured Guaranty Muni. Corp. Insured) | 90,000 | 73,895 | |
| Series 2016 B, 5% 9/1/46 | 40,000 | 41,365 | |
| Series 2017: | |||
5% 9/1/23 (Escrowed to Maturity) | 65,000 | 65,164 | |
5% 9/1/47 | 30,000 | 31,566 | |
| Series 2018, 5% 9/1/35 | 20,000 | 21,956 | |
| Series 2019 A, 5% 9/1/26 | 150,000 | 159,898 | |
| Series 2020 A, 5% 9/1/30 | 120,000 | 138,896 | |
| Monroe County Indl. Dev. Corp.: | |||
| (Univ. of Rochester Proj.) Series 2020 A, 5% 7/1/25 | 30,000 | 31,144 | |
| Series 2015 A, 5% 7/1/27 | 105,000 | 108,591 | |
| New York City Gen. Oblig.: | |||
| Series 2008 J9, 5% 8/1/26 | 250,000 | 265,319 | |
| Series 2008 L6, 5% 4/1/31 | 50,000 | 55,616 | |
| Series 2013 H, 5% 8/1/24 (Pre-Refunded to 8/31/23 @ 100) | 60,000 | 60,150 | |
| Series 2014 I, 4% 3/1/39 | 410,000 | 410,151 | |
| Series 2016 A, 5% 8/1/26 | 150,000 | 155,676 | |
| Series 2016, 3% 8/1/34 | 25,000 | 24,501 | |
| Series 2017 B1, 4% 10/1/40 | 260,000 | 260,505 | |
| Series 2017, 5% 8/1/27 | 25,000 | 27,047 | |
| Series 2018 1, 5% 8/1/28 | 10,000 | 10,843 | |
| Series 2018 B-1, 3.25% 10/1/42 | 55,000 | 48,367 | |
| Series 2018 E1, 5% 3/1/31 | 240,000 | 261,755 | |
| Series 2019 E, 5% 8/1/25 | 30,000 | 31,148 | |
| Series 2020 A, 4% 8/1/44 | 20,000 | 19,822 | |
| Series 2020 A1, 5% 8/1/35 | 120,000 | 132,668 | |
| Series 2020 C, 5% 8/1/26 | 200,000 | 212,255 | |
| Series 2021 C, 5% 8/1/29 | 260,000 | 292,186 | |
| Series 2023 B1, 5.25% 10/1/47 | 235,000 | 264,172 | |
| Series A, 5.25% 8/1/25 | 15,000 | 15,044 | |
| Series B1, 5% 10/1/32 | 70,000 | 78,359 | |
| Series D: | |||
4% 12/1/41 | 50,000 | 50,049 | |
4% 3/1/42 | 125,000 | 124,599 | |
| Series E, 5% 8/1/26 | 75,000 | 79,596 | |
| Series J, 5% 8/1/24 | 50,000 | 50,983 | |
| New York City Hsg. Dev. Corp.: | |||
| Bonds Series H, 2.95%, tender 2/1/26 (b) | 15,000 | 14,730 | |
| Series 2016 I1A, 3.95% 11/1/36 | 70,000 | 70,121 | |
| Series B1 2013, 5.25% 7/1/32 (Pre-Refunded to 7/3/23 @ 100) | 50,000 | 50,000 | |
| New York City Hsg. Dev. Corp. Multifamily Hsg.: | |||
| Bonds Series D2, 0.7%, tender 11/1/24 (b) | 70,000 | 66,482 | |
| Series 2019 E1, 3.25% 11/1/49 | 35,000 | 27,619 | |
| Series 2020 D1B, 2.4% 11/1/50 | 75,000 | 46,163 | |
| Series 2021 A1, 2.05% 11/1/33 | 135,000 | 110,473 | |
| Series 2021 C1, 2.25% 11/1/41 | 110,000 | 76,660 | |
| Series 2021 G, 2.15% 11/1/36 | 125,000 | 96,125 | |
| Series 2021 K1, 2.45% 11/1/41 | 160,000 | 117,810 | |
| Series E1, 3.45% 5/1/59 | 10,000 | 7,844 | |
| New York City Indl. Dev. Agcy. Rev. Series 2009 A: | |||
| 0% 3/1/27 | 90,000 | 78,247 | |
| 0% 3/1/37 | 50,000 | 27,663 | |
| 0% 3/1/39 (Assured Guaranty Corp. Insured) | 10,000 | 4,940 | |
| 0% 3/1/44 | 45,000 | 16,972 | |
| 0% 3/1/45 (Assured Guaranty Corp. Insured) | 25,000 | 8,928 | |
| New York City Muni. Wtr. Fin. Auth. Wtr. & Swr. Sys. Rev.: | |||
| Series 2013 DD, 4% 6/15/38 | 65,000 | 65,004 | |
| Series 2015 HH, 5% 6/15/29 | 65,000 | 67,307 | |
| Series 2016 BB, 5% 6/15/46 | 40,000 | 40,858 | |
| Series 2017 DD, 5.25% 6/15/47 | 60,000 | 63,036 | |
| Series 2017 EE, 5% 6/15/36 | 60,000 | 63,967 | |
| Series 2018 AA, 5% 6/15/37 | 5,000 | 5,312 | |
| Series 2018 DD1, 5% 6/15/48 | 15,000 | 15,756 | |
| Series 2018 FF, 5% 6/15/40 | 135,000 | 144,389 | |
| Series 2019 A, 5% 6/15/29 | 175,000 | 198,257 | |
| Series 2019 AA, 5% 6/15/27 | 150,000 | 162,839 | |
| Series 2019 DD, 5.25% 6/15/49 | 65,000 | 69,766 | |
| Series 2020 CC1: | |||
4% 6/15/39 | 100,000 | 100,812 | |
4% 6/15/49 | 35,000 | 34,463 | |
| Series 2020 FF, 5% 6/15/41 | 190,000 | 207,871 | |
| Series 2022 CC1, 4% 6/15/52 | 150,000 | 146,816 | |
| Series BB, 5% 6/15/49 | 180,000 | 192,171 | |
| Series CC: | |||
4% 6/15/42 | 90,000 | 89,911 | |
5% 6/15/30 | 25,000 | 28,495 | |
| Series DD: | |||
5% 6/15/25 | 75,000 | 75,647 | |
5% 6/15/36 | 95,000 | 96,407 | |
| Series EE, 5% 6/15/32 | 10,000 | 10,423 | |
| Series FF, 4% 6/15/37 | 80,000 | 81,831 | |
| New York City Transitional Fin. Auth. Bldg. Aid Rev.: | |||
| Series 2015 S1, 5% 7/15/43 | 230,000 | 234,330 | |
| Series 2018 S 4A, 5% 7/15/34 | 5,000 | 5,496 | |
| Series 2018 S2, 5% 7/15/24 (Escrowed to Maturity) | 70,000 | 71,360 | |
| Series 2018 S3, 3.625% 7/15/47 | 155,000 | 144,609 | |
| Series 2018 S4, 5% 7/15/31 | 30,000 | 33,101 | |
| Series 2023 S 1A, 5% 7/15/28 | 400,000 | 443,010 | |
| Series S1: | |||
5% 7/15/26 | 50,000 | 52,385 | |
5% 7/15/27 | 15,000 | 15,420 | |
5% 7/15/29 | 60,000 | 61,706 | |
5% 7/15/35 | 35,000 | 37,686 | |
| New York City Transitional Fin. Auth. Rev.: | |||
| Series 2014 B1, 5% 11/1/24 | 75,000 | 76,198 | |
| Series 2014 D1, 5% 2/1/38 | 170,000 | 171,156 | |
| Series 2014, 5% 11/1/25 | 30,000 | 30,419 | |
| Series 2015 A, 5% 8/1/29 | 100,000 | 101,860 | |
| Series 2015 E1, 5% 2/1/41 | 500,000 | 509,078 | |
| Series 2016 A, 5% 5/1/40 | 15,000 | 15,528 | |
| Series 2016 B1, 5% 11/1/35 | 105,000 | 108,730 | |
| Series 2017 C, 5% 11/1/24 | 135,000 | 138,445 | |
| Series 2017 F: | |||
3% 5/1/34 | 50,000 | 49,156 | |
4% 5/1/37 | 80,000 | 81,178 | |
| Series 2018 A, 5% 8/1/38 | 55,000 | 58,370 | |
| Series 2018 B, 5% 8/1/45 | 50,000 | 52,451 | |
| Series 2018 B1, 5% 8/1/29 | 150,000 | 161,950 | |
| Series 2019 C, 4% 11/1/37 | 30,000 | 30,579 | |
| Series 2019 C1, 4% 11/1/36 | 50,000 | 51,385 | |
| Series 2020 B1, 4% 11/1/45 | 415,000 | 409,443 | |
| Series 2020 C1, 5% 5/1/41 | 100,000 | 109,447 | |
| Series 2021 A, 5% 11/1/31 | 150,000 | 172,479 | |
| Series 2021 B1, 3% 8/1/48 | 340,000 | 264,511 | |
| Series 2021 C1, 4% 5/1/38 | 100,000 | 101,865 | |
| Series 2021 F1, 5% 11/1/32 | 170,000 | 196,689 | |
| Series 2022 C1, 5% 2/1/37 | 100,000 | 113,468 | |
| Series 2023 F1, 5.25% 2/1/47 | 190,000 | 213,324 | |
| Series A, 4% 11/1/35 | 80,000 | 83,656 | |
| Series A1, 5% 8/1/24 | 50,000 | 51,031 | |
| Series B: | |||
4% 8/1/38 | 100,000 | 101,345 | |
4% 8/1/39 | 20,000 | 20,131 | |
| Series B1, 5% 11/1/28 | 30,000 | 31,332 | |
| Series C: | |||
3.25% 11/1/43 | 140,000 | 121,562 | |
4% 2/1/27 | 70,000 | 72,460 | |
5% 11/1/26 | 40,000 | 42,683 | |
| Series C1: | |||
4% 5/1/40 | 10,000 | 10,001 | |
4% 5/1/44 | 30,000 | 29,635 | |
| New York City Trust Cultural Resources Rev. Series 2016 1E: | |||
| 4% 4/1/27 | 15,000 | 15,481 | |
| 4% 4/1/28 | 75,000 | 77,575 | |
| New York Convention Ctr. Dev. Corp. Rev. Series 2016 B: | |||
| 0% 11/15/32 | 90,000 | 61,918 | |
| 0% 11/15/36 | 100,000 | 55,360 | |
| 0% 11/15/38 | 75,000 | 36,816 | |
| 0% 11/15/44 | 75,000 | 25,701 | |
| New York Dorm. Auth. Personal Income Tax Rev. Series 2016 D, 5% 2/15/26 | 115,000 | 120,811 | |
| New York Dorm. Auth. Rev.: | |||
| Series 1: | |||
3% 7/1/34 | 105,000 | 99,329 | |
5% 7/1/30 | 20,000 | 22,698 | |
| Series 2014 A, 5.5% 1/1/39 (Pre-Refunded to 7/1/24 @ 100) | 20,000 | 20,461 | |
| Series 2015 A: | |||
4.125% 5/1/42 | 50,000 | 49,019 | |
5% 5/1/33 | 40,000 | 41,068 | |
5% 7/1/40 | 235,000 | 238,562 | |
| Series 2018 A: | |||
4% 8/1/38 | 60,000 | 54,075 | |
5% 8/1/25 | 100,000 | 100,173 | |
| Series 2019 A, 5% 7/1/27 | 20,000 | 21,758 | |
| Series 2019 C, 4% 7/1/49 | 45,000 | 43,333 | |
| Series 2020 A: | |||
4% 7/1/50 | 130,000 | 127,805 | |
5% 7/1/30 | 190,000 | 220,861 | |
| Series 2020 A2, 5% 7/1/31 | 25,000 | 28,757 | |
| Series 2020, 3% 2/1/50 | 55,000 | 40,731 | |
| Series 2021 A, 5% 7/1/26 | 100,000 | 104,711 | |
| Series 2021 B, 3% 7/1/45 | 100,000 | 79,232 | |
| New York Dorm. Auth. Sales Tax Rev.: | |||
| Series 2016 A, 5% 3/15/29 | 80,000 | 84,976 | |
| Series 2017 A: | |||
5% 3/15/43 | 75,000 | 78,756 | |
5% 3/15/44 | 210,000 | 220,172 | |
| Series 2018, 5% 3/15/48 | 75,000 | 79,612 | |
| New York Envir. Facilities Corp. Clean Wtr. & Drinking Wtr. (New York City Muni. Wtr. Fin. Auth. Proj.): | |||
| Series 2017 A, 3.5% 6/15/36 | 10,000 | 9,977 | |
| Series 2018 A, 5% 6/15/30 | 50,000 | 55,688 | |
| Series 2019 B, 5% 6/15/31 | 25,000 | 28,429 | |
| New York Liberty Dev. Corp.: | |||
| (Bank of America Tower at One Bryant Park Proj.) Series 2019 2, 2.625% 9/15/69 | 150,000 | 136,919 | |
| Series 2021 1WTC, 2.75% 2/15/44 | 240,000 | 178,558 | |
| New York Metropolitan Trans. Auth. Dedicated Tax Fund Rev.: | |||
| Series 2012 A: | |||
0% 11/15/32 | 225,000 | 161,032 | |
3% 11/15/28 | 190,000 | 188,801 | |
| Series 2016 A: | |||
5% 11/15/26 | 90,000 | 96,243 | |
5.25% 11/15/28 | 150,000 | 160,834 | |
| New York Metropolitan Trans. Auth. Rev.: | |||
| Series 2012 H, 3% 11/15/28 | 30,000 | 28,636 | |
| Series 2013 C, 5% 11/15/38 | 75,000 | 75,005 | |
| Series 2014 A1: | |||
5% 11/15/31 (Pre-Refunded to 11/15/23 @ 100) | 50,000 | 50,328 | |
5.25% 11/15/39 | 105,000 | 105,136 | |
| Series 2015 B, 4% 11/15/45 | 250,000 | 235,993 | |
| Series 2015 C, 5% 11/15/34 | 80,000 | 81,936 | |
| Series 2015 F, 3.25% 11/15/31 | 35,000 | 33,287 | |
| Series 2016 C1: | |||
4% 11/15/46 | 120,000 | 112,810 | |
5% 11/15/30 | 395,000 | 409,737 | |
| Series 2016 C2A, 3% 11/15/38 | 25,000 | 20,355 | |
| Series 2016 D: | |||
3% 11/15/32 | 50,000 | 45,832 | |
5% 11/15/27 | 10,000 | 10,412 | |
| Series 2017 A2, 5% 11/15/24 | 100,000 | 101,870 | |
| Series 2017 B, 5% 11/15/23 | 145,000 | 145,619 | |
| Series 2017 C1: | |||
4% 11/15/34 | 55,000 | 54,946 | |
4% 11/15/35 | 160,000 | 158,761 | |
5% 11/15/24 | 20,000 | 20,374 | |
5% 11/15/25 | 45,000 | 46,360 | |
5% 11/15/28 | 25,000 | 26,711 | |
| Series 2017 D: | |||
4% 11/15/42 | 85,000 | 81,560 | |
5% 11/15/27 | 100,000 | 105,722 | |
| Series 2018 B: | |||
5% 11/15/25 | 35,000 | 36,058 | |
5% 11/15/27 | 20,000 | 21,144 | |
| Series 2019 B, 4% 11/15/49 (Assured Guaranty Muni. Corp. Insured) | 40,000 | 38,915 | |
| New York State Dorm. Auth.: | |||
| Series 2017 A, 5% 2/15/27 (Escrowed to Maturity) | 110,000 | 118,153 | |
| Series 2017 B: | |||
5% 2/15/39 | 15,000 | 15,880 | |
5% 2/15/43 | 50,000 | 52,690 | |
| Series 2018 A, 5% 3/15/32 | 50,000 | 55,093 | |
| Series 2019 A: | |||
5% 3/15/39 | 100,000 | 108,128 | |
5% 3/15/40 | 90,000 | 97,020 | |
| Series 2019 D, 3% 2/15/49 | 120,000 | 94,004 | |
| Series 2020 A, 3% 3/15/49 | 105,000 | 82,222 | |
| Series 2022 A, 4% 3/15/39 | 220,000 | 221,498 | |
| New York State Envir. Facilities Corp. Rev.: | |||
| (2010 Master Fing. Prog.) Series 2014 B, 5% 11/15/39 | 5,000 | 5,068 | |
| Series 2019 A, 5% 2/15/49 | 30,000 | 32,239 | |
| New York State Gen. Oblig. Series 2013 A, 3.5% 3/1/43 | 40,000 | 36,581 | |
| New York State Hsg. Fin. Agcy. Rev.: | |||
| Series 2019 N, 3.05% 11/1/52 | 55,000 | 39,687 | |
| Series 2019 R, 3.15% 11/1/54 | 25,000 | 18,222 | |
| Series 2021 G, 2.4% 11/1/41 | 210,000 | 151,222 | |
| Series L, 3.45% 11/1/42 | 25,000 | 21,555 | |
| New York State Mtg. Agcy. Homeowner Mtg.: | |||
| Series 2019 220, 2.4% 10/1/34 | 225,000 | 192,201 | |
| Series 2020 225, 2.3% 10/1/40 | 155,000 | 112,317 | |
| Series 220, 2.85% 10/1/44 | 25,000 | 18,560 | |
| New York State Mtg. Agcy. Rev. Series 48, 3.45% 10/1/33 | 5,000 | 4,858 | |
| New York State Urban Dev. Corp. Series 2020 A: | |||
| 4% 3/15/45 | 65,000 | 64,053 | |
| 4% 3/15/49 | 85,000 | 82,907 | |
| New York State Urban Eev Corp. Series 2019 A, 4% 3/15/46 | 75,000 | 74,015 | |
| New York Thruway Auth. Gen. Rev.: | |||
| Series 2014 J, 5% 1/1/33 | 100,000 | 100,763 | |
| Series 2014 K, 5% 1/1/26 | 80,000 | 82,062 | |
| Series 2016 A, 5% 1/1/51 | 30,000 | 30,596 | |
| Series 2019 B, 3% 1/1/46 | 50,000 | 38,757 | |
| Series 2020 N, 4% 1/1/47 | 200,000 | 195,473 | |
| Series K: | |||
5% 1/1/28 | 10,000 | 10,252 | |
5% 1/1/29 | 90,000 | 92,241 | |
| Series L, 5% 1/1/34 | 70,000 | 76,209 | |
| New York Trans. Dev. Corp.: | |||
| (Delta Air Lines, Inc. LaGuardia Arpt. Terminals C&D Redev. Proj.) Series 2018, 5% 1/1/30 (c) | 30,000 | 31,146 | |
| (LaGuardia Arpt. Term. B Redev. Proj.) Series 2016 A: | |||
4% 7/1/41 (c) | 30,000 | 27,421 | |
4% 1/1/51 (Assured Guaranty Muni. Corp. Insured) (c) | 30,000 | 27,377 | |
| (Term. 4 JFK Int'l. Arpt. Proj.) Series 2020 A: | |||
4% 12/1/40 (c) | 50,000 | 47,483 | |
5% 12/1/25 (c) | 105,000 | 107,472 | |
| (Term. 4 John F. Kennedy Int'l. Arpt. Proj.) Series 2022, 5% 12/1/35 (c) | 150,000 | 160,531 | |
| New York Urban Dev. Corp. Rev.: | |||
| Series 2013 A1, 5% 3/15/29 | 40,000 | 40,045 | |
| Series 2016 A, 5% 3/15/26 | 20,000 | 21,079 | |
| Series 2019 A: | |||
5% 3/15/42 | 15,000 | 16,010 | |
5% 3/15/44 | 25,000 | 26,611 | |
| Series A2, 5.5% 3/15/24 (Nat'l. Pub. Fin. Guarantee Corp. Insured) | 60,000 | 61,010 | |
| Onondaga County Trust for Cultural Resources Rev. Series 2019: | |||
| 5% 12/1/39 | 25,000 | 27,456 | |
| 5% 12/1/40 | 160,000 | 175,127 | |
| Port Auth. of New York & New Jersey Series 2022 234, 5% 8/1/39 (c) | 180,000 | 193,915 | |
| Suffolk County Gen. Oblig. Series 2015 C, 5% 5/1/27 | 15,000 | 15,185 | |
| Suffolk County Wtr. Auth. Wtrwks. Rev. Series 2018 A, 4% 6/1/41 | 45,000 | 45,270 | |
| Tobacco Settlement Asset Securitization Corp. Series 2017 A, 5% 6/1/32 | 75,000 | 78,208 | |
| Triborough Bridge & Tunnel Auth. Series 2021 C3, 4% 5/15/51 | 540,000 | 522,243 | |
| Triborough Bridge & Tunnel Auth. Revs.: | |||
| Series 2008 B3, 5% 11/15/37 | 40,000 | 41,367 | |
| Series 2013 A: | |||
0% 11/15/30 | 105,000 | 80,836 | |
0% 11/15/32 | 35,000 | 24,684 | |
| Series 2013 B, 4% 11/15/23 | 50,000 | 50,134 | |
| Series 2016 A: | |||
5% 11/15/31 | 100,000 | 105,332 | |
5% 11/15/41 | 25,000 | 25,656 | |
| Series 2017 A, 5% 11/15/26 | 50,000 | 53,400 | |
| Series 2017 B: | |||
5% 11/15/25 | 80,000 | 83,695 | |
5% 11/15/36 | 90,000 | 95,888 | |
| Series 2018 C, 5% 11/15/37 | 25,000 | 27,121 | |
| Series 2019 A, 5% 11/15/49 | 45,000 | 47,602 | |
| Series 2021 A, 5% 11/1/25 | 140,000 | 146,280 | |
| Series B, 5% 11/15/31 | 200,000 | 235,716 | |
| Util. Debt Securitization Auth.: | |||
| Series 2015, 3% 12/15/32 | 80,000 | 80,287 | |
| Series 2017: | |||
5% 12/15/38 | 25,000 | 27,070 | |
5% 12/15/41 | 50,000 | 53,820 | |
| Westchester County Local Dev. Co. (Westchester Obligated Group Proj.) Series 2016, 3.75% 11/1/37 | 45,000 | 37,740 | |
TOTAL NEW YORK | 23,132,980 | ||
| New York And New Jersey - 1.3% | |||
| Port Auth. of New York & New Jersey: | |||
| Series 189, 5% 5/1/30 | 20,000 | 20,696 | |
| Series 194: | |||
5% 10/15/25 | 25,000 | 26,109 | |
5% 10/15/30 | 35,000 | 36,552 | |
5% 10/15/32 | 55,000 | 57,389 | |
5% 10/15/35 | 100,000 | 103,807 | |
5.25% 10/15/55 | 50,000 | 51,465 | |
| Series 198, 5% 11/15/46 | 15,000 | 15,371 | |
| Series 2012 171, 4% 1/15/42 | 205,000 | 204,801 | |
| Series 2014 185, 5% 9/1/25 (c) | 120,000 | 121,779 | |
| Series 2014, 3% 7/15/28 (c) | 50,000 | 48,352 | |
| Series 2015 189, 5% 5/1/45 | 140,000 | 142,746 | |
| Series 2017 202, 5% 10/15/34 (c) | 580,000 | 606,949 | |
| Series 2018 209, 5% 7/15/34 | 70,000 | 77,284 | |
| Series 2019 217, 5% 11/1/30 | 100,000 | 113,313 | |
| Series 202, 5% 10/15/30 (c) | 20,000 | 20,983 | |
| Series 2020 222, 5% 7/15/31 | 75,000 | 86,427 | |
| Series 2021 223, 5% 7/15/31 (c) | 55,000 | 61,126 | |
| Series 207, 5% 9/15/26 (c) | 185,000 | 192,831 | |
| Series 209, 5% 7/15/31 | 30,000 | 33,264 | |
TOTAL NEW YORK AND NEW JERSEY | 2,021,244 | ||
| North Carolina - 1.2% | |||
| Charlotte Int'l. Arpt. Rev. Series 2021 A, 4% 7/1/41 | 150,000 | 149,539 | |
| Charlotte-Mecklenburg Hosp. Auth. Health Care Sys. Rev. Bonds Series 2021 B, 5%, tender 12/2/24 (b) | 150,000 | 153,440 | |
| Greensboro Combined Enterprise Sys. Rev. Series 2017 A, 4% 6/1/47 | 95,000 | 92,934 | |
| Mecklenburg County Gen. Oblig.: | |||
| Series 2017 A, 3% 4/1/37 | 50,000 | 45,012 | |
| Series 2019, 4% 3/1/34 | 210,000 | 220,984 | |
| Series 2022, 5% 9/1/32 | 130,000 | 155,480 | |
| North Carolina Gen. Oblig. Series 2016 A, 5% 6/1/27 | 70,000 | 74,342 | |
| North Carolina Grant Anticipation Rev.: | |||
| Series 2015: | |||
5% 3/1/27 | 30,000 | 30,865 | |
5% 3/1/28 | 50,000 | 51,440 | |
| Series 2019: | |||
5% 3/1/31 | 45,000 | 50,010 | |
5% 3/1/33 | 75,000 | 83,240 | |
5% 3/1/34 | 40,000 | 44,313 | |
| North Carolina Ltd. Oblig.: | |||
| Series 2019 A, 5% 5/1/25 | 30,000 | 31,049 | |
| Series 2020 B: | |||
5% 5/1/24 | 100,000 | 101,536 | |
5% 5/1/29 | 20,000 | 22,495 | |
| North Carolina Med. Care Commission Health Care Facilities Rev.: | |||
| Series 2016 A, 5% 6/1/28 | 65,000 | 71,330 | |
| Series 2020 A, 4% 10/1/45 | 55,000 | 44,851 | |
| North Carolina Tpk. Auth. Triangle Expressway Sys.: | |||
| Series 2009 B, 0% 1/1/37 (Assured Guaranty Corp. Insured) | 150,000 | 84,492 | |
| Series 2018, 5% 1/1/31 | 85,000 | 91,211 | |
| Union County Enterprise Systems Rev. Series 2021, 3% 6/1/37 | 80,000 | 72,735 | |
| Wake County: | |||
| Series 2019 A, 3% 3/1/36 | 50,000 | 47,045 | |
| Series 2022 A, 5% 2/1/31 | 100,000 | 116,669 | |
TOTAL NORTH CAROLINA | 1,835,012 | ||
| North Dakota - 0.1% | |||
| North Dakota Hsg. Fin. Agcy. Series 2021 A, 2.25% 7/1/41 | 50,000 | 36,408 | |
| Univ. of North Dakota Series 2018 A, 4% 4/1/57 | 195,000 | 175,987 | |
TOTAL NORTH DAKOTA | 212,395 | ||
| Ohio - 2.0% | |||
| American Muni. Pwr., Inc. Rev. Series 2015 A, 5% 2/15/27 | 5,000 | 5,043 | |
| Buckeye Tobacco Settlement Fing. Auth. Series 2020 A2, 5% 6/1/34 | 240,000 | 259,985 | |
| Chillicothe Hosp. Facilities Rev. Series 2017, 5% 12/1/37 | 100,000 | 103,003 | |
| Cleveland Income Tax Rev. Series 2017 B1, 5% 10/1/28 | 115,000 | 126,118 | |
| Cleveland Pub. Pwr. Sys. Rev. Series B2, 0% 11/15/38 (Nat'l. Pub. Fin. Guarantee Corp. Insured) | 55,000 | 28,035 | |
| Columbus Gen. Oblig.: | |||
| Series 2016 A, 4% 8/15/27 | 45,000 | 45,828 | |
| Series 2018 A, 5% 4/1/30 | 120,000 | 133,703 | |
| Cuyahoga County Hosp. Rev. Series 2017, 5% 2/15/52 | 55,000 | 54,286 | |
| Franklin County Convention Facilities Auth. (Greater Columbus Convention Ctr. Hotel Expansion Proj.) Series 2019, 5% 12/1/44 | 130,000 | 123,967 | |
| Franklin County Ohio Sales Tax R Series 2018, 5% 6/1/48 | 30,000 | 31,710 | |
| Franklin County Rev. Series 2017 OH: | |||
| 4% 12/1/46 | 70,000 | 66,928 | |
| 5% 12/1/46 | 65,000 | 66,620 | |
| Gahanna-Jefferson School District Series 2021, 2% 12/1/50 (Assured Guaranty Muni. Corp. Insured) | 45,000 | 26,311 | |
| Hamilton County Sales Tax Rev. Series 2000 B, 0% 12/1/28 (AMBAC Insured) | 235,000 | 195,264 | |
| Northeastern Local School District of Clark and Champaign Series 2018, 4% 12/1/55 (Assured Guaranty Muni. Corp. Insured) | 65,000 | 60,859 | |
| Ohio Gen. Oblig.: | |||
| Series 2015 A, 5% 9/15/26 | 20,000 | 21,301 | |
| Series 2015 C: | |||
5% 11/1/28 | 35,000 | 36,205 | |
5% 11/1/30 | 50,000 | 51,685 | |
| Series 2017 C, 5% 8/1/26 | 25,000 | 26,555 | |
| Series 2018 A, 5% 2/1/29 | 25,000 | 26,235 | |
| Series 2019 A, 5% 5/1/27 | 60,000 | 64,811 | |
| Series 2021 B, 5% 9/15/31 | 120,000 | 140,687 | |
| Series R, 5% 5/1/24 | 15,000 | 15,232 | |
| Series S, 5% 5/1/29 | 50,000 | 52,748 | |
| Ohio Hosp. Facilities Rev.: | |||
| Series 2017 A, 5% 1/1/33 | 40,000 | 43,569 | |
| Series 2021 B, 5% 1/1/28 | 100,000 | 108,509 | |
| Ohio Hosp. Rev. Series 2016 A, 5% 1/15/41 | 20,000 | 20,358 | |
| Ohio Hsg. Fin. Agcy. Residential Mtg. Rev. (Mtg.-Backed Securities Prog.) Series 2021 A, 3% 3/1/52 | 130,000 | 125,208 | |
| Ohio Parks & Recreation Cap. Facilities Series 2017 A, 5% 12/1/31 | 20,000 | 21,709 | |
| Ohio Spl. Oblig. (Trans. Bldg. Fund Proj.) Series 2015 A, 5% 4/1/29 | 40,000 | 41,222 | |
| Ohio Tpk. Commission Tpk. Rev.: | |||
| (Infrastructure Proj.): | |||
Series 2005 A, 0% 2/15/43 | 25,000 | 10,227 | |
Series 2013 A2, 0% 2/15/37 | 20,000 | 11,424 | |
Series A, 0% 2/15/41 | 60,000 | 27,242 | |
| Series A, 5% 2/15/51 | 50,000 | 54,031 | |
| Ohio Wtr. Dev. Auth. Poll. Cont. Facilities Rev. Series 2019 A, 5% 6/1/27 | 55,000 | 59,524 | |
| Ohio Wtr. Dev. Auth. Wtr. Poll. Cont. Rev.: | |||
| Series 2017 A, 5% 12/1/28 | 30,000 | 32,479 | |
| Series 2019 B, 3% 6/1/46 | 90,000 | 73,465 | |
| Series 2020 A: | |||
5% 6/1/33 | 90,000 | 102,995 | |
5% 12/1/38 | 185,000 | 205,163 | |
5% 12/1/40 | 80,000 | 88,089 | |
| Scioto County Hosp. Facilities Rev. Series 2016, 3.5% 2/15/38 | 285,000 | 252,811 | |
| Southwest Licking Local School Series 2017 A, 3.375% 11/1/47 | 10,000 | 8,634 | |
TOTAL OHIO | 3,049,778 | ||
| Oklahoma - 0.4% | |||
| Cleveland County Edl. Facilities Auth. (Norman Pub. Schools Proj.) Series 2019, 5% 6/1/25 | 110,000 | 113,574 | |
| Edmond Pub. Works Auth. Sales Tax & Util. Sys. Rev. Series 2017, 4% 7/1/47 | 145,000 | 143,368 | |
| Oklahoma Cap. Imp Auth. St Hwy. Series 2016, 4% 7/1/33 | 10,000 | 10,156 | |
| Oklahoma Dev. Fin. Auth. Health Sys. Rev. (OU Medicine Proj.) Series 2018 B, 4% 8/15/48 (Assured Guaranty Muni. Corp. Insured) | 140,000 | 132,817 | |
| Oklahoma Pwr. Auth. Pwr. Supply Sys. Rev. Series 2016 A, 5% 1/1/47 | 15,000 | 15,305 | |
| Oklahoma Tpk. Auth. Tpk. Rev.: | |||
| Series 2017 A, 4% 1/1/47 | 35,000 | 34,535 | |
| Series 2017 D, 5% 1/1/26 | 65,000 | 68,110 | |
| Univ. of Oklahoma Gen. Rev. Series 2015 C, 5% 7/1/36 | 85,000 | 87,295 | |
TOTAL OKLAHOMA | 605,160 | ||
| Oregon - 0.9% | |||
| Bend La Pine General Obligation Series 2017, 5% 6/15/26 | 10,000 | 10,592 | |
| Clackamas County School District No. 46: | |||
| Series 2009: | |||
0% 6/15/33 | 60,000 | 41,245 | |
0% 6/15/36 | 85,000 | 50,316 | |
0% 6/15/39 | 155,000 | 76,881 | |
| Series B, 0% 6/15/34 | 35,000 | 23,079 | |
| Deschutes & Jefferson Counties School District #2J Redmond Series 2008 B, 0% 6/15/26 | 40,000 | 36,213 | |
| Greater Albany School Distrct No. 8J Series 2017, 5% 6/15/27 | 15,000 | 16,220 | |
| Medford Hosp. Facilities Auth. Rev. (Asante Projs.) Series 2020 A: | |||
| 4% 8/15/50 | 100,000 | 92,445 | |
| 5% 8/15/45 | 50,000 | 52,273 | |
| Oregon Dept. of Trans. Hwy. User Tax Rev. Series 2013 A, 5% 11/15/38 (Pre-Refunded to 11/15/23 @ 100) | 20,000 | 20,131 | |
| Oregon Facilities Auth. Rev.: | |||
| (Univ. of Portland Proj.) Series 2015 A, 5% 4/1/45 | 15,000 | 15,226 | |
| Series 2022 A, 5% 6/1/52 | 230,000 | 237,564 | |
| Oregon Gen. Oblig.: | |||
| Series 2021 A, 4% 5/1/38 | 195,000 | 198,586 | |
| Series A, 4% 5/1/37 | 110,000 | 112,385 | |
| Oregon Health and Science Univ. Spl. Rev.: | |||
| Series 2016 B, 5% 7/1/39 | 15,000 | 15,555 | |
| Series 2019 A, 5% 7/1/30 | 100,000 | 111,922 | |
| Portland Swr. Sys. Rev. Series B, 3% 10/1/28 | 110,000 | 109,179 | |
| Salem Hosp. Facility Auth. Rev. (Salem Health Projs.) Series 2019 A: | |||
| 3% 5/15/49 | 45,000 | 32,046 | |
| 5% 5/15/29 | 100,000 | 109,439 | |
| Tri-County Metropolitan Trans. District Rev. Series 2018 A, 3.25% 10/1/34 | 50,000 | 47,917 | |
TOTAL OREGON | 1,409,214 | ||
| Pennsylvania - 3.4% | |||
| Allegheny County Series C77, 5% 11/1/43 | 25,000 | 26,780 | |
| Allegheny County Arpt. Auth. Rev. Series 2021 A, 5% 1/1/51 (c) | 390,000 | 404,762 | |
| Allegheny County Hosp. Dev. Auth. Rev.: | |||
| Series 2018 A: | |||
4% 4/1/38 | 5,000 | 4,823 | |
5% 4/1/27 | 100,000 | 105,337 | |
| Series 2019 A, 5% 7/15/33 | 110,000 | 120,665 | |
| Allegheny County Sanitation Auth. Swr. Rev. Series 2020 B, 4% 6/1/50 | 185,000 | 179,778 | |
| Commonwealth Fing. Auth. Tobacco Series 2018, 4% 6/1/39 (Assured Guaranty Muni. Corp. Insured) | 60,000 | 58,984 | |
| Delaware County Auth. College Rev. Series 2017 A: | |||
| 5% 10/1/42 | 5,000 | 5,222 | |
| 5% 10/1/46 | 135,000 | 140,403 | |
| Delaware River Port Auth. Pennsylvania & New Jersey Rev. Series 2018 A, 5% 1/1/32 | 30,000 | 33,335 | |
| Lancaster County Hosp. Auth. Health Ctr. Rev. Series 2016 A, 5% 8/15/42 | 10,000 | 10,275 | |
| Lehigh County Auth. Wtr. and Swr. Rev. Series 2013 A, 5% 12/1/43 | 60,000 | 60,214 | |
| Lehigh County Gen. Purp. Hosp. Rev. Series 2012 B, 4% 7/1/43 | 40,000 | 37,413 | |
| Montgomery County Higher Ed. & Health Auth. Rev. Series 2019, 4% 9/1/44 | 90,000 | 83,237 | |
| Northampton County Gen. Purp. Auth. Hosp. Rev. (St. Luke's Univ. Health Network Proj.) Series 2016 A, 3.125% 8/15/35 | 35,000 | 32,220 | |
| Northampton County Gen. Purp. College Rev. Series 2017, 3.125% 11/1/34 | 60,000 | 57,316 | |
| Pennsylvania Econ. Dev. Fing. Auth.: | |||
| Series 2017 A: | |||
5% 11/15/27 | 40,000 | 42,938 | |
5% 11/15/28 | 90,000 | 96,699 | |
| Series 2020 A, 4% 4/15/50 | 25,000 | 23,234 | |
| Pennsylvania Econ. Dev. Fing. Auth. Indl. Dev. Rev.: | |||
| (The Pennsylvania Rapid Bridge Replacement Proj.) Series 2015: | |||
4.125% 12/31/38 (c) | 25,000 | 23,467 | |
5% 12/31/28 (c) | 160,000 | 164,364 | |
| Series 2014 A, 5% 2/1/45 | 120,000 | 120,815 | |
| Pennsylvania Gen. Oblig.: | |||
| Series 2015 1: | |||
5% 3/15/26 | 55,000 | 56,793 | |
5% 3/15/29 | 60,000 | 61,906 | |
| Series 2015: | |||
4% 8/15/34 | 175,000 | 177,568 | |
5% 8/15/32 | 60,000 | 62,356 | |
| Series 2016 2, 3% 9/15/36 | 45,000 | 41,174 | |
| Series 2016: | |||
5% 1/15/28 | 145,000 | 155,602 | |
5% 9/15/29 | 100,000 | 106,693 | |
| Series 2018, 3.75% 3/1/39 (Assured Guaranty Muni. Corp. Insured) | 200,000 | 196,596 | |
| Series 2020 1, 5% 5/1/28 | 100,000 | 109,930 | |
| Pennsylvania Higher Edl. Facilities Auth. Rev.: | |||
| Series 2016 C: | |||
3% 8/15/41 | 35,000 | 28,873 | |
5% 8/15/25 | 90,000 | 93,272 | |
| Series 2021 A, 4% 7/15/46 | 210,000 | 179,439 | |
| Pennsylvania Hsg. Fin. Agcy. Series 2019 129, 3.15% 10/1/39 | 195,000 | 167,200 | |
| Pennsylvania Hsg. Fin. Agcy. Single Family Mtg. Rev.: | |||
| Series 2017 123B, 3.45% 10/1/32 | 5,000 | 4,906 | |
| Series 2017 124A, 4% 10/1/38 (c) | 120,000 | 119,189 | |
| Series 2017 125B, 3.65% 10/1/42 | 30,000 | 26,927 | |
| Pennsylvania Pub. School Bldg. Auth. School Rev. (The School District of the City of Harrisburg Projs.) Series 2016 A, 4% 12/1/31 | 110,000 | 113,632 | |
| Pennsylvania Tpk. Commission Oil Franchise Tax Rev. Series 2018 A, 5.25% 12/1/44 | 200,000 | 213,974 | |
| Pennsylvania Tpk. Commission Tpk. Rev.: | |||
| Series 2013 B, 0% 12/1/41 (d) | 40,000 | 35,741 | |
| Series 2013 B2, 0% 12/1/37 (d) | 100,000 | 90,859 | |
| Series 2013 C, 5.5% 12/1/31 (Pre-Refunded to 12/1/23 @ 100) | 25,000 | 25,235 | |
| Series 2014 A, 0% 12/1/39 (d) | 5,000 | 5,034 | |
| Series 2014 C, 5% 12/1/39 | 30,000 | 30,600 | |
| Series 2014, 5% 12/1/33 | 55,000 | 56,319 | |
| Series 2015 A1, 4% 12/1/41 | 60,000 | 59,634 | |
| Series 2016 B, 5% 6/1/27 | 160,000 | 167,958 | |
| Series 2017 A, 5.5% 12/1/42 | 150,000 | 156,618 | |
| Series 2017 A1, 5% 12/1/30 | 40,000 | 43,632 | |
| Series 2017 B, 5.25% 6/1/47 | 55,000 | 56,830 | |
| Series 2017 B2, 5% 6/1/25 | 100,000 | 103,062 | |
| Series 2017, 5% 12/1/40 | 50,000 | 52,169 | |
| Series 2019 A, 5% 12/1/35 | 35,000 | 38,087 | |
| Series 2019, 5% 12/1/32 | 30,000 | 32,932 | |
| Series 2020 B, 5% 12/1/50 | 125,000 | 132,249 | |
| Philadelphia Arpt. Rev. Series 2021, 5% 7/1/31 (c) | 100,000 | 109,995 | |
| Philadelphia Auth. for Indl. Dev. (The Children's Hosp. of Philadelphia Proj.) Series 2017, 4% 7/1/37 | 5,000 | 5,040 | |
| Philadelphia Gen. Oblig.: | |||
| Series 2015 B, 5% 8/1/25 | 20,000 | 20,720 | |
| Series 2017 A, 5% 8/1/23 | 40,000 | 40,043 | |
| Philadelphia School District: | |||
| Series 2007 A, 5% 6/1/27 (FGIC Insured) (Nat'l. Pub. Fin. Guarantee Corp. Insured) | 50,000 | 53,141 | |
| Series 2016 F, 5% 9/1/26 | 110,000 | 115,255 | |
| Series 2018 B, 4% 9/1/43 (Assured Guaranty Muni. Corp. Insured) | 30,000 | 29,837 | |
| Series 2019 A, 5% 9/1/44 | 30,000 | 31,710 | |
| Pittsburgh Wtr. & Swr. Auth. Wtr. & Swr. Sys. Rev. Series B, 0% 9/1/28 (FGIC Insured) | 20,000 | 16,580 | |
| Pocono Mountains Indl. Park Auth. Series 2015 A, 4% 8/15/45 | 105,000 | 96,014 | |
TOTAL PENNSYLVANIA | 5,353,605 | ||
| Pennsylvania, New Jersey - 0.0% | |||
| Delaware River Joint Toll Bridge Commission Pennsylvania-New Jersey Bridge Rev. Series 2017, 5% 7/1/36 | 5,000 | 5,339 | |
| Rhode Island - 0.4% | |||
| Rhode Island & Providence Plantations: | |||
| Series 2019 C, 4% 1/15/33 | 200,000 | 207,319 | |
| Series C, 3% 1/15/36 | 30,000 | 27,892 | |
| Rhode Island Health & Edl. Bldg. Corp. Higher Ed. Facilities Rev. Series 2016: | |||
| 5% 5/15/24 | 5,000 | 5,042 | |
| 5% 5/15/31 | 50,000 | 51,157 | |
| Rhode Island Health and Edl. Bldg. Corp. Higher Ed. Facility Rev. Series 2022 A, 5% 9/1/33 | 260,000 | 312,335 | |
TOTAL RHODE ISLAND | 603,745 | ||
| South Carolina - 0.8% | |||
| Charleston Wtrwks. & Swr. Rev.: | |||
| Series 2022 A, 5% 1/1/47 | 130,000 | 144,250 | |
| Series 2022, 5% 1/1/42 | 150,000 | 168,610 | |
| South Carolina Jobs-Econ. Dev. Auth. (SPE Fayssoux Properties, LLC Proj.) Series 2016 A, 3% 8/15/38 | 40,000 | 30,853 | |
| South Carolina Ports Auth. Ports Rev. Series A, 5% 7/1/54 | 115,000 | 120,198 | |
| South Carolina Pub. Svc. Auth. Rev.: | |||
| Series 2013 A, 5% 12/1/38 | 160,000 | 160,410 | |
| Series 2013 B, 5.125% 12/1/43 | 25,000 | 25,038 | |
| Series 2014 A, 5.5% 12/1/54 | 25,000 | 25,159 | |
| Series 2014 C: | |||
5% 12/1/29 | 40,000 | 40,701 | |
5% 12/1/34 | 110,000 | 111,566 | |
5% 12/1/36 | 45,000 | 45,527 | |
| Series 2016 A: | |||
3.25% 12/1/35 | 15,000 | 13,779 | |
5% 12/1/27 | 50,000 | 52,028 | |
| Series 2016 B, 5% 12/1/33 | 55,000 | 57,025 | |
| Series 2022 A, 5% 12/1/44 | 125,000 | 130,876 | |
| Series A, 3% 12/1/41 | 30,000 | 23,710 | |
| South Carolina Trans. Infrastructure Bank Rev. Series 2017 A, 5% 10/1/38 | 85,000 | 90,060 | |
TOTAL SOUTH CAROLINA | 1,239,790 | ||
| Tennessee - 1.1% | |||
| Chattanooga Health Ed. & Hsg. Facility Board Rev. Series 2019 A1: | |||
| 3% 8/1/39 | 20,000 | 15,855 | |
| 3.25% 8/1/44 | 30,000 | 22,719 | |
| 4% 8/1/38 | 100,000 | 97,495 | |
| Knox County Health Edl. & Hsg. Facilities: | |||
| Series 2012 A, 5% 1/1/25 | 60,000 | 60,057 | |
| Series 2016 A, 4% 1/1/42 | 10,000 | 9,710 | |
| Series 2019, 4% 11/15/43 | 55,000 | 51,845 | |
| Memphis Gen. Oblig. Series 2014 B, 5% 4/1/44 | 245,000 | 246,739 | |
| Memphis-Shelby County Econ. Dev. Series 2017 B, 5% 11/1/30 | 80,000 | 84,773 | |
| Metropolitan Govt. Nashville & Davidson County Wtr. & Swr. Sys. Rev. Series 2013, 5% 7/1/32 (Pre-Refunded to 7/1/23 @ 100) | 70,000 | 70,000 | |
| Metropolitan Nashville Arpt. Auth. Rev. Series 2019 A: | |||
| 4% 7/1/49 | 55,000 | 52,544 | |
| 4% 7/1/54 | 35,000 | 32,926 | |
| 5% 7/1/44 | 65,000 | 69,514 | |
| Nashville and Davidson County Metropolitan Govt. Health & Edl. Facilities Board Rev. Series 2016 A, 5% 7/1/40 | 70,000 | 71,642 | |
| Tennessee Energy Acquisition Corp.: | |||
| Bonds Series 2018, 4%, tender 11/1/25 (b) | 30,000 | 29,837 | |
| Series 2006 A: | |||
5.25% 9/1/24 | 125,000 | 126,580 | |
5.25% 9/1/26 | 30,000 | 30,645 | |
| Series 2006 C: | |||
5% 2/1/24 | 10,000 | 10,037 | |
5% 2/1/27 | 15,000 | 15,119 | |
| Tennessee Gen. Oblig.: | |||
| Series 2016 A, 5% 8/1/35 | 50,000 | 52,747 | |
| Series 2021 A, 5% 11/1/31 | 290,000 | 342,779 | |
| Tennessee Hsg. Dev. Agcy. Residential: | |||
| Series 2015 2, 3.875% 7/1/35 | 5,000 | 4,976 | |
| Series 2018 1, 3.85% 7/1/38 | 45,000 | 44,716 | |
| Series 2018 3, 3.75% 7/1/38 | 30,000 | 29,732 | |
| Series 2020 1A, 2.4% 1/1/44 | 15,000 | 12,403 | |
| Tennessee School Board Auth. Series A, 5% 11/1/42 | 105,000 | 111,360 | |
TOTAL TENNESSEE | 1,696,750 | ||
| Texas - 9.3% | |||
| Aldine Independent School District Series 2017 A, 5% 2/15/30 | 50,000 | 53,410 | |
| Alvin Independent School District Series 2019, 3.375% 2/15/40 | 120,000 | 112,346 | |
| Arlington Higher Ed. Fin. Corp.: | |||
| Series 2019 A, 3% 8/15/54 | 60,000 | 42,773 | |
| Series 2021 A, 3% 2/15/46 | 210,000 | 159,575 | |
| Austin Convention Enterprises, Inc. Series 2017 A, 5% 1/1/25 | 80,000 | 80,338 | |
| Austin Independent School District: | |||
| Series 2017, 4% 8/1/33 | 20,000 | 20,394 | |
| Series 2019, 4% 8/1/35 | 25,000 | 25,846 | |
| Series 2023, 5% 8/1/41 | 220,000 | 247,705 | |
| Bexar County Hosp. District Series 2020, 3% 2/15/36 | 55,000 | 50,233 | |
| Bexar County Rev. Series 2015, 4% 8/15/51 (Pre-Refunded to 8/15/24 @ 100) | 35,000 | 35,322 | |
| Brownsville Util. Sys. Rev. Series 2013A, 5% 9/1/28 (Pre-Refunded to 9/1/23 @ 100) | 80,000 | 80,196 | |
| Central Reg'l. Mobility Auth. Series 2016, 3.375% 1/1/41 | 20,000 | 17,156 | |
| City of Denton Series 2017, 4% 2/15/47 | 50,000 | 48,118 | |
| Cleveland Independent School District Series 2020 A, 4% 2/15/52 | 150,000 | 145,799 | |
| College of the Mainland Series 2019, 3.75% 8/15/49 | 20,000 | 17,811 | |
| Collin County Cmnty. College District Series 2018 A, 3.25% 8/15/33 | 10,000 | 10,045 | |
| Conroe Independent School District Series 2020 A, 2.25% 2/15/46 | 115,000 | 77,422 | |
| Cypress-Fairbanks Independent School District: | |||
| Series 2019, 5% 2/15/30 | 45,000 | 50,225 | |
| Series 2020 A, 3% 2/15/35 | 120,000 | 114,875 | |
| Dallas Area Rapid Transit Sales Tax Rev. Series 2016 B: | |||
| 4% 12/1/36 | 200,000 | 202,152 | |
| 4% 12/1/38 | 350,000 | 351,471 | |
| Dallas Fort Worth Int'l. Arpt. Rev.: | |||
| Series 2014 A, 5.25% 11/1/27 (c) | 40,000 | 40,138 | |
| Series 2020 A, 5% 11/1/30 | 55,000 | 62,900 | |
| Series 2020 B, 5% 11/1/33 | 35,000 | 39,837 | |
| Dallas Gen. Oblig. Series 2013 A, 4% 2/15/32 | 5,000 | 5,355 | |
| Dallas Independent School District Series 2019 B, 4% 2/15/32 | 160,000 | 169,536 | |
| Del Valle Independent School District Series 2020, 4% 6/15/45 | 400,000 | 404,383 | |
| Denton Independent School District Series 2014, 5% 8/15/38 (Pre-Refunded to 8/15/24 @ 100) | 65,000 | 66,266 | |
| Eagle Mountain & Saginaw Independent School District: | |||
| Series 2019, 4% 8/15/50 | 105,000 | 103,130 | |
| Series 2021, 3% 8/15/40 | 150,000 | 129,999 | |
| El Paso County Cmnty. College District Series 2016, 5% 4/1/38 (Assured Guaranty Muni. Corp. Insured) | 70,000 | 72,834 | |
| El Paso County Hosp. District Series 2013, 5% 8/15/39 | 70,000 | 69,993 | |
| El Paso Independent School District Series 2019, 4% 8/15/38 | 385,000 | 390,387 | |
| Fort Bend Independent School District Series 2021 A, 2.3% 8/15/46 | 150,000 | 98,870 | |
| Fort Worth Independent School District Series 2016, 4% 2/15/39 | 130,000 | 130,584 | |
| Frisco Independent School District: | |||
| Series 2012 B, 3% 8/15/42 | 200,000 | 166,748 | |
| Series 2017, 4% 8/15/35 | 110,000 | 112,127 | |
| Grand Parkway Trans. Corp.: | |||
| Series 2013: | |||
0% 10/1/32 (d) | 40,000 | 43,798 | |
0% 10/1/46 (d) | 40,000 | 42,591 | |
0% 10/1/48 (d) | 30,000 | 31,940 | |
| Series 2018 A, 5% 10/1/37 | 40,000 | 42,900 | |
| Harris County Cultural Ed. Facilities Fin. Corp. Rev.: | |||
| Series 2015, 4% 12/1/45 | 75,000 | 71,453 | |
| Series 2016 A, 3.125% 7/1/38 | 210,000 | 182,872 | |
| Harris County Flood Cont. District: | |||
| Series 2017 A, 4% 10/1/38 | 75,000 | 75,269 | |
| Series 2021 A: | |||
4% 10/1/33 | 150,000 | 159,414 | |
4% 10/1/46 | 100,000 | 98,964 | |
| Harris County Gen. Oblig.: | |||
| Series 2015 B, 5% 8/15/28 | 100,000 | 103,553 | |
| Series 2016 A: | |||
5% 8/15/33 | 15,000 | 15,841 | |
5% 8/15/35 | 140,000 | 146,703 | |
| Harris County Hosp. District Rev. Series 2016, 3.25% 2/15/42 | 230,000 | 187,441 | |
| Harris County Toll Road Rev.: | |||
| Series 2018 A, 4% 8/15/48 | 40,000 | 39,793 | |
| Series 2019 A, 3% 8/15/44 | 120,000 | 96,630 | |
| Harris County-Houston Sports Auth. Rev.: | |||
| Series 2001 A, 0% 11/15/34 (Nat'l. Pub. Fin. Guarantee Corp. Insured) | 75,000 | 43,666 | |
| Series 2014 C, 5% 11/15/30 | 170,000 | 173,252 | |
| Series 2014: | |||
0% 11/15/48 (Assured Guaranty Muni. Corp. Insured) | 10,000 | 2,867 | |
0% 11/15/49 (Assured Guaranty Muni. Corp. Insured) | 25,000 | 6,789 | |
| Houston Arpt. Sys. Rev.: | |||
| Series 2018 D, 5% 7/1/38 | 55,000 | 58,601 | |
| Series 2021 A, 4% 7/1/40 (c) | 175,000 | 168,772 | |
| Houston Convention and Entertainment Facilities Dept. Hotel Occupancy Tax and Spl. Rev. Series 2001 B: | �� | ||
| 0% 9/1/23 (AMBAC Insured) | 60,000 | 59,631 | |
| 0% 9/1/33 (AMBAC Insured) | 80,000 | 53,595 | |
| Houston Independent School District: | |||
| Series 2016, 4% 2/15/40 | 250,000 | 250,932 | |
| Series 2017, 5% 2/15/27 | 50,000 | 53,680 | |
| Series 2018, 5% 7/15/27 | 55,000 | 59,450 | |
| Houston Util. Sys. Rev.: | |||
| Series 2014 C, 5% 5/15/26 | 75,000 | 75,947 | |
| Series 2016 B, 5% 11/15/25 | 275,000 | 286,935 | |
| Series 2017 B, 5% 11/15/29 | 45,000 | 48,928 | |
| Series 2019 B, 4% 11/15/44 | 55,000 | 54,846 | |
| Humble Independent School District Series 2020 A, 2% 2/15/42 | 25,000 | 16,448 | |
| Klein Independent School District Series 2017, 4% 8/1/46 | 215,000 | 210,893 | |
| Leander Independent School District: | |||
| Series 2014 D: | |||
0% 8/15/30 | 200,000 | 150,017 | |
0% 8/15/40 (Pre-Refunded to 8/15/24 @ 46.38) | 25,000 | 11,175 | |
0% 8/15/42 (Pre-Refunded to 8/15/24 @ 41.9852) | 90,000 | 36,418 | |
| Series 2016 A: | |||
0% 8/16/44 | 10,000 | 3,902 | |
0% 8/16/44 (Pre-Refunded to 8/16/26 @ 48.506) | 5,000 | 2,191 | |
| Lower Colorado River Auth. Rev. (LCRA Transmission Svcs. Corp. Proj.) Series 2020, 5% 5/15/34 | 90,000 | 99,111 | |
| Matagorda County Navigation District No. 1 Poll. Cont. Rev. Series 2005 A, 4.4% 5/1/30 (AMBAC Insured) | 20,000 | 20,342 | |
| Midland County Fresh Wtr. Supply District (City of Midland Proj.) Series 2012 A, 0% 9/15/35 (Pre-Refunded to 9/15/27 @ 68.049) | 5,000 | 2,935 | |
| North East Texas Reg'l. Mobility Auth. Series 2016 B, 5% 1/1/41 | 60,000 | 60,622 | |
| North Texas Tollway Auth. Rev.: | |||
| Series 2008 D: | |||
0% 1/1/30 (Assured Guaranty Corp. Insured) | 35,000 | 28,044 | |
0% 1/1/35 (Assured Guaranty Corp. Insured) | 5,000 | 3,235 | |
| Series 2012 A, 0% 1/1/36 (Assured Guaranty Corp. Insured) | 65,000 | 39,767 | |
| Series 2014 B, 5% 1/1/31 | 125,000 | 126,043 | |
| Series 2015 A, 5% 1/1/27 | 100,000 | 102,382 | |
| Series 2017 A, 5% 1/1/28 | 200,000 | 209,467 | |
| Series 2017 B, 4% 1/1/36 (Assured Guaranty Muni. Corp. Insured) | 185,000 | 186,900 | |
| Series 2018: | |||
4.25% 1/1/49 | 55,000 | 54,442 | |
5% 1/1/48 | 20,000 | 20,667 | |
| Series 2021 B, 5% 1/1/31 | 100,000 | 112,652 | |
| Northside Independent School District: | |||
| Series 2016, 4% 6/15/35 | 400,000 | 406,515 | |
| Series 2019 A, 4% 8/15/36 | 120,000 | 122,810 | |
| Series 2019, 4% 8/15/49 | 125,000 | 122,581 | |
| Port of Houston Auth. Series 2021, 4% 10/1/39 | 85,000 | 86,108 | |
| San Antonio Elec. & Gas Sys. Rev.: | |||
| Series 2015: | |||
5% 2/1/27 | 40,000 | 41,798 | |
5% 2/1/32 | 5,000 | 5,219 | |
| Series 2017, 5% 2/1/29 | 60,000 | 63,980 | |
| Series 2019: | |||
4% 2/1/28 | 10,000 | 10,393 | |
5% 2/1/35 | 125,000 | 139,124 | |
| San Antonio Gen. Oblig. Series 2015, 5% 2/1/31 (Pre-Refunded to 2/1/25 @ 100) | 195,000 | 200,737 | |
| San Antonio Independent School District Series 2019, 5% 8/15/30 | 50,000 | 55,188 | |
| San Antonio Wtr. Sys. Rev. Series 2021 A, 4% 5/15/51 | 300,000 | 285,272 | |
| San Jacinto Cmnty. College District Series 2019 A, 5% 2/15/44 | 175,000 | 186,911 | |
| Socorro Independent School District Series 2019, 5% 8/15/38 | 50,000 | 53,878 | |
| Tarrant County College Series 2020, 5% 8/15/30 | 130,000 | 149,261 | |
| Tarrant County Cultural Ed. Facilities Fin. Corp. Hosp. Rev. (Baylor Scott & White Health Proj.) Series 2016 A, 4% 11/15/36 | 140,000 | 140,729 | |
| Temple College District Series 2021, 3% 7/1/46 | 380,000 | 298,413 | |
| Texas Dept. of Hsg. & Cmnty. Affairs Single Family Mtg. Rev. Series 2020 A, 3% 3/1/50 | 30,000 | 22,204 | |
| Texas Gen. Oblig.: | |||
| Series 2014 A: | |||
5% 10/1/23 | 50,000 | 50,214 | |
5% 10/1/35 (Pre-Refunded to 10/1/24 @ 100) | 70,000 | 71,568 | |
| Series 2014, 5% 4/1/44 (Pre-Refunded to 4/1/24 @ 100) | 85,000 | 86,142 | |
| Series 2015 A: | |||
5% 10/1/24 | 55,000 | 56,286 | |
5% 10/1/26 | 100,000 | 104,061 | |
| Series 2016 A, 5% 4/1/30 | 50,000 | 52,708 | |
| Series 2017 A, 5% 10/1/33 | 50,000 | 53,894 | |
| Series 2017 B: | |||
5% 10/1/29 | 100,000 | 107,950 | |
5% 10/1/33 | 25,000 | 26,947 | |
| Series 2018 B, 5% 8/1/24 | 45,000 | 45,909 | |
| Texas Private Activity Bond Surface Trans. Corp.: | |||
| (LBJ Infrastructure Group LLC I-635 Managed Lanes Proj.) Series 2020 A, 4% 6/30/40 | 100,000 | 92,899 | |
| (NTE Mobility Partners LLC North Tarrant Express Managed Lanes Proj.) Series 2019 A, 5% 12/31/32 | 75,000 | 79,568 | |
| (NTE Mobility Partners Segments 3 LLC Segment 3C Proj.) Series 2019, 5% 6/30/58 (c) | 170,000 | 169,166 | |
| Texas Tpk. Auth. Central Texas Tpk. Sys. Rev. Series A, 0% 8/15/29 (AMBAC Insured) | 35,000 | 28,313 | |
| Texas Trans. Commission Central Texas Tpk. Sys. Rev.: | |||
| Series 2012 A, 4% 8/15/38 | 25,000 | 23,755 | |
| Series 2015 C: | |||
5% 8/15/25 | 90,000 | 90,893 | |
5% 8/15/29 | 115,000 | 116,383 | |
| Texas Wtr. Dev. Board Rev.: | |||
| Series 2017 A, 5% 10/15/47 | 60,000 | 63,168 | |
| Series 2018 A: | |||
4% 10/15/32 | 50,000 | 52,046 | |
4% 10/15/37 | 40,000 | 40,682 | |
| Series 2018, 5% 8/1/32 | 130,000 | 139,994 | |
| Series 2019 A: | |||
3% 10/15/39 | 125,000 | 110,553 | |
4% 10/15/49 | 90,000 | 89,065 | |
| Series 2020: | |||
3% 10/15/34 | 130,000 | 128,767 | |
5% 8/1/33 | 15,000 | 17,177 | |
| Series 2021: | |||
5% 8/1/26 | 125,000 | 132,735 | |
5% 10/15/33 | 170,000 | 198,283 | |
| Trinity River Auth. Reg'l. Wastewtr. Sys. Rev. Series 2017, 5% 8/1/33 | 115,000 | 123,162 | |
| Univ. of Texas Board of Regents Sys. Rev.: | |||
| Series 2016 J: | |||
5% 8/15/24 | 60,000 | 61,216 | |
5% 8/15/26 | 105,000 | 111,592 | |
| Series 2017 B, 3.375% 8/15/44 | 40,000 | 35,135 | |
| Series 2019 A, 5% 8/15/31 | 85,000 | 95,566 | |
| Waco Edl. Fin. Corp. Rev. Series 2021, 4% 3/1/46 | 205,000 | 197,073 | |
| Waco Independent School District Series 2022: | |||
| 3% 8/15/39 | 345,000 | 303,338 | |
| 3% 8/15/40 | 70,000 | 60,666 | |
| Waller Independent School District Series 2020, 4% 2/15/50 | 100,000 | 97,880 | |
| West Harris County Reg'l. Wtr. Auth. Wtr. Sys. Rev. Series 2019, 3% 12/15/58 | 150,000 | 103,451 | |
| Williamson County Series 2022, 4% 2/15/42 | 395,000 | 400,376 | |
TOTAL TEXAS | 14,450,707 | ||
| Utah - 0.8% | |||
| Salt Lake City Arpt. Rev. Series 2017 A, 5% 7/1/29 (c) | 525,000 | 552,842 | |
| Univ. of Utah Gen. Revs.: | |||
| Series 2017 A, 5% 8/1/29 | 45,000 | 48,621 | |
| Series 2017 B1, 5% 8/1/26 | 200,000 | 212,013 | |
| Series 2021 A1, 4% 8/1/41 | 145,000 | 145,670 | |
| Utah County Hosp. Rev. Series 2016 B, 5% 5/15/46 | 35,000 | 35,775 | |
| Utah Transit Auth. Sales Tax Rev.: | |||
| Series 2015 A: | |||
5% 6/15/26 (Pre-Refunded to 6/15/25 @ 100) | 15,000 | 15,546 | |
5% 6/15/29 (Pre-Refunded to 6/15/25 @ 100) | 15,000 | 15,546 | |
5% 6/15/37 (Pre-Refunded to 6/15/25 @ 100) | 155,000 | 160,642 | |
| Series 2016, 4% 12/15/29 | 25,000 | 25,592 | |
TOTAL UTAH | 1,212,247 | ||
| Virginia - 2.1% | |||
| Arlington County Series 2019, 4% 6/15/35 | 5,000 | 5,244 | |
| Chesapeake Bay Bridge and Tunnel District Gen. Resolution Rev. Series 2019, 5% 11/1/23 | 55,000 | 55,209 | |
| Chesterfield County Econ. Dev. Auth. Rev. (County Projs.) Series 2020 F, 2% 4/1/41 | 100,000 | 71,226 | |
| Commonwealth Trans. Board Grant Anticipation Rev. Series 2017 A, 5% 9/15/23 | 15,000 | 15,051 | |
| Fairfax County Econ. Dev. Auth.: | |||
| (Route 28 Proj.) Series 2016 A, 2.875% 4/1/35 | 15,000 | 14,162 | |
| Series 2016 A, 3% 4/1/36 | 155,000 | 142,616 | |
| Series 2016 B, 3% 4/1/36 | 100,000 | 92,010 | |
| Fairfax County Gen. Oblig. Series 2023 A, 4% 10/1/31 | 465,000 | 509,505 | |
| Hampton Roads Trans. Accountability Commission Series 2020 A, 5.25% 7/1/60 | 25,000 | 27,207 | |
| Henrico County Wtr. & Swr. Rev. Series 2016, 5% 5/1/46 (Pre-Refunded to 5/1/26 @ 100) | 170,000 | 179,675 | |
| Loudoun County Gen. Oblig. Series 2022 A, 4% 12/1/41 | 145,000 | 146,606 | |
| Lynchburg Econ. Dev. Series 2017 A, 4% 1/1/47 | 90,000 | 83,098 | |
| Norfolk Series 2021 A, 4% 3/1/40 | 170,000 | 172,830 | |
| Roanoke Econ. Dev. Authority. Bonds Series 2020 D, 5%, tender 7/1/30 (b) | 70,000 | 77,485 | |
| Univ. of Virginia Gen. Rev. Series 2017 A, 5% 4/1/42 | 225,000 | 238,117 | |
| Virginia College Bldg. Auth. Edl. Facilities Rev.: | |||
| (21st Century Collage and Equip. Programs) Series 2021 A, 3% 2/1/36 | 55,000 | 51,125 | |
| (21st Century College & Equip. Programs) Series 2019 A, 5% 2/1/29 | 75,000 | 83,923 | |
| (21st Century College and Equip. Progs.): | |||
Series 2015 A: | |||
5% 2/1/25 | 180,000 | 185,435 | |
5% 2/1/28 (Pre-Refunded to 2/1/25 @ 100) | 65,000 | 67,013 | |
Series 2017 E, 5% 2/1/24 | 5,000 | 5,054 | |
Series 2019 C, 5% 2/1/30 | 15,000 | 16,804 | |
| Series 2017 A, 5% 2/1/24 | 40,000 | 40,428 | |
| Virginia College Bldg. Auth. Edl. Facilities Rev. Rfdg. (Pub. Higher Ed. Fing. Prog.) Series 2016 A, 3% 9/1/26 | 55,000 | 54,411 | |
| Virginia Commonwealth Trans. Board Rev.: | |||
| Series 2014, 5% 5/15/26 | 125,000 | 127,166 | |
| Series 2016, 3% 5/15/40 | 5,000 | 4,339 | |
| Virginia Port Auth. Port Facilities Rev. Series 2015 A, 5% 7/1/33 (Pre-Refunded to 7/1/25 @ 100) (c) | 5,000 | 5,167 | |
| Virginia Small Bus. Fing. Auth.: | |||
| (95 Express Lanes LLC Proj.) Series 2022, 4% 7/1/39 (c) | 110,000 | 103,224 | |
| Series 2014, 4% 10/1/38 | 35,000 | 33,905 | |
| Virginia Small Bus. Fing. Auth. Health Care Facilities Rev. Series 2020, 4% 11/1/36 | 400,000 | 406,250 | |
| Virginia St Resources Auth. Inf Series 2016 C, 4% 11/1/36 | 195,000 | 198,211 | |
TOTAL VIRGINIA | 3,212,496 | ||
| Washington - 3.2% | |||
| Central Puget Sound Reg'l. Trans. Auth. Sales & Use Tax Rev. Series 2016 S1: | |||
| 5% 11/1/27 | 45,000 | 47,915 | |
| 5% 11/1/33 | 155,000 | 164,233 | |
| 5% 11/1/36 | 30,000 | 31,516 | |
| 5% 11/1/41 | 85,000 | 88,561 | |
| Energy Northwest Elec. Rev.: | |||
| Series 2014 A, 4% 7/1/24 | 150,000 | 151,298 | |
| Series 2015 A, 5% 7/1/25 | 130,000 | 134,879 | |
| Series 2016 A, 5% 7/1/28 | 215,000 | 227,641 | |
| Series 2018 C, 5% 7/1/33 | 30,000 | 33,016 | |
| Series 2020 A, 5% 7/1/28 | 70,000 | 77,396 | |
| King County Gen. Oblig. Series 2015 E, 5% 12/1/29 | 55,000 | 57,335 | |
| King County Hsg. Auth. Rev. Series 2018, 3.5% 5/1/38 | 15,000 | 13,793 | |
| King County Lake Washington School District #414 Gen. Oblig. Series 2016, 4% 12/1/26 | 1,000,000 | 1,028,245 | |
| King County School District 210 Series 2018, 5% 12/1/30 | 80,000 | 87,009 | |
| Port of Seattle Rev. Series 2018 B, 5% 5/1/24 (c) | 75,000 | 75,761 | |
| Seattle Muni. Lt. & Pwr. Rev.: | |||
| Series 2013, 4.125% 7/1/38 | 360,000 | 360,052 | |
| Series 2020 A, 5% 7/1/26 | 75,000 | 79,410 | |
| Spokane County School District #81 (Washington State School District Cr. Enhancement Prog.) Series 2021, 4% 12/1/28 | 155,000 | 164,297 | |
| Washington Biomedical Research Properties 3.2 Series 2015 A, 4% 1/1/48 | 150,000 | 146,174 | |
| Washington Convention Ctr. Pub. Facilities Series 2018, 4% 7/1/58 | 10,000 | 8,457 | |
| Washington Gen. Oblig.: | |||
| Series 2014 A, 5% 8/1/26 | 40,000 | 40,048 | |
| Series 2014 B, 5% 8/1/29 | 5,000 | 5,006 | |
| Series 2014 E, 5% 2/1/32 | 110,000 | 111,097 | |
| Series 2015 B, 5% 2/1/28 | 85,000 | 87,487 | |
| Series 2015 H: | |||
5% 7/1/26 | 30,000 | 30,826 | |
5% 7/1/29 | 40,000 | 41,102 | |
| Series 2016 A1, 5% 8/1/29 | 10,000 | 10,376 | |
| Series 2016 C: | |||
5% 2/1/33 | 200,000 | 209,932 | |
5% 2/1/35 | 20,000 | 20,958 | |
| Series 2016 R, 5% 7/1/24 | 125,000 | 127,375 | |
| Series 2017 B, 5% 8/1/29 | 150,000 | 158,602 | |
| Series 2018 C, 5% 8/1/28 | 55,000 | 59,591 | |
| Series 2018 D, 5% 8/1/28 | 30,000 | 32,504 | |
| Series 2020 A: | |||
5% 1/1/26 | 30,000 | 31,465 | |
5% 8/1/42 | 165,000 | 180,411 | |
| Series 2020 B, 5% 6/1/37 | 55,000 | 60,306 | |
| Series 2020 C, 5% 2/1/41 | 150,000 | 163,618 | |
| Series 2020 E, 5% 6/1/45 | 15,000 | 16,154 | |
| Series 2021 A, 5% 6/1/41 | 125,000 | 136,858 | |
| Series 2022 A, 5% 8/1/43 | 100,000 | 109,801 | |
| Series R, 5% 7/1/29 | 100,000 | 102,754 | |
| Washington Health Care Facilities Auth. Rev.: | |||
| Series 2012 A, 5% 10/1/38 | 40,000 | 40,042 | |
| Series 2017 B, 3.5% 8/15/38 | 60,000 | 52,851 | |
| Washington Higher Ed. Facilities Auth. Rev.: | |||
| (Gonzaga Univ. Proj.) Series 2019 A, 3% 4/1/49 | 65,000 | 49,084 | |
| (Seattle Pacific Univ. Proj.) Series 2020 A, 5% 10/1/42 | 25,000 | 24,462 | |
| Washington State Univ. Hsg. and Dining Sys. Rev. Series 2015, 5% 4/1/40 | 35,000 | 35,647 | |
TOTAL WASHINGTON | 4,915,345 | ||
| West Virginia - 0.3% | |||
| West Virginia Comm of Hwys Spl. Oblig. Series 2017 A, 5% 9/1/29 | 65,000 | 69,937 | |
| West Virginia Gen. Oblig. Series 2018 B, 5% 12/1/41 | 80,000 | 85,274 | |
| West Virginia Hosp. Fin. Auth. Hosp. Rev. Series 2016 A, 3% 6/1/33 | 30,000 | 28,236 | |
| West Virginia Parkways Auth. Series 2021, 4% 6/1/51 | 100,000 | 96,334 | |
| West Virginia Univ. Revs. (West Virginia Univ. Proj.) Series A, 4% 10/1/47 | 225,000 | 220,252 | |
TOTAL WEST VIRGINIA | 500,033 | ||
| Wisconsin - 0.7% | |||
| Ashwaubenon Cmnty. Dev. Auth. Lease Rev. (Brown County Expo Ctr. Proj.) Series 2019, 0% 6/1/49 | 160,000 | 47,103 | |
| Pub. Fin. Auth. Hosp. Rev. (Renown Reg'l. Med. Ctr. Proj.) Series 2016 A, 3% 6/1/36 | 45,000 | 38,969 | |
| Pub. Fin. Auth. Lease Dev. Rev. (KU Campus Dev. Corp. Central District Dev. Proj.) Series 2016: | |||
| 5% 3/1/29 | 40,000 | 41,716 | |
| 5% 3/1/46 | 50,000 | 50,732 | |
| Roseman Univ. of Health (Fargo-Moorhead Metropolitan Area Flood Risk Mgmt. Proj.) Series 2021, 4% 3/31/56 (c) | 10,000 | 7,950 | |
| Wisconsin Envir. Impt. Fund Rev. Series 2017, 5% 6/1/29 | 10,000 | 10,336 | |
| Wisconsin Gen. Oblig.: | |||
| Series 2016 2, 5% 11/1/29 | 70,000 | 73,886 | |
| Series 2021 B, 5% 5/1/35 | 85,000 | 94,696 | |
| Series 3, 5% 11/1/31 | 30,000 | 32,378 | |
| Series A: | |||
4% 5/1/27 | 30,000 | 30,843 | |
5% 5/1/30 | 125,000 | 131,836 | |
5% 5/1/34 | 120,000 | 123,742 | |
| Wisconsin Health & Edl. Facilities: | |||
| (Ascension Health Cr. Group Proj.) Series 2016 A, 5% 11/15/36 | 55,000 | 56,914 | |
| Series 2014 A, 5% 11/15/25 | 40,000 | 40,672 | |
| Series 2016 A: | |||
3.5% 2/15/46 | 195,000 | 151,259 | |
4% 11/15/39 | 40,000 | 39,731 | |
| Series 2017 A, 5% 4/1/28 | 35,000 | 37,150 | |
| Wisconsin Health & Edl. Facilities Auth. Sr. Living Facilities Rev. (Covenant Cmntys., Inc. Proj.) Series 2018 A1, 4.125% 7/1/53 | 135,000 | 101,334 | |
| Wisconsin Hsg. & Econ. Dev. Auth. Series 2017 A, 2.69% 7/1/47 | 18,784 | 17,521 | |
| Wisconsin St Gen. Fund Annual Appropriation Series 2017 B, 5% 5/1/36 | 25,000 | 26,353 | |
TOTAL WISCONSIN | 1,155,121 | ||
| Wyoming - 0.0% | |||
| Campbell County Solid Waste Facilities Rev. Series 2019 A, 3.625% 7/15/39 | 25,000 | 22,034 | |
| TOTAL MUNICIPAL BONDS (Cost $161,883,176) | 153,058,195 | ||
| Money Market Funds - 1.2% | |||
| Shares | Value ($) | ||
Fidelity Municipal Cash Central Fund 4.23% (e)(f) (Cost $1,901,001) | 1,900,620 | 1,900,963 | |
| TOTAL INVESTMENT IN SECURITIES - 99.4% (Cost $163,784,177) | 154,959,158 |
NET OTHER ASSETS (LIABILITIES) - 0.6% | 930,443 |
| NET ASSETS - 100.0% | 155,889,601 |
| (a) | Amount is stated in United States dollars unless otherwise noted. |
| (b) | Coupon rates for floating and adjustable rate securities reflect the rates in effect at period end. |
| (c) | Private activity obligations whose interest is subject to the federal alternative minimum tax for individuals. |
| (d) | Security initially issued in zero coupon form which converts to coupon form at a specified rate and date. The rate shown is the rate at period end. |
| (e) | Information in this report regarding holdings by state and security types does not reflect the holdings of the Fidelity Municipal Cash Central Fund. |
| (f) | Affiliated fund that is generally available only to investment companies and other accounts managed by Fidelity Investments. The rate quoted is the annualized seven-day yield of the fund at period end. A complete unaudited listing of the fund's holdings as of its most recent quarter end is available upon request. In addition, each Fidelity Central Fund's financial statements, which are not covered by the Fund's Report of Independent Registered Public Accounting Firm, are available on the SEC's website or upon request. |
| Affiliate | Value, beginning of period ($) | Purchases ($) | Sales Proceeds ($) | Dividend Income ($) | Realized Gain (loss) ($) | Change in Unrealized appreciation (depreciation) ($) | Value, end of period ($) | % ownership, end of period |
| Fidelity Municipal Cash Central Fund 4.23% | 2,771,978 | 52,300,005 | 53,171,000 | 44,187 | - | (20) | 1,900,963 | 0.1% |
| Total | 2,771,978 | 52,300,005 | 53,171,000 | 44,187 | - | (20) | 1,900,963 | |
| Valuation Inputs at Reporting Date: | ||||
| Description | Total ($) | Level 1 ($) | Level 2 ($) | Level 3 ($) |
Investments in Securities: | ||||
| Municipal Securities | 153,058,195 | - | 153,058,195 | - |
| Money Market Funds | 1,900,963 | 1,900,963 | - | - |
| Total Investments in Securities: | 154,959,158 | 1,900,963 | 153,058,195 | - |
| Statement of Assets and Liabilities | ||||
| June 30, 2023 | ||||
| Assets | ||||
| Investment in securities, at value - See accompanying schedule: | ||||
Unaffiliated issuers (cost $161,883,176) | $ | 153,058,195 | ||
Fidelity Central Funds (cost $1,901,001) | 1,900,963 | |||
| Total Investment in Securities (cost $163,784,177) | $ | 154,959,158 | ||
| Cash | 62,110 | |||
| Receivable for fund shares sold | 397,030 | |||
| Interest receivable | 1,812,617 | |||
| Distributions receivable from Fidelity Central Funds | 6,457 | |||
| Other receivables | 39 | |||
Total assets | 157,237,411 | |||
| Liabilities | ||||
| Payable for investments purchased | $ | 1,203,049 | ||
| Payable for fund shares redeemed | 38,868 | |||
| Distributions payable | 96,889 | |||
| Accrued management fee | 9,004 | |||
| Total Liabilities | 1,347,810 | |||
| Net Assets | $ | 155,889,601 | ||
| Net Assets consist of: | ||||
| Paid in capital | $ | 167,379,932 | ||
| Total accumulated earnings (loss) | (11,490,331) | |||
| Net Assets | $ | 155,889,601 | ||
Net Asset Value , offering price and redemption price per share ($155,889,601 ÷ 8,508,818 shares) | $ | 18.32 | ||
| Statement of Operations | ||||
Year ended June 30, 2023 | ||||
| Investment Income | ||||
| Interest | $ | 3,207,768 | ||
| Income from Fidelity Central Funds | 44,182 | |||
| Total Income | 3,251,950 | |||
| Expenses | ||||
| Management fee | $ | 100,044 | ||
| Independent trustees' fees and expenses | 479 | |||
| Total expenses before reductions | 100,523 | |||
| Expense reductions | (254) | |||
| Total expenses after reductions | 100,269 | |||
| Net Investment income (loss) | 3,151,681 | |||
| Realized and Unrealized Gain (Loss) | ||||
| Net realized gain (loss) on: | ||||
| Investment Securities: | ||||
| Unaffiliated issuers | (1,240,057) | |||
| Capital gain distributions from Fidelity Central Funds | 5 | |||
| Total net realized gain (loss) | (1,240,052) | |||
| Change in net unrealized appreciation (depreciation) on: | ||||
| Investment Securities: | ||||
| Unaffiliated issuers | 1,604,111 | |||
| Fidelity Central Funds | (20) | |||
| Total change in net unrealized appreciation (depreciation) | 1,604,091 | |||
| Net gain (loss) | 364,039 | |||
| Net increase (decrease) in net assets resulting from operations | $ | 3,515,720 | ||
| Statement of Changes in Net Assets | ||||
Year ended June 30, 2023 | Year ended June 30, 2022 | |||
| Increase (Decrease) in Net Assets | ||||
| Operations | ||||
| Net investment income (loss) | $ | 3,151,681 | $ | 1,819,385 |
| Net realized gain (loss) | (1,240,052) | (1,418,657) | ||
| Change in net unrealized appreciation (depreciation) | 1,604,091 | (12,842,455) | ||
| Net increase (decrease) in net assets resulting from operations | 3,515,720 | (12,441,727) | ||
| Distributions to shareholders | (3,111,991) | (1,813,504) | ||
| Share transactions | ||||
| Proceeds from sales of shares | 98,502,126 | 111,001,374 | ||
| Reinvestment of distributions | 2,178,053 | 1,296,085 | ||
| Cost of shares redeemed | (70,135,385) | (79,887,212) | ||
Net increase (decrease) in net assets resulting from share transactions | 30,544,794 | 32,410,247 | ||
| Total increase (decrease) in net assets | 30,948,523 | 18,155,016 | ||
| Net Assets | ||||
| Beginning of period | 124,941,078 | 106,786,062 | ||
| End of period | $ | 155,889,601 | $ | 124,941,078 |
| Other Information | ||||
| Shares | ||||
| Sold | 5,424,824 | 5,718,725 | ||
| Issued in reinvestment of distributions | 119,860 | 66,486 | ||
| Redeemed | (3,886,886) | (4,170,931) | ||
| Net increase (decrease) | 1,657,798 | 1,614,280 | ||
| Fidelity® Municipal Bond Index Fund |
| Years ended June 30, | 2023 | 2022 | 2021 | 2020 A | ||||
Selected Per-Share Data | ||||||||
| Net asset value, beginning of period | $ | 18.24 | $ | 20.39 | $ | 19.97 | $ | 20.00 |
| Income from Investment Operations | ||||||||
Net investment income (loss) B,C | .402 | .281 | .309 | .324 | ||||
| Net realized and unrealized gain (loss) | .073 | (2.152) | .421 | (.035) | ||||
| Total from investment operations | .475 | (1.871) | .730 | .289 | ||||
| Distributions from net investment income | (.395) | (.279) | (.310) | (.319) | ||||
| Total distributions | (.395) | (.279) | (.310) | (.319) | ||||
| Net asset value, end of period | $ | 18.32 | $ | 18.24 | $ | 20.39 | $ | 19.97 |
Total Return D,E | 2.64% | (9.26)% | 3.68% | 1.46% | ||||
Ratios to Average Net Assets C,F,G | ||||||||
| Expenses before reductions | .07% | .07% | .07% | .07% H | ||||
| Expenses net of fee waivers, if any | .07% | .07% | .07% | .07% H | ||||
| Expenses net of all reductions | .07% | .07% | .07% | .07% H | ||||
| Net investment income (loss) | 2.21% | 1.43% | 1.53% | 1.67% H | ||||
| Supplemental Data | ||||||||
| Net assets, end of period (000 omitted) | $ | 155,890 | $ | 124,941 | $ | 106,786 | $ | 60,060 |
Portfolio turnover rate I | 18% | 30% | 8% | 76% H |
| Fidelity Central Fund | Investment Manager | Investment Objective | Investment Practices | Expense Ratio A |
| Fidelity Money Market Central Funds | Fidelity Management & Research Company LLC (FMR) | Each fund seeks to obtain a high level of current income consistent with the preservation of capital and liquidity. | Short-term Investments | Less than .005% |
| Gross unrealized appreciation | $436,714 |
| Gross unrealized depreciation | (9,214,563) |
| Net unrealized appreciation (depreciation) | $(8,777,849) |
| Tax Cost | $163,737,007 |
| Capital loss carryforward | $(2,698,138) |
| Net unrealized appreciation (depreciation) on securities and other investments | $(8,777,849) |
Short-term | $(1,595,639) |
Long-term | (1,102,499) |
| Total capital loss carryforward | $(2,698,138) |
| June 30, 2023 | June 30, 2022 | |
| Tax-exempt Income | $3,111,991 | $1,813,504 |
| Purchases ($) | Sales ($) | |
| Fidelity Municipal Bond Index Fund | 57,512,699 | 25,359,925 |
| The Example is based on an investment of $1,000 invested at the beginning of the period and held for the entire period (January 1, 2023 to June 30, 2023). |
Annualized Expense Ratio- A | Beginning Account Value January 1, 2023 | Ending Account Value June 30, 2023 | Expenses Paid During Period- C January 1, 2023 to June 30, 2023 | |||||||
| Fidelity® Municipal Bond Index Fund | .07% | |||||||||
| Actual | $ 1,000 | $ 1,024.40 | $ .35 | |||||||
Hypothetical- B | $ 1,000 | $ 1,024.45 | $ .35 | |||||||
- Highly liquid investments - cash or convertible to cash within three business days or less
- Moderately liquid investments - convertible to cash in three to seven calendar days
- Less liquid investments - can be sold or disposed of, but not settled, within seven calendar days
- Illiquid investments - cannot be sold or disposed of within seven calendar days
 |


Contents
| Average Annual Total Returns | |||
Periods ended June 30, 2023 | Past 1 year | Life of Fund A |
| Fidelity® Mid Cap Growth Index Fund | 23.13% | 7.98% |
| $10,000 Over Life of Fund |
Let's say hypothetically that $10,000 was invested in Fidelity® Mid Cap Growth Index Fund, on July 11, 2019, when the fund started. The chart shows how the value of your investment would have changed, and also shows how the Russell Midcap® Growth Index performed over the same period. |
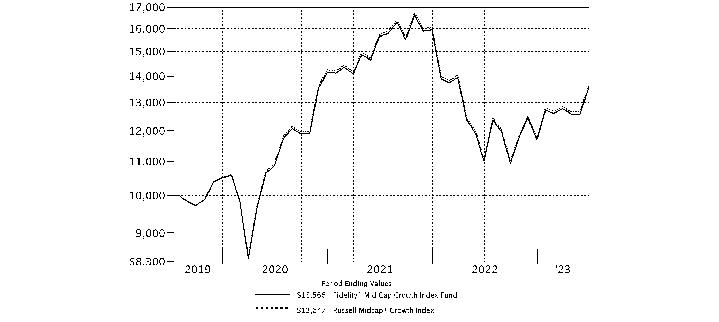 |
Top Holdings (% of Fund's net assets) | ||
| DexCom, Inc. | 1.7 | |
| IDEXX Laboratories, Inc. | 1.4 | |
| Apollo Global Management, Inc. | 1.4 | |
| Copart, Inc. | 1.3 | |
| IQVIA Holdings, Inc. | 1.3 | |
| Cintas Corp. | 1.3 | |
| Rockwell Automation, Inc. | 1.3 | |
| Cheniere Energy, Inc. | 1.3 | |
| Paychex, Inc. | 1.2 | |
| W.W. Grainger, Inc. | 1.2 | |
| 13.4 | ||
| Market Sectors (% of Fund's net assets) | ||
| Health Care | 21.8 | |
| Information Technology | 21.6 | |
| Industrials | 19.8 | |
| Consumer Discretionary | 12.8 | |
| Financials | 9.7 | |
| Communication Services | 4.3 | |
| Energy | 3.6 | |
| Consumer Staples | 3.1 | |
| Materials | 1.3 | |
| Real Estate | 1.2 | |
| Utilities | 0.4 | |
Asset Allocation (% of Fund's net assets) |
 |
Futures - 0.3% |
| Common Stocks - 99.6% | |||
| Shares | Value ($) | ||
| COMMUNICATION SERVICES - 4.3% | |||
| Diversified Telecommunication Services - 0.3% | |||
| Iridium Communications, Inc. | 28,074 | 1,743,957 | |
| Entertainment - 1.7% | |||
| Live Nation Entertainment, Inc. (a) | 8,508 | 775,164 | |
| Playtika Holding Corp. (a) | 4,734 | 54,914 | |
| Roblox Corp. (a) | 110,465 | 4,451,740 | |
| Roku, Inc. Class A (a)(b) | 3,675 | 235,053 | |
| Spotify Technology SA (a) | 33,735 | 5,416,154 | |
| World Wrestling Entertainment, Inc. Class A (b) | 10,368 | 1,124,617 | |
| 12,057,642 | |||
| Interactive Media & Services - 1.0% | |||
| Match Group, Inc. (a) | 60,421 | 2,528,619 | |
| Pinterest, Inc. Class A (a) | 142,741 | 3,902,539 | |
| Zoominfo Technologies, Inc. (a)(b) | 38,793 | 984,954 | |
| 7,416,112 | |||
| Media - 1.3% | |||
| Cable One, Inc. | 99 | 65,051 | |
| Liberty Broadband Corp.: | |||
| Class A (a) | 808 | 64,422 | |
| Class C (a) | 5,810 | 465,439 | |
| Nexstar Broadcasting Group, Inc. Class A | 2,822 | 470,004 | |
| The Trade Desk, Inc. (a) | 106,051 | 8,189,258 | |
| 9,254,174 | |||
TOTAL COMMUNICATION SERVICES | 30,471,885 | ||
| CONSUMER DISCRETIONARY - 12.8% | |||
| Broadline Retail - 0.9% | |||
| Coupang, Inc. Class A (a) | 263,637 | 4,587,284 | |
| eBay, Inc. | 7,973 | 356,313 | |
| Etsy, Inc. (a) | 16,560 | 1,401,142 | |
| Ollie's Bargain Outlet Holdings, Inc. (a) | 4,758 | 275,631 | |
| 6,620,370 | |||
| Distributors - 0.5% | |||
| Pool Corp. | 9,140 | 3,424,210 | |
| Diversified Consumer Services - 0.3% | |||
| Bright Horizons Family Solutions, Inc. (a)(b) | 1,712 | 158,274 | |
| Grand Canyon Education, Inc. (a) | 2,027 | 209,207 | |
| H&R Block, Inc. | 23,664 | 754,172 | |
| Service Corp. International | 13,028 | 841,479 | |
| 1,963,132 | |||
| Hotels, Restaurants & Leisure - 5.6% | |||
| Caesars Entertainment, Inc. (a) | 20,236 | 1,031,429 | |
| Choice Hotels International, Inc. | 7,308 | 858,836 | |
| Churchill Downs, Inc. | 17,103 | 2,380,225 | |
| Darden Restaurants, Inc. | 13,563 | 2,266,106 | |
| Domino's Pizza, Inc. | 8,514 | 2,869,133 | |
| Doordash, Inc. (a)(b) | 56,845 | 4,344,095 | |
| Draftkings Holdings, Inc. (a) | 100,576 | 2,672,304 | |
| Expedia, Inc. (a) | 25,293 | 2,766,801 | |
| Hilton Worldwide Holdings, Inc. | 28,337 | 4,124,450 | |
| Norwegian Cruise Line Holdings Ltd. (a)(b) | 24,504 | 533,452 | |
| Planet Fitness, Inc. (a) | 9,779 | 659,496 | |
| Royal Caribbean Cruises Ltd. (a) | 16,951 | 1,758,497 | |
| Texas Roadhouse, Inc. Class A | 16,079 | 1,805,350 | |
| Travel+Leisure Co. | 8,085 | 326,149 | |
| Vail Resorts, Inc. | 952 | 239,676 | |
| Wendy's Co. | 41,598 | 904,757 | |
| Wingstop, Inc. | 7,203 | 1,441,752 | |
| Wyndham Hotels & Resorts, Inc. | 1,443 | 98,947 | |
| Wynn Resorts Ltd. | 1,524 | 160,950 | |
| Yum! Brands, Inc. | 59,245 | 8,208,395 | |
| 39,450,800 | |||
| Household Durables - 0.1% | |||
| NVR, Inc. (a) | 63 | 400,089 | |
| Tempur Sealy International, Inc. | 8,146 | 326,410 | |
| TopBuild Corp. (a) | 496 | 131,946 | |
| 858,445 | |||
| Leisure Products - 0.2% | |||
| Brunswick Corp. | 1,368 | 118,524 | |
| Peloton Interactive, Inc. Class A (a) | 74,141 | 570,144 | |
| Polaris, Inc. (b) | 1,141 | 137,981 | |
| YETI Holdings, Inc. (a) | 20,834 | 809,193 | |
| 1,635,842 | |||
| Specialty Retail - 4.4% | |||
| Best Buy Co., Inc. | 6,421 | 526,201 | |
| Burlington Stores, Inc. (a) | 15,543 | 2,446,313 | |
| CarMax, Inc. (a)(b) | 2,128 | 178,114 | |
| Dick's Sporting Goods, Inc. | 1,070 | 141,443 | |
| Five Below, Inc. (a) | 13,179 | 2,590,201 | |
| Floor & Decor Holdings, Inc. Class A (a)(b) | 25,034 | 2,602,535 | |
| Murphy U.S.A., Inc. | 4,501 | 1,400,306 | |
| RH (a) | 641 | 211,267 | |
| Ross Stores, Inc. | 75,409 | 8,455,611 | |
| Tractor Supply Co. (b) | 26,353 | 5,826,648 | |
| Ulta Beauty, Inc. (a) | 12,036 | 5,664,081 | |
| Valvoline, Inc. | 10,814 | 405,633 | |
| Victoria's Secret & Co. (a) | 8,387 | 146,185 | |
| Wayfair LLC Class A (a)(b) | 6,924 | 450,129 | |
| Williams-Sonoma, Inc. (b) | 2,021 | 252,908 | |
| 31,297,575 | |||
| Textiles, Apparel & Luxury Goods - 0.8% | |||
| Crocs, Inc. (a) | 14,633 | 1,645,335 | |
| Deckers Outdoor Corp. (a) | 6,305 | 3,326,896 | |
| Skechers U.S.A., Inc. Class A (sub. vtg.) (a) | 2,351 | 123,804 | |
| Tapestry, Inc. | 3,631 | 155,407 | |
| 5,251,442 | |||
TOTAL CONSUMER DISCRETIONARY | 90,501,816 | ||
| CONSUMER STAPLES - 3.1% | |||
| Beverages - 0.8% | |||
| Boston Beer Co., Inc. Class A (a) | 2,089 | 644,331 | |
| Brown-Forman Corp.: | |||
| Class A (b) | 9,369 | 637,748 | |
| Class B (non-vtg.) | 35,101 | 2,344,045 | |
| Celsius Holdings, Inc. (a) | 13,079 | 1,951,256 | |
| 5,577,380 | |||
| Consumer Staples Distribution & Retail - 0.3% | |||
| Albertsons Companies, Inc. | 8,615 | 187,979 | |
| BJ's Wholesale Club Holdings, Inc. (a) | 11,070 | 697,521 | |
| Casey's General Stores, Inc. | 1,290 | 314,605 | |
| Performance Food Group Co. (a) | 17,321 | 1,043,417 | |
| 2,243,522 | |||
| Food Products - 0.6% | |||
| Freshpet, Inc. (a)(b) | 3,020 | 198,746 | |
| Lamb Weston Holdings, Inc. | 33,011 | 3,794,614 | |
| 3,993,360 | |||
| Household Products - 1.4% | |||
| Church & Dwight Co., Inc. | 52,669 | 5,279,014 | |
| The Clorox Co. | 29,757 | 4,732,553 | |
| 10,011,567 | |||
TOTAL CONSUMER STAPLES | 21,825,829 | ||
| ENERGY - 3.6% | |||
| Energy Equipment & Services - 0.2% | |||
| Halliburton Co. | 43,457 | 1,433,646 | |
| Oil, Gas & Consumable Fuels - 3.4% | |||
| Antero Midstream GP LP | 27,231 | 315,880 | |
| APA Corp. | 66,131 | 2,259,696 | |
| Cheniere Energy, Inc. | 58,359 | 8,891,577 | |
| Hess Corp. | 37,322 | 5,073,926 | |
| New Fortress Energy, Inc. | 15,576 | 417,125 | |
| ONEOK, Inc. | 5,915 | 365,074 | |
| Ovintiv, Inc. | 25,849 | 984,071 | |
| Targa Resources Corp. | 53,797 | 4,093,952 | |
| Texas Pacific Land Corp. | 1,390 | 1,829,935 | |
| 24,231,236 | |||
TOTAL ENERGY | 25,664,882 | ||
| FINANCIALS - 9.7% | |||
| Banks - 0.5% | |||
| First Citizens Bancshares, Inc. | 284 | 364,500 | |
| Nu Holdings Ltd. (a) | 380,206 | 2,999,825 | |
| 3,364,325 | |||
| Capital Markets - 4.4% | |||
| Ameriprise Financial, Inc. | 25,301 | 8,403,980 | |
| Ares Management Corp. | 38,558 | 3,715,063 | |
| Blue Owl Capital, Inc. Class A | 16,010 | 186,517 | |
| FactSet Research Systems, Inc. | 9,233 | 3,699,201 | |
| Houlihan Lokey | 891 | 87,594 | |
| KKR & Co. LP | 38,237 | 2,141,272 | |
| LPL Financial | 18,767 | 4,080,509 | |
| MarketAxess Holdings, Inc. | 8,911 | 2,329,514 | |
| Morningstar, Inc. | 6,182 | 1,212,105 | |
| MSCI, Inc. | 9,354 | 4,389,739 | |
| TPG, Inc. (b) | 4,478 | 131,026 | |
| Tradeweb Markets, Inc. Class A | 9,579 | 655,970 | |
| XP, Inc. Class A (a) | 6,631 | 155,563 | |
| 31,188,053 | |||
| Consumer Finance - 0.0% | |||
| SLM Corp. | 22,843 | 372,798 | |
| Financial Services - 3.5% | |||
| Apollo Global Management, Inc. | 125,558 | 9,644,110 | |
| Block, Inc. Class A (a) | 48,538 | 3,231,175 | |
| Equitable Holdings, Inc. | 85,985 | 2,335,353 | |
| Euronet Worldwide, Inc. (a) | 5,675 | 666,075 | |
| FleetCor Technologies, Inc. (a) | 16,083 | 4,038,120 | |
| Jack Henry & Associates, Inc. | 5,546 | 928,012 | |
| Rocket Companies, Inc. (a)(b) | 10,835 | 97,082 | |
| Shift4 Payments, Inc. (a)(b) | 13,073 | 887,787 | |
| The Western Union Co. | 13,220 | 155,071 | |
| Toast, Inc. (a)(b) | 85,214 | 1,923,280 | |
| UWM Holdings Corp. Class A (b) | 7,871 | 44,078 | |
| WEX, Inc. (a) | 4,710 | 857,550 | |
| 24,807,693 | |||
| Insurance - 1.3% | |||
| Arch Capital Group Ltd. (a) | 12,134 | 908,230 | |
| Arthur J. Gallagher & Co. (b) | 2,853 | 626,433 | |
| Brighthouse Financial, Inc. (a) | 1,653 | 78,270 | |
| Brown & Brown, Inc. | 22,246 | 1,531,415 | |
| Everest Re Group Ltd. | 1,374 | 469,716 | |
| Kinsale Capital Group, Inc. | 5,250 | 1,964,550 | |
| Lincoln National Corp. | 3,801 | 97,914 | |
| Primerica, Inc. | 5,661 | 1,119,519 | |
| RenaissanceRe Holdings Ltd. | 3,130 | 583,808 | |
| RLI Corp. | 2,137 | 291,636 | |
| Ryan Specialty Group Holdings, Inc. (a) | 22,313 | 1,001,631 | |
| Willis Towers Watson PLC | 3,205 | 754,778 | |
| 9,427,900 | |||
TOTAL FINANCIALS | 69,160,769 | ||
| HEALTH CARE - 21.8% | |||
| Biotechnology - 4.8% | |||
| Alnylam Pharmaceuticals, Inc. (a) | 23,919 | 4,543,175 | |
| Apellis Pharmaceuticals, Inc. (a) | 23,986 | 2,185,125 | |
| BioMarin Pharmaceutical, Inc. (a) | 5,312 | 460,444 | |
| Exact Sciences Corp. (a) | 14,905 | 1,399,580 | |
| Exelixis, Inc. (a) | 56,925 | 1,087,837 | |
| Horizon Therapeutics PLC (a) | 47,643 | 4,900,083 | |
| Incyte Corp. (a) | 32,727 | 2,037,256 | |
| Ionis Pharmaceuticals, Inc. (a)(b) | 29,487 | 1,209,852 | |
| Karuna Therapeutics, Inc. (a) | 7,646 | 1,658,035 | |
| Natera, Inc. (a) | 24,899 | 1,211,585 | |
| Neurocrine Biosciences, Inc. (a) | 23,247 | 2,192,192 | |
| Repligen Corp. (a) | 5,903 | 835,038 | |
| Roivant Sciences Ltd. (a) | 55,513 | 559,571 | |
| Sarepta Therapeutics, Inc. (a) | 21,516 | 2,464,012 | |
| Seagen, Inc. (a) | 33,725 | 6,490,714 | |
| Ultragenyx Pharmaceutical, Inc. (a) | 16,268 | 750,443 | |
| 33,984,942 | |||
| Health Care Equipment & Supplies - 7.3% | |||
| Align Technology, Inc. (a) | 18,371 | 6,496,720 | |
| DexCom, Inc. (a) | 93,083 | 11,962,088 | |
| IDEXX Laboratories, Inc. (a) | 19,818 | 9,953,194 | |
| Inspire Medical Systems, Inc. (a) | 6,916 | 2,245,210 | |
| Insulet Corp. (a) | 16,675 | 4,808,070 | |
| Masimo Corp. (a) | 11,428 | 1,880,477 | |
| Novocure Ltd. (a)(b) | 25,238 | 1,047,377 | |
| Penumbra, Inc. (a)(b) | 8,725 | 3,001,924 | |
| ResMed, Inc. | 34,939 | 7,634,172 | |
| Shockwave Medical, Inc. (a) | 8,722 | 2,489,346 | |
| Tandem Diabetes Care, Inc. (a) | 2,060 | 50,552 | |
| 51,569,130 | |||
| Health Care Providers & Services - 2.3% | |||
| agilon health, Inc. (a)(b) | 59,247 | 1,027,343 | |
| AmerisourceBergen Corp. | 38,898 | 7,485,142 | |
| Cardinal Health, Inc. | 31,782 | 3,005,624 | |
| Chemed Corp. | 2,524 | 1,367,175 | |
| DaVita HealthCare Partners, Inc. (a) | 12,988 | 1,304,904 | |
| Encompass Health Corp. | 1,621 | 109,758 | |
| Molina Healthcare, Inc. (a) | 7,562 | 2,277,977 | |
| 16,577,923 | |||
| Health Care Technology - 1.1% | |||
| Certara, Inc. (a) | 10,397 | 189,329 | |
| Doximity, Inc. (a)(b) | 11,408 | 388,100 | |
| Veeva Systems, Inc. Class A (a) | 34,851 | 6,891,088 | |
| 7,468,517 | |||
| Life Sciences Tools & Services - 6.2% | |||
| 10X Genomics, Inc. (a) | 22,080 | 1,232,947 | |
| Agilent Technologies, Inc. | 57,782 | 6,948,286 | |
| Bio-Techne Corp. | 35,301 | 2,881,621 | |
| Bruker Corp. | 25,541 | 1,887,991 | |
| ICON PLC (a) | 2,922 | 731,084 | |
| Illumina, Inc. (a) | 11,339 | 2,125,949 | |
| IQVIA Holdings, Inc. (a) | 41,130 | 9,244,790 | |
| Maravai LifeSciences Holdings, Inc. (a) | 15,298 | 190,154 | |
| Medpace Holdings, Inc. (a) | 5,603 | 1,345,673 | |
| Mettler-Toledo International, Inc. (a) | 5,241 | 6,874,305 | |
| Sotera Health Co. (a) | 16,695 | 314,534 | |
| Waters Corp. (a) | 14,090 | 3,755,549 | |
| West Pharmaceutical Services, Inc. | 17,808 | 6,811,026 | |
| 44,343,909 | |||
| Pharmaceuticals - 0.1% | |||
| Jazz Pharmaceuticals PLC (a) | 7,606 | 942,916 | |
TOTAL HEALTH CARE | 154,887,337 | ||
| INDUSTRIALS - 19.8% | |||
| Aerospace & Defense - 1.4% | |||
| Axon Enterprise, Inc. (a) | 16,735 | 3,265,333 | |
| BWX Technologies, Inc. | 3,754 | 268,674 | |
| HEICO Corp. | 9,823 | 1,738,082 | |
| HEICO Corp. Class A | 17,259 | 2,426,615 | |
| Spirit AeroSystems Holdings, Inc. Class A (b) | 2,618 | 76,419 | |
| TransDigm Group, Inc. | 2,132 | 1,906,370 | |
| 9,681,493 | |||
| Air Freight & Logistics - 0.4% | |||
| C.H. Robinson Worldwide, Inc. | 21,542 | 2,032,488 | |
| Expeditors International of Washington, Inc. | 4,994 | 604,923 | |
| 2,637,411 | |||
| Building Products - 1.3% | |||
| A.O. Smith Corp. | 3,158 | 229,839 | |
| Advanced Drain Systems, Inc. (b) | 14,981 | 1,704,538 | |
| Allegion PLC | 19,525 | 2,343,391 | |
| Armstrong World Industries, Inc. | 3,143 | 230,885 | |
| Trane Technologies PLC | 16,167 | 3,092,100 | |
| Trex Co., Inc. (a) | 26,121 | 1,712,493 | |
| 9,313,246 | |||
| Commercial Services & Supplies - 3.3% | |||
| Cintas Corp. | 18,559 | 9,225,308 | |
| Copart, Inc. (a) | 103,245 | 9,416,976 | |
| MSA Safety, Inc. | 1,498 | 260,592 | |
| RB Global, Inc. | 33,425 | 2,005,500 | |
| Rollins, Inc. (b) | 53,179 | 2,277,657 | |
| Tetra Tech, Inc. | 2,307 | 377,748 | |
| 23,563,781 | |||
| Construction & Engineering - 0.4% | |||
| EMCOR Group, Inc. | 3,901 | 720,827 | |
| Quanta Services, Inc. | 9,096 | 1,786,909 | |
| Valmont Industries, Inc. | 331 | 96,338 | |
| Willscot Mobile Mini Holdings (a) | 11,920 | 569,657 | |
| 3,173,731 | |||
| Electrical Equipment - 1.7% | |||
| ChargePoint Holdings, Inc. Class A (a)(b) | 67,238 | 591,022 | |
| Hubbell, Inc. Class B | 5,877 | 1,948,578 | |
| Rockwell Automation, Inc. | 27,653 | 9,110,281 | |
| Vertiv Holdings Co. | 5,676 | 140,595 | |
| 11,790,476 | |||
| Ground Transportation - 1.7% | |||
| Avis Budget Group, Inc. (a) | 1,690 | 386,452 | |
| J.B. Hunt Transport Services, Inc. | 3,901 | 706,198 | |
| Landstar System, Inc. | 6,846 | 1,318,129 | |
| Lyft, Inc. (a) | 73,739 | 707,157 | |
| Old Dominion Freight Lines, Inc. (b) | 22,101 | 8,171,845 | |
| Saia, Inc. (a) | 703 | 240,714 | |
| U-Haul Holding Co. | 816 | 45,141 | |
| U-Haul Holding Co. (non-vtg.) | 7,472 | 378,606 | |
| 11,954,242 | |||
| Machinery - 1.3% | |||
| Allison Transmission Holdings, Inc. | 2,122 | 119,808 | |
| Donaldson Co., Inc. | 12,083 | 755,308 | |
| Graco, Inc. | 16,439 | 1,419,508 | |
| IDEX Corp. | 1,473 | 317,078 | |
| Lincoln Electric Holdings, Inc. | 12,552 | 2,493,204 | |
| Otis Worldwide Corp. | 5,869 | 522,400 | |
| Toro Co. | 25,036 | 2,544,909 | |
| Xylem, Inc. | 6,790 | 764,690 | |
| 8,936,905 | |||
| Passenger Airlines - 0.2% | |||
| American Airlines Group, Inc. (a) | 57,965 | 1,039,892 | |
| Delta Air Lines, Inc. | 7,873 | 374,282 | |
| 1,414,174 | |||
| Professional Services - 5.6% | |||
| Booz Allen Hamilton Holding Corp. Class A | 31,286 | 3,491,518 | |
| Broadridge Financial Solutions, Inc. | 23,575 | 3,904,727 | |
| Ceridian HCM Holding, Inc. (a)(b) | 3,051 | 204,325 | |
| CoStar Group, Inc. (a) | 41,833 | 3,723,137 | |
| Equifax, Inc. | 20,291 | 4,774,472 | |
| FTI Consulting, Inc. (a) | 1,481 | 281,686 | |
| Genpact Ltd. | 10,736 | 403,352 | |
| KBR, Inc. (b) | 11,841 | 770,375 | |
| Paychex, Inc. | 77,551 | 8,675,630 | |
| Paycom Software, Inc. | 12,426 | 3,991,728 | |
| Paycor HCM, Inc. (a)(b) | 6,086 | 144,056 | |
| Paylocity Holding Corp. (a) | 10,102 | 1,864,122 | |
| Verisk Analytics, Inc. | 34,339 | 7,761,644 | |
| 39,990,772 | |||
| Trading Companies & Distributors - 2.5% | |||
| Fastenal Co. | 102,923 | 6,071,428 | |
| Ferguson PLC | 2,681 | 421,748 | |
| SiteOne Landscape Supply, Inc. (a) | 3,442 | 576,053 | |
| United Rentals, Inc. | 3,384 | 1,507,132 | |
| W.W. Grainger, Inc. | 10,742 | 8,471,034 | |
| Watsco, Inc. | 1,988 | 758,362 | |
| 17,805,757 | |||
TOTAL INDUSTRIALS | 140,261,988 | ||
| INFORMATION TECHNOLOGY - 21.6% | |||
| Communications Equipment - 0.0% | |||
| Ubiquiti, Inc. (b) | 843 | 148,157 | |
| Electronic Equipment, Instruments & Components - 2.6% | |||
| Amphenol Corp. Class A | 70,590 | 5,996,621 | |
| CDW Corp. | 30,639 | 5,622,257 | |
| Jabil, Inc. | 19,537 | 2,108,628 | |
| Keysight Technologies, Inc. (a) | 10,931 | 1,830,396 | |
| National Instruments Corp. | 24,643 | 1,414,508 | |
| Vontier Corp. | 12,650 | 407,457 | |
| Zebra Technologies Corp. Class A (a) | 2,216 | 655,559 | |
| 18,035,426 | |||
| IT Services - 3.5% | |||
| Cloudflare, Inc. (a)(b) | 69,199 | 4,523,539 | |
| EPAM Systems, Inc. (a) | 13,377 | 3,006,481 | |
| Gartner, Inc. (a) | 18,471 | 6,470,576 | |
| Globant SA (a) | 9,916 | 1,782,104 | |
| GoDaddy, Inc. (a) | 22,477 | 1,688,697 | |
| MongoDB, Inc. Class A (a) | 15,805 | 6,495,697 | |
| Okta, Inc. (a) | 2,312 | 160,337 | |
| Twilio, Inc. Class A (a) | 6,719 | 427,463 | |
| VeriSign, Inc. (a) | 1,154 | 260,769 | |
| 24,815,663 | |||
| Semiconductors & Semiconductor Equipment - 3.9% | |||
| Allegro MicroSystems LLC (a)(b) | 16,079 | 725,806 | |
| Enphase Energy, Inc. (a) | 32,020 | 5,362,710 | |
| Entegris, Inc. (b) | 1,868 | 207,012 | |
| Lattice Semiconductor Corp. (a) | 32,769 | 3,148,118 | |
| Microchip Technology, Inc. | 92,295 | 8,268,709 | |
| Monolithic Power Systems, Inc. | 10,918 | 5,898,231 | |
| Teradyne, Inc. | 31,236 | 3,477,504 | |
| Universal Display Corp. | 5,079 | 732,036 | |
| 27,820,126 | |||
| Software - 10.9% | |||
| Alteryx, Inc. Class A (a)(b) | 14,728 | 668,651 | |
| ANSYS, Inc. (a) | 17,230 | 5,690,552 | |
| AppLovin Corp. (a)(b) | 14,081 | 362,304 | |
| Bentley Systems, Inc. Class B (b) | 42,849 | 2,323,701 | |
| Confluent, Inc. (a)(b) | 44,513 | 1,571,754 | |
| Crowdstrike Holdings, Inc. (a) | 50,660 | 7,440,434 | |
| Datadog, Inc. Class A (a) | 65,715 | 6,465,042 | |
| DocuSign, Inc. (a) | 48,660 | 2,486,039 | |
| DoubleVerify Holdings, Inc. (a) | 27,044 | 1,052,552 | |
| Dropbox, Inc. Class A (a) | 55,988 | 1,493,200 | |
| Dynatrace, Inc. (a) | 52,576 | 2,706,087 | |
| Elastic NV (a) | 18,705 | 1,199,365 | |
| Fair Isaac Corp. (a) | 5,831 | 4,718,504 | |
| Five9, Inc. (a) | 17,101 | 1,409,977 | |
| Gen Digital, Inc. | 20,789 | 385,636 | |
| GitLab, Inc. (a) | 11,754 | 600,747 | |
| HashiCorp, Inc. (a) | 15,275 | 399,900 | |
| HubSpot, Inc. (a) | 10,988 | 5,846,605 | |
| Informatica, Inc. (a)(b) | 796 | 14,726 | |
| Manhattan Associates, Inc. (a) | 14,825 | 2,963,221 | |
| nCino, Inc. (a)(b) | 1,471 | 44,307 | |
| New Relic, Inc. (a) | 13,244 | 866,687 | |
| Nutanix, Inc. Class A (a) | 13,428 | 376,655 | |
| Palantir Technologies, Inc. (a) | 450,777 | 6,910,411 | |
| Pegasystems, Inc. | 10,084 | 497,141 | |
| Procore Technologies, Inc. (a)(b) | 18,877 | 1,228,326 | |
| PTC, Inc. (a)(b) | 13,681 | 1,946,806 | |
| RingCentral, Inc. (a) | 20,519 | 671,587 | |
| SentinelOne, Inc. (a)(b) | 6,110 | 92,261 | |
| Smartsheet, Inc. (a) | 30,175 | 1,154,496 | |
| Splunk, Inc. (a) | 38,726 | 4,108,441 | |
| Teradata Corp. (a) | 24,460 | 1,306,409 | |
| Tyler Technologies, Inc. (a)(b) | 7,571 | 3,153,094 | |
| UiPath, Inc. Class A (a)(b) | 69,302 | 1,148,334 | |
| Unity Software, Inc. (a)(b) | 27,240 | 1,182,761 | |
| Zscaler, Inc. (a) | 20,997 | 3,071,861 | |
| 77,558,574 | |||
| Technology Hardware, Storage & Peripherals - 0.7% | |||
| HP, Inc. | 42,416 | 1,302,595 | |
| NetApp, Inc. | 20,478 | 1,564,519 | |
| Pure Storage, Inc. Class A (a) | 52,902 | 1,947,852 | |
| 4,814,966 | |||
TOTAL INFORMATION TECHNOLOGY | 153,192,912 | ||
| MATERIALS - 1.3% | |||
| Chemicals - 0.5% | |||
| Axalta Coating Systems Ltd. (a) | 5,694 | 186,820 | |
| FMC Corp. | 4,476 | 467,026 | |
| Ginkgo Bioworks Holdings, Inc. Class A (a)(b) | 33,096 | 61,559 | |
| PPG Industries, Inc. | 14,178 | 2,102,597 | |
| RPM International, Inc. | 5,843 | 524,292 | |
| The Scotts Miracle-Gro Co. Class A (b) | 9,929 | 622,449 | |
| 3,964,743 | |||
| Construction Materials - 0.4% | |||
| Eagle Materials, Inc. | 5,649 | 1,053,087 | |
| Vulcan Materials Co. | 7,014 | 1,581,236 | |
| 2,634,323 | |||
| Containers & Packaging - 0.4% | |||
| Ardagh Metal Packaging SA | 32,146 | 120,869 | |
| Avery Dennison Corp. | 6,390 | 1,097,802 | |
| Graphic Packaging Holding Co. | 39,180 | 941,495 | |
| Sealed Air Corp. (b) | 19,120 | 764,800 | |
| 2,924,966 | |||
TOTAL MATERIALS | 9,524,032 | ||
| REAL ESTATE - 1.2% | |||
| Equity Real Estate Investment Trusts (REITs) - 1.2% | |||
| Equity Lifestyle Properties, Inc. | 13,976 | 934,855 | |
| Extra Space Storage, Inc. | 1,858 | 276,563 | |
| Iron Mountain, Inc. | 34,490 | 1,959,722 | |
| Lamar Advertising Co. Class A | 16,115 | 1,599,414 | |
| SBA Communications Corp. Class A | 2,610 | 604,894 | |
| Simon Property Group, Inc. | 17,024 | 1,965,932 | |
| Sun Communities, Inc. | 6,446 | 840,945 | |
| UDR, Inc. | 4,420 | 189,883 | |
| 8,372,208 | |||
| UTILITIES - 0.4% | |||
| Independent Power and Renewable Electricity Producers - 0.4% | |||
| The AES Corp. | 98,186 | 2,035,396 | |
| Vistra Corp. | 26,278 | 689,798 | |
| 2,725,194 | |||
| TOTAL COMMON STOCKS (Cost $617,796,302) | 706,588,852 | ||
| U.S. Treasury Obligations - 0.0% | |||
Principal Amount (c) | Value ($) | ||
U.S. Treasury Bills, yield at date of purchase 5.18% 9/7/23 (d) (Cost $99,031) | 100,000 | 99,059 | |
| Money Market Funds - 3.9% | |||
| Shares | Value ($) | ||
| Fidelity Cash Central Fund 5.14% (e) | 1,930,447 | 1,930,833 | |
| Fidelity Securities Lending Cash Central Fund 5.14% (e)(f) | 25,695,394 | 25,697,964 | |
| TOTAL MONEY MARKET FUNDS (Cost $27,628,797) | 27,628,797 | ||
| TOTAL INVESTMENT IN SECURITIES - 103.5% (Cost $645,524,130) | 734,316,708 |
NET OTHER ASSETS (LIABILITIES) - (3.5)% | (24,801,536) |
| NET ASSETS - 100.0% | 709,515,172 |
| Futures Contracts | |||||
Number of contracts | Expiration Date | Notional Amount ($) | Value ($) | Unrealized Appreciation/ (Depreciation) ($) | |
| Purchased | |||||
| Equity Index Contracts | |||||
| CME E-mini S&P MidCap 400 Index Contracts (United States) | 9 | Sep 2023 | 2,379,690 | 56,095 | 56,095 |
| The notional amount of futures purchased as a percentage of Net Assets is 0.3% | |||||
| (a) | Non-income producing |
| (b) | Security or a portion of the security is on loan at period end. |
| (c) | Amount is stated in United States dollars unless otherwise noted. |
| (d) | Security or a portion of the security was pledged to cover margin requirements for futures contracts. At period end, the value of securities pledged amounted to $99,059. |
| (e) | Affiliated fund that is generally available only to investment companies and other accounts managed by Fidelity Investments. The rate quoted is the annualized seven-day yield of the fund at period end. A complete unaudited listing of the fund's holdings as of its most recent quarter end is available upon request. In addition, each Fidelity Central Fund's financial statements, which are not covered by the Fund's Report of Independent Registered Public Accounting Firm, are available on the SEC's website or upon request. |
| (f) | Investment made with cash collateral received from securities on loan. |
| Affiliate | Value, beginning of period ($) | Purchases ($) | Sales Proceeds ($) | Dividend Income ($) | Realized Gain (loss) ($) | Change in Unrealized appreciation (depreciation) ($) | Value, end of period ($) | % ownership, end of period |
| Fidelity Cash Central Fund 5.14% | 576,947 | 164,819,253 | 163,465,367 | 90,994 | - | - | 1,930,833 | 0.0% |
| Fidelity Securities Lending Cash Central Fund 5.14% | 20,271,725 | 195,421,908 | 189,995,669 | 179,924 | - | - | 25,697,964 | 0.1% |
| Total | 20,848,672 | 360,241,161 | 353,461,036 | 270,918 | - | - | 27,628,797 | |
| Valuation Inputs at Reporting Date: | ||||
| Description | Total ($) | Level 1 ($) | Level 2 ($) | Level 3 ($) |
Investments in Securities: | ||||
| Equities: | ||||
Communication Services | 30,471,885 | 30,471,885 | - | - |
Consumer Discretionary | 90,501,816 | 90,501,816 | - | - |
Consumer Staples | 21,825,829 | 21,825,829 | - | - |
Energy | 25,664,882 | 25,664,882 | - | - |
Financials | 69,160,769 | 69,160,769 | - | - |
Health Care | 154,887,337 | 154,887,337 | - | - |
Industrials | 140,261,988 | 140,261,988 | - | - |
Information Technology | 153,192,912 | 153,192,912 | - | - |
Materials | 9,524,032 | 9,524,032 | - | - |
Real Estate | 8,372,208 | 8,372,208 | - | - |
Utilities | 2,725,194 | 2,725,194 | - | - |
| U.S. Government and Government Agency Obligations | 99,059 | - | 99,059 | - |
| Money Market Funds | 27,628,797 | 27,628,797 | - | - |
| Total Investments in Securities: | 734,316,708 | 734,217,649 | 99,059 | - |
Derivative Instruments: | ||||
| Assets | ||||
Futures Contracts | 56,095 | 56,095 | - | - |
| Total Assets | 56,095 | 56,095 | - | - |
| Total Derivative Instruments: | 56,095 | 56,095 | - | - |
Primary Risk Exposure / Derivative Type | Value | |
| Asset ($) | Liability ($) | |
| Equity Risk | ||
Futures Contracts (a) | 56,095 | 0 |
| Total Equity Risk | 56,095 | 0 |
| Total Value of Derivatives | 56,095 | 0 |
| Statement of Assets and Liabilities | ||||
| June 30, 2023 | ||||
| Assets | ||||
| Investment in securities, at value (including securities loaned of $25,385,469) - See accompanying schedule: | ||||
Unaffiliated issuers (cost $617,895,333) | $ | 706,687,911 | ||
Fidelity Central Funds (cost $27,628,797) | 27,628,797 | |||
| Total Investment in Securities (cost $645,524,130) | $ | 734,316,708 | ||
| Segregated cash with brokers for derivative instruments | 26,138 | |||
| Receivable for fund shares sold | 12,099,775 | |||
| Dividends receivable | 198,354 | |||
| Distributions receivable from Fidelity Central Funds | 23,114 | |||
| Receivable for daily variation margin on futures contracts | 13,236 | |||
Total assets | 746,677,325 | |||
| Liabilities | ||||
| Payable for investments purchased | $ | 10,618,813 | ||
| Payable for fund shares redeemed | 817,322 | |||
| Accrued management fee | 28,054 | |||
| Collateral on securities loaned | 25,697,964 | |||
| Total Liabilities | 37,162,153 | |||
| Net Assets | $ | 709,515,172 | ||
| Net Assets consist of: | ||||
| Paid in capital | $ | 690,439,554 | ||
| Total accumulated earnings (loss) | 19,075,618 | |||
| Net Assets | $ | 709,515,172 | ||
Net Asset Value , offering price and redemption price per share ($709,515,172 ÷ 28,249,406 shares) | $ | 25.12 | ||
| Statement of Operations | ||||
Year ended June 30, 2023 | ||||
| Investment Income | ||||
| Dividends | $ | 4,641,300 | ||
| Interest | 3,370 | |||
| Income from Fidelity Central Funds (including $179,924 from security lending) | 270,918 | |||
| Total Income | 4,915,588 | |||
| Expenses | ||||
| Management fee | $ | 285,057 | ||
| Independent trustees' fees and expenses | 1,882 | |||
| Interest | 2,602 | |||
| Total expenses before reductions | 289,541 | |||
| Expense reductions | (873) | |||
| Total expenses after reductions | 288,668 | |||
| Net Investment income (loss) | 4,626,920 | |||
| Realized and Unrealized Gain (Loss) | ||||
| Net realized gain (loss) on: | ||||
| Investment Securities: | ||||
| Unaffiliated issuers | 19,061,023 | |||
| Futures contracts | 237,260 | |||
| Total net realized gain (loss) | 19,298,283 | |||
| Change in net unrealized appreciation (depreciation) on: | ||||
| Investment Securities: | ||||
| Unaffiliated issuers | 92,614,306 | |||
| Futures contracts | 53,301 | |||
| Total change in net unrealized appreciation (depreciation) | 92,667,607 | |||
| Net gain (loss) | 111,965,890 | |||
| Net increase (decrease) in net assets resulting from operations | $ | 116,592,810 | ||
| Statement of Changes in Net Assets | ||||
Year ended June 30, 2023 | Year ended June 30, 2022 | |||
| Increase (Decrease) in Net Assets | ||||
| Operations | ||||
| Net investment income (loss) | $ | 4,626,920 | $ | 4,081,538 |
| Net realized gain (loss) | 19,298,283 | (85,689,263) | ||
| Change in net unrealized appreciation (depreciation) | 92,667,607 | (151,835,524) | ||
| Net increase (decrease) in net assets resulting from operations | 116,592,810 | (233,443,249) | ||
| Distributions to shareholders | (4,150,490) | (40,696,927) | ||
| Share transactions | ||||
| Proceeds from sales of shares | 300,411,658 | 459,206,091 | ||
| Reinvestment of distributions | 2,724,805 | 25,822,157 | ||
| Cost of shares redeemed | (163,391,944) | (407,072,810) | ||
Net increase (decrease) in net assets resulting from share transactions | 139,744,519 | 77,955,438 | ||
| Total increase (decrease) in net assets | 252,186,839 | (196,184,738) | ||
| Net Assets | ||||
| Beginning of period | 457,328,333 | 653,513,071 | ||
| End of period | $ | 709,515,172 | $ | 457,328,333 |
| Other Information | ||||
| Shares | ||||
| Sold | 13,089,461 | 16,475,807 | ||
| Issued in reinvestment of distributions | 120,408 | 868,015 | ||
| Redeemed | (7,201,423) | (16,131,262) | ||
| Net increase (decrease) | 6,008,446 | 1,212,560 | ||
| Fidelity® Mid Cap Growth Index Fund |
| Years ended June 30, | 2023 | 2022 | 2021 | 2020 A | ||||
Selected Per-Share Data | ||||||||
| Net asset value, beginning of period | $ | 20.56 | $ | 31.08 | $ | 21.71 | $ | 20.00 |
| Income from Investment Operations | ||||||||
Net investment income (loss) B,C | .18 | .17 | .13 | .15 | ||||
| Net realized and unrealized gain (loss) | 4.56 | (8.78) | 9.34 | 1.62 | ||||
| Total from investment operations | 4.74 | (8.61) | 9.47 | 1.77 | ||||
| Distributions from net investment income | (.18) | (.12) | (.10) | (.06) | ||||
| Distributions from net realized gain | - | (1.79) | - | - D | ||||
| Total distributions | (.18) | (1.91) | (.10) | (.06) | ||||
| Net asset value, end of period | $ | 25.12 | $ | 20.56 | $ | 31.08 | $ | 21.71 |
Total Return E,F | 23.13% | (29.57)% | 43.70% | 8.86% | ||||
Ratios to Average Net Assets C,G,H | ||||||||
| Expenses before reductions | .05% | .05% | .05% | .05% I | ||||
| Expenses net of fee waivers, if any | .05% | .05% | .05% | .05% I | ||||
| Expenses net of all reductions | .05% | .05% | .05% | .05% I | ||||
| Net investment income (loss) | .81% | .62% | .47% | .76% I | ||||
| Supplemental Data | ||||||||
| Net assets, end of period (000 omitted) | $ | 709,515 | $ | 457,328 | $ | 653,513 | $ | 208,955 |
Portfolio turnover rate J | 46% | 62% | 54% | 109% I |
| Average Annual Total Returns | |||
Periods ended June 30, 2023 | Past 1 year | Life of Fund A |
| Fidelity® Mid Cap Value Index Fund | 10.56% | 7.38% |
| $10,000 Over Life of Fund |
Let's say hypothetically that $10,000 was invested in Fidelity® Mid Cap Value Index Fund, on July 11, 2019, when the fund started. The chart shows how the value of your investment would have changed, and also shows how the Russell Midcap® Value Index performed over the same period. |
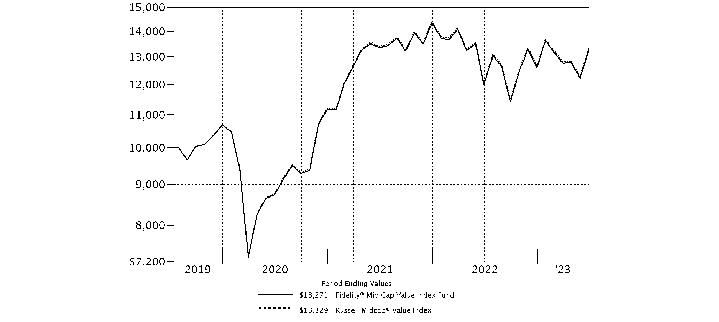 |
Top Holdings (% of Fund's net assets) | ||
| Marvell Technology, Inc. | 0.7 | |
| Parker Hannifin Corp. | 0.7 | |
| Phillips 66 Co. | 0.6 | |
| Arthur J. Gallagher & Co. | 0.6 | |
| PACCAR, Inc. | 0.6 | |
| AFLAC, Inc. | 0.6 | |
| Carrier Global Corp. | 0.6 | |
| Nucor Corp. | 0.6 | |
| Biogen, Inc. | 0.6 | |
| Corteva, Inc. | 0.6 | |
| 6.2 | ||
| Market Sectors (% of Fund's net assets) | ||
| Industrials | 19.1 | |
| Financials | 16.0 | |
| Real Estate | 10.1 | |
| Information Technology | 9.7 | |
| Consumer Discretionary | 9.4 | |
| Materials | 7.8 | |
| Health Care | 7.6 | |
| Utilities | 7.5 | |
| Energy | 5.0 | |
| Consumer Staples | 4.2 | |
| Communication Services | 3.4 | |
Asset Allocation (% of Fund's net assets) |
 |
Futures - 0.2% |
| Common Stocks - 99.8% | |||
| Shares | Value ($) | ||
| COMMUNICATION SERVICES - 3.4% | |||
| Diversified Telecommunication Services - 0.1% | |||
| Frontier Communications Parent, Inc. (a)(b) | 29,067 | 541,809 | |
| Iridium Communications, Inc. | 946 | 58,766 | |
| 600,575 | |||
| Entertainment - 1.8% | |||
| AMC Entertainment Holdings, Inc. Class A (a)(b) | 61,609 | 271,080 | |
| Electronic Arts, Inc. | 32,504 | 4,215,769 | |
| Liberty Media Corp. Liberty Formula One: | |||
| Class A (a) | 2,528 | 170,943 | |
| Series C (a) | 23,255 | 1,750,636 | |
| Live Nation Entertainment, Inc. (a) | 14,362 | 1,308,522 | |
| Madison Square Garden Sports Corp. | 2,207 | 415,026 | |
| Playtika Holding Corp. (a) | 100 | 1,160 | |
| Roku, Inc. Class A (a) | 12,798 | 818,560 | |
| Take-Two Interactive Software, Inc. (a) | 19,562 | 2,878,744 | |
| Warner Bros Discovery, Inc. (a) | 261,389 | 3,277,818 | |
| 15,108,258 | |||
| Interactive Media & Services - 0.1% | |||
| IAC, Inc. (a) | 9,126 | 573,113 | |
| Match Group, Inc. (a) | 3,275 | 137,059 | |
| TripAdvisor, Inc. (a) | 13,135 | 216,596 | |
| Zoominfo Technologies, Inc. (a) | 17,887 | 454,151 | |
| 1,380,919 | |||
| Media - 1.4% | |||
| Cable One, Inc. | 622 | 408,704 | |
| DISH Network Corp. Class A (a)(b) | 29,399 | 193,739 | |
| Fox Corp.: | |||
| Class A (b) | 34,673 | 1,178,882 | |
| Class B | 15,941 | 508,358 | |
| Interpublic Group of Companies, Inc. | 45,716 | 1,763,723 | |
| Liberty Broadband Corp.: | |||
| Class A (a) | 1,664 | 132,671 | |
| Class C (a) | 10,835 | 867,992 | |
| Liberty Media Corp. Liberty SiriusXM: | |||
| Series A (a) | 8,843 | 290,139 | |
| Series C (a) | 18,208 | 595,948 | |
| News Corp.: | |||
| Class A | 45,178 | 880,971 | |
| Class B | 13,752 | 271,189 | |
| Nexstar Broadcasting Group, Inc. Class A | 2,669 | 444,522 | |
| Omnicom Group, Inc. | 23,400 | 2,226,510 | |
| Paramount Global: | |||
| Class A (b) | 1,172 | 21,752 | |
| Class B | 68,286 | 1,086,430 | |
| Sirius XM Holdings, Inc. (b) | 76,508 | 346,581 | |
| The New York Times Co. Class A | 19,139 | 753,694 | |
| 11,971,805 | |||
TOTAL COMMUNICATION SERVICES | 29,061,557 | ||
| CONSUMER DISCRETIONARY - 9.4% | |||
| Automobile Components - 0.8% | |||
| Aptiv PLC (a) | 32,112 | 3,278,314 | |
| BorgWarner, Inc. | 27,664 | 1,353,046 | |
| Gentex Corp. | 27,784 | 812,960 | |
| Lear Corp. | 6,962 | 999,395 | |
| QuantumScape Corp. Class A (a)(b) | 34,608 | 276,518 | |
| 6,720,233 | |||
| Automobiles - 0.3% | |||
| Harley-Davidson, Inc. | 15,555 | 547,692 | |
| Lucid Group, Inc. Class A (a)(b) | 88,458 | 609,476 | |
| Rivian Automotive, Inc. (a)(b) | 61,169 | 1,019,076 | |
| Thor Industries, Inc. | 6,071 | 628,349 | |
| 2,804,593 | |||
| Broadline Retail - 0.6% | |||
| eBay, Inc. | 59,446 | 2,656,642 | |
| Etsy, Inc. (a) | 6,397 | 541,250 | |
| Kohl's Corp. | 13,123 | 302,485 | |
| Macy's, Inc. | 32,123 | 515,574 | |
| Nordstrom, Inc. | 13,548 | 277,328 | |
| Ollie's Bargain Outlet Holdings, Inc. (a) | 4,968 | 287,796 | |
| 4,581,075 | |||
| Distributors - 0.6% | |||
| Genuine Parts Co. | 16,637 | 2,815,480 | |
| LKQ Corp. | 31,590 | 1,840,749 | |
| 4,656,229 | |||
| Diversified Consumer Services - 0.2% | |||
| ADT, Inc. | 24,956 | 150,485 | |
| Bright Horizons Family Solutions, Inc. (a)(b) | 5,973 | 552,204 | |
| Grand Canyon Education, Inc. (a) | 2,586 | 266,901 | |
| H&R Block, Inc. | 6,347 | 202,279 | |
| Mister Car Wash, Inc. (a)(b) | 8,890 | 85,789 | |
| Service Corp. International | 11,214 | 724,312 | |
| 1,981,970 | |||
| Hotels, Restaurants & Leisure - 2.3% | |||
| ARAMARK Holdings Corp. | 27,762 | 1,195,154 | |
| Boyd Gaming Corp. | 8,722 | 605,045 | |
| Caesars Entertainment, Inc. (a) | 14,408 | 734,376 | |
| Carnival Corp. (a)(b) | 117,882 | 2,219,718 | |
| Darden Restaurants, Inc. | 7,630 | 1,274,820 | |
| Doordash, Inc. (a) | 7,777 | 594,318 | |
| Expedia, Inc. (a) | 4,571 | 500,022 | |
| Hilton Worldwide Holdings, Inc. | 16,529 | 2,405,796 | |
| Hyatt Hotels Corp. Class A | 5,522 | 632,711 | |
| Marriott Vacations Worldwide Corp. | 4,336 | 532,114 | |
| MGM Resorts International | 35,562 | 1,561,883 | |
| Norwegian Cruise Line Holdings Ltd. (a)(b) | 38,032 | 827,957 | |
| Penn Entertainment, Inc. (a) | 18,199 | 437,322 | |
| Planet Fitness, Inc. (a) | 5,293 | 356,960 | |
| Royal Caribbean Cruises Ltd. (a) | 19,406 | 2,013,178 | |
| Travel+Leisure Co. | 4,822 | 194,519 | |
| Vail Resorts, Inc. | 4,272 | 1,075,519 | |
| Wyndham Hotels & Resorts, Inc. | 9,252 | 634,410 | |
| Wynn Resorts Ltd. | 11,566 | 1,221,485 | |
| Yum! Brands, Inc. | 4,058 | 562,236 | |
| 19,579,543 | |||
| Household Durables - 2.3% | |||
| D.R. Horton, Inc. | 36,920 | 4,492,795 | |
| Garmin Ltd. | 18,225 | 1,900,685 | |
| Leggett & Platt, Inc. | 15,731 | 465,952 | |
| Lennar Corp.: | |||
| Class A | 29,519 | 3,699,026 | |
| Class B | 1,617 | 182,689 | |
| Mohawk Industries, Inc. (a) | 6,267 | 646,504 | |
| Newell Brands, Inc. | 45,172 | 392,996 | |
| NVR, Inc. (a) | 319 | 2,025,848 | |
| PulteGroup, Inc. | 26,310 | 2,043,761 | |
| Tempur Sealy International, Inc. | 15,763 | 631,623 | |
| Toll Brothers, Inc. | 13,089 | 1,034,947 | |
| TopBuild Corp. (a) | 3,511 | 933,996 | |
| Whirlpool Corp. (b) | 6,342 | 943,626 | |
| 19,394,448 | |||
| Leisure Products - 0.4% | |||
| Brunswick Corp. | 7,732 | 669,900 | |
| Hasbro, Inc. | 15,492 | 1,003,417 | |
| Mattel, Inc. (a) | 41,725 | 815,307 | |
| Polaris, Inc. | 5,828 | 704,780 | |
| 3,193,404 | |||
| Specialty Retail - 1.3% | |||
| Advance Auto Parts, Inc. | 7,050 | 495,615 | |
| AutoNation, Inc. (a) | 3,616 | 595,230 | |
| Bath & Body Works, Inc. | 27,164 | 1,018,650 | |
| Best Buy Co., Inc. | 19,937 | 1,633,837 | |
| CarMax, Inc. (a)(b) | 17,679 | 1,479,732 | |
| Dick's Sporting Goods, Inc. | 6,597 | 872,057 | |
| GameStop Corp. Class A (b) | 31,751 | 769,962 | |
| Gap, Inc. | 23,078 | 206,087 | |
| Lithia Motors, Inc. Class A (sub. vtg.) | 3,208 | 975,585 | |
| Murphy U.S.A., Inc. | 124 | 38,578 | |
| Penske Automotive Group, Inc. (b) | 2,384 | 397,246 | |
| Petco Health & Wellness Co., Inc. (a)(b) | 9,734 | 86,633 | |
| RH (a) | 1,614 | 531,958 | |
| Ross Stores, Inc. | 2,672 | 299,611 | |
| Valvoline, Inc. | 15,034 | 563,925 | |
| Victoria's Secret & Co. (a) | 5,144 | 89,660 | |
| Wayfair LLC Class A (a)(b) | 6,348 | 412,683 | |
| Williams-Sonoma, Inc. (b) | 6,726 | 841,692 | |
| 11,308,741 | |||
| Textiles, Apparel & Luxury Goods - 0.6% | |||
| Capri Holdings Ltd. (a) | 14,520 | 521,123 | |
| Carter's, Inc. (b) | 4,364 | 316,826 | |
| Columbia Sportswear Co. | 4,237 | 327,266 | |
| PVH Corp. | 7,402 | 628,948 | |
| Ralph Lauren Corp. | 4,822 | 594,553 | |
| Skechers U.S.A., Inc. Class A (sub. vtg.) (a) | 15,124 | 796,430 | |
| Tapestry, Inc. | 26,183 | 1,120,632 | |
| Under Armour, Inc.: | |||
| Class A (sub. vtg.) (a) | 23,241 | 167,800 | |
| Class C (non-vtg.) (a) | 21,033 | 141,131 | |
| VF Corp. | 41,428 | 790,861 | |
| 5,405,570 | |||
TOTAL CONSUMER DISCRETIONARY | 79,625,806 | ||
| CONSUMER STAPLES - 4.2% | |||
| Beverages - 0.2% | |||
| Boston Beer Co., Inc. Class A (a) | 84 | 25,909 | |
| Brown-Forman Corp.: | |||
| Class A | 388 | 26,411 | |
| Class B (non-vtg.) | 5,298 | 353,800 | |
| Molson Coors Beverage Co. Class B | 20,731 | 1,364,929 | |
| 1,771,049 | |||
| Consumer Staples Distribution & Retail - 1.7% | |||
| Albertsons Companies, Inc. | 45,150 | 985,173 | |
| BJ's Wholesale Club Holdings, Inc. (a) | 10,313 | 649,822 | |
| Casey's General Stores, Inc. | 3,779 | 921,623 | |
| Dollar Tree, Inc. (a) | 24,741 | 3,550,334 | |
| Grocery Outlet Holding Corp. (a)(b) | 11,238 | 343,995 | |
| Kroger Co. | 77,420 | 3,638,740 | |
| Performance Food Group Co. (a) | 9,640 | 580,714 | |
| U.S. Foods Holding Corp. (a) | 26,864 | 1,182,016 | |
| Walgreens Boots Alliance, Inc. | 84,978 | 2,421,023 | |
| 14,273,440 | |||
| Food Products - 2.1% | |||
| Bunge Ltd. | 17,711 | 1,671,033 | |
| Campbell Soup Co. | 22,683 | 1,036,840 | |
| Conagra Brands, Inc. (b) | 56,423 | 1,902,584 | |
| Darling Ingredients, Inc. (a) | 18,790 | 1,198,614 | |
| Flowers Foods, Inc. | 22,308 | 555,023 | |
| Freshpet, Inc. (a)(b) | 3,930 | 258,633 | |
| Hormel Foods Corp. | 34,332 | 1,380,833 | |
| Ingredion, Inc. | 7,819 | 828,423 | |
| Kellogg Co. (b) | 30,824 | 2,077,538 | |
| Lamb Weston Holdings, Inc. | 966 | 111,042 | |
| McCormick & Co., Inc. (non-vtg.) | 29,810 | 2,600,326 | |
| Pilgrim's Pride Corp. (a) | 4,876 | 104,785 | |
| Post Holdings, Inc. (a) | 6,351 | 550,314 | |
| Seaboard Corp. | 30 | 106,822 | |
| The J.M. Smucker Co. | 12,229 | 1,805,856 | |
| Tyson Foods, Inc. Class A | 32,956 | 1,682,074 | |
| 17,870,740 | |||
| Household Products - 0.1% | |||
| Church & Dwight Co., Inc. | 3,016 | 302,294 | |
| Reynolds Consumer Products, Inc. | 6,447 | 182,128 | |
| Spectrum Brands Holdings, Inc. (b) | 4,766 | 371,986 | |
| 856,408 | |||
| Personal Care Products - 0.1% | |||
| Coty, Inc. Class A (a) | 42,762 | 525,545 | |
| Olaplex Holdings, Inc. (a) | 15,469 | 57,545 | |
| 583,090 | |||
TOTAL CONSUMER STAPLES | 35,354,727 | ||
| ENERGY - 5.0% | |||
| Energy Equipment & Services - 1.0% | |||
| Baker Hughes Co. Class A | 120,198 | 3,799,459 | |
| Halliburton Co. | 85,168 | 2,809,692 | |
| NOV, Inc. | 46,509 | 746,004 | |
| TechnipFMC PLC (a) | 52,053 | 865,121 | |
| 8,220,276 | |||
| Oil, Gas & Consumable Fuels - 4.0% | |||
| Antero Midstream GP LP | 26,807 | 310,961 | |
| Antero Resources Corp. (a) | 33,523 | 772,035 | |
| APA Corp. | 4,201 | 143,548 | |
| Chesapeake Energy Corp. | 15,045 | 1,258,966 | |
| Coterra Energy, Inc. | 89,809 | 2,272,168 | |
| Devon Energy Corp. | 76,043 | 3,675,919 | |
| Diamondback Energy, Inc. | 21,491 | 2,823,058 | |
| DT Midstream, Inc. | 11,519 | 570,997 | |
| EQT Corp. | 42,757 | 1,758,595 | |
| Hess Corp. | 14,574 | 1,981,335 | |
| HF Sinclair Corp. | 16,738 | 746,682 | |
| Marathon Oil Corp. | 73,713 | 1,696,873 | |
| ONEOK, Inc. | 50,107 | 3,092,604 | |
| Ovintiv, Inc. (b) | 16,020 | 609,881 | |
| PDC Energy, Inc. | 10,276 | 731,035 | |
| Phillips 66 Co. | 54,684 | 5,215,760 | |
| Range Resources Corp. | 27,753 | 815,938 | |
| Southwestern Energy Co. (a) | 130,057 | 781,643 | |
| The Williams Companies, Inc. (b) | 144,512 | 4,715,427 | |
| 33,973,425 | |||
TOTAL ENERGY | 42,193,701 | ||
| FINANCIALS - 16.0% | |||
| Banks - 2.8% | |||
| Bank OZK | 13,082 | 525,373 | |
| BOK Financial Corp. | 3,363 | 271,663 | |
| Citizens Financial Group, Inc. | 57,255 | 1,493,210 | |
| Columbia Banking Systems, Inc. | 24,684 | 500,592 | |
| Comerica, Inc. | 15,595 | 660,604 | |
| Commerce Bancshares, Inc. | 13,534 | 659,106 | |
| Cullen/Frost Bankers, Inc. | 7,013 | 754,108 | |
| East West Bancorp, Inc. | 16,643 | 878,584 | |
| Fifth Third Bancorp | 80,500 | 2,109,905 | |
| First Citizens Bancshares, Inc. | 1,147 | 1,472,117 | |
| First Hawaiian, Inc. | 15,102 | 271,987 | |
| First Horizon National Corp. | 63,343 | 713,876 | |
| FNB Corp., Pennsylvania | 42,446 | 485,582 | |
| Huntington Bancshares, Inc. | 170,577 | 1,838,820 | |
| KeyCorp | 110,448 | 1,020,540 | |
| M&T Bank Corp. | 19,618 | 2,427,924 | |
| New York Community Bancorp, Inc. | 84,418 | 948,858 | |
| Nu Holdings Ltd. (a) | 86,186 | 680,008 | |
| Pinnacle Financial Partners, Inc. | 8,933 | 506,054 | |
| Popular, Inc. | 8,354 | 505,584 | |
| Prosperity Bancshares, Inc. | 10,312 | 582,422 | |
| Regions Financial Corp. | 110,829 | 1,974,973 | |
| Synovus Financial Corp. | 17,169 | 519,362 | |
| Webster Financial Corp. | 20,565 | 776,329 | |
| Western Alliance Bancorp. (b) | 12,836 | 468,129 | |
| Wintrust Financial Corp. | 7,222 | 524,462 | |
| Zions Bancorp NA | 17,275 | 464,007 | |
| 24,034,179 | |||
| Capital Markets - 4.3% | |||
| Affiliated Managers Group, Inc. | 4,225 | 633,285 | |
| Bank of New York Mellon Corp. | 93,760 | 4,174,195 | |
| Blue Owl Capital, Inc. Class A | 45,149 | 525,986 | |
| Carlyle Group LP (b) | 25,007 | 798,974 | |
| Cboe Global Markets, Inc. | 12,476 | 1,721,813 | |
| Coinbase Global, Inc. (a)(b) | 19,766 | 1,414,257 | |
| Evercore, Inc. Class A | 4,226 | 522,291 | |
| Franklin Resources, Inc. | 33,749 | 901,436 | |
| Houlihan Lokey | 5,465 | 537,264 | |
| Interactive Brokers Group, Inc. | 11,832 | 982,884 | |
| Invesco Ltd. | 43,967 | 739,085 | |
| Janus Henderson Group PLC | 15,892 | 433,057 | |
| Jefferies Financial Group, Inc. | 23,814 | 789,910 | |
| KKR & Co. LP | 57,777 | 3,235,512 | |
| Lazard Ltd. Class A | 12,995 | 415,840 | |
| MSCI, Inc. | 4,612 | 2,164,365 | |
| NASDAQ, Inc. | 40,515 | 2,019,673 | |
| Northern Trust Corp. | 24,299 | 1,801,528 | |
| Raymond James Financial, Inc. | 23,181 | 2,405,492 | |
| Robinhood Markets, Inc. (a) | 78,701 | 785,436 | |
| SEI Investments Co. | 12,060 | 719,017 | |
| State Street Corp. | 39,592 | 2,897,343 | |
| Stifel Financial Corp. | 12,163 | 725,766 | |
| T. Rowe Price Group, Inc. | 26,165 | 2,931,003 | |
| TPG, Inc. (b) | 5,410 | 158,297 | |
| Tradeweb Markets, Inc. Class A | 8,898 | 609,335 | |
| Virtu Financial, Inc. Class A | 10,610 | 181,325 | |
| XP, Inc. Class A (a) | 36,118 | 847,328 | |
| 36,071,697 | |||
| Consumer Finance - 1.0% | |||
| Ally Financial, Inc. | 32,072 | 866,265 | |
| Credit Acceptance Corp. (a)(b) | 760 | 386,027 | |
| Discover Financial Services | 30,067 | 3,513,329 | |
| OneMain Holdings, Inc. | 13,317 | 581,820 | |
| SLM Corp. | 17,340 | 282,989 | |
| SoFi Technologies, Inc. (a)(b) | 108,760 | 907,058 | |
| Synchrony Financial | 50,600 | 1,716,352 | |
| 8,253,840 | |||
| Financial Services - 1.7% | |||
| Affirm Holdings, Inc. (a)(b) | 25,830 | 395,974 | |
| Block, Inc. Class A (a) | 40,394 | 2,689,029 | |
| Corebridge Financial, Inc. | 17,562 | 310,145 | |
| Euronet Worldwide, Inc. (a) | 2,813 | 330,162 | |
| Fidelity National Information Services, Inc. | 70,232 | 3,841,690 | |
| FleetCor Technologies, Inc. (a) | 597 | 149,895 | |
| Global Payments, Inc. | 31,034 | 3,057,470 | |
| Jack Henry & Associates, Inc. | 5,889 | 985,406 | |
| MGIC Investment Corp. | 34,104 | 538,502 | |
| Rocket Companies, Inc. (a)(b) | 9,542 | 85,496 | |
| TFS Financial Corp. | 5,957 | 74,879 | |
| The Western Union Co. | 37,901 | 444,579 | |
| UWM Holdings Corp. Class A (b) | 7,075 | 39,620 | |
| Voya Financial, Inc. | 11,608 | 832,410 | |
| WEX, Inc. (a) | 2,751 | 500,875 | |
| 14,276,132 | |||
| Insurance - 5.8% | |||
| AFLAC, Inc. | 71,425 | 4,985,465 | |
| Allstate Corp. | 31,120 | 3,393,325 | |
| American Financial Group, Inc. | 8,625 | 1,024,219 | |
| Arch Capital Group Ltd. (a) | 36,450 | 2,728,283 | |
| Arthur J. Gallagher & Co. (b) | 23,720 | 5,208,200 | |
| Assurant, Inc. | 6,269 | 788,139 | |
| Assured Guaranty Ltd. | 6,748 | 376,538 | |
| Axis Capital Holdings Ltd. | 9,230 | 496,851 | |
| Brighthouse Financial, Inc. (a) | 7,109 | 336,611 | |
| Brown & Brown, Inc. | 17,154 | 1,180,881 | |
| Cincinnati Financial Corp. | 18,208 | 1,772,003 | |
| CNA Financial Corp. | 3,098 | 119,645 | |
| Everest Re Group Ltd. | 4,342 | 1,484,356 | |
| Fidelity National Financial, Inc. | 30,762 | 1,107,432 | |
| First American Financial Corp. | 11,877 | 677,227 | |
| Globe Life, Inc. | 10,523 | 1,153,531 | |
| Hanover Insurance Group, Inc. | 4,214 | 476,308 | |
| Hartford Financial Services Group, Inc. | 36,127 | 2,601,867 | |
| Kemper Corp. (b) | 7,147 | 344,914 | |
| Lincoln National Corp. | 18,031 | 464,479 | |
| Loews Corp. | 22,449 | 1,333,022 | |
| Markel Group, Inc. (a) | 1,558 | 2,154,994 | |
| Old Republic International Corp. | 32,227 | 811,154 | |
| Primerica, Inc. | 1,512 | 299,013 | |
| Principal Financial Group, Inc. | 28,675 | 2,174,712 | |
| Prudential Financial, Inc. (b) | 43,550 | 3,841,981 | |
| Reinsurance Group of America, Inc. | 7,884 | 1,093,432 | |
| RenaissanceRe Holdings Ltd. | 4,280 | 798,306 | |
| RLI Corp. | 3,719 | 507,532 | |
| Unum Group | 23,300 | 1,111,410 | |
| W.R. Berkley Corp. | 25,225 | 1,502,401 | |
| White Mountains Insurance Group Ltd. | 294 | 408,340 | |
| Willis Towers Watson PLC | 11,063 | 2,605,337 | |
| 49,361,908 | |||
| Mortgage Real Estate Investment Trusts - 0.4% | |||
| AGNC Investment Corp. | 68,016 | 689,002 | |
| Annaly Capital Management, Inc. | 58,562 | 1,171,826 | |
| Rithm Capital Corp. | 56,937 | 532,361 | |
| Starwood Property Trust, Inc. | 34,942 | 677,875 | |
| 3,071,064 | |||
TOTAL FINANCIALS | 135,068,820 | ||
| HEALTH CARE - 7.6% | |||
| Biotechnology - 1.4% | |||
| Alnylam Pharmaceuticals, Inc. (a) | 2,896 | 550,066 | |
| Biogen, Inc. (a) | 17,093 | 4,868,941 | |
| BioMarin Pharmaceutical, Inc. (a) | 19,572 | 1,696,501 | |
| Exact Sciences Corp. (a) | 13,826 | 1,298,261 | |
| Exelixis, Inc. (a) | 9,975 | 190,622 | |
| Horizon Therapeutics PLC (a) | 3,086 | 317,395 | |
| Incyte Corp. (a) | 5,735 | 357,004 | |
| Ionis Pharmaceuticals, Inc. (a) | 2,348 | 96,338 | |
| Karuna Therapeutics, Inc. (a) | 447 | 96,932 | |
| Mirati Therapeutics, Inc. (a)(b) | 5,418 | 195,752 | |
| Repligen Corp. (a) | 3,679 | 520,431 | |
| Roivant Sciences Ltd. (a) | 1,561 | 15,735 | |
| United Therapeutics Corp. (a) | 5,352 | 1,181,454 | |
| 11,385,432 | |||
| Health Care Equipment & Supplies - 2.2% | |||
| Baxter International, Inc. | 59,967 | 2,732,097 | |
| Dentsply Sirona, Inc. | 25,058 | 1,002,821 | |
| Enovis Corp. (a) | 6,225 | 399,147 | |
| Envista Holdings Corp. (a) | 19,403 | 656,598 | |
| Globus Medical, Inc. (a) | 9,408 | 560,152 | |
| Hologic, Inc. (a) | 28,818 | 2,333,393 | |
| ICU Medical, Inc. (a)(b) | 2,400 | 427,656 | |
| Integra LifeSciences Holdings Corp. (a) | 8,480 | 348,782 | |
| QuidelOrtho Corp. (a) | 6,343 | 525,581 | |
| STERIS PLC | 11,765 | 2,646,890 | |
| Tandem Diabetes Care, Inc. (a) | 6,616 | 162,357 | |
| Teleflex, Inc. (b) | 5,571 | 1,348,349 | |
| The Cooper Companies, Inc. | 5,762 | 2,209,324 | |
| Zimmer Biomet Holdings, Inc. | 24,913 | 3,627,333 | |
| 18,980,480 | |||
| Health Care Providers & Services - 1.6% | |||
| Acadia Healthcare Co., Inc. (a) | 10,631 | 846,653 | |
| agilon health, Inc. (a)(b) | 3,540 | 61,384 | |
| Amedisys, Inc. (a) | 3,803 | 347,746 | |
| Cardinal Health, Inc. | 14,933 | 1,412,214 | |
| Chemed Corp. | 496 | 268,668 | |
| Encompass Health Corp. | 10,907 | 738,513 | |
| Henry Schein, Inc. (a) | 15,453 | 1,253,238 | |
| Laboratory Corp. of America Holdings | 10,494 | 2,532,517 | |
| Molina Healthcare, Inc. (a) | 3,124 | 941,074 | |
| Premier, Inc. | 14,080 | 389,453 | |
| Quest Diagnostics, Inc. | 13,283 | 1,867,058 | |
| R1 RCM, Inc. | 18,152 | 334,904 | |
| Tenet Healthcare Corp. (a) | 11,966 | 973,793 | |
| Universal Health Services, Inc. Class B | 7,184 | 1,133,420 | |
| 13,100,635 | |||
| Health Care Technology - 0.1% | |||
| Certara, Inc. (a)(b) | 9,037 | 164,564 | |
| Doximity, Inc. (a)(b) | 7,275 | 247,496 | |
| Teladoc Health, Inc. (a)(b) | 19,294 | 488,524 | |
| 900,584 | |||
| Life Sciences Tools & Services - 1.6% | |||
| Agilent Technologies, Inc. | 6,549 | 787,517 | |
| Avantor, Inc. (a) | 80,009 | 1,643,385 | |
| Azenta, Inc. (a) | 8,087 | 377,501 | |
| Bio-Rad Laboratories, Inc. Class A (a) | 2,491 | 944,388 | |
| Bio-Techne Corp. | 1,053 | 85,956 | |
| Charles River Laboratories International, Inc. (a) | 6,017 | 1,265,074 | |
| ICON PLC (a) | 8,225 | 2,057,895 | |
| Illumina, Inc. (a) | 13,167 | 2,468,681 | |
| IQVIA Holdings, Inc. (a) | 1,599 | 359,407 | |
| Maravai LifeSciences Holdings, Inc. (a) | 5,492 | 68,266 | |
| QIAGEN NV (a) | 26,961 | 1,214,054 | |
| Revvity, Inc. | 14,973 | 1,778,643 | |
| Sotera Health Co. (a) | 3,482 | 65,601 | |
| Syneos Health, Inc. (a) | 12,248 | 516,131 | |
| 13,632,499 | |||
| Pharmaceuticals - 0.7% | |||
| Catalent, Inc. (a) | 21,325 | 924,652 | |
| Elanco Animal Health, Inc. (a) | 58,059 | 584,074 | |
| Jazz Pharmaceuticals PLC (a) | 3,493 | 433,027 | |
| Organon & Co. | 30,272 | 629,960 | |
| Perrigo Co. PLC | 16,017 | 543,777 | |
| Royalty Pharma PLC | 44,027 | 1,353,390 | |
| Viatris, Inc. | 141,851 | 1,415,673 | |
| 5,884,553 | |||
TOTAL HEALTH CARE | 63,884,183 | ||
| INDUSTRIALS - 19.1% | |||
| Aerospace & Defense - 1.6% | |||
| BWX Technologies, Inc. | 8,985 | 643,056 | |
| Curtiss-Wright Corp. | 4,527 | 831,429 | |
| HEICO Corp. | 635 | 112,357 | |
| HEICO Corp. Class A | 805 | 113,183 | |
| Hexcel Corp. | 9,987 | 759,212 | |
| Howmet Aerospace, Inc. | 44,979 | 2,229,159 | |
| Huntington Ingalls Industries, Inc. | 4,646 | 1,057,430 | |
| Mercury Systems, Inc. (a) | 5,886 | 203,597 | |
| Spirit AeroSystems Holdings, Inc. Class A | 11,131 | 324,914 | |
| Textron, Inc. | 23,874 | 1,614,599 | |
| TransDigm Group, Inc. | 5,169 | 4,621,965 | |
| Woodward, Inc. | 7,010 | 833,559 | |
| 13,344,460 | |||
| Air Freight & Logistics - 0.4% | |||
| C.H. Robinson Worldwide, Inc. | 3,017 | 284,654 | |
| Expeditors International of Washington, Inc. | 15,773 | 1,910,583 | |
| GXO Logistics, Inc. (a) | 13,869 | 871,251 | |
| 3,066,488 | |||
| Building Products - 2.3% | |||
| A.O. Smith Corp. | 12,992 | 945,558 | |
| Allegion PLC | 782 | 93,856 | |
| Armstrong World Industries, Inc. | 3,764 | 276,503 | |
| Builders FirstSource, Inc. (a) | 15,101 | 2,053,736 | |
| Carlisle Companies, Inc. | 6,008 | 1,541,232 | |
| Carrier Global Corp. | 98,854 | 4,914,032 | |
| Fortune Brands Home & Security, Inc. | 14,985 | 1,078,171 | |
| Hayward Holdings, Inc. (a)(b) | 13,115 | 168,528 | |
| Lennox International, Inc. | 3,790 | 1,235,805 | |
| Masco Corp. | 26,665 | 1,530,038 | |
| Owens Corning | 10,647 | 1,389,434 | |
| The AZEK Co., Inc. (a) | 14,554 | 440,841 | |
| Trane Technologies PLC | 19,049 | 3,643,312 | |
| 19,311,046 | |||
| Commercial Services & Supplies - 0.9% | |||
| Cintas Corp. | 1,131 | 562,197 | |
| Clean Harbors, Inc. (a) | 6,085 | 1,000,557 | |
| Driven Brands Holdings, Inc. (a) | 7,380 | 199,703 | |
| MSA Safety, Inc. | 3,628 | 631,127 | |
| RB Global, Inc. | 5,069 | 304,140 | |
| Republic Services, Inc. | 24,508 | 3,753,890 | |
| Stericycle, Inc. (a) | 10,934 | 507,775 | |
| Tetra Tech, Inc. | 5,144 | 842,279 | |
| 7,801,668 | |||
| Construction & Engineering - 0.9% | |||
| AECOM | 15,526 | 1,314,897 | |
| EMCOR Group, Inc. | 3,636 | 671,860 | |
| MasTec, Inc. (a)(b) | 7,370 | 869,439 | |
| MDU Resources Group, Inc. | 23,946 | 501,429 | |
| Quanta Services, Inc. | 12,568 | 2,468,984 | |
| Valmont Industries, Inc. | 2,296 | 668,251 | |
| Willscot Mobile Mini Holdings (a) | 17,442 | 833,553 | |
| 7,328,413 | |||
| Electrical Equipment - 1.4% | |||
| Acuity Brands, Inc. | 3,772 | 615,138 | |
| AMETEK, Inc. | 27,289 | 4,417,543 | |
| Generac Holdings, Inc. (a) | 7,211 | 1,075,376 | |
| Hubbell, Inc. Class B | 3,457 | 1,146,203 | |
| nVent Electric PLC | 19,503 | 1,007,720 | |
| Plug Power, Inc. (a)(b) | 61,683 | 640,886 | |
| Regal Rexnord Corp. | 7,842 | 1,206,884 | |
| Sensata Technologies, Inc. PLC | 17,878 | 804,331 | |
| Sunrun, Inc. (a)(b) | 25,054 | 447,464 | |
| Vertiv Holdings Co. | 35,527 | 880,004 | |
| 12,241,549 | |||
| Ground Transportation - 0.7% | |||
| Avis Budget Group, Inc. (a)(b) | 1,592 | 364,043 | |
| Hertz Global Holdings, Inc. (a) | 15,966 | 293,615 | |
| J.B. Hunt Transport Services, Inc. | 7,835 | 1,418,370 | |
| Knight-Swift Transportation Holdings, Inc. Class A | 18,508 | 1,028,304 | |
| Landstar System, Inc. | 865 | 166,547 | |
| Old Dominion Freight Lines, Inc. | 808 | 298,758 | |
| Ryder System, Inc. | 5,448 | 461,936 | |
| Saia, Inc. (a) | 2,802 | 959,433 | |
| Schneider National, Inc. Class B | 6,503 | 186,766 | |
| U-Haul Holding Co. (b) | 623 | 34,464 | |
| U-Haul Holding Co. (non-vtg.) | 5,946 | 301,284 | |
| XPO, Inc. (a) | 13,502 | 796,618 | |
| 6,310,138 | |||
| Machinery - 6.1% | |||
| AGCO Corp. | 7,419 | 975,005 | |
| Allison Transmission Holdings, Inc. | 9,721 | 548,848 | |
| CNH Industrial NV | 115,915 | 1,669,176 | |
| Crane Co. | 5,696 | 507,628 | |
| Crane Nxt Co. | 5,711 | 322,329 | |
| Cummins, Inc. | 16,823 | 4,124,327 | |
| Donaldson Co., Inc. | 8,409 | 525,647 | |
| Dover Corp. | 16,545 | 2,442,869 | |
| ESAB Corp. | 6,698 | 445,685 | |
| Flowserve Corp. | 15,529 | 576,902 | |
| Fortive Corp. | 41,953 | 3,136,826 | |
| Gates Industrial Corp. PLC (a) | 14,063 | 189,569 | |
| Graco, Inc. | 11,711 | 1,011,245 | |
| IDEX Corp. | 8,241 | 1,773,958 | |
| Ingersoll Rand, Inc. | 48,012 | 3,138,064 | |
| ITT, Inc. | 9,792 | 912,712 | |
| Lincoln Electric Holdings, Inc. | 430 | 85,411 | |
| Middleby Corp. (a) | 6,304 | 931,920 | |
| Nordson Corp. | 6,782 | 1,683,157 | |
| Oshkosh Corp. | 7,725 | 668,908 | |
| Otis Worldwide Corp. | 46,162 | 4,108,880 | |
| PACCAR, Inc. | 60,839 | 5,089,182 | |
| Parker Hannifin Corp. | 15,164 | 5,914,567 | |
| Pentair PLC | 19,453 | 1,256,664 | |
| RBC Bearings, Inc. (a) | 3,350 | 728,525 | |
| Snap-On, Inc. | 6,173 | 1,778,997 | |
| Stanley Black & Decker, Inc. | 18,157 | 1,701,492 | |
| Timken Co. | 7,405 | 677,780 | |
| Westinghouse Air Brake Tech Co. | 21,148 | 2,319,301 | |
| Xylem, Inc. | 24,785 | 2,791,287 | |
| 52,036,861 | |||
| Marine Transportation - 0.1% | |||
| Kirby Corp. (a) | 7,070 | 544,037 | |
| Passenger Airlines - 1.2% | |||
| Alaska Air Group, Inc. (a) | 14,858 | 790,148 | |
| American Airlines Group, Inc. (a) | 48,447 | 869,139 | |
| Delta Air Lines, Inc. | 72,254 | 3,434,955 | |
| Southwest Airlines Co. | 70,513 | 2,553,276 | |
| United Airlines Holdings, Inc. (a) | 38,747 | 2,126,048 | |
| 9,773,566 | |||
| Professional Services - 2.1% | |||
| Broadridge Financial Solutions, Inc. | 2,283 | 378,133 | |
| CACI International, Inc. Class A (a) | 2,675 | 911,747 | |
| Ceridian HCM Holding, Inc. (a)(b) | 15,982 | 1,070,315 | |
| Clarivate Analytics PLC (a) | 55,878 | 532,517 | |
| Concentrix Corp. | 5,213 | 420,950 | |
| CoStar Group, Inc. (a) | 27,337 | 2,432,993 | |
| Dun & Bradstreet Holdings, Inc. | 32,344 | 374,220 | |
| Equifax, Inc. | 4,451 | 1,047,320 | |
| FTI Consulting, Inc. (a) | 3,215 | 611,493 | |
| Genpact Ltd. | 15,956 | 599,467 | |
| Jacobs Solutions, Inc. | 14,921 | 1,773,958 | |
| KBR, Inc. | 10,197 | 663,417 | |
| Leidos Holdings, Inc. | 16,187 | 1,432,226 | |
| Manpower, Inc. | 5,981 | 474,891 | |
| Paycor HCM, Inc. (a)(b) | 3,556 | 84,171 | |
| Robert Half International, Inc. | 12,467 | 937,768 | |
| Science Applications International Corp. | 6,368 | 716,273 | |
| SS&C Technologies Holdings, Inc. | 25,767 | 1,561,480 | |
| TransUnion Holding Co., Inc. | 22,901 | 1,793,835 | |
| 17,817,174 | |||
| Trading Companies & Distributors - 1.4% | |||
| Air Lease Corp. Class A | 12,256 | 512,914 | |
| Core & Main, Inc. (a)(b) | 10,065 | 315,437 | |
| Fastenal Co. | 17,004 | 1,003,066 | |
| Ferguson PLC | 23,158 | 3,642,985 | |
| MSC Industrial Direct Co., Inc. Class A | 5,453 | 519,562 | |
| SiteOne Landscape Supply, Inc. (a) | 3,571 | 597,643 | |
| United Rentals, Inc. | 6,470 | 2,881,544 | |
| Univar Solutions, Inc. (a) | 18,390 | 659,098 | |
| Watsco, Inc. | 2,956 | 1,127,625 | |
| WESCO International, Inc. | 5,245 | 939,170 | |
| 12,199,044 | |||
TOTAL INDUSTRIALS | 161,774,444 | ||
| INFORMATION TECHNOLOGY - 9.7% | |||
| Communications Equipment - 0.5% | |||
| Ciena Corp. (a) | 17,582 | 747,059 | |
| F5, Inc. (a) | 7,145 | 1,045,028 | |
| Juniper Networks, Inc. | 37,738 | 1,182,332 | |
| Lumentum Holdings, Inc. (a) | 8,112 | 460,194 | |
| Ubiquiti, Inc. | 77 | 13,533 | |
| ViaSat, Inc. (a)(b) | 8,543 | 352,484 | |
| 3,800,630 | |||
| Electronic Equipment, Instruments & Components - 2.4% | |||
| Amphenol Corp. Class A | 34,385 | 2,921,006 | |
| Arrow Electronics, Inc. (a) | 6,791 | 972,675 | |
| Avnet, Inc. | 10,762 | 542,943 | |
| CDW Corp. | 932 | 171,022 | |
| Cognex Corp. | 20,478 | 1,147,178 | |
| Coherent Corp. (a)(b) | 14,129 | 720,296 | |
| Corning, Inc. | 90,230 | 3,161,659 | |
| IPG Photonics Corp. (a) | 3,560 | 483,519 | |
| Jabil, Inc. | 5,712 | 616,496 | |
| Keysight Technologies, Inc. (a) | 15,661 | 2,622,434 | |
| Littelfuse, Inc. | 2,867 | 835,186 | |
| National Instruments Corp. | 3,390 | 194,586 | |
| TD SYNNEX Corp. | 4,936 | 463,984 | |
| Teledyne Technologies, Inc. (a) | 5,526 | 2,271,794 | |
| Trimble, Inc. (a) | 29,216 | 1,546,695 | |
| Vontier Corp. | 12,232 | 393,993 | |
| Zebra Technologies Corp. Class A (a) | 4,977 | 1,472,346 | |
| 20,537,812 | |||
| IT Services - 1.5% | |||
| Akamai Technologies, Inc. (a) | 18,249 | 1,640,038 | |
| Amdocs Ltd. | 14,106 | 1,394,378 | |
| Cognizant Technology Solutions Corp. Class A | 60,271 | 3,934,491 | |
| DXC Technology Co. (a) | 26,923 | 719,383 | |
| GoDaddy, Inc. (a) | 7,214 | 541,988 | |
| Kyndryl Holdings, Inc. (a) | 24,344 | 323,288 | |
| Okta, Inc. (a) | 16,670 | 1,156,065 | |
| Twilio, Inc. Class A (a) | 16,762 | 1,066,398 | |
| VeriSign, Inc. (a) | 10,168 | 2,297,663 | |
| 13,073,692 | |||
| Semiconductors & Semiconductor Equipment - 2.8% | |||
| Cirrus Logic, Inc. (a) | 6,553 | 530,859 | |
| Entegris, Inc. | 16,789 | 1,860,557 | |
| First Solar, Inc. (a) | 12,624 | 2,399,696 | |
| GlobalFoundries, Inc. (a)(b) | 9,300 | 600,594 | |
| Marvell Technology, Inc. | 101,402 | 6,061,792 | |
| Microchip Technology, Inc. | 18,316 | 1,640,930 | |
| MKS Instruments, Inc. | 7,868 | 850,531 | |
| ON Semiconductor Corp. (a) | 51,158 | 4,838,524 | |
| Qorvo, Inc. (a) | 11,817 | 1,205,689 | |
| Skyworks Solutions, Inc. | 18,858 | 2,087,392 | |
| Teradyne, Inc. | 3,091 | 344,121 | |
| Universal Display Corp. | 3,039 | 438,011 | |
| Wolfspeed, Inc. (a)(b) | 14,701 | 817,229 | |
| 23,675,925 | |||
| Software - 1.6% | |||
| ANSYS, Inc. (a) | 1,804 | 595,807 | |
| AppLovin Corp. (a) | 20,098 | 517,122 | |
| Aspen Technology, Inc. (a) | 3,313 | 555,292 | |
| Bentley Systems, Inc. Class B | 1,667 | 90,401 | |
| Bill Holdings, Inc. (a) | 12,162 | 1,421,130 | |
| Black Knight, Inc. (a) | 18,381 | 1,097,897 | |
| CCC Intelligent Solutions Holdings, Inc. Class A (a) | 23,890 | 267,807 | |
| Dolby Laboratories, Inc. Class A | 7,025 | 587,852 | |
| Dropbox, Inc. Class A (a) | 3,455 | 92,145 | |
| Gen Digital, Inc. | 55,442 | 1,028,449 | |
| Guidewire Software, Inc. (a) | 9,666 | 735,389 | |
| HashiCorp, Inc. (a) | 3,484 | 91,211 | |
| Informatica, Inc. (a)(b) | 4,655 | 86,118 | |
| nCino, Inc. (a)(b) | 7,545 | 227,255 | |
| NCR Corp. (a) | 15,151 | 381,805 | |
| Nutanix, Inc. Class A (a) | 20,647 | 579,148 | |
| PTC, Inc. (a) | 6,150 | 875,145 | |
| SentinelOne, Inc. (a)(b) | 19,354 | 292,245 | |
| Tyler Technologies, Inc. (a) | 1,206 | 502,263 | |
| UiPath, Inc. Class A (a) | 10,394 | 172,229 | |
| Unity Software, Inc. (a)(b) | 20,653 | 896,753 | |
| Zoom Video Communications, Inc. Class A (a) | 29,320 | 1,990,242 | |
| 13,083,705 | |||
| Technology Hardware, Storage & Peripherals - 0.9% | |||
| Hewlett Packard Enterprise Co. | 153,423 | 2,577,506 | |
| HP, Inc. | 81,598 | 2,505,875 | |
| NetApp, Inc. | 15,271 | 1,166,704 | |
| Pure Storage, Inc. Class A (a) | 7,280 | 268,050 | |
| Western Digital Corp. (a) | 37,888 | 1,437,092 | |
| 7,955,227 | |||
TOTAL INFORMATION TECHNOLOGY | 82,126,991 | ||
| MATERIALS - 7.8% | |||
| Chemicals - 3.9% | |||
| Albemarle Corp. | 13,888 | 3,098,274 | |
| Ashland, Inc. | 5,962 | 518,157 | |
| Axalta Coating Systems Ltd. (a) | 23,419 | 768,377 | |
| Celanese Corp. Class A | 11,719 | 1,357,060 | |
| CF Industries Holdings, Inc. | 23,189 | 1,609,780 | |
| Corteva, Inc. | 84,643 | 4,850,044 | |
| DuPont de Nemours, Inc. | 54,476 | 3,891,765 | |
| Eastman Chemical Co. | 14,057 | 1,176,852 | |
| Element Solutions, Inc. | 26,498 | 508,762 | |
| FMC Corp. | 12,602 | 1,314,893 | |
| Ginkgo Bioworks Holdings, Inc. Class A (a)(b) | 165,688 | 308,180 | |
| Huntsman Corp. | 20,732 | 560,179 | |
| International Flavors & Fragrances, Inc. | 30,286 | 2,410,463 | |
| LyondellBasell Industries NV Class A | 30,693 | 2,818,538 | |
| NewMarket Corp. | 739 | 297,167 | |
| Olin Corp. | 15,307 | 786,627 | |
| PPG Industries, Inc. | 20,858 | 3,093,241 | |
| RPM International, Inc. | 12,199 | 1,094,616 | |
| The Chemours Co. LLC | 17,620 | 650,002 | |
| The Mosaic Co. (b) | 39,247 | 1,373,645 | |
| Westlake Corp. | 3,842 | 459,004 | |
| 32,945,626 | |||
| Construction Materials - 0.7% | |||
| Eagle Materials, Inc. | 1,449 | 270,123 | |
| Martin Marietta Materials, Inc. | 7,324 | 3,381,418 | |
| Vulcan Materials Co. | 12,260 | 2,763,894 | |
| 6,415,435 | |||
| Containers & Packaging - 1.6% | |||
| Amcor PLC | 175,515 | 1,751,640 | |
| Aptargroup, Inc. | 7,754 | 898,378 | |
| Ardagh Group SA (a) | 2,333 | 14,885 | |
| Ardagh Metal Packaging SA | 1,216 | 4,572 | |
| Avery Dennison Corp. | 6,425 | 1,103,815 | |
| Ball Corp. | 36,541 | 2,127,052 | |
| Berry Global Group, Inc. | 14,395 | 926,174 | |
| Crown Holdings, Inc. | 12,579 | 1,092,738 | |
| Graphic Packaging Holding Co. | 16,810 | 403,944 | |
| International Paper Co. | 41,070 | 1,306,437 | |
| Packaging Corp. of America | 10,493 | 1,386,755 | |
| Sealed Air Corp. (b) | 7,633 | 305,320 | |
| Silgan Holdings, Inc. | 9,917 | 465,008 | |
| Sonoco Products Co. | 11,586 | 683,806 | |
| WestRock Co. | 30,106 | 875,181 | |
| 13,345,705 | |||
| Metals & Mining - 1.5% | |||
| Alcoa Corp. | 21,072 | 714,973 | |
| Cleveland-Cliffs, Inc. (a) | 60,254 | 1,009,857 | |
| MP Materials Corp. (a) | 12,348 | 282,522 | |
| Nucor Corp. | 29,870 | 4,898,083 | |
| Reliance Steel & Aluminum Co. | 6,935 | 1,883,477 | |
| Royal Gold, Inc. | 7,774 | 892,300 | |
| SSR Mining, Inc. | 24,489 | 347,254 | |
| Steel Dynamics, Inc. | 19,054 | 2,075,552 | |
| United States Steel Corp. | 26,663 | 666,842 | |
| 12,770,860 | |||
| Paper & Forest Products - 0.1% | |||
| Louisiana-Pacific Corp. | 7,628 | 571,947 | |
TOTAL MATERIALS | 66,049,573 | ||
| REAL ESTATE - 10.1% | |||
| Equity Real Estate Investment Trusts (REITs) - 9.5% | |||
| Agree Realty Corp. | 10,548 | 689,734 | |
| Alexandria Real Estate Equities, Inc. | 20,344 | 2,308,841 | |
| American Homes 4 Rent Class A | 39,487 | 1,399,814 | |
| Americold Realty Trust | 32,016 | 1,034,117 | |
| Apartment Income (REIT) Corp. | 17,627 | 636,158 | |
| AvalonBay Communities, Inc. | 16,578 | 3,137,718 | |
| Boston Properties, Inc. | 18,597 | 1,071,001 | |
| Brixmor Property Group, Inc. | 35,475 | 780,450 | |
| Camden Property Trust (SBI) | 12,303 | 1,339,428 | |
| Cousins Properties, Inc. | 17,969 | 409,693 | |
| CubeSmart | 26,521 | 1,184,428 | |
| Digital Realty Trust, Inc. | 34,492 | 3,927,604 | |
| EastGroup Properties, Inc. | 5,198 | 902,373 | |
| EPR Properties | 8,813 | 412,448 | |
| Equity Lifestyle Properties, Inc. | 14,179 | 948,433 | |
| Equity Residential (SBI) | 44,251 | 2,919,238 | |
| Essex Property Trust, Inc. | 7,572 | 1,774,120 | |
| Extra Space Storage, Inc. | 14,880 | 2,214,888 | |
| Federal Realty Investment Trust (SBI) | 9,584 | 927,444 | |
| First Industrial Realty Trust, Inc. | 15,642 | 823,395 | |
| Gaming & Leisure Properties | 29,848 | 1,446,434 | |
| Healthcare Trust of America, Inc. | 45,029 | 849,247 | |
| Healthpeak Properties, Inc. | 64,889 | 1,304,269 | |
| Highwoods Properties, Inc. (SBI) | 12,359 | 295,504 | |
| Host Hotels & Resorts, Inc. | 83,850 | 1,411,196 | |
| Invitation Homes, Inc. | 72,500 | 2,494,000 | |
| Iron Mountain, Inc. | 17,349 | 985,770 | |
| Kilroy Realty Corp. | 13,853 | 416,837 | |
| Kimco Realty Corp. | 71,751 | 1,414,930 | |
| Lamar Advertising Co. Class A | 2,363 | 234,528 | |
| Life Storage, Inc. | 10,070 | 1,338,907 | |
| Medical Properties Trust, Inc. (b) | 70,363 | 651,561 | |
| Mid-America Apartment Communities, Inc. | 13,770 | 2,091,112 | |
| National Storage Affiliates Trust | 9,479 | 330,154 | |
| NNN (REIT), Inc. | 21,510 | 920,413 | |
| Omega Healthcare Investors, Inc. | 27,769 | 852,231 | |
| Park Hotels & Resorts, Inc. | 26,080 | 334,346 | |
| Rayonier, Inc. | 17,428 | 547,239 | |
| Realty Income Corp. | 78,443 | 4,690,107 | |
| Regency Centers Corp. | 20,188 | 1,247,013 | |
| Rexford Industrial Realty, Inc. | 23,751 | 1,240,277 | |
| SBA Communications Corp. Class A | 11,453 | 2,654,347 | |
| Simon Property Group, Inc. | 30,110 | 3,477,103 | |
| Spirit Realty Capital, Inc. | 16,696 | 657,488 | |
| Stag Industrial, Inc. | 21,280 | 763,526 | |
| Sun Communities, Inc. | 11,396 | 1,486,722 | |
| UDR, Inc. | 36,736 | 1,578,179 | |
| Ventas, Inc. | 47,395 | 2,240,362 | |
| VICI Properties, Inc. | 119,109 | 3,743,596 | |
| Vornado Realty Trust | 20,991 | 380,777 | |
| Welltower, Inc. | 58,963 | 4,769,517 | |
| Weyerhaeuser Co. | 86,883 | 2,911,449 | |
| WP Carey, Inc. | 25,146 | 1,698,864 | |
| 80,299,330 | |||
| Real Estate Management & Development - 0.6% | |||
| CBRE Group, Inc. (a) | 36,752 | 2,966,254 | |
| Howard Hughes Corp. (a) | 3,997 | 315,443 | |
| Jones Lang LaSalle, Inc. (a) | 5,617 | 875,129 | |
| Zillow Group, Inc.: | |||
| Class A (a) | 6,490 | 319,308 | |
| Class C (a) | 18,378 | 923,678 | |
| 5,399,812 | |||
TOTAL REAL ESTATE | 85,699,142 | ||
| UTILITIES - 7.5% | |||
| Electric Utilities - 3.8% | |||
| Alliant Energy Corp. (b) | 29,800 | 1,563,904 | |
| Avangrid, Inc. (b) | 8,440 | 318,019 | |
| Constellation Energy Corp. | 38,875 | 3,559,006 | |
| Edison International | 44,842 | 3,114,277 | |
| Entergy Corp. | 25,109 | 2,444,863 | |
| Evergy, Inc. | 26,412 | 1,542,989 | |
| Eversource Energy | 41,352 | 2,932,684 | |
| FirstEnergy Corp. | 64,605 | 2,511,842 | |
| Hawaiian Electric Industries, Inc. | 13,011 | 470,998 | |
| IDACORP, Inc. | 5,981 | 613,651 | |
| NRG Energy, Inc. | 27,364 | 1,023,140 | |
| OGE Energy Corp. | 23,687 | 850,600 | |
| PG&E Corp. (a) | 213,753 | 3,693,652 | |
| Pinnacle West Capital Corp. | 13,425 | 1,093,601 | |
| PPL Corp. | 87,565 | 2,316,970 | |
| Xcel Energy, Inc. | 65,383 | 4,064,861 | |
| 32,115,057 | |||
| Gas Utilities - 0.4% | |||
| Atmos Energy Corp. | 17,097 | 1,989,065 | |
| National Fuel Gas Co. | 10,526 | 540,615 | |
| UGI Corp. | 24,760 | 667,777 | |
| 3,197,457 | |||
| Independent Power and Renewable Electricity Producers - 0.3% | |||
| Brookfield Renewable Corp. | 15,164 | 477,969 | |
| Clearway Energy, Inc.: | |||
| Class A | 4,302 | 116,154 | |
| Class C | 9,552 | 272,805 | |
| The AES Corp. | 30,798 | 638,443 | |
| Vistra Corp. | 31,553 | 828,266 | |
| 2,333,637 | |||
| Multi-Utilities - 2.5% | |||
| Ameren Corp. | 31,068 | 2,537,324 | |
| CenterPoint Energy, Inc. | 74,863 | 2,182,256 | |
| CMS Energy Corp. (b) | 34,497 | 2,026,699 | |
| Consolidated Edison, Inc. | 41,183 | 3,722,943 | |
| DTE Energy Co. | 24,444 | 2,689,329 | |
| NiSource, Inc. | 49,029 | 1,340,943 | |
| Public Service Enterprise Group, Inc. | 59,017 | 3,695,054 | |
| WEC Energy Group, Inc. (b) | 37,445 | 3,304,147 | |
| 21,498,695 | |||
| Water Utilities - 0.5% | |||
| American Water Works Co., Inc. | 23,119 | 3,300,237 | |
| Essential Utilities, Inc. | 28,783 | 1,148,730 | |
| 4,448,967 | |||
TOTAL UTILITIES | 63,593,813 | ||
| TOTAL COMMON STOCKS (Cost $704,313,863) | 844,432,757 | ||
| U.S. Treasury Obligations - 0.0% | |||
Principal Amount (c) | Value ($) | ||
U.S. Treasury Bills, yield at date of purchase 5.18% 9/7/23 (d) (Cost $99,031) | 100,000 | 99,059 | |
| Money Market Funds - 5.3% | |||
| Shares | Value ($) | ||
| Fidelity Cash Central Fund 5.14% (e) | 596,337 | 596,456 | |
| Fidelity Securities Lending Cash Central Fund 5.14% (e)(f) | 44,018,345 | 44,022,747 | |
| TOTAL MONEY MARKET FUNDS (Cost $44,619,203) | 44,619,203 | ||
| TOTAL INVESTMENT IN SECURITIES - 105.1% (Cost $749,032,097) | 889,151,019 |
NET OTHER ASSETS (LIABILITIES) - (5.1)% | (42,812,812) |
| NET ASSETS - 100.0% | 846,338,207 |
| Futures Contracts | |||||
Number of contracts | Expiration Date | Notional Amount ($) | Value ($) | Unrealized Appreciation/ (Depreciation) ($) | |
| Purchased | |||||
| Equity Index Contracts | |||||
| CME E-mini S&P MidCap 400 Index Contracts (United States) | 7 | Sep 2023 | 1,850,870 | 26,904 | 26,904 |
| The notional amount of futures purchased as a percentage of Net Assets is 0.2% | |||||
| (a) | Non-income producing |
| (b) | Security or a portion of the security is on loan at period end. |
| (c) | Amount is stated in United States dollars unless otherwise noted. |
| (d) | Security or a portion of the security was pledged to cover margin requirements for futures contracts. At period end, the value of securities pledged amounted to $99,059. |
| (e) | Affiliated fund that is generally available only to investment companies and other accounts managed by Fidelity Investments. The rate quoted is the annualized seven-day yield of the fund at period end. A complete unaudited listing of the fund's holdings as of its most recent quarter end is available upon request. In addition, each Fidelity Central Fund's financial statements, which are not covered by the Fund's Report of Independent Registered Public Accounting Firm, are available on the SEC's website or upon request. |
| (f) | Investment made with cash collateral received from securities on loan. |
| Affiliate | Value, beginning of period ($) | Purchases ($) | Sales Proceeds ($) | Dividend Income ($) | Realized Gain (loss) ($) | Change in Unrealized appreciation (depreciation) ($) | Value, end of period ($) | % ownership, end of period |
| Fidelity Cash Central Fund 5.14% | - | 137,431,652 | 136,835,196 | 73,419 | - | - | 596,456 | 0.0% |
| Fidelity Securities Lending Cash Central Fund 5.14% | 23,207,975 | 194,456,455 | 173,641,683 | 514,617 | - | - | 44,022,747 | 0.2% |
| Total | 23,207,975 | 331,888,107 | 310,476,879 | 588,036 | - | - | 44,619,203 | |
| Valuation Inputs at Reporting Date: | ||||
| Description | Total ($) | Level 1 ($) | Level 2 ($) | Level 3 ($) |
Investments in Securities: | ||||
| Equities: | ||||
Communication Services | 29,061,557 | 29,061,557 | - | - |
Consumer Discretionary | 79,625,806 | 79,625,806 | - | - |
Consumer Staples | 35,354,727 | 35,354,727 | - | - |
Energy | 42,193,701 | 42,193,701 | - | - |
Financials | 135,068,820 | 135,068,820 | - | - |
Health Care | 63,884,183 | 63,884,183 | - | - |
Industrials | 161,774,444 | 161,774,444 | - | - |
Information Technology | 82,126,991 | 82,126,991 | - | - |
Materials | 66,049,573 | 66,049,573 | - | - |
Real Estate | 85,699,142 | 85,699,142 | - | - |
Utilities | 63,593,813 | 63,593,813 | - | - |
| U.S. Government and Government Agency Obligations | 99,059 | - | 99,059 | - |
| Money Market Funds | 44,619,203 | 44,619,203 | - | - |
| Total Investments in Securities: | 889,151,019 | 889,051,960 | 99,059 | - |
Derivative Instruments: | ||||
| Assets | ||||
Futures Contracts | 26,904 | 26,904 | - | - |
| Total Assets | 26,904 | 26,904 | - | - |
| Total Derivative Instruments: | 26,904 | 26,904 | - | - |
Primary Risk Exposure / Derivative Type | Value | |
| Asset ($) | Liability ($) | |
| Equity Risk | ||
Futures Contracts (a) | 26,904 | 0 |
| Total Equity Risk | 26,904 | 0 |
| Total Value of Derivatives | 26,904 | 0 |
| Statement of Assets and Liabilities | ||||
| June 30, 2023 | ||||
| Assets | ||||
| Investment in securities, at value (including securities loaned of $43,583,370) - See accompanying schedule: | ||||
Unaffiliated issuers (cost $704,412,894) | $ | 844,531,816 | ||
Fidelity Central Funds (cost $44,619,203) | 44,619,203 | |||
| Total Investment in Securities (cost $749,032,097) | $ | 889,151,019 | ||
| Segregated cash with brokers for derivative instruments | 11,738 | |||
| Cash | 15,092 | |||
| Receivable for fund shares sold | 216,602 | |||
| Dividends receivable | 1,232,922 | |||
| Distributions receivable from Fidelity Central Funds | 40,061 | |||
| Receivable for daily variation margin on futures contracts | 11,550 | |||
| Other receivables | 6,349 | |||
Total assets | 890,685,333 | |||
| Liabilities | ||||
| Payable for fund shares redeemed | $ | 289,867 | ||
| Accrued management fee | 34,338 | |||
| Other payables and accrued expenses | 174 | |||
| Collateral on securities loaned | 44,022,747 | |||
| Total Liabilities | 44,347,126 | |||
| Net Assets | $ | 846,338,207 | ||
| Net Assets consist of: | ||||
| Paid in capital | $ | 707,538,840 | ||
| Total accumulated earnings (loss) | 138,799,367 | |||
| Net Assets | $ | 846,338,207 | ||
Net Asset Value , offering price and redemption price per share ($846,338,207 ÷ 35,368,459 shares) | $ | 23.93 | ||
| Statement of Operations | ||||
Year ended June 30, 2023 | ||||
| Investment Income | ||||
| Dividends | $ | 17,234,664 | ||
| Interest | 4,040 | |||
| Income from Fidelity Central Funds (including $514,617 from security lending) | 588,036 | |||
| Total Income | 17,826,740 | |||
| Expenses | ||||
| Management fee | $ | 401,565 | ||
| Independent trustees' fees and expenses | 2,766 | |||
| Interest | 15,194 | |||
| Total expenses before reductions | 419,525 | |||
| Expense reductions | (974) | |||
| Total expenses after reductions | 418,551 | |||
| Net Investment income (loss) | 17,408,189 | |||
| Realized and Unrealized Gain (Loss) | ||||
| Net realized gain (loss) on: | ||||
| Investment Securities: | ||||
| Unaffiliated issuers | 1,130,079 | |||
| Futures contracts | 14,682 | |||
| Total net realized gain (loss) | 1,144,761 | |||
| Change in net unrealized appreciation (depreciation) on: | ||||
| Investment Securities: | ||||
| Unaffiliated issuers | 64,951,372 | |||
| Futures contracts | 316 | |||
| Total change in net unrealized appreciation (depreciation) | 64,951,688 | |||
| Net gain (loss) | 66,096,449 | |||
| Net increase (decrease) in net assets resulting from operations | $ | 83,504,638 | ||
| Statement of Changes in Net Assets | ||||
Year ended June 30, 2023 | Year ended June 30, 2022 | |||
| Increase (Decrease) in Net Assets | ||||
| Operations | ||||
| Net investment income (loss) | $ | 17,408,189 | $ | 16,663,664 |
| Net realized gain (loss) | 1,144,761 | 7,609,877 | ||
| Change in net unrealized appreciation (depreciation) | 64,951,688 | (123,503,389) | ||
| Net increase (decrease) in net assets resulting from operations | 83,504,638 | (99,229,848) | ||
| Distributions to shareholders | (21,922,393) | (53,176,354) | ||
| Share transactions | ||||
| Proceeds from sales of shares | 250,959,317 | 411,832,421 | ||
| Reinvestment of distributions | 7,596,612 | 21,077,325 | ||
| Cost of shares redeemed | (270,893,428) | (392,096,125) | ||
Net increase (decrease) in net assets resulting from share transactions | (12,337,499) | 40,813,621 | ||
| Total increase (decrease) in net assets | 49,244,746 | (111,592,581) | ||
| Net Assets | ||||
| Beginning of period | 797,093,461 | 908,686,042 | ||
| End of period | $ | 846,338,207 | $ | 797,093,461 |
| Other Information | ||||
| Shares | ||||
| Sold | 10,842,771 | 16,157,682 | ||
| Issued in reinvestment of distributions | 327,643 | 830,362 | ||
| Redeemed | (11,650,806) | (15,833,117) | ||
| Net increase (decrease) | (480,392) | 1,154,927 | ||
| Fidelity® Mid Cap Value Index Fund |
| Years ended June 30, | 2023 | 2022 | 2021 | 2020 A | ||||
Selected Per-Share Data | ||||||||
| Net asset value, beginning of period | $ | 22.23 | $ | 26.19 | $ | 17.36 | $ | 20.00 |
| Income from Investment Operations | ||||||||
Net investment income (loss) B,C | .50 | .43 | .41 | .46 | ||||
| Net realized and unrealized gain (loss) | 1.82 | (2.90) | 8.69 | (2.97) | ||||
| Total from investment operations | 2.32 | (2.47) | 9.10 | (2.51) | ||||
| Distributions from net investment income | (.45) | (.39) | (.27) | (.13) | ||||
| Distributions from net realized gain | (.17) | (1.11) | - | - | ||||
| Total distributions | (.62) | (1.49) D | (.27) | (.13) | ||||
| Net asset value, end of period | $ | 23.93 | $ | 22.23 | $ | 26.19 | $ | 17.36 |
Total Return E,F | 10.56% | (10.08)% | 52.83% | (12.65)% | ||||
Ratios to Average Net Assets C,G,H | ||||||||
| Expenses before reductions | .05% | .05% | .05% | .05% I | ||||
| Expenses net of fee waivers, if any | .05% | .05% | .05% | .05% I | ||||
| Expenses net of all reductions | .05% | .05% | .05% | .05% I | ||||
| Net investment income (loss) | 2.17% | 1.70% | 1.80% | 2.82% I | ||||
| Supplemental Data | ||||||||
| Net assets, end of period (000 omitted) | $ | 846,338 | $ | 797,093 | $ | 908,686 | $ | 249,744 |
Portfolio turnover rate J | 30% | 41% | 32% | 89% I |
| Average Annual Total Returns | |||
Periods ended June 30, 2023 | Past 1 year | Life of Fund A |
| Fidelity® Small Cap Growth Index Fund | 18.78% | 5.59% |
| $10,000 Over Life of Fund |
Let's say hypothetically that $10,000 was invested in Fidelity® Small Cap Growth Index Fund, on July 11, 2019, when the fund started. The chart shows how the value of your investment would have changed, and also shows how the Russell 2000® Growth Index performed over the same period. |
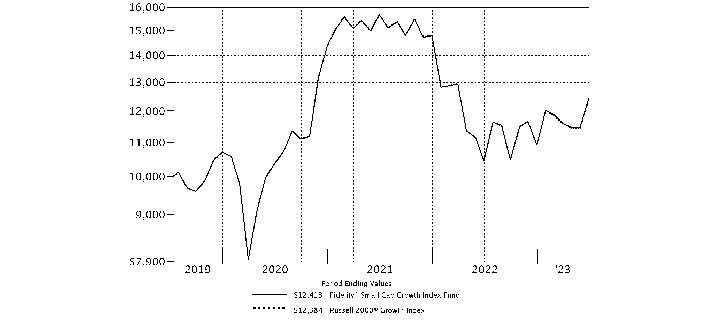 |
Top Holdings (% of Fund's net assets) | ||
| Super Micro Computer, Inc. | 1.0 | |
| SPS Commerce, Inc. | 0.6 | |
| Rambus, Inc. | 0.6 | |
| Novanta, Inc. | 0.5 | |
| Championx Corp. | 0.5 | |
| Atkore, Inc. | 0.5 | |
| Axcelis Technologies, Inc. | 0.5 | |
| Simpson Manufacturing Co. Ltd. | 0.5 | |
| Intra-Cellular Therapies, Inc. | 0.5 | |
| Comfort Systems U.S.A., Inc. | 0.5 | |
| 5.7 | ||
| Market Sectors (% of Fund's net assets) | ||
| Health Care | 23.6 | |
| Information Technology | 20.9 | |
| Industrials | 19.9 | |
| Consumer Discretionary | 10.7 | |
| Financials | 5.9 | |
| Energy | 4.5 | |
| Materials | 4.3 | |
| Consumer Staples | 4.2 | |
| Communication Services | 2.1 | |
| Utilities | 1.6 | |
| Real Estate | 1.6 | |
Asset Allocation (% of Fund's net assets) |
 |
Futures - 0.6% |
| Common Stocks - 99.3% | |||
| Shares | Value ($) | ||
| COMMUNICATION SERVICES - 2.1% | |||
| Diversified Telecommunication Services - 0.4% | |||
| Anterix, Inc. (a) | 7,161 | 226,932 | |
| AST SpaceMobile, Inc. (a)(b) | 25,989 | 122,148 | |
| Bandwidth, Inc. (a) | 2,333 | 31,915 | |
| Charge Enterprises, Inc. (a) | 57,757 | 56,602 | |
| Cogent Communications Group, Inc. | 11,764 | 791,600 | |
| Consolidated Communications Holdings, Inc. (a) | 3,688 | 14,125 | |
| Globalstar, Inc. (a)(b) | 263,625 | 284,715 | |
| IDT Corp. Class B (a) | 5,122 | 132,404 | |
| Ooma, Inc. (a) | 10,230 | 153,143 | |
| 1,813,584 | |||
| Entertainment - 0.5% | |||
| Cinemark Holdings, Inc. (a)(b) | 39,609 | 653,549 | |
| IMAX Corp. (a) | 19,564 | 332,392 | |
| Liberty Media Corp. Liberty Braves: | |||
| Class A (a)(b) | 4,248 | 173,828 | |
| Class C (a) | 16,245 | 643,627 | |
| Lions Gate Entertainment Corp.: | |||
| Class A (a) | 17,580 | 155,231 | |
| Class B (a) | 33,752 | 281,829 | |
| Loop Media, Inc. (a) | 15,636 | 37,370 | |
| Madison Square Garden Entertainment Corp. | 15,984 | 537,382 | |
| Vivid Seats, Inc. Class A (a) | 3,384 | 26,801 | |
| 2,842,009 | |||
| Interactive Media & Services - 0.9% | |||
| CarGurus, Inc. Class A (a) | 42,217 | 955,371 | |
| Cars.com, Inc. (a) | 28,826 | 571,331 | |
| Eventbrite, Inc. (a) | 30,522 | 291,485 | |
| EverQuote, Inc. Class A (a) | 8,300 | 53,950 | |
| Grindr, Inc. (a) | 17,590 | 97,273 | |
| Liberty TripAdvisor Holdings, Inc. (a) | 113 | 5,269 | |
| MediaAlpha, Inc. Class A (a) | 9,138 | 94,213 | |
| Nextdoor Holdings, Inc. (a) | 37,270 | 121,500 | |
| QuinStreet, Inc. (a) | 22,289 | 196,812 | |
| Shutterstock, Inc. | 10,692 | 520,380 | |
| Vimeo, Inc. (a) | 8,434 | 34,748 | |
| Yelp, Inc. (a) | 29,035 | 1,057,164 | |
| Ziff Davis, Inc. (a) | 4,667 | 326,970 | |
| ZipRecruiter, Inc. (a)(b) | 30,223 | 536,760 | |
| 4,863,226 | |||
| Media - 0.3% | |||
| Boston Omaha Corp. (a) | 698 | 13,136 | |
| Daily Journal Corp. (a) | 107 | 30,953 | |
| E.W. Scripps Co. Class A (a) | 12,019 | 109,974 | |
| Entravision Communication Corp. Class A | 25,805 | 113,284 | |
| Gambling.com Group Ltd. (a) | 4,572 | 46,817 | |
| Gray Television, Inc. | 2,340 | 18,439 | |
| Integral Ad Science Holding Corp. (a) | 16,476 | 296,238 | |
| Magnite, Inc. (a) | 24,724 | 337,483 | |
| PubMatic, Inc. (a) | 3,338 | 61,019 | |
| Sinclair, Inc. Class A (b) | 2,413 | 33,348 | |
| TechTarget, Inc. (a) | 11,345 | 353,170 | |
| Townsquare Media, Inc. | 5,009 | 59,657 | |
| 1,473,518 | |||
| Wireless Telecommunication Services - 0.0% | |||
| Gogo, Inc. (a) | 2,590 | 44,056 | |
TOTAL COMMUNICATION SERVICES | 11,036,393 | ||
| CONSUMER DISCRETIONARY - 10.7% | |||
| Automobile Components - 1.6% | |||
| Cooper-Standard Holding, Inc. (a) | 2,242 | 31,971 | |
| Dorman Products, Inc. (a) | 11,369 | 896,218 | |
| Fox Factory Holding Corp. (a) | 18,434 | 2,000,273 | |
| Gentherm, Inc. (a) | 14,300 | 808,093 | |
| LCI Industries (b) | 4,039 | 510,368 | |
| Luminar Technologies, Inc. (a)(b) | 117,684 | 809,666 | |
| Modine Manufacturing Co. (a) | 14,286 | 471,724 | |
| Patrick Industries, Inc. | 1,127 | 90,160 | |
| Stoneridge, Inc. (a) | 2,112 | 39,811 | |
| Visteon Corp. (a) | 12,156 | 1,745,723 | |
| XPEL, Inc. (a) | 9,767 | 822,577 | |
| 8,226,584 | |||
| Automobiles - 0.1% | |||
| Fisker, Inc. (a)(b) | 85,075 | 479,823 | |
| LiveWire Group, Inc. (b) | 4,727 | 55,826 | |
| Workhorse Group, Inc. (a)(b) | 3,584 | 3,124 | |
| 538,773 | |||
| Broadline Retail - 0.1% | |||
| Dillard's, Inc. Class A | 1,568 | 511,607 | |
| Qurate Retail, Inc. (a) | 745 | 6,184 | |
| 517,791 | |||
| Diversified Consumer Services - 1.3% | |||
| 2U, Inc. (a) | 1,702 | 6,859 | |
| Carriage Services, Inc. | 5,753 | 186,800 | |
| Chegg, Inc. (a) | 44,361 | 393,926 | |
| Coursera, Inc. (a) | 56,263 | 732,544 | |
| Duolingo, Inc. (a) | 12,406 | 1,773,314 | |
| European Wax Center, Inc. (a)(b) | 13,739 | 255,958 | |
| Frontdoor, Inc. (a) | 35,639 | 1,136,884 | |
| Laureate Education, Inc. Class A | 47,884 | 578,918 | |
| Nerdy, Inc. Class A (a)(b) | 25,421 | 106,006 | |
| OneSpaWorld Holdings Ltd. (a) | 31,735 | 383,994 | |
| Rover Group, Inc. Class A (a) | 39,844 | 195,634 | |
| Stride, Inc. (a) | 18,337 | 682,687 | |
| Udemy, Inc. (a) | 37,274 | 399,950 | |
| Universal Technical Institute, Inc. (a) | 2,508 | 17,330 | |
| 6,850,804 | |||
| Hotels, Restaurants & Leisure - 3.8% | |||
| Accel Entertainment, Inc. (a) | 23,136 | 244,316 | |
| Bally's Corp. (a) | 6,924 | 107,737 | |
| BJ's Restaurants, Inc. (a) | 6,142 | 195,316 | |
| Bloomin' Brands, Inc. | 37,810 | 1,016,711 | |
| Bluegreen Vacations Holding Corp. Class A | 3,702 | 131,976 | |
| Bowlero Corp. Class A (a) | 10,772 | 125,386 | |
| Brinker International, Inc. (a) | 17,446 | 638,524 | |
| Century Casinos, Inc. (a) | 10,173 | 72,228 | |
| Chuy's Holdings, Inc. (a) | 6,362 | 259,697 | |
| Cracker Barrel Old Country Store, Inc. (b) | 9,523 | 887,353 | |
| Dave & Buster's Entertainment, Inc. (a) | 18,726 | 834,431 | |
| Denny's Corp. (a) | 18,159 | 223,719 | |
| Dine Brands Global, Inc. | 6,120 | 355,144 | |
| Everi Holdings, Inc. (a) | 22,710 | 328,387 | |
| First Watch Restaurant Group, Inc. (a) | 2,685 | 45,377 | |
| Full House Resorts, Inc. (a) | 12,204 | 81,767 | |
| Global Business Travel Group, Inc. (a) | 13,841 | 100,070 | |
| Golden Entertainment, Inc. (a) | 8,806 | 368,091 | |
| Hilton Grand Vacations, Inc. (a) | 35,194 | 1,599,215 | |
| Inspired Entertainment, Inc. (a) | 9,311 | 136,965 | |
| International Game Technology PLC | 46,969 | 1,497,841 | |
| Jack in the Box, Inc. | 8,967 | 874,552 | |
| Krispy Kreme, Inc. (b) | 12,023 | 177,099 | |
| Kura Sushi U.S.A., Inc. Class A (a)(b) | 2,503 | 232,654 | |
| Life Time Group Holdings, Inc. (a) | 5,941 | 116,859 | |
| Light & Wonder, Inc. Class A (a) | 18,547 | 1,275,292 | |
| Lindblad Expeditions Holdings (a) | 1,489 | 16,200 | |
| Monarch Casino & Resort, Inc. | 5,852 | 412,273 | |
| Mondee Holdings, Inc. (a) | 16,727 | 149,038 | |
| Nathan's Famous, Inc. | 1,092 | 85,766 | |
| Noodles & Co. (a) | 18,149 | 61,344 | |
| Papa John's International, Inc. | 11,743 | 866,986 | |
| PlayAGS, Inc. (a) | 15,843 | 89,513 | |
| Portillo's, Inc. (a) | 18,448 | 415,633 | |
| Potbelly Corp. (a) | 11,196 | 98,301 | |
| RCI Hospitality Holdings, Inc. | 3,673 | 279,111 | |
| Red Robin Gourmet Burgers, Inc. (a) | 6,810 | 94,182 | |
| Red Rock Resorts, Inc. | 11,121 | 520,240 | |
| Rush Street Interactive, Inc. (a) | 27,016 | 84,290 | |
| Sabre Corp. (a)(b) | 35,167 | 112,183 | |
| SeaWorld Entertainment, Inc. (a) | 16,328 | 914,531 | |
| Shake Shack, Inc. Class A (a) | 16,352 | 1,270,877 | |
| Six Flags Entertainment Corp. (a) | 24,779 | 643,758 | |
| Super Group SGHC Ltd. (a) | 58,527 | 169,728 | |
| Sweetgreen, Inc. Class A (a) | 33,773 | 432,970 | |
| Target Hospitality Corp. (a) | 13,411 | 179,976 | |
| The Cheesecake Factory, Inc. (b) | 20,975 | 725,316 | |
| The ONE Group Hospitality, Inc. (a)(b) | 9,319 | 68,215 | |
| Xponential Fitness, Inc. (a) | 9,055 | 156,199 | |
| 19,773,337 | |||
| Household Durables - 1.1% | |||
| Cavco Industries, Inc. (a) | 3,790 | 1,118,050 | |
| Cricut, Inc. (b) | 20,516 | 250,295 | |
| Dream Finders Homes, Inc. (a)(b) | 4,219 | 103,745 | |
| Green Brick Partners, Inc. (a) | 3,713 | 210,898 | |
| Installed Building Products, Inc. | 10,259 | 1,437,901 | |
| iRobot Corp. (a)(b) | 10,761 | 486,935 | |
| LGI Homes, Inc. (a) | 679 | 91,590 | |
| Lovesac (a)(b) | 6,020 | 162,239 | |
| Skyline Champion Corp. (a) | 12,936 | 846,661 | |
| Sonos, Inc. (a)(b) | 54,843 | 895,586 | |
| Vizio Holding Corp. (a) | 28,987 | 195,662 | |
| 5,799,562 | |||
| Leisure Products - 0.4% | |||
| Acushnet Holdings Corp. | 13,492 | 737,743 | |
| Clarus Corp. (b) | 975 | 8,912 | |
| Escalade, Inc. | 357 | 4,766 | |
| Funko, Inc. (a)(b) | 10,262 | 111,035 | |
| Malibu Boats, Inc. Class A (a) | 5,381 | 315,649 | |
| Marine Products Corp. | 3,610 | 60,865 | |
| MasterCraft Boat Holdings, Inc. (a) | 7,519 | 230,457 | |
| Solo Brands, Inc. Class A (a) | 7,014 | 39,699 | |
| Sturm, Ruger & Co., Inc. | 7,032 | 372,415 | |
| 1,881,541 | |||
| Specialty Retail - 1.6% | |||
| Abercrombie & Fitch Co. Class A (a) | 10,984 | 413,877 | |
| Academy Sports & Outdoors, Inc. | 32,281 | 1,744,788 | |
| American Eagle Outfitters, Inc. | 17,643 | 208,187 | |
| Arko Corp. | 35,351 | 281,040 | |
| Boot Barn Holdings, Inc. (a) | 12,834 | 1,086,911 | |
| Build-A-Bear Workshop, Inc. | 4,463 | 95,597 | |
| Camping World Holdings, Inc. (b) | 18,121 | 545,442 | |
| CarParts.com, Inc. (a) | 22,782 | 96,824 | |
| Carvana Co. Class A (a)(b) | 18,311 | 474,621 | |
| Duluth Holdings, Inc. (a)(b) | 347 | 2,179 | |
| Envela Corp. (a) | 3,252 | 23,935 | |
| EVgo, Inc. Class A (a)(b) | 4,367 | 17,468 | |
| Franchise Group, Inc. (b) | 9,238 | 264,576 | |
| Guess?, Inc. (b) | 1,407 | 27,366 | |
| Hibbett, Inc. | 4,495 | 163,124 | |
| Leslie's, Inc. (a) | 6,557 | 61,570 | |
| National Vision Holdings, Inc. (a) | 2,333 | 56,669 | |
| Rent the Runway, Inc. Class A (a) | 1,241 | 2,457 | |
| Revolve Group, Inc. (a)(b) | 17,607 | 288,755 | |
| Sally Beauty Holdings, Inc. (a) | 43,801 | 540,942 | |
| Sleep Number Corp. (a)(b) | 4,869 | 132,826 | |
| Stitch Fix, Inc. (a)(b) | 17,262 | 66,459 | |
| The Buckle, Inc. | 13,249 | 458,415 | |
| thredUP, Inc. (a) | 5,573 | 13,598 | |
| Torrid Holdings, Inc. (a)(b) | 5,178 | 14,550 | |
| Upbound Group, Inc. | 22,348 | 695,693 | |
| Urban Outfitters, Inc. (a) | 9,202 | 304,862 | |
| Warby Parker, Inc. (a)(b) | 36,807 | 430,274 | |
| 8,513,005 | |||
| Textiles, Apparel & Luxury Goods - 0.7% | |||
| Hanesbrands, Inc. | 101,720 | 461,809 | |
| Kontoor Brands, Inc. | 24,003 | 1,010,526 | |
| Oxford Industries, Inc. | 4,910 | 483,242 | |
| Rocky Brands, Inc. | 372 | 7,812 | |
| Steven Madden Ltd. | 32,475 | 1,061,608 | |
| Wolverine World Wide, Inc. | 30,492 | 447,927 | |
| 3,472,924 | |||
TOTAL CONSUMER DISCRETIONARY | 55,574,321 | ||
| CONSUMER STAPLES - 4.2% | |||
| Beverages - 0.6% | |||
| Coca-Cola Bottling Co. Consolidated | 2,066 | 1,314,017 | |
| Duckhorn Portfolio, Inc. (a) | 3,656 | 47,418 | |
| MGP Ingredients, Inc. | 6,855 | 728,549 | |
| National Beverage Corp. (a)(b) | 10,275 | 496,796 | |
| Primo Water Corp. | 9,333 | 117,036 | |
| The Vita Coco Co., Inc. (a) | 12,450 | 334,532 | |
| Zevia PBC (a) | 6,127 | 26,407 | |
| 3,064,755 | |||
| Consumer Staples Distribution & Retail - 0.5% | |||
| Chefs' Warehouse Holdings (a) | 15,245 | 545,161 | |
| PriceSmart, Inc. | 7,882 | 583,741 | |
| Sprouts Farmers Market LLC (a) | 44,799 | 1,645,467 | |
| 2,774,369 | |||
| Food Products - 1.5% | |||
| Beyond Meat, Inc. (a)(b) | 25,433 | 330,120 | |
| BRC, Inc. Class A (a)(b) | 14,744 | 76,079 | |
| Cal-Maine Foods, Inc. | 15,464 | 695,880 | |
| Calavo Growers, Inc. | 7,424 | 215,444 | |
| Dole PLC | 17,402 | 235,275 | |
| Hostess Brands, Inc. Class A (a) | 10,601 | 268,417 | |
| J&J Snack Foods Corp. | 6,502 | 1,029,657 | |
| John B. Sanfilippo & Son, Inc. | 3,888 | 455,946 | |
| Lancaster Colony Corp. | 8,444 | 1,698,004 | |
| Mission Produce, Inc. (a) | 2,928 | 35,487 | |
| Sovos Brands, Inc. (a) | 17,286 | 338,114 | |
| SunOpta, Inc. (a) | 37,500 | 250,875 | |
| The Simply Good Foods Co. (a) | 39,291 | 1,437,658 | |
| TreeHouse Foods, Inc. (a) | 2,674 | 134,716 | |
| Utz Brands, Inc. Class A | 31,209 | 510,579 | |
| Vital Farms, Inc. (a) | 13,099 | 157,057 | |
| Westrock Coffee Holdings | 12,186 | 132,462 | |
| 8,001,770 | |||
| Household Products - 0.4% | |||
| Energizer Holdings, Inc. | 30,925 | 1,038,462 | |
| Oil-Dri Corp. of America | 547 | 32,268 | |
| WD-40 Co. | 5,882 | 1,109,639 | |
| 2,180,369 | |||
| Personal Care Products - 1.1% | |||
| BellRing Brands, Inc. (a) | 15,504 | 567,446 | |
| elf Beauty, Inc. (a) | 21,693 | 2,477,991 | |
| Herbalife Ltd. (a) | 31,462 | 416,557 | |
| Inter Parfums, Inc. | 7,916 | 1,070,481 | |
| MediFast, Inc. | 4,661 | 429,558 | |
| The Beauty Health Co. (a)(b) | 35,096 | 293,754 | |
| Thorne HealthTech, Inc. (a) | 3,303 | 15,524 | |
| USANA Health Sciences, Inc. (a) | 4,878 | 307,509 | |
| 5,578,820 | |||
| Tobacco - 0.1% | |||
| Ispire Technology, Inc. (b) | 1,172 | 10,689 | |
| Turning Point Brands, Inc. | 7,349 | 176,449 | |
| Vector Group Ltd. | 10,793 | 138,258 | |
| 325,396 | |||
TOTAL CONSUMER STAPLES | 21,925,479 | ||
| ENERGY - 4.5% | |||
| Energy Equipment & Services - 2.5% | |||
| Archrock, Inc. | 10,673 | 109,398 | |
| Atlas Energy Solutions, Inc. | 1,199 | 20,815 | |
| Borr Drilling Ltd. (a)(b) | 98,918 | 744,853 | |
| Cactus, Inc. | 27,998 | 1,184,875 | |
| Championx Corp. | 86,027 | 2,670,278 | |
| Core Laboratories, Inc. | 6,437 | 149,660 | |
| DMC Global, Inc. (a) | 2,596 | 46,105 | |
| Expro Group Holdings NV (a) | 14,191 | 251,465 | |
| KLX Energy Services Holdings, Inc. (a)(b) | 559 | 5,439 | |
| Liberty Oilfield Services, Inc. Class A | 4,396 | 58,775 | |
| Nabors Industries Ltd. (a) | 3,600 | 334,908 | |
| Nextier Oilfield Solutions, Inc. (a) | 11,600 | 103,704 | |
| Noble Corp. PLC | 38,598 | 1,594,483 | |
| Oceaneering International, Inc. (a) | 43,409 | 811,748 | |
| ProFrac Holding Corp. (a)(b) | 2,391 | 26,684 | |
| Solaris Oilfield Infrastructure, Inc. Class A (b) | 1,028 | 8,563 | |
| TETRA Technologies, Inc. (a) | 53,747 | 181,665 | |
| Tidewater, Inc. (a) | 20,503 | 1,136,686 | |
| Valaris Ltd. (a) | 26,545 | 1,670,477 | |
| Weatherford International PLC (a) | 30,776 | 2,044,142 | |
| 13,154,723 | |||
| Oil, Gas & Consumable Fuels - 2.0% | |||
| Crescent Energy, Inc. Class A (b) | 6,417 | 66,865 | |
| CVR Energy, Inc. (b) | 11,776 | 352,809 | |
| Denbury, Inc. (a) | 21,741 | 1,875,379 | |
| Dorian LPG Ltd. | 8,095 | 207,637 | |
| Empire Petroleum Corp. (a) | 4,471 | 40,686 | |
| Energy Fuels, Inc. (a)(b) | 58,918 | 367,648 | |
| Enviva, Inc. | 13,424 | 145,650 | |
| Equitrans Midstream Corp. | 54,900 | 524,844 | |
| Evolution Petroleum Corp. | 13,511 | 109,034 | |
| Excelerate Energy, Inc. | 6,052 | 123,037 | |
| FLEX LNG Ltd. | 8,613 | 262,955 | |
| Golar LNG Ltd. | 2,775 | 55,972 | |
| Green Plains, Inc. (a) | 4,365 | 140,728 | |
| HighPeak Energy, Inc. (b) | 3,821 | 41,572 | |
| Kinetik Holdings, Inc. (b) | 845 | 29,693 | |
| Kosmos Energy Ltd. (a) | 197,759 | 1,184,576 | |
| Magnolia Oil & Gas Corp. Class A | 74,238 | 1,551,574 | |
| Matador Resources Co. | 8,701 | 455,236 | |
| Nextdecade Corp. (a)(b) | 13,330 | 109,439 | |
| Northern Oil & Gas, Inc. | 28,554 | 979,973 | |
| Par Pacific Holdings, Inc. (a) | 9,101 | 242,178 | |
| Permian Resource Corp. Class A | 17,115 | 187,580 | |
| Rex American Resources Corp. (a) | 1,693 | 58,933 | |
| Riley Exploration Permian, Inc. | 3,793 | 135,486 | |
| SilverBow Resources, Inc. (a) | 801 | 23,325 | |
| Sitio Royalties Corp. | 15,456 | 406,029 | |
| Tellurian, Inc. (a)(b) | 13,257 | 18,692 | |
| VAALCO Energy, Inc. (b) | 5,069 | 19,059 | |
| Vertex Energy, Inc. (a)(b) | 28,956 | 180,975 | |
| W&T Offshore, Inc. (a)(b) | 42,151 | 163,124 | |
| 10,060,688 | |||
TOTAL ENERGY | 23,215,411 | ||
| FINANCIALS - 5.9% | |||
| Banks - 0.9% | |||
| Axos Financial, Inc. (a) | 2,926 | 115,401 | |
| BancFirst Corp. | 1,303 | 119,876 | |
| Bancorp, Inc., Delaware (a) | 23,103 | 754,313 | |
| Bank7 Corp. | 215 | 5,274 | |
| BayCom Corp. | 569 | 9,491 | |
| Burke & Herbert Financial Services Corp. | 206 | 13,225 | |
| Capital City Bank Group, Inc. | 1,950 | 59,748 | |
| Citizens Financial Services, Inc. | 351 | 26,139 | |
| City Holding Co. | 547 | 49,225 | |
| Coastal Financial Corp. of Washington (a) | 4,641 | 174,734 | |
| Columbia Financial, Inc. (a)(b) | 5,219 | 90,237 | |
| Esquire Financial Holdings, Inc. | 2,603 | 119,061 | |
| First Bancorp, Puerto Rico | 6,604 | 80,701 | |
| First Financial Bankshares, Inc. | 56,431 | 1,607,719 | |
| Five Star Bancorp | 2,325 | 52,010 | |
| FS Bancorp, Inc. | 549 | 16,508 | |
| Greene County Bancorp, Inc. | 1,565 | 46,637 | |
| HomeTrust Bancshares, Inc. | 1,469 | 30,687 | |
| Lakeland Financial Corp. | 690 | 33,479 | |
| Metropolitan Bank Holding Corp. (a) | 425 | 14,760 | |
| MVB Financial Corp. | 337 | 7,104 | |
| Pathward Financial, Inc. | 3,945 | 182,890 | |
| Plumas Bancorp | 301 | 10,743 | |
| ServisFirst Bancshares, Inc. | 7,388 | 302,317 | |
| Stellar Bancorp, Inc. | 1,060 | 24,263 | |
| Stock Yards Bancorp, Inc. | 10,357 | 469,897 | |
| The Bank of NT Butterfield & Son Ltd. | 1,587 | 43,420 | |
| Third Coast Bancshares, Inc. (a) | 339 | 5,380 | |
| Westamerica Bancorp. | 3,407 | 130,488 | |
| 4,595,727 | |||
| Capital Markets - 2.1% | |||
| Alti Global, Inc. Class A (a) | 9,021 | 69,101 | |
| Artisan Partners Asset Management, Inc. (b) | 19,201 | 754,791 | |
| Assetmark Financial Holdings, Inc. (a) | 9,432 | 279,753 | |
| Avantax, Inc. (a) | 15,218 | 340,579 | |
| B. Riley Financial, Inc. (b) | 8,129 | 373,771 | |
| BGC Partners, Inc. Class A | 64,328 | 284,973 | |
| BrightSphere Investment Group, Inc. | 5,439 | 113,947 | |
| Cohen & Steers, Inc. | 11,249 | 652,330 | |
| Diamond Hill Investment Group, Inc. | 1,246 | 213,440 | |
| Donnelley Financial Solutions, Inc. (a) | 7,683 | 349,807 | |
| Focus Financial Partners, Inc. Class A (a) | 25,412 | 1,334,384 | |
| GCM Grosvenor, Inc. Class A | 15,856 | 119,554 | |
| Hamilton Lane, Inc. Class A | 9,335 | 746,613 | |
| Moelis & Co. Class A | 16,975 | 769,647 | |
| Open Lending Corp. (a) | 39,807 | 418,372 | |
| P10, Inc. | 18,456 | 208,553 | |
| Patria Investments Ltd. | 23,682 | 338,653 | |
| Perella Weinberg Partners Class A | 18,284 | 152,306 | |
| Piper Jaffray Companies | 6,188 | 799,861 | |
| PJT Partners, Inc. | 10,510 | 731,916 | |
| Sculptor Capital Management, Inc. Class A | 6,102 | 53,881 | |
| Silvercrest Asset Management Group Class A | 4,093 | 82,883 | |
| StepStone Group, Inc. Class A | 23,357 | 579,487 | |
| StoneX Group, Inc. (a) | 835 | 69,372 | |
| Value Line, Inc. | 315 | 14,459 | |
| Victory Capital Holdings, Inc. | 10,848 | 342,146 | |
| Virtus Investment Partners, Inc. | 384 | 75,828 | |
| WisdomTree Investments, Inc. | 59,939 | 411,182 | |
| 10,681,589 | |||
| Consumer Finance - 0.6% | |||
| Atlanticus Holdings Corp. (a)(b) | 112 | 4,705 | |
| FirstCash Holdings, Inc. | 16,293 | 1,520,626 | |
| LendingTree, Inc. (a) | 1,075 | 23,768 | |
| NerdWallet, Inc. (a) | 14,687 | 138,205 | |
| PROG Holdings, Inc. (a) | 3,816 | 122,570 | |
| Regional Management Corp. | 456 | 13,908 | |
| Upstart Holdings, Inc. (a)(b) | 31,093 | 1,113,440 | |
| World Acceptance Corp. (a)(b) | 112 | 15,009 | |
| 2,952,231 | |||
| Financial Services - 1.3% | |||
| AvidXchange Holdings, Inc. (a) | 59,149 | 613,967 | |
| Cantaloupe, Inc. (a) | 16,675 | 132,733 | |
| Cass Information Systems, Inc. | 5,166 | 200,337 | |
| EVERTEC, Inc. | 28,183 | 1,037,980 | |
| Federal Agricultural Mortgage Corp. Class C (non-vtg.) | 646 | 92,856 | |
| Flywire Corp. (a) | 41,443 | 1,286,391 | |
| i3 Verticals, Inc. Class A (a) | 9,665 | 220,942 | |
| International Money Express, Inc. (a) | 13,448 | 329,879 | |
| Marqeta, Inc. Class A (a) | 27,761 | 135,196 | |
| NMI Holdings, Inc. (a) | 2,814 | 72,657 | |
| PagSeguro Digital Ltd. (a) | 52,429 | 494,930 | |
| Payoneer Global, Inc. (a) | 114,774 | 552,063 | |
| Paysign, Inc. (a) | 13,991 | 34,278 | |
| PennyMac Financial Services, Inc. | 689 | 48,444 | |
| Priority Technology Holdings, Inc. (a) | 8,166 | 29,561 | |
| Remitly Global, Inc. (a) | 36,464 | 686,252 | |
| StoneCo Ltd. Class A (a) | 76,217 | 971,005 | |
| 6,939,471 | |||
| Insurance - 1.0% | |||
| Amerisafe, Inc. | 4,183 | 223,038 | |
| BRP Group, Inc. (a) | 25,567 | 633,550 | |
| Crawford & Co. Class A | 6,215 | 68,924 | |
| eHealth, Inc. (a) | 3,688 | 29,652 | |
| F&G Annuities & Life, Inc. | 458 | 11,349 | |
| Goosehead Insurance (a)(b) | 9,328 | 586,638 | |
| HCI Group, Inc. (b) | 2,762 | 170,636 | |
| Investors Title Co. | 117 | 17,082 | |
| Kingsway Financial Services, Inc. (a) | 4,565 | 37,205 | |
| Lemonade, Inc. (a)(b) | 3,634 | 61,233 | |
| Oscar Health, Inc. (a) | 5,109 | 41,179 | |
| Palomar Holdings, Inc. (a) | 10,549 | 612,264 | |
| Selective Insurance Group, Inc. | 26,003 | 2,494,988 | |
| Siriuspoint Ltd. (a) | 3,809 | 34,395 | |
| Skyward Specialty Insurance Group, Inc. | 1,258 | 31,953 | |
| Tiptree, Inc. | 2,822 | 42,358 | |
| Trupanion, Inc. (a)(b) | 17,226 | 339,008 | |
| Universal Insurance Holdings, Inc. | 2,376 | 36,662 | |
| 5,472,114 | |||
| Mortgage Real Estate Investment Trusts - 0.0% | |||
| Hannon Armstrong Sustainable Infrastructure Capital, Inc. | 3,375 | 84,375 | |
TOTAL FINANCIALS | 30,725,507 | ||
| HEALTH CARE - 23.6% | |||
| Biotechnology - 10.0% | |||
| 4D Molecular Therapeutics, Inc. (a) | 1,139 | 20,582 | |
| 89Bio, Inc. (a) | 26,795 | 507,765 | |
| ACADIA Pharmaceuticals, Inc. (a) | 52,246 | 1,251,292 | |
| Actinium Pharmaceuticals, Inc. (a) | 10,572 | 78,444 | |
| ADMA Biologics, Inc. (a) | 47,910 | 176,788 | |
| Aerovate Therapeutics, Inc. (a) | 4,318 | 74,054 | |
| Agenus, Inc. (a) | 22,543 | 36,069 | |
| Akero Therapeutics, Inc. (a) | 19,377 | 904,712 | |
| Aldeyra Therapeutics, Inc. (a) | 19,980 | 167,632 | |
| Alector, Inc. (a) | 27,236 | 163,688 | |
| Alkermes PLC (a) | 71,623 | 2,241,800 | |
| Alpine Immune Sciences, Inc. (a) | 7,248 | 74,509 | |
| Amicus Therapeutics, Inc. (a) | 121,288 | 1,523,377 | |
| AnaptysBio, Inc. (a) | 6,686 | 135,993 | |
| Anavex Life Sciences Corp. (a)(b) | 30,124 | 244,908 | |
| Arbutus Biopharma Corp. (a) | 33,352 | 76,710 | |
| Arcellx, Inc. (a) | 16,439 | 519,801 | |
| Arcturus Therapeutics Holdings, Inc. (a)(b) | 871 | 24,980 | |
| Arcus Biosciences, Inc. (a) | 6,814 | 138,392 | |
| Arcutis Biotherapeutics, Inc. (a)(b) | 22,057 | 210,203 | |
| Ardelyx, Inc. (a) | 59,842 | 202,864 | |
| Arrowhead Pharmaceuticals, Inc. (a) | 44,311 | 1,580,130 | |
| Ars Pharmaceuticals, Inc. (a) | 2,303 | 15,430 | |
| Astria Therapeutics, Inc. (a) | 9,623 | 80,160 | |
| Atara Biotherapeutics, Inc. (a) | 3,532 | 5,687 | |
| Aurinia Pharmaceuticals, Inc. (a)(b) | 58,633 | 567,567 | |
| Avid Bioservices, Inc. (a) | 26,995 | 377,120 | |
| Avita Medical, Inc. (a) | 10,784 | 183,436 | |
| Beam Therapeutics, Inc. (a)(b) | 26,666 | 851,445 | |
| BioCryst Pharmaceuticals, Inc. (a)(b) | 62,032 | 436,705 | |
| Biomea Fusion, Inc. (a) | 8,521 | 187,036 | |
| BioVie, Inc. (a)(b) | 1,426 | 6,146 | |
| BioXcel Therapeutics, Inc. (a)(b) | 8,229 | 54,805 | |
| Blueprint Medicines Corp. (a) | 26,291 | 1,661,591 | |
| BridgeBio Pharma, Inc. (a) | 34,484 | 593,125 | |
| Cabaletta Bio, Inc. (a) | 9,775 | 126,195 | |
| Catalyst Pharmaceutical Partners, Inc. (a) | 41,730 | 560,851 | |
| Celldex Therapeutics, Inc. (a) | 5,144 | 174,536 | |
| Cerevel Therapeutics Holdings (a) | 26,697 | 848,698 | |
| Chinook Therapeutics, Inc. (a) | 7,068 | 271,553 | |
| Chinook Therapeutics, Inc. rights (a)(c) | 985 | 0 | |
| Cogent Biosciences, Inc. (a) | 16,005 | 189,499 | |
| Coherus BioSciences, Inc. (a)(b) | 27,010 | 115,333 | |
| Compass Therapeutics, Inc. (a) | 3,966 | 12,612 | |
| Crinetics Pharmaceuticals, Inc. (a) | 3,827 | 68,963 | |
| Cue Biopharma, Inc. (a) | 14,833 | 54,140 | |
| Cytokinetics, Inc. (a) | 37,108 | 1,210,463 | |
| Day One Biopharmaceuticals, Inc. (a) | 19,284 | 230,251 | |
| Deciphera Pharmaceuticals, Inc. (a) | 7,825 | 110,176 | |
| Denali Therapeutics, Inc. (a) | 51,103 | 1,508,050 | |
| Disc Medicine, Inc. (a) | 3,106 | 137,906 | |
| Dynavax Technologies Corp. (a)(b) | 47,098 | 608,506 | |
| Dyne Therapeutics, Inc. (a) | 5,272 | 59,310 | |
| Enanta Pharmaceuticals, Inc. (a) | 1,093 | 23,390 | |
| Fennec Pharmaceuticals, Inc. (a) | 2,002 | 17,678 | |
| Foghorn Therapeutics, Inc. (a) | 8,767 | 61,720 | |
| Genelux Corp. | 304 | 9,947 | |
| Geron Corp. (a) | 163,109 | 523,580 | |
| Halozyme Therapeutics, Inc. (a) | 57,661 | 2,079,832 | |
| Heron Therapeutics, Inc. (a)(b) | 44,306 | 51,395 | |
| HilleVax, Inc. (a)(b) | 2,159 | 37,113 | |
| Humacyte, Inc. Class A (a)(b) | 22,464 | 64,247 | |
| Ideaya Biosciences, Inc. (a) | 15,215 | 357,553 | |
| Immuneering Corp. (a) | 6,646 | 67,390 | |
| ImmunityBio, Inc. (a)(b) | 38,779 | 107,806 | |
| ImmunoGen, Inc. (a) | 61,152 | 1,153,938 | |
| Immunovant, Inc. (a) | 23,413 | 444,145 | |
| Inhibrx, Inc. (a)(b) | 9,754 | 253,214 | |
| Insmed, Inc. (a) | 56,863 | 1,199,809 | |
| Intellia Therapeutics, Inc. (a) | 5,451 | 222,292 | |
| Intercept Pharmaceuticals, Inc. (a)(b) | 10,528 | 116,440 | |
| Ironwood Pharmaceuticals, Inc. Class A (a) | 24,169 | 257,158 | |
| Iveric Bio, Inc. (a) | 59,639 | 2,346,198 | |
| Janux Therapeutics, Inc. (a) | 470 | 5,579 | |
| Karyopharm Therapeutics, Inc. (a)(b) | 48,595 | 86,985 | |
| Keros Therapeutics, Inc. (a) | 9,780 | 392,960 | |
| Krystal Biotech, Inc. (a) | 9,360 | 1,098,864 | |
| Kymera Therapeutics, Inc. (a)(b) | 16,521 | 379,818 | |
| Lexicon Pharmaceuticals, Inc. (a)(b) | 17,856 | 40,890 | |
| Lineage Cell Therapeutics, Inc. (a) | 55,385 | 78,093 | |
| Macrogenics, Inc. (a) | 7,862 | 42,062 | |
| Madrigal Pharmaceuticals, Inc. (a) | 5,891 | 1,360,821 | |
| MannKind Corp. (a)(b) | 90,957 | 370,195 | |
| MeiraGTx Holdings PLC (a) | 10,301 | 69,223 | |
| Merrimack Pharmaceuticals, Inc. (a) | 4,499 | 55,338 | |
| Mersana Therapeutics, Inc. (a) | 26,262 | 86,402 | |
| Mineralys Therapeutics, Inc. | 1,536 | 26,189 | |
| Mirum Pharmaceuticals, Inc. (a)(b) | 11,675 | 302,032 | |
| Morphic Holding, Inc. (a) | 11,639 | 667,264 | |
| Novavax, Inc. (a)(b) | 30,552 | 227,001 | |
| Nuvalent, Inc. Class A (a) | 10,404 | 438,737 | |
| Nuvectis Pharma, Inc. (a) | 2,940 | 46,952 | |
| Omega Therapeutics, Inc. (a) | 10,455 | 58,548 | |
| Omniab, Inc. (c) | 191 | 766 | |
| Omniab, Inc. (c) | 191 | 726 | |
| Organogenesis Holdings, Inc. Class A (a) | 3,535 | 11,736 | |
| Outlook Therapeutics, Inc. (a)(b) | 68,407 | 119,028 | |
| PDS Biotechnology Corp. (a)(b) | 11,997 | 60,345 | |
| PepGen, Inc. (a) | 1,040 | 9,298 | |
| Prime Medicine, Inc. (b) | 16,970 | 248,611 | |
| ProKidney Corp. (a) | 6,776 | 75,823 | |
| Protagonist Therapeutics, Inc. (a) | 14,784 | 408,334 | |
| Prothena Corp. PLC (a) | 17,944 | 1,225,216 | |
| PTC Therapeutics, Inc. (a) | 24,645 | 1,002,312 | |
| RAPT Therapeutics, Inc. (a) | 9,567 | 178,903 | |
| Reneo Pharmaceuticals, Inc. (a) | 2,708 | 17,764 | |
| Revolution Medicines, Inc. (a) | 43,919 | 1,174,833 | |
| Rhythm Pharmaceuticals, Inc. (a) | 22,335 | 368,304 | |
| Rigel Pharmaceuticals, Inc. (a) | 60,059 | 77,476 | |
| Rocket Pharmaceuticals, Inc. (a) | 21,525 | 427,702 | |
| Sage Therapeutics, Inc. (a) | 21,381 | 1,005,335 | |
| Sana Biotechnology, Inc. (a)(b) | 2,966 | 17,677 | |
| Savara, Inc. (a) | 2,072 | 6,620 | |
| Selecta Biosciences, Inc. (a) | 12,935 | 14,487 | |
| Seres Therapeutics, Inc. (a)(b) | 28,276 | 135,442 | |
| SpringWorks Therapeutics, Inc. (a) | 25,199 | 660,718 | |
| Summit Therapeutics, Inc. (a) | 49,701 | 124,750 | |
| Syndax Pharmaceuticals, Inc. (a) | 23,782 | 497,757 | |
| TG Therapeutics, Inc. (a) | 59,323 | 1,473,583 | |
| Travere Therapeutics, Inc. (a) | 29,296 | 449,987 | |
| Tyra Biosciences, Inc. (a) | 2,154 | 36,683 | |
| UroGen Pharma Ltd. (a) | 6,868 | 71,084 | |
| Vaxcyte, Inc. (a) | 39,715 | 1,983,367 | |
| Vaxxinity, Inc. Class A (a) | 18,291 | 46,093 | |
| Vera Therapeutics, Inc. (a)(b) | 6,991 | 112,206 | |
| Vericel Corp. (a) | 20,566 | 772,665 | |
| Viking Therapeutics, Inc. (a) | 41,516 | 672,974 | |
| Vir Biotechnology, Inc. (a) | 1,837 | 45,062 | |
| Viridian Therapeutics, Inc. (a) | 14,456 | 343,908 | |
| Voyager Therapeutics, Inc. (a) | 13,624 | 155,995 | |
| X4 Pharmaceuticals, Inc. (a) | 26,410 | 51,235 | |
| Xencor, Inc. (a) | 13,540 | 338,094 | |
| Y-mAbs Therapeutics, Inc. (a) | 7,387 | 50,158 | |
| Zentalis Pharmaceuticals, Inc. (a) | 21,252 | 599,519 | |
| 51,963,362 | |||
| Health Care Equipment & Supplies - 5.2% | |||
| Accuray, Inc. (a) | 37,919 | 146,747 | |
| Alphatec Holdings, Inc. (a) | 13,552 | 243,665 | |
| Artivion, Inc. (a) | 2,568 | 44,144 | |
| Atricure, Inc. (a) | 14,489 | 715,177 | |
| Atrion Corp. | 599 | 338,854 | |
| AxoGen, Inc. (a) | 17,439 | 159,218 | |
| Axonics Modulation Technologies, Inc. (a) | 21,243 | 1,072,134 | |
| Beyond Air, Inc. (a) | 9,576 | 40,794 | |
| Cerus Corp. (a) | 76,099 | 187,204 | |
| ClearPoint Neuro, Inc. (a) | 9,242 | 66,912 | |
| CONMED Corp. | 13,245 | 1,799,863 | |
| Cutera, Inc. (a) | 886 | 13,405 | |
| CVRx, Inc. (a) | 4,159 | 64,215 | |
| Embecta Corp. | 2,651 | 57,262 | |
| Figs, Inc. Class A (a)(b) | 49,049 | 405,635 | |
| Glaukos Corp. (a) | 20,265 | 1,443,071 | |
| Haemonetics Corp. (a) | 21,655 | 1,843,707 | |
| Inari Medical, Inc. (a)(b) | 20,854 | 1,212,452 | |
| InMode Ltd. (a) | 33,508 | 1,251,524 | |
| IRadimed Corp. | 3,135 | 149,665 | |
| iRhythm Technologies, Inc. (a) | 13,268 | 1,384,118 | |
| KORU Medical Systems, Inc. (a) | 14,989 | 51,712 | |
| Lantheus Holdings, Inc. (a) | 29,367 | 2,464,479 | |
| LeMaitre Vascular, Inc. | 8,544 | 574,840 | |
| LivaNova PLC (a) | 1,489 | 76,579 | |
| Merit Medical Systems, Inc. (a) | 24,528 | 2,051,522 | |
| Nano-X Imaging Ltd. (a)(b) | 2,105 | 32,606 | |
| Nevro Corp. (a) | 5,194 | 132,031 | |
| NuVasive, Inc. (a) | 19,512 | 811,504 | |
| Omnicell, Inc. (a) | 9,617 | 708,484 | |
| Orchestra BioMed Holdings, Inc. (a) | 1,796 | 12,572 | |
| OrthoPediatrics Corp. (a) | 6,004 | 263,275 | |
| Outset Medical, Inc. (a) | 21,424 | 468,543 | |
| Paragon 28, Inc. (a) | 19,117 | 339,136 | |
| PROCEPT BioRobotics Corp. (a) | 15,627 | 552,414 | |
| Pulmonx Corp. (a) | 15,732 | 206,247 | |
| Pulse Biosciences, Inc. (a)(b) | 1,773 | 12,748 | |
| RxSight, Inc. (a) | 11,795 | 339,696 | |
| Sanara Medtech, Inc. (a) | 1,628 | 65,283 | |
| Semler Scientific, Inc. (a) | 2,145 | 56,285 | |
| SI-BONE, Inc. (a) | 15,092 | 407,182 | |
| Sight Sciences, Inc. (a) | 9,269 | 76,747 | |
| Silk Road Medical, Inc. (a) | 16,631 | 540,341 | |
| Staar Surgical Co. (a)(b) | 21,048 | 1,106,493 | |
| SurModics, Inc. (a) | 5,906 | 184,917 | |
| Tactile Systems Technology, Inc. (a)(b) | 9,979 | 248,776 | |
| Tela Bio, Inc. (a) | 6,807 | 68,955 | |
| TransMedics Group, Inc. (a) | 13,730 | 1,153,045 | |
| Treace Medical Concepts, Inc. (a) | 19,596 | 501,266 | |
| UFP Technologies, Inc. (a) | 3,067 | 594,538 | |
| Utah Medical Products, Inc. | 1,382 | 128,802 | |
| Vicarious Surgical, Inc. (a)(b) | 14,187 | 25,962 | |
| ViewRay, Inc. (a) | 32,242 | 11,356 | |
| Zynex, Inc. (a)(b) | 8,640 | 82,858 | |
| 26,990,960 | |||
| Health Care Providers & Services - 4.3% | |||
| Accolade, Inc. (a) | 27,131 | 365,455 | |
| AdaptHealth Corp. (a) | 16,331 | 198,748 | |
| Addus HomeCare Corp. (a) | 3,169 | 293,766 | |
| Agiliti, Inc. (a)(b) | 11,387 | 187,886 | |
| AirSculpt Technologies, Inc. (b) | 4,907 | 42,298 | |
| Alignment Healthcare, Inc. (a) | 36,504 | 209,898 | |
| AMN Healthcare Services, Inc. (a) | 17,528 | 1,912,655 | |
| Apollo Medical Holdings, Inc. (a)(b) | 18,547 | 586,085 | |
| Aveanna Healthcare Holdings, Inc. (a) | 4,979 | 8,415 | |
| Cano Health, Inc. (a) | 7,692 | 10,692 | |
| Castle Biosciences, Inc. (a) | 4,103 | 56,293 | |
| Corvel Corp. (a) | 3,767 | 728,915 | |
| Cross Country Healthcare, Inc. (a) | 2,348 | 65,932 | |
| DocGo, Inc. Class A (a)(b) | 33,796 | 316,669 | |
| Guardant Health, Inc. (a) | 48,053 | 1,720,297 | |
| HealthEquity, Inc. (a) | 36,314 | 2,292,866 | |
| Hims & Hers Health, Inc. (a) | 52,982 | 498,031 | |
| InfuSystems Holdings, Inc. (a) | 7,791 | 75,027 | |
| Innovage Holding Corp. (a) | 8,114 | 60,855 | |
| Invitae Corp. (a)(b) | 97,402 | 110,064 | |
| LifeStance Health Group, Inc. (a)(b) | 24,765 | 226,104 | |
| Modivcare, Inc. (a)(b) | 5,575 | 252,046 | |
| National Research Corp. Class A | 6,178 | 268,805 | |
| NeoGenomics, Inc. (a) | 4,810 | 77,297 | |
| Option Care Health, Inc. (a) | 73,449 | 2,386,358 | |
| P3 Health Partners, Inc. Class A (a)(b) | 17,091 | 51,102 | |
| Patterson Companies, Inc. | 8,165 | 271,568 | |
| Pennant Group, Inc. (a) | 12,423 | 152,554 | |
| PetIQ, Inc. Class A (a) | 9,802 | 148,696 | |
| Privia Health Group, Inc. (a) | 29,224 | 763,039 | |
| Progyny, Inc. (a) | 33,984 | 1,336,931 | |
| Quipt Home Medical Corp. (a) | 17,311 | 92,441 | |
| RadNet, Inc. (a) | 21,339 | 696,078 | |
| Select Medical Holdings Corp. | 44,956 | 1,432,298 | |
| Surgery Partners, Inc. (a) | 26,538 | 1,193,945 | |
| The Ensign Group, Inc. | 23,554 | 2,248,465 | |
| The Joint Corp. (a) | 6,135 | 82,823 | |
| U.S. Physical Therapy, Inc. (b) | 5,610 | 680,998 | |
| Viemed Healthcare, Inc. (a) | 14,642 | 143,199 | |
| 22,245,594 | |||
| Health Care Technology - 0.8% | |||
| Definitive Healthcare Corp. (a) | 6,464 | 71,104 | |
| Evolent Health, Inc. (a) | 47,630 | 1,443,189 | |
| Health Catalyst, Inc. (a) | 13,001 | 162,513 | |
| HealthStream, Inc. | 4,280 | 105,117 | |
| Nextgen Healthcare, Inc. (a) | 13,260 | 215,077 | |
| OptimizeRx Corp. (a) | 7,268 | 103,860 | |
| Phreesia, Inc. (a) | 22,073 | 684,484 | |
| Schrodinger, Inc. (a)(b) | 23,494 | 1,172,820 | |
| Sharecare, Inc. Class A (a) | 6,738 | 11,792 | |
| Simulations Plus, Inc. | 6,802 | 294,731 | |
| 4,264,687 | |||
| Life Sciences Tools & Services - 0.5% | |||
| Adaptive Biotechnologies Corp. (a) | 35,712 | 239,628 | |
| Akoya Biosciences, Inc. (a) | 7,802 | 57,657 | |
| BioLife Solutions, Inc. (a) | 13,627 | 301,157 | |
| Codexis, Inc. (a) | 3,609 | 10,105 | |
| CryoPort, Inc. (a) | 15,739 | 271,498 | |
| Cytek Biosciences, Inc. (a)(b) | 52,590 | 449,119 | |
| Harvard Bioscience, Inc. (a) | 16,777 | 92,106 | |
| MaxCyte, Inc. (a) | 2,623 | 12,040 | |
| Mesa Laboratories, Inc. | 2,249 | 288,997 | |
| Nanostring Technologies, Inc. (a) | 18,601 | 75,334 | |
| Pacific Biosciences of California, Inc. (a) | 59,642 | 793,239 | |
| Quanterix Corp. (a) | 2,418 | 54,526 | |
| 2,645,406 | |||
| Pharmaceuticals - 2.8% | |||
| Aclaris Therapeutics, Inc. (a) | 30,278 | 313,983 | |
| Amphastar Pharmaceuticals, Inc. (a) | 16,386 | 941,703 | |
| Amylyx Pharmaceuticals, Inc. (a)(b) | 22,008 | 474,713 | |
| ANI Pharmaceuticals, Inc. (a) | 4,238 | 228,132 | |
| Arvinas Holding Co. LLC (a) | 20,160 | 500,371 | |
| Axsome Therapeutics, Inc. (a)(b) | 14,243 | 1,023,502 | |
| Biote Corp. Class A (a) | 2,770 | 18,725 | |
| Bright Green Corp. (a) | 25,873 | 26,132 | |
| Cassava Sciences, Inc. (a)(b) | 17,269 | 423,436 | |
| Citius Pharmaceuticals, Inc. (a) | 5,751 | 6,901 | |
| Collegium Pharmaceutical, Inc. (a) | 15,101 | 324,520 | |
| Corcept Therapeutics, Inc. (a) | 34,656 | 771,096 | |
| CorMedix, Inc. (a) | 17,764 | 70,434 | |
| CymaBay Therapeutics, Inc. (a) | 42,712 | 467,696 | |
| DICE Therapeutics, Inc. (a) | 13,782 | 640,312 | |
| Evolus, Inc. (a) | 17,763 | 129,137 | |
| Eyenovia, Inc. (a) | 11,936 | 28,288 | |
| Eyepoint Pharmaceuticals, Inc. (a)(b) | 6,090 | 52,983 | |
| Harmony Biosciences Holdings, Inc. (a)(b) | 14,290 | 502,865 | |
| Harrow Health, Inc. (a) | 11,154 | 212,372 | |
| Innoviva, Inc. (a) | 2,561 | 32,602 | |
| Intra-Cellular Therapies, Inc. (a) | 40,441 | 2,560,724 | |
| Ligand Pharmaceuticals, Inc. Class B (a) | 1,058 | 76,282 | |
| Liquidia Corp. (a) | 14,375 | 112,844 | |
| Longboard Pharmaceuticals, Inc. (a) | 2,306 | 16,926 | |
| Marinus Pharmaceuticals, Inc. (a) | 21,372 | 232,100 | |
| Ocular Therapeutix, Inc. (a)(b) | 33,474 | 172,726 | |
| Omeros Corp. (a) | 10,653 | 57,952 | |
| OptiNose, Inc. (a) | 31,284 | 38,479 | |
| Pacira Biosciences, Inc. (a) | 19,666 | 788,017 | |
| Phathom Pharmaceuticals, Inc. (a)(b) | 2,704 | 38,721 | |
| Phibro Animal Health Corp. Class A | 2,526 | 34,606 | |
| Pliant Therapeutics, Inc. (a) | 24,492 | 443,795 | |
| Rain Oncology, Inc. (a) | 3,968 | 4,762 | |
| Revance Therapeutics, Inc. (a) | 35,978 | 910,603 | |
| Scilex Holding Co. (b) | 2,699 | 14,282 | |
| scPharmaceuticals, Inc. (a) | 12,387 | 126,224 | |
| SIGA Technologies, Inc. (b) | 19,765 | 99,813 | |
| Supernus Pharmaceuticals, Inc. (a) | 21,250 | 638,775 | |
| Terns Pharmaceuticals, Inc. (a) | 12,131 | 106,146 | |
| Ventyx Biosciences, Inc. (a) | 20,230 | 663,544 | |
| Verrica Pharmaceuticals, Inc. (a) | 8,956 | 51,676 | |
| Xeris Biopharma Holdings, Inc. (a)(b) | 57,076 | 149,539 | |
| 14,528,439 | |||
TOTAL HEALTH CARE | 122,638,448 | ||
| INDUSTRIALS - 19.9% | |||
| Aerospace & Defense - 1.0% | |||
| Aerojet Rocketdyne Holdings, Inc. (a) | 34,496 | 1,892,796 | |
| AeroVironment, Inc. (a) | 10,865 | 1,111,272 | |
| Cadre Holdings, Inc. | 8,335 | 181,703 | |
| Eve Holding, Inc. (a)(b) | 7,762 | 81,346 | |
| Leonardo DRS, Inc. (a) | 21,951 | 380,630 | |
| Moog, Inc. Class A | 2,459 | 266,629 | |
| Parsons Corp. (a) | 8,195 | 394,507 | |
| Redwire Corp. (a)(b) | 3,374 | 8,604 | |
| Rocket Lab U.S.A., Inc. Class A (a)(b) | 120,547 | 723,282 | |
| Terran Orbital Corp. Class A (a) | 3,623 | 5,435 | |
| Virgin Galactic Holdings, Inc. (a)(b) | 60,899 | 236,288 | |
| 5,282,492 | |||
| Air Freight & Logistics - 0.2% | |||
| Forward Air Corp. | 11,325 | 1,201,696 | |
| Building Products - 1.8% | |||
| AAON, Inc. | 19,520 | 1,850,691 | |
| American Woodmark Corp. (a) | 457 | 34,901 | |
| Apogee Enterprises, Inc. | 3,612 | 171,462 | |
| CSW Industrials, Inc. | 6,649 | 1,104,997 | |
| Gibraltar Industries, Inc. (a) | 7,555 | 475,361 | |
| Griffon Corp. | 11,366 | 458,050 | |
| Janus International Group, Inc. (a) | 36,929 | 393,663 | |
| Masonite International Corp. (a) | 9,586 | 981,990 | |
| PGT Innovations, Inc. (a) | 25,132 | 732,598 | |
| Simpson Manufacturing Co. Ltd. | 18,548 | 2,568,898 | |
| UFP Industries, Inc. | 3,996 | 387,812 | |
| Zurn Elkay Water Solutions Cor | 12,638 | 339,836 | |
| 9,500,259 | |||
| Commercial Services & Supplies - 1.4% | |||
| ACV Auctions, Inc. Class A (a) | 54,830 | 946,914 | |
| Aris Water Solution, Inc. Class A | 873 | 9,009 | |
| Casella Waste Systems, Inc. Class A (a) | 24,043 | 2,174,689 | |
| Cimpress PLC (a) | 4,330 | 257,548 | |
| Healthcare Services Group, Inc. | 30,643 | 457,500 | |
| Heritage-Crystal Clean, Inc. (a) | 1,091 | 41,229 | |
| HNI Corp. | 1,881 | 53,007 | |
| LanzaTech Global, Inc. (a) | 8,843 | 60,398 | |
| Liquidity Services, Inc. (a) | 5,982 | 98,703 | |
| Matthews International Corp. Class A | 3,379 | 144,013 | |
| Montrose Environmental Group, Inc. (a) | 12,097 | 509,526 | |
| Performant Financial Corp. (a) | 21,590 | 58,293 | |
| Pitney Bowes, Inc. | 76,710 | 271,553 | |
| SP Plus Corp. (a) | 8,523 | 333,335 | |
| The Brink's Co. | 19,973 | 1,354,769 | |
| Viad Corp. (a) | 8,734 | 234,770 | |
| 7,005,256 | |||
| Construction & Engineering - 2.1% | |||
| Ameresco, Inc. Class A (a)(b) | 13,913 | 676,589 | |
| API Group Corp. (a) | 60,776 | 1,656,754 | |
| Bowman Consulting Group Ltd. (a) | 4,311 | 137,435 | |
| Comfort Systems U.S.A., Inc. | 15,295 | 2,511,439 | |
| Concrete Pumping Holdings, Inc. (a) | 6,478 | 52,018 | |
| Construction Partners, Inc. Class A (a) | 17,397 | 546,092 | |
| Dycom Industries, Inc. (a) | 12,398 | 1,409,033 | |
| Fluor Corp. (a) | 57,397 | 1,698,951 | |
| Granite Construction, Inc. | 2,614 | 103,985 | |
| IES Holdings, Inc. (a) | 3,515 | 199,933 | |
| INNOVATE Corp. (a) | 3,506 | 6,136 | |
| Limbach Holdings, Inc. (a) | 727 | 17,979 | |
| MYR Group, Inc. (a) | 7,093 | 981,246 | |
| Primoris Services Corp. | 1,461 | 44,517 | |
| Sterling Construction Co., Inc. (a) | 11,342 | 632,884 | |
| 10,674,991 | |||
| Electrical Equipment - 2.6% | |||
| 374Water, Inc. (a)(b) | 25,399 | 60,704 | |
| Allied Motion Technologies, Inc. | 5,942 | 237,323 | |
| Amprius Technologies, Inc. (b) | 2,306 | 16,557 | |
| Array Technologies, Inc. (a) | 65,541 | 1,481,227 | |
| Atkore, Inc. (a) | 17,102 | 2,666,886 | |
| Babcock & Wilcox Enterprises, Inc. (a) | 2,349 | 13,859 | |
| Blink Charging Co. (a)(b) | 10,538 | 63,123 | |
| Bloom Energy Corp. Class A (a)(b) | 83,398 | 1,363,557 | |
| Dragonfly Energy Holdings Corp. (a) | 6,528 | 9,661 | |
| EnerSys | 16,620 | 1,803,602 | |
| Enovix Corp. (a)(b) | 59,127 | 1,066,651 | |
| Eos Energy Enterprises, Inc. (a)(b) | 41,545 | 180,305 | |
| Fluence Energy, Inc. (a)(b) | 17,074 | 454,851 | |
| FTC Solar, Inc. (a)(b) | 27,285 | 87,858 | |
| GrafTech International Ltd. | 46,905 | 236,401 | |
| LSI Industries, Inc. | 8,505 | 106,823 | |
| Nextracker, Inc. Class A (b) | 13,398 | 533,374 | |
| NuScale Power Corp. (a) | 22,985 | 156,298 | |
| Preformed Line Products Co. | 490 | 76,489 | |
| SES AI Corp. Class A (a) | 4,869 | 11,880 | |
| Shoals Technologies Group, Inc. (a) | 74,119 | 1,894,482 | |
| SKYX Platforms Corp. (a) | 24,382 | 64,856 | |
| SunPower Corp. (a)(b) | 37,982 | 372,224 | |
| Thermon Group Holdings, Inc. (a) | 1,648 | 43,837 | |
| TPI Composites, Inc. (a)(b) | 17,971 | 186,359 | |
| Vicor Corp. (a) | 9,606 | 518,724 | |
| 13,707,911 | |||
| Ground Transportation - 0.4% | |||
| ArcBest Corp. | 4,128 | 407,846 | |
| Daseke, Inc. (a) | 17,699 | 126,194 | |
| Marten Transport Ltd. | 20,136 | 432,924 | |
| P.A.M. Transportation Services, Inc. (a) | 338 | 9,048 | |
| RXO, Inc. | 43,472 | 985,510 | |
| Werner Enterprises, Inc. | 3,959 | 174,909 | |
| 2,136,431 | |||
| Industrial Conglomerates - 0.0% | |||
| Brookfield Business Corp. Class A | 11,150 | 210,512 | |
| Machinery - 4.8% | |||
| Alamo Group, Inc. | 4,359 | 801,664 | |
| Albany International Corp. Class A | 11,833 | 1,103,782 | |
| Berkshire Grey, Inc. Class A (a)(b) | 27,159 | 38,294 | |
| Blue Bird Corp. (a) | 557 | 12,521 | |
| Chart Industries, Inc. (a) | 11,204 | 1,790,287 | |
| CIRCOR International, Inc. (a) | 7,038 | 397,295 | |
| Commercial Vehicle Group, Inc. (a) | 1,528 | 16,961 | |
| Douglas Dynamics, Inc. | 9,677 | 289,149 | |
| Energy Recovery, Inc. (a) | 24,086 | 673,204 | |
| Enerpac Tool Group Corp. Class A | 24,842 | 670,734 | |
| ESCO Technologies, Inc. | 6,401 | 663,336 | |
| Federal Signal Corp. | 25,924 | 1,659,914 | |
| Franklin Electric Co., Inc. | 19,967 | 2,054,604 | |
| Gorman-Rupp Co. | 2,170 | 62,561 | |
| Helios Technologies, Inc. | 14,141 | 934,579 | |
| Hillenbrand, Inc. | 29,880 | 1,532,246 | |
| Hyster-Yale Materials Handling, Inc. Class A | 4,658 | 260,103 | |
| John Bean Technologies Corp. | 13,773 | 1,670,665 | |
| Kadant, Inc. | 5,066 | 1,125,159 | |
| Lindsay Corp. | 4,784 | 570,923 | |
| Mayville Engineering Co., Inc. (a) | 421 | 5,246 | |
| Miller Industries, Inc. | 324 | 11,492 | |
| Mueller Industries, Inc. | 10,499 | 916,353 | |
| Mueller Water Products, Inc. Class A | 66,956 | 1,086,696 | |
| Omega Flex, Inc. | 1,403 | 145,603 | |
| Shyft Group, Inc. (The) | 15,000 | 330,900 | |
| SPX Technologies, Inc. (a) | 15,772 | 1,340,147 | |
| Standex International Corp. | 4,137 | 585,261 | |
| Tennant Co. | 4,249 | 344,636 | |
| Terex Corp. | 16,815 | 1,006,041 | |
| Trinity Industries, Inc. | 6,341 | 163,027 | |
| Velo3D, Inc. (a)(b) | 38,168 | 82,443 | |
| Wabash National Corp. | 20,554 | 527,005 | |
| Watts Water Technologies, Inc. Class A | 11,815 | 2,170,770 | |
| 25,043,601 | |||
| Marine Transportation - 0.0% | |||
| Himalaya Shipping Ltd. | 2,042 | 11,354 | |
| Passenger Airlines - 0.2% | |||
| Allegiant Travel Co. (a) | 692 | 87,386 | |
| Frontier Group Holdings, Inc. (a) | 16,348 | 158,085 | |
| Joby Aviation, Inc. (a)(b) | 40,449 | 415,007 | |
| Sun Country Airlines Holdings, Inc. (a) | 9,013 | 202,612 | |
| 863,090 | |||
| Professional Services - 3.6% | |||
| ASGN, Inc. (a) | 5,528 | 418,083 | |
| Asure Software, Inc. (a) | 1,452 | 17,656 | |
| Barrett Business Services, Inc. | 2,654 | 231,429 | |
| CBIZ, Inc. (a) | 20,760 | 1,106,093 | |
| CRA International, Inc. | 2,965 | 302,430 | |
| CSG Systems International, Inc. | 13,478 | 710,830 | |
| ExlService Holdings, Inc. (a) | 13,965 | 2,109,553 | |
| Exponent, Inc. | 21,876 | 2,041,468 | |
| First Advantage Corp. (a) | 2,134 | 32,885 | |
| FiscalNote Holdings, Inc. Class A (a) | 5,421 | 19,732 | |
| Forrester Research, Inc. (a) | 5,040 | 146,614 | |
| Franklin Covey Co. (a) | 5,232 | 228,534 | |
| Hirequest, Inc. | 2,298 | 59,817 | |
| Huron Consulting Group, Inc. (a) | 8,231 | 698,894 | |
| IBEX Ltd. (a) | 4,691 | 99,590 | |
| ICF International, Inc. | 8,077 | 1,004,698 | |
| Innodata, Inc. (a) | 10,819 | 122,579 | |
| Insperity, Inc. | 15,757 | 1,874,453 | |
| Kforce, Inc. | 8,397 | 526,156 | |
| LegalZoom.com, Inc. (a) | 45,099 | 544,796 | |
| Maximus, Inc. | 26,278 | 2,220,754 | |
| NV5 Global, Inc. (a) | 5,288 | 585,752 | |
| Planet Labs PBC Class A (a)(b) | 73,675 | 237,234 | |
| Red Violet, Inc. (a) | 4,778 | 98,283 | |
| Sterling Check Corp. (a) | 669 | 8,202 | |
| TriNet Group, Inc. (a) | 16,282 | 1,546,302 | |
| Ttec Holdings, Inc. | 8,342 | 282,293 | |
| Upwork, Inc. (a) | 53,670 | 501,278 | |
| Verra Mobility Corp. (a) | 60,438 | 1,191,837 | |
| 18,968,225 | |||
| Trading Companies & Distributors - 1.8% | |||
| Alta Equipment Group, Inc. | 8,158 | 141,378 | |
| Applied Industrial Technologies, Inc. | 16,682 | 2,416,054 | |
| Beacon Roofing Supply, Inc. (a) | 2,182 | 181,062 | |
| Custom Truck One Source, Inc. Class A (a) | 24,333 | 164,004 | |
| Distribution Solutions Group I (a) | 1,756 | 91,417 | |
| EVI Industries, Inc. (a) | 1,697 | 37,334 | |
| FTAI Aviation Ltd. | 43,086 | 1,364,103 | |
| GATX Corp. | 960 | 123,590 | |
| Global Industrial Co. | 4,415 | 122,605 | |
| GMS, Inc. (a) | 5,709 | 395,063 | |
| H&E Equipment Services, Inc. | 13,915 | 636,611 | |
| Herc Holdings, Inc. | 12,228 | 1,673,402 | |
| Hudson Technologies, Inc. (a) | 3,046 | 29,303 | |
| Karat Packaging, Inc. | 2,449 | 44,694 | |
| McGrath RentCorp. | 10,707 | 990,183 | |
| MRC Global, Inc. (a) | 12,244 | 123,297 | |
| Transcat, Inc. (a) | 3,167 | 270,177 | |
| Triton International Ltd. | 3,562 | 296,572 | |
| Xometry, Inc. (a)(b) | 1,645 | 34,841 | |
| 9,135,690 | |||
TOTAL INDUSTRIALS | 103,741,508 | ||
| INFORMATION TECHNOLOGY - 20.9% | |||
| Communications Equipment - 1.2% | |||
| Calix, Inc. (a) | 25,528 | 1,274,102 | |
| Cambium Networks Corp. (a) | 5,207 | 79,251 | |
| Clearfield, Inc. (a)(b) | 5,614 | 265,823 | |
| CommScope Holding Co., Inc. (a) | 89,821 | 505,692 | |
| Digi International, Inc. (a) | 13,519 | 532,513 | |
| Extreme Networks, Inc. (a) | 54,603 | 1,422,408 | |
| Harmonic, Inc. (a) | 47,560 | 769,045 | |
| Infinera Corp. (a)(b) | 86,665 | 418,592 | |
| Viavi Solutions, Inc. (a) | 79,628 | 902,185 | |
| 6,169,611 | |||
| Electronic Equipment, Instruments & Components - 3.3% | |||
| Advanced Energy Industries, Inc. | 16,266 | 1,812,846 | |
| Akoustis Technologies, Inc. (a)(b) | 29,660 | 94,319 | |
| Arlo Technologies, Inc. (a) | 33,274 | 363,019 | |
| Badger Meter, Inc. | 12,716 | 1,876,373 | |
| Bel Fuse, Inc. Class B (non-vtg.) | 340 | 19,519 | |
| Belden, Inc. | 11,400 | 1,090,410 | |
| Climb Global Solutions, Inc. | 1,478 | 70,737 | |
| CTS Corp. | 13,578 | 578,830 | |
| ePlus, Inc. (a) | 637 | 35,863 | |
| Evolv Technologies Holdings, Inc. (a) | 8,891 | 53,346 | |
| Fabrinet (a) | 15,904 | 2,065,612 | |
| FARO Technologies, Inc. (a) | 892 | 14,450 | |
| Insight Enterprises, Inc. (a) | 12,411 | 1,816,226 | |
| Iteris, Inc. (a) | 9,906 | 39,228 | |
| Itron, Inc. (a) | 1,857 | 133,890 | |
| Kimball Electronics, Inc. (a) | 2,434 | 67,251 | |
| Lightwave Logic, Inc. (a)(b) | 49,908 | 347,859 | |
| Luna Innovations, Inc. (a) | 13,776 | 125,637 | |
| MicroVision, Inc. (a)(b) | 75,877 | 347,517 | |
| Napco Security Technologies, Inc. | 13,683 | 474,116 | |
| Novanta, Inc. (a) | 15,464 | 2,846,922 | |
| OSI Systems, Inc. (a) | 6,846 | 806,664 | |
| Par Technology Corp. (a)(b) | 891 | 29,341 | |
| Plexus Corp. (a) | 10,479 | 1,029,457 | |
| Presto Automation, Inc. (a) | 1,365 | 7,125 | |
| Rogers Corp. (a) | 5,479 | 887,214 | |
| Sanmina Corp. (a) | 1,285 | 77,447 | |
| 17,111,218 | |||
| IT Services - 0.8% | |||
| BigBear.ai Holdings, Inc. (a)(b) | 11,517 | 27,065 | |
| BigCommerce Holdings, Inc. (a) | 28,834 | 286,898 | |
| CXApp, Inc. Class A (a)(b) | 837 | 9,140 | |
| Digitalocean Holdings, Inc. (a)(b) | 27,344 | 1,097,588 | |
| Fastly, Inc. Class A (a) | 42,865 | 675,981 | |
| Grid Dynamics Holdings, Inc. (a) | 19,177 | 177,387 | |
| Hackett Group, Inc. | 9,869 | 220,572 | |
| Information Services Group, Inc. | 8,143 | 43,646 | |
| Perficient, Inc. (a) | 14,854 | 1,237,784 | |
| Squarespace, Inc. Class A (a) | 5,827 | 183,784 | |
| Thoughtworks Holding, Inc. (a) | 40,371 | 304,801 | |
| Tucows, Inc. (a)(b) | 1,707 | 47,352 | |
| 4,311,998 | |||
| Semiconductors & Semiconductor Equipment - 4.7% | |||
| ACM Research, Inc. (a) | 3,324 | 43,478 | |
| AEHR Test Systems (a) | 11,221 | 462,866 | |
| Ambarella, Inc. (a) | 9,654 | 807,750 | |
| Atomera, Inc. (a)(b) | 6,483 | 56,856 | |
| Axcelis Technologies, Inc. (a) | 14,077 | 2,580,736 | |
| CEVA, Inc. (a) | 8,747 | 223,486 | |
| Credo Technology Group Holding Ltd. (a)(b) | 42,161 | 731,072 | |
| Diodes, Inc. (a) | 15,336 | 1,418,427 | |
| FormFactor, Inc. (a) | 33,428 | 1,143,906 | |
| Impinj, Inc. (a) | 9,923 | 889,597 | |
| indie Semiconductor, Inc. (a)(b) | 55,807 | 524,586 | |
| Intest Corp. (a) | 4,603 | 120,875 | |
| Kulicke & Soffa Industries, Inc. | 16,810 | 999,355 | |
| MACOM Technology Solutions Holdings, Inc. (a) | 23,521 | 1,541,331 | |
| Maxeon Solar Technologies Ltd. (a) | 7,253 | 204,244 | |
| MaxLinear, Inc. Class A (a) | 32,183 | 1,015,695 | |
| Navitas Semiconductor Corp. (a) | 6,918 | 72,916 | |
| NVE Corp. | 1,810 | 176,366 | |
| Onto Innovation, Inc. (a) | 18,134 | 2,112,067 | |
| PDF Solutions, Inc. (a) | 13,260 | 598,026 | |
| Power Integrations, Inc. | 24,562 | 2,325,285 | |
| Rambus, Inc. (a) | 47,121 | 3,023,755 | |
| Silicon Laboratories, Inc. (a) | 13,719 | 2,164,035 | |
| SiTime Corp. (a) | 7,416 | 874,866 | |
| SkyWater Technology, Inc. (a)(b) | 7,550 | 71,121 | |
| SMART Global Holdings, Inc. (a) | 4,499 | 130,516 | |
| Synaptics, Inc. (a) | 1,372 | 117,141 | |
| Transphorm, Inc. (a) | 11,593 | 39,416 | |
| 24,469,770 | |||
| Software - 9.8% | |||
| 8x8, Inc. (a)(b) | 48,564 | 205,426 | |
| A10 Networks, Inc. | 30,643 | 447,081 | |
| ACI Worldwide, Inc. (a) | 40,408 | 936,253 | |
| Adeia, Inc. | 40,536 | 446,301 | |
| Agilysys, Inc. (a) | 8,678 | 595,658 | |
| Alarm.com Holdings, Inc. (a) | 20,665 | 1,067,967 | |
| Alkami Technology, Inc. (a) | 16,949 | 277,794 | |
| Altair Engineering, Inc. Class A (a) | 23,209 | 1,760,171 | |
| American Software, Inc. Class A | 10,827 | 113,792 | |
| Amplitude, Inc. (a) | 29,510 | 324,610 | |
| AppFolio, Inc. (a) | 8,308 | 1,430,139 | |
| Appian Corp. Class A (a)(b) | 17,715 | 843,234 | |
| Applied Digital Corp. (a)(b) | 29,264 | 273,618 | |
| Asana, Inc. (a) | 34,333 | 756,699 | |
| AvePoint, Inc. (a)(b) | 66,651 | 383,910 | |
| Bit Digital, Inc. (a) | 4,991 | 20,263 | |
| Blackbaud, Inc. (a) | 18,836 | 1,340,746 | |
| BlackLine, Inc. (a) | 24,387 | 1,312,508 | |
| Box, Inc. Class A (a) | 60,871 | 1,788,390 | |
| Braze, Inc. (a) | 14,937 | 654,091 | |
| C3.ai, Inc. (a)(b) | 19,335 | 704,374 | |
| Cipher Mining, Inc. (a)(b) | 943 | 2,697 | |
| Cleanspark, Inc. (a)(b) | 4,069 | 17,456 | |
| Clear Secure, Inc. (b) | 35,991 | 833,911 | |
| CommVault Systems, Inc. (a) | 18,209 | 1,322,338 | |
| Consensus Cloud Solutions, Inc. (a) | 4,810 | 149,110 | |
| CoreCard Corp. (a) | 3,104 | 78,717 | |
| Couchbase, Inc. (a)(b) | 14,586 | 230,751 | |
| Digimarc Corp. (a)(b) | 6,098 | 179,525 | |
| Digital Turbine, Inc. (a) | 10,562 | 98,015 | |
| Domo, Inc. Class B (a) | 13,144 | 192,691 | |
| Ebix, Inc. (b) | 2,923 | 73,660 | |
| eGain Communications Corp. (a) | 9,166 | 68,653 | |
| Enfusion, Inc. Class A (a) | 10,867 | 121,928 | |
| EngageSmart, Inc. (a) | 21,110 | 402,990 | |
| Envestnet, Inc. (a) | 21,678 | 1,286,589 | |
| Everbridge, Inc. (a) | 17,648 | 474,731 | |
| EverCommerce, Inc. (a) | 7,830 | 92,707 | |
| Expensify, Inc. (a) | 23,687 | 189,022 | |
| ForgeRock, Inc. (a) | 20,515 | 421,378 | |
| Freshworks, Inc. (a) | 70,134 | 1,232,956 | |
| Instructure Holdings, Inc. (a)(b) | 8,365 | 210,463 | |
| Intapp, Inc. (a) | 6,707 | 281,090 | |
| InterDigital, Inc. | 11,735 | 1,133,014 | |
| Jamf Holding Corp. (a) | 30,250 | 590,480 | |
| Kaltura, Inc. (a) | 35,594 | 75,459 | |
| LivePerson, Inc. (a) | 27,236 | 123,107 | |
| Livevox Holdings, Inc. (a)(b) | 9,561 | 26,293 | |
| Marathon Digital Holdings, Inc. (a)(b) | 72,659 | 1,007,054 | |
| MeridianLink, Inc. (a)(b) | 7,648 | 159,078 | |
| MicroStrategy, Inc. Class A (a)(b) | 4,779 | 1,636,425 | |
| Mitek Systems, Inc. (a) | 17,263 | 187,131 | |
| Model N, Inc. (a) | 16,160 | 571,418 | |
| N-able, Inc. (a) | 27,356 | 394,200 | |
| Nextnav, Inc. (a)(b) | 21,476 | 63,139 | |
| Olo, Inc. (a) | 25,511 | 164,801 | |
| Onespan, Inc. (a) | 15,902 | 235,986 | |
| Pagerduty, Inc. (a) | 36,836 | 828,073 | |
| PowerSchool Holdings, Inc. (a) | 24,317 | 465,427 | |
| Progress Software Corp. | 18,770 | 1,090,537 | |
| PROS Holdings, Inc. (a) | 13,922 | 428,798 | |
| Q2 Holdings, Inc. (a) | 24,601 | 760,171 | |
| Qualys, Inc. (a) | 16,060 | 2,074,470 | |
| Rapid7, Inc. (a) | 25,976 | 1,176,193 | |
| Rimini Street, Inc. (a) | 21,475 | 102,865 | |
| Riot Platforms, Inc. (a)(b) | 48,313 | 571,060 | |
| Sapiens International Corp. NV | 13,372 | 355,695 | |
| Semrush Holdings, Inc. (a) | 13,440 | 128,621 | |
| SoundHound AI, Inc. (a)(b) | 60,047 | 273,214 | |
| SoundThinking, Inc. (a) | 3,923 | 85,757 | |
| Sprinklr, Inc. (a) | 37,683 | 521,156 | |
| Sprout Social, Inc. (a) | 20,615 | 951,588 | |
| SPS Commerce, Inc. (a) | 15,839 | 3,042,038 | |
| Tenable Holdings, Inc. (a) | 49,320 | 2,147,886 | |
| Varonis Systems, Inc. (a) | 47,052 | 1,253,936 | |
| Verint Systems, Inc. (a) | 25,334 | 888,210 | |
| Veritone, Inc. (a)(b) | 11,236 | 44,045 | |
| Viant Technology, Inc. (a) | 5,950 | 27,430 | |
| Weave Communications, Inc. (a) | 14,078 | 156,407 | |
| Workiva, Inc. (a) | 21,123 | 2,147,364 | |
| Yext, Inc. (a) | 46,460 | 525,463 | |
| Zeta Global Holdings Corp. (a) | 58,188 | 496,926 | |
| Zuora, Inc. (a) | 53,543 | 587,367 | |
| 51,142,685 | |||
| Technology Hardware, Storage & Peripherals - 1.1% | |||
| Avid Technology, Inc. (a) | 10,249 | 261,350 | |
| CompoSecure, Inc. (a)(b) | 6,288 | 43,136 | |
| Corsair Gaming, Inc. (a) | 15,852 | 281,214 | |
| CPI Card Group (a) | 1,825 | 42,431 | |
| IonQ, Inc. (a) | 10,828 | 146,503 | |
| Super Micro Computer, Inc. (a) | 20,042 | 4,995,466 | |
| 5,770,100 | |||
TOTAL INFORMATION TECHNOLOGY | 108,975,382 | ||
| MATERIALS - 4.3% | |||
| Chemicals - 2.6% | |||
| American Vanguard Corp. | 2,006 | 35,847 | |
| Amyris, Inc. (a)(b) | 13,140 | 13,534 | |
| Balchem Corp. | 13,825 | 1,863,748 | |
| Cabot Corp. | 23,949 | 1,601,949 | |
| Chase Corp. | 2,810 | 340,628 | |
| Core Molding Technologies, Inc. (a) | 246 | 5,597 | |
| Diversey Holdings Ltd. (a)(b) | 33,759 | 283,238 | |
| Ecovyst, Inc. (a) | 8,784 | 100,665 | |
| H.B. Fuller Co. | 20,880 | 1,493,129 | |
| Hawkins, Inc. | 8,410 | 401,073 | |
| Ingevity Corp. (a) | 16,145 | 938,993 | |
| Innospec, Inc. | 9,474 | 951,569 | |
| Livent Corp. (a)(b) | 77,997 | 2,139,458 | |
| Orion SA | 24,310 | 515,858 | |
| PureCycle Technologies, Inc. (a)(b) | 11,013 | 117,729 | |
| Quaker Houghton | 5,991 | 1,167,646 | |
| Sensient Technologies Corp. | 18,222 | 1,296,131 | |
| Stepan Co. | 1,070 | 102,249 | |
| 13,369,041 | |||
| Construction Materials - 0.0% | |||
| United States Lime & Minerals, Inc. | 883 | 184,450 | |
| Containers & Packaging - 0.3% | |||
| Myers Industries, Inc. | 15,686 | 304,779 | |
| O-I Glass, Inc. (a) | 57,295 | 1,222,102 | |
| 1,526,881 | |||
| Metals & Mining - 1.3% | |||
| 5E Advanced Materials, Inc. (a)(b) | 14,592 | 47,862 | |
| Alpha Metallurgical Resources | 384 | 63,114 | |
| ATI, Inc. (a) | 55,710 | 2,464,053 | |
| Century Aluminum Co. (a) | 22,581 | 196,906 | |
| Compass Minerals International, Inc. | 14,850 | 504,900 | |
| Constellium NV (a) | 33,893 | 582,960 | |
| Contango ORE, Inc. (a) | 777 | 19,798 | |
| Dakota Gold Corp. (a) | 15,530 | 45,348 | |
| Hecla Mining Co. | 54,145 | 278,847 | |
| i-80 Gold Corp. (a) | 5,407 | 12,166 | |
| Ivanhoe Electric, Inc. | 24,294 | 316,794 | |
| Kaiser Aluminum Corp. | 6,543 | 468,741 | |
| Materion Corp. | 8,861 | 1,011,926 | |
| NioCorp Developments Ltd. (a) | 952 | 4,789 | |
| Novagold Resources, Inc. (a) | 105,065 | 419,209 | |
| Perpetua Resources Corp. (a) | 16,205 | 59,472 | |
| Piedmont Lithium, Inc. (a)(b) | 2,609 | 150,565 | |
| Ryerson Holding Corp. | 648 | 28,110 | |
| 6,675,560 | |||
| Paper & Forest Products - 0.1% | |||
| Sylvamo Corp. | 15,746 | 636,926 | |
TOTAL MATERIALS | 22,392,858 | ||
| REAL ESTATE - 1.6% | |||
| Equity Real Estate Investment Trusts (REITs) - 1.0% | |||
| Alexanders, Inc. | 921 | 169,335 | |
| CareTrust (REIT), Inc. | 3,953 | 78,507 | |
| CBL & Associates Properties, Inc. | 8,672 | 191,131 | |
| Clipper Realty, Inc. (b) | 4,865 | 27,585 | |
| Community Healthcare Trust, Inc. | 7,317 | 241,607 | |
| Essential Properties Realty Trust, Inc. | 7,027 | 165,416 | |
| Four Corners Property Trust, Inc. | 4,055 | 102,997 | |
| Gladstone Commercial Corp. | 3,034 | 37,531 | |
| National Health Investors, Inc. | 1,755 | 91,997 | |
| NexPoint Residential Trust, Inc. | 2,866 | 130,346 | |
| Outfront Media, Inc. | 29,897 | 469,981 | |
| Phillips Edison & Co., Inc. | 8,608 | 293,361 | |
| Ryman Hospitality Properties, Inc. | 24,962 | 2,319,469 | |
| Saul Centers, Inc. | 4,596 | 169,271 | |
| Tanger Factory Outlet Centers, Inc. | 20,764 | 458,261 | |
| UMH Properties, Inc. | 4,063 | 64,927 | |
| Universal Health Realty Income Trust (SBI) | 5,522 | 262,737 | |
| 5,274,459 | |||
| Real Estate Management & Development - 0.6% | |||
| Anywhere Real Estate, Inc. (a) | 4,352 | 29,071 | |
| Compass, Inc. (a) | 111,221 | 389,274 | |
| Digitalbridge Group, Inc. | 22,292 | 327,915 | |
| eXp World Holdings, Inc. (b) | 29,970 | 607,792 | |
| Marcus & Millichap, Inc. | 3,978 | 125,347 | |
| Maui Land & Pineapple, Inc. (a) | 3,046 | 43,375 | |
| Opendoor Technologies, Inc. (a) | 12,411 | 49,892 | |
| Redfin Corp. (a)(b) | 45,998 | 571,295 | |
| The RMR Group, Inc. | 4,621 | 107,069 | |
| The St. Joe Co. | 14,892 | 719,879 | |
| 2,970,909 | |||
TOTAL REAL ESTATE | 8,245,368 | ||
| UTILITIES - 1.6% | |||
| Electric Utilities - 0.3% | |||
| Genie Energy Ltd. Class B | 4,467 | 63,163 | |
| MGE Energy, Inc. | 8,036 | 635,728 | |
| Otter Tail Corp. (b) | 9,459 | 746,883 | |
| PNM Resources, Inc. | 3,865 | 174,312 | |
| 1,620,086 | |||
| Gas Utilities - 0.4% | |||
| Brookfield Infrastructure Corp. A Shares | 4,143 | 188,838 | |
| Chesapeake Utilities Corp. | 4,871 | 579,649 | |
| New Jersey Resources Corp. | 21,961 | 1,036,559 | |
| RGC Resources, Inc. | 229 | 4,587 | |
| 1,809,633 | |||
| Independent Power and Renewable Electricity Producers - 0.3% | |||
| Montauk Renewables, Inc. (a)(b) | 28,594 | 212,739 | |
| Ormat Technologies, Inc. (b) | 14,864 | 1,195,957 | |
| Sunnova Energy International, Inc. (a)(b) | 21,298 | 389,966 | |
| 1,798,662 | |||
| Multi-Utilities - 0.0% | |||
| Unitil Corp. | 1,964 | 99,594 | |
| Water Utilities - 0.6% | |||
| American States Water Co. | 16,034 | 1,394,958 | |
| Artesian Resources Corp. Class A | 2,632 | 124,283 | |
| Cadiz, Inc. (a) | 17,395 | 70,624 | |
| California Water Service Group | 7,703 | 397,706 | |
| Consolidated Water Co., Inc. | 1,857 | 44,995 | |
| Global Water Resources, Inc. | 4,872 | 61,777 | |
| Middlesex Water Co. | 7,584 | 611,725 | |
| Pure Cycle Corp. (a) | 8,390 | 92,290 | |
| York Water Co. | 6,114 | 252,325 | |
| 3,050,683 | |||
TOTAL UTILITIES | 8,378,658 | ||
| TOTAL COMMON STOCKS (Cost $477,682,104) | 516,849,333 | ||
| U.S. Treasury Obligations - 0.0% | |||
Principal Amount (d) | Value ($) | ||
U.S. Treasury Bills, yield at date of purchase 5.18% 9/7/23 (e) (Cost $99,031) | 100,000 | 99,059 | |
| Money Market Funds - 9.2% | |||
| Shares | Value ($) | ||
| Fidelity Cash Central Fund 5.14% (f) | 2,544,656 | 2,545,165 | |
| Fidelity Securities Lending Cash Central Fund 5.14% (f)(g) | 45,440,065 | 45,444,609 | |
| TOTAL MONEY MARKET FUNDS (Cost $47,989,774) | 47,989,774 | ||
| TOTAL INVESTMENT IN SECURITIES - 108.5% (Cost $525,770,909) | 564,938,166 |
NET OTHER ASSETS (LIABILITIES) - (8.5)% | (44,463,069) |
| NET ASSETS - 100.0% | 520,475,097 |
| Futures Contracts | |||||
Number of contracts | Expiration Date | Notional Amount ($) | Value ($) | Unrealized Appreciation/ (Depreciation) ($) | |
| Purchased | |||||
| Equity Index Contracts | |||||
| CME E-mini Russell 2000 Index Contracts (United States) | 33 | Sep 2023 | 3,141,105 | 73,749 | 73,749 |
| The notional amount of futures purchased as a percentage of Net Assets is 0.6% | |||||
| (a) | Non-income producing |
| (b) | Security or a portion of the security is on loan at period end. |
| (c) | Level 3 security |
| (d) | Amount is stated in United States dollars unless otherwise noted. |
| (e) | Security or a portion of the security was pledged to cover margin requirements for futures contracts. At period end, the value of securities pledged amounted to $99,059. |
| (f) | Affiliated fund that is generally available only to investment companies and other accounts managed by Fidelity Investments. The rate quoted is the annualized seven-day yield of the fund at period end. A complete unaudited listing of the fund's holdings as of its most recent quarter end is available upon request. In addition, each Fidelity Central Fund's financial statements, which are not covered by the Fund's Report of Independent Registered Public Accounting Firm, are available on the SEC's website or upon request. |
| (g) | Investment made with cash collateral received from securities on loan. |
| Affiliate | Value, beginning of period ($) | Purchases ($) | Sales Proceeds ($) | Dividend Income ($) | Realized Gain (loss) ($) | Change in Unrealized appreciation (depreciation) ($) | Value, end of period ($) | % ownership, end of period |
| Fidelity Cash Central Fund 5.14% | 294,228 | 211,999,184 | 209,748,247 | 93,793 | - | - | 2,545,165 | 0.0% |
| Fidelity Securities Lending Cash Central Fund 5.14% | 31,870,574 | 157,333,478 | 143,759,443 | 838,071 | - | - | 45,444,609 | 0.2% |
| Total | 32,164,802 | 369,332,662 | 353,507,690 | 931,864 | - | - | 47,989,774 | |
| Valuation Inputs at Reporting Date: | ||||
| Description | Total ($) | Level 1 ($) | Level 2 ($) | Level 3 ($) |
Investments in Securities: | ||||
| Equities: | ||||
Communication Services | 11,036,393 | 11,036,393 | - | - |
Consumer Discretionary | 55,574,321 | 55,574,321 | - | - |
Consumer Staples | 21,925,479 | 21,925,479 | - | - |
Energy | 23,215,411 | 23,215,411 | - | - |
Financials | 30,725,507 | 30,725,507 | - | - |
Health Care | 122,638,448 | 122,622,674 | 14,282 | 1,492 |
Industrials | 103,741,508 | 103,741,508 | - | - |
Information Technology | 108,975,382 | 108,975,382 | - | - |
Materials | 22,392,858 | 22,392,858 | - | - |
Real Estate | 8,245,368 | 8,245,368 | - | - |
Utilities | 8,378,658 | 8,378,658 | - | - |
| U.S. Government and Government Agency Obligations | 99,059 | - | 99,059 | - |
| Money Market Funds | 47,989,774 | 47,989,774 | - | - |
| Total Investments in Securities: | 564,938,166 | 564,823,333 | 113,341 | 1,492 |
Derivative Instruments: | ||||
| Assets | ||||
Futures Contracts | 73,749 | 73,749 | - | - |
| Total Assets | 73,749 | 73,749 | - | - |
| Total Derivative Instruments: | 73,749 | 73,749 | - | - |
Primary Risk Exposure / Derivative Type | Value | |
| Asset ($) | Liability ($) | |
| Equity Risk | ||
Futures Contracts (a) | 73,749 | 0 |
| Total Equity Risk | 73,749 | 0 |
| Total Value of Derivatives | 73,749 | 0 |
| Statement of Assets and Liabilities | ||||
| June 30, 2023 | ||||
| Assets | ||||
| Investment in securities, at value (including securities loaned of $44,537,689) - See accompanying schedule: | ||||
Unaffiliated issuers (cost $477,781,135) | $ | 516,948,392 | ||
Fidelity Central Funds (cost $47,989,774) | 47,989,774 | |||
| Total Investment in Securities (cost $525,770,909) | $ | 564,938,166 | ||
| Segregated cash with brokers for derivative instruments | 95,973 | |||
| Foreign currency held at value (cost $378) | 382 | |||
| Receivable for investments sold | 403 | |||
| Receivable for fund shares sold | 2,778,237 | |||
| Dividends receivable | 149,958 | |||
| Distributions receivable from Fidelity Central Funds | 90,427 | |||
| Receivable for daily variation margin on futures contracts | 7,244 | |||
| Other receivables | 25,182 | |||
Total assets | 568,085,972 | |||
| Liabilities | ||||
| Payable for investments purchased | $ | 1,512,225 | ||
| Payable for fund shares redeemed | 633,061 | |||
| Accrued management fee | 20,980 | |||
| Collateral on securities loaned | 45,444,609 | |||
| Total Liabilities | 47,610,875 | |||
| Net Assets | $ | 520,475,097 | ||
| Net Assets consist of: | ||||
| Paid in capital | $ | 545,359,493 | ||
| Total accumulated earnings (loss) | (24,884,396) | |||
| Net Assets | $ | 520,475,097 | ||
Net Asset Value , offering price and redemption price per share ($520,475,097 ÷ 22,155,690 shares) | $ | 23.49 | ||
| Statement of Operations | ||||
Year ended June 30, 2023 | ||||
| Investment Income | ||||
| Dividends | $ | 3,333,176 | ||
| Interest | 3,787 | |||
| Income from Fidelity Central Funds (including $838,071 from security lending) | 931,864 | |||
| Total Income | 4,268,827 | |||
| Expenses | ||||
| Management fee | $ | 194,272 | ||
| Independent trustees' fees and expenses | 1,238 | |||
| Interest | 1,854 | |||
| Total expenses before reductions | 197,364 | |||
| Expense reductions | (1,960) | |||
| Total expenses after reductions | 195,404 | |||
| Net Investment income (loss) | 4,073,423 | |||
| Realized and Unrealized Gain (Loss) | ||||
| Net realized gain (loss) on: | ||||
| Investment Securities: | ||||
| Unaffiliated issuers | (5,350,895) | |||
| Foreign currency transactions | 2 | |||
| Futures contracts | 16,691 | |||
| Total net realized gain (loss) | (5,334,202) | |||
| Change in net unrealized appreciation (depreciation) on: | ||||
| Investment Securities: | ||||
| Unaffiliated issuers | 64,371,952 | |||
| Assets and liabilities in foreign currencies | 4 | |||
| Futures contracts | 60,572 | |||
| Total change in net unrealized appreciation (depreciation) | 64,432,528 | |||
| Net gain (loss) | 59,098,326 | |||
| Net increase (decrease) in net assets resulting from operations | $ | 63,171,749 | ||
| Statement of Changes in Net Assets | ||||
Year ended June 30, 2023 | Year ended June 30, 2022 | |||
| Increase (Decrease) in Net Assets | ||||
| Operations | ||||
| Net investment income (loss) | $ | 4,073,423 | $ | 2,156,091 |
| Net realized gain (loss) | (5,334,202) | (57,491,238) | ||
| Change in net unrealized appreciation (depreciation) | 64,432,528 | (78,701,931) | ||
| Net increase (decrease) in net assets resulting from operations | 63,171,749 | (134,037,078) | ||
| Distributions to shareholders | (2,541,670) | (11,137,021) | ||
| Share transactions | ||||
| Proceeds from sales of shares | 298,966,095 | 253,314,244 | ||
| Reinvestment of distributions | 2,183,459 | 9,762,975 | ||
| Cost of shares redeemed | (116,057,501) | (180,075,429) | ||
Net increase (decrease) in net assets resulting from share transactions | 185,092,053 | 83,001,790 | ||
| Total increase (decrease) in net assets | 245,722,132 | (62,172,309) | ||
| Net Assets | ||||
| Beginning of period | 274,752,965 | 336,925,274 | ||
| End of period | $ | 520,475,097 | $ | 274,752,965 |
| Other Information | ||||
| Shares | ||||
| Sold | 13,579,621 | 9,319,148 | ||
| Issued in reinvestment of distributions | 102,849 | 339,083 | ||
| Redeemed | (5,314,092) | (6,774,929) | ||
| Net increase (decrease) | 8,368,378 | 2,883,302 | ||
| Fidelity® Small Cap Growth Index Fund |
| Years ended June 30, | 2023 | 2022 | 2021 | 2020 A | ||||
Selected Per-Share Data | ||||||||
| Net asset value, beginning of period | $ | 19.93 | $ | 30.90 | $ | 20.66 | $ | 20.00 |
| Income from Investment Operations | ||||||||
Net investment income (loss) B,C | .23 | .17 | .14 | .15 | ||||
| Net realized and unrealized gain (loss) | 3.50 | (10.17) | 10.38 | .57 | ||||
| Total from investment operations | 3.73 | (10.00) | 10.52 | .72 | ||||
| Distributions from net investment income | (.17) | (.16) | (.11) | (.05) | ||||
| Distributions from net realized gain | - | (.81) | (.18) | (.01) | ||||
| Total distributions | (.17) | (.97) | (.28) D | (.06) | ||||
| Net asset value, end of period | $ | 23.49 | $ | 19.93 | $ | 30.90 | $ | 20.66 |
Total Return E,F | 18.78% | (33.33)% | 51.31% | 3.59% | ||||
Ratios to Average Net Assets C,G,H | ||||||||
| Expenses before reductions | .05% | .05% | .05% | .05% I | ||||
| Expenses net of fee waivers, if any | .05% | .05% | .05% | .05% I | ||||
| Expenses net of all reductions | .05% | .05% | .05% | .05% I | ||||
| Net investment income (loss) | 1.05% | .64% | .49% | .78% I | ||||
| Supplemental Data | ||||||||
| Net assets, end of period (000 omitted) | $ | 520,475 | $ | 274,753 | $ | 336,925 | $ | 54,213 |
Portfolio turnover rate J | 42% | 51% | 62% | 69% I |
| Average Annual Total Returns | |||
Periods ended June 30, 2023 | Past 1 year | Life of Fund A |
| Fidelity® Small Cap Value Index Fund | 6.14% | 6.37% |
| $10,000 Over Life of Fund |
Let's say hypothetically that $10,000 was invested in Fidelity® Small Cap Value Index Fund, on July 11, 2019, when the fund started. The chart shows how the value of your investment would have changed, and also shows how the Russell 2000® Value Index performed over the same period. |
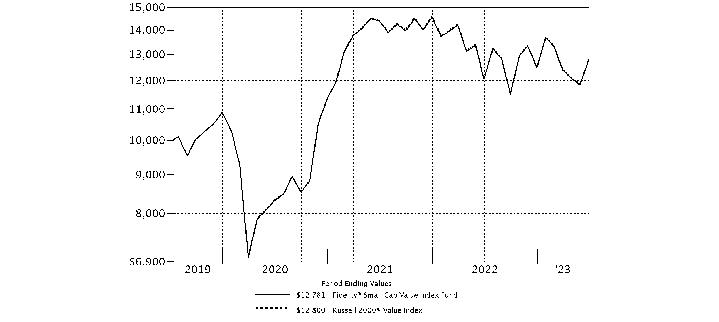 |
Top Holdings (% of Fund's net assets) | ||
| Chord Energy Corp. | 0.5 | |
| Commercial Metals Co. | 0.5 | |
| Murphy Oil Corp. | 0.5 | |
| Asbury Automotive Group, Inc. | 0.4 | |
| Meritage Homes Corp. | 0.5 | |
| Taylor Morrison Home Corp. | 0.4 | |
| Southstate Corp. | 0.4 | |
| Terreno Realty Corp. | 0.4 | |
| Essent Group Ltd. | 0.4 | |
| UFP Industries, Inc. | 0.4 | |
| 4.4 | ||
| Market Sectors (% of Fund's net assets) | ||
| Financials | 24.2 | |
| Industrials | 14.6 | |
| Real Estate | 10.5 | |
| Consumer Discretionary | 10.3 | |
| Health Care | 10.1 | |
| Energy | 9.1 | |
| Information Technology | 6.2 | |
| Materials | 4.9 | |
| Utilities | 4.4 | |
| Communication Services | 2.9 | |
| Consumer Staples | 2.6 | |
Asset Allocation (% of Fund's net assets) |
|
Futures - 0.2% |
| Common Stocks - 99.8% | |||
| Shares | Value ($) | ||
| COMMUNICATION SERVICES - 2.9% | |||
| Diversified Telecommunication Services - 0.7% | |||
| Anterix, Inc. (a) | 1,348 | 42,718 | |
| ATN International, Inc. | 8,168 | 298,949 | |
| Bandwidth, Inc. (a) | 13,507 | 184,776 | |
| Cogent Communications Group, Inc. | 11,998 | 807,345 | |
| Consolidated Communications Holdings, Inc. (a) | 48,715 | 186,578 | |
| EchoStar Holding Corp. Class A (a) | 24,996 | 433,431 | |
| Globalstar, Inc. (a)(b) | 66,715 | 72,052 | |
| IDT Corp. Class B (a) | 2,738 | 70,777 | |
| Liberty Latin America Ltd.: | |||
| Class A (a) | 17,748 | 155,295 | |
| Class C (a) | 117,061 | 1,009,066 | |
| Lumen Technologies, Inc. | 756,141 | 1,708,879 | |
| Radius Global Infrastructure, Inc. (a) | 63,492 | 946,031 | |
| 5,915,897 | |||
| Entertainment - 0.2% | |||
| Cinemark Holdings, Inc. (a)(b) | 13,476 | 222,354 | |
| Lions Gate Entertainment Corp.: | |||
| Class A (a) | 1 | 9 | |
| Class B (a) | 42,127 | 351,760 | |
| Madison Square Garden Entertainment Corp. | 4,697 | 157,913 | |
| Marcus Corp. (b) | 17,742 | 263,114 | |
| Playstudios, Inc. Class A (a) | 64,165 | 315,050 | |
| Reservoir Media, Inc. (a) | 14,485 | 87,200 | |
| Sphere Entertainment Co. (a) | 19,408 | 531,585 | |
| Vivid Seats, Inc. Class A (a) | 13,210 | 104,623 | |
| 2,033,608 | |||
| Interactive Media & Services - 0.5% | |||
| Bumble, Inc. (a) | 75,900 | 1,273,602 | |
| DHI Group, Inc. (a) | 32,683 | 125,176 | |
| Eventbrite, Inc. (a) | 5,636 | 53,824 | |
| EverQuote, Inc. Class A (a) | 1,473 | 9,575 | |
| fuboTV, Inc. (a)(b) | 153,295 | 318,854 | |
| Liberty TripAdvisor Holdings, Inc. (a) | 225 | 10,492 | |
| MediaAlpha, Inc. Class A (a) | 3,231 | 33,312 | |
| Nextdoor Holdings, Inc. (a) | 44,069 | 143,665 | |
| Outbrain, Inc. (a) | 30,969 | 152,367 | |
| System1, Inc. (a) | 18,231 | 82,040 | |
| TrueCar, Inc. (a) | 65,361 | 147,716 | |
| Vimeo, Inc. (a) | 99,432 | 409,660 | |
| Ziff Davis, Inc. (a) | 27,086 | 1,897,645 | |
| 4,657,928 | |||
| Media - 1.2% | |||
| Advantage Solutions, Inc. Class A (a)(b) | 65,791 | 153,951 | |
| AMC Networks, Inc. Class A (a) | 22,950 | 274,253 | |
| Boston Omaha Corp. (a) | 16,409 | 308,817 | |
| Cardlytics, Inc. (a) | 25,489 | 161,090 | |
| Clear Channel Outdoor Holdings, Inc. (a) | 276,811 | 379,231 | |
| Daily Journal Corp. (a) | 813 | 235,185 | |
| E.W. Scripps Co. Class A (a) | 23,460 | 214,659 | |
| Emerald Holding, Inc. (a) | 11,926 | 48,897 | |
| Gannett Co., Inc. (a) | 107,558 | 242,006 | |
| Gray Television, Inc. | 58,113 | 457,930 | |
| iHeartMedia, Inc. (a)(b) | 76,180 | 277,295 | |
| John Wiley & Sons, Inc. Class A | 32,138 | 1,093,656 | |
| Magnite, Inc. (a) | 57,881 | 790,076 | |
| PubMatic, Inc. (a) | 26,605 | 486,339 | |
| Quotient Technology, Inc. (a) | 67,367 | 258,689 | |
| Scholastic Corp. | 21,482 | 835,435 | |
| Sinclair, Inc. Class A (b) | 22,320 | 308,462 | |
| Stagwell, Inc. (a) | 80,895 | 583,253 | |
| TEGNA, Inc. | 167,865 | 2,726,128 | |
| Thryv Holdings, Inc. (a) | 22,952 | 564,619 | |
| Urban One, Inc.: | |||
| Class A (a) | 4,545 | 27,225 | |
| Class D (non-vtg.) (a) | 10,989 | 65,934 | |
| WideOpenWest, Inc. (a) | 38,125 | 321,775 | |
| 10,814,905 | |||
| Wireless Telecommunication Services - 0.3% | |||
| Gogo, Inc. (a) | 45,166 | 768,274 | |
| Shenandoah Telecommunications Co. | 36,099 | 701,404 | |
| Spok Holdings, Inc. | 13,674 | 181,727 | |
| Telephone & Data Systems, Inc. | 74,421 | 612,485 | |
| 2,263,890 | |||
TOTAL COMMUNICATION SERVICES | 25,686,228 | ||
| CONSUMER DISCRETIONARY - 10.3% | |||
| Automobile Components - 1.4% | |||
| Adient PLC (a) | 71,491 | 2,739,535 | |
| American Axle & Manufacturing Holdings, Inc. (a) | 85,525 | 707,292 | |
| Cooper-Standard Holding, Inc. (a) | 8,602 | 122,665 | |
| Dana, Inc. | 97,258 | 1,653,386 | |
| Holley, Inc. (a)(b) | 39,516 | 161,620 | |
| LCI Industries | 11,550 | 1,459,458 | |
| Modine Manufacturing Co. (a) | 13,784 | 455,148 | |
| Patrick Industries, Inc. | 14,008 | 1,120,640 | |
| Solid Power, Inc. (a)(b) | 116,142 | 295,001 | |
| Standard Motor Products, Inc. | 15,711 | 589,477 | |
| Stoneridge, Inc. (a) | 15,844 | 298,659 | |
| The Goodyear Tire & Rubber Co. (a) | 210,656 | 2,881,774 | |
| 12,484,655 | |||
| Automobiles - 0.2% | |||
| Winnebago Industries, Inc. | 22,383 | 1,492,722 | |
| Workhorse Group, Inc. (a)(b) | 122,068 | 106,394 | |
| 1,599,116 | |||
| Broadline Retail - 0.0% | |||
| Big Lots, Inc. | 21,374 | 188,732 | |
| ContextLogic, Inc. (a)(b) | 16,641 | 109,498 | |
| 298,230 | |||
| Distributors - 0.0% | |||
| Weyco Group, Inc. | 4,580 | 122,240 | |
| Diversified Consumer Services - 0.6% | |||
| 2U, Inc. (a) | 56,268 | 226,760 | |
| Adtalem Global Education, Inc. (a) | 34,058 | 1,169,552 | |
| Chegg, Inc. (a) | 12,302 | 109,242 | |
| European Wax Center, Inc. (a)(b) | 1,858 | 34,615 | |
| Graham Holdings Co. | 2,775 | 1,585,857 | |
| Laureate Education, Inc. Class A | 15,049 | 181,942 | |
| Lincoln Educational Services Corp. (a) | 17,938 | 120,902 | |
| Perdoceo Education Corp. (a) | 50,260 | 616,690 | |
| Strategic Education, Inc. | 17,050 | 1,156,672 | |
| Universal Technical Institute, Inc. (a) | 20,512 | 141,738 | |
| WW International, Inc. (a)(b) | 40,684 | 273,396 | |
| 5,617,366 | |||
| Hotels, Restaurants & Leisure - 0.9% | |||
| Bally's Corp. (a) | 9,835 | 153,033 | |
| Biglari Holdings, Inc. Class B (a) | 515 | 101,527 | |
| BJ's Restaurants, Inc. (a) | 6,232 | 198,178 | |
| Bluegreen Vacations Holding Corp. Class A | 1,600 | 57,040 | |
| Bowlero Corp. Class A (a)(b) | 3,160 | 36,782 | |
| Brinker International, Inc. (a) | 2,564 | 93,842 | |
| Carrols Restaurant Group, Inc. (a) | 27,128 | 136,725 | |
| Century Casinos, Inc. (a) | 3,600 | 25,560 | |
| Chuy's Holdings, Inc. (a) | 2,386 | 97,397 | |
| Denny's Corp. (a) | 8,604 | 106,001 | |
| Dine Brands Global, Inc. | 1,155 | 67,025 | |
| El Pollo Loco Holdings, Inc. | 21,293 | 186,740 | |
| Everi Holdings, Inc. (a) | 23,554 | 340,591 | |
| Fiesta Restaurant Group, Inc. (a) | 12,904 | 102,458 | |
| First Watch Restaurant Group, Inc. (a) | 6,760 | 114,244 | |
| Full House Resorts, Inc. (a) | 3,102 | 20,783 | |
| Krispy Kreme, Inc. (b) | 44,548 | 656,192 | |
| Life Time Group Holdings, Inc. (a) | 22,938 | 451,190 | |
| Light & Wonder, Inc. Class A (a) | 36,204 | 2,489,387 | |
| Lindblad Expeditions Holdings (a) | 23,770 | 258,618 | |
| Mondee Holdings, Inc. (a) | 4,808 | 42,839 | |
| Nathan's Famous, Inc. | 122 | 9,582 | |
| Papa John's International, Inc. | 5,723 | 422,529 | |
| Red Rock Resorts, Inc. | 16,107 | 753,485 | |
| Sabre Corp. (a)(b) | 182,732 | 582,915 | |
| SeaWorld Entertainment, Inc. (a) | 1,478 | 82,783 | |
| Six Flags Entertainment Corp. (a) | 11,085 | 287,988 | |
| Sweetgreen, Inc. Class A (a) | 14,275 | 183,006 | |
| Xponential Fitness, Inc. (a) | 2,721 | 46,937 | |
| 8,105,377 | |||
| Household Durables - 3.2% | |||
| Beazer Homes U.S.A., Inc. (a) | 21,989 | 622,069 | |
| Century Communities, Inc. | 21,293 | 1,631,470 | |
| Dream Finders Homes, Inc. (a)(b) | 10,832 | 266,359 | |
| Ethan Allen Interiors, Inc. | 17,246 | 487,717 | |
| GoPro, Inc. Class A (a) | 96,818 | 400,827 | |
| Green Brick Partners, Inc. (a) | 13,331 | 757,201 | |
| Helen of Troy Ltd. (a) | 18,041 | 1,948,789 | |
| Hooker Furnishings Corp. | 8,176 | 152,564 | |
| Hovnanian Enterprises, Inc. Class A (a) | 3,597 | 356,858 | |
| iRobot Corp. (a)(b) | 1,882 | 85,161 | |
| KB Home | 55,478 | 2,868,767 | |
| La-Z-Boy, Inc. | 32,553 | 932,318 | |
| Landsea Homes Corp. (a) | 10,182 | 95,100 | |
| Legacy Housing Corp. (a) | 7,465 | 173,113 | |
| LGI Homes, Inc. (a)(b) | 14,401 | 1,942,551 | |
| M.D.C. Holdings, Inc. | 44,066 | 2,060,967 | |
| M/I Homes, Inc. (a) | 20,156 | 1,757,402 | |
| Meritage Homes Corp. | 27,268 | 3,879,418 | |
| Purple Innovation, Inc. | 48,314 | 134,313 | |
| Skyline Champion Corp. (a) | 17,742 | 1,161,214 | |
| Snap One Holdings Corp. (a) | 13,821 | 161,015 | |
| Taylor Morrison Home Corp. (a) | 78,684 | 3,837,419 | |
| Traeger, Inc. (a)(b) | 26,210 | 111,393 | |
| TRI Pointe Homes, Inc. (a) | 74,124 | 2,435,715 | |
| United Homes Group, Inc. (a) | 4,622 | 51,582 | |
| Vizio Holding Corp. (a) | 6,173 | 41,668 | |
| VOXX International Corp. (a) | 10,337 | 129,006 | |
| Vuzix Corp. (a)(b) | 44,331 | 226,088 | |
| 28,708,064 | |||
| Leisure Products - 0.6% | |||
| AMMO, Inc. (a)(b) | 70,459 | 150,078 | |
| Clarus Corp. (b) | 20,247 | 185,058 | |
| Escalade, Inc. | 7,070 | 94,385 | |
| Funko, Inc. (a) | 8,112 | 87,772 | |
| JAKKS Pacific, Inc. (a) | 5,494 | 109,715 | |
| Johnson Outdoors, Inc. Class A | 4,012 | 246,537 | |
| Latham Group, Inc. (a) | 29,117 | 108,024 | |
| Malibu Boats, Inc. Class A (a) | 5,863 | 343,924 | |
| Smith & Wesson Brands, Inc. | 34,357 | 448,015 | |
| Solo Brands, Inc. Class A (a) | 4,382 | 24,802 | |
| Sturm, Ruger & Co., Inc. | 989 | 52,377 | |
| Topgolf Callaway Brands Corp. (a) | 107,623 | 2,136,317 | |
| Vista Outdoor, Inc. (a) | 42,238 | 1,168,725 | |
| 5,155,729 | |||
| Specialty Retail - 3.2% | |||
| 1-800-FLOWERS.com, Inc. Class A (a) | 19,414 | 151,429 | |
| Abercrombie & Fitch Co. Class A (a) | 17,651 | 665,090 | |
| America's Car Mart, Inc. (a) | 4,371 | 436,138 | |
| American Eagle Outfitters, Inc. | 106,194 | 1,253,089 | |
| Asbury Automotive Group, Inc. (a) | 16,228 | 3,901,536 | |
| BARK, Inc. (a)(b) | 80,231 | 106,707 | |
| Big 5 Sporting Goods Corp. (b) | 17,068 | 156,343 | |
| Build-A-Bear Workshop, Inc. | 2,237 | 47,917 | |
| Caleres, Inc. | 26,015 | 622,539 | |
| Carvana Co. Class A (a)(b) | 40,237 | 1,042,943 | |
| Chico's FAS, Inc. (a)(b) | 91,341 | 488,674 | |
| Designer Brands, Inc. Class A (b) | 37,170 | 375,417 | |
| Destination XL Group, Inc. (a) | 43,837 | 214,801 | |
| Duluth Holdings, Inc. (a)(b) | 9,374 | 58,869 | |
| EVgo, Inc. Class A (a)(b) | 46,472 | 185,888 | |
| Foot Locker, Inc. | 61,581 | 1,669,461 | |
| Franchise Group, Inc. (b) | 1,138 | 32,592 | |
| Genesco, Inc. (a) | 9,043 | 226,437 | |
| Group 1 Automotive, Inc. | 10,423 | 2,690,176 | |
| GrowGeneration Corp. (a) | 44,170 | 150,178 | |
| Guess?, Inc. (b) | 19,287 | 375,132 | |
| Haverty Furniture Companies, Inc. | 11,046 | 333,810 | |
| Hibbett, Inc. | 1,663 | 60,350 | |
| J.Jill, Inc. (a) | 3,363 | 72,069 | |
| Lands' End, Inc. (a) | 11,023 | 85,538 | |
| Lazydays Holdings, Inc. (a) | 9,405 | 108,722 | |
| Leslie's, Inc. (a) | 121,467 | 1,140,575 | |
| MarineMax, Inc. (a) | 16,132 | 551,069 | |
| Monro, Inc. | 23,338 | 948,223 | |
| National Vision Holdings, Inc. (a) | 54,070 | 1,313,360 | |
| OneWater Marine, Inc. Class A (a)(b) | 8,635 | 312,932 | |
| Overstock.com, Inc. (a) | 33,837 | 1,102,071 | |
| PetMed Express, Inc. | 15,781 | 217,620 | |
| Rent the Runway, Inc. Class A (a) | 33,835 | 66,993 | |
| Sally Beauty Holdings, Inc. (a) | 4,515 | 55,760 | |
| Shoe Carnival, Inc. | 12,648 | 296,975 | |
| Signet Jewelers Ltd. | 33,428 | 2,181,511 | |
| Sleep Number Corp. (a) | 7,472 | 203,836 | |
| Sonic Automotive, Inc. Class A (sub. vtg.) | 11,707 | 558,073 | |
| Sportsman's Warehouse Holdings, Inc. (a) | 28,006 | 159,634 | |
| Stitch Fix, Inc. (a)(b) | 32,983 | 126,985 | |
| The Aaron's Co., Inc. | 23,526 | 332,658 | |
| The Cato Corp. Class A (sub. vtg.) | 13,202 | 106,012 | |
| The Children's Place, Inc. (a)(b) | 8,932 | 207,312 | |
| The ODP Corp. (a) | 25,618 | 1,199,435 | |
| thredUP, Inc. (a) | 44,016 | 107,399 | |
| Tile Shop Holdings, Inc. (a)(b) | 21,333 | 118,185 | |
| Tilly's, Inc. (a)(b) | 16,528 | 115,861 | |
| Upbound Group, Inc. | 2,570 | 80,004 | |
| Urban Outfitters, Inc. (a) | 31,765 | 1,052,374 | |
| Winmark Corp. | 2,096 | 696,857 | |
| Zumiez, Inc. (a) | 11,880 | 197,921 | |
| 28,961,480 | |||
| Textiles, Apparel & Luxury Goods - 0.2% | |||
| Allbirds, Inc. Class A (a)(b) | 70,155 | 88,395 | |
| Fossil Group, Inc. (a) | 35,100 | 90,207 | |
| G-III Apparel Group Ltd. (a) | 31,200 | 601,224 | |
| Hanesbrands, Inc. | 87,304 | 396,360 | |
| Movado Group, Inc. | 11,606 | 311,389 | |
| Oxford Industries, Inc. | 2,742 | 269,868 | |
| Rocky Brands, Inc. | 4,873 | 102,333 | |
| Vera Bradley, Inc. (a) | 18,858 | 120,503 | |
| Wolverine World Wide, Inc. | 5,512 | 80,971 | |
| 2,061,250 | |||
TOTAL CONSUMER DISCRETIONARY | 93,113,507 | ||
| CONSUMER STAPLES - 2.6% | |||
| Beverages - 0.2% | |||
| Duckhorn Portfolio, Inc. (a) | 26,689 | 346,156 | |
| Primo Water Corp. | 101,225 | 1,269,362 | |
| Zevia PBC (a) | 8,217 | 35,415 | |
| 1,650,933 | |||
| Consumer Staples Distribution & Retail - 0.5% | |||
| Andersons, Inc. | 24,213 | 1,117,430 | |
| HF Foods Group, Inc. (a) | 30,379 | 142,478 | |
| Ingles Markets, Inc. Class A | 10,511 | 868,734 | |
| Natural Grocers by Vitamin Cottage, Inc. | 7,117 | 87,254 | |
| PriceSmart, Inc. | 5,722 | 423,771 | |
| SpartanNash Co. | 26,241 | 590,685 | |
| United Natural Foods, Inc. (a)(b) | 44,549 | 870,933 | |
| Village Super Market, Inc. Class A | 6,351 | 144,930 | |
| Weis Markets, Inc. | 12,351 | 793,058 | |
| 5,039,273 | |||
| Food Products - 0.8% | |||
| Alico, Inc. | 5,228 | 133,105 | |
| B&G Foods, Inc. Class A | 53,387 | 743,147 | |
| Benson Hill, Inc. (a) | 129,929 | 168,908 | |
| BRC, Inc. Class A (a)(b) | 2,436 | 12,570 | |
| Cal-Maine Foods, Inc. | 2,054 | 92,430 | |
| Dole PLC | 23,114 | 312,501 | |
| Forafric Global PLC (b) | 3,657 | 40,117 | |
| Fresh Del Monte Produce, Inc. | 25,499 | 655,579 | |
| Hostess Brands, Inc. Class A (a) | 81,082 | 2,052,996 | |
| Limoneira Co. | 13,242 | 206,046 | |
| Mission Produce, Inc. (a)(b) | 30,947 | 375,078 | |
| Seneca Foods Corp. Class A (a) | 3,868 | 126,406 | |
| SunOpta, Inc. (a) | 3,729 | 24,947 | |
| The Hain Celestial Group, Inc. (a) | 67,114 | 839,596 | |
| TreeHouse Foods, Inc. (a) | 33,904 | 1,708,084 | |
| 7,491,510 | |||
| Household Products - 0.2% | |||
| Central Garden & Pet Co. (a) | 8,217 | 318,573 | |
| Central Garden & Pet Co. Class A (non-vtg.) (a) | 28,534 | 1,040,350 | |
| Oil-Dri Corp. of America | 2,725 | 160,748 | |
| 1,519,671 | |||
| Personal Care Products - 0.7% | |||
| BellRing Brands, Inc. (a) | 73,163 | 2,677,766 | |
| Edgewell Personal Care Co. (b) | 38,317 | 1,582,875 | |
| Herbalife Ltd. (a) | 19,623 | 259,809 | |
| Nature's Sunshine Products, Inc. (a) | 9,818 | 134,016 | |
| Nu Skin Enterprises, Inc. Class A | 37,268 | 1,237,298 | |
| Thorne HealthTech, Inc. (a) | 5,122 | 24,073 | |
| Waldencast PLC (a) | 14,856 | 114,837 | |
| 6,030,674 | |||
| Tobacco - 0.2% | |||
| Universal Corp. | 18,228 | 910,306 | |
| Vector Group Ltd. | 89,973 | 1,152,554 | |
| 2,062,860 | |||
TOTAL CONSUMER STAPLES | 23,794,921 | ||
| ENERGY - 9.1% | |||
| Energy Equipment & Services - 2.1% | |||
| Archrock, Inc. | 85,327 | 874,602 | |
| Atlas Energy Solutions, Inc. | 10,042 | 174,329 | |
| Bristow Group, Inc. (a) | 17,496 | 502,660 | |
| Core Laboratories, Inc. | 23,789 | 553,094 | |
| Diamond Offshore Drilling, Inc. (a) | 76,170 | 1,084,661 | |
| DMC Global, Inc. (a) | 9,978 | 177,209 | |
| Dril-Quip, Inc. (a) | 25,332 | 589,476 | |
| Expro Group Holdings NV (a) | 41,394 | 733,502 | |
| Forum Energy Technologies, Inc. (a) | 7,169 | 183,455 | |
| Helix Energy Solutions Group, Inc. (a) | 106,966 | 789,409 | |
| Helmerich & Payne, Inc. | 75,330 | 2,670,449 | |
| KLX Energy Services Holdings, Inc. (a)(b) | 8,418 | 81,907 | |
| Liberty Oilfield Services, Inc. Class A | 120,751 | 1,614,441 | |
| Mammoth Energy Services, Inc. (a) | 16,773 | 81,014 | |
| Nabors Industries Ltd. (a)(b) | 639 | 59,446 | |
| Newpark Resources, Inc. (a) | 55,484 | 290,181 | |
| Nextier Oilfield Solutions, Inc. (a) | 125,801 | 1,124,661 | |
| Noble Corp. PLC | 13,813 | 570,615 | |
| Oil States International, Inc. (a) | 46,624 | 348,281 | |
| Patterson-UTI Energy, Inc. | 155,466 | 1,860,928 | |
| ProFrac Holding Corp. (a)(b) | 14,202 | 158,494 | |
| ProPetro Holding Corp. (a) | 73,386 | 604,701 | |
| Ranger Energy Services, Inc. Class A (a) | 11,553 | 118,303 | |
| RPC, Inc. | 63,905 | 456,921 | |
| SEACOR Marine Holdings, Inc. (a) | 17,635 | 201,568 | |
| Seadrill Ltd. (a) | 37,835 | 1,561,450 | |
| Select Water Solutions, Inc. Class A | 63,646 | 515,533 | |
| Solaris Oilfield Infrastructure, Inc. Class A (b) | 22,886 | 190,640 | |
| U.S. Silica Holdings, Inc. (a) | 56,227 | 682,034 | |
| 18,853,964 | |||
| Oil, Gas & Consumable Fuels - 7.0% | |||
| Amplify Energy Corp. (a)(b) | 27,094 | 183,426 | |
| Arch Resources, Inc. | 13,706 | 1,545,489 | |
| Ardmore Shipping Corp. | 30,834 | 380,800 | |
| Berry Corp. | 58,669 | 403,643 | |
| California Resources Corp. (b) | 53,696 | 2,431,892 | |
| Callon Petroleum Co. (a)(b) | 45,861 | 1,608,345 | |
| Centrus Energy Corp. Class A (a) | 9,165 | 298,412 | |
| Chord Energy Corp. | 31,424 | 4,832,980 | |
| Chord Energy Corp.: | |||
| warrants 9/1/24 (a) | 810 | 18,873 | |
| warrants 9/1/25 (a) | 405 | 6,415 | |
| Civitas Resources, Inc. | 52,171 | 3,619,102 | |
| Clean Energy Fuels Corp. (a)(b) | 126,100 | 625,456 | |
| CNX Resources Corp. (a) | 121,824 | 2,158,721 | |
| Comstock Resources, Inc. (b) | 68,969 | 800,040 | |
| CONSOL Energy, Inc. | 25,478 | 1,727,663 | |
| Crescent Energy, Inc. Class A (b) | 18,028 | 187,852 | |
| CVR Energy, Inc. (b) | 1,982 | 59,381 | |
| Delek U.S. Holdings, Inc. | 49,678 | 1,189,788 | |
| DHT Holdings, Inc. | 102,935 | 878,036 | |
| Dorian LPG Ltd. | 9,668 | 247,984 | |
| Earthstone Energy, Inc. (a)(b) | 42,823 | 611,941 | |
| enCore Energy Corp. (a) | 103,784 | 250,119 | |
| Energy Fuels, Inc. (a)(b) | 16,199 | 101,082 | |
| Equitrans Midstream Corp. | 231,989 | 2,217,815 | |
| Excelerate Energy, Inc. | 2,786 | 56,639 | |
| FLEX LNG Ltd. (b) | 7,392 | 225,678 | |
| Gevo, Inc. (a)(b) | 172,108 | 261,604 | |
| Golar LNG Ltd. | 70,775 | 1,427,532 | |
| Granite Ridge Resources, Inc. | 19,551 | 129,623 | |
| Green Plains, Inc. (a)(b) | 35,858 | 1,156,062 | |
| Gulfport Energy Corp. (a) | 7,510 | 789,076 | |
| Hallador Energy Co. (a) | 17,051 | 146,127 | |
| HighPeak Energy, Inc. (b) | 1,454 | 15,820 | |
| International Seaways, Inc. | 30,459 | 1,164,752 | |
| Kinetik Holdings, Inc. (b) | 11,628 | 408,608 | |
| Magnolia Oil & Gas Corp. Class A | 8,763 | 183,147 | |
| Matador Resources Co. | 69,867 | 3,655,441 | |
| Murphy Oil Corp. | 111,213 | 4,259,458 | |
| NACCO Industries, Inc. Class A | 3,234 | 112,090 | |
| Nordic American Tanker Shipping Ltd. | 153,591 | 563,679 | |
| Northern Oil & Gas, Inc. | 6,737 | 231,214 | |
| Overseas Shipholding Group, Inc. (a) | 41,632 | 173,605 | |
| Par Pacific Holdings, Inc. (a) | 25,409 | 676,133 | |
| PBF Energy, Inc. Class A | 87,152 | 3,568,003 | |
| Peabody Energy Corp. (b) | 93,247 | 2,019,730 | |
| Permian Resource Corp. Class A | 160,725 | 1,761,546 | |
| PrimeEnergy Corp. (a) | 517 | 47,580 | |
| Rex American Resources Corp. (a) | 8,523 | 296,686 | |
| Ring Energy, Inc. (a)(b) | 89,396 | 152,867 | |
| SandRidge Energy, Inc. | 23,750 | 362,188 | |
| Scorpio Tankers, Inc. | 39,472 | 1,864,263 | |
| SFL Corp. Ltd. | 85,995 | 802,333 | |
| SilverBow Resources, Inc. (a) | 11,823 | 344,286 | |
| Sitio Royalties Corp. | 34,176 | 897,804 | |
| SM Energy Co. | 89,941 | 2,844,834 | |
| Talos Energy, Inc. (a) | 83,633 | 1,159,990 | |
| Teekay Corp. (a) | 49,063 | 296,341 | |
| Teekay Tankers Ltd. | 17,913 | 684,814 | |
| Tellurian, Inc. (a)(b) | 375,368 | 529,269 | |
| Uranium Energy Corp. (a)(b) | 275,996 | 938,386 | |
| VAALCO Energy, Inc. | 72,207 | 271,498 | |
| Verde Clean Fuels, Inc. (a)(b) | 3,233 | 21,047 | |
| Vital Energy, Inc. (a) | 12,603 | 569,025 | |
| Vitesse Energy, Inc. | 18,821 | 421,590 | |
| World Kinect Corp. | 45,918 | 949,584 | |
| 62,825,207 | |||
TOTAL ENERGY | 81,679,171 | ||
| FINANCIALS - 24.2% | |||
| Banks - 14.8% | |||
| 1st Source Corp. | 12,362 | 518,339 | |
| ACNB Corp. | 6,220 | 206,317 | |
| Amalgamated Financial Corp. | 13,327 | 214,431 | |
| Amerant Bancorp, Inc. Class A | 19,201 | 330,065 | |
| American National Bankshares, Inc. | 7,635 | 221,262 | |
| Ameris Bancorp | 49,543 | 1,694,866 | |
| Ames National Corp. | 6,300 | 113,589 | |
| Arrow Financial Corp. | 10,816 | 217,834 | |
| Associated Banc-Corp. | 113,331 | 1,839,362 | |
| Atlantic Union Bankshares Corp. | 56,363 | 1,462,620 | |
| Axos Financial, Inc. (a) | 37,495 | 1,478,803 | |
| Banc of California, Inc. | 40,642 | 470,634 | |
| BancFirst Corp. | 14,219 | 1,308,148 | |
| Bank First National Corp. | 6,938 | 577,242 | |
| Bank of Hawaii Corp. | 29,519 | 1,217,068 | |
| Bank of Marin Bancorp | 11,924 | 210,697 | |
| Bank7 Corp. | 2,644 | 64,857 | |
| BankUnited, Inc. | 55,792 | 1,202,318 | |
| Bankwell Financial Group, Inc. | 4,482 | 109,271 | |
| Banner Corp. | 25,778 | 1,125,725 | |
| Bar Harbor Bankshares | 11,138 | 274,440 | |
| BayCom Corp. | 7,823 | 130,488 | |
| BCB Bancorp, Inc. | 11,591 | 136,078 | |
| Berkshire Hills Bancorp, Inc. | 32,955 | 683,157 | |
| Blue Foundry Bancorp (a) | 17,665 | 178,593 | |
| Blue Ridge Bankshares, Inc. | 13,725 | 121,466 | |
| Bridgewater Bancshares, Inc. (a) | 15,132 | 149,050 | |
| Brookline Bancorp, Inc., Delaware | 65,381 | 571,430 | |
| Burke & Herbert Financial Services Corp. | 4,411 | 283,186 | |
| Business First Bancshares, Inc. | 18,077 | 272,420 | |
| Byline Bancorp, Inc. | 18,294 | 330,938 | |
| C & F Financial Corp. | 2,413 | 129,578 | |
| Cadence Bank | 136,731 | 2,685,397 | |
| Cambridge Bancorp | 5,742 | 311,848 | |
| Camden National Corp. | 10,645 | 329,676 | |
| Capital Bancorp, Inc. | 7,166 | 129,705 | |
| Capital City Bank Group, Inc. | 6,386 | 195,667 | |
| Capitol Federal Financial, Inc. | 94,534 | 583,275 | |
| Capstar Financial Holdings, Inc. | 14,665 | 179,940 | |
| Carter Bankshares, Inc. (a) | 17,216 | 254,625 | |
| Cathay General Bancorp | 52,160 | 1,679,030 | |
| Central Pacific Financial Corp. | 20,292 | 318,787 | |
| Central Valley Community Bancorp | 7,419 | 114,624 | |
| Chemung Financial Corp. | 2,528 | 97,100 | |
| ChoiceOne Financial Services, Inc. | 5,206 | 119,738 | |
| Citizens & Northern Corp. | 11,347 | 218,997 | |
| Citizens Financial Services, Inc. | 2,609 | 194,292 | |
| City Holding Co. | 10,427 | 938,326 | |
| Civista Bancshares, Inc. | 11,562 | 201,179 | |
| CNB Financial Corp., Pennsylvania | 15,555 | 274,546 | |
| Codorus Valley Bancorp, Inc. | 6,930 | 135,897 | |
| Colony Bankcorp, Inc. | 12,093 | 113,916 | |
| Columbia Financial, Inc. (a)(b) | 12,905 | 223,127 | |
| Community Bank System, Inc. | 39,946 | 1,872,668 | |
| Community Financial Corp. | 3,739 | 101,290 | |
| Community Trust Bancorp, Inc. | 11,584 | 412,043 | |
| ConnectOne Bancorp, Inc. | 27,780 | 460,870 | |
| CrossFirst Bankshares, Inc. (a) | 32,970 | 329,700 | |
| Customers Bancorp, Inc. (a) | 21,423 | 648,260 | |
| CVB Financial Corp. | 100,184 | 1,330,444 | |
| Dime Community Bancshares, Inc. | 26,702 | 470,756 | |
| Eagle Bancorp, Inc. | 23,237 | 491,695 | |
| Eastern Bankshares, Inc. | 116,138 | 1,425,013 | |
| Enterprise Bancorp, Inc. | 7,084 | 205,011 | |
| Enterprise Financial Services Corp. | 27,240 | 1,065,084 | |
| Equity Bancshares, Inc. | 10,981 | 250,147 | |
| Esquire Financial Holdings, Inc. | 636 | 29,091 | |
| ESSA Bancorp, Inc. | 6,221 | 93,004 | |
| Evans Bancorp, Inc. | 3,801 | 94,759 | |
| Farmers & Merchants Bancorp, Inc. | 10,191 | 229,399 | |
| Farmers National Banc Corp. | 27,911 | 345,259 | |
| FB Financial Corp. | 26,489 | 743,016 | |
| Fidelity D & D Bancorp, Inc. | 3,507 | 170,405 | |
| Financial Institutions, Inc. | 11,492 | 180,884 | |
| First Bancorp, North Carolina | 29,871 | 888,662 | |
| First Bancorp, Puerto Rico | 121,645 | 1,486,502 | |
| First Bancshares, Inc. | 22,643 | 585,095 | |
| First Bank Hamilton New Jersey | 12,500 | 129,750 | |
| First Busey Corp. | 38,703 | 777,930 | |
| First Business Finance Services, Inc. | 5,783 | 170,541 | |
| First Commonwealth Financial Corp. | 76,878 | 972,507 | |
| First Community Bankshares, Inc. | 13,149 | 390,920 | |
| First Community Corp. | 5,259 | 91,296 | |
| First Financial Bancorp, Ohio | 70,494 | 1,440,897 | |
| First Financial Corp., Indiana | 8,773 | 284,859 | |
| First Foundation, Inc. | 38,892 | 154,401 | |
| First Interstate Bancsystem, Inc. | 62,392 | 1,487,425 | |
| First Merchants Corp. | 44,407 | 1,253,610 | |
| First Mid-Illinois Bancshares, Inc. | 14,271 | 344,502 | |
| First of Long Island Corp. | 16,105 | 193,582 | |
| First Western Financial, Inc. (a) | 5,811 | 108,085 | |
| Five Star Bancorp | 5,535 | 123,818 | |
| Flushing Financial Corp. | 21,268 | 261,384 | |
| FS Bancorp, Inc. | 3,889 | 116,942 | |
| Fulton Financial Corp. | 121,961 | 1,453,775 | |
| FVCBankcorp, Inc. (a) | 11,760 | 126,655 | |
| German American Bancorp, Inc. | 20,951 | 569,448 | |
| Glacier Bancorp, Inc. | 83,629 | 2,606,716 | |
| Great Southern Bancorp, Inc. | 6,638 | 336,746 | |
| Greene County Bancorp, Inc. | 2,513 | 74,887 | |
| Guaranty Bancshares, Inc. Texas | 6,170 | 167,084 | |
| Hancock Whitney Corp. | 65,014 | 2,495,237 | |
| Hanmi Financial Corp. | 23,383 | 349,108 | |
| HarborOne Bancorp, Inc. | 31,075 | 269,731 | |
| HBT Financial, Inc. | 9,968 | 183,810 | |
| Heartland Financial U.S.A., Inc. | 31,805 | 886,405 | |
| Heritage Commerce Corp. | 44,991 | 372,525 | |
| Heritage Financial Corp., Washington | 26,132 | 422,554 | |
| Hilltop Holdings, Inc. | 34,632 | 1,089,523 | |
| Hingham Institution for Savings | 1,119 | 238,548 | |
| Home Bancorp, Inc. | 5,326 | 176,876 | |
| Home Bancshares, Inc. | 142,587 | 3,250,984 | |
| HomeStreet, Inc. | 14,354 | 84,976 | |
| HomeTrust Bancshares, Inc. | 8,918 | 186,297 | |
| Hope Bancorp, Inc. | 86,811 | 730,949 | |
| Horizon Bancorp, Inc. Indiana | 33,048 | 344,030 | |
| Independent Bank Corp. | 33,230 | 1,479,067 | |
| Independent Bank Corp. | 15,220 | 258,131 | |
| Independent Bank Group, Inc. | 27,138 | 937,075 | |
| International Bancshares Corp. | 40,168 | 1,775,426 | |
| John Marshall Bankcorp, Inc. | 9,471 | 190,272 | |
| Kearny Financial Corp. | 42,493 | 299,576 | |
| Lakeland Bancorp, Inc. | 46,591 | 623,853 | |
| Lakeland Financial Corp. | 17,426 | 845,510 | |
| LCNB Corp. | 7,855 | 115,940 | |
| Live Oak Bancshares, Inc. | 25,218 | 663,486 | |
| Luther Burbank Corp. | 6,659 | 59,398 | |
| Macatawa Bank Corp. | 19,450 | 180,496 | |
| Mainstreet Bancshares, Inc. | 5,092 | 115,385 | |
| Mercantile Bank Corp. | 11,728 | 323,927 | |
| Metrocity Bankshares, Inc. | 13,637 | 243,966 | |
| Metropolitan Bank Holding Corp. (a) | 7,197 | 249,952 | |
| Mid Penn Bancorp, Inc. | 10,688 | 235,991 | |
| Middlefield Banc Corp. | 5,779 | 154,877 | |
| Midland States Bancorp, Inc. | 16,054 | 319,635 | |
| MidWestOne Financial Group, Inc. | 10,583 | 226,159 | |
| MVB Financial Corp. | 8,052 | 169,736 | |
| National Bank Holdings Corp. | 27,669 | 803,508 | |
| National Bankshares, Inc. | 4,301 | 125,546 | |
| NBT Bancorp, Inc. | 31,349 | 998,466 | |
| Nicolet Bankshares, Inc. | 9,558 | 649,084 | |
| Northeast Bank | 5,727 | 238,644 | |
| Northeast Community Bancorp, Inc. | 9,743 | 144,976 | |
| Northfield Bancorp, Inc. | 30,508 | 334,978 | |
| Northrim Bancorp, Inc. | 4,104 | 161,410 | |
| Northwest Bancshares, Inc. | 95,853 | 1,016,042 | |
| Norwood Financial Corp. | 5,476 | 161,706 | |
| Oak Valley Bancorp Oakdale California | 4,925 | 124,061 | |
| OceanFirst Financial Corp. | 43,788 | 683,969 | |
| OFG Bancorp | 35,080 | 914,886 | |
| Old National Bancorp, Indiana | 219,645 | 3,061,851 | |
| Old Second Bancorp, Inc. | 32,546 | 425,051 | |
| Orange County Bancorp, Inc. | 3,822 | 141,414 | |
| Origin Bancorp, Inc. | 21,710 | 636,103 | |
| Orrstown Financial Services, Inc. | 7,630 | 146,115 | |
| Pacific Premier Bancorp, Inc. | 71,738 | 1,483,542 | |
| PacWest Bancorp | 90,176 | 734,934 | |
| Park National Corp. | 10,757 | 1,100,656 | |
| Parke Bancorp, Inc. | 7,549 | 128,258 | |
| Pathward Financial, Inc. | 13,677 | 634,066 | |
| PCB Bancorp | 8,153 | 119,931 | |
| Peapack-Gladstone Financial Corp. | 12,575 | 340,531 | |
| Penns Woods Bancorp, Inc. | 4,972 | 124,449 | |
| Peoples Bancorp, Inc. | 25,601 | 679,707 | |
| Peoples Financial Services Corp. | 5,200 | 227,708 | |
| Pioneer Bancorp, Inc. (a) | 7,776 | 69,595 | |
| Plumas Bancorp | 3,548 | 126,628 | |
| Ponce Financial Group, Inc. (a) | 14,185 | 123,268 | |
| Preferred Bank, Los Angeles | 10,121 | 556,554 | |
| Premier Financial Corp. | 26,963 | 431,947 | |
| Primis Financial Corp. | 14,960 | 125,963 | |
| Princeton Bancorp, Inc. | 3,747 | 102,368 | |
| Provident Financial Services, Inc. | 55,385 | 904,991 | |
| QCR Holdings, Inc. | 12,189 | 500,115 | |
| RBB Bancorp | 12,704 | 151,686 | |
| Red River Bancshares, Inc. | 3,559 | 174,889 | |
| Renasant Corp. | 41,212 | 1,076,870 | |
| Republic Bancorp, Inc., Kentucky Class A | 6,323 | 268,728 | |
| S&T Bancorp, Inc. | 29,184 | 793,513 | |
| Sandy Spring Bancorp, Inc. | 33,025 | 749,007 | |
| Seacoast Banking Corp., Florida | 63,316 | 1,399,284 | |
| ServisFirst Bancshares, Inc. | 25,322 | 1,036,176 | |
| Shore Bancshares, Inc. | 13,472 | 155,736 | |
| Sierra Bancorp | 10,203 | 173,145 | |
| Simmons First National Corp. Class A | 94,604 | 1,631,919 | |
| SmartFinancial, Inc. | 11,669 | 251,000 | |
| South Plains Financial, Inc. | 8,775 | 197,525 | |
| Southern First Bancshares, Inc. (a) | 5,579 | 138,080 | |
| Southern Missouri Bancorp, Inc. | 6,441 | 247,656 | |
| Southern States Bancshares, Inc. | 5,518 | 116,430 | |
| Southside Bancshares, Inc. | 22,053 | 576,906 | |
| Southstate Corp. | 57,071 | 3,755,272 | |
| Stellar Bancorp, Inc. | 34,788 | 796,297 | |
| Sterling Bancorp, Inc. (a) | 14,012 | 76,646 | |
| Stock Yards Bancorp, Inc. | 2,573 | 116,737 | |
| Summit Financial Group, Inc. | 8,456 | 174,701 | |
| Texas Capital Bancshares, Inc. (a) | 35,777 | 1,842,516 | |
| The Bank of NT Butterfield & Son Ltd. | 35,233 | 963,975 | |
| The First Bancorp, Inc. | 7,414 | 180,457 | |
| Third Coast Bancshares, Inc. (a) | 8,893 | 141,132 | |
| Timberland Bancorp, Inc./Washington | 5,458 | 139,616 | |
| Tompkins Financial Corp. | 10,347 | 576,328 | |
| TowneBank | 52,336 | 1,216,289 | |
| Trico Bancshares | 23,377 | 776,116 | |
| Triumph Bancorp, Inc. (a) | 16,622 | 1,009,288 | |
| Trustco Bank Corp., New York | 13,876 | 396,992 | |
| Trustmark Corp. | 45,453 | 959,967 | |
| UMB Financial Corp. | 33,181 | 2,020,723 | |
| United Bankshares, Inc., West Virginia | 97,925 | 2,905,435 | |
| United Community Bank, Inc. | 86,806 | 2,169,282 | |
| Unity Bancorp, Inc. | 5,212 | 122,951 | |
| Univest Corp. of Pennsylvania | 21,706 | 392,444 | |
| USCB Financial Holdings, Inc. (a) | 7,572 | 77,234 | |
| Valley National Bancorp | 323,861 | 2,509,923 | |
| Veritex Holdings, Inc. | 39,615 | 710,297 | |
| Virginia National Bankshares C | 3,561 | 114,486 | |
| Washington Federal, Inc. | 49,029 | 1,300,249 | |
| Washington Trust Bancorp, Inc. | 12,820 | 343,704 | |
| WesBanco, Inc. | 43,238 | 1,107,325 | |
| West Bancorp., Inc. | 12,075 | 222,301 | |
| Westamerica Bancorp. | 13,838 | 529,995 | |
| WSFS Financial Corp. | 45,870 | 1,730,216 | |
| 133,040,657 | |||
| Capital Markets - 0.7% | |||
| Artisan Partners Asset Management, Inc. (b) | 12,871 | 505,959 | |
| Avantax, Inc. (a) | 3,146 | 70,407 | |
| Bakkt Holdings, Inc. Class A (a)(b) | 52,710 | 64,833 | |
| BGC Partners, Inc. Class A | 122,748 | 543,774 | |
| BrightSphere Investment Group, Inc. | 14,157 | 296,589 | |
| Donnelley Financial Solutions, Inc. (a) | 5,226 | 237,940 | |
| Forge Global Holdings, Inc. Class A (a) | 82,055 | 199,394 | |
| GCM Grosvenor, Inc. Class A | 4,339 | 32,716 | |
| Hamilton Lane, Inc. Class A | 11,241 | 899,055 | |
| MarketWise, Inc. Class A | 24,579 | 49,158 | |
| Moelis & Co. Class A | 20,716 | 939,263 | |
| Open Lending Corp. (a) | 6,008 | 63,144 | |
| Piper Jaffray Companies | 2,305 | 297,944 | |
| Sculptor Capital Management, Inc. Class A | 8,139 | 71,867 | |
| StoneX Group, Inc. (a) | 11,827 | 982,587 | |
| Value Line, Inc. | 64 | 2,938 | |
| Victory Capital Holdings, Inc. | 2,121 | 66,896 | |
| Virtus Investment Partners, Inc. | 4,525 | 893,552 | |
| 6,218,016 | |||
| Consumer Finance - 1.1% | |||
| Atlanticus Holdings Corp. (a)(b) | 3,304 | 138,801 | |
| Bread Financial Holdings, Inc. | 37,767 | 1,185,506 | |
| Consumer Portfolio Services, Inc. (a) | 6,928 | 80,850 | |
| Encore Capital Group, Inc. (a)(b) | 17,370 | 844,529 | |
| Enova International, Inc. (a) | 22,815 | 1,211,933 | |
| Green Dot Corp. Class A (a) | 34,883 | 653,707 | |
| LendingClub Corp. (a) | 80,714 | 786,962 | |
| LendingTree, Inc. (a) | 5,968 | 131,952 | |
| Navient Corp. | 68,754 | 1,277,449 | |
| Nelnet, Inc. Class A | 10,720 | 1,034,266 | |
| OppFi, Inc. Class A (a)(b) | 7,535 | 15,371 | |
| PRA Group, Inc. (a) | 28,748 | 656,892 | |
| PROG Holdings, Inc. (a) | 28,044 | 900,773 | |
| Regional Management Corp. | 5,201 | 158,631 | |
| World Acceptance Corp. (a)(b) | 2,600 | 348,426 | |
| 9,426,048 | |||
| Financial Services - 2.9% | |||
| A-Mark Precious Metals, Inc. | 14,223 | 532,438 | |
| Acacia Research Corp. (a) | 28,365 | 117,998 | |
| Alerus Financial Corp. | 13,775 | 247,675 | |
| AvidXchange Holdings, Inc. (a) | 9,627 | 99,928 | |
| Banco Latinoamericano de Comer Series E | 20,477 | 451,723 | |
| Cannae Holdings, Inc. (a) | 53,175 | 1,074,667 | |
| Cantaloupe, Inc. (a) | 13,954 | 111,074 | |
| Cass Information Systems, Inc. | 1,325 | 51,384 | |
| Compass Diversified Holdings | 47,811 | 1,037,021 | |
| Enact Holdings, Inc. | 22,365 | 562,032 | |
| Essent Group Ltd. | 79,274 | 3,710,023 | |
| Federal Agricultural Mortgage Corp. Class C (non-vtg.) | 5,634 | 809,831 | |
| Finance of America Companies, Inc. (a)(b) | 39,208 | 74,887 | |
| Home Point Capital, Inc. | 5,956 | 13,818 | |
| Jackson Financial, Inc. | 61,299 | 1,876,362 | |
| Marqeta, Inc. Class A (a) | 319,204 | 1,554,523 | |
| Merchants Bancorp | 11,969 | 306,167 | |
| Mr. Cooper Group, Inc. (a) | 49,793 | 2,521,518 | |
| Newtekone, Inc. | 17,911 | 284,785 | |
| NMI Holdings, Inc. (a) | 56,572 | 1,460,689 | |
| Ocwen Financial Corp. (a) | 4,641 | 139,091 | |
| PagSeguro Digital Ltd. (a) | 58,141 | 548,851 | |
| Paysafe Ltd. (a) | 24,177 | 243,946 | |
| PennyMac Financial Services, Inc. | 17,842 | 1,254,471 | |
| Radian Group, Inc. | 117,822 | 2,978,540 | |
| Repay Holdings Corp. (a) | 60,844 | 476,409 | |
| Security National Financial Corp. Class A | 8,797 | 78,029 | |
| StoneCo Ltd. Class A (a) | 85,800 | 1,093,092 | |
| SWK Holdings Corp. (a)(b) | 2,852 | 47,742 | |
| Velocity Financial, Inc. (a) | 6,392 | 73,700 | |
| Walker & Dunlop, Inc. | 23,910 | 1,891,042 | |
| Waterstone Financial, Inc. | 13,666 | 198,020 | |
| 25,921,476 | |||
| Insurance - 2.3% | |||
| AMBAC Financial Group, Inc. (a) | 32,760 | 466,502 | |
| American Equity Investment Life Holding Co. | 58,223 | 3,034,001 | |
| Amerisafe, Inc. | 6,941 | 370,094 | |
| Argo Group International Holdings, Ltd. | 23,736 | 702,823 | |
| CNO Financial Group, Inc. | 85,559 | 2,025,182 | |
| Donegal Group, Inc. Class A | 11,522 | 166,262 | |
| eHealth, Inc. (a) | 12,005 | 96,520 | |
| Employers Holdings, Inc. | 20,111 | 752,353 | |
| Enstar Group Ltd. (a) | 8,871 | 2,166,653 | |
| F&G Annuities & Life, Inc. | 13,250 | 328,335 | |
| Genworth Financial, Inc. Class A (a) | 363,448 | 1,817,240 | |
| GoHealth, Inc. (a)(b) | 2,916 | 57,474 | |
| Greenlight Capital Re, Ltd. (a) | 19,525 | 205,696 | |
| Hippo Holdings, Inc. (a) | 7,836 | 129,529 | |
| Horace Mann Educators Corp. | 31,028 | 920,290 | |
| Investors Title Co. | 764 | 111,544 | |
| James River Group Holdings Ltd. | 27,729 | 506,332 | |
| Lemonade, Inc. (a)(b) | 31,668 | 533,606 | |
| Maiden Holdings Ltd. (a) | 65,956 | 138,508 | |
| MBIA, Inc. (a) | 36,089 | 311,809 | |
| Mercury General Corp. | 20,012 | 605,763 | |
| National Western Life Group, Inc. | 1,702 | 707,283 | |
| NI Holdings, Inc. (a) | 5,866 | 87,110 | |
| Oscar Health, Inc. (a) | 107,171 | 863,798 | |
| ProAssurance Corp. | 40,358 | 609,002 | |
| Safety Insurance Group, Inc. | 10,843 | 777,660 | |
| Selectquote, Inc. (a) | 101,961 | 198,824 | |
| Siriuspoint Ltd. (a) | 61,701 | 557,160 | |
| Skyward Specialty Insurance Group, Inc. | 5,749 | 146,025 | |
| Stewart Information Services Corp. | 20,148 | 828,889 | |
| Tiptree, Inc. | 13,079 | 196,316 | |
| United Fire Group, Inc. | 15,775 | 357,462 | |
| United Insurance Holdings Corp. (a)(b) | 14,595 | 65,094 | |
| Universal Insurance Holdings, Inc. | 14,851 | 229,151 | |
| 21,070,290 | |||
| Mortgage Real Estate Investment Trusts - 2.4% | |||
| Angel Oak Mortgage (REIT), Inc. (b) | 9,077 | 74,794 | |
| Apollo Commercial Real Estate Finance, Inc. | 108,455 | 1,227,711 | |
| Arbor Realty Trust, Inc. (b) | 135,354 | 2,005,946 | |
| Ares Commercial Real Estate Corp. | 41,053 | 416,688 | |
| Armour Residential REIT, Inc. | 148,319 | 790,540 | |
| Blackstone Mortgage Trust, Inc. (b) | 130,437 | 2,714,394 | |
| BrightSpire Capital, Inc. | 99,808 | 671,708 | |
| Chimera Investment Corp. | 175,447 | 1,012,329 | |
| Claros Mortgage Trust, Inc. | 68,704 | 779,103 | |
| Dynex Capital, Inc. | 41,158 | 518,179 | |
| Ellington Financial LLC | 49,860 | 688,068 | |
| Franklin BSP Realty Trust, Inc. | 62,933 | 891,131 | |
| Granite Point Mortgage Trust, Inc. | 39,571 | 209,726 | |
| Hannon Armstrong Sustainable Infrastructure Capital, Inc. | 71,767 | 1,794,175 | |
| Invesco Mortgage Capital, Inc. | 32,295 | 370,424 | |
| KKR Real Estate Finance Trust, Inc. | 45,569 | 554,575 | |
| Ladder Capital Corp. Class A | 86,228 | 935,574 | |
| MFA Financial, Inc. | 77,470 | 870,763 | |
| New York Mortgage Trust, Inc. | 69,276 | 687,218 | |
| Nexpoint Real Estate Finance, Inc. | 6,288 | 98,030 | |
| Orchid Island Capital, Inc. | 29,951 | 309,993 | |
| PennyMac Mortgage Investment Trust | 66,936 | 902,297 | |
| Ready Capital Corp. | 122,144 | 1,377,784 | |
| Redwood Trust, Inc. | 86,707 | 552,324 | |
| TPG RE Finance Trust, Inc. | 52,526 | 389,218 | |
| Two Harbors Investment Corp. | 74,268 | 1,030,840 | |
| 21,873,532 | |||
TOTAL FINANCIALS | 217,550,019 | ||
| HEALTH CARE - 10.1% | |||
| Biotechnology - 5.0% | |||
| 2seventy bio, Inc. (a) | 37,503 | 379,530 | |
| 4D Molecular Therapeutics, Inc. (a)(b) | 21,558 | 389,553 | |
| Aadi Bioscience, Inc. (a) | 12,010 | 82,148 | |
| Acrivon Therapeutics, Inc. | 6,457 | 83,683 | |
| Actinium Pharmaceuticals, Inc. (a) | 1,238 | 9,186 | |
| Adicet Bio, Inc. (a) | 22,206 | 53,961 | |
| ADMA Biologics, Inc. (a) | 74,020 | 273,134 | |
| Agenus, Inc. (a) | 216,798 | 346,877 | |
| Agios Pharmaceuticals, Inc. (a)(b) | 41,636 | 1,179,132 | |
| Allakos, Inc. (a) | 49,430 | 215,515 | |
| Allogene Therapeutics, Inc. (a)(b) | 61,191 | 304,119 | |
| Allovir, Inc. (a)(b) | 31,289 | 106,383 | |
| Alpine Immune Sciences, Inc. (a) | 11,403 | 117,223 | |
| Altimmune, Inc. (a) | 36,800 | 129,904 | |
| ALX Oncology Holdings, Inc. (a)(b) | 15,886 | 119,304 | |
| AnaptysBio, Inc. (a)(b) | 2,429 | 49,406 | |
| Anika Therapeutics, Inc. (a) | 10,818 | 281,052 | |
| Annexon, Inc. (a) | 33,907 | 119,353 | |
| Arbutus Biopharma Corp. (a)(b) | 35,299 | 81,188 | |
| Arcturus Therapeutics Holdings, Inc. (a) | 15,935 | 457,016 | |
| Arcus Biosciences, Inc. (a) | 27,546 | 559,459 | |
| Ardelyx, Inc. (a) | 55,101 | 186,792 | |
| Ars Pharmaceuticals, Inc. (a) | 14,128 | 94,658 | |
| Astria Therapeutics, Inc. (a) | 2,336 | 19,459 | |
| Atara Biotherapeutics, Inc. (a) | 65,581 | 105,585 | |
| Aura Biosciences, Inc. (a) | 20,426 | 252,261 | |
| Avidity Biosciences, Inc. (a) | 53,092 | 588,790 | |
| Beam Therapeutics, Inc. (a) | 5,003 | 159,746 | |
| BioAtla, Inc. (a) | 32,943 | 98,829 | |
| BioCryst Pharmaceuticals, Inc. (a)(b) | 34,575 | 243,408 | |
| Biohaven Ltd. | 43,655 | 1,044,228 | |
| bluebird bio, Inc. (a)(b) | 79,585 | 261,835 | |
| BridgeBio Pharma, Inc. (a) | 25,923 | 445,876 | |
| Cabaletta Bio, Inc. (a) | 2,077 | 26,814 | |
| CareDx, Inc. (a) | 38,978 | 331,313 | |
| Caribou Biosciences, Inc. (a)(b) | 42,643 | 181,233 | |
| Carisma Therapeutics, Inc. | 19,989 | 175,304 | |
| Celcuity, Inc. (a) | 12,717 | 139,633 | |
| Celldex Therapeutics, Inc. (a) | 25,909 | 879,092 | |
| Century Therapeutics, Inc. (a) | 18,468 | 58,359 | |
| Chinook Therapeutics, Inc. (a) | 31,168 | 1,197,475 | |
| Chinook Therapeutics, Inc. rights (a)(c) | 488 | 0 | |
| Cogent Biosciences, Inc. (a) | 23,456 | 277,719 | |
| Coherus BioSciences, Inc. (a)(b) | 10,329 | 44,105 | |
| Compass Therapeutics, Inc. (a) | 61,235 | 194,727 | |
| Crinetics Pharmaceuticals, Inc. (a) | 33,616 | 605,760 | |
| Cullinan Oncology, Inc. (a) | 17,740 | 190,882 | |
| Cytokinetics, Inc. (a) | 5,195 | 169,461 | |
| Day One Biopharmaceuticals, Inc. (a) | 3,100 | 37,014 | |
| Deciphera Pharmaceuticals, Inc. (a) | 25,568 | 359,997 | |
| Design Therapeutics, Inc. (a)(b) | 24,296 | 153,065 | |
| Disc Medicine, Inc. (a) | 375 | 16,650 | |
| Dynavax Technologies Corp. (a) | 15,692 | 202,741 | |
| Dyne Therapeutics, Inc. (a) | 22,485 | 252,956 | |
| Eagle Pharmaceuticals, Inc. (a) | 7,738 | 150,427 | |
| Editas Medicine, Inc. (a)(b) | 52,030 | 428,207 | |
| Emergent BioSolutions, Inc. (a) | 37,614 | 276,463 | |
| Enanta Pharmaceuticals, Inc. (a) | 12,952 | 277,173 | |
| Entrada Therapeutics, Inc. (a) | 15,958 | 241,604 | |
| EQRx, Inc. (a) | 238,265 | 443,173 | |
| Erasca, Inc. (a)(b) | 61,438 | 169,569 | |
| Fate Therapeutics, Inc. (a) | 63,547 | 302,484 | |
| Fennec Pharmaceuticals, Inc. (a) | 10,044 | 88,689 | |
| FibroGen, Inc. (a) | 67,702 | 182,795 | |
| Genelux Corp. (b) | 1,538 | 50,323 | |
| Generation Bio Co. (a) | 33,780 | 185,790 | |
| Geron Corp. (a) | 91,087 | 292,389 | |
| Graphite Bio, Inc. (a) | 20,211 | 52,549 | |
| Gritstone Bio, Inc. (a) | 65,531 | 127,785 | |
| Heron Therapeutics, Inc. (a) | 8,264 | 9,586 | |
| HilleVax, Inc. (a)(b) | 12,059 | 207,294 | |
| Humacyte, Inc. Class A (a)(b) | 6,060 | 17,332 | |
| Icosavax, Inc. (a)(b) | 20,545 | 204,012 | |
| Ideaya Biosciences, Inc. (a)(b) | 14,441 | 339,364 | |
| IGM Biosciences, Inc. (a) | 8,851 | 81,695 | |
| Immuneering Corp. (a) | 3,567 | 36,169 | |
| ImmunityBio, Inc. (a)(b) | 15,169 | 42,170 | |
| ImmunoGen, Inc. (a) | 76,123 | 1,436,441 | |
| Inhibrx, Inc. (a) | 8,574 | 222,581 | |
| Inozyme Pharma, Inc. (a) | 25,280 | 140,810 | |
| Intellia Therapeutics, Inc. (a) | 56,623 | 2,309,086 | |
| Iovance Biotherapeutics, Inc. (a) | 156,144 | 1,099,254 | |
| Ironwood Pharmaceuticals, Inc. Class A (a) | 61,490 | 654,254 | |
| iTeos Therapeutics, Inc. (a) | 18,724 | 247,906 | |
| Janux Therapeutics, Inc. (a)(b) | 12,179 | 144,565 | |
| Kalvista Pharmaceuticals, Inc. (a) | 18,153 | 163,377 | |
| Kezar Life Sciences, Inc. (a) | 53,202 | 130,345 | |
| Kiniksa Pharmaceuticals Ltd. (a) | 23,601 | 332,302 | |
| Kodiak Sciences, Inc. (a) | 24,138 | 166,552 | |
| Kura Oncology, Inc. (a) | 48,571 | 513,881 | |
| Larimar Therapeutics, Inc. (a) | 19,194 | 60,077 | |
| Lexicon Pharmaceuticals, Inc. (a)(b) | 37,206 | 85,202 | |
| Lyell Immunopharma, Inc. (a)(b) | 129,801 | 412,767 | |
| Macrogenics, Inc. (a) | 31,800 | 170,130 | |
| MannKind Corp. (a)(b) | 35,126 | 142,963 | |
| MeiraGTx Holdings PLC (a) | 6,501 | 43,687 | |
| Mersana Therapeutics, Inc. (a) | 29,253 | 96,242 | |
| MiMedx Group, Inc. (a) | 85,006 | 561,890 | |
| Mineralys Therapeutics, Inc. | 7,571 | 129,086 | |
| Monte Rosa Therapeutics, Inc. (a) | 22,448 | 153,769 | |
| Morphic Holding, Inc. (a) | 2,605 | 149,345 | |
| Myriad Genetics, Inc. (a) | 60,524 | 1,402,946 | |
| Nkarta, Inc. (a)(b) | 22,530 | 49,341 | |
| Novavax, Inc. (a)(b) | 12,025 | 89,346 | |
| Nurix Therapeutics, Inc. (a) | 34,964 | 349,290 | |
| Ocean Biomedical, Inc. Class A (a) | 6,572 | 39,498 | |
| Olema Pharmaceuticals, Inc. (a) | 19,993 | 180,537 | |
| Omniab, Inc. (c) | 3,625 | 14,536 | |
| Omniab, Inc. (c) | 3,625 | 13,775 | |
| Organogenesis Holdings, Inc. Class A (a) | 46,760 | 155,243 | |
| ORIC Pharmaceuticals, Inc. (a) | 29,015 | 225,156 | |
| Ovid Therapeutics, Inc. (a) | 44,123 | 144,723 | |
| PepGen, Inc. (a) | 5,659 | 50,591 | |
| PMV Pharmaceuticals, Inc. (a)(b) | 29,181 | 182,673 | |
| Point Biopharma Global, Inc. (a)(b) | 67,514 | 611,677 | |
| Poseida Therapeutics, Inc. (a) | 51,093 | 89,924 | |
| Precigen, Inc. (a) | 101,031 | 116,186 | |
| Prelude Therapeutics, Inc. (a) | 7,257 | 32,657 | |
| ProKidney Corp. (a) | 34,293 | 383,739 | |
| Protagonist Therapeutics, Inc. (a) | 15,019 | 414,825 | |
| Protalix BioTherapeutics, Inc. (a) | 41,920 | 83,840 | |
| PTC Therapeutics, Inc. (a) | 10,139 | 412,353 | |
| Rallybio Corp. (a)(b) | 22,831 | 129,223 | |
| RAPT Therapeutics, Inc. (a) | 5,435 | 101,635 | |
| Recursion Pharmaceuticals, Inc. (a)(b) | 102,513 | 765,772 | |
| REGENXBIO, Inc. (a) | 30,306 | 605,817 | |
| Relay Therapeutics, Inc. (a)(b) | 67,641 | 849,571 | |
| Reneo Pharmaceuticals, Inc. (a) | 2,495 | 16,367 | |
| Replimune Group, Inc. (a) | 30,562 | 709,650 | |
| Rigel Pharmaceuticals, Inc. (a) | 23,048 | 29,732 | |
| Rocket Pharmaceuticals, Inc. (a) | 4,788 | 95,138 | |
| Sage Therapeutics, Inc. (a) | 2,459 | 115,622 | |
| Sana Biotechnology, Inc. (a)(b) | 64,532 | 384,611 | |
| Sangamo Therapeutics, Inc. (a) | 108,243 | 140,716 | |
| Savara, Inc. (a) | 53,429 | 170,706 | |
| Scholar Rock Holding Corp. (a) | 21,104 | 159,124 | |
| Selecta Biosciences, Inc. (a) | 65,209 | 73,034 | |
| Seres Therapeutics, Inc. (a) | 24,051 | 115,204 | |
| Stoke Therapeutics, Inc. (a) | 20,704 | 220,084 | |
| Sutro Biopharma, Inc. (a) | 44,812 | 208,376 | |
| Syndax Pharmaceuticals, Inc. (a) | 8,229 | 172,233 | |
| Tango Therapeutics, Inc. (a) | 33,437 | 111,011 | |
| Tenaya Therapeutics, Inc. (a) | 34,657 | 203,437 | |
| Travere Therapeutics, Inc. (a) | 3,907 | 60,012 | |
| Twist Bioscience Corp. (a)(b) | 42,817 | 876,036 | |
| Tyra Biosciences, Inc. (a)(b) | 6,663 | 113,471 | |
| UroGen Pharma Ltd. (a) | 2,693 | 27,873 | |
| Vanda Pharmaceuticals, Inc. (a) | 41,551 | 273,821 | |
| Vera Therapeutics, Inc. (a)(b) | 13,051 | 209,469 | |
| Veracyte, Inc. (a) | 54,692 | 1,393,005 | |
| Verve Therapeutics, Inc. (a)(b) | 38,050 | 713,438 | |
| Vigil Neuroscience, Inc. (a) | 11,966 | 112,480 | |
| Vir Biotechnology, Inc. (a) | 59,583 | 1,461,571 | |
| Viridian Therapeutics, Inc. (a) | 6,633 | 157,799 | |
| Vor Biopharma, Inc. (a) | 27,919 | 86,270 | |
| X4 Pharmaceuticals, Inc. (a) | 46,212 | 89,651 | |
| Xencor, Inc. (a) | 19,611 | 489,687 | |
| XOMA Corp. (a) | 5,455 | 103,045 | |
| Y-mAbs Therapeutics, Inc. (a) | 14,737 | 100,064 | |
| Zura Bio Ltd. Class A (a) | 5,718 | 46,888 | |
| Zymeworks, Inc. | 39,870 | 344,477 | |
| 45,185,423 | |||
| Health Care Equipment & Supplies - 1.8% | |||
| Accuray, Inc. (a) | 3,273 | 12,667 | |
| Alphatec Holdings, Inc. (a) | 33,943 | 610,295 | |
| Angiodynamics, Inc. (a) | 28,118 | 293,271 | |
| Artivion, Inc. (a) | 24,633 | 423,441 | |
| Atricure, Inc. (a) | 9,699 | 478,743 | |
| Avanos Medical, Inc. (a) | 34,623 | 884,964 | |
| Beyond Air, Inc. (a) | 2,159 | 9,197 | |
| Butterfly Network, Inc. Class A (a)(b) | 106,485 | 244,916 | |
| ClearPoint Neuro, Inc. (a) | 1,529 | 11,070 | |
| Cutera, Inc. (a) | 10,872 | 164,493 | |
| CVRx, Inc. (a) | 1,088 | 16,799 | |
| Embecta Corp. | 38,504 | 831,686 | |
| Figs, Inc. Class A (a)(b) | 11,333 | 93,724 | |
| Inari Medical, Inc. (a)(b) | 2,716 | 157,908 | |
| Inogen, Inc. (a) | 17,469 | 201,767 | |
| Integer Holdings Corp. (a) | 24,799 | 2,197,439 | |
| LivaNova PLC (a) | 37,987 | 1,953,671 | |
| Nano-X Imaging Ltd. (a)(b) | 30,641 | 474,629 | |
| Neogen Corp. (a)(b) | 162,977 | 3,544,750 | |
| Nevro Corp. (a) | 17,450 | 443,579 | |
| NuVasive, Inc. (a) | 5,549 | 230,783 | |
| Omnicell, Inc. (a) | 17,014 | 1,253,421 | |
| OraSure Technologies, Inc. (a) | 55,440 | 277,754 | |
| Orthofix International NV (a) | 26,082 | 471,041 | |
| OrthoPediatrics Corp. (a) | 1,410 | 61,829 | |
| Pulse Biosciences, Inc. (a)(b) | 8,856 | 63,675 | |
| Utah Medical Products, Inc. | 174 | 16,217 | |
| Varex Imaging Corp. (a)(b) | 28,804 | 678,910 | |
| Vicarious Surgical, Inc. (a)(b) | 28,009 | 51,256 | |
| ViewRay, Inc. (a) | 56,298 | 19,828 | |
| Zimvie, Inc. (a) | 19,210 | 215,728 | |
| 16,389,451 | |||
| Health Care Providers & Services - 1.3% | |||
| 23andMe Holding Co. Class A (a)(b) | 194,183 | 339,820 | |
| Accolade, Inc. (a) | 2,762 | 37,204 | |
| AdaptHealth Corp. (a) | 26,763 | 325,706 | |
| Addus HomeCare Corp. (a) | 6,258 | 580,117 | |
| Agiliti, Inc. (a)(b) | 2,820 | 46,530 | |
| AirSculpt Technologies, Inc. (b) | 1,346 | 11,603 | |
| Aveanna Healthcare Holdings, Inc. (a) | 27,671 | 46,764 | |
| Brookdale Senior Living, Inc. (a) | 126,883 | 535,446 | |
| Cano Health, Inc. (a) | 165,047 | 229,415 | |
| CareMax, Inc. Class A (a)(b) | 56,155 | 174,642 | |
| Castle Biosciences, Inc. (a) | 11,446 | 157,039 | |
| Community Health Systems, Inc. (a)(b) | 93,945 | 413,358 | |
| Cross Country Healthcare, Inc. (a) | 21,720 | 609,898 | |
| Enhabit Home Health & Hospice | 37,438 | 430,537 | |
| Fulgent Genetics, Inc. (a) | 15,313 | 567,040 | |
| Invitae Corp. (a)(b) | 26,318 | 29,739 | |
| LifeStance Health Group, Inc. (a)(b) | 36,071 | 329,328 | |
| National Healthcare Corp. | 9,328 | 576,657 | |
| NeoGenomics, Inc. (a) | 86,982 | 1,397,801 | |
| Opko Health, Inc. (a) | 300,723 | 652,569 | |
| Owens & Minor, Inc. (a)(b) | 55,723 | 1,060,966 | |
| Patterson Companies, Inc. | 51,947 | 1,727,757 | |
| Pediatrix Medical Group, Inc. (a) | 62,674 | 890,598 | |
| PetIQ, Inc. Class A (a) | 3,355 | 50,895 | |
| Surgery Partners, Inc. (a) | 4,738 | 213,163 | |
| 11,434,592 | |||
| Health Care Technology - 0.4% | |||
| American Well Corp. (a) | 182,600 | 383,460 | |
| Computer Programs & Systems, Inc. (a) | 10,741 | 265,195 | |
| Definitive Healthcare Corp. (a) | 23,037 | 253,407 | |
| Health Catalyst, Inc. (a) | 19,113 | 238,913 | |
| HealthStream, Inc. | 10,728 | 263,480 | |
| MultiPlan Corp. Class A (a)(b) | 282,628 | 596,345 | |
| Nextgen Healthcare, Inc. (a) | 17,539 | 284,483 | |
| Sharecare, Inc. Class A (a) | 218,761 | 382,832 | |
| Veradigm, Inc. (a)(b) | 81,342 | 1,024,909 | |
| 3,693,024 | |||
| Life Sciences Tools & Services - 0.4% | |||
| Adaptive Biotechnologies Corp. (a) | 22,859 | 153,384 | |
| BioLife Solutions, Inc. (a) | 2,344 | 51,802 | |
| Codexis, Inc. (a) | 43,854 | 122,791 | |
| CryoPort, Inc. (a) | 4,740 | 81,765 | |
| MaxCyte, Inc. (a) | 60,989 | 279,940 | |
| Nanostring Technologies, Inc. (a) | 3,668 | 14,855 | |
| Nautilus Biotechnology, Inc. (a) | 38,245 | 148,008 | |
| OmniAb, Inc. (a) | 69,793 | 351,059 | |
| Pacific Biosciences of California, Inc. (a) | 85,363 | 1,135,328 | |
| Quanterix Corp. (a) | 22,114 | 498,671 | |
| Quantum-Si, Inc. (a)(b) | 76,609 | 137,130 | |
| Seer, Inc. (a) | 44,041 | 188,055 | |
| SomaLogic, Inc. Class A (a) | 113,213 | 261,522 | |
| 3,424,310 | |||
| Pharmaceuticals - 1.2% | |||
| Amneal Pharmaceuticals, Inc. (a) | 90,880 | 281,728 | |
| ANI Pharmaceuticals, Inc. (a) | 2,247 | 120,956 | |
| Arvinas Holding Co. LLC (a) | 1,948 | 48,349 | |
| Assertio Holdings, Inc. (a) | 41,338 | 224,052 | |
| Atea Pharmaceuticals, Inc. (a) | 57,243 | 214,089 | |
| Biote Corp. Class A (a) | 5,530 | 37,383 | |
| Cara Therapeutics, Inc. (a) | 35,979 | 101,821 | |
| Citius Pharmaceuticals, Inc. (a) | 82,431 | 98,917 | |
| CorMedix, Inc. (a) | 2,718 | 10,777 | |
| DICE Therapeutics, Inc. (a) | 5,088 | 236,388 | |
| Edgewise Therapeutics, Inc. (a) | 31,841 | 246,768 | |
| Enliven Therapeutics, Inc. (a) | 17,402 | 355,175 | |
| Eyepoint Pharmaceuticals, Inc. (a)(b) | 9,054 | 78,770 | |
| Ikena Oncology, Inc. (a) | 15,897 | 104,284 | |
| Innoviva, Inc. (a) | 41,595 | 529,504 | |
| Ligand Pharmaceuticals, Inc. Class B (a) | 10,609 | 764,909 | |
| Liquidia Corp. (a) | 10,458 | 82,095 | |
| Longboard Pharmaceuticals, Inc. (a) | 7,580 | 55,637 | |
| NGM Biopharmaceuticals, Inc. (a) | 32,240 | 83,502 | |
| Nuvation Bio, Inc. (a) | 108,117 | 194,611 | |
| Omeros Corp. (a) | 26,791 | 145,743 | |
| Phathom Pharmaceuticals, Inc. (a) | 13,586 | 194,552 | |
| Phibro Animal Health Corp. Class A | 10,866 | 148,864 | |
| Prestige Brands Holdings, Inc. (a) | 37,270 | 2,214,956 | |
| Rain Oncology, Inc. (a) | 9,340 | 11,208 | |
| Reata Pharmaceuticals, Inc. (a)(b) | 21,387 | 2,180,619 | |
| Scilex Holding Co. (b) | 41,080 | 217,375 | |
| Taro Pharmaceutical Industries Ltd. (a) | 6,053 | 229,590 | |
| Tarsus Pharmaceuticals, Inc. (a)(b) | 17,628 | 318,538 | |
| Terns Pharmaceuticals, Inc. (a) | 10,882 | 95,218 | |
| Theravance Biopharma, Inc. (a)(b) | 45,889 | 474,951 | |
| Theseus Pharmaceuticals, Inc. (a)(b) | 15,077 | 140,668 | |
| Third Harmonics Bio, Inc. | 14,225 | 68,422 | |
| Trevi Therapeutics, Inc. (a) | 31,295 | 74,795 | |
| WAVE Life Sciences (a) | 44,258 | 161,099 | |
| Zevra Therapeutics, Inc. (a) | 25,963 | 132,411 | |
| 10,678,724 | |||
TOTAL HEALTH CARE | 90,805,524 | ||
| INDUSTRIALS - 14.6% | |||
| Aerospace & Defense - 1.0% | |||
| AAR Corp. (a) | 25,841 | 1,492,576 | |
| AerSale Corp. (a) | 19,668 | 289,120 | |
| Archer Aviation, Inc. Class A (a)(b) | 114,746 | 472,754 | |
| Astronics Corp. (a) | 19,324 | 383,775 | |
| Ducommun, Inc. (a) | 8,358 | 364,158 | |
| Kaman Corp. | 21,017 | 511,344 | |
| Kratos Defense & Security Solutions, Inc. (a) | 93,912 | 1,346,698 | |
| Moog, Inc. Class A | 16,941 | 1,836,913 | |
| National Presto Industries, Inc. | 3,901 | 285,553 | |
| Park Aerospace Corp. | 14,894 | 205,537 | |
| Parsons Corp. (a) | 16,521 | 795,321 | |
| Terran Orbital Corp. Class A (a)(b) | 59,137 | 88,706 | |
| Triumph Group, Inc. (a) | 48,075 | 594,688 | |
| V2X, Inc. (a) | 8,547 | 423,589 | |
| Virgin Galactic Holdings, Inc. (a)(b) | 82,718 | 320,946 | |
| 9,411,678 | |||
| Air Freight & Logistics - 0.3% | |||
| Air Transport Services Group, Inc. (a) | 42,216 | 796,616 | |
| Hub Group, Inc. Class A (a) | 24,608 | 1,976,515 | |
| Radiant Logistics, Inc. (a) | 27,756 | 186,520 | |
| 2,959,651 | |||
| Building Products - 1.6% | |||
| American Woodmark Corp. (a) | 11,662 | 890,627 | |
| Apogee Enterprises, Inc. | 10,295 | 488,704 | |
| AZZ, Inc. | 18,521 | 804,923 | |
| Gibraltar Industries, Inc. (a) | 10,162 | 639,393 | |
| Griffon Corp. | 13,194 | 531,718 | |
| Insteel Industries, Inc. | 14,090 | 438,481 | |
| Jeld-Wen Holding, Inc. (a) | 63,675 | 1,116,860 | |
| MasterBrand, Inc. | 97,113 | 1,129,424 | |
| Quanex Building Products Corp. | 24,821 | 666,444 | |
| Resideo Technologies, Inc. (a) | 109,479 | 1,933,399 | |
| UFP Industries, Inc. | 38,097 | 3,697,314 | |
| Zurn Elkay Water Solutions Cor | 88,673 | 2,384,417 | |
| 14,721,704 | |||
| Commercial Services & Supplies - 1.7% | |||
| ABM Industries, Inc. | 49,627 | 2,116,592 | |
| ACCO Brands Corp. | 68,888 | 358,906 | |
| Aris Water Solution, Inc. Class A | 20,969 | 216,400 | |
| Aurora Innovation, Inc. (a) | 227,265 | 668,159 | |
| BrightView Holdings, Inc. (a) | 30,825 | 221,324 | |
| CECO Environmental Corp. (a) | 22,189 | 296,445 | |
| Cimpress PLC (a) | 5,744 | 341,653 | |
| CompX International, Inc. Class A | 1,299 | 28,318 | |
| CoreCivic, Inc. (a) | 84,588 | 795,973 | |
| Deluxe Corp. | 32,852 | 574,253 | |
| Ennis, Inc. | 19,340 | 394,149 | |
| Enviri Corp. (a) | 58,626 | 578,639 | |
| Healthcare Services Group, Inc. | 2,936 | 43,834 | |
| Heritage-Crystal Clean, Inc. (a) | 9,829 | 371,438 | |
| HNI Corp. | 31,584 | 890,037 | |
| Interface, Inc. | 42,837 | 376,537 | |
| Li-Cycle Holdings Corp. (a)(b) | 103,199 | 572,754 | |
| Liquidity Services, Inc. (a) | 7,455 | 123,008 | |
| Matthews International Corp. Class A | 16,387 | 698,414 | |
| Millerknoll, Inc. | 57,150 | 844,677 | |
| NL Industries, Inc. | 6,528 | 36,100 | |
| OpenLane, Inc. (a) | 80,475 | 1,224,830 | |
| Performant Financial Corp. (a) | 12,689 | 34,260 | |
| Quad/Graphics, Inc. (a) | 22,826 | 85,826 | |
| Steelcase, Inc. Class A | 66,079 | 509,469 | |
| The GEO Group, Inc. (a) | 88,657 | 634,784 | |
| UniFirst Corp. | 11,216 | 1,738,592 | |
| VSE Corp. | 7,979 | 436,372 | |
| 15,211,743 | |||
| Construction & Engineering - 0.9% | |||
| API Group Corp. (a) | 51,741 | 1,410,460 | |
| Arcosa, Inc. | 36,337 | 2,753,254 | |
| Argan, Inc. | 9,537 | 375,853 | |
| Concrete Pumping Holdings, Inc. (a) | 8,037 | 64,537 | |
| Fluor Corp. (a) | 7,388 | 218,685 | |
| Granite Construction, Inc. | 28,592 | 1,137,390 | |
| Great Lakes Dredge & Dock Corp. (a) | 48,671 | 397,155 | |
| INNOVATE Corp. (a) | 27,876 | 48,783 | |
| Limbach Holdings, Inc. (a) | 5,603 | 138,562 | |
| Northwest Pipe Co. (a) | 7,333 | 221,750 | |
| Primoris Services Corp. | 37,152 | 1,132,021 | |
| Southland Holdings, Inc. (a) | 2,695 | 22,126 | |
| Sterling Construction Co., Inc. (a) | 2,770 | 154,566 | |
| Tutor Perini Corp. (a) | 31,371 | 224,303 | |
| 8,299,445 | |||
| Electrical Equipment - 0.7% | |||
| Babcock & Wilcox Enterprises, Inc. (a) | 40,073 | 236,431 | |
| Blink Charging Co. (a)(b) | 16,705 | 100,063 | |
| Encore Wire Corp. | 12,570 | 2,337,140 | |
| Energy Vault Holdings, Inc. Class A (a)(b) | 73,493 | 200,636 | |
| EnerSys | 2,144 | 232,667 | |
| Eos Energy Enterprises, Inc. (a)(b) | 8,206 | 35,614 | |
| ESS Tech, Inc. Class A (a)(b) | 69,191 | 101,711 | |
| FuelCell Energy, Inc. (a)(b) | 306,691 | 662,453 | |
| GrafTech International Ltd. | 62,914 | 317,087 | |
| LSI Industries, Inc. | 4,892 | 61,444 | |
| Powell Industries, Inc. | 6,862 | 415,769 | |
| Preformed Line Products Co. | 1,004 | 156,724 | |
| SES AI Corp. Class A (a) | 85,305 | 208,144 | |
| Stem, Inc. (a)(b) | 106,768 | 610,713 | |
| Thermon Group Holdings, Inc. (a) | 22,094 | 587,700 | |
| 6,264,296 | |||
| Ground Transportation - 0.6% | |||
| ArcBest Corp. | 10,995 | 1,086,306 | |
| Covenant Transport Group, Inc. Class A | 6,358 | 278,671 | |
| FTAI Infrastructure LLC | 73,633 | 271,706 | |
| Heartland Express, Inc. | 34,626 | 568,213 | |
| Marten Transport Ltd. | 8,675 | 186,513 | |
| P.A.M. Transportation Services, Inc. (a) | 4,017 | 107,535 | |
| RXO, Inc. | 11,470 | 260,025 | |
| TuSimple Holdings, Inc. (a)(b) | 123,590 | 205,159 | |
| U.S. Xpress Enterprises, Inc. (a) | 22,668 | 139,182 | |
| Universal Logistics Holdings, Inc. | 5,087 | 146,556 | |
| Werner Enterprises, Inc. | 40,433 | 1,786,330 | |
| 5,036,196 | |||
| Machinery - 2.7% | |||
| 3D Systems Corp. (a) | 95,619 | 949,497 | |
| Albany International Corp. Class A | 2,904 | 270,885 | |
| Astec Industries, Inc. | 17,086 | 776,388 | |
| Barnes Group, Inc. | 36,497 | 1,539,808 | |
| Blue Bird Corp. (a) | 12,076 | 271,468 | |
| Chart Industries, Inc. (a) | 12,222 | 1,952,953 | |
| CIRCOR International, Inc. (a) | 1,480 | 83,546 | |
| Columbus McKinnon Corp. (NY Shares) | 20,947 | 851,496 | |
| Commercial Vehicle Group, Inc. (a) | 21,188 | 235,187 | |
| Desktop Metal, Inc. (a)(b) | 209,750 | 371,258 | |
| EnPro Industries, Inc. | 15,718 | 2,098,825 | |
| ESCO Technologies, Inc. | 8,086 | 837,952 | |
| Gencor Industries, Inc. (a) | 7,783 | 121,259 | |
| Gorman-Rupp Co. | 13,313 | 383,814 | |
| Hillman Solutions Corp. Class A (a) | 129,905 | 1,170,444 | |
| Hyliion Holdings Corp. Class A (a)(b) | 110,357 | 184,296 | |
| Kennametal, Inc. | 60,503 | 1,717,680 | |
| Luxfer Holdings PLC sponsored | 20,651 | 293,864 | |
| Manitowoc Co., Inc. (a) | 25,996 | 489,505 | |
| Mayville Engineering Co., Inc. (a) | 7,538 | 93,923 | |
| Microvast Holdings, Inc. (a)(b) | 78,821 | 126,114 | |
| Miller Industries, Inc. | 7,684 | 272,551 | |
| Mueller Industries, Inc. | 23,801 | 2,077,351 | |
| Nikola Corp. (a)(b) | 443,677 | 612,274 | |
| Park-Ohio Holdings Corp. | 6,233 | 118,427 | |
| Proterra, Inc. Class A (a)(b) | 165,794 | 198,953 | |
| Proto Labs, Inc. (a) | 19,642 | 686,684 | |
| REV Group, Inc. | 23,952 | 317,604 | |
| SPX Technologies, Inc. (a) | 5,800 | 492,826 | |
| Standex International Corp. | 1,700 | 240,499 | |
| Tennant Co. | 6,523 | 529,081 | |
| Terex Corp. | 21,216 | 1,269,353 | |
| The Greenbrier Companies, Inc. | 23,664 | 1,019,918 | |
| Titan International, Inc. (a) | 39,466 | 453,070 | |
| Trinity Industries, Inc. | 49,644 | 1,276,347 | |
| 24,385,100 | |||
| Marine Transportation - 0.5% | |||
| Costamare, Inc. | 36,074 | 348,836 | |
| Eagle Bulk Shipping, Inc. (b) | 10,300 | 494,812 | |
| Eneti, Inc. | 18,419 | 223,054 | |
| Genco Shipping & Trading Ltd. | 32,060 | 449,802 | |
| Golden Ocean Group Ltd. (b) | 92,702 | 699,900 | |
| Himalaya Shipping Ltd. | 16,238 | 90,283 | |
| Matson, Inc. | 26,672 | 2,073,215 | |
| Pangaea Logistics Solutions Ltd. | 26,976 | 182,628 | |
| Safe Bulkers, Inc. | 52,810 | 172,161 | |
| 4,734,691 | |||
| Passenger Airlines - 1.0% | |||
| Allegiant Travel Co. (a) | 10,627 | 1,341,978 | |
| Blade Air Mobility, Inc. (a)(b) | 45,682 | 179,987 | |
| Hawaiian Holdings, Inc. (a) | 37,965 | 408,883 | |
| JetBlue Airways Corp. (a) | 247,010 | 2,188,509 | |
| Joby Aviation, Inc. (a)(b) | 139,185 | 1,428,038 | |
| SkyWest, Inc. (a) | 36,054 | 1,468,119 | |
| Spirit Airlines, Inc. | 81,619 | 1,400,582 | |
| Sun Country Airlines Holdings, Inc. (a) | 12,538 | 281,854 | |
| 8,697,950 | |||
| Professional Services - 1.2% | |||
| Alight, Inc. Class A (a) | 297,676 | 2,750,526 | |
| ASGN, Inc. (a) | 26,601 | 2,011,834 | |
| Asure Software, Inc. (a) | 11,623 | 141,336 | |
| Barrett Business Services, Inc. | 378 | 32,962 | |
| BlackSky Technology, Inc. Class A (a) | 89,247 | 198,128 | |
| Conduent, Inc. (a) | 127,946 | 435,016 | |
| First Advantage Corp. (a) | 37,264 | 574,238 | |
| FiscalNote Holdings, Inc. Class A (a) | 37,153 | 135,237 | |
| Heidrick & Struggles International, Inc. | 14,927 | 395,118 | |
| HireRight Holdings Corp. (a)(b) | 11,413 | 129,081 | |
| Kelly Services, Inc. Class A (non-vtg.) | 24,521 | 431,815 | |
| Korn Ferry | 39,121 | 1,938,054 | |
| MISTRAS Group, Inc. (a) | 15,508 | 119,722 | |
| NV5 Global, Inc. (a) | 1,045 | 115,755 | |
| Planet Labs PBC Class A (a)(b) | 14,540 | 46,819 | |
| Resources Connection, Inc. | 24,531 | 385,382 | |
| Skillsoft Corp. (a) | 57,482 | 71,278 | |
| Sterling Check Corp. (a) | 16,733 | 205,147 | |
| TrueBlue, Inc. (a) | 22,636 | 400,884 | |
| Willdan Group, Inc. (a) | 9,141 | 175,142 | |
| 10,693,474 | |||
| Trading Companies & Distributors - 2.4% | |||
| Beacon Roofing Supply, Inc. (a) | 32,820 | 2,723,404 | |
| BlueLinx Corp. (a) | 6,548 | 614,071 | |
| Boise Cascade Co. | 29,754 | 2,688,274 | |
| Distribution Solutions Group I (a) | 386 | 20,095 | |
| DXP Enterprises, Inc. (a) | 10,760 | 391,772 | |
| EVI Industries, Inc. (a) | 598 | 13,156 | |
| GATX Corp. | 24,798 | 3,192,495 | |
| Global Industrial Co. | 2,193 | 60,900 | |
| GMS, Inc. (a) | 21,298 | 1,473,822 | |
| Hudson Technologies, Inc. (a) | 27,850 | 267,917 | |
| MRC Global, Inc. (a) | 41,260 | 415,488 | |
| NOW, Inc. (a) | 81,998 | 849,499 | |
| Rush Enterprises, Inc.: | |||
| Class A | 34,607 | 2,102,029 | |
| Class B | 1,434 | 97,598 | |
| Textainer Group Holdings Ltd. | 32,166 | 1,266,697 | |
| Titan Machinery, Inc. (a) | 15,414 | 454,713 | |
| Triton International Ltd. | 34,528 | 2,874,801 | |
| Veritiv Corp. | 9,841 | 1,236,128 | |
| Willis Lease Finance Corp. (a) | 1,963 | 76,812 | |
| Xometry, Inc. (a)(b) | 22,548 | 477,567 | |
| 21,297,238 | |||
TOTAL INDUSTRIALS | 131,713,166 | ||
| INFORMATION TECHNOLOGY - 6.2% | |||
| Communications Equipment - 0.4% | |||
| ADTRAN Holdings, Inc. | 58,727 | 618,395 | |
| Aviat Networks, Inc. (a) | 8,293 | 276,737 | |
| Comtech Telecommunications Corp. | 20,562 | 187,937 | |
| Digi International, Inc. (a) | 2,984 | 117,540 | |
| DZS, Inc. (a) | 16,386 | 65,052 | |
| KVH Industries, Inc. (a) | 13,981 | 127,786 | |
| NETGEAR, Inc. (a) | 21,047 | 298,026 | |
| NetScout Systems, Inc. (a) | 51,186 | 1,584,207 | |
| Ribbon Communications, Inc. (a) | 65,750 | 183,443 | |
| Viavi Solutions, Inc. (a) | 29,217 | 331,029 | |
| 3,790,152 | |||
| Electronic Equipment, Instruments & Components - 2.3% | |||
| 908 Devices, Inc. (a)(b) | 16,519 | 113,320 | |
| Aeva Technologies, Inc. (a) | 60,257 | 75,321 | |
| Arlo Technologies, Inc. (a) | 7,585 | 82,752 | |
| Bel Fuse, Inc. Class B (non-vtg.) | 7,300 | 419,093 | |
| Belden, Inc. | 12,120 | 1,159,278 | |
| Benchmark Electronics, Inc. | 26,622 | 687,646 | |
| Climb Global Solutions, Inc. | 562 | 26,897 | |
| Daktronics, Inc. (a) | 29,201 | 186,886 | |
| ePlus, Inc. (a) | 18,873 | 1,062,550 | |
| Evolv Technologies Holdings, Inc. (a) | 68,888 | 413,328 | |
| FARO Technologies, Inc. (a) | 13,967 | 226,265 | |
| Iteris, Inc. (a) | 14,691 | 58,176 | |
| Itron, Inc. (a) | 30,818 | 2,221,978 | |
| Kimball Electronics, Inc. (a) | 13,645 | 377,011 | |
| Knowles Corp. (a) | 67,204 | 1,213,704 | |
| Methode Electronics, Inc. Class A | 26,456 | 886,805 | |
| Mirion Technologies, Inc. Class A (a)(b) | 149,884 | 1,266,520 | |
| nLIGHT, Inc. (a) | 32,880 | 507,010 | |
| Par Technology Corp. (a)(b) | 18,346 | 604,134 | |
| PC Connection, Inc. | 8,529 | 384,658 | |
| Plexus Corp. (a) | 2,314 | 227,327 | |
| Richardson Electronics Ltd. | 9,122 | 150,513 | |
| Rogers Corp. (a) | 3,452 | 558,982 | |
| Sanmina Corp. (a) | 40,937 | 2,467,273 | |
| ScanSource, Inc. (a) | 18,743 | 554,043 | |
| Smartrent, Inc. (a) | 137,820 | 527,851 | |
| Tingo Group, Inc. (a)(b) | 91,563 | 110,791 | |
| TTM Technologies, Inc. (a) | 76,394 | 1,061,877 | |
| Vishay Intertechnology, Inc. | 96,627 | 2,840,834 | |
| Vishay Precision Group, Inc. (a) | 9,194 | 341,557 | |
| 20,814,380 | |||
| IT Services - 0.2% | |||
| Brightcove, Inc. (a) | 32,785 | 131,468 | |
| Fastly, Inc. Class A (a) | 14,577 | 229,879 | |
| Grid Dynamics Holdings, Inc. (a) | 8,357 | 77,302 | |
| Hackett Group, Inc. | 1,829 | 40,878 | |
| Information Services Group, Inc. | 12,621 | 67,649 | |
| Rackspace Technology, Inc. (a)(b) | 59,011 | 160,510 | |
| Squarespace, Inc. Class A (a) | 23,207 | 731,949 | |
| Tucows, Inc. (a)(b) | 4,419 | 122,583 | |
| Unisys Corp. (a) | 49,665 | 197,667 | |
| 1,759,885 | |||
| Semiconductors & Semiconductor Equipment - 1.9% | |||
| ACM Research, Inc. (a) | 30,205 | 395,081 | |
| Alpha & Omega Semiconductor Ltd. (a) | 17,317 | 567,998 | |
| Ambarella, Inc. (a) | 10,611 | 887,822 | |
| Amkor Technology, Inc. | 76,589 | 2,278,523 | |
| Atomera, Inc. (a)(b) | 4,636 | 40,658 | |
| CEVA, Inc. (a) | 2,073 | 52,965 | |
| Cohu, Inc. (a) | 34,939 | 1,452,065 | |
| Diodes, Inc. (a) | 7,237 | 669,350 | |
| Ichor Holdings Ltd. (a) | 21,305 | 798,938 | |
| indie Semiconductor, Inc. (a) | 6,936 | 65,198 | |
| Kulicke & Soffa Industries, Inc. | 12,381 | 736,050 | |
| Maxeon Solar Technologies Ltd. (a) | 6,190 | 174,310 | |
| Navitas Semiconductor Corp. (a) | 64,189 | 676,552 | |
| NVE Corp. | 413 | 40,243 | |
| Onto Innovation, Inc. (a) | 5,254 | 611,933 | |
| Photronics, Inc. (a) | 45,735 | 1,179,506 | |
| Semtech Corp. (a) | 47,837 | 1,217,930 | |
| SMART Global Holdings, Inc. (a) | 28,302 | 821,041 | |
| Synaptics, Inc. (a) | 27,165 | 2,319,348 | |
| Ultra Clean Holdings, Inc. (a) | 33,282 | 1,280,026 | |
| Veeco Instruments, Inc. (a)(b) | 38,151 | 979,718 | |
| 17,245,255 | |||
| Software - 1.0% | |||
| ACI Worldwide, Inc. (a) | 11,163 | 258,647 | |
| Adeia, Inc. | 10,268 | 113,051 | |
| American Software, Inc. Class A | 5,665 | 59,539 | |
| Bit Digital, Inc. (a) | 45,456 | 184,551 | |
| C3.ai, Inc. (a)(b) | 10,458 | 380,985 | |
| Cerence, Inc. (a) | 30,211 | 883,068 | |
| Cipher Mining, Inc. (a)(b) | 28,791 | 82,342 | |
| Cleanspark, Inc. (a)(b) | 50,329 | 215,911 | |
| CommVault Systems, Inc. (a) | 1,965 | 142,698 | |
| Consensus Cloud Solutions, Inc. (a) | 6,339 | 196,509 | |
| CS Disco, Inc. (a) | 17,363 | 142,724 | |
| Digital Turbine, Inc. (a) | 52,836 | 490,318 | |
| E2open Parent Holdings, Inc. (a)(b) | 149,123 | 835,089 | |
| Ebix, Inc. (b) | 14,665 | 369,558 | |
| EverCommerce, Inc. (a) | 4,027 | 47,680 | |
| Liveramp Holdings, Inc. (a) | 47,937 | 1,369,081 | |
| Matterport, Inc. (a)(b) | 188,109 | 592,543 | |
| MeridianLink, Inc. (a) | 6,368 | 132,454 | |
| Mitek Systems, Inc. (a) | 2,306 | 24,997 | |
| N-able, Inc. (a) | 5,371 | 77,396 | |
| Nextnav, Inc. (a) | 3,623 | 10,652 | |
| Olo, Inc. (a) | 33,462 | 216,165 | |
| ON24, Inc. | 24,435 | 198,412 | |
| Onespan, Inc. (a) | 2,255 | 33,464 | |
| PROS Holdings, Inc. (a) | 9,447 | 290,968 | |
| Riot Platforms, Inc. (a)(b) | 36,141 | 427,187 | |
| SolarWinds, Inc. (a) | 37,358 | 383,293 | |
| TeraWulf, Inc. (a)(b) | 38,083 | 66,645 | |
| Verint Systems, Inc. (a) | 3,439 | 120,571 | |
| Xperi, Inc. | 31,604 | 415,593 | |
| 8,762,091 | |||
| Technology Hardware, Storage & Peripherals - 0.4% | |||
| Avid Technology, Inc. (a) | 7,545 | 192,398 | |
| CompoSecure, Inc. (a)(b) | 779 | 5,344 | |
| Eastman Kodak Co. (a) | 42,725 | 197,390 | |
| Immersion Corp. | 23,777 | 168,341 | |
| Intevac, Inc. (a) | 18,092 | 67,845 | |
| IonQ, Inc. (a)(b) | 101,592 | 1,374,540 | |
| Turtle Beach Corp. (a) | 11,629 | 135,478 | |
| Xerox Holdings Corp. | 86,016 | 1,280,778 | |
| 3,422,114 | |||
TOTAL INFORMATION TECHNOLOGY | 55,793,877 | ||
| MATERIALS - 4.9% | |||
| Chemicals - 1.5% | |||
| AdvanSix, Inc. | 19,940 | 697,501 | |
| American Vanguard Corp. | 16,572 | 296,142 | |
| Amyris, Inc. (a)(b) | 144,085 | 148,408 | |
| Aspen Aerogels, Inc. (a) | 38,214 | 301,508 | |
| Avient Corp. | 67,689 | 2,768,480 | |
| Chase Corp. | 804 | 97,461 | |
| Core Molding Technologies, Inc. (a) | 5,328 | 121,212 | |
| Danimer Scientific, Inc. (a)(b) | 65,571 | 156,059 | |
| Ecovyst, Inc. (a) | 55,167 | 632,214 | |
| FutureFuel Corp. | 19,439 | 172,035 | |
| H.B. Fuller Co. | 4,296 | 307,207 | |
| Innospec, Inc. | 2,207 | 221,671 | |
| Intrepid Potash, Inc. (a) | 7,924 | 179,796 | |
| Koppers Holdings, Inc. | 14,846 | 506,249 | |
| Kronos Worldwide, Inc. | 16,824 | 146,874 | |
| LSB Industries, Inc. (a) | 41,239 | 406,204 | |
| Mativ, Inc. | 41,181 | 622,657 | |
| Minerals Technologies, Inc. | 24,239 | 1,398,348 | |
| Origin Materials, Inc. Class A (a)(b) | 79,051 | 336,757 | |
| Perimeter Solutions SA (a)(b) | 116,753 | 718,031 | |
| PureCycle Technologies, Inc. (a)(b) | 67,742 | 724,162 | |
| Rayonier Advanced Materials, Inc. (a) | 47,762 | 204,421 | |
| Stepan Co. | 14,048 | 1,342,427 | |
| Trinseo PLC | 26,097 | 330,649 | |
| Tronox Holdings PLC | 87,732 | 1,115,074 | |
| Valhi, Inc. | 1,880 | 24,158 | |
| 13,975,705 | |||
| Construction Materials - 0.6% | |||
| Knife River Holding Co. | 38,102 | 1,657,437 | |
| Summit Materials, Inc. | 89,289 | 3,379,589 | |
| 5,037,026 | |||
| Containers & Packaging - 0.3% | |||
| Greif, Inc.: | |||
| Class A | 18,426 | 1,269,367 | |
| Class B | 3,969 | 306,605 | |
| O-I Glass, Inc. (a) | 17,100 | 364,743 | |
| Pactiv Evergreen, Inc. | 30,284 | 229,250 | |
| Ranpak Holdings Corp. (A Shares) (a) | 32,187 | 145,485 | |
| TriMas Corp. | 30,899 | 849,414 | |
| 3,164,864 | |||
| Metals & Mining - 2.4% | |||
| 5E Advanced Materials, Inc. (a)(b) | 4,058 | 13,310 | |
| Alpha Metallurgical Resources | 9,052 | 1,487,787 | |
| Arconic Corp. (a) | 73,965 | 2,187,885 | |
| Caledonia Mining Corp. PLC | 12,242 | 142,252 | |
| Carpenter Technology Corp. | 36,036 | 2,022,701 | |
| Coeur d'Alene Mines Corp. (a)(b) | 238,226 | 676,562 | |
| Commercial Metals Co. | 87,684 | 4,617,439 | |
| Constellium NV (a) | 35,935 | 618,082 | |
| Contango ORE, Inc. (a) | 1,253 | 31,926 | |
| Dakota Gold Corp. (a) | 12,360 | 36,091 | |
| Haynes International, Inc. | 9,341 | 474,710 | |
| Hecla Mining Co. | 355,084 | 1,828,683 | |
| i-80 Gold Corp. (a) | 133,167 | 299,626 | |
| Kaiser Aluminum Corp. | 628 | 44,990 | |
| Olympic Steel, Inc. (b) | 7,340 | 359,660 | |
| Piedmont Lithium, Inc. (a)(b) | 8,962 | 517,197 | |
| PolyMet Mining Corp. (a) | 24,114 | 19,050 | |
| Ramaco Resources, Inc. | 21,772 | 183,756 | |
| Ryerson Holding Corp. | 15,772 | 684,189 | |
| Schnitzer Steel Industries, Inc. Class A | 19,285 | 578,357 | |
| SunCoke Energy, Inc. | 62,560 | 492,347 | |
| TimkenSteel Corp. (a) | 32,485 | 700,701 | |
| Tredegar Corp. | 19,929 | 132,926 | |
| Warrior Metropolitan Coal, Inc. | 38,741 | 1,508,962 | |
| Worthington Industries, Inc. | 23,042 | 1,600,728 | |
| 21,259,917 | |||
| Paper & Forest Products - 0.1% | |||
| Clearwater Paper Corp. (a) | 12,579 | 393,974 | |
| Glatfelter Corp. | 33,156 | 100,131 | |
| 494,105 | |||
TOTAL MATERIALS | 43,931,617 | ||
| REAL ESTATE - 10.5% | |||
| Equity Real Estate Investment Trusts (REITs) - 9.6% | |||
| Acadia Realty Trust (SBI) | 71,519 | 1,029,158 | |
| Alexander & Baldwin, Inc. | 55,931 | 1,039,198 | |
| Alpine Income Property Trust, Inc. | 11,179 | 181,659 | |
| American Assets Trust, Inc. | 37,698 | 723,802 | |
| Apartment Investment & Management Co. Class A | 110,651 | 942,747 | |
| Apple Hospitality (REIT), Inc. | 163,151 | 2,465,212 | |
| Armada Hoffler Properties, Inc. | 52,488 | 613,060 | |
| Braemar Hotels & Resorts, Inc. | 51,612 | 207,480 | |
| Brandywine Realty Trust (SBI) | 132,684 | 616,981 | |
| Broadstone Net Lease, Inc. | 142,808 | 2,204,956 | |
| BRT Apartments Corp. | 10,019 | 198,376 | |
| CareTrust (REIT), Inc. | 69,320 | 1,376,695 | |
| CBL & Associates Properties, Inc. | 5,146 | 113,418 | |
| Centerspace | 11,701 | 717,973 | |
| Chatham Lodging Trust | 36,650 | 343,044 | |
| City Office REIT, Inc. | 31,388 | 174,831 | |
| Clipper Realty, Inc. | 1,528 | 8,664 | |
| Community Healthcare Trust, Inc. | 7,154 | 236,225 | |
| Corporate Office Properties Trust (SBI) | 85,486 | 2,030,293 | |
| CTO Realty Growth, Inc. | 17,687 | 303,155 | |
| DiamondRock Hospitality Co. | 159,023 | 1,273,774 | |
| Diversified Healthcare Trust (SBI) | 178,693 | 402,059 | |
| Douglas Emmett, Inc. | 128,601 | 1,616,515 | |
| Easterly Government Properties, Inc. | 71,717 | 1,039,897 | |
| Elme Communities (SBI) | 66,919 | 1,100,148 | |
| Empire State Realty Trust, Inc. | 99,320 | 743,907 | |
| Equity Commonwealth | 78,211 | 1,584,555 | |
| Essential Properties Realty Trust, Inc. | 100,732 | 2,371,231 | |
| Farmland Partners, Inc. | 38,514 | 470,256 | |
| Four Corners Property Trust, Inc. | 59,146 | 1,502,308 | |
| Getty Realty Corp. | 34,218 | 1,157,253 | |
| Gladstone Commercial Corp. | 26,553 | 328,461 | |
| Gladstone Land Corp. | 25,669 | 417,635 | |
| Global Medical REIT, Inc. | 48,603 | 443,745 | |
| Global Net Lease, Inc. | 80,672 | 829,308 | |
| Hersha Hospitality Trust | 24,577 | 149,674 | |
| Hudson Pacific Properties, Inc. | 105,529 | 445,332 | |
| Independence Realty Trust, Inc. | 170,891 | 3,113,634 | |
| InvenTrust Properties Corp. | 51,460 | 1,190,784 | |
| JBG SMITH Properties (b) | 84,887 | 1,276,700 | |
| Kite Realty Group Trust | 164,267 | 3,669,725 | |
| LTC Properties, Inc. | 31,475 | 1,039,305 | |
| LXP Industrial Trust (REIT) | 218,750 | 2,132,813 | |
| National Health Investors, Inc. | 28,605 | 1,499,474 | |
| Necessity Retail (REIT), Inc./The | 102,228 | 691,061 | |
| NETSTREIT Corp. | 48,011 | 857,957 | |
| NexPoint Diversified Real Estate Trust | 23,944 | 299,779 | |
| NexPoint Residential Trust, Inc. | 12,107 | 550,626 | |
| Office Properties Income Trust | 37,683 | 290,159 | |
| One Liberty Properties, Inc. | 13,343 | 271,130 | |
| Orion Office (REIT), Inc. | 44,923 | 296,941 | |
| Outfront Media, Inc. | 60,017 | 943,467 | |
| Paramount Group, Inc. | 140,026 | 620,315 | |
| Peakstone Realty Trust | 20,765 | 579,759 | |
| Pebblebrook Hotel Trust | 91,484 | 1,275,287 | |
| Phillips Edison & Co., Inc. | 74,360 | 2,534,189 | |
| Physicians Realty Trust | 180,634 | 2,527,070 | |
| Piedmont Office Realty Trust, Inc. Class A | 95,873 | 696,997 | |
| Plymouth Industrial REIT, Inc. | 32,905 | 757,473 | |
| Postal Realty Trust, Inc. | 15,786 | 232,212 | |
| Potlatch Corp. | 59,574 | 3,148,486 | |
| Retail Opportunity Investments Corp. | 94,147 | 1,271,926 | |
| RLJ Lodging Trust | 120,145 | 1,233,889 | |
| RPT Realty | 66,078 | 690,515 | |
| Sabra Health Care REIT, Inc. | 175,209 | 2,062,210 | |
| Safehold, Inc. | 22,428 | 532,216 | |
| Saul Centers, Inc. | 1,223 | 45,043 | |
| Service Properties Trust | 123,964 | 1,077,247 | |
| SITE Centers Corp. | 144,601 | 1,911,625 | |
| SL Green Realty Corp. | 49,722 | 1,494,146 | |
| Star Holdings | 10,181 | 149,355 | |
| Summit Hotel Properties, Inc. | 79,675 | 518,684 | |
| Sunstone Hotel Investors, Inc. | 157,240 | 1,591,269 | |
| Tanger Factory Outlet Centers, Inc. | 41,383 | 913,323 | |
| Terreno Realty Corp. | 61,800 | 3,714,180 | |
| The Macerich Co. | 162,892 | 1,835,793 | |
| UMH Properties, Inc. | 35,356 | 564,989 | |
| Uniti Group, Inc. | 180,004 | 831,618 | |
| Urban Edge Properties | 87,019 | 1,342,703 | |
| Urstadt Biddle Properties, Inc. Class A | 22,137 | 470,633 | |
| Veris Residential, Inc. (a) | 59,290 | 951,605 | |
| Whitestone REIT Class B | 38,379 | 372,276 | |
| Xenia Hotels & Resorts, Inc. | 84,390 | 1,038,841 | |
| 86,512,414 | |||
| Real Estate Management & Development - 0.9% | |||
| American Realty Investments, Inc. (a)(b) | 1,155 | 25,156 | |
| Anywhere Real Estate, Inc. (a) | 72,524 | 484,460 | |
| Compass, Inc. (a) | 32,075 | 112,263 | |
| Cushman & Wakefield PLC (a) | 124,672 | 1,019,817 | |
| Digitalbridge Group, Inc. | 82,913 | 1,219,650 | |
| Douglas Elliman, Inc. | 63,552 | 141,085 | |
| Forestar Group, Inc. (a) | 13,645 | 307,695 | |
| FRP Holdings, Inc. (a) | 4,886 | 281,287 | |
| Kennedy-Wilson Holdings, Inc. | 89,586 | 1,462,939 | |
| Marcus & Millichap, Inc. | 11,175 | 352,124 | |
| Maui Land & Pineapple, Inc. (a) | 687 | 9,783 | |
| Newmark Group, Inc. | 101,090 | 628,780 | |
| Opendoor Technologies, Inc. (a) | 387,170 | 1,556,423 | |
| RE/MAX Holdings, Inc. | 13,102 | 252,345 | |
| Stratus Properties, Inc. | 4,180 | 109,725 | |
| Tejon Ranch Co. (a) | 15,713 | 270,421 | |
| The RMR Group, Inc. | 3,860 | 89,436 | |
| Transcontinental Realty Investors, Inc. (a)(b) | 1,483 | 54,322 | |
| 8,377,711 | |||
TOTAL REAL ESTATE | 94,890,125 | ||
| UTILITIES - 4.4% | |||
| Electric Utilities - 1.2% | |||
| Allete, Inc. | 43,301 | 2,510,159 | |
| Genie Energy Ltd. Class B | 7,121 | 100,691 | |
| MGE Energy, Inc. | 13,410 | 1,060,865 | |
| Otter Tail Corp. (b) | 14,564 | 1,149,973 | |
| PNM Resources, Inc. | 57,157 | 2,577,781 | |
| Portland General Electric Co. | 72,672 | 3,403,230 | |
| 10,802,699 | |||
| Gas Utilities - 1.7% | |||
| Brookfield Infrastructure Corp. A Shares | 66,579 | 3,034,671 | |
| Chesapeake Utilities Corp. | 4,680 | 556,920 | |
| New Jersey Resources Corp. (b) | 34,654 | 1,635,669 | |
| Northwest Natural Holding Co. | 27,092 | 1,166,311 | |
| ONE Gas, Inc. | 41,455 | 3,184,159 | |
| RGC Resources, Inc. | 5,693 | 114,031 | |
| Southwest Gas Holdings, Inc. | 46,306 | 2,947,377 | |
| Spire, Inc. | 38,724 | 2,456,651 | |
| 15,095,789 | |||
| Independent Power and Renewable Electricity Producers - 0.2% | |||
| Altus Power, Inc. Class A (a)(b) | 48,167 | 260,102 | |
| Ormat Technologies, Inc. (b) | 14,292 | 1,149,934 | |
| Sunnova Energy International, Inc. (a)(b) | 39,115 | 716,196 | |
| 2,126,232 | |||
| Multi-Utilities - 0.9% | |||
| Avista Corp. | 56,613 | 2,223,193 | |
| Black Hills Corp. | 49,926 | 3,008,541 | |
| NorthWestern Energy Corp. | 45,127 | 2,561,409 | |
| Unitil Corp. | 8,551 | 433,621 | |
| 8,226,764 | |||
| Water Utilities - 0.4% | |||
| Artesian Resources Corp. Class A | 1,826 | 86,224 | |
| California Water Service Group | 28,936 | 1,493,966 | |
| Consolidated Water Co., Inc. | 8,120 | 196,748 | |
| SJW Group | 23,286 | 1,632,581 | |
| 3,409,519 | |||
TOTAL UTILITIES | 39,661,003 | ||
| TOTAL COMMON STOCKS (Cost $909,706,441) | 898,619,158 | ||
| U.S. Treasury Obligations - 0.0% | |||
Principal Amount (d) | Value ($) | ||
U.S. Treasury Bills, yield at date of purchase 5.18% 9/7/23 (e) (Cost $99,031) | 100,000 | 99,059 | |
| Money Market Funds - 6.1% | |||
| Shares | Value ($) | ||
| Fidelity Cash Central Fund 5.14% (f) | 2,009,356 | 2,009,758 | |
| Fidelity Securities Lending Cash Central Fund 5.14% (f)(g) | 52,535,127 | 52,540,381 | |
| TOTAL MONEY MARKET FUNDS (Cost $54,550,139) | 54,550,139 | ||
| TOTAL INVESTMENT IN SECURITIES - 105.9% (Cost $964,355,611) | 953,268,356 |
NET OTHER ASSETS (LIABILITIES) - (5.9)% | (53,062,363) |
| NET ASSETS - 100.0% | 900,205,993 |
| Futures Contracts | |||||
Number of contracts | Expiration Date | Notional Amount ($) | Value ($) | Unrealized Appreciation/ (Depreciation) ($) | |
| Purchased | |||||
| Equity Index Contracts | |||||
| CME E-mini Russell 2000 Index Contracts (United States) | 21 | Sep 2023 | 1,998,885 | 62,747 | 62,747 |
| The notional amount of futures purchased as a percentage of Net Assets is 0.2% | |||||
| (a) | Non-income producing |
| (b) | Security or a portion of the security is on loan at period end. |
| (c) | Level 3 security |
| (d) | Amount is stated in United States dollars unless otherwise noted. |
| (e) | Security or a portion of the security was pledged to cover margin requirements for futures contracts. At period end, the value of securities pledged amounted to $99,059. |
| (f) | Affiliated fund that is generally available only to investment companies and other accounts managed by Fidelity Investments. The rate quoted is the annualized seven-day yield of the fund at period end. A complete unaudited listing of the fund's holdings as of its most recent quarter end is available upon request. In addition, each Fidelity Central Fund's financial statements, which are not covered by the Fund's Report of Independent Registered Public Accounting Firm, are available on the SEC's website or upon request. |
| (g) | Investment made with cash collateral received from securities on loan. |
| Affiliate | Value, beginning of period ($) | Purchases ($) | Sales Proceeds ($) | Dividend Income ($) | Realized Gain (loss) ($) | Change in Unrealized appreciation (depreciation) ($) | Value, end of period ($) | % ownership, end of period |
| Fidelity Cash Central Fund 5.14% | 2,780,205 | 181,091,484 | 181,861,931 | 82,949 | - | - | 2,009,758 | 0.0% |
| Fidelity Securities Lending Cash Central Fund 5.14% | 66,426,259 | 254,595,720 | 268,481,598 | 1,188,185 | - | - | 52,540,381 | 0.2% |
| Total | 69,206,464 | 435,687,204 | 450,343,529 | 1,271,134 | - | - | 54,550,139 | |
| Valuation Inputs at Reporting Date: | ||||
| Description | Total ($) | Level 1 ($) | Level 2 ($) | Level 3 ($) |
Investments in Securities: | ||||
| Equities: | ||||
Communication Services | 25,686,228 | 25,686,228 | - | - |
Consumer Discretionary | 93,113,507 | 93,113,507 | - | - |
Consumer Staples | 23,794,921 | 23,794,921 | - | - |
Energy | 81,679,171 | 81,679,171 | - | - |
Financials | 217,550,019 | 217,550,019 | - | - |
Health Care | 90,805,524 | 90,559,838 | 217,375 | 28,311 |
Industrials | 131,713,166 | 131,713,166 | - | - |
Information Technology | 55,793,877 | 55,793,877 | - | - |
Materials | 43,931,617 | 43,931,617 | - | - |
Real Estate | 94,890,125 | 94,890,125 | - | - |
Utilities | 39,661,003 | 39,661,003 | - | - |
| U.S. Government and Government Agency Obligations | 99,059 | - | 99,059 | - |
| Money Market Funds | 54,550,139 | 54,550,139 | - | - |
| Total Investments in Securities: | 953,268,356 | 952,923,611 | 316,434 | 28,311 |
Derivative Instruments: | ||||
| Assets | ||||
Futures Contracts | 62,747 | 62,747 | - | - |
| Total Assets | 62,747 | 62,747 | - | - |
| Total Derivative Instruments: | 62,747 | 62,747 | - | - |
Primary Risk Exposure / Derivative Type | Value | |
| Asset ($) | Liability ($) | |
| Equity Risk | ||
Futures Contracts (a) | 62,747 | 0 |
| Total Equity Risk | 62,747 | 0 |
| Total Value of Derivatives | 62,747 | 0 |
| Statement of Assets and Liabilities | ||||
| June 30, 2023 | ||||
| Assets | ||||
| Investment in securities, at value (including securities loaned of $50,834,365) - See accompanying schedule: | ||||
Unaffiliated issuers (cost $909,805,472) | $ | 898,718,217 | ||
Fidelity Central Funds (cost $54,550,139) | 54,550,139 | |||
| Total Investment in Securities (cost $964,355,611) | $ | 953,268,356 | ||
| Segregated cash with brokers for derivative instruments | 208,538 | |||
| Cash | 275,169 | |||
| Receivable for fund shares sold | 1,015,021 | |||
| Dividends receivable | 1,532,496 | |||
| Distributions receivable from Fidelity Central Funds | 114,577 | |||
| Receivable for daily variation margin on futures contracts | 14,633 | |||
| Other receivables | 9,684 | |||
Total assets | 956,438,474 | |||
| Liabilities | ||||
| Payable for investments purchased | $ | 2,499,879 | ||
| Payable for fund shares redeemed | 1,155,149 | |||
| Accrued management fee | 37,072 | |||
| Collateral on securities loaned | 52,540,381 | |||
| Total Liabilities | 56,232,481 | |||
| Net Assets | $ | 900,205,993 | ||
| Net Assets consist of: | ||||
| Paid in capital | $ | 933,704,757 | ||
| Total accumulated earnings (loss) | (33,498,764) | |||
| Net Assets | $ | 900,205,993 | ||
Net Asset Value , offering price and redemption price per share ($900,205,993 ÷ 40,927,098 shares) | $ | 22.00 | ||
| Statement of Operations | ||||
Year ended June 30, 2023 | ||||
| Investment Income | ||||
| Dividends | $ | 19,659,636 | ||
| Interest | 5,143 | |||
| Income from Fidelity Central Funds (including $1,188,185 from security lending) | 1,271,134 | |||
| Total Income | 20,935,913 | |||
| Expenses | ||||
| Management fee | $ | 433,379 | ||
| Independent trustees' fees and expenses | 2,963 | |||
| Interest | 5,145 | |||
| Total expenses before reductions | 441,487 | |||
| Expense reductions | (850) | |||
| Total expenses after reductions | 440,637 | |||
| Net Investment income (loss) | 20,495,276 | |||
| Realized and Unrealized Gain (Loss) | ||||
| Net realized gain (loss) on: | ||||
| Investment Securities: | ||||
| Unaffiliated issuers | (18,457,249) | |||
| Futures contracts | 96,294 | |||
| Total net realized gain (loss) | (18,360,955) | |||
| Change in net unrealized appreciation (depreciation) on: | ||||
| Investment Securities: | ||||
| Unaffiliated issuers | 46,209,688 | |||
| Futures contracts | 13,499 | |||
| Total change in net unrealized appreciation (depreciation) | 46,223,187 | |||
| Net gain (loss) | 27,862,232 | |||
| Net increase (decrease) in net assets resulting from operations | $ | 48,357,508 | ||
| Statement of Changes in Net Assets | ||||
Year ended June 30, 2023 | Year ended June 30, 2022 | |||
| Increase (Decrease) in Net Assets | ||||
| Operations | ||||
| Net investment income (loss) | $ | 20,495,276 | $ | 14,699,224 |
| Net realized gain (loss) | (18,360,955) | 11,017,013 | ||
| Change in net unrealized appreciation (depreciation) | 46,223,187 | (182,137,893) | ||
| Net increase (decrease) in net assets resulting from operations | 48,357,508 | (156,421,656) | ||
| Distributions to shareholders | (30,079,235) | (66,728,802) | ||
| Share transactions | ||||
| Proceeds from sales of shares | 318,203,406 | 594,179,184 | ||
| Reinvestment of distributions | 24,216,686 | 53,788,479 | ||
| Cost of shares redeemed | (268,975,234) | (352,842,926) | ||
Net increase (decrease) in net assets resulting from share transactions | 73,444,858 | 295,124,737 | ||
| Total increase (decrease) in net assets | 91,723,131 | 71,974,279 | ||
| Net Assets | ||||
| Beginning of period | 808,482,862 | 736,508,583 | ||
| End of period | $ | 900,205,993 | $ | 808,482,862 |
| Other Information | ||||
| Shares | ||||
| Sold | 14,384,346 | 23,457,218 | ||
| Issued in reinvestment of distributions | 1,074,926 | 2,127,287 | ||
| Redeemed | (12,214,236) | (14,038,483) | ||
| Net increase (decrease) | 3,245,036 | 11,546,022 | ||
| Fidelity® Small Cap Value Index Fund |
| Years ended June 30, | 2023 | 2022 | 2021 | 2020 A | ||||
Selected Per-Share Data | ||||||||
| Net asset value, beginning of period | $ | 21.46 | $ | 28.18 | $ | 16.52 | $ | 20.00 |
| Income from Investment Operations | ||||||||
Net investment income (loss) B,C | .52 | .44 | .37 | .37 | ||||
| Net realized and unrealized gain (loss) | .81 | (4.69) | 11.59 | (3.72) | ||||
| Total from investment operations | 1.33 | (4.25) | 11.96 | (3.35) | ||||
| Distributions from net investment income | (.42) | (.44) D | (.30) | (.12) | ||||
| Distributions from net realized gain | (.38) | (2.03) D | - | (.02) | ||||
| Total distributions | (.79) E | (2.47) | (.30) | (.13) E | ||||
| Net asset value, end of period | $ | 22.00 | $ | 21.46 | $ | 28.18 | $ | 16.52 |
Total Return F,G | 6.14% | (16.30)% | 73.10% | (16.89)% | ||||
Ratios to Average Net Assets C,H,I | ||||||||
| Expenses before reductions | .05% | .05% | .05% | .05% J | ||||
| Expenses net of fee waivers, if any | .05% | .05% | .05% | .05% J | ||||
| Expenses net of all reductions | .05% | .05% | .05% | .05% J | ||||
| Net investment income (loss) | 2.37% | 1.77% | 1.56% | 2.24% J | ||||
| Supplemental Data | ||||||||
| Net assets, end of period (000 omitted) | $ | 900,206 | $ | 808,483 | $ | 736,509 | $ | 139,586 |
Portfolio turnover rate K | 33% | 38% | 60% | 74% J |
| Fidelity Central Fund | Investment Manager | Investment Objective | Investment Practices | Expense Ratio A |
| Fidelity Money Market Central Funds | Fidelity Management & Research Company LLC (FMR) | Each fund seeks to obtain a high level of current income consistent with the preservation of capital and liquidity. | Short-term Investments | Less than .005% |
| Tax cost | Gross unrealized appreciation | Gross unrealized depreciation | Net unrealized appreciation (depreciation) | |
| Fidelity Mid Cap Growth Index Fund | $657,365,237 | $122,942,390 | $(45,990,919) | $76,951,471 |
| Fidelity Mid Cap Value Index Fund | 756,429,783 | 183,036,123 | (50,314,887) | 132,721,236 |
| Fidelity Small Cap Growth Index Fund | 538,464,226 | 81,225,374 | (54,751,434) | 26,473,940 |
| Fidelity Small Cap Value Index Fund | 978,885,514 | 122,178,149 | (147,795,307) | (25,617,158) |
| Undistributed ordinary income | Capital loss carryforward | Net unrealized appreciation (depreciation) on securities and other investments | |
| Fidelity Mid Cap Growth Index Fund | $2,169,711 | $(60,045,563) | $76,951,471 |
| Fidelity Mid Cap Value Index Fund | 7,530,492 | - | 132,721,236 |
| Fidelity Small Cap Growth Index Fund | 2,059,540 | (53,417,880) | 26,473,944 |
| Fidelity Small Cap Value Index Fund | 8,986,815 | (16,868,419) | (25,617,158) |
| Short-term | Long-term | Total capital loss carryforward | |
| Fidelity Mid Cap Growth Index Fund | $ (60,045,563) | $- | $ (60,045,563) |
| Fidelity Small Cap Growth Index Fund | (34,486,747) | (18,931,133) | (53,417,880) |
| Fidelity Small Cap Value Index Fund | (1,886,043) | (14,982,376) | (16,868,419) |
Capital losses | |
| Fidelity Mid Cap Value Index Fund | $(1,452,362) |
| June 30, 2023 | |||
| Ordinary Income | Long-term Capital Gains | Total | |
| Fidelity Mid Cap Growth Index Fund | $4,150,490 | $- | $4,150,490 |
| Fidelity Mid Cap Value Index Fund | 15,937,291 | 5,985,102 | 21,922,393 |
| Fidelity Small Cap Growth Index Fund | 2,541,670 | - | 2,541,670 |
| Fidelity Small Cap Value Index Fund | 16,062,244 | 14,016,991 | 30,079,235 |
| June 30, 2022 | |||
| Ordinary Income | Long-term Capital Gains | Total | |
| Fidelity Mid Cap Growth Index Fund | $22,889,262 | $17,807,665 | $40,696,927 |
| Fidelity Mid Cap Value Index Fund | 40,467,167 | 12,709,187 | 53,176,354 |
| Fidelity Small Cap Growth Index Fund | 5,448,251 | 5,688,770 | 11,137,021 |
| Fidelity Small Cap Value Index Fund | 46,650,956 | 20,077,846 | 66,728,802 |
| Equity Risk | Equity risk relates to the fluctuations in the value of financial instruments as a result of changes in market prices (other than those arising from interest rate risk or foreign exchange risk), whether caused by factors specific to an individual investment, its issuer, or all factors affecting all instruments traded in a market or market segment. |
| Purchases ($) | Sales ($) | |
| Fidelity Mid Cap Growth Index Fund | 406,639,407 | 263,675,247 |
| Fidelity Mid Cap Value Index Fund | 240,253,426 | 247,265,017 |
| Fidelity Small Cap Growth Index Fund | 371,848,460 | 164,174,288 |
| Fidelity Small Cap Value Index Fund | 386,381,670 | 285,210,807 |
| % of Average Net Assets | |
| Fidelity Mid Cap Growth Index Fund | .05% |
| Fidelity Mid Cap Value Index Fund | .05% |
| Fidelity Small Cap Growth Index Fund | .05% |
| Fidelity Small Cap Value Index Fund | .05% |
| Borrower or Lender | Average Loan Balance | Weighted Average Interest Rate | Interest Expense | |
| Fidelity Mid Cap Growth Index Fund | Borrower | $ 5,325,500 | 2.87% | $2,550 |
| Fidelity Mid Cap Value Index Fund | Borrower | $ 6,401,520 | 3.42% | $15,194 |
| Fidelity Small Cap Growth Index Fund | Borrower | $16,423,000 | 4.07% | $1,854 |
| Fidelity Small Cap Value Index Fund | Borrower | $ 12,207,000 | 3.79% | $5,145 |
| Total Security Lending Fees Paid to NFS | Security Lending Income From Securities Loaned to NFS | Value of Securities Loaned to NFS at Period End | |
| Fidelity Mid Cap Growth Index Fund | $18,257 | $3,313 | $7,911 |
| Fidelity Mid Cap Value Index Fund | $53,859 | $50,373 | $14,546 |
| Fidelity Small Cap Growth Index Fund | $86,559 | $113,378 | $697,681 |
| Fidelity Small Cap Value Index Fund | $122,833 | $57,773 | $419,747 |
| Average Loan Balance | Weighted Average Interest Rate | Interest Expense | |
| Fidelity Mid Cap Growth Index Fund | $903,000 | 2.08% | $52 |
| Custodian credits | |
| Fidelity Mid Cap Growth Index Fund | $873 |
| Fidelity Mid Cap Value Index Fund | 974 |
Fidelity Small Cap Growth Index Fund | 1,960 |
| Fidelity Small Cap Value Index Fund | 850 |
| Fund | Number of Unaffiliated Shareholders | Unaffiliated Shareholders % |
| Fidelity Mid Cap Value Index Fund | 1 | 59% |
| The Example is based on an investment of $1,000 invested at the beginning of the period and held for the entire period (January 1, 2023 to June 30, 2023). |
Annualized Expense Ratio- A | Beginning Account Value January 1, 2023 | Ending Account Value June 30, 2023 | Expenses Paid During Period- C January 1, 2023 to June 30, 2023 | |||||||
| Fidelity® Mid Cap Growth Index Fund | .05% | |||||||||
| Actual | $ 1,000 | $ 1,159.20 | $ .27 | |||||||
Hypothetical- B | $ 1,000 | $ 1,024.55 | $ .25 | |||||||
| Fidelity® Mid Cap Value Index Fund | .05% | |||||||||
| Actual | $ 1,000 | $ 1,052.80 | $ .25 | |||||||
Hypothetical- B | $ 1,000 | $ 1,024.55 | $ .25 | |||||||
| Fidelity® Small Cap Growth Index Fund | .05% | |||||||||
| Actual | $ 1,000 | $ 1,137.00 | $ .26 | |||||||
Hypothetical- B | $ 1,000 | $ 1,024.55 | $ .25 | |||||||
| Fidelity® Small Cap Value Index Fund | .05% | |||||||||
| Actual | $ 1,000 | $ 1,026.10 | $ .25 | |||||||
Hypothetical- B | $ 1,000 | $ 1,024.55 | $ .25 | |||||||
| Fidelity Mid Cap Value Index Fund | $1,427,250 |
| Fidelity Mid Cap Growth Index Fund | |
| August 2022 | 100% |
| December 2022 | 87% |
| Fidelity Mid Cap Value Index Fund | |
| August 2022 | 100% |
| December 2022 | 77% |
| Fidelity Small Cap Growth Index Fund | |
| August 2022 | 99% |
| December 2022 | 72% |
| Fidelity Small Cap Value Index Fund | |
| August 2022 | 100% |
| December 2022 | 57% |
| Fidelity Mid Cap Growth Index Fund | |
| August 2022 | 99.85% |
| December 2022 | 91.22% |
| Fidelity Mid Cap Value Index Fund | |
| August 2022 | 100.00% |
| December 2022 | 80.82% |
| Fidelity Small Cap Growth Index Fund | |
| August 2022 | 99.22% |
| December 2022 | 75.05% |
| Fidelity Small Cap Value Index Fund | |
| August 2022 | 99.82% |
| December 2022 | 66.50% |
| Fidelity Mid Cap Growth Index Fund | |
| August 2022 | 0.15% |
| December 2022 | 7.92% |
| Fidelity Mid Cap Value Index Fund | |
| August 2022 | 0.01% |
| December 2022 | 17.87% |
| Fidelity Small Cap Growth Index Fund | |
| August 2022 | 0.21% |
| December 2022 | 6.47% |
| Fidelity Small Cap Value Index Fund | |
| August 2022 | 0.18% |
| December 2022 | 31.85% |
| Fidelity Mid Cap Growth Index Fund | $53,289 |
| Fidelity Small Cap Growth Index Fund | $29,880 |
- Highly liquid investments - cash or convertible to cash within three business days or less
- Moderately liquid investments - convertible to cash in three to seven calendar days
- Less liquid investments - can be sold or disposed of, but not settled, within seven calendar days
- Illiquid investments - cannot be sold or disposed of within seven calendar days
 |
Item 2.
Code of Ethics
As of the end of the period, June 30, 2023, Fidelity Salem Street Trust (the trust) has adopted a code of ethics, as defined in Item 2 of Form N-CSR, that applies to its President and Treasurer and its Chief Financial Officer. A copy of the code of ethics is filed as an exhibit to this Form N-CSR.
Item 3.
Audit Committee Financial Expert
The Board of Trustees of the trust has determined that Elizabeth S. Acton is an audit committee financial expert, as defined in Item 3 of Form N-CSR. Ms. Acton is independent for purposes of Item 3 of Form N-CSR.
Item 4.
Principal Accountant Fees and Services
Fees and Services
The following table presents fees billed by Deloitte & Touche LLP, the member firms of Deloitte Touche Tohmatsu, and their respective affiliates (collectively, “Deloitte Entities”) in each of the last two fiscal years for services rendered to Fidelity Mid Cap Growth Index Fund, Fidelity Mid Cap Value Index Fund, Fidelity Municipal Income 2023 Fund and Fidelity Municipal Income 2025 Fund (the “Funds”):
Services Billed by Deloitte Entities
June 30, 2023 FeesA
Audit Fees | Audit-Related Fees | Tax Fees | All Other Fees | |
Fidelity Mid Cap Growth Index Fund | $39,100 | $- | $7,400 | $1,000 |
Fidelity Mid Cap Value Index Fund | $39,100 | $- | $7,400 | $1,000 |
Fidelity Municipal Income 2023 Fund | $36,100 | $- | $7,400 | $900 |
Fidelity Municipal Income 2025 Fund | $36,100 | $- | $7,400 | $900 |
June 30, 2022 FeesA
Audit Fees | Audit-Related Fees | Tax Fees | All Other Fees | |
Fidelity Mid Cap Growth Index Fund | $38,800 | $- | $7,300 | $900 |
Fidelity Mid Cap Value Index Fund | $38,800 | $- | $7,300 | $900 |
Fidelity Municipal Income 2023 Fund | $35,600 | $- | $7,400 | $800 |
Fidelity Municipal Income 2025 Fund | $35,600 | $- | $7,600 | $800 |
A Amounts may reflect rounding.
The following table presents fees billed by PricewaterhouseCoopers LLP (“PwC”) in each of the last two fiscal years for services rendered to Fidelity Municipal Bond Index Fund, Fidelity SAI Municipal Bond Index Fund, Fidelity Small Cap Growth Index Fund and Fidelity Small Cap Value Index Fund (the “Funds”):
Services Billed by PwC
June 30, 2023 FeesA
Audit Fees | Audit-Related Fees | Tax Fees | All Other Fees | |
Fidelity Municipal Bond Index Fund | $49,700 | $4,000 | $5,500 | $1,700 |
Fidelity SAI Municipal Bond Index Fund | $49,700 | $4,000 | $5,500 | $1,700 |
Fidelity Small Cap Growth Index Fund | $38,700 | $3,400 | $11,500 | $1,500 |
Fidelity Small Cap Value Index Fund | $39,900 | $3,500 | $9,400 | $1,500 |
June 30, 2022 FeesA
Audit Fees | Audit-Related Fees | Tax Fees | All Other Fees | |
Fidelity Municipal Bond Index Fund | $47,400 | $3,900 | $5,200 | $1,700 |
Fidelity SAI Municipal Bond Index Fund | $47,400 | $3,900 | $5,200 | $1,700 |
Fidelity Small Cap Growth Index Fund | $37,000 | $3,400 | $10,000 | $1,500 |
Fidelity Small Cap Value Index Fund | $38,100 | $3,500 | $9,900 | $1,500 |
A Amounts may reflect rounding.
The following table(s) present(s) fees billed by Deloitte Entities and PwC that were required to be approved by the Audit Committee for services that relate directly to the operations and financial reporting of the Fund(s) and that are rendered on behalf of Fidelity Management & Research Company LLC ("FMR") and entities controlling, controlled by, or under common control with FMR (not including any sub-adviser whose role is primarily portfolio management and is subcontracted with or overseen by another investment adviser) that provide ongoing services to the Fund(s) (“Fund Service Providers”):
Services Billed by Deloitte Entities
June 30, 2023A | June 30, 2022A | |
Audit-Related Fees | $- | $- |
Tax Fees | $- | $- |
All Other Fees | $- | $- |
A Amounts may reflect rounding.
Services Billed by PwC
June 30, 2023A | June 30, 2022A | |
Audit-Related Fees | $8,284,200 | $7,914,600 |
Tax Fees | $1,000 | $353,200 |
All Other Fees | $- | $- |
A Amounts may reflect rounding.
“Audit-Related Fees” represent fees billed for assurance and related services that are reasonably related to the performance of the fund audit or the review of the fund's financial statements and that are not reported under Audit Fees.
“Tax Fees” represent fees billed for tax compliance, tax advice or tax planning that relate directly to the operations and financial reporting of the fund.
“All Other Fees” represent fees billed for services provided to the fund or Fund Service Provider, a significant portion of which are assurance related, that relate directly to the operations and financial reporting of the fund, excluding those services that are reported under Audit Fees, Audit-Related Fees or Tax Fees.
Assurance services must be performed by an independent public accountant.
* * *
The aggregate non-audit fees billed by Deloitte Entities and PwC for services rendered to the Fund(s), FMR (not including any sub-adviser whose role is primarily portfolio management and is subcontracted with or overseen by another investment adviser), and any Fund Service Provider for each of the last two fiscal years of the Fund(s) are as follows:
Billed By | June 30, 2023A | June 30, 2022A |
Deloitte Entities | $276,000 | $490,600 |
PwC | $13,641,000 | $13,336,600 |
A Amounts may reflect rounding.
The trust's Audit Committee has considered non-audit services that were not pre-approved that were provided by Deloitte Entities and PwC to Fund Service Providers to be compatible with maintaining the independence of Deloitte Entities and PwC in its(their) audit of the Fund(s), taking into account representations from Deloitte Entities and PwC, in accordance with Public Company Accounting Oversight Board rules, regarding its independence from the Fund(s) and its(their) related entities and FMR’s review of the appropriateness and permissibility under applicable law of such non-audit services prior to their provision to the Fund(s) Service Providers.
Audit Committee Pre-Approval Policies and Procedures
The trust’s Audit Committee must pre-approve all audit and non-audit services provided by a fund’s independent registered public accounting firm relating to the operations or financial reporting of the fund. Prior to the commencement of any audit or non-audit services to a fund, the Audit Committee reviews the services to determine whether they are appropriate and permissible under applicable law.
The Audit Committee has adopted policies and procedures to, among other purposes, provide a framework for the Committee’s consideration of non-audit services by the audit firms that audit the Fidelity funds. The policies and procedures require that any non-audit service provided by a fund audit firm to a Fidelity fund and any non-audit service provided by a fund auditor to a Fund Service Provider that relates directly to the operations and financial reporting of a Fidelity fund (“Covered Service”) are subject to approval by the Audit Committee before such service is provided.
All Covered Services must be approved in advance of provision of the service either: (i) by formal resolution of the Audit Committee, or (ii) by oral or written approval of the service by the Chair of the Audit Committee (or if the Chair is unavailable, such other member of the Audit Committee as may be designated by the Chair to act in the Chair’s absence). The approval contemplated by (ii) above is permitted where the Treasurer
determines that action on such an engagement is necessary before the next meeting of the Audit Committee.
Non-audit services provided by a fund audit firm to a Fund Service Provider that do not relate directly to the operations and financial reporting of a Fidelity fund are reported to the Audit Committee periodically.
Non-Audit Services Approved Pursuant to Rule 2-01(c)(7)(i)(C) and (ii) of Regulation S-X (“De Minimis Exception”)
There were no non-audit services approved or required to be approved by the Audit Committee pursuant to the De Minimis Exception during the Fund’s(s’) last two fiscal years relating to services provided to (i) the Fund(s) or (ii) any Fund Service Provider that relate directly to the operations and financial reporting of the Fund(s).
Item 5.
Audit Committee of Listed Registrants
Not applicable.
Item 6.
Investments
(a)
Not applicable.
(b)
Not applicable.
Item 7.
Disclosure of Proxy Voting Policies and Procedures for Closed-End Management Investment Companies
Not applicable.
Item 8.
Portfolio Managers of Closed-End Management Investment Companies
Not applicable.
Item 9.
Purchase of Equity Securities by Closed-End Management Investment Company and Affiliated Purchasers
Not applicable.
Item 10.
Submission of Matters to a Vote of Security Holders
There were no material changes to the procedures by which shareholders may recommend nominees to the trust’s Board of Trustees.
Item 11.
Controls and Procedures
(a)(i) The President and Treasurer and the Chief Financial Officer have concluded that the trust’s disclosure controls and procedures (as defined in Rule 30a-3(c) under the Investment Company Act) provide reasonable assurances that material information relating to the trust is made known to them by the appropriate persons, based on their evaluation of these controls and procedures as of a date within 90 days of the filing date of this report.
(a)(ii) There was no change in the trust’s internal control over financial reporting (as defined in Rule 30a-3(d) under the Investment Company Act) that occurred during the period covered by this report that has materially affected, or is reasonably likely to materially affect, the trust’s internal control over financial reporting.
Item 12.
Disclosure of Securities Lending Activities for Closed-End Management
Investment Companies
Not applicable.
Item 13.
Exhibits
(a) | (1) | Code of Ethics pursuant to Item 2 of Form N-CSR is filed and attached hereto as EX-99.CODE ETH. |
(a) | (2) | |
(a) | (3) | Not applicable. |
(b) |
SIGNATURES
Pursuant to the requirements of the Securities Exchange Act of 1934 and the Investment Company Act of 1940, the registrant has duly caused this report to be signed on its behalf by the undersigned, thereunto duly authorized.
Fidelity Salem Street Trust
By: | /s/Laura M. Del Prato |
Laura M. Del Prato | |
President and Treasurer | |
Date: | August 22, 2023 |
Pursuant to the requirements of the Securities Exchange Act of 1934 and the Investment Company Act of 1940, this report has been signed below by the following persons on behalf of the registrant and in the capacities and on the dates indicated.
By: | /s/Laura M. Del Prato |
Laura M. Del Prato | |
President and Treasurer | |
Date: | August 22, 2023 |
By: | /s/John J. Burke III |
John J. Burke III | |
Chief Financial Officer | |
Date: | August 22, 2023 |