UNITED STATES
SECURITIES AND EXCHANGE COMMISSION
Washington, D.C. 20549
FORM N-CSR
CERTIFIED SHAREHOLDER REPORT OF REGISTERED
MANAGEMENT INVESTMENT COMPANIES
Investment Company Act file number 811-02105
Fidelity Salem Street Trust
(Exact name of registrant as specified in charter)
245 Summer St., Boston, Massachusetts 02210
(Address of principal executive offices) (Zip code)
Margaret Carey, Secretary
245 Summer St.
Boston, Massachusetts 02210
(Name and address of agent for service)
Registrant's telephone number, including area code:
617-563-7000
| |
Date of fiscal year end: | March 31 |
|
|
Date of reporting period: | March 31, 2024 |
Item 1.
Reports to Stockholders
Fidelity® SAI Municipal Money Market Fund
Annual Report
March 31, 2024
Offered exclusively to certain clients of the Adviser, or its affiliates, including Strategic Advisers LLC (Strategic Advisers) - not available for sale to the general public. Fidelity® SAI is a product name of Fidelity® funds dedicated to certain programs affiliated with Strategic Advisers.
Contents
To view a fund's proxy voting guidelines and proxy voting record for the 12-month period ended June 30, visit http://www.fidelity.com/proxyvotingresults or visit the Securities and Exchange Commission's (SEC) web site at http://www.sec.gov.
You may also call 1-800-544-3455 to request a free copy of the proxy voting guidelines.
Standard & Poor's, S&P and S&P 500 are registered service marks of The McGraw-Hill Companies, Inc. and have been licensed for use by Fidelity Distributors Corporation.
Other third-party marks appearing herein are the property of their respective owners.
All other marks appearing herein are registered or unregistered trademarks or service marks of FMR LLC or an affiliated company. © 2024 FMR LLC. All rights reserved.
This report and the financial statements contained herein are submitted for the general information of the shareholders of the Fund. This report is not authorized for distribution to prospective investors in the Fund unless preceded or accompanied by an effective prospectus.
A fund files its complete schedule of portfolio holdings with the SEC for the first and third quarters of each fiscal year on Form N-PORT. Forms N-PORT are available on the SEC's web site at http://www.sec.gov. A fund's Forms N-PORT may be reviewed and copied at the SEC's Public Reference Room in Washington, DC. Information regarding the operation of the SEC's Public Reference Room may be obtained by calling 1-800-SEC-0330.
For a complete list of a fund's portfolio holdings, view the most recent holdings listing, semiannual report, or annual report on Fidelity's web site at http://www.fidelity.com, http://www.institutional.fidelity.com, or http://www.401k.com, as applicable.
NOT FDIC INSURED •MAY LOSE VALUE •NO BANK GUARANTEE
Neither the Fund nor Fidelity Distributors Corporation is a bank.
| Current 7-Day Yields |
| | | |
| Fidelity® SAI Municipal Money Market Fund | 3.61% | |
| | | |
Yield refers to the income paid by the Fund over a given period. Yield for money market funds is usually for seven-day periods, as it is here, though it is expressed as an annual percentage rate. Past performance is no guarantee of future results. Yield will vary and it's possible to lose money investing in the Fund. A portion of the Fund's expenses was reimbursed and/or waived. Absent such reimbursements and/or waivers the yield for the period ending March 31, 2024, the most recent period shown in the table, would have been 3.54% for Fidelity® SAI Municipal Money Market Fund. | |
| Effective Maturity Diversification (% of Fund's Investments) |
| Days |
| 1 - 7 | 90.4 | |
| 8 - 30 | 0.8 | |
| 31 - 60 | 2.7 | |
| 61 - 90 | 3.1 | |
| 91 - 180 | 2.5 | |
| > 180 | 0.4 | |
| Effective maturity is determined in accordance with the requirements of Rule 2a-7 under the Investment Company Act of 1940. |
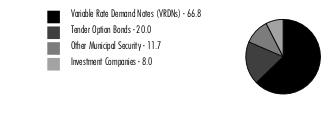
Asset Allocation (% of Fund's net assets) |
|
Net Other Assets (Liabilities) - (6.5)% |
|
Showing Percentage of Net Assets
| Variable Rate Demand Note - 66.8% |
| | | Principal Amount (a) | Value ($) |
| Alabama - 3.2% | | | |
| Walker County Econ. & Indl. Dev. Auth. Solid Waste Disp. Rev. (Alabama Pwr. Co. Plant Gorgas Proj.) Series 2023, 4.2% 4/1/24, VRDN (b)(c) | | 1,000,000 | 1,000,000 |
| West Jefferson Indl. Dev. Board Solid Waste Disp. Rev. (Alabama Pwr. Co. Plant Miller Proj.) Series 2023, 3.95% 4/4/24, VRDN (b)(c) | | 400,000 | 400,000 |
TOTAL ALABAMA | | | 1,400,000 |
| Arizona - 2.0% | | | |
| Maricopa County Poll. Cont. Rev.: | | | |
| Series 2009 B, 3.65% 4/4/24, VRDN (b) | | 500,000 | 500,000 |
| Series 2009 C, 3.7% 4/4/24, VRDN (b) | | 400,000 | 400,000 |
TOTAL ARIZONA | | | 900,000 |
| Delaware - 1.3% | | | |
| Delaware Econ. Dev. Auth. Rev. (Delmarva Pwr. & Lt. Co. Proj.): | | | |
| Series 1993 C, 3.84% 4/4/24, VRDN (b) | | 200,000 | 200,000 |
| Series 1999 B, 4% 4/4/24, VRDN (b)(c) | | 400,000 | 400,000 |
TOTAL DELAWARE | | | 600,000 |
| Florida - 2.2% | | | |
| Broward County Indl. Dev. Rev. (Florida Pwr. & Lt. Co. Proj.) Series 2018 B, 3.9% 4/4/24, VRDN (b)(c) | | 200,000 | 200,000 |
| Hillsborough County Hsg. Fin. Auth. Multi-family Rev. (Claymore Crossings Apt. Proj.) Series 2005, 3.66% 4/4/24, LOC Citibank NA, VRDN (b)(c) | | 465,000 | 465,000 |
| Lee County Indl. Dev. Auth. Rev. (Florida Pwr. & Lt. Co. Proj.) Series 2016 A, 3.9% 4/4/24, VRDN (b)(c) | | 300,000 | 300,000 |
TOTAL FLORIDA | | | 965,000 |
| Georgia - 2.2% | | | |
| Monroe County Dev. Auth. Rev. (Florida Pwr. & Lt. Co. Proj.) Series 2019, 3.55% 4/4/24, VRDN (b)(c) | | 1,000,000 | 1,000,000 |
| Illinois - 0.2% | | | |
| Illinois Dev. Fin. Auth. Rev. (Glenwood School for Boys Proj.) Series 1998, 3.68% 4/4/24, LOC Northern Trust Co., VRDN (b) | | 100,000 | 100,000 |
| Indiana - 2.0% | | | |
| Indiana Dev. Fin. Auth. Envir. Rev. (PSI Energy Proj.) Series 2003 A, 3.85% 4/4/24, VRDN (b)(c) | | 900,000 | 900,000 |
| Iowa - 1.8% | | | |
| Iowa Fin. Auth. Midwestern Disaster Area Rev. (ADM Proj.) Series 2011, 3.8% 4/4/24, VRDN (b) | | 100,000 | 100,000 |
| Iowa Fin. Auth. Solid Waste Facilities (MidAmerican Energy Co. Proj.) Series 2017, 4% 4/4/24, VRDN (b)(c) | | 700,000 | 700,000 |
TOTAL IOWA | | | 800,000 |
| Kansas - 1.6% | | | |
| Burlington Envir. Impt. Rev. (Kansas City Pwr. and Lt. Co. Proj.): | | | |
| Series 2007 A, 3.9% 4/4/24, VRDN (b) | | 100,000 | 100,000 |
| Series 2007 B, 3.9% 4/4/24, VRDN (b) | | 600,000 | 600,000 |
TOTAL KANSAS | | | 700,000 |
| Louisiana - 5.0% | | | |
| Saint James Parish Gen. Oblig. (Nucor Steel Louisiana LLC Proj.) Series 2010 B1, 3.9% 4/4/24, VRDN (b) | | 2,200,000 | 2,200,000 |
| Mississippi - 3.2% | | | |
| Mississippi Bus. Fin. Corp. Rev. (Gulf Pwr. Co. Proj.) Series 2019, 3.9% 4/4/24, VRDN (b)(c) | | 900,000 | 900,000 |
| Mississippi Bus. Fin. Corp. Solid Waste Disp. Rev. (Waste Mgmt., Inc. Proj.) Series 2003, 3.55% 4/4/24, LOC Bank of America NA, VRDN (b)(c) | | 500,000 | 500,000 |
TOTAL MISSISSIPPI | | | 1,400,000 |
| Nebraska - 3.4% | | | |
| Nebraska Invt. Fin. Auth. Single Family Hsg. Rev.: | | | |
| Series 2015 B, 3.6% 4/4/24 (Liquidity Facility Fed. Home Ln. Bank Topeka), VRDN (b)(c) | | 200,000 | 200,000 |
| Series B, 3.62% 4/4/24 (Liquidity Facility Fed. Home Ln. Bank Topeka), VRDN (b)(c) | | 1,100,000 | 1,100,000 |
| Stanton County Indl. Dev. Rev. Series 1998, 4.18% 4/4/24, VRDN (b)(c) | | 200,000 | 200,000 |
TOTAL NEBRASKA | | | 1,500,000 |
| Nevada - 1.1% | | | |
| Clark County Arpt. Rev. Series 2008 C1, 3.81% 4/4/24, LOC Bank of America NA, VRDN (b)(c) | | 500,000 | 500,000 |
| New York - 1.5% | | | |
| New York City Hsg. Dev. Corp. Multi-family Mtg. Rev. (Urban Horizons II Dev. Proj.) Series 2005 A, 3.95% 4/4/24, LOC Citibank NA, VRDN (b)(c) | | 100,000 | 100,000 |
| New York Hsg. Fin. Agcy. Rev. Series 2010 A, 3.65% 4/4/24, LOC Landesbank Hessen-Thuringen, VRDN (b) | | 570,000 | 570,000 |
TOTAL NEW YORK | | | 670,000 |
| North Carolina - 1.6% | | | |
| Lower Cape Fear Wtr. & Swr. Auth. Rev. (Bladen Bluffs Proj.) Series 2010, 3.56% 4/4/24, LOC Rabobank Nederland New York Branch, VRDN (b) | | 715,000 | 715,000 |
| Oregon - 0.6% | | | |
| FHLMC Portland Multi-family Hsg. Rev. (The Village at Lovejoy Fountain Proj.) Series 2009, 3.53% 4/4/24, LOC Freddie Mac, VRDN (b)(c) | | 250,000 | 250,000 |
| Rhode Island - 1.4% | | | |
| Rhode Island Health and Edl. Bldg. Corp. Higher Ed. Facility Rev. (New England Institute of Technology Proj.) Series 2008, 3.84% 4/4/24, LOC TD Banknorth, NA, VRDN (b) | | 615,000 | 615,000 |
| South Carolina - 4.1% | | | |
| South Carolina Jobs-Econ. Dev. Auth. Econ. Dev. Rev. (Waste Mgmt. of South Carolina, Inc. Proj.) Series 2003 A, 3.55% 4/4/24, LOC Wells Fargo Bank NA, VRDN (b)(c) | | 1,800,000 | 1,800,000 |
| Tennessee - 5.0% | | | |
| Loudon County Indl. Dev. Board Exempt Facilities Rev. (Kimberly-Clark Corp. Proj.) Series 1999, 3.85% 4/4/24, VRDN (b)(c) | | 2,200,000 | 2,200,000 |
| Texas - 10.4% | | | |
| Houston Util. Sys. Rev. Series 2004 B2, 3.5% 4/4/24, LOC Sumitomo Mitsui Banking Corp., VRDN (b) | | 370,000 | 370,000 |
| Texas Gen. Oblig.: | | | |
| Series 2003 A, 3.8% 4/4/24 (Liquidity Facility State Street Bank & Trust Co., Boston), VRDN (b)(c) | | 500,000 | 500,000 |
| Series 2012 B, 3.75% 4/4/24 (Liquidity Facility State Street Bank & Trust Co., Boston), VRDN (b) | | 500,000 | 500,000 |
| Series 2013 A, 3.75% 4/4/24 (Liquidity Facility State Street Bank & Trust Co., Boston), VRDN (b) | | 420,000 | 420,000 |
| Series 2014 A, 3.75% 4/4/24 (Liquidity Facility State Street Bank & Trust Co., Boston), VRDN (b) | | 300,000 | 300,000 |
| Series 2019, 3.6% 4/4/24 (Liquidity Facility JPMorgan Chase Bank), VRDN (b) | | 540,000 | 540,000 |
| FNMA Texas Dept. of Hsg. & Cmnty. Affairs Multi-family Hsg. Rev. (Pinnacle Apts. Proj.) Series 2004, 3.45% 4/4/24, LOC Fannie Mae, VRDN (b)(c) | | 2,000,000 | 2,000,000 |
TOTAL TEXAS | | | 4,630,000 |
| Utah - 0.4% | | | |
| Emery County Poll. Cont. Rev. (PacifiCorp Proj.) Series 1994, 4.15% 4/4/24, VRDN (b) | | 200,000 | 200,000 |
| Washington - 5.4% | | | |
| Washington Hsg. Fin. Commission Multi-family Hsg. Rev. (Interurban Sr. Living Apts. Proj.) Series 2012, 3.92% 4/4/24, LOC Freddie Mac, VRDN (b) | | 300,000 | 300,000 |
| FNMA Washington Hsg. Fin. Commission Multi-family Hsg. Rev.: | | | |
| (New Haven Apts. Proj.) Series 2009, 3.45% 4/4/24, LOC Fannie Mae, VRDN (b) | | 800,000 | 800,000 |
| (Pinehurst Apts. Proj.) Series A, 3.45% 4/4/24, LOC Fannie Mae, VRDN (b)(c) | | 1,000,000 | 1,000,000 |
| (The Cambridge Apts. Proj.) Series 2009, 3.45% 4/4/24, LOC Fannie Mae, VRDN (b) | | 300,000 | 300,000 |
TOTAL WASHINGTON | | | 2,400,000 |
| West Virginia - 2.0% | | | |
| West Virginia Econ. Dev. Auth. Solid Waste Disp. Facilities Rev. (Appalachian Pwr. Co.- Mountaineer Proj.) Series 2008 A, 3.58% 4/4/24, VRDN (b)(c) | | 900,000 | 900,000 |
| Wisconsin - 5.2% | | | |
| Green Bay Redev. Auth. (Green Bay Packaging, Inc. Proj.) Series 2019, 3.5% 4/4/24, LOC Wells Fargo Bank NA, VRDN (b)(c)(d) | | 2,300,000 | 2,300,000 |
| TOTAL VARIABLE RATE DEMAND NOTE (Cost $29,645,000) | | | 29,645,000 |
| | | | |
| Tender Option Bond - 20.0% |
| | | Principal Amount (a) | Value ($) |
| Arizona - 0.2% | | | |
| Arizona Indl. Dev. Auth. Hosp. Rev. Participating VRDN Series XM 10 13, 3.57% 4/4/24 (Liquidity Facility JPMorgan Chase Bank) (b)(e)(f) | | 75,000 | 75,000 |
| Colorado - 1.7% | | | |
| Colorado Health Facilities Auth. Rev. Bonds Participating VRDN Series 2023, 3.75% 5/2/24 (Liquidity Facility Barclays Bank PLC) (b)(e)(f) | | 100,000 | 100,000 |
| Denver City & County Arpt. Rev. Participating VRDN Series Floaters XG 01 96, 3.53% 4/4/24 (Liquidity Facility Toronto-Dominion Bank) (b)(c)(e)(f) | | 640,000 | 640,000 |
TOTAL COLORADO | | | 740,000 |
| Florida - 0.4% | | | |
| County of Broward Tourist Dev. Tax Rev. Participating VRDN Series XL 04 29, 3.56% 4/4/24 (Liquidity Facility Wells Fargo Bank NA) (b)(e)(f) | | 100,000 | 100,000 |
| South Miami Health Facilities Auth. Hosp. Rev. Participating VRDN Series YX 12 86, 3.52% 4/4/24 (Liquidity Facility Barclays Bank PLC) (b)(e)(f) | | 100,000 | 100,000 |
TOTAL FLORIDA | | | 200,000 |
| Georgia - 0.2% | | | |
| Fulton County Dev. Auth. Rev. Participating VRDN Series XL 02 68, 3.55% 4/4/24 (Liquidity Facility Bank of America NA) (b)(e)(f) | | 90,000 | 90,000 |
| Illinois - 1.1% | | | |
| Illinois Fin. Auth. Participating VRDN Series BAML 50 45, 3.53% 4/4/24 (Liquidity Facility Bank of America NA) (b)(e)(f) | | 500,000 | 500,000 |
| Michigan - 0.2% | | | |
| Mclaren Health Care Corp. Participating VRDN Series XL 02 71, 3.55% 4/4/24 (Liquidity Facility Bank of America NA) (b)(e)(f) | | 90,000 | 90,000 |
| Missouri - 0.7% | | | |
| Kansas City Indl. Dev. Auth. Participating VRDN Series XG 03 96, 3.53% 4/4/24 (Liquidity Facility Toronto-Dominion Bank) (b)(c)(e)(f) | | 300,000 | 300,000 |
| New Jersey - 0.5% | | | |
| New Jersey Hsg. & Mtg. Fin. Agcy. Multi-family Rev. Participating VRDN Series Floater 2024, 3.7% 5/2/24 (Liquidity Facility Barclays Bank PLC) (b)(e)(f) | | 200,000 | 200,000 |
| New York - 5.6% | | | |
| New York Trans. Dev. Corp. Participating VRDN Series 2022 E 154, 3.55% 4/4/24 (Liquidity Facility Royal Bank of Canada) (b)(c)(e)(f) | | 2,500,000 | 2,500,000 |
| North Carolina - 5.0% | | | |
| Charlotte Int'l. Arpt. Rev. Participating VRDN Series XG 05 27, 3.54% 4/4/24 (Liquidity Facility Bank of America NA) (b)(c)(e)(f) | | 130,000 | 130,000 |
| Greater Asheville Reg'l. Arpt. Auth. Participating VRDN Series XM 10 11, 3.52% 4/4/24 (Liquidity Facility Royal Bank of Canada) (b)(c)(e)(f) | | 2,100,000 | 2,100,000 |
TOTAL NORTH CAROLINA | | | 2,230,000 |
| Ohio - 0.9% | | | |
| Cuyahoga County Ctfs. of Prtn. Participating VRDN Series Floaters XG 02 06, 3.55% 4/4/24 (Liquidity Facility Bank of America NA) (b)(e)(f) | | 400,000 | 400,000 |
| Pennsylvania - 1.8% | | | |
| Allegheny County Arpt. Auth. Rev. Participating VRDN Series XG 05 41, 3.51% 4/4/24 (Liquidity Facility Royal Bank of Canada) (b)(c)(e)(f) | | 100,000 | 100,000 |
| Lehigh County Gen. Purp. Hosp. Rev. Participating VRDN Series BAML 23 50 39, 3.53% 5/2/24 (Liquidity Facility Bank of America NA) (b)(e)(f) | | 200,000 | 200,000 |
| Pennsylvania Econ. Dev. Fing. Auth. Participating VRDN Series XM 10 83, 3.53% 4/4/24 (Liquidity Facility Royal Bank of Canada) (b)(c)(e)(f) | | 500,000 | 500,000 |
TOTAL PENNSYLVANIA | | | 800,000 |
| Texas - 0.4% | | | |
| Texas Private Activity Bond Surface Trans. Corp. Participating VRDN Series XM 11 23, 3.52% 4/4/24 (Liquidity Facility Royal Bank of Canada) (b)(c)(e)(f) | | 100,000 | 100,000 |
| Texas Wtr. Dev. Board Rev. Bonds Series MS 00 17, 3.6%, tender 4/25/24 (Liquidity Facility Morgan Stanley Bank, West Valley City Utah) (b)(e)(f)(g) | | 100,000 | 100,000 |
TOTAL TEXAS | | | 200,000 |
| Virginia - 0.5% | | | |
| Suffolk Econ. Dev. Auth. Hosp. Facilities Rev. Participating VRDN Series MIZ 90 25, 3.55% 4/4/24 (Liquidity Facility Mizuho Cap. Markets LLC) (b)(e)(f) | | 200,000 | 200,000 |
| Washington - 0.8% | | | |
| Port of Seattle Rev. Participating VRDN: | | | |
| Series XF 13 71, 3.59% 4/4/24 (Liquidity Facility JPMorgan Chase Bank) (b)(c)(e)(f) | | 300,000 | 300,000 |
| Series XM 08 75, 3.55% 4/4/24 (Liquidity Facility JPMorgan Chase Bank) (b)(c)(e)(f) | | 65,000 | 65,000 |
TOTAL WASHINGTON | | | 365,000 |
| TOTAL TENDER OPTION BOND (Cost $8,890,000) | | | 8,890,000 |
| | | | |
| Other Municipal Security - 11.7% |
| | | Principal Amount (a) | Value ($) |
| California - 0.2% | | | |
| California Gen. Oblig. Bonds Series 2019, 5% 4/1/24 | | 100,000 | 100,000 |
| Connecticut - 0.4% | | | |
| Darien Gen. Oblig. BAN Series 2023, 4% 4/25/24 | | 190,000 | 190,016 |
| District Of Columbia - 1.1% | | | |
| District of Columbia Gen. Oblig. Bonds: | | | |
| Series 2015 A, 5% 6/1/24 | | 270,000 | 270,539 |
| Series 2023 B, 5% 6/1/24 | | 200,000 | 200,399 |
TOTAL DISTRICT OF COLUMBIA | | | 470,938 |
| Georgia - 0.9% | | | |
| Atlanta Arpt. Rev. Bonds Series 2023 C, 5% 7/1/24 (c) | | 380,000 | 380,845 |
| Illinois - 0.5% | | | |
| Illinois Gen. Oblig. Bonds: | | | |
| Series 2016, 5% 6/1/24 | | 100,000 | 100,208 |
| Series 2018 B, 5% 5/1/24 | | 105,000 | 105,106 |
TOTAL ILLINOIS | | | 205,314 |
| Kentucky - 0.9% | | | |
| Kentucky State Property & Buildings Commission Rev. Bonds Series 2017, 5% 4/1/24 | | 415,000 | 415,000 |
| Michigan - 0.5% | | | |
| Kent Hosp. Fin. Auth. Hosp. Facilities Rev. Bonds (Spectrum Health Sys. Proj.) Series 2015 A, SIFMA Municipal Swap Index + 0.250% 3.7%, tender 10/24/24 (b)(h) | | 100,000 | 100,000 |
| Michigan Fin. Auth. Rev. Bonds Series 2016 E1, 4%, tender 8/15/24 (b) | | 110,000 | 109,924 |
TOTAL MICHIGAN | | | 209,924 |
| New Jersey - 0.2% | | | |
| Jefferson Township Gen. Oblig. BAN Series 2023, 5% 6/14/24 | | 100,000 | 100,175 |
| North Carolina - 0.5% | | | |
| North Carolina Ltd. Oblig. Bonds: | | | |
| Series 2020 B, 5% 5/1/24 | | 100,000 | 100,090 |
| Series 2021 A, 5% 5/1/24 | | 135,000 | 135,122 |
TOTAL NORTH CAROLINA | | | 235,212 |
| Oregon - 1.4% | | | |
| Port of Portland Arpt. Rev. Bonds Series 2017 B, 5% 7/1/24 (c) | | 510,000 | 510,957 |
| Salem Hosp. Facility Auth. Rev. Bonds (Salem Health Projs.) Series 2019 A, 5% 5/15/24 | | 125,000 | 125,140 |
TOTAL OREGON | | | 636,097 |
| South Carolina - 0.4% | | | |
| Greenville County School District Bonds Series 2023 B, 5% 6/25/24 | | 155,000 | 155,358 |
| Texas - 3.6% | | | |
| Austin Elec. Util. Sys. Rev. Series 2024 A, 3.7% 6/5/24 (Liquidity Facility JPMorgan Chase Bank), CP | | 200,000 | 199,978 |
| Harris County Cultural Ed. Facilities Fin. Corp. Rev. Bonds Series 2020, 5% 6/1/24 | | 250,000 | 250,408 |
| Texas A&M Univ. Rev. Bonds Series 2017 E, 5% 5/15/24 | | 300,000 | 300,376 |
| Texas Gen. Oblig. Bonds: | | | |
| Series 2014, 5% 4/1/24 (Pre-Refunded to 4/1/24 @ 100) | | 425,000 | 425,000 |
| Series 2016, 5% 4/1/24 | | 150,000 | 150,000 |
| Texas Trans. Commission State Hwy. Fund Rev. Bonds Series 2014 A, 5% 4/1/24 (Pre-Refunded to 4/1/24 @ 100) | | 150,000 | 150,000 |
| Texas Wtr. Dev. Board Rev. Bonds Series 2023 A, 5% 4/15/24 | | 105,000 | 105,044 |
TOTAL TEXAS | | | 1,580,806 |
| Washington - 0.4% | | | |
| Port of Seattle Rev. Bonds Series 2022 B, 5% 8/1/24 (c) | | 195,000 | 195,480 |
| Wisconsin - 0.7% | | | |
| Wisconsin Clean Wtr. Rev. Bonds Series 2012 2, 5% 6/1/24 (Escrowed to Maturity) | | 205,000 | 205,331 |
| Wisconsin Gen. Oblig. Series 2024, 3.8% 12/10/24, CP | | 100,000 | 99,999 |
TOTAL WISCONSIN | | | 305,330 |
| TOTAL OTHER MUNICIPAL SECURITY (Cost $5,180,168) | | | 5,180,495 |
| | | | |
| Investment Company - 8.0% |
| | | Shares | Value ($) |
Fidelity Municipal Cash Central Fund 3.63% (i)(j) (Cost $3,542,891) | | 3,542,132 | 3,543,196 |
| | | | |
| TOTAL INVESTMENT IN SECURITIES - 106.5% (Cost $47,258,059) | 47,258,691 |
NET OTHER ASSETS (LIABILITIES) - (6.5)% | (2,905,013) |
| NET ASSETS - 100.0% | 44,353,678 |
| | |
Security Type Abbreviations
| BAN | - | BOND ANTICIPATION NOTE |
| CP | - | COMMERCIAL PAPER |
| VRDN | - | VARIABLE RATE DEMAND NOTE (A debt instrument that is payable upon demand, either daily, weekly or monthly) |
The date shown for securities represents the date when principal payments must be paid, taking into account any call options exercised by the issuer and any permissible maturity shortening features other than interest rate resets.
Legend
| (a) | Amount is stated in United States dollars unless otherwise noted. |
| (b) | Coupon rates for floating and adjustable rate securities reflect the rates in effect at period end. |
| (c) | Private activity obligations whose interest is subject to the federal alternative minimum tax for individuals. |
| (d) | Security exempt from registration under Rule 144A of the Securities Act of 1933. These securities may be resold in transactions exempt from registration, normally to qualified institutional buyers. At the end of the period, the value of these securities amounted to $2,300,000 or 5.2% of net assets. |
| (e) | Provides evidence of ownership in one or more underlying municipal bonds. |
| (f) | Coupon rates are determined by re-marketing agents based on current market conditions. |
| (g) | Restricted securities (including private placements) - Investment in securities not registered under the Securities Act of 1933 (excluding 144A issues). At the end of the period, the value of restricted securities (excluding 144A issues) amounted to $100,000 or 0.2% of net assets. |
| (h) | Coupon is indexed to a floating interest rate which may be multiplied by a specified factor and/or subject to caps or floors. |
| (i) | Information in this report regarding holdings by state and security types does not reflect the holdings of the Fidelity Municipal Cash Central Fund. |
| (j) | Affiliated fund that is generally available only to investment companies and other accounts managed by Fidelity Investments. The rate quoted is the annualized seven-day yield of the fund at period end. A complete unaudited listing of the fund's holdings as of its most recent quarter end is available upon request. In addition, each Fidelity Central Fund's financial statements, which are not covered by the Fund's Report of Independent Registered Public Accounting Firm, are available on the SEC's website or upon request. |
| Additional information on each restricted holding is as follows: |
| Security | Acquisition Date | Cost ($) |
| Texas Wtr. Dev. Board Rev. Bonds Series MS 00 17, 3.6%, tender 4/25/24 (Liquidity Facility Morgan Stanley Bank, West Valley City Utah) | 10/12/23 | 100,000 |
| | | |
Affiliated Central Funds
Fiscal year to date information regarding the Fund's investments in Fidelity Central Funds, including the ownership percentage, is presented below.
| Affiliate | Value, beginning of period ($) | Purchases ($) | Sales Proceeds ($) | Dividend Income ($) | Realized Gain (loss) ($) | Change in Unrealized appreciation (depreciation) ($) | Value, end of period ($) | % ownership, end of period |
| Fidelity Municipal Cash Central Fund 3.63% | 7,744,028 | 64,716,219 | 68,918,053 | 272,677 | 851 | 151 | 3,543,196 | 0.2% |
| Total | 7,744,028 | 64,716,219 | 68,918,053 | 272,677 | 851 | 151 | 3,543,196 | |
| | | | | | | | | |
Amounts in the dividend income column in the above table include any capital gain distributions from underlying funds, which are presented in the corresponding line item in the Statement of Operations, if applicable.
Amounts included in the purchases and sales proceeds columns may include in-kind transactions, if applicable.
Investment Valuation
The following is a summary of the inputs used, as of March 31, 2024, involving the Fund's assets and liabilities carried at fair value. The inputs or methodology used for valuing securities may not be an indication of the risk associated with investing in those securities. For more information on valuation inputs, and their aggregation into the levels used below, please refer to the Investment Valuation section in the accompanying Notes to Financial Statements.
| Valuation Inputs at Reporting Date: |
| Description | Total ($) | Level 1 ($) | Level 2 ($) | Level 3 ($) |
Investments in Securities: | | | | |
|
| Variable Rate Demand Note | 29,645,000 | - | 29,645,000 | - |
|
| Tender Option Bond | 8,890,000 | - | 8,890,000 | - |
|
| Other Municipal Security | 5,180,495 | - | 5,180,495 | - |
|
| Investment Company | 3,543,196 | 3,543,196 | - | - |
| Total Investments in Securities: | 47,258,691 | 3,543,196 | 43,715,495 | - |
| Statement of Assets and Liabilities |
| | | | March 31, 2024 |
| | | | | |
| Assets | | | | |
| Investment in securities, at value - See accompanying schedule: | | | | |
Unaffiliated issuers (cost $43,715,168) | $ | 43,715,495 | | |
Fidelity Central Funds (cost $3,542,891) | | 3,543,196 | | |
| | | | | |
| | | | | |
| Total Investment in Securities (cost $47,258,059) | | | $ | 47,258,691 |
| Cash | | | | 1,000 |
| Interest receivable | | | | 250,997 |
| Distributions receivable from Fidelity Central Funds | | | | 19,663 |
| Prepaid expenses | | | | 67 |
| Receivable from investment adviser for expense reductions | | | | 3,278 |
| Other receivables | | | | 341 |
Total assets | | | | 47,534,037 |
| Liabilities | | | | |
| Payable for fund shares redeemed | $ | 3,135,087 | | |
| Accrued management fee | | 5,940 | | |
| Other payables and accrued expenses | | 39,332 | | |
| Total liabilities | | | | 3,180,359 |
| Net Assets | | | $ | 44,353,678 |
| Net Assets consist of: | | | | |
| Paid in capital | | | $ | 44,378,031 |
| Total accumulated earnings (loss) | | | | (24,353) |
| Net Assets | | | $ | 44,353,678 |
Net Asset Value, offering price and redemption price per share ($44,353,678 ÷ 44,342,833 shares) | | | $ | 1.0002 |
| Statement of Operations |
| | | | Year ended March 31, 2024 |
| Investment Income | | | | |
| Interest | | | $ | 3,496,219 |
| Income from Fidelity Central Funds | | | | 272,677 |
| Total income | | | | 3,768,896 |
| Expenses | | | | |
| Management fee | $ | 147,187 | | |
| Custodian fees and expenses | | 4,368 | | |
| Independent trustees' fees and expenses | | 404 | | |
| Registration fees | | 21,726 | | |
| Audit | | 41,193 | | |
| Legal | | 96 | | |
| Miscellaneous | | 373 | | |
| Total expenses before reductions | | 215,347 | | |
| Expense reductions | | (67,252) | | |
| Total expenses after reductions | | | | 148,095 |
| Net Investment income (loss) | | | | 3,620,801 |
| Realized and Unrealized Gain (Loss) | | | | |
| Net realized gain (loss) on: | | | | |
| Investment Securities: | | | | |
| Unaffiliated issuers | | (656) | | |
| Fidelity Central Funds | | 851 | | |
| Total net realized gain (loss) | | | | 195 |
| Change in net unrealized appreciation (depreciation) on: | | | | |
| Investment Securities: | | | | |
| Unaffiliated issuers | | (27,116) | | |
| Fidelity Central Funds | | 151 | | |
| Total change in net unrealized appreciation (depreciation) | | | | (26,965) |
| Net gain (loss) | | | | (26,770) |
| Net increase in net assets resulting from operations | | | $ | 3,594,031 |
| Statement of Changes in Net Assets |
| |
| | Year ended March 31, 2024 | | Year ended March 31, 2023 |
| Increase (Decrease) in Net Assets | | | | |
| Operations | | | | |
| Net investment income (loss) | $ | 3,620,801 | $ | 5,336,986 |
| Net realized gain (loss) | | 195 | | (26,537) |
| Change in net unrealized appreciation (depreciation) | | (26,965) | | 209,645 |
Net increase in net assets resulting from operations | | 3,594,031 | | 5,520,094 |
| Distributions to shareholders | | (3,619,585) | | (5,339,450) |
| | | | | |
| Share transactions | | | | |
| Proceeds from sales of shares | | 12,384,099 | | 53,902,848 |
| Reinvestment of distributions | | 3,619,585 | | 5,339,450 |
| Cost of shares redeemed | | (132,108,751) | | (436,349,504) |
| | | | | |
Net increase (decrease) in net assets and shares resulting from share transactions | | (116,105,067) | | (377,107,206) |
| Total increase (decrease) in net assets | | (116,130,621) | | (376,926,562) |
| | | | | |
| Net Assets | | | | |
| Beginning of period | | 160,484,299 | | 537,410,861 |
| End of period | $ | 44,353,678 | $ | 160,484,299 |
| | | | | |
| Other Information | | | | |
| Shares | | | | |
| Sold | | 12,380,540 | | 53,885,181 |
| Issued in reinvestment of distributions | | 3,618,521 | | 5,337,763 |
| Redeemed | | (132,071,921) | | (436,220,379) |
| Net increase (decrease) | | (116,072,860) | | (376,997,435) |
| | | | | |
Financial Highlights
Fidelity® SAI Municipal Money Market Fund |
| |
| Years ended March 31, | | 2024 | | 2023 | | 2022 | | 2021 | | 2020 |
Selected Per-Share Data | | | | | | | | | | |
| Net asset value, beginning of period | $ | 1.0004 | $ | 1.0000 | $ | 1.0004 | $ | 1.0002 | $ | 1.0001 |
| Income from Investment Operations | | | | | | | | | | |
Net investment income (loss) A | | .0346 | | .0180 | | .0003 | | .0013 | | .0142 |
| Net realized and unrealized gain (loss) | | (.0002) | | .0004 | | (.0003) | | .0002 | | .0001 |
| Total from investment operations | | .0344 | | .0184 | | - | | .0015 | | .0143 |
| Distributions from net investment income | | (.0346) | | (.0180) | | (.0003) | | (.0013) | | (.0142) |
| Distributions from net realized gain | | - | | - | | (.0001) | | (.0001) | | - |
| Total distributions | | (.0346) | | (.0180) | | (.0004) | | (.0013) B | | (.0142) |
| Net asset value, end of period | $ | 1.0002 | $ | 1.0004 | $ | 1.0000 | $ | 1.0004 | $ | 1.0002 |
Total Return C | | | | 1.85% | | -% | | .15% | | 1.44% |
Ratios to Average Net Assets A,D,E | | | | | | | | | | |
| Expenses before reductions | | .20% | | .16% | | .16% | | .16% | | .19% |
| Expenses net of fee waivers, if any | | | | .14% | | .09% | | .12% | | .14% |
| Expenses net of all reductions | | .14% | | .14% | | .09% | | .12% | | .14% |
| Net investment income (loss) | | 3.43% | | 1.57% | | .03% | | .08% | | 1.41% |
| Supplemental Data | | | | | | | | | | |
| Net assets, end of period (000 omitted) | $ | 44,354 | $ | 160,484 | $ | 537,411 | $ | 445,828 | $ | 134,798 |
ANet investment income (loss) is affected by the timing of the declaration of dividends by any underlying mutual funds or exchange-traded funds (ETFs). Net investment income (loss) of any mutual funds or ETFs is not included in the Fund's net investment income (loss) ratio.
BTotal distributions per share do not sum due to rounding.
CTotal returns would have been lower if certain expenses had not been reduced during the applicable periods shown.
DFees and expenses of any underlying mutual funds or exchange-traded funds (ETFs) are not included in the Fund's expense ratio. The Fund indirectly bears its proportionate share of these expenses. For additional expense information related to investments in Fidelity Central Funds, please refer to the "Investments in Fidelity Central Funds" note found in the Notes to Financial Statements section of the most recent Annual or Semi-Annual report.
EExpense ratios reflect operating expenses of the class. Expenses before reductions do not reflect amounts reimbursed, waived, or reduced through arrangements with the investment adviser, brokerage services, or other offset arrangements, if applicable, and do not represent the amount paid by the class during periods when reimbursements, waivers or reductions occur.
For the period ended March 31, 2024
1. Organization.
Fidelity SAI Municipal Money Market Fund (the Fund) is a fund of Fidelity Salem Street Trust (the Trust) and is authorized to issue an unlimited number of shares. Shares are offered exclusively to certain clients of Fidelity Management & Research Company LLC (FMR) or its affiliates. The Trust is registered under the Investment Company Act of 1940, as amended (the 1940 Act), as an open-end management investment company organized as a Massachusetts business trust. The Fund has been designated an institutional money market fund, and the value of the Fund's shares are calculated to four decimal places that fluctuates based upon changes in the value of the Fund's investments.
2. Investments in Fidelity Central Funds.
Funds may invest in Fidelity Central Funds, which are open-end investment companies generally available only to other investment companies and accounts managed by the investment adviser and its affiliates. The Schedule of Investments lists any Fidelity Central Funds held as an investment as of period end, but does not include the underlying holdings of each Fidelity Central Fund. An investing fund indirectly bears its proportionate share of the expenses of the underlying Fidelity Central Funds.
Based on its investment objective, each Fidelity Central Fund may invest or participate in various investment vehicles or strategies that are similar to those of the investing fund. These strategies are consistent with the investment objectives of the investing fund and may involve certain economic risks which may cause a decline in value of each of the Fidelity Central Funds and thus a decline in the value of the investing fund.
| Fidelity Central Fund | Investment Manager | Investment Objective | Investment Practices | Expense RatioA |
| Fidelity Money Market Central Funds | Fidelity Management & Research Company LLC (FMR) | Each fund seeks to obtain a high level of current income consistent with the preservation of capital and liquidity. | Short-term Investments | Less than .005% |
A Expenses expressed as a percentage of average net assets and are as of each underlying Central Fund's most recent annual or semi-annual shareholder report.
A complete unaudited list of holdings for each Fidelity Central Fund is available upon request or at the Securities and Exchange Commission website at www.sec.gov. In addition, the financial statements of the Fidelity Central Funds which contain the significant accounting policies (including investment valuation policies) of those funds, and are not covered by the Report of Independent Registered Public Accounting Firm, are available on the Securities and Exchange Commission website or upon request.
3. Significant Accounting Policies.
The Fund is an investment company and applies the accounting and reporting guidance of the Financial Accounting Standards Board (FASB) Accounting Standards Codification Topic 946 Financial Services - Investment Companies. The financial statements have been prepared in conformity with accounting principles generally accepted in the United States of America (GAAP), which require management to make certain estimates and assumptions at the date of the financial statements. Actual results could differ from those estimates. Subsequent events, if any, through the date that the financial statements were issued have been evaluated in the preparation of the financial statements. The Fund's Schedule of Investments lists any underlying mutual funds or exchange-traded funds (ETFs) but does not include the underlying holdings of these funds. The following summarizes the significant accounting policies of the Fund:
Investment Valuation. Investments are valued as of 4:00 p.m. Eastern time on the last calendar day of the period. The Board of Trustees (the Board) has designated the Fund's investment adviser as the valuation designee responsible for the fair valuation function and performing fair value determinations as needed. The investment adviser has established a Fair Value Committee (the Committee) to carry out the day-to-day fair valuation responsibilities and has adopted policies and procedures to govern the fair valuation process and the activities of the Committee. In accordance with these fair valuation policies and procedures, which have been approved by the Board, the Fund attempts to obtain prices from one or more third party pricing services or brokers to value its investments. When current market prices, quotations or currency exchange rates are not readily available or reliable, investments will be fair valued in good faith by the Committee, in accordance with the policies and procedures. Factors used in determining fair value vary by investment type and may include market or investment specific events, transaction data, estimated cash flows, and market observations of comparable investments. The frequency that the fair valuation procedures are used cannot be predicted and they may be utilized to a significant extent. The Committee manages the Fund's fair valuation practices and maintains the fair valuation policies and procedures. The Fund's investment adviser reports to the Board information regarding the fair valuation process and related material matters.
The Fund categorizes the inputs to valuation techniques used to value its investments into a disclosure hierarchy consisting of three levels as shown below:
Level 1 - unadjusted quoted prices in active markets for identical investments
Level 2 - other significant observable inputs (including quoted prices for similar investments, interest rates, prepayment speeds, etc.)
Level 3 - unobservable inputs (including the Fund's own assumptions based on the best information available)
Valuation techniques used to value the Fund's investments by major category are as follows:
Debt securities, including restricted securities, are valued based on evaluated prices received from third party pricing services or from brokers who make markets in such securities. Municipal securities are valued by pricing services who utilize matrix pricing which considers yield or price of bonds of comparable quality, coupon, maturity and type or by broker-supplied prices. When independent prices are unavailable or unreliable, debt securities may be valued utilizing pricing methodologies which consider similar factors that would be used by third party pricing services. Debt securities are generally categorized as Level 2 in the hierarchy but may be Level 3 depending on the circumstances.
Investments in the Fidelity Central Funds are valued at their closing net asset value (NAV) each business day and are categorized as Level 1 in the hierarchy.
Securities held by a money market fund are generally high quality and liquid; however, they are reflected as Level 2 because the inputs used to determine fair value are not quoted prices in an active market.
The aggregate value of investments by input level as of March 31, 2024 is included at the end of the Fund's Schedule of Investments.
Investment Transactions and Income. The net asset value per share for processing shareholder transactions is calculated as of the close of business of the New York Stock Exchange (NYSE), normally 4:00 p.m. Eastern time. Security transactions, including the Fund's investment activity in the Fidelity Central Funds, are accounted for as of trade date. Gains and losses on securities sold are determined on the basis of identified cost. Income and capital gain distributions from Fidelity Central Funds, if any, are recorded on the ex-dividend date. Interest income is accrued as earned and includes coupon interest and amortization of premium and accretion of discount on debt securities as applicable.
Expenses. Expenses directly attributable to a fund are charged to that fund. Expenses attributable to more than one fund are allocated among the respective funds on the basis of relative net assets or other appropriate methods. Expenses included in the accompanying financial statements reflect the expenses of that fund and do not include any expenses associated with any underlying mutual funds or exchange-traded funds. Although not included in a fund's expenses, a fund indirectly bears its proportionate share of these expenses through the net asset value of each underlying mutual fund or exchange-traded fund. Expense estimates are accrued in the period to which they relate and adjustments are made when actual amounts are known.
Income Tax Information and Distributions to Shareholders. Each year, the Fund intends to qualify as a regulated investment company under Subchapter M of the Internal Revenue Code, including distributing substantially all of its taxable income and realized gains. As a result, no provision for U.S. Federal income taxes is required. As of March 31, 2024, the Fund did not have any unrecognized tax benefits in the financial statements; nor is the Fund aware of any tax positions for which it is reasonably possible that the total amounts of unrecognized tax benefits will significantly change in the next twelve months. The Fund files a U.S. federal tax return, in addition to state and local tax returns as required. The Fund's federal income tax returns are subject to examination by the Internal Revenue Service (IRS) for a period of three fiscal years after they are filed. State and local tax returns may be subject to examination for an additional fiscal year depending on the jurisdiction.
Distributions are declared and recorded daily and paid monthly from net investment income. Distributions from realized gains, if any, are declared and recorded on the ex-dividend date. Income and capital gain distributions are determined in accordance with income tax regulations, which may differ from GAAP.
Capital accounts within the financial statements are adjusted for permanent book-tax differences. These adjustments have no impact on net assets or the results of operations. Capital accounts are not adjusted for temporary book-tax differences which will reverse in a subsequent period.
Book-tax differences are primarily due capital loss carryforwards.
The Fund purchases municipal securities whose interest, in the opinion of the issuer, is free from federal income tax. There is no assurance that the IRS will agree with this opinion. In the event the IRS determines that the issuer does not comply with relevant tax requirements, interest payments from a security could become federally taxable, possibly retroactively to the date the security was issued.
As of period end, the cost and unrealized appreciation (depreciation) in securities for federal income tax purposes were as follows:
| Gross unrealized appreciation | $1,179 |
| Gross unrealized depreciation | (547) |
| Net unrealized appreciation (depreciation) | $632 |
| Tax Cost | $47,258,059 |
The tax-based components of distributable earnings as of period end were as follows:
| Undistributed tax-exempt income | $440 |
| Capital loss carryforward | $(25,462) |
| Net unrealized appreciation (depreciation) on securities and other investments | $632 |
Capital loss carryforwards are only available to offset future capital gains of the Fund to the extent provided by regulations and may be limited. The capital loss carryforward information presented below, including any applicable limitation, is estimated as of fiscal period end and is subject to adjustment.
The tax character of distributions paid was as follows:
| | March 31, 2024 | March 31, 2023 |
| Tax-exempt Income | 3,619,585 | 5,336,470 |
| Ordinary Income | - | $2,980 |
| Total | $3,619,585 | $5,339,450 |
Restricted Securities (including Private Placements). Funds may invest in securities that are subject to legal or contractual restrictions on resale. These securities generally may be resold in transactions exempt from registration or to the public if the securities are registered. Disposal of these securities may involve time-consuming negotiations and expense, and prompt sale at an acceptable price may be difficult. Information regarding restricted securities held at period end is included at the end of the Schedule of Investments, if applicable.
4. Fees and Other Transactions with Affiliates.
Management Fee. Fidelity Management & Research Company LLC (the investment adviser) and its affiliates provide the Fund with investment management related services for which the Fund pays a monthly management fee that is based on an annual rate of .14% of the Fund's average net assets.
Interfund Trades. Funds may purchase from or sell securities to other Fidelity Funds under procedures adopted by the Board. The procedures have been designed to ensure these interfund trades are executed in accordance with Rule 17a-7 of the 1940 Act. Interfund trades during the period are noted in the table below.
| | Purchases ($) | Sales ($) | Realized Gain (Loss)($) |
| Fidelity SAI Municipal Money Market Fund | 513,344 | 61,585,000 | - |
Sub-Advisory Arrangements. Effective March 1, 2024, the Fund's sub-advisory agreements with FMR Investment Management (UK) Limited, Fidelity Management & Research (Hong Kong) Limited, and Fidelity Management & Research (Japan) Limited were amended to provide that the investment adviser pays each sub-adviser monthly fees equal to 110% of the sub-adviser's costs for providing sub-advisory services.
5. Expense Reductions.
The investment adviser contractually agreed to reimburse the Fund to the extent annual operating expenses exceeded .14% of average net assets. Some expenses, for example the compensation of the independent Trustees, and certain miscellaneous expenses such as proxy and shareholder meeting expenses, are excluded from this reimbursement. During the period this reimbursement reduced the Fund's expenses by $67,252.
Effective April 1, 2024, the investment adviser contractually agreed to reimburse expenses to the extent annual operating expenses exceeded .07% of average net assets. This reimbursement will remain in place through July 31, 2025.
6. Other.
A fund's organizational documents provide former and current trustees and officers with a limited indemnification against liabilities arising in connection with the performance of their duties to the fund. In the normal course of business, a fund may also enter into contracts that provide general indemnifications. A fund's maximum exposure under these arrangements is unknown as this would be dependent on future claims that may be made against a fund. The risk of material loss from such claims is considered remote.
At the end of the period, the following mutual funds managed by the investment adviser or its affiliates were the owners of record of 10% or more of the total outstanding shares.
| | Strategic Advisers Tax-Sensitive Short Duration Fund |
| Fidelity SAI Municipal Money Market Fund | 99% |
Mutual funds managed by the investment adviser or its affiliates, in aggregate, were the owners of record of more than 20% of the total outstanding shares.
| Fund | % of shares held |
| Fidelity SAI Municipal Money Market Fund | 100% |
7. Risk and Uncertainties.
Many factors affect a fund's performance. Developments that disrupt global economies and financial markets, such as pandemics, epidemics, outbreaks of infectious diseases, war, terrorism, and environmental disasters, may significantly affect a fund's investment performance. The effects of these developments to a fund will be impacted by the types of securities in which a fund invests, the financial condition, industry, economic sector, and geographic location of an issuer, and a fund's level of investment in the securities of that issuer. Significant concentrations in security types, issuers, industries, sectors, and geographic locations may magnify the factors that affect a fund's performance.
To the Board of Trustees of Fidelity Salem Street Trust and Shareholders of Fidelity SAI Municipal Money Market Fund
Opinion on the Financial Statements
We have audited the accompanying statement of assets and liabilities, including the schedule of investments, of Fidelity SAI Municipal Money Market Fund (one of the funds constituting Fidelity Salem Street Trust, referred to hereafter as the "Fund") as of March 31, 2024, the related statement of operations for the year ended March 31, 2024, the statement of changes in net assets for each of the two years in the period ended March 31, 2024, including the related notes, and the financial highlights for each of the five years in the period ended March 31, 2024 (collectively referred to as the "financial statements"). In our opinion, the financial statements present fairly, in all material respects, the financial position of the Fund as of March 31, 2024, the results of its operations for the year then ended, the changes in its net assets for each of the two years in the period ended March 31, 2024 and the financial highlights for each of the five years in the period ended March 31, 2024 in conformity with accounting principles generally accepted in the United States of America.
Basis for Opinion
These financial statements are the responsibility of the Fund's management. Our responsibility is to express an opinion on the Fund's financial statements based on our audits. We are a public accounting firm registered with the Public Company Accounting Oversight Board (United States) (PCAOB) and are required to be independent with respect to the Fund in accordance with the U.S. federal securities laws and the applicable rules and regulations of the Securities and Exchange Commission and the PCAOB.
We conducted our audits of these financial statements in accordance with the standards of the PCAOB. Those standards require that we plan and perform the audit to obtain reasonable assurance about whether the financial statements are free of material misstatement, whether due to error or fraud.
Our audits included performing procedures to assess the risks of material misstatement of the financial statements, whether due to error or fraud, and performing procedures that respond to those risks. Such procedures included examining, on a test basis, evidence regarding the amounts and disclosures in the financial statements. Our audits also included evaluating the accounting principles used and significant estimates made by management, as well as evaluating the overall presentation of the financial statements. Our procedures included confirmation of securities owned as of March 31, 2024 by correspondence with the custodian. We believe that our audits provide a reasonable basis for our opinion.
/s/ PricewaterhouseCoopers LLP
Boston, Massachusetts
May 10, 2024
We have served as the auditor of one or more investment companies in the Fidelity group of funds since 1932.
The Trustees, Members of the Advisory Board (if any), and officers of the trust and fund, as applicable, are listed below. The Board of Trustees governs the fund and is responsible for protecting the interests of shareholders. The Trustees are experienced executives who meet periodically throughout the year to oversee the fund's activities, review contractual arrangements with companies that provide services to the fund, oversee management of the risks associated with such activities and contractual arrangements, and review the fund's performance. Except for Jonathan Chiel, each of the Trustees oversees 314 funds. Mr. Chiel oversees 192 funds.
The Trustees hold office without limit in time except that (a) any Trustee may resign; (b) any Trustee may be removed by written instrument, signed by at least two-thirds of the number of Trustees prior to such removal; (c) any Trustee who requests to be retired or who has become incapacitated by illness or injury may be retired by written instrument signed by a majority of the other Trustees; and (d) any Trustee may be removed at any special meeting of shareholders by a two-thirds vote of the outstanding voting securities of the trust. Each Trustee who is not an interested person (as defined in the 1940 Act) of the trust and the fund is referred to herein as an Independent Trustee. Each Independent Trustee shall retire not later than the last day of the calendar year in which his or her 75th birthday occurs. The Independent Trustees may waive this mandatory retirement age policy with respect to individual Trustees. Officers and Advisory Board Members hold office without limit in time, except that any officer or Advisory Board Member may resign or may be removed by a vote of a majority of the Trustees at any regular meeting or any special meeting of the Trustees. Except as indicated, each individual has held the office shown or other offices in the same company for the past five years.
The fund's Statement of Additional Information (SAI) includes more information about the Trustees. To request a free copy, call Fidelity at 1-800-544-3455.
Experience, Skills, Attributes, and Qualifications of the Trustees. The Governance and Nominating Committee has adopted a statement of policy that describes the experience, qualifications, attributes, and skills that are necessary and desirable for potential Independent Trustee candidates (Statement of Policy). The Board believes that each Trustee satisfied at the time he or she was initially elected or appointed a Trustee, and continues to satisfy, the standards contemplated by the Statement of Policy. The Governance and Nominating Committee also engages professional search firms to help identify potential Independent Trustee candidates who have the experience, qualifications, attributes, and skills consistent with the Statement of Policy. From time to time, additional criteria based on the composition and skills of the current Independent Trustees, as well as experience or skills that may be appropriate in light of future changes to board composition, business conditions, and regulatory or other developments, have also been considered by the professional search firms and the Governance and Nominating Committee. In addition, the Board takes into account the Trustees' commitment and participation in Board and committee meetings, as well as their leadership of standing and ad hoc committees throughout their tenure.
In determining that a particular Trustee was and continues to be qualified to serve as a Trustee, the Board has considered a variety of criteria, none of which, in isolation, was controlling. The Board believes that, collectively, the Trustees have balanced and diverse experience, qualifications, attributes, and skills, which allow the Board to operate effectively in governing the fund and protecting the interests of shareholders. Information about the specific experience, skills, attributes, and qualifications of each Trustee, which in each case led to the Board's conclusion that the Trustee should serve (or continue to serve) as a trustee of the fund, is provided below.
Board Structure and Oversight Function. Abigail P. Johnson is an interested person and currently serves as Chairman. The Trustees have determined that an interested Chairman is appropriate and benefits shareholders because an interested Chairman has a personal and professional stake in the quality and continuity of services provided to the fund. Independent Trustees exercise their informed business judgment to appoint an individual of their choosing to serve as Chairman, regardless of whether the Trustee happens to be independent or a member of management. The Independent Trustees have determined that they can act independently and effectively without having an Independent Trustee serve as Chairman and that a key structural component for assuring that they are in a position to do so is for the Independent Trustees to constitute a substantial majority for the Board. The Independent Trustees also regularly meet in executive session. Michael E. Kenneally serves as Chairman of the Independent Trustees and as such (i) acts as a liaison between the Independent Trustees and management with respect to matters important to the Independent Trustees and (ii) with management prepares agendas for Board meetings.
Fidelity® funds are overseen by different Boards of Trustees. The fund's Board oversees Fidelity's investment-grade bond, money market, asset allocation and certain equity funds, and other Boards oversee Fidelity's alternative investment, high income and other equity funds. The asset allocation funds may invest in Fidelity® funds that are overseen by such other Boards. The use of separate Boards, each with its own committee structure, allows the Trustees of each group of Fidelity® funds to focus on the unique issues of the funds they oversee, including common research, investment, and operational issues. On occasion, the separate Boards establish joint committees to address issues of overlapping consequences for the Fidelity® funds overseen by each Board.
The Trustees operate using a system of committees to facilitate the timely and efficient consideration of all matters of importance to the Trustees, the fund, and fund shareholders and to facilitate compliance with legal and regulatory requirements and oversight of the fund's activities and associated risks. The Board, acting through its committees, has charged FMR and its affiliates with (i) identifying events or circumstances the occurrence of which could have demonstrably adverse effects on the fund's business and/or reputation; (ii) implementing processes and controls to lessen the possibility that such events or circumstances occur or to mitigate the effects of such events or circumstances if they do occur; and (iii) creating and maintaining a system designed to evaluate continuously business and market conditions in order to facilitate the identification and implementation processes described in (i) and (ii) above. Because the day-to-day operations and activities of the fund are carried out by or through FMR, its affiliates, and other service providers, the fund's exposure to risks is mitigated but not eliminated by the processes overseen by the Trustees. While each of the Board's committees has responsibility for overseeing different aspects of the fund's activities, oversight is exercised primarily through the Operations and Audit Committees. In addition, an ad hoc Board committee of Independent Trustees has worked with FMR to enhance the Board's oversight of investment and financial risks, legal and regulatory risks, technology risks, and operational risks, including the development of additional risk reporting to the Board. The Operations Committee also worked and continues to work with FMR to enhance the stress tests required under SEC regulations for money market funds. Appropriate personnel, including but not limited to the fund's Chief Compliance Officer (CCO), FMR's internal auditor, the independent accountants, the fund's Treasurer and portfolio management personnel, make periodic reports to the Board's committees, as appropriate, including an annual review of Fidelity's risk management program for the Fidelity® funds. The responsibilities of each standing committee, including their oversight responsibilities, are described further under "Standing Committees of the Trustees."
Interested Trustees*:
Correspondence intended for a Trustee who is an interested person may be sent to Fidelity Investments, 245 Summer Street, Boston, Massachusetts 02210.
Name, Year of Birth; Principal Occupations and Other Relevant Experience+
Jonathan Chiel (1957)
Year of Election or Appointment: 2016
Trustee
Mr. Chiel also serves as Trustee of other Fidelity® funds. Mr. Chiel is Senior Counsel at Fidelity Investments (diversified financial services company, 2024-present). Previously, Mr. Chiel served as General Counsel (2012-2024) and Head of Legal, Risk and Compliance (2022-2024) for Fidelity Investments; Executive Vice President and General Counsel for FMR LLC (diversified financial services company, 2012-2024); Director and President of OH Company LLC (holding company, 2018-2024); General Counsel (2004-2012) and Senior Vice President and Deputy General Counsel (2000-2004) for John Hancock Financial Services; a partner with Choate, Hall & Stewart (law firm, 1996-2000); and an Assistant United States Attorney for the United States Attorney's Office of the District of Massachusetts (1986-1995), including Chief of the Criminal Division (1993-1995). Mr. Chiel is a director on the boards of the Harvard Law School Center on the Legal Profession and the U.S. Chamber Litigation Center.
Abigail P. Johnson (1961)
Year of Election or Appointment: 2009
Trustee
Chairman of the Board of Trustees
Ms. Johnson also serves as Trustee of other Fidelity® funds. Ms. Johnson serves as Chairman (2016-present), Chief Executive Officer (2014-present), and Director (2007-present) of FMR LLC (diversified financial services company), President of Fidelity Financial Services (2012-present) and President of Personal, Workplace and Institutional Services (2005-present). Ms. Johnson is Chairman and Director of Fidelity Management & Research Company LLC (investment adviser firm, 2011-present). Previously, Ms. Johnson served as Chairman and Director of FMR Co., Inc. (investment adviser firm, 2011-2019), Vice Chairman (2007-2016) and President (2013-2016) of FMR LLC, President and a Director of Fidelity Management & Research Company (2001-2005), a Trustee of other investment companies advised by Fidelity Management & Research Company, Fidelity Investments Money Management, Inc. (investment adviser firm), and FMR Co., Inc. (2001-2005), Senior Vice President of the Fidelity® funds (2001-2005), and managed a number of Fidelity® funds.
Jennifer Toolin McAuliffe (1959)
Year of Election or Appointment: 2016
Trustee
Ms. McAuliffe also serves as Trustee of other Fidelity® funds and as Trustee of Fidelity Charitable (2020-present). Previously, Ms. McAuliffe served as Co-Head of Fixed Income of Fidelity Investments Limited (now known as FIL Limited (FIL)) (diversified financial services company), Director of Research for FIL's credit and quantitative teams in London, Hong Kong and Tokyo and Director of Research for taxable and municipal bonds at Fidelity Investments Money Management, Inc. Ms. McAuliffe previously served as a member of the Advisory Board of certain Fidelity® funds (2016). Ms. McAuliffe was previously a lawyer at Ropes & Gray LLP and an international banker at Chemical Bank NA (now JPMorgan Chase & Co.). Ms. McAuliffe also currently serves as director or trustee of several not-for-profit entities.
Christine J. Thompson (1958)
Year of Election or Appointment: 2023
Trustee
Ms. Thompson also serves as a Trustee of other Fidelity® funds. Ms. Thompson serves as Leader of Advanced Technologies for Investment Management at Fidelity Investments (2018-present). Previously, Ms. Thompson served as Chief Investment Officer in the Bond group at Fidelity Management & Research Company (2010-2018) and held various other roles including Director of municipal bond portfolio managers and Portfolio Manager of certain Fidelity® funds.
* Determined to be an "Interested Trustee" by virtue of, among other things, his or her affiliation with the trust or various entities under common control with FMR.
+ The information includes the Trustee's principal occupation during the last five years and other information relating to the experience, attributes, and skills relevant to the Trustee's qualifications to serve as a Trustee, which led to the conclusion that the Trustee should serve as a Trustee for the fund.
Independent Trustees:
Correspondence intended for an Independent Trustee may be sent to Fidelity Investments, P.O. Box 55235, Boston, Massachusetts 02205-5235.
Name, Year of Birth; Principal Occupations and Other Relevant Experience+
Elizabeth S. Acton (1951)
Year of Election or Appointment: 2013
Trustee
Ms. Acton also serves as Trustee of other Fidelity® funds. Prior to her retirement, Ms. Acton served as Executive Vice President, Finance (2011-2012), Executive Vice President, Chief Financial Officer (2002-2011) and Treasurer (2004-2005) of Comerica Incorporated (financial services). Prior to joining Comerica, Ms. Acton held a variety of positions at Ford Motor Company (1983-2002), including Vice President and Treasurer (2000-2002) and Executive Vice President and Chief Financial Officer of Ford Motor Credit Company (1998-2000). Ms. Acton currently serves as a member of the Board and Audit and Finance Committees of Beazer Homes USA, Inc. (homebuilding, 2012-present). Ms. Acton previously served as a member of the Advisory Board of certain Fidelity® funds (2013-2016).
Laura M. Bishop (1961)
Year of Election or Appointment: 2023
Trustee
Ms. Bishop also serves as Trustee or Member of the Advisory Board of other Fidelity® funds. Prior to her retirement, Ms. Bishop held a variety of positions at United Services Automobile Association (2001-2020), including Executive Vice President and Chief Financial Officer (2014-2020) and Senior Vice President and Deputy Chief Financial Officer (2012-2014). Ms. Bishop currently serves as a member of the Audit Committee and Compensation and Personnel Committee (2021-present) of the Board of Directors of Korn Ferry (global organizational consulting). Previously, Ms. Bishop served as a Member of the Advisory Board of certain Fidelity® funds (2022-2023).
Ann E. Dunwoody (1953)
Year of Election or Appointment: 2018
Trustee
General Dunwoody also serves as Trustee of other Fidelity® funds. General Dunwoody (United States Army, Retired) was the first woman in U.S. military history to achieve the rank of four-star general and prior to her retirement in 2012 held a variety of positions within the U.S. Army, including Commanding General, U.S. Army Material Command (2008-2012). General Dunwoody currently serves as a member of the Board, Chair of Nomination Committee and a member of the Corporate Governance Committee of Kforce Inc. (professional staffing services, 2016-present) and a member of the Board of Automattic Inc. (software engineering, 2018-present). Previously, General Dunwoody served as President of First to Four LLC (leadership and mentoring services, 2012-2022), a member of the Advisory Board and Nominating and Corporate Governance Committee of L3 Technologies, Inc. (communication, electronic, sensor and aerospace systems, 2013-2019) and a member of the Board and Audit and Sustainability and Corporate Responsibility Committees of Republic Services, Inc. (waste collection, disposal and recycling, 2013-2016). General Dunwoody also serves on several boards for non-profit organizations, including as a member of the Board, Chair of the Nomination and Governance Committee and a member of the Audit Committee of the Noble Reach Foundation (formerly Logistics Management Institute) (consulting non-profit, 2012-present) and a member of the Board of ThanksUSA (military family education non-profit, 2014-present). Previously, General Dunwoody served as a member of the Board of Florida Institute of Technology (2015-2022) and a member of the Council of Trustees for the Association of the United States Army (advocacy non-profit, 2013-2021). General Dunwoody previously served as a member of the Advisory Board of certain Fidelity® funds (2018).
Robert F. Gartland (1951)
Year of Election or Appointment: 2010
Trustee
Mr. Gartland also serves as Trustee of other Fidelity® funds. Prior to his retirement, Mr. Gartland held a variety of positions at Morgan Stanley (financial services, 1979-2007), including Managing Director (1987-2007) and Chase Manhattan Bank (1975-1978). Mr. Gartland previously served as Chairman and an investor in Gartland & Mellina Group Corp. (consulting, 2009-2019), as a member of the Board of National Securities Clearing Corporation (1993-1996) and as Chairman of TradeWeb (2003-2004).
Robert W. Helm (1957)
Year of Election or Appointment: 2023
Trustee
Mr. Helm also serves as Trustee or Member of the Advisory Board of other Fidelity® funds. Mr. Helm was formerly Deputy Chairman (2003-2020), partner (1991-2020) and an associate (1984-1991) of Dechert LLP (formerly Dechert Price & Rhoads). Mr. Helm currently serves on boards and committees of several not-for-profit organizations, including as a Trustee and member of the Executive Committee of the Baltimore Council on Foreign Affairs, a member of the Board of Directors of the St. Vincent de Paul Society of Baltimore and a member of the Life Guard Society of Mt. Vernon. Previously, Mr. Helm served as a Member of the Advisory Board of certain Fidelity® funds (2021-2023).
Michael E. Kenneally (1954)
Year of Election or Appointment: 2009
Trustee
Chairman of the Independent Trustees
Mr. Kenneally also serves as Trustee of other Fidelity® funds and was Vice Chairman (2018-2021) of the Independent Trustees of certain Fidelity® funds. Prior to retirement in 2005, he was Chairman and Global Chief Executive Officer of Credit Suisse Asset Management, the worldwide fund management and institutional investment business of Credit Suisse Group. Previously, Mr. Kenneally was an Executive Vice President and the Chief Investment Officer for Bank of America. In this role, he was responsible for the investment management, strategy and products delivered to the bank's institutional, high-net-worth and retail clients. Earlier, Mr. Kenneally directed the organization's equity and quantitative research groups. He began his career as a research analyst and then spent more than a dozen years as a portfolio manager for endowments, pension plans and mutual funds. He earned the Chartered Financial Analyst (CFA) designation in 1991.
Mark A. Murray (1954)
Year of Election or Appointment: 2016
Trustee
Mr. Murray also serves as Trustee of other Fidelity® funds. Previously, Mr. Murray served as Co-Chief Executive Officer (2013-2016), President (2006-2013) and Vice Chairman (2013-2020) of Meijer, Inc. Mr. Murray serves as a member of the Board (2009-present) and Public Policy and Responsibility Committee (2009-present) and Chair of the Nuclear Review Committee (2019-present) of DTE Energy Company (diversified energy company). Mr. Murray previously served as a member of the Board of Spectrum Health (not-for-profit health system, 2015-2019) and as a member of the Board and Audit Committee and Chairman of the Nominating and Corporate Governance Committee of Universal Forest Products, Inc. (manufacturer and distributor of wood and wood-alternative products, 2004-2016). Mr. Murray also serves as a member of the Board of many community and professional organizations. Mr. Murray previously served as a member of the Advisory Board of certain Fidelity® funds (2016).
Carol J. Zierhoffer (1960)
Year of Election or Appointment: 2023
Trustee
Ms. Zierhoffer also serves as Trustee or Member of the Advisory Board of other Fidelity® funds. Prior to her retirement, Ms. Zierhoffer held a variety of positions at Bechtel Corporation (engineering company, 2013-2019), including Principal Vice President and Chief Information Officer (2013-2016) and Senior Vice President and Chief Information Officer (2016-2019). Ms. Zierhoffer currently serves as a member of the Board of Directors, Audit Committee and Compensation Committee of Allscripts Healthcare Solutions, Inc. (healthcare technology, 2020-present) and as a member of the Board of Directors, Audit and Finance Committee and Nominating and Governance Committee of Atlas Air Worldwide Holdings, Inc. (aviation operating services, 2021-present). Previously, Ms. Zierhoffer served as a member of the Board of Directors and Audit Committee and as the founding Chair of the Information Technology Committee of MedAssets, Inc. (healthcare technology, 2013-2016), and as a Member of the Advisory Board of certain Fidelity® funds (2023).
+ The information includes the Trustee's principal occupation during the last five years and other information relating to the experience, attributes, and skills relevant to the Trustee's qualifications to serve as a Trustee, which led to the conclusion that the Trustee should serve as a Trustee for the fund.
Advisory Board Members and Officers:
Correspondence intended for a Member of the Advisory Board (if any) may be sent to Fidelity Investments, P.O. Box 55235, Boston, Massachusetts 02205-5235. Correspondence intended for an officer may be sent to Fidelity Investments, 245 Summer Street, Boston, Massachusetts 02210.
Name, Year of Birth; Principal Occupations+
Lester Owens (1957)
Year of Election or Appointment: 2024
Member of the Advisory Board
Mr. Owens also serves as a Member of the Advisory Board of other Fidelity® funds. Prior to his retirement, Mr. Owens served as Senior Executive Vice President, Head of Operations, and member of the Operating Committee of Wells Fargo & Company (financial services, 2020-2023). Mr. Owens currently serves as Chairman of the Board of Directors of Robert Wood Johnson Barnabas Health, Inc. (academic healthcare system, 2022-present). Previously, Mr. Owens served as Senior Executive Vice President and Head of Operations at Bank of New York Mellon (financial services, 2019-2020) and held various roles at JPMorgan Chase & Co. (financial services, 2007-2019), including Managing Director for Wholesale Banking Operations. Mr. Owens also previously served as a member of the Board of Directors of the Depository Trust & Clearing Corporation (financial services, 2016) and as Chairman of the Board of Directors of the Clearing House Interbank Payments System (private clearing system, 2015-2016).
Heather Bonner (1977)
Year of Election or Appointment: 2023
Assistant Treasurer
Ms. Bonner also serves as an officer of other funds. Ms. Bonner is a Senior Vice President (2022-present) and is an employee of Fidelity Investments (2022-present). Ms. Bonner serves as Senior Vice President, Vice President, Treasurer, or Director of certain Fidelity entities. Prior to joining Fidelity, Ms. Bonner served as Managing Director at AQR Capital Management (2013-2022) and was the Treasurer and Principal Financial Officer of the AQR Funds (2013-2022).
Craig S. Brown (1977)
Year of Election or Appointment: 2019
Assistant Treasurer
Mr. Brown also serves as an officer of other funds. Mr. Brown is a Vice President (2015-present) and is an employee of Fidelity Investments. Mr. Brown serves as Assistant Treasurer of FIMM, LLC (2021-present). Previously, Mr. Brown served as Assistant Treasurer of certain Fidelity® funds (2019-2022).
John J. Burke III (1964)
Year of Election or Appointment: 2018
Chief Financial Officer
Mr. Burke also serves as Chief Financial Officer of other funds. Mr. Burke is Head of Fidelity Fund and Investment Operations (2018-present) and is an employee of Fidelity Investments. Mr. Burke serves as President, Executive Vice President, or Director of certain Fidelity entities. Previously Mr. Burke served as head of Asset Management Investment Operations (2012-2018).
Margaret Carey (1973)
Year of Election or Appointment: 2023
Secretary and Chief Legal Officer (CLO)
Ms. Carey also serves as an officer of other funds and as CLO of certain Fidelity entities. Ms. Carey is a Senior Vice President, Deputy General Counsel (2019-present) and is an employee of Fidelity Investments.
David J. Carter (1973)
Year of Election or Appointment: 2020
Assistant Secretary
Mr. Carter also serves as Assistant Secretary of other funds. Mr. Carter is a Senior Vice President, Deputy General Counsel (2022-present) and is an employee of Fidelity Investments. Mr. Carter serves as Chief Legal Officer of Fidelity Investments Institutional Operations Company LLC - Shareholder Division (transfer agent, 2020-present).
Jonathan Davis (1968)
Year of Election or Appointment: 2010
Assistant Treasurer
Mr. Davis also serves as an officer of other funds. Mr. Davis is a Vice President (2006-present) and is an employee of Fidelity Investments. Mr. Davis serves as Assistant Treasurer or Director of certain Fidelity entities.
Laura M. Del Prato (1964)
Year of Election or Appointment: 2018
President and Treasurer
Ms. Del Prato also serves as an officer of other funds. Ms. Del Prato is a Senior Vice President (2017-present) and is an employee of Fidelity Investments. Ms. Del Prato serves as Vice President, Assistant Treasurer, or Director of certain Fidelity entities. Previously, Ms. Del Prato served as President and Treasurer of The North Carolina Capital Management Trust: Cash Portfolio and Term Portfolio (2018-2020).
Robin Foley (1964)
Year of Election or Appointment: 2023
Vice President
Ms. Foley also serves as Vice President of other funds. Ms. Foley serves as Head of Fidelity's Fixed Income division (2023-present) and is an employee of Fidelity Investments. Previously, Ms. Foley served as Chief Investment Officer of Bonds (2017-2023).
Christopher M. Gouveia (1973)
Year of Election or Appointment: 2023
Chief Compliance Officer
Mr. Gouveia also serves as Chief Compliance Officer of other funds. Mr. Gouveia is a Senior Vice President of Asset Management Compliance (2019-present) and is an employee of Fidelity Investments. Mr. Gouveia serves as Compliance Officer of Fidelity Management Trust Company (2023-present). Previously, Mr. Gouveia served as Chief Compliance Officer of the North Carolina Capital Management Trust (2016-2019).
Colm A. Hogan (1973)
Year of Election or Appointment: 2016
Assistant Treasurer
Mr. Hogan also serves as an officer of other funds. Mr. Hogan is a Vice President (2016-present) and is an employee of Fidelity Investments. Mr. Hogan serves as Assistant Treasurer of certain Fidelity entities. Previously, Mr. Hogan served as Deputy Treasurer of certain Fidelity® funds (2016-2020) and Assistant Treasurer of certain Fidelity® funds (2016-2018).
Chris Maher (1972)
Year of Election or Appointment: 2013
Assistant Treasurer
Mr. Maher also serves as an officer of other funds. Mr. Maher is a Vice President (2008-present) and is an employee of Fidelity Investments. Mr. Maher serves as Assistant Treasurer of certain Fidelity entities. Previously, Mr. Maher served as Assistant Treasurer of certain funds (2013-2020).
Brett Segaloff (1972)
Year of Election or Appointment: 2021
Anti-Money Laundering (AML) Officer
Mr. Segaloff also serves as AML Officer of other funds. Mr. Segaloff is a Vice President (2022-present) and is an employee of Fidelity Investments. Mr. Segaloff serves as Anti Money Laundering Compliance Officer or Anti Money Laundering/Bank Secrecy Act Compliance Officer of certain Fidelity entities.
Stacie M. Smith (1974)
Year of Election or Appointment: 2013
Assistant Treasurer
Ms. Smith also serves as an officer of other funds. Ms. Smith is a Senior Vice President (2016-present) and is an employee of Fidelity Investments. Ms. Smith serves as Assistant Treasurer of certain Fidelity entities and has served in other fund officer roles.
Jim Wegmann (1979)
Year of Election or Appointment: 2021
Deputy Treasurer
Mr. Wegmann also serves as an officer of other funds. Mr. Wegmann is a Vice President (2016-present) and is an employee of Fidelity Investments. Mr. Wegmann serves as Assistant Treasurer of FIMM, LLC (2021-present). Previously, Mr. Wegmann served as Assistant Treasurer of certain Fidelity® funds (2019-2021).
+ The information includes principal occupation during the last five years.
As a shareholder, you incur two types of costs: (1) transaction costs, which may include sales charges (loads) on purchase payments or redemption proceeds, as applicable and (2) ongoing costs, which generally include management fees, distribution and/or service (12b-1) fees and other Fund expenses. This Example is intended to help you understand your ongoing costs (in dollars) of investing in a fund and to compare these costs with the ongoing costs of investing in other mutual funds.
| The Example is based on an investment of $1,000 invested at the beginning of the period and held for the entire period (October 1, 2023 to March 31, 2024). |
Actual Expenses
The first line of the accompanying table provides information about actual account values and actual expenses. You may use the information in this line, together with the amount you invested, to estimate the expenses that you paid over the period. Simply divide your account value by $1,000.00 (for example, an $8,600 account value divided by $1,000.00 = 8.6), then multiply the result by the number in the first line for a class/Fund under the heading entitled "Expenses Paid During Period" to estimate the expenses you paid on your account during this period. If any fund is a shareholder of any underlying mutual funds or exchange-traded funds (ETFs) (the Underlying Funds), such fund indirectly bears its proportional share of the expenses of the Underlying Funds in addition to the direct expenses incurred presented in the table. These fees and expenses are not included in the annualized expense ratio used to calculate the expense estimate in the table below.
Hypothetical Example for Comparison Purposes
The second line of the accompanying table provides information about hypothetical account values and hypothetical expenses based on the actual expense ratio and an assumed rate of return of 5% per year before expenses, which is not the actual return. The hypothetical account values and expenses may not be used to estimate the actual ending account balance or expenses you paid for the period. You may use this information to compare the ongoing costs of investing in the Fund and other funds. To do so, compare this 5% hypothetical example with the 5% hypothetical examples that appear in the shareholder reports of the other funds. If any fund is a shareholder of any Underlying Funds, such fund indirectly bears its proportional share of the expenses of the Underlying Funds in addition to the direct expenses as presented in the table. These fees and expenses are not included in the annualized expense ratio used to calculate the expense estimate in the table below.
Please note that the expenses shown in the table are meant to highlight your ongoing costs only and do not reflect any transaction costs. Therefore, the second line of the table is useful in comparing ongoing costs only, and will not help you determine the relative total costs of owning different funds. In addition, if these transactional costs were included, your costs would have been higher.
| | | | | Annualized Expense Ratio- A | | Beginning Account Value October 1, 2023 | | Ending Account Value March 31, 2024 | | Expenses Paid During Period- C October 1, 2023 to March 31, 2024 |
| | | | | | | | | | |
Fidelity® SAI Municipal Money Market Fund ** | | | | .14% | | | | | | |
| Actual | | | | | | $ 1,000 | | $ 1,017.50 | | $ .71 |
Hypothetical-B | | | | | | $ 1,000 | | $ 1,024.30 | | $ .71 |
| |
A Annualized expense ratio reflects expenses net of applicable fee waivers.
B 5% return per year before expenses
C Expenses are equal to the annualized expense ratio, multiplied by the average account value over the period, multiplied by 183/ 366 (to reflect the one-half year period). The fees and expenses of any Underlying Funds are not included in each annualized expense ratio.
** If fees and changes to the expense contract and/or expense cap, effective April 1, 2024, had been in effect during the current period, the restated annualized expense ratio and the expenses paid in the actual and hypothetical examples above would have been as shown in table below:
| | | | | Annualized Expense Ratio- A | | Expenses Paid |
| | | | | | |
| Fidelity® SAI Municipal Money Market Fund | | | | .07% | | |
| Actual | | | | | | $ 0.35 |
Hypothetical- B | | | | | | $ 0.35 |
| | | | | | | |
| A Annualized expense ratio reflects expenses net of applicable fee waivers. | | | | | | |
| B 5% return per year before expenses | | | | | | |
The dividend and capital gains distributions for the fund(s) are available on Fidelity.com or Institutional.Fidelity.com.
During fiscal year ended 2024, 100% of the fund's income dividends was free from federal income tax, and 62.87% of the fund's income dividends was subject to the federal alternative minimum tax.
The fund will notify shareholders in January 2025 of amounts for use in preparing 2024 income tax returns.
Board Approval of Investment Advisory Contracts
Fidelity SAI Municipal Money Market Fund
At its January 2024 meeting, the Board of Trustees, including the Independent Trustees (together, the Board), approved amended and restated sub-advisory agreements (the Sub-Advisory Contracts) for the fund, including the fund's sub-advisory agreements with FMR Investment Management (UK) Limited (FMR UK), Fidelity Management & Research (Hong Kong) Limited (FMR H.K.), and Fidelity Management & Research (Japan) Limited (FMR Japan). The Sub-Advisory Contracts will be effective March 1, 2024. The Board will consider the annual renewal of the fund's Sub-Advisory Contracts in September 2024, following its review of additional materials provided by FMR.
The Board considered the Sub-Advisory Contracts, which changed the arrangements for fees paid by FMR to the sub-advisers under the agreements. The Board noted that the agreements with FMR UK, FMR H.K., and FMR Japan were amended to provide that FMR will compensate each sub-adviser at a fee equal to 110% of the sub-adviser's costs incurred in providing services under the agreement. The Board considered that, under the Sub-Advisory Contracts, FMR, and not the fund, will continue to pay the sub-advisory fees to each applicable sub-adviser, and that the management fee paid by the fund under the management contract with FMR will remain unchanged.
The Board considered that the approval of the fund's Sub-Advisory Contracts will not result in any changes in the investment process or strategies employed in the management of the fund's assets or the day-to-day management of the fund or the persons primarily responsible for such management. Further, the Board considered that the Sub-Advisory Contracts would not change the obligations and services of FMR and its affiliates on behalf of the fund, and, in particular, there would be no change in the nature and level of services provided to the fund by FMR and its affiliates.
In connection with its consideration of future renewals of the fund's advisory contracts, the Board will consider: (i) the nature, extent and quality of services provided to the funds, including shareholder and administrative services and investment performance; (ii) the competitiveness of the management fee and total expenses for the fund; (iii) the costs of the services and profitability, including the revenues earned and the expenses incurred in conducting the business of developing, marketing, distributing, managing, administering, and servicing the fund and its shareholders, to the extent applicable; and (iv) whether there have been economies of scale in respect of the Fidelity funds, whether the Fidelity funds (including the fund) have appropriately benefited from any such economies of scale, and whether there is the potential for realization of any further economies.
Based on its evaluation of all of the conclusions noted above, and after considering all factors it believed relevant, the Board concluded that the fund's management fee structure is fair and reasonable, and that the fund's Sub-Advisory Contracts should be approved.
| A special meeting of shareholders was held on October 18, 2023. The results of votes taken among shareholders on the proposal before them are reported below. Each vote reported represents one dollar of net asset value held on the record date for the meeting. |
| Proposal 1 |
| To elect a Board of Trustees. |
| | # of Votes | % of Votes |
| Abigail P. Johnson |
| Affirmative | 378,729,502,260.01 | 97.58 |
| Withheld | 9,407,876,478.96 | 2.42 |
| TOTAL | 388,137,378,738.97 | 100.00 |
| Jennifer Toolin McAuliffe |
| Affirmative | 378,454,868,010.95 | 97.51 |
| Withheld | 9,682,510,728.02 | 2.49 |
| TOTAL | 388,137,378,738.97 | 100.00 |
| Christine J. Thompson |
| Affirmative | 378,837,121,274.52 | 97.60 |
| Withheld | 9,300,257,464.45 | 2.40 |
| TOTAL | 388,137,378,738.97 | 100.00 |
| Elizabeth S. Acton |
| Affirmative | 378,262,110,794.85 | 97.46 |
| Withheld | 9,875,267,944.12 | 2.54 |
| TOTAL | 388,137,378,738.97 | 100.00 |
| Laura M. Bishop |
| Affirmative | 380,482,113,171.06 | 98.03 |
| Withheld | 7,655,265,567.91 | 1.97 |
| TOTAL | 388,137,378,738.97 | 100.00 |
| Ann E. Dunwoody |
| Affirmative | 380,016,034,008.12 | 97.91 |
| Withheld | 8,121,344,730.85 | 2.09 |
| TOTAL | 388,137,378,738.97 | 100.00 |
| John Engler |
| Affirmative | 379,432,488,394.20 | 97.76 |
| Withheld | 8,704,890,344.77 | 2.24 |
| TOTAL | 388,137,378,738.97 | 100.00 |
| Robert F. Gartland |
| Affirmative | 378,741,819,600.60 | 97.58 |
| Withheld | 9,395,559,138.37 | 2.42 |
| TOTAL | 388,137,378,738.97 | 100.00 |
| Robert W. Helm |
| Affirmative | 380,389,324,755.07 | 98.00 |
| Withheld | 7,748,053,983.90 | 2.00 |
| TOTAL | 388,137,378,738.97 | 100.00 |
| Arthur E. Johnson |
| Affirmative | 378,427,694,151.67 | 97.50 |
| Withheld | 9,709,684,587.30 | 2.50 |
| TOTAL | 388,137,378,738.97 | 100.00 |
| Michael E. Kenneally |
| Affirmative | 377,842,228,145.18 | 97.35 |
| Withheld | 10,295,150,593.79 | 2.65 |
| TOTAL | 388,137,378,738.97 | 100.00 |
| Mark A. Murray |
| Affirmative | 380,158,432,703.37 | 97.94 |
| Withheld | 7,978,946,035.60 | 2.06 |
| TOTAL | 388,137,378,738.97 | 100.00 |
| Carol J. Zierhoffer |
| Affirmative | 380,522,113,360.24 | 98.04 |
| Withheld | 7,615,265,378.73 | 1.96 |
| TOTAL | 388,137,378,738.97 | 100.00 |
| | | |
| Proposal 1 reflects trust-wide proposal and voting results. |
1.9885508.106
OMM-ANN-0524
Item 2.
Code of Ethics
As of the end of the period, March 31, 2024, Fidelity Salem Street Trust (the trust) has adopted a code of ethics, as defined in Item 2 of Form N-CSR, that applies to its President and Treasurer and its Chief Financial Officer. A copy of the code of ethics is filed as an exhibit to this Form N-CSR.
Item 3.
Audit Committee Financial Expert
The Board of Trustees of the trust has determined that Elizabeth S. Acton is an audit committee financial expert, as defined in Item 3 of Form N-CSR. Ms. Acton is independent for purposes of Item 3 of Form N-CSR.
Item 4.
Principal Accountant Fees and Services
Fees and Services
The following table presents fees billed by PricewaterhouseCoopers LLP (“PwC”) in each of the last two fiscal years for services rendered to Fidelity SAI Municipal Money Market Fund (the “Fund”):
Services Billed by PwC
March 31, 2024 FeesA
| | | | |
| Audit Fees | Audit-Related Fees | Tax Fees | All Other Fees |
Fidelity SAI Municipal Money Market Fund | $34,500 | $2,700 | $2,100 | $1,100 |
| | | | |
| Audit Fees | Audit-Related Fees | Tax Fees | All Other Fees |
Fidelity SAI Municipal Money Market Fund | $34,700 | $2,600 | $2,100 | $1,100 |
A Amounts may reflect rounding.
The following table(s) present(s) fees billed by PwC that were required to be approved by the Audit Committee for services that relate directly to the operations and financial reporting of the Fund(s) and that are rendered on behalf of Fidelity Management & Research Company LLC ("FMR") and entities controlling, controlled by, or under
common control with FMR (not including any sub-adviser whose role is primarily portfolio management and is subcontracted with or overseen by another investment adviser) that provide ongoing services to the Fund(s) (“Fund Service Providers”):
Services Billed by PwC
| | |
| March 31, 2024A | March 31, 2023A |
Audit-Related Fees | $9,452,800 | $8,519,200 |
Tax Fees | $61,000 | $1,000 |
All Other Fees | $- | $- |
A Amounts may reflect rounding.
“Audit-Related Fees” represent fees billed for assurance and related services that are reasonably related to the performance of the fund audit or the review of the fund's financial statements and that are not reported under Audit Fees.
“Tax Fees” represent fees billed for tax compliance, tax advice or tax planning that relate directly to the operations and financial reporting of the fund.
“All Other Fees” represent fees billed for services provided to the fund or Fund Service Provider, a significant portion of which are assurance related, that relate directly to the operations and financial reporting of the fund, excluding those services that are reported under Audit Fees, Audit-Related Fees or Tax Fees.
Assurance services must be performed by an independent public accountant.
* * *
The aggregate non-audit fees billed by PwC for services rendered to the Fund(s), FMR (not including any sub-adviser whose role is primarily portfolio management and is subcontracted with or overseen by another investment adviser), and any Fund Service Provider for each of the last two fiscal years of the Fund(s) are as follows:
| | |
Billed By | March 31, 2024A | March 31, 2023A |
PwC | $15,004,400 | $14,279,800 |
A Amounts may reflect rounding.
The trust's Audit Committee has considered non-audit services that were not pre-approved that were provided by PwC to Fund Service Providers to be compatible with maintaining the independence of PwC in its(their) audit of the Fund(s), taking into account representations from PwC, in accordance with Public Company Accounting Oversight Board rules, regarding its independence from the Fund(s) and its(their) related
entities and FMR’s review of the appropriateness and permissibility under applicable law of such non-audit services prior to their provision to the Fund(s) Service Providers.
Audit Committee Pre-Approval Policies and Procedures
The trust’s Audit Committee must pre-approve all audit and non-audit services provided by a fund’s independent registered public accounting firm relating to the operations or financial reporting of the fund. Prior to the commencement of any audit or non-audit services to a fund, the Audit Committee reviews the services to determine whether they are appropriate and permissible under applicable law.
The Audit Committee has adopted policies and procedures to, among other purposes, provide a framework for the Committee’s consideration of non-audit services by the audit firms that audit the Fidelity funds. The policies and procedures require that any non-audit service provided by a fund audit firm to a Fidelity fund and any non-audit service provided by a fund auditor to a Fund Service Provider that relates directly to the operations and financial reporting of a Fidelity fund (“Covered Service”) are subject to approval by the Audit Committee before such service is provided.
All Covered Services must be approved in advance of provision of the service either: (i) by formal resolution of the Audit Committee, or (ii) by oral or written approval of the service by the Chair of the Audit Committee (or if the Chair is unavailable, such other member of the Audit Committee as may be designated by the Chair to act in the Chair’s absence). The approval contemplated by (ii) above is permitted where the Treasurer determines that action on such an engagement is necessary before the next meeting of the Audit Committee.
Non-audit services provided by a fund audit firm to a Fund Service Provider that do not relate directly to the operations and financial reporting of a Fidelity fund are reported to the Audit Committee periodically.
Non-Audit Services Approved Pursuant to Rule 2-01(c)(7)(i)(C) and (ii) of Regulation S-X (“De Minimis Exception”)
There were no non-audit services approved or required to be approved by the Audit Committee pursuant to the De Minimis Exception during the Fund’s(s’) last two fiscal years relating to services provided to (i) the Fund(s) or (ii) any Fund Service Provider that relate directly to the operations and financial reporting of the Fund(s).
The Registrant has not retained, for the preparation of the audit report on the financial statements included in the Form N-CSR, a registered public accounting firm that has a branch or office that is located in a foreign jurisdiction and that the Public Company Accounting Oversight Board (the “PCAOB”) has determined that the PCAOB is unable to inspect or investigate completely because of a position taken by an authority in the foreign jurisdiction.
The Registrant is not a “foreign issuer,” as defined in 17 CFR 240.3b-4.
Item 5.
Audit Committee of Listed Registrants
Not applicable.
Item 6.
Investments
(a)
Not applicable.
(b)
Not applicable.
Item 7.
Disclosure of Proxy Voting Policies and Procedures for Closed-End Management Investment Companies
Not applicable.
Item 8.
Portfolio Managers of Closed-End Management Investment Companies
Not applicable.
Item 9.
Purchase of Equity Securities by Closed-End Management Investment Company and Affiliated Purchasers
Not applicable.
Item 10.
Submission of Matters to a Vote of Security Holders
There were no material changes to the procedures by which shareholders may recommend nominees to the trust’s Board of Trustees.
Item 11.
Controls and Procedures
(a)(i) The President and Treasurer and the Chief Financial Officer have concluded that the trust’s disclosure controls and procedures (as defined in Rule 30a-3(c) under the Investment Company Act) provide reasonable assurances that material information relating to the trust is made known to them by the appropriate persons, based on their evaluation of these controls and procedures as of a date within 90 days of the filing date of this report.
(a)(ii) There was no change in the trust’s internal control over financial reporting (as defined in Rule 30a-3(d) under the Investment Company Act) that occurred during the period covered by this report that has materially affected, or is reasonably likely to materially affect, the trust’s internal control over financial reporting.
Item 12.
Disclosure of Securities Lending Activities for Closed-End Management
Investment Companies
Not applicable.
Item 18.
Recovery of Erroneously Awarded Compensation
(a)
Not applicable.
(b)
Not applicable.
Item 19.
Exhibits
SIGNATURES
Pursuant to the requirements of the Securities Exchange Act of 1934 and the Investment Company Act of 1940, the registrant has duly caused this report to be signed on its behalf by the undersigned, thereunto duly authorized.
Fidelity Salem Street Trust
| |
By: | /s/Laura M. Del Prato |
| Laura M. Del Prato |
| President and Treasurer (Principal Executive Officer) |
|
|
Date: | May 22, 2024 |
Pursuant to the requirements of the Securities Exchange Act of 1934 and the Investment Company Act of 1940, this report has been signed below by the following persons on behalf of the registrant and in the capacities and on the dates indicated.
| |
By: | /s/Laura M. Del Prato |
| Laura M. Del Prato |
| President and Treasurer (Principal Executive Officer) |
|
|
Date: | May 22, 2024 |
| |
By: | /s/John J. Burke III |
| John J. Burke III |
| Chief Financial Officer (Principal Financial Officer) |
|
|
Date: | May 22, 2024 |