UNITED STATES
SECURITIES AND EXCHANGE COMMISSION
Washington, D.C. 20549
FORM N-CSR
CERTIFIED SHAREHOLDER REPORT OF REGISTERED
MANAGEMENT INVESTMENT COMPANIES
Investment Company Act file number 811-02105
Fidelity Salem Street Trust
(Exact name of registrant as specified in charter)
245 Summer St., Boston, Massachusetts 02210
(Address of principal executive offices) (Zip code)
Margaret Carey, Secretary
245 Summer St.
Boston, Massachusetts 02210
(Name and address of agent for service)
Registrant's telephone number, including area code:
617-563-7000
| |
Date of fiscal year end: | June 30 |
|
|
Date of reporting period: | June 30, 2024 |
Item 1.
Reports to Stockholders
| |
| | ANNUAL SHAREHOLDER REPORT | AS OF JUNE 30, 2024 | |
| | Fidelity® Small Cap Value Index Fund Fidelity® Small Cap Value Index Fund : FISVX |
| | | |
This annual shareholder report contains information about Fidelity® Small Cap Value Index Fund for the period July 1, 2023 to June 30, 2024. You can find additional information about the Fund at fundresearch.fidelity.com/
prospectus/sec. You can also request this information by contacting us at 1-800-544-8544 or by sending an e-mail to fidfunddocuments@fidelity.com.
What were your Fund costs for the last year?(based on hypothetical $10,000 investment)
FUND COST (PREVIOUS YEAR)
| | Costs of a $10,000 investment | Costs paid as a percentage of a $10,000 investment | |
| Fidelity® Small Cap Value Index Fund | $ 6 | 0.05% | |
What affected the Fund's performance this period?
•U.S. equities gained considerably for the 12 months ending June 30, 2024, driven by resilient corporate profits, a frenzy over generative artificial intelligence and the Federal Reserve's likely pivot to cutting interest rates later this year. Amid this favorable backdrop for higher-risk assets, stocks continued their late-2023 momentum, powered by signs of continued U.S. economic strength.
•Against this backdrop, financials gained 21% and contributed most. Energy stocks also helped (+22%). Industrials rose 13%, consumer discretionary gained 12%, and materials advanced 15%.
•Conversely, health care returned approximately -3% and detracted most. This group was hampered by the health care equipment & services industry (-23%). Utilities (-7%) and communication services (-9%) also hurt.
•Turning to individual stocks, the biggest contributor was Carvana (+395%), from the consumer discretionary distribution & retail category. Also in consumer discretionary distribution & retail, Abercrombie & Fitch (+372%) helped. Jackson Financial, within the financial services industry, also contributed, gaining 155%.
•In contrast, the biggest individual detractor was Spirit Airlines (-77%), from the transportation category. Intellia Therapeutics (-45%) and Pacific Biosciences (-90%), within the pharmaceuticals, biotechnology & life sciences group, also hindered the fund's performance.
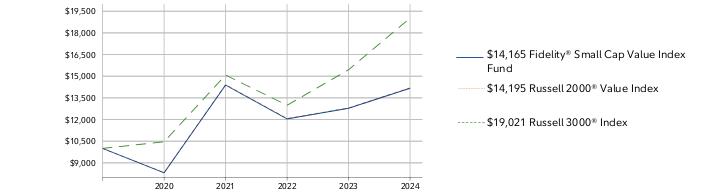
How did the Fund perform over the life of Fund?
CUMULATIVE PERFORMANCE
July 11, 2019 through June 30, 2024.
Initial investment of $10,000.
Fidelity® Small Cap Value Index Fund | $10,000 | $8,311 | $14,387 | $12,042 | $12,781 | $14,165 |
Russell 2000® Value Index | $10,000 | $8,323 | $14,423 | $12,075 | $12,800 | $14,195 |
Russell 3000® Index | $10,000 | $10,459 | $15,078 | $12,987 | $15,449 | $19,021 |
| | 2019 | 2020 | 2021 | 2022 | 2023 | 2024 |
AVERAGE ANNUAL TOTAL RETURNS: | | 1 Year | Life of Fund A |
| Fidelity® Small Cap Value Index Fund | 10.83% | 7.25% |
| Russell 2000® Value Index | 10.90% | 7.29% |
| Russell 3000® Index | 23.13% | 13.80% |
A From July 11, 2019
Visit www.fidelity.com for more recent performance information. |
The Fund's past performance is not a good predictor of the Fund's future performance. The graph and table do not reflect the deduction of taxes that a shareholder would pay on fund distributions or redemption of fund shares. |
Key Fund Statistics (as of June 30, 2024)
KEY FACTS | | |
| Fund Size | $1,152,113,306 | |
| Number of Holdings | 1,453 | |
| Total Advisory Fee | $487,130 | |
| Portfolio Turnover | 37% | |
What did the Fund invest in?
(as of June 30, 2024)
MARKET SECTORS (% of Fund's net assets) | | |
| Financials | 26.9 | |
| Industrials | 12.3 | |
| Real Estate | 10.7 | |
| Consumer Discretionary | 10.0 | |
| Energy | 9.2 | |
| Health Care | 9.1 | |
| Information Technology | 6.1 | |
| Materials | 5.2 | |
| Utilities | 5.0 | |
| Communication Services | 2.8 | |
| Consumer Staples | 2.2 | |
| |
| Common Stocks | 99.5 |
| Short-Term Investments and Net Other Assets (Liabilities) | 0.5 |
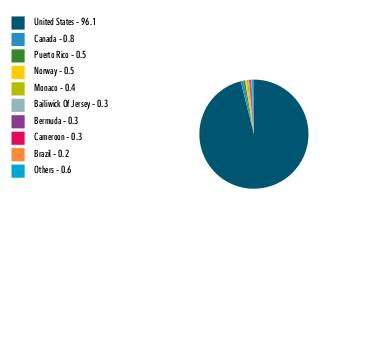
ASSET ALLOCATION (% of Fund's net assets) |
|
|
| United States | 96.1 |
| Canada | 0.8 |
| Puerto Rico | 0.5 |
| Norway | 0.5 |
| Monaco | 0.4 |
| Bailiwick Of Jersey | 0.3 |
| Bermuda | 0.3 |
| Cameroon | 0.3 |
| Brazil | 0.2 |
| Others | 0.6 |
GEOGRAPHIC DIVERSIFICATION (% of Fund's net assets) |
|
| |
|
TOP HOLDINGS (% of Fund's net assets) | | |
| Commercial Metals Co | 0.6 | |
| Murphy Oil Corp | 0.6 | |
| Essent Group Ltd | 0.6 | |
| SouthState Corp | 0.6 | |
| Meritage Homes Corp | 0.6 | |
| Taylor Morrison Home Corp | 0.5 | |
| Terreno Realty Corp | 0.5 | |
| Jackson Financial Inc | 0.5 | |
| Cytokinetics Inc | 0.5 | |
| Old National Bancorp/IN | 0.5 | |
| | 5.5 | |
| |
| Fidelity, the Fidelity Investments Logo and all other Fidelity trademarks or service marks used herein are trademarks or service marks of FMR LLC. Any third-party marks that are used herein are trademarks or service marks of their respective owners. © 2024 FMR LLC. All rights reserved. |
| | For additional information about the Fund; including its prospectus, financial information, holdings and proxy information, scan the QR code or visit fundresearch.fidelity.com/prospectus/sec 1.9913368.100 3406-TSRA-0824 |
| |
| | ANNUAL SHAREHOLDER REPORT | AS OF JUNE 30, 2024 | |
| | Fidelity® Small Cap Growth Index Fund Fidelity® Small Cap Growth Index Fund : FECGX |
| | | |
This annual shareholder report contains information about Fidelity® Small Cap Growth Index Fund for the period July 1, 2023 to June 30, 2024. You can find additional information about the Fund at fundresearch.fidelity.com/
prospectus/sec. You can also request this information by contacting us at 1-800-544-8544 or by sending an e-mail to fidfunddocuments@fidelity.com.
What were your Fund costs for the last year?(based on hypothetical $10,000 investment)
FUND COST (PREVIOUS YEAR)
| | Costs of a $10,000 investment | Costs paid as a percentage of a $10,000 investment | |
| Fidelity® Small Cap Growth Index Fund | $ 6 | 0.05% | |
What affected the Fund's performance this period?
•U.S. equities gained considerably for the 12 months ending June 30, 2024, driven by resilient corporate profits, a frenzy over generative artificial intelligence and the Federal Reserve's likely pivot to cutting interest rates later this year. Amid this favorable backdrop for higher-risk assets, stocks continued their late-2023 momentum, powered by signs of continued U.S. economic strength.
•Against this backdrop, information technology gained roughly 17% and contributed. Industrials stocks also helped (+11%), benefiting from capital goods (+15%). Consumer staples rose 25%, energy gained about 19%, and consumer discretionary advanced 7%.
•In contrast, utilities returned roughly -12% and detracted most. Materials (-4%) also hurt.
•Turning to individual stocks, the biggest contributor was Super Micro Computer (+227%), from the technology hardware & equipment group. Microstrategy, within the software & services group, gained about 303% and boosted the fund. In capital goods, Ftai Aviation gained 234% and contributed. Insmed, within the pharmaceuticals, biotechnology & life sciences category, gained 218% and contributed.
•Conversely, the biggest individual detractor was Arcadium Lithium (-51%), from the materials group. In capital goods, Shoals Technologies returned about -76% and detracted. Fox Factory Holding (-56%), from the automobiles & components group, also hurt.
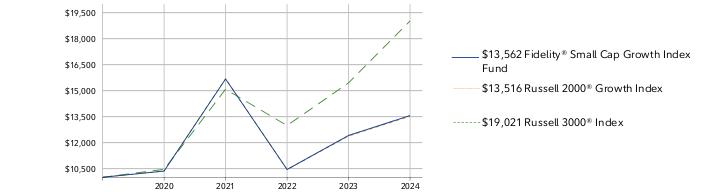
How did the Fund perform over the life of Fund?
CUMULATIVE PERFORMANCE
July 11, 2019 through June 30, 2024.
Initial investment of $10,000.
Fidelity® Small Cap Growth Index Fund | $10,000 | $10,359 | $15,675 | $10,451 | $12,413 | $13,562 |
Russell 2000® Growth Index | $10,000 | $10,369 | $15,695 | $10,448 | $12,384 | $13,516 |
Russell 3000® Index | $10,000 | $10,459 | $15,078 | $12,987 | $15,449 | $19,021 |
| | 2019 | 2020 | 2021 | 2022 | 2023 | 2024 |
AVERAGE ANNUAL TOTAL RETURNS: | | 1 Year | Life of Fund A |
| Fidelity® Small Cap Growth Index Fund | 9.26% | 6.32% |
| Russell 2000® Growth Index | 9.14% | 6.24% |
| Russell 3000® Index | 23.13% | 13.80% |
A From July 11, 2019
Visit www.fidelity.com for more recent performance information. |
The Fund's past performance is not a good predictor of the Fund's future performance. The graph and table do not reflect the deduction of taxes that a shareholder would pay on fund distributions or redemption of fund shares. |
Key Fund Statistics (as of June 30, 2024)
KEY FACTS | | |
| Fund Size | $654,727,211 | |
| Number of Holdings | 1,131 | |
| Total Advisory Fee | $279,883 | |
| Portfolio Turnover | 48% | |
What did the Fund invest in?
(as of June 30, 2024)
MARKET SECTORS (% of Fund's net assets) | | |
| Health Care | 25.3 | |
| Industrials | 22.0 | |
| Information Technology | 20.6 | |
| Consumer Discretionary | 10.0 | |
| Financials | 7.9 | |
| Energy | 4.2 | |
| Materials | 3.9 | |
| Consumer Staples | 3.2 | |
| Communication Services | 2.1 | |
| Real Estate | 1.4 | |
| Utilities | 0.5 | |
| |
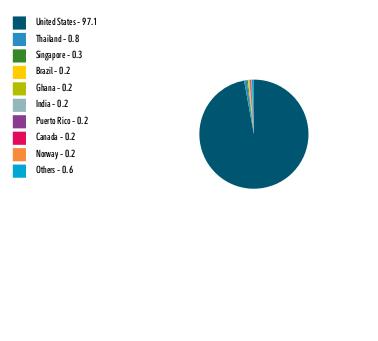
ASSET ALLOCATION (% of Fund's net assets) |
|
| Short-Term Investments and Net Other Assets (Liabilities) - (1.1)% |
|
| United States | 97.1 |
| Thailand | 0.8 |
| Singapore | 0.3 |
| Brazil | 0.2 |
| Ghana | 0.2 |
| India | 0.2 |
| Puerto Rico | 0.2 |
| Canada | 0.2 |
| Norway | 0.2 |
| Others | 0.6 |
GEOGRAPHIC DIVERSIFICATION (% of Fund's net assets) |
|
| |
|
TOP HOLDINGS (% of Fund's net assets) | | |
| Insmed Inc | 0.9 | |
| FTAI Aviation Ltd | 0.9 | |
| Abercrombie & Fitch Co Class A | 0.8 | |
| Fabrinet | 0.8 | |
| Vaxcyte Inc | 0.8 | |
| Sprouts Farmers Market Inc | 0.7 | |
| Applied Industrial Technologies Inc | 0.7 | |
| HealthEquity Inc | 0.7 | |
| SPS Commerce Inc | 0.7 | |
| Ensign Group Inc/The | 0.6 | |
| | 7.6 | |
| |
| Fidelity, the Fidelity Investments Logo and all other Fidelity trademarks or service marks used herein are trademarks or service marks of FMR LLC. Any third-party marks that are used herein are trademarks or service marks of their respective owners. © 2024 FMR LLC. All rights reserved. |
| | For additional information about the Fund; including its prospectus, financial information, holdings and proxy information, scan the QR code or visit fundresearch.fidelity.com/prospectus/sec 1.9913367.100 3405-TSRA-0824 |
| |
| | ANNUAL SHAREHOLDER REPORT | AS OF JUNE 30, 2024 | |
| | Fidelity® Mid Cap Growth Index Fund Fidelity® Mid Cap Growth Index Fund : FMDGX |
| | | |
This annual shareholder report contains information about Fidelity® Mid Cap Growth Index Fund for the period July 1, 2023 to June 30, 2024. You can find additional information about the Fund at fundresearch.fidelity.com/
prospectus/sec. You can also request this information by contacting us at 1-800-544-8544 or by sending an e-mail to fidfunddocuments@fidelity.com.
What were your Fund costs for the last year?(based on hypothetical $10,000 investment)
FUND COST (PREVIOUS YEAR)
| | Costs of a $10,000 investment | Costs paid as a percentage of a $10,000 investment | |
| Fidelity® Mid Cap Growth Index Fund | $ 6 | 0.05% | |
What affected the Fund's performance this period?
•U.S. equities gained considerably for the 12 months ending June 30, 2024, driven by resilient corporate profits, a frenzy over generative artificial intelligence and the Federal Reserve's likely pivot to cutting interest rates later this year. Amid this favorable backdrop for higher-risk assets, stocks continued their late-2023 momentum, powered by signs of continued U.S. economic strength.
•Against this backdrop, information technology gained 25% and contributed most, driven by the software & services industry (+28%). Financials stocks also helped (+28%), benefiting from financial services (+27%). Consumer discretionary rose about 20%, industrials gained 13%, and communication services advanced roughly 24%.
•Conversely, health care returned approximately -3% and detracted most. This group was hampered by the health care equipment & services industry (-11%). Consumer staples (-6%) also hurt, hampered by the food, beverage & tobacco industry (-16%).
•Turning to individual stocks, the biggest contributor was CrowdStrike Holdings (+161%), from the software & services category. Also in software & services, Palantir Technologies (+65%) and Fair Isaac (+84%) helped. Another notable contributor was Apollo Global Management (+57%), a stock in the financial services group, as well as Spotify Technology (+96%) in the media & entertainment category.
•In contrast, the biggest individual detractor was MongoDB (-39%), from the software & services category. Paycom Software (-55%), a stock in the commercial & professional services category, detracted. Enphase Energy, within the semiconductors & semiconductor equipment industry, returned approximately -40% and hindered the fund.
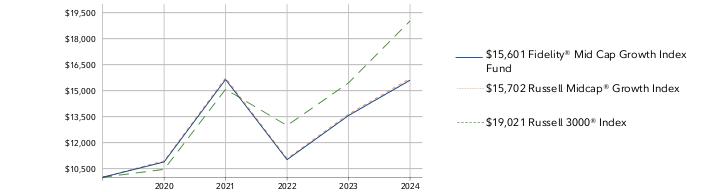
How did the Fund perform over the life of Fund?
CUMULATIVE PERFORMANCE
July 11, 2019 through June 30, 2024.
Initial investment of $10,000.
Fidelity® Mid Cap Growth Index Fund | $10,000 | $10,886 | $15,643 | $11,018 | $13,566 | $15,601 |
Russell Midcap® Growth Index | $10,000 | $10,946 | $15,738 | $11,083 | $13,647 | $15,702 |
Russell 3000® Index | $10,000 | $10,459 | $15,078 | $12,987 | $15,449 | $19,021 |
| | 2019 | 2020 | 2021 | 2022 | 2023 | 2024 |
AVERAGE ANNUAL TOTAL RETURNS: | | 1 Year | Life of Fund A |
| Fidelity® Mid Cap Growth Index Fund | 15.01% | 9.35% |
| Russell Midcap® Growth Index | 15.05% | 9.49% |
| Russell 3000® Index | 23.13% | 13.80% |
A From July 11, 2019
Visit www.fidelity.com for more recent performance information. |
The Fund's past performance is not a good predictor of the Fund's future performance. The graph and table do not reflect the deduction of taxes that a shareholder would pay on fund distributions or redemption of fund shares. |
Key Fund Statistics (as of June 30, 2024)
KEY FACTS | | |
| Fund Size | $1,106,274,971 | |
| Number of Holdings | 292 | |
| Total Advisory Fee | $419,189 | |
| Portfolio Turnover | 54% | |
What did the Fund invest in?
(as of June 30, 2024)
MARKET SECTORS (% of Fund's net assets) | | |
| Information Technology | 24.7 | |
| Industrials | 17.0 | |
| Consumer Discretionary | 15.1 | |
| Health Care | 14.4 | |
| Financials | 12.4 | |
| Communication Services | 4.4 | |
| Energy | 4.0 | |
| Consumer Staples | 2.8 | |
| Utilities | 1.4 | |
| Materials | 1.4 | |
| Real Estate | 1.2 | |
| |
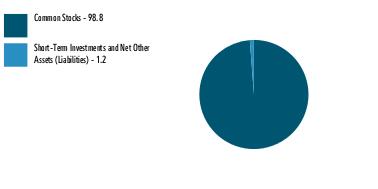
| Common Stocks | 98.8 |
| Short-Term Investments and Net Other Assets (Liabilities) | 1.2 |
ASSET ALLOCATION (% of Fund's net assets) |
|
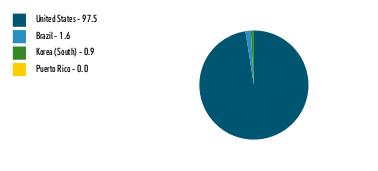
|
| United States | 97.5 |
| Brazil | 1.6 |
| Korea (South) | 0.9 |
| Puerto Rico | 0.0 |
GEOGRAPHIC DIVERSIFICATION (% of Fund's net assets) |
|
| |
|
TOP HOLDINGS (% of Fund's net assets) | | |
| Palantir Technologies Inc Class A | 1.9 | |
| Dexcom Inc | 1.8 | |
| Trade Desk Inc (The) Class A | 1.6 | |
| NU Holdings Ltd/Cayman Islands Class A | 1.6 | |
| Super Micro Computer Inc | 1.6 | |
| IDEXX Laboratories Inc | 1.5 | |
| Ameriprise Financial Inc | 1.5 | |
| Datadog Inc Class A | 1.5 | |
| Verisk Analytics Inc | 1.5 | |
| Monolithic Power Sys Inc | 1.4 | |
| | 15.9 | |
| |
| Fidelity, the Fidelity Investments Logo and all other Fidelity trademarks or service marks used herein are trademarks or service marks of FMR LLC. Any third-party marks that are used herein are trademarks or service marks of their respective owners. © 2024 FMR LLC. All rights reserved. |
| | For additional information about the Fund; including its prospectus, financial information, holdings and proxy information, scan the QR code or visit fundresearch.fidelity.com/prospectus/sec 1.9913365.100 3403-TSRA-0824 |
| |
| | ANNUAL SHAREHOLDER REPORT | AS OF JUNE 30, 2024 | This report describes changes to the Fund that occurred during the reporting period. |
| | Fidelity® Municipal Income 2025 Fund Fidelity Advisor® Municipal Income 2025 Fund Class I : FAMYX |
| | | |
This annual shareholder report contains information about Fidelity® Municipal Income 2025 Fund for the period July 1, 2023 to June 30, 2024. You can find additional information about the Fund at fundresearch.fidelity.com/
prospectus/sec. You can also request this information by contacting us at 1-877-208-0098 or by sending an e-mail to fidfunddocuments@fidelity.com.
What were your Fund costs for the last year?(based on hypothetical $10,000 investment)
FUND COST (PREVIOUS YEAR)
| | Costs of a $10,000 investment | Costs paid as a percentage of a $10,000 investment | |
| Class I | $ 41 | 0.40% | |
What affected the Fund's performance this period?
- •U.S. tax-exempt municipal bonds achieved a solid gain for the 12 months ending June 30, 2024. The full-year advance was largely the result of bond market rallies in the final months of 2023 and the final month of the period, but the 12 months were marked by high levels of volatility, as investors anxiously awaited the arrival of interest-rate reductions by the U.S. Federal Reserve.
- •The past 12 months, we focused on long-term objectives and sought to generate attractive tax-exempt income and a competitive risk-adjusted return.
- •Versus the 2025 index, the fund's carry advantage, meaning its larger-than-index exposure to higher-coupon municipal bonds, was the biggest contributor by far this period.
- •An overweight to lower-rated investment-grade municipal bonds also added value. These securities, helped by strong demand from investors seeking higher levels of income, bested higher-quality bonds this period.
- •Specifically, larger-than-index exposure to lower-rated health care and higher education bonds was helpful. Exposure to lower-rated tax-backed bonds that received credit rating upgrades was beneficial as well.
- •In contrast, differences in the way fund holdings and index components were priced detracted from relative performance. Fund holdings are priced by a third-party pricing service and validated daily by Fidelity Management and Research's fair-value processes. Securities within the index, however, are priced by the index provider.
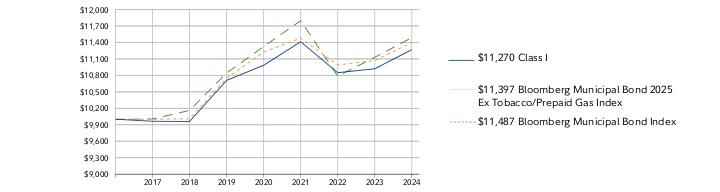
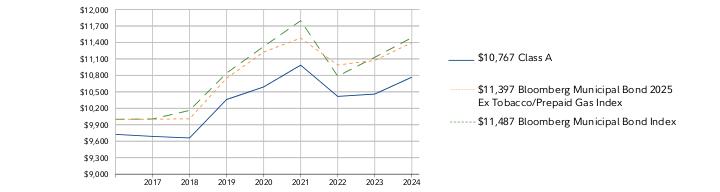
How did the Fund perform over the life of Fund?
CUMULATIVE PERFORMANCE
May 25, 2017 through June 30, 2024.
Initial investment of $10,000.
Class I | $10,000 | $9,964 | $9,960 | $10,709 | $10,984 | $11,413 | $10,848 | $10,920 |
Bloomberg Municipal Bond 2025 Ex Tobacco/Prepaid Gas Index | $10,000 | $10,001 | $10,008 | $10,749 | $11,225 | $11,480 | $10,989 | $11,072 |
Bloomberg Municipal Bond Index | $10,000 | $10,005 | $10,162 | $10,843 | $11,325 | $11,797 | $10,786 | $11,130 |
| | 2017 | 2018 | 2019 | 2020 | 2021 | 2022 | 2023 | 2024 |
AVERAGE ANNUAL TOTAL RETURNS: | | 1 Year | 5 Year | Life of Fund A |
| Class I | 3.20% | 1.03% | 1.70% |
| Bloomberg Municipal Bond 2025 Ex Tobacco/Prepaid Gas Index | 2.94% | 1.18% | 1.86% |
| Bloomberg Municipal Bond Index | 3.21% | 1.16% | 1.97% |
A From May 25, 2017
Visit institutional.fidelity.com for more recent performance information. |
The Fund's past performance is not a good predictor of the Fund's future performance. The graph and table do not reflect the deduction of taxes that a shareholder would pay on fund distributions or redemption of fund shares. |
Key Fund Statistics (as of June 30, 2024)
KEY FACTS | | |
| Fund Size | $23,727,435 | |
| Number of Holdings | 123 | |
| Total Advisory Fee | $73,069 | |
| Portfolio Turnover | 6% | |
What did the Fund invest in?
(as of June 30, 2024)
REVENUE SOURCES (% of Fund's net assets) |
| Health Care | 27.1 | |
| Transportation | 23.5 | |
| Education | 21.0 | |
| General Obligations | 9.9 | |
| Housing | 5.4 | |
| Others(Individually Less Than 5%) | 13.1 | |
| 100.0 | |
| |
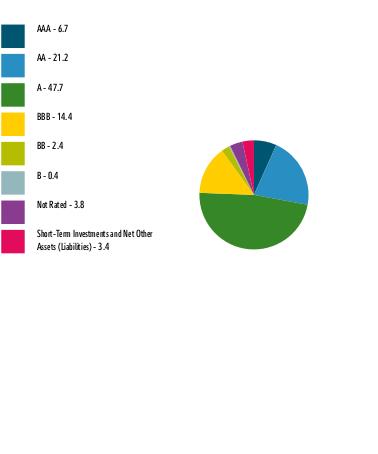
| AAA | 6.7 |
| AA | 21.2 |
| A | 47.7 |
| BBB | 14.4 |
| BB | 2.4 |
| B | 0.4 |
| Not Rated | 3.8 |
| Short-Term Investments and Net Other Assets (Liabilities) | 3.4 |
QUALITY DIVERSIFICATION (% of Fund's net assets) |
|
| |
| We have used ratings from Moody's Investors Service, Inc. Where Moody's® ratings are not available, we have used S&P® ratings. All ratings are as of the date indicated and do not reflect subsequent changes. |
TOP STATES (% of Fund's net assets) |
| Connecticut | 11.0 |
| Pennsylvania | 10.3 |
| Illinois | 8.0 |
| Florida | 6.7 |
| Massachusetts | 5.8 |
| | |
How has the Fund changed?
This is a summary of certain changes to the Fund since July 1, 2023. For more complete information, you may review the Fund's next prospectus, which we expect to be available by August 29, 2024 at fundresearch.fidelity.com/prospectus/sec or upon request at 1-877-208-0098 or by sending an e-mail to fidfunddocuments@fidelity.com.
The fund closed to new investors on June 28, 2024, in anticipation of its liquidation shortly after its target end date of June 30, 2025. | |
| Fidelity, the Fidelity Investments Logo and all other Fidelity trademarks or service marks used herein are trademarks or service marks of FMR LLC. Any third-party marks that are used herein are trademarks or service marks of their respective owners. © 2024 FMR LLC. All rights reserved. |
| | For additional information about the Fund; including its prospectus, financial information, holdings and proxy information, scan the QR code or visit fundresearch.fidelity.com/prospectus/sec 1.9913364.100 2950-TSRA-0824 |
| |
| | ANNUAL SHAREHOLDER REPORT | AS OF JUNE 30, 2024 | |
| | Fidelity® Municipal Bond Index Fund Fidelity® Municipal Bond Index Fund : FMBIX |
| | | |
This annual shareholder report contains information about Fidelity® Municipal Bond Index Fund for the period July 1, 2023 to June 30, 2024. You can find additional information about the Fund at fundresearch.fidelity.com/
prospectus/sec. You can also request this information by contacting us at 1-800-544-8544 or by sending an e-mail to fidfunddocuments@fidelity.com.
What were your Fund costs for the last year?(based on hypothetical $10,000 investment)
FUND COST (PREVIOUS YEAR)
| | Costs of a $10,000 investment | Costs paid as a percentage of a $10,000 investment | |
| Fidelity® Municipal Bond Index Fund | $ 7 | 0.07% | |
What affected the Fund's performance this period?
- •U.S. tax-exempt municipal bonds achieved a solid gain for the 12 months ending June 30, 2024. The full-year advance was largely the result of bond market rallies in the final months of 2023 and the final month of the period, but the 12 months were marked by high levels of volatility, as investors anxiously awaited the arrival of interest-rate reductions by the U.S. Federal Reserve.
- •Our goal is to produce monthly returns, before expenses, that closely match the benchmark's return.
- •We use statistical sampling techniques based on duration, maturity, interest-rate sensitivity, security structure and credit quality to attempt to replicate the returns of the Bloomberg Municipal Bond Index using a smaller number of securities.
- •This period, trading costs associated with the purchase and sale of municipal securities detracted from performance versus the benchmark, as market volatility triggered uneven shareholder flows.
- •Differences in the way fund holdings and index components were priced also detracted from the fund's relative performance. Fund holdings are priced by a third-party pricing service and validated daily by Fidelity Management & Research's (FMR) fair-value processes. Securities within the index, however, are priced by the index provider.
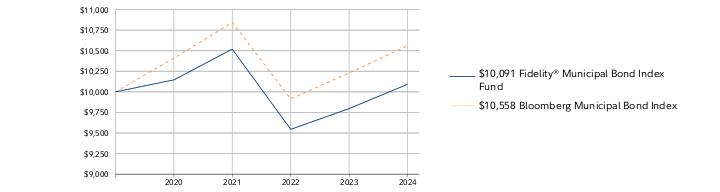
How did the Fund perform over the life of Fund?
CUMULATIVE PERFORMANCE
July 11, 2019 through June 30, 2024.
Initial investment of $10,000.
Fidelity® Municipal Bond Index Fund | $10,000 | $10,146 | $10,518 | $9,544 | $9,796 | $10,091 |
Bloomberg Municipal Bond Index | $10,000 | $10,410 | $10,843 | $9,914 | $10,230 | $10,558 |
| | 2019 | 2020 | 2021 | 2022 | 2023 | 2024 |
AVERAGE ANNUAL TOTAL RETURNS: | | 1 Year | Life of Fund A |
| Fidelity® Municipal Bond Index Fund | 3.01% | 0.18% |
| Bloomberg Municipal Bond Index | 3.21% | 1.10% |
A From July 11, 2019
Visit www.fidelity.com for more recent performance information. |
The Fund's past performance is not a good predictor of the Fund's future performance. The graph and table do not reflect the deduction of taxes that a shareholder would pay on fund distributions or redemption of fund shares. |
Key Fund Statistics (as of June 30, 2024)
KEY FACTS | | |
| Fund Size | $164,812,968 | |
| Number of Holdings | 1,847 | |
| Total Advisory Fee | $108,081 | |
| Portfolio Turnover | 15% | |
What did the Fund invest in?
(as of June 30, 2024)
REVENUE SOURCES (% of Fund's net assets) |
| General Obligations | 35.7 | |
| Transportation | 15.6 | |
| Special Tax | 11.1 | |
| Water & Sewer | 10.4 | |
| Health Care | 8.7 | |
| Education | 6.7 | |
| Others(Individually Less Than 5%) | 11.8 | |
| 100.0 | |
| |
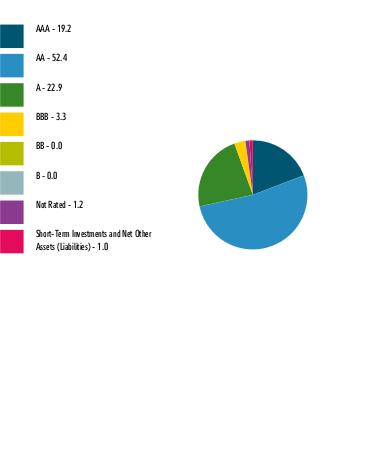
| AAA | 19.2 |
| AA | 52.4 |
| A | 22.9 |
| BBB | 3.3 |
| BB | 0.0 |
| B | 0.0 |
| Not Rated | 1.2 |
| Short-Term Investments and Net Other Assets (Liabilities) | 1.0 |
QUALITY DIVERSIFICATION (% of Fund's net assets) |
|
| |
| We have used ratings from Moody's Investors Service, Inc. Where Moody's® ratings are not available, we have used S&P® ratings. All ratings are as of the date indicated and do not reflect subsequent changes. |
TOP STATES (% of Fund's net assets) |
| California | 22.9 |
| New York | 15.0 |
| Texas | 7.8 |
| Florida | 4.7 |
| Illinois | 4.6 |
| | |
| Fidelity, the Fidelity Investments Logo and all other Fidelity trademarks or service marks used herein are trademarks or service marks of FMR LLC. Any third-party marks that are used herein are trademarks or service marks of their respective owners. © 2024 FMR LLC. All rights reserved. |
| | For additional information about the Fund; including its prospectus, financial information, holdings and proxy information, scan the QR code or visit fundresearch.fidelity.com/prospectus/sec 1.9913369.100 3469-TSRA-0824 |
| |
| | ANNUAL SHAREHOLDER REPORT | AS OF JUNE 30, 2024 | This report describes changes to the Fund that occurred during the reporting period. |
| | Fidelity® Mid Cap Value Index Fund Fidelity® Mid Cap Value Index Fund : FIMVX |
| | | |
This annual shareholder report contains information about Fidelity® Mid Cap Value Index Fund for the period July 1, 2023 to June 30, 2024. You can find additional information about the Fund at fundresearch.fidelity.com/
prospectus/sec. You can also request this information by contacting us at 1-800-544-8544 or by sending an e-mail to fidfunddocuments@fidelity.com.
What were your Fund costs for the last year?(based on hypothetical $10,000 investment)
FUND COST (PREVIOUS YEAR)
| | Costs of a $10,000 investment | Costs paid as a percentage of a $10,000 investment | |
| Fidelity® Mid Cap Value Index Fund | $ 6 | 0.06% | |
What affected the Fund's performance this period?
•U.S. equities gained considerably for the 12 months ending June 30, 2024, driven by resilient corporate profits, a frenzy over generative artificial intelligence and the Federal Reserve's likely pivot to cutting interest rates later this year. Amid this favorable backdrop for higher-risk assets, stocks continued their late-2023 momentum, powered by signs of continued U.S. economic strength.
•Against this backdrop, financials gained 28% and contributed most. Industrials stocks also helped (+18%), benefiting from capital goods (+23%). Energy rose approximately 26%, information technology gained 11%, and utilities advanced roughly 12%.
•In contrast, health care returned -8% and detracted most. Consumer staples (-7%) and communication services (-7%) also hurt.
•Turning to individual stocks, the top contributor was Constellation Energy (+120%), from the utilities group. In financial services, Coinbase Global (+210%) and KKR (+89%) boosted the fund. Phillips (+53%), a stock in the energy industry, lifted the fund.
•Conversely, the biggest individual detractor was Albemarle (-57%), from the materials group. ON Semiconductor (-28%), from the semiconductors & semiconductor equipment group, also hurt. Warner Bros Discovery, within the media & entertainment industry, returned -41% and hindered the fund.
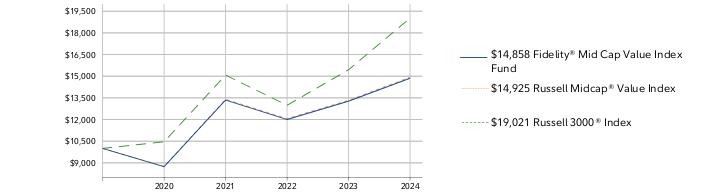
How did the Fund perform over the life of Fund?
CUMULATIVE PERFORMANCE
July 11, 2019 through June 30, 2024.
Initial investment of $10,000.
Fidelity® Mid Cap Value Index Fund | $10,000 | $8,735 | $13,349 | $12,003 | $13,271 | $14,858 |
Russell Midcap® Value Index | $10,000 | $8,756 | $13,402 | $12,062 | $13,329 | $14,925 |
Russell 3000® Index | $10,000 | $10,459 | $15,078 | $12,987 | $15,449 | $19,021 |
| | 2019 | 2020 | 2021 | 2022 | 2023 | 2024 |
AVERAGE ANNUAL TOTAL RETURNS: | | 1 Year | Life of Fund A |
| Fidelity® Mid Cap Value Index Fund | 11.96% | 8.28% |
| Russell Midcap® Value Index | 11.98% | 8.38% |
| Russell 3000® Index | 23.13% | 13.80% |
A From July 11, 2019
Visit www.fidelity.com for more recent performance information. |
The Fund's past performance is not a good predictor of the Fund's future performance. The graph and table do not reflect the deduction of taxes that a shareholder would pay on fund distributions or redemption of fund shares. |
Key Fund Statistics (as of June 30, 2024)
KEY FACTS | | |
| Fund Size | $854,245,859 | |
| Number of Holdings | 717 | |
| Total Advisory Fee | $426,336 | |
| Portfolio Turnover | 38% | |
What did the Fund invest in?
(as of June 30, 2024)
MARKET SECTORS (% of Fund's net assets) | | |
| Industrials | 17.3 | |
| Financials | 16.7 | |
| Real Estate | 9.9 | |
| Consumer Discretionary | 9.6 | |
| Information Technology | 9.3 | |
| Health Care | 9.3 | |
| Materials | 7.6 | |
| Utilities | 6.7 | |
| Consumer Staples | 6.3 | |
| Energy | 6.0 | |
| Communication Services | 3.2 | |
| |
ASSET ALLOCATION (% of Fund's net assets) |
|
| Short-Term Investments and Net Other Assets (Liabilities) - (1.9)% |
|
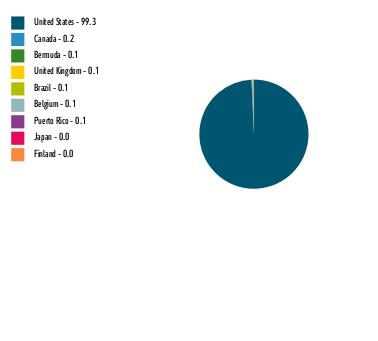
| United States | 99.3 |
| Canada | 0.2 |
| Bermuda | 0.1 |
| United Kingdom | 0.1 |
| Brazil | 0.1 |
| Belgium | 0.1 |
| Puerto Rico | 0.1 |
| Japan | 0.0 |
| Finland | 0.0 |
GEOGRAPHIC DIVERSIFICATION (% of Fund's net assets) |
|
| |
|
TOP HOLDINGS (% of Fund's net assets) | | |
| Arthur J Gallagher & Co | 0.7 | |
| Williams Cos Inc/The | 0.7 | |
| Digital Realty Trust Inc | 0.7 | |
| Microchip Technology Inc | 0.7 | |
| ONEOK Inc | 0.7 | |
| Humana Inc | 0.7 | |
| AFLAC Inc | 0.6 | |
| Realty Income Corp | 0.6 | |
| Bank of New York Mellon Corp/The | 0.6 | |
| L3Harris Technologies Inc | 0.6 | |
| | 6.6 | |
| |
How has the Fund changed?
This is a summary of certain changes to the Fund since July 1, 2023. For more complete information, you may review the Fund's next prospectus, which we expect to be available by August 29, 2024 at fundresearch.fidelity.com/prospectus/sec or upon request at 1-800-544-8544 or by sending an e-mail to fidfunddocuments@fidelity.com.
The fees associated with this class changed during the reporting year. The variations in class fees are primarily the result of the following changes: | |
| Fidelity, the Fidelity Investments Logo and all other Fidelity trademarks or service marks used herein are trademarks or service marks of FMR LLC. Any third-party marks that are used herein are trademarks or service marks of their respective owners. © 2024 FMR LLC. All rights reserved. |
| | For additional information about the Fund; including its prospectus, financial information, holdings and proxy information, scan the QR code or visit fundresearch.fidelity.com/prospectus/sec 1.9913366.100 3404-TSRA-0824 |
| |
| | ANNUAL SHAREHOLDER REPORT | AS OF JUNE 30, 2024 | |
| | Fidelity® SAI Municipal Bond Index Fund Fidelity® SAI Municipal Bond Index Fund : FSABX |
| | | |
This annual shareholder report contains information about Fidelity® SAI Municipal Bond Index Fund for the period July 1, 2023 to June 30, 2024. You can find additional information about the Fund at fundresearch.fidelity.com/
prospectus/sec. You can also request this information by contacting us at 1-800-544-3455 or by sending an e-mail to fidfunddocuments@fidelity.com.
What were your Fund costs for the last year?(based on hypothetical $10,000 investment)
FUND COST (PREVIOUS YEAR)
| | Costs of a $10,000 investment | Costs paid as a percentage of a $10,000 investment | |
| Fidelity® SAI Municipal Bond Index Fund | $ 7 | 0.07% | |
What affected the Fund's performance this period?
- •U.S. tax-exempt municipal bonds achieved a solid gain for the 12 months ending June 30, 2024. The full-year advance was largely the result of bond market rallies in the final months of 2023 and the final month of the period, but the 12 months were marked by high levels of volatility, as investors anxiously awaited the arrival of interest-rate reductions by the U.S. Federal Reserve.
- •Our goal is to produce monthly returns, before expenses, that closely match the benchmark's return.
- •We use statistical sampling techniques based on duration, maturity, interest-rate sensitivity, security structure and credit quality to attempt to replicate the returns of the Bloomberg Municipal Bond Index using a smaller number of securities.
- •This period, trading costs associated with the purchase and sale of municipal securities detracted from performance versus the benchmark, as market volatility triggered uneven shareholder flows.
- •Differences in the way fund holdings and index components were priced also detracted from the fund's relative performance. Fund holdings are priced by a third-party pricing service and validated daily by Fidelity Management & Research's (FMR) fair-value processes. Securities within the index, however, are priced by the index provider.
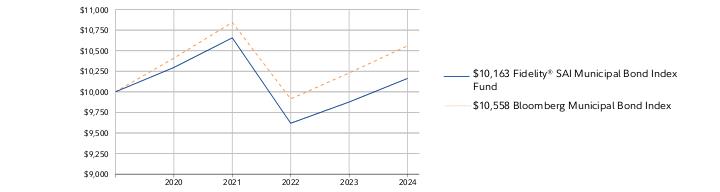
How did the Fund perform over the life of Fund?
CUMULATIVE PERFORMANCE
July 11, 2019 through June 30, 2024.
Initial investment of $10,000.
Fidelity® SAI Municipal Bond Index Fund | $10,000 | $10,296 | $10,656 | $9,618 | $9,876 | $10,163 |
Bloomberg Municipal Bond Index | $10,000 | $10,410 | $10,843 | $9,914 | $10,230 | $10,558 |
| | 2019 | 2020 | 2021 | 2022 | 2023 | 2024 |
AVERAGE ANNUAL TOTAL RETURNS: | | 1 Year | Life of Fund A |
| Fidelity® SAI Municipal Bond Index Fund | 2.90% | 0.33% |
| Bloomberg Municipal Bond Index | 3.21% | 1.10% |
A From July 11, 2019
Visit www.fidelity.com for more recent performance information. |
The Fund's past performance is not a good predictor of the Fund's future performance. The graph and table do not reflect the deduction of taxes that a shareholder would pay on fund distributions or redemption of fund shares. |
Key Fund Statistics (as of June 30, 2024)
KEY FACTS | | |
| Fund Size | $80,747,568 | |
| Number of Holdings | 1,351 | |
| Total Advisory Fee | $41,212 | |
| Portfolio Turnover | 17% | |
What did the Fund invest in?
(as of June 30, 2024)
REVENUE SOURCES (% of Fund's net assets) |
| General Obligations | 34.0 | |
| Transportation | 16.0 | |
| Special Tax | 13.8 | |
| Water & Sewer | 9.3 | |
| Health Care | 9.0 | |
| Electric Utilities | 6.1 | |
| Education | 6.0 | |
| Others(Individually Less Than 5%) | 5.8 | |
| 100.0 | |
| |
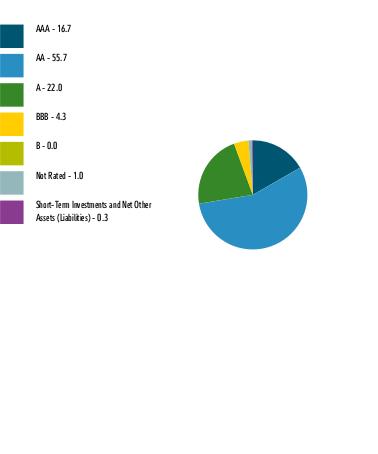
| AAA | 16.7 |
| AA | 55.7 |
| A | 22.0 |
| BBB | 4.3 |
| B | 0.0 |
| Not Rated | 1.0 |
| Short-Term Investments and Net Other Assets (Liabilities) | 0.3 |
QUALITY DIVERSIFICATION (% of Fund's net assets) |
|
| |
| We have used ratings from Moody's Investors Service, Inc. Where Moody's® ratings are not available, we have used S&P® ratings. All ratings are as of the date indicated and do not reflect subsequent changes. |
TOP STATES (% of Fund's net assets) |
| California | 19.3 |
| New York | 16.9 |
| Texas | 8.1 |
| Illinois | 4.7 |
| Washington | 4.3 |
| | |
| Fidelity, the Fidelity Investments Logo and all other Fidelity trademarks or service marks used herein are trademarks or service marks of FMR LLC. Any third-party marks that are used herein are trademarks or service marks of their respective owners. © 2024 FMR LLC. All rights reserved. |
| | For additional information about the Fund; including its prospectus, financial information, holdings and proxy information, scan the QR code or visit fundresearch.fidelity.com/prospectus/sec 1.9913370.100 3470-TSRA-0824 |
| |
| | ANNUAL SHAREHOLDER REPORT | AS OF JUNE 30, 2024 | This report describes changes to the Fund that occurred during the reporting period. |
| | Fidelity® Municipal Income 2025 Fund Fidelity® Municipal Income 2025 Fund : FIMSX |
| | | |
This annual shareholder report contains information about Fidelity® Municipal Income 2025 Fund for the period July 1, 2023 to June 30, 2024. You can find additional information about the Fund at fundresearch.fidelity.com/
prospectus/sec. You can also request this information by contacting us at 1-800-544-8544 or by sending an e-mail to fidfunddocuments@fidelity.com.
What were your Fund costs for the last year?(based on hypothetical $10,000 investment)
FUND COST (PREVIOUS YEAR)
| | Costs of a $10,000 investment | Costs paid as a percentage of a $10,000 investment | |
| Fidelity® Municipal Income 2025 Fund | $ 41 | 0.40% | |
What affected the Fund's performance this period?
- •U.S. tax-exempt municipal bonds achieved a solid gain for the 12 months ending June 30, 2024. The full-year advance was largely the result of bond market rallies in the final months of 2023 and the final month of the period, but the 12 months were marked by high levels of volatility, as investors anxiously awaited the arrival of interest-rate reductions by the U.S. Federal Reserve.
- •The past 12 months, we focused on long-term objectives and sought to generate attractive tax-exempt income and a competitive risk-adjusted return.
- •Versus the 2025 index, the fund's carry advantage, meaning its larger-than-index exposure to higher-coupon municipal bonds, was the biggest contributor by far this period.
- •An overweight to lower-rated investment-grade municipal bonds also added value. These securities, helped by strong demand from investors seeking higher levels of income, bested higher-quality bonds this period.
- •Specifically, larger-than-index exposure to lower-rated health care and higher education bonds was helpful. Exposure to lower-rated tax-backed bonds that received credit rating upgrades was beneficial as well.
- •In contrast, differences in the way fund holdings and index components were priced detracted from relative performance. Fund holdings are priced by a third-party pricing service and validated daily by Fidelity Management and Research's fair-value processes. Securities within the index, however, are priced by the index provider.
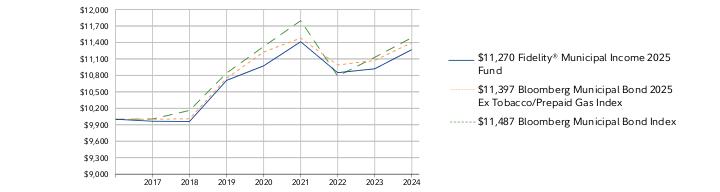
How did the Fund perform over the life of Fund?
CUMULATIVE PERFORMANCE
May 25, 2017 through June 30, 2024.
Initial investment of $10,000.
Fidelity® Municipal Income 2025 Fund | $10,000 | $9,964 | $9,960 | $10,709 | $10,973 | $11,413 | $10,849 | $10,920 |
Bloomberg Municipal Bond 2025 Ex Tobacco/Prepaid Gas Index | $10,000 | $10,001 | $10,008 | $10,749 | $11,225 | $11,480 | $10,989 | $11,072 |
Bloomberg Municipal Bond Index | $10,000 | $10,005 | $10,162 | $10,843 | $11,325 | $11,797 | $10,786 | $11,130 |
| | 2017 | 2018 | 2019 | 2020 | 2021 | 2022 | 2023 | 2024 |
AVERAGE ANNUAL TOTAL RETURNS: | | 1 Year | 5 Year | Life of Fund A |
| Fidelity® Municipal Income 2025 Fund | 3.20% | 1.03% | 1.70% |
| Bloomberg Municipal Bond 2025 Ex Tobacco/Prepaid Gas Index | 2.94% | 1.18% | 1.86% |
| Bloomberg Municipal Bond Index | 3.21% | 1.16% | 1.97% |
A From May 25, 2017
Visit www.fidelity.com for more recent performance information. |
The Fund's past performance is not a good predictor of the Fund's future performance. The graph and table do not reflect the deduction of taxes that a shareholder would pay on fund distributions or redemption of fund shares. |
Key Fund Statistics (as of June 30, 2024)
KEY FACTS | | |
| Fund Size | $23,727,435 | |
| Number of Holdings | 123 | |
| Total Advisory Fee | $73,069 | |
| Portfolio Turnover | 6% | |
What did the Fund invest in?
(as of June 30, 2024)
REVENUE SOURCES (% of Fund's net assets) |
| Health Care | 27.1 | |
| Transportation | 23.5 | |
| Education | 21.0 | |
| General Obligations | 9.9 | |
| Housing | 5.4 | |
| Others(Individually Less Than 5%) | 13.1 | |
| 100.0 | |
| |
| AAA | 6.7 |
| AA | 21.2 |
| A | 47.7 |
| BBB | 14.4 |
| BB | 2.4 |
| B | 0.4 |
| Not Rated | 3.8 |
| Short-Term Investments and Net Other Assets (Liabilities) | 3.4 |
QUALITY DIVERSIFICATION (% of Fund's net assets) |
|
| |
| We have used ratings from Moody's Investors Service, Inc. Where Moody's® ratings are not available, we have used S&P® ratings. All ratings are as of the date indicated and do not reflect subsequent changes. |
TOP STATES (% of Fund's net assets) |
| Connecticut | 11.0 |
| Pennsylvania | 10.3 |
| Illinois | 8.0 |
| Florida | 6.7 |
| Massachusetts | 5.8 |
| | |
How has the Fund changed?
This is a summary of certain changes to the Fund since July 1, 2023. For more complete information, you may review the Fund's next prospectus, which we expect to be available by August 29, 2024 at fundresearch.fidelity.com/prospectus/sec or upon request at 1-800-544-8544 or by sending an e-mail to fidfunddocuments@fidelity.com.
The fund closed to new investors on June 28, 2024, in anticipation of its liquidation shortly after its target end date of June 30, 2025. | |
| Fidelity, the Fidelity Investments Logo and all other Fidelity trademarks or service marks used herein are trademarks or service marks of FMR LLC. Any third-party marks that are used herein are trademarks or service marks of their respective owners. © 2024 FMR LLC. All rights reserved. |
| | For additional information about the Fund; including its prospectus, financial information, holdings and proxy information, scan the QR code or visit fundresearch.fidelity.com/prospectus/sec 1.9913362.100 2948-TSRA-0824 |
| |
| | ANNUAL SHAREHOLDER REPORT | AS OF JUNE 30, 2024 | This report describes changes to the Fund that occurred during the reporting period. |
| | Fidelity® Municipal Income 2025 Fund Fidelity Advisor® Municipal Income 2025 Fund Class A : FAMHX |
| | | |
This annual shareholder report contains information about Fidelity® Municipal Income 2025 Fund for the period July 1, 2023 to June 30, 2024. You can find additional information about the Fund at fundresearch.fidelity.com/
prospectus/sec. You can also request this information by contacting us at 1-877-208-0098 or by sending an e-mail to fidfunddocuments@fidelity.com.
What were your Fund costs for the last year?(based on hypothetical $10,000 investment)
FUND COST (PREVIOUS YEAR)
| | Costs of a $10,000 investment | Costs paid as a percentage of a $10,000 investment | |
| Class A | $ 66 | 0.65% | |
What affected the Fund's performance this period?
- •U.S. tax-exempt municipal bonds achieved a solid gain for the 12 months ending June 30, 2024. The full-year advance was largely the result of bond market rallies in the final months of 2023 and the final month of the period, but the 12 months were marked by high levels of volatility, as investors anxiously awaited the arrival of interest-rate reductions by the U.S. Federal Reserve.
- •The past 12 months, we focused on long-term objectives and sought to generate attractive tax-exempt income and a competitive risk-adjusted return.
- •Versus the 2025 index, the fund's carry advantage, meaning its larger-than-index exposure to higher-coupon municipal bonds, was the biggest contributor by far this period.
- •An overweight to lower-rated investment-grade municipal bonds also added value. These securities, helped by strong demand from investors seeking higher levels of income, bested higher-quality bonds this period.
- •Specifically, larger-than-index exposure to lower-rated health care and higher education bonds was helpful. Exposure to lower-rated tax-backed bonds that received credit rating upgrades was beneficial as well.
- •In contrast, differences in the way fund holdings and index components were priced detracted from relative performance. Fund holdings are priced by a third-party pricing service and validated daily by Fidelity Management and Research's fair-value processes. Securities within the index, however, are priced by the index provider.
How did the Fund perform over the life of Fund?
CUMULATIVE PERFORMANCE
May 25, 2017 through June 30, 2024.
Initial investment of $10,000 and the current sales charge was paid.
Class A | $9,725 | $9,688 | $9,660 | $10,360 | $10,589 | $10,986 | $10,417 | $10,459 |
Bloomberg Municipal Bond 2025 Ex Tobacco/Prepaid Gas Index | $10,000 | $10,001 | $10,008 | $10,749 | $11,225 | $11,480 | $10,989 | $11,072 |
Bloomberg Municipal Bond Index | $10,000 | $10,005 | $10,162 | $10,843 | $11,325 | $11,797 | $10,786 | $11,130 |
| | 2017 | 2018 | 2019 | 2020 | 2021 | 2022 | 2023 | 2024 |
AVERAGE ANNUAL TOTAL RETURNS: | | 1 Year | 5 Year | Life of Fund A |
| Class A (incl. 2.75% sales charge) | 0.11% | 0.21% | 1.05% |
| Class A (without 2.75% sales charge) | 2.94% | 0.77% | 1.44% |
| Bloomberg Municipal Bond 2025 Ex Tobacco/Prepaid Gas Index | 2.94% | 1.18% | 1.86% |
| Bloomberg Municipal Bond Index | 3.21% | 1.16% | 1.97% |
A From May 25, 2017
Visit institutional.fidelity.com for more recent performance information. |
The Fund's past performance is not a good predictor of the Fund's future performance. The graph and table do not reflect the deduction of taxes that a shareholder would pay on fund distributions or redemption of fund shares. |
Key Fund Statistics (as of June 30, 2024)
KEY FACTS | | |
| Fund Size | $23,727,435 | |
| Number of Holdings | 123 | |
| Total Advisory Fee | $73,069 | |
| Portfolio Turnover | 6% | |
What did the Fund invest in?
(as of June 30, 2024)
REVENUE SOURCES (% of Fund's net assets) |
| Health Care | 27.1 | |
| Transportation | 23.5 | |
| Education | 21.0 | |
| General Obligations | 9.9 | |
| Housing | 5.4 | |
| Others(Individually Less Than 5%) | 13.1 | |
| 100.0 | |
| |
| AAA | 6.7 |
| AA | 21.2 |
| A | 47.7 |
| BBB | 14.4 |
| BB | 2.4 |
| B | 0.4 |
| Not Rated | 3.8 |
| Short-Term Investments and Net Other Assets (Liabilities) | 3.4 |
QUALITY DIVERSIFICATION (% of Fund's net assets) |
|
| |
| We have used ratings from Moody's Investors Service, Inc. Where Moody's® ratings are not available, we have used S&P® ratings. All ratings are as of the date indicated and do not reflect subsequent changes. |
TOP STATES (% of Fund's net assets) |
| Connecticut | 11.0 |
| Pennsylvania | 10.3 |
| Illinois | 8.0 |
| Florida | 6.7 |
| Massachusetts | 5.8 |
| | |
How has the Fund changed?
This is a summary of certain changes to the Fund since July 1, 2023. For more complete information, you may review the Fund's next prospectus, which we expect to be available by August 29, 2024 at fundresearch.fidelity.com/prospectus/sec or upon request at 1-877-208-0098 or by sending an e-mail to fidfunddocuments@fidelity.com.
The fund closed to new investors on June 28, 2024, in anticipation of its liquidation shortly after its target end date of June 30, 2025. | |
| Fidelity, the Fidelity Investments Logo and all other Fidelity trademarks or service marks used herein are trademarks or service marks of FMR LLC. Any third-party marks that are used herein are trademarks or service marks of their respective owners. © 2024 FMR LLC. All rights reserved. |
| | For additional information about the Fund; including its prospectus, financial information, holdings and proxy information, scan the QR code or visit fundresearch.fidelity.com/prospectus/sec 1.9913363.100 2949-TSRA-0824 |
Item 2.
Code of Ethics
As of the end of the period, June 30, 2024, Fidelity Salem Street Trust (the trust) has adopted a code of ethics, as defined in Item 2 of Form N-CSR, that applies to its President and Treasurer and its Chief Financial Officer. A copy of the code of ethics is filed as an exhibit to this Form N-CSR.
Item 3.
Audit Committee Financial Expert
The Board of Trustees of the trust has determined that Elizabeth S. Acton is an audit committee financial expert, as defined in Item 3 of Form N-CSR. Ms. Acton is independent for purposes of Item 3 of Form N-CSR.
Item 4.
Principal Accountant Fees and Services
Fees and Services
The following table presents fees billed by Deloitte & Touche LLP, the member firms of Deloitte Touche Tohmatsu, and their respective affiliates (collectively, “Deloitte Entities”) in each of the last two fiscal years for services rendered to Fidelity Mid Cap Growth Index Fund, Fidelity Mid Cap Value Index Fund, and Fidelity Municipal Income 2025 Fund (the “Funds”):
Services Billed by Deloitte Entities
June 30, 2024 FeesA
| | | | |
| Audit Fees | Audit-Related Fees | Tax Fees | All Other Fees |
|
|
|
|
|
Fidelity Mid Cap Growth Index Fund | $38,900 | $- | $7,900 | $1,000 |
Fidelity Mid Cap Value Index Fund | $38,900 | $- | $7,900 | $1,000 |
Fidelity Municipal Income 2025 Fund | $35,900 | $- | $7,900 | $900 |
|
|
|
|
|
| | | | |
| Audit Fees | Audit-Related Fees | Tax Fees | All Other Fees |
Fidelity Mid Cap Growth Index Fund | $39,100 | $- | $7,400 | $1,000 |
Fidelity Mid Cap Value Index Fund | $39,100 | $- | $7,400 | $1,000 |
Fidelity Municipal Income 2025 Fund | $36,100 | $- | $7,400 | $900 |
|
|
|
|
|
A Amounts may reflect rounding.
The following table presents fees billed by PricewaterhouseCoopers LLP (“PwC”) in each of the last two fiscal years for services rendered to Fidelity Municipal Bond Index Fund, Fidelity SAI Municipal Bond Index Fund, Fidelity Small Cap Growth Index Fund and Fidelity Small Cap Value Index Fund (the “Funds”):
Services Billed by PwC
June 30, 2024 FeesA
| | | | |
| Audit Fees | Audit-Related Fees | Tax Fees | All Other Fees |
Fidelity Municipal Bond Index Fund | $49,500 | $4,000 | $5,500 | $1,700 |
Fidelity SAI Municipal Bond Index Fund | $49,500 | $4,000 | $5,500 | $1,700 |
Fidelity Small Cap Growth Index Fund | $38,500 | $3,400 | $11,000 | $1,500 |
Fidelity Small Cap Value Index Fund | $39,800 | $3,500 | $8,800 | $1,500 |
| | | | |
| Audit Fees | Audit-Related Fees | Tax Fees | All Other Fees |
Fidelity Municipal Bond Index Fund | $49,700 | $4,000 | $5,500 | $1,700 |
Fidelity SAI Municipal Bond Index Fund | $49,700 | $4,000 | $5,500 | $1,700 |
Fidelity Small Cap Growth Index Fund | $38,700 | $3,400 | $11,500 | $1,500 |
Fidelity Small Cap Value Index Fund | $39,900 | $3,500 | $9,400 | $1,500 |
A Amounts may reflect rounding.
The following table(s) present(s) fees billed by Deloitte Entities and PwC that were required to be approved by the Audit Committee for services that relate directly to the operations and financial reporting of the Fund(s) and that are rendered on behalf of Fidelity Management & Research Company LLC ("FMR") and entities controlling, controlled by, or under common control with FMR (not including any sub-adviser whose
role is primarily portfolio management and is subcontracted with or overseen by another investment adviser) that provide ongoing services to the Fund(s) (“Fund Service Providers”):
Services Billed by Deloitte Entities
| | |
| June 30, 2024A | June 30, 2023A |
Audit-Related Fees | $200,000 | $80,000 |
Tax Fees | $- | $- |
All Other Fees | $1,929,500 | $- |
A Amounts may reflect rounding.
Services Billed by PwC
| | |
| June 30, 2024A | June 30, 2023A |
Audit-Related Fees | $9,437,800 | $8,699,200 |
Tax Fees | $61,000 | $1,000 |
All Other Fees | $35,000 | $- |
A Amounts may reflect rounding.
“Audit-Related Fees” represent fees billed for assurance and related services that are reasonably related to the performance of the fund audit or the review of the fund's financial statements and that are not reported under Audit Fees.
“Tax Fees” represent fees billed for tax compliance, tax advice or tax planning that relate directly to the operations and financial reporting of the fund.
“All Other Fees” represent fees billed for services provided to the fund or Fund Service Provider, a significant portion of which are assurance related, that relate directly to the operations and financial reporting of the fund, excluding those services that are reported under Audit Fees, Audit-Related Fees or Tax Fees.
Assurance services must be performed by an independent public accountant.
* * *
The aggregate non-audit fees billed by Deloitte Entities and PwC for services rendered to the Fund(s), FMR (not including any sub-adviser whose role is primarily portfolio management and is subcontracted with or overseen by another investment adviser), and
any Fund Service Provider for each of the last two fiscal years of the Fund(s) are as follows:
| | |
Billed By | June 30, 2024A | June 30, 2023A |
Deloitte Entities | $6,225,500 | $2,081,400 |
PwC | $15,060,500 | $14,206,200 |
A Amounts may reflect rounding.
The trust's Audit Committee has considered non-audit services that were not pre-approved that were provided by Deloitte Entities and PwC to Fund Service Providers to be compatible with maintaining the independence of Deloitte Entities and PwC in its(their) audit of the Fund(s), taking into account representations from Deloitte Entities and PwC, in accordance with Public Company Accounting Oversight Board rules, regarding its independence from the Fund(s) and its(their) related entities and FMR’s review of the appropriateness and permissibility under applicable law of such non-audit services prior to their provision to the Fund(s) Service Providers.
Audit Committee Pre-Approval Policies and Procedures
The trust’s Audit Committee must pre-approve all audit and non-audit services provided by a fund’s independent registered public accounting firm relating to the operations or financial reporting of the fund. Prior to the commencement of any audit or non-audit services to a fund, the Audit Committee reviews the services to determine whether they are appropriate and permissible under applicable law.
The Audit Committee has adopted policies and procedures to, among other purposes, provide a framework for the Committee’s consideration of non-audit services by the audit firms that audit the Fidelity funds. The policies and procedures require that any non-audit service provided by a fund audit firm to a Fidelity fund and any non-audit service provided by a fund auditor to a Fund Service Provider that relates directly to the operations and financial reporting of a Fidelity fund (“Covered Service”) are subject to approval by the Audit Committee before such service is provided.
All Covered Services must be approved in advance of provision of the service either: (i) by formal resolution of the Audit Committee, or (ii) by oral or written approval of the service by the Chair of the Audit Committee (or if the Chair is unavailable, such other member of the Audit Committee as may be designated by the Chair to act in the Chair’s absence). The approval contemplated by (ii) above is permitted where the Treasurer determines that action on such an engagement is necessary before the next meeting of the Audit Committee.
Non-audit services provided by a fund audit firm to a Fund Service Provider that do not relate directly to the operations and financial reporting of a Fidelity fund are reported to the Audit Committee periodically.
Non-Audit Services Approved Pursuant to Rule 2-01(c)(7)(i)(C) and (ii) of Regulation S-X (“De Minimis Exception”)
There were no non-audit services approved or required to be approved by the Audit Committee pursuant to the De Minimis Exception during the Fund’s(s’) last two fiscal years relating to services provided to (i) the Fund(s) or (ii) any Fund Service Provider that relate directly to the operations and financial reporting of the Fund(s).
The Registrant has not retained, for the preparation of the audit report on the financial statements included in the Form N-CSR, a registered public accounting firm that has a branch or office that is located in a foreign jurisdiction and that the Public Company Accounting Oversight Board (the “PCAOB”) has determined that the PCAOB is unable to inspect or investigate completely because of a position taken by an authority in the foreign jurisdiction.
The Registrant is not a “foreign issuer,” as defined in 17 CFR 240.3b-4.
Item 5.
Audit Committee of Listed Registrants
Not applicable.
Item 6.
Investments
(a)
Not applicable.
(b)
Not applicable.
Item 7.
Financial Statements and Financial Highlights for Open-End Management Investment Companies
Fidelity® Mid Cap Growth Index Fund
Fidelity® Mid Cap Value Index Fund
Fidelity® Small Cap Growth Index Fund
Fidelity® Small Cap Value Index Fund
Annual Report
June 30, 2024
Contents
To view a fund's proxy voting guidelines and proxy voting record for the 12-month period ended June 30, visit http://www.fidelity.com/proxyvotingresults or visit the Securities and Exchange Commission's (SEC) web site at http://www.sec.gov.
You may also call 1-800-544-8544 to request a free copy of the proxy voting guidelines.
A fund is not in any way connected to or sponsored, endorsed, sold or promoted by the London Stock Exchange Group plc and its group undertakings (collectively, the "LSE Group"). The LSE Group does not accept any liability whatsoever to any person arising out of the use of a fund or the underlying data.
Standard & Poor's, S&P and S&P 500 are registered service marks of The McGraw-Hill Companies, Inc. and have been licensed for use by Fidelity Distributors Corporation.
Other third-party marks appearing herein are the property of their respective owners.
All other marks appearing herein are registered or unregistered trademarks or service marks of FMR LLC or an affiliated company. © 2024 FMR LLC. All rights reserved.
This report and the financial statements contained herein are submitted for the general information of the shareholders of the Funds. This report is not authorized for distribution to prospective investors in the Funds unless preceded or accompanied by an effective prospectus.
A fund files its complete schedule of portfolio holdings with the SEC for the first and third quarters of each fiscal year on Form N-PORT. Forms N-PORT are available on the SEC's web site at http://www.sec.gov. A fund's Forms N-PORT may be reviewed and copied at the SEC's Public Reference Room in Washington, DC. Information regarding the operation of the SEC's Public Reference Room may be obtained by calling 1-800-SEC-0330.
For a complete list of a fund's portfolio holdings, view the most recent holdings listing, semiannual report, or annual report on Fidelity's web site at http://www.fidelity.com, http://www.institutional.fidelity.com, or http://www.401k.com, as applicable.
NOT FDIC INSURED •MAY LOSE VALUE •NO BANK GUARANTEE
Neither the Funds nor Fidelity Distributors Corporation is a bank.
Item 7: Financial Statements and Financial Highlights for Open-End Management Investment Companies (Annual Report)
Fidelity® Mid Cap Growth Index Fund
Schedule of Investments June 30, 2024
Showing Percentage of Net Assets
| Common Stocks - 98.8% |
| | | Shares | Value ($) |
| COMMUNICATION SERVICES - 4.4% | | | |
| Diversified Telecommunication Services - 0.0% | | | |
| Iridium Communications, Inc. | | 4,520 | 120,322 |
| Entertainment - 1.6% | | | |
| Liberty Media Corp. Liberty Formula One: | | | |
| Class A | | 3,423 | 219,859 |
| Class C | | 28,913 | 2,077,110 |
| Live Nation Entertainment, Inc. (a) | | 65,462 | 6,136,408 |
| Madison Square Garden Sports Corp. (a) | | 616 | 115,888 |
| Roblox Corp. (a) | | 211,825 | 7,882,008 |
| Roku, Inc. Class A (a) | | 7,857 | 470,870 |
| TKO Group Holdings, Inc. | | 4,480 | 483,795 |
| | | | 17,385,938 |
| Interactive Media & Services - 1.0% | | | |
| Pinterest, Inc. Class A (a) | | 245,480 | 10,818,304 |
| TripAdvisor, Inc. (a) | | 2,370 | 42,210 |
| Trump Media & Technology Group (a) | | 14,958 | 489,875 |
| | | | 11,350,389 |
| Media - 1.8% | | | |
| Liberty Broadband Corp.: | | | |
| Class A (a) | | 1,678 | 91,619 |
| Class C (a) | | 11,207 | 614,368 |
| Nexstar Media Group, Inc. | | 5,049 | 838,184 |
| The Trade Desk, Inc. Class A (a) | | 183,242 | 17,897,246 |
| | | | 19,441,417 |
TOTAL COMMUNICATION SERVICES | | | 48,298,066 |
| CONSUMER DISCRETIONARY - 15.1% | | | |
| Broadline Retail - 1.1% | | | |
| Coupang, Inc. Class A (a) | | 480,166 | 10,059,478 |
| Etsy, Inc. (a) | | 31,433 | 1,853,918 |
| | | | 11,913,396 |
| Distributors - 0.4% | | | |
| Pool Corp. (b) | | 15,452 | 4,748,863 |
| Diversified Consumer Services - 0.4% | | | |
| Bright Horizons Family Solutions, Inc. (a) | | 3,583 | 394,417 |
| Duolingo, Inc. (a) | | 15,207 | 3,173,245 |
| Grand Canyon Education, Inc. (a) | | 3,913 | 547,468 |
| H&R Block, Inc. | | 11,217 | 608,298 |
| | | | 4,723,428 |
| Hotels, Restaurants & Leisure - 7.3% | | | |
| Cava Group, Inc. (b) | | 31,274 | 2,900,664 |
| Choice Hotels International, Inc. (b) | | 10,127 | 1,205,113 |
| Churchill Downs, Inc. | | 28,880 | 4,031,648 |
| Darden Restaurants, Inc. | | 26,056 | 3,942,794 |
| Domino's Pizza, Inc. | | 5,030 | 2,597,140 |
| Draftkings Holdings, Inc. (a) | | 184,231 | 7,032,097 |
| Dutch Bros, Inc. (a) | | 14,989 | 620,545 |
| Expedia Group, Inc. (a) | | 52,420 | 6,604,396 |
| Hilton Worldwide Holdings, Inc. | | 52,258 | 11,402,696 |
| Hyatt Hotels Corp. Class A | | 2,631 | 399,702 |
| Las Vegas Sands Corp. | | 148,418 | 6,567,497 |
| Light & Wonder, Inc. Class A (a) | | 37,406 | 3,923,141 |
| Norwegian Cruise Line Holdings Ltd. (a) | | 177,435 | 3,334,004 |
| Planet Fitness, Inc. (a) | | 19,589 | 1,441,555 |
| Royal Caribbean Cruises Ltd. (a) | | 34,106 | 5,437,520 |
| Texas Roadhouse, Inc. | | 27,638 | 4,745,721 |
| Vail Resorts, Inc. | | 13,222 | 2,381,679 |
| Wendy's Co. | | 35,177 | 596,602 |
| Wingstop, Inc. | | 12,162 | 5,140,391 |
| Wyndham Hotels & Resorts, Inc. | | 2,829 | 209,346 |
| Wynn Resorts Ltd. | | 3,176 | 284,252 |
| Yum! Brands, Inc. | | 44,858 | 5,941,891 |
| | | | 80,740,394 |
| Household Durables - 0.4% | | | |
| SharkNinja, Inc. | | 5,432 | 408,215 |
| Tempur Sealy International, Inc. | | 69,544 | 3,292,213 |
| TopBuild Corp. (a) | | 1,053 | 405,689 |
| | | | 4,106,117 |
| Leisure Products - 0.3% | | | |
| Hasbro, Inc. | | 50,382 | 2,947,347 |
| YETI Holdings, Inc. (a) | | 10,520 | 401,338 |
| | | | 3,348,685 |
| Specialty Retail - 4.2% | | | |
| Burlington Stores, Inc. (a) | | 26,286 | 6,308,640 |
| CarMax, Inc. (a) | | 4,562 | 334,577 |
| Carvana Co. Class A (a) | | 15,298 | 1,969,159 |
| Dick's Sporting Goods, Inc. | | 2,147 | 461,283 |
| Five Below, Inc. (a) | | 17,935 | 1,954,377 |
| Floor & Decor Holdings, Inc. Class A (a)(b) | | 15,882 | 1,578,830 |
| Murphy U.S.A., Inc. | | 7,806 | 3,664,605 |
| RH (a) | | 1,209 | 295,528 |
| Ross Stores, Inc. | | 31,509 | 4,578,888 |
| Tractor Supply Co. | | 44,719 | 12,074,130 |
| Ulta Beauty, Inc. (a) | | 17,178 | 6,628,475 |
| Valvoline, Inc. (a) | | 53,538 | 2,312,842 |
| Williams-Sonoma, Inc. | | 15,616 | 4,409,490 |
| | | | 46,570,824 |
| Textiles, Apparel & Luxury Goods - 1.0% | | | |
| Crocs, Inc. (a) | | 4,437 | 647,536 |
| Deckers Outdoor Corp. (a) | | 10,586 | 10,246,719 |
| Skechers U.S.A., Inc. Class A (sub. vtg.) (a) | | 4,874 | 336,891 |
| | | | 11,231,146 |
TOTAL CONSUMER DISCRETIONARY | | | 167,382,853 |
| CONSUMER STAPLES - 2.8% | | | |
| Beverages - 0.4% | | | |
| Boston Beer Co., Inc. Class A (a) | | 765 | 233,363 |
| Celsius Holdings, Inc. (a) | | 72,999 | 4,167,513 |
| | | | 4,400,876 |
| Consumer Staples Distribution & Retail - 1.0% | | | |
| Casey's General Stores, Inc. | | 2,654 | 1,012,660 |
| Performance Food Group Co. (a) | | 9,058 | 598,824 |
| Sysco Corp. | | 128,246 | 9,155,482 |
| | | | 10,766,966 |
| Food Products - 0.4% | | | |
| Freshpet, Inc. (a) | | 6,154 | 796,266 |
| Lamb Weston Holdings, Inc. | | 19,145 | 1,609,712 |
| Pilgrim's Pride Corp. (a) | | 1,607 | 61,853 |
| The Hershey Co. | | 8,502 | 1,562,923 |
| | | | 4,030,754 |
| Household Products - 0.6% | | | |
| The Clorox Co. | | 51,464 | 7,023,292 |
| Personal Care Products - 0.4% | | | |
| elf Beauty, Inc. (a) | | 21,932 | 4,621,511 |
TOTAL CONSUMER STAPLES | | | 30,843,399 |
| ENERGY - 4.0% | | | |
| Energy Equipment & Services - 0.3% | | | |
| Weatherford International PLC (a) | | 29,910 | 3,662,480 |
| Oil, Gas & Consumable Fuels - 3.7% | | | |
| Antero Midstream GP LP | | 53,670 | 791,096 |
| Cheniere Energy, Inc. | | 48,655 | 8,506,354 |
| Civitas Resources, Inc. | | 11,391 | 785,979 |
| Hess Corp. | | 74,940 | 11,055,149 |
| Matador Resources Co. | | 3,703 | 220,699 |
| New Fortress Energy, Inc. Class A (b) | | 14,277 | 313,808 |
| Permian Resource Corp. Class A | | 55,443 | 895,404 |
| Targa Resources Corp. | | 91,100 | 11,731,858 |
| Texas Pacific Land Corp. | | 7,785 | 5,716,292 |
| Viper Energy, Inc. | | 11,053 | 414,819 |
| | | | 40,431,458 |
TOTAL ENERGY | | | 44,093,938 |
| FINANCIALS - 12.4% | | | |
| Banks - 1.6% | | | |
| Nu Holdings Ltd. Class A (a) | | 1,319,306 | 17,005,854 |
| Popular, Inc. | | 3,045 | 269,269 |
| | | | 17,275,123 |
| Capital Markets - 6.6% | | | |
| Ameriprise Financial, Inc. | | 37,887 | 16,184,948 |
| Ares Management Corp. Class A, | | 73,925 | 9,852,724 |
| Blue Owl Capital, Inc. Class A | | 207,969 | 3,691,450 |
| Coinbase Global, Inc. (a) | | 68,739 | 15,275,868 |
| FactSet Research Systems, Inc. | | 5,581 | 2,278,555 |
| Houlihan Lokey | | 1,961 | 264,460 |
| Jefferies Financial Group, Inc. | | 21,054 | 1,047,647 |
| Lazard, Inc. Class A | | 42,466 | 1,621,352 |
| LPL Financial | | 30,861 | 8,619,477 |
| Morningstar, Inc. | | 11,064 | 3,273,284 |
| MSCI, Inc. | | 18,444 | 8,885,397 |
| TPG, Inc. | | 8,637 | 358,004 |
| Tradeweb Markets, Inc. Class A | | 19,006 | 2,014,636 |
| XP, Inc. Class A | | 17,081 | 300,455 |
| | | | 73,668,257 |
| Consumer Finance - 0.2% | | | |
| Ally Financial, Inc. | | 15,472 | 613,774 |
| Credit Acceptance Corp. (a) | | 2,031 | 1,045,315 |
| SoFi Technologies, Inc. (a) | | 67,481 | 446,049 |
| | | | 2,105,138 |
| Financial Services - 2.4% | | | |
| Block, Inc. Class A (a) | | 97,190 | 6,267,783 |
| Corpay, Inc. (a) | | 28,684 | 7,641,704 |
| Equitable Holdings, Inc. | | 135,433 | 5,533,792 |
| Shift4 Payments, Inc. (a)(b) | | 24,908 | 1,827,002 |
| The Western Union Co. | | 24,665 | 301,406 |
| Toast, Inc. (a) | | 183,869 | 4,738,304 |
| UWM Holdings Corp. Class A | | 26,860 | 186,140 |
| WEX, Inc. (a) | | 1,609 | 285,018 |
| | | | 26,781,149 |
| Insurance - 1.6% | | | |
| Allstate Corp. | | 16,990 | 2,712,623 |
| Arthur J. Gallagher & Co. | | 6,174 | 1,600,980 |
| Brown & Brown, Inc. | | 43,564 | 3,895,057 |
| Everest Re Group Ltd. | | 2,908 | 1,108,006 |
| Kinsale Capital Group, Inc. | | 9,129 | 3,517,221 |
| Markel Group, Inc. (a) | | 1,256 | 1,979,029 |
| RLI Corp. | | 1,047 | 147,302 |
| Ryan Specialty Group Holdings, Inc. (b) | | 42,412 | 2,456,079 |
| | | | 17,416,297 |
TOTAL FINANCIALS | | | 137,245,964 |
| HEALTH CARE - 14.4% | | | |
| Biotechnology - 3.7% | | | |
| Alnylam Pharmaceuticals, Inc. (a) | | 46,493 | 11,297,799 |
| Apellis Pharmaceuticals, Inc. (a) | | 43,286 | 1,660,451 |
| Cerevel Therapeutics Holdings (a) | | 28,584 | 1,168,800 |
| Exact Sciences Corp. (a) | | 29,869 | 1,261,965 |
| Exelixis, Inc. (a) | | 98,955 | 2,223,519 |
| Incyte Corp. (a) | | 4,534 | 274,851 |
| Ionis Pharmaceuticals, Inc. (a) | | 55,908 | 2,664,575 |
| Natera, Inc. (a) | | 46,915 | 5,080,425 |
| Neurocrine Biosciences, Inc. (a) | | 41,342 | 5,691,553 |
| Repligen Corp. (a) | | 3,302 | 416,250 |
| Sarepta Therapeutics, Inc. (a) | | 37,541 | 5,931,478 |
| Ultragenyx Pharmaceutical, Inc. (a) | | 36,172 | 1,486,669 |
| Viking Therapeutics, Inc. (a) | | 43,593 | 2,310,865 |
| | | | 41,469,200 |
| Health Care Equipment & Supplies - 5.0% | | | |
| Align Technology, Inc. (a) | | 18,205 | 4,395,233 |
| DexCom, Inc. (a) | | 164,009 | 18,595,340 |
| GE Healthcare Technologies, Inc. | | 16,616 | 1,294,719 |
| IDEXX Laboratories, Inc. (a) | | 34,178 | 16,651,522 |
| Inspire Medical Systems, Inc. (a) | | 12,335 | 1,650,793 |
| Insulet Corp. (a) | | 28,952 | 5,842,514 |
| Masimo Corp. (a) | | 9,233 | 1,162,804 |
| Penumbra, Inc. (a) | | 15,283 | 2,750,482 |
| ResMed, Inc. | | 16,456 | 3,150,008 |
| | | | 55,493,415 |
| Health Care Providers & Services - 2.7% | | | |
| Cardinal Health, Inc. | | 59,981 | 5,897,332 |
| Cencora, Inc. | | 69,710 | 15,705,663 |
| Chemed Corp. | | 627 | 340,198 |
| DaVita, Inc. (a) | | 20,901 | 2,896,252 |
| Molina Healthcare, Inc. (a) | | 15,191 | 4,516,284 |
| | | | 29,355,729 |
| Health Care Technology - 1.0% | | | |
| Doximity, Inc. (a) | | 3,723 | 104,132 |
| Veeva Systems, Inc. Class A (a) | | 61,150 | 11,191,062 |
| | | | 11,295,194 |
| Life Sciences Tools & Services - 1.7% | | | |
| 10X Genomics, Inc. (a) | | 28,905 | 562,202 |
| Bruker Corp. | | 27,554 | 1,758,221 |
| Fortrea Holdings, Inc. | | 3,745 | 87,408 |
| IQVIA Holdings, Inc. (a) | | 8,444 | 1,785,399 |
| Medpace Holdings, Inc. (a) | | 10,533 | 4,338,016 |
| Waters Corp. (a) | | 14,904 | 4,323,948 |
| West Pharmaceutical Services, Inc. | | 18,268 | 6,017,297 |
| | | | 18,872,491 |
| Pharmaceuticals - 0.3% | | | |
| Intra-Cellular Therapies, Inc. (a) | | 42,665 | 2,922,126 |
TOTAL HEALTH CARE | | | 159,408,155 |
| INDUSTRIALS - 17.0% | | | |
| Aerospace & Defense - 1.9% | | | |
| Axon Enterprise, Inc. (a) | | 29,767 | 8,758,642 |
| BWX Technologies, Inc. | | 7,709 | 732,355 |
| HEICO Corp. | | 18,271 | 4,085,578 |
| HEICO Corp. Class A | | 33,669 | 5,976,921 |
| Howmet Aerospace, Inc. | | 10,248 | 795,552 |
| Loar Holdings, Inc. | | 3,904 | 208,513 |
| Spirit AeroSystems Holdings, Inc. Class A (a)(b) | | 6,007 | 197,450 |
| | | | 20,755,011 |
| Air Freight & Logistics - 0.1% | | | |
| Expeditors International of Washington, Inc. | | 9,538 | 1,190,247 |
| Building Products - 1.7% | | | |
| AAON, Inc. | | 28,307 | 2,469,503 |
| Advanced Drain Systems, Inc. | | 10,439 | 1,674,311 |
| Armstrong World Industries, Inc. | | 6,069 | 687,254 |
| Builders FirstSource, Inc. (a) | | 4,527 | 626,582 |
| Carlisle Companies, Inc. | | 2,663 | 1,079,074 |
| Lennox International, Inc. | | 13,287 | 7,108,279 |
| Simpson Manufacturing Co. Ltd. | | 1,651 | 278,243 |
| The AZEK Co., Inc. Class A, (a) | | 41,773 | 1,759,896 |
| Trex Co., Inc. (a) | | 44,924 | 3,329,767 |
| | | | 19,012,909 |
| Commercial Services & Supplies - 1.0% | | | |
| Rollins, Inc. | | 115,836 | 5,651,638 |
| Tetra Tech, Inc. | | 4,749 | 971,076 |
| Veralto Corp. | | 46,075 | 4,398,780 |
| | | | 11,021,494 |
| Construction & Engineering - 1.1% | | | |
| Comfort Systems U.S.A., Inc. | | 14,568 | 4,430,420 |
| EMCOR Group, Inc. | | 7,612 | 2,778,989 |
| Quanta Services, Inc. | | 18,427 | 4,682,116 |
| Willscot Mobile Mini Holdings (a) | | 22,506 | 847,126 |
| | | | 12,738,651 |
| Electrical Equipment - 1.4% | | | |
| Generac Holdings, Inc. (a) | | 11,958 | 1,581,087 |
| Rockwell Automation, Inc. | | 4,371 | 1,203,249 |
| Vertiv Holdings Co. | | 148,424 | 12,849,066 |
| | | | 15,633,402 |
| Ground Transportation - 2.3% | | | |
| Avis Budget Group, Inc. | | 2,800 | 292,656 |
| Lyft, Inc. (a) | | 103,100 | 1,453,710 |
| Old Dominion Freight Lines, Inc. | | 81,440 | 14,382,304 |
| Saia, Inc. (a) | | 6,411 | 3,040,673 |
| U-Haul Holding Co. (a)(b) | | 1,382 | 85,311 |
| U-Haul Holding Co. (non-vtg.) | | 17,999 | 1,080,300 |
| XPO, Inc. (a) | | 47,386 | 5,030,024 |
| | | | 25,364,978 |
| Machinery - 0.1% | | | |
| Lincoln Electric Holdings, Inc. | | 6,382 | 1,203,900 |
| Passenger Airlines - 0.0% | | | |
| American Airlines Group, Inc. (a)(b) | | 19,535 | 221,332 |
| Professional Services - 4.2% | | | |
| Booz Allen Hamilton Holding Corp. Class A | | 53,080 | 8,169,012 |
| Broadridge Financial Solutions, Inc. | | 44,321 | 8,731,237 |
| Dayforce, Inc. (a)(b) | | 6,512 | 322,995 |
| Equifax, Inc. | | 10,236 | 2,481,821 |
| KBR, Inc. | | 4,744 | 304,280 |
| Paychex, Inc. | | 47,868 | 5,675,230 |
| Paycom Software, Inc. | | 13,298 | 1,902,146 |
| Paycor HCM, Inc. (a) | | 2,918 | 37,059 |
| Paylocity Holding Corp. (a) | | 18,171 | 2,395,846 |
| TransUnion | | 4,585 | 340,024 |
| Verisk Analytics, Inc. | | 59,053 | 15,917,736 |
| | | | 46,277,386 |
| Trading Companies & Distributors - 3.2% | | | |
| Core & Main, Inc. (a) | | 45,181 | 2,211,158 |
| Fastenal Co. | | 200,064 | 12,572,022 |
| Ferguson PLC | | 5,619 | 1,088,119 |
| SiteOne Landscape Supply, Inc. (a) | | 6,820 | 828,016 |
| United Rentals, Inc. | | 6,666 | 4,311,102 |
| W.W. Grainger, Inc. | | 15,678 | 14,145,319 |
| | | | 35,155,736 |
TOTAL INDUSTRIALS | | | 188,575,046 |
| INFORMATION TECHNOLOGY - 24.7% | | | |
| Communications Equipment - 0.0% | | | |
| Ubiquiti, Inc. (b) | | 773 | 112,595 |
| Electronic Equipment, Instruments & Components - 0.8% | | | |
| CDW Corp. | | 28,016 | 6,271,101 |
| Cognex Corp. | | 3,847 | 179,886 |
| Jabil, Inc. | | 3,993 | 434,398 |
| Zebra Technologies Corp. Class A (a) | | 4,537 | 1,401,615 |
| | | | 8,287,000 |
| IT Services - 4.2% | | | |
| Cloudflare, Inc. (a) | | 124,320 | 10,297,426 |
| EPAM Systems, Inc. (a) | | 1,450 | 272,760 |
| Gartner, Inc. (a) | | 31,248 | 14,032,227 |
| Globant SA (a) | | 13,109 | 2,336,810 |
| GoDaddy, Inc. (a) | | 58,611 | 8,188,543 |
| MongoDB, Inc. Class A (a) | | 28,236 | 7,057,871 |
| Okta, Inc. (a) | | 28,637 | 2,680,710 |
| Twilio, Inc. Class A (a) | | 14,295 | 812,099 |
| VeriSign, Inc. (a) | | 2,337 | 415,519 |
| | | | 46,093,965 |
| Semiconductors & Semiconductor Equipment - 4.0% | | | |
| Astera Labs, Inc. | | 456 | 27,593 |
| Enphase Energy, Inc. (a) | | 54,622 | 5,446,360 |
| Entegris, Inc. | | 62,421 | 8,451,803 |
| Lattice Semiconductor Corp. (a) | | 48,885 | 2,834,841 |
| MKS Instruments, Inc. | | 1,635 | 213,498 |
| Monolithic Power Systems, Inc. | | 19,471 | 15,998,931 |
| Onto Innovation, Inc. (a) | | 5,217 | 1,145,445 |
| Teradyne, Inc. | | 57,798 | 8,570,865 |
| Universal Display Corp. | | 9,745 | 2,048,886 |
| | | | 44,738,222 |
| Software - 12.8% | | | |
| AppFolio, Inc. Class A, (a) | | 9,113 | 2,228,766 |
| AppLovin Corp. Class A, (a) | | 108,735 | 9,048,927 |
| Bentley Systems, Inc. Class B (b) | | 58,086 | 2,867,125 |
| Bill Holdings, Inc. (a) | | 10,570 | 556,193 |
| Confluent, Inc. (a) | | 100,198 | 2,958,847 |
| Datadog, Inc. Class A (a) | | 123,930 | 16,072,482 |
| DocuSign, Inc. (a) | | 84,220 | 4,505,770 |
| DoubleVerify Holdings, Inc. (a) | | 33,878 | 659,605 |
| Dropbox, Inc. Class A (a) | | 31,435 | 706,344 |
| Dynatrace, Inc. (a) | | 107,881 | 4,826,596 |
| Elastic NV (a) | | 33,725 | 3,841,615 |
| Fair Isaac Corp. (a) | | 8,429 | 12,547,915 |
| Five9, Inc. (a) | | 30,375 | 1,339,538 |
| GitLab, Inc. (a) | | 49,112 | 2,441,849 |
| Guidewire Software, Inc. (a) | | 15,437 | 2,128,608 |
| HashiCorp, Inc. (a) | | 31,181 | 1,050,488 |
| HubSpot, Inc. (a) | | 20,259 | 11,948,556 |
| Manhattan Associates, Inc. (a) | | 25,389 | 6,262,959 |
| MicroStrategy, Inc. Class A (a) | | 409 | 563,389 |
| nCino, Inc. (a) | | 21,173 | 665,891 |
| Nutanix, Inc. Class A (a) | | 28,589 | 1,625,285 |
| Palantir Technologies, Inc. Class A (a) | | 834,186 | 21,129,925 |
| Pegasystems, Inc. | | 18,478 | 1,118,473 |
| Procore Technologies, Inc. (a) | | 43,641 | 2,893,835 |
| PTC, Inc. (a) | | 29,789 | 5,411,768 |
| RingCentral, Inc. (a) | | 34,056 | 960,379 |
| SentinelOne, Inc. (a) | | 15,298 | 322,023 |
| Smartsheet, Inc. (a) | | 52,551 | 2,316,448 |
| Teradata Corp. (a) | | 40,220 | 1,390,003 |
| Tyler Technologies, Inc. (a) | | 14,939 | 7,511,030 |
| UiPath, Inc. Class A (a) | | 138,528 | 1,756,535 |
| Unity Software, Inc. (a)(b) | | 54,739 | 890,056 |
| Zscaler, Inc. (a) | | 37,951 | 7,293,803 |
| | | | 141,841,026 |
| Technology Hardware, Storage & Peripherals - 2.9% | | | |
| HP, Inc. | | 98,129 | 3,436,478 |
| NetApp, Inc. | | 38,267 | 4,928,790 |
| Pure Storage, Inc. Class A (a) | | 104,824 | 6,730,749 |
| Super Micro Computer, Inc. (a) | | 20,540 | 16,829,449 |
| | | | 31,925,466 |
TOTAL INFORMATION TECHNOLOGY | | | 272,998,274 |
| MATERIALS - 1.4% | | | |
| Chemicals - 0.3% | | | |
| Celanese Corp. | | 11,774 | 1,588,195 |
| RPM International, Inc. | | 11,908 | 1,282,253 |
| The Chemours Co. LLC | | 4,572 | 103,190 |
| | | | 2,973,638 |
| Construction Materials - 0.6% | | | |
| Eagle Materials, Inc. | | 10,697 | 2,326,170 |
| Martin Marietta Materials, Inc. | | 1,423 | 770,981 |
| Vulcan Materials Co. | | 14,154 | 3,519,817 |
| | | | 6,616,968 |
| Containers & Packaging - 0.3% | | | |
| Avery Dennison Corp. | | 12,521 | 2,737,717 |
| Sealed Air Corp. | | 3,256 | 113,276 |
| | | | 2,850,993 |
| Metals & Mining - 0.1% | | | |
| Cleveland-Cliffs, Inc. (a) | | 63,441 | 976,357 |
| Paper & Forest Products - 0.1% | | | |
| Louisiana-Pacific Corp. | | 18,637 | 1,534,384 |
TOTAL MATERIALS | | | 14,952,340 |
| REAL ESTATE - 1.2% | | | |
| Equity Real Estate Investment Trusts (REITs) - 1.1% | | | |
| Iron Mountain, Inc. | | 68,922 | 6,176,790 |
| Lamar Advertising Co. Class A | | 9,096 | 1,087,245 |
| Simon Property Group, Inc. | | 34,339 | 5,212,660 |
| | | | 12,476,695 |
| Real Estate Management & Development - 0.1% | | | |
| Jones Lang LaSalle, Inc. (a) | | 6,071 | 1,246,255 |
TOTAL REAL ESTATE | | | 13,722,950 |
| UTILITIES - 1.4% | | | |
| Electric Utilities - 0.3% | | | |
| NRG Energy, Inc. | | 36,256 | 2,822,892 |
| Independent Power and Renewable Electricity Producers - 1.1% | | | |
| Vistra Corp. | | 142,827 | 12,280,265 |
TOTAL UTILITIES | | | 15,103,157 |
| TOTAL COMMON STOCKS (Cost $951,450,237) | | | 1,092,624,142 |
| | | | |
| U.S. Treasury Obligations - 0.0% |
| | | Principal Amount (c) | Value ($) |
U.S. Treasury Bills, yield at date of purchase 5.31% 8/22/24 (d) (Cost $169,705) | | 171,000 | 169,709 |
| | | | |
| Money Market Funds - 1.7% |
| | | Shares | Value ($) |
| Fidelity Cash Central Fund 5.38% (e) | | 4,426,430 | 4,427,315 |
| Fidelity Securities Lending Cash Central Fund 5.38% (e)(f) | | 14,175,532 | 14,176,950 |
| TOTAL MONEY MARKET FUNDS (Cost $18,604,265) | | | 18,604,265 |
| | | | |
| TOTAL INVESTMENT IN SECURITIES - 100.5% (Cost $970,224,207) | 1,111,398,116 |
NET OTHER ASSETS (LIABILITIES) - (0.5)% | (5,123,145) |
| NET ASSETS - 100.0% | 1,106,274,971 |
| | |
| Futures Contracts |
| | Number of contracts | Expiration Date | Notional Amount ($) | Value ($) | Unrealized Appreciation/ (Depreciation) ($) |
| Purchased | | | | | |
| | | | | | |
| Equity Index Contracts | | | | | |
| CME E-mini S&P MidCap 400 Index Contracts (United States) | 2 | Sep 2024 | 591,620 | 6,242 | 6,242 |
| | | | | | |
| The notional amount of futures purchased as a percentage of Net Assets is 0.1% |
Legend
| (b) | Security or a portion of the security is on loan at period end. |
| (c) | Amount is stated in United States dollars unless otherwise noted. |
| (d) | Security or a portion of the security was pledged to cover margin requirements for futures contracts. At period end, the value of securities pledged amounted to $169,709. |
| (e) | Affiliated fund that is generally available only to investment companies and other accounts managed by Fidelity Investments. The rate quoted is the annualized seven-day yield of the fund at period end. A complete unaudited listing of the fund's holdings as of its most recent quarter end is available upon request. In addition, each Fidelity Central Fund's financial statements, which are not covered by the Fund's Report of Independent Registered Public Accounting Firm, are available on the SEC's website or upon request. |
| (f) | Investment made with cash collateral received from securities on loan. |
Affiliated Central Funds
Fiscal year to date information regarding the Fund's investments in Fidelity Central Funds, including the ownership percentage, is presented below.
| Affiliate | Value, beginning of period ($) | Purchases ($) | Sales Proceeds ($) | Dividend Income ($) | Realized Gain (loss) ($) | Change in Unrealized appreciation (depreciation) ($) | Value, end of period ($) | % ownership, end of period |
| Fidelity Cash Central Fund 5.38% | 1,930,833 | 331,766,736 | 329,270,204 | 218,432 | (50) | - | 4,427,315 | 0.0% |
| Fidelity Securities Lending Cash Central Fund 5.38% | 25,697,964 | 161,683,510 | 173,204,524 | 45,323 | - | - | 14,176,950 | 0.1% |
| Total | 27,628,797 | 493,450,246 | 502,474,728 | 263,755 | (50) | - | 18,604,265 | |
| | | | | | | | | |
Amounts in the dividend income column in the above table include any capital gain distributions from underlying funds, which are presented in the corresponding line item in the Statement of Operations, if applicable.
Amounts in the dividend income column for Fidelity Securities Lending Cash Central Fund represents the income earned on investing cash collateral, less rebates paid to borrowers and any lending agent fees associated with the loan, plus any premium payments received for lending certain types of securities.
Amounts included in the purchases and sales proceeds columns may include in-kind transactions, if applicable.
Investment Valuation
The following is a summary of the inputs used, as of June 30, 2024, involving the Fund's assets and liabilities carried at fair value. The inputs or methodology used for valuing securities may not be an indication of the risk associated with investing in those securities. For more information on valuation inputs, and their aggregation into the levels used below, please refer to the Investment Valuation section in the accompanying Notes to Financial Statements.
| Valuation Inputs at Reporting Date: |
| Description | Total ($) | Level 1 ($) | Level 2 ($) | Level 3 ($) |
Investments in Securities: | | | | |
|
| Equities: | | | | |
Communication Services | 48,298,066 | 48,298,066 | - | - |
Consumer Discretionary | 167,382,853 | 167,382,853 | - | - |
Consumer Staples | 30,843,399 | 30,843,399 | - | - |
Energy | 44,093,938 | 44,093,938 | - | - |
Financials | 137,245,964 | 137,245,964 | - | - |
Health Care | 159,408,155 | 159,408,155 | - | - |
Industrials | 188,575,046 | 188,575,046 | - | - |
Information Technology | 272,998,274 | 272,998,274 | - | - |
Materials | 14,952,340 | 14,952,340 | - | - |
Real Estate | 13,722,950 | 13,722,950 | - | - |
Utilities | 15,103,157 | 15,103,157 | - | - |
|
| U.S. Government and Government Agency Obligations | 169,709 | - | 169,709 | - |
|
| Money Market Funds | 18,604,265 | 18,604,265 | - | - |
| Total Investments in Securities: | 1,111,398,116 | 1,111,228,407 | 169,709 | - |
Derivative Instruments: Assets | | | | |
Futures Contracts | 6,242 | 6,242 | - | - |
| Total Assets | 6,242 | 6,242 | - | - |
| Total Derivative Instruments: | 6,242 | 6,242 | - | - |
Value of Derivative Instruments
The following table is a summary of the Fund's value of derivative instruments by primary risk exposure as of June 30, 2024. For additional information on derivative instruments, please refer to the Derivative Instruments section in the accompanying Notes to Financial Statements.
Primary Risk Exposure / Derivative Type | Value |
| Asset ($) | Liability ($) |
| Equity Risk | | |
Futures Contracts (a) | 6,242 | 0 |
| Total Equity Risk | 6,242 | 0 |
| Total Value of Derivatives | 6,242 | 0 |
(a)Reflects gross cumulative appreciation (depreciation) on futures contracts as presented in the Schedule of Investments. In the Statement of Assets and Liabilities, the period end daily variation margin is included in receivable or payable for daily variation margin on futures contracts, and the net cumulative appreciation (depreciation) is included in Total accumulated earnings (loss).
Fidelity® Mid Cap Growth Index Fund
Financial Statements
| Statement of Assets and Liabilities |
| | | | June 30, 2024 |
| | | | | |
| Assets | | | | |
| Investment in securities, at value (including securities loaned of $13,802,534) - See accompanying schedule: | | | | |
Unaffiliated issuers (cost $951,619,942) | $ | 1,092,793,851 | | |
Fidelity Central Funds (cost $18,604,265) | | 18,604,265 | | |
| | | | | |
| | | | | |
| Total Investment in Securities (cost $970,224,207) | | | $ | 1,111,398,116 |
| Segregated cash with brokers for derivative instruments | | | | 118,112 |
| Cash | | | | 28,486 |
| Foreign currency held at value (cost $300) | | | | 297 |
| Receivable for investments sold | | | | 409,811,110 |
| Receivable for fund shares sold | | | | 17,050,438 |
| Dividends receivable | | | | 257,505 |
| Distributions receivable from Fidelity Central Funds | | | | 17,457 |
| Receivable for daily variation margin on futures contracts | | | | 8,087 |
| Other receivables | | | | 13,962 |
Total assets | | | | 1,538,703,570 |
| Liabilities | | | | |
| Payable for investments purchased | $ | 365,269,273 | | |
| Payable for fund shares redeemed | | 52,937,553 | | |
| Accrued management fee | | 44,823 | | |
| Collateral on securities loaned | | 14,176,950 | | |
| Total liabilities | | | | 432,428,599 |
| Net Assets | | | $ | 1,106,274,971 |
| Net Assets consist of: | | | | |
| Paid in capital | | | $ | 1,001,063,902 |
| Total accumulated earnings (loss) | | | | 105,211,069 |
| Net Assets | | | $ | 1,106,274,971 |
Net Asset Value, offering price and redemption price per share ($1,106,274,971 ÷ 38,548,045 shares) | | | $ | 28.70 |
| Statement of Operations |
| | | | Year ended June 30, 2024 |
| Investment Income | | | | |
| Dividends | | | $ | 6,204,404 |
| Interest | | | | 8,992 |
| Income from Fidelity Central Funds (including $45,323 from security lending) | | | | 263,755 |
| Total income | | | | 6,477,151 |
| Expenses | | | | |
| Management fee | $ | 419,189 | | |
| Independent trustees' fees and expenses | | 2,489 | | |
| Interest | | 10,607 | | |
| Miscellaneous | | 18,782 | | |
| Total expenses before reductions | | 451,067 | | |
| Expense reductions | | (959) | | |
| Total expenses after reductions | | | | 450,108 |
| Net Investment income (loss) | | | | 6,027,043 |
| Realized and Unrealized Gain (Loss) | | | | |
| Net realized gain (loss) on: | | | | |
| Investment Securities: | | | | |
| Unaffiliated issuers | | 33,290,954 | | |
| Redemptions in-kind | | 26,543,179 | | |
| Fidelity Central Funds | | (50) | | |
| Foreign currency transactions | | (6) | | |
| Futures contracts | | (58,099) | | |
| Total net realized gain (loss) | | | | 59,775,978 |
| Change in net unrealized appreciation (depreciation) on: | | | | |
| Investment Securities: | | | | |
| Unaffiliated issuers | | 52,381,331 | | |
| Assets and liabilities in foreign currencies | | (3) | | |
| Futures contracts | | (49,853) | | |
| Total change in net unrealized appreciation (depreciation) | | | | 52,331,475 |
| Net gain (loss) | | | | 112,107,453 |
| Net increase (decrease) in net assets resulting from operations | | | $ | 118,134,496 |
| Statement of Changes in Net Assets |
| |
| | Year ended June 30, 2024 | | Year ended June 30, 2023 |
| Increase (Decrease) in Net Assets | | | | |
| Operations | | | | |
| Net investment income (loss) | $ | 6,027,043 | $ | 4,626,920 |
| Net realized gain (loss) | | 59,775,978 | | 19,298,283 |
| Change in net unrealized appreciation (depreciation) | | 52,331,475 | | 92,667,607 |
| Net increase (decrease) in net assets resulting from operations | | 118,134,496 | | 116,592,810 |
| Distributions to shareholders | | (5,052,417) | | (4,150,490) |
| | | | | |
| Share transactions | | | | |
| Proceeds from sales of shares | | 649,400,298 | | 300,411,658 |
| Reinvestment of distributions | | 3,453,892 | | 2,724,805 |
| Cost of shares redeemed | | (369,176,470) | | (163,391,944) |
| | | | | |
Net increase (decrease) in net assets resulting from share transactions | | 283,677,720 | | 139,744,519 |
| Total increase (decrease) in net assets | | 396,759,799 | | 252,186,839 |
| | | | | |
| Net Assets | | | | |
| Beginning of period | | 709,515,172 | | 457,328,333 |
| End of period | $ | 1,106,274,971 | $ | 709,515,172 |
| | | | | |
| Other Information | | | | |
| Shares | | | | |
| Sold | | 23,879,699 | | 13,089,461 |
| Issued in reinvestment of distributions | | 133,872 | | 120,408 |
| Redeemed | | (13,714,932) | | (7,201,423) |
| Net increase (decrease) | | 10,298,639 | | 6,008,446 |
| | | | | |
Financial Highlights
Fidelity® Mid Cap Growth Index Fund |
| |
| Years ended June 30, | | 2024 | | 2023 | | 2022 | | 2021 | | 2020 A |
Selected Per-Share Data | | | | | | | | | | |
| Net asset value, beginning of period | $ | 25.12 | $ | 20.56 | $ | 31.08 | $ | 21.71 | $ | 20.00 |
| Income from Investment Operations | | | | | | | | | | |
Net investment income (loss) B,C | | .19 | | .18 | | .17 | | .13 | | .15 |
| Net realized and unrealized gain (loss) | | 3.56 | | 4.56 | | (8.78) | | 9.34 | | 1.62 |
| Total from investment operations | | 3.75 | | 4.74 | | (8.61) | | 9.47 | | 1.77 |
| Distributions from net investment income | | (.17) | | (.18) | | (.12) | | (.10) | | (.06) |
| Distributions from net realized gain | | - | | - | | (1.79) | | - | | - D |
| Total distributions | | (.17) | | (.18) | | (1.91) | | (.10) | | (.06) |
| Net asset value, end of period | $ | 28.70 | $ | 25.12 | $ | 20.56 | $ | 31.08 | $ | 21.71 |
Total Return E,F | | | | 23.13% | | (29.57)% | | 43.70% | | 8.86% |
Ratios to Average Net Assets C,G,H | | | | | | | | | | |
| Expenses before reductions | | .05% | | .05% | | .05% | | .05% | | .05% I |
| Expenses net of fee waivers, if any | | | | .05% | | .05% | | .05% | | .05% I |
| Expenses net of all reductions | | .05% | | .05% | | .05% | | .05% | | .05% I |
| Net investment income (loss) | | .72% | | .81% | | .62% | | .47% | | .76% I |
| Supplemental Data | | | | | | | | | | |
| Net assets, end of period (000 omitted) | $ | 1,106,275 | $ | 709,515 | $ | 457,328 | $ | 653,513 | $ | 208,955 |
Portfolio turnover rate J | | | | 46% | | 62% | | 54% | | 109% I |
AFor the period July 11, 2019 (commencement of operations) through June 30, 2020.
BCalculated based on average shares outstanding during the period.
CNet investment income (loss) is affected by the timing of the declaration of dividends by any underlying mutual funds or exchange-traded funds (ETFs). Net investment income (loss) of any mutual funds or ETFs is not included in the Fund's net investment income (loss) ratio.
DAmount represents less than $.005 per share.
ETotal returns for periods of less than one year are not annualized.
FTotal returns would have been lower if certain expenses had not been reduced during the applicable periods shown.
GFees and expenses of any underlying mutual funds or exchange-traded funds (ETFs) are not included in the Fund's expense ratio. The Fund indirectly bears its proportionate share of these expenses. For additional expense information related to investments in Fidelity Central Funds, please refer to the "Investments in Fidelity Central Funds" note found in the Notes to Financial Statements section of the most recent Annual or Semi-Annual report.
HExpense ratios reflect operating expenses of the class. Expenses before reductions do not reflect amounts reimbursed, waived, or reduced through arrangements with the investment adviser, brokerage services, or other offset arrangements, if applicable, and do not represent the amount paid by the class during periods when reimbursements, waivers or reductions occur.
IAnnualized.
JAmount does not include the portfolio activity of any underlying mutual funds or exchange-traded funds (ETFs).
KPortfolio turnover rate excludes securities received or delivered in-kind.
Fidelity® Mid Cap Value Index Fund
Schedule of Investments June 30, 2024
Showing Percentage of Net Assets
| Common Stocks - 101.9% |
| | | Shares | Value ($) |
| COMMUNICATION SERVICES - 3.2% | | | |
| Diversified Telecommunication Services - 0.2% | | | |
| Frontier Communications Parent, Inc. (a) | | 26,230 | 686,701 |
| GCI Liberty, Inc. Class A (Escrow) (b) | | 9,740 | 0 |
| Iridium Communications, Inc. | | 11,637 | 309,777 |
| Liberty Global Ltd.: | | | |
| Class A | | 17,722 | 308,894 |
| Class C | | 18,382 | 328,119 |
| | | | 1,633,491 |
| Entertainment - 1.4% | | | |
| Electronic Arts, Inc. | | 28,579 | 3,981,912 |
| Liberty Media Corp. Liberty Formula One: | | | |
| Class A | | 1,596 | 102,511 |
| Class C | | 13,482 | 968,547 |
| Liberty Media Corp. Liberty Live: | | | |
| Class C | | 4,960 | 189,819 |
| Series A | | 2,096 | 78,621 |
| Madison Square Garden Sports Corp. (a) | | 1,827 | 343,714 |
| Playtika Holding Corp. | | 7,516 | 59,151 |
| Roku, Inc. Class A (a) | | 11,477 | 687,817 |
| Take-Two Interactive Software, Inc. (a) | | 17,931 | 2,788,091 |
| TKO Group Holdings, Inc. | | 7,275 | 785,627 |
| Warner Bros Discovery, Inc. (a) | | 259,394 | 1,929,891 |
| | | | 11,915,701 |
| Interactive Media & Services - 0.2% | | | |
| IAC, Inc. (a) | | 7,948 | 372,364 |
| Match Group, Inc. (a) | | 28,285 | 859,298 |
| TripAdvisor, Inc. (a) | | 10,917 | 194,432 |
| Trump Media & Technology Group (a) | | 2,304 | 75,456 |
| Zoominfo Technologies, Inc. (a) | | 33,342 | 425,777 |
| | | | 1,927,327 |
| Media - 1.4% | | | |
| Charter Communications, Inc. Class A (a) | | 10,028 | 2,997,971 |
| Fox Corp.: | | | |
| Class A | | 25,404 | 873,135 |
| Class B | | 14,128 | 452,379 |
| Interpublic Group of Companies, Inc. | | 40,255 | 1,171,018 |
| Liberty Broadband Corp.: | | | |
| Class A (a) | | 1,334 | 72,836 |
| Class C (a) | | 8,902 | 488,008 |
| Liberty Media Corp. Liberty SiriusXM: | | | |
| Class A | | 7,582 | 167,941 |
| Class C | | 15,752 | 349,064 |
| News Corp.: | | | |
| Class A | | 40,661 | 1,121,024 |
| Class B | | 12,144 | 344,768 |
| Nexstar Media Group, Inc. | | 2,027 | 336,502 |
| Omnicom Group, Inc. | | 20,686 | 1,855,534 |
| Paramount Global: | | | |
| Class A (c) | | 986 | 18,123 |
| Class B | | 63,225 | 656,908 |
| Sirius XM Holdings, Inc. (c) | | 65,306 | 184,816 |
| The New York Times Co. Class A | | 17,177 | 879,634 |
| | | | 11,969,661 |
TOTAL COMMUNICATION SERVICES | | | 27,446,180 |
| CONSUMER DISCRETIONARY - 9.6% | | | |
| Automobile Components - 0.5% | | | |
| Aptiv PLC (a) | | 29,098 | 2,049,081 |
| BorgWarner, Inc. | | 24,573 | 792,234 |
| Gentex Corp. | | 24,714 | 833,109 |
| Lear Corp. | | 6,032 | 688,915 |
| QuantumScape Corp. Class A (a)(c) | | 37,445 | 184,229 |
| | | | 4,547,568 |
| Automobiles - 0.3% | | | |
| Harley-Davidson, Inc. | | 12,929 | 433,639 |
| Lucid Group, Inc. Class A (a)(c) | | 94,834 | 247,517 |
| Rivian Automotive, Inc. (a)(c) | | 87,926 | 1,179,967 |
| Thor Industries, Inc. | | 5,434 | 507,807 |
| | | | 2,368,930 |
| Broadline Retail - 0.6% | | | |
| Dillard's, Inc. Class A | | 328 | 144,448 |
| eBay, Inc. | | 54,088 | 2,905,607 |
| Etsy, Inc. (a) | | 4,324 | 255,030 |
| Kohl's Corp. (c) | | 11,801 | 271,305 |
| Macy's, Inc. | | 29,260 | 561,792 |
| Nordstrom, Inc. | | 10,688 | 226,799 |
| Ollie's Bargain Outlet Holdings, Inc. (a) | | 6,513 | 639,381 |
| | | | 5,004,362 |
| Distributors - 0.4% | | | |
| Genuine Parts Co. | | 14,862 | 2,055,712 |
| LKQ Corp. | | 28,433 | 1,182,528 |
| | | | 3,238,240 |
| Diversified Consumer Services - 0.3% | | | |
| ADT, Inc. (c) | | 30,993 | 235,547 |
| Bright Horizons Family Solutions, Inc. (a) | | 5,234 | 576,159 |
| Grand Canyon Education, Inc. (a) | | 2,114 | 295,770 |
| H&R Block, Inc. | | 11,936 | 647,289 |
| Service Corp. International | | 15,241 | 1,084,092 |
| | | | 2,838,857 |
| Hotels, Restaurants & Leisure - 2.3% | | | |
| Aramark | | 27,978 | 951,812 |
| Boyd Gaming Corp. | | 7,336 | 404,214 |
| Caesars Entertainment, Inc. (a) | | 22,981 | 913,265 |
| Carnival Corp. (a) | | 106,640 | 1,996,301 |
| Choice Hotels International, Inc. | | 464 | 55,216 |
| Darden Restaurants, Inc. | | 6,004 | 908,525 |
| Domino's Pizza, Inc. | | 2,419 | 1,249,002 |
| Dutch Bros, Inc. (a) | | 5,918 | 245,005 |
| Hilton Worldwide Holdings, Inc. | | 12,787 | 2,790,123 |
| Hyatt Hotels Corp. Class A | | 4,000 | 607,680 |
| Marriott Vacations Worldwide Corp. | | 3,718 | 324,656 |
| MGM Resorts International (a) | | 26,057 | 1,157,973 |
| Penn Entertainment, Inc. (a) | | 16,096 | 311,538 |
| Planet Fitness, Inc. (a) | | 4,250 | 312,758 |
| Royal Caribbean Cruises Ltd. (a) | | 16,544 | 2,637,610 |
| Travel+Leisure Co. | | 7,315 | 329,029 |
| Vail Resorts, Inc. | | 649 | 116,904 |
| Wendy's Co. | | 9,363 | 158,796 |
| Wyndham Hotels & Resorts, Inc. | | 7,652 | 566,248 |
| Wynn Resorts Ltd. | | 10,097 | 903,682 |
| Yum! Brands, Inc. | | 18,549 | 2,457,001 |
| | | | 19,397,338 |
| Household Durables - 2.4% | | | |
| D.R. Horton, Inc. | | 31,693 | 4,466,494 |
| Garmin Ltd. | | 16,548 | 2,696,000 |
| Leggett & Platt, Inc. | | 14,208 | 162,824 |
| Lennar Corp.: | | | |
| Class A | | 25,772 | 3,862,450 |
| Class B | | 1,213 | 169,129 |
| Mohawk Industries, Inc. (a) | | 5,670 | 644,055 |
| Newell Brands, Inc. | | 44,322 | 284,104 |
| NVR, Inc. (a) | | 318 | 2,413,162 |
| PulteGroup, Inc. | | 22,352 | 2,460,955 |
| SharkNinja, Inc. | | 5,671 | 426,176 |
| Toll Brothers, Inc. | | 11,083 | 1,276,540 |
| TopBuild Corp. (a) | | 3,122 | 1,202,813 |
| Whirlpool Corp. | | 5,653 | 577,737 |
| | | | 20,642,439 |
| Leisure Products - 0.2% | | | |
| Brunswick Corp. | | 7,213 | 524,890 |
| Hasbro, Inc. | | 1,872 | 109,512 |
| Mattel, Inc. (a) | | 36,604 | 595,181 |
| Polaris, Inc. | | 5,579 | 436,891 |
| YETI Holdings, Inc. (a) | | 6,388 | 243,702 |
| | | | 1,910,176 |
| Specialty Retail - 1.9% | | | |
| Advance Auto Parts, Inc. | | 6,360 | 402,779 |
| AutoNation, Inc. (a) | | 2,754 | 438,933 |
| Bath & Body Works, Inc. | | 24,041 | 938,801 |
| Best Buy Co., Inc. | | 23,034 | 1,941,536 |
| CarMax, Inc. (a) | | 15,622 | 1,145,717 |
| Carvana Co. Class A (a) | | 7,324 | 942,745 |
| Dick's Sporting Goods, Inc. | | 5,528 | 1,187,691 |
| Five Below, Inc. (a) | | 1,185 | 129,129 |
| Floor & Decor Holdings, Inc. Class A (a) | | 7,123 | 708,097 |
| GameStop Corp. Class A (a)(c) | | 28,755 | 709,961 |
| Gap, Inc. | | 21,444 | 512,297 |
| Lithia Motors, Inc. Class A (sub. vtg.) | | 2,895 | 730,843 |
| Penske Automotive Group, Inc. | | 1,971 | 293,718 |
| RH (a) | | 1,279 | 312,639 |
| Ross Stores, Inc. | | 27,039 | 3,929,307 |
| Ulta Beauty, Inc. (a) | | 685 | 264,321 |
| Wayfair LLC Class A (a)(c) | | 9,863 | 520,076 |
| Williams-Sonoma, Inc. | | 2,774 | 783,294 |
| | | | 15,891,884 |
| Textiles, Apparel & Luxury Goods - 0.7% | | | |
| Amer Sports, Inc. | | 12,942 | 162,681 |
| Birkenstock Holding PLC | | 2,697 | 146,744 |
| Capri Holdings Ltd. (a) | | 12,122 | 400,996 |
| Carter's, Inc. | | 3,831 | 237,407 |
| Columbia Sportswear Co. (c) | | 3,553 | 280,971 |
| Crocs, Inc. (a) | | 5,210 | 760,347 |
| PVH Corp. | | 6,120 | 647,924 |
| Ralph Lauren Corp. Class A | | 4,114 | 720,197 |
| Skechers U.S.A., Inc. Class A (sub. vtg.) (a) | | 13,185 | 911,347 |
| Tapestry, Inc. | | 24,467 | 1,046,943 |
| Under Armour, Inc.: | | | |
| Class A (sub. vtg.) (a) | | 20,159 | 134,461 |
| Class C (non-vtg.) (a) | | 20,680 | 135,040 |
| VF Corp. (c) | | 37,384 | 504,684 |
| | | | 6,089,742 |
TOTAL CONSUMER DISCRETIONARY | | | 81,929,536 |
| CONSUMER STAPLES - 6.3% | | | |
| Beverages - 0.3% | | | |
| Boston Beer Co., Inc. Class A (a) | | 774 | 236,109 |
| Brown-Forman Corp.: | | | |
| Class A | | 5,202 | 229,564 |
| Class B (non-vtg.) (c) | | 18,410 | 795,128 |
| Coca-Cola Consolidated, Inc. | | 630 | 683,550 |
| Molson Coors Beverage Co. Class B | | 18,702 | 950,623 |
| | | | 2,894,974 |
| Consumer Staples Distribution & Retail - 2.1% | | | |
| Albertsons Companies, Inc. | | 44,650 | 881,838 |
| BJ's Wholesale Club Holdings, Inc. (a) | | 14,094 | 1,238,017 |
| Casey's General Stores, Inc. | | 3,271 | 1,248,083 |
| Dollar General Corp. | | 23,478 | 3,104,496 |
| Dollar Tree, Inc. (a) | | 21,915 | 2,339,865 |
| Grocery Outlet Holding Corp. (a) | | 10,354 | 229,030 |
| Kroger Co. | | 70,905 | 3,540,287 |
| Maplebear, Inc. (NASDAQ) | | 18,386 | 590,926 |
| Performance Food Group Co. (a) | | 13,993 | 925,077 |
| Sysco Corp. | | 20,175 | 1,440,293 |
| U.S. Foods Holding Corp. (a) | | 24,475 | 1,296,686 |
| Walgreens Boots Alliance, Inc. (c) | | 76,502 | 925,292 |
| | | | 17,759,890 |
| Food Products - 2.9% | | | |
| Archer Daniels Midland Co. | | 52,696 | 3,185,473 |
| Bunge Global SA | | 15,050 | 1,606,889 |
| Campbell Soup Co. | | 20,515 | 927,073 |
| Conagra Brands, Inc. | | 50,920 | 1,447,146 |
| Darling Ingredients, Inc. (a) | | 16,939 | 622,508 |
| Flowers Foods, Inc. | | 20,023 | 444,511 |
| Freshpet, Inc. (a) | | 3,387 | 438,244 |
| General Mills, Inc. | | 60,359 | 3,818,310 |
| Hormel Foods Corp. | | 30,981 | 944,611 |
| Ingredion, Inc. | | 7,001 | 803,015 |
| Kellanova | | 28,016 | 1,615,963 |
| Lamb Weston Holdings, Inc. | | 10,439 | 877,711 |
| McCormick & Co., Inc. (non-vtg.) | | 26,918 | 1,909,563 |
| Pilgrim's Pride Corp. (a) | | 3,993 | 153,691 |
| Post Holdings, Inc. (a) | | 5,278 | 549,756 |
| Seaboard Corp. | | 27 | 85,340 |
| The Hershey Co. | | 13,575 | 2,495,492 |
| The J.M. Smucker Co. | | 11,027 | 1,202,384 |
| Tyson Foods, Inc. Class A | | 30,057 | 1,717,457 |
| | | | 24,845,137 |
| Household Products - 0.4% | | | |
| Church & Dwight Co., Inc. | | 26,072 | 2,703,145 |
| Reynolds Consumer Products, Inc. | | 5,809 | 162,536 |
| Spectrum Brands Holdings, Inc. | | 3,131 | 269,047 |
| | | | 3,134,728 |
| Personal Care Products - 0.6% | | | |
| BellRing Brands, Inc. (a) | | 13,923 | 795,560 |
| Coty, Inc. Class A (a) | | 42,035 | 421,191 |
| Kenvue, Inc. | | 204,659 | 3,720,701 |
| | | | 4,937,452 |
TOTAL CONSUMER STAPLES | | | 53,572,181 |
| ENERGY - 6.0% | | | |
| Energy Equipment & Services - 1.0% | | | |
| Baker Hughes Co. Class A | | 106,671 | 3,751,619 |
| Halliburton Co. | | 94,213 | 3,182,515 |
| NOV, Inc. | | 42,071 | 799,770 |
| TechnipFMC PLC | | 45,826 | 1,198,350 |
| | | | 8,932,254 |
| Oil, Gas & Consumable Fuels - 5.0% | | | |
| Antero Midstream GP LP | | 22,381 | 329,896 |
| Antero Resources Corp. (a) | | 30,994 | 1,011,334 |
| APA Corp. | | 38,664 | 1,138,268 |
| Cheniere Energy, Inc. | | 12,002 | 2,098,310 |
| Chesapeake Energy Corp. | | 14,024 | 1,152,633 |
| Chord Energy Corp. | | 6,602 | 1,107,023 |
| Civitas Resources, Inc. | | 7,741 | 534,129 |
| Coterra Energy, Inc. | | 79,277 | 2,114,318 |
| Devon Energy Corp. | | 67,250 | 3,187,650 |
| Diamondback Energy, Inc. | | 19,003 | 3,804,211 |
| DT Midstream, Inc. | | 10,376 | 737,007 |
| EQT Corp. | | 46,829 | 1,731,736 |
| Hess Corp. | | 10,539 | 1,554,713 |
| HF Sinclair Corp. | | 17,310 | 923,315 |
| Kinder Morgan, Inc. | | 207,185 | 4,116,766 |
| Marathon Oil Corp. | | 61,038 | 1,749,959 |
| Matador Resources Co. | | 11,604 | 691,598 |
| New Fortress Energy, Inc. Class A | | 3,277 | 72,028 |
| ONEOK, Inc. | | 62,363 | 5,085,703 |
| Ovintiv, Inc. | | 28,659 | 1,343,247 |
| Permian Resource Corp. Class A | | 52,805 | 852,801 |
| Range Resources Corp. | | 25,330 | 849,315 |
| Southwestern Energy Co. (a) | | 117,186 | 788,662 |
| The Williams Companies, Inc. | | 130,068 | 5,527,890 |
| Viper Energy, Inc. | | 6,908 | 259,257 |
| | | | 42,761,769 |
TOTAL ENERGY | | | 51,694,023 |
| FINANCIALS - 16.7% | | | |
| Banks - 3.1% | | | |
| Bank OZK | | 11,355 | 465,555 |
| BOK Financial Corp. | | 2,424 | 222,135 |
| Citizens Financial Group, Inc. | | 48,829 | 1,759,309 |
| Columbia Banking Systems, Inc. | | 22,278 | 443,109 |
| Comerica, Inc. | | 14,165 | 722,982 |
| Commerce Bancshares, Inc. | | 12,729 | 710,024 |
| Cullen/Frost Bankers, Inc. | | 6,284 | 638,643 |
| East West Bancorp, Inc. | | 14,741 | 1,079,483 |
| Fifth Third Bancorp | | 72,975 | 2,662,858 |
| First Citizens Bancshares, Inc. | | 1,280 | 2,155,021 |
| First Hawaiian, Inc. | | 13,609 | 282,523 |
| First Horizon National Corp. | | 58,323 | 919,754 |
| FNB Corp., Pennsylvania | | 38,003 | 519,881 |
| Huntington Bancshares, Inc. | | 154,284 | 2,033,463 |
| KeyCorp | | 98,893 | 1,405,270 |
| M&T Bank Corp. | | 17,759 | 2,688,002 |
| Pinnacle Financial Partners, Inc. | | 8,098 | 648,164 |
| Popular, Inc. | | 6,836 | 604,507 |
| Prosperity Bancshares, Inc. | | 9,585 | 586,027 |
| Regions Financial Corp. | | 98,177 | 1,967,467 |
| Synovus Financial Corp. | | 15,593 | 626,683 |
| TFS Financial Corp. | | 5,398 | 68,123 |
| Webster Financial Corp. | | 18,236 | 794,907 |
| Western Alliance Bancorp. | | 11,471 | 720,608 |
| Wintrust Financial Corp. | | 6,551 | 645,667 |
| Zions Bancorporation NA | | 15,452 | 670,153 |
| | | | 26,040,318 |
| Capital Markets - 4.1% | | | |
| Affiliated Managers Group, Inc. | | 3,413 | 533,213 |
| Ameriprise Financial, Inc. | | 942 | 402,413 |
| Bank of New York Mellon Corp. | | 80,038 | 4,793,476 |
| Carlyle Group LP | | 23,393 | 939,229 |
| Cboe Global Markets, Inc. | | 11,272 | 1,916,916 |
| Coinbase Global, Inc. (a) | | 3,375 | 750,026 |
| Evercore, Inc. Class A | | 3,832 | 798,704 |
| FactSet Research Systems, Inc. | | 2,625 | 1,071,709 |
| Franklin Resources, Inc. | | 30,447 | 680,490 |
| Houlihan Lokey | | 4,990 | 672,951 |
| Interactive Brokers Group, Inc. | | 11,098 | 1,360,615 |
| Invesco Ltd. | | 39,041 | 584,053 |
| Janus Henderson Group PLC | | 13,809 | 465,501 |
| Jefferies Financial Group, Inc. | | 13,818 | 687,584 |
| Lazard, Inc. Class A | | 748 | 28,559 |
| MarketAxess Holdings, Inc. | | 3,947 | 791,492 |
| MSCI, Inc. | | 3,457 | 1,665,410 |
| NASDAQ, Inc. | | 39,656 | 2,389,671 |
| Northern Trust Corp. | | 21,613 | 1,815,060 |
| Raymond James Financial, Inc. | | 20,206 | 2,497,664 |
| Robinhood Markets, Inc. (a) | | 70,966 | 1,611,638 |
| SEI Investments Co. | | 10,799 | 698,587 |
| State Street Corp. | | 32,210 | 2,383,540 |
| Stifel Financial Corp. | | 10,607 | 892,579 |
| T. Rowe Price Group, Inc. | | 23,440 | 2,702,866 |
| TPG, Inc. | | 6,751 | 279,829 |
| Tradeweb Markets, Inc. Class A | | 7,504 | 795,424 |
| Virtu Financial, Inc. Class A | | 8,816 | 197,919 |
| XP, Inc. Class A | | 39,191 | 689,370 |
| | | | 35,096,488 |
| Consumer Finance - 1.0% | | | |
| Ally Financial, Inc. | | 25,338 | 1,005,158 |
| Credit Acceptance Corp. (a) | | 141 | 72,570 |
| Discover Financial Services | | 26,723 | 3,495,636 |
| OneMain Holdings, Inc. | | 12,059 | 584,741 |
| SLM Corp. | | 23,310 | 484,615 |
| SoFi Technologies, Inc. (a)(c) | | 92,698 | 612,734 |
| Synchrony Financial | | 42,850 | 2,022,092 |
| | | | 8,277,546 |
| Financial Services - 1.8% | | | |
| Affirm Holdings, Inc. Class A, (a) | | 24,337 | 735,221 |
| Block, Inc. Class A (a) | | 34,314 | 2,212,910 |
| Corebridge Financial, Inc. | | 27,314 | 795,384 |
| Euronet Worldwide, Inc. (a) | | 4,617 | 477,860 |
| Fidelity National Information Services, Inc. | | 60,073 | 4,527,101 |
| Global Payments, Inc. | | 27,201 | 2,630,337 |
| Jack Henry & Associates, Inc. | | 7,749 | 1,286,489 |
| MGIC Investment Corp. | | 28,502 | 614,218 |
| Rocket Companies, Inc. (a)(c) | | 14,788 | 202,596 |
| The Western Union Co. | | 29,767 | 363,753 |
| UWM Holdings Corp. Class A | | 3,154 | 21,857 |
| Voya Financial, Inc. | | 10,827 | 770,341 |
| WEX, Inc. (a) | | 4,045 | 716,531 |
| | | | 15,354,598 |
| Insurance - 6.4% | | | |
| AFLAC, Inc. | | 61,127 | 5,459,252 |
| Allstate Corp. | | 23,694 | 3,782,984 |
| American Financial Group, Inc. | | 7,669 | 943,440 |
| Arch Capital Group Ltd. (a) | | 38,552 | 3,889,511 |
| Arthur J. Gallagher & Co. | | 21,476 | 5,568,929 |
| Assurant, Inc. | | 5,557 | 923,851 |
| Assured Guaranty Ltd. | | 5,663 | 436,900 |
| Axis Capital Holdings Ltd. | | 8,295 | 586,042 |
| Brighthouse Financial, Inc. (a) | | 6,597 | 285,914 |
| Brown & Brown, Inc. | | 14,292 | 1,277,848 |
| Cincinnati Financial Corp. | | 16,360 | 1,932,116 |
| CNA Financial Corp. | | 2,345 | 108,034 |
| Everest Re Group Ltd. | | 3,849 | 1,466,546 |
| Fidelity National Financial, Inc. | | 27,728 | 1,370,318 |
| First American Financial Corp. | | 10,676 | 575,970 |
| Globe Life, Inc. | | 9,909 | 815,313 |
| Hanover Insurance Group, Inc. | | 3,813 | 478,303 |
| Hartford Financial Services Group, Inc. | | 31,725 | 3,189,632 |
| Kemper Corp. | | 6,472 | 383,984 |
| Lincoln National Corp. | | 18,177 | 565,305 |
| Loews Corp. | | 19,358 | 1,446,817 |
| Markel Group, Inc. (a) | | 1,048 | 1,651,292 |
| Old Republic International Corp. | | 26,916 | 831,704 |
| Primerica, Inc. | | 3,692 | 873,453 |
| Principal Financial Group, Inc. | | 24,930 | 1,955,759 |
| Prudential Financial, Inc. | | 38,415 | 4,501,854 |
| Reinsurance Group of America, Inc. | | 7,018 | 1,440,585 |
| RenaissanceRe Holdings Ltd. | | 5,540 | 1,238,245 |
| RLI Corp. | | 4,156 | 584,708 |
| Unum Group | | 20,391 | 1,042,184 |
| W.R. Berkley Corp. | | 22,125 | 1,738,583 |
| White Mountains Insurance Group Ltd. | | 267 | 485,259 |
| Willis Towers Watson PLC | | 10,923 | 2,863,355 |
| | | | 54,693,990 |
| Mortgage Real Estate Investment Trusts - 0.3% | | | |
| AGNC Investment Corp. | | 74,164 | 707,525 |
| Annaly Capital Management, Inc. | | 53,468 | 1,019,100 |
| Rithm Capital Corp. | | 51,579 | 562,727 |
| Starwood Property Trust, Inc. | | 31,666 | 599,754 |
| | | | 2,889,106 |
TOTAL FINANCIALS | | | 142,352,046 |
| HEALTH CARE - 9.3% | | | |
| Biotechnology - 1.2% | | | |
| Alnylam Pharmaceuticals, Inc. (a) | | 1,511 | 367,173 |
| Biogen, Inc. (a) | | 15,568 | 3,608,974 |
| BioMarin Pharmaceutical, Inc. (a) | | 20,177 | 1,661,172 |
| Exact Sciences Corp. (a) | | 11,793 | 498,254 |
| Exelixis, Inc. (a) | | 5,077 | 114,080 |
| Grail, Inc. (c) | | 2,837 | 43,605 |
| Incyte Corp. (a) | | 18,642 | 1,130,078 |
| Ionis Pharmaceuticals, Inc. (a) | | 1,085 | 51,711 |
| Repligen Corp. (a) | | 5,101 | 643,032 |
| Roivant Sciences Ltd. (a) | | 37,448 | 395,825 |
| United Therapeutics Corp. (a) | | 4,666 | 1,486,354 |
| | | | 10,000,258 |
| Health Care Equipment & Supplies - 2.4% | | | |
| Align Technology, Inc. (a) | | 3,315 | 800,340 |
| Baxter International, Inc. | | 54,416 | 1,820,215 |
| Dentsply Sirona, Inc. | | 22,114 | 550,860 |
| Enovis Corp. (a) | | 5,810 | 262,612 |
| Envista Holdings Corp. (a) | | 18,360 | 305,327 |
| GE Healthcare Technologies, Inc. | | 41,282 | 3,216,693 |
| Globus Medical, Inc. (a) | | 11,962 | 819,277 |
| Hologic, Inc. (a) | | 24,695 | 1,833,604 |
| Masimo Corp. (a) | | 2,197 | 276,690 |
| QuidelOrtho Corp. (a) | | 5,759 | 191,314 |
| ResMed, Inc. | | 11,296 | 2,162,280 |
| Solventum Corp. | | 14,812 | 783,259 |
| STERIS PLC | | 10,532 | 2,312,195 |
| Teleflex, Inc. | | 5,032 | 1,058,381 |
| The Cooper Companies, Inc. | | 20,856 | 1,820,729 |
| Zimmer Biomet Holdings, Inc. | | 21,849 | 2,371,272 |
| | | | 20,585,048 |
| Health Care Providers & Services - 2.4% | | | |
| Acadia Healthcare Co., Inc. (a) | | 9,722 | 656,624 |
| Amedisys, Inc. (a) | | 3,424 | 314,323 |
| Cardinal Health, Inc. | | 10,568 | 1,039,046 |
| Centene Corp. (a) | | 57,012 | 3,779,896 |
| Chemed Corp. | | 1,424 | 772,634 |
| Encompass Health Corp. | | 10,574 | 907,143 |
| Henry Schein, Inc. (a) | | 13,649 | 874,901 |
| Humana, Inc. | | 12,884 | 4,814,107 |
| Labcorp Holdings, Inc. | | 8,982 | 1,827,927 |
| Molina Healthcare, Inc. (a) | | 2,290 | 680,817 |
| Premier, Inc. Class A | | 12,720 | 237,482 |
| Quest Diagnostics, Inc. | | 11,861 | 1,623,534 |
| R1 RCM, Inc. (a)(c) | | 16,760 | 210,506 |
| Tenet Healthcare Corp. (a) | | 10,359 | 1,378,058 |
| Universal Health Services, Inc. Class B | | 6,184 | 1,143,607 |
| | | | 20,260,605 |
| Health Care Technology - 0.0% | | | |
| Certara, Inc. (a) | | 12,850 | 177,973 |
| Doximity, Inc. (a) | | 11,836 | 331,053 |
| | | | 509,026 |
| Life Sciences Tools & Services - 2.6% | | | |
| 10X Genomics, Inc. (a) | | 3,670 | 71,382 |
| Agilent Technologies, Inc. | | 31,303 | 4,057,808 |
| Avantor, Inc. (a) | | 72,474 | 1,536,449 |
| Azenta, Inc. (a)(c) | | 5,856 | 308,143 |
| Bio-Rad Laboratories, Inc. Class A (a) | | 2,063 | 563,426 |
| Bio-Techne Corp. | | 16,597 | 1,189,175 |
| Bruker Corp. | | 4,100 | 261,621 |
| Charles River Laboratories International, Inc. (a) | | 5,458 | 1,127,514 |
| Fortrea Holdings, Inc. | | 8,592 | 200,537 |
| Illumina, Inc. (a) | | 17,023 | 1,776,861 |
| IQVIA Holdings, Inc. (a) | | 17,086 | 3,612,664 |
| Mettler-Toledo International, Inc. (a) | | 2,255 | 3,151,565 |
| QIAGEN NV | | 23,603 | 969,847 |
| Revvity, Inc. | | 13,146 | 1,378,490 |
| Sotera Health Co. (a) | | 13,418 | 159,272 |
| Waters Corp. (a) | | 2,456 | 712,535 |
| West Pharmaceutical Services, Inc. | | 3,049 | 1,004,310 |
| | | | 22,081,599 |
| Pharmaceuticals - 0.7% | | | |
| Catalent, Inc. (a) | | 19,338 | 1,087,376 |
| Elanco Animal Health, Inc. (a) | | 52,600 | 759,018 |
| Jazz Pharmaceuticals PLC (a) | | 6,502 | 693,958 |
| Organon & Co. | | 27,488 | 569,002 |
| Perrigo Co. PLC | | 14,479 | 371,821 |
| Royalty Pharma PLC | | 41,817 | 1,102,714 |
| Viatris, Inc. | | 126,821 | 1,348,107 |
| | | | 5,931,996 |
TOTAL HEALTH CARE | | | 79,368,532 |
| INDUSTRIALS - 17.3% | | | |
| Aerospace & Defense - 1.7% | | | |
| BWX Technologies, Inc. | | 7,754 | 736,630 |
| Curtiss-Wright Corp. | | 4,076 | 1,104,514 |
| Hexcel Corp. | | 8,840 | 552,058 |
| Howmet Aerospace, Inc. | | 40,662 | 3,156,591 |
| Huntington Ingalls Industries, Inc. | | 4,220 | 1,039,513 |
| L3Harris Technologies, Inc. | | 20,239 | 4,545,275 |
| Loar Holdings, Inc. | | 101 | 5,394 |
| Spirit AeroSystems Holdings, Inc. Class A (a) | | 10,840 | 356,311 |
| Textron, Inc. | | 20,325 | 1,745,105 |
| Woodward, Inc. | | 6,358 | 1,108,708 |
| | | | 14,350,099 |
| Air Freight & Logistics - 0.4% | | | |
| C.H. Robinson Worldwide, Inc. | | 12,256 | 1,079,999 |
| Expeditors International of Washington, Inc. | | 12,626 | 1,575,599 |
| GXO Logistics, Inc. (a) | | 12,542 | 633,371 |
| | | | 3,288,969 |
| Building Products - 1.4% | | | |
| A.O. Smith Corp. | | 12,842 | 1,050,219 |
| Advanced Drain Systems, Inc. | | 4,409 | 707,160 |
| Allegion PLC | | 9,345 | 1,104,112 |
| Armstrong World Industries, Inc. | | 3,078 | 348,553 |
| Builders FirstSource, Inc. (a) | | 11,657 | 1,613,445 |
| Carlisle Companies, Inc. | | 4,398 | 1,782,114 |
| Fortune Brands Innovations, Inc. | | 13,326 | 865,390 |
| Hayward Holdings, Inc. (a) | | 15,232 | 187,354 |
| Masco Corp. | | 23,515 | 1,567,745 |
| Owens Corning | | 9,218 | 1,601,351 |
| Simpson Manufacturing Co. Ltd. | | 4,103 | 691,479 |
| The AZEK Co., Inc. Class A, (a) | | 4,571 | 192,576 |
| | | | 11,711,498 |
| Commercial Services & Supplies - 0.7% | | | |
| Clean Harbors, Inc. (a) | | 5,508 | 1,245,634 |
| MSA Safety, Inc. | | 3,954 | 742,126 |
| RB Global, Inc. | | 19,565 | 1,493,983 |
| Stericycle, Inc. (a) | | 9,848 | 572,464 |
| Tetra Tech, Inc. | | 4,470 | 914,026 |
| Veralto Corp. | | 14,516 | 1,385,843 |
| Vestis Corp. | | 14,047 | 171,795 |
| | | | 6,525,871 |
| Construction & Engineering - 1.0% | | | |
| AECOM | | 14,503 | 1,278,294 |
| API Group Corp. (a) | | 24,300 | 914,409 |
| EMCOR Group, Inc. | | 3,006 | 1,097,430 |
| MasTec, Inc. (a) | | 6,694 | 716,191 |
| MDU Resources Group, Inc. | | 21,700 | 544,670 |
| Quanta Services, Inc. | | 10,773 | 2,737,312 |
| Valmont Industries, Inc. | | 2,126 | 583,481 |
| Willscot Mobile Mini Holdings (a) | | 13,931 | 524,363 |
| | | | 8,396,150 |
| Electrical Equipment - 1.6% | | | |
| Acuity Brands, Inc. | | 3,290 | 794,338 |
| AMETEK, Inc. | | 24,672 | 4,113,069 |
| Generac Holdings, Inc. (a) | | 3,208 | 424,162 |
| Hubbell, Inc. | | 5,722 | 2,091,277 |
| nVent Electric PLC | | 17,650 | 1,352,167 |
| Regal Rexnord Corp. | | 7,093 | 959,115 |
| Rockwell Automation, Inc. | | 11,121 | 3,061,389 |
| Sensata Technologies PLC | | 15,966 | 596,969 |
| | | | 13,392,486 |
| Ground Transportation - 0.6% | | | |
| Avis Budget Group, Inc. | | 1,115 | 116,540 |
| J.B. Hunt Transport Services, Inc. | | 8,873 | 1,419,680 |
| Knight-Swift Transportation Holdings, Inc. | | 16,719 | 834,612 |
| Landstar System, Inc. | | 3,800 | 701,024 |
| Lyft, Inc. (a) | | 11,996 | 169,144 |
| Ryder System, Inc. | | 4,603 | 570,220 |
| Saia, Inc. (a) | | 1,177 | 558,239 |
| Schneider National, Inc. Class B | | 5,015 | 121,162 |
| U-Haul Holding Co. (a)(c) | | 468 | 28,890 |
| U-Haul Holding Co. (non-vtg.) | | 6,074 | 364,561 |
| | | | 4,884,072 |
| Machinery - 5.1% | | | |
| AGCO Corp. | | 6,649 | 650,804 |
| Allison Transmission Holdings, Inc. | | 9,338 | 708,754 |
| CNH Industrial NV | | 93,277 | 944,896 |
| Crane Co. | | 5,225 | 757,521 |
| Cummins, Inc. | | 14,601 | 4,043,455 |
| Donaldson Co., Inc. | | 12,829 | 918,043 |
| Dover Corp. | | 14,654 | 2,644,314 |
| ESAB Corp. | | 6,042 | 570,546 |
| Flowserve Corp. | | 14,030 | 674,843 |
| Fortive Corp. | | 37,604 | 2,786,456 |
| Gates Industrial Corp. PLC (a) | | 21,896 | 346,176 |
| Graco, Inc. | | 17,872 | 1,416,892 |
| IDEX Corp. | | 8,094 | 1,628,513 |
| Ingersoll Rand, Inc. | | 43,130 | 3,917,929 |
| ITT, Inc. | | 8,803 | 1,137,172 |
| Lincoln Electric Holdings, Inc. | | 4,252 | 802,097 |
| Middleby Corp. (a) | | 5,689 | 697,528 |
| Nordson Corp. | | 6,063 | 1,406,252 |
| Oshkosh Corp. | | 6,970 | 754,154 |
| Otis Worldwide Corp. | | 43,175 | 4,156,026 |
| Pentair PLC | | 17,641 | 1,352,535 |
| RBC Bearings, Inc. (a) | | 3,037 | 819,322 |
| Snap-On, Inc. | | 5,528 | 1,444,964 |
| Stanley Black & Decker, Inc. | | 16,422 | 1,311,954 |
| Timken Co. | | 6,904 | 553,218 |
| Toro Co. | | 11,157 | 1,043,291 |
| Westinghouse Air Brake Tech Co. | | 18,694 | 2,954,587 |
| Xylem, Inc. | | 25,824 | 3,502,509 |
| | | | 43,944,751 |
| Marine Transportation - 0.1% | | | |
| Kirby Corp. (a) | | 6,198 | 742,087 |
| Passenger Airlines - 0.9% | | | |
| Alaska Air Group, Inc. (a) | | 13,407 | 541,643 |
| American Airlines Group, Inc. (a)(c) | | 64,903 | 735,351 |
| Delta Air Lines, Inc. | | 68,840 | 3,265,770 |
| Southwest Airlines Co. | | 63,842 | 1,826,520 |
| United Airlines Holdings, Inc. (a) | | 34,982 | 1,702,224 |
| | | | 8,071,508 |
| Professional Services - 2.3% | | | |
| Broadridge Financial Solutions, Inc. | | 1,089 | 214,533 |
| CACI International, Inc. (a) | | 2,358 | 1,014,247 |
| Clarivate PLC (a)(c) | | 43,613 | 248,158 |
| Concentrix Corp. | | 5,074 | 321,083 |
| Dayforce, Inc. (a)(c) | | 14,157 | 702,187 |
| Dun & Bradstreet Holdings, Inc. | | 32,313 | 299,218 |
| Equifax, Inc. | | 10,489 | 2,543,163 |
| FTI Consulting, Inc. (a) | | 3,757 | 809,746 |
| Genpact Ltd. | | 18,768 | 604,142 |
| Jacobs Solutions, Inc. | | 13,321 | 1,861,077 |
| KBR, Inc. | | 12,997 | 833,628 |
| Leidos Holdings, Inc. | | 14,406 | 2,101,547 |
| ManpowerGroup, Inc. | | 5,107 | 356,469 |
| Parsons Corp. (a) | | 4,888 | 399,887 |
| Paychex, Inc. | | 22,031 | 2,611,995 |
| Paycom Software, Inc. | | 2,013 | 287,940 |
| Paycor HCM, Inc. (a) | | 7,002 | 88,925 |
| Robert Half, Inc. | | 10,919 | 698,598 |
| Science Applications International Corp. | | 5,459 | 641,705 |
| SS&C Technologies Holdings, Inc. | | 22,964 | 1,439,154 |
| TransUnion | | 19,553 | 1,450,050 |
| | | | 19,527,452 |
| Trading Companies & Distributors - 1.5% | | | |
| Air Lease Corp. Class A | | 11,142 | 529,579 |
| Core & Main, Inc. (a) | | 6,080 | 297,555 |
| Fastenal Co. | | 9,604 | 603,515 |
| Ferguson PLC | | 20,172 | 3,906,308 |
| MSC Industrial Direct Co., Inc. Class A | | 4,903 | 388,857 |
| SiteOne Landscape Supply, Inc. (a) | | 3,006 | 364,958 |
| United Rentals, Inc. | | 5,382 | 3,480,701 |
| W.W. Grainger, Inc. | | 609 | 549,464 |
| Watsco, Inc. | | 3,695 | 1,711,672 |
| WESCO International, Inc. | | 4,660 | 738,703 |
| | | | 12,571,312 |
TOTAL INDUSTRIALS | | | 147,406,255 |
| INFORMATION TECHNOLOGY - 9.3% | | | |
| Communications Equipment - 0.4% | | | |
| Ciena Corp. (a) | | 15,379 | 740,960 |
| F5, Inc. (a) | | 6,241 | 1,074,887 |
| Juniper Networks, Inc. | | 34,348 | 1,252,328 |
| Lumentum Holdings, Inc. (a) | | 7,130 | 363,060 |
| Ubiquiti, Inc. | | 246 | 35,832 |
| | | | 3,467,067 |
| Electronic Equipment, Instruments & Components - 2.2% | | | |
| Arrow Electronics, Inc. (a) | | 5,753 | 694,732 |
| Avnet, Inc. | | 9,592 | 493,892 |
| CDW Corp. | | 7,135 | 1,597,098 |
| Cognex Corp. | | 17,373 | 812,361 |
| Coherent Corp. (a) | | 14,125 | 1,023,498 |
| Corning, Inc. | | 81,912 | 3,182,281 |
| Crane NXT Co. | | 5,236 | 321,595 |
| IPG Photonics Corp. (a) | | 3,038 | 256,377 |
| Jabil, Inc. | | 11,522 | 1,253,478 |
| Keysight Technologies, Inc. (a) | | 18,621 | 2,546,422 |
| Littelfuse, Inc. | | 2,608 | 666,579 |
| TD SYNNEX Corp. | | 8,053 | 929,316 |
| Teledyne Technologies, Inc. (a) | | 5,014 | 1,945,332 |
| Trimble, Inc. (a) | | 26,023 | 1,455,206 |
| Vontier Corp. | | 16,499 | 630,262 |
| Zebra Technologies Corp. Class A (a) | | 4,296 | 1,327,163 |
| | | | 19,135,592 |
| IT Services - 1.4% | | | |
| Akamai Technologies, Inc. (a) | | 16,087 | 1,449,117 |
| Amdocs Ltd. | | 12,238 | 965,823 |
| Cognizant Technology Solutions Corp. Class A | | 53,193 | 3,617,124 |
| DXC Technology Co. (a) | | 19,384 | 370,041 |
| EPAM Systems, Inc. (a) | | 5,562 | 1,046,268 |
| Globant SA (a) | | 1,114 | 198,582 |
| Kyndryl Holdings, Inc. (a) | | 24,291 | 639,096 |
| Okta, Inc. (a) | | 9,132 | 854,847 |
| Twilio, Inc. Class A (a) | | 14,926 | 847,946 |
| VeriSign, Inc. (a) | | 8,667 | 1,540,993 |
| | | | 11,529,837 |
| Semiconductors & Semiconductor Equipment - 2.3% | | | |
| Allegro MicroSystems LLC (a) | | 8,036 | 226,937 |
| Amkor Technology, Inc. | | 12,045 | 482,041 |
| Astera Labs, Inc. | | 2,236 | 135,300 |
| Cirrus Logic, Inc. (a) | | 5,744 | 733,279 |
| First Solar, Inc. (a) | | 11,393 | 2,568,666 |
| GlobalFoundries, Inc. (a)(c) | | 10,506 | 531,183 |
| Lattice Semiconductor Corp. (a) | | 1,950 | 113,081 |
| MACOM Technology Solutions Holdings, Inc. (a) | | 5,960 | 664,361 |
| Microchip Technology, Inc. | | 56,670 | 5,185,305 |
| MKS Instruments, Inc. | | 6,722 | 877,759 |
| ON Semiconductor Corp. (a) | | 45,879 | 3,145,005 |
| Onto Innovation, Inc. (a) | | 3,888 | 853,649 |
| Qorvo, Inc. (a) | | 10,293 | 1,194,400 |
| Skyworks Solutions, Inc. | | 17,163 | 1,829,233 |
| Teradyne, Inc. | | 1,455 | 215,762 |
| Universal Display Corp. | | 2,472 | 519,738 |
| Wolfspeed, Inc. (a)(c) | | 13,299 | 302,685 |
| | | | 19,578,384 |
| Software - 1.8% | | | |
| ANSYS, Inc. (a) | | 9,323 | 2,997,345 |
| Aspen Technology, Inc. (a) | | 2,873 | 570,664 |
| Bill Holdings, Inc. (a) | | 8,218 | 432,431 |
| CCC Intelligent Solutions Holdings, Inc. Class A (a) | | 44,953 | 499,428 |
| Dolby Laboratories, Inc. Class A | | 6,245 | 494,791 |
| DoubleVerify Holdings, Inc. (a) | | 6,751 | 131,442 |
| Dropbox, Inc. Class A (a) | | 18,464 | 414,886 |
| Fair Isaac Corp. (a) | | 395 | 588,021 |
| Gen Digital, Inc. | | 60,138 | 1,502,247 |
| Guidewire Software, Inc. (a) | | 4,766 | 657,184 |
| HashiCorp, Inc. (a) | | 2,241 | 75,499 |
| Informatica, Inc. (a)(c) | | 6,823 | 210,694 |
| MicroStrategy, Inc. Class A (a) | | 1,568 | 2,159,889 |
| nCino, Inc. (a) | | 3,359 | 105,641 |
| Nutanix, Inc. Class A (a) | | 18,579 | 1,056,216 |
| PTC, Inc. (a) | | 4,972 | 903,263 |
| SentinelOne, Inc. (a) | | 20,549 | 432,556 |
| Tyler Technologies, Inc. (a) | | 679 | 341,388 |
| UiPath, Inc. Class A (a) | | 5,861 | 74,317 |
| Unity Software, Inc. (a)(c) | | 17,669 | 287,298 |
| Zoom Video Communications, Inc. Class A (a) | | 26,633 | 1,576,407 |
| | | | 15,511,607 |
| Technology Hardware, Storage & Peripherals - 1.2% | | | |
| Hewlett Packard Enterprise Co. | | 138,662 | 2,935,475 |
| HP, Inc. | | 79,228 | 2,774,565 |
| NetApp, Inc. | | 12,154 | 1,565,435 |
| Pure Storage, Inc. Class A (a) | | 3,966 | 254,657 |
| Western Digital Corp. (a) | | 34,867 | 2,641,873 |
| | | | 10,172,005 |
TOTAL INFORMATION TECHNOLOGY | | | 79,394,492 |
| MATERIALS - 7.6% | | | |
| Chemicals - 3.8% | | | |
| Albemarle Corp. (c) | | 12,535 | 1,197,343 |
| Ashland, Inc. | | 5,336 | 504,199 |
| Axalta Coating Systems Ltd. (a) | | 23,533 | 804,123 |
| Celanese Corp. | | 8,867 | 1,196,070 |
| CF Industries Holdings, Inc. | | 20,004 | 1,482,696 |
| Corteva, Inc. | | 74,757 | 4,032,393 |
| Dow, Inc. | | 75,217 | 3,990,262 |
| DuPont de Nemours, Inc. | | 44,693 | 3,597,340 |
| Eastman Chemical Co. | | 12,496 | 1,224,233 |
| Element Solutions, Inc. | | 23,911 | 648,466 |
| FMC Corp. | | 13,304 | 765,645 |
| Huntsman Corp. | | 17,458 | 397,519 |
| International Flavors & Fragrances, Inc. | | 27,325 | 2,601,613 |
| LyondellBasell Industries NV Class A | | 27,819 | 2,661,166 |
| NewMarket Corp. | | 719 | 370,695 |
| Olin Corp. | | 12,759 | 601,587 |
| PPG Industries, Inc. | | 24,975 | 3,144,103 |
| RPM International, Inc. | | 10,512 | 1,131,932 |
| The Chemours Co. LLC | | 14,750 | 332,908 |
| The Mosaic Co. | | 34,183 | 987,889 |
| The Scotts Miracle-Gro Co. | | 4,538 | 295,242 |
| Westlake Corp. | | 3,582 | 518,745 |
| | | | 32,486,169 |
| Construction Materials - 0.7% | | | |
| Eagle Materials, Inc. | | 885 | 192,452 |
| Martin Marietta Materials, Inc. | | 6,184 | 3,350,491 |
| Vulcan Materials Co. | | 10,493 | 2,609,399 |
| | | | 6,152,342 |
| Containers & Packaging - 1.7% | | | |
| Amcor PLC | | 153,689 | 1,503,078 |
| Aptargroup, Inc. | | 7,053 | 993,133 |
| Avery Dennison Corp. | | 5,334 | 1,166,279 |
| Ball Corp. | | 33,273 | 1,997,045 |
| Berry Global Group, Inc. | | 12,375 | 728,269 |
| Crown Holdings, Inc. | | 12,493 | 929,354 |
| Graphic Packaging Holding Co. | | 32,491 | 851,589 |
| International Paper Co. | | 37,017 | 1,597,284 |
| Packaging Corp. of America | | 9,473 | 1,729,391 |
| Sealed Air Corp. | | 14,704 | 511,552 |
| Silgan Holdings, Inc. | | 8,855 | 374,832 |
| Sonoco Products Co. | | 10,463 | 530,683 |
| WestRock Co. | | 27,331 | 1,373,656 |
| | | | 14,286,145 |
| Metals & Mining - 1.4% | | | |
| Alcoa Corp. | | 19,069 | 758,565 |
| ATI, Inc. (a) | | 13,183 | 730,997 |
| Cleveland-Cliffs, Inc. (a) | | 33,656 | 517,966 |
| MP Materials Corp. (a)(c) | | 13,994 | 178,144 |
| Nucor Corp. | | 25,617 | 4,049,535 |
| Reliance, Inc. | | 6,102 | 1,742,731 |
| Royal Gold, Inc. | | 7,017 | 878,248 |
| Steel Dynamics, Inc. | | 15,881 | 2,056,590 |
| United States Steel Corp. | | 23,806 | 899,867 |
| | | | 11,812,643 |
| Paper & Forest Products - 0.0% | | | |
| Louisiana-Pacific Corp. | | 2,079 | 171,164 |
TOTAL MATERIALS | | | 64,908,463 |
| REAL ESTATE - 9.9% | | | |
| Equity Real Estate Investment Trusts (REITs) - 9.0% | | | |
| Agree Realty Corp. | | 10,581 | 655,387 |
| Alexandria Real Estate Equities, Inc. | | 18,510 | 2,165,115 |
| American Homes 4 Rent Class A | | 36,075 | 1,340,547 |
| Americold Realty Trust | | 30,360 | 775,394 |
| AvalonBay Communities, Inc. | | 15,159 | 3,136,246 |
| Brixmor Property Group, Inc. | | 32,015 | 739,226 |
| BXP, Inc. | | 16,780 | 1,032,977 |
| Camden Property Trust (SBI) | | 11,056 | 1,206,320 |
| Cousins Properties, Inc. | | 16,184 | 374,660 |
| Crown Castle, Inc. | | 46,462 | 4,539,337 |
| CubeSmart | | 23,906 | 1,079,834 |
| Digital Realty Trust, Inc. | | 34,514 | 5,247,854 |
| EastGroup Properties, Inc. | | 5,104 | 868,190 |
| EPR Properties | | 7,983 | 335,126 |
| Equity Lifestyle Properties, Inc. | | 19,689 | 1,282,345 |
| Equity Residential (SBI) | | 40,364 | 2,798,840 |
| Essex Property Trust, Inc. | | 6,822 | 1,856,948 |
| Extra Space Storage, Inc. | | 22,350 | 3,473,414 |
| Federal Realty Investment Trust (SBI) | | 8,806 | 889,142 |
| First Industrial Realty Trust, Inc. | | 14,110 | 670,366 |
| Gaming & Leisure Properties | | 27,830 | 1,258,194 |
| Healthcare Realty Trust, Inc. | | 40,621 | 669,434 |
| Healthpeak Properties, Inc. | | 75,749 | 1,484,680 |
| Highwoods Properties, Inc. (SBI) | | 11,142 | 292,700 |
| Host Hotels & Resorts, Inc. | | 74,472 | 1,339,007 |
| Invitation Homes, Inc. | | 65,394 | 2,346,991 |
| Iron Mountain, Inc. | | 13,348 | 1,196,248 |
| Kilroy Realty Corp. | | 12,487 | 389,220 |
| Kimco Realty Corp. | | 70,388 | 1,369,750 |
| Lamar Advertising Co. Class A | | 6,959 | 831,809 |
| Medical Properties Trust, Inc. (c) | | 63,420 | 273,340 |
| Mid-America Apartment Communities, Inc. | | 12,408 | 1,769,505 |
| National Storage Affiliates Trust | | 7,653 | 315,457 |
| NNN (REIT), Inc. | | 19,365 | 824,949 |
| Omega Healthcare Investors, Inc. | | 26,362 | 902,899 |
| Park Hotels & Resorts, Inc. | | 22,188 | 332,376 |
| Rayonier, Inc. | | 15,784 | 459,157 |
| Realty Income Corp. | | 92,109 | 4,865,197 |
| Regency Centers Corp. | | 19,641 | 1,221,670 |
| Rexford Industrial Realty, Inc. | | 23,040 | 1,027,354 |
| SBA Communications Corp. Class A | | 11,467 | 2,250,972 |
| Simon Property Group, Inc. | | 25,725 | 3,905,055 |
| STAG Industrial, Inc. | | 19,333 | 697,148 |
| Sun Communities, Inc. | | 13,179 | 1,585,961 |
| UDR, Inc. | | 35,077 | 1,443,419 |
| Ventas, Inc. | | 43,095 | 2,209,050 |
| VICI Properties, Inc. | | 111,410 | 3,190,782 |
| Vornado Realty Trust | | 18,725 | 492,280 |
| Weyerhaeuser Co. | | 77,898 | 2,211,524 |
| WP Carey, Inc. | | 23,153 | 1,274,573 |
| | | | 76,897,969 |
| Real Estate Management & Development - 0.9% | | | |
| CBRE Group, Inc. (a) | | 32,690 | 2,913,006 |
| CoStar Group, Inc. (a) | | 43,375 | 3,215,823 |
| Howard Hughes Holdings, Inc. | | 3,309 | 214,489 |
| Jones Lang LaSalle, Inc. (a) | | 3,484 | 715,196 |
| Zillow Group, Inc.: | | | |
| Class A (a) | | 5,025 | 226,326 |
| Class C (a) | | 16,946 | 786,125 |
| | | | 8,070,965 |
TOTAL REAL ESTATE | | | 84,968,934 |
| UTILITIES - 6.7% | | | |
| Electric Utilities - 3.4% | | | |
| Alliant Energy Corp. | | 27,380 | 1,393,642 |
| Avangrid, Inc. | | 7,578 | 269,246 |
| Edison International | | 40,654 | 2,919,364 |
| Entergy Corp. | | 22,781 | 2,437,567 |
| Evergy, Inc. | | 23,795 | 1,260,421 |
| Eversource Energy | | 37,532 | 2,128,440 |
| Exelon Corp. | | 106,933 | 3,700,951 |
| FirstEnergy Corp. | | 61,526 | 2,354,600 |
| IDACORP, Inc. | | 5,402 | 503,196 |
| NRG Energy, Inc. | | 13,505 | 1,051,499 |
| OGE Energy Corp. | | 21,358 | 762,481 |
| PG&E Corp. | | 228,461 | 3,988,929 |
| Pinnacle West Capital Corp. | | 12,131 | 926,566 |
| PPL Corp. | | 78,922 | 2,182,193 |
| Xcel Energy, Inc. | | 59,440 | 3,174,690 |
| | | | 29,053,785 |
| Gas Utilities - 0.4% | | | |
| Atmos Energy Corp. | | 16,074 | 1,875,032 |
| National Fuel Gas Co. | | 9,733 | 527,431 |
| UGI Corp. | | 22,419 | 513,395 |
| | | | 2,915,858 |
| Independent Power and Renewable Electricity Producers - 0.2% | | | |
| Brookfield Renewable Corp. | | 14,437 | 409,722 |
| Clearway Energy, Inc.: | | | |
| Class A | | 3,702 | 83,887 |
| Class C | | 8,756 | 216,186 |
| The AES Corp. | | 75,774 | 1,331,349 |
| | | | 2,041,144 |
| Multi-Utilities - 2.3% | | | |
| Ameren Corp. | | 28,433 | 2,021,871 |
| CenterPoint Energy, Inc. | | 67,693 | 2,097,129 |
| CMS Energy Corp. | | 31,804 | 1,893,292 |
| Consolidated Edison, Inc. | | 37,012 | 3,309,613 |
| DTE Energy Co. | | 22,092 | 2,452,433 |
| NiSource, Inc. | | 47,923 | 1,380,662 |
| Public Service Enterprise Group, Inc. | | 53,293 | 3,927,694 |
| WEC Energy Group, Inc. | | 33,800 | 2,651,948 |
| | | | 19,734,642 |
| Water Utilities - 0.4% | | | |
| American Water Works Co., Inc. | | 20,843 | 2,692,082 |
| Essential Utilities, Inc. | | 26,904 | 1,004,326 |
| | | | 3,696,408 |
TOTAL UTILITIES | | | 57,441,837 |
| TOTAL COMMON STOCKS (Cost $706,123,938) | | | 870,482,479 |
| | | | |
| U.S. Treasury Obligations - 0.0% |
| | | Principal Amount (d) | Value ($) |
U.S. Treasury Bills, yield at date of purchase 5.31% 8/22/24 (e) (Cost $124,054) | | 125,000 | 124,056 |
| | | | |
| Money Market Funds - 1.4% |
| | | Shares | Value ($) |
| Fidelity Cash Central Fund 5.38% (f) | | 1,855,513 | 1,855,884 |
| Fidelity Securities Lending Cash Central Fund 5.38% (f)(g) | | 9,732,059 | 9,733,032 |
| TOTAL MONEY MARKET FUNDS (Cost $11,588,916) | | | 11,588,916 |
| | | | |
| TOTAL INVESTMENT IN SECURITIES - 103.3% (Cost $717,836,908) | 882,195,451 |
NET OTHER ASSETS (LIABILITIES) - (3.3)% | (27,949,592) |
| NET ASSETS - 100.0% | 854,245,859 |
| | |
Legend
| (c) | Security or a portion of the security is on loan at period end. |
| (d) | Amount is stated in United States dollars unless otherwise noted. |
| (e) | Security or a portion of the security was pledged to cover margin requirements for futures contracts. At period end, the value of securities pledged amounted to $124,056. |
| (f) | Affiliated fund that is generally available only to investment companies and other accounts managed by Fidelity Investments. The rate quoted is the annualized seven-day yield of the fund at period end. A complete unaudited listing of the fund's holdings as of its most recent quarter end is available upon request. In addition, each Fidelity Central Fund's financial statements, which are not covered by the Fund's Report of Independent Registered Public Accounting Firm, are available on the SEC's website or upon request. |
| (g) | Investment made with cash collateral received from securities on loan. |
| Additional information on each restricted holding is as follows: |
| Security | Acquisition Date | Acquisition Cost ($) |
| GCI Liberty, Inc. Class A (Escrow) | 5/23/23 | 0 |
| | | |
Affiliated Central Funds
Fiscal year to date information regarding the Fund's investments in Fidelity Central Funds, including the ownership percentage, is presented below.
| Affiliate | Value, beginning of period ($) | Purchases ($) | Sales Proceeds ($) | Dividend Income ($) | Realized Gain (loss) ($) | Change in Unrealized appreciation (depreciation) ($) | Value, end of period ($) | % ownership, end of period |
| Fidelity Cash Central Fund 5.38% | 596,456 | 157,740,465 | 156,481,028 | 80,404 | (9) | - | 1,855,884 | 0.0% |
| Fidelity Securities Lending Cash Central Fund 5.38% | 44,022,747 | 101,852,797 | 136,142,512 | 267,385 | - | - | 9,733,032 | 0.0% |
| Total | 44,619,203 | 259,593,262 | 292,623,540 | 347,789 | (9) | - | 11,588,916 | |
| | | | | | | | | |
Amounts in the dividend income column in the above table include any capital gain distributions from underlying funds, which are presented in the corresponding line item in the Statement of Operations, if applicable.
Amounts in the dividend income column for Fidelity Securities Lending Cash Central Fund represents the income earned on investing cash collateral, less rebates paid to borrowers and any lending agent fees associated with the loan, plus any premium payments received for lending certain types of securities.
Amounts included in the purchases and sales proceeds columns may include in-kind transactions, if applicable.
Investment Valuation
The following is a summary of the inputs used, as of June 30, 2024, involving the Fund's assets and liabilities carried at fair value. The inputs or methodology used for valuing securities may not be an indication of the risk associated with investing in those securities. For more information on valuation inputs, and their aggregation into the levels used below, please refer to the Investment Valuation section in the accompanying Notes to Financial Statements.
| Valuation Inputs at Reporting Date: |
| Description | Total ($) | Level 1 ($) | Level 2 ($) | Level 3 ($) |
Investments in Securities: | | | | |
|
| Equities: | | | | |
Communication Services | 27,446,180 | 27,446,180 | - | - |
Consumer Discretionary | 81,929,536 | 81,929,536 | - | - |
Consumer Staples | 53,572,181 | 53,572,181 | - | - |
Energy | 51,694,023 | 51,694,023 | - | - |
Financials | 142,352,046 | 142,352,046 | - | - |
Health Care | 79,368,532 | 79,368,532 | - | - |
Industrials | 147,406,255 | 147,406,255 | - | - |
Information Technology | 79,394,492 | 79,394,492 | - | - |
Materials | 64,908,463 | 64,908,463 | - | - |
Real Estate | 84,968,934 | 84,968,934 | - | - |
Utilities | 57,441,837 | 57,441,837 | - | - |
|
| U.S. Government and Government Agency Obligations | 124,056 | - | 124,056 | - |
|
| Money Market Funds | 11,588,916 | 11,588,916 | - | - |
| Total Investments in Securities: | 882,195,451 | 882,071,395 | 124,056 | - |
Fidelity® Mid Cap Value Index Fund
Financial Statements
| Statement of Assets and Liabilities |
| | | | June 30, 2024 |
| | | | | |
| Assets | | | | |
| Investment in securities, at value (including securities loaned of $9,236,258) - See accompanying schedule: | | | | |
Unaffiliated issuers (cost $706,247,992) | $ | 870,606,535 | | |
Fidelity Central Funds (cost $11,588,916) | | 11,588,916 | | |
| | | | | |
| | | | | |
| Total Investment in Securities (cost $717,836,908) | | | $ | 882,195,451 |
| Segregated cash with brokers for derivative instruments | | | | 103,133 |
| Receivable for investments sold | | | | 190,658,507 |
| Receivable for fund shares sold | | | | 263,055 |
| Dividends receivable | | | | 1,067,747 |
| Distributions receivable from Fidelity Central Funds | | | | 10,350 |
| Receivable for daily variation margin on futures contracts | | | | 6,312 |
| Other receivables | | | | 14,599 |
Total assets | | | | 1,074,319,154 |
| Liabilities | | | | |
| Payable to custodian bank | $ | 31,279 | | |
| Payable for investments purchased | | 150,423,452 | | |
| Payable for fund shares redeemed | | 59,848,413 | | |
| Accrued management fee | | 37,119 | | |
| Collateral on securities loaned | | 9,733,032 | | |
| Total liabilities | | | | 220,073,295 |
| Net Assets | | | $ | 854,245,859 |
| Net Assets consist of: | | | | |
| Paid in capital | | | $ | 667,391,930 |
| Total accumulated earnings (loss) | | | | 186,853,929 |
| Net Assets | | | $ | 854,245,859 |
Net Asset Value, offering price and redemption price per share ($854,245,859 ÷ 32,507,115 shares) | | | $ | 26.28 |
| Statement of Operations |
| | | | Year ended June 30, 2024 |
| Investment Income | | | | |
| Dividends | | | $ | 16,984,751 |
| Interest | | | | 6,856 |
| Income from Fidelity Central Funds (including $267,385 from security lending) | | | | 347,789 |
| Total income | | | | 17,339,396 |
| Expenses | | | | |
| Management fee | $ | 426,336 | | |
| Independent trustees' fees and expenses | | 2,693 | | |
| Interest | | 30,901 | | |
| Miscellaneous | | 11,199 | | |
| Total expenses before reductions | | 471,129 | | |
| Expense reductions | | (59) | | |
| Total expenses after reductions | | | | 471,070 |
| Net Investment income (loss) | | | | 16,868,326 |
| Realized and Unrealized Gain (Loss) | | | | |
| Net realized gain (loss) on: | | | | |
| Investment Securities: | | | | |
| Unaffiliated issuers | | 23,576,318 | | |
| Redemptions in-kind | | 28,625,666 | | |
| Fidelity Central Funds | | (9) | | |
| Foreign currency transactions | | 718 | | |
| Futures contracts | | 307,347 | | |
| Total net realized gain (loss) | | | | 52,510,040 |
| Change in net unrealized appreciation (depreciation) on: | | | | |
| Investment Securities: | | | | |
| Unaffiliated issuers | | 24,239,621 | | |
| Futures contracts | | (26,904) | | |
| Total change in net unrealized appreciation (depreciation) | | | | 24,212,717 |
| Net gain (loss) | | | | 76,722,757 |
| Net increase (decrease) in net assets resulting from operations | | | $ | 93,591,083 |
| Statement of Changes in Net Assets |
| |
| | Year ended June 30, 2024 | | Year ended June 30, 2023 |
| Increase (Decrease) in Net Assets | | | | |
| Operations | | | | |
| Net investment income (loss) | $ | 16,868,326 | $ | 17,408,189 |
| Net realized gain (loss) | | 52,510,040 | | 1,144,761 |
| Change in net unrealized appreciation (depreciation) | | 24,212,717 | | 64,951,688 |
| Net increase (decrease) in net assets resulting from operations | | 93,591,083 | | 83,504,638 |
| Distributions to shareholders | | (16,377,481) | | (21,922,393) |
| | | | | |
| Share transactions | | | | |
| Proceeds from sales of shares | | 311,731,686 | | 250,959,317 |
| Reinvestment of distributions | | 6,481,804 | | 7,596,612 |
| Cost of shares redeemed | | (387,519,440) | | (270,893,428) |
| | | | | |
Net increase (decrease) in net assets resulting from share transactions | | (69,305,950) | | (12,337,499) |
| Total increase (decrease) in net assets | | 7,907,652 | | 49,244,746 |
| | | | | |
| Net Assets | | | | |
| Beginning of period | | 846,338,207 | | 797,093,461 |
| End of period | $ | 854,245,859 | $ | 846,338,207 |
| | | | | |
| Other Information | | | | |
| Shares | | | | |
| Sold | | 12,544,889 | | 10,842,771 |
| Issued in reinvestment of distributions | | 264,647 | | 327,643 |
| Redeemed | | (15,670,880) | | (11,650,806) |
| Net increase (decrease) | | (2,861,344) | | (480,392) |
| | | | | |
Financial Highlights
Fidelity® Mid Cap Value Index Fund |
| |
| Years ended June 30, | | 2024 | | 2023 | | 2022 | | 2021 | | 2020 A |
Selected Per-Share Data | | | | | | | | | | |
| Net asset value, beginning of period | $ | 23.93 | $ | 22.23 | $ | 26.19 | $ | 17.36 | $ | 20.00 |
| Income from Investment Operations | | | | | | | | | | |
Net investment income (loss) B,C | | .49 | | .50 | | .43 | | .41 | | .46 |
| Net realized and unrealized gain (loss) | | 2.34 | | 1.82 | | (2.90) | | 8.69 | | (2.97) |
| Total from investment operations | | 2.83 | | 2.32 | | (2.47) | | 9.10 | | (2.51) |
| Distributions from net investment income | | (.48) | | (.45) | | (.39) | | (.27) | | (.13) |
| Distributions from net realized gain | | - | | (.17) | | (1.11) | | - | | - |
| Total distributions | | (.48) | | (.62) | | (1.49) D | | (.27) | | (.13) |
| Net asset value, end of period | $ | 26.28 | $ | 23.93 | $ | 22.23 | $ | 26.19 | $ | 17.36 |
Total Return E,F | | | | 10.56% | | (10.08)% | | 52.83% | | (12.65)% |
Ratios to Average Net Assets C,G,H | | | | | | | | | | |
| Expenses before reductions | | .06% | | .05% | | .05% | | .05% | | .05% I |
| Expenses net of fee waivers, if any | | | | .05% | | .05% | | .05% | | .05% I |
| Expenses net of all reductions | | .06% | | .05% | | .05% | | .05% | | .05% I |
| Net investment income (loss) | | 1.98% | | 2.17% | | 1.70% | | 1.80% | | 2.82% I |
| Supplemental Data | | | | | | | | | | |
| Net assets, end of period (000 omitted) | $ | 854,246 | $ | 846,338 | $ | 797,093 | $ | 908,686 | $ | 249,744 |
Portfolio turnover rate J | | | | 30% | | 41% | | 32% | | 89% I |
AFor the period July 11, 2019 (commencement of operations) through June 30, 2020.
BCalculated based on average shares outstanding during the period.
CNet investment income (loss) is affected by the timing of the declaration of dividends by any underlying mutual funds or exchange-traded funds (ETFs). Net investment income (loss) of any mutual funds or ETFs is not included in the Fund's net investment income (loss) ratio.
DTotal distributions per share do not sum due to rounding.
ETotal returns would have been lower if certain expenses had not been reduced during the applicable periods shown.
FTotal returns for periods of less than one year are not annualized.
GFees and expenses of any underlying mutual funds or exchange-traded funds (ETFs) are not included in the Fund's expense ratio. The Fund indirectly bears its proportionate share of these expenses. For additional expense information related to investments in Fidelity Central Funds, please refer to the "Investments in Fidelity Central Funds" note found in the Notes to Financial Statements section of the most recent Annual or Semi-Annual report.
HExpense ratios reflect operating expenses of the class. Expenses before reductions do not reflect amounts reimbursed, waived, or reduced through arrangements with the investment adviser, brokerage services, or other offset arrangements, if applicable, and do not represent the amount paid by the class during periods when reimbursements, waivers or reductions occur.
IAnnualized.
JAmount does not include the portfolio activity of any underlying mutual funds or exchange-traded funds (ETFs).
KPortfolio turnover rate excludes securities received or delivered in-kind.
Fidelity® Small Cap Growth Index Fund
Schedule of Investments June 30, 2024
Showing Percentage of Net Assets
| Common Stocks - 101.0% |
| | | Shares | Value ($) |
| COMMUNICATION SERVICES - 2.1% | | | |
| Diversified Telecommunication Services - 0.4% | | | |
| Anterix, Inc. (a) | | 5,946 | 235,402 |
| Bandwidth, Inc. Class A, (a) | | 11,708 | 197,631 |
| Cogent Communications Group, Inc. | | 23,353 | 1,318,043 |
| Globalstar, Inc. (a)(b) | | 327,241 | 366,510 |
| IDT Corp. Class B | | 5,804 | 208,480 |
| | | | 2,326,066 |
| Entertainment - 0.5% | | | |
| Atlanta Braves Holdings, Inc.: | | | |
| Class A | | 5,537 | 228,844 |
| Class C, | | 26,470 | 1,043,977 |
| Cinemark Holdings, Inc. (a)(b) | | 46,403 | 1,003,233 |
| Eventbrite, Inc. (a) | | 38,791 | 187,748 |
| Golden Matrix Group, Inc. (a) | | 10,605 | 26,194 |
| IMAX Corp. (a) | | 22,737 | 381,299 |
| LiveOne, Inc. (a) | | 31,353 | 49,224 |
| Madison Square Garden Entertainment Corp. Class A (a) | | 2,035 | 69,658 |
| Reservoir Media, Inc. (a) | | 690 | 5,451 |
| Vivid Seats, Inc. Class A (a) | | 41,500 | 238,625 |
| | | | 3,234,253 |
| Interactive Media & Services - 0.7% | | | |
| Bumble, Inc. (a) | | 4,789 | 50,332 |
| CarGurus, Inc. Class A (a) | | 46,825 | 1,226,815 |
| EverQuote, Inc. Class A (a) | | 13,312 | 277,688 |
| fuboTV, Inc. (a) | | 12,280 | 15,227 |
| Getty Images Holdings, Inc. (a) | | 53,237 | 173,553 |
| Grindr, Inc. (a) | | 13,029 | 159,475 |
| MediaAlpha, Inc. Class A (a) | | 13,179 | 173,567 |
| QuinStreet, Inc. (a) | | 27,930 | 463,359 |
| Shutterstock, Inc. (b) | | 10,423 | 403,370 |
| System1, Inc. (a) | | 12,455 | 18,932 |
| Yelp, Inc. (a) | | 34,780 | 1,285,121 |
| ZipRecruiter, Inc. (a) | | 38,059 | 345,956 |
| | | | 4,593,395 |
| Media - 0.5% | | | |
| Boston Omaha Corp. (a) | | 803 | 10,808 |
| Cardlytics, Inc. (a) | | 21,281 | 174,717 |
| Clear Channel Outdoor Holdings, Inc. (a) | | 24,421 | 34,434 |
| Entravision Communication Corp. Class A | | 5,120 | 10,394 |
| Gambling.com Group Ltd. (a) | | 9,209 | 75,698 |
| Ibotta, Inc. | | 4,038 | 303,496 |
| Innovid Corp. (a) | | 6,499 | 12,023 |
| Integral Ad Science Holding Corp. (a) | | 4,489 | 43,633 |
| John Wiley & Sons, Inc. Class A | | 10,017 | 407,692 |
| Magnite, Inc. (a) | | 59,364 | 788,948 |
| PubMatic, Inc. Class A (a) | | 22,178 | 450,435 |
| Sinclair, Inc. Class A (b) | | 16,976 | 226,290 |
| Stagwell, Inc. (a) | | 8,402 | 57,302 |
| TechTarget, Inc. (a) | | 13,707 | 427,247 |
| Thryv Holdings, Inc. (a) | | 16,876 | 300,730 |
| Townsquare Media, Inc. | | 6,946 | 76,128 |
| | | | 3,399,975 |
| Wireless Telecommunication Services - 0.0% | | | |
| Gogo, Inc. (a) | | 14,637 | 140,808 |
TOTAL COMMUNICATION SERVICES | | | 13,694,497 |
| CONSUMER DISCRETIONARY - 10.0% | | | |
| Automobile Components - 1.5% | | | |
| Dorman Products, Inc. (a) | | 13,907 | 1,272,212 |
| Gentherm, Inc. (a) | | 16,656 | 821,474 |
| Holley, Inc. (a) | | 11,157 | 39,942 |
| LCI Industries | | 13,148 | 1,359,240 |
| Luminar Technologies, Inc. Class A (a)(b) | | 154,622 | 230,387 |
| Modine Manufacturing Co. (a) | | 27,388 | 2,744,004 |
| Patrick Industries, Inc. | | 11,446 | 1,242,463 |
| Visteon Corp. (a) | | 14,465 | 1,543,416 |
| XPEL, Inc. (a) | | 13,393 | 476,255 |
| | | | 9,729,393 |
| Automobiles - 0.0% | | | |
| LiveWire Group, Inc. (a) | | 9,669 | 74,065 |
| Broadline Retail - 0.0% | | | |
| 1stDibs.com, Inc. (a) | | 3,014 | 13,533 |
| Groupon, Inc. (a) | | 6,027 | 92,213 |
| Qurate Retail, Inc. Class B (a) | | 543 | 2,297 |
| Savers Value Village, Inc. (b) | | 12,404 | 151,825 |
| | | | 259,868 |
| Distributors - 0.0% | | | |
| GigaCloud Technology, Inc. Class A (a) | | 12,449 | 378,699 |
| Diversified Consumer Services - 1.0% | | | |
| Adtalem Global Education, Inc. (a) | | 3,811 | 259,948 |
| American Public Education, Inc. (a) | | 713 | 12,535 |
| Carriage Services, Inc. | | 5,461 | 146,573 |
| Coursera, Inc. (a) | | 72,951 | 522,329 |
| European Wax Center, Inc. (a)(b) | | 16,626 | 165,096 |
| Frontdoor, Inc. (a) | | 41,610 | 1,406,002 |
| Laureate Education, Inc. | | 57,401 | 857,571 |
| Mister Car Wash, Inc. (a) | | 42,983 | 306,039 |
| Nerdy, Inc. Class A (a) | | 38,592 | 64,449 |
| OneSpaWorld Holdings Ltd. (a) | | 53,275 | 818,837 |
| Stride, Inc. (a) | | 22,578 | 1,591,749 |
| Udemy, Inc. (a) | | 50,704 | 437,576 |
| Universal Technical Institute, Inc. (a) | | 20,949 | 329,528 |
| | | | 6,918,232 |
| Hotels, Restaurants & Leisure - 2.7% | | | |
| Accel Entertainment, Inc. (a) | | 27,791 | 285,136 |
| BJ's Restaurants, Inc. (a) | | 5,466 | 189,670 |
| Bloomin' Brands, Inc. | | 22,141 | 425,771 |
| Brinker International, Inc. (a) | | 21,075 | 1,525,619 |
| Cracker Barrel Old Country Store, Inc. (b) | | 2,593 | 109,321 |
| Dave & Buster's Entertainment, Inc. (a) | | 17,462 | 695,162 |
| Denny's Corp. (a) | | 19,460 | 138,166 |
| Despegar.com Corp. (a) | | 4,540 | 60,064 |
| Dine Brands Global, Inc. | | 1,018 | 36,852 |
| Empire Resorts, Inc. (c) | | 24 | 0 |
| Everi Holdings, Inc. (a) | | 22,786 | 191,402 |
| First Watch Restaurant Group, Inc. (a) | | 16,096 | 282,646 |
| Global Business Travel Group, Inc. (a) | | 57,151 | 377,197 |
| Hilton Grand Vacations, Inc. (a) | | 39,107 | 1,581,096 |
| Inspired Entertainment, Inc. (a) | | 11,636 | 106,469 |
| International Game Technology PLC | | 8,018 | 164,048 |
| Jack in the Box, Inc. | | 10,408 | 530,184 |
| Krispy Kreme, Inc. (b) | | 45,363 | 488,106 |
| Kura Sushi U.S.A., Inc. Class A (a)(b) | | 3,141 | 198,166 |
| Lindblad Expeditions Holdings (a) | | 13,271 | 128,065 |
| Monarch Casino & Resort, Inc. | | 6,949 | 473,435 |
| Mondee Holdings, Inc. Class A (a)(b) | | 16,770 | 40,248 |
| Nathan's Famous, Inc. | | 1,316 | 89,198 |
| Papa John's International, Inc. (b) | | 12,762 | 599,559 |
| PlayAGS, Inc. (a) | | 20,835 | 239,603 |
| Portillo's, Inc. Class A (a)(b) | | 22,776 | 221,383 |
| Potbelly Corp. (a) | | 14,537 | 116,732 |
| RCI Hospitality Holdings, Inc. | | 2,389 | 104,065 |
| Red Rock Resorts, Inc. | | 11,859 | 651,415 |
| Rush Street Interactive, Inc. (a) | | 40,298 | 386,458 |
| Sabre Corp. (a) | | 42,095 | 112,394 |
| Shake Shack, Inc. Class A (a) | | 20,158 | 1,814,220 |
| Six Flags Entertainment Corp. | | 28,791 | 954,134 |
| Super Group SGHC Ltd. | | 79,404 | 256,475 |
| Sweetgreen, Inc. Class A (a) | | 52,368 | 1,578,372 |
| Target Hospitality Corp. (a) | | 17,478 | 152,233 |
| The Cheesecake Factory, Inc. | | 25,593 | 1,005,549 |
| The ONE Group Hospitality, Inc. (a) | | 11,063 | 47,018 |
| United Parks & Resorts, Inc. (a)(b) | | 17,768 | 964,980 |
| Xponential Fitness, Inc. (a)(b) | | 12,700 | 198,120 |
| | | | 17,518,731 |
| Household Durables - 1.4% | | | |
| Cavco Industries, Inc. (a) | | 4,440 | 1,536,995 |
| Century Communities, Inc. | | 1,860 | 151,888 |
| Cricut, Inc. | | 19,905 | 119,231 |
| Dream Finders Homes, Inc. (a)(b) | | 14,835 | 383,040 |
| Green Brick Partners, Inc. (a) | | 4,580 | 262,159 |
| Hovnanian Enterprises, Inc. Class A (a) | | 166 | 23,559 |
| Installed Building Products, Inc. | | 12,705 | 2,613,164 |
| KB Home | | 4,911 | 344,654 |
| Landsea Homes Corp. Class A (a) | | 1,159 | 10,651 |
| LGI Homes, Inc. (a) | | 773 | 69,176 |
| Lovesac (a) | | 3,981 | 89,891 |
| Skyline Champion Corp. (a) | | 13,453 | 911,441 |
| Sonos, Inc. (a) | | 58,662 | 865,851 |
| TRI Pointe Homes, Inc. (a) | | 14,499 | 540,088 |
| United Homes Group, Inc. (a) | | 2,215 | 12,603 |
| Vizio Holding Corp. (a)(b) | | 47,094 | 508,615 |
| Worthington Enterprises, Inc. | | 14,853 | 702,992 |
| | | | 9,145,998 |
| Leisure Products - 0.3% | | | |
| Acushnet Holdings Corp. | | 15,360 | 975,053 |
| Marine Products Corp. | | 2,144 | 21,654 |
| Peloton Interactive, Inc. Class A (a) | | 166,550 | 562,939 |
| Smith & Wesson Brands, Inc. | | 1,969 | 28,235 |
| Sturm, Ruger & Co., Inc. | | 2,514 | 104,708 |
| | | | 1,692,589 |
| Specialty Retail - 2.2% | | | |
| 1-800-FLOWERS.com, Inc. Class A (a) | | 3,329 | 31,692 |
| Abercrombie & Fitch Co. Class A (a) | | 26,667 | 4,742,459 |
| Academy Sports & Outdoors, Inc. | | 9,964 | 530,583 |
| American Eagle Outfitters, Inc. | | 76,770 | 1,532,329 |
| Arhaus, Inc. Class A, | | 23,233 | 393,567 |
| Arko Corp. | | 4,356 | 27,312 |
| Boot Barn Holdings, Inc. (a) | | 15,688 | 2,022,654 |
| Build-A-Bear Workshop, Inc. | | 6,849 | 173,074 |
| Caleres, Inc. | | 5,493 | 184,565 |
| Camping World Holdings, Inc. (b) | | 22,448 | 400,921 |
| EVgo, Inc. Class A (a)(b) | | 6,705 | 16,427 |
| Genesco, Inc. (a) | | 1,561 | 40,367 |
| GrowGeneration Corp. (a) | | 2,194 | 4,717 |
| Hibbett, Inc. | | 4,876 | 425,236 |
| J. Jill, Inc. | | 2,245 | 78,508 |
| Leslie's, Inc. (a)(b) | | 57,847 | 242,379 |
| National Vision Holdings, Inc. (a) | | 2,689 | 35,199 |
| Revolve Group, Inc. (a)(b) | | 20,342 | 323,641 |
| Sonic Automotive, Inc. Class A (sub. vtg.) | | 2,216 | 120,706 |
| The Buckle, Inc. | | 16,376 | 604,929 |
| The RealReal, Inc. (a) | | 36,381 | 116,055 |
| thredUP, Inc. (a) | | 6,487 | 11,028 |
| Tile Shop Holdings, Inc. (a) | | 5,297 | 36,708 |
| Torrid Holdings, Inc. (a)(b) | | 6,492 | 48,625 |
| Upbound Group, Inc. | | 28,438 | 873,047 |
| Urban Outfitters, Inc. (a) | | 9,548 | 391,945 |
| Victoria's Secret & Co. (a) | | 9,739 | 172,088 |
| Warby Parker, Inc. (a) | | 46,232 | 742,486 |
| | | | 14,323,247 |
| Textiles, Apparel & Luxury Goods - 0.9% | | | |
| Figs, Inc. Class A (a) | | 3,805 | 20,281 |
| Hanesbrands, Inc. (a) | | 187,309 | 923,433 |
| Kontoor Brands, Inc. | | 29,507 | 1,951,888 |
| Oxford Industries, Inc. (b) | | 5,473 | 548,121 |
| Rocky Brands, Inc. | | 1,379 | 50,968 |
| Steven Madden Ltd. | | 38,417 | 1,625,039 |
| Superior Group of Companies, Inc. | | 1,060 | 20,045 |
| Wolverine World Wide, Inc. | | 42,095 | 569,124 |
| | | | 5,708,899 |
TOTAL CONSUMER DISCRETIONARY | | | 65,749,721 |
| CONSUMER STAPLES - 3.3% | | | |
| Beverages - 0.3% | | | |
| MGP Ingredients, Inc. | | 7,513 | 558,967 |
| National Beverage Corp. | | 12,456 | 638,245 |
| Primo Water Corp. | | 10,194 | 222,841 |
| The Vita Coco Co., Inc. (a) | | 20,816 | 579,726 |
| | | | 1,999,779 |
| Consumer Staples Distribution & Retail - 0.9% | | | |
| Andersons, Inc. | | 2,097 | 104,011 |
| Chefs' Warehouse Holdings (a) | | 18,554 | 725,647 |
| Natural Grocers by Vitamin Cottage, Inc. | | 1,268 | 26,882 |
| PriceSmart, Inc. | | 8,399 | 681,999 |
| Sprouts Farmers Market LLC (a) | | 53,408 | 4,468,113 |
| | | | 6,006,652 |
| Food Products - 1.3% | | | |
| Beyond Meat, Inc. (a)(b) | | 31,661 | 212,445 |
| BRC, Inc. Class A (a)(b) | | 25,042 | 153,507 |
| Cal-Maine Foods, Inc. | | 1,284 | 78,465 |
| Calavo Growers, Inc. | | 1,426 | 32,370 |
| Forafric Global PLC (a) | | 2,887 | 30,804 |
| J&J Snack Foods Corp. | | 8,088 | 1,313,249 |
| John B. Sanfilippo & Son, Inc. | | 4,756 | 462,141 |
| Lancaster Colony Corp. | | 10,372 | 1,959,997 |
| Lifeway Foods, Inc. (a) | | 2,392 | 30,546 |
| Mama's Creations, Inc. (a) | | 17,459 | 117,674 |
| Mission Produce, Inc. (a) | | 2,848 | 28,138 |
| SunOpta, Inc. (a) | | 48,650 | 262,710 |
| The Simply Good Foods Co. (a) | | 48,394 | 1,748,475 |
| Utz Brands, Inc. Class A | | 23,513 | 391,256 |
| Vital Farms, Inc. (a) | | 17,278 | 808,092 |
| Westrock Coffee Holdings (a)(b) | | 17,947 | 183,598 |
| WK Kellogg Co. | | 34,787 | 572,594 |
| | | | 8,386,061 |
| Household Products - 0.4% | | | |
| Central Garden & Pet Co. (a) | | 1,778 | 68,453 |
| Central Garden & Pet Co. Class A (non-vtg.) | | 3,807 | 125,745 |
| Energizer Holdings, Inc. | | 38,114 | 1,125,888 |
| Oil-Dri Corp. of America | | 570 | 36,531 |
| WD-40 Co. | | 7,221 | 1,586,020 |
| | | | 2,942,637 |
| Personal Care Products - 0.3% | | | |
| Herbalife Ltd. (a) | | 35,407 | 367,879 |
| Inter Parfums, Inc. | | 9,661 | 1,120,966 |
| Nature's Sunshine Products, Inc. (a) | | 1,426 | 21,490 |
| The Beauty Health Co. Class A, (a) | | 39,522 | 75,882 |
| The Honest Co., Inc. (a) | | 17,402 | 50,814 |
| Veru, Inc. (a) | | 51,908 | 43,670 |
| | | | 1,680,701 |
| Tobacco - 0.1% | | | |
| Ispire Technology, Inc. (a) | | 10,198 | 81,584 |
| Turning Point Brands, Inc. | | 7,801 | 250,334 |
| Vector Group Ltd. | | 11,623 | 122,855 |
| | | | 454,773 |
TOTAL CONSUMER STAPLES | | | 21,470,603 |
| ENERGY - 4.2% | | | |
| Energy Equipment & Services - 2.6% | | | |
| Archrock, Inc. | | 81,840 | 1,654,805 |
| Atlas Energy Solutions, Inc. (b) | | 36,028 | 718,038 |
| Cactus, Inc. | | 34,733 | 1,831,818 |
| Championx Corp. | | 101,139 | 3,358,826 |
| Core Laboratories, Inc. (b) | | 24,905 | 505,322 |
| DMC Global, Inc. (a) | | 2,715 | 39,150 |
| Drilling Tools International Corp. (a) | | 1,990 | 11,184 |
| Helix Energy Solutions Group, Inc. (a) | | 14,577 | 174,049 |
| Kodiak Gas Services, Inc. | | 2,923 | 79,681 |
| Liberty Energy, Inc. Class A | | 4,887 | 102,089 |
| Nabors Industries Ltd. (a) | | 1,501 | 106,811 |
| Natural Gas Services Group, Inc. (a) | | 1,215 | 24,446 |
| Noble Corp. PLC | | 47,720 | 2,130,698 |
| Oceaneering International, Inc. (a) | | 53,586 | 1,267,845 |
| Seadrill Ltd. (a) | | 11,633 | 599,100 |
| TETRA Technologies, Inc. (a) | | 66,584 | 230,381 |
| Tidewater, Inc. (a) | | 25,861 | 2,462,226 |
| Valaris Ltd. (a) | | 21,266 | 1,584,317 |
| | | | 16,880,786 |
| Oil, Gas & Consumable Fuels - 1.6% | | | |
| Berry Corp. | | 12,302 | 79,471 |
| Centrus Energy Corp. Class A (a) | | 5,326 | 227,687 |
| Crescent Energy, Inc. Class A | | 16,638 | 197,160 |
| CVR Energy, Inc. | | 16,223 | 434,290 |
| Delek U.S. Holdings, Inc. | | 9,247 | 228,956 |
| Diversified Energy Co. PLC | | 1,330 | 17,942 |
| Dorian LPG Ltd. | | 9,181 | 385,235 |
| Empire Petroleum Corp. (a)(b) | | 7,467 | 38,530 |
| enCore Energy Corp. (a) | | 69,269 | 272,920 |
| Equitrans Midstream Corp. | | 55,983 | 726,659 |
| Evolution Petroleum Corp. | | 4,662 | 24,569 |
| FLEX LNG Ltd. | | 9,653 | 261,017 |
| Gulfport Energy Corp. (a) | | 3,558 | 537,258 |
| Kinetik Holdings, Inc. | | 1,925 | 79,772 |
| Kosmos Energy Ltd. (a) | | 248,051 | 1,374,203 |
| Magnolia Oil & Gas Corp. Class A (b) | | 84,828 | 2,149,542 |
| Nextdecade Corp. (a) | | 61,319 | 486,873 |
| Northern Oil & Gas, Inc. | | 3,147 | 116,974 |
| Rex American Resources Corp. (a) | | 1,767 | 80,558 |
| Riley Exploration Permian, Inc. | | 901 | 25,507 |
| Sable Offshore Corp. (a) | | 26,758 | 403,243 |
| SFL Corp. Ltd. | | 12,523 | 173,819 |
| SilverBow Resources, Inc. (a) | | 1,084 | 41,008 |
| SM Energy Co. | | 10,246 | 442,935 |
| Ur-Energy, Inc. (a) | | 132,954 | 186,136 |
| Uranium Energy Corp. (a) | | 208,559 | 1,253,440 |
| VAALCO Energy, Inc. | | 5,449 | 34,165 |
| Verde Clean Fuels, Inc. (a) | | 1,762 | 7,295 |
| W&T Offshore, Inc. (b) | | 52,270 | 111,858 |
| World Kinect Corp. | | 3,234 | 83,437 |
| | | | 10,482,459 |
TOTAL ENERGY | | | 27,363,245 |
| FINANCIALS - 7.9% | | | |
| Banks - 1.0% | | | |
| Axos Financial, Inc. (a) | | 3,099 | 177,108 |
| BancFirst Corp. | | 1,278 | 112,081 |
| Bancorp, Inc., Delaware (a) | | 25,169 | 950,381 |
| Bank7 Corp. | | 122 | 3,819 |
| Citizens Financial Services, Inc. | | 166 | 7,460 |
| City Holding Co. | | 596 | 63,325 |
| Coastal Financial Corp. of Washington (a) | | 5,626 | 259,584 |
| Columbia Financial, Inc. (a) | | 827 | 12,380 |
| Esquire Financial Holdings, Inc. | | 3,223 | 153,415 |
| First Bancorp, Puerto Rico | | 6,887 | 125,963 |
| First Business Finance Services, Inc. | | 220 | 8,138 |
| First Financial Bankshares, Inc. | | 68,975 | 2,036,832 |
| First Foundation, Inc. | | 7,882 | 51,627 |
| First Internet Bancorp | | 1,703 | 46,015 |
| First Western Financial, Inc. (a) | | 1,203 | 20,451 |
| Greene County Bancorp, Inc. | | 3,721 | 125,435 |
| Lakeland Financial Corp. | | 806 | 49,585 |
| Live Oak Bancshares, Inc. | | 15,973 | 560,013 |
| Metrocity Bankshares, Inc. | | 791 | 20,882 |
| Nicolet Bankshares, Inc. | | 1,631 | 135,438 |
| Pathward Financial, Inc. | | 3,803 | 215,136 |
| Peoples Financial Services Corp. | | 1,171 | 53,327 |
| ServisFirst Bancshares, Inc. | | 7,613 | 481,065 |
| Shore Bancshares, Inc. | | 2,110 | 24,160 |
| Triumph Bancorp, Inc. (a) | | 10,719 | 876,278 |
| USCB Financial Holdings, Inc. | | 1,552 | 19,912 |
| | | | 6,589,810 |
| Capital Markets - 2.6% | | | |
| Artisan Partners Asset Management, Inc. Class A, | | 33,387 | 1,377,881 |
| Assetmark Financial Holdings, Inc. (a) | | 6,539 | 225,922 |
| B. Riley Financial, Inc. (b) | | 10,825 | 190,953 |
| BrightSphere Investment Group, Inc. (b) | | 14,639 | 324,547 |
| Cohen & Steers, Inc. (b) | | 14,578 | 1,057,780 |
| Diamond Hill Investment Group, Inc. | | 1,220 | 171,715 |
| Donnelley Financial Solutions, Inc. (a) | | 8,938 | 532,884 |
| GCM Grosvenor, Inc. Class A | | 19,061 | 186,035 |
| Hamilton Lane, Inc. Class A | | 20,365 | 2,516,707 |
| MarketWise, Inc. Class A | | 2,860 | 3,318 |
| Moelis & Co. Class A | | 37,464 | 2,130,203 |
| Open Lending Corp. (a) | | 54,180 | 302,324 |
| P10, Inc. Class A | | 18,961 | 160,789 |
| Patria Investments Ltd. | | 29,163 | 351,706 |
| Perella Weinberg Partners Class A | | 27,878 | 453,018 |
| Piper Sandler Cos. | | 9,204 | 2,118,485 |
| PJT Partners, Inc. Class A (b) | | 12,511 | 1,350,062 |
| StepStone Group, Inc. Class A | | 28,401 | 1,303,322 |
| StoneX Group, Inc. (a) | | 1,424 | 107,241 |
| Value Line, Inc. | | 392 | 16,883 |
| Victory Capital Holdings, Inc. | | 21,802 | 1,040,609 |
| Virtus Investment Partners, Inc. | | 2,964 | 669,419 |
| WisdomTree Investments, Inc. | | 73,987 | 733,211 |
| | | | 17,325,014 |
| Consumer Finance - 0.7% | | | |
| Atlanticus Holdings Corp. (a) | | 159 | 4,481 |
| FirstCash Holdings, Inc. | | 20,750 | 2,176,260 |
| LendingTree, Inc. (a) | | 4,917 | 204,498 |
| MoneyLion, Inc. Class A (a) | | 4,507 | 331,445 |
| NerdWallet, Inc. (a) | | 20,528 | 299,709 |
| OppFi, Inc. Class A | | 9,625 | 32,629 |
| PROG Holdings, Inc. | | 3,689 | 127,935 |
| Regional Management Corp. | | 514 | 14,772 |
| Upstart Holdings, Inc. (a)(b) | | 40,835 | 963,298 |
| World Acceptance Corp. (a) | | 1,751 | 216,389 |
| | | | 4,371,416 |
| Financial Services - 2.1% | | | |
| AvidXchange Holdings, Inc. (a) | | 92,134 | 1,111,136 |
| Cantaloupe, Inc. (a) | | 29,407 | 194,086 |
| Cass Information Systems, Inc. | | 6,120 | 245,228 |
| EVERTEC, Inc. (b) | | 34,193 | 1,136,917 |
| Federal Agricultural Mortgage Corp. Class C (non-vtg.) | | 4,300 | 777,526 |
| Flywire Corp. (a) | | 64,023 | 1,049,337 |
| i3 Verticals, Inc. Class A (a) | | 721 | 15,920 |
| International Money Express, Inc. (a) | | 16,819 | 350,508 |
| Marqeta, Inc. Class A (a) | | 213,579 | 1,170,413 |
| Mr. Cooper Group, Inc. (a) | | 12,381 | 1,005,709 |
| NCR Atleos Corp. | | 38,253 | 1,033,596 |
| NMI Holdings, Inc. Class A (a) | | 3,115 | 106,035 |
| PagSeguro Digital Ltd. (a) | | 52,289 | 611,258 |
| Payoneer Global, Inc. (a) | | 114,471 | 634,169 |
| Paysign, Inc. (a) | | 17,509 | 75,464 |
| PennyMac Financial Services, Inc. | | 7,790 | 736,934 |
| Priority Technology Holdings, Inc. (a) | | 9,631 | 50,852 |
| Remitly Global, Inc. (a) | | 76,896 | 931,980 |
| Sezzle, Inc. | | 1,115 | 98,365 |
| StoneCo Ltd. Class A (a) | | 78,911 | 946,143 |
| Walker & Dunlop, Inc. | | 12,365 | 1,214,243 |
| | | | 13,495,819 |
| Insurance - 1.5% | | | |
| American Coastal Insurance Cor (a) | | 5,564 | 58,700 |
| Amerisafe, Inc. | | 4,337 | 190,351 |
| Crawford & Co. Class A | | 8,060 | 69,638 |
| F&G Annuities & Life, Inc. | | 537 | 20,433 |
| Goosehead Insurance (a) | | 12,426 | 713,749 |
| HCI Group, Inc. (b) | | 4,303 | 396,608 |
| Investors Title Co. | | 116 | 20,895 |
| Kingsway Financial Services, Inc. (a) | | 6,819 | 56,189 |
| Lemonade, Inc. (a)(b) | | 22,498 | 371,217 |
| Mercury General Corp. | | 1,761 | 93,580 |
| Oscar Health, Inc. Class A (a) | | 103,087 | 1,630,836 |
| Palomar Holdings, Inc. (a) | | 12,981 | 1,053,408 |
| Root, Inc. (a) | | 4,579 | 236,322 |
| Selective Insurance Group, Inc. | | 27,447 | 2,575,352 |
| Siriuspoint Ltd. (a) | | 4,533 | 55,303 |
| Skyward Specialty Insurance Group, Inc. (a) | | 4,651 | 168,273 |
| The Baldwin Insurance Group, Inc. Class A, (a) | | 34,915 | 1,238,435 |
| Tiptree, Inc. | | 3,091 | 50,971 |
| Trupanion, Inc. (a)(b) | | 17,471 | 513,647 |
| Universal Insurance Holdings, Inc. | | 2,346 | 44,011 |
| | | | 9,557,918 |
| Mortgage Real Estate Investment Trusts - 0.0% | | | |
| AG Mortgage Investment Trust, Inc. | | 2,500 | 16,600 |
| Angel Oak Mortgage (REIT), Inc. | | 2,169 | 28,414 |
| KKR Real Estate Finance Trust, Inc. | | 8,295 | 75,070 |
| | | | 120,084 |
TOTAL FINANCIALS | | | 51,460,061 |
| HEALTH CARE - 25.2% | | | |
| Biotechnology - 13.1% | | | |
| 4D Molecular Therapeutics, Inc. (a) | | 17,117 | 359,286 |
| Absci Corp. (a) | | 31,016 | 95,529 |
| ACADIA Pharmaceuticals, Inc. (a) | | 63,437 | 1,030,851 |
| Achieve Life Sciences, Inc. (a) | | 11,045 | 51,912 |
| Actinium Pharmaceuticals, Inc. (a)(b) | | 15,953 | 118,052 |
| ADC Therapeutics SA (a) | | 22,496 | 71,087 |
| ADMA Biologics, Inc. (a) | | 119,379 | 1,334,657 |
| Aerovate Therapeutics, Inc. (a)(b) | | 7,130 | 11,836 |
| Agenus, Inc. (a) | | 1,435 | 24,036 |
| Akebia Therapeutics, Inc. (a) | | 10,202 | 10,406 |
| Akero Therapeutics, Inc. (a) | | 6,037 | 141,628 |
| Aldeyra Therapeutics, Inc. (a) | | 2,714 | 8,983 |
| Alector, Inc. (a) | | 42,771 | 194,180 |
| Alkermes PLC (a) | | 89,264 | 2,151,262 |
| Altimmune, Inc. (a) | | 20,483 | 136,212 |
| ALX Oncology Holdings, Inc. (a) | | 17,513 | 105,603 |
| Amicus Therapeutics, Inc. (a) | | 155,531 | 1,542,868 |
| AnaptysBio, Inc. (a) | | 10,372 | 259,922 |
| Anavex Life Sciences Corp. (a)(b) | | 10,213 | 43,099 |
| Anika Therapeutics, Inc. (a) | | 1,462 | 37,032 |
| Apogee Therapeutics, Inc. | | 19,174 | 754,497 |
| Applied Therapeutics, Inc. (a) | | 30,891 | 144,261 |
| Arbutus Biopharma Corp. (a) | | 69,101 | 213,522 |
| Arcellx, Inc. (a) | | 22,849 | 1,261,036 |
| Arcturus Therapeutics Holdings, Inc. (a) | | 10,823 | 263,540 |
| Arcus Biosciences, Inc. (a) | | 28,823 | 438,974 |
| Arcutis Biotherapeutics, Inc. (a) | | 56,327 | 523,841 |
| Ardelyx, Inc. (a) | | 123,199 | 912,905 |
| ArriVent Biopharma, Inc. (b) | | 3,154 | 58,507 |
| Arrowhead Pharmaceuticals, Inc. (a) | | 63,289 | 1,644,881 |
| Ars Pharmaceuticals, Inc. (a)(b) | | 26,104 | 222,145 |
| Astria Therapeutics, Inc. (a) | | 20,317 | 184,885 |
| Atossa Therapeutics, Inc. (a) | | 11,525 | 13,715 |
| Aurinia Pharmaceuticals, Inc. (a)(b) | | 55,711 | 318,110 |
| Avid Bioservices, Inc. (a) | | 31,097 | 222,033 |
| Avidity Biosciences, Inc. (a) | | 53,585 | 2,188,947 |
| Avita Medical, Inc. (a) | | 13,533 | 107,181 |
| BioCryst Pharmaceuticals, Inc. (a) | | 109,553 | 677,038 |
| Biohaven Ltd. (a) | | 39,808 | 1,381,736 |
| Biomea Fusion, Inc. (a)(b) | | 14,662 | 65,979 |
| Black Diamond Therapeutics, Inc. (a) | | 13,360 | 62,258 |
| Blueprint Medicines Corp. (a) | | 33,331 | 3,592,415 |
| Boundless Bio, Inc. | | 2,032 | 7,864 |
| BridgeBio Pharma, Inc. (a) | | 46,424 | 1,175,920 |
| Cabaletta Bio, Inc. (a) | | 5,102 | 38,163 |
| Candel Therapeutics, Inc. (a) | | 10,510 | 65,162 |
| Capricor Therapeutics, Inc. (a) | | 11,434 | 54,540 |
| Cardiff Oncology, Inc. (a) | | 7,979 | 17,713 |
| CareDx, Inc. (a) | | 5,839 | 90,680 |
| Cargo Therapeutics, Inc. (b) | | 1,041 | 17,093 |
| Cartesian Therapeutics, Inc. (a) | | 3,834 | 103,556 |
| Cartesian Therapeutics, Inc. rights (a)(c) | | 12,935 | 1,811 |
| Catalyst Pharmaceutical Partners, Inc. (a) | | 61,692 | 955,609 |
| Celcuity, Inc. (a) | | 11,641 | 190,680 |
| Celldex Therapeutics, Inc. (a) | | 27,942 | 1,034,133 |
| Cervomed, Inc. (a) | | 2,867 | 49,083 |
| CG Oncology, Inc. | | 7,481 | 236,175 |
| Chinook Therapeutics, Inc. rights (a)(c) | | 985 | 0 |
| Cogent Biosciences, Inc. (a) | | 45,247 | 381,432 |
| Coherus BioSciences, Inc. (a)(b) | | 15,247 | 26,377 |
| Corbus Pharmaceuticals Holdings, Inc. (a) | | 3,266 | 147,787 |
| Crinetics Pharmaceuticals, Inc. (a) | | 41,251 | 1,847,632 |
| Cullinan Oncology, Inc. (a) | | 18,200 | 317,408 |
| Cytokinetics, Inc. (a) | | 5,508 | 298,423 |
| Day One Biopharmaceuticals, Inc. (a) | | 24,630 | 339,401 |
| Denali Therapeutics, Inc. (a) | | 37,756 | 876,694 |
| Dianthus Therapeutics, Inc. (a) | | 941 | 24,353 |
| Disc Medicine, Inc. (a) | | 961 | 43,312 |
| Dynavax Technologies Corp. (a) | | 55,917 | 627,948 |
| Dyne Therapeutics, Inc. (a) | | 42,781 | 1,509,741 |
| Elevation Oncology, Inc. (a) | | 16,801 | 45,363 |
| Eliem Therapeutics, Inc. (a) | | 234 | 1,664 |
| Fennec Pharmaceuticals, Inc. (a) | | 2,692 | 16,448 |
| FibroBiologics, Inc. | | 13,495 | 67,340 |
| Foghorn Therapeutics, Inc. (a) | | 8,126 | 46,725 |
| G1 Therapeutics, Inc. (a) | | 26,169 | 59,665 |
| Galectin Therapeutics, Inc. (a) | | 6,577 | 14,864 |
| Geron Corp. (a) | | 212,489 | 900,953 |
| Greenwich Lifesciences, Inc. (a) | | 3,170 | 54,714 |
| Gyre Therapeutics, Inc. (a) | | 350 | 4,176 |
| Halozyme Therapeutics, Inc. (a) | | 66,132 | 3,462,672 |
| Heron Therapeutics, Inc. (a) | | 5,846 | 20,461 |
| HilleVax, Inc. (a) | | 3,366 | 48,672 |
| Humacyte, Inc. Class A (a)(b) | | 46,610 | 223,728 |
| Ideaya Biosciences, Inc. (a) | | 39,626 | 1,391,269 |
| IGM Biosciences, Inc. (a) | | 7,378 | 50,687 |
| ImmunityBio, Inc. (a)(b) | | 58,297 | 368,437 |
| Immunome, Inc. (a) | | 27,262 | 329,870 |
| Immunovant, Inc. (a) | | 30,771 | 812,354 |
| Inhibrx Biosciences, Inc. | | 3,231 | 45,783 |
| Inmune Bio, Inc. (a) | | 6,482 | 57,171 |
| Insmed, Inc. (a) | | 82,347 | 5,517,243 |
| Iovance Biotherapeutics, Inc. (a) | | 134,226 | 1,076,493 |
| Ironwood Pharmaceuticals, Inc. Class A (a) | | 25,435 | 165,836 |
| Janux Therapeutics, Inc. (a) | | 14,865 | 622,695 |
| Jasper Therapeutics, Inc. (a) | | 6,004 | 136,291 |
| Kalvista Pharmaceuticals, Inc. (a) | | 20,189 | 237,826 |
| Keros Therapeutics, Inc. (a) | | 15,623 | 713,971 |
| Kiniksa Pharmaceuticals Intern (a) | | 19,773 | 369,162 |
| Korro Bio, Inc. (a) | | 866 | 29,331 |
| Krystal Biotech, Inc. (a) | | 13,151 | 2,415,050 |
| Kura Oncology, Inc. (a) | | 38,440 | 791,480 |
| Kymera Therapeutics, Inc. (a)(b) | | 23,580 | 703,863 |
| Kyverna Therapeutics, Inc. | | 5,409 | 40,568 |
| Larimar Therapeutics, Inc. (a) | | 22,307 | 161,726 |
| Lexeo Therapeutics, Inc. | | 5,149 | 82,590 |
| Lexicon Pharmaceuticals, Inc. (a) | | 22,877 | 38,433 |
| Lineage Cell Therapeutics, Inc. (a)(b) | | 78,322 | 78,111 |
| Macrogenics, Inc. (a) | | 27,642 | 117,479 |
| Madrigal Pharmaceuticals, Inc. (a)(b) | | 9,300 | 2,605,488 |
| MannKind Corp. (a) | | 107,972 | 563,614 |
| MeiraGTx Holdings PLC (a) | | 13,806 | 58,123 |
| Mersana Therapeutics, Inc. (a) | | 31,494 | 63,303 |
| Metagenomi, Inc. | | 2,034 | 8,299 |
| MiMedx Group, Inc. (a) | | 29,722 | 205,973 |
| Mineralys Therapeutics, Inc. (a) | | 3,268 | 38,236 |
| Mirum Pharmaceuticals, Inc. (a)(b) | | 20,800 | 711,152 |
| Neurogene, Inc. (a) | | 2,885 | 104,985 |
| Novavax, Inc. (a) | | 57,963 | 733,812 |
| Nurix Therapeutics, Inc. (a) | | 22,136 | 461,978 |
| Nuvalent, Inc. Class A (a) | | 16,931 | 1,284,386 |
| Ocugen, Inc. (a) | | 135,676 | 210,298 |
| Olema Pharmaceuticals, Inc. (a) | | 5,486 | 59,359 |
| Omniab, Inc. (a)(c) | | 191 | 546 |
| Omniab, Inc. (a)(c) | | 191 | 500 |
| Organogenesis Holdings, Inc. Class A (a) | | 4,008 | 11,222 |
| ORIC Pharmaceuticals, Inc. (a) | | 7,439 | 52,594 |
| Outlook Therapeutics, Inc. (a)(b) | | 2,535 | 18,708 |
| Ovid Therapeutics, Inc. (a) | | 30,981 | 23,831 |
| PepGen, Inc. (a) | | 7,300 | 116,508 |
| Perspective Therapeutics, Inc. (a) | | 20,324 | 202,630 |
| Poseida Therapeutics, Inc. (a) | | 10,374 | 30,292 |
| Praxis Precision Medicines, Inc. (a) | | 9,143 | 378,154 |
| Precigen, Inc. (a) | | 5,240 | 8,279 |
| Prime Medicine, Inc. (a)(b) | | 30,070 | 154,560 |
| ProKidney Corp. Class A (a)(b) | | 26,254 | 64,585 |
| Protagonist Therapeutics, Inc. (a) | | 30,984 | 1,073,596 |
| Prothena Corp. PLC (a) | | 13,165 | 271,726 |
| PTC Therapeutics, Inc. (a) | | 30,686 | 938,378 |
| Puma Biotechnology, Inc. (a) | | 7,754 | 25,278 |
| Recursion Pharmaceuticals, Inc. Class A (a) | | 109,591 | 821,933 |
| Regulus Therapeutics, Inc. (a) | | 8,482 | 15,140 |
| Renovaro, Inc. (a) | | 16,400 | 28,700 |
| Revolution Medicines, Inc. (a) | | 52,663 | 2,043,851 |
| Rhythm Pharmaceuticals, Inc. (a) | | 29,026 | 1,191,808 |
| Rigel Pharmaceuticals, Inc. (a) | | 7,509 | 61,724 |
| Rocket Pharmaceuticals, Inc. (a) | | 34,866 | 750,665 |
| Sana Biotechnology, Inc. (a)(b) | | 70,093 | 382,708 |
| Savara, Inc. (a) | | 41,260 | 166,278 |
| Scholar Rock Holding Corp. (a) | | 32,672 | 272,158 |
| Sera Prognostics, Inc. (a) | | 14,645 | 86,698 |
| Shattuck Labs, Inc. (a) | | 13,897 | 53,642 |
| Skye Bioscience, Inc. (a) | | 1,373 | 10,998 |
| Soleno Therapeutics, Inc. (a) | | 11,658 | 475,646 |
| Solid Biosciences, Inc. (a) | | 1,135 | 6,435 |
| SpringWorks Therapeutics, Inc. (a) | | 36,444 | 1,372,845 |
| Spyre Therapeutics, Inc. (a) | | 1,707 | 40,132 |
| Stoke Therapeutics, Inc. (a) | | 18,856 | 254,745 |
| Summit Therapeutics, Inc. (a) | | 43,954 | 342,841 |
| Syndax Pharmaceuticals, Inc. (a) | | 43,554 | 894,164 |
| Tango Therapeutics, Inc. (a) | | 25,300 | 217,074 |
| Taysha Gene Therapies, Inc. (a) | | 84,804 | 189,961 |
| Tenaya Therapeutics, Inc. (a) | | 8,066 | 25,005 |
| Tevogen Bio Holdings, Inc. Class A (a) | | 6,540 | 4,730 |
| TG Therapeutics, Inc. (a) | | 74,012 | 1,316,673 |
| TScan Therapeutics, Inc. (a) | | 13,282 | 77,700 |
| Twist Bioscience Corp. (a) | | 30,493 | 1,502,695 |
| Tyra Biosciences, Inc. (a) | | 10,769 | 172,196 |
| UroGen Pharma Ltd. (a)(b) | | 14,102 | 236,632 |
| Vaxcyte, Inc. (a) | | 57,878 | 4,370,368 |
| Vera Therapeutics, Inc. (a) | | 20,661 | 747,515 |
| Verastem, Inc. (a) | | 13,458 | 40,105 |
| Vericel Corp. (a) | | 25,689 | 1,178,611 |
| Viridian Therapeutics, Inc. (a) | | 24,339 | 316,650 |
| Werewolf Therapeutics, Inc. (a) | | 4,064 | 9,916 |
| X4 Pharmaceuticals, Inc. (a) | | 89,086 | 51,670 |
| Xencor, Inc. (a) | | 14,458 | 273,690 |
| XOMA Corp. (a) | | 2,669 | 63,229 |
| Y-mAbs Therapeutics, Inc. (a) | | 19,503 | 235,596 |
| Zura Bio Ltd. Class A (a) | | 10,630 | 37,205 |
| | | | 85,601,426 |
| Health Care Equipment & Supplies - 5.1% | | | |
| Accuray, Inc. (a) | | 47,717 | 86,845 |
| Alphatec Holdings, Inc. (a) | | 54,411 | 568,595 |
| Artivion, Inc. (a) | | 16,009 | 410,631 |
| Atricure, Inc. (a) | | 16,364 | 372,608 |
| Atrion Corp. | | 727 | 328,917 |
| AxoGen, Inc. (a) | | 22,488 | 162,813 |
| Axonics, Inc. (a) | | 26,998 | 1,815,076 |
| Bioventus, Inc. (a) | | 7,178 | 41,274 |
| Cerus Corp. (a) | | 95,638 | 168,323 |
| CONMED Corp. | | 16,353 | 1,133,590 |
| CVRx, Inc. (a)(b) | | 7,049 | 84,518 |
| Embecta Corp. | | 2,954 | 36,925 |
| Fractyl Health, Inc. | | 2,424 | 10,350 |
| Glaukos Corp. (a) | | 25,941 | 3,070,117 |
| Haemonetics Corp. (a) | | 26,607 | 2,201,197 |
| Inari Medical, Inc. (a) | | 28,058 | 1,350,993 |
| InMode Ltd. (a)(b) | | 5,308 | 96,818 |
| Integer Holdings Corp. (a) | | 12,389 | 1,434,522 |
| IRadimed Corp. | | 4,270 | 187,624 |
| iRhythm Technologies, Inc. (a) | | 16,573 | 1,783,918 |
| Lantheus Holdings, Inc. (a) | | 36,046 | 2,894,133 |
| LeMaitre Vascular, Inc. | | 10,752 | 884,675 |
| LivaNova PLC (a) | | 1,735 | 95,113 |
| Merit Medical Systems, Inc. (a) | | 30,333 | 2,607,121 |
| NeuroPace, Inc. (a) | | 7,239 | 54,727 |
| Novocure Ltd. (a) | | 56,459 | 967,143 |
| Orchestra BioMed Holdings, Inc. (a)(b) | | 5,274 | 42,983 |
| Paragon 28, Inc. (a)(b) | | 24,986 | 170,904 |
| PROCEPT BioRobotics Corp. (a) | | 22,455 | 1,371,776 |
| Pulmonx Corp. (a) | | 20,064 | 127,206 |
| Pulse Biosciences, Inc. (a)(b) | | 9,708 | 108,633 |
| Pulse Biosciences, Inc. rights (a)(b) | | 2,567 | 332 |
| RxSight, Inc. (a) | | 18,035 | 1,085,166 |
| Sanara Medtech, Inc. (a) | | 2,121 | 59,855 |
| Semler Scientific, Inc. (a)(b) | | 2,518 | 86,619 |
| SI-BONE, Inc. (a) | | 17,510 | 226,404 |
| Sight Sciences, Inc. (a) | | 18,623 | 124,215 |
| Silk Road Medical, Inc. (a) | | 20,796 | 562,324 |
| Staar Surgical Co. (a) | | 26,230 | 1,248,810 |
| Stereotaxis, Inc. (a) | | 26,895 | 48,949 |
| SurModics, Inc. (a) | | 4,693 | 197,294 |
| Tandem Diabetes Care, Inc. (a) | | 34,332 | 1,383,236 |
| TransMedics Group, Inc. (a) | | 17,016 | 2,562,950 |
| Treace Medical Concepts, Inc. (a) | | 25,859 | 171,962 |
| UFP Technologies, Inc. (a) | | 3,851 | 1,016,163 |
| Vicarious Surgical, Inc. (a) | | 1 | 6 |
| Zynex, Inc. (a)(b) | | 8,105 | 75,539 |
| | | | 33,519,892 |
| Health Care Providers & Services - 4.2% | | | |
| Accolade, Inc. (a) | | 13,121 | 46,973 |
| AdaptHealth Corp. (a) | | 23,476 | 234,760 |
| Addus HomeCare Corp. (a) | | 3,310 | 384,324 |
| agilon health, Inc. (a) | | 163,564 | 1,069,709 |
| AirSculpt Technologies, Inc. (a)(b) | | 7,061 | 28,244 |
| Alignment Healthcare, Inc. (a) | | 53,073 | 415,031 |
| AMN Healthcare Services, Inc. (a) | | 20,095 | 1,029,467 |
| Astrana Health, Inc. (a) | | 22,845 | 926,593 |
| Aveanna Healthcare Holdings, Inc. (a) | | 19,102 | 52,722 |
| BrightSpring Health Services, Inc. (b) | | 28,547 | 324,294 |
| Brookdale Senior Living, Inc. (a) | | 86,949 | 593,862 |
| Castle Biosciences, Inc. (a) | | 4,419 | 96,202 |
| Community Health Systems, Inc. (a) | | 36,136 | 121,417 |
| Corvel Corp. (a) | | 4,702 | 1,195,578 |
| DocGo, Inc. Class A (a)(b) | | 9,936 | 30,702 |
| Enhabit Home Health & Hospice (a) | | 2,583 | 23,040 |
| GeneDx Holdings Corp. Class A (a) | | 826 | 21,592 |
| Guardant Health, Inc. (a) | | 62,565 | 1,806,877 |
| HealthEquity, Inc. (a) | | 44,890 | 3,869,518 |
| Hims & Hers Health, Inc. (a) | | 100,611 | 2,031,336 |
| InfuSystems Holdings, Inc. (a) | | 10,550 | 72,057 |
| Innovage Holding Corp. (a) | | 3,172 | 15,733 |
| LifeStance Health Group, Inc. (a) | | 29,037 | 142,572 |
| Modivcare, Inc. (a) | | 2,946 | 77,303 |
| Nano-X Imaging Ltd. (a)(b) | | 27,266 | 200,132 |
| National Research Corp. Class A | | 8,130 | 186,584 |
| NeoGenomics, Inc. (a) | | 5,390 | 74,759 |
| Option Care Health, Inc. (a) | | 43,362 | 1,201,127 |
| Owens & Minor, Inc. (a) | | 6,075 | 82,013 |
| PACS Group, Inc. | | 13,186 | 388,987 |
| Patterson Companies, Inc. | | 7,844 | 189,197 |
| Pennant Group, Inc. (a) | | 15,323 | 355,340 |
| Performant Financial Corp. (a) | | 25,780 | 74,762 |
| PetIQ, Inc. Class A (a) | | 2,134 | 47,076 |
| Privia Health Group, Inc. (a) | | 54,094 | 940,154 |
| Progyny, Inc. (a) | | 44,774 | 1,280,984 |
| Quipt Home Medical Corp. (a) | | 1,941 | 6,250 |
| RadNet, Inc. (a) | | 35,048 | 2,065,028 |
| Select Medical Holdings Corp. | | 38,749 | 1,358,540 |
| Sonida Senior Living, Inc. (a) | | 975 | 26,813 |
| Talkspace, Inc. Class A (a) | | 65,181 | 149,916 |
| The Ensign Group, Inc. | | 29,421 | 3,639,083 |
| The Joint Corp. (a) | | 5,775 | 81,197 |
| U.S. Physical Therapy, Inc. | | 7,929 | 732,798 |
| Viemed Healthcare, Inc. (a) | | 18,192 | 119,158 |
| | | | 27,809,804 |
| Health Care Technology - 0.5% | | | |
| Evolent Health, Inc. Class A (a) | | 61,213 | 1,170,393 |
| Health Catalyst, Inc. (a) | | 2,775 | 17,732 |
| HealthStream, Inc. | | 4,432 | 123,653 |
| Lifemd, Inc. (a) | | 11,441 | 78,485 |
| OptimizeRx Corp. (a) | | 9,321 | 93,210 |
| Phreesia, Inc. (a) | | 27,006 | 572,527 |
| Schrodinger, Inc. (a)(b) | | 29,483 | 570,201 |
| Simulations Plus, Inc. | | 8,422 | 409,478 |
| Teladoc Health, Inc. (a) | | 14,068 | 137,585 |
| | | | 3,173,264 |
| Life Sciences Tools & Services - 0.2% | | | |
| Akoya Biosciences, Inc. (a)(b) | | 14,102 | 32,999 |
| BioLife Solutions, Inc. (a) | | 16,796 | 359,938 |
| ChromaDex, Inc. (a) | | 25,991 | 70,955 |
| Codexis, Inc. (a) | | 4,150 | 12,865 |
| Conduit Pharmaceuticals, Inc. Class A (a) | | 7,421 | 7,866 |
| CryoPort, Inc. (a) | | 18,937 | 130,855 |
| Harvard Bioscience, Inc. (a) | | 5,676 | 16,177 |
| Maravai LifeSciences Holdings, Inc. Class A (a) | | 58,560 | 419,290 |
| Mesa Laboratories, Inc. | | 906 | 78,614 |
| OmniAb, Inc. (a) | | 5,715 | 21,431 |
| Quanterix Corp. (a) | | 2,643 | 34,914 |
| Standard BioTools, Inc. (a) | | 35,964 | 63,656 |
| | | | 1,249,560 |
| Pharmaceuticals - 2.1% | | | |
| Alimera Sciences, Inc. (a) | | 10,054 | 55,900 |
| Alto Neuroscience, Inc. | | 2,856 | 30,531 |
| Amneal Intermediate, Inc. Class A, (a) | | 70,768 | 449,377 |
| Amphastar Pharmaceuticals, Inc. (a) | | 20,399 | 815,960 |
| ANI Pharmaceuticals, Inc. (a) | | 6,952 | 442,703 |
| Aquestive Therapeutics, Inc. (a) | | 10,714 | 27,856 |
| Arvinas Holding Co. LLC (a) | | 34,055 | 906,544 |
| Avadel Pharmaceuticals PLC sponsored (a) | | 48,999 | 688,926 |
| Axsome Therapeutics, Inc. (a)(b) | | 19,314 | 1,554,777 |
| Biote Corp. Class A (a) | | 13,577 | 101,420 |
| Cassava Sciences, Inc. (a)(b) | | 21,532 | 265,920 |
| Collegium Pharmaceutical, Inc. (a) | | 17,264 | 555,901 |
| Contineum Therapeutics, Inc. Class A | | 2,230 | 39,270 |
| Corcept Therapeutics, Inc. (a)(b) | | 42,870 | 1,392,846 |
| CorMedix, Inc. (a)(b) | | 26,586 | 115,117 |
| Edgewise Therapeutics, Inc. (a) | | 38,487 | 693,151 |
| Enliven Therapeutics, Inc. (a) | | 17,696 | 413,556 |
| Esperion Therapeutics, Inc. (a) | | 27,252 | 60,499 |
| Evolus, Inc. (a) | | 29,295 | 317,851 |
| Eyepoint Pharmaceuticals, Inc. (a)(b) | | 12,115 | 105,401 |
| Fulcrum Therapeutics, Inc. (a) | | 13,969 | 86,608 |
| Harmony Biosciences Holdings, Inc. (a) | | 16,010 | 483,022 |
| Harrow, Inc. (a)(b) | | 16,197 | 338,355 |
| Innoviva, Inc. (a) | | 2,532 | 41,525 |
| Liquidia Corp. (a)(b) | | 30,567 | 366,804 |
| Longboard Pharmaceuticals, Inc. (a) | | 17,149 | 463,537 |
| Lyra Therapeutics, Inc. (a) | | 15,791 | 4,369 |
| MediWound Ltd. (a) | | 4,249 | 65,944 |
| Mind Medicine (MindMed), Inc. (a) | | 38,169 | 275,198 |
| Neumora Therapeutics, Inc. | | 44,597 | 438,389 |
| Novartis AG rights (a)(c) | | 7,324 | 0 |
| Ocular Therapeutix, Inc. (a)(b) | | 82,503 | 564,321 |
| Omeros Corp. (a)(b) | | 10,133 | 41,140 |
| Pacira Biosciences, Inc. (a) | | 1,799 | 51,469 |
| Phathom Pharmaceuticals, Inc. (a)(b) | | 3,915 | 40,325 |
| Phibro Animal Health Corp. Class A | | 2,607 | 43,719 |
| Revance Therapeutics, Inc. (a)(b) | | 55,201 | 141,867 |
| Scilex Holding Co. (a)(b)(h) | | 2,699 | 4,688 |
| scPharmaceuticals, Inc. (a)(b) | | 15,087 | 65,628 |
| SIGA Technologies, Inc. (b) | | 18,089 | 137,296 |
| Supernus Pharmaceuticals, Inc. (a) | | 1,916 | 51,253 |
| Tarsus Pharmaceuticals, Inc. (a) | | 19,507 | 530,200 |
| Telomir Pharmaceuticals, Inc. | | 1,452 | 6,984 |
| Terns Pharmaceuticals, Inc. (a) | | 1,639 | 11,162 |
| Trevi Therapeutics, Inc. (a) | | 19,119 | 56,975 |
| Verrica Pharmaceuticals, Inc. (a)(b) | | 10,045 | 73,228 |
| WAVE Life Sciences (a) | | 35,162 | 175,458 |
| Xeris Biopharma Holdings, Inc. (a) | | 74,321 | 167,222 |
| Zevra Therapeutics, Inc. (a) | | 11,785 | 57,747 |
| | | | 13,817,939 |
TOTAL HEALTH CARE | | | 165,171,885 |
| INDUSTRIALS - 22.0% | | | |
| Aerospace & Defense - 1.4% | | | |
| AAR Corp. (a) | | 3,689 | 268,190 |
| AeroVironment, Inc. (a) | | 13,877 | 2,527,834 |
| Archer Aviation, Inc. Class A (a) | | 116,955 | 411,682 |
| Byrna Technologies, Inc. (a) | | 9,178 | 91,596 |
| Cadre Holdings, Inc. | | 13,811 | 463,497 |
| Eve Holding, Inc. (a)(b) | | 9,476 | 38,378 |
| Intuitive Machines, Inc. Class A (a) | | 777 | 2,564 |
| Kratos Defense & Security Solutions, Inc. (a) | | 34,831 | 696,968 |
| Leonardo DRS, Inc. (a) | | 39,036 | 995,808 |
| Moog, Inc. Class A | | 15,060 | 2,519,538 |
| Park Aerospace Corp. | | 4,260 | 58,277 |
| Redwire Corp. Class A (a)(b) | | 3,224 | 23,116 |
| Rocket Lab U.S.A., Inc. Class A (a)(b) | | 184,451 | 885,365 |
| Terran Orbital Corp. Class A (a)(b) | | 5,411 | 4,437 |
| Virgin Galactic Holdings, Inc. (a)(b) | | 791 | 6,668 |
| VirTra, Inc. (a) | | 5,617 | 43,195 |
| | | | 9,037,113 |
| Building Products - 1.7% | | | |
| American Woodmark Corp. (a) | | 505 | 39,693 |
| Apogee Enterprises, Inc. | | 3,700 | 232,490 |
| AZZ, Inc. | | 12,875 | 994,594 |
| CSW Industrials, Inc. | | 8,204 | 2,176,603 |
| Gibraltar Industries, Inc. (a) | | 7,720 | 529,206 |
| Griffon Corp. | | 20,492 | 1,308,619 |
| Insteel Industries, Inc. | | 4,484 | 138,825 |
| Janus International Group, Inc. (a) | | 75,213 | 949,940 |
| Jeld-Wen Holding, Inc. (a) | | 15,756 | 212,233 |
| Tecnoglass, Inc. | | 11,910 | 597,644 |
| UFP Industries, Inc. | | 18,123 | 2,029,776 |
| Zurn Elkay Water Solutions Cor | | 73,071 | 2,148,287 |
| | | | 11,357,910 |
| Commercial Services & Supplies - 1.7% | | | |
| ACV Auctions, Inc. Class A (a) | | 78,446 | 1,431,640 |
| Aris Water Solution, Inc. Class A | | 908 | 14,228 |
| Bridger Aerospace Group Holdings, Inc. (a) | | 1,325 | 4,956 |
| Casella Waste Systems, Inc. Class A (a) | | 30,338 | 3,010,136 |
| CECO Environmental Corp. (a) | | 15,515 | 447,608 |
| Cimpress PLC (a) | | 6,510 | 570,341 |
| CompX International, Inc. Class A | | 470 | 11,595 |
| Driven Brands Holdings, Inc. (a) | | 31,764 | 404,356 |
| HNI Corp. | | 11,902 | 535,828 |
| Interface, Inc. | | 2,983 | 43,790 |
| LanzaTech Global, Inc. Class A (a)(b) | | 59,303 | 109,711 |
| Liquidity Services, Inc. (a) | | 11,381 | 227,392 |
| Montrose Environmental Group, Inc. (a) | | 16,857 | 751,148 |
| Perma-Fix Environmental Services, Inc. (a) | | 6,688 | 67,749 |
| Pitney Bowes, Inc. | | 25,226 | 128,148 |
| Quad/Graphics, Inc. Class A | | 9,917 | 54,048 |
| Quest Resource Holding Corp. (a) | | 9,175 | 80,740 |
| The Brink's Co. | | 23,820 | 2,439,168 |
| Viad Corp. (a) | | 10,846 | 368,764 |
| Virco Manufacturing Co. | | 378 | 5,269 |
| VSE Corp. | | 1,160 | 102,405 |
| | | | 10,809,020 |
| Construction & Engineering - 2.3% | | | |
| Ameresco, Inc. Class A (a)(b) | | 5,705 | 164,361 |
| Argan, Inc. | | 6,570 | 480,661 |
| Bowman Consulting Group Ltd. (a) | | 7,074 | 224,882 |
| Centuri Holdings, Inc. | | 7,245 | 141,133 |
| Construction Partners, Inc. Class A (a) | | 22,767 | 1,256,966 |
| Dycom Industries, Inc. (a) | | 15,059 | 2,541,357 |
| Fluor Corp. (a) | | 83,011 | 3,615,129 |
| Granite Construction, Inc. | | 19,232 | 1,191,807 |
| IES Holdings, Inc. (a) | | 4,417 | 615,421 |
| Limbach Holdings, Inc. (a) | | 5,417 | 308,390 |
| MYR Group, Inc. (a) | | 8,812 | 1,195,877 |
| Northwest Pipe Co. (a) | | 809 | 27,482 |
| Orion Group Holdings, Inc. (a) | | 2,461 | 23,404 |
| Primoris Services Corp. | | 26,127 | 1,303,476 |
| Sterling Construction Co., Inc. (a) | | 16,034 | 1,897,464 |
| | | | 14,987,810 |
| Electrical Equipment - 2.4% | | | |
| 374Water, Inc. (a)(b) | | 34,686 | 41,623 |
| Allient, Inc. | | 442 | 11,169 |
| American Superconductor Corp. (a) | | 18,097 | 423,289 |
| Amprius Technologies, Inc. (a)(b) | | 7,444 | 9,454 |
| Array Technologies, Inc. (a) | | 80,969 | 830,742 |
| Atkore, Inc. | | 19,471 | 2,627,222 |
| Blink Charging Co. (a)(b) | | 22,826 | 62,543 |
| Bloom Energy Corp. Class A (a)(b) | | 96,384 | 1,179,740 |
| ChargePoint Holdings, Inc. Class A (a) | | 114,130 | 172,336 |
| Encore Wire Corp. | | 6,633 | 1,922,442 |
| EnerSys | | 19,447 | 2,013,153 |
| Enovix Corp. (a)(b) | | 78,797 | 1,218,202 |
| Fluence Energy, Inc. (a)(b) | | 32,278 | 559,701 |
| GrafTech International Ltd. | | 126,410 | 122,618 |
| LSI Industries, Inc. | | 10,369 | 150,039 |
| Nextracker, Inc. Class A (a) | | 45,994 | 2,156,199 |
| NuScale Power Corp. Class A (a)(b) | | 41,145 | 480,985 |
| Plug Power, Inc. (a) | | 27,079 | 63,094 |
| Powell Industries, Inc. | | 4,956 | 710,690 |
| Preformed Line Products Co. | | 84 | 10,461 |
| SES AI Corp. Class A (a)(b) | | 5,796 | 7,245 |
| Shoals Technologies Group, Inc. (a) | | 90,948 | 567,516 |
| SolarMax Technology, Inc. | | 1,150 | 3,784 |
| Solidion Technology, Inc. Class A (a) | | 3,696 | 2,033 |
| Thermon Group Holdings, Inc. (a) | | 1,828 | 56,229 |
| Ultralife Corp. (a) | | 653 | 6,935 |
| Vicor Corp. (a) | | 6,563 | 217,629 |
| | | | 15,627,073 |
| Ground Transportation - 0.5% | | | |
| ArcBest Corp. | | 12,483 | 1,336,680 |
| Covenant Transport Group, Inc. Class A | | 744 | 36,672 |
| Heartland Express, Inc. | | 10,064 | 124,089 |
| Marten Transport Ltd. | | 6,438 | 118,781 |
| P.A.M. Transportation Services, Inc. (a) | | 374 | 6,496 |
| RXO, Inc. (a) | | 61,806 | 1,616,227 |
| Universal Logistics Holdings, Inc. | | 1,279 | 51,915 |
| Werner Enterprises, Inc. | | 4,276 | 153,209 |
| | | | 3,444,069 |
| Machinery - 4.9% | | | |
| Alamo Group, Inc. | | 5,431 | 939,563 |
| Albany International Corp. Class A | | 4,033 | 340,587 |
| Atmus Filtration Technologies, Inc. (a) | | 44,422 | 1,278,465 |
| Blue Bird Corp. (a) | | 17,041 | 917,658 |
| Chart Industries, Inc. (a)(b) | | 22,383 | 3,230,762 |
| Douglas Dynamics, Inc. | | 10,008 | 234,187 |
| Energy Recovery, Inc. (a) | | 30,115 | 400,228 |
| Enerpac Tool Group Corp. Class A | | 28,829 | 1,100,691 |
| EnPro Industries, Inc. | | 1,180 | 171,773 |
| ESCO Technologies, Inc. | | 6,724 | 706,289 |
| Federal Signal Corp. | | 31,881 | 2,667,483 |
| Franklin Electric Co., Inc. | | 24,014 | 2,313,028 |
| Gorman-Rupp Co. | | 11,111 | 407,885 |
| Graham Corp. (a) | | 5,441 | 153,219 |
| Helios Technologies, Inc. | | 12,043 | 575,053 |
| Hillenbrand, Inc. | | 12,469 | 499,009 |
| Hillman Solutions Corp. Class A (a) | | 17,778 | 157,335 |
| Hyster-Yale Materials Handling, Inc. Class A | | 3,690 | 257,304 |
| John Bean Technologies Corp. | | 1,179 | 111,970 |
| Kadant, Inc. | | 6,215 | 1,825,843 |
| Lindsay Corp. | | 2,893 | 355,492 |
| Mayville Engineering Co., Inc. (a) | | 551 | 9,180 |
| Miller Industries, Inc. | | 357 | 19,642 |
| Mueller Industries, Inc. | | 54,802 | 3,120,426 |
| Mueller Water Products, Inc. | | 82,364 | 1,475,963 |
| Omega Flex, Inc. | | 1,884 | 96,612 |
| REV Group, Inc. | | 21,269 | 529,385 |
| Shyft Group, Inc. (The) | | 1,097 | 13,010 |
| SPX Technologies, Inc. (a) | | 23,868 | 3,392,598 |
| Standex International Corp. | | 4,714 | 759,661 |
| Taylor Devices, Inc. (a) | | 1,267 | 56,990 |
| Tennant Co. | | 4,461 | 439,141 |
| Trinity Industries, Inc. | | 39,771 | 1,189,948 |
| Velo3D, Inc. (a) | | 1 | 3 |
| Watts Water Technologies, Inc. Class A | | 14,520 | 2,662,532 |
| | | | 32,408,915 |
| Marine Transportation - 0.0% | | | |
| Costamare, Inc. | | 1,561 | 25,647 |
| Himalaya Shipping Ltd. | | 14,792 | 135,495 |
| | | | 161,142 |
| Passenger Airlines - 0.2% | | | |
| Frontier Group Holdings, Inc. (a)(b) | | 22,354 | 110,205 |
| Joby Aviation, Inc. (a)(b) | | 213,024 | 1,086,422 |
| Sun Country Airlines Holdings, Inc. (a) | | 9,857 | 123,804 |
| Wheels Up Experience, Inc. Class A (a) | | 47,543 | 89,856 |
| | | | 1,410,287 |
| Professional Services - 3.7% | | | |
| Barrett Business Services, Inc. | | 12,350 | 404,710 |
| CBIZ, Inc. (a) | | 25,406 | 1,882,585 |
| CRA International, Inc. | | 3,535 | 608,798 |
| CSG Systems International, Inc. | | 15,699 | 646,328 |
| DLH Holdings Corp. (a) | | 1,606 | 16,959 |
| ExlService Holdings, Inc. (a) | | 83,349 | 2,613,825 |
| Exponent, Inc. | | 26,801 | 2,549,311 |
| First Advantage Corp. (b) | | 16,058 | 258,052 |
| FiscalNote Holdings, Inc. Class A (a)(b) | | 31,947 | 46,643 |
| Franklin Covey Co. (a) | | 6,045 | 229,710 |
| Hirequest, Inc. | | 2,401 | 29,652 |
| Huron Consulting Group, Inc. (a) | | 9,428 | 928,658 |
| ICF International, Inc. | | 9,891 | 1,468,418 |
| Innodata, Inc. (a)(b) | | 14,347 | 212,766 |
| Insperity, Inc. | | 19,038 | 1,736,456 |
| Kforce, Inc. | | 9,895 | 614,776 |
| LegalZoom.com, Inc. (a) | | 73,074 | 613,091 |
| Maximus, Inc. | | 32,336 | 2,771,195 |
| NV5 Global, Inc. (a) | | 1,392 | 129,414 |
| Spire Global, Inc. (a) | | 11,831 | 128,248 |
| Sterling Check Corp. (a) | | 10,518 | 155,666 |
| TriNet Group, Inc. | | 17,249 | 1,724,900 |
| Upwork, Inc. (a) | | 66,029 | 709,812 |
| Verra Mobility Corp. (a) | | 88,281 | 2,401,243 |
| WNS Holdings Ltd. | | 24,580 | 1,290,450 |
| | | | 24,171,666 |
| Trading Companies & Distributors - 3.2% | | | |
| Alta Equipment Group, Inc. | | 14,235 | 114,449 |
| Applied Industrial Technologies, Inc. | | 20,390 | 3,955,660 |
| Beacon Roofing Supply, Inc. (a) | | 31,505 | 2,851,203 |
| Boise Cascade Co. | | 10,015 | 1,193,988 |
| Custom Truck One Source, Inc. Class A (a)(b) | | 17,968 | 78,161 |
| Distribution Solutions Group I (a) | | 5,005 | 150,150 |
| DXP Enterprises, Inc. (a) | | 580 | 26,587 |
| EVI Industries, Inc. | | 2,187 | 41,378 |
| FTAI Aviation Ltd. | | 52,816 | 5,452,196 |
| Global Industrial Co. | | 7,223 | 226,513 |
| GMS, Inc. (a) | | 19,096 | 1,539,329 |
| H&E Equipment Services, Inc. | | 15,739 | 695,192 |
| Herc Holdings, Inc. | | 14,920 | 1,988,687 |
| Hudson Technologies, Inc. (a) | | 3,336 | 29,323 |
| Karat Packaging, Inc. | | 3,630 | 107,375 |
| McGrath RentCorp. | | 12,936 | 1,378,331 |
| Transcat, Inc. (a) | | 4,580 | 548,134 |
| Xometry, Inc. (a)(b) | | 22,303 | 257,823 |
| | | | 20,634,479 |
| Transportation Infrastructure - 0.0% | | | |
| Sky Harbour Group Corp. Class A (a) | | 6,018 | 55,667 |
TOTAL INDUSTRIALS | | | 144,105,151 |
| INFORMATION TECHNOLOGY - 20.5% | | | |
| Communications Equipment - 0.4% | | | |
| Calix, Inc. (a) | | 23,004 | 815,032 |
| Extreme Networks, Inc. (a) | | 35,649 | 479,479 |
| Harmonic, Inc. (a) | | 58,566 | 689,322 |
| Infinera Corp. (a)(b) | | 105,645 | 643,378 |
| | | | 2,627,211 |
| Electronic Equipment, Instruments & Components - 3.9% | | | |
| 908 Devices, Inc. (a) | | 979 | 5,042 |
| Advanced Energy Industries, Inc. | | 19,841 | 2,157,907 |
| Arlo Technologies, Inc. (a) | | 50,463 | 658,038 |
| Badger Meter, Inc. | | 15,584 | 2,904,078 |
| Belden, Inc. | | 11,478 | 1,076,636 |
| Climb Global Solutions, Inc. | | 2,231 | 140,129 |
| CTS Corp. | | 12,554 | 635,609 |
| Daktronics, Inc. (a) | | 2,815 | 39,269 |
| ePlus, Inc. (a) | | 9,391 | 691,929 |
| Evolv Technologies Holdings, Inc. (a)(b) | | 69,280 | 176,664 |
| Fabrinet (a) | | 19,336 | 4,733,259 |
| Insight Enterprises, Inc. (a) | | 14,789 | 2,933,546 |
| Iteris, Inc. (a) | | 21,317 | 92,303 |
| Itron, Inc. (a) | | 22,009 | 2,178,011 |
| Lightwave Logic, Inc. (a)(b) | | 63,674 | 190,385 |
| MicroVision, Inc. (a)(b) | | 58,953 | 62,490 |
| Mirion Technologies, Inc. Class A (a) | | 13,772 | 147,911 |
| Napco Security Technologies, Inc. | | 18,668 | 969,803 |
| nLIGHT, Inc. (a) | | 1,366 | 14,930 |
| Novanta, Inc. (a) | | 19,019 | 3,102,189 |
| OSI Systems, Inc. (a) | | 8,085 | 1,111,849 |
| Ouster, Inc. Class A (a) | | 3,969 | 39,015 |
| Par Technology Corp. (a)(b) | | 16,837 | 792,854 |
| Plexus Corp. (a) | | 4,309 | 444,603 |
| | | | 25,298,449 |
| IT Services - 1.1% | | | |
| Applied Digital Corp. (a)(b) | | 36,153 | 215,110 |
| ASGN, Inc. (a) | | 5,339 | 470,740 |
| Backblaze, Inc. Class A (a) | | 21,171 | 130,413 |
| BigBear.ai Holdings, Inc. (a)(b) | | 40,321 | 60,885 |
| BigCommerce Holdings, Inc. (a)(b) | | 37,389 | 301,355 |
| Core Scientific, Inc. | | 74,233 | 690,367 |
| Couchbase, Inc. (a) | | 20,636 | 376,813 |
| Digitalocean Holdings, Inc. (a) | | 34,800 | 1,209,300 |
| Fastly, Inc. Class A (a) | | 54,389 | 400,847 |
| Grid Dynamics Holdings, Inc. (a) | | 22,978 | 241,499 |
| Hackett Group, Inc. | | 12,137 | 263,616 |
| Perficient, Inc. (a) | | 18,401 | 1,376,211 |
| Squarespace, Inc. Class A (a) | | 32,196 | 1,404,711 |
| Tucows, Inc. (a)(b) | | 4,228 | 81,685 |
| | | | 7,223,552 |
| Semiconductors & Semiconductor Equipment - 4.0% | | | |
| ACM Research, Inc. Class A, (a) | | 18,529 | 427,279 |
| AEHR Test Systems (a)(b) | | 14,674 | 163,909 |
| Ambarella, Inc. (a) | | 10,543 | 568,795 |
| Axcelis Technologies, Inc. (a) | | 17,273 | 2,456,048 |
| CEVA, Inc. (a) | | 10,492 | 202,391 |
| Credo Technology Group Holding Ltd. (a) | | 67,489 | 2,155,599 |
| Diodes, Inc. (a) | | 2,560 | 184,141 |
| Everspin Technologies, Inc. (a) | | 8,656 | 51,849 |
| FormFactor, Inc. (a) | | 41,047 | 2,484,575 |
| GCT Semiconductor Holding, Inc. | | 4,024 | 20,965 |
| Ichor Holdings Ltd. (a) | | 5,431 | 209,365 |
| Impinj, Inc. (a) | | 11,986 | 1,879,045 |
| indie Semiconductor, Inc. (a)(b) | | 26,972 | 166,417 |
| Kulicke & Soffa Industries, Inc. | | 29,077 | 1,430,298 |
| MaxLinear, Inc. Class A (a) | | 39,591 | 797,363 |
| Navitas Semiconductor Corp. Class A (a)(b) | | 9,184 | 36,093 |
| NVE Corp. | | 2,538 | 189,563 |
| PDF Solutions, Inc. (a) | | 16,497 | 600,161 |
| Photronics, Inc. (a) | | 11,141 | 274,848 |
| Power Integrations, Inc. | | 30,000 | 2,105,700 |
| QuickLogic Corp. (a) | | 7,319 | 76,044 |
| Rambus, Inc. (a) | | 57,716 | 3,391,392 |
| Semtech Corp. (a) | | 34,349 | 1,026,348 |
| Silicon Laboratories, Inc. (a) | | 16,802 | 1,858,805 |
| SiTime Corp. (a) | | 9,745 | 1,212,083 |
| SkyWater Technology, Inc. (a) | | 14,441 | 110,474 |
| Synaptics, Inc. (a) | | 1,526 | 134,593 |
| Ultra Clean Holdings, Inc. (a) | | 23,463 | 1,149,687 |
| Veeco Instruments, Inc. (a) | | 24,906 | 1,163,359 |
| | | | 26,527,189 |
| Software - 10.9% | | | |
| 8x8, Inc. (a) | | 62,117 | 137,900 |
| A10 Networks, Inc. | | 37,630 | 521,176 |
| ACI Worldwide, Inc. (a) | | 55,926 | 2,214,110 |
| Adeia, Inc. | | 48,740 | 545,157 |
| Agilysys, Inc. (a) | | 11,728 | 1,221,354 |
| Airship AI Holdings, Inc. Class A (a) | | 1,649 | 5,920 |
| Alarm.com Holdings, Inc. (a) | | 25,592 | 1,626,116 |
| Alkami Technology, Inc. (a) | | 23,365 | 665,435 |
| Altair Engineering, Inc. Class A (a) | | 30,314 | 2,973,197 |
| Amplitude, Inc. Class A, (a) | | 40,546 | 360,859 |
| Appian Corp. Class A (a) | | 21,369 | 659,447 |
| Arteris, Inc. (a) | | 14,652 | 110,037 |
| Asana, Inc. (a)(b) | | 42,096 | 588,923 |
| AudioEye, Inc. (a) | | 3,712 | 65,368 |
| Aurora Innovation, Inc. Class A, (a) | | 240,753 | 666,886 |
| AvePoint, Inc. (a) | | 67,352 | 701,808 |
| Blackbaud, Inc. (a) | | 21,892 | 1,667,514 |
| BlackLine, Inc. (a) | | 30,605 | 1,482,812 |
| Blend Labs, Inc. (a) | | 122,444 | 288,968 |
| Box, Inc. Class A (a) | | 74,688 | 1,974,751 |
| Braze, Inc. (a) | | 27,768 | 1,078,509 |
| C3.ai, Inc. (a)(b) | | 43,828 | 1,269,259 |
| Cipher Mining, Inc. (a) | | 61,619 | 255,719 |
| Cleanspark, Inc. (a)(b) | | 117,491 | 1,873,981 |
| Clear Secure, Inc. | | 46,568 | 871,287 |
| Clearwater Analytics Holdings, Inc. (a) | | 74,258 | 1,375,258 |
| CommVault Systems, Inc. (a) | | 21,598 | 2,625,669 |
| CS Disco, Inc. (a) | | 9,850 | 58,706 |
| D-Wave Quantum, Inc. (a) | | 25,250 | 28,785 |
| Daily Journal Corp. (a) | | 528 | 208,285 |
| Dave, Inc. (a) | | 4,149 | 125,715 |
| Digimarc Corp. (a)(b) | | 7,616 | 236,172 |
| Domo, Inc. Class B (a) | | 17,963 | 138,674 |
| eGain Communications Corp. (a) | | 10,827 | 68,318 |
| Enfusion, Inc. Class A (a) | | 25,713 | 219,075 |
| Envestnet, Inc. (a) | | 26,867 | 1,681,606 |
| Everbridge, Inc. (a) | | 22,083 | 772,684 |
| EverCommerce, Inc. (a)(b) | | 8,326 | 91,419 |
| Freshworks, Inc. (a) | | 108,111 | 1,371,929 |
| Ilearningengines Holdings, Inc. Class A (a) | | 15,544 | 141,140 |
| Instructure Holdings, Inc. (a)(b) | | 6,491 | 151,954 |
| Intapp, Inc. (a) | | 20,708 | 759,362 |
| InterDigital, Inc. | | 13,414 | 1,563,536 |
| Jamf Holding Corp. (a) | | 39,343 | 649,160 |
| Kaltura, Inc. (a) | | 51,082 | 61,298 |
| Liveramp Holdings, Inc. (a) | | 34,560 | 1,069,286 |
| Marathon Digital Holdings, Inc. (a)(b) | | 118,725 | 2,356,691 |
| Matterport, Inc. Class A (a) | | 138,880 | 620,794 |
| MeridianLink, Inc. (a) | | 8,661 | 184,999 |
| Mitek Systems, Inc. (a) | | 24,566 | 274,648 |
| N-able, Inc. (a) | | 37,929 | 577,659 |
| NCR Voyix Corp. (a) | | 69,983 | 864,290 |
| Nextnav, Inc. Class A (a)(b) | | 39,798 | 322,762 |
| Olo, Inc. Class A (a) | | 27,227 | 120,343 |
| Onespan, Inc. (a) | | 18,293 | 234,516 |
| Ooma, Inc. (a) | | 1,859 | 18,460 |
| Pagerduty, Inc. (a) | | 47,339 | 1,085,483 |
| Porch Group, Inc. (a) | | 40,946 | 61,828 |
| PowerSchool Holdings, Inc. Class A (a)(b) | | 28,145 | 630,167 |
| Prairie Operating Co. (a) | | 2,057 | 22,318 |
| Progress Software Corp. | | 22,780 | 1,236,043 |
| PROS Holdings, Inc. (a) | | 24,262 | 695,106 |
| Q2 Holdings, Inc. (a) | | 31,202 | 1,882,417 |
| Qualys, Inc. (a) | | 19,688 | 2,807,509 |
| Rapid7, Inc. (a) | | 32,831 | 1,419,284 |
| Red Violet, Inc. (a) | | 5,863 | 148,920 |
| Rekor Systems, Inc. (a) | | 33,639 | 52,140 |
| Repositrak, Inc. | | 6,258 | 95,685 |
| Rimini Street, Inc. (a) | | 4,079 | 12,523 |
| Riot Platforms, Inc. (a)(b) | | 19,152 | 175,049 |
| Roadzen, Inc. (a) | | 573 | 1,272 |
| Sapiens International Corp. NV | | 16,332 | 554,145 |
| Semrush Holdings, Inc. (a) | | 19,256 | 257,838 |
| SoundHound AI, Inc. (a)(b) | | 150,488 | 594,428 |
| SoundThinking, Inc. (a) | | 4,757 | 57,940 |
| Sprinklr, Inc. (a) | | 54,593 | 525,185 |
| Sprout Social, Inc. (a)(b) | | 26,194 | 934,602 |
| SPS Commerce, Inc. (a) | | 19,732 | 3,712,773 |
| Tenable Holdings, Inc. (a) | | 62,534 | 2,725,232 |
| TeraWulf, Inc. (a) | | 113,970 | 507,167 |
| Varonis Systems, Inc. (a) | | 58,463 | 2,804,470 |
| Vertex, Inc. Class A (a) | | 28,788 | 1,037,807 |
| Viant Technology, Inc. (a) | | 8,275 | 81,674 |
| Weave Communications, Inc. (a) | | 20,792 | 187,544 |
| Workiva, Inc. (a) | | 26,782 | 1,954,818 |
| Yext, Inc. (a) | | 55,677 | 297,872 |
| Zeta Global Holdings Corp. (a) | | 87,218 | 1,539,398 |
| Zuora, Inc. (a) | | 68,727 | 682,459 |
| | | | 71,580,782 |
| Technology Hardware, Storage & Peripherals - 0.2% | | | |
| CompoSecure, Inc. (b) | | 8,162 | 55,502 |
| Corsair Gaming, Inc. (a) | | 5,042 | 55,664 |
| CPI Card Group (a) | | 2,657 | 72,403 |
| IonQ, Inc. (a)(b) | | 105,193 | 739,507 |
| Turtle Beach Corp. (a) | | 5,375 | 77,078 |
| | | | 1,000,154 |
TOTAL INFORMATION TECHNOLOGY | | | 134,257,337 |
| MATERIALS - 3.9% | | | |
| Chemicals - 2.0% | | | |
| Arq, Inc. (a) | | 1,559 | 9,463 |
| ASP Isotopes, Inc. (a) | | 21,032 | 64,358 |
| Aspen Aerogels, Inc. (a) | | 6,795 | 162,061 |
| Balchem Corp. | | 17,137 | 2,638,241 |
| Cabot Corp. | | 28,739 | 2,640,827 |
| H.B. Fuller Co. | | 8,179 | 629,456 |
| Hawkins, Inc. | | 10,255 | 933,205 |
| Ingevity Corp. (a) | | 19,305 | 843,822 |
| Innospec, Inc. | | 11,272 | 1,393,106 |
| Northern Technologies International Corp. | | 4,183 | 69,270 |
| Orion SA | | 30,518 | 669,565 |
| PureCycle Technologies, Inc. (a)(b) | | 12,301 | 72,822 |
| Quaker Chemical Corp. | | 7,411 | 1,257,647 |
| Sensient Technologies Corp. | | 21,172 | 1,570,751 |
| Stepan Co. | | 1,174 | 98,569 |
| | | | 13,053,163 |
| Construction Materials - 0.4% | | | |
| Knife River Holding Co. (a) | | 30,115 | 2,112,266 |
| Smith-Midland Corp. (a) | | 2,386 | 66,068 |
| United States Lime & Minerals, Inc. | | 1,116 | 406,425 |
| | | | 2,584,759 |
| Containers & Packaging - 0.1% | | | |
| Ardagh Metal Packaging SA | | 76,569 | 260,335 |
| Myers Industries, Inc. | | 19,465 | 260,442 |
| Pactiv Evergreen, Inc. | | 2,509 | 28,402 |
| | | | 549,179 |
| Metals & Mining - 1.4% | | | |
| Alpha Metallurgical Resources | | 5,826 | 1,634,368 |
| Carpenter Technology Corp. | | 25,230 | 2,764,703 |
| Century Aluminum Co. (a) | | 27,978 | 468,632 |
| Constellium NV (a) | | 68,630 | 1,293,676 |
| Contango ORE, Inc. (a) | | 1,693 | 30,593 |
| Critical Metals Corp. | | 3,887 | 43,806 |
| Dakota Gold Corp. (a) | | 20,768 | 52,958 |
| Ivanhoe Electric, Inc. (a)(b) | | 44,305 | 415,581 |
| Kaiser Aluminum Corp. | | 7,948 | 698,629 |
| Materion Corp. | | 10,280 | 1,111,576 |
| Metals Acquisition Ltd. | | 7,876 | 107,822 |
| Perpetua Resources Corp. (a) | | 20,407 | 106,116 |
| Piedmont Lithium, Inc. (a)(b) | | 2,716 | 27,106 |
| Ramaco Resources, Inc.: | | | |
| Class A | | 10,026 | 124,824 |
| Class B | | 7,475 | 81,179 |
| | | | 8,961,569 |
| Paper & Forest Products - 0.0% | | | |
| Sylvamo Corp. | | 4,045 | 277,487 |
TOTAL MATERIALS | | | 25,426,157 |
| REAL ESTATE - 1.4% | | | |
| Equity Real Estate Investment Trusts (REITs) - 0.9% | | | |
| Alexanders, Inc. | | 1,138 | 255,891 |
| Apartment Investment & Management Co. Class A (a) | | 36,151 | 299,692 |
| Armada Hoffler Properties, Inc. Class A, | | 2,489 | 27,603 |
| CareTrust (REIT), Inc. | | 5,946 | 149,245 |
| CBL & Associates Properties, Inc. | | 8,294 | 193,914 |
| Clipper Realty, Inc. | | 5,406 | 19,516 |
| Community Healthcare Trust, Inc. | | 1,118 | 26,150 |
| Gladstone Commercial Corp. | | 3,212 | 45,835 |
| NETSTREIT Corp. | | 7,733 | 124,501 |
| Outfront Media, Inc. | | 30,740 | 439,582 |
| Phillips Edison & Co., Inc. | | 9,557 | 312,609 |
| Postal Realty Trust, Inc. Class A | | 4,299 | 57,306 |
| Ryman Hospitality Properties, Inc. | | 31,091 | 3,104,747 |
| Saul Centers, Inc. | | 5,022 | 184,659 |
| Strawberry Fields (REIT), Inc. | | 3,081 | 35,154 |
| Tanger, Inc. | | 22,126 | 599,836 |
| UMH Properties, Inc. | | 5,016 | 80,206 |
| Universal Health Realty Income Trust (SBI) | | 5,669 | 221,885 |
| | | | 6,178,331 |
| Real Estate Management & Development - 0.5% | | | |
| Compass, Inc. (a) | | 193,274 | 695,786 |
| Digitalbridge Group, Inc. | | 22,347 | 306,154 |
| eXp World Holdings, Inc. (b) | | 42,935 | 484,521 |
| Forestar Group, Inc. (a) | | 1,190 | 38,068 |
| Maui Land & Pineapple, Inc. (a) | | 3,767 | 83,062 |
| Offerpad Solutions, Inc. Class A (a) | | 762 | 3,368 |
| Opendoor Technologies, Inc. Class A (a) | | 16,392 | 30,161 |
| Redfin Corp. (a)(b) | | 62,143 | 373,479 |
| The Real Brokerage, Inc. (a) | | 50,474 | 204,924 |
| The St. Joe Co. | | 19,120 | 1,045,864 |
| | | | 3,265,387 |
TOTAL REAL ESTATE | | | 9,443,718 |
| UTILITIES - 0.5% | | | |
| Electric Utilities - 0.3% | | | |
| Genie Energy Ltd. Class B | | 3,055 | 44,664 |
| MGE Energy, Inc. | | 8,269 | 617,860 |
| Otter Tail Corp. | | 9,801 | 858,470 |
| | | | 1,520,994 |
| Independent Power and Renewable Electricity Producers - 0.0% | | | |
| Montauk Renewables, Inc. (a) | | 35,013 | 199,574 |
| Water Utilities - 0.2% | | | |
| American States Water Co. | | 11,094 | 805,092 |
| Cadiz, Inc. (a)(b) | | 22,358 | 69,086 |
| California Water Service Group | | 8,125 | 393,981 |
| Consolidated Water Co., Inc. | | 1,941 | 51,514 |
| Global Water Resources, Inc. | | 6,141 | 74,306 |
| Middlesex Water Co. | | 1,185 | 61,928 |
| York Water Co. | | 973 | 36,089 |
| | | | 1,491,996 |
TOTAL UTILITIES | | | 3,212,564 |
| TOTAL COMMON STOCKS (Cost $590,553,521) | | | 661,354,939 |
| | | | |
| U.S. Treasury Obligations - 0.0% |
| | | Principal Amount (d) | Value ($) |
U.S. Treasury Bills, yield at date of purchase 5.31% 8/22/24 (e) (Cost $209,402) | | 211,000 | 209,407 |
| | | | |
| Money Market Funds - 7.2% |
| | | Shares | Value ($) |
| Fidelity Cash Central Fund 5.38% (f) | | 3,707,767 | 3,708,509 |
| Fidelity Securities Lending Cash Central Fund 5.38% (f)(g) | | 43,013,390 | 43,017,692 |
| TOTAL MONEY MARKET FUNDS (Cost $46,726,201) | | | 46,726,201 |
| | | | |
| TOTAL INVESTMENT IN SECURITIES - 108.2% (Cost $637,489,124) | 708,290,547 |
NET OTHER ASSETS (LIABILITIES) - (8.2)% | (53,563,336) |
| NET ASSETS - 100.0% | 654,727,211 |
| | |
| Futures Contracts |
| | Number of contracts | Expiration Date | Notional Amount ($) | Value ($) | Unrealized Appreciation/ (Depreciation) ($) |
| Purchased | | | | | |
| | | | | | |
| Equity Index Contracts | | | | | |
| CME E-mini Russell 2000 Index Contracts (United States) | 76 | Sep 2024 | 7,847,000 | 52,657 | 52,657 |
| | | | | | |
| The notional amount of futures purchased as a percentage of Net Assets is 1.2% |
Legend
| (b) | Security or a portion of the security is on loan at period end. |
| (d) | Amount is stated in United States dollars unless otherwise noted. |
| (e) | Security or a portion of the security was pledged to cover margin requirements for futures contracts. At period end, the value of securities pledged amounted to $209,407. |
| (f) | Affiliated fund that is generally available only to investment companies and other accounts managed by Fidelity Investments. The rate quoted is the annualized seven-day yield of the fund at period end. A complete unaudited listing of the fund's holdings as of its most recent quarter end is available upon request. In addition, each Fidelity Central Fund's financial statements, which are not covered by the Fund's Report of Independent Registered Public Accounting Firm, are available on the SEC's website or upon request. |
| (g) | Investment made with cash collateral received from securities on loan. |
| (h) | Equity security is subject to lock-up or market standoff agreement and valued at a discount to the market price of the equivalent equity security. As of period end, the total fair value of equity securities discounted due to contractual sale restrictions is $4,688 and all restrictions are set to expire on or before September 30, 2024. Under normal market conditions, there are no circumstances that could cause the restrictions to lapse. |
Affiliated Central Funds
Fiscal year to date information regarding the Fund's investments in Fidelity Central Funds, including the ownership percentage, is presented below.
| Affiliate | Value, beginning of period ($) | Purchases ($) | Sales Proceeds ($) | Dividend Income ($) | Realized Gain (loss) ($) | Change in Unrealized appreciation (depreciation) ($) | Value, end of period ($) | % ownership, end of period |
| Fidelity Cash Central Fund 5.38% | 2,545,165 | 223,836,160 | 222,672,654 | 155,606 | (162) | - | 3,708,509 | 0.0% |
| Fidelity Securities Lending Cash Central Fund 5.38% | 45,444,609 | 193,052,195 | 195,479,112 | 926,853 | - | - | 43,017,692 | 0.2% |
| Total | 47,989,774 | 416,888,355 | 418,151,766 | 1,082,459 | (162) | - | 46,726,201 | |
| | | | | | | | | |
Amounts in the dividend income column in the above table include any capital gain distributions from underlying funds, which are presented in the corresponding line item in the Statement of Operations, if applicable.
Amounts in the dividend income column for Fidelity Securities Lending Cash Central Fund represents the income earned on investing cash collateral, less rebates paid to borrowers and any lending agent fees associated with the loan, plus any premium payments received for lending certain types of securities.
Amounts included in the purchases and sales proceeds columns may include in-kind transactions, if applicable.
Investment Valuation
The following is a summary of the inputs used, as of June 30, 2024, involving the Fund's assets and liabilities carried at fair value. The inputs or methodology used for valuing securities may not be an indication of the risk associated with investing in those securities. For more information on valuation inputs, and their aggregation into the levels used below, please refer to the Investment Valuation section in the accompanying Notes to Financial Statements.
| Valuation Inputs at Reporting Date: |
| Description | Total ($) | Level 1 ($) | Level 2 ($) | Level 3 ($) |
Investments in Securities: | | | | |
|
| Equities: | | | | |
Communication Services | 13,694,497 | 13,694,497 | - | - |
Consumer Discretionary | 65,749,721 | 65,749,721 | - | - |
Consumer Staples | 21,470,603 | 21,470,603 | - | - |
Energy | 27,363,245 | 27,363,245 | - | - |
Financials | 51,460,061 | 51,460,061 | - | - |
Health Care | 165,171,885 | 165,164,008 | 5,020 | 2,857 |
Industrials | 144,105,151 | 144,105,151 | - | - |
Information Technology | 134,257,337 | 134,257,337 | - | - |
Materials | 25,426,157 | 25,426,157 | - | - |
Real Estate | 9,443,718 | 9,443,718 | - | - |
Utilities | 3,212,564 | 3,212,564 | - | - |
|
| U.S. Government and Government Agency Obligations | 209,407 | - | 209,407 | - |
|
| Money Market Funds | 46,726,201 | 46,726,201 | - | - |
| Total Investments in Securities: | 708,290,547 | 708,073,263 | 214,427 | 2,857 |
Derivative Instruments: Assets | | | | |
Futures Contracts | 52,657 | 52,657 | - | - |
| Total Assets | 52,657 | 52,657 | - | - |
| Total Derivative Instruments: | 52,657 | 52,657 | - | - |
Value of Derivative Instruments
The following table is a summary of the Fund's value of derivative instruments by primary risk exposure as of June 30, 2024. For additional information on derivative instruments, please refer to the Derivative Instruments section in the accompanying Notes to Financial Statements.
Primary Risk Exposure / Derivative Type | Value |
| Asset ($) | Liability ($) |
| Equity Risk | | |
Futures Contracts (a) | 52,657 | 0 |
| Total Equity Risk | 52,657 | 0 |
| Total Value of Derivatives | 52,657 | 0 |
(a)Reflects gross cumulative appreciation (depreciation) on futures contracts as presented in the Schedule of Investments. In the Statement of Assets and Liabilities, the period end daily variation margin is included in receivable or payable for daily variation margin on futures contracts, and the net cumulative appreciation (depreciation) is included in Total accumulated earnings (loss).
Fidelity® Small Cap Growth Index Fund
Financial Statements
| Statement of Assets and Liabilities |
| | | | June 30, 2024 |
| | | | | |
| Assets | | | | |
| Investment in securities, at value (including securities loaned of $41,007,732) - See accompanying schedule: | | | | |
Unaffiliated issuers (cost $590,762,923) | $ | 661,564,346 | | |
Fidelity Central Funds (cost $46,726,201) | | 46,726,201 | | |
| | | | | |
| | | | | |
| Total Investment in Securities (cost $637,489,124) | | | $ | 708,290,547 |
| Segregated cash with brokers for derivative instruments | | | | 58,229 |
| Cash | | | | 605,283 |
| Foreign currency held at value (cost $378) | | | | 370 |
| Receivable for investments sold | | | | 173,928,284 |
| Receivable for fund shares sold | | | | 2,051,415 |
| Dividends receivable | | | | 199,588 |
| Distributions receivable from Fidelity Central Funds | | | | 70,652 |
| Receivable for daily variation margin on futures contracts | | | | 10,709 |
| Other receivables | | | | 611 |
Total assets | | | | 885,215,688 |
| Liabilities | | | | |
| Payable for investments purchased | $ | 158,838,295 | | |
| Payable for fund shares redeemed | | 28,604,299 | | |
| Accrued management fee | | 28,191 | | |
| Collateral on securities loaned | | 43,017,692 | | |
| Total liabilities | | | | 230,488,477 |
| Net Assets | | | $ | 654,727,211 |
| Net Assets consist of: | | | | |
| Paid in capital | | | $ | 646,184,013 |
| Total accumulated earnings (loss) | | | | 8,543,198 |
| Net Assets | | | $ | 654,727,211 |
Net Asset Value, offering price and redemption price per share ($654,727,211 ÷ 25,726,416 shares) | | | $ | 25.45 |
| Statement of Operations |
| | | | Year ended June 30, 2024 |
| Investment Income | | | | |
| Dividends | | | $ | 3,594,323 |
| Interest | | | | 10,563 |
| Income from Fidelity Central Funds (including $926,853 from security lending) | | | | 1,082,459 |
| Total income | | | | 4,687,345 |
| Expenses | | | | |
| Management fee | $ | 279,883 | | |
| Independent trustees' fees and expenses | | 1,713 | | |
| Interest | | 7,320 | | |
| Miscellaneous | | 15,711 | | |
| Total expenses before reductions | | 304,627 | | |
| Expense reductions | | (2,934) | | |
| Total expenses after reductions | | | | 301,693 |
| Net Investment income (loss) | | | | 4,385,652 |
| Realized and Unrealized Gain (Loss) | | | | |
| Net realized gain (loss) on: | | | | |
| Investment Securities: | | | | |
| Unaffiliated issuers | | 1,853,885 | | |
| Redemptions in-kind | | 13,238,375 | | |
| Fidelity Central Funds | | (162) | | |
| Futures contracts | | 232,188 | | |
| Total net realized gain (loss) | | | | 15,324,286 |
| Change in net unrealized appreciation (depreciation) on: | | | | |
| Investment Securities: | | | | |
| Unaffiliated issuers | | 31,634,166 | | |
| Assets and liabilities in foreign currencies | | (12) | | |
| Futures contracts | | (21,092) | | |
| Total change in net unrealized appreciation (depreciation) | | | | 31,613,062 |
| Net gain (loss) | | | | 46,937,348 |
| Net increase (decrease) in net assets resulting from operations | | | $ | 51,323,000 |
| Statement of Changes in Net Assets |
| |
| | Year ended June 30, 2024 | | Year ended June 30, 2023 |
| Increase (Decrease) in Net Assets | | | | |
| Operations | | | | |
| Net investment income (loss) | $ | 4,385,652 | $ | 4,073,423 |
| Net realized gain (loss) | | 15,324,286 | | (5,334,202) |
| Change in net unrealized appreciation (depreciation) | | 31,613,062 | | 64,432,528 |
| Net increase (decrease) in net assets resulting from operations | | 51,323,000 | | 63,171,749 |
| Distributions to shareholders | | (4,416,179) | | (2,541,670) |
| | | | | |
| Share transactions | | | | |
| Proceeds from sales of shares | | 352,653,267 | | 298,966,095 |
| Reinvestment of distributions | | 3,894,236 | | 2,183,459 |
| Cost of shares redeemed | | (269,202,210) | | (116,057,501) |
| | | | | |
Net increase (decrease) in net assets resulting from share transactions | | 87,345,293 | | 185,092,053 |
| Total increase (decrease) in net assets | | 134,252,114 | | 245,722,132 |
| | | | | |
| Net Assets | | | | |
| Beginning of period | | 520,475,097 | | 274,752,965 |
| End of period | $ | 654,727,211 | $ | 520,475,097 |
| | | | | |
| Other Information | | | | |
| Shares | | | | |
| Sold | | 14,713,757 | | 13,579,621 |
| Issued in reinvestment of distributions | | 165,518 | | 102,849 |
| Redeemed | | (11,308,549) | | (5,314,092) |
| Net increase (decrease) | | 3,570,726 | | 8,368,378 |
| | | | | |
Financial Highlights
Fidelity® Small Cap Growth Index Fund |
| |
| Years ended June 30, | | 2024 | | 2023 | | 2022 | | 2021 | | 2020 A |
Selected Per-Share Data | | | | | | | | | | |
| Net asset value, beginning of period | $ | 23.49 | $ | 19.93 | $ | 30.90 | $ | 20.66 | $ | 20.00 |
| Income from Investment Operations | | | | | | | | | | |
Net investment income (loss) B,C | | .19 | | .23 | | .17 | | .14 | | .15 |
| Net realized and unrealized gain (loss) | | 1.97 | | 3.50 | | (10.17) | | 10.38 | | .57 |
| Total from investment operations | | 2.16 | | 3.73 | | (10.00) | | 10.52 | | .72 |
| Distributions from net investment income | | (.20) | | (.17) | | (.16) | | (.11) | | (.05) |
| Distributions from net realized gain | | - | | - | | (.81) | | (.18) | | (.01) |
| Total distributions | | (.20) | | (.17) | | (.97) | | (.28) D | | (.06) |
| Net asset value, end of period | $ | 25.45 | $ | 23.49 | $ | 19.93 | $ | 30.90 | $ | 20.66 |
Total Return E,F | | | | 18.78% | | (33.33)% | | 51.31% | | 3.59% |
Ratios to Average Net Assets C,G,H | | | | | | | | | | |
| Expenses before reductions | | .05% | | .05% | | .05% | | .05% | | .05% I |
| Expenses net of fee waivers, if any | | | | .05% | | .05% | | .05% | | .05% I |
| Expenses net of all reductions | | .05% | | .05% | | .05% | | .05% | | .05% I |
| Net investment income (loss) | | .78% | | 1.05% | | .64% | | .49% | | .78% I |
| Supplemental Data | | | | | | | | | | |
| Net assets, end of period (000 omitted) | $ | 654,727 | $ | 520,475 | $ | 274,753 | $ | 336,925 | $ | 54,213 |
Portfolio turnover rate J | | | | 42% | | 51% | | 62% | | 69% I |
AFor the period July 11, 2019 (commencement of operations) through June 30, 2020.
BCalculated based on average shares outstanding during the period.
CNet investment income (loss) is affected by the timing of the declaration of dividends by any underlying mutual funds or exchange-traded funds (ETFs). Net investment income (loss) of any mutual funds or ETFs is not included in the Fund's net investment income (loss) ratio.
DTotal distributions per share do not sum due to rounding.
ETotal returns for periods of less than one year are not annualized.
FTotal returns would have been lower if certain expenses had not been reduced during the applicable periods shown.
GFees and expenses of any underlying mutual funds or exchange-traded funds (ETFs) are not included in the Fund's expense ratio. The Fund indirectly bears its proportionate share of these expenses. For additional expense information related to investments in Fidelity Central Funds, please refer to the "Investments in Fidelity Central Funds" note found in the Notes to Financial Statements section of the most recent Annual or Semi-Annual report.
HExpense ratios reflect operating expenses of the class. Expenses before reductions do not reflect amounts reimbursed, waived, or reduced through arrangements with the investment adviser, brokerage services, or other offset arrangements, if applicable, and do not represent the amount paid by the class during periods when reimbursements, waivers or reductions occur.
IAnnualized.
JAmount does not include the portfolio activity of any underlying mutual funds or exchange-traded funds (ETFs).
KPortfolio turnover rate excludes securities received or delivered in-kind.
Fidelity® Small Cap Value Index Fund
Schedule of Investments June 30, 2024
Showing Percentage of Net Assets
| Common Stocks - 99.5% |
| | | Shares | Value ($) |
| COMMUNICATION SERVICES - 2.9% | | | |
| Diversified Telecommunication Services - 0.5% | | | |
| Anterix, Inc. (a) | | 1,425 | 56,416 |
| AST SpaceMobile, Inc. Class A, (a) | | 111,557 | 1,295,177 |
| ATN International, Inc. | | 9,865 | 224,922 |
| Bandwidth, Inc. Class A, (a) | | 2,598 | 43,854 |
| Consolidated Communications Holdings, Inc. (a) | | 69,622 | 306,337 |
| Globalstar, Inc. (a)(b) | | 107,215 | 120,081 |
| IDT Corp. Class B | | 4,261 | 153,055 |
| Liberty Latin America Ltd.: | | | |
| Class A (a) | | 22,802 | 219,127 |
| Class C (a) | | 134,223 | 1,291,225 |
| Lumen Technologies, Inc. (a)(b) | | 949,120 | 1,044,032 |
| Shenandoah Telecommunications Co. | | 45,821 | 748,257 |
| | | | 5,502,483 |
| Entertainment - 0.5% | | | |
| AMC Entertainment Holdings, Inc. Class A | | 262,573 | 1,307,614 |
| Cinemark Holdings, Inc. (a)(b) | | 21,222 | 458,820 |
| Eventbrite, Inc. (a) | | 8,875 | 42,955 |
| Lions Gate Entertainment Corp.: | | | |
| Class A (a)(b) | | 50,558 | 476,256 |
| Class B (a) | | 121,035 | 1,037,270 |
| LiveOne, Inc. (a) | | 10,187 | 15,994 |
| Madison Square Garden Entertainment Corp. Class A (a) | | 33,547 | 1,148,314 |
| Marcus Corp. | | 21,789 | 247,741 |
| Playstudios, Inc. Class A (a) | | 82,639 | 171,063 |
| Reservoir Media, Inc. (a) | | 16,915 | 133,629 |
| Sphere Entertainment Co. (a)(b) | | 25,046 | 878,113 |
| | | | 5,917,769 |
| Interactive Media & Services - 0.6% | | | |
| Bumble, Inc. (a) | | 81,718 | 858,856 |
| Cars.com, Inc. (a) | | 62,473 | 1,230,718 |
| fuboTV, Inc. (a)(b) | | 256,395 | 317,930 |
| Nextdoor Holdings, Inc. Class A (a) | | 165,351 | 459,676 |
| Outbrain, Inc. (a) | | 35,814 | 178,354 |
| Shutterstock, Inc. | | 5,106 | 197,602 |
| TrueCar, Inc. (a) | | 82,152 | 257,136 |
| Vimeo, Inc. (a) | | 140,478 | 523,983 |
| Ziff Davis, Inc. (a) | | 42,826 | 2,357,571 |
| | | | 6,381,826 |
| Media - 1.1% | | | |
| Advantage Solutions, Inc. Class A (a) | | 101,813 | 327,838 |
| AMC Networks, Inc. Class A (a)(b) | | 30,051 | 290,293 |
| Boston Omaha Corp. (a) | | 21,589 | 290,588 |
| Cable One, Inc. | | 5,313 | 1,880,802 |
| Clear Channel Outdoor Holdings, Inc. (a) | | 286,038 | 403,314 |
| E.W. Scripps Co. Class A (a) | | 56,513 | 177,451 |
| EchoStar Corp. Class A (a) | | 114,844 | 2,045,372 |
| Emerald Holding, Inc. (a)(b) | | 15,539 | 88,417 |
| Entravision Communication Corp. Class A | | 49,972 | 101,443 |
| Gannett Co., Inc. (a)(b) | | 134,413 | 619,644 |
| Gray Television, Inc. | | 80,268 | 417,394 |
| iHeartMedia, Inc. (a) | | 95,921 | 104,554 |
| Innovid Corp. (a) | | 90,569 | 167,553 |
| Integral Ad Science Holding Corp. (a) | | 60,507 | 588,128 |
| John Wiley & Sons, Inc. Class A | | 16,260 | 661,782 |
| Magnite, Inc. (a) | | 13,335 | 177,222 |
| National CineMedia, Inc. (a) | | 67,357 | 295,697 |
| Scholastic Corp. | | 22,268 | 789,846 |
| Stagwell, Inc. (a) | | 71,038 | 484,479 |
| TEGNA, Inc. | | 166,052 | 2,314,765 |
| WideOpenWest, Inc. (a) | | 46,027 | 249,006 |
| | | | 12,475,588 |
| Wireless Telecommunication Services - 0.2% | | | |
| Gogo, Inc. (a) | | 34,099 | 328,032 |
| Spok Holdings, Inc. | | 18,067 | 267,572 |
| Telephone & Data Systems, Inc. | | 93,408 | 1,936,348 |
| | | | 2,531,952 |
TOTAL COMMUNICATION SERVICES | | | 32,809,618 |
| CONSUMER DISCRETIONARY - 9.9% | | | |
| Automobile Components - 1.1% | | | |
| Adient PLC (a) | | 85,423 | 2,110,802 |
| American Axle & Manufacturing Holdings, Inc. (a) | | 108,154 | 755,996 |
| Cooper-Standard Holding, Inc. (a) | | 15,958 | 198,518 |
| Dana, Inc. | | 122,636 | 1,486,348 |
| Fox Factory Holding Corp. (a) | | 39,800 | 1,917,962 |
| Holley, Inc. (a) | | 23,595 | 84,470 |
| Luminar Technologies, Inc. Class A (a) | | 40,578 | 60,461 |
| Phinia, Inc. | | 42,970 | 1,691,299 |
| Solid Power, Inc. (a)(b) | | 147,896 | 244,028 |
| Standard Motor Products, Inc. | | 20,058 | 556,208 |
| Stoneridge, Inc. (a) | | 25,317 | 404,059 |
| The Goodyear Tire & Rubber Co. (a) | | 268,404 | 3,046,385 |
| | | | 12,556,536 |
| Automobiles - 0.1% | | | |
| Canoo, Inc. (a) | | 56,086 | 119,463 |
| Winnebago Industries, Inc. | | 27,162 | 1,472,180 |
| | | | 1,591,643 |
| Broadline Retail - 0.0% | | | |
| 1stDibs.com, Inc. (a) | | 19,029 | 85,440 |
| Groupon, Inc. (a) | | 11,018 | 168,575 |
| | | | 254,015 |
| Distributors - 0.0% | | | |
| Weyco Group, Inc. | | 5,907 | 179,100 |
| Diversified Consumer Services - 0.8% | | | |
| Adtalem Global Education, Inc. (a) | | 30,214 | 2,060,897 |
| American Public Education, Inc. (a) | | 13,783 | 242,305 |
| Carriage Services, Inc. | | 3,074 | 82,506 |
| Chegg, Inc. (a) | | 92,081 | 290,976 |
| European Wax Center, Inc. (a)(b) | | 2,056 | 20,416 |
| Graham Holdings Co. | | 3,109 | 2,174,901 |
| Laureate Education, Inc. | | 24,732 | 369,496 |
| Lincoln Educational Services Corp. (a) | | 25,011 | 296,630 |
| Mister Car Wash, Inc. (a) | | 11,773 | 83,824 |
| Perdoceo Education Corp. | | 62,149 | 1,331,232 |
| Strategic Education, Inc. | | 21,120 | 2,337,139 |
| | | | 9,290,322 |
| Hotels, Restaurants & Leisure - 1.0% | | | |
| Bally's Corp. (a)(b) | | 22,429 | 268,475 |
| Biglari Holdings, Inc. Class B (a) | | 672 | 129,951 |
| BJ's Restaurants, Inc. (a) | | 8,272 | 287,038 |
| Bloomin' Brands, Inc. | | 34,938 | 671,858 |
| Brinker International, Inc. (a) | | 4,123 | 298,464 |
| Chuy's Holdings, Inc. (a) | | 16,118 | 417,779 |
| Cracker Barrel Old Country Store, Inc. | | 16,320 | 688,051 |
| Denny's Corp. (a) | | 11,849 | 84,128 |
| Despegar.com Corp. (a) | | 50,745 | 671,356 |
| Dine Brands Global, Inc. | | 12,423 | 449,713 |
| El Pollo Loco Holdings, Inc. (a) | | 25,427 | 287,579 |
| Empire Resorts, Inc. (c) | | 41 | 0 |
| Everi Holdings, Inc. (a) | | 33,930 | 285,012 |
| Full House Resorts, Inc. (a) | | 31,067 | 155,335 |
| Global Business Travel Group, Inc. (a) | | 17,710 | 116,886 |
| Golden Entertainment, Inc. | | 19,071 | 593,299 |
| International Game Technology PLC | | 93,257 | 1,908,038 |
| Life Time Group Holdings, Inc. (a)(b) | | 55,716 | 1,049,132 |
| Lindblad Expeditions Holdings (a) | | 10,162 | 98,063 |
| Mondee Holdings, Inc. Class A (a)(b) | | 7,357 | 17,657 |
| Nathan's Famous, Inc. | | 68 | 4,609 |
| Papa John's International, Inc. (b) | | 8,403 | 394,773 |
| Portillo's, Inc. Class A (a) | | 10,271 | 99,834 |
| RCI Hospitality Holdings, Inc. | | 3,902 | 169,971 |
| Red Rock Resorts, Inc. | | 25,173 | 1,382,753 |
| Sabre Corp. (a) | | 280,466 | 748,844 |
| Six Flags Entertainment Corp. | | 17,766 | 588,765 |
| United Parks & Resorts, Inc. (a) | | 2,037 | 110,629 |
| Vacasa, Inc. Class A (a) | | 8,939 | 43,533 |
| | | | 12,021,525 |
| Household Durables - 3.0% | | | |
| Beazer Homes U.S.A., Inc. (a) | | 27,863 | 765,675 |
| Century Communities, Inc. | | 23,487 | 1,917,948 |
| Cricut, Inc. | | 7,339 | 43,961 |
| Ethan Allen Interiors, Inc. | | 21,746 | 606,496 |
| Flexsteel Industries, Inc. | | 4,391 | 136,384 |
| GoPro, Inc. Class A (a) | | 116,334 | 165,194 |
| Green Brick Partners, Inc. (a) | | 21,648 | 1,239,132 |
| Hamilton Beach Brands Holding Co. Class A | | 8,146 | 140,030 |
| Helen of Troy Ltd. (a) | | 22,386 | 2,076,078 |
| Hooker Furnishings Corp. | | 9,729 | 140,876 |
| Hovnanian Enterprises, Inc. Class A (a) | | 4,430 | 628,706 |
| iRobot Corp. (a) | | 26,526 | 241,652 |
| KB Home | | 54,971 | 3,857,865 |
| La-Z-Boy, Inc. | | 40,521 | 1,510,623 |
| Landsea Homes Corp. Class A (a) | | 14,854 | 136,508 |
| Legacy Housing Corp. (a) | | 10,468 | 240,136 |
| LGI Homes, Inc. (a) | | 18,309 | 1,638,472 |
| Lifetime Brands, Inc. | | 11,973 | 102,848 |
| Lovesac (a) | | 6,327 | 142,864 |
| M/I Homes, Inc. (a) | | 25,581 | 3,124,463 |
| Meritage Homes Corp. | | 33,987 | 5,500,796 |
| Purple Innovation, Inc. Class A (a) | | 54,999 | 57,199 |
| Skyline Champion Corp. (a) | | 26,809 | 1,816,310 |
| Sonos, Inc. (a) | | 11,809 | 174,301 |
| Taylor Morrison Home Corp. (a) | | 98,202 | 5,444,319 |
| Traeger, Inc. (a) | | 31,311 | 75,146 |
| TRI Pointe Homes, Inc. (a) | | 62,494 | 2,327,902 |
| United Homes Group, Inc. (a) | | 839 | 4,774 |
| Worthington Enterprises, Inc. | | 3,311 | 156,710 |
| | | | 34,413,368 |
| Leisure Products - 0.7% | | | |
| AMMO, Inc. (a) | | 83,361 | 140,046 |
| Clarus Corp. | | 28,708 | 193,205 |
| Escalade, Inc. | | 9,534 | 131,474 |
| Funko, Inc. (a) | | 29,149 | 284,494 |
| JAKKS Pacific, Inc. (a) | | 7,702 | 137,943 |
| Johnson Outdoors, Inc. Class A | | 4,267 | 149,260 |
| Latham Group, Inc. (a) | | 39,067 | 118,373 |
| Malibu Boats, Inc. Class A (a) | | 19,164 | 671,507 |
| Marine Products Corp. | | 4,842 | 48,904 |
| MasterCraft Boat Holdings, Inc. (a) | | 15,822 | 298,719 |
| Peloton Interactive, Inc. Class A (a) | | 22,432 | 75,820 |
| Smith & Wesson Brands, Inc. | | 39,357 | 564,379 |
| Solo Brands, Inc. Class A (a)(b) | | 14,570 | 33,220 |
| Sturm, Ruger & Co., Inc. | | 11,308 | 470,978 |
| Topgolf Callaway Brands Corp. (a) | | 133,882 | 2,048,395 |
| Vista Outdoor, Inc. (a) | | 55,069 | 2,073,348 |
| | | | 7,440,065 |
| Specialty Retail - 2.9% | | | |
| 1-800-FLOWERS.com, Inc. Class A (a)(b) | | 18,431 | 175,463 |
| a.k.a. Brands Holding Corp. (a) | | 679 | 10,355 |
| Academy Sports & Outdoors, Inc. | | 50,510 | 2,689,658 |
| America's Car Mart, Inc. (a) | | 5,644 | 339,825 |
| American Eagle Outfitters, Inc. | | 35,915 | 716,863 |
| Arhaus, Inc. Class A, | | 7,482 | 126,745 |
| Arko Corp. | | 67,495 | 423,194 |
| Asbury Automotive Group, Inc. (a) | | 19,142 | 4,361,888 |
| BARK, Inc. (a)(b) | | 127,044 | 229,950 |
| Beyond, Inc. (a)(b) | | 43,276 | 566,050 |
| Caleres, Inc. | | 22,706 | 762,922 |
| Citi Trends, Inc. (a) | | 7,488 | 159,195 |
| Designer Brands, Inc. Class A (b) | | 39,983 | 273,084 |
| Destination XL Group, Inc. (a) | | 50,196 | 182,713 |
| EVgo, Inc. Class A (a)(b) | | 83,386 | 204,296 |
| Foot Locker, Inc. | | 78,797 | 1,963,621 |
| Genesco, Inc. (a) | | 7,381 | 190,873 |
| Group 1 Automotive, Inc. | | 12,512 | 3,719,567 |
| GrowGeneration Corp. (a) | | 51,063 | 109,785 |
| Haverty Furniture Companies, Inc. | | 13,671 | 345,740 |
| Hibbett, Inc. | | 2,393 | 208,694 |
| J. Jill, Inc. | | 551 | 19,268 |
| Lands' End, Inc. (a) | | 13,442 | 182,677 |
| Leslie's, Inc. (a)(b) | | 66,271 | 277,675 |
| MarineMax, Inc. (a) | | 20,383 | 659,798 |
| Monro, Inc. | | 28,063 | 669,583 |
| National Vision Holdings, Inc. (a) | | 68,513 | 896,835 |
| OneWater Marine, Inc. Class A (a)(b) | | 11,157 | 307,598 |
| Petco Health & Wellness Co., Inc. Class A (a) | | 77,914 | 294,515 |
| RumbleON, Inc. Class B (a) | | 14,965 | 61,357 |
| Sally Beauty Holdings, Inc. (a) | | 98,372 | 1,055,532 |
| Shoe Carnival, Inc. | | 17,082 | 630,155 |
| Signet Jewelers Ltd. | | 40,392 | 3,618,315 |
| Sleep Number Corp. (a) | | 20,250 | 193,793 |
| Sonic Automotive, Inc. Class A (sub. vtg.) | | 9,790 | 533,261 |
| Stitch Fix, Inc. (a) | | 85,063 | 353,011 |
| The Aaron's Co., Inc. | | 28,807 | 287,494 |
| The ODP Corp. (a) | | 33,529 | 1,316,684 |
| The RealReal, Inc. (a) | | 28,012 | 89,358 |
| thredUP, Inc. (a) | | 63,178 | 107,403 |
| Tile Shop Holdings, Inc. (a) | | 18,024 | 124,906 |
| Tilly's, Inc. (a) | | 12,205 | 73,596 |
| Urban Outfitters, Inc. (a) | | 43,591 | 1,789,411 |
| Victoria's Secret & Co. (a) | | 56,631 | 1,000,670 |
| Winmark Corp. | | 2,712 | 956,333 |
| Zumiez, Inc. (a) | | 15,383 | 299,661 |
| | | | 33,559,370 |
| Textiles, Apparel & Luxury Goods - 0.3% | | | |
| Figs, Inc. Class A (a) | | 115,692 | 616,638 |
| G-III Apparel Group Ltd. (a) | | 38,168 | 1,033,208 |
| Movado Group, Inc. | | 14,319 | 355,970 |
| Oxford Industries, Inc. (b) | | 4,316 | 432,247 |
| Rocky Brands, Inc. | | 4,449 | 164,435 |
| Superior Group of Companies, Inc. | | 10,569 | 199,860 |
| Vera Bradley, Inc. (a) | | 24,228 | 151,667 |
| | | | 2,954,025 |
TOTAL CONSUMER DISCRETIONARY | | | 114,259,969 |
| CONSUMER STAPLES - 2.2% | | | |
| Beverages - 0.3% | | | |
| Duckhorn Portfolio, Inc. (a) | | 49,611 | 352,238 |
| Primo Water Corp. | | 131,918 | 2,883,727 |
| | | | 3,235,965 |
| Consumer Staples Distribution & Retail - 0.5% | | | |
| Andersons, Inc. | | 27,190 | 1,348,624 |
| HF Foods Group, Inc. (a) | | 37,044 | 111,132 |
| Ingles Markets, Inc. Class A | | 13,451 | 922,873 |
| Natural Grocers by Vitamin Cottage, Inc. | | 6,811 | 144,393 |
| PriceSmart, Inc. | | 8,804 | 714,885 |
| SpartanNash Co. | | 31,901 | 598,463 |
| United Natural Foods, Inc. (a) | | 55,233 | 723,552 |
| Village Super Market, Inc. Class A | | 8,175 | 215,902 |
| Weis Markets, Inc. | | 15,472 | 971,177 |
| | | | 5,751,001 |
| Food Products - 0.7% | | | |
| Alico, Inc. | | 6,613 | 171,343 |
| B&G Foods, Inc. | | 73,108 | 590,713 |
| BRC, Inc. Class A (a)(b) | | 4,784 | 29,326 |
| Cal-Maine Foods, Inc. | | 36,589 | 2,235,954 |
| Calavo Growers, Inc. | | 13,268 | 301,184 |
| Dole PLC | | 70,971 | 868,685 |
| Fresh Del Monte Produce, Inc. | | 31,525 | 688,821 |
| Limoneira Co. | | 16,173 | 336,560 |
| Mission Produce, Inc. (a) | | 35,960 | 355,285 |
| Seneca Foods Corp. Class A (a) | | 4,515 | 259,161 |
| The Hain Celestial Group, Inc. (a) | | 84,047 | 580,765 |
| TreeHouse Foods, Inc. (a) | | 46,086 | 1,688,591 |
| Utz Brands, Inc. Class A | | 19,980 | 332,467 |
| Whole Earth Brands, Inc. (a) | | 30,036 | 145,975 |
| | | | 8,584,830 |
| Household Products - 0.2% | | | |
| Central Garden & Pet Co. (a) | | 13,635 | 524,948 |
| Central Garden & Pet Co. Class A (non-vtg.) | | 33,850 | 1,118,066 |
| Oil-Dri Corp. of America | | 3,704 | 237,389 |
| | | | 1,880,403 |
| Personal Care Products - 0.3% | | | |
| Edgewell Personal Care Co. | | 46,346 | 1,862,646 |
| Herbalife Ltd. (a) | | 30,906 | 321,113 |
| MediFast, Inc. | | 10,064 | 219,596 |
| Nature's Sunshine Products, Inc. (a) | | 9,461 | 142,577 |
| Nu Skin Enterprises, Inc. Class A | | 45,931 | 484,113 |
| Olaplex Holdings, Inc. (a) | | 129,294 | 199,113 |
| The Honest Co., Inc. (a) | | 45,010 | 131,429 |
| USANA Health Sciences, Inc. (a) | | 10,539 | 476,784 |
| Veru, Inc. (a) | | 31,753 | 26,714 |
| Waldencast PLC (a) | | 22,769 | 81,741 |
| | | | 3,945,826 |
| Tobacco - 0.2% | | | |
| Turning Point Brands, Inc. | | 2,394 | 76,823 |
| Universal Corp. | | 22,820 | 1,099,696 |
| Vector Group Ltd. | | 117,479 | 1,241,753 |
| | | | 2,418,272 |
TOTAL CONSUMER STAPLES | | | 25,816,297 |
| ENERGY - 9.1% | | | |
| Energy Equipment & Services - 2.9% | | | |
| Borr Drilling Ltd. | | 223,928 | 1,444,336 |
| Bristow Group, Inc. (a) | | 23,014 | 771,659 |
| Diamond Offshore Drilling, Inc. (a) | | 96,710 | 1,498,038 |
| DMC Global, Inc. (a) | | 13,484 | 194,439 |
| Dril-Quip, Inc. (a) | | 32,114 | 597,320 |
| Drilling Tools International Corp. (a) | | 5,126 | 28,808 |
| Expro Group Holdings NV (a) | | 89,771 | 2,057,551 |
| Forum Energy Technologies, Inc. (a) | | 10,586 | 178,480 |
| Geospace Technologies Corp. (a) | | 11,816 | 106,108 |
| Helix Energy Solutions Group, Inc. (a) | | 110,148 | 1,315,167 |
| Helmerich & Payne, Inc. | | 91,353 | 3,301,497 |
| Kodiak Gas Services, Inc. | | 13,889 | 378,614 |
| Liberty Energy, Inc. Class A | | 144,161 | 3,011,523 |
| Mammoth Energy Services, Inc. (a) | | 21,095 | 69,192 |
| Nabors Industries Ltd. (a)(b) | | 5,825 | 414,507 |
| Natural Gas Services Group, Inc. (a) | | 8,156 | 164,099 |
| Newpark Resources, Inc. (a) | | 78,442 | 651,853 |
| Noble Corp. PLC | | 23,264 | 1,038,738 |
| Oil States International, Inc. (a) | | 55,408 | 246,012 |
| Patterson-UTI Energy, Inc. | | 376,967 | 3,905,378 |
| ProFrac Holding Corp. Class A (a)(b) | | 20,922 | 155,032 |
| ProPetro Holding Corp. (a) | | 84,894 | 736,031 |
| Ranger Energy Services, Inc. Class A | | 15,218 | 160,093 |
| RPC, Inc. | | 80,258 | 501,613 |
| SEACOR Marine Holdings, Inc. (a) | | 22,683 | 305,994 |
| Seadrill Ltd. (a) | | 49,542 | 2,551,413 |
| Select Water Solutions, Inc. Class A | | 86,818 | 928,953 |
| Solaris Oilfield Infrastructure, Inc. Class A | | 24,455 | 209,824 |
| Transocean Ltd. (United States) (a) | | 686,741 | 3,674,064 |
| U.S. Silica Holdings, Inc. (a) | | 71,479 | 1,104,351 |
| Valaris Ltd. (a) | | 21,411 | 1,595,120 |
| | | | 33,295,807 |
| Oil, Gas & Consumable Fuels - 6.2% | | | |
| Aemetis, Inc. (a) | | 34,260 | 103,123 |
| Amplify Energy Corp. (a) | | 36,407 | 246,839 |
| Ardmore Shipping Corp. | | 39,558 | 891,242 |
| Berry Corp. | | 50,688 | 327,444 |
| California Resources Corp. | | 65,126 | 3,466,006 |
| Centrus Energy Corp. Class A (a) | | 3,760 | 160,740 |
| Chord Energy Corp.: | | | |
| warrants 9/1/24 (a) | | 810 | 25,985 |
| warrants 9/1/25 (a) | | 405 | 9,538 |
| Clean Energy Fuels Corp. (a) | | 160,281 | 427,950 |
| CNX Resources Corp. (a) | | 141,281 | 3,433,128 |
| Comstock Resources, Inc. (b) | | 87,040 | 903,475 |
| CONSOL Energy, Inc. (a)(b) | | 27,671 | 2,823,272 |
| Crescent Energy, Inc. Class A | | 60,930 | 722,021 |
| CVR Energy, Inc. | | 3,507 | 93,882 |
| Delek U.S. Holdings, Inc. | | 43,409 | 1,074,807 |
| DHT Holdings, Inc. | | 127,942 | 1,480,289 |
| Diversified Energy Co. PLC | | 42,169 | 568,860 |
| Dorian LPG Ltd. | | 16,423 | 689,109 |
| enCore Energy Corp. (a) | | 44,881 | 176,831 |
| Energy Fuels, Inc. (a)(b) | | 153,465 | 929,998 |
| Equitrans Midstream Corp. | | 310,569 | 4,031,186 |
| Evolution Petroleum Corp. | | 20,861 | 109,937 |
| Excelerate Energy, Inc. | | 16,420 | 302,785 |
| FLEX LNG Ltd. | | 11,472 | 310,203 |
| FutureFuel Corp. | | 24,154 | 123,910 |
| Golar LNG Ltd. | | 93,451 | 2,929,689 |
| Granite Ridge Resources, Inc. | | 49,381 | 312,582 |
| Green Plains, Inc. (a) | | 59,821 | 948,761 |
| Gulfport Energy Corp. (a) | | 5,927 | 894,977 |
| Hallador Energy Co. (a) | | 23,365 | 181,546 |
| HighPeak Energy, Inc. (b) | | 13,845 | 194,661 |
| International Seaways, Inc. | | 38,284 | 2,263,733 |
| Kinetik Holdings, Inc. | | 33,178 | 1,374,896 |
| Magnolia Oil & Gas Corp. Class A (b) | | 12,673 | 321,134 |
| Murphy Oil Corp. | | 136,769 | 5,640,354 |
| NACCO Industries, Inc. Class A | | 3,828 | 105,921 |
| Nordic American Tanker Shipping Ltd. | | 193,388 | 769,684 |
| Northern Oil & Gas, Inc. | | 88,080 | 3,273,934 |
| Overseas Shipholding Group, Inc. Class A | | 46,355 | 393,090 |
| Par Pacific Holdings, Inc. (a) | | 53,915 | 1,361,354 |
| PBF Energy, Inc. Class A | | 98,114 | 4,515,206 |
| Peabody Energy Corp. | | 120,779 | 2,671,631 |
| PrimeEnergy Corp. (a) | | 649 | 69,021 |
| Rex American Resources Corp. (a) | | 11,462 | 522,553 |
| Riley Exploration Permian, Inc. | | 9,136 | 258,640 |
| Ring Energy, Inc. (a)(b) | | 136,187 | 230,156 |
| SandRidge Energy, Inc. | | 30,062 | 388,702 |
| Scorpio Tankers, Inc. | | 44,339 | 3,604,317 |
| SFL Corp. Ltd. | | 84,707 | 1,175,733 |
| SilverBow Resources, Inc. (a) | | 18,361 | 694,597 |
| Sitio Royalties Corp. | | 78,820 | 1,860,940 |
| SM Energy Co. | | 89,921 | 3,887,285 |
| Talos Energy, Inc. (a) | | 138,772 | 1,686,080 |
| Teekay Corp. (a) | | 54,020 | 484,559 |
| Teekay Tankers Ltd. | | 22,735 | 1,564,395 |
| Ur-Energy, Inc. (a) | | 24,542 | 34,359 |
| VAALCO Energy, Inc. | | 89,654 | 562,131 |
| Vital Energy, Inc. (a) | | 26,827 | 1,202,386 |
| Vitesse Energy, Inc. | | 23,985 | 568,445 |
| World Kinect Corp. | | 49,757 | 1,283,731 |
| | | | 71,663,743 |
TOTAL ENERGY | | | 104,959,550 |
| FINANCIALS - 26.7% | | | |
| Banks - 17.5% | | | |
| 1st Source Corp. | | 17,318 | 928,591 |
| ACNB Corp. | | 7,756 | 281,310 |
| Amalgamated Financial Corp. | | 17,305 | 474,157 |
| Amerant Bancorp, Inc. Class A | | 28,049 | 636,712 |
| Ameris Bancorp | | 62,469 | 3,145,314 |
| Ames National Corp. | | 8,258 | 169,206 |
| Arrow Financial Corp. | | 15,553 | 405,156 |
| Associated Banc-Corp. | | 141,680 | 2,996,532 |
| Atlantic Union Bankshares Corp. | | 84,797 | 2,785,581 |
| Axos Financial, Inc. (a) | | 46,202 | 2,640,444 |
| Banc of California, Inc. (b) | | 131,658 | 1,682,589 |
| BancFirst Corp. | | 16,529 | 1,449,593 |
| Bancorp, Inc., Delaware (a) | | 2,428 | 91,681 |
| Bank First National Corp. | | 9,240 | 763,132 |
| Bank of Hawaii Corp. | | 37,146 | 2,125,123 |
| Bank of Marin Bancorp | | 14,809 | 239,758 |
| Bank7 Corp. | | 3,700 | 115,810 |
| BankUnited, Inc. | | 70,447 | 2,061,984 |
| Bankwell Financial Group, Inc. | | 5,926 | 150,343 |
| Banner Corp. | | 32,426 | 1,609,627 |
| Bar Harbor Bankshares | | 13,919 | 374,143 |
| BayCom Corp. | | 9,661 | 196,601 |
| BCB Bancorp, Inc. | | 13,746 | 146,120 |
| Berkshire Hills Bancorp, Inc. | | 40,857 | 931,540 |
| Blue Foundry Bancorp (a) | | 18,038 | 163,605 |
| Bridgewater Bancshares, Inc. (a) | | 18,530 | 215,133 |
| Brookline Bancorp, Inc., Delaware | | 83,108 | 693,952 |
| Burke & Herbert Financial Services Corp. | | 12,244 | 624,199 |
| Business First Bancshares, Inc. | | 23,107 | 502,808 |
| Byline Bancorp, Inc. | | 29,337 | 696,460 |
| Cadence Bank | | 172,710 | 4,884,239 |
| California Bancorp, Inc. (a) | | 6,954 | 149,511 |
| Cambridge Bancorp | | 7,194 | 496,386 |
| Camden National Corp. | | 13,662 | 450,846 |
| Capital Bancorp, Inc. | | 8,443 | 173,082 |
| Capital City Bank Group, Inc. | | 12,812 | 364,373 |
| Capitol Federal Financial, Inc. | | 115,187 | 632,377 |
| Carter Bankshares, Inc. (a) | | 20,700 | 312,984 |
| Cathay General Bancorp | | 65,876 | 2,484,843 |
| Central Pacific Financial Corp. | | 25,591 | 542,529 |
| Chemung Financial Corp. | | 2,908 | 139,584 |
| ChoiceOne Financial Services, Inc. | | 6,714 | 192,356 |
| Citizens & Northern Corp. | | 14,055 | 251,444 |
| Citizens Financial Services, Inc. | | 3,901 | 175,311 |
| City Holding Co. | | 12,734 | 1,352,988 |
| Civista Bancshares, Inc. | | 13,723 | 212,569 |
| CNB Financial Corp., Pennsylvania | | 19,416 | 396,281 |
| Coastal Financial Corp. of Washington (a) | | 807 | 37,235 |
| Colony Bankcorp, Inc. | | 15,700 | 192,325 |
| Columbia Financial, Inc. (a) | | 23,103 | 345,852 |
| Community Bank System, Inc. | | 49,551 | 2,339,303 |
| Community Trust Bancorp, Inc. | | 14,455 | 631,105 |
| Community West Bank | | 15,925 | 294,613 |
| ConnectOne Bancorp, Inc. | | 34,233 | 646,661 |
| CrossFirst Bankshares, Inc. (a) | | 42,905 | 601,528 |
| Customers Bancorp, Inc. (a) | | 28,017 | 1,344,256 |
| CVB Financial Corp. | | 125,508 | 2,163,758 |
| Dime Community Bancshares, Inc. | | 33,687 | 687,215 |
| Eagle Bancorp, Inc. | | 27,838 | 526,138 |
| Eastern Bankshares, Inc. | | 147,441 | 2,061,225 |
| Enterprise Bancorp, Inc. | | 9,077 | 225,836 |
| Enterprise Financial Services Corp. | | 34,859 | 1,426,082 |
| Equity Bancshares, Inc. | | 13,808 | 486,042 |
| Esquire Financial Holdings, Inc. | | 1,004 | 47,790 |
| ESSA Bancorp, Inc. | | 7,338 | 129,075 |
| Farmers & Merchants Bancorp, Inc. | | 12,070 | 280,265 |
| Farmers National Banc Corp. | | 34,375 | 429,344 |
| FB Financial Corp. | | 33,722 | 1,316,170 |
| Fidelity D & D Bancorp, Inc. | | 4,553 | 199,421 |
| Financial Institutions, Inc. | | 14,417 | 278,536 |
| First Bancorp, North Carolina | | 37,892 | 1,209,513 |
| First Bancorp, Puerto Rico | | 144,439 | 2,641,789 |
| First Bancshares, Inc. | | 29,020 | 753,940 |
| First Bank Hamilton New Jersey | | 19,689 | 250,838 |
| First Busey Corp. | | 50,334 | 1,218,586 |
| First Business Finance Services, Inc. | | 7,079 | 261,852 |
| First Commonwealth Financial Corp. | | 95,752 | 1,322,335 |
| First Community Bankshares, Inc. | | 16,227 | 597,803 |
| First Financial Bancorp, Ohio | | 89,253 | 1,983,202 |
| First Financial Corp., Indiana | | 10,742 | 396,165 |
| First Financial Northwest, Inc. | | 6,569 | 138,803 |
| First Foundation, Inc. | | 35,365 | 231,641 |
| First Internet Bancorp | | 4,679 | 126,427 |
| First Interstate Bancsystem, Inc. | | 74,566 | 2,070,698 |
| First Merchants Corp. | | 55,331 | 1,841,969 |
| First Mid-Illinois Bancshares, Inc. | | 21,696 | 713,364 |
| First of Long Island Corp. | | 19,597 | 196,362 |
| First Western Financial, Inc. (a) | | 5,323 | 90,491 |
| Five Star Bancorp | | 15,466 | 365,771 |
| Flushing Financial Corp. | | 25,856 | 340,006 |
| FS Bancorp, Inc. | | 6,091 | 222,017 |
| Fulton Financial Corp. | | 169,415 | 2,876,667 |
| FVCBankcorp, Inc. (a) | | 15,081 | 164,685 |
| German American Bancorp, Inc. | | 26,948 | 952,612 |
| Glacier Bancorp, Inc. | | 107,732 | 4,020,558 |
| Great Southern Bancorp, Inc. | | 7,916 | 440,209 |
| Guaranty Bancshares, Inc. Texas | | 7,361 | 232,166 |
| Hancock Whitney Corp. | | 82,279 | 3,935,405 |
| Hanmi Financial Corp. | | 28,587 | 477,975 |
| HarborOne Bancorp, Inc. | | 36,458 | 405,778 |
| HBT Financial, Inc. | | 12,169 | 248,491 |
| Heartland Financial U.S.A., Inc. | | 40,216 | 1,787,601 |
| Heritage Commerce Corp. | | 56,334 | 490,106 |
| Heritage Financial Corp., Washington | | 32,034 | 577,573 |
| Hilltop Holdings, Inc. | | 43,017 | 1,345,572 |
| Hingham Institution for Savings (b) | | 1,412 | 252,579 |
| Home Bancorp, Inc. | | 6,608 | 264,386 |
| Home Bancshares, Inc. | | 177,943 | 4,263,514 |
| HomeStreet, Inc. | | 17,066 | 194,552 |
| HomeTrust Bancshares, Inc. | | 14,019 | 420,991 |
| Hope Bancorp, Inc. | | 109,831 | 1,179,585 |
| Horizon Bancorp, Inc. Indiana | | 41,107 | 508,494 |
| Independent Bank Corp. | | 40,118 | 2,034,785 |
| Independent Bank Corp. | | 19,282 | 520,614 |
| Independent Bank Group, Inc. | | 34,307 | 1,561,655 |
| International Bancshares Corp. | | 51,342 | 2,937,276 |
| Investar Holding Corp. | | 8,567 | 131,932 |
| John Marshall Bankcorp, Inc. | | 11,754 | 204,990 |
| Kearny Financial Corp. | | 49,796 | 306,245 |
| Lakeland Financial Corp. | | 22,231 | 1,367,651 |
| LCNB Corp. | | 11,505 | 160,035 |
| LINKBANCORP, Inc. | | 21,166 | 129,536 |
| Live Oak Bancshares, Inc. | | 4,421 | 155,000 |
| Macatawa Bank Corp. | | 25,048 | 365,701 |
| Mercantile Bank Corp. | | 14,960 | 606,927 |
| Metrocity Bankshares, Inc. | | 16,462 | 434,597 |
| Metropolitan Bank Holding Corp. (a) | | 9,979 | 420,016 |
| Mid Penn Bancorp, Inc. | | 13,872 | 304,490 |
| Middlefield Banc Corp. | | 6,778 | 163,011 |
| Midland States Bancorp, Inc. | | 19,985 | 452,660 |
| MidWestOne Financial Group, Inc. | | 13,306 | 299,252 |
| MVB Financial Corp. | | 10,592 | 197,435 |
| National Bank Holdings Corp. Class A | | 34,962 | 1,365,266 |
| National Bankshares, Inc. | | 5,415 | 153,136 |
| NB Bancorp, Inc. | | 36,687 | 553,240 |
| NBT Bancorp, Inc. | | 43,554 | 1,681,184 |
| New York Community Bancorp, Inc. | | 717,879 | 2,311,570 |
| Nicolet Bankshares, Inc. | | 9,688 | 804,492 |
| Northeast Bank | | 6,253 | 380,558 |
| Northeast Community Bancorp, Inc. | | 11,443 | 203,914 |
| Northfield Bancorp, Inc. | | 36,385 | 344,930 |
| Northrim Bancorp, Inc. | | 5,104 | 294,195 |
| Northwest Bancshares, Inc. | | 120,950 | 1,396,973 |
| Norwood Financial Corp. | | 6,960 | 176,645 |
| Oak Valley Bancorp Oakdale California | | 6,441 | 160,832 |
| OceanFirst Financial Corp. | | 54,337 | 863,415 |
| OFG Bancorp | | 44,259 | 1,657,500 |
| Old National Bancorp, Indiana | | 297,864 | 5,120,282 |
| Old Second Bancorp, Inc. | | 40,665 | 602,249 |
| Orange County Bancorp, Inc. | | 4,961 | 262,338 |
| Origin Bancorp, Inc. | | 27,571 | 874,552 |
| Orrstown Financial Services, Inc. | | 17,380 | 475,517 |
| Pacific Premier Bancorp, Inc. | | 90,976 | 2,089,719 |
| Park National Corp. | | 13,704 | 1,950,627 |
| Parke Bancorp, Inc. | | 9,601 | 167,057 |
| Pathward Financial, Inc. | | 17,266 | 976,738 |
| PCB Bancorp | | 10,151 | 165,258 |
| Peapack-Gladstone Financial Corp. | | 15,375 | 348,244 |
| Peoples Bancorp of North Carolina | | 4,313 | 125,940 |
| Peoples Bancorp, Inc. | | 32,935 | 988,050 |
| Peoples Financial Services Corp. | | 6,485 | 295,327 |
| Pioneer Bancorp, Inc. (a) | | 10,880 | 108,909 |
| Plumas Bancorp | | 5,035 | 181,159 |
| Ponce Financial Group, Inc. (a) | | 16,929 | 154,731 |
| Preferred Bank, Los Angeles | | 11,873 | 896,293 |
| Premier Financial Corp. | | 33,842 | 692,407 |
| Primis Financial Corp. | | 19,083 | 199,990 |
| Princeton Bancorp, Inc. | | 4,703 | 155,669 |
| Provident Bancorp, Inc. (a) | | 14,112 | 143,801 |
| Provident Financial Services, Inc. | | 118,887 | 1,706,028 |
| QCR Holdings, Inc. | | 15,457 | 927,420 |
| RBB Bancorp | | 16,439 | 309,218 |
| Red River Bancshares, Inc. | | 4,379 | 210,148 |
| Renasant Corp. | | 52,108 | 1,591,378 |
| Republic Bancorp, Inc., Kentucky Class A | | 7,802 | 418,265 |
| S&T Bancorp, Inc. | | 36,256 | 1,210,588 |
| Sandy Spring Bancorp, Inc. | | 41,667 | 1,015,008 |
| Seacoast Banking Corp., Florida | | 80,056 | 1,892,524 |
| ServisFirst Bancshares, Inc. | | 34,562 | 2,183,973 |
| Shore Bancshares, Inc. | | 25,673 | 293,956 |
| Sierra Bancorp | | 12,455 | 278,743 |
| Simmons First National Corp. Class A | | 116,938 | 2,055,770 |
| SmartFinancial, Inc. | | 14,617 | 345,984 |
| South Plains Financial, Inc. | | 10,924 | 294,948 |
| Southern California Bancorp (a) | | 10,712 | 144,291 |
| Southern First Bancshares, Inc. (a) | | 7,013 | 205,060 |
| Southern Missouri Bancorp, Inc. | | 8,933 | 402,074 |
| Southern States Bancshares, Inc. | | 7,865 | 213,456 |
| Southside Bancshares, Inc. | | 27,047 | 746,768 |
| Southstate Corp. | | 72,046 | 5,505,755 |
| Stellar Bancorp, Inc. | | 46,492 | 1,067,456 |
| Sterling Bancorp, Inc. (a) | | 17,489 | 91,467 |
| Stock Yards Bancorp, Inc. | | 24,324 | 1,208,173 |
| Texas Capital Bancshares, Inc. (a) | | 43,552 | 2,662,769 |
| The Bank of NT Butterfield & Son Ltd. | | 44,446 | 1,560,944 |
| The First Bancorp, Inc. | | 10,064 | 250,090 |
| Third Coast Bancshares, Inc. (a) | | 10,823 | 230,205 |
| Timberland Bancorp, Inc./Washington | | 6,979 | 189,061 |
| Tompkins Financial Corp. | | 11,893 | 581,568 |
| TowneBank | | 66,322 | 1,808,601 |
| Trico Bancshares | | 30,234 | 1,196,359 |
| Triumph Bancorp, Inc. (a) | | 1,764 | 144,207 |
| Trustco Bank Corp., New York | | 17,286 | 497,318 |
| Trustmark Corp. | | 57,729 | 1,734,179 |
| UMB Financial Corp. | | 42,434 | 3,539,844 |
| United Bankshares, Inc., West Virginia | | 125,000 | 4,055,000 |
| United Community Bank, Inc. | | 113,445 | 2,888,310 |
| Unity Bancorp, Inc. | | 6,593 | 194,955 |
| Univest Corp. of Pennsylvania | | 27,257 | 622,277 |
| USCB Financial Holdings, Inc. | | 6,897 | 88,489 |
| Valley National Bancorp | | 408,211 | 2,849,313 |
| Veritex Holdings, Inc. | | 49,857 | 1,051,484 |
| Virginia National Bankshares C | | 4,497 | 147,502 |
| WaFd, Inc. | | 62,825 | 1,795,539 |
| Washington Trust Bancorp, Inc. | | 16,064 | 440,314 |
| WesBanco, Inc. | | 54,344 | 1,516,741 |
| West Bancorp., Inc. | | 14,877 | 266,298 |
| Westamerica Bancorp. | | 24,314 | 1,179,958 |
| WSFS Financial Corp. | | 56,804 | 2,669,788 |
| | | | 201,767,832 |
| Capital Markets - 0.6% | | | |
| Alti Global, Inc. Class A (a) | | 31,600 | 164,636 |
| Assetmark Financial Holdings, Inc. (a) | | 10,069 | 347,884 |
| BGC Group, Inc. Class A | | 349,668 | 2,902,244 |
| Diamond Hill Investment Group, Inc. | | 358 | 50,389 |
| Donnelley Financial Solutions, Inc. (a) | | 8,788 | 523,941 |
| Forge Global Holdings, Inc. Class A (a) | | 108,235 | 158,023 |
| GCM Grosvenor, Inc. Class A | | 5,489 | 53,573 |
| MarketWise, Inc. Class A | | 30,913 | 35,859 |
| P10, Inc. Class A | | 5,593 | 47,429 |
| Silvercrest Asset Management Group Class A | | 9,021 | 140,637 |
| StoneX Group, Inc. (a) | | 23,070 | 1,737,402 |
| Value Line, Inc. | | 34 | 1,464 |
| Virtus Investment Partners, Inc. | | 1,097 | 247,757 |
| | | | 6,411,238 |
| Consumer Finance - 0.9% | | | |
| Atlanticus Holdings Corp. (a) | | 4,785 | 134,841 |
| Bread Financial Holdings, Inc. | | 47,084 | 2,098,063 |
| Consumer Portfolio Services, Inc. (a) | | 7,198 | 70,540 |
| Encore Capital Group, Inc. (a)(b) | | 22,035 | 919,521 |
| Enova International, Inc. (a) | | 24,793 | 1,543,364 |
| Green Dot Corp. Class A (a) | | 49,890 | 471,461 |
| LendingClub Corp. (a) | | 103,814 | 878,266 |
| LendingTree, Inc. (a) | | 749 | 31,151 |
| Medallion Financial Corp. | | 18,244 | 140,114 |
| Navient Corp. | | 74,295 | 1,081,735 |
| Nelnet, Inc. Class A | | 13,545 | 1,366,149 |
| PRA Group, Inc. (a) | | 36,656 | 720,657 |
| PROG Holdings, Inc. | | 33,557 | 1,163,757 |
| Regional Management Corp. | | 6,565 | 188,678 |
| World Acceptance Corp. (a)(b) | | 289 | 35,715 |
| | | | 10,844,012 |
| Financial Services - 3.2% | | | |
| A-Mark Precious Metals, Inc. | | 16,509 | 534,396 |
| Acacia Research Corp. (a) | | 37,229 | 186,517 |
| Alerus Financial Corp. | | 16,833 | 330,095 |
| Banco Latinoamericano de Comer Series E | | 25,868 | 767,504 |
| Burford Capital Ltd. | | 189,532 | 2,473,393 |
| Cannae Holdings, Inc. | | 52,659 | 955,234 |
| Cantaloupe, Inc. (a) | | 3,607 | 23,806 |
| Cass Information Systems, Inc. | | 2,141 | 85,790 |
| Compass Diversified Holdings | | 63,467 | 1,389,293 |
| Enact Holdings, Inc. | | 27,601 | 846,247 |
| Essent Group Ltd. | | 98,740 | 5,548,201 |
| Federal Agricultural Mortgage Corp. Class C (non-vtg.) | | 904 | 163,461 |
| i3 Verticals, Inc. Class A (a) | | 20,192 | 445,839 |
| Jackson Financial, Inc. | | 72,487 | 5,382,885 |
| Marqeta, Inc. Class A (a) | | 60,506 | 331,573 |
| Merchants Bancorp | | 16,364 | 663,397 |
| Mr. Cooper Group, Inc. (a) | | 38,127 | 3,097,056 |
| Newtekone, Inc. | | 21,883 | 275,069 |
| NMI Holdings, Inc. Class A (a) | | 69,517 | 2,366,359 |
| Onity Group, Inc. (a) | | 5,621 | 134,792 |
| PagSeguro Digital Ltd. (a) | | 85,882 | 1,003,961 |
| Payoneer Global, Inc. (a) | | 65,265 | 361,568 |
| Paysafe Ltd. (a) | | 30,730 | 543,306 |
| PennyMac Financial Services, Inc. | | 11,283 | 1,067,372 |
| Radian Group, Inc. | | 143,190 | 4,453,209 |
| Repay Holdings Corp. (a) | | 86,043 | 908,614 |
| Sezzle, Inc. | | 249 | 21,967 |
| StoneCo Ltd. Class A (a) | | 130,196 | 1,561,050 |
| SWK Holdings Corp. (a) | | 2,552 | 43,358 |
| Velocity Financial, Inc. (a)(b) | | 8,368 | 150,038 |
| Walker & Dunlop, Inc. | | 8,435 | 828,317 |
| Waterstone Financial, Inc. | | 15,018 | 192,080 |
| | | | 37,135,747 |
| Insurance - 2.2% | | | |
| AMBAC Financial Group, Inc. (a) | | 40,382 | 517,697 |
| American Coastal Insurance Cor (a) | | 13,211 | 139,376 |
| Amerisafe, Inc. | | 10,019 | 439,734 |
| CNO Financial Group, Inc. | | 101,404 | 2,810,919 |
| Donegal Group, Inc. Class A | | 13,965 | 179,869 |
| Employers Holdings, Inc. | | 23,691 | 1,009,947 |
| Enstar Group Ltd. (a) | | 11,909 | 3,640,581 |
| F&G Annuities & Life, Inc. | | 16,759 | 637,680 |
| Fidelis Insurance Holdings Ltd. | | 45,720 | 745,693 |
| Genworth Financial, Inc. Class A (a) | | 408,851 | 2,469,460 |
| GoHealth, Inc. (a) | | 3,447 | 33,505 |
| Greenlight Capital Re, Ltd. (a) | | 26,035 | 341,059 |
| Hamilton Insurance Group Ltd. | | 15,687 | 261,189 |
| Heritage Insurance Holdings, Inc. (a) | | 21,779 | 154,195 |
| Hippo Holdings, Inc. (a)(b) | | 18,805 | 323,258 |
| Horace Mann Educators Corp. | | 38,743 | 1,263,797 |
| Investors Title Co. | | 1,135 | 204,448 |
| James River Group Holdings Ltd. | | 29,200 | 225,716 |
| Lemonade, Inc. (a)(b) | | 8,915 | 147,098 |
| Maiden Holdings Ltd. (a) | | 83,042 | 171,067 |
| MBIA, Inc. (b) | | 42,293 | 232,189 |
| Mercury General Corp. | | 22,357 | 1,188,051 |
| National Western Life Group, Inc. Class A | | 2,116 | 1,051,525 |
| NI Holdings, Inc. (a) | | 7,060 | 108,018 |
| ProAssurance Corp. (a) | | 50,701 | 619,566 |
| Safety Insurance Group, Inc. | | 13,854 | 1,039,466 |
| Selective Insurance Group, Inc. | | 8,462 | 793,989 |
| Selectquote, Inc. (a) | | 127,121 | 350,854 |
| Siriuspoint Ltd. (a) | | 85,518 | 1,043,320 |
| Skyward Specialty Insurance Group, Inc. (a) | | 26,966 | 975,630 |
| Stewart Information Services Corp. | | 25,643 | 1,591,917 |
| Tiptree, Inc. | | 18,531 | 305,576 |
| United Fire Group, Inc. | | 19,708 | 423,525 |
| Universal Insurance Holdings, Inc. | | 18,567 | 348,317 |
| | | | 25,788,231 |
| Mortgage Real Estate Investment Trusts - 2.3% | | | |
| AG Mortgage Investment Trust, Inc. | | 23,414 | 155,469 |
| Angel Oak Mortgage (REIT), Inc. (b) | | 8,304 | 108,782 |
| Apollo Commercial Real Estate Finance, Inc. | | 137,944 | 1,350,472 |
| Arbor Realty Trust, Inc. (b) | | 174,826 | 2,508,753 |
| Ares Commercial Real Estate Corp. | | 51,981 | 345,674 |
| Armour Residential REIT, Inc. | | 47,507 | 920,686 |
| Blackstone Mortgage Trust, Inc. (b) | | 165,323 | 2,879,927 |
| BrightSpire Capital, Inc. | | 128,625 | 733,163 |
| Chimera Investment Corp. | | 76,075 | 973,760 |
| Claros Mortgage Trust, Inc. | | 82,261 | 659,733 |
| Dynex Capital, Inc. | | 60,845 | 726,489 |
| Ellington Financial LLC | | 78,720 | 950,938 |
| Franklin BSP Realty Trust, Inc. | | 81,119 | 1,022,099 |
| Granite Point Mortgage Trust, Inc. | | 47,735 | 141,773 |
| HA Sustainable Infrastructure Capital, Inc. | | 106,478 | 3,151,749 |
| Invesco Mortgage Capital, Inc. | | 48,284 | 452,421 |
| KKR Real Estate Finance Trust, Inc. | | 41,061 | 371,602 |
| Ladder Cap Corp. Class A | | 110,168 | 1,243,797 |
| MFA Financial, Inc. | | 99,888 | 1,062,808 |
| New York Mortgage Trust, Inc. | | 86,596 | 505,721 |
| Nexpoint Real Estate Finance, Inc. | | 7,460 | 102,351 |
| Orchid Island Capital, Inc. | | 51,648 | 430,744 |
| PennyMac Mortgage Investment Trust | | 83,253 | 1,144,729 |
| Ready Capital Corp. | | 156,177 | 1,277,528 |
| Redwood Trust, Inc. | | 124,515 | 808,102 |
| Seven Hills Realty Trust | | 13,479 | 170,914 |
| TPG RE Finance Trust, Inc. | | 55,358 | 478,293 |
| Two Harbors Investment Corp. | | 100,570 | 1,328,530 |
| | | | 26,007,007 |
TOTAL FINANCIALS | | | 307,954,067 |
| HEALTH CARE - 9.2% | | | |
| Biotechnology - 4.4% | | | |
| 2seventy bio, Inc. (a)(b) | | 46,645 | 179,583 |
| 4D Molecular Therapeutics, Inc. (a) | | 16,585 | 348,119 |
| 89Bio, Inc. (a) | | 76,303 | 611,187 |
| Absci Corp. (a) | | 21,574 | 66,448 |
| Acelyrin, Inc. (a) | | 68,065 | 300,167 |
| Achieve Life Sciences, Inc. (a) | | 12,442 | 58,477 |
| Acrivon Therapeutics, Inc. (a)(b) | | 11,058 | 64,136 |
| Acumen Pharmaceuticals, Inc. (a) | | 39,030 | 94,453 |
| ADC Therapeutics SA (a) | | 26,371 | 83,332 |
| Adverum Biotechnologies, Inc. (a) | | 19,459 | 133,489 |
| Agenus, Inc. (a) | | 16,591 | 277,899 |
| Agios Pharmaceuticals, Inc. (a) | | 53,458 | 2,305,109 |
| Akebia Therapeutics, Inc. (a) | | 178,296 | 181,862 |
| Akero Therapeutics, Inc. (a) | | 53,219 | 1,248,518 |
| Aldeyra Therapeutics, Inc. (a) | | 42,181 | 139,619 |
| Allogene Therapeutics, Inc. (a)(b) | | 98,266 | 228,960 |
| Altimmune, Inc. (a)(b) | | 30,807 | 204,867 |
| Anavex Life Sciences Corp. (a) | | 50,489 | 213,064 |
| Anika Therapeutics, Inc. (a) | | 11,080 | 280,656 |
| Annexon, Inc. (a) | | 79,663 | 390,349 |
| Applied Therapeutics, Inc. (a) | | 36,078 | 168,484 |
| Arbutus Biopharma Corp. (a)(b) | | 9,642 | 29,794 |
| Arcturus Therapeutics Holdings, Inc. (a) | | 2,448 | 59,609 |
| ArriVent Biopharma, Inc. (b) | | 3,647 | 67,652 |
| Astria Therapeutics, Inc. (a) | | 6,562 | 59,714 |
| Atossa Therapeutics, Inc. (a) | | 99,294 | 118,160 |
| Aura Biosciences, Inc. (a) | | 43,836 | 331,400 |
| Aurinia Pharmaceuticals, Inc. (a) | | 36,382 | 207,741 |
| Avid Bioservices, Inc. (a) | | 3,282 | 23,433 |
| Beam Therapeutics, Inc. (a) | | 72,328 | 1,694,645 |
| Black Diamond Therapeutics, Inc. (a) | | 11,483 | 53,511 |
| bluebird bio, Inc. (a)(b) | | 179,851 | 177,009 |
| Boundless Bio, Inc. | | 2,480 | 9,598 |
| BridgeBio Pharma, Inc. (a) | | 50,072 | 1,268,324 |
| C4 Therapeutics, Inc. (a) | | 55,592 | 256,835 |
| Cabaletta Bio, Inc. (a) | | 31,546 | 235,964 |
| Capricor Therapeutics, Inc. (a) | | 4,183 | 19,953 |
| Cardiff Oncology, Inc. (a) | | 23,405 | 51,959 |
| CareDx, Inc. (a) | | 36,868 | 572,560 |
| Cargo Therapeutics, Inc. (b) | | 16,555 | 271,833 |
| Caribou Biosciences, Inc. (a) | | 75,910 | 124,492 |
| Cartesian Therapeutics, Inc. rights (a)(c) | | 65,209 | 9,129 |
| Celcuity, Inc. (a) | | 1,303 | 21,343 |
| Celldex Therapeutics, Inc. (a) | | 11,228 | 415,548 |
| Century Therapeutics, Inc. (a)(b) | | 43,803 | 111,698 |
| CG Oncology, Inc. | | 8,616 | 272,007 |
| Chinook Therapeutics, Inc. rights (a)(c) | | 488 | 0 |
| Cibus, Inc. (a) | | 14,042 | 138,314 |
| Cogent Biosciences, Inc. (a) | | 5,911 | 49,830 |
| Coherus BioSciences, Inc. (a)(b) | | 76,652 | 132,608 |
| Compass Therapeutics, Inc. (a) | | 95,229 | 95,229 |
| Corbus Pharmaceuticals Holdings, Inc. (a) | | 3,810 | 172,403 |
| Cullinan Oncology, Inc. (a) | | 4,257 | 74,242 |
| Cytokinetics, Inc. (a) | | 95,646 | 5,182,100 |
| Day One Biopharmaceuticals, Inc. (a) | | 5,305 | 73,103 |
| Denali Therapeutics, Inc. (a) | | 50,178 | 1,165,133 |
| Design Therapeutics, Inc. (a) | | 29,745 | 99,646 |
| Dianthus Therapeutics, Inc. (a) | | 20,951 | 542,212 |
| Disc Medicine, Inc. (a) | | 13,805 | 622,191 |
| Dynavax Technologies Corp. (a) | | 24,172 | 271,452 |
| Editas Medicine, Inc. (a)(b) | | 78,289 | 365,610 |
| Elevation Oncology, Inc. (a) | | 19,883 | 53,684 |
| Eliem Therapeutics, Inc. (a) | | 6,670 | 47,424 |
| Enanta Pharmaceuticals, Inc. (a) | | 18,711 | 242,682 |
| Entrada Therapeutics, Inc. (a)(b) | | 23,360 | 332,880 |
| Erasca, Inc. (a) | | 106,936 | 252,369 |
| Fate Therapeutics, Inc. (a) | | 94,851 | 311,111 |
| Fennec Pharmaceuticals, Inc. (a) | | 17,646 | 107,817 |
| Foghorn Therapeutics, Inc. (a) | | 9,733 | 55,965 |
| Galectin Therapeutics, Inc. (a) | | 6,940 | 15,684 |
| Generation Bio Co. (a) | | 47,048 | 132,675 |
| Geron Corp. (a) | | 165,938 | 703,577 |
| Gyre Therapeutics, Inc. (a) | | 6,084 | 72,582 |
| Heron Therapeutics, Inc. (a)(b) | | 101,083 | 353,791 |
| HilleVax, Inc. (a) | | 23,877 | 345,261 |
| IGM Biosciences, Inc. (a)(b) | | 1,325 | 9,103 |
| ImmunityBio, Inc. (a)(b) | | 30,141 | 190,491 |
| Inhibrx Biosciences, Inc. | | 4,058 | 57,502 |
| Inovio Pharmaceuticals, Inc. (a) | | 24,165 | 195,253 |
| Inozyme Pharma, Inc. (a) | | 48,805 | 217,670 |
| Intellia Therapeutics, Inc. (a) | | 91,018 | 2,036,983 |
| Invivyd, Inc. (a) | | 75,858 | 83,444 |
| Ironwood Pharmaceuticals, Inc. Class A (a) | | 87,058 | 567,618 |
| iTeos Therapeutics, Inc. (a) | | 24,458 | 362,957 |
| Kodiak Sciences, Inc. (a) | | 31,722 | 74,547 |
| Korro Bio, Inc. (a) | | 4,222 | 142,999 |
| Kyverna Therapeutics, Inc. | | 6,032 | 45,240 |
| Lenz Therapeutics, Inc. (b) | | 11,902 | 205,786 |
| Lexeo Therapeutics, Inc. | | 473 | 7,587 |
| Lexicon Pharmaceuticals, Inc. (a) | | 67,299 | 113,062 |
| Lyell Immunopharma, Inc. (a)(b) | | 152,343 | 220,897 |
| Macrogenics, Inc. (a) | | 8,854 | 37,630 |
| MannKind Corp. (a) | | 57,986 | 302,687 |
| MeiraGTx Holdings PLC (a) | | 12,395 | 52,183 |
| Mersana Therapeutics, Inc. (a) | | 51,906 | 104,331 |
| Metagenomi, Inc. | | 2,330 | 9,506 |
| MiMedx Group, Inc. (a) | | 59,397 | 411,621 |
| Mineralys Therapeutics, Inc. (a) | | 21,099 | 246,858 |
| Monte Rosa Therapeutics, Inc. (a) | | 28,416 | 106,276 |
| Morphic Holding, Inc. (a) | | 37,595 | 1,280,862 |
| Myriad Genetics, Inc. (a) | | 84,509 | 2,067,090 |
| Neurogene, Inc. (a) | | 4,653 | 169,323 |
| Nkarta, Inc. (a) | | 50,352 | 297,580 |
| Novavax, Inc. (a) | | 30,261 | 383,104 |
| Nurix Therapeutics, Inc. (a) | | 17,851 | 372,550 |
| Olema Pharmaceuticals, Inc. (a) | | 28,021 | 303,187 |
| Omniab, Inc. (a)(c) | | 3,625 | 10,368 |
| Omniab, Inc. (a)(c) | | 3,625 | 9,498 |
| Organogenesis Holdings, Inc. Class A (a) | | 61,136 | 171,181 |
| ORIC Pharmaceuticals, Inc. (a) | | 44,840 | 317,019 |
| Outlook Therapeutics, Inc. (a) | | 2,793 | 20,612 |
| PepGen, Inc. (a) | | 1,732 | 27,643 |
| Perspective Therapeutics, Inc. (a) | | 8,352 | 83,269 |
| Poseida Therapeutics, Inc. (a) | | 47,016 | 137,287 |
| Precigen, Inc. (a) | | 110,765 | 175,009 |
| Prelude Therapeutics, Inc. (a) | | 13,269 | 50,555 |
| ProKidney Corp. Class A (a)(b) | | 12,928 | 31,803 |
| Prothena Corp. PLC (a) | | 16,655 | 343,759 |
| PTC Therapeutics, Inc. (a) | | 17,148 | 524,386 |
| Puma Biotechnology, Inc. (a) | | 25,333 | 82,586 |
| Pyxis Oncology, Inc. (a) | | 46,430 | 153,683 |
| Q32 Bio, Inc. (a) | | 5,693 | 102,189 |
| RAPT Therapeutics, Inc. (a) | | 27,628 | 84,265 |
| REGENXBIO, Inc. (a) | | 43,383 | 507,581 |
| Regulus Therapeutics, Inc. (a) | | 44,660 | 79,718 |
| Relay Therapeutics, Inc. (a) | | 93,809 | 611,635 |
| Renovaro, Inc. (a) | | 17,185 | 30,074 |
| Replimune Group, Inc. (a) | | 47,278 | 425,502 |
| Revolution Medicines, Inc. (a) | | 50,104 | 1,944,536 |
| Rigel Pharmaceuticals, Inc. (a) | | 3,545 | 29,140 |
| Sage Therapeutics, Inc. (a) | | 50,509 | 548,528 |
| Savara, Inc. (a) | | 18,780 | 75,683 |
| Scholar Rock Holding Corp. (a) | | 6,415 | 53,437 |
| Shattuck Labs, Inc. (a) | | 12,746 | 49,200 |
| Skye Bioscience, Inc. (a) | | 13,846 | 110,906 |
| Solid Biosciences, Inc. (a) | | 19,497 | 110,548 |
| Spyre Therapeutics, Inc. (a) | | 29,762 | 699,705 |
| Summit Therapeutics, Inc. (a) | | 4,472 | 34,882 |
| Sutro Biopharma, Inc. (a) | | 77,572 | 227,286 |
| Tenaya Therapeutics, Inc. (a) | | 38,037 | 117,915 |
| Tevogen Bio Holdings, Inc. Class A (a) | | 8,341 | 6,032 |
| Tourmaline Bio, Inc. | | 21,825 | 280,670 |
| Travere Therapeutics, Inc. (a) | | 69,350 | 570,057 |
| TScan Therapeutics, Inc. (a) | | 13,151 | 76,933 |
| UroGen Pharma Ltd. (a)(b) | | 7,397 | 124,122 |
| Vanda Pharmaceuticals, Inc. (a) | | 53,015 | 299,535 |
| Veracyte, Inc. (a) | | 72,720 | 1,575,842 |
| Verve Therapeutics, Inc. (a)(b) | | 67,340 | 328,619 |
| Vir Biotechnology, Inc. (a) | | 84,288 | 750,163 |
| Viridian Therapeutics, Inc. (a) | | 15,398 | 200,328 |
| Voyager Therapeutics, Inc. (a) | | 43,186 | 341,601 |
| Werewolf Therapeutics, Inc. (a) | | 21,701 | 52,950 |
| Xbiotech, Inc. (a) | | 17,121 | 88,002 |
| Xencor, Inc. (a) | | 30,287 | 573,333 |
| XOMA Corp. (a)(b) | | 2,760 | 65,384 |
| Zentalis Pharmaceuticals, Inc. (a) | | 53,642 | 219,396 |
| Zymeworks, Inc. (a) | | 52,629 | 447,873 |
| | | | 50,712,419 |
| Health Care Equipment & Supplies - 1.7% | | | |
| Accuray, Inc. (a) | | 4,092 | 7,447 |
| Angiodynamics, Inc. (a) | | 35,636 | 215,598 |
| Artivion, Inc. (a) | | 9,115 | 233,800 |
| Atricure, Inc. (a) | | 15,527 | 353,550 |
| Avanos Medical, Inc. (a) | | 42,818 | 852,935 |
| Bioventus, Inc. (a) | | 23,142 | 133,067 |
| Embecta Corp. | | 49,172 | 614,650 |
| Fractyl Health, Inc. | | 2,640 | 11,273 |
| ICU Medical, Inc. (a) | | 20,218 | 2,400,888 |
| InMode Ltd. (a) | | 65,771 | 1,199,663 |
| Inogen, Inc. (a) | | 22,318 | 181,445 |
| Integer Holdings Corp. (a) | | 9,434 | 1,092,363 |
| Integra LifeSciences Holdings Corp. (a) | | 64,546 | 1,880,870 |
| LivaNova PLC (a) | | 48,475 | 2,657,400 |
| Neogen Corp. (a)(b) | | 206,102 | 3,221,374 |
| Nevro Corp. (a) | | 33,993 | 286,221 |
| Omnicell, Inc. (a) | | 42,888 | 1,160,978 |
| OraSure Technologies, Inc. (a) | | 70,104 | 298,643 |
| Orchestra BioMed Holdings, Inc. (a) | | 12,574 | 102,478 |
| Orthofix Medical, Inc. (a) | | 31,770 | 421,270 |
| OrthoPediatrics Corp. (a) | | 15,584 | 448,196 |
| Pulse Biosciences, Inc. rights (a)(b) | | 11,081 | 1,432 |
| SI-BONE, Inc. (a) | | 7,171 | 92,721 |
| Stereotaxis, Inc. (a) | | 4,228 | 7,695 |
| SurModics, Inc. (a) | | 4,701 | 197,630 |
| Tactile Systems Technology, Inc. (a) | | 22,207 | 265,152 |
| Utah Medical Products, Inc. | | 3,156 | 210,852 |
| Varex Imaging Corp. (a) | | 36,152 | 532,519 |
| Zimvie, Inc. (a) | | 25,645 | 468,021 |
| | | | 19,550,131 |
| Health Care Providers & Services - 1.5% | | | |
| Accolade, Inc. (a) | | 46,682 | 167,122 |
| AdaptHealth Corp. (a) | | 54,373 | 543,730 |
| Addus HomeCare Corp. (a) | | 9,032 | 1,048,706 |
| Aveanna Healthcare Holdings, Inc. (a) | | 16,189 | 44,682 |
| Brookdale Senior Living, Inc. (a) | | 25,682 | 175,408 |
| Castle Biosciences, Inc. (a) | | 16,744 | 364,517 |
| Community Health Systems, Inc. (a)(b) | | 54,636 | 183,577 |
| Cross Country Healthcare, Inc. (a) | | 31,177 | 431,490 |
| DocGo, Inc. Class A (a) | | 78,436 | 242,367 |
| Enhabit Home Health & Hospice (a) | | 42,043 | 375,024 |
| Fulgent Genetics, Inc. (a) | | 18,635 | 365,619 |
| GeneDx Holdings Corp. Class A (a) | | 10,053 | 262,785 |
| Innovage Holding Corp. (a) | | 12,373 | 61,370 |
| LifeStance Health Group, Inc. (a) | | 61,193 | 300,458 |
| Modivcare, Inc. (a) | | 5,204 | 136,553 |
| Nano-X Imaging Ltd. (a)(b) | | 2,942 | 21,594 |
| National Healthcare Corp. | | 11,895 | 1,289,418 |
| NeoGenomics, Inc. (a) | | 110,725 | 1,535,756 |
| Opko Health, Inc. (a)(b) | | 305,738 | 382,173 |
| Option Care Health, Inc. (a) | | 87,494 | 2,423,584 |
| Owens & Minor, Inc. (a) | | 60,382 | 815,157 |
| Patterson Companies, Inc. | | 61,905 | 1,493,149 |
| Pediatrix Medical Group, Inc. (a) | | 78,843 | 595,265 |
| Performant Financial Corp. (a) | | 21,949 | 63,652 |
| PetIQ, Inc. Class A (a) | | 21,756 | 479,937 |
| Quipt Home Medical Corp. (a) | | 34,860 | 112,249 |
| Select Medical Holdings Corp. | | 31,755 | 1,113,330 |
| Sonida Senior Living, Inc. (a) | | 1,531 | 42,103 |
| Surgery Partners, Inc. (a) | | 72,602 | 1,727,202 |
| | | | 16,797,977 |
| Health Care Technology - 0.2% | | | |
| Definitive Healthcare Corp. (a) | | 51,110 | 279,061 |
| Health Catalyst, Inc. (a) | | 50,754 | 324,318 |
| HealthStream, Inc. | | 15,603 | 435,324 |
| Lifemd, Inc. (a) | | 12,937 | 88,748 |
| Teladoc Health, Inc. (a) | | 135,982 | 1,329,904 |
| | | | 2,457,355 |
| Life Sciences Tools & Services - 0.3% | | | |
| Adaptive Biotechnologies Corp. (a) | | 109,583 | 396,690 |
| BioLife Solutions, Inc. (a) | | 3,717 | 79,655 |
| Codexis, Inc. (a) | | 59,158 | 183,390 |
| Conduit Pharmaceuticals, Inc. Class A (a) | | 8,420 | 8,925 |
| CryoPort, Inc. (a) | | 7,326 | 50,623 |
| Cytek Biosciences, Inc. (a) | | 114,538 | 639,122 |
| Harvard Bioscience, Inc. (a) | | 27,259 | 77,688 |
| Lifecore Biomedical (a) | | 19,432 | 99,686 |
| MaxCyte, Inc. (a) | | 98,872 | 387,578 |
| Mesa Laboratories, Inc. | | 3,226 | 279,920 |
| Nautilus Biotechnology, Inc. Class A (a) | | 46,148 | 107,986 |
| OmniAb, Inc. (a) | | 76,054 | 285,203 |
| Pacific Biosciences of California, Inc. (a)(b) | | 257,503 | 352,779 |
| Quanterix Corp. (a) | | 29,182 | 385,494 |
| Quantum-Si, Inc. Class A (a) | | 93,118 | 97,774 |
| Standard BioTools, Inc. (a) | | 220,570 | 390,409 |
| | | | 3,822,922 |
| Pharmaceuticals - 1.1% | | | |
| Alimera Sciences, Inc. (a) | | 2,191 | 12,182 |
| Alto Neuroscience, Inc. | | 3,156 | 33,738 |
| Amneal Intermediate, Inc. Class A, (a) | | 24,517 | 155,683 |
| ANI Pharmaceuticals, Inc. (a) | | 5,133 | 326,869 |
| Aquestive Therapeutics, Inc. (a) | | 51,394 | 133,624 |
| Atea Pharmaceuticals, Inc. (a) | | 71,527 | 236,754 |
| Biote Corp. Class A (a) | | 1,082 | 8,083 |
| Contineum Therapeutics, Inc. Class A | | 2,565 | 45,170 |
| CorMedix, Inc. (a)(b) | | 5,415 | 23,447 |
| Enliven Therapeutics, Inc. (a)(b) | | 1,790 | 41,832 |
| Esperion Therapeutics, Inc. (a) | | 130,585 | 289,899 |
| Eyepoint Pharmaceuticals, Inc. (a)(b) | | 25,778 | 224,269 |
| Fulcrum Therapeutics, Inc. (a) | | 34,253 | 212,369 |
| Innoviva, Inc. (a)(b) | | 47,161 | 773,440 |
| Ligand Pharmaceuticals, Inc. (a) | | 16,104 | 1,356,923 |
| Lyra Therapeutics, Inc. (a) | | 18,727 | 5,182 |
| Nektar Therapeutics (a) | | 170,166 | 211,006 |
| Novartis AG rights (a)(c) | | 31,059 | 0 |
| Nuvation Bio, Inc. Class A (a) | | 170,094 | 496,674 |
| Omeros Corp. (a)(b) | | 34,218 | 138,925 |
| Pacira Biosciences, Inc. (a) | | 39,901 | 1,141,568 |
| Phathom Pharmaceuticals, Inc. (a)(b) | | 25,041 | 257,922 |
| Phibro Animal Health Corp. Class A | | 14,560 | 244,171 |
| Pliant Therapeutics, Inc. (a) | | 53,375 | 573,781 |
| Prestige Consumer Healthcare, Inc. (a) | | 46,669 | 3,213,161 |
| Scilex Holding Co. (a)(b)(h) | | 41,080 | 71,356 |
| SIGA Technologies, Inc. | | 11,900 | 90,321 |
| Supernus Pharmaceuticals, Inc. (a) | | 43,963 | 1,176,010 |
| Telomir Pharmaceuticals, Inc. | | 2,060 | 9,909 |
| Terns Pharmaceuticals, Inc. (a) | | 51,540 | 350,987 |
| Theravance Biopharma, Inc. (a) | | 34,285 | 290,737 |
| Third Harmonics Bio, Inc. (a) | | 19,073 | 247,949 |
| Trevi Therapeutics, Inc. (a) | | 21,773 | 64,884 |
| Ventyx Biosciences, Inc. (a) | | 57,009 | 131,691 |
| WAVE Life Sciences (a) | | 11,009 | 54,935 |
| Zevra Therapeutics, Inc. (a)(b) | | 18,831 | 92,272 |
| | | | 12,737,723 |
TOTAL HEALTH CARE | | | 106,078,527 |
| INDUSTRIALS - 12.5% | | | |
| Aerospace & Defense - 0.8% | | | |
| AAR Corp. (a) | | 25,985 | 1,889,110 |
| AerSale Corp. (a) | | 31,269 | 216,381 |
| Archer Aviation, Inc. Class A (a)(b) | | 12,853 | 45,243 |
| Astronics Corp. (a) | | 27,272 | 546,258 |
| Ducommun, Inc. (a) | | 12,753 | 740,439 |
| Intuitive Machines, Inc. Class A (a) | | 25,710 | 84,843 |
| Kratos Defense & Security Solutions, Inc. (a) | | 78,041 | 1,561,600 |
| Mercury Systems, Inc. (a) | | 51,549 | 1,391,308 |
| National Presto Industries, Inc. | | 4,894 | 367,686 |
| Park Aerospace Corp. | | 10,006 | 136,882 |
| Redwire Corp. Class A (a) | | 15,994 | 114,677 |
| Terran Orbital Corp. Class A (a)(b) | | 135,229 | 110,888 |
| Triumph Group, Inc. (a) | | 61,012 | 940,195 |
| V2X, Inc. (a) | | 11,451 | 549,190 |
| Virgin Galactic Holdings, Inc. (a)(b) | | 16,362 | 137,932 |
| | | | 8,832,632 |
| Air Freight & Logistics - 0.3% | | | |
| Air Transport Services Group, Inc. (a) | | 48,027 | 666,134 |
| Forward Air Corp. | | 23,486 | 447,173 |
| Hub Group, Inc. Class A | | 57,745 | 2,485,922 |
| Radiant Logistics, Inc. (a) | | 32,941 | 187,434 |
| | | | 3,786,663 |
| Building Products - 1.1% | | | |
| American Woodmark Corp. (a) | | 14,105 | 1,108,653 |
| Apogee Enterprises, Inc. | | 14,267 | 896,467 |
| AZZ, Inc. | | 4,951 | 382,465 |
| Caesarstone Sdot-Yam Ltd. (a) | | 19,103 | 95,515 |
| Gibraltar Industries, Inc. (a) | | 15,203 | 1,042,166 |
| Insteel Industries, Inc. | | 9,830 | 304,337 |
| Jeld-Wen Holding, Inc. (a) | | 52,845 | 711,822 |
| MasterBrand, Inc. (a) | | 119,771 | 1,758,238 |
| Quanex Building Products Corp. | | 31,298 | 865,390 |
| Resideo Technologies, Inc. (a) | | 138,184 | 2,702,879 |
| UFP Industries, Inc. | | 24,966 | 2,796,192 |
| Zurn Elkay Water Solutions Cor | | 7,281 | 214,061 |
| | | | 12,878,185 |
| Commercial Services & Supplies - 1.9% | | | |
| ABM Industries, Inc. | | 59,737 | 3,020,900 |
| ACCO Brands Corp. | | 86,305 | 405,634 |
| Aris Water Solution, Inc. Class A | | 24,184 | 378,963 |
| Bridger Aerospace Group Holdings, Inc. (a) | | 5,679 | 21,239 |
| BrightView Holdings, Inc. (a) | | 42,297 | 562,550 |
| Cimpress PLC (a) | | 5,451 | 477,562 |
| CompX International, Inc. Class A | | 648 | 15,986 |
| CoreCivic, Inc. (a) | | 104,077 | 1,350,919 |
| Deluxe Corp. | | 42,159 | 946,891 |
| Ennis, Inc. | | 23,953 | 524,331 |
| Enviri Corp. (a) | | 74,735 | 644,963 |
| Healthcare Services Group, Inc. (a) | | 68,424 | 723,926 |
| HNI Corp. | | 23,487 | 1,057,385 |
| Interface, Inc. | | 49,301 | 723,739 |
| Matthews International Corp. Class A | | 27,955 | 700,273 |
| Millerknoll, Inc. | | 67,735 | 1,794,300 |
| NL Industries, Inc. | | 8,343 | 50,308 |
| OpenLane, Inc. (a) | | 100,499 | 1,667,278 |
| Pitney Bowes, Inc. | | 107,663 | 546,928 |
| Quad/Graphics, Inc. Class A | | 10,566 | 57,585 |
| Steelcase, Inc. Class A | | 87,889 | 1,139,041 |
| The GEO Group, Inc. (a) | | 117,429 | 1,686,280 |
| UniFirst Corp. | | 14,201 | 2,435,898 |
| Virco Manufacturing Co. | | 9,466 | 131,956 |
| VSE Corp. | | 10,914 | 963,488 |
| | | | 22,028,323 |
| Construction & Engineering - 0.7% | | | |
| Ameresco, Inc. Class A (a) | | 20,265 | 583,835 |
| Arcosa, Inc. | | 45,833 | 3,822,931 |
| Concrete Pumping Holdings, Inc. (a) | | 22,214 | 133,506 |
| Fluor Corp. (a) | | 13,569 | 590,930 |
| Granite Construction, Inc. | | 7,503 | 464,961 |
| Great Lakes Dredge & Dock Corp. (a) | | 61,662 | 541,392 |
| Matrix Service Co. (a) | | 25,055 | 248,796 |
| Northwest Pipe Co. (a) | | 7,546 | 256,338 |
| Orion Group Holdings, Inc. (a) | | 24,879 | 236,599 |
| Primoris Services Corp. | | 4,162 | 207,642 |
| Southland Holdings, Inc. (a) | | 8,827 | 40,428 |
| Tutor Perini Corp. (a) | | 41,297 | 899,449 |
| | | | 8,026,807 |
| Electrical Equipment - 0.9% | | | |
| Allient, Inc. | | 12,848 | 324,669 |
| Blink Charging Co. (a)(b) | | 50,824 | 139,258 |
| Bloom Energy Corp. Class A (a) | | 16,198 | 198,264 |
| ChargePoint Holdings, Inc. Class A (a) | | 164,442 | 248,307 |
| Encore Wire Corp. | | 2,147 | 622,265 |
| Energy Vault Holdings, Inc. Class A (a)(b) | | 98,270 | 93,317 |
| EnerSys | | 3,129 | 323,914 |
| Freyr Battery, Inc. | | 105,188 | 178,820 |
| FuelCell Energy, Inc. (a)(b) | | 431,479 | 275,629 |
| GrafTech International Ltd. | | 15,661 | 15,191 |
| LSI Industries, Inc. | | 8,199 | 118,640 |
| Net Power, Inc. Class A (a) | | 19,990 | 196,502 |
| Nextracker, Inc. Class A (a) | | 28,318 | 1,327,548 |
| Plug Power, Inc. (a) | | 547,826 | 1,276,435 |
| Preformed Line Products Co. | | 2,140 | 266,516 |
| SES AI Corp. Class A (a)(b) | | 113,139 | 141,424 |
| SolarMax Technology, Inc. | | 2,790 | 9,179 |
| Stem, Inc. (a)(b) | | 143,989 | 159,828 |
| SunPower Corp. (a) | | 82,894 | 245,366 |
| Sunrun, Inc. (a) | | 206,440 | 2,448,378 |
| Thermon Group Holdings, Inc. (a) | | 28,441 | 874,845 |
| TPI Composites, Inc. (a) | | 43,494 | 173,541 |
| Ultralife Corp. (a) | | 8,730 | 92,713 |
| Vicor Corp. (a) | | 9,511 | 315,385 |
| | | | 10,065,934 |
| Ground Transportation - 0.4% | | | |
| Covenant Transport Group, Inc. Class A | | 6,320 | 311,513 |
| FTAI Infrastructure LLC | | 95,923 | 827,815 |
| Heartland Express, Inc. | | 25,474 | 314,094 |
| Hertz Global Holdings, Inc. (a) | | 114,762 | 405,110 |
| Marten Transport Ltd. | | 43,224 | 797,483 |
| P.A.M. Transportation Services, Inc. (a) | | 4,919 | 85,443 |
| Universal Logistics Holdings, Inc. | | 4,262 | 172,995 |
| Werner Enterprises, Inc. | | 51,800 | 1,855,994 |
| | | | 4,770,447 |
| Industrial Conglomerates - 0.0% | | | |
| Brookfield Business Corp. Class A | | 23,880 | 487,630 |
| Machinery - 2.7% | | | |
| 3D Systems Corp. (a) | | 119,936 | 368,204 |
| Albany International Corp. Class A | | 22,274 | 1,881,039 |
| Astec Industries, Inc. | | 21,462 | 636,563 |
| Barnes Group, Inc. | | 43,792 | 1,813,427 |
| Columbus McKinnon Corp. (NY Shares) | | 26,870 | 928,090 |
| Commercial Vehicle Group, Inc. (a) | | 29,373 | 143,928 |
| Desktop Metal, Inc. (a)(b) | | 1 | 4 |
| Douglas Dynamics, Inc. | | 3,621 | 84,731 |
| Eastern Co. | | 4,947 | 126,000 |
| EnPro Industries, Inc. | | 17,783 | 2,588,671 |
| ESCO Technologies, Inc. | | 12,500 | 1,313,000 |
| Gencor Industries, Inc. (a) | | 9,867 | 190,828 |
| Helios Technologies, Inc. | | 9,862 | 470,911 |
| Hillenbrand, Inc. | | 44,155 | 1,767,083 |
| Hillman Solutions Corp. Class A (a) | | 154,954 | 1,371,343 |
| Hyliion Holdings Corp. Class A (a) | | 133,831 | 216,806 |
| Hyster-Yale Materials Handling, Inc. Class A | | 4,340 | 302,628 |
| John Bean Technologies Corp. | | 27,859 | 2,645,769 |
| Kennametal, Inc. | | 74,775 | 1,760,204 |
| L.B. Foster Co. Class A (a) | | 8,581 | 184,663 |
| Lindsay Corp. | | 5,184 | 637,010 |
| Luxfer Holdings PLC sponsored | | 25,416 | 294,571 |
| Manitowoc Co., Inc. (a) | | 32,163 | 370,839 |
| Mayville Engineering Co., Inc. (a) | | 11,263 | 187,642 |
| Miller Industries, Inc. | | 10,009 | 550,695 |
| Mueller Industries, Inc. | | 8,121 | 462,410 |
| NN, Inc. (a) | | 43,948 | 131,844 |
| Park-Ohio Holdings Corp. | | 8,124 | 210,330 |
| Proto Labs, Inc. (a) | | 24,235 | 748,619 |
| REV Group, Inc. | | 11,071 | 275,557 |
| Shyft Group, Inc. (The) | | 29,897 | 354,578 |
| Standex International Corp. | | 2,617 | 421,730 |
| Tennant Co. | | 9,998 | 984,203 |
| Terex Corp. | | 63,041 | 3,457,168 |
| The Greenbrier Companies, Inc. | | 29,064 | 1,440,121 |
| Titan International, Inc. (a) | | 46,394 | 343,780 |
| Trinity Industries, Inc. | | 6,242 | 186,761 |
| Twin Disc, Inc. | | 10,398 | 122,488 |
| Wabash National Corp. | | 42,111 | 919,704 |
| | | | 30,893,942 |
| Marine Transportation - 0.7% | | | |
| Costamare, Inc. | | 37,668 | 618,885 |
| Genco Shipping & Trading Ltd. | | 39,913 | 850,546 |
| Golden Ocean Group Ltd. | | 115,325 | 1,591,485 |
| Himalaya Shipping Ltd. | | 1,914 | 17,532 |
| Matson, Inc. | | 32,118 | 4,206,494 |
| Pangaea Logistics Solutions Ltd. | | 29,173 | 228,425 |
| Safe Bulkers, Inc. | | 59,774 | 347,885 |
| | | | 7,861,252 |
| Passenger Airlines - 0.6% | | | |
| Allegiant Travel Co. | | 14,552 | 730,947 |
| Blade Air Mobility, Inc. (a)(b) | | 54,002 | 187,927 |
| Hawaiian Holdings, Inc. (a) | | 48,063 | 597,423 |
| JetBlue Airways Corp. (a) | | 288,797 | 1,758,774 |
| SkyWest, Inc. (a) | | 37,536 | 3,080,580 |
| Spirit Airlines, Inc. (b) | | 103,325 | 378,170 |
| Sun Country Airlines Holdings, Inc. (a) | | 19,446 | 244,242 |
| | | | 6,978,063 |
| Professional Services - 1.1% | | | |
| Alight, Inc. Class A (a) | | 448,230 | 3,307,937 |
| Asure Software, Inc. (a) | | 22,411 | 188,252 |
| Barrett Business Services, Inc. | | 2,491 | 81,630 |
| BlackSky Technology, Inc. Class A (a)(b) | | 100,899 | 107,962 |
| Conduent, Inc. (a) | | 151,448 | 493,720 |
| DLH Holdings Corp. (a) | | 4,908 | 51,828 |
| First Advantage Corp. (b) | | 19,693 | 316,467 |
| Forrester Research, Inc. (a) | | 10,898 | 186,138 |
| Heidrick & Struggles International, Inc. | | 19,112 | 603,557 |
| Hirequest, Inc. | | 927 | 11,448 |
| IBEX Ltd. (a) | | 8,262 | 133,679 |
| Kelly Services, Inc. Class A (non-vtg.) | | 28,937 | 619,541 |
| Korn Ferry | | 49,145 | 3,299,595 |
| MISTRAS Group, Inc. (a) | | 19,368 | 160,561 |
| NV5 Global, Inc. (a) | | 10,968 | 1,019,695 |
| Planet Labs PBC Class A (a) | | 160,475 | 298,484 |
| Resources Connection, Inc. | | 29,790 | 328,882 |
| Sterling Check Corp. (a)(b) | | 12,988 | 192,222 |
| TrueBlue, Inc. (a) | | 28,193 | 290,388 |
| Ttec Holdings, Inc. | | 18,012 | 105,911 |
| Willdan Group, Inc. (a) | | 12,112 | 349,431 |
| | | | 12,147,328 |
| Trading Companies & Distributors - 1.3% | | | |
| Beacon Roofing Supply, Inc. (a) | | 4,018 | 363,629 |
| BlueLinx Corp. (a) | | 7,961 | 741,089 |
| Boise Cascade Co. | | 19,642 | 2,341,719 |
| Custom Truck One Source, Inc. Class A (a) | | 15,799 | 68,726 |
| Distribution Solutions Group I (a) | | 1,225 | 36,750 |
| DNOW, Inc. (a) | | 102,036 | 1,400,954 |
| DXP Enterprises, Inc. (a) | | 10,766 | 493,513 |
| EVI Industries, Inc. | | 932 | 17,633 |
| GATX Corp. | | 33,565 | 4,442,663 |
| GMS, Inc. (a) | | 3,823 | 308,172 |
| H&E Equipment Services, Inc. | | 2,525 | 111,529 |
| Hudson Technologies, Inc. (a) | | 35,994 | 316,387 |
| MRC Global, Inc. (a) | | 79,623 | 1,027,933 |
| Rush Enterprises, Inc.: | | | |
| Class A | | 62,071 | 2,598,913 |
| Class B | | 2,958 | 116,072 |
| Titan Machinery, Inc. (a) | | 19,092 | 303,563 |
| Willis Lease Finance Corp. | | 2,816 | 195,149 |
| | | | 14,884,394 |
TOTAL INDUSTRIALS | | | 143,641,600 |
| INFORMATION TECHNOLOGY - 6.1% | | | |
| Communications Equipment - 0.7% | | | |
| ADTRAN Holdings, Inc. | | 74,146 | 390,008 |
| Applied Optoelectronics, Inc. (a) | | 35,176 | 291,609 |
| Aviat Networks, Inc. (a) | | 10,914 | 313,123 |
| Calix, Inc. (a) | | 14,699 | 520,786 |
| Clearfield, Inc. (a) | | 11,926 | 459,867 |
| CommScope Holding Co., Inc. (a) | | 198,941 | 244,697 |
| Digi International, Inc. (a) | | 33,829 | 775,699 |
| Extreme Networks, Inc. (a) | | 55,038 | 740,261 |
| NETGEAR, Inc. (a) | | 26,457 | 404,792 |
| NetScout Systems, Inc. (a) | | 65,094 | 1,190,569 |
| Ribbon Communications, Inc. (a) | | 86,368 | 284,151 |
| ViaSat, Inc. (a) | | 114,402 | 1,452,905 |
| Viavi Solutions, Inc. (a) | | 207,383 | 1,424,721 |
| | | | 8,493,188 |
| Electronic Equipment, Instruments & Components - 2.3% | | | |
| 908 Devices, Inc. (a) | | 20,572 | 105,946 |
| Aeva Technologies, Inc. (a)(b) | | 21,794 | 54,921 |
| Bel Fuse, Inc.: | | | |
| Class A | | 1,435 | 116,106 |
| Class B (non-vtg.) | | 10,045 | 655,336 |
| Belden, Inc. | | 17,801 | 1,669,734 |
| Benchmark Electronics, Inc. | | 33,937 | 1,339,154 |
| CTS Corp. | | 6,527 | 330,462 |
| Daktronics, Inc. (a) | | 30,226 | 421,653 |
| ePlus, Inc. (a) | | 8,206 | 604,618 |
| FARO Technologies, Inc. (a) | | 16,846 | 269,536 |
| Iteris, Inc. (a) | | 2,515 | 10,890 |
| Itron, Inc. (a) | | 4,247 | 420,283 |
| Kimball Electronics, Inc. (a) | | 22,684 | 498,594 |
| Knowles Corp. (a) | | 83,023 | 1,432,977 |
| Methode Electronics, Inc. | | 31,532 | 326,356 |
| MicroVision, Inc. (a) | | 91,171 | 96,641 |
| Mirion Technologies, Inc. Class A (a) | | 164,817 | 1,770,135 |
| nLIGHT, Inc. (a) | | 41,024 | 448,392 |
| OSI Systems, Inc. (a) | | 888 | 122,118 |
| Ouster, Inc. Class A (a) | | 34,132 | 335,518 |
| Par Technology Corp. (a)(b) | | 1,953 | 91,967 |
| PC Connection, Inc. | | 11,026 | 707,869 |
| Plexus Corp. (a) | | 17,947 | 1,851,771 |
| Powerfleet, Inc. (a) | | 86,367 | 394,697 |
| Richardson Electronics Ltd. | | 11,627 | 138,245 |
| Rogers Corp. (a) | | 17,690 | 2,133,591 |
| Sanmina Corp. (a) | | 51,797 | 3,431,551 |
| ScanSource, Inc. (a) | | 23,807 | 1,054,888 |
| Smartrent, Inc. (a)(b) | | 183,594 | 438,790 |
| TTM Technologies, Inc. (a) | | 95,639 | 1,858,266 |
| Vishay Intertechnology, Inc. (b) | | 118,950 | 2,652,585 |
| Vishay Precision Group, Inc. (a) | | 11,175 | 340,167 |
| | | | 26,123,757 |
| IT Services - 0.4% | | | |
| Applied Digital Corp. (a) | | 28,856 | 171,693 |
| ASGN, Inc. (a) | | 33,170 | 2,924,599 |
| BigBear.ai Holdings, Inc. (a) | | 25,213 | 38,072 |
| Core Scientific, Inc. | | 36,309 | 337,674 |
| Fastly, Inc. Class A (a) | | 25,026 | 184,442 |
| Grid Dynamics Holdings, Inc. (a) | | 14,056 | 147,729 |
| Hackett Group, Inc. | | 2,527 | 54,886 |
| Information Services Group, Inc. | | 33,104 | 97,326 |
| Rackspace Technology, Inc. (a)(b) | | 63,391 | 188,905 |
| Thoughtworks Holding, Inc. (a) | | 93,967 | 266,866 |
| Unisys Corp. (a) | | 62,376 | 257,613 |
| | | | 4,669,805 |
| Semiconductors & Semiconductor Equipment - 1.2% | | | |
| ACM Research, Inc. Class A, (a) | | 15,310 | 353,049 |
| Alpha & Omega Semiconductor Ltd. (a) | | 21,896 | 818,254 |
| Ambarella, Inc. (a) | | 16,978 | 915,963 |
| CEVA, Inc. (a) | | 3,346 | 64,544 |
| Cohu, Inc. (a) | | 43,650 | 1,444,815 |
| Diodes, Inc. (a) | | 38,449 | 2,765,637 |
| Everspin Technologies, Inc. (a) | | 2,327 | 13,939 |
| Ichor Holdings Ltd. (a) | | 21,106 | 813,636 |
| indie Semiconductor, Inc. (a)(b) | | 107,535 | 663,491 |
| MaxLinear, Inc. Class A (a) | | 4,044 | 81,446 |
| Navitas Semiconductor Corp. Class A (a)(b) | | 103,620 | 407,227 |
| Photronics, Inc. (a) | | 38,617 | 952,681 |
| Rigetti Computing, Inc. Class A (a) | | 134,921 | 144,365 |
| SMART Global Holdings, Inc. (a) | | 48,562 | 1,110,613 |
| Synaptics, Inc. (a) | | 34,064 | 3,004,445 |
| Veeco Instruments, Inc. (a)(b) | | 8,500 | 397,035 |
| | | | 13,951,140 |
| Software - 1.2% | | | |
| Adeia, Inc. | | 16,340 | 182,763 |
| American Software, Inc. Class A | | 30,197 | 275,699 |
| Aurora Innovation, Inc. Class A, (a)(b) | | 365,912 | 1,013,576 |
| Bit Digital, Inc. (a)(b) | | 111,046 | 353,126 |
| Cerence, Inc. (a)(b) | | 38,458 | 108,836 |
| Cipher Mining, Inc. (a) | | 53,813 | 223,324 |
| CommVault Systems, Inc. (a) | | 2,937 | 357,051 |
| Consensus Cloud Solutions, Inc. (a) | | 16,849 | 289,466 |
| CS Disco, Inc. (a) | | 10,734 | 63,975 |
| D-Wave Quantum, Inc. (a) | | 37,949 | 43,262 |
| Daily Journal Corp. (a) | | 388 | 153,058 |
| Digimarc Corp. (a) | | 890 | 27,599 |
| Digital Turbine, Inc. (a) | | 88,849 | 147,489 |
| E2open Parent Holdings, Inc. (a)(b) | | 161,444 | 724,884 |
| EverCommerce, Inc. (a) | | 6,123 | 67,231 |
| Hut 8 Mining Corp. (a) | | 75,763 | 1,135,687 |
| Instructure Holdings, Inc. (a) | | 9,572 | 224,081 |
| Marathon Digital Holdings, Inc. (a) | | 46,901 | 930,985 |
| MeridianLink, Inc. (a) | | 10,206 | 218,000 |
| NCR Voyix Corp. (a) | | 12,124 | 149,731 |
| Olo, Inc. Class A (a) | | 52,327 | 231,285 |
| ON24, Inc. | | 25,871 | 155,485 |
| Onespan, Inc. (a) | | 3,542 | 45,408 |
| Ooma, Inc. (a) | | 20,134 | 199,931 |
| Pagaya Technologies Ltd. Class A (a) | | 38,294 | 488,631 |
| PowerSchool Holdings, Inc. Class A (a) | | 6,506 | 145,669 |
| Prairie Operating Co. (a) | | 471 | 5,110 |
| Rekor Systems, Inc. (a) | | 7,875 | 12,206 |
| Rimini Street, Inc. (a) | | 43,738 | 134,276 |
| Riot Platforms, Inc. (a)(b) | | 222,495 | 2,033,604 |
| Roadzen, Inc. (a) | | 12,792 | 28,398 |
| SolarWinds, Inc. | | 51,607 | 621,864 |
| SoundThinking, Inc. (a) | | 1,015 | 12,363 |
| Telos Corp. (a) | | 53,647 | 215,661 |
| TeraWulf, Inc. (a) | | 14,665 | 65,259 |
| Verint Systems, Inc. (a) | | 58,508 | 1,883,958 |
| Xperi, Inc. (a) | | 42,660 | 350,239 |
| | | | 13,319,170 |
| Technology Hardware, Storage & Peripherals - 0.3% | | | |
| CompoSecure, Inc. (b) | | 1,286 | 8,745 |
| Corsair Gaming, Inc. (a) | | 32,821 | 362,344 |
| Diebold Nixdorf, Inc. | | 24,018 | 924,213 |
| Eastman Kodak Co. (a) | | 57,468 | 309,178 |
| Immersion Corp. | | 29,013 | 273,012 |
| Turtle Beach Corp. (a) | | 6,686 | 95,877 |
| Xerox Holdings Corp. | | 109,914 | 1,277,201 |
| | | | 3,250,570 |
TOTAL INFORMATION TECHNOLOGY | | | 69,807,630 |
| MATERIALS - 5.2% | | | |
| Chemicals - 2.0% | | | |
| AdvanSix, Inc. | | 23,687 | 542,906 |
| American Vanguard Corp. | | 23,045 | 198,187 |
| Arcadium Lithium PLC | | 1,023,262 | 3,438,160 |
| Arq, Inc. (a) | | 20,987 | 127,391 |
| Aspen Aerogels, Inc. (a) | | 43,152 | 1,029,175 |
| Avient Corp. | | 85,195 | 3,718,762 |
| Core Molding Technologies, Inc. (a) | | 6,927 | 110,416 |
| Ecovyst, Inc. (a) | | 108,615 | 974,277 |
| H.B. Fuller Co. | | 36,997 | 2,847,289 |
| Innospec, Inc. | | 3,522 | 435,284 |
| Intrepid Potash, Inc. (a) | | 10,223 | 239,525 |
| Koppers Holdings, Inc. | | 19,143 | 708,100 |
| Kronos Worldwide, Inc. | | 21,073 | 264,466 |
| LSB Industries, Inc. (a) | | 49,879 | 408,010 |
| Mativ, Inc. | | 50,899 | 863,247 |
| Minerals Technologies, Inc. | | 30,348 | 2,523,740 |
| Perimeter Solutions SA (a) | | 126,625 | 991,474 |
| PureCycle Technologies, Inc. (a)(b) | | 94,462 | 559,215 |
| Rayonier Advanced Materials, Inc. (a) | | 60,522 | 329,240 |
| Sensient Technologies Corp. | | 1,979 | 146,822 |
| Stepan Co. | | 17,912 | 1,503,892 |
| Tronox Holdings PLC | | 112,259 | 1,761,344 |
| Valhi, Inc. | | 2,260 | 40,296 |
| | | | 23,761,218 |
| Construction Materials - 0.4% | | | |
| Summit Materials, Inc. (a) | | 114,591 | 4,195,177 |
| Containers & Packaging - 0.4% | | | |
| Greif, Inc.: | | | |
| Class A | | 23,688 | 1,361,349 |
| Class B | | 4,304 | 268,957 |
| O-I Glass, Inc. (a) | | 145,898 | 1,623,845 |
| Pactiv Evergreen, Inc. | | 34,376 | 389,136 |
| Ranpak Holdings Corp. (A Shares) (a) | | 40,768 | 262,138 |
| TriMas Corp. | | 38,214 | 976,750 |
| | | | 4,882,175 |
| Metals & Mining - 2.2% | | | |
| Arch Resources, Inc. Class A, | | 16,628 | 2,531,280 |
| Caledonia Mining Corp. PLC | | 15,425 | 149,931 |
| Coeur d'Alene Mines Corp. (a) | | 373,940 | 2,101,543 |
| Commercial Metals Co. | | 109,239 | 6,007,038 |
| Compass Minerals International, Inc. | | 32,277 | 333,421 |
| Contango ORE, Inc. (a) | | 4,159 | 75,153 |
| Dakota Gold Corp. (a) | | 24,046 | 61,317 |
| Haynes International, Inc. | | 11,928 | 700,174 |
| Hecla Mining Co. | | 546,399 | 2,650,035 |
| i-80 Gold Corp. (a) | | 242,813 | 262,238 |
| Kaiser Aluminum Corp. | | 1,027 | 90,273 |
| Lifezone Metals Ltd. | | 34,397 | 264,169 |
| Materion Corp. | | 1,152 | 124,566 |
| Metallus, Inc. (a) | | 40,517 | 821,280 |
| Metals Acquisition Ltd. | | 36,660 | 501,875 |
| Novagold Resources, Inc. (a) | | 228,501 | 790,613 |
| Olympic Steel, Inc. | | 10,409 | 466,635 |
| Piedmont Lithium, Inc. (a)(b) | | 12,140 | 121,157 |
| Radius Recycling, Inc. Class A | | 24,638 | 376,222 |
| Ryerson Holding Corp. | | 27,259 | 531,551 |
| SSR Mining, Inc. | | 189,591 | 855,055 |
| SunCoke Energy, Inc. | | 79,813 | 782,167 |
| Tredegar Corp. | | 24,174 | 115,793 |
| Universal Stainless & Alloy Products, Inc. (a) | | 8,394 | 229,828 |
| Warrior Metropolitan Coal, Inc. | | 49,013 | 3,076,546 |
| Worthington Steel, Inc. | | 30,766 | 1,026,354 |
| | | | 25,046,214 |
| Paper & Forest Products - 0.2% | | | |
| Clearwater Paper Corp. (a) | | 15,382 | 745,566 |
| Sylvamo Corp. | | 26,120 | 1,791,832 |
| | | | 2,537,398 |
TOTAL MATERIALS | | | 60,422,182 |
| REAL ESTATE - 10.7% | | | |
| Equity Real Estate Investment Trusts (REITs) - 9.8% | | | |
| Acadia Realty Trust (SBI) | | 97,871 | 1,753,848 |
| Alexander & Baldwin, Inc. | | 71,767 | 1,217,168 |
| Alpine Income Property Trust, Inc. | | 14,034 | 218,369 |
| American Assets Trust, Inc. | | 47,722 | 1,068,018 |
| American Healthcare (REIT), Inc. | | 61,942 | 904,973 |
| Apartment Investment & Management Co. Class A (a) | | 70,061 | 580,806 |
| Apple Hospitality (REIT), Inc. | | 219,278 | 3,188,302 |
| Armada Hoffler Properties, Inc. Class A, | | 60,924 | 675,647 |
| Braemar Hotels & Resorts, Inc. | | 64,278 | 163,909 |
| Brandywine Realty Trust (SBI) | | 167,165 | 748,899 |
| Broadstone Net Lease, Inc. | | 181,984 | 2,888,086 |
| BRT Apartments Corp. | | 12,337 | 215,527 |
| CareTrust (REIT), Inc. | | 119,111 | 2,989,686 |
| CBL & Associates Properties, Inc. | | 7,650 | 178,857 |
| Centerspace | | 14,376 | 972,249 |
| Chatham Lodging Trust | | 48,839 | 416,108 |
| City Office REIT, Inc. | | 39,152 | 194,977 |
| Clipper Realty, Inc. | | 2,953 | 10,660 |
| Community Healthcare Trust, Inc. | | 24,389 | 570,459 |
| COPT Defense Properties (SBI) | | 107,849 | 2,699,460 |
| CTO Realty Growth, Inc. | | 22,858 | 399,101 |
| DiamondRock Hospitality Co. | | 203,421 | 1,718,907 |
| Diversified Healthcare Trust (SBI) | | 207,227 | 632,042 |
| Douglas Emmett, Inc. | | 154,118 | 2,051,311 |
| Easterly Government Properties, Inc. | | 96,484 | 1,193,507 |
| Elme Communities (SBI) | | 84,832 | 1,351,374 |
| Empire State Realty Trust, Inc. | | 129,517 | 1,214,869 |
| Equity Commonwealth (a) | | 100,267 | 1,945,180 |
| Essential Properties Realty Trust, Inc. | | 168,651 | 4,673,319 |
| Farmland Partners, Inc. | | 43,108 | 497,035 |
| Four Corners Property Trust, Inc. | | 89,123 | 2,198,664 |
| Franklin Street Properties Corp. | | 95,312 | 145,827 |
| Getty Realty Corp. | | 48,561 | 1,294,636 |
| Gladstone Commercial Corp. | | 34,505 | 492,386 |
| Gladstone Land Corp. | | 33,389 | 457,095 |
| Global Medical REIT, Inc. | | 61,477 | 558,211 |
| Global Net Lease, Inc. | | 194,195 | 1,427,333 |
| Hudson Pacific Properties, Inc. | | 129,905 | 624,843 |
| Independence Realty Trust, Inc. | | 216,047 | 4,048,721 |
| Industrial Logistics Properties Trust | | 62,487 | 229,952 |
| InvenTrust Properties Corp. | | 65,986 | 1,633,813 |
| JBG SMITH Properties | | 85,412 | 1,300,825 |
| Kite Realty Group Trust | | 207,629 | 4,646,737 |
| LTC Properties, Inc. | | 42,131 | 1,453,520 |
| LXP Industrial Trust (REIT) | | 278,806 | 2,542,711 |
| National Health Investors, Inc. | | 40,180 | 2,721,391 |
| Net Lease Office Properties | | 14,061 | 346,182 |
| NETSTREIT Corp. | | 59,264 | 954,150 |
| NexPoint Diversified Real Estate Trust | | 33,370 | 184,536 |
| NexPoint Residential Trust, Inc. | | 21,899 | 865,229 |
| One Liberty Properties, Inc. | | 17,180 | 403,386 |
| Orion Office (REIT), Inc. | | 55,883 | 200,620 |
| Outfront Media, Inc. | | 86,088 | 1,231,058 |
| Paramount Group, Inc. | | 176,131 | 815,487 |
| Peakstone Realty Trust | | 35,074 | 371,784 |
| Pebblebrook Hotel Trust | | 114,057 | 1,568,284 |
| Phillips Edison & Co., Inc. | | 100,905 | 3,300,603 |
| Piedmont Office Realty Trust, Inc. Class A | | 119,801 | 868,557 |
| Plymouth Industrial REIT, Inc. | | 40,643 | 868,947 |
| Postal Realty Trust, Inc. Class A | | 16,904 | 225,330 |
| PotlatchDeltic Corp. | | 75,928 | 2,990,804 |
| Retail Opportunity Investments Corp. | | 120,335 | 1,495,764 |
| RLJ Lodging Trust | | 147,976 | 1,425,009 |
| Sabra Health Care REIT, Inc. | | 221,034 | 3,403,924 |
| Safehold, Inc. | | 49,470 | 954,276 |
| Saul Centers, Inc. | | 1,683 | 61,884 |
| Service Properties Trust | | 159,262 | 818,607 |
| SITE Centers Corp. | | 182,855 | 2,651,398 |
| SL Green Realty Corp. | | 63,380 | 3,589,843 |
| Summit Hotel Properties, Inc. | | 104,060 | 623,319 |
| Sunstone Hotel Investors, Inc. | | 196,995 | 2,060,568 |
| Tanger, Inc. | | 62,602 | 1,697,140 |
| Terreno Realty Corp. | | 91,233 | 5,399,169 |
| The Macerich Co. | | 206,188 | 3,183,543 |
| UMH Properties, Inc. | | 53,741 | 859,319 |
| Uniti Group, Inc. | | 228,253 | 666,499 |
| Universal Health Realty Income Trust (SBI) | | 2,740 | 107,244 |
| Urban Edge Properties | | 115,485 | 2,133,008 |
| Veris Residential, Inc. | | 75,362 | 1,130,430 |
| Whitestone REIT | | 48,937 | 651,351 |
| Xenia Hotels & Resorts, Inc. | | 98,565 | 1,412,436 |
| | | | 112,629,006 |
| Real Estate Management & Development - 0.9% | | | |
| American Realty Investments, Inc. (a)(b) | | 1,298 | 18,432 |
| Anywhere Real Estate, Inc. (a) | | 92,171 | 305,086 |
| Cushman & Wakefield PLC (a) | | 217,219 | 2,259,078 |
| Digitalbridge Group, Inc. | | 110,809 | 1,518,083 |
| Forestar Group, Inc. (a) | | 16,061 | 513,791 |
| FRP Holdings, Inc. (a) | | 12,522 | 357,127 |
| Kennedy-Wilson Holdings, Inc. | | 106,990 | 1,039,943 |
| Marcus & Millichap, Inc. | | 22,422 | 706,741 |
| Maui Land & Pineapple, Inc. (a) | | 833 | 18,368 |
| Newmark Group, Inc. Class A | | 130,499 | 1,335,005 |
| Offerpad Solutions, Inc. Class A (a) | | 8,295 | 36,664 |
| Opendoor Technologies, Inc. Class A (a) | | 557,757 | 1,026,273 |
| RE/MAX Holdings, Inc. Class A | | 16,283 | 131,892 |
| Star Holdings (a) | | 11,236 | 135,506 |
| Stratus Properties, Inc. (a) | | 5,062 | 127,664 |
| Tejon Ranch Co. (a) | | 19,534 | 333,250 |
| The RMR Group, Inc. Class A | | 15,379 | 347,565 |
| Transcontinental Realty Investors, Inc. (a) | | 1,141 | 31,640 |
| | | | 10,242,108 |
TOTAL REAL ESTATE | | | 122,871,114 |
| UTILITIES - 5.0% | | | |
| Electric Utilities - 1.3% | | | |
| Allete, Inc. | | 54,958 | 3,426,631 |
| Genie Energy Ltd. Class B | | 6,983 | 102,091 |
| Hawaiian Electric Industries, Inc. | | 104,488 | 942,482 |
| MGE Energy, Inc. | | 19,669 | 1,469,668 |
| Otter Tail Corp. | | 21,695 | 1,900,265 |
| PNM Resources, Inc. | | 84,754 | 3,132,508 |
| Portland General Electric Co. | | 95,899 | 4,146,673 |
| | | | 15,120,318 |
| Gas Utilities - 1.9% | | | |
| Brookfield Infrastructure Corp. A Shares | | 113,667 | 3,826,031 |
| Chesapeake Utilities Corp. | | 20,956 | 2,225,527 |
| New Jersey Resources Corp. | | 92,842 | 3,968,067 |
| Northwest Natural Holding Co. | | 35,891 | 1,296,024 |
| ONE Gas, Inc. | | 53,264 | 3,400,906 |
| RGC Resources, Inc. | | 8,115 | 165,952 |
| Southwest Gas Holdings, Inc. | | 57,667 | 4,058,603 |
| Spire, Inc. | | 51,286 | 3,114,599 |
| | | | 22,055,709 |
| Independent Power and Renewable Electricity Producers - 0.4% | | | |
| Altus Power, Inc. Class A (a)(b) | | 71,760 | 281,299 |
| Ormat Technologies, Inc. | | 50,929 | 3,651,609 |
| Sunnova Energy International, Inc. (a)(b) | | 102,485 | 571,866 |
| | | | 4,504,774 |
| Multi-Utilities - 0.8% | | | |
| Avista Corp. | | 74,250 | 2,569,793 |
| Black Hills Corp. | | 64,867 | 3,527,467 |
| NorthWestern Energy Corp. | | 58,428 | 2,926,074 |
| Unitil Corp. | | 15,186 | 786,483 |
| | | | 9,809,817 |
| Water Utilities - 0.6% | | | |
| American States Water Co. | | 15,359 | 1,114,603 |
| California Water Service Group | | 40,347 | 1,956,426 |
| Consolidated Water Co., Inc. | | 11,068 | 293,745 |
| Middlesex Water Co. | | 14,572 | 761,533 |
| Pure Cycle Corp. (a) | | 19,110 | 182,501 |
| SJW Group | | 30,474 | 1,652,300 |
| York Water Co. | | 11,879 | 440,592 |
| | | | 6,401,700 |
TOTAL UTILITIES | | | 57,892,318 |
| TOTAL COMMON STOCKS (Cost $1,112,067,758) | | | 1,146,512,872 |
| | | | |
| U.S. Treasury Obligations - 0.0% |
| | | Principal Amount (d) | Value ($) |
U.S. Treasury Bills, yield at date of purchase 5.31% 8/22/24 (e) (Cost $153,826) | | 155,000 | 153,830 |
| | | | |
| Money Market Funds - 3.9% |
| | | Shares | Value ($) |
| Fidelity Cash Central Fund 5.38% (f) | | 4,791,362 | 4,792,321 |
| Fidelity Securities Lending Cash Central Fund 5.38% (f)(g) | | 39,991,499 | 39,995,498 |
| TOTAL MONEY MARKET FUNDS (Cost $44,787,819) | | | 44,787,819 |
| | | | |
| TOTAL INVESTMENT IN SECURITIES - 103.4% (Cost $1,157,009,403) | 1,191,454,521 |
NET OTHER ASSETS (LIABILITIES) - (3.4)% | (39,341,215) |
| NET ASSETS - 100.0% | 1,152,113,306 |
| | |
| Futures Contracts |
| | Number of contracts | Expiration Date | Notional Amount ($) | Value ($) | Unrealized Appreciation/ (Depreciation) ($) |
| Purchased | | | | | |
| | | | | | |
| Equity Index Contracts | | | | | |
| CME E-mini Russell 2000 Index Contracts (United States) | 46 | Sep 2024 | 4,749,500 | 63,439 | 63,439 |
| | | | | | |
| The notional amount of futures purchased as a percentage of Net Assets is 0.4% |
Legend
| (b) | Security or a portion of the security is on loan at period end. |
| (d) | Amount is stated in United States dollars unless otherwise noted. |
| (e) | Security or a portion of the security was pledged to cover margin requirements for futures contracts. At period end, the value of securities pledged amounted to $153,830. |
| (f) | Affiliated fund that is generally available only to investment companies and other accounts managed by Fidelity Investments. The rate quoted is the annualized seven-day yield of the fund at period end. A complete unaudited listing of the fund's holdings as of its most recent quarter end is available upon request. In addition, each Fidelity Central Fund's financial statements, which are not covered by the Fund's Report of Independent Registered Public Accounting Firm, are available on the SEC's website or upon request. |
| (g) | Investment made with cash collateral received from securities on loan. |
| (h) | Equity security is subject to lock-up or market standoff agreement and valued at a discount to the market price of the equivalent equity security. As of period end, the total fair value of equity securities discounted due to contractual sale restrictions is $71,356 and all restrictions are set to expire on or before September 30, 2024. Under normal market conditions, there are no circumstances that could cause the restrictions to lapse. |
Affiliated Central Funds
Fiscal year to date information regarding the Fund's investments in Fidelity Central Funds, including the ownership percentage, is presented below.
| Affiliate | Value, beginning of period ($) | Purchases ($) | Sales Proceeds ($) | Dividend Income ($) | Realized Gain (loss) ($) | Change in Unrealized appreciation (depreciation) ($) | Value, end of period ($) | % ownership, end of period |
| Fidelity Cash Central Fund 5.38% | 2,009,758 | 368,591,903 | 365,809,375 | 117,919 | 35 | - | 4,792,321 | 0.0% |
| Fidelity Securities Lending Cash Central Fund 5.38% | 52,540,381 | 237,111,928 | 249,656,811 | 985,107 | - | - | 39,995,498 | 0.2% |
| Total | 54,550,139 | 605,703,831 | 615,466,186 | 1,103,026 | 35 | - | 44,787,819 | |
| | | | | | | | | |
Amounts in the dividend income column in the above table include any capital gain distributions from underlying funds, which are presented in the corresponding line item in the Statement of Operations, if applicable.
Amounts in the dividend income column for Fidelity Securities Lending Cash Central Fund represents the income earned on investing cash collateral, less rebates paid to borrowers and any lending agent fees associated with the loan, plus any premium payments received for lending certain types of securities.
Amounts included in the purchases and sales proceeds columns may include in-kind transactions, if applicable.
Investment Valuation
The following is a summary of the inputs used, as of June 30, 2024, involving the Fund's assets and liabilities carried at fair value. The inputs or methodology used for valuing securities may not be an indication of the risk associated with investing in those securities. For more information on valuation inputs, and their aggregation into the levels used below, please refer to the Investment Valuation section in the accompanying Notes to Financial Statements.
| Valuation Inputs at Reporting Date: |
| Description | Total ($) | Level 1 ($) | Level 2 ($) | Level 3 ($) |
Investments in Securities: | | | | |
|
| Equities: | | | | |
Communication Services | 32,809,618 | 32,809,618 | - | - |
Consumer Discretionary | 114,259,969 | 114,259,969 | - | - |
Consumer Staples | 25,816,297 | 25,816,297 | - | - |
Energy | 104,959,550 | 104,959,550 | - | - |
Financials | 307,954,067 | 307,954,067 | - | - |
Health Care | 106,078,527 | 105,976,744 | 72,788 | 28,995 |
Industrials | 143,641,600 | 143,641,600 | - | - |
Information Technology | 69,807,630 | 69,807,630 | - | - |
Materials | 60,422,182 | 60,422,182 | - | - |
Real Estate | 122,871,114 | 122,871,114 | - | - |
Utilities | 57,892,318 | 57,892,318 | - | - |
|
| U.S. Government and Government Agency Obligations | 153,830 | - | 153,830 | - |
|
| Money Market Funds | 44,787,819 | 44,787,819 | - | - |
| Total Investments in Securities: | 1,191,454,521 | 1,191,198,908 | 226,618 | 28,995 |
Derivative Instruments: Assets | | | | |
Futures Contracts | 63,439 | 63,439 | - | - |
| Total Assets | 63,439 | 63,439 | - | - |
| Total Derivative Instruments: | 63,439 | 63,439 | - | - |
Value of Derivative Instruments
The following table is a summary of the Fund's value of derivative instruments by primary risk exposure as of June 30, 2024. For additional information on derivative instruments, please refer to the Derivative Instruments section in the accompanying Notes to Financial Statements.
Primary Risk Exposure / Derivative Type | Value |
| Asset ($) | Liability ($) |
| Equity Risk | | |
Futures Contracts (a) | 63,439 | 0 |
| Total Equity Risk | 63,439 | 0 |
| Total Value of Derivatives | 63,439 | 0 |
(a)Reflects gross cumulative appreciation (depreciation) on futures contracts as presented in the Schedule of Investments. In the Statement of Assets and Liabilities, the period end daily variation margin is included in receivable or payable for daily variation margin on futures contracts, and the net cumulative appreciation (depreciation) is included in Total accumulated earnings (loss).
Fidelity® Small Cap Value Index Fund
Financial Statements
| Statement of Assets and Liabilities |
| | | | June 30, 2024 |
| | | | | |
| Assets | | | | |
| Investment in securities, at value (including securities loaned of $38,151,476) - See accompanying schedule: | | | | |
Unaffiliated issuers (cost $1,112,221,584) | $ | 1,146,666,702 | | |
Fidelity Central Funds (cost $44,787,819) | | 44,787,819 | | |
| | | | | |
| | | | | |
| Total Investment in Securities (cost $1,157,009,403) | | | $ | 1,191,454,521 |
| Segregated cash with brokers for derivative instruments | | | | 256,505 |
| Cash | | | | 175,693 |
| Receivable for investments sold | | | | 259,501,066 |
| Receivable for fund shares sold | | | | 1,787,371 |
| Dividends receivable | | | | 1,789,718 |
| Distributions receivable from Fidelity Central Funds | | | | 97,080 |
| Receivable for daily variation margin on futures contracts | | | | 15,129 |
| Other receivables | | | | 82 |
Total assets | | | | 1,455,077,165 |
| Liabilities | | | | |
| Payable for investments purchased | $ | 208,055,476 | | |
| Payable for fund shares redeemed | | 54,865,117 | | |
| Accrued management fee | | 47,768 | | |
| Collateral on securities loaned | | 39,995,498 | | |
| Total liabilities | | | | 302,963,859 |
| Net Assets | | | $ | 1,152,113,306 |
| Net Assets consist of: | | | | |
| Paid in capital | | | $ | 1,138,347,877 |
| Total accumulated earnings (loss) | | | | 13,765,429 |
| Net Assets | | | $ | 1,152,113,306 |
Net Asset Value, offering price and redemption price per share ($1,152,113,306 ÷ 48,261,331 shares) | | | $ | 23.87 |
| Statement of Operations |
| | | | Year ended June 30, 2024 |
| Investment Income | | | | |
| Dividends | | | $ | 20,619,327 |
| Interest | | | | 9,743 |
| Income from Fidelity Central Funds (including $985,107 from security lending) | | | | 1,103,026 |
| Total income | | | | 21,732,096 |
| Expenses | | | | |
| Management fee | $ | 487,130 | | |
| Independent trustees' fees and expenses | | 3,008 | | |
| Interest | | 17,964 | | |
| Miscellaneous | | 25,804 | | |
| Total expenses before reductions | | 533,906 | | |
| Expense reductions | | (1,577) | | |
| Total expenses after reductions | | | | 532,329 |
| Net Investment income (loss) | | | | 21,199,767 |
| Realized and Unrealized Gain (Loss) | | | | |
| Net realized gain (loss) on: | | | | |
| Investment Securities: | | | | |
| Unaffiliated issuers | | 2,118,589 | | |
| Redemptions in-kind | | 33,642,050 | | |
| Fidelity Central Funds | | 35 | | |
| Futures contracts | | (155,865) | | |
| Total net realized gain (loss) | | | | 35,604,809 |
| Change in net unrealized appreciation (depreciation) on: | | | | |
| Investment Securities: | | | | |
| Unaffiliated issuers | | 45,532,373 | | |
| Futures contracts | | 692 | | |
| Total change in net unrealized appreciation (depreciation) | | | | 45,533,065 |
| Net gain (loss) | | | | 81,137,874 |
| Net increase (decrease) in net assets resulting from operations | | | $ | 102,337,641 |
| Statement of Changes in Net Assets |
| |
| | Year ended June 30, 2024 | | Year ended June 30, 2023 |
| Increase (Decrease) in Net Assets | | | | |
| Operations | | | | |
| Net investment income (loss) | $ | 21,199,767 | $ | 20,495,276 |
| Net realized gain (loss) | | 35,604,809 | | (18,360,955) |
| Change in net unrealized appreciation (depreciation) | | 45,533,065 | | 46,223,187 |
| Net increase (decrease) in net assets resulting from operations | | 102,337,641 | | 48,357,508 |
| Distributions to shareholders | | (20,400,767) | | (30,079,235) |
| | | | | |
| Share transactions | | | | |
| Proceeds from sales of shares | | 585,215,613 | | 318,203,406 |
| Reinvestment of distributions | | 16,744,037 | | 24,216,686 |
| Cost of shares redeemed | | (431,989,211) | | (268,975,234) |
| | | | | |
Net increase (decrease) in net assets resulting from share transactions | | 169,970,439 | | 73,444,858 |
| Total increase (decrease) in net assets | | 251,907,313 | | 91,723,131 |
| | | | | |
| Net Assets | | | | |
| Beginning of period | | 900,205,993 | | 808,482,862 |
| End of period | $ | 1,152,113,306 | $ | 900,205,993 |
| | | | | |
| Other Information | | | | |
| Shares | | | | |
| Sold | | 25,464,870 | | 14,384,346 |
| Issued in reinvestment of distributions | | 720,127 | | 1,074,926 |
| Redeemed | | (18,850,764) | | (12,214,236) |
| Net increase (decrease) | | 7,334,233 | | 3,245,036 |
| | | | | |
Financial Highlights
Fidelity® Small Cap Value Index Fund |
| |
| Years ended June 30, | | 2024 | | 2023 | | 2022 | | 2021 | | 2020 A |
Selected Per-Share Data | | | | | | | | | | |
| Net asset value, beginning of period | $ | 22.00 | $ | 21.46 | $ | 28.18 | $ | 16.52 | $ | 20.00 |
| Income from Investment Operations | | | | | | | | | | |
Net investment income (loss) B,C | | .50 | | .52 | | .44 | | .37 | | .37 |
| Net realized and unrealized gain (loss) | | 1.87 | | .81 | | (4.69) | | 11.59 | | (3.72) |
| Total from investment operations | | 2.37 | | 1.33 | | (4.25) | | 11.96 | | (3.35) |
| Distributions from net investment income | | (.50) | | (.42) | | (.44) D | | (.30) | | (.12) |
| Distributions from net realized gain | | - | | (.38) | | (2.03) D | | - | | (.02) |
| Total distributions | | (.50) | | (.79) E | | (2.47) | | (.30) | | (.13) E |
| Net asset value, end of period | $ | 23.87 | $ | 22.00 | $ | 21.46 | $ | 28.18 | $ | 16.52 |
Total Return F,G | | | | 6.14% | | (16.30)% | | 73.10% | | (16.89)% |
Ratios to Average Net Assets C,H,I | | | | | | | | | | |
| Expenses before reductions | | .05% | | .05% | | .05% | | .05% | | .05% J |
| Expenses net of fee waivers, if any | | | | .05% | | .05% | | .05% | | .05% J |
| Expenses net of all reductions | | .05% | | .05% | | .05% | | .05% | | .05% J |
| Net investment income (loss) | | 2.18% | | 2.37% | | 1.77% | | 1.56% | | 2.24% J |
| Supplemental Data | | | | | | | | | | |
| Net assets, end of period (000 omitted) | $ | 1,152,113 | $ | 900,206 | $ | 808,483 | $ | 736,509 | $ | 139,586 |
Portfolio turnover rate K | | | | 33% | | 38% | | 60% | | 74% J |
AFor the period July 11, 2019 (commencement of operations) through June 30, 2020.
BCalculated based on average shares outstanding during the period.
CNet investment income (loss) is affected by the timing of the declaration of dividends by any underlying mutual funds or exchange-traded funds (ETFs). Net investment income (loss) of any mutual funds or ETFs is not included in the Fund's net investment income (loss) ratio.
DThe amount shown reflects reclassifications related to book to tax differences that were made in the year shown.
ETotal distributions per share do not sum due to rounding.
FTotal returns for periods of less than one year are not annualized.
GTotal returns would have been lower if certain expenses had not been reduced during the applicable periods shown.
HFees and expenses of any underlying mutual funds or exchange-traded funds (ETFs) are not included in the Fund's expense ratio. The Fund indirectly bears its proportionate share of these expenses. For additional expense information related to investments in Fidelity Central Funds, please refer to the "Investments in Fidelity Central Funds" note found in the Notes to Financial Statements section of the most recent Annual or Semi-Annual report.
IExpense ratios reflect operating expenses of the class. Expenses before reductions do not reflect amounts reimbursed, waived, or reduced through arrangements with the investment adviser, brokerage services, or other offset arrangements, if applicable, and do not represent the amount paid by the class during periods when reimbursements, waivers or reductions occur.
JAnnualized.
KAmount does not include the portfolio activity of any underlying mutual funds or exchange-traded funds (ETFs).
LPortfolio turnover rate excludes securities received or delivered in-kind.
Notes to Financial Statements
For the period ended June 30, 2024
1. Organization.
Fidelity Mid Cap Growth Index Fund, Fidelity Mid Cap Value Index Fund, Fidelity Small Cap Growth Index Fund and Fidelity Small Cap Value Index Fund (the Funds) are funds of Fidelity Salem Street Trust (the Trust). Each Fund is authorized to issue an unlimited number of shares. Share transactions on the Statement of Changes in Net Assets may contain exchanges between affiliated funds. The Trust is registered under the Investment Company Act of 1940, as amended (the 1940 Act), as an open-end management investment company organized as a Massachusetts business trust.
2. Investments in Fidelity Central Funds.
Funds may invest in Fidelity Central Funds, which are open-end investment companies generally available only to other investment companies and accounts managed by the investment adviser and its affiliates. The Schedule of Investments lists any Fidelity Central Funds held as an investment as of period end, but does not include the underlying holdings of each Fidelity Central Fund. An investing fund indirectly bears its proportionate share of the expenses of the underlying Fidelity Central Funds.
Based on its investment objective, each Fidelity Central Fund may invest or participate in various investment vehicles or strategies that are similar to those of the investing fund. These strategies are consistent with the investment objectives of the investing fund and may involve certain economic risks which may cause a decline in value of each of the Fidelity Central Funds and thus a decline in the value of the investing fund.
| Fidelity Central Fund | Investment Manager | Investment Objective | Investment Practices | Expense RatioA |
| Fidelity Money Market Central Funds | Fidelity Management & Research Company LLC (FMR) | Each fund seeks to obtain a high level of current income consistent with the preservation of capital and liquidity. | Short-term Investments | Less than .005% |
A Expenses expressed as a percentage of average net assets and are as of each underlying Central Fund's most recent annual or semi-annual shareholder report.
A complete unaudited list of holdings for each Fidelity Central Fund is available upon request or at the Securities and Exchange Commission website at www.sec.gov. In addition, the financial statements of the Fidelity Central Funds which contain the significant accounting policies (including investment valuation policies) of those funds, and are not covered by the Report of Independent Registered Public Accounting Firm, are available on the Securities and Exchange Commission website or upon request.
3. Significant Accounting Policies.
Each Fund is an investment company and applies the accounting and reporting guidance of the Financial Accounting Standards Board (FASB) Accounting Standards Codification Topic 946 Financial Services - Investment Companies. The financial statements have been prepared in conformity with accounting principles generally accepted in the United States of America (GAAP), which require management to make certain estimates and assumptions at the date of the financial statements. Actual results could differ from those estimates. Subsequent events, if any, through the date that the financial statements were issued have been evaluated in the preparation of the financial statements. Each Fund's Schedule of Investments lists any underlying mutual funds or exchange-traded funds (ETFs) but does not include the underlying holdings of these funds. The following summarizes the significant accounting policies of each Fund:
Investment Valuation. Investments are valued as of 4:00 p.m. Eastern time on the last calendar day of the period. The Board of Trustees (the Board) has designated each Fund's investment adviser as the valuation designee responsible for the fair valuation function and performing fair value determinations as needed. The investment adviser has established a Fair Value Committee (the Committee) to carry out the day-to-day fair valuation responsibilities and has adopted policies and procedures to govern the fair valuation process and the activities of the Committee. In accordance with these fair valuation policies and procedures, which have been approved by the Board, each Fund attempts to obtain prices from one or more third party pricing services or brokers to value its investments. When current market prices, quotations or currency exchange rates are not readily available or reliable, investments will be fair valued in good faith by the Committee, in accordance with the policies and procedures. Factors used in determining fair value vary by investment type and may include market or investment specific events, transaction data, estimated cash flows, and market observations of comparable investments. The frequency that the fair valuation procedures are used cannot be predicted and they may be utilized to a significant extent. The Committee manages each Fund's fair valuation practices and maintains the fair valuation policies and procedures. Each Fund's investment adviser reports to the Board information regarding the fair valuation process and related material matters.
Each Fund categorizes the inputs to valuation techniques used to value its investments into a disclosure hierarchy consisting of three levels as shown below:
Level 1 - unadjusted quoted prices in active markets for identical investments
Level 2 - other significant observable inputs (including quoted prices for similar investments, interest rates, prepayment speeds, etc.)
Level 3 - unobservable inputs (including the Fund's own assumptions based on the best information available)
Valuation techniques used to value each Fund's investments by major category are as follows:
Equity securities, including restricted securities, for which market quotations are readily available, are valued at the last reported sale price or official closing price as reported by a third party pricing service on the primary market or exchange on which they are traded and are categorized as Level 1 in the hierarchy. In the event there were no sales during the day or closing prices are not available, securities are valued at the last quoted bid price or may be valued using the last available price and are generally categorized as Level 2 in the hierarchy. For foreign equity securities, when market or security specific events arise, comparisons to the valuation of American Depositary Receipts (ADRs), futures contracts, Exchange-Traded Funds (ETFs) and certain indexes as well as quoted prices for similar securities may be used and would be categorized as Level 2 in the hierarchy. For equity securities, including restricted securities, where observable inputs are limited, assumptions about market activity and risk are used and these securities may be categorized as Level 3 in the hierarchy.
Debt securities, including restricted securities, are valued based on evaluated prices received from third party pricing services or from brokers who make markets in such securities. U.S. government and government agency obligations are valued by pricing services who utilize matrix pricing which considers yield or price of bonds of comparable quality, coupon, maturity and type or by broker-supplied prices. When independent prices are unavailable or unreliable, debt securities may be valued utilizing pricing methodologies which consider similar factors that would be used by third party pricing services. Debt securities are generally categorized as Level 2 in the hierarchy but may be Level 3 depending on the circumstances.
Futures contracts are valued at the settlement price established each day by the board of trade or exchange on which they are traded and are categorized as Level 1 in the hierarchy. Investments in open-end mutual funds, including the Fidelity Central Funds, are valued at their closing net asset value (NAV) each business day and are categorized as Level 1 in the hierarchy.
Changes in valuation techniques may result in transfers in or out of an assigned level within the disclosure hierarchy. The aggregate value of investments by input level as of June 30, 2024 is included at the end of each Fund's Schedule of Investments.
Foreign Currency. Certain Funds may use foreign currency contracts to facilitate transactions in foreign-denominated securities. Gains and losses from these transactions may arise from changes in the value of the foreign currency or if the counterparties do not perform under the contracts' terms.
Foreign-denominated assets, including investment securities, and liabilities are translated into U.S. dollars at the exchange rates at period end. Purchases and sales of investment securities, income and dividends received, and expenses denominated in foreign currencies are translated into U.S. dollars at the exchange rate in effect on the transaction date.
The effects of exchange rate fluctuations on investments are included with the net realized and unrealized gain (loss) on investment securities. Other foreign currency transactions resulting in realized and unrealized gain (loss) are disclosed separately.
Investment Transactions and Income. For financial reporting purposes, the Funds' investment holdings and NAV include trades executed through the end of the last business day of the period. The NAV per share for processing shareholder transactions is calculated as of the close of business of the New York Stock Exchange (NYSE), normally 4:00 p.m. Eastern time and includes trades executed through the end of the prior business day. Gains and losses on securities sold are determined on the basis of identified cost and for certain Funds include proceeds received from litigation. Commissions paid to certain brokers with whom the investment adviser, or its affiliates, places trades on behalf of a fund include an amount in addition to trade execution, which may be rebated back to a fund. Any such rebates are included in net realized gain (loss) on investments in the Statement of Operations. Dividend income is recorded on the ex-dividend date, except for certain dividends from foreign securities where the ex-dividend date may have passed, which are recorded as soon as the Funds are informed of the ex-dividend date. Non-cash dividends included in dividend income, if any, are recorded at the fair market value of the securities received. Income and capital gain distributions from Fidelity Central Funds, if any, are recorded on the ex-dividend date. Certain distributions received by the Funds represent a return of capital or capital gain. The Funds determine the components of these distributions subsequent to the ex-dividend date, based upon receipt of tax filings or other correspondence relating to the underlying investment. These distributions are recorded as a reduction of cost of investments and/or as a realized gain. Interest income is accrued as earned and includes coupon interest and amortization of premium and accretion of discount on debt securities as applicable. Investment income is recorded net of foreign taxes withheld where recovery of such taxes is uncertain.
Expenses. Expenses directly attributable to a fund are charged to that fund. Expenses attributable to more than one fund are allocated among the respective funds on the basis of relative net assets or other appropriate methods. Expenses included in the accompanying financial statements reflect the expenses of that fund and do not include any expenses associated with any underlying mutual funds or exchange-traded funds. Although not included in a fund's expenses, a fund indirectly bears its proportionate share of these expenses through the net asset value of each underlying mutual fund or exchange-traded fund. Expense estimates are accrued in the period to which they relate and adjustments are made when actual amounts are known.
Income Tax Information and Distributions to Shareholders. Each year, each Fund intends to qualify as a regulated investment company under Subchapter M of the Internal Revenue Code, including distributing substantially all of its taxable income and realized gains. As a result, no provision for U.S. Federal income taxes is required. As of June 30, 2024, each Fund did not have any unrecognized tax benefits in the financial statements; nor is each Fund aware of any tax positions for which it is reasonably possible that the total amounts of unrecognized tax benefits will significantly change in the next twelve months. Each Fund files a U.S. federal tax return, in addition to state and local tax returns as required. Each Fund's federal income tax returns are subject to examination by the Internal Revenue Service (IRS) for a period of three fiscal years after they are filed. State and local tax returns may be subject to examination for an additional fiscal year depending on the jurisdiction. Foreign taxes are provided for based on each Fund's understanding of the tax rules and rates that exist in the foreign markets in which it invests.
Distributions are declared and recorded on the ex-dividend date. Income and capital gain distributions are determined in accordance with income tax regulations, which may differ from GAAP. These differences resulted in distribution reclassifications. In addition, the Funds claimed a portion of the payment made to redeeming shareholders as a distribution for income tax purposes.
Capital accounts within the financial statements are adjusted for permanent book-tax differences. These adjustments have no impact on net assets or the results of operations. Capital accounts are not adjusted for temporary book-tax differences which will reverse in a subsequent period.
Book-tax differences are primarily due to futures contracts, foreign currency transactions, passive foreign investment companies (PFIC), partnerships, redemptions in-kind, capital loss carryforwards and losses deferred due to wash sales and excise tax regulations.
As of period end, the cost and unrealized appreciation (depreciation) in securities, and derivatives if applicable, for federal income tax purposes were as follows for each Fund:
| | Tax cost ($) | Gross unrealized appreciation ($) | Gross unrealized depreciation ($) | Net unrealized appreciation (depreciation)($) |
| Fidelity Mid Cap Growth Index Fund | 980,934,272 | 170,508,019 | (40,044,175) | 130,463,844 |
| Fidelity Mid Cap Value Index Fund | 726,525,331 | 204,353,201 | (48,683,081) | 155,670,120 |
| Fidelity Small Cap Growth Index Fund | 655,511,917 | 113,410,154 | (60,631,524) | 52,778,630 |
| Fidelity Small Cap Value Index Fund | 1,171,131,047 | 155,017,485 | (134,694,011) | 20,323,474 |
The tax-based components of distributable earnings as of period end were as follows for each Fund:
| | Undistributed ordinary income ($) | Undistributed long-term capital gain ($) | Capital loss carryforward ($) | Net unrealized appreciation (depreciation) on securities and other investments ($) |
| Fidelity Mid Cap Growth Index Fund | 2,695,709 | - | (27,948,481) | 130,463,841 |
| Fidelity Mid Cap Value Index Fund | 9,026,881 | 22,156,928 | - | 155,670,120 |
| Fidelity Small Cap Growth Index Fund | 5,130,090 | - | (49,365,513) | 52,778,622 |
| Fidelity Small Cap Value Index Fund | 8,264,165 | - | (14,822,209) | 20,323,474 |
Capital loss carryforwards are only available to offset future capital gains of the Funds to the extent provided by regulations and may be limited. The capital loss carryforward information presented below, including any applicable limitation, is estimated as of fiscal period end and is subject to adjustment.
| | Short-term ($) | Long-term ($) | Total capital loss carryforward ($) |
| Fidelity Mid Cap Growth Index Fund | (27,948,481) | - | (27,948,481) |
| Fidelity Small Cap Growth Index Fund | (32,301,193) | (17,064,320) | (49,365,513) |
| Fidelity Small Cap Value Index Fund | - | (14,822,209) | (14,822,209) |
Due to large subscriptions in a prior period, Fidelity Small Cap Growth Index Fund is subject to an annual limit on its use of some of its unrealized capital losses to offset capital gains in future periods. If those losses are realized and the limitation prevents the Fund from using any of those losses in a future period, those capital losses will be available to offset capital gains in subsequent periods.
The tax character of distributions paid was as follows:
| June 30, 2024 | | | |
| | Ordinary Income ($) | Long-term Capital Gains ($) | Total ($) |
| Fidelity Mid Cap Growth Index Fund | 5,052,417 | - | 5,052,417 |
| Fidelity Mid Cap Value Index Fund | 16,377,481 | - | 16,377,481 |
| Fidelity Small Cap Growth Index Fund | 4,416,179 | - | 4,416,179 |
| Fidelity Small Cap Value Index Fund | 20,400,767 | - | 20,400,767 |
| June 30, 2023 | | | |
| | Ordinary Income ($) | Long-term Capital Gains ($) | Total ($) |
| Fidelity Mid Cap Growth Index Fund | 4,150,490 | - | 4,150,490 |
| Fidelity Mid Cap Value Index Fund | 15,937,291 | 5,985,102 | 21,922,393 |
| Fidelity Small Cap Growth Index Fund | 2,541,670 | - | 2,541,670 |
| Fidelity Small Cap Value Index Fund | 16,062,244 | 14,016,991 | 30,079,235 |
4. Derivative Instruments.
Risk Exposures and the Use of Derivative Instruments. Each Fund's investment objectives allow for various types of derivative instruments, including futures contracts. Derivatives are investments whose value is primarily derived from underlying assets, indices or reference rates and may be transacted on an exchange or over-the-counter (OTC). Derivatives may involve a future commitment to buy or sell a specified asset based on specified terms, to exchange future cash flows at periodic intervals based on a notional principal amount, or for one party to make one or more payments upon the occurrence of specified events in exchange for periodic payments from the other party.
Derivatives were used to increase returns and to manage exposure to certain risks as defined below. The success of any strategy involving derivatives depends on analysis of numerous economic factors, and if the strategies for investment do not work as intended, the objectives may not be achieved.
Derivatives were used to increase or decrease exposure to the following risk(s):
| Equity Risk | Equity risk relates to the fluctuations in the value of financial instruments as a result of changes in market prices (other than those arising from interest rate risk or foreign exchange risk), whether caused by factors specific to an individual investment, its issuer, or all factors affecting all instruments traded in a market or market segment. |
Funds are also exposed to additional risks from investing in derivatives, such as liquidity risk and counterparty credit risk. Liquidity risk is the risk that a fund will be unable to close out the derivative in the open market in a timely manner. Counterparty credit risk is the risk that the counterparty will not be able to fulfill its obligation to a fund. Counterparty credit risk related to exchange-traded contracts may be mitigated by the protection provided by the exchange on which they trade.
Investing in derivatives may involve greater risks than investing in the underlying assets directly and, to varying degrees, may involve risk of loss in excess of any initial investment and collateral received and amounts recognized in the Statement of Assets and Liabilities. In addition, there may be the risk that the change in value of the derivative contract does not correspond to the change in value of the underlying instrument.
Futures Contracts. A futures contract is an agreement between two parties to buy or sell a specified underlying instrument for a fixed price at a specified future date. Futures contracts were used to manage exposure to the stock market.
Upon entering into a futures contract, a fund is required to deposit either cash or securities (initial margin) with a clearing broker in an amount equal to a certain percentage of the face value of the contract. Futures contracts are marked-to-market daily and subsequent daily payments are made or received by a fund depending on the daily fluctuations in the value of the futures contracts and are recorded as unrealized appreciation or (depreciation). This receivable and/or payable, if any, is included in daily variation margin on futures contracts in the Statement of Assets and Liabilities. Realized gain or (loss) is recorded upon the expiration or closing of a futures contract. The net realized gain (loss) and change in net unrealized appreciation (depreciation) on futures contracts during the period is presented in the Statement of Operations.
Any open futures contracts at period end are presented in the Schedule of Investments under the caption "Futures Contracts". The notional amount at value reflects each contract's exposure to the underlying instrument or index at period end, and is representative of volume of activity during the period unless an average notional amount is presented. Any securities deposited to meet initial margin requirements are identified in the Schedule of Investments. Any cash deposited to meet initial margin requirements is presented as segregated cash with brokers for derivative instruments in the Statement of Assets and Liabilities.
5. Purchases and Sales of Investments.
Purchases and sales of securities, other than short-term securities, U.S. government securities and in-kind transactions, as applicable, are noted in the table below.
| | Purchases ($) | Sales ($) |
| Fidelity Mid Cap Growth Index Fund | 807,973,474 | 455,255,363 |
| Fidelity Mid Cap Value Index Fund | 325,994,824 | 334,074,402 |
| Fidelity Small Cap Growth Index Fund | 401,714,437 | 268,804,554 |
| Fidelity Small Cap Value Index Fund | 608,231,820 | 363,368,335 |
Unaffiliated Redemptions In-Kind. Shares that were redeemed in-kind for investments, including accrued interest and cash, if any, are shown in the table below. The net realized gain or loss on investments delivered through in-kind redemptions is included in the "Net realized gain (loss) on: Redemptions in-kind" line in the accompanying Statement of Operations. The amount of the in-kind redemptions is included in share transactions in the accompanying Statement of Changes in Net Assets. There was no gain or loss for federal income tax purposes.
| | Shares | Total net realized gain or loss ($) | Total Proceeds ($) |
| Fidelity Mid Cap Growth Index Fund | 1,781,348 | 26,543,179 | 51,124,694 |
| Fidelity Mid Cap Value Index Fund | 1,606,118 | 28,625,666 | 42,208,795 |
| Fidelity Small Cap Growth Index Fund | 715,990 | 13,238,375 | 18,221,957 |
| Fidelity Small Cap Value Index Fund | 2,260,128 | 33,642,050 | 53,949,254 |
6. Fees and Other Transactions with Affiliates.
Management Fee. Fidelity Management & Research Company LLC (the investment adviser) and its affiliates provide the Funds with investment management related services for which each Fund pays a monthly management fee. The management fee is based on the annual rates of each Fund's average net assets as noted in the table below. Under the management contract, the investment adviser pays all other operating expenses, except the compensation of the independent Trustees and certain miscellaneous expenses such as proxy and shareholder meeting expenses.
| | % of Average Net Assets |
| Fidelity Mid Cap Growth Index Fund | .05% |
| Fidelity Mid Cap Value Index Fund | .05% |
| Fidelity Small Cap Growth Index Fund | .05% |
| Fidelity Small Cap Value Index Fund | .05% |
Sub-Adviser. Geode Capital Management, LLC (Geode), serves as sub-adviser for the Funds. Geode provides discretionary investment advisory services to the Funds and is paid by the investment adviser for providing these services.
Interfund Lending Program. Pursuant to an Exemptive Order issued by the Securities and Exchange Commission (the SEC), each Fund, along with other registered investment companies having management contracts with Fidelity Management & Research Company LLC (FMR), or other affiliated entities of FMR, may participate in an interfund lending program. This program provides an alternative credit facility allowing each Fund to borrow from, or lend money to, other participating affiliated funds. At period end, there were no interfund loans outstanding. Activity in this program during the period for which loans were outstanding was as follows:
| | Borrower or Lender | Average Loan Balance ($) | Weighted Average Interest Rate | Interest Expense ($) |
| Fidelity Mid Cap Growth Index Fund | Borrower | 13,713,000 | 5.57% | 10,607 |
| Fidelity Mid Cap Value Index Fund | Borrower | 7,029,429 | 5.57% | 30,429 |
| Fidelity Small Cap Growth Index Fund | Borrower | 15,779,333 | 5.57% | 7,320 |
| Fidelity Small Cap Value Index Fund | Borrower | 9,680,417 | 5.57% | 17,964 |
Interfund Trades. Funds may purchase from or sell securities to other Fidelity Funds under procedures adopted by the Board. The procedures have been designed to ensure these interfund trades are executed in accordance with Rule 17a-7 of the 1940 Act. Any interfund trades are included within the respective purchases and sales amounts shown in the Purchases and Sales of Investments note. During the period, there were no interfund trades.
7. Committed Line of Credit.
Certain Funds participate with other funds managed by the investment adviser or an affiliate in a $4.25 billion credit facility (the "line of credit") to be utilized for temporary or emergency purposes to fund shareholder redemptions or for other short-term liquidity purposes. The commitment fees on the pro-rata portion of the line of credit are borne by the investment adviser. During the period, there were no borrowings on this line of credit.
8. Security Lending.
Funds lend portfolio securities from time to time in order to earn additional income. Lending agents are used, including National Financial Services (NFS), an affiliate of the investment adviser. Pursuant to a securities lending agreement, NFS will receive a fee, which is capped at 9.9% of a fund's daily lending revenue, for its services as lending agent. A fund may lend securities to certain qualified borrowers, including NFS. On the settlement date of the loan, a fund receives collateral (in the form of U.S. Treasury obligations, letters of credit and/or cash) against the loaned securities and maintains collateral in an amount not less than 100% of the market value of the loaned securities during the period of the loan. The market value of the loaned securities is determined at the close of business of a fund and any additional required collateral is delivered to a fund on the next business day. A fund or borrower may terminate the loan at any time, and if the borrower defaults on its obligation to return the securities loaned because of insolvency or other reasons, a fund may apply collateral received from the borrower against the obligation. A fund may experience delays and costs in recovering the securities loaned. Any cash collateral received is invested in the Fidelity Securities Lending Cash Central Fund. Any loaned securities are identified as such in the Schedule of Investments, and the value of loaned securities and cash collateral at period end, as applicable, are presented in the Statement of Assets and Liabilities. Security lending income represents the income earned on investing cash collateral, less rebates paid to borrowers and any lending agent fees associated with the loan, plus any premium payments received for lending certain types of securities. Security lending income is presented in the Statement of Operations as a component of income from Fidelity Central Funds. Affiliated security lending activity, if any, was as follows:
| | Total Security Lending Fees Paid to NFS ($) | Security Lending Income From Securities Loaned to NFS ($) | Value of Securities Loaned to NFS at Period End ($) |
| Fidelity Mid Cap Growth Index Fund | 4,578 | 4,928 | 27,029 |
| Fidelity Mid Cap Value Index Fund | 27,551 | 303 | - |
| Fidelity Small Cap Growth Index Fund | 96,407 | 14,742 | 180,429 |
| Fidelity Small Cap Value Index Fund | 102,311 | 17,370 | 185,447 |
9. Bank Borrowings.
Each Fund is permitted to have bank borrowings for temporary or emergency purposes to fund shareholder redemptions or for other short-term liquidity requirements. Each Fund has established borrowing arrangements with certain banks. The interest rate on the borrowings is the bank's base rate, as revised from time to time. Any open loans, including accrued interest, at period end are presented under the caption "Notes payable" in the Statement of Assets and Liabilities, if applicable. Activity in this program during the period for which loans were outstanding was as follows:
| | Average Loan Balance ($) | Weighted Average Interest Rate | Interest Expense ($) |
| Fidelity Mid Cap Value Index Fund | 416,000 | 5.83% | 472 |
10. Expense Reductions.
Through arrangements with each applicable Fund's custodian, credits realized as a result of certain uninvested cash balances were used to reduce each applicable Fund's expenses. All of the applicable expense reductions are noted in the table below.
| | Custodian credits ($) |
| Fidelity Mid Cap Growth Index Fund | 959 |
| Fidelity Mid Cap Value Index Fund | 59 |
| Fidelity Small Cap Growth Index Fund | 2,934 |
| Fidelity Small Cap Value Index Fund | 1,577 |
11. Other.
A fund's organizational documents provide former and current trustees and officers with a limited indemnification against liabilities arising in connection with the performance of their duties to the fund. In the normal course of business, a fund may also enter into contracts that provide general indemnifications. A fund's maximum exposure under these arrangements is unknown as this would be dependent on future claims that may be made against a fund. The risk of material loss from such claims is considered remote.
12. Risk and Uncertainties.
Many factors affect a fund's performance. Developments that disrupt global economies and financial markets, such as pandemics, epidemics, outbreaks of infectious diseases, war, terrorism, and environmental disasters, may significantly affect a fund's investment performance. The effects of these developments to a fund will be impacted by the types of securities in which a fund invests, the financial condition, industry, economic sector, and geographic location of an issuer, and a fund's level of investment in the securities of that issuer. Significant concentrations in security types, issuers, industries, sectors, and geographic locations may magnify the factors that affect a fund's performance.
Report of Independent Registered Public Accounting Firm
To the Board of Trustees of Fidelity Salem Street Trust and the Shareholders of Fidelity Mid Cap Growth Index Fund and Fidelity Mid Cap Value Index Fund:
Opinion on the Financial Statements and Financial Highlights
We have audited the accompanying statements of assets and liabilities of Fidelity Mid Cap Growth Index Fund and Fidelity Mid Cap Value Index Fund (the "Funds"), each a fund of Fidelity Salem Street Trust, including the schedules of investments, as of June 30, 2024, the related statements of operations for the year then ended, the statements of changes in net assets for each of the two years in the period then ended, the financial highlights for each of the four years in the period then ended and for the period from July 11, 2019 (commencement of operations) through June 30, 2020, and the related notes. In our opinion, the financial statements and financial highlights present fairly, in all material respects, the financial position of each of the Funds as of June 30, 2024, and the results of their operations for the year then ended, the changes in their net assets for each of the two years in the period then ended, and the financial highlights for each of the four years in the period then ended and for the period from July 11, 2019 (commencement of operations) through June 30, 2020, in conformity with accounting principles generally accepted in the United States of America.
Basis for Opinion
These financial statements and financial highlights are the responsibility of the Funds' management. Our responsibility is to express an opinion on the Funds' financial statements and financial highlights based on our audits. We are a public accounting firm registered with the Public Company Accounting Oversight Board (United States) (PCAOB) and are required to be independent with respect to the Funds in accordance with the U.S. federal securities laws and the applicable rules and regulations of the Securities and Exchange Commission and the PCAOB.
We conducted our audits in accordance with the standards of the PCAOB. Those standards require that we plan and perform the audit to obtain reasonable assurance about whether the financial statements and financial highlights are free of material misstatement, whether due to error or fraud. The Funds are not required to have, nor were we engaged to perform, an audit of their internal control over financial reporting. As part of our audits, we are required to obtain an understanding of internal control over financial reporting but not for the purpose of expressing an opinion on the effectiveness of the Funds' internal control over financial reporting. Accordingly, we express no such opinion.
Our audits included performing procedures to assess the risks of material misstatement of the financial statements and financial highlights, whether due to error or fraud, and performing procedures that respond to those risks. Such procedures included examining, on a test basis, evidence regarding the amounts and disclosures in the financial statements and financial highlights. Our audits also included evaluating the accounting principles used and significant estimates made by management, as well as evaluating the overall presentation of the financial statements and financial highlights. Our procedures included confirmation of securities owned as of June 30, 2024, by correspondence with the custodian and brokers; when replies were not received from brokers, we performed other auditing procedures. We believe that our audits provide a reasonable basis for our opinion.
/s/ Deloitte & Touche LLP
Boston, Massachusetts
August 14, 2024
We have served as the auditor of one or more of the Fidelity investment companies since 1999.
Report of Independent Registered Public Accounting Firm
To the Board of Trustees of Fidelity Salem Street Trust and Shareholders of Fidelity Small Cap Growth Index Fund and Fidelity Small Cap Value Index Fund
Opinions on the Financial Statements
We have audited the accompanying statements of assets and liabilities, including the schedules of investments, of Fidelity Small Cap Growth Index Fund and Fidelity Small Cap Value Index Fund (two of the funds constituting Fidelity Salem Street Trust, hereafter collectively referred to as the "Funds") as of June 30, 2024, the related statements of operations for the year ended June 30, 2024, the statements of changes in net assets for each of the two years in the period ended June 30, 2024, including the related notes, and the financial highlights for each of the four years in the period ended June 30, 2024 and for the period July 11, 2019 (commencement of operations) through June 30, 2020 (collectively referred to as the "financial statements"). In our opinion, the financial statements present fairly, in all material respects, the financial position of each of the Funds as of June 30, 2024, the results of each of their operations for the year then ended, the changes in each of their net assets for each of the two years in the period ended June 30, 2024 and each of the financial highlights for each of the four years in the period ended June 30, 2024 and for the period July 11, 2019 (commencement of operations) through June 30, 2020 in conformity with accounting principles generally accepted in the United States of America.
Basis for Opinions
These financial statements are the responsibility of the Funds' management. Our responsibility is to express an opinion on the Funds' financial statements based on our audits. We are a public accounting firm registered with the Public Company Accounting Oversight Board (United States) (PCAOB) and are required to be independent with respect to the Funds in accordance with the U.S. federal securities laws and the applicable rules and regulations of the Securities and Exchange Commission and the PCAOB.
We conducted our audits of these financial statements in accordance with the standards of the PCAOB. Those standards require that we plan and perform the audit to obtain reasonable assurance about whether the financial statements are free of material misstatement, whether due to error or fraud.
Our audits included performing procedures to assess the risks of material misstatement of the financial statements, whether due to error or fraud, and performing procedures that respond to those risks. Such procedures included examining, on a test basis, evidence regarding the amounts and disclosures in the financial statements. Our audits also included evaluating the accounting principles used and significant estimates made by management, as well as evaluating the overall presentation of the financial statements. Our procedures included confirmation of securities owned as of June 30, 2024 by correspondence with the custodian and brokers; when replies were not received from brokers, we performed other auditing procedures. We believe that our audits provide a reasonable basis for our opinions.
/s/ PricewaterhouseCoopers LLP
Boston, Massachusetts
August 14, 2024
We have served as the auditor of one or more investment companies in the Fidelity group of funds since 1932.
Distributions
(Unaudited)The dividend and capital gains distributions for the fund(s) are available on Fidelity.com or Institutional.Fidelity.com.
The funds hereby designate as capital gain dividend the amounts noted below for the taxable year ended June 30, 2024, or, if subsequently determined to be different, the net capital gain of such year.
| Fidelity Mid Cap Value Index Fund | $22,156,928 |
A percentage of the dividends distributed during the fiscal year for the following funds qualify for the dividends-received deduction for corporate shareholders:
| Fidelity Mid Cap Growth Index Fund | |
August 2023 December 2023 | 98% 88% |
| Fidelity Mid Cap Value Index Fund | |
August 2023 December 2023 | 83% 75% |
| Fidelity Small Cap Growth Index Fund | |
August 2023 December 2023 | 78% 60% |
| Fidelity Small Cap Value Index Fund | |
August 2023 December 2023 | 69% 60% |
A percentage of the dividends distributed during the fiscal year for the following funds may be taken into account as a dividend for purposes of the maximum rate under section 1(h)(11) of the Internal Revenue Code.
| Fidelity Mid Cap Growth Index Fund | |
August 2023 December 2023 | 99.91% 93.12% |
| Fidelity Mid Cap Value Index Fund | |
August 2023 December 2023 | 87.12% 80.81% |
| Fidelity Small Cap Growth Index Fund | |
August 2023 December 2023 | 79.61% 67.08% |
| Fidelity Small Cap Value Index Fund | |
August 2023 December 2023 | 77.47% 68.41% |
A percentage of the dividends distributed during the fiscal year for the following funds qualify as a section 199A dividend:
| Fidelity Mid Cap Growth Index Fund | |
August 2023 December 2023 | 0.09% 6.16% |
| Fidelity Mid Cap Value Index Fund | |
August 2023 December 2023 | 12.89% 19.20% |
| Fidelity Small Cap Growth Index Fund | |
August 2023 December 2023 | 2.48% 5.25% |
| Fidelity Small Cap Value Index Fund | |
August 2023 December 2023 | 22.10% 28.87% |
The funds hereby designate the amounts noted below as distributions paid during the fiscal year ended 2024 as qualifying to be taxed as section 163(j) interest dividends:
| Fidelity Mid Cap Growth Index Fund | $147,355 |
| Fidelity Mid Cap Value Index Fund | $106,552 |
| Fidelity Small Cap Growth Index Fund | $78,458 |
| Fidelity Small Cap Value Index Fund | $92,728 |
The funds will notify shareholders in January 2025 of amounts for use in preparing 2024 income tax returns.
Item 8: Changes in and Disagreements with Accountants for Open-End Management Investment Companies
Note: This is not applicable for any fund included in this document.
Item 9: Proxy Disclosures for Open-End Management Investment Companies
| A special meeting of shareholders was held on October 18, 2023. The results of votes taken among shareholders on the proposal before them are reported below. Each vote reported represents one dollar of net asset value held on the record date for the meeting. |
| Proposal 1 |
| To elect a Board of Trustees. |
| | # of Votes | % of Votes |
| Abigail P. Johnson |
| Affirmative | 378,729,502,260.01 | 97.58 |
| Withheld | 9,407,876,478.96 | 2.42 |
| TOTAL | 388,137,378,738.97 | 100.00 |
| Jennifer Toolin McAuliffe |
| Affirmative | 378,454,868,010.95 | 97.51 |
| Withheld | 9,682,510,728.02 | 2.49 |
| TOTAL | 388,137,378,738.97 | 100.00 |
| Christine J. Thompson |
| Affirmative | 378,837,121,274.52 | 97.60 |
| Withheld | 9,300,257,464.45 | 2.40 |
| TOTAL | 388,137,378,738.97 | 100.00 |
| Elizabeth S. Acton |
| Affirmative | 378,262,110,794.85 | 97.46 |
| Withheld | 9,875,267,944.12 | 2.54 |
| TOTAL | 388,137,378,738.97 | 100.00 |
| Laura M. Bishop |
| Affirmative | 380,482,113,171.06 | 98.03 |
| Withheld | 7,655,265,567.91 | 1.97 |
| TOTAL | 388,137,378,738.97 | 100.00 |
| Ann E. Dunwoody |
| Affirmative | 380,016,034,008.12 | 97.91 |
| Withheld | 8,121,344,730.85 | 2.09 |
| TOTAL | 388,137,378,738.97 | 100.00 |
| John Engler |
| Affirmative | 379,432,488,394.20 | 97.76 |
| Withheld | 8,704,890,344.77 | 2.24 |
| TOTAL | 388,137,378,738.97 | 100.00 |
| Robert F. Gartland |
| Affirmative | 378,741,819,600.60 | 97.58 |
| Withheld | 9,395,559,138.37 | 2.42 |
| TOTAL | 388,137,378,738.97 | 100.00 |
| Robert W. Helm |
| Affirmative | 380,389,324,755.07 | 98.00 |
| Withheld | 7,748,053,983.90 | 2.00 |
| TOTAL | 388,137,378,738.97 | 100.00 |
| Arthur E. Johnson |
| Affirmative | 378,427,694,151.67 | 97.50 |
| Withheld | 9,709,684,587.30 | 2.50 |
| TOTAL | 388,137,378,738.97 | 100.00 |
| Michael E. Kenneally |
| Affirmative | 377,842,228,145.18 | 97.35 |
| Withheld | 10,295,150,593.79 | 2.65 |
| TOTAL | 388,137,378,738.97 | 100.00 |
| Mark A. Murray |
| Affirmative | 380,158,432,703.37 | 97.94 |
| Withheld | 7,978,946,035.60 | 2.06 |
| TOTAL | 388,137,378,738.97 | 100.00 |
| Carol J. Zierhoffer |
| Affirmative | 380,522,113,360.24 | 98.04 |
| Withheld | 7,615,265,378.73 | 1.96 |
| TOTAL | 388,137,378,738.97 | 100.00 |
| | | |
| Proposal 1 reflects trust-wide proposal and voting results. |
Item 10: Remuneration Paid to Directors, Officers, and others of Open-End Management Investment Companies
Note: This information is disclosed as part of the financial statements for each Fund as part of Item 7: Financial Statements and Financial Highlights for Open-End Management Investment companies.
Item 11: Statement Regarding Basis for Approval of Investment Advisory Contract
Note: This is not applicable for any fund included in this document.
1.9896342.104
C06-ANN-0824
Fidelity® Defined Maturity Funds
Fidelity® Municipal Income 2025 Fund
Annual Report
June 30, 2024
Includes Fidelity and Fidelity Advisor share classes
Contents
To view a fund's proxy voting guidelines and proxy voting record for the 12-month period ended June 30, visit http://www.fidelity.com/proxyvotingresults or visit the Securities and Exchange Commission's (SEC) web site at http://www.sec.gov.
You may also call 1-800-544-8544 if you're an individual investing directly with Fidelity, call 1-800-835-5092 if you're a plan sponsor or participant with Fidelity as your recordkeeper or call 1-877-208-0098 on institutional accounts or if you're an advisor or invest through one to request a free copy of the proxy voting guidelines.
Standard & Poor's, S&P and S&P 500 are registered service marks of The McGraw-Hill Companies, Inc. and have been licensed for use by Fidelity Distributors Corporation.
Other third-party marks appearing herein are the property of their respective owners.
All other marks appearing herein are registered or unregistered trademarks or service marks of FMR LLC or an affiliated company. © 2024 FMR LLC. All rights reserved.
This report and the financial statements contained herein are submitted for the general information of the shareholders of the Fund. This report is not authorized for distribution to prospective investors in the Fund unless preceded or accompanied by an effective prospectus.
A fund files its complete schedule of portfolio holdings with the SEC for the first and third quarters of each fiscal year on Form N-PORT. Forms N-PORT are available on the SEC's web site at http://www.sec.gov. A fund's Forms N-PORT may be reviewed and copied at the SEC's Public Reference Room in Washington, DC. Information regarding the operation of the SEC's Public Reference Room may be obtained by calling 1-800-SEC-0330.
For a complete list of a fund's portfolio holdings, view the most recent holdings listing, semiannual report, or annual report on Fidelity's web site at http://www.fidelity.com, http://www.institutional.fidelity.com, or http://www.401k.com, as applicable.
NOT FDIC INSURED •MAY LOSE VALUE •NO BANK GUARANTEE
Neither the Fund nor Fidelity Distributors Corporation is a bank.
Item 7: Financial Statements and Financial Highlights for Open-End Management Investment Companies (Annual Report)
Fidelity® Municipal Income 2025 Fund
Schedule of Investments June 30, 2024
Showing Percentage of Net Assets
| Municipal Bonds - 96.6% |
| | | Principal Amount (a) | Value ($) |
| Alabama - 2.1% | | | |
| Black Belt Energy Gas District Series 2022 C1, 5.25% 6/1/25 | | 500,000 | 504,920 |
| Arizona - 2.1% | | | |
| Phoenix Civic Impt. Board Arpt. Rev.: | | | |
| Series 2017 A, 5% 7/1/25 (b) | | 250,000 | 253,442 |
| Series 2017 B, 5% 7/1/25 | | 250,000 | 254,157 |
TOTAL ARIZONA | | | 507,599 |
| California - 2.1% | | | |
| Poway Unified School District Series 2009, 0% 8/1/25 | | 90,000 | 86,839 |
| San Diego County Reg'l. Arpt. Auth. Arpt. Rev. (Sub Lien Proj.) Series 2017 B, 5% 7/1/25 (b) | | 150,000 | 151,756 |
| Washington Township Health Care District Rev. Series 2017 B, 5% 7/1/25 | | 270,000 | 271,707 |
TOTAL CALIFORNIA | | | 510,302 |
| Colorado - 0.8% | | | |
| E-470 Pub. Hwy. Auth. Rev. Series 1997 B, 0% 9/1/25 (Nat'l. Pub. Fin. Guarantee Corp. Insured) | | 200,000 | 191,666 |
| Connecticut - 11.0% | | | |
| Connecticut Gen. Oblig.: | | | |
| Series 2015 B, 5% 6/15/25 | | 175,000 | 177,911 |
| Series 2016 D, 5% 8/15/25 | | 330,000 | 336,541 |
| Connecticut Health & Edl. Facilities Auth. Rev.: | | | |
| (Quinnipiac Univ., Ct. Proj.) Series M, 5% 7/1/25 | | 40,000 | 40,594 |
| (Sacred Heart Univ., CT. Proj.) Series 2017 I-1, 5% 7/1/25 | | 400,000 | 405,547 |
| Series 2022 M, 5% 7/1/25 | | 175,000 | 176,277 |
| Series K1, 5% 7/1/25 | | 280,000 | 280,955 |
| Series K3, 5% 7/1/25 | | 200,000 | 200,682 |
| Series N, 5% 7/1/25 | | 50,000 | 49,883 |
| Connecticut Hsg. Fin. Auth. Series C, 5% 5/15/25 (b) | | 935,000 | 942,810 |
TOTAL CONNECTICUT | | | 2,611,200 |
| District Of Columbia - 1.4% | | | |
| District of Columbia Rev. Series 2018, 5% 10/1/25 | | 75,000 | 76,022 |
| Washington D.C. Metropolitan Transit Auth. Rev. Series 2017 B, 5% 7/1/25 | | 250,000 | 254,039 |
TOTAL DISTRICT OF COLUMBIA | | | 330,061 |
| Florida - 6.7% | | | |
| Broward County Arpt. Sys. Rev. Series 2017, 5% 10/1/25 (b) | | 500,000 | 507,060 |
| Greater Orlando Aviation Auth. Arpt. Facilities Rev. Series 2017 A: | | | |
| 5% 10/1/25 (b) | | 95,000 | 96,574 |
| 5% 10/1/25 (Escrowed to Maturity) (b) | | 205,000 | 208,146 |
| Lakeland Hosp. Sys. Rev. Series 2016, 5% 11/15/25 | | 430,000 | 438,446 |
| Seminole County School Board Ctfs. of Prtn. Series 2016 C, 5% 7/1/25 | | 40,000 | 40,677 |
| South Miami Health Facilities Auth. Hosp. Rev. (Baptist Med. Ctr., FL. Proj.) Series 2017, 5% 8/15/25 | | 200,000 | 203,405 |
| Tampa Hosp. Rev. (H. Lee Moffitt Cancer Ctr. Proj.) Series 2016 B, 5% 7/1/25 | | 100,000 | 101,171 |
TOTAL FLORIDA | | | 1,595,479 |
| Georgia - 3.6% | | | |
| Atlanta Arpt. Rev.: | | | |
| Series 2019 B, 5% 7/1/25 (b) | | 50,000 | 50,659 |
| Series 2023 G, 5% 7/1/25 (b) | | 800,000 | 810,542 |
TOTAL GEORGIA | | | 861,201 |
| Illinois - 8.0% | | | |
| Chicago O'Hare Int'l. Arpt. Rev. Series 2017 D, 5% 1/1/25 (b) | | 100,000 | 100,480 |
| Chicago Transit Auth. Cap. Grant Receipts Rev. Series 2017, 5% 6/1/25 | | 250,000 | 252,535 |
| Illinois Fin. Auth. Rev.: | | | |
| (Edward-Elmhurst Healthcare) Series 2017 A, 5% 1/1/25 (Escrowed to Maturity) | | 145,000 | 146,019 |
| (Northwestern Memorial Hosp.,IL. Proj.) Series 2017 A, 5% 7/15/25 | | 200,000 | 203,107 |
| Series 2016, 5% 5/15/25 | | 250,000 | 252,460 |
| Series 2019, 5% 9/1/25 | | 200,000 | 199,397 |
| Illinois Gen. Oblig. Series 2023 D, 5% 7/1/25 | | 200,000 | 202,718 |
| Illinois Sales Tax Rev. Series 2016 D, 5% 6/15/25 | | 100,000 | 101,074 |
| Kendall, Kane & Will Counties Cmnty. Unit School District #308 Series 2008, 0% 2/1/25 (Assured Guaranty Muni. Corp. Insured) | | 185,000 | 180,815 |
| Metropolitan Pier & Exposition Series 1994 A, 0% 6/15/25 | | 270,000 | 259,932 |
TOTAL ILLINOIS | | | 1,898,537 |
| Indiana - 1.6% | | | |
| Indiana Fin. Auth. Health Sys. Rev. Bonds Series 2019 B, 2.25%, tender 7/1/25 (c) | | 55,000 | 53,958 |
| Indiana Fin. Auth. Rev. (Cmnty. Foundation of Northwest Indiana Obligated Group) Series 2016, 5% 9/1/25 | | 25,000 | 25,397 |
| Indiana Hsg. & Cmnty. Dev. Auth. Series A, 5% 7/1/25 | | 300,000 | 303,855 |
TOTAL INDIANA | | | 383,210 |
| Kentucky - 1.7% | | | |
| Kentucky State Property & Buildings Commission Rev.: | | | |
| (Kentucky St) Series 2016, 5% 10/1/25 | | 100,000 | 102,053 |
| (Proj. No. 118) Series 2018, 5% 4/1/25 | | 300,000 | 303,639 |
TOTAL KENTUCKY | | | 405,692 |
| Louisiana - 0.4% | | | |
| New Orleans Aviation Board Rev. (North Term. Proj.) Series 2017 B, 5% 1/1/25 (b) | | 100,000 | 100,480 |
| Maine - 2.4% | | | |
| Maine Health & Higher Edl. Facilities Auth. Rev.: | | | |
| Series 2017 A, 4% 7/1/25 | | 465,000 | 466,148 |
| Series 2017 B, 4% 7/1/25 | | 100,000 | 100,247 |
TOTAL MAINE | | | 566,395 |
| Maryland - 0.6% | | | |
| Maryland Health & Higher Edl. Facilities Auth. Rev. (Lifebridge Health Proj.) Series 2017, 5% 7/1/25 | | 150,000 | 151,888 |
| Massachusetts - 5.8% | | | |
| Massachusetts Dev. Fin. Agcy. Rev.: | | | |
| (Fisher College) Series 2017, 5% 4/1/25 | | 250,000 | 251,087 |
| Bonds Series 2017 A2, 5%, tender 1/30/25 (c) | | 10,000 | 10,080 |
| Series 2015: | | | |
5% 7/1/25 | | 40,000 | 40,547 |
5% 7/1/25 (Escrowed to Maturity) | | 110,000 | 111,558 |
| Series 2016 I, 5% 7/1/25 | | 50,000 | 50,487 |
| Series 2019 K, 5% 7/1/25 | | 50,000 | 50,683 |
| Series 2019, 5% 7/1/25 | | 170,000 | 171,290 |
| Series 2022, 5% 7/1/25 | | 125,000 | 125,790 |
| Massachusetts Edl. Fing. Auth. Rev. Series 2017 A, 5% 7/1/25 (b) | | 250,000 | 253,513 |
| Massachusetts Port Auth. Rev. Series 2019 C, 5% 7/1/25 (b) | | 300,000 | 303,989 |
TOTAL MASSACHUSETTS | | | 1,369,024 |
| Michigan - 3.4% | | | |
| Flint Hosp. Bldg. Auth. Rev. Series 2020, 5% 7/1/25 | | 300,000 | 300,240 |
| Grand Traverse County Hosp. Fin. Auth. Series 2019 A, 5% 7/1/25 | | 150,000 | 151,977 |
| Saginaw Hosp. Fin. Auth. Hosp. Rev. Series 2020 J, 5% 7/1/25 | | 100,000 | 100,906 |
| Warren Consolidated School District Series 2017, 4% 5/1/25 (Assured Guaranty Muni. Corp. Insured) | | 250,000 | 251,064 |
TOTAL MICHIGAN | | | 804,187 |
| Missouri - 3.9% | | | |
| Saint Louis Arpt. Rev.: | | | |
| Series 2017 A, 5% 7/1/25 (Assured Guaranty Muni. Corp. Insured) | | 370,000 | 375,604 |
| Series 2017 B, 5% 7/1/25 (Assured Guaranty Muni. Corp. Insured) (b) | | 250,000 | 253,073 |
| Series 2019 C, 5% 7/1/25 | | 290,000 | 294,250 |
TOTAL MISSOURI | | | 922,927 |
| Nevada - 0.3% | | | |
| Clark County School District Series 2017 A, 5% 6/15/25 | | 60,000 | 60,873 |
| New Hampshire - 1.4% | | | |
| New Hampshire Health & Ed. Facilities Auth.: | | | |
| (Dartmouth-Hitchcock Oblgtd Grp Proj.) Series 2018 A, 5% 8/1/25 | | 50,000 | 50,560 |
| (Partners Healthcare Sys., Inc. Proj.) Series 2017, 5% 7/1/25 | | 200,000 | 203,523 |
| New Hampshire Health & Ed. Facilities Auth. Rev. Series 2016, 5% 10/1/25 | | 70,000 | 71,031 |
TOTAL NEW HAMPSHIRE | | | 325,114 |
| New Jersey - 4.9% | | | |
| New Jersey Econ. Dev. Auth. Lease Rev. (Libersty State Park Proj.) Series 2015 A, 5% 6/15/25 | | 200,000 | 202,679 |
| New Jersey Edl. Facility: | | | |
| (Stevens Institute of Techonolgy Proj.) Series 2017 A, 5% 7/1/25 | | 105,000 | 106,228 |
| (Stockton Univ. Proj.) Series A, 5% 7/1/25 | | 15,000 | 15,212 |
| Series 2016 E, 5% 7/1/25 | | 50,000 | 50,620 |
| New Jersey Health Care Facilities Fing. Auth. Rev. (St Joseph Hosp. & Med. Ctr., Proj.) Series 2016, 5% 7/1/25 | | 400,000 | 401,945 |
| New Jersey Tobacco Settlement Fing. Corp. Series 2018 A, 5% 6/1/25 | | 200,000 | 202,046 |
| New Jersey Trans. Trust Fund Auth.: | | | |
| Series 2006 C, 0% 12/15/25 | | 140,000 | 132,744 |
| Series 2016 A, 5% 6/15/25 | | 40,000 | 40,575 |
TOTAL NEW JERSEY | | | 1,152,049 |
| New York - 1.7% | | | |
| Dutchess County Local Dev. Corp. Rev. (Health Quest Systems, Inc. Proj.) Series 2016 A, 5% 7/1/25 | | 30,000 | 30,079 |
| Niagara Frontier Trans. Auth. Arpt. Rev. Series 2019 A, 5% 4/1/25 (b) | | 255,000 | 256,204 |
| Onondaga Civic Dev. Corp. (Le Moyne College Proj.): | | | |
| Series 2015, 5% 7/1/25 | | 100,000 | 100,632 |
| Series 2018, 5% 1/1/25 | | 15,000 | 15,035 |
TOTAL NEW YORK | | | 401,950 |
| Ohio - 4.2% | | | |
| Akron Bath Copley Hosp. District Rev. (Summa Health Sys.) Series 2016, 5% 11/15/25 | | 150,000 | 151,958 |
| Hamilton County Hosp. Facilities Rev. (Trihealth, Inc. Obligated Group Proj.) Series 2017 A, 5% 8/15/25 | | 140,000 | 142,275 |
| Lancaster Port Auth. Gas Rev. Series 2019, 5% 2/1/25 | | 200,000 | 201,017 |
| Ohio Higher Edl. Facility Commission Rev.: | | | |
| (Kenyon College, Oh. Proj.) Series 2017 5% 7/1/25 | | 200,000 | 202,931 |
| (Xavier Univ. 2015 Proj.) Series 2015 C, 5% 5/1/25 | | 190,000 | 192,373 |
| (Xavier Univ. 2016 Proj.) Series 2016, 5% 5/1/25 | | 100,000 | 101,249 |
TOTAL OHIO | | | 991,803 |
| Oregon - 2.6% | | | |
| Clackamas County Hosp. Facility Auth. (Williamette View, Inc.) Series 2017 A, 4% 5/15/25 | | 200,000 | 199,501 |
| Port of Portland Arpt. Rev. Series 24B, 5% 7/1/25 (b) | | 420,000 | 425,535 |
TOTAL OREGON | | | 625,036 |
| Pennsylvania - 10.3% | | | |
| Allegheny County Hosp. Dev. Auth. Rev. Series 2019 A, 5% 7/15/25 | | 600,000 | 609,752 |
| Butler County Hosp. Auth. Hosp. Rev. Series 2015 A, 5% 7/1/25 | | 30,000 | 29,914 |
| Centre County Pennsylvania Hosp. Auth. Rev. (Mount Nittany Med. Ctr. Proj.) Series 2018 A, 5% 11/15/25 | | 100,000 | 101,897 |
| Delaware County Auth. Rev. Series 2017, 5% 7/1/25 | | 125,000 | 124,907 |
| Doylestown Hosp. Auth. Hosp. Rev. Series 2016 A: | | | |
| 5% 7/1/25 | | 105,000 | 105,056 |
| 5% 7/1/25 (Escrowed to Maturity) | | 20,000 | 20,303 |
| Dubois Hosp. Auth. Hosp. Rev. (Penn Highlands Healthcare Proj.) Series 2018, 5% 7/15/25 | | 110,000 | 111,025 |
| Monroe County Hosp. Auth. Rev. Series 2016, 5% 7/1/25 | | 50,000 | 50,585 |
| Pennsylvania Higher Edl. Facilities Auth. Rev.: | | | |
| (Drexel Univ.) Series 2016, 5% 5/1/25 | | 445,000 | 449,059 |
| Series 2015: | | | |
5% 6/15/25 | | 165,000 | 167,476 |
5% 6/15/25 (Escrowed to Maturity) | | 35,000 | 35,524 |
| Philadelphia Arpt. Rev.: | | | |
| Series 2017 A, 5% 7/1/25 | | 50,000 | 50,777 |
| Series 2017 B, 5% 7/1/25 (b) | | 210,000 | 212,355 |
| Philadelphia School District: | | | |
| Series 2015 A, 5% 9/1/25 | | 20,000 | 20,323 |
| Series 2018 A, 5% 9/1/25 | | 50,000 | 50,807 |
| Southcentral Pennsylvania Gen. Auth. Rev. Series 2019 A, 5% 6/1/25 | | 300,000 | 303,685 |
TOTAL PENNSYLVANIA | | | 2,443,445 |
| Puerto Rico - 0.4% | | | |
| Puerto Rico Commonwealth Pub. Impt. Gen. Oblig. Series 2022 A1, 5.375% 7/1/25 | | 100,000 | 100,837 |
| Rhode Island - 0.3% | | | |
| Rhode Island Health and Edl. Bldg. Corp. Higher Ed. Facility Rev. Series 2024, 5% 6/1/25 | | 65,000 | 65,887 |
| Tennessee - 2.3% | | | |
| Chattanooga Health Ed. & Hsg. Facility Board Rev. Series 2019 A1, 5% 8/1/25 | | 250,000 | 253,919 |
| Knox County Health Edl. & Hsg. Facilities Board Rev.: | | | |
| Series 2016, 5% 9/1/25 | | 15,000 | 15,137 |
| Series 2017, 5% 4/1/25 | | 265,000 | 266,347 |
TOTAL TENNESSEE | | | 535,403 |
| Texas - 0.9% | | | |
| Houston Arpt. Sys. Rev. Series 2018 C, 5% 7/1/25 (b) | | 200,000 | 202,400 |
| Utah - 0.1% | | | |
| Salt Lake City Arpt. Rev. Series 2017 A, 5% 7/1/25 (b) | | 30,000 | 30,336 |
| Vermont - 2.8% | | | |
| Vermont Student Assistant Corp. Ed. Ln. Rev.: | | | |
| Series 2015 A, 5% 6/15/25 (b) | | 300,000 | 303,144 |
| Series 2019 A, 5% 6/15/25 (b) | | 105,000 | 105,757 |
| Series 2020 A, 5% 6/15/25 (b) | | 250,000 | 251,802 |
TOTAL VERMONT | | | 660,703 |
| Virginia - 0.5% | | | |
| Salem Econ. Dev. Auth. Series 2020, 5% 4/1/25 | | 125,000 | 125,543 |
| Washington - 4.2% | | | |
| Port of Seattle Rev. Series 2017 C, 5% 5/1/25 (b) | | 465,000 | 469,250 |
| Washington Convention Ctr. Pub. Facilities Series 2018, 5% 7/1/25 | | 155,000 | 156,408 |
| Washington Health Care Facilities Auth. Rev. Series 2015, 5% 8/15/25 | | 355,000 | 359,283 |
TOTAL WASHINGTON | | | 984,941 |
| Wisconsin - 2.1% | | | |
| Pub. Fin. Auth. Hosp. Rev. Series 2016, 5% 6/1/25 | | 180,000 | 181,531 |
| Wisconsin Health & Edl. Facilities: | | | |
| Bonds Series 2018 B, 5%, tender 1/29/25 (c) | | 40,000 | 40,300 |
| Series 2016, 5% 2/15/27 (Pre-Refunded to 8/15/25 @ 100) | | 10,000 | 10,126 |
| Series 2017 A: | | | |
5% 4/1/25 | | 155,000 | 156,475 |
5% 9/1/25 (Escrowed to Maturity) | | 100,000 | 101,657 |
TOTAL WISCONSIN | | | 490,089 |
| TOTAL MUNICIPAL BONDS (Cost $23,241,118) | | | 22,911,177 |
| | | | |
| Money Market Funds - 1.2% |
| | | Shares | Value ($) |
Fidelity Municipal Cash Central Fund 4.33% (d)(e) (Cost $289,026) | | 288,968 | 289,026 |
| | | | |
| TOTAL INVESTMENT IN SECURITIES - 97.8% (Cost $23,530,144) | 23,200,203 |
NET OTHER ASSETS (LIABILITIES) - 2.2% | 527,232 |
| NET ASSETS - 100.0% | 23,727,435 |
| | |
Legend
| (a) | Amount is stated in United States dollars unless otherwise noted. |
| (b) | Private activity obligations whose interest is subject to the federal alternative minimum tax for individuals. |
| (c) | Coupon rates for floating and adjustable rate securities reflect the rates in effect at period end. |
| (d) | Information in this report regarding holdings by state and security types does not reflect the holdings of the Fidelity Municipal Cash Central Fund. |
| (e) | Affiliated fund that is generally available only to investment companies and other accounts managed by Fidelity Investments. The rate quoted is the annualized seven-day yield of the fund at period end. A complete unaudited listing of the fund's holdings as of its most recent quarter end is available upon request. In addition, each Fidelity Central Fund's financial statements, which are not covered by the Fund's Report of Independent Registered Public Accounting Firm, are available on the SEC's website or upon request. |
Affiliated Central Funds
Fiscal year to date information regarding the Fund's investments in Fidelity Central Funds, including the ownership percentage, is presented below.
| Affiliate | Value, beginning of period ($) | Purchases ($) | Sales Proceeds ($) | Dividend Income ($) | Realized Gain (loss) ($) | Change in Unrealized appreciation (depreciation) ($) | Value, end of period ($) | % ownership, end of period |
| Fidelity Municipal Cash Central Fund 4.33% | 504,000 | 1,308,196 | 1,523,139 | 11,610 | (31) | - | 289,026 | 0.0% |
| Total | 504,000 | 1,308,196 | 1,523,139 | 11,610 | (31) | - | 289,026 | |
| | | | | | | | | |
Amounts in the dividend income column in the above table include any capital gain distributions from underlying funds, which are presented in the corresponding line item in the Statement of Operations, if applicable.
Amounts included in the purchases and sales proceeds columns may include in-kind transactions, if applicable.
Investment Valuation
The following is a summary of the inputs used, as of June 30, 2024, involving the Fund's assets and liabilities carried at fair value. The inputs or methodology used for valuing securities may not be an indication of the risk associated with investing in those securities. For more information on valuation inputs, and their aggregation into the levels used below, please refer to the Investment Valuation section in the accompanying Notes to Financial Statements.
| Valuation Inputs at Reporting Date: |
| Description | Total ($) | Level 1 ($) | Level 2 ($) | Level 3 ($) |
Investments in Securities: | | | | |
|
| Municipal Securities | 22,911,177 | - | 22,911,177 | - |
|
| Money Market Funds | 289,026 | 289,026 | - | - |
| Total Investments in Securities: | 23,200,203 | 289,026 | 22,911,177 | - |
Financial Statements
| Statement of Assets and Liabilities |
| | | | June 30, 2024 |
| | | | | |
| Assets | | | | |
| Investment in securities, at value - See accompanying schedule: | | | | |
Unaffiliated issuers (cost $23,241,118) | $ | 22,911,177 | | |
Fidelity Central Funds (cost $289,026) | | 289,026 | | |
| | | | | |
| | | | | |
| Total Investment in Securities (cost $23,530,144) | | | $ | 23,200,203 |
| Cash | | | | 80,138 |
| Receivable for fund shares sold | | | | 95,008 |
| Interest receivable | | | | 370,551 |
| Distributions receivable from Fidelity Central Funds | | | | 651 |
| Other receivables | | | | 60 |
Total assets | | | | 23,746,611 |
| Liabilities | | | | |
| Payable for fund shares redeemed | $ | 2,434 | | |
| Distributions payable | | 8,095 | | |
| Accrued management fee | | 5,951 | | |
| Transfer agent fee payable | | 1,985 | | |
| Distribution and service plan fees payable | | 711 | | |
| Total liabilities | | | | 19,176 |
| Net Assets | | | $ | 23,727,435 |
| Net Assets consist of: | | | | |
| Paid in capital | | | $ | 24,245,536 |
| Total accumulated earnings (loss) | | | | (518,101) |
| Net Assets | | | $ | 23,727,435 |
| | | | | |
| Net Asset Value and Maximum Offering Price | | | | |
| Class A : | | | | |
Net Asset Value and redemption price per share ($3,420,858 ÷ 344,877 shares)(a) | | | $ | 9.92 |
| Maximum offering price per share (100/97.25 of $9.92) | | | $ | 10.20 |
| Municipal Income 2025 : | | | | |
Net Asset Value, offering price and redemption price per share ($15,954,466 ÷ 1,608,410 shares) | | | $ | 9.92 |
| Class I : | | | | |
Net Asset Value, offering price and redemption price per share ($4,352,111 ÷ 438,701 shares) | | | $ | 9.92 |
(a)Redemption price per share is equal to net asset value less any applicable contingent deferred sales charge. |
| Statement of Operations |
| | | | Year ended June 30, 2024 |
| Investment Income | | | | |
| Interest | | | $ | 556,766 |
| Income from Fidelity Central Funds | | | | 11,610 |
| Total income | | | | 568,376 |
| Expenses | | | | |
| Management fee | $ | 73,069 | | |
| Transfer agent fees | | 24,359 | | |
| Distribution and service plan fees | | 8,450 | | |
| Independent trustees' fees and expenses | | 79 | | |
| Total expenses before reductions | | 105,957 | | |
| Expense reductions | | (78) | | |
| Total expenses after reductions | | | | 105,879 |
| Net Investment income (loss) | | | | 462,497 |
| Realized and Unrealized Gain (Loss) | | | | |
| Net realized gain (loss) on: | | | | |
| Investment Securities: | | | | |
| Unaffiliated issuers | | (31,461) | | |
| Fidelity Central Funds | | (31) | | |
| Total net realized gain (loss) | | | | (31,492) |
| Change in net unrealized appreciation (depreciation) on investment securities | | | | 330,097 |
| Net gain (loss) | | | | 298,605 |
| Net increase (decrease) in net assets resulting from operations | | | $ | 761,102 |
| Statement of Changes in Net Assets |
| |
| | Year ended June 30, 2024 | | Year ended June 30, 2023 |
| Increase (Decrease) in Net Assets | | | | |
| Operations | | | | |
| Net investment income (loss) | $ | 462,497 | $ | 445,816 |
| Net realized gain (loss) | | (31,492) | | (84,707) |
| Change in net unrealized appreciation (depreciation) | | 330,097 | | (204,924) |
| Net increase (decrease) in net assets resulting from operations | | 761,102 | | 156,185 |
| Distributions to shareholders | | (462,511) | | (445,770) |
| | | | | |
| Share transactions - net increase (decrease) | | (1,596,350) | | 902,522 |
| Total increase (decrease) in net assets | | (1,297,759) | | 612,937 |
| | | | | |
| Net Assets | | | | |
| Beginning of period | | 25,025,194 | | 24,412,257 |
| End of period | $ | 23,727,435 | $ | 25,025,194 |
| | | | | |
| | | | | |
Financial Highlights
Fidelity Advisor® Municipal Income 2025 Fund Class A |
| |
| Years ended June 30, | | 2024 | | 2023 | | 2022 | | 2021 | | 2020 |
Selected Per-Share Data | | | | | | | | | | |
| Net asset value, beginning of period | $ | 9.80 | $ | 9.91 | $ | 10.59 | $ | 10.35 | $ | 10.29 |
| Income from Investment Operations | | | | | | | | | | |
Net investment income (loss) A,B | | .166 | | .150 | | .135 | | .146 | | .166 |
| Net realized and unrealized gain (loss) | | .120 | | (.110) | | (.680) | | .241 | | .060 |
| Total from investment operations | | .286 | | .040 | | (.545) | | .387 | | .226 |
| Distributions from net investment income | | (.166) | | (.150) | | (.135) | | (.147) | | (.166) |
| Total distributions | | (.166) | | (.150) | | (.135) | | (.147) | | (.166) |
| Net asset value, end of period | $ | 9.92 | $ | 9.80 | $ | 9.91 | $ | 10.59 | $ | 10.35 |
Total Return C,D | | | | .41% | | (5.18)% | | 3.75% | | 2.21% |
Ratios to Average Net Assets B,E,F | | | | | | | | | | |
| Expenses before reductions | | .65% | | .65% | | .65% | | .65% | | .65% |
| Expenses net of fee waivers, if any | | | | .65% | | .65% | | .65% | | .65% |
| Expenses net of all reductions | | .65% | | .65% | | .65% | | .65% | | .65% |
| Net investment income (loss) | | 1.68% | | 1.52% | | 1.31% | | 1.39% | | 1.61% |
| Supplemental Data | | | | | | | | | | |
| Net assets, end of period (000 omitted) | $ | 3,421 | $ | 3,367 | $ | 3,309 | $ | 3,550 | $ | 3,510 |
Portfolio turnover rate G | | | | 6% | | 7% | | 6% | | 23% |
ACalculated based on average shares outstanding during the period.
BNet investment income (loss) is affected by the timing of the declaration of dividends by any underlying mutual funds or exchange-traded funds (ETFs). Net investment income (loss) of any mutual funds or ETFs is not included in the Fund's net investment income (loss) ratio.
CTotal returns would have been lower if certain expenses had not been reduced during the applicable periods shown.
DTotal returns do not include the effect of the sales charges.
EFees and expenses of any underlying mutual funds or exchange-traded funds (ETFs) are not included in the Fund's expense ratio. The Fund indirectly bears its proportionate share of these expenses. For additional expense information related to investments in Fidelity Central Funds, please refer to the "Investments in Fidelity Central Funds" note found in the Notes to Financial Statements section of the most recent Annual or Semi-Annual report.
FExpense ratios reflect operating expenses of the class. Expenses before reductions do not reflect amounts reimbursed, waived, or reduced through arrangements with the investment adviser, brokerage services, or other offset arrangements, if applicable, and do not represent the amount paid by the class during periods when reimbursements, waivers or reductions occur.
GAmount does not include the portfolio activity of any underlying mutual funds or exchange-traded funds (ETFs).
Fidelity® Municipal Income 2025 Fund |
| |
| Years ended June 30, | | 2024 | | 2023 | | 2022 | | 2021 | | 2020 |
Selected Per-Share Data | | | | | | | | | | |
| Net asset value, beginning of period | $ | 9.80 | $ | 9.91 | $ | 10.59 | $ | 10.35 | $ | 10.29 |
| Income from Investment Operations | | | | | | | | | | |
Net investment income (loss) A,B | | .190 | | .174 | | .161 | | .173 | | .193 |
| Net realized and unrealized gain (loss) | | .120 | | (.110) | | (.680) | | .240 | | .059 |
| Total from investment operations | | .310 | | .064 | | (.519) | | .413 | | .252 |
| Distributions from net investment income | | (.190) | | (.174) | | (.161) | | (.173) | | (.192) |
| Total distributions | | (.190) | | (.174) | | (.161) | | (.173) | | (.192) |
| Net asset value, end of period | $ | 9.92 | $ | 9.80 | $ | 9.91 | $ | 10.59 | $ | 10.35 |
Total Return C | | | | .66% | | (4.95)% | | 4.01% | | 2.47% |
Ratios to Average Net Assets B,D,E | | | | | | | | | | |
| Expenses before reductions | | .40% | | .40% | | .40% | | .40% | | .40% |
| Expenses net of fee waivers, if any | | | | .40% | | .40% | | .40% | | .40% |
| Expenses net of all reductions | | .40% | | .40% | | .40% | | .40% | | .40% |
| Net investment income (loss) | | 1.93% | | 1.77% | | 1.56% | | 1.64% | | 1.86% |
| Supplemental Data | | | | | | | | | | |
| Net assets, end of period (000 omitted) | $ | 15,954 | $ | 16,925 | $ | 15,820 | $ | 17,136 | $ | 14,596 |
Portfolio turnover rate F | | | | 6% | | 7% | | 6% | | 23% |
ACalculated based on average shares outstanding during the period.
BNet investment income (loss) is affected by the timing of the declaration of dividends by any underlying mutual funds or exchange-traded funds (ETFs). Net investment income (loss) of any mutual funds or ETFs is not included in the Fund's net investment income (loss) ratio.
CTotal returns would have been lower if certain expenses had not been reduced during the applicable periods shown.
DFees and expenses of any underlying mutual funds or exchange-traded funds (ETFs) are not included in the Fund's expense ratio. The Fund indirectly bears its proportionate share of these expenses. For additional expense information related to investments in Fidelity Central Funds, please refer to the "Investments in Fidelity Central Funds" note found in the Notes to Financial Statements section of the most recent Annual or Semi-Annual report.
EExpense ratios reflect operating expenses of the class. Expenses before reductions do not reflect amounts reimbursed, waived, or reduced through arrangements with the investment adviser, brokerage services, or other offset arrangements, if applicable, and do not represent the amount paid by the class during periods when reimbursements, waivers or reductions occur.
FAmount does not include the portfolio activity of any underlying mutual funds or exchange-traded funds (ETFs).
Fidelity Advisor® Municipal Income 2025 Fund Class I |
| |
| Years ended June 30, | | 2024 | | 2023 | | 2022 | | 2021 | | 2020 |
Selected Per-Share Data | | | | | | | | | | |
| Net asset value, beginning of period | $ | 9.80 | $ | 9.91 | $ | 10.59 | $ | 10.36 | $ | 10.29 |
| Income from Investment Operations | | | | | | | | | | |
Net investment income (loss) A,B | | .190 | | .175 | | .161 | | .173 | | .192 |
| Net realized and unrealized gain (loss) | | .120 | | (.111) | | (.680) | | .230 | | .070 |
| Total from investment operations | | .310 | | .064 | | (.519) | | .403 | | .262 |
| Distributions from net investment income | | (.190) | | (.174) | | (.161) | | (.173) | | (.192) |
| Total distributions | | (.190) | | (.174) | | (.161) | | (.173) | | (.192) |
| Net asset value, end of period | $ | 9.92 | $ | 9.80 | $ | 9.91 | $ | 10.59 | $ | 10.36 |
Total Return C | | | | .66% | | (4.95)% | | 3.91% | | 2.57% |
Ratios to Average Net Assets B,D,E | | | | | | | | | | |
| Expenses before reductions | | .40% | | .40% | | .40% | | .40% | | .40% |
| Expenses net of fee waivers, if any | | | | .40% | | .40% | | .40% | | .40% |
| Expenses net of all reductions | | .40% | | .40% | | .40% | | .40% | | .40% |
| Net investment income (loss) | | 1.93% | | 1.77% | | 1.56% | | 1.64% | | 1.86% |
| Supplemental Data | | | | | | | | | | |
| Net assets, end of period (000 omitted) | $ | 4,352 | $ | 4,733 | $ | 5,284 | $ | 5,827 | $ | 5,512 |
Portfolio turnover rate F | | | | 6% | | 7% | | 6% | | 23% |
ACalculated based on average shares outstanding during the period.
BNet investment income (loss) is affected by the timing of the declaration of dividends by any underlying mutual funds or exchange-traded funds (ETFs). Net investment income (loss) of any mutual funds or ETFs is not included in the Fund's net investment income (loss) ratio.
CTotal returns would have been lower if certain expenses had not been reduced during the applicable periods shown.
DFees and expenses of any underlying mutual funds or exchange-traded funds (ETFs) are not included in the Fund's expense ratio. The Fund indirectly bears its proportionate share of these expenses. For additional expense information related to investments in Fidelity Central Funds, please refer to the "Investments in Fidelity Central Funds" note found in the Notes to Financial Statements section of the most recent Annual or Semi-Annual report.
EExpense ratios reflect operating expenses of the class. Expenses before reductions do not reflect amounts reimbursed, waived, or reduced through arrangements with the investment adviser, brokerage services, or other offset arrangements, if applicable, and do not represent the amount paid by the class during periods when reimbursements, waivers or reductions occur.
FAmount does not include the portfolio activity of any underlying mutual funds or exchange-traded funds (ETFs).
Notes to Financial Statements
For the period ended June 30, 2024
1. Organization.
Fidelity Municipal Income 2025 Fund (the Fund) is a fund of Fidelity Salem Street Trust (the Trust) and is authorized to issue an unlimited number of shares. The Trust is registered under the Investment Company Act of 1940, as amended (the 1940 Act), as an open-end management investment company organized as a Massachusetts business trust. The Fund offers Class A, Municipal Income 2025 and Class I shares, each of which has equal rights as to assets and voting privileges. Class A and Class I are Fidelity Advisor classes. Each class has exclusive voting rights with respect to matters that affect that class. Effective after the close of business on June 28, 2024, the Fund was closed to all new investments other than dividend and capital gain reinvestments.
2. Investments in Fidelity Central Funds.
Funds may invest in Fidelity Central Funds, which are open-end investment companies generally available only to other investment companies and accounts managed by the investment adviser and its affiliates. The Schedule of Investments lists any Fidelity Central Funds held as an investment as of period end, but does not include the underlying holdings of each Fidelity Central Fund. An investing fund indirectly bears its proportionate share of the expenses of the underlying Fidelity Central Funds.
Based on its investment objective, each Fidelity Central Fund may invest or participate in various investment vehicles or strategies that are similar to those of the investing fund. These strategies are consistent with the investment objectives of the investing fund and may involve certain economic risks which may cause a decline in value of each of the Fidelity Central Funds and thus a decline in the value of the investing fund.
| Fidelity Central Fund | Investment Manager | Investment Objective | Investment Practices | Expense RatioA |
| Fidelity Money Market Central Funds | Fidelity Management & Research Company LLC (FMR) | Each fund seeks to obtain a high level of current income consistent with the preservation of capital and liquidity. | Short-term Investments | Less than .005% |
A Expenses expressed as a percentage of average net assets and are as of each underlying Central Fund's most recent annual or semi-annual shareholder report.
A complete unaudited list of holdings for each Fidelity Central Fund is available upon request or at the Securities and Exchange Commission website at www.sec.gov. In addition, the financial statements of the Fidelity Central Funds which contain the significant accounting policies (including investment valuation policies) of those funds, and are not covered by the Report of Independent Registered Public Accounting Firm, are available on the Securities and Exchange Commission website or upon request.
3. Significant Accounting Policies.
The Fund is an investment company and applies the accounting and reporting guidance of the Financial Accounting Standards Board (FASB) Accounting Standards Codification Topic 946 Financial Services - Investment Companies. The financial statements have been prepared in conformity with accounting principles generally accepted in the United States of America (GAAP), which require management to make certain estimates and assumptions at the date of the financial statements. Actual results could differ from those estimates. Subsequent events, if any, through the date that the financial statements were issued have been evaluated in the preparation of the financial statements. The Fund's Schedule of Investments lists any underlying mutual funds or exchange-traded funds (ETFs) but does not include the underlying holdings of these funds. The following summarizes the significant accounting policies of the Fund:
Investment Valuation. Investments are valued as of 4:00 p.m. Eastern time on the last calendar day of the period. The Board of Trustees (the Board) has designated the Fund's investment adviser as the valuation designee responsible for the fair valuation function and performing fair value determinations as needed. The investment adviser has established a Fair Value Committee (the Committee) to carry out the day-to-day fair valuation responsibilities and has adopted policies and procedures to govern the fair valuation process and the activities of the Committee. In accordance with these fair valuation policies and procedures, which have been approved by the Board, the Fund attempts to obtain prices from one or more third party pricing services or brokers to value its investments. When current market prices, quotations or currency exchange rates are not readily available or reliable, investments will be fair valued in good faith by the Committee, in accordance with the policies and procedures. Factors used in determining fair value vary by investment type and may include market or investment specific events, transaction data, estimated cash flows, and market observations of comparable investments. The frequency that the fair valuation procedures are used cannot be predicted and they may be utilized to a significant extent. The Committee manages the Fund's fair valuation practices and maintains the fair valuation policies and procedures. The Fund's investment adviser reports to the Board information regarding the fair valuation process and related material matters.
The Fund categorizes the inputs to valuation techniques used to value its investments into a disclosure hierarchy consisting of three levels as shown below:
Level 1 - unadjusted quoted prices in active markets for identical investments
Level 2 - other significant observable inputs (including quoted prices for similar investments, interest rates, prepayment speeds, etc.)
Level 3 - unobservable inputs (including the Fund's own assumptions based on the best information available)
Valuation techniques used to value the Fund's investments by major category are as follows:
Debt securities, including restricted securities, are valued based on evaluated prices received from third party pricing services or from brokers who make markets in such securities. Municipal securities are valued by pricing services who utilize matrix pricing which considers yield or price of bonds of comparable quality, coupon, maturity and type or by broker-supplied prices. When independent prices are unavailable or unreliable, debt securities may be valued utilizing pricing methodologies which consider similar factors that would be used by third party pricing services. Debt securities are generally categorized as Level 2 in the hierarchy but may be Level 3 depending on the circumstances.
Investments in open-end mutual funds, including the Fidelity Central Funds, are valued at their closing net asset value (NAV) each business day and are categorized as Level 1 in the hierarchy.
Changes in valuation techniques may result in transfers in or out of an assigned level within the disclosure hierarchy. The aggregate value of investments by input level as of June 30, 2024 is included at the end of the Fund's Schedule of Investments.
Investment Transactions and Income. For financial reporting purposes, the Fund's investment holdings and NAV include trades executed through the end of the last business day of the period. The NAV per share for processing shareholder transactions is calculated as of the close of business of the New York Stock Exchange (NYSE), normally 4:00 p.m. Eastern time and includes trades executed through the end of the prior business day. Gains and losses on securities sold are determined on the basis of identified cost. Income and capital gain distributions from Fidelity Central Funds, if any, are recorded on the ex-dividend date. Interest income is accrued as earned and includes coupon interest and amortization of premium and accretion of discount on debt securities as applicable. Debt obligations may be placed on non-accrual status and related interest income may be reduced by ceasing current accruals and writing off interest receivables when the collection of all or a portion of interest has become doubtful based on consistently applied procedures. A debt obligation is removed from non-accrual status when the issuer resumes interest payments or when collectability of interest is reasonably assured.
Class Allocations and Expenses. Investment income, realized and unrealized capital gains and losses, common expenses of a fund, and certain fund-level expense reductions, if any, are allocated daily on a pro-rata basis to each class based on the relative net assets of each class to the total net assets of a fund. Each class differs with respect to transfer agent and distribution and service plan fees incurred, as applicable. Certain expense reductions may also differ by class, if applicable. For the reporting period, the allocated portion of income and expenses to each class as a percent of its average net assets may vary due to the timing of recording these transactions in relation to fluctuating net assets of the classes. Expenses directly attributable to a fund are charged to that fund. Expenses attributable to more than one fund are allocated among the respective funds on the basis of relative net assets or other appropriate methods. Expenses included in the accompanying financial statements reflect the expenses of that fund and do not include any expenses associated with any underlying mutual funds or exchange-traded funds (ETFs). Although not included in a fund's expenses, a fund indirectly bears its proportionate share of these expenses through the net asset value of each underlying mutual fund or exchange-traded fund (ETF). Expense estimates are accrued in the period to which they relate and adjustments are made when actual amounts are known.
Income Tax Information and Distributions to Shareholders. Each year, the Fund intends to qualify as a regulated investment company under Subchapter M of the Internal Revenue Code, including distributing substantially all of its taxable income and realized gains. As a result, no provision for U.S. Federal income taxes is required. As of June 30, 2024, the Fund did not have any unrecognized tax benefits in the financial statements; nor is the Fund aware of any tax positions for which it is reasonably possible that the total amounts of unrecognized tax benefits will significantly change in the next twelve months. The Fund files a U.S. federal tax return, in addition to state and local tax returns as required. The Fund's federal income tax returns are subject to examination by the Internal Revenue Service (IRS) for a period of three fiscal years after they are filed. State and local tax returns may be subject to examination for an additional fiscal year depending on the jurisdiction.
Distributions are declared and recorded daily and paid monthly from net investment income. Distributions from realized gains, if any, are declared and recorded on the ex-dividend date. Income and capital gain distributions are declared separately for each class. Income and capital gain distributions are determined in accordance with income tax regulations, which may differ from GAAP.
Capital accounts within the financial statements are adjusted for permanent book-tax differences. These adjustments have no impact on net assets or the results of operations. Capital accounts are not adjusted for temporary book-tax differences which will reverse in a subsequent period.
Book-tax differences are primarily due to capital loss carryforwards.
The Fund purchases municipal securities whose interest, in the opinion of the issuer, is free from federal income tax. There is no assurance that IRS will agree with this opinion. In the event the IRS determines that the issuer does not comply with relevant tax requirements, interest payments from a security could become federally taxable, possibly retroactively to the date the security was issued.
As of period end, the cost and unrealized appreciation (depreciation) in securities, and derivatives if applicable, for federal income tax purposes were as follows:
| Gross unrealized appreciation | $3,819 |
| Gross unrealized depreciation | $(333,760) |
| Net unrealized appreciation (depreciation) | $(329,941) |
| Tax Cost | $23,530,144 |
The tax-based components of distributable earnings as of period end were as follows:
| Undistributed tax-exempt income | $36 |
| Undistributed ordinary income | $- |
| Capital loss carryforward | $(188,197) |
| Net unrealized appreciation (depreciation) on securities and other investments | $(329,941) |
Capital loss carryforwards are only available to offset future capital gains of the Fund to the extent provided by regulations and may be limited. The capital loss carryforward information presented below, including any applicable limitation, is estimated as of fiscal period end and is subject to adjustment.
Short-term | $(75,156) |
Long-term | (113,041) |
| Total capital loss carryforward | $(188,197) |
The tax character of distributions paid was as follows:
| | June 30, 2024 | June 30, 2023 |
| Tax-exempt Income | 462,511 | 445,770 |
4. Purchases and Sales of Investments.
Purchases and sales of securities, other than short-term securities and in-kind transactions, as applicable, are noted in the table below.
| | Purchases ($) | Sales ($) |
| Fidelity Municipal Income 2025 Fund | 1,441,755 | 2,399,743 |
5. Fees and Other Transactions with Affiliates.
Management Fee. Fidelity Management & Research Company LLC (the investment adviser) and its affiliates provide the Fund with investment management related services for which the Fund pays a monthly management fee that is based on an annual rate of .30% of the Fund's average net assets. Under the management contract, the investment adviser pays all other fund-level expenses, except the compensation of the independent Trustees and certain other expenses such as interest expense.
Distribution and Service Plan Fees. In accordance with Rule 12b-1 of the 1940 Act, the Fund has adopted separate Distribution and Service Plans for each class of shares. The Fund's Class A pays Fidelity Distributors Company (FDC), an affiliate of the investment adviser, a Service Fee based on an annual percentage of Class A's average net assets. In addition, FDC may pay financial intermediaries for selling shares of the Fund and providing shareholder support services. For the period, the Service Fee rate, total service fees and amounts retained by FDC were as follows:
| | Service Fee | Total Fees ($) | Retained by FDC ($) |
| Fidelity Municipal Income 2025 Fund | | | |
Class A | .25% | 8,450 | 6,928 |
Sales Load. FDC may receive a front-end sales charge of up to 2.75% for selling Class A shares, some of which is paid to financial intermediaries for selling shares of the Fund. Depending on the holding period, FDC may receive a contingent deferred sales charge levied on Class A redemptions. The deferred sales charges are .75% or .50% for certain purchases of Class A shares.
For the period, sales charge amounts retained by FDC were as follows:
| | Retained by FDC ($) |
| Class A | 8 |
Transfer Agent Fees. Fidelity Investments Institutional Operations Company LLC (FIIOC), an affiliate of the investment adviser, is the transfer, dividend disbursing and shareholder servicing agent for each class of the Fund. FIIOC receives asset-based fees of class-level average net assets for each class of the Fund. FIIOC pays for typesetting, printing and mailing of shareholder reports, except proxy statements.
For the period, transfer agent fees for each class were as follows:
| | Amount ($) | % of Class-Level Average Net Assets |
| Class A | 3,380 | .10 |
| Municipal Income 2025 | 16,447 | .10 |
| Class I | 4,532 | .10 |
| | 24,359 | |
Interfund Trades. Funds may purchase from or sell securities to other Fidelity Funds under procedures adopted by the Board. The procedures have been designed to ensure these interfund trades are executed in accordance with Rule 17a-7 of the 1940 Act. Any interfund trades are included within the respective purchases and sales amounts shown in the Purchases and Sales of Investments note. Interfund trades during the period are noted in the table below.
| | Purchases ($) | Sales ($) | Realized Gain (Loss)($) |
| Fidelity Municipal Income 2025 Fund | - | 125,287 | 13 |
6. Committed Line of Credit.
Certain Funds participate with other funds managed by the investment adviser or an affiliate in a $4.25 billion credit facility (the "line of credit") to be utilized for temporary or emergency purposes to fund shareholder redemptions or for other short-term liquidity purposes. The commitment fees on the pro-rata portion of the line of credit are borne by the investment adviser. During the period, there were no borrowings on this line of credit.
7. Expense Reductions.
Through arrangements with the Fund's custodian, credits realized as a result of certain uninvested cash balances were used to reduce the Fund's expenses. During the period, custodian credits reduced the Fund's expenses by $78.
8. Distributions to Shareholders.
Distributions to shareholders of each class were as follows:
| | Year ended June 30, 2024 | Year ended June 30, 2023 |
| Fidelity Municipal Income 2025 Fund | | |
| Distributions to shareholders | | |
| Class A | $56,895 | $50,842 |
| Municipal Income 2025 | 318,052 | 306,564 |
| Class I | 87,564 | 88,364 |
Total | $462,511 | $445,770 |
9. Share Transactions.
Share transactions for each class were as follows and may contain in-kind transactions, automatic conversions between classes or exchanges between affiliated funds:
| | Shares | Shares | Dollars | Dollars |
| | Year ended June 30, 2024 | Year ended June 30, 2023 | Year ended June 30, 2024 | Year ended June 30, 2023 |
| Fidelity Municipal Income 2025 Fund | | | | |
| Class A | | | | |
| Shares sold | 8,930 | 15,519 | $87,693 | $153,021 |
| Reinvestment of distributions | 5,768 | 5,176 | 56,795 | 50,815 |
| Shares redeemed | (13,456) | (11,080) | (131,235) | (108,045) |
| Net increase (decrease) | 1,242 | 9,615 | $13,253 | $95,791 |
| Municipal Income 2025 | | | | |
| Shares sold | 139,265 | 607,812 | $1,370,484 | $5,979,425 |
| Reinvestment of distributions | 21,705 | 21,478 | 213,747 | 210,879 |
| Shares redeemed | (279,813) | (498,993) | (2,758,178) | (4,892,485) |
| Net increase (decrease) | (118,843) | 130,297 | $(1,173,947) | $1,297,819 |
| Class I | | | | |
| Shares sold | 6,191 | 63,655 | $61,159 | $631,309 |
| Reinvestment of distributions | 8,372 | 8,582 | 82,428 | 84,261 |
| Shares redeemed | (58,818) | (122,582) | (579,243) | (1,206,658) |
| Net increase (decrease) | (44,255) | (50,345) | $(435,656) | $(491,088) |
10. Other.
A fund's organizational documents provide former and current trustees and officers with a limited indemnification against liabilities arising in connection with the performance of their duties to the fund. In the normal course of business, a fund may also enter into contracts that provide general indemnifications. A fund's maximum exposure under these arrangements is unknown as this would be dependent on future claims that may be made against a fund. The risk of material loss from such claims is considered remote.
At the end of the period, the investment adviser or its affiliates were owners of record of more than 10% of the outstanding shares as follows:
| Fund | Affiliated % |
| Fidelity Municipal Income 2025 Fund. | 47% |
11. Risk and Uncertainties.
Many factors affect a fund's performance. Developments that disrupt global economies and financial markets, such as pandemics, epidemics, outbreaks of infectious diseases, war, terrorism, and environmental disasters, may significantly affect a fund's investment performance. The effects of these developments to a fund will be impacted by the types of securities in which a fund invests, the financial condition, industry, economic sector, and geographic location of an issuer, and a fund's level of investment in the securities of that issuer. Significant concentrations in security types, issuers, industries, sectors, and geographic locations may magnify the factors that affect a fund's performance.
Report of Independent Registered Public Accounting Firm
To the Board of Trustees of Fidelity Salem Street Trust and the Shareholders of Fidelity Municipal Income 2025 Fund:
Opinion on the Financial Statements and Financial Highlights
We have audited the accompanying statement of assets and liabilities of Fidelity Municipal Income 2025 Fund (the "Fund"), a fund of Fidelity Salem Street Trust, including the schedule of investments, as of June 30, 2024, the related statement of operations for the year then ended, the statement of changes in net assets for each of the two years in the period then ended, the financial highlights for each of the five years in the period then ended, and the related notes. In our opinion, the financial statements and financial highlights present fairly, in all material respects, the financial position of the Fund as of June 30, 2024, and the results of its operations for the year then ended, the changes in its net assets for each of the two years in the period then ended, and the financial highlights for each of the five years in the period then ended in conformity with accounting principles generally accepted in the United States of America.
Basis for Opinion
These financial statements and financial highlights are the responsibility of the Fund's management. Our responsibility is to express an opinion on the Fund's financial statements and financial highlights based on our audits. We are a public accounting firm registered with the Public Company Accounting Oversight Board (United States) (PCAOB) and are required to be independent with respect to the Fund in accordance with the U.S. federal securities laws and the applicable rules and regulations of the Securities and Exchange Commission and the PCAOB.
We conducted our audits in accordance with the standards of the PCAOB. Those standards require that we plan and perform the audit to obtain reasonable assurance about whether the financial statements and financial highlights are free of material misstatement, whether due to error or fraud. The Fund is not required to have, nor were we engaged to perform, an audit of its internal control over financial reporting. As part of our audits, we are required to obtain an understanding of internal control over financial reporting but not for the purpose of expressing an opinion on the effectiveness of the Fund's internal control over financial reporting. Accordingly, we express no such opinion.
Our audits included performing procedures to assess the risks of material misstatement of the financial statements and financial highlights, whether due to error or fraud, and performing procedures that respond to those risks. Such procedures included examining, on a test basis, evidence regarding the amounts and disclosures in the financial statements and financial highlights. Our audits also included evaluating the accounting principles used and significant estimates made by management, as well as evaluating the overall presentation of the financial statements and financial highlights. Our procedures included confirmation of securities owned as of June 30, 2024, by correspondence with the custodian and brokers; when replies were not received from brokers, we performed other auditing procedures. We believe that our audits provide a reasonable basis for our opinion.
/s/ Deloitte & Touche LLP
Boston, Massachusetts
August 14, 2024
We have served as the auditor of one or more of the Fidelity investment companies since 1999.
Distributions
(Unaudited)The dividend and capital gains distributions for the fund(s) are available on Fidelity.com or Institutional.Fidelity.com.
During fiscal year ended 2024, 100% of the fund's income dividends were free from federal income tax, and 23.90% of the fund's income dividends was subject to the federal alternative minimum tax.
The fund will notify shareholders in January 2025 of amounts for use in preparing 2024 income tax returns.
Item 8: Changes in and Disagreements with Accountants for Open-End Management Investment Companies
Note: This is not applicable for any fund included in this document.
Item 9: Proxy Disclosures for Open-End Management Investment Companies
| A special meeting of shareholders was held on October 18, 2023. The results of votes taken among shareholders on the proposal before them are reported below. Each vote reported represents one dollar of net asset value held on the record date for the meeting. |
| Proposal 1 |
| To elect a Board of Trustees. |
| | # of Votes | % of Votes |
| Abigail P. Johnson |
| Affirmative | 378,729,502,260.01 | 97.58 |
| Withheld | 9,407,876,478.96 | 2.42 |
| TOTAL | 388,137,378,738.97 | 100.00 |
| Jennifer Toolin McAuliffe |
| Affirmative | 378,454,868,010.95 | 97.51 |
| Withheld | 9,682,510,728.02 | 2.49 |
| TOTAL | 388,137,378,738.97 | 100.00 |
| Christine J. Thompson |
| Affirmative | 378,837,121,274.52 | 97.60 |
| Withheld | 9,300,257,464.45 | 2.40 |
| TOTAL | 388,137,378,738.97 | 100.00 |
| Elizabeth S. Acton |
| Affirmative | 378,262,110,794.85 | 97.46 |
| Withheld | 9,875,267,944.12 | 2.54 |
| TOTAL | 388,137,378,738.97 | 100.00 |
| Laura M. Bishop |
| Affirmative | 380,482,113,171.06 | 98.03 |
| Withheld | 7,655,265,567.91 | 1.97 |
| TOTAL | 388,137,378,738.97 | 100.00 |
| Ann E. Dunwoody |
| Affirmative | 380,016,034,008.12 | 97.91 |
| Withheld | 8,121,344,730.85 | 2.09 |
| TOTAL | 388,137,378,738.97 | 100.00 |
| John Engler |
| Affirmative | 379,432,488,394.20 | 97.76 |
| Withheld | 8,704,890,344.77 | 2.24 |
| TOTAL | 388,137,378,738.97 | 100.00 |
| Robert F. Gartland |
| Affirmative | 378,741,819,600.60 | 97.58 |
| Withheld | 9,395,559,138.37 | 2.42 |
| TOTAL | 388,137,378,738.97 | 100.00 |
| Robert W. Helm |
| Affirmative | 380,389,324,755.07 | 98.00 |
| Withheld | 7,748,053,983.90 | 2.00 |
| TOTAL | 388,137,378,738.97 | 100.00 |
| Arthur E. Johnson |
| Affirmative | 378,427,694,151.67 | 97.50 |
| Withheld | 9,709,684,587.30 | 2.50 |
| TOTAL | 388,137,378,738.97 | 100.00 |
| Michael E. Kenneally |
| Affirmative | 377,842,228,145.18 | 97.35 |
| Withheld | 10,295,150,593.79 | 2.65 |
| TOTAL | 388,137,378,738.97 | 100.00 |
| Mark A. Murray |
| Affirmative | 380,158,432,703.37 | 97.94 |
| Withheld | 7,978,946,035.60 | 2.06 |
| TOTAL | 388,137,378,738.97 | 100.00 |
| Carol J. Zierhoffer |
| Affirmative | 380,522,113,360.24 | 98.04 |
| Withheld | 7,615,265,378.73 | 1.96 |
| TOTAL | 388,137,378,738.97 | 100.00 |
| | | |
| Proposal 1 reflects trust-wide proposal and voting results. |
Item 10: Remuneration Paid to Directors, Officers, and others of Open-End Management Investment Companies
Note: This information is disclosed as part of the financial statements for each Fund as part of Item 7: Financial Statements and Financial Highlights for Open-End Management Investment companies.
Item 11: Statement Regarding Basis for Approval of Investment Advisory Contract
Note: This is not applicable for any fund included in this document.
1.926259.113
DMI-ANN-0824
Fidelity® SAI Municipal Bond Index Fund
Annual Report
June 30, 2024
Offered exclusively to certain clients of the Adviser, or its affiliates, including Strategic Advisers LLC (Strategic Advisers) - not available for sale to the general public. Fidelity® SAI is a product name of Fidelity® funds dedicated to certain programs affiliated with Strategic Advisers.
Contents
To view a fund's proxy voting guidelines and proxy voting record for the 12-month period ended June 30, visit http://www.fidelity.com/proxyvotingresults or visit the Securities and Exchange Commission's (SEC) web site at http://www.sec.gov.
You may also call 1-800-544-3455 to request a free copy of the proxy voting guidelines.
BLOOMBERG ® is a trademark and service mark of Bloomberg Finance L.P. and its affiliates (collectively "Bloomberg"). Bloomberg or Bloomberg's licensors own all proprietary rights in the Bloomberg Indices. Neither Bloomberg nor Bloomberg's licensors approves or endorses this material, or guarantees the accuracy or completeness of any information herein, or makes any warranty, express or implied, as to the results to be obtained therefrom and, to the maximum extent allowed by law, neither shall have any liability or responsibility for injury or damages arising in connection therewith.
Standard & Poor's, S&P and S&P 500 are registered service marks of The McGraw-Hill Companies, Inc. and have been licensed for use by Fidelity Distributors Corporation.
Other third-party marks appearing herein are the property of their respective owners.
All other marks appearing herein are registered or unregistered trademarks or service marks of FMR LLC or an affiliated company. © 2024 FMR LLC. All rights reserved.
This report and the financial statements contained herein are submitted for the general information of the shareholders of the Fund. This report is not authorized for distribution to prospective investors in the Fund unless preceded or accompanied by an effective prospectus.
A fund files its complete schedule of portfolio holdings with the SEC for the first and third quarters of each fiscal year on Form N-PORT. Forms N-PORT are available on the SEC's web site at http://www.sec.gov. A fund's Forms N-PORT may be reviewed and copied at the SEC's Public Reference Room in Washington, DC. Information regarding the operation of the SEC's Public Reference Room may be obtained by calling 1-800-SEC-0330.
For a complete list of a fund's portfolio holdings, view the most recent holdings listing, semiannual report, or annual report on Fidelity's web site at http://www.fidelity.com, http://www.institutional.fidelity.com, or http://www.401k.com, as applicable.
NOT FDIC INSURED •MAY LOSE VALUE •NO BANK GUARANTEE
Neither the Fund nor Fidelity Distributors Corporation is a bank.
Item 7: Financial Statements and Financial Highlights for Open-End Management Investment Companies (Annual Report)
Fidelity® SAI Municipal Bond Index Fund
Schedule of Investments June 30, 2024
Showing Percentage of Net Assets
| Municipal Bonds - 99.7% |
| | | Principal Amount (a) | Value ($) |
| Alabama - 0.3% | | | |
| Alabama Fed. Aid Hwy. Fin. Auth. Series 2017 A, 4% 6/1/37 (Pre-Refunded to 9/1/27 @ 100) | | 25,000 | 25,692 |
| Birmingham Wtrwks. Board Series 2016, 3% 1/1/43 (Pre-Refunded to 1/1/27 @ 100) | | 30,000 | 29,852 |
| Decatur Wtr. & Swr. Rev. Series 2021 A, 2.125% 2/15/51 | | 90,000 | 51,897 |
| UAB Medicine Fin. Auth. Rev.: | | | |
| Series 2016 B, 5% 9/1/34 | | 50,000 | 51,176 |
| Series 2017 B1, 3.25% 9/1/31 | | 45,000 | 42,408 |
| Univ. of Alabama Gen. Rev.: | | | |
| Series 2012 A, 5% 7/1/24 | | 20,000 | 20,000 |
| Series 2017 B, 3% 7/1/35 | | 30,000 | 27,418 |
TOTAL ALABAMA | | | 248,443 |
| Arizona - 1.9% | | | |
| Arizona Health Facilities Auth. Rev. (Scottsdale Lincoln Hospitals Proj.) Series 2014 A, 5% 12/1/26 | | 15,000 | 15,089 |
| Arizona State Univ. Revs. Series 2019 B, 4% 7/1/49 | | 70,000 | 68,609 |
| Bullhead City Excise Taxes Series 2021, 2.7% 7/1/51 | | 90,000 | 61,577 |
| City of Lake Havasu Wastewtr. Sys. Rev. Series 2015 B, 4% 7/1/45 (Assured Guaranty Muni. Corp. Insured) | | 60,000 | 57,068 |
| Maricopa County Rev. Series 2016 A, 5% 1/1/38 | | 40,000 | 41,034 |
| McAllister Academic Village LLC Rev. Series 2016, 5% 7/1/39 | | 175,000 | 178,559 |
| Mesa Util. Sys. Rev. Series 2016, 3% 7/1/38 | | 125,000 | 110,485 |
| Phoenix Civic Impt. Board Arpt. Rev.: | | | |
| Series 2015 A, 5% 7/1/45 | | 95,000 | 95,528 |
| Series 2017 D, 5% 7/1/25 | | 20,000 | 20,333 |
| Series 2019 B: | | | |
5% 7/1/33 (b) | | 110,000 | 115,975 |
5% 7/1/44 (b) | | 40,000 | 41,175 |
| Phoenix Civic Impt. Corp. District Rev. Series 2005 B: | | | |
| 5.5% 7/1/36 (Nat'l. Pub. Fin. Guarantee Corp. Insured) | | 25,000 | 30,407 |
| 5.5% 7/1/41 (Nat'l. Pub. Fin. Guarantee Corp. Insured) | | 80,000 | 98,247 |
| Phoenix Civic Impt. Corp. Excise Tax Rev. Series 2015 A, 5% 7/1/31 | | 25,000 | 25,353 |
| Salt River Proj. Agricultural Impt. & Pwr. District Elec. Sys. Rev.: | | | |
| (Arizona Salt River Proj.) Series A, 5% 1/1/38 | | 145,000 | 149,805 |
| Series 2015 A, 5% 12/1/32 | | 25,000 | 25,292 |
| Series 2017 A, 5% 1/1/28 | | 55,000 | 58,609 |
| Series 2022 A, 5% 1/1/32 | | 145,000 | 164,422 |
| Salt Verde Finl. Corp. Sr. Gas Rev. Series 2007 1: | | | |
| 5% 12/1/32 | | 20,000 | 21,276 |
| 5.25% 12/1/24 | | 15,000 | 15,070 |
| 5.25% 12/1/26 | | 15,000 | 15,489 |
| Univ. of Arizona Univ. Revs. Series 2016 B, 5% 6/1/42 | | 95,000 | 97,010 |
TOTAL ARIZONA | | | 1,506,412 |
| Arkansas - 0.2% | | | |
| Fort Smith Wtr. & Swr. Rev. Series 2018, 5% 10/1/34 | | 145,000 | 153,770 |
| Pulaski County Pub. Facilities Board Series 2014, 5% 12/1/39 (Pre-Refunded to 12/1/24 @ 100) | | 35,000 | 35,170 |
TOTAL ARKANSAS | | | 188,940 |
| California - 19.3% | | | |
| Alameda Unified School District Gen. Oblig. Series 2024 B, 4% 8/1/52 | | 35,000 | 34,925 |
| Anaheim Pub. Fing. Auth. Lease Rev.: | | | |
| (Anaheim Pub. Impts. Proj.) Series 1997 C, 0% 9/1/36 (Escrowed to Maturity) | | 90,000 | 59,891 |
| Series 1997 C, 0% 9/1/35 (Escrowed to Maturity) | | 45,000 | 31,112 |
| Bay Area Toll Auth. San Francisco Bay Toll Bridge Rev.: | | | |
| Bonds Series 2018 A, 2.625%, tender 4/1/26 (c) | | 70,000 | 68,342 |
| Series 2017 S7: | | | |
4% 4/1/34 | | 50,000 | 50,337 |
4% 4/1/42 | | 10,000 | 9,993 |
4% 4/1/47 | | 45,000 | 44,175 |
| Bay Area Wtr. Supply & Conservation Agcy. (Cap. Cost Recovery Prepayment Prog.) Series 2023 A, 5% 10/1/32 | | 95,000 | 110,235 |
| Beaumont Calif Pub. Impt. Auth. W Series 2018 A, 5% 9/1/49 (Assured Guaranty Muni. Corp. Insured) | | 175,000 | 182,383 |
| Berkeley Unified School District Gen. Oblig. Series E, 3.5% 8/1/45 | | 100,000 | 92,558 |
| California Dept. of Wtr. Resources: | | | |
| Series 2019 A, 5% 12/1/34 | | 90,000 | 99,026 |
| Series AV, 4% 12/1/31 | | 10,000 | 10,166 |
| Series BA, 5% 12/1/32 | | 5,000 | 5,519 |
| California Edl. Facilities Auth. Rev.: | | | |
| Series 2001 A: | | | |
0% 10/1/30 | | 15,000 | 11,946 |
0% 10/1/34 (Nat'l. Pub. Fin. Guarantee Corp. Insured) | | 25,000 | 16,940 |
| Series T1, 5% 3/15/39 | | 20,000 | 24,162 |
| California Gen. Oblig.: | | | |
| Series 2012, 3.5% 9/1/32 | | 45,000 | 44,850 |
| Series 2013, 4% 4/1/43 | | 40,000 | 39,501 |
| Series 2014: | | | |
4% 11/1/44 | | 10,000 | 9,820 |
5% 10/1/28 | | 10,000 | 10,031 |
5% 8/1/35 | | 20,000 | 20,021 |
5% 10/1/39 | | 25,000 | 25,063 |
| Series 2015: | | | |
3.25% 3/1/32 | | 100,000 | 98,225 |
4% 3/1/45 | | 100,000 | 100,011 |
5% 8/1/26 | | 30,000 | 30,303 |
5% 8/1/26 | | 20,000 | 20,372 |
5% 9/1/26 | | 40,000 | 40,804 |
5% 9/1/28 | | 50,000 | 50,961 |
5% 8/1/29 | | 20,000 | 20,348 |
5% 8/1/30 | | 50,000 | 50,453 |
5% 8/1/45 | | 30,000 | 30,306 |
| Series 2016: | | | |
3% 9/1/33 | | 30,000 | 28,949 |
4% 9/1/36 | | 100,000 | 100,371 |
5% 9/1/25 | | 25,000 | 25,553 |
5% 9/1/26 | | 15,000 | 15,578 |
5% 9/1/30 | | 20,000 | 20,669 |
5% 9/1/45 | | 10,000 | 10,256 |
| Series 2017 A, 5% 8/1/26 | | 65,000 | 67,402 |
| Series 2017: | | | |
4% 8/1/27 | | 55,000 | 55,514 |
4% 11/1/36 | | 20,000 | 20,220 |
4% 8/1/37 | | 25,000 | 25,229 |
5% 8/1/27 | | 30,000 | 31,693 |
5% 11/1/27 | | 150,000 | 159,164 |
| Series 2018, 5% 10/1/39 | | 110,000 | 112,449 |
| Series 2019: | | | |
3% 10/1/36 | | 50,000 | 46,132 |
4% 4/1/25 | | 5,000 | 5,031 |
4% 4/1/49 | | 100,000 | 99,543 |
5% 4/1/25 | | 10,000 | 10,135 |
5% 4/1/27 | | 5,000 | 5,249 |
5% 11/1/27 | | 90,000 | 95,499 |
5% 4/1/28 | | 225,000 | 240,173 |
5% 11/1/34 | | 80,000 | 86,049 |
5% 4/1/35 | | 85,000 | 85,000 |
5% 4/1/37 | | 75,000 | 75,000 |
5% 4/1/45 | | 60,000 | 63,617 |
| Series 2020: | | | |
3% 11/1/35 | | 220,000 | 208,703 |
4% 3/1/28 | | 60,000 | 61,848 |
4% 3/1/37 | | 85,000 | 87,604 |
4% 3/1/50 | | 95,000 | 94,287 |
5% 11/1/31 | | 80,000 | 89,236 |
| Series 2021, 4% 10/1/37 | | 80,000 | 82,937 |
| Series 2022, 5% 4/1/32 | | 205,000 | 234,171 |
| California Health Facilities Fing. Auth. Rev.: | | | |
| Series 2013 A, 4% 3/1/43 | | 40,000 | 36,757 |
| Series 2016 B: | | | |
5% 11/15/46 | | 15,000 | 15,330 |
5% 11/15/46 (Pre-Refunded to 11/15/26 @ 100) | | 10,000 | 10,421 |
| Series 2018 A: | | | |
4% 11/15/42 | | 20,000 | 19,781 |
5% 11/15/33 | | 35,000 | 37,083 |
| Series A: | | | |
4% 8/15/50 | | 185,000 | 179,526 |
5% 8/15/47 | | 15,000 | 15,263 |
| California Infrastructure and Econ. Dev. Bank Rev.: | | | |
| (California Science Ctr. Phase III Proj.) Series 2021 B, 4% 5/1/46 | | 100,000 | 99,332 |
| Series 2020 A1, 5% 4/1/33 | | 90,000 | 105,121 |
| Series 2023 A, 5% 4/1/33 | | 75,000 | 87,601 |
| Series 2023, 5% 10/1/35 | | 90,000 | 104,300 |
| California Muni. Fin. Auth. Rev. Series 2018 A, 3.25% 12/31/32 (Assured Guaranty Muni. Corp. Insured) (b) | | 30,000 | 27,547 |
| California State Univ. Rev.: | | | |
| Series 2015 A, 5% 11/1/26 | | 15,000 | 15,351 |
| Series 2016 A: | | | |
3.2% 11/1/37 | | 15,000 | 14,091 |
5% 11/1/26 | | 40,000 | 41,414 |
| Series 2020 C, 3% 11/1/40 | | 100,000 | 88,421 |
| California Statewide Cmntys. Dev. Auth. Hosp. Rev. Series 2018: | | | |
| 4.375% 1/1/48 | | 10,000 | 10,021 |
| 5% 1/1/32 | | 30,000 | 31,925 |
| California Statewide Cmntys. Dev. Auth. Rev.: | | | |
| Series 2015, 3% 8/15/29 | | 50,000 | 49,895 |
| Series 2018 A, 3.5% 3/1/38 | | 155,000 | 147,596 |
| Chaffey Unified High School District Series 2019 D, 4% 8/1/49 | | 30,000 | 30,011 |
| Chino Valley Unified School District Series 2017 A, 5.25% 8/1/47 | | 25,000 | 26,070 |
| Compton Unified School District Series 2019 B, 3% 6/1/49 | | 75,000 | 60,136 |
| Contra Costa Cmnty. College District Series 2014 A, 4% 8/1/39 | | 5,000 | 5,000 |
| Corona-Norco Unified School District Series 2014, 3% 8/1/44 | | 125,000 | 103,686 |
| East Bay Muni. Util. District Wastewtr. Sys. Rev.: | | | |
| Series 2015 A, 5% 6/1/37 | | 65,000 | 65,968 |
| Series 2017 B, 5% 6/1/32 | | 45,000 | 47,601 |
| El Camino Cmnty. College District Series 2012 C: | | | |
| 0% 8/1/34 | | 60,000 | 42,979 |
| 0% 8/1/38 | | 85,000 | 50,051 |
| Elk Grove Unified School Distr. Ctfs. of Prtn. (Cap. Facilities Proj.) Series 2016, 3% 2/1/35 | | 65,000 | 59,605 |
| Facilities Fing. Auth. Sp (Irvine Great Park Infrastructure Proj.) Series 2023 A, 4% 9/1/58 (Build America Mutual Assurance Insured) | | 135,000 | 133,064 |
| Foothill-De Anza Cmnty. College District Series 2003 B: | | | |
| 0% 8/1/25 | | 75,000 | 72,481 |
| 0% 8/1/33 | | 85,000 | 63,794 |
| Foothill/Eastern Trans. Corridor Agcy. Toll Road Rev.: | | | |
| Series 1995 A, 0% 1/1/29 (Escrowed to Maturity) | | 30,000 | 26,122 |
| Series 2013 B1, 3.95% 1/15/53 (c) | | 65,000 | 60,499 |
| Series 2021 A, 4% 1/15/46 | | 15,000 | 14,586 |
| Fremont Union High School District, Santa Clara: | | | |
| Series 2015, 4% 8/1/44 | | 45,000 | 44,780 |
| Series 2019 A, 4% 8/1/46 | | 30,000 | 29,735 |
| Golden State Tobacco Securitization Corp. Tobacco Settlement Rev. Series 2015 A: | | | |
| 5% 6/1/35 (Pre-Refunded to 6/1/25 @ 100) | | 10,000 | 10,172 |
| 5% 6/1/40 (Pre-Refunded to 6/1/25 @ 100) | | 10,000 | 10,172 |
| Grossmont Union High School District: | | | |
| Series 2008, 0% 8/1/30 | | 40,000 | 32,384 |
| Series 2016 B, 3% 8/1/45 | | 30,000 | 24,355 |
| Grossmont-Cuyamaca Cmnty. College District Series 2018 B, 4% 8/1/47 | | 200,000 | 200,183 |
| Imperial Irrigation District Elec. Rev. Series 2015 C, 5% 11/1/38 | | 85,000 | 87,291 |
| Livermore Valley Joint Unified School District Series 2016, 3% 8/1/46 | | 155,000 | 127,800 |
| Long Beach Bond Fin. Auth. Natural Gas Purchase Rev. Series 2007 A: | | | |
| 5% 11/15/35 | | 25,000 | 27,095 |
| 5.5% 11/15/37 | | 30,000 | 34,042 |
| Long Beach Unified School District: | | | |
| Series 2016, 3% 8/1/32 | | 80,000 | 75,851 |
| Series B, 0% 8/1/35 | | 90,000 | 60,793 |
| Los Angeles Cmnty. College District: | | | |
| Series 2017 J, 5% 8/1/28 | | 20,000 | 21,211 |
| Series 2024: | | | |
5% 8/1/33 | | 25,000 | 29,231 |
5% 8/1/39 | | 15,000 | 17,476 |
| Series A, 5% 8/1/30 (Pre-Refunded to 8/1/24 @ 100) | | 20,000 | 20,027 |
| Series G, 5% 8/1/27 (Pre-Refunded to 8/1/24 @ 100) | | 20,000 | 20,027 |
| Los Angeles County Metropolitan Trans. Auth. Sales Tax Rev.: | | | |
| Series 2019 A, 5% 7/1/44 | | 45,000 | 47,581 |
| Series 2021 A, 4% 6/1/38 | | 95,000 | 99,732 |
| Series 2023 A, 5% 7/1/36 | | 75,000 | 87,778 |
| Series 2024 A, 5% 7/1/35 | | 30,000 | 35,726 |
| Los Angeles Dept. Arpt. Rev.: | | | |
| Series 2018 C, 5% 5/15/36 (b) | | 80,000 | 82,821 |
| Series 2020 A, 5% 5/15/38 | | 85,000 | 93,305 |
| Series 2021 B, 5% 5/15/37 | | 50,000 | 56,373 |
| Series 2022 C, 4% 5/15/41 (b) | | 50,000 | 48,742 |
| Series B, 5% 5/15/48 | | 90,000 | 97,273 |
| Series C, 5% 5/15/33 (b) | | 155,000 | 160,696 |
| Series D, 5% 5/15/26 (b) | | 5,000 | 5,131 |
| Los Angeles Dept. of Wtr. & Pwr. Rev.: | | | |
| Sereis 2014 C, 5% 7/1/29 (Pre-Refunded to 7/1/24 @ 100) | | 45,000 | 45,000 |
| Series 2014 C, 5% 7/1/29 | | 20,000 | 20,065 |
| Series 2014 D: | | | |
5% 7/1/44 | | 40,000 | 40,129 |
5% 7/1/44 (Pre-Refunded to 7/1/24 @ 100) | | 5,000 | 5,000 |
| Series 2017 C, 5% 7/1/36 | | 50,000 | 52,451 |
| Series 2018 C, 5% 7/1/25 | | 95,000 | 96,798 |
| Series 2019 B, 5% 7/1/35 | | 90,000 | 97,530 |
| Series 2019 D, 5% 7/1/44 | | 150,000 | 160,578 |
| Series 2022 A, 5% 7/1/40 | | 105,000 | 116,539 |
| Los Angeles Dept. of Wtr. & Pwr. Wtrwks. Rev.: | | | |
| Series 2014 A, 5% 7/1/44 | | 25,000 | 25,053 |
| Series 2022 D, 5% 7/1/33 | | 180,000 | 207,231 |
| Series A: | | | |
5% 7/1/33 | | 5,000 | 5,303 |
5% 7/1/33 | | 55,000 | 57,401 |
| Series B, 5% 7/1/37 | | 100,000 | 106,489 |
| Los Angeles Muni. Impt. Corp. Lease Rev. Series 2016 B, 4% 11/1/37 | | 40,000 | 40,198 |
| Los Angeles Solid Waste Resources Rev. Series 2018 A: | | | |
| 4% 2/1/32 | | 35,000 | 35,773 |
| 5% 2/1/25 | | 50,000 | 50,532 |
| Los Angeles Unified School District: | | | |
| Series 2014 C, 5% 7/1/24 | | 10,000 | 10,000 |
| Series 2016 A: | | | |
5% 7/1/29 | | 80,000 | 81,168 |
5% 7/1/40 | | 75,000 | 75,968 |
| Series 2019 A, 5% 7/1/28 | | 20,000 | 21,494 |
| Series 2021 A, 5% 7/1/25 | | 125,000 | 127,254 |
| Series 2023 QRR, 5% 7/1/37 | | 40,000 | 46,511 |
| Series A: | | | |
5% 7/1/29 | | 45,000 | 49,277 |
5% 7/1/30 | | 75,000 | 81,823 |
| Series B, 5% 7/1/25 | | 15,000 | 15,270 |
| Los Angeles Wastewtr. Sys. Rev. Series 2022 A, 5% 6/1/47 | | 85,000 | 93,445 |
| Marin Healthcare District Series 2017 A, 3% 8/1/37 | | 5,000 | 4,383 |
| Metropolitan Wtr. District of Southern California Wtr. Rev. Series 2020 A, 5% 10/1/36 | | 85,000 | 93,348 |
| Monterey Peninsula Cmnty. College District Series 2016, 0% 8/1/30 | | 20,000 | 15,895 |
| MSR Energy Auth. Gas Rev. Series 2009 B, 6.5% 11/1/39 | | 25,000 | 31,680 |
| Newport Mesa Unified School District: | | | |
| Series 2011, 0% 8/1/36 | | 70,000 | 46,028 |
| Series 2017, 0% 8/1/39 | | 5,000 | 2,739 |
| North Orange County Cmnty. College District Rev. Series 2016 A, 3% 8/1/40 | | 25,000 | 21,741 |
| Palo Alto Unified School District Gen. Oblig. Series 2008 2: | | | |
| 0% 8/1/30 | | 50,000 | 41,237 |
| 0% 8/1/32 | | 100,000 | 76,973 |
| 0% 8/1/33 | | 15,000 | 11,128 |
| Palomar Pomerado Health Series 2009 A, 0% 8/1/28 (Assured Guaranty Corp. Insured) | | 255,000 | 216,801 |
| Pasadena Elec. Rev. Series 2013 A, 4.5% 6/1/40 | | 15,000 | 15,006 |
| Peralta Cmnty. College District Gen. Oblig. Series 2016 A, 4% 8/1/39 | | 130,000 | 129,016 |
| Perris Union High School District Series A, 3% 9/1/44 (Assured Guaranty Muni. Corp. Insured) | | 25,000 | 20,709 |
| Port of Oakland Rev. Series 2017 E, 5% 11/1/26 | | 30,000 | 31,192 |
| Poway Unified School District: | | | |
| Series 2011 B, 0% 8/1/34 | | 50,000 | 35,152 |
| Series B, 0% 8/1/41 | | 190,000 | 95,149 |
| Pub. Utils. Commission San Francisco City & County Wastewtr. Rev. Series 2021 A: | | | |
| 4% 10/1/48 | | 100,000 | 99,450 |
| 4% 10/1/51 | | 100,000 | 97,932 |
| Riverside Elec. Rev. Series 2019 A, 5% 10/1/26 | | 50,000 | 52,156 |
| Sacramento County Sanitation District Fing. Auth. Rev. Series 2021, 5% 12/1/32 | | 100,000 | 116,078 |
| Sacramento TOT Rev. Series A, 5% 6/1/43 | | 100,000 | 103,424 |
| San Bernardino Cmnty. College District Series B, 0% 8/1/48 | | 45,000 | 15,783 |
| San Diego Cmnty. College District Series 2016, 5% 8/1/41 (Pre-Refunded to 8/1/26 @ 100) | | 5,000 | 5,214 |
| San Diego County Reg'l. Arpt. Auth. Arpt. Rev.: | | | |
| (Sub Lien Proj.) Series 2017 B, 5% 7/1/42 (b) | | 175,000 | 178,348 |
| Series 2019 A, 5% 7/1/34 | | 75,000 | 82,303 |
| San Diego Pub. Facilities Fing. Auth. Swr. Rev. Series 2016 A, 5% 5/15/39 | | 100,000 | 102,753 |
| San Diego Pub. Facilities Fing. Auth. Wtr. Rev. Series 2018 A: | | | |
| 5% 8/1/43 | | 325,000 | 342,104 |
| 5.25% 8/1/47 | | 10,000 | 10,568 |
| San Diego Unified School District: | | | |
| Series 1998 G1: | | | |
5.25% 7/1/27 (Assured Guaranty Muni. Corp. Insured) | | 10,000 | 10,678 |
5.25% 7/1/28 (Assured Guaranty Muni. Corp. Insured) | | 10,000 | 10,896 |
| Series 2017 I, 4% 7/1/47 | | 15,000 | 14,705 |
| Series 2017 J, 5% 7/1/30 | | 80,000 | 84,591 |
| Series 2021 N2, 4% 7/1/46 | | 25,000 | 25,171 |
| Series 2024 ZR5A, 5% 7/1/39 | | 20,000 | 23,448 |
| Series B, 3.25% 7/1/48 | | 80,000 | 69,129 |
| Series C, 0% 7/1/43 | | 40,000 | 18,598 |
| Series R1, 0% 7/1/30 | | 35,000 | 28,690 |
| San Francisco Bay Area Rapid Transit District Sales Tax Rev. Series 2019 A, 3% 7/1/44 | | 50,000 | 41,514 |
| San Francisco Bay Area Rapid Transit Fing. Auth.: | | | |
| Series 2020 C1, 4% 8/1/30 | | 125,000 | 131,089 |
| Series A1, 5% 8/1/47 | | 45,000 | 46,706 |
| San Francisco City & County Arpts. Commission Int'l. Arpt. Rev.: | | | |
| Series 2016 A, 5% 5/1/26 | | 20,000 | 20,677 |
| Series 2019 A, 5% 5/1/49 (b) | | 25,000 | 25,516 |
| Series 2019 E, 5% 5/1/34 (b) | | 125,000 | 131,873 |
| Series 2020 A, 4% 5/1/39 (b) | | 35,000 | 34,461 |
| Series 2020 B, 4% 5/1/39 | | 100,000 | 102,935 |
| San Francisco City & County Ctfs. of Prtn. (49 South Van Ness Proj.) Series 2019 A, 4% 4/1/41 | | 35,000 | 35,159 |
| San Francisco City & County Gen. Oblig. Series 2022 R1: | | | |
| 5% 6/15/32 | | 70,000 | 80,659 |
| 5% 6/15/34 | | 75,000 | 86,423 |
| San Francisco County Trans. Auth. Series 2017, 3% 2/1/33 | | 155,000 | 145,979 |
| San Francisco Muni. Trans. Agcy. Series 2021 C, 4% 3/1/46 | | 200,000 | 197,395 |
| San Francisco Pub. Utils. Commission Wtr. Rev.: | | | |
| Series 2015 A, 5% 11/1/29 | | 20,000 | 20,274 |
| Series 2016, 5% 11/1/31 | | 100,000 | 104,020 |
| Series 2020 A, 5% 11/1/50 | | 30,000 | 32,204 |
| San Joaquin Hills Trans. Corridor Agcy. Toll Road Rev.: | | | |
| Series 1997 A: | | | |
0% 1/15/25 (Nat'l. Pub. Fin. Guarantee Corp. Insured) | | 20,000 | 19,588 |
0% 1/15/29 (Nat'l. Pub. Fin. Guarantee Corp. Insured) | | 50,000 | 42,266 |
0% 1/15/32 (Nat'l. Pub. Fin. Guarantee Corp. Insured) | | 5,000 | 3,733 |
| Series 2021 A, 4% 1/15/50 | | 30,000 | 28,946 |
| Series A, 0% 1/15/31 (Nat'l. Pub. Fin. Guarantee Corp. Insured) | | 90,000 | 70,153 |
| San Jose Int. Arpt. Rev. Series 2017 B, 5% 3/1/42 | | 25,000 | 25,892 |
| San Mateo County Trans. District Sales Tax Rev. Series A, 3.25% 6/1/33 | | 60,000 | 58,834 |
| San Mateo Foster City (Clean Wtr. Prog.) Series 2019, 5% 8/1/49 | | 45,000 | 47,773 |
| San Mateo Unified School District Series 2011 A: | | | |
| 0% 9/1/33 (d) | | 50,000 | 47,305 |
| 0% 9/1/41 (d) | | 10,000 | 10,405 |
| Santa Clara County Fing. Auth. Lease Rev.: | | | |
| Series 2018 A, 3.5% 4/1/39 | | 40,000 | 38,941 |
| Series 2019 A, 3% 5/1/42 | | 100,000 | 84,719 |
| Series 2021 A, 3% 5/1/39 | | 100,000 | 89,949 |
| Santa Clara Unified School District Series 2019, 4% 7/1/48 | | 35,000 | 34,413 |
| Sequoia Union High School District Series 2016, 3% 7/1/31 | | 55,000 | 54,090 |
| Solano Cmnty. College District Series A, 5.125% 8/1/41 (Pre-Refunded to 8/1/28 @ 100) | | 10,000 | 10,731 |
| Southern CA Pub. Pwr. Auth. So Series 2023 1, 5% 7/1/35 | | 100,000 | 116,715 |
| Southern California Pub. Pwr. Auth. Rev.: | | | |
| Series 2007 A, 5.25% 11/1/25 | | 35,000 | 35,520 |
| Series A, 5.25% 11/1/26 | | 30,000 | 30,698 |
| Univ. of California Regents Med. Ctr. Pool Rev. Series 2022 P, 5% 5/15/41 | | 135,000 | 149,975 |
| Univ. of California Revs.: | | | |
| Series 2015 AO, 5% 5/15/25 | | 70,000 | 71,057 |
| Series 2016, 5% 5/15/35 | | 15,000 | 15,399 |
| Series 2017 AV: | | | |
5% 5/15/35 | | 50,000 | 52,398 |
5% 5/15/47 | | 110,000 | 113,848 |
| Series 2017 AY, 5% 5/15/25 | | 50,000 | 50,755 |
| Series 2017 M: | | | |
5% 5/15/31 | | 140,000 | 146,674 |
5% 5/15/32 | | 35,000 | 36,668 |
| Series 2020 BE: | | | |
4% 5/15/47 | | 115,000 | 114,160 |
5% 5/15/43 | | 15,000 | 16,196 |
| Series 2022 BK, 5% 5/15/32 | | 115,000 | 131,562 |
| Series 2022 S, 5% 5/15/36 | | 125,000 | 142,343 |
| Series 2023 BM, 5% 5/15/27 | | 100,000 | 105,617 |
| Series I, 5% 5/15/28 | | 10,000 | 10,138 |
| Series M, 5% 5/15/36 | | 20,000 | 20,926 |
| Upland Gen. Oblig. Ctfs. of Prtn. Series 2017, 4% 1/1/42 | | 10,000 | 9,069 |
| West Contra Costa Unified School District: | | | |
| Series 2020 E, 4% 8/1/49 (Assured Guaranty Muni. Corp. Insured) | | 75,000 | 74,414 |
| Series C1, 0% 8/1/27 (Assured Guaranty Corp. Insured) | | 70,000 | 63,058 |
| West County Facilities Fing. Auth. Calif Series 2021, 4% 6/1/46 | | 85,000 | 83,825 |
| West Hollywood Pub. Fing. Auth. Series 2016, 3% 4/1/41 | | 75,000 | 64,472 |
| Westminster Redev. Agcy. Series 2016: | | | |
| 3% 11/1/41 | | 25,000 | 21,129 |
| 3% 11/1/45 | | 75,000 | 61,082 |
| William S. Hart Union High School District Series 2005 B, 0% 9/1/28 (Assured Guaranty Muni. Corp. Insured) | | 140,000 | 121,436 |
| Yosemite Cmnty. College District Series 2010 D, 0% 8/1/31 | | 100,000 | 78,457 |
| Yuba Cmnty. College District Series 2016 A: | | | |
| 3% 8/1/36 | | 150,000 | 134,565 |
| 3% 8/1/37 | | 30,000 | 26,641 |
TOTAL CALIFORNIA | | | 15,620,147 |
| Colorado - 2.2% | | | |
| Colorado Ctfs. of Prtn. Series 2018 A, 3.625% 12/15/36 | | 200,000 | 197,982 |
| Colorado Health Facilities Auth. Rev. Bonds: | | | |
| Series 2018 A, 4% 11/15/48 | | 5,000 | 4,777 |
| Series 2019 A, 5% 1/1/30 | | 105,000 | 114,711 |
| Series 2019 A1: | | | |
4% 8/1/37 | | 90,000 | 90,074 |
4% 8/1/44 | | 10,000 | 9,728 |
5% 8/1/32 | | 120,000 | 128,164 |
| Series 2021 A, 4% 11/15/46 | | 100,000 | 95,443 |
| Colorado Springs Utils. Rev.: | | | |
| Series 2018 A2, 5% 11/15/48 | | 25,000 | 26,028 |
| Series 2021 B, 4% 11/15/40 | | 100,000 | 101,141 |
| Denver City & County Arpt. Rev.: | | | |
| Series 2017 A: | | | |
5% 11/15/26 (b) | | 55,000 | 56,776 |
5% 11/15/28 (b) | | 30,000 | 31,101 |
5% 11/15/29 (b) | | 20,000 | 20,759 |
| Series 2018 B, 3.5% 12/1/35 | | 10,000 | 9,613 |
| Series 2019 C, 5% 11/15/31 | | 20,000 | 21,874 |
| Series 2022 A, 5% 11/15/41 (b) | | 180,000 | 191,380 |
| Denver City & County Board Wtr. Rev. Series 2022 A, 5% 12/15/45 | | 100,000 | 109,463 |
| Denver Dedicated Tax Rev. Series 2021 A, 4% 8/1/42 | | 100,000 | 99,079 |
| E-470 Pub. Hwy. Auth. Rev. Series 2000 B: | | | |
| 0% 9/1/31 (Nat'l. Pub. Fin. Guarantee Corp. Insured) | | 30,000 | 22,919 |
| 0% 9/1/32 (Nat'l. Pub. Fin. Guarantee Corp. Insured) | | 50,000 | 36,637 |
| East Grand County Co. School District # 2 Series 2022, 4% 12/1/46 | | 100,000 | 99,945 |
| El Paso County Co. Scd # 2 Series 2019, 5% 12/1/37 | | 155,000 | 165,373 |
| Pueblo County Ctfs. of Prtn. (Jail Proj.) Series 2022 A, 5% 7/1/49 | | 135,000 | 142,088 |
| Univ. of Colorado Enterprise Sys. Rev. Series 2016 B1, 2.75% 6/1/30 | | 15,000 | 13,848 |
TOTAL COLORADO | | | 1,788,903 |
| Connecticut - 2.1% | | | |
| Connecticut Gen. Oblig.: | | | |
| Series 2015 B: | | | |
3.375% 6/15/29 | | 25,000 | 24,779 |
4% 6/15/33 | | 110,000 | 110,174 |
| Series 2016 A, 5% 3/15/26 | | 15,000 | 15,449 |
| Series 2019 A, 5% 4/15/27 | | 15,000 | 15,742 |
| Series 2020 C: | | | |
4% 6/1/30 | | 120,000 | 125,413 |
4% 6/1/31 | | 25,000 | 26,075 |
| Series 2021 B, 3% 6/1/39 | | 60,000 | 53,189 |
| Series A: | | | |
4% 1/15/25 | | 60,000 | 60,211 |
5% 3/15/28 | | 15,000 | 15,143 |
| Series D: | | | |
4% 8/15/31 | | 45,000 | 45,275 |
5% 4/15/26 | | 25,000 | 25,786 |
| Series E: | | | |
3.375% 10/15/36 | | 20,000 | 19,143 |
5% 9/15/25 | | 25,000 | 25,536 |
5% 10/15/25 | | 20,000 | 20,457 |
| Connecticut Health & Edl. Facilities Auth. Rev.: | | | |
| Series 2019 A: | | | |
4% 7/1/34 | | 45,000 | 44,365 |
5% 7/1/25 | | 100,000 | 100,351 |
| Series R, 3.375% 7/1/37 | | 10,000 | 9,435 |
| Connecticut Hsg. Fin. Auth.: | | | |
| Series 2017 D1, 3.2% 11/15/32 | | 10,000 | 9,346 |
| Series 2020 A1, 3.5% 11/15/45 | | 140,000 | 137,145 |
| Series 2022 A1, 3.5% 11/15/51 | | 95,000 | 92,803 |
| Connecticut Spl. Tax Oblig. Trans. Infrastructure Rev.: | | | |
| Series 2015 A: | | | |
5% 8/1/28 | | 60,000 | 60,886 |
5% 8/1/33 | | 95,000 | 96,298 |
| Series 2015 B, 5% 8/1/27 | | 55,000 | 55,819 |
| Series 2016 A, 5% 9/1/31 | | 25,000 | 25,740 |
| Series 2018 A, 5% 1/1/27 | | 20,000 | 20,879 |
| Series 2018 B, 5% 10/1/35 | | 175,000 | 185,739 |
| Series 2021 A, 5% 5/1/28 | | 135,000 | 144,293 |
| Series A, 4% 9/1/35 | | 55,000 | 55,150 |
| Series B, 5% 10/1/33 | | 15,000 | 15,942 |
| Univ. of Connecticut Gen. Oblig. Series 2018 A, 5% 4/15/29 | | 25,000 | 26,558 |
TOTAL CONNECTICUT | | | 1,663,121 |
| Delaware - 0.9% | | | |
| Delaware Gen. Oblig.: | | | |
| Series 2017, 3.25% 3/1/37 | | 6,000 | 5,860 |
| Series 2020 A, 5% 1/1/30 | | 115,000 | 127,327 |
| Series 2023 A: | | | |
5% 5/1/32 | | 85,000 | 97,700 |
5% 5/1/35 | | 100,000 | 116,372 |
| Delaware Health Facilities Auth. Rev. Series 2020 A: | | | |
| 4% 10/1/49 | | 60,000 | 57,350 |
| 5% 10/1/32 | | 65,000 | 70,652 |
| Delaware Trans. Auth. Trans. Sys. Rev. Series 2020, 5% 7/1/31 | | 210,000 | 232,958 |
TOTAL DELAWARE | | | 708,219 |
| Delaware, New Jersey - 0.1% | | | |
| Delaware River & Bay Auth. Rev. Series 2021, 4% 1/1/46 | | 65,000 | 65,223 |
| District Of Columbia - 2.0% | | | |
| District of Columbia Gen. Oblig.: | | | |
| Series 2016 A, 5% 6/1/32 | | 40,000 | 41,194 |
| Series 2017 A, 5% 6/1/29 | | 10,000 | 10,530 |
| Series 2019 A, 5% 10/15/28 | | 90,000 | 97,016 |
| Series 2021 D: | | | |
4% 2/1/40 | | 110,000 | 112,350 |
5% 2/1/31 | | 95,000 | 106,333 |
| District of Columbia Income Tax Rev.: | | | |
| Series 2020 A, 4% 3/1/45 | | 50,000 | 48,519 |
| Series 2020 B, 5% 10/1/31 | | 90,000 | 101,733 |
| Series 2023 C, 5% 10/1/32 | | 110,000 | 126,070 |
| District of Columbia Univ. Rev. Series 2017: | | | |
| 5% 4/1/31 | | 25,000 | 25,782 |
| 5% 4/1/32 | | 120,000 | 123,606 |
| District of Columbia Wtr. & Swr. Auth. Pub. Util. Rev.: | | | |
| Series 2014 C: | | | |
5% 10/1/27 | | 30,000 | 30,095 |
5% 10/1/28 | | 25,000 | 25,079 |
| Series 2016 A, 5% 10/1/31 | | 50,000 | 51,384 |
| Series 2019 A, 5% 10/1/44 | | 30,000 | 31,735 |
| Metropolitan Washington Arpts. Auth. Dulles Toll Road Rev.: | | | |
| (Dulles Metrorail and Cap. Impt. Proj.) Series 2019 B, 4% 10/1/53 | | 95,000 | 88,522 |
| (Dulles Metrorail and Cap. Impt. Projs.) Series 2019 B, 3% 10/1/50 (Assured Guaranty Muni. Corp. Insured) | | 10,000 | 7,544 |
| Series 2009 B: | | | |
0% 10/1/25 (Assured Guaranty Corp. Insured) | | 50,000 | 47,763 |
0% 10/1/30 (Assured Guaranty Corp. Insured) | | 65,000 | 51,406 |
0% 10/1/31 (Assured Guaranty Corp. Insured) | | 15,000 | 11,391 |
0% 10/1/34 (Assured Guaranty Corp. Insured) | | 35,000 | 23,400 |
0% 10/1/36 (Assured Guaranty Corp. Insured) | | 5,000 | 3,045 |
| Metropolitan Washington DC Arpts. Auth. Sys. Rev.: | | | |
| Series 2014 A: | | | |
5% 10/1/28 (b) | | 20,000 | 20,067 |
5% 10/1/29 (b) | | 50,000 | 50,167 |
5% 10/1/44 (b) | | 75,000 | 75,251 |
| Series 2018 A, 5% 10/1/27 (b) | | 40,000 | 41,488 |
| Series 2019 A, 5% 10/1/39 (b) | | 60,000 | 62,669 |
| Washington D.C. Metropolitan Transit Auth. Rev.: | | | |
| Series 2017 A1, 5% 7/1/29 | | 40,000 | 41,739 |
| Series 2017 B: | | | |
5% 7/1/26 | | 50,000 | 51,662 |
5% 7/1/42 | | 50,000 | 51,278 |
| Series 2018, 5% 7/1/30 | | 35,000 | 36,366 |
TOTAL DISTRICT OF COLUMBIA | | | 1,595,184 |
| Florida - 3.9% | | | |
| Alachua County Health Facilities Auth. Health Facilities Rev. Series 2019 A, 3% 12/1/46 | | 15,000 | 11,706 |
| Broward County Arpt. Sys. Rev.: | | | |
| Series 2015 A, 5% 10/1/33 (b) | | 35,000 | 35,422 |
| Series 2017, 5% 10/1/47 (b) | | 70,000 | 70,681 |
| Broward County Port Facilities Rev. Series 2019 B, 4% 9/1/44 (b) | | 75,000 | 71,166 |
| Central Florida Expressway Auth. Sr. Lien Rev.: | | | |
| Series 2016 B, 4% 7/1/40 | | 5,000 | 4,917 |
| Series 2017, 3.25% 7/1/39 | | 70,000 | 63,725 |
| Escambia County Health Facilities Auth. Health Facilities Rev. Series 2020 A, 3% 8/15/50 (Assured Guaranty Muni. Corp. Insured) | | 115,000 | 85,673 |
| Florida Board of Ed. Pub. Ed. Cap. Outlay: | | | |
| Series 2018 A, 4% 6/1/37 | | 55,000 | 55,957 |
| Series 2019 D, 4% 6/1/30 | | 65,000 | 67,608 |
| Series C, 5% 6/1/25 | | 15,000 | 15,233 |
| Series D, 4% 6/1/32 | | 50,000 | 50,448 |
| Florida Dept. of Envir. Protection Rev. Series 2016 A, 2% 7/1/28 | | 50,000 | 45,553 |
| Florida Dept. of Mgmt. Svcs. Ctfs. of Prtn. Series 2021 A, 2% 11/1/38 | | 190,000 | 139,637 |
| Florida Dept. of Trans. Tpk. Rev.: | | | |
| Series 2019 B: | | | |
3% 7/1/43 | | 30,000 | 25,192 |
3% 7/1/44 | | 200,000 | 166,362 |
| Series 2020 B, 2% 7/1/37 | | 55,000 | 41,621 |
| Florida Gen. Oblig. Series 2021 A, 5% 7/1/29 | | 95,000 | 103,803 |
| Florida Higher Edl. Facilities Fing. Auth.: | | | |
| (Nova Southeastern Univ. Proj.) Series 2016, 5% 4/1/35 | | 60,000 | 61,041 |
| (Ringling College Proj.) Series 2017, 4% 3/1/47 | | 70,000 | 62,209 |
| Florida Hsg. Fin. Corp. Rev. Series 2017 1, 3.6% 7/1/37 | | 20,000 | 18,875 |
| Greater Orlando Aviation Auth. Arpt. Facilities Rev.: | | | |
| Series 2017 A, 5% 10/1/30 (Pre-Refunded to 10/1/27 @ 100) (b) | | 30,000 | 31,255 |
| Series 2019 A, 5% 10/1/27 (b) | | 10,000 | 10,372 |
| Halifax Hosp. Med. Ctr. Rev. Series 2015, 4% 6/1/38 (Pre-Refunded to 6/1/25 @ 100) | | 25,000 | 25,102 |
| Jacksonville Spl. Rev. Series 2019 A: | | | |
| 5% 10/1/27 | | 20,000 | 21,131 |
| 5% 10/1/32 | | 10,000 | 10,838 |
| JEA Wtr. & Swr. Sys. Rev. Series 2020 A, 3% 10/1/36 | | 120,000 | 108,484 |
| Lakeland Hosp. Sys. Rev. Series 2016, 3% 11/15/32 | | 30,000 | 27,468 |
| Miami Beach Series 2019, 3.25% 5/1/49 | | 25,000 | 20,533 |
| Miami Beach Health Facilities Auth. Hosp. Rev. Series 2014 A, 5% 11/15/39 | | 15,000 | 15,028 |
| Miami Beach Wtr. & Swr. Rev. Series 2017, 5% 9/1/47 | | 125,000 | 128,500 |
| Miami-Dade County Aviation Rev.: | | | |
| Series 2014 A, 5% 10/1/33 (b) | | 85,000 | 85,107 |
| Series 2020 A, 4% 10/1/39 | | 70,000 | 70,036 |
| Miami-Dade County Cap. Asset Acquisition: | | | |
| Series 2009, 0% 10/1/41 | | 20,000 | 9,267 |
| Series 2016: | | | |
0% 10/1/31 | | 35,000 | 25,579 |
0% 10/1/32 | | 25,000 | 17,452 |
| Miami-Dade County Edl. Facilities Rev.: | | | |
| Series 2015 A, 4% 4/1/45 | | 10,000 | 9,512 |
| Series 2018 A, 4% 4/1/53 | | 25,000 | 23,975 |
| Miami-Dade County Gen. Oblig.: | | | |
| (Bldg. Better Cmntys. Prog.): | | | |
Series 2013 A, 5% 7/1/26 | | 5,000 | 5,074 |
Series 2015 B, 5% 7/1/27 | | 40,000 | 40,047 |
Series 2016 A, 5% 7/1/29 | | 70,000 | 71,894 |
| (Pub. Health Trust Prog.) Series 2019 A, 5% 7/1/43 | | 10,000 | 10,547 |
| Series 2015 D, 3% 7/1/39 | | 5,000 | 4,332 |
| Miami-Dade County Health Facilities Auth. Hosp. Rev. (Nicklaus Children's Hosp. Proj.) Series 2017, 5% 8/1/47 | | 85,000 | 85,590 |
| Miami-Dade County Pub. Facilities Rev. Series 2015 A, 5% 6/1/28 | | 120,000 | 121,223 |
| Miami-Dade County School Board Ctfs. of Prtn.: | | | |
| Series 2015 D, 5% 2/1/30 | | 85,000 | 86,896 |
| Series 2016 C, 5% 2/1/32 | | 90,000 | 92,049 |
| Miami-Dade County Sports Facilities: | | | |
| Series 2009 A, 6.875% 10/1/34 (Assured Guaranty Corp. Insured) | | 70,000 | 82,563 |
| Series C, 0% 10/1/48 (Assured Guaranty Corp. Insured) | | 60,000 | 19,271 |
| Miami-Dade County Transit Sales Surtax Rev. Series 2019, 5% 7/1/31 | | 25,000 | 27,203 |
| Miami-Dade County Wtr. & Swr. Rev.: | | | |
| Series 2017 A, 4% 10/1/39 | | 35,000 | 35,298 |
| Series 2017 B, 3.125% 10/1/39 | | 20,000 | 17,405 |
| Series 2019 B, 3% 10/1/49 | | 40,000 | 30,072 |
| Series 2021, 3% 10/1/40 | | 100,000 | 83,951 |
| North Broward Hosp. District Rev. Series 2017 B, 5% 1/1/32 | | 50,000 | 51,961 |
| Orange County Health Facilities Auth. Series 2016 A, 5% 10/1/44 | | 35,000 | 35,417 |
| Orange County School Board Ctfs. of Prtn. Series 2015 D, 5% 8/1/28 (Pre-Refunded to 8/1/25 @ 100) | | 50,000 | 50,901 |
| Orange County Tourist Dev. Tax Rev.: | | | |
| Series 2016 A, 4% 10/1/34 | | 20,000 | 19,799 |
| Series 2017, 5% 10/1/27 | | 25,000 | 26,334 |
| Palm Beach County Health Facilities Series 2016, 5% 11/15/32 | | 25,000 | 25,673 |
| Palm Beach County Pub. Impt. Rev. (Professional Sports Franchise Facility Proj.) Series 2015 D, 5% 12/1/40 (Pre-Refunded to 12/1/25 @ 100) | | 10,000 | 10,245 |
| Port Saint Lucie Util. Rev. Series 2007, 5.25% 9/1/26 (Nat'l. Pub. Fin. Guarantee Corp. Insured) | | 45,000 | 46,965 |
| Putnam County Dev. Auth. Poll. Cont. Rev. (Seminole Elec. Coop., Inc. Proj.) Series 2018 A, 5% 3/15/42 | | 60,000 | 61,495 |
| South Broward Hosp. District Rev. Series 2016 A, 3.5% 5/1/39 | | 15,000 | 13,566 |
| Tampa Health Sys. Rev. Series 2016 A, 4% 11/15/46 | | 125,000 | 118,615 |
| Tampa Tax Allocation (H. Lee Moffitt Cancer Ctr. Proj.) Series 2020 A, 0% 9/1/53 | | 195,000 | 45,566 |
TOTAL FLORIDA | | | 3,156,420 |
| Georgia - 2.1% | | | |
| Atlanta Arpt. Rev. Series 2019 B, 4% 7/1/49 (b) | | 50,000 | 46,926 |
| Atlanta Wtr. & Wastewtr. Rev. Series 2015: | | | |
| 5% 11/1/32 | | 30,000 | 30,373 |
| 5% 11/1/40 | | 20,000 | 20,182 |
| 5% 11/1/43 (Pre-Refunded to 5/1/25 @ 100) | | 50,000 | 50,724 |
| Brookhaven Dev. Auth. Rev. Series 2019 A, 5% 7/1/26 | | 10,000 | 10,332 |
| Fulton County Dev. Auth. Rev. Series 2019, 5% 6/15/44 | | 30,000 | 31,366 |
| Fulton County Wtr. & Swr. Rev. Series 2020 A, 3% 1/1/45 | | 5,000 | 4,034 |
| Gainesville & Hall County Hosp. Auth. Rev.: | | | |
| (Northeast Georgia Health Sys., Inc. Proj.): | | | |
Series 2017 A, 4% 2/15/42 | | 20,000 | 19,421 |
Series 2020 A, 5% 2/15/31 | | 40,000 | 43,019 |
| Series 2020 A, 3% 2/15/47 | | 65,000 | 53,081 |
| Georgia Gen. Oblig.: | | | |
| Series 2015 A, 3% 2/1/30 | | 55,000 | 53,849 |
| Series 2017 A: | | | |
5% 2/1/25 | | 75,000 | 75,711 |
5% 2/1/27 | | 10,000 | 10,478 |
| Series 2017 C: | | | |
5% 7/1/27 | | 5,000 | 5,282 |
5% 7/1/30 | | 25,000 | 26,275 |
| Series 2018 A: | | | |
3% 7/1/33 | | 25,000 | 23,734 |
5% 7/1/27 | | 20,000 | 21,127 |
5% 7/1/29 | | 50,000 | 53,841 |
| Series 2020 A, 5% 8/1/31 | | 50,000 | 55,746 |
| Series 2021 A, 5% 7/1/33 | | 100,000 | 113,028 |
| Series 2022 A, 4% 7/1/42 | | 100,000 | 102,244 |
| Georgia Hsg. & Fin. Auth.: | | | |
| Series 2017 C, 3.65% 12/1/42 | | 15,000 | 14,043 |
| Series 2020 A, 3.15% 12/1/44 | | 15,000 | 12,384 |
| Georgia Hsg. & Fin. Auth. Rev.: | | | |
| Series 2016 A, 3.35% 12/1/41 | | 20,000 | 17,880 |
| Series 2017 A, 3.65% 12/1/32 | | 15,000 | 14,887 |
| Series 2017 B, 3.2% 12/1/32 | | 20,000 | 18,847 |
| Georgia Muni. Elec. Auth. Pwr. Rev.: | | | |
| Series 2018 HH, 4.125% 1/1/49 (Assured Guaranty Muni. Corp. Insured) | | 110,000 | 108,934 |
| Series 2021 A, 5% 1/1/56 | | 80,000 | 82,257 |
| Georgia Port Auth. Rev. Series 2021, 2.625% 7/1/51 | | 120,000 | 81,049 |
| Glynn-Brunswick Memorial Hosp. Auth. Rev. (Southeast Georgia Health Sys. Proj.) Series 2015, 5% 8/1/34 | | 60,000 | 60,314 |
| Griffin-Spalding County Hosp. (Wellstar Health Sys., Inc. Proj.) Series 2017 A, 3.75% 4/1/47 | | 30,000 | 27,112 |
| Gwinnett County School District Gen. Oblig. Series 2022 B, 5% 8/1/26 | | 55,000 | 57,073 |
| Metropolitan Atlanta Rapid Transit Auth. Sales Tax Rev.: | | | |
| Series 2017 C, 3.5% 7/1/38 | | 30,000 | 29,097 |
| Series 2019 A, 3.125% 7/1/46 | | 5,000 | 4,176 |
| Series 2021 E2, 5% 7/1/24 | | 25,000 | 25,000 |
| Paulding County Wtr. & Sew Rev. Series 2016, 3% 12/1/48 | | 15,000 | 11,512 |
| Private Colleges & Univs. Auth. Rev.: | | | |
| Series 2020 B, 5% 9/1/30 | | 5,000 | 5,540 |
| Series 2023, 5% 9/1/33 | | 110,000 | 126,864 |
| World Congress Ctr. Auth. Convention Ctr. Hotel Second Tier Rev. Series 2021 A, 2.375% 1/1/31 | | 135,000 | 121,277 |
TOTAL GEORGIA | | | 1,669,019 |
| Hawaii - 0.3% | | | |
| Hawaii Arpts. Sys. Rev. Series 2020 D, 4% 7/1/39 | | 10,000 | 10,117 |
| Hawaii Dept. of Budget & Fin. Spl. Purp. Rev. Series 2015 A, 4% 7/1/40 | | 20,000 | 19,467 |
| Hawaii Gen. Oblig.: | | | |
| Series 2016 FG, 5% 10/1/30 | | 30,000 | 30,997 |
| Series 2018 FT, 5% 1/1/28 | | 100,000 | 106,375 |
| Series FH, 5% 10/1/29 | | 25,000 | 25,891 |
| Series FW, 3.5% 1/1/38 | | 5,000 | 4,861 |
| Honolulu City and County Wastewtr. Sys.: | | | |
| Series 2016 B, 4% 7/1/33 | | 15,000 | 15,112 |
| Series 2018 A, 3.375% 7/1/42 | | 5,000 | 4,477 |
TOTAL HAWAII | | | 217,297 |
| Idaho - 0.1% | | | |
| Idaho Health Facilities Auth. Rev.: | | | |
| (St. Luke's Health Sys. Proj.) Series 2018 A: | | | |
5% 3/1/27 | | 25,000 | 25,837 |
5% 3/1/28 | | 10,000 | 10,461 |
| Series 2015 ID, 5.5% 12/1/29 | | 25,000 | 25,408 |
TOTAL IDAHO | | | 61,706 |
| Illinois - 4.7% | | | |
| Chicago Gen. Oblig.: | | | |
| Series 1999, 0% 1/1/33 | | 70,000 | 48,413 |
| Series 2000, 0% 1/1/29 | | 55,000 | 45,558 |
| Series 2002 B: | | | |
5% 1/1/26 | | 10,000 | 10,049 |
5% 1/1/26 (Pre-Refunded to 1/1/25 @ 100) | | 20,000 | 20,145 |
| Series 2007 E, 5.5% 1/1/35 | | 20,000 | 20,114 |
| Series 2015 A: | | | |
5% 1/1/26 | | 5,000 | 5,024 |
5% 1/1/26 (Pre-Refunded to 1/1/25 @ 100)(Escrowed to Maturity) | | 10,000 | 10,055 |
5.5% 1/1/33 | | 15,000 | 15,095 |
5.5% 1/1/39 | | 120,000 | 120,378 |
| Series 2017 A, 5.75% 1/1/33 | | 50,000 | 51,968 |
| Chicago O'Hare Int'l. Arpt. Rev.: | | | |
| Series 2015 A, 5% 1/1/28 (b) | | 90,000 | 90,304 |
| Series 2015 B, 5% 1/1/29 | | 95,000 | 95,517 |
| Series 2015 D, 4% 1/1/35 | | 85,000 | 84,786 |
| Series 2017 A, 5% 1/1/27 | | 20,000 | 20,812 |
| Series 2017 B, 5% 1/1/33 | | 90,000 | 93,106 |
| Series 2017 C, 5% 1/1/41 | | 100,000 | 102,454 |
| Series 2017 D, 5% 1/1/42 (b) | | 15,000 | 15,164 |
| Series 2018 A, 4% 1/1/43 (b) | | 45,000 | 43,601 |
| Series 2018 B: | | | |
5% 1/1/37 | | 15,000 | 15,929 |
5% 1/1/38 | | 100,000 | 105,918 |
| Chicago Transit Auth. Series 2014, 5.25% 12/1/49 | | 125,000 | 125,289 |
| Chicago Transit Auth. Cap. Grant Receipts Rev. Series 2017, 5% 6/1/25 | | 20,000 | 20,192 |
| Chicago Wtr. Rev. Series 2000, 5% 11/1/30 | | 35,000 | 35,969 |
| Illinois Fin. Auth. Series 2020 A, 4% 4/1/50 | | 35,000 | 33,654 |
| Illinois Fin. Auth. Rev.: | | | |
| Series 2015 C, 4.125% 8/15/37 | | 65,000 | 61,904 |
| Series 2016 C, 5% 2/15/34 | | 60,000 | 62,190 |
| Series 2016: | | | |
3.25% 11/15/45 | | 20,000 | 16,230 |
4% 1/1/25 | | 10,000 | 10,021 |
4% 12/1/31 | | 25,000 | 25,030 |
4% 12/1/35 | | 50,000 | 49,532 |
| Series 2018 A: | | | |
5% 10/1/41 | | 10,000 | 10,303 |
5% 10/1/48 | | 30,000 | 30,655 |
| Series 2019: | | | |
5% 7/1/27 | | 15,000 | 15,813 |
5% 1/1/31 | | 115,000 | 124,430 |
| Illinois Gen. Oblig.: | | | |
| Series 2014, 5% 4/1/27 | | 5,000 | 5,004 |
| Series 2017 A, 4.5% 12/1/41 | | 15,000 | 15,104 |
| Series 2017 C, 5% 11/1/29 | | 65,000 | 67,725 |
| Series 2017 D: | | | |
3.25% 11/1/26 | | 10,000 | 9,811 |
5% 11/1/28 | | 60,000 | 62,564 |
| Series 2018 A, 5% 10/1/25 | | 50,000 | 50,892 |
| Series 2018 B: | | | |
5% 10/1/24 | | 30,000 | 30,084 |
5% 10/1/30 | | 100,000 | 105,204 |
| Series 2019 A, 5% 11/1/25 | | 50,000 | 50,920 |
| Series 2019 B, 5% 9/1/25 | | 15,000 | 15,239 |
| Series 2020 D, 5% 10/1/25 | | 5,000 | 5,086 |
| Series 2022 A, 5.5% 3/1/47 | | 200,000 | 217,411 |
| Series 2022, 5.25% 3/1/38 | | 85,000 | 94,146 |
| Series November 2016, 4.125% 11/1/31 | | 10,000 | 10,020 |
| Illinois Muni. Elec. Agcy. Pwr. Supply Series 2015 A, 4% 2/1/33 | | 70,000 | 69,170 |
| Illinois Sales Tax Rev.: | | | |
| Series 2016 A: | | | |
3% 6/15/33 | | 25,000 | 23,018 |
3% 6/15/34 | | 75,000 | 68,546 |
| Series 2016 D: | | | |
3% 6/15/31 | | 15,000 | 14,080 |
3% 6/15/32 | | 20,000 | 18,618 |
| Illinois Toll Hwy. Auth. Toll Hwy. Rev.: | | | |
| Series 2015 A, 5% 1/1/40 | | 25,000 | 25,179 |
| Series 2015 B, 5% 1/1/40 | | 55,000 | 55,834 |
| Series 2016 A, 5% 12/1/31 | | 60,000 | 61,079 |
| Series 2017 A, 5% 1/1/42 | | 50,000 | 52,040 |
| Series A, 5% 1/1/45 | | 100,000 | 106,316 |
| Series B: | | | |
5% 1/1/27 | | 35,000 | 36,494 |
5% 1/1/30 | | 5,000 | 5,443 |
| Series C, 5% 1/1/30 | | 30,000 | 32,657 |
| Metropolitan Pier & Exposition: | | | |
| (McCormick Place Expansion Proj.): | | | |
Series 2002 A: | | | |
0% 12/15/30 (Nat'l. Pub. Fin. Guarantee Corp. Insured) | | 70,000 | 53,840 |
0% 6/15/36 (Nat'l. Pub. Fin. Guarantee Corp. Insured) | | 30,000 | 18,345 |
Series 2010 B1: | | | |
0% 6/15/43 (Assured Guaranty Muni. Corp. Insured) | | 70,000 | 30,313 |
0% 6/15/45 (Assured Guaranty Muni. Corp. Insured) | | 345,000 | 131,783 |
| Series 2002 A: | | | |
0% 6/15/32 (Nat'l. Pub. Fin. Guarantee Corp. Insured) | | 30,000 | 21,716 |
0% 12/15/33 (Nat'l. Pub. Fin. Guarantee Corp. Insured) | | 50,000 | 34,047 |
0% 12/15/34 (Nat'l. Pub. Fin. Guarantee Corp. Insured) | | 10,000 | 6,536 |
| Series 2002, 0% 12/15/31 (Nat'l. Pub. Fin. Guarantee Corp. Insured) | | 20,000 | 14,775 |
| Series 2017 B, 0% 12/15/56 (Assured Guaranty Muni. Corp. Insured) | | 50,000 | 10,239 |
| Northern Illinois Muni. Pwr. Agcy. Rev. (Prairie State Proj.) Series 2016 A: | | | |
| 4% 12/1/41 | | 135,000 | 133,114 |
| 5% 12/1/28 | | 25,000 | 25,963 |
| Rosemont Gen. Oblig. Series 2016 A, 5% 12/1/46 (Assured Guaranty Muni. Corp. Insured) | | 335,000 | 343,495 |
| Sales Tax Securitization Corp. Series 2017 A, 5% 1/1/28 | | 50,000 | 52,682 |
TOTAL ILLINOIS | | | 3,820,134 |
| Indiana - 0.5% | | | |
| Carmel Local Pub. Impt. Bond Bank Series 2016, 5% 7/15/30 | | 10,000 | 10,275 |
| Indiana Bond Bank Series 2008 B, 0% 6/1/32 (Assured Guaranty Muni. Corp. Insured) | | 70,000 | 50,711 |
| Indiana Fin. Auth. Rev. Series 2019 E, 5% 2/1/36 | | 25,000 | 26,878 |
| Indiana Fin. Auth. Wastewtr. Util. Rev.: | | | |
| (CWA Auth. Proj.) Series 2014 A, 5% 10/1/31 | | 50,000 | 50,167 |
| Series 2021 I, 5% 10/1/27 | | 55,000 | 58,162 |
| Indiana Univ. Lease Purchase Oblig. Series 2020 A, 4% 6/1/45 | | 5,000 | 4,921 |
| Indianapolis Local Pub. Impt.: | | | |
| (Courthouse and Jail Proj.) Series 2019 A: | | | |
5% 2/1/33 | | 15,000 | 16,073 |
5% 2/1/54 | | 25,000 | 25,964 |
| (Pilot Infrastructure Prog.) Series 2017 C, 5% 1/1/33 | | 15,000 | 15,799 |
| Indianapolis Local Pub. Impt. Bond Bank Series E, 0% 2/1/28 (AMBAC Insured) | | 50,000 | 43,664 |
| Purdue Univ. Rev. Series 2020 EE, 5% 7/1/36 | | 80,000 | 87,989 |
TOTAL INDIANA | | | 390,603 |
| Iowa - 0.4% | | | |
| Iowa Fin. Auth. Rev.: | | | |
| Series 2016, 5% 8/1/26 | | 30,000 | 31,136 |
| Series 2017, 5% 8/1/37 | | 50,000 | 52,061 |
| Series 2020 A, 5% 8/1/28 | | 165,000 | 177,654 |
| Tobacco Settlement Auth. Tobacco Settlement Rev. Series 2021 A2, 4% 6/1/40 | | 100,000 | 96,799 |
TOTAL IOWA | | | 357,650 |
| Kansas - 0.2% | | | |
| Johnson & Miami County Unified School District Series 2016 B, 3% 9/1/37 | | 20,000 | 18,183 |
| Univ. of Kansas Hosp. Auth. Health Facilities Rev.: | | | |
| Series 2017 A, 5% 3/1/47 | | 85,000 | 86,336 |
| Series 2019 A, 4% 9/1/48 | | 25,000 | 23,655 |
TOTAL KANSAS | | | 128,174 |
| Kentucky - 0.4% | | | |
| Kentucky Eco Dev. Fin. Auth. Health Rev. Series 2000 B, 0% 10/1/27 (Nat'l. Pub. Fin. Guarantee Corp. Insured) | | 45,000 | 39,102 |
| Kentucky Econ. Dev. Fin. Auth. Hosp. Rev. Series 2017 A, 5.25% 6/1/41 | | 100,000 | 101,261 |
| Kentucky Muni. Pwr. Agcy. Pwr. Sys. Rev. (Prairie State Proj.) Series 2015 A: | | | |
| 4% 9/1/39 | | 75,000 | 72,528 |
| 5% 9/1/42 | | 25,000 | 25,036 |
| Kentucky State Property & Buildings Commission Rev. Series B, 5% 11/1/28 | | 30,000 | 30,996 |
| Louisville & Jefferson County Metropolitan Swr. District Swr. & Drain Sys. Rev. Series 2016 A, 3% 5/15/46 | | 60,000 | 46,688 |
| Univ. of Kentucky Gen. Rcpts Series A, 3.5% 10/1/47 | | 25,000 | 21,947 |
TOTAL KENTUCKY | | | 337,558 |
| Louisiana - 0.8% | | | |
| Louisiana Gas & Fuel Tax Rev. Series 2017 C, 5% 5/1/45 | | 250,000 | 256,615 |
| Louisiana Gen. Oblig.: | | | |
| Series 2014 D1, 3% 12/1/29 | | 60,000 | 57,612 |
| Series 2017 A, 5% 4/1/25 | | 25,000 | 25,313 |
| Series 2021 A, 5% 3/1/41 | | 115,000 | 124,939 |
| Louisiana Pub. Facilities Auth. Hosp. Rev. (Franciscan Missionaries of Our Lady Health Sys. Proj.) Series 2017 A, 3.75% 7/1/47 | | 25,000 | 23,033 |
| Louisiana Pub. Facilities Auth. Lease Rev. (Phase II Proj.) Series 2017, 5% 7/1/57 | | 50,000 | 50,462 |
| Louisiana Pub. Facilities Auth. Rev. Series 2016, 4% 5/15/41 | | 20,000 | 19,791 |
| New Orleans Wtr. Series 2015, 5% 12/1/40 (Pre-Refunded to 12/1/25 @ 100) | | 20,000 | 20,476 |
| Shreveport Wtr. & Swr. Rev. Series 2014 B, 4% 12/1/38 | | 25,000 | 24,233 |
| State of Louisiana Grant Anticipation Rev. Series 2019 A, 5% 9/1/29 | | 20,000 | 21,368 |
TOTAL LOUISIANA | | | 623,842 |
| Maine - 0.1% | | | |
| Maine Health & Higher Edl. Facilities Auth. Rev. Series 2021 A, 4% 7/1/50 (Assured Guaranty Muni. Corp. Insured) | | 75,000 | 71,090 |
| Maryland - 2.0% | | | |
| Anne Arundel County Gen. Oblig. Series 2021, 5% 4/1/29 | | 150,000 | 163,493 |
| Maryland Cmnty. Dev. Admin Dept. Hsg. & Cmnty. Dev. Series C, 3% 3/1/42 | | 20,000 | 16,543 |
| Maryland Dept. of Trans. Series 2016, 4% 11/1/29 | | 85,000 | 84,536 |
| Maryland Gen. Oblig.: | | | |
| Series 2015, 3% 8/1/28 | | 30,000 | 29,362 |
| Series 2019 1, 5% 3/15/31 | | 55,000 | 59,800 |
| Series 2019 A1, 5% 8/1/31 | | 100,000 | 107,257 |
| Series 2019, 5% 3/15/30 | | 30,000 | 32,598 |
| Series 2020 A, 5% 8/1/29 | | 150,000 | 164,506 |
| Series A, 5% 3/15/30 | | 30,000 | 31,989 |
| Maryland Health & Higher Edl. Facilities Auth. Rev. Series 2017 A, 4% 5/15/47 | | 50,000 | 47,777 |
| Maryland Stadium Auth. Built to Learn Rev. Series 2021, 2.75% 6/1/51 | | 205,000 | 140,343 |
| Maryland Trans. Auth. Trans. Facility Projs. Rev. Series 2021 A: | | | |
| 2.25% 7/1/39 | | 185,000 | 139,708 |
| 4% 7/1/40 | | 85,000 | 85,703 |
| Prince Georges County Gen. Oblig. Series 2018 A, 3.25% 7/15/36 | | 155,000 | 148,985 |
| Univ. of Maryland Sys. Auxiliary Facility & Tuition Rev. Series A, 3.25% 4/1/36 | | 50,000 | 48,208 |
| Washington Metropolitan Area Transit Auth. Series 2021 A, 3% 7/15/36 | | 150,000 | 139,559 |
| Washington Suburban San. District: | | | |
| Series 2016 2, 5% 6/1/34 | | 65,000 | 66,918 |
| Series 2016, 3% 6/1/46 | | 150,000 | 121,143 |
TOTAL MARYLAND | | | 1,628,428 |
| Massachusetts - 2.2% | | | |
| Massachusetts Bay Trans. Auth. Sales Tax Rev.: | | | |
| Series 2007, 5.25% 7/1/28 | | 10,000 | 10,806 |
| Series B, 5% 7/1/33 | | 85,000 | 86,260 |
| Massachusetts Commonwealth Trans. Fund Rev. (Rail Enhancement & Accelerated Bridge Prog.) Series 2017 A, 5% 6/1/47 | | 145,000 | 148,900 |
| Massachusetts Dev. Fin. Agcy. Rev.: | | | |
| Series 2016 A, 5% 7/15/40 | | 30,000 | 36,309 |
| Series 2016 I, 3% 7/1/32 | | 25,000 | 23,286 |
| Series BB1, 4% 10/1/46 | | 30,000 | 29,328 |
| Series F, 5% 8/15/24 | | 5,000 | 5,006 |
| Massachusetts Fed. Hwy. (Accelerated Bridge Prog.) Series 2016 A, 5% 6/15/27 | | 55,000 | 56,717 |
| Massachusetts Gen. Oblig.: | | | |
| Series 2004 C, 5.5% 12/1/24 | | 5,000 | 5,043 |
| Series 2016 B, 4% 7/1/33 | | 25,000 | 25,168 |
| Series 2016 G, 3% 9/1/46 | | 40,000 | 32,253 |
| Series 2017 E, 5% 11/1/24 | | 30,000 | 30,153 |
| Series 2017 F, 5% 11/1/44 | | 5,000 | 5,164 |
| Series 2019 A: | | | |
5% 1/1/38 | | 60,000 | 64,218 |
5% 1/1/49 | | 70,000 | 73,126 |
| Series 2019 C: | | | |
5% 5/1/31 | | 85,000 | 95,345 |
5% 5/1/41 | | 35,000 | 37,234 |
| Series 2020 D, 5% 7/1/41 | | 55,000 | 59,399 |
| Series 2020 E, 5% 11/1/25 | | 75,000 | 76,746 |
| Series 2021 B, 3% 4/1/47 | | 150,000 | 120,295 |
| Series 2022 C, 5% 10/1/47 | | 100,000 | 108,119 |
| Series 2023 A, 5% 5/1/48 | | 110,000 | 119,145 |
| Series A, 5% 7/1/31 | | 30,000 | 30,954 |
| Series B, 5% 7/1/26 | | 25,000 | 25,900 |
| Series C, 5% 5/1/30 | | 40,000 | 44,233 |
| Series D, 5% 7/1/26 | | 30,000 | 31,080 |
| Series E, 5% 11/1/45 | | 55,000 | 58,887 |
| Massachusetts Hsg. Fin. Agcy. Hsg. Rev. Series 2019 B1, 2.75% 12/1/34 | | 80,000 | 69,159 |
| Massachusetts Hsg. Fin. Agcy. Multi-Family Rev. Series A, 4.5% 12/1/48 (b) | | 5,000 | 4,759 |
| Massachusetts Port Auth. Rev. Series 2021 E, 5% 7/1/34 (b) | | 70,000 | 76,124 |
| Massachusetts School Bldg. Auth. Dedicated Sales Tax Rev.: | | | |
| Series 2016 B, 5% 11/15/46 | | 20,000 | 20,458 |
| Series 2018 B, 4% 2/15/40 | | 85,000 | 84,996 |
| Series A, 5% 8/15/50 | | 10,000 | 10,567 |
| Series C, 5% 11/15/34 | | 20,000 | 20,746 |
| Massachusetts Spl. Oblig. Dedicated Tax Rev. Series 2005, 5.5% 1/1/30 (Nat'l. Pub. Fin. Guarantee Corp. Insured) | | 65,000 | 72,424 |
TOTAL MASSACHUSETTS | | | 1,798,307 |
| Michigan - 0.9% | | | |
| Great Lakes Wtr. Auth. Sew Disp. Sys. Series 2016 C, 5% 7/1/36 | | 35,000 | 35,719 |
| Great Lakes Wtr. Auth. Wtr. Supply Sys. Rev.: | | | |
| Series 2018 A, 5% 7/1/27 | | 35,000 | 36,773 |
| Series 2023 A, 5% 7/1/38 | | 35,000 | 39,666 |
| Michigan Bldg. Auth. Rev.: | | | |
| (Facilities Prog.) Series I: | | | |
5% 4/15/26 | | 10,000 | 10,208 |
5% 10/15/28 | | 20,000 | 20,708 |
5% 10/15/30 | | 35,000 | 36,122 |
| Series I, 5% 4/15/38 | | 50,000 | 50,668 |
| Michigan Fin. Auth. Rev.: | | | |
| (Charter County of Wayne Criminal Justice Ctr. Proj.) Series 2018, 5% 11/1/29 | | 55,000 | 58,536 |
| (Detroit Wtr. and Sewerage Dept. Sewage Disp. Sys. Rev. Rfdg. Local Proj.) Series 2014 C, 5% 7/1/28 (Assured Guaranty Muni. Corp. Insured) | | 5,000 | 5,004 |
| Series 2016, 3.25% 11/15/42 | | 25,000 | 20,137 |
| Michigan Hosp. Fin. Auth. Rev.: | | | |
| (Trinity Health Proj.) Series 2008 C: | | | |
5% 12/1/26 | | 70,000 | 72,556 |
5% 12/1/27 | | 25,000 | 26,326 |
| Series 2010 F, 4% 11/15/47 | | 20,000 | 18,777 |
| Michigan Hsg. Dev. Auth. Rental Hsg. Rev. Series 2020 A1, 2.7% 10/1/45 | | 40,000 | 29,510 |
| Michigan Hsg. Dev. Auth. Single Family Mtg. Rev. Series 2016 A, 3.35% 12/1/31 | | 10,000 | 9,517 |
| Michigan State Univ. Revs. Series 2019 B, 4% 2/15/37 | | 60,000 | 60,621 |
| Michigan Strategic Fund Ltd. Oblig. Rev. (I-75 Impt. Proj.) Series 2018: | | | |
| 5% 12/31/26 (b) | | 50,000 | 50,769 |
| 5% 6/30/28 (b) | | 45,000 | 46,144 |
| 5% 12/31/31 (b) | | 15,000 | 15,492 |
| Michigan Trunk Line Fund Rev. Series 2020 B, 4% 11/15/37 | | 10,000 | 10,218 |
| Wayne County Arpt. Auth. Rev. Series 2021 B, 5% 12/1/35 (b) | | 100,000 | 108,070 |
TOTAL MICHIGAN | | | 761,541 |
| Minnesota - 2.1% | | | |
| Hennepin County Gen. Oblig. Series 2019 B, 5% 12/15/31 | | 480,000 | 517,515 |
| Minneapolis & Saint Paul Metropolitan Arpts. Commission Arpt. Rev. Series 2019 A, 5% 1/1/49 | | 35,000 | 36,430 |
| Minneapolis Health Care Sys. Rev. Series 2018 A, 4% 11/15/37 | | 95,000 | 90,313 |
| Minnesota Gen. Oblig.: | | | |
| Series 2016 A, 5% 8/1/25 | | 60,000 | 61,128 |
| Series 2017 A, 5% 10/1/28 | | 30,000 | 31,889 |
| Series 2018 B, 3.25% 8/1/36 | | 55,000 | 53,075 |
| Series 2022 B, 5% 8/1/32 | | 90,000 | 103,190 |
| Minnesota Hsg. Fin. Agcy.: | | | |
| Series 2019 F, 3.75% 1/1/50 | | 25,000 | 24,737 |
| Series 2021 B, 4% 8/1/43 | | 75,000 | 73,540 |
| Series 2021 D, 2.45% 1/1/52 | | 100,000 | 66,587 |
| Minnesota Muni. Gas Agcy. Rev. Bonds Series 2022 A, 4%, tender 12/1/27 (c) | | 280,000 | 282,037 |
| Owatonna Independent School District 761 (Minnesota School District Cr. Enhancement Prog.) Series 2020 A, 2.125% 2/1/40 | | 90,000 | 65,125 |
| Rochester Health Care Facilities Rev. Series 2016 B, 5% 11/15/29 | | 25,000 | 27,374 |
| Rochester Independent School District #535 (Minnesota School District Cr. Enhancement Prog.) Series 2020 A, 2% 2/1/33 | | 210,000 | 175,107 |
| Saint Cloud Health Care Rev.: | | | |
| Series 2016 A, 3.25% 5/1/39 | | 15,000 | 13,063 |
| Series 2019, 5% 5/1/48 | | 20,000 | 20,644 |
| Virginia Independent School District #706 Series 2019 A, 3% 2/1/36 | | 85,000 | 80,755 |
TOTAL MINNESOTA | | | 1,722,509 |
| Mississippi - 0.4% | | | |
| Mississippi Dev. Bank Spl. Oblig. (Mississippi Dept. of Corrections Walnut Grove Correctional Facility Rfdg. Bonds Proj.) Series 2016 A, 5% 8/1/26 | | 45,000 | 46,282 |
| Mississippi Gen. Oblig. Series 2016 B: | | | |
| 5% 12/1/31 (Pre-Refunded to 12/1/26 @ 100) | | 75,000 | 78,053 |
| 5% 12/1/35 (Pre-Refunded to 12/1/26 @ 100) | | 55,000 | 57,239 |
| Mississippi State Gaming Tax Rev. Series 2019 A, 5% 10/15/28 | | 5,000 | 5,280 |
| West Rankin Util. Auth. Rev. Series 2018, 5% 1/1/48 (Pre-Refunded to 1/1/28 @ 100) | | 100,000 | 106,729 |
TOTAL MISSISSIPPI | | | 293,583 |
| Missouri - 0.7% | | | |
| Metropolitan St. Louis Swr. District Wastewtr. Sys. Rev. Series 2015 B, 5% 5/1/45 (Pre-Refunded to 5/1/25 @ 100) | | 80,000 | 81,092 |
| Missouri Board of Pub. Buildings Spl. Oblig. Series 2014 A, 3% 10/1/29 | | 15,000 | 14,465 |
| Missouri Health & Edl. Facilities Auth. Rev. Series 2019 A, 5% 2/1/42 | | 125,000 | 127,457 |
| Missouri Health & Edl. Facilities Rev.: | | | |
| Series 2012, 4% 11/15/42 | | 85,000 | 81,433 |
| Series 2014 F, 4.25% 11/15/48 | | 15,000 | 14,859 |
| Series 2016, 5% 11/15/28 | | 30,000 | 30,834 |
| Series 2017 C: | | | |
3.625% 11/15/47 | | 25,000 | 22,377 |
4% 11/15/49 | | 55,000 | 51,725 |
| Missouri Joint Muni. Elec. Util. Commission Pwr. Proj. Rev. (Prairie State Proj.) Series 2016 A, 5% 12/1/40 | | 150,000 | 151,650 |
| Springfield Pub. Util. Rev. Series 2015, 4% 8/1/31 | | 35,000 | 34,926 |
TOTAL MISSOURI | | | 610,818 |
| Montana - 0.1% | | | |
| Montana Facility Fin. Auth. Series 2018 B, 4.125% 7/1/38 | | 75,000 | 74,285 |
| Montana Facility Fin. Auth. Rev. Series 2016, 5% 2/15/28 | | 20,000 | 20,465 |
TOTAL MONTANA | | | 94,750 |
| Nebraska - 0.4% | | | |
| Douglas County Hosp. Auth. #2 Health Facilities Rev. Series 2015, 4.25% 11/1/45 | | 35,000 | 33,639 |
| Nebraska Edl. Health Cultural & Social Svcs. Fin. Auth. Rev. Series 2019 A, 4% 1/1/49 | | 85,000 | 76,015 |
| Omaha Pub. Pwr. District Elec. Rev.: | | | |
| Series 2015 B, 4% 2/1/39 | | 55,000 | 53,869 |
| Series 2021 B, 4% 2/1/46 | | 125,000 | 123,143 |
| The Board of Regents of The Univ. of Nebraska Series 2016 A, 3% 7/1/39 (Pre-Refunded to 7/1/26 @ 100) | | 5,000 | 4,976 |
| Univ. of Nebraska Facilities Corp. Series 2021 A, 4% 7/15/62 | | 40,000 | 37,575 |
TOTAL NEBRASKA | | | 329,217 |
| Nevada - 0.6% | | | |
| Clark County Fuel Tax: | | | |
| Series 2017, 3% 11/1/38 | | 15,000 | 13,248 |
| Series 2018 A, 5% 6/1/43 | | 100,000 | 104,946 |
| Series 2019 A: | | | |
5% 12/1/24 | | 5,000 | 5,032 |
5% 12/1/28 | | 15,000 | 16,190 |
| Series 2019, 5% 6/1/25 | | 25,000 | 25,382 |
| Clark County Hwy. Impt. Rev. Series 2017, 5% 7/1/30 | | 50,000 | 52,225 |
| Clark County Poll. Cont. Rev. Series 2010, 2.1% 6/1/31 | | 100,000 | 86,124 |
| Clark County School District Series 2019 A, 3% 6/15/39 (Assured Guaranty Muni. Corp. Insured) | | 30,000 | 25,951 |
| Las Vegas Redev. Agcy., Tax Increment Rev. Series 2016, 5% 6/15/40 | | 100,000 | 101,107 |
| Washoe County School District Series 2017 C, 3.25% 10/1/42 (Assured Guaranty Muni. Corp. Insured) | | 50,000 | 43,393 |
TOTAL NEVADA | | | 473,598 |
| New Jersey - 3.2% | | | |
| New Jersey Econ. Dev. Auth. Series A: | | | |
| 4% 11/1/37 | | 60,000 | 60,644 |
| 5% 11/1/31 | | 20,000 | 21,538 |
| New Jersey Econ. Dev. Auth. Lease Rev. (State House Proj.) Series 2017 B, 5% 6/15/26 | | 20,000 | 20,575 |
| New Jersey Econ. Dev. Auth. Natural Gas Facilities Rev. (New Jersey Natural Gas Co. Proj.) Series 2011 C, 3% 8/1/41 (b) | | 20,000 | 16,357 |
| New Jersey Econ. Dev. Auth. Rev.: | | | |
| (New Jersey Transit Corp. Projs.) Series 2017, 4% 11/1/25 | | 20,000 | 20,123 |
| Series 2019 LLL, 5% 6/15/30 | | 80,000 | 86,296 |
| Series B, 5% 11/1/26 | | 5,000 | 5,166 |
| Series WW, 5.25% 6/15/28 | | 45,000 | 45,599 |
| Series XX, 4.375% 6/15/27 | | 15,000 | 15,058 |
| New Jersey Edl. Facility: | | | |
| Series 2014 A, 5% 9/1/25 | | 10,000 | 10,019 |
| Series 2015 D, 5% 7/1/25 | | 65,000 | 66,177 |
| Series A, 4% 7/1/47 | | 40,000 | 36,238 |
| New Jersey Gen. Oblig. Series 2014, 4% 6/1/34 (Pre-Refunded to 6/1/25 @ 100) | | 15,000 | 15,098 |
| New Jersey Health Care Facilities Fing. Auth. Rev.: | | | |
| (Hosp. Asset Transformation Prog.) Series 2017: | | | |
5% 10/1/26 | | 90,000 | 92,583 |
5% 10/1/27 | | 10,000 | 10,427 |
| Series 2016, 3% 7/1/32 | | 25,000 | 21,785 |
| Series 2017 A, 4% 7/1/52 | | 25,000 | 23,863 |
| New Jersey Higher Ed. Student Assistance Auth. Student Ln. Rev.: | | | |
| Series 2019 A, 5% 12/1/27 | | 35,000 | 36,715 |
| Series 2019 B, 3.25% 12/1/39 (b) | | 35,000 | 32,498 |
| New Jersey Hsg. & Mtg. Fin. Agcy. Rev. Series 2018 A, 3.75% 10/1/35 | | 70,000 | 68,843 |
| New Jersey Tobacco Settlement Fing. Corp. Series 2018 A, 5% 6/1/29 | | 30,000 | 31,567 |
| New Jersey Tpk. Auth. Tpk. Rev.: | | | |
| Series 2005 A, 5.25% 1/1/26 (Assured Guaranty Muni. Corp. Insured) | | 20,000 | 20,624 |
| Series 2014 A: | | | |
5% 1/1/28 | | 90,000 | 90,063 |
5% 1/1/29 | | 5,000 | 5,003 |
| Series 2016 A, 5% 1/1/33 | | 30,000 | 30,589 |
| Series 2017 A, 5% 1/1/33 | | 70,000 | 72,403 |
| Series 2017 B, 4% 1/1/35 | | 5,000 | 5,065 |
| Series 2017 E, 5% 1/1/29 | | 10,000 | 10,596 |
| Series 2021 A, 4% 1/1/51 | | 190,000 | 185,427 |
| Series 2023, 5% 1/1/33 | | 100,000 | 114,847 |
| New Jersey Trans. Trust Fund Auth.: | | | |
| Series 2006 C: | | | |
0% 12/15/25 | | 20,000 | 18,963 |
0% 12/15/29 (Assured Guaranty Muni. Corp. Insured) | | 5,000 | 4,105 |
0% 12/15/32 (Assured Guaranty Muni. Corp. Insured) | | 10,000 | 7,313 |
| Series 2008 A: | | | |
0% 12/15/37 | | 5,000 | 2,961 |
0% 12/15/38 | | 65,000 | 36,744 |
| Series 2009 A, 0% 12/15/33 | | 90,000 | 62,955 |
| Series 2010 A: | | | |
0% 12/15/25 | | 10,000 | 9,482 |
0% 12/15/27 | | 30,000 | 26,393 |
0% 12/15/32 | | 35,000 | 25,426 |
0% 12/15/33 | | 110,000 | 76,945 |
| Series 2015 AA: | | | |
5.25% 6/15/29 | | 45,000 | 45,667 |
5.25% 6/15/32 | | 5,000 | 5,073 |
| Series 2016 A, 5% 6/15/30 | | 25,000 | 25,604 |
| Series 2018 A: | | | |
5% 12/15/24 | | 20,000 | 20,117 |
5% 6/15/31 | | 75,000 | 76,741 |
| Series 2019 AA, 4.5% 6/15/49 | | 5,000 | 4,975 |
| Series 2019 B, 4% 6/15/37 | | 160,000 | 161,002 |
| Series 2019 BB, 5% 6/15/32 | | 80,000 | 84,648 |
| Series 2021 A: | | | |
5% 6/15/28 | | 85,000 | 90,293 |
5% 6/15/30 | | 50,000 | 54,542 |
| Series A: | | | |
0% 12/15/26 | | 70,000 | 63,961 |
4% 12/15/31 | | 80,000 | 81,135 |
4.25% 12/15/38 | | 95,000 | 96,310 |
| Series A1, 4.1% 6/15/31 | | 55,000 | 55,404 |
| Series AA, 5.25% 6/15/27 | | 30,000 | 30,430 |
| Series BB1, 5% 6/15/34 | | 85,000 | 89,829 |
| Series C, 5.25% 6/15/32 | | 35,000 | 35,207 |
TOTAL NEW JERSEY | | | 2,564,011 |
| New Mexico - 0.5% | | | |
| New Mexico Hosp. Equip. Ln. Council Rev. Series 2019 A, 3% 8/1/48 | | 10,000 | 7,493 |
| New Mexico Mtg. Fin. Auth.: | | | |
| Series 2021 C, 3% 1/1/52 | | 90,000 | 86,801 |
| Series 2021 D, 3% 7/1/52 | | 135,000 | 129,853 |
| Series 2022 C, 3.95% 9/1/47 | | 165,000 | 153,553 |
TOTAL NEW MEXICO | | | 377,700 |
| New York - 15.4% | | | |
| Battery Park City Auth. Rev.: | | | |
| Series 2019 A, 5% 11/1/49 | | 80,000 | 85,071 |
| Series 2019 B: | | | |
5% 11/1/34 | | 190,000 | 208,987 |
5% 11/1/39 | | 60,000 | 65,280 |
| Brooklyn Arena Local Dev. Corp. Series 2016 A, 3% 7/15/43 (Assured Guaranty Muni. Corp. Insured) | | 25,000 | 19,452 |
| Dorm. Auth. New York Univ. Rev.: | | | |
| Series 2016 A: | | | |
4% 7/1/43 | | 55,000 | 53,821 |
5% 7/1/26 | | 65,000 | 67,416 |
5% 7/1/37 | | 5,000 | 5,108 |
| Series 2017 1, 5% 7/1/25 | | 70,000 | 71,226 |
| Series 2017 A, 5% 10/1/29 | | 35,000 | 36,646 |
| Series 2018 B, 5% 10/1/38 | | 45,000 | 48,025 |
| Hudson Yards Infrastructure Corp. New York Rev.: | | | |
| Series 2017 A: | | | |
5% 2/15/30 | | 320,000 | 333,757 |
5% 2/15/39 | | 70,000 | 72,514 |
| Series 2022 A, 4% 2/15/39 | | 50,000 | 50,763 |
| Liberty Dev. Corp. Rev. Series 2005, 5.25% 10/1/35 | | 75,000 | 86,584 |
| Long Island Pwr. Auth. Elec. Sys. Rev.: | | | |
| Series 1998 A, 0% 12/1/26 (Assured Guaranty Muni. Corp. Insured) | | 125,000 | 113,666 |
| Series 2016 B, 5% 9/1/46 | | 10,000 | 10,193 |
| Series 2017, 5% 9/1/47 | | 20,000 | 20,550 |
| Series 2018, 5% 9/1/35 | | 30,000 | 32,128 |
| Monroe County Indl. Dev. Corp. (Univ. of Rochester Proj.) Series 2020 A, 5% 7/1/25 | | 70,000 | 71,185 |
| Nassau County Gen. Oblig. Series 2016 A, 3.5% 1/1/37 | | 130,000 | 125,394 |
| New York City Gen. Oblig.: | | | |
| Series 2008 J, 3% 8/1/26 | | 45,000 | 44,653 |
| Series 2013 F1, 3.5% 3/1/38 | | 120,000 | 115,187 |
| Series 2018 1, 5% 8/1/28 | | 30,000 | 31,439 |
| Series 2018 F1, 3.5% 4/1/46 | | 135,000 | 118,367 |
| Series 2019 B1, 5% 10/1/34 | | 95,000 | 103,156 |
| Series 2019 D, 5% 12/1/34 | | 25,000 | 26,594 |
| Series 2019 E, 5% 8/1/34 | | 70,000 | 75,308 |
| Series 2020 A1, 5% 8/1/35 | | 150,000 | 162,416 |
| Series 2020 D, 3% 3/1/45 | | 50,000 | 40,502 |
| Series 2021 A1, 4% 8/1/50 | | 140,000 | 136,735 |
| Series B1, 5% 10/1/32 | | 55,000 | 59,755 |
| Series C, 3% 8/1/29 | | 50,000 | 48,896 |
| Series E, 5% 8/1/26 | | 25,000 | 25,919 |
| Series J, 5% 8/1/24 | | 35,000 | 35,035 |
| New York City Hsg. Dev. Corp.: | | | |
| Bonds Series H, 2.95%, tender 2/1/26 (c) | | 60,000 | 58,705 |
| Series 2016 I1A, 3.95% 11/1/36 | | 10,000 | 9,864 |
| Series 2017 C1, 3.65% 11/1/47 | | 100,000 | 87,335 |
| Series 2020 A, 2.55% 8/1/40 | | 110,000 | 84,319 |
| New York City Hsg. Dev. Corp. Multi-family Mtg. Rev. Series 2014, 3% 2/15/48 | | 100,000 | 99,651 |
| New York City Hsg. Dev. Corp. Multifamily Hsg.: | | | |
| Bonds Series D2, 0.7%, tender 11/1/24 (c) | | 25,000 | 24,657 |
| Series 2019 E1, 3.25% 11/1/49 | | 30,000 | 24,127 |
| Series 2021 G, 2.15% 11/1/36 | | 165,000 | 128,896 |
| Series 2021 K1, 2.45% 11/1/41 | | 130,000 | 96,023 |
| New York City Indl. Dev. Agcy. Rev.: | | | |
| (Queens Baseball Stadium Proj.) Series 2021 A, 3% 1/1/37 (Assured Guaranty Corp. Insured) (Assured Guaranty Muni. Corp. Insured) | | 145,000 | 130,729 |
| Series 2009 A: | | | |
0% 3/1/39 (Assured Guaranty Corp. Insured) | | 20,000 | 10,519 |
0% 3/1/44 | | 90,000 | 35,888 |
0% 3/1/45 (Assured Guaranty Corp. Insured) | | 15,000 | 5,656 |
0% 3/1/46 (Assured Guaranty Corp. Insured) | | 25,000 | 8,916 |
| New York City Muni. Wtr. Fin. Auth. Wtr. & Swr. Sys. Rev.: | | | |
| Series 2015 HH, 5% 6/15/29 | | 5,000 | 5,072 |
| Series 2016 CC1, 4% 6/15/38 | | 25,000 | 24,988 |
| Series 2017 DD, 5.25% 6/15/47 | | 60,000 | 61,765 |
| Series 2018 AA, 5% 6/15/37 | | 25,000 | 25,991 |
| Series 2018 FF, 5% 6/15/40 | | 210,000 | 220,759 |
| Series 2020 BB, 3% 6/15/49 | | 105,000 | 81,544 |
| Series 2020 GG2, 5% 6/15/29 | | 135,000 | 143,009 |
| Series BB, 5% 6/15/49 | | 90,000 | 94,375 |
| Series CC: | | | |
4% 6/15/42 | | 15,000 | 14,748 |
5% 6/15/30 | | 25,000 | 27,255 |
| Series EE, 5% 6/15/34 | | 45,000 | 45,875 |
| New York City Transitional Fin. Auth. Bldg. Aid Rev.: | | | |
| Series 2015 S1: | | | |
5% 7/15/26 | | 100,000 | 100,897 |
5% 7/15/43 | | 75,000 | 75,366 |
| Series 2015 S2, 5% 7/15/40 | | 80,000 | 81,058 |
| Series 2018 S3, 3.625% 7/15/47 | | 125,000 | 112,958 |
| Series 2018 S4, 5% 7/15/31 | | 10,000 | 10,628 |
| Series 2020 S1, 3% 7/15/49 | | 50,000 | 38,893 |
| Series 2022 S1A, 5% 7/15/32 | | 100,000 | 114,449 |
| Series S1, 5% 7/15/27 | | 55,000 | 55,494 |
| Series S4, 5.25% 7/15/35 | | 35,000 | 37,519 |
| New York City Transitional Fin. Auth. Rev.: | | | |
| Series 2014, 5% 11/1/25 | | 55,000 | 55,067 |
| Series 2016 A, 5% 5/1/40 | | 105,000 | 106,987 |
| Series 2016 E, 5% 2/1/37 | | 130,000 | 132,515 |
| Series 2016 E1, 5% 2/1/35 | | 120,000 | 122,488 |
| Series 2016 F3, 3.25% 2/1/42 | | 50,000 | 44,605 |
| Series 2017 B, 4% 8/1/37 | | 50,000 | 50,006 |
| Series 2018 A2, 5% 8/1/39 | | 55,000 | 56,947 |
| Series 2018 B1, 3.375% 8/1/45 | | 65,000 | 56,821 |
| Series 2018 C3, 4% 5/1/44 | | 10,000 | 9,817 |
| Series 2019 A, 5% 8/1/40 | | 75,000 | 78,756 |
| Series 2019 B1, 4% 11/1/43 | | 50,000 | 49,087 |
| Series 2019 C, 4% 11/1/37 | | 70,000 | 70,559 |
| Series 2021 A: | | | |
3% 11/1/37 | | 115,000 | 105,423 |
5% 11/1/31 | | 80,000 | 88,992 |
| Series 2022 A1: | | | |
5% 11/1/25 | | 150,000 | 153,532 |
5% 11/1/28 | | 175,000 | 188,508 |
| Series 2022 F, 5% 2/1/26 | | 50,000 | 51,408 |
| Series 2023 E1, 5% 11/1/32 | | 105,000 | 119,901 |
| Series 2023 F1, 5.25% 2/1/47 | | 160,000 | 176,756 |
| Series A, 4% 11/1/35 | | 20,000 | 20,614 |
| Series B, 4% 8/1/39 | | 5,000 | 5,028 |
| Series B1, 5% 11/1/37 | | 100,000 | 101,593 |
| Series C, 3.25% 11/1/43 | | 30,000 | 26,232 |
| Series C1, 4% 5/1/44 | | 120,000 | 118,683 |
| Series E, 5% 2/1/40 | | 115,000 | 118,241 |
| New York City Trust Cultural Resources Rev. Series 2016 1E: | | | |
| 4% 4/1/26 | | 50,000 | 50,718 |
| 4% 4/1/28 | | 40,000 | 40,782 |
| New York Convention Ctr. Dev. Corp. Rev. Series 2016 B: | | | |
| 0% 11/15/32 | | 135,000 | 94,818 |
| 0% 11/15/38 | | 105,000 | 54,463 |
| 0% 11/15/44 | | 25,000 | 9,159 |
| New York Dorm. Auth. Rev.: | | | |
| Series 1: | | | |
3% 7/1/34 | | 25,000 | 22,695 |
5% 7/1/30 | | 30,000 | 32,720 |
| Series 2015 A: | | | |
3% 7/1/29 | | 50,000 | 49,675 |
3.75% 7/1/46 | | 55,000 | 47,972 |
5% 5/1/33 | | 35,000 | 35,236 |
| Series 2019 A, 4% 7/1/45 | | 30,000 | 29,142 |
| Series 2019 C, 4% 7/1/49 | | 30,000 | 28,946 |
| Series 2020 A, 4% 7/1/50 | | 95,000 | 92,642 |
| Series 2020 A2, 5% 7/1/31 | | 25,000 | 28,041 |
| Series 2021 A, 5% 7/1/26 | | 100,000 | 102,637 |
| Series 2022 A1, 4% 7/1/51 | | 90,000 | 86,500 |
| Series 2023 A, 5% 10/1/32 | | 90,000 | 102,310 |
| New York Dorm. Auth. Sales Tax Rev.: | | | |
| Series 2016 A, 5% 3/15/29 | | 70,000 | 72,210 |
| Series 2017 A: | | | |
5% 3/15/43 | | 75,000 | 77,142 |
5% 3/15/44 | | 15,000 | 15,411 |
| Series 2018, 5% 3/15/48 | | 25,000 | 25,899 |
| New York Envir. Facilities Corp. Clean Wtr. & Drinking Wtr. (New York City Muni. Wtr. Fin. Auth. Proj.): | | | |
| Series 2017 A, 3.5% 6/15/36 | | 40,000 | 40,048 |
| Series 2018 A, 5% 6/15/30 | | 30,000 | 32,169 |
| Series 2019 B, 5% 6/15/31 | | 25,000 | 27,389 |
| New York Liberty Dev. Corp. Series 2021 1WTC, 2.75% 2/15/44 | | 55,000 | 41,207 |
| New York Metropolitan Trans. Auth. Dedicated Tax Fund Rev.: | | | |
| Series 2012 A, 0% 11/15/32 | | 60,000 | 44,124 |
| Series 2016 A, 5% 11/15/26 | | 35,000 | 36,516 |
| Series 2017 A, 5% 11/15/47 | | 165,000 | 168,944 |
| New York Metropolitan Trans. Auth. Rev.: | | | |
| Series 2015 B, 4% 11/15/45 | | 50,000 | 48,057 |
| Series 2015 D1, 5% 11/15/31 | | 130,000 | 132,303 |
| Series 2015 F, 3.25% 11/15/31 | | 160,000 | 152,030 |
| Series 2016 B, 5% 11/15/29 | | 115,000 | 118,766 |
| Series 2016 C, 4% 11/15/26 | | 65,000 | 65,892 |
| Series 2016 D, 5% 11/15/27 | | 30,000 | 31,072 |
| Series 2017 B, 5% 11/15/26 | | 95,000 | 98,494 |
| Series 2017 C1: | | | |
3.25% 11/15/36 | | 85,000 | 75,732 |
5% 11/15/25 | | 15,000 | 15,317 |
5% 11/15/28 | | 35,000 | 37,079 |
| Series 2017 D: | | | |
4% 11/15/42 | | 15,000 | 14,752 |
5% 11/15/27 | | 50,000 | 52,631 |
| Series 2018 B: | | | |
5% 11/15/25 | | 15,000 | 15,317 |
5% 11/15/26 | | 80,000 | 82,942 |
5% 11/15/28 | | 50,000 | 53,347 |
| Series 2020 E, 5% 11/15/27 | | 130,000 | 136,841 |
| New York State Dorm. Auth.: | | | |
| Series 2015 B, 5% 2/15/42 | | 35,000 | 35,190 |
| Series 2016: | | | |
5% 2/15/26 | | 5,000 | 5,145 |
5% 2/15/26 (Escrowed to Maturity) | | 35,000 | 35,963 |
| Series 2017 B, 5% 2/15/39 | | 110,000 | 114,072 |
| Series 2019 A: | | | |
5% 3/15/40 | | 15,000 | 15,887 |
5% 3/15/42 | | 100,000 | 106,914 |
| New York State Envir. Facilities Corp. Rev. Series 2019 A, 5% 2/15/49 | | 30,000 | 31,533 |
| New York State Gen. Oblig. Series 2013 A, 3.5% 3/1/43 | | 10,000 | 8,902 |
| New York State Hsg. Fin. Agcy. Rev.: | | | |
| Series 2019 N, 3.05% 11/1/52 | | 65,000 | 48,954 |
| Series 2019 R, 3.15% 11/1/54 | | 5,000 | 3,877 |
| Series L, 3.45% 11/1/42 | | 15,000 | 13,283 |
| New York State Mtg. Agcy. Homeowner Mtg.: | | | |
| Series 2019 220, 2.4% 10/1/34 | | 75,000 | 61,822 |
| Series 220, 2.85% 10/1/44 | | 15,000 | 11,890 |
| New York State Mtg. Agcy. Rev. Series 48, 3.45% 10/1/33 | | 15,000 | 14,390 |
| New York State Urban Dev. Corp.: | | | |
| Series 2020 A, 3% 3/15/50 | | 250,000 | 192,109 |
| Series 2020 C, 3% 3/15/40 | | 180,000 | 156,384 |
| New York State Urban Eev Corp. Series 2021 A, 3% 3/15/41 | | 50,000 | 43,082 |
| New York Thruway Auth. Gen. Rev.: | | | |
| Series 2016 A, 5% 1/1/51 | | 35,000 | 35,289 |
| Series 2019 B, 4% 1/1/45 (Assured Guaranty Muni. Corp. Insured) | | 125,000 | 122,925 |
| Series K: | | | |
5% 1/1/28 | | 40,000 | 40,267 |
5% 1/1/29 | | 50,000 | 50,321 |
| New York Thruway Auth. Personal Income Tax Rev. Series 2021 A1, 5% 3/15/31 | | 190,000 | 211,971 |
| New York Trans. Dev. Corp.: | | | |
| (Delta Air Lines, Inc. LaGuardia Arpt. Terminals C&D Redev. Proj.) Series 2018, 5% 1/1/30 (b) | | 15,000 | 15,564 |
| (LaGuardia Arpt. Term. B Redev. Proj.) Series 2016 A, 4% 1/1/51 (Assured Guaranty Muni. Corp. Insured) (b) | | 20,000 | 18,394 |
| (Term. 4 JFK Int'l. Arpt. Proj.) Series 2020 C, 5% 12/1/30 | | 100,000 | 108,864 |
| (Term. 4 John F. Kennedy Int'l. Arpt. Proj.) Series 2022, 5% 12/1/32 (b) | | 80,000 | 86,289 |
| New York Urban Dev. Corp. Rev. Series 2019 A: | | | |
| 5% 3/15/42 | | 10,000 | 10,439 |
| 5% 3/15/44 | | 25,000 | 26,001 |
| Onondaga County Trust for Cultural Resources Rev. Series 2019: | | | |
| 5% 12/1/39 | | 75,000 | 80,666 |
| 5% 12/1/40 | | 65,000 | 69,459 |
| Suffolk County Gen. Oblig. Series 2015 C, 5% 5/1/27 | | 10,000 | 9,918 |
| Suffolk County Wtr. Auth. Wtrwks. Rev. Series 2018 A, 4% 6/1/41 | | 45,000 | 45,019 |
| Triborough Brdg & Tunl Auth. Series 2023 A: | | | |
| 4% 5/15/48 | | 130,000 | 126,148 |
| 4.125% 5/15/53 | | 150,000 | 146,717 |
| Triborough Bridge & Tunnel Auth. Series 2021 B, 5% 5/15/56 | | 80,000 | 82,530 |
| Triborough Bridge & Tunnel Auth. Revs.: | | | |
| Series 2002 F: | | | |
5% 11/1/27 | | 65,000 | 68,986 |
5% 11/1/31 | | 75,000 | 84,989 |
| Series 2008 B3, 5% 11/15/37 | | 60,000 | 60,921 |
| Series 2013 A: | | | |
0% 11/15/30 | | 85,000 | 66,172 |
0% 11/15/32 | | 90,000 | 64,257 |
| Series 2016 A: | | | |
5% 11/15/41 | | 25,000 | 25,396 |
5% 11/15/46 | | 50,000 | 50,638 |
| Troy Cap. Resource Corp. Rev. (Rensselaer Polytechnic Institute Proj.) Series 2020 A, 5% 9/1/37 | | 135,000 | 144,983 |
| Util. Debt Securitization Auth.: | | | |
| Series 2015, 3% 12/15/32 | | 15,000 | 14,502 |
| Series 2017, 5% 12/15/41 | | 50,000 | 52,154 |
| Westchester County Gen. Oblig. Series 2021 A, 5% 10/15/29 | | 65,000 | 71,829 |
| Westchester County Local Dev. Co. (Westchester Obligated Group Proj.) Series 2016, 3.75% 11/1/37 | | 30,000 | 25,719 |
TOTAL NEW YORK | | | 12,425,033 |
| New York And New Jersey - 1.5% | | | |
| Port Auth. of New York & New Jersey: | | | |
| Series 189: | | | |
5% 5/1/27 | | 60,000 | 60,759 |
5% 5/1/30 | | 80,000 | 80,992 |
| Series 194, 5% 10/15/30 | | 15,000 | 15,292 |
| Series 198, 5% 11/15/46 | | 50,000 | 50,604 |
| Series 2012 175, 3.25% 12/1/42 | | 130,000 | 109,238 |
| Series 2015 189, 5% 5/1/31 | | 50,000 | 50,616 |
| Series 2015 194: | | | |
4% 10/15/45 | | 105,000 | 103,038 |
5% 10/15/34 | | 55,000 | 56,027 |
| Series 2017 205: | | | |
5% 11/15/26 | | 110,000 | 114,769 |
5.25% 11/15/57 | | 175,000 | 183,026 |
| Series 2018 209, 5% 7/15/36 | | 115,000 | 122,144 |
| Series 2019 213, 5% 9/1/30 | | 70,000 | 76,396 |
| Series 2019 217, 5% 11/1/32 | | 50,000 | 54,616 |
| Series 202, 5% 10/15/30 (b) | | 30,000 | 30,813 |
| Series 207, 5% 9/15/26 (b) | | 5,000 | 5,156 |
| Series 209, 5% 7/15/31 | | 30,000 | 31,966 |
| Series 211, 4% 9/1/43 | | 55,000 | 54,056 |
TOTAL NEW YORK AND NEW JERSEY | | | 1,199,508 |
| North Carolina - 1.1% | | | |
| Charlotte Int'l. Arpt. Rev. Series 2017 A, 5% 7/1/47 | | 55,000 | 56,585 |
| Charlotte Wtr. & Swr. Sys. Rev. Series 2018, 4% 7/1/47 | | 25,000 | 24,951 |
| Charlotte-Mecklenburg Hosp. Auth. Health Care Sys. Rev. Series 2016 A, 4% 1/15/45 | | 150,000 | 142,729 |
| Mecklenburg County Gen. Oblig. Series 2018, 3.25% 3/1/34 | | 65,000 | 63,164 |
| North Carolina Cap. Facilities Fin. Agcy. Rev. (Duke Univ. Proj.) Series 2015 B, 5% 10/1/41 (Pre-Refunded to 10/1/25 @ 100) | | 10,000 | 10,209 |
| North Carolina Gen. Oblig.: | | | |
| Series 2016 A, 5% 6/1/27 | | 40,000 | 41,260 |
| Series 2018 A, 5% 6/1/29 | | 75,000 | 80,575 |
| North Carolina Grant Anticipation Rev.: | | | |
| Series 2015, 5% 3/1/27 | | 70,000 | 70,676 |
| Series 2019: | | | |
5% 3/1/31 | | 5,000 | 5,406 |
5% 3/1/32 | | 30,000 | 32,436 |
| North Carolina Ltd. Oblig.: | | | |
| Series 2019 A, 5% 5/1/25 | | 30,000 | 30,412 |
| Series 2020 B: | | | |
5% 5/1/28 | | 50,000 | 53,535 |
5% 5/1/29 | | 35,000 | 38,123 |
| North Carolina Med. Care Commission Health Care Facilities Rev. Series 2012 A, 4% 12/1/45 | | 10,000 | 9,656 |
| North Carolina Tpk. Auth. Triangle Expressway Sys. Series 2018, 5% 1/1/30 | | 55,000 | 58,161 |
| Union County Enterprise Systems Rev. Series 2021, 3% 6/1/37 | | 80,000 | 72,993 |
| Wake County Series 2021, 5% 3/1/31 | | 85,000 | 95,478 |
TOTAL NORTH CAROLINA | | | 886,349 |
| North Dakota - 0.2% | | | |
| Grand Forks Health Care Sys. Rev. Series 2021, 5% 12/1/27 | | 85,000 | 85,809 |
| North Dakota Hsg. Fin. Agcy.: | | | |
| Series 2021 A, 2.25% 7/1/41 | | 50,000 | 36,782 |
| Series C, 3.35% 7/1/42 | | 20,000 | 17,628 |
TOTAL NORTH DAKOTA | | | 140,219 |
| Ohio - 2.5% | | | |
| Akron Bath Copley Hosp. District Rev. Series 2020, 4% 11/15/37 | | 5,000 | 4,782 |
| Allen County Hosp. Facilities Rev.: | | | |
| (Mercy Health) Series 2017 A, 5% 8/1/27 | | 25,000 | 26,193 |
| Series 2020 A, 5% 12/1/35 | | 60,000 | 65,113 |
| Chillicothe Hosp. Facilities Rev. (Adena Health Sys. Obligated Group Proj.) Series 2017, 4% 12/1/42 | | 100,000 | 91,822 |
| Cleveland Pub. Pwr. Sys. Rev. Series B2, 0% 11/15/38 (Nat'l. Pub. Fin. Guarantee Corp. Insured) | | 45,000 | 23,531 |
| Columbus Gen. Oblig.: | | | |
| Series 2016 A, 4% 8/15/27 | | 30,000 | 30,152 |
| Series 2018 A, 5% 4/1/30 | | 30,000 | 32,360 |
| Cuyahoga County Hosp. Rev. Series 2017, 5% 2/15/52 | | 5,000 | 5,011 |
| Franklin County Ohio Sales Tax R Series 2018, 5% 6/1/48 | | 30,000 | 31,244 |
| Franklin County Rev. Series 2017 OH, 5% 12/1/46 | | 85,000 | 86,506 |
| Gahanna-Jefferson School District Series 2021, 2% 12/1/50 (Assured Guaranty Muni. Corp. Insured) | | 100,000 | 56,154 |
| Hamilton County Sales Tax Rev. Series 2016 A, 5% 12/1/27 | | 55,000 | 58,144 |
| Hamilton County Swr. Sys. Rev. Series 2019 A, 5% 12/1/29 | | 150,000 | 164,719 |
| Northeast Ohio Reg'l. Swr. District Wastewtr. Rev. Series 2019, 3% 11/15/40 | | 100,000 | 85,784 |
| Northeastern Local School District of Clark and Champaign Series 2018, 4% 12/1/55 (Assured Guaranty Muni. Corp. Insured) | | 100,000 | 92,760 |
| Ohio Gen. Oblig.: | | | |
| Series 2015 A, 5% 9/15/26 | | 35,000 | 36,363 |
| Series 2015 C, 5% 11/1/28 | | 25,000 | 25,345 |
| Series 2017 C, 5% 8/1/26 | | 20,000 | 20,733 |
| Series 2017 C1, 5% 9/1/28 | | 60,000 | 64,579 |
| Series 2018 A, 5% 2/1/29 | | 15,000 | 15,392 |
| Series 2021 A, 4% 3/1/38 | | 55,000 | 56,462 |
| Ohio Hosp. Facilities Rev. Series 2017 A: | | | |
| 5% 1/1/28 | | 145,000 | 153,625 |
| 5% 1/1/33 | | 40,000 | 42,230 |
| Ohio Hosp. Rev. Series 2021 A, 3% 1/15/46 | | 50,000 | 38,608 |
| Ohio Hsg. Fin. Agcy. Residential Mtg. Rev.: | | | |
| (Mtg.-Backed Securities Prog.) Series 2022 A, 3.25% 9/1/52 | | 105,000 | 102,097 |
| Series 2019 A: | | | |
3.5% 9/1/34 | | 5,000 | 4,884 |
4% 3/1/49 | | 10,000 | 9,302 |
| Ohio Parks & Recreation Cap. Facilities Series 2017 A, 5% 12/1/31 | | 40,000 | 42,083 |
| Ohio Spl. Oblig. (Trans. Bldg. Fund Proj.) Series 2015 A, 5% 4/1/29 | | 40,000 | 40,438 |
| Ohio Tpk. Commission Tpk. Rev. (Infrastructure Proj.): | | | |
| Series 2005 A, 0% 2/15/43 | | 30,000 | 13,041 |
| Series 2013 A2, 0% 2/15/37 | | 80,000 | 48,608 |
| Ohio Wtr. Dev. Auth. Wtr. Poll. Cont. Rev.: | | | |
| Series 2020 A, 5% 12/1/38 | | 65,000 | 71,256 |
| Series 2020 B, 4% 12/1/38 | | 260,000 | 267,932 |
| Southwest Licking Local School Series 2017 A, 3.375% 11/1/47 | | 15,000 | 12,877 |
| Willoughby-Eastlake City School District Series 2016, 4% 12/1/50 | | 160,000 | 145,591 |
TOTAL OHIO | | | 2,065,721 |
| Oklahoma - 0.5% | | | |
| Oklahoma Cap. Imp Auth. St Hwy. Series 2016, 4% 7/1/33 | | 40,000 | 40,199 |
| Oklahoma Dev. Fin. Auth. Lease Series 2016 D, 4% 6/1/36 | | 200,000 | 201,187 |
| Oklahoma Pwr. Auth. Pwr. Supply Sys. Rev. Series 2016 A, 5% 1/1/47 | | 10,000 | 10,097 |
| Oklahoma Tpk. Auth. Tpk. Rev.: | | | |
| Series 2017 C: | | | |
4% 1/1/42 | | 30,000 | 30,037 |
5% 1/1/47 | | 30,000 | 30,668 |
| Series 2017 D, 5% 1/1/26 | | 5,000 | 5,134 |
| Series 2017 E, 4% 1/1/31 | | 100,000 | 100,817 |
| Univ. of Oklahoma Gen. Rev. Series 2015 C, 5% 7/1/36 | | 5,000 | 5,050 |
TOTAL OKLAHOMA | | | 423,189 |
| Oregon - 0.9% | | | |
| Beaverton School District Series 2022 A, 0% 6/15/39 | | 200,000 | 103,052 |
| Clackamas County School District No. 46: | | | |
| Series 2009: | | | |
0% 6/15/32 | | 50,000 | 37,899 |
0% 6/15/39 | | 10,000 | 5,547 |
| Series B, 0% 6/15/34 | | 20,000 | 14,056 |
| Deschutes & Jefferson Counties School District #2J Redmond Series 2008 B, 0% 6/15/26 | | 10,000 | 9,313 |
| Medford Hosp. Facilities Auth. Rev. (Asante Projs.) Series 2020 A, 2.5% 8/15/35 (Assured Guaranty Muni. Corp. Insured) | | 190,000 | 161,341 |
| Oregon Facilities Auth. Rev.: | | | |
| (Univ. of Portland Proj.) Series 2015 A, 5% 4/1/45 | | 35,000 | 35,184 |
| Series 2022 A, 5% 6/1/52 | | 110,000 | 114,588 |
| Oregon Health and Science Univ. Spl. Rev. Series 2016 B, 5% 7/1/39 | | 35,000 | 35,693 |
| Sherwood School District No. 88J Washington, Clackamas, and Yamhill Counties Gen. Oblig. Series 2018 A, 0% 6/15/48 | | 255,000 | 79,060 |
| West Linn-Wilsonville School District No. 3 Series 2020 A, 0% 6/15/35 | | 165,000 | 105,041 |
TOTAL OREGON | | | 700,774 |
| Pennsylvania - 3.8% | | | |
| Allegheny County Series C77, 5% 11/1/43 | | 25,000 | 26,058 |
| Allegheny County Hosp. Dev. Auth. Rev. Series 2018 A, 4% 4/1/38 | | 30,000 | 28,851 |
| Chester County Health & Ed. Facilities Auth. Health Sys. Rev. Series 2020 A, 4% 9/1/50 | | 100,000 | 93,705 |
| Chester County Indl. Dev. Auth. Rev. (Longwood Gardens, Inc. Proj.) Series 2021, 4% 12/1/46 | | 110,000 | 106,301 |
| Commonwealth Fing. Auth. Tobacco Series 2018, 4% 6/1/39 (Assured Guaranty Muni. Corp. Insured) | | 15,000 | 15,092 |
| Cumberland County Muni. Auth. Rev. Series 2019, 3% 11/1/39 | | 170,000 | 145,412 |
| Delaware River Port Auth. Pennsylvania & New Jersey Rev. Series 2018 A, 5% 1/1/32 | | 10,000 | 10,756 |
| Geisinger Auth. Health Sys. Rev. Series 2017 A2, 4% 2/15/39 | | 100,000 | 98,611 |
| Lancaster County Hosp. Auth. Health Ctr. Rev. Series 2016 A, 5% 8/15/42 | | 10,000 | 10,187 |
| Lehigh County Gen. Purp. Hosp. Rev. Series 2015 A, 4.125% 7/1/40 | | 90,000 | 90,021 |
| Monroeville Fin. Auth. UPMC Rev. Series 2022 B, 4% 2/15/40 | | 105,000 | 103,617 |
| Northampton County Gen. Purp. Auth. Hosp. Rev. (St. Luke's Univ. Health Network Proj.) Series 2016 A, 3.125% 8/15/35 | | 10,000 | 9,220 |
| Pennsylvania Ctfs. Prtn. Series 2018 A, 4% 7/1/46 | | 55,000 | 52,602 |
| Pennsylvania Econ. Dev. Fing. Auth.: | | | |
| (The Penndot Major Bridges Package One Proj.) Series 2022, 5.25% 6/30/53 (b) | | 110,000 | 114,114 |
| Series 2017 A, 5% 11/15/28 | | 85,000 | 89,067 |
| Pennsylvania Econ. Dev. Fing. Auth. Indl. Dev. Rev. (The Pennsylvania Rapid Bridge Replacement Proj.) Series 2015: | | | |
| 4.125% 12/31/38 (b) | | 20,000 | 18,946 |
| 5% 12/31/28 (b) | | 70,000 | 70,849 |
| Pennsylvania Gen. Oblig.: | | | |
| Series 2015: | | | |
4% 8/15/34 | | 25,000 | 25,069 |
5% 8/15/32 | | 60,000 | 60,915 |
| Series 2016 2, 3% 9/15/36 | | 15,000 | 13,462 |
| Series 2016: | | | |
5% 9/15/25 | | 100,000 | 102,014 |
5% 9/15/27 | | 10,000 | 10,352 |
| Series 2021, 5% 5/15/31 | | 60,000 | 67,211 |
| Pennsylvania Higher Edl. Facilities Auth. Rev.: | | | |
| Series 2015 A: | | | |
5% 9/1/39 | | 135,000 | 135,742 |
5% 9/1/45 | | 135,000 | 135,510 |
5.25% 9/1/50 | | 50,000 | 50,182 |
| Series 2016 C: | | | |
3% 8/15/41 | | 35,000 | 29,576 |
5% 8/15/25 | | 55,000 | 56,028 |
| Pennsylvania Hsg. Fin. Agcy. Series 2021 134A, 1.85% 4/1/36 | | 100,000 | 74,871 |
| Pennsylvania Hsg. Fin. Agcy. Single Family Mtg. Rev.: | | | |
| Series 2017 123B, 3.45% 10/1/32 | | 15,000 | 14,223 |
| Series 2017 125B, 3.65% 10/1/42 | | 20,000 | 18,460 |
| Pennsylvania Pub. School Bldg. Auth. School Rev. Series 2016 A, 5% 12/1/27 | | 50,000 | 51,524 |
| Pennsylvania Tpk. Commission Tpk. Rev.: | | | |
| Series 2013 B, 0% 12/1/41 (d) | | 20,000 | 18,711 |
| Series 2014 A, 5.125% 12/1/39 | | 35,000 | 37,314 |
| Series 2014 C, 5% 12/1/44 | | 50,000 | 50,181 |
| Series 2016, 5% 6/1/36 | | 50,000 | 50,949 |
| Series 2017 2, 5% 12/1/30 | | 10,000 | 10,459 |
| Series 2017 A2, 5% 12/1/28 | | 115,000 | 121,295 |
| Series 2017, 5% 12/1/40 | | 10,000 | 10,325 |
| Series 2019 A: | | | |
4% 12/1/49 | | 100,000 | 94,290 |
4% 12/1/49 (Assured Guaranty Muni. Corp. Insured) | | 100,000 | 95,685 |
5% 12/1/34 | | 30,000 | 32,552 |
5% 12/1/35 | | 35,000 | 37,229 |
| Series 2019, 5% 12/1/32 | | 10,000 | 10,721 |
| Philadelphia Arpt. Rev. Series 2020 A, 4% 7/1/38 | | 60,000 | 60,427 |
| Philadelphia Auth. for Indl. Dev.: | | | |
| (The Children's Hosp. of Philadelphia Proj.) Series 2017, 4% 7/1/37 | | 45,000 | 44,399 |
| Series 2017 A, 4% 9/1/42 | | 25,000 | 24,186 |
| Philadelphia Gas Works Rev. Series 2017 15, 5% 8/1/42 | | 150,000 | 153,248 |
| Philadelphia Gen. Oblig. Series 2015 B, 5% 8/1/25 | | 15,000 | 15,262 |
| Philadelphia School District: | | | |
| Series 2007 A, 5% 6/1/27 (FGIC Insured) (Nat'l. Pub. Fin. Guarantee Corp. Insured) | | 10,000 | 10,457 |
| Series 2019 A, 5% 9/1/44 | | 25,000 | 25,980 |
| Pittsburgh Wtr. & Swr. Auth. Wtr. & Swr. Sys. Rev. Series B, 0% 9/1/28 (FGIC Insured) | | 15,000 | 12,791 |
| Pocono Mountains Indl. Park Auth. Series 2015 A, 4% 8/15/45 | | 110,000 | 101,704 |
| State Pub. School Bldg. Auth. Lease Rev. (The School District of Philadelphia Proj.) Series 2016 A, 5% 6/1/33 | | 90,000 | 92,471 |
| Westmoreland County Muni. Auth. Muni. Svc. Rev. Series 2016, 3% 8/15/42 | | 50,000 | 42,146 |
TOTAL PENNSYLVANIA | | | 3,081,330 |
| Pennsylvania, New Jersey - 0.1% | | | |
| Delaware River Joint Toll Bridge Commission Pennsylvania-New Jersey Bridge Rev. Series 2017, 5% 7/1/36 | | 65,000 | 67,938 |
| Rhode Island - 0.4% | | | |
| Rhode Island & Providence Plantations Series C, 3% 1/15/36 | | 95,000 | 85,192 |
| Rhode Island Gen. Oblig. Series 2021 E: | | | |
| 2% 8/1/38 | | 70,000 | 51,595 |
| 2% 8/1/39 | | 50,000 | 35,884 |
| Rhode Island Hsg. & Mtg. Fin. Corp. Series 2019 70, 2.8% 10/1/34 | | 145,000 | 129,303 |
TOTAL RHODE ISLAND | | | 301,974 |
| South Carolina - 0.7% | | | |
| Brookland-Cayce School District No. 002 Series 2016, 3% 3/1/38 | | 20,000 | 17,944 |
| Lexington County School District #1 Series 2019 B, 2.25% 2/1/34 | | 85,000 | 72,767 |
| South Carolina Jobs-Econ. Dev. Auth. (SPE Fayssoux Properties, LLC Proj.) Series 2016 A, 3% 8/15/38 | | 25,000 | 19,399 |
| South Carolina Pub. Svc. Auth. Rev.: | | | |
| Series 2014 A, 5.5% 12/1/54 | | 25,000 | 25,008 |
| Series 2014 C: | | | |
5% 12/1/29 | | 25,000 | 25,027 |
5% 12/1/36 | | 25,000 | 25,055 |
| Series 2016 A: | | | |
3.25% 12/1/35 | | 10,000 | 8,934 |
5% 12/1/30 | | 80,000 | 81,575 |
| Series 2022 E, 5.75% 12/1/47 | | 200,000 | 222,952 |
| Series A, 3% 12/1/41 | | 20,000 | 15,763 |
| South Carolina Trans. Infrastructure Bank Rev. Series 2017 A, 5% 10/1/38 | | 45,000 | 46,852 |
TOTAL SOUTH CAROLINA | | | 561,276 |
| Tennessee - 0.7% | | | |
| Chattanooga Health Ed. & Hsg. Facility Board Rev. Series 2019 A1, 3% 8/1/39 | | 20,000 | 16,457 |
| Knox County Health Edl. & Hsg. Facilities: | | | |
| Series 2012 A, 5% 1/1/25 | | 30,000 | 30,022 |
| Series 2016 A, 4% 1/1/42 | | 15,000 | 14,574 |
| Series 2019, 4% 11/15/43 | | 5,000 | 4,734 |
| Memphis Gen. Oblig. Series 2021: | | | |
| 4% 5/1/46 | | 50,000 | 49,228 |
| 5% 5/1/30 | | 80,000 | 88,321 |
| Metropolitan Nashville Arpt. Auth. Rev. Series 2019 A: | | | |
| 4% 7/1/54 | | 35,000 | 33,092 |
| 5% 7/1/54 | | 140,000 | 146,065 |
| Tennessee Energy Acquisition Corp.: | | | |
| Series 2006 A, 5.25% 9/1/26 | | 20,000 | 20,477 |
| Series 2006 B, 5.625% 9/1/26 | | 50,000 | 51,662 |
| Series 2006 C, 5% 2/1/27 | | 15,000 | 15,232 |
| Tennessee Gen. Oblig. Series 2016 A, 5% 8/1/35 | | 50,000 | 51,635 |
| Tennessee Hsg. Dev. Agcy. Residential: | | | |
| Series 2016 2B, 3.5% 1/1/47 | | 30,000 | 29,715 |
| Series 2020 1A, 2.4% 1/1/44 | | 10,000 | 7,133 |
| Tennessee School Board Auth. Series A, 5% 11/1/42 | | 50,000 | 51,610 |
TOTAL TENNESSEE | | | 609,957 |
| Texas - 8.1% | | | |
| Aldine Independent School District Series 2017 A, 5% 2/15/30 | | 50,000 | 52,201 |
| Alvin Independent School District: | | | |
| Series 2019, 3.375% 2/15/40 | | 15,000 | 14,091 |
| Series 2020, 4% 2/15/48 | | 100,000 | 97,251 |
| Arlington Higher Ed. Fin. Corp. Series 2018, 4% 8/15/48 | | 80,000 | 76,571 |
| Austin Elec. Util. Sys. Rev. Series 2015 A, 5% 11/15/45 | | 100,000 | 100,738 |
| Austin Independent School District: | | | |
| Series 2017, 4% 8/1/33 | | 5,000 | 5,035 |
| Series 2019, 4% 8/1/35 | | 25,000 | 25,548 |
| Bexar County Hosp. District Series 2020, 3% 2/15/36 | | 15,000 | 13,481 |
| Bexar County Rev. Series 2015, 4% 8/15/51 (Pre-Refunded to 8/15/24 @ 100) | | 15,000 | 15,004 |
| Central Reg'l. Mobility Auth. Series 2016, 3.375% 1/1/41 | | 45,000 | 39,729 |
| City of Denton Series 2017, 4% 2/15/47 | | 15,000 | 14,291 |
| College of the Mainland Series 2019, 3.75% 8/15/49 | | 50,000 | 44,326 |
| Collin County Cmnty. College District Series 2018 A, 3.25% 8/15/33 | | 40,000 | 39,392 |
| Conroe Independent School District Series 2020 A, 2.25% 2/15/46 | | 85,000 | 56,141 |
| Cypress-Fairbanks Independent School District: | | | |
| Series 2019, 5% 2/15/30 | | 45,000 | 48,655 |
| Series 2020 A, 3% 2/15/35 | | 180,000 | 169,875 |
| Dallas County Hosp. District Series 2019, 5% 8/15/30 | | 75,000 | 79,385 |
| Dallas Independent School District Series 2019 B, 3% 2/15/37 | | 20,000 | 18,309 |
| Dallas Wtrwks. & Swr. Sys. Rev.: | | | |
| Series 2018 C, 4% 10/1/43 | | 100,000 | 98,753 |
| Series 2020 C, 4% 10/1/49 | | 75,000 | 72,445 |
| Del Mar College District Series 2018 B, Series 2018 B, 4% 8/15/48 | | 150,000 | 139,397 |
| Denton Independent School District Series 2015 A, 5% 8/15/45 (Pre-Refunded to 8/15/25 @ 100) | | 100,000 | 101,755 |
| Eagle Mountain & Saginaw Independent School District Series 2019, 4% 8/15/50 | | 20,000 | 19,269 |
| El Paso Gen. Oblig. Series 2020, 4% 8/15/45 | | 100,000 | 95,622 |
| Frisco Independent School District: | | | |
| Series 2017, 4% 8/15/35 | | 30,000 | 30,177 |
| Series 2019, 4% 8/15/39 | | 35,000 | 35,284 |
| Grand Parkway Trans. Corp.: | | | |
| Series 2013: | | | |
5.3% 10/1/32 | | 35,000 | 37,943 |
5.85% 10/1/48 | | 70,000 | 75,433 |
| Series 2018 A, 5% 10/1/37 | | 40,000 | 42,222 |
| Harris County Cultural Ed. Facilities Fin. Corp. Rev. Series 2019 A, 3% 10/1/39 | | 55,000 | 48,404 |
| Harris County Cultural Ed. Facilities Fin. Corp. Thermal Util. Rev. (TECO Proj.) Series 2017, 4% 11/15/37 | | 55,000 | 54,902 |
| Harris County Flood Cont. District Series 2017 A, 4% 10/1/38 | | 200,000 | 199,655 |
| Harris County Gen. Oblig. Series 2016 A, 5% 8/15/33 | | 35,000 | 35,933 |
| Harris County Hosp. District Rev. Series 2016, 3.25% 2/15/42 | | 60,000 | 49,957 |
| Harris County Toll Road Rev. Series 2018 A, 4% 8/15/48 | | 105,000 | 100,887 |
| Harris County-Houston Sports Auth. Rev.: | | | |
| Series 2001 A, 0% 11/15/34 (Nat'l. Pub. Fin. Guarantee Corp. Insured) | | 15,000 | 9,232 |
| Series 2014: | | | |
0% 11/15/48 (Assured Guaranty Muni. Corp. Insured) | | 40,000 | 12,400 |
0% 11/15/49 (Assured Guaranty Muni. Corp. Insured) | | 35,000 | 10,297 |
| Houston Arpt. Sys. Rev.: | | | |
| Series 2018 D, 5% 7/1/38 | | 20,000 | 20,939 |
| Series 2021 A, 4% 7/1/41 (b) | | 110,000 | 107,222 |
| Houston Convention and Entertainment Facilities Dept. Hotel Occupancy Tax and Spl. Rev. Series 2001 B, 0% 9/1/33 (AMBAC Insured) | | 120,000 | 82,672 |
| Houston Independent School District: | | | |
| Series 2016 A, 5% 2/15/31 | | 55,000 | 56,402 |
| Series 2017, 5% 2/15/27 | | 30,000 | 31,407 |
| Houston Util. Sys. Rev. Series 2020 C, 4% 11/15/49 | | 155,000 | 147,683 |
| Houston Wtr. & Swr. Sys. Rev. Series 1998 A, 0% 12/1/27 (Escrowed to Maturity) | | 50,000 | 44,360 |
| Katy Independent School District: | | | |
| Series 2019, 4% 2/15/40 | | 35,000 | 35,009 |
| Series 2022, 4% 2/15/41 | | 125,000 | 126,642 |
| Keller Independent School District Series 2020, 4% 2/15/44 | | 100,000 | 100,025 |
| Lamar Consolidated Independent School District Series 2018, 4% 2/15/50 | | 75,000 | 72,330 |
| Leander Independent School District Series 2016 A: | | | |
| 0% 8/16/44 | | 130,000 | 51,342 |
| 0% 8/16/44 (Pre-Refunded to 8/16/26 @ 48.506) | | 10,000 | 4,486 |
| Lower Colorado River Auth. Rev. (LCRA Transmission Svcs. Corp. Proj.): | | | |
| Series 2019, 5% 5/15/44 | | 260,000 | 267,360 |
| Series 2020 A, 5% 5/15/50 | | 55,000 | 58,012 |
| Matagorda County Navigation District No. 1 Poll. Cont. Rev.: | | | |
| Series 2005 A, 4.4% 5/1/30 (AMBAC Insured) | | 10,000 | 10,109 |
| Series 2005 B, 4.55% 5/1/30 (b)(c) | | 50,000 | 50,517 |
| Midland County Fresh Wtr. Supply District (City of Midland Proj.) Series 2012 A: | | | |
| 0% 9/15/33 (Pre-Refunded to 9/15/27 @ 75.851) | | 150,000 | 100,929 |
| 0% 9/15/35 (Pre-Refunded to 9/15/27 @ 68.049) | | 50,000 | 30,182 |
| North East Texas Reg'l. Mobility Auth. Series 2016 B, 5% 1/1/41 | | 40,000 | 40,409 |
| North Texas Tollway Auth. Rev.: | | | |
| Series 2008 D: | | | |
0% 1/1/34 (Assured Guaranty Corp. Insured) | | 75,000 | 53,661 |
0% 1/1/38 (Assured Guaranty Corp. Insured) | | 100,000 | 59,724 |
| Series 2012 A, 0% 1/1/36 (Assured Guaranty Corp. Insured) | | 25,000 | 16,461 |
| Series 2015 A, 5% 1/1/27 | | 100,000 | 100,527 |
| Series 2018: | | | |
4.25% 1/1/49 | | 5,000 | 4,904 |
5% 1/1/48 | | 70,000 | 72,069 |
| Northside Independent School District Series 2019 A, 4% 8/15/36 | | 190,000 | 191,333 |
| Port of Houston Auth. Series 2021, 4% 10/1/39 | | 115,000 | 116,434 |
| San Antonio Elec. & Gas Sys. Rev.: | | | |
| Series 2015: | | | |
5% 2/1/27 | | 30,000 | 30,750 |
5% 2/1/32 | | 45,000 | 46,030 |
| Series 2019, 4% 2/1/28 | | 90,000 | 92,237 |
| San Antonio Independent School District Series 2019, 5% 8/15/30 | | 20,000 | 21,420 |
| San Jacinto Cmnty. College District Series 2019 A, 5% 2/15/44 | | 20,000 | 20,766 |
| Sherman Independent School District Series 2018 A, 5% 2/15/41 | | 50,000 | 52,192 |
| Texas A&M Univ. Rev.: | | | |
| Series 2017 E, 5% 5/15/35 | | 50,000 | 52,386 |
| Series 2021 A, 3% 5/15/37 | | 115,000 | 106,609 |
| Texas Dept. of Hsg. & Cmnty. Affairs Single Family Mtg. Rev. Series 2020 A, 3% 3/1/50 | | 35,000 | 26,185 |
| Texas Gen. Oblig.: | | | |
| Series 2016 A, 5% 4/1/30 | | 50,000 | 51,401 |
| Series 2017 B, 5% 10/1/33 | | 35,000 | 36,535 |
| Series 2018 A, 5% 10/1/26 | | 65,000 | 67,562 |
| Series 2018 B, 5% 8/1/24 (Escrowed to Maturity) | | 30,000 | 30,033 |
| Texas Private Activity Bond Surface Trans. Corp.: | | | |
| (LBJ Infrastructure Group LLC I-635 Managed Lanes Proj.) Series 2020 A, 4% 12/31/31 | | 65,000 | 66,182 |
| (NTE Mobility Partners LLC North Tarrant Express Managed Lanes Proj.) Series 2019 A, 5% 12/31/32 | | 55,000 | 58,768 |
| (NTE Mobility Partners Segments 3 LLC Segment 3C Proj.) Series 2019, 5% 6/30/58 (b) | | 105,000 | 107,090 |
| Texas Tpk. Auth. Central Texas Tpk. Sys. Rev. Series A, 0% 8/15/29 (AMBAC Insured) | | 15,000 | 12,298 |
| Texas Trans. Commission Central Texas Tpk. Sys. Rev. Series 2015 C: | | | |
| 5% 8/15/25 | | 65,000 | 65,058 |
| 5% 8/15/42 | | 30,000 | 30,011 |
| Texas Wtr. Dev. Board Rev.: | | | |
| Series 2017 A, 5% 10/15/47 | | 60,000 | 62,349 |
| Series 2018 A, 4% 10/15/37 | | 10,000 | 10,037 |
| Series 2018 B, 4% 10/15/34 | | 5,000 | 5,076 |
| Series 2019 A, 4% 10/15/49 | | 160,000 | 153,097 |
| Series 2020: | | | |
3% 10/15/34 | | 10,000 | 9,570 |
3% 8/1/39 | | 300,000 | 268,669 |
5% 8/1/33 | | 55,000 | 60,788 |
| Series 2022, 5% 10/15/34 | | 125,000 | 142,380 |
| Tomball Independent School District Series 2018, 5% 2/15/41 | | 125,000 | 130,870 |
| Univ. of Houston Univ. Revs. Series 2017 C, 3.25% 2/15/41 | | 165,000 | 143,862 |
| Univ. of Texas Board of Regents Sys. Rev.: | | | |
| Series 2016 A, 4% 8/15/42 | | 65,000 | 65,204 |
| Series 2016 J, 5% 8/15/26 | | 20,000 | 20,728 |
| Series 2017 B, 3.375% 8/15/44 | | 15,000 | 13,357 |
| Series 2019 A, 5% 8/15/31 | | 15,000 | 16,300 |
| Series 2021 A, 5% 8/15/31 | | 165,000 | 185,519 |
| Waller Independent School District Series 2020, 4% 2/15/50 | | 15,000 | 14,466 |
TOTAL TEXAS | | | 6,508,925 |
| Utah - 0.7% | | | |
| Salt Lake City Arpt. Rev. Series 2021 A, 4% 7/1/38 (b) | | 90,000 | 89,753 |
| Salt Lake City Pub. Utils. Rev. Series 2020, 4% 2/1/44 | | 100,000 | 99,612 |
| Univ. of Utah Gen. Revs.: | | | |
| Series 2017 A, 5% 8/1/29 | | 20,000 | 21,066 |
| Series 2020 A: | | | |
4% 8/1/39 | | 65,000 | 65,769 |
5% 8/1/37 | | 60,000 | 65,920 |
| Series 2021 A1, 4% 8/1/41 | | 80,000 | 80,498 |
| Utah County Hosp. Rev. Series 2018 A, 5% 5/15/41 | | 120,000 | 122,323 |
| Utah Transit Auth. Sales Tax Rev.: | | | |
| Series 2015 A: | | | |
5% 6/15/26 (Pre-Refunded to 6/15/25 @ 100) | | 10,000 | 10,159 |
5% 6/15/29 (Pre-Refunded to 6/15/25 @ 100) | | 20,000 | 20,318 |
| Series 2016, 4% 12/15/29 | | 25,000 | 25,228 |
TOTAL UTAH | | | 600,646 |
| Virginia - 2.2% | | | |
| Chesterfield County Econ. Dev. Auth. Rev. (County Mobility Projs.) Series 2024, 4% 4/1/50 | | 20,000 | 19,437 |
| Commonwealth Trans. Board Grant Anticipation Rev. Series 2017, 5% 3/15/27 | | 15,000 | 15,741 |
| Fairfax County Econ. Dev. Auth.: | | | |
| (Route 28 Proj.) Series 2016 A, 2.875% 4/1/35 | | 45,000 | 40,706 |
| Series 2016: | | | |
3% 4/1/36 | | 125,000 | 113,057 |
3% 4/1/36 (Pre-Refunded to 4/1/26 @ 100) | | 30,000 | 29,812 |
| Fairfax County Gen. Oblig. Series 2020 A, 5% 10/1/36 | | 270,000 | 298,821 |
| Fairfax County Indl. Dev. Auth. Series 2022, 5% 5/15/25 | | 55,000 | 55,745 |
| Henrico County Wtr. & Swr. Rev. Series 2016, 5% 5/1/46 (Pre-Refunded to 5/1/26 @ 100) | | 30,000 | 30,961 |
| Loudoun County Gen. Oblig. Series 2023 A, 5% 12/1/29 | | 155,000 | 170,943 |
| Lynchburg Econ. Dev.: | | | |
| Series 2017 A, 4% 1/1/47 | | 35,000 | 33,150 |
| Series 2021, 3% 1/1/51 | | 50,000 | 37,862 |
| Richmond Gen. Oblig. Series 2019 A, 3% 7/15/34 | | 40,000 | 37,268 |
| Roanoke Econ. Dev. Authority. Bonds Series 2020 D, 5%, tender 7/1/30 (c) | | 30,000 | 31,915 |
| Univ. of Virginia Gen. Rev. Series 2013 A, 4% 4/1/45 | | 55,000 | 54,560 |
| Virginia College Bldg. Auth. Edl. Facilities Rev.: | | | |
| (21st Century College And Equip. Programs) Series 2020 A, 5% 2/1/31 | | 100,000 | 109,810 |
| (21st Century College and Equip. Progs.): | | | |
Series 2015 A, 5% 2/1/28 (Pre-Refunded to 2/1/25 @ 100) | | 10,000 | 10,098 |
Series 2019 C, 5% 2/1/30 | | 45,000 | 48,793 |
| Series 2019 C, 5% 2/1/25 | | 65,000 | 65,649 |
| Series 2022 A, 5% 2/1/26 | | 100,000 | 102,860 |
| Virginia Commonwealth Trans. Board Rev. Series 2017, 3% 5/15/36 | | 125,000 | 115,310 |
| Virginia Gen. Oblig. Series 2018 A, 3% 6/1/32 | | 5,000 | 4,845 |
| Virginia Port Auth. Port Facilities Rev. Series 2015 A, 5% 7/1/33 (Pre-Refunded to 7/1/25 @ 100) (b) | | 35,000 | 35,461 |
| Virginia Pub. Bldg. Auth. Pub. Facilities Rev.: | | | |
| Series 2013 A, 3% 8/1/30 | | 100,000 | 95,289 |
| Series 2016 A, 3% 8/1/35 | | 15,000 | 13,697 |
| Series 2019 A, 5% 8/1/29 | | 60,000 | 65,645 |
| Virginia Small Bus. Fing. Auth.: | | | |
| (Elizabeth River Crossings OPCO, LLC Proj.) Series 2022, 3% 1/1/41 (b) | | 50,000 | 40,975 |
| Series 2014, 4% 10/1/38 | | 5,000 | 5,000 |
| Virginia St Pub. Bldg. Auth. Pubf Series 2022 A, 5% 8/1/31 | | 80,000 | 89,994 |
TOTAL VIRGINIA | | | 1,773,404 |
| Washington - 4.3% | | | |
| Central Puget Sound Reg'l. Trans. Auth. Sales & Use Tax Rev. Series 2016 S1: | | | |
| 5% 11/1/27 | | 45,000 | 46,747 |
| 5% 11/1/35 | | 65,000 | 67,286 |
| Clark County School District #114, Evergreen Series 2019, 3% 12/1/38 | | 20,000 | 17,974 |
| Energy Northwest Elec. Rev.: | | | |
| Series 2015 A, 5% 7/1/28 | | 75,000 | 76,125 |
| Series 2016 A, 5% 7/1/28 | | 55,000 | 56,961 |
| Series 2017 A, 5% 7/1/28 | | 95,000 | 100,059 |
| Series 2018 C, 5% 7/1/33 | | 65,000 | 69,358 |
| King County Gen. Oblig.: | | | |
| Series 2015 E, 5% 12/1/29 | | 45,000 | 45,993 |
| Series 2021 A, 4% 1/1/26 | | 50,000 | 50,613 |
| King County Hsg. Auth. Rev. Series 2018, 3.5% 5/1/38 | | 35,000 | 33,016 |
| King County School District #403 Series 2020 A, 4% 12/1/35 | | 100,000 | 102,275 |
| King County Swr. Rev. Series 2020 A, 4% 1/1/44 | | 225,000 | 225,214 |
| Port of Seattle Rev.: | | | |
| Series 2018 B, 5% 5/1/25 (b) | | 65,000 | 65,594 |
| Series 2019, 5% 4/1/34 (b) | | 150,000 | 157,828 |
| Seattle Muni. Lt. & Pwr. Rev.: | | | |
| Series 2019 A, 5% 4/1/42 | | 100,000 | 105,471 |
| Series 2020 A, 5% 7/1/27 | | 90,000 | 94,784 |
| Series 2021 A, 4% 7/1/43 | | 100,000 | 99,372 |
| Seattle Wtr. Sys. Rev. Series 2015, 4% 5/1/45 | | 50,000 | 48,804 |
| Tacoma Elec. Sys. Rev. Series 2021, 4% 1/1/51 | | 135,000 | 129,200 |
| Thurston & Pierce Counties Cmnty. Schools Series 2019, 4% 12/1/35 | | 50,000 | 50,943 |
| Univ. of Washington Univ. Revs. Series 2012 C, 3.25% 7/1/43 | | 135,000 | 113,480 |
| Washington Gen. Oblig.: | | | |
| Series 2015 B, 5% 2/1/28 | | 40,000 | 40,365 |
| Series 2015 H: | | | |
5% 7/1/26 | | 25,000 | 25,207 |
5% 7/1/29 | | 15,000 | 15,116 |
| Series 2016 B, 5% 7/1/32 | | 50,000 | 51,073 |
| Series 2016 C, 5% 2/1/35 | | 30,000 | 30,650 |
| Series 2018 D, 5% 8/1/28 | | 30,000 | 31,587 |
| Series 2020 A: | | | |
5% 1/1/26 | | 20,000 | 20,512 |
5% 8/1/28 | | 230,000 | 247,180 |
| Series 2020 E, 5% 6/1/45 | | 55,000 | 58,461 |
| Series 2021 A: | | | |
5% 8/1/29 | | 75,000 | 81,982 |
5% 2/1/31 | | 100,000 | 111,544 |
5% 8/1/43 | | 175,000 | 187,762 |
| Series 2023 RB, 5% 7/1/33 | | 95,000 | 109,475 |
| Series R 2015 C, 5% 7/1/27 | | 25,000 | 25,194 |
| Washington Health Care Facilities Auth. Rev.: | | | |
| Series 2012 A: | | | |
4% 10/1/34 | | 115,000 | 113,596 |
5% 10/1/38 | | 5,000 | 5,000 |
| Series 2014 C, 4% 10/1/44 | | 55,000 | 50,026 |
| Series 2015 B, 5% 8/15/24 | | 20,000 | 20,018 |
| Series 2017 B, 3.5% 8/15/38 | | 125,000 | 112,012 |
| Series 2017, 5% 8/15/37 | | 125,000 | 126,780 |
| Series 2020, 4% 9/1/50 | | 115,000 | 104,897 |
| Washington Higher Ed. Facilities Auth. Rev.: | | | |
| (Gonzaga Univ. Proj.) Series 2019 A, 3% 4/1/49 | | 40,000 | 31,269 |
| (Seattle Pacific Univ. Proj.) Series 2020 A, 5% 10/1/42 | | 75,000 | 70,681 |
| Washington State Univ. Hsg. and Dining Sys. Rev. Series 2015, 5% 4/1/40 | | 35,000 | 35,119 |
TOTAL WASHINGTON | | | 3,462,603 |
| West Virginia - 0.2% | | | |
| West Virginia Hosp. Fin. Auth. Hosp. Rev. Series 2016 A, 3% 6/1/33 | | 20,000 | 18,365 |
| West Virginia Parkways Auth. Series 2021, 4% 6/1/51 | | 145,000 | 138,202 |
TOTAL WEST VIRGINIA | | | 156,567 |
| Wisconsin - 0.8% | | | |
| Milwaukee Gen. Oblig. Series 2016 B3, 3% 3/1/31 | | 50,000 | 45,994 |
| Pub. Fin. Auth. Hosp. Rev. (Renown Reg'l. Med. Ctr. Proj.) Series 2016 A, 3% 6/1/36 | | 5,000 | 4,359 |
| Pub. Fin. Auth. Lease Dev. Rev. (KU Campus Dev. Corp. Central District Dev. Proj.) Series 2016, 5% 3/1/29 | | 40,000 | 40,947 |
| Roseman Univ. of Health (Fargo-Moorhead Metropolitan Area Flood Risk Mgmt. Proj.) Series 2021, 4% 3/31/56 (b) | | 5,000 | 4,155 |
| Wisconsin Gen. Oblig.: | | | |
| Series 1, 5% 11/1/26 | | 40,000 | 41,683 |
| Series 2015 1, 5% 5/1/25 | | 70,000 | 70,991 |
| Series 2016 2, 5% 11/1/29 | | 65,000 | 66,897 |
| Series 2017 2, 5% 11/1/25 | | 65,000 | 66,547 |
| Series 2022 4, 5% 5/1/31 | | 95,000 | 106,667 |
| Series 3, 5% 11/1/31 | | 25,000 | 26,250 |
| Series A, 4% 5/1/27 | | 20,000 | 20,212 |
| Wisconsin Health & Edl. Facilities: | | | |
| Series 2014 A, 5% 11/15/25 | | 10,000 | 10,037 |
| Series 2016 A, 3.125% 11/15/36 (Pre-Refunded to 5/15/26 @ 100) | | 50,000 | 49,784 |
| Series 2017 A, 5% 4/1/28 | | 5,000 | 5,173 |
| Wisconsin Hsg. & Econ. Dev. Auth. Series 2017 A, 2.69% 7/1/47 | | 8,402 | 7,180 |
| Wisconsin St Gen. Fund Annual Appropriation Series 2017 B, 5% 5/1/36 | | 35,000 | 36,090 |
| Wisconsin Trans. Rev. Series 2017 1, 5% 7/1/28 | | 10,000 | 10,521 |
TOTAL WISCONSIN | | | 613,487 |
| Wyoming - 0.0% | | | |
| Campbell County Solid Waste Facilities Rev. Series 2019 A, 3.625% 7/15/39 | | 30,000 | 27,142 |
| TOTAL MUNICIPAL BONDS (Cost $83,877,572) | | | 80,478,589 |
| | | | |
| TOTAL INVESTMENT IN SECURITIES - 99.7% (Cost $83,877,572) | 80,478,589 |
NET OTHER ASSETS (LIABILITIES) - 0.3% | 268,979 |
| NET ASSETS - 100.0% | 80,747,568 |
| | |
Legend
| (a) | Amount is stated in United States dollars unless otherwise noted. |
| (b) | Private activity obligations whose interest is subject to the federal alternative minimum tax for individuals. |
| (c) | Coupon rates for floating and adjustable rate securities reflect the rates in effect at period end. |
| (d) | Security initially issued in zero coupon form which converts to coupon form at a specified rate and date. The rate shown is the rate at period end. |
Affiliated Central Funds
Fiscal year to date information regarding the Fund's investments in Fidelity Central Funds, including the ownership percentage, is presented below.
| Affiliate | Value, beginning of period ($) | Purchases ($) | Sales Proceeds ($) | Dividend Income ($) | Realized Gain (loss) ($) | Change in Unrealized appreciation (depreciation) ($) | Value, end of period ($) | % ownership, end of period |
| Fidelity Municipal Cash Central Fund 4.33% | 554,974 | 19,202,700 | 19,757,835 | 24,486 | 145 | 16 | - | 0.0% |
| Total | 554,974 | 19,202,700 | 19,757,835 | 24,486 | 145 | 16 | - | |
| | | | | | | | | |
Amounts in the dividend income column in the above table include any capital gain distributions from underlying funds, which are presented in the corresponding line item in the Statement of Operations, if applicable.
Amounts included in the purchases and sales proceeds columns may include in-kind transactions, if applicable.
Investment Valuation
The following is a summary of the inputs used, as of June 30, 2024, involving the Fund's assets and liabilities carried at fair value. The inputs or methodology used for valuing securities may not be an indication of the risk associated with investing in those securities. For more information on valuation inputs, and their aggregation into the levels used below, please refer to the Investment Valuation section in the accompanying Notes to Financial Statements.
| Valuation Inputs at Reporting Date: |
| Description | Total ($) | Level 1 ($) | Level 2 ($) | Level 3 ($) |
Investments in Securities: | | | | |
|
| Municipal Securities | 80,478,589 | - | 80,478,589 | - |
| | | | | |
| Total Investments in Securities: | 80,478,589 | - | 80,478,589 | - |
Financial Statements
| Statement of Assets and Liabilities |
| | | | June 30, 2024 |
| | | | | |
| Assets | | | | |
Investment in securities, at value - See accompanying schedule Unaffiliated issuers (cost $83,877,572): | | | $ | 80,478,589 |
| Receivable for fund shares sold | | | | 155,610 |
| Interest receivable | | | | 962,481 |
| Distributions receivable from Fidelity Central Funds | | | | 224 |
| Receivable from investment adviser for expense reductions | | | | 20,421 |
| Other receivables | | | | 77 |
Total assets | | | | 81,617,402 |
| Liabilities | | | | |
| Payable to custodian bank | $ | 94,627 | | |
| Payable for investments purchased | | 366,827 | | |
| Payable for fund shares redeemed | | 166,330 | | |
| Distributions payable | | 181,949 | | |
| Accrued management fee | | 3,391 | | |
| Audit fee payable | | 53,311 | | |
| Other payables and accrued expenses | | 3,399 | | |
| Total liabilities | | | | 869,834 |
| Net Assets | | | $ | 80,747,568 |
| Net Assets consist of: | | | | |
| Paid in capital | | | $ | 87,374,438 |
| Total accumulated earnings (loss) | | | | (6,626,870) |
| Net Assets | | | $ | 80,747,568 |
Net Asset Value, offering price and redemption price per share ($80,747,568 ÷ 4,392,697 shares) | | | $ | 18.38 |
| Statement of Operations |
| | | | Year ended June 30, 2024 |
| Investment Income | | | | |
| Interest | | | $ | 2,299,203 |
| Income from Fidelity Central Funds | | | | 24,486 |
| Total income | | | | 2,323,689 |
| Expenses | | | | |
| Management fee | $ | 41,212 | | |
| Custodian fees and expenses | | 4,093 | | |
| Independent trustees' fees and expenses | | 267 | | |
| Registration fees | | 30,157 | | |
| Audit | | 62,857 | | |
| Legal | | 147 | | |
| Miscellaneous | | 565 | | |
| Total expenses before reductions | | 139,298 | | |
| Expense reductions | | (81,239) | | |
| Total expenses after reductions | | | | 58,059 |
| Net Investment income (loss) | | | | 2,265,630 |
| Realized and Unrealized Gain (Loss) | | | | |
| Net realized gain (loss) on: | | | | |
| Investment Securities: | | | | |
| Unaffiliated issuers | | (1,027,958) | | |
| Fidelity Central Funds | | 145 | | |
| Total net realized gain (loss) | | | | (1,027,813) |
| Change in net unrealized appreciation (depreciation) on: | | | | |
| Investment Securities: | | | | |
| Unaffiliated issuers | | 563,455 | | |
| Fidelity Central Funds | | 16 | | |
| Total change in net unrealized appreciation (depreciation) | | | | 563,471 |
| Net gain (loss) | | | | (464,342) |
| Net increase (decrease) in net assets resulting from operations | | | $ | 1,801,288 |
| Statement of Changes in Net Assets |
| |
| | Year ended June 30, 2024 | | Year ended June 30, 2023 |
| Increase (Decrease) in Net Assets | | | | |
| Operations | | | | |
| Net investment income (loss) | $ | 2,265,630 | $ | 2,274,240 |
| Net realized gain (loss) | | (1,027,813) | | (536,329) |
| Change in net unrealized appreciation (depreciation) | | 563,471 | | 549,454 |
| Net increase (decrease) in net assets resulting from operations | | 1,801,288 | | 2,287,365 |
| Distributions to shareholders | | (2,222,794) | | (2,239,158) |
| | | | | |
| Share transactions | | | | |
| Proceeds from sales of shares | | 59,628,992 | | 129,072,772 |
| Reinvestment of distributions | | 289 | | 289 |
| Cost of shares redeemed | | (67,272,229) | | (126,565,224) |
| | | | | |
Net increase (decrease) in net assets resulting from share transactions | | (7,642,948) | | 2,507,837 |
| Total increase (decrease) in net assets | | (8,064,454) | | 2,556,044 |
| | | | | |
| Net Assets | | | | |
| Beginning of period | | 88,812,022 | | 86,255,978 |
| End of period | $ | 80,747,568 | $ | 88,812,022 |
| | | | | |
| Other Information | | | | |
| Shares | | | | |
| Sold | | 3,336,429 | | 7,250,216 |
| Issued in reinvestment of distributions | | 16 | | 16 |
| Redeemed | | (3,783,308) | | (7,116,407) |
| Net increase (decrease) | | (446,863) | | 133,825 |
| | | | | |
Financial Highlights
Fidelity® SAI Municipal Bond Index Fund |
| |
| Years ended June 30, | | 2024 | | 2023 | | 2022 | | 2021 | | 2020 A |
Selected Per-Share Data | | | | | | | | | | |
| Net asset value, beginning of period | $ | 18.35 | $ | 18.33 | $ | 20.65 | $ | 20.26 | $ | 20.00 |
| Income from Investment Operations | | | | | | | | | | |
Net investment income (loss) B,C | | .501 | | .470 | | .330 | | .314 | | .333 |
| Net realized and unrealized gain (loss) | | .021 D | | .012 | | (2.320) | | .391 | | .254 |
| Total from investment operations | | .522 | | .482 | | (1.990) | | .705 | | .587 |
| Distributions from net investment income | | (.492) | | (.462) | | (.330) | | (.315) | | (.327) |
| Total distributions | | (.492) | | (.462) | | (.330) | | (.315) | | (.327) |
| Net asset value, end of period | $ | 18.38 | $ | 18.35 | $ | 18.33 | $ | 20.65 | $ | 20.26 |
Total Return E,F | | | | 2.68% | | (9.74)% | | 3.50% | | 2.96% |
Ratios to Average Net Assets B,G,H | | | | | | | | | | |
| Expenses before reductions | | .17% | | .18% | | .20% | | .17% | | .45% I |
| Expenses net of fee waivers, if any | | | | .07% | | .07% | | .07% | | .07% I |
| Expenses net of all reductions | | .07% | | .07% | | .07% | | .07% | | .07% I |
| Net investment income (loss) | | 2.75% | | 2.57% | | 1.65% | | 1.53% | | 1.72% I |
| Supplemental Data | | | | | | | | | | |
| Net assets, end of period (000 omitted) | $ | 80,748 | $ | 88,812 | $ | 86,256 | $ | 90,154 | $ | 54,824 |
Portfolio turnover rate J | | | | 17% | | 59% | | 13% | | 8% I |
AFor the period July 11, 2019 (commencement of operations) through June 30, 2020.
BNet investment income (loss) is affected by the timing of the declaration of dividends by any underlying mutual funds or exchange-traded funds (ETFs). Net investment income (loss) of any mutual funds or ETFs is not included in the Fund's net investment income (loss) ratio.
CCalculated based on average shares outstanding during the period.
DThe amount shown for a share outstanding does not correspond with the aggregate net gain (loss) on investments for the period due to the timing of sales and repurchases of shares in relation to fluctuating market values of the investments of the Fund.
ETotal returns for periods of less than one year are not annualized.
FTotal returns would have been lower if certain expenses had not been reduced during the applicable periods shown.
GFees and expenses of any underlying mutual funds or exchange-traded funds (ETFs) are not included in the Fund's expense ratio. The Fund indirectly bears its proportionate share of these expenses.
HExpense ratios reflect operating expenses of the class. Expenses before reductions do not reflect amounts reimbursed, waived, or reduced through arrangements with the investment adviser, brokerage services, or other offset arrangements, if applicable, and do not represent the amount paid by the class during periods when reimbursements, waivers or reductions occur.
IAnnualized.
JAmount does not include the portfolio activity of any underlying mutual funds or exchange-traded funds (ETFs).
Notes to Financial Statements
For the period ended June 30, 2024
1. Organization.
Fidelity SAI Municipal Bond Index Fund (the Fund) is a fund of Fidelity Salem Street Trust (the Trust) and is authorized to issue an unlimited number of shares. Shares are offered exclusively to certain clients of Fidelity Management & Research Company LLC (FMR) or its affiliates. The Trust is registered under the Investment Company Act of 1940, as amended (the 1940 Act), as an open-end management investment company organized as a Massachusetts business trust.
2. Significant Accounting Policies.
The Fund is an investment company and applies the accounting and reporting guidance of the Financial Accounting Standards Board (FASB) Accounting Standards Codification Topic 946 Financial Services - Investment Companies. The financial statements have been prepared in conformity with accounting principles generally accepted in the United States of America (GAAP), which require management to make certain estimates and assumptions at the date of the financial statements. Actual results could differ from those estimates. Subsequent events, if any, through the date that the financial statements were issued have been evaluated in the preparation of the financial statements. The Fund's Schedule of Investments lists any underlying mutual funds or exchange-traded funds (ETFs) but does not include the underlying holdings of these funds. The following summarizes the significant accounting policies of the Fund:
Investment Valuation. Investments are valued as of 4:00 p.m. Eastern time on the last calendar day of the period. The Board of Trustees (the Board) has designated the Fund's investment adviser as the valuation designee responsible for the fair valuation function and performing fair value determinations as needed. The investment adviser has established a Fair Value Committee (the Committee) to carry out the day-to-day fair valuation responsibilities and has adopted policies and procedures to govern the fair valuation process and the activities of the Committee. In accordance with these fair valuation policies and procedures, which have been approved by the Board, the Fund attempts to obtain prices from one or more third party pricing services or brokers to value its investments. When current market prices, quotations or currency exchange rates are not readily available or reliable, investments will be fair valued in good faith by the Committee, in accordance with the policies and procedures. Factors used in determining fair value vary by investment type and may include market or investment specific events, transaction data, estimated cash flows, and market observations of comparable investments. The frequency that the fair valuation procedures are used cannot be predicted and they may be utilized to a significant extent. The Committee manages the Fund's fair valuation practices and maintains the fair valuation policies and procedures. The Fund's investment adviser reports to the Board information regarding the fair valuation process and related material matters.
The Fund categorizes the inputs to valuation techniques used to value its investments into a disclosure hierarchy consisting of three levels as shown below:
Level 1 - unadjusted quoted prices in active markets for identical investments
Level 2 - other significant observable inputs (including quoted prices for similar investments, interest rates, prepayment speeds, etc.)
Level 3 - unobservable inputs (including the Fund's own assumptions based on the best information available)
Valuation techniques used to value the Fund's investments by major category are as follows:
Debt securities, including restricted securities, are valued based on evaluated prices received from third party pricing services or from brokers who make markets in such securities. Municipal securities are valued by pricing services who utilize matrix pricing which considers yield or price of bonds of comparable quality, coupon, maturity and type or by broker-supplied prices. When independent prices are unavailable or unreliable, debt securities may be valued utilizing pricing methodologies which consider similar factors that would be used by third party pricing services. Debt securities are generally categorized as Level 2 in the hierarchy but may be Level 3 depending on the circumstances.
Changes in valuation techniques may result in transfers in or out of an assigned level within the disclosure hierarchy. The aggregate value of investments by input level as of June 30, 2024 is included at the end of the Fund's Schedule of Investments.
Investment Transactions and Income. For financial reporting purposes, the Fund's investment holdings and NAV include trades executed through the end of the last business day of the period. The NAV per share for processing shareholder transactions is calculated as of the close of business of the New York Stock Exchange (NYSE), normally 4:00 p.m. Eastern time and includes trades executed through the end of the prior business day. Gains and losses on securities sold are determined on the basis of identified cost. Income and capital gain distributions from Fidelity Central Funds, if any, are recorded on the ex-dividend date. Interest income is accrued as earned and includes coupon interest and amortization of premium and accretion of discount on debt securities as applicable. Debt obligations may be placed on non-accrual status and related interest income may be reduced by ceasing current accruals and writing off interest receivables when the collection of all or a portion of interest has become doubtful based on consistently applied procedures. A debt obligation is removed from non-accrual status when the issuer resumes interest payments or when collectability of interest is reasonably assured.
Expenses. Expenses directly attributable to a fund are charged to that fund. Expenses attributable to more than one fund are allocated among the respective funds on the basis of relative net assets or other appropriate methods. Expenses included in the accompanying financial statements reflect the expenses of that fund and do not include any expenses associated with any underlying mutual funds or exchange-traded funds. Although not included in a fund's expenses, a fund indirectly bears its proportionate share of these expenses through the net asset value of each underlying mutual fund or exchange-traded fund. Expense estimates are accrued in the period to which they relate and adjustments are made when actual amounts are known.
Income Tax Information and Distributions to Shareholders. Each year, the Fund intends to qualify as a regulated investment company under Subchapter M of the Internal Revenue Code, including distributing substantially all of its taxable income and realized gains. As a result, no provision for U.S. Federal income taxes is required. During the period, the Fund incurred a corporate tax liability on undistributed net investment income, which is included in Miscellaneous expense on the Statement of Operations. As of June 30, 2024, the Fund did not have any unrecognized tax benefits in the financial statements; nor is the Fund aware of any tax positions for which it is reasonably possible that the total amounts of unrecognized tax benefits will significantly change in the next twelve months. The Fund files a U.S. federal tax return, in addition to state and local tax returns as required. The Fund's federal income tax returns are subject to examination by the Internal Revenue Service (IRS) for a period of three fiscal years after they are filed. State and local tax returns may be subject to examination for an additional fiscal year depending on the jurisdiction.
Distributions are declared and recorded daily and paid monthly from net investment income. Distributions from realized gains, if any, are declared and recorded on the ex-dividend date. Income and capital gain distributions are determined in accordance with income tax regulations, which may differ from GAAP.
Capital accounts within the financial statements are adjusted for permanent book-tax differences. These adjustments have no impact on net assets or the results of operations. Capital accounts are not adjusted for temporary book-tax differences which will reverse in a subsequent period.
Book-tax differences are primarily due to market discount and capital loss carryforwards.
The Fund purchases municipal securities whose interest, in the opinion of the issuer, is free from federal income tax. There is no assurance that the IRS will agree with this opinion. In the event the IRS determines that the issuer does not comply with relevant tax requirements, interest payments from a security could become federally taxable, possibly retroactively to the date the security was issued.
As of period end, the cost and unrealized appreciation (depreciation) in securities, and derivatives if applicable, for federal income tax purposes were as follows:
| Gross unrealized appreciation | $243,718 |
| Gross unrealized depreciation | (3,571,979) |
| Net unrealized appreciation (depreciation) | $(3,328,261) |
| Tax Cost | $83,806,850 |
The tax-based components of distributable earnings as of period end were as follows:
| Undistributed ordinary income | $1,971 |
| Capital loss carryforward | $(3,299,522) |
| Net unrealized appreciation (depreciation) on securities and other investments | $(3,328,261) |
Capital loss carryforwards are only available to offset future capital gains of the Fund to the extent provided by regulations and may be limited. The capital loss carryforward information presented below, including any applicable limitation, is estimated as of fiscal period end and is subject to adjustment.
Short-term | $(1,214,161) |
Long-term | (2,085,361) |
| Total capital loss carryforward | $(3,299,522) |
The tax character of distributions paid was as follows:
| | June 30, 2024 | June 30, 2023 |
| Tax-exempt Income | $2,222,794 | $2,239,158 |
3. Purchases and Sales of Investments.
Purchases and sales of securities, other than short-term securities and in-kind transactions, as applicable, are noted in the table below.
| | Purchases ($) | Sales ($) |
| Fidelity SAI Municipal Bond Index Fund | 14,207,128 | 19,693,607 |
4. Fees and Other Transactions with Affiliates.
Management Fee. Fidelity Management & Research Company LLC (the investment adviser) and its affiliates provide the Fund with investment management related services for which the Fund pays a monthly management fee that is based on an annual rate of .05% of the Fund's average net assets.
Interfund Trades. Funds may purchase from or sell securities to other Fidelity Funds under procedures adopted by the Board. The procedures have been designed to ensure these interfund trades are executed in accordance with Rule 17a-7 of the 1940 Act. Any interfund trades are included within the respective purchases and sales amounts shown in the Purchases and Sales of Investments note. During the period, there were no interfund trades.
Sub-Advisory Arrangements. Effective March 1, 2024, the Fund's sub-advisory agreements with FMR Investment Management (UK) Limited, Fidelity Management & Research (Hong Kong) Limited, and Fidelity Management & Research (Japan) Limited were amended to provide that the investment adviser pays each sub-adviser monthly fees equal to 110% of the sub-adviser's costs for providing sub-advisory services.
5. Committed Line of Credit.
Certain Funds participate with other funds managed by the investment adviser or an affiliate in a $4.25 billion credit facility (the "line of credit") to be utilized for temporary or emergency purposes to fund shareholder redemptions or for other short-term liquidity purposes. The participating funds have agreed to pay commitment fees on their pro-rata portion of the line of credit, which are reflected in Miscellaneous expenses on the Statement of Operations, and are listed below. During the period, there were no borrowings on this line of credit.
| | Amount ($) |
| Fidelity SAI Municipal Bond Index Fund | 148 |
6. Expense Reductions.
The investment adviser contractually agreed to reimburse the Fund to the extent annual operating expenses exceeded .07% of average net assets. This reimbursement will remain in place through October 31, 2025. Some expenses, for example the compensation of the independent Trustees, and certain miscellaneous expenses such as proxy and shareholder meeting expenses, are excluded from this reimbursement. During the period this reimbursement reduced the Fund's expenses by $81,111.
Through arrangements with the Fund's custodian, credits realized as a result of certain uninvested cash balances were used to reduce the Fund's expenses by $128.
7. Other.
A fund's organizational documents provide former and current trustees and officers with a limited indemnification against liabilities arising in connection with the performance of their duties to the fund. In the normal course of business, a fund may also enter into contracts that provide general indemnifications. A fund's maximum exposure under these arrangements is unknown as this would be dependent on future claims that may be made against a fund. The risk of material loss from such claims is considered remote.
8. Risk and Uncertainties.
Many factors affect a fund's performance. Developments that disrupt global economies and financial markets, such as pandemics, epidemics, outbreaks of infectious diseases, war, terrorism, and environmental disasters, may significantly affect a fund's investment performance. The effects of these developments to a fund will be impacted by the types of securities in which a fund invests, the financial condition, industry, economic sector, and geographic location of an issuer, and a fund's level of investment in the securities of that issuer. Significant concentrations in security types, issuers, industries, sectors, and geographic locations may magnify the factors that affect a fund's performance.
Report of Independent Registered Public Accounting Firm
To the Board of Trustees of Fidelity Salem Street Trust and Shareholders of Fidelity SAI Municipal Bond Index Fund
Opinion on the Financial Statements
We have audited the accompanying statement of assets and liabilities, including the schedule of investments, of Fidelity SAI Municipal Bond Index Fund (one of the funds constituting Fidelity Salem Street Trust, referred to hereafter as the "Fund") as of June 30, 2024, the related statement of operations for the year ended June 30, 2024, the statement of changes in net assets for each of the two years in the period ended June 30, 2024, including the related notes, and the financial highlights for each of the four years in the period ended June 30, 2024 and for the period July 11, 2019 (commencement of operations) through June 30, 2020 (collectively referred to as the "financial statements"). In our opinion, the financial statements present fairly, in all material respects, the financial position of the Fund as of June 30, 2024, the results of its operations for the year then ended, the changes in its net assets for each of the two years in the period ended June 30, 2024 and the financial highlights for each of the four years in the period ended June 30, 2024 and for the period July 11, 2019 (commencement of operations) through June 30, 2020 in conformity with accounting principles generally accepted in the United States of America.
Basis for Opinion
These financial statements are the responsibility of the Fund's management. Our responsibility is to express an opinion on the Fund's financial statements based on our audits. We are a public accounting firm registered with the Public Company Accounting Oversight Board (United States) (PCAOB) and are required to be independent with respect to the Fund in accordance with the U.S. federal securities laws and the applicable rules and regulations of the Securities and Exchange Commission and the PCAOB.
We conducted our audits of these financial statements in accordance with the standards of the PCAOB. Those standards require that we plan and perform the audit to obtain reasonable assurance about whether the financial statements are free of material misstatement, whether due to error or fraud.
Our audits included performing procedures to assess the risks of material misstatement of the financial statements, whether due to error or fraud, and performing procedures that respond to those risks. Such procedures included examining, on a test basis, evidence regarding the amounts and disclosures in the financial statements. Our audits also included evaluating the accounting principles used and significant estimates made by management, as well as evaluating the overall presentation of the financial statements. Our procedures included confirmation of securities owned as of June 30, 2024 by correspondence with the custodian and brokers; when replies were not received from brokers, we performed other auditing procedures. We believe that our audits provide a reasonable basis for our opinion.
/s/ PricewaterhouseCoopers LLP
Boston, Massachusetts
August 14, 2024
We have served as the auditor of one or more investment companies in the Fidelity group of funds since 1932.
Distributions
(Unaudited)
The dividend and capital gains distributions for the fund(s) are available on Fidelity.com or Institutional.Fidelity.com.
During the fiscal year ended 2024, 100% of the fund's income dividends was free from federal income tax, and 4.66% of the fund's income dividends was subject to the federal alternative minimum tax.
The fund will notify shareholders in January 2025 of amounts for use in preparing 2024 income tax returns.
Item 8: Changes in and Disagreements with Accountants for Open-End Management Investment Companies
Note: This is not applicable for any fund included in this document.
Item 9: Proxy Disclosures for Open-End Management Investment Companies
| A special meeting of shareholders was held on October 18, 2023. The results of votes taken among shareholders on the proposal before them are reported below. Each vote reported represents one dollar of net asset value held on the record date for the meeting. |
| Proposal 1 |
| To elect a Board of Trustees. |
| | # of Votes | % of Votes |
| Abigail P. Johnson |
| Affirmative | 378,729,502,260.01 | 97.58 |
| Withheld | 9,407,876,478.96 | 2.42 |
| TOTAL | 388,137,378,738.97 | 100.00 |
| Jennifer Toolin McAuliffe |
| Affirmative | 378,454,868,010.95 | 97.51 |
| Withheld | 9,682,510,728.02 | 2.49 |
| TOTAL | 388,137,378,738.97 | 100.00 |
| Christine J. Thompson |
| Affirmative | 378,837,121,274.52 | 97.60 |
| Withheld | 9,300,257,464.45 | 2.40 |
| TOTAL | 388,137,378,738.97 | 100.00 |
| Elizabeth S. Acton |
| Affirmative | 378,262,110,794.85 | 97.46 |
| Withheld | 9,875,267,944.12 | 2.54 |
| TOTAL | 388,137,378,738.97 | 100.00 |
| Laura M. Bishop |
| Affirmative | 380,482,113,171.06 | 98.03 |
| Withheld | 7,655,265,567.91 | 1.97 |
| TOTAL | 388,137,378,738.97 | 100.00 |
| Ann E. Dunwoody |
| Affirmative | 380,016,034,008.12 | 97.91 |
| Withheld | 8,121,344,730.85 | 2.09 |
| TOTAL | 388,137,378,738.97 | 100.00 |
| John Engler |
| Affirmative | 379,432,488,394.20 | 97.76 |
| Withheld | 8,704,890,344.77 | 2.24 |
| TOTAL | 388,137,378,738.97 | 100.00 |
| Robert F. Gartland |
| Affirmative | 378,741,819,600.60 | 97.58 |
| Withheld | 9,395,559,138.37 | 2.42 |
| TOTAL | 388,137,378,738.97 | 100.00 |
| Robert W. Helm |
| Affirmative | 380,389,324,755.07 | 98.00 |
| Withheld | 7,748,053,983.90 | 2.00 |
| TOTAL | 388,137,378,738.97 | 100.00 |
| Arthur E. Johnson |
| Affirmative | 378,427,694,151.67 | 97.50 |
| Withheld | 9,709,684,587.30 | 2.50 |
| TOTAL | 388,137,378,738.97 | 100.00 |
| Michael E. Kenneally |
| Affirmative | 377,842,228,145.18 | 97.35 |
| Withheld | 10,295,150,593.79 | 2.65 |
| TOTAL | 388,137,378,738.97 | 100.00 |
| Mark A. Murray |
| Affirmative | 380,158,432,703.37 | 97.94 |
| Withheld | 7,978,946,035.60 | 2.06 |
| TOTAL | 388,137,378,738.97 | 100.00 |
| Carol J. Zierhoffer |
| Affirmative | 380,522,113,360.24 | 98.04 |
| Withheld | 7,615,265,378.73 | 1.96 |
| TOTAL | 388,137,378,738.97 | 100.00 |
| | | |
| Proposal 1 reflects trust-wide proposal and voting results. |
Item 10: Remuneration Paid to Directors, Officers, and others of Open-End Management Investment Companies
Note: This information is disclosed as part of the financial statements for each Fund as part of Item 7: Financial Statements and Financial Highlights for Open-End Management Investment companies.
Item 11: Statement Regarding Basis for Approval of Investment Advisory Contract
Board Approval of Investment Advisory Contracts
Fidelity SAI Municipal Bond Index Fund
At its January 2024 meeting, the Board of Trustees, including the Independent Trustees (together, the Board), approved amended and restated sub-advisory agreements (the Sub-Advisory Contracts) for the fund, including the fund's sub-advisory agreements with FMR Investment Management (UK) Limited (FMR UK), Fidelity Management & Research (Hong Kong) Limited (FMR H.K.), and Fidelity Management & Research (Japan) Limited (FMR Japan). The Sub-Advisory Contracts will be effective March 1, 2024. The Board will consider the annual renewal of the fund's Sub-Advisory Contracts in September 2024, following its review of additional materials provided by FMR.
The Board considered the Sub-Advisory Contracts, which changed the arrangements for fees paid by FMR to the sub-advisers under the agreements. The Board noted that the agreements with FMR UK, FMR H.K., and FMR Japan were amended to provide that FMR will compensate each sub-adviser at a fee equal to 110% of the sub-adviser's costs incurred in providing services under the agreement. The Board considered that, under the Sub-Advisory Contracts, FMR, and not the fund, will continue to pay the sub-advisory fees to each applicable sub-adviser, and that the management fee paid by the fund under the management contract with FMR will remain unchanged.
The Board considered that the approval of the fund's Sub-Advisory Contracts will not result in any changes in the investment process or strategies employed in the management of the fund's assets or the day-to-day management of the fund or the persons primarily responsible for such management. Further, the Board considered that the Sub-Advisory Contracts would not change the obligations and services of FMR and its affiliates on behalf of the fund, and, in particular, there would be no change in the nature and level of services provided to the fund by FMR and its affiliates.
In connection with its consideration of future renewals of the fund's advisory contracts, the Board will consider: (i) the nature, extent and quality of services provided to the funds, including shareholder and administrative services and investment performance; (ii) the competitiveness of the management fee and total expenses for the fund; (iii) the costs of the services and profitability, including the revenues earned and the expenses incurred in conducting the business of developing, marketing, distributing, managing, administering, and servicing the fund and its shareholders, to the extent applicable; and (iv) whether there have been economies of scale in respect of the Fidelity funds, whether the Fidelity funds (including the fund) have appropriately benefited from any such economies of scale, and whether there is the potential for realization of any further economies.
Based on its evaluation of all of the conclusions noted above, and after considering all factors it believed relevant, the Board concluded that the fund's management fee structure is fair and reasonable, and that the fund's Sub-Advisory Contracts should be approved.
1.9894029.104
MBX-ANN-0824
Fidelity® Municipal Bond Index Fund
Annual Report
June 30, 2024
Contents
To view a fund's proxy voting guidelines and proxy voting record for the 12-month period ended June 30, visit http://www.fidelity.com/proxyvotingresults or visit the Securities and Exchange Commission's (SEC) web site at http://www.sec.gov.
You may also call 1-800-544-8544 to request a free copy of the proxy voting guidelines.
BLOOMBERG ® is a trademark and service mark of Bloomberg Finance L.P. and its affiliates (collectively "Bloomberg"). Bloomberg or Bloomberg's licensors own all proprietary rights in the Bloomberg Indices. Neither Bloomberg nor Bloomberg's licensors approves or endorses this material, or guarantees the accuracy or completeness of any information herein, or makes any warranty, express or implied, as to the results to be obtained therefrom and, to the maximum extent allowed by law, neither shall have any liability or responsibility for injury or damages arising in connection therewith.
Standard & Poor's, S&P and S&P 500 are registered service marks of The McGraw-Hill Companies, Inc. and have been licensed for use by Fidelity Distributors Corporation.
Other third-party marks appearing herein are the property of their respective owners.
All other marks appearing herein are registered or unregistered trademarks or service marks of FMR LLC or an affiliated company. © 2024 FMR LLC. All rights reserved.
This report and the financial statements contained herein are submitted for the general information of the shareholders of the Fund. This report is not authorized for distribution to prospective investors in the Fund unless preceded or accompanied by an effective prospectus.
A fund files its complete schedule of portfolio holdings with the SEC for the first and third quarters of each fiscal year on Form N-PORT. Forms N-PORT are available on the SEC's web site at http://www.sec.gov. A fund's Forms N-PORT may be reviewed and copied at the SEC's Public Reference Room in Washington, DC. Information regarding the operation of the SEC's Public Reference Room may be obtained by calling 1-800-SEC-0330.
For a complete list of a fund's portfolio holdings, view the most recent holdings listing, semiannual report, or annual report on Fidelity's web site at http://www.fidelity.com, http://www.institutional.fidelity.com, or http://www.401k.com, as applicable.
NOT FDIC INSURED •MAY LOSE VALUE •NO BANK GUARANTEE
Neither the Fund nor Fidelity Distributors Corporation is a bank.
Item 7: Financial Statements and Financial Highlights for Open-End Management Investment Companies (Annual Report)
Fidelity® Municipal Bond Index Fund
Schedule of Investments June 30, 2024
Showing Percentage of Net Assets
| Municipal Bonds - 98.9% |
| | | Principal Amount (a) | Value ($) |
| Alabama - 1.0% | | | |
| Alabama Fed. Aid Hwy. Fin. Auth.: | | | |
| Series 2015, 3.1% 9/1/29 (Pre-Refunded to 9/1/24 @ 100) | | 70,000 | 69,924 |
| Series 2017 A, 4% 6/1/37 (Pre-Refunded to 9/1/27 @ 100) | | 25,000 | 25,692 |
| Series 2017 B, 5% 9/1/26 (Escrowed to Maturity) | | 75,000 | 77,870 |
| Alabama Pub. School & College Auth. Rev. Series 2020 A: | | | |
| 4% 11/1/40 | | 100,000 | 101,264 |
| 5% 11/1/39 | | 320,000 | 350,606 |
| Alabama State Corrections Institution Fin. Auth. Series 2022 A, 5.25% 7/1/47 | | 150,000 | 161,958 |
| Birmingham Jefferson Civic Ctr. Auth. Series 2018 B, 4% 7/1/48 | | 30,000 | 28,279 |
| Birmingham Spl. Care Facilities Fin. Auth. Series 2015, 5% 6/1/25 | | 150,000 | 151,883 |
| Birmingham Wtrwks. Board: | | | |
| Series 2016 B, 5% 1/1/30 (Pre-Refunded to 1/1/27 @ 100) | | 135,000 | 140,872 |
| Series 2016, 3% 1/1/43 (Pre-Refunded to 1/1/27 @ 100) | | 5,000 | 4,975 |
| Decatur Wtr. & Swr. Rev. Series 2021 A, 2.125% 2/15/51 | | 35,000 | 20,182 |
| Infirmary Health Systems Spl. Care Facilities Fing. Auth. Rev. Series 2016 A, 3% 2/1/30 | | 40,000 | 37,433 |
| Tuscaloosa County Board of Ed. Series 2017, 5% 2/1/43 (Pre-Refunded to 2/1/27 @ 100) | | 45,000 | 47,084 |
| UAB Medicine Fin. Auth. Rev.: | | | |
| Series 2016 B: | | | |
3.625% 9/1/41 | | 195,000 | 180,666 |
5% 9/1/34 | | 130,000 | 133,056 |
| Series 2017 B1, 3.25% 9/1/31 | | 5,000 | 4,712 |
| Univ. of Alabama At Birmingham Series 2019 B, 3% 10/1/41 | | 50,000 | 42,403 |
| Univ. of Alabama Gen. Rev. Series 2017 B, 3% 7/1/35 | | 10,000 | 9,139 |
TOTAL ALABAMA | | | 1,587,998 |
| Alaska - 0.1% | | | |
| Alaska Gen. Oblig. Series 2015 B, 5% 8/1/27 | | 50,000 | 50,854 |
| Alaska Hsg. Fin. Corp. Series 2017 A, 5% 12/1/30 | | 75,000 | 78,218 |
TOTAL ALASKA | | | 129,072 |
| Arizona - 1.0% | | | |
| Arizona Health Facilities Auth. Rev. (Scottsdale Lincoln Hospitals Proj.) Series 2014 A, 5% 12/1/26 | | 35,000 | 35,207 |
| Arizona Indl. Dev. Auth. Student Hsg. Rev. (North Carolina Central Univ. Proj.) Series 2019 A, 5% 6/1/58 | | 65,000 | 66,687 |
| Arizona State Univ. Revs. Series 2019 B, 4% 7/1/49 | | 15,000 | 14,702 |
| Maricopa County Indl. Dev. Auth. Series 2021 A, 4% 9/1/51 | | 135,000 | 127,039 |
| Maricopa County Rev. Series 2016 A, 5% 1/1/38 | | 40,000 | 41,034 |
| Maricopa County Spl. Health Care District Gen. Oblig. Series 2018 C, 4% 7/1/38 | | 55,000 | 55,202 |
| Mesa Util. Sys. Rev. Series 2020, 4% 7/1/43 | | 180,000 | 179,816 |
| Phoenix Civic Impt. Board Arpt. Rev.: | | | |
| Series 2015 A, 5% 7/1/45 | | 175,000 | 175,973 |
| Series 2017 D, 5% 7/1/25 | | 15,000 | 15,249 |
| Phoenix Civic Impt. Corp. District Rev. Series 2005 B, 5.5% 7/1/36 (Nat'l. Pub. Fin. Guarantee Corp. Insured) | | 75,000 | 91,221 |
| Phoenix Civic Impt. Corp. Excise Tax Rev. Series 2015 A, 5% 7/1/31 | | 25,000 | 25,353 |
| Salt River Proj. Agricultural Impt. & Pwr. District Elec. Sys. Rev.: | | | |
| (Arizona Salt River Proj.) Series A, 5% 1/1/31 | | 45,000 | 46,764 |
| Series 2016 A, 5% 1/1/27 | | 50,000 | 52,263 |
| Series 2017 A: | | | |
5% 1/1/28 | | 100,000 | 106,563 |
5% 1/1/33 | | 50,000 | 52,865 |
| Series 2019 A, 4% 1/1/41 | | 175,000 | 175,913 |
| Series 2022 A, 5% 1/1/32 | | 140,000 | 158,752 |
| Series A: | | | |
5% 1/1/31 | | 40,000 | 42,439 |
5% 1/1/36 | | 40,000 | 41,422 |
| Salt Verde Finl. Corp. Sr. Gas Rev. Series 2007 1: | | | |
| 5% 12/1/32 | | 50,000 | 53,190 |
| 5.25% 12/1/24 | | 10,000 | 10,047 |
| 5.25% 12/1/26 | | 15,000 | 15,489 |
| Univ. of Arizona Univ. Revs.: | | | |
| Series 2016 B, 5% 6/1/42 | | 45,000 | 45,952 |
| Series 2020 A, 4% 8/1/44 | | 100,000 | 98,460 |
TOTAL ARIZONA | | | 1,727,602 |
| Arkansas - 0.1% | | | |
| Fort Smith Wtr. & Swr. Rev. Series 2018, 5% 10/1/34 | | 110,000 | 116,653 |
| Pulaski County Pub. Facilities Board Series 2014, 5% 12/1/39 (Pre-Refunded to 12/1/24 @ 100) | | 35,000 | 35,170 |
TOTAL ARKANSAS | | | 151,823 |
| California - 22.9% | | | |
| Anaheim Calif Hsg. & Pub. Impt. A (Wtr. Sys. Proj.) Series 2022 A, 5% 10/1/52 | | 525,000 | 542,094 |
| Anaheim Elementary School District Series 2016, 3% 8/1/46 | | 50,000 | 40,377 |
| Anaheim Pub. Fing. Auth. Lease Rev.: | | | |
| (Anaheim Pub. Impts. Proj.) Series 1997 C, 0% 9/1/36 (Escrowed to Maturity) | | 170,000 | 113,127 |
| Series 1997 C, 0% 9/1/28 (Assured Guaranty Muni. Corp. Insured) | | 95,000 | 82,742 |
| Antelope Valley Cmnty. College District Series B, 3% 8/1/50 | | 55,000 | 43,307 |
| Bay Area Toll Auth. San Francisco Bay Toll Bridge Rev.: | | | |
| Bonds: | | | |
Series 2018 A, 2.625%, tender 4/1/26 (b) | | 130,000 | 126,922 |
Series A, 2.95%, tender 4/1/26 (b) | | 110,000 | 107,829 |
| Series 2017 S7: | | | |
4% 4/1/34 | | 95,000 | 95,640 |
4% 4/1/38 | | 275,000 | 274,663 |
4% 4/1/47 | | 5,000 | 4,908 |
| Brea Redev. Agcy. Series 2003, 0% 8/1/29 (AMBAC Insured) | | 105,000 | 86,768 |
| Burbank Glendale Pasadena Arpt. Auth. Rev. Series 2024 A, 4% 7/1/54 (Assured Guaranty Muni. Corp. Insured) | | 205,000 | 201,264 |
| California Cmnty. Choice Fing. Auth. Clean Energy Proj. Rev. Bonds Series 2022 A1, 4%, tender 8/1/28 (b) | | 670,000 | 674,249 |
| California Dept. of Wtr. Resources: | | | |
| Series 2016 AW, 4% 12/1/34 | | 235,000 | 237,996 |
| Series 2017 AX, 5% 12/1/31 | | 435,000 | 464,408 |
| Series 2020 BB, 5% 12/1/35 | | 200,000 | 226,023 |
| Series AV, 4% 12/1/31 | | 40,000 | 40,663 |
| Series BA, 5% 12/1/32 | | 65,000 | 71,748 |
| California Edl. Facilities Auth. Rev.: | | | |
| (Loyola Marymount Univ. Proj.) Series 2001 A, 0% 10/1/29 (Nat'l. Pub. Fin. Guarantee Corp. Insured) | | 165,000 | 136,336 |
| Series 2001 A: | | | |
0% 10/1/30 | | 70,000 | 55,748 |
0% 10/1/34 (Nat'l. Pub. Fin. Guarantee Corp. Insured) | | 15,000 | 10,164 |
| Series 2018 B, 5% 10/1/43 | | 100,000 | 104,285 |
| Series 2023 V3, 5% 6/1/33 | | 175,000 | 205,493 |
| Series T1, 5% 3/15/39 | | 30,000 | 36,244 |
| Series U6, 5% 5/1/45 | | 35,000 | 42,152 |
| California Gen. Oblig.: | | | |
| Series 2014, 5% 10/1/28 | | 30,000 | 30,092 |
| Series 2015: | | | |
5% 8/1/26 | | 75,000 | 75,757 |
5% 8/1/26 | | 65,000 | 66,210 |
5% 9/1/26 | | 20,000 | 20,402 |
5% 9/1/28 | | 50,000 | 50,961 |
5% 8/1/29 | | 20,000 | 20,348 |
5% 8/1/30 | | 170,000 | 171,539 |
5% 8/1/45 | | 40,000 | 40,407 |
5.25% 8/1/30 | | 95,000 | 96,837 |
| Series 2016: | | | |
3% 9/1/33 | | 355,000 | 342,566 |
4% 9/1/28 | | 110,000 | 111,058 |
4% 9/1/35 | | 50,000 | 50,365 |
4% 9/1/36 | | 200,000 | 200,742 |
5% 9/1/24 | | 45,000 | 45,115 |
5% 9/1/26 | | 160,000 | 166,165 |
5% 8/1/27 | | 45,000 | 46,564 |
5% 9/1/30 | | 15,000 | 15,502 |
5% 9/1/32 | | 50,000 | 51,553 |
5% 9/1/45 | | 10,000 | 10,256 |
| Series 2017 A, 5% 8/1/26 | | 80,000 | 82,957 |
| Series 2017: | | | |
3.5% 8/1/27 | | 25,000 | 25,206 |
4% 8/1/37 | | 25,000 | 25,229 |
5% 11/1/25 | | 175,000 | 179,439 |
5% 11/1/27 | | 75,000 | 79,582 |
5% 11/1/27 | | 65,000 | 68,971 |
5% 11/1/31 | | 100,000 | 105,595 |
5% 8/1/33 | | 100,000 | 102,988 |
| Series 2018, 5% 10/1/48 | | 100,000 | 105,146 |
| Series 2019: | | | |
3% 10/1/33 | | 70,000 | 66,423 |
3% 10/1/34 | | 50,000 | 46,809 |
3% 10/1/37 | | 190,000 | 173,934 |
4% 4/1/25 | | 45,000 | 45,275 |
5% 4/1/25 | | 105,000 | 106,413 |
5% 10/1/25 | | 175,000 | 179,152 |
5% 4/1/27 | | 10,000 | 10,499 |
5% 4/1/29 | | 140,000 | 152,215 |
5% 4/1/30 | | 100,000 | 108,506 |
5% 4/1/35 | | 5,000 | 5,000 |
5% 4/1/36 | | 75,000 | 75,000 |
| Series 2020: | | | |
2% 11/1/36 | | 60,000 | 46,886 |
3% 3/1/28 | | 50,000 | 49,324 |
3% 11/1/35 | | 250,000 | 237,163 |
3% 11/1/41 | | 185,000 | 159,891 |
3% 11/1/50 | | 25,000 | 19,820 |
4% 3/1/28 | | 40,000 | 41,232 |
4% 3/1/29 | | 175,000 | 182,184 |
4% 3/1/50 | | 40,000 | 39,700 |
5% 11/1/27 | | 50,000 | 53,055 |
5% 11/1/31 | | 295,000 | 329,057 |
5% 3/1/32 | | 50,000 | 55,213 |
5% 3/1/32 | | 50,000 | 55,213 |
5% 3/1/35 | | 220,000 | 242,600 |
| Series 2021: | | | |
4% 12/1/24 | | 100,000 | 100,280 |
5% 9/1/31 | | 230,000 | 260,054 |
5% 12/1/31 | | 265,000 | 300,705 |
| Series 2023, 5% 9/1/33 | | 145,000 | 168,762 |
| California Health Facilities Fing. Auth. Rev.: | | | |
| Bonds (Providence St. Jospeh Health) Series 2016 B3, 2%, tender 10/1/25 (b) | | 150,000 | 145,407 |
| Series 2013 A, 4% 3/1/43 | | 35,000 | 32,163 |
| Series 2015, 5% 11/15/26 | | 50,000 | 51,143 |
| Series 2016 A: | | | |
3% 10/1/41 | | 50,000 | 43,184 |
3.25% 11/15/36 (Pre-Refunded to 11/15/25 @ 100) | | 110,000 | 110,216 |
| Series 2016 B: | | | |
5% 11/15/46 | | 15,000 | 15,330 |
5% 11/15/46 (Pre-Refunded to 11/15/26 @ 100) | | 10,000 | 10,421 |
| Series 2017 A: | | | |
5% 11/15/26 | | 275,000 | 287,908 |
5% 11/1/27 | | 40,000 | 42,548 |
| Series 2017 A2, 5% 11/1/47 | | 70,000 | 81,586 |
| Series 2018 A: | | | |
4% 11/15/42 | | 65,000 | 64,287 |
5% 11/15/26 | | 35,000 | 36,325 |
5% 11/15/33 | | 25,000 | 26,488 |
| California Infrastructure & Econ. Dev. Series 2019, 5% 8/1/44 | | 170,000 | 180,502 |
| California Infrastructure & Econ. Dev. Bank Rev. Series 2003 A, 5% 7/1/29 (Pre-Refunded to 1/1/28 @ 100) | | 165,000 | 175,348 |
| California Infrastructure and Econ. Dev. Bank Rev.: | | | |
| (California Science Ctr. Phase III Proj.) Series 2021 B, 4% 5/1/46 | | 200,000 | 198,664 |
| Series 2016: | | | |
5% 10/1/26 | | 15,000 | 15,532 |
5% 10/1/29 | | 25,000 | 25,813 |
| Series 2017, 5% 10/1/29 | | 405,000 | 428,239 |
| Series 2018, 5% 10/1/26 | | 25,000 | 26,117 |
| Series 2020 A1, 5% 4/1/32 | | 225,000 | 259,314 |
| Series 2022 A, 5% 10/1/52 | | 20,000 | 21,928 |
| Series 2023 A: | | | |
5% 4/1/33 | | 30,000 | 35,040 |
5% 11/1/36 | | 65,000 | 75,475 |
5% 11/1/38 | | 55,000 | 63,217 |
| Series 2023: | | | |
5% 10/1/32 | | 25,000 | 29,029 |
5% 10/1/35 | | 15,000 | 17,383 |
| Series 2024, 5% 10/1/35 | | 15,000 | 17,620 |
| California Muni. Fin. Auth. Rev.: | | | |
| (LINXS APM Proj.) Series 2018 A: | | | |
5% 12/31/28 (c) | | 60,000 | 61,839 |
5% 12/31/47 (c) | | 100,000 | 100,895 |
| Series 2018 A, 3.25% 12/31/32 (Assured Guaranty Muni. Corp. Insured) (c) | | 20,000 | 18,365 |
| California Pub. Works Board Lease Rev.: | | | |
| (Various Cap. Projs.): | | | |
Series 2020 B, 4% 3/1/45 | | 175,000 | 176,172 |
Series 2022 C, 5% 8/1/28 | | 50,000 | 53,685 |
| Series 2021 C, 4% 11/1/38 | | 260,000 | 268,175 |
| California State Univ. Rev.: | | | |
| Series 2015 A: | | | |
5% 11/1/27 | | 20,000 | 20,477 |
5% 11/1/33 | | 105,000 | 107,325 |
5% 11/1/43 | | 40,000 | 40,732 |
| Series 2016 A: | | | |
3.125% 11/1/36 | | 155,000 | 145,242 |
5% 11/1/26 | | 45,000 | 46,591 |
5% 11/1/45 | | 125,000 | 127,735 |
| Series 2017 A, 5% 11/1/25 | | 100,000 | 102,378 |
| California Statewide Cmntys. Dev. Auth. Series 2017, 5% 5/15/42 | | 100,000 | 101,772 |
| California Statewide Cmntys. Dev. Auth. Hosp. Rev. Series 2018: | | | |
| 4.375% 1/1/48 | | 40,000 | 40,085 |
| 5% 1/1/32 | | 20,000 | 21,283 |
| California Statewide Cmntys. Dev. Auth. Rev.: | | | |
| Bonds Series 2004 J, 5%, tender 11/1/29 (b) | | 25,000 | 27,073 |
| Series 2015, 5% 11/1/43 (Pre-Refunded to 11/1/24 @ 100) | | 85,000 | 85,371 |
| Series 2017 A, 5% 4/1/47 | | 55,000 | 56,026 |
| Series 2018 A, 3.5% 3/1/38 | | 125,000 | 119,029 |
| Carlsbad Unified School District Series 2011 C, 0% 8/1/35 (d) | | 180,000 | 202,027 |
| Cerritos Cmnty. College District Series 2019 C, 3% 8/1/44 | | 25,000 | 21,149 |
| Chaffey Unified High School District Series 2019 D, 4% 8/1/49 | | 20,000 | 20,007 |
| Chino Valley Unified School District Series 2017 A, 5.25% 8/1/47 | | 25,000 | 26,070 |
| Compton Unified School District Series 2019 B, 3% 6/1/49 | | 10,000 | 8,018 |
| Contra Costa Cmnty. College District Series 2014 A, 4% 8/1/39 | | 145,000 | 144,993 |
| Desert Cmnty. College District Series 2024, 4% 8/1/42 | | 90,000 | 92,062 |
| Downey Unified School District Series 2019 B, 3.625% 8/1/42 | | 355,000 | 338,397 |
| East Bay Muni. Util. District Wastewtr. Sys. Rev.: | | | |
| Series 2015 A, 5% 6/1/37 | | 65,000 | 65,968 |
| Series 2017 B, 5% 6/1/27 | | 5,000 | 5,293 |
| El Camino Cmnty. College District Series 2012 C: | | | |
| 0% 8/1/34 | | 165,000 | 118,192 |
| 0% 8/1/38 | | 65,000 | 38,275 |
| Elk Grove Unified School Distr. Ctfs. of Prtn. (Cap. Facilities Proj.) Series 2016, 3% 2/1/35 | | 60,000 | 55,020 |
| Facilities Fing. Auth. Sp (Irvine Great Park Infrastructure Proj.) Series 2023 A, 4% 9/1/58 (Build America Mutual Assurance Insured) | | 160,000 | 157,705 |
| Foothill-De Anza Cmnty. College District: | | | |
| Series 2003 B, 0% 8/1/25 | | 5,000 | 4,832 |
| Series 2007, 0% 8/1/36 (AMBAC Insured) | | 200,000 | 133,239 |
| Foothill/Eastern Trans. Corridor Agcy. Toll Road Rev.: | | | |
| Series 1995 A: | | | |
0% 1/1/27 (Escrowed to Maturity) | | 40,000 | 36,953 |
0% 1/1/29 (Escrowed to Maturity) | | 195,000 | 169,796 |
| Series 2013 B1, 3.95% 1/15/53 (b) | | 80,000 | 74,460 |
| Fremont Union High School District, Santa Clara Series 2019 A, 4% 8/1/46 | | 30,000 | 29,735 |
| Fresno Unified School District Series 2016 A, 4% 8/1/41 | | 150,000 | 150,189 |
| Garden Grove Calif Pub. Fing. Auth. Series 2024 A, 4% 4/1/54 | | 65,000 | 63,495 |
| Glendale Elec. Rev. Series 2024, 5% 2/1/49 | | 85,000 | 93,028 |
| Golden State Tobacco Securitization Corp. Tobacco Settlement Rev. Series 2015 A: | | | |
| 4% 6/1/31 (Pre-Refunded to 6/1/25 @ 100) | | 100,000 | 100,821 |
| 5% 6/1/35 (Pre-Refunded to 6/1/25 @ 100) | | 20,000 | 20,344 |
| 5% 6/1/40 (Pre-Refunded to 6/1/25 @ 100) | | 10,000 | 10,172 |
| 5% 6/1/40 (Pre-Refunded to 6/1/25 @ 100) | | 10,000 | 10,172 |
| 5% 6/1/45 (Pre-Refunded to 6/1/25 @ 100) | | 140,000 | 142,405 |
| Grossmont Union High School District: | | | |
| Series 2008, 0% 8/1/30 | | 10,000 | 8,096 |
| Series 2016 B, 3% 8/1/45 | | 20,000 | 16,237 |
| Hayward Unified School District Gen. Oblig. Series 2019 A, 4% 8/1/48 | | 200,000 | 195,011 |
| Imperial Irrigation District Elec. Rev. Series 2016 B1, 5% 11/1/46 | | 140,000 | 143,733 |
| Livermore Valley Joint Unified School District Series 2019, 4% 8/1/46 | | 190,000 | 188,597 |
| Long Beach Bond Fin. Auth. Natural Gas Purchase Rev. Series 2007 A, 5% 11/15/35 | | 25,000 | 27,095 |
| Long Beach Unified School District: | | | |
| Series 2012, 5% 8/1/29 | | 105,000 | 105,109 |
| Series 2016, 3% 8/1/32 | | 35,000 | 33,185 |
| Series B, 0% 8/1/35 | | 150,000 | 101,322 |
| Long Beach Wtr. Rev. Series 2024, 4% 5/1/54 | | 155,000 | 151,647 |
| Los Angeles Cmnty. College District: | | | |
| Series 2017 J: | | | |
4% 8/1/36 | | 30,000 | 30,227 |
5% 8/1/28 | | 30,000 | 31,817 |
| Series 2022 L: | | | |
5% 8/1/31 | | 100,000 | 113,592 |
5% 8/1/36 | | 10,000 | 11,484 |
| Series 2024, 5% 8/1/30 | | 15,000 | 16,776 |
| Series A, 5% 8/1/30 (Pre-Refunded to 8/1/24 @ 100) | | 30,000 | 30,041 |
| Series G, 5% 8/1/27 (Pre-Refunded to 8/1/24 @ 100) | | 10,000 | 10,014 |
| Los Angeles County Metropolitan Trans. Auth. Sales Tax Rev.: | | | |
| Series 2019 A, 5% 7/1/44 | | 45,000 | 47,581 |
| Series 2021 A, 5% 7/1/44 | | 190,000 | 208,392 |
| Los Angeles Dept. Arpt. Rev.: | | | |
| Series 2018 C, 5% 5/15/37 (c) | | 75,000 | 77,538 |
| Series 2018 D: | | | |
5% 5/15/31 (c) | | 80,000 | 84,471 |
5% 5/15/34 (c) | | 120,000 | 126,758 |
| Series 2020 A, 5% 5/15/40 | | 20,000 | 21,793 |
| Series 2021 B, 5% 5/15/40 | | 15,000 | 16,682 |
| Series 2022 I, 5% 5/15/42 | | 285,000 | 317,386 |
| Series A, 5% 5/15/36 (c) | | 50,000 | 52,705 |
| Series B: | | | |
5% 5/15/34 (c) | | 10,000 | 10,437 |
5% 5/15/48 | | 65,000 | 70,253 |
| Series C, 5% 5/15/33 (c) | | 90,000 | 93,307 |
| Series D, 5% 5/15/26 (c) | | 65,000 | 66,701 |
| Los Angeles Dept. of Wtr. & Pwr. Rev.: | | | |
| Sereis 2014 C, 5% 7/1/29 (Pre-Refunded to 7/1/24 @ 100) | | 30,000 | 30,000 |
| Series 2014 C, 5% 7/1/29 | | 10,000 | 10,032 |
| Series 2014 D: | | | |
5% 7/1/44 | | 40,000 | 40,129 |
5% 7/1/44 (Pre-Refunded to 7/1/24 @ 100) | | 5,000 | 5,000 |
| Series 2015 A, 3.25% 7/1/31 | | 100,000 | 97,575 |
| Series 2016 A: | | | |
5% 7/1/40 | | 125,000 | 127,509 |
5% 7/1/46 | | 70,000 | 71,237 |
| Series 2017 A, 5% 7/1/28 | | 5,000 | 5,239 |
| Series 2020 A, 5% 7/1/27 | | 135,000 | 142,715 |
| Series 2022 A, 5% 7/1/40 | | 275,000 | 305,222 |
| Series 2023 B, 5% 7/1/36 | | 30,000 | 34,566 |
| Series 2023 E: | | | |
5% 7/1/38 | | 35,000 | 40,310 |
5% 7/1/39 | | 35,000 | 40,180 |
| Series 2024 B, 5% 7/1/38 | | 140,000 | 162,258 |
| Series A, 5% 7/1/31 | | 15,000 | 15,982 |
| Series B, 5% 7/1/30 | | 55,000 | 59,753 |
| Series C, 5% 7/1/37 | | 25,000 | 27,273 |
| Los Angeles Dept. of Wtr. & Pwr. Wtrwks. Rev.: | | | |
| Series 2014 A, 5% 7/1/44 | | 25,000 | 25,053 |
| Series 2016 B, 5% 7/1/29 | | 50,000 | 51,218 |
| Series 2022 B: | | | |
4% 7/1/49 | | 140,000 | 137,825 |
5% 7/1/28 | | 430,000 | 463,292 |
| Series 2023 A, 5% 7/1/42 | | 15,000 | 16,927 |
| Series 2024 A, 5% 7/1/35 | | 15,000 | 17,601 |
| Series A: | | | |
5% 7/1/33 | | 25,000 | 26,513 |
5% 7/1/33 | | 20,000 | 20,873 |
| Los Angeles Muni. Impt. Corp. Lease Rev. Series 2016 B, 4% 11/1/37 | | 490,000 | 492,430 |
| Los Angeles Solid Waste Resources Rev. Series 2023 A: | | | |
| 5% 2/1/33 | | 20,000 | 23,338 |
| 5% 2/1/37 | | 25,000 | 29,063 |
| Los Angeles Unified School District: | | | |
| Series 2014 C, 5% 7/1/24 | | 40,000 | 40,000 |
| Series 2016 A, 5% 7/1/40 | | 30,000 | 30,387 |
| Series 2017 A, 5% 7/1/26 | | 175,000 | 181,471 |
| Series 2018 B1: | | | |
5% 7/1/33 | | 125,000 | 132,991 |
5.25% 7/1/42 | | 50,000 | 52,950 |
| Series 2019 A, 5% 7/1/28 | | 130,000 | 139,709 |
| Series 2020 C: | | | |
4% 7/1/32 | | 25,000 | 26,296 |
5% 7/1/30 | | 60,000 | 66,803 |
| Series 2020 RYQ, 5% 7/1/27 | | 65,000 | 68,676 |
| Series 2020, 5% 7/1/25 | | 10,000 | 10,180 |
| Series 2021 A, 5% 7/1/25 | | 75,000 | 76,352 |
| Series 2021 RYRR, 5% 7/1/31 | | 15,000 | 16,957 |
| Series 2022 QRR: | | | |
5% 7/1/35 | | 40,000 | 46,098 |
5% 7/1/42 | | 15,000 | 16,834 |
| Series 2023 QRR: | | | |
5% 7/1/33 | | 110,000 | 127,710 |
5% 7/1/36 | | 15,000 | 17,503 |
5% 7/1/43 | | 25,000 | 28,167 |
| Series A: | | | |
5% 7/1/24 | | 5,000 | 5,000 |
5% 7/1/29 | | 15,000 | 16,426 |
5% 7/1/30 | | 50,000 | 54,548 |
| Series B, 5% 7/1/25 | | 90,000 | 91,623 |
| Series C, 5% 7/1/28 | | 55,000 | 55,057 |
| Los Angeles Unified School District Ctfs. of Prtn. Series 2023 A: | | | |
| 5% 10/1/33 | | 85,000 | 98,406 |
| 5% 10/1/34 | | 15,000 | 17,316 |
| Marin Healthcare District Series 2017 A: | | | |
| 3% 8/1/37 | | 170,000 | 149,024 |
| 4% 8/1/47 | | 135,000 | 132,056 |
| Metropolitan Wtr. District of Southern California Wtr. Rev.: | | | |
| Series 2020 A: | | | |
5% 7/1/27 | | 140,000 | 148,455 |
5% 10/1/33 | | 55,000 | 60,495 |
| Series 2020 C, 5% 7/1/39 | | 225,000 | 249,246 |
| Series 2022 A, 5% 10/1/34 | | 200,000 | 231,566 |
| Montebello Unified School District Series A, 5% 8/1/41 | | 50,000 | 51,283 |
| Mount Diablo Unified School District Series 2022 B, 4% 8/1/36 | | 250,000 | 263,412 |
| MSR Energy Auth. Gas Rev.: | | | |
| Series 2009 A, 6.125% 11/1/29 | | 50,000 | 52,726 |
| Series 2009 B, 6.5% 11/1/39 | | 25,000 | 31,680 |
| Series 2009 C, 6.5% 11/1/39 | | 30,000 | 38,016 |
| Napa Valley Unified School District Series 2019 C, 4% 8/1/44 (Assured Guaranty Muni. Corp. Insured) | | 175,000 | 175,045 |
| Newport Mesa Unified School District: | | | |
| Series 2011, 0% 8/1/36 | | 230,000 | 151,236 |
| Series 2017, 0% 8/1/39 | | 495,000 | 271,112 |
| North Orange County Cmnty. College District Rev. Series 2016 A, 3% 8/1/40 | | 15,000 | 13,045 |
| Norwalk-Mirada Unified School District Series 2005 B, 0% 8/1/28 (Nat'l. Pub. Fin. Guarantee Corp. Insured) | | 70,000 | 60,938 |
| Oakland Unified School District Alameda County Series 2021 A, 4% 8/1/46 | | 205,000 | 201,349 |
| Orange County Local Trans. Auth. Sales Tax Rev. Series 2019, 5% 2/15/27 | | 195,000 | 205,175 |
| Orange County Wtr. District Rev.: | | | |
| Series 2017 A, 5% 8/15/29 | | 75,000 | 79,302 |
| Series 2019 C, 5% 8/15/32 | | 150,000 | 166,262 |
| Orange County Wtr. District Rev. Ctfs. of Prtn. Series 2003 B, 5% 8/15/28 (Escrowed to Maturity) | | 120,000 | 124,720 |
| Palo Alto Unified School District Gen. Oblig. Series 2008 2, 0% 8/1/33 | | 35,000 | 25,965 |
| Palomar Cmnty. College District Series 2010 B, 0% 8/1/45 (d) | | 65,000 | 60,201 |
| Palomar Pomerado Health Series 2009 A, 0% 8/1/28 (Assured Guaranty Corp. Insured) | | 200,000 | 170,040 |
| Port of Oakland Rev. Series 2017 E, 5% 11/1/26 | | 30,000 | 31,192 |
| Poway Unified School District Series 2011, 0% 8/1/46 | | 190,000 | 69,473 |
| Pub. Utils. Commission San Francisco City & County Wastewtr. Rev. Series 2023 A: | | | |
| 5% 10/1/32 | | 190,000 | 219,561 |
| 5% 10/1/34 | | 230,000 | 265,386 |
| Rancho Wtr. District Fing. Auth. Rev. Series 2019 A, 4% 8/1/39 | | 50,000 | 51,850 |
| Riverside Cmnty. College District Series 2019, 3% 8/1/36 | | 200,000 | 185,963 |
| Riverside County Pub. Fing. Auth. (Cap. Facilities Proj.) Series 2015: | | | |
| 4.125% 11/1/40 (Pre-Refunded to 11/1/25 @ 100) | | 100,000 | 101,415 |
| 5.25% 11/1/45 (Pre-Refunded to 11/1/25 @ 100) | | 180,000 | 185,173 |
| Riverside County Trans. Commission Sales Tax Rev. Series 2017 B, 5% 6/1/27 | | 40,000 | 42,331 |
| Sacramento Trsn Auth. Sl Tax Series 2023, 5% 10/1/33 | | 125,000 | 147,499 |
| Sacramento City Fing. Auth. Rev. Series 2005 A: | | | |
| 0% 12/1/29 (Nat'l. Pub. Fin. Guarantee Corp. Insured) | | 80,000 | 65,666 |
| 0% 12/1/34 (FGIC Insured) | | 100,000 | 67,215 |
| Sacramento County Sanitation District Fing. Auth. Rev. Series 2021: | | | |
| 5% 12/1/31 | | 200,000 | 228,755 |
| 5% 12/1/33 | | 15,000 | 17,105 |
| Sacramento Muni. Util. District Elec. Rev.: | | | |
| Series 2019 G, 5% 8/15/32 | | 245,000 | 269,207 |
| Series 2020 H, 5% 8/15/39 | | 70,000 | 77,373 |
| Sacramento TOT Rev. Series A, 5% 6/1/43 | | 55,000 | 56,883 |
| San Bernardino Cmnty. College District: | | | |
| Series 2008 E, 4.125% 8/1/49 | | 40,000 | 40,232 |
| Series B, 0% 8/1/48 | | 5,000 | 1,754 |
| San Diego Cmnty. College District Series 2016, 5% 8/1/41 (Pre-Refunded to 8/1/26 @ 100) | | 5,000 | 5,214 |
| San Diego County Reg'l. Arpt. Auth. Arpt. Rev. Series 2017 A, 5% 7/1/47 | | 50,000 | 51,612 |
| San Diego County Wtr. Auth. Rev. Series 2022 A, 5% 5/1/47 | | 140,000 | 155,208 |
| San Diego Pub. Facilities Fing. Auth. Wtr. Rev. Series 2018 A, 5.25% 8/1/47 | | 30,000 | 31,705 |
| San Diego Unified School District: | | | |
| (Election of 1998 Proj.) Series 2005 E2, 5.5% 7/1/26 (Assured Guaranty Muni. Corp. Insured) | | 80,000 | 83,919 |
| Series 1998 G1: | | | |
5.25% 7/1/27 (Assured Guaranty Muni. Corp. Insured) | | 5,000 | 5,339 |
5.25% 7/1/28 (Assured Guaranty Muni. Corp. Insured) | | 25,000 | 27,239 |
5.25% 7/1/28 (Escrowed to Maturity) | | 5,000 | 5,423 |
| Series 2008 E, 0% 7/1/49 | | 125,000 | 42,124 |
| Series 2009 1: | | | |
0% 7/1/30 | | 30,000 | 24,693 |
0% 7/1/30 (Escrowed to Maturity) | | 20,000 | 16,490 |
| Series 2017 K2, 0% 7/1/31 | | 430,000 | 332,428 |
| Series 2022 F2, 5% 7/1/42 | | 90,000 | 100,639 |
| Series 2023 SR 3A, 5% 7/1/35 | | 15,000 | 17,572 |
| Series A, 0% 7/1/31 | | 15,000 | 11,945 |
| Series C, 0% 7/1/43 | | 10,000 | 4,650 |
| Series R1, 0% 7/1/30 | | 35,000 | 28,690 |
| Series R4, 5% 7/1/28 | | 70,000 | 71,268 |
| Series R5, 5% 7/1/26 | | 50,000 | 51,967 |
| San Francisco Bay Area Rapid Transit District Sales Tax Rev. Series 2019 A, 3% 7/1/44 | | 5,000 | 4,151 |
| San Francisco Bay Area Rapid Transit Fing. Auth.: | | | |
| Series 2017 A1, 4% 8/1/42 | | 10,000 | 9,923 |
| Series 2019 B1, 3% 8/1/49 | | 200,000 | 159,288 |
| Series 2022 D1, 4.125% 8/1/52 | | 195,000 | 196,023 |
| Series A1, 5% 8/1/47 | | 80,000 | 83,033 |
| San Francisco City & County Arpts. Commission Int'l. Arpt. Rev.: | | | |
| Series 2016 A, 5% 5/1/26 | | 25,000 | 25,846 |
| Series 2017 A, 5% 5/1/47 (c) | | 40,000 | 40,533 |
| Series 2017 D, 5% 5/1/25 (c) | | 105,000 | 106,217 |
| Series 2019 A, 5% 5/1/49 (c) | | 25,000 | 25,516 |
| Series 2019 D: | | | |
5% 5/1/26 | | 135,000 | 139,571 |
5% 5/1/34 | | 325,000 | 355,644 |
5% 5/1/39 | | 30,000 | 32,428 |
| Series 2019 E, 5% 5/1/34 (c) | | 175,000 | 184,622 |
| Series 2020 A, 4% 5/1/39 (c) | | 15,000 | 14,769 |
| Series 2023 C, 5.75% 5/1/48 (c) | | 275,000 | 307,058 |
| San Francisco City & County Ctfs. of Prtn. (49 South Van Ness Proj.) Series 2019 A, 4% 4/1/41 | | 30,000 | 30,136 |
| San Francisco Muni. Trans. Agcy. Series 2017, 4% 3/1/42 | | 135,000 | 135,057 |
| San Francisco Pub. Utils. Commission Wtr. Rev.: | | | |
| Series 2015 A, 5% 11/1/29 | | 15,000 | 15,206 |
| Series 2020 A, 5% 11/1/50 | | 185,000 | 198,590 |
| San Joaquin Hills Trans. Corridor Agcy. Toll Road Rev.: | | | |
| Series 1993: | | | |
0% 1/1/26 (Escrowed to Maturity) | | 30,000 | 28,589 |
0% 1/1/28 (Escrowed to Maturity) | | 200,000 | 179,088 |
0% 1/1/28 (Escrowed to Maturity) | | 35,000 | 31,395 |
| Series 1997 A, 0% 1/15/32 (Nat'l. Pub. Fin. Guarantee Corp. Insured) | | 30,000 | 22,400 |
| Series 2014 A, 5% 1/15/44 (Pre-Refunded to 1/15/25 @ 100) | | 95,000 | 95,946 |
| Series A, 0% 1/15/31 (Nat'l. Pub. Fin. Guarantee Corp. Insured) | | 90,000 | 70,153 |
| San Jose Gen. Oblig. (Rfdg., Libraries, Parks and Pub. Safety Projs.) Series 2019 C, 5% 9/1/30 | | 265,000 | 290,623 |
| San Jose Int. Arpt. Rev. Series 2017 B, 5% 3/1/42 | | 20,000 | 20,714 |
| San Mateo County Cmnty. College District Series 2006 B: | | | |
| 0% 9/1/33 (Nat'l. Pub. Fin. Guarantee Corp. Insured) | | 130,000 | 94,949 |
| 0% 9/1/35 (Nat'l. Pub. Fin. Guarantee Corp. Insured) | | 200,000 | 135,204 |
| San Mateo Foster City (Clean Wtr. Prog.) Series 2019, 5% 8/1/49 | | 15,000 | 15,924 |
| San Mateo Unified School District Series 2011 A, 0% 9/1/41 (d) | | 50,000 | 52,024 |
| Santa Clara County Fing. Auth. Lease Rev.: | | | |
| (Multiple Facilities Proj.) Series Q, 3% 5/15/37 | | 200,000 | 177,238 |
| Series 2019 A, 3.125% 5/1/47 | | 225,000 | 183,831 |
| Santa Clara Unified School District: | | | |
| Series 2019, 4% 7/1/48 | | 35,000 | 34,413 |
| Series 2023, 4% 7/1/40 | | 160,000 | 165,897 |
| Santa Clara Valley Trans. Auth. Series 2023 A, 5% 4/1/33 | | 185,000 | 216,551 |
| Santa Clara Valley Wtr. District Series 2016 A, 5% 6/1/33 | | 75,000 | 76,823 |
| Saugus Union School District Series 2020 C, 2.375% 8/1/44 | | 150,000 | 106,362 |
| Sequoia Union High School District Series 2016, 3% 7/1/31 | | 145,000 | 142,601 |
| Sierra Joint Cmnty. College District Series 2021 B, 2% 8/1/46 | | 100,000 | 62,844 |
| Solano Cmnty. College District Series A, 5.125% 8/1/41 (Pre-Refunded to 8/1/28 @ 100) | | 40,000 | 42,926 |
| Sonoma County Jr. College District Rev.: | | | |
| Series 2019 B, 3% 8/1/36 | | 200,000 | 184,768 |
| Series B, 3% 8/1/41 | | 5,000 | 4,296 |
| Southern California Pub. Pwr. Auth. Rev. Series A, 5.25% 11/1/26 | | 30,000 | 30,698 |
| Southwestern Cmnty. College District Gen. Oblig. Series 2021 C, 2.375% 8/1/46 | | 100,000 | 67,443 |
| State Ctr. Cmnty. College District Series 2020 B, 2.25% 8/1/45 | | 250,000 | 169,338 |
| Sunnyvale Calif Fin. Auth. Lease (Civic Ctr. Proj.) Series 2020, 4% 4/1/50 | | 380,000 | 377,057 |
| Sweetwater Union High School District Series 2016, 4% 8/1/42 | | 350,000 | 350,090 |
| Turlock Irrigation District Rev. Series 2016, 5% 1/1/46 | | 205,000 | 211,815 |
| Twin Rivers Unified School District Series 2016: | | | |
| 0% 8/1/41 (Assured Guaranty Muni. Corp. Insured) | | 135,000 | 61,288 |
| 4% 8/1/43 (Assured Guaranty Muni. Corp. Insured) | | 400,000 | 397,782 |
| Univ. of California Regents Med. Ctr. Pool Rev. Series 2022 P, 4% 5/15/53 | | 235,000 | 229,231 |
| Univ. of California Revs.: | | | |
| Series 2015 AO, 5% 5/15/40 | | 125,000 | 126,148 |
| Series 2016, 5% 5/15/35 | | 135,000 | 138,592 |
| Series 2017 M, 5% 5/15/32 | | 75,000 | 78,575 |
| Series 2018 O: | | | |
4% 5/15/48 | | 165,000 | 162,538 |
5% 5/15/58 | | 105,000 | 109,616 |
| Series 2020 BE, 5% 5/15/31 | | 235,000 | 261,103 |
| Series 2021 Q, 5% 5/15/35 | | 250,000 | 281,381 |
| Series 2023 BN, 5% 5/15/30 | | 150,000 | 166,729 |
| Series 2023 BQ, 5% 5/15/35 | | 50,000 | 57,962 |
| Series 2024 BS, 5% 5/15/44 | | 20,000 | 22,534 |
| Series 2024 BV, 5% 5/15/38 | | 20,000 | 23,231 |
| Series AY, 5% 5/15/28 | | 20,000 | 21,093 |
| Series I: | | | |
5% 5/15/25 | | 50,000 | 50,755 |
5% 5/15/28 | | 40,000 | 40,551 |
| Series M, 5% 5/15/36 | | 80,000 | 83,704 |
| Series O, 4% 5/15/29 | | 25,000 | 25,932 |
| Upland Gen. Oblig. Ctfs. of Prtn. Series 2017, 5% 1/1/47 | | 80,000 | 81,355 |
| Upper Santa Clara Valley Joint Powers Auth. Series 2020 A, 4% 8/1/50 | | 85,000 | 83,396 |
| West Contra Costa Unified School District Series C1: | | | |
| 0% 8/1/27 (Assured Guaranty Corp. Insured) | | 15,000 | 13,512 |
| 0% 8/1/28 | | 60,000 | 52,233 |
| West Hollywood Pub. Fing. Auth. Series 2016, 3% 4/1/41 | | 140,000 | 120,348 |
| Westminster Redev. Agcy. Series 2016, 3% 11/1/41 | | 125,000 | 106,232 |
| William S. Hart Union High School District Series 2009 A, 0% 8/1/33 | | 50,000 | 36,501 |
| Yuba Cmnty. College District Series 2016 A: | | | |
| 3% 8/1/36 | | 165,000 | 148,022 |
| 3% 8/1/37 | | 35,000 | 31,082 |
TOTAL CALIFORNIA | | | 37,658,465 |
| Colorado - 1.8% | | | |
| Colorado Ctfs. of Prtn.: | | | |
| Series 2020 A, 3% 12/15/36 | | 105,000 | 95,972 |
| Series 2021 A, 4% 12/15/38 | | 285,000 | 289,346 |
| Colorado Health Facilities Auth. Rev. Bonds: | | | |
| (Bethesda Proj.) Series 2018 B, 5% 9/15/53 | | 90,000 | 77,330 |
| Series 2016 B, 5% 11/15/30 | | 150,000 | 154,356 |
| Series 2018 A, 4% 11/15/48 | | 100,000 | 95,549 |
| Series 2019 A, 5% 11/1/29 | | 35,000 | 37,235 |
| Series 2019 A1: | | | |
4% 8/1/37 | | 75,000 | 75,062 |
4% 8/1/39 | | 85,000 | 83,623 |
4% 8/1/44 | | 55,000 | 53,506 |
5% 8/1/26 | | 60,000 | 61,704 |
| Series 2021 A, 4% 11/15/50 | | 20,000 | 18,911 |
| Series 2022 A, 4% 5/15/52 | | 190,000 | 180,802 |
| Colorado Springs Utils. Rev.: | | | |
| Series 2018 A2, 5% 11/15/48 | | 25,000 | 26,028 |
| Series 2021 B, 4% 11/15/40 | | 20,000 | 20,228 |
| Denver City & County Arpt. Rev.: | | | |
| Series 2017 A, 5% 11/15/28 (c) | | 30,000 | 31,101 |
| Series 2018 A: | | | |
5% 12/1/25 (c) | | 115,000 | 117,129 |
5% 12/1/36 (c) | | 60,000 | 66,965 |
| Series 2018 B, 3.5% 12/1/35 | | 15,000 | 14,420 |
| Series 2019 C, 5% 11/15/31 | | 30,000 | 32,810 |
| Series 2022 A, 5% 11/15/41 (c) | | 245,000 | 260,490 |
| Series 2022 D, 5% 11/15/42 (c) | | 165,000 | 174,786 |
| Denver City & County Board Wtr. Rev. Series 2022 A, 5% 12/15/45 | | 165,000 | 180,614 |
| Denver Convention Ctr. Hotel Auth. Series 2017, 5% 12/1/26 | | 50,000 | 50,929 |
| E-470 Pub. Hwy. Auth. Rev.: | | | |
| Series 2000 B: | | | |
0% 9/1/30 (Nat'l. Pub. Fin. Guarantee Corp. Insured) | | 25,000 | 19,881 |
0% 9/1/31 (Nat'l. Pub. Fin. Guarantee Corp. Insured) | | 20,000 | 15,279 |
0% 9/1/32 (Nat'l. Pub. Fin. Guarantee Corp. Insured) | | 25,000 | 18,318 |
| Series 2006 B, 0% 9/1/37 (Nat'l. Pub. Fin. Guarantee Corp. Insured) | | 100,000 | 52,735 |
| Series 2020 A, 5% 9/1/35 | | 15,000 | 16,396 |
| Metropolitan Wastewtr. Reclamation District Series 2020 A, 2% 4/1/39 | | 100,000 | 73,224 |
| Park Creek Metropolitan District Series 2015 A, 5% 12/1/45 | | 445,000 | 445,520 |
| Univ. of Colorado Enterprise Sys. Rev. Series 2016 B1, 2.75% 6/1/30 | | 85,000 | 78,470 |
TOTAL COLORADO | | | 2,918,719 |
| Connecticut - 1.6% | | | |
| Connecticut Gen. Oblig.: | | | |
| Series 2015 B, 3.375% 6/15/29 | | 25,000 | 24,779 |
| Series 2016 A, 5% 3/15/26 | | 30,000 | 30,897 |
| Series 2017 A, 5% 4/15/27 | | 25,000 | 26,236 |
| Series 2018 D, 5% 4/15/27 | | 105,000 | 110,193 |
| Series 2019 A, 5% 4/15/27 | | 25,000 | 26,236 |
| Series 2020 C, 4% 6/1/31 | | 30,000 | 31,290 |
| Series 2021 B: | | | |
3% 6/1/29 | | 90,000 | 87,235 |
3% 6/1/39 | | 440,000 | 390,052 |
3% 6/1/40 | | 100,000 | 86,643 |
4% 6/1/31 | | 65,000 | 68,299 |
| Series A, 5% 3/15/28 | | 35,000 | 35,334 |
| Series D: | | | |
4% 8/15/31 | | 15,000 | 15,092 |
5% 4/15/26 | | 25,000 | 25,786 |
| Series E: | | | |
3.375% 10/15/36 | | 30,000 | 28,715 |
5% 9/15/25 | | 30,000 | 30,643 |
5% 10/15/25 | | 30,000 | 30,686 |
| Connecticut Health & Edl. Facilities Auth. Rev.: | | | |
| Series 2016 A, 2%, tender 7/1/26 (b) | | 225,000 | 217,381 |
| Series 2019 A: | | | |
4% 7/1/34 | | 30,000 | 29,577 |
5% 7/1/33 | | 135,000 | 138,253 |
| Series 2020 A, 5% 7/1/30 | | 50,000 | 53,024 |
| Connecticut Hsg. Fin. Auth.: | | | |
| Series 2017 D1, 3.2% 11/15/32 | | 15,000 | 14,019 |
| Series 2018 A, 3.5% 5/15/33 | | 5,000 | 4,849 |
| Series 2020 C1, 2.05% 5/15/37 | | 75,000 | 58,920 |
| Series B1, 3.45% 11/15/41 | | 5,000 | 4,597 |
| Connecticut Spl. Tax Oblig. Trans. Infrastructure Rev.: | | | |
| Series 2015 A, 5% 5/1/26 | | 150,000 | 154,948 |
| Series 2015 B, 5% 8/1/26 | | 110,000 | 111,807 |
| Series 2016 A, 5% 9/1/31 | | 5,000 | 5,148 |
| Series 2018 A, 5% 1/1/27 | | 35,000 | 36,538 |
| Series 2018 B, 5% 10/1/28 | | 120,000 | 129,212 |
| Series 2020 A, 5% 5/1/30 | | 200,000 | 220,464 |
| Series 2021 A, 4% 5/1/37 | | 35,000 | 35,920 |
| Series A: | | | |
4% 9/1/35 | | 145,000 | 145,395 |
5% 9/1/30 | | 60,000 | 61,766 |
| Series B: | | | |
5% 10/1/33 | | 10,000 | 10,628 |
5% 10/1/36 | | 85,000 | 90,076 |
| Univ. of Connecticut Gen. Oblig. Series 2018 A, 5% 4/15/29 | | 25,000 | 26,558 |
TOTAL CONNECTICUT | | | 2,597,196 |
| Delaware - 0.5% | | | |
| Delaware Gen. Oblig.: | | | |
| Series 2017, 3.25% 3/1/37 | | 4,000 | 3,907 |
| Series 2020 A, 5% 1/1/30 | | 255,000 | 282,334 |
| Series 2021, 5% 2/1/29 | | 45,000 | 49,012 |
| Series 2023 A, 5% 5/1/34 | | 150,000 | 174,925 |
| Series 2024 A, 5% 5/1/35 | | 35,000 | 41,292 |
| Delaware Health Facilities Auth. Rev. Series 2020 A: | | | |
| 4% 10/1/49 | | 155,000 | 148,154 |
| 5% 10/1/32 | | 15,000 | 16,304 |
| Delaware Trans. Auth. Series 2015, 4% 6/1/45 | | 50,000 | 48,720 |
TOTAL DELAWARE | | | 764,648 |
| District Of Columbia - 1.8% | | | |
| District of Columbia Gen. Oblig.: | | | |
| Series 2016 A: | | | |
4% 6/1/36 | | 400,000 | 401,409 |
5% 6/1/32 | | 40,000 | 41,194 |
| Series 2017 A, 5% 6/1/29 | | 45,000 | 47,384 |
| Series 2017 D: | | | |
5% 6/1/28 | | 100,000 | 105,380 |
5% 6/1/42 | | 35,000 | 36,235 |
| Series 2019 A: | | | |
5% 10/15/31 | | 80,000 | 87,136 |
5% 10/15/40 | | 295,000 | 314,331 |
5% 10/15/44 | | 15,000 | 15,902 |
| Series 2021 D, 5% 2/1/31 | | 60,000 | 67,158 |
| District of Columbia Hosp. Rev. Series 2015, 5% 7/15/24 | | 115,000 | 115,033 |
| District of Columbia Income Tax Rev.: | | | |
| Series 2019 C: | | | |
5% 10/1/29 | | 180,000 | 197,310 |
5% 10/1/33 | | 205,000 | 224,541 |
| Series 2020 C, 4% 5/1/40 | | 195,000 | 197,506 |
| District of Columbia Rev. Series 2020, 5% 12/1/27 | | 180,000 | 190,236 |
| District of Columbia Univ. Rev. Series 2017, 5% 4/1/31 | | 25,000 | 25,782 |
| District of Columbia Wtr. & Swr. Auth. Pub. Util. Rev.: | | | |
| Series 2014 C: | | | |
5% 10/1/27 | | 20,000 | 20,063 |
5% 10/1/28 | | 50,000 | 50,158 |
| Series 2019 A, 5% 10/1/44 | | 130,000 | 137,518 |
| Metropolitan Washington Arpts. Auth. Dulles Toll Road Rev.: | | | |
| (Dulles Metrorail and Cap. Impt. Proj.) Series 2019 B, 4% 10/1/53 | | 45,000 | 41,931 |
| (Dulles Metrorail and Cap. Impt. Projs.) Series 2019 B, 3% 10/1/50 (Assured Guaranty Muni. Corp. Insured) | | 20,000 | 15,089 |
| Series 2009 B: | | | |
0% 10/1/25 (Assured Guaranty Corp. Insured) | | 5,000 | 4,776 |
0% 10/1/31 (Assured Guaranty Corp. Insured) | | 35,000 | 26,579 |
0% 10/1/34 (Assured Guaranty Corp. Insured) | | 70,000 | 46,800 |
0% 10/1/36 (Assured Guaranty Corp. Insured) | | 20,000 | 12,180 |
| Series 2019 218, 4% 10/1/44 | | 100,000 | 97,419 |
| Metropolitan Washington DC Arpts. Auth. Sys. Rev.: | | | |
| Series 2014 A: | | | |
5% 10/1/28 (c) | | 40,000 | 40,134 |
5% 10/1/44 (c) | | 105,000 | 105,351 |
| Series 2018 A, 5% 10/1/27 (c) | | 65,000 | 67,418 |
| Series 2021 A, 4% 10/1/41 (c) | | 205,000 | 199,760 |
| Washington D.C. Metropolitan Transit Auth. Rev.: | | | |
| Series 2017 A1, 5% 7/1/29 | | 10,000 | 10,435 |
| Series 2017 B, 5% 7/1/42 | | 70,000 | 71,789 |
TOTAL DISTRICT OF COLUMBIA | | | 3,013,937 |
| Florida - 4.7% | | | |
| Brevard County Health Facilities Auth. Health Care Facilities Rev. (Health First, Inc. Proj.) Series 2014, 4% 4/1/36 | | 180,000 | 179,699 |
| Broward County Arpt. Sys. Rev.: | | | |
| Series 2015 A, 5% 10/1/33 (c) | | 35,000 | 35,422 |
| Series 2019 A, 5% 10/1/49 (c) | | 100,000 | 102,222 |
| Broward County Port Facilities Rev. Series 2019 B, 4% 9/1/38 (c) | | 75,000 | 74,913 |
| Broward County Wtr. & Swr. Util. Rev. Series 2019 A, 4% 10/1/43 | | 200,000 | 201,288 |
| Cap. Projs. Fin. Auth. Student Hsg. Rev. (Cap. Projs. Ln. Prog. - Florida Univs.) Series 2020 A, 5% 10/1/34 | | 215,000 | 220,296 |
| Central Florida Expressway Auth. Sr. Lien Rev.: | | | |
| Series 2016 B: | | | |
3% 7/1/37 (Assured Guaranty Muni. Corp. Insured) | | 50,000 | 44,475 |
4% 7/1/40 | | 20,000 | 19,669 |
| Series 2017, 3.375% 7/1/42 | | 70,000 | 62,101 |
| Series 2019 B, 5% 7/1/44 | | 125,000 | 130,432 |
| Series 2021, 5% 7/1/26 (Assured Guaranty Muni. Corp. Insured) | | 265,000 | 273,954 |
| County of Broward Tourist Dev. Tax Rev. (Convention Ctr. Expansion Proj.) Series 2021, 4% 9/1/51 | | 225,000 | 213,704 |
| Florida Board of Ed. Lottery Rev. Series 2016 B, 5% 7/1/26 | | 65,000 | 67,161 |
| Florida Board of Ed. Pub. Ed. Cap. Outlay: | | | |
| Series 2018 A, 4% 6/1/37 | | 55,000 | 55,957 |
| Series 2018 B, 4% 6/1/48 | | 160,000 | 156,915 |
| Series 2019 D, 4% 6/1/30 | | 35,000 | 36,404 |
| Series C, 5% 6/1/25 | | 90,000 | 91,401 |
| Series D, 4% 6/1/32 | | 25,000 | 25,224 |
| Florida Dept. of Trans. Tpk. Rev.: | | | |
| Series 2016 B, 2.625% 7/1/27 | | 60,000 | 57,719 |
| Series 2021 B, 2% 7/1/43 | | 155,000 | 101,415 |
| Series 2021 C, 3% 7/1/51 | | 185,000 | 142,494 |
| Florida Dev. Fin. Corp. Healthcare Facility Rev. Series 2021, 5% 11/15/26 | | 100,000 | 103,024 |
| Florida Gen. Oblig. Series 2021 B, 5% 7/1/32 | | 190,000 | 216,323 |
| Florida Higher Edl. Facilities Fing. Auth. (Nova Southeastern Univ. Proj.) Series 2016, 5% 4/1/35 | | 40,000 | 40,694 |
| Gainesville Utils. Sys. Rev. Series 2021 A1, 5% 10/1/46 | | 100,000 | 106,357 |
| Greater Orlando Aviation Auth. Arpt. Facilities Rev. Series 2017 A, 5% 10/1/30 (Pre-Refunded to 10/1/27 @ 100) (c) | | 30,000 | 31,255 |
| Hillsborough County Cap. Impt. Series 2019: | | | |
| 3.125% 8/1/46 | | 50,000 | 41,265 |
| 3.25% 8/1/49 | | 20,000 | 16,549 |
| Hillsborough County School Board Ctfs. of Prtn. Series 2020 A, 5% 7/1/29 | | 75,000 | 80,294 |
| Jacksonville Elec. Auth. Elec. Sys. Rev. Series 2017 B3, 5% 10/1/27 | | 125,000 | 130,811 |
| Jacksonville Spl. Rev.: | | | |
| Series 2014, 5% 10/1/28 | | 65,000 | 65,158 |
| Series 2019 A: | | | |
5% 10/1/24 | | 85,000 | 85,297 |
5% 10/1/27 | | 80,000 | 84,526 |
5% 10/1/29 | | 25,000 | 27,253 |
5% 10/1/32 | | 60,000 | 65,028 |
5% 10/1/34 | | 100,000 | 108,485 |
| Jacksonville Trans. Auth. Series 2015, 5% 8/1/35 | | 150,000 | 151,957 |
| JEA Wtr. & Swr. Sys. Rev.: | | | |
| Series 2017 A, 4% 10/1/34 | | 15,000 | 15,159 |
| Series 2020 A, 3% 10/1/36 | | 475,000 | 429,415 |
| Lakeland Hosp. Sys. Rev. Series 2016, 3% 11/15/32 | | 10,000 | 9,156 |
| Miami Beach Health Facilities Auth. Hosp. Rev. Series 2014 A, 5% 11/15/39 | | 25,000 | 25,047 |
| Miami Beach Wtr. & Swr. Rev. Series 2017, 5% 9/1/47 | | 115,000 | 118,220 |
| Miami-Dade County Series 2021 B2, 4% 10/1/43 | | 420,000 | 411,014 |
| Miami-Dade County Aviation Rev.: | | | |
| Series 2016 A, 5% 10/1/41 | | 20,000 | 20,391 |
| Series 2020 A, 4% 10/1/39 | | 130,000 | 130,067 |
| Miami-Dade County Cap. Asset Acquisition: | | | |
| Series 2009: | | | |
0% 10/1/44 | | 155,000 | 60,863 |
0% 10/1/46 | | 10,000 | 3,514 |
0% 10/1/47 | | 50,000 | 16,591 |
| Series 2016: | | | |
0% 10/1/31 | | 5,000 | 3,654 |
0% 10/1/32 | | 15,000 | 10,471 |
5% 10/1/26 | | 145,000 | 150,391 |
| Miami-Dade County Edl. Facilities Rev. Series 2015 A, 4% 4/1/45 | | 100,000 | 95,119 |
| Miami-Dade County Gen. Oblig.: | | | |
| (Bldg. Better Cmntys. Prog.): | | | |
Series 2013 A, 5% 7/1/26 | | 55,000 | 55,817 |
Series 2015 B, 5% 7/1/27 | | 40,000 | 40,047 |
| Series 2015 D, 3% 7/1/39 | | 10,000 | 8,664 |
| Miami-Dade County School Board Ctfs. of Prtn. Series 2015 A, 5% 5/1/26 | | 100,000 | 101,228 |
| Miami-Dade County Sports Facilities: | | | |
| Series 2009 A, 6.875% 10/1/34 (Assured Guaranty Corp. Insured) | | 255,000 | 300,766 |
| Series C, 0% 10/1/48 (Assured Guaranty Corp. Insured) | | 15,000 | 4,818 |
| Miami-Dade County Transit Sales Surtax Rev. Series 2019, 5% 7/1/31 | | 20,000 | 21,762 |
| Miami-Dade County Wtr. & Swr. Rev.: | | | |
| Series 2017 A, 4% 10/1/39 | | 75,000 | 75,639 |
| Series 2017 B, 3.125% 10/1/39 | | 5,000 | 4,351 |
| Series 2019 B, 3% 10/1/49 | | 10,000 | 7,518 |
| Series 2019, 5% 10/1/46 | | 165,000 | 170,608 |
| Series 2024 A, 4.125% 10/1/50 | | 160,000 | 156,379 |
| North Broward Hosp. District Rev. Series 2017 B, 5% 1/1/32 | | 10,000 | 10,392 |
| North Miami Beach Wtr. Rev. Series 2020 A, 5% 8/1/44 | | 60,000 | 63,396 |
| Orange County Health Facilities Auth.: | | | |
| Series 2016, 4% 10/1/45 | | 65,000 | 63,778 |
| Series 2022, 4% 10/1/52 | | 85,000 | 81,222 |
| Orange County Tourist Dev. Tax Rev.: | | | |
| Series 2016 A, 4% 10/1/34 | | 20,000 | 19,799 |
| Series 2016 B, 4% 10/1/36 | | 30,000 | 29,990 |
| Orlando Utils. Commission Util. Sys. Rev. Series 2018 A, 5% 10/1/34 | | 5,000 | 5,280 |
| Osceola County Trans. Impt. Rev. Series 2019 A2, 0% 10/1/38 | | 55,000 | 28,689 |
| Palm Beach County Health Facilities Series 2016, 5% 11/15/32 | | 25,000 | 25,673 |
| Palm Beach County Pub. Impt. Rev. (Professional Sports Franchise Facility Proj.) Series 2015 D: | | | |
| 5% 12/1/40 (Pre-Refunded to 12/1/25 @ 100) | | 40,000 | 40,980 |
| 5% 12/1/45 (Pre-Refunded to 12/1/25 @ 100) | | 100,000 | 102,450 |
| Putnam County Dev. Auth. Poll. Cont. Rev. (Seminole Elec. Coop., Inc. Proj.) Series 2018 A, 5% 3/15/42 | | 90,000 | 92,242 |
| South Broward Hosp. District Rev.: | | | |
| Series 2017, 5% 5/1/28 | | 55,000 | 57,246 |
| Series 2021 A, 2.375% 5/1/45 | | 375,000 | 256,227 |
| Tampa Bay Wtr. Reg'l. Wtr. Supply Auth. Util. Sys. Rev. Series 2020 A: | | | |
| 4% 10/1/38 | | 100,000 | 103,524 |
| 5% 10/1/54 | | 260,000 | 277,540 |
| Tampa Health Sys. Rev. Series 2016 A, 4% 11/15/46 | | 140,000 | 132,849 |
| Tampa Tax Allocation (H. Lee Moffitt Cancer Ctr. Proj.) Series 2020 A, 0% 9/1/53 | | 5,000 | 1,168 |
| Volusia County Edl. Facilities Auth. Rev. (Stetson Univ., Inc. Proj.) Series 2015, 5% 6/1/45 | | 305,000 | 306,300 |
TOTAL FLORIDA | | | 7,792,555 |
| Georgia - 1.7% | | | |
| Atlanta Arpt. Rev. Series 2019 B, 4% 7/1/49 (c) | | 125,000 | 117,316 |
| Atlanta Wtr. & Wastewtr. Rev.: | | | |
| Series 2015: | | | |
5% 11/1/28 | | 25,000 | 25,330 |
5% 11/1/29 | | 5,000 | 5,067 |
5% 11/1/35 (Pre-Refunded to 5/1/25 @ 100) | | 30,000 | 30,434 |
5% 11/1/40 | | 40,000 | 40,364 |
5% 11/1/43 (Pre-Refunded to 5/1/25 @ 100) | | 25,000 | 25,362 |
| Series 2017 A, 5% 11/1/32 | | 25,000 | 26,292 |
| Series 2018 C, 4% 11/1/37 | | 15,000 | 15,058 |
| Brookhaven Dev. Auth. Rev. Series 2019 A: | | | |
| 4% 7/1/49 | | 105,000 | 101,324 |
| 5% 7/1/26 | | 20,000 | 20,664 |
| Burke County Indl. Dev. Auth. Poll. Cont. Rev. (Oglethorpe Pwr. Corp. Vogtle Proj.) Series 2017 D, 4.125% 11/1/45 | | 20,000 | 18,195 |
| Cobb County Kennestone Hosp. Auth. Rev. (Wellstar Health Sys., Inc. Proj.) Series 2022 A, 4% 4/1/52 | | 70,000 | 68,039 |
| Fulton County Dev. Auth. Rev. Series 2019, 5% 6/15/44 | | 20,000 | 20,911 |
| Gainesville & Hall County Hosp. Auth. Rev.: | | | |
| (Northeast Georgia Health Sys., Inc. Proj.): | | | |
Series 2017 A, 5% 2/15/45 | | 255,000 | 258,486 |
Series 2020 A, 5% 2/15/31 | | 50,000 | 53,774 |
| (Northeast Georgia Healthcare Sys., Inc. Proj.) Series 2014 A, 4% 8/15/46 (Pre-Refunded to 2/15/25 @ 100) | | 55,000 | 55,202 |
| Georgia Gen. Oblig.: | | | |
| Series 2015 A, 3% 2/1/30 | | 20,000 | 19,582 |
| Series 2016 F, 5% 1/1/26 | | 25,000 | 25,670 |
| Series 2018 A: | | | |
3% 7/1/33 | | 25,000 | 23,734 |
4% 7/1/34 | | 155,000 | 159,767 |
5% 7/1/27 | | 5,000 | 5,282 |
| Series 2021 A, 4% 7/1/35 | | 105,000 | 110,524 |
| Series 2022 C, 5% 7/1/31 | | 205,000 | 232,464 |
| Georgia Hsg. & Fin. Auth.: | | | |
| Series 2015 A, 3.95% 12/1/43 | | 50,000 | 47,741 |
| Series 2017 C, 3.75% 6/1/48 | | 110,000 | 102,275 |
| Georgia Muni. Elec. Auth. Pwr. Rev. Series 2018 HH, 4.125% 1/1/49 (Assured Guaranty Muni. Corp. Insured) | | 65,000 | 64,370 |
| Griffin-Spalding County Hosp. (Wellstar Health Sys., Inc. Proj.) Series 2017 A, 3.75% 4/1/47 | | 275,000 | 248,524 |
| Gwinnett County School District Gen. Oblig. Series 2019, 5% 2/1/39 | | 100,000 | 107,426 |
| Hosp. Auth. of Savannah Auth. Rev. Series 2019 A, 3.125% 7/1/44 | | 110,000 | 90,316 |
| Main Street Natural Gas, Inc. Series 2019 A, 4% 5/15/39 | | 100,000 | 93,690 |
| Metropolitan Atlanta Rapid Transit Auth. Sales Tax Rev.: | | | |
| Series 2007 A, 5.25% 7/1/27 (Escrowed to Maturity) | | 65,000 | 68,817 |
| Series 2019 A, 3.125% 7/1/46 | | 25,000 | 20,881 |
| Paulding County Wtr. & Sew Rev. Series 2016, 3% 12/1/48 | | 20,000 | 15,349 |
| Private Colleges & Univs. Auth. Rev. Series 2020 B: | | | |
| 4% 9/1/41 | | 195,000 | 196,294 |
| 5% 9/1/30 | | 100,000 | 110,809 |
| Richmond County Hosp. Auth.: | | | |
| (Univ. Health Svcs., Inc. Projs.) Series 2016, 5% 1/1/27 | | 105,000 | 107,862 |
| (Univ. Health Svcs., Inc. Proj.) Series 2016, 4% 1/1/35 | | 70,000 | 69,733 |
TOTAL GEORGIA | | | 2,802,928 |
| Hawaii - 1.0% | | | |
| Hawaii Arpts. Sys. Rev.: | | | |
| Series 2020 A, 4% 7/1/35 (c) | | 80,000 | 80,231 |
| Series 2020 D, 4% 7/1/39 | | 100,000 | 101,173 |
| Hawaii Dept. of Budget & Fin. Spl. Purp. Rev. Series 2015 A, 4% 7/1/40 | | 35,000 | 34,067 |
| Hawaii Gen. Oblig.: | | | |
| Series 2015 EY, 5% 10/1/26 | | 130,000 | 132,482 |
| Series 2016 FG, 5% 10/1/30 | | 30,000 | 30,997 |
| Series 2020 C, 4% 7/1/32 | | 470,000 | 486,514 |
| Series FT: | | | |
5% 1/1/27 | | 50,000 | 52,232 |
5% 1/1/32 | | 65,000 | 68,751 |
| Series FW, 3.5% 1/1/38 | | 35,000 | 34,029 |
| Honolulu City & County Gen. Oblig.: | | | |
| Series 2015 C, 3% 10/1/28 | | 135,000 | 131,978 |
| Series A, 5% 10/1/39 | | 100,000 | 101,174 |
| Honolulu City and County Wastewtr. Sys.: | | | |
| Series 2016 B, 4% 7/1/33 | | 235,000 | 236,747 |
| Series 2018 A, 3.375% 7/1/42 | | 40,000 | 35,813 |
| Series 2019 A, 4% 7/1/37 | | 100,000 | 101,733 |
TOTAL HAWAII | | | 1,627,921 |
| Idaho - 0.1% | | | |
| Idaho Health Facilities Auth. Rev.: | | | |
| (St. Luke's Health Sys. Proj.) Series 2018 A, 5% 3/1/27 | | 25,000 | 25,837 |
| Series 2015 ID: | | | |
5.5% 12/1/27 | | 60,000 | 60,958 |
5.5% 12/1/29 | | 20,000 | 20,326 |
| Idaho Hsg. & Fin. Assoc. Single Family Mtg. Series 2021 A, 4% 7/15/38 | | 105,000 | 105,884 |
TOTAL IDAHO | | | 213,005 |
| Illinois - 4.6% | | | |
| Chicago Board of Ed. Series 2016, 5.75% 4/1/35 | | 100,000 | 105,387 |
| Chicago Gen. Oblig.: | | | |
| Series 1999: | | | |
0% 1/1/31 | | 40,000 | 30,400 |
0% 1/1/33 | | 50,000 | 34,581 |
| Series 2002 B: | | | |
5% 1/1/26 | | 5,000 | 5,024 |
5% 1/1/26 (Pre-Refunded to 1/1/25 @ 100) | | 10,000 | 10,073 |
| Series 2007 E, 5.5% 1/1/35 | | 45,000 | 45,257 |
| Series 2008 C: | | | |
0% 1/1/26 (Escrowed to Maturity) | | 85,000 | 80,349 |
0% 1/1/30 | | 85,000 | 66,671 |
| Series 2015 A: | | | |
5% 1/1/26 | | 10,000 | 10,049 |
5% 1/1/26 (Pre-Refunded to 1/1/25 @ 100)(Escrowed to Maturity) | | 5,000 | 5,028 |
5.5% 1/1/33 | | 20,000 | 20,127 |
| Series 2015 C, 5% 1/1/27 | | 195,000 | 197,840 |
| Series 2019 A, 5% 1/1/40 | | 15,000 | 15,419 |
| Series 2021 A, 4% 1/1/35 | | 35,000 | 35,045 |
| Chicago O'Hare Int'l. Arpt. Rev.: | | | |
| Series 2015 B: | | | |
5% 1/1/28 | | 45,000 | 45,240 |
5% 1/1/33 | | 105,000 | 105,471 |
| Series 2015 D, 5% 1/1/46 | | 110,000 | 110,153 |
| Series 2016 C, 5% 1/1/37 | | 100,000 | 101,586 |
| Series 2016 D, 5.25% 1/1/42 | | 250,000 | 257,765 |
| Series 2016 G, 5% 1/1/37 (c) | | 225,000 | 229,386 |
| Series 2017 A, 5% 1/1/30 | | 125,000 | 129,556 |
| Series 2017 B, 5% 1/1/33 | | 30,000 | 31,035 |
| Series 2018 A, 4% 1/1/43 (c) | | 35,000 | 33,912 |
| Series 2018 B: | | | |
5% 1/1/37 | | 45,000 | 47,786 |
5% 1/1/38 | | 20,000 | 21,184 |
5% 1/1/48 | | 10,000 | 10,350 |
| Series 2020 B, 5% 1/1/29 | | 60,000 | 64,441 |
| Chicago Transit Auth. Cap. Grant Receipts Rev. Series 2017, 5% 6/1/25 | | 30,000 | 30,288 |
| Chicago Wtr. Rev. Series 2000, 5% 11/1/30 | | 15,000 | 15,415 |
| Cook County Gen. Oblig. Series 2018, 5% 11/15/34 | | 100,000 | 102,681 |
| Illinois Fin. Auth.: | | | |
| (Bradley Univ. Proj.) Series 2021 A, 4% 8/1/43 | | 80,000 | 74,675 |
| Series 2015, 4.125% 5/1/45 | | 125,000 | 121,000 |
| Series 2020 A, 3% 5/15/50 | | 80,000 | 62,315 |
| Series 2021 A, 5% 10/1/32 | | 30,000 | 34,082 |
| Series 2024 A: | | | |
5% 4/1/33 | | 35,000 | 40,009 |
5.25% 4/1/45 | | 20,000 | 22,437 |
| Series 2024 B, 5% 4/1/34 (e) | | 15,000 | 17,358 |
| Illinois Fin. Auth. Rev.: | | | |
| Series 2014 A, 5% 10/1/30 | | 105,000 | 105,243 |
| Series 2015 A, 4% 11/15/39 | | 565,000 | 537,537 |
| Series 2016: | | | |
3.25% 5/15/39 | | 160,000 | 134,902 |
3.25% 11/15/45 | | 15,000 | 12,172 |
4% 1/1/25 | | 145,000 | 145,308 |
4% 7/1/30 | | 60,000 | 60,525 |
4% 12/1/31 | | 25,000 | 25,030 |
4% 12/1/40 | | 210,000 | 198,758 |
| Series 2017 A, 5% 8/1/42 | | 105,000 | 106,331 |
| Series 2017, 5% 8/15/26 | | 135,000 | 139,079 |
| Series 2018 A: | | | |
5% 10/1/41 | | 25,000 | 25,756 |
5% 10/1/48 | | 20,000 | 20,437 |
| Illinois Gen. Oblig.: | | | |
| Series 2014, 5% 4/1/27 | | 55,000 | 55,047 |
| Series 2016 June: | | | |
3.5% 6/1/30 | | 210,000 | 201,984 |
3.5% 6/1/31 | | 70,000 | 66,270 |
| Series 2016: | | | |
4% 1/1/31 | | 70,000 | 70,006 |
5% 2/1/27 | | 140,000 | 144,885 |
5% 11/1/36 | | 100,000 | 101,816 |
| Series 2017 A, 4.5% 12/1/41 | | 35,000 | 35,243 |
| Series 2017 B, 5% 12/1/24 | | 65,000 | 65,323 |
| Series 2017 C, 5% 11/1/29 | | 10,000 | 10,419 |
| Series 2017 D: | | | |
3.25% 11/1/26 | | 40,000 | 39,242 |
5% 11/1/26 | | 190,000 | 196,138 |
5% 11/1/28 | | 140,000 | 145,982 |
| Series 2018 B, 5% 10/1/24 | | 20,000 | 20,056 |
| Series 2019 B, 5% 9/1/25 | | 30,000 | 30,479 |
| Series 2019 C, 4% 11/1/44 | | 25,000 | 23,640 |
| Series 2020 C, 4% 10/1/40 | | 85,000 | 82,052 |
| Series 2020 D, 5% 10/1/25 | | 50,000 | 50,855 |
| Series 2021 A: | | | |
5% 3/1/27 | | 50,000 | 51,774 |
5% 3/1/30 | | 160,000 | 171,945 |
5% 12/1/31 | | 20,000 | 21,900 |
| Series 2023 B, 5% 12/1/36 | | 25,000 | 27,728 |
| Series 2023 D, 5% 7/1/32 | | 160,000 | 175,822 |
| Series 2024 B, 5.25% 5/1/49 | | 100,000 | 107,909 |
| Series November 2016, 4.125% 11/1/31 | | 40,000 | 40,082 |
| Illinois Hsg. Dev. Auth. Rev. Series 2018 A, 4.125% 10/1/38 | | 15,000 | 14,979 |
| Illinois Sales Tax Rev.: | | | |
| Series 2013, 5% 6/15/25 | | 5,000 | 5,008 |
| Series 2016 A, 3% 6/15/33 | | 25,000 | 23,018 |
| Series 2016 D, 3% 6/15/31 | | 35,000 | 32,853 |
| Series 2021 A, 4% 6/15/30 | | 60,000 | 61,676 |
| Illinois Toll Hwy. Auth. Toll Hwy. Rev.: | | | |
| Series 2014 C, 5% 1/1/30 | | 100,000 | 100,809 |
| Series 2015 A, 5% 1/1/40 | | 25,000 | 25,179 |
| Series 2016 A, 5% 12/1/31 | | 50,000 | 50,899 |
| Series 2017 A, 5% 1/1/36 | | 50,000 | 53,041 |
| Series 2019 C, 5% 1/1/31 | | 120,000 | 131,405 |
| Series 2023 A, 5% 1/1/44 | | 20,000 | 21,890 |
| Series 2024 A, 5% 1/1/33 | | 35,000 | 39,630 |
| Series A, 5% 1/1/45 | | 145,000 | 154,158 |
| Series B: | | | |
5% 1/1/27 | | 25,000 | 26,067 |
5% 1/1/30 | | 50,000 | 54,428 |
| Series C, 5% 1/1/30 | | 95,000 | 103,413 |
| Kendall, Kane & Will Counties Cmnty. Unit School District #308 Series 2016, 5% 2/1/31 | | 65,000 | 66,076 |
| Metropolitan Pier & Exposition: | | | |
| (McCormick Place Expansion Proj.): | | | |
Series 2002 A, 0% 6/15/36 (Nat'l. Pub. Fin. Guarantee Corp. Insured) | | 35,000 | 21,403 |
Series 2010 B1, 0% 6/15/47 (Assured Guaranty Muni. Corp. Insured) | | 600,000 | 203,255 |
Series A: | | | |
0% 6/15/37 (Nat'l. Pub. Fin. Guarantee Corp. Insured) | | 170,000 | 99,197 |
0% 6/15/38 (Nat'l. Pub. Fin. Guarantee Corp. Insured) | | 90,000 | 49,823 |
0% 12/15/38 (Nat'l. Pub. Fin. Guarantee Corp. Insured) | | 10,000 | 5,395 |
| Series 2002 A: | | | |
0% 12/15/26 | | 95,000 | 86,137 |
0% 6/15/32 (Nat'l. Pub. Fin. Guarantee Corp. Insured) | | 20,000 | 14,477 |
0% 12/15/34 (Nat'l. Pub. Fin. Guarantee Corp. Insured) | | 20,000 | 13,072 |
| Series 2002, 0% 12/15/31 (Nat'l. Pub. Fin. Guarantee Corp. Insured) | | 30,000 | 22,163 |
| Series 2017 B, 0% 12/15/56 (Assured Guaranty Muni. Corp. Insured) | | 15,000 | 3,072 |
| Northern Illinois Muni. Pwr. Agcy. Rev. (Prairie State Proj.) Series 2016 A, 5% 12/1/29 | | 45,000 | 46,564 |
| Sales Tax Securitization Corp. Series 2017 A, 5% 1/1/28 | | 50,000 | 52,682 |
| Springfield Elec. Rev. Series 2015: | | | |
| 4% 3/1/40 (Assured Guaranty Muni. Corp. Insured) | | 35,000 | 34,513 |
| 5% 3/1/31 | | 60,000 | 60,442 |
| 5% 3/1/32 | | 115,000 | 115,794 |
TOTAL ILLINOIS | | | 7,609,568 |
| Indiana - 1.0% | | | |
| Carmel Local Pub. Impt. Bond Bank Series 2016, 5% 7/15/30 | | 45,000 | 46,237 |
| Fishers Town Hall Bldg. Corp. Series 2023 A, 5.75% 7/15/58 | | 345,000 | 388,461 |
| Indiana Bond Bank Series 2008 B, 0% 6/1/32 (Assured Guaranty Muni. Corp. Insured) | | 70,000 | 50,711 |
| Indiana Fin. Auth. Health Sys. Rev. Series 2017, 5% 11/1/32 | | 70,000 | 73,390 |
| Indiana Fin. Auth. Hwy. Rev. Series 2016 C, 5% 12/1/25 | | 35,000 | 35,859 |
| Indiana Fin. Auth. Rev.: | | | |
| (Citizens Energy Group Proj.) Series 2021 A, 4% 10/1/51 | | 20,000 | 19,144 |
| Series 2019 E: | | | |
5% 2/1/36 | | 25,000 | 26,878 |
5% 2/1/40 | | 65,000 | 69,162 |
| Series 2021 B, 5% 2/1/41 | | 150,000 | 163,751 |
| Indiana Fin. Auth. Wastewtr. Util. Rev. (CWA Auth. Proj.) Series 2021 A, 3% 10/1/40 | | 45,000 | 38,875 |
| Indiana Health & Edl. Facilities Fing. Auth. Rev. Series 2006 B, 5% 11/15/46 | | 100,000 | 101,373 |
| Indiana Muni. Pwr. Agcy. Pwr. Supply Sys. Rev.: | | | |
| Series 2014 A: | | | |
5% 1/1/30 | | 100,000 | 100,603 |
5% 1/1/31 | | 65,000 | 65,395 |
| Series 2016 C, 5% 1/1/39 | | 230,000 | 233,729 |
| Indianapolis Local Pub. Impt.: | | | |
| (Courthouse and Jail Proj.) Series 2019 A: | | | |
5% 2/1/33 | | 100,000 | 107,153 |
5% 2/1/54 | | 25,000 | 25,964 |
| (Pilot Infrastructure Prog.) Series 2017 C, 5% 1/1/33 | | 40,000 | 42,131 |
| Indianapolis Local Pub. Impt. Bond Bank Series E, 0% 2/1/28 (AMBAC Insured) | | 5,000 | 4,366 |
| Indianapolis Wtr. Sys. Rev. Series 2018 A, 5% 10/1/30 | | 55,000 | 58,664 |
TOTAL INDIANA | | | 1,651,846 |
| Iowa - 0.4% | | | |
| Iowa Fin. Auth. Rev.: | | | |
| Series 2017, 5% 8/1/37 | | 115,000 | 119,739 |
| Series 2020 A, 5% 8/1/36 | | 105,000 | 116,490 |
| Series 2023 C, 5% 8/1/35 | | 40,000 | 46,205 |
| Iowa Fin. Auth. Single Family Mtg. (Mtg.-Backed Securities Prog.) Series 2019 A, 4% 7/1/47 | | 60,000 | 59,611 |
| Iowa Spl. Oblig. Series 2019, 5% 6/1/33 | | 30,000 | 32,608 |
| Tobacco Settlement Auth. Tobacco Settlement Rev. Series 2021 A2, 4% 6/1/40 | | 215,000 | 208,117 |
TOTAL IOWA | | | 582,770 |
| Kansas - 0.0% | | | |
| Johnson & Miami County Unified School District Series 2016 B, 3% 9/1/37 | | 30,000 | 27,274 |
| Univ. of Kansas Hosp. Auth. Health Facilities Rev. Series 2019 A, 4% 9/1/48 | | 50,000 | 47,310 |
TOTAL KANSAS | | | 74,584 |
| Kentucky - 0.5% | | | |
| Carroll County Envir. Facilities Rev. Series 2008 A, 2% 2/1/32 (c) | | 365,000 | 294,176 |
| Kentucky Eco Dev. Fin. Auth. Health Rev. Series 2000 B, 0% 10/1/26 (Nat'l. Pub. Fin. Guarantee Corp. Insured) | | 100,000 | 90,678 |
| Kentucky Muni. Pwr. Agcy. Pwr. Sys. Rev. (Prairie State Proj.) Series 2015 A: | | | |
| 4% 9/1/39 | | 160,000 | 154,726 |
| 5% 9/1/42 | | 5,000 | 5,007 |
| Kentucky State Property & Buildings Commission Rev. Series B, 5% 11/1/28 | | 30,000 | 30,996 |
| Kentucky, Inc. Pub. Energy Series 2019 C, 4% 8/1/27 | | 50,000 | 49,844 |
| Louisville & Jefferson County Series 2016 A, 3% 10/1/37 | | 95,000 | 81,801 |
| Louisville & Jefferson County Metropolitan Swr. District Swr. & Drain Sys. Rev.: | | | |
| Series 2016 A, 3% 5/15/46 | | 70,000 | 54,469 |
| Series 2017 A, 3.25% 5/15/46 | | 100,000 | 82,557 |
TOTAL KENTUCKY | | | 844,254 |
| Louisiana - 0.4% | | | |
| Jefferson Sales Tax District Series 2019 B, 4% 12/1/42 (Assured Guaranty Muni. Corp. Insured) | | 5,000 | 4,877 |
| Louisiana Gen. Oblig.: | | | |
| Series 2014 D1, 3% 12/1/29 | | 40,000 | 38,408 |
| Series 2017 A, 5% 4/1/25 | | 25,000 | 25,313 |
| Series 2021, 5% 3/1/32 | | 25,000 | 27,999 |
| Series 2023 A, 5% 4/1/36 | | 15,000 | 17,156 |
| Louisiana Local Govt. Envir. Facilities and Cmnty. Dev. Auth. (Woman's Hosp. Foundation Proj.) Series 2017 A, 4% 10/1/41 | | 50,000 | 47,232 |
| Louisiana Pub. Facilities Auth. Hosp. Rev. (Franciscan Missionaries of Our Lady Health Sys. Proj.) Series 2017 A, 3.75% 7/1/47 | | 30,000 | 27,639 |
| Louisiana Pub. Facilities Auth. Rev. (Loyola Univ. Proj.) Series 2017, 5.25% 10/1/46 | | 35,000 | 37,005 |
| New Orleans Aviation Board Series 2018 A, 4% 10/1/43 (Assured Guaranty Muni. Corp. Insured) | | 150,000 | 143,322 |
| New Orleans Wtr. Series 2015, 5% 12/1/40 (Pre-Refunded to 12/1/25 @ 100) | | 25,000 | 25,595 |
| State of Louisiana Grant Anticipation Rev.: | | | |
| Series 2019 A, 5% 9/1/29 | | 80,000 | 85,472 |
| Series 2021, 5% 9/1/33 | | 100,000 | 110,245 |
TOTAL LOUISIANA | | | 590,263 |
| Maryland - 1.6% | | | |
| Baltimore County Gen. Oblig. Series 2019, 4% 3/1/35 | | 40,000 | 41,178 |
| Maryland Dept. of Trans.: | | | |
| Series 2016, 4% 11/1/29 | | 85,000 | 84,536 |
| Series 2018, 3% 5/1/31 | | 40,000 | 38,030 |
| Series 2021 B, 4% 8/1/51 (c) | | 100,000 | 92,462 |
| Maryland Gen. Oblig.: | | | |
| Series 2017 B, 5% 8/1/25 | | 30,000 | 30,558 |
| Series 2019 1, 5% 3/15/31 | | 70,000 | 76,110 |
| Series 2019, 5% 3/15/30 | | 50,000 | 54,330 |
| Series 2020 A: | | | |
5% 8/1/29 | | 150,000 | 164,506 |
5% 8/1/35 | | 55,000 | 60,719 |
| Series 2021 2A, 5% 8/1/28 | | 120,000 | 129,218 |
| Series 2021 A, 5% 8/1/32 | | 130,000 | 147,226 |
| Series A, 5% 3/15/30 | | 30,000 | 31,989 |
| Series C, 5% 8/1/24 | | 5,000 | 5,006 |
| Maryland Health & Higher Edl. Series 2021 A, 2.5% 7/1/51 | | 90,000 | 56,829 |
| Maryland Health & Higher Edl. Facilities Auth. Rev.: | | | |
| Series 2015, 4% 7/1/35 (Pre-Refunded to 7/1/25 @ 100) | | 100,000 | 100,638 |
| Series 2017 A, 4% 5/15/47 | | 55,000 | 52,554 |
| Series 2017 MD, 4% 12/1/46 | | 15,000 | 14,354 |
| Maryland Stadium Auth. Built to Learn Rev. Series 2021: | | | |
| 2.75% 6/1/51 | | 190,000 | 130,074 |
| 4% 6/1/37 | | 115,000 | 117,624 |
| Maryland Trans. Auth. Passenger Facility Charge Rev. Series 2012 B, 2.625% 6/1/27 (c) | | 40,000 | 37,721 |
| Maryland Trans. Auth. Trans. Facility Projs. Rev. Series 2021 A: | | | |
| 2.25% 7/1/39 | | 65,000 | 49,087 |
| 3% 7/1/47 | | 145,000 | 115,070 |
| 4% 7/1/40 | | 180,000 | 181,489 |
| Montgomery County Gen. Oblig.: | | | |
| Series 2014 A, 5% 11/1/29 (Pre-Refunded to 11/1/24 @ 100) | | 85,000 | 85,447 |
| Series 2015 B, 3% 12/1/29 | | 70,000 | 68,224 |
| Series 2020 B, 4% 11/1/31 | | 100,000 | 106,711 |
| Univ. of Maryland Sys. Auxiliary Facility & Tuition Rev. Series 2021 A, 4% 4/1/47 | | 290,000 | 283,918 |
| Washington Metropolitan Area Transit Auth. Series 2021 A, 5% 7/15/46 | | 150,000 | 160,830 |
| Washington Suburban San. District: | | | |
| Series 2016 2: | | | |
4% 6/1/42 | | 10,000 | 10,008 |
5% 6/1/34 | | 65,000 | 66,918 |
| Series 2023, 5% 6/1/36 | | 25,000 | 28,853 |
TOTAL MARYLAND | | | 2,622,217 |
| Massachusetts - 3.2% | | | |
| Boston Gen. Oblig. Series A, 5% 4/1/26 | | 40,000 | 41,463 |
| Massachusetts Bay Trans. Auth. Assessment Rev. Series 2022 A2, 5% 7/1/52 | | 200,000 | 215,122 |
| Massachusetts Bay Trans. Auth. Sales Tax Rev.: | | | |
| Series 2005 A, 5% 7/1/25 | | 55,000 | 55,943 |
| Series 2007, 5.25% 7/1/28 | | 40,000 | 43,222 |
| Series A, 5.25% 7/1/28 | | 20,000 | 21,650 |
| Series B, 5% 7/1/33 | | 5,000 | 5,074 |
| Massachusetts Commonwealth Trans. Fund Rev.: | | | |
| (Rail Enhanacement and Accelerated Bridge Programs) Series 2016 B, 4% 6/1/45 | | 175,000 | 171,674 |
| (Rail Enhancement & Accelerated Bridge Prog.): | | | |
Series 2017 A, 5% 6/1/47 | | 20,000 | 20,538 |
Series 2018 A, 5% 6/1/48 | | 130,000 | 134,430 |
| (Rail Enhancement Prog.) Series 2021 A, 3% 6/1/50 | | 185,000 | 141,248 |
| Series 2015 A, 3.25% 6/1/35 | | 150,000 | 142,701 |
| Massachusetts Dev. Fin. Agcy. Rev.: | | | |
| Series 2016 I, 3% 7/1/32 | | 25,000 | 23,286 |
| Series 2018 L, 4% 7/1/44 | | 165,000 | 165,847 |
| Series 2021 B, 4% 6/1/50 | | 35,000 | 29,647 |
| Series BB1, 4% 10/1/46 | | 25,000 | 24,440 |
| Series C, 3% 10/1/45 (Assured Guaranty Muni. Corp. Insured) | | 10,000 | 7,760 |
| Series D, 4% 7/1/45 | | 25,000 | 22,976 |
| Series F, 5% 8/15/24 | | 110,000 | 110,137 |
| Massachusetts Edl. Fing. Auth. Rev. Series 2015 A, 5% 1/1/26 (c) | | 60,000 | 60,303 |
| Massachusetts Gen. Oblig.: | | | |
| Series 2004 C, 5.5% 12/1/24 | | 130,000 | 131,116 |
| Series 2015 A, 5% 7/1/26 | | 130,000 | 134,679 |
| Series 2016 B: | | | |
4% 7/1/33 | | 75,000 | 75,505 |
5% 7/1/27 | | 5,000 | 5,276 |
| Series 2016 G: | | | |
3% 9/1/46 | | 10,000 | 8,063 |
4% 9/1/32 | | 75,000 | 75,702 |
| Series 2017 A: | | | |
5% 4/1/35 | | 100,000 | 104,313 |
5% 4/1/47 | | 155,000 | 158,699 |
| Series 2017 E, 5% 11/1/24 | | 60,000 | 60,306 |
| Series 2017 F: | | | |
5% 11/1/41 | | 200,000 | 207,883 |
5% 11/1/44 | | 20,000 | 20,655 |
| Series 2018 C, 5% 9/1/30 | | 150,000 | 166,752 |
| Series 2018 E, 5% 9/1/25 | | 100,000 | 102,028 |
| Series 2019 A, 5% 1/1/49 | | 70,000 | 73,126 |
| Series 2019 C, 5% 5/1/41 | | 25,000 | 26,596 |
| Series 2019 G: | | | |
3% 9/1/39 | | 200,000 | 178,779 |
5% 9/1/29 | | 150,000 | 164,364 |
5% 9/1/32 | | 75,000 | 75,187 |
| Series 2020 D, 4% 11/1/41 | | 150,000 | 150,578 |
| Series 2020 E, 5% 11/1/33 | | 165,000 | 183,325 |
| Series 2021 B, 3% 4/1/47 | | 140,000 | 112,275 |
| Series 2021 C, 5% 9/1/29 | | 50,000 | 54,788 |
| Series 2023 B, 5% 5/1/34 | | 20,000 | 23,040 |
| Series 2024 B, 5% 11/1/32 | | 55,000 | 62,810 |
| Series A: | | | |
5% 3/1/29 | | 175,000 | 190,046 |
5% 7/1/29 | | 70,000 | 72,313 |
5% 7/1/31 | | 45,000 | 46,431 |
| Series B: | | | |
2% 3/1/34 | | 170,000 | 141,342 |
5% 7/1/26 | | 40,000 | 41,440 |
5% 7/1/27 | | 20,000 | 21,103 |
| Series C, 5% 5/1/30 | | 35,000 | 38,704 |
| Series D, 5% 7/1/26 | | 40,000 | 41,440 |
| Series E, 5% 11/1/26 | | 20,000 | 20,848 |
| Series F, 5% 11/1/40 | | 15,000 | 15,619 |
| Series G, 5% 9/1/33 | | 55,000 | 55,137 |
| Massachusetts Health & Edl. Facilities Auth. Rev. Series 2008 M2, 5.5% 6/1/35 | | 65,000 | 77,484 |
| Massachusetts Hsg. Fin. Agcy. Multi-Family Rev. Series A, 4.5% 12/1/48 (c) | | 10,000 | 9,518 |
| Massachusetts Port Auth. Rev. Series 2019 B, 3% 7/1/49 | | 70,000 | 53,734 |
| Massachusetts School Bldg. Auth. Dedicated Sales Tax Rev.: | | | |
| Series 2015 D, 4.75% 8/15/32 (Pre-Refunded to 8/15/25 @ 100) | | 185,000 | 188,048 |
| Series 2016 B, 5% 11/15/46 | | 30,000 | 30,687 |
| Series 2020 A, 5% 8/15/39 | | 15,000 | 16,462 |
| Series A: | | | |
5% 8/15/37 | | 15,000 | 16,581 |
5% 8/15/45 | | 50,000 | 53,427 |
| Series C, 5% 11/15/34 | | 35,000 | 36,305 |
| Massachusetts Spl. Oblig. Dedicated Tax Rev. Series 2005, 5.5% 1/1/30 (Nat'l. Pub. Fin. Guarantee Corp. Insured) | | 10,000 | 11,142 |
| Massachusetts Wtr. Resources Auth. Wtr. & Swr. Rev.: | | | |
| Series 2007 B, 5.25% 8/1/30 (Assured Guaranty Muni. Corp. Insured) | | 145,000 | 163,669 |
| Series 2007, 5.25% 8/1/32 (Assured Guaranty Muni. Corp. Insured) | | 25,000 | 29,173 |
| Series 2020 B, 5% 8/1/43 | | 140,000 | 151,050 |
TOTAL MASSACHUSETTS | | | 5,315,009 |
| Michigan - 1.7% | | | |
| Detroit School District School Bldg. and Site Impt. Series 2005 A, 5.25% 5/1/29 (Assured Guaranty Muni. Corp. Insured) | | 180,000 | 196,622 |
| Great Lakes Wtr. Auth. Sew Disp. Sys.: | | | |
| Series 2016 C, 5% 7/1/36 | | 15,000 | 15,308 |
| Series 2023 A, 5% 7/1/38 | | 25,000 | 28,333 |
| Great Lakes Wtr. Auth. Wtr. Supply Sys. Rev.: | | | |
| Series 2016 C, 5% 7/1/33 | | 50,000 | 51,270 |
| Series 2018 A, 5% 7/1/27 | | 65,000 | 68,293 |
| Series 2022 A, 5% 7/1/35 | | 50,000 | 56,763 |
| Series 2022 B, 5% 7/1/35 | | 15,000 | 16,814 |
| Series 2023 A, 5% 7/1/38 | | 15,000 | 17,000 |
| Lincoln Consolidated School District Series 2016 A, 5% 5/1/40 (Assured Guaranty Muni. Corp. Insured) | | 330,000 | 332,545 |
| Michigan Bldg. Auth. Rev.: | | | |
| (Facilities Prog.) Series I: | | | |
3% 10/15/45 | | 60,000 | 48,268 |
5% 4/15/26 | | 40,000 | 40,831 |
5% 10/15/28 | | 25,000 | 25,885 |
5% 10/15/30 | | 15,000 | 15,481 |
| Series 2016 I, 5% 4/15/36 | | 115,000 | 118,594 |
| Michigan Fin. Auth. Rev.: | | | |
| (Charter County of Wayne Criminal Justice Ctr. Proj.) Series 2018, 4% 11/1/48 | | 10,000 | 9,437 |
| (Detroit Wtr. and Sewerage Dept. Sewage Disp. Sys. Rev. Rfdg. Local Proj.) Series 2014 C, 5% 7/1/28 (Assured Guaranty Muni. Corp. Insured) | | 20,000 | 20,015 |
| (Detroit Wtr. And Sewerage Dept. Wtr. Supply Sys. Rev. Rfdg. Local Proj.) Series 2014 D, 5% 7/1/24 (Assured Guaranty Muni. Corp. Insured) | | 20,000 | 20,000 |
| Series 2014 C3, 5% 7/1/29 (Assured Guaranty Muni. Corp. Insured) | | 70,000 | 70,053 |
| Series 2014, 5% 7/1/26 (Assured Guaranty Muni. Corp. Insured) | | 30,000 | 30,023 |
| Series 2016: | | | |
3% 11/15/33 | | 240,000 | 222,559 |
3.25% 11/15/42 | | 25,000 | 20,137 |
4% 11/15/46 | | 50,000 | 47,610 |
| Series 2018 B, 5% 10/1/28 | | 130,000 | 139,867 |
| Series 2019 A: | | | |
4% 2/15/47 | | 40,000 | 37,784 |
4% 12/1/49 | | 20,000 | 18,908 |
5% 2/15/34 | | 55,000 | 58,504 |
| Michigan Hosp. Fin. Auth. Rev. (Trinity Health Proj.) Series 2008 C, 5% 12/1/27 | | 35,000 | 36,856 |
| Michigan Hsg. Dev. Auth. Rental Hsg. Rev.: | | | |
| Series 2018 A, 4.05% 10/1/48 | | 100,000 | 94,595 |
| Series 2020 A1, 2.7% 10/1/45 | | 160,000 | 118,038 |
| Michigan Hsg. Dev. Auth. Single Family Mtg. Rev.: | | | |
| Series 2019 B, 3.1% 12/1/44 | | 210,000 | 169,143 |
| Series B, 3.1% 12/1/31 | | 50,000 | 45,975 |
| Michigan Strategic Fund Ltd. Oblig. Rev. (I-75 Impt. Proj.) Series 2018: | | | |
| 5% 12/31/26 (c) | | 35,000 | 35,538 |
| 5% 6/30/28 (c) | | 15,000 | 15,381 |
| 5% 12/31/28 (c) | | 55,000 | 56,607 |
| 5% 6/30/29 (c) | | 60,000 | 61,805 |
| 5% 6/30/31 (c) | | 70,000 | 72,298 |
| 5% 12/31/31 (c) | | 20,000 | 20,656 |
| Michigan Trunk Line Fund Rev.: | | | |
| Series 2020 B, 4% 11/15/37 | | 25,000 | 25,544 |
| Series 2021 A, 4% 11/15/40 | | 80,000 | 80,350 |
| Muskegon City Pub. Schools Series 2021 II, 5% 5/1/51 | | 60,000 | 63,505 |
| Univ. of Michigan Rev. Series 2015, 5% 4/1/32 (Pre-Refunded to 4/1/26 @ 100) | | 125,000 | 129,030 |
| Wayne County Arpt. Auth. Rev.: | | | |
| Series 2018 A, 5% 12/1/34 | | 50,000 | 53,277 |
| Series 2021 B, 5% 12/1/35 (c) | | 50,000 | 54,035 |
TOTAL MICHIGAN | | | 2,859,537 |
| Minnesota - 1.3% | | | |
| Apple Valley Sr. Living (Minnesota Sr. Living LLC Proj.) Series 2016 A, 4.25% 1/1/37 | | 30,000 | 24,150 |
| Forest Lake Independent School District No. 831 Gen. Oblig. (MN School District Cr. Enhancement Prog.) Series 2016 A, 3.25% 2/1/46 | | 200,000 | 169,741 |
| Hennepin County Gen. Oblig.: | | | |
| Series 2019 B, 5% 12/15/29 | | 120,000 | 129,621 |
| Series 2020 C, 5% 12/15/35 | | 250,000 | 272,371 |
| Minneapolis & Saint Paul Metropolitan Arpts. Commission Arpt. Rev. Series 2019 A, 5% 1/1/49 | | 35,000 | 36,430 |
| Minnesota Gen. Oblig.: | | | |
| Series 2015 A, 5% 8/1/28 | | 110,000 | 112,138 |
| Series 2015 B, 2.95% 8/1/27 | | 40,000 | 38,777 |
| Series 2017 A, 5% 10/1/28 | | 25,000 | 26,574 |
| Series 2018 B, 3.25% 8/1/36 | | 5,000 | 4,825 |
| Series 2019 B, 5% 8/1/27 | | 100,000 | 105,628 |
| Series 2020 A, 5% 8/1/33 | | 100,000 | 111,150 |
| Series 2021 A: | | | |
4% 9/1/39 | | 455,000 | 470,128 |
5% 9/1/29 | | 125,000 | 137,201 |
| Minnesota Hsg. Fin. Agcy.: | | | |
| Series 2019 F, 3.75% 1/1/50 | | 100,000 | 98,948 |
| Series 2021 H, 2.55% 1/1/46 | | 285,000 | 204,333 |
| Owatonna Independent School District 761 (Minnesota School District Cr. Enhancement Prog.) Series 2020 A, 2.125% 2/1/40 | | 145,000 | 104,923 |
| Saint Cloud Health Care Rev. Series 2019, 5% 5/1/48 | | 15,000 | 15,483 |
TOTAL MINNESOTA | | | 2,062,421 |
| Mississippi - 0.1% | | | |
| Mississippi Dev. Bank Spl. Oblig.: | | | |
| (Madison County, Mississippi Hwy. Rfdg. Proj.) Series 2013 C, 5% 1/1/27 | | 15,000 | 15,590 |
| (Mississippi Dept. of Corrections Walnut Grove Correctional Facility Rfdg. Bonds Proj.) Series 2016 A: | | | |
5% 8/1/26 | | 65,000 | 66,852 |
5% 8/1/27 | | 50,000 | 52,126 |
| Mississippi Gen. Oblig. Series 2017 A, 5% 10/1/30 | | 65,000 | 68,435 |
| Mississippi State Gaming Tax Rev. Series 2019 A, 5% 10/15/28 | | 25,000 | 26,401 |
TOTAL MISSISSIPPI | | | 229,404 |
| Missouri - 0.3% | | | |
| Bi-State Dev. Agcy. Series 2019, 4% 10/1/48 | | 180,000 | 172,528 |
| Kansas City Indl. Dev. Auth. (Kansas City Int'l. Arpt. Term. Modernization Proj.) Series 2020 A, 5% 3/1/57 (Assured Guaranty Muni. Corp. Insured) (c) | | 65,000 | 66,847 |
| Missouri Board of Pub. Buildings Spl. Oblig. Series 2014 A, 3% 10/1/29 | | 30,000 | 28,929 |
| Missouri Health & Edl. Facilities Rev.: | | | |
| Series 2016, 5% 11/15/28 | | 10,000 | 10,278 |
| Series 2017 C, 3.625% 11/15/47 | | 25,000 | 22,377 |
| Series 2019 A, 4% 2/15/49 | | 140,000 | 134,660 |
| Missouri Hsg. Dev. Commission Single Family Mtg. Rev. (First Place Homeownership Ln. Prog.) Series B, 3.35% 11/1/49 | | 30,000 | 25,464 |
| Missouri Joint Muni. Elec. Util. Commission Pwr. Proj. Rev. (Prairie State Proj.) Series 2016 A, 4% 12/1/36 | | 40,000 | 40,067 |
| Springfield Pub. Util. Rev. Series 2015, 4% 8/1/31 | | 50,000 | 49,894 |
TOTAL MISSOURI | | | 551,044 |
| Montana - 0.2% | | | |
| Montana Facility Fin. Auth. Rev.: | | | |
| Series 2016, 5% 2/15/28 | | 65,000 | 66,510 |
| Series 2019 A: | | | |
4% 1/1/36 | | 110,000 | 111,153 |
5% 1/1/30 | | 150,000 | 163,636 |
TOTAL MONTANA | | | 341,299 |
| Nebraska - 0.2% | | | |
| Omaha Pub. Pwr. District Elec. Rev. Series 2022 A, 4% 2/1/42 | | 40,000 | 40,143 |
| Sarpy County Hosp. Auth. #1 Health Facilities Rev. Series 2016, 4% 5/15/51 | | 140,000 | 131,168 |
| The Board of Regents of The Univ. of Nebraska Series 2016 A, 3% 7/1/39 (Pre-Refunded to 7/1/26 @ 100) | | 45,000 | 44,783 |
| Univ. of Nebraska Facilities Corp. Series 2021 A, 4% 7/15/62 | | 85,000 | 79,848 |
TOTAL NEBRASKA | | | 295,942 |
| Nevada - 0.6% | | | |
| Clark County Arpt. Rev. Series 2019 B, 5% 7/1/42 | | 40,000 | 42,124 |
| Clark County Fuel Tax: | | | |
| Series 2016 A, 5% 11/1/25 | | 130,000 | 132,992 |
| Series 2016 B, 5% 11/1/27 | | 50,000 | 51,967 |
| Series 2019 A: | | | |
5% 12/1/24 | | 45,000 | 45,285 |
5% 12/1/28 | | 40,000 | 43,174 |
| Series 2019: | | | |
3% 6/1/38 | | 65,000 | 57,110 |
5% 6/1/25 | | 25,000 | 25,382 |
| Clark County Hwy. Impt. Rev. Series 2017, 5% 7/1/30 | | 10,000 | 10,445 |
| Clark County McCarran Int'l. Arpt. Passenger Facility Charge Rev. Series 2019 E, 5% 7/1/24 | | 140,000 | 140,000 |
| Clark County School District Series 2019 A, 3% 6/15/39 (Assured Guaranty Muni. Corp. Insured) | | 20,000 | 17,300 |
| Clark County Wtr. Reclamation District Series 2016, 3% 7/1/30 | | 75,000 | 72,225 |
| Las Vegas Convention & Visitors Auth.: | | | |
| Series 2018 B, 4% 7/1/49 | | 95,000 | 89,675 |
| Series 2018 C, 4% 7/1/48 | | 50,000 | 47,830 |
| Las Vegas Valley Wtr. District Wtr. Impt. Gen. Oblig. Series 2022 A, 4% 6/1/41 | | 215,000 | 216,538 |
| Washoe County School District Series 2017 C, 3.125% 10/1/40 (Assured Guaranty Muni. Corp. Insured) | | 50,000 | 43,682 |
TOTAL NEVADA | | | 1,035,729 |
| New Jersey - 3.4% | | | |
| Edison Township Gen. Oblig. Series 2021, 2% 3/15/37 | | 100,000 | 76,097 |
| New Jersey Bldg. Auth. State Bldg. Rev. Series 2016 A, 5% 6/15/29 (Pre-Refunded to 6/15/26 @ 100) | | 225,000 | 232,711 |
| New Jersey Econ. Dev. Auth. Series A: | | | |
| 4% 11/1/37 | | 40,000 | 40,429 |
| 5% 11/1/31 | | 35,000 | 37,691 |
| New Jersey Econ. Dev. Auth. Lease Rev. (State House Proj.) Series 2017 B, 5% 6/15/26 | | 15,000 | 15,431 |
| New Jersey Econ. Dev. Auth. Natural Gas Facilities Rev. (New Jersey Natural Gas Co. Proj.) Series 2011 C, 3% 8/1/41 (c) | | 205,000 | 167,660 |
| New Jersey Econ. Dev. Auth. Rev.: | | | |
| (New Jersey Transit Corp. Projs.) Series 2017, 4% 11/1/25 | | 30,000 | 30,185 |
| Series 2016 AAA, 5% 6/15/41 (Pre-Refunded to 12/15/26 @ 100) | | 55,000 | 57,407 |
| Series 2018 EE, 5% 6/15/33 | | 80,000 | 86,569 |
| Series WW: | | | |
5% 6/15/37 (Pre-Refunded to 6/15/25 @ 100) | | 30,000 | 30,500 |
5.25% 6/15/28 | | 30,000 | 30,399 |
| Series XX, 4.375% 6/15/27 | | 60,000 | 60,231 |
| New Jersey Econ. Dev. Auth. Wtr. Facilities Rev. Bonds (New Jersey American Wtr. Co., Inc. Proj.) Series 2019 B, 2.05%, tender 12/3/29 (b) | | 75,000 | 66,359 |
| New Jersey Edl. Facility: | | | |
| Series 2014 A, 5% 9/1/25 | | 45,000 | 45,086 |
| Series 2014, 5% 6/15/28 | | 50,000 | 50,048 |
| Series A, 4% 7/1/47 | | 40,000 | 36,238 |
| New Jersey Gen. Oblig.: | | | |
| Series 2014, 4% 6/1/34 (Pre-Refunded to 6/1/25 @ 100) | | 10,000 | 10,065 |
| Series 2020 A, 3% 6/1/32 | | 90,000 | 85,851 |
| Series 2021, 2% 6/1/37 | | 105,000 | 78,671 |
| New Jersey Health Care Facilities Fing. Auth. Rev.: | | | |
| (Hosp. Asset Transformation Prog.) Series 2017: | | | |
5% 10/1/26 | | 135,000 | 138,875 |
5% 10/1/27 | | 15,000 | 15,640 |
| (Inspira Health Proj.) Series 2017 A, 5% 7/1/42 | | 40,000 | 40,776 |
| Series 2016: | | | |
3% 7/1/32 | | 25,000 | 21,785 |
3.125% 7/1/33 | | 150,000 | 130,545 |
| Series 2017 A, 4% 7/1/52 | | 125,000 | 119,314 |
| New Jersey Higher Ed. Student Assistance Auth. Student Ln. Rev.: | | | |
| Series 2019 A, 5% 12/1/27 | | 35,000 | 36,715 |
| Series 2019 B, 3.25% 12/1/39 (c) | | 40,000 | 37,141 |
| New Jersey Tobacco Settlement Fing. Corp. Series 2018 A: | | | |
| 4% 6/1/37 | | 30,000 | 30,021 |
| 5% 6/1/29 | | 130,000 | 136,792 |
| New Jersey Tpk. Auth. Tpk. Rev.: | | | |
| Series 2004 C2, 5.5% 1/1/25 (AMBAC Insured) | | 25,000 | 25,262 |
| Series 2005 A, 5.25% 1/1/26 (Assured Guaranty Muni. Corp. Insured) | | 30,000 | 30,935 |
| Series 2014 A: | | | |
4% 1/1/35 | | 110,000 | 110,003 |
5% 1/1/27 | | 50,000 | 50,036 |
5% 1/1/29 | | 45,000 | 45,024 |
| Series 2015 E, 5% 1/1/45 | | 240,000 | 241,271 |
| Series 2016 A, 5% 1/1/33 | | 50,000 | 50,982 |
| Series 2017 A, 5% 1/1/35 | | 110,000 | 113,779 |
| Series 2017 B, 4% 1/1/35 | | 30,000 | 30,389 |
| Series 2017 E: | | | |
5% 1/1/29 | | 15,000 | 15,894 |
5% 1/1/31 | | 155,000 | 163,408 |
| Series 2022 B: | | | |
4.25% 1/1/43 | | 50,000 | 51,217 |
5% 1/1/46 | | 225,000 | 244,597 |
| New Jersey Trans. Trust Fund Auth.: | | | |
| Series 2006 C: | | | |
0% 12/15/24 | | 30,000 | 29,488 |
0% 12/15/25 | | 60,000 | 56,890 |
0% 12/15/29 (Assured Guaranty Muni. Corp. Insured) | | 45,000 | 36,949 |
0% 12/15/32 (Assured Guaranty Muni. Corp. Insured) | | 40,000 | 29,252 |
| Series 2008 A: | | | |
0% 12/15/37 | | 45,000 | 26,651 |
0% 12/15/38 | | 35,000 | 19,785 |
| Series 2010 A: | | | |
0% 12/15/25 | | 40,000 | 37,927 |
0% 12/15/27 | | 30,000 | 26,393 |
0% 12/15/29 | | 20,000 | 16,334 |
0% 12/15/32 | | 65,000 | 47,221 |
0% 12/15/33 | | 15,000 | 10,493 |
| Series 2010 A3, 0% 12/15/34 | | 140,000 | 94,264 |
| Series 2015 AA: | | | |
4.625% 6/15/30 | | 165,000 | 166,422 |
5.25% 6/15/31 | | 135,000 | 136,987 |
5.25% 6/15/32 | | 70,000 | 71,016 |
| Series 2016 A, 5% 6/15/30 | | 25,000 | 25,604 |
| Series 2018 A: | | | |
5% 12/15/24 | | 55,000 | 55,320 |
5% 12/15/34 | | 250,000 | 264,147 |
| Series 2019 BB, 3.25% 6/15/39 | | 25,000 | 22,528 |
| Series 2021 A, 5% 6/15/30 | | 305,000 | 332,708 |
| Series 2022 CC, 5% 6/15/48 | | 230,000 | 245,332 |
| Series 2023 BB, 5% 6/15/38 | | 200,000 | 223,534 |
| Series A: | | | |
0% 12/15/26 | | 90,000 | 82,235 |
0% 12/15/31 | | 180,000 | 136,024 |
5% 6/15/30 | | 50,000 | 51,208 |
| Series A1, 4.1% 6/15/31 | | 15,000 | 15,110 |
| Series AA: | | | |
4% 6/15/36 | | 20,000 | 20,178 |
5.25% 6/15/27 | | 20,000 | 20,286 |
| Series BB, 5% 6/15/33 | | 75,000 | 79,256 |
| Series C, 5.25% 6/15/32 | | 65,000 | 65,385 |
| South Jersey Port Corp. Rev. (New Jersey Gen. Oblig. Proj.) Series 2017 B, 5% 1/1/37 (c) | | 25,000 | 26,003 |
TOTAL NEW JERSEY | | | 5,588,959 |
| New Mexico - 0.5% | | | |
| New Mexico Hosp. Equip. Ln. Council Rev. Series 2015 A, 4.125% 8/1/44 (Pre-Refunded to 8/1/25 @ 100) | | 40,000 | 40,309 |
| New Mexico Mtg. Fin. Auth.: | | | |
| Series 2019 F: | | | |
3.05% 7/1/44 | | 100,000 | 81,090 |
3.5% 7/1/50 | | 45,000 | 44,123 |
| Series 2021 C, 3% 1/1/52 | | 320,000 | 308,624 |
| Series 2022 C, 3.95% 9/1/47 | | 195,000 | 181,472 |
| New Mexico Severance Tax Rev.: | | | |
| Series 2018 A, 5% 7/1/25 | | 65,000 | 66,114 |
| Series 2022 B, 5% 7/1/31 | | 135,000 | 151,553 |
TOTAL NEW MEXICO | | | 873,285 |
| New York - 13.5% | | | |
| Battery Park City Auth. Rev.: | | | |
| Series 2019 A, 5% 11/1/49 | | 190,000 | 202,045 |
| Series 2023 A, 5% 11/1/53 | | 145,000 | 158,105 |
| Brookhaven Gen. Oblig. Series 2020 C, 5% 1/15/27 | | 115,000 | 120,592 |
| Brooklyn Arena Local Dev. Corp. Series 2016 A, 3% 7/15/43 (Assured Guaranty Muni. Corp. Insured) | | 25,000 | 19,452 |
| Dorm. Auth. New York Univ. Rev.: | | | |
| Series 2016 A: | | | |
4% 7/1/43 | | 100,000 | 97,581 |
4% 7/1/43 | | 165,000 | 161,464 |
5% 7/1/29 | | 60,000 | 61,833 |
5% 7/1/37 | | 100,000 | 102,158 |
| Series 2017 A: | | | |
5% 7/1/24 | | 30,000 | 30,000 |
5% 10/1/29 | | 15,000 | 15,705 |
5% 10/1/47 | | 30,000 | 35,306 |
| Series 2018 A, 5% 7/1/40 | | 30,000 | 31,755 |
| Series 2018 B, 5% 10/1/38 | | 45,000 | 48,025 |
| Dutchess County Local Dev. Corp. Rev. Series 2016 B: | | | |
| 3% 7/1/29 | | 150,000 | 135,931 |
| 4% 7/1/41 | | 40,000 | 38,332 |
| Hempstead Town Gen. Oblig. Series 2021, 2.125% 6/15/40 | | 250,000 | 181,977 |
| Hudson Yards Infrastructure Corp. New York Rev.: | | | |
| Series 2017 A: | | | |
4% 2/15/36 | | 120,000 | 121,676 |
4% 2/15/44 | | 35,000 | 34,290 |
5% 2/15/30 | | 55,000 | 57,364 |
5% 2/15/39 | | 40,000 | 41,437 |
| Series 2022 A, 4% 2/15/39 | | 95,000 | 96,449 |
| Liberty Dev. Corp. Rev.: | | | |
| Series 2005, 5.25% 10/1/35 | | 115,000 | 132,762 |
| Series 2007, 5.5% 10/1/37 | | 25,000 | 29,625 |
| Long Island Pwr. Auth. Elec. Sys. Rev.: | | | |
| Series 2000, 0% 6/1/29 (Assured Guaranty Muni. Corp. Insured) | | 90,000 | 73,993 |
| Series 2016 B, 5% 9/1/46 | | 40,000 | 40,770 |
| Series 2017, 5% 9/1/47 | | 30,000 | 30,825 |
| Series 2018, 5% 9/1/35 | | 20,000 | 21,418 |
| Series 2019 A, 5% 9/1/26 | | 150,000 | 155,762 |
| Series 2020 A, 5% 9/1/30 | | 120,000 | 133,880 |
| Monroe County Indl. Dev. Corp.: | | | |
| (Univ. of Rochester Proj.) Series 2020 A, 5% 7/1/25 | | 30,000 | 30,508 |
| Series 2015 A, 5% 7/1/27 | | 105,000 | 106,458 |
| New York City Gen. Oblig.: | | | |
| Series 2008 J9, 5% 8/1/26 | | 250,000 | 259,188 |
| Series 2008 L6, 5% 4/1/31 | | 50,000 | 53,964 |
| Series 2016 A, 5% 8/1/26 | | 150,000 | 152,306 |
| Series 2016, 3% 8/1/34 | | 25,000 | 22,749 |
| Series 2017 B1, 4% 10/1/40 | | 260,000 | 256,253 |
| Series 2017, 5% 8/1/27 | | 25,000 | 26,381 |
| Series 2018 1, 5% 8/1/28 | | 10,000 | 10,480 |
| Series 2018 B-1, 3.25% 10/1/42 | | 55,000 | 47,554 |
| Series 2018 E1, 5% 3/1/31 | | 240,000 | 253,140 |
| Series 2019 E, 5% 8/1/25 | | 30,000 | 30,547 |
| Series 2020 A, 4% 8/1/44 | | 20,000 | 19,643 |
| Series 2020 A1, 5% 8/1/35 | | 120,000 | 129,933 |
| Series 2020 C, 5% 8/1/26 | | 200,000 | 207,350 |
| Series 2021 C, 5% 8/1/29 | | 260,000 | 283,751 |
| Series 2023 B1, 5.25% 10/1/47 | | 235,000 | 258,534 |
| Series B1, 5% 10/1/32 | | 70,000 | 76,052 |
| Series D: | | | |
4% 12/1/41 | | 50,000 | 49,070 |
4% 3/1/42 | | 125,000 | 123,982 |
| Series E, 5% 8/1/26 | | 75,000 | 77,756 |
| Series J, 5% 8/1/24 | | 50,000 | 50,050 |
| New York City Hsg. Dev. Corp.: | | | |
| Bonds Series H, 2.95%, tender 2/1/26 (b) | | 15,000 | 14,676 |
| Series 2016 I1A, 3.95% 11/1/36 | | 70,000 | 69,047 |
| New York City Hsg. Dev. Corp. Multifamily Hsg.: | | | |
| Bonds Series D2, 0.7%, tender 11/1/24 (b) | | 70,000 | 69,040 |
| Series 2019 E1, 3.25% 11/1/49 | | 30,000 | 24,127 |
| Series 2020 D1B, 2.4% 11/1/50 | | 75,000 | 47,844 |
| Series 2021 A1, 2.05% 11/1/33 | | 135,000 | 111,207 |
| Series 2021 C1, 2.25% 11/1/41 | | 110,000 | 78,653 |
| Series 2021 G, 2.15% 11/1/36 | | 205,000 | 160,143 |
| Series 2021 K1, 2.45% 11/1/41 | | 160,000 | 118,183 |
| Series E1, 3.45% 5/1/59 | | 10,000 | 7,818 |
| New York City Indl. Dev. Agcy. Rev. Series 2009 A: | | | |
| 0% 3/1/27 | | 90,000 | 81,150 |
| 0% 3/1/37 | | 50,000 | 29,504 |
| 0% 3/1/39 (Assured Guaranty Corp. Insured) | | 10,000 | 5,259 |
| 0% 3/1/44 | | 45,000 | 17,944 |
| 0% 3/1/45 (Assured Guaranty Corp. Insured) | | 25,000 | 9,426 |
| New York City Muni. Wtr. Fin. Auth. Wtr. & Swr. Sys. Rev.: | | | |
| Series 2013 DD, 4% 6/15/38 | | 65,000 | 65,009 |
| Series 2015 HH, 5% 6/15/29 | | 65,000 | 65,937 |
| Series 2016 BB, 5% 6/15/46 | | 40,000 | 40,348 |
| Series 2017 DD, 5.25% 6/15/47 | | 60,000 | 61,765 |
| Series 2017 EE, 5% 6/15/36 | | 60,000 | 62,491 |
| Series 2018 AA, 5% 6/15/37 | | 5,000 | 5,198 |
| Series 2018 DD1, 5% 6/15/48 | | 15,000 | 15,455 |
| Series 2018 FF, 5% 6/15/40 | | 135,000 | 141,917 |
| Series 2019 AA, 5% 6/15/27 | | 150,000 | 158,481 |
| Series 2019 DD, 5.25% 6/15/49 | | 65,000 | 68,117 |
| Series 2020 CC1: | | | |
4% 6/15/39 | | 100,000 | 100,000 |
4% 6/15/49 | | 35,000 | 34,091 |
| Series 2020 FF, 5% 6/15/41 | | 190,000 | 205,295 |
| Series 2022 CC1, 4% 6/15/52 | | 150,000 | 144,590 |
| Series BB, 5% 6/15/49 | | 180,000 | 188,750 |
| Series CC: | | | |
4% 6/15/42 | | 90,000 | 88,489 |
5% 6/15/30 | | 25,000 | 27,255 |
| Series EE, 5% 6/15/32 | | 10,000 | 10,200 |
| Series FF, 4% 6/15/37 | | 80,000 | 80,635 |
| New York City Transitional Fin. Auth.: | | | |
| Series 2017, 5% 8/1/24 | | 50,000 | 50,058 |
| Series 2024 D, 5% 11/1/41 | | 20,000 | 22,405 |
| New York City Transitional Fin. Auth. Bldg. Aid Rev.: | | | |
| Series 2018 S 4A, 5% 7/15/34 | | 5,000 | 5,312 |
| Series 2018 S2, 5% 7/15/24 (Escrowed to Maturity) | | 70,000 | 70,037 |
| Series 2018 S3, 3.625% 7/15/47 | | 155,000 | 140,069 |
| Series 2018 S4, 5% 7/15/31 | | 30,000 | 31,884 |
| Series 2023 S 1A, 5% 7/15/28 | | 400,000 | 429,726 |
| Series S1: | | | |
5% 7/15/26 | | 50,000 | 51,215 |
5% 7/15/27 | | 15,000 | 15,135 |
5% 7/15/29 | | 60,000 | 60,526 |
5% 7/15/35 | | 35,000 | 36,215 |
| New York City Transitional Fin. Auth. Rev.: | | | |
| Series 2014 B1, 5% 11/1/24 | | 75,000 | 75,076 |
| Series 2014, 5% 11/1/25 | | 30,000 | 30,036 |
| Series 2015 A, 5% 8/1/29 | | 100,000 | 100,105 |
| Series 2016 A, 5% 5/1/40 | | 15,000 | 15,284 |
| Series 2016 B1, 5% 11/1/35 | | 105,000 | 106,810 |
| Series 2017 F: | | | |
3% 5/1/34 | | 50,000 | 47,785 |
4% 5/1/37 | | 80,000 | 80,242 |
| Series 2018 A, 5% 8/1/38 | | 55,000 | 57,026 |
| Series 2018 B, 5% 8/1/45 | | 50,000 | 51,353 |
| Series 2018 B1, 5% 8/1/29 | | 150,000 | 156,569 |
| Series 2019 C, 4% 11/1/37 | | 30,000 | 30,240 |
| Series 2019 C1, 4% 11/1/36 | | 50,000 | 50,497 |
| Series 2020 A3, 4% 5/1/42 | | 260,000 | 256,470 |
| Series 2020 B1, 4% 11/1/45 | | 415,000 | 405,264 |
| Series 2020 C1, 5% 5/1/41 | | 100,000 | 108,209 |
| Series 2021 A, 5% 11/1/31 | | 150,000 | 166,859 |
| Series 2021 C1, 4% 5/1/38 | | 100,000 | 101,604 |
| Series 2021 F1, 5% 11/1/32 | | 170,000 | 190,331 |
| Series 2022 B1, 5% 11/1/33 | | 445,000 | 508,128 |
| Series 2022 C1, 5% 2/1/37 | | 100,000 | 112,343 |
| Series 2023 F1, 5.25% 2/1/47 | | 190,000 | 209,898 |
| Series A, 4% 11/1/35 | | 80,000 | 82,457 |
| Series B: | | | |
4% 8/1/38 | | 100,000 | 100,882 |
4% 8/1/39 | | 20,000 | 20,113 |
| Series B1, 5% 11/1/28 | | 30,000 | 30,584 |
| Series C: | | | |
3.25% 11/1/43 | | 140,000 | 122,414 |
4% 2/1/27 | | 70,000 | 71,394 |
5% 11/1/26 | | 40,000 | 41,648 |
| Series C1: | | | |
4% 5/1/40 | | 10,000 | 10,007 |
4% 5/1/44 | | 30,000 | 29,671 |
| New York City Trust Cultural Resources Rev. Series 2016 1E: | | | |
| 4% 4/1/27 | | 15,000 | 15,283 |
| 4% 4/1/28 | | 75,000 | 76,467 |
| New York Convention Ctr. Dev. Corp. Rev. Series 2016 B: | | | |
| 0% 11/15/32 | | 90,000 | 63,212 |
| 0% 11/15/36 | | 100,000 | 57,976 |
| 0% 11/15/38 | | 75,000 | 38,902 |
| 0% 11/15/44 | | 75,000 | 27,478 |
| New York Dorm. Auth. Rev.: | | | |
| Series 1: | | | |
3% 7/1/34 | | 105,000 | 95,321 |
5% 7/1/30 | | 20,000 | 21,813 |
| Series 2014 A, 5.5% 1/1/39 (Pre-Refunded to 7/1/24 @ 100) | | 20,000 | 20,000 |
| Series 2015 A: | | | |
4.125% 5/1/42 | | 50,000 | 49,348 |
5% 5/1/33 | | 40,000 | 40,270 |
5% 7/1/40 | | 235,000 | 235,861 |
| Series 2018 A: | | | |
4% 8/1/38 | | 60,000 | 57,675 |
5% 8/1/25 | | 100,000 | 99,849 |
| Series 2019 A, 5% 7/1/27 | | 20,000 | 21,120 |
| Series 2019 C, 4% 7/1/49 | | 45,000 | 43,419 |
| Series 2020 A: | | | |
4% 7/1/50 | | 130,000 | 126,774 |
5% 7/1/30 | | 190,000 | 212,999 |
5% 10/1/31 (Assured Guaranty Muni. Corp. Insured) | | 225,000 | 237,775 |
| Series 2020 A2, 5% 7/1/31 | | 25,000 | 28,041 |
| Series 2020, 3% 2/1/50 | | 55,000 | 41,253 |
| Series 2021 A, 5% 7/1/26 | | 100,000 | 102,637 |
| Series 2021 B, 3% 7/1/45 | | 100,000 | 78,683 |
| Series 2022 A, 4.25% 5/1/52 | | 40,000 | 40,022 |
| New York Dorm. Auth. Sales Tax Rev.: | | | |
| Series 2016 A, 5% 3/15/29 | | 80,000 | 82,526 |
| Series 2017 A: | | | |
5% 3/15/43 | | 75,000 | 77,142 |
5% 3/15/44 | | 210,000 | 215,749 |
| Series 2018, 5% 3/15/48 | | 75,000 | 77,698 |
| New York Envir. Facilities Corp. Clean Wtr. & Drinking Wtr.: | | | |
| (New York City Muni. Wtr. Fin. Auth. Proj.): | | | |
Series 2017 A, 3.5% 6/15/36 | | 10,000 | 10,012 |
Series 2018 A, 5% 6/15/30 | | 50,000 | 53,615 |
Series 2019 B, 5% 6/15/31 | | 25,000 | 27,389 |
| (New York City Muni. Wtr. Fin. Auth. Projs. - Second Resolution Bonds): | | | |
Series 2023 B, 5% 6/15/32 | | 135,000 | 155,153 |
Series 2024 A: | | | |
5% 6/15/37 | | 15,000 | 17,546 |
5% 6/15/38 | | 85,000 | 98,864 |
| New York Liberty Dev. Corp. (Bank of America Tower at One Bryant Park Proj.) Series 2019 2, 2.625% 9/15/69 | | 150,000 | 136,817 |
| New York Metropolitan Trans. Auth. Dedicated Tax Fund Rev.: | | | |
| Series 2012 A: | | | |
0% 11/15/32 | | 225,000 | 165,464 |
3% 11/15/28 | | 190,000 | 187,967 |
| Series 2016 A: | | | |
5% 11/15/26 | | 90,000 | 93,899 |
5.25% 11/15/28 | | 150,000 | 156,637 |
| New York Metropolitan Trans. Auth. Rev.: | | | |
| Series 2015 B, 4% 11/15/45 | | 250,000 | 240,283 |
| Series 2015 C, 5% 11/15/34 | | 80,000 | 81,407 |
| Series 2015 F, 3.25% 11/15/31 | | 35,000 | 33,257 |
| Series 2016 C1: | | | |
4% 11/15/46 | | 120,000 | 114,365 |
5% 11/15/30 | | 395,000 | 407,119 |
| Series 2016 C2A, 3% 11/15/38 | | 25,000 | 20,773 |
| Series 2016 D: | | | |
3% 11/15/32 | | 50,000 | 46,048 |
5% 11/15/27 | | 10,000 | 10,357 |
| Series 2017 A2, 5% 11/15/24 | | 100,000 | 100,431 |
| Series 2017 C1: | | | |
4% 11/15/34 | | 55,000 | 55,341 |
4% 11/15/35 | | 160,000 | 160,690 |
5% 11/15/24 | | 20,000 | 20,086 |
5% 11/15/25 | | 45,000 | 45,950 |
5% 11/15/28 | | 25,000 | 26,485 |
| Series 2017 D: | | | |
4% 11/15/42 | | 95,000 | 93,426 |
5% 11/15/27 | | 100,000 | 105,263 |
| Series 2018 B: | | | |
5% 11/15/25 | | 35,000 | 35,739 |
5% 11/15/27 | | 20,000 | 21,053 |
| Series 2019 B, 4% 11/15/49 (Assured Guaranty Muni. Corp. Insured) | | 40,000 | 38,797 |
| Series 2020 A1, 4% 11/15/52 | | 20,000 | 18,906 |
| Series 2020, 4% 11/15/49 | | 25,000 | 23,868 |
| Series 2021 A1, 4% 11/15/49 | | 25,000 | 23,868 |
| Series 2024 A, 5% 11/15/44 | | 25,000 | 27,055 |
| New York State Dorm. Auth.: | | | |
| Series 2016: | | | |
5% 2/15/26 | | 10,000 | 10,290 |
5% 2/15/26 (Escrowed to Maturity) | | 105,000 | 107,889 |
| Series 2017 A, 5% 2/15/27 (Escrowed to Maturity) | | 110,000 | 115,422 |
| Series 2017 B: | | | |
5% 2/15/39 | | 15,000 | 15,555 |
5% 2/15/43 | | 50,000 | 51,479 |
| Series 2018 A, 5% 3/15/32 | | 50,000 | 53,568 |
| Series 2019 A: | | | |
5% 3/15/39 | | 100,000 | 106,449 |
5% 3/15/40 | | 90,000 | 95,323 |
| Series 2019 D, 3% 2/15/49 | | 120,000 | 92,460 |
| Series 2020 A, 3% 3/15/49 | | 105,000 | 80,910 |
| Series 2022 A, 4% 3/15/39 | | 220,000 | 220,500 |
| New York State Envir. Facilities Corp. Rev.: | | | |
| (2010 Master Fing. Prog.): | | | |
Series 2014 B, 5% 11/15/39 | | 5,000 | 5,006 |
Series 2017 C, 5% 8/15/47 | | 175,000 | 180,276 |
| Series 2019 A, 5% 2/15/49 | | 30,000 | 31,533 |
| New York State Gen. Oblig. Series 2013 A, 3.5% 3/1/43 | | 40,000 | 35,609 |
| New York State Hsg. Fin. Agcy. Rev.: | | | |
| Series 2019 N, 3.05% 11/1/52 | | 55,000 | 41,423 |
| Series 2019 R, 3.15% 11/1/54 | | 25,000 | 19,383 |
| Series 2021 G, 2.4% 11/1/41 | | 210,000 | 153,819 |
| Series L, 3.45% 11/1/42 | | 25,000 | 22,139 |
| New York State Mtg. Agcy. Homeowner Mtg.: | | | |
| Series 2020 225, 2.3% 10/1/40 | | 155,000 | 115,417 |
| Series 220, 2.85% 10/1/44 | | 25,000 | 19,817 |
| New York State Mtg. Agcy. Rev. Series 48, 3.45% 10/1/33 | | 5,000 | 4,797 |
| New York State Urban Dev. Corp.: | | | |
| Series 2016 A, 5% 3/15/26 | | 20,000 | 20,612 |
| Series 2020 A: | | | |
4% 3/15/45 | | 65,000 | 63,773 |
4% 3/15/49 | | 85,000 | 82,736 |
| New York State Urban Eev Corp. Series 2019 A, 4% 3/15/46 | | 75,000 | 72,940 |
| New York Thruway Auth. Gen. Rev.: | | | |
| Series 2014 K, 5% 1/1/26 | | 80,000 | 80,627 |
| Series 2016 A, 5% 1/1/51 | | 30,000 | 30,248 |
| Series 2019 B, 3% 1/1/46 | | 50,000 | 39,714 |
| Series 2020 N, 4% 1/1/47 | | 200,000 | 196,026 |
| Series 2024 P: | | | |
5% 1/1/31 | | 25,000 | 28,087 |
5% 1/1/33 | | 10,000 | 11,572 |
| Series K: | | | |
5% 1/1/28 | | 10,000 | 10,067 |
5% 1/1/29 | | 90,000 | 90,578 |
| Series L, 5% 1/1/34 | | 70,000 | 74,404 |
| New York Trans. Dev. Corp.: | | | |
| (Delta Air Lines, Inc. LaGuardia Arpt. Terminals C&D Redev. Proj.) Series 2018, 5% 1/1/30 (c) | | 30,000 | 31,127 |
| (LaGuardia Arpt. Term. B Redev. Proj.) Series 2016 A: | | | |
4% 7/1/41 (c) | | 30,000 | 28,369 |
4% 1/1/51 (Assured Guaranty Muni. Corp. Insured) (c) | | 30,000 | 27,590 |
| (Term. 4 JFK Int'l. Arpt. Proj.) Series 2020 A: | | | |
4% 12/1/40 (c) | | 50,000 | 48,875 |
5% 12/1/25 (c) | | 105,000 | 106,409 |
| (Term. 4 John F. Kennedy Int'l. Arpt. Proj.) Series 2022, 5% 12/1/35 (c) | | 150,000 | 161,144 |
| New York Urban Dev. Corp. Rev. Series 2019 A: | | | |
| 5% 3/15/42 | | 15,000 | 15,659 |
| 5% 3/15/44 | | 25,000 | 26,001 |
| Onondaga County Trust for Cultural Resources Rev. Series 2019: | | | |
| 5% 12/1/39 | | 25,000 | 26,889 |
| 5% 12/1/40 | | 160,000 | 170,977 |
| Suffolk County Gen. Oblig. Series 2015 C, 5% 5/1/27 | | 15,000 | 14,878 |
| Suffolk County Wtr. Auth. Wtrwks. Rev. Series 2018 A, 4% 6/1/41 | | 45,000 | 45,019 |
| Tobacco Settlement Asset Securitization Corp. Series 2017 A, 5% 6/1/32 | | 75,000 | 77,755 |
| Triborough Bridge & Tunnel Auth. Series 2021 C3, 4% 5/15/51 | | 540,000 | 526,657 |
| Triborough Bridge & Tunnel Auth. Revs.: | | | |
| Series 2008 B3, 5% 11/15/37 | | 40,000 | 40,614 |
| Series 2013 A: | | | |
0% 11/15/30 | | 105,000 | 81,742 |
0% 11/15/32 | | 35,000 | 24,989 |
| Series 2016 A: | | | |
5% 11/15/31 | | 100,000 | 102,855 |
5% 11/15/41 | | 25,000 | 25,396 |
| Series 2017 A, 5% 11/15/26 | | 50,000 | 52,121 |
| Series 2017 B: | | | |
5% 11/15/25 | | 80,000 | 81,996 |
5% 11/15/36 | | 90,000 | 93,462 |
| Series 2018 C, 5% 11/15/37 | | 25,000 | 26,580 |
| Series 2018 D, 5% 11/15/34 | | 150,000 | 166,907 |
| Series 2019 A, 5% 11/15/49 | | 45,000 | 46,774 |
| Series 2021 A, 5% 11/1/25 | | 140,000 | 143,278 |
| Series B, 5% 11/15/31 | | 200,000 | 226,765 |
| Troy Cap. Resource Corp. Rev. (Rensselaer Polytechnic Institute Proj.) Series 2020 A, 5% 9/1/37 | | 375,000 | 402,732 |
| Util. Debt Securitization Auth.: | | | |
| Series 2015, 3% 12/15/32 | | 80,000 | 77,346 |
| Series 2017: | | | |
5% 12/15/38 | | 25,000 | 26,279 |
5% 12/15/41 | | 50,000 | 52,154 |
| Westchester County Gen. Oblig.: | | | |
| Series 2018 A, 4% 12/1/27 | | 50,000 | 51,253 |
| Series 2019 D, 4% 12/15/28 | | 20,000 | 20,622 |
| Westchester County Local Dev. Co. (Westchester Obligated Group Proj.) Series 2016, 3.75% 11/1/37 | | 45,000 | 38,579 |
TOTAL NEW YORK | | | 22,235,550 |
| New York And New Jersey - 1.5% | | | |
| Port Auth. of New York & New Jersey: | | | |
| Series 189, 5% 5/1/30 | | 20,000 | 20,248 |
| Series 194: | | | |
5% 10/15/25 | | 25,000 | 25,571 |
5% 10/15/30 | | 35,000 | 35,680 |
5% 10/15/32 | | 55,000 | 56,055 |
5% 10/15/35 | | 100,000 | 101,855 |
5.25% 10/15/55 | | 50,000 | 50,805 |
| Series 198, 5% 11/15/46 | | 15,000 | 15,181 |
| Series 2012 171, 4% 1/15/42 | | 205,000 | 205,046 |
| Series 2013 177th, 4% 1/15/43 (c) | | 195,000 | 186,478 |
| Series 2014 185, 5% 9/1/25 (c) | | 120,000 | 120,229 |
| Series 2014, 3% 7/15/28 (c) | | 50,000 | 47,790 |
| Series 2015 189, 5% 5/1/45 | | 140,000 | 141,231 |
| Series 2017 202, 5% 10/15/34 (c) | | 580,000 | 595,754 |
| Series 2018 209, 5% 7/15/34 | | 70,000 | 74,501 |
| Series 2019 217, 5% 11/1/30 | | 100,000 | 109,418 |
| Series 202, 5% 10/15/30 (c) | | 20,000 | 20,542 |
| Series 2020 222, 5% 7/15/31 | | 75,000 | 83,690 |
| Series 2021 223, 5% 7/15/31 (c) | | 55,000 | 59,626 |
| Series 2024 244, 5% 7/15/45 | | 225,000 | 250,007 |
| Series 207, 5% 9/15/26 (c) | | 185,000 | 190,776 |
| Series 209, 5% 7/15/31 | | 30,000 | 31,966 |
TOTAL NEW YORK AND NEW JERSEY | | | 2,422,449 |
| North Carolina - 1.1% | | | |
| Charlotte Gen. Oblig. Series 2023 B, 5% 7/1/28 | | 25,000 | 26,877 |
| Charlotte Int'l. Arpt. Rev. Series 2021 A, 4% 7/1/41 | | 150,000 | 150,916 |
| Greensboro Combined Enterprise Sys. Rev. Series 2017 A, 4% 6/1/47 | | 95,000 | 94,388 |
| Mecklenburg County Gen. Oblig.: | | | |
| Series 2017 A, 3% 4/1/37 | | 50,000 | 45,784 |
| Series 2019, 4% 3/1/34 | | 210,000 | 216,779 |
| Series 2022, 5% 9/1/32 | | 130,000 | 149,639 |
| North Carolina Gen. Oblig.: | | | |
| Series 2016 A, 5% 6/1/27 | | 70,000 | 72,205 |
| Series 2018 A, 5% 6/1/29 | | 45,000 | 48,345 |
| North Carolina Grant Anticipation Rev.: | | | |
| Series 2015: | | | |
5% 3/1/27 | | 30,000 | 30,290 |
5% 3/1/28 | | 50,000 | 50,468 |
| Series 2019: | | | |
5% 3/1/31 | | 45,000 | 48,650 |
5% 3/1/33 | | 75,000 | 80,981 |
5% 3/1/34 | | 40,000 | 43,138 |
| North Carolina Ltd. Oblig.: | | | |
| Series 2019 A, 5% 5/1/25 | | 30,000 | 30,412 |
| Series 2020 B, 5% 5/1/29 | | 20,000 | 21,785 |
| North Carolina Med. Care Commission Health Care Facilities Rev.: | | | |
| Series 2016 A, 5% 6/1/28 | | 65,000 | 69,213 |
| Series 2020 A, 4% 10/1/45 | | 55,000 | 50,904 |
| North Carolina Tpk. Auth. Triangle Expressway Sys.: | | | |
| Series 2009 B: | | | |
0% 1/1/37 (Assured Guaranty Corp. Insured) | | 275,000 | 167,812 |
0% 1/1/38 | | 110,000 | 63,726 |
| Series 2018, 5% 1/1/31 | | 85,000 | 89,914 |
| Union County Enterprise Systems Rev. Series 2021, 3% 6/1/37 | | 80,000 | 72,993 |
| Wake County: | | | |
| Series 2019 A, 3% 3/1/36 | | 50,000 | 46,543 |
| Series 2022 A, 5% 2/1/31 | | 100,000 | 112,630 |
TOTAL NORTH CAROLINA | | | 1,784,392 |
| North Dakota - 0.0% | | | |
| North Dakota Hsg. Fin. Agcy. Series 2021 A, 2.25% 7/1/41 | | 50,000 | 36,782 |
| Ohio - 2.4% | | | |
| Allen County Hosp. Facilities Rev. Series 2015 A, 4% 11/1/44 | | 245,000 | 239,687 |
| Buckeye Tobacco Settlement Fing. Auth. Series 2020 A2, 5% 6/1/34 | | 240,000 | 257,357 |
| Chillicothe Hosp. Facilities Rev. Series 2017, 5% 12/1/37 | | 100,000 | 102,896 |
| Cleveland Income Tax Rev. Series 2017 B1, 5% 10/1/28 | | 115,000 | 121,431 |
| Cleveland Pub. Pwr. Sys. Rev. Series B2, 0% 11/15/38 (Nat'l. Pub. Fin. Guarantee Corp. Insured) | | 55,000 | 28,761 |
| Columbus Gen. Oblig.: | | | |
| Series 2016 A, 4% 8/15/27 | | 45,000 | 45,228 |
| Series 2018 A, 5% 4/1/30 | | 120,000 | 129,439 |
| Series 2024 A, 5% 8/15/40 | | 65,000 | 74,296 |
| Cuyahoga County Hosp. Rev. Series 2017, 5% 2/15/52 | | 55,000 | 55,116 |
| Franklin County Ohio Sales Tax R Series 2018, 5% 6/1/48 | | 30,000 | 31,244 |
| Franklin County Rev. Series 2017 OH: | | | |
| 4% 12/1/46 | | 70,000 | 66,987 |
| 5% 12/1/46 | | 65,000 | 66,152 |
| Gahanna-Jefferson School District Series 2021, 2% 12/1/50 (Assured Guaranty Muni. Corp. Insured) | | 45,000 | 25,269 |
| Hamilton County Hosp. Facilities Rev. (Trihealth, Inc. Obligated Group Proj.) Series 2020 A, 4% 8/15/50 | | 20,000 | 18,858 |
| Hamilton County Sales Tax Rev. Series 2000 B, 0% 12/1/28 (AMBAC Insured) | | 235,000 | 199,743 |
| Northeastern Local School District of Clark and Champaign Series 2018, 4% 12/1/55 (Assured Guaranty Muni. Corp. Insured) | | 65,000 | 60,294 |
| Ohio Gen. Oblig.: | | | |
| Series 2015 A, 5% 9/15/26 | | 20,000 | 20,779 |
| Series 2015 C: | | | |
5% 11/1/28 | | 35,000 | 35,483 |
5% 11/1/30 | | 50,000 | 50,661 |
| Series 2017 C, 5% 8/1/26 | | 25,000 | 25,916 |
| Series 2018 A, 5% 2/1/29 | | 25,000 | 25,653 |
| Series 2019 A, 5% 5/1/27 | | 60,000 | 63,067 |
| Series 2021 B, 5% 9/15/31 | | 120,000 | 135,633 |
| Series 2024 A, 5% 3/1/39 | | 65,000 | 74,116 |
| Series S, 5% 5/1/29 | | 50,000 | 51,527 |
| Ohio Hosp. Facilities Rev.: | | | |
| Series 2017 A, 5% 1/1/33 | | 40,000 | 42,230 |
| Series 2021 B, 5% 1/1/28 | | 100,000 | 105,948 |
| Ohio Hosp. Rev. Series 2016 A, 5% 1/15/41 | | 20,000 | 20,204 |
| Ohio Hsg. Fin. Agcy. Residential Mtg. Rev.: | | | |
| (Mtg. - Backed Securities Prog.) Series 2021 C, 2.7% 9/1/46 | | 485,000 | 357,739 |
| (Mtg.-Backed Securities Prog.) Series 2021 A, 3% 3/1/52 | | 120,000 | 116,166 |
| Ohio Parks & Recreation Cap. Facilities Series 2017 A, 5% 12/1/31 | | 20,000 | 21,041 |
| Ohio Spl. Oblig. (Trans. Bldg. Fund Proj.) Series 2015 A, 5% 4/1/29 | | 40,000 | 40,438 |
| Ohio Tpk. Commission Tpk. Rev.: | | | |
| (Infrastructure Proj.): | | | |
Series 2005 A, 0% 2/15/43 | | 25,000 | 10,867 |
Series 2013 A2, 0% 2/15/37 | | 20,000 | 12,152 |
Series A, 0% 2/15/41 | | 60,000 | 29,060 |
| Series A, 5% 2/15/51 | | 50,000 | 53,092 |
| Ohio Wtr. Dev. Auth. Poll. Cont. Facilities Rev. Series 2019 A, 5% 6/1/27 | | 55,000 | 57,912 |
| Ohio Wtr. Dev. Auth. Wtr. Poll. Cont. Rev.: | | | |
| Series 2017 A, 5% 12/1/28 | | 30,000 | 31,532 |
| Series 2019 B, 3% 6/1/46 | | 90,000 | 71,798 |
| Series 2020 A: | | | |
5% 6/1/33 | | 90,000 | 99,685 |
5% 12/1/40 | | 80,000 | 86,944 |
| Series 2020 B, 4% 12/1/38 | | 490,000 | 504,948 |
| Series 2023 C, 5% 12/1/33 | | 30,000 | 34,777 |
| Scioto County Hosp. Facilities Rev. Series 2016, 3.5% 2/15/38 | | 285,000 | 260,426 |
| Southwest Licking Local School Series 2017 A, 3.375% 11/1/47 | | 10,000 | 8,584 |
TOTAL OHIO | | | 3,971,136 |
| Oklahoma - 0.4% | | | |
| Cleveland County Edl. Facilities Auth. (Norman Pub. Schools Proj.) Series 2019, 5% 6/1/25 | | 110,000 | 111,349 |
| Edmond Pub. Works Auth. Sales Tax & Util. Sys. Rev. Series 2017, 4% 7/1/47 | | 145,000 | 141,116 |
| Oklahoma Cap. Imp Auth. St Hwy. Series 2016, 4% 7/1/33 | | 10,000 | 10,050 |
| Oklahoma Dev. Fin. Auth. Health Sys. Rev. (OU Medicine Proj.) Series 2018 B, 4% 8/15/48 (Assured Guaranty Muni. Corp. Insured) | | 140,000 | 128,380 |
| Oklahoma Pwr. Auth. Pwr. Supply Sys. Rev. Series 2016 A, 5% 1/1/47 | | 15,000 | 15,146 |
| Oklahoma St Wtr. Resources Board Rev. Fund Series 2023 A, 4.125% 4/1/53 | | 20,000 | 19,574 |
| Oklahoma Tpk. Auth. Tpk. Rev.: | | | |
| Series 2017 A, 4% 1/1/47 | | 35,000 | 34,063 |
| Series 2017 D, 5% 1/1/26 | | 65,000 | 66,742 |
| Univ. of Oklahoma Gen. Rev. Series 2015 C, 5% 7/1/36 | | 85,000 | 85,846 |
TOTAL OKLAHOMA | | | 612,266 |
| Oregon - 1.1% | | | |
| Bend La Pine General Obligation Series 2017, 5% 6/15/26 | | 10,000 | 10,344 |
| Clackamas County School District No. 46: | | | |
| Series 2009: | | | |
0% 6/15/33 | | 60,000 | 43,794 |
0% 6/15/36 | | 85,000 | 54,666 |
0% 6/15/39 | | 155,000 | 85,978 |
| Series B, 0% 6/15/34 | | 35,000 | 24,598 |
| Deschutes & Jefferson Counties School District #2J Redmond Series 2008 B, 0% 6/15/26 | | 40,000 | 37,252 |
| Deschutes Ore Pub. Libr District Series 2021, 3% 12/1/41 | | 205,000 | 175,068 |
| Greater Albany School Distrct No. 8J Series 2017, 5% 6/15/27 | | 15,000 | 15,782 |
| Medford Hosp. Facilities Auth. Rev. (Asante Projs.) Series 2020 A: | | | |
| 4% 8/15/50 | | 100,000 | 93,549 |
| 5% 8/15/45 | | 50,000 | 52,169 |
| Oregon Facilities Auth. Rev.: | | | |
| (Univ. of Portland Proj.) Series 2015 A, 5% 4/1/45 | | 15,000 | 15,079 |
| Series 2022 A, 5% 6/1/52 | | 230,000 | 239,593 |
| Oregon Gen. Oblig.: | | | |
| Series 2021 A, 4% 5/1/38 | | 195,000 | 200,156 |
| Series A, 4% 5/1/37 | | 110,000 | 112,257 |
| Oregon Health and Science Univ. Spl. Rev.: | | | |
| Series 2016 B, 5% 7/1/39 | | 15,000 | 15,297 |
| Series 2019 A, 5% 7/1/30 | | 100,000 | 108,885 |
| Port of Portland Arpt. Rev. Series 2022 28, 5% 7/1/30 (c) | | 155,000 | 165,302 |
| Portland Swr. Sys. Rev. Series B, 3% 10/1/28 | | 110,000 | 107,892 |
| Salem Hosp. Facility Auth. Rev. (Salem Health Projs.) Series 2019 A: | | | |
| 3% 5/15/49 | | 45,000 | 35,202 |
| 5% 5/15/29 | | 100,000 | 106,727 |
| Tri-County Metropolitan Trans. District Rev. Series 2018 A, 3.25% 10/1/34 | | 50,000 | 48,071 |
TOTAL OREGON | | | 1,747,661 |
| Pennsylvania - 3.3% | | | |
| Allegheny County Series C77, 5% 11/1/43 | | 25,000 | 26,058 |
| Allegheny County Arpt. Auth. Rev. Series 2021 A, 5% 1/1/51 (c) | | 465,000 | 478,948 |
| Allegheny County Hosp. Dev. Auth. Rev.: | | | |
| Series 2018 A: | | | |
4% 4/1/38 | | 5,000 | 4,809 |
5% 4/1/27 | | 100,000 | 103,174 |
| Series 2019 A, 5% 7/15/33 | | 110,000 | 117,629 |
| Allegheny County Sanitation Auth. Swr. Rev. Series 2020 B, 4% 6/1/50 | | 185,000 | 175,294 |
| Chester County Indl. Dev. Auth. Rev. (Longwood Gardens, Inc. Proj.) Series 2021, 4% 12/1/46 | | 165,000 | 159,451 |
| Commonwealth Fing. Auth. Tobacco Series 2018, 4% 6/1/39 (Assured Guaranty Muni. Corp. Insured) | | 60,000 | 60,367 |
| Delaware County Auth. College Rev. Series 2017 A: | | | |
| 5% 10/1/42 | | 5,000 | 5,121 |
| 5% 10/1/46 | | 135,000 | 137,531 |
| Delaware River Port Auth. Pennsylvania & New Jersey Rev. Series 2018 A, 5% 1/1/32 | | 30,000 | 32,269 |
| Lancaster County Hosp. Auth. Health Ctr. Rev. Series 2016 A, 5% 8/15/42 | | 10,000 | 10,187 |
| Lehigh County Gen. Purp. Hosp. Rev. Series 2012 B, 4% 7/1/43 | | 40,000 | 37,638 |
| Montgomery County Higher Ed. & Health Auth. Rev. Series 2019, 4% 9/1/44 | | 90,000 | 85,069 |
| Northampton County Gen. Purp. Auth. Hosp. Rev. (St. Luke's Univ. Health Network Proj.) Series 2016 A, 3.125% 8/15/35 | | 35,000 | 32,271 |
| Northampton County Gen. Purp. College Rev. Series 2017, 3.125% 11/1/34 | | 60,000 | 56,043 |
| Pennsylvania Econ. Dev. Series 2024 B, 4.25% 1/1/50 | | 230,000 | 224,062 |
| Pennsylvania Econ. Dev. Fing. Auth.: | | | |
| Series 2017 A: | | | |
5% 11/15/27 | | 40,000 | 42,067 |
5% 11/15/28 | | 90,000 | 94,306 |
| Series 2020 A, 4% 4/15/50 | | 25,000 | 23,303 |
| Pennsylvania Econ. Dev. Fing. Auth. Indl. Dev. Rev.: | | | |
| (The Pennsylvania Rapid Bridge Replacement Proj.) Series 2015: | | | |
4.125% 12/31/38 (c) | | 25,000 | 23,682 |
5% 12/31/28 (c) | | 160,000 | 161,940 |
| Series 2014 A, 5% 2/1/45 | | 120,000 | 120,030 |
| Pennsylvania Gen. Oblig.: | | | |
| Series 2015 1: | | | |
5% 3/15/26 | | 55,000 | 55,582 |
5% 3/15/29 | | 60,000 | 60,505 |
| Series 2015: | | | |
4% 8/15/34 | | 175,000 | 175,483 |
5% 8/15/32 | | 60,000 | 60,915 |
| Series 2016 2, 3% 9/15/36 | | 45,000 | 40,385 |
| Series 2016: | | | |
5% 1/15/28 | | 145,000 | 151,009 |
5% 9/15/29 | | 100,000 | 103,241 |
| Series 2018, 3.75% 3/1/39 (Assured Guaranty Muni. Corp. Insured) | | 200,000 | 198,221 |
| Series 2020 1, 5% 5/1/28 | | 100,000 | 106,955 |
| Series 2022: | | | |
5% 10/1/32 | | 15,000 | 17,119 |
5% 10/1/38 | | 20,000 | 22,463 |
| Series 2023, 5% 9/1/32 | | 15,000 | 17,101 |
| Pennsylvania Higher Edl. Facilities Auth. Rev. Series 2016 C: | | | |
| 3% 8/15/41 | | 120,000 | 101,402 |
| 5% 8/15/25 | | 90,000 | 91,682 |
| Pennsylvania Hsg. Fin. Agcy.: | | | |
| Series 2019 129, 3.15% 10/1/39 | | 195,000 | 170,121 |
| Series 2024 144A, 4.05% 10/1/39 | | 35,000 | 35,016 |
| Pennsylvania Hsg. Fin. Agcy. Single Family Mtg. Rev.: | | | |
| Series 2017 123B, 3.45% 10/1/32 | | 5,000 | 4,741 |
| Series 2017 124A, 4% 10/1/38 (c) | | 75,000 | 74,649 |
| Series 2017 125B, 3.65% 10/1/42 | | 80,000 | 73,839 |
| Pennsylvania Pub. School Bldg. Auth. School Rev. (The School District of the City of Harrisburg Projs.) Series 2016 A, 4% 12/1/31 | | 110,000 | 111,692 |
| Pennsylvania Tpk. Commission Tpk. Rev.: | | | |
| Series 2013 B, 0% 12/1/41 (d) | | 40,000 | 37,421 |
| Series 2013 B2, 0% 12/1/37 (d) | | 100,000 | 95,439 |
| Series 2014 A, 5.125% 12/1/39 | | 5,000 | 5,331 |
| Series 2014 C, 5% 12/1/39 | | 30,000 | 30,127 |
| Series 2014, 5% 12/1/33 | | 55,000 | 55,211 |
| Series 2015 A1, 4% 12/1/41 | | 60,000 | 58,942 |
| Series 2016 B, 5% 6/1/27 | | 160,000 | 164,245 |
| Series 2017 A, 5.5% 12/1/42 | | 150,000 | 154,711 |
| Series 2017 A1, 5% 12/1/30 | | 40,000 | 42,236 |
| Series 2017 B, 5.25% 6/1/47 | | 55,000 | 56,564 |
| Series 2017 B2, 5% 6/1/25 | | 100,000 | 101,420 |
| Series 2017, 5% 12/1/40 | | 50,000 | 51,623 |
| Series 2019 A, 5% 12/1/35 | | 35,000 | 37,229 |
| Series 2019, 5% 12/1/32 | | 30,000 | 32,163 |
| Series 2021 A, 4% 12/1/45 | | 180,000 | 175,769 |
| Series 2021 C: | | | |
5% 12/1/30 | | 25,000 | 27,832 |
5% 12/1/31 | | 30,000 | 33,798 |
| Philadelphia Arpt. Rev. Series 2021, 5% 7/1/31 (c) | | 100,000 | 107,681 |
| Philadelphia Auth. for Indl. Dev. (The Children's Hosp. of Philadelphia Proj.) Series 2017, 4% 7/1/37 | | 5,000 | 4,933 |
| Philadelphia Gen. Oblig. Series 2015 B, 5% 8/1/25 | | 20,000 | 20,350 |
| Philadelphia School District: | | | |
| Series 2007 A, 5% 6/1/27 (FGIC Insured) (Nat'l. Pub. Fin. Guarantee Corp. Insured) | | 50,000 | 52,284 |
| Series 2016 F, 5% 9/1/26 | | 110,000 | 113,712 |
| Series 2018 B, 4% 9/1/43 (Assured Guaranty Muni. Corp. Insured) | | 30,000 | 29,556 |
| Series 2019 A, 5% 9/1/44 | | 30,000 | 31,176 |
| Pittsburgh Wtr. & Swr. Auth. Wtr. & Swr. Sys. Rev. Series B, 0% 9/1/28 (FGIC Insured) | | 20,000 | 17,055 |
| Pocono Mountains Indl. Park Auth. Series 2015 A, 4% 8/15/45 | | 105,000 | 97,081 |
TOTAL PENNSYLVANIA | | | 5,517,259 |
| Pennsylvania, New Jersey - 0.0% | | | |
| Delaware River Joint Toll Bridge Commission Pennsylvania-New Jersey Bridge Rev. Series 2017, 5% 7/1/36 | | 5,000 | 5,226 |
| Rhode Island - 0.4% | | | |
| Rhode Island & Providence Plantations: | | | |
| Series 2019 C, 4% 1/15/33 | | 200,000 | 204,578 |
| Series C, 3% 1/15/36 | | 30,000 | 26,903 |
| Rhode Island Health & Edl. Bldg. Corp. Higher Ed. Facilities Rev. Series 2016, 5% 5/15/31 | | 50,000 | 50,716 |
| Rhode Island Health and Edl. Bldg. Corp. Higher Ed. Facility Rev. Series 2022 A, 5% 9/1/33 | | 260,000 | 297,076 |
TOTAL RHODE ISLAND | | | 579,273 |
| South Carolina - 0.8% | | | |
| Charleston Wtrwks. & Swr. Rev.: | | | |
| Series 2022 A, 5% 1/1/47 | | 130,000 | 142,240 |
| Series 2022, 5% 1/1/42 | | 150,000 | 166,735 |
| South Carolina Jobs-Econ. Dev. Auth.: | | | |
| (SPE Fayssoux Properties, LLC Proj.) Series 2016 A, 3% 8/15/38 | | 40,000 | 31,038 |
| Series 2023, 4% 2/1/43 | | 200,000 | 199,126 |
| South Carolina Ports Auth. Ports Rev. Series A, 5% 7/1/54 | | 115,000 | 117,917 |
| South Carolina Pub. Svc. Auth. Rev.: | | | |
| Series 2013 B, 5.125% 12/1/43 | | 25,000 | 25,001 |
| Series 2014 A, 5.5% 12/1/54 | | 25,000 | 25,008 |
| Series 2014 C: | | | |
5% 12/1/29 | | 40,000 | 40,044 |
5% 12/1/34 | | 110,000 | 110,080 |
5% 12/1/36 | | 45,000 | 45,100 |
| Series 2016 A: | | | |
3.25% 12/1/35 | | 15,000 | 13,401 |
5% 12/1/27 | | 50,000 | 51,034 |
| Series 2016 B, 5% 12/1/33 | | 55,000 | 56,000 |
| Series 2021 B, 4% 12/1/47 | | 45,000 | 42,561 |
| Series 2022 A, 5% 12/1/44 | | 125,000 | 132,013 |
| Series A, 3% 12/1/41 | | 30,000 | 23,645 |
| South Carolina Trans. Infrastructure Bank Rev. Series 2017 A, 5% 10/1/38 | | 85,000 | 88,498 |
TOTAL SOUTH CAROLINA | | | 1,309,441 |
| Tennessee - 0.9% | | | |
| Chattanooga Health Ed. & Hsg. Facility Board Rev. Series 2019 A1: | | | |
| 3% 8/1/39 | | 20,000 | 16,457 |
| 3.25% 8/1/44 | | 30,000 | 24,684 |
| 4% 8/1/38 | | 100,000 | 99,231 |
| Knox County Health Edl. & Hsg. Facilities: | | | |
| Series 2012 A, 5% 1/1/25 | | 60,000 | 60,044 |
| Series 2016 A, 4% 1/1/42 | | 10,000 | 9,716 |
| Series 2019, 4% 11/15/43 | | 55,000 | 52,079 |
| Memphis-Shelby County Econ. Dev. Series 2017 B, 5% 11/1/30 | | 80,000 | 82,733 |
| Metropolitan Govt. of Nashville & Davidson County Series 2021, 4% 5/1/51 | | 30,000 | 28,748 |
| Metropolitan Nashville Arpt. Auth. Rev. Series 2019 A: | | | |
| 4% 7/1/49 | | 55,000 | 52,583 |
| 4% 7/1/54 | | 35,000 | 33,092 |
| 5% 7/1/44 | | 65,000 | 68,900 |
| Nashville and Davidson County Metropolitan Govt. Health & Edl. Facilities Board Rev. Series 2016 A, 5% 7/1/40 | | 70,000 | 70,955 |
| New Memphis Arena Bldg. Auth. (City of Memphis Proj.) Series 2021, 0% 4/1/37 | | 500,000 | 286,274 |
| Tennessee Energy Acquisition Corp.: | | | |
| Bonds Series 2018, 4%, tender 11/1/25 (b) | | 30,000 | 30,015 |
| Series 2006 A, 5.25% 9/1/26 | | 30,000 | 30,716 |
| Series 2006 C, 5% 2/1/27 | | 15,000 | 15,232 |
| Tennessee Gen. Oblig.: | | | |
| Series 2016 A, 5% 8/1/35 | | 50,000 | 51,635 |
| Series 2021 A, 5% 11/1/31 | | 290,000 | 329,670 |
| Tennessee Hsg. Dev. Agcy. Residential: | | | |
| Series 2015 2, 3.875% 7/1/35 | | 5,000 | 4,976 |
| Series 2018 1, 3.85% 7/1/38 | | 45,000 | 43,676 |
| Series 2018 3, 3.75% 7/1/38 | | 30,000 | 28,515 |
| Series 2020 1A, 2.4% 1/1/44 | | 15,000 | 10,700 |
| Tennessee School Board Auth. Series A, 5% 11/1/42 | | 105,000 | 108,381 |
TOTAL TENNESSEE | | | 1,539,012 |
| Texas - 7.8% | | | |
| Aldine Independent School District Series 2017 A, 5% 2/15/30 | | 50,000 | 52,201 |
| Alvin Independent School District Series 2019, 3.375% 2/15/40 | | 120,000 | 112,727 |
| Arlington Higher Ed. Fin. Corp.: | | | |
| Series 2019 A, 3% 8/15/54 | | 60,000 | 43,440 |
| Series 2021 A, 3% 2/15/46 | | 210,000 | 161,950 |
| Austin Convention Enterprises, Inc. Series 2017 A, 5% 1/1/25 | | 80,000 | 79,978 |
| Austin Independent School District: | | | |
| Series 2017, 4% 8/1/33 | | 20,000 | 20,140 |
| Series 2019, 4% 8/1/35 | | 25,000 | 25,548 |
| Series 2023, 5% 8/1/41 | | 220,000 | 244,090 |
| Bexar County Hosp. District Series 2020, 3% 2/15/36 | | 55,000 | 49,432 |
| Bexar County Rev. Series 2015, 4% 8/15/51 (Pre-Refunded to 8/15/24 @ 100) | | 35,000 | 35,010 |
| Central Reg'l. Mobility Auth. Series 2016, 3.375% 1/1/41 | | 20,000 | 17,657 |
| City of Denton Series 2017, 4% 2/15/47 | | 50,000 | 47,638 |
| Cleveland Independent School District Series 2020 A, 4% 2/15/52 | | 150,000 | 143,626 |
| Clifton Higher Ed. Fin. Corp. Ed. Rev. Series 2021 T, 4% 8/15/47 | | 25,000 | 24,043 |
| College of the Mainland Series 2019, 3.75% 8/15/49 | | 20,000 | 17,730 |
| Collin County Cmnty. College District Series 2018 A, 3.25% 8/15/33 | | 10,000 | 9,848 |
| Conroe Independent School District Series 2020 A, 2.25% 2/15/46 | | 115,000 | 75,955 |
| Cypress-Fairbanks Independent School District: | | | |
| Series 2019, 5% 2/15/30 | | 45,000 | 48,655 |
| Series 2020 A, 3% 2/15/35 | | 120,000 | 113,250 |
| Series 2023, 4% 2/15/48 | | 415,000 | 405,421 |
| Dallas Area Rapid Transit Sales Tax Rev. Series 2016 B: | | | |
| 4% 12/1/36 | | 200,000 | 200,716 |
| 4% 12/1/38 | | 350,000 | 348,814 |
| Dallas Fort Worth Int'l. Arpt. Rev.: | | | |
| Series 2020 A, 5% 11/1/30 | | 55,000 | 60,668 |
| Series 2020 B, 5% 11/1/33 | | 35,000 | 38,299 |
| Series 2021 A, 3% 11/1/40 | | 315,000 | 270,336 |
| Series 2022 B, 4% 11/1/45 | | 20,000 | 19,451 |
| Dallas Gen. Oblig. Series 2013 A, 4% 2/15/32 | | 5,000 | 5,177 |
| Dallas Independent School District Series 2019 B, 4% 2/15/32 | | 160,000 | 163,389 |
| Denton Independent School District Series 2014, 5% 8/15/38 (Pre-Refunded to 8/15/24 @ 100) | | 65,000 | 65,096 |
| Eagle Mountain & Saginaw Independent School District: | | | |
| Series 2019, 4% 8/15/50 | | 105,000 | 101,160 |
| Series 2021, 3% 8/15/40 | | 150,000 | 127,215 |
| El Paso County Cmnty. College District Series 2016, 5% 4/1/38 (Assured Guaranty Muni. Corp. Insured) | | 70,000 | 71,752 |
| El Paso County Hosp. District Series 2013, 5% 8/15/39 | | 70,000 | 69,851 |
| Fort Bend Independent School District Series 2021 A, 2.3% 8/15/46 | | 150,000 | 97,516 |
| Fort Worth Independent School District Series 2016, 4% 2/15/39 | | 130,000 | 127,968 |
| Frisco Independent School District: | | | |
| Series 2012 B, 3% 8/15/42 | | 200,000 | 167,661 |
| Series 2017, 4% 8/15/35 | | 110,000 | 110,648 |
| Grand Parkway Trans. Corp.: | | | |
| Series 2013: | | | |
5.3% 10/1/32 | | 40,000 | 43,363 |
5.8% 10/1/46 | | 40,000 | 43,097 |
5.85% 10/1/48 | | 30,000 | 32,328 |
| Series 2018 A, 5% 10/1/37 | | 40,000 | 42,222 |
| Harris County Cultural Ed. Facilities Fin. Corp. Rev.: | | | |
| Series 2015, 4% 12/1/45 | | 75,000 | 71,222 |
| Series 2016 A, 3.125% 7/1/38 | | 210,000 | 183,729 |
| Harris County Flood Cont. District: | | | |
| Series 2017 A, 4% 10/1/38 | | 75,000 | 74,870 |
| Series 2021 A: | | | |
4% 10/1/33 | | 150,000 | 155,421 |
4% 10/1/46 | | 100,000 | 97,286 |
| Harris County Gen. Oblig.: | | | |
| Series 2015 B, 5% 8/15/28 | | 100,000 | 101,595 |
| Series 2016 A: | | | |
5% 8/15/33 | | 15,000 | 15,400 |
5% 8/15/35 | | 140,000 | 143,500 |
| Harris County Toll Road Rev.: | | | |
| Series 2018 A, 4% 8/15/48 | | 40,000 | 38,433 |
| Series 2019 A, 3% 8/15/44 | | 120,000 | 98,017 |
| Harris County-Houston Sports Auth. Rev.: | | | |
| Series 2001 A, 0% 11/15/34 (Nat'l. Pub. Fin. Guarantee Corp. Insured) | | 75,000 | 46,159 |
| Series 2014: | | | |
0% 11/15/48 (Assured Guaranty Muni. Corp. Insured) | | 10,000 | 3,100 |
0% 11/15/49 (Assured Guaranty Muni. Corp. Insured) | | 25,000 | 7,355 |
| Hidalgo County Reginal Mobility Auth. Series 2022 A, 4% 12/1/41 | | 80,000 | 77,650 |
| Houston Arpt. Sys. Rev.: | | | |
| Series 2018 D, 5% 7/1/38 | | 55,000 | 57,582 |
| Series 2021 A, 4% 7/1/40 (c) | | 175,000 | 171,938 |
| Houston Convention and Entertainment Facilities Dept. Hotel Occupancy Tax and Spl. Rev. Series 2001 B, 0% 9/1/33 (AMBAC Insured) | | 80,000 | 55,115 |
| Houston Independent School District: | | | |
| Series 2017, 5% 2/15/27 | | 50,000 | 52,345 |
| Series 2018, 5% 7/15/27 | | 55,000 | 57,875 |
| Houston Util. Sys. Rev.: | | | |
| Series 2002 C, 3% 11/15/47 | | 50,000 | 38,845 |
| Series 2014 C, 5% 5/15/26 | | 75,000 | 75,093 |
| Series 2017 B, 5% 11/15/29 | | 45,000 | 47,366 |
| Series 2019 B, 4% 11/15/44 | | 55,000 | 53,767 |
| Series 2020 C, 4% 11/15/49 | | 25,000 | 23,820 |
| Series 2024 A, 5% 11/15/36 | | 20,000 | 23,033 |
| Humble Independent School District Series 2020 A, 2% 2/15/42 | | 25,000 | 16,880 |
| Katy Independent School District Series 2022, 4% 2/15/41 | | 350,000 | 354,598 |
| Klein Independent School District Series 2017, 4% 8/1/46 | | 215,000 | 208,988 |
| Leander Independent School District: | | | |
| Series 2014 D: | | | |
0% 8/15/30 | | 200,000 | 153,486 |
0% 8/15/40 (Pre-Refunded to 8/15/24 @ 46.38) | | 25,000 | 11,540 |
0% 8/15/42 (Pre-Refunded to 8/15/24 @ 41.9852) | | 90,000 | 37,604 |
| Series 2016 A: | | | |
0% 8/16/44 | | 10,000 | 3,949 |
0% 8/16/44 (Pre-Refunded to 8/16/26 @ 48.506) | | 5,000 | 2,243 |
| Lower Colorado River Auth. Rev. (LCRA Transmission Svcs. Corp. Proj.) Series 2020, 5% 5/15/34 | | 90,000 | 96,389 |
| Matagorda County Navigation District No. 1 Poll. Cont. Rev. Series 2005 A, 4.4% 5/1/30 (AMBAC Insured) | | 20,000 | 20,218 |
| Midland County Fresh Wtr. Supply District (City of Midland Proj.) Series 2012 A, 0% 9/15/35 (Pre-Refunded to 9/15/27 @ 68.049) | | 5,000 | 3,018 |
| North East Texas Reg'l. Mobility Auth. Series 2016 B, 5% 1/1/41 | | 60,000 | 60,613 |
| North Texas Tollway Auth. Rev.: | | | |
| Series 2008 D: | | | |
0% 1/1/30 (Assured Guaranty Corp. Insured) | | 35,000 | 28,990 |
0% 1/1/35 (Assured Guaranty Corp. Insured) | | 5,000 | 3,441 |
| Series 2012 A, 0% 1/1/36 (Assured Guaranty Corp. Insured) | | 65,000 | 42,799 |
| Series 2015 A, 5% 1/1/27 | | 100,000 | 100,527 |
| Series 2017 B, 4% 1/1/36 (Assured Guaranty Muni. Corp. Insured) | | 185,000 | 185,971 |
| Series 2018: | | | |
4.25% 1/1/49 | | 55,000 | 53,944 |
5% 1/1/48 | | 20,000 | 20,591 |
| Series 2021 B, 5% 1/1/31 | | 100,000 | 110,127 |
| Northside Independent School District: | | | |
| Series 2016, 4% 6/15/35 | | 400,000 | 401,107 |
| Series 2019 A, 4% 8/15/36 | | 120,000 | 120,842 |
| Series 2019, 4% 8/15/49 | | 125,000 | 120,675 |
| Port of Houston Auth. Series 2021, 4% 10/1/39 | | 85,000 | 86,060 |
| Prosper Independent School District Series 2023, 4% 2/15/53 | | 20,000 | 19,028 |
| San Antonio Elec. & Gas Sys. Rev.: | | | |
| Series 2015: | | | |
5% 2/1/27 | | 40,000 | 41,000 |
5% 2/1/32 | | 5,000 | 5,114 |
| Series 2017, 5% 2/1/29 | | 60,000 | 62,494 |
| Series 2019: | | | |
4% 2/1/28 | | 10,000 | 10,249 |
5% 2/1/35 | | 125,000 | 136,674 |
| Series 2022, 4% 2/1/43 | | 35,000 | 34,458 |
| Series 2023 A, 5% 2/1/32 | | 15,000 | 16,875 |
| Series 2023 C, 5% 2/1/42 | | 15,000 | 16,556 |
| San Antonio Independent School District Series 2019, 5% 8/15/30 | | 50,000 | 53,551 |
| San Antonio Wtr. Sys. Rev. Series 2021 A, 4% 5/15/51 | | 300,000 | 287,001 |
| San Jacinto Cmnty. College District Series 2019 A, 5% 2/15/44 | | 175,000 | 181,705 |
| Socorro Independent School District Series 2019, 5% 8/15/38 | | 50,000 | 52,497 |
| Tarrant County College Series 2020, 5% 8/15/30 | | 130,000 | 143,190 |
| Tarrant County Cultural Ed. Facilities Fin. Corp. Hosp. Rev. (Baylor Scott & White Health Proj.) Series 2016 A, 4% 11/15/36 | | 140,000 | 138,126 |
| Texas City Tex Independent School District Series 2023, 4% 8/15/48 | | 25,000 | 24,148 |
| Texas Dept. of Hsg. & Cmnty. Affairs Single Family Mtg. Rev. Series 2020 A, 3% 3/1/50 | | 30,000 | 22,444 |
| Texas Gen. Oblig.: | | | |
| Series 2014 A, 5% 10/1/35 (Pre-Refunded to 10/1/24 @ 100) | | 70,000 | 70,243 |
| Series 2015 A: | | | |
5% 10/1/24 | | 55,000 | 55,204 |
5% 10/1/26 | | 100,000 | 101,976 |
| Series 2016 A, 5% 4/1/30 | | 50,000 | 51,401 |
| Series 2017 A, 5% 10/1/33 | | 50,000 | 52,193 |
| Series 2017 B: | | | |
5% 10/1/29 | | 100,000 | 104,461 |
5% 10/1/33 | | 25,000 | 26,096 |
| Series 2018 B, 5% 8/1/24 (Escrowed to Maturity) | | 45,000 | 45,049 |
| Texas Private Activity Bond Surface Trans. Corp.: | | | |
| (LBJ Infrastructure Group LLC I-635 Managed Lanes Proj.) Series 2020 A: | | | |
4% 6/30/37 | | 40,000 | 40,220 |
4% 6/30/40 | | 100,000 | 99,291 |
| (NTE Mobility Partners LLC North Tarrant Express Managed Lanes Proj.) Series 2019 A, 5% 12/31/32 | | 75,000 | 80,138 |
| (NTE Mobility Partners Segments 3 LLC Segment 3C Proj.) Series 2019, 5% 6/30/58 (c) | | 170,000 | 173,383 |
| Texas Tpk. Auth. Central Texas Tpk. Sys. Rev. Series A, 0% 8/15/29 (AMBAC Insured) | | 35,000 | 28,696 |
| Texas Trans. Commission Central Texas Tpk. Sys. Rev.: | | | |
| Series 2012 A, 4% 8/15/38 | | 30,000 | 28,796 |
| Series 2015 C: | | | |
5% 8/15/25 | | 90,000 | 90,080 |
5% 8/15/29 | | 115,000 | 115,166 |
| Texas Wtr. Dev. Board Rev.: | | | |
| Series 2017 A, 5% 10/15/47 | | 60,000 | 62,349 |
| Series 2018 A: | | | |
4% 10/15/32 | | 50,000 | 50,787 |
4% 10/15/37 | | 40,000 | 40,150 |
| Series 2018, 5% 8/1/32 | | 130,000 | 135,821 |
| Series 2019 A: | | | |
3% 10/15/39 | | 125,000 | 111,786 |
4% 10/15/49 | | 355,000 | 339,684 |
| Series 2020: | | | |
3% 10/15/34 | | 130,000 | 124,406 |
3% 10/15/40 | | 100,000 | 87,876 |
5% 8/1/33 | | 15,000 | 16,579 |
| Series 2021: | | | |
5% 8/1/26 | | 125,000 | 129,512 |
5% 10/15/33 | | 170,000 | 191,155 |
| Trinity River Auth. Reg'l. Wastewtr. Sys. Rev. Series 2017, 5% 8/1/33 | | 115,000 | 120,275 |
| Univ. of Texas Board of Regents Sys. Rev.: | | | |
| Series 2016 J: | | | |
5% 8/15/24 | | 60,000 | 60,094 |
5% 8/15/26 | | 105,000 | 108,820 |
| Series 2017 B, 3.375% 8/15/44 | | 40,000 | 35,619 |
| Series 2019 A, 5% 8/15/31 | | 85,000 | 92,365 |
| Series 2020 A, 3.5% 8/15/50 | | 35,000 | 30,309 |
| Waco Edl. Fin. Corp. Rev. Series 2021, 4% 3/1/46 | | 205,000 | 200,073 |
| Waller Independent School District Series 2020, 4% 2/15/50 | | 100,000 | 96,440 |
| West Harris County Reg'l. Wtr. Auth. Wtr. Sys. Rev. Series 2021, 3% 12/15/51 | | 25,000 | 18,600 |
| Williamson County Series 2022, 4% 2/15/42 | | 395,000 | 397,550 |
TOTAL TEXAS | | | 12,807,935 |
| Utah - 0.7% | | | |
| Salt Lake City Arpt. Rev. Series 2017 A, 5% 7/1/29 (c) | | 525,000 | 542,272 |
| Univ. of Utah Gen. Revs.: | | | |
| Series 2017 A, 5% 8/1/29 | | 45,000 | 47,399 |
| Series 2017 B1, 5% 8/1/26 | | 200,000 | 206,847 |
| Series 2021 A1, 4% 8/1/41 | | 145,000 | 145,903 |
| Utah County Hosp. Rev. Series 2016 B, 5% 5/15/46 | | 35,000 | 35,503 |
| Utah Transit Auth. Sales Tax Rev.: | | | |
| Series 2015 A: | | | |
5% 6/15/26 (Pre-Refunded to 6/15/25 @ 100) | | 15,000 | 15,239 |
5% 6/15/29 (Pre-Refunded to 6/15/25 @ 100) | | 15,000 | 15,239 |
5% 6/15/37 (Pre-Refunded to 6/15/25 @ 100) | | 155,000 | 157,468 |
| Series 2016, 4% 12/15/29 | | 25,000 | 25,228 |
TOTAL UTAH | | | 1,191,098 |
| Virginia - 2.6% | | | |
| Alexandria Gen. Oblig. Series 2023, 5% 12/15/31 | | 170,000 | 193,200 |
| Arlington County Series 2019, 4% 6/15/35 | | 5,000 | 5,176 |
| Chesterfield County Econ. Dev. Auth. Rev.: | | | |
| (County Mobility Projs.) Series 2024, 4% 4/1/50 | | 80,000 | 77,747 |
| (County Projs.) Series 2020 F, 2% 4/1/41 | | 100,000 | 69,963 |
| Fairfax County Econ. Dev. Auth.: | | | |
| (Route 28 Proj.) Series 2016 A, 2.875% 4/1/35 | | 15,000 | 13,569 |
| Series 2016 B, 3% 4/1/36 | | 100,000 | 90,446 |
| Series 2016: | | | |
3% 4/1/36 | | 130,000 | 117,579 |
3% 4/1/36 (Pre-Refunded to 4/1/26 @ 100) | | 25,000 | 24,843 |
| Fairfax County Gen. Oblig. Series 2023 A, 4% 10/1/31 | | 465,000 | 495,482 |
| Hampton Roads Trans. Accountability Commission Series 2020 A, 5.25% 7/1/60 | | 25,000 | 26,861 |
| Henrico County Wtr. & Swr. Rev. Series 2016, 5% 5/1/46 (Pre-Refunded to 5/1/26 @ 100) | | 170,000 | 175,448 |
| Loudoun County Sanitation Auth. Wtr. & Swr. Series 2015, 4% 1/1/42 | | 745,000 | 744,534 |
| Loudoun County Gen. Oblig. Series 2022 A, 4% 12/1/41 | | 145,000 | 147,285 |
| Lynchburg Econ. Dev. Series 2017 A, 4% 1/1/47 | | 90,000 | 85,242 |
| Norfolk Series 2021 A, 4% 3/1/40 | | 170,000 | 174,284 |
| Roanoke Econ. Dev. Authority. Bonds Series 2020 D, 5%, tender 7/1/30 (b) | | 70,000 | 74,468 |
| Univ. of Virginia Gen. Rev. Series 2017 A, 5% 4/1/42 | | 225,000 | 233,283 |
| Virginia College Bldg. Auth. Edl. Facilities Rev.: | | | |
| (21st Century Collage and Equip. Programs) Series 2021 A: | | | |
3% 2/1/36 | | 55,000 | 50,790 |
5% 2/1/30 | | 160,000 | 175,946 |
| (21st Century College & Equip. Programs) Series 2019 A, 5% 2/1/29 | | 75,000 | 81,088 |
| (21St Century College and Equip. Programs) Series 2023 A, 5% 2/1/30 | | 235,000 | 258,421 |
| (21st Century College and Equip. Progs.): | | | |
Series 2015 A, 5% 2/1/28 (Pre-Refunded to 2/1/25 @ 100) | | 65,000 | 65,634 |
Series 2019 C, 5% 2/1/30 | | 15,000 | 16,264 |
| Virginia College Bldg. Auth. Edl. Facilities Rev. Rfdg. (Pub. Higher Ed. Fing. Prog.) Series 2016 A, 3% 9/1/26 | | 55,000 | 54,387 |
| Virginia Commonwealth Trans. Board Rev.: | | | |
| Series 2016, 3% 5/15/40 | | 105,000 | 90,835 |
| Series 2022, 4% 5/15/47 | | 50,000 | 50,099 |
| Virginia Port Auth. Port Facilities Rev. Series 2015 A, 5% 7/1/33 (Pre-Refunded to 7/1/25 @ 100) (c) | | 5,000 | 5,066 |
| Virginia Small Bus. Fing. Auth.: | | | |
| (95 Express Lanes LLC Proj.) Series 2022, 4% 7/1/39 (c) | | 110,000 | 106,739 |
| Series 2014, 4% 10/1/38 | | 35,000 | 34,999 |
| Virginia Small Bus. Fing. Auth. Health Care Facilities Rev. Series 2020, 4% 11/1/36 | | 400,000 | 405,030 |
| Virginia St Resources Auth. Inf Series 2016 C, 4% 11/1/36 | | 195,000 | 195,635 |
TOTAL VIRGINIA | | | 4,340,343 |
| Washington - 2.6% | | | |
| Central Puget Sound Reg'l. Trans. Auth. Sales & Use Tax Rev. Series 2016 S1: | | | |
| 5% 11/1/27 | | 45,000 | 46,747 |
| 5% 11/1/33 | | 155,000 | 160,558 |
| 5% 11/1/36 | | 30,000 | 31,014 |
| 5% 11/1/41 | | 85,000 | 87,125 |
| Energy Northwest Elec. Rev.: | | | |
| Series 2015 A, 5% 7/1/25 | | 130,000 | 131,972 |
| Series 2016 A, 5% 7/1/28 | | 215,000 | 222,664 |
| Series 2018 C, 5% 7/1/33 | | 30,000 | 32,011 |
| Series 2020 A, 5% 7/1/28 | | 70,000 | 74,992 |
| Series 2021 A, 4% 7/1/42 | | 175,000 | 174,618 |
| King County Gen. Oblig. Series 2015 E, 5% 12/1/29 | | 55,000 | 56,214 |
| King County Hsg. Auth. Rev. Series 2018, 3.5% 5/1/38 | | 15,000 | 14,150 |
| King County School District 210 Series 2018, 5% 12/1/30 | | 80,000 | 84,638 |
| Seattle Muni. Lt. & Pwr. Rev. Series 2020 A, 5% 7/1/26 | | 75,000 | 77,493 |
| Spokane County School District #81 (Washington State School District Cr. Enhancement Prog.) Series 2021, 4% 12/1/28 | | 155,000 | 160,265 |
| Univ. of Washington Univ. Revs. Series 2024 B, 5% 7/1/33 | | 185,000 | 213,071 |
| Washington Biomedical Research Properties 3.2 Series 2015 A, 4% 1/1/48 | | 150,000 | 145,156 |
| Washington Convention Ctr. Pub. Facilities Series 2018, 4% 7/1/58 | | 130,000 | 117,560 |
| Washington Gen. Oblig.: | | | |
| Series 2015 B, 5% 2/1/28 | | 85,000 | 85,776 |
| Series 2015 H: | | | |
5% 7/1/26 | | 30,000 | 30,249 |
5% 7/1/29 | | 40,000 | 40,310 |
| Series 2016 A1, 5% 8/1/29 | | 10,000 | 10,166 |
| Series 2016 C: | | | |
5% 2/1/33 | | 200,000 | 204,519 |
5% 2/1/35 | | 20,000 | 20,433 |
| Series 2016 R, 5% 7/1/24 | | 125,000 | 125,000 |
| Series 2017 B, 5% 8/1/29 | | 150,000 | 155,038 |
| Series 2018 A, 5% 8/1/41 | | 195,000 | 201,776 |
| Series 2018 C, 5% 8/1/28 | | 55,000 | 57,993 |
| Series 2018 D, 5% 8/1/28 | | 30,000 | 31,587 |
| Series 2020 A: | | | |
5% 1/1/26 | | 30,000 | 30,768 |
5% 8/1/42 | | 165,000 | 177,681 |
| Series 2020 B, 5% 6/1/37 | | 55,000 | 59,332 |
| Series 2020 C, 5% 2/1/41 | | 150,000 | 161,484 |
| Series 2020 E, 5% 6/1/45 | | 15,000 | 15,944 |
| Series 2021 A, 5% 6/1/41 | | 125,000 | 135,088 |
| Series 2022 A, 5% 8/1/43 | | 100,000 | 108,410 |
| Series 2023 A: | | | |
5% 8/1/31 | | 225,000 | 252,803 |
5% 8/1/46 | | 165,000 | 178,884 |
| Series R, 5% 7/1/29 | | 100,000 | 100,722 |
| Washington Health Care Facilities Auth. Rev.: | | | |
| Series 2012 A, 5% 10/1/38 | | 40,000 | 39,999 |
| Series 2017 A, 4% 7/1/42 | | 85,000 | 74,498 |
| Series 2017 B, 3.5% 8/15/38 | | 60,000 | 53,766 |
| Washington Higher Ed. Facilities Auth. Rev.: | | | |
| (Gonzaga Univ. Proj.) Series 2019 A, 3% 4/1/49 | | 65,000 | 50,813 |
| (Seattle Pacific Univ. Proj.) Series 2020 A, 5% 10/1/42 | | 25,000 | 23,560 |
| Washington State Univ. Hsg. and Dining Sys. Rev. Series 2015, 5% 4/1/40 | | 35,000 | 35,119 |
TOTAL WASHINGTON | | | 4,291,966 |
| West Virginia - 0.3% | | | |
| West Virginia Comm of Hwys Spl. Oblig. Series 2017 A, 5% 9/1/29 | | 65,000 | 68,470 |
| West Virginia Gen. Oblig. Series 2018 B, 5% 12/1/41 | | 80,000 | 83,224 |
| West Virginia Hosp. Fin. Auth. Hosp. Rev. Series 2016 A, 3% 6/1/33 | | 30,000 | 27,547 |
| West Virginia Parkways Auth. Series 2021, 4% 6/1/51 | | 100,000 | 95,312 |
| West Virginia Univ. Revs. (West Virginia Univ. Proj.) Series A, 4% 10/1/47 | | 225,000 | 216,540 |
TOTAL WEST VIRGINIA | | | 491,093 |
| Wisconsin - 1.2% | | | |
| Ashwaubenon Cmnty. Dev. Auth. Lease Rev. (Brown County Expo Ctr. Proj.) Series 2019, 0% 6/1/49 | | 160,000 | 49,816 |
| Pub. Fin. Auth. Hosp. Rev. (Renown Reg'l. Med. Ctr. Proj.) Series 2016 A, 3% 6/1/36 | | 45,000 | 39,228 |
| Pub. Fin. Auth. Lease Dev. Rev. (KU Campus Dev. Corp. Central District Dev. Proj.) Series 2016: | | | |
| 5% 3/1/29 | | 40,000 | 40,947 |
| 5% 3/1/46 | | 50,000 | 50,690 |
| Roseman Univ. of Health (Fargo-Moorhead Metropolitan Area Flood Risk Mgmt. Proj.) Series 2021, 4% 3/31/56 (c) | | 10,000 | 8,310 |
| Wisconsin Ctr. District Tax Rev. Series 2020 C, 0% 12/15/50 (Assured Guaranty Muni. Corp. Insured) | | 70,000 | 19,368 |
| Wisconsin Envir. Impt. Fund Rev. Series 2017, 5% 6/1/29 | | 10,000 | 10,144 |
| Wisconsin Gen. Oblig.: | | | |
| Series 2016 2, 5% 11/1/29 | | 70,000 | 72,043 |
| Series 2021 B, 5% 5/1/35 | | 85,000 | 92,803 |
| Series 2022 4, 5% 5/1/31 | | 135,000 | 151,580 |
| Series 2023 2, 5% 5/1/35 | | 215,000 | 248,007 |
| Series 3, 5% 11/1/31 | | 30,000 | 31,500 |
| Series A: | | | |
4% 5/1/27 | | 30,000 | 30,319 |
5% 5/1/30 | | 125,000 | 129,008 |
5% 5/1/34 | | 120,000 | 121,588 |
| Wisconsin Health & Edl. Facilities: | | | |
| (Ascension Health Cr. Group Proj.) Series 2016 A, 5% 11/15/36 | | 55,000 | 56,244 |
| Series 2014 A, 5% 11/15/25 | | 40,000 | 40,150 |
| Series 2016 A: | | | |
3.5% 2/15/46 | | 195,000 | 146,309 |
4% 11/15/39 | | 40,000 | 39,291 |
| Series 2017 A, 5% 4/1/28 | | 35,000 | 36,211 |
| Wisconsin Health & Edl. Facilities Auth. Rev. Series 2022, 4% 12/1/51 | | 255,000 | 235,007 |
| Wisconsin Health & Edl. Facilities Auth. Sr. Living Facilities Rev. (Covenant Cmntys., Inc. Proj.) Series 2018 A1, 4.125% 7/1/53 | | 135,000 | 104,533 |
| Wisconsin Hsg. & Econ. Dev. Auth. Series 2017 A, 2.69% 7/1/47 | | 16,804 | 14,359 |
| Wisconsin St Gen. Fund Annual Appropriation Series 2017 B: | | | |
| 5% 5/1/35 | | 215,000 | 221,697 |
| 5% 5/1/36 | | 25,000 | 25,779 |
TOTAL WISCONSIN | | | 2,014,931 |
| Wyoming - 0.0% | | | |
| Campbell County Solid Waste Facilities Rev. Series 2019 A, 3.625% 7/15/39 | | 25,000 | 22,618 |
| Univ. Univ. Revs. Series 2021, 4% 6/1/51 (Assured Guaranty Muni. Corp. Insured) | | 25,000 | 23,838 |
TOTAL WYOMING | | | 46,456 |
| TOTAL MUNICIPAL BONDS (Cost $170,720,789) | | | 163,058,269 |
| | | | |
| Money Market Funds - 0.3% |
| | | Shares | Value ($) |
Fidelity Municipal Cash Central Fund 4.33% (f)(g) (Cost $396,887) | | 396,807 | 396,887 |
| | | | |
| TOTAL INVESTMENT IN SECURITIES - 99.2% (Cost $171,117,676) | 163,455,156 |
NET OTHER ASSETS (LIABILITIES) - 0.8% | 1,357,812 |
| NET ASSETS - 100.0% | 164,812,968 |
| | |
Legend
| (a) | Amount is stated in United States dollars unless otherwise noted. |
| (b) | Coupon rates for floating and adjustable rate securities reflect the rates in effect at period end. |
| (c) | Private activity obligations whose interest is subject to the federal alternative minimum tax for individuals. |
| (d) | Security initially issued in zero coupon form which converts to coupon form at a specified rate and date. The rate shown is the rate at period end. |
| (e) | Security or a portion of the security purchased on a delayed delivery or when-issued basis. |
| (f) | Information in this report regarding holdings by state and security types does not reflect the holdings of the Fidelity Municipal Cash Central Fund. |
| (g) | Affiliated fund that is generally available only to investment companies and other accounts managed by Fidelity Investments. The rate quoted is the annualized seven-day yield of the fund at period end. A complete unaudited listing of the fund's holdings as of its most recent quarter end is available upon request. In addition, each Fidelity Central Fund's financial statements, which are not covered by the Fund's Report of Independent Registered Public Accounting Firm, are available on the SEC's website or upon request. |
Affiliated Central Funds
Fiscal year to date information regarding the Fund's investments in Fidelity Central Funds, including the ownership percentage, is presented below.
| Affiliate | Value, beginning of period ($) | Purchases ($) | Sales Proceeds ($) | Dividend Income ($) | Realized Gain (loss) ($) | Change in Unrealized appreciation (depreciation) ($) | Value, end of period ($) | % ownership, end of period |
| Fidelity Municipal Cash Central Fund 4.33% | 1,900,963 | 37,822,115 | 39,325,988 | 44,971 | (241) | 38 | 396,887 | 0.0% |
| Total | 1,900,963 | 37,822,115 | 39,325,988 | 44,971 | (241) | 38 | 396,887 | |
| | | | | | | | | |
Amounts in the dividend income column in the above table include any capital gain distributions from underlying funds, which are presented in the corresponding line item in the Statement of Operations, if applicable.
Amounts included in the purchases and sales proceeds columns may include in-kind transactions, if applicable.
Investment Valuation
The following is a summary of the inputs used, as of June 30, 2024, involving the Fund's assets and liabilities carried at fair value. The inputs or methodology used for valuing securities may not be an indication of the risk associated with investing in those securities. For more information on valuation inputs, and their aggregation into the levels used below, please refer to the Investment Valuation section in the accompanying Notes to Financial Statements.
| Valuation Inputs at Reporting Date: |
| Description | Total ($) | Level 1 ($) | Level 2 ($) | Level 3 ($) |
Investments in Securities: | | | | |
|
| Municipal Securities | 163,058,269 | - | 163,058,269 | - |
|
| Money Market Funds | 396,887 | 396,887 | - | - |
| Total Investments in Securities: | 163,455,156 | 396,887 | 163,058,269 | - |
Financial Statements
| Statement of Assets and Liabilities |
| | | | June 30, 2024 |
| | | | | |
| Assets | | | | |
| Investment in securities, at value - See accompanying schedule: | | | | |
Unaffiliated issuers (cost $170,720,789) | $ | 163,058,269 | | |
Fidelity Central Funds (cost $396,887) | | 396,887 | | |
| | | | | |
| | | | | |
| Total Investment in Securities (cost $171,117,676) | | | $ | 163,455,156 |
| Cash | | | | 140,162 |
| Receivable for fund shares sold | | | | 412,906 |
| Interest receivable | | | | 1,955,810 |
| Distributions receivable from Fidelity Central Funds | | | | 3,114 |
| Other receivables | | | | 81 |
Total assets | | | | 165,967,229 |
| Liabilities | | | | |
| Payable for investments purchased | | | | |
Regular delivery | $ | 683,298 | | |
Delayed delivery | | 17,324 | | |
| Payable for fund shares redeemed | | 312,837 | | |
| Distributions payable | | 131,240 | | |
| Accrued management fee | | 9,562 | | |
| Total liabilities | | | | 1,154,261 |
| Net Assets | | | $ | 164,812,968 |
| Net Assets consist of: | | | | |
| Paid in capital | | | $ | 175,991,279 |
| Total accumulated earnings (loss) | | | | (11,178,311) |
| Net Assets | | | $ | 164,812,968 |
Net Asset Value, offering price and redemption price per share ($164,812,968 ÷ 8,951,133 shares) | | | $ | 18.41 |
| Statement of Operations |
| | | | Year ended June 30, 2024 |
| Investment Income | | | | |
| Interest | | | $ | 3,951,219 |
| Income from Fidelity Central Funds | | | | 44,971 |
| Total income | | | | 3,996,190 |
| Expenses | | | | |
| Management fee | $ | 108,081 | | |
| Independent trustees' fees and expenses | | 491 | | |
| Miscellaneous | | 921 | | |
| Total expenses before reductions | | 109,493 | | |
| Expense reductions | | (138) | | |
| Total expenses after reductions | | | | 109,355 |
| Net Investment income (loss) | | | | 3,886,835 |
| Realized and Unrealized Gain (Loss) | | | | |
| Net realized gain (loss) on: | | | | |
| Investment Securities: | | | | |
| Unaffiliated issuers | | (909,018) | | |
| Fidelity Central Funds | | (241) | | |
| Total net realized gain (loss) | | | | (909,259) |
| Change in net unrealized appreciation (depreciation) on: | | | | |
| Investment Securities: | | | | |
| Unaffiliated issuers | | 1,162,461 | | |
| Fidelity Central Funds | | 38 | | |
| Total change in net unrealized appreciation (depreciation) | | | | 1,162,499 |
| Net gain (loss) | | | | 253,240 |
| Net increase (decrease) in net assets resulting from operations | | | $ | 4,140,075 |
| Statement of Changes in Net Assets |
| |
| | Year ended June 30, 2024 | | Year ended June 30, 2023 |
| Increase (Decrease) in Net Assets | | | | |
| Operations | | | | |
| Net investment income (loss) | $ | 3,886,835 | $ | 3,151,681 |
| Net realized gain (loss) | | (909,259) | | (1,240,052) |
| Change in net unrealized appreciation (depreciation) | | 1,162,499 | | 1,604,091 |
| Net increase (decrease) in net assets resulting from operations | | 4,140,075 | | 3,515,720 |
| Distributions to shareholders | | (3,821,144) | | (3,111,991) |
| | | | | |
| Share transactions | | | | |
| Proceeds from sales of shares | | 65,069,600 | | 98,502,126 |
| Reinvestment of distributions | | 2,412,193 | | 2,178,053 |
| Cost of shares redeemed | | (58,877,357) | | (70,135,385) |
| | | | | |
Net increase (decrease) in net assets resulting from share transactions | | 8,604,436 | | 30,544,794 |
| Total increase (decrease) in net assets | | 8,923,367 | | 30,948,523 |
| | | | | |
| Net Assets | | | | |
| Beginning of period | | 155,889,601 | | 124,941,078 |
| End of period | $ | 164,812,968 | $ | 155,889,601 |
| | | | | |
| Other Information | | | | |
| Shares | | | | |
| Sold | | 3,556,452 | | 5,424,824 |
| Issued in reinvestment of distributions | | 132,431 | | 119,860 |
| Redeemed | | (3,246,568) | | (3,886,886) |
| Net increase (decrease) | | 442,315 | | 1,657,798 |
| | | | | |
Financial Highlights
Fidelity® Municipal Bond Index Fund |
| |
| Years ended June 30, | | 2024 | | 2023 | | 2022 | | 2021 | | 2020 A |
Selected Per-Share Data | | | | | | | | | | |
| Net asset value, beginning of period | $ | 18.32 | $ | 18.24 | $ | 20.39 | $ | 19.97 | $ | 20.00 |
| Income from Investment Operations | | | | | | | | | | |
Net investment income (loss) B,C | | .459 | | .402 | | .281 | | .309 | | .324 |
| Net realized and unrealized gain (loss) | | .082 | | .073 | | (2.152) | | .421 | | (.035) |
| Total from investment operations | | .541 | | .475 | | (1.871) | | .730 | | .289 |
| Distributions from net investment income | | (.451) | | (.395) | | (.279) | | (.310) | | (.319) |
| Total distributions | | (.451) | | (.395) | | (.279) | | (.310) | | (.319) |
| Net asset value, end of period | $ | 18.41 | $ | 18.32 | $ | 18.24 | $ | 20.39 | $ | 19.97 |
Total Return D,E | | | | 2.64% | | (9.26)% | | 3.68% | | 1.46% |
Ratios to Average Net Assets C,F,G | | | | | | | | | | |
| Expenses before reductions | | .07% | | .07% | | .07% | | .07% | | .07% H |
| Expenses net of fee waivers, if any | | | | .07% | | .07% | | .07% | | .07% H |
| Expenses net of all reductions | | .07% | | .07% | | .07% | | .07% | | .07% H |
| Net investment income (loss) | | 2.52% | | 2.21% | | 1.43% | | 1.53% | | 1.67% H |
| Supplemental Data | | | | | | | | | | |
| Net assets, end of period (000 omitted) | $ | 164,813 | $ | 155,890 | $ | 124,941 | $ | 106,786 | $ | 60,060 |
Portfolio turnover rate I | | | | 18% | | 30% | | 8% | | 76% H |
AFor the period July 11, 2019 (commencement of operations) through June 30, 2020.
BCalculated based on average shares outstanding during the period.
CNet investment income (loss) is affected by the timing of the declaration of dividends by any underlying mutual funds or exchange-traded funds (ETFs). Net investment income (loss) of any mutual funds or ETFs is not included in the Fund's net investment income (loss) ratio.
DTotal returns for periods of less than one year are not annualized.
ETotal returns would have been lower if certain expenses had not been reduced during the applicable periods shown.
FFees and expenses of any underlying mutual funds or exchange-traded funds (ETFs) are not included in the Fund's expense ratio. The Fund indirectly bears its proportionate share of these expenses. For additional expense information related to investments in Fidelity Central Funds, please refer to the "Investments in Fidelity Central Funds" note found in the Notes to Financial Statements section of the most recent Annual or Semi-Annual report.
GExpense ratios reflect operating expenses of the class. Expenses before reductions do not reflect amounts reimbursed, waived, or reduced through arrangements with the investment adviser, brokerage services, or other offset arrangements, if applicable, and do not represent the amount paid by the class during periods when reimbursements, waivers or reductions occur.
HAnnualized.
IAmount does not include the portfolio activity of any underlying mutual funds or exchange-traded funds (ETFs).
Notes to Financial Statements
For the period ended June 30, 2024
1. Organization.
Fidelity Municipal Bond Index Fund (the Fund) is a fund of Fidelity Salem Street Trust (the Trust) and is authorized to issue an unlimited number of shares. Share transactions on the Statement of Changes in Net Assets may contain exchanges between affiliated funds. The Trust is registered under the Investment Company Act of 1940, as amended (the 1940 Act), as an open-end management investment company organized as a Massachusetts business trust.
2. Investments in Fidelity Central Funds.
Funds may invest in Fidelity Central Funds, which are open-end investment companies generally available only to other investment companies and accounts managed by the investment adviser and its affiliates. The Schedule of Investments lists any Fidelity Central Funds held as an investment as of period end, but does not include the underlying holdings of each Fidelity Central Fund. An investing fund indirectly bears its proportionate share of the expenses of the underlying Fidelity Central Funds.
Based on its investment objective, each Fidelity Central Fund may invest or participate in various investment vehicles or strategies that are similar to those of the investing fund. These strategies are consistent with the investment objectives of the investing fund and may involve certain economic risks which may cause a decline in value of each of the Fidelity Central Funds and thus a decline in the value of the investing fund.
| Fidelity Central Fund | Investment Manager | Investment Objective | Investment Practices | Expense RatioA |
| Fidelity Money Market Central Funds | Fidelity Management & Research Company LLC (FMR) | Each fund seeks to obtain a high level of current income consistent with the preservation of capital and liquidity. | Short-term Investments | Less than .005% |
A Expenses expressed as a percentage of average net assets and are as of each underlying Central Fund's most recent annual or semi-annual shareholder report.
A complete unaudited list of holdings for each Fidelity Central Fund is available upon request or at the Securities and Exchange Commission website at www.sec.gov. In addition, the financial statements of the Fidelity Central Funds which contain the significant accounting policies (including investment valuation policies) of those funds, and are not covered by the Report of Independent Registered Public Accounting Firm, are available on the Securities and Exchange Commission website or upon request.
3. Significant Accounting Policies.
The Fund is an investment company and applies the accounting and reporting guidance of the Financial Accounting Standards Board (FASB) Accounting Standards Codification Topic 946 Financial Services - Investment Companies. The financial statements have been prepared in conformity with accounting principles generally accepted in the United States of America (GAAP), which require management to make certain estimates and assumptions at the date of the financial statements. Actual results could differ from those estimates. Subsequent events, if any, through the date that the financial statements were issued have been evaluated in the preparation of the financial statements. The Fund's Schedule of Investments lists any underlying mutual funds or exchange-traded funds (ETFs) but does not include the underlying holdings of these funds. The following summarizes the significant accounting policies of the Fund:
Investment Valuation. Investments are valued as of 4:00 p.m. Eastern time on the last calendar day of the period. The Board of Trustees (the Board) has designated the Fund's investment adviser as the valuation designee responsible for the fair valuation function and performing fair value determinations as needed. The investment adviser has established a Fair Value Committee (the Committee) to carry out the day-to-day fair valuation responsibilities and has adopted policies and procedures to govern the fair valuation process and the activities of the Committee. In accordance with these fair valuation policies and procedures, which have been approved by the Board, the Fund attempts to obtain prices from one or more third party pricing services or brokers to value its investments. When current market prices, quotations or currency exchange rates are not readily available or reliable, investments will be fair valued in good faith by the Committee, in accordance with the policies and procedures. Factors used in determining fair value vary by investment type and may include market or investment specific events, transaction data, estimated cash flows, and market observations of comparable investments. The frequency that the fair valuation procedures are used cannot be predicted and they may be utilized to a significant extent. The Committee manages the Fund's fair valuation practices and maintains the fair valuation policies and procedures. The Fund's investment adviser reports to the Board information regarding the fair valuation process and related material matters.
The Fund categorizes the inputs to valuation techniques used to value its investments into a disclosure hierarchy consisting of three levels as shown below:
Level 1 - unadjusted quoted prices in active markets for identical investments
Level 2 - other significant observable inputs (including quoted prices for similar investments, interest rates, prepayment speeds, etc.)
Level 3 - unobservable inputs (including the Fund's own assumptions based on the best information available)
Valuation techniques used to value the Fund's investments by major category are as follows:
Debt securities, including restricted securities, are valued based on evaluated prices received from third party pricing services or from brokers who make markets in such securities. Municipal securities are valued by pricing services who utilize matrix pricing which considers yield or price of bonds of comparable quality, coupon, maturity and type or by broker-supplied prices. When independent prices are unavailable or unreliable, debt securities may be valued utilizing pricing methodologies which consider similar factors that would be used by third party pricing services. Debt securities are generally categorized as Level 2 in the hierarchy but may be Level 3 depending on the circumstances.
Investments in open-end mutual funds, including the Fidelity Central Funds, are valued at their closing net asset value (NAV) each business day and are categorized as Level 1 in the hierarchy.
Changes in valuation techniques may result in transfers in or out of an assigned level within the disclosure hierarchy. The aggregate value of investments by input level as of June 30, 2024 is included at the end of the Fund's Schedule of Investments.
Investment Transactions and Income. For financial reporting purposes, the Fund's investment holdings and NAV include trades executed through the end of the last business day of the period. The NAV per share for processing shareholder transactions is calculated as of the close of business of the New York Stock Exchange (NYSE), normally 4:00 p.m. Eastern time and includes trades executed through the end of the prior business day. Gains and losses on securities sold are determined on the basis of identified cost. Income and capital gain distributions from Fidelity Central Funds, if any, are recorded on the ex-dividend date. Interest income is accrued as earned and includes coupon interest and amortization of premium and accretion of discount on debt securities as applicable.
Expenses. Expenses directly attributable to a fund are charged to that fund. Expenses attributable to more than one fund are allocated among the respective funds on the basis of relative net assets or other appropriate methods. Expenses included in the accompanying financial statements reflect the expenses of that fund and do not include any expenses associated with any underlying mutual funds or exchange-traded funds. Although not included in a fund's expenses, a fund indirectly bears its proportionate share of these expenses through the net asset value of each underlying mutual fund or exchange-traded fund. Expense estimates are accrued in the period to which they relate and adjustments are made when actual amounts are known.
Income Tax Information and Distributions to Shareholders. Each year, the Fund intends to qualify as a regulated investment company under Subchapter M of the Internal Revenue Code, including distributing substantially all of its taxable income and realized gains. As a result, no provision for U.S. Federal income taxes is required. As of June 30, 2024, the Fund did not have any unrecognized tax benefits in the financial statements; nor is the Fund aware of any tax positions for which it is reasonably possible that the total amounts of unrecognized tax benefits will significantly change in the next twelve months. The Fund files a U.S. federal tax return, in addition to state and local tax returns as required. The Fund's federal income tax returns are subject to examination by the Internal Revenue Service (IRS) for a period of three fiscal years after they are filed. State and local tax returns may be subject to examination for an additional fiscal year depending on the jurisdiction.
Distributions are declared and recorded daily and paid monthly from net investment income. Distributions from realized gains, if any, are declared and recorded on the ex-dividend date. Income and capital gain distributions are determined in accordance with income tax regulations, which may differ from GAAP.
Capital accounts within the financial statements are adjusted for permanent book-tax differences. These adjustments have no impact on net assets or the results of operations. Capital accounts are not adjusted for temporary book-tax differences which will reverse in a subsequent period.
Book-tax differences are primarily due to market discount and capital loss carryforwards and losses deferred due to wash sales.
The Fund purchases municipal securities whose interest, in the opinion of the issuer, is free from federal income tax. There is no assurance that the IRS will agree with this opinion. In the event the IRS determines that the issuer does not comply with relevant tax requirements, interest payments from a security could become federally taxable, possibly retroactively to the date the security was issued.
As of period end, the cost and unrealized appreciation (depreciation) in securities, and derivatives if applicable, for federal income tax purposes were as follows:
| Gross unrealized appreciation | $534,211 |
| Gross unrealized depreciation | (8,093,187) |
| Net unrealized appreciation (depreciation) | $(7,558,976) |
| Tax Cost | $171,014,132 |
The tax-based components of distributable earnings as of period end were as follows:
| Capital loss carryforward | $(3,598,015) |
| Net unrealized appreciation (depreciation) on securities and other investments | $(7,558,976) |
Capital loss carryforwards are only available to offset future capital gains of the Fund to the extent provided by regulations and may be limited. The capital loss carryforward information presented below, including any applicable limitation, is estimated as of fiscal period end and is subject to adjustment.
Short-term | $(1,850,933) |
Long-term | (1,747,082) |
| Total capital loss carryforward | $(3,598,015) |
The tax character of distributions paid was as follows:
| | June 30, 2024 | June 30, 2023 |
| Tax-exempt Income | $3,821,144 | $3,111,991 |
| Total | $3,821,144 | $3,111,991 |
Delayed Delivery Transactions and When-Issued Securities. During the period, certain Funds transacted in securities on a delayed delivery or when-issued basis. Payment and delivery may take place after the customary settlement period for that security. The price of the underlying securities and the date when the securities will be delivered and paid for are fixed at the time the transaction is negotiated. Securities purchased on a delayed delivery or when-issued basis are identified as such in the Schedule of Investments. Compensation for interest forgone in the purchase of a delayed delivery or when-issued debt security may be received. With respect to purchase commitments, each applicable Fund identifies securities as segregated in its records with a value at least equal to the amount of the commitment. Payables and receivables associated with the purchases and sales of delayed delivery securities having the same coupon, settlement date and broker are offset. Delayed delivery or when-issued securities that have been purchased from and sold to different brokers are reflected as both payables and receivables in the Statement of Assets and Liabilities under the caption "Delayed delivery", as applicable. Losses may arise due to changes in the value of the underlying securities or if the counterparty does not perform under the contract's terms, or if the issuer does not issue the securities due to political, economic, or other factors.
4. Purchases and Sales of Investments.
Purchases and sales of securities, other than short-term securities and in-kind transactions, as applicable, are noted in the table below.
| | Purchases ($) | Sales ($) |
| Fidelity Municipal Bond Index Fund | 35,527,626 | 23,385,490 |
5. Fees and Other Transactions with Affiliates.
Management Fee. Fidelity Management & Research Company LLC (the investment adviser) and its affiliates provide the Fund with investment management related services for which the Fund pays a monthly management fee. The management fee is based on an annual rate of .07% of the Fund's average net assets. Under the management contract, the investment adviser pays all other operating expenses, except the compensation of the independent Trustees and certain miscellaneous expenses such as proxy and shareholder meeting expenses.
Interfund Trades. Funds may purchase from or sell securities to other Fidelity Funds under procedures adopted by the Board. The procedures have been designed to ensure these interfund trades are executed in accordance with Rule 17a-7 of the 1940 Act. Any interfund trades are included within the respective purchases and sales amounts shown in the Purchases and Sales of Investments note. During the period, there were no interfund trades.
Sub-Advisory Arrangements. Effective March 1, 2024, the Fund's sub-advisory agreements with FMR Investment Management (UK) Limited, Fidelity Management & Research (Hong Kong) Limited, and Fidelity Management & Research (Japan) Limited were amended to provide that the investment adviser pays each sub-adviser monthly fees equal to 110% of the sub-adviser's costs for providing sub-advisory services.
6. Committed Line of Credit.
Certain Funds participate with other funds managed by the investment adviser or an affiliate in a $4.25 billion credit facility (the "line of credit") to be utilized for temporary or emergency purposes to fund shareholder redemptions or for other short-term liquidity purposes. The commitment fees on the pro-rata portion of the line of credit are borne by the investment adviser. During the period, there were no borrowings on this line of credit.
7. Expense Reductions.
Through arrangements with the Fund's custodian, credits realized as a result of certain uninvested cash balances were used to reduce the Fund's expenses by $138.
8. Other.
A fund's organizational documents provide former and current trustees and officers with a limited indemnification against liabilities arising in connection with the performance of their duties to the fund. In the normal course of business, a fund may also enter into contracts that provide general indemnifications. A fund's maximum exposure under these arrangements is unknown as this would be dependent on future claims that may be made against a fund. The risk of material loss from such claims is considered remote.
9. Risk and Uncertainties.
Many factors affect a fund's performance. Developments that disrupt global economies and financial markets, such as pandemics, epidemics, outbreaks of infectious diseases, war, terrorism, and environmental disasters, may significantly affect a fund's investment performance. The effects of these developments to a fund will be impacted by the types of securities in which a fund invests, the financial condition, industry, economic sector, and geographic location of an issuer, and a fund's level of investment in the securities of that issuer. Significant concentrations in security types, issuers, industries, sectors, and geographic locations may magnify the factors that affect a fund's performance.
Report of Independent Registered Public Accounting Firm
To the Board of Trustees of Fidelity Salem Street Trust and Shareholders of Fidelity Municipal Bond Index Fund
Opinion on the Financial Statements
We have audited the accompanying statement of assets and liabilities, including the schedule of investments, of Fidelity Municipal Bond Index Fund (one of the funds constituting Fidelity Salem Street Trust, referred to hereafter as the "Fund") as of June 30, 2024, the related statement of operations for the year ended June 30, 2024, the statement of changes in net assets for each of the two years in the period ended June 30, 2024, including the related notes, and the financial highlights for each of the four years in the period ended June 30, 2024 and for the period July 11, 2019 (commencement of operations) through June 30, 2020 (collectively referred to as the "financial statements"). In our opinion, the financial statements present fairly, in all material respects, the financial position of the Fund as of June 30, 2024, the results of its operations for the year then ended, the changes in its net assets for each of the two years in the period ended June 30, 2024 and the financial highlights for each of the four years in the period ended June 30, 2024 and for the period July 11, 2019 (commencement of operations) through June 30, 2020 in conformity with accounting principles generally accepted in the United States of America.
Basis for Opinion
These financial statements are the responsibility of the Fund's management. Our responsibility is to express an opinion on the Fund's financial statements based on our audits. We are a public accounting firm registered with the Public Company Accounting Oversight Board (United States) (PCAOB) and are required to be independent with respect to the Fund in accordance with the U.S. federal securities laws and the applicable rules and regulations of the Securities and Exchange Commission and the PCAOB.
We conducted our audits of these financial statements in accordance with the standards of the PCAOB. Those standards require that we plan and perform the audit to obtain reasonable assurance about whether the financial statements are free of material misstatement, whether due to error or fraud.
Our audits included performing procedures to assess the risks of material misstatement of the financial statements, whether due to error or fraud, and performing procedures that respond to those risks. Such procedures included examining, on a test basis, evidence regarding the amounts and disclosures in the financial statements. Our audits also included evaluating the accounting principles used and significant estimates made by management, as well as evaluating the overall presentation of the financial statements. Our procedures included confirmation of securities owned as of June 30, 2024 by correspondence with the custodian and brokers; when replies were not received from brokers, we performed other auditing procedures. We believe that our audits provide a reasonable basis for our opinion.
/s/ PricewaterhouseCoopers LLP
Boston, Massachusetts
August 13, 2024
We have served as the auditor of one or more investment companies in the Fidelity group of funds since 1932.
Distributions
(Unaudited)
The dividend and capital gains distributions for the fund(s) are available on Fidelity.com or Institutional.Fidelity.com.
During fiscal year ended 2024, 100% of the fund's income dividends was free from federal income tax, and 6.29% of the fund's income dividends was subject to the federal alternative minimum tax.
The fund will notify shareholders in January 2025 of amounts for use in preparing 2024 income tax returns.
Item 8: Changes in and Disagreements with Accountants for Open-End Management Investment Companies
Note: This is not applicable for any fund included in this document.
Item 9: Proxy Disclosures for Open-End Management Investment Companies
| A special meeting of shareholders was held on October 18, 2023. The results of votes taken among shareholders on the proposal before them are reported below. Each vote reported represents one dollar of net asset value held on the record date for the meeting. |
| Proposal 1 |
| To elect a Board of Trustees. |
| | # of Votes | % of Votes |
| Abigail P. Johnson |
| Affirmative | 378,729,502,260.01 | 97.58 |
| Withheld | 9,407,876,478.96 | 2.42 |
| TOTAL | 388,137,378,738.97 | 100.00 |
| Jennifer Toolin McAuliffe |
| Affirmative | 378,454,868,010.95 | 97.51 |
| Withheld | 9,682,510,728.02 | 2.49 |
| TOTAL | 388,137,378,738.97 | 100.00 |
| Christine J. Thompson |
| Affirmative | 378,837,121,274.52 | 97.60 |
| Withheld | 9,300,257,464.45 | 2.40 |
| TOTAL | 388,137,378,738.97 | 100.00 |
| Elizabeth S. Acton |
| Affirmative | 378,262,110,794.85 | 97.46 |
| Withheld | 9,875,267,944.12 | 2.54 |
| TOTAL | 388,137,378,738.97 | 100.00 |
| Laura M. Bishop |
| Affirmative | 380,482,113,171.06 | 98.03 |
| Withheld | 7,655,265,567.91 | 1.97 |
| TOTAL | 388,137,378,738.97 | 100.00 |
| Ann E. Dunwoody |
| Affirmative | 380,016,034,008.12 | 97.91 |
| Withheld | 8,121,344,730.85 | 2.09 |
| TOTAL | 388,137,378,738.97 | 100.00 |
| John Engler |
| Affirmative | 379,432,488,394.20 | 97.76 |
| Withheld | 8,704,890,344.77 | 2.24 |
| TOTAL | 388,137,378,738.97 | 100.00 |
| Robert F. Gartland |
| Affirmative | 378,741,819,600.60 | 97.58 |
| Withheld | 9,395,559,138.37 | 2.42 |
| TOTAL | 388,137,378,738.97 | 100.00 |
| Robert W. Helm |
| Affirmative | 380,389,324,755.07 | 98.00 |
| Withheld | 7,748,053,983.90 | 2.00 |
| TOTAL | 388,137,378,738.97 | 100.00 |
| Arthur E. Johnson |
| Affirmative | 378,427,694,151.67 | 97.50 |
| Withheld | 9,709,684,587.30 | 2.50 |
| TOTAL | 388,137,378,738.97 | 100.00 |
| Michael E. Kenneally |
| Affirmative | 377,842,228,145.18 | 97.35 |
| Withheld | 10,295,150,593.79 | 2.65 |
| TOTAL | 388,137,378,738.97 | 100.00 |
| Mark A. Murray |
| Affirmative | 380,158,432,703.37 | 97.94 |
| Withheld | 7,978,946,035.60 | 2.06 |
| TOTAL | 388,137,378,738.97 | 100.00 |
| Carol J. Zierhoffer |
| Affirmative | 380,522,113,360.24 | 98.04 |
| Withheld | 7,615,265,378.73 | 1.96 |
| TOTAL | 388,137,378,738.97 | 100.00 |
| | | |
| Proposal 1 reflects trust-wide proposal and voting results. |
Item 10: Remuneration Paid to Directors, Officers, and others of Open-End Management Investment Companies
Note: This information is disclosed as part of the financial statements for each Fund as part of Item 7: Financial Statements and Financial Highlights for Open-End Management Investment companies.
Item 11: Statement Regarding Basis for Approval of Investment Advisory Contract
Board Approval of Investment Advisory Contracts
Fidelity Municipal Bond Index Fund
At its January 2024 meeting, the Board of Trustees, including the Independent Trustees (together, the Board), approved amended and restated sub-advisory agreements (the Sub-Advisory Contracts) for the fund, including the fund's sub-advisory agreements with FMR Investment Management (UK) Limited (FMR UK), Fidelity Management & Research (Hong Kong) Limited (FMR H.K.), and Fidelity Management & Research (Japan) Limited (FMR Japan). The Sub-Advisory Contracts will be effective March 1, 2024. The Board will consider the annual renewal of the fund's Sub-Advisory Contracts in September 2024, following its review of additional materials provided by FMR.
The Board considered the Sub-Advisory Contracts, which changed the arrangements for fees paid by FMR to the sub-advisers under the agreements. The Board noted that the agreements with FMR UK, FMR H.K., and FMR Japan were amended to provide that FMR will compensate each sub-adviser at a fee equal to 110% of the sub-adviser's costs incurred in providing services under the agreement. The Board considered that, under the Sub-Advisory Contracts, FMR, and not the fund, will continue to pay the sub-advisory fees to each applicable sub-adviser, and that the management fee paid by the fund under the management contract with FMR will remain unchanged.
The Board considered that the approval of the fund's Sub-Advisory Contracts will not result in any changes in the investment process or strategies employed in the management of the fund's assets or the day-to-day management of the fund or the persons primarily responsible for such management. Further, the Board considered that the Sub-Advisory Contracts would not change the obligations and services of FMR and its affiliates on behalf of the fund, and, in particular, there would be no change in the nature and level of services provided to the fund by FMR and its affiliates.
In connection with its consideration of future renewals of the fund's advisory contracts, the Board will consider: (i) the nature, extent and quality of services provided to the funds, including shareholder and administrative services and investment performance; (ii) the competitiveness of the management fee and total expenses for the fund; (iii) the costs of the services and profitability, including the revenues earned and the expenses incurred in conducting the business of developing, marketing, distributing, managing, administering, and servicing the fund and its shareholders, to the extent applicable; and (iv) whether there have been economies of scale in respect of the Fidelity funds, whether the Fidelity funds (including the fund) have appropriately benefited from any such economies of scale, and whether there is the potential for realization of any further economies.
Based on its evaluation of all of the conclusions noted above, and after considering all factors it believed relevant, the Board concluded that the fund's management fee structure is fair and reasonable, and that the fund's Sub-Advisory Contracts should be approved.
1.9894016.104
MBL-ANN-0824
Item 8.
Changes in and Disagreements with Accountants for Open-End Management Investment Companies
See Item 7.
Item 9.
Proxy Disclosures for Open-End Management Investment Companies
See Item 7.
Item 10.
Remuneration Paid to Directors, Officers, and Others of Open-End Management Investment Companies
See Item 7.
Item 11.
Statement Regarding Basis for Approval of Investment Advisory Contract
See Item 7.
Item 12.
Disclosure of Proxy Voting Policies and Procedures for Closed-End Management Investment Companies
Not applicable.
Item 13.
Portfolio Managers of Closed-End Management Investment Companies
Not applicable.
Item 14.
Purchase of Equity Securities by Closed-End Management Investment Company and Affiliated Purchasers
Not applicable.
Item 15.
Submission of Matters to a Vote of Security Holders
There were no material changes to the procedures by which shareholders may recommend nominees to the trust’s Board of Trustees.
Item 16.
Controls and Procedures
(a)(i) The President and Treasurer and the Chief Financial Officer have concluded that the trust’s disclosure controls and procedures (as defined in Rule 30a-3(c) under the Investment Company Act) provide reasonable assurances that material information relating to the trust is made known to them by the appropriate persons, based on their evaluation of these controls and procedures as of a date within 90 days of the filing date of this report.
(a)(ii) There was no change in the trust’s internal control over financial reporting (as defined in Rule 30a-3(d) under the Investment Company Act) that occurred during the period covered by this report that has materially affected, or is reasonably likely to materially affect, the trust’s internal control over financial reporting.
Item 17.
Disclosure of Securities Lending Activities for Closed-End Management Investment Companies
Not applicable.
Item 18.
Recovery of Erroneously Awarded Compensation
(a)
Not applicable.
(b)
Not applicable.
Item 19.
Exhibits
SIGNATURES
Pursuant to the requirements of the Securities Exchange Act of 1934 and the Investment Company Act of 1940, the registrant has duly caused this report to be signed on its behalf by the undersigned, thereunto duly authorized.
Fidelity Salem Street Trust
|
By: | /s/Laura M. Del Prato |
| Laura M. Del Prato |
| President and Treasurer (Principal Executive Officer) |
|
|
Date: | August 22, 2024 |
Pursuant to the requirements of the Securities Exchange Act of 1934 and the Investment Company Act of 1940, this report has been signed below by the following persons on behalf of the registrant and in the capacities and on the dates indicated.
|
By: | /s/Laura M. Del Prato |
| Laura M. Del Prato |
| President and Treasurer (Principal Executive Officer) |
|
|
Date: | August 22, 2024 |
|
By: | /s/John J. Burke III |
| John J. Burke III |
| Chief Financial Officer (Principal Financial Officer) |
|
|
Date: | August 22, 2024 |