UNITED STATES
SECURITIES AND EXCHANGE COMMISSION
Washington, D.C. 20549
FORM N-CSR
CERTIFIED SHAREHOLDER REPORT OF REGISTERED
MANAGEMENT INVESTMENT COMPANIES
Investment Company Act file number 811-02105
Fidelity Salem Street Trust
(Exact name of registrant as specified in charter)
245 Summer St., Boston, Massachusetts 02210
(Address of principal executive offices) (Zip code)
Nicole Macarchuk, Secretary
245 Summer St.
Boston, Massachusetts 02210
(Name and address of agent for service)
Registrant's telephone number, including area code:
617-563-7000
| |
Date of fiscal year end: | August 31 |
|
|
Date of reporting period: | August 31, 2024 |
This report on Form N-CSR relates solely to the Registrant’s Fidelity Corporate Bond Fund, Fidelity Flex U.S. Bond Index Fund, Fidelity Series Bond Index Fund, Fidelity Series Government Money Market Fund, Fidelity Series Investment Grade Bond Fund, Fidelity Series Short-Term Credit Fund, and Fidelity U.S. Bond Index Fund (the “Funds”).
Item 1.
Reports to Stockholders
| |
| | ANNUAL SHAREHOLDER REPORT | AS OF AUGUST 31, 2024 | |
| | Fidelity® Series Investment Grade Bond Fund Fidelity® Series Investment Grade Bond Fund : FSIGX |
| | | |
This annual shareholder report contains information about Fidelity® Series Investment Grade Bond Fund for the period September 1, 2023 to August 31, 2024. You can find additional information about the Fund at fundresearch.fidelity.com/prospectus/sec. You can also request this information by contacting us at 1-800-544-8544.
What were your Fund costs for the last year?(based on hypothetical $10,000 investment)
FUND COST (PREVIOUS YEAR)
| | Costs of a $10,000 investment | Costs paid as a percentage of a $10,000 investment | |
| Fidelity® Series Investment Grade Bond Fund | $ 0 A | 0.00%B | |
A Amount represents less than $.50
B Amount represents less than 0.005%
What affected the Fund's performance this period?
•U.S. taxable investment-grade bonds posted a strong advance for the 12 months ending August 31, 2024, helped by a late-period gain as the bond market reflected anticipated interest-rate reductions by the U.S. Federal Reserve, which are expected to start in September. The full 12-month period was marked by high levels of volatility.
•Against this backdrop, both sector allocation and security selection contributed to the fund's outperformance of the Bloomberg U.S. Aggregate Bond Index for the fiscal year.
•In terms of sector allocation, the fund's overweights in asset-backed securities, mortgage-backed securities and commercial mortgage-backed securities segments each helped relative performance the past 12 months.
•As for security selection, fund holdings in the corporate segment made a notable contribution, led by picks among financials, particularly REITs and banks.
•Picks among MBS also helped relative performance this period, as did choices among ABS, with fund holdings in collateralized loan obligations providing a boost. Security selection among CMBS were beneficial as well.
•In contrast, the fund's underweight in industrial bonds within the corporate sector detracted versus the index the past 12 months.
How did the Fund perform over the past 10 years?
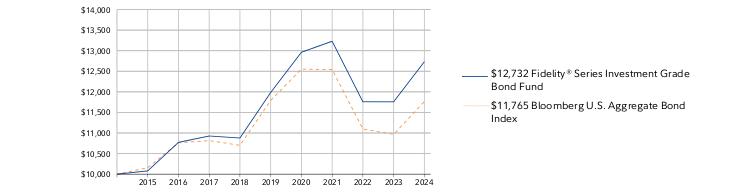
CUMULATIVE PERFORMANCE
August 31, 2014 through August 31, 2024.
Initial investment of $10,000.
Fidelity® Series Investment Grade Bond Fund | $10,000 | $10,079 | $10,771 | $10,927 | $10,878 | $11,983 | $12,962 | $13,229 | $11,759 | $11,757 | $12,732 |
Bloomberg U.S. Aggregate Bond Index | $10,000 | $10,156 | $10,761 | $10,814 | $10,701 | $11,789 | $12,553 | $12,542 | $11,098 | $10,965 | $11,765 |
| | 2014 | 2015 | 2016 | 2017 | 2018 | 2019 | 2020 | 2021 | 2022 | 2023 | 2024 |
AVERAGE ANNUAL TOTAL RETURNS: | | 1 Year | 5 Year | 10 Year |
| Fidelity® Series Investment Grade Bond Fund | 8.29% | 1.22% | 2.44% |
| Bloomberg U.S. Aggregate Bond Index | 7.30% | -0.04% | 1.64% |
Visit www.fidelity.com for more recent performance information. |
The Fund's past performance is not a good predictor of the Fund's future performance. The graph and table do not reflect the deduction of taxes that a shareholder would pay on fund distributions or redemption of fund shares. |
Key Fund Statistics (as of August 31, 2024)
KEY FACTS | | |
| Fund Size | $36,297,786,651 | |
| Number of Holdings | 5,101 | |
| Total Advisory Fee | $0 | |
| Portfolio Turnover | 219% | |
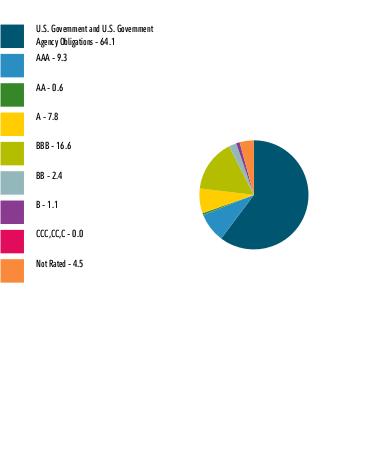
What did the Fund invest in?
(as of August 31, 2024)
| U.S. Government and U.S. Government Agency Obligations | 64.1 |
| AAA | 9.3 |
| AA | 0.6 |
| A | 7.8 |
| BBB | 16.6 |
| BB | 2.4 |
| B | 1.1 |
| CCC,CC,C | 0.0 |
| Not Rated | 4.5 |
QUALITY DIVERSIFICATION (% of Fund's net assets) |
|
| Short-Term Investments and Net Other Assets (Liabilities) - (6.4)% |
| |
| We have used ratings from Moody's Investors Service, Inc. Where Moody's® ratings are not available, we have used S&P® ratings. All ratings are as of the date indicated and do not reflect subsequent changes. |
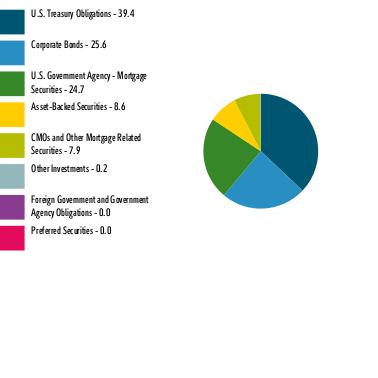
| U.S. Treasury Obligations | 39.4 |
| Corporate Bonds | 25.6 |
| U.S. Government Agency - Mortgage Securities | 24.7 |
| Asset-Backed Securities | 8.6 |
| CMOs and Other Mortgage Related Securities | 7.9 |
| Other Investments | 0.2 |
| Foreign Government and Government Agency Obligations | 0.0 |
| Preferred Securities | 0.0 |
ASSET ALLOCATION (% of Fund's net assets) |
|
| Short-Term Investments and Net Other Assets (Liabilities) - (6.4)% |
|
| United States | 90.1 |
| Grand Cayman (UK Overseas Ter) | 4.5 |
| United Kingdom | 1.3 |
| Mexico | 1.1 |
| Ireland | 0.7 |
| Switzerland | 0.6 |
| Germany | 0.5 |
| France | 0.3 |
| Canada | 0.2 |
| Others | 0.7 |
GEOGRAPHIC DIVERSIFICATION (% of Fund's net assets) |
|
| |
|
TOP HOLDINGS (% of Fund's net assets) | | |
| US Treasury Notes | 29.4 | |
| US Treasury Bonds | 10.0 | |
| Fannie Mae Mortgage pass-thru certificates | 8.0 | |
| Ginnie Mae II Pool | 6.2 | |
| Freddie Mac Gold Pool | 5.2 | |
| Uniform Mortgage Backed Securities | 4.3 | |
| Freddie Mac Multiclass Mortgage participation certificates | 1.2 | |
| Petroleos Mexicanos | 1.1 | |
| JPMorgan Chase & Co | 1.1 | |
| Goldman Sachs Group Inc/The | 0.9 | |
| | 67.4 | |
| Fidelity, the Fidelity Investments Logo and all other Fidelity trademarks or service marks used herein are trademarks or service marks of FMR LLC. Any third-party marks that are used herein are trademarks or service marks of their respective owners. © 2024 FMR LLC. All rights reserved. |
| | For additional information about the Fund; including its prospectus, financial information, holdings and proxy information, scan the QR code or visit fundresearch.fidelity.com/prospectus/sec 1.9913635.100 2114-TSRA-1024 |
| |
| | ANNUAL SHAREHOLDER REPORT | AS OF AUGUST 31, 2024 | |
| | Fidelity® Corporate Bond Fund Fidelity Advisor® Corporate Bond Fund Class M : FCBTX |
| | | |
This annual shareholder report contains information about Fidelity® Corporate Bond Fund for the period September 1, 2023 to August 31, 2024. You can find additional information about the Fund at fundresearch.fidelity.com/prospectus/sec. You can also request this information by contacting us at 1-877-208-0098 or by sending an e-mail to fidfunddocuments@fidelity.com.
What were your Fund costs for the last year?(based on hypothetical $10,000 investment)
FUND COST (PREVIOUS YEAR)
| | Costs of a $10,000 investment | Costs paid as a percentage of a $10,000 investment | |
| Class M | $ 86 | 0.82% | |
What affected the Fund's performance this period?
•U.S. taxable investment-grade bonds posted a strong advance for the 12 months ending August 31, 2024, helped by a late-period gain, as the bond market reflected anticipated interest-rate reductions by the U.S. Federal Reserve, which are expected to start in September. The full 12-month period was marked by high volatility.
•Against this backdrop, security selection contributed to the fund's performance versus the benchmark for the fiscal year, while sector positioning had a roughly neutral impact overall.
•Bond picks among issuers in the financials sector added the most value. Having greater-than-benchmark exposure to financials also helped.
•Within financials, selection among banks contributed the most, followed by investment choices among insurance companies and overall positioning in real estate investment trusts.
•Picks among industrial issuers also notably aided relative performance, as did a sizable underweight in the sector.
•Within industrials, selection among consumer-focused companies led the way. Positioning among information technology issuers in the benchmark provided a further boost, along with picks in the energy category.
•Holding of bonds issued by electric utility companies modestly contributed.
•In terms of yield-curve positioning, the fund benefited from overweight exposure to the intermediate-maturity 5-10 year portion of the curve.
•Outside of corporate credit, an allocation to U.S. Treasuries and cash - held for liquidity and risk-management purposes - meaningfully detracted. This negative was somewhat offset by underweighting other government-related categories, as these bonds lagged credit in an improving market environment.
How did the Fund perform over the past 10 years?
CUMULATIVE PERFORMANCE
August 31, 2014 through August 31, 2024.
Initial investment of $10,000 and the current sales charge was paid.
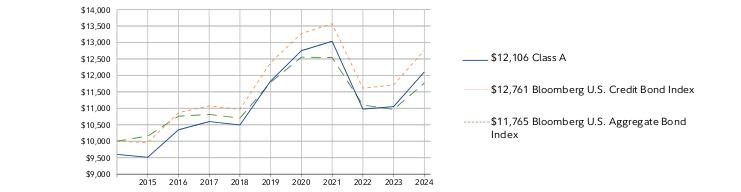
Class M | $9,600 | $9,505 | $10,331 | $10,573 | $10,462 | $11,784 | $12,694 | $12,975 | $10,918 | $10,989 | $12,031 |
Bloomberg U.S. Credit Bond Index | $10,000 | $9,957 | $10,868 | $11,074 | $10,965 | $12,389 | $13,269 | $13,569 | $11,611 | $11,709 | $12,761 |
Bloomberg U.S. Aggregate Bond Index | $10,000 | $10,156 | $10,761 | $10,814 | $10,701 | $11,789 | $12,553 | $12,542 | $11,098 | $10,965 | $11,765 |
| | 2014 | 2015 | 2016 | 2017 | 2018 | 2019 | 2020 | 2021 | 2022 | 2023 | 2024 |
AVERAGE ANNUAL TOTAL RETURNS: | | 1 Year | 5 Year | 10 Year |
| Class M (incl. 4.00% sales charge) | 5.11% | -0.40% | 1.87% |
| Class M (without 4.00% sales charge) | 9.49% | 0.42% | 2.28% |
| Bloomberg U.S. Credit Bond Index | 8.98% | 0.59% | 2.47% |
| Bloomberg U.S. Aggregate Bond Index | 7.30% | -0.04% | 1.64% |
Visit institutional.fidelity.com for more recent performance information. |
The Fund's past performance is not a good predictor of the Fund's future performance. The graph and table do not reflect the deduction of taxes that a shareholder would pay on fund distributions or redemption of fund shares. |
Key Fund Statistics (as of August 31, 2024)
KEY FACTS | | |
| Fund Size | $2,001,136,363 | |
| Number of Holdings | 621 | |
| Total Advisory Fee | $6,038,514 | |
| Portfolio Turnover | 30% | |
What did the Fund invest in?
(as of August 31, 2024)
| U.S. Government and U.S. Government Agency Obligations | 9.8 |
| AAA | 0.1 |
| AA | 0.0 |
| A | 17.0 |
| BBB | 60.7 |
| BB | 6.5 |
| B | 0.7 |
| Not Rated | 0.2 |
| Short-Term Investments and Net Other Assets (Liabilities) | 5.0 |
QUALITY DIVERSIFICATION (% of Fund's net assets) |
|
| |
| We have used ratings from Moody's Investors Service, Inc. Where Moody's® ratings are not available, we have used S&P® ratings. All ratings are as of the date indicated and do not reflect subsequent changes. |
| Corporate Bonds | 84.4 |
| U.S. Treasury Obligations | 9.8 |
| Asset-Backed Securities | 0.3 |
| Preferred Securities | 0.3 |
| Foreign Government and Government Agency Obligations | 0.1 |
| Other Investments | 0.1 |
| Municipal Securities | 0.0 |
| Short-Term Investments and Net Other Assets (Liabilities) | 5.0 |
ASSET ALLOCATION (% of Fund's net assets) |
|
|
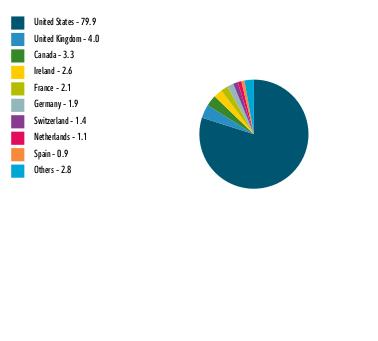
| United States | 79.9 |
| United Kingdom | 4.0 |
| Canada | 3.3 |
| Ireland | 2.6 |
| France | 2.1 |
| Germany | 1.9 |
| Switzerland | 1.4 |
| Netherlands | 1.1 |
| Spain | 0.9 |
| Others | 2.8 |
GEOGRAPHIC DIVERSIFICATION (% of Fund's net assets) |
|
| |
|
TOP HOLDINGS (% of Fund's net assets) | | |
| US Treasury Bonds | 9.5 | |
| Bank of America Corp | 2.1 | |
| JPMorgan Chase & Co | 1.9 | |
| Boeing Co | 1.5 | |
| UBS Group AG | 1.4 | |
| AerCap Ireland Capital DAC / AerCap Global Aviation Trust | 1.1 | |
| Wells Fargo & Co | 1.1 | |
| Duke Energy Corp | 1.1 | |
| HSBC Holdings PLC | 1.1 | |
| CVS Health Corp | 1.1 | |
| | 21.9 | |
| Fidelity, the Fidelity Investments Logo and all other Fidelity trademarks or service marks used herein are trademarks or service marks of FMR LLC. Any third-party marks that are used herein are trademarks or service marks of their respective owners. © 2024 FMR LLC. All rights reserved. |
| | For additional information about the Fund; including its prospectus, financial information, holdings and proxy information, scan the QR code or visit fundresearch.fidelity.com/prospectus/sec 1.9913639.100 2218-TSRA-1024 |
| |
| | ANNUAL SHAREHOLDER REPORT | AS OF AUGUST 31, 2024 | |
| | Fidelity® Corporate Bond Fund Fidelity® Corporate Bond Fund : FCBFX |
| | | |
This annual shareholder report contains information about Fidelity® Corporate Bond Fund for the period September 1, 2023 to August 31, 2024. You can find additional information about the Fund at fundresearch.fidelity.com/prospectus/sec. You can also request this information by contacting us at 1-800-544-8544 or by sending an e-mail to fidfunddocuments@fidelity.com.
What were your Fund costs for the last year?(based on hypothetical $10,000 investment)
FUND COST (PREVIOUS YEAR)
| | Costs of a $10,000 investment | Costs paid as a percentage of a $10,000 investment | |
| Fidelity® Corporate Bond Fund | $ 47 | 0.45% | |
What affected the Fund's performance this period?
•U.S. taxable investment-grade bonds posted a strong advance for the 12 months ending August 31, 2024, helped by a late-period gain, as the bond market reflected anticipated interest-rate reductions by the U.S. Federal Reserve, which are expected to start in September. The full 12-month period was marked by high volatility.
•Against this backdrop, security selection contributed to the fund's performance versus the benchmark for the fiscal year, while sector positioning had a roughly neutral impact overall.
•Bond picks among issuers in the financials sector added the most value. Having greater-than-benchmark exposure to financials also helped.
•Within financials, selection among banks contributed the most, followed by investment choices among insurance companies and overall positioning in real estate investment trusts.
•Picks among industrial issuers also notably aided relative performance, as did a sizable underweight in the sector.
•Within industrials, selection among consumer-focused companies led the way. Positioning among information technology issuers in the benchmark provided a further boost, along with picks in the energy category.
•Holding of bonds issued by electric utility companies modestly contributed.
•In terms of yield-curve positioning, the fund benefited from overweight exposure to the intermediate-maturity 5-10 year portion of the curve.
•Outside of corporate credit, an allocation to U.S. Treasuries and cash - held for liquidity and risk-management purposes - meaningfully detracted. This negative was somewhat offset by underweighting other government-related categories, as these bonds lagged credit in an improving market environment.
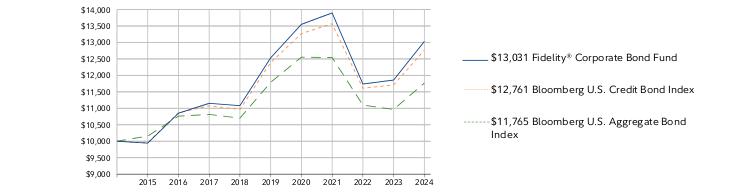
How did the Fund perform over the past 10 years?
CUMULATIVE PERFORMANCE
August 31, 2014 through August 31, 2024.
Initial investment of $10,000.
Fidelity® Corporate Bond Fund | $10,000 | $9,942 | $10,850 | $11,151 | $11,080 | $12,532 | $13,550 | $13,897 | $11,737 | $11,858 | $13,031 |
Bloomberg U.S. Credit Bond Index | $10,000 | $9,957 | $10,868 | $11,074 | $10,965 | $12,389 | $13,269 | $13,569 | $11,611 | $11,709 | $12,761 |
Bloomberg U.S. Aggregate Bond Index | $10,000 | $10,156 | $10,761 | $10,814 | $10,701 | $11,789 | $12,553 | $12,542 | $11,098 | $10,965 | $11,765 |
| | 2014 | 2015 | 2016 | 2017 | 2018 | 2019 | 2020 | 2021 | 2022 | 2023 | 2024 |
AVERAGE ANNUAL TOTAL RETURNS: | | 1 Year | 5 Year | 10 Year |
| Fidelity® Corporate Bond Fund | 9.89% | 0.78% | 2.68% |
| Bloomberg U.S. Credit Bond Index | 8.98% | 0.59% | 2.47% |
| Bloomberg U.S. Aggregate Bond Index | 7.30% | -0.04% | 1.64% |
Visit www.fidelity.com for more recent performance information. |
The Fund's past performance is not a good predictor of the Fund's future performance. The graph and table do not reflect the deduction of taxes that a shareholder would pay on fund distributions or redemption of fund shares. |
Key Fund Statistics (as of August 31, 2024)
KEY FACTS | | |
| Fund Size | $2,001,136,363 | |
| Number of Holdings | 621 | |
| Total Advisory Fee | $6,038,514 | |
| Portfolio Turnover | 30% | |
What did the Fund invest in?
(as of August 31, 2024)
| U.S. Government and U.S. Government Agency Obligations | 9.8 |
| AAA | 0.1 |
| AA | 0.0 |
| A | 17.0 |
| BBB | 60.7 |
| BB | 6.5 |
| B | 0.7 |
| Not Rated | 0.2 |
| Short-Term Investments and Net Other Assets (Liabilities) | 5.0 |
QUALITY DIVERSIFICATION (% of Fund's net assets) |
|
| |
| We have used ratings from Moody's Investors Service, Inc. Where Moody's® ratings are not available, we have used S&P® ratings. All ratings are as of the date indicated and do not reflect subsequent changes. |
| Corporate Bonds | 84.4 |
| U.S. Treasury Obligations | 9.8 |
| Asset-Backed Securities | 0.3 |
| Preferred Securities | 0.3 |
| Foreign Government and Government Agency Obligations | 0.1 |
| Other Investments | 0.1 |
| Municipal Securities | 0.0 |
| Short-Term Investments and Net Other Assets (Liabilities) | 5.0 |
ASSET ALLOCATION (% of Fund's net assets) |
|
|
| United States | 79.9 |
| United Kingdom | 4.0 |
| Canada | 3.3 |
| Ireland | 2.6 |
| France | 2.1 |
| Germany | 1.9 |
| Switzerland | 1.4 |
| Netherlands | 1.1 |
| Spain | 0.9 |
| Others | 2.8 |
GEOGRAPHIC DIVERSIFICATION (% of Fund's net assets) |
|
| |
|
TOP HOLDINGS (% of Fund's net assets) | | |
| US Treasury Bonds | 9.5 | |
| Bank of America Corp | 2.1 | |
| JPMorgan Chase & Co | 1.9 | |
| Boeing Co | 1.5 | |
| UBS Group AG | 1.4 | |
| AerCap Ireland Capital DAC / AerCap Global Aviation Trust | 1.1 | |
| Wells Fargo & Co | 1.1 | |
| Duke Energy Corp | 1.1 | |
| HSBC Holdings PLC | 1.1 | |
| CVS Health Corp | 1.1 | |
| | 21.9 | |
| Fidelity, the Fidelity Investments Logo and all other Fidelity trademarks or service marks used herein are trademarks or service marks of FMR LLC. Any third-party marks that are used herein are trademarks or service marks of their respective owners. © 2024 FMR LLC. All rights reserved. |
| | For additional information about the Fund; including its prospectus, financial information, holdings and proxy information, scan the QR code or visit fundresearch.fidelity.com/prospectus/sec 1.9913636.100 2208-TSRA-1024 |
| |
| | ANNUAL SHAREHOLDER REPORT | AS OF AUGUST 31, 2024 | |
| | Fidelity® Series Short-Term Credit Fund Fidelity® Series Short-Term Credit Fund : FYBTX |
| | | |
This annual shareholder report contains information about Fidelity® Series Short-Term Credit Fund for the period September 1, 2023 to August 31, 2024. You can find additional information about the Fund at fundresearch.fidelity.com/prospectus/sec. You can also request this information by contacting us at 1-800-544-8544.
What were your Fund costs for the last year?(based on hypothetical $10,000 investment)
FUND COST (PREVIOUS YEAR)
| | Costs of a $10,000 investment | Costs paid as a percentage of a $10,000 investment | |
| Fidelity® Series Short-Term Credit Fund | $ 0 A | 0.00%B | |
A Amount represents less than $.50
B Amount represents less than 0.005%
What affected the Fund's performance this period?
•U.S. taxable investment-grade bonds posted a strong advance for the 12 months ending August 31, 2024, helped by a late-period gain, as the bond market reflected anticipated interest-rate reductions by the U.S. Federal Reserve, which are expected to start in September. The full 12-month period was marked by high volatility.
•Against this backdrop, security selection and, to a lesser extent, sector allocation each contributed to performance versus the benchmark.
•The fund's non-benchmark exposure to asset-backed securities, including car loan debt and collateralized loan obligations, meaningfully contributed. An out-of-benchmark allocation to commercial mortgage-backed securities helped as well.
•In contrast, the fund's yield-curve positioning detracted from relative performance.
•At period end, corporate credit holdings made up 71% of fund assets, down from roughly 76% a year ago and underweight versus the benchmark average of 82%. Out-of-benchmark exposure to asset-backed securities stood at roughly 17% as of August 31, while U.S. Treasurys composed about 6% of the portfolio.
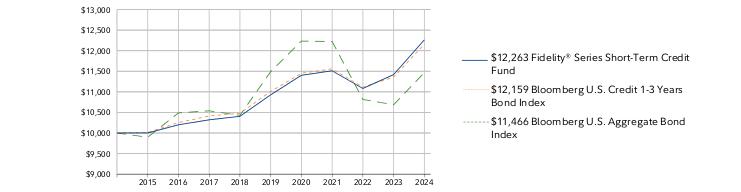
How did the Fund perform over the life of Fund?
CUMULATIVE PERFORMANCE
March 27, 2015 through August 31, 2024.
Initial investment of $10,000.
Fidelity® Series Short-Term Credit Fund | $10,000 | $10,001 | $10,199 | $10,320 | $10,405 | $10,927 | $11,402 | $11,511 | $11,082 | $11,419 |
Bloomberg U.S. Credit 1-3 Years Bond Index | $10,000 | $10,013 | $10,251 | $10,414 | $10,476 | $11,009 | $11,451 | $11,558 | $11,112 | $11,359 |
Bloomberg U.S. Aggregate Bond Index | $10,000 | $9,897 | $10,488 | $10,539 | $10,429 | $11,490 | $12,233 | $12,223 | $10,816 | $10,686 |
| | 2015 | 2016 | 2017 | 2018 | 2019 | 2020 | 2021 | 2022 | 2023 | 2024 |
AVERAGE ANNUAL TOTAL RETURNS: | | 1 Year | 5 Year | Life of Fund A |
| Fidelity® Series Short-Term Credit Fund | 7.40% | 2.33% | 2.19% |
| Bloomberg U.S. Credit 1-3 Years Bond Index | 7.04% | 2.01% | 2.09% |
| Bloomberg U.S. Aggregate Bond Index | 7.30% | -0.04% | 1.46% |
A From March 27, 2015
Visit www.fidelity.com for more recent performance information. |
The Fund's past performance is not a good predictor of the Fund's future performance. The graph and table do not reflect the deduction of taxes that a shareholder would pay on fund distributions or redemption of fund shares. |
Key Fund Statistics (as of August 31, 2024)
KEY FACTS | | |
| Fund Size | $480,107,974 | |
| Number of Holdings | 401 | |
| Total Advisory Fee | $0 | |
| Portfolio Turnover | 72% | |
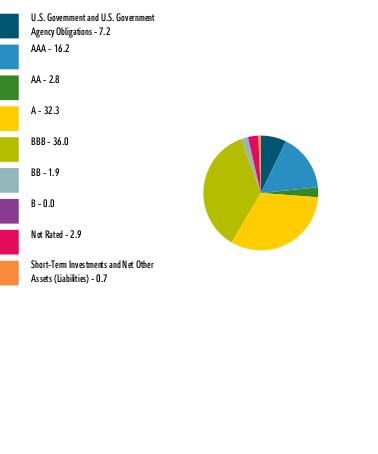
What did the Fund invest in?
(as of August 31, 2024)
| U.S. Government and U.S. Government Agency Obligations | 7.2 |
| AAA | 16.2 |
| AA | 2.8 |
| A | 32.3 |
| BBB | 36.0 |
| BB | 1.9 |
| B | 0.0 |
| Not Rated | 2.9 |
| Short-Term Investments and Net Other Assets (Liabilities) | 0.7 |
QUALITY DIVERSIFICATION (% of Fund's net assets) |
|
| |
| We have used ratings from Moody's Investors Service, Inc. Where Moody's® ratings are not available, we have used S&P® ratings. All ratings are as of the date indicated and do not reflect subsequent changes. |
| Corporate Bonds | 69.6 |
| Asset-Backed Securities | 16.0 |
| U.S. Treasury Obligations | 6.3 |
| CMOs and Other Mortgage Related Securities | 5.3 |
| Other Investments | 1.2 |
| U.S. Government Agency - Mortgage Securities | 0.9 |
| Short-Term Investments and Net Other Assets (Liabilities) | 0.7 |
ASSET ALLOCATION (% of Fund's net assets) |
|
|
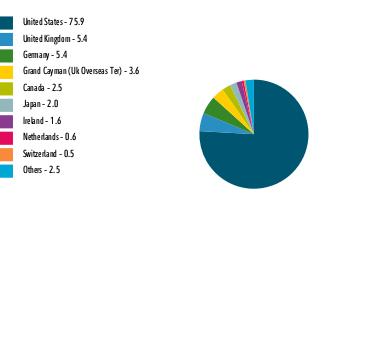
| United States | 75.9 |
| United Kingdom | 5.4 |
| Germany | 5.4 |
| Grand Cayman (Uk Overseas Ter) | 3.6 |
| Canada | 2.5 |
| Japan | 2.0 |
| Ireland | 1.6 |
| Netherlands | 0.6 |
| Switzerland | 0.5 |
| Others | 2.5 |
GEOGRAPHIC DIVERSIFICATION (% of Fund's net assets) |
|
| |
|
TOP HOLDINGS (% of Fund's net assets) | | |
| US Treasury Notes | 6.3 | |
| JPMorgan Chase & Co | 3.1 | |
| Bank of America Corp | 2.8 | |
| Wells Fargo & Co | 2.3 | |
| HSBC Holdings PLC | 2.1 | |
| General Motors Financial Co Inc | 2.1 | |
| T-Mobile USA Inc | 1.8 | |
| Hyundai Capital America | 1.6 | |
| Cf Hippolyta Issuer LLC | 1.6 | |
| AerCap Ireland Capital DAC / AerCap Global Aviation Trust | 1.4 | |
| | 25.1 | |
| Fidelity, the Fidelity Investments Logo and all other Fidelity trademarks or service marks used herein are trademarks or service marks of FMR LLC. Any third-party marks that are used herein are trademarks or service marks of their respective owners. © 2024 FMR LLC. All rights reserved. |
| | For additional information about the Fund; including its prospectus, financial information, holdings and proxy information, scan the QR code or visit fundresearch.fidelity.com/prospectus/sec 1.9913649.100 2743-TSRA-1024 |
| |
| | ANNUAL SHAREHOLDER REPORT | AS OF AUGUST 31, 2024 | |
| | Fidelity® Corporate Bond Fund Fidelity Advisor® Corporate Bond Fund Class A : FCBAX |
| | | |
This annual shareholder report contains information about Fidelity® Corporate Bond Fund for the period September 1, 2023 to August 31, 2024. You can find additional information about the Fund at fundresearch.fidelity.com/prospectus/sec. You can also request this information by contacting us at 1-877-208-0098 or by sending an e-mail to fidfunddocuments@fidelity.com.
What were your Fund costs for the last year?(based on hypothetical $10,000 investment)
FUND COST (PREVIOUS YEAR)
| | Costs of a $10,000 investment | Costs paid as a percentage of a $10,000 investment | |
| Class A | $ 81 | 0.77% | |
What affected the Fund's performance this period?
•U.S. taxable investment-grade bonds posted a strong advance for the 12 months ending August 31, 2024, helped by a late-period gain, as the bond market reflected anticipated interest-rate reductions by the U.S. Federal Reserve, which are expected to start in September. The full 12-month period was marked by high volatility.
•Against this backdrop, security selection contributed to the fund's performance versus the benchmark for the fiscal year, while sector positioning had a roughly neutral impact overall.
•Bond picks among issuers in the financials sector added the most value. Having greater-than-benchmark exposure to financials also helped.
•Within financials, selection among banks contributed the most, followed by investment choices among insurance companies and overall positioning in real estate investment trusts.
•Picks among industrial issuers also notably aided relative performance, as did a sizable underweight in the sector.
•Within industrials, selection among consumer-focused companies led the way. Positioning among information technology issuers in the benchmark provided a further boost, along with picks in the energy category.
•Holding of bonds issued by electric utility companies modestly contributed.
•In terms of yield-curve positioning, the fund benefited from overweight exposure to the intermediate-maturity 5-10 year portion of the curve.
•Outside of corporate credit, an allocation to U.S. Treasuries and cash - held for liquidity and risk-management purposes - meaningfully detracted. This negative was somewhat offset by underweighting other government-related categories, as these bonds lagged credit in an improving market environment.
How did the Fund perform over the past 10 years?
CUMULATIVE PERFORMANCE
August 31, 2014 through August 31, 2024.
Initial investment of $10,000 and the current sales charge was paid.
Class A | $9,600 | $9,512 | $10,346 | $10,597 | $10,494 | $11,830 | $12,750 | $13,036 | $10,975 | $11,051 | $12,106 |
Bloomberg U.S. Credit Bond Index | $10,000 | $9,957 | $10,868 | $11,074 | $10,965 | $12,389 | $13,269 | $13,569 | $11,611 | $11,709 | $12,761 |
Bloomberg U.S. Aggregate Bond Index | $10,000 | $10,156 | $10,761 | $10,814 | $10,701 | $11,789 | $12,553 | $12,542 | $11,098 | $10,965 | $11,765 |
| | 2014 | 2015 | 2016 | 2017 | 2018 | 2019 | 2020 | 2021 | 2022 | 2023 | 2024 |
AVERAGE ANNUAL TOTAL RETURNS: | | 1 Year | 5 Year | 10 Year |
| Class A (incl. 4.00% sales charge) | 5.16% | -0.35% | 1.93% |
| Class A (without 4.00% sales charge) | 9.54% | 0.46% | 2.35% |
| Bloomberg U.S. Credit Bond Index | 8.98% | 0.59% | 2.47% |
| Bloomberg U.S. Aggregate Bond Index | 7.30% | -0.04% | 1.64% |
Visit institutional.fidelity.com for more recent performance information. |
The Fund's past performance is not a good predictor of the Fund's future performance. The graph and table do not reflect the deduction of taxes that a shareholder would pay on fund distributions or redemption of fund shares. |
Key Fund Statistics (as of August 31, 2024)
KEY FACTS | | |
| Fund Size | $2,001,136,363 | |
| Number of Holdings | 621 | |
| Total Advisory Fee | $6,038,514 | |
| Portfolio Turnover | 30% | |
What did the Fund invest in?
(as of August 31, 2024)
| U.S. Government and U.S. Government Agency Obligations | 9.8 |
| AAA | 0.1 |
| AA | 0.0 |
| A | 17.0 |
| BBB | 60.7 |
| BB | 6.5 |
| B | 0.7 |
| Not Rated | 0.2 |
| Short-Term Investments and Net Other Assets (Liabilities) | 5.0 |
QUALITY DIVERSIFICATION (% of Fund's net assets) |
|
| |
| We have used ratings from Moody's Investors Service, Inc. Where Moody's® ratings are not available, we have used S&P® ratings. All ratings are as of the date indicated and do not reflect subsequent changes. |
| Corporate Bonds | 84.4 |
| U.S. Treasury Obligations | 9.8 |
| Asset-Backed Securities | 0.3 |
| Preferred Securities | 0.3 |
| Foreign Government and Government Agency Obligations | 0.1 |
| Other Investments | 0.1 |
| Municipal Securities | 0.0 |
| Short-Term Investments and Net Other Assets (Liabilities) | 5.0 |
ASSET ALLOCATION (% of Fund's net assets) |
|
|
| United States | 79.9 |
| United Kingdom | 4.0 |
| Canada | 3.3 |
| Ireland | 2.6 |
| France | 2.1 |
| Germany | 1.9 |
| Switzerland | 1.4 |
| Netherlands | 1.1 |
| Spain | 0.9 |
| Others | 2.8 |
GEOGRAPHIC DIVERSIFICATION (% of Fund's net assets) |
|
| |
|
TOP HOLDINGS (% of Fund's net assets) | | |
| US Treasury Bonds | 9.5 | |
| Bank of America Corp | 2.1 | |
| JPMorgan Chase & Co | 1.9 | |
| Boeing Co | 1.5 | |
| UBS Group AG | 1.4 | |
| AerCap Ireland Capital DAC / AerCap Global Aviation Trust | 1.1 | |
| Wells Fargo & Co | 1.1 | |
| Duke Energy Corp | 1.1 | |
| HSBC Holdings PLC | 1.1 | |
| CVS Health Corp | 1.1 | |
| | 21.9 | |
| Fidelity, the Fidelity Investments Logo and all other Fidelity trademarks or service marks used herein are trademarks or service marks of FMR LLC. Any third-party marks that are used herein are trademarks or service marks of their respective owners. © 2024 FMR LLC. All rights reserved. |
| | For additional information about the Fund; including its prospectus, financial information, holdings and proxy information, scan the QR code or visit fundresearch.fidelity.com/prospectus/sec 1.9913637.100 2209-TSRA-1024 |
| |
| | ANNUAL SHAREHOLDER REPORT | AS OF AUGUST 31, 2024 | |
| | Fidelity® Corporate Bond Fund Fidelity Advisor® Corporate Bond Fund Class C : FCCCX |
| | | |
This annual shareholder report contains information about Fidelity® Corporate Bond Fund for the period September 1, 2023 to August 31, 2024. You can find additional information about the Fund at fundresearch.fidelity.com/prospectus/sec. You can also request this information by contacting us at 1-877-208-0098 or by sending an e-mail to fidfunddocuments@fidelity.com.
What were your Fund costs for the last year?(based on hypothetical $10,000 investment)
FUND COST (PREVIOUS YEAR)
| | Costs of a $10,000 investment | Costs paid as a percentage of a $10,000 investment | |
| Class C | $ 160 | 1.54% | |
What affected the Fund's performance this period?
•U.S. taxable investment-grade bonds posted a strong advance for the 12 months ending August 31, 2024, helped by a late-period gain, as the bond market reflected anticipated interest-rate reductions by the U.S. Federal Reserve, which are expected to start in September. The full 12-month period was marked by high volatility.
•Against this backdrop, security selection contributed to the fund's performance versus the benchmark for the fiscal year, while sector positioning had a roughly neutral impact overall.
•Bond picks among issuers in the financials sector added the most value. Having greater-than-benchmark exposure to financials also helped.
•Within financials, selection among banks contributed the most, followed by investment choices among insurance companies and overall positioning in real estate investment trusts.
•Picks among industrial issuers also notably aided relative performance, as did a sizable underweight in the sector.
•Within industrials, selection among consumer-focused companies led the way. Positioning among information technology issuers in the benchmark provided a further boost, along with picks in the energy category.
•Holding of bonds issued by electric utility companies modestly contributed.
•In terms of yield-curve positioning, the fund benefited from overweight exposure to the intermediate-maturity 5-10 year portion of the curve.
•Outside of corporate credit, an allocation to U.S. Treasuries and cash - held for liquidity and risk-management purposes - meaningfully detracted. This negative was somewhat offset by underweighting other government-related categories, as these bonds lagged credit in an improving market environment.
How did the Fund perform over the past 10 years?
CUMULATIVE PERFORMANCE
August 31, 2014 through August 31, 2024.
Initial investment of $10,000.
Class C | $10,000 | $9,833 | $10,606 | $10,792 | $10,607 | $11,856 | $12,690 | $12,876 | $10,756 | $10,832 | $11,865 |
Bloomberg U.S. Credit Bond Index | $10,000 | $9,957 | $10,868 | $11,074 | $10,965 | $12,389 | $13,269 | $13,569 | $11,611 | $11,709 | $12,761 |
Bloomberg U.S. Aggregate Bond Index | $10,000 | $10,156 | $10,761 | $10,814 | $10,701 | $11,789 | $12,553 | $12,542 | $11,098 | $10,965 | $11,765 |
| | 2014 | 2015 | 2016 | 2017 | 2018 | 2019 | 2020 | 2021 | 2022 | 2023 | 2024 |
AVERAGE ANNUAL TOTAL RETURNS: | | 1 Year | 5 Year | 10 Year |
| Class C (incl. contingent deferred sales charge) | 7.71% | -0.29% | 1.72% |
| Class C | 8.71% | -0.29% | 1.72% |
| Bloomberg U.S. Credit Bond Index | 8.98% | 0.59% | 2.47% |
| Bloomberg U.S. Aggregate Bond Index | 7.30% | -0.04% | 1.64% |
Visit institutional.fidelity.com for more recent performance information. |
The Fund's past performance is not a good predictor of the Fund's future performance. The graph and table do not reflect the deduction of taxes that a shareholder would pay on fund distributions or redemption of fund shares. |
Key Fund Statistics (as of August 31, 2024)
KEY FACTS | | |
| Fund Size | $2,001,136,363 | |
| Number of Holdings | 621 | |
| Total Advisory Fee | $6,038,514 | |
| Portfolio Turnover | 30% | |
What did the Fund invest in?
(as of August 31, 2024)
| U.S. Government and U.S. Government Agency Obligations | 9.8 |
| AAA | 0.1 |
| AA | 0.0 |
| A | 17.0 |
| BBB | 60.7 |
| BB | 6.5 |
| B | 0.7 |
| Not Rated | 0.2 |
| Short-Term Investments and Net Other Assets (Liabilities) | 5.0 |
QUALITY DIVERSIFICATION (% of Fund's net assets) |
|
| |
| We have used ratings from Moody's Investors Service, Inc. Where Moody's® ratings are not available, we have used S&P® ratings. All ratings are as of the date indicated and do not reflect subsequent changes. |
| Corporate Bonds | 84.4 |
| U.S. Treasury Obligations | 9.8 |
| Asset-Backed Securities | 0.3 |
| Preferred Securities | 0.3 |
| Foreign Government and Government Agency Obligations | 0.1 |
| Other Investments | 0.1 |
| Municipal Securities | 0.0 |
| Short-Term Investments and Net Other Assets (Liabilities) | 5.0 |
ASSET ALLOCATION (% of Fund's net assets) |
|
|
| United States | 79.9 |
| United Kingdom | 4.0 |
| Canada | 3.3 |
| Ireland | 2.6 |
| France | 2.1 |
| Germany | 1.9 |
| Switzerland | 1.4 |
| Netherlands | 1.1 |
| Spain | 0.9 |
| Others | 2.8 |
GEOGRAPHIC DIVERSIFICATION (% of Fund's net assets) |
|
| |
|
TOP HOLDINGS (% of Fund's net assets) | | |
| US Treasury Bonds | 9.5 | |
| Bank of America Corp | 2.1 | |
| JPMorgan Chase & Co | 1.9 | |
| Boeing Co | 1.5 | |
| UBS Group AG | 1.4 | |
| AerCap Ireland Capital DAC / AerCap Global Aviation Trust | 1.1 | |
| Wells Fargo & Co | 1.1 | |
| Duke Energy Corp | 1.1 | |
| HSBC Holdings PLC | 1.1 | |
| CVS Health Corp | 1.1 | |
| | 21.9 | |
| Fidelity, the Fidelity Investments Logo and all other Fidelity trademarks or service marks used herein are trademarks or service marks of FMR LLC. Any third-party marks that are used herein are trademarks or service marks of their respective owners. © 2024 FMR LLC. All rights reserved. |
| | For additional information about the Fund; including its prospectus, financial information, holdings and proxy information, scan the QR code or visit fundresearch.fidelity.com/prospectus/sec 1.9913638.100 2217-TSRA-1024 |
| |
| | ANNUAL SHAREHOLDER REPORT | AS OF AUGUST 31, 2024 | |
| | Fidelity® U.S. Bond Index Fund Fidelity® U.S. Bond Index Fund : FXNAX |
| | | |
This annual shareholder report contains information about Fidelity® U.S. Bond Index Fund for the period September 1, 2023 to August 31, 2024. You can find additional information about the Fund at fundresearch.fidelity.com/prospectus/sec. You can also request this information by contacting us at 1-800-544-8544 or by sending an e-mail to fidfunddocuments@fidelity.com.
What were your Fund costs for the last year?(based on hypothetical $10,000 investment)
FUND COST (PREVIOUS YEAR)
| | Costs of a $10,000 investment | Costs paid as a percentage of a $10,000 investment | |
| Fidelity® U.S. Bond Index Fund | $ 3 | 0.02% | |
What affected the Fund's performance this period?
•U.S. taxable investment-grade bonds posted a strong advance for the 12 months ending August 31, 2024, helped by late-period gains as the bond market priced in anticipated interest-rate reductions by the U.S. Federal Reserve, which are expected to start in September. The full 12-month period was marked by high levels of volatility.
•Given the large number of securities in the index (roughly 13,600) and the significant costs associated with full replication of the index, we construct the portfolio using optimization. This approach minimizes the differences between risk exposures of the fund relative to the index.
•Exposures include duration, key rate durations, credit quality, sector and issuer allocation, and other factors.
How did the Fund perform over the past 10 years?
CUMULATIVE PERFORMANCE
August 31, 2014 through August 31, 2024.
Initial investment of $10,000.
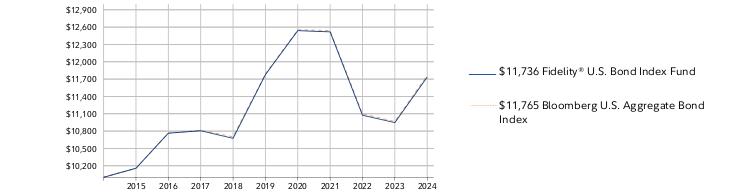
Fidelity® U.S. Bond Index Fund | $10,000 | $10,157 | $10,764 | $10,806 | $10,674 | $11,776 | $12,539 | $12,517 | $11,075 | $10,946 | $11,736 |
Bloomberg U.S. Aggregate Bond Index | $10,000 | $10,156 | $10,761 | $10,814 | $10,701 | $11,789 | $12,553 | $12,542 | $11,098 | $10,965 | $11,765 |
| | 2014 | 2015 | 2016 | 2017 | 2018 | 2019 | 2020 | 2021 | 2022 | 2023 | 2024 |
AVERAGE ANNUAL TOTAL RETURNS: | | 1 Year | 5 Year | 10 Year |
| Fidelity® U.S. Bond Index Fund | 7.21% | -0.07% | 1.61% |
| Bloomberg U.S. Aggregate Bond Index | 7.30% | -0.04% | 1.64% |
Visit www.fidelity.com for more recent performance information. |
The Fund's past performance is not a good predictor of the Fund's future performance. The graph and table do not reflect the deduction of taxes that a shareholder would pay on fund distributions or redemption of fund shares. |
Key Fund Statistics (as of August 31, 2024)
KEY FACTS | | |
| Fund Size | $59,137,195,352 | |
| Number of Holdings | 9,428 | |
| Total Advisory Fee | $14,113,948 | |
| Portfolio Turnover | 43% | |
What did the Fund invest in?
(as of August 31, 2024)
| U.S. Government and U.S. Government Agency Obligations | 69.5 |
| AAA | 2.8 |
| AA | 2.6 |
| A | 13.2 |
| BBB | 11.2 |
| BB | 0.4 |
| Not Rated | 0.8 |
QUALITY DIVERSIFICATION (% of Fund's net assets) |
|
| Short-Term Investments and Net Other Assets (Liabilities) - (0.5)% |
| |
| We have used ratings from Moody's Investors Service, Inc. Where Moody's® ratings are not available, we have used S&P® ratings. All ratings are as of the date indicated and do not reflect subsequent changes. |
| U.S. Treasury Obligations | 42.8 |
| Corporate Bonds | 26.4 |
| U.S. Government Agency - Mortgage Securities | 26.0 |
| CMOs and Other Mortgage Related Securities | 1.6 |
| Foreign Government and Government Agency Obligations | 1.4 |
| Supranational Obligations | 0.8 |
| U.S. Government Agency Obligations | 0.7 |
| Municipal Securities | 0.5 |
| Asset-Backed Securities | 0.3 |
| Other Investments | 0.0 |
ASSET ALLOCATION (% of Fund's net assets) |
|
| Short-Term Investments and Net Other Assets (Liabilities) - (0.5)% |
|
| United States | 93.9 |
| United Kingdom | 1.1 |
| Canada | 1.1 |
| Multi-national | 0.8 |
| Japan | 0.6 |
| Mexico | 0.2 |
| Germany | 0.2 |
| Belgium | 0.2 |
| Australia | 0.2 |
| Others | 1.7 |
GEOGRAPHIC DIVERSIFICATION (% of Fund's net assets) |
|
| |
|
TOP HOLDINGS (% of Fund's net assets) | | |
| US Treasury Notes | 34.2 | |
| Fannie Mae Mortgage pass-thru certificates | 10.8 | |
| Freddie Mac Gold Pool | 8.6 | |
| US Treasury Bonds | 8.6 | |
| Ginnie Mae II Pool | 4.9 | |
| Ginnie Mae I Pool | 1.1 | |
| Freddie Mac Multiclass Mortgage participation certificates | 0.9 | |
| Bank of America Corp | 0.9 | |
| JPMorgan Chase & Co | 0.7 | |
| Uniform Mortgage Backed Securities | 0.6 | |
| | 71.3 | |
| Fidelity, the Fidelity Investments Logo and all other Fidelity trademarks or service marks used herein are trademarks or service marks of FMR LLC. Any third-party marks that are used herein are trademarks or service marks of their respective owners. © 2024 FMR LLC. All rights reserved. |
| | For additional information about the Fund; including its prospectus, financial information, holdings and proxy information, scan the QR code or visit fundresearch.fidelity.com/prospectus/sec 1.9913626.100 2326-TSRA-1024 |
| |
| | ANNUAL SHAREHOLDER REPORT | AS OF AUGUST 31, 2024 | This report describes changes to the Fund that occurred during the reporting period. |
| | Fidelity Flex® U.S. Bond Index Fund Fidelity Flex® U.S. Bond Index Fund : FIBUX |
| | | |
This annual shareholder report contains information about Fidelity Flex® U.S. Bond Index Fund for the period September 1, 2023 to August 31, 2024. You can find additional information about the Fund at fundresearch.fidelity.com/prospectus/sec. You can also request this information by contacting us at 1-800-544-3455 or by sending an e-mail to fidfunddocuments@fidelity.com.
What were your Fund costs for the last year?(based on hypothetical $10,000 investment)
FUND COST (PREVIOUS YEAR)
| | Costs of a $10,000 investment | Costs paid as a percentage of a $10,000 investment | |
| Fidelity Flex® U.S. Bond Index Fund | $ 0 A | 0.00%B | |
A Amount represents less than $.50
B Amount represents less than 0.005%
What affected the Fund's performance this period?
•U.S. taxable investment-grade bonds posted a strong advance for the 12 months ending August 31, 2024, helped by late-period gains as the bond market priced in anticipated interest-rate reductions by the U.S. Federal Reserve, which are expected to start in September. The full 12-month period was marked by high levels of volatility.
•Given the large number of securities in the index (roughly 13,600) and the significant costs associated with full replication of the index, we construct the portfolio using optimization. This approach minimizes the differences between risk exposures of the fund relative to the index.
•Exposures include duration, key rate durations, credit quality, sector and issuer allocation, and other factors.
How did the Fund perform over the life of Fund?
CUMULATIVE PERFORMANCE
March 9, 2017 through August 31, 2024.
Initial investment of $10,000.
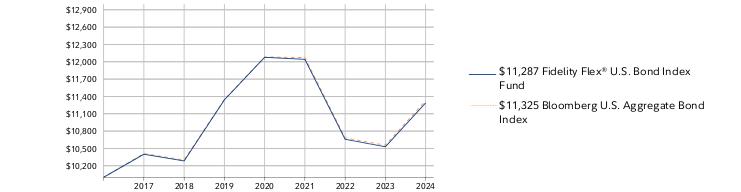
Fidelity Flex® U.S. Bond Index Fund | $10,000 | $10,399 | $10,283 | $11,340 | $12,077 | $12,042 | $10,659 | $10,528 |
Bloomberg U.S. Aggregate Bond Index | $10,000 | $10,410 | $10,300 | $11,348 | $12,083 | $12,073 | $10,682 | $10,555 |
| | 2017 | 2018 | 2019 | 2020 | 2021 | 2022 | 2023 | 2024 |
AVERAGE ANNUAL TOTAL RETURNS: | | 1 Year | 5 Year | Life of Fund A |
| Fidelity Flex® U.S. Bond Index Fund | 7.21% | -0.09% | 1.63% |
| Bloomberg U.S. Aggregate Bond Index | 7.30% | -0.04% | 1.68% |
A From March 9, 2017
Visit www.401k.com for more recent performance information. |
The Fund's past performance is not a good predictor of the Fund's future performance. The graph and table do not reflect the deduction of taxes that a shareholder would pay on fund distributions or redemption of fund shares. |
Key Fund Statistics (as of August 31, 2024)
KEY FACTS | | |
| Fund Size | $2,412,947,179 | |
| Number of Holdings | 4,419 | |
| Total Advisory Fee | $0 | |
| Portfolio Turnover | 65% | |
What did the Fund invest in?
(as of August 31, 2024)
| U.S. Government and U.S. Government Agency Obligations | 69.5 |
| AAA | 3.3 |
| AA | 2.7 |
| A | 13.1 |
| BBB | 12.1 |
| BB | 0.4 |
| Not Rated | 0.3 |
QUALITY DIVERSIFICATION (% of Fund's net assets) |
|
| Short-Term Investments and Net Other Assets (Liabilities) - (1.4)% |
| |
| We have used ratings from Moody's Investors Service, Inc. Where Moody's® ratings are not available, we have used S&P® ratings. All ratings are as of the date indicated and do not reflect subsequent changes. |
| U.S. Treasury Obligations | 43.5 |
| Corporate Bonds | 27.3 |
| U.S. Government Agency - Mortgage Securities | 25.3 |
| Foreign Government and Government Agency Obligations | 1.5 |
| CMOs and Other Mortgage Related Securities | 1.2 |
| Supranational Obligations | 1.1 |
| U.S. Government Agency Obligations | 0.7 |
| Municipal Securities | 0.4 |
| Asset-Backed Securities | 0.2 |
| Other Investments | 0.2 |
| Preferred Securities | 0.0 |
ASSET ALLOCATION (% of Fund's net assets) |
|
| Short-Term Investments and Net Other Assets (Liabilities) - (1.4)% |
|
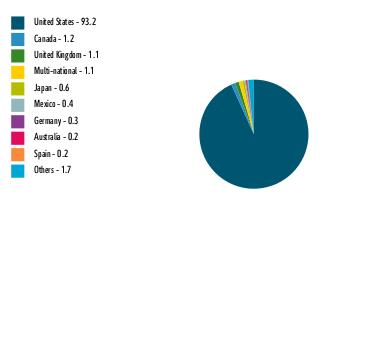
| United States | 93.2 |
| Canada | 1.2 |
| United Kingdom | 1.1 |
| Multi-national | 1.1 |
| Japan | 0.6 |
| Mexico | 0.4 |
| Germany | 0.3 |
| Australia | 0.2 |
| Spain | 0.2 |
| Others | 1.7 |
GEOGRAPHIC DIVERSIFICATION (% of Fund's net assets) |
|
| |
|
TOP HOLDINGS (% of Fund's net assets) | | |
| US Treasury Notes | 33.9 | |
| Fannie Mae Mortgage pass-thru certificates | 10.7 | |
| US Treasury Bonds | 9.6 | |
| Freddie Mac Gold Pool | 7.4 | |
| Ginnie Mae II Pool | 4.7 | |
| Uniform Mortgage Backed Securities | 1.4 | |
| Ginnie Mae I Pool | 1.1 | |
| Bank of America Corp | 0.8 | |
| Freddie Mac Multiclass Mortgage participation certificates | 0.7 | |
| Goldman Sachs Group Inc/The | 0.6 | |
| | 70.9 | |
How has the Fund changed?
This is a summary of certain changes to the Fund since September 1, 2023. For more complete information, you may review the Fund's next prospectus, which we expect to be available by October 30, 2024 at fundresearch.fidelity.com/prospectus/sec or upon request at 1-800-544-3455 or by sending an e-mail to fidfunddocuments@fidelity.com.
The fund added a contractual proxy and shareholder meeting expense cap during the reporting period. | |
| Fidelity, the Fidelity Investments Logo and all other Fidelity trademarks or service marks used herein are trademarks or service marks of FMR LLC. Any third-party marks that are used herein are trademarks or service marks of their respective owners. © 2024 FMR LLC. All rights reserved. |
| | For additional information about the Fund; including its prospectus, financial information, holdings and proxy information, scan the QR code or visit fundresearch.fidelity.com/prospectus/sec 1.9913651.100 2917-TSRA-1024 |
| |
| | ANNUAL SHAREHOLDER REPORT | AS OF AUGUST 31, 2024 | |
| | Fidelity® Series Bond Index Fund Fidelity® Series Bond Index Fund : FIFZX |
| | | |
This annual shareholder report contains information about Fidelity® Series Bond Index Fund for the period September 1, 2023 to August 31, 2024. You can find additional information about the Fund at fundresearch.fidelity.com/prospectus/sec. You can also request this information by contacting us at 1-800-544-8544.
What were your Fund costs for the last year?(based on hypothetical $10,000 investment)
FUND COST (PREVIOUS YEAR)
| | Costs of a $10,000 investment | Costs paid as a percentage of a $10,000 investment | |
| Fidelity® Series Bond Index Fund | $ 0 A | 0.00%B | |
A Amount represents less than $.50
B Amount represents less than 0.005%
What affected the Fund's performance this period?
•U.S. taxable investment-grade bonds posted a strong advance for the 12 months ending August 31, 2024, helped by late-period gains as the bond market priced in anticipated interest-rate reductions by the U.S. Federal Reserve, which are expected to start in September. The full 12-month period was marked by high levels of volatility.
•Given the large number of securities in the index (roughly 13,600) and the significant costs associated with full replication of the index, we construct the portfolio using optimization. This approach minimizes the differences between risk exposures of the fund relative to the index. Exposures include duration, key rate durations, credit quality, sector and issuer allocation, and other factors.
How did the Fund perform over the life of Fund?
CUMULATIVE PERFORMANCE
April 26, 2019 through August 31, 2024.
Initial investment of $10,000.
Fidelity® Series Bond Index Fund | $10,000 | $10,601 | $11,282 | $11,266 | $9,962 | $9,850 |
Bloomberg U.S. Aggregate Bond Index | $10,000 | $10,596 | $11,282 | $11,272 | $9,974 | $9,855 |
| | 2019 | 2020 | 2021 | 2022 | 2023 | 2024 |
AVERAGE ANNUAL TOTAL RETURNS: | | 1 Year | 5 Year | Life of Fund A |
| Fidelity® Series Bond Index Fund | 7.24% | -0.07% | 1.03% |
| Bloomberg U.S. Aggregate Bond Index | 7.30% | -0.04% | 1.05% |
A From April 26, 2019
Visit www.fidelity.com for more recent performance information. |
The Fund's past performance is not a good predictor of the Fund's future performance. The graph and table do not reflect the deduction of taxes that a shareholder would pay on fund distributions or redemption of fund shares. |
Key Fund Statistics (as of August 31, 2024)
KEY FACTS | | |
| Fund Size | $25,937,339,168 | |
| Number of Holdings | 8,841 | |
| Total Advisory Fee | $0 | |
| Portfolio Turnover | 50% | |
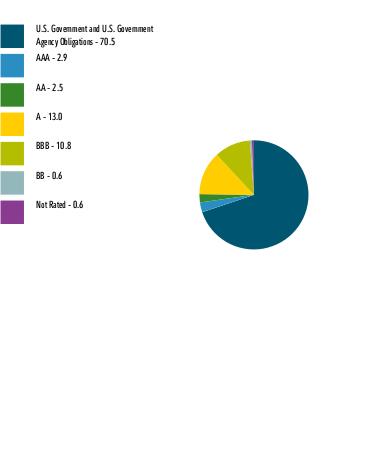
What did the Fund invest in?
(as of August 31, 2024)
| U.S. Government and U.S. Government Agency Obligations | 70.5 |
| AAA | 2.9 |
| AA | 2.5 |
| A | 13.0 |
| BBB | 10.8 |
| BB | 0.6 |
| Not Rated | 0.6 |
QUALITY DIVERSIFICATION (% of Fund's net assets) |
|
| Short-Term Investments and Net Other Assets (Liabilities) - (0.9)% |
| |
| We have used ratings from Moody's Investors Service, Inc. Where Moody's® ratings are not available, we have used S&P® ratings. All ratings are as of the date indicated and do not reflect subsequent changes. |
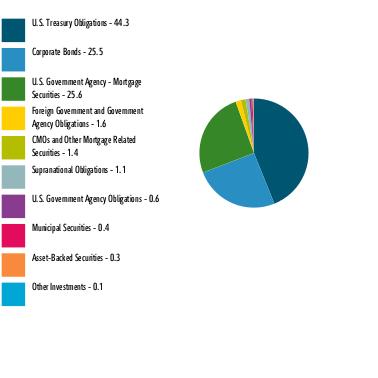
| U.S. Treasury Obligations | 44.3 |
| Corporate Bonds | 25.5 |
| U.S. Government Agency - Mortgage Securities | 25.6 |
| Foreign Government and Government Agency Obligations | 1.6 |
| CMOs and Other Mortgage Related Securities | 1.4 |
| Supranational Obligations | 1.1 |
| U.S. Government Agency Obligations | 0.6 |
| Municipal Securities | 0.4 |
| Asset-Backed Securities | 0.3 |
| Other Investments | 0.1 |
ASSET ALLOCATION (% of Fund's net assets) |
|
| Short-Term Investments and Net Other Assets (Liabilities) - (0.9)% |
|
| United States | 93.5 |
| Canada | 1.2 |
| Multi-national | 1.1 |
| United Kingdom | 1.1 |
| Japan | 0.6 |
| Mexico | 0.3 |
| Germany | 0.2 |
| Australia | 0.2 |
| Spain | 0.2 |
| Others | 1.6 |
GEOGRAPHIC DIVERSIFICATION (% of Fund's net assets) |
|
| |
|
TOP HOLDINGS (% of Fund's net assets) | | |
| US Treasury Notes | 35.1 | |
| Fannie Mae Mortgage pass-thru certificates | 10.7 | |
| US Treasury Bonds | 9.2 | |
| Freddie Mac Gold Pool | 8.1 | |
| Ginnie Mae II Pool | 4.9 | |
| Ginnie Mae I Pool | 1.0 | |
| Uniform Mortgage Backed Securities | 0.9 | |
| Bank of America Corp | 0.8 | |
| Freddie Mac Multiclass Mortgage participation certificates | 0.8 | |
| JPMorgan Chase & Co | 0.7 | |
| | 72.2 | |
| Fidelity, the Fidelity Investments Logo and all other Fidelity trademarks or service marks used herein are trademarks or service marks of FMR LLC. Any third-party marks that are used herein are trademarks or service marks of their respective owners. © 2024 FMR LLC. All rights reserved. |
| | For additional information about the Fund; including its prospectus, financial information, holdings and proxy information, scan the QR code or visit fundresearch.fidelity.com/prospectus/sec 1.9913662.100 3357-TSRA-1024 |
| |
| | ANNUAL SHAREHOLDER REPORT | AS OF AUGUST 31, 2024 | This report describes changes to the Fund that occurred during the reporting period. |
| | Fidelity® Series Government Money Market Fund Fidelity® Series Government Money Market Fund : FGNXX |
| | | |
This annual shareholder report contains information about Fidelity® Series Government Money Market Fund for the period September 1, 2023 to August 31, 2024. You can find additional information about the Fund at fundresearch.fidelity.com/prospectus/sec. You can also request this information by contacting us at 1-800-544-8544.
What were your Fund costs for the last year?(based on hypothetical $10,000 investment)
FUND COST (PREVIOUS YEAR)
| | Costs of a $10,000 investment | Costs paid as a percentage of a $10,000 investment | |
| Fidelity® Series Government Money Market Fund | $ 0 A | 0.00%B | |
A Amount represents less than $.50
B Amount represents less than 0.005%
Key Fund Statistics (as of August 31, 2024)
KEY FACTS | | |
| Fund Size | $2,367,257,097 | |
| Number of Holdings | 415 | |
| Total Advisory Fee | $0 | |
What did the Fund invest in?
(as of August 31, 2024)
EFFECTIVE MATURITY DIVERSIFICATION (% of Fund's net assets) |
| Days |
| 1-7 | 62.4 | |
| 8-30 | 8.1 | |
| 31-60 | 17.0 | |
| 61-90 | 5.7 | |
| 91-180 | 7.9 | |
| >180 | 0.9 | |
| |
| Repurchase Agreements | 37.6 |
| U.S. Treasury Obligations | 35.8 |
| U.S. Government Agency - Debt | 28.7 |
ASSET ALLOCATION (% of Fund's net assets) |
|
| Net Other Assets (Liabilities) - (2.1)% |
|
How has the Fund changed?
This is a summary of certain changes to the Fund since September 1, 2023. For more complete information, you may review the Fund's next prospectus, which we expect to be available by October 30, 2024 at fundresearch.fidelity.com/prospectus/sec or upon request at 1-800-544-8544 .
The fund's principal investment risks were updated in connection with the implementation of recent rule amendments related to money market funds adopted by the SEC. The fund's principal investment risks were updated in connection with the implementation of recent rule amendments related to money market funds adopted by the SEC. | |
| Fidelity, the Fidelity Investments Logo and all other Fidelity trademarks or service marks used herein are trademarks or service marks of FMR LLC. Any third-party marks that are used herein are trademarks or service marks of their respective owners. © 2024 FMR LLC. All rights reserved. |
| | For additional information about the Fund; including its prospectus, financial information, holdings and proxy information, scan the QR code or visit fundresearch.fidelity.com/prospectus/sec 1.9913650.100 2815-TSRA-1024 |
| |
| | ANNUAL SHAREHOLDER REPORT | AS OF AUGUST 31, 2024 | |
| | Fidelity® Corporate Bond Fund Fidelity Advisor® Corporate Bond Fund Class Z : FIKOX |
| | | |
This annual shareholder report contains information about Fidelity® Corporate Bond Fund for the period September 1, 2023 to August 31, 2024. You can find additional information about the Fund at fundresearch.fidelity.com/prospectus/sec. You can also request this information by contacting us at 1-877-208-0098 or by sending an e-mail to fidfunddocuments@fidelity.com.
What were your Fund costs for the last year?(based on hypothetical $10,000 investment)
FUND COST (PREVIOUS YEAR)
| | Costs of a $10,000 investment | Costs paid as a percentage of a $10,000 investment | |
| Class Z | $ 38 | 0.36% | |
What affected the Fund's performance this period?
•U.S. taxable investment-grade bonds posted a strong advance for the 12 months ending August 31, 2024, helped by a late-period gain, as the bond market reflected anticipated interest-rate reductions by the U.S. Federal Reserve, which are expected to start in September. The full 12-month period was marked by high volatility.
•Against this backdrop, security selection contributed to the fund's performance versus the benchmark for the fiscal year, while sector positioning had a roughly neutral impact overall.
•Bond picks among issuers in the financials sector added the most value. Having greater-than-benchmark exposure to financials also helped.
•Within financials, selection among banks contributed the most, followed by investment choices among insurance companies and overall positioning in real estate investment trusts.
•Picks among industrial issuers also notably aided relative performance, as did a sizable underweight in the sector.
•Within industrials, selection among consumer-focused companies led the way. Positioning among information technology issuers in the benchmark provided a further boost, along with picks in the energy category.
•Holding of bonds issued by electric utility companies modestly contributed.
•In terms of yield-curve positioning, the fund benefited from overweight exposure to the intermediate-maturity 5-10 year portion of the curve.
•Outside of corporate credit, an allocation to U.S. Treasuries and cash - held for liquidity and risk-management purposes - meaningfully detracted. This negative was somewhat offset by underweighting other government-related categories, as these bonds lagged credit in an improving market environment.
How did the Fund perform over the life of Fund?
CUMULATIVE PERFORMANCE
October 2, 2018 through August 31, 2024.
Initial investment of $10,000.
Class Z | $10,000 | $11,334 | $12,275 | $12,601 | $10,652 | $10,761 | $11,848 |
Bloomberg U.S. Credit Bond Index | $10,000 | $11,331 | $12,135 | $12,409 | $10,618 | $10,708 | $11,670 |
Bloomberg U.S. Aggregate Bond Index | $10,000 | $11,086 | $11,804 | $11,794 | $10,436 | $10,311 | $11,064 |
| | 2018 | 2019 | 2020 | 2021 | 2022 | 2023 | 2024 |
AVERAGE ANNUAL TOTAL RETURNS: | | 1 Year | 5 Year | Life of Fund A |
| Class Z | 10.10% | 0.89% | 2.91% |
| Bloomberg U.S. Credit Bond Index | 8.98% | 0.59% | 2.64% |
| Bloomberg U.S. Aggregate Bond Index | 7.30% | -0.04% | 1.72% |
A From October 2, 2018
Visit institutional.fidelity.com for more recent performance information. |
The Fund's past performance is not a good predictor of the Fund's future performance. The graph and table do not reflect the deduction of taxes that a shareholder would pay on fund distributions or redemption of fund shares. |
Key Fund Statistics (as of August 31, 2024)
KEY FACTS | | |
| Fund Size | $2,001,136,363 | |
| Number of Holdings | 621 | |
| Total Advisory Fee | $6,038,514 | |
| Portfolio Turnover | 30% | |
What did the Fund invest in?
(as of August 31, 2024)
| U.S. Government and U.S. Government Agency Obligations | 9.8 |
| AAA | 0.1 |
| AA | 0.0 |
| A | 17.0 |
| BBB | 60.7 |
| BB | 6.5 |
| B | 0.7 |
| Not Rated | 0.2 |
| Short-Term Investments and Net Other Assets (Liabilities) | 5.0 |
QUALITY DIVERSIFICATION (% of Fund's net assets) |
|
| |
| We have used ratings from Moody's Investors Service, Inc. Where Moody's® ratings are not available, we have used S&P® ratings. All ratings are as of the date indicated and do not reflect subsequent changes. |
| Corporate Bonds | 84.4 |
| U.S. Treasury Obligations | 9.8 |
| Asset-Backed Securities | 0.3 |
| Preferred Securities | 0.3 |
| Foreign Government and Government Agency Obligations | 0.1 |
| Other Investments | 0.1 |
| Municipal Securities | 0.0 |
| Short-Term Investments and Net Other Assets (Liabilities) | 5.0 |
ASSET ALLOCATION (% of Fund's net assets) |
|
|
| United States | 79.9 |
| United Kingdom | 4.0 |
| Canada | 3.3 |
| Ireland | 2.6 |
| France | 2.1 |
| Germany | 1.9 |
| Switzerland | 1.4 |
| Netherlands | 1.1 |
| Spain | 0.9 |
| Others | 2.8 |
GEOGRAPHIC DIVERSIFICATION (% of Fund's net assets) |
|
| |
|
TOP HOLDINGS (% of Fund's net assets) | | |
| US Treasury Bonds | 9.5 | |
| Bank of America Corp | 2.1 | |
| JPMorgan Chase & Co | 1.9 | |
| Boeing Co | 1.5 | |
| UBS Group AG | 1.4 | |
| AerCap Ireland Capital DAC / AerCap Global Aviation Trust | 1.1 | |
| Wells Fargo & Co | 1.1 | |
| Duke Energy Corp | 1.1 | |
| HSBC Holdings PLC | 1.1 | |
| CVS Health Corp | 1.1 | |
| | 21.9 | |
| Fidelity, the Fidelity Investments Logo and all other Fidelity trademarks or service marks used herein are trademarks or service marks of FMR LLC. Any third-party marks that are used herein are trademarks or service marks of their respective owners. © 2024 FMR LLC. All rights reserved. |
| | For additional information about the Fund; including its prospectus, financial information, holdings and proxy information, scan the QR code or visit fundresearch.fidelity.com/prospectus/sec 1.9913641.100 3304-TSRA-1024 |
| |
| | ANNUAL SHAREHOLDER REPORT | AS OF AUGUST 31, 2024 | |
| | Fidelity® Corporate Bond Fund Fidelity Advisor® Corporate Bond Fund Class I : FCBIX |
| | | |
This annual shareholder report contains information about Fidelity® Corporate Bond Fund for the period September 1, 2023 to August 31, 2024. You can find additional information about the Fund at fundresearch.fidelity.com/prospectus/sec. You can also request this information by contacting us at 1-877-208-0098 or by sending an e-mail to fidfunddocuments@fidelity.com.
What were your Fund costs for the last year?(based on hypothetical $10,000 investment)
FUND COST (PREVIOUS YEAR)
| | Costs of a $10,000 investment | Costs paid as a percentage of a $10,000 investment | |
| Class I | $ 52 | 0.50% | |
What affected the Fund's performance this period?
•U.S. taxable investment-grade bonds posted a strong advance for the 12 months ending August 31, 2024, helped by a late-period gain, as the bond market reflected anticipated interest-rate reductions by the U.S. Federal Reserve, which are expected to start in September. The full 12-month period was marked by high volatility.
•Against this backdrop, security selection contributed to the fund's performance versus the benchmark for the fiscal year, while sector positioning had a roughly neutral impact overall.
•Bond picks among issuers in the financials sector added the most value. Having greater-than-benchmark exposure to financials also helped.
•Within financials, selection among banks contributed the most, followed by investment choices among insurance companies and overall positioning in real estate investment trusts.
•Picks among industrial issuers also notably aided relative performance, as did a sizable underweight in the sector.
•Within industrials, selection among consumer-focused companies led the way. Positioning among information technology issuers in the benchmark provided a further boost, along with picks in the energy category.
•Holding of bonds issued by electric utility companies modestly contributed.
•In terms of yield-curve positioning, the fund benefited from overweight exposure to the intermediate-maturity 5-10 year portion of the curve.
•Outside of corporate credit, an allocation to U.S. Treasuries and cash - held for liquidity and risk-management purposes - meaningfully detracted. This negative was somewhat offset by underweighting other government-related categories, as these bonds lagged credit in an improving market environment.
How did the Fund perform over the past 10 years?
CUMULATIVE PERFORMANCE
August 31, 2014 through August 31, 2024.
Initial investment of $10,000.
Class I | $10,000 | $9,937 | $10,839 | $11,134 | $11,058 | $12,502 | $13,510 | $13,850 | $11,692 | $11,807 | $12,969 |
Bloomberg U.S. Credit Bond Index | $10,000 | $9,957 | $10,868 | $11,074 | $10,965 | $12,389 | $13,269 | $13,569 | $11,611 | $11,709 | $12,761 |
Bloomberg U.S. Aggregate Bond Index | $10,000 | $10,156 | $10,761 | $10,814 | $10,701 | $11,789 | $12,553 | $12,542 | $11,098 | $10,965 | $11,765 |
| | 2014 | 2015 | 2016 | 2017 | 2018 | 2019 | 2020 | 2021 | 2022 | 2023 | 2024 |
AVERAGE ANNUAL TOTAL RETURNS: | | 1 Year | 5 Year | 10 Year |
| Class I | 9.84% | 0.74% | 2.63% |
| Bloomberg U.S. Credit Bond Index | 8.98% | 0.59% | 2.47% |
| Bloomberg U.S. Aggregate Bond Index | 7.30% | -0.04% | 1.64% |
Visit institutional.fidelity.com for more recent performance information. |
The Fund's past performance is not a good predictor of the Fund's future performance. The graph and table do not reflect the deduction of taxes that a shareholder would pay on fund distributions or redemption of fund shares. |
Key Fund Statistics (as of August 31, 2024)
KEY FACTS | | |
| Fund Size | $2,001,136,363 | |
| Number of Holdings | 621 | |
| Total Advisory Fee | $6,038,514 | |
| Portfolio Turnover | 30% | |
What did the Fund invest in?
(as of August 31, 2024)
| U.S. Government and U.S. Government Agency Obligations | 9.8 |
| AAA | 0.1 |
| AA | 0.0 |
| A | 17.0 |
| BBB | 60.7 |
| BB | 6.5 |
| B | 0.7 |
| Not Rated | 0.2 |
| Short-Term Investments and Net Other Assets (Liabilities) | 5.0 |
QUALITY DIVERSIFICATION (% of Fund's net assets) |
|
| |
| We have used ratings from Moody's Investors Service, Inc. Where Moody's® ratings are not available, we have used S&P® ratings. All ratings are as of the date indicated and do not reflect subsequent changes. |
| Corporate Bonds | 84.4 |
| U.S. Treasury Obligations | 9.8 |
| Asset-Backed Securities | 0.3 |
| Preferred Securities | 0.3 |
| Foreign Government and Government Agency Obligations | 0.1 |
| Other Investments | 0.1 |
| Municipal Securities | 0.0 |
| Short-Term Investments and Net Other Assets (Liabilities) | 5.0 |
ASSET ALLOCATION (% of Fund's net assets) |
|
|
| United States | 79.9 |
| United Kingdom | 4.0 |
| Canada | 3.3 |
| Ireland | 2.6 |
| France | 2.1 |
| Germany | 1.9 |
| Switzerland | 1.4 |
| Netherlands | 1.1 |
| Spain | 0.9 |
| Others | 2.8 |
GEOGRAPHIC DIVERSIFICATION (% of Fund's net assets) |
|
| |
|
TOP HOLDINGS (% of Fund's net assets) | | |
| US Treasury Bonds | 9.5 | |
| Bank of America Corp | 2.1 | |
| JPMorgan Chase & Co | 1.9 | |
| Boeing Co | 1.5 | |
| UBS Group AG | 1.4 | |
| AerCap Ireland Capital DAC / AerCap Global Aviation Trust | 1.1 | |
| Wells Fargo & Co | 1.1 | |
| Duke Energy Corp | 1.1 | |
| HSBC Holdings PLC | 1.1 | |
| CVS Health Corp | 1.1 | |
| | 21.9 | |
| Fidelity, the Fidelity Investments Logo and all other Fidelity trademarks or service marks used herein are trademarks or service marks of FMR LLC. Any third-party marks that are used herein are trademarks or service marks of their respective owners. © 2024 FMR LLC. All rights reserved. |
| | For additional information about the Fund; including its prospectus, financial information, holdings and proxy information, scan the QR code or visit fundresearch.fidelity.com/prospectus/sec 1.9913640.100 2220-TSRA-1024 |
Item 2.
Code of Ethics
As of the end of the period, August 31, 2024, Fidelity Salem Street Trust (the trust) has adopted a code of ethics, as defined in Item 2 of Form N-CSR, that applies to its President and Treasurer and its Chief Financial Officer. A copy of the code of ethics is filed as an exhibit to this Form N-CSR.
Item 3.
Audit Committee Financial Expert
The Board of Trustees of the trust has determined that Elizabeth S. Acton is an audit committee financial expert, as defined in Item 3 of Form N-CSR. Ms. Acton is independent for purposes of Item 3 of Form N-CSR.
Item 4.
Principal Accountant Fees and Services
Fees and Services
The following table presents fees billed by PricewaterhouseCoopers LLP (“PwC”) in each of the last two fiscal years for services rendered to Fidelity Corporate Bond Fund, Fidelity Flex U.S. Bond Index Fund, Fidelity Series Bond Index Fund, Fidelity Series Government Money Market Fund, Fidelity Series Investment Grade Bond Fund, Fidelity Series Short-Term Credit Fund, and Fidelity U.S. Bond Index Fund (the “Funds”):
Services Billed by PwC
| | | | |
August 31, 2024 FeesA | Audit Fees | Audit-Related Fees | Tax Fees | All Other Fees |
Fidelity Corporate Bond Fund | $74,400 | $6,100 | $19,300 | $2,600 |
Fidelity Flex U.S. Bond Index Fund | $74,800 | $6,100 | $9,200 | $2,600 |
Fidelity Series Bond Index Fund | $89,400 | $7,400 | $12,300 | $3,100 |
Fidelity Series Government Money Market Fund | $36,900 | $2,900 | $2,600 | $1,200 |
Fidelity Series Investment Grade Bond Fund | $110,500 | $9,000 | $14,500 | $3,900 |
Fidelity Series Short-Term Credit Fund | $66,100 | $5,600 | $10,100 | $2,400 |
Fidelity U.S. Bond Index Fund | $91,000 | $7,300 | $11,600 | $3,100 |
| | | | | |
| Audit Fees | Audit-Related Fees | Tax Fees | All Other Fees |
Fidelity Corporate Bond Fund | $72,100 | $6,100 | $11,600 | $2,600 |
Fidelity Flex U.S. Bond Index Fund | $74,900 | $6,100 | $9,200 | $2,600 |
Fidelity Series Bond Index Fund | $89,400 | $7,300 | $12,300 | $3,100 |
Fidelity Series Government Money Market Fund | $36,900 | $2,900 | $2,600 | $1,200 |
Fidelity Series Investment Grade Bond Fund | $110,500 | $9,000 | $14,500 | $3,800 |
Fidelity Series Short-Term Credit Fund | $66,300 | $5,500 | $10,100 | $2,400 |
Fidelity U.S. Bond Index Fund | $93,100 | $7,300 | $14,100 | $3,100 |
A Amounts may reflect rounding.
The following table(s) present(s) fees billed by PwC that were required to be approved by the Audit Committee for services that relate directly to the operations and financial reporting of the Fund(s) and that are rendered on behalf of Fidelity Management & Research Company LLC ("FMR") and entities controlling, controlled by, or under common control with FMR (not including any sub-adviser whose role is primarily portfolio management and is subcontracted with or overseen by another investment adviser) that provide ongoing services to the Fund(s) (“Fund Service Providers”):
Services Billed by PwC
| | |
| August 31, 2024A | August 31, 2023A |
Audit-Related Fees | $9,437,800 | $8,379,200 |
Tax Fees | $61,000 | $1,000 |
All Other Fees | $35,000 | $- |
A Amounts may reflect rounding.
“Audit-Related Fees” represent fees billed for assurance and related services that are reasonably related to the performance of the fund audit or the review of the fund's financial statements and that are not reported under Audit Fees.
“Tax Fees” represent fees billed for tax compliance, tax advice or tax planning that relate directly to the operations and financial reporting of the fund.
“All Other Fees” represent fees billed for services provided to the fund or Fund Service Provider, a significant portion of which are assurance related, that relate directly to the
operations and financial reporting of the fund, excluding those services that are reported under Audit Fees, Audit-Related Fees or Tax Fees.
Assurance services must be performed by an independent public accountant.
* * *
The aggregate non-audit fees billed by PwC for services rendered to the Fund(s), FMR (not including any sub-adviser whose role is primarily portfolio management and is subcontracted with or overseen by another investment adviser), and any Fund Service Provider for each of the last two fiscal years of the Fund(s) are as follows:
| | |
Billed By | August 31, 2024A | August 31, 2023A |
PwC | $15,151,300 | $13,970,400 |
A Amounts may reflect rounding.
The trust's Audit Committee has considered non-audit services that were not pre-approved that were provided by PwC to Fund Service Providers to be compatible with maintaining the independence of PwC in its(their) audit of the Fund(s), taking into account representations from PwC, in accordance with Public Company Accounting Oversight Board rules, regarding its independence from the Fund(s) and its(their) related entities and FMR’s review of the appropriateness and permissibility under applicable law of such non-audit services prior to their provision to the Fund(s) Service Providers.
Audit Committee Pre-Approval Policies and Procedures
The trust’s Audit Committee must pre-approve all audit and non-audit services provided by a fund’s independent registered public accounting firm relating to the operations or financial reporting of the fund. Prior to the commencement of any audit or non-audit services to a fund, the Audit Committee reviews the services to determine whether they are appropriate and permissible under applicable law.
The Audit Committee has adopted policies and procedures to, among other purposes, provide a framework for the Committee’s consideration of non-audit services by the audit firms that audit the Fidelity funds. The policies and procedures require that any non-audit service provided by a fund audit firm to a Fidelity fund and any non-audit service provided by a fund auditor to a Fund Service Provider that relates directly to the operations and financial reporting of a Fidelity fund (“Covered Service”) are subject to approval by the Audit Committee before such service is provided.
All Covered Services must be approved in advance of provision of the service either: (i) by formal resolution of the Audit Committee, or (ii) by oral or written approval of the
service by the Chair of the Audit Committee (or if the Chair is unavailable, such other member of the Audit Committee as may be designated by the Chair to act in the Chair’s absence). The approval contemplated by (ii) above is permitted where the Treasurer determines that action on such an engagement is necessary before the next meeting of the Audit Committee.
Non-audit services provided by a fund audit firm to a Fund Service Provider that do not relate directly to the operations and financial reporting of a Fidelity fund are reported to the Audit Committee periodically.
Non-Audit Services Approved Pursuant to Rule 2-01(c)(7)(i)(C) and (ii) of Regulation S-X (“De Minimis Exception”)
There were no non-audit services approved or required to be approved by the Audit Committee pursuant to the De Minimis Exception during the Fund’s(s’) last two fiscal years relating to services provided to (i) the Fund(s) or (ii) any Fund Service Provider that relate directly to the operations and financial reporting of the Fund(s).
The Registrant has not retained, for the preparation of the audit report on the financial statements included in the Form N-CSR, a registered public accounting firm that has a branch or office that is located in a foreign jurisdiction and that the Public Company Accounting Oversight Board (the “PCAOB”) has determined that the PCAOB is unable to inspect or investigate completely because of a position taken by an authority in the foreign jurisdiction.
The Registrant is not a “foreign issuer,” as defined in 17 CFR 240.3b-4.
Item 5.
Audit Committee of Listed Registrants
Not applicable.
Item 6.
Investments
(a)
Not applicable.
(b)
Not applicable.
Item 7.
Financial Statements and Financial Highlights for Open-End Management Investment Companies
Fidelity® U.S. Bond Index Fund
Annual Report
August 31, 2024
Contents
To view a fund's proxy voting guidelines and proxy voting record for the 12-month period ended June 30, visit http://www.fidelity.com/proxyvotingresults or visit the Securities and Exchange Commission's (SEC) web site at http://www.sec.gov.
You may also call 1-800-544-8544 to request a free copy of the proxy voting guidelines.
BLOOMBERG ® is a trademark and service mark of Bloomberg Finance L.P. and its affiliates (collectively "Bloomberg"). Bloomberg or Bloomberg's licensors own all proprietary rights in the Bloomberg Indices. Neither Bloomberg nor Bloomberg's licensors approves or endorses this material, or guarantees the accuracy or completeness of any information herein, or makes any warranty, express or implied, as to the results to be obtained therefrom and, to the maximum extent allowed by law, neither shall have any liability or responsibility for injury or damages arising in connection therewith.
Standard & Poor's, S&P and S&P 500 are registered service marks of The McGraw-Hill Companies, Inc. and have been licensed for use by Fidelity Distributors Corporation.
Other third-party marks appearing herein are the property of their respective owners.
All other marks appearing herein are registered or unregistered trademarks or service marks of FMR LLC or an affiliated company. © 2024 FMR LLC. All rights reserved.
This report and the financial statements contained herein are submitted for the general information of the shareholders of the Fund. This report is not authorized for distribution to prospective investors in the Fund unless preceded or accompanied by an effective prospectus.
A fund files its complete schedule of portfolio holdings with the SEC for the first and third quarters of each fiscal year on Form N-PORT. Forms N-PORT are available on the SEC's web site at http://www.sec.gov. A fund's Forms N-PORT may be reviewed and copied at the SEC's Public Reference Room in Washington, DC. Information regarding the operation of the SEC's Public Reference Room may be obtained by calling 1-800-SEC-0330.
For a complete list of a fund's portfolio holdings, view the most recent holdings listing, semiannual report, or annual report on Fidelity's web site at http://www.fidelity.com, http://www.institutional.fidelity.com, or http://www.401k.com, as applicable.
NOT FDIC INSURED •MAY LOSE VALUE •NO BANK GUARANTEE
Neither the Fund nor Fidelity Distributors Corporation is a bank.
Item 7: Financial Statements and Financial Highlights for Open-End Management Investment Companies (Annual Report)
Fidelity® U.S. Bond Index Fund
Schedule of Investments August 31, 2024
Showing Percentage of Net Assets
| Nonconvertible Bonds - 26.4% |
| | | Principal Amount (a) (000s) | Value ($) (000s) |
| COMMUNICATION SERVICES - 2.0% | | | |
| Diversified Telecommunication Services - 0.6% | | | |
| AT&T, Inc.: | | | |
| 1.65% 2/1/28 | | 8,216 | 7,491 |
| 2.25% 2/1/32 | | 13,533 | 11,411 |
| 2.75% 6/1/31 | | 14,741 | 13,074 |
| 2.95% 7/15/26 | | 6,356 | 6,181 |
| 3.3% 2/1/52 | | 14,016 | 9,765 |
| 3.5% 6/1/41 | | 7,559 | 6,031 |
| 3.5% 9/15/53 | | 25,048 | 17,820 |
| 3.5% 2/1/61 | | 3,800 | 2,612 |
| 3.55% 9/15/55 | | 54,468 | 38,509 |
| 3.65% 6/1/51 | | 11,600 | 8,607 |
| 3.65% 9/15/59 | | 31,190 | 22,000 |
| 3.8% 2/15/27 | | 7,149 | 7,045 |
| 4.35% 6/15/45 | | 5,085 | 4,391 |
| 4.5% 3/9/48 | | 6,502 | 5,607 |
| 4.65% 6/1/44 | | 6,251 | 5,562 |
| British Telecommunications PLC 9.625% 12/15/30 | | 12,479 | 15,662 |
| Orange SA 5.5% 2/6/44 | | 2,383 | 2,411 |
| Sprint Capital Corp. 8.75% 3/15/32 | | 10,000 | 12,337 |
| Telefonica Emisiones S.A.U.: | | | |
| 4.103% 3/8/27 | | 10,645 | 10,530 |
| 4.895% 3/6/48 | | 3,000 | 2,664 |
| 5.213% 3/8/47 | | 5,203 | 4,804 |
| 5.52% 3/1/49 | | 2,700 | 2,615 |
| 7.045% 6/20/36 | | 2,065 | 2,343 |
| Verizon Communications, Inc.: | | | |
| 1.5% 9/18/30 | | 3,190 | 2,705 |
| 1.68% 10/30/30 | | 2,665 | 2,260 |
| 2.355% 3/15/32 | | 19,271 | 16,373 |
| 2.55% 3/21/31 | | 41,913 | 36,868 |
| 2.987% 10/30/56 | | 69,319 | 44,539 |
| 3.55% 3/22/51 | | 8,661 | 6,518 |
| 4.125% 3/16/27 | | 5,561 | 5,517 |
| 4.272% 1/15/36 | | 19,285 | 18,187 |
| 4.329% 9/21/28 | | 12,151 | 12,125 |
| 4.4% 11/1/34 | | 2,999 | 2,879 |
| 4.75% 11/1/41 | | 795 | 752 |
| 5.012% 4/15/49 | | 913 | 906 |
| 5.012% 8/21/54 | | 9,975 | 9,488 |
| | | | 378,589 |
| Entertainment - 0.1% | | | |
| Netflix, Inc. 4.9% 8/15/34 | | 8,610 | 8,819 |
| The Walt Disney Co.: | | | |
| 2% 9/1/29 | | 8,297 | 7,453 |
| 2.65% 1/13/31 | | 12,615 | 11,365 |
| 2.75% 9/1/49 | | 8,288 | 5,499 |
| 3.5% 5/13/40 | | 5,423 | 4,495 |
| 3.6% 1/13/51 | | 5,404 | 4,208 |
| 3.7% 10/15/25 | | 5,561 | 5,513 |
| 3.8% 5/13/60 | | 5,423 | 4,207 |
| 4.7% 3/23/50 | | 3,867 | 3,672 |
| 5.4% 10/1/43 | | 3,078 | 3,146 |
| 6.15% 3/1/37 | | 3,142 | 3,498 |
| 6.15% 2/15/41 | | 8,340 | 9,278 |
| | | | 71,153 |
| Interactive Media & Services - 0.2% | | | |
| Alphabet, Inc.: | | | |
| 0.45% 8/15/25 | | 5,896 | 5,682 |
| 1.1% 8/15/30 | | 11,696 | 9,908 |
| 1.998% 8/15/26 | | 1,827 | 1,758 |
| 2.05% 8/15/50 | | 11,696 | 7,118 |
| Baidu, Inc. 3.425% 4/7/30 | | 9,666 | 9,106 |
| Meta Platforms, Inc.: | | | |
| 3.5% 8/15/27 | | 6,820 | 6,718 |
| 3.85% 8/15/32 | | 7,620 | 7,299 |
| 4.3% 8/15/29 | | 4,300 | 4,329 |
| 4.45% 8/15/52 | | 12,000 | 10,736 |
| 4.6% 5/15/28 | | 4,630 | 4,712 |
| 4.65% 8/15/62 | | 1,800 | 1,618 |
| 4.75% 8/15/34 | | 3,000 | 3,019 |
| 4.95% 5/15/33 | | 6,700 | 6,913 |
| 5.4% 8/15/54 | | 5,348 | 5,454 |
| 5.6% 5/15/53 | | 6,190 | 6,525 |
| | | | 90,895 |
| Media - 0.7% | | | |
| Charter Communications Operating LLC/Charter Communications Operating Capital Corp.: | | | |
| 2.8% 4/1/31 | | 20,299 | 17,218 |
| 3.5% 6/1/41 | | 26,758 | 18,647 |
| 3.7% 4/1/51 | | 7,027 | 4,459 |
| 4.2% 3/15/28 | | 8,737 | 8,455 |
| 4.4% 4/1/33 | | 5,700 | 5,181 |
| 4.908% 7/23/25 | | 1,461 | 1,456 |
| 5.05% 3/30/29 | | 4,833 | 4,784 |
| 5.125% 7/1/49 | | 9,816 | 7,865 |
| 5.375% 5/1/47 | | 4,534 | 3,781 |
| 5.75% 4/1/48 | | 4,154 | 3,606 |
| 6.1% 6/1/29 | | 3,000 | 3,100 |
| 6.384% 10/23/35 | | 10,684 | 10,818 |
| 6.484% 10/23/45 | | 3,725 | 3,560 |
| 6.55% 6/1/34 | | 3,000 | 3,108 |
| Comcast Corp.: | | | |
| 1.5% 2/15/31 | | 11,310 | 9,404 |
| 1.95% 1/15/31 | | 2,030 | 1,735 |
| 2.35% 1/15/27 | | 18,905 | 18,079 |
| 2.45% 8/15/52 | | 11,310 | 6,716 |
| 2.65% 2/1/30 | | 6,264 | 5,732 |
| 2.8% 1/15/51 | | 6,476 | 4,189 |
| 2.887% 11/1/51 | | 15,309 | 10,022 |
| 2.937% 11/1/56 | | 57,662 | 36,678 |
| 3.15% 3/1/26 | | 3,972 | 3,897 |
| 3.3% 2/1/27 | | 9,461 | 9,244 |
| 3.375% 8/15/25 | | 10,882 | 10,748 |
| 3.4% 4/1/30 | | 5,800 | 5,498 |
| 3.45% 2/1/50 | | 5,896 | 4,371 |
| 3.75% 4/1/40 | | 4,644 | 3,947 |
| 3.969% 11/1/47 | | 4,131 | 3,371 |
| 4% 3/1/48 | | 9,532 | 7,796 |
| 4.15% 10/15/28 | | 14,973 | 14,864 |
| 4.4% 8/15/35 | | 7,700 | 7,393 |
| Discovery Communications LLC: | | | |
| 3.625% 5/15/30 | | 9,512 | 8,443 |
| 5.2% 9/20/47 | | 6,673 | 5,248 |
| Fox Corp.: | | | |
| 4.709% 1/25/29 | | 8,245 | 8,303 |
| 5.476% 1/25/39 | | 3,027 | 3,016 |
| 5.576% 1/25/49 | | 7,398 | 7,158 |
| Paramount Global: | | | |
| 3.375% 2/15/28 | | 8,381 | 7,833 |
| 4.2% 6/1/29 | | 7,143 | 6,708 |
| 4.375% 3/15/43 | | 2,093 | 1,504 |
| 4.6% 1/15/45 | | 5,799 | 4,160 |
| 4.95% 1/15/31 | | 13,185 | 12,248 |
| Time Warner Cable LLC: | | | |
| 4.5% 9/15/42 | | 16,137 | 12,230 |
| 6.55% 5/1/37 | | 7,500 | 7,400 |
| 7.3% 7/1/38 | | 3,177 | 3,323 |
| TWDC Enterprises 18 Corp.: | | | |
| 1.85% 7/30/26 | | 4,059 | 3,878 |
| 3% 7/30/46 | | 3,575 | 2,523 |
| 3.15% 9/17/25 | | 7,522 | 7,412 |
| 4.125% 6/1/44 | | 4,528 | 3,924 |
| 4.375% 8/16/41 | | 5,200 | 4,727 |
| Warnermedia Holdings, Inc.: | | | |
| 3.755% 3/15/27 | | 8,767 | 8,399 |
| 4.279% 3/15/32 | | 24,337 | 21,274 |
| 5.05% 3/15/42 | | 1,164 | 933 |
| 5.141% 3/15/52 | | 23,164 | 17,619 |
| | | | 417,985 |
| Wireless Telecommunication Services - 0.4% | | | |
| America Movil S.A.B. de CV: | | | |
| 3.625% 4/22/29 | | 6,667 | 6,400 |
| 6.125% 11/15/37 | | 6,645 | 7,241 |
| Rogers Communications, Inc.: | | | |
| 2.9% 11/15/26 | | 1,986 | 1,915 |
| 3.625% 12/15/25 | | 1,589 | 1,565 |
| 3.7% 11/15/49 | | 4,833 | 3,582 |
| 3.8% 3/15/32 | | 23,199 | 21,378 |
| 5.45% 10/1/43 | | 4,588 | 4,476 |
| T-Mobile U.S.A., Inc.: | | | |
| 2.05% 2/15/28 | | 11,928 | 10,990 |
| 3.3% 2/15/51 | | 11,928 | 8,426 |
| 3.5% 4/15/25 | | 10,079 | 9,971 |
| 3.75% 4/15/27 | | 6,689 | 6,568 |
| 3.875% 4/15/30 | | 6,689 | 6,435 |
| 4.375% 4/15/40 | | 6,689 | 6,029 |
| 4.5% 4/15/50 | | 11,522 | 9,997 |
| 4.8% 7/15/28 | | 6,375 | 6,447 |
| 4.95% 3/15/28 | | 14,700 | 14,922 |
| 5.05% 7/15/33 | | 30,475 | 30,848 |
| 5.2% 1/15/33 | | 7,265 | 7,432 |
| 5.65% 1/15/53 | | 10,210 | 10,477 |
| Vodafone Group PLC: | | | |
| 4.375% 5/30/28 | | 20,333 | 20,503 |
| 5.125% 6/19/59 | | 5,220 | 4,762 |
| 5.25% 5/30/48 | | 18,988 | 18,173 |
| 5.75% 6/28/54 | | 2,470 | 2,502 |
| | | | 221,039 |
TOTAL COMMUNICATION SERVICES | | | 1,179,661 |
| CONSUMER DISCRETIONARY - 1.5% | | | |
| Automobile Components - 0.0% | | | |
| Lear Corp. 3.55% 1/15/52 | | 2,600 | 1,773 |
| Automobiles - 0.3% | | | |
| American Honda Finance Corp.: | | | |
| 1.2% 7/8/25 | | 9,305 | 9,031 |
| 2% 3/24/28 | | 2,000 | 1,844 |
| 2.25% 1/12/29 | | 1,900 | 1,739 |
| 2.3% 9/9/26 | | 3,972 | 3,815 |
| 5.125% 7/7/28 | | 4,550 | 4,669 |
| Ford Motor Co.: | | | |
| 5.291% 12/8/46 | | 8,130 | 7,368 |
| 6.1% 8/19/32 | | 17,360 | 17,838 |
| General Motors Co.: | | | |
| 5% 10/1/28 | | 5,463 | 5,534 |
| 5.15% 4/1/38 | | 1,300 | 1,246 |
| 5.2% 4/1/45 | | 3,392 | 3,112 |
| 5.6% 10/15/32 | | 4,900 | 5,067 |
| 5.95% 4/1/49 | | 5,027 | 5,063 |
| 6.6% 4/1/36 | | 4,639 | 5,022 |
| 6.75% 4/1/46 | | 5,684 | 6,227 |
| 6.8% 10/1/27 | | 10,536 | 11,129 |
| General Motors Financial Co., Inc.: | | | |
| 2.35% 1/8/31 | | 2,000 | 1,701 |
| 2.4% 4/10/28 | | 2,000 | 1,843 |
| 2.4% 10/15/28 | | 1,700 | 1,546 |
| 3.85% 1/5/28 | | 5,561 | 5,414 |
| 4% 1/15/25 | | 4,902 | 4,876 |
| 4% 10/6/26 | | 2,923 | 2,883 |
| 4.3% 7/13/25 | | 9,850 | 9,786 |
| 4.35% 1/17/27 | | 6,356 | 6,302 |
| 5.6% 6/18/31 | | 4,220 | 4,319 |
| 5.65% 1/17/29 | | 16,996 | 17,472 |
| 6.4% 1/9/33 | | 10,000 | 10,717 |
| Honda Motor Co. Ltd. 2.534% 3/10/27 | | 14,164 | 13,574 |
| Mercedes-Benz Finance North America LLC 8.5% 1/18/31 | | 2,000 | 2,426 |
| Toyota Motor Corp.: | | | |
| 2.362% 3/25/31 | | 10,633 | 9,437 |
| 5.118% 7/13/28 | | 2,000 | 2,061 |
| | | | 183,061 |
| Broadline Retail - 0.3% | | | |
| Alibaba Group Holding Ltd.: | | | |
| 2.125% 2/9/31 | | 16,568 | 14,218 |
| 3.15% 2/9/51 | | 17,076 | 11,671 |
| Amazon.com, Inc.: | | | |
| 0.8% 6/3/25 | | 8,758 | 8,520 |
| 1% 5/12/26 | | 5,087 | 4,826 |
| 1.5% 6/3/30 | | 15,466 | 13,374 |
| 2.1% 5/12/31 | | 7,251 | 6,334 |
| 2.5% 6/3/50 | | 5,085 | 3,259 |
| 2.875% 5/12/41 | | 27,600 | 21,427 |
| 3.1% 5/12/51 | | 5,251 | 3,785 |
| 3.15% 8/22/27 | | 8,309 | 8,106 |
| 3.6% 4/13/32 | | 2,000 | 1,906 |
| 3.875% 8/22/37 | | 8,728 | 8,018 |
| 4.05% 8/22/47 | | 15,112 | 13,147 |
| 4.25% 8/22/57 | | 7,208 | 6,340 |
| 4.55% 12/1/27 | | 10,000 | 10,142 |
| 4.7% 12/1/32 | | 28,300 | 28,993 |
| 4.8% 12/5/34 | | 6,766 | 6,964 |
| eBay, Inc.: | | | |
| 1.9% 3/11/25 | | 10,000 | 9,833 |
| 2.6% 5/10/31 | | 2,000 | 1,761 |
| 2.7% 3/11/30 | | 2,000 | 1,829 |
| 5.95% 11/22/27 | | 8,000 | 8,379 |
| | | | 192,832 |
| Distributors - 0.0% | | | |
| Genuine Parts Co. 2.75% 2/1/32 | | 2,000 | 1,717 |
| Diversified Consumer Services - 0.1% | | | |
| American University 3.672% 4/1/49 | | 1,903 | 1,543 |
| Duke University 2.832% 10/1/55 | | 3,714 | 2,560 |
| George Washington University: | | | |
| 4.126% 9/15/48 | | 5,575 | 4,933 |
| 4.3% 9/15/44 | | 1,589 | 1,440 |
| Massachusetts Institute of Technology: | | | |
| 2.989% 7/1/50 | | 3,722 | 2,748 |
| 3.885% 7/1/2116 | | 2,248 | 1,756 |
| 3.959% 7/1/38 | | 3,753 | 3,582 |
| Northwestern University: | | | |
| 3.662% 12/1/57 | | 4,398 | 3,589 |
| 4.643% 12/1/44 | | 2,661 | 2,594 |
| President and Fellows of Harvard College: | | | |
| 3.3% 7/15/56 | | 3,852 | 2,933 |
| 3.619% 10/1/37 | | 795 | 718 |
| Rice University 3.774% 5/15/55 | | 1,510 | 1,259 |
| Trane Technologies Global Holding Co. Ltd.: | | | |
| 3.75% 8/21/28 | | 3,694 | 3,611 |
| 4.3% 2/21/48 | | 3,948 | 3,423 |
| Trustees of Princeton Univ. 5.7% 3/1/39 | | 795 | 896 |
| University Notre Dame du Lac 3.438% 2/15/45 | | 2,646 | 2,142 |
| University of Chicago 3% 10/1/52 | | 5,027 | 3,670 |
| University of Southern California: | | | |
| 2.945% 10/1/51 | | 9,096 | 6,487 |
| 5.25% 10/1/2111 | | 1,589 | 1,648 |
| | | | 51,532 |
| Hotels, Restaurants & Leisure - 0.2% | | | |
| Expedia Group, Inc.: | | | |
| 2.95% 3/15/31 | | 2,000 | 1,799 |
| 3.25% 2/15/30 | | 6,863 | 6,406 |
| 4.625% 8/1/27 | | 2,000 | 2,006 |
| Marriott International, Inc.: | | | |
| 2.85% 4/15/31 | | 17,100 | 15,171 |
| 4.875% 5/15/29 | | 6,000 | 6,072 |
| 5.35% 3/15/35 | | 3,450 | 3,491 |
| McDonald's Corp.: | | | |
| 3.3% 7/1/25 | | 4,790 | 4,731 |
| 3.5% 7/1/27 | | 7,617 | 7,454 |
| 3.6% 7/1/30 | | 5,684 | 5,455 |
| 3.625% 9/1/49 | | 9,831 | 7,498 |
| 3.7% 1/30/26 | | 13,400 | 13,246 |
| 4.2% 4/1/50 | | 6,666 | 5,583 |
| 4.45% 3/1/47 | | 4,511 | 3,980 |
| 4.875% 12/9/45 | | 4,313 | 4,067 |
| 6.3% 3/1/38 | | 5,596 | 6,258 |
| Metropolitan Museum of Art 3.4% 7/1/45 | | 2,383 | 1,897 |
| Starbucks Corp.: | | | |
| 2% 3/12/27 | | 9,502 | 8,974 |
| 2.45% 6/15/26 | | 7,944 | 7,677 |
| 3% 2/14/32 | | 4,900 | 4,407 |
| 3.5% 11/15/50 | | 3,287 | 2,436 |
| 3.8% 8/15/25 | | 5,520 | 5,464 |
| 4% 11/15/28 | | 5,561 | 5,492 |
| 4.5% 11/15/48 | | 3,734 | 3,272 |
| | | | 132,836 |
| Household Durables - 0.1% | | | |
| D.R. Horton, Inc.: | | | |
| 1.3% 10/15/26 | | 2,000 | 1,873 |
| 5% 10/15/34 | | 3,000 | 2,994 |
| Lennar Corp. 4.75% 11/29/27 | | 6,283 | 6,339 |
| Toll Brothers Finance Corp. 4.35% 2/15/28 | | 1,900 | 1,878 |
| Whirlpool Corp. 5.5% 3/1/33 | | 8,400 | 8,461 |
| | | | 21,545 |
| Leisure Products - 0.0% | | | |
| Hasbro, Inc.: | | | |
| 3.9% 11/19/29 | | 2,000 | 1,912 |
| 5.1% 5/15/44 | | 3,400 | 3,057 |
| | | | 4,969 |
| Specialty Retail - 0.4% | | | |
| AutoNation, Inc.: | | | |
| 2.4% 8/1/31 | | 1,000 | 834 |
| 3.85% 3/1/32 | | 6,090 | 5,569 |
| AutoZone, Inc.: | | | |
| 3.25% 4/15/25 | | 3,177 | 3,138 |
| 3.625% 4/15/25 | | 9,202 | 9,116 |
| 3.75% 6/1/27 | | 4,611 | 4,525 |
| 4% 4/15/30 | | 9,521 | 9,249 |
| 5.1% 7/15/29 | | 1,730 | 1,768 |
| 5.4% 7/15/34 | | 1,530 | 1,567 |
| Lowe's Companies, Inc.: | | | |
| 1.3% 4/15/28 | | 6,380 | 5,730 |
| 1.7% 10/15/30 | | 9,666 | 8,216 |
| 3.65% 4/5/29 | | 10,507 | 10,155 |
| 3.7% 4/15/46 | | 2,780 | 2,134 |
| 3.75% 4/1/32 | | 32,063 | 30,128 |
| 4.05% 5/3/47 | | 9,135 | 7,399 |
| 4.5% 4/15/30 | | 9,618 | 9,635 |
| 4.8% 4/1/26 | | 8,100 | 8,125 |
| 5.625% 4/15/53 | | 5,000 | 5,056 |
| 5.75% 7/1/53 | | 4,623 | 4,752 |
| O'Reilly Automotive, Inc. 4.7% 6/15/32 | | 8,100 | 8,079 |
| The Home Depot, Inc.: | | | |
| 2.375% 3/15/51 | | 13,507 | 8,223 |
| 2.5% 4/15/27 | | 9,637 | 9,247 |
| 2.8% 9/14/27 | | 3,972 | 3,821 |
| 2.95% 6/15/29 | | 16,616 | 15,713 |
| 3% 4/1/26 | | 7,967 | 7,804 |
| 3.125% 12/15/49 | | 5,317 | 3,816 |
| 3.3% 4/15/40 | | 6,833 | 5,591 |
| 3.9% 12/6/28 | | 4,575 | 4,534 |
| 3.9% 6/15/47 | | 6,813 | 5,676 |
| 4.2% 4/1/43 | | 1,251 | 1,112 |
| 4.25% 4/1/46 | | 2,606 | 2,309 |
| 4.5% 12/6/48 | | 10,434 | 9,500 |
| 4.75% 6/25/29 | | 2,000 | 2,045 |
| 4.875% 2/15/44 | | 2,283 | 2,203 |
| 4.95% 6/25/34 | | 11,600 | 11,887 |
| 5.875% 12/16/36 | | 13,741 | 15,120 |
| | | | 243,776 |
| Textiles, Apparel & Luxury Goods - 0.1% | | | |
| NIKE, Inc.: | | | |
| 2.4% 3/27/25 | | 4,969 | 4,907 |
| 2.85% 3/27/30 | | 4,775 | 4,447 |
| 3.25% 3/27/40 | | 9,666 | 7,887 |
| 3.375% 11/1/46 | | 3,575 | 2,777 |
| 3.375% 3/27/50 | | 4,775 | 3,639 |
| Tapestry, Inc. 3.05% 3/15/32 | | 2,320 | 1,942 |
| | | | 25,599 |
TOTAL CONSUMER DISCRETIONARY | | | 859,640 |
| CONSUMER STAPLES - 1.6% | | | |
| Beverages - 0.6% | | | |
| Anheuser-Busch Companies LLC / Anheuser-Busch InBev Worldwide, Inc. 4.7% 2/1/36 | | 10,000 | 9,877 |
| Anheuser-Busch InBev Finance, Inc.: | | | |
| 4.625% 2/1/44 | | 4,567 | 4,265 |
| 4.7% 2/1/36 | | 3,868 | 3,820 |
| 4.9% 2/1/46 | | 14,442 | 13,822 |
| Anheuser-Busch InBev Worldwide, Inc.: | | | |
| 3.5% 6/1/30 | | 5,000 | 4,803 |
| 4.439% 10/6/48 | | 5,873 | 5,253 |
| 4.6% 4/15/48 | | 14,894 | 13,799 |
| 5.55% 1/23/49 | | 33,724 | 35,341 |
| 5.8% 1/23/59 (Reg. S) | | 11,081 | 12,165 |
| 8.2% 1/15/39 | | 3,624 | 4,785 |
| Constellation Brands, Inc.: | | | |
| 3.5% 5/9/27 | | 7,944 | 7,741 |
| 3.7% 12/6/26 | | 5,997 | 5,890 |
| 4.75% 5/9/32 | | 5,000 | 4,982 |
| 5.25% 11/15/48 | | 5,751 | 5,577 |
| Diageo Capital PLC: | | | |
| 1.375% 9/29/25 | | 11,020 | 10,658 |
| 2% 4/29/30 | | 11,793 | 10,402 |
| 2.125% 4/29/32 | | 10,633 | 8,960 |
| Keurig Dr. Pepper, Inc.: | | | |
| 2.25% 3/15/31 | | 2,000 | 1,726 |
| 3.2% 5/1/30 | | 2,000 | 1,864 |
| 3.8% 5/1/50 | | 2,513 | 1,975 |
| 4.05% 4/15/32 | | 11,200 | 10,773 |
| 4.417% 5/25/25 | | 10,000 | 9,969 |
| Molson Coors Beverage Co.: | | | |
| 3% 7/15/26 | | 13,822 | 13,444 |
| 4.2% 7/15/46 | | 10,509 | 8,809 |
| PepsiCo, Inc.: | | | |
| 1.4% 2/25/31 | | 12,450 | 10,413 |
| 1.625% 5/1/30 | | 34,299 | 29,853 |
| 2.375% 10/6/26 | | 5,362 | 5,179 |
| 3% 10/15/27 | | 14,466 | 14,026 |
| 3.6% 8/13/42 | | 2,383 | 1,979 |
| 3.875% 3/19/60 | | 4,833 | 3,938 |
| 4.25% 10/22/44 | | 4,766 | 4,262 |
| 4.45% 4/14/46 | | 4,607 | 4,231 |
| The Coca-Cola Co.: | | | |
| 1.375% 3/15/31 | | 9,666 | 8,069 |
| 1.45% 6/1/27 | | 6,650 | 6,213 |
| 1.65% 6/1/30 | | 6,660 | 5,791 |
| 2.5% 6/1/40 | | 6,660 | 4,905 |
| 2.5% 3/15/51 | | 4,833 | 3,088 |
| 2.6% 6/1/50 | | 6,660 | 4,366 |
| 2.75% 6/1/60 | | 6,660 | 4,241 |
| 5% 5/13/34 | | 6,760 | 7,028 |
| 5.2% 1/14/55 | | 5,290 | 5,390 |
| | | | 333,672 |
| Consumer Staples Distribution & Retail - 0.3% | | | |
| Costco Wholesale Corp.: | | | |
| 1.375% 6/20/27 | | 13,997 | 13,024 |
| 1.6% 4/20/30 | | 2,000 | 1,744 |
| 1.75% 4/20/32 | | 2,000 | 1,674 |
| Dollar General Corp. 5% 11/1/32 | | 9,230 | 9,057 |
| Dollar Tree, Inc.: | | | |
| 4% 5/15/25 | | 6,356 | 6,304 |
| 4.2% 5/15/28 | | 8,178 | 8,026 |
| Kroger Co.: | | | |
| 1.7% 1/15/31 | | 5,315 | 4,438 |
| 2.65% 10/15/26 | | 2,264 | 2,179 |
| 3.5% 2/1/26 | | 3,177 | 3,125 |
| 3.95% 1/15/50 | | 2,900 | 2,287 |
| 4.65% 9/15/29 | | 6,250 | 6,250 |
| 4.9% 9/15/31 | | 2,960 | 2,958 |
| 5% 9/15/34 | | 4,540 | 4,526 |
| 5.15% 8/1/43 | | 2,165 | 2,066 |
| 5.4% 1/15/49 | | 5,171 | 5,059 |
| 5.5% 9/15/54 | | 4,670 | 4,578 |
| 5.65% 9/15/64 | | 2,660 | 2,599 |
| Sysco Corp.: | | | |
| 3.3% 7/15/26 | | 2,606 | 2,549 |
| 3.3% 2/15/50 | | 11,213 | 8,059 |
| 3.75% 10/1/25 | | 4,528 | 4,480 |
| 6.6% 4/1/40 | | 7,830 | 8,750 |
| Target Corp.: | | | |
| 3.9% 11/15/47 | | 11,736 | 9,759 |
| 4% 7/1/42 | | 5,561 | 4,910 |
| 4.4% 1/15/33 | | 8,300 | 8,311 |
| Walmart, Inc.: | | | |
| 2.95% 9/24/49 | | 5,027 | 3,645 |
| 3.7% 6/26/28 | | 9,771 | 9,720 |
| 3.9% 4/15/28 | | 7,300 | 7,283 |
| 4.05% 6/29/48 | | 14,433 | 12,705 |
| 4.1% 4/15/33 | | 7,300 | 7,226 |
| 4.3% 4/22/44 | | 4,766 | 4,455 |
| 5.625% 4/1/40 | | 1,589 | 1,744 |
| 5.625% 4/15/41 | | 3,654 | 3,982 |
| 6.5% 8/15/37 | | 6,573 | 7,767 |
| | | | 185,239 |
| Food Products - 0.3% | | | |
| Archer Daniels Midland Co. 4.5% 8/15/33 | | 16,900 | 16,677 |
| Bunge Ltd. Finance Corp. 2.75% 5/14/31 | | 2,000 | 1,771 |
| Campbell Soup Co. 4.8% 3/15/48 | | 11,120 | 10,111 |
| Conagra Brands, Inc.: | | | |
| 4.85% 11/1/28 | | 10,827 | 10,914 |
| 5.3% 11/1/38 | | 3,936 | 3,875 |
| 5.4% 11/1/48 | | 7,130 | 6,874 |
| General Mills, Inc.: | | | |
| 2.875% 4/15/30 | | 5,778 | 5,295 |
| 3% 2/1/51 | | 4,854 | 3,251 |
| 4.2% 4/17/28 | | 13,662 | 13,580 |
| Kellanova: | | | |
| 3.25% 4/1/26 | | 2,955 | 2,896 |
| 4.3% 5/15/28 | | 4,766 | 4,749 |
| Kraft Heinz Foods Co.: | | | |
| 3.875% 5/15/27 | | 28,999 | 28,596 |
| 4.375% 6/1/46 | | 14,500 | 12,388 |
| 5% 7/15/35 | | 1,000 | 1,014 |
| 5% 6/4/42 | | 9,800 | 9,247 |
| 6.875% 1/26/39 | | 2,000 | 2,311 |
| Tyson Foods, Inc.: | | | |
| 4% 3/1/26 | | 5,854 | 5,795 |
| 4.35% 3/1/29 | | 7,149 | 7,067 |
| 5.1% 9/28/48 | | 7,408 | 6,859 |
| Unilever Capital Corp.: | | | |
| 1.375% 9/14/30 | | 14,582 | 12,312 |
| 1.75% 8/12/31 | | 2,000 | 1,695 |
| 2% 7/28/26 | | 1,716 | 1,649 |
| 3.1% 7/30/25 | | 2,383 | 2,354 |
| | | | 171,280 |
| Household Products - 0.1% | | | |
| Colgate-Palmolive Co.: | | | |
| 3.1% 8/15/25 | | 2,000 | 1,974 |
| 3.25% 8/15/32 | | 2,000 | 1,858 |
| Kimberly-Clark Corp.: | | | |
| 1.05% 9/15/27 | | 16,774 | 15,290 |
| 3.1% 3/26/30 | | 3,346 | 3,163 |
| 3.2% 7/30/46 | | 1,986 | 1,485 |
| 3.95% 11/1/28 | | 6,766 | 6,715 |
| 6.625% 8/1/37 | | 1,200 | 1,413 |
| Procter & Gamble Co.: | | | |
| 1% 4/23/26 | | 9,135 | 8,684 |
| 1.95% 4/23/31 | | 14,500 | 12,759 |
| 2.3% 2/1/32 | | 2,000 | 1,780 |
| 2.85% 8/11/27 | | 3,575 | 3,464 |
| 3% 3/25/30 | | 9,868 | 9,361 |
| 5.55% 3/5/37 | | 2,000 | 2,203 |
| | | | 70,149 |
| Personal Care Products - 0.0% | | | |
| Estee Lauder Companies, Inc. 1.95% 3/15/31 | | 13,533 | 11,575 |
| Kenvue, Inc.: | | | |
| 4.9% 3/22/33 | | 6,173 | 6,316 |
| 5.05% 3/22/28 | | 5,583 | 5,737 |
| 5.05% 3/22/53 | | 6,173 | 6,149 |
| | | | 29,777 |
| Tobacco - 0.3% | | | |
| Altria Group, Inc.: | | | |
| 3.4% 2/4/41 | | 10,000 | 7,585 |
| 3.875% 9/16/46 | | 7,944 | 6,077 |
| 4.25% 8/9/42 | | 7,768 | 6,527 |
| 4.8% 2/14/29 | | 10,541 | 10,601 |
| 5.8% 2/14/39 | | 7,428 | 7,659 |
| 5.95% 2/14/49 | | 8,261 | 8,513 |
| BAT Capital Corp.: | | | |
| 3.557% 8/15/27 | | 16,817 | 16,405 |
| 3.984% 9/25/50 | | 2,900 | 2,174 |
| 4.39% 8/15/37 | | 8,622 | 7,692 |
| 4.54% 8/15/47 | | 13,298 | 10,876 |
| 4.758% 9/6/49 | | 9,666 | 8,093 |
| 6.421% 8/2/33 | | 5,000 | 5,422 |
| BAT International Finance PLC 5.931% 2/2/29 | | 3,000 | 3,148 |
| Philip Morris International, Inc.: | | | |
| 2.75% 2/25/26 | | 2,979 | 2,903 |
| 3.875% 8/21/42 | | 3,833 | 3,173 |
| 4.125% 3/4/43 | | 7,944 | 6,750 |
| 4.875% 2/15/28 | | 6,100 | 6,186 |
| 4.875% 11/15/43 | | 4,766 | 4,483 |
| 5.125% 11/17/27 | | 8,330 | 8,516 |
| 5.375% 2/15/33 | | 6,430 | 6,631 |
| 5.75% 11/17/32 | | 5,880 | 6,222 |
| 6.375% 5/16/38 | | 1,152 | 1,298 |
| Reynolds American, Inc.: | | | |
| 4.45% 6/12/25 | | 5,607 | 5,578 |
| 5.85% 8/15/45 | | 3,368 | 3,299 |
| 7.25% 6/15/37 | | 5,735 | 6,507 |
| | | | 162,318 |
TOTAL CONSUMER STAPLES | | | 952,435 |
| ENERGY - 1.7% | | | |
| Energy Equipment & Services - 0.0% | | | |
| Baker Hughes Co.: | | | |
| 4.08% 12/15/47 | | 19,106 | 15,882 |
| 5.125% 9/15/40 | | 1,589 | 1,562 |
| Halliburton Co.: | | | |
| 2.92% 3/1/30 | | 7,656 | 7,030 |
| 3.8% 11/15/25 | | 203 | 201 |
| 5% 11/15/45 | | 5,989 | 5,616 |
| 7.45% 9/15/39 | | 1,192 | 1,455 |
| | | | 31,746 |
| Oil, Gas & Consumable Fuels - 1.7% | | | |
| 6297782 LLC: | | | |
| 5.026% 10/1/29 (b) | | 2,620 | 2,614 |
| 5.584% 10/1/34 (b) | | 2,320 | 2,310 |
| 6.176% 10/1/54 (b) | | 2,320 | 2,319 |
| Apache Corp. 5.1% 9/1/40 | | 2,383 | 2,108 |
| Boardwalk Pipelines LP: | | | |
| 3.4% 2/15/31 | | 2,000 | 1,806 |
| 4.95% 12/15/24 | | 3,774 | 3,766 |
| BP Capital Markets PLC 3.279% 9/19/27 | | 10,121 | 9,852 |
| Canadian Natural Resources Ltd.: | | | |
| 3.9% 2/1/25 | | 1,489 | 1,480 |
| 4.95% 6/1/47 | | 5,084 | 4,537 |
| 5.85% 2/1/35 | | 9,570 | 9,931 |
| 6.25% 3/15/38 | | 5,441 | 5,798 |
| Cenovus Energy, Inc.: | | | |
| 2.65% 1/15/32 | | 5,664 | 4,833 |
| 4.25% 4/15/27 | | 7,547 | 7,464 |
| 5.4% 6/15/47 | | 4,439 | 4,259 |
| 6.75% 11/15/39 | | 457 | 511 |
| Chevron Corp.: | | | |
| 1.554% 5/11/25 | | 5,916 | 5,784 |
| 1.995% 5/11/27 | | 4,949 | 4,688 |
| 2.236% 5/11/30 | | 5,916 | 5,307 |
| 2.954% 5/16/26 | | 8,737 | 8,553 |
| 2.978% 5/11/40 | | 4,949 | 3,884 |
| 3.078% 5/11/50 | | 5,916 | 4,265 |
| Chevron U.S.A., Inc.: | | | |
| 4.2% 10/15/49 | | 3,480 | 2,993 |
| 4.95% 8/15/47 | | 10,963 | 10,492 |
| Columbia Pipeline Group, Inc. 4.5% 6/1/25 | | 2,641 | 2,626 |
| ConocoPhillips Co.: | | | |
| 5.05% 9/15/33 | | 9,450 | 9,691 |
| 5.55% 3/15/54 | | 9,450 | 9,713 |
| 5.95% 3/15/46 | | 4,766 | 5,136 |
| 6.5% 2/1/39 | | 5,981 | 6,863 |
| DCP Midstream Operating LP: | | | |
| 3.25% 2/15/32 | | 1,000 | 887 |
| 8.125% 8/16/30 | | 2,000 | 2,339 |
| Devon Energy Corp.: | | | |
| 5% 6/15/45 | | 13,220 | 11,797 |
| 5.6% 7/15/41 | | 2,283 | 2,228 |
| Diamondback Energy, Inc. 6.25% 3/15/33 | | 11,200 | 12,031 |
| Eastern Gas Transmission & Storage, Inc. 3.9% 11/15/49 | | 9,666 | 7,214 |
| Enbridge, Inc.: | | | |
| 5.5% 12/1/46 | | 11,511 | 11,499 |
| 5.625% 4/5/34 | | 5,500 | 5,675 |
| 5.7% 3/8/33 | | 3,480 | 3,629 |
| 8.5% 1/15/84 (c) | | 1,880 | 2,060 |
| Energy Transfer LP: | | | |
| 3.75% 5/15/30 | | 13,291 | 12,572 |
| 3.9% 7/15/26 | | 5,974 | 5,885 |
| 4.95% 6/15/28 | | 7,490 | 7,568 |
| 5% 5/15/50 | | 14,074 | 12,482 |
| 5.15% 3/15/45 | | 6,356 | 5,815 |
| 5.3% 4/1/44 | | 4,607 | 4,303 |
| 5.4% 10/1/47 | | 4,369 | 4,085 |
| 5.8% 6/15/38 | | 6,960 | 7,132 |
| 6% 6/15/48 | | 15,589 | 15,742 |
| 6.25% 4/15/49 | | 2,315 | 2,409 |
| Enterprise Products Operating LP: | | | |
| 3.3% 2/15/53 | | 3,026 | 2,117 |
| 3.7% 2/15/26 | | 1,405 | 1,391 |
| 3.95% 2/15/27 | | 20,557 | 20,392 |
| 4.2% 1/31/50 | | 4,727 | 3,960 |
| 4.25% 2/15/48 | | 15,839 | 13,465 |
| 4.8% 2/1/49 | | 5,834 | 5,345 |
| 4.85% 8/15/42 | | 1,986 | 1,867 |
| 4.85% 3/15/44 | | 3,972 | 3,714 |
| 4.9% 5/15/46 | | 3,400 | 3,182 |
| 4.95% 2/15/35 | | 2,230 | 2,239 |
| 5.35% 1/31/33 | | 7,800 | 8,112 |
| 5.55% 2/16/55 | | 2,230 | 2,269 |
| 5.7% 2/15/42 | | 1,589 | 1,640 |
| 7.55% 4/15/38 | | 1,589 | 1,947 |
| EOG Resources, Inc. 4.15% 1/15/26 | | 4,448 | 4,436 |
| EQT Corp. 5.7% 4/1/28 | | 6,471 | 6,647 |
| Equinor ASA: | | | |
| 2.375% 5/22/30 | | 9,144 | 8,261 |
| 3.125% 4/6/30 | | 7,926 | 7,450 |
| 3.625% 9/10/28 | | 9,596 | 9,388 |
| 3.7% 4/6/50 | | 12,681 | 10,062 |
| 5.1% 8/17/40 | | 1,589 | 1,590 |
| Exxon Mobil Corp.: | | | |
| 3.043% 3/1/26 | | 6,618 | 6,500 |
| 3.452% 4/15/51 | | 3,316 | 2,521 |
| 3.482% 3/19/30 | | 19,333 | 18,618 |
| 3.567% 3/6/45 | | 5,282 | 4,260 |
| 4.227% 3/19/40 | | 20,900 | 19,199 |
| Hess Corp.: | | | |
| 5.6% 2/15/41 | | 2,701 | 2,762 |
| 5.8% 4/1/47 | | 3,383 | 3,509 |
| 6% 1/15/40 | | 2,000 | 2,123 |
| 7.875% 10/1/29 | | 3,300 | 3,769 |
| Kinder Morgan Energy Partners LP: | | | |
| 4.7% 11/1/42 | | 3,019 | 2,626 |
| 5% 3/1/43 | | 795 | 717 |
| 5.5% 3/1/44 | | 5,558 | 5,360 |
| 5.625% 9/1/41 | | 795 | 781 |
| 6.55% 9/15/40 | | 2,383 | 2,551 |
| Kinder Morgan, Inc.: | | | |
| 4.3% 3/1/28 | | 7,919 | 7,878 |
| 4.8% 2/1/33 | | 2,000 | 1,954 |
| 5.2% 6/1/33 | | 5,970 | 5,984 |
| 5.2% 3/1/48 | | 6,974 | 6,429 |
| 5.3% 12/1/34 | | 6,792 | 6,832 |
| 5.55% 6/1/45 | | 12,933 | 12,546 |
| Marathon Oil Corp.: | | | |
| 5.2% 6/1/45 | | 3,972 | 3,811 |
| 6.6% 10/1/37 | | 2,000 | 2,239 |
| Marathon Petroleum Corp.: | | | |
| 4.5% 4/1/48 | | 4,630 | 3,894 |
| 4.7% 5/1/25 | | 17,399 | 17,331 |
| 6.5% 3/1/41 | | 795 | 857 |
| MPLX LP: | | | |
| 4.125% 3/1/27 | | 7,506 | 7,423 |
| 4.7% 4/15/48 | | 15,489 | 13,339 |
| 4.8% 2/15/29 | | 7,300 | 7,369 |
| 5.2% 3/1/47 | | 4,861 | 4,529 |
| 5.5% 2/15/49 | | 6,892 | 6,609 |
| Occidental Petroleum Corp. 6.6% 3/15/46 | | 19,100 | 20,624 |
| ONEOK, Inc.: | | | |
| 3.1% 3/15/30 | | 2,000 | 1,846 |
| 3.4% 9/1/29 | | 1,300 | 1,228 |
| 4.25% 9/15/46 | | 4,369 | 3,548 |
| 4.35% 3/15/29 | | 2,000 | 1,979 |
| 4.45% 9/1/49 | | 4,640 | 3,772 |
| 4.5% 3/15/50 | | 1,100 | 900 |
| 4.95% 7/13/47 | | 4,647 | 4,138 |
| 5% 3/1/26 | | 2,383 | 2,387 |
| 5.2% 7/15/48 | | 2,399 | 2,202 |
| 5.65% 11/1/28 | | 3,550 | 3,687 |
| 6.1% 11/15/32 | | 8,780 | 9,323 |
| 6.625% 9/1/53 | | 6,710 | 7,391 |
| Ovintiv, Inc. 6.5% 2/1/38 | | 7,055 | 7,493 |
| Phillips 66 Co.: | | | |
| 3.85% 4/9/25 | | 2,000 | 1,983 |
| 3.9% 3/15/28 | | 2,000 | 1,961 |
| 4.65% 11/15/34 | | 2,000 | 1,935 |
| 4.875% 11/15/44 | | 795 | 731 |
| 5.875% 5/1/42 | | 7,547 | 7,880 |
| Plains All American Pipeline LP/PAA Finance Corp.: | | | |
| 3.55% 12/15/29 | | 1,000 | 941 |
| 3.6% 11/1/24 | | 5,719 | 5,699 |
| 4.65% 10/15/25 | | 9,730 | 9,692 |
| 4.9% 2/15/45 | | 1,509 | 1,330 |
| 6.65% 1/15/37 | | 4,220 | 4,579 |
| Sabine Pass Liquefaction LLC 4.5% 5/15/30 | | 15,000 | 14,843 |
| Schlumberger Investment SA 5% 6/1/34 | | 3,600 | 3,670 |
| Shell International Finance BV: | | | |
| 2% 11/7/24 | | 7,830 | 7,784 |
| 2.375% 11/7/29 | | 26,293 | 24,018 |
| 3.125% 11/7/49 | | 11,116 | 7,891 |
| 3.25% 5/11/25 | | 11,249 | 11,138 |
| 3.875% 11/13/28 | | 6,766 | 6,692 |
| 4% 5/10/46 | | 3,177 | 2,665 |
| 4.375% 5/11/45 | | 10,565 | 9,420 |
| 6.375% 12/15/38 | | 5,337 | 6,094 |
| Spectra Energy Partners LP 3.375% 10/15/26 | | 12,956 | 12,631 |
| Suncor Energy, Inc.: | | | |
| 4% 11/15/47 | | 3,972 | 3,075 |
| 6.8% 5/15/38 | | 6,708 | 7,494 |
| 6.85% 6/1/39 | | 1,589 | 1,776 |
| Targa Resources Corp.: | | | |
| 4.95% 4/15/52 | | 6,000 | 5,310 |
| 6.125% 3/15/33 | | 9,100 | 9,667 |
| Targa Resources Partners LP/Targa Resources Partners Finance Corp.: | | | |
| 4% 1/15/32 | | 2,000 | 1,856 |
| 4.875% 2/1/31 | | 2,000 | 1,964 |
| 5% 1/15/28 | | 1,300 | 1,298 |
| 5.5% 3/1/30 | | 2,000 | 2,028 |
| The Williams Companies, Inc.: | | | |
| 3.75% 6/15/27 | | 18,557 | 18,174 |
| 3.9% 1/15/25 | | 2,800 | 2,785 |
| 4.85% 3/1/48 | | 6,697 | 6,009 |
| 5.4% 3/2/26 | | 3,600 | 3,635 |
| 5.65% 3/15/33 | | 2,610 | 2,711 |
| 5.75% 6/24/44 | | 1,509 | 1,522 |
| TotalEnergies Capital International SA: | | | |
| 3.127% 5/29/50 | | 2,832 | 2,014 |
| 3.455% 2/19/29 | | 16,952 | 16,414 |
| 3.461% 7/12/49 | | 5,181 | 3,915 |
| TotalEnergies Capital SA: | | | |
| 5.15% 4/5/34 | | 2,040 | 2,109 |
| 5.488% 4/5/54 | | 2,040 | 2,105 |
| 5.638% 4/5/64 | | 1,020 | 1,059 |
| TransCanada PipeLines Ltd.: | | | |
| 4.625% 3/1/34 | | 10,000 | 9,717 |
| 4.75% 5/15/38 | | 8,334 | 7,908 |
| 4.875% 1/15/26 | | 3,972 | 3,976 |
| 4.875% 5/15/48 | | 3,908 | 3,591 |
| 5.1% 3/15/49 | | 2,778 | 2,646 |
| 6.1% 6/1/40 | | 5,321 | 5,630 |
| Transcontinental Gas Pipe Line Co. LLC: | | | |
| 3.25% 5/15/30 | | 4,640 | 4,308 |
| 3.95% 5/15/50 | | 4,640 | 3,652 |
| 4.45% 8/1/42 | | 6,157 | 5,541 |
| 4.6% 3/15/48 | | 3,177 | 2,760 |
| Valero Energy Corp.: | | | |
| 2.85% 4/15/25 | | 13,126 | 12,925 |
| 4% 4/1/29 | | 7,408 | 7,246 |
| 4% 6/1/52 | | 5,100 | 3,894 |
| 6.625% 6/15/37 | | 7,605 | 8,405 |
| Western Midstream Operating LP 4.05% 2/1/30 | | 10,100 | 9,668 |
| | | | 987,611 |
TOTAL ENERGY | | | 1,019,357 |
| FINANCIALS - 8.9% | | | |
| Banks - 4.6% | | | |
| Australia and New Zealand Banking Group Ltd. 3.7% 11/16/25 | | 5,696 | 5,647 |
| Banco Bilbao Vizcaya Argentaria SA 6.138% 9/14/28 (c) | | 2,000 | 2,078 |
| Banco Santander SA: | | | |
| 1.849% 3/25/26 | | 13,000 | 12,414 |
| 2.749% 12/3/30 | | 1,000 | 870 |
| 2.958% 3/25/31 | | 14,400 | 12,810 |
| 3.225% 11/22/32 (c) | | 7,800 | 6,723 |
| 4.175% 3/24/28 (c) | | 6,000 | 5,899 |
| 5.294% 8/18/27 | | 2,000 | 2,034 |
| 5.538% 3/14/30 (c) | | 13,600 | 13,973 |
| 6.35% 3/14/34 | | 3,400 | 3,563 |
| 6.921% 8/8/33 | | 2,600 | 2,817 |
| Bank of America Corp.: | | | |
| U.S. Secured Overnight Fin. Rate (SOFR) Index + 1.290% 5.08% 1/20/27 (c) | | 22,900 | 22,998 |
| 1.53% 12/6/25 (c) | | 39,149 | 38,745 |
| 1.658% 3/11/27 (c) | | 15,408 | 14,710 |
| 1.734% 7/22/27 (c) | | 19,987 | 18,961 |
| 2.015% 2/13/26 (c) | | 20,058 | 19,764 |
| 2.087% 6/14/29 (c) | | 4,543 | 4,159 |
| 2.299% 7/21/32 (c) | | 7,772 | 6,616 |
| 2.482% 9/21/36 (c) | | 2,100 | 1,740 |
| 2.651% 3/11/32 (c) | | 14,674 | 12,875 |
| 2.676% 6/19/41 (c) | | 18,560 | 13,565 |
| 2.687% 4/22/32 (c) | | 7,115 | 6,250 |
| 2.831% 10/24/51 (c) | | 7,984 | 5,350 |
| 2.972% 7/21/52 (c) | | 7,772 | 5,387 |
| 3.194% 7/23/30 (c) | | 38,178 | 35,744 |
| 3.248% 10/21/27 | | 2,979 | 2,888 |
| 3.311% 4/22/42 (c) | | 15,200 | 11,986 |
| 3.366% 1/23/26 (c) | | 20,987 | 20,815 |
| 3.419% 12/20/28 (c) | | 24,064 | 23,203 |
| 3.593% 7/21/28 (c) | | 8,818 | 8,587 |
| 3.705% 4/24/28 (c) | | 6,991 | 6,834 |
| 3.824% 1/20/28 (c) | | 17,200 | 16,900 |
| 3.846% 3/8/37 (c) | | 4,603 | 4,178 |
| 3.97% 3/5/29 (c) | | 17,399 | 17,041 |
| 3.974% 2/7/30 (c) | | 11,231 | 10,930 |
| 4% 1/22/25 | | 4,766 | 4,740 |
| 4.083% 3/20/51 (c) | | 5,027 | 4,231 |
| 4.183% 11/25/27 | | 12,307 | 12,184 |
| 4.244% 4/24/38 (c) | | 2,000 | 1,855 |
| 4.25% 10/22/26 | | 3,177 | 3,161 |
| 4.271% 7/23/29 (c) | | 14,306 | 14,154 |
| 4.33% 3/15/50 (c) | | 10,398 | 9,145 |
| 4.443% 1/20/48 (c) | | 12,114 | 10,865 |
| 4.45% 3/3/26 | | 10,327 | 10,291 |
| 4.948% 7/22/28 (c) | | 5,000 | 5,051 |
| 5% 1/21/44 | | 4,265 | 4,246 |
| 5.015% 7/22/33 (c) | | 8,900 | 9,004 |
| 5.288% 4/25/34 (c) | | 6,160 | 6,318 |
| 5.425% 8/15/35 (c) | | 3,410 | 3,417 |
| 5.872% 9/15/34 (c) | | 1,240 | 1,318 |
| 5.875% 2/7/42 | | 2,610 | 2,850 |
| 6.11% 1/29/37 | | 6,621 | 7,192 |
| 6.204% 11/10/28 (c) | | 7,700 | 8,070 |
| 7.75% 5/14/38 | | 3,317 | 4,116 |
| Bank of Montreal: | | | |
| 3.803% 12/15/32 (c) | | 9,260 | 8,918 |
| 4.7% 9/14/27 | | 9,700 | 9,795 |
| 5.266% 12/11/26 | | 5,200 | 5,293 |
| Bank of Nova Scotia: | | | |
| 4.5% 12/16/25 | | 12,615 | 12,539 |
| 4.75% 2/2/26 | | 3,500 | 3,509 |
| 4.85% 2/1/30 | | 12,240 | 12,430 |
| 5.25% 6/12/28 | | 3,450 | 3,549 |
| Barclays PLC: | | | |
| 2.279% 11/24/27 (c) | | 14,500 | 13,723 |
| 2.852% 5/7/26 (c) | | 10,633 | 10,452 |
| 2.894% 11/24/32 (c) | | 15,080 | 13,001 |
| 3.564% 9/23/35 (c) | | 7,500 | 6,753 |
| 4.375% 1/12/26 | | 4,289 | 4,264 |
| 4.836% 5/9/28 | | 7,626 | 7,564 |
| 4.95% 1/10/47 | | 12,837 | 12,018 |
| 5.25% 8/17/45 | | 4,602 | 4,533 |
| 5.501% 8/9/28 (c) | | 4,980 | 5,077 |
| 6.224% 5/9/34 (c) | | 6,500 | 6,905 |
| 7.119% 6/27/34 (c) | | 6,000 | 6,583 |
| Canadian Imperial Bank of Commerce: | | | |
| 3.6% 4/7/32 | | 3,614 | 3,331 |
| 6.092% 10/3/33 | | 7,914 | 8,512 |
| Citigroup, Inc.: | | | |
| 1.122% 1/28/27 (c) | | 14,113 | 13,402 |
| 2.561% 5/1/32 (c) | | 11,986 | 10,383 |
| 2.904% 11/3/42 (c) | | 9,400 | 6,838 |
| 3.106% 4/8/26 (c) | | 24,746 | 24,420 |
| 3.52% 10/27/28 (c) | | 18,312 | 17,752 |
| 3.668% 7/24/28 (c) | | 32,410 | 31,601 |
| 3.7% 1/12/26 | | 10,841 | 10,700 |
| 3.785% 3/17/33 (c) | | 7,100 | 6,554 |
| 3.887% 1/10/28 (c) | | 3,575 | 3,517 |
| 3.98% 3/20/30 (c) | | 28,276 | 27,453 |
| 4.125% 7/25/28 | | 17,365 | 17,080 |
| 4.4% 6/10/25 | | 3,177 | 3,160 |
| 4.412% 3/31/31 (c) | | 7,733 | 7,606 |
| 4.45% 9/29/27 | | 28,129 | 27,997 |
| 4.6% 3/9/26 | | 4,766 | 4,754 |
| 4.65% 7/23/48 | | 11,261 | 10,268 |
| 4.75% 5/18/46 | | 9,151 | 8,272 |
| 5.3% 5/6/44 | | 1,589 | 1,561 |
| 5.316% 3/26/41 (c) | | 3,000 | 2,992 |
| 5.449% 6/11/35 (c) | | 12,600 | 12,949 |
| 5.5% 9/13/25 | | 3,972 | 3,992 |
| 5.875% 1/30/42 | | 4,328 | 4,637 |
| 8.125% 7/15/39 | | 6,356 | 8,271 |
| Citizens Financial Group, Inc.: | | | |
| 2.638% 9/30/32 | | 3,302 | 2,682 |
| 5.718% 7/23/32 (c) | | 5,800 | 5,920 |
| Comerica, Inc. 3.8% 7/22/26 | | 2,899 | 2,824 |
| Commonwealth Bank of Australia New York Branch 5.079% 1/10/25 | | 2,900 | 2,899 |
| Cooperatieve Rabobank UA: | | | |
| 3.75% 7/21/26 | | 15,291 | 14,965 |
| 4.375% 8/4/25 | | 5,147 | 5,110 |
| 5.25% 5/24/41 | | 4,583 | 4,724 |
| Cooperatieve Rabobank UA/NY 3.375% 5/21/25 | | 3,217 | 3,181 |
| Export-Import Bank of Korea: | | | |
| 0.625% 2/9/26 | | 20,831 | 19,762 |
| 1.125% 12/29/26 | | 3,300 | 3,072 |
| 2.875% 1/21/25 | | 6,037 | 5,995 |
| 5.125% 9/18/33 | | 10,400 | 10,813 |
| Fifth Third Bancorp: | | | |
| 2.55% 5/5/27 | | 11,793 | 11,192 |
| 4.772% 7/28/30 (c) | | 6,100 | 6,065 |
| 8.25% 3/1/38 | | 3,651 | 4,527 |
| HSBC Holdings PLC: | | | |
| U.S. Secured Overnight Fin. Rate (SOFR) Index + 2.650% 6.332% 3/9/44 (c) | | 5,100 | 5,580 |
| 1.645% 4/18/26 (c) | | 2,000 | 1,954 |
| 2.013% 9/22/28 (c) | | 38,714 | 35,737 |
| 2.099% 6/4/26 (c) | | 14,500 | 14,159 |
| 2.804% 5/24/32 (c) | | 22,528 | 19,566 |
| 4.25% 8/18/25 | | 4,602 | 4,564 |
| 4.292% 9/12/26 (c) | | 38,971 | 38,677 |
| 4.375% 11/23/26 | | 22,797 | 22,569 |
| 4.755% 6/9/28 (c) | | 7,000 | 7,000 |
| 4.762% 3/29/33 (c) | | 8,100 | 7,811 |
| 5.21% 8/11/28 (c) | | 2,000 | 2,028 |
| 5.25% 3/14/44 | | 3,946 | 3,843 |
| 5.597% 5/17/28 (c) | | 3,610 | 3,688 |
| 5.733% 5/17/32 (c) | | 10,000 | 10,379 |
| 5.887% 8/14/27 (c) | | 5,500 | 5,615 |
| 6.254% 3/9/34 (c) | | 16,000 | 17,205 |
| 6.5% 9/15/37 | | 8,340 | 8,943 |
| 6.8% 6/1/38 | | 4,833 | 5,316 |
| Huntington Bancshares, Inc.: | | | |
| 4.443% 8/4/28 (c) | | 3,100 | 3,091 |
| 6.208% 8/21/29 (c) | | 7,490 | 7,869 |
| Huntington National Bank 4.552% 5/17/28 (c) | | 10,000 | 9,927 |
| ING Groep NV: | | | |
| 1.726% 4/1/27 (c) | | 7,323 | 6,981 |
| 2.727% 4/1/32 (c) | | 7,404 | 6,492 |
| 4.252% 3/28/33 (c) | | 7,800 | 7,483 |
| JPMorgan Chase & Co.: | | | |
| 1.47% 9/22/27 (c) | | 23,779 | 22,337 |
| 1.953% 2/4/32 (c) | | 12,760 | 10,777 |
| 2.083% 4/22/26 (c) | | 29,270 | 28,714 |
| 2.522% 4/22/31 (c) | | 9,521 | 8,544 |
| 2.545% 11/8/32 (c) | | 18,588 | 16,076 |
| 2.95% 10/1/26 | | 20,041 | 19,490 |
| 2.956% 5/13/31 (c) | | 9,908 | 9,012 |
| 3.109% 4/22/51 (c) | | 11,841 | 8,515 |
| 3.3% 4/1/26 | | 7,149 | 7,019 |
| 3.509% 1/23/29 (c) | | 25,133 | 24,326 |
| 3.54% 5/1/28 (c) | | 13,504 | 13,169 |
| 3.882% 7/24/38 (c) | | 13,575 | 12,111 |
| 3.9% 7/15/25 | | 17,158 | 17,044 |
| 3.96% 1/29/27 (c) | | 9,666 | 9,564 |
| 3.964% 11/15/48 (c) | | 7,466 | 6,254 |
| 4.005% 4/23/29 (c) | | 16,311 | 16,005 |
| 4.125% 12/15/26 | | 4,667 | 4,636 |
| 4.203% 7/23/29 (c) | | 34,701 | 34,273 |
| 4.452% 12/5/29 (c) | | 9,705 | 9,667 |
| 4.586% 4/26/33 (c) | | 9,454 | 9,332 |
| 4.85% 2/1/44 | | 3,972 | 3,897 |
| 4.912% 7/25/33 (c) | | 20,900 | 21,015 |
| 4.95% 6/1/45 | | 7,581 | 7,413 |
| 4.995% 7/22/30 (c) | | 6,050 | 6,161 |
| 5.012% 1/23/30 (c) | | 12,500 | 12,717 |
| 5.294% 7/22/35 (c) | | 5,350 | 5,490 |
| 5.336% 1/23/35 (c) | | 15,000 | 15,447 |
| 5.35% 6/1/34 (c) | | 8,400 | 8,666 |
| 5.5% 10/15/40 | | 4,528 | 4,773 |
| 5.6% 7/15/41 | | 1,192 | 1,273 |
| 5.625% 8/16/43 | | 3,972 | 4,222 |
| 6.4% 5/15/38 | | 10,000 | 11,573 |
| KeyBank NA 3.4% 5/20/26 | | 4,289 | 4,158 |
| KeyCorp 4.789% 6/1/33 (c) | | 7,300 | 7,035 |
| Lloyds Banking Group PLC: | | | |
| 3.574% 11/7/28 (c) | | 2,000 | 1,933 |
| 3.75% 3/18/28 (c) | | 2,000 | 1,956 |
| 4.344% 1/9/48 | | 11,915 | 9,799 |
| 4.582% 12/10/25 | | 9,260 | 9,189 |
| 4.65% 3/24/26 | | 6,831 | 6,788 |
| 4.716% 8/11/26 (c) | | 2,000 | 1,991 |
| 4.976% 8/11/33 (c) | | 2,000 | 1,985 |
| 5.721% 6/5/30 (c) | | 8,400 | 8,714 |
| 5.871% 3/6/29 (c) | | 10,800 | 11,188 |
| Mitsubishi UFJ Financial Group, Inc.: | | | |
| 1 year U.S. Treasury Index + 1.630% 5.441% 2/22/34 (c) | | 6,660 | 6,918 |
| 1.538% 7/20/27 (c) | | 8,941 | 8,439 |
| 2.309% 7/20/32 (c) | | 8,700 | 7,415 |
| 3.195% 7/18/29 | | 11,297 | 10,623 |
| 3.751% 7/18/39 | | 6,297 | 5,511 |
| 3.85% 3/1/26 | | 538 | 532 |
| 3.961% 3/2/28 | | 17,476 | 17,245 |
| 5.242% 4/19/29 (c) | | 17,500 | 17,884 |
| 5.422% 2/22/29 (c) | | 12,500 | 12,815 |
| Mizuho Financial Group, Inc.: | | | |
| 1.554% 7/9/27 (c) | | 9,183 | 8,669 |
| 2.226% 5/25/26 (c) | | 10,826 | 10,603 |
| 2.26% 7/9/32 (c) | | 9,086 | 7,650 |
| 2.591% 5/25/31 (c) | | 13,146 | 11,704 |
| 5.382% 7/10/30 (c) | | 4,120 | 4,235 |
| 5.594% 7/10/35 (c) | | 4,300 | 4,459 |
| 5.748% 7/6/34 (c) | | 4,000 | 4,201 |
| 5.778% 7/6/29 (c) | | 5,120 | 5,320 |
| National Australia Bank Ltd. 5.132% 11/22/24 | | 9,111 | 9,106 |
| NatWest Group PLC: | | | |
| 3 month U.S. LIBOR + 1.750% 4.892% 5/18/29 (c) | | 6,766 | 6,784 |
| 3.754% 11/1/29 (c) | | 10,246 | 10,211 |
| 4.445% 5/8/30 (c) | | 5,748 | 5,664 |
| 4.8% 4/5/26 | | 10,366 | 10,365 |
| 5.516% 9/30/28 (c) | | 9,700 | 9,937 |
| 5.778% 3/1/35 (c) | | 2,300 | 2,403 |
| 5.808% 9/13/29 (c) | | 5,200 | 5,404 |
| Oesterreichische Kontrollbank AG 0.375% 9/17/25 | | 8,660 | 8,310 |
| PNC Financial Services Group, Inc.: | | | |
| 1.15% 8/13/26 | | 10,008 | 9,390 |
| 2.2% 11/1/24 | | 5,355 | 5,325 |
| 2.6% 7/23/26 | | 19,333 | 18,642 |
| 4.626% 6/6/33 (c) | | 5,000 | 4,826 |
| 5.354% 12/2/28 (c) | | 11,710 | 12,031 |
| 5.582% 6/12/29 (c) | | 9,650 | 9,967 |
| 5.676% 1/22/35 (c) | | 4,700 | 4,905 |
| 5.939% 8/18/34 (c) | | 10,750 | 11,381 |
| Royal Bank of Canada: | | | |
| 1.2% 4/27/26 | | 23,522 | 22,340 |
| 2.05% 1/21/27 | | 16,433 | 15,608 |
| 3.625% 5/4/27 | | 7,900 | 7,770 |
| 4.65% 1/27/26 | | 10,319 | 10,299 |
| 5% 5/2/33 | | 4,070 | 4,172 |
| 6% 11/1/27 | | 10,000 | 10,481 |
| Santander Holdings U.S.A., Inc.: | | | |
| 2.49% 1/6/28 (c) | | 2,000 | 1,877 |
| 4.4% 7/13/27 | | 4,600 | 4,544 |
| 6.565% 6/12/29 (c) | | 2,900 | 3,035 |
| Santander UK Group Holdings PLC: | | | |
| 2.469% 1/11/28 (c) | | 9,666 | 9,134 |
| 2.896% 3/15/32 (c) | | 1,600 | 1,396 |
| 6.534% 1/10/29 (c) | | 8,050 | 8,439 |
| Sumitomo Mitsui Financial Group, Inc.: | | | |
| 1.474% 7/8/25 | | 11,310 | 10,996 |
| 2.142% 9/23/30 | | 11,020 | 9,513 |
| 2.174% 1/14/27 | | 22,619 | 21,427 |
| 2.348% 1/15/25 | | 7,153 | 7,079 |
| 2.75% 1/15/30 | | 6,766 | 6,144 |
| 3.05% 1/14/42 | | 11,600 | 8,991 |
| 5.52% 1/13/28 | | 13,700 | 14,113 |
| 5.558% 7/9/34 | | 2,320 | 2,417 |
| 5.766% 1/13/33 | | 7,800 | 8,277 |
| 5.776% 7/13/33 | | 5,600 | 5,949 |
| The Toronto-Dominion Bank: | | | |
| 4.108% 6/8/27 | | 9,800 | 9,713 |
| 4.693% 9/15/27 | | 10,000 | 10,076 |
| 5.156% 1/10/28 | | 22,920 | 23,399 |
| Truist Financial Corp.: | | | |
| 1.267% 3/2/27 (c) | | 26,042 | 24,621 |
| 4.916% 7/28/33 (c) | | 4,850 | 4,690 |
| 5.122% 1/26/34 (c) | | 7,900 | 7,857 |
| 5.153% 8/5/32 (c) | | 3,000 | 3,030 |
| 5.711% 1/24/35 (c) | | 4,420 | 4,578 |
| 5.867% 6/8/34 (c) | | 3,770 | 3,939 |
| U.S. Bancorp: | | | |
| 1.375% 7/22/30 | | 9,666 | 8,136 |
| 2.677% 1/27/33 (c) | | 6,900 | 5,941 |
| 3% 7/30/29 | | 8,603 | 7,979 |
| 3.1% 4/27/26 | | 7,149 | 6,972 |
| 4.839% 2/1/34 (c) | | 12,000 | 11,797 |
| 5.1% 7/23/30 (c) | | 4,100 | 4,174 |
| 5.775% 6/12/29 (c) | | 8,900 | 9,241 |
| Wells Fargo & Co.: | | | |
| 2.164% 2/11/26 (c) | | 31,482 | 31,051 |
| 2.188% 4/30/26 (c) | | 23,344 | 22,881 |
| 2.406% 10/30/25 (c) | | 40,463 | 40,251 |
| 2.572% 2/11/31 (c) | | 18,666 | 16,748 |
| 3% 10/23/26 | | 16,149 | 15,686 |
| 3.068% 4/30/41 (c) | | 14,113 | 10,787 |
| 3.35% 3/2/33 (c) | | 4,543 | 4,088 |
| 3.526% 3/24/28 (c) | | 5,000 | 4,869 |
| 3.55% 9/29/25 | | 3,368 | 3,326 |
| 3.584% 5/22/28 (c) | | 8,313 | 8,089 |
| 3.9% 5/1/45 | | 3,781 | 3,147 |
| 4.1% 6/3/26 | | 2,562 | 2,537 |
| 4.4% 6/14/46 | | 5,672 | 4,824 |
| 4.54% 8/15/26 (c) | | 10,000 | 9,955 |
| 4.75% 12/7/46 | | 12,709 | 11,366 |
| 4.897% 7/25/33 (c) | | 19,800 | 19,704 |
| 4.9% 11/17/45 | | 7,663 | 7,023 |
| 5.013% 4/4/51 (c) | | 4,814 | 4,613 |
| 5.198% 1/23/30 (c) | | 8,500 | 8,676 |
| 5.375% 11/2/43 | | 5,336 | 5,279 |
| 5.389% 4/24/34 (c) | | 25,070 | 25,692 |
| 5.499% 1/23/35 (c) | | 9,000 | 9,288 |
| 5.557% 7/25/34 (c) | | 9,000 | 9,288 |
| 5.574% 7/25/29 (c) | | 12,000 | 12,392 |
| 5.606% 1/15/44 | | 9,040 | 9,155 |
| Westpac Banking Corp.: | | | |
| 1.953% 11/20/28 | | 5,800 | 5,282 |
| 2.668% 11/15/35 (c) | | 2,000 | 1,721 |
| 2.85% 5/13/26 | | 3,774 | 3,679 |
| 3.02% 11/18/36 (c) | | 2,000 | 1,716 |
| 4.11% 7/24/34 (c) | | 11,666 | 11,187 |
| 4.421% 7/24/39 | | 6,630 | 6,171 |
| 5.35% 10/18/24 | | 4,800 | 4,799 |
| 5.405% 8/10/33 (c) | | 2,000 | 2,028 |
| 5.457% 11/18/27 | | 10,000 | 10,334 |
| | | | 2,737,276 |
| Capital Markets - 1.9% | | | |
| Affiliated Managers Group, Inc. 3.5% 8/1/25 | | 3,774 | 3,722 |
| Ameriprise Financial, Inc. 5.15% 5/15/33 | | 2,900 | 2,985 |
| Ares Capital Corp.: | | | |
| 2.15% 7/15/26 | | 20,441 | 19,277 |
| 3.25% 7/15/25 | | 5,027 | 4,942 |
| 5.95% 7/15/29 | | 7,200 | 7,337 |
| Bank of New York Mellon Corp.: | | | |
| 1.8% 7/28/31 | | 16,619 | 13,920 |
| 2.8% 5/4/26 | | 4,472 | 4,357 |
| 4.414% 7/24/26 (c) | | 17,300 | 17,221 |
| 4.543% 2/1/29 (c) | | 7,200 | 7,236 |
| 4.975% 3/14/30 (c) | | 9,000 | 9,210 |
| 5.188% 3/14/35 (c) | | 9,740 | 9,949 |
| Bank of New York, New York 5.224% 11/21/25 (c) | | 10,000 | 9,996 |
| Blackrock Funding, Inc.: | | | |
| 4.6% 7/26/27 | | 4,530 | 4,595 |
| 5.35% 1/8/55 | | 5,390 | 5,531 |
| BlackRock, Inc. 2.1% 2/25/32 | | 11,503 | 9,774 |
| Blackstone Private Credit Fund: | | | |
| 2.7% 1/15/25 | | 12,663 | 12,518 |
| 4.7% 3/24/25 | | 16,881 | 16,789 |
| 5.95% 7/16/29 (b) | | 7,400 | 7,454 |
| Brookfield Finance, Inc.: | | | |
| 2.724% 4/15/31 | | 19,988 | 17,696 |
| 3.625% 2/15/52 | | 1,600 | 1,166 |
| 5.968% 3/4/54 | | 4,350 | 4,581 |
| Charles Schwab Corp.: | | | |
| 2% 3/20/28 | | 16,771 | 15,452 |
| 2.45% 3/3/27 | | 19,333 | 18,411 |
| 2.9% 3/3/32 | | 7,200 | 6,369 |
| 6.136% 8/24/34 (c) | | 4,350 | 4,673 |
| CI Financial Corp. 3.2% 12/17/30 | | 2,000 | 1,654 |
| CME Group, Inc.: | | | |
| 2.65% 3/15/32 | | 2,803 | 2,499 |
| 5.3% 9/15/43 | | 4,930 | 5,172 |
| Deutsche Bank AG: | | | |
| 4.1% 1/13/26 | | 9,570 | 9,479 |
| 4.5% 4/1/25 | | 2,573 | 2,557 |
| Deutsche Bank AG New York Branch: | | | |
| 2.311% 11/16/27 (c) | | 4,949 | 4,668 |
| 3.035% 5/28/32 (c) | | 9,100 | 7,964 |
| 3.729% 1/14/32 (c) | | 10,100 | 8,931 |
| 4.1% 1/13/26 | | 17,316 | 17,090 |
| Franklin Resources, Inc.: | | | |
| 1.6% 10/30/30 | | 2,000 | 1,674 |
| 2.85% 3/30/25 | | 3,019 | 2,980 |
| GE Capital Funding LLC 4.4% 5/15/30 | | 5,000 | 4,886 |
| Goldman Sachs Group, Inc.: | | | |
| 0.855% 2/12/26 (c) | | 13,639 | 13,366 |
| 1.093% 12/9/26 (c) | | 33,156 | 31,570 |
| 2.383% 7/21/32 (c) | | 22,445 | 19,111 |
| 2.6% 2/7/30 | | 9,666 | 8,773 |
| 2.615% 4/22/32 (c) | | 24,562 | 21,360 |
| 2.65% 10/21/32 (c) | | 12,566 | 10,847 |
| 3.102% 2/24/33 (c) | | 5,000 | 4,423 |
| 3.272% 9/29/25 (c) | | 4,833 | 4,823 |
| 3.436% 2/24/43 (c) | | 5,063 | 4,009 |
| 3.5% 1/23/25 | | 41,477 | 41,201 |
| 3.691% 6/5/28 (c) | | 14,113 | 13,779 |
| 3.75% 2/25/26 | | 4,622 | 4,569 |
| 3.85% 1/26/27 | | 24,021 | 23,670 |
| 4.017% 10/31/38 (c) | | 1,000 | 886 |
| 4.25% 10/21/25 | | 3,972 | 3,943 |
| 4.411% 4/23/39 (c) | | 5,770 | 5,331 |
| 4.75% 10/21/45 | | 12,534 | 11,857 |
| 5.049% 7/23/30 (c) | | 18,500 | 18,776 |
| 5.95% 1/15/27 | | 11,915 | 12,276 |
| 6.25% 2/1/41 | | 5,900 | 6,585 |
| 6.75% 10/1/37 | | 20,049 | 22,597 |
| HPS Corporate Lending Fund 6.25% 9/30/29 (b) | | 4,100 | 4,175 |
| Intercontinental Exchange, Inc.: | | | |
| 1.85% 9/15/32 | | 8,990 | 7,319 |
| 2.65% 9/15/40 | | 10,990 | 8,060 |
| 3.75% 12/1/25 | | 4,567 | 4,519 |
| 3.75% 9/21/28 | | 7,411 | 7,227 |
| 4% 9/15/27 | | 11,200 | 11,091 |
| 4.25% 9/21/48 | | 8,390 | 7,309 |
| 4.6% 3/15/33 | | 4,600 | 4,578 |
| Jefferies Financial Group, Inc.: | | | |
| 2.625% 10/15/31 | | 1,933 | 1,645 |
| 4.15% 1/23/30 | | 11,213 | 10,784 |
| Moody's Corp.: | | | |
| 2% 8/19/31 | | 1,400 | 1,188 |
| 3.25% 1/15/28 | | 12,663 | 12,266 |
| 3.75% 3/24/25 | | 1,000 | 993 |
| 4.25% 8/8/32 | | 1,000 | 973 |
| 4.875% 12/17/48 | | 8,233 | 7,728 |
| Morgan Stanley: | | | |
| 1.164% 10/21/25 (c) | | 23,310 | 23,170 |
| 1.512% 7/20/27 (c) | | 7,810 | 7,366 |
| 1.593% 5/4/27 (c) | | 11,397 | 10,827 |
| 2.188% 4/28/26 (c) | | 19,478 | 19,096 |
| 2.239% 7/21/32 (c) | | 21,895 | 18,529 |
| 2.475% 1/21/28 (c) | | 2,000 | 1,904 |
| 2.484% 9/16/36 (c) | | 1,600 | 1,319 |
| 2.511% 10/20/32 (c) | | 3,963 | 3,398 |
| 3.125% 7/27/26 | | 4,448 | 4,336 |
| 3.217% 4/22/42 (c) | | 14,442 | 11,324 |
| 3.591% 7/22/28 (c) | | 47,701 | 46,368 |
| 3.7% 10/23/24 | | 4,766 | 4,755 |
| 3.772% 1/24/29 (c) | | 9,753 | 9,517 |
| 3.875% 1/27/26 | | 6,171 | 6,105 |
| 3.95% 4/23/27 | | 27,155 | 26,769 |
| 3.971% 7/22/38 (c) | | 18,965 | 16,901 |
| 4.3% 1/27/45 | | 1,589 | 1,425 |
| 4.375% 1/22/47 | | 8,818 | 7,888 |
| 4.457% 4/22/39 (c) | | 6,005 | 5,635 |
| 5.042% 7/19/30 (c) | | 8,300 | 8,441 |
| 5.123% 2/1/29 (c) | | 14,400 | 14,652 |
| 5.297% 4/20/37 (c) | | 7,300 | 7,240 |
| 5.32% 7/19/35 (c) | | 8,400 | 8,581 |
| 5.597% 3/24/51 (c) | | 10,295 | 10,954 |
| 5.948% 1/19/38 (c) | | 2,720 | 2,817 |
| 6.296% 10/18/28 (c) | | 24,000 | 25,230 |
| 6.375% 7/24/42 | | 2,303 | 2,655 |
| 7.25% 4/1/32 | | 795 | 933 |
| NASDAQ, Inc.: | | | |
| 2.5% 12/21/40 | | 2,000 | 1,392 |
| 5.35% 6/28/28 | | 4,280 | 4,422 |
| 5.55% 2/15/34 | | 3,920 | 4,083 |
| 5.95% 8/15/53 | | 1,232 | 1,320 |
| 6.1% 6/28/63 | | 4,600 | 4,981 |
| Nomura Holdings, Inc.: | | | |
| 2.608% 7/14/31 | | 1,000 | 855 |
| 3.103% 1/16/30 | | 19,128 | 17,449 |
| 5.099% 7/3/25 | | 2,000 | 1,999 |
| 5.605% 7/6/29 | | 7,500 | 7,727 |
| 6.07% 7/12/28 | | 5,700 | 5,946 |
| Northern Trust Corp. 1.95% 5/1/30 | | 17,158 | 15,140 |
| S&P Global, Inc.: | | | |
| 2.9% 3/1/32 | | 34,219 | 30,775 |
| 2.95% 1/22/27 | | 4,833 | 4,687 |
| State Street Corp.: | | | |
| 1.684% 11/18/27 (c) | | 15,869 | 14,986 |
| 2.65% 5/19/26 | | 5,997 | 5,825 |
| 4.821% 1/26/34 (c) | | 5,200 | 5,194 |
| UBS AG: | | | |
| 5% 7/9/27 | | 2,000 | 2,028 |
| 7.5% 2/15/28 | | 15,400 | 16,810 |
| UBS Group AG: | | | |
| 4.55% 4/17/26 | | 8,685 | 8,656 |
| 4.875% 5/15/45 | | 8,979 | 8,478 |
| | | | 1,149,210 |
| Consumer Finance - 0.8% | | | |
| AerCap Ireland Capital Ltd./AerCap Global Aviation Trust: | | | |
| 1.65% 10/29/24 | | 4,778 | 4,747 |
| 2.45% 10/29/26 | | 10,778 | 10,272 |
| 3% 10/29/28 | | 5,800 | 5,424 |
| 3.4% 10/29/33 | | 5,896 | 5,140 |
| 3.65% 7/21/27 | | 3,698 | 3,599 |
| 3.85% 10/29/41 | | 5,896 | 4,840 |
| 3.875% 1/23/28 | | 12,472 | 12,147 |
| 4.45% 10/1/25 | | 7,824 | 7,778 |
| 5.3% 1/19/34 | | 2,050 | 2,076 |
| 6.45% 4/15/27 | | 23,302 | 24,246 |
| Ally Financial, Inc.: | | | |
| 2.2% 11/2/28 | | 11,270 | 10,107 |
| 5.8% 5/1/25 | | 14,790 | 14,820 |
| 6.184% 7/26/35 (c) | | 6,930 | 7,058 |
| 6.848% 1/3/30 (c) | | 2,900 | 3,067 |
| 6.992% 6/13/29 (c) | | 2,870 | 3,044 |
| 8% 11/1/31 | | 2,000 | 2,283 |
| American Express Co.: | | | |
| 3.95% 8/1/25 | | 18,100 | 17,956 |
| 4.05% 12/3/42 | | 5,541 | 4,901 |
| 5.282% 7/27/29 (c) | | 12,000 | 12,326 |
| 5.284% 7/26/35 (c) | | 10,480 | 10,710 |
| Capital One Financial Corp.: | | | |
| 2.359% 7/29/32 (c) | | 3,300 | 2,648 |
| 3.3% 10/30/24 | | 11,544 | 11,503 |
| 3.75% 7/28/26 | | 7,746 | 7,588 |
| 3.75% 3/9/27 | | 28,095 | 27,523 |
| 3.8% 1/31/28 | | 10,327 | 10,019 |
| 5.247% 7/26/30 (c) | | 5,600 | 5,657 |
| 5.817% 2/1/34 (c) | | 3,450 | 3,525 |
| 6.051% 2/1/35 (c) | | 6,850 | 7,110 |
| 6.377% 6/8/34 (c) | | 3,470 | 3,687 |
| Discover Financial Services 4.5% 1/30/26 | | 14,948 | 14,857 |
| Ford Motor Credit Co. LLC: | | | |
| 5.85% 5/17/27 | | 9,000 | 9,153 |
| 6.125% 3/8/34 | | 5,000 | 5,059 |
| 6.798% 11/7/28 | | 10,510 | 11,077 |
| 6.8% 5/12/28 | | 23,835 | 25,006 |
| 7.122% 11/7/33 | | 6,390 | 6,903 |
| GE Capital International Funding Co. 3.373% 11/15/25 | | 22,877 | 22,516 |
| John Deere Capital Corp.: | | | |
| 2.65% 6/10/26 | | 3,972 | 3,862 |
| 2.8% 9/8/27 | | 5,561 | 5,343 |
| 3.45% 3/7/29 | | 15,887 | 15,349 |
| 5.05% 6/12/34 | | 6,740 | 6,934 |
| Synchrony Financial: | | | |
| 3.7% 8/4/26 | | 3,752 | 3,666 |
| 5.15% 3/19/29 | | 21,635 | 21,548 |
| Toyota Motor Credit Corp.: | | | |
| 1.15% 8/13/27 | | 16,723 | 15,318 |
| 1.9% 1/13/27 | | 8,796 | 8,332 |
| 3% 4/1/25 | | 2,000 | 1,978 |
| 3.05% 3/22/27 | | 11,570 | 11,250 |
| 4.45% 6/29/29 | | 2,000 | 2,012 |
| 4.55% 8/9/29 | | 17,190 | 17,335 |
| | | | 453,299 |
| Financial Services - 0.9% | | | |
| Aon Corp. / Aon Global Holdings PLC 2.6% 12/2/31 | | 15,853 | 13,792 |
| Berkshire Hathaway, Inc.: | | | |
| 3.125% 3/15/26 | | 9,135 | 9,006 |
| 4.5% 2/11/43 | | 1,589 | 1,552 |
| Blue Owl Credit Income Corp. 6.6% 9/15/29 (b) | | 3,431 | 3,495 |
| BP Capital Markets America, Inc.: | | | |
| 2.721% 1/12/32 | | 28,999 | 25,530 |
| 3% 2/24/50 | | 11,116 | 7,599 |
| 3.017% 1/16/27 | | 7,547 | 7,329 |
| 3.06% 6/17/41 | | 6,766 | 5,157 |
| 4.812% 2/13/33 | | 5,950 | 5,952 |
| Corebridge Financial, Inc.: | | | |
| 3.9% 4/5/32 | | 4,549 | 4,212 |
| 4.35% 4/5/42 | | 4,800 | 4,130 |
| 6.875% 12/15/52 (c) | | 5,300 | 5,414 |
| DH Europe Finance II SARL: | | | |
| 2.2% 11/15/24 | | 6,563 | 6,521 |
| 2.6% 11/15/29 | | 7,675 | 7,076 |
| 3.4% 11/15/49 | | 8,313 | 6,302 |
| Equitable Holdings, Inc.: | | | |
| 4.35% 4/20/28 | | 6,519 | 6,436 |
| 5% 4/20/48 | | 2,000 | 1,866 |
| 5.594% 1/11/33 | | 2,700 | 2,792 |
| Fidelity National Information Services, Inc.: | | | |
| 1.15% 3/1/26 | | 16,937 | 16,072 |
| 2.25% 3/1/31 | | 16,065 | 13,899 |
| Fiserv, Inc.: | | | |
| 3.5% 7/1/29 | | 8,797 | 8,424 |
| 4.4% 7/1/49 | | 14,614 | 12,528 |
| Global Payments, Inc.: | | | |
| 1.2% 3/1/26 | | 23,465 | 22,251 |
| 2.15% 1/15/27 | | 10,000 | 9,469 |
| 2.9% 5/15/30 | | 2,000 | 1,800 |
| 4.45% 6/1/28 | | 2,000 | 1,979 |
| 5.95% 8/15/52 | | 5,500 | 5,590 |
| Jackson Financial, Inc. 5.17% 6/8/27 | | 9,500 | 9,629 |
| Japan International Cooperation Agency 1.75% 4/28/31 | | 7,910 | 6,790 |
| Jbs U.S.A. Holding Lux/ Jbs U.S.A. F: | | | |
| 3% 5/15/32 | | 8,000 | 6,837 |
| 5.75% 4/1/33 | | 19,650 | 20,115 |
| KfW: | | | |
| 0.375% 7/18/25 | | 13,678 | 13,201 |
| 0.625% 1/22/26 | | 42,629 | 40,592 |
| 2% 5/2/25 | | 3,038 | 2,985 |
| 2.5% 11/20/24 | | 8,281 | 8,233 |
| 2.875% 4/3/28 | | 12,201 | 11,824 |
| MasterCard, Inc.: | | | |
| 3.3% 3/26/27 | | 5,744 | 5,631 |
| 3.35% 3/26/30 | | 7,992 | 7,652 |
| 3.8% 11/21/46 | | 3,019 | 2,536 |
| 3.85% 3/26/50 | | 14,152 | 11,748 |
| National Rural Utilities Cooperative Finance Corp.: | | | |
| 4.15% 12/15/32 | | 14,810 | 14,209 |
| 5.8% 1/15/33 | | 5,500 | 5,875 |
| PayPal Holdings, Inc.: | | | |
| 1.65% 6/1/25 | | 10,855 | 10,597 |
| 2.3% 6/1/30 | | 12,566 | 11,244 |
| 4.4% 6/1/32 | | 10,000 | 9,924 |
| Sixth Street Lending Partners 6.5% 3/11/29 (b) | | 3,790 | 3,871 |
| The Western Union Co. 2.85% 1/10/25 | | 8,700 | 8,621 |
| Visa, Inc.: | | | |
| 1.1% 2/15/31 | | 16,240 | 13,415 |
| 1.9% 4/15/27 | | 11,387 | 10,792 |
| 2.05% 4/15/30 | | 16,761 | 15,022 |
| 2.7% 4/15/40 | | 9,473 | 7,260 |
| 2.75% 9/15/27 | | 9,468 | 9,114 |
| 3.15% 12/14/25 | | 9,257 | 9,113 |
| 4.3% 12/14/45 | | 5,275 | 4,783 |
| Voya Financial, Inc.: | | | |
| 3.65% 6/15/26 | | 12,542 | 12,324 |
| 5.7% 7/15/43 | | 2,979 | 2,966 |
| | | | 513,076 |
| Insurance - 0.7% | | | |
| AFLAC, Inc.: | | | |
| 3.6% 4/1/30 | | 4,833 | 4,615 |
| 4% 10/15/46 | | 3,003 | 2,488 |
| Allstate Corp.: | | | |
| 3.28% 12/15/26 | | 3,750 | 3,657 |
| 4.2% 12/15/46 | | 6,005 | 5,105 |
| American International Group, Inc.: | | | |
| 3.875% 1/15/35 | | 2,145 | 1,981 |
| 4.2% 4/1/28 | | 14,734 | 14,517 |
| 4.375% 6/30/50 | | 4,543 | 3,945 |
| 4.5% 7/16/44 | | 7,050 | 6,294 |
| 4.7% 7/10/35 | | 4,607 | 4,415 |
| 4.75% 4/1/48 | | 7,808 | 7,189 |
| Aon Corp. 3.75% 5/2/29 | | 1,800 | 1,743 |
| Aon North America, Inc.: | | | |
| 5.45% 3/1/34 | | 5,950 | 6,157 |
| 5.75% 3/1/54 | | 3,200 | 3,314 |
| Aon PLC: | | | |
| 4.6% 6/14/44 | | 1,271 | 1,130 |
| 4.75% 5/15/45 | | 4,671 | 4,260 |
| Arthur J. Gallagher & Co.: | | | |
| 3.5% 5/20/51 | | 1,200 | 865 |
| 5.75% 3/2/53 | | 4,060 | 4,119 |
| Assurant, Inc. 4.9% 3/27/28 | | 3,900 | 3,905 |
| Athene Holding Ltd.: | | | |
| 3.5% 1/15/31 | | 5,413 | 4,981 |
| 3.95% 5/25/51 | | 2,000 | 1,487 |
| 4.125% 1/12/28 | | 2,000 | 1,961 |
| Baylor Scott & White Holdings: | | | |
| Series 2021, 2.839% 11/15/50 | | 14,016 | 9,682 |
| 3.967% 11/15/46 | | 1,986 | 1,716 |
| Berkshire Hathaway Finance Corp.: | | | |
| 1.45% 10/15/30 | | 7,588 | 6,482 |
| 2.85% 10/15/50 | | 10,633 | 7,302 |
| 2.875% 3/15/32 | | 2,000 | 1,823 |
| 4.2% 8/15/48 | | 9,429 | 8,456 |
| 5.75% 1/15/40 | | 11,222 | 12,411 |
| Brighthouse Financial, Inc. 3.85% 12/22/51 | | 7,600 | 4,986 |
| Brown & Brown, Inc. 4.2% 3/17/32 | | 6,283 | 5,945 |
| Chubb INA Holdings, Inc.: | | | |
| 1.375% 9/15/30 | | 21,411 | 18,168 |
| 3.35% 5/3/26 | | 7,152 | 7,024 |
| 4.35% 11/3/45 | | 3,177 | 2,852 |
| 5% 3/15/34 | | 3,100 | 3,177 |
| CNA Financial Corp. 5.5% 6/15/33 | | 3,100 | 3,211 |
| Fairfax Financial Holdings Ltd.: | | | |
| 4.625% 4/29/30 | | 5,123 | 5,071 |
| 4.85% 4/17/28 | | 1,700 | 1,709 |
| 5.625% 8/16/32 | | 1,900 | 1,938 |
| 6.1% 3/15/55 (b) | | 5,000 | 5,057 |
| Hartford Financial Services Group, Inc.: | | | |
| 2.8% 8/19/29 | | 5,649 | 5,201 |
| 3.6% 8/19/49 | | 6,760 | 5,146 |
| 4.4% 3/15/48 | | 7,713 | 6,748 |
| Lincoln National Corp.: | | | |
| 3.625% 12/12/26 | | 4,766 | 4,673 |
| 4.35% 3/1/48 | | 2,417 | 1,929 |
| 4.375% 6/15/50 | | 4,833 | 3,830 |
| Manulife Financial Corp. 4.15% 3/4/26 | | 9,666 | 9,617 |
| Markel Group, Inc.: | | | |
| 3.35% 9/17/29 | | 4,833 | 4,559 |
| 3.5% 11/1/27 | | 4,000 | 3,877 |
| 6% 5/16/54 | | 5,200 | 5,388 |
| Marsh & McLennan Companies, Inc.: | | | |
| 4.2% 3/1/48 | | 3,868 | 3,312 |
| 4.35% 1/30/47 | | 2,224 | 1,940 |
| 4.375% 3/15/29 | | 6,116 | 6,139 |
| 4.9% 3/15/49 | | 7,388 | 6,995 |
| MetLife, Inc.: | | | |
| 3.6% 11/13/25 | | 9,666 | 9,557 |
| 4.125% 8/13/42 | | 6,959 | 6,040 |
| 4.55% 3/23/30 | | 8,990 | 9,117 |
| 4.6% 5/13/46 | | 3,589 | 3,283 |
| 4.721% 12/15/44 (c) | | 3,972 | 3,650 |
| 5.375% 7/15/33 | | 5,845 | 6,120 |
| 5.875% 2/6/41 | | 2,059 | 2,197 |
| 6.375% 6/15/34 | | 2,000 | 2,234 |
| Principal Financial Group, Inc.: | | | |
| 4.3% 11/15/46 | | 6,356 | 5,489 |
| 5.375% 3/15/33 | | 1,200 | 1,236 |
| Progressive Corp.: | | | |
| 2.45% 1/15/27 | | 3,765 | 3,612 |
| 2.5% 3/15/27 | | 7,346 | 7,030 |
| 3% 3/15/32 | | 13,862 | 12,554 |
| 4.2% 3/15/48 | | 4,398 | 3,811 |
| Prudential Financial, Inc.: | | | |
| 3.878% 3/27/28 | | 3,305 | 3,246 |
| 3.905% 12/7/47 | | 437 | 352 |
| 3.935% 12/7/49 | | 8,515 | 6,854 |
| 4.35% 2/25/50 | | 9,924 | 8,599 |
| 4.418% 3/27/48 | | 5,044 | 4,381 |
| 5.125% 3/1/52 (c) | | 3,335 | 3,249 |
| 5.7% 12/14/36 | | 302 | 322 |
| 6% 9/1/52 (c) | | 5,360 | 5,498 |
| 6.75% 3/1/53 (c) | | 1,800 | 1,913 |
| The Chubb Corp. 6.5% 5/15/38 | | 2,788 | 3,226 |
| The Travelers Companies, Inc.: | | | |
| 4.1% 3/4/49 | | 4,833 | 4,131 |
| 4.3% 8/25/45 | | 1,159 | 1,026 |
| 5.45% 5/25/53 | | 2,300 | 2,405 |
| 6.25% 6/15/37 | | 6,633 | 7,462 |
| 6.75% 6/20/36 | | 4,500 | 5,249 |
| Unum Group 6% 6/15/54 | | 4,580 | 4,663 |
| Willis Group North America, Inc.: | | | |
| 4.65% 6/15/27 | | 5,827 | 5,837 |
| 5.35% 5/15/33 | | 6,000 | 6,110 |
| | | | 414,945 |
TOTAL FINANCIALS | | | 5,267,806 |
| HEALTH CARE - 2.9% | | | |
| Biotechnology - 0.6% | | | |
| AbbVie, Inc.: | | | |
| 2.6% 11/21/24 | | 12,276 | 12,201 |
| 2.95% 11/21/26 | | 8,990 | 8,738 |
| 3.2% 11/21/29 | | 15,370 | 14,564 |
| 3.6% 5/14/25 | | 7,149 | 7,081 |
| 3.8% 3/15/25 | | 7,006 | 6,958 |
| 4.05% 11/21/39 | | 8,990 | 8,143 |
| 4.25% 11/14/28 | | 6,585 | 6,610 |
| 4.25% 11/21/49 | | 14,886 | 12,979 |
| 4.3% 5/14/36 | | 4,972 | 4,763 |
| 4.4% 11/6/42 | | 3,793 | 3,485 |
| 4.45% 5/14/46 | | 5,561 | 5,038 |
| 4.5% 5/14/35 | | 10,000 | 9,831 |
| 4.55% 3/15/35 | | 5,282 | 5,211 |
| 4.7% 5/14/45 | | 10,467 | 9,840 |
| 4.75% 3/15/45 | | 5,028 | 4,774 |
| 4.8% 3/15/29 | | 6,500 | 6,640 |
| 4.875% 11/14/48 | | 4,630 | 4,451 |
| 5.05% 3/15/34 | | 9,930 | 10,233 |
| 5.4% 3/15/54 | | 6,500 | 6,736 |
| Amgen, Inc.: | | | |
| 1.65% 8/15/28 | | 15,418 | 13,883 |
| 1.9% 2/21/25 | | 6,476 | 6,375 |
| 2.3% 2/25/31 | | 16,400 | 14,292 |
| 2.6% 8/19/26 | | 8,340 | 8,049 |
| 2.8% 8/15/41 | | 15,756 | 11,643 |
| 3.125% 5/1/25 | | 1,589 | 1,568 |
| 3.35% 2/22/32 | | 5,640 | 5,166 |
| 3.375% 2/21/50 | | 8,893 | 6,590 |
| 4.4% 5/1/45 | | 7,888 | 6,871 |
| 4.663% 6/15/51 | | 9,908 | 8,819 |
| 4.875% 3/1/53 | | 8,280 | 7,608 |
| 5.15% 3/2/28 | | 12,880 | 13,156 |
| 5.25% 3/2/33 | | 8,730 | 8,972 |
| 5.6% 3/2/43 | | 10,000 | 10,220 |
| 5.65% 3/2/53 | | 11,643 | 11,975 |
| Biogen, Inc.: | | | |
| 2.25% 5/1/30 | | 1,600 | 1,412 |
| 4.05% 9/15/25 | | 10,000 | 9,916 |
| Gilead Sciences, Inc.: | | | |
| 1.65% 10/1/30 | | 11,928 | 10,150 |
| 2.8% 10/1/50 | | 11,832 | 7,770 |
| 3.65% 3/1/26 | | 4,909 | 4,843 |
| 4.15% 3/1/47 | | 9,882 | 8,375 |
| 4.75% 3/1/46 | | 8,737 | 8,094 |
| Regeneron Pharmaceuticals, Inc. 1.75% 9/15/30 | | 2,000 | 1,710 |
| | | | 335,733 |
| Health Care Equipment & Supplies - 0.3% | | | |
| Abbott Laboratories: | | | |
| 3.75% 11/30/26 | | 5,539 | 5,490 |
| 4.75% 11/30/36 | | 3,575 | 3,618 |
| 4.9% 11/30/46 | | 8,261 | 8,178 |
| Baxter International, Inc.: | | | |
| 1.915% 2/1/27 | | 11,725 | 11,008 |
| 2.539% 2/1/32 | | 12,914 | 11,029 |
| Becton, Dickinson & Co.: | | | |
| 2.823% 5/20/30 | | 6,989 | 6,388 |
| 3.7% 6/6/27 | | 22,048 | 21,605 |
| 4.685% 12/15/44 | | 8,630 | 7,836 |
| 5.081% 6/7/29 | | 6,000 | 6,147 |
| Boston Scientific Corp.: | | | |
| 4% 3/1/29 | | 8,579 | 8,433 |
| 4.7% 3/1/49 | | 13,845 | 12,984 |
| GE Healthcare Technologies, Inc.: | | | |
| 5.65% 11/15/27 | | 5,180 | 5,349 |
| 5.905% 11/22/32 | | 10,170 | 10,836 |
| Medtronic, Inc. 4.625% 3/15/45 | | 10,267 | 9,654 |
| Stryker Corp.: | | | |
| 1.95% 6/15/30 | | 7,395 | 6,458 |
| 2.9% 6/15/50 | | 7,395 | 5,082 |
| Zimmer Biomet Holdings, Inc. 3.55% 4/1/25 | | 9,040 | 8,951 |
| | | | 149,046 |
| Health Care Providers & Services - 1.2% | | | |
| Aetna, Inc.: | | | |
| 3.875% 8/15/47 | | 4,157 | 3,151 |
| 4.125% 11/15/42 | | 9,013 | 7,358 |
| Allina Health System, Inc. 3.887% 4/15/49 | | 5,269 | 4,340 |
| Banner Health: | | | |
| 2.907% 1/1/42 | | 1,305 | 981 |
| 2.913% 1/1/51 | | 10,923 | 7,606 |
| Baptist Healthcare System Obli 3.54% 8/15/50 | | 10,657 | 8,115 |
| Bon Secours Mercy Health, Inc. 2.095% 6/1/31 | | 7,302 | 6,255 |
| Cardinal Health, Inc. 4.368% 6/15/47 | | 11,033 | 9,314 |
| Centene Corp.: | | | |
| 2.5% 3/1/31 | | 2,000 | 1,698 |
| 2.625% 8/1/31 | | 14,500 | 12,300 |
| 3.375% 2/15/30 | | 16,200 | 14,834 |
| Children's Hospital Medical Center 4.268% 5/15/44 | | 2,637 | 2,386 |
| Children's Hospital of Philadelphia 2.704% 7/1/50 | | 8,032 | 5,426 |
| Cigna Group: | | | |
| 4.125% 11/15/25 | | 7,829 | 7,776 |
| 4.375% 10/15/28 | | 21,090 | 20,973 |
| 4.5% 2/25/26 | | 9,262 | 9,246 |
| 4.8% 8/15/38 | | 18,723 | 17,954 |
| 4.8% 7/15/46 | | 6,037 | 5,486 |
| 4.9% 12/15/48 | | 6,764 | 6,214 |
| 6.125% 11/15/41 | | 2,383 | 2,559 |
| CommonSpirit Health: | | | |
| 3.91% 10/1/50 | | 12,300 | 9,770 |
| 4.35% 11/1/42 | | 1,589 | 1,401 |
| CVS Health Corp.: | | | |
| 2.7% 8/21/40 | | 12,035 | 8,309 |
| 2.875% 6/1/26 | | 5,958 | 5,777 |
| 3% 8/15/26 | | 13,153 | 12,740 |
| 3.25% 8/15/29 | | 13,963 | 13,048 |
| 3.875% 7/20/25 | | 3,701 | 3,664 |
| 4.1% 3/25/25 | | 3,272 | 3,254 |
| 4.3% 3/25/28 | | 18,985 | 18,756 |
| 4.875% 7/20/35 | | 2,462 | 2,375 |
| 5% 1/30/29 | | 19,800 | 20,081 |
| 5.05% 3/25/48 | | 21,765 | 19,292 |
| 5.125% 7/20/45 | | 6,997 | 6,318 |
| 5.3% 6/1/33 | | 15,530 | 15,596 |
| 5.3% 12/5/43 | | 3,489 | 3,275 |
| 5.625% 2/21/53 | | 3,100 | 2,967 |
| 6.05% 6/1/54 | | 6,650 | 6,707 |
| Elevance Health, Inc.: | | | |
| 2.55% 3/15/31 | | 1,100 | 972 |
| 3.125% 5/15/50 | | 6,766 | 4,702 |
| 3.65% 12/1/27 | | 27,589 | 26,993 |
| 4.1% 5/15/32 | | 9,100 | 8,780 |
| 4.375% 12/1/47 | | 8,311 | 7,178 |
| 4.55% 3/1/48 | | 3,741 | 3,296 |
| 4.625% 5/15/42 | | 2,065 | 1,895 |
| 4.65% 1/15/43 | | 1,589 | 1,454 |
| 4.75% 2/15/33 | | 10,000 | 9,969 |
| Franciscan Missionaries of Our Lady Health System, Inc. 3.914% 7/1/49 | | 8,468 | 6,806 |
| HCA Holdings, Inc.: | | | |
| 3.625% 3/15/32 | | 2,000 | 1,818 |
| 4.125% 6/15/29 | | 11,900 | 11,609 |
| 4.375% 3/15/42 | | 10,000 | 8,555 |
| 5.25% 6/15/49 | | 18,865 | 17,510 |
| 5.6% 4/1/34 | | 10,000 | 10,276 |
| Humana, Inc.: | | | |
| 1.35% 2/3/27 | | 10,039 | 9,300 |
| 2.15% 2/3/32 | | 11,863 | 9,838 |
| 3.125% 8/15/29 | | 6,457 | 6,033 |
| 4.95% 10/1/44 | | 1,986 | 1,804 |
| ICON Investments Six Designated Activity 5.849% 5/8/29 | | 3,056 | 3,193 |
| INTEGRIS Baptist Medical Center, Inc. 3.875% 8/15/50 | | 9,083 | 7,036 |
| Kaiser Foundation Hospitals: | | | |
| 3.266% 11/1/49 | | 7,259 | 5,471 |
| 4.15% 5/1/47 | | 5,204 | 4,561 |
| 4.875% 4/1/42 | | 1,430 | 1,402 |
| Massachusetts General Brigham, Inc. 4.117% 7/1/55 | | 2,780 | 2,380 |
| Memorial Sloan-Kettring Cancer Center 4.2% 7/1/55 | | 2,383 | 2,083 |
| MidMichigan Health 3.409% 6/1/50 | | 3,730 | 2,766 |
| New York & Presbyterian Hospital: | | | |
| 4.024% 8/1/45 | | 2,780 | 2,408 |
| 4.063% 8/1/56 | | 2,089 | 1,793 |
| Novant Health, Inc. 3.168% 11/1/51 | | 6,588 | 4,687 |
| NYU Hospitals Center 4.784% 7/1/44 | | 6,037 | 5,861 |
| Orlando Health Obligated Group 3.327% 10/1/50 | | 6,016 | 4,572 |
| Piedmont Healthcare, Inc. 2.719% 1/1/42 | | 1,208 | 878 |
| Providence St. Joseph Health Obligated Group 2.7% 10/1/51 | | 2,136 | 1,313 |
| Sabra Health Care LP 3.2% 12/1/31 | | 2,000 | 1,735 |
| Sutter Health 3.361% 8/15/50 | | 14,596 | 10,934 |
| Trinity Health Corp. 2.632% 12/1/40 | | 3,512 | 2,593 |
| UnitedHealth Group, Inc.: | | | |
| 1.15% 5/15/26 | | 3,155 | 2,993 |
| 1.25% 1/15/26 | | 6,254 | 5,997 |
| 2% 5/15/30 | | 2,900 | 2,556 |
| 2.3% 5/15/31 | | 2,662 | 2,324 |
| 2.9% 5/15/50 | | 6,273 | 4,269 |
| 3.05% 5/15/41 | | 16,300 | 12,532 |
| 3.25% 5/15/51 | | 3,045 | 2,195 |
| 3.375% 4/15/27 | | 4,289 | 4,198 |
| 3.7% 8/15/49 | | 8,334 | 6,567 |
| 3.75% 7/15/25 | | 2,780 | 2,763 |
| 3.75% 10/15/47 | | 7,594 | 6,069 |
| 3.85% 6/15/28 | | 9,222 | 9,105 |
| 3.875% 12/15/28 | | 11,908 | 11,736 |
| 3.875% 8/15/59 | | 9,958 | 7,708 |
| 4.2% 1/15/47 | | 2,859 | 2,463 |
| 4.375% 3/15/42 | | 9,373 | 8,527 |
| 4.625% 7/15/35 | | 7,300 | 7,241 |
| 4.75% 7/15/45 | | 1,327 | 1,251 |
| 4.95% 5/15/62 | | 4,700 | 4,384 |
| 5.15% 7/15/34 | | 7,200 | 7,398 |
| 5.25% 2/15/28 | | 8,360 | 8,666 |
| 5.35% 2/15/33 | | 7,610 | 7,965 |
| 5.625% 7/15/54 | | 12,470 | 13,025 |
| 5.8% 3/15/36 | | 1,000 | 1,082 |
| 5.875% 2/15/53 | | 7,600 | 8,217 |
| 6.625% 11/15/37 | | 2,000 | 2,323 |
| 6.875% 2/15/38 | | 1,300 | 1,541 |
| Universal Health Services, Inc. 2.65% 10/15/30 | | 4,000 | 3,535 |
| West Virginia University Health System Obligated Group 3.129% 6/1/50 | | 4,940 | 3,369 |
| | | | 683,755 |
| Life Sciences Tools & Services - 0.0% | | | |
| Danaher Corp. 4.375% 9/15/45 | | 1,883 | 1,718 |
| Revvity, Inc.: | | | |
| 0.85% 9/15/24 | | 4,476 | 4,468 |
| 2.25% 9/15/31 | | 5,519 | 4,650 |
| Thermo Fisher Scientific, Inc.: | | | |
| 2.6% 10/1/29 | | 12,965 | 11,997 |
| 5.086% 8/10/33 | | 2,820 | 2,909 |
| 5.3% 2/1/44 | | 4,622 | 4,668 |
| | | | 30,410 |
| Pharmaceuticals - 0.8% | | | |
| AstraZeneca Finance LLC: | | | |
| 1.2% 5/28/26 | | 7,201 | 6,832 |
| 2.25% 5/28/31 | | 7,008 | 6,110 |
| 4.875% 3/3/33 | | 4,110 | 4,219 |
| AstraZeneca PLC: | | | |
| 4.375% 11/16/45 | | 5,989 | 5,459 |
| 4.375% 8/17/48 | | 9,825 | 8,873 |
| 6.45% 9/15/37 | | 4,582 | 5,280 |
| Bayer U.S. Finance II LLC: | | | |
| 2.85% 4/15/25 (b) | | 3,038 | 2,981 |
| 3.95% 4/15/45 (b) | | 1,104 | 816 |
| Bristol-Myers Squibb Co.: | | | |
| 3.2% 6/15/26 | | 2,128 | 2,088 |
| 3.25% 8/1/42 | | 2,224 | 1,727 |
| 3.4% 7/26/29 | | 4,508 | 4,332 |
| 3.55% 3/15/42 | | 18,866 | 15,396 |
| 4.125% 6/15/39 | | 3,769 | 3,413 |
| 4.25% 10/26/49 | | 9,631 | 8,228 |
| 4.35% 11/15/47 | | 5,317 | 4,626 |
| 4.55% 2/20/48 | | 11,255 | 10,116 |
| 4.9% 2/22/29 | | 7,530 | 7,721 |
| 5.2% 2/22/34 | | 12,270 | 12,727 |
| 5.55% 2/22/54 | | 8,543 | 8,819 |
| Eli Lilly & Co.: | | | |
| 2.25% 5/15/50 | | 17,138 | 10,544 |
| 4.2% 8/14/29 | | 6,460 | 6,474 |
| 4.6% 8/14/34 | | 5,440 | 5,455 |
| 4.875% 2/27/53 | | 4,640 | 4,544 |
| 4.95% 2/27/63 | | 3,300 | 3,220 |
| 5.05% 8/14/54 | | 7,780 | 7,810 |
| GlaxoSmithKline Capital, Inc. 6.375% 5/15/38 | | 5,734 | 6,568 |
| Haleon U.S. Capital LLC: | | | |
| 3.375% 3/24/27 | | 14,422 | 14,071 |
| 3.625% 3/24/32 | | 14,451 | 13,426 |
| Johnson & Johnson: | | | |
| 0.55% 9/1/25 | | 6,409 | 6,167 |
| 2.1% 9/1/40 | | 7,409 | 5,224 |
| 2.45% 3/1/26 | | 4,440 | 4,331 |
| 2.45% 9/1/60 | | 7,409 | 4,483 |
| 3.4% 1/15/38 | | 7,411 | 6,519 |
| 3.5% 1/15/48 | | 4,766 | 3,859 |
| 3.625% 3/3/37 | | 3,177 | 2,897 |
| 4.375% 12/5/33 | | 2,600 | 2,647 |
| 4.5% 9/1/40 | | 1,800 | 1,758 |
| 4.5% 12/5/43 | | 5,262 | 5,131 |
| 4.85% 5/15/41 | | 3,383 | 3,433 |
| 4.9% 6/1/31 | | 5,000 | 5,194 |
| Merck & Co., Inc.: | | | |
| 2.35% 6/24/40 | | 10,000 | 7,134 |
| 2.45% 6/24/50 | | 4,418 | 2,758 |
| 2.75% 2/10/25 | | 5,729 | 5,674 |
| 3.6% 9/15/42 | | 1,589 | 1,315 |
| 3.7% 2/10/45 | | 5,084 | 4,167 |
| 3.9% 3/7/39 | | 11,666 | 10,490 |
| 4.05% 5/17/28 | | 7,500 | 7,499 |
| 4.5% 5/17/33 | | 11,325 | 11,338 |
| 5% 5/17/53 | | 11,000 | 10,830 |
| Mylan NV 5.2% 4/15/48 | | 2,383 | 2,041 |
| Novartis Capital Corp.: | | | |
| 1.75% 2/14/25 | | 7,443 | 7,338 |
| 2.75% 8/14/50 | | 10,923 | 7,510 |
| 3% 11/20/25 | | 8,317 | 8,184 |
| 3.1% 5/17/27 | | 4,679 | 4,563 |
| 3.7% 9/21/42 | | 2,244 | 1,919 |
| 4% 11/20/45 | | 4,162 | 3,641 |
| Pfizer Investment Enterprises: | | | |
| 4.45% 5/19/28 | | 20,080 | 20,178 |
| 4.65% 5/19/30 | | 9,923 | 10,088 |
| 4.75% 5/19/33 | | 6,140 | 6,173 |
| 5.11% 5/19/43 | | 10,390 | 10,272 |
| 5.34% 5/19/63 | | 17,600 | 17,467 |
| Pfizer, Inc.: | | | |
| 2.55% 5/28/40 | | 7,297 | 5,310 |
| 2.7% 5/28/50 | | 3,596 | 2,409 |
| 3% 12/15/26 | | 5,321 | 5,187 |
| 3.45% 3/15/29 | | 6,618 | 6,415 |
| 3.9% 3/15/39 | | 5,004 | 4,462 |
| 4% 12/15/36 | | 9,447 | 8,832 |
| 4.1% 9/15/38 | | 2,000 | 1,837 |
| 4.125% 12/15/46 | | 2,613 | 2,255 |
| 4.2% 9/15/48 | | 6,196 | 5,365 |
| 4.4% 5/15/44 | | 3,328 | 3,094 |
| 7.2% 3/15/39 | | 4,289 | 5,245 |
| Royalty Pharma PLC 3.35% 9/2/51 | | 8,800 | 5,944 |
| Shire Acquisitions Investments Ireland DAC 3.2% 9/23/26 | | 710 | 695 |
| Takeda Pharmaceutical Co. Ltd. 2.05% 3/31/30 | | 12,000 | 10,536 |
| Utah Acquisition Sub, Inc.: | | | |
| 3.95% 6/15/26 | | 2,248 | 2,216 |
| 5.25% 6/15/46 | | 2,622 | 2,271 |
| Viatris, Inc.: | | | |
| 1.65% 6/22/25 | | 1,800 | 1,748 |
| 2.7% 6/22/30 | | 12,760 | 11,233 |
| 4% 6/22/50 | | 8,750 | 6,202 |
| Wyeth LLC 5.95% 4/1/37 | | 2,000 | 2,186 |
| Zoetis, Inc.: | | | |
| 3.95% 9/12/47 | | 1,589 | 1,302 |
| 4.7% 2/1/43 | | 1,032 | 959 |
| | | | 499,800 |
TOTAL HEALTH CARE | | | 1,698,744 |
| INDUSTRIALS - 1.7% | | | |
| Aerospace & Defense - 0.5% | | | |
| General Dynamics Corp.: | | | |
| 3.75% 5/15/28 | | 7,466 | 7,359 |
| 4.25% 4/1/50 | | 3,867 | 3,395 |
| General Electric Co.: | | | |
| 3.625% 5/1/30 | | 9,492 | 9,066 |
| 6.875% 1/10/39 | | 119 | 140 |
| Huntington Ingalls Industries, Inc. 4.2% 5/1/30 | | 2,000 | 1,938 |
| L3Harris Technologies, Inc.: | | | |
| 2.9% 12/15/29 | | 1,000 | 924 |
| 3.832% 4/27/25 | | 5,000 | 4,959 |
| 5.4% 7/31/33 | | 7,000 | 7,216 |
| Lockheed Martin Corp.: | | | |
| 3.55% 1/15/26 | | 3,017 | 2,981 |
| 4.09% 9/15/52 | | 12,077 | 10,276 |
| 4.95% 10/15/25 | | 10,000 | 10,045 |
| 5.25% 1/15/33 | | 10,000 | 10,490 |
| 5.7% 11/15/54 | | 5,000 | 5,436 |
| Northrop Grumman Corp.: | | | |
| 3.25% 1/15/28 | | 6,673 | 6,439 |
| 3.85% 4/15/45 | | 1,489 | 1,224 |
| 4.03% 10/15/47 | | 14,958 | 12,489 |
| 4.75% 6/1/43 | | 3,177 | 2,975 |
| RTX Corp.: | | | |
| 1.9% 9/1/31 | | 9,570 | 7,991 |
| 3.15% 12/15/24 | | 7,070 | 6,995 |
| 3.75% 11/1/46 | | 5,929 | 4,704 |
| 4.05% 5/4/47 | | 1,851 | 1,529 |
| 4.125% 11/16/28 | | 11,685 | 11,537 |
| 4.35% 4/15/47 | | 5,243 | 4,537 |
| 4.45% 11/16/38 | | 12,715 | 11,839 |
| 4.5% 6/1/42 | | 5,863 | 5,307 |
| 4.625% 11/16/48 | | 10,491 | 9,450 |
| 4.875% 10/15/40 | | 795 | 760 |
| 5.15% 2/27/33 | | 9,600 | 9,843 |
| 5.4% 5/1/35 | | 1,800 | 1,870 |
| 5.7% 4/15/40 | | 1,589 | 1,670 |
| The Boeing Co.: | | | |
| 2.5% 3/1/25 | | 3,654 | 3,595 |
| 2.7% 2/1/27 | | 6,297 | 5,969 |
| 2.95% 2/1/30 | | 8,056 | 7,157 |
| 3.625% 3/1/48 | | 3,177 | 2,163 |
| 3.65% 3/1/47 | | 2,192 | 1,502 |
| 3.75% 2/1/50 | | 12,276 | 8,479 |
| 4.875% 5/1/25 | | 13,891 | 13,833 |
| 5.15% 5/1/30 | | 9,666 | 9,641 |
| 5.705% 5/1/40 | | 31,541 | 30,658 |
| 5.805% 5/1/50 | | 14,268 | 13,467 |
| 6.298% 5/1/29 (b) | | 5,180 | 5,410 |
| 6.528% 5/1/34 (b) | | 5,200 | 5,507 |
| 6.875% 3/15/39 | | 2,622 | 2,831 |
| | | | 285,596 |
| Air Freight & Logistics - 0.1% | | | |
| FedEx Corp.: | | | |
| 2.4% 5/15/31 | | 6,900 | 6,061 |
| 3.1% 8/5/29 | | 5,027 | 4,727 |
| 3.9% 2/1/35 | | 4,686 | 4,328 |
| 4.05% 2/15/48 | | 2,900 | 2,344 |
| 4.4% 1/15/47 | | 6,356 | 5,404 |
| 4.55% 4/1/46 | | 1,192 | 1,042 |
| 4.95% 10/17/48 | | 6,273 | 5,779 |
| 5.25% 5/15/50 | | 3,383 | 3,273 |
| United Parcel Service, Inc.: | | | |
| 2.4% 11/15/26 | | 5,958 | 5,720 |
| 3.4% 11/15/46 | | 2,104 | 1,653 |
| 3.625% 10/1/42 | | 1,100 | 901 |
| 3.75% 11/15/47 | | 6,842 | 5,462 |
| 4.25% 3/15/49 | | 3,190 | 2,759 |
| 4.45% 4/1/30 | | 4,833 | 4,880 |
| 5.5% 5/22/54 | | 3,600 | 3,745 |
| 6.2% 1/15/38 | | 6,986 | 7,837 |
| | | | 65,915 |
| Building Products - 0.1% | | | |
| Carrier Global Corp.: | | | |
| 2.242% 2/15/25 | | 10,053 | 9,905 |
| 2.493% 2/15/27 | | 7,105 | 6,810 |
| 2.722% 2/15/30 | | 12,373 | 11,325 |
| 3.377% 4/5/40 | | 4,959 | 4,000 |
| 3.577% 4/5/50 | | 11,213 | 8,589 |
| Johnson Controls International PLC/Tyco Fire & Security Finance SCA 4.9% 12/1/32 | | 11,850 | 11,972 |
| Masco Corp.: | | | |
| 2% 2/15/31 | | 7,383 | 6,251 |
| 3.125% 2/15/51 | | 3,735 | 2,551 |
| Owens Corning: | | | |
| 3.95% 8/15/29 | | 5,413 | 5,238 |
| 5.95% 6/15/54 | | 4,330 | 4,475 |
| | | | 71,116 |
| Commercial Services & Supplies - 0.1% | | | |
| Republic Services, Inc.: | | | |
| 1.45% 2/15/31 | | 17,786 | 14,700 |
| 2.9% 7/1/26 | | 3,352 | 3,260 |
| 3.2% 3/15/25 | | 8,957 | 8,866 |
| 3.95% 5/15/28 | | 8,340 | 8,233 |
| 5.2% 11/15/34 | | 4,520 | 4,657 |
| Waste Management, Inc.: | | | |
| 4.15% 7/15/49 | | 10,186 | 8,868 |
| 4.95% 7/3/27 | | 1,920 | 1,957 |
| 4.95% 7/3/31 | | 1,860 | 1,910 |
| | | | 52,451 |
| Ground Transportation - 0.4% | | | |
| Burlington Northern Santa Fe LLC: | | | |
| 3% 4/1/25 | | 10,000 | 9,886 |
| 3.05% 2/15/51 | | 3,499 | 2,436 |
| 3.25% 6/15/27 | | 5,958 | 5,815 |
| 3.55% 2/15/50 | | 4,833 | 3,754 |
| 3.9% 8/1/46 | | 3,686 | 3,057 |
| 4.05% 6/15/48 | | 13,373 | 11,331 |
| 4.125% 6/15/47 | | 2,264 | 1,948 |
| 4.15% 4/1/45 | | 1,350 | 1,169 |
| 4.375% 9/1/42 | | 3,575 | 3,244 |
| 4.45% 3/15/43 | | 2,000 | 1,826 |
| 4.55% 9/1/44 | | 2,383 | 2,186 |
| 4.9% 4/1/44 | | 3,177 | 3,063 |
| 5.2% 4/15/54 | | 2,400 | 2,412 |
| 6.15% 5/1/37 | | 2,000 | 2,243 |
| Canadian National Railway Co.: | | | |
| 2.45% 5/1/50 | | 13,253 | 8,326 |
| 3.2% 8/2/46 | | 2,622 | 1,974 |
| 3.85% 8/5/32 | | 2,000 | 1,902 |
| Canadian Pacific Railway Co.: | | | |
| 1.75% 12/2/26 | | 8,990 | 8,484 |
| 2.05% 3/5/30 | | 1,800 | 1,590 |
| 2.45% 12/2/31 | | 20,546 | 17,770 |
| 3.1% 12/2/51 | | 9,405 | 6,543 |
| CSX Corp.: | | | |
| 3.25% 6/1/27 | | 3,972 | 3,872 |
| 3.8% 11/1/46 | | 4,544 | 3,680 |
| 3.95% 5/1/50 | | 2,840 | 2,345 |
| 4.1% 11/15/32 | | 13,500 | 13,079 |
| 4.1% 3/15/44 | | 5,382 | 4,647 |
| 4.5% 3/15/49 | | 10,963 | 9,817 |
| 4.75% 11/15/48 | | 4,599 | 4,282 |
| Norfolk Southern Corp.: | | | |
| 3% 3/15/32 | | 4,000 | 3,586 |
| 3.65% 8/1/25 | | 9,532 | 9,425 |
| 3.8% 8/1/28 | | 9,444 | 9,280 |
| 3.95% 10/1/42 | | 1,509 | 1,273 |
| 4.05% 8/15/52 | | 6,859 | 5,600 |
| 4.45% 3/1/33 | | 22,050 | 21,713 |
| 4.65% 1/15/46 | | 2,589 | 2,349 |
| Union Pacific Corp.: | | | |
| 2.15% 2/5/27 | | 7,153 | 6,808 |
| 2.375% 5/20/31 | | 2,000 | 1,772 |
| 2.4% 2/5/30 | | 2,000 | 1,819 |
| 2.75% 3/1/26 | | 5,290 | 5,158 |
| 2.8% 2/14/32 | | 11,666 | 10,455 |
| 2.891% 4/6/36 | | 7,292 | 6,154 |
| 3% 4/15/27 | | 3,972 | 3,849 |
| 3.25% 2/5/50 | | 10,720 | 7,859 |
| 3.35% 8/15/46 | | 3,750 | 2,829 |
| 3.375% 2/14/42 | | 4,000 | 3,194 |
| 3.6% 9/15/37 | | 2,622 | 2,303 |
| 3.799% 10/1/51 | | 2,224 | 1,783 |
| 3.839% 3/20/60 | | 11,170 | 8,648 |
| 3.95% 9/10/28 | | 2,000 | 1,984 |
| 4.95% 5/15/53 | | 3,730 | 3,642 |
| | | | 264,164 |
| Industrial Conglomerates - 0.2% | | | |
| 3M Co.: | | | |
| 2% 2/14/25 | | 5,027 | 4,958 |
| 2.375% 8/26/29 | | 8,822 | 7,993 |
| 2.65% 4/15/25 | | 3,613 | 3,564 |
| 2.875% 10/15/27 | | 3,177 | 3,040 |
| 3.05% 4/15/30 | | 2,912 | 2,725 |
| 3.125% 9/19/46 | | 2,192 | 1,574 |
| 3.25% 8/26/49 | | 6,797 | 4,921 |
| 3.7% 4/15/50 | | 3,595 | 2,795 |
| 5.7% 3/15/37 | | 1,900 | 2,064 |
| Honeywell International, Inc.: | | | |
| 1.35% 6/1/25 | | 8,120 | 7,923 |
| 1.95% 6/1/30 | | 8,796 | 7,758 |
| 2.5% 11/1/26 | | 5,688 | 5,491 |
| 2.8% 6/1/50 | | 8,168 | 5,643 |
| 3.812% 11/21/47 | | 1,113 | 913 |
| 4.7% 2/1/30 | | 3,540 | 3,600 |
| 4.875% 9/1/29 | | 4,580 | 4,701 |
| 5% 3/1/35 | | 6,720 | 6,894 |
| 5.25% 3/1/54 | | 4,580 | 4,648 |
| Trane Technologies Financing Ltd.: | | | |
| 3.8% 3/21/29 | | 11,400 | 11,106 |
| 4.65% 11/1/44 | | 4,766 | 4,381 |
| | | | 96,692 |
| Machinery - 0.2% | | | |
| Caterpillar Financial Services Corp.: | | | |
| 1.1% 9/14/27 | | 11,416 | 10,425 |
| 2.4% 8/9/26 | | 2,264 | 2,183 |
| Caterpillar, Inc.: | | | |
| 3.25% 9/19/49 | | 13,214 | 9,823 |
| 3.803% 8/15/42 | | 1,986 | 1,694 |
| 5.3% 9/15/35 | | 5,561 | 5,982 |
| Cummins, Inc. 1.5% 9/1/30 | | 4,833 | 4,133 |
| Deere & Co.: | | | |
| 2.875% 9/7/49 | | 9,579 | 6,732 |
| 3.9% 6/9/42 | | 7,000 | 6,117 |
| 5.375% 10/16/29 | | 795 | 837 |
| Eaton Corp.: | | | |
| 4% 11/2/32 | | 1,509 | 1,455 |
| 4.15% 11/2/42 | | 1,509 | 1,339 |
| 4.7% 8/23/52 | | 5,800 | 5,446 |
| Otis Worldwide Corp.: | | | |
| 2.565% 2/15/30 | | 10,633 | 9,603 |
| 3.362% 2/15/50 | | 8,091 | 5,936 |
| Parker Hannifin Corp.: | | | |
| 3.25% 3/1/27 | | 4,488 | 4,363 |
| 4% 6/14/49 | | 4,727 | 3,911 |
| 4.1% 3/1/47 | | 4,496 | 3,783 |
| 4.5% 9/15/29 | | 2,000 | 2,004 |
| Stanley Black & Decker, Inc.: | | | |
| 2.3% 2/24/25 | | 2,000 | 1,971 |
| 4.25% 11/15/28 | | 4,000 | 3,974 |
| 5.2% 9/1/40 | | 7,100 | 6,967 |
| | | | 98,678 |
| Passenger Airlines - 0.1% | | | |
| American Airlines Pass Through Trust equipment trust certificate 2.875% 1/11/36 | | 5,885 | 5,090 |
| American Airlines, Inc. equipment trust certificate 3.2% 12/15/29 | | 4,040 | 3,796 |
| Southwest Airlines Co.: | | | |
| 2.625% 2/10/30 | | 2,000 | 1,789 |
| 5.125% 6/15/27 | | 8,833 | 8,907 |
| United Airlines 2015-1 Class AA pass-thru trust 3.45% 6/1/29 | | 345 | 329 |
| United Airlines Pass-Through Trust Series 2023-1 Class A, 5.8% 7/15/37 | | 7,626 | 7,881 |
| United Airlines pass-thru trust equipment trust certificate 3.1% 1/7/30 | | 7,843 | 7,362 |
| United Airlines, Inc. equipment trust certificate Series 2012-2B 4% 4/29/26 | | 1,784 | 1,779 |
| | | | 36,933 |
| Professional Services - 0.0% | | | |
| Leidos, Inc. 2.3% 2/15/31 | | 1,300 | 1,112 |
| Thomson Reuters Corp.: | | | |
| 3.35% 5/15/26 | | 5,561 | 5,437 |
| 5.5% 8/15/35 | | 2,000 | 2,082 |
| | | | 8,631 |
| Trading Companies & Distributors - 0.0% | | | |
| Air Lease Corp.: | | | |
| 2.2% 1/15/27 | | 6,863 | 6,489 |
| 2.3% 2/1/25 | | 5,000 | 4,934 |
| 3% 2/1/30 | | 1,900 | 1,736 |
| 3.125% 12/1/30 | | 9,666 | 8,737 |
| 3.625% 12/1/27 | | 7,593 | 7,361 |
| 5.2% 7/15/31 | | 2,600 | 2,619 |
| | | | 31,876 |
TOTAL INDUSTRIALS | | | 1,012,052 |
| INFORMATION TECHNOLOGY - 1.9% | | | |
| Communications Equipment - 0.1% | | | |
| Cisco Systems, Inc.: | | | |
| 2.5% 9/20/26 | | 3,972 | 3,847 |
| 3.5% 6/15/25 | | 3,392 | 3,362 |
| 4.85% 2/26/29 | | 7,570 | 7,777 |
| 5.05% 2/26/34 | | 7,300 | 7,563 |
| 5.3% 2/26/54 | | 3,650 | 3,768 |
| 5.9% 2/15/39 | | 9,863 | 10,913 |
| | | | 37,230 |
| Electronic Equipment, Instruments & Components - 0.1% | | | |
| Amphenol Corp. 5.25% 4/5/34 | | 5,710 | 5,875 |
| Corning, Inc.: | | | |
| 3.9% 11/15/49 | | 4,833 | 3,879 |
| 4.75% 3/15/42 | | 3,972 | 3,667 |
| Dell International LLC/EMC Corp.: | | | |
| 4.9% 10/1/26 | | 7,506 | 7,545 |
| 5.3% 10/1/29 | | 19,994 | 20,645 |
| 6.02% 6/15/26 | | 9,161 | 9,357 |
| 8.1% 7/15/36 | | 8,303 | 10,214 |
| 8.35% 7/15/46 | | 9,542 | 12,719 |
| Tyco Electronics Group SA: | | | |
| 3.7% 2/15/26 | | 4,253 | 4,205 |
| 7.125% 10/1/37 | | 1,966 | 2,361 |
| Vontier Corp. 2.95% 4/1/31 | | 3,500 | 3,027 |
| | | | 83,494 |
| IT Services - 0.1% | | | |
| CDW LLC/CDW Finance Corp.: | | | |
| 2.67% 12/1/26 | | 11,406 | 10,882 |
| 5.55% 8/22/34 | | 3,740 | 3,771 |
| IBM Corp.: | | | |
| 1.95% 5/15/30 | | 11,102 | 9,711 |
| 2.95% 5/15/50 | | 11,005 | 7,383 |
| 3.3% 5/15/26 | | 9,666 | 9,480 |
| 3.5% 5/15/29 | | 13,474 | 12,990 |
| 4.25% 5/15/49 | | 8,612 | 7,326 |
| 4.4% 7/27/32 | | 8,100 | 7,987 |
| 4.7% 2/19/46 | | 3,932 | 3,610 |
| 5.6% 11/30/39 | | 6,500 | 6,866 |
| | | | 80,006 |
| Semiconductors & Semiconductor Equipment - 0.6% | | | |
| Analog Devices, Inc.: | | | |
| 2.8% 10/1/41 | | 11,812 | 8,706 |
| 3.5% 12/5/26 | | 1,700 | 1,672 |
| Applied Materials, Inc. 4.35% 4/1/47 | | 10,263 | 9,329 |
| Broadcom Corp./Broadcom Cayman LP: | | | |
| 3.5% 1/15/28 | | 5,561 | 5,382 |
| 3.875% 1/15/27 | | 3,043 | 3,001 |
| Broadcom, Inc.: | | | |
| 2.45% 2/15/31 (b) | | 28,182 | 24,590 |
| 2.6% 2/15/33 (b) | | 9,400 | 7,880 |
| 3.187% 11/15/36 (b) | | 1,000 | 827 |
| 3.419% 4/15/33 (b) | | 11,000 | 9,801 |
| 3.459% 9/15/26 | | 10,027 | 9,818 |
| 3.469% 4/15/34 (b) | | 3,391 | 2,996 |
| 3.75% 2/15/51 (b) | | 17,216 | 13,383 |
| 4.3% 11/15/32 | | 9,956 | 9,615 |
| 4.75% 4/15/29 | | 13,584 | 13,687 |
| Intel Corp.: | | | |
| 2% 8/12/31 | | 7,124 | 5,860 |
| 2.45% 11/15/29 | | 10,216 | 9,057 |
| 2.8% 8/12/41 | | 10,000 | 6,831 |
| 3.05% 8/12/51 | | 7,124 | 4,426 |
| 3.25% 11/15/49 | | 8,313 | 5,403 |
| 3.734% 12/8/47 | | 2,594 | 1,851 |
| 3.9% 3/25/30 | | 9,048 | 8,591 |
| 4% 8/5/29 | | 2,000 | 1,925 |
| 4.1% 5/19/46 | | 5,561 | 4,296 |
| 4.1% 5/11/47 | | 1,906 | 1,467 |
| 4.15% 8/5/32 | | 2,000 | 1,875 |
| 4.6% 3/25/40 | | 2,000 | 1,765 |
| 4.75% 3/25/50 | | 9,512 | 7,980 |
| 4.875% 2/10/28 | | 10,180 | 10,171 |
| 5.625% 2/10/43 | | 5,000 | 4,854 |
| 5.7% 2/10/53 | | 8,000 | 7,651 |
| 5.9% 2/10/63 | | 1,600 | 1,555 |
| Lam Research Corp. 2.875% 6/15/50 | | 11,648 | 7,960 |
| Marvell Technology, Inc. 2.95% 4/15/31 | | 2,000 | 1,787 |
| Micron Technology, Inc.: | | | |
| 2.703% 4/15/32 | | 8,400 | 7,196 |
| 4.663% 2/15/30 | | 6,573 | 6,561 |
| 5.375% 4/15/28 | | 8,560 | 8,751 |
| NVIDIA Corp.: | | | |
| 2% 6/15/31 | | 20,182 | 17,636 |
| 2.85% 4/1/30 | | 8,603 | 8,067 |
| 3.5% 4/1/50 | | 4,785 | 3,877 |
| NXP BV/NXP Funding LLC/NXP U.S.A., Inc.: | | | |
| 2.65% 2/15/32 | | 17,641 | 15,133 |
| 5% 1/15/33 | | 8,500 | 8,491 |
| Qualcomm, Inc.: | | | |
| 1.65% 5/20/32 | | 14,000 | 11,468 |
| 3.45% 5/20/25 | | 2,000 | 1,982 |
| 4.3% 5/20/47 | | 8,023 | 7,144 |
| 4.8% 5/20/45 | | 2,000 | 1,933 |
| 5.4% 5/20/33 | | 18,000 | 19,257 |
| Texas Instruments, Inc.: | | | |
| 1.9% 9/15/31 | | 2,000 | 1,723 |
| 3.65% 8/16/32 | | 2,000 | 1,909 |
| 4.15% 5/15/48 | | 5,526 | 4,838 |
| 4.6% 2/15/28 | | 10,000 | 10,146 |
| 5.05% 5/18/63 | | 7,000 | 6,883 |
| | | | 358,987 |
| Software - 0.6% | | | |
| Fortinet, Inc. 2.2% 3/15/31 | | 2,000 | 1,714 |
| Microsoft Corp.: | | | |
| 2.525% 6/1/50 | | 32,153 | 21,415 |
| 2.675% 6/1/60 | | 5,334 | 3,462 |
| 2.7% 2/12/25 | | 13,643 | 13,516 |
| 2.921% 3/17/52 | | 36,922 | 26,721 |
| 3.041% 3/17/62 | | 3,278 | 2,297 |
| 3.45% 8/8/36 | | 2,307 | 2,110 |
| 4.2% 11/3/35 | | 1,700 | 1,700 |
| Oracle Corp.: | | | |
| 1.65% 3/25/26 | | 9,109 | 8,697 |
| 2.5% 4/1/25 | | 8,564 | 8,432 |
| 2.65% 7/15/26 | | 7,149 | 6,903 |
| 2.875% 3/25/31 | | 11,675 | 10,447 |
| 2.95% 5/15/25 | | 3,972 | 3,915 |
| 2.95% 4/1/30 | | 12,477 | 11,459 |
| 3.25% 11/15/27 | | 13,584 | 13,125 |
| 3.6% 4/1/40 | | 13,600 | 10,954 |
| 3.6% 4/1/50 | | 12,383 | 9,041 |
| 3.85% 7/15/36 | | 8,047 | 7,075 |
| 3.85% 4/1/60 | | 14,393 | 10,399 |
| 3.95% 3/25/51 | | 10,575 | 8,177 |
| 4% 7/15/46 | | 7,785 | 6,195 |
| 4% 11/15/47 | | 13,899 | 10,983 |
| 4.125% 5/15/45 | | 2,383 | 1,944 |
| 4.3% 7/8/34 | | 3,078 | 2,910 |
| 4.9% 2/6/33 | | 15,000 | 15,010 |
| 5.375% 7/15/40 | | 19,029 | 18,816 |
| 6.125% 7/8/39 | | 1,800 | 1,942 |
| Roper Technologies, Inc.: | | | |
| 1% 9/15/25 | | 7,443 | 7,161 |
| 1.4% 9/15/27 | | 7,250 | 6,636 |
| 1.75% 2/15/31 | | 7,250 | 6,044 |
| 2% 6/30/30 | | 14,306 | 12,414 |
| 3.8% 12/15/26 | | 6,752 | 6,654 |
| Salesforce, Inc.: | | | |
| 1.95% 7/15/31 | | 10,300 | 8,795 |
| 2.7% 7/15/41 | | 12,000 | 8,812 |
| VMware, Inc.: | | | |
| 1.4% 8/15/26 | | 22,344 | 21,018 |
| 4.65% 5/15/27 | | 2,000 | 2,003 |
| 4.7% 5/15/30 | | 2,000 | 1,998 |
| | | | 320,894 |
| Technology Hardware, Storage & Peripherals - 0.4% | | | |
| Apple, Inc.: | | | |
| 0.55% 8/20/25 | | 14,113 | 13,591 |
| 0.7% 2/8/26 | | 10,933 | 10,403 |
| 1.125% 5/11/25 | | 10,000 | 9,759 |
| 1.2% 2/8/28 | | 10,000 | 9,122 |
| 1.25% 8/20/30 | | 13,098 | 11,174 |
| 1.7% 8/5/31 | | 7,886 | 6,741 |
| 2.375% 2/8/41 | | 13,368 | 9,746 |
| 2.45% 8/4/26 | | 16,363 | 15,845 |
| 2.55% 8/20/60 | | 5,162 | 3,399 |
| 2.65% 5/11/50 | | 4,157 | 2,814 |
| 2.85% 8/5/61 | | 7,887 | 5,224 |
| 2.9% 9/12/27 | | 11,161 | 10,811 |
| 2.95% 9/11/49 | | 21,247 | 15,315 |
| 3% 11/13/27 | | 7,944 | 7,727 |
| 3.2% 5/13/25 | | 8,332 | 8,254 |
| 3.2% 5/11/27 | | 13,008 | 12,745 |
| 3.35% 8/8/32 | | 7,000 | 6,614 |
| 3.75% 9/12/47 | | 4,833 | 4,079 |
| 3.75% 11/13/47 | | 5,541 | 4,651 |
| 3.85% 5/4/43 | | 10,327 | 9,120 |
| 4% 5/10/28 | | 3,300 | 3,311 |
| 4.25% 2/9/47 | | 1,986 | 1,829 |
| 4.3% 5/10/33 | | 3,300 | 3,365 |
| 4.375% 5/13/45 | | 3,725 | 3,505 |
| 4.5% 2/23/36 | | 7,355 | 7,520 |
| 4.65% 2/23/46 | | 14,788 | 14,483 |
| Hewlett Packard Enterprise Co.: | | | |
| 4.9% 10/15/25 (c) | | 7,746 | 7,741 |
| 6.2% 10/15/35 (c) | | 6,390 | 6,878 |
| 6.35% 10/15/45 (c) | | 1,493 | 1,603 |
| HP, Inc.: | | | |
| 2.2% 6/17/25 | | 11,261 | 11,005 |
| 4.2% 4/15/32 | | 6,450 | 6,150 |
| 5.5% 1/15/33 | | 2,000 | 2,069 |
| 6% 9/15/41 | | 3,192 | 3,363 |
| | | | 249,956 |
TOTAL INFORMATION TECHNOLOGY | | | 1,130,567 |
| MATERIALS - 0.8% | | | |
| Chemicals - 0.4% | | | |
| Air Products & Chemicals, Inc.: | | | |
| 1.5% 10/15/25 | | 4,785 | 4,629 |
| 2.05% 5/15/30 | | 5,220 | 4,633 |
| 2.7% 5/15/40 | | 4,495 | 3,362 |
| 2.8% 5/15/50 | | 5,346 | 3,621 |
| Celanese U.S. Holdings LLC: | | | |
| 6.33% 7/15/29 | | 2,000 | 2,114 |
| 6.35% 11/15/28 | | 3,640 | 3,830 |
| 6.379% 7/15/32 | | 7,400 | 7,822 |
| 6.7% 11/15/33 | | 3,500 | 3,784 |
| CF Industries Holdings, Inc. 4.95% 6/1/43 | | 5,900 | 5,407 |
| DuPont de Nemours, Inc.: | | | |
| 4.725% 11/15/28 | | 13,619 | 13,816 |
| 5.319% 11/15/38 | | 5,128 | 5,504 |
| Eastman Chemical Co. 4.65% 10/15/44 | | 2,383 | 2,100 |
| Ecolab, Inc.: | | | |
| 1.3% 1/30/31 | | 6,356 | 5,249 |
| 2.7% 11/1/26 | | 5,243 | 5,066 |
| 2.75% 8/18/55 | | 8,768 | 5,653 |
| Linde, Inc.: | | | |
| 3.2% 1/30/26 | | 5,036 | 4,951 |
| 3.55% 11/7/42 | | 1,589 | 1,315 |
| LYB International Finance BV 4.875% 3/15/44 | | 4,647 | 4,220 |
| LYB International Finance II BV 3.5% 3/2/27 | | 19,438 | 18,958 |
| LYB International Finance III LLC: | | | |
| 3.375% 10/1/40 | | 7,366 | 5,671 |
| 3.625% 4/1/51 | | 7,366 | 5,305 |
| LyondellBasell Industries NV 4.625% 2/26/55 | | 2,970 | 2,520 |
| Nutrien Ltd.: | | | |
| 4% 12/15/26 | | 9,055 | 8,947 |
| 4.2% 4/1/29 | | 4,109 | 4,057 |
| 5% 4/1/49 | | 7,152 | 6,579 |
| 5.25% 1/15/45 | | 2,780 | 2,664 |
| 5.625% 12/1/40 | | 1,430 | 1,444 |
| Sherwin-Williams Co.: | | | |
| 2.95% 8/15/29 | | 2,000 | 1,862 |
| 3.45% 6/1/27 | | 17,609 | 17,167 |
| 3.8% 8/15/49 | | 2,919 | 2,305 |
| 4.5% 6/1/47 | | 6,776 | 6,005 |
| The Dow Chemical Co.: | | | |
| 2.1% 11/15/30 | | 6,863 | 6,014 |
| 3.6% 11/15/50 | | 7,056 | 5,155 |
| 4.375% 11/15/42 | | 3,872 | 3,335 |
| 4.8% 11/30/28 | | 6,792 | 6,886 |
| 4.8% 5/15/49 | | 6,112 | 5,432 |
| 9.4% 5/15/39 | | 2,383 | 3,274 |
| The Mosaic Co.: | | | |
| 4.05% 11/15/27 | | 4,575 | 4,495 |
| 5.625% 11/15/43 | | 2,979 | 2,956 |
| Westlake Corp.: | | | |
| 3.125% 8/15/51 | | 6,500 | 4,257 |
| 5% 8/15/46 | | 1,589 | 1,447 |
| | | | 213,811 |
| Construction Materials - 0.0% | | | |
| CRH America Finance, Inc. 5.4% 5/21/34 | | 4,800 | 4,944 |
| Martin Marietta Materials, Inc. 3.5% 12/15/27 | | 2,000 | 1,947 |
| | | | 6,891 |
| Containers & Packaging - 0.1% | | | |
| Amcor Group Finance 5.45% 5/23/29 | | 13,600 | 13,988 |
| International Paper Co.: | | | |
| 4.4% 8/15/47 | | 6,908 | 5,917 |
| 5.15% 5/15/46 | | 1,438 | 1,368 |
| WRKCo, Inc.: | | | |
| 3% 6/15/33 | | 2,000 | 1,746 |
| 3.375% 9/15/27 | | 2,000 | 1,931 |
| 4.2% 6/1/32 | | 4,833 | 4,657 |
| | | | 29,607 |
| Metals & Mining - 0.3% | | | |
| ArcelorMittal SA: | | | |
| 6.35% 6/17/54 | | 2,810 | 2,826 |
| 6.8% 11/29/32 | | 9,000 | 9,851 |
| Barrick Gold Corp. 5.25% 4/1/42 | | 3,575 | 3,523 |
| Barrick North America Finance LLC 5.75% 5/1/43 | | 2,000 | 2,062 |
| Barrick PD Australia Finance Pty Ltd. 5.95% 10/15/39 | | 2,000 | 2,114 |
| BHP Billiton Financial (U.S.A.) Ltd.: | | | |
| 4.75% 2/28/28 | | 7,460 | 7,547 |
| 4.9% 2/28/33 | | 8,000 | 8,103 |
| 5% 9/30/43 | | 3,783 | 3,705 |
| Freeport-McMoRan, Inc. 4.625% 8/1/30 | | 32,382 | 32,029 |
| Newmont Corp.: | | | |
| 2.25% 10/1/30 | | 14,340 | 12,716 |
| 2.8% 10/1/29 | | 2,707 | 2,513 |
| 5.45% 6/9/44 | | 5,093 | 5,141 |
| Nucor Corp.: | | | |
| 2.7% 6/1/30 | | 3,900 | 3,568 |
| 2.979% 12/15/55 | | 3,177 | 2,019 |
| 6.4% 12/1/37 | | 4,833 | 5,483 |
| Rio Tinto Finance (U.S.A.) Ltd.: | | | |
| 5.2% 11/2/40 | | 10,343 | 10,432 |
| 7.125% 7/15/28 | | 1,589 | 1,741 |
| Rio Tinto Finance (U.S.A.) PLC 5.125% 3/9/53 | | 5,600 | 5,563 |
| Southern Copper Corp.: | | | |
| 3.875% 4/23/25 | | 2,915 | 2,886 |
| 5.25% 11/8/42 | | 4,588 | 4,441 |
| 7.5% 7/27/35 | | 4,833 | 5,698 |
| Vale Overseas Ltd.: | | | |
| 3.75% 7/8/30 | | 19,333 | 18,048 |
| 6.125% 6/12/33 | | 2,150 | 2,252 |
| 6.4% 6/28/54 | | 1,270 | 1,295 |
| Vale SA 5.625% 9/11/42 | | 5,243 | 5,247 |
| | | | 160,803 |
| Paper & Forest Products - 0.0% | | | |
| Suzano Austria GmbH: | | | |
| 2.5% 9/15/28 | | 11,930 | 10,704 |
| 6% 1/15/29 | | 9,570 | 9,778 |
| | | | 20,482 |
TOTAL MATERIALS | | | 431,594 |
| REAL ESTATE - 0.9% | | | |
| Equity Real Estate Investment Trusts (REITs) - 0.8% | | | |
| Alexandria Real Estate Equities, Inc.: | | | |
| 2% 5/18/32 | | 7,371 | 5,988 |
| 3% 5/18/51 | | 5,582 | 3,550 |
| 4.85% 4/15/49 | | 9,154 | 8,113 |
| American Homes 4 Rent LP: | | | |
| 4.25% 2/15/28 | | 7,636 | 7,505 |
| 5.5% 7/15/34 | | 3,900 | 3,978 |
| American Tower Corp.: | | | |
| 1.3% 9/15/25 | | 7,221 | 6,949 |
| 2.1% 6/15/30 | | 12,189 | 10,606 |
| 3.1% 6/15/50 | | 4,456 | 3,037 |
| 3.55% 7/15/27 | | 6,792 | 6,594 |
| 3.7% 10/15/49 | | 4,833 | 3,665 |
| AvalonBay Communities, Inc.: | | | |
| 2.05% 1/15/32 | | 2,000 | 1,697 |
| 2.3% 3/1/30 | | 4,833 | 4,327 |
| 5% 2/15/33 | | 3,800 | 3,835 |
| Boston Properties, Inc.: | | | |
| 2.55% 4/1/32 | | 1,100 | 893 |
| 2.75% 10/1/26 | | 5,561 | 5,298 |
| 2.9% 3/15/30 | | 1,400 | 1,235 |
| 3.25% 1/30/31 | | 15,176 | 13,361 |
| 3.4% 6/21/29 | | 2,300 | 2,124 |
| Brixmor Operating Partnership LP: | | | |
| 3.9% 3/15/27 | | 4,480 | 4,381 |
| 4.05% 7/1/30 | | 4,868 | 4,663 |
| 4.125% 6/15/26 | | 5,997 | 5,925 |
| 4.125% 5/15/29 | | 5,363 | 5,202 |
| Camden Property Trust 4.1% 10/15/28 | | 2,000 | 1,965 |
| Corporate Office Properties LP 2.75% 4/15/31 | | 4,000 | 3,431 |
| Crown Castle, Inc.: | | | |
| 1.35% 7/15/25 | | 21,460 | 20,811 |
| 2.25% 1/15/31 | | 5,771 | 4,927 |
| 3.25% 1/15/51 | | 5,220 | 3,621 |
| 5.1% 5/1/33 | | 12,860 | 12,853 |
| EPR Properties: | | | |
| 4.5% 6/1/27 | | 2,000 | 1,957 |
| 4.95% 4/15/28 | | 4,000 | 3,952 |
| Equinix Europe 2 Financing Corp. LLC 5.5% 6/15/34 | | 12,510 | 12,947 |
| ERP Operating LP: | | | |
| 1.85% 8/1/31 | | 14,500 | 12,178 |
| 3.25% 8/1/27 | | 10,314 | 10,020 |
| GLP Capital LP/GLP Financing II, Inc. 5.625% 9/15/34 | | 9,020 | 9,119 |
| Healthpeak OP, LLC: | | | |
| 3% 1/15/30 | | 9,937 | 9,163 |
| 3.4% 2/1/25 | | 387 | 384 |
| 5.25% 12/15/32 | | 3,000 | 3,052 |
| Invitation Homes Operating Partnership LP 4.15% 4/15/32 | | 6,186 | 5,829 |
| Kilroy Realty LP: | | | |
| 2.5% 11/15/32 | | 2,100 | 1,636 |
| 2.65% 11/15/33 | | 1,700 | 1,302 |
| Kimco Realty OP, LLC: | | | |
| 1.9% 3/1/28 | | 8,216 | 7,486 |
| 3.8% 4/1/27 | | 3,177 | 3,113 |
| 4.125% 12/1/46 | | 7,944 | 6,342 |
| 4.45% 9/1/47 | | 4,114 | 3,463 |
| Kite Realty Group Trust 4% 3/15/25 | | 1,400 | 1,386 |
| LXP Industrial Trust (REIT) 2.375% 10/1/31 | | 2,417 | 1,992 |
| NNN (REIT), Inc. 3% 4/15/52 | | 6,766 | 4,359 |
| Omega Healthcare Investors, Inc.: | | | |
| 3.375% 2/1/31 | | 3,093 | 2,757 |
| 4.5% 1/15/25 | | 6,362 | 6,335 |
| 4.5% 4/1/27 | | 7,547 | 7,457 |
| Prologis LP: | | | |
| 1.625% 3/15/31 | | 11,425 | 9,510 |
| 1.75% 2/1/31 | | 23,383 | 19,698 |
| 2.125% 4/15/27 | | 9,502 | 8,993 |
| 3.25% 10/1/26 | | 3,701 | 3,624 |
| 4.875% 6/15/28 | | 2,700 | 2,748 |
| 5.25% 6/15/53 | | 3,300 | 3,268 |
| Realty Income Corp.: | | | |
| 3.4% 1/15/30 | | 2,000 | 1,882 |
| 3.95% 8/15/27 | | 6,200 | 6,115 |
| 4.7% 12/15/28 | | 4,500 | 4,537 |
| 4.85% 3/15/30 | | 15,000 | 15,210 |
| 4.9% 7/15/33 | | 6,450 | 6,411 |
| 5.05% 1/13/26 | | 4,500 | 4,500 |
| Simon Property Group LP: | | | |
| 2.2% 2/1/31 | | 21,169 | 18,335 |
| 3.25% 9/13/49 | | 9,260 | 6,571 |
| 3.375% 12/1/27 | | 17,551 | 17,018 |
| UDR, Inc. 2.1% 6/15/33 | | 12,929 | 10,189 |
| Ventas Realty LP: | | | |
| 3.25% 10/15/26 | | 2,780 | 2,696 |
| 3.5% 2/1/25 | | 3,177 | 3,148 |
| 3.85% 4/1/27 | | 7,547 | 7,398 |
| 4% 3/1/28 | | 17,202 | 16,828 |
| 4.125% 1/15/26 | | 1,152 | 1,140 |
| 4.375% 2/1/45 | | 2,383 | 2,020 |
| 4.875% 4/15/49 | | 2,262 | 2,042 |
| VICI Properties LP: | | | |
| 4.375% 5/15/25 | | 2,000 | 1,981 |
| 4.75% 2/15/28 | | 11,117 | 11,073 |
| 5.125% 5/15/32 | | 5,838 | 5,771 |
| 6.125% 4/1/54 | | 3,000 | 3,060 |
| Vornado Realty LP 3.4% 6/1/31 | | 2,000 | 1,698 |
| Welltower OP LLC: | | | |
| 4.95% 9/1/48 | | 7,944 | 7,514 |
| 6.5% 3/15/41 | | 1,100 | 1,217 |
| Weyerhaeuser Co. 4% 4/15/30 | | 9,183 | 8,862 |
| WP Carey, Inc. 2.45% 2/1/32 | | 2,000 | 1,680 |
| | | | 493,500 |
| Real Estate Management & Development - 0.1% | | | |
| CBRE Group, Inc. 4.875% 3/1/26 | | 4,528 | 4,533 |
| Digital Realty Trust LP: | | | |
| 3.7% 8/15/27 | | 8,356 | 8,151 |
| 4.45% 7/15/28 | | 2,000 | 1,985 |
| Essex Portfolio LP: | | | |
| 1.65% 1/15/31 | | 2,000 | 1,649 |
| 1.7% 3/1/28 | | 2,000 | 1,813 |
| 2.55% 6/15/31 | | 2,000 | 1,727 |
| 3% 1/15/30 | | 1,477 | 1,358 |
| 3.375% 4/15/26 | | 2,000 | 1,954 |
| 4% 3/1/29 | | 4,833 | 4,691 |
| Extra Space Storage LP 5.35% 1/15/35 | | 9,180 | 9,254 |
| Mid-America Apartments LP: | | | |
| 1.1% 9/15/26 | | 2,000 | 1,866 |
| 3.95% 3/15/29 | | 5,510 | 5,399 |
| Tanger Properties LP 3.875% 7/15/27 | | 4,925 | 4,784 |
| | | | 49,164 |
TOTAL REAL ESTATE | | | 542,664 |
| UTILITIES - 2.5% | | | |
| Electric Utilities - 1.9% | | | |
| AEP Texas, Inc.: | | | |
| 3.8% 10/1/47 | | 3,383 | 2,564 |
| 4.7% 5/15/32 | | 4,000 | 3,939 |
| AEP Transmission Co. LLC: | | | |
| 2.75% 8/15/51 | | 5,703 | 3,622 |
| 4% 12/1/46 | | 3,000 | 2,491 |
| 5.4% 3/15/53 | | 3,440 | 3,458 |
| Alabama Power Co.: | | | |
| 1.45% 9/15/30 | | 14,500 | 12,249 |
| 3.7% 12/1/47 | | 4,679 | 3,670 |
| 3.75% 3/1/45 | | 795 | 639 |
| 4.15% 8/15/44 | | 3,694 | 3,164 |
| 4.3% 7/15/48 | | 4,671 | 4,009 |
| 5.2% 6/1/41 | | 3,058 | 2,976 |
| American Electric Power Co., Inc.: | | | |
| 3.25% 3/1/50 | | 2,494 | 1,717 |
| 4.3% 12/1/28 | | 13,893 | 13,737 |
| Appalachian Power Co.: | | | |
| 4.45% 6/1/45 | | 4,766 | 4,003 |
| 4.5% 3/1/49 | | 7,259 | 6,100 |
| Arizona Public Service Co.: | | | |
| 2.95% 9/15/27 | | 5,861 | 5,595 |
| 5.55% 8/1/33 | | 8,900 | 9,150 |
| 6.35% 12/15/32 | | 4,000 | 4,342 |
| Baltimore Gas & Electric Co.: | | | |
| 2.25% 6/15/31 | | 2,000 | 1,726 |
| 2.9% 6/15/50 | | 6,360 | 4,200 |
| 3.5% 8/15/46 | | 1,986 | 1,518 |
| 5.4% 6/1/53 | | 2,300 | 2,324 |
| CenterPoint Energy Houston Electric LLC: | | | |
| 3.35% 4/1/51 | | 9,077 | 6,565 |
| 3.55% 8/1/42 | | 1,509 | 1,203 |
| 4.25% 2/1/49 | | 2,068 | 1,754 |
| 4.95% 4/1/33 | | 4,500 | 4,522 |
| Cleco Corporate Holdings LLC 3.743% 5/1/26 | | 4,496 | 4,404 |
| Commonwealth Edison Co.: | | | |
| 3.2% 11/15/49 | | 13,533 | 9,504 |
| 3.65% 6/15/46 | | 2,272 | 1,774 |
| 3.7% 3/1/45 | | 2,462 | 1,967 |
| 3.75% 8/15/47 | | 4,885 | 3,860 |
| 4% 3/1/48 | | 5,426 | 4,451 |
| 4% 3/1/49 | | 4,762 | 3,872 |
| Connecticut Light & Power Co. 5.25% 1/15/53 | | 4,200 | 4,221 |
| Consolidated Edison Co. of New York, Inc.: | | | |
| 3.875% 6/15/47 | | 2,272 | 1,815 |
| 4.45% 3/15/44 | | 6,356 | 5,656 |
| 4.5% 5/15/58 | | 7,530 | 6,478 |
| 4.65% 12/1/48 | | 8,317 | 7,520 |
| 5.2% 3/1/33 | | 30,000 | 30,998 |
| 5.5% 12/1/39 | | 1,986 | 2,035 |
| Dayton Power & Light Co. 3.95% 6/15/49 | | 1,400 | 1,072 |
| DTE Electric Co.: | | | |
| 1.9% 4/1/28 | | 7,800 | 7,176 |
| 3.95% 3/1/49 | | 2,900 | 2,400 |
| 5.2% 3/1/34 | | 5,700 | 5,881 |
| 5.4% 4/1/53 | | 4,690 | 4,776 |
| Duke Energy Carolinas LLC: | | | |
| 2.85% 3/15/32 | | 2,417 | 2,148 |
| 2.95% 12/1/26 | | 4,766 | 4,626 |
| 3.2% 8/15/49 | | 6,345 | 4,455 |
| 3.75% 6/1/45 | | 1,589 | 1,266 |
| 3.875% 3/15/46 | | 3,097 | 2,502 |
| 4% 9/30/42 | | 2,979 | 2,540 |
| 4.95% 1/15/33 | | 8,000 | 8,125 |
| 5.4% 1/15/54 | | 4,800 | 4,857 |
| 6% 1/15/38 | | 1,800 | 1,960 |
| Duke Energy Corp.: | | | |
| 2.45% 6/1/30 | | 5,220 | 4,666 |
| 2.65% 9/1/26 | | 10,605 | 10,231 |
| 3.75% 9/1/46 | | 7,253 | 5,539 |
| 4.2% 6/15/49 | | 7,520 | 6,098 |
| 4.5% 8/15/32 | | 1,000 | 974 |
| 4.8% 12/15/45 | | 2,216 | 1,983 |
| 5% 8/15/52 | | 1,600 | 1,468 |
| 5.45% 6/15/34 | | 8,340 | 8,593 |
| Duke Energy Florida LLC 3.4% 10/1/46 | | 1,986 | 1,471 |
| Duke Energy Ohio, Inc. 4.3% 2/1/49 | | 21,562 | 18,177 |
| Duke Energy Progress LLC: | | | |
| 3.4% 4/1/32 | | 9,666 | 8,870 |
| 4.15% 12/1/44 | | 1,430 | 1,211 |
| 4.375% 3/30/44 | | 1,589 | 1,409 |
| 5.35% 3/15/53 | | 7,000 | 6,966 |
| Edison International: | | | |
| 4.125% 3/15/28 | | 2,000 | 1,959 |
| 5.75% 6/15/27 | | 2,000 | 2,049 |
| Entergy Corp.: | | | |
| 0.9% 9/15/25 | | 13,436 | 12,929 |
| 2.95% 9/1/26 | | 3,734 | 3,620 |
| 3.75% 6/15/50 | | 3,287 | 2,417 |
| Entergy Louisiana LLC: | | | |
| 2.35% 6/15/32 | | 18,700 | 15,824 |
| 3.12% 9/1/27 | | 1,600 | 1,543 |
| 4.2% 9/1/48 | | 2,526 | 2,083 |
| Entergy Mississippi LLC 5.85% 6/1/54 | | 3,120 | 3,292 |
| Entergy, Inc.: | | | |
| 3.55% 9/30/49 | | 3,211 | 2,356 |
| 4% 3/30/29 | | 14,040 | 13,809 |
| 5.15% 1/15/33 | | 3,100 | 3,173 |
| 5.3% 9/15/33 | | 5,730 | 5,863 |
| Eversource Energy: | | | |
| 2.55% 3/15/31 | | 12,735 | 11,005 |
| 2.9% 10/1/24 | | 6,792 | 6,778 |
| 3.35% 3/15/26 | | 5,251 | 5,144 |
| 3.45% 1/15/50 | | 3,548 | 2,585 |
| Exelon Corp.: | | | |
| 3.95% 6/15/25 | | 15,612 | 15,485 |
| 4.05% 4/15/30 | | 2,000 | 1,950 |
| 5.1% 6/15/45 | | 874 | 831 |
| 5.3% 3/15/33 | | 12,280 | 12,640 |
| FirstEnergy Corp.: | | | |
| 1.6% 1/15/26 | | 9,970 | 9,538 |
| 2.25% 9/1/30 | | 10,730 | 9,336 |
| 3.4% 3/1/50 | | 2,900 | 2,062 |
| 4.15% 7/15/27 | | 6,752 | 6,623 |
| 5.1% 7/15/47 | | 3,732 | 3,331 |
| Florida Power & Light Co.: | | | |
| 2.45% 2/3/32 | | 2,000 | 1,740 |
| 3.125% 12/1/25 | | 4,051 | 3,985 |
| 3.15% 10/1/49 | | 5,556 | 3,995 |
| 3.8% 12/15/42 | | 8,900 | 7,445 |
| 4.05% 10/1/44 | | 4,304 | 3,694 |
| 4.125% 6/1/48 | | 9,771 | 8,323 |
| 5.1% 4/1/33 | | 7,400 | 7,623 |
| Georgia Power Co.: | | | |
| 3.25% 3/30/27 | | 6,781 | 6,618 |
| 4.65% 5/16/28 | | 4,830 | 4,879 |
| 4.7% 5/15/32 | | 4,000 | 4,008 |
| 4.95% 5/17/33 | | 10,160 | 10,270 |
| 5.25% 3/15/34 | | 5,700 | 5,878 |
| Indiana Michigan Power Co. 3.25% 5/1/51 | | 3,867 | 2,691 |
| Interstate Power and Light Co.: | | | |
| 2.3% 6/1/30 | | 11,051 | 9,757 |
| 3.25% 12/1/24 | | 2,000 | 1,989 |
| IPALCO Enterprises, Inc. 5.75% 4/1/34 | | 4,000 | 4,117 |
| ITC Holdings Corp. 3.35% 11/15/27 | | 2,000 | 1,929 |
| MidAmerican Energy Co. 3.15% 4/15/50 | | 7,100 | 5,009 |
| Nevada Power Co. 3.125% 8/1/50 | | 5,300 | 3,566 |
| NextEra Energy Capital Holdings, Inc.: | | | |
| 1.875% 1/15/27 | | 13,726 | 12,934 |
| 1.9% 6/15/28 | | 9,666 | 8,808 |
| 2.44% 1/15/32 | | 13,630 | 11,618 |
| 5% 7/15/32 | | 8,800 | 8,912 |
| 5.05% 2/28/33 | | 9,100 | 9,176 |
| Northern States Power Co.: | | | |
| 2.6% 6/1/51 | | 10,440 | 6,579 |
| 2.9% 3/1/50 | | 9,483 | 6,398 |
| 3.4% 8/15/42 | | 1,589 | 1,258 |
| 4.125% 5/15/44 | | 3,575 | 3,047 |
| NSTAR Electric Co.: | | | |
| 3.2% 5/15/27 | | 6,076 | 5,893 |
| 4.95% 9/15/52 | | 3,710 | 3,530 |
| Oglethorpe Power Corp.: | | | |
| 4.5% 4/1/47 | | 2,500 | 2,128 |
| 5.05% 10/1/48 | | 2,000 | 1,838 |
| 5.8% 6/1/54 (b) | | 4,250 | 4,334 |
| Oncor Electric Delivery Co. LLC: | | | |
| 0.55% 10/1/25 | | 25,429 | 24,346 |
| 3.1% 9/15/49 | | 15,204 | 10,506 |
| 3.8% 9/30/47 | | 7,733 | 6,222 |
| Pacific Gas & Electric Co.: | | | |
| 3.15% 1/1/26 | | 11,600 | 11,325 |
| 3.25% 6/1/31 | | 4,833 | 4,322 |
| 3.45% 7/1/25 | | 4,833 | 4,765 |
| 3.5% 6/15/25 | | 9,666 | 9,530 |
| 4.2% 3/1/29 | | 1,000 | 973 |
| 4.2% 6/1/41 | | 24,166 | 19,633 |
| 4.55% 7/1/30 | | 30,062 | 29,399 |
| 4.75% 2/15/44 | | 967 | 831 |
| 5.45% 6/15/27 | | 1,100 | 1,117 |
| 6.7% 4/1/53 | | 5,910 | 6,466 |
| PacifiCorp: | | | |
| 4.125% 1/15/49 | | 10,692 | 8,622 |
| 4.15% 2/15/50 | | 2,900 | 2,318 |
| 6% 1/15/39 | | 4,919 | 5,203 |
| PG&E Wildfire Recovery: | | | |
| 5.081% 6/1/43 | | 1,000 | 1,017 |
| 5.099% 6/1/54 | | 5,100 | 5,156 |
| 5.212% 12/1/49 | | 11,120 | 11,261 |
| Potomac Electric Power Co. 6.5% 11/15/37 | | 3,024 | 3,460 |
| PPL Capital Funding, Inc. 3.1% 5/15/26 | | 6,356 | 6,187 |
| PPL Electric Utilities Corp.: | | | |
| 3% 10/1/49 | | 10,557 | 7,397 |
| 4.15% 10/1/45 | | 2,780 | 2,394 |
| Progress Energy, Inc. 6% 12/1/39 | | 4,131 | 4,358 |
| Public Service Co. of Colorado: | | | |
| 2.9% 5/15/25 | | 8,737 | 8,606 |
| 3.8% 6/15/47 | | 3,678 | 2,853 |
| 4.1% 6/1/32 | | 2,000 | 1,923 |
| 4.1% 6/15/48 | | 2,000 | 1,612 |
| 6.25% 9/1/37 | | 2,000 | 2,196 |
| Public Service Electric & Gas Co.: | | | |
| 2.45% 1/15/30 | | 8,071 | 7,291 |
| 3.15% 1/1/50 | | 9,135 | 6,556 |
| 3.65% 9/1/42 | | 2,244 | 1,841 |
| 4% 6/1/44 | | 3,972 | 3,292 |
| 5.2% 8/1/33 | | 3,300 | 3,413 |
| 5.3% 8/1/54 | | 2,870 | 2,925 |
| Puget Sound Energy, Inc. 4.3% 5/20/45 | | 5,092 | 4,344 |
| Southern California Edison Co.: | | | |
| 2.25% 6/1/30 | | 7,198 | 6,355 |
| 2.95% 2/1/51 | | 15,950 | 10,573 |
| 3.7% 8/1/25 | | 2,000 | 1,979 |
| 4% 4/1/47 | | 7,944 | 6,431 |
| 4.125% 3/1/48 | | 5,606 | 4,630 |
| 4.875% 3/1/49 | | 8,000 | 7,370 |
| 5.7% 3/1/53 | | 3,300 | 3,380 |
| 5.85% 11/1/27 | | 9,900 | 10,301 |
| Southern Co.: | | | |
| 3.25% 7/1/26 | | 10,737 | 10,480 |
| 3.7% 4/30/30 | | 10,000 | 9,552 |
| 4.4% 7/1/46 | | 5,814 | 5,067 |
| 5.15% 10/6/25 | | 8,000 | 8,025 |
| Southwestern Electric Power Co.: | | | |
| 1.65% 3/15/26 | | 10,000 | 9,568 |
| 5.3% 4/1/33 | | 5,310 | 5,389 |
| Tampa Electric Co.: | | | |
| 4.45% 6/15/49 | | 9,306 | 8,181 |
| 6.15% 5/15/37 | | 4,972 | 5,387 |
| Tucson Electric Power Co. 5.2% 9/15/34 | | 6,200 | 6,224 |
| Union Electric Co.: | | | |
| 3.9% 9/15/42 | | 2,940 | 2,469 |
| 5.45% 3/15/53 | | 7,400 | 7,459 |
| Virginia Electric & Power Co.: | | | |
| 3.1% 5/15/25 | | 3,177 | 3,140 |
| 3.3% 12/1/49 | | 5,800 | 4,117 |
| 3.8% 4/1/28 | | 11,844 | 11,604 |
| 3.8% 9/15/47 | | 6,522 | 5,079 |
| 4.2% 5/15/45 | | 8,383 | 7,090 |
| 4.45% 2/15/44 | | 2,185 | 1,943 |
| 4.6% 12/1/48 | | 5,624 | 4,978 |
| 5.05% 8/15/34 | | 2,170 | 2,184 |
| 6% 5/15/37 | | 1,589 | 1,716 |
| Wisconsin Electric Power Co. 4.25% 6/1/44 | | 3,734 | 3,180 |
| Xcel Energy, Inc.: | | | |
| 3.35% 12/1/26 | | 2,383 | 2,318 |
| 4% 6/15/28 | | 1,900 | 1,861 |
| 4.6% 6/1/32 | | 11,300 | 11,013 |
| | | | 1,096,129 |
| Gas Utilities - 0.2% | | | |
| Atmos Energy Corp.: | | | |
| 1.5% 1/15/31 | | 2,000 | 1,666 |
| 5.45% 10/15/32 | | 13,820 | 14,547 |
| 5.9% 11/15/33 | | 7,550 | 8,179 |
| CenterPoint Energy Resources Corp.: | | | |
| 4% 4/1/28 | | 7,400 | 7,257 |
| 4.4% 7/1/32 | | 2,000 | 1,935 |
| 5.25% 3/1/28 | | 2,400 | 2,452 |
| 5.4% 7/1/34 | | 5,710 | 5,824 |
| Eastern Energy Gas Holdings LLC 2.5% 11/15/24 | | 8,816 | 8,762 |
| Piedmont Natural Gas Co., Inc.: | | | |
| 3.5% 6/1/29 | | 10,000 | 9,552 |
| 5.1% 2/15/35 | | 2,450 | 2,446 |
| Southern California Gas Co.: | | | |
| 2.6% 6/15/26 | | 10,509 | 10,170 |
| 5.05% 9/1/34 | | 8,300 | 8,418 |
| 6.35% 11/15/52 | | 4,200 | 4,727 |
| Southern Co. Gas Capital Corp. 3.95% 10/1/46 | | 10,740 | 8,585 |
| Southwest Gas Corp. 5.45% 3/23/28 | | 6,606 | 6,754 |
| Washington Gas Light Co. 3.796% 9/15/46 | | 2,400 | 1,893 |
| | | | 103,167 |
| Independent Power and Renewable Electricity Producers - 0.0% | | | |
| Constellation Energy Generation, LLC: | | | |
| 3.25% 6/1/25 | | 15,566 | 15,348 |
| 5.75% 3/15/54 | | 7,400 | 7,467 |
| 6.25% 10/1/39 | | 2,000 | 2,172 |
| Emera U.S. Finance LP: | | | |
| 3.55% 6/15/26 | | 2,100 | 2,045 |
| 4.75% 6/15/46 | | 4,138 | 3,568 |
| | | | 30,600 |
| Multi-Utilities - 0.4% | | | |
| Ameren Corp. 1.95% 3/15/27 | | 8,995 | 8,428 |
| Ameren Illinois Co.: | | | |
| 3.8% 5/15/28 | | 1,500 | 1,473 |
| 4.5% 3/15/49 | | 5,993 | 5,339 |
| 4.95% 6/1/33 | | 4,600 | 4,652 |
| 5.55% 7/1/54 | | 2,700 | 2,783 |
| Berkshire Hathaway Energy Co.: | | | |
| 3.25% 4/15/28 | | 7,944 | 7,663 |
| 3.7% 7/15/30 | | 7,954 | 7,657 |
| 3.8% 7/15/48 | | 7,944 | 6,160 |
| 4.25% 10/15/50 | | 6,859 | 5,698 |
| 4.5% 2/1/45 | | 5,282 | 4,801 |
| 5.15% 11/15/43 | | 6,144 | 6,055 |
| CenterPoint Energy, Inc. 3.7% 9/1/49 | | 4,833 | 3,617 |
| CMS Energy Corp. 4.875% 3/1/44 | | 3,972 | 3,724 |
| Consumers Energy Co.: | | | |
| 2.65% 8/15/52 | | 5,707 | 3,763 |
| 3.5% 8/1/51 | | 2,900 | 2,267 |
| 4.7% 1/15/30 | | 7,660 | 7,771 |
| Delmarva Power & Light Co. 4% 6/1/42 | | 3,177 | 2,610 |
| Dominion Energy, Inc.: | | | |
| 3.375% 4/1/30 | | 20,308 | 19,012 |
| 3.9% 10/1/25 | | 10,247 | 10,147 |
| 4.35% 8/15/32 | | 2,000 | 1,949 |
| 4.9% 8/1/41 | | 1,589 | 1,461 |
| DTE Energy Co.: | | | |
| 2.85% 10/1/26 | | 4,766 | 4,610 |
| 3.8% 3/15/27 | | 10,732 | 10,456 |
| 4.22% 11/1/24 | | 6,090 | 6,076 |
| 4.95% 7/1/27 | | 5,690 | 5,752 |
| NiSource, Inc.: | | | |
| 0.95% 8/15/25 | | 10,826 | 10,423 |
| 1.7% 2/15/31 | | 12,856 | 10,681 |
| 3.49% 5/15/27 | | 6,076 | 5,919 |
| 3.95% 3/30/48 | | 7,944 | 6,296 |
| 4.375% 5/15/47 | | 3,797 | 3,238 |
| 4.8% 2/15/44 | | 4,369 | 3,989 |
| Public Service Enterprise Group, Inc. 2.45% 11/15/31 | | 5,100 | 4,377 |
| Puget Energy, Inc.: | | | |
| 3.65% 5/15/25 | | 6,411 | 6,335 |
| 4.1% 6/15/30 | | 11,406 | 10,870 |
| San Diego Gas & Electric Co.: | | | |
| 4.5% 8/15/40 | | 795 | 742 |
| 5.35% 4/1/53 | | 1,300 | 1,298 |
| Sempra: | | | |
| 3.25% 6/15/27 | | 4,846 | 4,686 |
| 3.8% 2/1/38 | | 6,737 | 5,738 |
| 4% 2/1/48 | | 17,508 | 13,888 |
| 6% 10/15/39 | | 795 | 834 |
| | | | 233,238 |
| Water Utilities - 0.0% | | | |
| American Water Capital Corp.: | | | |
| 2.8% 5/1/30 | | 2,000 | 1,828 |
| 2.95% 9/1/27 | | 4,833 | 4,654 |
| 3.45% 6/1/29 | | 4,833 | 4,637 |
| 4.45% 6/1/32 | | 12,000 | 11,895 |
| 6.593% 10/15/37 | | 5,173 | 5,961 |
| | | | 28,975 |
TOTAL UTILITIES | | | 1,492,109 |
| TOTAL NONCONVERTIBLE BONDS (Cost $16,853,179) | | | 15,586,629 |
| | | | |
| U.S. Government and Government Agency Obligations - 43.4% |
| | | Principal Amount (a) (000s) | Value ($) (000s) |
| U.S. Government Agency Obligations - 0.6% | | | |
| Fannie Mae: | | | |
| 0.375% 8/25/25 | | 28,421 | 27,341 |
| 0.5% 6/17/25 | | 31,957 | 30,962 |
| 0.625% 4/22/25 | | 33,907 | 33,071 |
| 0.75% 10/8/27 | | 16,844 | 15,345 |
| 0.875% 8/5/30 | | 40,385 | 34,053 |
| 1.625% 10/15/24 | | 17,834 | 17,758 |
| 1.875% 9/24/26 | | 10,605 | 10,174 |
| 2.125% 4/24/26 | | 3,177 | 3,082 |
| 6.625% 11/15/30 | | 9,666 | 11,082 |
| Federal Home Loan Bank: | | | |
| 0.375% 9/4/25 | | 7,170 | 6,898 |
| 0.5% 4/14/25 | | 44,410 | 43,317 |
| 3.25% 11/16/28 | | 19,830 | 19,419 |
| 5.5% 7/15/36 | | 13,190 | 14,809 |
| Freddie Mac: | | | |
| 0.375% 7/21/25 | | 20,972 | 20,243 |
| 0.375% 9/23/25 | | 23,695 | 22,724 |
| 6.25% 7/15/32 | | 6,116 | 7,071 |
| 6.75% 3/15/31 | | 20,653 | 23,989 |
| Tennessee Valley Authority: | | | |
| 0.75% 5/15/25 | | 27,394 | 26,646 |
| 4.25% 9/15/65 | | 5,896 | 5,328 |
| 5.25% 9/15/39 | | 15,887 | 17,061 |
| 5.375% 4/1/56 | | 4,286 | 4,716 |
TOTAL U.S. GOVERNMENT AGENCY OBLIGATIONS | | | 395,089 |
| U.S. Treasury Obligations - 42.8% | | | |
| U.S. Treasury Bonds: | | | |
| 1.125% 5/15/40 | | 225,912 | 146,225 |
| 1.125% 8/15/40 | | 46,741 | 29,987 |
| 1.25% 5/15/50 | | 23,148 | 12,161 |
| 1.375% 11/15/40 | | 42,618 | 28,304 |
| 1.375% 8/15/50 | | 17,748 | 9,612 |
| 1.625% 11/15/50 | | 144,329 | 83,457 |
| 1.75% 8/15/41 | | 185,755 | 129,122 |
| 1.875% 2/15/41 | | 60,554 | 43,547 |
| 1.875% 2/15/51 | | 176,269 | 108,702 |
| 1.875% 11/15/51 | | 107,574 | 66,007 |
| 2% 11/15/41 | | 67,944 | 49,039 |
| 2% 2/15/50 | | 17,590 | 11,262 |
| 2% 8/15/51 | | 272,800 | 172,951 |
| 2.25% 5/15/41 | | 172,934 | 131,450 |
| 2.25% 8/15/46 | | 25,430 | 17,877 |
| 2.25% 8/15/49 | | 15,290 | 10,404 |
| 2.25% 2/15/52 | | 109,990 | 73,998 |
| 2.375% 2/15/42 | | 48,988 | 37,397 |
| 2.375% 11/15/49 | | 8,121 | 5,672 |
| 2.375% 5/15/51 | | 217,870 | 151,173 |
| 2.5% 2/15/45 | | 80,939 | 60,786 |
| 2.5% 2/15/46 | | 20,048 | 14,885 |
| 2.75% 11/15/42 | | 1,066 | 857 |
| 2.75% 8/15/47 | | 7,039 | 5,395 |
| 2.75% 11/15/47 | | 27,659 | 21,152 |
| 2.875% 5/15/43 | | 89,344 | 72,693 |
| 2.875% 5/15/52 | | 167,800 | 129,678 |
| 3% 11/15/44 | | 41,913 | 34,360 |
| 3% 5/15/45 | | 119,853 | 97,980 |
| 3% 11/15/45 | | 16,313 | 13,287 |
| 3% 2/15/47 | | 10,813 | 8,714 |
| 3% 5/15/47 | | 19,396 | 15,603 |
| 3% 8/15/52 | | 353,800 | 280,649 |
| 3.125% 2/15/43 | | 23,007 | 19,520 |
| 3.125% 8/15/44 | | 72,478 | 60,732 |
| 3.25% 5/15/42 | | 271,300 | 236,391 |
| 3.375% 8/15/42 | | 273,700 | 242,182 |
| 3.375% 5/15/44 | | 147,527 | 128,746 |
| 3.375% 11/15/48 | | 4,631 | 3,947 |
| 3.625% 8/15/43 | | 65,327 | 59,415 |
| 3.625% 2/15/44 | | 2,123 | 1,926 |
| 3.625% 2/15/53 | | 87,850 | 78,801 |
| 3.625% 5/15/53 | | 108,800 | 97,661 |
| 3.75% 11/15/43 | | 1,970 | 1,821 |
| 3.875% 2/15/43 | | 54,200 | 51,293 |
| 3.875% 5/15/43 | | 57,550 | 54,322 |
| 4% 11/15/42 | | 245,800 | 237,159 |
| 4% 11/15/52 | | 310,100 | 297,599 |
| 4.125% 8/15/53 | | 119,400 | 117,250 |
| 4.25% 5/15/39 | | 6,384 | 6,513 |
| 4.25% 11/15/40 | | 644 | 653 |
| 4.25% 8/15/44 | | 81,650 | 79,673 |
| 4.25% 2/15/54 | | 406,859 | 408,448 |
| 4.25% 8/15/54 | | 99,650 | 100,273 |
| 4.375% 2/15/38 | | 20,955 | 21,802 |
| 4.375% 11/15/39 | | 80 | 82 |
| 4.375% 5/15/40 | | 6,355 | 6,558 |
| 4.375% 5/15/41 | | 6,610 | 6,785 |
| 4.375% 8/15/43 | | 185,800 | 187,629 |
| 4.5% 2/15/36 (d) | | 20,270 | 21,476 |
| 4.5% 5/15/38 | | 5,410 | 5,693 |
| 4.5% 8/15/39 | | 4,450 | 4,656 |
| 4.5% 2/15/44 | | 57,150 | 58,579 |
| 4.625% 2/15/40 | | 8,282 | 8,784 |
| 4.625% 5/15/44 | | 71,850 | 74,825 |
| 4.625% 5/15/54 | | 108,100 | 115,532 |
| 4.75% 2/15/41 | | 4,765 | 5,122 |
| 4.75% 11/15/43 | | 142,750 | 151,337 |
| 6.25% 5/15/30 | | 48,578 | 54,694 |
| U.S. Treasury Notes: | | | |
| 0.375% 12/31/25 | | 242,294 | 230,473 |
| 0.375% 1/31/26 | | 13 | 12 |
| 0.375% 7/31/27 | | 251,927 | 228,358 |
| 0.375% 9/30/27 | | 49,874 | 44,980 |
| 0.5% 2/28/26 | | 286,549 | 271,707 |
| 0.5% 10/31/27 | | 354,566 | 320,107 |
| 0.625% 7/31/26 | | 184,631 | 173,387 |
| 0.625% 11/30/27 | | 37,166 | 33,614 |
| 0.625% 12/31/27 | | 42,643 | 38,469 |
| 0.625% 5/15/30 | | 293,612 | 246,588 |
| 0.625% 8/15/30 | | 30,689 | 25,573 |
| 0.75% 5/31/26 | | 102,419 | 96,838 |
| 0.75% 8/31/26 | | 301,288 | 283,058 |
| 0.875% 6/30/26 | | 74,538 | 70,488 |
| 0.875% 9/30/26 | | 155,614 | 146,325 |
| 1.125% 10/31/26 | | 125,566 | 118,415 |
| 1.125% 2/28/27 | | 143,363 | 134,184 |
| 1.125% 2/29/28 | | 262,029 | 239,429 |
| 1.125% 8/31/28 | | 64,238 | 58,012 |
| 1.25% 11/30/26 | | 60,243 | 56,873 |
| 1.25% 12/31/26 | | 111,104 | 104,737 |
| 1.25% 5/31/28 | | 78,201 | 71,377 |
| 1.25% 6/30/28 | | 329,983 | 300,581 |
| 1.25% 8/15/31 | | 214,724 | 181,258 |
| 1.375% 8/31/26 | | 46,589 | 44,323 |
| 1.375% 12/31/28 | | 106,427 | 96,416 |
| 1.5% 8/15/26 | | 104,698 | 99,930 |
| 1.5% 1/31/27 | | 380,445 | 359,982 |
| 1.5% 11/30/28 | | 41,895 | 38,218 |
| 1.5% 2/15/30 | | 723,990 | 643,446 |
| 1.625% 2/15/26 | | 0 | 0 |
| 1.625% 5/15/26 | | 4,456 | 4,282 |
| 1.625% 11/30/26 | | 45,785 | 43,581 |
| 1.625% 8/15/29 | | 16,548 | 14,992 |
| 1.625% 5/15/31 | | 30,670 | 26,733 |
| 1.75% 1/31/29 | | 110,873 | 101,899 |
| 1.875% 6/30/26 | | 21,678 | 20,878 |
| 1.875% 2/28/27 | | 166,929 | 159,195 |
| 2% 11/15/26 | | 37,465 | 35,985 |
| 2.25% 2/15/27 | | 24,751 | 23,826 |
| 2.25% 8/15/27 | | 337,064 | 322,634 |
| 2.25% 11/15/27 | | 36,349 | 34,669 |
| 2.375% 5/15/29 | | 20,544 | 19,336 |
| 2.5% 2/28/26 | | 72,343 | 70,673 |
| 2.5% 3/31/27 | | 5,000 | 4,840 |
| 2.625% 12/31/25 | | 106,891 | 104,740 |
| 2.625% 5/31/27 | | 39,800 | 38,573 |
| 2.625% 2/15/29 | | 56,726 | 54,114 |
| 2.625% 7/31/29 | | 603,100 | 572,804 |
| 2.75% 4/30/27 | | 243,000 | 236,460 |
| 2.75% 7/31/27 | | 323,600 | 314,221 |
| 2.75% 2/15/28 | | 40 | 39 |
| 2.75% 5/31/29 | | 32,300 | 30,899 |
| 2.75% 8/15/32 | | 648,086 | 599,353 |
| 2.875% 5/15/28 | | 139,625 | 135,305 |
| 2.875% 8/15/28 | | 150,635 | 145,698 |
| 2.875% 4/30/29 | | 33,500 | 32,245 |
| 2.875% 5/15/32 | | 42,500 | 39,761 |
| 3.125% 11/15/28 | | 19,870 | 19,374 |
| 3.125% 8/31/29 | | 59,600 | 57,900 |
| 3.25% 6/30/27 | | 72,000 | 70,943 |
| 3.375% 5/15/33 | | 221,600 | 213,238 |
| 3.5% 1/31/28 | | 414,100 | 410,380 |
| 3.5% 4/30/28 | | 312,800 | 309,904 |
| 3.5% 1/31/30 | | 125,900 | 124,213 |
| 3.5% 2/15/33 | | 115,200 | 112,068 |
| 3.625% 3/31/28 | | 152,800 | 152,120 |
| 3.625% 5/31/28 | | 199,900 | 198,916 |
| 3.625% 8/31/29 | | 49,000 | 48,837 |
| 3.625% 8/31/29 | | 74,150 | 73,849 |
| 3.625% 3/31/30 | | 119,300 | 118,382 |
| 3.75% 4/15/26 | | 177,400 | 176,555 |
| 3.75% 12/31/28 | | 87,800 | 87,790 |
| 3.75% 5/31/30 | | 175,600 | 175,312 |
| 3.75% 6/30/30 | | 41,700 | 41,620 |
| 3.75% 12/31/30 | | 20,950 | 20,890 |
| 3.875% 1/15/26 | | 187,800 | 187,074 |
| 3.875% 11/30/27 | | 55,100 | 55,242 |
| 3.875% 12/31/27 | | 234,000 | 234,740 |
| 3.875% 9/30/29 | | 73,200 | 73,589 |
| 3.875% 11/30/29 | | 51,600 | 51,872 |
| 3.875% 12/31/29 | | 36,600 | 36,782 |
| 3.875% 8/15/33 | | 444,400 | 443,411 |
| 3.875% 8/15/34 | | 237,400 | 236,509 |
| 4% 12/15/25 | | 171,000 | 170,526 |
| 4% 2/15/26 | | 20,800 | 20,766 |
| 4% 1/15/27 | | 67,450 | 67,653 |
| 4% 2/29/28 | | 111,400 | 112,218 |
| 4% 6/30/28 | | 54,700 | 55,168 |
| 4% 1/31/29 | | 202,100 | 204,145 |
| 4% 7/31/29 | | 85,400 | 86,399 |
| 4% 10/31/29 | | 138,800 | 140,318 |
| 4% 2/28/30 | | 46,600 | 47,121 |
| 4% 7/31/30 | | 35,300 | 35,693 |
| 4% 1/31/31 | | 117,950 | 119,245 |
| 4% 2/15/34 | | 242,150 | 243,663 |
| 4.125% 6/15/26 | | 66,900 | 67,039 |
| 4.125% 9/30/27 | | 282,400 | 285,268 |
| 4.125% 10/31/27 | | 396,200 | 400,054 |
| 4.125% 7/31/28 | | 52,950 | 53,641 |
| 4.125% 3/31/29 | | 131,700 | 133,778 |
| 4.125% 8/31/30 | | 258,800 | 263,440 |
| 4.125% 3/31/31 | | 21,850 | 22,253 |
| 4.125% 7/31/31 | | 319,950 | 325,871 |
| 4.25% 12/31/25 | | 85,050 | 85,082 |
| 4.25% 1/31/26 | | 420,500 | 421,042 |
| 4.25% 2/28/29 | | 204,400 | 208,728 |
| 4.25% 2/28/31 | | 304,850 | 312,614 |
| 4.375% 7/31/26 (d) | | 760,750 | 766,456 |
| 4.375% 12/15/26 | | 29,250 | 29,565 |
| 4.375% 11/30/28 | | 247,600 | 253,568 |
| 4.375% 11/30/30 | | 240,500 | 248,110 |
| 4.375% 5/15/34 | | 126,050 | 130,619 |
| 4.5% 3/31/26 | | 93,750 | 94,336 |
| 4.5% 5/31/29 | | 78,350 | 80,936 |
| 4.5% 11/15/33 | | 525,250 | 549,112 |
| 4.625% 2/28/26 | | 477,250 | 480,680 |
| 4.625% 6/30/26 | | 110,000 | 111,203 |
| 4.625% 9/30/28 | | 181,900 | 187,783 |
| 4.625% 4/30/29 | | 31,000 | 32,158 |
| 4.625% 4/30/31 | | 58,900 | 61,702 |
| 4.625% 5/31/31 | | 160,200 | 167,835 |
| 4.875% 4/30/26 | | 714,050 | 723,282 |
| 4.875% 5/31/26 | | 409,600 | 415,344 |
| 4.875% 10/31/28 | | 191,946 | 200,111 |
| 4.875% 10/31/30 | | 123,100 | 130,371 |
TOTAL U.S. TREASURY OBLIGATIONS | | | 25,303,564 |
| TOTAL U.S. GOVERNMENT AND GOVERNMENT AGENCY OBLIGATIONS (Cost $26,902,011) | | | 25,698,653 |
| | | | |
| U.S. Government Agency - Mortgage Securities - 26.4% |
| | | Principal Amount (a) (000s) | Value ($) (000s) |
| Fannie Mae - 10.8% | | | |
| FTSE USD IBOR Consumer Cash Fallbacks Term 1Y + 1.510% 6.2% 11/1/34 (c)(e) | | 1,156 | 1,189 |
| FTSE USD IBOR Consumer Cash Fallbacks Term 1Y + 1.640% 7.02% 4/1/41 (c)(e) | | 72 | 74 |
| FTSE USD IBOR Consumer Cash Fallbacks Term 1Y + 1.880% 6.479% 11/1/34 (c)(e) | | 88 | 90 |
| 1.5% 8/1/31 to 11/1/51 | | 383,504 | 320,158 |
| 2% 10/1/26 to 3/1/52 | | 1,998,421 | 1,676,106 |
| 2.5% 7/1/26 to 8/1/52 | | 1,320,233 | 1,149,811 |
| 3% 3/1/26 to 6/1/52 | | 1,033,896 | 942,213 |
| 3.5% 6/1/25 to 7/1/52 | | 630,742 | 592,593 |
| 4% 1/1/25 to 5/1/53 | | 565,592 | 544,451 |
| 4% 11/1/41 | | 6 | 5 |
| 4.5% to 4.5% 10/1/24 to 4/1/54 | | 263,997 | 259,537 |
| 5% 9/1/25 to 1/1/54 | | 296,256 | 295,606 |
| 5.5% 6/1/27 to 7/1/54 | | 228,532 | 231,128 |
| 6% to 6% 11/1/32 to 7/1/54 | | 225,585 | 230,418 |
| 6.5% 5/1/31 to 1/1/54 | | 100,425 | 103,585 |
| 7% 12/1/53 | | 11,773 | 12,337 |
TOTAL FANNIE MAE | | | 6,359,301 |
| Freddie Mac - 8.7% | | | |
| FTSE USD IBOR Consumer Cash Fallbacks Term 1Y + 1.900% 7.216% 9/1/37 (c)(e) | | 57 | 59 |
| U.S. TREASURY 1 YEAR INDEX + 1.710% 5.928% 3/1/36 (c)(e) | | 917 | 920 |
| U.S. TREASURY 1 YEAR INDEX + 2.230% 6.419% 12/1/35 (c)(e) | | 401 | 406 |
| U.S. TREASURY 1 YEAR INDEX + 2.250% 6.454% 3/1/35 (c)(e) | | 212 | 215 |
| 1.5% 7/1/35 to 12/1/51 | | 481,118 | 399,186 |
| 2% 5/1/33 to 4/1/52 | | 1,731,054 | 1,445,409 |
| 2% 9/1/35 | | 6,584 | 5,995 |
| 2% 10/1/35 | | 42,707 | 38,792 |
| 2.5% 2/1/27 to 4/1/52 | | 1,249,754 | 1,082,209 |
| 3% 10/1/26 to 6/1/53 | | 435,514 | 396,034 |
| 3% 8/1/47 | | 151 | 137 |
| 3.5% 9/1/25 to 7/1/52 | | 345,176 | 323,875 |
| 3.5% 8/1/47 | | 147 | 137 |
| 3.5% 9/1/47 | | 93 | 87 |
| 3.5% 9/1/47 | | 6,477 | 6,089 |
| 3.5% 10/1/48 | | 284 | 264 |
| 4% 9/1/24 to 10/1/52 | | 203,177 | 196,333 |
| 4.5% 6/1/25 to 4/1/53 | | 271,775 | 266,493 |
| 5% 10/1/26 to 4/1/54 | | 211,065 | 210,572 |
| 5.5% 4/1/27 to 6/1/54 | | 331,913 | 335,033 |
| 6% 4/1/32 to 5/1/54 | | 230,886 | 236,537 |
| 6.5% 11/1/36 to 1/1/54 | | 167,549 | 172,944 |
| 7% 1/1/54 | | 5,891 | 6,193 |
TOTAL FREDDIE MAC | | | 5,123,919 |
| Freddie Mac Multi-family Structured pass-thru certificates - 0.0% | | | |
| 2.5% 12/1/31 | | 31 | 29 |
| 2.5% 12/1/31 | | 2 | 2 |
| 2.5% 1/1/32 | | 23 | 22 |
| 2.5% 2/1/32 | | 41 | 39 |
TOTAL FREDDIE MAC MULTI-FAMILY STRUCTURED PASS-THRU CERTIFICATES | | | 92 |
| Ginnie Mae - 6.1% | | | |
| 3.5% 10/15/40 to 11/20/52 | | 428,805 | 402,649 |
| 4% 1/15/25 to 2/20/53 | | 278,979 | 268,495 |
| 5% 1/20/39 to 2/20/54 | | 226,262 | 226,362 |
| 1.5% 10/20/43 to 3/20/52 | | 10,268 | 8,334 |
| 2% 10/20/50 to 8/20/52 | | 729,996 | 614,445 |
| 2.5% 10/20/42 to 5/20/52 | | 752,597 | 658,314 |
| 3% 4/15/42 to 7/20/52 | | 558,887 | 508,600 |
| 4.5% to 4.5% 3/20/33 to 7/20/53 | | 233,014 | 229,357 |
| 4.5% 9/1/54 (f) | | 15,250 | 14,927 |
| 5% 9/1/54 (f) | | 28,550 | 28,490 |
| 5% 10/1/54 (f) | | 28,550 | 28,450 |
| 5.5% 10/20/32 to 8/20/54 | | 193,589 | 195,088 |
| 5.5% 9/1/54 (f) | | 16,600 | 16,706 |
| 5.5% 9/1/54 (f) | | 8,150 | 8,202 |
| 5.5% 9/1/54 (f) | | 12,600 | 12,681 |
| 5.5% 9/1/54 (f) | | 45,800 | 46,093 |
| 6% to 6% 5/20/34 to 8/20/53 | | 44,760 | 45,490 |
| 6% 9/1/54 (f) | | 38,900 | 39,464 |
| 6% 9/1/54 (f) | | 3,350 | 3,399 |
| 6% 9/1/54 (f) | | 1,675 | 1,699 |
| 6% 9/1/54 (f) | | 50,000 | 50,725 |
| 6% 9/1/54 (f) | | 29,975 | 30,410 |
| 6% 9/1/54 (f) | | 22,200 | 22,522 |
| 6% 9/1/54 (f) | | 46,900 | 47,580 |
| 6.5% 8/20/36 to 7/20/53 | | 26,348 | 26,896 |
| 6.5% 9/1/54 (f) | | 60,300 | 61,566 |
| 6.5% 9/1/54 (f) | | 20,250 | 20,675 |
| 6.5% 9/1/54 (f) | | 17,850 | 18,225 |
TOTAL GINNIE MAE | | | 3,635,844 |
| Uniform Mortgage Backed Securities - 0.8% | | | |
| 3.5% 9/1/54 (f) | | 25,150 | 23,149 |
| 5% 9/1/54 (f) | | 33,950 | 33,702 |
| 5.5% 9/1/54 (f) | | 56,400 | 56,786 |
| 5.5% 9/1/54 (f) | | 55,075 | 55,451 |
| 6% 9/1/54 (f) | | 21,400 | 21,794 |
| 6% 9/1/54 (f) | | 46,375 | 47,228 |
| 6% 9/1/54 (f) | | 38,150 | 38,852 |
| 6.5% 9/1/54 (f) | | 104,000 | 107,083 |
| 7% 9/1/54 (f) | | 63,025 | 65,441 |
| 7% 9/1/54 (f) | | 27,575 | 28,632 |
TOTAL UNIFORM MORTGAGE BACKED SECURITIES | | | 478,118 |
| TOTAL U.S. GOVERNMENT AGENCY - MORTGAGE SECURITIES (Cost $17,248,731) | | | 15,597,274 |
| | | | |
| Asset-Backed Securities - 0.3% |
| | | Principal Amount (a) (000s) | Value ($) (000s) |
| American Express Credit Accoun Series 2023-4 Class A, 5.15% 9/15/30 | | 6,500 | 6,729 |
| Capital One Multi-Asset Execution Trust: | | | |
| Series 2019-A3 Class A3, 2.06% 8/15/28 | | 8,197 | 7,846 |
| Series 2021-A2 Class A2, 1.39% 7/15/30 | | 13,710 | 12,319 |
| Capital One Prime Auto Receivables Series 2023-1 Class A3, 4.87% 2/15/28 | | 5,000 | 5,009 |
| CarMax Auto Owner Trust: | | | |
| Series 2021-1 Class A3, 0.34% 12/15/25 | | 484 | 483 |
| Series 2022-3 Class A2A, 3.97% 4/15/27 | | 21,003 | 20,849 |
| Series 2023 2 Class A3, 5.05% 1/18/28 | | 20,000 | 20,077 |
| Chase Issuance Trust Series 2023-A2 Class A, 5.08% 9/15/30 | | 18,550 | 19,154 |
| Citibank Credit Card Issuance Trust: | | | |
| Series 2007-A3 Class A3, 6.15% 6/15/39 | | 4,935 | 5,347 |
| Series 2018-A7 Class A7, 3.96% 10/13/30 | | 12,808 | 12,676 |
| Ford Credit Auto Owner Trust Series 2023-A Class A3, 4.65% 2/15/28 | | 13,597 | 13,582 |
| Ford Credit Floorplan Master Owner Trust Series 2018-4 Class A, 4.06% 11/15/30 | | 5,000 | 4,918 |
| GM Financial Consumer Automobile Receivables Series 2023 2 Class A3, 4.47% 2/16/28 | | 20,000 | 19,943 |
| Hyundai Auto Receivables Trust: | | | |
| Series 2022-B Class A3, 3.72% 11/16/26 | | 12,854 | 12,746 |
| Series 2022-C Class A3, 5.39% 6/15/27 | | 11,952 | 11,999 |
| Series 2023 A Class A3, 4.58% 4/15/27 | | 20,000 | 19,952 |
| TOTAL ASSET-BACKED SECURITIES (Cost $196,113) | | | 193,629 |
| | | | |
| Commercial Mortgage Securities - 1.6% |
| | | Principal Amount (a) (000s) | Value ($) (000s) |
| BANK sequential payer: | | | |
| Series 2017-BNK4 Class ASB, 3.419% 5/15/50 | | 9,245 | 9,088 |
| Series 2020-BN28 Class A4, 1.844% 3/15/63 | | 33,272 | 28,344 |
| Series 2021-BN35 Class A5, 2.285% 6/15/64 | | 16,433 | 14,024 |
| Series 2022-BNK39 Class A4, 2.928% 2/15/55 | | 6,000 | 5,279 |
| Series 2022-BNK41 Class A4, 3.7902% 4/15/65 (c) | | 27,916 | 26,187 |
| Series 2023-BNK45 Class A5, 5.203% 2/15/56 (c) | | 5,000 | 5,092 |
| Barclays Commercial Mortgage Securities sequential payer Series 2021-C12 Class A5, 2.689% 11/15/54 | | 20,880 | 18,265 |
| BBCMS Mortgage Trust sequential payer: | | | |
| Series 2021-C11 Class A5, 2.322% 9/15/54 | | 20,928 | 17,943 |
| Series 2021-C9 Class A5, 2.299% 2/15/54 | | 7,000 | 6,063 |
| Series 2024-C26 Class A5, 5.829% 5/15/57 (c) | | 18,028 | 19,394 |
| Benchmark Mortgage Trust: | | | |
| sequential payer: | | | |
Series 2020-B19 Class A5, 1.85% 9/15/53 | | 13,581 | 11,263 |
Series 2021-B24 Class A5, 2.5843% 3/15/54 | | 20,299 | 17,370 |
Series 2023-B39 Class A5, 5.7536% 7/15/56 | | 3,500 | 3,727 |
| Series 2019-B12 Class A5, 3.1156% 8/15/52 | | 7,925 | 7,332 |
| Series 2019-B9 Class A5, 4.0156% 3/15/52 | | 18,628 | 17,808 |
| BMO Mortgage Trust sequential payer Series 2022-C1 Class A5, 3.374% 2/15/55 | | 9,440 | 8,554 |
| Citigroup Commercial Mortgage Trust sequential payer: | | | |
| Series 2014-GC25 Class A4, 3.635% 10/10/47 | | 4,809 | 4,802 |
| Series 2015-GC29 Class A4, 3.192% 4/10/48 | | 9,038 | 8,902 |
| Series 2015-P1 Class A5, 3.717% 9/15/48 | | 4,659 | 4,584 |
| Series 2016-C1 Class A4, 3.209% 5/10/49 | | 14,743 | 14,310 |
| Series 2016-P4 Class A4, 2.902% 7/10/49 | | 17,079 | 16,372 |
| COMM Mortgage Trust Series 2015-CR22 Class A5, 3.309% 3/10/48 | | 15,430 | 15,245 |
| Computershare Corporate Trust Series 2018-C48 Class A5, 4.302% 1/15/52 | | 15,529 | 15,263 |
| CSAIL Commercial Mortgage Trust sequential payer: | | | |
| Series 2015-C3 Class A4, 3.7182% 8/15/48 | | 9,981 | 9,817 |
| Series 2019-C17: | | | |
Class A4, 2.7628% 9/15/52 | | 14,978 | 13,715 |
Class A5, 3.0161% 9/15/52 | | 14,978 | 13,591 |
| Freddie Mac: | | | |
| sequential payer: | | | |
Series 2016-K057 Class A2, 2.57% 7/25/26 | | 12,674 | 12,284 |
Series 2020-K104 Class A2, 2.253% 1/25/30 | | 59,506 | 54,254 |
Series 2020-K116 Class A2, 1.378% 7/25/30 | | 50,584 | 43,341 |
Series 2020-K117 Class A2, 1.406% 8/25/30 | | 25,809 | 22,085 |
Series 2020-K118 Class A2, 1.493% 9/25/30 | | 12,257 | 10,523 |
Series 2020-K121 Class A2, 1.547% 10/25/30 | | 17,206 | 14,766 |
Series 2021-K125 Class A2, 1.846% 1/25/31 | | 6,670 | 5,799 |
Series 2021-K126 Class A2, 2.074% 1/25/31 | | 9,492 | 8,378 |
Series 2021-K130 Class A2, 1.723% 6/25/31 | | 8,168 | 6,990 |
Series 2021-K136 Class A2, 2.127% 11/25/31 | | 22,339 | 19,439 |
Series 2022-151 Class A2: | | | |
| 3.78% 11/25/32 | | 30,500 | 29,417 |
| 3.8% 10/25/32 | | 4,000 | 3,864 |
Series 2022-K140 Class A2, 2.25% 1/25/32 | | 2,600 | 2,273 |
Series 2022-K145 Class A2, 2.58% 5/25/32 | | 6,900 | 6,142 |
Series 2023-154 Class A2, 4.35% 1/25/33 | | 15,000 | 15,034 |
Series 2023-157 Class A2, 4.2% 5/25/33 | | 10,300 | 10,208 |
Series 2023-K-153 Class A2, 3.82% 12/25/32 | | 15,000 | 14,502 |
Series 2023-K751 Class A2, 4.412% 3/25/30 | | 12,675 | 12,811 |
Series K080 Class A2, 3.926% 7/25/28 | | 13,178 | 13,065 |
| Series 2017-K064 Class A2, 3.224% 3/25/27 | | 13,702 | 13,381 |
| Series 2017-K068 Class A2, 3.244% 8/25/27 | | 18,911 | 18,442 |
| Series 2018-K730 Class A2, 3.59% 1/25/25 | | 28,217 | 28,025 |
| Series 2019-K094 Class A2, 2.903% 6/25/29 | | 40,856 | 38,708 |
| Series 2019-K1510 Class A2, 3.718% 1/25/31 | | 11,797 | 11,433 |
| Series 2021-K123 Class A2, 1.621% 12/25/30 | | 22,648 | 19,484 |
| Series K046 Class A2, 3.205% 3/25/25 | | 26,219 | 25,919 |
| Series K047 Class A2, 3.329% 5/25/25 | | 3,039 | 3,002 |
| Series K053 Class A2, 2.995% 12/25/25 | | 5,649 | 5,538 |
| Series K056 Class A2, 2.525% 5/25/26 | | 16,483 | 15,983 |
| Series K062 Class A1, 3.032% 9/25/26 | | 3,457 | 3,410 |
| Series K079 Class A2, 3.926% 6/25/28 | | 6,181 | 6,128 |
| GS Mortgage Securities Trust sequential payer Series 2020-GC45 Class A5, 2.9106% 2/13/53 | | 36,094 | 32,919 |
| JPMBB Commercial Mortgage Securities Trust sequential payer: | | | |
| Series 2014-C23 Class A5, 3.9342% 9/15/47 | | 1,595 | 1,591 |
| Series 2014-C24 Class A5, 3.6385% 11/15/47 | | 20,704 | 20,342 |
| Series 2015-C29 Class A4, 3.6108% 5/15/48 | | 7,149 | 7,056 |
| Morgan Stanley BAML Trust Series 2015-C20 Class A4, 3.249% 2/15/48 | | 11,696 | 11,605 |
| Morgan Stanley Capital I Trust sequential payer Series 2020-L4 Class A3, 2.698% 2/15/53 | | 14,132 | 12,659 |
| Wells Fargo Commercial Mortgage Trust sequential payer: | | | |
| Series 2019-C52 Class A5, 2.892% 8/15/52 | | 25,720 | 23,513 |
| Series 2019-C54 Class A4, 3.146% 12/15/52 | | 1,837 | 1,694 |
| Wells Fargo Commercial Mtg Trust 2020-C sequential payer Series 2020-C55 Class A5, 2.725% 2/15/53 | | 12,719 | 11,511 |
| WF-RBS Commercial Mortgage Trust Series 2014-C25 Class A5, 3.631% 11/15/47 | | 9,291 | 9,239 |
| TOTAL COMMERCIAL MORTGAGE SECURITIES (Cost $1,035,863) | | | 959,091 |
| | | | |
| Municipal Securities - 0.5% |
| | | Principal Amount (a) (000s) | Value ($) (000s) |
| American Muni. Pwr., Inc. Rev. (Combined Hydroelectric Proj.) Series 2010 B, 8.084% 2/15/50 | | 7,725 | 10,460 |
| Bay Area Toll Auth. San Francisco Bay Toll Bridge Rev.: | | | |
| Series 2009 F2, 6.263% 4/1/49 | | 3,750 | 4,256 |
| Series 2010 S1, 7.043% 4/1/50 | | 5,635 | 7,009 |
| California Gen. Oblig.: | | | |
| Series 2009, 7.55% 4/1/39 | | 19,660 | 24,495 |
| Series 2010, 7.6% 11/1/40 | | 10,305 | 12,913 |
| Series 2018, 3.5% 4/1/28 | | 10,235 | 10,030 |
| California State Univ. Rev. Series 2021 B, 2.719% 11/1/52 | | 6,750 | 4,595 |
| Chicago O'Hare Int'l. Arpt. Rev. Series 2010 B, 6.395% 1/1/40 | | 7,250 | 8,202 |
| Commonwealth Fing. Auth. Rev. Series 2016 A, 4.144% 6/1/38 | | 6,095 | 5,749 |
| Dallas Area Rapid Transit Sales Tax Rev. Series 2021 A, 2.613% 12/1/48 | | 12,565 | 8,931 |
| Dallas Fort Worth Int'l. Arpt. Rev.: | | | |
| Series 2019 A, 3.144% 11/1/45 | | 1,850 | 1,443 |
| Series 2021 C, 2.843% 11/1/46 | | 11,600 | 8,703 |
| Series 2022 A, 4.507% 11/1/51 | | 4,485 | 4,161 |
| Golden State Tobacco Securitization Corp. Tobacco Settlement Rev. Series 2021 B: | | | |
| 2.746% 6/1/34 | | 5,025 | 4,345 |
| 3.293% 6/1/42 | | 2,435 | 1,920 |
| Idaho Energy Resources Auth. Series 2021, 2.861% 9/1/46 | | 2,955 | 2,202 |
| Illinois Gen. Oblig. Series 2003, 5.1% 6/1/33 | | 20,466 | 20,589 |
| Kansas St Dev. Fin. Auth. Rev. Series 2015 H, 4.927% 4/15/45 | | 6,035 | 6,028 |
| Los Angeles Cmnty. College District Series 2008 E, 6.75% 8/1/49 | | 7,505 | 8,927 |
| Los Angeles Dept. Arpt. Rev. Series 2009 C, 6.582% 5/15/39 | | 3,455 | 3,828 |
| Massachusetts Gen. Oblig. Series F, 3.277% 6/1/46 | | 3,750 | 3,113 |
| Massachusetts Wtr. Resources Auth. Wtr. & Swr. Rev. Series 2021 C, 2.823% 8/1/41 | | 4,445 | 3,545 |
| Michigan Strategic Fund Ltd. Oblig. Rev. Series 2021 A, 3.225% 9/1/47 | | 6,815 | 5,424 |
| New Jersey Econ. Dev. Auth. State Pension Fdg. Rev. Series 1997, 7.425% 2/15/29 (Nat'l. Pub. Fin. Guarantee Corp. Insured) | | 967 | 1,042 |
| New Jersey Tpk. Auth. Tpk. Rev. Series 2009 E, 7.414% 1/1/40 | | 3,734 | 4,560 |
| New York City Muni. Wtr. Fin. Auth. Wtr. & Swr. Sys. Rev. Series 2010 DD, 5.952% 6/15/42 | | 7,170 | 7,765 |
| New York City Transitional Fin. Auth. Rev. Series 2011 A, 5.508% 8/1/37 | | 8,520 | 8,878 |
| New York Metropolitan Trans. Auth. Rev. Series 2010 A, 6.668% 11/15/39 | | 4,895 | 5,468 |
| New York State Dorm. Auth. Series 2021 C, 2.202% 3/15/34 | | 16,190 | 13,350 |
| Port Auth. of New York & New Jersey: | | | |
| Series 180, 4.96% 8/1/46 | | 4,115 | 4,029 |
| Series 2010 164, 5.647% 11/1/40 | | 4,135 | 4,471 |
| Series 225, 3.175% 7/15/60 | | 18,365 | 12,745 |
| Port of Morrow Transmission Facilities Rev. (Bonneville Coorporation Proj.) Series 2016 1, 2.987% 9/1/36 | | 4,495 | 3,869 |
| San Francisco Pub. Utils. Commission Wtr. Rev. Series 2010 E, 6% 11/1/40 | | 5,015 | 5,330 |
| South Carolina Pub. Svc. Auth. Rev. Series 2013 C, 5.784% 12/1/41 | | 8,986 | 9,325 |
| Univ. of California Regents Med. Ctr. Pool Rev. Series N: | | | |
| 3.006% 5/15/50 | | 10,465 | 7,405 |
| 3.256% 5/15/60 | | 10,635 | 7,545 |
| Univ. of California Revs. Series 2015 AP, 3.931% 5/15/45 | | 2,970 | 2,749 |
| Univ. of Virginia Gen. Rev.: | | | |
| (Multi-Year Cap. Proj. Fing. Prog.) Series 2017 C, 4.179% 9/1/2117 | | 3,775 | 3,186 |
| Series 2021 B, 2.584% 11/1/51 | | 1,885 | 1,263 |
| TOTAL MUNICIPAL SECURITIES (Cost $319,412) | | | 273,848 |
| | | | |
| Foreign Government and Government Agency Obligations - 1.4% |
| | | Principal Amount (a) (000s) | Value ($) (000s) |
| Alberta Province: | | | |
| 1% 5/20/25 | | 28,032 | 27,345 |
| 3.3% 3/15/28 | | 7,930 | 7,763 |
| British Columbia Province: | | | |
| 2.25% 6/2/26 | | 18,944 | 18,346 |
| 4.2% 7/6/33 | | 7,700 | 7,634 |
| 4.9% 4/24/29 | | 12,800 | 13,312 |
| Chilean Republic: | | | |
| 2.55% 7/27/33 | | 24,746 | 20,934 |
| 3.125% 1/21/26 | | 1,000 | 978 |
| 3.24% 2/6/28 | | 9,215 | 8,841 |
| 3.625% 10/30/42 | | 10,385 | 8,388 |
| 3.86% 6/21/47 | | 4,931 | 4,014 |
| 4.95% 1/5/36 | | 9,000 | 9,000 |
| 5.33% 1/5/54 | | 8,800 | 8,729 |
| Hungarian Republic 7.625% 3/29/41 | | 5,792 | 6,842 |
| Indonesian Republic: | | | |
| 2.85% 2/14/30 | | 27,839 | 25,577 |
| 3.4% 9/18/29 | | 12,400 | 11,799 |
| 3.5% 2/14/50 | | 21,266 | 16,601 |
| 5.35% 2/11/49 | | 13,600 | 14,110 |
| Israeli State: | | | |
| 3.25% 1/17/28 | | 11,430 | 10,757 |
| 3.375% 1/15/50 | | 23,561 | 15,910 |
| 5.375% 3/12/29 | | 3,700 | 3,734 |
| 5.5% 3/12/34 | | 3,500 | 3,497 |
| 5.75% 3/12/54 | | 3,700 | 3,552 |
| Italian Republic: | | | |
| 2.375% 10/17/24 | | 5,000 | 4,981 |
| 2.875% 10/17/29 | | 21,266 | 19,540 |
| 3.875% 5/6/51 | | 3,300 | 2,415 |
| 4% 10/17/49 | | 9,200 | 7,093 |
| Japan Bank International Cooperation: | | | |
| 1.25% 1/21/31 | | 31,080 | 26,150 |
| 1.875% 7/21/26 | | 3,260 | 3,124 |
| 2.125% 2/10/25 | | 1,716 | 1,694 |
| 2.25% 11/4/26 | | 4,486 | 4,311 |
| 2.375% 4/20/26 | | 10,372 | 10,059 |
| 2.75% 1/21/26 | | 2,720 | 2,660 |
| 2.875% 6/1/27 | | 6,038 | 5,851 |
| 3.25% 7/20/28 | | 7,150 | 6,958 |
| Jordanian Kingdom 3% 6/30/25 | | 2,059 | 2,027 |
| Korea Development Bank 1.625% 1/19/31 | | 10,633 | 8,910 |
| Landwirtschaftliche Rentenbank: | | | |
| 1.75% 7/27/26 | | 6,752 | 6,469 |
| 2.5% 11/15/27 | | 7,022 | 6,735 |
| Ontario Province: | | | |
| 0.625% 1/21/26 | | 2,030 | 1,930 |
| 1.125% 10/7/30 | | 19,052 | 16,072 |
| 2.3% 6/15/26 | | 11,337 | 10,981 |
| 2.5% 4/27/26 | | 3,972 | 3,867 |
| Panamanian Republic: | | | |
| 3.16% 1/23/30 | | 14,972 | 12,996 |
| 3.75% 3/16/25 | | 3,260 | 3,222 |
| 4.3% 4/29/53 | | 4,663 | 3,187 |
| 4.5% 4/16/50 | | 10,235 | 7,273 |
| 4.5% 4/1/56 | | 15,853 | 11,053 |
| 6.4% 2/14/35 | | 16,340 | 16,302 |
| Peruvian Republic: | | | |
| 1.862% 12/1/32 | | 19,951 | 15,844 |
| 2.78% 12/1/60 | | 3,287 | 1,951 |
| 2.844% 6/20/30 | | 12,979 | 11,733 |
| 3.55% 3/10/51 | | 14,983 | 11,195 |
| 5.875% 8/8/54 | | 5,450 | 5,682 |
| 6.55% 3/14/37 | | 2,443 | 2,718 |
| Philippine Republic: | | | |
| 1.648% 6/10/31 | | 14,500 | 12,044 |
| 2.65% 12/10/45 | | 18,269 | 12,526 |
| 3% 2/1/28 | | 15,092 | 14,422 |
| 3.95% 1/20/40 | | 12,692 | 11,276 |
| 5.17% 10/13/27 | | 6,800 | 6,945 |
| 6.375% 10/23/34 | | 25,842 | 29,121 |
| Polish Government: | | | |
| 3.25% 4/6/26 | | 5,243 | 5,161 |
| 4.625% 3/18/29 | | 4,160 | 4,240 |
| 5.125% 9/18/34 | | 9,500 | 9,744 |
| 5.5% 4/4/53 | | 8,010 | 8,182 |
| 5.5% 3/18/54 | | 5,660 | 5,792 |
| Quebec Province: | | | |
| 1.5% 2/11/25 | | 22,909 | 22,575 |
| 2.5% 4/20/26 | | 9,329 | 9,108 |
| 2.75% 4/12/27 | | 10,154 | 9,847 |
| 2.875% 10/16/24 | | 1,648 | 1,644 |
| 4.25% 9/5/34 | | 4,100 | 4,078 |
| 4.5% 9/8/33 | | 7,800 | 7,922 |
| United Mexican States: | | | |
| 3.25% 4/16/30 | | 10,605 | 9,624 |
| 3.5% 2/12/34 | | 32,290 | 27,204 |
| 4.28% 8/14/41 | | 34,799 | 28,078 |
| 4.35% 1/15/47 | | 11,447 | 8,882 |
| 4.5% 1/31/50 | | 7,346 | 5,757 |
| 4.6% 1/23/46 | | 4,766 | 3,813 |
| 4.6% 2/10/48 | | 13,941 | 11,048 |
| 4.75% 3/8/44 | | 15,804 | 13,167 |
| 5.55% 1/21/45 | | 3,111 | 2,913 |
| 6.05% 1/11/40 | | 3,812 | 3,817 |
| 6.35% 2/9/35 | | 18,700 | 19,436 |
| Uruguay Republic: | | | |
| 4.125% 11/20/45 | | 3,773 | 3,438 |
| 4.375% 10/27/27 | | 967 | 973 |
| 4.375% 1/23/31 | | 12,587 | 12,657 |
| 4.975% 4/20/55 | | 16,419 | 15,808 |
| TOTAL FOREIGN GOVERNMENT AND GOVERNMENT AGENCY OBLIGATIONS (Cost $955,514) | | | 843,888 |
| | | | |
| Supranational Obligations - 0.8% |
| | | Principal Amount (a) (000s) | Value ($) (000s) |
| African Development Bank 0.875% 7/22/26 | | 12,141 | 11,441 |
| Asian Development Bank: | | | |
| 0.375% 9/3/25 | | 31,972 | 30,718 |
| 0.5% 2/4/26 | | 17,689 | 16,793 |
| 0.75% 10/8/30 | | 15,466 | 12,872 |
| 1.5% 10/18/24 | | 17,883 | 17,799 |
| 2% 4/24/26 | | 5,004 | 4,835 |
| 2.5% 11/2/27 | | 5,321 | 5,110 |
| 2.625% 1/12/27 | | 5,164 | 5,013 |
| 2.75% 1/19/28 | | 29,894 | 28,870 |
| Corporacion Andina de Fomento 5% 1/24/29 | | 4,395 | 4,504 |
| European Investment Bank: | | | |
| 0.75% 9/23/30 | | 22,088 | 18,452 |
| 0.875% 5/17/30 | | 5,299 | 4,500 |
| 1.25% 2/14/31 | | 9,586 | 8,157 |
| 1.875% 2/10/25 | | 2,383 | 2,352 |
| 2.375% 5/24/27 | | 3,177 | 3,055 |
| 2.5% 10/15/24 | | 4,548 | 4,533 |
| Inter-American Development Bank: | | | |
| 0.625% 7/15/25 | | 17,588 | 17,012 |
| 0.875% 4/20/26 | | 40,212 | 38,157 |
| 1.75% 3/14/25 | | 14,635 | 14,401 |
| 2% 6/2/26 | | 3,177 | 3,064 |
| 2.125% 1/15/25 | | 1,454 | 1,439 |
| 2.25% 6/18/29 | | 15,187 | 14,148 |
| 2.375% 7/7/27 | | 5,346 | 5,131 |
| 4.375% 1/24/44 | | 6,926 | 6,773 |
| International Bank for Reconstruction & Development: | | | |
| 0.375% 7/28/25 | | 20,783 | 20,039 |
| 0.5% 10/28/25 | | 26,222 | 25,101 |
| 0.75% 8/26/30 | | 13,146 | 10,979 |
| 0.875% 5/14/30 | | 16,078 | 13,656 |
| 1.25% 2/10/31 | | 14,403 | 12,233 |
| 1.625% 1/15/25 | | 14,127 | 13,955 |
| 1.875% 10/27/26 | | 3,781 | 3,619 |
| 2.5% 11/25/24 | | 4,528 | 4,500 |
| 2.5% 7/29/25 | | 3,010 | 2,958 |
| 4% 7/25/30 | | 26,650 | 26,842 |
| 4.75% 11/14/33 | | 28,960 | 30,615 |
| International Finance Corp. 0.75% 8/27/30 | | 8,767 | 7,329 |
| TOTAL SUPRANATIONAL OBLIGATIONS (Cost $479,745) | | | 450,955 |
| | | | |
| Bank Notes - 0.1% |
| | | Principal Amount (a) (000s) | Value ($) (000s) |
| Bank of America NA 6% 10/15/36 | | 4,075 | 4,428 |
| Citizens Bank NA: | | | |
| 2.25% 4/28/25 | | 10,391 | 10,168 |
| 3.75% 2/18/26 | | 10,723 | 10,525 |
| Discover Bank 3.45% 7/27/26 | | 10,127 | 9,838 |
| KeyBank NA: | | | |
| 3.9% 4/13/29 | | 1,400 | 1,308 |
| 4.9% 8/8/32 | | 2,000 | 1,896 |
| Truist Bank: | | | |
| 2.636% 9/17/29 (c) | | 9,000 | 8,971 |
| 3.3% 5/15/26 | | 6,037 | 5,891 |
| 3.8% 10/30/26 | | 2,573 | 2,519 |
| Wells Fargo Bank NA 5.45% 8/7/26 | | 5,000 | 5,092 |
| TOTAL BANK NOTES (Cost $61,201) | | | 60,636 |
| | | | |
| Money Market Funds - 0.7% |
| | | Shares | Value ($) (000s) |
| Fidelity Cash Central Fund 5.39% (g) | | 301,390,554 | 301,451 |
| Fidelity Securities Lending Cash Central Fund 5.39% (g)(h) | | 117,733,514 | 117,745 |
| TOTAL MONEY MARKET FUNDS (Cost $419,196) | | | 419,196 |
| | | | |
| TOTAL INVESTMENT IN SECURITIES - 101.6% (Cost $64,470,965) | 60,083,799 |
NET OTHER ASSETS (LIABILITIES) - (1.6)% | (946,604) |
| NET ASSETS - 100.0% | 59,137,195 |
| | |
| TBA Sale Commitments |
| | Principal Amount (a) (000s) | Value ($) (000s) |
| Ginnie Mae | | |
| 2% 9/1/54 | (15,250) | (12,840) |
| 2.5% 9/1/54 | (28,550) | (24,948) |
| 3% 9/1/54 | (27,650) | (25,004) |
| 3.5% 9/1/54 | (20,675) | (19,241) |
| 5% 9/1/54 | (28,550) | (28,490) |
| | | |
| TOTAL GINNIE MAE | | (110,523) |
| | | |
| Uniform Mortgage Backed Securities | | |
| 2% 9/1/54 | (47,250) | (38,645) |
| 2.5% 9/1/54 | (37,000) | (31,541) |
| 3% 9/1/54 | (11,225) | (9,952) |
| 3.5% 9/1/54 | (25,150) | (23,149) |
| | | |
| TOTAL UNIFORM MORTGAGE BACKED SECURITIES | | (103,287) |
| | | |
TOTAL TBA SALE COMMITMENTS (Proceeds $215,238) | | (213,810) |
Any values shown as $0 in the Schedule of Investments may reflect amounts less than $500.
Legend
| (a) | Amount is stated in United States dollars unless otherwise noted. |
| (b) | Security exempt from registration under Rule 144A of the Securities Act of 1933. These securities may be resold in transactions exempt from registration, normally to qualified institutional buyers. At the end of the period, the value of these securities amounted to $109,820,000 or 0.2% of net assets. |
| (c) | Coupon rates for floating and adjustable rate securities reflect the rates in effect at period end. |
| (d) | Security or a portion of the security is on loan at period end. |
| (e) | Coupon is indexed to a floating interest rate which may be multiplied by a specified factor and/or subject to caps or floors. |
| (f) | Security or a portion of the security purchased on a delayed delivery or when-issued basis. |
| (g) | Affiliated fund that is generally available only to investment companies and other accounts managed by Fidelity Investments. The rate quoted is the annualized seven-day yield of the fund at period end. A complete unaudited listing of the fund's holdings as of its most recent quarter end is available upon request. In addition, each Fidelity Central Fund's financial statements, which are not covered by the Fund's Report of Independent Registered Public Accounting Firm, are available on the SEC's website or upon request. |
| (h) | Investment made with cash collateral received from securities on loan. |
Affiliated Central Funds
Fiscal year to date information regarding the Fund's investments in Fidelity Central Funds, including the ownership percentage, is presented below.
| Affiliate (Amounts in thousands) | Value, beginning of period ($) | Purchases ($) | Sales Proceeds ($) | Dividend Income ($) | Realized Gain (loss) ($) | Change in Unrealized appreciation (depreciation) ($) | Value, end of period ($) | % ownership, end of period |
| Fidelity Cash Central Fund 5.39% | 113,100 | 7,620,512 | 7,432,163 | 8,344 | 2 | - | 301,451 | 0.7% |
| Fidelity Securities Lending Cash Central Fund 5.39% | 379,147 | 6,031,642 | 6,293,044 | 682 | - | - | 117,745 | 0.5% |
| Total | 492,247 | 13,652,154 | 13,725,207 | 9,026 | 2 | - | 419,196 | |
| | | | | | | | | |
Amounts in the dividend income column in the above table include any capital gain distributions from underlying funds, which are presented in the corresponding line item in the Statement of Operations, if applicable.
Amounts in the dividend income column for Fidelity Securities Lending Cash Central Fund represents the income earned on investing cash collateral, less rebates paid to borrowers and any lending agent fees associated with the loan, plus any premium payments received for lending certain types of securities.
Amounts included in the purchases and sales proceeds columns may include in-kind transactions, if applicable.
Investment Valuation
The following is a summary of the inputs used, as of August 31, 2024, involving the Fund's assets and liabilities carried at fair value. The inputs or methodology used for valuing securities may not be an indication of the risk associated with investing in those securities. For more information on valuation inputs, and their aggregation into the levels used below, please refer to the Investment Valuation section in the accompanying Notes to Financial Statements.
| Valuation Inputs at Reporting Date: |
Description (Amounts in thousands) | Total ($) | Level 1 ($) | Level 2 ($) | Level 3 ($) |
Investments in Securities: | | | | |
|
| Corporate Bonds | 15,586,629 | - | 15,586,629 | - |
|
| U.S. Government and Government Agency Obligations | 25,698,653 | - | 25,698,653 | - |
|
| U.S. Government Agency - Mortgage Securities | 15,597,274 | - | 15,597,274 | - |
|
| Asset-Backed Securities | 193,629 | - | 193,629 | - |
|
| Commercial Mortgage Securities | 959,091 | - | 959,091 | - |
|
| Municipal Securities | 273,848 | - | 273,848 | - |
|
| Foreign Government and Government Agency Obligations | 843,888 | - | 843,888 | - |
|
| Supranational Obligations | 450,955 | - | 450,955 | - |
|
| Bank Notes | 60,636 | - | 60,636 | - |
|
| Money Market Funds | 419,196 | 419,196 | - | - |
| Total Investments in Securities: | 60,083,799 | 419,196 | 59,664,603 | - |
Other Financial Instruments: | | | | |
TBA Sale Commitments | (213,810) | - | (213,810) | - |
| Total Other Financial Instruments: | (213,810) | - | (213,810) | - |
Financial Statements
| Statement of Assets and Liabilities |
As of August 31, 2024 Amounts in thousands (except per-share amount) |
| Assets | | | | |
| Investment in securities, at value (including securities loaned of $114,872) - See accompanying schedule: | | | | |
Unaffiliated issuers (cost $64,051,769) | $ | 59,664,603 | | |
Fidelity Central Funds (cost $419,196) | | 419,196 | | |
| | | | | |
| | | | | |
| Total Investment in Securities (cost $64,470,965) | | | $ | 60,083,799 |
| Cash | | | | 85 |
| Foreign currency held at value (cost $1) | | | | 1 |
| Receivable for investments sold | | | | 13 |
| Receivable for TBA sale commitments | | | | 215,238 |
| Receivable for fund shares sold | | | | 514,737 |
| Interest receivable | | | | 415,871 |
| Distributions receivable from Fidelity Central Funds | | | | 686 |
| Other receivables | | | | 677 |
Total assets | | | | 61,231,107 |
| Liabilities | | | | |
| Payable for investments purchased | | | | |
Regular delivery | $ | 755,196 | | |
Delayed delivery | | 928,581 | | |
| TBA sale commitments, at value | | 213,810 | | |
| Payable for fund shares redeemed | | 65,062 | | |
| Distributions payable | | 11,618 | | |
| Accrued management fee | | 1,220 | | |
| Other payables and accrued expenses | | 680 | | |
| Collateral on securities loaned | | 117,745 | | |
| Total liabilities | | | | 2,093,912 |
| Net Assets | | | $ | 59,137,195 |
| Net Assets consist of: | | | | |
| Paid in capital | | | $ | 65,271,345 |
| Total accumulated earnings (loss) | | | | (6,134,150) |
| Net Assets | | | $ | 59,137,195 |
Net Asset Value, offering price and redemption price per share ($59,137,195 ÷ 5,620,422 shares) | | | $ | 10.52 |
| Statement of Operations |
| Year ended August 31, 2024 Amounts in thousands |
| Investment Income | | | | |
| Interest | | | $ | 1,978,141 |
| Income from Fidelity Central Funds (including $682 from security lending) | | | | 9,026 |
| Total income | | | | 1,987,167 |
| Expenses | | | | |
| Management fee | $ | 14,114 | | |
| Independent trustees' fees and expenses | | 175 | | |
| Total expenses before reductions | | 14,289 | | |
| Expense reductions | | (22) | | |
| Total expenses after reductions | | | | 14,267 |
| Net Investment income (loss) | | | | 1,972,900 |
| Realized and Unrealized Gain (Loss) | | | | |
| Net realized gain (loss) on: | | | | |
| Investment Securities: | | | | |
| Unaffiliated issuers | | (1,070,917) | | |
| Fidelity Central Funds | | 2 | | |
| Total net realized gain (loss) | | | | (1,070,915) |
| Change in net unrealized appreciation (depreciation) on: | | | | |
| Investment Securities: | | | | |
| Unaffiliated issuers | | 2,970,769 | | |
| TBA Sale commitments | | 4,831 | | |
| Total change in net unrealized appreciation (depreciation) | | | | 2,975,600 |
| Net gain (loss) | | | | 1,904,685 |
| Net increase (decrease) in net assets resulting from operations | | | $ | 3,877,585 |
| Statement of Changes in Net Assets |
| |
| Amount in thousands | | Year ended August 31, 2024 | | Year ended August 31, 2023 |
| Increase (Decrease) in Net Assets | | | | |
| Operations | | | | |
| Net investment income (loss) | $ | 1,972,900 | $ | 1,708,483 |
| Net realized gain (loss) | | (1,070,915) | | (504,134) |
| Change in net unrealized appreciation (depreciation) | | 2,975,600 | | (1,874,453) |
| Net increase (decrease) in net assets resulting from operations | | 3,877,585 | | (670,104) |
| Distributions to shareholders | | (1,881,357) | | (1,612,062) |
| | | | | |
| Share transactions | | | | |
| Proceeds from sales of shares | | 19,678,818 | | 20,874,738 |
| Reinvestment of distributions | | 1,751,942 | | 1,509,540 |
| Cost of shares redeemed | | (24,303,853) | | (15,664,583) |
| | | | | |
Net increase (decrease) in net assets resulting from share transactions | | (2,873,093) | | 6,719,695 |
| Total increase (decrease) in net assets | | (876,865) | | 4,437,529 |
| | | | | |
| Net Assets | | | | |
| Beginning of period | | 60,014,060 | | 55,576,531 |
| End of period | $ | 59,137,195 | $ | 60,014,060 |
| | | | | |
| Other Information | | | | |
| Shares | | | | |
| Sold | | 1,930,888 | | 2,035,365 |
| Issued in reinvestment of distributions | | 172,144 | | 147,271 |
| Redeemed | | (2,402,921) | | (1,527,862) |
| Net increase (decrease) | | (299,889) | | 654,774 |
| | | | | |
Financial Highlights
Fidelity® U.S. Bond Index Fund |
| |
| Years ended August 31, | | 2024 | | 2023 | | 2022 | | 2021 | | 2020 |
Selected Per-Share Data | | | | | | | | | | |
| Net asset value, beginning of period | $ | 10.14 | $ | 10.55 | $ | 12.20 | $ | 12.57 | $ | 12.08 |
| Income from Investment Operations | | | | | | | | | | |
Net investment income (loss) A,B | | .351 | | .304 | | .236 | | .222 | | .291 |
| Net realized and unrealized gain (loss) | | .364 | | (.427) | | (1.626) | | (.245) | | .481 |
| Total from investment operations | | .715 | | (.123) | | (1.390) | | (.023) | | .772 |
| Distributions from net investment income | | (.335) | | (.287) | | (.230) | | (.224) | | (.282) |
| Distributions from net realized gain | | - | | - | | (.030) | | (.123) | | - |
| Total distributions | | (.335) | | (.287) | | (.260) | | (.347) | | (.282) |
| Net asset value, end of period | $ | 10.52 | $ | 10.14 | $ | 10.55 | $ | 12.20 | $ | 12.57 |
Total Return C | | | | (1.16)% | | (11.52)% | | (.17)% | | 6.48% |
Ratios to Average Net Assets B,D,E | | | | | | | | | | |
| Expenses before reductions | | .02% F | | .02% F | | .02% F | | .03% | | .03% |
| Expenses net of fee waivers, if any | | | | .02% F | | .02% F | | .03% | | .03% |
| Expenses net of all reductions | | .02% F | | .02% F | | .02% F | | .02% | | .03% |
| Net investment income (loss) | | 3.45% | | 2.97% | | 2.08% | | 1.81% | | 2.38% |
| Supplemental Data | | | | | | | | | | |
| Net assets, end of period (in millions) | $ | 59,137 | $ | 60,014 | $ | 55,577 | $ | 59,844 | $ | 55,526 |
Portfolio turnover rate G | | | | 34% | | 50% H | | 76% | | 59% H |
ACalculated based on average shares outstanding during the period.
BNet investment income (loss) is affected by the timing of the declaration of dividends by any underlying mutual funds or exchange-traded funds (ETFs). Net investment income (loss) of any mutual funds or ETFs is not included in the Fund's net investment income (loss) ratio.
CTotal returns would have been lower if certain expenses had not been reduced during the applicable periods shown.
DFees and expenses of any underlying mutual funds or exchange-traded funds (ETFs) are not included in the Fund's expense ratio. The Fund indirectly bears its proportionate share of these expenses. For additional expense information related to investments in Fidelity Central Funds, please refer to the "Investments in Fidelity Central Funds" note found in the Notes to Financial Statements section of the most recent Annual or Semi-Annual report.
EExpense ratios reflect operating expenses of the class. Expenses before reductions do not reflect amounts reimbursed, waived, or reduced through arrangements with the investment adviser, brokerage services, or other offset arrangements, if applicable, and do not represent the amount paid by the class during periods when reimbursements, waivers or reductions occur.
FThe size and fluctuation of net assets and expense amounts may cause ratios to differ from contractual rates.
GAmount does not include the portfolio activity of any underlying mutual funds or exchange-traded funds (ETFs).
HPortfolio turnover rate excludes securities received or delivered in-kind.
Notes to Financial Statements
For the period ended August 31, 2024
(Amounts in thousands except percentages)
1. Organization.
Fidelity U.S. Bond Index Fund (the Fund) is a fund of Fidelity Salem Street Trust (the Trust) and is authorized to issue an unlimited number of shares. Share transactions on the Statement of Changes in Net Assets may contain exchanges between affiliated funds. The Trust is registered under the Investment Company Act of 1940, as amended (the 1940 Act), as an open-end management investment company organized as a Massachusetts business trust.
2. Investments in Fidelity Central Funds.
Funds may invest in Fidelity Central Funds, which are open-end investment companies generally available only to other investment companies and accounts managed by the investment adviser and its affiliates. The Schedule of Investments lists any Fidelity Central Funds held as an investment as of period end, but does not include the underlying holdings of each Fidelity Central Fund. An investing fund indirectly bears its proportionate share of the expenses of the underlying Fidelity Central Funds.
Based on its investment objective, each Fidelity Central Fund may invest or participate in various investment vehicles or strategies that are similar to those of the investing fund. These strategies are consistent with the investment objectives of the investing fund and may involve certain economic risks which may cause a decline in value of each of the Fidelity Central Funds and thus a decline in the value of the investing fund.
| Fidelity Central Fund | Investment Manager | Investment Objective | Investment Practices | Expense RatioA |
| Fidelity Money Market Central Funds | Fidelity Management & Research Company LLC (FMR) | Each fund seeks to obtain a high level of current income consistent with the preservation of capital and liquidity. | Short-term Investments | Less than .005% |
A Expenses expressed as a percentage of average net assets and are as of each underlying Central Fund's most recent annual or semi-annual shareholder report.
A complete unaudited list of holdings for each Fidelity Central Fund is available upon request or at the Securities and Exchange Commission website at www.sec.gov. In addition, the financial statements of the Fidelity Central Funds which contain the significant accounting policies (including investment valuation policies) of those funds, and are not covered by the Report of Independent Registered Public Accounting Firm, are available on the Securities and Exchange Commission website or upon request.
3. Significant Accounting Policies.
The Fund is an investment company and applies the accounting and reporting guidance of the Financial Accounting Standards Board (FASB) Accounting Standards Codification Topic 946 Financial Services - Investment Companies. The financial statements have been prepared in conformity with accounting principles generally accepted in the United States of America (GAAP), which require management to make certain estimates and assumptions at the date of the financial statements. Actual results could differ from those estimates. Subsequent events, if any, through the date that the financial statements were issued have been evaluated in the preparation of the financial statements. The Fund's Schedule of Investments lists any underlying mutual funds or exchange-traded funds (ETFs) but does not include the underlying holdings of these funds. The following summarizes the significant accounting policies of the Fund:
Investment Valuation. Investments are valued as of 4:00 p.m. Eastern time on the last calendar day of the period. The Board of Trustees (the Board) has designated the Fund's investment adviser as the valuation designee responsible for the fair valuation function and performing fair value determinations as needed. The investment adviser has established a Fair Value Committee (the Committee) to carry out the day-to-day fair valuation responsibilities and has adopted policies and procedures to govern the fair valuation process and the activities of the Committee. In accordance with these fair valuation policies and procedures, which have been approved by the Board, the Fund attempts to obtain prices from one or more third party pricing services or brokers to value its investments. When current market prices, quotations or currency exchange rates are not readily available or reliable, investments will be fair valued in good faith by the Committee, in accordance with the policies and procedures. Factors used in determining fair value vary by investment type and may include market or investment specific events, transaction data, estimated cash flows, and market observations of comparable investments. The frequency that the fair valuation procedures are used cannot be predicted and they may be utilized to a significant extent. The Committee manages the Fund's fair valuation practices and maintains the fair valuation policies and procedures. The Fund's investment adviser reports to the Board information regarding the fair valuation process and related material matters.
The Fund categorizes the inputs to valuation techniques used to value its investments into a disclosure hierarchy consisting of three levels as shown below:
Level 1 - unadjusted quoted prices in active markets for identical investments
Level 2 - other significant observable inputs (including quoted prices for similar investments, interest rates, prepayment speeds, etc.)
Level 3 - unobservable inputs (including the Fund's own assumptions based on the best information available)
Valuation techniques used to value the Fund's investments by major category are as follows:
Debt securities, including restricted securities, are valued based on evaluated prices received from third party pricing services or from brokers who make markets in such securities. Corporate bonds, bank notes, foreign government and government agency obligations, municipal securities, supranational obligations and U.S. government and government agency obligations are valued by pricing services who utilize matrix pricing which considers yield or price of bonds of comparable quality, coupon, maturity and type or by broker-supplied prices. Asset backed securities, commercial mortgage securities and U.S. government agency mortgage securities are valued by pricing services who utilize matrix pricing which considers prepayment speed assumptions, attributes of the collateral, yield or price of bonds of comparable quality, coupon, maturity and type or by broker-supplied prices. When independent prices are unavailable or unreliable, debt securities may be valued utilizing pricing methodologies which consider similar factors that would be used by third party pricing services. Debt securities are generally categorized as Level 2 in the hierarchy but may be Level 3 depending on the circumstances.
Investments in open-end mutual funds, including the Fidelity Central Funds, are valued at their closing net asset value (NAV) each business day and are categorized as Level 1 in the hierarchy.
Changes in valuation techniques may result in transfers in or out of an assigned level within the disclosure hierarchy. The aggregate value of investments by input level as of August 31, 2024 is included at the end of the Fund's Schedule of Investments.
Foreign Currency. Certain Funds may use foreign currency contracts to facilitate transactions in foreign-denominated securities. Gains and losses from these transactions may arise from changes in the value of the foreign currency or if the counterparties do not perform under the contracts' terms.
Foreign-denominated assets, including investment securities, and liabilities are translated into U.S. dollars at the exchange rates at period end. Purchases and sales of investment securities, income and dividends received, and expenses denominated in foreign currencies are translated into U.S. dollars at the exchange rate in effect on the transaction date.
The effects of exchange rate fluctuations on investments are included with the net realized and unrealized gain (loss) on investment securities. Other foreign currency transactions resulting in realized and unrealized gain (loss) are disclosed separately.
Investment Transactions and Income. For financial reporting purposes, the Fund's investment holdings and NAV include trades executed through the end of the last business day of the period. The NAV per share for processing shareholder transactions is calculated as of the close of business of the New York Stock Exchange (NYSE), normally 4:00 p.m. Eastern time and includes trades executed through the end of the prior business day. Gains and losses on securities sold are determined on the basis of identified cost and include proceeds received from litigation. Income and capital gain distributions from Fidelity Central Funds, if any, are recorded on the ex-dividend date. Interest income is accrued as earned and includes coupon interest and amortization of premium and accretion of discount on debt securities as applicable. Investment income is recorded net of foreign taxes withheld where recovery of such taxes is uncertain. Debt obligations may be placed on non-accrual status and related interest income may be reduced by ceasing current accruals and writing off interest receivables when the collection of all or a portion of interest has become doubtful based on consistently applied procedures. A debt obligation is removed from non-accrual status when the issuer resumes interest payments or when collectability of interest is reasonably assured.
Expenses. Expenses directly attributable to a fund are charged to that fund. Expenses attributable to more than one fund are allocated among the respective funds on the basis of relative net assets or other appropriate methods. Expenses included in the accompanying financial statements reflect the expenses of that fund and do not include any expenses associated with any underlying mutual funds or exchange-traded funds. Although not included in a fund's expenses, a fund indirectly bears its proportionate share of these expenses through the net asset value of each underlying mutual fund or exchange-traded fund. Expense estimates are accrued in the period to which they relate and adjustments are made when actual amounts are known.
Deferred Trustee Compensation. Under a Deferred Compensation Plan (the Plan) for certain Funds, certain independent Trustees have elected to defer receipt of a portion of their annual compensation. Deferred amounts are invested in affiliated mutual funds, are marked-to-market and remain in a fund until distributed in accordance with the Plan. The investment of deferred amounts and the offsetting payable to the Trustees presented below are included in the accompanying Statement of Assets and Liabilities in other receivables and other payables and accrued expenses, as applicable.
| Fidelity U.S. Bond Index Fund | $676 |
Income Tax Information and Distributions to Shareholders. Each year, the Fund intends to qualify as a regulated investment company under Subchapter M of the Internal Revenue Code, including distributing substantially all of its taxable income and realized gains. As a result, no provision for U.S. Federal income taxes is required. As of August 31, 2024, the Fund did not have any unrecognized tax benefits in the financial statements; nor is the Fund aware of any tax positions for which it is reasonably possible that the total amounts of unrecognized tax benefits will significantly change in the next twelve months. The Fund files a U.S. federal tax return, in addition to state and local tax returns as required. The Fund's federal income tax returns are subject to examination by the Internal Revenue Service (IRS) for a period of three fiscal years after they are filed. State and local tax returns may be subject to examination for an additional fiscal year depending on the jurisdiction. Foreign taxes are provided for based on the Fund's understanding of the tax rules and rates that exist in the foreign markets in which it invests.
Distributions are declared and recorded daily and paid monthly from net investment income. Distributions from realized gains, if any, are declared and recorded on the ex-dividend date. Income and capital gain distributions are determined in accordance with income tax regulations, which may differ from GAAP.
Capital accounts within the financial statements are adjusted for permanent book-tax differences. These adjustments have no impact on net assets or the results of operations. Capital accounts are not adjusted for temporary book-tax differences which will reverse in a subsequent period.
Book-tax differences are primarily due to market discount, capital loss carryforwards and losses deferred due to wash sales.
As of period end, the cost and unrealized appreciation (depreciation) in securities, and derivatives if applicable, for federal income tax purposes were as follows:
| Gross unrealized appreciation | $491,230 |
| Gross unrealized depreciation | (4,737,858) |
| Net unrealized appreciation (depreciation) | $(4,246,628) |
| Tax Cost | $64,331,856 |
The tax-based components of distributable earnings as of period end were as follows:
| Capital loss carryforward | $(1,860,214) |
| Net unrealized appreciation (depreciation) on securities and other investments | $(4,246,628) |
Capital loss carryforwards are only available to offset future capital gains of the Fund to the extent provided by regulations and may be limited. The capital loss carryforward information presented below, including any applicable limitation, is estimated as of fiscal period end and is subject to adjustment.
Short-term | $(565,099) |
Long-term | (1,295,115) |
| Total capital loss carryforward | $(1,860,214) |
The tax character of distributions paid was as follows:
| | August 31, 2024 | August 31, 2023 |
| Ordinary Income | $ 1,881,357 | $ 1,612,062 |
| Total | $ 1,881,357 | $ 1,612,062 |
Delayed Delivery Transactions and When-Issued Securities. During the period, certain Funds transacted in securities on a delayed delivery or when-issued basis. Payment and delivery may take place after the customary settlement period for that security. The price of the underlying securities and the date when the securities will be delivered and paid for are fixed at the time the transaction is negotiated. Securities purchased on a delayed delivery or when-issued basis are identified as such in the Schedule of Investments. Compensation for interest forgone in the purchase of a delayed delivery or when-issued debt security may be received. With respect to purchase commitments, each applicable Fund identifies securities as segregated in its records with a value at least equal to the amount of the commitment. Payables and receivables associated with the purchases and sales of delayed delivery securities having the same coupon, settlement date and broker are offset. Delayed delivery or when-issued securities that have been purchased from and sold to different brokers are reflected as both payables and receivables in the Statement of Assets and Liabilities under the caption "Delayed delivery", as applicable. Losses may arise due to changes in the value of the underlying securities or if the counterparty does not perform under the contract's terms, or if the issuer does not issue the securities due to political, economic, or other factors.
To-Be-Announced (TBA) Securities and Mortgage Dollar Rolls. TBA securities involve buying or selling mortgage-backed securities (MBS) on a forward commitment basis. A TBA transaction typically does not designate the actual security to be delivered and only includes an approximate principal amount; however delivered securities must meet specified terms defined by industry guidelines, including issuer, rate and current principal amount outstanding on underlying mortgage pools. Funds may enter into a TBA transaction with the intent to take possession of or deliver the underlying MBS, or a fund may elect to extend the settlement by entering into either a mortgage or reverse mortgage dollar roll. Mortgage dollar rolls are transactions where a fund sells TBA securities and simultaneously agrees to repurchase MBS on a later date at a lower price and with the same counterparty. Reverse mortgage dollar rolls involve the purchase and simultaneous agreement to sell TBA securities on a later date at a lower price. Transactions in mortgage dollar rolls and reverse mortgage dollar rolls are accounted for as purchases and sales and may result in an increase to a fund's portfolio turnover rate.
Purchases and sales of TBA securities involve risks similar to those discussed above for delayed delivery and when-issued securities. Also, if the counterparty in a mortgage dollar roll or a reverse mortgage dollar roll transaction files for bankruptcy or becomes insolvent, a fund's right to repurchase or sell securities may be limited. Additionally, when a fund sells TBA securities without already owning or having the right to obtain the deliverable securities (an uncovered forward commitment to sell), it incurs a risk of loss because it could have to purchase the securities at a price that is higher than the price at which it sold them. A fund may be unable to purchase the deliverable securities if the corresponding market is illiquid.
TBA securities subject to a forward commitment to sell at period end are included at the end of the Schedule of Investments under the caption "TBA Sale Commitments." The value of these commitments and proceeds to be received at contractual settlement date are reflected in the Statement of Assets and Liabilities as "TBA sale commitments, at value" and "Receivable for TBA sale commitments," respectively. If the TBA sale commitment is closed through the acquisition of an offsetting TBA purchase commitment, a fund realizes a gain or loss. If a fund delivers securities under the commitment, a fund realizes a gain or loss from the sale of the securities based upon the price established at the date the commitment was entered into.
Restricted Securities (including Private Placements). Funds may invest in securities that are subject to legal or contractual restrictions on resale. These securities generally may be resold in transactions exempt from registration or to the public if the securities are registered. Disposal of these securities may involve time-consuming negotiations and expense, and prompt sale at an acceptable price may be difficult. Information regarding restricted securities held at period end is included at the end of the Schedule of Investments, if applicable.
4. Purchases and Sales of Investments.
Purchases and sales of securities, other than short-term securities, U.S. government securities and in-kind transactions, as applicable, are noted in the table below.
| | Purchases ($) | Sales ($) |
| Fidelity U.S. Bond Index Fund | 7,886,430 | 8,374,630 |
5. Fees and Other Transactions with Affiliates.
Management Fee and Expense Contract. Fidelity Management & Research Company LLC (the investment adviser) and its affiliates provide the Fund with investment management related services for which the Fund pays a monthly management fee. The management fee is based on an annual rate of .025% of the Fund's average net assets. The management fee is reduced by an amount equal to the fees and expenses paid by the Fund to the independent Trustees. Under the management contract, the investment adviser pays all other operating expenses, except the compensation of the independent Trustees and certain other expenses such as interest expense.
Under the expense contract, the investment adviser pays all other operating expenses, except the compensation of the independent Trustees, as necessary so that the total expenses do not exceed .025% of average net assets. This expense contract will remain in place through October 31, 2025.
Interfund Trades. Funds may purchase from or sell securities to other Fidelity Funds under procedures adopted by the Board. The procedures have been designed to ensure these interfund trades are executed in accordance with Rule 17a-7 of the 1940 Act. Any interfund trades are included within the respective purchases and sales amounts shown in the Purchases and Sales of Investments note. During the period, there were no interfund trades.
Sub-Advisory Arrangements. Effective March 1, 2024, the Fund's sub-advisory agreements with FMR Investment Management (UK) Limited, Fidelity Management & Research (Hong Kong) Limited, and Fidelity Management & Research (Japan) Limited were amended to provide that the investment adviser pays each sub-adviser monthly fees equal to 110% of the sub-adviser's costs for providing sub-advisory services.
6. Committed Line of Credit.
Certain Funds participate with other funds managed by the investment adviser or an affiliate in a $4.25 billion credit facility (the "line of credit") to be utilized for temporary or emergency purposes to fund shareholder redemptions or for other short-term liquidity purposes. The commitment fees on the pro-rata portion of the line of credit are borne by the investment adviser. During the period, there were no borrowings on this line of credit.
7. Security Lending.
Funds lend portfolio securities from time to time in order to earn additional income. Lending agents are used, including National Financial Services (NFS), an affiliate of the investment adviser. Pursuant to a securities lending agreement, NFS will receive a fee, which is capped at 9.9% of a fund's daily lending revenue, for its services as lending agent. A fund may lend securities to certain qualified borrowers, including NFS. On the settlement date of the loan, a fund receives collateral (in the form of U.S. Treasury obligations, letters of credit and/or cash) against the loaned securities and maintains collateral in an amount not less than 100% of the market value of the loaned securities during the period of the loan. The market value of the loaned securities is determined at the close of business of a fund and any additional required collateral is delivered to a fund on the next business day. A fund or borrower may terminate the loan at any time, and if the borrower defaults on its obligation to return the securities loaned because of insolvency or other reasons, a fund may apply collateral received from the borrower against the obligation. A fund may experience delays and costs in recovering the securities loaned. Any cash collateral received is invested in the Fidelity Securities Lending Cash Central Fund. Any loaned securities are identified as such in the Schedule of Investments, and the value of loaned securities and cash collateral at period end, as applicable, are presented in the Statement of Assets and Liabilities. Security lending income represents the income earned on investing cash collateral, less rebates paid to borrowers and any lending agent fees associated with the loan, plus any premium payments received for lending certain types of securities. Security lending income is presented in the Statement of Operations as a component of income from Fidelity Central Funds. Affiliated security lending activity, if any, was as follows:
| | Total Security Lending Fees Paid to NFS ($) | Security Lending Income From Securities Loaned to NFS ($) | Value of Securities Loaned to NFS at Period End ($) |
| Fidelity U.S. Bond Index Fund | 70 | - | - |
8. Expense Reductions.
Through arrangements with the Fund's custodian, credits realized as a result of certain uninvested cash balances were used to reduce the Fund's expenses by $22.
9. Other.
A fund's organizational documents provide former and current trustees and officers with a limited indemnification against liabilities arising in connection with the performance of their duties to the fund. In the normal course of business, a fund may also enter into contracts that provide general indemnifications. A fund's maximum exposure under these arrangements is unknown as this would be dependent on future claims that may be made against a fund. The risk of material loss from such claims is considered remote.
10. Risk and Uncertainties.
Many factors affect a fund's performance. Developments that disrupt global economies and financial markets, such as pandemics, epidemics, outbreaks of infectious diseases, war, terrorism, and environmental disasters, may significantly affect a fund's investment performance. The effects of these developments to a fund will be impacted by the types of securities in which a fund invests, the financial condition, industry, economic sector, and geographic location of an issuer, and a fund's level of investment in the securities of that issuer. Significant concentrations in security types, issuers, industries, sectors, and geographic locations may magnify the factors that affect a fund's performance.
Report of Independent Registered Public Accounting Firm
To the Board of Trustees of Fidelity Salem Street Trust and Shareholders of Fidelity U.S. Bond Index Fund
Opinion on the Financial Statements
We have audited the accompanying statement of assets and liabilities, including the schedule of investments, of Fidelity U.S. Bond Index Fund (one of the funds constituting Fidelity Salem Street Trust, referred to hereafter as the "Fund") as of August 31, 2024, the related statement of operations for the year ended August 31, 2024, the statement of changes in net assets for each of the two years in the period ended August 31, 2024, including the related notes, and the financial highlights for each of the five years in the period ended August 31, 2024 (collectively referred to as the "financial statements"). In our opinion, the financial statements present fairly, in all material respects, the financial position of the Fund as of August 31, 2024, the results of its operations for the year then ended, the changes in its net assets for each of the two years in the period ended August 31, 2024 and the financial highlights for each of the five years in the period ended August 31, 2024 in conformity with accounting principles generally accepted in the United States of America.
Basis for Opinion
These financial statements are the responsibility of the Fund's management. Our responsibility is to express an opinion on the Fund's financial statements based on our audits. We are a public accounting firm registered with the Public Company Accounting Oversight Board (United States) (PCAOB) and are required to be independent with respect to the Fund in accordance with the U.S. federal securities laws and the applicable rules and regulations of the Securities and Exchange Commission and the PCAOB.
We conducted our audits of these financial statements in accordance with the standards of the PCAOB. Those standards require that we plan and perform the audit to obtain reasonable assurance about whether the financial statements are free of material misstatement, whether due to error or fraud.
Our audits included performing procedures to assess the risks of material misstatement of the financial statements, whether due to error or fraud, and performing procedures that respond to those risks. Such procedures included examining, on a test basis, evidence regarding the amounts and disclosures in the financial statements. Our audits also included evaluating the accounting principles used and significant estimates made by management, as well as evaluating the overall presentation of the financial statements. Our procedures included confirmation of securities owned as of August 31, 2024 by correspondence with the custodian and brokers; when replies were not received from brokers, we performed other auditing procedures. We believe that our audits provide a reasonable basis for our opinion.
/s/ PricewaterhouseCoopers LLP
Boston, Massachusetts
October 14, 2024
We have served as the auditor of one or more investment companies in the Fidelity group of funds since 1932.
Distributions
(Unaudited)The dividend and capital gains distributions for the fund(s) are available on Fidelity.com or Institutional.Fidelity.com.
A total of 38.37% of the dividends distributed during the fiscal year was derived from interest on U.S. Government securities which is generally exempt from state income tax.
The fund designates $1,638,789,827 of distributions paid in the calendar year 2023 as qualifying to be taxed as interest-related dividends for nonresident alien shareholders.
The fund designates $1,881,357,002 of distributions paid during the fiscal year ended 2024 as qualifying to be taxed as section 163(j) interest dividends.
The fund will notify shareholders in January 2025 of amounts for use in preparing 2024 income tax returns.
Item 8: Changes in and Disagreements with Accountants for Open-End Management Investment Companies
(Unaudited)
Note: This is not applicable for any fund included in this document.
Item 9: Proxy Disclosures for Open-End Management Investment Companies
(Unaudited)
| A special meeting of shareholders was held on October 18, 2023. The results of votes taken among shareholders on the proposal before them are reported below. Each vote reported represents one dollar of net asset value held on the record date for the meeting. |
| Proposal 1 |
| To elect a Board of Trustees. |
| | # of Votes | % of Votes |
| Abigail P. Johnson |
| Affirmative | 378,729,502,260.01 | 97.58 |
| Withheld | 9,407,876,478.96 | 2.42 |
| TOTAL | 388,137,378,738.97 | 100.00 |
| Jennifer Toolin McAuliffe |
| Affirmative | 378,454,868,010.95 | 97.51 |
| Withheld | 9,682,510,728.02 | 2.49 |
| TOTAL | 388,137,378,738.97 | 100.00 |
| Christine J. Thompson |
| Affirmative | 378,837,121,274.52 | 97.60 |
| Withheld | 9,300,257,464.45 | 2.40 |
| TOTAL | 388,137,378,738.97 | 100.00 |
| Elizabeth S. Acton |
| Affirmative | 378,262,110,794.85 | 97.46 |
| Withheld | 9,875,267,944.12 | 2.54 |
| TOTAL | 388,137,378,738.97 | 100.00 |
| Laura M. Bishop |
| Affirmative | 380,482,113,171.06 | 98.03 |
| Withheld | 7,655,265,567.91 | 1.97 |
| TOTAL | 388,137,378,738.97 | 100.00 |
| Ann E. Dunwoody |
| Affirmative | 380,016,034,008.12 | 97.91 |
| Withheld | 8,121,344,730.85 | 2.09 |
| TOTAL | 388,137,378,738.97 | 100.00 |
| John Engler |
| Affirmative | 379,432,488,394.20 | 97.76 |
| Withheld | 8,704,890,344.77 | 2.24 |
| TOTAL | 388,137,378,738.97 | 100.00 |
| Robert F. Gartland |
| Affirmative | 378,741,819,600.60 | 97.58 |
| Withheld | 9,395,559,138.37 | 2.42 |
| TOTAL | 388,137,378,738.97 | 100.00 |
| Robert W. Helm |
| Affirmative | 380,389,324,755.07 | 98.00 |
| Withheld | 7,748,053,983.90 | 2.00 |
| TOTAL | 388,137,378,738.97 | 100.00 |
| Arthur E. Johnson |
| Affirmative | 378,427,694,151.67 | 97.50 |
| Withheld | 9,709,684,587.30 | 2.50 |
| TOTAL | 388,137,378,738.97 | 100.00 |
| Michael E. Kenneally |
| Affirmative | 377,842,228,145.18 | 97.35 |
| Withheld | 10,295,150,593.79 | 2.65 |
| TOTAL | 388,137,378,738.97 | 100.00 |
| Mark A. Murray |
| Affirmative | 380,158,432,703.37 | 97.94 |
| Withheld | 7,978,946,035.60 | 2.06 |
| TOTAL | 388,137,378,738.97 | 100.00 |
| Carol J. Zierhoffer |
| Affirmative | 380,522,113,360.24 | 98.04 |
| Withheld | 7,615,265,378.73 | 1.96 |
| TOTAL | 388,137,378,738.97 | 100.00 |
| | | |
| Proposal 1 reflects trust-wide proposal and voting results. |
Item 10: Remuneration Paid to Directors, Officers, and others of Open-End Management Investment Companies
(Unaudited)
Note: This information is disclosed as part of the financial statements for each Fund as part of Item 7: Financial Statements and Financial Highlights for Open-End Management Investment companies.
Item 11: Statement Regarding Basis for Approval of Investment Advisory Contract
(Unaudited)
Note: This is not applicable for any fund included in this document.
1.925929.113
UII-UDV-ANN-1024
Fidelity Flex® Funds
Fidelity Flex® U.S. Bond Index Fund
Annual Report
August 31, 2024
Contents
To view a fund's proxy voting guidelines and proxy voting record for the 12-month period ended June 30, visit http://www.fidelity.com/proxyvotingresults or visit the Securities and Exchange Commission's (SEC) web site at http://www.sec.gov.
You may also call 1-800-544-3455 (for managed account clients) or 1-800-835-5092 (for retirement plan participants) to request a free copy of the proxy voting guidelines.
BLOOMBERG ® is a trademark and service mark of Bloomberg Finance L.P. and its affiliates (collectively "Bloomberg"). Bloomberg or Bloomberg's licensors own all proprietary rights in the Bloomberg Indices. Neither Bloomberg nor Bloomberg's licensors approves or endorses this material, or guarantees the accuracy or completeness of any information herein, or makes any warranty, express or implied, as to the results to be obtained therefrom and, to the maximum extent allowed by law, neither shall have any liability or responsibility for injury or damages arising in connection therewith.
Standard & Poor's, S&P and S&P 500 are registered service marks of The McGraw-Hill Companies, Inc. and have been licensed for use by Fidelity Distributors Corporation.
Other third-party marks appearing herein are the property of their respective owners.
All other marks appearing herein are registered or unregistered trademarks or service marks of FMR LLC or an affiliated company. © 2024 FMR LLC. All rights reserved.
This report and the financial statements contained herein are submitted for the general information of the shareholders of the Fund. This report is not authorized for distribution to prospective investors in the Fund unless preceded or accompanied by an effective prospectus.
A fund files its complete schedule of portfolio holdings with the SEC for the first and third quarters of each fiscal year on Form N-PORT. Forms N-PORT are available on the SEC's web site at http://www.sec.gov. A fund's Forms N-PORT may be reviewed and copied at the SEC's Public Reference Room in Washington, DC. Information regarding the operation of the SEC's Public Reference Room may be obtained by calling 1-800-SEC-0330.
For a complete list of a fund's portfolio holdings, view the most recent holdings listing, semiannual report, or annual report on Fidelity's web site at http://www.fidelity.com, http://www.institutional.fidelity.com, or http://www.401k.com, as applicable.
NOT FDIC INSURED •MAY LOSE VALUE •NO BANK GUARANTEE
Neither the Fund nor Fidelity Distributors Corporation is a bank.
Item 7: Financial Statements and Financial Highlights for Open-End Management Investment Companies (Annual Report)
Fidelity Flex® U.S. Bond Index Fund
Schedule of Investments August 31, 2024
Showing Percentage of Net Assets
| Nonconvertible Bonds - 27.2% |
| | | Principal Amount (a) | Value ($) |
| COMMUNICATION SERVICES - 2.1% | | | |
| Diversified Telecommunication Services - 0.7% | | | |
| AT&T, Inc.: | | | |
| 1.65% 2/1/28 | | 200,000 | 182,346 |
| 1.7% 3/25/26 | | 1,160,000 | 1,108,953 |
| 2.25% 2/1/32 | | 1,280,000 | 1,079,268 |
| 2.55% 12/1/33 | | 210,000 | 173,935 |
| 2.75% 6/1/31 | | 401,000 | 355,664 |
| 3.1% 2/1/43 | | 210,000 | 156,795 |
| 3.3% 2/1/52 | | 350,000 | 243,838 |
| 3.5% 6/1/41 | | 630,000 | 502,643 |
| 3.5% 9/15/53 | | 1,009,000 | 717,823 |
| 3.5% 2/1/61 | | 410,000 | 281,786 |
| 3.55% 9/15/55 | | 723,000 | 511,168 |
| 3.65% 6/1/51 | | 220,000 | 163,242 |
| 3.65% 9/15/59 | | 419,000 | 295,538 |
| 4.3% 2/15/30 | | 520,000 | 514,729 |
| 4.5% 5/15/35 | | 220,000 | 210,015 |
| 4.65% 6/1/44 | | 110,000 | 97,875 |
| 4.75% 5/15/46 | | 130,000 | 117,704 |
| 5.15% 3/15/42 | | 236,000 | 228,883 |
| 5.45% 3/1/47 | | 160,000 | 160,034 |
| 5.7% 3/1/57 | | 110,000 | 109,816 |
| Bell Canada: | | | |
| 2.15% 2/15/32 | | 230,000 | 191,328 |
| 3.2% 2/15/52 | | 100,000 | 68,985 |
| 4.464% 4/1/48 | | 130,000 | 113,014 |
| 5.55% 2/15/54 | | 140,000 | 141,882 |
| British Telecommunications PLC 9.625% 12/15/30 | | 154,000 | 193,281 |
| Deutsche Telekom International Financial BV 8.75% 6/15/30 (b) | | 370,000 | 444,795 |
| Orange SA 5.375% 1/13/42 | | 270,000 | 268,505 |
| Sprint Capital Corp. 6.875% 11/15/28 | | 490,000 | 530,729 |
| Telefonica Emisiones S.A.U.: | | | |
| 4.103% 3/8/27 | | 300,000 | 296,757 |
| 5.213% 3/8/47 | | 160,000 | 147,743 |
| 7.045% 6/20/36 | | 100,000 | 113,439 |
| Telefonica Europe BV 8.25% 9/15/30 | | 608,000 | 709,474 |
| TELUS Corp. 4.3% 6/15/49 | | 100,000 | 81,954 |
| Verizon Communications, Inc.: | | | |
| 1.5% 9/18/30 | | 930,000 | 788,715 |
| 2.355% 3/15/32 | | 615,000 | 522,510 |
| 2.85% 9/3/41 | | 920,000 | 673,420 |
| 2.987% 10/30/56 | | 802,000 | 515,297 |
| 3.55% 3/22/51 | | 500,000 | 376,306 |
| 3.7% 3/22/61 | | 140,000 | 103,095 |
| 4.016% 12/3/29 | | 1,020,000 | 998,905 |
| 4.125% 3/16/27 | | 540,000 | 535,747 |
| 4.272% 1/15/36 | | 106,000 | 99,965 |
| 4.329% 9/21/28 | | 270,000 | 269,415 |
| 4.4% 11/1/34 | | 100,000 | 95,987 |
| 4.5% 8/10/33 | | 300,000 | 291,761 |
| 4.812% 3/15/39 | | 780,000 | 751,286 |
| 5.012% 4/15/49 | | 146,000 | 144,821 |
| 5.012% 8/21/54 | | 214,000 | 203,554 |
| 5.25% 3/16/37 | | 102,000 | 104,549 |
| | | | 16,989,274 |
| Entertainment - 0.1% | | | |
| Netflix, Inc.: | | | |
| 4.9% 8/15/34 | | 170,000 | 174,131 |
| 6.375% 5/15/29 | | 390,000 | 422,585 |
| The Walt Disney Co.: | | | |
| 2% 9/1/29 | | 730,000 | 655,724 |
| 2.65% 1/13/31 | | 200,000 | 180,184 |
| 2.75% 9/1/49 | | 160,000 | 106,152 |
| 3.5% 5/13/40 | | 163,000 | 135,103 |
| 3.6% 1/13/51 | | 300,000 | 233,623 |
| 3.7% 10/15/25 | | 434,000 | 430,264 |
| 3.8% 5/13/60 | | 60,000 | 46,551 |
| 4.75% 9/15/44 | | 151,000 | 141,325 |
| 6.15% 3/1/37 | | 120,000 | 133,606 |
| 6.15% 2/15/41 | | 100,000 | 111,247 |
| 6.2% 12/15/34 | | 150,000 | 168,428 |
| | | | 2,938,923 |
| Interactive Media & Services - 0.1% | | | |
| Alphabet, Inc.: | | | |
| 0.45% 8/15/25 | | 100,000 | 96,364 |
| 1.1% 8/15/30 | | 410,000 | 347,308 |
| 1.9% 8/15/40 | | 100,000 | 69,161 |
| 2.05% 8/15/50 | | 510,000 | 310,383 |
| Baidu, Inc. 3.075% 4/7/25 | | 210,000 | 207,629 |
| Meta Platforms, Inc.: | | | |
| 3.5% 8/15/27 | | 470,000 | 462,966 |
| 3.85% 8/15/32 | | 120,000 | 114,951 |
| 4.3% 8/15/29 | | 200,000 | 201,353 |
| 4.45% 8/15/52 | | 480,000 | 429,454 |
| 4.75% 8/15/34 | | 230,000 | 231,443 |
| 4.95% 5/15/33 | | 290,000 | 299,219 |
| 5.4% 8/15/54 | | 176,000 | 179,493 |
| 5.6% 5/15/53 | | 150,000 | 158,107 |
| 5.75% 5/15/63 | | 180,000 | 191,827 |
| | | | 3,299,658 |
| Media - 0.8% | | | |
| Charter Communications Operating LLC/Charter Communications Operating Capital Corp.: | | | |
| 2.8% 4/1/31 | | 100,000 | 84,820 |
| 3.5% 6/1/41 | | 280,000 | 195,124 |
| 3.5% 3/1/42 | | 430,000 | 295,996 |
| 3.75% 2/15/28 | | 150,000 | 143,486 |
| 3.85% 4/1/61 | | 300,000 | 182,102 |
| 3.95% 6/30/62 | | 310,000 | 191,601 |
| 4.4% 4/1/33 | | 700,000 | 636,240 |
| 4.4% 12/1/61 | | 120,000 | 81,031 |
| 5.125% 7/1/49 | | 200,000 | 160,242 |
| 5.375% 4/1/38 | | 110,000 | 100,085 |
| 5.375% 5/1/47 | | 100,000 | 83,394 |
| 5.5% 4/1/63 | | 370,000 | 296,642 |
| 5.75% 4/1/48 | | 250,000 | 217,041 |
| 6.1% 6/1/29 | | 210,000 | 216,967 |
| 6.484% 10/23/45 | | 100,000 | 95,583 |
| 6.834% 10/23/55 | | 140,000 | 138,936 |
| Comcast Corp.: | | | |
| 1.5% 2/15/31 | | 295,000 | 245,279 |
| 1.95% 1/15/31 | | 300,000 | 256,423 |
| 2.35% 1/15/27 | | 2,935,000 | 2,806,816 |
| 2.45% 8/15/52 | | 295,000 | 175,173 |
| 2.65% 2/1/30 | | 680,000 | 622,218 |
| 2.8% 1/15/51 | | 120,000 | 77,619 |
| 2.887% 11/1/51 | | 273,000 | 178,712 |
| 2.937% 11/1/56 | | 660,000 | 419,816 |
| 2.987% 11/1/63 | | 160,000 | 98,834 |
| 3.2% 7/15/36 | | 390,000 | 329,311 |
| 3.45% 2/1/50 | | 230,000 | 170,498 |
| 3.969% 11/1/47 | | 170,000 | 138,719 |
| 3.999% 11/1/49 | | 300,000 | 244,784 |
| 4% 3/1/48 | | 150,000 | 122,688 |
| 4.049% 11/1/52 | | 15,000 | 12,185 |
| 4.15% 10/15/28 | | 150,000 | 148,910 |
| 4.55% 1/15/29 | | 330,000 | 333,063 |
| 5.35% 5/15/53 | | 330,000 | 330,344 |
| 5.5% 5/15/64 | | 350,000 | 352,751 |
| 5.65% 6/15/35 | | 476,000 | 504,308 |
| 7.05% 3/15/33 | | 210,000 | 242,947 |
| Discovery Communications LLC: | | | |
| 3.625% 5/15/30 | | 475,000 | 421,615 |
| 3.95% 3/20/28 | | 570,000 | 539,545 |
| 5% 9/20/37 | | 340,000 | 290,487 |
| Fox Corp.: | | | |
| 3.5% 4/8/30 | | 290,000 | 273,549 |
| 4.709% 1/25/29 | | 220,000 | 221,542 |
| 5.476% 1/25/39 | | 214,000 | 213,193 |
| 5.576% 1/25/49 | | 56,000 | 54,183 |
| Grupo Televisa SA de CV: | | | |
| 5% 5/13/45 | | 100,000 | 87,219 |
| 6.625% 1/15/40 | | 110,000 | 112,888 |
| Paramount Global: | | | |
| 4.2% 6/1/29 | | 200,000 | 187,828 |
| 4.2% 5/19/32 | | 150,000 | 130,247 |
| 4.375% 3/15/43 | | 100,000 | 71,857 |
| 4.6% 1/15/45 | | 110,000 | 78,902 |
| 4.95% 1/15/31 | | 237,000 | 220,149 |
| 4.95% 5/19/50 | | 70,000 | 52,253 |
| 5.85% 9/1/43 | | 239,000 | 203,591 |
| RELX Capital, Inc. 4% 3/18/29 | | 240,000 | 235,897 |
| Time Warner Cable Enterprises 8.375% 7/15/33 | | 100,000 | 113,868 |
| Time Warner Cable LLC: | | | |
| 5.5% 9/1/41 | | 110,000 | 95,188 |
| 5.875% 11/15/40 | | 360,000 | 324,968 |
| 6.55% 5/1/37 | | 100,000 | 98,661 |
| 7.3% 7/1/38 | | 100,000 | 104,583 |
| TWDC Enterprises 18 Corp.: | | | |
| 1.85% 7/30/26 | | 470,000 | 449,039 |
| 3% 7/30/46 | | 110,000 | 77,627 |
| 3.7% 12/1/42 | | 250,000 | 206,233 |
| 4.125% 6/1/44 | | 192,000 | 166,378 |
| 7% 3/1/32 | | 290,000 | 334,356 |
| Warnermedia Holdings, Inc.: | | | |
| 3.755% 3/15/27 | | 180,000 | 172,448 |
| 4.279% 3/15/32 | | 345,000 | 301,582 |
| 5.05% 3/15/42 | | 330,000 | 264,440 |
| 5.141% 3/15/52 | | 651,000 | 495,150 |
| 5.391% 3/15/62 | | 410,000 | 307,894 |
| | | | 17,838,048 |
| Wireless Telecommunication Services - 0.4% | | | |
| America Movil S.A.B. de CV: | | | |
| 2.875% 5/7/30 | | 511,000 | 465,489 |
| 3.625% 4/22/29 | | 200,000 | 192,000 |
| 6.125% 3/30/40 | | 100,000 | 107,674 |
| Rogers Communications, Inc.: | | | |
| 2.9% 11/15/26 | | 90,000 | 86,770 |
| 2.95% 3/15/25 | | 1,350,000 | 1,333,919 |
| 4.3% 2/15/48 | | 240,000 | 197,322 |
| 4.55% 3/15/52 | | 200,000 | 169,457 |
| 5% 3/15/44 | | 210,000 | 195,025 |
| T-Mobile U.S.A., Inc.: | | | |
| 2.05% 2/15/28 | | 200,000 | 184,265 |
| 2.55% 2/15/31 | | 190,000 | 166,835 |
| 2.625% 4/15/26 | | 1,300,000 | 1,259,603 |
| 3% 2/15/41 | | 210,000 | 156,924 |
| 3.3% 2/15/51 | | 400,000 | 282,574 |
| 3.5% 4/15/25 | | 830,000 | 821,106 |
| 3.6% 11/15/60 | | 560,000 | 398,016 |
| 3.875% 4/15/30 | | 190,000 | 182,798 |
| 4.375% 4/15/40 | | 100,000 | 90,126 |
| 4.5% 4/15/50 | | 480,000 | 416,480 |
| 4.8% 7/15/28 | | 350,000 | 353,930 |
| 5.05% 7/15/33 | | 350,000 | 354,281 |
| 5.2% 1/15/33 | | 150,000 | 153,452 |
| 5.65% 1/15/53 | | 370,000 | 379,687 |
| 5.8% 9/15/62 | | 330,000 | 340,764 |
| Vodafone Group PLC: | | | |
| 4.375% 5/30/28 | | 250,000 | 252,095 |
| 4.875% 6/19/49 | | 280,000 | 252,890 |
| 5% 5/30/38 | | 130,000 | 128,283 |
| 5.125% 6/19/59 | | 340,000 | 310,139 |
| 5.75% 6/28/54 | | 260,000 | 263,340 |
| | | | 9,495,244 |
TOTAL COMMUNICATION SERVICES | | | 50,561,147 |
| CONSUMER DISCRETIONARY - 1.6% | | | |
| Automobile Components - 0.0% | | | |
| Lear Corp.: | | | |
| 3.55% 1/15/52 | | 80,000 | 54,569 |
| 3.8% 9/15/27 | | 240,000 | 233,543 |
| | | | 288,112 |
| Automobiles - 0.4% | | | |
| American Honda Finance Corp.: | | | |
| 1% 9/10/25 | | 240,000 | 231,498 |
| 1.2% 7/8/25 | | 400,000 | 388,229 |
| 1.8% 1/13/31 | | 140,000 | 118,907 |
| 2.15% 9/10/24 | | 120,000 | 119,916 |
| 2.35% 1/8/27 | | 690,000 | 659,366 |
| 4.9% 1/10/34 | | 140,000 | 141,261 |
| 5.125% 7/7/28 | | 170,000 | 174,459 |
| Ford Motor Co.: | | | |
| 4.75% 1/15/43 | | 400,000 | 333,764 |
| 5.291% 12/8/46 | | 250,000 | 226,575 |
| 6.1% 8/19/32 | | 540,000 | 554,863 |
| General Motors Co.: | | | |
| 4.2% 10/1/27 | | 90,000 | 88,724 |
| 5% 4/1/35 | | 260,000 | 252,212 |
| 5.15% 4/1/38 | | 120,000 | 115,053 |
| 5.4% 4/1/48 | | 90,000 | 84,131 |
| 5.6% 10/15/32 | | 360,000 | 372,277 |
| 5.95% 4/1/49 | | 260,000 | 261,876 |
| 6.75% 4/1/46 | | 255,000 | 279,364 |
| 6.8% 10/1/27 | | 330,000 | 348,566 |
| General Motors Financial Co., Inc.: | | | |
| 2.4% 4/10/28 | | 190,000 | 175,074 |
| 2.7% 8/20/27 | | 140,000 | 132,758 |
| 3.85% 1/5/28 | | 160,000 | 155,761 |
| 4.3% 4/6/29 | | 370,000 | 362,425 |
| 4.35% 1/17/27 | | 1,540,000 | 1,526,845 |
| 5.25% 3/1/26 | | 170,000 | 170,756 |
| 5.4% 4/6/26 | | 360,000 | 363,313 |
| 5.6% 6/18/31 | | 100,000 | 102,342 |
| 5.65% 1/17/29 | | 130,000 | 133,643 |
| 6% 1/9/28 | | 330,000 | 342,664 |
| Honda Motor Co. Ltd. 2.967% 3/10/32 | | 130,000 | 117,498 |
| Mercedes-Benz Finance North America LLC 8.5% 1/18/31 | | 100,000 | 121,304 |
| Toyota Motor Corp. 3.669% 7/20/28 | | 290,000 | 285,262 |
| | | | 8,740,686 |
| Broadline Retail - 0.3% | | | |
| Alibaba Group Holding Ltd.: | | | |
| 2.125% 2/9/31 | | 340,000 | 291,785 |
| 3.15% 2/9/51 | | 235,000 | 160,615 |
| 4% 12/6/37 | | 140,000 | 124,226 |
| 4.5% 11/28/34 | | 230,000 | 221,660 |
| Amazon.com, Inc.: | | | |
| 0.8% 6/3/25 | | 130,000 | 126,460 |
| 1% 5/12/26 | | 200,000 | 189,735 |
| 1.5% 6/3/30 | | 160,000 | 138,357 |
| 2.1% 5/12/31 | | 360,000 | 314,480 |
| 2.5% 6/3/50 | | 780,000 | 499,914 |
| 3.1% 5/12/51 | | 200,000 | 144,167 |
| 3.15% 8/22/27 | | 680,000 | 663,427 |
| 3.45% 4/13/29 | | 100,000 | 97,732 |
| 3.875% 8/22/37 | | 280,000 | 257,212 |
| 4.05% 8/22/47 | | 228,000 | 198,354 |
| 4.1% 4/13/62 | | 490,000 | 411,036 |
| 4.25% 8/22/57 | | 100,000 | 87,963 |
| 4.6% 12/1/25 | | 1,280,000 | 1,283,487 |
| 4.8% 12/5/34 | | 230,000 | 236,740 |
| 4.95% 12/5/44 | | 200,000 | 201,949 |
| eBay, Inc.: | | | |
| 1.4% 5/10/26 | | 410,000 | 388,616 |
| 3.6% 6/5/27 | | 190,000 | 186,136 |
| 4% 7/15/42 | | 150,000 | 124,494 |
| | | | 6,348,545 |
| Distributors - 0.0% | | | |
| Genuine Parts Co.: | | | |
| 1.875% 11/1/30 | | 100,000 | 84,604 |
| 2.75% 2/1/32 | | 100,000 | 85,872 |
| | | | 170,476 |
| Diversified Consumer Services - 0.1% | | | |
| American University 3.672% 4/1/49 | | 200,000 | 162,205 |
| Duke University 2.832% 10/1/55 | | 34,000 | 23,433 |
| George Washington University 4.126% 9/15/48 | | 200,000 | 176,955 |
| Massachusetts Institute of Technology: | | | |
| 2.294% 7/1/51 | | 1,000,000 | 631,461 |
| 2.989% 7/1/50 | | 400,000 | 295,318 |
| Northwestern University: | | | |
| 3.662% 12/1/57 | | 100,000 | 81,614 |
| 3.868% 12/1/48 | | 120,000 | 101,734 |
| President and Fellows of Harvard College 2.517% 10/15/50 | | 500,000 | 333,176 |
| Trane Technologies Global Holding Co. Ltd.: | | | |
| 3.75% 8/21/28 | | 240,000 | 234,614 |
| 4.3% 2/21/48 | | 30,000 | 26,011 |
| University of Chicago 3% 10/1/52 | | 120,000 | 87,614 |
| University of Southern California 2.945% 10/1/51 | | 350,000 | 249,620 |
| | | | 2,403,755 |
| Hotels, Restaurants & Leisure - 0.2% | | | |
| Expedia Group, Inc.: | | | |
| 3.25% 2/15/30 | | 110,000 | 102,681 |
| 3.8% 2/15/28 | | 100,000 | 97,283 |
| 5% 2/15/26 | | 255,000 | 255,564 |
| Marriott International, Inc.: | | | |
| 2.75% 10/15/33 | | 100,000 | 83,890 |
| 3.125% 6/15/26 | | 510,000 | 496,616 |
| 3.5% 10/15/32 | | 130,000 | 117,209 |
| 4.625% 6/15/30 | | 123,000 | 123,159 |
| 4.875% 5/15/29 | | 300,000 | 303,613 |
| 5.35% 3/15/35 | | 240,000 | 242,885 |
| 5.75% 5/1/25 | | 110,000 | 110,577 |
| McDonald's Corp.: | | | |
| 3.3% 7/1/25 | | 280,000 | 276,576 |
| 3.6% 7/1/30 | | 1,010,000 | 969,230 |
| 3.625% 5/1/43 | | 180,000 | 144,933 |
| 3.625% 9/1/49 | | 160,000 | 122,034 |
| 4.2% 4/1/50 | | 110,000 | 92,125 |
| 4.45% 3/1/47 | | 153,000 | 134,987 |
| 4.45% 9/1/48 | | 124,000 | 109,276 |
| 4.6% 9/9/32 | | 210,000 | 210,991 |
| 4.7% 12/9/35 | | 100,000 | 99,377 |
| 4.95% 8/14/33 | | 140,000 | 143,271 |
| 6.3% 3/1/38 | | 100,000 | 111,838 |
| Starbucks Corp.: | | | |
| 2.25% 3/12/30 | | 190,000 | 169,875 |
| 2.55% 11/15/30 | | 400,000 | 358,405 |
| 3.5% 11/15/50 | | 110,000 | 81,529 |
| 3.75% 12/1/47 | | 100,000 | 77,686 |
| 4% 11/15/28 | | 350,000 | 345,639 |
| 4.45% 8/15/49 | | 100,000 | 86,672 |
| 5% 2/15/34 | | 120,000 | 121,792 |
| | | | 5,589,713 |
| Household Durables - 0.0% | | | |
| D.R. Horton, Inc.: | | | |
| 1.3% 10/15/26 | | 130,000 | 121,756 |
| 5% 10/15/34 | | 120,000 | 119,749 |
| Lennar Corp. 4.75% 11/29/27 | | 100,000 | 100,889 |
| Toll Brothers Finance Corp. 4.35% 2/15/28 | | 100,000 | 98,852 |
| Whirlpool Corp.: | | | |
| 2.4% 5/15/31 | | 80,000 | 67,800 |
| 4.6% 5/15/50 | | 100,000 | 81,505 |
| 5.5% 3/1/33 | | 50,000 | 50,364 |
| | | | 640,915 |
| Leisure Products - 0.1% | | | |
| Brunswick Corp. 5.85% 3/18/29 | | 300,000 | 306,921 |
| Hasbro, Inc.: | | | |
| 3.55% 11/19/26 | | 445,000 | 432,897 |
| 3.9% 11/19/29 | | 222,000 | 212,225 |
| | | | 952,043 |
| Specialty Retail - 0.4% | | | |
| AutoNation, Inc. 3.85% 3/1/32 | | 160,000 | 146,310 |
| AutoZone, Inc.: | | | |
| 1.65% 1/15/31 | | 180,000 | 150,235 |
| 3.625% 4/15/25 | | 270,000 | 267,475 |
| 3.75% 4/18/29 | | 210,000 | 202,760 |
| 4.5% 2/1/28 | | 240,000 | 240,065 |
| 5.1% 7/15/29 | | 50,000 | 51,109 |
| 5.4% 7/15/34 | | 50,000 | 51,223 |
| Lowe's Companies, Inc.: | | | |
| 2.8% 9/15/41 | | 370,000 | 263,702 |
| 3.375% 9/15/25 | | 210,000 | 207,178 |
| 3.65% 4/5/29 | | 620,000 | 599,257 |
| 3.7% 4/15/46 | | 100,000 | 76,757 |
| 4.05% 5/3/47 | | 132,000 | 106,914 |
| 4.25% 4/1/52 | | 140,000 | 114,832 |
| 4.45% 4/1/62 | | 270,000 | 220,405 |
| 4.8% 4/1/26 | | 300,000 | 300,920 |
| 5% 4/15/33 | | 260,000 | 264,341 |
| 5% 4/15/40 | | 330,000 | 319,059 |
| 5.15% 7/1/33 | | 200,000 | 205,858 |
| 5.625% 4/15/53 | | 230,000 | 232,590 |
| 5.8% 9/15/62 | | 50,000 | 50,962 |
| O'Reilly Automotive, Inc.: | | | |
| 1.75% 3/15/31 | | 270,000 | 225,234 |
| 4.35% 6/1/28 | | 150,000 | 149,332 |
| The Home Depot, Inc.: | | | |
| 1.375% 3/15/31 | | 460,000 | 380,443 |
| 2.375% 3/15/51 | | 250,000 | 152,208 |
| 2.5% 4/15/27 | | 750,000 | 719,653 |
| 2.75% 9/15/51 | | 160,000 | 105,027 |
| 2.95% 6/15/29 | | 330,000 | 312,067 |
| 3% 4/1/26 | | 900,000 | 881,583 |
| 3.3% 4/15/40 | | 100,000 | 81,827 |
| 4.2% 4/1/43 | | 300,000 | 266,555 |
| 4.25% 4/1/46 | | 150,000 | 132,885 |
| 4.4% 3/15/45 | | 156,000 | 141,599 |
| 4.5% 12/6/48 | | 100,000 | 91,050 |
| 4.75% 6/25/29 | | 130,000 | 132,910 |
| 4.95% 6/25/34 | | 600,000 | 614,852 |
| 4.95% 9/15/52 | | 280,000 | 271,129 |
| 5.3% 6/25/54 | | 200,000 | 204,158 |
| 5.875% 12/16/36 | | 290,000 | 319,104 |
| 5.95% 4/1/41 | | 120,000 | 132,238 |
| TJX Companies, Inc. 1.6% 5/15/31 | | 250,000 | 208,891 |
| | | | 9,594,697 |
| Textiles, Apparel & Luxury Goods - 0.1% | | | |
| NIKE, Inc.: | | | |
| 2.4% 3/27/25 | | 1,100,000 | 1,086,194 |
| 2.75% 3/27/27 | | 230,000 | 222,162 |
| 3.375% 3/27/50 | | 260,000 | 198,149 |
| 3.875% 11/1/45 | | 110,000 | 92,944 |
| Tapestry, Inc.: | | | |
| 7% 11/27/26 | | 215,000 | 221,771 |
| 7.05% 11/27/25 | | 280,000 | 285,190 |
| 7.35% 11/27/28 | | 170,000 | 178,318 |
| 7.85% 11/27/33 | | 170,000 | 181,905 |
| VF Corp. 2.8% 4/23/27 | | 150,000 | 140,446 |
| | | | 2,607,079 |
TOTAL CONSUMER DISCRETIONARY | | | 37,336,021 |
| CONSUMER STAPLES - 1.6% | | | |
| Beverages - 0.5% | | | |
| Anheuser-Busch Companies LLC / Anheuser-Busch InBev Worldwide, Inc.: | | | |
| 4.7% 2/1/36 | | 200,000 | 197,538 |
| 4.9% 2/1/46 | | 100,000 | 96,008 |
| Anheuser-Busch InBev Finance, Inc.: | | | |
| 4.7% 2/1/36 | | 220,000 | 217,292 |
| 4.9% 2/1/46 | | 100,000 | 95,710 |
| Anheuser-Busch InBev Worldwide, Inc.: | | | |
| 4.35% 6/1/40 | | 180,000 | 166,024 |
| 4.439% 10/6/48 | | 1,195,000 | 1,068,863 |
| 4.6% 4/15/48 | | 487,000 | 451,204 |
| 4.6% 6/1/60 | | 120,000 | 111,419 |
| 4.95% 1/15/42 | | 230,000 | 225,677 |
| 5.45% 1/23/39 | | 380,000 | 399,866 |
| 5.55% 1/23/49 | | 180,000 | 188,630 |
| 5.8% 1/23/59 (Reg. S) | | 370,000 | 406,184 |
| 5.875% 6/15/35 | | 180,000 | 196,953 |
| 8.2% 1/15/39 | | 110,000 | 145,245 |
| Coca-Cola FEMSA S.A.B. de CV 2.75% 1/22/30 | | 150,000 | 137,183 |
| Constellation Brands, Inc.: | | | |
| 2.875% 5/1/30 | | 560,000 | 511,380 |
| 3.6% 2/15/28 | | 272,000 | 263,578 |
| 4.5% 5/9/47 | | 100,000 | 87,349 |
| 4.9% 5/1/33 | | 80,000 | 79,738 |
| Diageo Capital PLC: | | | |
| 1.375% 9/29/25 | | 200,000 | 193,429 |
| 2% 4/29/30 | | 400,000 | 352,814 |
| 2.125% 4/29/32 | | 200,000 | 168,536 |
| 5.875% 9/30/36 | | 120,000 | 130,833 |
| Keurig Dr. Pepper, Inc.: | | | |
| 3.8% 5/1/50 | | 430,000 | 337,968 |
| 4.417% 5/25/25 | | 86,000 | 85,729 |
| 5.085% 5/25/48 | | 120,000 | 117,188 |
| Molson Coors Beverage Co.: | | | |
| 3% 7/15/26 | | 254,000 | 247,052 |
| 4.2% 7/15/46 | | 160,000 | 134,125 |
| 5% 5/1/42 | | 100,000 | 94,995 |
| PepsiCo, Inc.: | | | |
| 1.4% 2/25/31 | | 680,000 | 568,764 |
| 1.625% 5/1/30 | | 309,000 | 268,942 |
| 2.625% 10/21/41 | | 100,000 | 73,229 |
| 2.75% 10/21/51 | | 180,000 | 120,894 |
| 2.85% 2/24/26 | | 250,000 | 245,103 |
| 2.875% 10/15/49 | | 80,000 | 56,130 |
| 3% 10/15/27 | | 100,000 | 96,957 |
| 3.625% 3/19/50 | | 100,000 | 79,826 |
| 3.875% 3/19/60 | | 210,000 | 171,107 |
| 4.45% 4/14/46 | | 140,000 | 128,582 |
| 7% 3/1/29 | | 100,000 | 111,734 |
| The Coca-Cola Co.: | | | |
| 1% 3/15/28 | | 230,000 | 207,747 |
| 1.45% 6/1/27 | | 120,000 | 112,119 |
| 1.65% 6/1/30 | | 240,000 | 208,680 |
| 2.125% 9/6/29 | | 140,000 | 127,441 |
| 2.25% 1/5/32 | | 120,000 | 105,037 |
| 2.5% 6/1/40 | | 260,000 | 191,470 |
| 2.5% 3/15/51 | | 100,000 | 63,901 |
| 2.6% 6/1/50 | | 230,000 | 150,767 |
| 2.75% 6/1/60 | | 120,000 | 76,407 |
| 2.875% 5/5/41 | | 210,000 | 161,597 |
| 3.45% 3/25/30 | | 160,000 | 154,093 |
| 5% 5/13/34 | | 520,000 | 540,613 |
| 5.2% 1/14/55 | | 230,000 | 234,334 |
| | | | 11,163,984 |
| Consumer Staples Distribution & Retail - 0.3% | | | |
| Costco Wholesale Corp.: | | | |
| 1.375% 6/20/27 | | 150,000 | 139,568 |
| 1.6% 4/20/30 | | 240,000 | 209,268 |
| 3% 5/18/27 | | 210,000 | 205,099 |
| Dollar General Corp.: | | | |
| 3.5% 4/3/30 | | 210,000 | 194,012 |
| 5% 11/1/32 | | 100,000 | 98,123 |
| 5.2% 7/5/28 | | 100,000 | 100,813 |
| 5.45% 7/5/33 | | 120,000 | 120,069 |
| Dollar Tree, Inc.: | | | |
| 4% 5/15/25 | | 478,000 | 474,110 |
| 4.2% 5/15/28 | | 160,000 | 157,032 |
| Kroger Co.: | | | |
| 1.7% 1/15/31 | | 240,000 | 200,383 |
| 3.5% 2/1/26 | | 130,000 | 127,855 |
| 3.7% 8/1/27 | | 120,000 | 117,586 |
| 3.95% 1/15/50 | | 100,000 | 78,862 |
| 4.45% 2/1/47 | | 130,000 | 111,355 |
| 4.65% 9/15/29 | | 350,000 | 349,982 |
| 4.65% 1/15/48 | | 50,000 | 44,115 |
| 4.9% 9/15/31 | | 120,000 | 119,910 |
| 5% 9/15/34 | | 130,000 | 129,596 |
| 5.4% 1/15/49 | | 70,000 | 68,490 |
| 5.5% 9/15/54 | | 190,000 | 186,238 |
| 5.65% 9/15/64 | | 130,000 | 127,007 |
| 7.5% 4/1/31 | | 110,000 | 126,192 |
| Sysco Corp.: | | | |
| 2.4% 2/15/30 | | 150,000 | 134,369 |
| 2.45% 12/14/31 | | 240,000 | 206,494 |
| 3.3% 2/15/50 | | 260,000 | 186,871 |
| 6.6% 4/1/50 | | 140,000 | 160,909 |
| Target Corp.: | | | |
| 1.95% 1/15/27 | | 280,000 | 267,364 |
| 2.5% 4/15/26 | | 100,000 | 97,725 |
| 3.375% 4/15/29 | | 310,000 | 301,025 |
| 3.9% 11/15/47 | | 270,000 | 224,510 |
| 4.8% 1/15/53 | | 200,000 | 191,579 |
| Walmart, Inc.: | | | |
| 1.8% 9/22/31 | | 240,000 | 205,953 |
| 2.5% 9/22/41 | | 390,000 | 284,912 |
| 2.65% 9/22/51 | | 100,000 | 66,777 |
| 3.05% 7/8/26 | | 400,000 | 392,708 |
| 3.25% 7/8/29 | | 220,000 | 214,027 |
| 3.7% 6/26/28 | | 140,000 | 139,272 |
| 3.9% 4/15/28 | | 100,000 | 99,764 |
| 4.1% 4/15/33 | | 300,000 | 296,957 |
| 4.5% 4/15/53 | | 110,000 | 103,502 |
| 5.25% 9/1/35 | | 645,000 | 691,927 |
| 5.625% 4/15/41 | | 169,000 | 184,184 |
| | | | 7,936,494 |
| Food Products - 0.3% | | | |
| Archer Daniels Midland Co.: | | | |
| 3.25% 3/27/30 | | 330,000 | 311,652 |
| 3.75% 9/15/47 | | 100,000 | 78,591 |
| 4.5% 8/15/33 | | 100,000 | 98,678 |
| 4.5% 3/15/49 | | 90,000 | 80,015 |
| Bunge Ltd. Finance Corp. 2.75% 5/14/31 | | 110,000 | 97,401 |
| Campbell Soup Co.: | | | |
| 2.375% 4/24/30 | | 100,000 | 89,416 |
| 4.15% 3/15/28 | | 410,000 | 406,429 |
| 5.4% 3/21/34 | | 160,000 | 165,244 |
| Conagra Brands, Inc.: | | | |
| 4.85% 11/1/28 | | 510,000 | 514,099 |
| 5.3% 11/1/38 | | 121,000 | 119,130 |
| General Mills, Inc.: | | | |
| 3% 2/1/51 | | 110,000 | 73,679 |
| 4% 4/17/25 | | 130,000 | 129,136 |
| 4.2% 4/17/28 | | 200,000 | 198,793 |
| 4.95% 3/29/33 | | 250,000 | 252,132 |
| Hormel Foods Corp. 1.8% 6/11/30 | | 200,000 | 174,629 |
| Ingredion, Inc. 3.2% 10/1/26 | | 270,000 | 262,836 |
| Kellanova: | | | |
| 2.1% 6/1/30 | | 160,000 | 141,680 |
| 3.25% 4/1/26 | | 290,000 | 284,215 |
| 7.45% 4/1/31 | | 110,000 | 126,366 |
| Kraft Heinz Foods Co.: | | | |
| 3.75% 4/1/30 | | 200,000 | 192,386 |
| 4.375% 6/1/46 | | 50,000 | 42,718 |
| 4.625% 10/1/39 | | 100,000 | 92,919 |
| 5% 6/4/42 | | 100,000 | 94,353 |
| 5.5% 6/1/50 | | 590,000 | 588,639 |
| McCormick & Co., Inc. 1.85% 2/15/31 | | 260,000 | 219,493 |
| Mondelez International, Inc.: | | | |
| 1.875% 10/15/32 | | 370,000 | 304,289 |
| 2.75% 4/13/30 | | 190,000 | 174,252 |
| Pilgrim's Pride Corp.: | | | |
| 4.25% 4/15/31 | | 140,000 | 131,971 |
| 6.25% 7/1/33 | | 180,000 | 190,310 |
| The Hershey Co.: | | | |
| 1.7% 6/1/30 | | 340,000 | 296,075 |
| 2.65% 6/1/50 | | 55,000 | 35,643 |
| The J.M. Smucker Co.: | | | |
| 4.25% 3/15/35 | | 200,000 | 188,001 |
| 6.5% 11/15/43 | | 270,000 | 295,682 |
| Tyson Foods, Inc.: | | | |
| 4% 3/1/26 | | 160,000 | 158,383 |
| 4.35% 3/1/29 | | 450,000 | 444,827 |
| 4.55% 6/2/47 | | 100,000 | 85,446 |
| 4.875% 8/15/34 | | 80,000 | 79,260 |
| 5.1% 9/28/48 | | 100,000 | 92,582 |
| Unilever Capital Corp.: | | | |
| 1.375% 9/14/30 | | 380,000 | 320,851 |
| 2.9% 5/5/27 | | 400,000 | 387,131 |
| 4.875% 9/8/28 | | 180,000 | 184,218 |
| | | | 8,203,550 |
| Household Products - 0.1% | | | |
| Church & Dwight Co., Inc. 3.95% 8/1/47 | | 150,000 | 123,238 |
| Colgate-Palmolive Co.: | | | |
| 3.1% 8/15/27 | | 410,000 | 400,343 |
| 3.25% 8/15/32 | | 130,000 | 120,747 |
| Kimberly-Clark Corp.: | | | |
| 1.05% 9/15/27 | | 184,000 | 167,718 |
| 3.2% 4/25/29 | | 260,000 | 249,565 |
| 3.2% 7/30/46 | | 100,000 | 74,786 |
| 6.625% 8/1/37 | | 140,000 | 164,857 |
| Procter & Gamble Co.: | | | |
| 1.2% 10/29/30 | | 710,000 | 599,787 |
| 1.95% 4/23/31 | | 200,000 | 175,987 |
| 2.85% 8/11/27 | | 140,000 | 135,646 |
| 3% 3/25/30 | | 100,000 | 94,861 |
| 4.55% 1/29/34 | | 280,000 | 285,450 |
| | | | 2,592,985 |
| Personal Care Products - 0.1% | | | |
| Estee Lauder Companies, Inc.: | | | |
| 1.95% 3/15/31 | | 330,000 | 282,257 |
| 2.375% 12/1/29 | | 220,000 | 199,887 |
| 3.125% 12/1/49 | | 130,000 | 91,933 |
| 3.15% 3/15/27 | | 260,000 | 252,911 |
| Kenvue, Inc.: | | | |
| 4.9% 3/22/33 | | 260,000 | 266,035 |
| 5.05% 3/22/28 | | 140,000 | 143,867 |
| 5.05% 3/22/53 | | 200,000 | 199,231 |
| 5.35% 3/22/26 | | 140,000 | 142,020 |
| | | | 1,578,141 |
| Tobacco - 0.3% | | | |
| Altria Group, Inc.: | | | |
| 2.45% 2/4/32 | | 520,000 | 437,476 |
| 3.4% 5/6/30 | | 100,000 | 93,566 |
| 3.4% 2/4/41 | | 180,000 | 136,537 |
| 3.875% 9/16/46 | | 374,000 | 286,090 |
| 4.8% 2/14/29 | | 30,000 | 30,172 |
| 5.8% 2/14/39 | | 330,000 | 340,283 |
| 5.95% 2/14/49 | | 240,000 | 247,320 |
| BAT Capital Corp.: | | | |
| 3.215% 9/6/26 | | 100,000 | 97,342 |
| 3.462% 9/6/29 | | 430,000 | 406,768 |
| 3.557% 8/15/27 | | 450,000 | 438,969 |
| 3.734% 9/25/40 | | 50,000 | 38,800 |
| 3.984% 9/25/50 | | 100,000 | 74,976 |
| 4.39% 8/15/37 | | 470,000 | 419,311 |
| 4.54% 8/15/47 | | 128,000 | 104,691 |
| 4.7% 4/2/27 | | 270,000 | 270,830 |
| 4.742% 3/16/32 | | 170,000 | 167,678 |
| 4.758% 9/6/49 | | 260,000 | 217,697 |
| 5.282% 4/2/50 | | 100,000 | 91,187 |
| 5.65% 3/16/52 | | 50,000 | 47,211 |
| 5.834% 2/20/31 | | 100,000 | 104,962 |
| 6.421% 8/2/33 | | 200,000 | 216,864 |
| BAT International Finance PLC 5.931% 2/2/29 | | 70,000 | 73,447 |
| Philip Morris International, Inc.: | | | |
| 4.125% 3/4/43 | | 330,000 | 280,401 |
| 4.25% 11/10/44 | | 110,000 | 94,285 |
| 4.875% 2/15/28 | | 170,000 | 172,397 |
| 4.875% 11/15/43 | | 224,000 | 210,697 |
| 5.125% 11/17/27 | | 170,000 | 173,792 |
| 5.125% 2/15/30 | | 520,000 | 534,616 |
| 5.375% 2/15/33 | | 480,000 | 494,998 |
| 5.75% 11/17/32 | | 120,000 | 126,978 |
| Reynolds American, Inc.: | | | |
| 4.45% 6/12/25 | | 140,000 | 139,274 |
| 5.7% 8/15/35 | | 110,000 | 112,628 |
| 5.85% 8/15/45 | | 100,000 | 97,948 |
| | | | 6,780,191 |
TOTAL CONSUMER STAPLES | | | 38,255,345 |
| ENERGY - 1.9% | | | |
| Energy Equipment & Services - 0.1% | | | |
| Baker Hughes Co. 4.08% 12/15/47 | | 290,000 | 241,069 |
| Halliburton Co.: | | | |
| 4.75% 8/1/43 | | 50,000 | 45,607 |
| 5% 11/15/45 | | 210,000 | 196,927 |
| 6.7% 9/15/38 | | 100,000 | 114,127 |
| 7.45% 9/15/39 | | 120,000 | 146,517 |
| NOV, Inc. 3.6% 12/1/29 | | 280,000 | 265,590 |
| | | | 1,009,837 |
| Oil, Gas & Consumable Fuels - 1.8% | | | |
| 6297782 LLC: | | | |
| 5.026% 10/1/29 (c) | | 100,000 | 99,779 |
| 5.584% 10/1/34 (c) | | 100,000 | 99,568 |
| 6.176% 10/1/54 (c) | | 100,000 | 99,944 |
| Apache Corp. 5.25% 2/1/42 | | 250,000 | 221,197 |
| Boardwalk Pipelines LP: | | | |
| 4.45% 7/15/27 | | 140,000 | 139,275 |
| 4.95% 12/15/24 | | 102,000 | 101,786 |
| 5.625% 8/1/34 | | 120,000 | 122,508 |
| Burlington Resources LLC 5.95% 10/15/36 | | 110,000 | 119,403 |
| Canadian Natural Resources Ltd.: | | | |
| 3.85% 6/1/27 | | 152,000 | 149,070 |
| 3.9% 2/1/25 | | 100,000 | 99,400 |
| 4.95% 6/1/47 | | 210,000 | 187,408 |
| 6.45% 6/30/33 | | 140,000 | 151,088 |
| Cenovus Energy, Inc. 5.4% 6/15/47 | | 171,000 | 164,057 |
| Cheniere Corpus Christi Holdings LLC 2.742% 12/31/39 | | 160,000 | 130,201 |
| Cheniere Energy Partners LP: | | | |
| 3.25% 1/31/32 | | 160,000 | 141,961 |
| 4% 3/1/31 | | 280,000 | 264,099 |
| 5.75% 8/15/34 (c) | | 180,000 | 186,362 |
| Cheniere Energy, Inc. 5.65% 4/15/34 (c) | | 190,000 | 195,518 |
| Chevron Corp.: | | | |
| 1.554% 5/11/25 | | 70,000 | 68,434 |
| 1.995% 5/11/27 | | 70,000 | 66,307 |
| 2.236% 5/11/30 | | 70,000 | 62,796 |
| 2.954% 5/16/26 | | 231,000 | 226,127 |
| 2.978% 5/11/40 | | 70,000 | 54,934 |
| 3.078% 5/11/50 | | 70,000 | 50,464 |
| Chevron U.S.A., Inc.: | | | |
| 4.95% 8/15/47 | | 100,000 | 95,704 |
| 5.05% 11/15/44 | | 70,000 | 70,301 |
| Columbia Pipeline Group, Inc. 5.8% 6/1/45 | | 50,000 | 50,606 |
| Conoco Funding Co. 7.25% 10/15/31 | | 110,000 | 127,010 |
| ConocoPhillips Co.: | | | |
| 3.8% 3/15/52 | | 100,000 | 79,108 |
| 4.025% 3/15/62 | | 230,000 | 181,850 |
| 5.05% 9/15/33 | | 50,000 | 51,275 |
| 5.3% 5/15/53 | | 130,000 | 129,231 |
| 5.55% 3/15/54 | | 50,000 | 51,390 |
| 5.7% 9/15/63 | | 130,000 | 135,706 |
| 6.5% 2/1/39 | | 120,000 | 137,697 |
| Continental Resources, Inc.: | | | |
| 4.375% 1/15/28 | | 100,000 | 98,109 |
| 4.9% 6/1/44 | | 60,000 | 51,016 |
| DCP Midstream Operating LP 5.6% 4/1/44 | | 80,000 | 78,934 |
| Devon Energy Corp. 5% 6/15/45 | | 315,000 | 281,089 |
| Diamondback Energy, Inc.: | | | |
| 4.25% 3/15/52 | | 160,000 | 128,308 |
| 4.4% 3/24/51 | | 100,000 | 82,879 |
| 5.15% 1/30/30 | | 160,000 | 163,556 |
| 5.9% 4/18/64 | | 370,000 | 371,515 |
| Eastern Gas Transmission & Storage, Inc. 3.9% 11/15/49 | | 90,000 | 67,168 |
| Enbridge Energy Partners LP 7.375% 10/15/45 | | 110,000 | 130,280 |
| Enbridge, Inc.: | | | |
| 1.6% 10/4/26 | | 860,000 | 810,324 |
| 2.5% 8/1/33 | | 520,000 | 430,231 |
| 3.125% 11/15/29 | | 420,000 | 391,759 |
| 3.4% 8/1/51 | | 190,000 | 134,692 |
| 4.5% 6/10/44 | | 120,000 | 103,824 |
| 5.625% 4/5/34 | | 100,000 | 103,179 |
| 5.7% 3/8/33 | | 200,000 | 208,540 |
| 8.5% 1/15/84 (b) | | 60,000 | 65,761 |
| Energy Transfer LP: | | | |
| 3.75% 5/15/30 | | 390,000 | 368,909 |
| 4.4% 3/15/27 | | 170,000 | 169,190 |
| 4.95% 6/15/28 | | 567,000 | 572,876 |
| 5% 5/15/50 | | 330,000 | 292,679 |
| 5.25% 4/15/29 | | 310,000 | 316,922 |
| 5.3% 4/15/47 | | 50,000 | 46,379 |
| 5.4% 10/1/47 | | 80,000 | 74,799 |
| 5.75% 4/1/25 | | 3,090,000 | 3,087,582 |
| 5.8% 6/15/38 | | 260,000 | 266,422 |
| 6% 6/15/48 | | 330,000 | 333,233 |
| 6.05% 9/1/54 | | 110,000 | 112,572 |
| 6.25% 4/15/49 | | 130,000 | 135,263 |
| 6.4% 12/1/30 | | 100,000 | 108,199 |
| 6.55% 12/1/33 | | 220,000 | 240,601 |
| 6.625% 10/15/36 | | 280,000 | 304,946 |
| 7.5% 7/1/38 | | 210,000 | 246,830 |
| Enterprise Products Operating LP: | | | |
| 2.8% 1/31/30 | | 560,000 | 517,763 |
| 3.2% 2/15/52 | | 290,000 | 200,623 |
| 3.3% 2/15/53 | | 100,000 | 69,952 |
| 3.95% 2/15/27 | | 214,000 | 212,285 |
| 4.2% 1/31/50 | | 370,000 | 310,003 |
| 4.25% 2/15/48 | | 270,000 | 229,531 |
| 4.45% 2/15/43 | | 100,000 | 89,146 |
| 4.8% 2/1/49 | | 56,000 | 51,302 |
| 4.85% 8/15/42 | | 170,000 | 159,782 |
| 4.95% 2/15/35 | | 130,000 | 130,550 |
| 5.35% 1/31/33 | | 500,000 | 519,972 |
| 5.55% 2/16/55 | | 130,000 | 132,271 |
| 7.55% 4/15/38 | | 120,000 | 147,061 |
| EOG Resources, Inc. 4.95% 4/15/50 | | 100,000 | 94,795 |
| EQT Corp.: | | | |
| 5.7% 4/1/28 | | 154,000 | 158,200 |
| 5.75% 2/1/34 | | 110,000 | 112,340 |
| Equinor ASA: | | | |
| 2.375% 5/22/30 | | 310,000 | 280,057 |
| 2.875% 4/6/25 | | 400,000 | 395,496 |
| 3.625% 9/10/28 | | 130,000 | 127,187 |
| 4.8% 11/8/43 | | 130,000 | 125,326 |
| 5.1% 8/17/40 | | 180,000 | 180,093 |
| Exxon Mobil Corp.: | | | |
| 2.995% 8/16/39 | | 350,000 | 281,758 |
| 3.452% 4/15/51 | | 610,000 | 463,827 |
| 4.114% 3/1/46 | | 200,000 | 174,163 |
| 4.327% 3/19/50 | | 100,000 | 88,672 |
| Hess Corp.: | | | |
| 5.6% 2/15/41 | | 190,000 | 194,289 |
| 7.125% 3/15/33 | | 170,000 | 193,652 |
| Kinder Morgan Energy Partners LP: | | | |
| 4.25% 9/1/24 | | 340,000 | 340,000 |
| 6.55% 9/15/40 | | 100,000 | 107,059 |
| 6.95% 1/15/38 | | 100,000 | 112,329 |
| Kinder Morgan, Inc.: | | | |
| 3.6% 2/15/51 | | 170,000 | 121,260 |
| 4.8% 2/1/33 | | 600,000 | 586,340 |
| 5.05% 2/15/46 | | 50,000 | 45,397 |
| 5.2% 3/1/48 | | 264,000 | 243,376 |
| 5.45% 8/1/52 | | 210,000 | 199,642 |
| 5.55% 6/1/45 | | 300,000 | 291,017 |
| Marathon Oil Corp.: | | | |
| 5.7% 4/1/34 | | 130,000 | 137,164 |
| 6.6% 10/1/37 | | 120,000 | 134,315 |
| Marathon Petroleum Corp.: | | | |
| 4.5% 4/1/48 | | 280,000 | 235,487 |
| 4.7% 5/1/25 | | 370,000 | 368,560 |
| 6.5% 3/1/41 | | 50,000 | 53,883 |
| MPLX LP: | | | |
| 4.125% 3/1/27 | | 60,000 | 59,340 |
| 4.5% 4/15/38 | | 570,000 | 520,279 |
| 4.7% 4/15/48 | | 226,000 | 194,627 |
| 4.95% 9/1/32 | | 130,000 | 128,681 |
| 5% 3/1/33 | | 500,000 | 494,788 |
| 5.5% 2/15/49 | | 100,000 | 95,889 |
| Occidental Petroleum Corp.: | | | |
| 4.2% 3/15/48 | | 290,000 | 224,514 |
| 5.55% 10/1/34 | | 150,000 | 152,419 |
| 6.05% 10/1/54 | | 150,000 | 152,549 |
| 6.125% 1/1/31 | | 60,000 | 63,238 |
| 6.375% 9/1/28 | | 980,000 | 1,027,998 |
| 6.45% 9/15/36 | | 80,000 | 86,701 |
| ONEOK Partners LP 6.65% 10/1/36 | | 350,000 | 386,101 |
| ONEOK, Inc.: | | | |
| 3.95% 3/1/50 | | 35,000 | 26,566 |
| 4% 7/13/27 | | 80,000 | 78,975 |
| 4.45% 9/1/49 | | 50,000 | 40,649 |
| 4.85% 2/1/49 | | 130,000 | 113,401 |
| 5% 3/1/26 | | 147,000 | 147,254 |
| 5.2% 7/15/48 | | 22,000 | 20,192 |
| 5.65% 11/1/28 | | 60,000 | 62,323 |
| 6.1% 11/15/32 | | 340,000 | 361,008 |
| 6.625% 9/1/53 | | 130,000 | 143,185 |
| 7.15% 1/15/51 | | 150,000 | 170,621 |
| Ovintiv, Inc.: | | | |
| 5.65% 5/15/28 | | 250,000 | 257,283 |
| 6.5% 2/1/38 | | 70,000 | 74,346 |
| 6.625% 8/15/37 | | 100,000 | 106,782 |
| Phillips 66 Co.: | | | |
| 3.3% 3/15/52 | | 180,000 | 122,412 |
| 3.9% 3/15/28 | | 380,000 | 372,555 |
| 4.65% 11/15/34 | | 220,000 | 212,897 |
| 4.68% 2/15/45 | | 100,000 | 89,080 |
| 5.25% 6/15/31 | | 100,000 | 102,822 |
| 5.65% 6/15/54 | | 130,000 | 129,953 |
| Pioneer Natural Resources Co. 1.9% 8/15/30 | | 210,000 | 182,930 |
| Plains All American Pipeline LP/PAA Finance Corp.: | | | |
| 3.8% 9/15/30 | | 760,000 | 715,733 |
| 4.7% 6/15/44 | | 90,000 | 77,434 |
| Sabine Pass Liquefaction LLC 4.5% 5/15/30 | | 420,000 | 415,611 |
| Schlumberger Investment SA: | | | |
| 4.5% 5/15/28 | | 200,000 | 200,970 |
| 4.85% 5/15/33 | | 70,000 | 71,050 |
| 5% 6/1/34 | | 100,000 | 101,936 |
| Shell International Finance BV: | | | |
| 2% 11/7/24 | | 1,770,000 | 1,759,628 |
| 2.375% 11/7/29 | | 320,000 | 292,316 |
| 2.5% 9/12/26 | | 270,000 | 260,805 |
| 2.875% 11/26/41 | | 440,000 | 327,307 |
| 3% 11/26/51 | | 100,000 | 68,485 |
| 3.125% 11/7/49 | | 100,000 | 70,986 |
| 3.25% 4/6/50 | | 240,000 | 174,248 |
| 3.75% 9/12/46 | | 106,000 | 85,331 |
| 4.125% 5/11/35 | | 170,000 | 162,578 |
| 4.375% 5/11/45 | | 160,000 | 142,653 |
| 4.55% 8/12/43 | | 100,000 | 93,603 |
| 5.5% 3/25/40 | | 190,000 | 199,190 |
| Suncor Energy, Inc.: | | | |
| 4% 11/15/47 | | 234,000 | 181,135 |
| 6.8% 5/15/38 | | 130,000 | 145,237 |
| 7.15% 2/1/32 | | 90,000 | 100,898 |
| Targa Resources Corp.: | | | |
| 4.2% 2/1/33 | | 130,000 | 120,908 |
| 6.125% 3/15/33 | | 250,000 | 265,577 |
| 6.5% 2/15/53 | | 190,000 | 207,500 |
| Targa Resources Partners LP/Targa Resources Partners Finance Corp. 6.875% 1/15/29 | | 620,000 | 637,143 |
| Tennessee Gas Pipeline Co. 7% 10/15/28 | | 630,000 | 679,861 |
| The Williams Companies, Inc.: | | | |
| 3.75% 6/15/27 | | 460,000 | 450,495 |
| 4.85% 3/1/48 | | 50,000 | 44,866 |
| 5.1% 9/15/45 | | 100,000 | 93,006 |
| 5.15% 3/15/34 | | 130,000 | 130,565 |
| 5.4% 3/2/26 | | 160,000 | 161,545 |
| 5.65% 3/15/33 | | 230,000 | 238,881 |
| 5.8% 11/15/43 | | 100,000 | 102,117 |
| 7.5% 1/15/31 | | 205,000 | 232,086 |
| TotalEnergies Capital International SA: | | | |
| 3.127% 5/29/50 | | 100,000 | 71,111 |
| 3.386% 6/29/60 | | 100,000 | 70,493 |
| 3.461% 7/12/49 | | 140,000 | 105,778 |
| TotalEnergies Capital SA: | | | |
| 3.883% 10/11/28 | | 470,000 | 462,795 |
| 5.15% 4/5/34 | | 110,000 | 113,726 |
| 5.488% 4/5/54 | | 240,000 | 247,624 |
| 5.638% 4/5/64 | | 70,000 | 72,683 |
| TransCanada PipeLines Ltd.: | | | |
| 1% 10/12/24 | | 340,000 | 338,112 |
| 4.1% 4/15/30 | | 270,000 | 262,870 |
| 4.25% 5/15/28 | | 320,000 | 316,578 |
| 4.875% 5/15/48 | | 80,000 | 73,521 |
| 5% 10/16/43 | | 440,000 | 417,480 |
| 6.1% 6/1/40 | | 170,000 | 179,873 |
| Transcontinental Gas Pipe Line Co. LLC: | | | |
| 3.25% 5/15/30 | | 1,105,000 | 1,025,919 |
| 3.95% 5/15/50 | | 100,000 | 78,712 |
| 4.6% 3/15/48 | | 190,000 | 165,068 |
| Valero Energy Corp.: | | | |
| 3.4% 9/15/26 | | 110,000 | 107,352 |
| 3.65% 12/1/51 | | 110,000 | 78,692 |
| 4.35% 6/1/28 | | 70,000 | 69,401 |
| 6.625% 6/15/37 | | 200,000 | 221,028 |
| Valero Energy Partners LP 4.5% 3/15/28 | | 270,000 | 268,553 |
| Western Midstream Operating LP: | | | |
| 4.05% 2/1/30 | | 230,000 | 220,156 |
| 5.3% 3/1/48 | | 150,000 | 135,579 |
| 6.15% 4/1/33 | | 110,000 | 115,600 |
| | | | 43,938,801 |
TOTAL ENERGY | | | 44,948,638 |
| FINANCIALS - 8.9% | | | |
| Banks - 4.6% | | | |
| Australia and New Zealand Banking Group Ltd. 4.75% 1/18/27 | | 340,000 | 343,664 |
| Banco Bilbao Vizcaya Argentaria SA: | | | |
| 1.125% 9/18/25 | | 200,000 | 192,399 |
| 5.862% 9/14/26 (b) | | 400,000 | 402,876 |
| Banco Santander SA: | | | |
| 1.722% 9/14/27 (b) | | 800,000 | 750,706 |
| 3.306% 6/27/29 | | 200,000 | 189,094 |
| 3.8% 2/23/28 | | 600,000 | 582,632 |
| 5.179% 11/19/25 | | 400,000 | 399,762 |
| 5.294% 8/18/27 | | 200,000 | 203,353 |
| 5.538% 3/14/30 (b) | | 400,000 | 410,975 |
| 6.35% 3/14/34 | | 200,000 | 209,589 |
| 6.921% 8/8/33 | | 200,000 | 216,707 |
| Bank of America Corp.: | | | |
| U.S. Secured Overnight Fin. Rate (SOFR) Index + 1.290% 5.08% 1/20/27 (b) | | 1,000,000 | 1,004,283 |
| 0.981% 9/25/25 (b) | | 800,000 | 797,611 |
| 1.658% 3/11/27 (b) | | 340,000 | 324,604 |
| 1.734% 7/22/27 (b) | | 510,000 | 483,810 |
| 2.087% 6/14/29 (b) | | 1,210,000 | 1,107,705 |
| 2.299% 7/21/32 (b) | | 110,000 | 93,634 |
| 2.482% 9/21/36 (b) | | 70,000 | 58,000 |
| 2.572% 10/20/32 (b) | | 1,690,000 | 1,461,821 |
| 2.651% 3/11/32 (b) | | 340,000 | 298,314 |
| 2.676% 6/19/41 (b) | | 1,480,000 | 1,081,661 |
| 2.687% 4/22/32 (b) | | 410,000 | 360,129 |
| 2.831% 10/24/51 (b) | | 140,000 | 93,821 |
| 2.972% 2/4/33 (b) | | 250,000 | 220,390 |
| 2.972% 7/21/52 (b) | | 110,000 | 76,245 |
| 3.093% 10/1/25 (b) | | 400,000 | 399,212 |
| 3.194% 7/23/30 (b) | | 270,000 | 252,786 |
| 3.419% 12/20/28 (b) | | 445,000 | 429,070 |
| 3.946% 1/23/49 (b) | | 360,000 | 298,968 |
| 3.95% 4/21/25 | | 1,320,000 | 1,309,667 |
| 3.97% 3/5/29 (b) | | 780,000 | 763,955 |
| 3.974% 2/7/30 (b) | | 825,000 | 802,875 |
| 4% 1/22/25 | | 512,000 | 509,179 |
| 4.078% 4/23/40 (b) | | 100,000 | 89,344 |
| 4.083% 3/20/51 (b) | | 100,000 | 84,161 |
| 4.244% 4/24/38 (b) | | 480,000 | 445,098 |
| 4.271% 7/23/29 (b) | | 360,000 | 356,170 |
| 4.33% 3/15/50 (b) | | 200,000 | 175,894 |
| 4.376% 4/27/28 (b) | | 1,000,000 | 994,699 |
| 5% 1/21/44 | | 235,000 | 233,957 |
| 5.202% 4/25/29 (b) | | 200,000 | 204,308 |
| 5.425% 8/15/35 (b) | | 300,000 | 300,650 |
| 5.872% 9/15/34 (b) | | 480,000 | 510,152 |
| 6.11% 1/29/37 | | 508,000 | 551,796 |
| 6.204% 11/10/28 (b) | | 400,000 | 419,244 |
| 6.22% 9/15/26 | | 480,000 | 496,158 |
| 7.75% 5/14/38 | | 120,000 | 148,917 |
| Bank of Montreal: | | | |
| 1.25% 9/15/26 | | 395,000 | 370,280 |
| 2.65% 3/8/27 | | 460,000 | 441,842 |
| 3.088% 1/10/37 (b) | | 110,000 | 93,864 |
| 3.803% 12/15/32 (b) | | 100,000 | 96,308 |
| 5.717% 9/25/28 | | 320,000 | 334,117 |
| Bank of Nova Scotia: | | | |
| 2.45% 2/2/32 | | 110,000 | 94,432 |
| 4.588% 5/4/37 (b) | | 120,000 | 112,531 |
| 4.85% 2/1/30 | | 210,000 | 213,263 |
| 5.25% 6/12/28 | | 330,000 | 339,479 |
| 5.45% 6/12/25 | | 900,000 | 903,590 |
| Barclays PLC: | | | |
| 2.279% 11/24/27 (b) | | 300,000 | 283,925 |
| 2.894% 11/24/32 (b) | | 520,000 | 448,301 |
| 3.33% 11/24/42 (b) | | 465,000 | 348,251 |
| 3.564% 9/23/35 (b) | | 240,000 | 216,091 |
| 4.375% 1/12/26 | | 210,000 | 208,759 |
| 4.836% 5/9/28 | | 310,000 | 307,464 |
| 4.95% 1/10/47 | | 200,000 | 187,235 |
| 5.088% 6/20/30 (b) | | 200,000 | 199,250 |
| 5.2% 5/12/26 | | 360,000 | 360,942 |
| 5.304% 8/9/26 (b) | | 250,000 | 250,404 |
| 5.501% 8/9/28 (b) | | 590,000 | 601,435 |
| 5.746% 8/9/33 (b) | | 200,000 | 206,830 |
| 5.829% 5/9/27 (b) | | 400,000 | 405,633 |
| 6.49% 9/13/29 (b) | | 800,000 | 847,453 |
| Canadian Imperial Bank of Commerce: | | | |
| 3.6% 4/7/32 | | 85,000 | 78,339 |
| 5.001% 4/28/28 | | 310,000 | 315,499 |
| 5.926% 10/2/26 | | 210,000 | 215,899 |
| 6.092% 10/3/33 | | 186,000 | 200,051 |
| Citibank NA 4.838% 8/6/29 | | 510,000 | 517,014 |
| Citigroup, Inc.: | | | |
| 1.122% 1/28/27 (b) | | 600,000 | 569,787 |
| 1.462% 6/9/27 (b) | | 300,000 | 283,711 |
| 2.561% 5/1/32 (b) | | 600,000 | 519,736 |
| 2.572% 6/3/31 (b) | | 250,000 | 222,379 |
| 3.07% 2/24/28 (b) | | 610,000 | 588,618 |
| 3.2% 10/21/26 | | 80,000 | 77,855 |
| 3.52% 10/27/28 (b) | | 2,060,000 | 1,997,003 |
| 3.785% 3/17/33 (b) | | 100,000 | 92,304 |
| 3.878% 1/24/39 (b) | | 470,000 | 409,997 |
| 3.887% 1/10/28 (b) | | 140,000 | 137,741 |
| 3.98% 3/20/30 (b) | | 150,000 | 145,632 |
| 4.075% 4/23/29 (b) | | 770,000 | 757,333 |
| 4.45% 9/29/27 | | 235,000 | 233,893 |
| 4.6% 3/9/26 | | 1,590,000 | 1,586,110 |
| 4.65% 7/30/45 | | 267,000 | 244,421 |
| 4.65% 7/23/48 | | 195,000 | 177,804 |
| 4.75% 5/18/46 | | 208,000 | 188,025 |
| 5.316% 3/26/41 (b) | | 500,000 | 498,593 |
| 5.449% 6/11/35 (b) | | 300,000 | 308,310 |
| 5.61% 9/29/26 (b) | | 500,000 | 503,589 |
| 5.827% 2/13/35 (b) | | 380,000 | 390,552 |
| 5.875% 2/22/33 | | 310,000 | 325,507 |
| 6.27% 11/17/33 (b) | | 100,000 | 108,336 |
| 6.625% 6/15/32 | | 100,000 | 109,686 |
| 6.675% 9/13/43 | | 200,000 | 228,750 |
| Citizens Financial Group, Inc.: | | | |
| 2.5% 2/6/30 | | 190,000 | 167,560 |
| 5.641% 5/21/37 (b) | | 70,000 | 67,580 |
| 5.718% 7/23/32 (b) | | 150,000 | 153,107 |
| Comerica, Inc. 5.982% 1/30/30 (b) | | 140,000 | 142,417 |
| Cooperatieve Rabobank UA: | | | |
| 3.75% 7/21/26 | | 250,000 | 244,668 |
| 4.375% 8/4/25 | | 290,000 | 287,912 |
| 5.25% 5/24/41 | | 180,000 | 185,536 |
| Export-Import Bank of Korea: | | | |
| 0.625% 2/9/26 | | 400,000 | 379,469 |
| 1.25% 9/21/30 | | 680,000 | 570,761 |
| 4.25% 9/15/27 | | 430,000 | 430,140 |
| 5.125% 9/18/28 | | 290,000 | 299,861 |
| Fifth Third Bancorp: | | | |
| 2.55% 5/5/27 | | 100,000 | 94,901 |
| 3.95% 3/14/28 | | 50,000 | 49,013 |
| 4.337% 4/25/33 (b) | | 50,000 | 47,155 |
| 4.772% 7/28/30 (b) | | 170,000 | 169,014 |
| 6.361% 10/27/28 (b) | | 380,000 | 397,308 |
| 8.25% 3/1/38 | | 90,000 | 111,597 |
| HSBC Holdings PLC: | | | |
| U.S. Secured Overnight Fin. Rate (SOFR) Index + 2.650% 6.332% 3/9/44 (b) | | 330,000 | 361,071 |
| 2.013% 9/22/28 (b) | | 630,000 | 581,548 |
| 2.206% 8/17/29 (b) | | 550,000 | 498,861 |
| 2.633% 11/7/25 (b) | | 600,000 | 596,861 |
| 2.804% 5/24/32 (b) | | 340,000 | 295,293 |
| 3.973% 5/22/30 (b) | | 214,000 | 206,332 |
| 4.292% 9/12/26 (b) | | 1,600,000 | 1,587,928 |
| 4.375% 11/23/26 | | 640,000 | 633,605 |
| 4.762% 3/29/33 (b) | | 210,000 | 202,497 |
| 5.402% 8/11/33 (b) | | 680,000 | 697,231 |
| 5.597% 5/17/28 (b) | | 390,000 | 398,388 |
| 6.1% 1/14/42 | | 240,000 | 266,011 |
| 6.5% 5/2/36 | | 100,000 | 108,621 |
| 6.5% 9/15/37 | | 140,000 | 151,467 |
| 6.5% 9/15/37 | | 170,000 | 182,292 |
| 6.547% 6/20/34 (b) | | 200,000 | 213,704 |
| 6.8% 6/1/38 | | 100,000 | 111,619 |
| 7.399% 11/13/34 (b) | | 310,000 | 347,362 |
| 8.113% 11/3/33 (b) | | 290,000 | 338,449 |
| Huntington Bancshares, Inc.: | | | |
| 2.55% 2/4/30 | | 310,000 | 275,718 |
| 4.443% 8/4/28 (b) | | 290,000 | 289,151 |
| 6.208% 8/21/29 (b) | | 100,000 | 105,066 |
| ING Groep NV: | | | |
| 2.727% 4/1/32 (b) | | 200,000 | 175,377 |
| 3.95% 3/29/27 | | 200,000 | 197,104 |
| 4.017% 3/28/28 (b) | | 200,000 | 197,129 |
| 4.252% 3/28/33 (b) | | 200,000 | 191,872 |
| 5.55% 3/19/35 (b) | | 220,000 | 226,621 |
| JPMorgan Chase & Co.: | | | |
| 1.045% 11/19/26 (b) | | 1,200,000 | 1,146,442 |
| 1.47% 9/22/27 (b) | | 360,000 | 338,167 |
| 1.578% 4/22/27 (b) | | 300,000 | 285,453 |
| 1.953% 2/4/32 (b) | | 300,000 | 253,374 |
| 2.069% 6/1/29 (b) | | 340,000 | 311,157 |
| 2.525% 11/19/41 (b) | | 340,000 | 244,310 |
| 2.545% 11/8/32 (b) | | 1,080,000 | 934,025 |
| 2.58% 4/22/32 (b) | | 300,000 | 262,613 |
| 2.739% 10/15/30 (b) | | 570,000 | 521,907 |
| 2.95% 10/1/26 | | 190,000 | 184,776 |
| 2.956% 5/13/31 (b) | | 360,000 | 327,443 |
| 3.109% 4/22/41 (b) | | 220,000 | 171,744 |
| 3.109% 4/22/51 (b) | | 50,000 | 35,954 |
| 3.328% 4/22/52 (b) | | 320,000 | 238,508 |
| 3.702% 5/6/30 (b) | | 240,000 | 231,116 |
| 3.897% 1/23/49 (b) | | 350,000 | 291,362 |
| 4.323% 4/26/28 (b) | | 550,000 | 547,481 |
| 4.452% 12/5/29 (b) | | 630,000 | 627,523 |
| 4.586% 4/26/33 (b) | | 1,230,000 | 1,214,146 |
| 4.95% 6/1/45 | | 190,000 | 185,793 |
| 4.995% 7/22/30 (b) | | 150,000 | 152,751 |
| 5.294% 7/22/35 (b) | | 150,000 | 153,934 |
| 5.35% 6/1/34 (b) | | 1,600,000 | 1,650,713 |
| 5.5% 10/15/40 | | 430,000 | 453,260 |
| 5.6% 7/15/41 | | 325,000 | 347,160 |
| 5.625% 8/16/43 | | 247,000 | 262,541 |
| 5.766% 4/22/35 (b) | | 440,000 | 467,342 |
| JPMorgan Chase Bank 5.11% 12/8/26 | | 725,000 | 737,349 |
| KeyCorp 2.25% 4/6/27 | | 280,000 | 263,035 |
| Lloyds Banking Group PLC: | | | |
| 3.369% 12/14/46 (b) | | 200,000 | 144,262 |
| 3.574% 11/7/28 (b) | | 420,000 | 405,909 |
| 4.375% 3/22/28 | | 656,000 | 650,881 |
| 4.976% 8/11/33 (b) | | 200,000 | 198,514 |
| 5.721% 6/5/30 (b) | | 300,000 | 311,214 |
| 7.953% 11/15/33 (b) | | 200,000 | 231,410 |
| M&T Bank Corp.: | | | |
| 5.053% 1/27/34 (b) | | 190,000 | 184,385 |
| 6.082% 3/13/32 (b) | | 100,000 | 103,871 |
| Mitsubishi UFJ Financial Group, Inc.: | | | |
| 1 year U.S. Treasury Index + 1.630% 5.441% 2/22/34 (b) | | 240,000 | 249,297 |
| 1.538% 7/20/27 (b) | | 550,000 | 519,097 |
| 2.309% 7/20/32 (b) | | 550,000 | 468,769 |
| 2.341% 1/19/28 (b) | | 330,000 | 313,443 |
| 2.559% 2/25/30 | | 200,000 | 180,372 |
| 2.757% 9/13/26 | | 1,050,000 | 1,014,017 |
| 3.195% 7/18/29 | | 670,000 | 630,017 |
| 3.961% 3/2/28 | | 100,000 | 98,678 |
| 4.153% 3/7/39 | | 150,000 | 138,318 |
| 4.286% 7/26/38 | | 110,000 | 104,014 |
| 5.475% 2/22/31 (b) | | 200,000 | 207,456 |
| Mizuho Financial Group, Inc.: | | | |
| 1.554% 7/9/27 (b) | | 200,000 | 188,802 |
| 1.979% 9/8/31 (b) | | 280,000 | 238,718 |
| 2.226% 5/25/26 (b) | | 200,000 | 195,885 |
| 5.669% 9/13/33 (b) | | 200,000 | 208,694 |
| 5.739% 5/27/31 (b) | | 590,000 | 616,389 |
| 5.778% 7/6/29 (b) | | 430,000 | 446,805 |
| Morgan Stanley Bank, West Valley City Utah 4.754% 4/21/26 | | 1,710,000 | 1,716,826 |
| National Australia Bank Ltd.: | | | |
| 4.9% 6/13/28 | | 300,000 | 306,379 |
| 4.944% 1/12/28 | | 250,000 | 254,629 |
| NatWest Group PLC: | | | |
| 3.032% 11/28/35 (b) | | 200,000 | 175,944 |
| 3.754% 11/1/29 (b) | | 400,000 | 398,628 |
| 5.516% 9/30/28 (b) | | 290,000 | 297,077 |
| 5.778% 3/1/35 (b) | | 400,000 | 417,869 |
| 5.847% 3/2/27 (b) | | 480,000 | 486,949 |
| 7.472% 11/10/26 (b) | | 330,000 | 338,873 |
| Oesterreichische Kontrollbank AG 0.375% 9/17/25 | | 100,000 | 95,962 |
| PNC Financial Services Group, Inc.: | | | |
| 1.15% 8/13/26 | | 400,000 | 375,299 |
| 2.2% 11/1/24 | | 250,000 | 248,607 |
| 2.55% 1/22/30 | | 530,000 | 481,630 |
| 3.45% 4/23/29 | | 710,000 | 682,178 |
| 4.626% 6/6/33 (b) | | 220,000 | 212,335 |
| 5.068% 1/24/34 (b) | | 160,000 | 159,936 |
| 5.582% 6/12/29 (b) | | 80,000 | 82,628 |
| 5.676% 1/22/35 (b) | | 200,000 | 208,726 |
| 5.939% 8/18/34 (b) | | 200,000 | 211,738 |
| Royal Bank of Canada: | | | |
| 1.2% 4/27/26 | | 1,030,000 | 978,235 |
| 2.05% 1/21/27 | | 300,000 | 284,935 |
| 3.625% 5/4/27 | | 410,000 | 403,262 |
| 4.24% 8/3/27 | | 390,000 | 389,961 |
| 4.65% 1/27/26 | | 210,000 | 209,590 |
| 4.95% 2/1/29 | | 90,000 | 92,059 |
| 5% 5/2/33 | | 200,000 | 205,035 |
| 5.15% 2/1/34 | | 100,000 | 102,490 |
| Santander Holdings U.S.A., Inc.: | | | |
| 4.4% 7/13/27 | | 110,000 | 108,666 |
| 4.5% 7/17/25 | | 406,000 | 403,243 |
| 6.565% 6/12/29 (b) | | 100,000 | 104,666 |
| 7.66% 11/9/31 (b) | | 280,000 | 312,165 |
| Santander UK Group Holdings PLC: | | | |
| 1.532% 8/21/26 (b) | | 250,000 | 241,222 |
| 6.534% 1/10/29 (b) | | 250,000 | 262,082 |
| Sumitomo Mitsui Financial Group, Inc.: | | | |
| 1.474% 7/8/25 | | 650,000 | 631,976 |
| 2.142% 9/23/30 | | 260,000 | 224,433 |
| 2.174% 1/14/27 | | 1,010,000 | 956,769 |
| 2.75% 1/15/30 | | 200,000 | 181,626 |
| 3.01% 10/19/26 | | 725,000 | 702,472 |
| 3.05% 1/14/42 | | 260,000 | 201,517 |
| 5.52% 1/13/28 | | 500,000 | 515,086 |
| 5.558% 7/9/34 | | 200,000 | 208,359 |
| 5.776% 7/13/33 | | 280,000 | 297,461 |
| 5.8% 7/13/28 | | 300,000 | 313,669 |
| 5.808% 9/14/33 | | 200,000 | 213,897 |
| 6.184% 7/13/43 | | 60,000 | 66,919 |
| The Toronto-Dominion Bank: | | | |
| 2% 9/10/31 | | 200,000 | 169,677 |
| 3.2% 3/10/32 | | 190,000 | 171,077 |
| 3.766% 6/6/25 | | 1,440,000 | 1,428,357 |
| 4.456% 6/8/32 | | 100,000 | 97,791 |
| 5.156% 1/10/28 | | 620,000 | 632,969 |
| 5.264% 12/11/26 | | 300,000 | 305,352 |
| Truist Financial Corp.: | | | |
| 1.2% 8/5/25 | | 850,000 | 820,686 |
| 1.267% 3/2/27 (b) | | 950,000 | 898,171 |
| 4.916% 7/28/33 (b) | | 250,000 | 241,755 |
| 5.153% 8/5/32 (b) | | 160,000 | 161,598 |
| 5.711% 1/24/35 (b) | | 270,000 | 279,636 |
| 5.867% 6/8/34 (b) | | 300,000 | 313,468 |
| U.S. Bancorp: | | | |
| 2.491% 11/3/36 (b) | | 100,000 | 82,726 |
| 2.677% 1/27/33 (b) | | 190,000 | 163,606 |
| 3.9% 4/26/28 | | 550,000 | 540,669 |
| 4.839% 2/1/34 (b) | | 490,000 | 481,704 |
| 4.967% 7/22/33 (b) | | 150,000 | 147,298 |
| 5.775% 6/12/29 (b) | | 100,000 | 103,834 |
| 5.85% 10/21/33 (b) | | 460,000 | 483,276 |
| Wachovia Corp. 5.5% 8/1/35 | | 350,000 | 359,825 |
| Wells Fargo & Co.: | | | |
| 2.393% 6/2/28 (b) | | 220,000 | 207,541 |
| 2.406% 10/30/25 (b) | | 550,000 | 547,112 |
| 3% 10/23/26 | | 710,000 | 689,629 |
| 3.068% 4/30/41 (b) | | 380,000 | 290,456 |
| 3.9% 5/1/45 | | 310,000 | 258,043 |
| 3.908% 4/25/26 (b) | | 630,000 | 624,562 |
| 4.4% 6/14/46 | | 120,000 | 102,052 |
| 4.54% 8/15/26 (b) | | 500,000 | 497,771 |
| 4.611% 4/25/53 (b) | | 1,160,000 | 1,050,720 |
| 4.75% 12/7/46 | | 508,000 | 454,329 |
| 4.897% 7/25/33 (b) | | 200,000 | 199,026 |
| 4.9% 11/17/45 | | 97,000 | 88,895 |
| 5.013% 4/4/51 (b) | | 280,000 | 268,295 |
| 5.198% 1/23/30 (b) | | 720,000 | 734,876 |
| 5.375% 11/2/43 | | 100,000 | 98,939 |
| 5.389% 4/24/34 (b) | | 580,000 | 594,400 |
| 5.557% 7/25/34 (b) | | 590,000 | 608,881 |
| 5.574% 7/25/29 (b) | | 400,000 | 413,054 |
| 5.606% 1/15/44 | | 360,000 | 364,588 |
| Wells Fargo Bank NA 5.254% 12/11/26 | | 1,760,000 | 1,794,087 |
| Westpac Banking Corp.: | | | |
| 1.953% 11/20/28 | | 170,000 | 154,814 |
| 2.894% 2/4/30 (b) | | 390,000 | 385,577 |
| 3.02% 11/18/36 (b) | | 180,000 | 154,478 |
| 3.35% 3/8/27 | | 670,000 | 655,801 |
| 4.043% 8/26/27 | | 230,000 | 229,106 |
| 4.11% 7/24/34 (b) | | 500,000 | 479,459 |
| 4.322% 11/23/31 (b) | | 270,000 | 266,338 |
| 5.405% 8/10/33 (b) | | 100,000 | 101,406 |
| 6.82% 11/17/33 | | 100,000 | 111,596 |
| | | | 111,243,285 |
| Capital Markets - 1.9% | | | |
| Ameriprise Financial, Inc.: | | | |
| 3% 4/2/25 | | 210,000 | 207,670 |
| 5.15% 5/15/33 | | 70,000 | 72,050 |
| 5.7% 12/15/28 | | 130,000 | 136,666 |
| Ares Capital Corp.: | | | |
| 2.875% 6/15/28 | | 100,000 | 91,349 |
| 3.2% 11/15/31 | | 150,000 | 129,418 |
| 3.875% 1/15/26 | | 200,000 | 196,176 |
| 4.25% 3/1/25 | | 100,000 | 99,401 |
| 5.95% 7/15/29 | | 190,000 | 193,617 |
| 7% 1/15/27 | | 90,000 | 93,364 |
| Bank of New York Mellon Corp.: | | | |
| 1.8% 7/28/31 | | 170,000 | 142,395 |
| 1.9% 1/25/29 | | 245,000 | 222,163 |
| 2.1% 10/24/24 | | 370,000 | 368,349 |
| 4.414% 7/24/26 (b) | | 500,000 | 497,708 |
| 4.543% 2/1/29 (b) | | 560,000 | 562,776 |
| 4.596% 7/26/30 (b) | | 100,000 | 100,731 |
| 4.975% 3/14/30 (b) | | 150,000 | 153,493 |
| 5.188% 3/14/35 (b) | | 260,000 | 265,569 |
| 6.317% 10/25/29 (b) | | 500,000 | 533,607 |
| Blackrock Funding, Inc.: | | | |
| 4.6% 7/26/27 | | 90,000 | 91,292 |
| 5% 3/14/34 | | 100,000 | 103,146 |
| 5.25% 3/14/54 | | 60,000 | 60,846 |
| 5.35% 1/8/55 | | 100,000 | 102,611 |
| BlackRock, Inc.: | | | |
| 2.4% 4/30/30 | | 550,000 | 497,802 |
| 3.2% 3/15/27 | | 220,000 | 215,302 |
| 3.25% 4/30/29 | | 180,000 | 173,493 |
| 4.75% 5/25/33 | | 80,000 | 81,016 |
| Blackstone Private Credit Fund: | | | |
| 2.7% 1/15/25 | | 280,000 | 276,786 |
| 3.25% 3/15/27 | | 140,000 | 132,575 |
| 4.7% 3/24/25 | | 350,000 | 348,088 |
| 5.95% 7/16/29 (c) | | 110,000 | 110,802 |
| 6.25% 1/25/31 (c) | | 50,000 | 51,141 |
| 7.3% 11/27/28 (c) | | 50,000 | 53,002 |
| Blue Owl Capital Corp. 2.875% 6/11/28 | | 270,000 | 246,849 |
| Brookfield Capital Finance LLC 6.087% 6/14/33 | | 100,000 | 106,776 |
| Brookfield Finance LLC / Brookfield Finance, Inc. 3.45% 4/15/50 | | 120,000 | 85,901 |
| Brookfield Finance, Inc.: | | | |
| 2.724% 4/15/31 | | 330,000 | 292,161 |
| 3.5% 3/30/51 | | 100,000 | 73,439 |
| 3.9% 1/25/28 | | 190,000 | 185,608 |
| 5.968% 3/4/54 | | 100,000 | 105,309 |
| 6.35% 1/5/34 | | 70,000 | 76,157 |
| Cboe Global Markets, Inc. 1.625% 12/15/30 | | 130,000 | 110,373 |
| Charles Schwab Corp.: | | | |
| 0.9% 3/11/26 | | 460,000 | 434,701 |
| 1.65% 3/11/31 | | 197,000 | 163,758 |
| 2% 3/20/28 | | 120,000 | 110,559 |
| 2.9% 3/3/32 | | 310,000 | 274,205 |
| 3.2% 3/2/27 | | 910,000 | 882,779 |
| 6.136% 8/24/34 (b) | | 240,000 | 257,817 |
| CI Financial Corp. 3.2% 12/17/30 | | 220,000 | 181,920 |
| CME Group, Inc.: | | | |
| 3.75% 6/15/28 | | 140,000 | 138,198 |
| 5.3% 9/15/43 | | 150,000 | 157,358 |
| Credit Suisse U.S.A., Inc. 7.125% 7/15/32 | | 220,000 | 251,004 |
| Deutsche Bank AG 4.1% 1/13/26 | | 700,000 | 693,375 |
| Deutsche Bank AG New York Branch: | | | |
| 2.311% 11/16/27 (b) | | 250,000 | 235,784 |
| 3.547% 9/18/31 (b) | | 150,000 | 137,780 |
| 3.729% 1/14/32 (b) | | 250,000 | 221,071 |
| 4.1% 1/13/26 | | 154,000 | 151,991 |
| 4.875% 12/1/32 (b) | | 200,000 | 194,779 |
| 6.72% 1/18/29 (b) | | 150,000 | 157,918 |
| 6.819% 11/20/29 (b) | | 280,000 | 297,942 |
| Goldman Sachs Group, Inc.: | | | |
| 0.855% 2/12/26 (b) | | 110,000 | 107,797 |
| 1.093% 12/9/26 (b) | | 1,000,000 | 952,151 |
| 1.948% 10/21/27 (b) | | 600,000 | 566,818 |
| 2.383% 7/21/32 (b) | | 1,250,000 | 1,064,332 |
| 2.615% 4/22/32 (b) | | 460,000 | 400,025 |
| 2.908% 7/21/42 (b) | | 470,000 | 346,550 |
| 3.102% 2/24/33 (b) | | 140,000 | 123,838 |
| 3.5% 4/1/25 | | 2,620,000 | 2,594,651 |
| 3.85% 1/26/27 | | 960,000 | 945,955 |
| 4.017% 10/31/38 (b) | | 350,000 | 310,030 |
| 4.223% 5/1/29 (b) | | 1,650,000 | 1,627,220 |
| 4.482% 8/23/28 (b) | | 820,000 | 818,127 |
| 4.75% 10/21/45 | | 245,000 | 231,758 |
| 4.8% 7/8/44 | | 120,000 | 114,023 |
| 5.049% 7/23/30 (b) | | 500,000 | 507,470 |
| 5.15% 5/22/45 | | 330,000 | 324,287 |
| 6.25% 2/1/41 | | 220,000 | 245,552 |
| 6.561% 10/24/34 (b) | | 110,000 | 122,027 |
| 6.75% 10/1/37 | | 492,000 | 554,540 |
| HPS Corporate Lending Fund: | | | |
| 6.25% 9/30/29 (c) | | 100,000 | 101,820 |
| 6.75% 1/30/29 (c) | | 60,000 | 62,122 |
| Intercontinental Exchange, Inc.: | | | |
| 1.85% 9/15/32 | | 160,000 | 130,261 |
| 2.65% 9/15/40 | | 270,000 | 198,018 |
| 3% 9/15/60 | | 100,000 | 63,834 |
| 3.1% 9/15/27 | | 535,000 | 515,651 |
| 3.75% 9/21/28 | | 100,000 | 97,520 |
| 4% 9/15/27 | | 380,000 | 376,296 |
| 4.25% 9/21/48 | | 120,000 | 104,542 |
| 4.6% 3/15/33 | | 100,000 | 99,517 |
| 5.2% 6/15/62 | | 210,000 | 208,812 |
| Invesco Finance PLC 3.75% 1/15/26 | | 240,000 | 237,143 |
| Jefferies Financial Group, Inc.: | | | |
| 2.75% 10/15/32 | | 110,000 | 92,160 |
| 4.15% 1/23/30 | | 507,000 | 487,605 |
| 4.85% 1/15/27 | | 110,000 | 110,228 |
| 5.875% 7/21/28 | | 130,000 | 134,620 |
| Lazard Group LLC: | | | |
| 4.375% 3/11/29 | | 110,000 | 107,711 |
| 4.5% 9/19/28 | | 100,000 | 98,805 |
| Legg Mason, Inc. 5.625% 1/15/44 | | 60,000 | 60,949 |
| LPL Holdings, Inc. 6.75% 11/17/28 | | 80,000 | 85,319 |
| Moody's Corp.: | | | |
| 2% 8/19/31 | | 140,000 | 118,769 |
| 2.55% 8/18/60 | | 100,000 | 56,076 |
| 4.875% 12/17/48 | | 120,000 | 112,639 |
| 5% 8/5/34 | | 200,000 | 202,209 |
| Morgan Stanley: | | | |
| 1.164% 10/21/25 (b) | | 100,000 | 99,398 |
| 1.512% 7/20/27 (b) | | 470,000 | 443,253 |
| 1.593% 5/4/27 (b) | | 1,100,000 | 1,045,031 |
| 1.794% 2/13/32 (b) | | 260,000 | 216,382 |
| 2.188% 4/28/26 (b) | | 610,000 | 598,046 |
| 2.239% 7/21/32 (b) | | 470,000 | 397,736 |
| 2.484% 9/16/36 (b) | | 520,000 | 428,675 |
| 3.625% 1/20/27 | | 160,000 | 157,530 |
| 3.772% 1/24/29 (b) | | 180,000 | 175,646 |
| 3.971% 7/22/38 (b) | | 340,000 | 303,003 |
| 4.21% 4/20/28 (b) | | 575,000 | 569,842 |
| 4.3% 1/27/45 | | 120,000 | 107,644 |
| 4.375% 1/22/47 | | 324,000 | 289,832 |
| 4.457% 4/22/39 (b) | | 250,000 | 234,596 |
| 5.042% 7/19/30 (b) | | 110,000 | 111,875 |
| 5.123% 2/1/29 (b) | | 500,000 | 508,763 |
| 5.164% 4/20/29 (b) | | 630,000 | 641,864 |
| 5.25% 4/21/34 (b) | | 1,480,000 | 1,504,959 |
| 5.297% 4/20/37 (b) | | 330,000 | 327,301 |
| 5.32% 7/19/35 (b) | | 110,000 | 112,365 |
| 5.424% 7/21/34 (b) | | 480,000 | 493,100 |
| 5.597% 3/24/51 (b) | | 190,000 | 202,168 |
| 5.942% 2/7/39 (b) | | 200,000 | 206,436 |
| 6.375% 7/24/42 | | 528,000 | 608,800 |
| NASDAQ, Inc.: | | | |
| 1.65% 1/15/31 | | 290,000 | 243,089 |
| 2.5% 12/21/40 | | 100,000 | 69,584 |
| 3.95% 3/7/52 | | 85,000 | 66,974 |
| 5.35% 6/28/28 | | 100,000 | 103,313 |
| 5.95% 8/15/53 | | 168,000 | 179,978 |
| Nomura Holdings, Inc.: | | | |
| 1.851% 7/16/25 | | 666,000 | 647,648 |
| 2.329% 1/22/27 | | 290,000 | 274,011 |
| 2.679% 7/16/30 | | 210,000 | 185,509 |
| 2.999% 1/22/32 | | 565,000 | 489,841 |
| 6.07% 7/12/28 | | 200,000 | 208,615 |
| Northern Trust Corp.: | | | |
| 1.95% 5/1/30 | | 150,000 | 132,357 |
| 6.125% 11/2/32 | | 100,000 | 109,593 |
| S&P Global, Inc.: | | | |
| 1.25% 8/15/30 | | 120,000 | 101,258 |
| 2.45% 3/1/27 | | 300,000 | 287,071 |
| 2.7% 3/1/29 | | 270,000 | 252,271 |
| 2.95% 1/22/27 | | 220,000 | 213,341 |
| 3.9% 3/1/62 | | 200,000 | 159,031 |
| 4.25% 5/1/29 | | 110,000 | 109,654 |
| Sixth Street Specialty Lending, Inc. 6.125% 3/1/29 | | 80,000 | 82,004 |
| State Street Corp.: | | | |
| 1.684% 11/18/27 (b) | | 515,000 | 486,352 |
| 3.031% 11/1/34 (b) | | 170,000 | 155,439 |
| 4.164% 8/4/33 (b) | | 110,000 | 105,801 |
| 4.821% 1/26/34 (b) | | 100,000 | 99,875 |
| 5.272% 8/3/26 | | 440,000 | 446,873 |
| 5.684% 11/21/29 (b) | | 200,000 | 209,504 |
| UBS AG 1.25% 8/7/26 | | 1,010,000 | 950,334 |
| UBS AG London Branch 4.5% 6/26/48 | | 210,000 | 193,080 |
| UBS Group AG 3.75% 3/26/25 | | 800,000 | 793,688 |
| | | | 45,550,026 |
| Consumer Finance - 0.7% | | | |
| AerCap Ireland Capital Ltd./AerCap Global Aviation Trust: | | | |
| 2.45% 10/29/26 | | 1,000,000 | 953,084 |
| 3% 10/29/28 | | 250,000 | 233,812 |
| 3.4% 10/29/33 | | 250,000 | 217,948 |
| 3.85% 10/29/41 | | 250,000 | 205,213 |
| 4.45% 10/1/25 | | 300,000 | 298,249 |
| 4.625% 10/15/27 | | 270,000 | 269,496 |
| 5.3% 1/19/34 | | 200,000 | 202,544 |
| 6.45% 4/15/27 | | 219,000 | 227,876 |
| Ally Financial, Inc.: | | | |
| 2.2% 11/2/28 | | 100,000 | 89,684 |
| 4.75% 6/9/27 | | 100,000 | 99,641 |
| 5.125% 9/30/24 | | 510,000 | 509,643 |
| 5.8% 5/1/25 | | 150,000 | 150,300 |
| 6.184% 7/26/35 (b) | | 200,000 | 203,687 |
| 6.848% 1/3/30 (b) | | 240,000 | 253,823 |
| 6.992% 6/13/29 (b) | | 50,000 | 53,030 |
| 8% 11/1/31 | | 100,000 | 114,130 |
| American Express Co.: | | | |
| 3.3% 5/3/27 | | 510,000 | 496,395 |
| 3.95% 8/1/25 | | 400,000 | 396,816 |
| 4.05% 12/3/42 | | 140,000 | 123,832 |
| 4.989% 5/26/33 (b) | | 150,000 | 149,941 |
| 5.043% 5/1/34 (b) | | 250,000 | 252,759 |
| 5.284% 7/26/35 (b) | | 420,000 | 429,207 |
| 5.85% 11/5/27 | | 420,000 | 439,133 |
| Capital One Financial Corp.: | | | |
| 2.359% 7/29/32 (b) | | 110,000 | 88,267 |
| 3.3% 10/30/24 | | 230,000 | 229,178 |
| 3.75% 3/9/27 | | 280,000 | 274,302 |
| 3.8% 1/31/28 | | 438,000 | 424,958 |
| 4.2% 10/29/25 | | 100,000 | 98,894 |
| 5.247% 7/26/30 (b) | | 470,000 | 474,818 |
| 5.468% 2/1/29 (b) | | 450,000 | 457,763 |
| 5.817% 2/1/34 (b) | | 70,000 | 71,530 |
| 6.051% 2/1/35 (b) | | 200,000 | 207,585 |
| 6.312% 6/8/29 (b) | | 270,000 | 282,426 |
| 6.377% 6/8/34 (b) | | 150,000 | 159,362 |
| Discover Financial Services 4.5% 1/30/26 | | 208,000 | 206,738 |
| Ford Motor Credit Co. LLC: | | | |
| 6.798% 11/7/28 | | 310,000 | 326,720 |
| 6.8% 5/12/28 | | 740,000 | 776,346 |
| 6.95% 3/6/26 | | 260,000 | 265,891 |
| 7.122% 11/7/33 | | 210,000 | 226,858 |
| 7.2% 6/10/30 | | 520,000 | 559,737 |
| John Deere Capital Corp.: | | | |
| 1.45% 1/15/31 | | 170,000 | 142,931 |
| 2.35% 3/8/27 | | 200,000 | 190,929 |
| 2.8% 9/8/27 | | 290,000 | 278,657 |
| 2.8% 7/18/29 | | 310,000 | 289,846 |
| 4.35% 9/15/32 | | 320,000 | 318,419 |
| 4.75% 6/8/26 | | 730,000 | 735,443 |
| 4.95% 7/14/28 | | 450,000 | 461,631 |
| 5.05% 6/12/34 | | 210,000 | 216,058 |
| 5.15% 9/8/33 | | 170,000 | 177,178 |
| Synchrony Financial: | | | |
| 3.95% 12/1/27 | | 380,000 | 366,148 |
| 5.15% 3/19/29 | | 109,000 | 108,563 |
| Toyota Motor Credit Corp.: | | | |
| 1.15% 8/13/27 | | 470,000 | 430,510 |
| 1.65% 1/10/31 | | 180,000 | 152,006 |
| 1.9% 9/12/31 | | 210,000 | 175,977 |
| 3.2% 1/11/27 | | 810,000 | 791,159 |
| 4.45% 6/29/29 | | 340,000 | 342,016 |
| 4.8% 1/5/34 | | 70,000 | 70,413 |
| 5.4% 11/20/26 | | 1,155,000 | 1,180,533 |
| 5.55% 11/20/30 | | 190,000 | 200,840 |
| | | | 18,130,873 |
| Financial Services - 0.9% | | | |
| AB Svensk Exportkredit 2.25% 3/22/27 | | 970,000 | 927,683 |
| Aon Corp. / Aon Global Holdings PLC: | | | |
| 2.85% 5/28/27 | | 100,000 | 96,192 |
| 3.9% 2/28/52 | | 150,000 | 116,961 |
| Berkshire Hathaway, Inc.: | | | |
| 3.125% 3/15/26 | | 222,000 | 218,857 |
| 4.5% 2/11/43 | | 110,000 | 107,470 |
| Blue Owl Credit Income Corp.: | | | |
| 6.6% 9/15/29 (c) | | 80,000 | 81,487 |
| 6.65% 3/15/31 | | 190,000 | 193,285 |
| BP Capital Markets America, Inc.: | | | |
| 2.939% 6/4/51 | | 220,000 | 147,557 |
| 3% 2/24/50 | | 130,000 | 88,865 |
| 3.001% 3/17/52 | | 200,000 | 135,317 |
| 3.017% 1/16/27 | | 635,000 | 616,623 |
| 3.06% 6/17/41 | | 810,000 | 617,366 |
| 3.379% 2/8/61 | | 110,000 | 76,152 |
| 4.234% 11/6/28 | | 830,000 | 827,319 |
| 4.812% 2/13/33 | | 150,000 | 150,040 |
| CNH Industrial Capital LLC: | | | |
| 4.55% 4/10/28 | | 180,000 | 179,674 |
| 5.5% 1/12/29 | | 120,000 | 124,110 |
| Corebridge Financial, Inc.: | | | |
| 3.65% 4/5/27 | | 290,000 | 283,940 |
| 3.9% 4/5/32 | | 210,000 | 194,428 |
| 4.4% 4/5/52 | | 190,000 | 157,877 |
| DH Europe Finance II SARL: | | | |
| 2.2% 11/15/24 | | 110,000 | 109,296 |
| 2.6% 11/15/29 | | 320,000 | 295,037 |
| 3.4% 11/15/49 | | 80,000 | 60,652 |
| Equitable Holdings, Inc.: | | | |
| 4.35% 4/20/28 | | 380,000 | 375,180 |
| 5% 4/20/48 | | 120,000 | 111,944 |
| Fedex Corp. 2020-1 Class AA pass-thru Trust equipment trust certificate 1.875% 8/20/35 | | 196,527 | 168,649 |
| Fidelity National Information Services, Inc.: | | | |
| 1.15% 3/1/26 | | 246,000 | 233,431 |
| 2.25% 3/1/31 | | 200,000 | 173,037 |
| 5.625% 7/15/52 | | 100,000 | 103,491 |
| Fiserv, Inc.: | | | |
| 2.25% 6/1/27 | | 100,000 | 94,362 |
| 3.5% 7/1/29 | | 520,000 | 497,932 |
| 4.4% 7/1/49 | | 310,000 | 265,755 |
| 5.375% 8/21/28 | | 300,000 | 309,558 |
| 5.45% 3/2/28 | | 150,000 | 154,589 |
| Global Payments, Inc.: | | | |
| 1.2% 3/1/26 | | 350,000 | 331,897 |
| 2.9% 5/15/30 | | 310,000 | 279,054 |
| 3.2% 8/15/29 | | 110,000 | 102,018 |
| 4.45% 6/1/28 | | 170,000 | 168,176 |
| 5.95% 8/15/52 | | 100,000 | 101,644 |
| Jackson Financial, Inc.: | | | |
| 3.125% 11/23/31 | | 64,000 | 55,384 |
| 5.17% 6/8/27 | | 110,000 | 111,496 |
| 5.67% 6/8/32 | | 85,000 | 87,745 |
| Japan International Cooperation Agency 1.75% 4/28/31 | | 200,000 | 171,685 |
| Jbs U.S.A. Holding Lux/ Jbs U.S.A. F: | | | |
| 5.75% 4/1/33 | | 500,000 | 511,830 |
| 6.5% 12/1/52 | | 180,000 | 189,619 |
| 6.75% 3/15/34 (c) | | 110,000 | 120,596 |
| 7.25% 11/15/53 (c) | | 70,000 | 80,356 |
| KfW: | | | |
| 0% 6/29/37 | | 1,000,000 | 585,128 |
| 0.375% 7/18/25 | | 208,000 | 200,747 |
| 0.625% 1/22/26 | | 900,000 | 857,004 |
| 2.5% 11/20/24 | | 280,000 | 278,390 |
| 3% 5/20/27 | | 2,200,000 | 2,150,567 |
| MasterCard, Inc.: | | | |
| 2.95% 11/21/26 | | 615,000 | 598,798 |
| 3.8% 11/21/46 | | 120,000 | 100,797 |
| 3.85% 3/26/50 | | 310,000 | 257,342 |
| 3.95% 2/26/48 | | 100,000 | 85,446 |
| 4.85% 3/9/33 | | 160,000 | 164,689 |
| 4.875% 3/9/28 | | 210,000 | 215,727 |
| National Rural Utilities Cooperative Finance Corp.: | | | |
| 4.15% 12/15/32 | | 340,000 | 326,207 |
| 4.3% 3/15/49 | | 70,000 | 60,117 |
| 4.85% 2/7/29 | | 220,000 | 224,043 |
| 5.05% 9/15/28 | | 300,000 | 306,853 |
| 5.8% 1/15/33 | | 110,000 | 117,492 |
| PayPal Holdings, Inc.: | | | |
| 1.65% 6/1/25 | | 80,000 | 78,102 |
| 2.3% 6/1/30 | | 130,000 | 116,325 |
| 2.85% 10/1/29 | | 420,000 | 391,034 |
| 5.05% 6/1/52 | | 160,000 | 155,659 |
| 5.15% 6/1/34 | | 260,000 | 267,045 |
| Rexford Industrial Realty LP 5% 6/15/28 | | 100,000 | 101,152 |
| Sixth Street Lending Partners 6.5% 3/11/29 (c) | | 130,000 | 132,779 |
| The Western Union Co.: | | | |
| 2.75% 3/15/31 | | 110,000 | 94,601 |
| 2.85% 1/10/25 | | 100,000 | 99,091 |
| Visa, Inc.: | | | |
| 2% 8/15/50 | | 100,000 | 59,760 |
| 2.05% 4/15/30 | | 430,000 | 385,380 |
| 2.7% 4/15/40 | | 120,000 | 91,965 |
| 2.75% 9/15/27 | | 815,000 | 784,522 |
| 3.15% 12/14/25 | | 160,000 | 157,515 |
| 4.3% 12/14/45 | | 402,000 | 364,494 |
| Voya Financial, Inc.: | | | |
| 3.65% 6/15/26 | | 170,000 | 167,045 |
| 5.7% 7/15/43 | | 50,000 | 49,790 |
| | | | 20,631,222 |
| Insurance - 0.8% | | | |
| AFLAC, Inc. 3.6% 4/1/30 | | 340,000 | 324,686 |
| Allstate Corp.: | | | |
| CME Term SOFR 3 Month Index + 3.190% 8.3177% 8/15/53 (b)(d) | | 160,000 | 160,400 |
| 1.45% 12/15/30 | | 500,000 | 414,325 |
| 4.5% 6/15/43 | | 180,000 | 161,514 |
| American International Group, Inc.: | | | |
| 4.375% 6/30/50 | | 170,000 | 147,614 |
| 4.5% 7/16/44 | | 115,000 | 102,676 |
| 4.7% 7/10/35 | | 200,000 | 191,670 |
| 4.75% 4/1/48 | | 40,000 | 36,829 |
| 5.75% 4/1/48 (b) | | 190,000 | 188,288 |
| Aon Corp. 4.5% 12/15/28 | | 310,000 | 309,665 |
| Aon North America, Inc.: | | | |
| 5.45% 3/1/34 | | 300,000 | 310,445 |
| 5.75% 3/1/54 | | 150,000 | 155,324 |
| Aon PLC: | | | |
| 4.6% 6/14/44 | | 165,000 | 146,669 |
| 4.75% 5/15/45 | | 140,000 | 127,672 |
| Arch Capital Finance LLC 4.011% 12/15/26 | | 360,000 | 355,087 |
| Arch Capital Group Ltd. 3.635% 6/30/50 | | 187,000 | 141,330 |
| Arthur J. Gallagher & Co.: | | | |
| 3.5% 5/20/51 | | 100,000 | 72,090 |
| 5.75% 3/2/53 | | 100,000 | 101,445 |
| 6.75% 2/15/54 | | 100,000 | 115,352 |
| Assurant, Inc. 4.9% 3/27/28 | | 100,000 | 100,129 |
| Assured Guaranty U.S. Holdings, Inc.: | | | |
| 3.6% 9/15/51 | | 35,000 | 24,991 |
| 6.125% 9/15/28 | | 180,000 | 189,708 |
| Athene Holding Ltd.: | | | |
| 3.5% 1/15/31 | | 220,000 | 202,439 |
| 4.125% 1/12/28 | | 90,000 | 88,231 |
| 6.25% 4/1/54 | | 100,000 | 103,815 |
| 6.65% 2/1/33 | | 100,000 | 108,915 |
| Baylor Scott & White Holdings Series 2021, 2.839% 11/15/50 | | 250,000 | 172,702 |
| Berkshire Hathaway Finance Corp.: | | | |
| 1.45% 10/15/30 | | 900,000 | 768,783 |
| 2.85% 10/15/50 | | 180,000 | 123,619 |
| 3.85% 3/15/52 | | 220,000 | 181,066 |
| 4.2% 8/15/48 | | 130,000 | 116,589 |
| 4.25% 1/15/49 | | 100,000 | 90,823 |
| 4.4% 5/15/42 | | 300,000 | 288,127 |
| 5.75% 1/15/40 | | 160,000 | 176,955 |
| Brighthouse Financial, Inc.: | | | |
| 3.85% 12/22/51 | | 65,000 | 42,643 |
| 5.625% 5/15/30 | | 309,000 | 315,352 |
| Brown & Brown, Inc.: | | | |
| 4.2% 3/17/32 | | 140,000 | 132,466 |
| 5.65% 6/11/34 | | 130,000 | 134,005 |
| Chubb INA Holdings, Inc.: | | | |
| 1.375% 9/15/30 | | 380,000 | 322,435 |
| 2.85% 12/15/51 | | 155,000 | 105,684 |
| 3.05% 12/15/61 | | 90,000 | 59,817 |
| 3.15% 3/15/25 | | 310,000 | 306,885 |
| 4.35% 11/3/45 | | 74,000 | 66,441 |
| CNA Financial Corp.: | | | |
| 3.45% 8/15/27 | | 190,000 | 184,742 |
| 3.9% 5/1/29 | | 100,000 | 97,285 |
| Fairfax Financial Holdings Ltd.: | | | |
| 4.625% 4/29/30 | | 240,000 | 237,556 |
| 5.625% 8/16/32 | | 70,000 | 71,397 |
| 6.1% 3/15/55 (c) | | 50,000 | 50,573 |
| 6.35% 3/22/54 (c) | | 150,000 | 156,565 |
| Globe Life, Inc. 2.15% 8/15/30 | | 100,000 | 85,249 |
| Hartford Financial Services Group, Inc.: | | | |
| 2.8% 8/19/29 | | 490,000 | 451,116 |
| 2.9% 9/15/51 | | 50,000 | 33,110 |
| 4.4% 3/15/48 | | 30,000 | 26,245 |
| Lincoln National Corp.: | | | |
| 3.8% 3/1/28 | | 230,000 | 223,668 |
| 4.35% 3/1/48 | | 210,000 | 167,592 |
| Manulife Financial Corp.: | | | |
| 4.15% 3/4/26 | | 510,000 | 507,428 |
| 5.375% 3/4/46 | | 50,000 | 50,805 |
| Markel Group, Inc.: | | | |
| 3.35% 9/17/29 | | 100,000 | 94,326 |
| 3.5% 11/1/27 | | 300,000 | 290,799 |
| 5% 5/20/49 | | 120,000 | 109,534 |
| 6% 5/16/54 | | 100,000 | 103,619 |
| Marsh & McLennan Companies, Inc.: | | | |
| 2.25% 11/15/30 | | 140,000 | 123,843 |
| 3.5% 3/10/25 | | 190,000 | 188,425 |
| 4.2% 3/1/48 | | 40,000 | 34,255 |
| 4.375% 3/15/29 | | 120,000 | 120,445 |
| 4.75% 3/15/39 | | 120,000 | 116,571 |
| 4.9% 3/15/49 | | 270,000 | 255,629 |
| 5.7% 9/15/53 | | 190,000 | 201,963 |
| MetLife, Inc.: | | | |
| 4.125% 8/13/42 | | 180,000 | 156,227 |
| 4.55% 3/23/30 | | 110,000 | 111,551 |
| 4.6% 5/13/46 | | 272,000 | 248,816 |
| 4.875% 11/13/43 | | 145,000 | 137,999 |
| 5% 7/15/52 | | 120,000 | 115,560 |
| 5.375% 7/15/33 | | 210,000 | 219,885 |
| 6.375% 6/15/34 | | 210,000 | 234,582 |
| 6.4% 12/15/66 (b) | | 150,000 | 157,789 |
| Principal Financial Group, Inc.: | | | |
| 2.125% 6/15/30 | | 160,000 | 139,150 |
| 3.4% 5/15/25 | | 390,000 | 385,285 |
| 3.7% 5/15/29 | | 180,000 | 173,853 |
| 5.5% 3/15/53 | | 50,000 | 50,278 |
| Progressive Corp.: | | | |
| 2.5% 3/15/27 | | 270,000 | 258,370 |
| 3% 3/15/32 | | 260,000 | 235,469 |
| 3.2% 3/26/30 | | 400,000 | 377,202 |
| 4.2% 3/15/48 | | 100,000 | 86,656 |
| Prudential Financial, Inc.: | | | |
| 3% 3/10/40 | | 110,000 | 85,133 |
| 3.878% 3/27/28 | | 45,000 | 44,198 |
| 3.935% 12/7/49 | | 70,000 | 56,345 |
| 4.35% 2/25/50 | | 180,000 | 155,973 |
| 4.418% 3/27/48 | | 100,000 | 86,854 |
| 4.6% 5/15/44 | | 110,000 | 100,851 |
| 5.125% 3/1/52 (b) | | 140,000 | 136,408 |
| 5.7% 12/14/36 | | 120,000 | 128,057 |
| 5.7% 9/15/48 (b) | | 74,000 | 73,644 |
| 6% 9/1/52 (b) | | 230,000 | 235,943 |
| 6.5% 3/15/54 (b) | | 110,000 | 113,762 |
| Prudential Funding Asia PLC 3.125% 4/14/30 | | 100,000 | 92,973 |
| Reinsurance Group of America, Inc.: | | | |
| 3.9% 5/15/29 | | 120,000 | 116,156 |
| 3.95% 9/15/26 | | 200,000 | 197,575 |
| The Chubb Corp. 6.5% 5/15/38 | | 258,000 | 298,505 |
| The Travelers Companies, Inc.: | | | |
| 2.55% 4/27/50 | | 360,000 | 230,148 |
| 3.05% 6/8/51 | | 100,000 | 70,455 |
| 4.05% 3/7/48 | | 74,000 | 63,051 |
| 6.25% 6/15/37 | | 256,000 | 287,989 |
| Travelers Property Casualty Corp. 6.375% 3/15/33 | | 160,000 | 180,081 |
| Unum Group: | | | |
| 4% 6/15/29 | | 100,000 | 97,183 |
| 5.75% 8/15/42 | | 110,000 | 109,658 |
| 6% 6/15/54 | | 60,000 | 61,084 |
| Willis Group North America, Inc.: | | | |
| 4.5% 9/15/28 | | 504,000 | 501,504 |
| 5.9% 3/5/54 | | 190,000 | 195,284 |
| | | | 18,575,927 |
TOTAL FINANCIALS | | | 214,131,333 |
| HEALTH CARE - 2.9% | | | |
| Biotechnology - 0.5% | | | |
| AbbVie, Inc.: | | | |
| 2.6% 11/21/24 | | 120,000 | 119,271 |
| 2.95% 11/21/26 | | 100,000 | 97,192 |
| 3.2% 11/21/29 | | 1,940,000 | 1,838,298 |
| 4.05% 11/21/39 | | 210,000 | 190,205 |
| 4.25% 11/14/28 | | 92,000 | 92,343 |
| 4.25% 11/21/49 | | 470,000 | 409,793 |
| 4.3% 5/14/36 | | 25,000 | 23,949 |
| 4.45% 5/14/46 | | 280,000 | 253,661 |
| 4.5% 5/14/35 | | 300,000 | 294,937 |
| 4.55% 3/15/35 | | 50,000 | 49,328 |
| 4.75% 3/15/45 | | 420,000 | 398,781 |
| 4.8% 3/15/29 | | 370,000 | 377,979 |
| 4.85% 6/15/44 | | 340,000 | 327,248 |
| 5.05% 3/15/34 | | 560,000 | 577,060 |
| 5.4% 3/15/54 | | 370,000 | 383,436 |
| Amgen, Inc.: | | | |
| 1.65% 8/15/28 | | 550,000 | 495,251 |
| 1.9% 2/21/25 | | 100,000 | 98,444 |
| 2.8% 8/15/41 | | 200,000 | 147,791 |
| 3% 1/15/52 | | 100,000 | 68,979 |
| 3.15% 2/21/40 | | 320,000 | 248,612 |
| 3.2% 11/2/27 | | 70,000 | 67,614 |
| 3.35% 2/22/32 | | 140,000 | 128,230 |
| 3.375% 2/21/50 | | 210,000 | 155,610 |
| 4.2% 3/1/33 | | 130,000 | 124,433 |
| 4.4% 5/1/45 | | 188,000 | 163,773 |
| 4.4% 2/22/62 | | 110,000 | 91,173 |
| 4.563% 6/15/48 | | 120,000 | 105,817 |
| 4.663% 6/15/51 | | 100,000 | 89,005 |
| 4.875% 3/1/53 | | 130,000 | 119,454 |
| 4.95% 10/1/41 | | 200,000 | 190,609 |
| 5.15% 3/2/28 | | 400,000 | 408,584 |
| 5.25% 3/2/30 | | 600,000 | 621,538 |
| 5.25% 3/2/33 | | 310,000 | 318,580 |
| 5.6% 3/2/43 | | 250,000 | 255,508 |
| 5.65% 3/2/53 | | 460,000 | 473,116 |
| 5.75% 3/2/63 | | 290,000 | 297,432 |
| Biogen, Inc.: | | | |
| 2.25% 5/1/30 | | 280,000 | 247,173 |
| 3.15% 5/1/50 | | 100,000 | 67,765 |
| 3.25% 2/15/51 | | 150,000 | 103,399 |
| Gilead Sciences, Inc.: | | | |
| 1.65% 10/1/30 | | 590,000 | 502,063 |
| 2.6% 10/1/40 | | 580,000 | 418,224 |
| 2.8% 10/1/50 | | 180,000 | 118,209 |
| 2.95% 3/1/27 | | 430,000 | 416,371 |
| 4.15% 3/1/47 | | 112,000 | 94,920 |
| 4.6% 9/1/35 | | 100,000 | 98,056 |
| 4.75% 3/1/46 | | 240,000 | 222,350 |
| Regeneron Pharmaceuticals, Inc. 1.75% 9/15/30 | | 300,000 | 256,470 |
| | | | 12,648,034 |
| Health Care Equipment & Supplies - 0.2% | | | |
| Abbott Laboratories: | | | |
| 4.75% 11/30/36 | | 170,000 | 172,061 |
| 4.75% 4/15/43 | | 170,000 | 167,277 |
| 5.3% 5/27/40 | | 390,000 | 411,636 |
| Baxter International, Inc.: | | | |
| 1.915% 2/1/27 | | 330,000 | 309,821 |
| 2.539% 2/1/32 | | 330,000 | 281,836 |
| 3.95% 4/1/30 | | 140,000 | 135,658 |
| Becton, Dickinson & Co.: | | | |
| 2.823% 5/20/30 | | 260,000 | 237,648 |
| 3.7% 6/6/27 | | 60,000 | 58,795 |
| 4.669% 6/6/47 | | 290,000 | 261,924 |
| 4.693% 2/13/28 | | 130,000 | 130,749 |
| 5.081% 6/7/29 | | 400,000 | 409,807 |
| Boston Scientific Corp.: | | | |
| 4% 3/1/29 | | 100,000 | 98,304 |
| 4.7% 3/1/49 | | 230,000 | 215,701 |
| GE Healthcare Technologies, Inc.: | | | |
| 5.65% 11/15/27 | | 120,000 | 123,908 |
| 5.905% 11/22/32 | | 230,000 | 245,067 |
| 6.377% 11/22/52 | | 100,000 | 113,968 |
| Medtronic Global Holdings SCA 4.5% 3/30/33 | | 80,000 | 79,474 |
| Medtronic, Inc.: | | | |
| 4.375% 3/15/35 | | 280,000 | 274,227 |
| 4.625% 3/15/45 | | 110,000 | 103,431 |
| Stryker Corp.: | | | |
| 1.95% 6/15/30 | | 100,000 | 87,324 |
| 2.9% 6/15/50 | | 200,000 | 137,431 |
| 3.5% 3/15/26 | | 570,000 | 560,476 |
| Zimmer Biomet Holdings, Inc.: | | | |
| 3.55% 4/1/25 | | 175,000 | 173,278 |
| 3.55% 3/20/30 | | 194,000 | 181,398 |
| | | | 4,971,199 |
| Health Care Providers & Services - 1.2% | | | |
| Aetna, Inc.: | | | |
| 3.875% 8/15/47 | | 180,000 | 136,453 |
| 4.75% 3/15/44 | | 100,000 | 87,899 |
| AHS Hospital Corp. 2.78% 7/1/51 | | 250,000 | 167,084 |
| Allina Health System, Inc. 3.887% 4/15/49 | | 40,000 | 32,948 |
| Banner Health: | | | |
| 2.907% 1/1/42 | | 400,000 | 300,775 |
| 2.913% 1/1/51 | | 150,000 | 104,456 |
| Baptist Healthcare System Obli 3.54% 8/15/50 | | 125,000 | 95,189 |
| Bon Secours Mercy Health, Inc. 2.095% 6/1/31 | | 89,000 | 76,242 |
| Cardinal Health, Inc.: | | | |
| 3.41% 6/15/27 | | 460,000 | 447,526 |
| 4.368% 6/15/47 | | 30,000 | 25,325 |
| 4.9% 9/15/45 | | 100,000 | 91,094 |
| Cencora, Inc.: | | | |
| 2.7% 3/15/31 | | 170,000 | 150,695 |
| 2.8% 5/15/30 | | 300,000 | 272,727 |
| Centene Corp.: | | | |
| 2.5% 3/1/31 | | 110,000 | 93,382 |
| 2.625% 8/1/31 | | 365,000 | 309,614 |
| 3.375% 2/15/30 | | 400,000 | 366,262 |
| 4.25% 12/15/27 | | 410,000 | 400,857 |
| 4.625% 12/15/29 | | 390,000 | 379,428 |
| Children's Hospital of Philadelphia 2.704% 7/1/50 | | 98,000 | 66,210 |
| Cigna Group: | | | |
| 3.4% 3/1/27 | | 790,000 | 770,033 |
| 4.125% 11/15/25 | | 99,000 | 98,328 |
| 4.375% 10/15/28 | | 100,000 | 99,443 |
| 4.8% 8/15/38 | | 290,000 | 278,085 |
| 4.8% 7/15/46 | | 230,000 | 209,006 |
| 4.9% 12/15/48 | | 350,000 | 321,538 |
| 5.125% 5/15/31 | | 100,000 | 102,582 |
| 5.4% 3/15/33 | | 300,000 | 310,615 |
| 5.6% 2/15/54 | | 250,000 | 251,684 |
| CommonSpirit Health: | | | |
| 3.91% 10/1/50 | | 150,000 | 119,152 |
| 4.35% 11/1/42 | | 560,000 | 493,737 |
| 5.318% 12/1/34 | | 300,000 | 306,811 |
| CVS Health Corp.: | | | |
| 1.75% 8/21/30 | | 735,000 | 618,691 |
| 2.7% 8/21/40 | | 400,000 | 276,177 |
| 2.875% 6/1/26 | | 60,000 | 58,182 |
| 3% 8/15/26 | | 38,000 | 36,808 |
| 3.25% 8/15/29 | | 250,000 | 233,610 |
| 4.125% 4/1/40 | | 100,000 | 83,634 |
| 4.3% 3/25/28 | | 1,000,000 | 987,954 |
| 4.78% 3/25/38 | | 612,000 | 562,204 |
| 5.05% 3/25/48 | | 250,000 | 221,594 |
| 5.125% 2/21/30 | | 160,000 | 162,520 |
| 5.125% 7/20/45 | | 420,000 | 379,270 |
| 5.25% 1/30/31 | | 330,000 | 335,546 |
| 5.3% 6/1/33 | | 470,000 | 472,007 |
| 5.3% 12/5/43 | | 310,000 | 290,977 |
| 5.625% 2/21/53 | | 140,000 | 134,008 |
| 6.05% 6/1/54 | | 100,000 | 100,853 |
| 6.125% 9/15/39 | | 100,000 | 103,473 |
| Elevance Health, Inc.: | | | |
| 2.375% 1/15/25 | | 1,100,000 | 1,088,186 |
| 3.125% 5/15/50 | | 100,000 | 69,497 |
| 4.101% 3/1/28 | | 130,000 | 128,585 |
| 4.55% 3/1/48 | | 80,000 | 70,493 |
| 4.625% 5/15/42 | | 150,000 | 137,654 |
| 4.65% 1/15/43 | | 180,000 | 164,723 |
| 4.75% 2/15/33 | | 160,000 | 159,503 |
| 5.1% 1/15/44 | | 132,000 | 127,058 |
| 5.5% 10/15/32 | | 100,000 | 104,984 |
| 6.1% 10/15/52 | | 440,000 | 478,260 |
| Franciscan Missionaries of Our Lady Health System, Inc. 3.914% 7/1/49 | | 120,000 | 96,443 |
| HCA Holdings, Inc.: | | | |
| 4.125% 6/15/29 | | 242,000 | 236,088 |
| 5.125% 6/15/39 | | 100,000 | 96,576 |
| 5.25% 6/15/49 | | 120,000 | 111,380 |
| 5.45% 4/1/31 | | 1,100,000 | 1,128,581 |
| 5.5% 6/15/47 | | 610,000 | 589,831 |
| 5.6% 4/1/34 | | 700,000 | 719,348 |
| 6% 4/1/54 | | 180,000 | 185,714 |
| Humana, Inc.: | | | |
| 1.35% 2/3/27 | | 170,000 | 157,480 |
| 2.15% 2/3/32 | | 170,000 | 140,981 |
| 3.125% 8/15/29 | | 100,000 | 93,431 |
| 3.95% 8/15/49 | | 100,000 | 77,479 |
| 4.875% 4/1/30 | | 380,000 | 383,325 |
| 4.95% 10/1/44 | | 180,000 | 163,525 |
| 5.875% 3/1/33 | | 170,000 | 178,718 |
| ICON Investments Six Designated Activity 5.849% 5/8/29 | | 200,000 | 208,969 |
| Indiana University Health, Inc. 2.852% 11/1/51 | | 200,000 | 138,041 |
| INTEGRIS Baptist Medical Center, Inc. 3.875% 8/15/50 | | 104,000 | 80,557 |
| Kaiser Foundation Hospitals: | | | |
| 2.81% 6/1/41 | | 290,000 | 219,350 |
| 3.266% 11/1/49 | | 110,000 | 82,906 |
| 4.15% 5/1/47 | | 460,000 | 403,169 |
| Laboratory Corp. of America Holdings 2.7% 6/1/31 | | 160,000 | 140,742 |
| Massachusetts General Brigham, Inc. 3.342% 7/1/60 | | 150,000 | 107,686 |
| Mayo Clinic 3.196% 11/15/61 | | 120,000 | 84,177 |
| McKesson Corp. 5.1% 7/15/33 | | 100,000 | 102,691 |
| Memorial Sloan-Kettring Cancer Center 2.955% 1/1/50 | | 160,000 | 114,025 |
| MidMichigan Health 3.409% 6/1/50 | | 42,000 | 31,147 |
| Mount Sinai Hospital 3.737% 7/1/49 | | 130,000 | 91,329 |
| Novant Health, Inc. 3.168% 11/1/51 | | 110,000 | 78,263 |
| Orlando Health Obligated Group 3.327% 10/1/50 | | 68,000 | 51,680 |
| Piedmont Healthcare, Inc. 2.719% 1/1/42 | | 150,000 | 109,012 |
| Providence St. Joseph Health Obligated Group 2.7% 10/1/51 | | 280,000 | 172,076 |
| Quest Diagnostics, Inc.: | | | |
| 2.8% 6/30/31 | | 200,000 | 177,294 |
| 2.95% 6/30/30 | | 150,000 | 137,562 |
| Sabra Health Care LP 3.2% 12/1/31 | | 100,000 | 86,735 |
| Sutter Health: | | | |
| 3.361% 8/15/50 | | 170,000 | 127,351 |
| 5.164% 8/15/33 | | 160,000 | 164,368 |
| Trinity Health Corp. 2.632% 12/1/40 | | 50,000 | 36,923 |
| UnitedHealth Group, Inc.: | | | |
| 1.25% 1/15/26 | | 223,000 | 213,831 |
| 2% 5/15/30 | | 170,000 | 149,852 |
| 2.3% 5/15/31 | | 270,000 | 235,676 |
| 2.875% 8/15/29 | | 360,000 | 337,544 |
| 2.9% 5/15/50 | | 1,197,000 | 814,563 |
| 3.05% 5/15/41 | | 100,000 | 76,882 |
| 3.25% 5/15/51 | | 100,000 | 72,096 |
| 3.375% 4/15/27 | | 220,000 | 215,333 |
| 3.45% 1/15/27 | | 370,000 | 364,164 |
| 3.7% 8/15/49 | | 90,000 | 70,921 |
| 3.85% 6/15/28 | | 960,000 | 947,841 |
| 3.875% 8/15/59 | | 170,000 | 131,584 |
| 4.25% 1/15/29 | | 300,000 | 300,132 |
| 4.45% 12/15/48 | | 68,000 | 60,692 |
| 4.75% 7/15/45 | | 182,000 | 171,585 |
| 4.95% 5/15/62 | | 160,000 | 149,230 |
| 5.05% 4/15/53 | | 360,000 | 348,706 |
| 5.15% 7/15/34 | | 500,000 | 513,758 |
| 5.25% 2/15/28 | | 100,000 | 103,656 |
| 5.35% 2/15/33 | | 100,000 | 104,660 |
| 5.5% 4/15/64 | | 320,000 | 326,339 |
| 5.625% 7/15/54 | | 150,000 | 156,677 |
| 5.95% 2/15/41 | | 100,000 | 108,190 |
| 6.05% 2/15/63 | | 440,000 | 483,103 |
| 6.625% 11/15/37 | | 310,000 | 360,058 |
| 6.875% 2/15/38 | | 126,000 | 149,317 |
| Universal Health Services, Inc. 2.65% 10/15/30 | | 180,000 | 159,076 |
| West Virginia University Health System Obligated Group 3.129% 6/1/50 | | 70,000 | 47,746 |
| | | | 29,029,796 |
| Life Sciences Tools & Services - 0.1% | | | |
| Danaher Corp. 2.6% 10/1/50 | | 245,000 | 157,677 |
| Revvity, Inc.: | | | |
| 0.85% 9/15/24 | | 100,000 | 99,818 |
| 2.25% 9/15/31 | | 100,000 | 84,252 |
| 3.3% 9/15/29 | | 150,000 | 140,412 |
| 3.625% 3/15/51 | | 45,000 | 32,784 |
| Thermo Fisher Scientific, Inc.: | | | |
| 2.6% 10/1/29 | | 520,000 | 481,186 |
| 2.8% 10/15/41 | | 410,000 | 304,484 |
| 4.953% 8/10/26 | | 430,000 | 435,280 |
| 5.086% 8/10/33 | | 120,000 | 123,795 |
| | | | 1,859,688 |
| Pharmaceuticals - 0.9% | | | |
| AstraZeneca Finance LLC: | | | |
| 1.2% 5/28/26 | | 1,220,000 | 1,157,432 |
| 2.25% 5/28/31 | | 170,000 | 148,220 |
| 4.875% 3/3/33 | | 380,000 | 390,037 |
| AstraZeneca PLC: | | | |
| 1.375% 8/6/30 | | 240,000 | 204,386 |
| 2.125% 8/6/50 | | 90,000 | 52,881 |
| 3.125% 6/12/27 | | 140,000 | 136,142 |
| 4% 9/18/42 | | 220,000 | 192,741 |
| 4.375% 8/17/48 | | 180,000 | 162,561 |
| 6.45% 9/15/37 | | 149,000 | 171,701 |
| Bayer U.S. Finance II LLC 2.85% 4/15/25 (c) | | 177,000 | 173,683 |
| Bristol-Myers Squibb Co.: | | | |
| 2.35% 11/13/40 | | 210,000 | 146,141 |
| 2.55% 11/13/50 | | 410,000 | 254,429 |
| 3.2% 6/15/26 | | 1,626,000 | 1,595,508 |
| 3.4% 7/26/29 | | 31,000 | 29,789 |
| 3.7% 3/15/52 | | 230,000 | 176,366 |
| 3.9% 2/20/28 | | 270,000 | 266,640 |
| 3.9% 3/15/62 | | 120,000 | 91,537 |
| 4.125% 6/15/39 | | 100,000 | 90,566 |
| 4.25% 10/26/49 | | 100,000 | 85,434 |
| 4.35% 11/15/47 | | 100,000 | 86,997 |
| 4.55% 2/20/48 | | 159,000 | 142,914 |
| 4.9% 2/22/29 | | 190,000 | 194,819 |
| 5% 8/15/45 | | 110,000 | 107,523 |
| 5.2% 2/22/34 | | 280,000 | 290,431 |
| 5.5% 2/22/44 | | 250,000 | 257,983 |
| 5.55% 2/22/54 | | 193,000 | 199,246 |
| 6.4% 11/15/63 | | 250,000 | 286,325 |
| Eli Lilly & Co.: | | | |
| 2.25% 5/15/50 | | 685,000 | 421,433 |
| 3.95% 3/15/49 | | 220,000 | 187,243 |
| 4.15% 3/15/59 | | 100,000 | 85,122 |
| 4.2% 8/14/29 | | 290,000 | 290,639 |
| 4.6% 8/14/34 | | 290,000 | 290,814 |
| 4.875% 2/27/53 | | 60,000 | 58,762 |
| 4.95% 2/27/63 | | 110,000 | 107,348 |
| 5.1% 2/9/64 | | 290,000 | 289,323 |
| GlaxoSmithKline Capital, Inc. 6.375% 5/15/38 | | 331,000 | 379,119 |
| Haleon U.S. Capital LLC: | | | |
| 3.375% 3/24/27 | | 250,000 | 243,908 |
| 3.625% 3/24/32 | | 250,000 | 232,267 |
| Haleon UK Capital PLC 3.125% 3/24/25 | | 340,000 | 336,242 |
| Johnson & Johnson: | | | |
| 0.55% 9/1/25 | | 100,000 | 96,222 |
| 2.1% 9/1/40 | | 590,000 | 416,001 |
| 2.25% 9/1/50 | | 100,000 | 62,719 |
| 2.45% 9/1/60 | | 310,000 | 187,562 |
| 3.4% 1/15/38 | | 388,000 | 341,296 |
| 4.5% 12/5/43 | | 100,000 | 97,519 |
| 4.9% 6/1/31 | | 100,000 | 103,872 |
| Merck & Co., Inc.: | | | |
| 2.15% 12/10/31 | | 380,000 | 327,168 |
| 2.35% 6/24/40 | | 210,000 | 149,810 |
| 2.45% 6/24/50 | | 200,000 | 124,862 |
| 2.75% 12/10/51 | | 150,000 | 98,664 |
| 3.6% 9/15/42 | | 130,000 | 107,565 |
| 3.7% 2/10/45 | | 322,000 | 263,950 |
| 4.15% 5/18/43 | | 100,000 | 89,054 |
| 4.5% 5/17/33 | | 400,000 | 400,462 |
| 4.9% 5/17/44 | | 300,000 | 293,729 |
| 5% 5/17/53 | | 170,000 | 167,374 |
| Mylan NV: | | | |
| 5.2% 4/15/48 | | 74,000 | 63,390 |
| 5.4% 11/29/43 | | 170,000 | 153,473 |
| Novartis Capital Corp.: | | | |
| 2.2% 8/14/30 | | 290,000 | 260,489 |
| 2.75% 8/14/50 | | 310,000 | 213,123 |
| 4.4% 5/6/44 | | 120,000 | 112,037 |
| Pfizer Investment Enterprises: | | | |
| 4.45% 5/19/26 | | 1,590,000 | 1,590,881 |
| 4.45% 5/19/28 | | 500,000 | 502,452 |
| 4.65% 5/19/30 | | 300,000 | 304,994 |
| 4.75% 5/19/33 | | 360,000 | 361,936 |
| 5.11% 5/19/43 | | 200,000 | 197,730 |
| 5.3% 5/19/53 | | 878,000 | 882,313 |
| 5.34% 5/19/63 | | 150,000 | 148,864 |
| Pfizer, Inc.: | | | |
| 2.55% 5/28/40 | | 120,000 | 87,318 |
| 2.7% 5/28/50 | | 100,000 | 66,979 |
| 3.45% 3/15/29 | | 100,000 | 96,935 |
| 3.9% 3/15/39 | | 70,000 | 62,425 |
| 4% 12/15/36 | | 190,000 | 177,637 |
| 4% 3/15/49 | | 300,000 | 253,732 |
| 4.3% 6/15/43 | | 106,000 | 95,679 |
| 4.4% 5/15/44 | | 110,000 | 102,260 |
| 7.2% 3/15/39 | | 230,000 | 281,257 |
| Pharmacia LLC 6.6% 12/1/28 (b) | | 190,000 | 206,590 |
| Royalty Pharma PLC 3.35% 9/2/51 | | 290,000 | 195,891 |
| Shire Acquisitions Investments Ireland DAC 3.2% 9/23/26 | | 14,000 | 13,695 |
| Takeda Pharmaceutical Co. Ltd.: | | | |
| 2.05% 3/31/30 | | 290,000 | 254,618 |
| 3.025% 7/9/40 | | 330,000 | 249,269 |
| 5% 11/26/28 | | 210,000 | 214,002 |
| Utah Acquisition Sub, Inc. 3.95% 6/15/26 | | 320,000 | 315,452 |
| Viatris, Inc.: | | | |
| 2.7% 6/22/30 | | 428,000 | 376,775 |
| 3.85% 6/22/40 | | 200,000 | 152,738 |
| 4% 6/22/50 | | 70,000 | 49,616 |
| Wyeth LLC 5.95% 4/1/37 | | 50,000 | 54,649 |
| Zoetis, Inc.: | | | |
| 3% 9/12/27 | | 50,000 | 48,003 |
| 3.95% 9/12/47 | | 290,000 | 237,707 |
| | | | 21,727,390 |
TOTAL HEALTH CARE | | | 70,236,107 |
| INDUSTRIALS - 1.8% | | | |
| Aerospace & Defense - 0.7% | | | |
| General Dynamics Corp.: | | | |
| 2.625% 11/15/27 | | 180,000 | 171,656 |
| 2.85% 6/1/41 | | 120,000 | 90,184 |
| 3.25% 4/1/25 | | 1,040,000 | 1,029,722 |
| 3.75% 5/15/28 | | 100,000 | 98,573 |
| 4.25% 4/1/40 | | 104,000 | 94,940 |
| 4.25% 4/1/50 | | 30,000 | 26,340 |
| General Electric Co.: | | | |
| 4.25% 5/1/40 | | 50,000 | 43,096 |
| 4.35% 5/1/50 | | 170,000 | 150,396 |
| 4.5% 3/11/44 | | 200,000 | 182,908 |
| Howmet Aerospace, Inc.: | | | |
| 5.9% 2/1/27 | | 455,000 | 468,980 |
| 5.95% 2/1/37 | | 50,000 | 54,192 |
| Huntington Ingalls Industries, Inc. 3.483% 12/1/27 | | 170,000 | 164,120 |
| L3Harris Technologies, Inc.: | | | |
| 1.8% 1/15/31 | | 575,000 | 482,440 |
| 5.5% 8/15/54 | | 90,000 | 91,192 |
| 5.6% 7/31/53 | | 170,000 | 175,272 |
| Lockheed Martin Corp.: | | | |
| 3.6% 3/1/35 | | 450,000 | 411,816 |
| 3.9% 6/15/32 | | 160,000 | 154,778 |
| 4.07% 12/15/42 | | 110,000 | 97,348 |
| 4.09% 9/15/52 | | 119,000 | 101,255 |
| 4.15% 6/15/53 | | 150,000 | 128,210 |
| 4.7% 5/15/46 | | 136,000 | 129,276 |
| 5.1% 11/15/27 | | 210,000 | 215,889 |
| 5.7% 11/15/54 | | 100,000 | 108,727 |
| 5.9% 11/15/63 | | 150,000 | 167,826 |
| 6.15% 9/1/36 | | 100,000 | 112,617 |
| Northrop Grumman Corp.: | | | |
| 2.93% 1/15/25 | | 120,000 | 119,015 |
| 3.25% 1/15/28 | | 100,000 | 96,489 |
| 3.85% 4/15/45 | | 130,000 | 106,864 |
| 4.03% 10/15/47 | | 328,000 | 273,868 |
| 4.4% 5/1/30 | | 210,000 | 209,375 |
| 4.7% 3/15/33 | | 120,000 | 120,209 |
| 4.75% 6/1/43 | | 110,000 | 103,017 |
| 5.15% 5/1/40 | | 150,000 | 148,939 |
| 5.2% 6/1/54 | | 105,000 | 103,965 |
| 5.25% 5/1/50 | | 70,000 | 69,616 |
| RTX Corp.: | | | |
| 1.9% 9/1/31 | | 470,000 | 392,446 |
| 2.25% 7/1/30 | | 130,000 | 115,205 |
| 2.82% 9/1/51 | | 210,000 | 135,538 |
| 3.75% 11/1/46 | | 100,000 | 79,342 |
| 3.95% 8/16/25 | | 80,000 | 79,309 |
| 4.125% 11/16/28 | | 400,000 | 394,925 |
| 4.35% 4/15/47 | | 100,000 | 86,543 |
| 4.45% 11/16/38 | | 360,000 | 335,195 |
| 4.5% 6/1/42 | | 40,000 | 36,204 |
| 4.875% 10/15/40 | | 210,000 | 200,718 |
| 5.15% 2/27/33 | | 100,000 | 102,529 |
| 5.7% 4/15/40 | | 160,000 | 168,159 |
| 6.1% 3/15/34 | | 500,000 | 544,325 |
| 6.125% 7/15/38 | | 640,000 | 699,763 |
| Textron, Inc. 4% 3/15/26 | | 200,000 | 197,834 |
| The Boeing Co.: | | | |
| 2.75% 2/1/26 | | 140,000 | 135,350 |
| 2.95% 2/1/30 | | 220,000 | 195,459 |
| 3.2% 3/1/29 | | 320,000 | 295,079 |
| 3.375% 6/15/46 | | 120,000 | 80,100 |
| 3.75% 2/1/50 | | 70,000 | 48,346 |
| 3.9% 5/1/49 | | 130,000 | 92,627 |
| 3.95% 8/1/59 | | 160,000 | 107,816 |
| 4.875% 5/1/25 | | 2,590,000 | 2,579,242 |
| 5.705% 5/1/40 | | 700,000 | 680,403 |
| 5.805% 5/1/50 | | 320,000 | 302,030 |
| 5.93% 5/1/60 | | 330,000 | 311,704 |
| 6.298% 5/1/29 (c) | | 170,000 | 177,540 |
| 6.388% 5/1/31 (c) | | 120,000 | 126,404 |
| 6.528% 5/1/34 (c) | | 486,000 | 514,728 |
| 6.858% 5/1/54 (c) | | 70,000 | 75,372 |
| 6.875% 3/15/39 | | 160,000 | 172,778 |
| | | | 15,766,123 |
| Air Freight & Logistics - 0.1% | | | |
| FedEx Corp.: | | | |
| 2.4% 5/15/31 | | 350,000 | 307,458 |
| 3.25% 5/15/41 | | 310,000 | 237,141 |
| 3.875% 8/1/42 | | 50,000 | 40,710 |
| 3.9% 2/1/35 | | 120,000 | 110,840 |
| 4.05% 2/15/48 | | 80,000 | 64,659 |
| 4.1% 2/1/45 | | 130,000 | 106,836 |
| 4.25% 5/15/30 | | 130,000 | 128,936 |
| 4.9% 1/15/34 | | 100,000 | 100,977 |
| 4.95% 10/17/48 | | 80,000 | 73,695 |
| 5.25% 5/15/50 | | 178,000 | 172,193 |
| United Parcel Service, Inc.: | | | |
| 3.05% 11/15/27 | | 150,000 | 144,707 |
| 3.4% 11/15/46 | | 190,000 | 149,241 |
| 3.75% 11/15/47 | | 160,000 | 127,719 |
| 3.9% 4/1/25 | | 350,000 | 347,881 |
| 4.45% 4/1/30 | | 150,000 | 151,468 |
| 4.875% 3/3/33 | | 160,000 | 163,519 |
| 5.2% 4/1/40 | | 100,000 | 101,130 |
| 5.5% 5/22/54 | | 380,000 | 395,352 |
| 6.2% 1/15/38 | | 234,000 | 262,497 |
| | | | 3,186,959 |
| Building Products - 0.1% | | | |
| Carrier Global Corp.: | | | |
| 2.242% 2/15/25 | | 300,000 | 295,591 |
| 2.493% 2/15/27 | | 100,000 | 95,847 |
| 2.722% 2/15/30 | | 410,000 | 375,287 |
| 3.377% 4/5/40 | | 150,000 | 120,988 |
| 3.577% 4/5/50 | | 100,000 | 76,596 |
| 5.9% 3/15/34 | | 521,000 | 562,001 |
| Johnson Controls International PLC/Tyco Fire & Security Finance SCA: | | | |
| 1.75% 9/15/30 | | 300,000 | 257,364 |
| 2% 9/16/31 | | 280,000 | 234,508 |
| Masco Corp.: | | | |
| 1.5% 2/15/28 | | 100,000 | 90,030 |
| 2% 2/15/31 | | 90,000 | 76,204 |
| 3.125% 2/15/51 | | 90,000 | 61,464 |
| Owens Corning: | | | |
| 3.4% 8/15/26 | | 100,000 | 97,809 |
| 3.875% 6/1/30 | | 70,000 | 67,074 |
| 4.3% 7/15/47 | | 110,000 | 91,244 |
| 5.95% 6/15/54 | | 100,000 | 103,355 |
| | | | 2,605,362 |
| Commercial Services & Supplies - 0.1% | | | |
| Republic Services, Inc.: | | | |
| 1.45% 2/15/31 | | 500,000 | 413,249 |
| 3.95% 5/15/28 | | 200,000 | 197,426 |
| 5% 12/15/33 | | 140,000 | 142,495 |
| 5.2% 11/15/34 | | 200,000 | 206,046 |
| Veralto Corp. 5.45% 9/18/33 (c) | | 110,000 | 113,674 |
| Waste Connections, Inc. 3.05% 4/1/50 | | 250,000 | 175,566 |
| Waste Management, Inc.: | | | |
| 1.5% 3/15/31 | | 140,000 | 116,646 |
| 2.5% 11/15/50 | | 150,000 | 95,404 |
| 2.95% 6/1/41 | | 130,000 | 98,216 |
| 3.15% 11/15/27 | | 50,000 | 48,392 |
| 4.15% 4/15/32 | | 220,000 | 214,910 |
| 4.95% 7/3/27 | | 70,000 | 71,362 |
| 4.95% 7/3/31 | | 70,000 | 71,888 |
| | | | 1,965,274 |
| Electrical Equipment - 0.0% | | | |
| ABB Finance (U.S.A.), Inc. 4.375% 5/8/42 | | 70,000 | 64,989 |
| Emerson Electric Co. 2.8% 12/21/51 | | 220,000 | 145,994 |
| Hubbell, Inc. 3.35% 3/1/26 | | 110,000 | 107,794 |
| Regal Rexnord Corp.: | | | |
| 6.3% 2/15/30 | | 290,000 | 306,256 |
| 6.4% 4/15/33 | | 50,000 | 53,061 |
| Rockwell Automation, Inc. 4.2% 3/1/49 | | 100,000 | 86,853 |
| | | | 764,947 |
| Ground Transportation - 0.3% | | | |
| Burlington Northern Santa Fe LLC: | | | |
| 2.875% 6/15/52 | | 280,000 | 187,510 |
| 3.05% 2/15/51 | | 30,000 | 20,887 |
| 3.25% 6/15/27 | | 550,000 | 536,804 |
| 3.3% 9/15/51 | | 140,000 | 102,506 |
| 4.05% 6/15/48 | | 182,000 | 154,213 |
| 4.15% 12/15/48 | | 100,000 | 85,489 |
| 4.45% 3/15/43 | | 151,000 | 137,834 |
| 5.15% 9/1/43 | | 100,000 | 100,612 |
| 5.2% 4/15/54 | | 240,000 | 241,176 |
| 5.5% 3/15/55 | | 170,000 | 177,931 |
| 5.75% 5/1/40 | | 100,000 | 106,352 |
| 6.15% 5/1/37 | | 70,000 | 78,505 |
| Canadian National Railway Co.: | | | |
| 2.45% 5/1/50 | | 290,000 | 182,184 |
| 2.75% 3/1/26 | | 150,000 | 146,407 |
| 3.65% 2/3/48 | | 100,000 | 80,648 |
| 4.45% 1/20/49 | | 50,000 | 45,412 |
| 6.125% 11/1/53 | | 60,000 | 69,884 |
| Canadian Pacific Railway Co.: | | | |
| 1.75% 12/2/26 | | 200,000 | 188,740 |
| 2.45% 12/2/31 | | 200,000 | 172,976 |
| 3.1% 12/2/51 | | 200,000 | 139,142 |
| 3.5% 5/1/50 | | 260,000 | 195,991 |
| 4.2% 11/15/69 | | 50,000 | 39,576 |
| 4.8% 8/1/45 | | 230,000 | 215,363 |
| CSX Corp.: | | | |
| 2.4% 2/15/30 | | 340,000 | 307,308 |
| 2.5% 5/15/51 | | 110,000 | 68,239 |
| 3.35% 11/1/25 | | 250,000 | 246,347 |
| 3.8% 3/1/28 | | 50,000 | 49,219 |
| 4.25% 3/15/29 | | 150,000 | 149,713 |
| 4.3% 3/1/48 | | 210,000 | 182,994 |
| 4.4% 3/1/43 | | 50,000 | 45,144 |
| 4.65% 3/1/68 | | 280,000 | 248,141 |
| 4.75% 11/15/48 | | 160,000 | 148,981 |
| 6.15% 5/1/37 | | 100,000 | 111,326 |
| Norfolk Southern Corp.: | | | |
| 2.9% 6/15/26 | | 370,000 | 359,819 |
| 3.05% 5/15/50 | | 100,000 | 68,642 |
| 3.155% 5/15/55 | | 100,000 | 67,087 |
| 3.8% 8/1/28 | | 72,000 | 70,748 |
| 3.95% 10/1/42 | | 305,000 | 257,340 |
| 4.1% 5/15/21 | | 200,000 | 152,385 |
| 4.15% 2/28/48 | | 100,000 | 84,309 |
| 4.55% 6/1/53 | | 80,000 | 70,795 |
| 5.35% 8/1/54 | | 60,000 | 60,199 |
| 5.55% 3/15/34 | | 230,000 | 243,015 |
| Union Pacific Corp.: | | | |
| 2.15% 2/5/27 | | 120,000 | 114,207 |
| 2.75% 3/1/26 | | 360,000 | 351,032 |
| 2.891% 4/6/36 | | 390,000 | 329,162 |
| 3.25% 2/5/50 | | 270,000 | 197,952 |
| 3.375% 2/14/42 | | 150,000 | 119,780 |
| 3.799% 4/6/71 | | 330,000 | 245,590 |
| 3.85% 2/14/72 | | 230,000 | 173,961 |
| 3.875% 2/1/55 | | 80,000 | 63,789 |
| 4% 4/15/47 | | 90,000 | 74,849 |
| 5.15% 1/20/63 | | 210,000 | 204,680 |
| | | | 8,272,895 |
| Industrial Conglomerates - 0.2% | | | |
| 3M Co.: | | | |
| 2.25% 9/19/26 | | 330,000 | 315,318 |
| 2.375% 8/26/29 | | 270,000 | 244,630 |
| 2.875% 10/15/27 | | 210,000 | 200,967 |
| 3.25% 8/26/49 | | 100,000 | 72,397 |
| 3.375% 3/1/29 | | 110,000 | 105,469 |
| 3.7% 4/15/50 | | 96,000 | 74,634 |
| 5.7% 3/15/37 | | 100,000 | 108,632 |
| Honeywell International, Inc.: | | | |
| 1.35% 6/1/25 | | 100,000 | 97,579 |
| 1.95% 6/1/30 | | 100,000 | 88,195 |
| 2.5% 11/1/26 | | 580,000 | 559,886 |
| 2.7% 8/15/29 | | 210,000 | 196,280 |
| 2.8% 6/1/50 | | 200,000 | 138,171 |
| 4.7% 2/1/30 | | 110,000 | 111,870 |
| 4.875% 9/1/29 | | 120,000 | 123,161 |
| 5% 2/15/33 | | 440,000 | 452,826 |
| 5% 3/1/35 | | 190,000 | 194,921 |
| 5.25% 3/1/54 | | 120,000 | 121,789 |
| 5.35% 3/1/64 | | 70,000 | 71,602 |
| Trane Technologies Financing Ltd.: | | | |
| 3.8% 3/21/29 | | 180,000 | 175,360 |
| 5.25% 3/3/33 | | 80,000 | 82,936 |
| | | | 3,536,623 |
| Machinery - 0.2% | | | |
| Caterpillar Financial Services Corp. 1.1% 9/14/27 | | 540,000 | 493,120 |
| Caterpillar, Inc.: | | | |
| 2.6% 4/9/30 | | 210,000 | 192,909 |
| 3.25% 9/19/49 | | 170,000 | 126,376 |
| 3.25% 4/9/50 | | 130,000 | 96,938 |
| 3.803% 8/15/42 | | 200,000 | 170,644 |
| 5.2% 5/27/41 | | 300,000 | 306,158 |
| Cummins, Inc.: | | | |
| 1.5% 9/1/30 | | 190,000 | 162,468 |
| 4.875% 10/1/43 | | 250,000 | 240,715 |
| Deere & Co. 2.875% 9/7/49 | | 190,000 | 133,535 |
| Eaton Corp.: | | | |
| 4.15% 3/15/33 | | 340,000 | 330,520 |
| 4.15% 11/2/42 | | 100,000 | 88,753 |
| Illinois Tool Works, Inc. 3.9% 9/1/42 | | 100,000 | 86,373 |
| Ingersoll Rand, Inc.: | | | |
| 5.4% 8/14/28 | | 220,000 | 226,711 |
| 5.7% 8/14/33 | | 340,000 | 358,643 |
| Otis Worldwide Corp.: | | | |
| 2.293% 4/5/27 | | 170,000 | 161,037 |
| 2.565% 2/15/30 | | 220,000 | 198,687 |
| 3.362% 2/15/50 | | 80,000 | 58,697 |
| Parker Hannifin Corp.: | | | |
| 3.25% 3/1/27 | | 180,000 | 174,994 |
| 3.25% 6/14/29 | | 210,000 | 199,103 |
| 4% 6/14/49 | | 160,000 | 132,380 |
| 4.25% 9/15/27 | | 170,000 | 169,120 |
| Stanley Black & Decker, Inc.: | | | |
| 2.75% 11/15/50 | | 151,000 | 91,748 |
| 3% 5/15/32 | | 190,000 | 168,934 |
| 6% 3/6/28 | | 100,000 | 104,813 |
| Westinghouse Air Brake Tech Co.: | | | |
| 3.45% 11/15/26 | | 200,000 | 195,088 |
| 4.7% 9/15/28 | | 200,000 | 200,591 |
| | | | 4,869,055 |
| Passenger Airlines - 0.0% | | | |
| American Airlines Pass Through Trust equipment trust certificate 2.875% 1/11/36 | | 187,478 | 162,163 |
| Southwest Airlines Co.: | | | |
| 5.125% 6/15/27 | | 251,000 | 253,116 |
| 5.25% 5/4/25 | | 130,000 | 130,016 |
| United Airlines 2020-1 Class B Pass Through Trust 4.875% 7/15/27 | | 88,592 | 87,492 |
| United Airlines Pass-Through Trust Series 2023-1 Class A, 5.8% 7/15/37 | | 254,191 | 262,686 |
| | | | 895,473 |
| Professional Services - 0.0% | | | |
| Leidos, Inc. 5.75% 3/15/33 | | 140,000 | 145,561 |
| Thomson Reuters Corp. 5.85% 4/15/40 | | 110,000 | 115,180 |
| | | | 260,741 |
| Trading Companies & Distributors - 0.1% | | | |
| Air Lease Corp.: | | | |
| 2.1% 9/1/28 | | 190,000 | 172,004 |
| 2.2% 1/15/27 | | 140,000 | 132,366 |
| 3.625% 12/1/27 | | 140,000 | 135,715 |
| 3.75% 6/1/26 | | 290,000 | 284,525 |
| 4.625% 10/1/28 | | 350,000 | 348,057 |
| 5.2% 7/15/31 | | 300,000 | 302,239 |
| GATX Corp.: | | | |
| 6.05% 3/15/34 | | 130,000 | 138,179 |
| 6.9% 5/1/34 | | 300,000 | 338,341 |
| W.W. Grainger, Inc. 3.75% 5/15/46 | | 120,000 | 98,082 |
| | | | 1,949,508 |
TOTAL INDUSTRIALS | | | 44,072,960 |
| INFORMATION TECHNOLOGY - 2.2% | | | |
| Communications Equipment - 0.1% | | | |
| Cisco Systems, Inc.: | | | |
| 4.85% 2/26/29 | | 300,000 | 308,209 |
| 5.05% 2/26/34 | | 300,000 | 310,807 |
| 5.3% 2/26/54 | | 140,000 | 144,535 |
| 5.5% 1/15/40 | | 192,000 | 203,711 |
| 5.9% 2/15/39 | | 400,000 | 442,586 |
| Motorola Solutions, Inc.: | | | |
| 2.3% 11/15/30 | | 330,000 | 287,711 |
| 4.6% 2/23/28 | | 110,000 | 110,349 |
| 5.4% 4/15/34 | | 130,000 | 134,122 |
| | | | 1,942,030 |
| Electronic Equipment, Instruments & Components - 0.1% | | | |
| Amphenol Corp.: | | | |
| 2.2% 9/15/31 | | 140,000 | 119,217 |
| 5.25% 4/5/34 | | 180,000 | 185,209 |
| Corning, Inc.: | | | |
| 5.35% 11/15/48 | | 300,000 | 297,228 |
| 5.75% 8/15/40 | | 100,000 | 103,318 |
| Dell International LLC/EMC Corp.: | | | |
| 3.375% 12/15/41 | | 105,000 | 80,331 |
| 4.9% 10/1/26 | | 450,000 | 452,356 |
| 5.3% 10/1/29 | | 90,000 | 92,931 |
| 5.75% 2/1/33 | | 110,000 | 116,459 |
| 8.1% 7/15/36 | | 310,000 | 381,355 |
| 8.35% 7/15/46 | | 92,000 | 122,629 |
| Keysight Technologies, Inc. 4.55% 10/30/24 | | 130,000 | 129,737 |
| Teledyne Technologies, Inc.: | | | |
| 2.25% 4/1/28 | | 100,000 | 92,467 |
| 2.75% 4/1/31 | | 100,000 | 88,525 |
| Tyco Electronics Group SA: | | | |
| 2.5% 2/4/32 | | 110,000 | 96,525 |
| 4.5% 2/13/26 | | 200,000 | 200,335 |
| Vontier Corp.: | | | |
| 1.8% 4/1/26 | | 180,000 | 171,186 |
| 2.4% 4/1/28 | | 70,000 | 64,026 |
| | | | 2,793,834 |
| IT Services - 0.2% | | | |
| CDW LLC/CDW Finance Corp.: | | | |
| 2.67% 12/1/26 | | 430,000 | 410,234 |
| 3.569% 12/1/31 | | 70,000 | 63,077 |
| 5.55% 8/22/34 | | 110,000 | 110,924 |
| IBM Corp.: | | | |
| 1.7% 5/15/27 | | 800,000 | 746,442 |
| 1.95% 5/15/30 | | 100,000 | 87,475 |
| 2.85% 5/15/40 | | 110,000 | 82,522 |
| 2.95% 5/15/50 | | 100,000 | 67,090 |
| 3.43% 2/9/52 | | 180,000 | 130,912 |
| 3.5% 5/15/29 | | 520,000 | 501,322 |
| 4.15% 5/15/39 | | 450,000 | 404,078 |
| 4.5% 2/6/28 | | 680,000 | 685,050 |
| 4.7% 2/19/46 | | 204,000 | 187,303 |
| 5.6% 11/30/39 | | 540,000 | 570,408 |
| 5.875% 11/29/32 | | 120,000 | 130,321 |
| | | | 4,177,158 |
| Semiconductors & Semiconductor Equipment - 0.7% | | | |
| Advanced Micro Devices, Inc. 4.393% 6/1/52 | | 70,000 | 64,103 |
| Analog Devices, Inc.: | | | |
| 1.7% 10/1/28 | | 150,000 | 136,168 |
| 2.1% 10/1/31 | | 140,000 | 120,277 |
| 2.8% 10/1/41 | | 150,000 | 110,554 |
| 2.95% 4/1/25 | | 240,000 | 237,118 |
| 2.95% 10/1/51 | | 160,000 | 110,867 |
| Applied Materials, Inc.: | | | |
| 1.75% 6/1/30 | | 170,000 | 147,858 |
| 3.3% 4/1/27 | | 190,000 | 185,727 |
| 4.35% 4/1/47 | | 90,000 | 81,808 |
| 5.1% 10/1/35 | | 120,000 | 125,107 |
| Broadcom Corp./Broadcom Cayman LP 3.875% 1/15/27 | | 770,000 | 759,412 |
| Broadcom, Inc.: | | | |
| 2.45% 2/15/31 (c) | | 160,000 | 139,606 |
| 2.6% 2/15/33 (c) | | 100,000 | 83,829 |
| 3.137% 11/15/35 (c) | | 290,000 | 242,437 |
| 3.15% 11/15/25 | | 230,000 | 225,733 |
| 3.187% 11/15/36 (c) | | 220,000 | 182,033 |
| 3.419% 4/15/33 (c) | | 190,000 | 169,293 |
| 3.459% 9/15/26 | | 432,000 | 423,002 |
| 3.469% 4/15/34 (c) | | 230,000 | 203,233 |
| 3.75% 2/15/51 (c) | | 530,000 | 411,996 |
| 4.15% 11/15/30 | | 250,000 | 243,520 |
| 4.15% 4/15/32 (c) | | 100,000 | 95,400 |
| 4.3% 11/15/32 | | 410,000 | 395,975 |
| 4.926% 5/15/37 (c) | | 200,000 | 195,393 |
| 5% 4/15/30 | | 292,000 | 300,186 |
| 5.05% 7/12/29 | | 200,000 | 203,902 |
| Intel Corp.: | | | |
| 2% 8/12/31 | | 50,000 | 41,132 |
| 2.45% 11/15/29 | | 720,000 | 638,314 |
| 2.8% 8/12/41 | | 220,000 | 150,292 |
| 3.05% 8/12/51 | | 50,000 | 31,063 |
| 3.25% 11/15/49 | | 180,000 | 116,990 |
| 3.734% 12/8/47 | | 110,000 | 78,506 |
| 4.15% 8/5/32 | | 110,000 | 103,101 |
| 4.6% 3/25/40 | | 110,000 | 97,055 |
| 4.75% 3/25/50 | | 390,000 | 327,207 |
| 4.875% 2/10/28 | | 1,000,000 | 999,163 |
| 5.05% 8/5/62 | | 470,000 | 395,139 |
| 5.2% 2/10/33 | | 540,000 | 537,878 |
| 5.7% 2/10/53 | | 120,000 | 114,762 |
| 5.9% 2/10/63 | | 190,000 | 184,604 |
| KLA Corp.: | | | |
| 4.1% 3/15/29 | | 160,000 | 159,100 |
| 4.65% 7/15/32 | | 450,000 | 454,442 |
| 5.25% 7/15/62 | | 120,000 | 120,172 |
| Lam Research Corp.: | | | |
| 2.875% 6/15/50 | | 150,000 | 102,512 |
| 3.125% 6/15/60 | | 50,000 | 33,474 |
| 4% 3/15/29 | | 210,000 | 207,538 |
| Marvell Technology, Inc.: | | | |
| 1.65% 4/15/26 | | 230,000 | 219,044 |
| 2.45% 4/15/28 | | 120,000 | 110,912 |
| 5.95% 9/15/33 | | 70,000 | 74,350 |
| Microchip Technology, Inc.: | | | |
| 0.983% 9/1/24 | | 170,000 | 169,868 |
| 5.05% 3/15/29 | | 160,000 | 163,125 |
| Micron Technology, Inc.: | | | |
| 3.366% 11/1/41 | | 90,000 | 67,676 |
| 4.663% 2/15/30 | | 120,000 | 119,781 |
| 5.3% 1/15/31 | | 100,000 | 102,524 |
| 5.327% 2/6/29 | | 310,000 | 317,478 |
| 5.375% 4/15/28 | | 300,000 | 306,705 |
| 5.875% 9/15/33 | | 100,000 | 105,339 |
| NVIDIA Corp.: | | | |
| 2% 6/15/31 | | 480,000 | 419,449 |
| 3.5% 4/1/40 | | 90,000 | 77,917 |
| 3.5% 4/1/50 | | 167,000 | 135,321 |
| NXP BV/NXP Funding LLC/NXP U.S.A., Inc.: | | | |
| 2.65% 2/15/32 | | 300,000 | 257,352 |
| 3.25% 5/11/41 | | 190,000 | 142,745 |
| 3.4% 5/1/30 | | 100,000 | 93,208 |
| 3.875% 6/18/26 | | 140,000 | 138,060 |
| 4.3% 6/18/29 | | 100,000 | 98,016 |
| Qualcomm, Inc.: | | | |
| 2.15% 5/20/30 | | 380,000 | 339,906 |
| 4.3% 5/20/47 | | 313,000 | 278,711 |
| 4.5% 5/20/52 | | 180,000 | 162,768 |
| 4.8% 5/20/45 | | 130,000 | 125,616 |
| Texas Instruments, Inc.: | | | |
| 2.25% 9/4/29 | | 510,000 | 466,785 |
| 2.9% 11/3/27 | | 160,000 | 154,152 |
| 3.875% 3/15/39 | | 210,000 | 192,953 |
| 4.9% 3/14/33 | | 270,000 | 279,904 |
| 5.05% 5/18/63 | | 210,000 | 206,503 |
| | | | 15,813,149 |
| Software - 0.7% | | | |
| Adobe, Inc.: | | | |
| 2.15% 2/1/27 | | 240,000 | 228,974 |
| 4.95% 4/4/34 | | 160,000 | 165,332 |
| Autodesk, Inc. 2.85% 1/15/30 | | 140,000 | 128,979 |
| Fortinet, Inc. 1% 3/15/26 | | 210,000 | 198,689 |
| Microsoft Corp.: | | | |
| 2.4% 8/8/26 | | 520,000 | 503,881 |
| 2.5% 9/15/50 | | 230,000 | 151,204 |
| 2.525% 6/1/50 | | 510,000 | 339,681 |
| 2.675% 6/1/60 | | 200,000 | 129,797 |
| 2.921% 3/17/52 | | 170,000 | 123,031 |
| 3.041% 3/17/62 | | 460,000 | 322,279 |
| 3.3% 2/6/27 | | 1,650,000 | 1,624,388 |
| 3.45% 8/8/36 | | 830,000 | 759,087 |
| 3.5% 2/12/35 | | 180,000 | 169,641 |
| 3.75% 2/12/45 | | 100,000 | 88,482 |
| 5.3% 2/8/41 | | 280,000 | 320,391 |
| Oracle Corp.: | | | |
| 2.5% 4/1/25 | | 5,100,000 | 5,021,654 |
| 2.65% 7/15/26 | | 100,000 | 96,556 |
| 2.875% 3/25/31 | | 820,000 | 733,768 |
| 3.25% 11/15/27 | | 600,000 | 579,743 |
| 3.25% 5/15/30 | | 110,000 | 102,580 |
| 3.6% 4/1/40 | | 610,000 | 491,317 |
| 3.6% 4/1/50 | | 210,000 | 153,321 |
| 3.8% 11/15/37 | | 340,000 | 292,302 |
| 3.85% 4/1/60 | | 340,000 | 245,645 |
| 3.9% 5/15/35 | | 100,000 | 90,274 |
| 3.95% 3/25/51 | | 200,000 | 154,654 |
| 4% 11/15/47 | | 388,000 | 306,591 |
| 4.1% 3/25/61 | | 720,000 | 543,753 |
| 4.125% 5/15/45 | | 110,000 | 89,740 |
| 4.375% 5/15/55 | | 200,000 | 164,301 |
| 4.5% 7/8/44 | | 120,000 | 103,855 |
| 4.9% 2/6/33 | | 260,000 | 260,174 |
| 5.375% 7/15/40 | | 270,000 | 266,979 |
| 6.125% 7/8/39 | | 114,000 | 122,968 |
| 6.25% 11/9/32 | | 150,000 | 163,449 |
| Roper Technologies, Inc.: | | | |
| 1% 9/15/25 | | 60,000 | 57,727 |
| 1.4% 9/15/27 | | 60,000 | 54,918 |
| 1.75% 2/15/31 | | 60,000 | 50,020 |
| 2% 6/30/30 | | 400,000 | 347,098 |
| 4.9% 10/15/34 | | 260,000 | 257,631 |
| Salesforce, Inc.: | | | |
| 1.5% 7/15/28 | | 140,000 | 126,898 |
| 1.95% 7/15/31 | | 100,000 | 85,391 |
| 2.9% 7/15/51 | | 390,000 | 264,569 |
| 3.7% 4/11/28 | | 140,000 | 137,902 |
| VMware, Inc.: | | | |
| 1.4% 8/15/26 | | 690,000 | 649,040 |
| 4.7% 5/15/30 | | 100,000 | 99,882 |
| | | | 17,368,536 |
| Technology Hardware, Storage & Peripherals - 0.4% | | | |
| Apple, Inc.: | | | |
| 0.7% 2/8/26 | | 2,500,000 | 2,378,811 |
| 1.125% 5/11/25 | | 500,000 | 487,974 |
| 1.7% 8/5/31 | | 280,000 | 239,334 |
| 2.05% 9/11/26 | | 290,000 | 278,247 |
| 2.375% 2/8/41 | | 920,000 | 670,749 |
| 2.4% 8/20/50 | | 330,000 | 212,537 |
| 2.55% 8/20/60 | | 110,000 | 72,439 |
| 2.65% 5/11/50 | | 330,000 | 223,363 |
| 2.7% 8/5/51 | | 190,000 | 128,669 |
| 2.8% 2/8/61 | | 230,000 | 150,875 |
| 2.85% 8/5/61 | | 490,000 | 324,564 |
| 2.95% 9/11/49 | | 180,000 | 129,745 |
| 3% 11/13/27 | | 890,000 | 865,665 |
| 3.35% 2/9/27 | | 240,000 | 236,306 |
| 3.75% 9/12/47 | | 110,000 | 92,847 |
| 3.75% 11/13/47 | | 90,000 | 75,547 |
| 4% 5/10/28 | | 500,000 | 501,710 |
| 4.3% 5/10/33 | | 1,000,000 | 1,019,749 |
| 4.375% 5/13/45 | | 120,000 | 112,919 |
| 4.45% 5/6/44 | | 100,000 | 97,658 |
| 4.5% 2/23/36 | | 110,000 | 112,465 |
| 4.65% 2/23/46 | | 201,000 | 196,852 |
| Hewlett Packard Enterprise Co.: | | | |
| 1.75% 4/1/26 | | 180,000 | 171,946 |
| 4.9% 10/15/25 (b) | | 1,108,000 | 1,107,281 |
| 5.25% 7/1/28 | | 140,000 | 143,240 |
| 6.2% 10/15/35 (b) | | 50,000 | 53,817 |
| HP, Inc.: | | | |
| 2.2% 6/17/25 | | 190,000 | 185,684 |
| 2.65% 6/17/31 | | 210,000 | 182,920 |
| 3.4% 6/17/30 | | 250,000 | 234,606 |
| 4.2% 4/15/32 | | 140,000 | 133,493 |
| 5.5% 1/15/33 | | 100,000 | 103,427 |
| | | | 10,925,439 |
TOTAL INFORMATION TECHNOLOGY | | | 53,020,146 |
| MATERIALS - 0.8% | | | |
| Chemicals - 0.4% | | | |
| Air Products & Chemicals, Inc.: | | | |
| 1.5% 10/15/25 | | 100,000 | 96,736 |
| 2.05% 5/15/30 | | 40,000 | 35,500 |
| 2.7% 5/15/40 | | 220,000 | 164,534 |
| 2.8% 5/15/50 | | 40,000 | 27,092 |
| 4.8% 3/3/33 | | 120,000 | 122,479 |
| Albemarle Corp.: | | | |
| 4.65% 6/1/27 | | 160,000 | 159,571 |
| 5.05% 6/1/32 | | 130,000 | 128,481 |
| Celanese U.S. Holdings LLC: | | | |
| 6.165% 7/15/27 | | 650,000 | 670,716 |
| 6.7% 11/15/33 | | 140,000 | 151,340 |
| CF Industries Holdings, Inc. 5.375% 3/15/44 | | 130,000 | 124,627 |
| DuPont de Nemours, Inc.: | | | |
| 4.493% 11/15/25 | | 320,000 | 318,781 |
| 4.725% 11/15/28 | | 240,000 | 243,463 |
| 5.319% 11/15/38 | | 368,000 | 394,970 |
| Eastman Chemical Co.: | | | |
| 4.5% 12/1/28 | | 406,000 | 405,110 |
| 4.8% 9/1/42 | | 80,000 | 72,698 |
| Ecolab, Inc.: | | | |
| 1.3% 1/30/31 | | 560,000 | 462,428 |
| 2.125% 8/15/50 | | 150,000 | 88,437 |
| Huntsman International LLC 4.5% 5/1/29 | | 120,000 | 116,849 |
| International Flavors & Fragrances, Inc.: | | | |
| 4.45% 9/26/28 | | 130,000 | 129,556 |
| 5% 9/26/48 | | 90,000 | 80,839 |
| Linde, Inc.: | | | |
| 2% 8/10/50 | | 100,000 | 57,392 |
| 3.2% 1/30/26 | | 230,000 | 226,111 |
| LYB International Finance II BV 3.5% 3/2/27 | | 680,000 | 663,205 |
| LYB International Finance III LLC: | | | |
| 3.375% 10/1/40 | | 220,000 | 169,385 |
| 3.625% 4/1/51 | | 110,000 | 79,229 |
| 3.8% 10/1/60 | | 100,000 | 72,383 |
| 5.5% 3/1/34 | | 130,000 | 133,265 |
| 5.625% 5/15/33 | | 160,000 | 167,965 |
| LyondellBasell Industries NV 4.625% 2/26/55 | | 90,000 | 76,376 |
| Nutrien Ltd.: | | | |
| 3.95% 5/13/50 | | 170,000 | 133,926 |
| 4.125% 3/15/35 | | 150,000 | 137,665 |
| 4.2% 4/1/29 | | 32,000 | 31,592 |
| 4.9% 3/27/28 | | 380,000 | 385,110 |
| 5% 4/1/49 | | 106,000 | 97,512 |
| 5.4% 6/21/34 | | 300,000 | 305,703 |
| Rohm & Haas Co. 7.85% 7/15/29 | | 120,000 | 135,409 |
| RPM International, Inc.: | | | |
| 2.95% 1/15/32 | | 70,000 | 60,728 |
| 3.75% 3/15/27 | | 100,000 | 97,712 |
| 4.55% 3/1/29 | | 120,000 | 119,201 |
| Sherwin-Williams Co.: | | | |
| 2.95% 8/15/29 | | 120,000 | 111,728 |
| 3.45% 6/1/27 | | 210,000 | 204,732 |
| 3.8% 8/15/49 | | 80,000 | 63,169 |
| 4% 12/15/42 | | 60,000 | 49,974 |
| 4.5% 6/1/47 | | 200,000 | 177,248 |
| 4.8% 9/1/31 | | 170,000 | 171,054 |
| The Dow Chemical Co.: | | | |
| 2.1% 11/15/30 | | 450,000 | 394,307 |
| 3.6% 11/15/50 | | 170,000 | 124,193 |
| 4.375% 11/15/42 | | 100,000 | 86,144 |
| 5.15% 2/15/34 | | 220,000 | 222,364 |
| 5.25% 11/15/41 | | 130,000 | 126,723 |
| 5.55% 11/30/48 | | 80,000 | 79,086 |
| 6.9% 5/15/53 | | 50,000 | 57,922 |
| 7.375% 11/1/29 | | 110,000 | 124,314 |
| The Mosaic Co.: | | | |
| 4.05% 11/15/27 | | 170,000 | 167,036 |
| 5.45% 11/15/33 | | 150,000 | 153,086 |
| Westlake Corp.: | | | |
| 3.125% 8/15/51 | | 80,000 | 52,388 |
| 3.375% 6/15/30 | | 210,000 | 196,475 |
| 3.6% 8/15/26 | | 858,000 | 840,970 |
| | | | 10,546,989 |
| Construction Materials - 0.0% | | | |
| CRH America Finance, Inc. 5.4% 5/21/34 | | 200,000 | 206,020 |
| Martin Marietta Materials, Inc.: | | | |
| 2.5% 3/15/30 | | 110,000 | 99,276 |
| 4.25% 12/15/47 | | 120,000 | 101,653 |
| | | | 406,949 |
| Containers & Packaging - 0.1% | | | |
| Amcor Flexibles North America, Inc.: | | | |
| 2.69% 5/25/31 | | 220,000 | 191,692 |
| 4% 5/17/25 | | 200,000 | 198,362 |
| Amcor Group Finance 5.45% 5/23/29 | | 150,000 | 154,278 |
| Avery Dennison Corp. 2.65% 4/30/30 | | 140,000 | 126,253 |
| International Paper Co.: | | | |
| 5% 9/15/35 | | 328,000 | 328,718 |
| 6% 11/15/41 | | 70,000 | 74,847 |
| Smurfit Kappa Treasury ULC 5.438% 4/3/34 (c) | | 300,000 | 308,526 |
| WRKCo, Inc.: | | | |
| 3.9% 6/1/28 | | 170,000 | 165,472 |
| 4.65% 3/15/26 | | 400,000 | 398,199 |
| 4.9% 3/15/29 | | 140,000 | 141,559 |
| | | | 2,087,906 |
| Metals & Mining - 0.3% | | | |
| ArcelorMittal SA: | | | |
| 6.35% 6/17/54 | | 100,000 | 100,572 |
| 6.55% 11/29/27 | | 230,000 | 242,477 |
| 6.8% 11/29/32 | | 270,000 | 295,517 |
| Barrick North America Finance LLC 5.7% 5/30/41 | | 142,000 | 146,518 |
| Barrick PD Australia Finance Pty Ltd. 5.95% 10/15/39 | | 100,000 | 105,700 |
| BHP Billiton Financial (U.S.A.) Ltd.: | | | |
| 4.125% 2/24/42 | | 225,000 | 199,380 |
| 4.75% 2/28/28 | | 400,000 | 404,641 |
| 5% 9/30/43 | | 151,000 | 147,887 |
| 5.25% 9/8/33 | | 330,000 | 340,539 |
| 5.5% 9/8/53 | | 50,000 | 52,056 |
| Freeport-McMoRan, Inc.: | | | |
| 4.375% 8/1/28 | | 110,000 | 108,483 |
| 4.625% 8/1/30 | | 190,000 | 187,931 |
| 5.45% 3/15/43 | | 160,000 | 156,705 |
| Newmont Corp.: | | | |
| 2.25% 10/1/30 | | 160,000 | 141,883 |
| 2.6% 7/15/32 | | 120,000 | 104,738 |
| 4.875% 3/15/42 | | 520,000 | 501,010 |
| 5.45% 6/9/44 | | 100,000 | 100,937 |
| Nucor Corp.: | | | |
| 2.979% 12/15/55 | | 110,000 | 69,894 |
| 3.125% 4/1/32 | | 200,000 | 180,504 |
| 3.95% 5/23/25 | | 450,000 | 446,709 |
| Rio Tinto Finance (U.S.A.) Ltd.: | | | |
| 2.75% 11/2/51 | | 160,000 | 104,430 |
| 5.2% 11/2/40 | | 324,000 | 326,778 |
| Rio Tinto Finance (U.S.A.) PLC 5% 3/9/33 | | 200,000 | 206,346 |
| Southern Copper Corp.: | | | |
| 3.875% 4/23/25 | | 210,000 | 207,900 |
| 5.25% 11/8/42 | | 100,000 | 96,800 |
| 5.875% 4/23/45 | | 178,000 | 182,797 |
| 7.5% 7/27/35 | | 110,000 | 129,697 |
| Vale Overseas Ltd.: | | | |
| 3.75% 7/8/30 | | 500,000 | 466,775 |
| 6.125% 6/12/33 | | 70,000 | 73,308 |
| 6.4% 6/28/54 | | 150,000 | 153,000 |
| 6.875% 11/21/36 | | 120,000 | 131,588 |
| | | | 6,113,500 |
| Paper & Forest Products - 0.0% | | | |
| Suzano Austria GmbH: | | | |
| 2.5% 9/15/28 | | 320,000 | 287,104 |
| 6% 1/15/29 | | 230,000 | 235,003 |
| | | | 522,107 |
TOTAL MATERIALS | | | 19,677,451 |
| REAL ESTATE - 1.0% | | | |
| Equity Real Estate Investment Trusts (REITs) - 0.9% | | | |
| Agree LP 2.9% 10/1/30 | | 100,000 | 89,733 |
| Alexandria Real Estate Equities, Inc.: | | | |
| 2% 5/18/32 | | 250,000 | 203,110 |
| 3.375% 8/15/31 | | 340,000 | 310,862 |
| 3.95% 1/15/27 | | 395,000 | 388,382 |
| 4.5% 7/30/29 | | 100,000 | 99,151 |
| 4.85% 4/15/49 | | 140,000 | 124,079 |
| 5.625% 5/15/54 | | 150,000 | 147,735 |
| American Homes 4 Rent LP: | | | |
| 3.375% 7/15/51 | | 170,000 | 116,751 |
| 5.5% 2/1/34 | | 90,000 | 91,653 |
| American Tower Corp.: | | | |
| 1.3% 9/15/25 | | 120,000 | 115,476 |
| 2.1% 6/15/30 | | 120,000 | 104,417 |
| 3.1% 6/15/50 | | 120,000 | 81,789 |
| 3.125% 1/15/27 | | 950,000 | 918,085 |
| 3.6% 1/15/28 | | 70,000 | 67,692 |
| 3.7% 10/15/49 | | 150,000 | 113,755 |
| 3.8% 8/15/29 | | 100,000 | 95,986 |
| 5.25% 7/15/28 | | 470,000 | 480,030 |
| 5.65% 3/15/33 | | 370,000 | 385,653 |
| AvalonBay Communities, Inc.: | | | |
| 2.3% 3/1/30 | | 408,000 | 365,251 |
| 3.35% 5/15/27 | | 170,000 | 165,708 |
| 5.3% 12/7/33 | | 100,000 | 102,845 |
| Boston Properties, Inc.: | | | |
| 2.75% 10/1/26 | | 100,000 | 95,274 |
| 3.25% 1/30/31 | | 227,000 | 199,849 |
| 3.4% 6/21/29 | | 230,000 | 212,396 |
| 3.65% 2/1/26 | | 130,000 | 127,116 |
| 4.5% 12/1/28 | | 280,000 | 272,780 |
| Brixmor Operating Partnership LP: | | | |
| 4.05% 7/1/30 | | 48,000 | 45,981 |
| 4.125% 6/15/26 | | 170,000 | 167,957 |
| 4.125% 5/15/29 | | 44,000 | 42,679 |
| 5.5% 2/15/34 | | 80,000 | 80,915 |
| Camden Property Trust: | | | |
| 2.8% 5/15/30 | | 170,000 | 155,612 |
| 3.15% 7/1/29 | | 190,000 | 179,133 |
| Corporate Office Properties LP 2.75% 4/15/31 | | 110,000 | 94,351 |
| Crown Castle, Inc.: | | | |
| 1.35% 7/15/25 | | 90,000 | 87,276 |
| 2.25% 1/15/31 | | 100,000 | 85,376 |
| 3.25% 1/15/51 | | 190,000 | 131,805 |
| 3.3% 7/1/30 | | 480,000 | 442,812 |
| 3.65% 9/1/27 | | 464,000 | 451,084 |
| 5.1% 5/1/33 | | 280,000 | 279,849 |
| CubeSmart LP 3% 2/15/30 | | 210,000 | 192,549 |
| EPR Properties: | | | |
| 4.5% 6/1/27 | | 210,000 | 205,515 |
| 4.75% 12/15/26 | | 130,000 | 128,435 |
| Equinix Europe 2 Financing Corp. LLC 5.5% 6/15/34 | | 310,000 | 320,834 |
| Equinix, Inc.: | | | |
| 1.45% 5/15/26 | | 200,000 | 189,456 |
| 2.5% 5/15/31 | | 210,000 | 182,501 |
| ERP Operating LP: | | | |
| 1.85% 8/1/31 | | 240,000 | 201,564 |
| 2.5% 2/15/30 | | 160,000 | 144,838 |
| 3.5% 3/1/28 | | 160,000 | 155,137 |
| Federal Realty OP LP: | | | |
| 1.25% 2/15/26 | | 200,000 | 189,992 |
| 5.375% 5/1/28 | | 290,000 | 296,566 |
| GLP Capital LP/GLP Financing II, Inc.: | | | |
| 5.25% 6/1/25 | | 310,000 | 309,206 |
| 5.625% 9/15/34 | | 350,000 | 353,830 |
| Healthpeak OP, LLC: | | | |
| 2.875% 1/15/31 | | 430,000 | 385,248 |
| 3% 1/15/30 | | 320,000 | 295,064 |
| Highwoods Realty LP: | | | |
| 4.125% 3/15/28 | | 140,000 | 134,798 |
| 4.2% 4/15/29 | | 170,000 | 162,473 |
| Invitation Homes Operating Partnership LP: | | | |
| 2.3% 11/15/28 | | 170,000 | 154,213 |
| 4.15% 4/15/32 | | 110,000 | 103,645 |
| Kilroy Realty LP: | | | |
| 2.65% 11/15/33 | | 100,000 | 76,569 |
| 6.25% 1/15/36 | | 70,000 | 69,484 |
| Kimco Realty OP, LLC: | | | |
| 1.9% 3/1/28 | | 610,000 | 555,821 |
| 2.8% 10/1/26 | | 216,000 | 208,179 |
| 4.6% 2/1/33 | | 120,000 | 117,281 |
| Kite Realty Group LP 5.5% 3/1/34 | | 70,000 | 70,961 |
| LXP Industrial Trust (REIT) 6.75% 11/15/28 | | 130,000 | 137,939 |
| NNN (REIT), Inc.: | | | |
| 3% 4/15/52 | | 200,000 | 128,863 |
| 3.6% 12/15/26 | | 530,000 | 519,212 |
| Omega Healthcare Investors, Inc.: | | | |
| 3.375% 2/1/31 | | 110,000 | 98,057 |
| 4.5% 4/1/27 | | 140,000 | 138,329 |
| 4.75% 1/15/28 | | 201,000 | 199,265 |
| Piedmont Operating Partnership LP 3.15% 8/15/30 | | 100,000 | 85,625 |
| Prologis LP: | | | |
| 1.625% 3/15/31 | | 150,000 | 124,858 |
| 1.75% 2/1/31 | | 340,000 | 286,415 |
| 2.125% 4/15/27 | | 170,000 | 160,889 |
| 2.125% 10/15/50 | | 100,000 | 55,629 |
| 2.875% 11/15/29 | | 370,000 | 343,327 |
| 4.625% 1/15/33 | | 100,000 | 99,174 |
| 4.875% 6/15/28 | | 100,000 | 101,767 |
| 5.125% 1/15/34 | | 100,000 | 102,281 |
| 5.25% 6/15/53 | | 100,000 | 99,033 |
| Public Storage Operating Co. 5.1% 8/1/33 | | 430,000 | 440,027 |
| Realty Income Corp.: | | | |
| 2.85% 12/15/32 | | 338,000 | 290,616 |
| 3% 1/15/27 | | 640,000 | 617,629 |
| 3.2% 2/15/31 | | 160,000 | 145,977 |
| 3.25% 1/15/31 | | 238,000 | 218,585 |
| 4.9% 7/15/33 | | 150,000 | 149,091 |
| Regency Centers LP: | | | |
| 3.7% 6/15/30 | | 150,000 | 142,895 |
| 5.1% 1/15/35 | | 200,000 | 200,631 |
| 5.25% 1/15/34 | | 130,000 | 132,330 |
| Simon Property Group LP: | | | |
| 2% 9/13/24 | | 420,000 | 419,564 |
| 2.2% 2/1/31 | | 250,000 | 216,527 |
| 2.65% 7/15/30 | | 138,000 | 125,238 |
| 2.65% 2/1/32 | | 130,000 | 113,063 |
| 3.375% 12/1/27 | | 150,000 | 145,443 |
| 3.5% 9/1/25 | | 230,000 | 227,261 |
| 4.25% 11/30/46 | | 116,000 | 98,118 |
| 4.75% 3/15/42 | | 110,000 | 101,760 |
| 5.85% 3/8/53 | | 130,000 | 135,807 |
| 6.25% 1/15/34 | | 160,000 | 174,900 |
| Store Capital LLC 4.5% 3/15/28 | | 200,000 | 194,855 |
| Sun Communities Operating LP: | | | |
| 2.3% 11/1/28 | | 170,000 | 153,755 |
| 5.5% 1/15/29 | | 170,000 | 173,754 |
| UDR, Inc.: | | | |
| 2.1% 6/15/33 | | 100,000 | 78,811 |
| 3% 8/15/31 | | 100,000 | 89,585 |
| 3.2% 1/15/30 | | 100,000 | 92,869 |
| Ventas Realty LP: | | | |
| 4% 3/1/28 | | 184,000 | 179,996 |
| 4.875% 4/15/49 | | 160,000 | 144,456 |
| VICI Properties LP: | | | |
| 4.75% 2/15/28 | | 580,000 | 577,718 |
| 5.125% 5/15/32 | | 140,000 | 138,390 |
| 6.125% 4/1/54 | | 80,000 | 81,596 |
| Welltower OP LLC: | | | |
| 2.05% 1/15/29 | | 390,000 | 350,311 |
| 2.75% 1/15/32 | | 110,000 | 95,715 |
| 4.25% 4/15/28 | | 174,000 | 172,051 |
| Weyerhaeuser Co.: | | | |
| 4% 11/15/29 | | 270,000 | 261,972 |
| 6.95% 10/1/27 | | 150,000 | 159,694 |
| WP Carey, Inc. 2.4% 2/1/31 | | 140,000 | 120,304 |
| | | | 22,766,504 |
| Real Estate Management & Development - 0.1% | | | |
| CBRE Group, Inc.: | | | |
| 5.5% 4/1/29 | | 140,000 | 144,784 |
| 5.95% 8/15/34 | | 100,000 | 105,659 |
| Digital Realty Trust LP 3.7% 8/15/27 | | 370,000 | 360,907 |
| Essex Portfolio LP: | | | |
| 2.65% 3/15/32 | | 210,000 | 180,253 |
| 3% 1/15/30 | | 230,000 | 211,531 |
| Extra Space Storage LP: | | | |
| 3.9% 4/1/29 | | 520,000 | 502,673 |
| 4% 6/15/29 | | 80,000 | 77,601 |
| 5.35% 1/15/35 | | 130,000 | 131,044 |
| Mid-America Apartments LP: | | | |
| 2.875% 9/15/51 | | 65,000 | 42,077 |
| 4.2% 6/15/28 | | 260,000 | 256,834 |
| 5% 3/15/34 | | 50,000 | 50,089 |
| Tanger Properties LP 3.125% 9/1/26 | | 100,000 | 96,177 |
| | | | 2,159,629 |
TOTAL REAL ESTATE | | | 24,926,133 |
| UTILITIES - 2.4% | | | |
| Electric Utilities - 1.9% | | | |
| AEP Texas, Inc.: | | | |
| 3.45% 5/15/51 | | 70,000 | 48,570 |
| 3.8% 10/1/47 | | 80,000 | 60,643 |
| 4.15% 5/1/49 | | 120,000 | 95,388 |
| AEP Transmission Co. LLC: | | | |
| 2.75% 8/15/51 | | 100,000 | 63,513 |
| 3.65% 4/1/50 | | 139,000 | 106,122 |
| 5.4% 3/15/53 | | 100,000 | 100,514 |
| Alabama Power Co.: | | | |
| 1.45% 9/15/30 | | 800,000 | 675,796 |
| 3% 3/15/52 | | 170,000 | 115,634 |
| 5.85% 11/15/33 | | 190,000 | 204,234 |
| American Electric Power Co., Inc.: | | | |
| 2.3% 3/1/30 | | 120,000 | 106,265 |
| 3.25% 3/1/50 | | 174,000 | 119,782 |
| 4.3% 12/1/28 | | 194,000 | 191,822 |
| Appalachian Power Co.: | | | |
| 4.5% 8/1/32 | | 140,000 | 134,800 |
| 5.65% 4/1/34 | | 120,000 | 124,059 |
| 7% 4/1/38 | | 100,000 | 115,144 |
| Arizona Public Service Co.: | | | |
| 2.6% 8/15/29 | | 160,000 | 146,759 |
| 3.35% 5/15/50 | | 200,000 | 140,893 |
| 5.55% 8/1/33 | | 160,000 | 164,495 |
| Avangrid, Inc. 3.2% 4/15/25 | | 170,000 | 167,873 |
| Baltimore Gas & Electric Co.: | | | |
| 2.9% 6/15/50 | | 120,000 | 79,243 |
| 3.75% 8/15/47 | | 210,000 | 164,951 |
| 5.3% 6/1/34 | | 230,000 | 237,372 |
| CenterPoint Energy Houston Electric LLC: | | | |
| 2.9% 7/1/50 | | 100,000 | 65,661 |
| 3.35% 4/1/51 | | 70,000 | 50,626 |
| 4.25% 2/1/49 | | 185,000 | 156,917 |
| 4.95% 4/1/33 | | 330,000 | 331,595 |
| Cleco Corporate Holdings LLC 4.973% 5/1/46 | | 50,000 | 43,500 |
| Commonwealth Edison Co.: | | | |
| 2.55% 6/15/26 | | 470,000 | 455,190 |
| 2.75% 9/1/51 | | 330,000 | 209,294 |
| 3.2% 11/15/49 | | 120,000 | 84,270 |
| 4% 3/1/48 | | 208,000 | 170,614 |
| 6.45% 1/15/38 | | 240,000 | 271,255 |
| Connecticut Light & Power Co.: | | | |
| 4% 4/1/48 | | 60,000 | 49,977 |
| 4.15% 6/1/45 | | 100,000 | 85,547 |
| 5.25% 1/15/53 | | 120,000 | 120,601 |
| Consolidated Edison Co. of New York, Inc.: | | | |
| 3.35% 4/1/30 | | 270,000 | 256,967 |
| 3.7% 11/15/59 | | 100,000 | 72,768 |
| 3.85% 6/15/46 | | 100,000 | 79,959 |
| 3.95% 4/1/50 | | 245,000 | 202,260 |
| 4.5% 5/15/58 | | 220,000 | 189,254 |
| 4.65% 12/1/48 | | 385,000 | 348,094 |
| 5.2% 3/1/33 | | 330,000 | 340,977 |
| 6.15% 11/15/52 | | 150,000 | 167,297 |
| 6.2% 6/15/36 | | 300,000 | 330,060 |
| 6.75% 4/1/38 | | 110,000 | 126,678 |
| Dayton Power & Light Co. 3.95% 6/15/49 | | 55,000 | 42,128 |
| Dominion Energy South Carolina: | | | |
| 2.3% 12/1/31 | | 230,000 | 195,685 |
| 5.1% 6/1/65 | | 60,000 | 56,675 |
| 5.3% 5/15/33 | | 100,000 | 103,236 |
| DTE Electric Co.: | | | |
| 2.95% 3/1/50 | | 80,000 | 54,807 |
| 3% 3/1/32 | | 180,000 | 162,109 |
| 3.65% 3/1/52 | | 190,000 | 146,228 |
| 3.95% 3/1/49 | | 56,000 | 46,340 |
| 4.05% 5/15/48 | | 100,000 | 84,401 |
| 5.2% 3/1/34 | | 110,000 | 113,499 |
| Duke Energy Carolinas LLC: | | | |
| 3.2% 8/15/49 | | 120,000 | 84,258 |
| 3.75% 6/1/45 | | 150,000 | 119,469 |
| 3.875% 3/15/46 | | 240,000 | 193,903 |
| 3.95% 3/15/48 | | 210,000 | 171,280 |
| 4% 9/30/42 | | 179,000 | 152,601 |
| 4.25% 12/15/41 | | 130,000 | 114,662 |
| Duke Energy Corp.: | | | |
| 2.45% 6/1/30 | | 200,000 | 178,773 |
| 3.15% 8/15/27 | | 352,000 | 339,427 |
| 3.3% 6/15/41 | | 515,000 | 393,534 |
| 3.75% 9/1/46 | | 110,000 | 84,001 |
| 4.2% 6/15/49 | | 310,000 | 251,360 |
| 5% 8/15/52 | | 100,000 | 91,747 |
| 5.45% 6/15/34 | | 140,000 | 144,243 |
| Duke Energy Florida LLC: | | | |
| 3.2% 1/15/27 | | 240,000 | 234,071 |
| 4.2% 7/15/48 | | 140,000 | 117,588 |
| 6.4% 6/15/38 | | 360,000 | 403,935 |
| Duke Energy Indiana LLC: | | | |
| 6.35% 8/15/38 | | 170,000 | 190,924 |
| 6.45% 4/1/39 | | 110,000 | 123,236 |
| Duke Energy Ohio, Inc.: | | | |
| 2.125% 6/1/30 | | 210,000 | 184,490 |
| 3.65% 2/1/29 | | 210,000 | 203,535 |
| 4.3% 2/1/49 | | 65,000 | 54,797 |
| Duke Energy Progress LLC: | | | |
| 2% 8/15/31 | | 270,000 | 227,611 |
| 3.45% 3/15/29 | | 600,000 | 578,231 |
| 4.1% 5/15/42 | | 130,000 | 110,956 |
| 4.2% 8/15/45 | | 180,000 | 153,341 |
| 5.25% 3/15/33 | | 100,000 | 103,514 |
| Edison International: | | | |
| 4.125% 3/15/28 | | 100,000 | 97,960 |
| 6.95% 11/15/29 | | 70,000 | 76,551 |
| Entergy Corp.: | | | |
| 0.9% 9/15/25 | | 500,000 | 481,125 |
| 2.4% 6/15/31 | | 120,000 | 102,594 |
| 3.75% 6/15/50 | | 190,000 | 139,705 |
| Entergy Louisiana LLC: | | | |
| 3.12% 9/1/27 | | 490,000 | 472,599 |
| 4% 3/15/33 | | 190,000 | 177,864 |
| 5.7% 3/15/54 | | 250,000 | 258,049 |
| Entergy Mississippi LLC: | | | |
| 5% 9/1/33 | | 100,000 | 100,498 |
| 5.85% 6/1/54 | | 80,000 | 84,409 |
| Entergy, Inc.: | | | |
| 3.35% 6/15/52 | | 100,000 | 70,560 |
| 3.55% 9/30/49 | | 194,000 | 142,338 |
| 5.3% 9/15/33 | | 70,000 | 71,630 |
| Eversource Energy: | | | |
| 1.65% 8/15/30 | | 100,000 | 84,114 |
| 2.55% 3/15/31 | | 200,000 | 172,830 |
| 3.45% 1/15/50 | | 120,000 | 87,423 |
| 4.75% 5/15/26 | | 270,000 | 270,089 |
| 5.45% 3/1/28 | | 250,000 | 256,297 |
| 5.95% 7/15/34 | | 110,000 | 115,753 |
| Exelon Corp.: | | | |
| 3.35% 3/15/32 | | 190,000 | 173,097 |
| 3.95% 6/15/25 | | 163,000 | 161,674 |
| 4.05% 4/15/30 | | 650,000 | 633,616 |
| 4.45% 4/15/46 | | 125,000 | 107,774 |
| 4.7% 4/15/50 | | 110,000 | 97,416 |
| 5.1% 6/15/45 | | 160,000 | 152,172 |
| FirstEnergy Corp.: | | | |
| 1.6% 1/15/26 | | 97,000 | 92,792 |
| 2.25% 9/1/30 | | 150,000 | 130,506 |
| 5.1% 7/15/47 | | 150,000 | 133,899 |
| Florida Power & Light Co.: | | | |
| 2.875% 12/4/51 | | 190,000 | 127,371 |
| 3.95% 3/1/48 | | 160,000 | 132,657 |
| 3.99% 3/1/49 | | 133,000 | 110,815 |
| 4.05% 6/1/42 | | 210,000 | 182,976 |
| 4.05% 10/1/44 | | 170,000 | 145,899 |
| 4.125% 2/1/42 | | 405,000 | 356,360 |
| 5.6% 6/15/54 | | 130,000 | 138,052 |
| 5.625% 4/1/34 | | 140,000 | 150,393 |
| Georgia Power Co.: | | | |
| 2.65% 9/15/29 | | 640,000 | 590,935 |
| 4.65% 5/16/28 | | 170,000 | 171,731 |
| 4.95% 5/17/33 | | 340,000 | 343,695 |
| 5.25% 3/15/34 | | 100,000 | 103,128 |
| Indiana Michigan Power Co.: | | | |
| 3.25% 5/1/51 | | 80,000 | 55,673 |
| 3.75% 7/1/47 | | 120,000 | 93,055 |
| Interstate Power and Light Co.: | | | |
| 2.3% 6/1/30 | | 104,000 | 91,823 |
| 4.1% 9/26/28 | | 260,000 | 256,257 |
| IPALCO Enterprises, Inc. 5.75% 4/1/34 | | 70,000 | 72,040 |
| ITC Holdings Corp.: | | | |
| 3.25% 6/30/26 | | 220,000 | 214,384 |
| 5.3% 7/1/43 | | 35,000 | 33,574 |
| Kentucky Utilities Co. 5.125% 11/1/40 | | 170,000 | 168,043 |
| Louisville Gas & Electric Co. 4.25% 4/1/49 | | 60,000 | 50,042 |
| MidAmerican Energy Co.: | | | |
| 3.65% 8/1/48 | | 280,000 | 218,856 |
| 3.95% 8/1/47 | | 100,000 | 81,851 |
| 4.25% 7/15/49 | | 100,000 | 86,106 |
| 5.35% 1/15/34 | | 200,000 | 209,460 |
| 5.8% 10/15/36 | | 110,000 | 118,758 |
| Mississippi Power Co.: | | | |
| 3.95% 3/30/28 | | 120,000 | 117,807 |
| 4.25% 3/15/42 | | 50,000 | 43,241 |
| Nevada Power Co.: | | | |
| 3.125% 8/1/50 | | 150,000 | 100,936 |
| 6% 3/15/54 | | 70,000 | 74,755 |
| NextEra Energy Capital Holdings, Inc.: | | | |
| 1.875% 1/15/27 | | 300,000 | 282,679 |
| 2.44% 1/15/32 | | 400,000 | 340,962 |
| 3% 1/15/52 | | 110,000 | 72,692 |
| 4.9% 2/28/28 | | 900,000 | 911,564 |
| 5% 7/15/32 | | 80,000 | 81,022 |
| 5.55% 3/15/54 | | 140,000 | 141,099 |
| 5.749% 9/1/25 | | 310,000 | 312,552 |
| 6.051% 3/1/25 | | 1,820,000 | 1,827,837 |
| Northern States Power Co.: | | | |
| 2.6% 6/1/51 | | 300,000 | 189,051 |
| 3.2% 4/1/52 | | 80,000 | 56,660 |
| 4% 8/15/45 | | 110,000 | 91,136 |
| NSTAR Electric Co.: | | | |
| 3.1% 6/1/51 | | 100,000 | 69,291 |
| 4.95% 9/15/52 | | 100,000 | 95,143 |
| Oglethorpe Power Corp.: | | | |
| 3.75% 8/1/50 | | 100,000 | 74,865 |
| 5.05% 10/1/48 | | 50,000 | 45,944 |
| 5.8% 6/1/54 (c) | | 100,000 | 101,970 |
| 5.95% 11/1/39 | | 110,000 | 113,897 |
| Ohio Power Co.: | | | |
| 4% 6/1/49 | | 100,000 | 78,862 |
| 5% 6/1/33 | | 100,000 | 99,954 |
| Oncor Electric Delivery Co. LLC: | | | |
| 3.1% 9/15/49 | | 100,000 | 69,099 |
| 3.75% 4/1/45 | | 100,000 | 79,923 |
| 3.8% 6/1/49 | | 390,000 | 309,880 |
| 4.55% 9/15/32 | | 150,000 | 148,410 |
| 4.6% 6/1/52 | | 150,000 | 133,058 |
| 5.55% 6/15/54 (c) | | 100,000 | 102,631 |
| 5.75% 3/15/29 | | 230,000 | 242,655 |
| Pacific Gas & Electric Co.: | | | |
| 2.5% 2/1/31 | | 445,000 | 381,969 |
| 3.15% 1/1/26 | | 110,000 | 107,394 |
| 3.3% 8/1/40 | | 100,000 | 74,648 |
| 3.5% 6/15/25 | | 506,000 | 498,903 |
| 4.2% 3/1/29 | | 200,000 | 194,585 |
| 4.55% 7/1/30 | | 603,000 | 589,693 |
| 4.75% 2/15/44 | | 370,000 | 317,788 |
| 4.95% 7/1/50 | | 230,000 | 200,407 |
| 5.25% 3/1/52 | | 230,000 | 207,014 |
| 5.8% 5/15/34 | | 120,000 | 123,504 |
| 5.9% 6/15/32 | | 300,000 | 310,916 |
| 6.15% 1/15/33 | | 100,000 | 105,279 |
| 6.7% 4/1/53 | | 90,000 | 98,465 |
| 6.75% 1/15/53 | | 340,000 | 371,825 |
| PacifiCorp: | | | |
| 2.9% 6/15/52 | | 100,000 | 62,653 |
| 4.15% 2/15/50 | | 250,000 | 199,865 |
| 5.3% 2/15/31 | | 110,000 | 112,814 |
| 5.35% 12/1/53 | | 100,000 | 95,977 |
| 5.8% 1/15/55 | | 270,000 | 274,627 |
| 6% 1/15/39 | | 330,000 | 349,043 |
| PECO Energy Co.: | | | |
| 4.6% 5/15/52 | | 210,000 | 187,294 |
| 4.9% 6/15/33 | | 230,000 | 233,048 |
| PG&E Wildfire Recovery: | | | |
| 5.099% 6/1/54 | | 150,000 | 151,640 |
| 5.212% 12/1/49 | | 260,000 | 263,286 |
| Potomac Electric Power Co.: | | | |
| 4.15% 3/15/43 | | 110,000 | 95,077 |
| 6.5% 11/15/37 | | 60,000 | 68,647 |
| PPL Capital Funding, Inc. 4% 9/15/47 | | 90,000 | 67,621 |
| PPL Electric Utilities Corp.: | | | |
| 3% 10/1/49 | | 70,000 | 49,048 |
| 5% 5/15/33 | | 100,000 | 101,467 |
| 5.25% 5/15/53 | | 100,000 | 100,352 |
| Progress Energy, Inc. 7.75% 3/1/31 | | 240,000 | 277,719 |
| Public Service Co. of Colorado: | | | |
| 3.2% 3/1/50 | | 210,000 | 146,262 |
| 5.25% 4/1/53 | | 120,000 | 116,049 |
| 6.25% 9/1/37 | | 130,000 | 142,754 |
| Public Service Co. of New Hampshire 5.35% 10/1/33 | | 140,000 | 146,085 |
| Public Service Co. of Oklahoma 5.25% 1/15/33 | | 100,000 | 101,202 |
| Public Service Electric & Gas Co.: | | | |
| 2.45% 1/15/30 | | 80,000 | 72,273 |
| 3% 5/15/25 | | 220,000 | 217,433 |
| 3.15% 1/1/50 | | 300,000 | 215,313 |
| 3.2% 8/1/49 | | 110,000 | 80,044 |
| 3.65% 9/1/42 | | 130,000 | 106,629 |
| 3.7% 5/1/28 | | 120,000 | 117,324 |
| 5.2% 8/1/33 | | 190,000 | 196,501 |
| 5.3% 8/1/54 | | 130,000 | 132,504 |
| 5.45% 8/1/53 | | 70,000 | 72,319 |
| Puget Sound Energy, Inc.: | | | |
| 4.223% 6/15/48 | | 70,000 | 58,132 |
| 4.3% 5/20/45 | | 180,000 | 153,542 |
| 5.33% 6/15/34 | | 250,000 | 258,010 |
| Southern California Edison Co.: | | | |
| 2.95% 2/1/51 | | 250,000 | 165,728 |
| 3.65% 2/1/50 | | 410,000 | 309,956 |
| 3.65% 6/1/51 | | 110,000 | 82,091 |
| 3.9% 3/15/43 | | 230,000 | 188,029 |
| 4.05% 3/15/42 | | 160,000 | 134,003 |
| 4.125% 3/1/48 | | 285,000 | 235,372 |
| 4.65% 10/1/43 | | 158,000 | 143,158 |
| 4.9% 6/1/26 | | 410,000 | 411,937 |
| 5.75% 4/15/54 | | 70,000 | 72,714 |
| 6.05% 3/15/39 | | 100,000 | 107,410 |
| Southern Co.: | | | |
| 3.25% 7/1/26 | | 765,000 | 746,689 |
| 3.7% 4/30/30 | | 150,000 | 143,285 |
| 4.4% 7/1/46 | | 383,000 | 333,801 |
| Southwestern Electric Power Co.: | | | |
| 3.25% 11/1/51 | | 65,000 | 43,229 |
| 3.85% 2/1/48 | | 70,000 | 52,874 |
| 5.3% 4/1/33 | | 190,000 | 192,835 |
| Southwestern Public Service Co. 4.5% 8/15/41 | | 160,000 | 141,295 |
| Tampa Electric Co.: | | | |
| 4.3% 6/15/48 | | 60,000 | 50,970 |
| 4.45% 6/15/49 | | 140,000 | 123,082 |
| 4.9% 3/1/29 | | 170,000 | 173,244 |
| Tucson Electric Power Co.: | | | |
| 1.5% 8/1/30 | | 100,000 | 84,315 |
| 5.5% 4/15/53 | | 90,000 | 89,657 |
| Union Electric Co.: | | | |
| 2.625% 3/15/51 | | 140,000 | 87,271 |
| 2.95% 3/15/30 | | 170,000 | 157,149 |
| 3.9% 4/1/52 | | 120,000 | 96,245 |
| 5.45% 3/15/53 | | 100,000 | 100,804 |
| Virginia Electric & Power Co.: | | | |
| 2.4% 3/30/32 | | 110,000 | 94,153 |
| 2.45% 12/15/50 | | 200,000 | 119,451 |
| 3.8% 4/1/28 | | 90,000 | 88,177 |
| 3.8% 9/15/47 | | 180,000 | 140,162 |
| 4.6% 12/1/48 | | 208,000 | 184,119 |
| 4.625% 5/15/52 | | 100,000 | 88,415 |
| 5% 4/1/33 | | 100,000 | 100,742 |
| 5.05% 8/15/34 | | 300,000 | 301,969 |
| 5.3% 8/15/33 | | 240,000 | 246,557 |
| 5.45% 4/1/53 | | 80,000 | 79,964 |
| 6% 5/15/37 | | 120,000 | 129,594 |
| Wisconsin Electric Power Co. 1.7% 6/15/28 | | 490,000 | 445,894 |
| Wisconsin Power & Light Co.: | | | |
| 3.95% 9/1/32 | | 120,000 | 113,124 |
| 4.95% 4/1/33 | | 170,000 | 170,690 |
| Wisconsin Public Service Corp. 2.85% 12/1/51 | | 150,000 | 97,283 |
| Xcel Energy, Inc.: | | | |
| 3.35% 12/1/26 | | 316,000 | 307,387 |
| 3.4% 6/1/30 | | 73,000 | 68,206 |
| 3.5% 12/1/49 | | 100,000 | 71,543 |
| 5.45% 8/15/33 | | 70,000 | 71,546 |
| | | | 45,233,734 |
| Gas Utilities - 0.1% | | | |
| Atmos Energy Corp.: | | | |
| 2.85% 2/15/52 | | 100,000 | 65,172 |
| 3.375% 9/15/49 | | 200,000 | 146,730 |
| 4.125% 10/15/44 | | 210,000 | 181,156 |
| 5.45% 10/15/32 | | 140,000 | 147,361 |
| 5.9% 11/15/33 | | 150,000 | 162,489 |
| CenterPoint Energy Resources Corp.: | | | |
| 1.75% 10/1/30 | | 100,000 | 84,555 |
| 4.4% 7/1/32 | | 80,000 | 77,404 |
| 5.4% 3/1/33 | | 120,000 | 123,947 |
| 5.4% 7/1/34 | | 160,000 | 163,185 |
| Eastern Energy Gas Holdings LLC 2.5% 11/15/24 | | 80,000 | 79,508 |
| ONE Gas, Inc. 2% 5/15/30 | | 260,000 | 228,536 |
| Piedmont Natural Gas Co., Inc.: | | | |
| 2.5% 3/15/31 | | 220,000 | 191,644 |
| 3.35% 6/1/50 | | 100,000 | 70,549 |
| Southern California Gas Co.: | | | |
| 2.55% 2/1/30 | | 210,000 | 189,979 |
| 3.75% 9/15/42 | | 50,000 | 40,423 |
| 4.3% 1/15/49 | | 130,000 | 109,818 |
| 5.05% 9/1/34 | | 100,000 | 101,419 |
| 5.2% 6/1/33 | | 310,000 | 318,544 |
| Southern Co. Gas Capital Corp.: | | | |
| 3.15% 9/30/51 | | 250,000 | 165,565 |
| 5.75% 9/15/33 | | 100,000 | 105,701 |
| Southwest Gas Corp.: | | | |
| 3.18% 8/15/51 | | 100,000 | 64,556 |
| 5.45% 3/23/28 | | 165,000 | 168,689 |
| | | | 2,986,930 |
| Independent Power and Renewable Electricity Producers - 0.0% | | | |
| Constellation Energy Generation, LLC: | | | |
| 3.25% 6/1/25 | | 100,000 | 98,602 |
| 5.6% 6/15/42 | | 200,000 | 199,743 |
| 5.8% 3/1/33 | | 100,000 | 105,025 |
| 6.125% 1/15/34 | | 50,000 | 53,739 |
| 6.5% 10/1/53 | | 180,000 | 199,417 |
| Emera U.S. Finance LP: | | | |
| 3.55% 6/15/26 | | 160,000 | 155,802 |
| 4.75% 6/15/46 | | 100,000 | 86,216 |
| Southern Power Co. 5.25% 7/15/43 | | 90,000 | 87,342 |
| The AES Corp.: | | | |
| 2.45% 1/15/31 | | 100,000 | 85,278 |
| 5.45% 6/1/28 | | 110,000 | 112,034 |
| | | | 1,183,198 |
| Multi-Utilities - 0.4% | | | |
| Ameren Corp. 3.5% 1/15/31 | | 250,000 | 232,415 |
| Ameren Illinois Co.: | | | |
| 4.5% 3/15/49 | | 210,000 | 187,072 |
| 4.95% 6/1/33 | | 90,000 | 91,009 |
| 5.55% 7/1/54 | | 160,000 | 164,945 |
| Berkshire Hathaway Energy Co.: | | | |
| 1.65% 5/15/31 | | 160,000 | 132,809 |
| 2.85% 5/15/51 | | 120,000 | 78,045 |
| 3.25% 4/15/28 | | 450,000 | 434,082 |
| 4.45% 1/15/49 | | 100,000 | 86,072 |
| 4.5% 2/1/45 | | 180,000 | 163,596 |
| 4.6% 5/1/53 | | 100,000 | 87,328 |
| 5.15% 11/15/43 | | 75,000 | 73,917 |
| 5.95% 5/15/37 | | 120,000 | 129,594 |
| 6.125% 4/1/36 | | 110,000 | 119,968 |
| CenterPoint Energy, Inc. 2.95% 3/1/30 | | 120,000 | 109,672 |
| CMS Energy Corp. 4.75% 6/1/50 (b) | | 100,000 | 94,004 |
| Consumers Energy Co.: | | | |
| 2.65% 8/15/52 | | 115,000 | 75,835 |
| 3.1% 8/15/50 | | 200,000 | 145,405 |
| 4.35% 4/15/49 | | 210,000 | 185,905 |
| 4.625% 5/15/33 | | 160,000 | 158,969 |
| Dominion Energy, Inc.: | | | |
| 3.375% 4/1/30 | | 660,000 | 617,891 |
| 4.85% 8/15/52 | | 280,000 | 251,885 |
| 5.25% 8/1/33 | | 230,000 | 233,076 |
| DTE Energy Co.: | | | |
| 2.85% 10/1/26 | | 200,000 | 193,473 |
| 3.8% 3/15/27 | | 90,000 | 87,688 |
| 5.85% 6/1/34 | | 150,000 | 157,989 |
| National Grid PLC: | | | |
| 5.418% 1/11/34 | | 60,000 | 61,299 |
| 5.809% 6/12/33 | | 100,000 | 104,754 |
| NiSource, Inc.: | | | |
| 0.95% 8/15/25 | | 700,000 | 673,970 |
| 1.7% 2/15/31 | | 510,000 | 423,723 |
| 3.49% 5/15/27 | | 442,000 | 430,585 |
| 3.6% 5/1/30 | | 90,000 | 85,344 |
| 4.375% 5/15/47 | | 60,000 | 51,166 |
| 5% 6/15/52 | | 70,000 | 65,514 |
| 5.95% 6/15/41 | | 110,000 | 114,647 |
| 6.95% 11/30/54 (b) | | 130,000 | 131,710 |
| Public Service Enterprise Group, Inc.: | | | |
| 1.6% 8/15/30 | | 100,000 | 84,263 |
| 5.2% 4/1/29 | | 230,000 | 236,060 |
| 5.85% 11/15/27 | | 100,000 | 103,919 |
| 6.125% 10/15/33 | | 50,000 | 53,792 |
| Puget Energy, Inc. 4.1% 6/15/30 | | 253,000 | 241,101 |
| San Diego Gas & Electric Co.: | | | |
| 2.95% 8/15/51 | | 220,000 | 150,550 |
| 4.1% 6/15/49 | | 130,000 | 106,629 |
| 5.35% 4/1/53 | | 170,000 | 169,781 |
| Sempra: | | | |
| 3.4% 2/1/28 | | 50,000 | 48,172 |
| 3.7% 4/1/29 | | 170,000 | 163,656 |
| 3.8% 2/1/38 | | 270,000 | 229,965 |
| 4% 2/1/48 | | 136,000 | 107,884 |
| 4.125% 4/1/52 (b) | | 100,000 | 93,028 |
| WEC Energy Group, Inc. 4.75% 1/15/28 | | 200,000 | 201,790 |
| | | | 8,425,946 |
| Water Utilities - 0.0% | | | |
| American Water Capital Corp.: | | | |
| 2.3% 6/1/31 | | 220,000 | 189,991 |
| 2.95% 9/1/27 | | 430,000 | 414,076 |
| 3.75% 9/1/47 | | 413,000 | 327,141 |
| 4.3% 12/1/42 | | 100,000 | 88,641 |
| 4.3% 9/1/45 | | 100,000 | 87,918 |
| | | | 1,107,767 |
TOTAL UTILITIES | | | 58,937,575 |
| TOTAL NONCONVERTIBLE BONDS (Cost $688,977,026) | | | 656,102,856 |
| | | | |
| U.S. Government and Government Agency Obligations - 44.2% |
| | | Principal Amount (a) | Value ($) |
| U.S. Government Agency Obligations - 0.8% | | | |
| Fannie Mae: | | | |
| 0.375% 8/25/25 | | 238,000 | 228,958 |
| 0.5% 6/17/25 | | 650,000 | 629,765 |
| 0.54% 10/27/25 | | 500,000 | 480,028 |
| 0.625% 4/22/25 | | 90,000 | 87,781 |
| 0.75% 10/8/27 | | 250,000 | 227,751 |
| 0.875% 8/5/30 | | 108,000 | 91,067 |
| 6.625% 11/15/30 | | 1,650,000 | 1,891,665 |
| Federal Farm Credit Bank: | | | |
| 1.4% 3/10/28 | | 2,230,000 | 2,040,721 |
| 3.8% 4/5/32 | | 1,000,000 | 962,811 |
| Federal Home Loan Bank: | | | |
| 0.375% 9/4/25 | | 175,000 | 168,368 |
| 0.5% 4/14/25 | | 390,000 | 380,398 |
| 0.9% 2/26/27 | | 3,290,000 | 3,048,348 |
| 0.96% 3/5/26 | | 1,300,000 | 1,238,810 |
| 3.25% 6/9/28 | | 210,000 | 206,271 |
| 3.25% 11/16/28 | | 30,000 | 29,378 |
| 4.75% 3/10/34 | | 1,000,000 | 1,041,381 |
| Freddie Mac: | | | |
| 0.375% 7/21/25 | | 480,000 | 463,306 |
| 0.375% 9/23/25 | | 370,000 | 354,845 |
| 1.5% 2/12/25 | | 630,000 | 620,650 |
| 6.25% 7/15/32 | | 830,000 | 959,562 |
| 6.75% 3/15/31 | | 870,000 | 1,010,509 |
| Tennessee Valley Authority: | | | |
| 0.75% 5/15/25 | | 560,000 | 544,708 |
| 2.875% 2/1/27 | | 145,000 | 141,510 |
| 4.25% 9/15/52 | | 150,000 | 138,311 |
| 4.25% 9/15/65 | | 210,000 | 189,783 |
| 4.375% 8/1/34 | | 269,000 | 271,100 |
| 5.25% 9/15/39 | | 420,000 | 451,034 |
| 5.88% 4/1/36 | | 110,000 | 125,899 |
TOTAL U.S. GOVERNMENT AGENCY OBLIGATIONS | | | 18,024,718 |
| U.S. Treasury Obligations - 43.4% | | | |
| U.S. Treasury Bonds: | | | |
| 1.125% 5/15/40 | | 2,000 | 1,295 |
| 1.125% 8/15/40 | | 76,000 | 48,759 |
| 1.25% 5/15/50 | | 238,000 | 125,034 |
| 1.375% 11/15/40 | | 1,276,000 | 847,443 |
| 1.375% 8/15/50 | | 290,000 | 157,053 |
| 1.625% 11/15/50 | | 6,241,000 | 3,608,810 |
| 1.75% 8/15/41 | | 6,137,000 | 4,265,934 |
| 1.875% 2/15/41 | | 14,910,000 | 10,722,387 |
| 1.875% 2/15/51 | | 9,063,000 | 5,588,968 |
| 1.875% 11/15/51 | | 1,574,000 | 965,797 |
| 2% 11/15/41 | | 3,170,000 | 2,287,972 |
| 2% 2/15/50 | | 683,000 | 437,280 |
| 2% 8/15/51 | | 8,892,000 | 5,637,389 |
| 2.25% 5/15/41 | | 12,975,000 | 9,862,521 |
| 2.25% 8/15/46 | | 148,000 | 104,039 |
| 2.25% 8/15/49 | | 267,000 | 181,685 |
| 2.375% 11/15/49 | | 38,000 | 26,539 |
| 2.375% 5/15/51 | | 2,285,000 | 1,585,487 |
| 2.5% 2/15/46 | | 329,000 | 244,270 |
| 2.5% 5/15/46 | | 122,000 | 90,309 |
| 2.75% 11/15/42 | | 329,000 | 264,434 |
| 2.75% 8/15/47 | | 177,000 | 135,654 |
| 2.75% 11/15/47 | | 157,000 | 120,068 |
| 2.875% 8/15/45 | | 268,000 | 214,096 |
| 2.875% 11/15/46 | | 359,000 | 283,526 |
| 2.875% 5/15/49 | | 361,000 | 280,156 |
| 2.875% 5/15/52 | | 2,960,000 | 2,287,525 |
| 3% 5/15/42 | | 238,000 | 200,199 |
| 3% 11/15/44 | | 264,000 | 216,428 |
| 3% 11/15/45 | | 76,000 | 61,904 |
| 3% 2/15/47 | | 83,000 | 66,883 |
| 3% 5/15/47 | | 1,607,000 | 1,292,756 |
| 3% 2/15/48 | | 121,000 | 96,748 |
| 3% 8/15/48 | | 188,000 | 149,871 |
| 3% 2/15/49 | | 264,000 | 210,014 |
| 3% 8/15/52 | | 7,670,000 | 6,084,168 |
| 3.125% 11/15/41 | | 229,000 | 198,264 |
| 3.125% 2/15/42 | | 264,000 | 227,401 |
| 3.125% 5/15/48 | | 48,000 | 39,208 |
| 3.25% 5/15/42 | | 6,160,000 | 5,367,381 |
| 3.375% 8/15/42 | | 14,140,000 | 12,511,691 |
| 3.375% 5/15/44 | | 186,000 | 162,321 |
| 3.375% 11/15/48 | | 68,000 | 57,946 |
| 3.625% 8/15/43 | | 86,000 | 78,216 |
| 3.625% 2/15/53 | | 9,520,000 | 8,539,366 |
| 3.625% 5/15/53 | | 6,910,000 | 6,202,535 |
| 3.75% 8/15/41 | | 225,000 | 212,906 |
| 3.75% 11/15/43 | | 94,000 | 86,924 |
| 3.875% 8/15/40 | | 126,000 | 122,323 |
| 3.875% 2/15/43 | | 10,190,000 | 9,643,482 |
| 3.875% 5/15/43 | | 7,160,000 | 6,758,366 |
| 4% 11/15/42 | | 10,370,000 | 10,005,430 |
| 4% 11/15/52 | | 6,250,000 | 5,998,047 |
| 4.125% 8/15/53 | | 4,510,000 | 4,428,785 |
| 4.25% 8/15/44 | | 1,610,000 | 1,571,008 |
| 4.25% 2/15/54 | | 29,973,000 | 30,090,082 |
| 4.25% 8/15/54 | | 3,070,000 | 3,089,188 |
| 4.375% 2/15/38 | | 81,000 | 84,275 |
| 4.375% 11/15/39 | | 5,000 | 5,161 |
| 4.375% 5/15/41 | | 433,000 | 444,434 |
| 4.375% 8/15/43 | | 4,130,000 | 4,170,655 |
| 4.5% 2/15/36 | | 223,000 | 236,267 |
| 4.5% 5/15/38 | | 69,000 | 72,606 |
| 4.5% 2/15/44 | | 22,650,000 | 23,216,250 |
| 4.625% 5/15/44 | | 8,980,000 | 9,351,828 |
| 4.625% 5/15/54 | | 8,840,000 | 9,447,750 |
| 4.75% 11/15/43 | | 18,010,000 | 19,093,414 |
| 5% 5/15/37 | | 391,000 | 431,734 |
| U.S. Treasury Notes: | | | |
| 0.25% 8/31/25 | | 7,956,000 | 7,638,506 |
| 0.25% 9/30/25 | | 4,049,000 | 3,876,759 |
| 0.375% 11/30/25 | | 7,417,000 | 7,072,805 |
| 0.375% 12/31/25 | | 8,153,000 | 7,755,223 |
| 0.375% 1/31/26 | | 9,105,000 | 8,638,369 |
| 0.375% 7/31/27 | | 3,005,000 | 2,723,868 |
| 0.375% 9/30/27 | | 3,744,000 | 3,376,620 |
| 0.5% 2/28/26 | | 5,602,000 | 5,311,834 |
| 0.5% 4/30/27 | | 546,000 | 500,528 |
| 0.5% 5/31/27 | | 43,000 | 39,320 |
| 0.5% 6/30/27 | | 856,000 | 780,799 |
| 0.5% 8/31/27 | | 2,377,000 | 2,157,777 |
| 0.625% 7/31/26 | | 3,960,000 | 3,718,842 |
| 0.625% 3/31/27 | | 884,000 | 814,868 |
| 0.625% 11/30/27 | | 2,407,000 | 2,176,925 |
| 0.625% 12/31/27 | | 1,696,000 | 1,529,978 |
| 0.625% 8/15/30 | | 644,000 | 536,633 |
| 0.75% 3/31/26 | | 6,314,000 | 5,996,327 |
| 0.75% 4/30/26 | | 3,206,000 | 3,037,935 |
| 0.75% 5/31/26 | | 3,183,000 | 3,009,551 |
| 0.75% 8/31/26 | | 5,654,000 | 5,311,889 |
| 0.75% 1/31/28 | | 4,807,000 | 4,345,077 |
| 0.875% 6/30/26 | | 894,000 | 845,424 |
| 0.875% 9/30/26 | | 6,070,000 | 5,707,697 |
| 1.125% 10/31/26 | | 8,680,000 | 8,185,647 |
| 1.125% 2/29/28 | | 5,030,000 | 4,596,163 |
| 1.125% 8/31/28 | | 5,215,000 | 4,709,593 |
| 1.25% 11/30/26 | | 429,000 | 405,003 |
| 1.25% 12/31/26 | | 7,670,000 | 7,230,473 |
| 1.25% 3/31/28 | | 4,619,000 | 4,231,257 |
| 1.25% 4/30/28 | | 3,357,000 | 3,069,688 |
| 1.25% 5/31/28 | | 2,807,000 | 2,562,045 |
| 1.25% 6/30/28 | | 3,624,000 | 3,301,096 |
| 1.25% 9/30/28 | | 2,821,000 | 2,555,540 |
| 1.25% 8/15/31 | | 3,247,000 | 2,740,925 |
| 1.375% 8/31/26 | | 366,000 | 348,200 |
| 1.375% 10/31/28 | | 7,420,000 | 6,743,505 |
| 1.375% 12/31/28 | | 2,240,000 | 2,029,300 |
| 1.5% 8/15/26 | | 283,000 | 270,110 |
| 1.5% 1/31/27 | | 5,829,000 | 5,515,464 |
| 1.5% 11/30/28 | | 1,062,000 | 968,785 |
| 1.5% 2/15/30 | | 724,000 | 643,455 |
| 1.625% 2/15/26 | | 702,000 | 677,430 |
| 1.625% 9/30/26 | | 1,345,000 | 1,284,160 |
| 1.625% 11/30/26 | | 454,000 | 432,151 |
| 1.625% 8/15/29 | | 2,954,000 | 2,676,139 |
| 1.625% 5/15/31 | | 9,580,000 | 8,350,317 |
| 1.75% 3/15/25 | | 3,230,000 | 3,180,047 |
| 1.75% 1/31/29 | | 4,210,000 | 3,869,253 |
| 1.875% 7/31/26 | | 800,000 | 769,625 |
| 1.875% 2/28/29 | | 820,000 | 756,898 |
| 2% 11/15/26 | | 562,000 | 539,805 |
| 2.25% 2/15/27 | | 4,017,000 | 3,866,833 |
| 2.25% 8/15/27 | | 1,371,000 | 1,312,304 |
| 2.25% 11/15/27 | | 255,000 | 243,216 |
| 2.375% 5/15/27 | | 1,576,000 | 1,517,208 |
| 2.375% 5/15/29 | | 473,000 | 445,193 |
| 2.5% 2/28/26 | | 273,000 | 266,698 |
| 2.5% 3/31/27 | | 11,290,000 | 10,929,690 |
| 2.625% 12/31/25 | | 118,000 | 115,626 |
| 2.625% 1/31/26 | | 420,000 | 411,305 |
| 2.625% 5/31/27 | | 3,110,000 | 3,014,149 |
| 2.625% 2/15/29 | | 1,038,000 | 990,195 |
| 2.625% 7/31/29 | | 13,410,000 | 12,736,357 |
| 2.75% 5/15/25 | | 100,000 | 98,719 |
| 2.75% 6/30/25 | | 237,000 | 233,730 |
| 2.75% 8/31/25 | | 304,000 | 299,174 |
| 2.75% 4/30/27 | | 1,920,000 | 1,868,325 |
| 2.75% 7/31/27 | | 4,190,000 | 4,068,555 |
| 2.75% 2/15/28 | | 629,000 | 607,919 |
| 2.75% 8/15/32 | | 13,225,000 | 12,230,542 |
| 2.875% 4/30/25 | | 81,000 | 80,067 |
| 2.875% 7/31/25 | | 258,000 | 254,446 |
| 2.875% 11/30/25 | | 288,000 | 283,286 |
| 2.875% 5/15/28 | | 231,000 | 223,853 |
| 2.875% 8/15/28 | | 1,186,000 | 1,147,131 |
| 2.875% 4/30/29 | | 290,000 | 279,136 |
| 3% 7/15/25 | | 910,000 | 898,918 |
| 3% 10/31/25 | | 535,000 | 527,309 |
| 3.125% 8/15/25 | | 6,350,000 | 6,273,998 |
| 3.125% 8/31/27 | | 3,090,000 | 3,031,821 |
| 3.125% 11/15/28 | | 331,000 | 322,738 |
| 3.125% 8/31/29 | | 2,250,000 | 2,185,840 |
| 3.25% 6/30/27 | | 3,320,000 | 3,271,238 |
| 3.25% 6/30/29 | | 1,750,000 | 1,710,967 |
| 3.375% 5/15/33 | | 960,000 | 923,775 |
| 3.5% 9/15/25 | | 4,490,000 | 4,450,537 |
| 3.5% 1/31/28 | | 5,420,000 | 5,371,305 |
| 3.5% 4/30/28 | | 4,370,000 | 4,329,539 |
| 3.5% 1/31/30 | | 5,650,000 | 5,574,299 |
| 3.5% 4/30/30 | | 7,080,000 | 6,979,884 |
| 3.5% 2/15/33 | | 7,830,000 | 7,617,122 |
| 3.625% 5/15/26 | | 9,550,000 | 9,485,241 |
| 3.625% 3/31/28 | | 2,180,000 | 2,170,292 |
| 3.625% 5/31/28 | | 13,510,000 | 13,443,505 |
| 3.625% 8/31/29 | | 5,210,000 | 5,188,834 |
| 3.625% 3/31/30 | | 410,000 | 406,845 |
| 3.75% 12/31/28 | | 8,390,000 | 8,389,017 |
| 3.75% 5/31/30 | | 1,860,000 | 1,856,948 |
| 3.75% 6/30/30 | | 6,970,000 | 6,956,659 |
| 3.75% 12/31/30 | | 3,600,000 | 3,589,734 |
| 3.875% 1/15/26 | | 10,260,000 | 10,220,323 |
| 3.875% 12/31/27 | | 5,110,000 | 5,126,151 |
| 3.875% 9/30/29 | | 5,080,000 | 5,106,988 |
| 3.875% 11/30/29 | | 3,970,000 | 3,990,936 |
| 3.875% 12/31/29 | | 5,560,000 | 5,587,583 |
| 3.875% 8/15/33 | | 4,340,000 | 4,330,337 |
| 3.875% 8/15/34 | | 5,810,000 | 5,788,200 |
| 4% 12/15/25 | | 4,400,000 | 4,387,797 |
| 4% 2/15/26 | | 540,000 | 539,114 |
| 4% 1/15/27 | | 7,640,000 | 7,662,980 |
| 4% 2/29/28 | | 3,620,000 | 3,646,584 |
| 4% 6/30/28 | | 9,110,000 | 9,187,933 |
| 4% 1/31/29 | | 11,640,000 | 11,757,764 |
| 4% 7/31/29 | | 4,650,000 | 4,704,374 |
| 4% 10/31/29 | | 10,290,000 | 10,402,547 |
| 4% 2/28/30 | | 2,170,000 | 2,194,243 |
| 4% 7/31/30 | | 1,020,000 | 1,031,355 |
| 4% 1/31/31 | | 9,240,000 | 9,341,423 |
| 4% 2/15/34 | | 6,580,000 | 6,621,125 |
| 4.125% 6/15/26 | | 13,790,000 | 13,818,550 |
| 4.125% 2/15/27 | | 17,430,000 | 17,538,257 |
| 4.125% 10/31/27 | | 7,580,000 | 7,653,727 |
| 4.125% 3/31/29 | | 12,990,000 | 13,194,998 |
| 4.125% 8/31/30 | | 6,720,000 | 6,840,488 |
| 4.125% 3/31/31 | | 10,520,000 | 10,713,963 |
| 4.125% 7/31/31 | | 15,070,000 | 15,348,899 |
| 4.125% 11/15/32 | | 9,650,000 | 9,830,561 |
| 4.25% 5/31/25 | | 1,850,000 | 1,845,688 |
| 4.25% 12/31/25 | | 5,830,000 | 5,832,176 |
| 4.25% 1/31/26 | | 5,600,000 | 5,607,219 |
| 4.25% 3/15/27 | | 12,680,000 | 12,808,781 |
| 4.25% 2/28/29 | | 7,430,000 | 7,587,307 |
| 4.25% 6/30/29 | | 7,990,000 | 8,166,209 |
| 4.25% 2/28/31 | | 6,710,000 | 6,880,895 |
| 4.25% 6/30/31 | | 6,210,000 | 6,373,013 |
| 4.375% 8/15/26 | | 210,000 | 211,690 |
| 4.375% 12/15/26 | | 10,500,000 | 10,613,203 |
| 4.375% 7/15/27 | | 14,500,000 | 14,721,005 |
| 4.375% 11/30/28 | | 6,830,000 | 6,994,614 |
| 4.375% 11/30/30 | | 8,470,000 | 8,737,996 |
| 4.375% 5/15/34 | | 8,680,000 | 8,994,650 |
| 4.5% 11/15/25 | | 2,900,000 | 2,908,270 |
| 4.5% 7/15/26 | | 10,340,000 | 10,435,726 |
| 4.5% 4/15/27 | | 22,980,000 | 23,359,709 |
| 4.5% 5/15/27 | | 16,650,000 | 16,932,269 |
| 4.5% 5/31/29 | | 990,000 | 1,022,678 |
| 4.5% 11/15/33 | | 12,920,000 | 13,506,952 |
| 4.625% 3/15/26 | | 8,780,000 | 8,848,594 |
| 4.625% 6/30/26 | | 6,500,000 | 6,571,094 |
| 4.625% 9/15/26 | | 6,990,000 | 7,083,655 |
| 4.625% 10/15/26 | | 5,150,000 | 5,223,428 |
| 4.625% 11/15/26 | | 6,220,000 | 6,314,515 |
| 4.625% 6/15/27 | | 11,480,000 | 11,727,538 |
| 4.625% 9/30/28 | | 3,820,000 | 3,943,553 |
| 4.625% 4/30/29 | | 5,660,000 | 5,871,366 |
| 4.625% 4/30/31 | | 8,070,000 | 8,453,955 |
| 4.625% 5/31/31 | | 10,900,000 | 11,419,453 |
| 4.875% 11/30/25 | | 5,960,000 | 6,004,234 |
| 4.875% 5/31/26 | | 2,910,000 | 2,950,808 |
| 4.875% 10/31/28 | | 3,722,000 | 3,880,330 |
| 4.875% 10/31/30 | | 7,650,000 | 8,101,828 |
| 5% 8/31/25 | | 250,000 | 251,422 |
| 5% 9/30/25 | | 5,700,000 | 5,738,520 |
| 5% 10/31/25 | | 3,000,000 | 3,023,026 |
TOTAL U.S. TREASURY OBLIGATIONS | | | 1,048,238,864 |
| TOTAL U.S. GOVERNMENT AND GOVERNMENT AGENCY OBLIGATIONS (Cost $1,091,140,916) | | | 1,066,263,582 |
| | | | |
| U.S. Government Agency - Mortgage Securities - 25.7% |
| | | Principal Amount (a) | Value ($) |
| Fannie Mae - 10.8% | | | |
| 1.5% 2/1/36 to 4/1/52 | | 17,167,230 | 14,155,509 |
| 2% 6/1/27 to 4/1/52 | | 81,721,791 | 68,465,045 |
| 2.5% 4/1/30 to 1/1/54 | | 49,339,247 | 42,862,402 |
| 3% 12/1/26 to 7/1/53 | | 46,604,223 | 42,111,522 |
| 3.5% 12/1/25 to 9/1/52 | | 22,804,422 | 21,389,012 |
| 4% 4/1/26 to 5/1/53 | | 18,566,014 | 17,807,983 |
| 4.5% 11/1/38 to 8/1/54 | | 10,977,786 | 10,734,799 |
| 5% 11/1/44 to 7/1/54 | | 12,241,443 | 12,203,172 |
| 5.5% 9/1/40 to 9/1/54 | | 14,955,539 | 15,083,062 |
| 6% 12/1/52 to 7/1/54 | | 8,719,474 | 8,895,019 |
| 6.5% 3/1/29 to 5/1/54 | | 4,931,504 | 5,086,078 |
| 7% 12/1/53 | | 457,797 | 479,751 |
TOTAL FANNIE MAE | | | 259,273,354 |
| Freddie Mac - 7.4% | | | |
| 1.5% 7/1/36 to 3/1/52 | | 12,750,892 | 10,717,399 |
| 2% 3/1/28 to 4/1/52 | | 57,798,392 | 48,445,352 |
| 2% 9/1/35 | | 1,076,822 | 980,456 |
| 2% 11/1/35 | | 258,714 | 234,995 |
| 2% 11/1/35 | | 319,331 | 290,055 |
| 2.5% 2/1/30 to 1/1/54 | | 53,002,855 | 45,670,611 |
| 3% 2/1/29 to 7/1/53 | | 10,901,346 | 9,905,412 |
| 3.5% 12/1/25 to 6/1/52 | | 8,064,863 | 7,542,342 |
| 4% 6/1/34 to 3/1/53 | | 11,562,927 | 11,108,916 |
| 4% 4/1/48 | | 860 | 829 |
| 4.5% 11/1/40 to 8/1/54 | | 9,755,185 | 9,557,340 |
| 5% 5/1/39 to 9/1/54 | | 9,416,790 | 9,377,664 |
| 5.5% 6/1/49 to 9/1/54 | | 10,097,885 | 10,187,077 |
| 6% 10/1/28 to 5/1/54 | | 9,041,873 | 9,256,354 |
| 6.5% 1/1/53 to 1/1/54 | | 4,959,112 | 5,118,422 |
| 7% 1/1/54 | | 229,077 | 240,848 |
TOTAL FREDDIE MAC | | | 178,634,072 |
| Ginnie Mae - 5.8% | | | |
| 1.5% 4/20/51 to 11/20/51 | | 541,998 | 439,642 |
| 2% 10/20/50 to 8/20/52 | | 27,892,258 | 23,483,787 |
| 2% 9/1/54 (e) | | 475,000 | 399,925 |
| 2.5% 3/20/47 to 10/20/53 | | 29,334,584 | 25,646,261 |
| 2.5% 9/1/54 (e) | | 250,000 | 218,462 |
| 3% 7/20/42 to 11/20/52 | | 20,337,947 | 18,433,121 |
| 3% 9/1/54 (e) | | 650,000 | 587,805 |
| 3% 9/1/54 (e) | | 25,000 | 22,608 |
| 3% 9/1/54 (e) | | 100,000 | 90,431 |
| 3.5% 5/20/44 to 5/20/54 | | 15,705,749 | 14,665,154 |
| 3.5% 9/1/54 (e) | | 150,000 | 139,594 |
| 4% 12/20/45 to 4/20/54 | | 10,523,807 | 10,082,150 |
| 4% 9/1/54 (e) | | 150,000 | 143,334 |
| 4.5% 6/20/45 to 6/20/54 | | 9,945,171 | 9,755,964 |
| 5% 11/20/45 to 6/20/54 | | 9,126,589 | 9,121,030 |
| 5% 9/1/54 (e) | | 400,000 | 399,155 |
| 5% 9/1/54 (e) | | 300,000 | 299,366 |
| 5% 9/1/54 (e) | | 300,000 | 299,366 |
| 5% 10/1/54 (e) | | 1,000,000 | 996,480 |
| 5.5% 12/20/44 to 8/20/54 | | 7,719,015 | 7,771,592 |
| 5.5% 9/1/54 (e) | | 800,000 | 805,117 |
| 5.5% 9/1/54 (e) | | 400,000 | 402,559 |
| 5.5% 9/1/54 (e) | | 1,400,000 | 1,408,955 |
| 5.5% 9/1/54 (e) | | 600,000 | 603,838 |
| 6% 12/20/52 to 6/20/53 | | 2,284,855 | 2,320,574 |
| 6% 9/1/54 (e) | | 1,900,000 | 1,927,554 |
| 6% 9/1/54 (e) | | 150,000 | 152,175 |
| 6% 9/1/54 (e) | | 75,000 | 76,088 |
| 6% 9/1/54 (e) | | 2,500,000 | 2,536,255 |
| 6% 9/1/54 (e) | | 1,500,000 | 1,521,753 |
| 6% 9/1/54 (e) | | 1,100,000 | 1,115,952 |
| 6% 9/1/54 (e) | | 250,000 | 253,625 |
| 6.5% 12/20/52 to 9/20/53 | | 1,439,477 | 1,469,381 |
| 6.5% 9/1/54 (e) | | 1,600,000 | 1,633,580 |
| 6.5% 9/1/54 (e) | | 525,000 | 536,018 |
| 6.5% 9/1/54 (e) | | 475,000 | 484,969 |
TOTAL GINNIE MAE | | | 140,243,620 |
| Uniform Mortgage Backed Securities - 1.7% | | | |
| 2% 9/1/54 (e) | | 1,800,000 | 1,472,203 |
| 2% 9/1/54 (e) | | 1,200,000 | 981,469 |
| 2% 9/1/54 (e) | | 2,750,000 | 2,249,199 |
| 2% 9/1/54 (e) | | 2,750,000 | 2,249,199 |
| 2% 9/1/54 (e) | | 1,450,000 | 1,185,941 |
| 2% 9/1/54 (e) | | 3,450,000 | 2,821,723 |
| 2.5% 9/1/54 (e) | | 3,250,000 | 2,770,498 |
| 3% 9/1/54 (e) | | 600,000 | 531,961 |
| 3.5% 9/1/54 (e) | | 7,475,000 | 6,880,212 |
| 3.5% 9/1/54 (e) | | 425,000 | 391,183 |
| 4% 9/1/54 (e) | | 550,000 | 521,576 |
| 5% 9/1/54 (e) | | 200,000 | 198,539 |
| 5% 9/1/54 (e) | | 325,000 | 322,626 |
| 5.5% 9/1/54 (e) | | 625,000 | 629,272 |
| 5.5% 9/1/54 (e) | | 1,825,000 | 1,837,476 |
| 6% 9/1/54 (e) | | 2,775,000 | 2,826,056 |
| 6% 9/1/54 (e) | | 3,000,000 | 3,055,195 |
| 6% 9/1/54 (e) | | 150,000 | 152,760 |
| 6.5% 9/1/54 (e) | | 600,000 | 617,789 |
| 6.5% 9/1/54 (e) | | 5,075,000 | 5,225,466 |
| 7% 9/1/54 (e) | | 100,000 | 103,833 |
| 7% 9/1/54 (e) | | 3,650,000 | 3,789,902 |
TOTAL UNIFORM MORTGAGE BACKED SECURITIES | | | 40,814,078 |
| TOTAL U.S. GOVERNMENT AGENCY - MORTGAGE SECURITIES (Cost $653,288,490) | | | 618,965,124 |
| | | | |
| Asset-Backed Securities - 0.2% |
| | | Principal Amount (a) | Value ($) |
| American Express Credit Accoun Series 2023-4 Class A, 5.15% 9/15/30 | | 200,000 | 207,059 |
| Capital One Multi-Asset Execution Trust: | | | |
| Series 2019-A3 Class A3, 2.06% 8/15/28 | | 111,000 | 106,250 |
| Series 2021-A2 Class A2, 1.39% 7/15/30 | | 280,000 | 251,599 |
| Capital One Prime Auto Receivables Series 2023-1 Class A3, 4.87% 2/15/28 | | 120,000 | 120,224 |
| CarMax Auto Owner Trust: | | | |
| Series 2021-1 Class A3, 0.34% 12/15/25 | | 6,236 | 6,222 |
| Series 2022-3 Class A2A, 3.97% 4/15/27 | | 512,653 | 508,897 |
| Series 2023 2 Class A3, 5.05% 1/18/28 | | 480,000 | 481,860 |
| Chase Issuance Trust Series 2023-A2 Class A, 5.08% 9/15/30 | | 600,000 | 619,533 |
| Citibank Credit Card Issuance Trust: | | | |
| Series 2007-A3 Class A3, 6.15% 6/15/39 | | 200,000 | 216,691 |
| Series 2018-A7 Class A7, 3.96% 10/13/30 | | 250,000 | 247,418 |
| Ford Credit Auto Owner Trust Series 2023-A Class A3, 4.65% 2/15/28 | | 339,000 | 338,626 |
| Ford Credit Floorplan Master Owner Trust Series 2018-4 Class A, 4.06% 11/15/30 | | 821,000 | 807,520 |
| GM Financial Consumer Automobile Receivables Series 2023 2 Class A3, 4.47% 2/16/28 | | 480,000 | 478,640 |
| Hyundai Auto Receivables Trust: | | | |
| Series 2022-B Class A3, 3.72% 11/16/26 | | 313,566 | 310,940 |
| Series 2022-C Class A3, 5.39% 6/15/27 | | 300,000 | 301,189 |
| Series 2023 A Class A3, 4.58% 4/15/27 | | 480,000 | 478,853 |
| TOTAL ASSET-BACKED SECURITIES (Cost $5,516,036) | | | 5,481,521 |
| | | | |
| Commercial Mortgage Securities - 1.2% |
| | | Principal Amount (a) | Value ($) |
| BANK sequential payer: | | | |
| Series 2017-BNK4 Class ASB, 3.419% 5/15/50 | | 135,541 | 133,238 |
| Series 2020-BN28 Class A4, 1.844% 3/15/63 | | 380,000 | 323,715 |
| Series 2021-BN35 Class A5, 2.285% 6/15/64 | | 700,000 | 597,387 |
| Series 2022-BNK39 Class A4, 2.928% 2/15/55 | | 300,000 | 263,926 |
| Series 2022-BNK41 Class A4, 3.7902% 4/15/65 (b) | | 950,000 | 891,132 |
| Series 2023-BNK45 Class A5, 5.203% 2/15/56 (b) | | 1,440,000 | 1,466,495 |
| Barclays Commercial Mortgage Securities sequential payer Series 2021-C12 Class A5, 2.689% 11/15/54 | | 300,000 | 262,425 |
| BBCMS Mortgage Trust sequential payer: | | | |
| Series 2021-C10 Class A5, 2.492% 7/15/54 | | 450,000 | 395,877 |
| Series 2021-C11 Class A5, 2.322% 9/15/54 | | 450,000 | 385,829 |
| Series 2021-C9 Class A5, 2.299% 2/15/54 | | 550,000 | 476,356 |
| Series 2024-C26 Class A5, 5.829% 5/15/57 (b) | | 1,885,000 | 2,027,875 |
| Benchmark Mortgage Trust: | | | |
| sequential payer: | | | |
Series 2020-B19 Class A5, 1.85% 9/15/53 | | 350,000 | 290,264 |
Series 2021-B24 Class A5, 2.5843% 3/15/54 | | 450,000 | 385,061 |
Series 2023-B39 Class A5, 5.7536% 7/15/56 | | 500,000 | 532,486 |
| Series 2019-B12 Class A5, 3.1156% 8/15/52 | | 89,000 | 82,347 |
| Series 2019-B9 Class A5, 4.0156% 3/15/52 | | 160,000 | 152,956 |
| Bmo 2024-C9 Mtg Trust sequential payer Series 2024-C9 Class A5, 5.7592% 7/15/57 | | 575,000 | 613,711 |
| BMO Mortgage Trust sequential payer Series 2022-C1 Class A5, 3.374% 2/15/55 | | 300,000 | 271,834 |
| Citigroup Commercial Mortgage Trust sequential payer: | | | |
| Series 2015-GC29 Class A4, 3.192% 4/10/48 | | 500,000 | 492,458 |
| Series 2016-C1 Class A4, 3.209% 5/10/49 | | 480,000 | 465,882 |
| Series 2018-B2 Class A4, 4.009% 3/10/51 | | 250,000 | 243,012 |
| Computershare Corporate Trust Series 2018-C48 Class A5, 4.302% 1/15/52 | | 240,000 | 235,887 |
| CSAIL Commercial Mortgage Trust sequential payer Series 2019-C17: | | | |
| Class A4, 2.7628% 9/15/52 | | 200,000 | 183,131 |
| Class A5, 3.0161% 9/15/52 | | 200,000 | 181,479 |
| Freddie Mac: | | | |
| sequential payer: | | | |
Series 2016-K057 Class A2, 2.57% 7/25/26 | | 330,000 | 319,839 |
Series 2020-K104 Class A2, 2.253% 1/25/30 | | 760,000 | 692,915 |
Series 2020-K116 Class A2, 1.378% 7/25/30 | | 640,000 | 548,357 |
Series 2020-K117 Class A2, 1.406% 8/25/30 | | 710,000 | 607,557 |
Series 2020-K118 Class A2, 1.493% 9/25/30 | | 430,000 | 369,167 |
Series 2020-K121 Class A2, 1.547% 10/25/30 | | 70,000 | 60,072 |
Series 2021-K125 Class A2, 1.846% 1/25/31 | | 450,000 | 391,235 |
Series 2021-K126 Class A2, 2.074% 1/25/31 | | 180,000 | 158,861 |
Series 2021-K128 Class A2, 2.02% 3/25/31 | | 540,000 | 474,195 |
Series 2021-K129 Class A2, 1.914% 5/25/31 | | 540,000 | 469,633 |
Series 2021-K130 Class A2, 1.723% 6/25/31 | | 650,000 | 556,221 |
Series 2021-K136 Class A2, 2.127% 11/25/31 | | 1,090,000 | 948,488 |
Series 2022-K140 Class A2, 2.25% 1/25/32 | | 1,900,000 | 1,661,391 |
Series 2022-K145 Class A2, 2.58% 5/25/32 | | 2,500,000 | 2,225,542 |
Series 2023-154 Class A2, 4.35% 1/25/33 | | 500,000 | 501,131 |
Series 2023-156 Class A2, 4.43% 2/25/33 | | 1,400,000 | 1,410,949 |
Series 2023-157 Class A2, 4.2% 5/25/33 | | 600,000 | 594,653 |
Series 2023-K751 Class A2, 4.412% 3/25/30 | | 500,000 | 505,381 |
| Series 2017-K064 Class A2, 3.224% 3/25/27 | | 250,000 | 244,142 |
| Series 2017-K068 Class A2, 3.244% 8/25/27 | | 570,000 | 555,868 |
| Series 2018-K730 Class A2, 3.59% 1/25/25 | | 45,919 | 45,605 |
| Series 2019-K094 Class A2, 2.903% 6/25/29 | | 430,000 | 407,398 |
| Series 2019-K1510 Class A2, 3.718% 1/25/31 | | 165,000 | 159,913 |
| Series 2021-K123 Class A2, 1.621% 12/25/30 | | 540,000 | 464,566 |
| GS Mortgage Securities Trust sequential payer Series 2020-GC45 Class A5, 2.9106% 2/13/53 | | 300,000 | 273,610 |
| JPMBB Commercial Mortgage Securities Trust sequential payer Series 2014-C24 Class A5, 3.6385% 11/15/47 | | 400,000 | 393,000 |
| JPMDB Commercial Mortgage Securities Trust sequential payer Series 2020-COR7 Class A5, 2.1798% 5/13/53 | | 500,000 | 409,171 |
| Morgan Stanley Capital I Trust sequential payer Series 2020-L4 Class A3, 2.698% 2/15/53 | | 150,000 | 134,359 |
| UBS Commercial Mortgage Trust sequential payer Series 2019-C16 Class A4, 3.6048% 4/15/52 | | 350,000 | 327,223 |
| Wells Fargo Commercial Mortgage Trust sequential payer: | | | |
| Series 2019-C52 Class A5, 2.892% 8/15/52 | | 200,000 | 182,835 |
| Series 2019-C54 Class A4, 3.146% 12/15/52 | | 500,000 | 461,136 |
| Wells Fargo Commercial Mtg Trust 2020-C sequential payer Series 2020-C55 Class A5, 2.725% 2/15/53 | | 135,000 | 122,174 |
| TOTAL COMMERCIAL MORTGAGE SECURITIES (Cost $29,696,039) | | | 28,031,350 |
| | | | |
| Municipal Securities - 0.4% |
| | | Principal Amount (a) | Value ($) |
| American Muni. Pwr., Inc. Rev. (Combined Hydroelectric Proj.) Series 2010 B, 7.834% 2/15/41 | | 170,000 | 212,967 |
| Bay Area Toll Auth. San Francisco Bay Toll Bridge Rev.: | | | |
| Series 2009 F2, 6.263% 4/1/49 | | 325,000 | 368,842 |
| Series 2010 S1, 7.043% 4/1/50 | | 55,000 | 68,411 |
| California Gen. Oblig.: | | | |
| Series 2009: | | | |
7.5% 4/1/34 | | 980,000 | 1,171,075 |
7.55% 4/1/39 | | 360,000 | 448,539 |
| Series 2010, 7.6% 11/1/40 | | 350,000 | 438,573 |
| Series 2018, 3.5% 4/1/28 | | 175,000 | 171,497 |
| California State Univ. Rev. Series 2021 B, 2.719% 11/1/52 | | 280,000 | 190,603 |
| Charlotte-Mecklenburg Hosp. Auth. Health Care Sys. Rev. Series 2021 A, 3.204% 1/15/51 | | 150,000 | 110,504 |
| Chicago O'Hare Int'l. Arpt. Rev. Series 2010 B, 6.395% 1/1/40 | | 300,000 | 339,411 |
| Dallas Area Rapid Transit Sales Tax Rev. Series 2021 A, 2.613% 12/1/48 | | 300,000 | 213,243 |
| Dallas Fort Worth Int'l. Arpt. Rev.: | | | |
| Series 2019 A, 3.144% 11/1/45 | | 20,000 | 15,602 |
| Series 2021 C, 2.843% 11/1/46 | | 250,000 | 187,558 |
| Series 2022 A, 4.507% 11/1/51 | | 100,000 | 92,779 |
| Florida State Board Administration Fin. Corp. Series 2024 A, 5.526% 7/1/34 | | 300,000 | 311,101 |
| Golden State Tobacco Securitization Corp. Tobacco Settlement Rev. Series 2021 B: | | | |
| 2.746% 6/1/34 | | 112,000 | 96,848 |
| 3.293% 6/1/42 | | 60,000 | 47,314 |
| Idaho Energy Resources Auth. Series 2021, 2.861% 9/1/46 | | 75,000 | 55,894 |
| Illinois Gen. Oblig.: | | | |
| Series 2003, 5.1% 6/1/33 | | 705,882 | 710,117 |
| Series 2010-3, 7.35% 7/1/35 | | 78,571 | 85,892 |
| Kansas St Dev. Fin. Auth. Rev. Series 2015 H, 4.927% 4/15/45 | | 140,000 | 139,844 |
| Los Angeles Dept. of Aiports (Consolidated Rental Car Facility Proj.) Series 2022 A, 4.242% 5/15/48 (Assured Guaranty Muni. Corp. Insured) | | 300,000 | 269,364 |
| Massachusetts Gen. Oblig. Series 2009 E, 5.456% 12/1/39 | | 145,000 | 151,148 |
| Massachusetts School Bldg. Auth. Dedicated Sales Tax Rev. Series 2019 B, % | | 250,000 | 213,104 |
| Massachusetts Wtr. Resources Auth. Wtr. & Swr. Rev. Series 2021 C, 2.823% 8/1/41 | | 300,000 | 239,259 |
| Michigan Strategic Fund Ltd. Oblig. Rev. Series 2021 A, 3.225% 9/1/47 | | 100,000 | 79,592 |
| New Jersey Tpk. Auth. Tpk. Rev.: | | | |
| Series 2009 E, 7.414% 1/1/40 | | 320,000 | 390,794 |
| Series 2010 A, 7.102% 1/1/41 | | 140,000 | 166,131 |
| New York City Gen. Oblig. Series 2011 F1, 6.271% 12/1/37 | | 280,000 | 309,175 |
| New York City Muni. Wtr. Fin. Auth. Wtr. & Swr. Sys. Rev. Series 2010 EE, 6.011% 6/15/42 | | 280,000 | 304,956 |
| New York Metropolitan Trans. Auth. Rev. Series 2010 E, 6.814% 11/15/40 | | 130,000 | 145,652 |
| New York State Dorm. Auth. Series 2021 C, 2.202% 3/15/34 | | 300,000 | 247,373 |
| Port Auth. of New York & New Jersey: | | | |
| Series 180, 4.96% 8/1/46 | | 70,000 | 68,543 |
| Series 225, 3.175% 7/15/60 | | 300,000 | 208,200 |
| San Antonio Elec. & Gas Sys. Rev. Series 2012, 4.427% 2/1/42 | | 300,000 | 292,473 |
| Texas Gen. Oblig.: | | | |
| Series 2010 A, 4.681% 4/1/40 | | 300,000 | 293,485 |
| Series 2015 C, 3.738% 10/1/31 | | 190,000 | 186,907 |
| Univ. of California Regents Med. Ctr. Pool Rev. Series N: | | | |
| 3.006% 5/15/50 | | 150,000 | 106,139 |
| 3.256% 5/15/60 | | 700,000 | 496,607 |
| Univ. of Michigan Rev. Series 2022 A, 4.454% 4/1/22 | | 180,000 | 157,620 |
| Univ. of Minnesota Gen. Oblig. Series 2022, 4.048% 4/1/52 | | 210,000 | 185,859 |
| Univ. of Virginia Gen. Rev. Series 2021 B, 2.584% 11/1/51 | | 210,000 | 140,729 |
| TOTAL MUNICIPAL SECURITIES (Cost $11,288,105) | | | 10,129,724 |
| | | | |
| Foreign Government and Government Agency Obligations - 1.5% |
| | | Principal Amount (a) | Value ($) |
| Alberta Province: | | | |
| 1% 5/20/25 | | 260,000 | 253,633 |
| 1.3% 7/22/30 | | 360,000 | 308,786 |
| 3.3% 3/15/28 | | 225,000 | 220,253 |
| 4.5% 1/24/34 | | 120,000 | 121,934 |
| British Columbia Province: | | | |
| 2.25% 6/2/26 | | 350,000 | 338,947 |
| 4.2% 7/6/33 | | 360,000 | 356,930 |
| 4.9% 4/24/29 | | 500,000 | 520,005 |
| Chilean Republic: | | | |
| 2.55% 7/27/33 | | 1,330,000 | 1,125,100 |
| 3.125% 3/27/25 | | 840,000 | 827,333 |
| 3.24% 2/6/28 | | 200,000 | 191,876 |
| 3.625% 10/30/42 | | 394,000 | 318,230 |
| 4.95% 1/5/36 | | 290,000 | 290,000 |
| Export Development Canada 4.125% 2/13/29 | | 880,000 | 890,595 |
| Hungarian Republic 7.625% 3/29/41 | | 110,000 | 129,938 |
| Indonesian Republic: | | | |
| 1.85% 3/12/31 | | 460,000 | 390,569 |
| 2.85% 2/14/30 | | 200,000 | 183,750 |
| 3.35% 3/12/71 | | 270,000 | 188,663 |
| 3.4% 9/18/29 | | 360,000 | 342,563 |
| 3.5% 2/14/50 | | 400,000 | 312,250 |
| 3.85% 10/15/30 | | 750,000 | 721,875 |
| 4.1% 4/24/28 | | 240,000 | 237,975 |
| 4.35% 1/11/48 | | 250,000 | 226,172 |
| 4.45% 4/15/70 | | 150,000 | 131,203 |
| Israeli State: | | | |
| 3.25% 1/17/28 | | 760,000 | 715,221 |
| 3.375% 1/15/50 | | 475,000 | 320,747 |
| 4.5% 1/30/43 | | 200,000 | 169,972 |
| 5.375% 3/12/29 | | 200,000 | 201,845 |
| 5.5% 3/12/34 | | 200,000 | 199,850 |
| 5.75% 3/12/54 | | 200,000 | 192,000 |
| Italian Republic: | | | |
| 1.25% 2/17/26 | | 1,161,000 | 1,106,572 |
| 2.375% 10/17/24 | | 400,000 | 398,478 |
| 2.875% 10/17/29 | | 400,000 | 367,542 |
| 3.875% 5/6/51 | | 200,000 | 146,360 |
| Japan Bank International Cooperation: | | | |
| 1.25% 1/21/31 | | 1,012,000 | 851,488 |
| 2% 10/17/29 | | 240,000 | 217,527 |
| 2.75% 11/16/27 | | 760,000 | 730,660 |
| 4.875% 10/18/28 | | 390,000 | 402,980 |
| Korea Development Bank: | | | |
| 1.625% 1/19/31 | | 250,000 | 209,484 |
| 2% 10/25/31 | | 350,000 | 295,744 |
| Korean Republic 2.75% 1/19/27 | | 570,000 | 552,420 |
| Landwirtschaftliche Rentenbank 3.875% 9/28/27 | | 1,110,000 | 1,110,272 |
| Manitoba Province 4.9% 5/31/34 | | 190,000 | 199,099 |
| Ontario Province: | | | |
| 1.125% 10/7/30 | | 1,111,000 | 937,206 |
| 2.3% 6/15/26 | | 70,000 | 67,803 |
| 2.5% 4/27/26 | | 300,000 | 292,047 |
| Panamanian Republic: | | | |
| 3.16% 1/23/30 | | 800,000 | 694,400 |
| 3.87% 7/23/60 | | 200,000 | 122,062 |
| 4.5% 5/15/47 | | 240,000 | 175,183 |
| 4.5% 4/16/50 | | 400,000 | 284,240 |
| 6.4% 2/14/35 | | 480,000 | 478,872 |
| 6.7% 1/26/36 | | 240,000 | 244,350 |
| Peruvian Republic: | | | |
| 1.862% 12/1/32 | | 420,000 | 333,533 |
| 2.78% 12/1/60 | | 810,000 | 480,684 |
| 3.55% 3/10/51 | | 250,000 | 186,797 |
| 5.375% 2/8/35 | | 290,000 | 294,640 |
| 6.55% 3/14/37 | | 275,000 | 305,938 |
| Philippine Republic: | | | |
| 2.65% 12/10/45 | | 610,000 | 418,231 |
| 2.95% 5/5/45 | | 370,000 | 267,903 |
| 3% 2/1/28 | | 200,000 | 191,125 |
| 3.95% 1/20/40 | | 300,000 | 266,531 |
| 4.75% 3/5/35 | | 400,000 | 398,000 |
| 5.17% 10/13/27 | | 1,200,000 | 1,225,500 |
| 5.25% 5/14/34 | | 400,000 | 415,250 |
| 5.5% 1/17/48 | | 200,000 | 209,000 |
| 6.375% 10/23/34 | | 130,000 | 146,494 |
| 9.5% 2/2/30 | | 170,000 | 209,844 |
| Polish Government: | | | |
| 4.625% 3/18/29 | | 560,000 | 570,763 |
| 4.875% 10/4/33 | | 260,000 | 262,756 |
| 5.125% 9/18/34 | | 300,000 | 307,707 |
| 5.5% 4/4/53 | | 260,000 | 265,580 |
| 5.5% 3/18/54 | | 200,000 | 204,664 |
| 5.75% 11/16/32 | | 200,000 | 214,670 |
| Quebec Province: | | | |
| 1.9% 4/21/31 | | 600,000 | 524,352 |
| 2.5% 4/20/26 | | 590,000 | 575,993 |
| 2.75% 4/12/27 | | 320,000 | 310,314 |
| 3.625% 4/13/28 | | 510,000 | 504,291 |
| 4.25% 9/5/34 | | 130,000 | 129,306 |
| United Mexican States: | | | |
| 3.25% 4/16/30 | | 400,000 | 363,000 |
| 3.5% 2/12/34 | | 1,226,000 | 1,032,905 |
| 3.75% 1/11/28 | | 320,000 | 309,700 |
| 4.5% 4/22/29 | | 250,000 | 244,845 |
| 4.5% 1/31/50 | | 1,920,000 | 1,504,800 |
| 4.6% 2/10/48 | | 270,000 | 213,975 |
| 4.75% 4/27/32 | | 200,000 | 190,563 |
| 5% 4/27/51 | | 1,195,000 | 992,597 |
| 5.4% 2/9/28 | | 200,000 | 203,250 |
| 5.55% 1/21/45 | | 560,000 | 524,300 |
| 6.05% 1/11/40 | | 120,000 | 120,150 |
| 6.35% 2/9/35 | | 430,000 | 446,931 |
| Uruguay Republic: | | | |
| 4.125% 11/20/45 | | 130,000 | 118,463 |
| 4.375% 10/27/27 | | 140,000 | 140,893 |
| 4.375% 1/23/31 | | 270,000 | 271,519 |
| 4.975% 4/20/55 | | 462,000 | 444,818 |
| 5.1% 6/18/50 | | 100,000 | 99,250 |
| 7.625% 3/21/36 | | 130,000 | 161,038 |
| TOTAL FOREIGN GOVERNMENT AND GOVERNMENT AGENCY OBLIGATIONS (Cost $39,196,009) | | | 36,915,867 |
| | | | |
| Supranational Obligations - 1.1% |
| | | Principal Amount (a) | Value ($) |
| African Development Bank 0.875% 7/22/26 | | 200,000 | 188,464 |
| Asian Development Bank: | | | |
| 0.375% 9/3/25 | | 700,000 | 672,542 |
| 0.75% 10/8/30 | | 150,000 | 124,844 |
| 1.5% 10/18/24 | | 200,000 | 199,057 |
| 1.875% 1/24/30 | | 1,139,000 | 1,030,737 |
| 2.5% 11/2/27 | | 20,000 | 19,207 |
| 4% 1/12/33 | | 500,000 | 501,039 |
| 4.375% 3/6/29 | | 1,340,000 | 1,370,447 |
| 4.5% 8/25/28 | | 630,000 | 646,077 |
| Asian Infrastructure Investment Bank 4.25% 3/13/34 | | 300,000 | 305,053 |
| Corporacion Andina de Fomento 5% 1/24/29 | | 330,000 | 338,194 |
| Council of Europe Development Bank 1.375% 2/27/25 | | 2,279,000 | 2,240,513 |
| European Investment Bank: | | | |
| 0.75% 9/23/30 | | 400,000 | 334,150 |
| 0.875% 5/17/30 | | 80,000 | 67,944 |
| 1.25% 2/14/31 | | 630,000 | 536,099 |
| 1.75% 3/15/29 | | 2,950,000 | 2,699,350 |
| 3.625% 7/15/30 | | 1,710,000 | 1,690,753 |
| 4.875% 2/15/36 | | 400,000 | 428,170 |
| Inter-American Development Bank: | | | |
| 0.625% 7/15/25 | | 140,000 | 135,418 |
| 0.875% 4/20/26 | | 400,000 | 379,559 |
| 1.125% 1/13/31 | | 730,000 | 616,048 |
| 1.5% 1/13/27 | | 1,000,000 | 945,442 |
| 3.125% 9/18/28 | | 680,000 | 662,950 |
| 4% 1/12/28 | | 1,500,000 | 1,507,260 |
| 4.375% 1/24/44 | | 190,000 | 185,799 |
| 4.5% 9/13/33 | | 270,000 | 280,394 |
| International Bank for Reconstruction & Development: | | | |
| 0.375% 7/28/25 | | 350,000 | 337,463 |
| 0.5% 10/28/25 | | 364,000 | 348,445 |
| 0.75% 8/26/30 | | 1,433,000 | 1,196,752 |
| 0.875% 5/14/30 | | 1,054,000 | 895,224 |
| 1.625% 1/15/25 | | 110,000 | 108,659 |
| 1.875% 10/27/26 | | 320,000 | 306,282 |
| 2.5% 11/22/27 | | 1,340,000 | 1,286,225 |
| 3.625% 9/21/29 | | 2,750,000 | 2,723,670 |
| 4% 7/25/30 | | 750,000 | 755,414 |
| 4.75% 11/14/33 | | 530,000 | 560,288 |
| International Finance Corp.: | | | |
| 0.375% 7/16/25 | | 160,000 | 154,428 |
| 0.75% 8/27/30 | | 100,000 | 83,597 |
| TOTAL SUPRANATIONAL OBLIGATIONS (Cost $27,404,986) | | | 26,861,957 |
| | | | |
| Bank Notes - 0.2% |
| | | Principal Amount (a) | Value ($) |
| Citizens Bank NA: | | | |
| 2.25% 4/28/25 | | 250,000 | 244,632 |
| 3.75% 2/18/26 | | 250,000 | 245,390 |
| Discover Bank 2.7% 2/6/30 | | 500,000 | 445,044 |
| KeyBank NA 5.85% 11/15/27 | | 710,000 | 730,689 |
| Manufacturers & Traders Trust Co. 2.9% 2/6/25 | | 360,000 | 355,916 |
| Morgan Stanley Bank, West Valley City Utah 4.952% 1/14/28 (b) | | 730,000 | 735,650 |
| PNC Bank NA 3.1% 10/25/27 | | 310,000 | 297,580 |
| Wells Fargo Bank NA 5.45% 8/7/26 | | 800,000 | 814,757 |
| TOTAL BANK NOTES (Cost $3,901,296) | | | 3,869,658 |
| | | | |
| Preferred Securities - 0.0% |
| | | Principal Amount (a) | Value ($) |
| ENERGY - 0.0% | | | |
| Oil, Gas & Consumable Fuels - 0.0% | | | |
BP Capital Markets PLC 6.45% (b)(f) (Cost $218,926) | | 210,000 | 225,239 |
| | | | |
| Money Market Funds - 0.9% |
| | | Shares | Value ($) |
Fidelity Cash Central Fund 5.39% (g) (Cost $21,756,543) | | 21,752,193 | 21,756,543 |
| | | | |
| TOTAL INVESTMENT IN SECURITIES - 102.6% (Cost $2,572,384,372) | 2,474,603,421 |
NET OTHER ASSETS (LIABILITIES) - (2.6)% | (61,656,242) |
| NET ASSETS - 100.0% | 2,412,947,179 |
| | |
| TBA Sale Commitments |
| | Principal Amount (a) | Value ($) |
| Ginnie Mae | | |
| 5% 9/1/54 | (1,000,000) | (997,886) |
| | | |
| Uniform Mortgage Backed Securities | | |
| 2% 9/1/54 | (1,925,000) | (1,574,439) |
| 2% 9/1/54 | (475,000) | (388,498) |
| 2.5% 9/1/54 | (1,200,000) | (1,022,953) |
| 2.5% 9/1/54 | (1,800,000) | (1,534,430) |
| 2.5% 9/1/54 | (250,000) | (213,115) |
| 3% 9/1/54 | (75,000) | (66,495) |
| 3% 9/1/54 | (100,000) | (88,660) |
| 3.5% 9/1/54 | (150,000) | (138,064) |
| 4% 9/1/54 | (150,000) | (142,248) |
| 5% 9/1/54 | (300,000) | (297,809) |
| 5.5% 9/1/54 | (600,000) | (604,102) |
| 6% 9/1/54 | (250,000) | (254,600) |
| | | |
| TOTAL UNIFORM MORTGAGE BACKED SECURITIES | | (6,325,413) |
| | | |
TOTAL TBA SALE COMMITMENTS (Proceeds $7,364,726) | | (7,323,299) |
Legend
| (a) | Amount is stated in United States dollars unless otherwise noted. |
| (b) | Coupon rates for floating and adjustable rate securities reflect the rates in effect at period end. |
| (c) | Security exempt from registration under Rule 144A of the Securities Act of 1933. These securities may be resold in transactions exempt from registration, normally to qualified institutional buyers. At the end of the period, the value of these securities amounted to $5,100,162 or 0.2% of net assets. |
| (d) | Coupon is indexed to a floating interest rate which may be multiplied by a specified factor and/or subject to caps or floors. |
| (e) | Security or a portion of the security purchased on a delayed delivery or when-issued basis. |
| (f) | Security is perpetual in nature with no stated maturity date. |
| (g) | Affiliated fund that is generally available only to investment companies and other accounts managed by Fidelity Investments. The rate quoted is the annualized seven-day yield of the fund at period end. A complete unaudited listing of the fund's holdings as of its most recent quarter end is available upon request. In addition, each Fidelity Central Fund's financial statements, which are not covered by the Fund's Report of Independent Registered Public Accounting Firm, are available on the SEC's website or upon request. |
Affiliated Central Funds
Fiscal year to date information regarding the Fund's investments in Fidelity Central Funds, including the ownership percentage, is presented below.
| Affiliate | Value, beginning of period ($) | Purchases ($) | Sales Proceeds ($) | Dividend Income ($) | Realized Gain (loss) ($) | Change in Unrealized appreciation (depreciation) ($) | Value, end of period ($) | % ownership, end of period |
| Fidelity Cash Central Fund 5.39% | 19,067,420 | 499,025,291 | 496,336,229 | 815,772 | 61 | - | 21,756,543 | 0.0% |
| Total | 19,067,420 | 499,025,291 | 496,336,229 | 815,772 | 61 | - | 21,756,543 | |
| | | | | | | | | |
Amounts in the dividend income column in the above table include any capital gain distributions from underlying funds, which are presented in the corresponding line item in the Statement of Operations, if applicable.
Amounts included in the purchases and sales proceeds columns may include in-kind transactions, if applicable.
Investment Valuation
The following is a summary of the inputs used, as of August 31, 2024, involving the Fund's assets and liabilities carried at fair value. The inputs or methodology used for valuing securities may not be an indication of the risk associated with investing in those securities. For more information on valuation inputs, and their aggregation into the levels used below, please refer to the Investment Valuation section in the accompanying Notes to Financial Statements.
| Valuation Inputs at Reporting Date: |
| Description | Total ($) | Level 1 ($) | Level 2 ($) | Level 3 ($) |
Investments in Securities: | | | | |
|
| Corporate Bonds | 656,102,856 | - | 656,102,856 | - |
|
| U.S. Government and Government Agency Obligations | 1,066,263,582 | - | 1,066,263,582 | - |
|
| U.S. Government Agency - Mortgage Securities | 618,965,124 | - | 618,965,124 | - |
|
| Asset-Backed Securities | 5,481,521 | - | 5,481,521 | - |
|
| Commercial Mortgage Securities | 28,031,350 | - | 28,031,350 | - |
|
| Municipal Securities | 10,129,724 | - | 10,129,724 | - |
|
| Foreign Government and Government Agency Obligations | 36,915,867 | - | 36,915,867 | - |
|
| Supranational Obligations | 26,861,957 | - | 26,861,957 | - |
|
| Bank Notes | 3,869,658 | - | 3,869,658 | - |
|
| Preferred Securities | 225,239 | - | 225,239 | - |
|
| Money Market Funds | 21,756,543 | 21,756,543 | - | - |
| Total Investments in Securities: | 2,474,603,421 | 21,756,543 | 2,452,846,878 | - |
Other Financial Instruments: | | | | |
TBA Sale Commitments | (7,323,299) | - | (7,323,299) | - |
| Total Other Financial Instruments: | (7,323,299) | - | (7,323,299) | - |
Financial Statements
| Statement of Assets and Liabilities |
As of August 31, 2024 |
| Assets | | | | |
| Investment in securities, at value - See accompanying schedule: | | | | |
Unaffiliated issuers (cost $2,550,627,829) | $ | 2,452,846,878 | | |
Fidelity Central Funds (cost $21,756,543) | | 21,756,543 | | |
| | | | | |
| | | | | |
| Total Investment in Securities (cost $2,572,384,372) | | | $ | 2,474,603,421 |
| Cash | | | | 3,587 |
| Foreign currency held at value (cost $10) | | | | 10 |
| Receivable for TBA sale commitments | | | | 7,364,726 |
| Receivable for fund shares sold | | | | 2,732,572 |
| Interest receivable | | | | 18,605,690 |
| Distributions receivable from Fidelity Central Funds | | | | 70,613 |
Total assets | | | | 2,503,380,619 |
| Liabilities | | | | |
| Payable for investments purchased | | | | |
Regular delivery | $ | 23,948,423 | | |
Delayed delivery | | 57,519,007 | | |
| TBA sale commitments, at value | | 7,323,299 | | |
| Payable for fund shares redeemed | | 1,639,350 | | |
| Distributions payable | | 3,361 | | |
| Total liabilities | | | | 90,433,440 |
| Net Assets | | | $ | 2,412,947,179 |
| Net Assets consist of: | | | | |
| Paid in capital | | | $ | 2,544,892,364 |
| Total accumulated earnings (loss) | | | | (131,945,185) |
| Net Assets | | | $ | 2,412,947,179 |
Net Asset Value, offering price and redemption price per share ($2,412,947,179 ÷ 260,753,237 shares) | | | $ | 9.25 |
| Statement of Operations |
| Year ended August 31, 2024 |
| Investment Income | | | | |
| Interest | | | $ | 74,011,233 |
| Income from Fidelity Central Funds | | | | 815,772 |
| Total income | | | | 74,827,005 |
| Expenses | | | | |
| Independent trustees' fees and expenses | $ | 5,761 | | |
| Proxy fee | | 5,103 | | |
| Total expenses | | | | 10,864 |
| Net Investment income (loss) | | | | 74,816,141 |
| Realized and Unrealized Gain (Loss) | | | | |
| Net realized gain (loss) on: | | | | |
| Investment Securities: | | | | |
| Unaffiliated issuers | | (16,028,475) | | |
| Fidelity Central Funds | | 61 | | |
| Total net realized gain (loss) | | | | (16,028,414) |
| Change in net unrealized appreciation (depreciation) on: | | | | |
| Investment Securities: | | | | |
| Unaffiliated issuers | | 91,374,622 | | |
| TBA Sale commitments | | 255,852 | | |
| Total change in net unrealized appreciation (depreciation) | | | | 91,630,474 |
| Net gain (loss) | | | | 75,602,060 |
| Net increase (decrease) in net assets resulting from operations | | | $ | 150,418,201 |
| Statement of Changes in Net Assets |
| |
| | Year ended August 31, 2024 | | Year ended August 31, 2023 |
| Increase (Decrease) in Net Assets | | | | |
| Operations | | | | |
| Net investment income (loss) | $ | 74,816,141 | $ | 42,849,831 |
| Net realized gain (loss) | | (16,028,414) | | (18,088,582) |
| Change in net unrealized appreciation (depreciation) | | 91,630,474 | | (41,714,346) |
| Net increase (decrease) in net assets resulting from operations | | 150,418,201 | | (16,953,097) |
| Distributions to shareholders | | (69,215,077) | | (39,909,969) |
| | | | | |
| Share transactions | | | | |
| Proceeds from sales of shares | | 1,000,964,330 | | 747,761,429 |
| Reinvestment of distributions | | 69,174,908 | | 39,882,158 |
| Cost of shares redeemed | | (449,980,027) | | (334,569,503) |
| | | | | |
Net increase (decrease) in net assets resulting from share transactions | | 620,159,211 | | 453,074,084 |
| Total increase (decrease) in net assets | | 701,362,335 | | 396,211,018 |
| | | | | |
| Net Assets | | | | |
| Beginning of period | | 1,711,584,844 | | 1,315,373,826 |
| End of period | $ | 2,412,947,179 | $ | 1,711,584,844 |
| | | | | |
| Other Information | | | | |
| Shares | | | | |
| Sold | | 111,630,504 | | 82,718,597 |
| Issued in reinvestment of distributions | | 7,709,836 | | 4,416,360 |
| Redeemed | | (50,252,375) | | (37,071,844) |
| Net increase (decrease) | | 69,087,965 | | 50,063,113 |
| | | | | |
Financial Highlights
Fidelity Flex® U.S. Bond Index Fund |
| |
| Years ended August 31, | | 2024 | | 2023 | | 2022 | | 2021 | | 2020 |
Selected Per-Share Data | | | | | | | | | | |
| Net asset value, beginning of period | $ | 8.93 | $ | 9.29 | $ | 10.68 | $ | 10.97 | $ | 10.57 |
| Income from Investment Operations | | | | | | | | | | |
Net investment income (loss) A,B | | .335 | | .266 | | .180 | | .159 | | .256 |
| Net realized and unrealized gain (loss) | | .294 | | (.380) | | (1.397) | | (.192) | | .420 |
| Total from investment operations | | .629 | | (.114) | | (1.217) | | (.033) | | .676 |
| Distributions from net investment income | | (.309) | | (.246) | | (.173) | | (.163) | | (.256) |
| Distributions from net realized gain | | - | | - | | - | | (.094) | | (.020) |
| Total distributions | | (.309) | | (.246) | | (.173) | | (.257) | | (.276) |
| Net asset value, end of period | $ | 9.25 | $ | 8.93 | $ | 9.29 | $ | 10.68 | $ | 10.97 |
Total Return C | | | | (1.22)% | | (11.49)% | | (.29)% | | 6.50% |
Ratios to Average Net Assets B,D,E | | | | | | | | | | |
| Expenses before reductions | | -% F | | .01% | | -% F | | -% F | | -% F |
Expenses net of fee waivers, if any F | | | | -% | | -% | | -% | | -% |
Expenses net of all reductions F | | -% | | -% | | -% | | -% | | -% |
| Net investment income (loss) | | 3.74% | | 2.95% | | 1.81% | | 1.50% | | 2.40% |
| Supplemental Data | | | | | | | | | | |
| Net assets, end of period (000 omitted) | $ | 2,412,947 | $ | 1,711,585 | $ | 1,315,374 | $ | 1,146,646 | $ | 584,965 |
Portfolio turnover rate G | | | | 49% | | 55% | | 115% | | 79% |
ACalculated based on average shares outstanding during the period.
BNet investment income (loss) is affected by the timing of the declaration of dividends by any underlying mutual funds or exchange-traded funds (ETFs). Net investment income (loss) of any mutual funds or ETFs is not included in the Fund's net investment income (loss) ratio.
CTotal returns would have been lower if certain expenses had not been reduced during the applicable periods shown.
DFees and expenses of any underlying mutual funds or exchange-traded funds (ETFs) are not included in the Fund's expense ratio. The Fund indirectly bears its proportionate share of these expenses. For additional expense information related to investments in Fidelity Central Funds, please refer to the "Investments in Fidelity Central Funds" note found in the Notes to Financial Statements section of the most recent Annual or Semi-Annual report.
EExpense ratios reflect operating expenses of the class. Expenses before reductions do not reflect amounts reimbursed, waived, or reduced through arrangements with the investment adviser, brokerage services, or other offset arrangements, if applicable, and do not represent the amount paid by the class during periods when reimbursements, waivers or reductions occur.
FAmount represents less than .005%.
GAmount does not include the portfolio activity of any underlying mutual funds or exchange-traded funds (ETFs).
Notes to Financial Statements
For the period ended August 31, 2024
1. Organization.
Fidelity Flex U.S. Bond Index Fund (the Fund) is a fund of Fidelity Salem Street Trust (the Trust) and is authorized to issue an unlimited number of shares. Share transactions on the Statement of Changes in Net Assets may contain exchanges between affiliated funds. The Trust is registered under the Investment Company Act of 1940, as amended (the 1940 Act), as an open-end management investment company organized as a Massachusetts business trust. The Fund is available only to certain fee-based accounts and advisory programs offered by Fidelity.
2. Investments in Fidelity Central Funds.
Funds may invest in Fidelity Central Funds, which are open-end investment companies generally available only to other investment companies and accounts managed by the investment adviser and its affiliates. The Schedule of Investments lists any Fidelity Central Funds held as an investment as of period end, but does not include the underlying holdings of each Fidelity Central Fund. An investing fund indirectly bears its proportionate share of the expenses of the underlying Fidelity Central Funds.
Based on its investment objective, each Fidelity Central Fund may invest or participate in various investment vehicles or strategies that are similar to those of the investing fund. These strategies are consistent with the investment objectives of the investing fund and may involve certain economic risks which may cause a decline in value of each of the Fidelity Central Funds and thus a decline in the value of the investing fund.
| Fidelity Central Fund | Investment Manager | Investment Objective | Investment Practices | Expense RatioA |
| Fidelity Money Market Central Funds | Fidelity Management & Research Company LLC (FMR) | Each fund seeks to obtain a high level of current income consistent with the preservation of capital and liquidity. | Short-term Investments | Less than .005% |
A Expenses expressed as a percentage of average net assets and are as of each underlying Central Fund's most recent annual or semi-annual shareholder report.
A complete unaudited list of holdings for each Fidelity Central Fund is available upon request or at the Securities and Exchange Commission website at www.sec.gov. In addition, the financial statements of the Fidelity Central Funds which contain the significant accounting policies (including investment valuation policies) of those funds, and are not covered by the Report of Independent Registered Public Accounting Firm, are available on the Securities and Exchange Commission website or upon request.
3. Significant Accounting Policies.
The Fund is an investment company and applies the accounting and reporting guidance of the Financial Accounting Standards Board (FASB) Accounting Standards Codification Topic 946 Financial Services - Investment Companies. The financial statements have been prepared in conformity with accounting principles generally accepted in the United States of America (GAAP), which require management to make certain estimates and assumptions at the date of the financial statements. Actual results could differ from those estimates. Subsequent events, if any, through the date that the financial statements were issued have been evaluated in the preparation of the financial statements. The Fund's Schedule of Investments lists any underlying mutual funds or exchange-traded funds (ETFs) but does not include the underlying holdings of these funds. The following summarizes the significant accounting policies of the Fund:
Investment Valuation. Investments are valued as of 4:00 p.m. Eastern time on the last calendar day of the period. The Board of Trustees (the Board) has designated the Fund's investment adviser as the valuation designee responsible for the fair valuation function and performing fair value determinations as needed. The investment adviser has established a Fair Value Committee (the Committee) to carry out the day-to-day fair valuation responsibilities and has adopted policies and procedures to govern the fair valuation process and the activities of the Committee. In accordance with these fair valuation policies and procedures, which have been approved by the Board, the Fund attempts to obtain prices from one or more third party pricing services or brokers to value its investments. When current market prices, quotations or currency exchange rates are not readily available or reliable, investments will be fair valued in good faith by the Committee, in accordance with the policies and procedures. Factors used in determining fair value vary by investment type and may include market or investment specific events, transaction data, estimated cash flows, and market observations of comparable investments. The frequency that the fair valuation procedures are used cannot be predicted and they may be utilized to a significant extent. The Committee manages the Fund's fair valuation practices and maintains the fair valuation policies and procedures. The Fund's investment adviser reports to the Board information regarding the fair valuation process and related material matters.
The Fund categorizes the inputs to valuation techniques used to value its investments into a disclosure hierarchy consisting of three levels as shown below:
Level 1 - unadjusted quoted prices in active markets for identical investments
Level 2 - other significant observable inputs (including quoted prices for similar investments, interest rates, prepayment speeds, etc.)
Level 3 - unobservable inputs (including the Fund's own assumptions based on the best information available)
Valuation techniques used to value the Fund's investments by major category are as follows:
Debt securities, including restricted securities, are valued based on evaluated prices received from third party pricing services or from brokers who make markets in such securities. Corporate bonds, bank notes, foreign government and government agency obligations, municipal securities, preferred securities, supranational obligations and U.S. government and government agency obligations are valued by pricing services who utilize matrix pricing which considers yield or price of bonds of comparable quality, coupon, maturity and type or by broker-supplied prices. Asset backed securities, commercial mortgage securities and U.S. government agency mortgage securities are valued by pricing services who utilize matrix pricing which considers prepayment speed assumptions, attributes of the collateral, yield or price of bonds of comparable quality, coupon, maturity and type or by broker-supplied prices. When independent prices are unavailable or unreliable, debt securities may be valued utilizing pricing methodologies which consider similar factors that would be used by third party pricing services. Debt securities are generally categorized as Level 2 in the hierarchy but may be Level 3 depending on the circumstances.
Investments in open-end mutual funds, including the Fidelity Central Funds, are valued at their closing net asset value (NAV) each business day and are categorized as Level 1 in the hierarchy.
Changes in valuation techniques may result in transfers in or out of an assigned level within the disclosure hierarchy. The aggregate value of investments by input level as of August 31, 2024 is included at the end of the Fund's Schedule of Investments.
Investment Transactions and Income. For financial reporting purposes, the Fund's investment holdings and NAV include trades executed through the end of the last business day of the period. The NAV per share for processing shareholder transactions is calculated as of the close of business of the New York Stock Exchange (NYSE), normally 4:00 p.m. Eastern time and includes trades executed through the end of the prior business day. Gains and losses on securities sold are determined on the basis of identified cost and include proceeds received from litigation. Income and capital gain distributions from Fidelity Central Funds, if any, are recorded on the ex-dividend date. Interest income is accrued as earned and includes coupon interest and amortization of premium and accretion of discount on debt securities as applicable. Debt obligations may be placed on non-accrual status and related interest income may be reduced by ceasing current accruals and writing off interest receivables when the collection of all or a portion of interest has become doubtful based on consistently applied procedures. A debt obligation is removed from non-accrual status when the issuer resumes interest payments or when collectability of interest is reasonably assured.
Expenses. Expenses directly attributable to a fund are charged to that fund. Expenses attributable to more than one fund are allocated among the respective funds on the basis of relative net assets or other appropriate methods. Expenses included in the accompanying financial statements reflect the expenses of that fund and do not include any expenses associated with any underlying mutual funds or exchange-traded funds. Although not included in a fund's expenses, a fund indirectly bears its proportionate share of these expenses through the net asset value of each underlying mutual fund or exchange-traded fund. Expense estimates are accrued in the period to which they relate and adjustments are made when actual amounts are known.
Income Tax Information and Distributions to Shareholders. Each year, the Fund intends to qualify as a regulated investment company under Subchapter M of the Internal Revenue Code, including distributing substantially all of its taxable income and realized gains. As a result, no provision for U.S. Federal income taxes is required. As of August 31, 2024, the Fund did not have any unrecognized tax benefits in the financial statements; nor is the Fund aware of any tax positions for which it is reasonably possible that the total amounts of unrecognized tax benefits will significantly change in the next twelve months. The Fund files a U.S. federal tax return, in addition to state and local tax returns as required. The Fund's federal income tax returns are subject to examination by the Internal Revenue Service (IRS) for a period of three fiscal years after they are filed. State and local tax returns may be subject to examination for an additional fiscal year depending on the jurisdiction.
Distributions are declared and recorded daily and paid monthly from net investment income. Distributions from realized gains, if any, are declared and recorded on the ex-dividend date. Income and capital gain distributions are determined in accordance with income tax regulations, which may differ from GAAP.
Capital accounts within the financial statements are adjusted for permanent book-tax differences. These adjustments have no impact on net assets or the results of operations. Capital accounts are not adjusted for temporary book-tax differences which will reverse in a subsequent period.
Book-tax differences are primarily due to market discount, capital loss carryforwards and losses deferred due to wash sales.
As of period end, the cost and unrealized appreciation (depreciation) in securities, and derivatives if applicable, for federal income tax purposes were as follows:
| Gross unrealized appreciation | $34,437,804 |
| Gross unrealized depreciation | (125,211,405) |
| Net unrealized appreciation (depreciation) | $(90,773,601) |
| Tax Cost | $2,565,418,449 |
The tax-based components of distributable earnings as of period end were as follows:
| Undistributed ordinary income | $236,051 |
| Capital loss carryforward | $(41,407,635) |
| Net unrealized appreciation (depreciation) on securities and other investments | $(90,773,601) |
Capital loss carryforwards are only available to offset future capital gains of the Fund to the extent provided by regulations and may be limited. The capital loss carryforward information presented below, including any applicable limitation, is estimated as of fiscal period end and is subject to adjustment.
Short-term | $(13,900,878) |
Long-term | (27,506,757) |
| Total capital loss carryforward | $(41,407,635) |
The tax character of distributions paid was as follows:
| | August 31, 2024 | August 31, 2023 |
| Ordinary Income | $69,215,077 | $ 39,909,969 |
| Total | $69,215,077 | $ 39,909,969 |
Delayed Delivery Transactions and When-Issued Securities. During the period, certain Funds transacted in securities on a delayed delivery or when-issued basis. Payment and delivery may take place after the customary settlement period for that security. The price of the underlying securities and the date when the securities will be delivered and paid for are fixed at the time the transaction is negotiated. Securities purchased on a delayed delivery or when-issued basis are identified as such in the Schedule of Investments. Compensation for interest forgone in the purchase of a delayed delivery or when-issued debt security may be received. With respect to purchase commitments, each applicable Fund identifies securities as segregated in its records with a value at least equal to the amount of the commitment. Payables and receivables associated with the purchases and sales of delayed delivery securities having the same coupon, settlement date and broker are offset. Delayed delivery or when-issued securities that have been purchased from and sold to different brokers are reflected as both payables and receivables in the Statement of Assets and Liabilities under the caption "Delayed delivery", as applicable. Losses may arise due to changes in the value of the underlying securities or if the counterparty does not perform under the contract's terms, or if the issuer does not issue the securities due to political, economic, or other factors.
To-Be-Announced (TBA) Securities and Mortgage Dollar Rolls. TBA securities involve buying or selling mortgage-backed securities (MBS) on a forward commitment basis. A TBA transaction typically does not designate the actual security to be delivered and only includes an approximate principal amount; however delivered securities must meet specified terms defined by industry guidelines, including issuer, rate and current principal amount outstanding on underlying mortgage pools. Funds may enter into a TBA transaction with the intent to take possession of or deliver the underlying MBS, or a fund may elect to extend the settlement by entering into either a mortgage or reverse mortgage dollar roll. Mortgage dollar rolls are transactions where a fund sells TBA securities and simultaneously agrees to repurchase MBS on a later date at a lower price and with the same counterparty. Reverse mortgage dollar rolls involve the purchase and simultaneous agreement to sell TBA securities on a later date at a lower price. Transactions in mortgage dollar rolls and reverse mortgage dollar rolls are accounted for as purchases and sales and may result in an increase to a fund's portfolio turnover rate.
Purchases and sales of TBA securities involve risks similar to those discussed above for delayed delivery and when-issued securities. Also, if the counterparty in a mortgage dollar roll or a reverse mortgage dollar roll transaction files for bankruptcy or becomes insolvent, a fund's right to repurchase or sell securities may be limited. Additionally, when a fund sells TBA securities without already owning or having the right to obtain the deliverable securities (an uncovered forward commitment to sell), it incurs a risk of loss because it could have to purchase the securities at a price that is higher than the price at which it sold them. A fund may be unable to purchase the deliverable securities if the corresponding market is illiquid.
TBA securities subject to a forward commitment to sell at period end are included at the end of the Schedule of Investments under the caption "TBA Sale Commitments." The value of these commitments and proceeds to be received at contractual settlement date are reflected in the Statement of Assets and Liabilities as "TBA sale commitments, at value" and "Receivable for TBA sale commitments," respectively. If the TBA sale commitment is closed through the acquisition of an offsetting TBA purchase commitment, a fund realizes a gain or loss. If a fund delivers securities under the commitment, a fund realizes a gain or loss from the sale of the securities based upon the price established at the date the commitment was entered into.
Restricted Securities (including Private Placements). Funds may invest in securities that are subject to legal or contractual restrictions on resale. These securities generally may be resold in transactions exempt from registration or to the public if the securities are registered. Disposal of these securities may involve time-consuming negotiations and expense, and prompt sale at an acceptable price may be difficult. Information regarding restricted securities held at period end is included at the end of the Schedule of Investments, if applicable.
4. Purchases and Sales of Investments.
Purchases and sales of securities, other than short-term securities, U.S. government securities and in-kind transactions, as applicable, are noted in the table below.
| | Purchases ($) | Sales ($) |
| Fidelity Flex U.S. Bond Index Fund | 878,475,066 | 664,544,215 |
5. Fees and Other Transactions with Affiliates.
Management Fee. Fidelity Management & Research Company LLC (the investment adviser) and its affiliates provide the Fund with investment management related services and the Fund does not pay any fees for these services. Under the management contract, the investment adviser or an affiliate pays all other expenses of the Fund, excluding fees and expenses of the independent Trustees, and certain miscellaneous expenses such as proxy and shareholder meeting expenses.
Interfund Trades. Funds may purchase from or sell securities to other Fidelity Funds under procedures adopted by the Board. The procedures have been designed to ensure these interfund trades are executed in accordance with Rule 17a-7 of the 1940 Act. Any interfund trades are included within the respective purchases and sales amounts shown in the Purchases and Sales of Investments note. During the period, there were no interfund trades.
Sub-Advisory Arrangements. Effective March 1, 2024, the Fund's sub-advisory agreements with FMR Investment Management (UK) Limited, Fidelity Management & Research (Hong Kong) Limited, and Fidelity Management & Research (Japan) Limited were amended to provide that the investment adviser pays each sub-adviser monthly fees equal to 110% of the sub-adviser's costs for providing sub-advisory services.
6. Committed Line of Credit.
Certain Funds participate with other funds managed by the investment adviser or an affiliate in a $4.25 billion credit facility (the "line of credit") to be utilized for temporary or emergency purposes to fund shareholder redemptions or for other short-term liquidity purposes. The commitment fees on the pro-rata portion of the line of credit are borne by the investment adviser. During the period, there were no borrowings on this line of credit.
7. Other.
A fund's organizational documents provide former and current trustees and officers with a limited indemnification against liabilities arising in connection with the performance of their duties to the fund. In the normal course of business, a fund may also enter into contracts that provide general indemnifications. A fund's maximum exposure under these arrangements is unknown as this would be dependent on future claims that may be made against a fund. The risk of material loss from such claims is considered remote.
8. Risk and Uncertainties.
Many factors affect a fund's performance. Developments that disrupt global economies and financial markets, such as pandemics, epidemics, outbreaks of infectious diseases, war, terrorism, and environmental disasters, may significantly affect a fund's investment performance. The effects of these developments to a fund will be impacted by the types of securities in which a fund invests, the financial condition, industry, economic sector, and geographic location of an issuer, and a fund's level of investment in the securities of that issuer. Significant concentrations in security types, issuers, industries, sectors, and geographic locations may magnify the factors that affect a fund's performance.
Report of Independent Registered Public Accounting Firm
To the Board of Trustees of Fidelity Salem Street Trust and Shareholders of Fidelity Flex U.S. Bond Index Fund
Opinion on the Financial Statements
We have audited the accompanying statement of assets and liabilities, including the schedule of investments, of Fidelity Flex U.S. Bond Index Fund (one of the funds constituting Fidelity Salem Street Trust, referred to hereafter as the "Fund") as of August 31, 2024, the related statement of operations for the year ended August 31, 2024, the statement of changes in net assets for each of the two years in the period ended August 31, 2024, including the related notes, and the financial highlights for each of the five years in the period ended August 31, 2024 (collectively referred to as the "financial statements"). In our opinion, the financial statements present fairly, in all material respects, the financial position of the Fund as of August 31, 2024, the results of its operations for the year then ended, the changes in its net assets for each of the two years in the period ended August 31, 2024 and the financial highlights for each of the five years in the period ended August 31, 2024 in conformity with accounting principles generally accepted in the United States of America.
Basis for Opinion
These financial statements are the responsibility of the Fund's management. Our responsibility is to express an opinion on the Fund's financial statements based on our audits. We are a public accounting firm registered with the Public Company Accounting Oversight Board (United States) (PCAOB) and are required to be independent with respect to the Fund in accordance with the U.S. federal securities laws and the applicable rules and regulations of the Securities and Exchange Commission and the PCAOB.
We conducted our audits of these financial statements in accordance with the standards of the PCAOB. Those standards require that we plan and perform the audit to obtain reasonable assurance about whether the financial statements are free of material misstatement, whether due to error or fraud.
Our audits included performing procedures to assess the risks of material misstatement of the financial statements, whether due to error or fraud, and performing procedures that respond to those risks. Such procedures included examining, on a test basis, evidence regarding the amounts and disclosures in the financial statements. Our audits also included evaluating the accounting principles used and significant estimates made by management, as well as evaluating the overall presentation of the financial statements. Our procedures included confirmation of securities owned as of August 31, 2024 by correspondence with the custodian and brokers; when replies were not received from brokers, we performed other auditing procedures. We believe that our audits provide a reasonable basis for our opinion.
/s/ PricewaterhouseCoopers LLP
Boston, Massachusetts
October 14, 2024
We have served as the auditor of one or more investment companies in the Fidelity group of funds since 1932.
Distributions
(Unaudited)
The dividend and capital gains distributions for the fund(s) are available on Fidelity.com or Institutional.Fidelity.com.
A total of 41.32% of the dividends distributed during the fiscal year was derived from interest on U.S. Government securities which is generally exempt from state income tax.
The fund designates $45,404,491 of distributions paid in the calendar year 2023 as qualifying to be taxed as interest-related dividends for nonresident alien shareholders.
The fund designates $69,215,077 of distributions paid during the fiscal year ended 2024 as qualifying to be taxed as section 163(j) interest dividends.
The fund will notify shareholders in January 2025 of amounts for use in preparing 2024 income tax returns.
Item 8: Changes in and Disagreements with Accountants for Open-End Management Investment Companies
(Unaudited)
Note: This is not applicable for any fund included in this document.
Item 9: Proxy Disclosures for Open-End Management Investment Companies
(Unaudited)
| A special meeting of shareholders was held on October 18, 2023. The results of votes taken among shareholders on the proposal before them are reported below. Each vote reported represents one dollar of net asset value held on the record date for the meeting. |
| Proposal 1 |
| To elect a Board of Trustees. |
| | # of Votes | % of Votes |
| Abigail P. Johnson |
| Affirmative | 378,729,502,260.01 | 97.58 |
| Withheld | 9,407,876,478.96 | 2.42 |
| TOTAL | 388,137,378,738.97 | 100.00 |
| Jennifer Toolin McAuliffe |
| Affirmative | 378,454,868,010.95 | 97.51 |
| Withheld | 9,682,510,728.02 | 2.49 |
| TOTAL | 388,137,378,738.97 | 100.00 |
| Christine J. Thompson |
| Affirmative | 378,837,121,274.52 | 97.60 |
| Withheld | 9,300,257,464.45 | 2.40 |
| TOTAL | 388,137,378,738.97 | 100.00 |
| Elizabeth S. Acton |
| Affirmative | 378,262,110,794.85 | 97.46 |
| Withheld | 9,875,267,944.12 | 2.54 |
| TOTAL | 388,137,378,738.97 | 100.00 |
| Laura M. Bishop |
| Affirmative | 380,482,113,171.06 | 98.03 |
| Withheld | 7,655,265,567.91 | 1.97 |
| TOTAL | 388,137,378,738.97 | 100.00 |
| Ann E. Dunwoody |
| Affirmative | 380,016,034,008.12 | 97.91 |
| Withheld | 8,121,344,730.85 | 2.09 |
| TOTAL | 388,137,378,738.97 | 100.00 |
| John Engler |
| Affirmative | 379,432,488,394.20 | 97.76 |
| Withheld | 8,704,890,344.77 | 2.24 |
| TOTAL | 388,137,378,738.97 | 100.00 |
| Robert F. Gartland |
| Affirmative | 378,741,819,600.60 | 97.58 |
| Withheld | 9,395,559,138.37 | 2.42 |
| TOTAL | 388,137,378,738.97 | 100.00 |
| Robert W. Helm |
| Affirmative | 380,389,324,755.07 | 98.00 |
| Withheld | 7,748,053,983.90 | 2.00 |
| TOTAL | 388,137,378,738.97 | 100.00 |
| Arthur E. Johnson |
| Affirmative | 378,427,694,151.67 | 97.50 |
| Withheld | 9,709,684,587.30 | 2.50 |
| TOTAL | 388,137,378,738.97 | 100.00 |
| Michael E. Kenneally |
| Affirmative | 377,842,228,145.18 | 97.35 |
| Withheld | 10,295,150,593.79 | 2.65 |
| TOTAL | 388,137,378,738.97 | 100.00 |
| Mark A. Murray |
| Affirmative | 380,158,432,703.37 | 97.94 |
| Withheld | 7,978,946,035.60 | 2.06 |
| TOTAL | 388,137,378,738.97 | 100.00 |
| Carol J. Zierhoffer |
| Affirmative | 380,522,113,360.24 | 98.04 |
| Withheld | 7,615,265,378.73 | 1.96 |
| TOTAL | 388,137,378,738.97 | 100.00 |
| | | |
| Proposal 1 reflects trust-wide proposal and voting results. |
Item 10: Remuneration Paid to Directors, Officers, and others of Open-End Management Investment Companies
(Unaudited)
Note: This information is disclosed as part of the financial statements for each Fund as part of Item 7: Financial Statements and Financial Highlights for Open-End Management Investment companies.
Item 11: Statement Regarding Basis for Approval of Investment Advisory Contract
(Unaudited)
Note: This is not applicable for any fund included in this document.
1.9881611.107
ZUB-ANN-1024
Fidelity® Corporate Bond Fund
Annual Report
August 31, 2024
Includes Fidelity and Fidelity Advisor share classes
Contents
To view a fund's proxy voting guidelines and proxy voting record for the 12-month period ended June 30, visit http://www.fidelity.com/proxyvotingresults or visit the Securities and Exchange Commission's (SEC) web site at http://www.sec.gov.
You may also call 1-800-544-8544 if you're an individual investing directly with Fidelity, call 1-800-835-5092 if you're a plan sponsor or participant with Fidelity as your recordkeeper or call 1-877-208-0098 on institutional accounts or if you're an advisor or invest through one to request a free copy of the proxy voting guidelines.
Standard & Poor's, S&P and S&P 500 are registered service marks of The McGraw-Hill Companies, Inc. and have been licensed for use by Fidelity Distributors Corporation.
Other third-party marks appearing herein are the property of their respective owners.
All other marks appearing herein are registered or unregistered trademarks or service marks of FMR LLC or an affiliated company. © 2024 FMR LLC. All rights reserved.
This report and the financial statements contained herein are submitted for the general information of the shareholders of the Fund. This report is not authorized for distribution to prospective investors in the Fund unless preceded or accompanied by an effective prospectus.
A fund files its complete schedule of portfolio holdings with the SEC for the first and third quarters of each fiscal year on Form N-PORT. Forms N-PORT are available on the SEC's web site at http://www.sec.gov. A fund's Forms N-PORT may be reviewed and copied at the SEC's Public Reference Room in Washington, DC. Information regarding the operation of the SEC's Public Reference Room may be obtained by calling 1-800-SEC-0330.
For a complete list of a fund's portfolio holdings, view the most recent holdings listing, semiannual report, or annual report on Fidelity's web site at http://www.fidelity.com, http://www.institutional.fidelity.com, or http://www.401k.com, as applicable.
NOT FDIC INSURED •MAY LOSE VALUE •NO BANK GUARANTEE
Neither the Fund nor Fidelity Distributors Corporation is a bank.
Item 7: Financial Statements and Financial Highlights for Open-End Management Investment Companies (Annual Report)
Fidelity® Corporate Bond Fund
Schedule of Investments August 31, 2024
Showing Percentage of Net Assets
| Nonconvertible Bonds - 84.4% |
| | | Principal Amount (a) | Value ($) |
| COMMUNICATION SERVICES - 5.3% | | | |
| Diversified Telecommunication Services - 1.8% | | | |
| AT&T, Inc.: | | | |
| 2.25% 2/1/32 | | 4,905,000 | 4,135,787 |
| 3.55% 9/15/55 | | 2,075,000 | 1,467,044 |
| 3.65% 9/15/59 | | 1,452,000 | 1,024,154 |
| 3.8% 12/1/57 | | 6,174,000 | 4,525,279 |
| 4.3% 2/15/30 | | 1,886,000 | 1,866,881 |
| 4.5% 5/15/35 | | 1,446,000 | 1,380,373 |
| Verizon Communications, Inc.: | | | |
| 2.355% 3/15/32 | | 5,282,000 | 4,487,642 |
| 2.55% 3/21/31 | | 1,827,000 | 1,607,089 |
| 3% 11/20/60 | | 3,160,000 | 1,986,445 |
| 3.15% 3/22/30 | | 272,000 | 253,774 |
| 3.7% 3/22/61 | | 4,527,000 | 3,333,647 |
| 4.016% 12/3/29 | | 3,773,000 | 3,694,969 |
| 4.4% 11/1/34 | | 4,919,000 | 4,721,602 |
| 4.5% 8/10/33 | | 395,000 | 384,152 |
| 4.78% 2/15/35 (b) | | 863,000 | 850,960 |
| | | | 35,719,798 |
| Entertainment - 0.2% | | | |
| The Walt Disney Co. 6.65% 11/15/37 | | 3,552,000 | 4,137,724 |
| Media - 2.4% | | | |
| CCO Holdings LLC/CCO Holdings Capital Corp. 4.5% 8/15/30 (b) | | 4,980,000 | 4,441,198 |
| Charter Communications Operating LLC/Charter Communications Operating Capital Corp.: | | | |
| 3.7% 4/1/51 | | 2,754,000 | 1,747,390 |
| 3.85% 4/1/61 | | 3,207,000 | 1,946,668 |
| 5.25% 4/1/53 | | 4,995,000 | 4,090,289 |
| 5.375% 5/1/47 | | 2,622,000 | 2,186,592 |
| 5.5% 4/1/63 | | 1,396,000 | 1,119,221 |
| Comcast Corp.: | | | |
| 2.937% 11/1/56 | | 977,000 | 621,455 |
| 2.987% 11/1/63 | | 3,786,000 | 2,338,669 |
| 3.999% 11/1/49 | | 538,000 | 438,980 |
| Discovery Communications LLC: | | | |
| 3.95% 3/20/28 | | 4,905,000 | 4,642,925 |
| 4.65% 5/15/50 | | 1,259,000 | 918,331 |
| Time Warner Cable LLC: | | | |
| 5.5% 9/1/41 | | 212,000 | 183,453 |
| 5.875% 11/15/40 | | 2,823,000 | 2,548,293 |
| 6.55% 5/1/37 | | 728,000 | 718,250 |
| 6.75% 6/15/39 | | 470,000 | 467,322 |
| 7.3% 7/1/38 | | 2,609,000 | 2,728,559 |
| Warnermedia Holdings, Inc.: | | | |
| 3.755% 3/15/27 | | 794,000 | 760,687 |
| 4.054% 3/15/29 | | 275,000 | 256,924 |
| 4.279% 3/15/32 | | 6,748,000 | 5,898,770 |
| 5.05% 3/15/42 | | 1,147,000 | 919,131 |
| 5.141% 3/15/52 | | 9,521,000 | 7,241,659 |
| 5.391% 3/15/62 | | 2,071,000 | 1,555,242 |
| | | | 47,770,008 |
| Wireless Telecommunication Services - 0.9% | | | |
| Rogers Communications, Inc.: | | | |
| 3.8% 3/15/32 | | 4,507,000 | 4,153,205 |
| 4.55% 3/15/52 | | 4,154,000 | 3,519,622 |
| T-Mobile U.S.A., Inc.: | | | |
| 2.4% 3/15/29 | | 1,197,000 | 1,092,915 |
| 2.7% 3/15/32 | | 8,119,000 | 7,043,937 |
| 5.65% 1/15/53 | | 1,509,000 | 1,548,507 |
| Vodafone Group PLC 3.25% 6/4/81 (c) | | 1,094,000 | 1,046,160 |
| | | | 18,404,346 |
TOTAL COMMUNICATION SERVICES | | | 106,031,876 |
| CONSUMER DISCRETIONARY - 4.1% | | | |
| Automobiles - 1.7% | | | |
| Ford Motor Co. 3.25% 2/12/32 | | 4,150,000 | 3,534,661 |
| General Motors Co.: | | | |
| 5% 4/1/35 | | 860,000 | 834,238 |
| 5.15% 4/1/38 | | 4,000,000 | 3,835,085 |
| 5.2% 4/1/45 | | 981,000 | 900,016 |
| 5.4% 4/1/48 | | 396,000 | 370,179 |
| 5.6% 10/15/32 | | 1,886,000 | 1,950,317 |
| 5.95% 4/1/49 | | 1,871,000 | 1,884,496 |
| General Motors Financial Co., Inc.: | | | |
| 3.1% 1/12/32 | | 4,550,000 | 3,965,492 |
| 4.3% 4/6/29 | | 4,225,000 | 4,138,498 |
| Stellantis Finance U.S., Inc.: | | | |
| 1.711% 1/29/27 (b) | | 2,261,000 | 2,111,341 |
| 2.691% 9/15/31 (b) | | 4,207,000 | 3,583,571 |
| Volkswagen Group of America Finance LLC: | | | |
| 1.625% 11/24/27 (b) | | 4,527,000 | 4,113,270 |
| 4.75% 11/13/28 (b) | | 3,045,000 | 3,043,436 |
| | | | 34,264,600 |
| Distributors - 0.1% | | | |
| Genuine Parts Co. 2.75% 2/1/32 | | 2,276,000 | 1,954,453 |
| Diversified Consumer Services - 0.1% | | | |
| Massachusetts Institute of Technology 3.885% 7/1/2116 | | 2,494,000 | 1,947,981 |
| Trane Technologies Global Holding Co. Ltd. 5.75% 6/15/43 | | 135,000 | 142,871 |
| | | | 2,090,852 |
| Leisure Products - 0.2% | | | |
| Brunswick Corp. 5.85% 3/18/29 | | 3,964,000 | 4,055,452 |
| Specialty Retail - 1.4% | | | |
| Advance Auto Parts, Inc. 1.75% 10/1/27 | | 1,890,000 | 1,690,998 |
| AutoNation, Inc.: | | | |
| 1.95% 8/1/28 | | 4,659,000 | 4,171,686 |
| 2.4% 8/1/31 | | 2,075,000 | 1,729,625 |
| 3.85% 3/1/32 | | 2,037,000 | 1,862,715 |
| 4.75% 6/1/30 | | 134,000 | 132,390 |
| AutoZone, Inc. 4% 4/15/30 | | 3,622,000 | 3,518,510 |
| Lowe's Companies, Inc.: | | | |
| 3% 10/15/50 | | 4,414,000 | 2,911,379 |
| 3.75% 4/1/32 | | 3,773,000 | 3,545,264 |
| 5.625% 4/15/53 | | 2,433,000 | 2,460,395 |
| O'Reilly Automotive, Inc. 3.9% 6/1/29 | | 1,101,000 | 1,071,501 |
| The Home Depot, Inc.: | | | |
| 4.95% 6/25/34 | | 3,400,000 | 3,484,162 |
| 5.95% 4/1/41 | | 319,000 | 351,531 |
| | | | 26,930,156 |
| Textiles, Apparel & Luxury Goods - 0.6% | | | |
| Tapestry, Inc.: | | | |
| 3.05% 3/15/32 | | 4,631,000 | 3,876,903 |
| 7% 11/27/26 | | 643,000 | 663,249 |
| 7.35% 11/27/28 | | 1,029,000 | 1,079,346 |
| 7.7% 11/27/30 | | 3,300,000 | 3,513,855 |
| 7.85% 11/27/33 | | 3,300,000 | 3,531,091 |
| | | | 12,664,444 |
TOTAL CONSUMER DISCRETIONARY | | | 81,959,957 |
| CONSUMER STAPLES - 3.3% | | | |
| Beverages - 0.1% | | | |
| Constellation Brands, Inc. 2.875% 5/1/30 | | 3,254,000 | 2,971,481 |
| Consumer Staples Distribution & Retail - 0.7% | | | |
| Alimentation Couche-Tard, Inc. 2.95% 1/25/30 (b) | | 3,630,000 | 3,330,008 |
| Dollar General Corp. 3.5% 4/3/30 | | 4,214,000 | 3,893,168 |
| Dollar Tree, Inc.: | | | |
| 2.65% 12/1/31 | | 4,527,000 | 3,862,992 |
| 4.2% 5/15/28 | | 2,406,000 | 2,361,374 |
| | | | 13,447,542 |
| Food Products - 0.4% | | | |
| JDE Peet's BV 2.25% 9/24/31 (b) | | 1,612,000 | 1,335,925 |
| Smithfield Foods, Inc. 3% 10/15/30 (b) | | 798,000 | 702,115 |
| Viterra Finance BV 4.9% 4/21/27 (b) | | 5,018,000 | 5,024,605 |
| | | | 7,062,645 |
| Tobacco - 2.1% | | | |
| BAT Capital Corp.: | | | |
| 2.259% 3/25/28 | | 4,358,000 | 4,015,188 |
| 2.726% 3/25/31 | | 5,810,000 | 5,109,752 |
| 3.215% 9/6/26 | | 4,258,000 | 4,144,806 |
| 3.557% 8/15/27 | | 795,000 | 775,511 |
| 4.7% 4/2/27 | | 759,000 | 761,334 |
| 5.834% 2/20/31 | | 1,415,000 | 1,485,217 |
| 7.75% 10/19/32 | | 3,622,000 | 4,229,371 |
| BAT International Finance PLC 4.448% 3/16/28 | | 2,886,000 | 2,864,800 |
| Imperial Brands Finance PLC: | | | |
| 3.5% 7/26/26 (b) | | 2,929,000 | 2,854,826 |
| 6.125% 7/27/27 (b) | | 725,000 | 750,273 |
| Philip Morris International, Inc.: | | | |
| 4.375% 11/15/41 | | 712,000 | 631,200 |
| 5.125% 2/15/30 | | 6,763,000 | 6,953,092 |
| 5.625% 11/17/29 | | 3,301,000 | 3,476,678 |
| 5.75% 11/17/32 | | 3,508,000 | 3,711,987 |
| Reynolds American, Inc. 5.7% 8/15/35 | | 103,000 | 105,461 |
| | | | 41,869,496 |
TOTAL CONSUMER STAPLES | | | 65,351,164 |
| ENERGY - 7.2% | | | |
| Oil, Gas & Consumable Fuels - 7.2% | | | |
| Canadian Natural Resources Ltd.: | | | |
| 2.95% 7/15/30 | | 5,193,000 | 4,702,376 |
| 5.85% 2/1/35 | | 180,000 | 186,792 |
| 6.25% 3/15/38 | | 1,474,000 | 1,570,585 |
| Cenovus Energy, Inc.: | | | |
| 2.65% 1/15/32 | | 465,000 | 396,737 |
| 3.75% 2/15/52 | | 1,441,000 | 1,048,273 |
| 5.25% 6/15/37 | | 376,000 | 369,638 |
| 5.375% 7/15/25 | | 3,447,000 | 3,452,951 |
| 5.4% 6/15/47 | | 899,000 | 862,498 |
| 6.75% 11/15/39 | | 262,000 | 292,959 |
| Columbia Pipelines Operating Co. LLC: | | | |
| 5.927% 8/15/30 (b) | | 242,000 | 254,209 |
| 6.036% 11/15/33 (b) | | 652,000 | 688,398 |
| 6.497% 8/15/43 (b) | | 195,000 | 211,961 |
| 6.544% 11/15/53 (b) | | 351,000 | 389,271 |
| DCP Midstream Operating LP: | | | |
| 5.125% 5/15/29 | | 3,085,000 | 3,135,579 |
| 5.6% 4/1/44 | | 116,000 | 114,455 |
| 6.75% 9/15/37 (b) | | 726,000 | 800,443 |
| Eastern Gas Transmission & Storage, Inc.: | | | |
| 3% 11/15/29 | | 2,833,000 | 2,628,952 |
| 3.9% 11/15/49 | | 2,641,000 | 1,970,993 |
| Enbridge, Inc.: | | | |
| 6.7% 11/15/53 | | 1,300,000 | 1,476,163 |
| 7.2% 6/27/54 (c) | | 2,600,000 | 2,680,135 |
| Energy Transfer LP: | | | |
| 3.75% 5/15/30 | | 4,020,000 | 3,802,596 |
| 4% 10/1/27 | | 1,530,000 | 1,502,310 |
| 4.95% 6/15/28 | | 333,000 | 336,451 |
| 5% 5/15/50 | | 6,282,000 | 5,571,552 |
| 5.4% 10/1/47 | | 661,000 | 618,030 |
| 5.6% 9/1/34 | | 5,000,000 | 5,146,650 |
| 5.75% 2/15/33 | | 1,509,000 | 1,569,221 |
| 5.8% 6/15/38 | | 186,000 | 190,594 |
| 6% 6/15/48 | | 121,000 | 122,185 |
| EnLink Midstream LLC 5.65% 9/1/34 | | 6,179,000 | 6,286,768 |
| EQT Corp. 5.75% 2/1/34 | | 8,593,000 | 8,775,825 |
| Florida Gas Transmission Co. LLC 4.35% 7/15/25 (b) | | 1,702,000 | 1,688,001 |
| Hess Corp.: | | | |
| 5.6% 2/15/41 | | 2,853,000 | 2,917,407 |
| 5.8% 4/1/47 | | 4,188,000 | 4,344,254 |
| 7.3% 8/15/31 | | 1,198,000 | 1,366,943 |
| 7.875% 10/1/29 | | 2,092,000 | 2,389,362 |
| MPLX LP: | | | |
| 2.65% 8/15/30 | | 4,527,000 | 4,046,058 |
| 4.95% 9/1/32 | | 1,461,000 | 1,446,176 |
| 5.65% 3/1/53 | | 5,304,000 | 5,180,186 |
| Occidental Petroleum Corp.: | | | |
| 5.2% 8/1/29 | | 1,428,000 | 1,448,041 |
| 5.375% 1/1/32 | | 1,812,000 | 1,838,751 |
| 5.55% 3/15/26 | | 253,000 | 255,082 |
| 5.55% 10/1/34 | | 1,329,000 | 1,350,435 |
| ONEOK, Inc. 3.25% 6/1/30 | | 3,848,000 | 3,565,458 |
| Ovintiv, Inc.: | | | |
| 5.15% 11/15/41 | | 611,000 | 532,687 |
| 7.375% 11/1/31 | | 393,000 | 439,109 |
| 8.125% 9/15/30 | | 1,754,000 | 2,026,579 |
| Petroleos Mexicanos: | | | |
| 4.5% 1/23/26 | | 2,641,000 | 2,539,487 |
| 6.49% 1/23/27 | | 374,000 | 362,830 |
| 6.5% 3/13/27 | | 3,234,000 | 3,110,300 |
| Plains All American Pipeline LP/PAA Finance Corp.: | | | |
| 3.8% 9/15/30 | | 639,000 | 601,781 |
| 5.7% 9/15/34 | | 8,500,000 | 8,693,503 |
| Spectra Energy Partners LP 4.5% 3/15/45 | | 329,000 | 281,246 |
| Suncor Energy, Inc. 6.5% 6/15/38 | | 1,289,000 | 1,419,749 |
| Targa Resources Corp. 5.5% 2/15/35 | | 5,914,000 | 6,004,495 |
| The Williams Companies, Inc.: | | | |
| 2.6% 3/15/31 | | 4,640,000 | 4,055,949 |
| 3.5% 11/15/30 | | 1,436,000 | 1,345,490 |
| 4.65% 8/15/32 | | 1,460,000 | 1,436,223 |
| 5.3% 8/15/52 | | 323,000 | 309,262 |
| 5.75% 6/24/44 | | 1,664,000 | 1,678,105 |
| TransCanada PipeLines Ltd. 4.25% 5/15/28 | | 3,697,000 | 3,657,467 |
| Transcontinental Gas Pipe Line Co. LLC 3.25% 5/15/30 | | 169,000 | 156,905 |
| Western Midstream Operating LP: | | | |
| 4.05% 2/1/30 | | 7,975,000 | 7,633,674 |
| 4.65% 7/1/26 | | 90,000 | 89,538 |
| 5.3% 3/1/48 | | 1,447,000 | 1,307,882 |
| 6.15% 4/1/33 | | 2,655,000 | 2,790,169 |
| | | | 143,464,134 |
| FINANCIALS - 32.5% | | | |
| Banks - 17.1% | | | |
| AIB Group PLC: | | | |
| 5.871% 3/28/35 (b)(c) | | 4,100,000 | 4,241,140 |
| 7.583% 10/14/26 (b)(c) | | 3,792,000 | 3,896,164 |
| Banco Santander SA 2.749% 12/3/30 | | 6,600,000 | 5,744,623 |
| Bank of America Corp.: | | | |
| 1.898% 7/23/31 (c) | | 4,225,000 | 3,617,354 |
| 2.592% 4/29/31 (c) | | 4,716,000 | 4,230,504 |
| 2.972% 2/4/33 (c) | | 11,318,000 | 9,977,487 |
| 3.194% 7/23/30 (c) | | 6,399,000 | 5,991,036 |
| 3.705% 4/24/28 (c) | | 2,372,000 | 2,318,578 |
| 4.571% 4/27/33 (c) | | 5,282,000 | 5,167,450 |
| 5.015% 7/22/33 (c) | | 6,866,000 | 6,945,985 |
| 6.11% 1/29/37 | | 812,000 | 882,005 |
| Bank of Ireland Group PLC 5.601% 3/20/30 (b)(c) | | 3,123,000 | 3,196,499 |
| Barclays PLC: | | | |
| 3.811% 3/10/42 (c) | | 4,527,000 | 3,602,794 |
| 5.088% 6/20/30 (c) | | 4,072,000 | 4,056,726 |
| 5.746% 8/9/33 (c) | | 1,257,000 | 1,299,923 |
| 7.437% 11/2/33 (c) | | 4,452,000 | 5,072,894 |
| BNP Paribas SA: | | | |
| 1.323% 1/13/27 (b)(c)(d) | | 2,450,000 | 2,332,309 |
| 1.904% 9/30/28 (b)(c) | | 4,433,000 | 4,085,503 |
| 2.159% 9/15/29 (b)(c) | | 2,375,000 | 2,141,732 |
| 2.591% 1/20/28 (b)(c) | | 1,660,000 | 1,579,289 |
| 2.824% 1/26/41 (b) | | 3,509,000 | 2,486,339 |
| BPCE SA: | | | |
| 2.277% 1/20/32 (b)(c) | | 4,556,000 | 3,802,465 |
| 3.116% 10/19/32 (b)(c) | | 3,697,000 | 3,139,235 |
| 6.508% 1/18/35 (b)(c) | | 4,250,000 | 4,415,049 |
| CaixaBank SA: | | | |
| 5.673% 3/15/30 (b)(c) | | 4,350,000 | 4,478,193 |
| 6.037% 6/15/35 (b)(c) | | 4,550,000 | 4,739,893 |
| Citigroup, Inc.: | | | |
| 2.666% 1/29/31 (c) | | 3,094,000 | 2,786,986 |
| 3.785% 3/17/33 (c) | | 3,773,000 | 3,482,643 |
| 3.98% 3/20/30 (c) | | 4,527,000 | 4,395,176 |
| 4.412% 3/31/31 (c) | | 3,773,000 | 3,711,226 |
| 4.6% 3/9/26 | | 347,000 | 346,151 |
| 4.91% 5/24/33 (c) | | 1,983,000 | 1,972,403 |
| 6.174% 5/25/34 (c) | | 975,000 | 1,029,206 |
| 8.125% 7/15/39 | | 652,000 | 848,488 |
| Citizens Financial Group, Inc.: | | | |
| 2.638% 9/30/32 | | 2,619,000 | 2,127,579 |
| 5.718% 7/23/32 (c) | | 2,696,000 | 2,751,843 |
| 6.645% 4/25/35 (c) | | 4,879,000 | 5,272,728 |
| Commonwealth Bank of Australia 3.784% 3/14/32 (b) | | 9,980,000 | 9,138,867 |
| Cooperatieve Rabobank UA: | | | |
| 3.649% 4/6/28 (b)(c) | | 4,207,000 | 4,100,206 |
| 3.75% 7/21/26 | | 2,548,000 | 2,493,659 |
| Credit Agricole SA 2.811% 1/11/41 (b) | | 2,524,000 | 1,794,524 |
| Fifth Third Bancorp 8.25% 3/1/38 | | 1,305,000 | 1,618,159 |
| HSBC Holdings PLC: | | | |
| 2.357% 8/18/31 (c) | | 9,356,000 | 8,131,717 |
| 2.848% 6/4/31 (c) | | 3,697,000 | 3,318,569 |
| 4.041% 3/13/28 (c) | | 2,266,000 | 2,226,229 |
| 4.762% 3/29/33 (c) | | 4,735,000 | 4,565,822 |
| 4.95% 3/31/30 | | 200,000 | 203,396 |
| 5.402% 8/11/33 (c) | | 3,062,000 | 3,139,588 |
| Huntington Bancshares, Inc.: | | | |
| 2.487% 8/15/36 (c) | | 3,756,000 | 2,998,539 |
| 4.443% 8/4/28 (c) | | 1,702,000 | 1,697,018 |
| 6.208% 8/21/29 (c) | | 5,300,000 | 5,568,511 |
| ING Groep NV: | | | |
| 4.017% 3/28/28 (c) | | 5,659,000 | 5,577,762 |
| 4.252% 3/28/33 (c) | | 3,773,000 | 3,619,662 |
| Intesa Sanpaolo SpA 5.71% 1/15/26 (b) | | 7,182,000 | 7,206,077 |
| JPMorgan Chase & Co.: | | | |
| 2.739% 10/15/30 (c) | | 5,659,000 | 5,181,532 |
| 2.956% 5/13/31 (c) | | 711,000 | 646,700 |
| 2.963% 1/25/33 (c) | | 5,659,000 | 5,011,049 |
| 4.586% 4/26/33 (c) | | 5,659,000 | 5,586,057 |
| 4.912% 7/25/33 (c) | | 7,546,000 | 7,587,544 |
| 5.717% 9/14/33 (c) | | 11,714,000 | 12,253,044 |
| KBC Group NV 5.796% 1/19/29 (b)(c) | | 3,826,000 | 3,937,351 |
| Lloyds Banking Group PLC: | | | |
| 4.375% 3/22/28 | | 2,617,000 | 2,596,577 |
| 4.976% 8/11/33 (c) | | 3,773,000 | 3,744,959 |
| 7.953% 11/15/33 (c) | | 3,754,000 | 4,343,568 |
| Mizuho Financial Group, Inc. 2.564% 9/13/31 | | 6,414,000 | 5,419,629 |
| PNC Financial Services Group, Inc.: | | | |
| 5.068% 1/24/34 (c) | | 9,168,000 | 9,164,347 |
| 5.582% 6/12/29 (c) | | 4,400,000 | 4,544,539 |
| Royal Bank of Canada 4.65% 1/27/26 | | 400,000 | 399,219 |
| Santander Holdings U.S.A., Inc.: | | | |
| 2.49% 1/6/28 (c) | | 1,044,000 | 979,790 |
| 5.807% 9/9/26 (c) | | 2,250,000 | 2,258,854 |
| 6.499% 3/9/29 (c) | | 1,662,000 | 1,732,762 |
| Societe Generale: | | | |
| 1.488% 12/14/26 (b)(c) | | 1,736,000 | 1,653,755 |
| 3.625% 3/1/41 (b) | | 4,242,000 | 3,022,133 |
| 4.25% 4/14/25 (b) | | 1,018,000 | 1,007,981 |
| 4.75% 11/24/25 (b) | | 2,438,000 | 2,412,950 |
| 6.221% 6/15/33 (b)(c) | | 3,585,000 | 3,682,164 |
| 6.446% 1/10/29 (b)(c) | | 4,150,000 | 4,295,637 |
| Truist Financial Corp.: | | | |
| 5.122% 1/26/34 (c) | | 2,565,000 | 2,551,184 |
| 5.153% 8/5/32 (c) | | 7,000,000 | 7,069,893 |
| U.S. Bancorp 5.775% 6/12/29 (c) | | 6,700,000 | 6,956,868 |
| UniCredit SpA 1.982% 6/3/27 (b)(c) | | 3,735,000 | 3,548,130 |
| Wells Fargo & Co.: | | | |
| 3.068% 4/30/41 (c) | | 4,716,000 | 3,604,713 |
| 4.897% 7/25/33 (c) | | 3,944,000 | 3,924,792 |
| 5.499% 1/23/35 (c) | | 10,000,000 | 10,319,551 |
| 6.491% 10/23/34 (c) | | 4,100,000 | 4,515,222 |
| Westpac Banking Corp. 5.405% 8/10/33 (c) | | 6,036,000 | 6,120,882 |
| Zions Bancorp. NA 3.25% 10/29/29 | | 3,105,000 | 2,721,020 |
| | | | 342,358,299 |
| Capital Markets - 4.9% | | | |
| Ares Capital Corp.: | | | |
| 2.15% 7/15/26 | | 10,800,000 | 10,184,759 |
| 3.25% 7/15/25 | | 5,300,000 | 5,209,999 |
| 3.875% 1/15/26 | | 6,017,000 | 5,901,955 |
| Athene Global Funding: | | | |
| 1.45% 1/8/26 (b) | | 6,772,000 | 6,466,954 |
| 2.5% 3/24/28 (b) | | 4,225,000 | 3,876,209 |
| Blackstone Holdings Finance Co. LLC: | | | |
| 2.8% 9/30/50 (b) | | 755,000 | 478,737 |
| 3.5% 9/10/49 (b) | | 2,795,000 | 2,075,376 |
| Blackstone Private Credit Fund 7.05% 9/29/25 | | 4,993,000 | 5,071,787 |
| Deutsche Bank AG 4.5% 4/1/25 | | 5,744,000 | 5,707,686 |
| Deutsche Bank AG New York Branch: | | | |
| 2.129% 11/24/26 (c) | | 4,762,000 | 4,586,953 |
| 3.035% 5/28/32 (c) | | 2,440,000 | 2,135,512 |
| 6.72% 1/18/29 (c) | | 1,056,000 | 1,111,740 |
| Morgan Stanley: | | | |
| 1.794% 2/13/32 (c) | | 4,433,000 | 3,689,309 |
| 2.699% 1/22/31 (c) | | 3,773,000 | 3,415,891 |
| 6.342% 10/18/33 (c) | | 9,055,000 | 9,911,973 |
| Nuveen LLC 5.55% 1/15/30 (b) | | 884,000 | 916,490 |
| Peachtree Corners Funding Trust 3.976% 2/15/25 (b) | | 2,552,000 | 2,529,014 |
| S&P Global, Inc. 3.9% 3/1/62 | | 1,462,000 | 1,162,518 |
| UBS Group AG: | | | |
| 3.091% 5/14/32 (b)(c) | | 3,207,000 | 2,839,083 |
| 3.126% 8/13/30 (b)(c) | | 3,246,000 | 3,006,220 |
| 4.194% 4/1/31 (b)(c) | | 3,632,000 | 3,509,609 |
| 4.55% 4/17/26 | | 1,838,000 | 1,831,965 |
| 4.988% 8/5/33 (b)(c) | | 6,338,000 | 6,298,385 |
| 6.537% 8/12/33 (b)(c) | | 4,339,000 | 4,706,094 |
| 9.016% 11/15/33 (b)(c) | | 1,264,000 | 1,572,193 |
| | | | 98,196,411 |
| Consumer Finance - 3.2% | | | |
| AerCap Ireland Capital Ltd./AerCap Global Aviation Trust: | | | |
| 1.75% 1/30/26 | | 2,343,000 | 2,243,045 |
| 2.45% 10/29/26 | | 3,344,000 | 3,187,111 |
| 3% 10/29/28 | | 2,623,000 | 2,453,157 |
| 3.3% 1/30/32 | | 788,000 | 700,435 |
| 3.4% 10/29/33 | | 1,630,000 | 1,421,018 |
| 3.85% 10/29/41 | | 2,664,000 | 2,186,750 |
| 6.15% 9/30/30 | | 8,600,000 | 9,163,260 |
| 6.45% 4/15/27 | | 1,131,000 | 1,176,837 |
| Ally Financial, Inc.: | | | |
| 2.2% 11/2/28 | | 1,496,000 | 1,341,669 |
| 5.75% 11/20/25 | | 2,910,000 | 2,917,735 |
| 8% 11/1/31 | | 7,762,000 | 8,858,797 |
| Capital One Financial Corp.: | | | |
| 5.247% 7/26/30 (c) | | 2,443,000 | 2,468,041 |
| 5.468% 2/1/29 (c) | | 1,251,000 | 1,272,582 |
| 5.817% 2/1/34 (c) | | 2,175,000 | 2,222,545 |
| 6.312% 6/8/29 (c) | | 4,200,000 | 4,393,292 |
| Discover Financial Services: | | | |
| 4.5% 1/30/26 | | 393,000 | 390,616 |
| 6.7% 11/29/32 | | 384,000 | 418,501 |
| Ford Motor Credit Co. LLC: | | | |
| 3.375% 11/13/25 | | 3,301,000 | 3,224,740 |
| 3.625% 6/17/31 | | 200,000 | 177,204 |
| 4.063% 11/1/24 | | 3,018,000 | 3,008,946 |
| 4.95% 5/28/27 | | 6,187,000 | 6,153,695 |
| 7.122% 11/7/33 | | 5,000,000 | 5,401,376 |
| | | | 64,781,352 |
| Financial Services - 3.1% | | | |
| Aon Corp. / Aon Global Holdings PLC 2.6% 12/2/31 | | 1,246,000 | 1,083,973 |
| Aviation Capital Group LLC 6.75% 10/25/28 (b) | | 4,100,000 | 4,343,763 |
| Corebridge Financial, Inc.: | | | |
| 3.65% 4/5/27 | | 564,000 | 552,215 |
| 3.85% 4/5/29 | | 554,000 | 534,853 |
| 3.9% 4/5/32 | | 659,000 | 610,134 |
| 4.35% 4/5/42 | | 4,150,000 | 3,570,529 |
| 4.4% 4/5/52 | | 2,943,000 | 2,445,425 |
| 6.05% 9/15/33 | | 6,000,000 | 6,390,213 |
| Equitable Holdings, Inc.: | | | |
| 4.35% 4/20/28 | | 2,304,000 | 2,274,778 |
| 5% 4/20/48 | | 763,000 | 711,778 |
| Essent Group Ltd. 6.25% 7/1/29 | | 4,400,000 | 4,557,669 |
| Fiserv, Inc. 3.5% 7/1/29 | | 1,423,000 | 1,362,609 |
| Jackson Financial, Inc.: | | | |
| 3.125% 11/23/31 | | 7,409,000 | 6,411,554 |
| 4% 11/23/51 | | 2,264,000 | 1,652,100 |
| 5.17% 6/8/27 | | 611,000 | 619,309 |
| 5.67% 6/8/32 | | 2,914,000 | 3,008,115 |
| Jbs U.S.A. Holding Lux/ Jbs U.S.A. F: | | | |
| 2.5% 1/15/27 | | 4,986,000 | 4,733,945 |
| 3% 5/15/32 | | 4,771,000 | 4,077,466 |
| 4.375% 2/2/52 | | 2,067,000 | 1,623,514 |
| 5.5% 1/15/30 | | 4,848,000 | 4,883,143 |
| 6.5% 12/1/52 | | 3,018,000 | 3,179,287 |
| Rexford Industrial Realty LP 2.15% 9/1/31 | | 1,749,000 | 1,455,146 |
| Voya Financial, Inc.: | | | |
| 4.7% 1/23/48 (c) | | 1,897,000 | 1,676,127 |
| 5.7% 7/15/43 | | 883,000 | 879,284 |
| | | | 62,636,929 |
| Insurance - 4.2% | | | |
| AIA Group Ltd.: | | | |
| 3.2% 9/16/40 (b) | | 658,000 | 504,463 |
| 3.375% 4/7/30 (b) | | 1,030,000 | 970,481 |
| 3.6% 4/9/29 (b) | | 1,320,000 | 1,271,860 |
| Allianz SE 5.6% 9/3/54 (b)(c) | | 4,000,000 | 3,992,187 |
| American International Group, Inc. 5.75% 4/1/48 (c) | | 2,168,000 | 2,148,470 |
| AmFam Holdings, Inc. 2.805% 3/11/31 (b) | | 3,311,000 | 2,601,786 |
| Aon Corp. 6.25% 9/30/40 | | 86,000 | 93,796 |
| Assurant, Inc. 2.65% 1/15/32 | | 4,697,000 | 3,994,377 |
| Athene Holding Ltd.: | | | |
| 3.45% 5/15/52 | | 4,150,000 | 2,768,382 |
| 3.95% 5/25/51 | | 971,000 | 721,806 |
| 6.65% 2/1/33 | | 3,056,000 | 3,328,447 |
| Brown & Brown, Inc. 4.2% 3/17/32 | | 2,151,000 | 2,035,239 |
| Empower Finance 2020 LP 3.075% 9/17/51 (b) | | 2,134,000 | 1,428,103 |
| Fairfax Financial Holdings Ltd.: | | | |
| 3.375% 3/3/31 | | 2,081,000 | 1,868,268 |
| 5.625% 8/16/32 | | 8,111,000 | 8,272,832 |
| 6.1% 3/15/55 (b) | | 2,500,000 | 2,528,635 |
| Hartford Financial Services Group, Inc. 4.3% 4/15/43 | | 411,000 | 362,282 |
| Intact Financial Corp. 5.459% 9/22/32 (b) | | 4,464,000 | 4,533,414 |
| Liberty Mutual Group, Inc. 5.5% 6/15/52 (b) | | 3,214,000 | 3,103,498 |
| Massachusetts Mutual Life Insurance Co.: | | | |
| 3.2% 12/1/61 (b) | | 3,669,000 | 2,355,216 |
| 3.729% 10/15/70 (b) | | 982,000 | 692,255 |
| Pacific LifeCorp: | | | |
| 3.35% 9/15/50 (b) | | 4,263,000 | 3,032,330 |
| 5.125% 1/30/43 (b) | | 436,000 | 418,299 |
| Pine Street Trust III 6.223% 5/15/54 (b) | | 9,000,000 | 9,525,823 |
| Principal Financial Group, Inc. 3.7% 5/15/29 | | 477,000 | 460,711 |
| Prudential Financial, Inc. 6% 9/1/52 (c) | | 2,597,000 | 2,664,099 |
| Reinsurance Group of America, Inc. 5.75% 9/15/34 | | 5,250,000 | 5,453,040 |
| Unum Group: | | | |
| 4.125% 6/15/51 | | 5,196,000 | 3,975,488 |
| 5.75% 8/15/42 | | 1,270,000 | 1,266,056 |
| 6% 6/15/54 | | 2,600,000 | 2,646,952 |
| Willis Group North America, Inc. 5.35% 5/15/33 | | 4,000,000 | 4,073,191 |
| | | | 83,091,786 |
TOTAL FINANCIALS | | | 651,064,777 |
| HEALTH CARE - 6.1% | | | |
| Biotechnology - 0.4% | | | |
| Amgen, Inc.: | | | |
| 4.663% 6/15/51 | | 2,264,000 | 2,015,078 |
| 5.25% 3/2/30 | | 856,000 | 886,728 |
| 5.25% 3/2/33 | | 966,000 | 992,736 |
| 5.65% 3/2/53 | | 457,000 | 470,030 |
| 5.75% 3/2/63 | | 832,000 | 853,322 |
| Regeneron Pharmaceuticals, Inc.: | | | |
| 1.75% 9/15/30 | | 2,226,000 | 1,903,008 |
| 2.8% 9/15/50 | | 1,509,000 | 977,062 |
| | | | 8,097,964 |
| Health Care Providers & Services - 4.0% | | | |
| Centene Corp.: | | | |
| 2.625% 8/1/31 | | 11,274,000 | 9,563,245 |
| 3% 10/15/30 | | 5,857,000 | 5,203,578 |
| 4.25% 12/15/27 | | 609,000 | 595,419 |
| 4.625% 12/15/29 | | 2,218,000 | 2,157,875 |
| Cigna Group: | | | |
| 3.4% 3/15/50 | | 2,641,000 | 1,882,722 |
| 3.4% 3/15/51 | | 2,641,000 | 1,872,009 |
| 4.8% 8/15/38 | | 1,634,000 | 1,566,865 |
| 4.9% 12/15/48 | | 314,000 | 288,466 |
| CVS Health Corp.: | | | |
| 4.78% 3/25/38 | | 1,312,000 | 1,205,247 |
| 5% 1/30/29 | | 698,000 | 707,899 |
| 5.125% 2/21/30 | | 8,572,000 | 8,707,022 |
| 5.25% 1/30/31 | | 286,000 | 290,806 |
| 5.3% 6/1/33 | | 5,000,000 | 5,021,356 |
| 6.05% 6/1/54 | | 5,500,000 | 5,546,931 |
| Elevance Health, Inc. 2.25% 5/15/30 | | 3,292,000 | 2,918,926 |
| HCA Holdings, Inc.: | | | |
| 3.375% 3/15/29 | | 1,332,000 | 1,259,052 |
| 3.625% 3/15/32 | | 4,729,000 | 4,299,365 |
| 4.625% 3/15/52 | | 2,003,000 | 1,694,813 |
| 5.125% 6/15/39 | | 1,137,000 | 1,098,064 |
| 5.25% 6/15/49 | | 1,254,000 | 1,163,923 |
| Humana, Inc. 5.375% 4/15/31 | | 1,051,000 | 1,076,311 |
| ICON Investments Six Designated Activity: | | | |
| 5.849% 5/8/29 | | 2,566,000 | 2,681,070 |
| 6% 5/8/34 | | 2,999,000 | 3,158,054 |
| Quest Diagnostics, Inc. 2.95% 6/30/30 | | 3,773,000 | 3,460,154 |
| Sabra Health Care LP: | | | |
| 3.2% 12/1/31 | | 3,672,000 | 3,184,919 |
| 3.9% 10/15/29 | | 476,000 | 445,433 |
| UnitedHealth Group, Inc. 4.625% 7/15/35 | | 253,000 | 250,948 |
| Universal Health Services, Inc.: | | | |
| 2.65% 10/15/30 | | 5,690,000 | 5,028,560 |
| 2.65% 1/15/32 | | 5,770,000 | 4,923,448 |
| | | | 81,252,480 |
| Pharmaceuticals - 1.7% | | | |
| Bayer U.S. Finance II LLC: | | | |
| 4.25% 12/15/25 (b) | | 5,031,000 | 4,973,080 |
| 4.375% 12/15/28 (b) | | 3,207,000 | 3,137,699 |
| 4.875% 6/25/48 (b) | | 3,224,000 | 2,743,795 |
| Bayer U.S. Finance LLC 6.875% 11/21/53 (b) | | 2,400,000 | 2,612,545 |
| Bristol-Myers Squibb Co.: | | | |
| 5.1% 2/22/31 | | 1,669,000 | 1,725,507 |
| 5.2% 2/22/34 | | 3,300,000 | 3,422,940 |
| 5.5% 2/22/44 | | 689,000 | 711,000 |
| 5.55% 2/22/54 | | 2,339,000 | 2,414,694 |
| 5.65% 2/22/64 | | 3,400,000 | 3,504,545 |
| Elanco Animal Health, Inc. 6.65% 8/28/28 (c) | | 4,309,000 | 4,462,073 |
| Perrigo Finance PLC 4.65% 6/15/30 | | 3,924,000 | 3,792,422 |
| | | | 33,500,300 |
TOTAL HEALTH CARE | | | 122,850,744 |
| INDUSTRIALS - 5.0% | | | |
| Aerospace & Defense - 2.1% | | | |
| BAE Systems PLC: | | | |
| 3.4% 4/15/30 (b) | | 326,000 | 306,102 |
| 5.25% 3/26/31 (b) | | 363,000 | 373,801 |
| 5.3% 3/26/34 (b) | | 2,500,000 | 2,564,041 |
| 5.5% 3/26/54 (b) | | 893,000 | 910,936 |
| RTX Corp.: | | | |
| 6.1% 3/15/34 | | 3,600,000 | 3,919,140 |
| 6.4% 3/15/54 | | 3,500,000 | 4,017,042 |
| The Boeing Co.: | | | |
| 2.75% 2/1/26 | | 1,254,000 | 1,212,347 |
| 3.25% 2/1/28 | | 2,641,000 | 2,488,172 |
| 5.04% 5/1/27 | | 9,998,000 | 10,011,246 |
| 5.15% 5/1/30 | | 6,225,000 | 6,209,014 |
| 5.805% 5/1/50 | | 4,905,000 | 4,629,560 |
| 6.298% 5/1/29 (b) | | 485,000 | 506,512 |
| 6.388% 5/1/31 (b) | | 367,000 | 386,585 |
| 6.528% 5/1/34 (b) | | 393,000 | 416,231 |
| 6.858% 5/1/54 (b) | | 3,091,000 | 3,328,192 |
| 7.008% 5/1/64 (b) | | 558,000 | 600,977 |
| | | | 41,879,898 |
| Building Products - 0.4% | | | |
| Carlisle Companies, Inc. 2.75% 3/1/30 | | 3,773,000 | 3,427,832 |
| Carrier Global Corp.: | | | |
| 2.7% 2/15/31 | | 3,848,000 | 3,423,332 |
| 5.9% 3/15/34 | | 160,000 | 172,591 |
| 6.2% 3/15/54 | | 99,000 | 112,250 |
| | | | 7,136,005 |
| Ground Transportation - 0.2% | | | |
| Burlington Northern Santa Fe LLC: | | | |
| 4.15% 4/1/45 | | 342,000 | 296,022 |
| 4.4% 3/15/42 | | 847,000 | 772,176 |
| CSX Corp. 4.3% 3/1/48 | | 3,346,000 | 2,915,709 |
| | | | 3,983,907 |
| Industrial Conglomerates - 0.0% | | | |
| Trane Technologies Financing Ltd. 4.65% 11/1/44 | | 190,000 | 174,636 |
| Machinery - 0.8% | | | |
| AGCO Corp. 5.8% 3/21/34 | | 3,844,000 | 3,953,534 |
| Ingersoll Rand, Inc.: | | | |
| 5.314% 6/15/31 | | 4,500,000 | 4,654,669 |
| 5.45% 6/15/34 | | 4,300,000 | 4,472,114 |
| 5.7% 8/14/33 | | 2,250,000 | 2,373,371 |
| | | | 15,453,688 |
| Passenger Airlines - 0.1% | | | |
| American Airlines 2019-1 Class B Pass Through Trust equipment trust certificate 3.85% 8/15/29 | | 671,742 | 633,743 |
| American Airlines, Inc. 3.75% 4/15/27 | | 856,546 | 837,472 |
| British Airways 2021-1 Class A Pass Through Trust equipment trust certificate 2.9% 9/15/36 (b) | | 770,891 | 681,538 |
| United Airlines 2019-2 Class B Pass Through Trust equipment trust certificate 3.5% 11/1/29 | | 478,989 | 453,031 |
| United Airlines, Inc. equipment trust certificate 4.6% 9/1/27 | | 421,658 | 415,705 |
| | | | 3,021,489 |
| Professional Services - 0.2% | | | |
| Booz Allen Hamilton, Inc. 5.95% 8/4/33 | | 3,095,000 | 3,276,336 |
| Trading Companies & Distributors - 0.6% | | | |
| Air Lease Corp.: | | | |
| 2.875% 1/15/26 | | 2,641,000 | 2,569,818 |
| 2.875% 1/15/32 | | 5,772,000 | 4,998,205 |
| 5.3% 2/1/28 | | 4,263,000 | 4,346,513 |
| | | | 11,914,536 |
| Transportation Infrastructure - 0.6% | | | |
| Avolon Holdings Funding Ltd.: | | | |
| 2.528% 11/18/27 (b) | | 5,125,000 | 4,741,541 |
| 4.25% 4/15/26 (b) | | 529,000 | 520,796 |
| 4.375% 5/1/26 (b) | | 380,000 | 374,307 |
| 5.5% 1/15/26 (b) | | 679,000 | 679,846 |
| 5.75% 3/1/29 (b) | | 5,000,000 | 5,120,452 |
| 6.375% 5/4/28 (b) | | 1,538,000 | 1,598,719 |
| | | | 13,035,661 |
TOTAL INDUSTRIALS | | | 99,876,156 |
| INFORMATION TECHNOLOGY - 3.6% | | | |
| Electronic Equipment, Instruments & Components - 0.7% | | | |
| Dell International LLC/EMC Corp.: | | | |
| 3.375% 12/15/41 | | 2,264,000 | 1,732,095 |
| 3.45% 12/15/51 | | 1,091,000 | 777,501 |
| 5.3% 10/1/29 | | 3,773,000 | 3,895,873 |
| Vontier Corp.: | | | |
| 2.4% 4/1/28 | | 4,659,000 | 4,261,354 |
| 2.95% 4/1/31 | | 5,228,000 | 4,521,790 |
| | | | 15,188,613 |
| IT Services - 0.5% | | | |
| CDW LLC/CDW Finance Corp.: | | | |
| 2.67% 12/1/26 | | 3,241,000 | 3,092,017 |
| 5.1% 3/1/30 | | 1,929,000 | 1,937,912 |
| 5.55% 8/22/34 | | 5,900,000 | 5,949,560 |
| | | | 10,979,489 |
| Semiconductors & Semiconductor Equipment - 1.8% | | | |
| Broadcom, Inc.: | | | |
| 2.45% 2/15/31 (b) | | 2,716,000 | 2,369,805 |
| 2.6% 2/15/33 (b) | | 2,750,000 | 2,305,308 |
| 3.137% 11/15/35 (b) | | 4,150,000 | 3,469,351 |
| 3.5% 2/15/41 (b) | | 2,186,000 | 1,746,598 |
| 3.75% 2/15/51 (b) | | 1,026,000 | 797,562 |
| 5.05% 7/12/29 | | 3,560,000 | 3,629,450 |
| 5.15% 11/15/31 | | 5,600,000 | 5,720,754 |
| Marvell Technology, Inc.: | | | |
| 2.45% 4/15/28 | | 3,018,000 | 2,789,425 |
| 5.75% 2/15/29 | | 2,365,000 | 2,464,526 |
| 5.95% 9/15/33 | | 1,909,000 | 2,027,643 |
| Micron Technology, Inc.: | | | |
| 2.703% 4/15/32 | | 1,236,000 | 1,058,905 |
| 3.366% 11/1/41 | | 1,347,000 | 1,012,887 |
| 3.477% 11/1/51 | | 1,351,000 | 960,003 |
| 5.3% 1/15/31 | | 4,778,000 | 4,898,618 |
| | | | 35,250,835 |
| Software - 0.6% | | | |
| Oracle Corp.: | | | |
| 2.875% 3/25/31 | | 4,527,000 | 4,050,937 |
| 3.95% 3/25/51 | | 3,211,000 | 2,482,962 |
| 4.375% 5/15/55 | | 1,405,000 | 1,154,214 |
| 5.375% 7/15/40 | | 81,000 | 80,094 |
| Roper Technologies, Inc.: | | | |
| 1.75% 2/15/31 | | 2,264,000 | 1,887,426 |
| 2.95% 9/15/29 | | 1,714,000 | 1,594,990 |
| | | | 11,250,623 |
TOTAL INFORMATION TECHNOLOGY | | | 72,669,560 |
| MATERIALS - 1.8% | | | |
| Chemicals - 1.3% | | | |
| Celanese U.S. Holdings LLC: | | | |
| 6.165% 7/15/27 | | 7,168,000 | 7,396,445 |
| 6.33% 7/15/29 | | 2,264,000 | 2,393,211 |
| 6.35% 11/15/28 | | 831,000 | 874,306 |
| 6.55% 11/15/30 | | 841,000 | 901,889 |
| 6.7% 11/15/33 | | 493,000 | 532,933 |
| International Flavors & Fragrances, Inc.: | | | |
| 1.832% 10/15/27 (b) | | 3,188,000 | 2,924,572 |
| 2.3% 11/1/30 (b) | | 3,207,000 | 2,780,590 |
| LYB International Finance III LLC 2.25% 10/1/30 | | 1,964,000 | 1,718,733 |
| The Dow Chemical Co.: | | | |
| 4.55% 11/30/25 | | 51,000 | 50,779 |
| 5.15% 2/15/34 | | 5,900,000 | 5,963,390 |
| | | | 25,536,848 |
| Containers & Packaging - 0.3% | | | |
| Smurfit Kappa Treasury ULC 5.438% 4/3/34 (b) | | 5,100,000 | 5,244,942 |
| Metals & Mining - 0.2% | | | |
| Anglo American Capital PLC 3.875% 3/16/29 (b) | | 3,773,000 | 3,633,871 |
| Vale Overseas Ltd. 6.4% 6/28/54 | | 1,520,000 | 1,550,400 |
| | | | 5,184,271 |
TOTAL MATERIALS | | | 35,966,061 |
| REAL ESTATE - 6.0% | | | |
| Equity Real Estate Investment Trusts (REITs) - 5.6% | | | |
| Agree LP: | | | |
| 4.8% 10/1/32 | | 4,123,000 | 4,048,104 |
| 5.625% 6/15/34 | | 4,300,000 | 4,435,159 |
| Alexandria Real Estate Equities, Inc.: | | | |
| 1.875% 2/1/33 | | 6,131,000 | 4,811,440 |
| 4.7% 7/1/30 | | 521,000 | 518,524 |
| American Homes 4 Rent LP 5.5% 7/15/34 | | 1,747,000 | 1,782,100 |
| American Tower Corp. 2.1% 6/15/30 | | 2,150,000 | 1,870,806 |
| Brixmor Operating Partnership LP: | | | |
| 2.25% 4/1/28 | | 1,426,000 | 1,305,803 |
| 4.05% 7/1/30 | | 819,000 | 784,555 |
| 4.125% 5/15/29 | | 420,000 | 407,392 |
| Corporate Office Properties LP: | | | |
| 2% 1/15/29 | | 2,896,000 | 2,547,028 |
| 2.25% 3/15/26 | | 314,000 | 301,058 |
| 2.75% 4/15/31 | | 1,519,000 | 1,302,903 |
| 2.9% 12/1/33 | | 4,982,000 | 4,074,875 |
| Crown Castle, Inc. 3.3% 7/1/30 | | 5,282,000 | 4,872,774 |
| GLP Capital LP/GLP Financing II, Inc. 5.625% 9/15/34 | | 5,800,000 | 5,863,475 |
| Hudson Pacific Properties LP: | | | |
| 3.95% 11/1/27 | | 1,559,000 | 1,384,826 |
| 5.95% 2/15/28 | | 10,874,000 | 9,712,546 |
| Invitation Homes Operating Partnership LP: | | | |
| 2% 8/15/31 | | 1,752,000 | 1,446,574 |
| 4.15% 4/15/32 | | 886,000 | 834,815 |
| Kite Realty Group LP 5.5% 3/1/34 | | 269,000 | 272,695 |
| Kite Realty Group Trust 4.75% 9/15/30 | | 1,720,000 | 1,703,538 |
| Omega Healthcare Investors, Inc.: | | | |
| 3.25% 4/15/33 | | 1,168,000 | 988,278 |
| 3.375% 2/1/31 | | 11,399,000 | 10,161,398 |
| 4.75% 1/15/28 | | 1,886,000 | 1,869,717 |
| Phillips Edison Grocery Center Operating Partnership I LP 5.75% 7/15/34 | | 277,000 | 285,215 |
| Piedmont Operating Partnership LP: | | | |
| 2.75% 4/1/32 | | 253,000 | 198,798 |
| 6.875% 7/15/29 | | 798,000 | 829,060 |
| Realty Income Corp.: | | | |
| 2.1% 3/15/28 | | 1,856,000 | 1,709,465 |
| 2.85% 12/15/32 | | 181,000 | 155,625 |
| Store Capital LLC: | | | |
| 2.7% 12/1/31 | | 4,905,000 | 4,116,088 |
| 2.75% 11/18/30 | | 369,000 | 319,068 |
| Sun Communities Operating LP: | | | |
| 2.3% 11/1/28 | | 288,000 | 260,478 |
| 2.7% 7/15/31 | | 733,000 | 627,715 |
| 4.2% 4/15/32 | | 5,659,000 | 5,248,373 |
| 5.7% 1/15/33 | | 4,680,000 | 4,764,039 |
| UDR, Inc. 2.1% 8/1/32 | | 2,714,000 | 2,204,826 |
| Ventas Realty LP: | | | |
| 2.5% 9/1/31 | | 2,126,000 | 1,816,797 |
| 3% 1/15/30 | | 3,071,000 | 2,810,517 |
| 4.4% 1/15/29 | | 3,773,000 | 3,734,624 |
| VICI Properties LP: | | | |
| 4.75% 2/15/28 | | 1,217,000 | 1,212,211 |
| 4.95% 2/15/30 | | 3,641,000 | 3,627,935 |
| 5.125% 5/15/32 | | 8,309,000 | 8,213,464 |
| 5.75% 4/1/34 | | 211,000 | 217,342 |
| Vornado Realty LP: | | | |
| 2.15% 6/1/26 | | 316,000 | 298,943 |
| 3.4% 6/1/31 | | 1,142,000 | 969,713 |
| WP Carey, Inc. 2.4% 2/1/31 | | 2,127,000 | 1,827,764 |
| | | | 112,748,443 |
| Real Estate Management & Development - 0.4% | | | |
| Brandywine Operating Partnership LP: | | | |
| 4.55% 10/1/29 | | 682,000 | 624,898 |
| 8.05% 3/15/28 | | 1,600,000 | 1,702,525 |
| 8.875% 4/12/29 | | 1,131,000 | 1,229,111 |
| Tanger Properties LP 2.75% 9/1/31 | | 3,679,000 | 3,134,920 |
| | | | 6,691,454 |
TOTAL REAL ESTATE | | | 119,439,897 |
| UTILITIES - 9.5% | | | |
| Electric Utilities - 6.7% | | | |
| Alabama Power Co. 3.05% 3/15/32 | | 1,154,000 | 1,035,880 |
| American Transmission Systems, Inc. 2.65% 1/15/32 (b) | | 3,542,000 | 3,060,553 |
| Cleco Corporate Holdings LLC: | | | |
| 3.375% 9/15/29 | | 4,212,000 | 3,840,516 |
| 3.743% 5/1/26 | | 10,569,000 | 10,353,509 |
| Cleveland Electric Illuminating Co.: | | | |
| 3.5% 4/1/28 (b) | | 1,357,000 | 1,303,852 |
| 5.95% 12/15/36 | | 1,245,000 | 1,319,281 |
| Consolidated Edison Co. of New York, Inc. 5.2% 3/1/33 | | 4,905,000 | 5,068,151 |
| Duke Energy Corp.: | | | |
| 2.45% 6/1/30 | | 479,000 | 428,162 |
| 2.55% 6/15/31 | | 2,641,000 | 2,291,934 |
| 4.5% 8/15/32 | | 7,595,000 | 7,398,791 |
| 5% 8/15/52 | | 7,595,000 | 6,968,209 |
| 5.45% 6/15/34 | | 5,000,000 | 5,151,533 |
| Duke Energy Indiana LLC 4.9% 7/15/43 | | 1,016,000 | 961,736 |
| Duquesne Light Holdings, Inc.: | | | |
| 2.532% 10/1/30 (b) | | 440,000 | 380,652 |
| 2.775% 1/7/32 (b) | | 1,619,000 | 1,368,824 |
| 3.616% 8/1/27 (b) | | 1,658,000 | 1,606,031 |
| Edison International 5.45% 6/15/29 | | 4,029,000 | 4,142,768 |
| ENEL Finance International NV 5.5% 6/26/34 (b) | | 4,401,000 | 4,467,759 |
| Exelon Corp.: | | | |
| 3.35% 3/15/32 | | 7,856,000 | 7,157,121 |
| 4.05% 4/15/30 | | 2,862,000 | 2,789,859 |
| 4.1% 3/15/52 | | 230,000 | 186,024 |
| 5.45% 3/15/34 | | 3,500,000 | 3,614,232 |
| 5.6% 3/15/53 | | 3,400,000 | 3,441,612 |
| FirstEnergy Corp.: | | | |
| 2.05% 3/1/25 | | 828,000 | 813,071 |
| 2.25% 9/1/30 | | 3,488,000 | 3,034,700 |
| 2.65% 3/1/30 | | 6,250,000 | 5,643,801 |
| 5.1% 7/15/47 | | 3,500,000 | 3,124,309 |
| Georgia Power Co. 5.25% 3/15/34 | | 4,300,000 | 4,434,499 |
| IPALCO Enterprises, Inc.: | | | |
| 4.25% 5/1/30 | | 5,433,000 | 5,204,721 |
| 5.75% 4/1/34 | | 1,829,000 | 1,882,309 |
| ITC Holdings Corp. 5.65% 5/9/34 (b) | | 6,000,000 | 6,211,876 |
| PPL Capital Funding, Inc. 5.25% 9/1/34 | | 4,167,000 | 4,217,933 |
| Southern Co.: | | | |
| 3.7% 4/30/30 | | 5,591,000 | 5,340,701 |
| 4.4% 7/1/46 | | 4,905,000 | 4,274,917 |
| 5.113% 8/1/27 (e) | | 6,980,000 | 7,092,097 |
| Tampa Electric Co. 6.55% 5/15/36 | | 169,000 | 187,372 |
| Virginia Electric & Power Co. 5.55% 8/15/54 | | 1,358,000 | 1,379,813 |
| Xcel Energy, Inc.: | | | |
| 3.5% 12/1/49 | | 2,768,000 | 1,980,314 |
| 4.8% 9/15/41 | | 188,000 | 169,369 |
| | | | 133,328,791 |
| Gas Utilities - 0.2% | | | |
| Boston Gas Co. 4.487% 2/15/42 (b) | | 678,000 | 576,511 |
| ONE Gas, Inc. 2% 5/15/30 | | 1,965,000 | 1,727,202 |
| Southern Co. Gas Capital Corp. 3.15% 9/30/51 | | 1,845,000 | 1,221,872 |
| | | | 3,525,585 |
| Independent Power and Renewable Electricity Producers - 1.3% | | | |
| Atlantica Sustainable Infrastructure PLC 4.125% 6/15/28 (b) | | 3,773,000 | 3,738,549 |
| Emera U.S. Finance LP: | | | |
| 2.639% 6/15/31 | | 4,782,000 | 4,108,935 |
| 3.55% 6/15/26 | | 5,527,000 | 5,381,971 |
| 4.75% 6/15/46 | | 3,302,000 | 2,846,845 |
| The AES Corp.: | | | |
| 1.375% 1/15/26 | | 1,815,000 | 1,728,794 |
| 2.45% 1/15/31 | | 6,228,000 | 5,311,134 |
| 3.3% 7/15/25 (b) | | 1,482,000 | 1,452,889 |
| 3.95% 7/15/30 (b) | | 2,106,000 | 1,988,277 |
| | | | 26,557,394 |
| Multi-Utilities - 1.3% | | | |
| Berkshire Hathaway Energy Co. 2.85% 5/15/51 | | 2,452,000 | 1,594,723 |
| NiSource, Inc.: | | | |
| 1.7% 2/15/31 | | 1,886,000 | 1,566,945 |
| 2.95% 9/1/29 | | 678,000 | 628,103 |
| 3.6% 5/1/30 | | 3,080,000 | 2,920,665 |
| 4.375% 5/15/47 | | 1,886,000 | 1,608,315 |
| 4.8% 2/15/44 | | 3,018,000 | 2,755,675 |
| 5% 6/15/52 | | 1,320,000 | 1,235,414 |
| 5.25% 2/15/43 | | 80,000 | 77,481 |
| 5.95% 6/15/41 | | 386,000 | 402,308 |
| Puget Energy, Inc.: | | | |
| 2.379% 6/15/28 | | 3,992,000 | 3,647,701 |
| 3.65% 5/15/25 | | 994,000 | 982,214 |
| 4.1% 6/15/30 | | 1,049,000 | 999,663 |
| 4.224% 3/15/32 | | 6,457,000 | 5,954,174 |
| WEC Energy Group, Inc.: | | | |
| CME Term SOFR 3 Month Index + 2.110% 7.4922% 5/15/67 (c)(d) | | 40,000 | 38,913 |
| 2.2% 12/15/28 | | 1,886,000 | 1,720,779 |
| | | | 26,133,073 |
TOTAL UTILITIES | | | 189,544,843 |
| TOTAL NONCONVERTIBLE BONDS (Cost $1,788,945,292) | | | 1,688,219,169 |
| | | | |
| U.S. Treasury Obligations - 9.8% |
| | | Principal Amount (a) | Value ($) |
| U.S. Treasury Bonds: | | | |
| 1.75% 8/15/41 | | 8,036,000 | 5,585,962 |
| 1.875% 2/15/41 | | 7,545,500 | 5,426,276 |
| 2% 11/15/41 | | 4,695,500 | 3,389,014 |
| 4.25% 2/15/54 | | 67,423,000 | 67,686,371 |
| 4.25% 8/15/54 | | 16,900,000 | 17,005,625 |
| 4.625% 5/15/54 | | 85,180,000 | 91,036,129 |
| U.S. Treasury Notes 4.5% 11/15/33 | | 5,000,000 | 5,227,148 |
| TOTAL U.S. TREASURY OBLIGATIONS (Cost $192,459,511) | | | 195,356,525 |
| | | | |
| Asset-Backed Securities - 0.3% |
| | | Principal Amount (a) | Value ($) |
| Dominos Pizza Master Issuer LLC Series 2018-1A Class A2I, 4.116% 7/25/48 (b) | | 2,177,355 | 2,147,716 |
| Subway Funding LLC Issuer Series 2024-1A: | | | |
| Class A23, 6.505% 7/30/54 (b) | | 1,138,000 | 1,189,098 |
| Class A2I, 6.028% 7/30/54 (b) | | 2,183,000 | 2,239,765 |
| Class A2II, 6.268% 7/30/54 (b) | | 1,298,000 | 1,345,587 |
| TOTAL ASSET-BACKED SECURITIES (Cost $6,796,355) | | | 6,922,166 |
| | | | |
| Municipal Securities - 0.0% |
| | | Principal Amount (a) | Value ($) |
| American Muni. Pwr., Inc. Rev. (Combined Hydroelectric Proj.) Series 2010 B, 8.084% 2/15/50 | | 525,000 | 710,841 |
| California Gen. Oblig. Series 2010, 7.625% 3/1/40 | | 115,000 | 142,583 |
| TOTAL MUNICIPAL SECURITIES (Cost $925,583) | | | 853,424 |
| | | | |
| Foreign Government and Government Agency Obligations - 0.1% |
| | | Principal Amount (a) | Value ($) |
United Mexican States 4.5% 4/22/29 (Cost $2,049,839) | | 1,886,000 | 1,847,111 |
| | | | |
| Bank Notes - 0.1% |
| | | Principal Amount (a) | Value ($) |
Regions Bank 6.45% 6/26/37 (Cost $1,044,740) | | 985,000 | 1,048,825 |
| | | | |
| Preferred Securities - 0.3% |
| | | Principal Amount (a) | Value ($) |
| ENERGY - 0.1% | | | |
| Oil, Gas & Consumable Fuels - 0.1% | | | |
| Enbridge, Inc. 5.75% 7/15/80 (c) | | 2,153,000 | 2,074,538 |
| FINANCIALS - 0.2% | | | |
| Capital Markets - 0.2% | | | |
| UBS Group AG: | | | |
| 4.375% (b)(c)(f) | | 1,356,000 | 1,164,106 |
| 4.875% (b)(c)(f) | | 2,890,000 | 2,763,566 |
| | | | 3,927,672 |
| TOTAL PREFERRED SECURITIES (Cost $6,399,000) | | | 6,002,210 |
| | | | |
| Money Market Funds - 4.7% |
| | | Shares | Value ($) |
Fidelity Cash Central Fund 5.39% (g) (Cost $94,093,556) | | 94,076,012 | 94,094,828 |
| | | | |
| TOTAL INVESTMENT IN SECURITIES - 99.7% (Cost $2,092,713,876) | 1,994,344,258 |
NET OTHER ASSETS (LIABILITIES) - 0.3% | 6,792,105 |
| NET ASSETS - 100.0% | 2,001,136,363 |
| | |
Legend
| (a) | Amount is stated in United States dollars unless otherwise noted. |
| (b) | Security exempt from registration under Rule 144A of the Securities Act of 1933. These securities may be resold in transactions exempt from registration, normally to qualified institutional buyers. At the end of the period, the value of these securities amounted to $304,939,778 or 15.2% of net assets. |
| (c) | Coupon rates for floating and adjustable rate securities reflect the rates in effect at period end. |
| (d) | Coupon is indexed to a floating interest rate which may be multiplied by a specified factor and/or subject to caps or floors. |
| (e) | Security initially issued at one coupon which converts to a higher coupon at a specified date. The rate shown is the rate at period end. |
| (f) | Security is perpetual in nature with no stated maturity date. |
| (g) | Affiliated fund that is generally available only to investment companies and other accounts managed by Fidelity Investments. The rate quoted is the annualized seven-day yield of the fund at period end. A complete unaudited listing of the fund's holdings as of its most recent quarter end is available upon request. In addition, each Fidelity Central Fund's financial statements, which are not covered by the Fund's Report of Independent Registered Public Accounting Firm, are available on the SEC's website or upon request. |
Affiliated Central Funds
Fiscal year to date information regarding the Fund's investments in Fidelity Central Funds, including the ownership percentage, is presented below.
| Affiliate | Value, beginning of period ($) | Purchases ($) | Sales Proceeds ($) | Dividend Income ($) | Realized Gain (loss) ($) | Change in Unrealized appreciation (depreciation) ($) | Value, end of period ($) | % ownership, end of period |
| Fidelity Cash Central Fund 5.39% | 55,375,813 | 467,232,293 | 428,513,172 | 2,130,909 | (106) | - | 94,094,828 | 0.2% |
| Total | 55,375,813 | 467,232,293 | 428,513,172 | 2,130,909 | (106) | - | 94,094,828 | |
| | | | | | | | | |
Amounts in the dividend income column in the above table include any capital gain distributions from underlying funds, which are presented in the corresponding line item in the Statement of Operations, if applicable.
Amounts included in the purchases and sales proceeds columns may include in-kind transactions, if applicable.
Investment Valuation
The following is a summary of the inputs used, as of August 31, 2024, involving the Fund's assets and liabilities carried at fair value. The inputs or methodology used for valuing securities may not be an indication of the risk associated with investing in those securities. For more information on valuation inputs, and their aggregation into the levels used below, please refer to the Investment Valuation section in the accompanying Notes to Financial Statements.
| Valuation Inputs at Reporting Date: |
| Description | Total ($) | Level 1 ($) | Level 2 ($) | Level 3 ($) |
Investments in Securities: | | | | |
|
| Corporate Bonds | 1,688,219,169 | - | 1,688,219,169 | - |
|
| U.S. Government and Government Agency Obligations | 195,356,525 | - | 195,356,525 | - |
|
| Asset-Backed Securities | 6,922,166 | - | 6,922,166 | - |
|
| Municipal Securities | 853,424 | - | 853,424 | - |
|
| Foreign Government and Government Agency Obligations | 1,847,111 | - | 1,847,111 | - |
|
| Bank Notes | 1,048,825 | - | 1,048,825 | - |
|
| Preferred Securities | 6,002,210 | - | 6,002,210 | - |
|
| Money Market Funds | 94,094,828 | 94,094,828 | - | - |
| Total Investments in Securities: | 1,994,344,258 | 94,094,828 | 1,900,249,430 | - |
Financial Statements
| Statement of Assets and Liabilities |
As of August 31, 2024 |
| Assets | | | | |
| Investment in securities, at value - See accompanying schedule: | | | | |
Unaffiliated issuers (cost $1,998,620,320) | $ | 1,900,249,430 | | |
Fidelity Central Funds (cost $94,093,556) | | 94,094,828 | | |
| | | | | |
| | | | | |
| Total Investment in Securities (cost $2,092,713,876) | | | $ | 1,994,344,258 |
| Receivable for investments sold | | | | 1,349,948 |
| Receivable for fund shares sold | | | | 1,999,979 |
| Interest receivable | | | | 22,041,913 |
| Distributions receivable from Fidelity Central Funds | | | | 377,179 |
| Receivable from investment adviser for expense reductions | | | | 20,731 |
Total assets | | | | 2,020,134,008 |
| Liabilities | | | | |
| Payable for investments purchased | $ | 15,443,641 | | |
| Payable for fund shares redeemed | | 2,154,067 | | |
| Distributions payable | | 655,808 | | |
| Accrued management fee | | 576,977 | | |
| Distribution and service plan fees payable | | 21,159 | | |
| Other affiliated payables | | 145,993 | | |
| Total liabilities | | | | 18,997,645 |
| Net Assets | | | $ | 2,001,136,363 |
| Net Assets consist of: | | | | |
| Paid in capital | | | $ | 2,205,311,391 |
| Total accumulated earnings (loss) | | | | (204,175,028) |
| Net Assets | | | $ | 2,001,136,363 |
| | | | | |
| Net Asset Value and Maximum Offering Price | | | | |
| Class A : | | | | |
Net Asset Value and redemption price per share ($64,512,574 ÷ 6,029,727 shares)(a) | | | $ | 10.70 |
| Maximum offering price per share (100/96.00 of $10.70) | | | $ | 11.15 |
| Class M : | | | | |
Net Asset Value and redemption price per share ($8,194,254 ÷ 765,838 shares)(a) | | | $ | 10.70 |
| Maximum offering price per share (100/96.00 of $10.70) | | | $ | 11.15 |
| Class C : | | | | |
Net Asset Value and offering price per share ($7,552,603 ÷ 706,028 shares)(a) | | | $ | 10.70 |
| Corporate Bond : | | | | |
Net Asset Value, offering price and redemption price per share ($965,348,427 ÷ 90,230,141 shares) | | | $ | 10.70 |
| Class I : | | | | |
Net Asset Value, offering price and redemption price per share ($221,241,528 ÷ 20,678,043 shares) | | | $ | 10.70 |
| Class Z : | | | | |
Net Asset Value, offering price and redemption price per share ($734,286,977 ÷ 68,649,425 shares) | | | $ | 10.70 |
(a)Redemption price per share is equal to net asset value less any applicable contingent deferred sales charge. |
| Statement of Operations |
| Year ended August 31, 2024 |
| Investment Income | | | | |
| Dividends | | | $ | 324,010 |
| Interest | | | | 74,257,592 |
| Income from Fidelity Central Funds | | | | 2,130,909 |
| Total income | | | | 76,712,511 |
| Expenses | | | | |
| Management fee | $ | 6,038,514 | | |
| Transfer agent fees | | 1,556,290 | | |
| Distribution and service plan fees | | 246,635 | | |
| Independent trustees' fees and expenses | | 5,144 | | |
| Total expenses before reductions | | 7,846,583 | | |
| Expense reductions | | (242,375) | | |
| Total expenses after reductions | | | | 7,604,208 |
| Net Investment income (loss) | | | | 69,108,303 |
| Realized and Unrealized Gain (Loss) | | | | |
| Net realized gain (loss) on: | | | | |
| Investment Securities: | | | | |
| Unaffiliated issuers | | (36,819,564) | | |
| Fidelity Central Funds | | (106) | | |
| Total net realized gain (loss) | | | | (36,819,670) |
| Change in net unrealized appreciation (depreciation) on investment securities | | | | 138,226,550 |
| Net gain (loss) | | | | 101,406,880 |
| Net increase (decrease) in net assets resulting from operations | | | $ | 170,515,183 |
| Statement of Changes in Net Assets |
| |
| | Year ended August 31, 2024 | | Year ended August 31, 2023 |
| Increase (Decrease) in Net Assets | | | | |
| Operations | | | | |
| Net investment income (loss) | $ | 69,108,303 | $ | 122,900,826 |
| Net realized gain (loss) | | (36,819,670) | | (353,341,567) |
| Change in net unrealized appreciation (depreciation) | | 138,226,550 | | 279,032,878 |
| Net increase (decrease) in net assets resulting from operations | | 170,515,183 | | 48,592,137 |
| Distributions to shareholders | | (68,746,009) | | (119,460,178) |
| | | | | |
| Share transactions - net increase (decrease) | | 220,144,658 | | (2,482,173,322) |
| Total increase (decrease) in net assets | | 321,913,832 | | (2,553,041,363) |
| | | | | |
| Net Assets | | | | |
| Beginning of period | | 1,679,222,531 | | 4,232,263,894 |
| End of period | $ | 2,001,136,363 | $ | 1,679,222,531 |
| | | | | |
| | | | | |
Financial Highlights
Fidelity Advisor® Corporate Bond Fund Class A |
| |
| Years ended August 31, | | 2024 | | 2023 | | 2022 | | 2021 | | 2020 |
Selected Per-Share Data | | | | | | | | | | |
| Net asset value, beginning of period | $ | 10.13 | $ | 10.41 | $ | 12.76 | $ | 12.86 | $ | 12.24 |
| Income from Investment Operations | | | | | | | | | | |
Net investment income (loss) A,B | | .377 | | .358 | | .287 | | .277 | | .311 |
| Net realized and unrealized gain (loss) | | .568 | | (.290) | | (2.270) | | .004 | | .624 |
| Total from investment operations | | .945 | | .068 | | (1.983) | | .281 | | .935 |
| Distributions from net investment income | | (.375) | | (.348) | | (.280) | | (.274) | | (.315) |
| Distributions from net realized gain | | - | | - | | (.087) | | (.107) | | - |
| Total distributions | | (.375) | | (.348) | | (.367) | | (.381) | | (.315) |
| Net asset value, end of period | $ | 10.70 | $ | 10.13 | $ | 10.41 | $ | 12.76 | $ | 12.86 |
Total Return C,D | | | | .70% | | (15.81)% | | 2.24% | | 7.78% |
Ratios to Average Net Assets B,E,F | | | | | | | | | | |
| Expenses before reductions | | .77% | | .78% | | .77% | | .77% | | .77% |
| Expenses net of fee waivers, if any | | | | .78% | | .77% | | .77% | | .77% |
| Expenses net of all reductions | | .77% | | .78% | | .77% | | .77% | | .77% |
| Net investment income (loss) | | 3.67% | | 3.52% | | 2.47% | | 2.19% | | 2.53% |
| Supplemental Data | | | | | | | | | | |
| Net assets, end of period (000 omitted) | $ | 64,513 | $ | 57,501 | $ | 59,296 | $ | 81,746 | $ | 74,657 |
Portfolio turnover rate G | | | | 24% H | | 26% | | 46% | | 31% H |
ACalculated based on average shares outstanding during the period.
BNet investment income (loss) is affected by the timing of the declaration of dividends by any underlying mutual funds or exchange-traded funds (ETFs). Net investment income (loss) of any mutual funds or ETFs is not included in the Fund's net investment income (loss) ratio.
CTotal returns would have been lower if certain expenses had not been reduced during the applicable periods shown.
DTotal returns do not include the effect of the sales charges.
EFees and expenses of any underlying mutual funds or exchange-traded funds (ETFs) are not included in the Fund's expense ratio. The Fund indirectly bears its proportionate share of these expenses. For additional expense information related to investments in Fidelity Central Funds, please refer to the "Investments in Fidelity Central Funds" note found in the Notes to Financial Statements section of the most recent Annual or Semi-Annual report.
FExpense ratios reflect operating expenses of the class. Expenses before reductions do not reflect amounts reimbursed, waived, or reduced through arrangements with the investment adviser, brokerage services, or other offset arrangements, if applicable, and do not represent the amount paid by the class during periods when reimbursements, waivers or reductions occur.
GAmount does not include the portfolio activity of any underlying mutual funds or exchange-traded funds (ETFs).
HPortfolio turnover rate excludes securities received or delivered in-kind.
Fidelity Advisor® Corporate Bond Fund Class M |
| |
| Years ended August 31, | | 2024 | | 2023 | | 2022 | | 2021 | | 2020 |
Selected Per-Share Data | | | | | | | | | | |
| Net asset value, beginning of period | $ | 10.13 | $ | 10.41 | $ | 12.76 | $ | 12.86 | $ | 12.24 |
| Income from Investment Operations | | | | | | | | | | |
Net investment income (loss) A,B | | .372 | | .353 | | .282 | | .274 | | .304 |
| Net realized and unrealized gain (loss) | | .568 | | (.290) | | (2.270) | | .004 | | .624 |
| Total from investment operations | | .940 | | .063 | | (1.988) | | .278 | | .928 |
| Distributions from net investment income | | (.370) | | (.343) | | (.275) | | (.271) | | (.308) |
| Distributions from net realized gain | | - | | - | | (.087) | | (.107) | | - |
| Total distributions | | (.370) | | (.343) | | (.362) | | (.378) | | (.308) |
| Net asset value, end of period | $ | 10.70 | $ | 10.13 | $ | 10.41 | $ | 12.76 | $ | 12.86 |
Total Return C,D | | | | .65% | | (15.85)% | | 2.21% | | 7.72% |
Ratios to Average Net Assets B,E,F | | | | | | | | | | |
| Expenses before reductions | | .82% | | .84% | | .81% | | .79% | | .82% |
| Expenses net of fee waivers, if any | | | | .84% | | .81% | | .79% | | .82% |
| Expenses net of all reductions | | .82% | | .83% | | .81% | | .79% | | .82% |
| Net investment income (loss) | | 3.62% | | 3.47% | | 2.42% | | 2.16% | | 2.47% |
| Supplemental Data | | | | | | | | | | |
| Net assets, end of period (000 omitted) | $ | 8,194 | $ | 8,061 | $ | 8,439 | $ | 12,127 | $ | 11,858 |
Portfolio turnover rate G | | | | 24% H | | 26% | | 46% | | 31% H |
ACalculated based on average shares outstanding during the period.
BNet investment income (loss) is affected by the timing of the declaration of dividends by any underlying mutual funds or exchange-traded funds (ETFs). Net investment income (loss) of any mutual funds or ETFs is not included in the Fund's net investment income (loss) ratio.
CTotal returns would have been lower if certain expenses had not been reduced during the applicable periods shown.
DTotal returns do not include the effect of the sales charges.
EFees and expenses of any underlying mutual funds or exchange-traded funds (ETFs) are not included in the Fund's expense ratio. The Fund indirectly bears its proportionate share of these expenses. For additional expense information related to investments in Fidelity Central Funds, please refer to the "Investments in Fidelity Central Funds" note found in the Notes to Financial Statements section of the most recent Annual or Semi-Annual report.
FExpense ratios reflect operating expenses of the class. Expenses before reductions do not reflect amounts reimbursed, waived, or reduced through arrangements with the investment adviser, brokerage services, or other offset arrangements, if applicable, and do not represent the amount paid by the class during periods when reimbursements, waivers or reductions occur.
GAmount does not include the portfolio activity of any underlying mutual funds or exchange-traded funds (ETFs).
HPortfolio turnover rate excludes securities received or delivered in-kind.
Fidelity Advisor® Corporate Bond Fund Class C |
| |
| Years ended August 31, | | 2024 | | 2023 | | 2022 | | 2021 | | 2020 |
Selected Per-Share Data | | | | | | | | | | |
| Net asset value, beginning of period | $ | 10.13 | $ | 10.41 | $ | 12.76 | $ | 12.86 | $ | 12.23 |
| Income from Investment Operations | | | | | | | | | | |
Net investment income (loss) A,B | | .299 | | .280 | | .199 | | .180 | | .215 |
| Net realized and unrealized gain (loss) | | .567 | | (.290) | | (2.271) | | .003 | | .634 |
| Total from investment operations | | .866 | | (.010) | | (2.072) | | .183 | | .849 |
| Distributions from net investment income | | (.296) | | (.270) | | (.191) | | (.176) | | (.219) |
| Distributions from net realized gain | | - | | - | | (.087) | | (.107) | | - |
| Total distributions | | (.296) | | (.270) | | (.278) | | (.283) | | (.219) |
| Net asset value, end of period | $ | 10.70 | $ | 10.13 | $ | 10.41 | $ | 12.76 | $ | 12.86 |
Total Return C,D | | | | (.07)% | | (16.46)% | | 1.46% | | 7.04% |
Ratios to Average Net Assets B,E,F | | | | | | | | | | |
| Expenses before reductions | | 1.54% | | 1.54% | | 1.54% | | 1.54% | | 1.54% |
| Expenses net of fee waivers, if any | | | | 1.54% | | 1.54% | | 1.54% | | 1.54% |
| Expenses net of all reductions | | 1.54% | | 1.54% | | 1.54% | | 1.54% | | 1.54% |
| Net investment income (loss) | | 2.91% | | 2.75% | | 1.70% | | 1.42% | | 1.75% |
| Supplemental Data | | | | | | | | | | |
| Net assets, end of period (000 omitted) | $ | 7,553 | $ | 8,171 | $ | 9,756 | $ | 17,010 | $ | 17,956 |
Portfolio turnover rate G | | | | 24% H | | 26% | | 46% | | 31% H |
ACalculated based on average shares outstanding during the period.
BNet investment income (loss) is affected by the timing of the declaration of dividends by any underlying mutual funds or exchange-traded funds (ETFs). Net investment income (loss) of any mutual funds or ETFs is not included in the Fund's net investment income (loss) ratio.
CTotal returns would have been lower if certain expenses had not been reduced during the applicable periods shown.
DTotal returns do not include the effect of the contingent deferred sales charge.
EFees and expenses of any underlying mutual funds or exchange-traded funds (ETFs) are not included in the Fund's expense ratio. The Fund indirectly bears its proportionate share of these expenses. For additional expense information related to investments in Fidelity Central Funds, please refer to the "Investments in Fidelity Central Funds" note found in the Notes to Financial Statements section of the most recent Annual or Semi-Annual report.
FExpense ratios reflect operating expenses of the class. Expenses before reductions do not reflect amounts reimbursed, waived, or reduced through arrangements with the investment adviser, brokerage services, or other offset arrangements, if applicable, and do not represent the amount paid by the class during periods when reimbursements, waivers or reductions occur.
GAmount does not include the portfolio activity of any underlying mutual funds or exchange-traded funds (ETFs).
HPortfolio turnover rate excludes securities received or delivered in-kind.
Fidelity® Corporate Bond Fund |
| |
| Years ended August 31, | | 2024 | | 2023 | | 2022 | | 2021 | | 2020 |
Selected Per-Share Data | | | | | | | | | | |
| Net asset value, beginning of period | $ | 10.13 | $ | 10.41 | $ | 12.76 | $ | 12.86 | $ | 12.24 |
| Income from Investment Operations | | | | | | | | | | |
Net investment income (loss) A,B | | .410 | | .391 | | .325 | | .318 | | .350 |
| Net realized and unrealized gain (loss) | | .568 | | (.290) | | (2.270) | | .003 | | .624 |
| Total from investment operations | | .978 | | .101 | | (1.945) | | .321 | | .974 |
| Distributions from net investment income | | (.408) | | (.381) | | (.318) | | (.314) | | (.354) |
| Distributions from net realized gain | | - | | - | | (.087) | | (.107) | | - |
| Total distributions | | (.408) | | (.381) | | (.405) | | (.421) | | (.354) |
| Net asset value, end of period | $ | 10.70 | $ | 10.13 | $ | 10.41 | $ | 12.76 | $ | 12.86 |
Total Return C | | | | 1.03% | | (15.54)% | | 2.56% | | 8.12% |
Ratios to Average Net Assets B,D,E | | | | | | | | | | |
| Expenses before reductions | | .45% | | .45% | | .44% | | .45% | | .45% |
| Expenses net of fee waivers, if any | | | | .45% | | .44% | | .45% | | .45% |
| Expenses net of all reductions | | .45% | | .45% | | .44% | | .45% | | .45% |
| Net investment income (loss) | | 3.99% | | 3.85% | | 2.79% | | 2.50% | | 2.84% |
| Supplemental Data | | | | | | | | | | |
| Net assets, end of period (000 omitted) | $ | 965,348 | $ | 863,480 | $ | 975,308 | $ | 1,481,426 | $ | 2,179,540 |
Portfolio turnover rate F | | | | 24% G | | 26% | | 46% | | 31% G |
ACalculated based on average shares outstanding during the period.
BNet investment income (loss) is affected by the timing of the declaration of dividends by any underlying mutual funds or exchange-traded funds (ETFs). Net investment income (loss) of any mutual funds or ETFs is not included in the Fund's net investment income (loss) ratio.
CTotal returns would have been lower if certain expenses had not been reduced during the applicable periods shown.
DFees and expenses of any underlying mutual funds or exchange-traded funds (ETFs) are not included in the Fund's expense ratio. The Fund indirectly bears its proportionate share of these expenses. For additional expense information related to investments in Fidelity Central Funds, please refer to the "Investments in Fidelity Central Funds" note found in the Notes to Financial Statements section of the most recent Annual or Semi-Annual report.
EExpense ratios reflect operating expenses of the class. Expenses before reductions do not reflect amounts reimbursed, waived, or reduced through arrangements with the investment adviser, brokerage services, or other offset arrangements, if applicable, and do not represent the amount paid by the class during periods when reimbursements, waivers or reductions occur.
FAmount does not include the portfolio activity of any underlying mutual funds or exchange-traded funds (ETFs).
GPortfolio turnover rate excludes securities received or delivered in-kind.
Fidelity Advisor® Corporate Bond Fund Class I |
| |
| Years ended August 31, | | 2024 | | 2023 | | 2022 | | 2021 | | 2020 |
Selected Per-Share Data | | | | | | | | | | |
| Net asset value, beginning of period | $ | 10.13 | $ | 10.41 | $ | 12.76 | $ | 12.86 | $ | 12.24 |
| Income from Investment Operations | | | | | | | | | | |
Net investment income (loss) A,B | | .404 | | .386 | | .322 | | .311 | | .344 |
| Net realized and unrealized gain (loss) | | .569 | | (.289) | | (2.273) | | .004 | | .624 |
| Total from investment operations | | .973 | | .097 | | (1.951) | | .315 | | .968 |
| Distributions from net investment income | | (.403) | | (.377) | | (.312) | | (.308) | | (.348) |
| Distributions from net realized gain | | - | | - | | (.087) | | (.107) | | - |
| Total distributions | | (.403) | | (.377) | | (.399) | | (.415) | | (.348) |
| Net asset value, end of period | $ | 10.70 | $ | 10.13 | $ | 10.41 | $ | 12.76 | $ | 12.86 |
Total Return C | | | | .98% | | (15.58)% | | 2.51% | | 8.07% |
Ratios to Average Net Assets A,D,E | | | | | | | | | | |
| Expenses before reductions | | .50% | | .50% | | .50% | | .50% | | .50% |
| Expenses net of fee waivers, if any | | | | .50% | | .50% | | .50% | | .50% |
| Expenses net of all reductions | | .50% | | .50% | | .50% | | .50% | | .50% |
| Net investment income (loss) | | 3.95% | | 3.80% | | 2.74% | | 2.45% | | 2.80% |
| Supplemental Data | | | | | | | | | | |
| Net assets, end of period (000 omitted) | $ | 221,242 | $ | 127,334 | $ | 111,046 | $ | 200,288 | $ | 183,627 |
Portfolio turnover rate F | | | | 24% G | | 26% | | 46% | | 31% G |
ANet investment income (loss) is affected by the timing of the declaration of dividends by any underlying mutual funds or exchange-traded funds (ETFs). Net investment income (loss) of any mutual funds or ETFs is not included in the Fund's net investment income (loss) ratio.
BCalculated based on average shares outstanding during the period.
CTotal returns would have been lower if certain expenses had not been reduced during the applicable periods shown.
DFees and expenses of any underlying mutual funds or exchange-traded funds (ETFs) are not included in the Fund's expense ratio. The Fund indirectly bears its proportionate share of these expenses. For additional expense information related to investments in Fidelity Central Funds, please refer to the "Investments in Fidelity Central Funds" note found in the Notes to Financial Statements section of the most recent Annual or Semi-Annual report.
EExpense ratios reflect operating expenses of the class. Expenses before reductions do not reflect amounts reimbursed, waived, or reduced through arrangements with the investment adviser, brokerage services, or other offset arrangements, if applicable, and do not represent the amount paid by the class during periods when reimbursements, waivers or reductions occur.
FAmount does not include the portfolio activity of any underlying mutual funds or exchange-traded funds (ETFs).
GPortfolio turnover rate excludes securities received or delivered in-kind.
Fidelity Advisor® Corporate Bond Fund Class Z |
| |
| Years ended August 31, | | 2024 | | 2023 | | 2022 | | 2021 | | 2020 |
Selected Per-Share Data | | | | | | | | | | |
| Net asset value, beginning of period | $ | 10.12 | $ | 10.41 | $ | 12.76 | $ | 12.86 | $ | 12.23 |
| Income from Investment Operations | | | | | | | | | | |
Net investment income (loss) A,B | | .419 | | .404 | | .326 | | .328 | | .360 |
| Net realized and unrealized gain (loss) | | .578 | | (.304) | | (2.262) | | .005 | | .635 |
| Total from investment operations | | .997 | | .100 | | (1.936) | | .333 | | .995 |
| Distributions from net investment income | | (.417) | | (.390) | | (.327) | | (.326) | | (.365) |
| Distributions from net realized gain | | - | | - | | (.087) | | (.107) | | - |
| Total distributions | | (.417) | | (.390) | | (.414) | | (.433) | | (.365) |
| Net asset value, end of period | $ | 10.70 | $ | 10.12 | $ | 10.41 | $ | 12.76 | $ | 12.86 |
Total Return C | | | | 1.02% | | (15.47)% | | 2.66% | | 8.30% |
Ratios to Average Net Assets A,D,E | | | | | | | | | | |
| Expenses before reductions | | .40% | | .40% | | .40% | | .40% | | .40% |
| Expenses net of fee waivers, if any | | | | .36% | | .36% | | .36% | | .36% |
| Expenses net of all reductions | | .36% | | .36% | | .36% | | .36% | | .36% |
| Net investment income (loss) | | 4.08% | | 3.94% | | 2.87% | | 2.59% | | 2.93% |
| Supplemental Data | | | | | | | | | | |
| Net assets, end of period (000 omitted) | $ | 734,287 | $ | 614,675 | $ | 3,068,418 | $ | 1,673,604 | $ | 852,967 |
Portfolio turnover rate F | | | | 24% G | | 26% | | 46% | | 31% G |
ANet investment income (loss) is affected by the timing of the declaration of dividends by any underlying mutual funds or exchange-traded funds (ETFs). Net investment income (loss) of any mutual funds or ETFs is not included in the Fund's net investment income (loss) ratio.
BCalculated based on average shares outstanding during the period.
CTotal returns would have been lower if certain expenses had not been reduced during the applicable periods shown.
DExpense ratios reflect operating expenses of the class. Expenses before reductions do not reflect amounts reimbursed, waived, or reduced through arrangements with the investment adviser, brokerage services, or other offset arrangements, if applicable, and do not represent the amount paid by the class during periods when reimbursements, waivers or reductions occur.
EFees and expenses of any underlying mutual funds or exchange-traded funds (ETFs) are not included in the Fund's expense ratio. The Fund indirectly bears its proportionate share of these expenses. For additional expense information related to investments in Fidelity Central Funds, please refer to the "Investments in Fidelity Central Funds" note found in the Notes to Financial Statements section of the most recent Annual or Semi-Annual report.
FAmount does not include the portfolio activity of any underlying mutual funds or exchange-traded funds (ETFs).
GPortfolio turnover rate excludes securities received or delivered in-kind.
Notes to Financial Statements
For the period ended August 31, 2024
1. Organization.
Fidelity Corporate Bond Fund (the Fund) is a fund of Fidelity Salem Street Trust (the Trust) and is authorized to issue an unlimited number of shares. The Trust is registered under the Investment Company Act of 1940, as amended (the 1940 Act), as an open-end management investment company organized as a Massachusetts business trust. The Fund offers Class A, Class M, Class C, Corporate Bond, Class I and Class Z shares, each of which has equal rights as to assets and voting privileges. Class A, Class M, Class C, Class I and Class Z are Fidelity Advisor classes. Each class has exclusive voting rights with respect to matters that affect that class. Class C shares will automatically convert to Class A shares after a holding period of eight years from the initial date of purchase, with certain exceptions.
2. Investments in Fidelity Central Funds.
Funds may invest in Fidelity Central Funds, which are open-end investment companies generally available only to other investment companies and accounts managed by the investment adviser and its affiliates. The Schedule of Investments lists any Fidelity Central Funds held as an investment as of period end, but does not include the underlying holdings of each Fidelity Central Fund. An investing fund indirectly bears its proportionate share of the expenses of the underlying Fidelity Central Funds.
Based on its investment objective, each Fidelity Central Fund may invest or participate in various investment vehicles or strategies that are similar to those of the investing fund. These strategies are consistent with the investment objectives of the investing fund and may involve certain economic risks which may cause a decline in value of each of the Fidelity Central Funds and thus a decline in the value of the investing fund.
| Fidelity Central Fund | Investment Manager | Investment Objective | Investment Practices | Expense RatioA |
| Fidelity Money Market Central Funds | Fidelity Management & Research Company LLC (FMR) | Each fund seeks to obtain a high level of current income consistent with the preservation of capital and liquidity. | Short-term Investments | Less than .005% |
A Expenses expressed as a percentage of average net assets and are as of each underlying Central Fund's most recent annual or semi-annual shareholder report.
A complete unaudited list of holdings for each Fidelity Central Fund is available upon request or at the Securities and Exchange Commission website at www.sec.gov. In addition, the financial statements of the Fidelity Central Funds which contain the significant accounting policies (including investment valuation policies) of those funds, and are not covered by the Report of Independent Registered Public Accounting Firm, are available on the Securities and Exchange Commission website or upon request.
3. Significant Accounting Policies.
The Fund is an investment company and applies the accounting and reporting guidance of the Financial Accounting Standards Board (FASB) Accounting Standards Codification Topic 946 Financial Services - Investment Companies. The financial statements have been prepared in conformity with accounting principles generally accepted in the United States of America (GAAP), which require management to make certain estimates and assumptions at the date of the financial statements. Actual results could differ from those estimates. Subsequent events, if any, through the date that the financial statements were issued have been evaluated in the preparation of the financial statements. The Fund's Schedule of Investments lists any underlying mutual funds or exchange-traded funds (ETFs) but does not include the underlying holdings of these funds. The following summarizes the significant accounting policies of the Fund:
Investment Valuation. Investments are valued as of 4:00 p.m. Eastern time on the last calendar day of the period. The Board of Trustees (the Board) has designated the Fund's investment adviser as the valuation designee responsible for the fair valuation function and performing fair value determinations as needed. The investment adviser has established a Fair Value Committee (the Committee) to carry out the day-to-day fair valuation responsibilities and has adopted policies and procedures to govern the fair valuation process and the activities of the Committee. In accordance with these fair valuation policies and procedures, which have been approved by the Board, the Fund attempts to obtain prices from one or more third party pricing services or brokers to value its investments. When current market prices, quotations or currency exchange rates are not readily available or reliable, investments will be fair valued in good faith by the Committee, in accordance with the policies and procedures. Factors used in determining fair value vary by investment type and may include market or investment specific events, transaction data, estimated cash flows, and market observations of comparable investments. The frequency that the fair valuation procedures are used cannot be predicted and they may be utilized to a significant extent. The Committee manages the Fund's fair valuation practices and maintains the fair valuation policies and procedures. The Fund's investment adviser reports to the Board information regarding the fair valuation process and related material matters.
The Fund categorizes the inputs to valuation techniques used to value its investments into a disclosure hierarchy consisting of three levels as shown below:
Level 1 - unadjusted quoted prices in active markets for identical investments
Level 2 - other significant observable inputs (including quoted prices for similar investments, interest rates, prepayment speeds, etc.)
Level 3 - unobservable inputs (including the Fund's own assumptions based on the best information available)
Valuation techniques used to value the Fund's investments by major category are as follows:
Debt securities, including restricted securities, are valued based on evaluated prices received from third party pricing services or from brokers who make markets in such securities. Corporate bonds, bank notes, foreign government and government agency obligations, municipal securities, preferred securities and U.S. government and government agency obligations are valued by pricing services who utilize matrix pricing which considers yield or price of bonds of comparable quality, coupon, maturity and type or by broker-supplied prices. Asset backed securities are valued by pricing services who utilize matrix pricing which considers prepayment speed assumptions, attributes of the collateral, yield or price of bonds of comparable quality, coupon, maturity and type or by broker-supplied prices. When independent prices are unavailable or unreliable, debt securities may be valued utilizing pricing methodologies which consider similar factors that would be used by third party pricing services. Debt securities are generally categorized as Level 2 in the hierarchy but may be Level 3 depending on the circumstances.
Investments in open-end mutual funds, including the Fidelity Central Funds, are valued at their closing net asset value (NAV) each business day and are categorized as Level 1 in the hierarchy.
Changes in valuation techniques may result in transfers in or out of an assigned level within the disclosure hierarchy. The aggregate value of investments by input level as of August 31, 2024 is included at the end of the Fund's Schedule of Investments.
Investment Transactions and Income. For financial reporting purposes, the Fund's investment holdings and NAV include trades executed through the end of the last business day of the period. The NAV per share for processing shareholder transactions is calculated as of the close of business of the New York Stock Exchange (NYSE), normally 4:00 p.m. Eastern time and includes trades executed through the end of the prior business day. Gains and losses on securities sold are determined on the basis of identified cost and include proceeds received from litigation. Dividend income is recorded on the ex-dividend date. Non-cash dividends included in dividend income, if any, are recorded at the fair market value of the securities received. Income and capital gain distributions from Fidelity Central Funds, if any, are recorded on the ex-dividend date. Interest income is accrued as earned and includes coupon interest and amortization of premium and accretion of discount on debt securities as applicable. Debt obligations may be placed on non-accrual status and related interest income may be reduced by ceasing current accruals and writing off interest receivables when the collection of all or a portion of interest has become doubtful based on consistently applied procedures. A debt obligation is removed from non-accrual status when the issuer resumes interest payments or when collectability of interest is reasonably assured.
Class Allocations and Expenses. Investment income, realized and unrealized capital gains and losses, common expenses of a fund, and certain fund-level expense reductions, if any, are allocated daily on a pro-rata basis to each class based on the relative net assets of each class to the total net assets of a fund. Each class differs with respect to transfer agent and distribution and service plan fees incurred, as applicable. Certain expense reductions may also differ by class, if applicable. For the reporting period, the allocated portion of income and expenses to each class as a percent of its average net assets may vary due to the timing of recording these transactions in relation to fluctuating net assets of the classes. Expenses directly attributable to a fund are charged to that fund. Expenses attributable to more than one fund are allocated among the respective funds on the basis of relative net assets or other appropriate methods. Expenses included in the accompanying financial statements reflect the expenses of that fund and do not include any expenses associated with any underlying mutual funds or exchange-traded funds (ETFs). Although not included in a fund's expenses, a fund indirectly bears its proportionate share of these expenses through the net asset value of each underlying mutual fund or exchange-traded fund (ETF). Expense estimates are accrued in the period to which they relate and adjustments are made when actual amounts are known.
Income Tax Information and Distributions to Shareholders. Each year, the Fund intends to qualify as a regulated investment company under Subchapter M of the Internal Revenue Code, including distributing substantially all of its taxable income and realized gains. As a result, no provision for U.S. Federal income taxes is required. As of August 31, 2024, the Fund did not have any unrecognized tax benefits in the financial statements; nor is the Fund aware of any tax positions for which it is reasonably possible that the total amounts of unrecognized tax benefits will significantly change in the next twelve months. The Fund files a U.S. federal tax return, in addition to state and local tax returns as required. The Fund's federal income tax returns are subject to examination by the Internal Revenue Service (IRS) for a period of three fiscal years after they are filed. State and local tax returns may be subject to examination for an additional fiscal year depending on the jurisdiction.
Distributions are declared and recorded daily and paid monthly from net investment income. Distributions from realized gains, if any, are declared and recorded on the ex-dividend date. Income and capital gain distributions are declared separately for each class. Income and capital gain distributions are determined in accordance with income tax regulations, which may differ from GAAP.
Capital accounts within the financial statements are adjusted for permanent book-tax differences. These adjustments have no impact on net assets or the results of operations. Capital accounts are not adjusted for temporary book-tax differences which will reverse in a subsequent period.
Book-tax differences are primarily due to market discount, capital loss carryforwards and losses deferred due to wash sales.
As of period end, the cost and unrealized appreciation (depreciation) in securities, and derivatives if applicable, for federal income tax purposes were as follows:
| Gross unrealized appreciation | $34,039,530 |
| Gross unrealized depreciation | (129,786,263) |
| Net unrealized appreciation (depreciation) | $(95,746,733) |
| Tax Cost | $2,090,090,991 |
The tax-based components of distributable earnings as of period end were as follows:
| Capital loss carryforward | $(108,267,297) |
| Net unrealized appreciation (depreciation) on securities and other investments | $(95,746,733) |
Capital loss carryforwards are only available to offset future capital gains of the Fund to the extent provided by regulations and may be limited. The capital loss carryforward information presented below, including any applicable limitation, is estimated as of fiscal period end and is subject to adjustment.
Short-term | $(70,694,256) |
Long-term | (37,573,041) |
| Total capital loss carryforward | $(108,267,297) |
Due to large redemptions in a prior period, the Fund is subject to an annual limit on its use of some of its unrealized capital losses to offset capital gains in future periods. If those losses are realized and the limitation prevents the Fund from using any of those losses in a future period, those capital losses will be available to offset capital gains in subsequent periods.
The tax character of distributions paid was as follows:
| | August 31, 2024 | August 31, 2023 |
| Ordinary Income | $68,746,009 | $ 119,460,178 |
| Long-term Capital Gains | - | - |
| Total | $68,746,009 | $ 119,460,178 |
Restricted Securities (including Private Placements). Funds may invest in securities that are subject to legal or contractual restrictions on resale. These securities generally may be resold in transactions exempt from registration or to the public if the securities are registered. Disposal of these securities may involve time-consuming negotiations and expense, and prompt sale at an acceptable price may be difficult. Information regarding restricted securities held at period end is included at the end of the Schedule of Investments, if applicable.
4. Purchases and Sales of Investments.
Purchases and sales of securities, other than short-term securities, U.S. government securities and in-kind transactions, as applicable, are noted in the table below.
| | Purchases ($) | Sales ($) |
| Fidelity Corporate Bond Fund | 368,689,444 | 243,095,502 |
5. Fees and Other Transactions with Affiliates.
Management Fee. Fidelity Management & Research Company LLC (the investment adviser) and its affiliates provide the Fund with investment management related services for which the Fund pays a monthly management fee that is based on an annual rate of .35% of the Fund's average net assets. Under the management contract, the investment adviser pays all other expenses, except the compensation of the independent Trustees and certain other expenses such as transfer agent and distribution and service plan fees, and other expenses such as interest expense.
Distribution and Service Plan Fees. In accordance with Rule 12b-1 of the 1940 Act, the Fund has adopted separate Distribution and Service Plans for each class of shares. Certain classes pay Fidelity Distributors Company LLC (FDC), an affiliate of the investment adviser, separate Distribution and Service Fees, each of which is based on an annual percentage of each class' average net assets. In addition, FDC may pay financial intermediaries for selling shares of the Fund and providing shareholder support services. For the period, the Distribution and Service Fee rates, total fees and amounts retained by FDC were as follows:
| | Distribution Fee | Service Fee | Total Fees ($) | Retained by FDC ($) |
| Class A | - % | .25% | 150,859 | 6,893 |
| Class M | - % | .25% | 19,975 | 14 |
| Class C | .75% | .25% | 75,801 | 8,811 |
| | | | 246,635 | 15,718 |
Sales Load. FDC may receive a front-end sales charge of up to 4.00% for selling Class A shares and Class M shares, some of which is paid to financial intermediaries for selling shares of the Fund. Depending on the holding period, FDC may receive contingent deferred sales charges levied on Class A, Class M and Class C redemptions. The deferred sales charges are 1.00% for Class C shares, .75% for certain purchases of Class A shares and .25% for certain purchases of Class M shares.
For the period, sales charge amounts retained by FDC were as follows:
| | Retained by FDC ($) |
| Class A | 11,455 |
| Class M | 599 |
Class C A | 609 |
| | 12,663 |
A When Class C shares are initially sold, FDC pays commissions from its own resources to financial intermediaries through which the sales are made.
Transfer Agent Fees. Fidelity Investments Institutional Operations Company LLC (FIIOC), an affiliate of the investment adviser, is the transfer, dividend disbursing and shareholder servicing agent for each class of the Fund. FIIOC receives account fees and asset-based fees that vary according to the account size and type of account of the shareholders of each respective class of the Fund, with the exception of Corporate Bond and Class Z. FIIOC receives an asset-based fee of Corporate Bond's and Class Z's average net assets. FIIOC pays for typesetting, printing and mailing of shareholder reports, except proxy statements. For the period, transfer agent fees for each class were as follows:
| | Amount ($) | % of Class-Level Average Net Assets |
| Class A | 105,229 | .17 |
| Class M | 17,751 | .22 |
| Class C | 14,185 | .19 |
| Corporate Bond | 884,294 | .10 |
| Class I | 231,918 | .15 |
| Class Z | 302,913 | .05 |
| | 1,556,290 | |
Interfund Trades. Funds may purchase from or sell securities to other Fidelity Funds under procedures adopted by the Board. The procedures have been designed to ensure these interfund trades are executed in accordance with Rule 17a-7 of the 1940 Act. Any interfund trades are included within the respective purchases and sales amounts shown in the Purchases and Sales of Investments note. During the period, there were no interfund trades.
Prior Fiscal Year Affiliated Redemptions In-Kind. Shares that were redeemed in-kind for investments, including accrued interest and cash, if any, are shown in the table below; along with realized gain or loss on investments delivered through in-kind redemptions. The amount of the in-kind redemptions is included in share transactions in the accompanying Statement of Changes in Net Assets. There was no gain or loss for federal income tax purposes.
| | Shares | Total net realized gain or loss ($) | Total Proceeds ($) |
| Fidelity Corporate Bond Fund | 271,635,650 | (306,798,495) | 2,797,847,189 |
Sub-Advisory Arrangements. Effective March 1, 2024, the Fund's sub-advisory agreements with FMR Investment Management (UK) Limited, Fidelity Management & Research (Hong Kong) Limited, and Fidelity Management & Research (Japan) Limited were amended to provide that the investment adviser pays each sub-adviser monthly fees equal to 110% of the sub-adviser's costs for providing sub-advisory services.
6. Committed Line of Credit.
Certain Funds participate with other funds managed by the investment adviser or an affiliate in a $4.25 billion credit facility (the "line of credit") to be utilized for temporary or emergency purposes to fund shareholder redemptions or for other short-term liquidity purposes. The commitment fees on the pro-rata portion of the line of credit are borne by the investment adviser. During the period, there were no borrowings on this line of credit.
7. Expense Reductions.
The investment adviser contractually agreed to reimburse expenses of each class to the extent annual operating expenses exceeded certain levels of class-level average net assets as noted in the table below. This reimbursement will remain in place through December 31, 2025. Some expenses, for example the compensation of the independent Trustees, and certain other expenses such as interest expense, are excluded from this reimbursement.
The following classes were in reimbursement during the period:
| | Expense Limitations | Reimbursement ($) |
| Class Z | .36% | 240,461 |
| | | 240,461 |
Through arrangements with the Fund's custodian and each class' transfer agent, credits realized as a result of certain uninvested cash balances were used to reduce the Fund's expenses. During the period, custodian credits reduced the Fund's expenses by $1,889. During the period, transfer agent credits reduced each class' expenses as noted in the table below.
| | Expense reduction ($) |
| | |
| Class M | 25 |
8. Distributions to Shareholders.
Distributions to shareholders of each class were as follows:
| | Year ended August 31, 2024 | Year ended August 31, 2023 |
| Fidelity Corporate Bond Fund | | |
| Distributions to shareholders | | |
| Class A | $2,201,293 | $1,955,268 |
| Class M | 287,792 | 274,530 |
| Class C | 218,759 | 235,971 |
| Corporate Bond | 35,259,443 | 33,206,920 |
| Class I | 6,147,086 | 4,114,668 |
| Class Z | 24,631,636 | 79,672,821 |
Total | $68,746,009 | $119,460,178 |
9. Share Transactions.
Share transactions for each class were as follows and may contain in-kind transactions, automatic conversions between classes or exchanges between affiliated funds:
| | Shares | Shares | Dollars | Dollars |
| | Year ended August 31, 2024 | Year ended August 31, 2023 | Year ended August 31, 2024 | Year ended August 31, 2023 |
| Fidelity Corporate Bond Fund | | | | |
| Class A | | | | |
| Shares sold | 1,692,890 | 1,423,074 | $17,433,797 | $14,514,579 |
| Reinvestment of distributions | 212,271 | 190,673 | 2,183,438 | 1,937,063 |
| Shares redeemed | (1,552,856) | (1,633,205) | (15,868,715) | (16,602,695) |
| Net increase (decrease) | 352,305 | (19,458) | $3,748,520 | $(151,053) |
| Class M | | | | |
| Shares sold | 79,334 | 96,681 | $811,870 | $988,404 |
| Reinvestment of distributions | 27,826 | 26,868 | 286,123 | 272,953 |
| Shares redeemed | (137,196) | (138,360) | (1,406,203) | (1,403,006) |
| Net increase (decrease) | (30,036) | (14,811) | $(308,210) | $(141,649) |
| Class C | | | | |
| Shares sold | 189,806 | 156,679 | $1,970,038 | $1,597,652 |
| Reinvestment of distributions | 21,177 | 23,099 | 217,609 | 234,588 |
| Shares redeemed | (311,819) | (310,353) | (3,191,409) | (3,149,840) |
| Net increase (decrease) | (100,836) | (130,575) | $(1,003,762) | $(1,317,600) |
| Corporate Bond | | | | |
| Shares sold | 25,505,483 | 13,930,427 | $263,619,194 | $142,011,626 |
| Reinvestment of distributions | 3,001,818 | 2,893,315 | 30,877,522 | 29,373,877 |
| Shares redeemed | (23,535,147) | (25,270,881) | (242,004,342) | (254,078,941) |
| Net increase (decrease) | 4,972,154 | (8,447,139) | $52,492,374 | $(82,693,438) |
| Class I | | | | |
| Shares sold | 15,797,664 | 9,044,481 | $161,584,097 | $92,367,489 |
| Reinvestment of distributions | 586,354 | 376,245 | 6,045,920 | 3,824,737 |
| Shares redeemed | (8,278,242) | (7,517,022) | (85,897,998) | (76,536,603) |
| Net increase (decrease) | 8,105,776 | 1,903,704 | $81,732,019 | $19,655,623 |
| Class Z | | | | |
| Shares sold | 30,653,412 | 44,097,392 | $316,827,397 | $448,830,214 |
| Reinvestment of distributions | 2,236,724 | 7,070,433 | 22,997,347 | 71,397,858 |
| Shares redeemed | (24,954,418) | (285,342,930) | (256,341,027) | (2,937,753,277) |
| Net increase (decrease) | 7,935,718 | (234,175,105) | $83,483,717 | $(2,417,525,205) |
10. Other.
A fund's organizational documents provide former and current trustees and officers with a limited indemnification against liabilities arising in connection with the performance of their duties to the fund. In the normal course of business, a fund may also enter into contracts that provide general indemnifications. A fund's maximum exposure under these arrangements is unknown as this would be dependent on future claims that may be made against a fund. The risk of material loss from such claims is considered remote.
11. Risk and Uncertainties.
Many factors affect a fund's performance. Developments that disrupt global economies and financial markets, such as pandemics, epidemics, outbreaks of infectious diseases, war, terrorism, and environmental disasters, may significantly affect a fund's investment performance. The effects of these developments to a fund will be impacted by the types of securities in which a fund invests, the financial condition, industry, economic sector, and geographic location of an issuer, and a fund's level of investment in the securities of that issuer. Significant concentrations in security types, issuers, industries, sectors, and geographic locations may magnify the factors that affect a fund's performance.
Report of Independent Registered Public Accounting Firm
To the Board of Trustees of Fidelity Salem Street Trust and Shareholders of Fidelity Corporate Bond Fund
Opinion on the Financial Statements
We have audited the accompanying statement of assets and liabilities, including the schedule of investments, of Fidelity Corporate Bond Fund (one of the funds constituting Fidelity Salem Street Trust, referred to hereafter as the "Fund") as of August 31, 2024, the related statement of operations for the year ended August 31, 2024, the statement of changes in net assets for each of the two years in the period ended August 31, 2024, including the related notes, and the financial highlights for each of the five years in the period ended August 31, 2024 (collectively referred to as the "financial statements"). In our opinion, the financial statements present fairly, in all material respects, the financial position of the Fund as of August 31, 2024, the results of its operations for the year then ended, the changes in its net assets for each of the two years in the period ended August 31, 2024 and the financial highlights for each of the five years in the period ended August 31, 2024 in conformity with accounting principles generally accepted in the United States of America.
Basis for Opinion
These financial statements are the responsibility of the Fund's management. Our responsibility is to express an opinion on the Fund's financial statements based on our audits. We are a public accounting firm registered with the Public Company Accounting Oversight Board (United States) (PCAOB) and are required to be independent with respect to the Fund in accordance with the U.S. federal securities laws and the applicable rules and regulations of the Securities and Exchange Commission and the PCAOB.
We conducted our audits of these financial statements in accordance with the standards of the PCAOB. Those standards require that we plan and perform the audit to obtain reasonable assurance about whether the financial statements are free of material misstatement, whether due to error or fraud.
Our audits included performing procedures to assess the risks of material misstatement of the financial statements, whether due to error or fraud, and performing procedures that respond to those risks. Such procedures included examining, on a test basis, evidence regarding the amounts and disclosures in the financial statements. Our audits also included evaluating the accounting principles used and significant estimates made by management, as well as evaluating the overall presentation of the financial statements. Our procedures included confirmation of securities owned as of August 31, 2024 by correspondence with the custodian and brokers; when replies were not received from brokers, we performed other auditing procedures. We believe that our audits provide a reasonable basis for our opinion.
/s/ PricewaterhouseCoopers LLP
Boston, Massachusetts
October 16, 2024
We have served as the auditor of one or more investment companies in the Fidelity group of funds since 1932.
Distributions
(Unaudited)
The dividend and capital gains distributions for the fund(s) are available on Fidelity.com or Institutional.Fidelity.com.
A total of 8.66% of the dividends distributed during the fiscal year was derived from interest on U.S. Government securities which is generally exempt from state income tax.
The fund designates $70,893,734 of distributions paid in the calendar year 2023 as qualifying to be taxed as interest-related dividends for nonresident alien shareholders.
The fund designates $68,746,009 of distributions paid during the fiscal year ended 2024 as qualifying to be taxed as section 163(j) interest dividends.
The fund will notify shareholders in January 2025 of amounts for use in preparing 2024 income tax returns.
Item 8: Changes in and Disagreements with Accountants for Open-End Management Investment Companies
(Unaudited)
Note: This is not applicable for any fund included in this document.
Item 9: Proxy Disclosures for Open-End Management Investment Companies
(Unaudited)
| A special meeting of shareholders was held on October 18, 2023. The results of votes taken among shareholders on the proposal before them are reported below. Each vote reported represents one dollar of net asset value held on the record date for the meeting. |
| Proposal 1 |
| To elect a Board of Trustees. |
| | # of Votes | % of Votes |
| Abigail P. Johnson |
| Affirmative | 378,729,502,260.01 | 97.58 |
| Withheld | 9,407,876,478.96 | 2.42 |
| TOTAL | 388,137,378,738.97 | 100.00 |
| Jennifer Toolin McAuliffe |
| Affirmative | 378,454,868,010.95 | 97.51 |
| Withheld | 9,682,510,728.02 | 2.49 |
| TOTAL | 388,137,378,738.97 | 100.00 |
| Christine J. Thompson |
| Affirmative | 378,837,121,274.52 | 97.60 |
| Withheld | 9,300,257,464.45 | 2.40 |
| TOTAL | 388,137,378,738.97 | 100.00 |
| Elizabeth S. Acton |
| Affirmative | 378,262,110,794.85 | 97.46 |
| Withheld | 9,875,267,944.12 | 2.54 |
| TOTAL | 388,137,378,738.97 | 100.00 |
| Laura M. Bishop |
| Affirmative | 380,482,113,171.06 | 98.03 |
| Withheld | 7,655,265,567.91 | 1.97 |
| TOTAL | 388,137,378,738.97 | 100.00 |
| Ann E. Dunwoody |
| Affirmative | 380,016,034,008.12 | 97.91 |
| Withheld | 8,121,344,730.85 | 2.09 |
| TOTAL | 388,137,378,738.97 | 100.00 |
| John Engler |
| Affirmative | 379,432,488,394.20 | 97.76 |
| Withheld | 8,704,890,344.77 | 2.24 |
| TOTAL | 388,137,378,738.97 | 100.00 |
| Robert F. Gartland |
| Affirmative | 378,741,819,600.60 | 97.58 |
| Withheld | 9,395,559,138.37 | 2.42 |
| TOTAL | 388,137,378,738.97 | 100.00 |
| Robert W. Helm |
| Affirmative | 380,389,324,755.07 | 98.00 |
| Withheld | 7,748,053,983.90 | 2.00 |
| TOTAL | 388,137,378,738.97 | 100.00 |
| Arthur E. Johnson |
| Affirmative | 378,427,694,151.67 | 97.50 |
| Withheld | 9,709,684,587.30 | 2.50 |
| TOTAL | 388,137,378,738.97 | 100.00 |
| Michael E. Kenneally |
| Affirmative | 377,842,228,145.18 | 97.35 |
| Withheld | 10,295,150,593.79 | 2.65 |
| TOTAL | 388,137,378,738.97 | 100.00 |
| Mark A. Murray |
| Affirmative | 380,158,432,703.37 | 97.94 |
| Withheld | 7,978,946,035.60 | 2.06 |
| TOTAL | 388,137,378,738.97 | 100.00 |
| Carol J. Zierhoffer |
| Affirmative | 380,522,113,360.24 | 98.04 |
| Withheld | 7,615,265,378.73 | 1.96 |
| TOTAL | 388,137,378,738.97 | 100.00 |
| | | |
| Proposal 1 reflects trust-wide proposal and voting results. |
Item 10: Remuneration Paid to Directors, Officers, and others of Open-End Management Investment Companies
(Unaudited)
Note: This information is disclosed as part of the financial statements for each Fund as part of Item 7: Financial Statements and Financial Highlights for Open-End Management Investment companies.
Item 11: Statement Regarding Basis for Approval of Investment Advisory Contract
(Unaudited)
Note: This is not applicable for any fund included in this document.
1.907004.114
CBD-ANN-1024
Fidelity® Series Government Money Market Fund
Annual Report
August 31, 2024
Contents
To view a fund's proxy voting guidelines and proxy voting record for the 12-month period ended June 30, visit http://www.fidelity.com/proxyvotingresults or visit the Securities and Exchange Commission's (SEC) web site at http://www.sec.gov.
You may also call 1-800-544-8544 to request a free copy of the proxy voting guidelines.
Standard & Poor's, S&P and S&P 500 are registered service marks of The McGraw-Hill Companies, Inc. and have been licensed for use by Fidelity Distributors Corporation.
Other third-party marks appearing herein are the property of their respective owners.
All other marks appearing herein are registered or unregistered trademarks or service marks of FMR LLC or an affiliated company. © 2024 FMR LLC. All rights reserved.
This report and the financial statements contained herein are submitted for the general information of the shareholders of the Fund. This report is not authorized for distribution to prospective investors in the Fund unless preceded or accompanied by an effective prospectus.
A fund files its complete schedule of portfolio holdings with the SEC for the first and third quarters of each fiscal year on Form N-PORT. Forms N-PORT are available on the SEC's web site at http://www.sec.gov. A fund's Forms N-PORT may be reviewed and copied at the SEC's Public Reference Room in Washington, DC. Information regarding the operation of the SEC's Public Reference Room may be obtained by calling 1-800-SEC-0330.
For a complete list of a fund's portfolio holdings, view the most recent holdings listing, semiannual report, or annual report on Fidelity's web site at http://www.fidelity.com, http://www.institutional.fidelity.com, or http://www.401k.com, as applicable.
NOT FDIC INSURED •MAY LOSE VALUE •NO BANK GUARANTEE
Neither the Fund nor Fidelity Distributors Corporation is a bank.
Item 7: Financial Statements and Financial Highlights for Open-End Management Investment Companies (Annual Report)
Fidelity® Series Government Money Market Fund
Schedule of Investments August 31, 2024
Showing Percentage of Net Assets
| U.S. Government Agency Repurchase Agreement - 15.1% |
| | | Maturity Amount ($) | Value ($) |
| In a joint trading account at 5.33% dated 8/30/24 due 9/3/24 (Collateralized by U.S. Government Obligations) # | | 119,632,817 | 119,562,000 |
| With: | | | |
| ABN AMRO Bank NV at 5.35%, dated 8/30/24 due 9/3/24 (Collateralized by U.S. Government Obligations valued at $3,061,884, 0.38% - 6.00%, 11/15/25 - 2/1/54) | | 3,001,783 | 3,000,000 |
| Bank of America NA at 5.39%, dated 5/6/24 due 9/3/24 (Collateralized by U.S. Government Obligations valued at $1,038,326, 3.00%, 9/1/42) | | 1,017,967 | 1,000,000 |
| Barclays Bank PLC at 5.34%, dated 8/30/24 due 9/3/24 (Collateralized by U.S. Government Obligations valued at $4,082,421, 4.00%, 1/20/54) | | 4,002,373 | 4,000,000 |
| BMO Harris Bank NA at: | | | |
5.34%, dated: | | | |
| 8/5/24 due 9/6/24 (Collateralized by U.S. Government Obligations valued at $2,048,776, 7.00% - 8.00%, 4/20/54 - 8/20/54) | | 2,011,273 | 2,000,000 |
| 8/19/24 due 9/6/24 (Collateralized by U.S. Government Obligations valued at $1,032,293, 6.50%, 7/20/54) | | 1,004,598 | 1,000,000 |
| 8/23/24 due 9/6/24 (Collateralized by U.S. Government Obligations valued at $2,063,362, 6.50%, 7/20/54) | | 2,007,120 | 2,000,000 |
5.35%, dated 8/13/24 due 9/6/24 (Collateralized by U.S. Government Obligations valued at $2,066,429, 6.50%, 7/20/54) | | 2,009,214 | 2,000,000 |
| BNP Paribas, SA at 5.34%, dated 8/2/24 due 9/6/24 (Collateralized by U.S. Treasury Obligations valued at $6,192,662, 0.00% - 6.50%, 10/31/25 - 6/1/54) | | 6,042,720 | 6,000,000 |
| BNY Mellon Capital Markets Corp. at 5.39%, dated 8/1/24 due 9/19/24 (Collateralized by U.S. Treasury Obligations valued at $4,100,239, 0.00% - 5.50%, 9/30/24 - 8/1/54) | | 4,029,346 | 4,000,000 |
| BofA Securities, Inc. at: | | | |
5.14%, dated 8/27/24 due 11/27/24 (Collateralized by U.S. Government Obligations valued at $1,021,020, 2.00% - 6.00%, 8/1/26 - 5/1/54) | | 1,013,136 | 1,000,000 |
5.37%, dated 7/2/24 due 9/6/24 (Collateralized by U.S. Government Obligations valued at $2,059,201, 2.00% - 6.50%, 4/1/28 - 1/1/53) (c)(d)(f) | | 2,027,447 | 2,000,000 |
5.39%, dated: | | | |
| 6/4/24 due 9/4/24 (Collateralized by U.S. Government Obligations valued at $1,033,909, 2.00% - 6.00%, 7/1/34 - 8/1/52) (c)(d)(f) | | 1,013,774 | 1,000,000 |
| 6/6/24 due 9/6/24 (Collateralized by U.S. Government Obligations valued at $3,100,808, 2.50% - 7.00%, 9/1/25 - 8/20/64) (c)(d)(f) | | 3,041,323 | 3,000,000 |
| 7/2/24 due 10/2/24 (Collateralized by U.S. Government Obligations valued at $8,237,088, 2.50% - 7.50%, 4/1/30 - 8/20/54) (c)(d)(f) | | 8,110,196 | 8,000,000 |
| 7/18/24 due 10/18/24 (Collateralized by U.S. Government Obligations valued at $4,108,750, 2.50% - 5.50%, 8/1/27 - 12/1/53) (c)(d)(f) | | 4,055,098 | 4,000,000 |
| 7/25/24 due 10/25/24 (Collateralized by U.S. Government Obligations valued at $1,026,117, 2.00% - 5.50%, 2/1/34 - 4/1/54) (c)(d)(f) | | 1,013,774 | 1,000,000 |
| 7/26/24 due 10/28/24 (Collateralized by U.S. Government Obligations valued at $1,025,965, 2.00% - 7.00%, 7/1/38 - 11/20/63) (c)(d)(f) | | 1,014,074 | 1,000,000 |
| 7/30/24 due 10/30/24 (Collateralized by U.S. Government Obligations valued at $6,152,102, 4.00% - 4.35%, 1/1/32 - 9/1/52) (c)(d)(f) | | 6,082,647 | 6,000,000 |
5.43%, dated 8/16/24 due 11/29/24 (Collateralized by U.S. Government Obligations valued at $4,091,078, 2.50% - 7.50%, 8/1/28 - 9/20/53) (c)(d)(f) | | 4,063,350 | 4,000,000 |
| CIBC Bank U.S.A. at: | | | |
5.35%, dated: | | | |
| 7/22/24 due 9/6/24 (Collateralized by U.S. Government Obligations valued at $2,053,104, 0.75% - 6.00%, 1/15/26 - 10/1/53) | | 2,017,536 | 2,000,000 |
| 8/13/24 due 9/6/24 (Collateralized by U.S. Government Obligations valued at $5,115,953, 1.38% - 7.00%, 9/30/25 - 3/1/54) | | 5,025,264 | 5,000,000 |
5.41%, dated 7/22/24 due 9/19/24 (Collateralized by U.S. Government Obligations valued at $1,026,686, 0.88% - 7.03%, 6/30/26 - 11/20/70) | | 1,008,866 | 1,000,000 |
| Citibank NA at 5.36%, dated 8/28/24 due 9/4/24 (Collateralized by U.S. Government Obligations valued at $3,063,764, 1.91% - 7.00%, 8/15/28 - 12/15/65) | | 3,003,127 | 3,000,000 |
| Citigroup Global Capital Markets, Inc. at: | | | |
5.34%, dated 8/7/24 due 9/6/24 (Collateralized by U.S. Government Obligations valued at $3,072,306, 1.13% - 6.00%, 2/28/27 - 11/1/36) | | 3,013,350 | 3,000,000 |
5.36%, dated 8/28/24 due 9/4/24 (Collateralized by U.S. Government Obligations valued at $5,104,570, 1.25% - 5.50%, 4/30/28 - 6/1/39) | | 5,005,211 | 5,000,000 |
5.37%, dated: | | | |
| 8/6/24 due 10/7/24 (Collateralized by U.S. Government Obligations valued at $6,145,623, 1.25% - 6.50%, 4/30/28 - 6/1/54) | | 6,055,490 | 6,000,000 |
| 8/28/24 due 10/29/24 (Collateralized by U.S. Government Obligations valued at $7,146,415, 1.25% - 6.50%, 4/30/28 - 4/1/54) | | 7,064,738 | 7,000,000 |
5.38%, dated 8/16/24 due 10/17/24 (Collateralized by U.S. Government Obligations valued at $6,136,534, 1.25% - 6.50%, 4/30/28 - 4/1/54) | | 6,055,593 | 6,000,000 |
| Fixed Income Clearing Corp. - Mizuho Bank at 5.33%, dated 8/30/24 due 9/3/24 (Collateralized by U.S. Government Obligations valued at $11,226,698, 1.25% - 7.50%, 4/30/28 - 8/20/54) | | 11,006,514 | 11,000,000 |
| Fixed Income Clearing Corp. - SSB at 5.35%, dated 8/30/24 due 9/3/24 (Collateralized by U.S. Government Obligations valued at $7,348,245, 2.00% - 6.50%, 9/1/34 - 8/1/54) | | 7,004,161 | 7,000,000 |
| Goldman Sachs & Co. at: | | | |
5.34%, dated: | | | |
| 8/29/24 due 9/5/24 (Collateralized by U.S. Treasury Obligations valued at $15,311,398, 2.13%, 5/31/26) | | 15,015,575 | 15,000,000 |
| 8/30/24 due 9/6/24 (Collateralized by U.S. Treasury Obligations valued at $24,494,549, 0.50% - 6.50%, 11/15/24 - 12/20/52) | | 24,024,920 | 24,000,000 |
5.35%, dated 8/28/24 due 9/4/24 (Collateralized by U.S. Government Obligations valued at $17,355,538, 1.50% - 6.00%, 4/30/31 - 8/1/54) | | 17,017,685 | 17,000,000 |
| ING Financial Markets LLC at 5.39%, dated: | | | |
8/1/24 due 9/19/24 (Collateralized by U.S. Government Obligations valued at $5,125,199, 6.00%, 1/20/54) | | 5,036,682 | 5,000,000 |
8/2/24 due 9/20/24 (Collateralized by U.S. Government Obligations valued at $2,049,775, 6.00%, 1/20/54) | | 2,014,673 | 2,000,000 |
8/5/24 due 9/19/24 (Collateralized by U.S. Government Obligations valued at $2,048,859, 6.00%, 1/20/54) | | 2,013,475 | 2,000,000 |
| Mitsubishi UFJ Securities (U.S.A.), Inc. at 5.39%, dated 8/1/24 due 10/23/24 (Collateralized by U.S. Government Obligations valued at $9,225,357, 2.50% - 6.00%, 7/1/27 - 5/1/54), | | 9,111,843 | 9,000,000 |
| MUFG Securities (Canada), Ltd. at 5.39%, dated 8/1/24 due 10/23/24 (Collateralized by U.S. Government Obligations valued at $2,050,158, 0.13% - 6.50%, 7/15/26 - 7/1/54) | | 2,024,854 | 2,000,000 |
| Pnc Bank NA (GOV REPO) at 5.34%, dated 8/30/24 due 9/3/24 (Collateralized by U.S. Government Obligations valued at $1,020,606, 2.00%, 3/1/36) | | 1,000,593 | 1,000,000 |
| RBC Dominion Securities at 5.36%, dated 8/27/24 due 9/3/24 (Collateralized by U.S. Government Obligations valued at $2,042,156, 0.00% - 6.50%, 10/15/24 - 3/1/54) | | 2,002,084 | 2,000,000 |
| RBC Financial Group at 5.35%, dated 7/31/24 due 9/6/24 (Collateralized by U.S. Government Obligations valued at $21,623,123, 0.00% - 7.50%, 1/31/25 - 8/20/54) | | 21,156,042 | 21,000,000 |
| SMBC Nikko Securities America, Inc. at 5.33%, dated 8/30/24 due 9/3/24 (Collateralized by U.S. Government Obligations valued at $3,061,812, 5.00% - 6.50%, 9/1/52 - 1/1/54) | | 3,001,777 | 3,000,000 |
| TD Securities (U.S.A.) at 5.34%, dated 8/30/24 due 9/3/24 (Collateralized by U.S. Treasury Obligations valued at $4,122,469, 2.13%, 2/15/54) | | 4,002,373 | 4,000,000 |
| Wells Fargo Securities, LLC at: | | | |
5.17%, dated 8/26/24 due 11/26/24 (Collateralized by U.S. Government Obligations valued at $3,063,517, 6.00%, 7/1/54) | | 3,039,637 | 3,000,000 |
5.39%, dated: | | | |
| 6/11/24 due 9/19/24 (Collateralized by U.S. Government Obligations valued at $3,098,485, 5.00%, 2/1/53) | | 3,044,917 | 3,000,000 |
| 6/12/24 due 9/19/24 (Collateralized by U.S. Government Obligations valued at $3,098,027, 5.50% - 6.50%, 11/1/52 - 8/1/54) | | 3,044,468 | 3,000,000 |
| 6/13/24 due 9/19/24 (Collateralized by U.S. Government Obligations valued at $3,097,568, 5.00% - 6.50%, 2/1/53 - 8/1/54) | | 3,044,018 | 3,000,000 |
| 6/21/24 due 9/19/24 (Collateralized by U.S. Government Obligations valued at $4,125,204, 6.00%, 7/1/54) | | 4,053,900 | 4,000,000 |
| 7/16/24 due 9/16/24 (Collateralized by U.S. Government Obligations valued at $3,082,449, 5.50%, 5/1/39) | | 3,027,848 | 3,000,000 |
| TOTAL U.S. GOVERNMENT AGENCY REPURCHASE AGREEMENT (Cost $357,562,000) | | | 357,562,000 |
| | | | |
| U.S. Treasury Repurchase Agreement - 22.5% |
| | | Maturity Amount ($) | Value ($) |
| With: | | | |
| Barclays Bank PLC at 5.34%, dated: | | | |
8/1/24 due 9/6/24 (Collateralized by U.S. Treasury Obligations valued at $9,224,958, 4.00%, 7/31/29) | | 9,065,415 | 9,000,000 |
8/5/24 due 9/6/24 (Collateralized by U.S. Treasury Obligations valued at $2,048,827, 4.00%, 7/31/29) | | 2,013,350 | 2,000,000 |
| BMO Capital Markets Corp. at 5.34%, dated 8/28/24 due 9/6/24 (Collateralized by U.S. Treasury Obligations valued at $1,020,919, 0.25% - 4.38%, 5/31/25 - 11/15/51) | | 1,002,077 | 1,000,000 |
| BMO Harris Bank NA at 5.33%, dated 8/19/24 due 9/6/24 (Collateralized by U.S. Treasury Obligations valued at $1,022,323, 0.00%, 2/27/25) | | 1,004,590 | 1,000,000 |
| BNP Paribas, SA at: | | | |
5.31%, dated 8/1/24 due 9/6/24 (Collateralized by U.S. Treasury Obligations valued at $7,226,678, 0.00% - 5.24%, 10/31/24 - 11/15/53) | | 7,062,983 | 7,000,000 |
5.33%, dated 8/2/24 due 9/6/24 (Collateralized by U.S. Treasury Obligations valued at $15,372,801, 0.50% - 4.63%, 12/31/26 - 8/15/49) | | 15,106,600 | 15,000,000 |
5.35%, dated 7/26/24 due 9/6/24 | | | |
| (Collateralized by U.S. Treasury Obligations valued at $6,155,622, 0.38% - 5.29%, 10/31/24 - 5/15/53) | | 6,049,042 | 6,000,000 |
| (Collateralized by U.S. Treasury Obligations valued at $2,051,944, 1.25% - 5.24%, 10/31/24 - 8/15/49) (c)(d)(f) | | 2,018,428 | 2,000,000 |
5.36%, dated: | | | |
| 6/14/24 due 9/6/24 (Collateralized by U.S. Treasury Obligations valued at $33,116,971, 0.38% - 4.63%, 11/15/26 - 2/15/51) (c)(d)(f) | | 32,447,858 | 32,000,000 |
| 6/17/24 due 9/6/24 (Collateralized by U.S. Treasury Obligations valued at $5,159,323, 1.13% - 5.18%, 10/31/24 - 11/15/39) (c)(d)(f) | | 5,068,489 | 5,000,000 |
5.38%, dated 5/3/24 due 9/3/24 (Collateralized by U.S. Treasury Obligations valued at $1,038,789, 1.13% - 5.29%, 10/31/24 - 2/15/48) (c)(d)(f) | | 1,018,382 | 1,000,000 |
| BofA Securities, Inc. at 5.37%, dated: | | | |
7/1/24 due 10/1/24 (Collateralized by U.S. Treasury Obligations valued at $1,039,867, 1.88%, 2/15/51) (c)(d)(f) | | 1,013,723 | 1,000,000 |
7/25/24 due 10/25/24 (Collateralized by U.S. Treasury Obligations valued at $2,072,329, 2.50% - 2.75%, 5/31/29 - 2/15/46) (c)(d)(f) | | 2,027,447 | 2,000,000 |
| CIBC Bank U.S.A. at: | | | |
5.3%, dated 8/23/24 due 9/6/24 (Collateralized by U.S. Treasury Obligations valued at $1,021,652, 0.75% - 3.88%, 12/31/25 - 6/30/26) | | 1,004,564 | 1,000,000 |
5.33%, dated: | | | |
| 8/19/24 due 9/6/24 (Collateralized by U.S. Treasury Obligations valued at $1,022,288, 1.38% - 5.00%, 1/31/25 - 5/15/39) | | 1,004,590 | 1,000,000 |
| 8/20/24 due 9/6/24 (Collateralized by U.S. Treasury Obligations valued at $1,022,115, 0.75% - 4.63%, 10/31/24 - 5/15/44) | | 1,003,109 | 1,000,000 |
5.34%, dated 8/1/24 due 9/6/24 (Collateralized by U.S. Treasury Obligations valued at $2,049,987, 0.38% - 4.63%, 1/31/25 - 8/15/50) | | 2,014,537 | 2,000,000 |
| Credit AG at 5.35%, dated 8/15/24 due 9/6/24 (Collateralized by U.S. Treasury Obligations valued at $2,045,845, 4.88%, 4/30/26) | | 2,010,403 | 2,000,000 |
| Fixed Income Clearing Corp. - Credit AG at: | | | |
5.32%, dated 8/30/24 due 9/3/24 (Collateralized by U.S. Treasury Obligations valued at $5,099,593, 4.38%, 11/30/28) | | 5,002,956 | 5,000,000 |
5.34%, dated 9/3/24 due 9/4/24 (g) | | 32,004,747 | 32,000,000 |
5.35%, dated 8/30/24 due 9/3/24 (Collateralized by U.S. Treasury Obligations valued at $32,696,913, 0.75%, 5/31/26) | | 32,019,022 | 32,000,000 |
| Fixed Income Clearing Corp. - Citigroup at 5.32%, dated 8/30/24 due 9/3/24 (Collateralized by U.S. Treasury Obligations valued at $9,186,454, 0.00% - 4.38%, 10/31/24 - 8/15/52) | | 9,006,321 | 9,001,000 |
| Fixed Income Clearing Corp. - ING Financial Markets at 5.32%, dated 8/30/24 due 9/3/24 (Collateralized by U.S. Treasury Obligations valued at $35,716,426, 1.25%, 6/30/28) | | 35,020,689 | 35,000,000 |
| Fixed Income Clearing Corp. - Natixis at 5.32%, dated 8/30/24 due 9/3/24 (Collateralized by U.S. Treasury Obligations valued at $8,158,681, 4.63%, 6/15/27) | | 8,004,729 | 8,000,000 |
| Fixed Income Clearing Corp. - Nomura at 5.33%, dated 8/30/24 due 9/3/24 (Collateralized by U.S. Treasury Obligations valued at $17,350,287, 0.00% - 4.38%, 11/21/24 - 12/15/26) | | 17,010,068 | 17,000,000 |
| Fixed Income Clearing Corp. - BNP at 5.32%, dated 8/30/24 due 9/3/24 (Collateralized by U.S. Treasury Obligations valued at $19,391,469, 0.00% - 5.24%, 11/29/24 - 5/15/54) | | 19,011,231 | 19,000,000 |
| Fixed Income Clearing Corp. - BNYM at 5.32%, dated 8/30/24 due 9/3/24 (Collateralized by U.S. Treasury Obligations valued at $71,400,055, 4.50%, 5/31/29) | | 70,041,378 | 70,000,000 |
| Fixed Income Clearing Corp. - SSB at 5.32%, dated 8/30/24 due 9/3/24 (Collateralized by U.S. Treasury Obligations valued at $55,101,762, 3.50%, 1/31/30) | | 54,031,920 | 54,000,000 |
| Goldman Sachs & Co. at 5.35%, dated: | | | |
8/16/24 due 9/6/24 (Collateralized by U.S. Treasury Obligations valued at $2,045,470, 4.25% - 4.50%, 4/15/27 - 2/15/54) (c)(d)(f) | | 2,010,403 | 2,000,000 |
8/20/24 due 9/6/24 (Collateralized by U.S. Treasury Obligations valued at $2,044,284, 0.38% - 4.38%, 1/31/26 - 11/15/31) (c)(d)(f) | | 2,009,214 | 2,000,000 |
| HSBC Securities, Inc. at 5.36%, dated 8/27/24 due 9/3/24 (Collateralized by U.S. Treasury Obligations valued at $4,084,257, 0.00%, 10/10/24 - 10/31/24) | | 4,004,169 | 4,000,000 |
| ING Financial Markets LLC at: | | | |
5.34%, dated: | | | |
| 8/29/24 due 9/5/24 (Collateralized by U.S. Treasury Obligations valued at $1,020,828, 0.00%, 1/30/25) | | 1,001,038 | 1,000,000 |
| 8/30/24 due 9/6/24 (Collateralized by U.S. Treasury Obligations valued at $1,020,632, 0.00%, 1/30/25) | | 1,001,038 | 1,000,000 |
5.36%, dated 8/27/24 due 9/3/24 (Collateralized by U.S. Treasury Obligations valued at $1,021,122, 0.00%, 1/30/25) | | 1,001,042 | 1,000,000 |
| J.P. Morgan Securities, LLC at 5.35%, dated 8/14/24 due 9/6/24 (Collateralized by U.S. Treasury Obligations valued at $58,884,534, 1.88%, 11/15/51) (c)(d)(f) | | 57,194,829 | 57,000,000 |
| Lloyds Bank Corp. Markets PLC at 5.35%, dated: | | | |
8/27/24 due 9/3/24 (Collateralized by U.S. Treasury Obligations valued at $6,129,184, 4.63%, 9/15/26) | | 6,006,242 | 6,000,000 |
9/3/24 due 9/10/24 (g) | | 6,006,242 | 6,000,000 |
| Lloyds Bank PLC at: | | | |
5.16%, dated 8/28/24 due 11/29/24 (Collateralized by U.S. Treasury Obligations valued at $2,039,926, 2.25% - 4.13%, 2/15/27 - 7/31/28) | | 2,026,660 | 2,000,000 |
5.38%, dated 7/25/24 due 9/25/24 (Collateralized by U.S. Treasury Obligations valued at $1,052,048, 1.63% - 2.25%, 2/15/27 - 5/15/31) | | 1,009,266 | 1,000,000 |
5.39%, dated 6/20/24 due 9/20/24 (Collateralized by U.S. Treasury Obligations valued at $2,082,120, 2.25% - 4.50%, 2/15/27 - 11/15/33) | | 2,027,549 | 2,000,000 |
| Mitsubishi UFJ Securities (U.S.A.), Inc. at 5.38%, dated 8/1/24 due 10/23/24 (Collateralized by U.S. Treasury Obligations valued at $2,050,066, 0.00% - 4.63%, 10/15/24 - 8/15/52) | | 2,024,808 | 2,000,000 |
| Mizuho Bank, Ltd. at 5.33%, dated 8/30/24 due 9/3/24 (Collateralized by U.S. Treasury Obligations valued at $5,107,453, 1.63%, 5/15/31) | | 5,002,961 | 5,000,000 |
| Mizuho Securities U.S.A., Inc. at 5.36%, dated 8/27/24 due 9/3/24 (Collateralized by U.S. Treasury Obligations valued at $1,021,088, 2.88%, 5/15/28) | | 1,001,042 | 1,000,000 |
| MUFG Securities (Canada), Ltd. at: | | | |
5.35%, dated 8/1/24 due 9/6/24 (Collateralized by U.S. Treasury Obligations valued at $1,025,131, 0.38% - 4.38%, 9/15/24 - 8/15/49) | | 1,007,282 | 1,000,000 |
5.38%, dated 8/1/24 due 10/23/24 (Collateralized by U.S. Treasury Obligations valued at $2,050,096, 2.38% - 5.21%, 6/30/25 - 8/15/48) | | 2,024,808 | 2,000,000 |
| MUFG Securities EMEA PLC at: | | | |
5.32%, dated 8/30/24 due 9/3/24 (Collateralized by U.S. Treasury Obligations valued at $2,040,071, 0.00%, 11/29/24) | | 2,001,182 | 2,000,000 |
5.34%, dated: | | | |
| 7/31/24 due 9/6/24 (Collateralized by U.S. Treasury Obligations valued at $6,189,922, 4.38% - 4.88%, 11/30/28 - 10/31/30) | | 6,044,500 | 6,000,000 |
| 8/1/24 due 9/6/24 (Collateralized by U.S. Treasury Obligations valued at $6,195,754, 1.13% - 4.38%, 6/30/26 - 11/30/28) | | 6,034,710 | 6,000,000 |
| Natixis SA at 5.34%, dated 7/30/24 due 9/6/24 (Collateralized by U.S. Treasury Obligations valued at $4,101,222, 0.00% - 4.25%, 11/21/24 - 2/15/54) | | 4,029,667 | 4,000,000 |
| NatWest Markets Securities, Inc. at 5.36%, dated 8/27/24 due 9/3/24 (Collateralized by U.S. Treasury Obligations valued at $4,084,290, 3.75%, 8/15/27) | | 4,004,169 | 4,000,000 |
| Norinchukin Bank at: | | | |
5.35%, dated 8/30/24 due 9/3/24 (Collateralized by U.S. Treasury Obligations valued at $1,020,187, 0.00%, 4/30/28 - 5/15/32) | | 1,000,594 | 1,000,000 |
5.36%, dated 8/27/24 due 9/3/24 (Collateralized by U.S. Treasury Obligations valued at $2,040,964, 0.00%, 5/15/32) | | 2,002,084 | 2,000,000 |
| RBC Dominion Securities at 5.34%, dated 8/1/24 due 9/6/24 (Collateralized by U.S. Treasury Obligations valued at $8,199,950, 0.00% - 4.88%, 12/17/24 - 5/15/52) | | 8,058,147 | 8,000,000 |
| SMBC Nikko Securities America, Inc. at 5.32%, dated 8/30/24 due 9/3/24 (Collateralized by U.S. Treasury Obligations valued at $23,473,956, 0.00% - 4.63%, 11/19/24 - 5/15/51) | | 23,013,596 | 23,000,000 |
| Societe Generale at: | | | |
5.34%, dated 8/29/24 due 9/5/24 (Collateralized by U.S. Treasury Obligations valued at $1,020,778, 0.00%, 11/29/24) | | 1,001,038 | 1,000,000 |
5.35%, dated 8/28/24 due 9/4/24 (Collateralized by U.S. Treasury Obligations valued at $5,104,581, 0.00%, 11/29/24) | | 5,005,201 | 5,000,000 |
| TD Securities (U.S.A.) at 5.33%, dated 8/30/24 due 9/6/24 (Collateralized by U.S. Treasury Obligations valued at $2,041,265, 3.00% - 3.63%, 9/30/25 - 4/30/30) | | 2,002,073 | 2,000,000 |
| TOTAL U.S. TREASURY REPURCHASE AGREEMENT (Cost $532,001,000) | | | 532,001,000 |
| | | | |
| U.S. Treasury Debt - 35.8% |
| | | Yield (%) (a) | Principal Amount (b) | Value ($) |
| U.S. Treasury Obligations - 35.8% | | | | |
| U.S. Treasury Bills | | | | |
| 9/3/24 to 2/27/25 | | 4.79 to 5.36 | 824,300,000 | 817,385,524 |
| U.S. Treasury Notes | | | | |
| 10/31/24 to 5/15/25 (c) | | 4.91 to 5.20 | 31,000,000 | 30,655,728 |
| | | | | |
| TOTAL U.S. TREASURY DEBT (Cost $848,041,252) | | | | 848,041,252 |
| | | | | |
| U.S. Government Agency Debt - 28.7% |
| | | Yield (%) (a) | Principal Amount (b) | Value ($) |
| Federal Agencies - 28.7% | | | | |
| Fannie Mae | | | | |
| 6/18/26 to 8/21/26 (c)(d) | | 5.43 to 5.47 | 4,000,000 | 3,999,896 |
| Federal Farm Credit Bank | | | | |
| 9/3/24 to 8/26/26 (c)(d) | | 5.35 to 5.53 | 170,727,000 | 170,730,636 |
| 9/3/26 (c)(d) | | 5.49 | 1,000,000 | 1,000,000 |
| Federal Home Loan Bank | | | | |
| 1/6/25 (c)(d) | | 5.37 | 2,000,000 | 2,000,000 |
| 3/27/25 (c)(d)(e) | | 5.38 | 1,000,000 | 1,000,000 |
| 9/4/24 to 11/1/24 | | 5.17 to 5.33 | 26,000,000 | 25,865,884 |
| 9/5/24 to 8/21/26 (c) | | 4.84 to 5.52 | 463,700,000 | 463,704,632 |
| Freddie Mac | | | | |
| 1/26/26 (c)(d) | | 5.42 | 11,000,000 | 11,000,000 |
| | | | | |
| TOTAL U.S. GOVERNMENT AGENCY DEBT (Cost $679,301,048) | | | | 679,301,048 |
| | | | | |
| TOTAL INVESTMENT IN SECURITIES - 102.1% (Cost $2,416,905,300) | 2,416,905,300 |
NET OTHER ASSETS (LIABILITIES) - (2.1)% | (49,648,203) |
| NET ASSETS - 100.0% | 2,367,257,097 |
| | |
The date shown for securities represents the date when principal payments must be paid, taking into account any call options exercised by the issuer and any permissible maturity shortening features other than interest rate resets.
Legend
| (a) | Yield represents either the annualized yield at the date of purchase, or the stated coupon rate, or, for floating and adjustable rate securities, the rate at period end. |
| (b) | Amount is stated in United States dollars unless otherwise noted. |
| (c) | Coupon rates for floating and adjustable rate securities reflect the rates in effect at period end. |
| (d) | Coupon is indexed to a floating interest rate which may be multiplied by a specified factor and/or subject to caps or floors. |
| (e) | Security or a portion of the security purchased on a delayed delivery or when-issued basis. |
| (f) | The maturity amount is based on the rate at period end. |
| (g) | Represents a forward settling transaction and therefore no collateral securities had been allocated as of period end. The agreement contemplated the delivery of U.S. Treasury Obligations as collateral on settlement date. |
Investment Valuation
All investments are categorized as Level 2 under the Fair Value Hierarchy. The inputs or methodology used for valuing securities may not be an indication of the risk associated with investing in these securities. For more information on valuation inputs, refer to the Investment Valuation section in the accompanying Notes to Financial Statements.
| Other Information |
| # Additional information on each counterparty to the repurchase agreement is as follows: |
| Repurchase Agreement / Counterparty | Value ($) | |
| $119,562,000 due 9/03/24 at 5.33% | | |
| BNP Paribas, S.A. | 2,211,000 | |
| BNY Mellon Capital Markets LLC | 2,812,000 | |
| Bank of America, N.A. | 7,959,000 | |
| BofA Securities, Inc. | 5,639,000 | |
| Citigroup Global Markets, Inc. | 5,527,000 | |
| Credit Agricole CIB New York Branch | 1,327,000 | |
| HSBC Securities (USA), Inc. | 995,000 | |
| JP Morgan Securities LLC | 26,535,000 | |
| Mitsubishi UFJ Securities Holdings Ltd | 8,402,000 | |
| Mitsubishi UFJ Securities Holdings Ltd (USA) | 1,106,000 | |
| Nomura Securities International | 2,211,000 | |
| RBC Dominion Securities, Inc. | 8,845,000 | |
| Sumitomo Mitsui Banking Corp. | 38,696,000 | |
| Wells Fargo Securities LLC | 7,297,000 | |
| | 119,562,000 | |
Financial Statements
| Statement of Assets and Liabilities |
As of August 31, 2024 |
| Assets | | | | |
Investment in securities, at value (including repurchase agreements of $889,563,000) - See accompanying schedule Unaffiliated issuers (cost $2,416,905,300): | | | $ | 2,416,905,300 |
| Cash | | | | 28,000,135 |
| Receivable for fund shares sold | | | | 52,755,666 |
| Interest receivable | | | | 6,522,252 |
Total assets | | | | 2,504,183,353 |
| Liabilities | | | | |
| Payable for investments purchased | | | | |
Regular delivery | $ | 135,638,673 | | |
Delayed delivery | | 1,000,000 | | |
| Payable for fund shares redeemed | | 271,553 | | |
| Other payables and accrued expenses | | 16,030 | | |
| Total liabilities | | | | 136,926,256 |
| Net Assets | | | $ | 2,367,257,097 |
| Net Assets consist of: | | | | |
| Paid in capital | | | $ | 2,367,229,135 |
| Total accumulated earnings (loss) | | | | 27,962 |
| Net Assets | | | $ | 2,367,257,097 |
Net Asset Value, offering price and redemption price per share ($2,367,257,097 ÷ 2,367,238,362 shares) | | | $ | 1.00 |
| Statement of Operations |
| Year ended August 31, 2024 |
| Investment Income | | | | |
| Interest | | | $ | 189,197,391 |
| Expenses | | | | |
| Custodian fees and expenses | $ | 56,957 | | |
| Independent trustees' fees and expenses | | 11,827 | | |
| Miscellaneous | | 2 | | |
| Total expenses | | | | 68,786 |
| Net Investment income (loss) | | | | 189,128,605 |
| Realized and Unrealized Gain (Loss) | | | | |
| Net realized gain (loss) on: | | | | |
| Investment Securities: | | | | |
| Unaffiliated issuers | | 14,800 | | |
| Total net realized gain (loss) | | | | 14,800 |
| Net increase in net assets resulting from operations | | | $ | 189,143,405 |
| Statement of Changes in Net Assets |
| |
| | Year ended August 31, 2024 | | Year ended August 31, 2023 |
| Increase (Decrease) in Net Assets | | | | |
| Operations | | | | |
| Net investment income (loss) | $ | 189,128,605 | $ | 187,036,655 |
| Net realized gain (loss) | | 14,800 | | (77,719) |
Net increase in net assets resulting from operations | | 189,143,405 | | 186,958,936 |
| Distributions to shareholders | | (189,129,793) | | (187,148,956) |
| | | | | |
| Share transactions | | | | |
| Proceeds from sales of shares | | 1,521,804,482 | | 5,147,361,735 |
| Reinvestment of distributions | | 188,894,204 | | 185,138,909 |
| Cost of shares redeemed | | (4,394,105,969) | | (2,654,426,557) |
| | | | | |
Net increase (decrease) in net assets and shares resulting from share transactions | | (2,683,407,283) | | 2,678,074,087 |
| Total increase (decrease) in net assets | | (2,683,393,671) | | 2,677,884,067 |
| | | | | |
| Net Assets | | | | |
| Beginning of period | | 5,050,650,768 | | 2,372,766,701 |
| End of period | $ | 2,367,257,097 | $ | 5,050,650,768 |
| | | | | |
| Other Information | | | | |
| Shares | | | | |
| Sold | | 1,521,804,482 | | 5,147,361,735 |
| Issued in reinvestment of distributions | | 188,894,204 | | 185,138,909 |
| Redeemed | | (4,394,105,969) | | (2,654,426,557) |
| Net increase (decrease) | | (2,683,407,283) | | 2,678,074,087 |
| | | | | |
Financial Highlights
Fidelity® Series Government Money Market Fund |
| |
| Years ended August 31, | | 2024 | | 2023 | | 2022 | | 2021 | | 2020 |
Selected Per-Share Data | | | | | | | | | | |
| Net asset value, beginning of period | $ | 1.00 | $ | 1.00 | $ | 1.00 | $ | 1.00 | $ | 1.00 |
| Income from Investment Operations | | | | | | | | | | |
Net investment income (loss) A | | .055 | | .046 | | .003 | | .001 | | .010 |
| Net realized and unrealized gain (loss) | | (.001) B | | (.002) | | .002 | | - C | | .001 |
| Total from investment operations | | .054 | | .044 | | .005 | | .001 | | .011 |
| Distributions from net investment income | | (.054) | | (.044) | | (.005) | | (.001) | | (.011) |
| Total distributions | | (.054) | | (.044) | | (.005) | | (.001) | | (.011) |
| Net asset value, end of period | $ | 1.00 | $ | 1.00 | $ | 1.00 | $ | 1.00 | $ | 1.00 |
Total Return D | | | | 4.54% | | .53% | | .10% | | 1.08% |
Ratios to Average Net Assets A,E,F | | | | | | | | | | |
Expenses before reductions G | | -% | | -% | | -% | | -% | | -% |
Expenses net of fee waivers, if any G | | | | -% | | -% | | -% | | -% |
Expenses net of all reductions G | | -% | | -% | | -% | | -% | | -% |
| Net investment income (loss) | | 5.42% | | 4.59% | | .31% | | .10% | | .98% |
| Supplemental Data | | | | | | | | | | |
| Net assets, end of period (000 omitted) | $ | 2,367,257 | $ | 5,050,651 | $ | 2,372,767 | $ | 9,692,737 | $ | 9,500,272 |
ANet investment income (loss) is affected by the timing of the declaration of dividends by any underlying mutual funds or exchange-traded funds (ETFs). Net investment income (loss) of any mutual funds or ETFs is not included in the Fund's net investment income (loss) ratio.
BThe amount shown for a share outstanding does not correspond with the aggregate net gain (loss) on investments for the period due to the timing of sales and repurchases of shares in relation to fluctuating market values of the investments of the Fund.
CAmount represents less than $.0005 per share.
DTotal returns would have been lower if certain expenses had not been reduced during the applicable periods shown.
EFees and expenses of any underlying mutual funds or exchange-traded funds (ETFs) are not included in the Fund's expense ratio. The Fund indirectly bears its proportionate share of these expenses.
FExpense ratios reflect operating expenses of the class. Expenses before reductions do not reflect amounts reimbursed, waived, or reduced through arrangements with the investment adviser, brokerage services, or other offset arrangements, if applicable, and do not represent the amount paid by the class during periods when reimbursements, waivers or reductions occur.
GAmount represents less than .005%.
Notes to Financial Statements
For the period ended August 31, 2024
1. Organization.
Fidelity Series Government Money Market Fund (the Fund) is a fund of Fidelity Salem Street Trust (the Trust) and is authorized to issue an unlimited number of shares. The Trust is registered under the Investment Company Act of 1940, as amended (the 1940 Act), as an open-end management investment company organized as a Massachusetts business trust. Shares are offered only to certain other Fidelity funds, Fidelity managed 529 plans, and Fidelity managed collective investment trusts.
2. Significant Accounting Policies.
The Fund is an investment company and applies the accounting and reporting guidance of the Financial Accounting Standards Board (FASB) Accounting Standards Codification Topic 946 Financial Services - Investment Companies. The financial statements have been prepared in conformity with accounting principles generally accepted in the United States of America (GAAP), which require management to make certain estimates and assumptions at the date of the financial statements. Actual results could differ from those estimates. Subsequent events, if any, through the date that the financial statements were issued have been evaluated in the preparation of the financial statements. The Fund's Schedule of Investments lists any underlying mutual funds or exchange-traded funds (ETFs) but does not include the underlying holdings of these funds. The following summarizes the significant accounting policies of the Fund:
Investment Valuation. The Fund categorizes the inputs to valuation techniques used to value its investments into a disclosure hierarchy consisting of three levels as shown below:
Level 1 - unadjusted quoted prices in active markets for identical investments
Level 2 - other significant observable inputs (including quoted prices for similar investments, interest rates, prepayment speeds, etc.)
Level 3 - unobservable inputs (including the Fund's own assumptions based on the best information available)
As permitted by compliance with certain conditions under Rule 2a-7 of the 1940 Act, securities are valued at amortized cost, which approximates fair value. The amortized cost of an instrument is determined by valuing it at its original cost and thereafter amortizing any discount or premium from its face value at a constant rate until maturity. Securities held by a money market fund are generally high quality and liquid; however, they are reflected as Level 2 because the inputs used to determine fair value are not quoted prices in an active market.
Investment Transactions and Income. The net asset value per share for processing shareholder transactions is calculated as of the close of business of the New York Stock Exchange (NYSE), normally 4:00 p.m. Eastern time. Security transactions are accounted for as of trade date. Gains and losses on securities sold are determined on the basis of identified cost. Interest income is accrued as earned and includes coupon interest and amortization of premium and accretion of discount on debt securities as applicable.
Expenses. Expenses directly attributable to a fund are charged to that fund. Expenses attributable to more than one fund are allocated among the respective funds on the basis of relative net assets or other appropriate methods. Expenses included in the accompanying financial statements reflect the expenses of that fund and do not include any expenses associated with any underlying mutual funds or exchange-traded funds. Although not included in a fund's expenses, a fund indirectly bears its proportionate share of these expenses through the net asset value of each underlying mutual fund or exchange-traded fund. Expense estimates are accrued in the period to which they relate and adjustments are made when actual amounts are known.
Income Tax Information and Distributions to Shareholders. Each year, the Fund intends to qualify as a regulated investment company under Subchapter M of the Internal Revenue Code, including distributing substantially all of its taxable income and realized gains. As a result, no provision for U.S. Federal income taxes is required. As of August 31, 2024, the Fund did not have any unrecognized tax benefits in the financial statements; nor is the Fund aware of any tax positions for which it is reasonably possible that the total amounts of unrecognized tax benefits will significantly change in the next twelve months. The Fund files a U.S. federal tax return, in addition to state and local tax returns as required. The Fund's federal income tax returns are subject to examination by the Internal Revenue Service (IRS) for a period of three fiscal years after they are filed. State and local tax returns may be subject to examination for an additional fiscal year depending on the jurisdiction.
Distributions are declared and recorded daily and paid monthly from net investment income. Distributions from realized gains, if any, are declared and recorded on the ex-dividend date. Income and capital gain distributions are determined in accordance with income tax regulations, which may differ from GAAP.
Capital accounts within the financial statements are adjusted for permanent book-tax differences. These adjustments have no impact on net assets or the results of operations. Capital accounts are not adjusted for temporary book-tax differences which will reverse in a subsequent period.
Book-tax differences are primarily due to capital loss carryforwards and losses deferred due to wash sales.
As of period end, the cost and unrealized appreciation (depreciation) in securities for federal income tax purposes were as follows:
| Gross unrealized appreciation | $- |
| Gross unrealized depreciation | - |
| Net unrealized appreciation (depreciation) | $- |
| Tax Cost | $2,416,905,300 |
The tax-based components of distributable earnings as of period end were as follows:
| Undistributed ordinary income | $93,247 |
| Capital loss carryforward | $(65,281) |
| Net unrealized appreciation (depreciation) on securities and other investments | $- |
Capital loss carryforwards are only available to offset future capital gains of the Fund to the extent provided by regulations and may be limited. The capital loss carryforward information presented below, including any applicable limitation, is estimated as of fiscal period end and is subject to adjustment.
Short-term | $- |
Long-term | (65,281) |
| Total capital loss carryforward | $(65,281) |
The tax character of distributions paid was as follows:
| | August 31, 2024 | August 31, 2023 |
| Ordinary Income | $189,129,793 | $187,148,956 |
| Total | $189,129,793 | $187,148,956 |
Repurchase Agreements. Pursuant to an Exemptive Order issued by the Securities and Exchange Commission, funds and other registered investment companies having management contracts with Fidelity Management and Research Company LLC, or its affiliates are permitted to transfer uninvested cash balances into joint trading accounts which are then invested in repurchase agreements. Funds may also invest directly with institutions in repurchase agreements. Repurchase agreements may be collateralized by cash or government securities. Upon settlement date, collateral is held in segregated accounts with custodian banks and may be obtained in the event of a default of the counterparty. The collateral balance is monitored on a daily basis to ensure it is at least equal to the principal amount of the repurchase agreement (including accrued interest). In the event of a default by the counterparty, realization of the collateral proceeds could be delayed, during which time the value of the collateral may decline.
Delayed Delivery Transactions and When-Issued Securities. During the period, certain Funds transacted in securities on a delayed delivery or when-issued basis. Payment and delivery may take place after the customary settlement period for that security. The price of the underlying securities and the date when the securities will be delivered and paid for are fixed at the time the transaction is negotiated. Securities purchased on a delayed delivery or when-issued basis are identified as such in the Schedule of Investments. Compensation for interest forgone in the purchase of a delayed delivery or when-issued debt security may be received. With respect to purchase commitments, each applicable Fund identifies securities as segregated in its records with a value at least equal to the amount of the commitment. Payables and receivables associated with the purchases and sales of delayed delivery securities having the same coupon, settlement date and broker are offset. Delayed delivery or when-issued securities that have been purchased from and sold to different brokers are reflected as both payables and receivables in the Statement of Assets and Liabilities under the caption "Delayed delivery", as applicable. Losses may arise due to changes in the value of the underlying securities or if the counterparty does not perform under the contract's terms, or if the issuer does not issue the securities due to political, economic, or other factors.
New Rule Issuance. In July 2023, the Securities and Exchange Commission issued a Final Rule relative to Money Market Reform. Among other things, the Final Rule includes amendments for: (1) Removal of redemption gates except for liquidations; (2) Required liquidity fees for institutional prime and institutional tax-exempt money market funds; (3) Discretionary liquidity fees for non-government money market funds; (4) Higher liquidity requirements; and (5) Changes to reporting requirements for Form N-MFP and Form N-CR. The Final Rule imposes different implementation dates for the amendments through October 2, 2024. The amendments have been implemented to date and management has concluded that there are no material impacts to the Fund's financial statements and related disclosures.
3. Fees and Other Transactions with Affiliates.
Management Fee. Fidelity Management & Research Company LLC (the investment adviser) and its affiliates provide the Fund with investment management related services for which the Fund does not pay a management fee. Under the management contract, the investment adviser or an affiliate pays all ordinary operating expenses of the Fund, except custody fees, fees and expenses of the independent Trustees, and certain miscellaneous expenses such as proxy and shareholder meeting expenses.
Interfund Trades. Funds may purchase from or sell securities to other Fidelity Funds under procedures adopted by the Board. The procedures have been designed to ensure these interfund trades are executed in accordance with Rule 17a-7 of the 1940 Act. During the period, there were no interfund trades.
Sub-Advisory Arrangements. Effective March 1, 2024, the Fund's sub-advisory agreements with FMR Investment Management (UK) Limited, Fidelity Management & Research (Hong Kong) Limited, and Fidelity Management & Research (Japan) Limited were amended to provide that the investment adviser pays each sub-adviser monthly fees equal to 110% of the sub-adviser's costs for providing sub-advisory services.
4. Other.
A fund's organizational documents provide former and current trustees and officers with a limited indemnification against liabilities arising in connection with the performance of their duties to the fund. In the normal course of business, a fund may also enter into contracts that provide general indemnifications. A fund's maximum exposure under these arrangements is unknown as this would be dependent on future claims that may be made against a fund. The risk of material loss from such claims is considered remote.
At the end of the period, mutual funds and accounts managed by the investment adviser or its affiliates were the owners of record of all of the outstanding shares of the Fund.
5. Risk and Uncertainties.
Many factors affect a fund's performance. Developments that disrupt global economies and financial markets, such as pandemics, epidemics, outbreaks of infectious diseases, war, terrorism, and environmental disasters, may significantly affect a fund's investment performance. The effects of these developments to a fund will be impacted by the types of securities in which a fund invests, the financial condition, industry, economic sector, and geographic location of an issuer, and a fund's level of investment in the securities of that issuer. Significant concentrations in security types, issuers, industries, sectors, and geographic locations may magnify the factors that affect a fund's performance.
Report of Independent Registered Public Accounting Firm
To the Board of Trustees of Fidelity Salem Street Trust and Shareholders of Fidelity Series Government Money Market Fund
Opinion on the Financial Statements
We have audited the accompanying statement of assets and liabilities, including the schedule of investments, of Fidelity Series Government Money Market Fund (one of the funds constituting Fidelity Salem Street Trust, referred to hereafter as the "Fund") as of August 31, 2024, the related statement of operations for the year ended August 31, 2024, the statement of changes in net assets for each of the two years in the period ended August 31, 2024, including the related notes, and the financial highlights for each of the five years in the period ended August 31, 2024 (collectively referred to as the "financial statements"). In our opinion, the financial statements present fairly, in all material respects, the financial position of the Fund as of August 31, 2024, the results of its operations for the year then ended, the changes in its net assets for each of the two years in the period ended August 31, 2024 and the financial highlights for each of the five years in the period ended August 31, 2024 in conformity with accounting principles generally accepted in the United States of America.
Basis for Opinion
These financial statements are the responsibility of the Fund's management. Our responsibility is to express an opinion on the Fund's financial statements based on our audits. We are a public accounting firm registered with the Public Company Accounting Oversight Board (United States) (PCAOB) and are required to be independent with respect to the Fund in accordance with the U.S. federal securities laws and the applicable rules and regulations of the Securities and Exchange Commission and the PCAOB.
We conducted our audits of these financial statements in accordance with the standards of the PCAOB. Those standards require that we plan and perform the audit to obtain reasonable assurance about whether the financial statements are free of material misstatement, whether due to error or fraud.
Our audits included performing procedures to assess the risks of material misstatement of the financial statements, whether due to error or fraud, and performing procedures that respond to those risks. Such procedures included examining, on a test basis, evidence regarding the amounts and disclosures in the financial statements. Our audits also included evaluating the accounting principles used and significant estimates made by management, as well as evaluating the overall presentation of the financial statements. Our procedures included confirmation of securities owned as of August 31, 2024 by correspondence with the custodians and brokers; when replies were not received from brokers, we performed other auditing procedures. We believe that our audits provide a reasonable basis for our opinion.
/s/ PricewaterhouseCoopers LLP
Boston, Massachusetts
October 14, 2024
We have served as the auditor of one or more investment companies in the Fidelity group of funds since 1932.
Distributions
(Unaudited)
The dividend and capital gains distributions for the fund(s) are available on Fidelity.com or Institutional.Fidelity.com.
A total of 53.83% of the dividends distributed during the fiscal year was derived from interest on U.S. Government securities which is generally exempt from state income tax.
The fund designates $189,035,358 of distributions paid during the fiscal year ended 2024 as qualifying to be taxed as section 163(j) interest dividends.
The fund will notify shareholders in January 2025 of amounts for use in preparing 2024 income tax returns.
Item 8: Changes in and Disagreements with Accountants for Open-End Management Investment Companies
(Unaudited)
Note: This is not applicable for any fund included in this document.
Item 9: Proxy Disclosures for Open-End Management Investment Companies
(Unaudited)
| A special meeting of shareholders was held on October 18, 2023. The results of votes taken among shareholders on the proposal before them are reported below. Each vote reported represents one dollar of net asset value held on the record date for the meeting. |
| Proposal 1 |
| To elect a Board of Trustees. |
| | # of Votes | % of Votes |
| Abigail P. Johnson |
| Affirmative | 378,729,502,260.01 | 97.58 |
| Withheld | 9,407,876,478.96 | 2.42 |
| TOTAL | 388,137,378,738.97 | 100.00 |
| Jennifer Toolin McAuliffe |
| Affirmative | 378,454,868,010.95 | 97.51 |
| Withheld | 9,682,510,728.02 | 2.49 |
| TOTAL | 388,137,378,738.97 | 100.00 |
| Christine J. Thompson |
| Affirmative | 378,837,121,274.52 | 97.60 |
| Withheld | 9,300,257,464.45 | 2.40 |
| TOTAL | 388,137,378,738.97 | 100.00 |
| Elizabeth S. Acton |
| Affirmative | 378,262,110,794.85 | 97.46 |
| Withheld | 9,875,267,944.12 | 2.54 |
| TOTAL | 388,137,378,738.97 | 100.00 |
| Laura M. Bishop |
| Affirmative | 380,482,113,171.06 | 98.03 |
| Withheld | 7,655,265,567.91 | 1.97 |
| TOTAL | 388,137,378,738.97 | 100.00 |
| Ann E. Dunwoody |
| Affirmative | 380,016,034,008.12 | 97.91 |
| Withheld | 8,121,344,730.85 | 2.09 |
| TOTAL | 388,137,378,738.97 | 100.00 |
| John Engler |
| Affirmative | 379,432,488,394.20 | 97.76 |
| Withheld | 8,704,890,344.77 | 2.24 |
| TOTAL | 388,137,378,738.97 | 100.00 |
| Robert F. Gartland |
| Affirmative | 378,741,819,600.60 | 97.58 |
| Withheld | 9,395,559,138.37 | 2.42 |
| TOTAL | 388,137,378,738.97 | 100.00 |
| Robert W. Helm |
| Affirmative | 380,389,324,755.07 | 98.00 |
| Withheld | 7,748,053,983.90 | 2.00 |
| TOTAL | 388,137,378,738.97 | 100.00 |
| Arthur E. Johnson |
| Affirmative | 378,427,694,151.67 | 97.50 |
| Withheld | 9,709,684,587.30 | 2.50 |
| TOTAL | 388,137,378,738.97 | 100.00 |
| Michael E. Kenneally |
| Affirmative | 377,842,228,145.18 | 97.35 |
| Withheld | 10,295,150,593.79 | 2.65 |
| TOTAL | 388,137,378,738.97 | 100.00 |
| Mark A. Murray |
| Affirmative | 380,158,432,703.37 | 97.94 |
| Withheld | 7,978,946,035.60 | 2.06 |
| TOTAL | 388,137,378,738.97 | 100.00 |
| Carol J. Zierhoffer |
| Affirmative | 380,522,113,360.24 | 98.04 |
| Withheld | 7,615,265,378.73 | 1.96 |
| TOTAL | 388,137,378,738.97 | 100.00 |
| | | |
| Proposal 1 reflects trust-wide proposal and voting results. |
Item 10: Remuneration Paid to Directors, Officers, and others of Open-End Management Investment Companies
(Unaudited)
Note: This information is disclosed as part of the financial statements for each Fund as part of Item 7: Financial Statements and Financial Highlights for Open-End Management Investment companies.
Item 11: Statement Regarding Basis for Approval of Investment Advisory Contract
(Unaudited)
Note: This is not applicable for any fund included in this document.
1.9878695.108
GVM-ANN-1024
Fidelity® Series Bond Index Fund
Annual Report
August 31, 2024
Contents
To view a fund's proxy voting guidelines and proxy voting record for the 12-month period ended June 30, visit http://www.fidelity.com/proxyvotingresults or visit the Securities and Exchange Commission's (SEC) web site at http://www.sec.gov.
You may also call 1-800-544-8544 to request a free copy of the proxy voting guidelines.
BLOOMBERG ® is a trademark and service mark of Bloomberg Finance L.P. and its affiliates (collectively "Bloomberg"). Bloomberg or Bloomberg's licensors own all proprietary rights in the Bloomberg Indices. Neither Bloomberg nor Bloomberg's licensors approves or endorses this material, or guarantees the accuracy or completeness of any information herein, or makes any warranty, express or implied, as to the results to be obtained therefrom and, to the maximum extent allowed by law, neither shall have any liability or responsibility for injury or damages arising in connection therewith.
Standard & Poor's, S&P and S&P 500 are registered service marks of The McGraw-Hill Companies, Inc. and have been licensed for use by Fidelity Distributors Corporation.
Other third-party marks appearing herein are the property of their respective owners.
All other marks appearing herein are registered or unregistered trademarks or service marks of FMR LLC or an affiliated company. © 2024 FMR LLC. All rights reserved.
This report and the financial statements contained herein are submitted for the general information of the shareholders of the Fund. This report is not authorized for distribution to prospective investors in the Fund unless preceded or accompanied by an effective prospectus.
A fund files its complete schedule of portfolio holdings with the SEC for the first and third quarters of each fiscal year on Form N-PORT. Forms N-PORT are available on the SEC's web site at http://www.sec.gov. A fund's Forms N-PORT may be reviewed and copied at the SEC's Public Reference Room in Washington, DC. Information regarding the operation of the SEC's Public Reference Room may be obtained by calling 1-800-SEC-0330.
For a complete list of a fund's portfolio holdings, view the most recent holdings listing, semiannual report, or annual report on Fidelity's web site at http://www.fidelity.com, http://www.institutional.fidelity.com, or http://www.401k.com, as applicable.
NOT FDIC INSURED •MAY LOSE VALUE •NO BANK GUARANTEE
Neither the Fund nor Fidelity Distributors Corporation is a bank.
Item 7: Financial Statements and Financial Highlights for Open-End Management Investment Companies (Annual Report)
Fidelity® Series Bond Index Fund
Schedule of Investments August 31, 2024
Showing Percentage of Net Assets
| Nonconvertible Bonds - 25.5% |
| | | Principal Amount (a) | Value ($) |
| COMMUNICATION SERVICES - 1.9% | | | |
| Diversified Telecommunication Services - 0.7% | | | |
| AT&T, Inc.: | | | |
| 1.65% 2/1/28 | | 8,000,000 | 7,293,830 |
| 2.25% 2/1/32 | | 3,000,000 | 2,529,533 |
| 2.55% 12/1/33 | | 7,900,000 | 6,543,269 |
| 2.75% 6/1/31 | | 3,000,000 | 2,660,831 |
| 2.95% 7/15/26 | | 1,425,000 | 1,385,751 |
| 3.5% 6/1/41 | | 15,600,000 | 12,446,395 |
| 3.55% 9/15/55 | | 14,021,000 | 9,912,976 |
| 3.65% 6/1/51 | | 5,750,000 | 4,266,556 |
| 3.65% 9/15/59 | | 8,327,000 | 5,873,368 |
| 3.8% 2/15/27 | | 1,604,000 | 1,580,558 |
| 3.85% 6/1/60 | | 2,670,000 | 1,953,081 |
| 4.3% 2/15/30 | | 18,240,000 | 18,055,095 |
| 4.35% 3/1/29 | | 3,665,000 | 3,652,074 |
| 4.35% 6/15/45 | | 1,141,000 | 985,315 |
| 4.5% 3/9/48 | | 1,460,000 | 1,258,937 |
| 4.65% 6/1/44 | | 1,403,000 | 1,248,347 |
| 5.45% 3/1/47 | | 1,500,000 | 1,500,319 |
| Bell Canada: | | | |
| 3.65% 8/15/52 | | 1,000,000 | 754,809 |
| 4.464% 4/1/48 | | 2,540,000 | 2,208,120 |
| British Telecommunications PLC 9.625% 12/15/30 | | 3,618,000 | 4,540,841 |
| Deutsche Telekom International Financial BV 8.75% 6/15/30 (b) | | 4,399,000 | 5,288,257 |
| Orange SA 5.5% 2/6/44 | | 535,000 | 541,223 |
| Sprint Capital Corp. 8.75% 3/15/32 | | 3,700,000 | 4,564,657 |
| Telefonica Emisiones S.A.U.: | | | |
| 4.103% 3/8/27 | | 2,388,000 | 2,362,185 |
| 4.665% 3/6/38 | | 1,050,000 | 965,516 |
| 5.213% 3/8/47 | | 3,871,000 | 3,574,456 |
| 5.52% 3/1/49 | | 600,000 | 581,011 |
| 7.045% 6/20/36 | | 1,564,000 | 1,774,181 |
| Telefonica Europe BV 8.25% 9/15/30 | | 1,000,000 | 1,166,898 |
| TELUS Corp. 3.4% 5/13/32 | | 3,000,000 | 2,698,068 |
| Verizon Communications, Inc.: | | | |
| 1.5% 9/18/30 | | 3,600,000 | 3,053,091 |
| 1.68% 10/30/30 | | 2,598,000 | 2,203,444 |
| 2.355% 3/15/32 | | 7,035,000 | 5,977,009 |
| 2.55% 3/21/31 | | 4,000,000 | 3,518,530 |
| 2.987% 10/30/56 | | 9,153,000 | 5,880,942 |
| 3.15% 3/22/30 | | 6,172,000 | 5,758,430 |
| 3.55% 3/22/51 | | 11,000,000 | 8,278,726 |
| 3.7% 3/22/61 | | 1,140,000 | 839,487 |
| 3.875% 3/1/52 | | 9,800,000 | 7,815,159 |
| 4.016% 12/3/29 | | 5,000,000 | 4,896,593 |
| 4.125% 3/16/27 | | 1,247,000 | 1,237,178 |
| 4.272% 1/15/36 | | 9,027,000 | 8,513,090 |
| 4.4% 11/1/34 | | 673,000 | 645,993 |
| 4.75% 11/1/41 | | 178,000 | 168,442 |
| 5.012% 4/15/49 | | 205,000 | 203,344 |
| 5.012% 8/21/54 | | 2,238,000 | 2,128,752 |
| 5.5% 3/16/47 | | 572,000 | 597,727 |
| | | | 175,882,394 |
| Entertainment - 0.1% | | | |
| Netflix, Inc. 4.9% 8/15/34 | | 3,790,000 | 3,882,089 |
| The Walt Disney Co.: | | | |
| 2% 9/1/29 | | 77,000 | 69,165 |
| 2.65% 1/13/31 | | 5,000,000 | 4,504,593 |
| 2.75% 9/1/49 | | 4,076,000 | 2,704,212 |
| 3.35% 3/24/25 | | 5,400,000 | 5,352,740 |
| 3.5% 5/13/40 | | 1,000,000 | 828,850 |
| 3.6% 1/13/51 | | 3,600,000 | 2,803,478 |
| 3.7% 10/15/25 | | 1,247,000 | 1,236,264 |
| 3.8% 5/13/60 | | 4,400,000 | 3,413,734 |
| 4.7% 3/23/50 | | 2,257,000 | 2,143,119 |
| 5.4% 10/1/43 | | 691,000 | 706,266 |
| 6.15% 3/1/37 | | 705,000 | 784,934 |
| 6.15% 2/15/41 | | 1,872,000 | 2,082,539 |
| | | | 30,511,983 |
| Interactive Media & Services - 0.2% | | | |
| Alphabet, Inc.: | | | |
| 0.45% 8/15/25 | | 3,400,000 | 3,276,374 |
| 1.1% 8/15/30 | | 2,700,000 | 2,287,150 |
| 1.9% 8/15/40 | | 1,792,000 | 1,239,364 |
| 1.998% 8/15/26 | | 410,000 | 394,405 |
| 2.05% 8/15/50 | | 2,700,000 | 1,643,205 |
| Baidu, Inc. 1.72% 4/9/26 | | 8,500,000 | 8,111,125 |
| Meta Platforms, Inc.: | | | |
| 3.5% 8/15/27 | | 3,600,000 | 3,546,122 |
| 3.85% 8/15/32 | | 1,600,000 | 1,532,680 |
| 4.3% 8/15/29 | | 1,820,000 | 1,832,308 |
| 4.45% 8/15/52 | | 6,000,000 | 5,368,175 |
| 4.6% 5/15/28 | | 1,000,000 | 1,017,622 |
| 4.65% 8/15/62 | | 1,700,000 | 1,527,785 |
| 4.75% 8/15/34 | | 2,400,000 | 2,415,062 |
| 4.95% 5/15/33 | | 3,000,000 | 3,095,365 |
| 5.4% 8/15/54 | | 1,500,000 | 1,529,773 |
| 5.6% 5/15/53 | | 2,400,000 | 2,529,704 |
| | | | 41,346,219 |
| Media - 0.6% | | | |
| Charter Communications Operating LLC/Charter Communications Operating Capital Corp.: | | | |
| 3.5% 6/1/41 | | 5,200,000 | 3,623,738 |
| 3.5% 3/1/42 | | 3,200,000 | 2,202,762 |
| 3.7% 4/1/51 | | 700,000 | 444,144 |
| 3.75% 2/15/28 | | 3,250,000 | 3,108,863 |
| 3.85% 4/1/61 | | 4,200,000 | 2,549,425 |
| 4.2% 3/15/28 | | 1,961,000 | 1,897,797 |
| 4.4% 4/1/33 | | 3,300,000 | 2,999,417 |
| 4.4% 12/1/61 | | 2,040,000 | 1,377,525 |
| 4.908% 7/23/25 | | 974,000 | 970,788 |
| 5.125% 7/1/49 | | 2,445,000 | 1,958,955 |
| 5.375% 5/1/47 | | 2,900,000 | 2,418,428 |
| 5.75% 4/1/48 | | 933,000 | 809,998 |
| 6.1% 6/1/29 | | 1,000,000 | 1,033,178 |
| 6.384% 10/23/35 | | 2,397,000 | 2,427,009 |
| 6.484% 10/23/45 | | 2,036,000 | 1,946,076 |
| 6.65% 2/1/34 | | 5,000,000 | 5,207,519 |
| 6.834% 10/23/55 | | 1,300,000 | 1,290,118 |
| Comcast Corp.: | | | |
| 1.95% 1/15/31 | | 90,000 | 76,927 |
| 2.35% 1/15/27 | | 4,242,000 | 4,056,733 |
| 2.65% 2/1/30 | | 1,500,000 | 1,372,539 |
| 2.887% 11/1/51 | | 4,521,000 | 2,959,543 |
| 2.937% 11/1/56 | | 23,249,000 | 14,788,329 |
| 2.987% 11/1/63 | | 6,882,000 | 4,251,115 |
| 3.15% 3/1/26 | | 891,000 | 874,231 |
| 3.3% 2/1/27 | | 5,722,000 | 5,590,865 |
| 3.375% 8/15/25 | | 2,442,000 | 2,411,926 |
| 3.45% 2/1/50 | | 2,000,000 | 1,482,590 |
| 3.9% 3/1/38 | | 2,000,000 | 1,772,377 |
| 3.969% 11/1/47 | | 926,000 | 755,612 |
| 4% 3/1/48 | | 2,139,000 | 1,749,525 |
| 4.15% 10/15/28 | | 60,000 | 59,564 |
| 4.25% 10/15/30 | | 5,000,000 | 4,943,596 |
| 4.55% 1/15/29 | | 2,000,000 | 2,018,567 |
| 4.65% 2/15/33 | | 6,600,000 | 6,598,024 |
| 4.75% 3/1/44 | | 2,100,000 | 1,948,791 |
| 5.35% 5/15/53 | | 2,000,000 | 2,002,084 |
| 6.45% 3/15/37 | | 1,000,000 | 1,136,257 |
| Discovery Communications LLC: | | | |
| 3.625% 5/15/30 | | 3,200,000 | 2,840,351 |
| 3.95% 3/20/28 | | 4,900,000 | 4,638,192 |
| 5.2% 9/20/47 | | 1,497,000 | 1,177,346 |
| 5.3% 5/15/49 | | 800,000 | 622,031 |
| Fox Corp.: | | | |
| 3.5% 4/8/30 | | 2,400,000 | 2,263,850 |
| 4.709% 1/25/29 | | 1,850,000 | 1,862,964 |
| 5.476% 1/25/39 | | 1,478,000 | 1,472,424 |
| 5.576% 1/25/49 | | 1,660,000 | 1,606,127 |
| Grupo Televisa SA de CV: | | | |
| 5% 5/13/45 | | 1,100,000 | 959,406 |
| 5.25% 5/24/49 | | 2,360,000 | 2,127,115 |
| Paramount Global: | | | |
| 3.375% 2/15/28 | | 1,880,000 | 1,757,184 |
| 4.375% 3/15/43 | | 470,000 | 337,729 |
| 4.6% 1/15/45 | | 1,301,000 | 933,192 |
| 4.95% 1/15/31 | | 4,800,000 | 4,458,717 |
| 4.95% 5/19/50 | | 1,440,000 | 1,074,922 |
| 5.85% 9/1/43 | | 2,611,000 | 2,224,171 |
| RELX Capital, Inc. 4% 3/18/29 | | 3,200,000 | 3,145,298 |
| TCI Communications, Inc. 7.125% 2/15/28 | | 7,100,000 | 7,712,478 |
| Time Warner Cable Enterprises 8.375% 7/15/33 | | 2,300,000 | 2,618,953 |
| Time Warner Cable LLC: | | | |
| 4.5% 9/15/42 | | 1,961,000 | 1,486,205 |
| 5.875% 11/15/40 | | 2,300,000 | 2,076,187 |
| 6.55% 5/1/37 | | 1,040,000 | 1,026,071 |
| 7.3% 7/1/38 | | 713,000 | 745,674 |
| TWDC Enterprises 18 Corp.: | | | |
| 1.85% 7/30/26 | | 911,000 | 870,372 |
| 3% 7/30/46 | | 802,000 | 565,974 |
| 3.15% 9/17/25 | | 1,688,000 | 1,663,344 |
| 4.125% 6/1/44 | | 1,016,000 | 880,418 |
| Warnermedia Holdings, Inc.: | | | |
| 4.279% 3/15/32 | | 5,299,000 | 4,632,126 |
| 5.05% 3/15/42 | | 5,600,000 | 4,487,474 |
| 5.141% 3/15/52 | | 8,426,000 | 6,408,803 |
| 5.391% 3/15/62 | | 1,600,000 | 1,201,539 |
| | | | 166,991,572 |
| Wireless Telecommunication Services - 0.3% | | | |
| America Movil S.A.B. de CV: | | | |
| 3.625% 4/22/29 | | 1,903,000 | 1,826,880 |
| 4.375% 7/16/42 | | 2,510,000 | 2,225,843 |
| 6.125% 11/15/37 | | 1,491,000 | 1,624,623 |
| Rogers Communications, Inc.: | | | |
| 2.9% 11/15/26 | | 445,000 | 429,028 |
| 3.625% 12/15/25 | | 356,000 | 350,522 |
| 3.7% 11/15/49 | | 1,300,000 | 963,479 |
| 3.8% 3/15/32 | | 3,100,000 | 2,856,653 |
| 4.3% 2/15/48 | | 1,850,000 | 1,521,027 |
| 4.55% 3/15/52 | | 3,400,000 | 2,880,769 |
| 5.45% 10/1/43 | | 1,029,000 | 1,003,959 |
| T-Mobile U.S.A., Inc.: | | | |
| 2.05% 2/15/28 | | 2,700,000 | 2,487,574 |
| 2.875% 2/15/31 | | 3,600,000 | 3,229,249 |
| 3.3% 2/15/51 | | 7,500,000 | 5,298,264 |
| 3.5% 4/15/25 | | 4,990,000 | 4,936,527 |
| 3.6% 11/15/60 | | 3,900,000 | 2,771,895 |
| 3.75% 4/15/27 | | 10,000,000 | 9,818,503 |
| 3.875% 4/15/30 | | 7,550,000 | 7,263,826 |
| 4.95% 3/15/28 | | 1,000,000 | 1,015,110 |
| 5.05% 7/15/33 | | 3,400,000 | 3,441,589 |
| 5.2% 1/15/33 | | 1,750,000 | 1,790,273 |
| 5.65% 1/15/53 | | 5,400,000 | 5,541,376 |
| 5.75% 1/15/54 | | 3,900,000 | 4,055,143 |
| Vodafone Group PLC: | | | |
| 4.375% 5/30/28 | | 6,205,000 | 6,256,997 |
| 5% 5/30/38 | | 701,000 | 691,744 |
| 5.125% 6/19/59 | | 3,600,000 | 3,283,824 |
| 5.25% 5/30/48 | | 2,907,000 | 2,782,202 |
| 5.75% 6/28/54 | | 2,220,000 | 2,248,520 |
| 6.15% 2/27/37 | | 638,000 | 692,548 |
| | | | 83,287,947 |
TOTAL COMMUNICATION SERVICES | | | 498,020,115 |
| CONSUMER DISCRETIONARY - 1.4% | | | |
| Automobile Components - 0.0% | | | |
| Lear Corp. 5.25% 5/15/49 | | 1,420,000 | 1,300,311 |
| Automobiles - 0.3% | | | |
| American Honda Finance Corp.: | | | |
| 1.2% 7/8/25 | | 1,030,000 | 999,688 |
| 1.8% 1/13/31 | | 2,300,000 | 1,953,464 |
| 2.3% 9/9/26 | | 891,000 | 855,853 |
| 5.125% 7/7/28 | | 6,300,000 | 6,465,227 |
| Ford Motor Co.: | | | |
| 5.291% 12/8/46 | | 3,100,000 | 2,809,527 |
| 6.1% 8/19/32 | | 6,860,000 | 7,048,818 |
| 9.625% 4/22/30 | | 6,200,000 | 7,359,034 |
| General Motors Co.: | | | |
| 4.2% 10/1/27 | | 1,000,000 | 985,819 |
| 5% 10/1/28 | | 248,000 | 251,231 |
| 5.15% 4/1/38 | | 1,500,000 | 1,438,157 |
| 5.2% 4/1/45 | | 761,000 | 698,178 |
| 5.4% 10/15/29 | | 3,800,000 | 3,889,702 |
| 5.4% 4/1/48 | | 1,800,000 | 1,682,630 |
| 5.6% 10/15/32 | | 1,200,000 | 1,240,923 |
| 5.95% 4/1/49 | | 2,178,000 | 2,193,711 |
| 6.6% 4/1/36 | | 2,041,000 | 2,209,650 |
| 6.75% 4/1/46 | | 3,375,000 | 3,697,463 |
| General Motors Financial Co., Inc.: | | | |
| 2.35% 2/26/27 | | 5,700,000 | 5,395,646 |
| 2.7% 8/20/27 | | 1,000,000 | 948,272 |
| 2.7% 6/10/31 | | 1,100,000 | 946,660 |
| 2.9% 2/26/25 | | 1,050,000 | 1,037,644 |
| 3.5% 11/7/24 | | 1,000,000 | 995,986 |
| 3.85% 1/5/28 | | 1,247,000 | 1,213,962 |
| 4% 1/15/25 | | 2,629,000 | 2,614,868 |
| 4% 10/6/26 | | 656,000 | 647,103 |
| 4.3% 7/13/25 | | 2,210,000 | 2,195,607 |
| 4.35% 1/17/27 | | 1,425,000 | 1,412,827 |
| 5% 4/9/27 | | 3,300,000 | 3,328,561 |
| 5.6% 6/18/31 | | 2,600,000 | 2,660,886 |
| 5.65% 1/17/29 | | 3,507,000 | 3,605,288 |
| Honda Motor Co. Ltd. 2.534% 3/10/27 | | 5,000,000 | 4,791,876 |
| Toyota Motor Corp. 1.339% 3/25/26 | | 1,700,000 | 1,621,214 |
| | | | 79,195,475 |
| Broadline Retail - 0.3% | | | |
| Alibaba Group Holding Ltd.: | | | |
| 2.125% 2/9/31 | | 4,810,000 | 4,127,894 |
| 3.15% 2/9/51 | | 4,960,000 | 3,390,011 |
| 3.6% 11/28/24 | | 1,000,000 | 996,200 |
| 4% 12/6/37 | | 2,100,000 | 1,863,393 |
| Amazon.com, Inc.: | | | |
| 0.8% 6/3/25 | | 2,000,000 | 1,945,541 |
| 1% 5/12/26 | | 3,900,000 | 3,699,834 |
| 1.5% 6/3/30 | | 4,000,000 | 3,458,921 |
| 2.1% 5/12/31 | | 3,900,000 | 3,406,866 |
| 2.5% 6/3/50 | | 7,197,000 | 4,612,672 |
| 3.1% 5/12/51 | | 3,900,000 | 2,811,260 |
| 3.15% 8/22/27 | | 8,864,000 | 8,647,968 |
| 3.3% 4/13/27 | | 8,600,000 | 8,430,493 |
| 3.875% 8/22/37 | | 9,601,000 | 8,819,610 |
| 4.05% 8/22/47 | | 5,346,000 | 4,650,890 |
| 4.1% 4/13/62 | | 2,800,000 | 2,348,777 |
| 4.25% 8/22/57 | | 1,183,000 | 1,040,602 |
| 4.8% 12/5/34 | | 1,069,000 | 1,100,325 |
| eBay, Inc.: | | | |
| 1.4% 5/10/26 | | 2,926,000 | 2,773,393 |
| 1.9% 3/11/25 | | 6,540,000 | 6,430,771 |
| 4% 7/15/42 | | 2,600,000 | 2,157,902 |
| | | | 76,713,323 |
| Distributors - 0.0% | | | |
| Genuine Parts Co. 1.75% 2/1/25 | | 3,100,000 | 3,053,730 |
| Diversified Consumer Services - 0.1% | | | |
| American University 3.672% 4/1/49 | | 1,000,000 | 811,026 |
| Duke University 2.832% 10/1/55 | | 850,000 | 585,836 |
| George Washington University: | | | |
| 4.126% 9/15/48 | | 3,000,000 | 2,654,330 |
| 4.3% 9/15/44 | | 356,000 | 322,526 |
| Massachusetts Institute of Technology: | | | |
| 2.989% 7/1/50 | | 3,250,000 | 2,399,459 |
| 3.885% 7/1/2116 | | 504,000 | 393,658 |
| 3.959% 7/1/38 | | 842,000 | 803,586 |
| Northwestern University: | | | |
| 3.662% 12/1/57 | | 2,000,000 | 1,632,278 |
| 4.643% 12/1/44 | | 597,000 | 581,885 |
| President and Fellows of Harvard College: | | | |
| 3.3% 7/15/56 | | 865,000 | 658,654 |
| 3.619% 10/1/37 | | 178,000 | 160,824 |
| Rice University 3.774% 5/15/55 | | 340,000 | 283,462 |
| Trane Technologies Global Holding Co. Ltd.: | | | |
| 3.75% 8/21/28 | | 829,000 | 810,396 |
| 4.3% 2/21/48 | | 886,000 | 768,194 |
| Trustees of Princeton Univ. 5.7% 3/1/39 | | 178,000 | 200,666 |
| University Notre Dame du Lac 3.438% 2/15/45 | | 593,000 | 480,123 |
| University of Chicago 3% 10/1/52 | | 1,100,000 | 803,126 |
| University of Southern California: | | | |
| 2.945% 10/1/51 | | 5,000,000 | 3,566,007 |
| 5.25% 10/1/2111 | | 356,000 | 369,133 |
| | | | 18,285,169 |
| Hotels, Restaurants & Leisure - 0.2% | | | |
| Expedia Group, Inc. 2.95% 3/15/31 | | 4,240,000 | 3,813,532 |
| Marriott International, Inc.: | | | |
| 3.5% 10/15/32 | | 4,080,000 | 3,678,557 |
| 4.875% 5/15/29 | | 2,000,000 | 2,024,089 |
| 5% 10/15/27 | | 3,000,000 | 3,046,870 |
| 5.35% 3/15/35 | | 2,280,000 | 2,307,407 |
| 5.75% 5/1/25 | | 2,800,000 | 2,814,700 |
| McDonald's Corp.: | | | |
| 3.6% 7/1/30 | | 1,350,000 | 1,295,506 |
| 3.625% 9/1/49 | | 6,943,000 | 5,295,526 |
| 3.7% 1/30/26 | | 3,007,000 | 2,972,404 |
| 4.45% 3/1/47 | | 1,013,000 | 893,736 |
| 4.6% 9/9/32 | | 3,200,000 | 3,215,108 |
| 4.875% 12/9/45 | | 968,000 | 912,820 |
| 5.45% 8/14/53 | | 2,600,000 | 2,632,458 |
| 6.3% 3/1/38 | | 1,256,000 | 1,404,691 |
| Metropolitan Museum of Art 3.4% 7/1/45 | | 535,000 | 425,874 |
| Starbucks Corp.: | | | |
| 2.25% 3/12/30 | | 2,716,000 | 2,428,315 |
| 2.45% 6/15/26 | | 1,782,000 | 1,722,216 |
| 2.55% 11/15/30 | | 1,880,000 | 1,684,501 |
| 3% 2/14/32 | | 1,200,000 | 1,079,355 |
| 3.5% 3/1/28 | | 1,000,000 | 972,125 |
| 3.5% 11/15/50 | | 1,700,000 | 1,259,991 |
| 3.8% 8/15/25 | | 1,239,000 | 1,226,510 |
| 4% 11/15/28 | | 2,547,000 | 2,515,263 |
| 4.3% 6/15/45 | | 1,400,000 | 1,205,687 |
| 4.5% 11/15/48 | | 837,000 | 733,392 |
| | | | 51,560,633 |
| Household Durables - 0.0% | | | |
| D.R. Horton, Inc.: | | | |
| 1.3% 10/15/26 | | 1,700,000 | 1,592,189 |
| 5% 10/15/34 | | 1,230,000 | 1,227,427 |
| Lennar Corp. 5% 6/15/27 | | 1,700,000 | 1,714,405 |
| Toll Brothers Finance Corp. 4.35% 2/15/28 | | 1,300,000 | 1,285,075 |
| Whirlpool Corp.: | | | |
| 4.5% 6/1/46 | | 400,000 | 329,476 |
| 5.5% 3/1/33 | | 3,000,000 | 3,021,822 |
| | | | 9,170,394 |
| Leisure Products - 0.0% | | | |
| Brunswick Corp. 4.4% 9/15/32 | | 1,800,000 | 1,673,006 |
| Hasbro, Inc.: | | | |
| 3.55% 11/19/26 | | 5,340,000 | 5,194,765 |
| 3.9% 11/19/29 | | 1,100,000 | 1,051,563 |
| 6.35% 3/15/40 | | 600,000 | 628,878 |
| | | | 8,548,212 |
| Specialty Retail - 0.4% | | | |
| AutoNation, Inc. 3.85% 3/1/32 | | 1,800,000 | 1,645,992 |
| AutoZone, Inc.: | | | |
| 3.25% 4/15/25 | | 713,000 | 704,302 |
| 3.75% 6/1/27 | | 1,034,000 | 1,014,813 |
| 4.75% 8/1/32 | | 2,000,000 | 1,990,088 |
| 5.1% 7/15/29 | | 1,180,000 | 1,206,181 |
| 5.4% 7/15/34 | | 1,230,000 | 1,260,086 |
| Lowe's Companies, Inc.: | | | |
| 1.3% 4/15/28 | | 2,000,000 | 1,796,231 |
| 1.7% 10/15/30 | | 3,300,000 | 2,804,995 |
| 3.65% 4/5/29 | | 4,409,000 | 4,261,494 |
| 3.7% 4/15/46 | | 624,000 | 478,966 |
| 3.75% 4/1/32 | | 1,000,000 | 939,640 |
| 4.05% 5/3/47 | | 2,050,000 | 1,660,399 |
| 4.4% 9/8/25 | | 9,800,000 | 9,760,268 |
| 4.55% 4/5/49 | | 1,688,000 | 1,458,271 |
| 4.65% 4/15/42 | | 1,158,000 | 1,056,475 |
| 4.8% 4/1/26 | | 2,000,000 | 2,006,131 |
| 5% 4/15/40 | | 2,280,000 | 2,204,405 |
| 5.125% 4/15/50 | | 1,200,000 | 1,137,785 |
| 5.15% 7/1/33 | | 2,000,000 | 2,058,576 |
| 5.625% 4/15/53 | | 1,500,000 | 1,516,890 |
| 5.75% 7/1/53 | | 1,514,000 | 1,556,181 |
| 5.85% 4/1/63 | | 2,100,000 | 2,148,567 |
| O'Reilly Automotive, Inc. 4.7% 6/15/32 | | 2,300,000 | 2,294,023 |
| Ross Stores, Inc. 0.875% 4/15/26 | | 1,900,000 | 1,789,054 |
| The Home Depot, Inc.: | | | |
| 1.375% 3/15/31 | | 5,900,000 | 4,879,600 |
| 2.375% 3/15/51 | | 2,500,000 | 1,522,076 |
| 2.5% 4/15/27 | | 3,300,000 | 3,166,474 |
| 2.8% 9/14/27 | | 891,000 | 857,237 |
| 2.875% 4/15/27 | | 5,000,000 | 4,845,889 |
| 2.95% 6/15/29 | | 4,000,000 | 3,782,636 |
| 3% 4/1/26 | | 1,788,000 | 1,751,411 |
| 3.125% 12/15/49 | | 1,483,000 | 1,064,446 |
| 3.25% 4/15/32 | | 5,500,000 | 5,076,639 |
| 3.625% 4/15/52 | | 2,000,000 | 1,555,300 |
| 3.9% 12/6/28 | | 1,027,000 | 1,017,696 |
| 3.9% 6/15/47 | | 1,529,000 | 1,273,799 |
| 4.2% 4/1/43 | | 281,000 | 249,674 |
| 4.25% 4/1/46 | | 584,000 | 517,365 |
| 4.5% 12/6/48 | | 4,879,000 | 4,442,313 |
| 4.75% 6/25/29 | | 2,240,000 | 2,290,150 |
| 4.875% 2/15/44 | | 513,000 | 495,126 |
| 5.3% 6/25/54 | | 4,420,000 | 4,511,887 |
| 5.875% 12/16/36 | | 3,154,000 | 3,470,527 |
| 5.95% 4/1/41 | | 1,300,000 | 1,432,573 |
| TJX Companies, Inc. 1.6% 5/15/31 | | 5,125,000 | 4,282,258 |
| | | | 101,234,889 |
| Textiles, Apparel & Luxury Goods - 0.1% | | | |
| NIKE, Inc.: | | | |
| 2.4% 3/27/25 | | 10,010,000 | 9,884,363 |
| 2.85% 3/27/30 | | 1,110,000 | 1,033,839 |
| 3.25% 3/27/40 | | 4,500,000 | 3,671,744 |
| 3.375% 11/1/46 | | 802,000 | 623,004 |
| Tapestry, Inc.: | | | |
| 7.35% 11/27/28 | | 2,230,000 | 2,339,108 |
| 7.85% 11/27/33 | | 2,670,000 | 2,856,973 |
| VF Corp. 2.8% 4/23/27 | | 2,000,000 | 1,872,615 |
| | | | 22,281,646 |
TOTAL CONSUMER DISCRETIONARY | | | 371,343,782 |
| CONSUMER STAPLES - 1.6% | | | |
| Beverages - 0.5% | | | |
| Anheuser-Busch Companies LLC / Anheuser-Busch InBev Worldwide, Inc. 4.7% 2/1/36 | | 5,540,000 | 5,471,814 |
| Anheuser-Busch InBev Finance, Inc.: | | | |
| 4.625% 2/1/44 | | 1,025,000 | 957,265 |
| 4.7% 2/1/36 | | 868,000 | 857,317 |
| 4.9% 2/1/46 | | 3,240,000 | 3,100,994 |
| Anheuser-Busch InBev Worldwide, Inc.: | | | |
| 4.439% 10/6/48 | | 1,318,000 | 1,178,880 |
| 4.6% 4/15/48 | | 3,342,000 | 3,096,350 |
| 4.6% 6/1/60 | | 1,372,000 | 1,273,889 |
| 4.75% 4/15/58 | | 2,600,000 | 2,431,253 |
| 4.95% 1/15/42 | | 2,400,000 | 2,354,894 |
| 5.55% 1/23/49 | | 10,112,000 | 10,596,796 |
| 5.8% 1/23/59 (Reg. S) | | 5,127,000 | 5,628,397 |
| 8.2% 1/15/39 | | 499,000 | 658,883 |
| Constellation Brands, Inc.: | | | |
| 2.875% 5/1/30 | | 2,300,000 | 2,100,309 |
| 3.15% 8/1/29 | | 366,000 | 342,993 |
| 3.5% 5/9/27 | | 1,782,000 | 1,736,407 |
| 3.7% 12/6/26 | | 1,346,000 | 1,321,974 |
| 4.5% 5/9/47 | | 1,400,000 | 1,222,883 |
| 4.9% 5/1/33 | | 3,100,000 | 3,089,832 |
| Diageo Capital PLC: | | | |
| 1.375% 9/29/25 | | 2,400,000 | 2,321,143 |
| 2% 4/29/30 | | 2,600,000 | 2,293,289 |
| 5.875% 9/30/36 | | 2,300,000 | 2,507,635 |
| Keurig Dr. Pepper, Inc.: | | | |
| 3.8% 5/1/50 | | 2,400,000 | 1,886,332 |
| 4.05% 4/15/32 | | 4,000,000 | 3,847,351 |
| 4.417% 5/25/25 | | 3,878,000 | 3,865,786 |
| 4.5% 4/15/52 | | 1,000,000 | 881,726 |
| 4.597% 5/25/28 | | 3,000,000 | 3,013,552 |
| Molson Coors Beverage Co.: | | | |
| 3% 7/15/26 | | 3,101,000 | 3,016,170 |
| 4.2% 7/15/46 | | 2,358,000 | 1,976,666 |
| PepsiCo Singapore Financing I Pte. Ltd. 4.55% 2/16/29 | | 9,400,000 | 9,495,697 |
| PepsiCo, Inc.: | | | |
| 1.625% 5/1/30 | | 3,571,000 | 3,108,060 |
| 2.375% 10/6/26 | | 1,203,000 | 1,161,919 |
| 3% 10/15/27 | | 45,000 | 43,631 |
| 3.875% 3/19/60 | | 2,400,000 | 1,955,511 |
| 4% 5/2/47 | | 3,200,000 | 2,734,804 |
| 4.25% 10/22/44 | | 1,069,000 | 955,852 |
| 4.45% 2/15/33 | | 5,000,000 | 5,166,725 |
| 4.45% 4/14/46 | | 1,034,000 | 949,669 |
| The Coca-Cola Co.: | | | |
| 1.65% 6/1/30 | | 6,300,000 | 5,477,846 |
| 2.25% 1/5/32 | | 5,370,000 | 4,700,398 |
| 2.5% 6/1/40 | | 3,700,000 | 2,724,770 |
| 2.5% 3/15/51 | | 1,500,000 | 958,517 |
| 2.6% 6/1/50 | | 1,500,000 | 983,263 |
| 2.75% 6/1/60 | | 1,500,000 | 955,086 |
| 5% 5/13/34 | | 4,700,000 | 4,886,314 |
| 5.2% 1/14/55 | | 3,000,000 | 3,056,533 |
| | | | 122,345,375 |
| Consumer Staples Distribution & Retail - 0.3% | | | |
| Costco Wholesale Corp. 1.375% 6/20/27 | | 2,000,000 | 1,860,907 |
| Dollar General Corp. 5% 11/1/32 | | 3,000,000 | 2,943,704 |
| Dollar Tree, Inc.: | | | |
| 3.375% 12/1/51 | | 1,000,000 | 669,463 |
| 4% 5/15/25 | | 1,425,000 | 1,413,402 |
| Kroger Co.: | | | |
| 1.7% 1/15/31 | | 4,600,000 | 3,840,680 |
| 2.65% 10/15/26 | | 508,000 | 488,883 |
| 3.5% 2/1/26 | | 713,000 | 701,238 |
| 4.45% 2/1/47 | | 2,100,000 | 1,798,813 |
| 4.65% 9/15/29 | | 4,000,000 | 3,999,797 |
| 4.9% 9/15/31 | | 1,250,000 | 1,249,065 |
| 5% 9/15/34 | | 1,300,000 | 1,295,960 |
| 5.15% 8/1/43 | | 485,000 | 462,884 |
| 5.4% 1/15/49 | | 1,161,000 | 1,135,956 |
| 5.5% 9/15/54 | | 1,990,000 | 1,950,593 |
| 5.65% 9/15/64 | | 1,450,000 | 1,416,614 |
| Sysco Corp.: | | | |
| 2.4% 2/15/30 | | 2,300,000 | 2,060,325 |
| 2.45% 12/14/31 | | 3,100,000 | 2,667,209 |
| 3.3% 7/15/26 | | 584,000 | 571,178 |
| 3.3% 2/15/50 | | 1,700,000 | 1,221,848 |
| 3.75% 10/1/25 | | 1,016,000 | 1,005,334 |
| 6.6% 4/1/40 | | 2,600,000 | 2,905,441 |
| Target Corp.: | | | |
| 2.25% 4/15/25 | | 15,000,000 | 14,770,222 |
| 3.9% 11/15/47 | | 1,549,000 | 1,288,021 |
| 4% 7/1/42 | | 1,247,000 | 1,101,045 |
| Walmart, Inc.: | | | |
| 3.625% 12/15/47 | | 2,215,000 | 1,818,506 |
| 3.7% 6/26/28 | | 2,192,000 | 2,180,605 |
| 3.9% 4/15/28 | | 2,000,000 | 1,995,277 |
| 3.95% 9/9/27 | | 2,000,000 | 2,003,405 |
| 4.05% 6/29/48 | | 4,969,000 | 4,373,963 |
| 4.1% 4/15/33 | | 2,000,000 | 1,979,712 |
| 4.3% 4/22/44 | | 1,069,000 | 999,178 |
| 4.5% 4/15/53 | | 2,800,000 | 2,634,585 |
| 5.25% 9/1/35 | | 1,540,000 | 1,652,042 |
| 5.625% 4/1/40 | | 356,000 | 390,751 |
| 5.625% 4/15/41 | | 820,000 | 893,675 |
| 6.5% 8/15/37 | | 1,475,000 | 1,742,849 |
| | | | 75,483,130 |
| Food Products - 0.4% | | | |
| Archer Daniels Midland Co.: | | | |
| 3.25% 3/27/30 | | 6,980,000 | 6,591,917 |
| 4.5% 3/15/49 | | 1,300,000 | 1,155,766 |
| Bunge Ltd. Finance Corp. 2.75% 5/14/31 | | 2,000,000 | 1,770,921 |
| Campbell Soup Co. 4.8% 3/15/48 | | 2,496,000 | 2,269,626 |
| Conagra Brands, Inc.: | | | |
| 4.85% 11/1/28 | | 2,429,000 | 2,448,524 |
| 5.3% 11/1/38 | | 2,484,000 | 2,445,611 |
| 5.4% 11/1/48 | | 324,000 | 312,364 |
| General Mills, Inc.: | | | |
| 3% 2/1/51 | | 803,000 | 537,853 |
| 4% 4/17/25 | | 4,100,000 | 4,072,756 |
| 4.2% 4/17/28 | | 3,066,000 | 3,047,491 |
| 4.95% 3/29/33 | | 3,500,000 | 3,529,848 |
| Kellanova: | | | |
| 3.25% 4/1/26 | | 663,000 | 649,774 |
| 4.3% 5/15/28 | | 1,069,000 | 1,065,198 |
| 4.5% 4/1/46 | | 1,300,000 | 1,150,968 |
| Kraft Heinz Foods Co.: | | | |
| 3.75% 4/1/30 | | 2,900,000 | 2,789,602 |
| 3.875% 5/15/27 | | 18,800,000 | 18,538,591 |
| 5% 7/15/35 | | 1,700,000 | 1,724,218 |
| 5.5% 6/1/50 | | 2,100,000 | 2,095,156 |
| 6.875% 1/26/39 | | 3,300,000 | 3,813,613 |
| McCormick & Co., Inc. 4.95% 4/15/33 | | 1,800,000 | 1,829,352 |
| Mondelez International, Inc.: | | | |
| 1.875% 10/15/32 | | 2,000,000 | 1,644,806 |
| 2.625% 9/4/50 | | 1,900,000 | 1,204,788 |
| Pilgrim's Pride Corp. 6.25% 7/1/33 | | 3,100,000 | 3,277,559 |
| The J.M. Smucker Co.: | | | |
| 2.375% 3/15/30 | | 3,800,000 | 3,393,695 |
| 6.5% 11/15/43 | | 3,700,000 | 4,051,940 |
| Tyson Foods, Inc.: | | | |
| 4% 3/1/26 | | 1,314,000 | 1,300,723 |
| 4.35% 3/1/29 | | 4,604,000 | 4,551,079 |
| 5.1% 9/28/48 | | 3,036,000 | 2,810,801 |
| Unilever Capital Corp.: | | | |
| 1.375% 9/14/30 | | 3,597,000 | 3,037,110 |
| 1.75% 8/12/31 | | 4,100,000 | 3,475,207 |
| 2% 7/28/26 | | 284,000 | 272,992 |
| 3.1% 7/30/25 | | 517,000 | 510,816 |
| | | | 91,370,665 |
| Household Products - 0.1% | | | |
| Church & Dwight Co., Inc. 2.3% 12/15/31 | | 3,700,000 | 3,188,041 |
| Colgate-Palmolive Co.: | | | |
| 3.7% 8/1/47 | | 1,200,000 | 1,006,622 |
| 4% 8/15/45 | | 1,000,000 | 884,368 |
| Kimberly-Clark Corp.: | | | |
| 1.05% 9/15/27 | | 3,500,000 | 3,190,283 |
| 3.05% 8/15/25 | | 4,000,000 | 3,942,518 |
| 3.2% 4/25/29 | | 3,610,000 | 3,465,113 |
| 3.2% 7/30/46 | | 445,000 | 332,798 |
| 6.625% 8/1/37 | | 1,100,000 | 1,295,304 |
| Procter & Gamble Co.: | | | |
| 2.45% 11/3/26 | | 3,400,000 | 3,288,039 |
| 2.8% 3/25/27 | | 4,860,000 | 4,716,206 |
| 2.85% 8/11/27 | | 802,000 | 777,058 |
| 3% 3/25/30 | | 8,500,000 | 8,063,210 |
| | | | 34,149,560 |
| Personal Care Products - 0.0% | | | |
| Estee Lauder Companies, Inc.: | | | |
| 1.95% 3/15/31 | | 4,300,000 | 3,677,888 |
| 4.15% 3/15/47 | | 1,300,000 | 1,092,294 |
| 5.15% 5/15/53 | | 600,000 | 602,132 |
| Kenvue, Inc.: | | | |
| 4.9% 3/22/33 | | 1,900,000 | 1,944,102 |
| 5.05% 3/22/28 | | 1,900,000 | 1,952,478 |
| 5.05% 3/22/53 | | 2,900,000 | 2,888,847 |
| | | | 12,157,741 |
| Tobacco - 0.3% | | | |
| Altria Group, Inc.: | | | |
| 2.45% 2/4/32 | | 2,700,000 | 2,271,509 |
| 3.4% 5/6/30 | | 1,570,000 | 1,468,980 |
| 4% 2/4/61 | | 1,700,000 | 1,268,041 |
| 4.25% 8/9/42 | | 1,744,000 | 1,465,493 |
| 4.8% 2/14/29 | | 2,465,000 | 2,479,148 |
| 5.375% 1/31/44 | | 1,000,000 | 991,047 |
| 5.8% 2/14/39 | | 4,010,000 | 4,134,950 |
| 5.95% 2/14/49 | | 3,554,000 | 3,662,391 |
| BAT Capital Corp.: | | | |
| 3.462% 9/6/29 | | 3,400,000 | 3,216,302 |
| 3.557% 8/15/27 | | 3,773,000 | 3,680,508 |
| 4.39% 8/15/37 | | 3,200,000 | 2,854,883 |
| 4.54% 8/15/47 | | 6,083,000 | 4,975,278 |
| 4.7% 4/2/27 | | 2,000,000 | 2,006,150 |
| 4.758% 9/6/49 | | 2,900,000 | 2,428,156 |
| 4.906% 4/2/30 | | 2,700,000 | 2,715,054 |
| 6.421% 8/2/33 | | 3,000,000 | 3,252,966 |
| BAT International Finance PLC: | | | |
| 1.668% 3/25/26 | | 1,000,000 | 954,454 |
| 5.931% 2/2/29 | | 2,460,000 | 2,581,141 |
| Philip Morris International, Inc.: | | | |
| 2.75% 2/25/26 | | 668,000 | 650,848 |
| 3.375% 8/15/29 | | 2,800,000 | 2,665,194 |
| 3.875% 8/21/42 | | 860,000 | 711,897 |
| 4.125% 3/4/43 | | 5,432,000 | 4,615,566 |
| 4.875% 2/15/28 | | 2,200,000 | 2,231,017 |
| 4.875% 11/15/43 | | 1,069,000 | 1,005,516 |
| 5.125% 11/17/27 | | 2,300,000 | 2,351,308 |
| 5.375% 2/15/33 | | 5,400,000 | 5,568,723 |
| 5.75% 11/17/32 | | 1,600,000 | 1,693,039 |
| 6.375% 5/16/38 | | 258,000 | 290,617 |
| Reynolds American, Inc.: | | | |
| 4.45% 6/12/25 | | 1,259,000 | 1,252,472 |
| 5.7% 8/15/35 | | 1,000,000 | 1,023,894 |
| 5.85% 8/15/45 | | 756,000 | 740,485 |
| 7.25% 6/15/37 | | 1,287,000 | 1,460,259 |
| | | | 72,667,286 |
TOTAL CONSUMER STAPLES | | | 408,173,757 |
| ENERGY - 1.8% | | | |
| Energy Equipment & Services - 0.0% | | | |
| Baker Hughes Co.: | | | |
| 4.08% 12/15/47 | | 4,181,000 | 3,475,549 |
| 5.125% 9/15/40 | | 356,000 | 349,995 |
| Halliburton Co.: | | | |
| 3.8% 11/15/25 | | 46,000 | 45,493 |
| 4.5% 11/15/41 | | 2,300,000 | 2,049,888 |
| 5% 11/15/45 | | 1,344,000 | 1,260,335 |
| 6.7% 9/15/38 | | 2,780,000 | 3,172,739 |
| 7.45% 9/15/39 | | 267,000 | 326,001 |
| | | | 10,680,000 |
| Oil, Gas & Consumable Fuels - 1.8% | | | |
| 6297782 LLC: | | | |
| 5.026% 10/1/29 (c) | | 1,140,000 | 1,137,480 |
| 5.584% 10/1/34 (c) | | 1,040,000 | 1,035,505 |
| 6.176% 10/1/54 (c) | | 1,040,000 | 1,039,422 |
| Apache Corp.: | | | |
| 5.1% 9/1/40 | | 535,000 | 473,172 |
| 5.25% 2/1/42 | | 2,900,000 | 2,565,886 |
| Boardwalk Pipelines LP: | | | |
| 4.45% 7/15/27 | | 4,900,000 | 4,874,632 |
| 4.95% 12/15/24 | | 846,000 | 844,222 |
| BP Capital Markets PLC: | | | |
| 3.279% 9/19/27 | | 670,000 | 652,193 |
| 3.723% 11/28/28 | | 9,700,000 | 9,453,926 |
| Canadian Natural Resources Ltd.: | | | |
| 2.95% 7/15/30 | | 4,300,000 | 3,893,745 |
| 3.9% 2/1/25 | | 335,000 | 332,991 |
| 4.95% 6/1/47 | | 1,141,000 | 1,018,250 |
| 6.25% 3/15/38 | | 1,221,000 | 1,301,007 |
| Cenovus Energy, Inc.: | | | |
| 2.65% 1/15/32 | | 3,000,000 | 2,559,596 |
| 4.25% 4/15/27 | | 1,693,000 | 1,674,359 |
| 5.4% 6/15/47 | | 997,000 | 956,519 |
| 6.75% 11/15/39 | | 447,000 | 499,819 |
| Cheniere Corpus Christi Holdings LLC 3.7% 11/15/29 | | 3,730,000 | 3,550,295 |
| Cheniere Energy Partners LP 5.95% 6/30/33 | | 4,200,000 | 4,421,260 |
| Chevron Corp.: | | | |
| 1.554% 5/11/25 | | 1,300,000 | 1,270,908 |
| 2.236% 5/11/30 | | 100,000 | 89,708 |
| 2.954% 5/16/26 | | 1,961,000 | 1,919,632 |
| 2.978% 5/11/40 | | 1,300,000 | 1,020,209 |
| 3.078% 5/11/50 | | 1,300,000 | 937,189 |
| Chevron U.S.A., Inc.: | | | |
| 4.2% 10/15/49 | | 1,100,000 | 945,981 |
| 4.95% 8/15/47 | | 2,459,000 | 2,353,361 |
| Columbia Pipeline Group, Inc. 4.5% 6/1/25 | | 593,000 | 589,657 |
| ConocoPhillips Co.: | | | |
| 4.025% 3/15/62 | | 2,000,000 | 1,581,306 |
| 4.875% 10/1/47 | | 1,400,000 | 1,349,556 |
| 5.05% 9/15/33 | | 6,500,000 | 6,665,739 |
| 5.55% 3/15/54 | | 1,300,000 | 1,336,143 |
| 5.95% 3/15/46 | | 1,069,000 | 1,151,950 |
| 6.5% 2/1/39 | | 3,342,000 | 3,834,853 |
| Devon Energy Corp.: | | | |
| 5% 6/15/45 | | 4,024,000 | 3,590,795 |
| 5.6% 7/15/41 | | 513,000 | 500,601 |
| Diamondback Energy, Inc.: | | | |
| 4.25% 3/15/52 | | 3,500,000 | 2,806,746 |
| 5.4% 4/18/34 | | 1,200,000 | 1,221,405 |
| 5.9% 4/18/64 | | 1,400,000 | 1,405,733 |
| Eastern Gas Transmission & Storage, Inc. 3.9% 11/15/49 | | 2,300,000 | 1,716,503 |
| Enbridge, Inc.: | | | |
| 3.4% 8/1/51 | | 2,030,000 | 1,439,081 |
| 4.5% 6/10/44 | | 1,000,000 | 865,197 |
| 5.5% 12/1/46 | | 2,582,000 | 2,579,314 |
| 5.625% 4/5/34 | | 3,900,000 | 4,023,979 |
| 5.7% 3/8/33 | | 3,100,000 | 3,232,364 |
| 8.5% 1/15/84 (b) | | 800,000 | 876,808 |
| Energy Transfer LP: | | | |
| 3.9% 7/15/26 | | 1,340,000 | 1,320,040 |
| 4.95% 6/15/28 | | 1,681,000 | 1,698,420 |
| 5% 5/15/44 (b) | | 1,200,000 | 1,076,596 |
| 5% 5/15/50 | | 900,000 | 798,217 |
| 5.15% 2/1/43 | | 1,800,000 | 1,656,374 |
| 5.15% 3/15/45 | | 1,425,000 | 1,303,808 |
| 5.25% 4/15/29 | | 3,400,000 | 3,475,920 |
| 5.3% 4/1/44 | | 1,034,000 | 965,805 |
| 5.4% 10/1/47 | | 980,000 | 916,293 |
| 5.5% 6/1/27 | | 9,800,000 | 9,992,706 |
| 5.75% 2/15/33 | | 3,500,000 | 3,639,678 |
| 5.8% 6/15/38 | | 5,730,000 | 5,871,533 |
| 6% 6/15/48 | | 3,656,000 | 3,691,815 |
| 6.25% 4/15/49 | | 105,000 | 109,251 |
| 6.625% 10/15/36 | | 2,600,000 | 2,831,640 |
| Enterprise Products Operating LP: | | | |
| 3.125% 7/31/29 | | 1,000,000 | 947,428 |
| 3.2% 2/15/52 | | 1,700,000 | 1,176,063 |
| 3.3% 2/15/53 | | 3,600,000 | 2,518,273 |
| 3.7% 2/15/26 | | 316,000 | 312,740 |
| 3.95% 2/15/27 | | 4,613,000 | 4,576,023 |
| 3.95% 1/31/60 | | 2,310,000 | 1,773,299 |
| 4.2% 1/31/50 | | 2,500,000 | 2,094,613 |
| 4.25% 2/15/48 | | 5,564,000 | 4,730,043 |
| 4.8% 2/1/49 | | 265,000 | 242,767 |
| 4.85% 8/15/42 | | 445,000 | 418,254 |
| 4.85% 3/15/44 | | 891,000 | 833,213 |
| 4.9% 5/15/46 | | 763,000 | 714,123 |
| 4.95% 2/15/35 | | 310,000 | 311,311 |
| 5.35% 1/31/33 | | 3,000,000 | 3,119,831 |
| 5.55% 2/16/55 | | 310,000 | 315,416 |
| 5.7% 2/15/42 | | 356,000 | 367,492 |
| 6.45% 9/1/40 | | 1,000,000 | 1,118,186 |
| 7.55% 4/15/38 | | 356,000 | 436,281 |
| EOG Resources, Inc. 4.15% 1/15/26 | | 998,000 | 995,218 |
| EQT Corp.: | | | |
| 3.9% 10/1/27 | | 3,700,000 | 3,615,296 |
| 5.7% 4/1/28 | | 2,071,000 | 2,127,480 |
| Equinor ASA: | | | |
| 2.375% 5/22/30 | | 2,880,000 | 2,601,824 |
| 3.125% 4/6/30 | | 3,353,000 | 3,151,726 |
| 3.25% 11/18/49 | | 1,250,000 | 916,430 |
| 3.625% 9/10/28 | | 2,153,000 | 2,106,416 |
| 3.7% 4/6/50 | | 3,000,000 | 2,380,333 |
| 3.95% 5/15/43 | | 1,000,000 | 854,414 |
| 5.1% 8/17/40 | | 356,000 | 356,183 |
| Exxon Mobil Corp.: | | | |
| 3.043% 3/1/26 | | 1,484,000 | 1,457,578 |
| 3.452% 4/15/51 | | 7,600,000 | 5,778,827 |
| 3.482% 3/19/30 | | 12,700,000 | 12,230,242 |
| 3.567% 3/6/45 | | 1,186,000 | 956,484 |
| 4.227% 3/19/40 | | 2,310,000 | 2,122,039 |
| Hess Corp.: | | | |
| 4.3% 4/1/27 | | 2,800,000 | 2,780,842 |
| 5.6% 2/15/41 | | 606,000 | 619,681 |
| 6% 1/15/40 | | 1,000,000 | 1,061,740 |
| 7.125% 3/15/33 | | 2,500,000 | 2,847,818 |
| Kinder Morgan Energy Partners LP: | | | |
| 4.7% 11/1/42 | | 677,000 | 588,811 |
| 5% 3/1/43 | | 178,000 | 160,599 |
| 5.4% 9/1/44 | | 2,700,000 | 2,564,156 |
| 5.5% 3/1/44 | | 1,247,000 | 1,202,527 |
| 5.625% 9/1/41 | | 178,000 | 174,755 |
| 6.55% 9/15/40 | | 535,000 | 572,767 |
| Kinder Morgan, Inc.: | | | |
| 4.3% 3/1/28 | | 1,776,000 | 1,766,723 |
| 5.2% 6/1/33 | | 6,800,000 | 6,815,581 |
| 5.2% 3/1/48 | | 885,000 | 815,862 |
| 5.3% 12/1/34 | | 1,524,000 | 1,533,002 |
| 5.4% 2/1/34 | | 3,500,000 | 3,551,999 |
| 5.45% 8/1/52 | | 300,000 | 285,203 |
| 5.55% 6/1/45 | | 3,400,000 | 3,298,195 |
| 7.75% 1/15/32 | | 1,000,000 | 1,159,928 |
| 7.8% 8/1/31 | | 1,200,000 | 1,386,088 |
| Marathon Oil Corp.: | | | |
| 4.4% 7/15/27 | | 3,070,000 | 3,058,513 |
| 5.2% 6/1/45 | | 891,000 | 854,858 |
| 5.7% 4/1/34 | | 1,500,000 | 1,582,663 |
| Marathon Petroleum Corp.: | | | |
| 4.5% 4/1/48 | | 3,210,000 | 2,699,696 |
| 6.5% 3/1/41 | | 178,000 | 191,823 |
| MPLX LP: | | | |
| 4.125% 3/1/27 | | 1,685,000 | 1,666,459 |
| 4.7% 4/15/48 | | 3,476,000 | 2,993,466 |
| 4.8% 2/15/29 | | 2,638,000 | 2,662,930 |
| 5% 3/1/33 | | 4,000,000 | 3,958,303 |
| 5.2% 3/1/47 | | 1,091,000 | 1,016,489 |
| 5.5% 2/15/49 | | 1,800,000 | 1,725,995 |
| 5.65% 3/1/53 | | 1,600,000 | 1,562,650 |
| Occidental Petroleum Corp.: | | | |
| 4.4% 4/15/46 | | 1,000,000 | 820,457 |
| 6.05% 10/1/54 | | 2,680,000 | 2,725,536 |
| 6.375% 9/1/28 | | 6,200,000 | 6,503,664 |
| 7.875% 9/15/31 | | 6,500,000 | 7,504,270 |
| ONEOK, Inc.: | | | |
| 3.95% 3/1/50 | | 1,590,000 | 1,206,855 |
| 4.25% 9/15/46 | | 980,000 | 795,904 |
| 4.45% 9/1/49 | | 1,110,000 | 902,404 |
| 4.95% 7/13/47 | | 1,043,000 | 928,735 |
| 5% 3/1/26 | | 535,000 | 535,925 |
| 5.2% 7/15/48 | | 538,000 | 493,796 |
| 5.65% 11/1/28 | | 900,000 | 934,841 |
| 6.05% 9/1/33 | | 3,200,000 | 3,377,409 |
| 6.1% 11/15/32 | | 4,500,000 | 4,778,051 |
| 6.35% 1/15/31 | | 5,000,000 | 5,366,360 |
| 6.625% 9/1/53 | | 1,800,000 | 1,982,558 |
| Ovintiv, Inc.: | | | |
| 6.25% 7/15/33 | | 1,000,000 | 1,055,794 |
| 6.5% 2/1/38 | | 2,591,000 | 2,751,875 |
| Phillips 66 Co.: | | | |
| 3.15% 12/15/29 | | 4,300,000 | 4,018,959 |
| 3.9% 3/15/28 | | 4,400,000 | 4,313,799 |
| 4.65% 11/15/34 | | 1,000,000 | 967,716 |
| 4.875% 11/15/44 | | 178,000 | 163,692 |
| 5.65% 6/15/54 | | 2,600,000 | 2,599,068 |
| 5.875% 5/1/42 | | 1,693,000 | 1,767,597 |
| Pioneer Natural Resources Co. 1.9% 8/15/30 | | 3,500,000 | 3,048,827 |
| Plains All American Pipeline LP/PAA Finance Corp.: | | | |
| 3.8% 9/15/30 | | 4,890,000 | 4,605,175 |
| 4.9% 2/15/45 | | 339,000 | 298,819 |
| 6.65% 1/15/37 | | 1,498,000 | 1,625,383 |
| Sabine Pass Liquefaction LLC: | | | |
| 4.5% 5/15/30 | | 3,200,000 | 3,166,559 |
| 5.875% 6/30/26 | | 8,200,000 | 8,308,643 |
| Schlumberger Investment SA 5% 6/1/34 | | 1,300,000 | 1,325,163 |
| Shell International Finance BV: | | | |
| 2.375% 11/7/29 | | 7,700,000 | 7,033,851 |
| 3.125% 11/7/49 | | 3,000,000 | 2,129,574 |
| 3.25% 5/11/25 | | 2,523,000 | 2,498,161 |
| 3.875% 11/13/28 | | 10,100,000 | 9,989,287 |
| 4% 5/10/46 | | 713,000 | 598,092 |
| 4.375% 5/11/45 | | 3,970,000 | 3,539,586 |
| 4.55% 8/12/43 | | 2,800,000 | 2,620,891 |
| 6.375% 12/15/38 | | 748,000 | 854,099 |
| Spectra Energy Partners LP 3.375% 10/15/26 | | 2,907,000 | 2,834,081 |
| Suncor Energy, Inc.: | | | |
| 4% 11/15/47 | | 3,021,000 | 2,338,494 |
| 6.8% 5/15/38 | | 1,505,000 | 1,681,403 |
| 6.85% 6/1/39 | | 356,000 | 397,819 |
| Targa Resources Corp.: | | | |
| 4.95% 4/15/52 | | 1,000,000 | 884,918 |
| 6.125% 3/15/33 | | 6,400,000 | 6,798,779 |
| Targa Resources Partners LP/Targa Resources Partners Finance Corp. 5% 1/15/28 | | 5,000,000 | 4,990,552 |
| The Williams Companies, Inc.: | | | |
| 3.5% 11/15/30 | | 4,500,000 | 4,216,369 |
| 3.75% 6/15/27 | | 4,163,000 | 4,076,977 |
| 4.85% 3/1/48 | | 1,722,000 | 1,545,200 |
| 5.4% 3/2/26 | | 4,720,000 | 4,765,567 |
| 5.65% 3/15/33 | | 2,500,000 | 2,596,537 |
| 5.75% 6/24/44 | | 339,000 | 341,874 |
| TotalEnergies Capital International SA: | | | |
| 3.127% 5/29/50 | | 600,000 | 426,665 |
| 3.455% 2/19/29 | | 3,803,000 | 3,682,335 |
| 3.461% 7/12/49 | | 1,500,000 | 1,133,335 |
| TotalEnergies Capital SA: | | | |
| 3.883% 10/11/28 | | 7,780,000 | 7,660,741 |
| 5.15% 4/5/34 | | 1,700,000 | 1,757,576 |
| 5.488% 4/5/54 | | 1,700,000 | 1,754,003 |
| 5.638% 4/5/64 | | 1,200,000 | 1,245,989 |
| TransCanada PipeLines Ltd.: | | | |
| 2.5% 10/12/31 | | 4,700,000 | 4,099,125 |
| 4.75% 5/15/38 | | 378,000 | 358,661 |
| 4.875% 1/15/26 | | 891,000 | 891,872 |
| 4.875% 5/15/48 | | 877,000 | 805,970 |
| 5.1% 3/15/49 | | 1,836,000 | 1,748,819 |
| 6.1% 6/1/40 | | 1,195,000 | 1,264,401 |
| 7.625% 1/15/39 | | 1,700,000 | 2,069,325 |
| Transcontinental Gas Pipe Line Co. LLC: | | | |
| 3.25% 5/15/30 | | 3,970,000 | 3,685,879 |
| 3.95% 5/15/50 | | 970,000 | 763,505 |
| 4.45% 8/1/42 | | 2,181,000 | 1,962,799 |
| 4.6% 3/15/48 | | 2,813,000 | 2,443,873 |
| Valero Energy Corp.: | | | |
| 2.8% 12/1/31 | | 2,100,000 | 1,833,437 |
| 3.4% 9/15/26 | | 2,720,000 | 2,654,522 |
| 4% 4/1/29 | | 1,836,000 | 1,795,751 |
| 4% 6/1/52 | | 1,200,000 | 916,172 |
| 6.625% 6/15/37 | | 966,000 | 1,067,567 |
| Western Midstream Operating LP: | | | |
| 4.5% 3/1/28 | | 1,000,000 | 986,216 |
| 4.65% 7/1/26 | | 2,900,000 | 2,885,099 |
| 5.45% 4/1/44 | | 2,500,000 | 2,336,214 |
| 5.5% 8/15/48 | | 900,000 | 825,652 |
| | | | 454,414,509 |
TOTAL ENERGY | | | 465,094,509 |
| FINANCIALS - 8.4% | | | |
| Banks - 4.4% | | | |
| Australia and New Zealand Banking Group Ltd.: | | | |
| 3.7% 11/16/25 | | 944,000 | 935,931 |
| 4.75% 1/18/27 | | 3,700,000 | 3,739,875 |
| Banco Bilbao Vizcaya Argentaria SA: | | | |
| 6.138% 9/14/28 (b) | | 1,400,000 | 1,454,496 |
| 7.883% 11/15/34 (b) | | 600,000 | 679,261 |
| Banco Santander SA: | | | |
| 1.722% 9/14/27 (b) | | 7,200,000 | 6,756,352 |
| 1.849% 3/25/26 | | 4,400,000 | 4,201,694 |
| 2.749% 12/3/30 | | 1,400,000 | 1,218,556 |
| 2.958% 3/25/31 | | 4,400,000 | 3,914,034 |
| 3.225% 11/22/32 (b) | | 1,000,000 | 861,917 |
| 3.8% 2/23/28 | | 1,000,000 | 971,054 |
| 4.175% 3/24/28 (b) | | 1,000,000 | 983,232 |
| 4.25% 4/11/27 | | 2,600,000 | 2,568,754 |
| 5.294% 8/18/27 | | 1,400,000 | 1,423,468 |
| 5.538% 3/14/30 (b) | | 2,800,000 | 2,876,825 |
| 6.35% 3/14/34 | | 1,400,000 | 1,467,124 |
| 6.921% 8/8/33 | | 2,200,000 | 2,383,773 |
| Bank of America Corp.: | | | |
| U.S. Secured Overnight Fin. Rate (SOFR) Index + 1.290% 5.08% 1/20/27 (b) | | 4,000,000 | 4,017,130 |
| 1.658% 3/11/27 (b) | | 9,900,000 | 9,451,719 |
| 1.734% 7/22/27 (b) | | 7,800,000 | 7,399,451 |
| 1.898% 7/23/31 (b) | | 4,200,000 | 3,595,949 |
| 2.015% 2/13/26 (b) | | 15,400,000 | 15,174,538 |
| 2.087% 6/14/29 (b) | | 8,400,000 | 7,689,851 |
| 2.299% 7/21/32 (b) | | 3,700,000 | 3,149,517 |
| 2.456% 10/22/25 (b) | | 2,600,000 | 2,588,855 |
| 2.482% 9/21/36 (b) | | 1,900,000 | 1,574,285 |
| 2.572% 10/20/32 (b) | | 7,000,000 | 6,054,880 |
| 2.651% 3/11/32 (b) | | 12,800,000 | 11,230,638 |
| 2.676% 6/19/41 (b) | | 9,300,000 | 6,796,924 |
| 2.687% 4/22/32 (b) | | 5,100,000 | 4,479,648 |
| 2.831% 10/24/51 (b) | | 3,893,000 | 2,608,897 |
| 2.884% 10/22/30 (b) | | 1,100,000 | 1,010,473 |
| 2.972% 7/21/52 (b) | | 2,700,000 | 1,871,463 |
| 3.194% 7/23/30 (b) | | 2,934,000 | 2,746,945 |
| 3.248% 10/21/27 | | 3,268,000 | 3,168,696 |
| 3.366% 1/23/26 (b) | | 8,569,000 | 8,498,636 |
| 3.419% 12/20/28 (b) | | 19,130,000 | 18,445,192 |
| 3.593% 7/21/28 (b) | | 1,978,000 | 1,926,220 |
| 3.705% 4/24/28 (b) | | 1,568,000 | 1,532,686 |
| 3.974% 2/7/30 (b) | | 2,521,000 | 2,453,392 |
| 4% 1/22/25 | | 1,069,000 | 1,063,111 |
| 4.078% 4/23/40 (b) | | 5,000,000 | 4,467,184 |
| 4.083% 3/20/51 (b) | | 8,350,000 | 7,027,462 |
| 4.183% 11/25/27 | | 10,318,000 | 10,215,162 |
| 4.25% 10/22/26 | | 713,000 | 709,319 |
| 4.271% 7/23/29 (b) | | 7,550,000 | 7,469,666 |
| 4.33% 3/15/50 (b) | | 2,333,000 | 2,051,800 |
| 4.443% 1/20/48 (b) | | 2,718,000 | 2,437,664 |
| 4.45% 3/3/26 | | 2,317,000 | 2,309,028 |
| 4.948% 7/22/28 (b) | | 2,800,000 | 2,828,790 |
| 5% 1/21/44 | | 958,000 | 953,747 |
| 5.202% 4/25/29 (b) | | 2,000,000 | 2,043,083 |
| 5.288% 4/25/34 (b) | | 1,800,000 | 1,846,137 |
| 5.425% 8/15/35 (b) | | 2,140,000 | 2,144,639 |
| 5.872% 9/15/34 (b) | | 6,700,000 | 7,120,876 |
| 5.875% 2/7/42 | | 409,000 | 446,667 |
| 6.11% 1/29/37 | | 1,224,000 | 1,329,525 |
| 7.75% 5/14/38 | | 2,324,000 | 2,884,027 |
| Bank of Montreal: | | | |
| 3.088% 1/10/37 (b) | | 1,000,000 | 853,310 |
| 3.803% 12/15/32 (b) | | 1,720,000 | 1,656,490 |
| 4.7% 9/14/27 | | 3,700,000 | 3,736,383 |
| 5.266% 12/11/26 | | 4,900,000 | 4,987,906 |
| Bank of Nova Scotia: | | | |
| 4.5% 12/16/25 | | 2,830,000 | 2,812,893 |
| 4.588% 5/4/37 (b) | | 1,200,000 | 1,125,306 |
| 4.85% 2/1/30 | | 3,400,000 | 3,452,831 |
| 5.25% 12/6/24 | | 6,500,000 | 6,496,932 |
| 5.25% 6/12/28 | | 3,300,000 | 3,394,785 |
| Barclays PLC: | | | |
| 2.279% 11/24/27 (b) | | 4,700,000 | 4,448,162 |
| 2.852% 5/7/26 (b) | | 300,000 | 294,898 |
| 2.894% 11/24/32 (b) | | 4,700,000 | 4,051,948 |
| 3.33% 11/24/42 (b) | | 1,000,000 | 748,926 |
| 3.564% 9/23/35 (b) | | 2,000,000 | 1,800,759 |
| 4.375% 1/12/26 | | 711,000 | 706,797 |
| 4.836% 5/9/28 | | 1,711,000 | 1,697,002 |
| 4.95% 1/10/47 | | 3,320,000 | 3,108,108 |
| 4.972% 5/16/29 (b) | | 759,000 | 761,360 |
| 5.088% 6/20/30 (b) | | 1,000,000 | 996,249 |
| 5.2% 5/12/26 | | 2,580,000 | 2,586,751 |
| 5.25% 8/17/45 | | 998,000 | 982,951 |
| 5.501% 8/9/28 (b) | | 1,080,000 | 1,100,932 |
| 5.829% 5/9/27 (b) | | 2,000,000 | 2,028,163 |
| 6.036% 3/12/55 (b) | | 300,000 | 319,685 |
| 6.224% 5/9/34 (b) | | 1,800,000 | 1,912,282 |
| 6.49% 9/13/29 (b) | | 3,000,000 | 3,177,948 |
| 7.119% 6/27/34 (b) | | 1,900,000 | 2,084,689 |
| 7.437% 11/2/33 (b) | | 5,400,000 | 6,153,105 |
| Canadian Imperial Bank of Commerce: | | | |
| 3.6% 4/7/32 | | 1,285,000 | 1,184,306 |
| 6.092% 10/3/33 | | 2,815,000 | 3,027,655 |
| Citibank NA 4.838% 8/6/29 | | 2,640,000 | 2,676,308 |
| Citigroup, Inc.: | | | |
| 1.122% 1/28/27 (b) | | 9,700,000 | 9,211,556 |
| 1.462% 6/9/27 (b) | | 9,250,000 | 8,747,745 |
| 2.561% 5/1/32 (b) | | 3,000,000 | 2,598,681 |
| 2.904% 11/3/42 (b) | | 1,900,000 | 1,382,205 |
| 3.057% 1/25/33 (b) | | 4,300,000 | 3,783,607 |
| 3.4% 5/1/26 | | 9,800,000 | 9,619,800 |
| 3.52% 10/27/28 (b) | | 16,306,000 | 15,807,344 |
| 3.668% 7/24/28 (b) | | 1,351,000 | 1,317,280 |
| 3.7% 1/12/26 | | 1,984,000 | 1,958,104 |
| 3.785% 3/17/33 (b) | | 5,600,000 | 5,169,044 |
| 3.887% 1/10/28 (b) | | 802,000 | 789,060 |
| 3.98% 3/20/30 (b) | | 5,278,000 | 5,124,307 |
| 4.125% 7/25/28 | | 2,752,000 | 2,706,857 |
| 4.3% 11/20/26 | | 2,984,000 | 2,965,281 |
| 4.4% 6/10/25 | | 713,000 | 709,077 |
| 4.412% 3/31/31 (b) | | 1,800,000 | 1,770,529 |
| 4.6% 3/9/26 | | 1,069,000 | 1,066,385 |
| 4.65% 7/30/45 | | 2,930,000 | 2,682,218 |
| 4.75% 5/18/46 | | 1,403,000 | 1,268,266 |
| 5.3% 5/6/44 | | 356,000 | 349,687 |
| 5.316% 3/26/41 (b) | | 3,530,000 | 3,520,068 |
| 5.449% 6/11/35 (b) | | 3,000,000 | 3,083,095 |
| 5.5% 9/13/25 | | 891,000 | 895,548 |
| 5.61% 9/29/26 (b) | | 4,000,000 | 4,028,709 |
| 5.875% 2/22/33 | | 2,000,000 | 2,100,048 |
| 5.875% 1/30/42 | | 1,298,000 | 1,390,570 |
| 6.27% 11/17/33 (b) | | 2,500,000 | 2,708,402 |
| 6.625% 6/15/32 | | 1,600,000 | 1,754,972 |
| 6.675% 9/13/43 | | 3,800,000 | 4,346,259 |
| 8.125% 7/15/39 | | 3,263,000 | 4,246,344 |
| Citizens Financial Group, Inc.: | | | |
| 2.638% 9/30/32 | | 337,000 | 273,766 |
| 5.641% 5/21/37 (b) | | 500,000 | 482,713 |
| 5.718% 7/23/32 (b) | | 3,420,000 | 3,490,840 |
| Comerica, Inc. 3.8% 7/22/26 | | 651,000 | 634,153 |
| Cooperatieve Rabobank UA: | | | |
| 3.75% 7/21/26 | | 3,431,000 | 3,357,828 |
| 4.375% 8/4/25 | | 853,000 | 846,857 |
| 5.25% 5/24/41 | | 535,000 | 551,453 |
| 5.75% 12/1/43 | | 1,590,000 | 1,648,090 |
| Cooperatieve Rabobank UA/NY: | | | |
| 3.375% 5/21/25 | | 533,000 | 527,051 |
| 4.8% 1/9/29 | | 3,700,000 | 3,769,454 |
| Export-Import Bank of Korea: | | | |
| 0.625% 2/9/26 | | 5,100,000 | 4,838,227 |
| 1.125% 12/29/26 | | 2,000,000 | 1,861,624 |
| 2.5% 6/29/41 | | 1,660,000 | 1,223,473 |
| 2.875% 1/21/25 | | 4,215,000 | 4,185,971 |
| 5.125% 9/18/33 | | 4,000,000 | 4,158,680 |
| Fifth Third Bancorp: | | | |
| 2.55% 5/5/27 | | 4,300,000 | 4,080,754 |
| 5.631% 1/29/32 (b) | | 1,300,000 | 1,335,642 |
| 6.339% 7/27/29 (b) | | 1,100,000 | 1,156,501 |
| 6.361% 10/27/28 (b) | | 3,130,000 | 3,272,559 |
| 8.25% 3/1/38 | | 371,000 | 460,028 |
| HSBC Holdings PLC: | | | |
| U.S. Secured Overnight Fin. Rate (SOFR) Index + 2.650% 6.332% 3/9/44 (b) | | 4,300,000 | 4,704,866 |
| 2.013% 9/22/28 (b) | | 1,800,000 | 1,661,565 |
| 2.206% 8/17/29 (b) | | 5,590,000 | 5,070,238 |
| 2.633% 11/7/25 (b) | | 9,800,000 | 9,748,726 |
| 2.804% 5/24/32 (b) | | 5,730,000 | 4,976,552 |
| 2.848% 6/4/31 (b) | | 1,800,000 | 1,615,749 |
| 4.25% 8/18/25 | | 998,000 | 989,794 |
| 4.292% 9/12/26 (b) | | 13,003,000 | 12,904,889 |
| 4.375% 11/23/26 | | 3,716,000 | 3,678,872 |
| 4.762% 3/29/33 (b) | | 2,100,000 | 2,024,969 |
| 5.25% 3/14/44 | | 1,654,000 | 1,610,872 |
| 5.597% 5/17/28 (b) | | 3,200,000 | 3,268,824 |
| 5.719% 3/4/35 (b) | | 500,000 | 521,237 |
| 5.887% 8/14/27 (b) | | 6,300,000 | 6,432,071 |
| 6.1% 1/14/42 | | 1,400,000 | 1,551,733 |
| 6.254% 3/9/34 (b) | | 6,200,000 | 6,666,942 |
| 6.5% 5/2/36 | | 807,000 | 863,137 |
| 6.5% 9/15/37 | | 2,564,000 | 2,749,386 |
| 6.8% 6/1/38 | | 2,600,000 | 2,859,872 |
| 7.39% 11/3/28 (b) | | 4,700,000 | 5,058,885 |
| 7.399% 11/13/34 (b) | | 2,100,000 | 2,353,097 |
| 8.113% 11/3/33 (b) | | 3,700,000 | 4,318,138 |
| Huntington Bancshares, Inc.: | | | |
| 4.443% 8/4/28 (b) | | 2,000,000 | 1,994,146 |
| 5.709% 2/2/35 (b) | | 1,000,000 | 1,024,975 |
| 6.208% 8/21/29 (b) | | 1,500,000 | 1,575,994 |
| Huntington National Bank 4.552% 5/17/28 (b) | | 3,900,000 | 3,871,359 |
| ING Groep NV: | | | |
| 1.726% 4/1/27 (b) | | 2,300,000 | 2,192,705 |
| 2.727% 4/1/32 (b) | | 2,300,000 | 2,016,832 |
| 3.869% 3/28/26 (b) | | 4,900,000 | 4,863,363 |
| 4.017% 3/28/28 (b) | | 1,800,000 | 1,774,160 |
| 4.252% 3/28/33 (b) | | 1,000,000 | 959,359 |
| 5.55% 3/19/35 (b) | | 3,200,000 | 3,296,310 |
| JPMorgan Chase & Co.: | | | |
| 1.47% 9/22/27 (b) | | 3,400,000 | 3,193,801 |
| 1.578% 4/22/27 (b) | | 7,261,000 | 6,908,908 |
| 1.953% 2/4/32 (b) | | 10,000,000 | 8,445,795 |
| 2.069% 6/1/29 (b) | | 5,500,000 | 5,033,422 |
| 2.545% 11/8/32 (b) | | 4,100,000 | 3,545,835 |
| 2.58% 4/22/32 (b) | | 7,281,000 | 6,373,615 |
| 2.739% 10/15/30 (b) | | 2,600,000 | 2,380,630 |
| 2.95% 10/1/26 | | 4,497,000 | 4,373,347 |
| 2.956% 5/13/31 (b) | | 5,000,000 | 4,547,821 |
| 2.963% 1/25/33 (b) | | 12,800,000 | 11,334,409 |
| 3.109% 4/22/51 (b) | | 300,000 | 215,727 |
| 3.3% 4/1/26 | | 1,604,000 | 1,574,735 |
| 3.328% 4/22/52 (b) | | 1,500,000 | 1,118,005 |
| 3.509% 1/23/29 (b) | | 11,000,000 | 10,646,664 |
| 3.54% 5/1/28 (b) | | 3,030,000 | 2,954,849 |
| 3.882% 7/24/38 (b) | | 2,572,000 | 2,294,587 |
| 3.9% 7/15/25 | | 3,850,000 | 3,824,489 |
| 3.964% 11/15/48 (b) | | 1,676,000 | 1,403,913 |
| 4.005% 4/23/29 (b) | | 1,686,000 | 1,654,352 |
| 4.125% 12/15/26 | | 1,047,000 | 1,040,144 |
| 4.203% 7/23/29 (b) | | 14,141,000 | 13,966,393 |
| 4.25% 10/1/27 | | 5,400,000 | 5,388,482 |
| 4.323% 4/26/28 (b) | | 1,500,000 | 1,493,129 |
| 4.565% 6/14/30 (b) | | 4,100,000 | 4,102,660 |
| 4.586% 4/26/33 (b) | | 8,600,000 | 8,489,148 |
| 4.85% 2/1/44 | | 2,000,000 | 1,962,153 |
| 4.851% 7/25/28 (b) | | 6,200,000 | 6,255,727 |
| 4.95% 6/1/45 | | 707,000 | 691,345 |
| 4.995% 7/22/30 (b) | | 5,000,000 | 5,091,711 |
| 5.294% 7/22/35 (b) | | 5,000,000 | 5,131,129 |
| 5.35% 6/1/34 (b) | | 8,500,000 | 8,769,415 |
| 5.5% 10/15/40 | | 1,016,000 | 1,070,958 |
| 5.6% 7/15/41 | | 267,000 | 285,205 |
| 5.625% 8/16/43 | | 891,000 | 947,062 |
| 5.766% 4/22/35 (b) | | 3,000,000 | 3,186,423 |
| 6.4% 5/15/38 | | 4,660,000 | 5,393,002 |
| KeyBank NA: | | | |
| 3.4% 5/20/26 | | 711,000 | 689,244 |
| 4.15% 8/8/25 | | 1,000,000 | 990,573 |
| 5% 1/26/33 | | 3,000,000 | 2,923,818 |
| KeyCorp 4.789% 6/1/33 (b) | | 1,500,000 | 1,445,639 |
| Lloyds Banking Group PLC: | | | |
| 1.627% 5/11/27 (b) | | 3,600,000 | 3,413,117 |
| 4.344% 1/9/48 | | 2,674,000 | 2,199,139 |
| 4.375% 3/22/28 | | 4,000,000 | 3,968,785 |
| 4.582% 12/10/25 | | 420,000 | 416,787 |
| 4.65% 3/24/26 | | 1,533,000 | 1,523,366 |
| 4.976% 8/11/33 (b) | | 2,500,000 | 2,481,420 |
| 5.721% 6/5/30 (b) | | 3,100,000 | 3,215,882 |
| 5.871% 3/6/29 (b) | | 4,000,000 | 4,143,788 |
| 7.953% 11/15/33 (b) | | 1,900,000 | 2,198,396 |
| M&T Bank Corp.: | | | |
| 5.053% 1/27/34 (b) | | 900,000 | 873,402 |
| 7.413% 10/30/29 (b) | | 1,200,000 | 1,306,931 |
| Manufacturers & Traders Trust Co. 4.7% 1/27/28 | | 4,700,000 | 4,669,459 |
| Mitsubishi UFJ Financial Group, Inc.: | | | |
| 1.538% 7/20/27 (b) | | 8,000,000 | 7,550,501 |
| 2.309% 7/20/32 (b) | | 7,850,000 | 6,690,611 |
| 2.494% 10/13/32 (b) | | 1,300,000 | 1,114,455 |
| 3.195% 7/18/29 | | 3,113,000 | 2,927,229 |
| 3.751% 7/18/39 | | 3,286,000 | 2,875,815 |
| 3.85% 3/1/26 | | 1,173,000 | 1,159,184 |
| 4.153% 3/7/39 | | 4,100,000 | 3,780,685 |
| 5.422% 2/22/29 (b) | | 4,000,000 | 4,100,732 |
| Mizuho Financial Group, Inc.: | | | |
| 1.554% 7/9/27 (b) | | 3,712,000 | 3,504,173 |
| 2.226% 5/25/26 (b) | | 1,600,000 | 1,567,078 |
| 2.26% 7/9/32 (b) | | 3,800,000 | 3,199,608 |
| 2.591% 5/25/31 (b) | | 1,400,000 | 1,246,477 |
| 5.382% 7/10/30 (b) | | 2,970,000 | 3,053,240 |
| 5.594% 7/10/35 (b) | | 3,000,000 | 3,110,666 |
| 5.748% 7/6/34 (b) | | 3,000,000 | 3,151,104 |
| 5.778% 7/6/29 (b) | | 1,500,000 | 1,558,623 |
| National Australia Bank Ltd.: | | | |
| 4.787% 1/10/29 | | 4,100,000 | 4,179,987 |
| 5.132% 11/22/24 | | 5,820,000 | 5,816,693 |
| NatWest Group PLC: | | | |
| 3 month U.S. LIBOR + 1.750% 4.892% 5/18/29 (b) | | 2,600,000 | 2,607,005 |
| 3.754% 11/1/29 (b) | | 7,840,000 | 7,813,116 |
| 4.445% 5/8/30 (b) | | 252,000 | 248,325 |
| 4.8% 4/5/26 | | 1,176,000 | 1,175,897 |
| 5.778% 3/1/35 (b) | | 2,300,000 | 2,402,746 |
| 5.808% 9/13/29 (b) | | 2,100,000 | 2,182,335 |
| 5.847% 3/2/27 (b) | | 2,120,000 | 2,150,691 |
| Oesterreichische Kontrollbank AG 0.375% 9/17/25 | | 2,083,000 | 1,998,892 |
| PNC Financial Services Group, Inc.: | | | |
| 1.15% 8/13/26 | | 15,000,000 | 14,073,725 |
| 2.2% 11/1/24 | | 3,500,000 | 3,480,492 |
| 5.354% 12/2/28 (b) | | 2,250,000 | 2,311,670 |
| 5.582% 6/12/29 (b) | | 2,000,000 | 2,065,700 |
| 5.676% 1/22/35 (b) | | 2,600,000 | 2,713,432 |
| 5.939% 8/18/34 (b) | | 5,300,000 | 5,611,057 |
| Royal Bank of Canada: | | | |
| 2.05% 1/21/27 | | 5,000,000 | 4,748,911 |
| 4.24% 8/3/27 | | 4,200,000 | 4,199,579 |
| 4.65% 1/27/26 | | 2,315,000 | 2,310,481 |
| 4.95% 2/1/29 | | 5,200,000 | 5,318,980 |
| 5% 2/1/33 | | 2,400,000 | 2,449,158 |
| 5% 5/2/33 | | 2,100,000 | 2,152,864 |
| 6% 11/1/27 | | 2,000,000 | 2,096,127 |
| Santander Holdings U.S.A., Inc.: | | | |
| 2.49% 1/6/28 (b) | | 3,800,000 | 3,566,284 |
| 6.174% 1/9/30 (b) | | 1,800,000 | 1,865,465 |
| 6.565% 6/12/29 (b) | | 900,000 | 941,990 |
| Santander UK Group Holdings PLC: | | | |
| 6.534% 1/10/29 (b) | | 5,600,000 | 5,870,631 |
| 6.833% 11/21/26 (b) | | 6,400,000 | 6,525,596 |
| Sumitomo Mitsui Financial Group, Inc.: | | | |
| 1.474% 7/8/25 | | 2,000,000 | 1,944,542 |
| 2.13% 7/8/30 | | 3,200,000 | 2,779,780 |
| 2.142% 9/23/30 | | 5,967,000 | 5,150,748 |
| 2.174% 1/14/27 | | 8,300,000 | 7,862,554 |
| 2.348% 1/15/25 | | 2,000,000 | 1,979,199 |
| 2.75% 1/15/30 | | 2,000,000 | 1,816,257 |
| 3.05% 1/14/42 | | 4,100,000 | 3,177,762 |
| 3.544% 1/17/28 | | 4,800,000 | 4,649,279 |
| 5.52% 1/13/28 | | 1,600,000 | 1,648,275 |
| 5.558% 7/9/34 | | 1,680,000 | 1,750,213 |
| 5.776% 7/13/33 | | 4,000,000 | 4,249,436 |
| The Toronto-Dominion Bank: | | | |
| 3.2% 3/10/32 | | 3,700,000 | 3,331,497 |
| 4.108% 6/8/27 | | 5,000,000 | 4,955,776 |
| 4.693% 9/15/27 | | 2,000,000 | 2,015,242 |
| 4.98% 4/5/27 | | 8,400,000 | 8,514,622 |
| 5.264% 12/11/26 | | 4,600,000 | 4,682,061 |
| 5.523% 7/17/28 | | 1,200,000 | 1,243,342 |
| Truist Financial Corp.: | | | |
| 1.125% 8/3/27 | | 6,000,000 | 5,456,793 |
| 3.875% 3/19/29 | | 5,000,000 | 4,828,210 |
| 4.26% 7/28/26 (b) | | 5,000,000 | 4,954,824 |
| 5.153% 8/5/32 (b) | | 1,440,000 | 1,454,378 |
| 5.711% 1/24/35 (b) | | 5,100,000 | 5,282,018 |
| 5.867% 6/8/34 (b) | | 1,200,000 | 1,253,872 |
| U.S. Bancorp: | | | |
| 1.375% 7/22/30 | | 6,900,000 | 5,807,471 |
| 3.1% 4/27/26 | | 6,704,000 | 6,538,227 |
| 3.9% 4/26/28 | | 5,500,000 | 5,406,688 |
| 4.548% 7/22/28 (b) | | 5,900,000 | 5,901,969 |
| 4.967% 7/22/33 (b) | | 2,300,000 | 2,258,565 |
| 5.678% 1/23/35 (b) | | 3,400,000 | 3,536,942 |
| 5.775% 6/12/29 (b) | | 2,100,000 | 2,180,511 |
| 5.85% 10/21/33 (b) | | 1,800,000 | 1,891,081 |
| Wells Fargo & Co.: | | | |
| 2.406% 10/30/25 (b) | | 11,000,000 | 10,942,245 |
| 3% 10/23/26 | | 3,624,000 | 3,520,019 |
| 3.068% 4/30/41 (b) | | 7,000,000 | 5,350,507 |
| 3.35% 3/2/33 (b) | | 6,500,000 | 5,848,540 |
| 3.55% 9/29/25 | | 756,000 | 746,531 |
| 3.9% 5/1/45 | | 849,000 | 706,706 |
| 4.1% 6/3/26 | | 575,000 | 569,378 |
| 4.15% 1/24/29 | | 665,000 | 657,449 |
| 4.4% 6/14/46 | | 1,272,000 | 1,081,751 |
| 4.54% 8/15/26 (b) | | 10,000,000 | 9,955,412 |
| 4.611% 4/25/53 (b) | | 6,500,000 | 5,887,656 |
| 4.75% 12/7/46 | | 3,496,000 | 3,126,643 |
| 4.808% 7/25/28 (b) | | 4,800,000 | 4,827,687 |
| 4.897% 7/25/33 (b) | | 3,100,000 | 3,084,903 |
| 4.9% 11/17/45 | | 742,000 | 680,002 |
| 5.013% 4/4/51 (b) | | 3,840,000 | 3,679,478 |
| 5.375% 11/2/43 | | 5,130,000 | 5,075,578 |
| 5.389% 4/24/34 (b) | | 9,700,000 | 9,940,826 |
| 5.557% 7/25/34 (b) | | 3,600,000 | 3,715,205 |
| 5.574% 7/25/29 (b) | | 3,150,000 | 3,252,800 |
| 5.606% 1/15/44 | | 6,636,000 | 6,720,571 |
| 6.491% 10/23/34 (b) | | 6,200,000 | 6,827,896 |
| Westpac Banking Corp.: | | | |
| 2.85% 5/13/26 | | 846,000 | 824,746 |
| 2.894% 2/4/30 (b) | | 6,140,000 | 6,070,373 |
| 3.133% 11/18/41 | | 2,200,000 | 1,634,012 |
| 3.735% 8/26/25 | | 2,000,000 | 1,983,542 |
| 4.043% 8/26/27 | | 6,800,000 | 6,773,563 |
| 4.11% 7/24/34 (b) | | 1,590,000 | 1,524,679 |
| 4.421% 7/24/39 | | 1,910,000 | 1,777,682 |
| 5.405% 8/10/33 (b) | | 2,000,000 | 2,028,125 |
| 5.457% 11/18/27 | | 3,500,000 | 3,617,047 |
| 5.535% 11/17/28 | | 2,200,000 | 2,306,316 |
| 6.82% 11/17/33 | | 800,000 | 892,764 |
| | | | 1,145,221,879 |
| Capital Markets - 1.9% | | | |
| Affiliated Managers Group, Inc. 3.5% 8/1/25 | | 846,000 | 834,289 |
| Ameriprise Financial, Inc. 5.15% 5/15/33 | | 1,300,000 | 1,338,075 |
| Ares Capital Corp.: | | | |
| 2.15% 7/15/26 | | 4,800,000 | 4,526,560 |
| 3.2% 11/15/31 | | 900,000 | 776,508 |
| 3.25% 7/15/25 | | 1,000,000 | 983,019 |
| 3.875% 1/15/26 | | 1,500,000 | 1,471,320 |
| 5.95% 7/15/29 | | 2,300,000 | 2,343,786 |
| 7% 1/15/27 | | 1,500,000 | 1,556,074 |
| Ares Management Corp. 6.375% 11/10/28 | | 900,000 | 960,320 |
| Bank of New York Mellon Corp.: | | | |
| 1.05% 10/15/26 | | 10,900,000 | 10,186,060 |
| 1.8% 7/28/31 | | 6,500,000 | 5,444,525 |
| 2.8% 5/4/26 | | 1,004,000 | 978,191 |
| 4.414% 7/24/26 (b) | | 5,000,000 | 4,977,077 |
| 4.967% 4/26/34 (b) | | 1,700,000 | 1,714,174 |
| 4.975% 3/14/30 (b) | | 3,500,000 | 3,581,502 |
| 5.188% 3/14/35 (b) | | 1,000,000 | 1,021,418 |
| 5.834% 10/25/33 (b) | | 2,000,000 | 2,130,484 |
| Blackrock Funding, Inc.: | | | |
| 4.6% 7/26/27 | | 1,620,000 | 1,643,252 |
| 5% 3/14/34 | | 2,100,000 | 2,166,074 |
| 5.35% 1/8/55 | | 1,750,000 | 1,795,689 |
| BlackRock, Inc. 1.9% 1/28/31 | | 5,500,000 | 4,741,522 |
| Blackstone Private Credit Fund: | | | |
| 2.7% 1/15/25 | | 4,700,000 | 4,646,056 |
| 4.7% 3/24/25 | | 5,000,000 | 4,972,686 |
| 5.95% 7/16/29 (c) | | 1,400,000 | 1,410,212 |
| 7.3% 11/27/28 (c) | | 1,770,000 | 1,876,262 |
| Blue Owl Capital Corp. 2.875% 6/11/28 | | 4,400,000 | 4,022,719 |
| Brookfield Finance I PLC / Brookfield Finance, Inc. 2.34% 1/30/32 | | 4,100,000 | 3,460,006 |
| Brookfield Finance, Inc.: | | | |
| 2.724% 4/15/31 | | 6,700,000 | 5,931,761 |
| 3.9% 1/25/28 | | 2,500,000 | 2,442,207 |
| 5.968% 3/4/54 | | 1,500,000 | 1,579,637 |
| Cboe Global Markets, Inc. 1.625% 12/15/30 | | 1,600,000 | 1,358,437 |
| Charles Schwab Corp.: | | | |
| 0.9% 3/11/26 | | 3,900,000 | 3,685,508 |
| 1.65% 3/11/31 | | 4,520,000 | 3,757,290 |
| 2% 3/20/28 | | 1,600,000 | 1,474,116 |
| 2.45% 3/3/27 | | 4,600,000 | 4,380,511 |
| 3.2% 3/2/27 | | 5,100,000 | 4,947,440 |
| 3.85% 5/21/25 | | 1,950,000 | 1,935,254 |
| 4% 2/1/29 | | 2,100,000 | 2,065,460 |
| 5.643% 5/19/29 (b) | | 1,000,000 | 1,034,633 |
| 6.136% 8/24/34 (b) | | 1,800,000 | 1,933,631 |
| CI Financial Corp. 3.2% 12/17/30 | | 3,700,000 | 3,059,558 |
| CME Group, Inc. 5.3% 9/15/43 | | 1,840,000 | 1,930,258 |
| Deutsche Bank AG: | | | |
| 4.1% 1/13/26 | | 4,800,000 | 4,754,573 |
| 4.5% 4/1/25 | | 427,000 | 424,301 |
| Deutsche Bank AG New York Branch: | | | |
| 2.311% 11/16/27 (b) | | 3,500,000 | 3,300,974 |
| 3.729% 1/14/32 (b) | | 4,300,000 | 3,802,423 |
| 4.1% 1/13/26 | | 3,886,000 | 3,835,300 |
| 5.706% 2/8/28 (b) | | 1,400,000 | 1,423,271 |
| 6.119% 7/14/26 (b) | | 3,000,000 | 3,018,068 |
| 6.819% 11/20/29 (b) | | 4,570,000 | 4,862,847 |
| 7.079% 2/10/34 (b) | | 1,200,000 | 1,269,536 |
| 7.146% 7/13/27 (b) | | 1,600,000 | 1,659,715 |
| Franklin Resources, Inc. 2.85% 3/30/25 | | 677,000 | 668,254 |
| Goldman Sachs Group, Inc.: | | | |
| 0.855% 2/12/26 (b) | | 9,000,000 | 8,819,778 |
| 2.383% 7/21/32 (b) | | 12,700,000 | 10,813,608 |
| 2.615% 4/22/32 (b) | | 16,100,000 | 14,000,860 |
| 3.5% 1/23/25 | | 891,000 | 885,082 |
| 3.691% 6/5/28 (b) | | 7,900,000 | 7,713,124 |
| 3.75% 2/25/26 | | 1,038,000 | 1,026,123 |
| 3.8% 3/15/30 | | 1,644,000 | 1,585,083 |
| 3.85% 1/26/27 | | 5,390,000 | 5,311,145 |
| 4.017% 10/31/38 (b) | | 4,100,000 | 3,631,779 |
| 4.223% 5/1/29 (b) | | 17,900,000 | 17,652,870 |
| 4.25% 10/21/25 | | 391,000 | 388,180 |
| 4.411% 4/23/39 (b) | | 3,500,000 | 3,233,565 |
| 4.75% 10/21/45 | | 2,813,000 | 2,660,959 |
| 5.15% 5/22/45 | | 4,190,000 | 4,117,459 |
| 5.33% 7/23/35 (b) | | 2,680,000 | 2,730,378 |
| 5.7% 11/1/24 | | 2,000,000 | 2,000,533 |
| 5.95% 1/15/27 | | 2,674,000 | 2,754,959 |
| 6.125% 2/15/33 | | 2,400,000 | 2,657,469 |
| 6.75% 10/1/37 | | 5,170,000 | 5,827,173 |
| HPS Corporate Lending Fund 6.25% 9/30/29 (c) | | 1,800,000 | 1,832,753 |
| Intercontinental Exchange, Inc.: | | | |
| 1.85% 9/15/32 | | 4,020,000 | 3,272,805 |
| 2.65% 9/15/40 | | 4,020,000 | 2,948,269 |
| 3% 6/15/50 | | 2,892,000 | 2,005,469 |
| 3.75% 12/1/25 | | 1,025,000 | 1,014,243 |
| 4% 9/15/27 | | 4,000,000 | 3,961,009 |
| 4.6% 3/15/33 | | 6,200,000 | 6,170,068 |
| Invesco Finance PLC 3.75% 1/15/26 | | 3,000,000 | 2,964,284 |
| Jefferies Financial Group, Inc.: | | | |
| 2.625% 10/15/31 | | 1,000,000 | 851,163 |
| 2.75% 10/15/32 | | 2,100,000 | 1,759,418 |
| 4.15% 1/23/30 | | 4,700,000 | 4,520,203 |
| 4.85% 1/15/27 | | 1,100,000 | 1,102,283 |
| Legg Mason, Inc. 5.625% 1/15/44 | | 700,000 | 711,071 |
| LPL Holdings, Inc. 6.75% 11/17/28 | | 1,000,000 | 1,066,486 |
| Moody's Corp.: | | | |
| 2% 8/19/31 | | 1,100,000 | 933,183 |
| 4.25% 8/8/32 | | 1,700,000 | 1,653,635 |
| 4.875% 12/17/48 | | 2,500,000 | 2,346,646 |
| 5% 8/5/34 | | 1,150,000 | 1,162,699 |
| Morgan Stanley: | | | |
| 1.164% 10/21/25 (b) | | 8,200,000 | 8,150,649 |
| 1.512% 7/20/27 (b) | | 6,100,000 | 5,752,862 |
| 1.593% 5/4/27 (b) | | 17,500,000 | 16,625,488 |
| 1.794% 2/13/32 (b) | | 5,470,000 | 4,552,339 |
| 2.188% 4/28/26 (b) | | 2,320,000 | 2,274,537 |
| 2.239% 7/21/32 (b) | | 16,300,000 | 13,793,822 |
| 3.125% 7/27/26 | | 998,000 | 972,957 |
| 3.591% 7/22/28 (b) | | 1,515,000 | 1,472,678 |
| 3.7% 10/23/24 | | 1,069,000 | 1,066,437 |
| 3.772% 1/24/29 (b) | | 20,700,000 | 20,199,313 |
| 3.875% 1/27/26 | | 935,000 | 925,007 |
| 3.95% 4/23/27 | | 8,938,000 | 8,810,803 |
| 3.971% 7/22/38 (b) | | 1,114,000 | 992,780 |
| 4.21% 4/20/28 (b) | | 6,700,000 | 6,639,901 |
| 4.3% 1/27/45 | | 356,000 | 319,343 |
| 4.375% 1/22/47 | | 1,978,000 | 1,769,404 |
| 4.457% 4/22/39 (b) | | 5,218,000 | 4,896,486 |
| 5.042% 7/19/30 (b) | | 3,500,000 | 3,559,665 |
| 5.123% 2/1/29 (b) | | 2,500,000 | 2,543,815 |
| 5.164% 4/20/29 (b) | | 1,400,000 | 1,426,365 |
| 5.173% 1/16/30 (b) | | 10,200,000 | 10,408,974 |
| 5.25% 4/21/34 (b) | | 3,500,000 | 3,559,025 |
| 5.297% 4/20/37 (b) | | 2,500,000 | 2,479,550 |
| 5.32% 7/19/35 (b) | | 3,500,000 | 3,575,243 |
| 5.597% 3/24/51 (b) | | 1,100,000 | 1,170,444 |
| 5.948% 1/19/38 (b) | | 1,100,000 | 1,139,149 |
| 6.296% 10/18/28 (b) | | 2,000,000 | 2,102,504 |
| 6.342% 10/18/33 (b) | | 2,000,000 | 2,189,282 |
| 6.375% 7/24/42 | | 4,662,000 | 5,375,430 |
| 7.25% 4/1/32 | | 178,000 | 208,805 |
| NASDAQ, Inc.: | | | |
| 1.65% 1/15/31 | | 3,450,000 | 2,891,923 |
| 3.85% 6/30/26 | | 1,000,000 | 989,269 |
| 5.35% 6/28/28 | | 2,900,000 | 2,996,072 |
| 5.95% 8/15/53 | | 2,234,000 | 2,393,282 |
| Nomura Holdings, Inc.: | | | |
| 1.653% 7/14/26 | | 1,000,000 | 943,192 |
| 2.172% 7/14/28 | | 1,300,000 | 1,179,009 |
| 3.103% 1/16/30 | | 6,459,000 | 5,892,130 |
| 5.386% 7/6/27 | | 2,600,000 | 2,645,470 |
| 6.07% 7/12/28 | | 1,000,000 | 1,043,076 |
| 6.181% 1/18/33 | | 1,000,000 | 1,069,927 |
| Northern Trust Corp.: | | | |
| 1.95% 5/1/30 | | 50,000 | 44,119 |
| 4% 5/10/27 | | 1,100,000 | 1,095,508 |
| 6.125% 11/2/32 | | 1,300,000 | 1,424,714 |
| S&P Global, Inc.: | | | |
| 2.45% 3/1/27 | | 3,500,000 | 3,349,165 |
| 2.7% 3/1/29 | | 2,100,000 | 1,962,110 |
| 2.9% 3/1/32 | | 6,200,000 | 5,575,907 |
| 3.25% 12/1/49 | | 2,000,000 | 1,483,648 |
| Sixth Street Specialty Lending, Inc. 6.125% 3/1/29 | | 900,000 | 922,546 |
| State Street Corp.: | | | |
| 1.684% 11/18/27 (b) | | 5,652,000 | 5,337,592 |
| 2.65% 5/19/26 | | 1,346,000 | 1,307,442 |
| 4.821% 1/26/34 (b) | | 3,900,000 | 3,895,127 |
| 5.272% 8/3/26 | | 5,800,000 | 5,890,595 |
| 5.684% 11/21/29 (b) | | 1,400,000 | 1,466,531 |
| 6.123% 11/21/34 (b) | | 600,000 | 644,117 |
| UBS AG 5% 7/9/27 | | 1,300,000 | 1,318,231 |
| UBS AG London Branch 4.5% 6/26/48 | | 2,500,000 | 2,298,568 |
| UBS Group AG: | | | |
| 4.55% 4/17/26 | | 1,515,000 | 1,510,025 |
| 4.875% 5/15/45 | | 3,199,000 | 3,020,584 |
| | | | 487,721,573 |
| Consumer Finance - 0.6% | | | |
| AerCap Ireland Capital Ltd./AerCap Global Aviation Trust: | | | |
| 2.45% 10/29/26 | | 4,000,000 | 3,812,334 |
| 3% 10/29/28 | | 3,750,000 | 3,507,183 |
| 3.4% 10/29/33 | | 2,500,000 | 2,179,475 |
| 3.65% 7/21/27 | | 802,000 | 780,558 |
| 3.85% 10/29/41 | | 2,500,000 | 2,052,130 |
| 3.875% 1/23/28 | | 2,798,000 | 2,725,012 |
| 4.45% 10/1/25 | | 1,756,000 | 1,745,752 |
| 5.3% 1/19/34 | | 3,100,000 | 3,139,429 |
| 6.45% 4/15/27 | | 1,531,000 | 1,593,048 |
| Ally Financial, Inc.: | | | |
| 4.75% 6/9/27 | | 1,100,000 | 1,096,052 |
| 6.184% 7/26/35 (b) | | 2,000,000 | 2,036,871 |
| 6.848% 1/3/30 (b) | | 2,700,000 | 2,855,504 |
| 6.992% 6/13/29 (b) | | 1,500,000 | 1,590,908 |
| 8% 11/1/31 | | 1,762,000 | 2,010,218 |
| American Express Co.: | | | |
| 4.05% 12/3/42 | | 1,243,000 | 1,099,447 |
| 4.42% 8/3/33 (b) | | 1,000,000 | 976,094 |
| 5.282% 7/27/29 (b) | | 9,500,000 | 9,758,478 |
| 5.284% 7/26/35 (b) | | 3,000,000 | 3,065,764 |
| 5.85% 11/5/27 | | 2,000,000 | 2,091,111 |
| Capital One Financial Corp.: | | | |
| 3.3% 10/30/24 | | 3,800,000 | 3,786,419 |
| 3.75% 7/28/26 | | 1,737,000 | 1,701,681 |
| 3.75% 3/9/27 | | 4,135,000 | 4,050,852 |
| 3.8% 1/31/28 | | 2,317,000 | 2,248,007 |
| 4.927% 5/10/28 (b) | | 2,400,000 | 2,411,788 |
| 4.985% 7/24/26 (b) | | 5,000,000 | 4,989,110 |
| 5.247% 7/26/30 (b) | | 4,300,000 | 4,344,076 |
| 5.268% 5/10/33 (b) | | 1,000,000 | 995,663 |
| 5.817% 2/1/34 (b) | | 1,000,000 | 1,021,860 |
| 6.051% 2/1/35 (b) | | 2,300,000 | 2,387,228 |
| 6.377% 6/8/34 (b) | | 2,300,000 | 2,443,557 |
| Discover Financial Services 4.5% 1/30/26 | | 3,354,000 | 3,333,650 |
| Ford Motor Credit Co. LLC: | | | |
| 4% 11/13/30 | | 900,000 | 829,730 |
| 5.85% 5/17/27 | | 2,000,000 | 2,034,000 |
| 6.798% 11/7/28 | | 3,500,000 | 3,688,774 |
| 6.8% 5/12/28 | | 9,045,000 | 9,489,258 |
| 7.122% 11/7/33 | | 2,400,000 | 2,592,660 |
| John Deere Capital Corp.: | | | |
| 2.65% 6/10/26 | | 891,000 | 866,284 |
| 2.8% 9/8/27 | | 47,000 | 45,162 |
| 3.05% 1/6/28 | | 5,000,000 | 4,820,550 |
| 3.45% 3/13/25 | | 1,850,000 | 1,835,834 |
| 3.45% 3/7/29 | | 2,779,000 | 2,684,826 |
| 4.15% 9/15/27 | | 2,000,000 | 2,000,827 |
| 4.35% 9/15/32 | | 2,000,000 | 1,990,120 |
| 4.7% 6/10/30 | | 5,100,000 | 5,211,367 |
| 4.9% 3/3/28 | | 2,100,000 | 2,148,014 |
| 5.05% 6/12/34 | | 3,740,000 | 3,847,891 |
| Synchrony Financial: | | | |
| 3.7% 8/4/26 | | 842,000 | 822,696 |
| 5.15% 3/19/29 | | 5,225,000 | 5,204,055 |
| Toyota Motor Credit Corp.: | | | |
| 1.15% 8/13/27 | | 7,300,000 | 6,686,646 |
| 1.65% 1/10/31 | | 2,100,000 | 1,773,401 |
| 1.9% 4/6/28 | | 1,250,000 | 1,152,557 |
| 2.15% 2/13/30 | | 2,000,000 | 1,787,263 |
| 3% 4/1/25 | | 5,350,000 | 5,290,277 |
| 3.05% 3/22/27 | | 2,500,000 | 2,430,900 |
| 4.45% 6/29/29 | | 2,600,000 | 2,615,419 |
| 4.55% 9/20/27 | | 1,400,000 | 1,411,578 |
| 4.55% 8/9/29 | | 1,120,000 | 1,129,418 |
| 5.55% 11/20/30 | | 4,400,000 | 4,651,033 |
| | | | 160,869,799 |
| Financial Services - 0.8% | | | |
| AB Svensk Exportkredit 4.875% 10/4/30 | | 5,000,000 | 5,224,485 |
| Aon Corp. / Aon Global Holdings PLC: | | | |
| 2.05% 8/23/31 | | 900,000 | 758,642 |
| 2.6% 12/2/31 | | 4,000,000 | 3,479,849 |
| 2.85% 5/28/27 | | 4,500,000 | 4,328,651 |
| Berkshire Hathaway, Inc.: | | | |
| 3.125% 3/15/26 | | 2,050,000 | 2,020,979 |
| 4.5% 2/11/43 | | 356,000 | 347,813 |
| Blue Owl Credit Income Corp.: | | | |
| 4.7% 2/8/27 | | 6,000,000 | 5,858,799 |
| 6.6% 9/15/29 (c) | | 1,000,000 | 1,018,592 |
| BP Capital Markets America, Inc.: | | | |
| 3% 2/24/50 | | 5,290,000 | 3,616,136 |
| 3.001% 3/17/52 | | 5,300,000 | 3,585,888 |
| 3.017% 1/16/27 | | 1,693,000 | 1,644,005 |
| 3.06% 6/17/41 | | 3,600,000 | 2,743,850 |
| 3.633% 4/6/30 | | 5,000,000 | 4,812,997 |
| 4.812% 2/13/33 | | 2,700,000 | 2,700,726 |
| CNH Industrial Capital LLC 5.5% 1/12/29 | | 3,440,000 | 3,557,818 |
| Corebridge Financial, Inc.: | | | |
| 4.4% 4/5/52 | | 2,000,000 | 1,661,858 |
| 5.75% 1/15/34 | | 1,100,000 | 1,146,826 |
| 6.875% 12/15/52 (b) | | 1,800,000 | 1,838,851 |
| DH Europe Finance II SARL: | | | |
| 2.6% 11/15/29 | | 1,500,000 | 1,382,985 |
| 3.25% 11/15/39 | | 2,600,000 | 2,152,079 |
| 3.4% 11/15/49 | | 1,000,000 | 758,144 |
| Equitable Holdings, Inc. 5% 4/20/48 | | 2,150,000 | 2,005,665 |
| Fidelity National Information Services, Inc.: | | | |
| 1.15% 3/1/26 | | 5,023,000 | 4,766,355 |
| 2.25% 3/1/31 | | 4,000,000 | 3,460,744 |
| 5.625% 7/15/52 | | 600,000 | 620,948 |
| Fiserv, Inc.: | | | |
| 2.25% 6/1/27 | | 5,700,000 | 5,378,623 |
| 3.2% 7/1/26 | | 6,500,000 | 6,346,465 |
| 3.5% 7/1/29 | | 2,799,000 | 2,680,212 |
| 4.4% 7/1/49 | | 3,482,000 | 2,985,024 |
| 5.375% 8/21/28 | | 3,050,000 | 3,147,178 |
| Global Payments, Inc.: | | | |
| 1.2% 3/1/26 | | 7,100,000 | 6,732,771 |
| 2.9% 5/15/30 | | 4,600,000 | 4,140,803 |
| 4.8% 4/1/26 | | 1,000,000 | 997,583 |
| 5.4% 8/15/32 | | 2,600,000 | 2,651,712 |
| Japan International Cooperation Agency 1.75% 4/28/31 | | 2,622,000 | 2,250,787 |
| Jbs U.S.A. Holding Lux/ Jbs U.S.A. F: | | | |
| 3% 5/15/32 | | 2,000,000 | 1,709,271 |
| 5.75% 4/1/33 | | 8,100,000 | 8,291,638 |
| 7.25% 11/15/53 (c) | | 2,100,000 | 2,410,672 |
| John Deere Capital Corp. 4.5% 1/8/27 | | 8,200,000 | 8,273,014 |
| KfW: | | | |
| 0% 4/18/36 | | 13,551,000 | 8,357,476 |
| 0.375% 7/18/25 | | 3,680,000 | 3,551,675 |
| 2% 5/2/25 | | 682,000 | 670,174 |
| 2.5% 11/20/24 | | 5,558,000 | 5,526,048 |
| 2.875% 4/3/28 | | 2,738,000 | 2,653,380 |
| MasterCard, Inc.: | | | |
| 3.3% 3/26/27 | | 1,600,000 | 1,568,420 |
| 3.8% 11/21/46 | | 677,000 | 568,661 |
| 3.85% 3/26/50 | | 4,600,000 | 3,818,616 |
| 4.85% 3/9/33 | | 1,900,000 | 1,955,677 |
| National Rural Utilities Cooperative Finance Corp.: | | | |
| 4.15% 12/15/32 | | 5,800,000 | 5,564,707 |
| 5.8% 1/15/33 | | 1,700,000 | 1,815,783 |
| PayPal Holdings, Inc.: | | | |
| 1.65% 6/1/25 | | 4,300,000 | 4,197,973 |
| 2.3% 6/1/30 | | 2,800,000 | 2,505,457 |
| 2.85% 10/1/29 | | 3,160,000 | 2,942,063 |
| 3.25% 6/1/50 | | 1,300,000 | 937,449 |
| 5.25% 6/1/62 | | 1,400,000 | 1,364,081 |
| Rexford Industrial Realty LP 2.125% 12/1/30 | | 1,300,000 | 1,109,449 |
| Sixth Street Lending Partners 6.5% 3/11/29 (c) | | 1,400,000 | 1,429,923 |
| The Western Union Co.: | | | |
| 2.75% 3/15/31 | | 1,400,000 | 1,204,012 |
| 2.85% 1/10/25 | | 2,130,000 | 2,110,644 |
| Visa, Inc.: | | | |
| 1.9% 4/15/27 | | 5,100,000 | 4,833,646 |
| 2.05% 4/15/30 | | 13,400,000 | 12,009,507 |
| 2.7% 4/15/40 | | 1,000,000 | 766,376 |
| 2.75% 9/15/27 | | 2,125,000 | 2,045,533 |
| 3.15% 12/14/25 | | 1,606,000 | 1,581,053 |
| 4.3% 12/14/45 | | 2,719,000 | 2,465,318 |
| Voya Financial, Inc.: | | | |
| 3.65% 6/15/26 | | 2,814,000 | 2,765,079 |
| 5.7% 7/15/43 | | 668,000 | 665,189 |
| | | | 204,472,807 |
| Insurance - 0.7% | | | |
| AFLAC, Inc.: | | | |
| 3.6% 4/1/30 | | 4,959,000 | 4,735,639 |
| 4% 10/15/46 | | 673,000 | 557,637 |
| Allstate Corp.: | | | |
| 1.45% 12/15/30 | | 7,877,000 | 6,527,272 |
| 3.28% 12/15/26 | | 841,000 | 820,176 |
| 4.2% 12/15/46 | | 1,348,000 | 1,146,031 |
| American International Group, Inc.: | | | |
| 3.875% 1/15/35 | | 481,000 | 444,147 |
| 4.2% 4/1/28 | | 3,307,000 | 3,258,379 |
| 4.375% 6/30/50 | | 2,390,000 | 2,075,278 |
| 4.5% 7/16/44 | | 1,582,000 | 1,412,466 |
| 4.7% 7/10/35 | | 1,034,000 | 990,932 |
| 4.75% 4/1/48 | | 923,000 | 849,819 |
| 5.75% 4/1/48 (b) | | 2,050,000 | 2,031,533 |
| Aon North America, Inc.: | | | |
| 5.45% 3/1/34 | | 3,100,000 | 3,207,935 |
| 5.75% 3/1/54 | | 3,200,000 | 3,313,586 |
| Aon PLC: | | | |
| 4.6% 6/14/44 | | 885,000 | 786,679 |
| 4.75% 5/15/45 | | 1,048,000 | 955,713 |
| Arch Capital Group Ltd. 3.635% 6/30/50 | | 2,400,000 | 1,813,859 |
| Arthur J. Gallagher & Co.: | | | |
| 5.75% 3/2/53 | | 1,300,000 | 1,318,781 |
| 5.75% 7/15/54 | | 800,000 | 815,764 |
| 6.5% 2/15/34 | | 2,300,000 | 2,529,207 |
| Assurant, Inc. 4.9% 3/27/28 | | 1,000,000 | 1,001,289 |
| Athene Holding Ltd.: | | | |
| 3.45% 5/15/52 | | 2,100,000 | 1,400,868 |
| 3.5% 1/15/31 | | 1,100,000 | 1,012,193 |
| 3.95% 5/25/51 | | 1,200,000 | 892,036 |
| Baylor Scott & White Holdings: | | | |
| Series 2021, 2.839% 11/15/50 | | 4,000,000 | 2,763,229 |
| 3.967% 11/15/46 | | 445,000 | 384,442 |
| Berkshire Hathaway Finance Corp.: | | | |
| 1.45% 10/15/30 | | 7,300,000 | 6,235,681 |
| 2.85% 10/15/50 | | 3,200,000 | 2,197,670 |
| 3.85% 3/15/52 | | 1,400,000 | 1,152,239 |
| 4.2% 8/15/48 | | 2,116,000 | 1,897,715 |
| 4.25% 1/15/49 | | 1,528,000 | 1,387,776 |
| 4.4% 5/15/42 | | 2,500,000 | 2,401,054 |
| 5.75% 1/15/40 | | 891,000 | 985,421 |
| Brighthouse Financial, Inc.: | | | |
| 3.7% 6/22/27 | | 1,090,000 | 1,054,321 |
| 3.85% 12/22/51 | | 1,700,000 | 1,115,268 |
| Brown & Brown, Inc. 4.95% 3/17/52 | | 1,000,000 | 904,062 |
| Chubb INA Holdings, Inc.: | | | |
| 1.375% 9/15/30 | | 6,000,000 | 5,091,081 |
| 3.05% 12/15/61 | | 700,000 | 465,244 |
| 3.35% 5/3/26 | | 4,752,000 | 4,667,238 |
| 4.35% 11/3/45 | | 713,000 | 640,169 |
| 6.7% 5/15/36 | | 1,100,000 | 1,276,580 |
| CNA Financial Corp. 5.5% 6/15/33 | | 1,000,000 | 1,035,727 |
| Fairfax Financial Holdings Ltd.: | | | |
| 4.625% 4/29/30 | | 1,800,000 | 1,781,667 |
| 5.625% 8/16/32 | | 1,500,000 | 1,529,928 |
| 6.1% 3/15/55 (c) | | 670,000 | 677,674 |
| 6.35% 3/22/54 (c) | | 1,500,000 | 1,565,650 |
| Globe Life, Inc. 4.8% 6/15/32 | | 1,000,000 | 972,844 |
| Hartford Financial Services Group, Inc.: | | | |
| 2.8% 8/19/29 | | 1,256,000 | 1,156,329 |
| 3.6% 8/19/49 | | 1,107,000 | 842,639 |
| 4.4% 3/15/48 | | 1,731,000 | 1,514,344 |
| Lincoln National Corp.: | | | |
| 3.625% 12/12/26 | | 1,069,000 | 1,048,164 |
| 4.35% 3/1/48 | | 2,260,000 | 1,803,610 |
| Manulife Financial Corp.: | | | |
| 4.15% 3/4/26 | | 6,250,000 | 6,218,486 |
| 5.375% 3/4/46 | | 600,000 | 609,660 |
| Markel Group, Inc.: | | | |
| 3.35% 9/17/29 | | 1,600,000 | 1,509,217 |
| 5% 5/20/49 | | 1,700,000 | 1,551,733 |
| 6% 5/16/54 | | 1,200,000 | 1,243,427 |
| Marsh & McLennan Companies, Inc.: | | | |
| 2.375% 12/15/31 | | 2,200,000 | 1,900,276 |
| 3.75% 3/14/26 | | 2,000,000 | 1,978,357 |
| 4.2% 3/1/48 | | 868,000 | 743,341 |
| 4.35% 1/30/47 | | 499,000 | 435,197 |
| 4.9% 3/15/49 | | 1,657,000 | 1,568,806 |
| 5.7% 9/15/53 | | 5,180,000 | 5,506,144 |
| MetLife, Inc.: | | | |
| 4.05% 3/1/45 | | 690,000 | 583,828 |
| 4.125% 8/13/42 | | 2,600,000 | 2,256,612 |
| 4.6% 5/13/46 | | 4,308,000 | 3,940,814 |
| 4.721% 12/15/44 (b) | | 891,000 | 818,793 |
| 5.375% 7/15/33 | | 2,400,000 | 2,512,974 |
| 5.875% 2/6/41 | | 341,000 | 363,938 |
| 6.4% 12/15/66 (b) | | 1,800,000 | 1,893,469 |
| Principal Financial Group, Inc.: | | | |
| 2.125% 6/15/30 | | 1,760,000 | 1,530,648 |
| 4.3% 11/15/46 | | 1,425,000 | 1,230,586 |
| 4.35% 5/15/43 | | 500,000 | 443,526 |
| Progressive Corp.: | | | |
| 2.45% 1/15/27 | | 2,145,000 | 2,057,777 |
| 3.2% 3/26/30 | | 2,600,000 | 2,451,812 |
| 4.125% 4/15/47 | | 2,390,000 | 2,052,877 |
| 4.2% 3/15/48 | | 1,100,000 | 953,217 |
| Prudential Financial, Inc.: | | | |
| 3.878% 3/27/28 | | 740,000 | 726,813 |
| 3.905% 12/7/47 | | 2,119,000 | 1,706,579 |
| 3.935% 12/7/49 | | 1,910,000 | 1,537,415 |
| 4.35% 2/25/50 | | 2,633,000 | 2,281,532 |
| 4.418% 3/27/48 | | 1,132,000 | 983,184 |
| 4.6% 5/15/44 | | 1,400,000 | 1,283,563 |
| 5.125% 3/1/52 (b) | | 1,000,000 | 974,345 |
| 5.7% 12/14/36 | | 68,000 | 72,566 |
| 6% 9/1/52 (b) | | 2,800,000 | 2,872,344 |
| 6.5% 3/15/54 (b) | | 1,100,000 | 1,137,621 |
| Prudential Funding Asia PLC 3.125% 4/14/30 | | 1,200,000 | 1,115,673 |
| Reinsurance Group of America, Inc.: | | | |
| 3.9% 5/15/29 | | 1,000,000 | 967,968 |
| 3.95% 9/15/26 | | 3,300,000 | 3,259,982 |
| The Chubb Corp.: | | | |
| 6% 5/11/37 | | 983,000 | 1,082,185 |
| 6.5% 5/15/38 | | 626,000 | 724,281 |
| The Travelers Companies, Inc.: | | | |
| 4.05% 3/7/48 | | 600,000 | 511,228 |
| 4.1% 3/4/49 | | 800,000 | 683,831 |
| 4.3% 8/25/45 | | 261,000 | 231,043 |
| 6.25% 6/15/37 | | 5,488,000 | 6,173,766 |
| Unum Group: | | | |
| 4.5% 12/15/49 | | 1,000,000 | 820,300 |
| 6% 6/15/54 | | 1,000,000 | 1,018,059 |
| Willis Group North America, Inc.: | | | |
| 2.95% 9/15/29 | | 3,000,000 | 2,772,320 |
| 3.875% 9/15/49 | | 1,300,000 | 1,002,279 |
| 4.5% 9/15/28 | | 3,479,000 | 3,461,771 |
| | | | 176,201,148 |
TOTAL FINANCIALS | | | 2,174,487,206 |
| HEALTH CARE - 2.8% | | | |
| Biotechnology - 0.5% | | | |
| AbbVie, Inc.: | | | |
| 2.95% 11/21/26 | | 13,300,000 | 12,926,490 |
| 3.2% 11/21/29 | | 4,000,000 | 3,790,304 |
| 4.05% 11/21/39 | | 9,370,000 | 8,486,758 |
| 4.25% 11/14/28 | | 1,478,000 | 1,483,506 |
| 4.25% 11/21/49 | | 4,700,000 | 4,097,926 |
| 4.3% 5/14/36 | | 1,116,000 | 1,069,075 |
| 4.4% 11/6/42 | | 1,851,000 | 1,700,542 |
| 4.45% 5/14/46 | | 1,247,000 | 1,129,696 |
| 4.55% 3/15/35 | | 3,686,000 | 3,636,489 |
| 4.7% 5/14/45 | | 1,752,000 | 1,647,027 |
| 4.75% 3/15/45 | | 1,128,000 | 1,071,012 |
| 4.8% 3/15/29 | | 3,450,000 | 3,524,396 |
| 4.875% 11/14/48 | | 1,710,000 | 1,643,814 |
| 5.05% 3/15/34 | | 5,000,000 | 5,152,318 |
| 5.4% 3/15/54 | | 3,570,000 | 3,699,635 |
| Amgen, Inc.: | | | |
| 1.65% 8/15/28 | | 1,200,000 | 1,080,547 |
| 1.9% 2/21/25 | | 2,000,000 | 1,968,872 |
| 2.6% 8/19/26 | | 1,872,000 | 1,806,602 |
| 2.77% 9/1/53 | | 1,460,000 | 927,505 |
| 2.8% 8/15/41 | | 5,000,000 | 3,694,768 |
| 3.125% 5/1/25 | | 356,000 | 351,359 |
| 3.15% 2/21/40 | | 3,890,000 | 3,022,192 |
| 3.375% 2/21/50 | | 2,500,000 | 1,852,497 |
| 4.2% 3/1/33 | | 9,330,000 | 8,930,473 |
| 4.2% 2/22/52 | | 1,500,000 | 1,242,886 |
| 4.4% 5/1/45 | | 1,770,000 | 1,541,906 |
| 4.663% 6/15/51 | | 2,224,000 | 1,979,476 |
| 4.95% 10/1/41 | | 1,200,000 | 1,143,655 |
| 5.15% 3/2/28 | | 5,000,000 | 5,107,296 |
| 5.25% 3/2/33 | | 3,000,000 | 3,083,031 |
| 5.6% 3/2/43 | | 1,700,000 | 1,737,453 |
| 5.65% 3/2/53 | | 10,340,000 | 10,634,822 |
| Biogen, Inc. 3.15% 5/1/50 | | 3,250,000 | 2,202,351 |
| Gilead Sciences, Inc.: | | | |
| 1.65% 10/1/30 | | 3,200,000 | 2,723,053 |
| 2.8% 10/1/50 | | 1,600,000 | 1,050,747 |
| 3.65% 3/1/26 | | 1,102,000 | 1,087,237 |
| 4.15% 3/1/47 | | 2,217,000 | 1,878,903 |
| 4.75% 3/1/46 | | 4,393,000 | 4,069,929 |
| 4.8% 4/1/44 | | 3,000,000 | 2,817,940 |
| 5.55% 10/15/53 | | 2,400,000 | 2,493,718 |
| Regeneron Pharmaceuticals, Inc. 1.75% 9/15/30 | | 2,100,000 | 1,795,291 |
| | | | 125,283,497 |
| Health Care Equipment & Supplies - 0.3% | | | |
| Abbott Laboratories: | | | |
| 1.15% 1/30/28 | | 5,000,000 | 4,546,380 |
| 3.75% 11/30/26 | | 7,242,000 | 7,178,437 |
| 4.75% 11/30/36 | | 802,000 | 811,722 |
| 4.9% 11/30/46 | | 2,854,000 | 2,825,274 |
| 5.3% 5/27/40 | | 700,000 | 738,835 |
| 6.15% 11/30/37 | | 1,900,000 | 2,156,137 |
| Baxter International, Inc.: | | | |
| 1.915% 2/1/27 | | 4,700,000 | 4,412,603 |
| 2.539% 2/1/32 | | 4,700,000 | 4,014,022 |
| Becton, Dickinson & Co.: | | | |
| 2.823% 5/20/30 | | 1,900,000 | 1,736,657 |
| 3.7% 6/6/27 | | 7,803,000 | 7,646,234 |
| 4.669% 6/6/47 | | 256,000 | 231,215 |
| 4.685% 12/15/44 | | 1,937,000 | 1,758,861 |
| 4.693% 2/13/28 | | 2,400,000 | 2,413,830 |
| 5.081% 6/7/29 | | 6,100,000 | 6,249,560 |
| Boston Scientific Corp.: | | | |
| 2.65% 6/1/30 | | 1,500,000 | 1,366,706 |
| 4% 3/1/29 | | 1,925,000 | 1,892,346 |
| 4.7% 3/1/49 | | 1,257,000 | 1,178,853 |
| GE Healthcare Technologies, Inc.: | | | |
| 5.6% 11/15/25 | | 5,100,000 | 5,141,393 |
| 5.65% 11/15/27 | | 1,600,000 | 1,652,105 |
| 5.905% 11/22/32 | | 4,800,000 | 5,114,445 |
| Medtronic, Inc. 4.625% 3/15/45 | | 3,404,000 | 3,200,716 |
| Stryker Corp.: | | | |
| 1.95% 6/15/30 | | 1,650,000 | 1,440,839 |
| 2.9% 6/15/50 | | 1,150,000 | 790,227 |
| 3.5% 3/15/26 | | 3,600,000 | 3,539,849 |
| 4.1% 4/1/43 | | 1,300,000 | 1,122,292 |
| Zimmer Biomet Holdings, Inc.: | | | |
| 2.6% 11/24/31 | | 2,000,000 | 1,733,225 |
| 3.55% 4/1/25 | | 7,228,000 | 7,156,887 |
| | | | 82,049,650 |
| Health Care Providers & Services - 1.1% | | | |
| Aetna, Inc.: | | | |
| 4.125% 11/15/42 | | 2,022,000 | 1,650,822 |
| 4.75% 3/15/44 | | 500,000 | 439,497 |
| 6.625% 6/15/36 | | 1,160,000 | 1,287,630 |
| AHS Hospital Corp. 2.78% 7/1/51 | | 3,500,000 | 2,339,171 |
| Allina Health System, Inc. 3.887% 4/15/49 | | 1,239,000 | 1,020,565 |
| Banner Health: | | | |
| 2.907% 1/1/42 | | 1,500,000 | 1,127,907 |
| 2.913% 1/1/51 | | 2,700,000 | 1,880,210 |
| Baptist Healthcare System Obli 3.54% 8/15/50 | | 3,000,000 | 2,284,540 |
| Bon Secours Mercy Health, Inc. 2.095% 6/1/31 | | 1,786,000 | 1,529,972 |
| Cardinal Health, Inc. 4.368% 6/15/47 | | 2,476,000 | 2,090,129 |
| Cencora, Inc. 2.7% 3/15/31 | | 4,100,000 | 3,634,414 |
| Centene Corp.: | | | |
| 2.5% 3/1/31 | | 700,000 | 594,250 |
| 2.625% 8/1/31 | | 5,000,000 | 4,241,283 |
| 3.375% 2/15/30 | | 5,000,000 | 4,578,277 |
| 4.25% 12/15/27 | | 5,100,000 | 4,986,270 |
| Children's Hospital Medical Center 4.268% 5/15/44 | | 592,000 | 535,587 |
| Children's Hospital of Philadelphia 2.704% 7/1/50 | | 1,964,000 | 1,326,898 |
| Cigna Group: | | | |
| 1.25% 3/15/26 | | 3,645,000 | 3,463,429 |
| 2.375% 3/15/31 | | 1,500,000 | 1,303,895 |
| 2.4% 3/15/30 | | 9,400,000 | 8,425,846 |
| 3.4% 3/15/50 | | 1,000,000 | 712,882 |
| 4.375% 10/15/28 | | 8,532,000 | 8,484,487 |
| 4.8% 8/15/38 | | 4,201,000 | 4,028,396 |
| 4.8% 7/15/46 | | 2,355,000 | 2,140,041 |
| 4.9% 12/15/48 | | 2,618,000 | 2,405,105 |
| 5.6% 2/15/54 | | 800,000 | 805,388 |
| 6.125% 11/15/41 | | 535,000 | 574,456 |
| CommonSpirit Health: | | | |
| 3.91% 10/1/50 | | 3,000,000 | 2,383,041 |
| 4.35% 11/1/42 | | 356,000 | 313,876 |
| CVS Health Corp.: | | | |
| 2.7% 8/21/40 | | 5,000,000 | 3,452,216 |
| 3% 8/15/26 | | 1,016,000 | 984,129 |
| 3.75% 4/1/30 | | 3,030,000 | 2,872,528 |
| 4.1% 3/25/25 | | 735,000 | 731,045 |
| 4.125% 4/1/40 | | 1,400,000 | 1,170,870 |
| 4.3% 3/25/28 | | 4,260,000 | 4,208,683 |
| 4.78% 3/25/38 | | 2,600,000 | 2,388,446 |
| 4.875% 7/20/35 | | 553,000 | 533,539 |
| 5% 2/20/26 | | 5,000,000 | 5,014,451 |
| 5% 1/30/29 | | 7,360,000 | 7,464,375 |
| 5.05% 3/25/48 | | 4,884,000 | 4,329,065 |
| 5.125% 7/20/45 | | 4,500,000 | 4,063,604 |
| 5.25% 2/21/33 | | 3,000,000 | 3,017,997 |
| 5.3% 12/5/43 | | 4,832,000 | 4,535,490 |
| 5.4% 6/1/29 | | 2,600,000 | 2,671,505 |
| 5.625% 2/21/53 | | 1,800,000 | 1,722,959 |
| 5.7% 6/1/34 | | 1,000,000 | 1,024,492 |
| 6% 6/1/63 | | 2,600,000 | 2,583,021 |
| Elevance Health, Inc.: | | | |
| 2.25% 5/15/30 | | 1,000,000 | 886,673 |
| 2.55% 3/15/31 | | 1,000,000 | 883,536 |
| 3.65% 12/1/27 | | 6,799,000 | 6,652,079 |
| 3.7% 9/15/49 | | 1,140,000 | 876,620 |
| 4.375% 12/1/47 | | 6,457,000 | 5,576,571 |
| 4.625% 5/15/42 | | 464,000 | 425,811 |
| 4.65% 1/15/43 | | 356,000 | 325,786 |
| 5.125% 2/15/53 | | 3,300,000 | 3,143,455 |
| 5.375% 6/15/34 | | 1,400,000 | 1,450,776 |
| 5.5% 10/15/32 | | 1,800,000 | 1,889,712 |
| Franciscan Missionaries of Our Lady Health System, Inc. 3.914% 7/1/49 | | 2,400,000 | 1,928,861 |
| HCA Holdings, Inc.: | | | |
| 3.625% 3/15/32 | | 5,700,000 | 5,182,148 |
| 4.125% 6/15/29 | | 1,540,000 | 1,502,380 |
| 4.5% 2/15/27 | | 5,500,000 | 5,478,818 |
| 4.625% 3/15/52 | | 4,100,000 | 3,469,163 |
| 5.25% 6/15/26 | | 1,499,000 | 1,504,233 |
| 5.25% 6/15/49 | | 3,120,000 | 2,895,884 |
| 5.6% 4/1/34 | | 3,000,000 | 3,082,919 |
| 6% 4/1/54 | | 6,200,000 | 6,396,819 |
| Humana, Inc.: | | | |
| 1.35% 2/3/27 | | 1,800,000 | 1,667,437 |
| 2.15% 2/3/32 | | 1,900,000 | 1,575,666 |
| 3.95% 3/15/27 | | 5,493,000 | 5,410,187 |
| 4.95% 10/1/44 | | 445,000 | 404,269 |
| 5.75% 4/15/54 | | 2,400,000 | 2,407,858 |
| 5.95% 3/15/34 | | 1,300,000 | 1,374,582 |
| ICON Investments Six Designated Activity 5.849% 5/8/29 | | 1,340,000 | 1,400,091 |
| Indiana University Health, Inc. 2.852% 11/1/51 | | 3,600,000 | 2,484,746 |
| INTEGRIS Baptist Medical Center, Inc. 3.875% 8/15/50 | | 2,292,000 | 1,775,350 |
| Kaiser Foundation Hospitals: | | | |
| 2.81% 6/1/41 | | 1,107,000 | 837,311 |
| 3.266% 11/1/49 | | 1,900,000 | 1,432,021 |
| 4.15% 5/1/47 | | 1,136,000 | 995,651 |
| 4.875% 4/1/42 | | 321,000 | 314,660 |
| Laboratory Corp. of America Holdings 3.6% 9/1/27 | | 5,700,000 | 5,547,561 |
| Massachusetts General Brigham, Inc.: | | | |
| 3.342% 7/1/60 | | 1,000,000 | 717,904 |
| 4.117% 7/1/55 | | 624,000 | 534,303 |
| Memorial Sloan-Kettring Cancer Center: | | | |
| 4.2% 7/1/55 | | 535,000 | 467,613 |
| 5% 7/1/42 | | 1,600,000 | 1,598,027 |
| MidMichigan Health 3.409% 6/1/50 | | 833,000 | 617,743 |
| Mount Sinai Hospital 3.737% 7/1/49 | | 1,400,000 | 983,539 |
| New York & Presbyterian Hospital: | | | |
| 4.024% 8/1/45 | | 624,000 | 540,545 |
| 4.063% 8/1/56 | | 469,000 | 402,482 |
| Novant Health, Inc. 3.168% 11/1/51 | | 2,300,000 | 1,636,398 |
| NYU Hospitals Center 4.784% 7/1/44 | | 1,355,000 | 1,315,559 |
| Orlando Health Obligated Group 3.327% 10/1/50 | | 1,481,000 | 1,125,557 |
| Piedmont Healthcare, Inc. 2.719% 1/1/42 | | 2,688,000 | 1,953,489 |
| Providence St. Joseph Health Obligated Group 2.7% 10/1/51 | | 3,600,000 | 2,212,403 |
| Quest Diagnostics, Inc. 2.95% 6/30/30 | | 2,850,000 | 2,613,687 |
| Sabra Health Care LP 3.2% 12/1/31 | | 1,300,000 | 1,127,558 |
| Sutter Health 3.361% 8/15/50 | | 3,600,000 | 2,696,841 |
| Trinity Health Corp. 2.632% 12/1/40 | | 1,000,000 | 738,457 |
| UnitedHealth Group, Inc.: | | | |
| 1.15% 5/15/26 | | 1,800,000 | 1,707,787 |
| 1.25% 1/15/26 | | 1,100,000 | 1,054,771 |
| 2% 5/15/30 | | 1,500,000 | 1,322,223 |
| 2.75% 5/15/40 | | 5,332,000 | 3,984,062 |
| 2.9% 5/15/50 | | 100,000 | 68,050 |
| 3.125% 5/15/60 | | 1,300,000 | 864,800 |
| 3.25% 5/15/51 | | 1,800,000 | 1,297,722 |
| 3.375% 4/15/27 | | 963,000 | 942,569 |
| 3.7% 8/15/49 | | 1,728,000 | 1,361,676 |
| 3.75% 7/15/25 | | 5,080,000 | 5,049,250 |
| 3.75% 10/15/47 | | 1,704,000 | 1,361,728 |
| 3.875% 12/15/28 | | 371,000 | 365,653 |
| 3.875% 8/15/59 | | 1,798,000 | 1,391,692 |
| 4.2% 1/15/47 | | 642,000 | 553,060 |
| 4.25% 1/15/29 | | 5,000,000 | 5,002,203 |
| 4.25% 6/15/48 | | 370,000 | 319,213 |
| 4.375% 3/15/42 | | 2,103,000 | 1,913,266 |
| 4.625% 7/15/35 | | 1,100,000 | 1,091,078 |
| 4.625% 11/15/41 | | 1,000,000 | 942,355 |
| 4.75% 7/15/45 | | 297,000 | 280,005 |
| 4.9% 4/15/31 | | 9,600,000 | 9,816,191 |
| 4.95% 5/15/62 | | 3,100,000 | 2,891,331 |
| 5.05% 4/15/53 | | 4,200,000 | 4,068,235 |
| 5.15% 7/15/34 | | 1,000,000 | 1,027,516 |
| 5.2% 4/15/63 | | 2,100,000 | 2,033,605 |
| 5.25% 2/15/28 | | 2,400,000 | 2,487,747 |
| 5.35% 2/15/33 | | 4,400,000 | 4,605,050 |
| 5.625% 7/15/54 | | 4,000,000 | 4,178,041 |
| 5.8% 3/15/36 | | 1,100,000 | 1,190,324 |
| 5.875% 2/15/53 | | 2,400,000 | 2,594,685 |
| 6.05% 2/15/63 | | 1,000,000 | 1,097,961 |
| 6.625% 11/15/37 | | 1,100,000 | 1,277,624 |
| Universal Health Services, Inc. 2.65% 10/15/30 | | 2,000,000 | 1,767,508 |
| West Virginia University Health System Obligated Group 3.129% 6/1/50 | | 1,400,000 | 954,917 |
| | | | 296,682,316 |
| Life Sciences Tools & Services - 0.1% | | | |
| Danaher Corp. 4.375% 9/15/45 | | 422,000 | 384,937 |
| Revvity, Inc. 2.25% 9/15/31 | | 1,900,000 | 1,600,784 |
| Thermo Fisher Scientific, Inc.: | | | |
| 2.6% 10/1/29 | | 788,000 | 729,182 |
| 2.8% 10/15/41 | | 800,000 | 594,116 |
| 4.8% 11/21/27 | | 7,000,000 | 7,127,957 |
| 5.086% 8/10/33 | | 2,400,000 | 2,475,894 |
| 5.3% 2/1/44 | | 1,038,000 | 1,048,352 |
| 5.404% 8/10/43 | | 1,200,000 | 1,248,651 |
| | | | 15,209,873 |
| Pharmaceuticals - 0.8% | | | |
| AstraZeneca Finance LLC: | | | |
| 1.2% 5/28/26 | | 5,100,000 | 4,838,445 |
| 2.25% 5/28/31 | | 2,100,000 | 1,830,951 |
| 4.875% 3/3/33 | | 4,700,000 | 4,824,145 |
| AstraZeneca PLC: | | | |
| 3.375% 11/16/25 | | 3,000,000 | 2,960,850 |
| 4.375% 11/16/45 | | 1,344,000 | 1,225,056 |
| 4.375% 8/17/48 | | 2,246,000 | 2,028,405 |
| 6.45% 9/15/37 | | 579,000 | 667,214 |
| Bayer U.S. Finance II LLC 3.95% 4/15/45 (c) | | 248,000 | 183,357 |
| Bristol-Myers Squibb Co.: | | | |
| 2.35% 11/13/40 | | 1,356,000 | 943,656 |
| 3.2% 6/15/26 | | 1,409,000 | 1,382,578 |
| 3.25% 8/1/42 | | 499,000 | 387,496 |
| 3.4% 7/26/29 | | 669,000 | 642,866 |
| 3.7% 3/15/52 | | 1,700,000 | 1,303,572 |
| 3.9% 2/20/28 | | 5,000,000 | 4,937,785 |
| 4.125% 6/15/39 | | 7,803,000 | 7,066,846 |
| 4.25% 10/26/49 | | 3,437,000 | 2,936,378 |
| 4.35% 11/15/47 | | 3,400,000 | 2,957,897 |
| 4.55% 2/20/48 | | 269,000 | 241,785 |
| 4.9% 2/22/29 | | 4,800,000 | 4,921,753 |
| 5.2% 2/22/34 | | 7,200,000 | 7,468,234 |
| 5.55% 2/22/54 | | 4,952,000 | 5,112,254 |
| Eli Lilly & Co.: | | | |
| 2.25% 5/15/50 | | 800,000 | 492,184 |
| 3.95% 3/15/49 | | 2,610,000 | 2,221,378 |
| 4.2% 8/14/29 | | 2,960,000 | 2,966,524 |
| 4.6% 8/14/34 | | 2,960,000 | 2,968,306 |
| 4.875% 2/27/53 | | 2,200,000 | 2,154,608 |
| 5% 2/9/54 | | 6,900,000 | 6,871,290 |
| GlaxoSmithKline Capital, Inc. 6.375% 5/15/38 | | 3,752,000 | 4,297,447 |
| Haleon U.S. Capital LLC: | | | |
| 3.375% 3/24/27 | | 2,700,000 | 2,634,202 |
| 3.625% 3/24/32 | | 6,000,000 | 5,574,396 |
| Johnson & Johnson: | | | |
| 0.55% 9/1/25 | | 100,000 | 96,222 |
| 2.1% 9/1/40 | | 5,228,000 | 3,686,192 |
| 2.45% 3/1/26 | | 997,000 | 972,589 |
| 2.45% 9/1/60 | | 1,600,000 | 968,064 |
| 3.4% 1/15/38 | | 1,663,000 | 1,462,823 |
| 3.5% 1/15/48 | | 5,369,000 | 4,347,361 |
| 3.625% 3/3/37 | | 713,000 | 650,184 |
| 4.5% 12/5/43 | | 1,181,000 | 1,151,701 |
| 4.85% 5/15/41 | | 760,000 | 771,234 |
| 4.9% 6/1/31 | | 300,000 | 311,615 |
| Merck & Co., Inc.: | | | |
| 2.15% 12/10/31 | | 5,500,000 | 4,735,321 |
| 2.9% 12/10/61 | | 1,600,000 | 1,000,064 |
| 3.6% 9/15/42 | | 1,356,000 | 1,121,986 |
| 3.7% 2/10/45 | | 1,141,000 | 935,300 |
| 3.9% 3/7/39 | | 4,800,000 | 4,316,060 |
| 4% 3/7/49 | | 2,900,000 | 2,445,632 |
| 4.05% 5/17/28 | | 2,000,000 | 1,999,636 |
| 4.5% 5/17/33 | | 3,250,000 | 3,253,757 |
| 5% 5/17/53 | | 3,200,000 | 3,150,567 |
| Mylan NV 5.2% 4/15/48 | | 2,735,000 | 2,342,842 |
| Novartis Capital Corp.: | | | |
| 1.75% 2/14/25 | | 1,000,000 | 985,934 |
| 2% 2/14/27 | | 1,400,000 | 1,331,325 |
| 2.75% 8/14/50 | | 2,900,000 | 1,993,734 |
| 3% 11/20/25 | | 1,866,000 | 1,836,211 |
| 3.1% 5/17/27 | | 49,000 | 47,789 |
| 3.7% 9/21/42 | | 1,504,000 | 1,286,105 |
| 4% 11/20/45 | | 934,000 | 816,981 |
| Pfizer Investment Enterprises: | | | |
| 4.45% 5/19/28 | | 7,000,000 | 7,034,328 |
| 4.65% 5/19/30 | | 4,000,000 | 4,066,593 |
| 4.75% 5/19/33 | | 9,300,000 | 9,350,008 |
| 5.11% 5/19/43 | | 3,100,000 | 3,064,812 |
| 5.3% 5/19/53 | | 4,248,000 | 4,268,869 |
| 5.34% 5/19/63 | | 3,900,000 | 3,870,463 |
| Pfizer, Inc.: | | | |
| 2.55% 5/28/40 | | 4,203,000 | 3,058,324 |
| 2.7% 5/28/50 | | 800,000 | 535,833 |
| 3% 12/15/26 | | 1,195,000 | 1,164,925 |
| 3.45% 3/15/29 | | 12,884,000 | 12,489,148 |
| 3.9% 3/15/39 | | 1,123,000 | 1,001,469 |
| 4% 12/15/36 | | 1,693,000 | 1,582,838 |
| 4.125% 12/15/46 | | 2,472,000 | 2,133,606 |
| 4.2% 9/15/48 | | 1,390,000 | 1,203,464 |
| 4.3% 6/15/43 | | 442,000 | 398,964 |
| 4.4% 5/15/44 | | 747,000 | 694,440 |
| 7.2% 3/15/39 | | 963,000 | 1,177,610 |
| Royalty Pharma PLC 3.35% 9/2/51 | | 3,800,000 | 2,566,853 |
| Shire Acquisitions Investments Ireland DAC 3.2% 9/23/26 | | 160,000 | 156,515 |
| Takeda Pharmaceutical Co. Ltd.: | | | |
| 2.05% 3/31/30 | | 3,710,000 | 3,257,355 |
| 3.025% 7/9/40 | | 3,356,000 | 2,534,994 |
| 3.175% 7/9/50 | | 300,000 | 208,449 |
| Utah Acquisition Sub, Inc.: | | | |
| 3.95% 6/15/26 | | 504,000 | 496,837 |
| 5.25% 6/15/46 | | 588,000 | 509,296 |
| Viatris, Inc.: | | | |
| 2.7% 6/22/30 | | 1,780,000 | 1,566,961 |
| 4% 6/22/50 | | 2,280,000 | 1,616,060 |
| Wyeth LLC 5.95% 4/1/37 | | 1,000,000 | 1,092,987 |
| Zoetis, Inc.: | | | |
| 3.95% 9/12/47 | | 356,000 | 291,806 |
| 4.7% 2/1/43 | | 3,132,000 | 2,909,943 |
| | | | 211,362,837 |
TOTAL HEALTH CARE | | | 730,588,173 |
| INDUSTRIALS - 1.8% | | | |
| Aerospace & Defense - 0.5% | | | |
| General Dynamics Corp.: | | | |
| 3.75% 5/15/28 | | 1,676,000 | 1,652,086 |
| 4.25% 4/1/40 | | 2,170,000 | 1,980,968 |
| 4.25% 4/1/50 | | 900,000 | 790,207 |
| General Electric Co.: | | | |
| 4.35% 5/1/50 | | 2,400,000 | 2,123,240 |
| 4.5% 3/11/44 | | 5,413,000 | 4,950,416 |
| Howmet Aerospace, Inc. 5.95% 2/1/37 | | 900,000 | 975,464 |
| L3Harris Technologies, Inc.: | | | |
| 3.85% 12/15/26 | | 1,330,000 | 1,311,931 |
| 4.4% 6/15/28 | | 5,400,000 | 5,376,853 |
| 5.4% 1/15/27 | | 3,500,000 | 3,572,929 |
| 5.4% 7/31/33 | | 1,000,000 | 1,030,888 |
| 5.6% 7/31/53 | | 1,300,000 | 1,340,315 |
| Lockheed Martin Corp.: | | | |
| 3.55% 1/15/26 | | 7,985,000 | 7,888,486 |
| 3.8% 3/1/45 | | 1,900,000 | 1,592,422 |
| 4.09% 9/15/52 | | 2,704,000 | 2,300,786 |
| 4.7% 5/15/46 | | 2,789,000 | 2,651,108 |
| 4.75% 2/15/34 | | 3,200,000 | 3,240,879 |
| 4.8% 8/15/34 | | 3,200,000 | 3,248,190 |
| 5.9% 11/15/63 | | 2,000,000 | 2,237,681 |
| Northrop Grumman Corp.: | | | |
| 3.25% 1/15/28 | | 1,497,000 | 1,444,439 |
| 3.85% 4/15/45 | | 335,000 | 275,380 |
| 4.03% 10/15/47 | | 1,456,000 | 1,215,705 |
| 4.4% 5/1/30 | | 4,458,000 | 4,444,728 |
| 4.7% 3/15/33 | | 3,500,000 | 3,506,084 |
| 4.75% 6/1/43 | | 1,713,000 | 1,604,250 |
| 5.2% 6/1/54 | | 2,600,000 | 2,574,368 |
| RTX Corp.: | | | |
| 1.9% 9/1/31 | | 6,600,000 | 5,510,939 |
| 3.15% 12/15/24 | | 1,586,000 | 1,569,122 |
| 3.75% 11/1/46 | | 186,000 | 147,576 |
| 4.05% 5/4/47 | | 1,448,000 | 1,196,458 |
| 4.15% 5/15/45 | | 3,500,000 | 2,967,329 |
| 4.35% 4/15/47 | | 1,176,000 | 1,017,741 |
| 4.45% 11/16/38 | | 3,300,000 | 3,072,619 |
| 4.5% 6/1/42 | | 1,315,000 | 1,190,197 |
| 4.625% 11/16/48 | | 1,247,000 | 1,123,276 |
| 4.875% 10/15/40 | | 178,000 | 170,132 |
| 5.15% 2/27/33 | | 5,600,000 | 5,741,627 |
| 5.375% 2/27/53 | | 1,400,000 | 1,400,971 |
| 5.4% 5/1/35 | | 1,060,000 | 1,101,459 |
| 5.7% 4/15/40 | | 1,356,000 | 1,425,146 |
| 6.1% 3/15/34 | | 5,300,000 | 5,769,845 |
| The Boeing Co.: | | | |
| 2.7% 2/1/27 | | 7,286,000 | 6,906,988 |
| 2.95% 2/1/30 | | 1,666,000 | 1,480,154 |
| 3.65% 3/1/47 | | 492,000 | 337,172 |
| 3.95% 8/1/59 | | 2,100,000 | 1,415,085 |
| 5.04% 5/1/27 | | 3,200,000 | 3,204,240 |
| 5.15% 5/1/30 | | 9,470,000 | 9,445,681 |
| 5.705% 5/1/40 | | 10,164,000 | 9,879,454 |
| 5.805% 5/1/50 | | 4,000,000 | 3,775,380 |
| 5.93% 5/1/60 | | 3,100,000 | 2,928,130 |
| 6.298% 5/1/29 (c) | | 1,500,000 | 1,566,532 |
| 6.388% 5/1/31 (c) | | 1,600,000 | 1,685,385 |
| 6.528% 5/1/34 (c) | | 3,000,000 | 3,177,336 |
| 6.858% 5/1/54 (c) | | 1,580,000 | 1,701,244 |
| 6.875% 3/15/39 | | 588,000 | 634,958 |
| | | | 144,871,979 |
| Air Freight & Logistics - 0.1% | | | |
| FedEx Corp.: | | | |
| 3.25% 5/15/41 | | 2,300,000 | 1,759,431 |
| 3.9% 2/1/35 | | 1,052,000 | 971,697 |
| 4.2% 10/17/28 | | 3,000,000 | 2,980,153 |
| 4.25% 5/15/30 | | 1,866,000 | 1,850,722 |
| 4.4% 1/15/47 | | 1,425,000 | 1,211,519 |
| 4.55% 4/1/46 | | 267,000 | 233,378 |
| 4.95% 10/17/48 | | 2,731,000 | 2,515,766 |
| 5.25% 5/15/50 | | 2,143,000 | 2,073,087 |
| United Parcel Service, Inc.: | | | |
| 2.4% 11/15/26 | | 1,336,000 | 1,282,624 |
| 3.4% 11/15/46 | | 473,000 | 371,533 |
| 3.625% 10/1/42 | | 1,100,000 | 900,807 |
| 3.75% 11/15/47 | | 1,102,000 | 879,668 |
| 4.45% 4/1/30 | | 1,840,000 | 1,858,011 |
| 4.875% 3/3/33 | | 7,200,000 | 7,358,333 |
| 5.5% 5/22/54 | | 3,300,000 | 3,433,322 |
| 6.2% 1/15/38 | | 1,645,000 | 1,845,334 |
| | | | 31,525,385 |
| Building Products - 0.1% | | | |
| Carrier Global Corp.: | | | |
| 2.242% 2/15/25 | | 2,700,000 | 2,660,316 |
| 2.493% 2/15/27 | | 2,000,000 | 1,916,933 |
| 2.722% 2/15/30 | | 3,000,000 | 2,746,006 |
| 3.377% 4/5/40 | | 2,702,000 | 2,179,406 |
| 3.577% 4/5/50 | | 2,550,000 | 1,953,193 |
| 5.9% 3/15/34 | | 1,620,000 | 1,747,488 |
| Johnson Controls International PLC/Tyco Fire & Security Finance SCA: | | | |
| 1.75% 9/15/30 | | 6,320,000 | 5,421,801 |
| 2% 9/16/31 | | 1,000,000 | 837,528 |
| Masco Corp.: | | | |
| 2% 2/15/31 | | 2,500,000 | 2,116,768 |
| 3.125% 2/15/51 | | 1,200,000 | 819,514 |
| Owens Corning: | | | |
| 4.3% 7/15/47 | | 1,600,000 | 1,327,188 |
| 5.95% 6/15/54 | | 1,000,000 | 1,033,548 |
| | | | 24,759,689 |
| Commercial Services & Supplies - 0.1% | | | |
| Republic Services, Inc.: | | | |
| 1.75% 2/15/32 | | 2,300,000 | 1,894,698 |
| 2.9% 7/1/26 | | 7,752,000 | 7,539,093 |
| 3.2% 3/15/25 | | 1,509,000 | 1,493,609 |
| 3.95% 5/15/28 | | 1,872,000 | 1,847,911 |
| 5% 12/15/33 | | 2,100,000 | 2,137,430 |
| 5.2% 11/15/34 | | 2,500,000 | 2,575,575 |
| Veralto Corp.: | | | |
| 5.35% 9/18/28 (c) | | 1,700,000 | 1,752,628 |
| 5.45% 9/18/33 (c) | | 600,000 | 620,040 |
| Waste Management, Inc.: | | | |
| 2.5% 11/15/50 | | 3,280,000 | 2,086,166 |
| 4.15% 4/15/32 | | 3,700,000 | 3,614,398 |
| 4.15% 7/15/49 | | 462,000 | 402,229 |
| | | | 25,963,777 |
| Electrical Equipment - 0.0% | | | |
| Emerson Electric Co. 2.75% 10/15/50 | | 2,800,000 | 1,882,063 |
| Hubbell, Inc. 3.15% 8/15/27 | | 2,200,000 | 2,115,841 |
| Regal Rexnord Corp. 6.4% 4/15/33 | | 2,700,000 | 2,865,289 |
| | | | 6,863,193 |
| Ground Transportation - 0.4% | | | |
| Burlington Northern Santa Fe LLC: | | | |
| 3.05% 2/15/51 | | 2,100,000 | 1,462,082 |
| 3.25% 6/15/27 | | 36,000 | 35,136 |
| 3.9% 8/1/46 | | 827,000 | 685,984 |
| 4.05% 6/15/48 | | 3,755,000 | 3,181,698 |
| 4.125% 6/15/47 | | 508,000 | 437,004 |
| 4.15% 4/1/45 | | 303,000 | 262,265 |
| 4.375% 9/1/42 | | 802,000 | 727,763 |
| 4.45% 1/15/53 | | 2,000,000 | 1,792,181 |
| 4.55% 9/1/44 | | 535,000 | 490,749 |
| 4.7% 9/1/45 | | 418,000 | 390,282 |
| 4.9% 4/1/44 | | 713,000 | 687,483 |
| 5.15% 9/1/43 | | 2,203,000 | 2,216,488 |
| 5.2% 4/15/54 | | 1,000,000 | 1,004,901 |
| 5.75% 5/1/40 | | 1,100,000 | 1,169,872 |
| 6.15% 5/1/37 | | 2,400,000 | 2,691,596 |
| Canadian National Railway Co.: | | | |
| 2.45% 5/1/50 | | 1,500,000 | 942,334 |
| 3.2% 8/2/46 | | 588,000 | 442,713 |
| 3.65% 2/3/48 | | 1,127,000 | 908,905 |
| 4.4% 8/5/52 | | 1,400,000 | 1,261,151 |
| Canadian Pacific Railway Co.: | | | |
| 1.75% 12/2/26 | | 8,000,000 | 7,549,582 |
| 2.45% 12/2/31 | | 3,800,000 | 3,286,553 |
| 3.1% 12/2/51 | | 1,800,000 | 1,252,279 |
| 3.5% 5/1/50 | | 2,100,000 | 1,583,002 |
| 4.2% 11/15/69 | | 1,100,000 | 870,671 |
| 4.8% 8/1/45 | | 1,500,000 | 1,404,540 |
| CSX Corp.: | | | |
| 2.5% 5/15/51 | | 85,000 | 52,730 |
| 3.25% 6/1/27 | | 91,000 | 88,715 |
| 3.35% 11/1/25 | | 4,900,000 | 4,828,400 |
| 3.8% 11/1/46 | | 1,019,000 | 825,227 |
| 3.95% 5/1/50 | | 637,000 | 526,066 |
| 4.1% 11/15/32 | | 5,000,000 | 4,843,923 |
| 4.1% 3/15/44 | | 1,207,000 | 1,042,137 |
| 4.25% 3/15/29 | | 3,300,000 | 3,293,681 |
| 4.3% 3/1/48 | | 1,600,000 | 1,394,242 |
| 4.5% 3/15/49 | | 2,229,000 | 1,995,954 |
| 4.5% 11/15/52 | | 2,000,000 | 1,801,015 |
| 4.75% 11/15/48 | | 1,032,000 | 960,926 |
| Norfolk Southern Corp.: | | | |
| 2.3% 5/15/31 | | 1,000,000 | 874,127 |
| 3.65% 8/1/25 | | 2,139,000 | 2,115,062 |
| 3.8% 8/1/28 | | 1,740,000 | 1,709,741 |
| 3.95% 10/1/42 | | 339,000 | 286,027 |
| 4.05% 8/15/52 | | 1,234,000 | 1,007,562 |
| 4.1% 5/15/21 | | 1,300,000 | 990,501 |
| 4.15% 2/28/48 | | 4,436,000 | 3,739,950 |
| 4.65% 1/15/46 | | 582,000 | 528,083 |
| 5.35% 8/1/54 | | 3,700,000 | 3,712,295 |
| Union Pacific Corp.: | | | |
| 2.15% 2/5/27 | | 1,800,000 | 1,713,106 |
| 2.75% 3/1/26 | | 1,187,000 | 1,157,432 |
| 2.891% 4/6/36 | | 7,001,000 | 5,908,880 |
| 2.973% 9/16/62 | | 1,700,000 | 1,064,486 |
| 3% 4/15/27 | | 891,000 | 863,322 |
| 3.25% 2/5/50 | | 2,100,000 | 1,539,629 |
| 3.6% 9/15/37 | | 588,000 | 516,355 |
| 3.799% 10/1/51 | | 499,000 | 400,002 |
| 3.799% 4/6/71 | | 4,483,000 | 3,336,300 |
| 3.839% 3/20/60 | | 2,844,000 | 2,201,887 |
| 4.95% 5/15/53 | | 2,500,000 | 2,441,257 |
| 6.625% 2/1/29 | | 3,500,000 | 3,835,238 |
| | | | 98,331,472 |
| Industrial Conglomerates - 0.1% | | | |
| 3M Co.: | | | |
| 2% 2/14/25 | | 4,092,000 | 4,035,552 |
| 2.875% 10/15/27 | | 12,000 | 11,484 |
| 3.05% 4/15/30 | | 8,000,000 | 7,487,413 |
| 3.125% 9/19/46 | | 492,000 | 353,234 |
| 3.25% 8/26/49 | | 108,000 | 78,189 |
| 4% 9/14/48 | | 2,000,000 | 1,699,405 |
| Honeywell International, Inc.: | | | |
| 1.35% 6/1/25 | | 1,800,000 | 1,756,421 |
| 1.95% 6/1/30 | | 100,000 | 88,195 |
| 2.5% 11/1/26 | | 1,276,000 | 1,231,750 |
| 2.7% 8/15/29 | | 3,500,000 | 3,271,327 |
| 2.8% 6/1/50 | | 2,800,000 | 1,934,401 |
| 3.812% 11/21/47 | | 249,000 | 204,351 |
| 4.25% 1/15/29 | | 4,300,000 | 4,330,615 |
| 4.7% 2/1/30 | | 1,880,000 | 1,911,960 |
| 4.875% 9/1/29 | | 1,600,000 | 1,642,149 |
| 5% 2/15/33 | | 2,000,000 | 2,058,302 |
| 5% 3/1/35 | | 2,780,000 | 2,851,995 |
| 5.25% 3/1/54 | | 1,600,000 | 1,623,856 |
| Trane Technologies Financing Ltd.: | | | |
| 3.8% 3/21/29 | | 2,557,000 | 2,491,080 |
| 4.65% 11/1/44 | | 1,069,000 | 982,555 |
| | | | 40,044,234 |
| Machinery - 0.3% | | | |
| Caterpillar Financial Services Corp.: | | | |
| 1.7% 1/8/27 | | 5,500,000 | 5,195,186 |
| 2.4% 8/9/26 | | 508,000 | 489,858 |
| 3.6% 8/12/27 | | 2,000,000 | 1,973,410 |
| Caterpillar, Inc.: | | | |
| 2.6% 4/9/30 | | 10,300,000 | 9,461,733 |
| 3.25% 9/19/49 | | 1,973,000 | 1,466,707 |
| 3.803% 8/15/42 | | 445,000 | 379,684 |
| 5.3% 9/15/35 | | 1,247,000 | 1,341,456 |
| Cummins, Inc.: | | | |
| 1.5% 9/1/30 | | 3,890,000 | 3,326,325 |
| 5.45% 2/20/54 | | 1,500,000 | 1,539,861 |
| Deere & Co.: | | | |
| 2.875% 9/7/49 | | 2,470,000 | 1,735,953 |
| 5.375% 10/16/29 | | 1,278,000 | 1,345,926 |
| Eaton Corp.: | | | |
| 4% 11/2/32 | | 4,139,000 | 3,990,236 |
| 4.15% 3/15/33 | | 2,000,000 | 1,944,236 |
| 4.15% 11/2/42 | | 339,000 | 300,873 |
| Illinois Tool Works, Inc. 3.9% 9/1/42 | | 2,300,000 | 1,986,581 |
| Ingersoll Rand, Inc.: | | | |
| 5.176% 6/15/29 | | 3,000,000 | 3,077,519 |
| 5.45% 6/15/34 | | 1,300,000 | 1,352,035 |
| 5.7% 8/14/33 | | 1,400,000 | 1,476,764 |
| Otis Worldwide Corp.: | | | |
| 2.293% 4/5/27 | | 1,400,000 | 1,326,188 |
| 2.565% 2/15/30 | | 3,000,000 | 2,709,373 |
| 3.362% 2/15/50 | | 400,000 | 293,483 |
| 5.25% 8/16/28 | | 1,900,000 | 1,955,240 |
| Parker Hannifin Corp.: | | | |
| 3.25% 3/1/27 | | 1,007,000 | 978,995 |
| 4% 6/14/49 | | 900,000 | 744,637 |
| 4.1% 3/1/47 | | 1,009,000 | 848,961 |
| 4.25% 9/15/27 | | 5,100,000 | 5,073,591 |
| 4.5% 9/15/29 | | 2,200,000 | 2,204,512 |
| Stanley Black & Decker, Inc.: | | | |
| 2.3% 3/15/30 | | 6,550,000 | 5,779,594 |
| 5.2% 9/1/40 | | 500,000 | 490,611 |
| Westinghouse Air Brake Tech Co. 3.45% 11/15/26 | | 2,600,000 | 2,536,147 |
| | | | 67,325,675 |
| Passenger Airlines - 0.1% | | | |
| American Airlines Pass Through Trust equipment trust certificate 2.875% 1/11/36 | | 2,499,710 | 2,162,170 |
| American Airlines, Inc. equipment trust certificate 3.2% 12/15/29 | | 906,280 | 851,495 |
| Southwest Airlines Co.: | | | |
| 2.625% 2/10/30 | | 1,000,000 | 894,493 |
| 5.25% 5/4/25 | | 7,660,000 | 7,660,953 |
| United Airlines 2015-1 Class AA pass-thru trust 3.45% 6/1/29 | | 76,647 | 73,252 |
| United Airlines 2020-1 Class B Pass Through Trust 4.875% 7/15/27 | | 1,627,200 | 1,607,003 |
| United Airlines Pass-Through Trust Series 2023-1 Class A, 5.8% 7/15/37 | | 2,248,611 | 2,323,762 |
| United Airlines pass-thru trust equipment trust certificate 3.1% 1/7/30 | | 1,062,626 | 997,541 |
| United Airlines, Inc. equipment trust certificate Series 2012-2B 4% 4/29/26 | | 399,971 | 398,668 |
| | | | 16,969,337 |
| Professional Services - 0.0% | | | |
| Thomson Reuters Corp.: | | | |
| 3.35% 5/15/26 | | 1,247,000 | 1,219,101 |
| 5.5% 8/15/35 | | 1,400,000 | 1,457,684 |
| | | | 2,676,785 |
| Trading Companies & Distributors - 0.1% | | | |
| Air Lease Corp.: | | | |
| 2.875% 1/15/32 | | 1,700,000 | 1,472,098 |
| 3.125% 12/1/30 | | 1,120,000 | 1,012,370 |
| 3.375% 7/1/25 | | 2,000,000 | 1,971,307 |
| 3.625% 12/1/27 | | 4,145,000 | 4,018,124 |
| 3.75% 6/1/26 | | 3,707,000 | 3,637,016 |
| 5.2% 7/15/31 | | 2,500,000 | 2,518,662 |
| GATX Corp.: | | | |
| 6.05% 6/5/54 | | 1,000,000 | 1,047,371 |
| 6.9% 5/1/34 | | 3,400,000 | 3,834,529 |
| | | | 19,511,477 |
TOTAL INDUSTRIALS | | | 478,843,003 |
| INFORMATION TECHNOLOGY - 1.7% | | | |
| Communications Equipment - 0.1% | | | |
| Cisco Systems, Inc.: | | | |
| 2.5% 9/20/26 | | 91,000 | 88,128 |
| 3.5% 6/15/25 | | 761,000 | 754,287 |
| 4.8% 2/26/27 | | 5,500,000 | 5,589,110 |
| 4.85% 2/26/29 | | 2,500,000 | 2,568,409 |
| 5.05% 2/26/34 | | 2,500,000 | 2,590,060 |
| 5.3% 2/26/54 | | 2,900,000 | 2,993,934 |
| 5.9% 2/15/39 | | 4,673,000 | 5,170,511 |
| Motorola Solutions, Inc.: | | | |
| 4.6% 5/23/29 | | 3,900,000 | 3,910,337 |
| 5.5% 9/1/44 | | 1,400,000 | 1,411,491 |
| | | | 25,076,267 |
| Electronic Equipment, Instruments & Components - 0.1% | | | |
| Amphenol Corp.: | | | |
| 2.8% 2/15/30 | | 2,300,000 | 2,113,119 |
| 5.25% 4/5/34 | | 1,700,000 | 1,749,201 |
| Corning, Inc.: | | | |
| 3.9% 11/15/49 | | 3,700,000 | 2,969,919 |
| 4.75% 3/15/42 | | 891,000 | 822,566 |
| 5.35% 11/15/48 | | 1,000,000 | 990,761 |
| Dell International LLC/EMC Corp.: | | | |
| 5.3% 10/1/29 | | 6,046,000 | 6,242,897 |
| 8.1% 7/15/36 | | 3,200,000 | 3,936,563 |
| 8.35% 7/15/46 | | 1,049,000 | 1,398,235 |
| Tyco Electronics Group SA: | | | |
| 2.5% 2/4/32 | | 1,500,000 | 1,316,256 |
| 7.125% 10/1/37 | | 441,000 | 529,622 |
| Vontier Corp.: | | | |
| 1.8% 4/1/26 | | 1,300,000 | 1,236,346 |
| 2.4% 4/1/28 | | 1,300,000 | 1,189,045 |
| | | | 24,494,530 |
| IT Services - 0.1% | | | |
| CDW LLC/CDW Finance Corp.: | | | |
| 2.67% 12/1/26 | | 5,500,000 | 5,247,175 |
| 3.569% 12/1/31 | | 800,000 | 720,879 |
| 5.55% 8/22/34 | | 1,090,000 | 1,099,156 |
| IBM Corp.: | | | |
| 1.95% 5/15/30 | | 2,400,000 | 2,099,397 |
| 2.95% 5/15/50 | | 1,500,000 | 1,006,343 |
| 3.5% 5/15/29 | | 111,000 | 107,013 |
| 4% 6/20/42 | | 5,900,000 | 5,052,017 |
| 4.15% 7/27/27 | | 7,000,000 | 6,975,187 |
| 4.15% 5/15/39 | | 353,000 | 316,977 |
| 4.25% 5/15/49 | | 8,481,000 | 7,215,006 |
| 4.7% 2/19/46 | | 882,000 | 809,809 |
| 4.9% 7/27/52 | | 1,000,000 | 936,793 |
| | | | 31,585,752 |
| Semiconductors & Semiconductor Equipment - 0.6% | | | |
| Advanced Micro Devices, Inc. 4.393% 6/1/52 | | 600,000 | 549,453 |
| Analog Devices, Inc.: | | | |
| 2.8% 10/1/41 | | 3,500,000 | 2,579,600 |
| 3.5% 12/5/26 | | 1,500,000 | 1,475,715 |
| Applied Materials, Inc.: | | | |
| 2.75% 6/1/50 | | 1,200,000 | 819,970 |
| 4.35% 4/1/47 | | 2,303,000 | 2,093,381 |
| Broadcom Corp./Broadcom Cayman LP: | | | |
| 3.5% 1/15/28 | | 4,847,000 | 4,690,818 |
| 3.875% 1/15/27 | | 3,047,000 | 3,005,103 |
| Broadcom, Inc.: | | | |
| 2.45% 2/15/31 (c) | | 3,200,000 | 2,792,112 |
| 2.6% 2/15/33 (c) | | 3,600,000 | 3,017,858 |
| 3.137% 11/15/35 (c) | | 1,000,000 | 835,988 |
| 3.15% 11/15/25 | | 4,600,000 | 4,514,670 |
| 3.419% 4/15/33 (c) | | 2,500,000 | 2,227,546 |
| 3.459% 9/15/26 | | 3,250,000 | 3,182,310 |
| 3.469% 4/15/34 (c) | | 3,397,000 | 3,001,659 |
| 3.5% 2/15/41 (c) | | 2,900,000 | 2,317,079 |
| 3.75% 2/15/51 (c) | | 5,800,000 | 4,508,633 |
| 4.3% 11/15/32 | | 1,700,000 | 1,641,846 |
| 4.75% 4/15/29 | | 3,167,000 | 3,191,039 |
| 5% 4/15/30 | | 4,750,000 | 4,883,157 |
| 5.15% 11/15/31 | | 3,330,000 | 3,401,805 |
| Intel Corp.: | | | |
| 3.05% 8/12/51 | | 1,100,000 | 683,383 |
| 3.15% 5/11/27 | | 4,300,000 | 4,117,409 |
| 3.25% 11/15/49 | | 2,050,000 | 1,332,385 |
| 3.734% 12/8/47 | | 583,000 | 416,079 |
| 3.75% 8/5/27 | | 1,400,000 | 1,359,354 |
| 3.9% 3/25/30 | | 4,700,000 | 4,462,711 |
| 4.1% 5/19/46 | | 1,247,000 | 963,263 |
| 4.1% 5/11/47 | | 428,000 | 329,399 |
| 4.6% 3/25/40 | | 1,869,000 | 1,649,046 |
| 4.75% 3/25/50 | | 8,091,000 | 6,788,278 |
| 4.875% 2/10/28 | | 3,000,000 | 2,997,490 |
| 4.95% 3/25/60 | | 1,000,000 | 843,654 |
| 5.05% 8/5/62 | | 2,500,000 | 2,101,801 |
| 5.2% 2/10/33 | | 12,260,000 | 12,211,830 |
| 5.7% 2/10/53 | | 2,210,000 | 2,113,532 |
| KLA Corp.: | | | |
| 4.65% 7/15/32 | | 3,900,000 | 3,938,494 |
| 4.7% 2/1/34 | | 2,000,000 | 2,011,308 |
| 5.25% 7/15/62 | | 1,300,000 | 1,301,866 |
| Lam Research Corp. 2.875% 6/15/50 | | 2,800,000 | 1,913,562 |
| Marvell Technology, Inc.: | | | |
| 2.45% 4/15/28 | | 2,600,000 | 2,403,083 |
| 5.95% 9/15/33 | | 1,000,000 | 1,062,149 |
| Micron Technology, Inc.: | | | |
| 3.477% 11/1/51 | | 1,500,000 | 1,065,881 |
| 5.327% 2/6/29 | | 2,750,000 | 2,816,341 |
| 5.375% 4/15/28 | | 2,800,000 | 2,862,581 |
| 5.875% 9/15/33 | | 1,400,000 | 1,474,753 |
| 6.75% 11/1/29 | | 800,000 | 870,550 |
| NVIDIA Corp.: | | | |
| 2% 6/15/31 | | 1,200,000 | 1,048,623 |
| 2.85% 4/1/30 | | 88,000 | 82,515 |
| 3.5% 4/1/40 | | 1,000,000 | 865,741 |
| 3.5% 4/1/50 | | 3,900,000 | 3,160,196 |
| NXP BV/NXP Funding LLC 5.55% 12/1/28 | | 1,300,000 | 1,340,521 |
| NXP BV/NXP Funding LLC/NXP U.S.A., Inc.: | | | |
| 2.65% 2/15/32 | | 2,200,000 | 1,887,248 |
| 3.25% 5/11/41 | | 1,700,000 | 1,277,193 |
| 4.3% 6/18/29 | | 4,080,000 | 3,999,032 |
| Qualcomm, Inc.: | | | |
| 1.65% 5/20/32 | | 4,500,000 | 3,686,102 |
| 2.15% 5/20/30 | | 1,100,000 | 983,937 |
| 3.25% 5/20/27 | | 20,000 | 19,508 |
| 4.3% 5/20/47 | | 1,800,000 | 1,602,812 |
| 4.65% 5/20/35 | | 1,200,000 | 1,210,341 |
| 4.8% 5/20/45 | | 2,790,000 | 2,695,903 |
| 5.4% 5/20/33 | | 2,200,000 | 2,353,676 |
| Texas Instruments, Inc.: | | | |
| 2.9% 11/3/27 | | 2,000,000 | 1,926,900 |
| 4.15% 5/15/48 | | 1,613,000 | 1,412,039 |
| 4.6% 2/15/28 | | 5,000,000 | 5,072,803 |
| 5% 3/14/53 | | 1,300,000 | 1,285,807 |
| 5.05% 5/18/63 | | 1,400,000 | 1,376,686 |
| | | | 156,107,507 |
| Software - 0.5% | | | |
| Microsoft Corp.: | | | |
| 2.5% 9/15/50 | | 1,800,000 | 1,183,338 |
| 2.525% 6/1/50 | | 4,290,000 | 2,857,321 |
| 2.675% 6/1/60 | | 1,815,000 | 1,177,912 |
| 2.7% 2/12/25 | | 61,000 | 60,434 |
| 2.921% 3/17/52 | | 15,678,000 | 11,346,388 |
| 3.041% 3/17/62 | | 736,000 | 515,647 |
| 3.3% 2/6/27 | | 2,000,000 | 1,968,955 |
| 3.45% 8/8/36 | | 518,000 | 473,743 |
| 3.5% 11/15/42 | | 1,000,000 | 865,615 |
| 4.1% 2/6/37 | | 2,900,000 | 2,847,941 |
| 4.2% 11/3/35 | | 3,800,000 | 3,799,495 |
| Oracle Corp.: | | | |
| 2.5% 4/1/25 | | 3,370,000 | 3,318,230 |
| 2.65% 7/15/26 | | 1,604,000 | 1,548,755 |
| 2.8% 4/1/27 | | 17,700,000 | 17,011,559 |
| 2.875% 3/25/31 | | 5,200,000 | 4,653,164 |
| 3.6% 4/1/50 | | 500,000 | 365,049 |
| 3.65% 3/25/41 | | 4,000,000 | 3,195,028 |
| 3.85% 7/15/36 | | 1,805,000 | 1,587,007 |
| 3.85% 4/1/60 | | 3,600,000 | 2,600,943 |
| 3.9% 5/15/35 | | 8,200,000 | 7,402,492 |
| 3.95% 3/25/51 | | 5,200,000 | 4,020,991 |
| 4% 7/15/46 | | 1,746,000 | 1,389,452 |
| 4% 11/15/47 | | 4,491,000 | 3,548,717 |
| 4.1% 3/25/61 | | 1,520,000 | 1,147,922 |
| 4.125% 5/15/45 | | 535,000 | 436,463 |
| 4.3% 7/8/34 | | 1,691,000 | 1,598,906 |
| 4.375% 5/15/55 | | 2,781,000 | 2,284,605 |
| 5.375% 7/15/40 | | 8,098,000 | 8,007,402 |
| 6.25% 11/9/32 | | 4,100,000 | 4,467,618 |
| 6.9% 11/9/52 | | 1,500,000 | 1,747,151 |
| Roper Technologies, Inc.: | | | |
| 1% 9/15/25 | | 1,810,000 | 1,741,418 |
| 1.4% 9/15/27 | | 144,000 | 131,804 |
| 1.75% 2/15/31 | | 1,860,000 | 1,550,624 |
| 2% 6/30/30 | | 3,360,000 | 2,915,624 |
| 3.8% 12/15/26 | | 1,515,000 | 1,492,959 |
| 4.9% 10/15/34 | | 2,420,000 | 2,397,947 |
| Salesforce, Inc.: | | | |
| 2.7% 7/15/41 | | 2,100,000 | 1,542,183 |
| 2.9% 7/15/51 | | 4,300,000 | 2,917,039 |
| VMware, Inc.: | | | |
| 1.4% 8/15/26 | | 8,200,000 | 7,713,235 |
| 4.65% 5/15/27 | | 2,400,000 | 2,403,517 |
| | | | 122,234,593 |
| Technology Hardware, Storage & Peripherals - 0.3% | | | |
| Apple, Inc.: | | | |
| 0.7% 2/8/26 | | 700,000 | 666,067 |
| 1.125% 5/11/25 | | 2,000,000 | 1,951,898 |
| 1.7% 8/5/31 | | 2,700,000 | 2,307,863 |
| 2.2% 9/11/29 | | 6,000,000 | 5,501,489 |
| 2.375% 2/8/41 | | 5,500,000 | 4,009,912 |
| 2.4% 8/20/50 | | 1,000,000 | 644,052 |
| 2.45% 8/4/26 | | 3,672,000 | 3,555,835 |
| 2.55% 8/20/60 | | 3,400,000 | 2,239,021 |
| 2.85% 8/5/61 | | 8,100,000 | 5,365,244 |
| 2.9% 9/12/27 | | 2,004,000 | 1,941,163 |
| 2.95% 9/11/49 | | 2,630,000 | 1,895,724 |
| 3% 11/13/27 | | 1,782,000 | 1,733,275 |
| 3.2% 5/13/25 | | 1,870,000 | 1,852,551 |
| 3.2% 5/11/27 | | 8,593,000 | 8,419,106 |
| 3.75% 11/13/47 | | 1,243,000 | 1,043,382 |
| 3.85% 5/4/43 | | 4,217,000 | 3,724,316 |
| 4.1% 8/8/62 | | 1,600,000 | 1,376,942 |
| 4.25% 2/9/47 | | 445,000 | 409,918 |
| 4.3% 5/10/33 | | 400,000 | 407,899 |
| 4.375% 5/13/45 | | 836,000 | 786,672 |
| 4.5% 2/23/36 | | 1,651,000 | 1,687,996 |
| 4.65% 2/23/46 | | 10,307,000 | 10,094,294 |
| Hewlett Packard Enterprise Co.: | | | |
| 4.9% 10/15/25 (b) | | 1,737,000 | 1,735,872 |
| 6.2% 10/15/35 (b) | | 776,000 | 835,243 |
| 6.35% 10/15/45 (b) | | 1,669,000 | 1,792,492 |
| HP, Inc.: | | | |
| 2.2% 6/17/25 | | 2,800,000 | 2,736,399 |
| 3.4% 6/17/30 | | 5,820,000 | 5,461,632 |
| 6% 9/15/41 | | 1,367,000 | 1,440,418 |
| | | | 75,616,675 |
TOTAL INFORMATION TECHNOLOGY | | | 435,115,324 |
| MATERIALS - 0.8% | | | |
| Chemicals - 0.4% | | | |
| Air Products & Chemicals, Inc.: | | | |
| 1.5% 10/15/25 | | 1,500,000 | 1,451,034 |
| 2.7% 5/15/40 | | 1,561,000 | 1,167,440 |
| 4.6% 2/8/29 | | 6,500,000 | 6,609,586 |
| Albemarle Corp. 5.65% 6/1/52 | | 1,100,000 | 997,109 |
| Celanese U.S. Holdings LLC: | | | |
| 6.165% 7/15/27 | | 2,200,000 | 2,270,114 |
| 6.35% 11/15/28 | | 800,000 | 841,691 |
| 6.379% 7/15/32 | | 2,600,000 | 2,748,311 |
| 6.7% 11/15/33 | | 800,000 | 864,800 |
| CF Industries Holdings, Inc. 5.375% 3/15/44 | | 2,000,000 | 1,917,338 |
| DuPont de Nemours, Inc.: | | | |
| 4.725% 11/15/28 | | 1,056,000 | 1,071,238 |
| 5.319% 11/15/38 | | 2,238,000 | 2,402,016 |
| 5.419% 11/15/48 | | 1,000,000 | 1,085,989 |
| Eastman Chemical Co.: | | | |
| 4.5% 12/1/28 | | 2,700,000 | 2,694,084 |
| 4.65% 10/15/44 | | 535,000 | 471,564 |
| 5.625% 2/20/34 | | 1,200,000 | 1,235,325 |
| 5.75% 3/8/33 | | 600,000 | 624,913 |
| Ecolab, Inc.: | | | |
| 2.7% 11/1/26 | | 1,176,000 | 1,136,404 |
| 2.7% 12/15/51 | | 2,800,000 | 1,830,795 |
| 2.75% 8/18/55 | | 73,000 | 47,066 |
| 3.95% 12/1/47 | | 593,000 | 506,282 |
| 4.8% 3/24/30 | | 1,745,000 | 1,784,636 |
| Huntsman International LLC 4.5% 5/1/29 | | 1,100,000 | 1,071,120 |
| International Flavors & Fragrances, Inc. 5% 9/26/48 | | 1,500,000 | 1,347,309 |
| Linde, Inc.: | | | |
| 3.2% 1/30/26 | | 1,130,000 | 1,110,891 |
| 3.55% 11/7/42 | | 856,000 | 708,417 |
| LYB International Finance BV 4.875% 3/15/44 | | 1,743,000 | 1,582,675 |
| LYB International Finance II BV 3.5% 3/2/27 | | 4,361,000 | 4,253,292 |
| LYB International Finance III LLC: | | | |
| 3.375% 10/1/40 | | 2,400,000 | 1,847,831 |
| 4.2% 10/15/49 | | 1,500,000 | 1,197,333 |
| LyondellBasell Industries NV 4.625% 2/26/55 | | 2,067,000 | 1,754,094 |
| Nutrien Ltd.: | | | |
| 2.95% 5/13/30 | | 2,600,000 | 2,392,441 |
| 4% 12/15/26 | | 2,032,000 | 2,007,837 |
| 4.9% 6/1/43 | | 400,000 | 370,081 |
| 5% 4/1/49 | | 1,605,000 | 1,476,474 |
| 5.25% 1/15/45 | | 624,000 | 598,003 |
| 5.625% 12/1/40 | | 321,000 | 324,196 |
| 5.8% 3/27/53 | | 1,000,000 | 1,030,476 |
| PPG Industries, Inc. 1.2% 3/15/26 | | 3,600,000 | 3,414,333 |
| RPM International, Inc. 4.55% 3/1/29 | | 3,000,000 | 2,980,021 |
| Sherwin-Williams Co.: | | | |
| 2.95% 8/15/29 | | 5,000,000 | 4,655,329 |
| 3.45% 6/1/27 | | 6,613,000 | 6,447,095 |
| 4.5% 6/1/47 | | 1,520,000 | 1,347,086 |
| 4.8% 9/1/31 | | 1,600,000 | 1,609,919 |
| The Dow Chemical Co.: | | | |
| 2.1% 11/15/30 | | 4,695,000 | 4,113,938 |
| 3.6% 11/15/50 | | 283,000 | 206,745 |
| 4.25% 10/1/34 | | 1,300,000 | 1,227,961 |
| 4.375% 11/15/42 | | 869,000 | 748,587 |
| 4.8% 11/30/28 | | 1,524,000 | 1,545,183 |
| 4.8% 5/15/49 | | 1,277,000 | 1,134,897 |
| 5.6% 2/15/54 | | 1,200,000 | 1,204,874 |
| 6.9% 5/15/53 | | 1,800,000 | 2,085,193 |
| 9.4% 5/15/39 | | 535,000 | 734,960 |
| The Mosaic Co.: | | | |
| 4.05% 11/15/27 | | 2,727,000 | 2,679,457 |
| 5.45% 11/15/33 | | 500,000 | 510,285 |
| 5.625% 11/15/43 | | 668,000 | 662,852 |
| Westlake Corp.: | | | |
| 3.375% 6/15/30 | | 1,600,000 | 1,496,949 |
| 3.6% 8/15/26 | | 10,080,000 | 9,879,925 |
| 5% 8/15/46 | | 356,000 | 324,287 |
| | | | 105,840,081 |
| Construction Materials - 0.0% | | | |
| CRH America Finance, Inc. 5.4% 5/21/34 | | 2,000,000 | 2,060,197 |
| Martin Marietta Materials, Inc.: | | | |
| 3.2% 7/15/51 | | 1,000,000 | 696,258 |
| 4.25% 12/15/47 | | 1,400,000 | 1,185,954 |
| | | | 3,942,409 |
| Containers & Packaging - 0.1% | | | |
| Amcor Group Finance 5.45% 5/23/29 | | 5,000,000 | 5,142,589 |
| Avery Dennison Corp. 4.875% 12/6/28 | | 3,100,000 | 3,137,488 |
| International Paper Co.: | | | |
| 4.4% 8/15/47 | | 854,000 | 731,456 |
| 5% 9/15/35 | | 2,600,000 | 2,605,690 |
| 5.15% 5/15/46 | | 2,281,000 | 2,170,530 |
| Smurfit Kappa Treasury ULC 5.438% 4/3/34 (c) | | 3,600,000 | 3,702,312 |
| WRKCo, Inc. 3% 6/15/33 | | 2,820,000 | 2,461,161 |
| | | | 19,951,226 |
| Metals & Mining - 0.3% | | | |
| ArcelorMittal SA: | | | |
| 6.35% 6/17/54 | | 1,400,000 | 1,408,009 |
| 6.8% 11/29/32 | | 3,500,000 | 3,830,776 |
| Barrick Gold Corp. 5.25% 4/1/42 | | 802,000 | 790,260 |
| Barrick North America Finance LLC 5.7% 5/30/41 | | 2,354,000 | 2,428,902 |
| Barrick PD Australia Finance Pty Ltd. 5.95% 10/15/39 | | 1,000,000 | 1,056,999 |
| BHP Billiton Financial (U.S.A.) Ltd.: | | | |
| 5% 9/30/43 | | 3,615,000 | 3,540,463 |
| 5.25% 9/8/33 | | 4,850,000 | 5,004,888 |
| Freeport-McMoRan, Inc.: | | | |
| 4.375% 8/1/28 | | 5,673,000 | 5,594,767 |
| 4.625% 8/1/30 | | 2,300,000 | 2,274,956 |
| Newmont Corp.: | | | |
| 2.25% 10/1/30 | | 1,100,000 | 975,446 |
| 4.875% 3/15/42 | | 700,000 | 674,436 |
| 5.45% 6/9/44 | | 1,141,000 | 1,151,686 |
| 6.25% 10/1/39 | | 2,100,000 | 2,323,630 |
| Newmont Corp. / Newcrest Finance Pty Ltd.: | | | |
| 3.25% 5/13/30 (c) | | 1,100,000 | 1,030,324 |
| 5.35% 3/15/34 (c) | | 1,300,000 | 1,345,061 |
| Nucor Corp.: | | | |
| 2.979% 12/15/55 | | 2,013,000 | 1,279,063 |
| 3.125% 4/1/32 | | 1,000,000 | 902,518 |
| 4.3% 5/23/27 | | 1,800,000 | 1,798,797 |
| Rio Tinto Alcan, Inc. 7.25% 3/15/31 | | 800,000 | 911,095 |
| Rio Tinto Finance (U.S.A.) Ltd.: | | | |
| 5.2% 11/2/40 | | 3,917,000 | 3,950,585 |
| 7.125% 7/15/28 | | 2,166,000 | 2,372,544 |
| Rio Tinto Finance (U.S.A.) PLC 5.125% 3/9/53 | | 1,000,000 | 993,321 |
| Southern Copper Corp.: | | | |
| 3.875% 4/23/25 | | 2,654,000 | 2,627,460 |
| 5.25% 11/8/42 | | 1,029,000 | 996,072 |
| 5.875% 4/23/45 | | 3,010,000 | 3,091,120 |
| Vale Overseas Ltd.: | | | |
| 3.75% 7/8/30 | | 5,900,000 | 5,507,945 |
| 6.125% 6/12/33 | | 300,000 | 314,175 |
| 6.4% 6/28/54 | | 1,000,000 | 1,020,000 |
| 6.875% 11/21/36 | | 1,700,000 | 1,864,156 |
| Vale SA 5.625% 9/11/42 | | 1,176,000 | 1,176,941 |
| | | | 62,236,395 |
| Paper & Forest Products - 0.0% | | | |
| Suzano Austria GmbH: | | | |
| 2.5% 9/15/28 | | 3,800,000 | 3,409,360 |
| 3.125% 1/15/32 | | 1,300,000 | 1,106,950 |
| 6% 1/15/29 | | 1,400,000 | 1,430,450 |
| | | | 5,946,760 |
TOTAL MATERIALS | | | 197,916,871 |
| REAL ESTATE - 1.0% | | | |
| Equity Real Estate Investment Trusts (REITs) - 0.9% | | | |
| Alexandria Real Estate Equities, Inc.: | | | |
| 2% 5/18/32 | | 2,000,000 | 1,624,877 |
| 3% 5/18/51 | | 2,250,000 | 1,431,140 |
| 3.55% 3/15/52 | | 1,500,000 | 1,061,481 |
| 4.5% 7/30/29 | | 1,900,000 | 1,883,876 |
| 4.85% 4/15/49 | | 2,300,000 | 2,038,443 |
| American Homes 4 Rent LP: | | | |
| 3.375% 7/15/51 | | 400,000 | 274,709 |
| 5.5% 7/15/34 | | 2,100,000 | 2,142,193 |
| American Tower Corp.: | | | |
| 1.3% 9/15/25 | | 900,000 | 866,067 |
| 2.1% 6/15/30 | | 1,500,000 | 1,305,214 |
| 3.1% 6/15/50 | | 1,500,000 | 1,022,365 |
| 3.55% 7/15/27 | | 4,824,000 | 4,683,080 |
| 3.6% 1/15/28 | | 511,000 | 494,152 |
| 3.8% 8/15/29 | | 5,241,000 | 5,030,647 |
| 5.55% 7/15/33 | | 4,500,000 | 4,664,953 |
| AvalonBay Communities, Inc.: | | | |
| 2.45% 1/15/31 | | 2,000,000 | 1,760,798 |
| 2.95% 5/11/26 | | 4,800,000 | 4,676,508 |
| 3.45% 6/1/25 | | 8,100,000 | 8,007,777 |
| 5.3% 12/7/33 | | 1,100,000 | 1,131,294 |
| Boston Properties, Inc.: | | | |
| 2.75% 10/1/26 | | 1,247,000 | 1,188,070 |
| 2.9% 3/15/30 | | 396,000 | 349,394 |
| 3.25% 1/30/31 | | 800,000 | 704,313 |
| 3.4% 6/21/29 | | 3,600,000 | 3,324,455 |
| 4.5% 12/1/28 | | 2,800,000 | 2,727,801 |
| Brixmor Operating Partnership LP: | | | |
| 3.9% 3/15/27 | | 1,005,000 | 982,886 |
| 4.05% 7/1/30 | | 1,138,000 | 1,090,139 |
| 4.125% 6/15/26 | | 1,346,000 | 1,329,823 |
| 4.125% 5/15/29 | | 1,216,000 | 1,179,497 |
| Camden Property Trust 4.9% 1/15/34 | | 1,800,000 | 1,788,704 |
| Corporate Office Properties LP 2.75% 4/15/31 | | 1,100,000 | 943,511 |
| Crown Castle, Inc.: | | | |
| 2.25% 1/15/31 | | 3,900,000 | 3,329,664 |
| 3.65% 9/1/27 | | 3,123,000 | 3,036,067 |
| 3.8% 2/15/28 | | 3,000,000 | 2,915,542 |
| 4.3% 2/15/29 | | 2,100,000 | 2,061,327 |
| 4.45% 2/15/26 | | 2,000,000 | 1,990,220 |
| 5.1% 5/1/33 | | 2,800,000 | 2,798,487 |
| CubeSmart LP 2.5% 2/15/32 | | 2,200,000 | 1,873,749 |
| EPR Properties: | | | |
| 4.5% 4/1/25 | | 1,000,000 | 991,989 |
| 4.5% 6/1/27 | | 2,800,000 | 2,740,198 |
| Equinix Europe 2 Financing Corp. LLC 5.5% 6/15/34 | | 2,400,000 | 2,483,873 |
| Equinix, Inc.: | | | |
| 1.45% 5/15/26 | | 4,119,000 | 3,901,837 |
| 2.5% 5/15/31 | | 3,600,000 | 3,128,580 |
| ERP Operating LP: | | | |
| 1.85% 8/1/31 | | 3,100,000 | 2,603,541 |
| 3% 7/1/29 | | 1,900,000 | 1,780,686 |
| 3.25% 8/1/27 | | 2,314,000 | 2,248,059 |
| Federal Realty OP LP 3.5% 6/1/30 | | 2,900,000 | 2,706,783 |
| GLP Capital LP/GLP Financing II, Inc. 5.625% 9/15/34 | | 3,960,000 | 4,003,338 |
| Healthpeak OP, LLC: | | | |
| 2.875% 1/15/31 | | 3,150,000 | 2,822,163 |
| 3% 1/15/30 | | 3,700,000 | 3,411,674 |
| 3.4% 2/1/25 | | 87,000 | 86,246 |
| Highwoods Realty LP 7.65% 2/1/34 | | 1,200,000 | 1,347,804 |
| Invitation Homes Operating Partnership LP 2.3% 11/15/28 | | 5,100,000 | 4,626,399 |
| Kilroy Realty LP 3.05% 2/15/30 | | 3,200,000 | 2,803,801 |
| Kimco Realty OP, LLC: | | | |
| 1.9% 3/1/28 | | 3,000,000 | 2,733,545 |
| 3.8% 4/1/27 | | 713,000 | 698,649 |
| 4.125% 12/1/46 | | 1,782,000 | 1,422,531 |
| 4.45% 9/1/47 | | 924,000 | 777,816 |
| Kite Realty Group LP 5.5% 3/1/34 | | 900,000 | 912,361 |
| LXP Industrial Trust (REIT) 6.75% 11/15/28 | | 1,600,000 | 1,697,710 |
| NNN (REIT), Inc. 3% 4/15/52 | | 2,400,000 | 1,546,359 |
| Omega Healthcare Investors, Inc.: | | | |
| 3.375% 2/1/31 | | 1,000,000 | 891,429 |
| 4.5% 1/15/25 | | 1,428,000 | 1,421,906 |
| 4.5% 4/1/27 | | 3,693,000 | 3,648,913 |
| Piedmont Operating Partnership LP 3.15% 8/15/30 | | 1,200,000 | 1,027,497 |
| Prologis LP: | | | |
| 1.25% 10/15/30 | | 6,800,000 | 5,661,992 |
| 1.75% 2/1/31 | | 4,700,000 | 3,959,263 |
| 2.25% 4/15/30 | | 2,159,000 | 1,930,046 |
| 3.05% 3/1/50 | | 700,000 | 479,906 |
| 3.25% 10/1/26 | | 831,000 | 813,622 |
| 4.875% 6/15/28 | | 1,000,000 | 1,017,668 |
| 5.25% 6/15/53 | | 1,000,000 | 990,335 |
| Public Storage Operating Co. 5.1% 8/1/33 | | 4,100,000 | 4,195,602 |
| Realty Income Corp.: | | | |
| 2.85% 12/15/32 | | 2,610,000 | 2,244,102 |
| 3.25% 1/15/31 | | 5,250,000 | 4,821,720 |
| 4.75% 2/15/29 | | 3,200,000 | 3,230,012 |
| 4.875% 6/1/26 | | 3,700,000 | 3,710,076 |
| 4.9% 7/15/33 | | 800,000 | 795,150 |
| Regency Centers LP: | | | |
| 3.7% 6/15/30 | | 2,020,000 | 1,924,315 |
| 5.1% 1/15/35 | | 1,520,000 | 1,524,799 |
| 5.25% 1/15/34 | | 1,400,000 | 1,425,091 |
| Simon Property Group LP: | | | |
| 2.2% 2/1/31 | | 1,700,000 | 1,472,384 |
| 2.45% 9/13/29 | | 4,940,000 | 4,493,620 |
| 3.25% 9/13/49 | | 1,820,000 | 1,291,467 |
| 3.3% 1/15/26 | | 5,700,000 | 5,600,593 |
| 3.375% 12/1/27 | | 4,210,000 | 4,082,096 |
| 3.8% 7/15/50 | | 2,369,000 | 1,839,656 |
| 6.25% 1/15/34 | | 2,100,000 | 2,295,561 |
| Store Capital LLC 2.75% 11/18/30 | | 1,200,000 | 1,037,621 |
| Sun Communities Operating LP: | | | |
| 2.3% 11/1/28 | | 2,300,000 | 2,080,208 |
| 5.5% 1/15/29 | | 1,900,000 | 1,941,959 |
| UDR, Inc. 2.1% 6/15/33 | | 3,800,000 | 2,994,823 |
| Ventas Realty LP: | | | |
| 3.25% 10/15/26 | | 624,000 | 605,134 |
| 3.85% 4/1/27 | | 1,693,000 | 1,659,485 |
| 4% 3/1/28 | | 3,744,000 | 3,662,532 |
| 4.125% 1/15/26 | | 258,000 | 255,287 |
| 4.375% 2/1/45 | | 535,000 | 453,414 |
| 4.875% 4/15/49 | | 1,000,000 | 902,848 |
| VICI Properties LP: | | | |
| 4.375% 5/15/25 | | 1,100,000 | 1,089,623 |
| 4.75% 2/15/28 | | 2,000,000 | 1,992,130 |
| 4.95% 2/15/30 | | 2,145,000 | 2,137,303 |
| 5.125% 5/15/32 | | 2,000,000 | 1,977,004 |
| 6.125% 4/1/54 | | 1,300,000 | 1,325,929 |
| Vornado Realty LP 3.5% 1/15/25 | | 1,000,000 | 990,443 |
| Welltower OP LLC: | | | |
| 4% 6/1/25 | | 2,257,000 | 2,237,015 |
| 4.95% 9/1/48 | | 1,782,000 | 1,685,454 |
| 6.5% 3/15/41 | | 1,000,000 | 1,106,201 |
| Weyerhaeuser Co.: | | | |
| 4% 4/15/30 | | 2,460,000 | 2,373,945 |
| 4% 3/9/52 | | 800,000 | 626,184 |
| WP Carey, Inc. 2.45% 2/1/32 | | 1,200,000 | 1,007,801 |
| | | | 230,120,329 |
| Real Estate Management & Development - 0.1% | | | |
| CBRE Group, Inc.: | | | |
| 4.875% 3/1/26 | | 1,016,000 | 1,017,183 |
| 5.95% 8/15/34 | | 1,100,000 | 1,162,251 |
| Digital Realty Trust LP: | | | |
| 3.6% 7/1/29 | | 1,700,000 | 1,625,337 |
| 3.7% 8/15/27 | | 1,425,000 | 1,389,980 |
| Essex Portfolio LP 2.65% 3/15/32 | | 4,300,000 | 3,690,897 |
| Extra Space Storage LP: | | | |
| 3.9% 4/1/29 | | 6,400,000 | 6,186,749 |
| 5.35% 1/15/35 | | 590,000 | 594,738 |
| 5.9% 1/15/31 | | 1,100,000 | 1,156,965 |
| Mid-America Apartments LP: | | | |
| 1.7% 2/15/31 | | 2,100,000 | 1,753,780 |
| 3.95% 3/15/29 | | 1,700,000 | 1,665,897 |
| Tanger Properties LP 3.875% 7/15/27 | | 1,105,000 | 1,073,263 |
| | | | 21,317,040 |
TOTAL REAL ESTATE | | | 251,437,369 |
| UTILITIES - 2.3% | | | |
| Electric Utilities - 1.7% | | | |
| AEP Texas, Inc.: | | | |
| 3.45% 5/15/51 | | 1,500,000 | 1,040,775 |
| 4.15% 5/1/49 | | 1,000,000 | 794,900 |
| AEP Transmission Co. LLC: | | | |
| 2.75% 8/15/51 | | 3,000,000 | 1,905,404 |
| 5.4% 3/15/53 | | 900,000 | 904,628 |
| Alabama Power Co.: | | | |
| 3.7% 12/1/47 | | 1,049,000 | 822,829 |
| 3.75% 9/1/27 | | 2,000,000 | 1,974,134 |
| 3.75% 3/1/45 | | 178,000 | 143,049 |
| 4.15% 8/15/44 | | 829,000 | 709,981 |
| 4.3% 7/15/48 | | 1,048,000 | 899,495 |
| 5.2% 6/1/41 | | 686,000 | 667,639 |
| 6% 3/1/39 | | 1,800,000 | 1,956,190 |
| American Electric Power Co., Inc.: | | | |
| 3.25% 3/1/50 | | 2,003,000 | 1,378,873 |
| 4.3% 12/1/28 | | 3,117,000 | 3,082,000 |
| Appalachian Power Co.: | | | |
| 4.45% 6/1/45 | | 1,069,000 | 897,836 |
| 4.5% 8/1/32 | | 2,000,000 | 1,925,715 |
| 5.65% 4/1/34 | | 1,400,000 | 1,447,353 |
| Arizona Public Service Co.: | | | |
| 3.35% 5/15/50 | | 2,900,000 | 2,042,955 |
| 5.55% 8/1/33 | | 2,000,000 | 2,056,191 |
| Avangrid, Inc. 3.8% 6/1/29 | | 1,000,000 | 963,246 |
| Baltimore Gas & Electric Co.: | | | |
| 2.9% 6/15/50 | | 2,000,000 | 1,320,714 |
| 3.5% 8/15/46 | | 445,000 | 340,142 |
| 5.3% 6/1/34 | | 1,600,000 | 1,651,281 |
| 5.4% 6/1/53 | | 1,200,000 | 1,212,460 |
| CenterPoint Energy Houston Electric LLC: | | | |
| 3.35% 4/1/51 | | 3,700,000 | 2,675,921 |
| 3.55% 8/1/42 | | 339,000 | 270,286 |
| 4.45% 10/1/32 | | 2,000,000 | 1,963,321 |
| Cleco Corporate Holdings LLC 3.743% 5/1/26 | | 1,009,000 | 988,428 |
| Commonwealth Edison Co.: | | | |
| 2.75% 9/1/51 | | 3,000,000 | 1,902,668 |
| 3.2% 11/15/49 | | 1,500,000 | 1,053,380 |
| 3.65% 6/15/46 | | 510,000 | 398,269 |
| 3.7% 3/1/45 | | 553,000 | 441,728 |
| 3.75% 8/15/47 | | 1,096,000 | 866,100 |
| 4% 3/1/48 | | 1,217,000 | 998,256 |
| 4% 3/1/49 | | 84,000 | 68,308 |
| 5.3% 2/1/53 | | 1,400,000 | 1,383,863 |
| Connecticut Light & Power Co.: | | | |
| 4% 4/1/48 | | 900,000 | 749,660 |
| 5.25% 1/15/53 | | 1,400,000 | 1,407,009 |
| Consolidated Edison Co. of New York, Inc.: | | | |
| 3.2% 12/1/51 | | 1,100,000 | 763,254 |
| 3.875% 6/15/47 | | 510,000 | 407,399 |
| 3.95% 4/1/50 | | 2,695,000 | 2,224,863 |
| 4.45% 3/15/44 | | 1,425,000 | 1,268,049 |
| 4.5% 5/15/58 | | 2,690,000 | 2,314,063 |
| 4.65% 12/1/48 | | 1,866,000 | 1,687,124 |
| 5.5% 3/15/34 | | 5,500,000 | 5,786,617 |
| 5.5% 12/1/39 | | 1,445,000 | 1,480,532 |
| 5.85% 3/15/36 | | 2,800,000 | 2,999,069 |
| 6.15% 11/15/52 | | 1,000,000 | 1,115,312 |
| Dominion Energy South Carolina 6.05% 1/15/38 | | 2,800,000 | 3,052,059 |
| DTE Electric Co.: | | | |
| 4.05% 5/15/48 | | 1,570,000 | 1,325,093 |
| 5.4% 4/1/53 | | 3,700,000 | 3,768,042 |
| Duke Energy Carolinas LLC: | | | |
| 2.85% 3/15/32 | | 3,900,000 | 3,465,268 |
| 2.95% 12/1/26 | | 1,069,000 | 1,037,535 |
| 3.75% 6/1/45 | | 356,000 | 283,539 |
| 3.875% 3/15/46 | | 696,000 | 562,319 |
| 3.95% 3/15/48 | | 3,100,000 | 2,528,416 |
| 4% 9/30/42 | | 668,000 | 569,485 |
| 5.35% 1/15/53 | | 3,000,000 | 3,000,700 |
| 6.05% 4/15/38 | | 111,000 | 121,945 |
| Duke Energy Corp.: | | | |
| 2.45% 6/1/30 | | 1,300,000 | 1,162,026 |
| 2.65% 9/1/26 | | 2,379,000 | 2,295,088 |
| 3.3% 6/15/41 | | 4,630,000 | 3,537,987 |
| 3.75% 9/1/46 | | 1,627,000 | 1,242,448 |
| 3.95% 8/15/47 | | 1,420,000 | 1,115,027 |
| 4.8% 12/15/45 | | 2,998,000 | 2,683,366 |
| 5.45% 6/15/34 | | 2,280,000 | 2,349,099 |
| Duke Energy Florida LLC: | | | |
| 3.4% 10/1/46 | | 445,000 | 329,591 |
| 5.875% 11/15/33 | | 4,000,000 | 4,305,709 |
| 5.95% 11/15/52 | | 2,800,000 | 3,002,863 |
| Duke Energy Indiana LLC 3.25% 10/1/49 | | 3,100,000 | 2,206,834 |
| Duke Energy Ohio, Inc. 4.3% 2/1/49 | | 2,109,000 | 1,777,939 |
| Duke Energy Progress LLC: | | | |
| 2.9% 8/15/51 | | 4,000,000 | 2,628,314 |
| 4.1% 3/15/43 | | 1,300,000 | 1,107,757 |
| 4.15% 12/1/44 | | 321,000 | 271,901 |
| 4.375% 3/30/44 | | 356,000 | 315,659 |
| 5.35% 3/15/53 | | 1,000,000 | 995,201 |
| Edison International 5.75% 6/15/27 | | 7,890,000 | 8,084,862 |
| Entergy Corp.: | | | |
| 0.9% 9/15/25 | | 3,200,000 | 3,079,200 |
| 2.8% 6/15/30 | | 1,211,000 | 1,095,254 |
| 2.95% 9/1/26 | | 837,000 | 811,373 |
| 3.75% 6/15/50 | | 3,400,000 | 2,499,991 |
| Entergy Louisiana LLC: | | | |
| 2.35% 6/15/32 | | 4,500,000 | 3,807,867 |
| 4% 3/15/33 | | 2,277,000 | 2,131,555 |
| 5.7% 3/15/54 | | 1,200,000 | 1,238,634 |
| Entergy Mississippi LLC: | | | |
| 3.85% 6/1/49 | | 1,000,000 | 777,392 |
| 5.85% 6/1/54 | | 600,000 | 633,067 |
| Entergy, Inc.: | | | |
| 3.55% 9/30/49 | | 1,300,000 | 953,811 |
| 5.3% 9/15/33 | | 2,900,000 | 2,967,523 |
| 5.45% 6/1/34 | | 1,300,000 | 1,354,382 |
| Eversource Energy: | | | |
| 2.55% 3/15/31 | | 5,000,000 | 4,320,753 |
| 3.35% 3/15/26 | | 1,178,000 | 1,154,104 |
| 3.45% 1/15/50 | | 1,000,000 | 728,524 |
| 5.45% 3/1/28 | | 800,000 | 820,149 |
| 5.95% 2/1/29 | | 2,700,000 | 2,830,775 |
| Exelon Corp.: | | | |
| 3.4% 4/15/26 | | 2,000,000 | 1,963,073 |
| 3.95% 6/15/25 | | 3,502,000 | 3,473,510 |
| 4.45% 4/15/46 | | 1,100,000 | 948,413 |
| 5.1% 6/15/45 | | 196,000 | 186,411 |
| 5.3% 3/15/33 | | 2,000,000 | 2,058,684 |
| 5.6% 3/15/53 | | 2,800,000 | 2,834,268 |
| FirstEnergy Corp.: | | | |
| 2.25% 9/1/30 | | 1,950,000 | 1,696,578 |
| 5.1% 7/15/47 | | 1,969,000 | 1,757,647 |
| Florida Power & Light Co.: | | | |
| 2.85% 4/1/25 | | 3,700,000 | 3,656,873 |
| 2.875% 12/4/51 | | 2,600,000 | 1,742,970 |
| 3.125% 12/1/25 | | 909,000 | 894,233 |
| 3.15% 10/1/49 | | 252,000 | 181,220 |
| 3.7% 12/1/47 | | 1,100,000 | 877,117 |
| 3.8% 12/15/42 | | 3,600,000 | 3,011,617 |
| 4.05% 10/1/44 | | 3,466,000 | 2,974,618 |
| 4.125% 6/1/48 | | 2,192,000 | 1,867,129 |
| 5.05% 4/1/28 | | 6,500,000 | 6,656,462 |
| Fortis, Inc. 3.055% 10/4/26 | | 1,100,000 | 1,061,122 |
| Georgia Power Co.: | | | |
| 3.25% 3/30/27 | | 6,245,000 | 6,095,137 |
| 4.3% 3/15/42 | | 2,000,000 | 1,766,172 |
| 4.95% 5/17/33 | | 1,900,000 | 1,920,646 |
| 5.125% 5/15/52 | | 1,600,000 | 1,560,636 |
| 5.25% 3/15/34 | | 600,000 | 618,767 |
| Indiana Michigan Power Co.: | | | |
| 3.25% 5/1/51 | | 1,500,000 | 1,043,866 |
| 5.625% 4/1/53 | | 1,100,000 | 1,135,432 |
| Interstate Power and Light Co. 2.3% 6/1/30 | | 2,510,000 | 2,216,117 |
| IPALCO Enterprises, Inc.: | | | |
| 4.25% 5/1/30 | | 700,000 | 670,588 |
| 5.75% 4/1/34 | | 1,000,000 | 1,029,147 |
| Kentucky Utilities Co.: | | | |
| 3.3% 6/1/50 | | 500,000 | 356,165 |
| 5.125% 11/1/40 | | 1,730,000 | 1,710,086 |
| Louisville Gas & Electric Co. 5.45% 4/15/33 | | 1,000,000 | 1,042,238 |
| MidAmerican Energy Co.: | | | |
| 3.15% 4/15/50 | | 1,600,000 | 1,128,676 |
| 3.65% 8/1/48 | | 4,102,000 | 3,206,247 |
| 5.35% 1/15/34 | | 3,300,000 | 3,456,090 |
| Nevada Power Co. 5.9% 5/1/53 | | 1,200,000 | 1,271,462 |
| NextEra Energy Capital Holdings, Inc.: | | | |
| 2.25% 6/1/30 | | 1,301,000 | 1,148,695 |
| 2.75% 11/1/29 | | 8,382,000 | 7,729,365 |
| 3% 1/15/52 | | 1,500,000 | 991,258 |
| 3.5% 4/1/29 | | 3,900,000 | 3,729,422 |
| 4.625% 7/15/27 | | 2,000,000 | 2,013,508 |
| 4.9% 2/28/28 | | 2,100,000 | 2,126,984 |
| 5.25% 2/28/53 | | 3,400,000 | 3,314,862 |
| 6.7% 9/1/54 (b) | | 1,000,000 | 1,017,309 |
| Northern States Power Co.: | | | |
| 2.6% 6/1/51 | | 1,000,000 | 630,169 |
| 3.4% 8/15/42 | | 356,000 | 281,796 |
| 4.125% 5/15/44 | | 802,000 | 683,502 |
| 5.1% 5/15/53 | | 2,200,000 | 2,130,959 |
| NSTAR Electric Co.: | | | |
| 3.2% 5/15/27 | | 1,364,000 | 1,322,862 |
| 4.95% 9/15/52 | | 1,000,000 | 951,426 |
| 5.4% 6/1/34 | | 2,000,000 | 2,088,008 |
| Oglethorpe Power Corp.: | | | |
| 4.5% 4/1/47 | | 1,800,000 | 1,532,009 |
| 5.8% 6/1/54 (c) | | 1,000,000 | 1,019,703 |
| 5.95% 11/1/39 | | 1,200,000 | 1,242,513 |
| Ohio Power Co.: | | | |
| 5% 6/1/33 | | 2,000,000 | 1,999,075 |
| 5.65% 6/1/34 | | 1,400,000 | 1,455,242 |
| Oncor Electric Delivery Co. LLC: | | | |
| 0.55% 10/1/25 | | 6,243,000 | 5,977,125 |
| 3.1% 9/15/49 | | 971,000 | 670,950 |
| 3.75% 4/1/45 | | 3,100,000 | 2,477,628 |
| 3.8% 9/30/47 | | 2,700,000 | 2,172,284 |
| 4.1% 11/15/48 | | 1,000,000 | 828,957 |
| 4.55% 9/15/32 | | 1,100,000 | 1,088,341 |
| Pacific Gas & Electric Co.: | | | |
| 2.1% 8/1/27 | | 3,800,000 | 3,531,859 |
| 2.5% 2/1/31 | | 4,200,000 | 3,605,099 |
| 3.25% 6/1/31 | | 4,400,000 | 3,934,804 |
| 3.3% 8/1/40 | | 2,850,000 | 2,127,473 |
| 3.45% 7/1/25 | | 1,000,000 | 985,808 |
| 4% 12/1/46 | | 2,822,000 | 2,132,619 |
| 4.2% 6/1/41 | | 1,000,000 | 812,415 |
| 4.3% 3/15/45 | | 5,099,000 | 4,073,793 |
| 4.55% 7/1/30 | | 4,496,000 | 4,396,780 |
| 5.8% 5/15/34 | | 500,000 | 514,598 |
| 5.9% 6/15/32 | | 600,000 | 621,833 |
| 6.75% 1/15/53 | | 2,700,000 | 2,952,732 |
| 6.95% 3/15/34 | | 3,300,000 | 3,682,499 |
| PacifiCorp: | | | |
| 2.9% 6/15/52 | | 1,700,000 | 1,065,098 |
| 4.125% 1/15/49 | | 2,399,000 | 1,934,456 |
| 5.35% 12/1/53 | | 2,600,000 | 2,495,403 |
| 5.8% 1/15/55 | | 2,000,000 | 2,034,276 |
| 6% 1/15/39 | | 1,104,000 | 1,167,707 |
| 6.25% 10/15/37 | | 1,100,000 | 1,188,399 |
| PECO Energy Co. 3.9% 3/1/48 | | 4,200,000 | 3,424,042 |
| PG&E Wildfire Recovery: | | | |
| 5.099% 6/1/54 | | 1,900,000 | 1,920,768 |
| 5.212% 12/1/49 | | 3,600,000 | 3,645,495 |
| Potomac Electric Power Co. 6.5% 11/15/37 | | 678,000 | 775,715 |
| PPL Capital Funding, Inc. 3.1% 5/15/26 | | 1,425,000 | 1,387,081 |
| PPL Electric Utilities Corp.: | | | |
| 3% 10/1/49 | | 2,479,000 | 1,736,982 |
| 4.15% 10/1/45 | | 624,000 | 537,399 |
| 5.25% 5/15/53 | | 1,000,000 | 1,003,521 |
| Progress Energy, Inc. 6% 12/1/39 | | 926,000 | 976,993 |
| Public Service Co. of Colorado: | | | |
| 2.9% 5/15/25 | | 1,961,000 | 1,931,640 |
| 3.7% 6/15/28 | | 2,300,000 | 2,244,187 |
| 3.8% 6/15/47 | | 825,000 | 639,860 |
| 4.5% 6/1/52 | | 2,300,000 | 1,971,014 |
| 6.25% 9/1/37 | | 1,000,000 | 1,098,106 |
| Public Service Co. of New Hampshire 5.35% 10/1/33 | | 900,000 | 939,115 |
| Public Service Co. of Oklahoma 2.2% 8/15/31 | | 1,500,000 | 1,266,732 |
| Public Service Electric & Gas Co.: | | | |
| 2.45% 1/15/30 | | 1,700,000 | 1,535,803 |
| 3% 3/1/51 | | 2,400,000 | 1,654,420 |
| 3.1% 3/15/32 | | 2,200,000 | 1,994,306 |
| 3.15% 1/1/50 | | 2,300,000 | 1,650,736 |
| 3.65% 9/1/42 | | 504,000 | 413,394 |
| 4% 6/1/44 | | 891,000 | 738,519 |
| 5.2% 8/1/33 | | 2,770,000 | 2,864,782 |
| 5.3% 8/1/54 | | 1,000,000 | 1,019,262 |
| Puget Sound Energy, Inc.: | | | |
| 4.3% 5/20/45 | | 2,142,000 | 1,827,150 |
| 5.685% 6/15/54 | | 1,000,000 | 1,040,631 |
| Southern California Edison Co.: | | | |
| 1.2% 2/1/26 | | 2,000,000 | 1,903,066 |
| 2.25% 6/1/30 | | 2,054,000 | 1,813,343 |
| 2.95% 2/1/51 | | 4,900,000 | 3,248,269 |
| 3.45% 2/1/52 | | 3,200,000 | 2,307,541 |
| 4% 4/1/47 | | 1,782,000 | 1,442,683 |
| 4.65% 10/1/43 | | 1,805,000 | 1,635,441 |
| 5.7% 3/1/53 | | 1,600,000 | 1,638,644 |
| 5.85% 11/1/27 | | 1,300,000 | 1,352,716 |
| 5.95% 2/1/38 | | 1,300,000 | 1,386,380 |
| 6.05% 3/15/39 | | 1,700,000 | 1,825,972 |
| Southern Co.: | | | |
| 3.7% 4/30/30 | | 5,713,000 | 5,457,240 |
| 4% 1/15/51 (b) | | 3,100,000 | 3,031,258 |
| 4.25% 7/1/36 | | 1,000,000 | 921,414 |
| 4.4% 7/1/46 | | 1,305,000 | 1,137,363 |
| 5.7% 3/15/34 | | 700,000 | 738,547 |
| Southwestern Electric Power Co.: | | | |
| 1.65% 3/15/26 | | 4,000,000 | 3,827,234 |
| 3.85% 2/1/48 | | 1,600,000 | 1,208,548 |
| 5.3% 4/1/33 | | 400,000 | 405,968 |
| Tampa Electric Co.: | | | |
| 4.45% 6/15/49 | | 2,088,000 | 1,835,685 |
| 6.15% 5/15/37 | | 1,116,000 | 1,209,068 |
| Tucson Electric Power Co. 5.2% 9/15/34 | | 2,700,000 | 2,710,637 |
| Union Electric Co.: | | | |
| 2.625% 3/15/51 | | 1,800,000 | 1,122,059 |
| 3.9% 9/15/42 | | 659,000 | 553,367 |
| 3.9% 4/1/52 | | 1,200,000 | 962,446 |
| 5.45% 3/15/53 | | 300,000 | 302,411 |
| Virginia Electric & Power Co.: | | | |
| 2.875% 7/15/29 | | 4,800,000 | 4,474,489 |
| 3.1% 5/15/25 | | 713,000 | 704,751 |
| 3.8% 4/1/28 | | 2,657,000 | 2,603,184 |
| 3.8% 9/15/47 | | 2,543,000 | 1,980,176 |
| 4.2% 5/15/45 | | 2,128,000 | 1,799,882 |
| 4.45% 2/15/44 | | 490,000 | 435,681 |
| 4.6% 12/1/48 | | 3,452,000 | 3,055,666 |
| 5.05% 8/15/34 | | 2,690,000 | 2,707,655 |
| 5.3% 8/15/33 | | 700,000 | 719,124 |
| 5.45% 4/1/53 | | 1,200,000 | 1,199,467 |
| 6% 5/15/37 | | 356,000 | 384,461 |
| Wisconsin Electric Power Co.: | | | |
| 1.7% 6/15/28 | | 80,000 | 72,799 |
| 4.25% 6/1/44 | | 837,000 | 712,848 |
| Wisconsin Power & Light Co. 4.95% 4/1/33 | | 2,400,000 | 2,409,738 |
| Xcel Energy, Inc.: | | | |
| 3.35% 12/1/26 | | 535,000 | 520,417 |
| 3.4% 6/1/30 | | 1,740,000 | 1,625,743 |
| 4% 6/15/28 | | 13,000,000 | 12,731,098 |
| | | | 439,984,847 |
| Gas Utilities - 0.2% | | | |
| Atmos Energy Corp.: | | | |
| 4.125% 3/15/49 | | 2,900,000 | 2,412,717 |
| 4.3% 10/1/48 | | 1,000,000 | 858,278 |
| 5.45% 10/15/32 | | 1,000,000 | 1,052,578 |
| 5.9% 11/15/33 | | 2,200,000 | 2,383,178 |
| 6.2% 11/15/53 | | 500,000 | 564,478 |
| CenterPoint Energy Resources Corp.: | | | |
| 4.4% 7/1/32 | | 2,300,000 | 2,225,358 |
| 5.25% 3/1/28 | | 2,000,000 | 2,043,082 |
| 5.4% 7/1/34 | | 2,000,000 | 2,039,812 |
| Eastern Energy Gas Holdings LLC 2.5% 11/15/24 | | 2,000,000 | 1,987,709 |
| ONE Gas, Inc. 4.658% 2/1/44 | | 1,380,000 | 1,253,644 |
| Piedmont Natural Gas Co., Inc.: | | | |
| 3.5% 6/1/29 | | 4,457,000 | 4,257,323 |
| 5.1% 2/15/35 | | 1,000,000 | 998,337 |
| 5.4% 6/15/33 | | 800,000 | 825,319 |
| Southern California Gas Co.: | | | |
| 2.55% 2/1/30 | | 3,200,000 | 2,894,911 |
| 2.6% 6/15/26 | | 2,358,000 | 2,282,036 |
| 5.05% 9/1/34 | | 1,100,000 | 1,115,610 |
| 5.75% 6/1/53 | | 700,000 | 727,369 |
| 6.35% 11/15/52 | | 1,800,000 | 2,025,749 |
| Southern Co. Gas Capital Corp.: | | | |
| 3.95% 10/1/46 | | 1,409,000 | 1,126,240 |
| 5.875% 3/15/41 | | 2,600,000 | 2,722,018 |
| Southwest Gas Corp.: | | | |
| 4.05% 3/15/32 | | 1,600,000 | 1,501,311 |
| 5.45% 3/23/28 | | 2,163,000 | 2,211,358 |
| | | | 39,508,415 |
| Independent Power and Renewable Electricity Producers - 0.1% | | | |
| Constellation Energy Generation, LLC: | | | |
| 3.25% 6/1/25 | | 1,400,000 | 1,380,424 |
| 5.6% 3/1/28 | | 3,500,000 | 3,627,567 |
| 5.75% 3/15/54 | | 600,000 | 605,437 |
| 6.25% 10/1/39 | | 1,242,000 | 1,348,592 |
| 6.5% 10/1/53 | | 1,900,000 | 2,104,961 |
| Emera U.S. Finance LP: | | | |
| 2.639% 6/15/31 | | 1,000,000 | 859,250 |
| 3.55% 6/15/26 | | 1,000,000 | 973,760 |
| 4.75% 6/15/46 | | 929,000 | 800,945 |
| Southern Power Co. 4.95% 12/15/46 | | 1,200,000 | 1,091,912 |
| The AES Corp. 1.375% 1/15/26 | | 5,890,000 | 5,610,245 |
| | | | 18,403,093 |
| Multi-Utilities - 0.3% | | | |
| Ameren Corp. 3.5% 1/15/31 | | 8,850,000 | 8,227,494 |
| Ameren Illinois Co.: | | | |
| 4.95% 6/1/33 | | 2,400,000 | 2,426,915 |
| 5.55% 7/1/54 | | 2,940,000 | 3,030,869 |
| Berkshire Hathaway Energy Co.: | | | |
| 3.25% 4/15/28 | | 82,000 | 79,099 |
| 3.7% 7/15/30 | | 788,000 | 758,561 |
| 3.8% 7/15/48 | | 4,048,000 | 3,138,939 |
| 4.05% 4/15/25 | | 1,958,000 | 1,947,136 |
| 4.5% 2/1/45 | | 1,186,000 | 1,077,913 |
| 5.15% 11/15/43 | | 3,279,000 | 3,231,667 |
| CenterPoint Energy, Inc. 3.7% 9/1/49 | | 1,420,000 | 1,062,667 |
| CMS Energy Corp.: | | | |
| 4.75% 6/1/50 (b) | | 1,000,000 | 940,044 |
| 4.875% 3/1/44 | | 891,000 | 835,268 |
| Consumers Energy Co.: | | | |
| 2.5% 5/1/60 | | 1,100,000 | 667,062 |
| 2.65% 8/15/52 | | 574,000 | 378,516 |
| 4.35% 4/15/49 | | 3,810,000 | 3,372,851 |
| Delmarva Power & Light Co. 4% 6/1/42 | | 713,000 | 585,832 |
| Dominion Energy, Inc.: | | | |
| 3.9% 10/1/25 | | 2,299,000 | 2,276,531 |
| 4.35% 8/15/32 | | 2,000,000 | 1,949,178 |
| 4.85% 8/15/52 | | 2,700,000 | 2,428,893 |
| 4.9% 8/1/41 | | 356,000 | 327,298 |
| 5.375% 11/15/32 | | 3,200,000 | 3,296,035 |
| 6.875% 2/1/55 (b) | | 2,200,000 | 2,340,215 |
| DTE Energy Co.: | | | |
| 2.85% 10/1/26 | | 1,069,000 | 1,034,114 |
| 3.8% 3/15/27 | | 2,408,000 | 2,346,128 |
| 5.85% 6/1/34 | | 1,200,000 | 1,263,908 |
| National Grid PLC: | | | |
| 5.418% 1/11/34 | | 500,000 | 510,824 |
| 5.809% 6/12/33 | | 1,300,000 | 1,361,797 |
| NiSource, Inc.: | | | |
| 0.95% 8/15/25 | | 4,288,000 | 4,128,550 |
| 1.7% 2/15/31 | | 3,300,000 | 2,741,738 |
| 2.95% 9/1/29 | | 1,420,000 | 1,315,497 |
| 3.49% 5/15/27 | | 1,364,000 | 1,328,775 |
| 3.95% 3/30/48 | | 1,782,000 | 1,412,351 |
| 4.375% 5/15/47 | | 852,000 | 726,556 |
| 4.8% 2/15/44 | | 980,000 | 894,818 |
| Public Service Enterprise Group, Inc.: | | | |
| 2.45% 11/15/31 | | 1,500,000 | 1,287,372 |
| 5.45% 4/1/34 | | 600,000 | 616,841 |
| 5.85% 11/15/27 | | 3,700,000 | 3,844,995 |
| Puget Energy, Inc.: | | | |
| 3.65% 5/15/25 | | 1,438,000 | 1,420,950 |
| 4.1% 6/15/30 | | 2,600,000 | 2,477,716 |
| San Diego Gas & Electric Co.: | | | |
| 3.7% 3/15/52 | | 2,400,000 | 1,831,426 |
| 4.5% 8/15/40 | | 1,378,000 | 1,286,779 |
| 5.35% 4/1/53 | | 1,700,000 | 1,697,805 |
| Sempra: | | | |
| 3.25% 6/15/27 | | 1,087,000 | 1,051,166 |
| 4% 2/1/48 | | 5,578,000 | 4,424,819 |
| 6% 10/15/39 | | 178,000 | 186,729 |
| WEC Energy Group, Inc. 4.75% 1/15/28 | | 4,400,000 | 4,439,389 |
| | | | 88,010,026 |
| Water Utilities - 0.0% | | | |
| American Water Capital Corp.: | | | |
| 2.95% 9/1/27 | | 1,600,000 | 1,540,746 |
| 3.45% 5/1/50 | | 1,200,000 | 893,976 |
| 3.75% 9/1/28 | | 5,687,000 | 5,559,581 |
| 3.75% 9/1/47 | | 3,254,000 | 2,577,519 |
| 5.45% 3/1/54 | | 1,200,000 | 1,221,872 |
| | | | 11,793,694 |
TOTAL UTILITIES | | | 597,700,075 |
| TOTAL NONCONVERTIBLE BONDS (Cost $7,115,174,847) | | | 6,608,720,184 |
| | | | |
| U.S. Government and Government Agency Obligations - 44.9% |
| | | Principal Amount (a) | Value ($) |
| U.S. Government Agency Obligations - 0.6% | | | |
| Fannie Mae: | | | |
| 0.375% 8/25/25 | | 8,339,000 | 8,022,201 |
| 0.5% 6/17/25 | | 10,000,000 | 9,688,689 |
| 0.625% 4/22/25 | | 6,300,000 | 6,144,670 |
| 0.75% 10/8/27 | | 11,000,000 | 10,021,041 |
| 0.875% 8/5/30 | | 9,584,000 | 8,081,390 |
| 1.875% 9/24/26 | | 2,379,000 | 2,282,338 |
| 2.125% 4/24/26 | | 713,000 | 691,665 |
| 2.625% 9/6/24 | | 713,000 | 712,840 |
| 6.25% 5/15/29 | | 2,000,000 | 2,215,159 |
| 7.25% 5/15/30 | | 5,220,000 | 6,116,047 |
| Federal Home Loan Bank: | | | |
| 0.375% 9/4/25 | | 2,300,000 | 2,212,841 |
| 0.5% 4/14/25 | | 9,755,000 | 9,514,826 |
| 3.25% 6/9/28 | | 1,700,000 | 1,669,814 |
| 3.25% 11/16/28 | | 4,230,000 | 4,142,265 |
| 5.5% 7/15/36 | | 11,370,000 | 12,765,625 |
| Freddie Mac: | | | |
| 0% 11/15/38 | | 3,200,000 | 1,690,707 |
| 0.375% 7/21/25 | | 5,568,000 | 5,374,346 |
| 0.375% 9/23/25 | | 10,325,000 | 9,902,081 |
| 6.25% 7/15/32 | | 9,453,000 | 10,928,598 |
| 6.75% 3/15/31 | | 5,634,000 | 6,543,920 |
| Tennessee Valley Authority: | | | |
| 0.75% 5/15/25 | | 6,800,000 | 6,614,314 |
| 4.375% 8/1/34 | | 4,738,000 | 4,774,980 |
| 5.25% 9/15/39 | | 3,565,000 | 3,828,418 |
| 5.375% 4/1/56 | | 961,000 | 1,057,409 |
| 5.88% 4/1/36 | | 7,540,000 | 8,629,819 |
TOTAL U.S. GOVERNMENT AGENCY OBLIGATIONS | | | 143,626,003 |
| U.S. Treasury Obligations - 44.3% | | | |
| U.S. Treasury Bonds: | | | |
| 1.125% 5/15/40 | | 15,433,000 | 9,989,250 |
| 1.125% 8/15/40 | | 65,011,000 | 41,708,620 |
| 1.25% 5/15/50 | | 18,595,000 | 9,768,912 |
| 1.375% 11/15/40 | | 89,071,000 | 59,155,669 |
| 1.375% 8/15/50 | | 6,524,000 | 3,533,154 |
| 1.625% 11/15/50 | | 143,869,000 | 83,191,126 |
| 1.75% 8/15/41 | | 5,202,000 | 3,616,000 |
| 1.875% 2/15/41 | | 171,299,000 | 123,188,069 |
| 1.875% 2/15/51 | | 157,669,000 | 97,231,270 |
| 1.875% 11/15/51 | | 29,202,000 | 17,918,165 |
| 2% 11/15/41 | | 49,533,000 | 35,750,830 |
| 2% 2/15/50 | | 130,000 | 83,230 |
| 2% 8/15/51 | | 3,587,000 | 2,274,102 |
| 2.25% 5/15/41 | | 15,212,000 | 11,562,903 |
| 2.25% 8/15/46 | | 8,327,300 | 5,853,832 |
| 2.25% 8/15/49 | | 936,600 | 637,327 |
| 2.25% 2/15/52 | | 54,100,000 | 36,397,043 |
| 2.375% 11/15/49 | | 7,928,000 | 5,536,903 |
| 2.375% 5/15/51 | | 8,194,000 | 5,685,548 |
| 2.5% 2/15/46 | | 12,667,600 | 9,405,198 |
| 2.5% 5/15/46 | | 4,826,500 | 3,572,741 |
| 2.75% 8/15/47 | | 1,857,800 | 1,423,830 |
| 2.75% 11/15/47 | | 3,369,900 | 2,577,184 |
| 2.875% 5/15/43 | | 1,252,400 | 1,018,994 |
| 2.875% 8/15/45 | | 91,000 | 72,697 |
| 2.875% 11/15/46 | | 2,461,500 | 1,944,008 |
| 2.875% 5/15/49 | | 400 | 310 |
| 2.875% 5/15/52 | | 13,900,000 | 10,742,094 |
| 3% 11/15/44 | | 41,796,400 | 34,264,885 |
| 3% 5/15/45 | | 16,727,200 | 13,674,486 |
| 3% 2/15/47 | | 7,118,100 | 5,735,910 |
| 3% 5/15/47 | | 519,600 | 417,994 |
| 3% 2/15/48 | | 4,353,000 | 3,480,530 |
| 3% 8/15/52 | | 69,100,000 | 54,813,035 |
| 3.125% 11/15/41 | | 1,577,000 | 1,365,337 |
| 3.125% 8/15/44 | | 76,300 | 63,934 |
| 3.125% 5/15/48 | | 466,400 | 380,972 |
| 3.25% 5/15/42 | | 49,500,000 | 43,130,742 |
| 3.375% 8/15/42 | | 213,700,000 | 189,091,109 |
| 3.375% 5/15/44 | | 2,243,400 | 1,957,805 |
| 3.375% 11/15/48 | | 4,431,700 | 3,776,466 |
| 3.625% 8/15/43 | | 320,900 | 291,856 |
| 3.625% 2/15/44 | | 1,062,700 | 964,027 |
| 3.625% 2/15/53 | | 225,800,000 | 202,540,837 |
| 3.875% 8/15/40 | | 1,400 | 1,359 |
| 3.875% 2/15/43 | | 100,400,000 | 95,015,266 |
| 3.875% 5/15/43 | | 135,950,000 | 128,323,994 |
| 4% 11/15/42 | | 97,300,000 | 93,879,297 |
| 4% 11/15/52 | | 64,100,000 | 61,515,969 |
| 4.125% 8/15/53 | | 39,100,000 | 38,395,895 |
| 4.25% 5/15/39 | | 1,432,500 | 1,461,318 |
| 4.25% 11/15/40 | | 144,500 | 146,549 |
| 4.25% 8/15/44 | | 38,800,000 | 37,860,313 |
| 4.25% 2/15/54 | | 240,817,000 | 241,757,691 |
| 4.25% 8/15/54 | | 27,700,000 | 27,873,125 |
| 4.375% 11/15/39 | | 17,800 | 18,374 |
| 4.375% 5/15/40 | | 1,900 | 1,961 |
| 4.375% 8/15/43 | | 40,800,000 | 41,201,625 |
| 4.5% 5/15/38 | | 4,680,500 | 4,925,129 |
| 4.5% 8/15/39 | | 73,900 | 77,329 |
| 4.5% 2/15/44 | | 130,700,000 | 133,967,500 |
| 4.625% 5/15/44 | | 77,300,000 | 80,500,703 |
| 4.625% 5/15/54 | | 96,600,000 | 103,241,250 |
| 4.75% 2/15/37 | | 5,326,400 | 5,752,720 |
| 4.75% 2/15/41 | | 489,700 | 526,408 |
| 4.75% 11/15/43 | | 145,800,000 | 154,570,781 |
| U.S. Treasury Notes: | | | |
| 0.25% 8/31/25 | | 770,000 | 739,272 |
| 0.25% 9/30/25 | | 5,654,000 | 5,413,484 |
| 0.375% 11/30/25 | | 48,770,000 | 46,506,767 |
| 0.375% 12/31/25 | | 109,512,000 | 104,169,012 |
| 0.375% 1/31/26 | | 124,970,000 | 118,565,288 |
| 0.375% 7/31/27 | | 41,405,000 | 37,531,368 |
| 0.375% 9/30/27 | | 4,380,000 | 3,950,213 |
| 0.5% 2/28/26 | | 3,914,000 | 3,711,267 |
| 0.5% 4/30/27 | | 76,857,000 | 70,456,253 |
| 0.5% 6/30/27 | | 6,547,000 | 5,971,836 |
| 0.5% 10/31/27 | | 69,435,000 | 62,686,786 |
| 0.625% 7/31/26 | | 47,986,000 | 45,063,727 |
| 0.625% 3/31/27 | | 798,000 | 735,594 |
| 0.625% 11/30/27 | | 1,471,000 | 1,330,393 |
| 0.625% 12/31/27 | | 11,851,000 | 10,690,898 |
| 0.625% 5/15/30 | | 6,869,000 | 5,768,887 |
| 0.625% 8/15/30 | | 9,936,000 | 8,279,483 |
| 0.75% 3/31/26 | | 42,400,000 | 40,266,750 |
| 0.75% 4/30/26 | | 228,803,000 | 216,808,717 |
| 0.75% 5/31/26 | | 85,730,000 | 81,058,385 |
| 0.75% 8/31/26 | | 52,800,000 | 49,605,188 |
| 0.75% 1/31/28 | | 5,976,000 | 5,401,744 |
| 0.875% 6/30/26 | | 46,368,000 | 43,848,551 |
| 0.875% 9/30/26 | | 57,100,000 | 53,691,844 |
| 1.125% 10/31/26 | | 167,200,000 | 157,677,438 |
| 1.125% 2/29/28 | | 119,508,000 | 109,200,435 |
| 1.25% 11/30/26 | | 106,012,000 | 100,081,954 |
| 1.25% 12/31/26 | | 14,400,000 | 13,574,812 |
| 1.25% 3/31/28 | | 15,582,000 | 14,273,964 |
| 1.25% 4/30/28 | | 53,309,000 | 48,746,499 |
| 1.25% 5/31/28 | | 39,296,000 | 35,866,810 |
| 1.25% 6/30/28 | | 77,172,000 | 70,295,854 |
| 1.25% 9/30/28 | | 70,716,000 | 64,061,514 |
| 1.25% 8/15/31 | | 121,027,000 | 102,163,807 |
| 1.375% 8/31/26 | | 2,670,800 | 2,540,911 |
| 1.375% 12/31/28 | | 22,700,000 | 20,564,781 |
| 1.5% 8/15/26 | | 11,644,100 | 11,113,748 |
| 1.5% 1/31/27 | | 50,200,000 | 47,499,789 |
| 1.5% 11/30/28 | | 113,349,000 | 103,399,968 |
| 1.5% 2/15/30 | | 87,477,000 | 77,745,184 |
| 1.625% 2/15/26 | | 1,812,700 | 1,749,256 |
| 1.625% 5/15/26 | | 999,900 | 960,685 |
| 1.625% 9/30/26 | | 1,274,000 | 1,216,371 |
| 1.625% 10/31/26 | | 1,670,000 | 1,591,914 |
| 1.625% 11/30/26 | | 2,021,000 | 1,923,739 |
| 1.625% 8/15/29 | | 29,838,600 | 27,031,907 |
| 1.625% 5/15/31 | | 38,120,000 | 33,226,940 |
| 1.875% 6/30/26 | | 15,666,100 | 15,088,413 |
| 1.875% 7/31/26 | | 33,197,000 | 31,936,551 |
| 2% 2/15/25 | | 647,800 | 639,614 |
| 2% 8/15/25 | | 41,400 | 40,473 |
| 2% 11/15/26 | | 11,997,900 | 11,524,077 |
| 2.25% 11/15/25 | | 18,937,500 | 18,494,392 |
| 2.25% 2/15/27 | | 944,000 | 908,711 |
| 2.25% 8/15/27 | | 5,291,000 | 5,064,479 |
| 2.25% 11/15/27 | | 27,839,100 | 26,552,629 |
| 2.375% 5/15/27 | | 68,262,000 | 65,715,507 |
| 2.5% 2/28/26 | | 9,949,100 | 9,719,416 |
| 2.5% 3/31/27 | | 39,000,000 | 37,755,352 |
| 2.625% 12/31/25 | | 3,480,100 | 3,410,090 |
| 2.625% 1/31/26 | | 9,021,000 | 8,834,237 |
| 2.625% 5/31/27 | | 7,200,000 | 6,978,094 |
| 2.625% 2/15/29 | | 20,536,100 | 19,590,316 |
| 2.625% 7/31/29 | | 155,300,000 | 147,498,601 |
| 2.75% 4/30/27 | | 35,700,000 | 34,739,168 |
| 2.75% 7/31/27 | | 85,000,000 | 82,536,328 |
| 2.75% 8/15/32 | | 238,719,800 | 220,769,191 |
| 2.875% 5/15/28 | | 46,361,100 | 44,926,803 |
| 2.875% 8/15/28 | | 38,531,600 | 37,268,787 |
| 2.875% 4/30/29 | | 11,600,000 | 11,165,453 |
| 2.875% 5/15/32 | | 1,900,000 | 1,777,539 |
| 3% 10/31/25 | | 7,767,100 | 7,655,448 |
| 3.125% 8/31/27 | | 41,900,000 | 41,111,102 |
| 3.125% 11/15/28 | | 3,802,200 | 3,707,294 |
| 3.125% 8/31/29 | | 43,000,000 | 41,773,828 |
| 3.25% 6/30/27 | | 37,300,000 | 36,752,156 |
| 3.25% 6/30/29 | | 11,400,000 | 11,145,727 |
| 3.375% 5/15/33 | | 13,600,000 | 13,086,812 |
| 3.5% 1/31/28 | | 99,800,000 | 98,903,359 |
| 3.5% 4/30/28 | | 126,400,000 | 125,229,700 |
| 3.5% 1/31/30 | | 83,200,000 | 82,085,250 |
| 3.5% 4/30/30 | | 67,900,000 | 66,939,852 |
| 3.5% 2/15/33 | | 163,400,000 | 158,957,563 |
| 3.625% 5/15/26 | | 171,800,000 | 170,635,007 |
| 3.625% 3/31/28 | | 49,700,000 | 49,478,680 |
| 3.625% 5/31/28 | | 30,400,000 | 30,250,375 |
| 3.625% 8/31/29 | | 34,200,000 | 34,061,063 |
| 3.625% 3/31/30 | | 78,900,000 | 78,292,840 |
| 3.75% 8/15/27 | | 82,100,000 | 82,010,203 |
| 3.75% 12/31/28 | | 33,000,000 | 32,996,133 |
| 3.75% 6/30/30 | | 167,850,000 | 167,528,725 |
| 3.75% 12/31/30 | | 2,400,000 | 2,393,156 |
| 3.875% 11/30/27 | | 118,900,000 | 119,206,538 |
| 3.875% 12/31/27 | | 92,900,000 | 93,193,620 |
| 3.875% 9/30/29 | | 27,400,000 | 27,545,563 |
| 3.875% 11/30/29 | | 73,000,000 | 73,384,961 |
| 3.875% 12/31/29 | | 29,300,000 | 29,445,356 |
| 3.875% 8/15/33 | | 67,600,000 | 67,449,485 |
| 3.875% 8/15/34 | | 48,300,000 | 48,118,774 |
| 4% 12/15/25 | | 75,200,000 | 74,991,437 |
| 4% 1/15/27 | | 58,600,000 | 58,776,258 |
| 4% 6/30/28 | | 126,700,000 | 127,783,879 |
| 4% 1/31/29 | | 107,000,000 | 108,082,539 |
| 4% 7/31/29 | | 53,800,000 | 54,429,100 |
| 4% 10/31/29 | | 128,400,000 | 129,804,375 |
| 4% 2/28/30 | | 11,800,000 | 11,931,828 |
| 4% 1/31/31 | | 11,600,000 | 11,727,328 |
| 4% 2/15/34 | | 139,400,000 | 140,271,250 |
| 4.125% 2/15/27 | | 131,100,000 | 131,914,254 |
| 4.125% 9/30/27 | | 27,300,000 | 27,577,266 |
| 4.125% 10/31/27 | | 153,700,000 | 155,194,972 |
| 4.125% 7/31/28 | | 99,300,000 | 100,595,555 |
| 4.125% 3/31/29 | | 78,700,000 | 79,941,984 |
| 4.125% 8/31/30 | | 69,700,000 | 70,949,699 |
| 4.125% 7/31/31 | | 129,500,000 | 131,896,644 |
| 4.25% 10/15/25 | | 125,500,000 | 125,421,563 |
| 4.25% 12/31/25 | | 33,500,000 | 33,512,502 |
| 4.25% 1/31/26 | | 73,700,000 | 73,795,004 |
| 4.25% 3/15/27 | | 65,200,000 | 65,862,188 |
| 4.25% 2/28/29 | | 80,600,000 | 82,306,454 |
| 4.25% 6/30/29 | | 42,200,000 | 43,130,666 |
| 4.25% 2/28/31 | | 163,500,000 | 167,664,141 |
| 4.375% 7/31/26 (d) | | 75,000,000 | 75,562,500 |
| 4.375% 12/15/26 | | 66,200,000 | 66,913,719 |
| 4.375% 7/15/27 | | 103,200,000 | 104,772,943 |
| 4.375% 11/30/28 | | 145,300,000 | 148,801,957 |
| 4.375% 11/30/30 | | 171,900,000 | 177,339,023 |
| 4.375% 5/15/34 | | 55,900,000 | 57,926,375 |
| 4.5% 11/15/25 | | 22,900,000 | 22,965,301 |
| 4.5% 3/31/26 | | 29,100,000 | 29,281,875 |
| 4.5% 7/15/26 | | 95,000,000 | 95,879,492 |
| 4.5% 4/15/27 | | 36,800,000 | 37,408,063 |
| 4.5% 5/15/27 | | 122,300,000 | 124,373,367 |
| 4.5% 5/31/29 | | 18,500,000 | 19,110,644 |
| 4.5% 11/15/33 | | 165,800,000 | 173,332,243 |
| 4.625% 2/28/26 | | 132,200,000 | 133,150,188 |
| 4.625% 6/30/26 | | 32,700,000 | 33,057,656 |
| 4.625% 9/15/26 | | 52,500,000 | 53,203,418 |
| 4.625% 10/15/26 | | 32,300,000 | 32,760,527 |
| 4.625% 11/15/26 | | 114,600,000 | 116,341,383 |
| 4.625% 6/15/27 | | 67,900,000 | 69,364,094 |
| 4.625% 9/30/28 | | 96,400,000 | 99,517,938 |
| 4.625% 4/30/29 | | 67,000,000 | 69,502,031 |
| 4.625% 9/30/30 | | 11,900,000 | 12,432,246 |
| 4.625% 4/30/31 | | 48,000,000 | 50,283,750 |
| 4.625% 5/31/31 | | 143,700,000 | 150,548,203 |
| 4.875% 11/30/25 | | 94,300,000 | 94,999,883 |
| 4.875% 4/30/26 | | 41,900,000 | 42,441,754 |
| 4.875% 5/31/26 | | 72,500,000 | 73,516,699 |
| 4.875% 10/31/28 | | 5,440,000 | 5,671,412 |
| 5% 9/30/25 | | 169,900,000 | 171,048,152 |
| 5% 10/31/25 | | 50,000,000 | 50,383,770 |
TOTAL U.S. TREASURY OBLIGATIONS | | | 11,495,287,760 |
| TOTAL U.S. GOVERNMENT AND GOVERNMENT AGENCY OBLIGATIONS (Cost $12,066,115,704) | | | 11,638,913,763 |
| | | | |
| U.S. Government Agency - Mortgage Securities - 25.9% |
| | | Principal Amount (a) | Value ($) |
| Fannie Mae - 10.7% | | | |
| FTSE USD IBOR Consumer Cash Fallbacks Term 1Y + 1.510% 6.2% 11/1/34 (b)(e) | | 259,471 | 266,862 |
| FTSE USD IBOR Consumer Cash Fallbacks Term 1Y + 1.640% 7.02% 4/1/41 (b)(e) | | 16,061 | 16,523 |
| FTSE USD IBOR Consumer Cash Fallbacks Term 1Y + 1.880% 6.479% 11/1/34 (b)(e) | | 19,685 | 20,251 |
| 1.5% 10/1/35 to 6/1/52 | | 233,107,317 | 194,302,103 |
| 2% 6/1/27 to 7/1/52 | | 824,164,011 | 689,648,791 |
| 2.5% 4/1/25 to 5/1/53 | | 596,731,428 | 518,470,945 |
| 3% 5/1/26 to 3/1/53 | | 503,030,848 | 456,082,432 |
| 3.5% 9/1/25 to 11/1/52 | | 251,573,820 | 236,220,629 |
| 4% 9/1/24 to 5/1/53 | | 206,034,820 | 198,222,323 |
| 4.5% to 4.5% 10/1/24 to 6/1/54 | | 84,781,571 | 83,469,183 |
| 5% 9/1/25 to 5/1/54 | | 125,827,513 | 125,505,495 |
| 5.5% 6/1/27 to 6/1/54 | | 106,152,693 | 107,201,752 |
| 6% to 6% 11/1/32 to 5/1/54 | | 98,031,294 | 100,034,920 |
| 6.5% 8/1/26 to 5/1/54 | | 65,653,270 | 67,650,326 |
| 7% 12/1/53 | | 4,905,298 | 5,140,533 |
TOTAL FANNIE MAE | | | 2,782,253,068 |
| Freddie Mac - 8.1% | | | |
| FTSE USD IBOR Consumer Cash Fallbacks Term 1Y + 1.900% 7.216% 9/1/37 (b)(e) | | 12,896 | 13,267 |
| U.S. TREASURY 1 YEAR INDEX + 1.710% 5.928% 3/1/36 (b)(e) | | 205,688 | 206,546 |
| U.S. TREASURY 1 YEAR INDEX + 2.230% 6.419% 12/1/35 (b)(e) | | 89,863 | 91,101 |
| U.S. TREASURY 1 YEAR INDEX + 2.250% 6.454% 3/1/35 (b)(e) | | 47,625 | 48,251 |
| 1.5% 8/1/35 to 4/1/52 | | 123,887,646 | 102,431,904 |
| 2% 2/1/28 to 6/1/52 | | 733,782,780 | 613,181,579 |
| 2% 9/1/35 | | 27,776,278 | 25,290,551 |
| 2% 11/1/35 | | 11,305,124 | 10,268,687 |
| 2.5% 8/1/25 to 10/1/53 | | 505,041,922 | 436,253,671 |
| 3% 10/1/26 to 6/1/53 | | 124,471,791 | 113,213,795 |
| 3% 8/1/47 | | 33,927 | 30,661 |
| 3% 5/1/49 | | 22,424 | 20,157 |
| 3.5% 9/1/25 to 11/1/53 | | 120,254,546 | 112,677,239 |
| 3.5% 8/1/47 | | 33,001 | 30,867 |
| 3.5% 9/1/47 | | 15,337 | 14,345 |
| 3.5% 9/1/47 | | 1,453,337 | 1,366,178 |
| 4% 9/1/24 to 1/1/53 | | 117,140,618 | 112,503,367 |
| 4.5% 6/1/25 to 2/1/54 | | 137,156,096 | 134,116,994 |
| 5% 10/1/26 to 5/1/54 | | 102,441,456 | 102,152,817 |
| 5.5% 4/1/27 to 7/1/54 | | 166,132,763 | 167,549,707 |
| 6% 4/1/32 to 5/1/54 | | 100,277,571 | 102,708,822 |
| 6.5% 9/1/33 to 4/1/54 | | 65,355,664 | 67,460,651 |
| 7% 1/1/54 | | 2,454,398 | 2,580,516 |
TOTAL FREDDIE MAC | | | 2,104,211,673 |
| Freddie Mac Multi-family Structured pass-thru certificates - 0.0% | | | |
| 2.5% 2/1/32 | | 6,698 | 6,400 |
| Ginnie Mae - 5.9% | | | |
| 3.5% 11/15/40 to 6/20/53 | | 174,053,948 | 163,055,522 |
| 4% 1/15/25 to 8/20/54 | | 115,743,125 | 111,186,186 |
| 1.5% 6/20/45 to 12/20/51 | | 3,651,453 | 2,963,533 |
| 2% 10/20/50 to 1/20/54 | | 305,227,867 | 256,953,041 |
| 2.5% 10/20/42 to 12/20/53 | | 316,605,607 | 276,895,419 |
| 3% 4/15/42 to 6/20/53 | | 227,925,560 | 207,022,946 |
| 3% 9/1/54 (f) | | 50,000 | 45,216 |
| 3% 9/1/54 (f) | | 1,100,000 | 994,746 |
| 4% 9/1/54 (f) | | 2,775,000 | 2,651,682 |
| 4.5% to 4.5% 3/20/33 to 6/20/54 | | 104,296,130 | 102,476,837 |
| 4.5% 9/1/54 (f) | | 2,300,000 | 2,251,308 |
| 5% 6/20/33 to 6/20/54 | | 101,606,166 | 101,601,832 |
| 5% 9/1/54 (f) | | 3,550,000 | 3,542,497 |
| 5% 9/1/54 (f) | | 2,375,000 | 2,369,981 |
| 5% 9/1/54 (f) | | 2,000,000 | 1,995,773 |
| 5% 10/1/54 (f) | | 7,925,000 | 7,897,107 |
| 5.5% 12/20/32 to 7/20/54 | | 87,941,955 | 88,566,185 |
| 5.5% 9/1/54 (f) | | 8,000,000 | 8,051,173 |
| 5.5% 9/1/54 (f) | | 3,850,000 | 3,874,627 |
| 5.5% 9/1/54 (f) | | 13,250,000 | 13,334,755 |
| 5.5% 9/1/54 (f) | | 5,475,000 | 5,510,021 |
| 6% to 6% 5/20/34 to 7/20/53 | | 19,926,772 | 20,240,815 |
| 6% 9/1/54 (f) | | 20,600,000 | 20,898,739 |
| 6% 9/1/54 (f) | | 1,750,000 | 1,775,378 |
| 6% 9/1/54 (f) | | 875,000 | 887,689 |
| 6% 9/1/54 (f) | | 26,450,000 | 26,833,575 |
| 6% 9/1/54 (f) | | 15,875,000 | 16,105,218 |
| 6% 9/1/54 (f) | | 11,775,000 | 11,945,760 |
| 6% 9/1/54 (f) | | 7,675,000 | 7,786,302 |
| 6.5% 8/20/36 to 7/20/53 | | 12,176,056 | 12,426,551 |
| 6.5% 9/1/54 (f) | | 25,275,000 | 25,805,459 |
| 6.5% 9/1/54 (f) | | 8,525,000 | 8,703,918 |
| 6.5% 9/1/54 (f) | | 7,500,000 | 7,657,406 |
TOTAL GINNIE MAE | | | 1,524,307,197 |
| Uniform Mortgage Backed Securities - 1.2% | | | |
| 2% 9/1/54 (f) | | 9,200,000 | 7,524,594 |
| 2% 9/1/54 (f) | | 9,200,000 | 7,524,594 |
| 2% 9/1/54 (f) | | 5,000,000 | 4,089,453 |
| 2% 9/1/54 (f) | | 9,900,000 | 8,097,117 |
| 2% 9/1/54 (f) | | 10,300,000 | 8,424,273 |
| 2.5% 9/1/54 (f) | | 3,325,000 | 2,834,432 |
| 2.5% 9/1/54 (f) | | 7,050,000 | 6,009,849 |
| 3% 9/1/54 (f) | | 3,675,000 | 3,258,261 |
| 3.5% 9/1/54 (f) | | 69,175,000 | 63,670,725 |
| 4.5% 9/1/54 (f) | | 8,650,000 | 8,417,869 |
| 5% 9/1/54 (f) | | 11,325,000 | 11,242,274 |
| 5.5% 9/1/54 (f) | | 6,625,000 | 6,670,288 |
| 5.5% 9/1/54 (f) | | 12,650,000 | 12,736,474 |
| 5.5% 9/1/54 (f) | | 6,250,000 | 6,292,724 |
| 6% 9/1/54 (f) | | 32,900,000 | 33,505,307 |
| 6% 9/1/54 (f) | | 4,675,000 | 4,761,013 |
| 6% 9/1/54 (f) | | 18,700,000 | 19,044,050 |
| 6% 9/1/54 (f) | | 3,050,000 | 3,106,115 |
| 6.5% 9/1/54 (f) | | 26,500,000 | 27,285,683 |
| 6.5% 9/1/54 (f) | | 10,300,000 | 10,605,379 |
| 7% 9/1/54 (f) | | 36,300,000 | 37,691,350 |
| 7% 9/1/54 (f) | | 3,300,000 | 3,426,486 |
TOTAL UNIFORM MORTGAGE BACKED SECURITIES | | | 296,218,310 |
| TOTAL U.S. GOVERNMENT AGENCY - MORTGAGE SECURITIES (Cost $7,281,082,401) | | | 6,706,996,648 |
| | | | |
| Asset-Backed Securities - 0.3% |
| | | Principal Amount (a) | Value ($) |
| American Express Credit Accoun Series 2023-4 Class A, 5.15% 9/15/30 | | 2,000,000 | 2,070,591 |
| Capital One Multi-Asset Execution Trust: | | | |
| Series 2019-A3 Class A3, 2.06% 8/15/28 | | 2,360,000 | 2,259,018 |
| Series 2021-A2 Class A2, 1.39% 7/15/30 | | 4,200,000 | 3,773,982 |
| Capital One Prime Auto Receivables Series 2023-1 Class A3, 4.87% 2/15/28 | | 1,690,000 | 1,693,161 |
| CarMax Auto Owner Trust: | | | |
| Series 2021-1 Class A3, 0.34% 12/15/25 | | 138,569 | 138,270 |
| Series 2022-3 Class A2A, 3.97% 4/15/27 | | 7,730,486 | 7,673,838 |
| Series 2023 2 Class A3, 5.05% 1/18/28 | | 6,500,000 | 6,525,186 |
| Chase Issuance Trust Series 2023-A2 Class A, 5.08% 9/15/30 | | 7,000,000 | 7,227,884 |
| Citibank Credit Card Issuance Trust: | | | |
| Series 2007-A3 Class A3, 6.15% 6/15/39 | | 2,400,000 | 2,600,288 |
| Series 2018-A7 Class A7, 3.96% 10/13/30 | | 2,750,000 | 2,721,603 |
| Ford Credit Auto Owner Trust Series 2023-A Class A3, 4.65% 2/15/28 | | 4,451,000 | 4,446,083 |
| Ford Credit Floorplan Master Owner Trust Series 2018-4 Class A, 4.06% 11/15/30 | | 2,525,000 | 2,483,543 |
| GM Financial Consumer Automobile Receivables Series 2023 2 Class A3, 4.47% 2/16/28 | | 6,500,000 | 6,481,585 |
| Hyundai Auto Receivables Trust: | | | |
| Series 2022-B Class A3, 3.72% 11/16/26 | | 4,730,791 | 4,691,168 |
| Series 2022-C Class A3, 5.39% 6/15/27 | | 4,000,000 | 4,015,848 |
| Series 2023 A Class A3, 4.58% 4/15/27 | | 6,500,000 | 6,484,472 |
| TOTAL ASSET-BACKED SECURITIES (Cost $65,852,554) | | | 65,286,520 |
| | | | |
| Commercial Mortgage Securities - 1.4% |
| | | Principal Amount (a) | Value ($) |
| BANK sequential payer: | | | |
| Series 2017-BNK4 Class ASB, 3.419% 5/15/50 | | 2,074,741 | 2,039,489 |
| Series 2020-BN28 Class A4, 1.844% 3/15/63 | | 6,780,000 | 5,775,758 |
| Series 2021-BN35 Class A5, 2.285% 6/15/64 | | 12,700,000 | 10,838,307 |
| Series 2022-BNK39 Class A4, 2.928% 2/15/55 | | 1,800,000 | 1,583,556 |
| Series 2022-BNK41 Class A4, 3.7902% 4/15/65 (b) | | 9,500,000 | 8,911,315 |
| Series 2023-BNK45 Class A5, 5.203% 2/15/56 (b) | | 4,000,000 | 4,073,598 |
| Barclays Commercial Mortgage Securities sequential payer Series 2021-C12 Class A5, 2.689% 11/15/54 | | 6,000,000 | 5,248,490 |
| BBCMS Mortgage Trust sequential payer: | | | |
| Series 2021-C10 Class A5, 2.492% 7/15/54 | | 11,850,000 | 10,424,767 |
| Series 2021-C9 Class A5, 2.299% 2/15/54 | | 2,000,000 | 1,732,205 |
| Series 2024-C26 Class A5, 5.829% 5/15/57 (b) | | 8,703,000 | 9,362,650 |
| Benchmark Mortgage Trust: | | | |
| sequential payer: | | | |
Series 2020-B19 Class A5, 1.85% 9/15/53 | | 3,100,000 | 2,570,907 |
Series 2021-B24 Class A5, 2.5843% 3/15/54 | | 10,300,000 | 8,813,628 |
Series 2023-B39 Class A5, 5.7536% 7/15/56 | | 3,000,000 | 3,194,914 |
| Series 2019-B12 Class A5, 3.1156% 8/15/52 | | 1,772,000 | 1,639,546 |
| Series 2019-B9 Class A5, 4.0156% 3/15/52 | | 4,179,000 | 3,995,022 |
| Bmo 2024-C9 Mtg Trust sequential payer Series 2024-C9 Class A5, 5.7592% 7/15/57 | | 6,400,000 | 6,830,876 |
| BMO Mortgage Trust sequential payer Series 2022-C1 Class A5, 3.374% 2/15/55 | | 3,500,000 | 3,171,402 |
| Citigroup Commercial Mortgage Trust sequential payer: | | | |
| Series 2014-GC25 Class A4, 3.635% 10/10/47 | | 1,079,172 | 1,077,414 |
| Series 2015-GC29 Class A4, 3.192% 4/10/48 | | 2,028,000 | 1,997,409 |
| Series 2015-P1 Class A5, 3.717% 9/15/48 | | 1,045,000 | 1,028,052 |
| Series 2016-C1 Class A4, 3.209% 5/10/49 | | 3,308,000 | 3,210,703 |
| Series 2016-P4 Class A4, 2.902% 7/10/49 | | 3,832,000 | 3,673,489 |
| Series 2018-B2 Class A4, 4.009% 3/10/51 | | 2,641,000 | 2,567,177 |
| COMM Mortgage Trust Series 2015-CR22 Class A5, 3.309% 3/10/48 | | 3,462,000 | 3,420,338 |
| Computershare Corporate Trust Series 2018-C48 Class A5, 4.302% 1/15/52 | | 3,485,000 | 3,425,269 |
| CSAIL Commercial Mortgage Trust sequential payer: | | | |
| Series 2015-C3 Class A4, 3.7182% 8/15/48 | | 2,240,000 | 2,203,272 |
| Series 2019-C17: | | | |
Class A4, 2.7628% 9/15/52 | | 3,480,000 | 3,186,475 |
Class A5, 3.0161% 9/15/52 | | 3,480,000 | 3,157,733 |
| Freddie Mac: | | | |
| sequential payer: | | | |
Series 2016-K057 Class A2, 2.57% 7/25/26 | | 2,844,000 | 2,756,428 |
Series 2020-K104 Class A2, 2.253% 1/25/30 | | 16,200,000 | 14,770,029 |
Series 2020-K116 Class A2, 1.378% 7/25/30 | | 12,400,000 | 10,624,411 |
Series 2020-K117 Class A2, 1.406% 8/25/30 | | 12,400,000 | 10,610,847 |
Series 2020-K118 Class A2, 1.493% 9/25/30 | | 6,200,000 | 5,322,880 |
Series 2020-K121 Class A2, 1.547% 10/25/30 | | 8,900,000 | 7,637,709 |
Series 2021-K125 Class A2, 1.846% 1/25/31 | | 2,000,000 | 1,738,823 |
Series 2021-K126 Class A2, 2.074% 1/25/31 | | 8,200,000 | 7,237,001 |
Series 2021-K128 Class A2, 2.02% 3/25/31 | | 6,410,000 | 5,628,867 |
Series 2021-K129 Class A2, 1.914% 5/25/31 | | 6,160,000 | 5,357,298 |
Series 2021-K130 Class A2, 1.723% 6/25/31 | | 7,200,000 | 6,161,213 |
Series 2021-K136 Class A2, 2.127% 11/25/31 | | 7,800,000 | 6,787,349 |
Series 2022-151 Class A2: | | | |
| 3.78% 11/25/32 | | 7,500,000 | 7,233,713 |
| 3.8% 10/25/32 | | 1,000,000 | 965,924 |
Series 2022-K140 Class A2, 2.25% 1/25/32 | | 12,000,000 | 10,492,993 |
Series 2023-154 Class A2, 4.35% 1/25/33 | | 9,000,000 | 9,020,360 |
Series 2023-156 Class A2, 4.43% 2/25/33 | | 9,025,000 | 9,095,585 |
Series 2023-157 Class A2, 4.2% 5/25/33 | | 8,500,000 | 8,424,246 |
Series 2023-K751 Class A2, 4.412% 3/25/30 | | 4,000,000 | 4,043,044 |
Series K080 Class A2, 3.926% 7/25/28 | | 2,957,000 | 2,931,582 |
| Series 2017-K064 Class A2, 3.224% 3/25/27 | | 3,075,000 | 3,002,941 |
| Series 2017-K068 Class A2, 3.244% 8/25/27 | | 4,243,000 | 4,137,802 |
| Series 2018-K730 Class A2, 3.59% 1/25/25 | | 6,331,245 | 6,288,077 |
| Series 2019-K094 Class A2, 2.903% 6/25/29 | | 9,484,000 | 8,985,487 |
| Series 2019-K1510 Class A2, 3.718% 1/25/31 | | 2,646,000 | 2,564,428 |
| Series 2021-K123 Class A2, 1.621% 12/25/30 | | 8,000,000 | 6,882,456 |
| Series K046 Class A2, 3.205% 3/25/25 | | 5,882,771 | 5,815,431 |
| Series K047 Class A2, 3.329% 5/25/25 | | 681,984 | 673,606 |
| Series K053 Class A2, 2.995% 12/25/25 | | 1,267,000 | 1,241,992 |
| Series K056 Class A2, 2.525% 5/25/26 | | 3,698,000 | 3,585,902 |
| Series K062 Class A1, 3.032% 9/25/26 | | 775,578 | 765,051 |
| Series K079 Class A2, 3.926% 6/25/28 | | 1,386,000 | 1,374,098 |
| GS Mortgage Securities Trust sequential payer Series 2020-GC45 Class A5, 2.9106% 2/13/53 | | 9,700,000 | 8,846,718 |
| JPMBB Commercial Mortgage Securities Trust sequential payer: | | | |
| Series 2014-C23 Class A5, 3.9342% 9/15/47 | | 357,810 | 356,910 |
| Series 2014-C24 Class A5, 3.6385% 11/15/47 | | 4,646,000 | 4,564,695 |
| Series 2015-C29 Class A4, 3.6108% 5/15/48 | | 1,604,000 | 1,583,114 |
| JPMDB Commercial Mortgage Securities Trust sequential payer Series 2020-COR7 Class A5, 2.1798% 5/13/53 | | 8,000,000 | 6,546,741 |
| Morgan Stanley BAML Trust Series 2015-C20 Class A4, 3.249% 2/15/48 | | 2,625,000 | 2,604,440 |
| Morgan Stanley Capital I Trust sequential payer Series 2020-L4 Class A3, 2.698% 2/15/53 | | 4,000,000 | 3,582,908 |
| UBS Commercial Mortgage Trust sequential payer Series 2019-C16 Class A4, 3.6048% 4/15/52 | | 7,470,000 | 6,983,867 |
| Wells Fargo Commercial Mortgage Trust sequential payer: | | | |
| Series 2019-C52 Class A5, 2.892% 8/15/52 | | 5,667,000 | 5,180,616 |
| Series 2019-C54 Class A4, 3.146% 12/15/52 | | 8,500,000 | 7,839,318 |
| Wells Fargo Commercial Mtg Trust 2020-C sequential payer Series 2020-C55 Class A5, 2.725% 2/15/53 | | 3,600,000 | 3,257,982 |
| WF-RBS Commercial Mortgage Trust Series 2014-C25 Class A5, 3.631% 11/15/47 | | 2,085,094 | 2,073,562 |
| TOTAL COMMERCIAL MORTGAGE SECURITIES (Cost $387,397,345) | | | 354,732,205 |
| | | | |
| Municipal Securities - 0.4% |
| | | Principal Amount (a) | Value ($) |
| American Muni. Pwr., Inc. Rev. (Combined Hydroelectric Proj.) Series 2010 B, 8.084% 2/15/50 | | 1,730,000 | 2,342,389 |
| Bay Area Toll Auth. San Francisco Bay Toll Bridge Rev.: | | | |
| Series 2009 F2, 6.263% 4/1/49 | | 2,900,000 | 3,291,202 |
| Series 2010 S1, 7.043% 4/1/50 | | 1,325,000 | 1,648,086 |
| California Gen. Oblig.: | | | |
| Series 2009, 7.55% 4/1/39 | | 7,910,000 | 9,855,402 |
| Series 2010, 7.6% 11/1/40 | | 6,390,000 | 8,007,091 |
| Series 2018, 3.5% 4/1/28 | | 2,300,000 | 2,253,962 |
| California State Univ. Rev. Series 2021 B, 2.719% 11/1/52 | | 3,540,000 | 2,409,772 |
| Charlotte-Mecklenburg Hosp. Auth. Health Care Sys. Rev. Series 2021 A, 3.204% 1/15/51 | | 2,200,000 | 1,620,731 |
| Chicago O'Hare Int'l. Arpt. Rev. Series 2010 B, 6.395% 1/1/40 | | 5,350,000 | 6,052,827 |
| Commonwealth Fing. Auth. Rev. Series 2016 A, 4.144% 6/1/38 | | 1,365,000 | 1,287,501 |
| Dallas Area Rapid Transit Sales Tax Rev. Series 2021 A, 2.613% 12/1/48 | | 4,750,000 | 3,376,348 |
| Dallas Fort Worth Int'l. Arpt. Rev.: | | | |
| Series 2019 A, 3.144% 11/1/45 | | 435,000 | 339,352 |
| Series 2021 C, 2.843% 11/1/46 | | 4,000,000 | 3,000,932 |
| Series 2022 A, 4.507% 11/1/51 | | 1,580,000 | 1,465,915 |
| Golden State Tobacco Securitization Corp. Tobacco Settlement Rev. Series 2021 B: | | | |
| 2.746% 6/1/34 | | 1,920,000 | 1,660,251 |
| 3.293% 6/1/42 | | 1,000,000 | 788,567 |
| Idaho Energy Resources Auth. Series 2021, 2.861% 9/1/46 | | 1,175,000 | 875,674 |
| Illinois Gen. Oblig. Series 2003, 5.1% 6/1/33 | | 12,164,706 | 12,237,681 |
| Kansas St Dev. Fin. Auth. Rev. Series 2015 H, 4.927% 4/15/45 | | 1,355,000 | 1,353,490 |
| Los Angeles Cmnty. College District Series 2008 E, 6.75% 8/1/49 | | 1,685,000 | 2,004,263 |
| Los Angeles Dept. Arpt. Rev. Series 2009 C, 6.582% 5/15/39 | | 780,000 | 864,171 |
| Massachusetts Gen. Oblig. Series F, 3.277% 6/1/46 | | 840,000 | 697,373 |
| Massachusetts School Bldg. Auth. Dedicated Sales Tax Rev. Series 2019 B, % | | 2,650,000 | 2,258,905 |
| Massachusetts Wtr. Resources Auth. Wtr. & Swr. Rev. Series 2021 C, 2.823% 8/1/41 | | 3,000,000 | 2,392,593 |
| Michigan Strategic Fund Ltd. Oblig. Rev. Series 2021 A, 3.225% 9/1/47 | | 2,000,000 | 1,591,844 |
| New Jersey Tpk. Auth. Tpk. Rev. Series 2009 E, 7.414% 1/1/40 | | 3,537,000 | 4,319,497 |
| New York City Gen. Oblig. Series 2011 F1, 6.271% 12/1/37 | | 3,100,000 | 3,423,007 |
| New York City Muni. Wtr. Fin. Auth. Wtr. & Swr. Sys. Rev. Series 2010 DD, 5.952% 6/15/42 | | 1,610,000 | 1,743,655 |
| New York City Transitional Fin. Auth. Rev. Series 2011 A, 5.508% 8/1/37 | | 1,910,000 | 1,990,241 |
| New York Metropolitan Trans. Auth. Rev. Series 2010 A, 6.668% 11/15/39 | | 1,095,000 | 1,223,240 |
| New York State Dorm. Auth. Series 2021 C, 2.202% 3/15/34 | | 6,000,000 | 4,947,452 |
| Port Auth. of New York & New Jersey: | | | |
| Series 180, 4.96% 8/1/46 | | 920,000 | 900,848 |
| Series 2010 164, 5.647% 11/1/40 | | 930,000 | 1,005,512 |
| Series 225, 3.175% 7/15/60 | | 6,000,000 | 4,164,003 |
| Port of Morrow Transmission Facilities Rev. (Bonneville Coorporation Proj.) Series 2016 1, 2.987% 9/1/36 | | 1,010,000 | 869,371 |
| San Francisco Pub. Utils. Commission Wtr. Rev. Series 2010 E, 6% 11/1/40 | | 1,130,000 | 1,200,941 |
| South Carolina Pub. Svc. Auth. Rev. Series 2013 C, 5.784% 12/1/41 | | 2,016,000 | 2,092,011 |
| Univ. of California Regents Med. Ctr. Pool Rev. Series N: | | | |
| 3.006% 5/15/50 | | 3,000,000 | 2,122,787 |
| 3.256% 5/15/60 | | 5,400,000 | 3,830,966 |
| Univ. of California Revs. Series 2015 AP, 3.931% 5/15/45 | | 665,000 | 615,578 |
| Univ. of Michigan Rev. Series 2022 A, 4.454% 4/1/22 | | 2,900,000 | 2,539,436 |
| Univ. of Virginia Gen. Rev.: | | | |
| (Multi-Year Cap. Proj. Fing. Prog.) Series 2017 C, 4.179% 9/1/2117 | | 845,000 | 713,115 |
| Series 2021 B, 2.584% 11/1/51 | | 2,400,000 | 1,608,337 |
| TOTAL MUNICIPAL SECURITIES (Cost $135,590,126) | | | 112,986,319 |
| | | | |
| Foreign Government and Government Agency Obligations - 1.6% |
| | | Principal Amount (a) | Value ($) |
| Alberta Province: | | | |
| 1% 5/20/25 | | 35,763,000 | 34,887,164 |
| 3.3% 3/15/28 | | 696,000 | 681,314 |
| British Columbia Province: | | | |
| 2.25% 6/2/26 | | 6,672,000 | 6,461,298 |
| 4.2% 7/6/33 | | 4,140,000 | 4,104,691 |
| 4.9% 4/24/29 | | 5,000,000 | 5,200,050 |
| Chilean Republic: | | | |
| 2.45% 1/31/31 | | 6,000,000 | 5,310,000 |
| 2.55% 7/27/33 | | 7,750,000 | 6,556,035 |
| 3.24% 2/6/28 | | 2,067,000 | 1,983,038 |
| 3.625% 10/30/42 | | 3,150,000 | 2,544,224 |
| 3.86% 6/21/47 | | 3,039,000 | 2,473,928 |
| 4.95% 1/5/36 | | 3,440,000 | 3,440,000 |
| 5.33% 1/5/54 | | 3,400,000 | 3,372,392 |
| Export Development Canada 4.125% 2/13/29 | | 10,570,000 | 10,697,263 |
| Hungarian Republic 7.625% 3/29/41 | | 1,500,000 | 1,771,875 |
| Indonesian Republic: | | | |
| 2.85% 2/14/30 | | 5,800,000 | 5,328,750 |
| 3.35% 3/12/71 | | 2,160,000 | 1,509,300 |
| 3.4% 9/18/29 | | 5,600,000 | 5,328,750 |
| 3.5% 2/14/50 | | 4,200,000 | 3,278,625 |
| 4.35% 1/11/48 | | 901,000 | 815,123 |
| 4.45% 4/15/70 | | 1,300,000 | 1,137,094 |
| 5.35% 2/11/49 | | 5,800,000 | 6,017,500 |
| Israeli State: | | | |
| 2.75% 7/3/30 | | 1,310,000 | 1,144,200 |
| 3.25% 1/17/28 | | 2,565,000 | 2,413,870 |
| 3.375% 1/15/50 | | 4,900,000 | 3,308,754 |
| 3.875% 7/3/50 | | 4,660,000 | 3,424,820 |
| 5.375% 3/12/29 | | 1,400,000 | 1,412,914 |
| 5.5% 3/12/34 | | 1,400,000 | 1,398,950 |
| 5.75% 3/12/54 | | 1,400,000 | 1,344,000 |
| Italian Republic: | | | |
| 1.25% 2/17/26 | | 4,100,000 | 3,907,792 |
| 2.375% 10/17/24 | | 1,400,000 | 1,394,672 |
| 2.875% 10/17/29 | | 9,060,000 | 8,324,835 |
| 4% 10/17/49 | | 2,982,000 | 2,299,122 |
| Japan Bank International Cooperation: | | | |
| 1.25% 1/21/31 | | 8,076,000 | 6,795,075 |
| 1.875% 7/21/26 | | 4,640,000 | 4,445,993 |
| 2.125% 2/10/25 | | 284,000 | 280,370 |
| 2.25% 11/4/26 | | 744,000 | 714,893 |
| 2.375% 4/20/26 | | 470,000 | 455,828 |
| 2.75% 1/21/26 | | 450,000 | 440,150 |
| 2.875% 6/1/27 | | 13,584,000 | 13,163,282 |
| 3.25% 7/20/28 | | 1,604,000 | 1,560,896 |
| 3.5% 10/31/28 | | 1,000,000 | 981,016 |
| 4.625% 7/22/27 | | 1,800,000 | 1,828,141 |
| Jordanian Kingdom 3% 6/30/25 | | 341,000 | 335,623 |
| Korea Development Bank: | | | |
| 1.625% 1/19/31 | | 2,750,000 | 2,304,321 |
| 2% 10/25/31 | | 4,500,000 | 3,802,426 |
| Korean Republic: | | | |
| 2.5% 6/19/29 | | 4,000,000 | 3,762,106 |
| 2.75% 1/19/27 | | 4,000,000 | 3,876,632 |
| Landwirtschaftliche Rentenbank: | | | |
| 1.75% 7/27/26 | | 1,515,000 | 1,451,578 |
| 2.5% 11/15/27 | | 1,576,000 | 1,511,645 |
| 5% 10/24/33 | | 2,490,000 | 2,670,241 |
| Manitoba Province 4.3% 7/27/33 | | 1,400,000 | 1,396,920 |
| Ontario Province: | | | |
| 1.125% 10/7/30 | | 3,750,000 | 3,163,388 |
| 1.8% 10/14/31 | | 10,000,000 | 8,568,474 |
| 2.3% 6/15/26 | | 22,624,000 | 21,914,059 |
| 2.5% 4/27/26 | | 891,000 | 867,380 |
| Panamanian Republic: | | | |
| 2.252% 9/29/32 | | 6,180,000 | 4,625,730 |
| 3.16% 1/23/30 | | 3,711,000 | 3,221,148 |
| 3.75% 3/16/25 | | 11,010,000 | 10,881,734 |
| 4.3% 4/29/53 | | 1,012,000 | 691,641 |
| 4.5% 4/16/50 | | 3,012,000 | 2,140,327 |
| 4.5% 4/1/56 | | 4,200,000 | 2,928,198 |
| 6.4% 2/14/35 | | 3,800,000 | 3,791,070 |
| 6.7% 1/26/36 | | 1,760,000 | 1,791,900 |
| Peruvian Republic: | | | |
| 1.862% 12/1/32 | | 6,740,000 | 5,352,403 |
| 2.78% 12/1/60 | | 3,300,000 | 1,958,344 |
| 2.844% 6/20/30 | | 3,820,000 | 3,453,280 |
| 3.55% 3/10/51 | | 4,400,000 | 3,287,625 |
| 5.375% 2/8/35 | | 1,920,000 | 1,950,720 |
| 5.875% 8/8/54 | | 1,730,000 | 1,803,525 |
| 6.55% 3/14/37 | | 2,718,000 | 3,023,775 |
| Philippine Republic: | | | |
| 1.648% 6/10/31 | | 1,850,000 | 1,536,656 |
| 2.65% 12/10/45 | | 1,200,000 | 822,750 |
| 3% 2/1/28 | | 3,387,000 | 3,236,702 |
| 3.7% 3/1/41 | | 11,200,000 | 9,516,500 |
| 3.75% 1/14/29 | | 1,000,000 | 974,610 |
| 3.95% 1/20/40 | | 3,734,000 | 3,317,426 |
| 4.75% 3/5/35 | | 2,800,000 | 2,786,000 |
| 5.17% 10/13/27 | | 5,000,000 | 5,106,250 |
| 5.25% 5/14/34 | | 2,500,000 | 2,595,313 |
| 6.375% 10/23/34 | | 1,849,000 | 2,083,592 |
| 7.75% 1/14/31 | | 3,000,000 | 3,511,875 |
| 9.5% 2/2/30 | | 2,500,000 | 3,085,938 |
| Polish Government: | | | |
| 3.25% 4/6/26 | | 1,176,000 | 1,157,549 |
| 4.625% 3/18/29 | | 1,500,000 | 1,528,830 |
| 5.125% 9/18/34 | | 3,000,000 | 3,077,070 |
| 5.5% 4/4/53 | | 2,700,000 | 2,757,942 |
| 5.5% 3/18/54 | | 3,000,000 | 3,069,960 |
| 5.75% 11/16/32 | | 3,600,000 | 3,864,060 |
| Quebec Province: | | | |
| 1.5% 2/11/25 | | 6,000,000 | 5,912,400 |
| 2.5% 4/20/26 | | 1,009,000 | 985,046 |
| 2.75% 4/12/27 | | 8,846,000 | 8,578,232 |
| 2.875% 10/16/24 | | 370,000 | 369,212 |
| 4.25% 9/5/34 | | 1,850,000 | 1,840,121 |
| 4.5% 9/8/33 | | 3,000,000 | 3,047,070 |
| United Mexican States: | | | |
| 3.5% 2/12/34 | | 16,778,000 | 14,135,465 |
| 3.75% 4/19/71 | | 7,000,000 | 4,403,438 |
| 4.28% 8/14/41 | | 3,000,000 | 2,420,625 |
| 4.35% 1/15/47 | | 2,568,000 | 1,992,608 |
| 4.5% 1/31/50 | | 15,110,000 | 11,842,463 |
| 4.6% 1/23/46 | | 1,034,000 | 827,200 |
| 4.6% 2/10/48 | | 3,128,000 | 2,478,940 |
| 4.75% 4/27/32 | | 5,000,000 | 4,764,063 |
| 4.75% 3/8/44 | | 7,230,000 | 6,023,494 |
| 5.55% 1/21/45 | | 2,198,000 | 2,057,878 |
| 6.05% 1/11/40 | | 3,556,000 | 3,560,445 |
| Uruguay Republic: | | | |
| 4.125% 11/20/45 | | 846,621 | 771,483 |
| 4.375% 1/23/31 | | 8,324,181 | 8,371,005 |
| 4.975% 4/20/55 | | 5,889,811 | 5,670,769 |
| 7.625% 3/21/36 | | 380,000 | 470,725 |
| TOTAL FOREIGN GOVERNMENT AND GOVERNMENT AGENCY OBLIGATIONS (Cost $465,522,212) | | | 425,015,905 |
| | | | |
| Supranational Obligations - 1.1% |
| | | Principal Amount (a) | Value ($) |
| African Development Bank 0.875% 7/22/26 | | 4,400,000 | 4,146,215 |
| Asian Development Bank: | | | |
| 0.375% 9/3/25 | | 13,000,000 | 12,490,067 |
| 0.75% 10/8/30 | | 3,000,000 | 2,496,874 |
| 1.5% 10/18/24 | | 4,500,000 | 4,478,783 |
| 1.875% 1/24/30 | | 8,574,000 | 7,759,033 |
| 2% 4/24/26 | | 1,123,000 | 1,085,078 |
| 2.5% 11/2/27 | | 1,195,000 | 1,147,608 |
| 2.625% 1/12/27 | | 1,158,000 | 1,124,176 |
| 2.75% 1/19/28 | | 11,074,000 | 10,694,764 |
| 4% 1/12/33 | | 6,100,000 | 6,112,675 |
| 4.375% 3/6/29 | | 10,890,000 | 11,137,438 |
| Corporacion Andina de Fomento 5% 1/24/29 | | 3,930,000 | 4,027,581 |
| European Investment Bank: | | | |
| 0.75% 9/23/30 | | 7,250,000 | 6,056,474 |
| 0.875% 5/17/30 | | 1,760,000 | 1,494,774 |
| 1.25% 2/14/31 | | 6,300,000 | 5,360,994 |
| 1.625% 3/14/25 | | 21,997,000 | 21,634,321 |
| 1.875% 2/10/25 | | 535,000 | 528,001 |
| 2.375% 5/24/27 | | 713,000 | 685,719 |
| 3.625% 7/15/30 | | 16,270,000 | 16,086,877 |
| 3.75% 2/14/33 | | 9,300,000 | 9,169,328 |
| 4.125% 2/13/34 | | 3,000,000 | 3,037,079 |
| Inter-American Development Bank: | | | |
| 0.625% 7/15/25 | | 4,000,000 | 3,869,075 |
| 1.75% 3/14/25 | | 16,400,000 | 16,138,212 |
| 2% 6/2/26 | | 713,000 | 687,706 |
| 2% 7/23/26 | | 6,000,000 | 5,777,635 |
| 2.125% 1/15/25 | | 326,000 | 322,556 |
| 2.25% 6/18/29 | | 3,189,000 | 2,970,867 |
| 2.375% 7/7/27 | | 1,200,000 | 1,151,786 |
| 3.125% 9/18/28 | | 17,330,000 | 16,895,477 |
| 4.375% 1/24/44 | | 2,313,000 | 2,261,856 |
| 4.5% 9/13/33 | | 4,500,000 | 4,673,241 |
| International Bank for Reconstruction & Development: | | | |
| 0.375% 7/28/25 | | 5,350,000 | 5,158,361 |
| 0.5% 10/28/25 | | 8,582,000 | 8,215,269 |
| 0.75% 3/11/25 | | 64,000 | 62,674 |
| 0.75% 8/26/30 | | 8,100,000 | 6,764,612 |
| 0.875% 5/14/30 | | 3,108,000 | 2,639,807 |
| 1.625% 1/15/25 | | 21,300,000 | 21,040,309 |
| 1.875% 10/27/26 | | 849,000 | 812,603 |
| 2.5% 11/25/24 | | 1,016,000 | 1,009,781 |
| 2.5% 7/29/25 | | 676,000 | 664,266 |
| 4% 7/25/30 | | 8,500,000 | 8,561,361 |
| 4% 1/10/31 | | 14,200,000 | 14,273,441 |
| 4.5% 6/26/28 | | 10,500,000 | 10,500,294 |
| 4.75% 11/14/33 | | 11,300,000 | 11,945,772 |
| International Finance Corp.: | | | |
| 0.375% 7/16/25 | | 19,670,000 | 18,984,961 |
| 0.75% 8/27/30 | | 2,100,000 | 1,755,537 |
| TOTAL SUPRANATIONAL OBLIGATIONS (Cost $306,190,961) | | | 297,891,318 |
| | | | |
| Bank Notes - 0.1% |
| | | Principal Amount (a) | Value ($) |
| Bank of America NA 6% 10/15/36 | | 2,144,000 | 2,329,547 |
| Citizens Bank NA 2.25% 4/28/25 | | 3,750,000 | 3,669,478 |
| Discover Bank: | | | |
| 2.7% 2/6/30 | | 5,000,000 | 4,450,443 |
| 3.45% 7/27/26 | | 2,273,000 | 2,208,241 |
| KeyBank NA 4.9% 8/8/32 | | 1,200,000 | 1,137,499 |
| PNC Bank NA 2.7% 10/22/29 | | 2,100,000 | 1,905,349 |
| Truist Bank: | | | |
| 1.5% 3/10/25 | | 1,500,000 | 1,471,459 |
| 2.636% 9/17/29 (b) | | 5,000,000 | 4,984,002 |
| 3.3% 5/15/26 | | 1,355,000 | 1,322,198 |
| 3.8% 10/30/26 | | 427,000 | 418,093 |
| Wells Fargo Bank NA 5.45% 8/7/26 | | 5,500,000 | 5,601,451 |
| TOTAL BANK NOTES (Cost $30,609,844) | | | 29,497,760 |
| | | | |
| Money Market Funds - 0.3% |
| | | Shares | Value ($) |
| Fidelity Cash Central Fund 5.39% (g) | | 57,938,572 | 57,950,160 |
| Fidelity Securities Lending Cash Central Fund 5.39% (g)(h) | | 25,809,919 | 25,812,500 |
| TOTAL MONEY MARKET FUNDS (Cost $83,762,660) | | | 83,762,660 |
| | | | |
| TOTAL INVESTMENT IN SECURITIES - 101.5% (Cost $27,937,298,654) | 26,323,803,282 |
NET OTHER ASSETS (LIABILITIES) - (1.5)% | (386,464,114) |
| NET ASSETS - 100.0% | 25,937,339,168 |
| | |
| TBA Sale Commitments |
| | Principal Amount (a) | Value ($) |
| Ginnie Mae | | |
| 5% 9/1/54 | (7,925,000) | (7,908,251) |
| | | |
| Uniform Mortgage Backed Securities | | |
| 2% 9/1/54 | (20,700,000) | (16,930,335) |
| 2.5% 9/1/54 | (8,300,000) | (7,075,425) |
| 3% 9/1/54 | (1,100,000) | (975,262) |
| 3% 9/1/54 | (2,575,000) | (2,282,999) |
| 3.5% 9/1/54 | (10,075,000) | (9,273,329) |
| 4% 9/1/54 | (2,775,000) | (2,631,589) |
| 4.5% 9/1/54 | (2,300,000) | (2,238,277) |
| 5% 9/1/54 | (2,000,000) | (1,985,391) |
| 5.5% 9/1/54 | (5,475,000) | (5,512,427) |
| 6% 9/1/54 | (7,675,000) | (7,816,208) |
| | | |
| TOTAL UNIFORM MORTGAGE BACKED SECURITIES | | (56,721,242) |
| | | |
TOTAL TBA SALE COMMITMENTS (Proceeds $64,970,656) | | (64,629,493) |
Legend
| (a) | Amount is stated in United States dollars unless otherwise noted. |
| (b) | Coupon rates for floating and adjustable rate securities reflect the rates in effect at period end. |
| (c) | Security exempt from registration under Rule 144A of the Securities Act of 1933. These securities may be resold in transactions exempt from registration, normally to qualified institutional buyers. At the end of the period, the value of these securities amounted to $51,918,942 or 0.2% of net assets. |
| (d) | Security or a portion of the security is on loan at period end. |
| (e) | Coupon is indexed to a floating interest rate which may be multiplied by a specified factor and/or subject to caps or floors. |
| (f) | Security or a portion of the security purchased on a delayed delivery or when-issued basis. |
| (g) | Affiliated fund that is generally available only to investment companies and other accounts managed by Fidelity Investments. The rate quoted is the annualized seven-day yield of the fund at period end. A complete unaudited listing of the fund's holdings as of its most recent quarter end is available upon request. In addition, each Fidelity Central Fund's financial statements, which are not covered by the Fund's Report of Independent Registered Public Accounting Firm, are available on the SEC's website or upon request. |
| (h) | Investment made with cash collateral received from securities on loan. |
Affiliated Central Funds
Fiscal year to date information regarding the Fund's investments in Fidelity Central Funds, including the ownership percentage, is presented below.
| Affiliate | Value, beginning of period ($) | Purchases ($) | Sales Proceeds ($) | Dividend Income ($) | Realized Gain (loss) ($) | Change in Unrealized appreciation (depreciation) ($) | Value, end of period ($) | % ownership, end of period |
| Fidelity Cash Central Fund 5.39% | 118,582,584 | 3,312,387,261 | 3,373,015,812 | 4,523,508 | (3,873) | - | 57,950,160 | 0.1% |
| Fidelity Securities Lending Cash Central Fund 5.39% | 76,218,750 | 2,530,628,026 | 2,581,034,276 | 482,907 | - | - | 25,812,500 | 0.1% |
| Total | 194,801,334 | 5,843,015,287 | 5,954,050,088 | 5,006,415 | (3,873) | - | 83,762,660 | |
| | | | | | | | | |
Amounts in the dividend income column in the above table include any capital gain distributions from underlying funds, which are presented in the corresponding line item in the Statement of Operations, if applicable.
Amounts in the dividend income column for Fidelity Securities Lending Cash Central Fund represents the income earned on investing cash collateral, less rebates paid to borrowers and any lending agent fees associated with the loan, plus any premium payments received for lending certain types of securities.
Amounts included in the purchases and sales proceeds columns may include in-kind transactions, if applicable.
Investment Valuation
The following is a summary of the inputs used, as of August 31, 2024, involving the Fund's assets and liabilities carried at fair value. The inputs or methodology used for valuing securities may not be an indication of the risk associated with investing in those securities. For more information on valuation inputs, and their aggregation into the levels used below, please refer to the Investment Valuation section in the accompanying Notes to Financial Statements.
| Valuation Inputs at Reporting Date: |
| Description | Total ($) | Level 1 ($) | Level 2 ($) | Level 3 ($) |
Investments in Securities: | | | | |
|
| Corporate Bonds | 6,608,720,184 | - | 6,608,720,184 | - |
|
| U.S. Government and Government Agency Obligations | 11,638,913,763 | - | 11,638,913,763 | - |
|
| U.S. Government Agency - Mortgage Securities | 6,706,996,648 | - | 6,706,996,648 | - |
|
| Asset-Backed Securities | 65,286,520 | - | 65,286,520 | - |
|
| Commercial Mortgage Securities | 354,732,205 | - | 354,732,205 | - |
|
| Municipal Securities | 112,986,319 | - | 112,986,319 | - |
|
| Foreign Government and Government Agency Obligations | 425,015,905 | - | 425,015,905 | - |
|
| Supranational Obligations | 297,891,318 | - | 297,891,318 | - |
|
| Bank Notes | 29,497,760 | - | 29,497,760 | - |
|
| Money Market Funds | 83,762,660 | 83,762,660 | - | - |
| Total Investments in Securities: | 26,323,803,282 | 83,762,660 | 26,240,040,622 | - |
Other Financial Instruments: | | | | |
TBA Sale Commitments | (64,629,493) | - | (64,629,493) | - |
| Total Other Financial Instruments: | (64,629,493) | - | (64,629,493) | - |
Financial Statements
| Statement of Assets and Liabilities |
As of August 31, 2024 |
| Assets | | | | |
| Investment in securities, at value (including securities loaned of $25,187,500) - See accompanying schedule: | | | | |
Unaffiliated issuers (cost $27,853,535,994) | $ | 26,240,040,622 | | |
Fidelity Central Funds (cost $83,762,660) | | 83,762,660 | | |
| | | | | |
| | | | | |
| Total Investment in Securities (cost $27,937,298,654) | | | $ | 26,323,803,282 |
| Foreign currency held at value (cost $557) | | | | 567 |
| Receivable for investments sold | | | | 125,944,244 |
| Receivable for TBA sale commitments | | | | 64,970,656 |
| Receivable for fund shares sold | | | | 117,490,789 |
| Interest receivable | | | | 192,325,906 |
| Distributions receivable from Fidelity Central Funds | | | | 204,891 |
| Other receivables | | | | 25 |
Total assets | | | | 26,824,740,360 |
| Liabilities | | | | |
| Payable to custodian bank | $ | 143 | | |
| Payable for investments purchased | | | | |
Regular delivery | | 311,786,173 | | |
Delayed delivery | | 475,143,658 | | |
| TBA sale commitments, at value | | 64,629,493 | | |
| Payable for fund shares redeemed | | 9,929,955 | | |
| Other payables and accrued expenses | | 99,270 | | |
| Collateral on securities loaned | | 25,812,500 | | |
| Total liabilities | | | | 887,401,192 |
| Net Assets | | | $ | 25,937,339,168 |
| Net Assets consist of: | | | | |
| Paid in capital | | | $ | 28,249,805,916 |
| Total accumulated earnings (loss) | | | | (2,312,466,748) |
| Net Assets | | | $ | 25,937,339,168 |
Net Asset Value, offering price and redemption price per share ($25,937,339,168 ÷ 2,837,995,809 shares) | | | $ | 9.14 |
| Statement of Operations |
| Year ended August 31, 2024 |
| Investment Income | | | | |
| Interest | | | $ | 819,681,916 |
| Income from Fidelity Central Funds (including $482,907 from security lending) | | | | 5,006,415 |
| Total income | | | | 824,688,331 |
| Expenses | | | | |
| Custodian fees and expenses | $ | 233,713 | | |
| Independent trustees' fees and expenses | | 68,633 | | |
| Total expenses before reductions | | 302,346 | | |
| Expense reductions | | (469) | | |
| Total expenses after reductions | | | | 301,877 |
| Net Investment income (loss) | | | | 824,386,454 |
| Realized and Unrealized Gain (Loss) | | | | |
| Net realized gain (loss) on: | | | | |
| Investment Securities: | | | | |
| Unaffiliated issuers | | (171,785,946) | | |
| Fidelity Central Funds | | (3,873) | | |
| Foreign currency transactions | | 1 | | |
| Total net realized gain (loss) | | | | (171,789,818) |
| Change in net unrealized appreciation (depreciation) on: | | | | |
| Investment Securities: | | | | |
| Unaffiliated issuers | | 1,024,619,804 | | |
| Assets and liabilities in foreign currencies | | 10 | | |
| TBA Sale commitments | | 1,670,997 | | |
| Total change in net unrealized appreciation (depreciation) | | | | 1,026,290,811 |
| Net gain (loss) | | | | 854,500,993 |
| Net increase (decrease) in net assets resulting from operations | | | $ | 1,678,887,447 |
| Statement of Changes in Net Assets |
| |
| | Year ended August 31, 2024 | | Year ended August 31, 2023 |
| Increase (Decrease) in Net Assets | | | | |
| Operations | | | | |
| Net investment income (loss) | $ | 824,386,454 | $ | 552,883,526 |
| Net realized gain (loss) | | (171,789,818) | | (276,439,477) |
| Change in net unrealized appreciation (depreciation) | | 1,026,290,811 | | (494,015,510) |
| Net increase (decrease) in net assets resulting from operations | | 1,678,887,447 | | (217,571,461) |
| Distributions to shareholders | | (824,021,691) | | (553,320,158) |
| | | | | |
| Share transactions | | | | |
| Proceeds from sales of shares | | 5,001,016,662 | | 5,926,389,109 |
| Reinvestment of distributions | | 823,866,684 | | 552,731,183 |
| Cost of shares redeemed | | (2,164,097,679) | | (2,049,740,409) |
| | | | | |
Net increase (decrease) in net assets resulting from share transactions | | 3,660,785,667 | | 4,429,379,883 |
| Total increase (decrease) in net assets | | 4,515,651,423 | | 3,658,488,264 |
| | | | | |
| Net Assets | | | | |
| Beginning of period | | 21,421,687,745 | | 17,763,199,481 |
| End of period | $ | 25,937,339,168 | $ | 21,421,687,745 |
| | | | | |
| Other Information | | | | |
| Shares | | | | |
| Sold | | 552,175,268 | | 663,556,930 |
| Issued in reinvestment of distributions | | 93,012,350 | | 61,881,218 |
| Redeemed | | (233,969,619) | | (230,646,238) |
| Net increase (decrease) | | 411,217,999 | | 494,791,910 |
| | | | | |
Financial Highlights
Fidelity® Series Bond Index Fund |
| |
| Years ended August 31, | | 2024 | | 2023 | | 2022 | | 2021 | | 2020 |
Selected Per-Share Data | | | | | | | | | | |
| Net asset value, beginning of period | $ | 8.83 | $ | 9.19 | $ | 10.59 | $ | 10.90 | $ | 10.50 |
| Income from Investment Operations | | | | | | | | | | |
Net investment income (loss) A,B | | .314 | | .258 | | .181 | | .165 | | .242 |
| Net realized and unrealized gain (loss) | | .309 | | (.361) | | (1.396) | | (.182) | | .422 |
| Total from investment operations | | .623 | | (.103) | | (1.215) | | (.017) | | .664 |
| Distributions from net investment income | | (.313) | | (.257) | | (.185) | | (.174) | | (.250) |
| Distributions from net realized gain | | - | | - | | - | | (.119) | | (.014) |
| Total distributions | | (.313) | | (.257) | | (.185) | | (.293) | | (.264) |
| Net asset value, end of period | $ | 9.14 | $ | 8.83 | $ | 9.19 | $ | 10.59 | $ | 10.90 |
Total Return C | | | | (1.12)% | | (11.57)% | | (.14)% | | 6.42% |
Ratios to Average Net Assets B,D,E | | | | | | | | | | |
Expenses before reductions F | | -% | | -% | | -% | | -% | | -% |
Expenses net of fee waivers, if any F | | | | -% | | -% | | -% | | -% |
Expenses net of all reductions F | | -% | | -% | | -% | | -% | | -% |
| Net investment income (loss) | | 3.55% | | 2.89% | | 1.82% | | 1.56% | | 2.29% |
| Supplemental Data | | | | | | | | | | |
| Net assets, end of period (000 omitted) | $ | 25,937,339 | $ | 21,421,688 | $ | 17,763,199 | $ | 20,808,897 | $ | 13,160,897 |
Portfolio turnover rate G | | | | 42% | | 61% | | 108% | | 71% H |
ACalculated based on average shares outstanding during the period.
BNet investment income (loss) is affected by the timing of the declaration of dividends by any underlying mutual funds or exchange-traded funds (ETFs). Net investment income (loss) of any mutual funds or ETFs is not included in the Fund's net investment income (loss) ratio.
CTotal returns would have been lower if certain expenses had not been reduced during the applicable periods shown.
DFees and expenses of any underlying mutual funds or exchange-traded funds (ETFs) are not included in the Fund's expense ratio. The Fund indirectly bears its proportionate share of these expenses. For additional expense information related to investments in Fidelity Central Funds, please refer to the "Investments in Fidelity Central Funds" note found in the Notes to Financial Statements section of the most recent Annual or Semi-Annual report.
EExpense ratios reflect operating expenses of the class. Expenses before reductions do not reflect amounts reimbursed, waived, or reduced through arrangements with the investment adviser, brokerage services, or other offset arrangements, if applicable, and do not represent the amount paid by the class during periods when reimbursements, waivers or reductions occur.
FAmount represents less than .005%.
GAmount does not include the portfolio activity of any underlying mutual funds or exchange-traded funds (ETFs).
HPortfolio turnover rate excludes securities received or delivered in-kind.
Notes to Financial Statements
For the period ended August 31, 2024
1. Organization.
Fidelity Series Bond Index Fund (the Fund) is a fund of Fidelity Salem Street Trust (the Trust) and is authorized to issue an unlimited number of shares. Shares are offered only to certain other Fidelity funds, Fidelity managed 529 plans, and Fidelity managed collective investment trusts. The Trust is registered under the Investment Company Act of 1940, as amended (the 1940 Act), as an open-end management investment company organized as a Massachusetts business trust.
2. Investments in Fidelity Central Funds.
Funds may invest in Fidelity Central Funds, which are open-end investment companies generally available only to other investment companies and accounts managed by the investment adviser and its affiliates. The Schedule of Investments lists any Fidelity Central Funds held as an investment as of period end, but does not include the underlying holdings of each Fidelity Central Fund. An investing fund indirectly bears its proportionate share of the expenses of the underlying Fidelity Central Funds.
Based on its investment objective, each Fidelity Central Fund may invest or participate in various investment vehicles or strategies that are similar to those of the investing fund. These strategies are consistent with the investment objectives of the investing fund and may involve certain economic risks which may cause a decline in value of each of the Fidelity Central Funds and thus a decline in the value of the investing fund.
| Fidelity Central Fund | Investment Manager | Investment Objective | Investment Practices | Expense RatioA |
| Fidelity Money Market Central Funds | Fidelity Management & Research Company LLC (FMR) | Each fund seeks to obtain a high level of current income consistent with the preservation of capital and liquidity. | Short-term Investments | Less than .005% |
A Expenses expressed as a percentage of average net assets and are as of each underlying Central Fund's most recent annual or semi-annual shareholder report.
A complete unaudited list of holdings for each Fidelity Central Fund is available upon request or at the Securities and Exchange Commission website at www.sec.gov. In addition, the financial statements of the Fidelity Central Funds which contain the significant accounting policies (including investment valuation policies) of those funds, and are not covered by the Report of Independent Registered Public Accounting Firm, are available on the Securities and Exchange Commission website or upon request.
3. Significant Accounting Policies.
The Fund is an investment company and applies the accounting and reporting guidance of the Financial Accounting Standards Board (FASB) Accounting Standards Codification Topic 946 Financial Services - Investment Companies. The financial statements have been prepared in conformity with accounting principles generally accepted in the United States of America (GAAP), which require management to make certain estimates and assumptions at the date of the financial statements. Actual results could differ from those estimates. Subsequent events, if any, through the date that the financial statements were issued have been evaluated in the preparation of the financial statements. The Fund's Schedule of Investments lists any underlying mutual funds or exchange-traded funds (ETFs) but does not include the underlying holdings of these funds. The following summarizes the significant accounting policies of the Fund:
Investment Valuation. Investments are valued as of 4:00 p.m. Eastern time on the last calendar day of the period. The Board of Trustees (the Board) has designated the Fund's investment adviser as the valuation designee responsible for the fair valuation function and performing fair value determinations as needed. The investment adviser has established a Fair Value Committee (the Committee) to carry out the day-to-day fair valuation responsibilities and has adopted policies and procedures to govern the fair valuation process and the activities of the Committee. In accordance with these fair valuation policies and procedures, which have been approved by the Board, the Fund attempts to obtain prices from one or more third party pricing services or brokers to value its investments. When current market prices, quotations or currency exchange rates are not readily available or reliable, investments will be fair valued in good faith by the Committee, in accordance with the policies and procedures. Factors used in determining fair value vary by investment type and may include market or investment specific events, transaction data, estimated cash flows, and market observations of comparable investments. The frequency that the fair valuation procedures are used cannot be predicted and they may be utilized to a significant extent. The Committee manages the Fund's fair valuation practices and maintains the fair valuation policies and procedures. The Fund's investment adviser reports to the Board information regarding the fair valuation process and related material matters.
The Fund categorizes the inputs to valuation techniques used to value its investments into a disclosure hierarchy consisting of three levels as shown below:
Level 1 - unadjusted quoted prices in active markets for identical investments
Level 2 - other significant observable inputs (including quoted prices for similar investments, interest rates, prepayment speeds, etc.)
Level 3 - unobservable inputs (including the Fund's own assumptions based on the best information available)
Valuation techniques used to value the Fund's investments by major category are as follows:
Debt securities, including restricted securities, are valued based on evaluated prices received from third party pricing services or from brokers who make markets in such securities. Corporate bonds, bank notes, foreign government and government agency obligations, municipal securities, supranational obligations and U.S. government and government agency obligations are valued by pricing services who utilize matrix pricing which considers yield or price of bonds of comparable quality, coupon, maturity and type or by broker-supplied prices. Asset backed securities, commercial mortgage securities and U.S. government agency mortgage securities are valued by pricing services who utilize matrix pricing which considers prepayment speed assumptions, attributes of the collateral, yield or price of bonds of comparable quality, coupon, maturity and type or by broker-supplied prices. When independent prices are unavailable or unreliable, debt securities may be valued utilizing pricing methodologies which consider similar factors that would be used by third party pricing services. Debt securities are generally categorized as Level 2 in the hierarchy but may be Level 3 depending on the circumstances.
Investments in open-end mutual funds, including the Fidelity Central Funds, are valued at their closing net asset value (NAV) each business day and are categorized as Level 1 in the hierarchy.
Changes in valuation techniques may result in transfers in or out of an assigned level within the disclosure hierarchy. The aggregate value of investments by input level as of August 31, 2024 is included at the end of the Fund's Schedule of Investments.
Foreign Currency. Certain Funds may use foreign currency contracts to facilitate transactions in foreign-denominated securities. Gains and losses from these transactions may arise from changes in the value of the foreign currency or if the counterparties do not perform under the contracts' terms.
Foreign-denominated assets, including investment securities, and liabilities are translated into U.S. dollars at the exchange rates at period end. Purchases and sales of investment securities, income and dividends received, and expenses denominated in foreign currencies are translated into U.S. dollars at the exchange rate in effect on the transaction date.
The effects of exchange rate fluctuations on investments are included with the net realized and unrealized gain (loss) on investment securities. Other foreign currency transactions resulting in realized and unrealized gain (loss) are disclosed separately.
Investment Transactions and Income. For financial reporting purposes, the Fund's investment holdings and NAV include trades executed through the end of the last business day of the period. The NAV per share for processing shareholder transactions is calculated as of the close of business of the New York Stock Exchange (NYSE), normally 4:00 p.m. Eastern time and includes trades executed through the end of the prior business day. Gains and losses on securities sold are determined on the basis of identified cost. Income and capital gain distributions from Fidelity Central Funds, if any, are recorded on the ex-dividend date. Interest income is accrued as earned and includes coupon interest and amortization of premium and accretion of discount on debt securities as applicable. Investment income is recorded net of foreign taxes withheld where recovery of such taxes is uncertain. Debt obligations may be placed on non-accrual status and related interest income may be reduced by ceasing current accruals and writing off interest receivables when the collection of all or a portion of interest has become doubtful based on consistently applied procedures. A debt obligation is removed from non-accrual status when the issuer resumes interest payments or when collectability of interest is reasonably assured.
Expenses. Expenses directly attributable to a fund are charged to that fund. Expenses attributable to more than one fund are allocated among the respective funds on the basis of relative net assets or other appropriate methods. Expenses included in the accompanying financial statements reflect the expenses of that fund and do not include any expenses associated with any underlying mutual funds or exchange-traded funds. Although not included in a fund's expenses, a fund indirectly bears its proportionate share of these expenses through the net asset value of each underlying mutual fund or exchange-traded fund. Expense estimates are accrued in the period to which they relate and adjustments are made when actual amounts are known.
Income Tax Information and Distributions to Shareholders. Each year, the Fund intends to qualify as a regulated investment company under Subchapter M of the Internal Revenue Code, including distributing substantially all of its taxable income and realized gains. As a result, no provision for U.S. Federal income taxes is required. As of August 31, 2024, the Fund did not have any unrecognized tax benefits in the financial statements; nor is the Fund aware of any tax positions for which it is reasonably possible that the total amounts of unrecognized tax benefits will significantly change in the next twelve months. The Fund files a U.S. federal tax return, in addition to state and local tax returns as required. The Fund's federal income tax returns are subject to examination by the Internal Revenue Service (IRS) for a period of three fiscal years after they are filed. State and local tax returns may be subject to examination for an additional fiscal year depending on the jurisdiction. Foreign taxes are provided for based on the Fund's understanding of the tax rules and rates that exist in the foreign markets in which it invests.
Distributions are declared and recorded daily and paid monthly from net investment income. Distributions from realized gains, if any, are declared and recorded on the ex-dividend date. Income and capital gain distributions are determined in accordance with income tax regulations, which may differ from GAAP.
Capital accounts within the financial statements are adjusted for permanent book-tax differences. These adjustments have no impact on net assets or the results of operations. Capital accounts are not adjusted for temporary book-tax differences which will reverse in a subsequent period.
Book-tax differences are primarily due to foreign currency transactions, capital loss carryforwards and losses deferred due to wash sales.
As of period end, the cost and unrealized appreciation (depreciation) in securities, and derivatives if applicable, for federal income tax purposes were as follows:
| Gross unrealized appreciation | $239,589,626 |
| Gross unrealized depreciation | (1,865,361,991) |
| Net unrealized appreciation (depreciation) | $(1,625,772,365) |
| Tax Cost | $27,949,916,809 |
The tax-based components of distributable earnings as of period end were as follows:
| Undistributed ordinary income | $- |
| Capital loss carryforward | $(660,825,272) |
| Net unrealized appreciation (depreciation) on securities and other investments | $(1,625,772,354) |
Capital loss carryforwards are only available to offset future capital gains of the Fund to the extent provided by regulations and may be limited. The capital loss carryforward information presented below, including any applicable limitation, is estimated as of fiscal period end and is subject to adjustment.
Short-term | $(235,492,584) |
Long-term | (425,332,688) |
| Total capital loss carryforward | $(660,825,272) |
The tax character of distributions paid was as follows:
| | August 31, 2024 | August 31, 2023 |
| Ordinary Income | $824,021,691 | $ 553,320,158 |
| Long-term Capital Gains | - | - |
| Total | $824,021,691 | $ 553,320,158 |
Delayed Delivery Transactions and When-Issued Securities. During the period, certain Funds transacted in securities on a delayed delivery or when-issued basis. Payment and delivery may take place after the customary settlement period for that security. The price of the underlying securities and the date when the securities will be delivered and paid for are fixed at the time the transaction is negotiated. Securities purchased on a delayed delivery or when-issued basis are identified as such in the Schedule of Investments. Compensation for interest forgone in the purchase of a delayed delivery or when-issued debt security may be received. With respect to purchase commitments, each applicable Fund identifies securities as segregated in its records with a value at least equal to the amount of the commitment. Payables and receivables associated with the purchases and sales of delayed delivery securities having the same coupon, settlement date and broker are offset. Delayed delivery or when-issued securities that have been purchased from and sold to different brokers are reflected as both payables and receivables in the Statement of Assets and Liabilities under the caption "Delayed delivery", as applicable. Losses may arise due to changes in the value of the underlying securities or if the counterparty does not perform under the contract's terms, or if the issuer does not issue the securities due to political, economic, or other factors.
To-Be-Announced (TBA) Securities and Mortgage Dollar Rolls. TBA securities involve buying or selling mortgage-backed securities (MBS) on a forward commitment basis. A TBA transaction typically does not designate the actual security to be delivered and only includes an approximate principal amount; however delivered securities must meet specified terms defined by industry guidelines, including issuer, rate and current principal amount outstanding on underlying mortgage pools. Funds may enter into a TBA transaction with the intent to take possession of or deliver the underlying MBS, or a fund may elect to extend the settlement by entering into either a mortgage or reverse mortgage dollar roll. Mortgage dollar rolls are transactions where a fund sells TBA securities and simultaneously agrees to repurchase MBS on a later date at a lower price and with the same counterparty. Reverse mortgage dollar rolls involve the purchase and simultaneous agreement to sell TBA securities on a later date at a lower price. Transactions in mortgage dollar rolls and reverse mortgage dollar rolls are accounted for as purchases and sales and may result in an increase to a fund's portfolio turnover rate.
Purchases and sales of TBA securities involve risks similar to those discussed above for delayed delivery and when-issued securities. Also, if the counterparty in a mortgage dollar roll or a reverse mortgage dollar roll transaction files for bankruptcy or becomes insolvent, a fund's right to repurchase or sell securities may be limited. Additionally, when a fund sells TBA securities without already owning or having the right to obtain the deliverable securities (an uncovered forward commitment to sell), it incurs a risk of loss because it could have to purchase the securities at a price that is higher than the price at which it sold them. A fund may be unable to purchase the deliverable securities if the corresponding market is illiquid.
TBA securities subject to a forward commitment to sell at period end are included at the end of the Schedule of Investments under the caption "TBA Sale Commitments." The value of these commitments and proceeds to be received at contractual settlement date are reflected in the Statement of Assets and Liabilities as "TBA sale commitments, at value" and "Receivable for TBA sale commitments," respectively. If the TBA sale commitment is closed through the acquisition of an offsetting TBA purchase commitment, a fund realizes a gain or loss. If a fund delivers securities under the commitment, a fund realizes a gain or loss from the sale of the securities based upon the price established at the date the commitment was entered into.
Restricted Securities (including Private Placements). Funds may invest in securities that are subject to legal or contractual restrictions on resale. These securities generally may be resold in transactions exempt from registration or to the public if the securities are registered. Disposal of these securities may involve time-consuming negotiations and expense, and prompt sale at an acceptable price may be difficult. Information regarding restricted securities held at period end is included at the end of the Schedule of Investments, if applicable.
4. Purchases and Sales of Investments.
Purchases and sales of securities, other than short-term securities, U.S. government securities and in-kind transactions, as applicable, are noted in the table below.
| | Purchases ($) | Sales ($) |
| Fidelity Series Bond Index Fund | 5,970,793,784 | 4,957,843,672 |
5. Fees and Other Transactions with Affiliates.
Management Fee. Fidelity Management & Research Company LLC (the investment adviser) and its affiliates provide the Fund with investment management related services for which the Fund does not pay a management fee. Under the management contract, the investment adviser or an affiliate pays all ordinary operating expenses of the Fund, except custody fees, fees and expenses of the independent Trustees, and certain miscellaneous expenses such as proxy and shareholder meeting expenses.
Interfund Trades. Funds may purchase from or sell securities to other Fidelity Funds under procedures adopted by the Board. The procedures have been designed to ensure these interfund trades are executed in accordance with Rule 17a-7 of the 1940 Act. Any interfund trades are included within the respective purchases and sales amounts shown in the Purchases and Sales of Investments note. During the period, there were no interfund trades.
Sub-Advisory Arrangements. Effective March 1, 2024, the Fund's sub-advisory agreements with FMR Investment Management (UK) Limited, Fidelity Management & Research (Hong Kong) Limited, and Fidelity Management & Research (Japan) Limited were amended to provide that the investment adviser pays each sub-adviser monthly fees equal to 110% of the sub-adviser's costs for providing sub-advisory services.
6. Committed Line of Credit.
Certain Funds participate with other funds managed by the investment adviser or an affiliate in a $4.25 billion credit facility (the "line of credit") to be utilized for temporary or emergency purposes to fund shareholder redemptions or for other short-term liquidity purposes. The commitment fees on the pro-rata portion of the line of credit are borne by the investment adviser. During the period, there were no borrowings on this line of credit.
7. Security Lending.
Funds lend portfolio securities from time to time in order to earn additional income. Lending agents are used, including National Financial Services (NFS), an affiliate of the investment adviser. Pursuant to a securities lending agreement, NFS will receive a fee, which is capped at 9.9% of a fund's daily lending revenue, for its services as lending agent. A fund may lend securities to certain qualified borrowers, including NFS. On the settlement date of the loan, a fund receives collateral (in the form of U.S. Treasury obligations, letters of credit and/or cash) against the loaned securities and maintains collateral in an amount not less than 100% of the market value of the loaned securities during the period of the loan. The market value of the loaned securities is determined at the close of business of a fund and any additional required collateral is delivered to a fund on the next business day. A fund or borrower may terminate the loan at any time, and if the borrower defaults on its obligation to return the securities loaned because of insolvency or other reasons, a fund may apply collateral received from the borrower against the obligation. A fund may experience delays and costs in recovering the securities loaned. Any cash collateral received is invested in the Fidelity Securities Lending Cash Central Fund. Any loaned securities are identified as such in the Schedule of Investments, and the value of loaned securities and cash collateral at period end, as applicable, are presented in the Statement of Assets and Liabilities. Security lending income represents the income earned on investing cash collateral, less rebates paid to borrowers and any lending agent fees associated with the loan, plus any premium payments received for lending certain types of securities. Security lending income is presented in the Statement of Operations as a component of income from Fidelity Central Funds. Affiliated security lending activity, if any, was as follows:
| | Total Security Lending Fees Paid to NFS ($) | Security Lending Income From Securities Loaned to NFS ($) | Value of Securities Loaned to NFS at Period End ($) |
| Fidelity Series Bond Index Fund | 50,171 | - | - |
8. Expense Reductions.
Through arrangements with the Fund's custodian, credits realized as a result of certain uninvested cash balances were used to reduce the Fund's expenses by $469.
9. Other.
A fund's organizational documents provide former and current trustees and officers with a limited indemnification against liabilities arising in connection with the performance of their duties to the fund. In the normal course of business, a fund may also enter into contracts that provide general indemnifications. A fund's maximum exposure under these arrangements is unknown as this would be dependent on future claims that may be made against a fund. The risk of material loss from such claims is considered remote.
At the end of the period, mutual funds and accounts managed by the investment adviser or its affiliates were the owners of record of all of the outstanding shares of the Fund.
10. Risk and Uncertainties.
Many factors affect a fund's performance. Developments that disrupt global economies and financial markets, such as pandemics, epidemics, outbreaks of infectious diseases, war, terrorism, and environmental disasters, may significantly affect a fund's investment performance. The effects of these developments to a fund will be impacted by the types of securities in which a fund invests, the financial condition, industry, economic sector, and geographic location of an issuer, and a fund's level of investment in the securities of that issuer. Significant concentrations in security types, issuers, industries, sectors, and geographic locations may magnify the factors that affect a fund's performance.
Report of Independent Registered Public Accounting Firm
To the Board of Trustees of Fidelity Salem Street Trust and Shareholders of Fidelity Series Bond Index Fund
Opinion on the Financial Statements
We have audited the accompanying statement of assets and liabilities, including the schedule of investments, of Fidelity Series Bond Index Fund (one of the funds constituting Fidelity Salem Street Trust, referred to hereafter as the "Fund") as of August 31, 2024, the related statement of operations for the year ended August 31, 2024, the statement of changes in net assets for each of the two years in the period ended August 31, 2024, including the related notes, and the financial highlights for each of the five years in the period ended August 31, 2024 (collectively referred to as the "financial statements"). In our opinion, the financial statements present fairly, in all material respects, the financial position of the Fund as of August 31, 2024, the results of its operations for the year then ended, the changes in its net assets for each of the two years in the period ended August 31, 2024 and the financial highlights for each of the five years in the period ended August 31, 2024 in conformity with accounting principles generally accepted in the United States of America.
Basis for Opinion
These financial statements are the responsibility of the Fund's management. Our responsibility is to express an opinion on the Fund's financial statements based on our audits. We are a public accounting firm registered with the Public Company Accounting Oversight Board (United States) (PCAOB) and are required to be independent with respect to the Fund in accordance with the U.S. federal securities laws and the applicable rules and regulations of the Securities and Exchange Commission and the PCAOB.
We conducted our audits of these financial statements in accordance with the standards of the PCAOB. Those standards require that we plan and perform the audit to obtain reasonable assurance about whether the financial statements are free of material misstatement, whether due to error or fraud.
Our audits included performing procedures to assess the risks of material misstatement of the financial statements, whether due to error or fraud, and performing procedures that respond to those risks. Such procedures included examining, on a test basis, evidence regarding the amounts and disclosures in the financial statements. Our audits also included evaluating the accounting principles used and significant estimates made by management, as well as evaluating the overall presentation of the financial statements. Our procedures included confirmation of securities owned as of August 31, 2024 by correspondence with the custodian and brokers; when replies were not received from brokers, we performed other auditing procedures. We believe that our audits provide a reasonable basis for our opinion.
/s/ PricewaterhouseCoopers LLP
Boston, Massachusetts
October 16, 2024
We have served as the auditor of one or more investment companies in the Fidelity group of funds since 1932.
Distributions
(Unaudited)
The dividend and capital gains distributions for the fund(s) are available on Fidelity.com or Institutional.Fidelity.com.
A total of 41.67% of the dividends distributed during the fiscal year was derived from interest on U.S. Government securities which is generally exempt from state income tax.
The fund designates $824,021,691 of distributions paid during the fiscal year ended 2024 as qualifying to be taxed as section 163(j) interest dividends.
The fund will notify shareholders in January 2025 of amounts for use in preparing 2024 income tax returns.
Item 8: Changes in and Disagreements with Accountants for Open-End Management Investment Companies
(Unaudited)
Note: This is not applicable for any fund included in this document.
Item 9: Proxy Disclosures for Open-End Management Investment Companies
(Unaudited)
| A special meeting of shareholders was held on October 18, 2023. The results of votes taken among shareholders on the proposal before them are reported below. Each vote reported represents one dollar of net asset value held on the record date for the meeting. |
| Proposal 1 |
| To elect a Board of Trustees. |
| | # of Votes | % of Votes |
| Abigail P. Johnson |
| Affirmative | 378,729,502,260.01 | 97.58 |
| Withheld | 9,407,876,478.96 | 2.42 |
| TOTAL | 388,137,378,738.97 | 100.00 |
| Jennifer Toolin McAuliffe |
| Affirmative | 378,454,868,010.95 | 97.51 |
| Withheld | 9,682,510,728.02 | 2.49 |
| TOTAL | 388,137,378,738.97 | 100.00 |
| Christine J. Thompson |
| Affirmative | 378,837,121,274.52 | 97.60 |
| Withheld | 9,300,257,464.45 | 2.40 |
| TOTAL | 388,137,378,738.97 | 100.00 |
| Elizabeth S. Acton |
| Affirmative | 378,262,110,794.85 | 97.46 |
| Withheld | 9,875,267,944.12 | 2.54 |
| TOTAL | 388,137,378,738.97 | 100.00 |
| Laura M. Bishop |
| Affirmative | 380,482,113,171.06 | 98.03 |
| Withheld | 7,655,265,567.91 | 1.97 |
| TOTAL | 388,137,378,738.97 | 100.00 |
| Ann E. Dunwoody |
| Affirmative | 380,016,034,008.12 | 97.91 |
| Withheld | 8,121,344,730.85 | 2.09 |
| TOTAL | 388,137,378,738.97 | 100.00 |
| John Engler |
| Affirmative | 379,432,488,394.20 | 97.76 |
| Withheld | 8,704,890,344.77 | 2.24 |
| TOTAL | 388,137,378,738.97 | 100.00 |
| Robert F. Gartland |
| Affirmative | 378,741,819,600.60 | 97.58 |
| Withheld | 9,395,559,138.37 | 2.42 |
| TOTAL | 388,137,378,738.97 | 100.00 |
| Robert W. Helm |
| Affirmative | 380,389,324,755.07 | 98.00 |
| Withheld | 7,748,053,983.90 | 2.00 |
| TOTAL | 388,137,378,738.97 | 100.00 |
| Arthur E. Johnson |
| Affirmative | 378,427,694,151.67 | 97.50 |
| Withheld | 9,709,684,587.30 | 2.50 |
| TOTAL | 388,137,378,738.97 | 100.00 |
| Michael E. Kenneally |
| Affirmative | 377,842,228,145.18 | 97.35 |
| Withheld | 10,295,150,593.79 | 2.65 |
| TOTAL | 388,137,378,738.97 | 100.00 |
| Mark A. Murray |
| Affirmative | 380,158,432,703.37 | 97.94 |
| Withheld | 7,978,946,035.60 | 2.06 |
| TOTAL | 388,137,378,738.97 | 100.00 |
| Carol J. Zierhoffer |
| Affirmative | 380,522,113,360.24 | 98.04 |
| Withheld | 7,615,265,378.73 | 1.96 |
| TOTAL | 388,137,378,738.97 | 100.00 |
| | | |
| Proposal 1 reflects trust-wide proposal and voting results. |
Item 10: Remuneration Paid to Directors, Officers, and others of Open-End Management Investment Companies
(Unaudited)
Note: This information is disclosed as part of the financial statements for each Fund as part of Item 7: Financial Statements and Financial Highlights for Open-End Management Investment companies.
Item 11: Statement Regarding Basis for Approval of Investment Advisory Contract
(Unaudited)
Note: This is not applicable for any fund included in this document.
1.9892975.105
SBX-ANN-1024
Fidelity® Series Investment Grade Bond Fund
Annual Report
August 31, 2024
Contents
To view a fund's proxy voting guidelines and proxy voting record for the 12-month period ended June 30, visit http://www.fidelity.com/proxyvotingresults or visit the Securities and Exchange Commission's (SEC) web site at http://www.sec.gov.
You may also call 1-800-544-8544 to request a free copy of the proxy voting guidelines.
Standard & Poor's, S&P and S&P 500 are registered service marks of The McGraw-Hill Companies, Inc. and have been licensed for use by Fidelity Distributors Corporation.
Other third-party marks appearing herein are the property of their respective owners.
All other marks appearing herein are registered or unregistered trademarks or service marks of FMR LLC or an affiliated company. © 2024 FMR LLC. All rights reserved.
This report and the financial statements contained herein are submitted for the general information of the shareholders of the Fund. This report is not authorized for distribution to prospective investors in the Fund unless preceded or accompanied by an effective prospectus.
A fund files its complete schedule of portfolio holdings with the SEC for the first and third quarters of each fiscal year on Form N-PORT. Forms N-PORT are available on the SEC's web site at http://www.sec.gov. A fund's Forms N-PORT may be reviewed and copied at the SEC's Public Reference Room in Washington, DC. Information regarding the operation of the SEC's Public Reference Room may be obtained by calling 1-800-SEC-0330.
For a complete list of a fund's portfolio holdings, view the most recent holdings listing, semiannual report, or annual report on Fidelity's web site at http://www.fidelity.com, http://www.institutional.fidelity.com, or http://www.401k.com, as applicable.
NOT FDIC INSURED •MAY LOSE VALUE •NO BANK GUARANTEE
Neither the Fund nor Fidelity Distributors Corporation is a bank.
Item 7: Financial Statements and Financial Highlights for Open-End Management Investment Companies (Annual Report)
Fidelity® Series Investment Grade Bond Fund
Schedule of Investments August 31, 2024
Showing Percentage of Net Assets
| Nonconvertible Bonds - 25.7% |
| | | Principal Amount (a) | Value ($) |
| COMMUNICATION SERVICES - 2.1% | | | |
| Diversified Telecommunication Services - 0.5% | | | |
| AT&T, Inc.: | | | |
| 2.55% 12/1/33 | | 8,942,000 | 7,406,318 |
| 3.8% 12/1/57 | | 74,998,000 | 54,970,345 |
| 4.3% 2/15/30 | | 15,664,000 | 15,505,209 |
| 4.75% 5/15/46 | | 20,994,000 | 19,008,339 |
| Verizon Communications, Inc.: | | | |
| 2.55% 3/21/31 | | 30,343,000 | 26,690,691 |
| 4.5% 8/10/33 | | 17,268,000 | 16,793,749 |
| 4.78% 2/15/35 (b) | | 37,359,000 | 36,837,781 |
| 5.012% 4/15/49 | | 705,000 | 699,307 |
| | | | 177,911,739 |
| Media - 1.4% | | | |
| Charter Communications Operating LLC/Charter Communications Operating Capital Corp.: | | | |
| 2.25% 1/15/29 | | 16,500,000 | 14,580,799 |
| 4.4% 4/1/33 | | 9,969,000 | 9,060,965 |
| 5.05% 3/30/29 | | 9,500,000 | 9,403,412 |
| 5.25% 4/1/53 | | 23,544,000 | 19,279,631 |
| 5.375% 5/1/47 | | 63,824,000 | 53,225,422 |
| 5.5% 4/1/63 | | 9,969,000 | 7,992,486 |
| 5.75% 4/1/48 | | 9,412,000 | 8,171,171 |
| 6.1% 6/1/29 | | 23,527,000 | 24,307,571 |
| 6.484% 10/23/45 | | 26,013,000 | 24,864,084 |
| 6.55% 6/1/34 | | 12,828,000 | 13,288,361 |
| Discovery Communications LLC 3.625% 5/15/30 | | 18,602,000 | 16,511,313 |
| Fox Corp.: | | | |
| 4.709% 1/25/29 | | 9,867,000 | 9,936,142 |
| 5.476% 1/25/39 | | 9,730,000 | 9,693,294 |
| 5.576% 1/25/49 | | 6,456,000 | 6,246,479 |
| Time Warner Cable LLC: | | | |
| 4.5% 9/15/42 | | 21,984,000 | 16,661,258 |
| 5.5% 9/1/41 | | 15,667,000 | 13,557,344 |
| 5.875% 11/15/40 | | 11,331,000 | 10,228,379 |
| 6.55% 5/1/37 | | 50,619,000 | 49,941,039 |
| 6.75% 6/15/39 | | 13,940,000 | 13,860,559 |
| 7.3% 7/1/38 | | 32,280,000 | 33,759,253 |
| Warnermedia Holdings, Inc.: | | | |
| 3.755% 3/15/27 | | 22,043,000 | 21,118,162 |
| 4.054% 3/15/29 | | 7,640,000 | 7,137,821 |
| 4.279% 3/15/32 | | 30,761,000 | 26,889,756 |
| 5.05% 3/15/42 | | 15,981,000 | 12,806,129 |
| 5.141% 3/15/52 | | 67,439,000 | 51,294,006 |
| | | | 483,814,836 |
| Wireless Telecommunication Services - 0.2% | | | |
| T-Mobile U.S.A., Inc.: | | | |
| 3.75% 4/15/27 | | 32,520,000 | 31,929,772 |
| 3.875% 4/15/30 | | 47,090,000 | 45,305,109 |
| | | | 77,234,881 |
TOTAL COMMUNICATION SERVICES | | | 738,961,456 |
| CONSUMER DISCRETIONARY - 0.3% | | | |
| Automobiles - 0.1% | | | |
| General Motors Financial Co., Inc. 2.35% 2/26/27 | | 21,000,000 | 19,878,696 |
| Hotels, Restaurants & Leisure - 0.0% | | | |
| McDonald's Corp. 3.5% 7/1/27 | | 9,188,000 | 8,990,998 |
| Household Durables - 0.0% | | | |
| Lennar Corp. 5% 6/15/27 | | 2,921,000 | 2,945,751 |
| Specialty Retail - 0.2% | | | |
| AutoNation, Inc. 4.75% 6/1/30 | | 4,077,000 | 4,028,003 |
| AutoZone, Inc. 4% 4/15/30 | | 28,926,000 | 28,099,509 |
| Lowe's Companies, Inc.: | | | |
| 3.35% 4/1/27 | | 3,413,000 | 3,328,682 |
| 3.75% 4/1/32 | | 10,505,000 | 9,870,923 |
| 4.45% 4/1/62 | | 44,060,000 | 35,966,834 |
| O'Reilly Automotive, Inc. 4.2% 4/1/30 | | 6,418,000 | 6,302,719 |
| | | | 87,596,670 |
TOTAL CONSUMER DISCRETIONARY | | | 119,412,115 |
| CONSUMER STAPLES - 0.6% | | | |
| Consumer Staples Distribution & Retail - 0.1% | | | |
| Sysco Corp. 5.95% 4/1/30 | | 19,674,000 | 20,997,957 |
| Tobacco - 0.5% | | | |
| Altria Group, Inc.: | | | |
| 4.25% 8/9/42 | | 26,130,000 | 21,957,187 |
| 4.5% 5/2/43 | | 17,568,000 | 15,144,731 |
| 4.8% 2/14/29 | | 4,818,000 | 4,845,652 |
| 5.95% 2/14/49 | | 6,241,000 | 6,431,340 |
| BAT Capital Corp. 6.421% 8/2/33 | | 15,947,000 | 17,291,681 |
| Imperial Brands Finance PLC: | | | |
| 4.25% 7/21/25 (b) | | 2,664,000 | 2,640,432 |
| 6.125% 7/27/27 (b) | | 16,185,000 | 16,749,193 |
| Reynolds American, Inc.: | | | |
| 4.45% 6/12/25 | | 7,893,000 | 7,852,074 |
| 5.7% 8/15/35 | | 6,607,000 | 6,764,867 |
| 5.85% 8/15/45 | | 50,684,000 | 49,643,840 |
| 6.15% 9/15/43 | | 11,136,000 | 11,306,801 |
| 7.25% 6/15/37 | | 15,680,000 | 17,790,874 |
| | | | 178,418,672 |
TOTAL CONSUMER STAPLES | | | 199,416,629 |
| ENERGY - 3.2% | | | |
| Energy Equipment & Services - 0.0% | | | |
| Halliburton Co.: | | | |
| 3.8% 11/15/25 | | 315,000 | 311,530 |
| 4.85% 11/15/35 | | 11,266,000 | 11,121,689 |
| | | | 11,433,219 |
| Oil, Gas & Consumable Fuels - 3.2% | | | |
| Canadian Natural Resources Ltd. 5.85% 2/1/35 | | 12,899,000 | 13,385,738 |
| Cenovus Energy, Inc.: | | | |
| 3.75% 2/15/52 | | 23,742,000 | 17,271,405 |
| 5.4% 6/15/47 | | 3,321,000 | 3,186,159 |
| 6.75% 11/15/39 | | 3,701,000 | 4,138,319 |
| Columbia Pipelines Operating Co. LLC: | | | |
| 5.927% 8/15/30 (b) | | 4,934,000 | 5,182,921 |
| 6.036% 11/15/33 (b) | | 13,297,000 | 14,039,311 |
| 6.497% 8/15/43 (b) | | 3,976,000 | 4,321,823 |
| 6.544% 11/15/53 (b) | | 7,158,000 | 7,938,468 |
| 6.714% 8/15/63 (b) | | 4,285,000 | 4,763,868 |
| DCP Midstream Operating LP: | | | |
| 5.6% 4/1/44 | | 1,458,000 | 1,438,575 |
| 6.45% 11/3/36 (b) | | 7,882,000 | 8,555,336 |
| 6.75% 9/15/37 (b) | | 2,991,000 | 3,297,694 |
| Energy Transfer LP: | | | |
| 3.75% 5/15/30 | | 34,654,000 | 32,779,888 |
| 4.95% 6/15/28 | | 22,521,000 | 22,754,381 |
| 5% 5/15/50 | | 37,928,000 | 33,638,623 |
| 5.25% 4/15/29 | | 11,043,000 | 11,289,584 |
| 5.4% 10/1/47 | | 7,311,000 | 6,835,731 |
| 5.8% 6/15/38 | | 12,558,000 | 12,868,186 |
| 6% 6/15/48 | | 8,178,000 | 8,258,114 |
| 6.25% 4/15/49 | | 7,585,000 | 7,892,075 |
| Hess Corp.: | | | |
| 5.6% 2/15/41 | | 13,347,000 | 13,648,310 |
| 5.8% 4/1/47 | | 19,267,000 | 19,985,849 |
| 7.125% 3/15/33 | | 5,555,000 | 6,327,852 |
| 7.3% 8/15/31 | | 7,267,000 | 8,291,801 |
| 7.875% 10/1/29 | | 2,497,000 | 2,851,930 |
| Kinder Morgan Energy Partners LP 6.55% 9/15/40 | | 2,324,000 | 2,488,059 |
| Kinder Morgan, Inc.: | | | |
| 3.6% 2/15/51 | | 45,000,000 | 32,098,171 |
| 5.55% 6/1/45 | | 13,098,000 | 12,705,813 |
| MPLX LP: | | | |
| 2.65% 8/15/30 | | 10,000,000 | 8,937,613 |
| 4.8% 2/15/29 | | 5,907,000 | 5,962,823 |
| 4.875% 12/1/24 | | 15,019,000 | 14,994,809 |
| 4.95% 9/1/32 | | 30,643,000 | 30,332,090 |
| 5.5% 2/15/49 | | 17,721,000 | 16,992,421 |
| Occidental Petroleum Corp.: | | | |
| 5.55% 3/15/26 | | 28,220,000 | 28,452,251 |
| 6.45% 9/15/36 | | 24,570,000 | 26,628,168 |
| 6.6% 3/15/46 | | 53,949,000 | 58,253,857 |
| 7.5% 5/1/31 | | 40,626,000 | 46,087,475 |
| Ovintiv, Inc. 8.125% 9/15/30 | | 2,868,000 | 3,313,699 |
| Petroleos Mexicanos: | | | |
| 4.5% 1/23/26 | | 20,014,000 | 19,244,712 |
| 5.95% 1/28/31 | | 37,031,000 | 30,631,673 |
| 6.35% 2/12/48 | | 13,566,000 | 8,955,188 |
| 6.49% 1/23/27 | | 38,273,000 | 37,129,887 |
| 6.5% 3/13/27 | | 37,289,000 | 35,862,696 |
| 6.7% 2/16/32 | | 80,790,000 | 69,358,215 |
| 6.75% 9/21/47 | | 95,358,000 | 64,880,630 |
| 6.84% 1/23/30 | | 35,198,000 | 31,692,279 |
| 6.95% 1/28/60 | | 19,817,000 | 13,497,953 |
| 7.69% 1/23/50 | | 124,733,000 | 92,576,833 |
| Phillips 66 Co. 3.85% 4/9/25 | | 3,215,000 | 3,187,551 |
| Plains All American Pipeline LP/PAA Finance Corp.: | | | |
| 3.55% 12/15/29 | | 7,628,000 | 7,180,282 |
| 3.6% 11/1/24 | | 6,687,000 | 6,663,819 |
| Sabine Pass Liquefaction LLC 4.5% 5/15/30 | | 42,700,000 | 42,253,776 |
| The Williams Companies, Inc.: | | | |
| 2.6% 3/15/31 | | 21,000,000 | 18,356,665 |
| 3.5% 11/15/30 | | 55,862,000 | 52,341,062 |
| 3.9% 1/15/25 | | 6,023,000 | 5,990,301 |
| 4.65% 8/15/32 | | 32,008,000 | 31,486,728 |
| 5.3% 8/15/52 | | 7,262,000 | 6,953,138 |
| Transcontinental Gas Pipe Line Co. LLC 3.25% 5/15/30 | | 5,447,000 | 5,057,175 |
| Western Midstream Operating LP: | | | |
| 4.65% 7/1/26 | | 8,954,000 | 8,907,991 |
| 4.75% 8/15/28 | | 6,312,000 | 6,281,887 |
| | | | 1,160,679,631 |
TOTAL ENERGY | | | 1,172,112,850 |
| FINANCIALS - 12.0% | | | |
| Banks - 5.0% | | | |
| Bank of America Corp.: | | | |
| 2.299% 7/21/32 (c) | | 42,030,000 | 35,776,809 |
| 2.972% 2/4/33 (c) | | 21,000,000 | 18,512,743 |
| 3.419% 12/20/28 (c) | | 32,593,000 | 31,426,249 |
| 4% 1/22/25 | | 14,494,000 | 14,414,148 |
| 4.183% 11/25/27 | | 3,728,000 | 3,690,844 |
| 4.25% 10/22/26 | | 45,120,000 | 44,887,074 |
| 5.015% 7/22/33 (c) | | 152,527,000 | 154,303,853 |
| Barclays PLC: | | | |
| 2.852% 5/7/26 (c) | | 42,733,000 | 42,006,207 |
| 2.894% 11/24/32 (c) | | 14,928,000 | 12,869,675 |
| 4.836% 5/9/28 | | 3,148,000 | 3,122,245 |
| 5.088% 6/20/30 (c) | | 44,892,000 | 44,723,609 |
| 5.2% 5/12/26 | | 41,312,000 | 41,420,095 |
| 5.69% 3/12/30 (c) | | 34,049,000 | 35,102,578 |
| 6.49% 9/13/29 (c) | | 37,876,000 | 40,122,655 |
| BNP Paribas SA 2.219% 6/9/26 (b)(c) | | 40,110,000 | 39,183,108 |
| BPCE SA 4.875% 4/1/26 (b) | | 3,984,000 | 3,959,127 |
| Citigroup, Inc.: | | | |
| 3.785% 3/17/33 (c) | | 21,000,000 | 19,383,915 |
| 4.075% 4/23/29 (c) | | 14,005,000 | 13,774,604 |
| 4.125% 7/25/28 | | 3,728,000 | 3,666,847 |
| 4.3% 11/20/26 | | 9,646,000 | 9,585,490 |
| 4.4% 6/10/25 | | 29,307,000 | 29,145,759 |
| 4.412% 3/31/31 (c) | | 57,587,000 | 56,644,151 |
| 4.45% 9/29/27 | | 48,296,000 | 48,068,520 |
| 4.6% 3/9/26 | | 10,087,000 | 10,062,324 |
| 4.91% 5/24/33 (c) | | 5,636,000 | 5,605,883 |
| 5.3% 5/6/44 | | 5,127,000 | 5,036,082 |
| Citizens Financial Group, Inc. 2.638% 9/30/32 | | 32,329,000 | 26,262,884 |
| Commonwealth Bank of Australia: | | | |
| 3.61% 9/12/34 (b)(c) | | 14,950,000 | 13,948,485 |
| 3.784% 3/14/32 (b) | | 11,585,000 | 10,608,595 |
| Cooperatieve Rabobank UA 4.375% 8/4/25 | | 42,555,000 | 42,248,543 |
| HSBC Holdings PLC: | | | |
| 2.804% 5/24/32 (c) | | 7,768,000 | 6,746,572 |
| 3.973% 5/22/30 (c) | | 10,000,000 | 9,641,662 |
| 5.25% 3/14/44 | | 560,000 | 545,398 |
| Intesa Sanpaolo SpA 5.71% 1/15/26 (b) | | 81,601,000 | 81,874,555 |
| JPMorgan Chase & Co.: | | | |
| 2.739% 10/15/30 (c) | | 55,000,000 | 50,359,472 |
| 2.956% 5/13/31 (c) | | 23,105,000 | 21,015,483 |
| 2.963% 1/25/33 (c) | | 21,000,000 | 18,595,515 |
| 3.875% 9/10/24 | | 56,148,000 | 56,126,763 |
| 4.586% 4/26/33 (c) | | 155,774,000 | 153,766,109 |
| 4.912% 7/25/33 (c) | | 38,769,000 | 38,982,439 |
| 5.299% 7/24/29 (c) | | 34,500,000 | 35,400,715 |
| NatWest Group PLC: | | | |
| 3.073% 5/22/28 (c) | | 24,822,000 | 23,797,846 |
| 4.8% 4/5/26 | | 20,881,000 | 20,879,171 |
| 4.892% 5/18/29 (c) | | 10,000,000 | 10,026,942 |
| Santander Holdings U.S.A., Inc. 2.49% 1/6/28 (c) | | 29,541,000 | 27,724,103 |
| Societe Generale: | | | |
| 1.488% 12/14/26 (b)(c) | | 51,731,000 | 49,280,196 |
| 3.337% 1/21/33 (b)(c) | | 21,000,000 | 18,218,572 |
| 4.25% 4/14/25 (b) | | 3,837,000 | 3,799,238 |
| Wells Fargo & Co.: | | | |
| 3.196% 6/17/27 (c) | | 34,559,000 | 33,687,604 |
| 3.526% 3/24/28 (c) | | 46,819,000 | 45,588,777 |
| 4.478% 4/4/31 (c) | | 77,500,000 | 76,704,955 |
| 5.013% 4/4/51 (c) | | 87,446,000 | 83,790,536 |
| 5.499% 1/23/35 (c) | | 27,292,000 | 28,164,119 |
| 5.574% 7/25/29 (c) | | 38,000,000 | 39,240,122 |
| Westpac Banking Corp. 4.11% 7/24/34 (c) | | 20,547,000 | 19,702,875 |
| | | | 1,813,222,840 |
| Capital Markets - 3.2% | | | |
| Ares Capital Corp. 3.875% 1/15/26 | | 65,900,000 | 64,639,997 |
| Athene Global Funding: | | | |
| 5.339% 1/15/27 (b) | | 51,492,000 | 52,110,907 |
| 5.583% 1/9/29 (b) | | 25,932,000 | 26,629,758 |
| Blackstone Private Credit Fund: | | | |
| 4.7% 3/24/25 | | 80,609,000 | 80,168,651 |
| 7.05% 9/29/25 | | 38,296,000 | 38,900,290 |
| Deutsche Bank AG 4.5% 4/1/25 | | 70,869,000 | 70,420,967 |
| Deutsche Bank AG New York Branch: | | | |
| 3.035% 5/28/32 (c) | | 9,360,000 | 8,191,965 |
| 4.1% 1/13/26 | | 4,496,000 | 4,437,341 |
| 6.72% 1/18/29 (c) | | 20,750,000 | 21,845,263 |
| 6.819% 11/20/29 (c) | | 34,596,000 | 36,812,919 |
| Goldman Sachs Group, Inc.: | | | |
| 2.383% 7/21/32 (c) | | 50,634,000 | 43,113,090 |
| 3.102% 2/24/33 (c) | | 39,600,000 | 35,028,386 |
| 3.272% 9/29/25 (c) | | 104,473,000 | 104,260,703 |
| 3.8% 3/15/30 | | 57,860,000 | 55,786,447 |
| 4.25% 10/21/25 | | 32,884,000 | 32,646,830 |
| 6.75% 10/1/37 | | 31,825,000 | 35,870,367 |
| Moody's Corp. 3.25% 1/15/28 | | 12,370,000 | 11,982,508 |
| Morgan Stanley: | | | |
| 2.943% 1/21/33 (c) | | 21,000,000 | 18,468,730 |
| 3.622% 4/1/31 (c) | | 54,679,000 | 51,880,825 |
| 4.431% 1/23/30 (c) | | 23,749,000 | 23,599,505 |
| 4.889% 7/20/33 (c) | | 94,211,000 | 93,983,398 |
| 5.449% 7/20/29 (c) | | 21,363,000 | 22,018,782 |
| UBS Group AG: | | | |
| 1.494% 8/10/27 (b)(c) | | 31,236,000 | 29,284,950 |
| 2.593% 9/11/25 (b)(c) | | 58,126,000 | 58,087,965 |
| 3.091% 5/14/32 (b)(c) | | 15,102,000 | 13,369,451 |
| 3.75% 3/26/25 | | 31,994,000 | 31,741,556 |
| 3.869% 1/12/29 (b)(c) | | 19,608,000 | 19,001,654 |
| 4.125% 9/24/25 (b) | | 27,816,000 | 27,564,558 |
| 4.194% 4/1/31 (b)(c) | | 52,365,000 | 50,600,408 |
| 4.55% 4/17/26 | | 1,588,000 | 1,582,786 |
| | | | 1,164,030,957 |
| Consumer Finance - 2.2% | | | |
| AerCap Ireland Capital Ltd./AerCap Global Aviation Trust: | | | |
| 1.65% 10/29/24 | | 14,665,000 | 14,570,588 |
| 2.45% 10/29/26 | | 20,465,000 | 19,504,855 |
| 3% 10/29/28 | | 21,434,000 | 20,046,121 |
| 3.3% 1/30/32 | | 22,930,000 | 20,381,946 |
| 4.45% 4/3/26 | | 16,892,000 | 16,766,787 |
| 6.45% 4/15/27 | | 70,156,000 | 72,999,261 |
| 6.5% 7/15/25 | | 19,270,000 | 19,455,623 |
| Ally Financial, Inc.: | | | |
| 4.625% 3/30/25 | | 10,429,000 | 10,380,784 |
| 5.125% 9/30/24 | | 11,402,000 | 11,394,025 |
| 5.8% 5/1/25 | | 27,438,000 | 27,492,891 |
| 7.1% 11/15/27 | | 36,750,000 | 39,027,604 |
| 8% 11/1/31 | | 22,726,000 | 25,937,262 |
| Capital One Financial Corp.: | | | |
| 2.636% 3/3/26 (c) | | 24,182,000 | 23,841,126 |
| 3.273% 3/1/30 (c) | | 35,931,000 | 33,478,286 |
| 3.65% 5/11/27 | | 72,123,000 | 70,361,644 |
| 3.8% 1/31/28 | | 34,796,000 | 33,759,882 |
| 4.985% 7/24/26 (c) | | 30,637,000 | 30,570,271 |
| 5.247% 7/26/30 (c) | | 39,510,000 | 39,914,983 |
| Discover Financial Services: | | | |
| 3.75% 3/4/25 | | 20,000,000 | 19,843,673 |
| 3.95% 11/6/24 | | 17,423,000 | 17,366,755 |
| 4.1% 2/9/27 | | 1,920,000 | 1,886,912 |
| 4.5% 1/30/26 | | 25,399,000 | 25,244,894 |
| 6.7% 11/29/32 | | 7,709,000 | 8,401,626 |
| Ford Motor Credit Co. LLC 4.063% 11/1/24 | | 101,625,000 | 101,320,117 |
| Synchrony Financial: | | | |
| 3.95% 12/1/27 | | 42,034,000 | 40,501,711 |
| 5.15% 3/19/29 | | 34,299,000 | 34,161,510 |
| | | | 778,611,137 |
| Financial Services - 0.9% | | | |
| Corebridge Financial, Inc.: | | | |
| 3.5% 4/4/25 | | 10,416,000 | 10,307,510 |
| 3.65% 4/5/27 | | 35,355,000 | 34,616,249 |
| 3.85% 4/5/29 | | 14,571,000 | 14,067,399 |
| 3.9% 4/5/32 | | 17,347,000 | 16,060,678 |
| 4.35% 4/5/42 | | 3,946,000 | 3,395,014 |
| 4.4% 4/5/52 | | 11,669,000 | 9,696,113 |
| Corebridge Global Funding 5.9% 9/19/28 (b) | | 20,514,000 | 21,399,660 |
| Equitable Holdings, Inc. 4.572% 2/15/29 (b) | | 8,015,000 | 7,941,483 |
| Jackson Financial, Inc.: | | | |
| 3.125% 11/23/31 | | 3,876,000 | 3,354,189 |
| 5.17% 6/8/27 | | 15,288,000 | 15,495,891 |
| 5.67% 6/8/32 | | 16,451,000 | 16,982,326 |
| Jbs U.S.A. Holding Lux/ Jbs U.S.A. F: | | | |
| 2.5% 1/15/27 | | 46,350,000 | 44,006,892 |
| 3% 5/15/32 | | 51,930,000 | 44,381,222 |
| 3.625% 1/15/32 | | 19,632,000 | 17,641,033 |
| 5.125% 2/1/28 | | 16,760,000 | 16,844,521 |
| 5.5% 1/15/30 | | 6,359,000 | 6,405,096 |
| 5.75% 4/1/33 | | 25,066,000 | 25,659,036 |
| Pine Street Trust II 5.568% 2/15/49 (b) | | 31,271,000 | 30,190,415 |
| | | | 338,444,727 |
| Insurance - 0.7% | | | |
| Five Corners Funding Trust II 2.85% 5/15/30 (b) | | 58,620,000 | 53,501,847 |
| Hartford Financial Services Group, Inc. 2.8% 8/19/29 | | 6,834,000 | 6,291,683 |
| Liberty Mutual Group, Inc. 4.569% 2/1/29 (b) | | 17,650,000 | 17,566,730 |
| Marsh & McLennan Companies, Inc. 4.375% 3/15/29 | | 21,405,000 | 21,484,418 |
| Massachusetts Mutual Life Insurance Co. 3.729% 10/15/70 (b) | | 37,673,000 | 26,557,339 |
| Pricoa Global Funding I 5.375% 5/15/45 (c) | | 28,973,000 | 28,772,730 |
| Swiss Re Finance Luxembourg SA 5% 4/2/49 (b)(c) | | 4,000,000 | 3,993,200 |
| TIAA Asset Management Finance LLC 4.125% 11/1/24 (b) | | 10,865,000 | 10,838,232 |
| Unum Group: | | | |
| 3.875% 11/5/25 | | 25,368,000 | 25,055,865 |
| 4% 6/15/29 | | 24,228,000 | 23,545,551 |
| 5.75% 8/15/42 | | 41,569,000 | 41,439,913 |
| | | | 259,047,508 |
TOTAL FINANCIALS | | | 4,353,357,169 |
| HEALTH CARE - 1.6% | | | |
| Biotechnology - 0.2% | | | |
| Amgen, Inc.: | | | |
| 5.25% 3/2/30 | | 16,718,000 | 17,318,130 |
| 5.25% 3/2/33 | | 18,873,000 | 19,395,351 |
| 5.6% 3/2/43 | | 17,930,000 | 18,325,019 |
| 5.65% 3/2/53 | | 8,913,000 | 9,167,134 |
| 5.75% 3/2/63 | | 16,243,000 | 16,659,272 |
| | | | 80,864,906 |
| Health Care Providers & Services - 1.0% | | | |
| Centene Corp.: | | | |
| 2.45% 7/15/28 | | 43,675,000 | 39,960,428 |
| 2.625% 8/1/31 | | 20,375,000 | 17,283,228 |
| 3.375% 2/15/30 | | 21,905,000 | 20,057,432 |
| 4.25% 12/15/27 | | 25,155,000 | 24,594,044 |
| 4.625% 12/15/29 | | 39,085,000 | 38,025,492 |
| Cigna Group: | | | |
| 3.05% 10/15/27 | | 17,500,000 | 16,826,651 |
| 4.8% 8/15/38 | | 20,493,000 | 19,651,017 |
| CVS Health Corp.: | | | |
| 3% 8/15/26 | | 3,494,000 | 3,384,397 |
| 3.625% 4/1/27 | | 9,782,000 | 9,575,846 |
| 4.78% 3/25/38 | | 33,481,000 | 30,756,758 |
| 5% 1/30/29 | | 14,082,000 | 14,281,702 |
| 5.25% 1/30/31 | | 5,774,000 | 5,871,036 |
| HCA Holdings, Inc.: | | | |
| 3.5% 9/1/30 | | 15,777,000 | 14,710,132 |
| 3.625% 3/15/32 | | 4,163,000 | 3,784,786 |
| 5.625% 9/1/28 | | 19,767,000 | 20,385,198 |
| 5.875% 2/1/29 | | 21,543,000 | 22,380,991 |
| Humana, Inc. 3.7% 3/23/29 | | 13,384,000 | 12,918,795 |
| Sabra Health Care LP 3.2% 12/1/31 | | 48,562,000 | 42,120,377 |
| Toledo Hospital 5.325% 11/15/28 | | 11,480,000 | 11,279,100 |
| | | | 367,847,410 |
| Pharmaceuticals - 0.4% | | | |
| Bayer U.S. Finance II LLC 4.25% 12/15/25 (b) | | 46,388,000 | 45,853,957 |
| Elanco Animal Health, Inc. 6.65% 8/28/28 (c) | | 7,291,000 | 7,550,005 |
| Utah Acquisition Sub, Inc. 3.95% 6/15/26 | | 38,227,000 | 37,683,701 |
| Viatris, Inc.: | | | |
| 2.7% 6/22/30 | | 43,085,000 | 37,928,374 |
| 4% 6/22/50 | | 10,202,000 | 7,231,159 |
| | | | 136,247,196 |
TOTAL HEALTH CARE | | | 584,959,512 |
| INDUSTRIALS - 0.8% | | | |
| Aerospace & Defense - 0.5% | | | |
| BAE Systems Holdings, Inc. 3.8% 10/7/24 (b) | | 15,580,000 | 15,553,102 |
| BAE Systems PLC 3.4% 4/15/30 (b) | | 11,875,000 | 11,150,190 |
| The Boeing Co.: | | | |
| 5.15% 5/1/30 | | 21,453,000 | 21,397,909 |
| 5.705% 5/1/40 | | 15,530,000 | 15,095,231 |
| 5.805% 5/1/50 | | 36,500,000 | 34,450,341 |
| 5.93% 5/1/60 | | 15,530,000 | 14,668,988 |
| 6.259% 5/1/27 (b) | | 3,461,000 | 3,560,626 |
| 6.298% 5/1/29 (b) | | 9,888,000 | 10,326,578 |
| 6.388% 5/1/31 (b) | | 7,489,000 | 7,888,657 |
| 6.528% 5/1/34 (b) | | 8,015,000 | 8,488,782 |
| 6.858% 5/1/54 (b) | | 12,066,000 | 12,991,902 |
| 7.008% 5/1/64 (b) | | 11,387,000 | 12,264,033 |
| | | | 167,836,339 |
| Building Products - 0.0% | | | |
| Carrier Global Corp.: | | | |
| 5.9% 3/15/34 | | 3,229,000 | 3,483,111 |
| 6.2% 3/15/54 | | 2,000,000 | 2,267,684 |
| | | | 5,750,795 |
| Professional Services - 0.0% | | | |
| Thomson Reuters Corp. 3.85% 9/29/24 | | 5,745,000 | 5,735,682 |
| Trading Companies & Distributors - 0.1% | | | |
| Air Lease Corp. 3.375% 7/1/25 | | 33,735,000 | 33,251,017 |
| Transportation Infrastructure - 0.2% | | | |
| Avolon Holdings Funding Ltd.: | | | |
| 4.25% 4/15/26 (b) | | 8,740,000 | 8,604,456 |
| 4.375% 5/1/26 (b) | | 25,641,000 | 25,256,852 |
| 6.375% 5/4/28 (b) | | 30,919,000 | 32,139,653 |
| | | | 66,000,961 |
TOTAL INDUSTRIALS | | | 278,574,794 |
| INFORMATION TECHNOLOGY - 0.8% | | | |
| Electronic Equipment, Instruments & Components - 0.1% | | | |
| Dell International LLC/EMC Corp.: | | | |
| 5.3% 10/1/29 | | 12,450,000 | 12,855,452 |
| 6.2% 7/15/30 | | 10,663,000 | 11,491,359 |
| | | | 24,346,811 |
| Semiconductors & Semiconductor Equipment - 0.5% | | | |
| Broadcom, Inc.: | | | |
| 1.95% 2/15/28 (b) | | 8,829,000 | 8,116,415 |
| 2.45% 2/15/31 (b) | | 75,132,000 | 65,555,300 |
| 2.6% 2/15/33 (b) | | 75,132,000 | 62,982,692 |
| 3.5% 2/15/41 (b) | | 60,671,000 | 48,475,693 |
| | | | 185,130,100 |
| Software - 0.2% | | | |
| Oracle Corp.: | | | |
| 1.65% 3/25/26 | | 35,590,000 | 33,980,297 |
| 2.3% 3/25/28 | | 56,229,000 | 52,183,255 |
| | | | 86,163,552 |
TOTAL INFORMATION TECHNOLOGY | | | 295,640,463 |
| MATERIALS - 0.1% | | | |
| Chemicals - 0.1% | | | |
| Celanese U.S. Holdings LLC: | | | |
| 6.35% 11/15/28 | | 17,220,000 | 18,117,397 |
| 6.55% 11/15/30 | | 17,466,000 | 18,730,556 |
| 6.7% 11/15/33 | | 10,208,000 | 11,034,852 |
| | | | 47,882,805 |
| REAL ESTATE - 3.1% | | | |
| Equity Real Estate Investment Trusts (REITs) - 2.6% | | | |
| Alexandria Real Estate Equities, Inc. 4.9% 12/15/30 | | 22,618,000 | 22,870,261 |
| American Homes 4 Rent LP: | | | |
| 2.375% 7/15/31 | | 4,099,000 | 3,461,506 |
| 3.625% 4/15/32 | | 15,949,000 | 14,503,611 |
| Boston Properties, Inc.: | | | |
| 3.25% 1/30/31 | | 20,338,000 | 17,905,398 |
| 4.5% 12/1/28 | | 20,395,000 | 19,869,107 |
| 6.75% 12/1/27 | | 23,825,000 | 24,902,294 |
| Brixmor Operating Partnership LP: | | | |
| 3.85% 2/1/25 | | 22,346,000 | 22,181,518 |
| 4.05% 7/1/30 | | 26,564,000 | 25,446,793 |
| 4.125% 6/15/26 | | 25,594,000 | 25,286,390 |
| 4.125% 5/15/29 | | 28,249,000 | 27,401,002 |
| Corporate Office Properties LP: | | | |
| 2.25% 3/15/26 | | 8,922,000 | 8,554,254 |
| 2.75% 4/15/31 | | 6,692,000 | 5,739,977 |
| Healthcare Realty Holdings LP: | | | |
| 3.1% 2/15/30 | | 7,500,000 | 6,823,225 |
| 3.5% 8/1/26 | | 7,811,000 | 7,631,439 |
| Healthpeak OP, LLC: | | | |
| 3.25% 7/15/26 | | 3,144,000 | 3,067,622 |
| 3.5% 7/15/29 | | 3,594,000 | 3,415,469 |
| Hudson Pacific Properties LP 4.65% 4/1/29 | | 42,373,000 | 35,029,030 |
| Invitation Homes Operating Partnership LP 4.15% 4/15/32 | | 23,566,000 | 22,204,567 |
| Kite Realty Group LP 5.5% 3/1/34 | | 5,710,000 | 5,788,424 |
| Kite Realty Group Trust: | | | |
| 4% 3/15/25 | | 32,398,000 | 32,067,494 |
| 4.75% 9/15/30 | | 50,933,000 | 50,445,526 |
| LXP Industrial Trust (REIT) 2.7% 9/15/30 | | 9,405,000 | 8,246,353 |
| Omega Healthcare Investors, Inc.: | | | |
| 3.25% 4/15/33 | | 34,179,000 | 28,919,831 |
| 3.625% 10/1/29 | | 33,134,000 | 30,834,208 |
| 4.5% 1/15/25 | | 14,849,000 | 14,785,629 |
| 4.5% 4/1/27 | | 74,033,000 | 73,149,204 |
| 4.75% 1/15/28 | | 36,570,000 | 36,254,269 |
| 5.25% 1/15/26 | | 31,863,000 | 31,863,196 |
| Phillips Edison Grocery Center Operating Partnership I LP 5.75% 7/15/34 | | 5,694,000 | 5,862,870 |
| Piedmont Operating Partnership LP 2.75% 4/1/32 | | 7,712,000 | 6,059,805 |
| Prologis LP 3.25% 6/30/26 | | 318,000 | 311,520 |
| Realty Income Corp.: | | | |
| 2.2% 6/15/28 | | 4,085,000 | 3,759,069 |
| 2.85% 12/15/32 | | 5,025,000 | 4,320,542 |
| 3.25% 1/15/31 | | 5,362,000 | 4,924,584 |
| 3.4% 1/15/28 | | 8,338,000 | 8,050,250 |
| Retail Opportunity Investments Partnership LP 4% 12/15/24 | | 5,977,000 | 5,946,945 |
| Simon Property Group LP: | | | |
| 2.45% 9/13/29 | | 8,537,000 | 7,765,594 |
| 3.375% 12/1/27 | | 17,457,000 | 16,926,639 |
| Store Capital LLC: | | | |
| 2.75% 11/18/30 | | 10,084,000 | 8,719,472 |
| 4.625% 3/15/29 | | 9,743,000 | 9,478,304 |
| Sun Communities Operating LP: | | | |
| 2.3% 11/1/28 | | 8,675,000 | 7,846,003 |
| 2.7% 7/15/31 | | 23,304,000 | 19,956,715 |
| Ventas Realty LP: | | | |
| 3% 1/15/30 | | 43,597,000 | 39,899,093 |
| 3.5% 2/1/25 | | 8,762,000 | 8,681,530 |
| 4% 3/1/28 | | 12,591,000 | 12,317,025 |
| 4.125% 1/15/26 | | 8,982,000 | 8,887,548 |
| 4.75% 11/15/30 | | 53,358,000 | 53,333,564 |
| VICI Properties LP: | | | |
| 4.375% 5/15/25 | | 4,156,000 | 4,116,795 |
| 4.75% 2/15/28 | | 32,852,000 | 32,722,724 |
| 4.95% 2/15/30 | | 42,556,000 | 42,403,292 |
| 5.125% 5/15/32 | | 10,727,000 | 10,603,662 |
| 5.75% 4/1/34 | | 4,481,000 | 4,615,681 |
| Vornado Realty LP 2.15% 6/1/26 | | 10,254,000 | 9,700,502 |
| WP Carey, Inc. 3.85% 7/15/29 | | 7,008,000 | 6,744,654 |
| | | | 952,601,979 |
| Real Estate Management & Development - 0.5% | | | |
| Brandywine Operating Partnership LP: | | | |
| 3.95% 11/15/27 | | 24,749,000 | 23,185,529 |
| 4.55% 10/1/29 | | 31,499,000 | 28,861,696 |
| 8.05% 3/15/28 | | 32,475,000 | 34,555,933 |
| CBRE Group, Inc.: | | | |
| 2.5% 4/1/31 | | 30,503,000 | 26,287,876 |
| 4.875% 3/1/26 | | 4,233,000 | 4,237,929 |
| Tanger Properties LP: | | | |
| 2.75% 9/1/31 | | 23,464,000 | 19,993,958 |
| 3.125% 9/1/26 | | 16,163,000 | 15,545,110 |
| 3.875% 7/15/27 | | 8,715,000 | 8,464,698 |
| | | | 161,132,729 |
TOTAL REAL ESTATE | | | 1,113,734,708 |
| UTILITIES - 1.1% | | | |
| Electric Utilities - 0.3% | | | |
| Alabama Power Co. 3.05% 3/15/32 | | 33,143,000 | 29,750,570 |
| Cleco Corporate Holdings LLC 3.375% 9/15/29 | | 19,437,000 | 17,722,722 |
| Duke Energy Corp. 2.45% 6/1/30 | | 14,856,000 | 13,279,276 |
| Duquesne Light Holdings, Inc.: | | | |
| 2.532% 10/1/30 (b) | | 7,078,000 | 6,123,308 |
| 2.775% 1/7/32 (b) | | 24,917,000 | 21,066,707 |
| Entergy Corp. 2.8% 6/15/30 | | 15,246,000 | 13,788,799 |
| Exelon Corp.: | | | |
| 3.35% 3/15/32 | | 8,906,000 | 8,113,712 |
| 4.05% 4/15/30 | | 9,268,000 | 9,034,387 |
| | | | 118,879,481 |
| Gas Utilities - 0.0% | | | |
| Nakilat, Inc. 6.067% 12/31/33 (b) | | 4,882,840 | 5,147,344 |
| Independent Power and Renewable Electricity Producers - 0.4% | | | |
| Emera U.S. Finance LP 3.55% 6/15/26 | | 9,377,000 | 9,130,946 |
| The AES Corp.: | | | |
| 2.45% 1/15/31 | | 9,656,000 | 8,234,474 |
| 3.3% 7/15/25 (b) | | 45,861,000 | 44,960,143 |
| 3.95% 7/15/30 (b) | | 66,879,000 | 63,140,544 |
| | | | 125,466,107 |
| Multi-Utilities - 0.4% | | | |
| NiSource, Inc.: | | | |
| 2.95% 9/1/29 | | 47,860,000 | 44,337,798 |
| 3.6% 5/1/30 | | 21,965,000 | 20,828,703 |
| 5.8% 2/1/42 | | 11,523,000 | 11,740,735 |
| 5.95% 6/15/41 | | 17,565,000 | 18,307,099 |
| Puget Energy, Inc.: | | | |
| 4.1% 6/15/30 | | 17,963,000 | 17,118,155 |
| 4.224% 3/15/32 | | 30,357,000 | 27,993,011 |
| Sempra 6% 10/15/39 | | 1,481,000 | 1,553,630 |
| WEC Energy Group, Inc. CME Term SOFR 3 Month Index + 2.110% 7.4922% 5/15/67 (c)(d) | | 14,096,000 | 13,712,824 |
| | | | 155,591,955 |
TOTAL UTILITIES | | | 405,084,887 |
| TOTAL NONCONVERTIBLE BONDS (Cost $9,804,817,574) | | | 9,309,137,388 |
| | | | |
| U.S. Treasury Obligations - 39.4% |
| | | Principal Amount (a) | Value ($) |
| U.S. Treasury Bonds: | | | |
| 1.75% 8/15/41 | | 238,590,000 | 165,848,010 |
| 1.875% 11/15/51 | | 440,986,000 | 270,586,253 |
| 2% 11/15/41 | | 311,610,000 | 224,906,951 |
| 2% 8/15/51 | | 517,650,000 | 328,182,014 |
| 2.25% 2/15/52 | | 336,840,000 | 226,617,006 |
| 2.875% 5/15/52 | | 83,620,000 | 64,622,581 |
| 3% 2/15/47 | | 557,997,000 | 449,645,316 |
| 3.25% 5/15/42 | | 163,800,000 | 142,723,546 |
| 3.625% 2/15/53 | | 200,000,000 | 179,398,438 |
| 3.625% 5/15/53 | | 150,000,000 | 134,642,579 |
| 4.125% 8/15/53 | | 887,834,000 | 871,846,054 |
| 4.25% 2/15/54 | | 538,523,000 | 540,626,605 |
| 4.625% 5/15/44 | | 32,000,000 | 33,325,000 |
| 4.625% 5/15/54 | | 5,650,000 | 6,038,438 |
| U.S. Treasury Notes: | | | |
| 1.125% 8/31/28 | | 150,720,000 | 136,113,113 |
| 1.25% 5/31/28 | | 429,352,000 | 391,884,332 |
| 2.5% 3/31/27 | | 138,000,000 | 133,595,860 |
| 2.625% 7/31/29 | | 30,000,000 | 28,492,969 |
| 2.75% 8/15/32 | | 545,773,000 | 504,733,430 |
| 2.875% 5/15/32 | | 580,926,000 | 543,483,507 |
| 3.125% 8/31/29 | | 250,000,000 | 242,871,095 |
| 3.375% 5/15/33 | | 1,000,000 | 962,266 |
| 3.5% 2/15/33 | | 609,000,000 | 592,442,813 |
| 3.75% 8/15/27 | | 25,600,000 | 25,572,000 |
| 3.875% 11/30/29 | | 375,000,000 | 376,977,540 |
| 3.875% 8/15/33 | | 282,336,000 | 281,707,362 |
| 3.875% 8/15/34 | | 25,450,000 | 25,354,509 |
| 4% 7/31/29 | | 200,000,000 | 202,338,660 |
| 4% 10/31/29 | | 1,270,000,000 | 1,283,890,620 |
| 4% 2/28/30 | | 12,900,000 | 13,044,117 |
| 4% 7/31/30 (e) | | 500,000,000 | 505,566,405 |
| 4% 2/15/34 | | 480,000,000 | 483,000,000 |
| 4.125% 3/31/29 | | 260,000,000 | 264,103,125 |
| 4.125% 7/31/31 | | 175,000,000 | 178,238,708 |
| 4.125% 11/15/32 | | 950,000,000 | 967,775,393 |
| 4.25% 12/31/25 | | 16,978,000 | 16,984,336 |
| 4.25% 3/15/27 | | 85,670,000 | 86,540,086 |
| 4.25% 6/30/29 | | 300,000,000 | 306,616,110 |
| 4.25% 2/28/31 | | 381,500,000 | 391,216,328 |
| 4.25% 6/30/31 | | 18,270,000 | 18,749,588 |
| 4.375% 10/31/24 | | 32,900,000 | 32,853,092 |
| 4.375% 12/15/26 | | 37,970,000 | 38,379,364 |
| 4.375% 11/30/30 | | 580,000,000 | 598,351,560 |
| 4.375% 5/15/34 | | 291,320,000 | 301,880,350 |
| 4.5% 5/31/29 | | 19,230,000 | 19,864,740 |
| 4.5% 11/15/33 | | 450,000,000 | 470,443,361 |
| 4.625% 3/15/26 | | 79,510,000 | 80,131,172 |
| 4.625% 6/15/27 | | 24,810,000 | 25,344,966 |
| 4.625% 4/30/31 | | 276,000,000 | 289,131,561 |
| 4.875% 10/31/28 | | 274,364,000 | 286,035,187 |
| 4.875% 10/31/30 | | 475,000,000 | 503,054,688 |
| TOTAL U.S. TREASURY OBLIGATIONS (Cost $15,223,531,707) | | | 14,286,733,104 |
| | | | |
| U.S. Government Agency - Mortgage Securities - 29.3% |
| | | Principal Amount (a) | Value ($) |
| Fannie Mae - 8.0% | | | |
| FTSE USD IBOR Consumer Cash Fallbacks Term 1Y + 1.360% 5.873% 10/1/35 (c)(d) | | 22,990 | 23,597 |
| FTSE USD IBOR Consumer Cash Fallbacks Term 1Y + 1.440% 5.945% 4/1/37 (c)(d) | | 41,033 | 42,011 |
| FTSE USD IBOR Consumer Cash Fallbacks Term 1Y + 1.460% 6.085% 1/1/35 (c)(d) | | 12,106 | 12,393 |
| FTSE USD IBOR Consumer Cash Fallbacks Term 1Y + 1.470% 6.058% 10/1/33 (c)(d) | | 8,818 | 8,941 |
| FTSE USD IBOR Consumer Cash Fallbacks Term 1Y + 1.480% 7.48% 7/1/34 (c)(d) | | 8,998 | 9,226 |
| FTSE USD IBOR Consumer Cash Fallbacks Term 1Y + 1.500% 6.755% 1/1/35 (c)(d) | | 60,529 | 61,388 |
| FTSE USD IBOR Consumer Cash Fallbacks Term 1Y + 1.510% 7.26% 2/1/33 (c)(d) | | 6,127 | 6,206 |
| FTSE USD IBOR Consumer Cash Fallbacks Term 1Y + 1.530% 6.461% 12/1/34 (c)(d) | | 18,212 | 18,480 |
| FTSE USD IBOR Consumer Cash Fallbacks Term 1Y + 1.530% 6.785% 3/1/35 (c)(d) | | 14,715 | 14,938 |
| FTSE USD IBOR Consumer Cash Fallbacks Term 1Y + 1.550% 7.174% 10/1/33 (c)(d) | | 8,321 | 8,435 |
| FTSE USD IBOR Consumer Cash Fallbacks Term 1Y + 1.550% 7.428% 6/1/36 (c)(d) | | 25,739 | 26,479 |
| FTSE USD IBOR Consumer Cash Fallbacks Term 1Y + 1.560% 6.065% 3/1/37 (c)(d) | | 44,018 | 45,152 |
| FTSE USD IBOR Consumer Cash Fallbacks Term 1Y + 1.560% 7.315% 7/1/35 (c)(d) | | 11,860 | 12,062 |
| FTSE USD IBOR Consumer Cash Fallbacks Term 1Y + 1.590% 5.971% 3/1/36 (c)(d) | | 1,937 | 1,989 |
| FTSE USD IBOR Consumer Cash Fallbacks Term 1Y + 1.600% 7.436% 8/1/35 (c)(d) | | 5,247 | 5,398 |
| FTSE USD IBOR Consumer Cash Fallbacks Term 1Y + 1.630% 5.815% 9/1/36 (c)(d) | | 9,169 | 9,432 |
| FTSE USD IBOR Consumer Cash Fallbacks Term 1Y + 1.640% 6.413% 5/1/35 (c)(d) | | 70,716 | 72,717 |
| FTSE USD IBOR Consumer Cash Fallbacks Term 1Y + 1.640% 6.414% 3/1/33 (c)(d) | | 29,823 | 30,498 |
| FTSE USD IBOR Consumer Cash Fallbacks Term 1Y + 1.640% 6.837% 11/1/36 (c)(d) | | 53,081 | 54,510 |
| FTSE USD IBOR Consumer Cash Fallbacks Term 1Y + 1.680% 7.061% 5/1/36 (c)(d) | | 29,092 | 29,902 |
| FTSE USD IBOR Consumer Cash Fallbacks Term 1Y + 1.690% 6.406% 7/1/43 (c)(d) | | 41,555 | 42,750 |
| FTSE USD IBOR Consumer Cash Fallbacks Term 1Y + 1.700% 7.167% 6/1/42 (c)(d) | | 243,478 | 250,478 |
| FTSE USD IBOR Consumer Cash Fallbacks Term 1Y + 1.730% 6.028% 3/1/40 (c)(d) | | 77,992 | 80,234 |
| FTSE USD IBOR Consumer Cash Fallbacks Term 1Y + 1.750% 6.434% 8/1/41 (c)(d) | | 127,738 | 131,410 |
| FTSE USD IBOR Consumer Cash Fallbacks Term 1Y + 1.750% 6.439% 7/1/35 (c)(d) | | 32,122 | 33,004 |
| FTSE USD IBOR Consumer Cash Fallbacks Term 1Y + 1.800% 6.055% 1/1/42 (c)(d) | | 165,232 | 169,982 |
| FTSE USD IBOR Consumer Cash Fallbacks Term 1Y + 1.800% 6.444% 12/1/40 (c)(d) | | 2,242,282 | 2,306,747 |
| FTSE USD IBOR Consumer Cash Fallbacks Term 1Y + 1.800% 7.635% 7/1/41 (c)(d) | | 74,082 | 76,212 |
| FTSE USD IBOR Consumer Cash Fallbacks Term 1Y + 1.810% 6.06% 12/1/39 (c)(d) | | 25,793 | 26,534 |
| FTSE USD IBOR Consumer Cash Fallbacks Term 1Y + 1.810% 6.068% 9/1/41 (c)(d) | | 109,739 | 112,894 |
| FTSE USD IBOR Consumer Cash Fallbacks Term 1Y + 1.810% 6.297% 2/1/42 (c)(d) | | 73,291 | 75,398 |
| FTSE USD IBOR Consumer Cash Fallbacks Term 1Y + 1.810% 7.64% 7/1/41 (c)(d) | | 146,110 | 150,310 |
| FTSE USD IBOR Consumer Cash Fallbacks Term 1Y + 1.820% 6.297% 2/1/35 (c)(d) | | 7,626 | 7,840 |
| FTSE USD IBOR Consumer Cash Fallbacks Term 1Y + 1.830% 6.08% 10/1/41 (c)(d) | | 94,096 | 95,465 |
| FTSE USD IBOR Consumer Cash Fallbacks Term 1Y + 1.950% 6.703% 9/1/36 (c)(d) | | 39,927 | 41,075 |
| FTSE USD IBOR Consumer Cash Fallbacks Term 1Y + 1.950% 7.703% 7/1/37 (c)(d) | | 44,183 | 45,453 |
| FTSE USD IBOR Consumer Cash Fallbacks Term 1Y + 1.960% 6.418% 9/1/35 (c)(d) | | 10,630 | 10,905 |
| U.S. TREASURY 1 YEAR INDEX + 2.200% 6.583% 3/1/35 (c)(d) | | 27,952 | 28,369 |
| U.S. TREASURY 1 YEAR INDEX + 2.270% 6.395% 6/1/36 (c)(d) | | 60,031 | 61,019 |
| U.S. TREASURY 1 YEAR INDEX + 2.280% 6.402% 10/1/33 (c)(d) | | 46,014 | 46,740 |
| U.S. TREASURY 1 YEAR INDEX + 2.300% 7.12% 12/1/33 (c)(d) | | 160,988 | 163,652 |
| U.S. TREASURY 1 YEAR INDEX + 2.460% 6.852% 5/1/35 (c)(d) | | 9,777 | 9,961 |
| U.S. TREASURY 1 YEAR INDEX + 2.460% 7.177% 7/1/34 (c)(d) | | 56,720 | 57,823 |
| 1.5% 11/1/35 to 4/1/52 | | 260,077,722 | 215,138,617 |
| 2% 2/1/28 to 4/1/52 | | 677,031,480 | 579,816,622 |
| 2.5% 4/1/31 to 6/1/52 | | 646,947,685 | 567,121,393 |
| 3% 4/1/29 to 3/1/52 (e)(f) | | 412,883,723 | 376,873,183 |
| 3.4% 7/1/42 to 9/1/42 | | 60,479 | 57,063 |
| 3.5% 8/1/34 to 10/1/52 | | 260,616,056 | 244,757,636 |
| 3.65% 5/1/42 to 8/1/42 | | 14,415 | 13,759 |
| 3.9% 4/1/42 | | 5,218 | 5,054 |
| 4% 3/1/36 to 4/1/52 | | 146,562,832 | 142,320,869 |
| 4.25% 11/1/41 | | 9,786 | 9,658 |
| 4.5% to 4.5% 5/1/25 to 12/1/52 (e) | | 147,081,450 | 145,467,753 |
| 5% 9/1/25 to 4/1/53 | | 104,966,432 | 105,287,836 |
| 5.288% 8/1/41 (c) | | 1,227,066 | 1,239,755 |
| 5.5% 9/1/52 to 6/1/54 | | 159,933,362 | 162,507,833 |
| 6% to 6% 9/1/29 to 8/1/54 | | 253,419,795 | 259,331,978 |
| 6.5% 7/1/32 to 7/1/54 | | 88,644,061 | 92,258,813 |
| 6.723% 2/1/39 (c) | | 424,736 | 438,879 |
| 7% to 7% 8/1/25 to 7/1/37 | | 477,150 | 496,501 |
| 7.5% to 7.5% 11/1/24 to 9/1/32 | | 209,555 | 215,252 |
| 8% 3/1/37 | | 23,977 | 25,661 |
| 8.5% 9/1/25 | | 29 | 29 |
| 9% 10/1/30 | | 4,964 | 5,320 |
TOTAL FANNIE MAE | | | 2,897,907,473 |
| Freddie Mac - 5.5% | | | |
| FTSE USD IBOR Consumer Cash Fallbacks Term 1Y + 1.120% 6.029% 8/1/37 (c)(d) | | 59,400 | 59,588 |
| FTSE USD IBOR Consumer Cash Fallbacks Term 1Y + 1.320% 5.575% 1/1/36 (c)(d) | | 28,805 | 29,235 |
| FTSE USD IBOR Consumer Cash Fallbacks Term 1Y + 1.370% 5.625% 3/1/36 (c)(d) | | 149,162 | 152,018 |
| FTSE USD IBOR Consumer Cash Fallbacks Term 1Y + 1.500% 5.824% 3/1/36 (c)(d) | | 96,054 | 98,051 |
| FTSE USD IBOR Consumer Cash Fallbacks Term 1Y + 1.650% 7.3% 4/1/35 (c)(d) | | 41,340 | 41,927 |
| FTSE USD IBOR Consumer Cash Fallbacks Term 1Y + 1.750% 6% 12/1/40 (c)(d) | | 931,852 | 958,595 |
| FTSE USD IBOR Consumer Cash Fallbacks Term 1Y + 1.750% 6% 9/1/41 (c)(d) | | 349,930 | 359,991 |
| FTSE USD IBOR Consumer Cash Fallbacks Term 1Y + 1.750% 7.567% 7/1/41 (c)(d) | | 206,354 | 212,287 |
| FTSE USD IBOR Consumer Cash Fallbacks Term 1Y + 1.860% 6.422% 10/1/36 (c)(d) | | 106,689 | 108,819 |
| FTSE USD IBOR Consumer Cash Fallbacks Term 1Y + 1.860% 7.239% 4/1/36 (c)(d) | | 61,469 | 63,237 |
| FTSE USD IBOR Consumer Cash Fallbacks Term 1Y + 1.880% 6.13% 9/1/41 (c)(d) | | 150,652 | 154,983 |
| FTSE USD IBOR Consumer Cash Fallbacks Term 1Y + 1.880% 7.255% 4/1/41 (c)(d) | | 35,228 | 36,241 |
| FTSE USD IBOR Consumer Cash Fallbacks Term 1Y + 1.910% 7.155% 5/1/41 (c)(d) | | 281,993 | 290,100 |
| FTSE USD IBOR Consumer Cash Fallbacks Term 1Y + 1.910% 7.54% 5/1/41 (c)(d) | | 278,889 | 286,907 |
| FTSE USD IBOR Consumer Cash Fallbacks Term 1Y + 1.910% 7.628% 6/1/41 (c)(d) | | 272,256 | 280,083 |
| FTSE USD IBOR Consumer Cash Fallbacks Term 1Y + 1.910% 7.785% 6/1/41 (c)(d) | | 110,646 | 113,827 |
| FTSE USD IBOR Consumer Cash Fallbacks Term 1Y + 1.920% 6.601% 10/1/42 (c)(d) | | 121,352 | 124,840 |
| FTSE USD IBOR Consumer Cash Fallbacks Term 1Y + 1.960% 7.711% 6/1/33 (c)(d) | | 5,133 | 5,281 |
| FTSE USD IBOR Consumer Cash Fallbacks Term 1Y + 1.990% 7% 10/1/35 (c)(d) | | 71,587 | 72,961 |
| FTSE USD IBOR Consumer Cash Fallbacks Term 1Y + 2.020% 6.936% 4/1/38 (c)(d) | | 51,267 | 52,741 |
| FTSE USD IBOR Consumer Cash Fallbacks Term 1Y + 2.020% 7.635% 6/1/37 (c)(d) | | 52,253 | 53,520 |
| FTSE USD IBOR Consumer Cash Fallbacks Term 1Y + 2.030% 6.158% 3/1/33 (c)(d) | | 1,601 | 1,647 |
| FTSE USD IBOR Consumer Cash Fallbacks Term 1Y + 2.040% 7.91% 7/1/36 (c)(d) | | 64,722 | 66,583 |
| FTSE USD IBOR Consumer Cash Fallbacks Term 1Y + 2.160% 6.41% 11/1/35 (c)(d) | | 2,300 | 2,367 |
| FTSE USD IBOR Consumer Cash Fallbacks Term 1Y + 2.200% 6.45% 12/1/36 (c)(d) | | 78,488 | 80,744 |
| FTSE USD IBOR Consumer Cash Fallbacks Term 1Y + 3.010% 8.637% 10/1/35 (c)(d) | | 8,333 | 8,573 |
| U.S. TREASURY 1 YEAR INDEX + 2.030% 6.782% 6/1/33 (c)(d) | | 97,044 | 97,898 |
| U.S. TREASURY 1 YEAR INDEX + 2.240% 6.371% 1/1/35 (c)(d) | | 1,737 | 1,759 |
| U.S. TREASURY 1 YEAR INDEX + 2.260% 7.127% 6/1/33 (c)(d) | | 184,697 | 186,981 |
| U.S. TREASURY 1 YEAR INDEX + 2.460% 6.899% 3/1/35 (c)(d) | | 321,490 | 326,770 |
| 1.5% 7/1/35 to 8/1/51 (f) | | 204,750,789 | 168,690,780 |
| 2% 6/1/35 to 8/1/52 | | 527,623,219 | 445,345,366 |
| 2.5% 5/1/30 to 7/1/52 | | 378,697,173 | 333,870,489 |
| 3% 12/1/30 to 6/1/52 | | 259,535,080 | 235,016,604 |
| 3.5% 1/1/32 to 12/1/52 | | 268,987,459 | 252,762,537 |
| 4% 1/1/36 to 10/1/52 | | 144,949,831 | 140,941,965 |
| 4% 4/1/48 | | 49,357 | 47,555 |
| 4.5% 6/1/25 to 11/1/52 | | 49,817,505 | 49,503,640 |
| 5% 7/1/33 to 8/1/53 | | 92,973,674 | 93,520,942 |
| 5.5% 9/1/52 to 2/1/54 (g) | | 140,669,642 | 143,337,640 |
| 6% 7/1/28 to 4/1/54 | | 78,028,166 | 80,132,543 |
| 6.5% 5/1/31 to 1/1/54 | | 70,375,982 | 73,332,375 |
| 7% 3/1/26 to 9/1/36 | | 534,802 | 557,123 |
| 7.5% 1/1/27 to 7/1/34 | | 47,941 | 50,379 |
| 8% 7/1/25 to 4/1/32 | | 13,170 | 13,704 |
| 8.5% 4/1/25 to 1/1/28 | | 8,052 | 8,239 |
TOTAL FREDDIE MAC | | | 2,021,460,435 |
| Ginnie Mae - 8.2% | | | |
| 3.5% 10/20/40 to 12/20/49 | | 61,773,858 | 58,509,173 |
| 4% 7/20/33 to 5/20/49 | | 74,827,519 | 72,647,549 |
| 4.5% 6/20/33 to 5/20/54 | | 75,902,135 | 74,773,520 |
| 5.5% 6/15/33 to 9/15/39 | | 1,100,640 | 1,133,804 |
| 6% to 6% 10/15/30 to 5/15/40 | | 2,001,258 | 2,078,434 |
| 7% to 7% 8/15/25 to 11/15/32 | | 958,938 | 987,326 |
| 7.5% to 7.5% 7/15/25 to 9/15/31 | | 104,446 | 106,728 |
| 8% 10/15/24 to 11/15/29 | | 14,829 | 15,198 |
| 8.5% to 8.5% 11/15/27 to 1/15/31 | | 11,572 | 12,228 |
| 2% 10/20/50 to 6/20/52 | | 527,917,108 | 444,381,724 |
| 2% 9/1/54 (h) | | 18,100,000 | 15,239,246 |
| 2% 9/1/54 (h) | | 45,100,000 | 37,971,823 |
| 2% 9/1/54 (h) | | 13,575,000 | 11,429,435 |
| 2% 9/1/54 (h) | | 16,600,000 | 13,976,325 |
| 2% 9/1/54 (h) | | 43,400,000 | 36,540,513 |
| 2% 9/1/54 (h) | | 20,000,000 | 16,838,946 |
| 2% 9/1/54 (h) | | 21,675,000 | 18,249,208 |
| 2% 10/1/54 (h) | | 26,600,000 | 22,420,736 |
| 2.5% 6/20/51 to 8/20/53 | | 445,054,580 | 387,157,968 |
| 3% 2/20/31 to 2/20/50 | | 39,744,613 | 37,214,208 |
| 3% 9/1/54 (h) | | 12,850,000 | 11,620,445 |
| 3% 9/1/54 (h) | | 12,850,000 | 11,620,445 |
| 3% 9/1/54 (h) | | 12,850,000 | 11,620,445 |
| 3% 9/1/54 (h) | | 32,250,000 | 29,164,152 |
| 3% 9/1/54 (h) | | 70,500,000 | 63,754,193 |
| 3% 9/1/54 (h) | | 11,925,000 | 10,783,954 |
| 3% 9/1/54 (h) | | 37,800,000 | 34,183,099 |
| 3% 9/1/54 (h) | | 113,350,000 | 102,504,083 |
| 3% 10/1/54 (h) | | 32,800,000 | 29,684,587 |
| 3% 10/1/54 (h) | | 63,350,000 | 57,332,884 |
| 3.5% 9/1/54 (h) | | 68,650,000 | 63,887,550 |
| 3.5% 9/1/54 (h) | | 5,200,000 | 4,839,261 |
| 3.5% 9/1/54 (h) | | 46,450,000 | 43,227,629 |
| 3.5% 9/1/54 (h) | | 34,300,000 | 31,920,510 |
| 3.5% 9/1/54 (h) | | 34,400,000 | 32,013,572 |
| 4% 9/1/54 (h) | | 36,600,000 | 34,973,536 |
| 4.5% 9/1/54 (h) | | 40,100,000 | 39,251,063 |
| 4.5% 9/1/54 (h) | | 4,250,000 | 4,160,025 |
| 5% 12/15/32 to 4/20/48 | | 13,686,751 | 13,895,263 |
| 5% 9/1/54 (h) | | 39,750,000 | 39,665,992 |
| 5% 9/1/54 (h) | | 5,200,000 | 5,189,010 |
| 5% 9/1/54 (h) | | 48,400,000 | 48,297,711 |
| 5% 9/1/54 (h) | | 25,600,000 | 25,545,897 |
| 5% 9/1/54 (h) | | 17,225,000 | 17,188,597 |
| 5% 9/1/54 (h) | | 25,000 | 24,947 |
| 5% 10/1/54 (h) | | 61,150,000 | 60,934,776 |
| 5% 10/1/54 (h) | | 48,150,000 | 47,980,531 |
| 5% 10/1/54 (h) | | 26,900,000 | 26,805,323 |
| 5.5% 9/1/54 (h) | | 58,750,000 | 59,125,800 |
| 5.5% 9/1/54 (h) | | 52,000,000 | 52,332,623 |
| 5.5% 9/1/54 (h) | | 36,900,000 | 37,136,035 |
| 5.5% 9/1/54 (h) | | 57,450,000 | 57,817,485 |
| 5.5% 10/1/54 (h) | | 108,325,000 | 108,992,520 |
| 6% 9/1/54 (h) | | 26,050,000 | 26,427,774 |
| 6% 9/1/54 (h) | | 41,500,000 | 42,101,829 |
| 6% 9/1/54 (h) | | 28,750,000 | 29,166,930 |
| 6% 9/1/54 (h) | | 9,250,000 | 9,384,143 |
| 6% 9/1/54 (h) | | 39,300,000 | 39,869,925 |
| 6% 9/1/54 (h) | | 45,700,000 | 46,362,737 |
| 6% 9/1/54 (h) | | 3,900,000 | 3,956,557 |
| 6% 9/1/54 (h) | | 1,975,000 | 2,003,641 |
| 6% 9/1/54 (h) | | 58,650,000 | 59,500,536 |
| 6% 9/1/54 (h) | | 35,125,000 | 35,634,379 |
| 6% 10/1/54 (h) | | 121,100,000 | 122,804,156 |
| 6.5% 3/20/31 to 6/15/37 | | 287,921 | 299,393 |
| 6.5% 9/1/54 (h) | | 21,675,000 | 22,129,904 |
| 6.5% 9/1/54 (h) | | 32,875,000 | 33,564,964 |
| 6.5% 9/1/54 (h) | | 29,000,000 | 29,608,638 |
TOTAL GINNIE MAE | | | 2,971,973,541 |
| Uniform Mortgage Backed Securities - 7.6% | | | |
| 2% 9/1/39 (h) | | 28,800,000 | 26,043,751 |
| 2% 9/1/39 (h) | | 14,000,000 | 12,660,157 |
| 2% 10/1/39 (h) | | 23,600,000 | 21,370,907 |
| 2% 9/1/54 (h) | | 237,450,000 | 194,208,123 |
| 2% 9/1/54 (h) | | 7,975,000 | 6,522,678 |
| 2% 9/1/54 (h) | | 3,500,000 | 2,862,617 |
| 2% 9/1/54 (h) | | 669,450,000 | 547,536,862 |
| 2% 9/1/54 (h) | | 65,000,000 | 53,162,889 |
| 2% 9/1/54 (h) | | 65,050,000 | 53,203,784 |
| 2% 9/1/54 (h) | | 66,300,000 | 54,226,147 |
| 2% 9/1/54 (h) | | 18,650,000 | 15,253,660 |
| 2% 10/1/54 (h) | | 303,750,000 | 248,766,481 |
| 2% 10/1/54 (h) | | 336,300,000 | 275,424,420 |
| 2.5% 9/1/54 (h) | | 15,850,000 | 13,511,505 |
| 2.5% 9/1/54 (h) | | 12,325,000 | 10,506,581 |
| 2.5% 9/1/54 (h) | | 6,950,000 | 5,924,603 |
| 2.5% 9/1/54 (h) | | 101,850,000 | 86,823,143 |
| 2.5% 9/1/54 (h) | | 60,800,000 | 51,829,623 |
| 2.5% 9/1/54 (h) | | 59,200,000 | 50,465,685 |
| 2.5% 10/1/54 (h) | | 173,050,000 | 147,694,126 |
| 3% 9/1/54 (h) | | 16,775,000 | 14,872,742 |
| 3% 9/1/54 (h) | | 94,750,000 | 84,005,502 |
| 3% 10/1/54 (h) | | 16,775,000 | 14,887,157 |
| 3.5% 9/1/54 (h) | | 17,100,000 | 15,739,348 |
| 4% 9/1/54 (h) | | 98,175,000 | 93,101,345 |
| 4% 9/1/54 (h) | | 9,875,000 | 9,364,663 |
| 5% 9/1/39 (h) | | 36,775,000 | 37,032,138 |
| 5% 9/1/39 (h) | | 28,325,000 | 28,523,054 |
| 5% 9/1/39 (h) | | 32,200,000 | 32,425,149 |
| 5.5% 9/1/54 (h) | | 18,675,000 | 18,802,660 |
| 5.5% 9/1/54 (h) | | 35,625,000 | 35,868,529 |
| 5.5% 9/1/54 (h) | | 60,000,000 | 60,410,154 |
| 5.5% 9/1/54 (h) | | 28,200,000 | 28,392,772 |
| 5.5% 9/1/54 (h) | | 64,300,000 | 64,739,548 |
| 6% 9/1/54 (h) | | 52,350,000 | 53,313,156 |
| 6% 9/1/54 (h) | | 52,400,000 | 53,364,076 |
| 6% 9/1/54 (h) | | 29,050,000 | 29,584,474 |
| 6% 9/1/54 (h) | | 13,400,000 | 13,646,539 |
| 6% 9/1/54 (h) | | 66,300,000 | 67,519,814 |
| 6% 9/1/54 (h) | | 63,550,000 | 64,719,218 |
| 6% 9/1/54 (h) | | 46,900,000 | 47,762,885 |
| 6.5% 9/1/54 (h) | | 13,850,000 | 14,260,630 |
| 6.5% 9/1/54 (h) | | 275,000 | 283,153 |
TOTAL UNIFORM MORTGAGE BACKED SECURITIES | | | 2,760,616,448 |
| TOTAL U.S. GOVERNMENT AGENCY - MORTGAGE SECURITIES (Cost $10,855,768,110) | | | 10,651,957,897 |
| | | | |
| Asset-Backed Securities - 8.5% |
| | | Principal Amount (a) | Value ($) |
| Aaset 2024-1 U.S. Ltd. / Aaset 20 Series 2024-1A: | | | |
| Class A1, 6.261% 5/16/49 (b) | | 19,655,602 | 20,303,728 |
| Class A2, 6.261% 5/16/49 (b) | | 17,890,815 | 18,480,747 |
| AASET Trust: | | | |
| Series 2018-1A Class A, 3.844% 1/16/38 (b) | | 11,279,266 | 8,087,171 |
| Series 2019-1 Class A, 3.844% 5/15/39 (b) | | 1,448,611 | 1,397,949 |
| Series 2019-2: | | | |
Class A, 3.376% 10/16/39 (b) | | 19,593,666 | 18,688,619 |
Class B, 4.458% 10/16/39 (b) | | 5,909,968 | 3,546,035 |
| Series 2021-1A Class A, 2.95% 11/16/41 (b) | | 22,217,414 | 20,656,572 |
| Series 2021-2A Class A, 2.798% 1/15/47 (b) | | 42,811,627 | 38,806,389 |
| Affirm Asset Securitization Trust: | | | |
| Series 2024-A Class 1A, 5.61% 2/15/29 (b) | | 6,200,000 | 6,257,193 |
| Series 2024-X1 Class A, 6.27% 5/15/29 (b) | | 7,524,158 | 7,544,483 |
| Aimco Series 2024-10A Class ARR, CME Term SOFR 3 Month Index + 1.410% 6.692% 7/22/37 (b)(c)(d) | | 15,020,000 | 15,075,829 |
| Aimco Clo 17 Ltd. / Aimco Clo 1 Series 2024-17A Class A1R, CME Term SOFR 3 Month Index + 1.350% 6.632% 7/20/37 (b)(c)(d) | | 24,948,049 | 24,956,506 |
| Aimco Clo 21 Ltd. / Aimco Clo 2 Series 2024-21A Class A1, CME Term SOFR 3 Month Index + 1.500% 6.8251% 4/18/37 (b)(c)(d) | | 21,260,000 | 21,354,692 |
| AIMCO CLO Ltd. Series 2024-11A Class A1R2, CME Term SOFR 3 Month Index + 1.340% 6.5839% 7/17/37 (b)(c)(d) | | 25,958,000 | 25,957,611 |
| AIMCO CLO Ltd. / AIMCO CLO LLC Series 2021-14A Class A, CME Term SOFR 3 Month Index + 1.250% 6.5336% 4/20/34 (b)(c)(d) | | 56,239,000 | 56,268,863 |
| Allegro Clo Xii Ltd. Series 2024-1A Class A1R, CME Term SOFR 3 Month Index + 1.440% 6.7236% 7/21/37 (b)(c)(d) | | 39,309,000 | 39,367,964 |
| Allegro CLO XV, Ltd. / Allegro CLO VX LLC Series 2022-1A Class A, CME Term SOFR 3 Month Index + 1.500% 6.782% 7/20/35 (b)(c)(d) | | 28,071,000 | 28,088,881 |
| Allegro CLO, Ltd. Series 2021-1A Class A, CME Term SOFR 3 Month Index + 1.400% 6.6836% 7/20/34 (b)(c)(d) | | 27,167,000 | 27,132,933 |
| Ally Auto Receivables Trust Series 2024-1 Class A3, 5.08% 12/15/28 | | 16,840,000 | 16,982,557 |
| American Express Credit Account Master Trust Series 2023-1 Class A, 4.87% 5/15/28 | | 10,070,000 | 10,136,439 |
| Apollo Aviation Securitization Equity Trust Series 2020-1A: | | | |
| Class A, 3.351% 1/16/40 (b) | | 6,593,120 | 6,296,490 |
| Class B, 4.335% 1/16/40 (b) | | 1,551,112 | 1,283,403 |
| Ares CLO Series 2024-54A Class AR, CME Term SOFR 3 Month Index + 1.270% 6.5714% 10/15/32 (b)(c)(d) | | 32,133,000 | 32,139,234 |
| Ares LIX CLO Ltd. Series 2021-59A Class A, CME Term SOFR 3 Month Index + 1.290% 6.5762% 4/25/34 (b)(c)(d) | | 18,644,000 | 18,645,361 |
| Ares Ln Funding V Ltd. / Ares Ln Fund Series 2024-ALF5A Class A1, CME Term SOFR 3 Month Index + 1.500% 6.8235% 7/27/37 (b)(c)(d) | | 28,926,000 | 29,000,484 |
| Ares LV CLO Ltd. Series 2021-55A Class A1R, CME Term SOFR 3 Month Index + 1.390% 6.693% 7/15/34 (b)(c)(d) | | 24,631,000 | 24,658,193 |
| Ares LVIII CLO LLC Series 2022-58A Class AR, CME Term SOFR 3 Month Index + 1.330% 6.6314% 1/15/35 (b)(c)(d) | | 42,880,000 | 42,909,330 |
| Ares XLI CLO Ltd. / Ares XLI CLO LLC Series 2021-41A Class AR2, CME Term SOFR 3 Month Index + 1.330% 6.633% 4/15/34 (b)(c)(d) | | 37,984,000 | 37,990,115 |
| Babson CLO Ltd. Series 2021-1A Class AR, CME Term SOFR 3 Month Index + 1.410% 6.713% 10/15/36 (b)(c)(d) | | 21,905,000 | 21,925,591 |
| Barings CLO Ltd.: | | | |
| Series 2021-1A Class A, CME Term SOFR 3 Month Index + 1.280% 6.5662% 4/25/34 (b)(c)(d) | | 40,974,000 | 40,990,185 |
| Series 2021-4A Class A, CME Term SOFR 3 Month Index + 1.480% 6.7636% 1/20/32 (b)(c)(d) | | 20,962,354 | 20,962,354 |
| Series 2024-4A Class AR, 0% 10/20/37 (b)(c) | | 32,719,000 | 32,719,000 |
| Bear Stearns Asset Backed Securities I Trust Series 2005-HE2 Class M2, CME Term SOFR 1 Month Index + 1.230% 6.5174% 2/25/35 (c)(d) | | 216,905 | 215,191 |
| BETHP Series 2021-1A Class A, CME Term SOFR 3 Month Index + 1.390% 6.693% 1/15/35 (b)(c)(d) | | 33,084,000 | 33,118,043 |
| Blackbird Capital Aircraft: | | | |
| Series 2016-1A Class A, 4.213% 12/16/41 (b) | | 19,539,438 | 19,379,019 |
| Series 2021-1A Class A, 2.443% 7/15/46 (b) | | 36,028,878 | 32,806,743 |
| Blueberry Park Clo Ltd. Series 2024-1A Class A, CME Term SOFR 3 Month Index + 1.350% 1.35% 10/20/37 (b)(c)(d)(h) | | 28,952,000 | 28,961,844 |
| Bofa Auto Trust 2024-1 Series 2024-1A Class A3, 5.35% 11/15/28 (b) | | 6,274,000 | 6,375,958 |
| Bristol Park CLO, Ltd. Series 2020-1A Class AR, CME Term SOFR 3 Month Index + 1.250% 6.553% 4/15/29 (b)(c)(d) | | 4,855,054 | 4,858,123 |
| Carlyle U.S. CLO Ltd. Series 2024-11A Class A1R, CME Term SOFR 3 Month Index + 1.410% 6.7329% 7/25/37 (b)(c)(d) | | 33,779,000 | 33,780,621 |
| Carmax Auto Owner Trust Series 2024-2 Class A3, 5.5% 1/16/29 | | 12,009,000 | 12,255,237 |
| Carmax Auto Owner Trust 2023-4 Series 2023-4 Class A3, 6% 7/17/28 | | 15,337,000 | 15,673,031 |
| Castlelake Aircraft Securitization Trust Series 2019-1A: | | | |
| Class A, 3.967% 4/15/39 (b) | | 18,856,651 | 17,254,452 |
| Class B, 5.095% 4/15/39 (b) | | 11,988,233 | 8,184,717 |
| Castlelake Aircraft Structured Trust: | | | |
| Series 2018-1 Class A, 4.125% 6/15/43 (b) | | 6,148,193 | 5,733,616 |
| Series 2021-1A Class A, 3.474% 1/15/46 (b) | | 4,308,374 | 4,139,170 |
| Cedar Funding Ltd.: | | | |
| Series 2021-10A Class AR, CME Term SOFR 3 Month Index + 1.360% 6.6436% 10/20/32 (b)(c)(d) | | 26,444,000 | 26,448,839 |
| Series 2021-12A Class A1R, CME Term SOFR 3 Month Index + 1.390% 6.6762% 10/25/34 (b)(c)(d) | | 19,756,000 | 19,770,244 |
| Series 2022-15A Class A, CME Term SOFR 3 Month Index + 1.320% 6.602% 4/20/35 (b)(c)(d) | | 39,364,000 | 39,361,323 |
| CEDF Series 2021-6A Class ARR, CME Term SOFR 3 Month Index + 1.310% 6.5936% 4/20/34 (b)(c)(d) | | 32,995,000 | 32,987,873 |
| CFMT LLC Series 2023 HB12 Class A, 4.25% 4/25/33 (b) | | 7,052,620 | 6,920,065 |
| Chase Auto Owner Trust Series 2024-1A Class A3, 5.13% 5/25/29 (b) | | 12,200,000 | 12,370,829 |
| Chesapeake Funding II LLC: | | | |
| Series 2023-2A Class A1, 6.16% 10/15/35 (b) | | 8,972,538 | 9,102,520 |
| Series 2024-1A Class A1, 5.52% 5/15/36 (b) | | 13,393,977 | 13,525,755 |
| Citizens Auto Receivables Trust Series 2024-2 Class A3, 5.33% 8/15/28 (b) | | 9,500,000 | 9,616,002 |
| Columbia Cent CLO 29 Ltd./Columbia Cent CLO 29 Corp. Series 2021-29A Class AR, CME Term SOFR 3 Month Index + 1.430% 6.7136% 10/20/34 (b)(c)(d) | | 32,158,000 | 32,190,126 |
| Columbia Cent CLO 31 Ltd. Series 2021-31A Class A1, CME Term SOFR 3 Month Index + 1.460% 6.7436% 4/20/34 (b)(c)(d) | | 35,800,000 | 35,827,280 |
| Daimler Trucks Retail Trust 20 Series 2023-1 Class A2, 6.03% 9/15/25 | | 16,751,026 | 16,771,484 |
| DB Master Finance LLC: | | | |
| Series 2017-1A Class A2II, 4.03% 11/20/47 (b) | | 29,660,070 | 28,791,244 |
| Series 2019-1A Class A23, 4.352% 5/20/49 (b) | | 2,693,250 | 2,611,408 |
| Discover Card Execution Note Trust: | | | |
| Series 2022-A4, Class A, 5.03% 10/15/27 | | 6,607,000 | 6,626,959 |
| Series 2023 A1 Class A, 4.31% 3/15/28 | | 8,200,000 | 8,171,781 |
| Dllaa 2023-1A Series 2023-1A: | | | |
| Class A2, 5.93% 7/20/26 (b) | | 5,825,933 | 5,845,928 |
| Class A3, 5.64% 2/22/28 (b) | | 6,812,000 | 6,939,301 |
| DLLAD: | | | |
| Series 2023-1A Class A3, 4.79% 1/20/28 (b) | | 7,600,000 | 7,617,410 |
| Series 2024-1A Class A3, 5.3% 7/20/29 (b) | | 5,218,000 | 5,326,011 |
| Dllmt 2024-1 LLC Series 2024-1A Class A3, 4.84% 8/21/28 (b) | | 14,100,000 | 14,135,058 |
| Dryden 98 CLO Ltd. Series 2022-98A Class A, CME Term SOFR 3 Month Index + 1.300% 6.582% 4/20/35 (b)(c)(d) | | 22,130,000 | 22,172,113 |
| Dryden CLO, Ltd. Series 2024-83A Class AR, CME Term SOFR 3 Month Index + 1.530% 6.8642% 4/18/37 (b)(c)(d) | | 28,334,000 | 28,363,977 |
| Dryden Senior Loan Fund: | | | |
| Series 2018-70X Class A1, CME Term SOFR 3 Month Index + 1.430% 6.7177% 1/16/32 (c)(d) | | 320,888 | 321,035 |
| Series 2021-90A Class A1A, CME Term SOFR 3 Month Index + 1.390% 6.52% 2/20/35 (b)(c)(d) | | 16,803,000 | 16,828,137 |
| Series 2024-85A Class A1R2, CME Term SOFR 3 Month Index + 1.380% 6.6814% 7/15/37 (b)(c)(d) | | 26,822,000 | 26,863,547 |
| Eaton Vance CLO, Ltd.: | | | |
| Series 2021-2A Class AR, CME Term SOFR 3 Month Index + 1.410% 6.713% 1/15/35 (b)(c)(d) | | 37,869,000 | 37,882,178 |
| Series 2024-1A: | | | |
Class AR2, CME Term SOFR 3 Month Index + 1.510% 6.8399% 7/15/37 (b)(c)(d) | | 27,328,000 | 27,462,700 |
Class ARR, CME Term SOFR 3 Month Index + 1.390% 6.6914% 10/15/37 (b)(c)(d) | | 26,302,000 | 26,402,000 |
| Eaton Vance CLO, Ltd. / Eaton Vance CLO LLC Series 2021-1A Class A13R, CME Term SOFR 3 Month Index + 1.510% 6.813% 1/15/34 (b)(c)(d) | | 7,800,000 | 7,800,936 |
| Enterprise Fleet Financing Series 2024-2: | | | |
| Class A2, 5.74% 12/20/26 (b) | | 11,000,000 | 11,102,381 |
| Class A3, 5.61% 4/20/28 (b) | | 10,874,000 | 11,136,167 |
| Enterprise Fleet Financing 2023-3 L Series 2023-3 Class A2, 6.4% 3/20/30 (b) | | 23,176,473 | 23,608,126 |
| Flatiron CLO Ltd.: | | | |
| Series 2021-1A: | | | |
Class A1, CME Term SOFR 3 Month Index + 1.370% 6.6511% 7/19/34 (b)(c)(d) | | 24,705,000 | 24,744,207 |
Class AR, CME Term SOFR 3 Month Index + 1.340% 6.4371% 11/16/34 (b)(c)(d) | | 20,757,000 | 20,705,751 |
| Series 2024-1A Class A1R, 0% 10/19/37 (b)(c) | | 36,883,000 | 36,883,000 |
| Ford Credit Auto Owner Trust: | | | |
| Series 2018-1 Class A, 3.19% 7/15/31 (b) | | 7,300,000 | 7,243,011 |
| Series 2020-2 Class A, 1.06% 4/15/33 (b) | | 9,900,000 | 9,488,966 |
| Ford Credit Floorplan Master Owner Trust: | | | |
| Series 2023-1 Class A1, 4.92% 5/15/28 (b) | | 52,066,000 | 52,347,583 |
| Series 2024-1 Class A1, 5.29% 4/15/29 (b) | | 16,200,000 | 16,513,230 |
| GM Financial Automobile Leasing Trust Series 2023-2 Class A2A, 5.44% 10/20/25 | | 2,205,374 | 2,205,596 |
| Gm Financial Leasing Trust 202 Series 2023-3 Class A3, 5.38% 11/20/26 | | 7,077,000 | 7,114,894 |
| Gm Financial Revolving Receiva Series 2024-1 Class A, 4.98% 12/11/36 (b) | | 6,868,000 | 6,990,874 |
| Honda Auto Receivables Series 2023-2 Class A3, 4.93% 11/15/27 | | 14,844,000 | 14,887,625 |
| Horizon Aircraft Finance I Ltd. Series 2018-1 Class A, 4.458% 12/15/38 (b) | | 10,146,662 | 9,385,642 |
| Horizon Aircraft Finance Ltd. Series 2019-1 Class A, 3.721% 7/15/39 (b) | | 9,402,418 | 8,697,217 |
| Hyundai Auto Lease Securitizat Series 2024-B Class A3, 5.41% 5/17/27 (b) | | 24,000,000 | 24,329,561 |
| Hyundai Auto Receivables Trust Series 2024-A Class A3, 4.99% 2/15/29 | | 17,572,000 | 17,782,332 |
| Invesco CLO Ltd. Series 2021-3A Class A, CME Term SOFR 3 Month Index + 1.390% 6.6736% 10/22/34 (b)(c)(d) | | 22,628,000 | 22,652,574 |
| Invesco U.S. Clo 2024-1 Ltd. Series 2024-1RA Class AR, CME Term SOFR 3 Month Index + 1.550% 6.8514% 4/15/37 (b)(c)(d) | | 10,710,000 | 10,751,512 |
| Invesco U.S. CLO Ltd. Series 2024-3A Class A, CME Term SOFR 3 Month Index + 1.510% 6.8292% 7/20/37 (b)(c)(d) | | 22,457,000 | 22,636,544 |
| KKR CLO Ltd. Series 2022-41A Class A1, CME Term SOFR 3 Month Index + 1.330% 6.6314% 4/15/35 (b)(c)(d) | | 30,000,000 | 30,014,850 |
| Madison Park Funding Series 2024-19A Class AR3, CME Term SOFR 3 Month Index + 1.600% 6.882% 1/22/37 (b)(c)(d) | | 17,772,000 | 17,873,834 |
| Madison Park Funding L Ltd. / Madison Park Funding L LLC Series 2021-50A Class A, CME Term SOFR 3 Month Index + 1.400% 6.6811% 4/19/34 (b)(c)(d) | | 38,620,000 | 38,631,045 |
| Madison Park Funding LII Ltd. / Madison Park Funding LII LLC Series 2021-52A Class A, CME Term SOFR 3 Month Index + 1.360% 6.6436% 1/22/35 (b)(c)(d) | | 36,551,000 | 36,566,059 |
| Madison Park Funding XLV Ltd./Madison Park Funding XLV LLC Series 2021-45A Class AR, CME Term SOFR 3 Month Index + 1.380% 6.683% 7/15/34 (b)(c)(d) | | 24,703,000 | 24,702,778 |
| Magnetite CLO Ltd. Series 2021-27A Class AR, CME Term SOFR 3 Month Index + 1.400% 6.6836% 10/20/34 (b)(c)(d) | | 7,927,000 | 7,939,184 |
| Magnetite IX, Ltd. / Magnetite IX LLC Series 2021-30A Class A, CME Term SOFR 3 Month Index + 1.390% 6.6762% 10/25/34 (b)(c)(d) | | 39,908,000 | 39,972,611 |
| Magnetite XXI Ltd. Series 2021-21A Class AR, CME Term SOFR 3 Month Index + 1.280% 6.5636% 4/20/34 (b)(c)(d) | | 31,864,000 | 31,904,754 |
| Magnetite XXIII, Ltd. Series 2021-23A Class AR, CME Term SOFR 3 Month Index + 1.390% 6.6762% 1/25/35 (b)(c)(d) | | 26,894,000 | 26,935,820 |
| Magnetite XXIX, Ltd. / Magnetite XXIX LLC Series 2024-29A Class AR, CME Term SOFR 3 Month Index + 1.350% 6.5917% 7/15/37 (b)(c)(d) | | 33,543,000 | 33,545,717 |
| Marlette Funding Trust 2023-3 Series 2023-3A Class A, 6.49% 9/15/33 (b) | | 3,328,372 | 3,331,241 |
| Mercedes-Benz Auto Lease Trust Series 2024-A Class A3, 5.32% 1/18/28 | | 4,300,000 | 4,377,285 |
| Merchants Fleet Funding LLC Series 2024-1A Class A, 5.82% 4/20/37 (b) | | 16,000,000 | 16,205,138 |
| Milos CLO, Ltd. Series 2020-1A Class AR, CME Term SOFR 3 Month Index + 1.330% 6.6136% 10/20/30 (b)(c)(d) | | 22,801,033 | 22,835,531 |
| Neuberger Berman Loan Advisers Series 2024-25A Class AR2, CME Term SOFR 3 Month Index + 1.400% 6.723% 7/18/38 (b)(c)(d) | | 25,542,000 | 25,568,129 |
| Nissan Master Owner Trust Receiva Series 2024-B Class A, 5.05% 2/15/29 (b) | | 9,700,000 | 9,820,937 |
| Oak Hill Credit Partners Series 2024-13A Class AR, CME Term SOFR 3 Month Index + 1.350% 6.632% 7/20/37 (b)(c)(d) | | 42,834,000 | 42,848,521 |
| Park Place Securities, Inc. Series 2005-WCH1 Class M4, CME Term SOFR 1 Month Index + 1.350% 6.6374% 1/25/36 (c)(d) | | 136,284 | 134,844 |
| Peace Park CLO, Ltd. Series 2021-1A Class A, CME Term SOFR 3 Month Index + 1.390% 6.6736% 10/20/34 (b)(c)(d) | | 13,185,000 | 13,191,962 |
| PK ALIFT Loan Funding 3 LP Series 2024-1 Class A1, 5.842% 9/15/39 (b) | | 6,011,000 | 6,126,096 |
| Planet Fitness Master Issuer LLC: | | | |
| Series 2019-1A Class A2, 3.858% 12/5/49 (b) | | 27,083,800 | 25,234,816 |
| Series 2022-1A: | | | |
Class A2I, 3.251% 12/5/51 (b) | | 25,933,075 | 24,803,775 |
Class A2II, 4.008% 12/5/51 (b) | | 23,173,593 | 21,340,909 |
| Project Silver Series 2019-1 Class A, 3.967% 7/15/44 (b) | | 19,086,461 | 17,559,926 |
| Prpm 2023-Rcf2 LLC Series 2023-RCF2 Class A1, 4% 11/25/53 (b) | | 8,094,116 | 7,907,104 |
| Rockland Park CLO Ltd. Series 2021-1A Class A, CME Term SOFR 3 Month Index + 1.380% 6.6636% 4/20/34 (b)(c)(d) | | 46,460,000 | 46,500,978 |
| RR Ltd. Series 2022-7A Class A1AB, CME Term SOFR 3 Month Index + 1.340% 6.6414% 1/15/37 (b)(c)(d) | | 42,692,000 | 42,709,888 |
| Sapphire Aviation Finance Series 2020-1A: | | | |
| Class A, 3.228% 3/15/40 (b) | | 20,978,785 | 19,254,539 |
| Class B, 4.335% 3/15/40 (b) | | 2,304,030 | 1,820,754 |
| SBA Tower Trust: | | | |
| Series 2019, 2.836% 1/15/50 (b) | | 34,963,000 | 34,606,755 |
| 1.884% 7/15/50 (b) | | 12,544,000 | 12,004,663 |
| 2.328% 7/15/52 (b) | | 9,591,000 | 8,787,950 |
| Sbna Auto Lease Trust Series 2024-B Class A3, 5.56% 11/22/27 (b) | | 16,000,000 | 16,230,952 |
| Sfs Auto Receivables Securitiz Series 2023-1A Class A2A, 5.89% 3/22/27 (b) | | 5,250,972 | 5,260,701 |
| Sfs Auto Receivables Securitization Trust Series 2024-2A Class A3, 5.33% 11/20/29 (b) | | 9,375,000 | 9,553,098 |
| Subway Funding LLC Issuer Series 2024-1A: | | | |
| Class A23, 6.505% 7/30/54 (b) | | 23,407,000 | 24,458,021 |
| Class A2I, 6.028% 7/30/54 (b) | | 44,896,000 | 46,063,449 |
| Class A2II, 6.268% 7/30/54 (b) | | 26,690,000 | 27,668,498 |
| SYMP Series 2022-32A Class A1, CME Term SOFR 3 Month Index + 1.320% 6.603% 4/23/35 (b)(c)(d) | | 44,162,000 | 44,080,256 |
| Symphony Clo 43 Ltd. Series 2024-43A Class A1, CME Term SOFR 3 Month Index + 1.520% 6.8465% 4/15/37 (b)(c)(d) | | 22,556,000 | 22,655,833 |
| Symphony CLO XXI, Ltd. Series 2021-21A Class AR, CME Term SOFR 3 Month Index + 1.320% 6.623% 7/15/32 (b)(c)(d) | | 4,219,000 | 4,222,945 |
| Symphony CLO XXVI Ltd. / Symphony CLO XXVI LLC Series 2021-26A Class AR, CME Term SOFR 3 Month Index + 1.340% 6.6236% 4/20/33 (b)(c)(d) | | 34,701,713 | 34,736,415 |
| Terwin Mortgage Trust Series 2003-4HE Class A1, CME Term SOFR 1 Month Index + 0.970% 6.2524% 9/25/34 (c)(d) | | 79,133 | 80,384 |
| Tesla Series 2024-A Class A2A, 5.37% 6/22/26 (b) | | 7,007,316 | 7,010,557 |
| Tesla Auto Lease Trust 2023-B Series 2023-B: | | | |
| Class A2, 6.02% 9/22/25 (b) | | 18,560,116 | 18,588,550 |
| Class A3, 6.13% 9/21/26 (b) | | 20,000,000 | 20,176,608 |
| Tesla Auto Lease Trust 23-A Series 2023-A Class A3, 5.89% 6/22/26 (b) | | 16,431,000 | 16,487,629 |
| Thunderbolt Aircraft Lease Ltd. Series 2018-A Class A, 4.147% 9/15/38 (b)(c) | | 22,378,131 | 20,588,592 |
| Thunderbolt III Aircraft Lease Ltd. Series 2019-1 Class A, 3.671% 11/15/39 (b) | | 29,545,518 | 26,590,966 |
| Towd Point Mortgage Trust Series 2018-1 Class A1, 3% 1/25/58 (b) | | 1,079,455 | 1,056,211 |
| Toyota Lease Owner Trust: | | | |
| Series 2023 A Class A3, 4.93% 4/20/26 (b) | | 16,605,000 | 16,582,970 |
| Series 2024-A Class A3, 5.25% 4/20/27 (b) | | 13,200,000 | 13,324,520 |
| Trapeza CDO XII Ltd./Trapeza CDO XII, Inc. Series 2007-12A Class B, CME Term SOFR 3 Month Index + 0.820% 6.1359% 4/6/42 (b)(c)(d) | | 2,720,000 | 1,919,781 |
| Usaa Auto Owner Trust 2024-A Series 2024-A Class A3, 5.03% 3/15/29 (b) | | 12,100,000 | 12,239,557 |
| Volkswagen Auto Lease Trust 2024- Series 2024-A Class A3, 5.21% 6/21/27 | | 12,340,000 | 12,501,842 |
| Voya CLO Ltd./Voya CLO LLC: | | | |
| Series 2021-2A Class A1R, CME Term SOFR 3 Month Index + 1.420% 6.7011% 7/19/34 (b)(c)(d) | | 11,307,000 | 11,309,341 |
| Series 2021-3A Class AR, CME Term SOFR 3 Month Index + 1.410% 6.6936% 10/20/34 (b)(c)(d) | | 44,263,000 | 44,265,434 |
| Wheels Fleet Lease Funding 1 L: | | | |
| Series 2023-2A Class A, 6.46% 8/18/38 (b) | | 28,612,835 | 28,808,968 |
| Series 2024-1A Class A1, 5.49% 2/18/39 (b) | | 15,100,000 | 15,250,666 |
| Series 2024-2A Class A1, 4.87% 6/21/39 (b) | | 18,100,000 | 18,176,967 |
| Willis Engine Structured Trust Vi Series 2023-A Class A, 8% 10/15/48 (b) | | 13,685,445 | 14,539,328 |
| World Omni Auto Receivables Trust: | | | |
| Series 2023 B Class A3, 4.66% 5/15/28 | | 17,581,000 | 17,565,538 |
| Series 2023-C Class A3, 5.15% 11/15/28 | | 8,696,000 | 8,755,136 |
| TOTAL ASSET-BACKED SECURITIES (Cost $3,116,895,223) | | | 3,093,415,628 |
| | | | |
| Collateralized Mortgage Obligations - 2.2% |
| | | Principal Amount (a) | Value ($) |
| Private Sponsor - 0.4% | | | |
| Brass PLC Series 2021-10A Class A1, 0.669% 4/16/69 (b)(c) | | 2,598,865 | 2,572,541 |
| Bravo Residential Funding Trust sequential payer Series 2023-RPL1 Class A1, 5% 5/25/63 (b) | | 16,714,012 | 16,733,089 |
| CFMT Series 2022-HB10 Class A, 3.25% 11/25/35 (b) | | 6,326,199 | 6,237,483 |
| Cfmt 2024-Hb15 LLC sequential payer Series 2024-HB15 Class A, 4% 8/25/34 (b)(c) | | 7,147,000 | 7,010,492 |
| Cfmt LLC floater sequential payer Series 2024-HB13 Class A, 3% 5/25/34 (b)(c) | | 7,936,873 | 7,590,223 |
| CSMC: | | | |
| floater Series 2015-1R Class 6A1, CME Term SOFR 1 Month Index + 0.390% 4.181% 5/27/37 (b)(c)(d) | | 33,074 | 32,615 |
| Series 2014-3R: | | | |
Class 2A1, CME Term SOFR 1 Month Index + 0.810% 0% 5/27/37 (b)(c)(d)(i) | | 316,680 | 32 |
Class AA1, CME Term SOFR 1 Month Index + 0.390% 4.181% 5/27/37 (b)(c)(d) | | 240,848 | 231,556 |
| Gs Mtg-Backed Securities Trust 2024-Rpl Series 2024-RPL2 Class A1, 3.75% 7/25/61 (b) | | 5,248,850 | 5,083,863 |
| Mfra Trst sequential payer Series 2024-RPL1 Class A1, 4.25% 2/25/66 (b)(c) | | 5,061,896 | 4,794,436 |
| New Residential Mortgage Loan Trust Series 2020-1A Class A1B, 3.5% 10/25/59 (b) | | 10,355,057 | 9,684,520 |
| New York Mortgage Trust sequential payer Series 2021-SP1 Class A1, 4.6696% 8/25/61 (b) | | 13,614,812 | 13,230,120 |
| NYMT Loan Trust sequential payer Series 2021-CP1 Class A1, 2.0424% 7/25/61 (b) | | 3,906,459 | 3,598,081 |
| Nymt Loan Trust 2024-Cp1 sequential payer Series 2024-CP1 Class A1, 3.75% 2/25/68 (b) | | 6,240,229 | 5,860,160 |
| Ocwen Ln Investment Trust 2023-Hb1 Series 2023-HB1 Class A, 3% 6/25/36 (b) | | 2,408,493 | 2,346,103 |
| Ocwen Loan Invest Trust Series 2024-HB1 Class A, 3% 2/25/37 (b) | | 2,054,124 | 1,993,301 |
| Preston Ridge Partners Mortgage Trust Series 2021-RPL1 Class A1, 1.319% 7/25/51 (b) | | 8,247,093 | 7,495,210 |
| Pret 2024-Rpl1 Trust sequential payer Series 2024-RPL1 Class A1, 3.9% 10/25/63 (b) | | 10,896,360 | 10,379,088 |
| Prmi Securitization Trust 2024-Cm floater Series 2024-CMG1 Class A1, U.S. 30-Day Avg. Secured Overnight Fin. Rate (SOFR) Index + 1.300% 6.8012% 7/25/54 (b)(c)(d) | | 10,611,912 | 10,579,113 |
| Prpm 2024-Rpl2 LLC Series 2024-RPL2 Class A1, 3.5% 5/25/54 (b)(c) | | 12,566,978 | 12,111,238 |
| RMF Buyout Issuance Trust: | | | |
| sequential payer Series 2021-HB1 Class A, 1.2586% 11/25/31 (b) | | 2,821,818 | 2,789,730 |
| Series 2020-HB1 Class A1, 1.7188% 10/25/50 (b) | | 4,163,519 | 3,956,746 |
| Sequoia Mortgage Trust floater Series 2004-6 Class A3B, CME Term SOFR 6 Month Index + 1.300% 6.5772% 7/20/34 (c)(d) | | 3,516 | 3,248 |
| Thornburg Mortgage Securities Trust floater Series 2003-4 Class A1, CME Term SOFR 1 Month Index + 0.750% 6.0324% 9/25/43 (c)(d) | | 79,040 | 75,219 |
| Towd Point Mortgage Trust sequential payer Series 2022-K147 Class A2, 3.75% 7/25/62 (b) | | 15,836,358 | 15,002,241 |
| Wells Fargo Mortgage Backed Securities Trust Series 2003-I Class A1, 7.4128% 9/25/33 (c) | | 10,073 | 9,997 |
TOTAL PRIVATE SPONSOR | | | 149,400,445 |
| U.S. Government Agency - 1.8% | | | |
| Fannie Mae: | | | |
| floater: | | | |
Series 2002-18 Class FD, U.S. 30-Day Avg. Secured Overnight Fin. Rate (SOFR) Index + 0.910% 6.2633% 2/25/32 (c)(d) | | 13,133 | 13,173 |
Series 2002-39 Class FD, U.S. 30-Day Avg. Secured Overnight Fin. Rate (SOFR) Index + 1.110% 6.4677% 3/18/32 (c)(d) | | 23,987 | 24,184 |
Series 2002-60 Class FV, U.S. 30-Day Avg. Secured Overnight Fin. Rate (SOFR) Index + 1.110% 6.4633% 4/25/32 (c)(d) | | 25,732 | 25,944 |
Series 2002-63 Class FN, U.S. 30-Day Avg. Secured Overnight Fin. Rate (SOFR) Index + 1.110% 6.4633% 10/25/32 (c)(d) | | 31,892 | 32,158 |
Series 2002-7 Class FC, U.S. 30-Day Avg. Secured Overnight Fin. Rate (SOFR) Index + 0.860% 6.2133% 1/25/32 (c)(d) | | 12,087 | 12,092 |
Series 2003-118 Class S, 7.980% - U.S. 30-Day Avg. Secured Overnight Fin. Rate (SOFR) Index 2.6367% 12/25/33 (c)(j)(k) | | 494,065 | 74,072 |
Series 2006-104 Class GI, 6.560% - U.S. 30-Day Avg. Secured Overnight Fin. Rate (SOFR) Index 1.2167% 11/25/36 (c)(j)(k) | | 357,858 | 38,015 |
Series 2012-70 Class FB, U.S. 30-Day Avg. Secured Overnight Fin. Rate (SOFR) Index + 0.560% 5.9133% 7/25/42 (c)(d) | | 12,118,293 | 12,013,731 |
| planned amortization class: | | | |
Series 1999-17 Class PG, 6% 4/25/29 | | 107,798 | 109,655 |
Series 1999-32 Class PL, 6% 7/25/29 | | 151,781 | 154,415 |
Series 1999-33 Class PK, 6% 7/25/29 | | 110,350 | 112,177 |
Series 2001-52 Class YZ, 6.5% 10/25/31 | | 19,959 | 20,610 |
Series 2005-102 Class CO 11/25/35 (l) | | 71,491 | 61,562 |
Series 2005-39 Class TE, 5% 5/25/35 | | 19,099 | 19,421 |
Series 2005-73 Class SA, 17.500% x U.S. 30-Day Avg. Secured Overnight Fin. Rate (SOFR) Index 3.3454% 8/25/35 (c)(d)(k) | | 14,772 | 15,417 |
Series 2005-81 Class PC, 5.5% 9/25/35 | | 241,310 | 248,073 |
Series 2006-12 Class BO 10/25/35 (l) | | 320,417 | 282,932 |
Series 2006-15 Class OP 3/25/36 (l) | | 479,851 | 407,699 |
Series 2006-37 Class OW 5/25/36 (l) | | 48,710 | 39,669 |
Series 2006-45 Class OP 6/25/36 (l) | | 148,526 | 123,262 |
Series 2006-62 Class KP 4/25/36 (l) | | 233,073 | 194,609 |
Series 2012-149: | | | |
Class DA, 1.75% 1/25/43 | | 1,754,560 | 1,627,399 |
Class GA, 1.75% 6/25/42 | | 2,112,130 | 1,954,950 |
Series 2017-32 Class PA, 2.7% 5/25/47 | | 17,350,552 | 15,805,095 |
Series 2017-37 Class AB, 2.55% 9/25/46 | | 4,362,637 | 4,003,215 |
Series 2019-76 Class FC, U.S. 30-Day Avg. Secured Overnight Fin. Rate (SOFR) Index + 0.610% 5.9633% 12/25/49 (c)(d) | | 6,458,678 | 6,325,971 |
Series 2021-69 Class JK, 1.5% 10/25/51 | | 3,897,473 | 3,292,082 |
Series 2022-2 Class TH, 2.5% 2/25/52 | | 2,264,612 | 2,083,284 |
| sequential payer: | | | |
Series 1997-41 Class J, 7.5% 6/18/27 | | 16,553 | 16,977 |
Series 1999-25 Class Z, 6% 6/25/29 | | 113,070 | 113,706 |
Series 2001-20 Class Z, 6% 5/25/31 | | 143,677 | 146,729 |
Series 2001-31 Class ZC, 6.5% 7/25/31 | | 63,166 | 64,106 |
Series 2002-16 Class ZD, 6.5% 4/25/32 | | 64,402 | 66,632 |
Series 2002-74 Class SV, 7.430% - U.S. 30-Day Avg. Secured Overnight Fin. Rate (SOFR) Index 2.0867% 11/25/32 (c)(j)(k) | | 59,827 | 1,498 |
Series 2012-67 Class AI, 4.5% 7/25/27 (j) | | 34,922 | 455 |
Series 2020-43 Class MA, 2% 1/25/45 | | 9,093,984 | 8,396,387 |
Series 2020-49 Class JA, 2% 8/25/44 | | 1,955,146 | 1,815,309 |
Series 2020-80 Class BA, 1.5% 3/25/45 | | 7,711,574 | 6,790,513 |
Series 2021-85 Class L, 2.5% 8/25/48 | | 2,244,767 | 2,000,142 |
Series 2021-95: | | | |
Class 0, 2.5% 9/25/48 | | 10,870,773 | 9,709,874 |
Class BA, 2.5% 6/25/49 | | 16,529,342 | 14,688,585 |
Series 2021-96 Class HA, 2.5% 2/25/50 | | 3,615,148 | 3,217,159 |
Series 2022-1 Class KA, 3% 5/25/48 | | 3,517,344 | 3,270,501 |
Series 2022-11 Class B, 3% 6/25/49 | | 4,820,403 | 4,506,499 |
Series 2022-13: | | | |
Class HA, 3% 8/25/46 | | 3,929,458 | 3,709,476 |
Class JA, 3% 5/25/48 | | 7,011,703 | 6,575,347 |
Series 2022-15 Class GC, 3% 1/25/47 | | 5,644,001 | 5,305,691 |
Series 2022-17 Class BH, 3% 5/25/47 | | 6,164,723 | 5,851,461 |
Series 2022-25 Class AB, 4% 9/25/47 | | 6,182,449 | 6,065,261 |
Series 2022-3: | | | |
Class D, 2% 2/25/48 | | 16,043,161 | 14,431,108 |
Class N, 2% 10/25/47 | | 41,664,617 | 37,306,115 |
Series 2022-30 Class E, 4.5% 7/25/48 | | 9,237,452 | 9,122,405 |
Series 2022-35 Class CK, 4% 3/25/47 | | 12,867,000 | 12,430,888 |
Series 2022-4 Class B, 2.5% 5/25/49 | | 2,628,114 | 2,348,637 |
Series 2022-49 Class TC, 4% 12/25/48 | | 2,946,508 | 2,856,259 |
Series 2022-5: | | | |
Class 0, 2.5% 6/25/48 | | 4,360,886 | 3,959,469 |
Class DA, 2.25% 11/25/47 | | 13,476,762 | 12,166,199 |
Series 2022-7: | | | |
Class A, 3% 5/25/48 | | 5,009,846 | 4,658,495 |
Class E, 2.5% 11/25/47 | | 15,869,928 | 14,497,067 |
Series 2022-9 Class BA, 3% 5/25/48 | | 5,355,116 | 4,979,868 |
| Series 06-116 Class SG, 6.520% - U.S. 30-Day Avg. Secured Overnight Fin. Rate (SOFR) Index 1.1767% 12/25/36 (c)(j)(k) | | 247,315 | 26,501 |
| Series 07-40 Class SE, 6.320% - U.S. 30-Day Avg. Secured Overnight Fin. Rate (SOFR) Index 0.9767% 5/25/37 (c)(j)(k) | | 121,289 | 14,426 |
| Series 2003-21 Class SK, 7.980% - U.S. 30-Day Avg. Secured Overnight Fin. Rate (SOFR) Index 2.6367% 3/25/33 (c)(j)(k) | | 27,249 | 2,974 |
| Series 2005-72 Class ZC, 5.5% 8/25/35 | | 1,949,090 | 1,980,215 |
| Series 2005-79 Class ZC, 5.9% 9/25/35 | | 841,504 | 858,090 |
| Series 2007-57 Class SA, 40.600% x U.S. 30-Day Avg. Secured Overnight Fin. Rate (SOFR) Index 7.8401% 6/25/37 (c)(d)(k) | | 108,901 | 137,500 |
| Series 2007-66: | | | |
Class SA, 38.910% x U.S. 30-Day Avg. Secured Overnight Fin. Rate (SOFR) Index 6.8201% 7/25/37 (c)(d)(k) | | 150,224 | 191,458 |
Class SB, 38.910% x U.S. 30-Day Avg. Secured Overnight Fin. Rate (SOFR) Index 6.8201% 7/25/37 (c)(d)(k) | | 36,013 | 40,570 |
| Series 2010-135 Class ZA, 4.5% 12/25/40 | | 1,548,721 | 1,570,626 |
| Series 2010-150 Class ZC, 4.75% 1/25/41 | | 3,372,381 | 3,383,447 |
| Series 2010-95 Class ZC, 5% 9/25/40 | | 7,016,476 | 7,107,096 |
| Series 2011-39 Class ZA, 6% 11/25/32 | | 560,345 | 582,518 |
| Series 2011-4 Class PZ, 5% 2/25/41 | | 1,136,670 | 1,117,537 |
| Series 2011-67 Class AI, 4% 7/25/26 (j) | | 17,153 | 250 |
| Series 2012-100 Class WI, 3% 9/25/27 (j) | | 849,768 | 24,756 |
| Series 2012-9 Class SH, 6.430% - U.S. 30-Day Avg. Secured Overnight Fin. Rate (SOFR) Index 1.0867% 6/25/41 (c)(j)(k) | | 33,057 | 144 |
| Series 2013-133 Class IB, 3% 4/25/32 (j) | | 199,721 | 2,306 |
| Series 2013-134 Class SA, 5.930% - U.S. 30-Day Avg. Secured Overnight Fin. Rate (SOFR) Index 0.5867% 1/25/44 (c)(j)(k) | | 430,030 | 48,293 |
| Series 2013-51 Class GI, 3% 10/25/32 (j) | | 1,247,174 | 58,216 |
| Series 2013-N1 Class A, 6.600% - U.S. 30-Day Avg. Secured Overnight Fin. Rate (SOFR) Index 1.2567% 6/25/35 (c)(j)(k) | | 638,907 | 51,466 |
| Series 2015-42 Class IL, 6% 6/25/45 (j) | | 2,294,327 | 366,578 |
| Series 2015-70 Class JC, 3% 10/25/45 | | 3,380,339 | 3,223,831 |
| Series 2017-30 Class AI, 5.5% 5/25/47 (j) | | 1,357,258 | 218,627 |
| Series 2020-45 Class JL, 3% 7/25/40 | | 347,086 | 319,149 |
| Series 2021-59 Class H, 2% 6/25/48 | | 2,358,893 | 1,960,885 |
| Series 2021-66: | | | |
Class DA, 2% 1/25/48 | | 2,528,610 | 2,111,716 |
Class DM, 2% 1/25/48 | | 2,687,188 | 2,244,148 |
| Series 2022-28 Class A, 2.5% 2/25/52 | | 11,554,350 | 10,908,294 |
| Series 2023-13 Class CK, 1.5% 11/25/50 | | 12,233,286 | 9,901,931 |
| Fannie Mae Stripped Mortgage-Backed Securities: | | | |
| Series 339 Class 5, 5.5% 7/25/33 (j) | | 121,874 | 18,369 |
| Series 343 Class 16, 5.5% 5/25/34 (j) | | 113,689 | 17,281 |
| Series 348 Class 14, 6.5% 8/25/34 (c)(j) | | 78,254 | 14,382 |
| Series 351: | | | |
Class 12, 5.5% 4/25/34 (c)(j) | | 48,293 | 7,651 |
Class 13, 6% 3/25/34 (j) | | 74,829 | 12,990 |
| Series 359 Class 19, 6% 7/25/35 (c)(j) | | 43,311 | 7,875 |
| Series 384 Class 6, 5% 7/25/37 (j) | | 481,468 | 79,206 |
| Freddie Mac: | | | |
| floater: | | | |
Series 2412 Class FK, U.S. 30-Day Avg. Secured Overnight Fin. Rate (SOFR) Index + 0.910% 6.268% 1/15/32 (c)(d) | | 9,528 | 9,554 |
Series 2423 Class FA, U.S. 30-Day Avg. Secured Overnight Fin. Rate (SOFR) Index + 1.010% 6.368% 3/15/32 (c)(d) | | 13,816 | 13,888 |
Series 2424 Class FM, U.S. 30-Day Avg. Secured Overnight Fin. Rate (SOFR) Index + 1.110% 6.468% 3/15/32 (c)(d) | | 12,921 | 13,004 |
Series 2432: | | | |
Class FE, U.S. 30-Day Avg. Secured Overnight Fin. Rate (SOFR) Index + 1.010% 6.368% 6/15/31 (c)(d) | | 22,139 | 22,213 |
Class FG, U.S. 30-Day Avg. Secured Overnight Fin. Rate (SOFR) Index + 1.010% 6.368% 3/15/32 (c)(d) | | 7,988 | 8,018 |
| planned amortization class: | | | |
Series 2020-5050 Class KP, 1% 12/25/50 | | 2,583,764 | 2,151,490 |
Series 2021-5141 Class JM, 1.5% 4/25/51 | | 2,878,776 | 2,440,795 |
Series 2021-5148: | | | |
Class AD, 1.5% 10/25/51 | | 3,870,698 | 3,277,236 |
Class PC, 1.5% 10/25/51 | | 3,825,590 | 3,207,595 |
Series 2095 Class PE, 6% 11/15/28 | | 143,515 | 146,027 |
Series 2101 Class PD, 6% 11/15/28 | | 12,655 | 12,898 |
Series 2104 Class PG, 6% 12/15/28 | | 2,971 | 3,025 |
Series 2121 Class MG, 6% 2/15/29 | | 61,961 | 63,097 |
Series 2131 Class BG, 6% 3/15/29 | | 408,952 | 416,756 |
Series 2137 Class PG, 6% 3/15/29 | | 68,164 | 69,415 |
Series 2154 Class PT, 6% 5/15/29 | | 112,996 | 115,119 |
Series 2162 Class PH, 6% 6/15/29 | | 21,158 | 21,535 |
Series 2520 Class BE, 6% 11/15/32 | | 245,818 | 254,074 |
Series 2693 Class MD, 5.5% 10/15/33 | | 655,251 | 664,624 |
Series 2802 Class OB, 6% 5/15/34 | | 156,381 | 160,323 |
Series 3002 Class NE, 5% 7/15/35 | | 569,567 | 579,933 |
Series 3110 Class OP 9/15/35 (l) | | 73,081 | 70,136 |
Series 3119 Class PO 2/15/36 (l) | | 561,271 | 458,973 |
Series 3121 Class KO 3/15/36 (l) | | 86,102 | 74,207 |
Series 3123 Class LO 3/15/36 (l) | | 308,935 | 254,946 |
Series 3145 Class GO 4/15/36 (l) | | 336,032 | 279,581 |
Series 3189 Class PD, 6% 7/15/36 | | 521,114 | 546,147 |
Series 3225 Class EO 10/15/36 (l) | | 170,014 | 139,477 |
Series 3258 Class PM, 5.5% 12/15/36 | | 175,985 | 180,864 |
Series 3415 Class PC, 5% 12/15/37 | | 238,772 | 241,105 |
Series 3832 Class PE, 5% 3/15/41 | | 2,330,369 | 2,373,598 |
Series 4135 Class AB, 1.75% 6/15/42 | | 1,626,790 | 1,514,505 |
| sequential payer: | | | |
Series 2020-4993 Class LA, 2% 8/25/44 | | 8,632,813 | 8,019,742 |
Series 2020-5018: | | | |
Class LC, 3% 10/25/40 | | 2,341,537 | 2,157,651 |
Class LY, 3% 10/25/40 | | 1,778,664 | 1,638,550 |
Series 2020-5058 Class BE, 3% 11/25/50 | | 8,276,878 | 7,337,770 |
Series 2020-5066 Class A, 1.5% 11/25/44 | | 2,586,075 | 2,279,476 |
Series 2021-5115 Class A, 2% 3/25/40 | | 2,268,454 | 2,027,768 |
Series 2021-5139 Class JC, 2% 8/25/40 | | 2,169,182 | 1,917,347 |
Series 2021-5147 Class WN, 2% 1/25/40 | | 2,332,156 | 2,065,775 |
Series 2021-5169: | | | |
Class BA, 2.5% 5/25/49 | | 14,876,982 | 13,217,184 |
Class TP, 2.5% 6/25/49 | | 3,464,554 | 3,075,323 |
Series 2021-5175 Class CB, 2.5% 4/25/50 | | 13,068,152 | 11,605,341 |
Series 2021-5178: | | | |
Class CT, 2% 11/25/40 | | 2,367,607 | 2,084,462 |
Class TP, 2.5% 4/25/49 | | 8,580,747 | 7,639,588 |
Series 2021-5180 Class KA, 2.5% 10/25/47 | | 2,608,293 | 2,373,798 |
Series 2022-5189: | | | |
Class DA, 2.5% 5/25/49 | | 2,768,497 | 2,468,485 |
Class TP, 2.5% 5/25/49 | | 5,970,005 | 5,329,554 |
Series 2022-5190: | | | |
Class BA, 2.5% 11/25/47 | | 2,603,374 | 2,366,999 |
Class CA, 2.5% 5/25/49 | | 4,991,036 | 4,455,126 |
Series 2022-5191 Class CA, 2.5% 4/25/50 | | 3,061,844 | 2,701,848 |
Series 2022-5197: | | | |
Class A, 2.5% 6/25/49 | | 4,991,050 | 4,455,127 |
Class DA, 2.5% 11/25/47 | | 1,976,212 | 1,798,840 |
Series 2022-5198 Class BA, 2.5% 11/25/47 | | 8,872,975 | 8,113,681 |
Series 2022-5200 Class C, 3% 5/25/48 | | 12,117,529 | 11,406,803 |
Series 2022-5202: | | | |
Class AG, 3% 1/25/49 | | 2,742,264 | 2,540,802 |
Class BC, 3% 5/25/48 | | 10,831,484 | 10,072,565 |
Class LB, 2.5% 10/25/47 | | 2,118,180 | 1,929,536 |
Class UA, 3% 4/25/50 | | 4,225,784 | 3,895,140 |
Series 2022-5210 Class TA, 3.5% 11/25/46 | | 3,678,936 | 3,495,809 |
Series 2114 Class ZM, 6% 1/15/29 | | 1,254 | 1,278 |
Series 2135 Class JE, 6% 3/15/29 | | 26,071 | 26,673 |
Series 2274 Class ZM, 6.5% 1/15/31 | | 43,045 | 43,607 |
Series 2281 Class ZB, 6% 3/15/30 | | 73,663 | 75,291 |
Series 2303 Class ZV, 6% 4/15/31 | | 37,781 | 38,791 |
Series 2357 Class ZB, 6.5% 9/15/31 | | 368,601 | 378,928 |
Series 2502 Class ZC, 6% 9/15/32 | | 98,696 | 101,991 |
Series 2519 Class ZD, 5.5% 11/15/32 | | 128,013 | 131,129 |
Series 2998 Class LY, 5.5% 7/15/25 | | 6,628 | 6,616 |
| Series 06-3115 Class SM, 6.480% - U.S. 30-Day Avg. Secured Overnight Fin. Rate (SOFR) Index 1.132% 2/15/36 (c)(j)(k) | | 170,095 | 16,717 |
| Series 2013-4281 Class AI, 4% 12/15/28 (j) | | 14,536 | 100 |
| Series 2017-4683 Class LM, 3% 5/15/47 | | 3,318,508 | 3,185,532 |
| Series 2020-5041: | | | |
Class LA, 1.5% 11/25/40 | | 21,711,761 | 18,297,176 |
Class LB, 3% 11/25/40 | | 3,984,889 | 3,674,601 |
| Series 2020-5046 Class PT, 1.5% 11/25/40 | | 16,493,536 | 13,897,845 |
| Series 2021-5083 Class VA, 1% 8/15/38 | | 8,755,865 | 8,273,062 |
| Series 2021-5182 Class A, 2.5% 10/25/48 | | 17,155,195 | 15,305,067 |
| Series 2022-5210 Class AB, 3% 1/25/42 | | 6,502,200 | 6,090,555 |
| Series 2022-5213 Class AH, 2.25% 4/25/37 | | 9,678,213 | 9,038,825 |
| Series 2022-5236 Class P, 5% 4/25/48 | | 4,129,734 | 4,153,002 |
| Series 2022-5266 Class CD, 4.5% 10/25/44 | | 9,730,548 | 9,679,396 |
| Series 2380 Class SY, 8.080% - U.S. 30-Day Avg. Secured Overnight Fin. Rate (SOFR) Index 2.732% 11/15/31 (c)(j)(k) | | 5,456 | 250 |
| Series 2587 Class IM, 6.5% 3/15/33 (j) | | 3,264 | 514 |
| Series 2933 Class ZM, 5.75% 2/15/35 | | 1,840,516 | 1,907,915 |
| Series 2947 Class XZ, 6% 3/15/35 | | 1,051,786 | 1,095,575 |
| Series 2996 Class ZD, 5.5% 6/15/35 | | 1,227,987 | 1,262,480 |
| Series 3237 Class C, 5.5% 11/15/36 | | 1,633,623 | 1,675,321 |
| Series 3244 Class SG, 6.540% - U.S. 30-Day Avg. Secured Overnight Fin. Rate (SOFR) Index 1.192% 11/15/36 (c)(j)(k) | | 745,507 | 69,637 |
| Series 3336 Class LI, 6.460% - U.S. 30-Day Avg. Secured Overnight Fin. Rate (SOFR) Index 1.112% 6/15/37 (c)(j)(k) | | 480,264 | 57,973 |
| Series 3949 Class MK, 4.5% 10/15/34 | | 388,784 | 387,756 |
| Series 4055 Class BI, 3.5% 5/15/31 (j) | | 59,510 | 133 |
| Series 4149 Class IO, 3% 1/15/33 (j) | | 701,371 | 50,111 |
| Series 4314 Class AI, 5% 3/15/34 (j) | | 19,042 | 249 |
| Series 4427 Class LI, 3.5% 2/15/34 (j) | | 1,104,786 | 49,071 |
| Series 4471 Class PA 4% 12/15/40 | | 1,261,011 | 1,245,753 |
| target amortization class: | | | |
Series 2007-3366 Class FD, U.S. 30-Day Avg. Secured Overnight Fin. Rate (SOFR) Index + 0.360% 5.718% 5/15/37 (c)(d) | | 593,097 | 577,969 |
Series 2156 Class TC, 6.25% 5/15/29 | | 18,738 | 18,731 |
| Freddie Mac Manufactured Housing participation certificates guaranteed: | | | |
| planned amortization class Series 2043 Class CJ, 6.5% 4/15/28 | | 3,354 | 3,391 |
| sequential payer: | | | |
Series 2043 Class ZH, 6% 4/15/28 | | 37,396 | 37,993 |
Series 2056 Class Z, 6% 5/15/28 | | 107,959 | 109,913 |
| Freddie Mac Multi-family Structured pass-thru certificates: | | | |
| planned amortization class Series 2021-5165 Class PC, 1.5% 11/25/51 | | 4,895,336 | 4,152,559 |
| sequential payer: | | | |
Series 2021-5159: | | | |
Class EA, 2.5% 8/25/48 | | 3,417,442 | 3,046,362 |
Class GC, 2% 11/25/47 | | 2,088,158 | 1,861,058 |
Series 2021-5164 Class M, 2.5% 7/25/48 | | 3,483,199 | 3,106,350 |
| Series 4386 Class AZ, 4.5% 11/15/40 | | 5,110,285 | 5,024,938 |
| Ginnie Mae guaranteed REMIC pass-thru certificates: | | | |
| floater: | | | |
Series 2007-37 Class TS, 6.570% - CME Term SOFR 1 Month Index 1.2369% 6/16/37 (c)(j)(k) | | 312,899 | 33,886 |
Series 2010-H03 Class FA, CME Term SOFR 1 Month Index + 0.660% 6.0116% 3/20/60 (c)(d)(m) | | 1,587,810 | 1,585,559 |
Series 2010-H17 Class FA, CME Term SOFR 1 Month Index + 0.440% 5.7916% 7/20/60 (c)(d)(m) | | 446,767 | 445,171 |
Series 2010-H18 Class AF, CME Term SOFR 1 Month Index + 0.410% 5.7464% 9/20/60 (c)(d)(m) | | 385,472 | 383,319 |
Series 2010-H19 Class FG, CME Term SOFR 1 Month Index + 0.410% 5.7464% 8/20/60 (c)(d)(m) | | 362,243 | 360,585 |
Series 2010-H27 Class FA, CME Term SOFR 1 Month Index + 0.380% 5.8264% 12/20/60 (c)(d)(m) | | 959,675 | 956,134 |
Series 2011-H05 Class FA, CME Term SOFR 1 Month Index + 0.610% 5.9464% 12/20/60 (c)(d)(m) | | 668,772 | 667,427 |
Series 2011-H07 Class FA, CME Term SOFR 1 Month Index + 0.610% 5.9464% 2/20/61 (c)(d)(m) | | 677,630 | 676,006 |
Series 2011-H12 Class FA, CME Term SOFR 1 Month Index + 0.600% 5.9364% 2/20/61 (c)(d)(m) | | 847,580 | 845,178 |
Series 2011-H13 Class FA, CME Term SOFR 1 Month Index + 0.610% 5.9464% 4/20/61 (c)(d)(m) | | 801,938 | 800,493 |
Series 2011-H14: | | | |
Class FB, CME Term SOFR 1 Month Index + 0.610% 5.9464% 5/20/61 (c)(d)(m) | | 859,572 | 857,421 |
Class FC, CME Term SOFR 1 Month Index + 0.610% 5.9464% 5/20/61 (c)(d)(m) | | 820,462 | 819,018 |
Series 2011-H17 Class FA, CME Term SOFR 1 Month Index + 0.640% 5.9764% 6/20/61 (c)(d)(m) | | 885,775 | 884,531 |
Series 2011-H20 Class FA, CME Term SOFR 1 Month Index + 0.660% 5.9964% 9/20/61 (c)(d)(m) | | 174,263 | 174,032 |
Series 2011-H21 Class FA, CME Term SOFR 1 Month Index + 0.710% 6.0464% 10/20/61 (c)(d)(m) | | 872,959 | 872,286 |
Series 2012-98 Class FA, CME Term SOFR 1 Month Index + 0.510% 5.8502% 8/20/42 (c)(d) | | 181,928 | 178,720 |
Series 2012-H01 Class FA, CME Term SOFR 1 Month Index + 0.810% 6.1464% 11/20/61 (c)(d)(m) | | 1,064,660 | 1,065,375 |
Series 2012-H03 Class FA, CME Term SOFR 1 Month Index + 0.810% 6.1464% 1/20/62 (c)(d)(m) | | 495,405 | 495,716 |
Series 2012-H06 Class FA, CME Term SOFR 1 Month Index + 0.740% 6.0764% 1/20/62 (c)(d)(m) | | 991,028 | 990,563 |
Series 2012-H07 Class FA, CME Term SOFR 1 Month Index + 0.740% 6.0764% 3/20/62 (c)(d)(m) | | 497,222 | 496,346 |
Series 2012-H21 Class DF, CME Term SOFR 1 Month Index + 0.760% 6.0964% 5/20/61 (c)(d)(m) | | 24,358 | 24,285 |
Series 2012-H23 Class WA, CME Term SOFR 1 Month Index + 0.630% 5.9664% 10/20/62 (c)(d)(m) | | 149,476 | 149,214 |
Series 2013-H07 Class BA, CME Term SOFR 1 Month Index + 0.360% 5.8064% 3/20/63 (c)(d)(m) | | 180,746 | 180,019 |
Series 2014-H03 Class FA, CME Term SOFR 1 Month Index + 0.710% 6.0464% 1/20/64 (c)(d)(m) | | 500,110 | 499,711 |
Series 2014-H05 Class FB, CME Term SOFR 1 Month Index + 0.710% 6.0464% 12/20/63 (c)(d)(m) | | 768,154 | 767,256 |
Series 2014-H11 Class BA, CME Term SOFR 1 Month Index + 0.610% 5.9464% 6/20/64 (c)(d)(m) | | 652,283 | 650,973 |
Series 2015-H13 Class FL, CME Term SOFR 1 Month Index + 0.390% 5.7264% 5/20/63 (c)(d)(m) | | 21,020 | 20,755 |
Series 2015-H19 Class FA, CME Term SOFR 1 Month Index + 0.310% 5.6464% 4/20/63 (c)(d)(m) | | 26,693 | 26,364 |
Series 2016-H20 Class FM, CME Term SOFR 1 Month Index + 0.510% 5.8464% 12/20/62 (c)(d)(m) | | 6,423 | 6,354 |
Series 2019-11 Class F, CME Term SOFR 1 Month Index + 0.510% 5.8502% 1/20/49 (c)(d) | | 4,664,681 | 4,618,613 |
Series 2019-128 Class FH, CME Term SOFR 1 Month Index + 0.610% 5.9502% 10/20/49 (c)(d) | | 1,773,501 | 1,738,349 |
Series 2019-23 Class NF, CME Term SOFR 1 Month Index + 0.560% 5.9002% 2/20/49 (c)(d) | | 3,570,286 | 3,515,572 |
| planned amortization class: | | | |
Series 2011-136 Class WI, 4.5% 5/20/40 (j) | | 87,589 | 4,683 |
Series 2016-69 Class WA, 3% 2/20/46 | | 4,114,525 | 3,857,311 |
Series 2017-134 Class BA, 2.5% 11/20/46 | | 2,481,188 | 2,285,708 |
Series 2017-153 Class GA, 3% 9/20/47 | | 4,678,713 | 4,306,714 |
Series 2017-182 Class KA, 3% 10/20/47 | | 3,687,649 | 3,419,350 |
Series 2018-13 Class Q, 3% 4/20/47 | | 4,410,761 | 4,169,657 |
| sequential payer: | | | |
Series 2004-24 Class ZM, 5% 4/20/34 | | 848,946 | 844,759 |
Series 2010-160 Class DY, 4% 12/20/40 | | 4,940,106 | 4,852,121 |
Series 2010-170 Class B, 4% 12/20/40 | | 1,092,210 | 1,071,651 |
Series 2017-139 Class BA, 3% 9/20/47 | | 8,471,858 | 7,733,698 |
| Series 2004-32 Class GS, 6.380% - CME Term SOFR 1 Month Index 1.0469% 5/16/34 (c)(j)(k) | | 183,363 | 13,250 |
| Series 2004-73 Class AL, 7.080% - CME Term SOFR 1 Month Index 1.7469% 8/17/34 (c)(j)(k) | | 170,200 | 15,754 |
| Series 2007-35 Class SC, 39.510% x CME Term SOFR 1 Month Index 7.4813% 6/16/37 (c)(d)(k) | | 6,266 | 7,285 |
| Series 2010-116 Class QB, 4% 9/16/40 | | 1,132,223 | 1,093,224 |
| Series 2010-H10 Class FA, CME Term SOFR 1 Month Index + 0.440% 5.7916% 5/20/60 (c)(d)(m) | | 1,073,378 | 1,069,769 |
| Series 2011-52 Class HI, 7% 4/16/41 (j) | | 39,098 | 5,269 |
| Series 2011-94 Class SA, 5.980% - CME Term SOFR 1 Month Index 0.6498% 7/20/41 (c)(j)(k) | | 474,033 | 48,326 |
| Series 2013-149 Class MA, 2.5% 5/20/40 | | 2,669,825 | 2,601,537 |
| Series 2014-2 Class BA, 3% 1/20/44 | | 8,602,209 | 7,994,388 |
| Series 2014-21 Class HA, 3% 2/20/44 | | 3,192,340 | 2,988,812 |
| Series 2014-25 Class HC, 3% 2/20/44 | | 5,461,129 | 5,061,470 |
| Series 2014-5 Class A, 3% 1/20/44 | | 4,422,080 | 4,108,623 |
| Series 2015-H13 Class HA, 2.5% 8/20/64 (m) | | 38,422 | 37,022 |
| Series 2016-H13 Class FB, U.S. TREASURY 1 YEAR INDEX + 0.500% 5.6% 5/20/66 (c)(d)(m) | | 149,414 | 148,796 |
| Series 2017-186 Class HK, 3% 11/16/45 | | 533,137 | 496,863 |
| Series 2017-H06 Class FA, U.S. TREASURY 1 YEAR INDEX + 0.350% 5.45% 8/20/66 (c)(d)(m) | | 2,514,808 | 2,502,903 |
| Ginnie Mae REMIC Trust Series 2015-H17 Class GZ, 4.2558% 5/20/65 (c)(m) | | 358,416 | 354,111 |
| Prpm 2024-Rcf4 LLC Series 2024-RCF4 Class A1, 4% 7/25/54 (b) | | 3,658,994 | 3,555,243 |
TOTAL U.S. GOVERNMENT AGENCY | | | 659,640,946 |
| TOTAL COLLATERALIZED MORTGAGE OBLIGATIONS (Cost $802,249,817) | | | 809,041,391 |
| | | | |
| Commercial Mortgage Securities - 5.7% |
| | | Principal Amount (a) | Value ($) |
| BAMLL Commercial Mortgage Securities Trust: | | | |
| floater Series 2022-DKLX: | | | |
Class A, CME Term SOFR 1 Month Index + 1.150% 6.487% 1/15/39 (b)(c)(d) | | 23,840,000 | 23,501,281 |
Class B, CME Term SOFR 1 Month Index + 1.550% 6.887% 1/15/39 (b)(c)(d) | | 4,503,000 | 4,419,546 |
Class C, CME Term SOFR 1 Month Index + 2.150% 7.487% 1/15/39 (b)(c)(d) | | 3,215,000 | 3,148,455 |
| sequential payer Series 2019-BPR: | | | |
Class AMP, 3.287% 11/5/32 (b) | | 38,600,000 | 37,345,500 |
Class ANM, 3.112% 11/5/32 (b) | | 22,568,000 | 20,988,240 |
| Series 2019-BPR: | | | |
Class BNM, 3.465% 11/5/32 (b) | | 5,065,000 | 4,368,563 |
Class CNM, 3.8425% 11/5/32 (b)(c) | | 2,095,000 | 1,524,113 |
| BANK: | | | |
| sequential payer: | | | |
Series 2017-BNK9 Class A4, 3.538% 11/15/54 | | 19,688,000 | 18,948,141 |
Series 2018-BN10 Class A5, 3.688% 2/15/61 | | 965,000 | 932,609 |
Series 2018-BN14 Class A4, 4.231% 9/15/60 | | 16,350,000 | 16,037,615 |
Series 2019-BN20 Class ASB, 2.933% 9/15/62 | | 800,000 | 763,995 |
Series 2019-BN21 Class A5, 2.851% 10/17/52 | | 26,963,000 | 24,334,161 |
Series 2019-BN23 Class ASB, 2.846% 12/15/52 | | 2,300,000 | 2,196,616 |
Series 2023-5YR1 Class A3, 6.26% 4/15/56 | | 8,900,000 | 9,266,271 |
| Series 2020-BN25 Class XB, 0.5319% 1/15/63 (c)(j) | | 27,800,000 | 576,055 |
| Series 2021-BN33 Class XA, 1.163% 5/15/64 (c)(j) | | 14,478,499 | 695,992 |
| Bank 2018-Bnk13 sequential payer Series 2018-BN13 Class A4, 3.953% 8/15/61 | | 5,300,000 | 5,141,395 |
| Bank5 2023-5Yr3 sequential payer Series 2023-5YR3 Class A3, 6.724% 9/15/56 | | 8,400,000 | 8,945,964 |
| Bayview Commercial Asset Trust floater: | | | |
| Series 2005-3A Class A2, CME Term SOFR 1 Month Index + 0.710% 5.9924% 11/25/35 (b)(c)(d) | | 11,823 | 11,591 |
| Series 2005-4A: | | | |
Class A2, CME Term SOFR 1 Month Index + 0.690% 5.9774% 1/25/36 (b)(c)(d) | | 27,963 | 26,820 |
Class M1, CME Term SOFR 1 Month Index + 0.780% 6.0674% 1/25/36 (b)(c)(d) | | 9,020 | 8,582 |
| Series 2006-4A Class A2, CME Term SOFR 1 Month Index + 0.510% 5.7974% 12/25/36 (b)(c)(d) | | 59,117 | 56,043 |
| Series 2007-1 Class A2, CME Term SOFR 1 Month Index + 0.510% 5.7974% 3/25/37 (b)(c)(d) | | 14,540 | 13,807 |
| Series 2007-2A: | | | |
Class A1, CME Term SOFR 1 Month Index + 0.380% 5.7974% 7/25/37 (b)(c)(d) | | 49,320 | 46,174 |
Class A2, CME Term SOFR 1 Month Index + 0.430% 5.8724% 7/25/37 (b)(c)(d) | | 46,231 | 42,750 |
Class M1, CME Term SOFR 1 Month Index + 0.480% 5.9474% 7/25/37 (b)(c)(d) | | 15,778 | 14,491 |
| Series 2007-3: | | | |
Class A2, CME Term SOFR 1 Month Index + 0.540% 5.8274% 7/25/37 (b)(c)(d) | | 16,964 | 16,035 |
Class M1, CME Term SOFR 1 Month Index + 0.570% 5.8574% 7/25/37 (b)(c)(d) | | 9,000 | 8,291 |
Class M2, CME Term SOFR 1 Month Index + 0.620% 5.9024% 7/25/37 (b)(c)(d) | | 9,637 | 8,787 |
Class M3, CME Term SOFR 1 Month Index + 0.660% 5.9474% 7/25/37 (b)(c)(d) | | 15,451 | 14,085 |
Class M4, CME Term SOFR 1 Month Index + 0.860% 6.1424% 7/25/37 (b)(c)(d) | | 24,371 | 22,414 |
Class M5, CME Term SOFR 1 Month Index + 1.010% 6.2924% 7/25/37 (b)(c)(d) | | 14,631 | 14,839 |
| BBCMS Mortgage Trust sequential payer Series 2023-C21 Class A3, 6.5064% 9/15/56 (c) | | 8,600,000 | 9,269,832 |
| Benchmark 2024-V9 Mortgage Tru sequential payer Series 2024-V9 Class A3, 5.6019% 8/15/57 | | 10,100,000 | 10,408,670 |
| Benchmark Mortgage Trust: | | | |
| sequential payer: | | | |
Series 2018-B4 Class A5, 4.121% 7/15/51 | | 3,988,000 | 3,877,340 |
Series 2018-B7 Class A4, 4.51% 5/15/53 | | 2,500,000 | 2,459,424 |
Series 2019-B10 Class A4, 3.717% 3/15/62 | | 6,658,000 | 6,379,222 |
Series 2019-B13 Class A4, 2.952% 8/15/57 | | 25,034,000 | 22,903,699 |
Series 2019-B15 Class AAB, 2.859% 12/15/72 | | 3,385,000 | 3,235,675 |
Series 2023-V3 Class A3, 6.3629% 7/15/56 | | 6,500,000 | 6,827,895 |
| Series 2018-B8 Class A5, 4.2317% 1/15/52 | | 49,694,000 | 47,997,203 |
| Series 2019-B14 Class XA, 0.8924% 12/15/62 (c)(j) | | 146,691,021 | 3,353,445 |
| Series 2020-B17 Class XA, 1.5346% 3/15/53 (c)(j) | | 134,445,453 | 5,912,373 |
| BLP Commercial Mortgage Trust sequential payer Series 2024-IND2 Class A, CME Term SOFR 1 Month Index + 1.340% 6.679% 3/15/41 (b)(c)(d) | | 15,198,000 | 15,122,010 |
| Bmo 2024-5C5 Mtg Trust sequential payer Series 2024-5C5 Class A3, 5.8574% 2/15/57 | | 4,100,000 | 4,269,765 |
| BMO Mortgage Trust sequential payer Series 2023-5C1 Class A3, 6.534% 8/15/56 | | 4,700,000 | 4,955,135 |
| BMP floater Series 2024-MF23: | | | |
| Class A, CME Term SOFR 1 Month Index + 1.370% 6.7088% 6/15/41 (b)(c)(d) | | 19,969,000 | 19,887,876 |
| Class B, CME Term SOFR 1 Month Index + 1.640% 6.9785% 6/15/41 (b)(c)(d) | | 9,859,000 | 9,785,113 |
| Class C, CME Term SOFR 1 Month Index + 1.840% 7.1782% 6/15/41 (b)(c)(d) | | 6,971,000 | 6,910,004 |
| BPR Trust floater Series 2022-OANA: | | | |
| Class A, CME Term SOFR 1 Month Index + 1.890% 7.2349% 4/15/37 (b)(c)(d) | | 82,074,000 | 82,176,593 |
| Class B, CME Term SOFR 1 Month Index + 2.440% 7.7839% 4/15/37 (b)(c)(d) | | 21,804,000 | 21,831,255 |
| BX Commercial Mortgage Trust: | | | |
| floater: | | | |
Series 2019-IMC: | | | |
| Class B, CME Term SOFR 1 Month Index + 1.340% 6.6833% 4/15/34 (b)(c)(d) | | 16,075,000 | 15,834,225 |
| Class C, CME Term SOFR 1 Month Index + 1.640% 6.9833% 4/15/34 (b)(c)(d) | | 10,627,000 | 10,428,032 |
| Class D, CME Term SOFR 1 Month Index + 1.940% 7.2833% 4/15/34 (b)(c)(d) | | 11,156,000 | 10,905,351 |
Series 2021-LBA Class AJV, CME Term SOFR 1 Month Index + 0.910% 6.2515% 2/15/36 (b)(c)(d) | | 2,800,000 | 2,772,875 |
Series 2021-PAC: | | | |
| Class A, CME Term SOFR 1 Month Index + 0.800% 6.1406% 10/15/36 (b)(c)(d) | | 43,844,000 | 43,419,261 |
| Class B, CME Term SOFR 1 Month Index + 1.010% 6.3503% 10/15/36 (b)(c)(d) | | 6,559,000 | 6,431,919 |
| Class C, CME Term SOFR 1 Month Index + 1.210% 6.5501% 10/15/36 (b)(c)(d) | | 8,779,000 | 8,581,473 |
| Class D, CME Term SOFR 1 Month Index + 1.410% 6.7498% 10/15/36 (b)(c)(d) | | 8,523,000 | 8,293,944 |
| Class E, CME Term SOFR 1 Month Index + 2.060% 7.399% 10/15/36 (b)(c)(d) | | 29,632,000 | 29,039,360 |
Series 2022-IND Class A, CME Term SOFR 1 Month Index + 1.490% 6.8279% 4/15/37 (b)(c)(d) | | 32,754,767 | 32,632,972 |
Series 2022-LP2: | | | |
| Class A, CME Term SOFR 1 Month Index + 1.010% 6.3498% 2/15/39 (b)(c)(d) | | 44,255,083 | 43,840,192 |
| Class B, CME Term SOFR 1 Month Index + 1.310% 6.6492% 2/15/39 (b)(c)(d) | | 15,444,370 | 15,203,052 |
| Class C, CME Term SOFR 1 Month Index + 1.560% 6.8986% 2/15/39 (b)(c)(d) | | 13,334,455 | 13,109,436 |
| Class D, CME Term SOFR 1 Month Index + 1.960% 7.2977% 2/15/39 (b)(c)(d) | | 13,334,455 | 13,096,935 |
Series 2023-XL3: | | | |
| Class A, CME Term SOFR 1 Month Index + 1.760% 7.0983% 12/9/40 (b)(c)(d) | | 19,234,531 | 19,282,617 |
| Class B, CME Term SOFR 1 Month Index + 2.190% 7.5277% 12/9/40 (b)(c)(d) | | 4,252,417 | 4,251,081 |
| Class C, CME Term SOFR 1 Month Index + 2.640% 7.9771% 12/9/40 (b)(c)(d) | | 2,303,289 | 2,300,410 |
| floater sequential payer: | | | |
Series 2019-CALM Class A, CME Term SOFR 1 Month Index + 0.990% 6.3275% 11/15/32 (b)(c)(d) | | 1,688,087 | 1,686,504 |
Series 2019-IMC Class A, CME Term SOFR 1 Month Index + 1.040% 6.3833% 4/15/34 (b)(c)(d) | | 15,288,935 | 15,145,810 |
Series 2021-SOAR Class A, CME Term SOFR 1 Month Index + 0.780% 6.1215% 6/15/38 (b)(c)(d) | | 14,203,152 | 14,047,806 |
Series 2024-XL5 Class A, CME Term SOFR 1 Month Index + 1.390% 6.7285% 3/15/41 (b)(c)(d) | | 80,200,670 | 79,950,043 |
| BX Commercial Mortgage Trust 2024-Xl4: | | | |
| floater: | | | |
Series 2024-XL4 Class B, CME Term SOFR 1 Month Index + 1.790% 7.1284% 2/15/39 (b)(c)(d) | | 4,401,773 | 4,374,262 |
Series 2024-XL5: | | | |
| Class B, CME Term SOFR 1 Month Index + 1.690% 7.0281% 3/15/41 (b)(c)(d) | | 13,701,943 | 13,582,143 |
| Class C, CME Term SOFR 1 Month Index + 1.940% 7.2778% 3/15/41 (b)(c)(d) | | 18,189,981 | 17,985,500 |
| floater sequential payer Series 2024-XL4 Class A, CME Term SOFR 1 Month Index + 1.440% 6.7789% 2/15/39 (b)(c)(d) | | 35,174,784 | 35,130,816 |
| BX Commercial Mtg Trust floater Series 2024-MDHS Class A, 6.9782% 5/15/41 (b)(c) | | 44,036,139 | 43,953,628 |
| BX Trust floater: | | | |
| Series 2022-GPA Class A, CME Term SOFR 1 Month Index + 2.160% 7.5019% 8/15/39 (b)(c)(d) | | 19,895,341 | 19,920,189 |
| Series 2022-IND: | | | |
Class B, CME Term SOFR 1 Month Index + 1.940% 7.2769% 4/15/37 (b)(c)(d) | | 16,696,707 | 16,655,255 |
Class C, CME Term SOFR 1 Month Index + 2.290% 7.6269% 4/15/37 (b)(c)(d) | | 3,767,428 | 3,760,401 |
Class D, CME Term SOFR 1 Month Index + 2.830% 8.1759% 4/15/37 (b)(c)(d) | | 3,154,712 | 3,148,823 |
| Series 2024-CNYN: | | | |
Class A, CME Term SOFR 1 Month Index + 1.440% 6.7788% 4/15/41 (b)(c)(d) | | 52,728,539 | 52,497,266 |
Class B, CME Term SOFR 1 Month Index + 1.690% 7.0284% 4/15/41 (b)(c)(d) | | 8,404,164 | 8,301,738 |
Class C, CME Term SOFR 1 Month Index + 1.940% 7.2781% 4/15/41 (b)(c)(d) | | 6,976,930 | 6,837,391 |
| CD Mortgage Trust sequential payer Series 2017-CD5 Class AAB, 3.22% 8/15/50 | | 1,730,582 | 1,689,004 |
| CF Hippolyta Issuer LLC sequential payer Series 2021-1A Class A1, 1.53% 3/15/61 (b) | | 52,201,228 | 48,611,276 |
| CFCRE Commercial Mortgage Trust sequential payer Series 2016-C7 Class A2, 3.5853% 12/10/54 | | 12,956,350 | 12,524,735 |
| Cgms Commercial Mortgage Trust sequential payer Series 2017-B1 Class A3, 3.197% 8/15/50 | | 4,644,705 | 4,464,179 |
| Citigroup Commercial Mortgage Trust: | | | |
| Series 2015-GC27 Class A5, 3.137% 2/10/48 | | 9,800,000 | 9,754,365 |
| Series 2015-GC33 Class XA, 1.0182% 9/10/58 (c)(j) | | 2,512,049 | 14,643 |
| Series 2016-P6 Class XA, 0.692% 12/10/49 (c)(j) | | 2,038,538 | 19,859 |
| Series 2019-GC41 Class XA, 1.1599% 8/10/56 (c)(j) | | 13,761,319 | 506,634 |
| COMM Mortgage Trust: | | | |
| Series 2014-CR20 Class XA, 0.8921% 11/10/47 (c)(j) | | 316,649 | 7 |
| Series 2014-LC17 Class XA, 0.6896% 10/10/47 (c)(j) | | 902,789 | 16 |
| Series 2014-UBS6 Class XA, 0.8612% 12/10/47 (c)(j) | | 988,719 | 21 |
| Computershare Corporate Trust Series 2018-C48 Class A5, 4.302% 1/15/52 | | 12,901,000 | 12,679,885 |
| Credit Suisse Mortgage Trust sequential payer Series 2020-NET Class A, 2.2569% 8/15/37 (b) | | 5,518,217 | 5,259,256 |
| CSAIL 2018-CX12 Commercial Mortgage Trust sequential payer Series 2018-CX12 Class A3, 3.9585% 8/15/51 | | 4,890,000 | 4,745,778 |
| DTP Commercial Mortgage Trust 2023-Ste2 sequential payer Series 2023-STE2 Class A, 6.038% 1/15/41 (b)(c) | | 6,955,000 | 7,114,731 |
| ELP Commercial Mortgage Trust floater Series 2021-ELP Class A, CME Term SOFR 1 Month Index + 0.810% 6.1525% 11/15/38 (b)(c)(d) | | 59,745,457 | 58,961,298 |
| Eqt Trust 2024-Extr sequential payer Series 2024-EXTR Class A, 5.3308% 7/5/41 (b)(c) | | 20,805,000 | 21,187,021 |
| Extended Stay America Trust floater Series 2021-ESH: | | | |
| Class A, CME Term SOFR 1 Month Index + 1.190% 6.5315% 7/15/38 (b)(c)(d) | | 19,383,041 | 19,298,241 |
| Class B, CME Term SOFR 1 Month Index + 1.490% 6.8315% 7/15/38 (b)(c)(d) | | 11,039,140 | 10,942,642 |
| Class C, CME Term SOFR 1 Month Index + 1.810% 7.1515% 7/15/38 (b)(c)(d) | | 8,138,790 | 8,067,707 |
| Class D, CME Term SOFR 1 Month Index + 2.360% 7.7015% 7/15/38 (b)(c)(d) | | 16,310,866 | 16,229,390 |
| Fannie Mae sequential payer Series 2018-M10 Class A2, 3.4689% 7/25/28 (c) | | 861,960 | 839,056 |
| Freddie Mac: | | | |
| sequential payer: | | | |
Series 2015-K043 Class A2, 3.062% 12/25/24 | | 19,553,071 | 19,399,284 |
Series 2015-K049 Class A2, 3.01% 7/25/25 | | 2,894,753 | 2,848,178 |
Series 2019-K735 Class A2, 2.862% 5/25/26 | | 3,877,553 | 3,780,009 |
Series 2019-K736 Class A2, 2.282% 7/25/26 | | 18,900,000 | 18,241,252 |
Series 2023-K751 Class A2, 4.412% 3/25/30 | | 4,800,000 | 4,851,653 |
Series 2024-K517 Class A2, 5.355% 1/25/29 | | 20,000,000 | 20,823,964 |
Series K058 Class A2, 2.653% 8/25/26 | | 18,073,000 | 17,507,736 |
| Series 2016-K059 Class A2, 3.12% 9/25/26 (c) | | 1,675,000 | 1,636,615 |
| Series K090 Class A2, 3.422% 2/25/29 | | 7,504,618 | 7,284,393 |
| GS Mortgage Securities Trust: | | | |
| floater: | | | |
Series 2018-3PCK Class A, CME Term SOFR 1 Month Index + 2.060% 7.4015% 9/15/31 (b)(c)(d) | | 4,635,488 | 4,610,149 |
Series 2021-IP: | | | |
| Class A, CME Term SOFR 1 Month Index + 1.060% 6.4015% 10/15/36 (b)(c)(d) | | 26,417,000 | 26,021,242 |
| Class B, CME Term SOFR 1 Month Index + 1.260% 6.6015% 10/15/36 (b)(c)(d) | | 4,084,000 | 3,983,422 |
| Class C, CME Term SOFR 1 Month Index + 1.660% 7.0015% 10/15/36 (b)(c)(d) | | 3,365,000 | 3,280,979 |
| sequential payer: | | | |
Series 2015-GC34 Class A3, 3.244% 10/10/48 | | 1,692,046 | 1,659,663 |
Series 2017-GS6 Class A2, 3.164% 5/10/50 | | 2,476,729 | 2,361,667 |
Series 2018-GS10 Class A5, 4.155% 7/10/51 | | 3,600,000 | 3,479,787 |
Series 2018-GS9 Class A4, 3.992% 3/10/51 | | 4,100,000 | 3,956,036 |
Series 2019-GSA1 Class A4, 3.0479% 11/10/52 | | 5,500,000 | 5,096,124 |
| Series 2015-GC34 Class XA, 1.3458% 10/10/48 (c)(j) | | 1,212,536 | 10,329 |
| Intown Mortgage Trust floater sequential payer Series 2022-STAY Class A, CME Term SOFR 1 Month Index + 2.480% 7.8256% 8/15/39 (b)(c)(d) | | 37,020,000 | 37,054,706 |
| JPMDB Commercial Mortgage Securities Trust sequential payer: | | | |
| Series 2016-C4 Class A2, 2.8822% 12/15/49 | | 4,245,522 | 4,084,841 |
| Series 2019-COR6 Class A4, 3.0565% 11/13/52 | | 8,383,000 | 7,362,722 |
| JPMorgan Chase Commercial Mortgage Securities Trust Series 2018-WPT: | | | |
| Class AFX, 4.2475% 7/5/33 (b) | | 11,968,000 | 10,935,000 |
| Class CFX, 4.9498% 7/5/33 (b) | | 4,047,000 | 3,126,658 |
| Class DFX, 5.3503% 7/5/33 (b) | | 6,993,000 | 5,067,733 |
| Class XAFX, 1.2948% 7/5/33 (b)(c)(j) | | 1,280,000 | 25,333 |
| Life Financial Services Trust floater Series 2022-BMR2: | | | |
| Class A1, CME Term SOFR 1 Month Index + 1.290% 6.6321% 5/15/39 (b)(c)(d) | | 54,000,000 | 52,829,960 |
| Class B, CME Term SOFR 1 Month Index + 1.790% 7.1308% 5/15/39 (b)(c)(d) | | 37,495,000 | 35,904,533 |
| Class C, CME Term SOFR 1 Month Index + 2.090% 7.43% 5/15/39 (b)(c)(d) | | 21,010,000 | 19,771,456 |
| Class D, CME Term SOFR 1 Month Index + 2.540% 7.8788% 5/15/39 (b)(c)(d) | | 18,672,000 | 17,404,573 |
| LIFE Mortgage Trust floater Series 2021-BMR: | | | |
| Class A, CME Term SOFR 1 Month Index + 0.810% 6.1515% 3/15/38 (b)(c)(d) | | 26,726,244 | 26,235,133 |
| Class B, CME Term SOFR 1 Month Index + 0.990% 6.3315% 3/15/38 (b)(c)(d) | | 7,652,952 | 7,467,035 |
| Class C, CME Term SOFR 1 Month Index + 1.210% 6.5515% 3/15/38 (b)(c)(d) | | 4,815,118 | 4,681,643 |
| Class D, CME Term SOFR 1 Month Index + 1.510% 6.8515% 3/15/38 (b)(c)(d) | | 6,698,019 | 6,516,851 |
| Class E, CME Term SOFR 1 Month Index + 1.860% 7.2015% 3/15/38 (b)(c)(d) | | 5,851,744 | 5,618,445 |
| Morgan Stanley BAML Trust Series 2015-C25 Class XA, 1.1751% 10/15/48 (c)(j) | | 1,430,599 | 7,998 |
| Morgan Stanley Capital I Trust: | | | |
| floater Series 2018-BOP Class A, CME Term SOFR 1 Month Index + 0.890% 6.234% 8/15/33 (b)(c)(d) | | 236,691 | 193,223 |
| floater sequential payer Series 2019-NUGS Class A, CME Term SOFR 1 Month Index + 1.060% 6.4015% 12/15/36 (b)(c)(d) | | 34,300,000 | 27,802,747 |
| sequential payer: | | | |
Series 2017-HR2 Class A4, 3.587% 12/15/50 | | 5,210,000 | 5,001,186 |
Series 2019-MEAD Class A, 3.17% 11/10/36 (b) | | 51,615,000 | 49,428,733 |
| Series 2018-H4 Class A4, 4.31% 12/15/51 | | 11,199,000 | 10,916,888 |
| Series 2019-MEAD: | | | |
Class B, 3.283% 11/10/36 (b)(c) | | 7,093,000 | 6,721,630 |
Class C, 3.283% 11/10/36 (b)(c) | | 6,805,000 | 6,346,634 |
| Series 2021-L6 Class XA, 1.3148% 6/15/54 (c)(j) | | 41,894,908 | 2,115,014 |
| Open Trust 2023-Air sequential payer Series 2023-AIR: | | | |
| Class A, CME Term SOFR 1 Month Index + 3.080% 8.426% 10/15/28 (b)(c)(d) | | 18,427,420 | 18,588,660 |
| Class B, CME Term SOFR 1 Month Index + 3.830% 9.1749% 10/15/28 (b)(c)(d) | | 11,102,999 | 11,144,522 |
| SPGN Mortgage Trust floater Series 2022-TFLM: | | | |
| Class B, CME Term SOFR 1 Month Index + 2.000% 7.3369% 2/15/39 (b)(c)(d) | | 10,413,000 | 10,192,594 |
| Class C, CME Term SOFR 1 Month Index + 2.650% 7.9869% 2/15/39 (b)(c)(d) | | 5,415,000 | 5,263,295 |
| SREIT Trust floater Series 2021-MFP: | | | |
| Class A, CME Term SOFR 1 Month Index + 0.840% 6.1822% 11/15/38 (b)(c)(d) | | 43,172,697 | 42,646,530 |
| Class B, CME Term SOFR 1 Month Index + 1.190% 6.5312% 11/15/38 (b)(c)(d) | | 22,258,544 | 21,980,649 |
| Class C, CME Term SOFR 1 Month Index + 1.440% 6.7804% 11/15/38 (b)(c)(d) | | 13,824,756 | 13,617,635 |
| Class D, CME Term SOFR 1 Month Index + 1.690% 7.0296% 11/15/38 (b)(c)(d) | | 9,085,414 | 8,903,706 |
| UBS Commercial Mortgage Trust: | | | |
| sequential payer Series 2018-C9 Class A4, 4.117% 3/15/51 | | 3,100,000 | 2,977,634 |
| Series 2017-C7 Class XA, 1.1325% 12/15/50 (c)(j) | | 1,697,105 | 44,401 |
| VLS Commercial Mortgage Trust: | | | |
| sequential payer Series 2020-LAB Class A, 2.13% 10/10/42 (b) | | 30,230,000 | 24,711,755 |
| Series 2020-LAB: | | | |
Class B, 2.453% 10/10/42 (b) | | 1,800,000 | 1,469,588 |
Class X, 0.5162% 10/10/42 (b)(c)(j) | | 57,900,000 | 1,262,463 |
| Wells Fargo Commercial Mortage Trust 20 floater Series 2024-MGP: | | | |
| Class A11, CME Term SOFR 1 Month Index + 1.990% 7.3407% 8/15/41 (b)(c)(d) | | 3,600,000 | 3,590,611 |
| Class A12, CME Term SOFR 1 Month Index + 1.690% 7.0412% 8/15/41 (b)(c)(d) | | 14,200,000 | 14,162,971 |
| Wells Fargo Commercial Mortgage Trust: | | | |
| floater Series 2021-FCMT Class A, CME Term SOFR 1 Month Index + 1.310% 6.6515% 5/15/31 (b)(c)(d) | | 25,318,000 | 24,673,009 |
| sequential payer: | | | |
Series 2015-C26 Class A4, 3.166% 2/15/48 | | 20,013,000 | 19,824,970 |
Series 2017-C40 Class A3, 3.317% 10/15/50 | | 2,600,000 | 2,498,640 |
Series 2019-C50 Class ASB, 3.635% 5/15/52 | | 1,875,058 | 1,825,304 |
| Series 2015-C31 Class XA, 1.0985% 11/15/48 (c)(j) | | 1,261,030 | 8,593 |
| Series 2017-C42 Class XA, 1.004% 12/15/50 (c)(j) | | 2,445,040 | 56,307 |
| Series 2018-C46 Class XA, 1.0782% 8/15/51 (c)(j) | | 11,229,740 | 256,998 |
| Wells Fargo Commercial Mtg Trust 2024-5 sequential payer Series 2024-5C1 Class A3, 5.928% 7/15/57 | | 8,300,000 | 8,674,785 |
| WF-RBS Commercial Mortgage Trust Series 2014-C24 Class XA, 0.9584% 11/15/47 (c)(j) | | 550,267 | 14 |
| TOTAL COMMERCIAL MORTGAGE SECURITIES (Cost $2,131,067,827) | | | 2,072,140,995 |
| | | | |
| Foreign Government and Government Agency Obligations - 0.1% |
| | | Principal Amount (a) | Value ($) |
| Kingdom of Saudi Arabia: | | | |
| 3.25% 10/22/30 (b) | | 14,315,000 | 13,345,016 |
| 4.5% 4/22/60 (b) | | 9,380,000 | 7,987,656 |
| TOTAL FOREIGN GOVERNMENT AND GOVERNMENT AGENCY OBLIGATIONS (Cost $23,545,612) | | | 21,332,672 |
| | | | |
| Bank Notes - 0.2% |
| | | Principal Amount (a) | Value ($) |
| Discover Bank ICE IBA - USD SOFR SPREAD-ADJ + 1.730% 5.974% 8/9/28 (c)(d) | | 15,090,000 | 15,503,044 |
| KeyBank NA 6.95% 2/1/28 | | 3,200,000 | 3,369,834 |
| Regions Bank 6.45% 6/26/37 | | 42,478,000 | 45,230,424 |
| TOTAL BANK NOTES (Cost $58,898,688) | | | 64,103,302 |
| | | | |
| Preferred Securities - 0.0% |
| | | Principal Amount (a) | Value ($) |
| FINANCIALS - 0.0% | | | |
| Banks - 0.0% | | | |
Bank of Nova Scotia CME Term SOFR 3 Month Index + 2.900% 8.2137% (c)(d)(n) (Cost $7,052,335) | | 6,962,000 | 6,919,906 |
| | | | |
| Money Market Funds - 1.4% |
| | | Shares | Value ($) |
Fidelity Cash Central Fund 5.39% (o) (Cost $501,961,573) | | 501,867,413 | 501,967,787 |
| | | | |
| Purchased Swaptions - 0.0% |
| | Expiration Date | Notional Amount (a) | Value ($) |
| Put Options - 0.0% | | | | |
| Option on an interest rate swap with Bank of America N.A. to pay annually a fixed rate of 3.7375% and receive annually a floating rate based on the U.S. Secured Overnight Fin. Rate (SOFR) Index, expiring February 2035. | 2/26/25 | | 42,800,000 | 573,783 |
| Option on an interest rate swap with Citibank N.A. to pay annually a fixed rate of 3.778% and receive annually a floating rate based on the U.S. Secured Overnight Fin. Rate (SOFR) Index, expiring February 2035. | 2/24/25 | | 28,900,000 | 357,288 |
| Option on an interest rate swap with Goldman Sachs Bank U.S.A. to pay annually a fixed rate of 3.455% and receive annually a floating rate based on the U.S. Secured Overnight Fin. Rate (SOFR) Index, expiring August 2034. | 8/29/29 | | 26,400,000 | 1,061,183 |
| Option on an interest rate swap with Goldman Sachs Bank U.S.A. to pay annually a fixed rate of 3.53% and receive annually a floating rate based on the U.S. Secured Overnight Fin. Rate (SOFR) Index, expiring August 2034. | 8/01/29 | | 54,000,000 | 2,085,728 |
| Option on an interest rate swap with Goldman Sachs Bank U.S.A. to pay annually a fixed rate of 3.865% and receive annually a floating rate based on the U.S. Secured Overnight Fin. Rate (SOFR) Index, expiring May 2035. | 5/15/25 | | 45,400,000 | 649,842 |
| Option on an interest rate swap with JPMorgan Chase Bank N.A. to pay annually a fixed rate of 3.8225% and receive annually a floating rate based on the U.S. Secured Overnight Fin. Rate (SOFR) Index, expiring February 2035. | 2/24/25 | | 27,900,000 | 317,968 |
| | | | | |
| TOTAL PUT OPTIONS | | | | 5,045,792 |
| Call Options - 0.0% | | | | |
| Option on an interest rate swap with Bank of America N.A. to receive annually a fixed rate of 3.7375% and pay annually a floating rate based on the U.S. Secured Overnight Fin. Rate (SOFR) Index, expiring February 2035. | 2/26/25 | | 42,800,000 | 1,816,874 |
| Option on an interest rate swap with Citibank N.A. to receive annually a fixed rate of 3.778% and pay annually a floating rate based on the U.S. Secured Overnight Fin. Rate (SOFR) Index, expiring February 2035. | 2/24/25 | | 28,900,000 | 1,293,089 |
| Option on an interest rate swap with Goldman Sachs Bank U.S.A. to receive annually a fixed rate of 3.455% and pay annually a floating rate based on the U.S. Secured Overnight Fin. Rate (SOFR) Index, expiring August 2034. | 8/29/29 | | 26,400,000 | 1,014,685 |
| Option on an interest rate swap with Goldman Sachs Bank U.S.A. to receive annually a fixed rate of 3.53% and pay annually a floating rate based on the U.S. Secured Overnight Fin. Rate (SOFR) Index, expiring August 2034. | 8/01/29 | | 54,000,000 | 2,158,384 |
| Option on an interest rate swap with Goldman Sachs Bank U.S.A. to receive annually a fixed rate of 3.865% and pay annually a floating rate based on the U.S. Secured Overnight Fin. Rate (SOFR) Index, expiring May 2035. | 5/15/25 | | 45,400,000 | 2,466,675 |
| Option on an interest rate swap with JPMorgan Chase Bank N.A. to receive annually a fixed rate of 3.8225% and pay annually a floating rate based on the U.S. Secured Overnight Fin. Rate (SOFR) Index, expiring February 2035. | 2/24/25 | | 27,900,000 | 1,324,359 |
| | | | | |
| TOTAL CALL OPTIONS | | | | 10,074,066 |
TOTAL PURCHASED SWAPTIONS (Cost $16,507,678) | | | | 15,119,858 |
| TOTAL INVESTMENT IN SECURITIES - 112.5% (Cost $42,542,296,144) | 40,831,869,928 |
NET OTHER ASSETS (LIABILITIES) - (12.5)% | (4,534,083,277) |
| NET ASSETS - 100.0% | 36,297,786,651 |
| | |
| TBA Sale Commitments |
| | Principal Amount (a) | Value ($) |
| Ginnie Mae | | |
| 2% 9/1/54 | (26,600,000) | (22,395,799) |
| 3% 9/1/54 | (32,800,000) | (29,661,525) |
| 3% 9/1/54 | (63,350,000) | (57,288,343) |
| 3.5% 9/1/54 | (7,900,000) | (7,351,954) |
| 5% 9/1/54 | (61,150,000) | (61,020,766) |
| 5% 9/1/54 | (48,150,000) | (48,048,240) |
| 5% 9/1/54 | (26,900,000) | (26,843,150) |
| 5.5% 9/1/54 | (108,325,000) | (109,017,912) |
| 6% 9/1/54 | (121,100,000) | (122,856,180) |
| | | |
| TOTAL GINNIE MAE | | (484,483,869) |
| | | |
| Uniform Mortgage Backed Securities | | |
| 2% 9/1/39 | (23,600,000) | (21,341,407) |
| 2% 9/1/54 | (303,750,000) | (248,434,270) |
| 2% 9/1/54 | (237,450,000) | (194,208,123) |
| 2% 9/1/54 | (336,300,000) | (275,056,609) |
| 2% 9/1/54 | (5,500,000) | (4,498,398) |
| 2.5% 9/1/54 | (173,050,000) | (147,518,359) |
| 2.5% 9/1/54 | (60,000,000) | (51,147,654) |
| 3% 9/1/54 | (16,775,000) | (14,872,742) |
| 3% 9/1/54 | (7,100,000) | (6,294,871) |
| 3% 9/1/54 | (6,525,000) | (5,785,075) |
| 3% 9/1/54 | (16,775,000) | (14,872,742) |
| 3% 9/1/54 | (45,450,000) | (40,296,043) |
| 3% 9/1/54 | (13,900,000) | (12,323,762) |
| 3% 9/1/54 | (5,000,000) | (4,433,008) |
| 3% 10/1/54 | (16,775,000) | (14,887,157) |
| 3.5% 9/1/54 | (29,300,000) | (26,968,590) |
| 4% 9/1/54 | (21,500,000) | (20,388,886) |
| 4% 9/1/54 | (15,000,000) | (14,224,805) |
| 4.5% 9/1/54 | (3,050,000) | (2,968,151) |
| 6% 9/1/54 | (30,500,000) | (31,061,151) |
| 6% 9/1/54 | (18,450,000) | (18,789,450) |
| 6% 9/1/54 | (5,950,000) | (6,059,470) |
| 6% 9/1/54 | (25,100,000) | (25,561,800) |
| | | |
| TOTAL UNIFORM MORTGAGE BACKED SECURITIES | | (1,201,992,523) |
| | | |
TOTAL TBA SALE COMMITMENTS (Proceeds $1,672,836,053) | | (1,686,476,392) |
| Futures Contracts |
| | Number of contracts | Expiration Date | Notional Amount ($) | Value ($) | Unrealized Appreciation/ (Depreciation) ($) |
| Purchased | | | | | |
| | | | | | |
| Treasury Contracts | | | | | |
| CBOT 2-Year U.S. Treasury Note Contracts (United States) | 385 | Dec 2024 | 79,905,547 | (95,701) | (95,701) |
| CBOT 5-Year U.S. Treasury Note Contracts (United States) | 15,103 | Dec 2024 | 1,652,244,602 | (7,105,546) | (7,105,546) |
| CBOT Ultra Long Term U.S. Treasury Bond Contracts (United States) | 96 | Dec 2024 | 12,666,000 | (316,916) | (316,916) |
| | | | | | |
| TOTAL PURCHASED | | | | | (7,518,163) |
| | | | | | |
| Sold | | | | | |
| | | | | | |
| Treasury Contracts | | | | | |
| CBOT 10-Year U.S. Treasury Note Contracts (United States) | 2,674 | Dec 2024 | 303,666,125 | 2,439,196 | 2,439,196 |
| CBOT 5-Year U.S. Treasury Note Contracts (United States) | 746 | Dec 2024 | 81,611,234 | 345,310 | 345,310 |
| CBOT Long Term U.S. Treasury Bond Contracts (United States) | 551 | Dec 2024 | 67,841,875 | 1,341,994 | 1,341,994 |
| | | | | | |
| TOTAL SOLD | | | | | 4,126,500 |
| | | | | | |
| TOTAL FUTURES CONTRACTS | | | | | (3,391,663) |
| The notional amount of futures purchased as a percentage of Net Assets is 4.8% |
| The notional amount of futures sold as a percentage of Net Assets is 1.2% |
| Credit Default Swaps |
| Underlying Reference | Rating(1) | Maturity Date | Clearinghouse / Counterparty | Fixed Payment Received/ (Paid) | Payment Frequency | Notional Amount(2)(3) | Value ($)(1) | Upfront Premium Received/ (Paid) ($) | Unrealized Appreciation/ (Depreciation) ($) |
| Buy Protection | | | | | | | | | | |
| CMBX N.A. AAA Index Series 13 | | Dec 2072 | Citigroup Global Markets Ltd. | (0.5%) | Monthly | | 2,890,000 | 9,541 | (30,874) | (21,333) |
| CMBX N.A. BBB- Index Series 16 | | Apr 2065 | Citigroup Global Markets Ltd. | (3%) | Monthly | | 2,650,000 | 391,173 | (752,884) | (361,711) |
| CMBX N.A. BBB- Index Series 16 | | Apr 2065 | Citigroup Global Markets Ltd. | (3%) | Monthly | | 1,190,000 | 175,659 | (264,071) | (88,412) |
| CMBX N.A. BBB- Index Series 16 | | Apr 2065 | Citigroup Global Markets Ltd. | (3%) | Monthly | | 3,700,000 | 546,166 | (827,089) | (280,923) |
| CMBX N.A. BBB- Index Series 16 | | Apr 2065 | Citigroup Global Markets Ltd. | (3%) | Monthly | | 630,000 | 92,996 | (172,195) | (79,199) |
| CMBX N.A. BBB- Index Series 16 | | Apr 2065 | Citigroup Global Markets Ltd. | (3%) | Monthly | | 1,970,000 | 290,796 | (478,796) | (188,000) |
| CMBX N.A. BBB- Index Series 16 | | Apr 2065 | Citigroup Global Markets Ltd. | (3%) | Monthly | | 3,760,000 | 555,023 | (910,434) | (355,411) |
| CMBX N.A. BBB- Index Series 16 | | Apr 2065 | Citigroup Global Markets Ltd. | (3%) | Monthly | | 4,580,000 | 676,065 | (1,197,929) | (521,864) |
| CMBX N.A. BBB- Index Series 16 | | Apr 2065 | Goldman Sachs & Co. LLC | (3%) | Monthly | | 7,550,000 | 1,114,474 | (2,199,913) | (1,085,439) |
| CMBX N.A. BBB- Index Series 16 | | Apr 2065 | Goldman Sachs & Co. LLC | (3%) | Monthly | | 1,240,000 | 183,039 | (301,704) | (118,665) |
| CMBX N.A. BBB- Index Series 16 | | Apr 2065 | Goldman Sachs & Co. LLC | (3%) | Monthly | | 1,230,000 | 181,563 | (293,517) | (111,954) |
| CMBX N.A. BBB- Index Series 16 | | Apr 2065 | Goldman Sachs & Co. LLC | (3%) | Monthly | | 1,020,000 | 150,565 | (259,653) | (109,088) |
| CMBX N.A. BBB- Index Series 16 | | Apr 2065 | Goldman Sachs & Co. LLC | (3%) | Monthly | | 810,000 | 119,566 | (211,750) | (92,184) |
| CMBX N.A. BBB- Index Series 16 | | Apr 2065 | Goldman Sachs & Co. LLC | (3%) | Monthly | | 3,160,000 | 466,455 | (907,348) | (440,893) |
| CMBX N.A. BBB- Index Series 16 | | Apr 2065 | Goldman Sachs & Co. LLC | (3%) | Monthly | | 2,300,000 | 339,509 | (680,229) | (340,720) |
| CMBX N.A. BBB- Index Series 16 | | Apr 2065 | JPMorgan Securities LLC | (3%) | Monthly | | 1,770,000 | 261,274 | (532,688) | (271,414) |
| CMBX N.A. BBB- Index Series 16 | | Apr 2065 | JPMorgan Securities LLC | (3%) | Monthly | | 3,270,000 | 482,693 | (918,342) | (435,649) |
| CMBX N.A. BBB- Index Series 16 | | Apr 2065 | JPMorgan Securities LLC | (3%) | Monthly | | 2,610,000 | 385,268 | (726,738) | (341,470) |
| CMBX N.A. BBB- Index Series 16 | | Apr 2065 | Morgan Stanley Capital Services LLC | (3%) | Monthly | | 2,430,000 | 358,698 | (579,031) | (220,333) |
| CMBX N.A. BBB- Index Series 16 | | Apr 2065 | Morgan Stanley Capital Services LLC | (3%) | Monthly | | 3,650,000 | 538,785 | (897,179) | (358,394) |
| CMBX N.A. BBB- Index Series 16 | | Apr 2065 | Morgan Stanley Capital Services LLC | (3%) | Monthly | | 2,450,000 | 361,650 | (605,189) | (243,539) |
| CMBX N.A. BBB- Index Series 16 | | Apr 2065 | Morgan Stanley Capital Services LLC | (3%) | Monthly | | 2,500,000 | 369,031 | (587,843) | (218,812) |
| CMBX N.A. BBB- Index Series 16 | | Apr 2065 | Morgan Stanley Capital Services LLC | (3%) | Monthly | | 1,600,000 | 236,180 | (366,119) | (129,939) |
| CMBX N.A. BBB- Index Series 16 | | Apr 2065 | Morgan Stanley Capital Services LLC | (3%) | Monthly | | 4,010,000 | 591,926 | (1,008,401) | (416,475) |
| CMBX N.A. BBB- Index Series 17 | | Dec 2056 | Citigroup Global Markets Ltd. | (3%) | Monthly | | 2,000,000 | 220,110 | (323,456) | (103,346) |
| CMBX N.A. BBB- Index Series 17 | | Dec 2056 | Goldman Sachs & Co. LLC | (3%) | Monthly | | 3,200,000 | 352,175 | (456,757) | (104,582) |
| CMBX N.A. BBB- Index Series 17 | | Dec 2056 | Goldman Sachs & Co. LLC | (3%) | Monthly | | 2,150,000 | 236,618 | (277,804) | (41,186) |
| CMBX N.A. BBB- Index Series 17 | | Dec 2056 | Morgan Stanley Capital Services LLC | (3%) | Monthly | | 1,400,000 | 154,077 | (194,968) | (40,891) |
| CMBX N.A. BBB- Index Series 17 | | Dec 2056 | Morgan Stanley Capital Services LLC | (3%) | Monthly | | 800,000 | 88,044 | (114,189) | (26,145) |
| | | | | | | | | | | |
| TOTAL BUY PROTECTION | | | | | | | | 9,929,119 | (17,077,090) | (7,147,971) |
| Sell Protection | | | | | | | | | | |
| CMBX N.A. AAA Index Series 13 | NR | Dec 2072 | Morgan Stanley Capital Services LLC | 0.5% | Monthly | | 2,890,000 | (9,541) | 67,004 | 57,463 |
| CMBX N.A. AAA Index Series 15 | NR | Nov 2064 | Morgan Stanley Capital Services LLC | 0.5% | Monthly | | 9,900,000 | (105,136) | 155,007 | 49,871 |
| CMBX N.A. AAA Index Series 16 | NR | Apr 2065 | Citigroup Global Markets Ltd. | 0.5% | Monthly | | 40,225,000 | (596,074) | 809,904 | 213,830 |
| CMBX N.A. AAA Index Series 16 | NR | Apr 2065 | Citigroup Global Markets Ltd. | 0.5% | Monthly | | 6,400,000 | (94,838) | 101,213 | 6,375 |
| CMBX N.A. AAA Index Series 17 | NR | Dec 2056 | Citigroup Global Markets Ltd. | 0.5% | Monthly | | 42,900,000 | (855,928) | 1,077,734 | 221,806 |
| CMBX N.A. AAA Index Series 17 | NR | Dec 2056 | Citigroup Global Markets Ltd. | 0.5% | Monthly | | 6,300,000 | (125,696) | 131,755 | 6,059 |
| CMBX N.A. AAA Index Series 17 | NR | Dec 2056 | Citigroup Global Markets Ltd. | 0.5% | Monthly | | 14,800,000 | (295,285) | 369,442 | 74,157 |
| CMBX N.A. AAA Index Series 17 | NR | Dec 2056 | Goldman Sachs & Co. LLC | 0.5% | Monthly | | 14,400,000 | (287,304) | 325,085 | 37,781 |
| | | | | | | | | | | |
| TOTAL SELL PROTECTION | | | | | | | | (2,369,802) | 3,037,144 | 667,342 |
| TOTAL CREDIT DEFAULT SWAPS | | | | | | | | 7,559,317 | (14,039,946) | (6,480,629) |
(1)Ratings are presented for credit default swaps in which the Fund has sold protection on the underlying referenced debt. Ratings for an underlying index represent a weighted average of the ratings of all securities included in the index. The credit rating or value can be measures of the current payment/performance risk. Ratings are from Moody's Investors Service, Inc. Where Moody's® ratings are not available, S&P® ratings are disclosed and are indicated as such. All ratings are as of the report date and do not reflect subsequent changes.
(2)The notional amount of each credit default swap where the Fund has sold protection approximates the maximum potential amount of future payments that the Fund could be required to make if a credit event were to occur.
(3)Notional amount is stated in U.S. Dollars unless otherwise noted.
| Interest Rate Swaps |
| Payment Received | Payment Frequency | Payment Paid | Payment Frequency | Clearinghouse / Counterparty(1) | Maturity Date | Notional Amount(2) | Value ($) | Upfront Premium Received/ (Paid) ($)(3) | Unrealized Appreciation/ (Depreciation) ($) |
U.S. Secured Overnight Fin. Rate (SOFR) Index(4) | Annual | 3.75% | Annual | LCH | Sep 2026 | | 340,519,000 | (3,995,013) | 0 | (3,995,013) |
U.S. Secured Overnight Fin. Rate (SOFR) Index(4) | Annual | 3.5% | Annual | LCH | Sep 2027 | | 283,242,000 | (3,924,585) | 0 | (3,924,585) |
U.S. Secured Overnight Fin. Rate (SOFR) Index(4) | Annual | 3.5% | Annual | LCH | Sep 2029 | | 47,243,000 | (954,229) | 0 | (954,229) |
U.S. Secured Overnight Fin. Rate (SOFR) Index(4) | Annual | 3.5% | Annual | LCH | Sep 2031 | | 224,498,000 | (5,180,320) | 0 | (5,180,320) |
| 3.75% | Annual | U.S. Secured Overnight Fin. Rate (SOFR) Index(4) | Annual | LCH | Sep 2034 | | 10,767,000 | 283,632 | 0 | 283,632 |
U.S. Secured Overnight Fin. Rate (SOFR) Index(4) | Annual | 3.75% | Annual | LCH | Sep 2044 | | 57,651,000 | (1,776,814) | 0 | (1,776,814) |
| 3.5% | Annual | U.S. Secured Overnight Fin. Rate (SOFR) Index(4) | Annual | LCH | Sep 2054 | | 4,840,000 | 139,000 | 0 | 139,000 |
| TOTAL INTEREST RATE SWAPS | | | | | | | | (15,408,329) | 0 | (15,408,329) |
| | | | | | | | | | | |
(1)Swaps with LCH Clearnet Group (LCH) are centrally cleared swaps.
(2)Notional amount is stated in U.S. Dollars unless otherwise noted.
(3)Any premiums for centrally cleared swaps are recorded periodically throughout the term of the swap to variation margin and included in unrealized appreciation (depreciation).
(4)Represents floating rate.
Legend
| (a) | Amount is stated in United States dollars unless otherwise noted. |
| (b) | Security exempt from registration under Rule 144A of the Securities Act of 1933. These securities may be resold in transactions exempt from registration, normally to qualified institutional buyers. At the end of the period, the value of these securities amounted to $6,015,161,864 or 16.6% of net assets. |
| (c) | Coupon rates for floating and adjustable rate securities reflect the rates in effect at period end. |
| (d) | Coupon is indexed to a floating interest rate which may be multiplied by a specified factor and/or subject to caps or floors. |
| (e) | Security or a portion of the security was pledged to cover margin requirements for futures contracts. At period end, the value of securities pledged amounted to $29,632,183. |
| (f) | Security or a portion of the security was pledged to cover margin requirements for centrally cleared swaps. At period end, the value of securities pledged amounted to $26,969,793. |
| (g) | Security or a portion of the security has been segregated as collateral for open options and bi-lateral over the counter (OTC) swaps. At period end, the value of securities pledged amounted to $1,159,188. |
| (h) | Security or a portion of the security purchased on a delayed delivery or when-issued basis. |
| (j) | Interest Only (IO) security represents the right to receive only monthly interest payments on an underlying pool of mortgages or assets. Principal shown is the outstanding par amount of the pool as of the end of the period. |
| (k) | Coupon is inversely indexed to a floating interest rate multiplied by a specified factor. The price may be considerably more volatile than the price of a comparable fixed rate security. |
| (l) | Principal Only Strips represent the right to receive the monthly principal payments on an underlying pool of mortgage loans. |
| (m) | Represents an investment in an underlying pool of reverse mortgages which typically do not require regular principal and interest payments as repayment is deferred until a maturity event. |
| (n) | Security is perpetual in nature with no stated maturity date. |
| (o) | Affiliated fund that is generally available only to investment companies and other accounts managed by Fidelity Investments. The rate quoted is the annualized seven-day yield of the fund at period end. A complete unaudited listing of the fund's holdings as of its most recent quarter end is available upon request. In addition, each Fidelity Central Fund's financial statements, which are not covered by the Fund's Report of Independent Registered Public Accounting Firm, are available on the SEC's website or upon request. |
Affiliated Central Funds
Fiscal year to date information regarding the Fund's investments in Fidelity Central Funds, including the ownership percentage, is presented below.
| Affiliate | Value, beginning of period ($) | Purchases ($) | Sales Proceeds ($) | Dividend Income ($) | Realized Gain (loss) ($) | Change in Unrealized appreciation (depreciation) ($) | Value, end of period ($) | % ownership, end of period |
| Fidelity Cash Central Fund 5.39% | 612,070,274 | 7,688,083,421 | 7,798,191,252 | 28,675,118 | 5,344 | - | 501,967,787 | 1.1% |
| Fidelity Securities Lending Cash Central Fund 5.39% | 434,445,859 | 4,366,026,722 | 4,800,472,581 | 393,061 | - | - | - | 0.0% |
| Total | 1,046,516,133 | 12,054,110,143 | 12,598,663,833 | 29,068,179 | 5,344 | - | 501,967,787 | |
| | | | | | | | | |
Amounts in the dividend income column in the above table include any capital gain distributions from underlying funds, which are presented in the corresponding line item in the Statement of Operations, if applicable.
Amounts in the dividend income column for Fidelity Securities Lending Cash Central Fund represents the income earned on investing cash collateral, less rebates paid to borrowers and any lending agent fees associated with the loan, plus any premium payments received for lending certain types of securities.
Amounts included in the purchases and sales proceeds columns may include in-kind transactions, if applicable.
Investment Valuation
The following is a summary of the inputs used, as of August 31, 2024, involving the Fund's assets and liabilities carried at fair value. The inputs or methodology used for valuing securities may not be an indication of the risk associated with investing in those securities. For more information on valuation inputs, and their aggregation into the levels used below, please refer to the Investment Valuation section in the accompanying Notes to Financial Statements.
| Valuation Inputs at Reporting Date: |
| Description | Total ($) | Level 1 ($) | Level 2 ($) | Level 3 ($) |
Investments in Securities: | | | | |
|
| Corporate Bonds | 9,309,137,388 | - | 9,309,137,388 | - |
|
| U.S. Government and Government Agency Obligations | 14,286,733,104 | - | 14,286,733,104 | - |
|
| U.S. Government Agency - Mortgage Securities | 10,651,957,897 | - | 10,651,957,897 | - |
|
| Asset-Backed Securities | 3,093,415,628 | - | 3,093,415,628 | - |
|
| Collateralized Mortgage Obligations | 809,041,391 | - | 809,041,359 | 32 |
|
| Commercial Mortgage Securities | 2,072,140,995 | - | 2,072,140,995 | - |
|
| Foreign Government and Government Agency Obligations | 21,332,672 | - | 21,332,672 | - |
|
| Bank Notes | 64,103,302 | - | 64,103,302 | - |
|
| Preferred Securities | 6,919,906 | - | 6,919,906 | - |
|
| Money Market Funds | 501,967,787 | 501,967,787 | - | - |
|
| Purchased Swaptions | 15,119,858 | - | 15,119,858 | - |
| Total Investments in Securities: | 40,831,869,928 | 501,967,787 | 40,329,902,109 | 32 |
Derivative Instruments: Assets | | | | |
Futures Contracts | 4,126,500 | 4,126,500 | - | - |
Swaps | 10,351,751 | - | 10,351,751 | - |
| Total Assets | 14,478,251 | 4,126,500 | 10,351,751 | - |
| Liabilities | | | | |
Futures Contracts | (7,518,163) | (7,518,163) | - | - |
Swaps | (18,200,763) | - | (18,200,763) | - |
| Total Liabilities | (25,718,926) | (7,518,163) | (18,200,763) | - |
| Total Derivative Instruments: | (11,240,675) | (3,391,663) | (7,849,012) | - |
Other Financial Instruments: | | | | |
TBA Sale Commitments | (1,686,476,392) | - | (1,686,476,392) | - |
| Total Other Financial Instruments: | (1,686,476,392) | - | (1,686,476,392) | - |
Value of Derivative Instruments
The following table is a summary of the Fund's value of derivative instruments by primary risk exposure as of August 31, 2024. For additional information on derivative instruments, please refer to the Derivative Instruments section in the accompanying Notes to Financial Statements.
Primary Risk Exposure / Derivative Type | Value |
| Asset ($) | Liability ($) |
| Credit Risk | | |
Swaps (a) | 9,929,119 | (2,369,802) |
| Total Credit Risk | 9,929,119 | (2,369,802) |
| Interest Rate Risk | | |
Futures Contracts (b) | 4,126,500 | (7,518,163) |
Purchased Swaptions (c) | 15,119,858 | 0 |
Swaps (d) | 422,632 | (15,830,961) |
| Total Interest Rate Risk | 19,668,990 | (23,349,124) |
| Total Value of Derivatives | 29,598,109 | (25,718,926) |
(a)For bi-lateral over-the-counter (OTC) swaps, reflects gross value which is presented in the Statement of Assets and Liabilities in the bi-lateral OTC swaps, at value line-items.
(b)Reflects gross cumulative appreciation (depreciation) on futures contracts as presented in the Schedule of Investments. In the Statement of Assets and Liabilities, the period end daily variation margin is included in receivable or payable for daily variation margin on futures contracts, and the net cumulative appreciation (depreciation) is included in Total accumulated earnings (loss).
(c)Gross value is presented in the Statement of Assets and Liabilities in the Investments in Securities at value line-item.
(d)For centrally cleared swaps, reflects gross cumulative appreciation (depreciation) as presented in the Schedule of Investments. In the Statement of Assets and Liabilities, the period end daily variation margin for centrally cleared swaps is included in receivable or payable for daily variation margin on centrally cleared swaps, and the net cumulative appreciation (depreciation) for centrally cleared swaps is included in Total accumulated earnings (loss).
Financial Statements
| Statement of Assets and Liabilities |
As of August 31, 2024 |
| Assets | | | | |
| Investment in securities, at value - See accompanying schedule: | | | | |
Unaffiliated issuers (cost $42,040,334,571) | $ | 40,329,902,141 | | |
Fidelity Central Funds (cost $501,961,573) | | 501,967,787 | | |
| | | | | |
| | | | | |
| Total Investment in Securities (cost $42,542,296,144) | | | $ | 40,831,869,928 |
| Cash | | | | 27,023 |
| Receivable for investments sold | | | | |
Regular delivery | | | | 702,048 |
Delayed delivery | | | | 325,523 |
| Receivable for TBA sale commitments | | | | 1,672,836,053 |
| Receivable for fund shares sold | | | | 26,070,497 |
| Interest receivable | | | | 284,224,212 |
| Distributions receivable from Fidelity Central Funds | | | | 2,108,939 |
| Receivable for daily variation margin on centrally cleared swaps | | | | 1,322,902 |
| Bi-lateral OTC swaps, at value | | | | 9,929,119 |
Total assets | | | | 42,829,416,244 |
| Liabilities | | | | |
| Payable for investments purchased | | | | |
Regular delivery | $ | 99,717,011 | | |
Delayed delivery | | 4,605,657,310 | | |
| TBA sale commitments, at value | | 1,686,476,392 | | |
| Payable for fund shares redeemed | | 135,243,378 | | |
| Distributions payable | | 9,256 | | |
| Bi-lateral OTC swaps, at value | | 2,369,802 | | |
| Payable for daily variation margin on futures contracts | | 1,883,859 | | |
| Other payables and accrued expenses | | 272,585 | | |
| Total liabilities | | | | 6,531,629,593 |
| Net Assets | | | $ | 36,297,786,651 |
| Net Assets consist of: | | | | |
| Paid in capital | | | $ | 40,179,847,479 |
| Total accumulated earnings (loss) | | | | (3,882,060,828) |
| Net Assets | | | $ | 36,297,786,651 |
Net Asset Value, offering price and redemption price per share ($36,297,786,651 ÷ 3,560,144,345 shares) | | | $ | 10.20 |
| Statement of Operations |
| Year ended August 31, 2024 |
| Investment Income | | | | |
| Dividends | | | $ | 583,754 |
| Interest | | | | 1,503,389,211 |
| Income from Fidelity Central Funds (including $393,061 from security lending) | | | | 29,068,179 |
| Total income | | | | 1,533,041,144 |
| Expenses | | | | |
| Custodian fees and expenses | $ | 462,171 | | |
| Independent trustees' fees and expenses | | 105,466 | | |
| Miscellaneous | | 2 | | |
| Total expenses before reductions | | 567,639 | | |
| Expense reductions | | (21,466) | | |
| Total expenses after reductions | | | | 546,173 |
| Net Investment income (loss) | | | | 1,532,494,971 |
| Realized and Unrealized Gain (Loss) | | | | |
| Net realized gain (loss) on: | | | | |
| Investment Securities: | | | | |
| Unaffiliated issuers | | (593,899,738) | | |
| Fidelity Central Funds | | 5,344 | | |
| Futures contracts | | 1,892,963 | | |
| Swaps | | (10,297,150) | | |
| Written options | | 570,813 | | |
| Total net realized gain (loss) | | | | (601,727,768) |
| Change in net unrealized appreciation (depreciation) on: | | | | |
| Investment Securities: | | | | |
| Unaffiliated issuers | | 1,864,489,047 | | |
| Futures contracts | | 4,781,029 | | |
| Swaps | | (19,035,333) | | |
| TBA Sale commitments | | (1,535,181) | | |
| Total change in net unrealized appreciation (depreciation) | | | | 1,848,699,562 |
| Net gain (loss) | | | | 1,246,971,794 |
| Net increase (decrease) in net assets resulting from operations | | | $ | 2,779,466,765 |
| Statement of Changes in Net Assets |
| |
| | Year ended August 31, 2024 | | Year ended August 31, 2023 |
| Increase (Decrease) in Net Assets | | | | |
| Operations | | | | |
| Net investment income (loss) | $ | 1,532,494,971 | $ | 1,298,539,336 |
| Net realized gain (loss) | | (601,727,768) | | (953,079,948) |
| Change in net unrealized appreciation (depreciation) | | 1,848,699,562 | | (351,210,366) |
| Net increase (decrease) in net assets resulting from operations | | 2,779,466,765 | | (5,750,978) |
| Distributions to shareholders | | (1,496,948,909) | | (1,280,808,882) |
| | | | | |
| Share transactions | | | | |
| Proceeds from sales of shares | | 5,781,881,932 | | 8,139,321,755 |
| Reinvestment of distributions | | 1,496,205,845 | | 1,277,420,636 |
| Cost of shares redeemed | | (6,739,123,188) | | (6,529,349,884) |
| | | | | |
Net increase (decrease) in net assets resulting from share transactions | | 538,964,589 | | 2,887,392,507 |
| Total increase (decrease) in net assets | | 1,821,482,445 | | 1,600,832,647 |
| | | | | |
| Net Assets | | | | |
| Beginning of period | | 34,476,304,206 | | 32,875,471,559 |
| End of period | $ | 36,297,786,651 | $ | 34,476,304,206 |
| | | | | |
| Other Information | | | | |
| Shares | | | | |
| Sold | | 585,124,141 | | 818,510,936 |
| Issued in reinvestment of distributions | | 151,767,192 | | 128,574,853 |
| Redeemed | | (682,503,219) | | (657,826,356) |
| Net increase (decrease) | | 54,388,114 | | 289,259,433 |
| | | | | |
Financial Highlights
Fidelity® Series Investment Grade Bond Fund |
| |
| Years ended August 31, | | 2024 | | 2023 | | 2022 | | 2021 | | 2020 |
Selected Per-Share Data | | | | | | | | | | |
| Net asset value, beginning of period | $ | 9.83 | $ | 10.22 | $ | 11.80 | $ | 12.28 | $ | 11.68 |
| Income from Investment Operations | | | | | | | | | | |
Net investment income (loss) A,B | | .432 | | .391 | | .273 | | .267 | | .333 |
| Net realized and unrealized gain (loss) | | .360 | | (.395) | | (1.568) | | (.028) | | .603 |
| Total from investment operations | | .792 | | (.004) | | (1.295) | | .239 | | .936 |
| Distributions from net investment income | | (.422) | | (.386) | | (.276) | | (.251) | | (.336) |
| Distributions from net realized gain | | - | | - | | (.009) | | (.468) | | - |
| Total distributions | | (.422) | | (.386) | | (.285) | | (.719) | | (.336) |
| Net asset value, end of period | $ | 10.20 | $ | 9.83 | $ | 10.22 | $ | 11.80 | $ | 12.28 |
Total Return C | | | | (.01)% | | (11.11)% | | 2.06% | | 8.16% |
Ratios to Average Net Assets B,D,E | | | | | | | | | | |
Expenses before reductions F | | -% | | -% | | -% | | -% | | -% |
Expenses net of fee waivers, if any F | | | | -% | | -% | | -% | | -% |
Expenses net of all reductions F | | -% | | -% | | -% | | -% | | -% |
| Net investment income (loss) | | 4.38% | | 3.94% | | 2.47% | | 2.27% | | 2.82% |
| Supplemental Data | | | | | | | | | | |
| Net assets, end of period (000 omitted) | $ | 36,297,787 | $ | 34,476,304 | $ | 32,875,472 | $ | 40,477,064 | $ | 35,945,504 |
Portfolio turnover rate G | | | | 202% | | 159% | | 248% | | 259% H |
ACalculated based on average shares outstanding during the period.
BNet investment income (loss) is affected by the timing of the declaration of dividends by any underlying mutual funds or exchange-traded funds (ETFs). Net investment income (loss) of any mutual funds or ETFs is not included in the Fund's net investment income (loss) ratio.
CTotal returns would have been lower if certain expenses had not been reduced during the applicable periods shown.
DFees and expenses of any underlying mutual funds or exchange-traded funds (ETFs) are not included in the Fund's expense ratio. The Fund indirectly bears its proportionate share of these expenses. For additional expense information related to investments in Fidelity Central Funds, please refer to the "Investments in Fidelity Central Funds" note found in the Notes to Financial Statements section of the most recent Annual or Semi-Annual report.
EExpense ratios reflect operating expenses of the class. Expenses before reductions do not reflect amounts reimbursed, waived, or reduced through arrangements with the investment adviser, brokerage services, or other offset arrangements, if applicable, and do not represent the amount paid by the class during periods when reimbursements, waivers or reductions occur.
FAmount represents less than .005%.
GAmount does not include the portfolio activity of any underlying mutual funds or exchange-traded funds (ETFs).
HPortfolio turnover rate excludes securities received or delivered in-kind.
Notes to Financial Statements
For the period ended August 31, 2024
1. Organization.
Fidelity Series Investment Grade Bond Fund (the Fund) is a fund of Fidelity Salem Street Trust (the Trust) and is authorized to issue an unlimited number of shares. Shares are offered only to certain other Fidelity funds, Fidelity managed 529 plans, and Fidelity managed collective investment trusts. The Trust is registered under the Investment Company Act of 1940, as amended (the 1940 Act), as an open-end management investment company organized as a Massachusetts business trust.
2. Investments in Fidelity Central Funds.
Funds may invest in Fidelity Central Funds, which are open-end investment companies generally available only to other investment companies and accounts managed by the investment adviser and its affiliates. The Schedule of Investments lists any Fidelity Central Funds held as an investment as of period end, but does not include the underlying holdings of each Fidelity Central Fund. An investing fund indirectly bears its proportionate share of the expenses of the underlying Fidelity Central Funds.
Based on its investment objective, each Fidelity Central Fund may invest or participate in various investment vehicles or strategies that are similar to those of the investing fund. These strategies are consistent with the investment objectives of the investing fund and may involve certain economic risks which may cause a decline in value of each of the Fidelity Central Funds and thus a decline in the value of the investing fund.
| Fidelity Central Fund | Investment Manager | Investment Objective | Investment Practices | Expense RatioA |
| Fidelity Money Market Central Funds | Fidelity Management & Research Company LLC (FMR) | Each fund seeks to obtain a high level of current income consistent with the preservation of capital and liquidity. | Short-term Investments | Less than .005% |
A Expenses expressed as a percentage of average net assets and are as of each underlying Central Fund's most recent annual or semi-annual shareholder report.
A complete unaudited list of holdings for each Fidelity Central Fund is available upon request or at the Securities and Exchange Commission website at www.sec.gov. In addition, the financial statements of the Fidelity Central Funds which contain the significant accounting policies (including investment valuation policies) of those funds, and are not covered by the Report of Independent Registered Public Accounting Firm, are available on the Securities and Exchange Commission website or upon request.
3. Significant Accounting Policies.
The Fund is an investment company and applies the accounting and reporting guidance of the Financial Accounting Standards Board (FASB) Accounting Standards Codification Topic 946 Financial Services - Investment Companies. The financial statements have been prepared in conformity with accounting principles generally accepted in the United States of America (GAAP), which require management to make certain estimates and assumptions at the date of the financial statements. Actual results could differ from those estimates. Subsequent events, if any, through the date that the financial statements were issued have been evaluated in the preparation of the financial statements. The Fund's Schedule of Investments lists any underlying mutual funds or exchange-traded funds (ETFs) but does not include the underlying holdings of these funds. The following summarizes the significant accounting policies of the Fund:
Investment Valuation. Investments are valued as of 4:00 p.m. Eastern time on the last calendar day of the period. The Board of Trustees (the Board) has designated the Fund's investment adviser as the valuation designee responsible for the fair valuation function and performing fair value determinations as needed. The investment adviser has established a Fair Value Committee (the Committee) to carry out the day-to-day fair valuation responsibilities and has adopted policies and procedures to govern the fair valuation process and the activities of the Committee. In accordance with these fair valuation policies and procedures, which have been approved by the Board, the Fund attempts to obtain prices from one or more third party pricing services or brokers to value its investments. When current market prices, quotations or currency exchange rates are not readily available or reliable, investments will be fair valued in good faith by the Committee, in accordance with the policies and procedures. Factors used in determining fair value vary by investment type and may include market or investment specific events, transaction data, estimated cash flows, and market observations of comparable investments. The frequency that the fair valuation procedures are used cannot be predicted and they may be utilized to a significant extent. The Committee manages the Fund's fair valuation practices and maintains the fair valuation policies and procedures. The Fund's investment adviser reports to the Board information regarding the fair valuation process and related material matters.
The Fund categorizes the inputs to valuation techniques used to value its investments into a disclosure hierarchy consisting of three levels as shown below:
Level 1 - unadjusted quoted prices in active markets for identical investments
Level 2 - other significant observable inputs (including quoted prices for similar investments, interest rates, prepayment speeds, etc.)
Level 3 - unobservable inputs (including the Fund's own assumptions based on the best information available)
Valuation techniques used to value the Fund's investments by major category are as follows:
Debt securities, including restricted securities, are valued based on evaluated prices received from third party pricing services or from brokers who make markets in such securities. Corporate bonds, bank notes, foreign government and government agency obligations, preferred securities and U.S. government and government agency obligations are valued by pricing services who utilize matrix pricing which considers yield or price of bonds of comparable quality, coupon, maturity and type or by broker-supplied prices. Asset backed securities, collateralized mortgage obligations, commercial mortgage securities and U.S. government agency mortgage securities are valued by pricing services who utilize matrix pricing which considers prepayment speed assumptions, attributes of the collateral, yield or price of bonds of comparable quality, coupon, maturity and type or by broker-supplied prices. Swaps are marked-to-market daily based on valuations from third party pricing services, registered derivatives clearing organizations (clearinghouses) or broker-supplied valuations. These pricing sources may utilize inputs such as interest rate curves, credit spread curves, default possibilities and recovery rates. When independent prices are unavailable or unreliable, debt securities and swaps may be valued utilizing pricing methodologies which consider similar factors that would be used by third party pricing services. Debt securities and swaps are generally categorized as Level 2 in the hierarchy but may be Level 3 depending on the circumstances.
Futures contracts are valued at the settlement price established each day by the board of trade or exchange on which they are traded and are categorized as Level 1 in the hierarchy. Options traded over-the-counter are valued using service or broker-supplied valuations and are categorized as Level 2 in the hierarchy. Investments in open-end mutual funds, including the Fidelity Central Funds, are valued at their closing net asset value (NAV) each business day and are categorized as Level 1 in the hierarchy.
Changes in valuation techniques may result in transfers in or out of an assigned level within the disclosure hierarchy. The aggregate value of investments by input level as of August 31, 2024 is included at the end of the Fund's Schedule of Investments.
Investment Transactions and Income. For financial reporting purposes, the Fund's investment holdings and NAV include trades executed through the end of the last business day of the period. The NAV per share for processing shareholder transactions is calculated as of the close of business of the New York Stock Exchange (NYSE), normally 4:00 p.m. Eastern time and includes trades executed through the end of the prior business day. Gains and losses on securities sold are determined on the basis of identified cost and include proceeds received from litigation. Dividend income is recorded on the ex-dividend date. Income and capital gain distributions from Fidelity Central Funds, if any, are recorded on the ex-dividend date. Interest income is accrued as earned and includes coupon interest and amortization of premium and accretion of discount on debt securities as applicable. Debt obligations may be placed on non-accrual status and related interest income may be reduced by ceasing current accruals and writing off interest receivables when the collection of all or a portion of interest has become doubtful based on consistently applied procedures. A debt obligation is removed from non-accrual status when the issuer resumes interest payments or when collectability of interest is reasonably assured.
Expenses. Expenses directly attributable to a fund are charged to that fund. Expenses attributable to more than one fund are allocated among the respective funds on the basis of relative net assets or other appropriate methods. Expenses included in the accompanying financial statements reflect the expenses of that fund and do not include any expenses associated with any underlying mutual funds or exchange-traded funds. Although not included in a fund's expenses, a fund indirectly bears its proportionate share of these expenses through the net asset value of each underlying mutual fund or exchange-traded fund. Expense estimates are accrued in the period to which they relate and adjustments are made when actual amounts are known.
Income Tax Information and Distributions to Shareholders. Each year, the Fund intends to qualify as a regulated investment company under Subchapter M of the Internal Revenue Code, including distributing substantially all of its taxable income and realized gains. As a result, no provision for U.S. Federal income taxes is required. As of August 31, 2024, the Fund did not have any unrecognized tax benefits in the financial statements; nor is the Fund aware of any tax positions for which it is reasonably possible that the total amounts of unrecognized tax benefits will significantly change in the next twelve months. The Fund files a U.S. federal tax return, in addition to state and local tax returns as required. The Fund's federal income tax returns are subject to examination by the Internal Revenue Service (IRS) for a period of three fiscal years after they are filed. State and local tax returns may be subject to examination for an additional fiscal year depending on the jurisdiction.
Distributions are declared and recorded daily and paid monthly from net investment income. Distributions from realized gains, if any, are declared and recorded on the ex-dividend date. Income and capital gain distributions are determined in accordance with income tax regulations, which may differ from GAAP.
Capital accounts within the financial statements are adjusted for permanent book-tax differences. These adjustments have no impact on net assets or the results of operations. Capital accounts are not adjusted for temporary book-tax differences which will reverse in a subsequent period.
Book-tax differences are primarily due to futures contracts, swaps, options, market discount, capital loss carryforwards and losses deferred due to wash sales and futures transactions.
As of period end, the cost and unrealized appreciation (depreciation) in securities, and derivatives if applicable, for federal income tax purposes were as follows:
| Gross unrealized appreciation | $461,457,762 |
| Gross unrealized depreciation | (2,157,510,807) |
| Net unrealized appreciation (depreciation) | $(1,696,053,045) |
| Tax Cost | $42,503,255,400 |
The tax-based components of distributable earnings as of period end were as follows:
| Undistributed ordinary income | $16,187,744 |
| Capital loss carryforward | $(2,166,634,056) |
| Net unrealized appreciation (depreciation) on securities and other investments | $(1,731,614,517) |
Capital loss carryforwards are only available to offset future capital gains of the Fund to the extent provided by regulations and may be limited. The capital loss carryforward information presented below, including any applicable limitation, is estimated as of fiscal period end and is subject to adjustment.
Short-term | $(1,080,975,738) |
Long-term | (1,085,658,318) |
| Total capital loss carryforward | $(2,166,634,056) |
The tax character of distributions paid was as follows:
| | August 31, 2024 | August 31, 2023 |
| Ordinary Income | $1,496,948,909 | $ 1,280,808,882 |
Delayed Delivery Transactions and When-Issued Securities. During the period, certain Funds transacted in securities on a delayed delivery or when-issued basis. Payment and delivery may take place after the customary settlement period for that security. The price of the underlying securities and the date when the securities will be delivered and paid for are fixed at the time the transaction is negotiated. Securities purchased on a delayed delivery or when-issued basis are identified as such in the Schedule of Investments. Compensation for interest forgone in the purchase of a delayed delivery or when-issued debt security may be received. With respect to purchase commitments, each applicable Fund identifies securities as segregated in its records with a value at least equal to the amount of the commitment. Payables and receivables associated with the purchases and sales of delayed delivery securities having the same coupon, settlement date and broker are offset. Delayed delivery or when-issued securities that have been purchased from and sold to different brokers are reflected as both payables and receivables in the Statement of Assets and Liabilities under the caption "Delayed delivery", as applicable. Losses may arise due to changes in the value of the underlying securities or if the counterparty does not perform under the contract's terms, or if the issuer does not issue the securities due to political, economic, or other factors.
To-Be-Announced (TBA) Securities and Mortgage Dollar Rolls. TBA securities involve buying or selling mortgage-backed securities (MBS) on a forward commitment basis. A TBA transaction typically does not designate the actual security to be delivered and only includes an approximate principal amount; however delivered securities must meet specified terms defined by industry guidelines, including issuer, rate and current principal amount outstanding on underlying mortgage pools. Funds may enter into a TBA transaction with the intent to take possession of or deliver the underlying MBS, or a fund may elect to extend the settlement by entering into either a mortgage or reverse mortgage dollar roll. Mortgage dollar rolls are transactions where a fund sells TBA securities and simultaneously agrees to repurchase MBS on a later date at a lower price and with the same counterparty. Reverse mortgage dollar rolls involve the purchase and simultaneous agreement to sell TBA securities on a later date at a lower price. Transactions in mortgage dollar rolls and reverse mortgage dollar rolls are accounted for as purchases and sales and may result in an increase to a fund's portfolio turnover rate.
Purchases and sales of TBA securities involve risks similar to those discussed above for delayed delivery and when-issued securities. Also, if the counterparty in a mortgage dollar roll or a reverse mortgage dollar roll transaction files for bankruptcy or becomes insolvent, a fund's right to repurchase or sell securities may be limited. Additionally, when a fund sells TBA securities without already owning or having the right to obtain the deliverable securities (an uncovered forward commitment to sell), it incurs a risk of loss because it could have to purchase the securities at a price that is higher than the price at which it sold them. A fund may be unable to purchase the deliverable securities if the corresponding market is illiquid.
TBA securities subject to a forward commitment to sell at period end are included at the end of the Schedule of Investments under the caption "TBA Sale Commitments." The value of these commitments and proceeds to be received at contractual settlement date are reflected in the Statement of Assets and Liabilities as "TBA sale commitments, at value" and "Receivable for TBA sale commitments," respectively. If the TBA sale commitment is closed through the acquisition of an offsetting TBA purchase commitment, a fund realizes a gain or loss. If a fund delivers securities under the commitment, a fund realizes a gain or loss from the sale of the securities based upon the price established at the date the commitment was entered into.
Restricted Securities (including Private Placements). Funds may invest in securities that are subject to legal or contractual restrictions on resale. These securities generally may be resold in transactions exempt from registration or to the public if the securities are registered. Disposal of these securities may involve time-consuming negotiations and expense, and prompt sale at an acceptable price may be difficult. Information regarding restricted securities held at period end is included at the end of the Schedule of Investments, if applicable.
4. Derivative Instruments.
Risk Exposures and the Use of Derivative Instruments. The Fund's investment objectives allow for various types of derivative instruments, including futures contracts, swaps and options. Derivatives are investments whose value is primarily derived from underlying assets, indices or reference rates and may be transacted on an exchange or over-the-counter (OTC). Derivatives may involve a future commitment to buy or sell a specified asset based on specified terms, to exchange future cash flows at periodic intervals based on a notional principal amount, or for one party to make one or more payments upon the occurrence of specified events in exchange for periodic payments from the other party.
Derivatives were used to increase returns, to gain exposure to certain types of assets and to manage exposure to certain risks as defined below. The success of any strategy involving derivatives depends on analysis of numerous economic factors, and if the strategies for investment do not work as intended, the objectives may not be achieved.
Derivatives were used to increase or decrease exposure to the following risk(s):
| | |
| Credit Risk | Credit risk relates to the ability of the issuer of a financial instrument to make further principal or interest payments on an obligation or commitment that it has to a fund. |
| Interest Rate Risk | Interest rate risk relates to the fluctuations in the value of interest-bearing securities due to changes in the prevailing levels of market interest rates. |
Funds are also exposed to additional risks from investing in derivatives, such as liquidity risk and counterparty credit risk. Liquidity risk is the risk that a fund will be unable to close out the derivative in the open market in a timely manner. Counterparty credit risk is the risk that the counterparty will not be able to fulfill its obligation to a fund. Derivative counterparty credit risk is managed through formal evaluation of the creditworthiness of all potential counterparties. On certain OTC derivatives such as options and bi-lateral swaps, a fund attempts to reduce its exposure to counterparty credit risk by entering into an International Swaps and Derivatives Association, Inc. (ISDA) Master Agreement with each of its counterparties. The ISDA Master Agreement gives a fund the right to terminate all transactions traded under such agreement upon the deterioration in the credit quality of the counterparty beyond specified levels. The ISDA Master Agreement gives each party the right, upon an event of default by the other party or a termination of the agreement, to close out all transactions traded under such agreement and to net amounts owed under each transaction to one net payable by one party to the other. To mitigate counterparty credit risk on bi-lateral OTC derivatives, a fund receives collateral in the form of cash or securities once net unrealized appreciation on outstanding derivative contracts under an ISDA Master Agreement exceeds certain applicable thresholds, subject to certain minimum transfer provisions. The collateral received is held in segregated accounts with the custodian bank in accordance with the collateral agreements entered into between a fund, the counterparty and the custodian bank. A fund could experience delays and costs in gaining access to the collateral even though it is held by the custodian bank. The maximum risk of loss to a fund from counterparty credit risk related to bi-lateral OTC derivatives is generally the aggregate unrealized appreciation and unpaid counterparty payments in excess of any collateral pledged by the counterparty to a fund. For OTC written options with upfront premiums received, a fund is obligated to perform and therefore does not have counterparty risk. For OTC written options with premiums to be received at a future date, the maximum risk of loss from counterparty credit risk is the amount of the premium in excess of any collateral pledged by the counterparty. A fund may be required to pledge collateral for the benefit of the counterparties on bi-lateral OTC derivatives in an amount not less than each counterparty's unrealized appreciation on outstanding derivative contracts, subject to certain minimum transfer provisions, and any such pledged collateral is identified in the Schedule of Investments. Exchange-traded contracts are not covered by the ISDA Master Agreement; however counterparty credit risk related to these contracts may be mitigated by the protection provided by the exchange on which they trade. Counterparty credit risk related to centrally cleared swaps may be mitigated by the protection provided by the clearinghouse.
Investing in derivatives may involve greater risks than investing in the underlying assets directly and, to varying degrees, may involve risk of loss in excess of any initial investment and collateral received and amounts recognized in the Statement of Assets and Liabilities. In addition, there may be the risk that the change in value of the derivative contract does not correspond to the change in value of the underlying instrument.
Net Realized Gain (Loss) and Change in Net Unrealized Appreciation (Depreciation) on Derivatives. The table below, which reflects the impacts of derivatives on the financial performance, summarizes the net realized gain (loss) and change in net unrealized appreciation (depreciation) for derivatives during the period as presented in the Statement of Operations.
| Primary Risk Exposure / Derivative Type | Net Realized Gain (Loss)($) | Change in Net Unrealized Appreciation (Depreciation)($) |
| Fidelity Series Investment Grade Bond Fund | | |
| Credit Risk | | |
| Swaps | (1,955,132) | (4,859,482) |
| Total Credit Risk | (1,955,132) | (4,859,482) |
| Interest Rate Risk | | |
| Futures Contracts | 1,892,963 | 4,781,029 |
| Purchased Options | 363,439 | (1,427,934) |
| Written Options | 570,813 | - |
| Swaps | (8,342,018) | (14,175,851) |
| Total Interest Rate Risk | (5,514,803) | (10,822,756) |
| Totals | (7,469,935) | (15,682,238) |
If there are any open positions at period end, a summary of the value of derivatives by primary risk exposure is included at the end of the Schedule of Investments.
Futures Contracts. A futures contract is an agreement between two parties to buy or sell a specified underlying instrument for a fixed price at a specified future date. Futures contracts were used to manage exposure to the bond market and fluctuations in interest rates.
Upon entering into a futures contract, a fund is required to deposit either cash or securities (initial margin) with a clearing broker in an amount equal to a certain percentage of the face value of the contract. Futures contracts are marked-to-market daily and subsequent daily payments are made or received by a fund depending on the daily fluctuations in the value of the futures contracts and are recorded as unrealized appreciation or (depreciation). This receivable and/or payable, if any, is included in daily variation margin on futures contracts in the Statement of Assets and Liabilities. Realized gain or (loss) is recorded upon the expiration or closing of a futures contract. The net realized gain (loss) and change in net unrealized appreciation (depreciation) on futures contracts during the period is presented in the Statement of Operations.
Any open futures contracts at period end are presented in the Schedule of Investments under the caption "Futures Contracts". The notional amount at value reflects each contract's exposure to the underlying instrument or index at period end, and is representative of volume of activity during the period unless an average notional amount is presented. Any securities deposited to meet initial margin requirements are identified in the Schedule of Investments. Any cash deposited to meet initial margin requirements is presented as segregated cash with brokers for derivative instruments in the Statement of Assets and Liabilities.
Options. Options give the purchaser the right, but not the obligation, to buy (call) or sell (put) an underlying security or financial instrument at an agreed exercise or strike price between or on certain dates. Options obligate the seller (writer) to buy (put) or sell (call) an underlying instrument at the exercise or strike price or cash settle an underlying derivative instrument if the holder exercises the option on or before the expiration date. OTC options, such as swaptions, which are options where the underlying instrument is a swap, were used to manage exposure to fluctuations in interest rates.
Upon entering into an options contract, a fund will pay or receive a premium. Premiums paid on purchased options are reflected as cost of investments and premiums received on written options are reflected as a liability on the Statement of Assets and Liabilities. Certain options may be purchased or written with premiums to be paid or received on a future date. Options are valued daily and any unrealized appreciation (depreciation) is reflected in total accumulated earnings (loss) in the Statement of Assets and Liabilities. When an option is exercised, the cost or proceeds of the underlying instrument purchased or sold is adjusted by the amount of the premium. When an option is closed, a gain or loss is realized depending on whether the proceeds or amount paid for the closing sale transaction is greater or less than the premium received or paid. When an option expires, gains and losses are realized to the extent of premiums received and paid, respectively. The net realized and unrealized gains (losses) on purchased options are included in the Statement of Operations in net realized gain (loss) and change in net unrealized appreciation (depreciation) on investment securities. The net realized gain (loss) and change in net unrealized appreciation (depreciation) on written options are presented in the Statement of Operations.
Any open options at period end are presented in the Schedule of Investments under the captions "Purchased Options," "Purchased Swaptions," "Written Options" and "Written Swaptions," as applicable, and are representative of volume of activity during the period unless an average notional amount is presented.
Writing puts and buying calls tend to increase exposure to the underlying instrument while buying puts and writing calls tend to decrease exposure to the underlying instrument. For purchased options, risk of loss is limited to the premium paid, and for written options, risk of loss is the change in value in excess of the premium received.
Swaps. A swap is a contract between two parties to exchange future cash flows at periodic intervals based on a notional principal amount. A bi-lateral OTC swap is a transaction between a fund and a dealer counterparty where cash flows are exchanged between the two parties for the life of the swap. A centrally cleared swap is a transaction executed between a fund and a dealer counterparty, then cleared by a futures commission merchant (FCM) through a clearinghouse. Once cleared, the clearinghouse serves as a central counterparty, with whom a fund exchanges cash flows for the life of the transaction, similar to transactions in futures contracts.
Bi-lateral OTC swaps are marked-to-market daily and changes in value are reflected in the Statement of Assets and Liabilities in the bi-lateral OTC swaps at value line items. Any upfront premiums paid or received upon entering a bi-lateral OTC swap to compensate for differences between stated terms of the swap and prevailing market conditions (e.g. credit spreads, interest rates or other factors) are recorded in total accumulated earnings (loss) in the Statement of Assets and Liabilities and amortized to realized gain or (loss) ratably over the term of the swap. Any unamortized upfront premiums are presented in the Schedule of Investments.
Centrally cleared swaps require a fund to deposit either cash or securities (initial margin) with the FCM, at the instruction of and for the benefit of the clearinghouse. Any securities deposited to meet initial margin requirements are identified in the Schedule of Investments. Any cash deposited to meet initial margin requirements is presented in segregated cash with brokers for derivative instruments in the Statement of Assets and Liabilities. Centrally cleared swaps are marked-to-market daily and subsequent payments (variation margin) are made or received depending on the daily fluctuations in the value of the swaps and are recorded as unrealized appreciation or (depreciation). These daily payments, if any, are included in receivable or payable for daily variation margin on centrally cleared swaps in the Statement of Assets and Liabilities. Any premiums for centrally cleared swaps are recorded periodically throughout the term of the swap to variation margin and included in total accumulated earnings (loss) in the Statement of Assets and Liabilities. Any premiums are recognized as realized gain (loss) upon termination or maturity of the swap.
For both bi-lateral and centrally cleared swaps, payments are exchanged at specified intervals, accrued daily commencing with the effective date of the contract and recorded as realized gain or (loss). Some swaps may be terminated prior to the effective date and realize a gain or loss upon termination. The net realized gain (loss) and change in net unrealized appreciation (depreciation) on swaps during the period is presented in the Statement of Operations.
Any open swaps at period end are included in the Schedule of Investments under the caption "Swaps", and are representative of volume of activity during the period unless an average notional amount is presented.
Credit Default Swaps. Credit default swaps enable a fund to buy or sell protection against specified credit events on a single-name issuer or a traded credit index. Under the terms of a credit default swap the buyer of protection (buyer) receives credit protection in exchange for making periodic payments to the seller of protection (seller) based on a fixed percentage applied to a notional principal amount. In return for these payments, the seller will be required to make a payment upon the occurrence of one or more specified credit events. A fund enters into credit default swaps as a seller to gain credit exposure to an issuer and/or as a buyer to obtain a measure of protection against defaults of an issuer. Periodic payments are made over the life of the contract by the buyer provided that no credit event occurs.
For credit default swaps on most corporate and sovereign issuers, credit events include bankruptcy, failure to pay or repudiation/moratorium. For credit default swaps on corporate or sovereign issuers, the obligation that may be put to the seller is not limited to the specific reference obligation described in the Schedule of Investments. For credit default swaps on asset-backed securities, a credit event may be triggered by events such as failure to pay principal, maturity extension, rating downgrade or write-down. For credit default swaps on asset-backed securities, the reference obligation described represents the security that may be put to the seller. For credit default swaps on a traded credit index, a specified credit event may affect all or individual underlying securities included in the index.
As a seller, if an underlying credit event occurs, a fund will pay a net settlement amount of cash equal to the notional amount of the swap less the recovery value of the reference obligation or underlying securities comprising an index. Only in the event of the industry's inability to value the underlying asset will a fund be required to take delivery of the reference obligation or underlying securities comprising an index and pay an amount equal to the notional amount of the swap.
As a buyer, if an underlying credit event occurs, a fund will receive a net settlement amount of cash equal to the notional amount of the swap less the recovery value of the reference obligation or underlying securities comprising an index. Only in the event of the industry's inability to value the underlying asset will a fund be required to deliver the reference obligation or underlying securities comprising an index in exchange for payment of an amount equal to the notional amount of the swap.
Typically, the value of each credit default swap and credit rating disclosed for each reference obligation in the Schedule of Investments, where a fund is the seller, can be used as measures of the current payment/performance risk of the swap. As the value of the swap changes as a positive or negative percentage of the total notional amount, the payment/performance risk may decrease or increase, respectively. In addition to these measures, the investment adviser monitors a variety of factors including cash flow assumptions, market activity and market sentiment as part of its ongoing process of assessing payment/performance risk.
Interest Rate Swaps. Interest rate swaps are agreements between counterparties to exchange cash flows, one based on a fixed rate, and the other on a floating rate. A fund enters into interest rate swaps to manage its exposure to interest rate changes. Changes in interest rates can have an effect on both the value of bond holdings as well as the amount of interest income earned. In general, the value of bonds can fall when interest rates rise and can rise when interest rates fall.
5. Purchases and Sales of Investments.
Purchases and sales of securities, other than short-term securities, U.S. government securities and in-kind transactions, as applicable, are noted in the table below.
| | Purchases ($) | Sales ($) |
| Fidelity Series Investment Grade Bond Fund | 44,647,904,184 | 45,613,472,356 |
6. Fees and Other Transactions with Affiliates.
Management Fee. Fidelity Management & Research Company LLC (the investment adviser) and its affiliates provide the Fund with investment management related services for which the Fund does not pay a management fee. Under the management contract, the investment adviser or an affiliate pays all ordinary operating expenses of the Fund, except custody fees, fees and expenses of the independent Trustees, and certain miscellaneous expenses such as proxy and shareholder meeting expenses.
Interfund Trades. Funds may purchase from or sell securities to other Fidelity Funds under procedures adopted by the Board. The procedures have been designed to ensure these interfund trades are executed in accordance with Rule 17a-7 of the 1940 Act. Any interfund trades are included within the respective purchases and sales amounts shown in the Purchases and Sales of Investments note. During the period, there were no interfund trades.
Sub-Advisory Arrangements. Effective March 1, 2024, each Fund's sub-advisory agreements with FMR Investment Management (UK) Limited, Fidelity Management & Research (Hong Kong) Limited, and Fidelity Management & Research (Japan) Limited were amended to provide that the investment adviser pays each sub-adviser monthly fees equal to 110% of the sub-adviser's costs for providing sub-advisory services.
7. Committed Line of Credit.
Certain Funds participate with other funds managed by the investment adviser or an affiliate in a $4.25 billion credit facility (the "line of credit") to be utilized for temporary or emergency purposes to fund shareholder redemptions or for other short-term liquidity purposes. The commitment fees on the pro-rata portion of the line of credit are borne by the investment adviser. During the period, there were no borrowings on this line of credit.
8. Security Lending.
Funds lend portfolio securities from time to time in order to earn additional income. Lending agents are used, including National Financial Services (NFS), an affiliate of the investment adviser. Pursuant to a securities lending agreement, NFS will receive a fee, which is capped at 9.9% of a fund's daily lending revenue, for its services as lending agent. A fund may lend securities to certain qualified borrowers, including NFS. On the settlement date of the loan, a fund receives collateral (in the form of U.S. Treasury obligations, letters of credit and/or cash) against the loaned securities and maintains collateral in an amount not less than 100% of the market value of the loaned securities during the period of the loan. The market value of the loaned securities is determined at the close of business of a fund and any additional required collateral is delivered to a fund on the next business day. A fund or borrower may terminate the loan at any time, and if the borrower defaults on its obligation to return the securities loaned because of insolvency or other reasons, a fund may apply collateral received from the borrower against the obligation. A fund may experience delays and costs in recovering the securities loaned. Any cash collateral received is invested in the Fidelity Securities Lending Cash Central Fund. Any loaned securities are identified as such in the Schedule of Investments, and the value of loaned securities and cash collateral at period end, as applicable, are presented in the Statement of Assets and Liabilities. Security lending income represents the income earned on investing cash collateral, less rebates paid to borrowers and any lending agent fees associated with the loan, plus any premium payments received for lending certain types of securities. Security lending income is presented in the Statement of Operations as a component of income from Fidelity Central Funds. Affiliated security lending activity, if any, was as follows:
| | Total Security Lending Fees Paid to NFS ($) | Security Lending Income From Securities Loaned to NFS ($) | Value of Securities Loaned to NFS at Period End ($) |
| Fidelity Series Investment Grade Bond Fund | 41,388 | - | - |
9. Expense Reductions.
Through arrangements with the Fund's custodian, credits realized as a result of certain uninvested cash balances were used to reduce the Fund's expenses by $21,466.
10. Other.
A fund's organizational documents provide former and current trustees and officers with a limited indemnification against liabilities arising in connection with the performance of their duties to the fund. In the normal course of business, a fund may also enter into contracts that provide general indemnifications. A fund's maximum exposure under these arrangements is unknown as this would be dependent on future claims that may be made against a fund. The risk of material loss from such claims is considered remote.
At the end of the period, mutual funds and accounts managed by the investment adviser or its affiliates were the owners of record of all of the outstanding shares of the Fund.
11. Risk and Uncertainties.
Many factors affect a fund's performance. Developments that disrupt global economies and financial markets, such as pandemics, epidemics, outbreaks of infectious diseases, war, terrorism, and environmental disasters, may significantly affect a fund's investment performance. The effects of these developments to a fund will be impacted by the types of securities in which a fund invests, the financial condition, industry, economic sector, and geographic location of an issuer, and a fund's level of investment in the securities of that issuer. Significant concentrations in security types, issuers, industries, sectors, and geographic locations may magnify the factors that affect a fund's performance.
Report of Independent Registered Public Accounting Firm
To the Board of Trustees of Fidelity Salem Street Trust and Shareholders of Fidelity Series Investment Grade Bond Fund
Opinion on the Financial Statements
We have audited the accompanying statement of assets and liabilities, including the schedule of investments, of Fidelity Series Investment Grade Bond Fund (one of the funds constituting Fidelity Salem Street Trust, referred to hereafter as the "Fund") as of August 31, 2024, the related statement of operations for the year ended August 31, 2024, the statement of changes in net assets for each of the two years in the period ended August 31, 2024, including the related notes, and the financial highlights for each of the five years in the period ended August 31, 2024 (collectively referred to as the "financial statements"). In our opinion, the financial statements present fairly, in all material respects, the financial position of the Fund as of August 31, 2024, the results of its operations for the year then ended, the changes in its net assets for each of the two years in the period ended August 31, 2024 and the financial highlights for each of the five years in the period ended August 31, 2024 in conformity with accounting principles generally accepted in the United States of America.
Basis for Opinion
These financial statements are the responsibility of the Fund's management. Our responsibility is to express an opinion on the Fund's financial statements based on our audits. We are a public accounting firm registered with the Public Company Accounting Oversight Board (United States) (PCAOB) and are required to be independent with respect to the Fund in accordance with the U.S. federal securities laws and the applicable rules and regulations of the Securities and Exchange Commission and the PCAOB.
We conducted our audits of these financial statements in accordance with the standards of the PCAOB. Those standards require that we plan and perform the audit to obtain reasonable assurance about whether the financial statements are free of material misstatement, whether due to error or fraud.
Our audits included performing procedures to assess the risks of material misstatement of the financial statements, whether due to error or fraud, and performing procedures that respond to those risks. Such procedures included examining, on a test basis, evidence regarding the amounts and disclosures in the financial statements. Our audits also included evaluating the accounting principles used and significant estimates made by management, as well as evaluating the overall presentation of the financial statements. Our procedures included confirmation of securities owned as of August 31, 2024 by correspondence with the custodian and brokers; when replies were not received from brokers, we performed other auditing procedures. We believe that our audits provide a reasonable basis for our opinion.
/s/ PricewaterhouseCoopers LLP
Boston, Massachusetts
October 16, 2024
We have served as the auditor of one or more investment companies in the Fidelity group of funds since 1932.
Distributions
(Unaudited)
The dividend and capital gains distributions for the fund(s) are available on Fidelity.com or Institutional.Fidelity.com.
A total of 32.49% of the dividends distributed during the fiscal year was derived from interest on U.S. Government securities which is generally exempt from state income tax.
The fund designates $1,496,948,909 of distributions paid during the fiscal year ended 2024 as qualifying to be taxed as section 163(j) interest dividends.
The fund will notify shareholders in January 2025 of amounts for use in preparing 2024 income tax returns.
Item 8: Changes in and Disagreements with Accountants for Open-End Management Investment Companies
(Unaudited)
Note: This is not applicable for any fund included in this document.
Item 9: Proxy Disclosures for Open-End Management Investment Companies
(Unaudited)
| A special meeting of shareholders was held on October 18, 2023. The results of votes taken among shareholders on the proposal before them are reported below. Each vote reported represents one dollar of net asset value held on the record date for the meeting. |
| Proposal 1 |
| To elect a Board of Trustees. |
| | # of Votes | % of Votes |
| Abigail P. Johnson |
| Affirmative | 378,729,502,260.01 | 97.58 |
| Withheld | 9,407,876,478.96 | 2.42 |
| TOTAL | 388,137,378,738.97 | 100.00 |
| Jennifer Toolin McAuliffe |
| Affirmative | 378,454,868,010.95 | 97.51 |
| Withheld | 9,682,510,728.02 | 2.49 |
| TOTAL | 388,137,378,738.97 | 100.00 |
| Christine J. Thompson |
| Affirmative | 378,837,121,274.52 | 97.60 |
| Withheld | 9,300,257,464.45 | 2.40 |
| TOTAL | 388,137,378,738.97 | 100.00 |
| Elizabeth S. Acton |
| Affirmative | 378,262,110,794.85 | 97.46 |
| Withheld | 9,875,267,944.12 | 2.54 |
| TOTAL | 388,137,378,738.97 | 100.00 |
| Laura M. Bishop |
| Affirmative | 380,482,113,171.06 | 98.03 |
| Withheld | 7,655,265,567.91 | 1.97 |
| TOTAL | 388,137,378,738.97 | 100.00 |
| Ann E. Dunwoody |
| Affirmative | 380,016,034,008.12 | 97.91 |
| Withheld | 8,121,344,730.85 | 2.09 |
| TOTAL | 388,137,378,738.97 | 100.00 |
| John Engler |
| Affirmative | 379,432,488,394.20 | 97.76 |
| Withheld | 8,704,890,344.77 | 2.24 |
| TOTAL | 388,137,378,738.97 | 100.00 |
| Robert F. Gartland |
| Affirmative | 378,741,819,600.60 | 97.58 |
| Withheld | 9,395,559,138.37 | 2.42 |
| TOTAL | 388,137,378,738.97 | 100.00 |
| Robert W. Helm |
| Affirmative | 380,389,324,755.07 | 98.00 |
| Withheld | 7,748,053,983.90 | 2.00 |
| TOTAL | 388,137,378,738.97 | 100.00 |
| Arthur E. Johnson |
| Affirmative | 378,427,694,151.67 | 97.50 |
| Withheld | 9,709,684,587.30 | 2.50 |
| TOTAL | 388,137,378,738.97 | 100.00 |
| Michael E. Kenneally |
| Affirmative | 377,842,228,145.18 | 97.35 |
| Withheld | 10,295,150,593.79 | 2.65 |
| TOTAL | 388,137,378,738.97 | 100.00 |
| Mark A. Murray |
| Affirmative | 380,158,432,703.37 | 97.94 |
| Withheld | 7,978,946,035.60 | 2.06 |
| TOTAL | 388,137,378,738.97 | 100.00 |
| Carol J. Zierhoffer |
| Affirmative | 380,522,113,360.24 | 98.04 |
| Withheld | 7,615,265,378.73 | 1.96 |
| TOTAL | 388,137,378,738.97 | 100.00 |
| | | |
| Proposal 1 reflects trust-wide proposal and voting results. |
Item 10: Remuneration Paid to Directors, Officers, and others of Open-End Management Investment Companies
(Unaudited)
Note: This information is disclosed as part of the financial statements for each Fund as part of Item 7: Financial Statements and Financial Highlights for Open-End Management Investment companies.
Item 11: Statement Regarding Basis for Approval of Investment Advisory Contract
(Unaudited)
Note: This is not applicable for any fund included in this document.
1.873109.115
LIG-ANN-1024
Fidelity® Series Short-Term Credit Fund
Annual Report
August 31, 2024
Contents
To view a fund's proxy voting guidelines and proxy voting record for the 12-month period ended June 30, visit http://www.fidelity.com/proxyvotingresults or visit the Securities and Exchange Commission's (SEC) web site at http://www.sec.gov.
You may also call 1-800-544-8544 to request a free copy of the proxy voting guidelines.
Standard & Poor's, S&P and S&P 500 are registered service marks of The McGraw-Hill Companies, Inc. and have been licensed for use by Fidelity Distributors Corporation.
Other third-party marks appearing herein are the property of their respective owners.
All other marks appearing herein are registered or unregistered trademarks or service marks of FMR LLC or an affiliated company. © 2024 FMR LLC. All rights reserved.
This report and the financial statements contained herein are submitted for the general information of the shareholders of the Fund. This report is not authorized for distribution to prospective investors in the Fund unless preceded or accompanied by an effective prospectus.
A fund files its complete schedule of portfolio holdings with the SEC for the first and third quarters of each fiscal year on Form N-PORT. Forms N-PORT are available on the SEC's web site at http://www.sec.gov. A fund's Forms N-PORT may be reviewed and copied at the SEC's Public Reference Room in Washington, DC. Information regarding the operation of the SEC's Public Reference Room may be obtained by calling 1-800-SEC-0330.
For a complete list of a fund's portfolio holdings, view the most recent holdings listing, semiannual report, or annual report on Fidelity's web site at http://www.fidelity.com, http://www.institutional.fidelity.com, or http://www.401k.com, as applicable.
NOT FDIC INSURED •MAY LOSE VALUE •NO BANK GUARANTEE
Neither the Fund nor Fidelity Distributors Corporation is a bank.
Item 7: Financial Statements and Financial Highlights for Open-End Management Investment Companies (Annual Report)
Fidelity® Series Short-Term Credit Fund
Schedule of Investments August 31, 2024
Showing Percentage of Net Assets
| Nonconvertible Bonds - 69.6% |
| | | Principal Amount (a) | Value ($) |
| COMMUNICATION SERVICES - 6.0% | | | |
| Diversified Telecommunication Services - 2.4% | | | |
| AT&T, Inc.: | | | |
| 1.7% 3/25/26 | | 3,100,000 | 2,963,582 |
| 2.3% 6/1/27 | | 1,000,000 | 945,838 |
| NTT Finance Corp. 1.162% 4/3/26 (b) | | 5,299,000 | 5,026,181 |
| Verizon Communications, Inc.: | | | |
| 2.625% 8/15/26 | | 1,460,000 | 1,410,958 |
| 4.125% 3/16/27 | | 1,000,000 | 992,124 |
| | | | 11,338,683 |
| Media - 1.4% | | | |
| Charter Communications Operating LLC/Charter Communications Operating Capital Corp.: | | | |
| 3.75% 2/15/28 | | 1,000,000 | 956,573 |
| 6.15% 11/10/26 | | 870,000 | 891,303 |
| Discovery Communications LLC 4.9% 3/11/26 | | 1,460,000 | 1,451,337 |
| Warnermedia Holdings, Inc. 3.788% 3/15/25 | | 3,700,000 | 3,666,114 |
| | | | 6,965,327 |
| Wireless Telecommunication Services - 2.2% | | | |
| Rogers Communications, Inc. 3.2% 3/15/27 | | 2,000,000 | 1,934,856 |
| T-Mobile U.S.A., Inc.: | | | |
| 1.5% 2/15/26 | | 1,170,000 | 1,117,636 |
| 2.25% 2/15/26 | | 1,600,000 | 1,545,890 |
| 3.5% 4/15/25 | | 4,500,000 | 4,451,777 |
| 3.75% 4/15/27 | | 1,540,000 | 1,512,049 |
| | | | 10,562,208 |
TOTAL COMMUNICATION SERVICES | | | 28,866,218 |
| CONSUMER DISCRETIONARY - 7.9% | | | |
| Automobiles - 6.5% | | | |
| American Honda Finance Corp.: | | | |
| 4.75% 1/12/26 | | 1,100,000 | 1,103,350 |
| 4.9% 7/9/27 | | 1,000,000 | 1,014,949 |
| BMW U.S. Capital LLC 4.65% 8/13/26 (b) | | 1,024,000 | 1,028,140 |
| General Motors Financial Co., Inc.: | | | |
| 1.25% 1/8/26 | | 4,954,000 | 4,726,865 |
| 5.25% 3/1/26 | | 3,100,000 | 3,113,777 |
| 5.4% 5/8/27 | | 1,500,000 | 1,527,459 |
| Hyundai Capital America: | | | |
| 1% 9/17/24 (b) | | 5,519,000 | 5,508,934 |
| 5.45% 6/24/26 (b) | | 873,000 | 883,620 |
| 5.8% 6/26/25 (b) | | 1,500,000 | 1,508,476 |
| Mercedes-Benz Finance North America LLC: | | | |
| 4.75% 8/1/27 (b) | | 1,250,000 | 1,262,139 |
| 4.8% 3/30/26 (b) | | 2,000,000 | 2,006,962 |
| 5.5% 11/27/24 (b) | | 1,460,000 | 1,460,426 |
| Volkswagen Group of America Finance LLC: | | | |
| 3.2% 9/26/26 (b) | | 3,919,000 | 3,801,578 |
| 5.8% 9/12/25 (b) | | 1,500,000 | 1,513,405 |
| 6% 11/16/26 (b) | | 550,000 | 564,419 |
| | | | 31,024,499 |
| Hotels, Restaurants & Leisure - 0.4% | | | |
| Starbucks Corp.: | | | |
| 2% 3/12/27 | | 1,000,000 | 944,450 |
| 4.75% 2/15/26 | | 1,200,000 | 1,202,629 |
| | | | 2,147,079 |
| Household Durables - 0.2% | | | |
| Toll Brothers Finance Corp. 4.875% 3/15/27 | | 1,000,000 | 1,000,995 |
| Specialty Retail - 0.8% | | | |
| Advance Auto Parts, Inc. 5.9% 3/9/26 | | 574,000 | 578,846 |
| AutoNation, Inc. 4.5% 10/1/25 | | 1,460,000 | 1,449,452 |
| AutoZone, Inc. 5.05% 7/15/26 | | 1,000,000 | 1,009,543 |
| Lowe's Companies, Inc. 4.8% 4/1/26 | | 215,000 | 215,659 |
| O'Reilly Automotive, Inc. 5.75% 11/20/26 | | 393,000 | 402,556 |
| | | | 3,656,056 |
| Textiles, Apparel & Luxury Goods - 0.0% | | | |
| Tapestry, Inc. 7.05% 11/27/25 | | 77,000 | 78,427 |
TOTAL CONSUMER DISCRETIONARY | | | 37,907,056 |
| CONSUMER STAPLES - 4.1% | | | |
| Beverages - 0.2% | | | |
| Constellation Brands, Inc. 3.5% 5/9/27 | | 1,000,000 | 974,415 |
| Consumer Staples Distribution & Retail - 0.9% | | | |
| Dollar General Corp.: | | | |
| 4.25% 9/20/24 | | 1,370,000 | 1,368,933 |
| 4.625% 11/1/27 | | 1,000,000 | 993,280 |
| Dollar Tree, Inc. 4% 5/15/25 | | 2,000,000 | 1,983,723 |
| | | | 4,345,936 |
| Food Products - 1.4% | | | |
| Campbell Soup Co. 5.3% 3/20/26 | | 292,000 | 295,421 |
| Conagra Brands, Inc. 4.6% 11/1/25 | | 1,800,000 | 1,793,701 |
| McCormick & Co., Inc. 0.9% 2/15/26 | | 5,000,000 | 4,735,837 |
| | | | 6,824,959 |
| Tobacco - 1.6% | | | |
| BAT International Finance PLC 1.668% 3/25/26 | | 6,600,000 | 6,299,397 |
| Philip Morris International, Inc. 2.75% 2/25/26 | | 1,460,000 | 1,422,511 |
| | | | 7,721,908 |
TOTAL CONSUMER STAPLES | | | 19,867,218 |
| ENERGY - 5.4% | | | |
| Oil, Gas & Consumable Fuels - 5.4% | | | |
| 6297782 LLC 4.911% 9/1/27 (b) | | 290,000 | 290,609 |
| Canadian Natural Resources Ltd. 2.05% 7/15/25 | | 4,381,000 | 4,269,370 |
| DCP Midstream Operating LP 5.625% 7/15/27 | | 1,555,000 | 1,595,385 |
| Devon Energy Corp. 5.25% 9/15/24 | | 1,200,000 | 1,199,230 |
| Diamondback Energy, Inc. 5.2% 4/18/27 | | 1,364,000 | 1,386,981 |
| Enbridge, Inc.: | | | |
| 3.7% 7/15/27 | | 1,000,000 | 978,544 |
| 5.9% 11/15/26 | | 549,000 | 564,379 |
| Energy Transfer LP: | | | |
| 2.9% 5/15/25 | | 1,800,000 | 1,770,847 |
| 5.5% 6/1/27 | | 1,000,000 | 1,019,664 |
| Equinor ASA 1.75% 1/22/26 | | 909,000 | 876,444 |
| MPLX LP 1.75% 3/1/26 | | 5,000,000 | 4,780,347 |
| Occidental Petroleum Corp. 5% 8/1/27 | | 875,000 | 882,258 |
| Phillips 66 Co.: | | | |
| 1.3% 2/15/26 | | 1,750,000 | 1,668,030 |
| 3.85% 4/9/25 | | 3,100,000 | 3,073,533 |
| The Williams Companies, Inc.: | | | |
| 4% 9/15/25 | | 1,460,000 | 1,446,466 |
| 5.4% 3/2/26 | | 290,000 | 292,800 |
| | | | 26,094,887 |
| FINANCIALS - 30.2% | | | |
| Banks - 19.0% | | | |
| Banco Santander SA 5.365% 7/15/28 (c) | | 2,400,000 | 2,439,366 |
| Bank of America Corp.: | | | |
| 4.948% 7/22/28 (c) | | 5,000,000 | 5,051,411 |
| 5.202% 4/25/29 (c) | | 8,000,000 | 8,172,333 |
| Barclays PLC: | | | |
| 5.674% 3/12/28 (c) | | 1,250,000 | 1,275,574 |
| 6.496% 9/13/27 (c) | | 2,370,000 | 2,448,570 |
| Citibank NA 4.929% 8/6/26 | | 2,000,000 | 2,016,938 |
| Citigroup, Inc.: | | | |
| 3.52% 10/27/28 (c) | | 2,107,000 | 2,042,566 |
| 3.887% 1/10/28 (c) | | 2,000,000 | 1,967,730 |
| 4.075% 4/23/29 (c) | | 1,700,000 | 1,672,033 |
| Cooperatieve Rabobank UA 5.564% 2/28/29 (b)(c) | | 1,500,000 | 1,539,334 |
| Danske Bank A/S 6.259% 9/22/26 (b)(c) | | 1,228,000 | 1,244,532 |
| HSBC Holdings PLC: | | | |
| 1.645% 4/18/26 (c) | | 4,469,000 | 4,366,762 |
| 5.597% 5/17/28 (c) | | 1,500,000 | 1,532,261 |
| 5.887% 8/14/27 (c) | | 2,390,000 | 2,440,103 |
| 6.161% 3/9/29 (c) | | 1,500,000 | 1,568,294 |
| ING Groep NV 4.55% 10/2/28 | | 1,500,000 | 1,497,162 |
| JPMorgan Chase & Co.: | | | |
| 2.083% 4/22/26 (c) | | 5,000,000 | 4,904,938 |
| 2.182% 6/1/28 (c) | | 1,000,000 | 940,327 |
| 4.851% 7/25/28 (c) | | 5,000,000 | 5,044,942 |
| 4.979% 7/22/28 (c) | | 2,500,000 | 2,531,943 |
| 5.571% 4/22/28 (c) | | 861,000 | 882,676 |
| Lloyds Banking Group PLC 5.871% 3/6/29 (c) | | 2,570,000 | 2,662,384 |
| Mitsubishi UFJ Financial Group, Inc.: | | | |
| 5.354% 9/13/28 (c) | | 900,000 | 919,074 |
| 5.422% 2/22/29 (c) | | 1,000,000 | 1,025,183 |
| Mizuho Financial Group, Inc. 5.414% 9/13/28 (c) | | 2,400,000 | 2,456,209 |
| Morgan Stanley Bank, West Valley City Utah 5.882% 10/30/26 | | 2,000,000 | 2,060,878 |
| NatWest Group PLC 5.516% 9/30/28 (c) | | 1,820,000 | 1,864,415 |
| NatWest Markets PLC 5.416% 5/17/27 (b) | | 1,000,000 | 1,019,520 |
| PNC Financial Services Group, Inc.: | | | |
| 5.3% 1/21/28 (c) | | 568,000 | 577,851 |
| 5.354% 12/2/28 (c) | | 2,000,000 | 2,054,818 |
| Santander Holdings U.S.A., Inc.: | | | |
| 3.244% 10/5/26 | | 1,000,000 | 966,383 |
| 6.124% 5/31/27 (c) | | 410,000 | 416,754 |
| 6.499% 3/9/29 (c) | | 989,000 | 1,031,108 |
| Societe Generale: | | | |
| 2.625% 10/16/24 (b) | | 908,000 | 904,751 |
| 6.446% 1/10/29 (b)(c) | | 974,000 | 1,008,181 |
| The Toronto-Dominion Bank 4.98% 4/5/27 | | 2,500,000 | 2,534,114 |
| Truist Financial Corp. 4.873% 1/26/29 (c) | | 1,120,000 | 1,122,661 |
| U.S. Bancorp 4.653% 2/1/29 (c) | | 2,100,000 | 2,102,356 |
| Wells Fargo & Co.: | | | |
| 2.164% 2/11/26 (c) | | 5,000,000 | 4,931,614 |
| 2.393% 6/2/28 (c) | | 1,780,000 | 1,679,192 |
| 3.584% 5/22/28 (c) | | 1,000,000 | 973,042 |
| 4.808% 7/25/28 (c) | | 2,000,000 | 2,011,536 |
| 5.707% 4/22/28 (c) | | 1,500,000 | 1,540,664 |
| | | | 91,442,483 |
| Capital Markets - 4.7% | | | |
| Athene Global Funding 5.516% 3/25/27 (b) | | 3,000,000 | 3,058,279 |
| Bank of New York Mellon Corp. 3.992% 6/13/28 (c) | | 1,000,000 | 987,832 |
| Deutsche Bank AG New York Branch: | | | |
| 5.706% 2/8/28 (c) | | 1,500,000 | 1,524,933 |
| 6.72% 1/18/29 (c) | | 1,790,000 | 1,884,483 |
| Goldman Sachs Group, Inc.: | | | |
| 2.64% 2/24/28 (c) | | 3,000,000 | 2,862,623 |
| 4.223% 5/1/29 (c) | | 1,130,000 | 1,114,399 |
| 4.482% 8/23/28 (c) | | 1,000,000 | 997,716 |
| Intercontinental Exchange, Inc. 3.625% 9/1/28 (b) | | 1,500,000 | 1,450,102 |
| Morgan Stanley: | | | |
| 3.591% 7/22/28 (c) | | 1,000,000 | 972,065 |
| 3.772% 1/24/29 (c) | | 2,111,000 | 2,059,940 |
| 5.123% 2/1/29 (c) | | 1,507,000 | 1,533,411 |
| 5.164% 4/20/29 (c) | | 1,630,000 | 1,660,696 |
| UBS Group AG: | | | |
| 3.869% 1/12/29 (b)(c) | | 1,063,000 | 1,030,128 |
| 6.442% 8/11/28 (b)(c) | | 1,509,000 | 1,579,018 |
| | | | 22,715,625 |
| Consumer Finance - 3.8% | | | |
| AerCap Ireland Capital Ltd./AerCap Global Aviation Trust: | | | |
| 1.65% 10/29/24 | | 788,000 | 782,927 |
| 1.75% 1/30/26 | | 4,184,000 | 4,005,506 |
| 6.45% 4/15/27 | | 2,006,000 | 2,087,299 |
| American Express Co.: | | | |
| 5.098% 2/16/28 (c) | | 1,000,000 | 1,013,331 |
| 6.338% 10/30/26 (c) | | 500,000 | 508,481 |
| Capital One Financial Corp. 7.149% 10/29/27 (c) | | 2,000,000 | 2,096,309 |
| Ford Motor Credit Co. LLC: | | | |
| 5.8% 3/5/27 | | 1,500,000 | 1,522,686 |
| 6.95% 6/10/26 | | 5,000,000 | 5,137,593 |
| Toyota Motor Credit Corp. 4.55% 8/7/26 | | 925,000 | 928,561 |
| | | | 18,082,693 |
| Financial Services - 1.2% | | | |
| Aon Corp. / Aon Global Holdings PLC 2.85% 5/28/27 | | 2,000,000 | 1,923,845 |
| Corebridge Global Funding: | | | |
| 4.65% 8/20/27 (b) | | 424,000 | 425,868 |
| 5.75% 7/2/26 (b) | | 1,200,000 | 1,224,000 |
| Fiserv, Inc. 5.45% 3/2/28 | | 900,000 | 927,533 |
| The Western Union Co. 2.85% 1/10/25 | | 1,063,000 | 1,053,340 |
| | | | 5,554,586 |
| Insurance - 1.5% | | | |
| Equitable Financial Life Global Funding 1.7% 11/12/26 (b) | | 2,000,000 | 1,878,975 |
| Jackson National Life Global Funding 5.55% 7/2/27 (b) | | 832,000 | 849,877 |
| MassMutual Global Funding II: | | | |
| 4.5% 4/10/26 (b) | | 1,500,000 | 1,502,759 |
| 5.1% 4/9/27 (b) | | 1,000,000 | 1,021,830 |
| New York Life Global Funding 5.45% 9/18/26 (b) | | 2,000,000 | 2,041,872 |
| | | | 7,295,313 |
TOTAL FINANCIALS | | | 145,090,700 |
| HEALTH CARE - 3.8% | | | |
| Biotechnology - 0.5% | | | |
| AbbVie, Inc. 3.2% 5/14/26 | | 1,460,000 | 1,431,625 |
| Amgen, Inc. 5.15% 3/2/28 | | 900,000 | 919,313 |
| | | | 2,350,938 |
| Health Care Providers & Services - 1.8% | | | |
| Centene Corp. 2.45% 7/15/28 | | 570,000 | 521,521 |
| Cigna Group: | | | |
| 1.25% 3/15/26 | | 728,000 | 691,736 |
| 3.4% 3/1/27 | | 1,000,000 | 974,726 |
| CVS Health Corp.: | | | |
| 3% 8/15/26 | | 1,460,000 | 1,414,201 |
| 5% 2/20/26 | | 1,500,000 | 1,504,335 |
| HCA Holdings, Inc.: | | | |
| 3.125% 3/15/27 | | 1,000,000 | 964,629 |
| 5.875% 2/15/26 | | 1,400,000 | 1,411,510 |
| ICON Investments Six Designated Activity 5.809% 5/8/27 | | 1,224,000 | 1,255,449 |
| | | | 8,738,107 |
| Pharmaceuticals - 1.5% | | | |
| Bayer U.S. Finance II LLC 4.25% 12/15/25 (b) | | 6,250,000 | 6,178,047 |
| Haleon U.S. Capital LLC 3.375% 3/24/27 | | 1,000,000 | 975,630 |
| | | | 7,153,677 |
TOTAL HEALTH CARE | | | 18,242,722 |
| INDUSTRIALS - 5.1% | | | |
| Aerospace & Defense - 2.0% | | | |
| BAE Systems PLC 5% 3/26/27 (b) | | 440,000 | 444,772 |
| L3Harris Technologies, Inc. 5.4% 1/15/27 | | 2,000,000 | 2,041,674 |
| RTX Corp.: | | | |
| 3.125% 5/4/27 | | 1,000,000 | 967,547 |
| 5.75% 11/8/26 | | 593,000 | 608,330 |
| The Boeing Co.: | | | |
| 2.196% 2/4/26 | | 1,750,000 | 1,676,800 |
| 4.875% 5/1/25 | | 3,000,000 | 2,987,539 |
| 6.259% 5/1/27 (b) | | 1,010,000 | 1,039,073 |
| | | | 9,765,735 |
| Building Products - 0.4% | | | |
| Carrier Global Corp. 2.242% 2/15/25 | | 1,750,000 | 1,724,279 |
| Machinery - 1.3% | | | |
| Daimler Trucks Finance North America LLC: | | | |
| 1.625% 12/13/24 (b) | | 1,475,000 | 1,458,804 |
| 5% 1/15/27 (b) | | 1,000,000 | 1,009,458 |
| 5.125% 9/25/27 (b) | | 399,000 | 405,589 |
| 5.15% 1/16/26 (b) | | 1,700,000 | 1,710,138 |
| Ingersoll Rand, Inc. 5.197% 6/15/27 | | 1,500,000 | 1,526,291 |
| | | | 6,110,280 |
| Passenger Airlines - 1.0% | | | |
| Delta Air Lines, Inc. 2.9% 10/28/24 | | 4,794,000 | 4,767,990 |
| Trading Companies & Distributors - 0.2% | | | |
| Air Lease Corp. 3.625% 4/1/27 | | 1,000,000 | 969,391 |
| Transportation Infrastructure - 0.2% | | | |
| Avolon Holdings Funding Ltd. 2.875% 2/15/25 (b) | | 1,000,000 | 986,965 |
TOTAL INDUSTRIALS | | | 24,324,640 |
| INFORMATION TECHNOLOGY - 2.2% | | | |
| Electronic Equipment, Instruments & Components - 0.3% | | | |
| Amphenol Corp. 5.05% 4/5/27 | | 222,000 | 226,170 |
| Dell International LLC/EMC Corp. 6.02% 6/15/26 | | 1,144,000 | 1,168,414 |
| | | | 1,394,584 |
| IT Services - 0.2% | | | |
| CDW LLC/CDW Finance Corp. 4.25% 4/1/28 | | 1,000,000 | 982,101 |
| Semiconductors & Semiconductor Equipment - 1.5% | | | |
| Broadcom, Inc. 5.05% 7/12/27 | | 1,500,000 | 1,522,968 |
| Microchip Technology, Inc. 0.983% 9/1/24 | | 3,079,000 | 3,076,614 |
| Micron Technology, Inc. 4.185% 2/15/27 | | 1,000,000 | 990,042 |
| NXP BV/NXP Funding LLC/NXP U.S.A., Inc. 3.875% 6/18/26 | | 1,460,000 | 1,439,764 |
| | | | 7,029,388 |
| Software - 0.2% | | | |
| Oracle Corp. 2.8% 4/1/27 | | 1,000,000 | 961,105 |
TOTAL INFORMATION TECHNOLOGY | | | 10,367,178 |
| MATERIALS - 1.1% | | | |
| Chemicals - 0.8% | | | |
| Celanese U.S. Holdings LLC: | | | |
| 6.05% 3/15/25 | | 1,460,000 | 1,465,256 |
| 6.165% 7/15/27 | | 900,000 | 928,683 |
| Westlake Corp. 3.6% 8/15/26 | | 1,460,000 | 1,431,021 |
| | | | 3,824,960 |
| Metals & Mining - 0.3% | | | |
| Glencore Funding LLC 5.338% 4/4/27 (b) | | 1,250,000 | 1,271,220 |
TOTAL MATERIALS | | | 5,096,180 |
| REAL ESTATE - 0.5% | | | |
| Equity Real Estate Investment Trusts (REITs) - 0.5% | | | |
| Crown Castle, Inc.: | | | |
| 1.35% 7/15/25 | | 444,000 | 430,563 |
| 4% 3/1/27 | | 2,000,000 | 1,970,785 |
| | | | 2,401,348 |
| UTILITIES - 3.3% | | | |
| Electric Utilities - 1.9% | | | |
| Duke Energy Corp. 3.15% 8/15/27 | | 1,000,000 | 964,280 |
| ENEL Finance International NV 5.125% 6/26/29 (b) | | 1,230,000 | 1,248,558 |
| Eversource Energy 2.9% 3/1/27 | | 1,000,000 | 959,741 |
| Exelon Corp. 5.15% 3/15/29 | | 286,000 | 293,597 |
| FirstEnergy Corp.: | | | |
| 1.6% 1/15/26 | | 476,000 | 455,351 |
| 2.05% 3/1/25 | | 2,724,000 | 2,674,886 |
| Firstenergy Pennsylvania Elect 5.15% 3/30/26 (b) | | 550,000 | 551,978 |
| Georgia Power Co. 5.004% 2/23/27 | | 425,000 | 431,664 |
| Southern Co. 5.15% 10/6/25 | | 1,400,000 | 1,404,380 |
| | | | 8,984,435 |
| Gas Utilities - 0.2% | | | |
| CenterPoint Energy Resources Corp. 5.25% 3/1/28 | | 900,000 | 919,387 |
| Multi-Utilities - 1.2% | | | |
| Dominion Energy, Inc. 3.6% 3/15/27 | | 1,000,000 | 976,470 |
| DTE Energy Co.: | | | |
| 4.22% 11/1/24 | | 1,600,000 | 1,596,386 |
| 4.95% 7/1/27 | | 394,000 | 398,275 |
| NiSource, Inc. 0.95% 8/15/25 | | 1,953,000 | 1,880,377 |
| WEC Energy Group, Inc. 5.15% 10/1/27 | | 1,000,000 | 1,020,121 |
| | | | 5,871,629 |
TOTAL UTILITIES | | | 15,775,451 |
| TOTAL NONCONVERTIBLE BONDS (Cost $332,683,086) | | | 334,033,598 |
| | | | |
| U.S. Treasury Obligations - 6.3% |
| | | Principal Amount (a) | Value ($) |
| U.S. Treasury Notes: | | | |
| 4.625% 6/30/26 | | 11,728,900 | 11,857,185 |
| 4.875% 5/31/26 (d) | | 17,998,800 | 18,251,207 |
| TOTAL U.S. TREASURY OBLIGATIONS (Cost $29,844,349) | | | 30,108,392 |
| | | | |
| U.S. Government Agency - Mortgage Securities - 0.9% |
| | | Principal Amount (a) | Value ($) |
| Fannie Mae - 0.9% | | | |
| 4.5% 3/1/39 to 9/1/49 | | 3,358,759 | 3,337,115 |
| 5.5% 11/1/34 | | 751,182 | 771,755 |
| 7.5% 11/1/31 | | 136 | 143 |
TOTAL FANNIE MAE | | | 4,109,013 |
| Freddie Mac - 0.0% | | | |
| 8.5% 5/1/26 to 7/1/28 | | 4,691 | 4,827 |
| Ginnie Mae - 0.0% | | | |
| 7% to 7% 11/15/27 to 8/15/32 | | 69,357 | 71,021 |
| TOTAL U.S. GOVERNMENT AGENCY - MORTGAGE SECURITIES (Cost $4,468,395) | | | 4,184,861 |
| | | | |
| Asset-Backed Securities - 16.0% |
| | | Principal Amount (a) | Value ($) |
| Affirm Asset Securitization Trust Series 2024-X1 Class A, 6.27% 5/15/29 (b) | | 139,949 | 140,327 |
| Ally Auto Receivables Trust Series 2024-1 Class A3, 5.08% 12/15/28 | | 241,000 | 243,040 |
| American Express Credit Account Master Trust: | | | |
| Series 2022-4 Class A, 4.95% 10/15/27 | | 947,000 | 949,842 |
| Series 2023-1 Class A, 4.87% 5/15/28 | | 792,000 | 797,225 |
| Series 2023-3 Class A, 5.23% 9/15/28 | | 1,594,000 | 1,624,049 |
| Ares CLO Series 2024-54A Class AR, CME Term SOFR 3 Month Index + 1.270% 6.5714% 10/15/32 (b)(c)(e) | | 460,000 | 460,089 |
| Ares XXXIV CLO Ltd. Series 2024-2A Class AR3, CME Term SOFR 3 Month Index + 1.320% 6.6058% 4/17/33 (b)(c)(e) | | 2,206,000 | 2,206,607 |
| Ari Fleet Lease Trust 2023-B Series 2023-B Class A2, 6.05% 7/15/32 (b) | | 926,971 | 934,910 |
| Ari Fleet Lease Trust 2024-B Series 2024-B Class A3, 5.26% 4/15/33 (b) | | 114,000 | 116,573 |
| Bank of America Credit Card Master Trust: | | | |
| Series 2023-A1 Class A1, 4.79% 5/15/28 | | 575,000 | 578,361 |
| Series 2023-A2 Class A2, 4.98% 11/15/28 | | 767,000 | 778,499 |
| Bofa Auto Trust 2024-1 Series 2024-1A Class A3, 5.35% 11/15/28 (b) | | 88,000 | 89,430 |
| Carmax Auto Owner Trust: | | | |
| Series 2024-1 Class A3, 4.92% 10/16/28 | | 571,000 | 575,223 |
| Series 2024-2 Class A3, 5.5% 1/16/29 | | 172,000 | 175,527 |
| Carmax Auto Owner Trust 2023-4 Series 2023-4 Class A3, 6% 7/17/28 | | 253,000 | 258,543 |
| Carmax Auto Owner Trust 2024-3 Series 2024-3 Class A3, 4.89% 7/16/29 | | 716,000 | 723,776 |
| Cent CLO LP Series 2021-21A Class A1R3, CME Term SOFR 3 Month Index + 1.230% 6.4952% 7/27/30 (b)(c)(e) | | 700,953 | 701,173 |
| CFMT LLC Series 2023 HB12 Class A, 4.25% 4/25/33 (b) | | 124,175 | 121,841 |
| Chase Auto Owner Trust Series 2024-4A Class A3, 4.94% 7/25/29 (b) | | 1,089,000 | 1,101,368 |
| Chase Auto Owner Trust 24-3 Series 2024-3A Class A3, 5.22% 7/25/29 (b) | | 880,000 | 895,237 |
| Chase Issuance Trust Series 2023-A1 Class A, 5.16% 9/15/28 | | 1,866,000 | 1,897,176 |
| Chesapeake Funding II LLC: | | | |
| Series 2023 1A Class A1, 5.65% 5/15/35 (b) | | 836,185 | 841,377 |
| Series 2023-2A Class A1, 6.16% 10/15/35 (b) | | 145,530 | 147,639 |
| Series 2024-1A Class A1, 5.52% 5/15/36 (b) | | 252,997 | 255,486 |
| Citibank Credit Card Issuance Trust Series 2023-A1 Class A1, 5.23% 12/8/27 | | 591,000 | 595,142 |
| Citizens Auto Receivables Trust: | | | |
| Series 2024-1 Class A3, 5.11% 4/17/28 (b) | | 574,000 | 577,766 |
| Series 2024-2 Class A3, 5.33% 8/15/28 (b) | | 278,000 | 281,395 |
| Countrywide Home Loans, Inc. Series 2004-2 Class 3A4, CME Term SOFR 1 Month Index + 0.610% 5.8924% 7/25/34 (c)(e) | | 93,109 | 91,852 |
| Daimler Trucks Retail Trust 20 Series 2024-1 Class A3, 5.49% 12/15/27 | | 809,000 | 820,879 |
| Dell Equipment Finance Trust 2: | | | |
| Series 2023-3 Class A3, 5.93% 4/23/29 (b) | | 648,000 | 657,733 |
| Series 2024-1 Class A3, 5.39% 3/22/30 (b) | | 377,000 | 382,877 |
| Dell Equipment Finance Trust 2023-2 Series 2023-2 Class A3, 5.65% 1/22/29 (b) | | 456,000 | 459,227 |
| Dllaa 2023-1A Series 2023-1A Class A3, 5.64% 2/22/28 (b) | | 114,000 | 116,130 |
| DLLAD Series 2024-1A Class A3, 5.3% 7/20/29 (b) | | 73,000 | 74,511 |
| Dllmt 2024-1 LLC Series 2024-1A Class A3, 4.84% 8/21/28 (b) | | 435,000 | 436,082 |
| Enterprise Fleet Financing Series 2024-2 Class A3, 5.61% 4/20/28 (b) | | 155,000 | 158,737 |
| Enterprise Fleet Financing 202 Series 2024-3 Class A3, 4.98% 8/21/28 (b) | | 776,000 | 786,117 |
| Enterprise Fleet Financing 2023-3 L Series 2023-3 Class A2, 6.4% 3/20/30 (b) | | 386,401 | 393,598 |
| Enterprise Fleet Financing LLC: | | | |
| Series 2022-3 Class A2, 4.38% 7/20/29 (b) | | 130,226 | 129,567 |
| Series 2024-1 Class A2, 5.23% 3/20/30 (b) | | 1,313,000 | 1,320,878 |
| Flatiron Clo 28 Ltd. / Flatiron Series 2024-1A Class A1, CME Term SOFR 3 Month Index + 1.320% 6.5866% 7/15/36 (b)(c)(e) | | 1,387,000 | 1,391,978 |
| Ford Credit Auto Owner Trust Series 2023-B Class A3, 5.23% 5/15/28 | | 886,000 | 894,081 |
| Ford Credit Floorplan Master Owner Trust Series 2024-1 Class A1, 5.29% 4/15/29 (b) | | 1,146,000 | 1,168,158 |
| GM Financial Consumer Automobile Receivables Series 2023 2 Class A3, 4.47% 2/16/28 | | 376,000 | 374,935 |
| GM Financial Consumer Automobile Receivables Trust Series 2023-4 Class A3, 5.78% 8/16/28 | | 1,043,000 | 1,064,474 |
| GMF Floorplan Owner Revolving Trust: | | | |
| Series 2023-1 Class A1, 5.34% 6/15/28 (b) | | 1,306,000 | 1,323,547 |
| Series 2024-1A Class A1, 5.13% 3/15/29 (b) | | 1,260,000 | 1,283,276 |
| Harot 2023-4 Series 2023-4 Class A3, 5.67% 6/21/28 | | 934,000 | 952,008 |
| Hyundai Auto Lease Securitizat: | | | |
| Series 2023-B Class A3, 5.15% 6/15/26 (b) | | 1,500,000 | 1,500,149 |
| Series 2024-B Class A3, 5.41% 5/17/27 (b) | | 406,000 | 411,575 |
| Hyundai Auto Receivables Trust Series 2024-A Class A3, 4.99% 2/15/29 | | 249,000 | 251,980 |
| John Deere Owner Trust Series 2024-A Class A3, 4.96% 11/15/28 | | 1,457,000 | 1,474,740 |
| Juniper Valley Park CLO LLC Series 2024-1A Class AR, CME Term SOFR 3 Month Index + 1.250% 6.532% 7/20/36 (b)(c)(e) | | 1,250,000 | 1,250,493 |
| Kubota Credit Owner Trust Series 2024-2A Class A3, 5.26% 11/15/28 (b) | | 199,000 | 202,921 |
| Magnetite Xxii Ltd. / Magnetite Series 2024-22A Class ARR, CME Term SOFR 3 Month Index + 1.250% 6.5258% 7/15/36 (b)(c)(e) | | 1,168,000 | 1,168,729 |
| Marlette Funding Trust 2024-1 Series 2024-1A Class A, 5.95% 7/17/34 (b) | | 80,819 | 81,102 |
| Mercedes-Benz Auto Lease Trust Series 2024-A Class A3, 5.32% 1/18/28 | | 258,000 | 262,637 |
| Merchants Fleet Funding LLC Series 2024-1A Class A, 5.82% 4/20/37 (b) | | 231,000 | 233,962 |
| Neuberger Berman Ln Advisers N Series 2024-50A Class AR, CME Term SOFR 3 Month Index + 1.250% 6.533% 7/23/36 (b)(c)(e) | | 1,233,000 | 1,233,617 |
| Niagara Park CLO, Ltd. Series 2021-1A Class AR, CME Term SOFR 3 Month Index + 1.260% 6.5474% 7/17/32 (b)(c)(e) | | 6,160,000 | 6,165,661 |
| Nissan Master Owner Trust Receiva Series 2024-B Class A, 5.05% 2/15/29 (b) | | 440,000 | 445,486 |
| Palmer Square Loan Funding 202 Series 2024-3A Class A1, CME Term SOFR 3 Month Index + 1.080% 6.4166% 8/8/32 (b)(c)(e) | | 770,000 | 770,182 |
| Park Place Securities, Inc. Series 2005-WCH1 Class M4, CME Term SOFR 1 Month Index + 1.350% 6.6374% 1/25/36 (c)(e) | | 46,344 | 45,854 |
| Porsche Financial Auto Securitization Trust Series 2023-2A Class A3, 5.79% 1/22/29 (b) | | 564,000 | 570,420 |
| Prpm 2021-5, LLC Series 2021-5 Class A1, 4.793% 6/25/26 (b)(c) | | 2,646,903 | 2,610,602 |
| Rr 16 Ltd. Series 2021-16A Class A1, CME Term SOFR 3 Month Index + 1.370% 6.673% 7/15/36 (b)(c)(e) | | 667,000 | 667,031 |
| Sbna Auto Lease Trust Series 2024-B Class A3, 5.56% 11/22/27 (b) | | 231,000 | 234,334 |
| Sfs Auto Receivables Securitiz Series 2023-1A Class A3, 5.47% 10/20/28 (b) | | 1,424,000 | 1,439,255 |
| Sfs Auto Receivables Securitization Trust: | | | |
| Series 2024-1A Class A3, 4.95% 5/21/29 (b) | | 440,000 | 442,559 |
| Series 2024-2A Class A3, 5.33% 11/20/29 (b) | | 132,000 | 134,508 |
| Sofi Consumer Loan Program Series 2023-1S Class A, 5.81% 5/15/31 (b) | | 30,386 | 30,385 |
| TCI-Flatiron CLO Ltd. / LLC Series 2021-1A Class AR, CME Term SOFR 3 Month Index + 1.220% 6.3232% 11/18/30 (b)(c)(e) | | 1,022,845 | 1,023,778 |
| Terwin Mortgage Trust Series 2003-4HE Class A1, CME Term SOFR 1 Month Index + 0.970% 6.2524% 9/25/34 (c)(e) | | 111,105 | 112,862 |
| Tesla Series 2024-A Class A3, 5.3% 6/21/27 (b) | | 555,000 | 558,875 |
| Tesla Electric Vehicle Trust 2023-1 Series 2023-1 Class A3, 5.38% 6/20/28 (b) | | 606,000 | 616,413 |
| TMUST Series 2024-1A Class A, 5.05% 9/20/29 (b) | | 1,036,000 | 1,046,238 |
| Toyota Lease Owner Trust Series 2024-A Class A3, 5.25% 4/20/27 (b) | | 250,000 | 252,358 |
| Toyota Lease Owner Trust 2023- Series 2023-B Class A3, 5.66% 11/20/26 (b) | | 1,198,000 | 1,211,346 |
| Upstart Securitization Trust 2 Series 2023-3 Class A, 6.9% 10/20/33 (b) | | 568,265 | 573,464 |
| Usaa Auto Owner Trust 2023-A Series 2023-A Class A3, 5.58% 5/15/28 (b) | | 1,345,000 | 1,357,955 |
| VCAT Asset Securitization, LLC: | | | |
| Series 2021-NPL1 Class A1, 5.2891% 12/26/50 (b) | | 111,479 | 111,236 |
| Series 2021-NPL2 Class A1, 5.115% 3/27/51 (b) | | 1,298,000 | 1,294,729 |
| Series 2021-NPL3 Class A1, 4.743% 5/25/51 (b)(c) | | 1,478,481 | 1,463,307 |
| Verizon Master Trust: | | | |
| Series 2023 2 Class A, 4.89% 4/13/28 | | 1,137,000 | 1,135,367 |
| Series 2023-4 Class A1A, 5.16% 6/20/29 | | 1,416,000 | 1,431,490 |
| Series 2023-5 Class A1A, 5.61% 9/8/28 | | 1,170,000 | 1,179,497 |
| Volkswagen Auto Loan Enhanced: | | | |
| Series 2023-1 Class A3, 5.02% 6/20/28 | | 650,000 | 654,000 |
| Series 2023-2 Class A3, 5.48% 12/20/28 | | 878,000 | 896,755 |
| Voya Clo 2022-1 Ltd. / Voya Clo Series 2024-1A Class A1R, CME Term SOFR 3 Month Index + 1.250% 0% 4/20/35 (b)(c)(e) | | 892,000 | 892,000 |
| Wheels Fleet Lease Funding 1 L: | | | |
| Series 2023-2A Class A, 6.46% 8/18/38 (b) | | 1,199,612 | 1,207,835 |
| Series 2024-1A Class A1, 5.49% 2/18/39 (b) | | 1,196,000 | 1,207,934 |
| Series 2024-2A Class A1, 4.87% 6/21/39 (b) | | 332,000 | 333,412 |
| World Omni Auto Receivables Trust: | | | |
| Series 2023-C Class A3, 5.15% 11/15/28 | | 142,000 | 142,966 |
| Series 2023-D Class A3, 5.79% 2/15/29 | | 851,000 | 870,710 |
| Series 2024-A Class A3, 4.86% 3/15/29 | | 1,300,000 | 1,312,014 |
| Series 2024-B Class A3, 5.27% 9/17/29 | | 602,000 | 614,169 |
| World Omni Auto Trust 2024-C Series 2024-C Class A3, 4.43% 12/17/29 | | 717,000 | 717,160 |
| World Omni Automobile Lease Se Series 2024-A Class A3, 5.26% 10/15/27 | | 559,000 | 567,619 |
| TOTAL ASSET-BACKED SECURITIES (Cost $76,173,685) | | | 76,761,937 |
| | | | |
| Collateralized Mortgage Obligations - 0.5% |
| | | Principal Amount (a) | Value ($) |
| Private Sponsor - 0.2% | | | |
| Brass PLC Series 2021-10A Class A1, 0.669% 4/16/69 (b)(c) | | 160,133 | 158,511 |
| Cfmt 2024-Hb15 LLC sequential payer Series 2024-HB15 Class A, 4% 8/25/34 (b)(c) | | 100,000 | 98,090 |
| Cfmt LLC floater sequential payer Series 2024-HB13 Class A, 3% 5/25/34 (b)(c) | | 175,681 | 168,008 |
| Prpm 2024-Rpl2 LLC Series 2024-RPL2 Class A1, 3.5% 5/25/54 (b)(c) | | 551,388 | 531,392 |
| Sequoia Mortgage Trust floater Series 2004-6 Class A3B, CME Term SOFR 6 Month Index + 1.300% 6.5772% 7/20/34 (c)(e) | | 962 | 889 |
TOTAL PRIVATE SPONSOR | | | 956,890 |
| U.S. Government Agency - 0.3% | | | |
| Fannie Mae: | | | |
| floater Series 2015-27 Class KF, U.S. 30-Day Avg. Secured Overnight Fin. Rate (SOFR) Index + 0.410% 5.7633% 5/25/45 (c)(e) | | 326,484 | 323,990 |
| sequential payer Series 2001-40 Class Z, 6% 8/25/31 | | 23,872 | 24,155 |
| Series 2016-27: | | | |
Class HK, 3% 1/25/41 | | 395,246 | 377,872 |
Class KG, 3% 1/25/40 | | 176,806 | 168,700 |
| Series 2016-42 Class FL, U.S. 30-Day Avg. Secured Overnight Fin. Rate (SOFR) Index + 0.460% 5.8133% 7/25/46 (c)(e) | | 354,271 | 352,636 |
| Freddie Mac Series 3949 Class MK, 4.5% 10/15/34 | | 194,932 | 194,416 |
TOTAL U.S. GOVERNMENT AGENCY | | | 1,441,769 |
| TOTAL COLLATERALIZED MORTGAGE OBLIGATIONS (Cost $2,438,670) | | | 2,398,659 |
| | | | |
| Commercial Mortgage Securities - 4.8% |
| | | Principal Amount (a) | Value ($) |
| BAMLL Commercial Mortgage Securities Trust sequential payer Series 2019-BPR Class ANM, 3.112% 11/5/32 (b) | | 1,502,000 | 1,396,860 |
| BLOX Trust floater sequential payer Series 2021-BLOX Class A, CME Term SOFR 1 Month Index + 0.860% 6.2015% 9/15/26 (b)(c)(e) | | 3,055,000 | 2,970,838 |
| BLP Commercial Mortgage Trust sequential payer Series 2024-IND2 Class A, CME Term SOFR 1 Month Index + 1.340% 6.679% 3/15/41 (b)(c)(e) | | 219,000 | 217,905 |
| BMP floater Series 2024-MF23 Class A, CME Term SOFR 1 Month Index + 1.370% 6.7088% 6/15/41 (b)(c)(e) | | 279,000 | 277,867 |
| BX Commercial Mortgage Trust 2024-Xl4 floater sequential payer Series 2024-XL4 Class A, CME Term SOFR 1 Month Index + 1.440% 6.7789% 2/15/39 (b)(c)(e) | | 511,193 | 510,554 |
| BX Commercial Mtg Trust floater Series 2024-MDHS Class A, 6.9782% 5/15/41 (b)(c) | | 622,439 | 621,273 |
| BX Trust floater Series 2022-GPA Class A, CME Term SOFR 1 Month Index + 2.160% 7.5019% 8/15/39 (b)(c)(e) | | 323,885 | 324,289 |
| CF Hippolyta Issuer LLC sequential payer: | | | |
| Series 2020-1 Class A1, 1.69% 7/15/60 (b) | | 4,794,079 | 4,609,269 |
| Series 2021-1A Class A1, 1.53% 3/15/61 (b) | | 3,194,897 | 2,975,180 |
| COMM Mortgage Trust sequential payer Series 2015 LC19 Class A3, 2.922% 2/10/48 | | 201,363 | 201,063 |
| CSMC Trust Series 2017-CHOP Class A, PRIME RATE - 2.300% 6.194% 7/15/32 (b)(c)(e) | | 304,511 | 297,294 |
| GS Mortgage Securities Trust Series 2011-GC5 Class A/S, 5.209% 8/10/44 (b)(c) | | 2,958,232 | 2,826,534 |
| JPMorgan Chase Commercial Mortgage Securities Trust floater Series 2019-BKWD Class A, CME Term SOFR 1 Month Index + 1.610% 6.9515% 9/15/29 (b)(c)(e) | | 871,283 | 819,130 |
| Morgan Stanley Capital I Trust sequential payer Series 2019-MEAD Class A, 3.17% 11/10/36 (b) | | 3,286,000 | 3,146,814 |
| Open Trust 2023-Air sequential payer Series 2023-AIR Class A, CME Term SOFR 1 Month Index + 3.080% 8.426% 10/15/28 (b)(c)(e) | | 307,318 | 310,007 |
| Voya CLO Ltd. floater Series 2024-2A Class AR, CME Term SOFR 3 Month Index + 1.200% 6.482% 7/20/32 (b)(c)(e) | | 1,800,000 | 1,800,295 |
| TOTAL COMMERCIAL MORTGAGE SECURITIES (Cost $24,431,067) | | | 23,305,172 |
| | | | |
| Bank Notes - 1.2% |
| | | Principal Amount (a) | Value ($) |
| Citibank NA 5.438% 4/30/26 | | 1,000,000 | 1,014,504 |
| Goldman Sachs Bank U.S.A. 5.283% 3/18/27 (c) | | 3,800,000 | 3,828,789 |
| Morgan Stanley Bank, West Valley City Utah 4.968% 7/14/28 (c) | | 1,000,000 | 1,012,448 |
| TOTAL BANK NOTES (Cost $5,800,000) | | | 5,855,741 |
| | | | |
| Money Market Funds - 0.0% |
| | | Shares | Value ($) |
Fidelity Cash Central Fund 5.39% (f) (Cost $160,392) | | 160,360 | 160,392 |
| | | | |
| TOTAL INVESTMENT IN SECURITIES - 99.3% (Cost $475,999,644) | 476,808,752 |
NET OTHER ASSETS (LIABILITIES) - 0.7% | 3,299,222 |
| NET ASSETS - 100.0% | 480,107,974 |
| | |
| Futures Contracts |
| | Number of contracts | Expiration Date | Notional Amount ($) | Value ($) | Unrealized Appreciation/ (Depreciation) ($) |
| Purchased | | | | | |
| | | | | | |
| Treasury Contracts | | | | | |
| CBOT 2-Year U.S. Treasury Note Contracts (United States) | 217 | Dec 2024 | 45,037,672 | (59,709) | (59,709) |
| | | | | | |
| The notional amount of futures purchased as a percentage of Net Assets is 9.4% |
For the period, the average monthly notional amount at value for futures contracts in the aggregate was $56,851,049.
Legend
| (a) | Amount is stated in United States dollars unless otherwise noted. |
| (b) | Security exempt from registration under Rule 144A of the Securities Act of 1933. These securities may be resold in transactions exempt from registration, normally to qualified institutional buyers. At the end of the period, the value of these securities amounted to $138,696,112 or 28.9% of net assets. |
| (c) | Coupon rates for floating and adjustable rate securities reflect the rates in effect at period end. |
| (d) | Security or a portion of the security was pledged to cover margin requirements for futures contracts. At period end, the value of securities pledged amounted to $306,817. |
| (e) | Coupon is indexed to a floating interest rate which may be multiplied by a specified factor and/or subject to caps or floors. |
| (f) | Affiliated fund that is generally available only to investment companies and other accounts managed by Fidelity Investments. The rate quoted is the annualized seven-day yield of the fund at period end. A complete unaudited listing of the fund's holdings as of its most recent quarter end is available upon request. In addition, each Fidelity Central Fund's financial statements, which are not covered by the Fund's Report of Independent Registered Public Accounting Firm, are available on the SEC's website or upon request. |
Affiliated Central Funds
Fiscal year to date information regarding the Fund's investments in Fidelity Central Funds, including the ownership percentage, is presented below.
| Affiliate | Value, beginning of period ($) | Purchases ($) | Sales Proceeds ($) | Dividend Income ($) | Realized Gain (loss) ($) | Change in Unrealized appreciation (depreciation) ($) | Value, end of period ($) | % ownership, end of period |
| Fidelity Cash Central Fund 5.39% | 2,455,314 | 221,559,443 | 223,854,552 | 342,973 | 187 | - | 160,392 | 0.0% |
| Fidelity Securities Lending Cash Central Fund 5.39% | - | 33,429,893 | 33,429,893 | 42 | - | - | - | 0.0% |
| Total | 2,455,314 | 254,989,336 | 257,284,445 | 343,015 | 187 | - | 160,392 | |
| | | | | | | | | |
Amounts in the dividend income column in the above table include any capital gain distributions from underlying funds, which are presented in the corresponding line item in the Statement of Operations, if applicable.
Amounts in the dividend income column for Fidelity Securities Lending Cash Central Fund represents the income earned on investing cash collateral, less rebates paid to borrowers and any lending agent fees associated with the loan, plus any premium payments received for lending certain types of securities.
Amounts included in the purchases and sales proceeds columns may include in-kind transactions, if applicable.
Investment Valuation
The following is a summary of the inputs used, as of August 31, 2024, involving the Fund's assets and liabilities carried at fair value. The inputs or methodology used for valuing securities may not be an indication of the risk associated with investing in those securities. For more information on valuation inputs, and their aggregation into the levels used below, please refer to the Investment Valuation section in the accompanying Notes to Financial Statements.
| Valuation Inputs at Reporting Date: |
| Description | Total ($) | Level 1 ($) | Level 2 ($) | Level 3 ($) |
Investments in Securities: | | | | |
|
| Corporate Bonds | 334,033,598 | - | 334,033,598 | - |
|
| U.S. Government and Government Agency Obligations | 30,108,392 | - | 30,108,392 | - |
|
| U.S. Government Agency - Mortgage Securities | 4,184,861 | - | 4,184,861 | - |
|
| Asset-Backed Securities | 76,761,937 | - | 76,761,937 | - |
|
| Collateralized Mortgage Obligations | 2,398,659 | - | 2,398,659 | - |
|
| Commercial Mortgage Securities | 23,305,172 | - | 23,305,172 | - |
|
| Bank Notes | 5,855,741 | - | 5,855,741 | - |
|
| Money Market Funds | 160,392 | 160,392 | - | - |
| Total Investments in Securities: | 476,808,752 | 160,392 | 476,648,360 | - |
Derivative Instruments: Liabilities | | | | |
Futures Contracts | (59,709) | (59,709) | - | - |
| Total Liabilities | (59,709) | (59,709) | - | - |
| Total Derivative Instruments: | (59,709) | (59,709) | - | - |
Value of Derivative Instruments
The following table is a summary of the Fund's value of derivative instruments by primary risk exposure as of August 31, 2024. For additional information on derivative instruments, please refer to the Derivative Instruments section in the accompanying Notes to Financial Statements.
Primary Risk Exposure / Derivative Type | Value |
| Asset ($) | Liability ($) |
| Interest Rate Risk | | |
Futures Contracts (a) | 0 | (59,709) |
| Total Interest Rate Risk | 0 | (59,709) |
| Total Value of Derivatives | 0 | (59,709) |
(a)Reflects gross cumulative appreciation (depreciation) on futures contracts as presented in the Schedule of Investments. In the Statement of Assets and Liabilities, the period end daily variation margin is included in receivable or payable for daily variation margin on futures contracts, and the net cumulative appreciation (depreciation) is included in Total accumulated earnings (loss).
Financial Statements
| Statement of Assets and Liabilities |
As of August 31, 2024 |
| Assets | | | | |
| Investment in securities, at value - See accompanying schedule: | | | | |
Unaffiliated issuers (cost $475,839,252) | $ | 476,648,360 | | |
Fidelity Central Funds (cost $160,392) | | 160,392 | | |
| | | | | |
| | | | | |
| Total Investment in Securities (cost $475,999,644) | | | $ | 476,808,752 |
| Receivable for fund shares sold | | | | 50,385 |
| Interest receivable | | | | 4,524,195 |
| Distributions receivable from Fidelity Central Funds | | | | 5,445 |
| Receivable from investment adviser for expense reductions | | | | 3,319 |
Total assets | | | | 481,392,096 |
| Liabilities | | | | |
| Payable for investments purchased | $ | 892,000 | | |
| Payable for fund shares redeemed | | 343,098 | | |
| Payable for daily variation margin on futures contracts | | 37,297 | | |
| Other payables and accrued expenses | | 11,727 | | |
| Total liabilities | | | | 1,284,122 |
| Net Assets | | | $ | 480,107,974 |
| Net Assets consist of: | | | | |
| Paid in capital | | | $ | 509,930,952 |
| Total accumulated earnings (loss) | | | | (29,822,978) |
| Net Assets | | | $ | 480,107,974 |
Net Asset Value, offering price and redemption price per share ($480,107,974 ÷ 47,940,298 shares) | | | $ | 10.01 |
| Statement of Operations |
| Year ended August 31, 2024 |
| Investment Income | | | | |
| Interest | | | $ | 19,696,866 |
| Income from Fidelity Central Funds (including $42 from security lending) | | | | 343,015 |
| Total income | | | | 20,039,881 |
| Expenses | | | | |
| Custodian fees and expenses | $ | 21,505 | | |
| Independent trustees' fees and expenses | | 1,598 | | |
| Miscellaneous | | 1 | | |
| Total expenses before reductions | | 23,104 | | |
| Expense reductions | | (7,900) | | |
| Total expenses after reductions | | | | 15,204 |
| Net Investment income (loss) | | | | 20,024,677 |
| Realized and Unrealized Gain (Loss) | | | | |
| Net realized gain (loss) on: | | | | |
| Investment Securities: | | | | |
| Unaffiliated issuers | | (2,978,611) | | |
| Fidelity Central Funds | | 187 | | |
| Futures contracts | | 503,870 | | |
| Total net realized gain (loss) | | | | (2,474,554) |
| Change in net unrealized appreciation (depreciation) on: | | | | |
| Investment Securities: | | | | |
| Unaffiliated issuers | | 19,354,480 | | |
| Futures contracts | | (360,141) | | |
| Total change in net unrealized appreciation (depreciation) | | | | 18,994,339 |
| Net gain (loss) | | | | 16,519,785 |
| Net increase (decrease) in net assets resulting from operations | | | $ | 36,544,462 |
| Statement of Changes in Net Assets |
| |
| | Year ended August 31, 2024 | | Year ended August 31, 2023 |
| Increase (Decrease) in Net Assets | | | | |
| Operations | | | | |
| Net investment income (loss) | $ | 20,024,677 | $ | 15,878,783 |
| Net realized gain (loss) | | (2,474,554) | | (5,957,751) |
| Change in net unrealized appreciation (depreciation) | | 18,994,339 | | 7,333,893 |
| Net increase (decrease) in net assets resulting from operations | | 36,544,462 | | 17,254,925 |
| Distributions to shareholders | | (18,308,328) | | (14,431,421) |
| | | | | |
| Share transactions | | | | |
| Proceeds from sales of shares | | 68,158,044 | | 204,291,280 |
| Reinvestment of distributions | | 18,265,565 | | 14,141,415 |
| Cost of shares redeemed | | (179,171,534) | | (270,179,944) |
| | | | | |
Net increase (decrease) in net assets resulting from share transactions | | (92,747,925) | | (51,747,249) |
| Total increase (decrease) in net assets | | (74,511,791) | | (48,923,745) |
| | | | | |
| Net Assets | | | | |
| Beginning of period | | 554,619,765 | | 603,543,510 |
| End of period | $ | 480,107,974 | $ | 554,619,765 |
| | | | | |
| Other Information | | | | |
| Shares | | | | |
| Sold | | 6,940,771 | | 21,337,155 |
| Issued in reinvestment of distributions | | 1,858,391 | | 1,472,731 |
| Redeemed | | (18,260,710) | | (28,209,874) |
| Net increase (decrease) | | (9,461,548) | | (5,399,988) |
| | | | | |
Financial Highlights
Fidelity® Series Short-Term Credit Fund |
| |
| Years ended August 31, | | 2024 | | 2023 | | 2022 | | 2021 | | 2020 |
Selected Per-Share Data | | | | | | | | | | |
| Net asset value, beginning of period | $ | 9.66 | $ | 9.61 | $ | 10.17 | $ | 10.27 | $ | 10.09 |
| Income from Investment Operations | | | | | | | | | | |
Net investment income (loss) A,B | | .384 | | .261 | | .136 | | .170 | | .252 |
| Net realized and unrealized gain (loss) | | .318 | | .027 | | (.511) | | (.073) | | .180 |
| Total from investment operations | | .702 | | .288 | | (.375) | | .097 | | .432 |
| Distributions from net investment income | | (.352) | | (.238) | | (.143) C | | (.169) | | (.252) |
| Distributions from net realized gain | | - | | - | | (.042) C | | (.028) | | - |
| Total distributions | | (.352) | | (.238) | | (.185) | | (.197) | | (.252) |
| Net asset value, end of period | $ | 10.01 | $ | 9.66 | $ | 9.61 | $ | 10.17 | $ | 10.27 |
Total Return D | | | | 3.04% | | (3.73)% | | .95% | | 4.35% |
Ratios to Average Net Assets B,E,F | | | | | | | | | | |
Expenses before reductions G | | -% | | -% | | -% | | -% | | -% |
Expenses net of fee waivers, if any G | | | | -% | | -% | | -% | | -% |
Expenses net of all reductions G | | -% | | -% | | -% | | -% | | -% |
| Net investment income (loss) | | 3.91% | | 2.72% | | 1.36% | | 1.67% | | 2.49% |
| Supplemental Data | | | | | | | | | | |
| Net assets, end of period (000 omitted) | $ | 480,108 | $ | 554,620 | $ | 603,544 | $ | 2,304,598 | $ | 2,393,482 |
Portfolio turnover rate H | | | | 41% | | 36% | | 60% | | 62% I |
ACalculated based on average shares outstanding during the period.
BNet investment income (loss) is affected by the timing of the declaration of dividends by any underlying mutual funds or exchange-traded funds (ETFs). Net investment income (loss) of any mutual funds or ETFs is not included in the Fund's net investment income (loss) ratio.
CThe amount shown reflects reclassifications related to book to tax differences that were made in the year shown.
DTotal returns would have been lower if certain expenses had not been reduced during the applicable periods shown.
EFees and expenses of any underlying mutual funds or exchange-traded funds (ETFs) are not included in the Fund's expense ratio. The Fund indirectly bears its proportionate share of these expenses. For additional expense information related to investments in Fidelity Central Funds, please refer to the "Investments in Fidelity Central Funds" note found in the Notes to Financial Statements section of the most recent Annual or Semi-Annual report.
FExpense ratios reflect operating expenses of the class. Expenses before reductions do not reflect amounts reimbursed, waived, or reduced through arrangements with the investment adviser, brokerage services, or other offset arrangements, if applicable, and do not represent the amount paid by the class during periods when reimbursements, waivers or reductions occur.
GAmount represents less than .005%.
HAmount does not include the portfolio activity of any underlying mutual funds or exchange-traded funds (ETFs).
IPortfolio turnover rate excludes securities received or delivered in-kind.
Notes to Financial Statements
For the period ended August 31, 2024
1. Organization.
Fidelity Series Short-Term Credit Fund (the Fund) is a fund of Fidelity Salem Street Trust (the Trust) and is authorized to issue an unlimited number of shares. Shares are offered only to certain other Fidelity funds, Fidelity managed 529 plans, and Fidelity managed collective investment trusts. The Trust is registered under the Investment Company Act of 1940, as amended (the 1940 Act), as an open-end management investment company organized as a Massachusetts business trust.
2. Investments in Fidelity Central Funds.
Funds may invest in Fidelity Central Funds, which are open-end investment companies generally available only to other investment companies and accounts managed by the investment adviser and its affiliates. The Schedule of Investments lists any Fidelity Central Funds held as an investment as of period end, but does not include the underlying holdings of each Fidelity Central Fund. An investing fund indirectly bears its proportionate share of the expenses of the underlying Fidelity Central Funds.
Based on its investment objective, each Fidelity Central Fund may invest or participate in various investment vehicles or strategies that are similar to those of the investing fund. These strategies are consistent with the investment objectives of the investing fund and may involve certain economic risks which may cause a decline in value of each of the Fidelity Central Funds and thus a decline in the value of the investing fund.
| Fidelity Central Fund | Investment Manager | Investment Objective | Investment Practices | Expense RatioA |
| Fidelity Money Market Central Funds | Fidelity Management & Research Company LLC (FMR) | Each fund seeks to obtain a high level of current income consistent with the preservation of capital and liquidity. | Short-term Investments | Less than .005% |
A Expenses expressed as a percentage of average net assets and are as of each underlying Central Fund's most recent annual or semi-annual shareholder report.
A complete unaudited list of holdings for each Fidelity Central Fund is available upon request or at the Securities and Exchange Commission website at www.sec.gov. In addition, the financial statements of the Fidelity Central Funds which contain the significant accounting policies (including investment valuation policies) of those funds, and are not covered by the Report of Independent Registered Public Accounting Firm, are available on the Securities and Exchange Commission website or upon request.
3. Significant Accounting Policies.
The Fund is an investment company and applies the accounting and reporting guidance of the Financial Accounting Standards Board (FASB) Accounting Standards Codification Topic 946 Financial Services - Investment Companies. The financial statements have been prepared in conformity with accounting principles generally accepted in the United States of America (GAAP), which require management to make certain estimates and assumptions at the date of the financial statements. Actual results could differ from those estimates. Subsequent events, if any, through the date that the financial statements were issued have been evaluated in the preparation of the financial statements. The Fund's Schedule of Investments lists any underlying mutual funds or exchange-traded funds (ETFs) but does not include the underlying holdings of these funds. The following summarizes the significant accounting policies of the Fund:
Investment Valuation. Investments are valued as of 4:00 p.m. Eastern time on the last calendar day of the period. The Board of Trustees (the Board) has designated the Fund's investment adviser as the valuation designee responsible for the fair valuation function and performing fair value determinations as needed. The investment adviser has established a Fair Value Committee (the Committee) to carry out the day-to-day fair valuation responsibilities and has adopted policies and procedures to govern the fair valuation process and the activities of the Committee. In accordance with these fair valuation policies and procedures, which have been approved by the Board, the Fund attempts to obtain prices from one or more third party pricing services or brokers to value its investments. When current market prices, quotations or currency exchange rates are not readily available or reliable, investments will be fair valued in good faith by the Committee, in accordance with the policies and procedures. Factors used in determining fair value vary by investment type and may include market or investment specific events, transaction data, estimated cash flows, and market observations of comparable investments. The frequency that the fair valuation procedures are used cannot be predicted and they may be utilized to a significant extent. The Committee manages the Fund's fair valuation practices and maintains the fair valuation policies and procedures. The Fund's investment adviser reports to the Board information regarding the fair valuation process and related material matters.
The Fund categorizes the inputs to valuation techniques used to value its investments into a disclosure hierarchy consisting of three levels as shown below:
Level 1 - unadjusted quoted prices in active markets for identical investments
Level 2 - other significant observable inputs (including quoted prices for similar investments, interest rates, prepayment speeds, etc.)
Level 3 - unobservable inputs (including the Fund's own assumptions based on the best information available)
Valuation techniques used to value the Fund's investments by major category are as follows:
Debt securities, including restricted securities, are valued based on evaluated prices received from third party pricing services or from brokers who make markets in such securities. Corporate bonds, bank notes and U.S. government and government agency obligations are valued by pricing services who utilize matrix pricing which considers yield or price of bonds of comparable quality, coupon, maturity and type or by broker-supplied prices. Asset backed securities, collateralized mortgage obligations, commercial mortgage securities and U.S. government agency mortgage securities are valued by pricing services who utilize matrix pricing which considers prepayment speed assumptions, attributes of the collateral, yield or price of bonds of comparable quality, coupon, maturity and type or by broker-supplied prices. When independent prices are unavailable or unreliable, debt securities may be valued utilizing pricing methodologies which consider similar factors that would be used by third party pricing services. Debt securities are generally categorized as Level 2 in the hierarchy but may be Level 3 depending on the circumstances.
Futures contracts are valued at the settlement price established each day by the board of trade or exchange on which they are traded and are categorized as Level 1 in the hierarchy. Investments in open-end mutual funds, including the Fidelity Central Funds, are valued at their closing net asset value (NAV) each business day and are categorized as Level 1 in the hierarchy.
Changes in valuation techniques may result in transfers in or out of an assigned level within the disclosure hierarchy. The aggregate value of investments by input level as of August 31, 2024 is included at the end of the Fund's Schedule of Investments.
Investment Transactions and Income. For financial reporting purposes, the Fund's investment holdings and NAV include trades executed through the end of the last business day of the period. The NAV per share for processing shareholder transactions is calculated as of the close of business of the New York Stock Exchange (NYSE), normally 4:00 p.m. Eastern time and includes trades executed through the end of the prior business day. Gains and losses on securities sold are determined on the basis of identified cost and include proceeds received from litigation. Income and capital gain distributions from Fidelity Central Funds, if any, are recorded on the ex-dividend date. Interest income is accrued as earned and includes coupon interest and amortization of premium and accretion of discount on debt securities as applicable. Debt obligations may be placed on non-accrual status and related interest income may be reduced by ceasing current accruals and writing off interest receivables when the collection of all or a portion of interest has become doubtful based on consistently applied procedures. A debt obligation is removed from non-accrual status when the issuer resumes interest payments or when collectability of interest is reasonably assured.
Expenses. Expenses directly attributable to a fund are charged to that fund. Expenses attributable to more than one fund are allocated among the respective funds on the basis of relative net assets or other appropriate methods. Expenses included in the accompanying financial statements reflect the expenses of that fund and do not include any expenses associated with any underlying mutual funds or exchange-traded funds. Although not included in a fund's expenses, a fund indirectly bears its proportionate share of these expenses through the net asset value of each underlying mutual fund or exchange-traded fund. Expense estimates are accrued in the period to which they relate and adjustments are made when actual amounts are known.
Income Tax Information and Distributions to Shareholders. Each year, the Fund intends to qualify as a regulated investment company under Subchapter M of the Internal Revenue Code, including distributing substantially all of its taxable income and realized gains. As a result, no provision for U.S. Federal income taxes is required. As of August 31, 2024, the Fund did not have any unrecognized tax benefits in the financial statements; nor is the Fund aware of any tax positions for which it is reasonably possible that the total amounts of unrecognized tax benefits will significantly change in the next twelve months. The Fund files a U.S. federal tax return, in addition to state and local tax returns as required. The Fund's federal income tax returns are subject to examination by the Internal Revenue Service (IRS) for a period of three fiscal years after they are filed. State and local tax returns may be subject to examination for an additional fiscal year depending on the jurisdiction.
Distributions are declared and recorded daily and paid monthly from net investment income. Distributions from realized gains, if any, are declared and recorded on the ex-dividend date. Income and capital gain distributions are determined in accordance with income tax regulations, which may differ from GAAP.
Capital accounts within the financial statements are adjusted for permanent book-tax differences. These adjustments have no impact on net assets or the results of operations. Capital accounts are not adjusted for temporary book-tax differences which will reverse in a subsequent period.
Book-tax differences are primarily due to futures contracts, market discount, capital loss carryforwards and losses deferred due to wash sales.
As of period end, the cost and unrealized appreciation (depreciation) in securities, and derivatives if applicable, for federal income tax purposes were as follows:
| Gross unrealized appreciation | $6,717,067 |
| Gross unrealized depreciation | (3,758,902) |
| Net unrealized appreciation (depreciation) | $2,958,165 |
| Tax Cost | $473,850,587 |
The tax-based components of distributable earnings as of period end were as follows:
| Undistributed ordinary income | $295,714 |
| Capital loss carryforward | $(33,076,856) |
| Net unrealized appreciation (depreciation) on securities and other investments | $2,958,165 |
Capital loss carryforwards are only available to offset future capital gains of the Fund to the extent provided by regulations and may be limited. The capital loss carryforward information presented below, including any applicable limitation, is estimated as of fiscal period end and is subject to adjustment.
Short-term | $(9,158,690) |
Long-term | (23,918,166) |
| Total capital loss carryforward | $(33,076,856) |
The tax character of distributions paid was as follows:
| | August 31, 2024 | August 31, 2023 |
| Ordinary Income | $18,308,328 | $14,431,421 |
| Total | $18,308,328 | $14,431,421 |
Restricted Securities (including Private Placements). Funds may invest in securities that are subject to legal or contractual restrictions on resale. These securities generally may be resold in transactions exempt from registration or to the public if the securities are registered. Disposal of these securities may involve time-consuming negotiations and expense, and prompt sale at an acceptable price may be difficult. Information regarding restricted securities held at period end is included at the end of the Schedule of Investments, if applicable.
4. Derivative Instruments.
Risk Exposures and the Use of Derivative Instruments. The Fund's investment objectives allow for various types of derivative instruments, including futures contracts. Derivatives are investments whose value is primarily derived from underlying assets, indices or reference rates and may be transacted on an exchange or over-the-counter (OTC). Derivatives may involve a future commitment to buy or sell a specified asset based on specified terms, to exchange future cash flows at periodic intervals based on a notional principal amount, or for one party to make one or more payments upon the occurrence of specified events in exchange for periodic payments from the other party.
Derivatives were used to increase returns and to manage exposure to certain risks as defined below. The success of any strategy involving derivatives depends on analysis of numerous economic factors, and if the strategies for investment do not work as intended, the objectives may not be achieved.
Derivatives were used to increase or decrease exposure to the following risk(s):
| Interest Rate Risk | Interest rate risk relates to the fluctuations in the value of interest-bearing securities due to changes in the prevailing levels of market interest rates. |
Funds are also exposed to additional risks from investing in derivatives, such as liquidity risk and counterparty credit risk. Liquidity risk is the risk that a fund will be unable to close out the derivative in the open market in a timely manner. Counterparty credit risk is the risk that the counterparty will not be able to fulfill its obligation to a fund. Counterparty credit risk related to exchange-traded contracts may be mitigated by the protection provided by the exchange on which they trade.
Investing in derivatives may involve greater risks than investing in the underlying assets directly and, to varying degrees, may involve risk of loss in excess of any initial investment and collateral received and amounts recognized in the Statement of Assets and Liabilities. In addition, there may be the risk that the change in value of the derivative contract does not correspond to the change in value of the underlying instrument.
Futures Contracts. A futures contract is an agreement between two parties to buy or sell a specified underlying instrument for a fixed price at a specified future date. Futures contracts were used to manage exposure to the bond market and fluctuations in interest rates.
Upon entering into a futures contract, a fund is required to deposit either cash or securities (initial margin) with a clearing broker in an amount equal to a certain percentage of the face value of the contract. Futures contracts are marked-to-market daily and subsequent daily payments are made or received by a fund depending on the daily fluctuations in the value of the futures contracts and are recorded as unrealized appreciation or (depreciation). This receivable and/or payable, if any, is included in daily variation margin on futures contracts in the Statement of Assets and Liabilities. Realized gain or (loss) is recorded upon the expiration or closing of a futures contract. The net realized gain (loss) and change in net unrealized appreciation (depreciation) on futures contracts during the period is presented in the Statement of Operations.
Any open futures contracts at period end are presented in the Schedule of Investments under the caption "Futures Contracts". The notional amount at value reflects each contract's exposure to the underlying instrument or index at period end, and is representative of volume of activity during the period unless an average notional amount is presented. Any securities deposited to meet initial margin requirements are identified in the Schedule of Investments. Any cash deposited to meet initial margin requirements is presented as segregated cash with brokers for derivative instruments in the Statement of Assets and Liabilities.
5. Purchases and Sales of Investments.
Purchases and sales of securities, other than short-term securities, U.S. government securities and in-kind transactions, as applicable, are noted in the table below.
| | Purchases ($) | Sales ($) |
| Fidelity Series Short-Term Credit Fund | 239,797,211 | 318,952,023 |
6. Fees and Other Transactions with Affiliates.
Management Fee. Fidelity Management & Research Company LLC (the investment adviser) and its affiliates provide the Fund with investment management related services for which the Fund does not pay a management fee. Under the management contract, the investment adviser or an affiliate pays all ordinary operating expenses of the Fund, except custody fees, fees and expenses of the independent Trustees, and certain miscellaneous expenses such as proxy and shareholder meeting expenses.
Interfund Trades. Funds may purchase from or sell securities to other Fidelity Funds under procedures adopted by the Board. The procedures have been designed to ensure these interfund trades are executed in accordance with Rule 17a-7 of the 1940 Act. Any interfund trades are included within the respective purchases and sales amounts shown in the Purchases and Sales of Investments note. During the period, there were no interfund trades.
Sub-Advisory Arrangements. Effective March 1, 2024, the Fund's sub-advisory agreements with FMR Investment Management (UK) Limited, Fidelity Management & Research (Hong Kong) Limited, and Fidelity Management & Research (Japan) Limited were amended to provide that the investment adviser pays each sub-adviser monthly fees equal to 110% of the sub-adviser's costs for providing sub-advisory services.
7. Committed Line of Credit.
Certain Funds participate with other funds managed by the investment adviser or an affiliate in a $4.25 billion credit facility (the "line of credit") to be utilized for temporary or emergency purposes to fund shareholder redemptions or for other short-term liquidity purposes. The commitment fees on the pro-rata portion of the line of credit are borne by the investment adviser. During the period, there were no borrowings on this line of credit.
8. Security Lending.
Funds lend portfolio securities from time to time in order to earn additional income. Lending agents are used, including National Financial Services (NFS), an affiliate of the investment adviser. Pursuant to a securities lending agreement, NFS will receive a fee, which is capped at 9.9% of a fund's daily lending revenue, for its services as lending agent. A fund may lend securities to certain qualified borrowers, including NFS. On the settlement date of the loan, a fund receives collateral (in the form of U.S. Treasury obligations, letters of credit and/or cash) against the loaned securities and maintains collateral in an amount not less than 100% of the market value of the loaned securities during the period of the loan. The market value of the loaned securities is determined at the close of business of a fund and any additional required collateral is delivered to a fund on the next business day. A fund or borrower may terminate the loan at any time, and if the borrower defaults on its obligation to return the securities loaned because of insolvency or other reasons, a fund may apply collateral received from the borrower against the obligation. A fund may experience delays and costs in recovering the securities loaned. Any cash collateral received is invested in the Fidelity Securities Lending Cash Central Fund. Any loaned securities are identified as such in the Schedule of Investments, and the value of loaned securities and cash collateral at period end, as applicable, are presented in the Statement of Assets and Liabilities. Security lending income represents the income earned on investing cash collateral, less rebates paid to borrowers and any lending agent fees associated with the loan, plus any premium payments received for lending certain types of securities. Security lending income is presented in the Statement of Operations as a component of income from Fidelity Central Funds. Affiliated security lending activity, if any, was as follows:
| | Total Security Lending Fees Paid to NFS ($) | Security Lending Income From Securities Loaned to NFS ($) | Value of Securities Loaned to NFS at Period End ($) |
| Fidelity Series Short-Term Credit Fund | 5 | - | - |
9. Expense Reductions.
The investment adviser contractually agreed to reimburse the Fund to the extent annual operating expenses exceeded .003% of average net assets. This reimbursement will remain in place through December 31, 2027. Some expenses, for example the compensation of the independent Trustees, and certain other expenses such as interest expense, are excluded from this reimbursement. During the period this reimbursement reduced the Fund's expenses by $6,131.
Through arrangements with the Fund's custodian, credits realized as a result of certain uninvested cash balances were used to reduce the Fund's expenses by $1,769.
10. Other.
A fund's organizational documents provide former and current trustees and officers with a limited indemnification against liabilities arising in connection with the performance of their duties to the fund. In the normal course of business, a fund may also enter into contracts that provide general indemnifications. A fund's maximum exposure under these arrangements is unknown as this would be dependent on future claims that may be made against a fund. The risk of material loss from such claims is considered remote.
At the end of the period, mutual funds and accounts managed by the investment adviser or its affiliates were the owners of record of all of the outstanding shares of the Fund.
11. Risk and Uncertainties.
Many factors affect a fund's performance. Developments that disrupt global economies and financial markets, such as pandemics, epidemics, outbreaks of infectious diseases, war, terrorism, and environmental disasters, may significantly affect a fund's investment performance. The effects of these developments to a fund will be impacted by the types of securities in which a fund invests, the financial condition, industry, economic sector, and geographic location of an issuer, and a fund's level of investment in the securities of that issuer. Significant concentrations in security types, issuers, industries, sectors, and geographic locations may magnify the factors that affect a fund's performance.
Report of Independent Registered Public Accounting Firm
To the Board of Trustees of Fidelity Salem Street Trust and Shareholders of Fidelity Series Short-Term Credit Fund
Opinion on the Financial Statements
We have audited the accompanying statement of assets and liabilities, including the schedule of investments, of Fidelity Series Short-Term Credit Fund (one of the funds constituting Fidelity Salem Street Trust, referred to hereafter as the "Fund") as of August 31, 2024, the related statement of operations for the year ended August 31, 2024, the statement of changes in net assets for each of the two years in the period ended August 31, 2024, including the related notes, and the financial highlights for each of the five years in the period ended August 31, 2024 (collectively referred to as the "financial statements"). In our opinion, the financial statements present fairly, in all material respects, the financial position of the Fund as of August 31, 2024, the results of its operations for the year then ended, the changes in its net assets for each of the two years in the period ended August 31, 2024 and the financial highlights for each of the five years in the period ended August 31, 2024 in conformity with accounting principles generally accepted in the United States of America.
Basis for Opinion
These financial statements are the responsibility of the Fund's management. Our responsibility is to express an opinion on the Fund's financial statements based on our audits. We are a public accounting firm registered with the Public Company Accounting Oversight Board (United States) (PCAOB) and are required to be independent with respect to the Fund in accordance with the U.S. federal securities laws and the applicable rules and regulations of the Securities and Exchange Commission and the PCAOB.
We conducted our audits of these financial statements in accordance with the standards of the PCAOB. Those standards require that we plan and perform the audit to obtain reasonable assurance about whether the financial statements are free of material misstatement, whether due to error or fraud.
Our audits included performing procedures to assess the risks of material misstatement of the financial statements, whether due to error or fraud, and performing procedures that respond to those risks. Such procedures included examining, on a test basis, evidence regarding the amounts and disclosures in the financial statements. Our audits also included evaluating the accounting principles used and significant estimates made by management, as well as evaluating the overall presentation of the financial statements. Our procedures included confirmation of securities owned as of August 31, 2024 by correspondence with the custodian and brokers; when replies were not received from brokers, we performed other auditing procedures. We believe that our audits provide a reasonable basis for our opinion.
/s/ PricewaterhouseCoopers LLP
Boston, Massachusetts
October 16, 2024
We have served as the auditor of one or more investment companies in the Fidelity group of funds since 1932.
Distributions
(Unaudited)
The dividend and capital gains distributions for the fund(s) are available on Fidelity.com or Institutional.Fidelity.com.
A total of 8.98% of the dividends distributed during the fiscal year was derived from interest on U.S. Government securities which is generally exempt from state income tax.
The fund designates $18,308,328 of distributions paid during the fiscal year ended 2024 as qualifying to be taxed as section 163(j) interest dividends.
The fund will notify shareholders in January 2025 of amounts for use in preparing 2024 income tax returns.
Item 8: Changes in and Disagreements with Accountants for Open-End Management Investment Companies
(Unaudited)
Note: This is not applicable for any fund included in this document.
Item 9: Proxy Disclosures for Open-End Management Investment Companies
(Unaudited)
| A special meeting of shareholders was held on October 18, 2023. The results of votes taken among shareholders on the proposal before them are reported below. Each vote reported represents one dollar of net asset value held on the record date for the meeting. |
| Proposal 1 |
| To elect a Board of Trustees. |
| | # of Votes | % of Votes |
| Abigail P. Johnson |
| Affirmative | 378,729,502,260.01 | 97.58 |
| Withheld | 9,407,876,478.96 | 2.42 |
| TOTAL | 388,137,378,738.97 | 100.00 |
| Jennifer Toolin McAuliffe |
| Affirmative | 378,454,868,010.95 | 97.51 |
| Withheld | 9,682,510,728.02 | 2.49 |
| TOTAL | 388,137,378,738.97 | 100.00 |
| Christine J. Thompson |
| Affirmative | 378,837,121,274.52 | 97.60 |
| Withheld | 9,300,257,464.45 | 2.40 |
| TOTAL | 388,137,378,738.97 | 100.00 |
| Elizabeth S. Acton |
| Affirmative | 378,262,110,794.85 | 97.46 |
| Withheld | 9,875,267,944.12 | 2.54 |
| TOTAL | 388,137,378,738.97 | 100.00 |
| Laura M. Bishop |
| Affirmative | 380,482,113,171.06 | 98.03 |
| Withheld | 7,655,265,567.91 | 1.97 |
| TOTAL | 388,137,378,738.97 | 100.00 |
| Ann E. Dunwoody |
| Affirmative | 380,016,034,008.12 | 97.91 |
| Withheld | 8,121,344,730.85 | 2.09 |
| TOTAL | 388,137,378,738.97 | 100.00 |
| John Engler |
| Affirmative | 379,432,488,394.20 | 97.76 |
| Withheld | 8,704,890,344.77 | 2.24 |
| TOTAL | 388,137,378,738.97 | 100.00 |
| Robert F. Gartland |
| Affirmative | 378,741,819,600.60 | 97.58 |
| Withheld | 9,395,559,138.37 | 2.42 |
| TOTAL | 388,137,378,738.97 | 100.00 |
| Robert W. Helm |
| Affirmative | 380,389,324,755.07 | 98.00 |
| Withheld | 7,748,053,983.90 | 2.00 |
| TOTAL | 388,137,378,738.97 | 100.00 |
| Arthur E. Johnson |
| Affirmative | 378,427,694,151.67 | 97.50 |
| Withheld | 9,709,684,587.30 | 2.50 |
| TOTAL | 388,137,378,738.97 | 100.00 |
| Michael E. Kenneally |
| Affirmative | 377,842,228,145.18 | 97.35 |
| Withheld | 10,295,150,593.79 | 2.65 |
| TOTAL | 388,137,378,738.97 | 100.00 |
| Mark A. Murray |
| Affirmative | 380,158,432,703.37 | 97.94 |
| Withheld | 7,978,946,035.60 | 2.06 |
| TOTAL | 388,137,378,738.97 | 100.00 |
| Carol J. Zierhoffer |
| Affirmative | 380,522,113,360.24 | 98.04 |
| Withheld | 7,615,265,378.73 | 1.96 |
| TOTAL | 388,137,378,738.97 | 100.00 |
| | | |
| Proposal 1 reflects trust-wide proposal and voting results. |
Item 10: Remuneration Paid to Directors, Officers, and others of Open-End Management Investment Companies
(Unaudited)
Note: This information is disclosed as part of the financial statements for each Fund as part of Item 7: Financial Statements and Financial Highlights for Open-End Management Investment companies.
Item 11: Statement Regarding Basis for Approval of Investment Advisory Contract
(Unaudited)
Note: This is not applicable for any fund included in this document.
1.9863239.109
SS1-ANN-1024
Item 8.
Changes in and Disagreements with Accountants for Open-End Management Investment Companies
See Item 7.
Item 9.
Proxy Disclosures for Open-End Management Investment Companies
See Item 7.
Item 10.
Remuneration Paid to Directors, Officers, and Others of Open-End Management Investment Companies
See Item 7.
Item 11.
Statement Regarding Basis for Approval of Investment Advisory Contract
See Item 7.
Item 12.
Disclosure of Proxy Voting Policies and Procedures for Closed-End Management Investment Companies
Not applicable.
Item 13.
Portfolio Managers of Closed-End Management Investment Companies
Not applicable.
Item 14.
Purchase of Equity Securities by Closed-End Management Investment Company and Affiliated Purchasers
Not applicable.
Item 15.
Submission of Matters to a Vote of Security Holders
There were no material changes to the procedures by which shareholders may recommend nominees to the trust’s Board of Trustees.
Item 16.
Controls and Procedures
(a)(i) The President and Treasurer and the Chief Financial Officer have concluded that the trust’s disclosure controls and procedures (as defined in Rule 30a-3(c) under the Investment Company Act) provide reasonable assurances that material information relating to the trust is made known to them by the appropriate persons, based on their evaluation of these controls and procedures as of a date within 90 days of the filing date of this report.
(a)(ii) There was no change in the trust’s internal control over financial reporting (as defined in Rule 30a-3(d) under the Investment Company Act) that occurred during the period covered by this report that has materially affected, or is reasonably likely to materially affect, the trust’s internal control over financial reporting.
Item 17.
Disclosure of Securities Lending Activities for Closed-End Management Investment Companies
Not applicable.
Item 18.
Recovery of Erroneously Awarded Compensation
(a)
Not applicable.
(b)
Not applicable.
Item 19.
Exhibits
SIGNATURES
Pursuant to the requirements of the Securities Exchange Act of 1934 and the Investment Company Act of 1940, the registrant has duly caused this report to be signed on its behalf by the undersigned, thereunto duly authorized.
Fidelity Salem Street Trust
|
By: | /s/Laura M. Del Prato |
| Laura M. Del Prato |
| President and Treasurer (Principal Executive Officer) |
|
|
Date: | October 24, 2024 |
Pursuant to the requirements of the Securities Exchange Act of 1934 and the Investment Company Act of 1940, this report has been signed below by the following persons on behalf of the registrant and in the capacities and on the dates indicated.
|
By: | /s/Laura M. Del Prato |
| Laura M. Del Prato |
| President and Treasurer (Principal Executive Officer) |
|
|
Date: | October 24, 2024 |
|
By: | /s/John J. Burke III |
| John J. Burke III |
| Chief Financial Officer (Principal Financial Officer) |
|
|
Date: | October 24, 2024 |