UNITED STATES
SECURITIES AND EXCHANGE COMMISSION
Washington, D.C. 20549
FORM N-CSR
CERTIFIED SHAREHOLDER REPORT OF REGISTERED
MANAGEMENT INVESTMENT COMPANIES
Investment Company Act file number 811-02105
Fidelity Salem Street Trust
(Exact name of registrant as specified in charter)
245 Summer St., Boston, MA 02210
(Address of principal executive offices) (Zip code)
Nicole Macarchuk, Secretary
245 Summer St.
Boston, Massachusetts 02210
(Name and address of agent for service)
Registrant's telephone number, including area code:
617-563-7000
|
Date of fiscal year end: | February 29 |
|
|
Date of reporting period: | August 31, 2024 |
Item 1.
Reports to Stockholders
| |
| | SEMI-ANNUAL SHAREHOLDER REPORT | AS OF AUGUST 31, 2024 | |
| | Fidelity® SAI U.S. Treasury Bond Index Fund Fidelity® SAI U.S. Treasury Bond Index Fund : FUTBX |
| | | |
This semi-annual shareholder report contains information about Fidelity® SAI U.S. Treasury Bond Index Fund for the period March 1, 2024 to August 31, 2024. You can find additional information about the Fund at fundresearch.fidelity.com/prospectus/sec. You can also request this information by contacting us at 1-800-544-3455 or by sending an e-mail to fidfunddocuments@fidelity.com.
What were your Fund costs for the last six months?(based on hypothetical $10,000 investment)
| | Costs of a $10,000 investment | Costs paid as a percentage of a $10,000 investment | |
| Fidelity® SAI U.S. Treasury Bond Index Fund | $ 2 | 0.03% | |
Key Fund Statistics (as of August 31, 2024)
KEY FACTS | | |
| Fund Size | $16,425,057,420 | |
| Number of Holdings | 254 | |
| Portfolio Turnover | 39% | |
What did the Fund invest in?
(as of August 31, 2024)
COUPON DISTRIBUTION (% of Fund's net assets) |
| 0.01 - 0.99% | 15.0 | |
| 1 - 1.99% | 20.9 | |
| 2 - 2.99% | 15.7 | |
| 3 - 3.99% | 17.5 | |
| 4 - 4.99% | 27.1 | |
| 5 - 5.99% | 1.1 | |
| 6 - 6.99% | 1.9 | |
| U.S. Treasury Obligations | 99.2 |
| Short-Term Investments and Net Other Assets (Liabilities) | 0.8 |
ASSET ALLOCATION (% of Fund's net assets) |
|
|
TOP HOLDINGS (% of Fund's net assets) | | |
| US Treasury Notes | 76.8 | |
| US Treasury Bonds | 22.4 | |
| | 99.2 | |
| Fidelity, the Fidelity Investments Logo and all other Fidelity trademarks or service marks used herein are trademarks or service marks of FMR LLC. Any third-party marks that are used herein are trademarks or service marks of their respective owners. © 2024 FMR LLC. All rights reserved. |
| | For additional information about the Fund; including its prospectus, financial information, holdings and proxy information, scan the QR code or visit fundresearch.fidelity.com/prospectus/sec 1.9914573.100 2814-TSRS-1024 |
| |
| | SEMI-ANNUAL SHAREHOLDER REPORT | AS OF AUGUST 31, 2024 | |
| | Fidelity® SAI Long-Term Treasury Bond Index Fund Fidelity® SAI Long-Term Treasury Bond Index Fund : FBLTX |
| | | |
This semi-annual shareholder report contains information about Fidelity® SAI Long-Term Treasury Bond Index Fund for the period March 1, 2024 to August 31, 2024. You can find additional information about the Fund at fundresearch.fidelity.com/prospectus/sec. You can also request this information by contacting us at 1-800-544-3455 or by sending an e-mail to fidfunddocuments@fidelity.com.
What were your Fund costs for the last six months?(based on hypothetical $10,000 investment)
| | Costs of a $10,000 investment | Costs paid as a percentage of a $10,000 investment | |
| Fidelity® SAI Long-Term Treasury Bond Index Fund | $ 2 | 0.03% | |
Key Fund Statistics (as of August 31, 2024)
KEY FACTS | | |
| Fund Size | $3,303,938,491 | |
| Number of Holdings | 42 | |
| Portfolio Turnover | 18% | |
What did the Fund invest in?
(as of August 31, 2024)
COUPON DISTRIBUTION (% of Fund's net assets) |
| 1 - 1.99% | 10.6 | |
| 2 - 2.99% | 40.3 | |
| 3 - 3.99% | 29.8 | |
| 4 - 4.99% | 18.5 | |
| U.S. Treasury Obligations | 99.2 |
| Short-Term Investments and Net Other Assets (Liabilities) | 0.8 |
ASSET ALLOCATION (% of Fund's net assets) |
|
|
TOP HOLDINGS (% of Fund's net assets) | | |
| US Treasury Bonds | 99.2 | |
| | 99.2 | |
| Fidelity, the Fidelity Investments Logo and all other Fidelity trademarks or service marks used herein are trademarks or service marks of FMR LLC. Any third-party marks that are used herein are trademarks or service marks of their respective owners. © 2024 FMR LLC. All rights reserved. |
| | For additional information about the Fund; including its prospectus, financial information, holdings and proxy information, scan the QR code or visit fundresearch.fidelity.com/prospectus/sec 1.9914572.100 2801-TSRS-1024 |
| |
| | SEMI-ANNUAL SHAREHOLDER REPORT | AS OF AUGUST 31, 2024 | |
| | Fidelity® Intermediate Treasury Bond Index Fund Fidelity® Intermediate Treasury Bond Index Fund : FUAMX |
| | | |
This semi-annual shareholder report contains information about Fidelity® Intermediate Treasury Bond Index Fund for the period March 1, 2024 to August 31, 2024. You can find additional information about the Fund at fundresearch.fidelity.com/prospectus/sec. You can also request this information by contacting us at 1-800-544-8544 or by sending an e-mail to fidfunddocuments@fidelity.com.
What were your Fund costs for the last six months?(based on hypothetical $10,000 investment)
| | Costs of a $10,000 investment | Costs paid as a percentage of a $10,000 investment | |
| Fidelity® Intermediate Treasury Bond Index Fund | $ 2 | 0.03% | |
Key Fund Statistics (as of August 31, 2024)
KEY FACTS | | |
| Fund Size | $9,049,221,050 | |
| Number of Holdings | 44 | |
| Portfolio Turnover | 46% | |
What did the Fund invest in?
(as of August 31, 2024)
COUPON DISTRIBUTION (% of Fund's net assets) |
| 0.01 - 0.99% | 12.5 | |
| 1 - 1.99% | 20.8 | |
| 2 - 2.99% | 7.2 | |
| 3 - 3.99% | 17.2 | |
| 4 - 4.99% | 40.0 | |
| 5 - 5.99% | 0.1 | |
| 6 - 6.99% | 1.5 | |
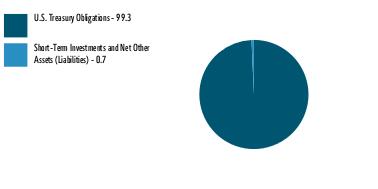
| U.S. Treasury Obligations | 99.3 |
| Short-Term Investments and Net Other Assets (Liabilities) | 0.7 |
ASSET ALLOCATION (% of Fund's net assets) |
|
|
TOP HOLDINGS (% of Fund's net assets) | | |
| US Treasury Notes | 97.7 | |
| US Treasury Bonds | 1.6 | |
| | 99.3 | |
| Fidelity, the Fidelity Investments Logo and all other Fidelity trademarks or service marks used herein are trademarks or service marks of FMR LLC. Any third-party marks that are used herein are trademarks or service marks of their respective owners. © 2024 FMR LLC. All rights reserved. |
| | For additional information about the Fund; including its prospectus, financial information, holdings and proxy information, scan the QR code or visit fundresearch.fidelity.com/prospectus/sec 1.9914566.100 3045-TSRS-1024 |
| |
| | SEMI-ANNUAL SHAREHOLDER REPORT | AS OF AUGUST 31, 2024 | |
| | Fidelity® Short-Term Treasury Bond Index Fund Fidelity® Short-Term Treasury Bond Index Fund : FUMBX |
| | | |
This semi-annual shareholder report contains information about Fidelity® Short-Term Treasury Bond Index Fund for the period March 1, 2024 to August 31, 2024. You can find additional information about the Fund at fundresearch.fidelity.com/prospectus/sec. You can also request this information by contacting us at 1-800-544-8544 or by sending an e-mail to fidfunddocuments@fidelity.com.
What were your Fund costs for the last six months?(based on hypothetical $10,000 investment)
| | Costs of a $10,000 investment | Costs paid as a percentage of a $10,000 investment | |
| Fidelity® Short-Term Treasury Bond Index Fund | $ 2 | 0.03% | |
Key Fund Statistics (as of August 31, 2024)
KEY FACTS | | |
| Fund Size | $3,384,007,509 | |
| Number of Holdings | 103 | |
| Portfolio Turnover | 40% | |
What did the Fund invest in?
(as of August 31, 2024)
COUPON DISTRIBUTION (% of Fund's net assets) |
| 0.01 - 0.99% | 36.4 | |
| 1 - 1.99% | 18.7 | |
| 2 - 2.99% | 11.9 | |
| 3 - 3.99% | 10.7 | |
| 4 - 4.99% | 17.8 | |
| 5 - 5.99% | 1.5 | |
| 6 - 6.99% | 2.2 | |
| U.S. Treasury Obligations | 99.2 |
| Short-Term Investments and Net Other Assets (Liabilities) | 0.8 |
ASSET ALLOCATION (% of Fund's net assets) |
|
|
TOP HOLDINGS (% of Fund's net assets) | | |
| US Treasury Notes | 96.6 | |
| US Treasury Bonds | 2.6 | |
| | 99.2 | |
| Fidelity, the Fidelity Investments Logo and all other Fidelity trademarks or service marks used herein are trademarks or service marks of FMR LLC. Any third-party marks that are used herein are trademarks or service marks of their respective owners. © 2024 FMR LLC. All rights reserved. |
| | For additional information about the Fund; including its prospectus, financial information, holdings and proxy information, scan the QR code or visit fundresearch.fidelity.com/prospectus/sec 1.9914565.100 3049-TSRS-1024 |
| |
| | SEMI-ANNUAL SHAREHOLDER REPORT | AS OF AUGUST 31, 2024 | |
| | Fidelity® Long-Term Treasury Bond Index Fund Fidelity® Long-Term Treasury Bond Index Fund : FNBGX |
| | | |
This semi-annual shareholder report contains information about Fidelity® Long-Term Treasury Bond Index Fund for the period March 1, 2024 to August 31, 2024. You can find additional information about the Fund at fundresearch.fidelity.com/prospectus/sec. You can also request this information by contacting us at 1-800-544-8544 or by sending an e-mail to fidfunddocuments@fidelity.com.
What were your Fund costs for the last six months?(based on hypothetical $10,000 investment)
| | Costs of a $10,000 investment | Costs paid as a percentage of a $10,000 investment | |
| Fidelity® Long-Term Treasury Bond Index Fund | $ 2 | 0.03% | |
Key Fund Statistics (as of August 31, 2024)
KEY FACTS | | |
| Fund Size | $4,559,818,465 | |
| Number of Holdings | 85 | |
| Portfolio Turnover | 18% | |
What did the Fund invest in?
(as of August 31, 2024)
COUPON DISTRIBUTION (% of Fund's net assets) |
| 1 - 1.99% | 16.3 | |
| 2 - 2.99% | 22.9 | |
| 3 - 3.99% | 35.8 | |
| 4 - 4.99% | 24.1 | |
| 5 - 5.99% | 0.2 | |
| U.S. Treasury Obligations | 99.3 |
| Short-Term Investments and Net Other Assets (Liabilities) | 0.7 |
ASSET ALLOCATION (% of Fund's net assets) |
|
|
TOP HOLDINGS (% of Fund's net assets) | | |
| US Treasury Bonds | 99.3 | |
| | 99.3 | |
| Fidelity, the Fidelity Investments Logo and all other Fidelity trademarks or service marks used herein are trademarks or service marks of FMR LLC. Any third-party marks that are used herein are trademarks or service marks of their respective owners. © 2024 FMR LLC. All rights reserved. |
| | For additional information about the Fund; including its prospectus, financial information, holdings and proxy information, scan the QR code or visit fundresearch.fidelity.com/prospectus/sec 1.9914567.100 3047-TSRS-1024 |
| |
| | SEMI-ANNUAL SHAREHOLDER REPORT | AS OF AUGUST 31, 2024 | |
| | Fidelity® Series Long-Term Treasury Bond Index Fund Fidelity® Series Long-Term Treasury Bond Index Fund : FTLTX |
| | | |
This semi-annual shareholder report contains information about Fidelity® Series Long-Term Treasury Bond Index Fund for the period March 1, 2024 to August 31, 2024. You can find additional information about the Fund at fundresearch.fidelity.com/prospectus/sec. You can also request this information by contacting us at 1-800-544-8544.
What were your Fund costs for the last six months?(based on hypothetical $10,000 investment)
| | Costs of a $10,000 investment | Costs paid as a percentage of a $10,000 investment | |
| Fidelity® Series Long-Term Treasury Bond Index Fund | $ 0 A | 0.00%B | |
A Amount represents less than $.50
B Amount represents less than 0.005%
Key Fund Statistics (as of August 31, 2024)
KEY FACTS | | |
| Fund Size | $19,527,574,876 | |
| Number of Holdings | 83 | |
| Portfolio Turnover | 15% | |
What did the Fund invest in?
(as of August 31, 2024)
COUPON DISTRIBUTION (% of Fund's net assets) |
| 1 - 1.99% | 10.1 | |
| 2 - 2.99% | 38.4 | |
| 3 - 3.99% | 30.9 | |
| 4 - 4.99% | 18.8 | |
| 5 - 5.99% | 0.6 | |
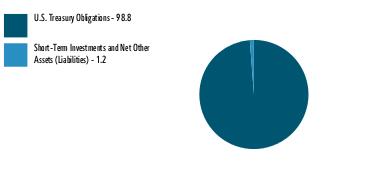
| U.S. Treasury Obligations | 98.8 |
| Short-Term Investments and Net Other Assets (Liabilities) | 1.2 |
ASSET ALLOCATION (% of Fund's net assets) |
|
|
TOP HOLDINGS (% of Fund's net assets) | | |
| US Treasury Bonds | 98.8 | |
| | 98.8 | |
| Fidelity, the Fidelity Investments Logo and all other Fidelity trademarks or service marks used herein are trademarks or service marks of FMR LLC. Any third-party marks that are used herein are trademarks or service marks of their respective owners. © 2024 FMR LLC. All rights reserved. |
| | For additional information about the Fund; including its prospectus, financial information, holdings and proxy information, scan the QR code or visit fundresearch.fidelity.com/prospectus/sec 1.9914574.100 2840-TSRS-1024 |
Item 2.
Code of Ethics
Not applicable.
Item 3.
Audit Committee Financial Expert
Not applicable.
Item 4.
Principal Accountant Fees and Services
Not applicable.
Item 5.
Audit Committee of Listed Registrants
Not applicable.
Item 6.
Investments
(a)
Not applicable.
(b)
Not applicable
Item 7.
Financial Statements and Financial Highlights for Open-End Management Investment Companies
Fidelity® Short-Term Treasury Bond Index Fund
Fidelity® Intermediate Treasury Bond Index Fund
Fidelity® Long-Term Treasury Bond Index Fund
Semi-Annual Report
August 31, 2024
Contents
To view a fund's proxy voting guidelines and proxy voting record for the 12-month period ended June 30, visit http://www.fidelity.com/proxyvotingresults or visit the Securities and Exchange Commission's (SEC) web site at http://www.sec.gov.
You may also call 1-800-544-8544 to request a free copy of the proxy voting guidelines.
BLOOMBERG ® is a trademark and service mark of Bloomberg Finance L.P. and its affiliates (collectively "Bloomberg"). Bloomberg or Bloomberg's licensors own all proprietary rights in the Bloomberg Indices. Neither Bloomberg nor Bloomberg's licensors approves or endorses this material, or guarantees the accuracy or completeness of any information herein, or makes any warranty, express or implied, as to the results to be obtained therefrom and, to the maximum extent allowed by law, neither shall have any liability or responsibility for injury or damages arising in connection therewith.
Standard & Poor's, S&P and S&P 500 are registered service marks of The McGraw-Hill Companies, Inc. and have been licensed for use by Fidelity Distributors Corporation.
Other third-party marks appearing herein are the property of their respective owners.
All other marks appearing herein are registered or unregistered trademarks or service marks of FMR LLC or an affiliated company. © 2024 FMR LLC. All rights reserved.
This report and the financial statements contained herein are submitted for the general information of the shareholders of the Funds. This report is not authorized for distribution to prospective investors in the Funds unless preceded or accompanied by an effective prospectus.
A fund files its complete schedule of portfolio holdings with the SEC for the first and third quarters of each fiscal year on Form N-PORT. Forms N-PORT are available on the SEC's web site at http://www.sec.gov. A fund's Forms N-PORT may be reviewed and copied at the SEC's Public Reference Room in Washington, DC. Information regarding the operation of the SEC's Public Reference Room may be obtained by calling 1-800-SEC-0330.
For a complete list of a fund's portfolio holdings, view the most recent holdings listing, semiannual report, or annual report on Fidelity's web site at http://www.fidelity.com, http://www.institutional.fidelity.com, or http://www.401k.com, as applicable.
NOT FDIC INSURED •MAY LOSE VALUE •NO BANK GUARANTEE
Neither the Funds nor Fidelity Distributors Corporation is a bank.
Item 7: Financial Statements and Financial Highlights for Open-End Management Investment Companies (Semi-Annual Report)
Fidelity® Short-Term Treasury Bond Index Fund
Schedule of Investments August 31, 2024 (Unaudited)
Showing Percentage of Net Assets
| U.S. Government and Government Agency Obligations - 99.2% |
| | | Principal Amount (a) | Value ($) |
| U.S. Treasury Obligations - 99.2% | | | |
| U.S. Treasury Bonds: | | | |
| 5.5% 8/15/28 | | 11,500,000 | 12,272,656 |
| 6% 2/15/26 | | 56,000,000 | 57,660,313 |
| 6.375% 8/15/27 | | 13,450,000 | 14,438,785 |
| 6.5% 11/15/26 | | 4,300,000 | 4,566,902 |
| U.S. Treasury Notes: | | | |
| 0.25% 5/31/25 | | 2,299,000 | 2,226,959 |
| 0.25% 7/31/25 | | 2,759,000 | 2,657,154 |
| 0.25% 9/30/25 | | 73,948,000 | 70,802,322 |
| 0.25% 10/31/25 | | 65,108,000 | 62,165,424 |
| 0.375% 11/30/25 | | 74,272,000 | 70,825,315 |
| 0.375% 12/31/25 | | 44,806,000 | 42,619,957 |
| 0.375% 1/31/26 | | 53,641,000 | 50,891,899 |
| 0.375% 7/31/27 | | 69,145,000 | 62,676,161 |
| 0.375% 9/30/27 | | 37,250,000 | 33,594,844 |
| 0.5% 2/28/26 | | 108,901,000 | 103,260,268 |
| 0.5% 4/30/27 | | 16,600,000 | 15,217,531 |
| 0.5% 5/31/27 | | 38,450,000 | 35,159,221 |
| 0.5% 6/30/27 | | 42,550,000 | 38,811,916 |
| 0.5% 8/31/27 | | 4,638,000 | 4,210,253 |
| 0.5% 10/31/27 | | 38,100,000 | 34,397,156 |
| 0.625% 7/31/26 | | 114,762,000 | 107,773,173 |
| 0.625% 3/31/27 | | 42,900,000 | 39,545,086 |
| 0.625% 11/30/27 | | 17,100,000 | 15,465,480 |
| 0.625% 12/31/27 | | 62,900,000 | 56,742,680 |
| 0.75% 3/31/26 | | 37,599,000 | 35,707,300 |
| 0.75% 4/30/26 | | 111,232,000 | 105,401,009 |
| 0.75% 5/31/26 | | 59,484,000 | 56,242,587 |
| 0.75% 8/31/26 | | 32,555,000 | 30,585,168 |
| 0.75% 1/31/28 | | 70,000,000 | 63,273,438 |
| 0.875% 6/30/26 | | 31,918,000 | 30,183,705 |
| 0.875% 9/30/26 | | 56,400,000 | 53,033,625 |
| 1% 7/31/28 | | 53,050,000 | 47,751,217 |
| 1.125% 10/31/26 | | 39,200,000 | 36,967,438 |
| 1.125% 2/29/28 | | 6,900,000 | 6,304,875 |
| 1.25% 11/30/26 | | 33,550,000 | 31,673,297 |
| 1.25% 12/31/26 | | 86,000,000 | 81,071,797 |
| 1.25% 3/31/28 | | 2,450,000 | 2,244,334 |
| 1.25% 4/30/28 | | 39,400,000 | 36,027,914 |
| 1.25% 5/31/28 | | 75,600,000 | 69,002,719 |
| 1.25% 6/30/28 | | 1,250,000 | 1,138,623 |
| 1.25% 9/30/28 | | 69,650,000 | 63,095,826 |
| 1.5% 8/15/26 | | 7,000,000 | 6,681,172 |
| 1.5% 1/31/27 | | 43,913,000 | 41,550,961 |
| 1.625% 2/15/26 | | 18,261,000 | 17,621,865 |
| 1.625% 5/15/26 | | 31,645,000 | 30,403,923 |
| 1.625% 10/31/26 | | 49,350,000 | 47,042,502 |
| 1.875% 7/31/26 | | 8,900,000 | 8,562,078 |
| 1.875% 2/28/27 | | 23,400,000 | 22,315,922 |
| 1.875% 2/28/29 | | 89,550,000 | 82,658,848 |
| 2.125% 9/30/24 | | 17,000 | 16,960 |
| 2.125% 5/15/25 | | 2,259,000 | 2,220,491 |
| 2.125% 5/31/26 | | 12,650,000 | 12,251,723 |
| 2.25% 11/15/25 | | 34,438,000 | 33,632,205 |
| 2.25% 2/15/27 | | 8,100,000 | 7,797,199 |
| 2.25% 8/15/27 | | 14,900,000 | 14,262,094 |
| 2.25% 11/15/27 | | 24,300,000 | 23,177,074 |
| 2.375% 5/15/27 | | 17,650,000 | 16,991,572 |
| 2.375% 3/31/29 | | 41,550,000 | 39,149,514 |
| 2.375% 5/15/29 | | 12,350,000 | 11,623,955 |
| 2.5% 3/31/27 | | 21,250,000 | 20,571,826 |
| 2.625% 12/31/25 | | 1,150,000 | 1,126,865 |
| 2.625% 1/31/26 | | 21,100,000 | 20,663,164 |
| 2.625% 5/31/27 | | 47,250,000 | 45,793,740 |
| 2.75% 4/30/27 | | 15,400,000 | 14,985,523 |
| 2.75% 7/31/27 | | 14,000,000 | 13,594,219 |
| 2.75% 2/15/28 | | 11,700,000 | 11,307,867 |
| 2.75% 5/31/29 | | 39,300,000 | 37,595,976 |
| 2.875% 11/30/25 | | 29,550,000 | 29,066,350 |
| 2.875% 4/30/29 | | 49,500,000 | 47,645,683 |
| 3.125% 8/31/27 | | 6,444,000 | 6,322,672 |
| 3.25% 6/30/27 | | 9,050,000 | 8,917,078 |
| 3.5% 1/31/28 | | 59,350,000 | 58,816,777 |
| 3.5% 4/30/28 | | 1,600,000 | 1,585,186 |
| 3.625% 5/15/26 | | 2,050,000 | 2,036,099 |
| 3.625% 8/31/29 | | 15,950,000 | 15,897,041 |
| 3.625% 8/31/29 | | 69,400,000 | 69,118,063 |
| 3.75% 4/15/26 | | 11,500,000 | 11,445,195 |
| 3.75% 8/15/27 | | 22,260,000 | 22,235,653 |
| 3.75% 12/31/28 | | 110,100,000 | 110,087,099 |
| 3.875% 11/30/27 | | 55,850,000 | 55,993,988 |
| 4% 12/15/25 | | 1,500,000 | 1,495,840 |
| 4% 2/29/28 | | 3,550,000 | 3,576,070 |
| 4% 7/31/29 | | 56,080,000 | 56,735,760 |
| 4.125% 6/15/26 | | 4,050,000 | 4,058,385 |
| 4.125% 9/30/27 | | 1,700,000 | 1,717,266 |
| 4.125% 10/31/27 | | 7,250,000 | 7,320,518 |
| 4.125% 3/31/29 | | 1,750,000 | 1,777,617 |
| 4.25% 6/30/29 | | 52,950,000 | 54,117,743 |
| 4.375% 7/31/26 | | 5,510,000 | 5,551,325 |
| 4.375% 12/15/26 | | 16,850,000 | 17,031,664 |
| 4.375% 7/15/27 | | 24,250,000 | 24,619,611 |
| 4.375% 8/31/28 | | 94,000,000 | 96,126,016 |
| 4.375% 11/30/28 | | 95,600,000 | 97,904,109 |
| 4.5% 5/31/29 | | 28,800,000 | 29,750,625 |
| 4.625% 6/30/26 | | 25,000,000 | 25,273,438 |
| 4.625% 9/15/26 | | 63,550,000 | 64,401,471 |
| 4.625% 10/15/26 | | 15,950,000 | 16,177,412 |
| 4.625% 11/15/26 | | 1,950,000 | 1,979,631 |
| 4.625% 6/15/27 | | 21,850,000 | 22,321,141 |
| 4.875% 5/31/26 | | 11,450,000 | 11,610,568 |
| 4.875% 10/31/28 | | 64,400,000 | 67,139,515 |
| 5% 10/31/25 | | 35,550,000 | 35,822,860 |
| | | | |
| TOTAL U.S. GOVERNMENT AND GOVERNMENT AGENCY OBLIGATIONS (Cost $3,360,276,595) | | | 3,356,961,034 |
| | | | |
| Money Market Funds - 0.5% |
| | | Shares | Value ($) |
Fidelity Cash Central Fund 5.39% (b) (Cost $15,327,140) | | 15,324,075 | 15,327,140 |
| | | | |
| TOTAL INVESTMENT IN SECURITIES - 99.7% (Cost $3,375,603,735) | 3,372,288,174 |
NET OTHER ASSETS (LIABILITIES) - 0.3% | 11,719,335 |
| NET ASSETS - 100.0% | 3,384,007,509 |
| | |
Legend
| (a) | Amount is stated in United States dollars unless otherwise noted. |
| (b) | Affiliated fund that is generally available only to investment companies and other accounts managed by Fidelity Investments. The rate quoted is the annualized seven-day yield of the fund at period end. A complete unaudited listing of the fund's holdings as of its most recent quarter end is available upon request. In addition, each Fidelity Central Fund's financial statements are available on the SEC's website or upon request. |
Affiliated Central Funds
Fiscal year to date information regarding the Fund's investments in Fidelity Central Funds, including the ownership percentage, is presented below.
| Affiliate | Value, beginning of period ($) | Purchases ($) | Sales Proceeds ($) | Dividend Income ($) | Realized Gain (loss) ($) | Change in Unrealized appreciation (depreciation) ($) | Value, end of period ($) | % ownership, end of period |
| Fidelity Cash Central Fund 5.39% | 21,932,692 | 234,517,120 | 241,123,274 | 408,551 | 602 | - | 15,327,140 | 0.0% |
| Fidelity Securities Lending Cash Central Fund 5.39% | 33,872,580 | 94,617,511 | 128,490,091 | 644 | - | - | - | 0.0% |
| Total | 55,805,272 | 329,134,631 | 369,613,365 | 409,195 | 602 | - | 15,327,140 | |
| | | | | | | | | |
Amounts in the dividend income column in the above table include any capital gain distributions from underlying funds, which are presented in the corresponding line item in the Statement of Operations, if applicable.
Amounts in the dividend income column for Fidelity Securities Lending Cash Central Fund represents the income earned on investing cash collateral, less rebates paid to borrowers and any lending agent fees associated with the loan, plus any premium payments received for lending certain types of securities.
Amounts included in the purchases and sales proceeds columns may include in-kind transactions, if applicable.
Investment Valuation
The following is a summary of the inputs used, as of August 31, 2024, involving the Fund's assets and liabilities carried at fair value. The inputs or methodology used for valuing securities may not be an indication of the risk associated with investing in those securities. For more information on valuation inputs, and their aggregation into the levels used below, please refer to the Investment Valuation section in the accompanying Notes to Financial Statements.
| Valuation Inputs at Reporting Date: |
| Description | Total ($) | Level 1 ($) | Level 2 ($) | Level 3 ($) |
Investments in Securities: | | | | |
|
| U.S. Government and Government Agency Obligations | 3,356,961,034 | - | 3,356,961,034 | - |
|
| Money Market Funds | 15,327,140 | 15,327,140 | - | - |
| Total Investments in Securities: | 3,372,288,174 | 15,327,140 | 3,356,961,034 | - |
Fidelity® Short-Term Treasury Bond Index Fund
Financial Statements (Unaudited)
| Statement of Assets and Liabilities |
| As of August 31, 2024 (Unaudited) |
| Assets | | | | |
| Investment in securities, at value - See accompanying schedule: | | | | |
Unaffiliated issuers (cost $3,360,276,595) | $ | 3,356,961,034 | | |
Fidelity Central Funds (cost $15,327,140) | | 15,327,140 | | |
| | | | | |
| | | | | |
| Total Investment in Securities (cost $3,375,603,735) | | | $ | 3,372,288,174 |
| Receivable for investments sold | | | | 101,156,965 |
| Receivable for fund shares sold | | | | 3,497,395 |
| Interest receivable | | | | 18,361,996 |
| Distributions receivable from Fidelity Central Funds | | | | 148,269 |
Total assets | | | | 3,495,452,799 |
| Liabilities | | | | |
| Payable for investments purchased | $ | 107,336,232 | | |
| Payable for fund shares redeemed | | 2,715,154 | | |
| Distributions payable | | 1,310,779 | | |
| Accrued management fee | | 83,125 | | |
| Total liabilities | | | | 111,445,290 |
| Net Assets | | | $ | 3,384,007,509 |
| Net Assets consist of: | | | | |
| Paid in capital | | | $ | 3,482,390,225 |
| Total accumulated earnings (loss) | | | | (98,382,716) |
| Net Assets | | | $ | 3,384,007,509 |
Net Asset Value, offering price and redemption price per share ($3,384,007,509 ÷ 327,966,732 shares) | | | $ | 10.32 |
| Statement of Operations |
Six months ended August 31, 2024 (Unaudited) |
| Investment Income | | | | |
| Interest | | | $ | 59,391,122 |
| Income from Fidelity Central Funds (including $644 from security lending) | | | | 409,195 |
| Total income | | | | 59,800,317 |
| Expenses | | | | |
| Management fee | $ | 501,145 | | |
| Independent trustees' fees and expenses | | 4,791 | | |
| Total expenses before reductions | | 505,936 | | |
| Expense reductions | | (33) | | |
| Total expenses after reductions | | | | 505,903 |
| Net Investment income (loss) | | | | 59,294,414 |
| Realized and Unrealized Gain (Loss) | | | | |
| Net realized gain (loss) on: | | | | |
| Investment Securities: | | | | |
| Unaffiliated issuers | | (15,592,613) | | |
| Fidelity Central Funds | | 602 | | |
| Total net realized gain (loss) | | | | (15,592,011) |
| Change in net unrealized appreciation (depreciation) on investment securities | | | | 76,593,000 |
| Net gain (loss) | | | | 61,000,989 |
| Net increase (decrease) in net assets resulting from operations | | | $ | 120,295,403 |
| Statement of Changes in Net Assets |
| |
| | Six months ended August 31, 2024 (Unaudited) | | Year ended February 29, 2024 |
| Increase (Decrease) in Net Assets | | | | |
| Operations | | | | |
| Net investment income (loss) | $ | 59,294,414 | $ | 115,482,783 |
| Net realized gain (loss) | | (15,592,011) | | (85,090,999) |
| Change in net unrealized appreciation (depreciation) | | 76,593,000 | | 133,588,040 |
| Net increase (decrease) in net assets resulting from operations | | 120,295,403 | | 163,979,824 |
| Distributions to shareholders | | (32,076,866) | | (66,054,224) |
| | | | | |
| Share transactions | | | | |
| Proceeds from sales of shares | | 415,320,966 | | 2,018,014,533 |
| Reinvestment of distributions | | 24,260,354 | | 52,204,755 |
| Cost of shares redeemed | | (614,737,401) | | (2,958,447,612) |
| | | | | |
Net increase (decrease) in net assets resulting from share transactions | | (175,156,081) | | (888,228,324) |
| Total increase (decrease) in net assets | | (86,937,544) | | (790,302,724) |
| | | | | |
| Net Assets | | | | |
| Beginning of period | | 3,470,945,053 | | 4,261,247,777 |
| End of period | $ | 3,384,007,509 | $ | 3,470,945,053 |
| | | | | |
| Other Information | | | | |
| Shares | | | | |
| Sold | | 40,910,706 | | 202,462,371 |
| Issued in reinvestment of distributions | | 2,396,599 | | 5,229,439 |
| Redeemed | | (60,949,780) | | (295,927,816) |
| Net increase (decrease) | | (17,642,475) | | (88,236,006) |
| | | | | |
Financial Highlights
Fidelity® Short-Term Treasury Bond Index Fund |
| |
| | Six months ended (Unaudited) August 31, 2024 | | Years ended February 28, 2024 A | | 2023 | | 2022 | | 2021 | | 2020 A |
Selected Per-Share Data | | | | | | | | | | | | |
| Net asset value, beginning of period | $ | 10.04 | $ | 9.82 | $ | 10.38 | $ | 10.76 | $ | 10.72 | $ | 10.30 |
| Income from Investment Operations | | | | | | | | | | | | |
Net investment income (loss) B,C | | .179 | | .300 | | .164 | | .087 | | .127 | | .217 |
| Net realized and unrealized gain (loss) | | .198 | | .094 | | (.606) | | (.333) | | .068 | | .402 |
| Total from investment operations | | .377 | | .394 | | (.442) | | (.246) | | .195 | | .619 |
| Distributions from net investment income | | (.097) | | (.174) | | (.118) | | (.086) | | (.125) | | (.199) |
| Distributions from net realized gain | | - | | - | | - | | (.048) | | (.030) | | - |
| Total distributions | | (.097) | | (.174) | | (.118) | | (.134) | | (.155) | | (.199) |
| Net asset value, end of period | $ | 10.32 | $ | 10.04 | $ | 9.82 | $ | 10.38 | $ | 10.76 | $ | 10.72 |
Total Return D,E | | | | 4.03% | | (4.26)% | | (2.31)% | | 1.82% | | 6.06% |
Ratios to Average Net Assets B,F,G | | | | | | | | | | | | |
| Expenses before reductions | | .03% H | | .03% | | .03% | | .03% | | .03% | | .03% |
| Expenses net of fee waivers, if any | | | | .03% | | .03% | | .03% | | .03% | | .03% |
| Expenses net of all reductions | | .03% H | | .03% | | .03% | | .03% | | .03% | | .03% |
| Net investment income (loss) | | 3.52% H | | 3.01% | | 1.65% | | .82% | | 1.17% | | 2.07% |
| Supplemental Data | | | | | | | | | | | | |
| Net assets, end of period (000 omitted) | $ | 3,384,008 | $ | 3,470,945 | $ | 4,261,248 | $ | 3,911,330 | $ | 3,870,957 | $ | 2,570,535 |
Portfolio turnover rate I | | | | 69% | | 60% | | 48% | | 54% | | 46% |
AFor the year ended February 29.
BNet investment income (loss) is affected by the timing of the declaration of dividends by any underlying mutual funds or exchange-traded funds (ETFs). Net investment income (loss) of any mutual funds or ETFs is not included in the Fund's net investment income (loss) ratio.
CCalculated based on average shares outstanding during the period.
DTotal returns for periods of less than one year are not annualized.
ETotal returns would have been lower if certain expenses had not been reduced during the applicable periods shown.
FFees and expenses of any underlying mutual funds or exchange-traded funds (ETFs) are not included in the Fund's expense ratio. The Fund indirectly bears its proportionate share of these expenses. For additional expense information related to investments in Fidelity Central Funds, please refer to the "Investments in Fidelity Central Funds" note found in the Notes to Financial Statements section of the most recent Annual or Semi-Annual report.
GExpense ratios reflect operating expenses of the class. Expenses before reductions do not reflect amounts reimbursed, waived, or reduced through arrangements with the investment adviser, brokerage services, or other offset arrangements, if applicable, and do not represent the amount paid by the class during periods when reimbursements, waivers or reductions occur.
HAnnualized.
IAmount does not include the portfolio activity of any underlying mutual funds or exchange-traded funds (ETFs).
Fidelity® Intermediate Treasury Bond Index Fund
Schedule of Investments August 31, 2024 (Unaudited)
Showing Percentage of Net Assets
| U.S. Government and Government Agency Obligations - 99.3% |
| | | Principal Amount (a) | Value ($) |
| U.S. Treasury Obligations - 99.3% | | | |
| U.S. Treasury Bonds: | | | |
| 5.25% 2/15/29 | | 4,944,000 | 5,265,553 |
| 6.25% 5/15/30 | | 124,504,000 | 140,178,859 |
| U.S. Treasury Notes: | | | |
| 0.625% 5/15/30 | | 279,105,000 | 234,404,590 |
| 0.625% 8/15/30 | | 491,822,000 | 409,826,051 |
| 0.875% 11/15/30 | | 577,791,000 | 485,773,271 |
| 1.25% 8/15/31 | | 595,458,000 | 502,650,284 |
| 1.375% 11/15/31 | | 357,485,000 | 302,661,322 |
| 1.5% 2/15/30 | | 317,987,000 | 282,610,946 |
| 1.625% 8/15/29 | | 91,476,000 | 82,871,539 |
| 1.625% 5/15/31 | | 241,616,000 | 210,602,320 |
| 1.75% 11/15/29 | | 253,086,000 | 229,458,048 |
| 1.875% 2/15/32 | | 322,072,000 | 281,208,761 |
| 2.625% 7/31/29 | | 7,500,000 | 7,123,242 |
| 2.75% 8/15/32 | | 290,850,000 | 268,979,444 |
| 2.875% 5/15/32 | | 408,050,000 | 381,749,904 |
| 3.125% 8/31/29 | | 87,959,000 | 85,450,795 |
| 3.25% 6/30/29 | | 5,850,000 | 5,719,518 |
| 3.375% 5/15/33 | | 416,850,000 | 401,120,424 |
| 3.5% 4/30/30 | | 15,150,000 | 14,935,770 |
| 3.5% 2/15/33 | | 350,100,000 | 340,581,656 |
| 3.625% 3/31/30 | | 120,200,000 | 119,275,024 |
| 3.875% 9/30/29 | | 46,800,000 | 47,048,625 |
| 3.875% 11/30/29 | | 96,350,000 | 96,858,096 |
| 3.875% 12/31/29 | | 26,700,000 | 26,832,457 |
| 3.875% 8/15/33 | | 276,700,000 | 276,083,911 |
| 3.875% 8/15/34 | | 143,700,000 | 143,160,823 |
| 4% 10/31/29 | | 50,800,000 | 51,355,625 |
| 4% 2/28/30 | | 32,650,000 | 33,014,762 |
| 4% 7/31/30 | | 245,000,000 | 247,727,538 |
| 4% 1/31/31 | | 291,850,000 | 295,053,509 |
| 4% 2/15/34 | | 396,050,000 | 398,525,313 |
| 4.125% 8/31/30 | | 37,850,000 | 38,528,639 |
| 4.125% 3/31/31 | | 158,600,000 | 161,524,188 |
| 4.125% 7/31/31 | | 258,150,000 | 262,927,556 |
| 4.125% 11/15/32 | | 263,200,000 | 268,124,719 |
| 4.25% 2/28/31 | | 438,000,000 | 449,155,313 |
| 4.375% 11/30/30 | | 128,100,000 | 132,153,163 |
| 4.375% 5/15/34 | | 377,700,000 | 391,391,625 |
| 4.5% 11/15/33 | | 391,700,000 | 409,494,810 |
| 4.625% 4/30/31 | | 102,800,000 | 107,691,031 |
| 4.625% 5/31/31 | | 151,250,000 | 158,458,008 |
| 4.875% 10/31/30 | | 186,900,000 | 197,938,781 |
| | | | |
| TOTAL U.S. GOVERNMENT AND GOVERNMENT AGENCY OBLIGATIONS (Cost $9,008,300,331) | | | 8,985,495,813 |
| | | | |
| Money Market Funds - 0.7% |
| | | Shares | Value ($) |
Fidelity Cash Central Fund 5.39% (b) (Cost $63,579,221) | | 63,566,508 | 63,579,221 |
| | | | |
| TOTAL INVESTMENT IN SECURITIES - 100.0% (Cost $9,071,879,552) | 9,049,075,034 |
NET OTHER ASSETS (LIABILITIES) - 0.0% | 146,016 |
| NET ASSETS - 100.0% | 9,049,221,050 |
| | |
Legend
| (a) | Amount is stated in United States dollars unless otherwise noted. |
| (b) | Affiliated fund that is generally available only to investment companies and other accounts managed by Fidelity Investments. The rate quoted is the annualized seven-day yield of the fund at period end. A complete unaudited listing of the fund's holdings as of its most recent quarter end is available upon request. In addition, each Fidelity Central Fund's financial statements are available on the SEC's website or upon request. |
Affiliated Central Funds
Fiscal year to date information regarding the Fund's investments in Fidelity Central Funds, including the ownership percentage, is presented below.
| Affiliate | Value, beginning of period ($) | Purchases ($) | Sales Proceeds ($) | Dividend Income ($) | Realized Gain (loss) ($) | Change in Unrealized appreciation (depreciation) ($) | Value, end of period ($) | % ownership, end of period |
| Fidelity Cash Central Fund 5.39% | 66,409,718 | 478,573,752 | 481,403,360 | 858,110 | (889) | - | 63,579,221 | 0.1% |
| Fidelity Securities Lending Cash Central Fund 5.39% | - | 857,601,598 | 857,601,598 | 64,324 | - | - | - | 0.0% |
| Total | 66,409,718 | 1,336,175,350 | 1,339,004,958 | 922,434 | (889) | - | 63,579,221 | |
| | | | | | | | | |
Amounts in the dividend income column in the above table include any capital gain distributions from underlying funds, which are presented in the corresponding line item in the Statement of Operations, if applicable.
Amounts in the dividend income column for Fidelity Securities Lending Cash Central Fund represents the income earned on investing cash collateral, less rebates paid to borrowers and any lending agent fees associated with the loan, plus any premium payments received for lending certain types of securities.
Amounts included in the purchases and sales proceeds columns may include in-kind transactions, if applicable.
Investment Valuation
The following is a summary of the inputs used, as of August 31, 2024, involving the Fund's assets and liabilities carried at fair value. The inputs or methodology used for valuing securities may not be an indication of the risk associated with investing in those securities. For more information on valuation inputs, and their aggregation into the levels used below, please refer to the Investment Valuation section in the accompanying Notes to Financial Statements.
| Valuation Inputs at Reporting Date: |
| Description | Total ($) | Level 1 ($) | Level 2 ($) | Level 3 ($) |
Investments in Securities: | | | | |
|
| U.S. Government and Government Agency Obligations | 8,985,495,813 | - | 8,985,495,813 | - |
|
| Money Market Funds | 63,579,221 | 63,579,221 | - | - |
| Total Investments in Securities: | 9,049,075,034 | 63,579,221 | 8,985,495,813 | - |
Fidelity® Intermediate Treasury Bond Index Fund
Financial Statements (Unaudited)
| Statement of Assets and Liabilities |
| As of August 31, 2024 (Unaudited) |
| Assets | | | | |
| Investment in securities, at value - See accompanying schedule: | | | | |
Unaffiliated issuers (cost $9,008,300,331) | $ | 8,985,495,813 | | |
Fidelity Central Funds (cost $63,579,221) | | 63,579,221 | | |
| | | | | |
| | | | | |
| Total Investment in Securities (cost $9,071,879,552) | | | $ | 9,049,075,034 |
| Receivable for investments sold | | | | 229,087,082 |
| Receivable for fund shares sold | | | | 73,555,064 |
| Interest receivable | | | | 60,534,528 |
| Distributions receivable from Fidelity Central Funds | | | | 201,176 |
Total assets | | | | 9,412,452,884 |
| Liabilities | | | | |
| Payable for investments purchased | $ | 341,729,918 | | |
| Payable for fund shares redeemed | | 18,379,131 | | |
| Distributions payable | | 2,898,383 | | |
| Accrued management fee | | 224,402 | | |
| Total liabilities | | | | 363,231,834 |
| Net Assets | | | $ | 9,049,221,050 |
| Net Assets consist of: | | | | |
| Paid in capital | | | $ | 9,490,034,867 |
| Total accumulated earnings (loss) | | | | (440,813,817) |
| Net Assets | | | $ | 9,049,221,050 |
Net Asset Value, offering price and redemption price per share ($9,049,221,050 ÷ 917,189,540 shares) | | | $ | 9.87 |
| Statement of Operations |
Six months ended August 31, 2024 (Unaudited) |
| Investment Income | | | | |
| Interest | | | $ | 157,698,446 |
| Income from Fidelity Central Funds (including $64,324 from security lending) | | | | 922,434 |
| Total income | | | | 158,620,880 |
| Expenses | | | | |
| Management fee | $ | 1,274,981 | | |
| Independent trustees' fees and expenses | | 11,779 | | |
| Total expenses before reductions | | 1,286,760 | | |
| Expense reductions | | (1) | | |
| Total expenses after reductions | | | | 1,286,759 |
| Net Investment income (loss) | | | | 157,334,121 |
| Realized and Unrealized Gain (Loss) | | | | |
| Net realized gain (loss) on: | | | | |
| Investment Securities: | | | | |
| Unaffiliated issuers | | (64,326,194) | | |
| Fidelity Central Funds | | (889) | | |
| Total net realized gain (loss) | | | | (64,327,083) |
| Change in net unrealized appreciation (depreciation) on investment securities | | | | 323,174,252 |
| Net gain (loss) | | | | 258,847,169 |
| Net increase (decrease) in net assets resulting from operations | | | $ | 416,181,290 |
| Statement of Changes in Net Assets |
| |
| | Six months ended August 31, 2024 (Unaudited) | | Year ended February 29, 2024 |
| Increase (Decrease) in Net Assets | | | | |
| Operations | | | | |
| Net investment income (loss) | $ | 157,334,121 | $ | 237,076,943 |
| Net realized gain (loss) | | (64,327,083) | | (256,157,570) |
| Change in net unrealized appreciation (depreciation) | | 323,174,252 | | 162,127,103 |
| Net increase (decrease) in net assets resulting from operations | | 416,181,290 | | 143,046,476 |
| Distributions to shareholders | | (124,942,050) | | (171,642,129) |
| | | | | |
| Share transactions | | | | |
| Proceeds from sales of shares | | 1,366,877,024 | | 4,605,616,582 |
| Reinvestment of distributions | | 108,850,771 | | 147,718,337 |
| Cost of shares redeemed | | (865,663,127) | | (2,219,320,181) |
| | | | | |
Net increase (decrease) in net assets resulting from share transactions | | 610,064,668 | | 2,534,014,738 |
| Total increase (decrease) in net assets | | 901,303,908 | | 2,505,419,085 |
| | | | | |
| Net Assets | | | | |
| Beginning of period | | 8,147,917,142 | | 5,642,498,057 |
| End of period | $ | 9,049,221,050 | $ | 8,147,917,142 |
| | | | | |
| Other Information | | | | |
| Shares | | | | |
| Sold | | 142,787,665 | | 479,453,157 |
| Issued in reinvestment of distributions | | 11,352,452 | | 15,423,695 |
| Redeemed | | (90,415,176) | | (232,163,347) |
| Net increase (decrease) | | 63,724,941 | | 262,713,505 |
| | | | | |
Financial Highlights
Fidelity® Intermediate Treasury Bond Index Fund |
| |
| | Six months ended (Unaudited) August 31, 2024 | | Years ended February 28, 2024 A | | 2023 | | 2022 | | 2021 | | 2020 A |
Selected Per-Share Data | | | | | | | | | | | | |
| Net asset value, beginning of period | $ | 9.55 | $ | 9.55 | $ | 10.87 | $ | 11.38 | $ | 11.65 | $ | 10.54 |
| Income from Investment Operations | | | | | | | | | | | | |
Net investment income (loss) B,C | | .177 | | .315 | | .196 | | .151 | | .174 | | .255 |
| Net realized and unrealized gain (loss) | | .284 | | (.089) | | (1.352) | | (.443) | | (.092) | | 1.092 |
| Total from investment operations | | .461 | | .226 | | (1.156) | | (.292) | | .082 | | 1.347 |
| Distributions from net investment income | | (.141) | | (.226) | | (.164) | | (.148) | | (.171) | | (.237) |
| Distributions from net realized gain | | - | | - | | - | | (.070) | | (.181) | | - |
| Total distributions | | (.141) | | (.226) | | (.164) | | (.218) | | (.352) | | (.237) |
| Net asset value, end of period | $ | 9.87 | $ | 9.55 | $ | 9.55 | $ | 10.87 | $ | 11.38 | $ | 11.65 |
Total Return D,E | | | | 2.39% | | (10.67)% | | (2.60)% | | .63% | | 12.91% |
Ratios to Average Net Assets C,F,G | | | | | | | | | | | | |
| Expenses before reductions | | .03% H | | .03% | | .03% | | .03% | | .03% | | .03% |
| Expenses net of fee waivers, if any | | | | .03% | | .03% | | .03% | | .03% | | .03% |
| Expenses net of all reductions | | .03% H | | .03% | | .03% | | .03% | | .03% | | .03% |
| Net investment income (loss) | | 3.67% H | | 3.30% | | 1.97% | | 1.35% | | 1.46% | | 2.30% |
| Supplemental Data | | | | | | | | | | | | |
| Net assets, end of period (000 omitted) | $ | 9,049,221 | $ | 8,147,917 | $ | 5,642,498 | $ | 4,396,511 | $ | 4,571,767 | $ | 3,508,883 |
Portfolio turnover rate I | | | | 48% | | 41% | | 54% | | 56% | | 58% |
AFor the year ended February 29.
BCalculated based on average shares outstanding during the period.
CNet investment income (loss) is affected by the timing of the declaration of dividends by any underlying mutual funds or exchange-traded funds (ETFs). Net investment income (loss) of any mutual funds or ETFs is not included in the Fund's net investment income (loss) ratio.
DTotal returns for periods of less than one year are not annualized.
ETotal returns would have been lower if certain expenses had not been reduced during the applicable periods shown.
FFees and expenses of any underlying mutual funds or exchange-traded funds (ETFs) are not included in the Fund's expense ratio. The Fund indirectly bears its proportionate share of these expenses. For additional expense information related to investments in Fidelity Central Funds, please refer to the "Investments in Fidelity Central Funds" note found in the Notes to Financial Statements section of the most recent Annual or Semi-Annual report.
GExpense ratios reflect operating expenses of the class. Expenses before reductions do not reflect amounts reimbursed, waived, or reduced through arrangements with the investment adviser, brokerage services, or other offset arrangements, if applicable, and do not represent the amount paid by the class during periods when reimbursements, waivers or reductions occur.
HAnnualized.
IAmount does not include the portfolio activity of any underlying mutual funds or exchange-traded funds (ETFs).
Fidelity® Long-Term Treasury Bond Index Fund
Schedule of Investments August 31, 2024 (Unaudited)
Showing Percentage of Net Assets
| U.S. Government and Government Agency Obligations - 99.3% |
| | | Principal Amount (a) | Value ($) |
| U.S. Treasury Obligations - 99.3% | | | |
| U.S. Treasury Bonds: | | | |
| 1.125% 5/15/40 | | 11,709,000 | 7,578,833 |
| 1.125% 8/15/40 | | 57,604,000 | 36,956,566 |
| 1.25% 5/15/50 | | 92,053,000 | 48,360,187 |
| 1.375% 11/15/40 | | 98,738,000 | 65,575,917 |
| 1.375% 8/15/50 | | 220,345,000 | 119,330,589 |
| 1.625% 11/15/50 | | 130,631,000 | 75,536,356 |
| 1.75% 8/15/41 | | 87,455,000 | 60,791,474 |
| 1.875% 2/15/41 | | 141,748,000 | 101,936,745 |
| 1.875% 2/15/51 | | 185,960,000 | 114,677,755 |
| 1.875% 11/15/51 | | 189,400,000 | 116,214,656 |
| 2% 11/15/41 | | 77,050,000 | 55,611,439 |
| 2% 2/15/50 | | 119,266,900 | 76,358,770 |
| 2% 8/15/51 | | 107,954,000 | 68,441,150 |
| 2.25% 5/15/41 | | 102,827,000 | 78,160,570 |
| 2.25% 8/15/46 | | 9,663,000 | 6,792,787 |
| 2.25% 8/15/49 | | 25,759,000 | 17,528,195 |
| 2.25% 2/15/52 | | 110,450,000 | 74,307,826 |
| 2.375% 2/15/42 | | 79,900,000 | 60,994,605 |
| 2.375% 11/15/49 | | 70,595,000 | 49,303,438 |
| 2.375% 5/15/51 | | 203,247,000 | 141,026,427 |
| 2.5% 2/15/45 | | 22,364,000 | 16,795,713 |
| 2.5% 2/15/46 | | 18,123,000 | 13,455,620 |
| 2.5% 5/15/46 | | 41,212,000 | 30,506,539 |
| 2.75% 8/15/42 | | 7,787,000 | 6,282,831 |
| 2.75% 11/15/42 | | 30,225,000 | 24,293,344 |
| 2.75% 8/15/47 | | 21,492,000 | 16,471,603 |
| 2.75% 11/15/47 | | 10,975,000 | 8,393,303 |
| 2.875% 5/15/43 | | 78,118,000 | 63,559,368 |
| 2.875% 8/15/45 | | 67,587,500 | 53,993,436 |
| 2.875% 11/15/46 | | 72,529,000 | 57,280,911 |
| 2.875% 5/15/49 | | 28,090,000 | 21,799,376 |
| 2.875% 5/15/52 | | 121,700,000 | 94,051,281 |
| 3% 5/15/42 | | 57,501,000 | 48,368,224 |
| 3% 11/15/44 | | 45,937,000 | 37,659,368 |
| 3% 5/15/45 | | 76,164,000 | 62,264,070 |
| 3% 11/15/45 | | 62,732,000 | 51,097,174 |
| 3% 2/15/47 | | 31,990,000 | 25,778,192 |
| 3% 5/15/47 | | 11,507,000 | 9,256,842 |
| 3% 2/15/48 | | 85,947,000 | 68,720,669 |
| 3% 8/15/48 | | 105,591,000 | 84,175,825 |
| 3% 2/15/49 | | 37,900,000 | 30,149,746 |
| 3% 8/15/52 | | 90,950,000 | 72,145,377 |
| 3.125% 11/15/41 | | 64,820,000 | 56,119,941 |
| 3.125% 2/15/42 | | 106,856,000 | 92,042,252 |
| 3.125% 2/15/43 | | 47,347,000 | 40,170,970 |
| 3.125% 8/15/44 | | 36,284,300 | 30,403,692 |
| 3.125% 5/15/48 | | 88,953,000 | 72,660,007 |
| 3.25% 5/15/42 | | 147,200,000 | 128,259,499 |
| 3.375% 8/15/42 | | 34,950,000 | 30,925,289 |
| 3.375% 5/15/44 | | 22,229,300 | 19,399,406 |
| 3.375% 11/15/48 | | 70,244,000 | 59,858,315 |
| 3.625% 8/15/43 | | 123,303,000 | 112,143,116 |
| 3.625% 2/15/44 | | 73,325,000 | 66,516,659 |
| 3.625% 2/15/53 | | 79,450,000 | 71,266,030 |
| 3.625% 5/15/53 | | 109,600,000 | 98,378,844 |
| 3.75% 8/15/41 | | 95,131,000 | 90,017,709 |
| 3.75% 11/15/43 | | 80,368,000 | 74,318,424 |
| 3.875% 8/15/40 | | 19,822,000 | 19,243,600 |
| 3.875% 2/15/43 | | 7,850,000 | 7,428,982 |
| 3.875% 5/15/43 | | 68,600,000 | 64,751,938 |
| 4% 11/15/42 | | 76,850,000 | 74,148,242 |
| 4% 11/15/52 | | 100,200,000 | 96,160,688 |
| 4.125% 8/15/53 | | 117,400,000 | 115,285,883 |
| 4.25% 5/15/39 | | 6,131,000 | 6,254,338 |
| 4.25% 11/15/40 | | 37,399,000 | 37,929,306 |
| 4.25% 2/15/54 | | 82,600,000 | 82,922,656 |
| 4.25% 8/15/54 | | 39,600,000 | 39,847,500 |
| 4.375% 11/15/39 | | 9,343,000 | 9,644,093 |
| 4.375% 5/15/40 | | 23,064,000 | 23,800,967 |
| 4.375% 5/15/41 | | 61,803,000 | 63,434,985 |
| 4.375% 8/15/43 | | 66,350,000 | 67,003,133 |
| 4.5% 2/15/36 (b) | | 26,565,000 | 28,145,410 |
| 4.5% 5/15/38 | | 510,000 | 536,655 |
| 4.5% 8/15/39 | | 8,833,000 | 9,242,906 |
| 4.5% 2/15/44 | | 55,350,000 | 56,733,750 |
| 4.625% 2/15/40 | | 14,372,000 | 15,243,864 |
| 4.625% 5/15/44 | | 26,800,000 | 27,909,688 |
| 4.625% 5/15/54 | | 110,150,000 | 117,722,813 |
| 4.75% 2/15/37 (b) | | 22,478,000 | 24,277,118 |
| 4.75% 2/15/41 | | 38,071,000 | 40,924,838 |
| 4.75% 11/15/43 | | 52,200,000 | 55,340,156 |
| 4.75% 11/15/53 | | 109,900,000 | 119,722,313 |
| 5% 5/15/37 | | 7,319,000 | 8,081,491 |
| TOTAL U.S. GOVERNMENT AND GOVERNMENT AGENCY OBLIGATIONS (Cost $5,143,552,501) | | | 4,526,200,563 |
| | | | |
| Money Market Funds - 1.6% |
| | | Shares | Value ($) |
| Fidelity Cash Central Fund 5.39% (c) | | 40,114,159 | 40,122,182 |
| Fidelity Securities Lending Cash Central Fund 5.39% (c)(d) | | 32,628,457 | 32,631,720 |
| TOTAL MONEY MARKET FUNDS (Cost $72,753,902) | | | 72,753,902 |
| | | | |
| TOTAL INVESTMENT IN SECURITIES - 100.9% (Cost $5,216,306,403) | 4,598,954,465 |
NET OTHER ASSETS (LIABILITIES) - (0.9)% | (39,136,000) |
| NET ASSETS - 100.0% | 4,559,818,465 |
| | |
Legend
| (a) | Amount is stated in United States dollars unless otherwise noted. |
| (b) | Security or a portion of the security is on loan at period end. |
| (c) | Affiliated fund that is generally available only to investment companies and other accounts managed by Fidelity Investments. The rate quoted is the annualized seven-day yield of the fund at period end. A complete unaudited listing of the fund's holdings as of its most recent quarter end is available upon request. In addition, each Fidelity Central Fund's financial statements are available on the SEC's website or upon request. |
| (d) | Investment made with cash collateral received from securities on loan. |
Affiliated Central Funds
Fiscal year to date information regarding the Fund's investments in Fidelity Central Funds, including the ownership percentage, is presented below.
| Affiliate | Value, beginning of period ($) | Purchases ($) | Sales Proceeds ($) | Dividend Income ($) | Realized Gain (loss) ($) | Change in Unrealized appreciation (depreciation) ($) | Value, end of period ($) | % ownership, end of period |
| Fidelity Cash Central Fund 5.39% | 45,152,929 | 229,574,043 | 234,604,813 | 359,101 | 23 | - | 40,122,182 | 0.1% |
| Fidelity Securities Lending Cash Central Fund 5.39% | - | 134,475,483 | 101,843,763 | 13,469 | - | - | 32,631,720 | 0.1% |
| Total | 45,152,929 | 364,049,526 | 336,448,576 | 372,570 | 23 | - | 72,753,902 | |
| | | | | | | | | |
Amounts in the dividend income column in the above table include any capital gain distributions from underlying funds, which are presented in the corresponding line item in the Statement of Operations, if applicable.
Amounts in the dividend income column for Fidelity Securities Lending Cash Central Fund represents the income earned on investing cash collateral, less rebates paid to borrowers and any lending agent fees associated with the loan, plus any premium payments received for lending certain types of securities.
Amounts included in the purchases and sales proceeds columns may include in-kind transactions, if applicable.
Investment Valuation
The following is a summary of the inputs used, as of August 31, 2024, involving the Fund's assets and liabilities carried at fair value. The inputs or methodology used for valuing securities may not be an indication of the risk associated with investing in those securities. For more information on valuation inputs, and their aggregation into the levels used below, please refer to the Investment Valuation section in the accompanying Notes to Financial Statements.
| Valuation Inputs at Reporting Date: |
| Description | Total ($) | Level 1 ($) | Level 2 ($) | Level 3 ($) |
Investments in Securities: | | | | |
|
| U.S. Government and Government Agency Obligations | 4,526,200,563 | - | 4,526,200,563 | - |
|
| Money Market Funds | 72,753,902 | 72,753,902 | - | - |
| Total Investments in Securities: | 4,598,954,465 | 72,753,902 | 4,526,200,563 | - |
Fidelity® Long-Term Treasury Bond Index Fund
Financial Statements (Unaudited)
| Statement of Assets and Liabilities |
| As of August 31, 2024 (Unaudited) |
| Assets | | | | |
| Investment in securities, at value (including securities loaned of $31,771,098) - See accompanying schedule: | | | | |
Unaffiliated issuers (cost $5,143,552,501) | $ | 4,526,200,563 | | |
Fidelity Central Funds (cost $72,753,902) | | 72,753,902 | | |
| | | | | |
| | | | | |
| Total Investment in Securities (cost $5,216,306,403) | | | $ | 4,598,954,465 |
| Receivable for investments sold | | | | 14,628,298 |
| Receivable for fund shares sold | | | | 14,976,079 |
| Interest receivable | | | | 29,320,210 |
| Distributions receivable from Fidelity Central Funds | | | | 125,268 |
Total assets | | | | 4,658,004,320 |
| Liabilities | | | | |
| Payable for investments purchased | $ | 58,963,484 | | |
| Payable for fund shares redeemed | | 5,766,374 | | |
| Distributions payable | | 711,261 | | |
| Accrued management fee | | 113,016 | | |
| Collateral on securities loaned | | 32,631,720 | | |
| Total liabilities | | | | 98,185,855 |
| Net Assets | | | $ | 4,559,818,465 |
| Net Assets consist of: | | | | |
| Paid in capital | | | $ | 5,680,832,060 |
| Total accumulated earnings (loss) | | | | (1,121,013,595) |
| Net Assets | | | $ | 4,559,818,465 |
Net Asset Value, offering price and redemption price per share ($4,559,818,465 ÷ 457,153,282 shares) | | | $ | 9.97 |
| Statement of Operations |
Six months ended August 31, 2024 (Unaudited) |
| Investment Income | | | | |
| Interest | | | $ | 83,881,467 |
| Income from Fidelity Central Funds (including $13,469 from security lending) | | | | 372,570 |
| Total income | | | | 84,254,037 |
| Expenses | | | | |
| Management fee | $ | 631,693 | | |
| Independent trustees' fees and expenses | | 5,838 | | |
| Total expenses before reductions | | 637,531 | | |
| Expense reductions | | (217) | | |
| Total expenses after reductions | | | | 637,314 |
| Net Investment income (loss) | | | | 83,616,723 |
| Realized and Unrealized Gain (Loss) | | | | |
| Net realized gain (loss) on: | | | | |
| Investment Securities: | | | | |
| Unaffiliated issuers | | (96,701,490) | | |
| Fidelity Central Funds | | 23 | | |
| Total net realized gain (loss) | | | | (96,701,467) |
| Change in net unrealized appreciation (depreciation) on investment securities | | | | 227,966,887 |
| Net gain (loss) | | | | 131,265,420 |
| Net increase (decrease) in net assets resulting from operations | | | $ | 214,882,143 |
| Statement of Changes in Net Assets |
| |
| | Six months ended August 31, 2024 (Unaudited) | | Year ended February 29, 2024 |
| Increase (Decrease) in Net Assets | | | | |
| Operations | | | | |
| Net investment income (loss) | $ | 83,616,723 | $ | 131,231,123 |
| Net realized gain (loss) | | (96,701,467) | | (200,459,923) |
| Change in net unrealized appreciation (depreciation) | | 227,966,887 | | (32,466,761) |
| Net increase (decrease) in net assets resulting from operations | | 214,882,143 | | (101,695,561) |
| Distributions to shareholders | | (75,988,836) | | (120,865,981) |
| | | | | |
| Share transactions | | | | |
| Proceeds from sales of shares | | 915,818,602 | | 2,242,343,907 |
| Reinvestment of distributions | | 71,205,882 | | 113,470,210 |
| Cost of shares redeemed | | (648,801,253) | | (1,253,838,113) |
| | | | | |
Net increase (decrease) in net assets resulting from share transactions | | 338,223,231 | | 1,101,976,004 |
| Total increase (decrease) in net assets | | 477,116,538 | | 879,414,462 |
| | | | | |
| Net Assets | | | | |
| Beginning of period | | 4,082,701,927 | | 3,203,287,465 |
| End of period | $ | 4,559,818,465 | $ | 4,082,701,927 |
| | | | | |
| Other Information | | | | |
| Shares | | | | |
| Sold | | 94,819,284 | | 228,087,448 |
| Issued in reinvestment of distributions | | 7,431,744 | | 11,509,987 |
| Redeemed | | (67,592,126) | | (128,464,955) |
| Net increase (decrease) | | 34,658,902 | | 111,132,480 |
| | | | | |
Financial Highlights
Fidelity® Long-Term Treasury Bond Index Fund |
| |
| | Six months ended (Unaudited) August 31, 2024 | | Years ended February 28, 2024 A | | 2023 | | 2022 | | 2021 | | 2020 A |
Selected Per-Share Data | | | | | | | | | | | | |
| Net asset value, beginning of period | $ | 9.66 | $ | 10.29 | $ | 13.94 | $ | 14.49 | $ | 16.10 | $ | 12.53 |
| Income from Investment Operations | | | | | | | | | | | | |
Net investment income (loss) B,C | | .190 | | .357 | | .320 | | .310 | | .336 | | .378 |
| Net realized and unrealized gain (loss) | | .293 | | (.659) | | (3.663) | | (.448) | | (1.296) | | 3.562 |
| Total from investment operations | | .483 | | (.302) | | (3.343) | | (.138) | | (.960) | | 3.940 |
| Distributions from net investment income | | (.173) | | (.328) | | (.307) | | (.301) | | (.330) | | (.370) |
| Distributions from net realized gain | | - | | - | | - | | (.111) | | (.320) | | - |
| Total distributions | | (.173) | | (.328) | | (.307) | | (.412) | | (.650) | | (.370) |
| Net asset value, end of period | $ | 9.97 | $ | 9.66 | $ | 10.29 | $ | 13.94 | $ | 14.49 | $ | 16.10 |
Total Return D,E | | | | (2.96)% | | (24.10)% | | (1.02)% | | (6.32)% | | 31.86% |
Ratios to Average Net Assets C,F,G | | | | | | | | | | | | |
| Expenses before reductions | | .03% H | | .03% | | .03% | | .03% | | .03% | | .03% |
| Expenses net of fee waivers, if any | | | | .03% | | .03% | | .03% | | .03% | | .03% |
| Expenses net of all reductions | | .03% H | | .03% | | .03% | | .03% | | .03% | | .03% |
| Net investment income (loss) | | 3.93% H | | 3.61% | | 2.85% | | 2.15% | | 2.04% | | 2.69% |
| Supplemental Data | | | | | | | | | | | | |
| Net assets, end of period (000 omitted) | $ | 4,559,818 | $ | 4,082,702 | $ | 3,203,287 | $ | 3,858,260 | $ | 3,011,856 | $ | 2,691,210 |
Portfolio turnover rate I | | | | 17% | | 26% | | 22% | | 41% | | 54% |
AFor the year ended February 29.
BCalculated based on average shares outstanding during the period.
CNet investment income (loss) is affected by the timing of the declaration of dividends by any underlying mutual funds or exchange-traded funds (ETFs). Net investment income (loss) of any mutual funds or ETFs is not included in the Fund's net investment income (loss) ratio.
DTotal returns for periods of less than one year are not annualized.
ETotal returns would have been lower if certain expenses had not been reduced during the applicable periods shown.
FFees and expenses of any underlying mutual funds or exchange-traded funds (ETFs) are not included in the Fund's expense ratio. The Fund indirectly bears its proportionate share of these expenses. For additional expense information related to investments in Fidelity Central Funds, please refer to the "Investments in Fidelity Central Funds" note found in the Notes to Financial Statements section of the most recent Annual or Semi-Annual report.
GExpense ratios reflect operating expenses of the class. Expenses before reductions do not reflect amounts reimbursed, waived, or reduced through arrangements with the investment adviser, brokerage services, or other offset arrangements, if applicable, and do not represent the amount paid by the class during periods when reimbursements, waivers or reductions occur.
HAnnualized.
IAmount does not include the portfolio activity of any underlying mutual funds or exchange-traded funds (ETFs).
Notes to Financial Statements
(Unaudited)For the period ended August 31, 2024
1. Organization.
Fidelity Short-Term Treasury Bond Index Fund, Fidelity Intermediate Treasury Bond Index Fund and Fidelity Long-Term Treasury Bond Index Fund (the Funds) are funds of Fidelity Salem Street Trust (the Trust). Each Fund is authorized to issue an unlimited number of shares. Share transactions on the Statement of Changes in Net Assets may contain exchanges between affiliated funds. The Trust is registered under the Investment Company Act of 1940, as amended (the 1940 Act), as an open-end management investment company organized as a Massachusetts business trust.
2. Investments in Fidelity Central Funds.
Funds may invest in Fidelity Central Funds, which are open-end investment companies generally available only to other investment companies and accounts managed by the investment adviser and its affiliates. The Schedule of Investments lists any Fidelity Central Funds held as an investment as of period end, but does not include the underlying holdings of each Fidelity Central Fund. An investing fund indirectly bears its proportionate share of the expenses of the underlying Fidelity Central Funds.
Based on its investment objective, each Fidelity Central Fund may invest or participate in various investment vehicles or strategies that are similar to those of the investing fund. These strategies are consistent with the investment objectives of the investing fund and may involve certain economic risks which may cause a decline in value of each of the Fidelity Central Funds and thus a decline in the value of the investing fund.
| Fidelity Central Fund | Investment Manager | Investment Objective | Investment Practices | Expense RatioA |
| Fidelity Money Market Central Funds | Fidelity Management & Research Company LLC (FMR) | Each fund seeks to obtain a high level of current income consistent with the preservation of capital and liquidity. | Short-term Investments | Less than .005% |
A Expenses expressed as a percentage of average net assets and are as of each underlying Central Fund's most recent annual or semi-annual shareholder report.
A complete unaudited list of holdings for each Fidelity Central Fund is available upon request or at the Securities and Exchange Commission website at www.sec.gov. In addition, the financial statements of the Fidelity Central Funds which contain the significant accounting policies (including investment valuation policies) of those funds, and are not covered by the Report of Independent Registered Public Accounting Firm, are available on the Securities and Exchange Commission website or upon request.
3. Significant Accounting Policies.
Each Fund is an investment company and applies the accounting and reporting guidance of the Financial Accounting Standards Board (FASB) Accounting Standards Codification Topic 946 Financial Services - Investment Companies. The financial statements have been prepared in conformity with accounting principles generally accepted in the United States of America (GAAP), which require management to make certain estimates and assumptions at the date of the financial statements. Actual results could differ from those estimates. Subsequent events, if any, through the date that the financial statements were issued have been evaluated in the preparation of the financial statements. Each Fund's Schedule of Investments lists any underlying mutual funds or exchange-traded funds (ETFs) but does not include the underlying holdings of these funds. The following summarizes the significant accounting policies of each Fund:
Investment Valuation. Investments are valued as of 4:00 p.m. Eastern time on the last calendar day of the period. The Board of Trustees (the Board) has designated each Fund's investment adviser as the valuation designee responsible for the fair valuation function and performing fair value determinations as needed. The investment adviser has established a Fair Value Committee (the Committee) to carry out the day-to-day fair valuation responsibilities and has adopted policies and procedures to govern the fair valuation process and the activities of the Committee. In accordance with these fair valuation policies and procedures, which have been approved by the Board, each Fund attempts to obtain prices from one or more third party pricing services or brokers to value its investments. When current market prices, quotations or currency exchange rates are not readily available or reliable, investments will be fair valued in good faith by the Committee, in accordance with the policies and procedures. Factors used in determining fair value vary by investment type and may include market or investment specific events, transaction data, estimated cash flows, and market observations of comparable investments. The frequency that the fair valuation procedures are used cannot be predicted and they may be utilized to a significant extent. The Committee manages each Fund's fair valuation practices and maintains the fair valuation policies and procedures. Each Fund's investment adviser reports to the Board information regarding the fair valuation process and related material matters.
Each Fund categorizes the inputs to valuation techniques used to value its investments into a disclosure hierarchy consisting of three levels as shown below:
Level 1 - unadjusted quoted prices in active markets for identical investments
Level 2 - other significant observable inputs (including quoted prices for similar investments, interest rates, prepayment speeds, etc.)
Level 3 - unobservable inputs (including the Fund's own assumptions based on the best information available)
Valuation techniques used to value each Fund's investments by major category are as follows:
Debt securities, including restricted securities, are valued based on evaluated prices received from third party pricing services or from brokers who make markets in such securities. U.S. government and government agency obligations are valued by pricing services who utilize matrix pricing which considers yield or price of bonds of comparable quality, coupon, maturity and type or by broker-supplied prices. When independent prices are unavailable or unreliable, debt securities may be valued utilizing pricing methodologies which consider similar factors that would be used by third party pricing services. Debt securities are generally categorized as Level 2 in the hierarchy but may be Level 3 depending on the circumstances.
Investments in open-end mutual funds, including Fidelity Central Funds, are valued at their closing net asset value (NAV) each business day and are categorized as Level 1 in the hierarchy.
Changes in valuation techniques may result in transfers in or out of an assigned level within the disclosure hierarchy. The aggregate value of investments by input level as of August 31, 2024 is included at the end of each Fund's Schedule of Investments.
Investment Transactions and Income. For financial reporting purposes, the Funds' investment holdings and NAV include trades executed through the end of the last business day of the period. The NAV per share for processing shareholder transactions is calculated as of the close of business of the New York Stock Exchange (NYSE), normally 4:00 p.m. Eastern time and includes trades executed through the end of the prior business day. Gains and losses on securities sold are determined on the basis of identified cost. Income and capital gain distributions from Fidelity Central Funds, if any, are recorded on the ex-dividend date. Interest income is accrued as earned and includes coupon interest and amortization of premium and accretion of discount on debt securities as applicable.
Expenses. Expenses directly attributable to a fund are charged to that fund. Expenses attributable to more than one fund are allocated among the respective funds on the basis of relative net assets or other appropriate methods. Expenses included in the accompanying financial statements reflect the expenses of that fund and do not include any expenses associated with any underlying mutual funds or exchange-traded funds. Although not included in a fund's expenses, a fund indirectly bears its proportionate share of these expenses through the net asset value of each underlying mutual fund or exchange-traded fund. Expense estimates are accrued in the period to which they relate and adjustments are made when actual amounts are known.
Income Tax Information and Distributions to Shareholders. Each year, each Fund intends to qualify as a regulated investment company under Subchapter M of the Internal Revenue Code, including distributing substantially all of its taxable income and realized gains. As a result, no provision for U.S. Federal income taxes is required. Each Fund files a U.S. federal tax return, in addition to state and local tax returns as required. Each Fund's federal income tax returns are subject to examination by the Internal Revenue Service (IRS) for a period of three fiscal years after they are filed. State and local tax returns may be subject to examination for an additional fiscal year depending on the jurisdiction.
Distributions are declared and recorded daily and paid monthly from net investment income. Distributions from realized gains, if any, are declared and recorded on the ex-dividend date. Income and capital gain distributions are determined in accordance with income tax regulations, which may differ from GAAP.
Capital accounts within the financial statements are adjusted for permanent book-tax differences. These adjustments have no impact on net assets or the results of operations. Capital accounts are not adjusted for temporary book-tax differences which will reverse in a subsequent period.
Book-tax differences are primarily due to market discount, capital loss carryforwards and losses deferred due to wash sales.
As of period end, the cost and unrealized appreciation (depreciation) in securities, and derivatives if applicable, for federal income tax purposes were as follows for each Fund:
| | Tax cost ($) | Gross unrealized appreciation ($) | Gross unrealized depreciation ($) | Net unrealized appreciation (depreciation)($) |
Fidelity Short-Term Treasury Bond Index Fund | 3,313,806,401 | 87,984,848 | (29,503,075) | 58,481,773 |
Fidelity Intermediate Treasury Bond Index Fund | 9,007,519,496 | 203,757,709 | (162,202,171) | 41,555,538 |
Fidelity Long-Term Treasury Bond Index Fund | 5,244,519,367 | 69,544,117 | (715,109,019) | (645,564,902) |
Capital loss carryforwards are only available to offset future capital gains of the Funds to the extent provided by regulations and may be limited. The capital loss carryforward information presented below, including any applicable limitation, is estimated as of prior fiscal period end and is subject to adjustment.
| | Short-term ($) | Long-term ($) | Total capital loss carryforward ($) |
Fidelity Short-Term Treasury Bond Index Fund | (38,319,683) | (121,964,018) | (160,283,701) |
Fidelity Intermediate Treasury Bond Index Fund | (69,810,934) | (352,378,722) | (422,189,656) |
Fidelity Long-Term Treasury Bond Index Fund | (41,694,286) | (340,761,319) | (382,455,605) |
4. Fees and Other Transactions with Affiliates.
Management Fee. Fidelity Management & Research Company LLC (the investment adviser) and its affiliates provide the Funds with investment management related services for which the Funds pay a monthly management fee. The management fee is based on an annual rate of .03% of each Fund's average net assets. Under the management contract, the investment adviser pays all other operating expenses, except the compensation of the independent Trustees and certain other expenses such as interest expense.
Interfund Trades. Funds may purchase from or sell securities to other Fidelity Funds under procedures adopted by the Board. The procedures have been designed to ensure these interfund trades are executed in accordance with Rule 17a-7 of the 1940 Act. During the period, there were no interfund trades.
Sub-Advisory Arrangements. Effective March 1, 2024, the Fund's sub-advisory agreements with FMR Investment Management (UK) Limited, Fidelity Management & Research (Hong Kong) Limited, and Fidelity Management & Research (Japan) Limited were amended to provide that the investment adviser pays each sub-adviser monthly fees equal to 110% of the sub-adviser's costs for providing sub-advisory services.
5. Committed Line of Credit.
Certain Funds participate with other funds managed by the investment adviser or an affiliate in a $4.25 billion credit facility (the "line of credit") to be utilized for temporary or emergency purposes to fund shareholder redemptions or for other short-term liquidity purposes. The commitment fees on the pro-rata portion of the line of credit are borne by the investment adviser. During the period, there were no borrowings on this line of credit.
6. Security Lending.
Funds lend portfolio securities from time to time in order to earn additional income. Lending agents are used, including National Financial Services (NFS), an affiliate of the investment adviser. Pursuant to a securities lending agreement, NFS will receive a fee, which is capped at 9.9% of a fund's daily lending revenue, for its services as lending agent. A fund may lend securities to certain qualified borrowers, including NFS. On the settlement date of the loan, a fund receives collateral (in the form of U.S. Treasury obligations, letters of credit and/or cash) against the loaned securities and maintains collateral in an amount not less than 100% of the market value of the loaned securities during the period of the loan. The market value of the loaned securities is determined at the close of business of a fund and any additional required collateral is delivered to a fund on the next business day. A fund or borrower may terminate the loan at any time, and if the borrower defaults on its obligation to return the securities loaned because of insolvency or other reasons, a fund may apply collateral received from the borrower against the obligation. A fund may experience delays and costs in recovering the securities loaned. Any cash collateral received is invested in the Fidelity Securities Lending Cash Central Fund. Any loaned securities are identified as such in the Schedule of Investments, and the value of loaned securities and cash collateral at period end, as applicable, are presented in the Statement of Assets and Liabilities. Security lending income represents the income earned on investing cash collateral, less rebates paid to borrowers and any lending agent fees associated with the loan, plus any premium payments received for lending certain types of securities. Security lending income is presented in the Statement of Operations as a component of income from Fidelity Central Funds. Affiliated security lending activity, if any, was as follows:
| | Total Security Lending Fees Paid to NFS ($) | Security Lending Income From Securities Loaned to NFS ($) | Value of Securities Loaned to NFS at Period End ($) |
| Fidelity Short-Term Treasury Bond Index Fund | 47 | - | - |
| Fidelity Intermediate Treasury Bond Index Fund | 6,976 | - | - |
| Fidelity Long-Term Treasury Bond Index Fund | 1,442 | - | - |
7. Expense Reductions.
Through arrangements with each applicable Fund's custodian, credits realized as a result of certain uninvested cash balances were used to reduce each applicable Fund's expenses. All of the applicable expense reductions are noted in the table below.
| | | Custodian credits ($) | |
Fidelity Short-Term Treasury Bond Index Fund | | 33 | |
Fidelity Intermediate Treasury Bond Index Fund | | 1 | |
Fidelity Long-Term Treasury Bond Index Fund | | 217 | |
8. Other.
A fund's organizational documents provide former and current trustees and officers with a limited indemnification against liabilities arising in connection with the performance of their duties to the fund. In the normal course of business, a fund may also enter into contracts that provide general indemnifications. A fund's maximum exposure under these arrangements is unknown as this would be dependent on future claims that may be made against a fund. The risk of material loss from such claims is considered remote.
At the end of the period, the following mutual funds managed by the investment adviser or its affiliates were the owners of record of 10% or more of the total outstanding shares.
| | Strategic Advisers Fidelity Core Income Fund |
Fidelity Intermediate Treasury Bond Index Fund | 29% |
Fidelity Short-Term Treasury Bond Index Fund | 13% |
Affiliated Redemptions In-Kind. Effective subsequent to period end, shares of the Fund were redeemed in-kind for investments, including accrued interest and cash, if any. The net realized gain or (loss) on the investments delivered through in-kind redemptions are shown in the table below. There was no gain or (loss) for federal income tax purposes.
| | Shares | Total net realized gain or (loss) ($) | Total Proceeds ($) |
Fidelity Intermediate Treasury Bond Index Fund | 252,881,098 | 98,486,612 | 2,528,810,977 |
| | | | |
9. Risk and Uncertainties.
Many factors affect a fund's performance. Developments that disrupt global economies and financial markets, such as pandemics, epidemics, outbreaks of infectious diseases, war, terrorism, and environmental disasters, may significantly affect a fund's investment performance. The effects of these developments to a fund will be impacted by the types of securities in which a fund invests, the financial condition, industry, economic sector, and geographic location of an issuer, and a fund's level of investment in the securities of that issuer. Significant concentrations in security types, issuers, industries, sectors, and geographic locations may magnify the factors that affect a fund's performance.
Item 8: Changes in and Disagreements with Accountants for Open-End Management Investment Companies
(Unaudited)
Note: This is not applicable for any fund included in this document.
Item 9: Proxy Disclosures for Open-End Management Investment Companies
(Unaudited)
Note: This is not applicable for any fund included in this document.
Item 10: Remuneration Paid to Directors, Officers, and others of Open-End Management Investment Companies
(Unaudited)
Note: This information is disclosed as part of the financial statements for each Fund as part of Item 7: Financial Statements and Financial Highlights for Open-End Management Investment companies.
Item 11: Statement Regarding Basis for Approval of Investment Advisory Contract
(Unaudited)
Note: This is not applicable for any fund included in this document.
1.9885079.106
LBX-I-SANN-1024
Fidelity® SAI U.S. Treasury Bond Index Fund
Semi-Annual Report
August 31, 2024
Offered exclusively to certain clients of the Adviser, or its affiliates, including Strategic Advisers LLC (Strategic Advisers) - not available for sale to the general public. Fidelity® SAI is a product name of Fidelity® funds dedicated to certain programs affiliated with Strategic Advisers.
Contents
To view a fund's proxy voting guidelines and proxy voting record for the 12-month period ended June 30, visit http://www.fidelity.com/proxyvotingresults or visit the Securities and Exchange Commission's (SEC) web site at http://www.sec.gov.
You may also call 1-800-544-3455 to request a free copy of the proxy voting guidelines.
BLOOMBERG ® is a trademark and service mark of Bloomberg Finance L.P. and its affiliates (collectively "Bloomberg"). Bloomberg or Bloomberg's licensors own all proprietary rights in the Bloomberg Indices. Neither Bloomberg nor Bloomberg's licensors approves or endorses this material, or guarantees the accuracy or completeness of any information herein, or makes any warranty, express or implied, as to the results to be obtained therefrom and, to the maximum extent allowed by law, neither shall have any liability or responsibility for injury or damages arising in connection therewith.
Standard & Poor's, S&P and S&P 500 are registered service marks of The McGraw-Hill Companies, Inc. and have been licensed for use by Fidelity Distributors Corporation.
Other third-party marks appearing herein are the property of their respective owners.
All other marks appearing herein are registered or unregistered trademarks or service marks of FMR LLC or an affiliated company. © 2024 FMR LLC. All rights reserved.
This report and the financial statements contained herein are submitted for the general information of the shareholders of the Fund. This report is not authorized for distribution to prospective investors in the Fund unless preceded or accompanied by an effective prospectus.
A fund files its complete schedule of portfolio holdings with the SEC for the first and third quarters of each fiscal year on Form N-PORT. Forms N-PORT are available on the SEC's web site at http://www.sec.gov. A fund's Forms N-PORT may be reviewed and copied at the SEC's Public Reference Room in Washington, DC. Information regarding the operation of the SEC's Public Reference Room may be obtained by calling 1-800-SEC-0330.
For a complete list of a fund's portfolio holdings, view the most recent holdings listing, semiannual report, or annual report on Fidelity's web site at http://www.fidelity.com, http://www.institutional.fidelity.com, or http://www.401k.com, as applicable.
NOT FDIC INSURED •MAY LOSE VALUE •NO BANK GUARANTEE
Neither the Fund nor Fidelity Distributors Corporation is a bank.
Item 7: Financial Statements and Financial Highlights for Open-End Management Investment Companies (Semi-Annual Report)
Fidelity® SAI U.S. Treasury Bond Index Fund
Schedule of Investments August 31, 2024 (Unaudited)
Showing Percentage of Net Assets
| U.S. Government and Government Agency Obligations - 99.2% |
| | | Principal Amount (a) | Value ($) |
| U.S. Treasury Obligations - 99.2% | | | |
| U.S. Treasury Bonds: | | | |
| 1.125% 5/15/40 | | 15,484,000 | 10,022,261 |
| 1.125% 8/15/40 | | 121,437,000 | 77,909,425 |
| 1.25% 5/15/50 | | 12,672,000 | 6,657,255 |
| 1.375% 11/15/40 | | 60,934,300 | 40,468,944 |
| 1.375% 8/15/50 | | 4,170,000 | 2,258,316 |
| 1.625% 11/15/50 | | 92,037,500 | 53,219,966 |
| 1.75% 8/15/41 | | 142,327,000 | 98,933,944 |
| 1.875% 2/15/41 | | 14,329,000 | 10,304,566 |
| 1.875% 2/15/51 | | 158,731,000 | 97,886,184 |
| 1.875% 11/15/51 | | 158,063,000 | 96,986,469 |
| 2% 11/15/41 | | 95,700,000 | 69,072,222 |
| 2% 2/15/50 | | 94,678,000 | 60,616,111 |
| 2% 8/15/51 | | 140,345,000 | 88,976,538 |
| 2.25% 5/15/41 | | 75,633,000 | 57,489,943 |
| 2.25% 8/15/46 | | 1,600,000 | 1,124,750 |
| 2.25% 8/15/49 | | 25,580,000 | 17,406,391 |
| 2.25% 2/15/52 | | 138,800,000 | 93,380,953 |
| 2.375% 2/15/42 | | 97,200,000 | 74,201,197 |
| 2.375% 11/15/49 | | 84,960,000 | 59,335,931 |
| 2.375% 5/15/51 | | 189,037,000 | 131,166,572 |
| 2.5% 2/15/45 | | 4,601,000 | 3,455,423 |
| 2.5% 2/15/46 | | 15,623,000 | 11,599,467 |
| 2.5% 5/15/46 | | 24,683,000 | 18,271,205 |
| 2.75% 8/15/42 | | 59,738,000 | 48,198,765 |
| 2.75% 11/15/42 | | 32,626,000 | 26,223,148 |
| 2.75% 8/15/47 | | 12,031,000 | 9,220,634 |
| 2.75% 11/15/47 | | 318,000 | 243,195 |
| 2.875% 5/15/43 | | 56,884,000 | 46,282,689 |
| 2.875% 8/15/45 | | 45,054,000 | 35,992,162 |
| 2.875% 11/15/46 | | 4,289,000 | 3,387,305 |
| 2.875% 5/15/49 | | 34,111,000 | 26,472,002 |
| 2.875% 5/15/52 | | 33,900,000 | 26,198,344 |
| 3% 5/15/42 | | 33,338,000 | 28,042,988 |
| 3% 11/15/44 | | 77,500,000 | 63,534,863 |
| 3% 5/15/45 | | 39,700,000 | 32,454,750 |
| 3% 11/15/45 | | 57,800,000 | 47,079,906 |
| 3% 2/15/47 | | 77,389,000 | 62,361,628 |
| 3% 5/15/47 | | 82,292,000 | 66,200,056 |
| 3% 2/15/48 | | 23,859,000 | 19,076,948 |
| 3% 8/15/48 | | 39,808,000 | 31,734,440 |
| 3% 2/15/49 | | 78,711,000 | 62,615,215 |
| 3% 8/15/52 | | 101,400,000 | 80,434,758 |
| 3.125% 11/15/41 | | 50,864,000 | 44,037,098 |
| 3.125% 2/15/42 | | 11,800,000 | 10,164,133 |
| 3.125% 2/15/43 | | 67,701,000 | 57,440,067 |
| 3.125% 5/15/48 | | 99,204,500 | 81,033,801 |
| 3.25% 5/15/42 | | 144,500,000 | 125,906,913 |
| 3.375% 8/15/42 | | 70,200,000 | 62,116,031 |
| 3.375% 5/15/44 | | 61,800,000 | 53,932,570 |
| 3.375% 11/15/48 | | 8,391,300 | 7,150,633 |
| 3.5% 2/15/39 | | 315,000 | 296,592 |
| 3.625% 8/15/43 | | 33,301,000 | 30,286,999 |
| 3.625% 2/15/44 | | 38,656,000 | 35,066,730 |
| 3.625% 2/15/53 | | 63,100,000 | 56,600,207 |
| 3.625% 5/15/53 | | 95,300,000 | 85,542,918 |
| 3.75% 11/15/43 | | 12,484,000 | 11,544,286 |
| 3.875% 2/15/43 | | 31,600,000 | 29,905,203 |
| 3.875% 5/15/43 | | 17,000,000 | 16,046,399 |
| 4% 11/15/42 | | 109,500,000 | 105,650,391 |
| 4% 11/15/52 | | 117,700,000 | 112,955,219 |
| 4.125% 8/15/53 | | 79,800,000 | 78,362,977 |
| 4.25% 5/15/39 | | 1,598,000 | 1,630,147 |
| 4.25% 11/15/40 | | 17,780,000 | 18,032,115 |
| 4.25% 2/15/54 | | 45,900,000 | 46,079,297 |
| 4.25% 8/15/54 | | 27,700,000 | 27,873,125 |
| 4.375% 2/15/38 | | 6,284,000 | 6,538,060 |
| 4.375% 11/15/39 | | 6,740,000 | 6,957,207 |
| 4.375% 5/15/41 | | 7,517,000 | 7,715,496 |
| 4.375% 8/15/43 | | 6,500,000 | 6,563,984 |
| 4.5% 2/15/36 (b) | | 24,732,200 | 26,203,573 |
| 4.5% 5/15/38 | | 24,300,000 | 25,570,055 |
| 4.5% 8/15/39 | | 22,931,000 | 23,995,142 |
| 4.5% 2/15/44 | | 29,300,000 | 30,032,500 |
| 4.625% 2/15/40 | | 4,405,000 | 4,672,225 |
| 4.625% 5/15/44 | | 29,300,000 | 30,513,203 |
| 4.625% 5/15/54 | | 63,100,000 | 67,438,125 |
| 4.75% 2/15/37 | | 13,000 | 14,041 |
| 4.75% 2/15/41 | | 33,300,000 | 35,796,199 |
| 4.75% 11/15/43 | | 7,400,000 | 7,845,156 |
| 4.75% 11/15/53 | | 37,400,000 | 40,742,625 |
| 5% 5/15/37 | | 1,967,000 | 2,171,921 |
| 5.25% 11/15/28 | | 31,601,000 | 33,447,683 |
| 5.25% 2/15/29 | | 10,374,000 | 11,048,715 |
| 6% 2/15/26 | | 3,771,000 | 3,882,804 |
| 6.125% 11/15/27 | | 139,604,000 | 149,490,799 |
| 6.25% 5/15/30 | | 116,378,000 | 131,029,809 |
| 6.375% 8/15/27 | | 21,500,000 | 23,080,586 |
| 6.5% 11/15/26 | | 39,000 | 41,421 |
| 6.625% 2/15/27 | | 9,550,000 | 10,205,443 |
| 6.75% 8/15/26 | | 2,423,000 | 2,556,833 |
| 6.875% 8/15/25 | | 91,000 | 93,492 |
| U.S. Treasury Notes: | | | |
| 0.25% 7/31/25 | | 157,226,000 | 151,422,150 |
| 0.25% 9/30/25 | | 150,380,000 | 143,982,976 |
| 0.25% 10/31/25 | | 50,021,300 | 47,760,572 |
| 0.375% 11/30/25 | | 32,600,000 | 31,087,156 |
| 0.375% 12/31/25 | | 86,183,100 | 81,978,308 |
| 0.375% 1/31/26 | | 123,905,000 | 117,554,869 |
| 0.375% 7/31/27 | | 141,814,000 | 128,546,635 |
| 0.375% 9/30/27 | | 61,826,000 | 55,759,324 |
| 0.5% 2/28/26 | | 156,611,000 | 148,499,039 |
| 0.5% 4/30/27 | | 119,444,000 | 109,496,554 |
| 0.5% 5/31/27 | | 38,920,000 | 35,588,995 |
| 0.5% 6/30/27 | | 25,881,000 | 23,607,314 |
| 0.5% 8/31/27 | | 76,109,000 | 69,089,729 |
| 0.5% 10/31/27 | | 104,300,000 | 94,163,344 |
| 0.625% 7/31/26 | | 129,205,000 | 121,336,617 |
| 0.625% 3/31/27 | | 17,704,000 | 16,319,492 |
| 0.625% 11/30/27 | | 28,200,700 | 25,505,110 |
| 0.625% 12/31/27 | | 15,039,900 | 13,567,635 |
| 0.625% 5/15/30 | | 154,627,000 | 129,862,520 |
| 0.625% 8/15/30 | | 182,194,900 | 151,819,594 |
| 0.75% 3/31/26 | | 114,616,000 | 108,849,383 |
| 0.75% 4/30/26 | | 79,288,000 | 75,131,574 |
| 0.75% 5/31/26 | | 144,299,000 | 136,435,831 |
| 0.75% 8/31/26 | | 57,499,000 | 54,019,861 |
| 0.75% 1/31/28 | | 122,528,000 | 110,753,825 |
| 0.875% 6/30/26 | | 32,001,000 | 30,262,196 |
| 0.875% 9/30/26 | | 199,077,000 | 187,194,592 |
| 0.875% 11/15/30 | | 64,580,900 | 54,295,887 |
| 1% 7/31/28 | | 142,409,000 | 128,184,789 |
| 1.125% 10/31/26 | | 107,215,000 | 101,108,771 |
| 1.125% 2/28/27 | | 169,238,000 | 158,402,801 |
| 1.125% 2/29/28 | | 29,970,000 | 27,385,088 |
| 1.125% 8/31/28 | | 190,807,000 | 172,315,119 |
| 1.25% 11/30/26 | | 76,047,000 | 71,793,121 |
| 1.25% 12/31/26 | | 85,700,000 | 80,788,988 |
| 1.25% 3/31/28 | | 39,508,000 | 36,191,489 |
| 1.25% 4/30/28 | | 44,999,000 | 41,147,718 |
| 1.25% 5/31/28 | | 51,374,000 | 46,890,816 |
| 1.25% 6/30/28 | | 147,635,000 | 134,480,491 |
| 1.25% 9/30/28 | | 131,538,000 | 119,160,069 |
| 1.25% 8/15/31 | | 240,266,000 | 202,818,290 |
| 1.375% 8/31/26 | | 132,600,000 | 126,151,289 |
| 1.375% 10/31/28 | | 131,200,000 | 119,238,249 |
| 1.375% 12/31/28 | | 23,700,000 | 21,470,719 |
| 1.375% 11/15/31 | | 85,946,000 | 72,765,375 |
| 1.5% 8/15/26 | | 102,770,000 | 98,089,147 |
| 1.5% 1/31/27 | | 129,900,000 | 122,912,801 |
| 1.5% 11/30/28 | | 67,400,000 | 61,484,070 |
| 1.5% 2/15/30 | | 30,793,000 | 27,367,279 |
| 1.625% 2/15/26 | | 29,244,000 | 28,220,460 |
| 1.625% 9/30/26 | | 75,600,000 | 72,180,281 |
| 1.625% 10/31/26 | | 87,777,000 | 83,672,740 |
| 1.625% 11/30/26 | | 9,625,000 | 9,161,797 |
| 1.625% 8/15/29 | | 121,862,000 | 110,399,356 |
| 1.625% 5/15/31 | | 276,993,000 | 241,438,349 |
| 1.75% 12/31/26 | | 39,400,000 | 37,568,515 |
| 1.75% 1/31/29 | | 76,700,000 | 70,492,094 |
| 1.75% 11/15/29 | | 21,907,000 | 19,861,776 |
| 1.875% 6/30/26 | | 30,005,000 | 28,898,566 |
| 1.875% 7/31/26 | | 63,142,000 | 60,744,577 |
| 1.875% 2/28/27 | | 71,600,000 | 68,282,907 |
| 1.875% 2/28/29 | | 2,900,000 | 2,676,836 |
| 1.875% 2/15/32 | | 128,600,000 | 112,283,734 |
| 2% 11/15/26 | | 30,050,000 | 28,863,260 |
| 2.125% 5/31/26 | | 37,900,000 | 36,706,742 |
| 2.25% 11/15/25 | | 54,523,000 | 53,247,247 |
| 2.25% 2/15/27 | | 44,880,000 | 43,202,259 |
| 2.25% 8/15/27 | | 15,984,000 | 15,299,685 |
| 2.25% 11/15/27 | | 43,000,000 | 41,012,930 |
| 2.375% 4/30/26 | | 9,000 | 8,762 |
| 2.375% 5/15/27 | | 7,901,000 | 7,606,256 |
| 2.375% 3/31/29 | | 113,600,000 | 107,036,937 |
| 2.375% 5/15/29 | | 162,799,000 | 153,228,200 |
| 2.5% 2/28/26 | | 2,000 | 1,954 |
| 2.625% 12/31/25 | | 83,200,000 | 81,526,250 |
| 2.625% 1/31/26 | | 28,504,000 | 27,913,878 |
| 2.625% 5/31/27 | | 40,400,000 | 39,154,859 |
| 2.625% 2/15/29 | | 76,744,000 | 73,209,579 |
| 2.625% 7/31/29 | | 29,600,000 | 28,113,062 |
| 2.75% 4/30/27 | | 69,500,000 | 67,629,473 |
| 2.75% 7/31/27 | | 30,800,000 | 29,907,281 |
| 2.75% 2/15/28 | | 86,418,200 | 83,521,840 |
| 2.75% 5/31/29 | | 158,100,000 | 151,244,882 |
| 2.75% 8/15/32 | | 118,900,000 | 109,959,278 |
| 2.875% 7/31/25 | | 16,097,000 | 15,875,289 |
| 2.875% 11/30/25 | | 93,000,000 | 91,477,851 |
| 2.875% 5/15/28 | | 52,785,000 | 51,151,964 |
| 2.875% 8/15/28 | | 92,876,000 | 89,832,134 |
| 2.875% 4/30/29 | | 74,400,000 | 71,612,906 |
| 2.875% 5/15/32 | | 183,300,000 | 171,485,743 |
| 3% 9/30/25 | | 81,060,000 | 79,929,593 |
| 3% 10/31/25 | | 72,984,000 | 71,934,855 |
| 3.125% 8/31/27 | | 151,400,000 | 148,549,423 |
| 3.125% 11/15/28 | | 26,503,000 | 25,841,460 |
| 3.125% 8/31/29 | | 63,333,900 | 61,527,895 |
| 3.25% 6/30/27 | | 46,500,000 | 45,817,031 |
| 3.25% 6/30/29 | | 51,100,000 | 49,960,230 |
| 3.375% 5/15/33 | | 131,200,000 | 126,249,249 |
| 3.5% 2/15/33 | | 114,100,000 | 110,997,906 |
| 3.625% 3/31/28 | | 35,900,000 | 35,740,133 |
| 3.625% 8/31/29 | | 109,900,000 | 109,453,531 |
| 3.625% 3/31/30 | | 31,600,000 | 31,356,828 |
| 3.75% 12/31/28 | | 182,200,000 | 182,178,648 |
| 3.75% 6/30/30 | | 84,600,000 | 84,438,071 |
| 3.75% 12/31/30 | | 64,200,000 | 64,016,930 |
| 3.75% 8/31/31 | | 32,300,000 | 32,173,828 |
| 3.875% 1/15/26 | | 34,100,000 | 33,968,129 |
| 3.875% 11/30/27 | | 6,500,000 | 6,516,758 |
| 3.875% 12/31/27 | | 35,600,000 | 35,712,517 |
| 3.875% 9/30/29 | | 4,900,000 | 4,926,031 |
| 3.875% 11/30/29 | | 32,200,000 | 32,369,805 |
| 3.875% 12/31/29 | | 69,900,000 | 70,246,770 |
| 3.875% 8/15/33 | | 147,100,000 | 146,772,473 |
| 3.875% 8/15/34 | | 54,600,000 | 54,395,135 |
| 4% 12/15/25 | | 53,800,000 | 53,650,789 |
| 4% 2/15/26 | | 82,200,000 | 82,065,141 |
| 4% 1/15/27 | | 132,200,000 | 132,597,632 |
| 4% 6/30/28 | | 42,000,000 | 42,359,297 |
| 4% 1/31/29 | | 65,200,000 | 65,859,641 |
| 4% 10/31/29 | | 16,600,000 | 16,781,563 |
| 4% 7/31/30 | | 57,300,000 | 57,937,910 |
| 4% 1/31/31 | | 134,000,000 | 135,470,859 |
| 4% 2/15/34 | | 166,800,000 | 167,842,500 |
| 4.125% 2/15/27 | | 40,600,000 | 40,852,164 |
| 4.125% 9/30/27 | | 94,400,000 | 95,358,750 |
| 4.125% 7/31/28 | | 5,300,000 | 5,369,148 |
| 4.125% 3/31/29 | | 155,100,000 | 157,547,672 |
| 4.125% 8/31/30 | | 46,600,000 | 47,435,524 |
| 4.125% 3/31/31 | | 49,300,000 | 50,208,969 |
| 4.125% 7/31/31 | | 35,100,000 | 35,749,592 |
| 4.125% 11/15/32 | | 146,700,000 | 149,444,895 |
| 4.25% 10/15/25 | | 7,500,000 | 7,495,313 |
| 4.25% 12/31/25 | | 137,800,000 | 137,851,427 |
| 4.25% 3/15/27 | | 127,000,000 | 128,289,844 |
| 4.25% 2/28/29 | | 15,600,000 | 15,930,281 |
| 4.25% 2/28/31 | | 61,500,000 | 63,066,328 |
| 4.25% 6/30/31 | | 35,400,000 | 36,329,250 |
| 4.375% 8/15/26 | | 69,700,000 | 70,260,868 |
| 4.375% 12/15/26 | | 152,300,000 | 153,941,984 |
| 4.375% 8/31/28 | | 59,900,000 | 61,254,770 |
| 4.375% 11/30/28 | | 75,100,000 | 76,910,027 |
| 4.375% 11/30/30 | | 35,900,000 | 37,035,898 |
| 4.375% 5/15/34 | | 147,600,000 | 152,950,500 |
| 4.5% 11/15/25 | | 13,300,000 | 13,337,926 |
| 4.5% 7/15/26 | | 107,600,000 | 108,596,140 |
| 4.5% 4/15/27 | | 134,900,000 | 137,129,012 |
| 4.5% 5/15/27 | | 160,000,000 | 162,712,499 |
| 4.5% 5/31/29 | | 173,000,000 | 178,710,351 |
| 4.5% 11/15/33 | | 159,300,000 | 166,536,950 |
| 4.625% 10/15/26 | | 118,500,000 | 120,189,550 |
| 4.625% 6/15/27 | | 77,900,000 | 79,579,719 |
| 4.625% 9/30/28 | | 13,200,000 | 13,626,938 |
| 4.625% 4/30/29 | | 120,100,000 | 124,584,984 |
| 4.625% 9/30/30 | | 95,600,000 | 99,875,859 |
| 4.625% 4/30/31 | | 41,900,000 | 43,893,523 |
| 4.625% 5/31/31 | | 10,100,000 | 10,581,328 |
| 4.875% 11/30/25 | | 75,500,000 | 76,060,352 |
| 4.875% 5/31/26 | | 13,500,000 | 13,689,316 |
| 4.875% 10/31/28 | | 84,100,000 | 87,677,535 |
| 4.875% 10/31/30 | | 68,000,000 | 72,016,250 |
| 5% 10/31/25 | | 133,700,000 | 134,726,201 |
| | | | |
| TOTAL U.S. GOVERNMENT AND GOVERNMENT AGENCY OBLIGATIONS (Cost $16,822,571,483) | | | 16,287,995,025 |
| | | | |
| Money Market Funds - 0.6% |
| | | Shares | Value ($) |
| Fidelity Cash Central Fund 5.39% (c) | | 79,011,364 | 79,027,166 |
| Fidelity Securities Lending Cash Central Fund 5.39% (c)(d) | | 21,514,036 | 21,516,188 |
| TOTAL MONEY MARKET FUNDS (Cost $100,543,354) | | | 100,543,354 |
| | | | |
| TOTAL INVESTMENT IN SECURITIES - 99.8% (Cost $16,923,114,837) | 16,388,538,379 |
NET OTHER ASSETS (LIABILITIES) - 0.2% | 36,519,041 |
| NET ASSETS - 100.0% | 16,425,057,420 |
| | |
Legend
| (a) | Amount is stated in United States dollars unless otherwise noted. |
| (b) | Security or a portion of the security is on loan at period end. |
| (c) | Affiliated fund that is generally available only to investment companies and other accounts managed by Fidelity Investments. The rate quoted is the annualized seven-day yield of the fund at period end. A complete unaudited listing of the fund's holdings as of its most recent quarter end is available upon request. In addition, each Fidelity Central Fund's financial statements are available on the SEC's website or upon request. |
| (d) | Investment made with cash collateral received from securities on loan. |
Affiliated Central Funds
Fiscal year to date information regarding the Fund's investments in Fidelity Central Funds, including the ownership percentage, is presented below.
| Affiliate | Value, beginning of period ($) | Purchases ($) | Sales Proceeds ($) | Dividend Income ($) | Realized Gain (loss) ($) | Change in Unrealized appreciation (depreciation) ($) | Value, end of period ($) | % ownership, end of period |
| Fidelity Cash Central Fund 5.39% | 202,074,752 | 586,597,092 | 709,644,781 | 1,486,073 | 103 | - | 79,027,166 | 0.2% |
| Fidelity Securities Lending Cash Central Fund 5.39% | 117,899,759 | 1,056,924,375 | 1,153,307,946 | 39,177 | - | - | 21,516,188 | 0.1% |
| Total | 319,974,511 | 1,643,521,467 | 1,862,952,727 | 1,525,250 | 103 | - | 100,543,354 | |
| | | | | | | | | |
Amounts in the dividend income column in the above table include any capital gain distributions from underlying funds, which are presented in the corresponding line item in the Statement of Operations, if applicable.
Amounts in the dividend income column for Fidelity Securities Lending Cash Central Fund represents the income earned on investing cash collateral, less rebates paid to borrowers and any lending agent fees associated with the loan, plus any premium payments received for lending certain types of securities.
Amounts included in the purchases and sales proceeds columns may include in-kind transactions, if applicable.
Investment Valuation
The following is a summary of the inputs used, as of August 31, 2024, involving the Fund's assets and liabilities carried at fair value. The inputs or methodology used for valuing securities may not be an indication of the risk associated with investing in those securities. For more information on valuation inputs, and their aggregation into the levels used below, please refer to the Investment Valuation section in the accompanying Notes to Financial Statements.
| Valuation Inputs at Reporting Date: |
| Description | Total ($) | Level 1 ($) | Level 2 ($) | Level 3 ($) |
Investments in Securities: | | | | |
|
| U.S. Government and Government Agency Obligations | 16,287,995,025 | - | 16,287,995,025 | - |
|
| Money Market Funds | 100,543,354 | 100,543,354 | - | - |
| Total Investments in Securities: | 16,388,538,379 | 100,543,354 | 16,287,995,025 | - |
Financial Statements (Unaudited)
| Statement of Assets and Liabilities |
| As of August 31, 2024 (Unaudited) |
| Assets | | | | |
| Investment in securities, at value (including securities loaned of $20,962,010) - See accompanying schedule: | | | | |
Unaffiliated issuers (cost $16,822,571,483) | $ | 16,287,995,025 | | |
Fidelity Central Funds (cost $100,543,354) | | 100,543,354 | | |
| | | | | |
| | | | | |
| Total Investment in Securities (cost $16,923,114,837) | | | $ | 16,388,538,379 |
| Receivable for investments sold | | | | 280,326,095 |
| Receivable for fund shares sold | | | | 7,377,272 |
| Interest receivable | | | | 111,192,708 |
| Distributions receivable from Fidelity Central Funds | | | | 343,874 |
| Prepaid expenses | | | | 22,754 |
| Receivable from investment adviser for expense reductions | | | | 153,508 |
Total assets | | | | 16,787,954,590 |
| Liabilities | | | | |
| Payable for investments purchased | $ | 325,943,758 | | |
| Payable for fund shares redeemed | | 11,770,285 | | |
| Distributions payable | | 3,025,591 | | |
| Accrued management fee | | 551,929 | | |
| Other payables and accrued expenses | | 89,419 | | |
| Collateral on securities loaned | | 21,516,188 | | |
| Total liabilities | | | | 362,897,170 |
| Net Assets | | | $ | 16,425,057,420 |
| Net Assets consist of: | | | | |
| Paid in capital | | | $ | 17,999,415,104 |
| Total accumulated earnings (loss) | | | | (1,574,357,684) |
| Net Assets | | | $ | 16,425,057,420 |
Net Asset Value, offering price and redemption price per share ($16,425,057,420 ÷ 1,844,216,747 shares) | | | $ | 8.91 |
| Statement of Operations |
Six months ended August 31, 2024 (Unaudited) |
| Investment Income | | | | |
| Interest | | | $ | 282,327,146 |
| Income from Fidelity Central Funds (including $39,177 from security lending) | | | | 1,525,250 |
| Total income | | | | 283,852,396 |
| Expenses | | | | |
| Management fee | $ | 3,170,727 | | |
| Custodian fees and expenses | | 68,615 | | |
| Independent trustees' fees and expenses | | 21,699 | | |
| Registration fees | | 96,190 | | |
| Audit fees | | 30,419 | | |
| Legal | | 4,058 | | |
| Miscellaneous | | 36,715 | | |
| Total expenses before reductions | | 3,428,423 | | |
| Expense reductions | | (1,009,361) | | |
| Total expenses after reductions | | | | 2,419,062 |
| Net Investment income (loss) | | | | 281,433,334 |
| Realized and Unrealized Gain (Loss) | | | | |
| Net realized gain (loss) on: | | | | |
| Investment Securities: | | | | |
| Unaffiliated issuers | | (196,714,254) | | |
| Fidelity Central Funds | | 103 | | |
| Total net realized gain (loss) | | | | (196,714,151) |
| Change in net unrealized appreciation (depreciation) on investment securities | | | | 585,161,502 |
| Net gain (loss) | | | | 388,447,351 |
| Net increase (decrease) in net assets resulting from operations | | | $ | 669,880,685 |
| Statement of Changes in Net Assets |
| |
| | Six months ended August 31, 2024 (Unaudited) | | Year ended February 29, 2024 |
| Increase (Decrease) in Net Assets | | | | |
| Operations | | | | |
| Net investment income (loss) | $ | 281,433,334 | $ | 418,118,414 |
| Net realized gain (loss) | | (196,714,151) | | (414,743,660) |
| Change in net unrealized appreciation (depreciation) | | 585,161,502 | | 231,592,953 |
| Net increase (decrease) in net assets resulting from operations | | 669,880,685 | | 234,967,707 |
| Distributions to shareholders | | (213,056,753) | | (313,253,523) |
| | | | | |
| Share transactions | | | | |
| Proceeds from sales of shares | | 2,354,866,062 | | 8,204,835,452 |
| Reinvestment of distributions | | 196,817,826 | | 281,774,224 |
| Cost of shares redeemed | | (2,426,689,012) | | (6,022,265,993) |
| | | | | |
Net increase (decrease) in net assets resulting from share transactions | | 124,994,876 | | 2,464,343,683 |
| Total increase (decrease) in net assets | | 581,818,808 | | 2,386,057,867 |
| | | | | |
| Net Assets | | | | |
| Beginning of period | | 15,843,238,612 | | 13,457,180,745 |
| End of period | $ | 16,425,057,420 | $ | 15,843,238,612 |
| | | | | |
| Other Information | | | | |
| Shares | | | | |
| Sold | | 270,979,210 | | 941,510,346 |
| Issued in reinvestment of distributions | | 22,651,050 | | 32,477,756 |
| Redeemed | | (279,408,909) | | (698,661,878) |
| Net increase (decrease) | | 14,221,351 | | 275,326,224 |
| | | | | |
Financial Highlights
Fidelity® SAI U.S. Treasury Bond Index Fund |
| |
| | Six months ended (Unaudited) August 31, 2024 | | Years ended February 28, 2024 A | | 2023 | | 2022 | | 2021 | | 2020 A |
Selected Per-Share Data | | | | | | | | | | | | |
| Net asset value, beginning of period | $ | 8.66 | $ | 8.66 | $ | 9.79 | $ | 10.10 | $ | 10.60 | $ | 9.65 |
| Income from Investment Operations | | | | | | | | | | | | |
Net investment income (loss) B,C | | .154 | | .257 | | .184 | | .106 | | .168 | | .229 |
| Net realized and unrealized gain (loss) | | .213 | | (.063) | | (1.170) | | (.316) | | (.191) | | .937 |
| Total from investment operations | | .367 | | .194 | | (.986) | | (.210) | | (.023) | | 1.166 |
| Distributions from net investment income | | (.117) | | (.194) | | (.144) | | (.098) | | (.175) | | (.216) |
| Distributions from net realized gain | | - | | - | | - | | (.002) | | (.302) | | - |
| Total distributions | | (.117) | | (.194) | | (.144) | | (.100) | | (.477) | | (.216) |
| Net asset value, end of period | $ | 8.91 | $ | 8.66 | $ | 8.66 | $ | 9.79 | $ | 10.10 | $ | 10.60 |
Total Return D,E | | | | 2.25% | | (10.10)% | | (2.09)% | | (.33)% | | 12.21% |
Ratios to Average Net Assets C,F,G | | | | | | | | | | | | |
| Expenses before reductions | | .04% H | | .05% | | .05% | | .05% | | .05% | | .08% |
| Expenses net of fee waivers, if any | | | | .03% | | .03% | | .03% | | .03% | | .03% |
| Expenses net of all reductions | | .03% H | | .03% | | .03% | | .03% | | .03% | | .03% |
| Net investment income (loss) | | 3.52% H | | 2.97% | | 2.05% | | 1.06% | | 1.56% | | 2.27% |
| Supplemental Data | | | | | | | | | | | | |
| Net assets, end of period (000 omitted) | $ | 16,425,057 | $ | 15,843,239 | $ | 13,457,181 | $ | 11,227,354 | $ | 9,575,368 | $ | 9,284,624 |
Portfolio turnover rate I | | | | 37% | | 60% | | 45% | | 167% | | 23% |
AFor the year ended February 29.
BCalculated based on average shares outstanding during the period.
CNet investment income (loss) is affected by the timing of the declaration of dividends by any underlying mutual funds or exchange-traded funds (ETFs). Net investment income (loss) of any mutual funds or ETFs is not included in the Fund's net investment income (loss) ratio.
DTotal returns for periods of less than one year are not annualized.
ETotal returns would have been lower if certain expenses had not been reduced during the applicable periods shown.
FFees and expenses of any underlying mutual funds or exchange-traded funds (ETFs) are not included in the Fund's expense ratio. The Fund indirectly bears its proportionate share of these expenses. For additional expense information related to investments in Fidelity Central Funds, please refer to the "Investments in Fidelity Central Funds" note found in the Notes to Financial Statements section of the most recent Annual or Semi-Annual report.
GExpense ratios reflect operating expenses of the class. Expenses before reductions do not reflect amounts reimbursed, waived, or reduced through arrangements with the investment adviser, brokerage services, or other offset arrangements, if applicable, and do not represent the amount paid by the class during periods when reimbursements, waivers or reductions occur.
HAnnualized.
IAmount does not include the portfolio activity of any underlying mutual funds or exchange-traded funds (ETFs).
Notes to Financial Statements
(Unaudited)For the period ended August 31, 2024
1. Organization.
Fidelity SAI U.S. Treasury Bond Index Fund (the Fund) is a fund of Fidelity Salem Street Trust (the Trust) and is authorized to issue an unlimited number of shares. Shares are offered exclusively to certain clients of Fidelity Management & Research Company LLC (FMR) or its affiliates. The Trust is registered under the Investment Company Act of 1940, as amended (the 1940 Act), as an open-end management investment company organized as a Massachusetts business trust.
2. Investments in Fidelity Central Funds.
Funds may invest in Fidelity Central Funds, which are open-end investment companies generally available only to other investment companies and accounts managed by the investment adviser and its affiliates. The Schedule of Investments lists any Fidelity Central Funds held as an investment as of period end, but does not include the underlying holdings of each Fidelity Central Fund. An investing fund indirectly bears its proportionate share of the expenses of the underlying Fidelity Central Funds.
Based on its investment objective, each Fidelity Central Fund may invest or participate in various investment vehicles or strategies that are similar to those of the investing fund. These strategies are consistent with the investment objectives of the investing fund and may involve certain economic risks which may cause a decline in value of each of the Fidelity Central Funds and thus a decline in the value of the investing fund.
| Fidelity Central Fund | Investment Manager | Investment Objective | Investment Practices | Expense RatioA |
| Fidelity Money Market Central Funds | Fidelity Management & Research Company LLC (FMR) | Each fund seeks to obtain a high level of current income consistent with the preservation of capital and liquidity. | Short-term Investments | Less than .005% |
A Expenses expressed as a percentage of average net assets and are as of each underlying Central Fund's most recent annual or semi-annual shareholder report.
A complete unaudited list of holdings for each Fidelity Central Fund is available upon request or at the Securities and Exchange Commission website at www.sec.gov. In addition, the financial statements of the Fidelity Central Funds which contain the significant accounting policies (including investment valuation policies) of those funds, and are not covered by the Report of Independent Registered Public Accounting Firm, are available on the Securities and Exchange Commission website or upon request.
3. Significant Accounting Policies.
The Fund is an investment company and applies the accounting and reporting guidance of the Financial Accounting Standards Board (FASB) Accounting Standards Codification Topic 946 Financial Services - Investment Companies. The financial statements have been prepared in conformity with accounting principles generally accepted in the United States of America (GAAP), which require management to make certain estimates and assumptions at the date of the financial statements. Actual results could differ from those estimates. Subsequent events, if any, through the date that the financial statements were issued have been evaluated in the preparation of the financial statements. The Fund's Schedule of Investments lists any underlying mutual funds or exchange-traded funds (ETFs) but does not include the underlying holdings of these funds. The following summarizes the significant accounting policies of the Fund:
Investment Valuation. Investments are valued as of 4:00 p.m. Eastern time on the last calendar day of the period. The Board of Trustees (the Board) has designated the Fund's investment adviser as the valuation designee responsible for the fair valuation function and performing fair value determinations as needed. The investment adviser has established a Fair Value Committee (the Committee) to carry out the day-to-day fair valuation responsibilities and has adopted policies and procedures to govern the fair valuation process and the activities of the Committee. In accordance with these fair valuation policies and procedures, which have been approved by the Board, the Fund attempts to obtain prices from one or more third party pricing services or brokers to value its investments. When current market prices, quotations or currency exchange rates are not readily available or reliable, investments will be fair valued in good faith by the Committee, in accordance with the policies and procedures. Factors used in determining fair value vary by investment type and may include market or investment specific events, transaction data, estimated cash flows, and market observations of comparable investments. The frequency that the fair valuation procedures are used cannot be predicted and they may be utilized to a significant extent. The Committee manages the Fund's fair valuation practices and maintains the fair valuation policies and procedures. The Fund's investment adviser reports to the Board information regarding the fair valuation process and related material matters.
The Fund categorizes the inputs to valuation techniques used to value its investments into a disclosure hierarchy consisting of three levels as shown below:
Level 1 - unadjusted quoted prices in active markets for identical investments
Level 2 - other significant observable inputs (including quoted prices for similar investments, interest rates, prepayment speeds, etc.)
Level 3 - unobservable inputs (including the Fund's own assumptions based on the best information available)
Valuation techniques used to value the Fund's investments by major category are as follows:
Debt securities, including restricted securities, are valued based on evaluated prices received from third party pricing services or from brokers who make markets in such securities. U.S. government and government agency obligations are valued by pricing services who utilize matrix pricing which considers yield or price of bonds of comparable quality, coupon, maturity and type or by broker-supplied prices. When independent prices are unavailable or unreliable, debt securities may be valued utilizing pricing methodologies which consider similar factors that would be used by third party pricing services. Debt securities are generally categorized as Level 2 in the hierarchy but may be Level 3 depending on the circumstances.
Investments in open-end mutual funds, including the Fidelity Central Funds, are valued at their closing net asset value (NAV) each business day and are categorized as Level 1 in the hierarchy.
Changes in valuation techniques may result in transfers in or out of an assigned level within the disclosure hierarchy. The aggregate value of investments by input level as of August 31, 2024 is included at the end of the Fund's Schedule of Investments.
Investment Transactions and Income. For financial reporting purposes, the Fund's investment holdings and NAV include trades executed through the end of the last business day of the period. The NAV per share for processing shareholder transactions is calculated as of the close of business of the New York Stock Exchange (NYSE), normally 4:00 p.m. Eastern time and includes trades executed through the end of the prior business day. Gains and losses on securities sold are determined on the basis of identified cost. Income and capital gain distributions from Fidelity Central Funds, if any, are recorded on the ex-dividend date. Interest income is accrued as earned and includes coupon interest and amortization of premium and accretion of discount on debt securities as applicable.
Expenses. Expenses directly attributable to a fund are charged to that fund. Expenses attributable to more than one fund are allocated among the respective funds on the basis of relative net assets or other appropriate methods. Expenses included in the accompanying financial statements reflect the expenses of that fund and do not include any expenses associated with any underlying mutual funds or exchange-traded funds. Although not included in a fund's expenses, a fund indirectly bears its proportionate share of these expenses through the net asset value of each underlying mutual fund or exchange-traded fund. Expense estimates are accrued in the period to which they relate and adjustments are made when actual amounts are known.
Income Tax Information and Distributions to Shareholders. Each year, the Fund intends to qualify as a regulated investment company under Subchapter M of the Internal Revenue Code, including distributing substantially all of its taxable income and realized gains. As a result, no provision for U.S. Federal income taxes is required. The Fund files a U.S. federal tax return, in addition to state and local tax returns as required. The Fund's federal income tax returns are subject to examination by the Internal Revenue Service (IRS) for a period of three fiscal years after they are filed. State and local tax returns may be subject to examination for an additional fiscal year depending on the jurisdiction.
Distributions are declared and recorded daily and paid monthly from net investment income. Distributions from realized gains, if any, are declared and recorded on the ex-dividend date. Income and capital gain distributions are determined in accordance with income tax regulations, which may differ from GAAP.
Capital accounts within the financial statements are adjusted for permanent book-tax differences. These adjustments have no impact on net assets or the results of operations. Capital accounts are not adjusted for temporary book-tax differences which will reverse in a subsequent period.
Book-tax differences are primarily due to market discount, capital loss carryforwards and losses deferred due to wash sales.
As of period end, the cost and unrealized appreciation (depreciation) in securities, and derivatives if applicable, for federal income tax purposes were as follows:
| Gross unrealized appreciation | $268,577,287 |
| Gross unrealized depreciation | (638,938,169) |
| Net unrealized appreciation (depreciation) | $(370,360,882) |
| Tax cost | $16,758,899,261 |
Capital loss carryforwards are only available to offset future capital gains of the Fund to the extent provided by regulations and may be limited. The capital loss carryforward information presented below, including any applicable limitation, is estimated as of prior fiscal period end and is subject to adjustment.
Short-term | $(368,834,696) |
Long-term | (664,316,022) |
| Total capital loss carryforward | $(1,033,150,718) |
4. Fees and Other Transactions with Affiliates.
Management Fee. Fidelity Management & Research Company LLC (the investment adviser) and its affiliates provide the Fund with investment management related services for which the Fund pays a monthly management fee that is based on an annual rate of .04% of the Fund's average net assets.
Interfund Trades. Funds may purchase from or sell securities to other Fidelity Funds under procedures adopted by the Board. The procedures have been designed to ensure these interfund trades are executed in accordance with Rule 17a-7 of the 1940 Act. Any interfund trades are included within the respective purchases and sales amounts shown in the Purchases and Sales of Investments note. During the period, there were no interfund trades.
Sub-Advisory Arrangements. Effective March 1, 2024, the Fund's sub-advisory agreements with FMR Investment Management (UK) Limited, Fidelity Management & Research (Hong Kong) Limited, and Fidelity Management & Research (Japan) Limited were amended to provide that the investment adviser pays each sub-adviser monthly fees equal to 110% of the sub-adviser's costs for providing sub-advisory services.
5. Committed Line of Credit.
Certain Funds participate with other funds managed by the investment adviser or an affiliate in a $4.25 billion credit facility (the "line of credit") to be utilized for temporary or emergency purposes to fund shareholder redemptions or for other short-term liquidity purposes. The participating funds have agreed to pay commitment fees on their pro-rata portion of the line of credit, which are reflected in Miscellaneous expenses on the Statement of Operations, and are listed below. During the period, there were no borrowings on this line of credit.
| | Amount ($) |
| Fidelity SAI U.S. Treasury Bond Index Fund | 13,312 |
6. Security Lending.
Funds lend portfolio securities from time to time in order to earn additional income. Lending agents are used, including National Financial Services (NFS), an affiliate of the investment adviser. Pursuant to a securities lending agreement, NFS will receive a fee, which is capped at 9.9% of a fund's daily lending revenue, for its services as lending agent. A fund may lend securities to certain qualified borrowers, including NFS. On the settlement date of the loan, a fund receives collateral (in the form of U.S. Treasury obligations, letters of credit and/or cash) against the loaned securities and maintains collateral in an amount not less than 100% of the market value of the loaned securities during the period of the loan. The market value of the loaned securities is determined at the close of business of a fund and any additional required collateral is delivered to a fund on the next business day. A fund or borrower may terminate the loan at any time, and if the borrower defaults on its obligation to return the securities loaned because of insolvency or other reasons, a fund may apply collateral received from the borrower against the obligation. A fund may experience delays and costs in recovering the securities loaned. Any cash collateral received is invested in the Fidelity Securities Lending Cash Central Fund. Any loaned securities are identified as such in the Schedule of Investments, and the value of loaned securities and cash collateral at period end, as applicable, are presented in the Statement of Assets and Liabilities. Security lending income represents the income earned on investing cash collateral, less rebates paid to borrowers and any lending agent fees associated with the loan, plus any premium payments received for lending certain types of securities. Security lending income is presented in the Statement of Operations as a component of income from Fidelity Central Funds. Affiliated security lending activity, if any, was as follows:
| | Total Security Lending Fees Paid to NFS ($) | Security Lending Income From Securities Loaned to NFS ($) | Value of Securities Loaned to NFS at Period End ($) |
| Fidelity SAI U.S. Treasury Bond Index Fund | 4,189 | - | - |
7. Expense Reductions.
The investment adviser contractually agreed to reimburse the Fund to the extent annual operating expenses exceeded .03% of average net assets. This reimbursement will remain in place through June 30, 2025. Some expenses, for example the compensation of the independent Trustees, and certain miscellaneous expenses such as proxy and shareholder meeting expenses, are excluded from this reimbursement. During the period this reimbursement reduced the Fund's expenses by $1,009,336.
Through arrangements with the Fund's custodian, credits realized as a result of certain uninvested cash balances were used to reduce the Fund's expenses by $25.
8. Other.
A fund's organizational documents provide former and current trustees and officers with a limited indemnification against liabilities arising in connection with the performance of their duties to the fund. In the normal course of business, a fund may also enter into contracts that provide general indemnifications. A fund's maximum exposure under these arrangements is unknown as this would be dependent on future claims that may be made against a fund. The risk of material loss from such claims is considered remote.
At the end of the period, the following mutual funds managed by the investment adviser or its affiliates were the owners of record of 10% or more of the total outstanding shares.
| | Strategic Advisers Fidelity Core Income Fund |
| Fidelity SAI U.S. Treasury Bond Index Fund | 38% |
Mutual funds managed by the investment adviser or its affiliates, in aggregate, were the owners of record of more than 20% of the total outstanding shares.
| Fund | % of shares held |
| Fidelity SAI U.S. Treasury Bond Index Fund | 48% |
| | |
9. Risk and Uncertainties.
Many factors affect a fund's performance. Developments that disrupt global economies and financial markets, such as pandemics, epidemics, outbreaks of infectious diseases, war, terrorism, and environmental disasters, may significantly affect a fund's investment performance. The effects of these developments to a fund will be impacted by the types of securities in which a fund invests, the financial condition, industry, economic sector, and geographic location of an issuer, and a fund's level of investment in the securities of that issuer. Significant concentrations in security types, issuers, industries, sectors, and geographic locations may magnify the factors that affect a fund's performance.
Item 8: Changes in and Disagreements with Accountants for Open-End Management Investment Companies
(Unaudited)
Note: This is not applicable for any fund included in this document.
Item 9: Proxy Disclosures for Open-End Management Investment Companies
(Unaudited)
Note: This is not applicable for any fund included in this document.
Item 10: Remuneration Paid to Directors, Officers, and others of Open-End Management Investment Companies
(Unaudited)
Note: This information is disclosed as part of the financial statements for each Fund as part of Item 7: Financial Statements and Financial Highlights for Open-End Management Investment companies.
Item 11: Statement Regarding Basis for Approval of Investment Advisory Contract
(Unaudited)
Note: This is not applicable for any fund included in this document.
1.9872607.108
UYB-SANN-1024
Fidelity® Series Long-Term Treasury Bond Index Fund
Semi-Annual Report
August 31, 2024
Contents
To view a fund's proxy voting guidelines and proxy voting record for the 12-month period ended June 30, visit http://www.fidelity.com/proxyvotingresults or visit the Securities and Exchange Commission's (SEC) web site at http://www.sec.gov.
You may also call 1-800-544-8544 to request a free copy of the proxy voting guidelines.
BLOOMBERG ® is a trademark and service mark of Bloomberg Finance L.P. and its affiliates (collectively "Bloomberg"). Bloomberg or Bloomberg's licensors own all proprietary rights in the Bloomberg Indices. Neither Bloomberg nor Bloomberg's licensors approves or endorses this material, or guarantees the accuracy or completeness of any information herein, or makes any warranty, express or implied, as to the results to be obtained therefrom and, to the maximum extent allowed by law, neither shall have any liability or responsibility for injury or damages arising in connection therewith.
Standard & Poor's, S&P and S&P 500 are registered service marks of The McGraw-Hill Companies, Inc. and have been licensed for use by Fidelity Distributors Corporation.
Other third-party marks appearing herein are the property of their respective owners.
All other marks appearing herein are registered or unregistered trademarks or service marks of FMR LLC or an affiliated company. © 2024 FMR LLC. All rights reserved.
This report and the financial statements contained herein are submitted for the general information of the shareholders of the Fund. This report is not authorized for distribution to prospective investors in the Fund unless preceded or accompanied by an effective prospectus.
A fund files its complete schedule of portfolio holdings with the SEC for the first and third quarters of each fiscal year on Form N-PORT. Forms N-PORT are available on the SEC's web site at http://www.sec.gov. A fund's Forms N-PORT may be reviewed and copied at the SEC's Public Reference Room in Washington, DC. Information regarding the operation of the SEC's Public Reference Room may be obtained by calling 1-800-SEC-0330.
For a complete list of a fund's portfolio holdings, view the most recent holdings listing, semiannual report, or annual report on Fidelity's web site at http://www.fidelity.com, http://www.institutional.fidelity.com, or http://www.401k.com, as applicable.
NOT FDIC INSURED •MAY LOSE VALUE •NO BANK GUARANTEE
Neither the Fund nor Fidelity Distributors Corporation is a bank.
Item 7: Financial Statements and Financial Highlights for Open-End Management Investment Companies (Semi-Annual Report)
Fidelity® Series Long-Term Treasury Bond Index Fund
Schedule of Investments August 31, 2024 (Unaudited)
Showing Percentage of Net Assets
| U.S. Government and Government Agency Obligations - 98.8% |
| | | Principal Amount (a) | Value ($) |
| U.S. Treasury Obligations - 98.8% | | | |
| U.S. Treasury Bonds: | | | |
| 1.125% 5/15/40 | | 4,517,000 | 2,923,699 |
| 1.125% 8/15/40 | | 67,470,000 | 43,286,222 |
| 1.375% 11/15/40 | | 691,363,000 | 459,162,251 |
| 1.375% 8/15/50 | | 11,528,000 | 6,243,133 |
| 1.75% 8/15/41 | | 278,340,000 | 193,478,919 |
| 1.875% 2/15/41 | | 633,606,000 | 455,651,812 |
| 1.875% 2/15/51 | | 616,105,000 | 379,939,440 |
| 1.875% 11/15/51 | | 729,220,000 | 447,444,834 |
| 2% 11/15/41 | | 915,080,000 | 660,466,137 |
| 2% 2/15/50 | | 256,849,000 | 164,443,560 |
| 2% 8/15/51 | | 819,020,000 | 519,245,887 |
| 2.25% 5/15/41 | | 831,582,000 | 632,099,773 |
| 2.25% 8/15/46 | | 172,941,000 | 121,572,119 |
| 2.25% 8/15/49 | | 171,447,000 | 116,664,326 |
| 2.25% 2/15/52 | | 1,405,440,000 | 945,542,704 |
| 2.375% 2/15/42 | | 1,255,860,000 | 958,706,942 |
| 2.375% 11/15/49 (b) | | 666,492,000 | 465,476,973 |
| 2.375% 5/15/51 | | 635,974,000 | 441,281,492 |
| 2.5% 2/15/45 | | 707,149,000 | 531,079,945 |
| 2.5% 2/15/46 | | 117,718,000 | 87,401,017 |
| 2.5% 5/15/46 | | 136,970,000 | 101,389,903 |
| 2.75% 8/15/42 | | 252,260,000 | 203,532,434 |
| 2.75% 11/15/42 | | 193,274,000 | 155,343,978 |
| 2.75% 8/15/47 | | 458,264,000 | 351,216,394 |
| 2.75% 11/15/47 | | 267,357,000 | 204,465,442 |
| 2.875% 5/15/43 | | 241,482,000 | 196,477,678 |
| 2.875% 8/15/45 | | 36,432,000 | 29,104,329 |
| 2.875% 11/15/46 | | 11,125,000 | 8,786,143 |
| 2.875% 5/15/49 | | 579,799,000 | 449,955,733 |
| 2.875% 5/15/52 | | 187,580,000 | 144,964,169 |
| 3% 5/15/42 | | 79,079,000 | 66,519,031 |
| 3% 11/15/44 | | 172,537,000 | 141,446,642 |
| 3% 5/15/45 | | 158,044,000 | 129,200,970 |
| 3% 11/15/45 | | 381,862,000 | 311,038,532 |
| 3% 2/15/47 | | 489,794,000 | 394,685,953 |
| 3% 5/15/47 | | 234,862,000 | 188,935,469 |
| 3% 2/15/48 | | 595,209,000 | 475,911,445 |
| 3% 8/15/48 | | 203,982,000 | 162,611,901 |
| 3% 2/15/49 | | 360,187,000 | 286,531,572 |
| 3% 8/15/52 | | 566,180,000 | 449,117,863 |
| 3.125% 11/15/41 | | 59,163,000 | 51,222,216 |
| 3.125% 2/15/42 | | 154,840,000 | 133,374,096 |
| 3.125% 2/15/43 | | 170,521,000 | 144,676,411 |
| 3.125% 8/15/44 | | 77,966,000 | 65,330,026 |
| 3.125% 5/15/48 | | 256,342,000 | 209,389,359 |
| 3.25% 5/15/42 | | 329,100,000 | 286,754,084 |
| 3.375% 8/15/42 | | 295,660,000 | 261,612,903 |
| 3.375% 5/15/44 | | 122,930,000 | 107,280,434 |
| 3.375% 11/15/48 | | 235,391,000 | 200,588,073 |
| 3.5% 2/15/39 | | 128,034,000 | 120,552,013 |
| 3.625% 8/15/43 | | 393,132,000 | 357,550,484 |
| 3.625% 2/15/44 | | 142,857,000 | 129,592,505 |
| 3.625% 2/15/53 | | 342,780,000 | 307,470,983 |
| 3.625% 5/15/53 | | 741,700,000 | 665,762,670 |
| 3.75% 8/15/41 | | 107,358,000 | 101,587,508 |
| 3.75% 11/15/43 | | 103,069,000 | 95,310,642 |
| 3.875% 2/15/43 | | 194,800,000 | 184,352,329 |
| 3.875% 5/15/43 | | 17,000,000 | 16,046,399 |
| 4% 11/15/42 | | 126,720,000 | 122,265,000 |
| 4% 11/15/52 | | 371,200,000 | 356,236,000 |
| 4.125% 8/15/53 | | 456,800,000 | 448,574,032 |
| 4.25% 5/15/39 | | 7,357,000 | 7,505,002 |
| 4.25% 11/15/40 | | 47,867,000 | 48,545,739 |
| 4.25% 2/15/54 | | 47,800,000 | 47,986,719 |
| 4.25% 8/15/54 | | 133,300,000 | 134,133,125 |
| 4.375% 2/15/38 | | 57,424,000 | 59,745,635 |
| 4.375% 11/15/39 | | 80,000 | 82,578 |
| 4.375% 5/15/40 | | 164,823,000 | 170,089,609 |
| 4.375% 5/15/41 | | 93,368,000 | 95,833,499 |
| 4.375% 8/15/43 | | 88,670,000 | 89,542,845 |
| 4.5% 2/15/36 (b) | | 69,718,000 | 73,865,677 |
| 4.5% 5/15/38 | | 29,300,000 | 30,831,383 |
| 4.5% 8/15/39 | | 48,244,000 | 50,482,823 |
| 4.5% 2/15/44 | | 28,200,000 | 28,905,000 |
| 4.625% 2/15/40 | | 35,743,000 | 37,911,316 |
| 4.625% 5/15/54 | | 444,700,000 | 475,273,125 |
| 4.75% 2/15/37 (b) | | 35,563,000 | 38,409,429 |
| 4.75% 2/15/41 | | 110,773,000 | 119,076,648 |
| 4.75% 11/15/43 | | 383,000,000 | 406,039,844 |
| 4.75% 11/15/53 | | 746,800,000 | 813,545,250 |
| 5% 5/15/37 | | 111,927,000 | 123,587,520 |
| TOTAL U.S. GOVERNMENT AND GOVERNMENT AGENCY OBLIGATIONS (Cost $23,066,062,388) | | | 19,300,267,699 |
| | | | |
| Money Market Funds - 3.7% |
| | | Shares | Value ($) |
| Fidelity Cash Central Fund 5.39% (c) | | 264,562,533 | 264,615,445 |
| Fidelity Securities Lending Cash Central Fund 5.39% (c)(d) | | 451,484,077 | 451,529,225 |
| TOTAL MONEY MARKET FUNDS (Cost $716,144,670) | | | 716,144,670 |
| | | | |
| TOTAL INVESTMENT IN SECURITIES - 102.5% (Cost $23,782,207,058) | 20,016,412,369 |
NET OTHER ASSETS (LIABILITIES) - (2.5)% | (488,837,493) |
| NET ASSETS - 100.0% | 19,527,574,876 |
| | |
Legend
| (a) | Amount is stated in United States dollars unless otherwise noted. |
| (b) | Security or a portion of the security is on loan at period end. |
| (c) | Affiliated fund that is generally available only to investment companies and other accounts managed by Fidelity Investments. The rate quoted is the annualized seven-day yield of the fund at period end. A complete unaudited listing of the fund's holdings as of its most recent quarter end is available upon request. In addition, each Fidelity Central Fund's financial statements are available on the SEC's website or upon request. |
| (d) | Investment made with cash collateral received from securities on loan. |
Affiliated Central Funds
Fiscal year to date information regarding the Fund's investments in Fidelity Central Funds, including the ownership percentage, is presented below.
| Affiliate | Value, beginning of period ($) | Purchases ($) | Sales Proceeds ($) | Dividend Income ($) | Realized Gain (loss) ($) | Change in Unrealized appreciation (depreciation) ($) | Value, end of period ($) | % ownership, end of period |
| Fidelity Cash Central Fund 5.39% | 253,791,208 | 736,894,374 | 726,077,630 | 3,445,953 | 7,493 | - | 264,615,445 | 0.6% |
| Fidelity Securities Lending Cash Central Fund 5.39% | - | 548,685,461 | 97,156,236 | 10,560 | - | - | 451,529,225 | 1.9% |
| Total | 253,791,208 | 1,285,579,835 | 823,233,866 | 3,456,513 | 7,493 | - | 716,144,670 | |
| | | | | | | | | |
Amounts in the dividend income column in the above table include any capital gain distributions from underlying funds, which are presented in the corresponding line item in the Statement of Operations, if applicable.
Amounts in the dividend income column for Fidelity Securities Lending Cash Central Fund represents the income earned on investing cash collateral, less rebates paid to borrowers and any lending agent fees associated with the loan, plus any premium payments received for lending certain types of securities.
Amounts included in the purchases and sales proceeds columns may include in-kind transactions, if applicable.
Investment Valuation
The following is a summary of the inputs used, as of August 31, 2024, involving the Fund's assets and liabilities carried at fair value. The inputs or methodology used for valuing securities may not be an indication of the risk associated with investing in those securities. For more information on valuation inputs, and their aggregation into the levels used below, please refer to the Investment Valuation section in the accompanying Notes to Financial Statements.
| Valuation Inputs at Reporting Date: |
| Description | Total ($) | Level 1 ($) | Level 2 ($) | Level 3 ($) |
Investments in Securities: | | | | |
|
| U.S. Government and Government Agency Obligations | 19,300,267,699 | - | 19,300,267,699 | - |
|
| Money Market Funds | 716,144,670 | 716,144,670 | - | - |
| Total Investments in Securities: | 20,016,412,369 | 716,144,670 | 19,300,267,699 | - |
Financial Statements (Unaudited)
| Statement of Assets and Liabilities |
| As of August 31, 2024 (Unaudited) |
| Assets | | | | |
| Investment in securities, at value (including securities loaned of $435,292,995) - See accompanying schedule: | | | | |
Unaffiliated issuers (cost $23,066,062,388) | $ | 19,300,267,699 | | |
Fidelity Central Funds (cost $716,144,670) | | 716,144,670 | | |
| | | | | |
| | | | | |
| Total Investment in Securities (cost $23,782,207,058) | | | $ | 20,016,412,369 |
| Receivable for investments sold | | | | 128,644,156 |
| Receivable for fund shares sold | | | | 1,791,419 |
| Interest receivable | | | | 118,695,202 |
| Distributions receivable from Fidelity Central Funds | | | | 915,023 |
Total assets | | | | 20,266,458,169 |
| Liabilities | | | | |
| Payable for investments purchased | $ | 134,179,988 | | |
| Payable for fund shares redeemed | | 153,102,641 | | |
| Distributions payable | | 3,357 | | |
| Other payables and accrued expenses | | 68,082 | | |
| Collateral on securities loaned | | 451,529,225 | | |
| Total liabilities | | | | 738,883,293 |
| Net Assets | | | $ | 19,527,574,876 |
| Net Assets consist of: | | | | |
| Paid in capital | | | $ | 25,086,484,110 |
| Total accumulated earnings (loss) | | | | (5,558,909,234) |
| Net Assets | | | $ | 19,527,574,876 |
Net Asset Value, offering price and redemption price per share ($19,527,574,876 ÷ 3,383,179,175 shares) | | | $ | 5.77 |
| Statement of Operations |
Six months ended August 31, 2024 (Unaudited) |
| Investment Income | | | | |
| Interest | | | $ | 361,270,173 |
| Income from Fidelity Central Funds (including $10,560 from security lending) | | | | 3,456,513 |
| Total income | | | | 364,726,686 |
| Expenses | | | | |
| Custodian fees and expenses | $ | 82,481 | | |
| Independent trustees' fees and expenses | | 27,094 | | |
| Total expenses before reductions | | 109,575 | | |
| Expense reductions | | (2,116) | | |
| Total expenses after reductions | | | | 107,459 |
| Net Investment income (loss) | | | | 364,619,227 |
| Realized and Unrealized Gain (Loss) | | | | |
| Net realized gain (loss) on: | | | | |
| Investment Securities: | | | | |
| Unaffiliated issuers | | (684,575,615) | | |
| Fidelity Central Funds | | 7,493 | | |
| Total net realized gain (loss) | | | | (684,568,122) |
| Change in net unrealized appreciation (depreciation) on investment securities | | | | 1,284,030,145 |
| Net gain (loss) | | | | 599,462,023 |
| Net increase (decrease) in net assets resulting from operations | | | $ | 964,081,250 |
| Statement of Changes in Net Assets |
| |
| | Six months ended August 31, 2024 (Unaudited) | | Year ended February 29, 2024 |
| Increase (Decrease) in Net Assets | | | | |
| Operations | | | | |
| Net investment income (loss) | $ | 364,619,227 | $ | 655,040,859 |
| Net realized gain (loss) | | (684,568,122) | | (724,264,803) |
| Change in net unrealized appreciation (depreciation) | | 1,284,030,145 | | (364,854,037) |
| Net increase (decrease) in net assets resulting from operations | | 964,081,250 | | (434,077,981) |
| Distributions to shareholders | | (337,959,816) | | (606,523,970) |
| | | | | |
| Share transactions | | | | |
| Proceeds from sales of shares | | 1,514,779,535 | | 5,632,851,217 |
| Reinvestment of distributions | | 337,901,860 | | 606,520,433 |
| Cost of shares redeemed | | (2,714,770,334) | | (2,980,965,139) |
| | | | | |
Net increase (decrease) in net assets resulting from share transactions | | (862,088,939) | | 3,258,406,511 |
| Total increase (decrease) in net assets | | (235,967,505) | | 2,217,804,560 |
| | | | | |
| Net Assets | | | | |
| Beginning of period | | 19,763,542,381 | | 17,545,737,821 |
| End of period | $ | 19,527,574,876 | $ | 19,763,542,381 |
| | | | | |
| Other Information | | | | |
| Shares | | | | |
| Sold | | 275,507,534 | | 993,209,134 |
| Issued in reinvestment of distributions | | 60,952,609 | | 106,407,571 |
| Redeemed | | (488,648,246) | | (517,708,239) |
| Net increase (decrease) | | (152,188,103) | | 581,908,466 |
| | | | | |
Financial Highlights
Fidelity® Series Long-Term Treasury Bond Index Fund |
| |
| | Six months ended (Unaudited) August 31, 2024 | | Years ended February 28, 2024 A | | 2023 | | 2022 | | 2021 | | 2020 A |
Selected Per-Share Data | | | | | | | | | | | | |
| Net asset value, beginning of period | $ | 5.59 | $ | 5.94 | $ | 8.05 | $ | 8.33 | $ | 10.06 | $ | 8.43 |
| Income from Investment Operations | | | | | | | | | | | | |
Net investment income (loss) B,C | | .107 | | .202 | | .185 | | .175 | | .201 | | .249 |
| Net realized and unrealized gain (loss) | | .172 | | (.365) | | (2.121) | | (.253) | | (.752) | | 2.319 |
| Total from investment operations | | .279 | | (.163) | | (1.936) | | (.078) | | (.551) | | 2.568 |
| Distributions from net investment income | | (.099) | | (.187) | | (.174) | | (.169) | | (.199) | | (.243) |
| Distributions from net realized gain | | - | | - | | - | | (.033) | | (.980) | | (.695) |
| Total distributions | | (.099) | | (.187) | | (.174) | | (.202) | | (1.179) | | (.938) |
| Net asset value, end of period | $ | 5.77 | $ | 5.59 | $ | 5.94 | $ | 8.05 | $ | 8.33 | $ | 10.06 |
Total Return D,E | | | | (2.77)% | | (24.16)% | | (1.01)% | | (6.47)% | | 31.91% |
Ratios to Average Net Assets C,F,G | | | | | | | | | | | | |
Expenses before reductions H | | -% I | | -% | | -% | | -% | | -% | | -% |
Expenses net of fee waivers, if any H | | | | -% | | -% | | -% | | -% | | -% |
Expenses net of all reductions H | | -% I | | -% | | -% | | -% | | -% | | -% |
| Net investment income (loss) | | 3.80% I | | 3.53% | | 2.87% | | 2.10% | | 2.03% | | 2.68% |
| Supplemental Data | | | | | | | | | | | | |
| Net assets, end of period (000 omitted) | $ | 19,527,575 | $ | 19,763,542 | $ | 17,545,738 | $ | 15,129,018 | $ | 9,356,431 | $ | 7,414,223 |
Portfolio turnover rate J | | | | 11% | | 10% | | 18% | | 56% | | 33% K |
AFor the year ended February 29.
BCalculated based on average shares outstanding during the period.
CNet investment income (loss) is affected by the timing of the declaration of dividends by any underlying mutual funds or exchange-traded funds (ETFs). Net investment income (loss) of any mutual funds or ETFs is not included in the Fund's net investment income (loss) ratio.
DTotal returns for periods of less than one year are not annualized.
ETotal returns would have been lower if certain expenses had not been reduced during the applicable periods shown.
FFees and expenses of any underlying mutual funds or exchange-traded funds (ETFs) are not included in the Fund's expense ratio. The Fund indirectly bears its proportionate share of these expenses. For additional expense information related to investments in Fidelity Central Funds, please refer to the "Investments in Fidelity Central Funds" note found in the Notes to Financial Statements section of the most recent Annual or Semi-Annual report.
GExpense ratios reflect operating expenses of the class. Expenses before reductions do not reflect amounts reimbursed, waived, or reduced through arrangements with the investment adviser, brokerage services, or other offset arrangements, if applicable, and do not represent the amount paid by the class during periods when reimbursements, waivers or reductions occur.
HAmount represents less than .005%.
IAnnualized.
JAmount does not include the portfolio activity of any underlying mutual funds or exchange-traded funds (ETFs).
KPortfolio turnover rate excludes securities received or delivered in-kind.
Notes to Financial Statements
(Unaudited)For the period ended August 31, 2024
1. Organization.
Fidelity Series Long-Term Treasury Bond Index Fund (the Fund) is a fund of Fidelity Salem Street Trust (the Trust) and is authorized to issue an unlimited number of shares. Shares are offered only to certain other Fidelity funds, Fidelity managed 529 plans, and Fidelity managed collective investment trusts. The Trust is registered under the Investment Company Act of 1940, as amended (the 1940 Act), as an open-end management investment company organized as a Massachusetts business trust.
2. Investments in Fidelity Central Funds.
Funds may invest in Fidelity Central Funds, which are open-end investment companies generally available only to other investment companies and accounts managed by the investment adviser and its affiliates. The Schedule of Investments lists any Fidelity Central Funds held as an investment as of period end, but does not include the underlying holdings of each Fidelity Central Fund. An investing fund indirectly bears its proportionate share of the expenses of the underlying Fidelity Central Funds.
Based on its investment objective, each Fidelity Central Fund may invest or participate in various investment vehicles or strategies that are similar to those of the investing fund. These strategies are consistent with the investment objectives of the investing fund and may involve certain economic risks which may cause a decline in value of each of the Fidelity Central Funds and thus a decline in the value of the investing fund.
| Fidelity Central Fund | Investment Manager | Investment Objective | Investment Practices | Expense RatioA |
| Fidelity Money Market Central Funds | Fidelity Management & Research Company LLC (FMR) | Each fund seeks to obtain a high level of current income consistent with the preservation of capital and liquidity. | Short-term Investments | Less than .005% |
A Expenses expressed as a percentage of average net assets and are as of each underlying Central Fund's most recent annual or semi-annual shareholder report.
A complete unaudited list of holdings for each Fidelity Central Fund is available upon request or at the Securities and Exchange Commission website at www.sec.gov. In addition, the financial statements of the Fidelity Central Funds which contain the significant accounting policies (including investment valuation policies) of those funds, and are not covered by the Report of Independent Registered Public Accounting Firm, are available on the Securities and Exchange Commission website or upon request.
3. Significant Accounting Policies.
The Fund is an investment company and applies the accounting and reporting guidance of the Financial Accounting Standards Board (FASB) Accounting Standards Codification Topic 946 Financial Services - Investment Companies. The financial statements have been prepared in conformity with accounting principles generally accepted in the United States of America (GAAP), which require management to make certain estimates and assumptions at the date of the financial statements. Actual results could differ from those estimates. Subsequent events, if any, through the date that the financial statements were issued have been evaluated in the preparation of the financial statements. The Fund's Schedule of Investments lists any underlying mutual funds or exchange-traded funds (ETFs) but does not include the underlying holdings of these funds. The following summarizes the significant accounting policies of the Fund:
Investment Valuation. Investments are valued as of 4:00 p.m. Eastern time on the last calendar day of the period. The Board of Trustees (the Board) has designated the Fund's investment adviser as the valuation designee responsible for the fair valuation function and performing fair value determinations as needed. The investment adviser has established a Fair Value Committee (the Committee) to carry out the day-to-day fair valuation responsibilities and has adopted policies and procedures to govern the fair valuation process and the activities of the Committee. In accordance with these fair valuation policies and procedures, which have been approved by the Board, the Fund attempts to obtain prices from one or more third party pricing services or brokers to value its investments. When current market prices, quotations or currency exchange rates are not readily available or reliable, investments will be fair valued in good faith by the Committee, in accordance with the policies and procedures. Factors used in determining fair value vary by investment type and may include market or investment specific events, transaction data, estimated cash flows, and market observations of comparable investments. The frequency that the fair valuation procedures are used cannot be predicted and they may be utilized to a significant extent. The Committee manages the Fund's fair valuation practices and maintains the fair valuation policies and procedures. The Fund's investment adviser reports to the Board information regarding the fair valuation process and related material matters.
The Fund categorizes the inputs to valuation techniques used to value its investments into a disclosure hierarchy consisting of three levels as shown below:
Level 1 - unadjusted quoted prices in active markets for identical investments
Level 2 - other significant observable inputs (including quoted prices for similar investments, interest rates, prepayment speeds, etc.)
Level 3 - unobservable inputs (including the Fund's own assumptions based on the best information available)
Valuation techniques used to value the Fund's investments by major category are as follows:
Debt securities, including restricted securities, are valued based on evaluated prices received from third party pricing services or from brokers who make markets in such securities. U.S. government and government agency obligations are valued by pricing services who utilize matrix pricing which considers yield or price of bonds of comparable quality, coupon, maturity and type or by broker-supplied prices. When independent prices are unavailable or unreliable, debt securities may be valued utilizing pricing methodologies which consider similar factors that would be used by third party pricing services. Debt securities are generally categorized as Level 2 in the hierarchy but may be Level 3 depending on the circumstances.
Investments in open-end mutual funds, including the Fidelity Central Funds, are valued at their closing net asset value (NAV) each business day and are categorized as Level 1 in the hierarchy.
Changes in valuation techniques may result in transfers in or out of an assigned level within the disclosure hierarchy. The aggregate value of investments by input level as of August 31, 2024 is included at the end of the Fund's Schedule of Investments.
Investment Transactions and Income. For financial reporting purposes, the Fund's investment holdings and NAV include trades executed through the end of the last business day of the period. The NAV per share for processing shareholder transactions is calculated as of the close of business of the New York Stock Exchange (NYSE), normally 4:00 p.m. Eastern time and includes trades executed through the end of the prior business day. Gains and losses on securities sold are determined on the basis of identified cost. Income and capital gain distributions from Fidelity Central Funds, if any, are recorded on the ex-dividend date. Interest income is accrued as earned and includes coupon interest and amortization of premium and accretion of discount on debt securities as applicable.
Expenses. Expenses directly attributable to a fund are charged to that fund. Expenses attributable to more than one fund are allocated among the respective funds on the basis of relative net assets or other appropriate methods. Expenses included in the accompanying financial statements reflect the expenses of that fund and do not include any expenses associated with any underlying mutual funds or exchange-traded funds. Although not included in a fund's expenses, a fund indirectly bears its proportionate share of these expenses through the net asset value of each underlying mutual fund or exchange-traded fund. Expense estimates are accrued in the period to which they relate and adjustments are made when actual amounts are known.
Income Tax Information and Distributions to Shareholders. Each year, the Fund intends to qualify as a regulated investment company under Subchapter M of the Internal Revenue Code, including distributing substantially all of its taxable income and realized gains. As a result, no provision for U.S. Federal income taxes is required. The Fund files a U.S. federal tax return, in addition to state and local tax returns as required. The Fund's federal income tax returns are subject to examination by the Internal Revenue Service (IRS) for a period of three fiscal years after they are filed. State and local tax returns may be subject to examination for an additional fiscal year depending on the jurisdiction.
Distributions are declared and recorded daily and paid monthly from net investment income. Distributions from realized gains, if any, are declared and recorded on the ex-dividend date. Income and capital gain distributions are determined in accordance with income tax regulations, which may differ from GAAP.
Capital accounts within the financial statements are adjusted for permanent book-tax differences. These adjustments have no impact on net assets or the results of operations. Capital accounts are not adjusted for temporary book-tax differences which will reverse in a subsequent period.
Book-tax differences are primarily due to market discount, capital loss carryforwards and losses deferred due to wash sales.
As of period end, the cost and unrealized appreciation (depreciation) in securities, and derivatives if applicable, for federal income tax purposes were as follows:
| Gross unrealized appreciation | $223,769,641 |
| Gross unrealized depreciation | (3,938,582,885) |
| Net unrealized appreciation (depreciation) | $(3,714,813,244) |
| Tax cost | $23,731,225,613 |
Capital loss carryforwards are only available to offset future capital gains of the Fund to the extent provided by regulations and may be limited. The capital loss carryforward information presented below, including any applicable limitation, is estimated as of prior fiscal period end and is subject to adjustment.
Short-term | $(183,630,013) |
Long-term | (994,779,154) |
| Total capital loss carryforward | $(1,178,409,167) |
4. Fees and Other Transactions with Affiliates.
Management Fee. Fidelity Management & Research Company LLC (the investment adviser) and its affiliates provide the Fund with investment management related services for which the Fund does not pay a management fee. Under the management contract, the investment adviser or an affiliate pays all ordinary operating expenses of the Fund, except custody fees, fees and expenses of the independent Trustees, and certain miscellaneous expenses such as proxy and shareholder meeting expenses.
Interfund Trades. Funds may purchase from or sell securities to other Fidelity Funds under procedures adopted by the Board. The procedures have been designed to ensure these interfund trades are executed in accordance with Rule 17a-7 of the 1940 Act. Any interfund trades are included within the respective purchases and sales amounts shown in the Purchases and Sales of Investments note. During the period, there were no interfund trades.
Sub-Advisory Arrangements. Effective March 1, 2024, each Fund's sub-advisory agreements with FMR Investment Management (UK) Limited, Fidelity Management & Research (Hong Kong) Limited, and Fidelity Management & Research (Japan) Limited were amended to provide that the investment adviser pays each sub-adviser monthly fees equal to 110% of the sub-adviser's costs for providing sub-advisory services.
5. Committed Line of Credit.
Certain Funds participate with other funds managed by the investment adviser or an affiliate in a $4.25 billion credit facility (the "line of credit") to be utilized for temporary or emergency purposes to fund shareholder redemptions or for other short-term liquidity purposes. The commitment fees on the pro-rata portion of the line of credit are borne by the investment adviser. During the period, there were no borrowings on this line of credit.
6. Security Lending.
Funds lend portfolio securities from time to time in order to earn additional income. Lending agents are used, including National Financial Services (NFS), an affiliate of the investment adviser. Pursuant to a securities lending agreement, NFS will receive a fee, which is capped at 9.9% of a fund's daily lending revenue, for its services as lending agent. A fund may lend securities to certain qualified borrowers, including NFS. On the settlement date of the loan, a fund receives collateral (in the form of U.S. Treasury obligations, letters of credit and/or cash) against the loaned securities and maintains collateral in an amount not less than 100% of the market value of the loaned securities during the period of the loan. The market value of the loaned securities is determined at the close of business of a fund and any additional required collateral is delivered to a fund on the next business day. A fund or borrower may terminate the loan at any time, and if the borrower defaults on its obligation to return the securities loaned because of insolvency or other reasons, a fund may apply collateral received from the borrower against the obligation. A fund may experience delays and costs in recovering the securities loaned. Any cash collateral received is invested in the Fidelity Securities Lending Cash Central Fund. Any loaned securities are identified as such in the Schedule of Investments, and the value of loaned securities and cash collateral at period end, as applicable, are presented in the Statement of Assets and Liabilities. Security lending income represents the income earned on investing cash collateral, less rebates paid to borrowers and any lending agent fees associated with the loan, plus any premium payments received for lending certain types of securities. Security lending income is presented in the Statement of Operations as a component of income from Fidelity Central Funds. Affiliated security lending activity, if any, was as follows:
| | Total Security Lending Fees Paid to NFS ($) | Security Lending Income From Securities Loaned to NFS ($) | Value of Securities Loaned to NFS at Period End ($) |
| Fidelity Series Long-Term Treasury Bond Index Fund | 1,310 | - | - |
7. Expense Reductions.
Through arrangements with the Fund's custodian, credits realized as a result of certain uninvested cash balances were used to reduce the Fund's expenses by $2,116.
8. Other.
A fund's organizational documents provide former and current trustees and officers with a limited indemnification against liabilities arising in connection with the performance of their duties to the fund. In the normal course of business, a fund may also enter into contracts that provide general indemnifications. A fund's maximum exposure under these arrangements is unknown as this would be dependent on future claims that may be made against a fund. The risk of material loss from such claims is considered remote.
At the end of the period, mutual funds and accounts managed by the investment adviser or its affiliates were the owners of record of all of the outstanding shares of the Fund.
9. Risk and Uncertainties.
Many factors affect a fund's performance. Developments that disrupt global economies and financial markets, such as pandemics, epidemics, outbreaks of infectious diseases, war, terrorism, and environmental disasters, may significantly affect a fund's investment performance. The effects of these developments to a fund will be impacted by the types of securities in which a fund invests, the financial condition, industry, economic sector, and geographic location of an issuer, and a fund's level of investment in the securities of that issuer. Significant concentrations in security types, issuers, industries, sectors, and geographic locations may magnify the factors that affect a fund's performance.
Item 8: Changes in and Disagreements with Accountants for Open-End Management Investment Companies
(Unaudited)
Note: This is not applicable for any fund included in this document.
Item 9: Proxy Disclosures for Open-End Management Investment Companies
(Unaudited)
Note: This is not applicable for any fund included in this document.
Item 10: Remuneration Paid to Directors, Officers, and others of Open-End Management Investment Companies
(Unaudited)
Note: This information is disclosed as part of the financial statements for each Fund as part of Item 7: Financial Statements and Financial Highlights for Open-End Management Investment companies.
Item 11: Statement Regarding Basis for Approval of Investment Advisory Contract
(Unaudited)
Note: This is not applicable for any fund included in this document.
1.9872675.108
XS8-SANN-1024
Fidelity® SAI Long-Term Treasury Bond Index Fund
Semi-Annual Report
August 31, 2024
Offered exclusively to certain clients of the Adviser, or its affiliates, including Strategic Advisers LLC (Strategic Advisers) - not available for sale to the general public. Fidelity® SAI is a product name of Fidelity® funds dedicated to certain programs affiliated with Strategic Advisers.
Contents
To view a fund's proxy voting guidelines and proxy voting record for the 12-month period ended June 30, visit http://www.fidelity.com/proxyvotingresults or visit the Securities and Exchange Commission's (SEC) web site at http://www.sec.gov.
You may also call 1-800-544-3455 to request a free copy of the proxy voting guidelines.
BLOOMBERG ® is a trademark and service mark of Bloomberg Finance L.P. and its affiliates (collectively "Bloomberg"). Bloomberg or Bloomberg's licensors own all proprietary rights in the Bloomberg Indices. Neither Bloomberg nor Bloomberg's licensors approves or endorses this material, or guarantees the accuracy or completeness of any information herein, or makes any warranty, express or implied, as to the results to be obtained therefrom and, to the maximum extent allowed by law, neither shall have any liability or responsibility for injury or damages arising in connection therewith.
Standard & Poor's, S&P and S&P 500 are registered service marks of The McGraw-Hill Companies, Inc. and have been licensed for use by Fidelity Distributors Corporation.
Other third-party marks appearing herein are the property of their respective owners.
All other marks appearing herein are registered or unregistered trademarks or service marks of FMR LLC or an affiliated company. © 2024 FMR LLC. All rights reserved.
This report and the financial statements contained herein are submitted for the general information of the shareholders of the Fund. This report is not authorized for distribution to prospective investors in the Fund unless preceded or accompanied by an effective prospectus.
A fund files its complete schedule of portfolio holdings with the SEC for the first and third quarters of each fiscal year on Form N-PORT. Forms N-PORT are available on the SEC's web site at http://www.sec.gov. A fund's Forms N-PORT may be reviewed and copied at the SEC's Public Reference Room in Washington, DC. Information regarding the operation of the SEC's Public Reference Room may be obtained by calling 1-800-SEC-0330.
For a complete list of a fund's portfolio holdings, view the most recent holdings listing, semiannual report, or annual report on Fidelity's web site at http://www.fidelity.com, http://www.institutional.fidelity.com, or http://www.401k.com, as applicable.
NOT FDIC INSURED •MAY LOSE VALUE •NO BANK GUARANTEE
Neither the Fund nor Fidelity Distributors Corporation is a bank.
Item 7: Financial Statements and Financial Highlights for Open-End Management Investment Companies (Semi-Annual Report)
Fidelity® SAI Long-Term Treasury Bond Index Fund
Schedule of Investments August 31, 2024 (Unaudited)
Showing Percentage of Net Assets
| U.S. Government and Government Agency Obligations - 99.2% |
| | | Principal Amount (a) | Value ($) |
| U.S. Treasury Obligations - 99.2% | | | |
| U.S. Treasury Bonds: | | | |
| 1.25% 5/15/50 | | 253,000 | 132,914 |
| 1.625% 11/15/50 | | 100,842,000 | 58,311,099 |
| 1.875% 2/15/51 | | 218,813,000 | 134,937,533 |
| 1.875% 11/15/51 | | 250,900,000 | 153,950,672 |
| 2% 2/15/50 | | 105,543,800 | 67,572,769 |
| 2% 8/15/51 | | 224,588,000 | 142,385,284 |
| 2.25% 8/15/46 | | 38,354,000 | 26,961,663 |
| 2.25% 8/15/49 | | 20,000,000 | 13,609,375 |
| 2.25% 2/15/52 | | 91,300,000 | 61,424,215 |
| 2.375% 11/15/49 | | 57,625,000 | 40,245,210 |
| 2.375% 5/15/51 | | 474,770,000 | 329,427,327 |
| 2.5% 2/15/46 | | 107,485,000 | 79,803,414 |
| 2.5% 5/15/46 | | 56,400,000 | 41,749,219 |
| 2.75% 8/15/42 | | 3,500 | 2,824 |
| 2.75% 8/15/47 | | 232,357,000 | 178,079,857 |
| 2.75% 11/15/47 | | 70,354,000 | 53,804,320 |
| 2.875% 5/15/43 | | 20,200 | 16,435 |
| 2.875% 8/15/45 | | 42,359,100 | 33,839,295 |
| 2.875% 11/15/46 | | 40,096,000 | 31,666,442 |
| 2.875% 5/15/49 | | 119,018,000 | 92,364,477 |
| 2.875% 5/15/52 | | 178,000,000 | 137,560,625 |
| 3% 11/15/44 | | 800 | 656 |
| 3% 5/15/45 | | 2,446,800 | 2,000,259 |
| 3% 11/15/45 | | 135,806,000 | 110,618,231 |
| 3% 2/15/47 | | 42,346,000 | 34,123,267 |
| 3% 5/15/47 | | 50,348,000 | 40,502,606 |
| 3% 2/15/48 | | 127,187,000 | 101,694,949 |
| 3% 8/15/48 | | 122,455,000 | 97,619,595 |
| 3% 2/15/49 | | 32,159,000 | 25,582,736 |
| 3% 8/15/52 | | 278,900,000 | 221,235,247 |
| 3.125% 2/15/42 | | 68,100 | 58,659 |
| 3.125% 5/15/48 | | 154,814,000 | 126,457,639 |
| 3.625% 2/15/53 | | 212,600,000 | 190,700,540 |
| 3.625% 5/15/53 | | 41,700,000 | 37,430,637 |
| 4% 11/15/52 | | 169,200,000 | 162,379,125 |
| 4.125% 8/15/53 | | 215,600,000 | 211,717,516 |
| 4.25% 2/15/54 | | 54,900,000 | 55,114,453 |
| 4.25% 8/15/54 | | 69,000,000 | 69,431,250 |
| 4.625% 5/15/54 | | 64,900,000 | 69,361,875 |
| 4.75% 11/15/53 | | 40,600,000 | 44,228,625 |
| TOTAL U.S. GOVERNMENT AND GOVERNMENT AGENCY OBLIGATIONS (Cost $3,587,594,628) | | | 3,278,102,834 |
| | | | |
| Money Market Funds - 1.0% |
| | | Shares | Value ($) |
Fidelity Cash Central Fund 5.39% (b) (Cost $34,063,180) | | 34,056,369 | 34,063,180 |
| | | | |
| TOTAL INVESTMENT IN SECURITIES - 100.2% (Cost $3,621,657,808) | 3,312,166,014 |
NET OTHER ASSETS (LIABILITIES) - (0.2)% | (8,227,523) |
| NET ASSETS - 100.0% | 3,303,938,491 |
| | |
Legend
| (a) | Amount is stated in United States dollars unless otherwise noted. |
| (b) | Affiliated fund that is generally available only to investment companies and other accounts managed by Fidelity Investments. The rate quoted is the annualized seven-day yield of the fund at period end. A complete unaudited listing of the fund's holdings as of its most recent quarter end is available upon request. In addition, each Fidelity Central Fund's financial statements are available on the SEC's website or upon request. |
Affiliated Central Funds
Fiscal year to date information regarding the Fund's investments in Fidelity Central Funds, including the ownership percentage, is presented below.
| Affiliate | Value, beginning of period ($) | Purchases ($) | Sales Proceeds ($) | Dividend Income ($) | Realized Gain (loss) ($) | Change in Unrealized appreciation (depreciation) ($) | Value, end of period ($) | % ownership, end of period |
| Fidelity Cash Central Fund 5.39% | 33,489,230 | 88,836,716 | 88,262,823 | 261,517 | 57 | - | 34,063,180 | 0.1% |
| Total | 33,489,230 | 88,836,716 | 88,262,823 | 261,517 | 57 | - | 34,063,180 | |
| | | | | | | | | |
Amounts in the dividend income column in the above table include any capital gain distributions from underlying funds, which are presented in the corresponding line item in the Statement of Operations, if applicable.
Amounts included in the purchases and sales proceeds columns may include in-kind transactions, if applicable.
Investment Valuation
The following is a summary of the inputs used, as of August 31, 2024, involving the Fund's assets and liabilities carried at fair value. The inputs or methodology used for valuing securities may not be an indication of the risk associated with investing in those securities. For more information on valuation inputs, and their aggregation into the levels used below, please refer to the Investment Valuation section in the accompanying Notes to Financial Statements.
| Valuation Inputs at Reporting Date: |
| Description | Total ($) | Level 1 ($) | Level 2 ($) | Level 3 ($) |
Investments in Securities: | | | | |
|
| U.S. Government and Government Agency Obligations | 3,278,102,834 | - | 3,278,102,834 | - |
|
| Money Market Funds | 34,063,180 | 34,063,180 | - | - |
| Total Investments in Securities: | 3,312,166,014 | 34,063,180 | 3,278,102,834 | - |
Financial Statements (Unaudited)
| Statement of Assets and Liabilities |
| As of August 31, 2024 (Unaudited) |
| Assets | | | | |
| Investment in securities, at value - See accompanying schedule: | | | | |
Unaffiliated issuers (cost $3,587,594,628) | $ | 3,278,102,834 | | |
Fidelity Central Funds (cost $34,063,180) | | 34,063,180 | | |
| | | | | |
| | | | | |
| Total Investment in Securities (cost $3,621,657,808) | | | $ | 3,312,166,014 |
| Receivable for investments sold | | | | 55,385,634 |
| Receivable for fund shares sold | | | | 92,316 |
| Interest receivable | | | | 19,660,155 |
| Distributions receivable from Fidelity Central Funds | | | | 88,101 |
| Prepaid expenses | | | | 4,586 |
| Receivable from investment adviser for expense reductions | | | | 31,512 |
Total assets | | | | 3,387,428,318 |
| Liabilities | | | | |
| Payable for investments purchased | $ | 83,061,758 | | |
| Payable for fund shares redeemed | | 259,000 | | |
| Distributions payable | | 25,400 | | |
| Accrued management fee | | 110,969 | | |
| Other payables and accrued expenses | | 32,700 | | |
| Total liabilities | | | | 83,489,827 |
| Net Assets | | | $ | 3,303,938,491 |
| Net Assets consist of: | | | | |
| Paid in capital | | | $ | 6,029,637,265 |
| Total accumulated earnings (loss) | | | | (2,725,698,774) |
| Net Assets | | | $ | 3,303,938,491 |
Net Asset Value, offering price and redemption price per share ($3,303,938,491 ÷ 447,590,747 shares) | | | $ | 7.38 |
| Statement of Operations |
Six months ended August 31, 2024 (Unaudited) |
| Investment Income | | | | |
| Interest | | | $ | 67,434,307 |
| Income from Fidelity Central Funds | | | | 261,517 |
| Total income | | | | 67,695,824 |
| Expenses | | | | |
| Management fee | $ | 642,463 | | |
| Custodian fees and expenses | | 139 | | |
| Independent trustees' fees and expenses | | 4,740 | | |
| Registration fees | | 25,802 | | |
| Audit fees | | 29,837 | | |
| Legal | | 907 | | |
| Miscellaneous | | 8,656 | | |
| Total expenses before reductions | | 712,544 | | |
| Expense reductions | | (222,382) | | |
| Total expenses after reductions | | | | 490,162 |
| Net Investment income (loss) | | | | 67,205,662 |
| Realized and Unrealized Gain (Loss) | | | | |
| Net realized gain (loss) on: | | | | |
| Investment Securities: | | | | |
| Unaffiliated issuers | | (129,939,861) | | |
| Fidelity Central Funds | | 57 | | |
| Total net realized gain (loss) | | | | (129,939,804) |
| Change in net unrealized appreciation (depreciation) on investment securities | | | | 213,323,494 |
| Net gain (loss) | | | | 83,383,690 |
| Net increase (decrease) in net assets resulting from operations | | | $ | 150,589,352 |
| Statement of Changes in Net Assets |
| |
| | Six months ended August 31, 2024 (Unaudited) | | Year ended February 29, 2024 |
| Increase (Decrease) in Net Assets | | | | |
| Operations | | | | |
| Net investment income (loss) | $ | 67,205,662 | $ | 142,240,240 |
| Net realized gain (loss) | | (129,939,804) | | (285,914,913) |
| Change in net unrealized appreciation (depreciation) | | 213,323,494 | | 88,170,554 |
| Net increase (decrease) in net assets resulting from operations | | 150,589,352 | | (55,504,119) |
| Distributions to shareholders | | (59,279,435) | | (126,136,529) |
| | | | | |
| Share transactions | | | | |
| Proceeds from sales of shares | | 10,581,531 | | 1,571,655,121 |
| Reinvestment of distributions | | 59,080,149 | | 124,963,502 |
| Cost of shares redeemed | | (195,140,064) | | (1,415,721,451) |
| | | | | |
Net increase (decrease) in net assets resulting from share transactions | | (125,478,384) | | 280,897,172 |
| Total increase (decrease) in net assets | | (34,168,467) | | 99,256,524 |
| | | | | |
| Net Assets | | | | |
| Beginning of period | | 3,338,106,958 | | 3,238,850,434 |
| End of period | $ | 3,303,938,491 | $ | 3,338,106,958 |
| | | | | |
| Other Information | | | | |
| Shares | | | | |
| Sold | | 1,492,359 | | 226,044,229 |
| Issued in reinvestment of distributions | | 8,347,881 | | 17,057,001 |
| Redeemed | | (27,463,091) | | (196,792,164) |
| Net increase (decrease) | | (17,622,851) | | 46,309,066 |
| | | | | |
Financial Highlights
Fidelity® SAI Long-Term Treasury Bond Index Fund |
| |
| | Six months ended (Unaudited) August 31, 2024 | | Years ended February 28, 2024 A | | 2023 | | 2022 | | 2021 | | 2020 A |
Selected Per-Share Data | | | | | | | | | | | | |
| Net asset value, beginning of period | $ | 7.18 | $ | 7.73 | $ | 10.71 | $ | 11.04 | $ | 12.59 | $ | 9.72 |
| Income from Investment Operations | | | | | | | | | | | | |
Net investment income (loss) B,C | | .149 | | .283 | | .243 | | .219 | | .227 | | .251 |
| Net realized and unrealized gain (loss) | | .182 | | (.582) | | (2.991) | | (.309) | | (.965) | | 2.876 |
| Total from investment operations | | .331 | | (.299) | | (2.748) | | (.090) | | (.738) | | 3.127 |
| Distributions from net investment income | | (.131) | | (.251) | | (.232) | | (.213) | | (.226) | | (.257) |
| Distributions from net realized gain | | - | | - | | - | | (.027) | | (.586) | | - |
| Total distributions | | (.131) | | (.251) | | (.232) | | (.240) | | (.812) | | (.257) |
| Net asset value, end of period | $ | 7.38 | $ | 7.18 | $ | 7.73 | $ | 10.71 | $ | 11.04 | $ | 12.59 |
Total Return D,E | | | | (3.91)% | | (25.78)% | | (.85)% | | (6.39)% | | 32.55% |
Ratios to Average Net Assets C,F,G | | | | | | | | | | | | |
| Expenses before reductions | | .04% H | | .04% | | .04% | | .08% | | .05% | | .08% |
| Expenses net of fee waivers, if any | | | | .03% | | .03% | | .03% | | .03% | | .03% |
| Expenses net of all reductions | | .03% H | | .03% | | .03% | | .03% | | .03% | | .03% |
| Net investment income (loss) | | 4.15% H | | 3.85% | | 2.85% | | 1.97% | | 1.77% | | 2.21% |
| Supplemental Data | | | | | | | | | | | | |
| Net assets, end of period (000 omitted) | $ | 3,303,938 | $ | 3,338,107 | $ | 3,238,850 | $ | 7,086,638 | $ | 1,174,635 | $ | 1,055,440 |
Portfolio turnover rate I | | | | 51% | | 107% | | 62% | | 47% | | 18% |
AFor the year ended February 29.
BCalculated based on average shares outstanding during the period.
CNet investment income (loss) is affected by the timing of the declaration of dividends by any underlying mutual funds or exchange-traded funds (ETFs). Net investment income (loss) of any mutual funds or ETFs is not included in the Fund's net investment income (loss) ratio.
DTotal returns for periods of less than one year are not annualized.
ETotal returns would have been lower if certain expenses had not been reduced during the applicable periods shown.
FFees and expenses of any underlying mutual funds or exchange-traded funds (ETFs) are not included in the Fund's expense ratio. The Fund indirectly bears its proportionate share of these expenses.
GExpense ratios reflect operating expenses of the class. Expenses before reductions do not reflect amounts reimbursed, waived, or reduced through arrangements with the investment adviser, brokerage services, or other offset arrangements, if applicable, and do not represent the amount paid by the class during periods when reimbursements, waivers or reductions occur.
HAnnualized.
IAmount does not include the portfolio activity of any underlying mutual funds or exchange-traded funds (ETFs).
Notes to Financial Statements
(Unaudited)For the period ended August 31, 2024
1. Organization.
Fidelity SAI Long-Term Treasury Bond Index Fund (the Fund) is a fund of Fidelity Salem Street Trust (the Trust) and is authorized to issue an unlimited number of shares. Shares are offered exclusively to certain clients of Fidelity Management & Research Company LLC (FMR) or its affiliates. The Trust is registered under the Investment Company Act of 1940, as amended (the 1940 Act), as an open-end management investment company organized as a Massachusetts business trust.
2. Investments in Fidelity Central Funds.
Funds may invest in Fidelity Central Funds, which are open-end investment companies generally available only to other investment companies and accounts managed by the investment adviser and its affiliates. The Schedule of Investments lists any Fidelity Central Funds held as an investment as of period end, but does not include the underlying holdings of each Fidelity Central Fund. An investing fund indirectly bears its proportionate share of the expenses of the underlying Fidelity Central Funds.
Based on its investment objective, each Fidelity Central Fund may invest or participate in various investment vehicles or strategies that are similar to those of the investing fund. These strategies are consistent with the investment objectives of the investing fund and may involve certain economic risks which may cause a decline in value of each of the Fidelity Central Funds and thus a decline in the value of the investing fund.
| Fidelity Central Fund | Investment Manager | Investment Objective | Investment Practices | Expense RatioA |
| Fidelity Money Market Central Funds | Fidelity Management & Research Company LLC (FMR) | Each fund seeks to obtain a high level of current income consistent with the preservation of capital and liquidity. | Short-term Investments | Less than .005% |
A Expenses expressed as a percentage of average net assets and are as of each underlying Central Fund's most recent annual or semi-annual shareholder report.
A complete unaudited list of holdings for each Fidelity Central Fund is available upon request or at the Securities and Exchange Commission website at www.sec.gov. In addition, the financial statements of the Fidelity Central Funds which contain the significant accounting policies (including investment valuation policies) of those funds, and are not covered by the Report of Independent Registered Public Accounting Firm, are available on the Securities and Exchange Commission website or upon request.
3. Significant Accounting Policies.
The Fund is an investment company and applies the accounting and reporting guidance of the Financial Accounting Standards Board (FASB) Accounting Standards Codification Topic 946 Financial Services - Investment Companies. The financial statements have been prepared in conformity with accounting principles generally accepted in the United States of America (GAAP), which require management to make certain estimates and assumptions at the date of the financial statements. Actual results could differ from those estimates. Subsequent events, if any, through the date that the financial statements were issued have been evaluated in the preparation of the financial statements. The Fund's Schedule of Investments lists any underlying mutual funds or exchange-traded funds (ETFs) but does not include the underlying holdings of these funds. The following summarizes the significant accounting policies of the Fund:
Investment Valuation. Investments are valued as of 4:00 p.m. Eastern time on the last calendar day of the period. The Board of Trustees (the Board) has designated the Fund's investment adviser as the valuation designee responsible for the fair valuation function and performing fair value determinations as needed. The investment adviser has established a Fair Value Committee (the Committee) to carry out the day-to-day fair valuation responsibilities and has adopted policies and procedures to govern the fair valuation process and the activities of the Committee. In accordance with these fair valuation policies and procedures, which have been approved by the Board, the Fund attempts to obtain prices from one or more third party pricing services or brokers to value its investments. When current market prices, quotations or currency exchange rates are not readily available or reliable, investments will be fair valued in good faith by the Committee, in accordance with the policies and procedures. Factors used in determining fair value vary by investment type and may include market or investment specific events, transaction data, estimated cash flows, and market observations of comparable investments. The frequency that the fair valuation procedures are used cannot be predicted and they may be utilized to a significant extent. The Committee manages the Fund's fair valuation practices and maintains the fair valuation policies and procedures. The Fund's investment adviser reports to the Board information regarding the fair valuation process and related material matters.
The Fund categorizes the inputs to valuation techniques used to value its investments into a disclosure hierarchy consisting of three levels as shown below:
Level 1 - unadjusted quoted prices in active markets for identical investments
Level 2 - other significant observable inputs (including quoted prices for similar investments, interest rates, prepayment speeds, etc.)
Level 3 - unobservable inputs (including the Fund's own assumptions based on the best information available)
Valuation techniques used to value the Fund's investments by major category are as follows:
Debt securities, including restricted securities, are valued based on evaluated prices received from third party pricing services or from brokers who make markets in such securities. U.S. government and government agency obligations are valued by pricing services who utilize matrix pricing which considers yield or price of bonds of comparable quality, coupon, maturity and type or by broker-supplied prices. When independent prices are unavailable or unreliable, debt securities may be valued utilizing pricing methodologies which consider similar factors that would be used by third party pricing services. Debt securities are generally categorized as Level 2 in the hierarchy but may be Level 3 depending on the circumstances.
Investments in open-end mutual funds, including the Fidelity Central Funds, are valued at their closing net asset value (NAV) each business day and are categorized as Level 1 in the hierarchy.
Changes in valuation techniques may result in transfers in or out of an assigned level within the disclosure hierarchy. The aggregate value of investments by input level as of August 31, 2024 is included at the end of the Fund's Schedule of Investments.
Investment Transactions and Income. For financial reporting purposes, the Fund's investment holdings and NAV include trades executed through the end of the last business day of the period. The NAV per share for processing shareholder transactions is calculated as of the close of business of the New York Stock Exchange (NYSE), normally 4:00 p.m. Eastern time and includes trades executed through the end of the prior business day. Gains and losses on securities sold are determined on the basis of identified cost. Income and capital gain distributions from Fidelity Central Funds, if any, are recorded on the ex-dividend date. Interest income is accrued as earned and includes coupon interest and amortization of premium and accretion of discount on debt securities as applicable.
Expenses. Expenses directly attributable to a fund are charged to that fund. Expenses attributable to more than one fund are allocated among the respective funds on the basis of relative net assets or other appropriate methods. Expenses included in the accompanying financial statements reflect the expenses of that fund and do not include any expenses associated with any underlying mutual funds or exchange-traded funds. Although not included in a fund's expenses, a fund indirectly bears its proportionate share of these expenses through the net asset value of each underlying mutual fund or exchange-traded fund. Expense estimates are accrued in the period to which they relate and adjustments are made when actual amounts are known.
Income Tax Information and Distributions to Shareholders. Each year, the Fund intends to qualify as a regulated investment company under Subchapter M of the Internal Revenue Code, including distributing substantially all of its taxable income and realized gains. As a result, no provision for U.S. Federal income taxes is required. The Fund files a U.S. federal tax return, in addition to state and local tax returns as required. The Fund's federal income tax returns are subject to examination by the Internal Revenue Service (IRS) for a period of three fiscal years after they are filed. State and local tax returns may be subject to examination for an additional fiscal year depending on the jurisdiction.
Distributions are declared and recorded daily and paid monthly from net investment income. Distributions from realized gains, if any, are declared and recorded on the ex-dividend date. Income and capital gain distributions are determined in accordance with income tax regulations, which may differ from GAAP.
Capital accounts within the financial statements are adjusted for permanent book-tax differences. These adjustments have no impact on net assets or the results of operations. Capital accounts are not adjusted for temporary book-tax differences which will reverse in a subsequent period.
Book-tax differences are primarily due to market discount, capital loss carryforwards, and losses deferred due to wash sales.
As of period end, the cost and unrealized appreciation (depreciation) in securities, and derivatives if applicable, for federal income tax purposes were as follows:
| Gross unrealized appreciation | $76,639,652 |
| Gross unrealized depreciation | (376,745,687) |
| Net unrealized appreciation (depreciation) | $(300,106,035) |
| Tax cost | $3,612,272,049 |
Capital loss carryforwards are only available to offset future capital gains of the Fund to the extent provided by regulations and may be limited. The capital loss carryforward information presented below, including any applicable limitation, is estimated as of prior fiscal period end and is subject to adjustment.
Short-term | $(812,706,493) |
Long-term | (1,470,288,522) |
| Total capital loss carryforward | $(2,282,995,015) |
Due to large redemptions in a prior period, approximately $1,583,982,571 of the Fund's realized capital losses are subject to limitation. Due to this limitation, the Fund will only be permitted to use approximately $75,457,734 of those capital losses per year to offset capital gains. Additionally, the Fund is subject to an annual limit on its use of some of its unrealized capital losses to offset capital gains in future periods. If those losses are realized and the limitation prevents the Fund from using any of those losses in a future period, those capital losses will be available to offset capital gains in subsequent periods.
4. Fees and Other Transactions with Affiliates.
Management Fee. Fidelity Management & Research Company LLC (the investment adviser) and its affiliates provide the Fund with investment management related services for which the Fund pays a monthly management fee that is based on an annual rate of .04% of the Fund's average net assets.
Interfund Trades. Funds may purchase from or sell securities to other Fidelity Funds under procedures adopted by the Board. The procedures have been designed to ensure these interfund trades are executed in accordance with Rule 17a-7 of the 1940 Act. Any interfund trades are included within the respective purchases and sales amounts shown in the Purchases and Sales of Investments note. During the period, there were no interfund trades.
Sub-Advisory Arrangements. Effective March 1, 2024, each Fund's sub-advisory agreements with FMR Investment Management (UK) Limited, Fidelity Management & Research (Hong Kong) Limited, and Fidelity Management & Research (Japan) Limited were amended to provide that the investment adviser pays each sub-adviser monthly fees equal to 110% of the sub-adviser's costs for providing sub-advisory services.
5. Committed Line of Credit.
Certain Funds participate with other funds managed by the investment adviser or an affiliate in a $4.25 billion credit facility (the "line of credit") to be utilized for temporary or emergency purposes to fund shareholder redemptions or for other short-term liquidity purposes. The participating funds have agreed to pay commitment fees on their pro-rata portion of the line of credit, which are reflected in Miscellaneous expenses on the Statement of Operations, and are listed below. During the period, there were no borrowings on this line of credit.
| | Amount ($) |
| Fidelity SAI Long-Term Treasury Bond Index Fund | 2,986 |
6. Expense Reductions.
The investment adviser contractually agreed to reimburse the Fund to the extent annual operating expenses exceeded .03% of average net assets. This reimbursement will remain in place through June 30, 2025. Some expenses, for example the compensation of the independent Trustees, and certain miscellaneous expenses such as proxy and shareholder meeting expenses, are excluded from this reimbursement. During the period this reimbursement reduced the Fund's expenses by $222,053.
Through arrangements with the Fund's custodian, credits realized as a result of certain uninvested cash balances were used to reduce the Fund's expenses by $329.
7. Other.
A fund's organizational documents provide former and current trustees and officers with a limited indemnification against liabilities arising in connection with the performance of their duties to the fund. In the normal course of business, a fund may also enter into contracts that provide general indemnifications. A fund's maximum exposure under these arrangements is unknown as this would be dependent on future claims that may be made against a fund. The risk of material loss from such claims is considered remote.
At the end of the period, the following mutual funds managed by the investment adviser or its affiliates were the owners of record of 10% or more of the total outstanding shares.
| | Strategic Advisers Core Income Fund | Strategic Advisers Fidelity Core Income Fund |
| Fidelity SAI Long-Term Treasury Bond Index Fund | 13% | 82% |
Mutual funds managed by the investment adviser or its affiliates, in aggregate, were the owners of record of more than 20% of the total outstanding shares.
| Fund | % of shares held |
| Fidelity SAI Long-Term Treasury Bond Index Fund | 95% |
8. Risk and Uncertainties.
Many factors affect a fund's performance. Developments that disrupt global economies and financial markets, such as pandemics, epidemics, outbreaks of infectious diseases, war, terrorism, and environmental disasters, may significantly affect a fund's investment performance. The effects of these developments to a fund will be impacted by the types of securities in which a fund invests, the financial condition, industry, economic sector, and geographic location of an issuer, and a fund's level of investment in the securities of that issuer. Significant concentrations in security types, issuers, industries, sectors, and geographic locations may magnify the factors that affect a fund's performance.
Item 8: Changes in and Disagreements with Accountants for Open-End Management Investment Companies
(Unaudited)
Note: This is not applicable for any fund included in this document.
Item 9: Proxy Disclosures for Open-End Management Investment Companies
(Unaudited)
Note: This is not applicable for any fund included in this document.
Item 10: Remuneration Paid to Directors, Officers, and others of Open-End Management Investment Companies
(Unaudited)
Note: This information is disclosed as part of the financial statements for each Fund as part of Item 7: Financial Statements and Financial Highlights for Open-End Management Investment companies.
Item 11: Statement Regarding Basis for Approval of Investment Advisory Contract
(Unaudited)
Note: This is not applicable for any fund included in this document.
1.9869415.108
SV5-SANN-1024
Item 8.
Changes in and Disagreements with Accountants for Open-End Management Investment Companies
See Item 7.
Item 9.
Proxy Disclosures for Open-End Management Investment Companies
See Item 7.
Item 10.
Remuneration Paid to Directors, Officers, and Others of Open-End Management Investment Companies
See Item 7.
Item 11.
Statement Regarding Basis for Approval of Investment Advisory Contract
See Item 7.
Item 12.
Disclosure of Proxy Voting Policies and Procedures for Closed-End Management Investment Companies
Not applicable.
Item 13.
Portfolio Managers of Closed-End Management Investment Companies
Not applicable.
Item 14.
Purchases of Equity Securities by Closed-End Management Investment Company and Affiliated Purchasers
Not applicable.
Item 15.
Submission of Matters to a Vote of Security Holders
There were no material changes to the procedures by which shareholders may recommend nominees to the Fidelity Salem Street Trust’s Board of Trustees.
Item 16.
Controls and Procedures
(a)(i) The President and Treasurer and the Chief Financial Officer have concluded that the Fidelity Salem Street Trust’s (the “Trust”) disclosure controls and procedures (as defined in Rule 30a-3(c) under the Investment Company Act) provide reasonable assurances that material information relating to the Trust is made known to them by the appropriate persons, based on their evaluation of these controls and procedures as of a date within 90 days of the filing date of this report.
(a)(ii) There was no change in the Trust’s internal control over financial reporting (as defined in Rule 30a-3(d) under the Investment Company Act) that occurred during the period covered by this report that has materially affected, or is reasonably likely to materially affect, the Trust’s internal control over financial reporting.
Item 17.
Disclosure of Securities Lending Activities for Closed-End Management Investment Companies
Not applicable.
Item 18.
Recovery of Erroneously Awarded Compensation
(a)
Not applicable.
(b)
Not applicable.
Item 19.
Exhibits
SIGNATURES
Pursuant to the requirements of the Securities Exchange Act of 1934 and the Investment Company Act of 1940, the registrant has duly caused this report to be signed on its behalf by the undersigned, thereunto duly authorized.
Fidelity Salem Street Trust
|
By: | /s/Laura M. Del Prato |
| Laura M. Del Prato |
| President and Treasurer (Principal Executive Officer) |
|
|
Date: | October 23, 2024 |
Pursuant to the requirements of the Securities Exchange Act of 1934 and the Investment Company Act of 1940, this report has been signed below by the following persons on behalf of the registrant and in the capacities and on the dates indicated.
|
By: | /s/Laura M. Del Prato |
| Laura M. Del Prato |
| President and Treasurer (Principal Executive Officer) |
|
|
Date: | October 23, 2024 |
|
By: | /s/John J. Burke III |
| John J. Burke III |
| Chief Financial Officer (Principal Financial Officer) |
|
|
Date: | October 23, 2024 |