UNITED STATES
SECURITIES AND EXCHANGE COMMISSION
Washington, D.C. 20549
FORM N-CSR
CERTIFIED SHAREHOLDER REPORT OF REGISTERED
MANAGEMENT INVESTMENT COMPANIES
Investment Company Act file number 811-02105
Fidelity Salem Street Trust
(Exact name of registrant as specified in charter)
245 Summer St., Boston, MA 02210
(Address of principal executive offices) (Zip code)
Nicole Macarchuk, Secretary
245 Summer St.
Boston, Massachusetts 02210
(Name and address of agent for service)
Registrant's telephone number, including area code:
617-563-7000
| |
Date of fiscal year end: | June 30 |
|
|
Date of reporting period: | December 31, 2024 |
Item 1.
Reports to Stockholders
| |
| | SEMI-ANNUAL SHAREHOLDER REPORT | AS OF DECEMBER 31, 2024 | |
| | Fidelity® Small Cap Growth Index Fund Fidelity® Small Cap Growth Index Fund : FECGX |
| | | |
This semi-annual shareholder report contains information about Fidelity® Small Cap Growth Index Fund for the period July 1, 2024 to December 31, 2024. You can find additional information about the Fund at fundresearch.fidelity.com/prospectus/sec. You can also request this information by contacting us at 1-800-544-8544 or by sending an e-mail to fidfunddocuments@fidelity.com.
What were your Fund costs for the last six months?(based on hypothetical $10,000 investment)
| | Costs of a $10,000 investment | Costs paid as a percentage of a $10,000 investment | |
| Fidelity® Small Cap Growth Index Fund | $ 3 | 0.05% | |
Key Fund Statistics(as of December 31, 2024)
KEY FACTS | | |
| Fund Size | $839,605,762 | |
| Number of Holdings | 1,129 | |
| Portfolio Turnover | 13% | |
What did the Fund invest in?
(as of December 31, 2024)
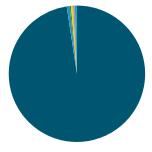
MARKET SECTORS (% of Fund's net assets) | | |
| Health Care | 23.5 | |
| Industrials | 22.6 | |
| Information Technology | 20.9 | |
| Consumer Discretionary | 10.1 | |
| Financials | 8.5 | |
| Materials | 3.7 | |
| Consumer Staples | 3.4 | |
| Energy | 3.2 | |
| Communication Services | 2.1 | |
| Real Estate | 1.4 | |
| Utilities | 0.4 | |
| |
| Common Stocks | 99.8 |
| Short-Term Investments and Net Other Assets (Liabilities) | 0.2 |
ASSET ALLOCATION (% of Fund's net assets) |
|
| | Common Stocks - 99.8 |
| | Short-Term Investments and Net Other Assets (Liabilities) - 0.2 |
| |
| United States | 97.6 |
| Thailand | 0.7 |
| Canada | 0.3 |
| Singapore | 0.3 |
| Puerto Rico | 0.2 |
| India | 0.1 |
| Bahamas (Nassau) | 0.1 |
| Brazil | 0.1 |
| Ghana | 0.1 |
| Others | 0.5 |
GEOGRAPHIC DIVERSIFICATION (% of Fund's net assets) |
|
| | United States - 97.6 |
| | Thailand - 0.7 |
| | Canada - 0.3 |
| | Singapore - 0.3 |
| | Puerto Rico - 0.2 |
| | India - 0.1 |
| | Bahamas (Nassau) - 0.1 |
| | Brazil - 0.1 |
| | Ghana - 0.1 |
| | Others - 0.5 |
| |
TOP HOLDINGS(% of Fund's net assets) | | |
| FTAI Aviation Ltd | 1.1 | |
| Sprouts Farmers Market Inc | 1.0 | |
| Insmed Inc | 1.0 | |
| Vaxcyte Inc | 0.8 | |
| Credo Technology Group Holding Ltd | 0.8 | |
| Applied Industrial Technologies Inc | 0.7 | |
| Rocket Lab USA Inc Class A | 0.7 | |
| IonQ Inc | 0.7 | |
| HealthEquity Inc | 0.7 | |
| Mueller Industries Inc | 0.7 | |
| | 8.2 | |
| Fidelity, the Fidelity Investments Logo and all other Fidelity trademarks or service marks used herein are trademarks or service marks of FMR LLC. Any third-party marks that are used herein are trademarks or service marks of their respective owners. © 2025 FMR LLC. All rights reserved. |
| | For additional information about the Fund; including its prospectus, financial information, holdings and proxy information, scan the QR code or visit fundresearch.fidelity.com/prospectus/sec 1.9915168.100 3405-TSRS-0325 |
| |
| | SEMI-ANNUAL SHAREHOLDER REPORT | AS OF DECEMBER 31, 2024 | |
| | Fidelity® Small Cap Value Index Fund Fidelity® Small Cap Value Index Fund : FISVX |
| | | |
This semi-annual shareholder report contains information about Fidelity® Small Cap Value Index Fund for the period July 1, 2024 to December 31, 2024. You can find additional information about the Fund at fundresearch.fidelity.com/prospectus/sec. You can also request this information by contacting us at 1-800-544-8544 or by sending an e-mail to fidfunddocuments@fidelity.com.
What were your Fund costs for the last six months?(based on hypothetical $10,000 investment)
| | Costs of a $10,000 investment | Costs paid as a percentage of a $10,000 investment | |
| Fidelity® Small Cap Value Index Fund | $ 3 | 0.05% | |
Key Fund Statistics(as of December 31, 2024)
KEY FACTS | | |
| Fund Size | $1,313,781,363 | |
| Number of Holdings | 1,449 | |
| Portfolio Turnover | 13% | |
What did the Fund invest in?
(as of December 31, 2024)
MARKET SECTORS (% of Fund's net assets) | | |
| Financials | 29.2 | |
| Industrials | 12.6 | |
| Real Estate | 11.0 | |
| Consumer Discretionary | 9.2 | |
| Health Care | 8.7 | |
| Energy | 7.1 | |
| Information Technology | 6.5 | |
| Utilities | 5.2 | |
| Materials | 4.8 | |
| Communication Services | 3.1 | |
| Consumer Staples | 2.3 | |
| |
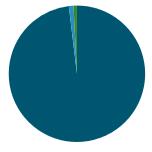
| Common Stocks | 99.7 |
| Short-Term Investments and Net Other Assets (Liabilities) | 0.3 |
ASSET ALLOCATION (% of Fund's net assets) |
|
| | Common Stocks - 99.7 |
| | Short-Term Investments and Net Other Assets (Liabilities) - 0.3 |
| |
| United States | 96.4 |
| Canada | 1.0 |
| Argentina | 0.5 |
| Puerto Rico | 0.4 |
| Norway | 0.4 |
| Cameroon | 0.3 |
| Monaco | 0.2 |
| Bermuda | 0.2 |
| Brazil | 0.1 |
| Others | 0.5 |
GEOGRAPHIC DIVERSIFICATION (% of Fund's net assets) |
|
| | United States - 96.4 |
| | Canada - 1.0 |
| | Argentina - 0.5 |
| | Puerto Rico - 0.4 |
| | Norway - 0.4 |
| | Cameroon - 0.3 |
| | Monaco - 0.2 |
| | Bermuda - 0.2 |
| | Brazil - 0.1 |
| | Others - 0.5 |
| |
TOP HOLDINGS(% of Fund's net assets) | | |
| SouthState Corp | 0.7 | |
| Old National Bancorp/IN | 0.6 | |
| Jackson Financial Inc | 0.6 | |
| Cadence Bank | 0.6 | |
| Taylor Morrison Home Corp | 0.6 | |
| Summit Materials Inc Class A | 0.5 | |
| Glacier Bancorp Inc | 0.5 | |
| Commercial Metals Co | 0.5 | |
| Terreno Realty Corp | 0.4 | |
| Essent Group Ltd | 0.4 | |
| | 5.4 | |
| Fidelity, the Fidelity Investments Logo and all other Fidelity trademarks or service marks used herein are trademarks or service marks of FMR LLC. Any third-party marks that are used herein are trademarks or service marks of their respective owners. © 2025 FMR LLC. All rights reserved. |
| | For additional information about the Fund; including its prospectus, financial information, holdings and proxy information, scan the QR code or visit fundresearch.fidelity.com/prospectus/sec 1.9915169.100 3406-TSRS-0325 |
| |
| | SEMI-ANNUAL SHAREHOLDER REPORT | AS OF DECEMBER 31, 2024 | |
| | Fidelity® SAI Municipal Bond Index Fund Fidelity® SAI Municipal Bond Index Fund : FSABX |
| | | |
This semi-annual shareholder report contains information about Fidelity® SAI Municipal Bond Index Fund for the period July 1, 2024 to December 31, 2024. You can find additional information about the Fund at fundresearch.fidelity.com/prospectus/sec. You can also request this information by contacting us at 1-800-544-3455 or by sending an e-mail to fidfunddocuments@fidelity.com.
What were your Fund costs for the last six months?(based on hypothetical $10,000 investment)
| | Costs of a $10,000 investment | Costs paid as a percentage of a $10,000 investment | |
| Fidelity® SAI Municipal Bond Index Fund | $ 4 | 0.07% | |
Key Fund Statistics(as of December 31, 2024)
KEY FACTS | | |
| Fund Size | $81,891,847 | |
| Number of Holdings | 1,242 | |
| Portfolio Turnover | 19% | |
What did the Fund invest in?
(as of December 31, 2024)
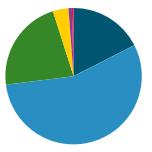
REVENUE SOURCES (% of Fund's net assets) |
| General Obligations | 35.0 | |
| Transportation | 15.4 | |
| Special Tax | 15.2 | |
| Water & Sewer | 9.3 | |
| Health Care | 8.4 | |
| Electric Utilities | 6.0 | |
| Education | 5.8 | |
| Others(Individually Less Than 5%) | 4.9 | |
| 100.0 | |
| |
| AAA | 16.5 |
| AA | 57.0 |
| A | 22.0 |
| BBB | 3.9 |
| B | 0.0 |
| Not Rated | 0.8 |
QUALITY DIVERSIFICATION (% of Fund's net assets) |
| |
| | AAA - 16.5 |
| | AA - 57.0 |
| | A - 22.0 |
| | BBB - 3.9 |
| | B - 0.0 |
| | Not Rated - 0.8 |
| Short-Term Investments and Net Other Assets (Liabilities) - (0.2)% |
| |
| We have used ratings from Moody's Investors Service, Inc. Where Moody's® ratings are not available, we have used S&P® ratings. All ratings are as of the date indicated and do not reflect subsequent changes. |
TOP STATES (% of Fund's net assets) |
| California | 19.0 |
| New York | 19.0 |
| Texas | 8.4 |
| Illinois | 4.5 |
| Washington | 4.1 |
| | |
| Fidelity, the Fidelity Investments Logo and all other Fidelity trademarks or service marks used herein are trademarks or service marks of FMR LLC. Any third-party marks that are used herein are trademarks or service marks of their respective owners. © 2025 FMR LLC. All rights reserved. |
| | For additional information about the Fund; including its prospectus, financial information, holdings and proxy information, scan the QR code or visit fundresearch.fidelity.com/prospectus/sec 1.9915171.100 3470-TSRS-0325 |
| |
| | SEMI-ANNUAL SHAREHOLDER REPORT | AS OF DECEMBER 31, 2024 | |
| | Fidelity® Municipal Income 2025 Fund Fidelity Advisor® Municipal Income 2025 Fund Class A : FAMHX |
| | | |
This semi-annual shareholder report contains information about Fidelity® Municipal Income 2025 Fund for the period July 1, 2024 to December 31, 2024. You can find additional information about the Fund at fundresearch.fidelity.com/prospectus/sec. You can also request this information by contacting us at 1-877-208-0098 or by sending an e-mail to fidfunddocuments@fidelity.com.
What were your Fund costs for the last six months?(based on hypothetical $10,000 investment)
| | Costs of a $10,000 investment | Costs paid as a percentage of a $10,000 investment | |
| Class A | $ 33 | 0.65% | |
Key Fund Statistics(as of December 31, 2024)
KEY FACTS | | |
| Fund Size | $22,111,435 | |
| Number of Holdings | 118 | |
| Portfolio Turnover | 0% | |
What did the Fund invest in?
(as of December 31, 2024)
REVENUE SOURCES (% of Fund's net assets) |
| Health Care | 27.4 | |
| Transportation | 24.9 | |
| Education | 22.0 | |
| General Obligations | 11.0 | |
| Housing | 5.7 | |
| Others(Individually Less Than 5%) | 9.0 | |
| 100.0 | |
| |
| AAA | 9.8 |
| AA | 23.6 |
| A | 41.8 |
| BBB | 16.6 |
| BB | 3.1 |
| B | 0.5 |
| Not Rated | 4.0 |
| Short-Term Investments and Net Other Assets (Liabilities) | 0.6 |
QUALITY DIVERSIFICATION (% of Fund's net assets) |
| |
| | AAA - 9.8 |
| | AA - 23.6 |
| | A - 41.8 |
| | BBB - 16.6 |
| | BB - 3.1 |
| | B - 0.5 |
| | Not Rated - 4.0 |
| | Short-Term Investments and Net Other Assets (Liabilities) - 0.6 |
| |
| We have used ratings from Moody's Investors Service, Inc. Where Moody's® ratings are not available, we have used S&P® ratings. All ratings are as of the date indicated and do not reflect subsequent changes. |
TOP STATES (% of Fund's net assets) |
| Connecticut | 11.8 |
| Pennsylvania | 10.0 |
| Illinois | 8.2 |
| Massachusetts | 6.2 |
| Ohio | 5.4 |
| | |
| Fidelity, the Fidelity Investments Logo and all other Fidelity trademarks or service marks used herein are trademarks or service marks of FMR LLC. Any third-party marks that are used herein are trademarks or service marks of their respective owners. © 2025 FMR LLC. All rights reserved. |
| | For additional information about the Fund; including its prospectus, financial information, holdings and proxy information, scan the QR code or visit fundresearch.fidelity.com/prospectus/sec 1.9915164.100 2949-TSRS-0325 |
| |
| | SEMI-ANNUAL SHAREHOLDER REPORT | AS OF DECEMBER 31, 2024 | |
| | Fidelity® Municipal Income 2025 Fund Fidelity Advisor® Municipal Income 2025 Fund Class I : FAMYX |
| | | |
This semi-annual shareholder report contains information about Fidelity® Municipal Income 2025 Fund for the period July 1, 2024 to December 31, 2024. You can find additional information about the Fund at fundresearch.fidelity.com/prospectus/sec. You can also request this information by contacting us at 1-877-208-0098 or by sending an e-mail to fidfunddocuments@fidelity.com.
What were your Fund costs for the last six months?(based on hypothetical $10,000 investment)
| | Costs of a $10,000 investment | Costs paid as a percentage of a $10,000 investment | |
| Class I | $ 20 | 0.40% | |
Key Fund Statistics(as of December 31, 2024)
KEY FACTS | | |
| Fund Size | $22,111,435 | |
| Number of Holdings | 118 | |
| Portfolio Turnover | 0% | |
What did the Fund invest in?
(as of December 31, 2024)
REVENUE SOURCES (% of Fund's net assets) |
| Health Care | 27.4 | |
| Transportation | 24.9 | |
| Education | 22.0 | |
| General Obligations | 11.0 | |
| Housing | 5.7 | |
| Others(Individually Less Than 5%) | 9.0 | |
| 100.0 | |
| |
| AAA | 9.8 |
| AA | 23.6 |
| A | 41.8 |
| BBB | 16.6 |
| BB | 3.1 |
| B | 0.5 |
| Not Rated | 4.0 |
| Short-Term Investments and Net Other Assets (Liabilities) | 0.6 |
QUALITY DIVERSIFICATION (% of Fund's net assets) |
| |
| | AAA - 9.8 |
| | AA - 23.6 |
| | A - 41.8 |
| | BBB - 16.6 |
| | BB - 3.1 |
| | B - 0.5 |
| | Not Rated - 4.0 |
| | Short-Term Investments and Net Other Assets (Liabilities) - 0.6 |
| |
| We have used ratings from Moody's Investors Service, Inc. Where Moody's® ratings are not available, we have used S&P® ratings. All ratings are as of the date indicated and do not reflect subsequent changes. |
TOP STATES (% of Fund's net assets) |
| Connecticut | 11.8 |
| Pennsylvania | 10.0 |
| Illinois | 8.2 |
| Massachusetts | 6.2 |
| Ohio | 5.4 |
| | |
| Fidelity, the Fidelity Investments Logo and all other Fidelity trademarks or service marks used herein are trademarks or service marks of FMR LLC. Any third-party marks that are used herein are trademarks or service marks of their respective owners. © 2025 FMR LLC. All rights reserved. |
| | For additional information about the Fund; including its prospectus, financial information, holdings and proxy information, scan the QR code or visit fundresearch.fidelity.com/prospectus/sec 1.9915165.100 2950-TSRS-0325 |
| |
| | SEMI-ANNUAL SHAREHOLDER REPORT | AS OF DECEMBER 31, 2024 | |
| | Fidelity® Mid Cap Growth Index Fund Fidelity® Mid Cap Growth Index Fund : FMDGX |
| | | |
This semi-annual shareholder report contains information about Fidelity® Mid Cap Growth Index Fund for the period July 1, 2024 to December 31, 2024. You can find additional information about the Fund at fundresearch.fidelity.com/prospectus/sec. You can also request this information by contacting us at 1-800-544-8544 or by sending an e-mail to fidfunddocuments@fidelity.com.
What were your Fund costs for the last six months?(based on hypothetical $10,000 investment)
| | Costs of a $10,000 investment | Costs paid as a percentage of a $10,000 investment | |
| Fidelity® Mid Cap Growth Index Fund | $ 3 | 0.05% | |
Key Fund Statistics(as of December 31, 2024)
KEY FACTS | | |
| Fund Size | $1,555,968,229 | |
| Number of Holdings | 294 | |
| Portfolio Turnover | 10% | |
What did the Fund invest in?
(as of December 31, 2024)
MARKET SECTORS (% of Fund's net assets) | | |
| Information Technology | 27.4 | |
| Industrials | 17.3 | |
| Consumer Discretionary | 14.7 | |
| Financials | 12.8 | |
| Health Care | 12.5 | |
| Communication Services | 4.5 | |
| Energy | 4.0 | |
| Consumer Staples | 2.3 | |
| Utilities | 1.8 | |
| Real Estate | 1.3 | |
| Materials | 1.1 | |
| |
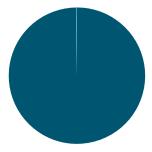
| Common Stocks | 99.7 |
| Short-Term Investments and Net Other Assets (Liabilities) | 0.3 |
ASSET ALLOCATION (% of Fund's net assets) |
|
| | Common Stocks - 99.7 |
| | Short-Term Investments and Net Other Assets (Liabilities) - 0.3 |
| |
| United States | 98.1 |
| Brazil | 1.1 |
| Korea (South) | 0.8 |
| Puerto Rico | 0.0 |
GEOGRAPHIC DIVERSIFICATION (% of Fund's net assets) |
|
| | United States - 98.1 |
| | Brazil - 1.1 |
| | Korea (South) - 0.8 |
| | Puerto Rico - 0.0 |
| |
TOP HOLDINGS(% of Fund's net assets) | | |
| Palantir Technologies Inc Class A | 5.1 | |
| AppLovin Corp Class A | 2.8 | |
| Trade Desk Inc (The) Class A | 1.7 | |
| Ameriprise Financial Inc | 1.6 | |
| Vistra Corp | 1.6 | |
| Datadog Inc Class A | 1.4 | |
| Axon Enterprise Inc | 1.4 | |
| Coinbase Global Inc Class A | 1.4 | |
| Vertiv Holdings Co Class A | 1.4 | |
| Fair Isaac Corp | 1.3 | |
| | 19.7 | |
| Fidelity, the Fidelity Investments Logo and all other Fidelity trademarks or service marks used herein are trademarks or service marks of FMR LLC. Any third-party marks that are used herein are trademarks or service marks of their respective owners. © 2025 FMR LLC. All rights reserved. |
| | For additional information about the Fund; including its prospectus, financial information, holdings and proxy information, scan the QR code or visit fundresearch.fidelity.com/prospectus/sec 1.9915166.100 3403-TSRS-0325 |
| |
| | SEMI-ANNUAL SHAREHOLDER REPORT | AS OF DECEMBER 31, 2024 | |
| | Fidelity® Mid Cap Value Index Fund Fidelity® Mid Cap Value Index Fund : FIMVX |
| | | |
This semi-annual shareholder report contains information about Fidelity® Mid Cap Value Index Fund for the period July 1, 2024 to December 31, 2024. You can find additional information about the Fund at fundresearch.fidelity.com/prospectus/sec. You can also request this information by contacting us at 1-800-544-8544 or by sending an e-mail to fidfunddocuments@fidelity.com.
What were your Fund costs for the last six months?(based on hypothetical $10,000 investment)
| | Costs of a $10,000 investment | Costs paid as a percentage of a $10,000 investment | |
| Fidelity® Mid Cap Value Index Fund | $ 3 | 0.05% | |
Key Fund Statistics(as of December 31, 2024)
KEY FACTS | | |
| Fund Size | $949,777,691 | |
| Number of Holdings | 716 | |
| Portfolio Turnover | 25% | |
What did the Fund invest in?
(as of December 31, 2024)
MARKET SECTORS (% of Fund's net assets) | | |
| Financials | 18.0 | |
| Industrials | 17.1 | |
| Real Estate | 9.8 | |
| Consumer Discretionary | 9.3 | |
| Information Technology | 9.1 | |
| Health Care | 8.2 | |
| Utilities | 6.9 | |
| Materials | 6.7 | |
| Energy | 5.7 | |
| Consumer Staples | 5.7 | |
| Communication Services | 3.3 | |
| |
| Common Stocks | 99.8 |
| Short-Term Investments and Net Other Assets (Liabilities) | 0.2 |
ASSET ALLOCATION (% of Fund's net assets) |
|
| | Common Stocks - 99.8 |
| | Short-Term Investments and Net Other Assets (Liabilities) - 0.2 |
| |
| United States | 99.1 |
| Canada | 0.3 |
| Bailiwick Of Jersey | 0.3 |
| Bermuda | 0.1 |
| United Kingdom | 0.1 |
| Puerto Rico | 0.1 |
| Brazil | 0.0 |
| Belgium | 0.0 |
| Japan | 0.0 |
GEOGRAPHIC DIVERSIFICATION (% of Fund's net assets) |
|
| | United States - 99.1 |
| | Canada - 0.3 |
| | Bailiwick Of Jersey - 0.3 |
| | Bermuda - 0.1 |
| | United Kingdom - 0.1 |
| | Puerto Rico - 0.1 |
| | Brazil - 0.0 |
| | Belgium - 0.0 |
| | Japan - 0.0 |
| |
TOP HOLDINGS(% of Fund's net assets) | | |
| Williams Cos Inc/The | 0.8 | |
| Arthur J Gallagher & Co | 0.7 | |
| Digital Realty Trust Inc | 0.7 | |
| ONEOK Inc | 0.7 | |
| AFLAC Inc | 0.7 | |
| Bank of New York Mellon Corp/The | 0.7 | |
| Kinder Morgan Inc | 0.6 | |
| Cummins Inc | 0.5 | |
| Realty Income Corp | 0.5 | |
| MicroStrategy Inc Class A | 0.5 | |
| | 6.4 | |
| Fidelity, the Fidelity Investments Logo and all other Fidelity trademarks or service marks used herein are trademarks or service marks of FMR LLC. Any third-party marks that are used herein are trademarks or service marks of their respective owners. © 2025 FMR LLC. All rights reserved. |
| | For additional information about the Fund; including its prospectus, financial information, holdings and proxy information, scan the QR code or visit fundresearch.fidelity.com/prospectus/sec 1.9915167.100 3404-TSRS-0325 |
| |
| | SEMI-ANNUAL SHAREHOLDER REPORT | AS OF DECEMBER 31, 2024 | |
| | Fidelity® Municipal Income 2025 Fund Fidelity® Municipal Income 2025 Fund : FIMSX |
| | | |
This semi-annual shareholder report contains information about Fidelity® Municipal Income 2025 Fund for the period July 1, 2024 to December 31, 2024. You can find additional information about the Fund at fundresearch.fidelity.com/prospectus/sec. You can also request this information by contacting us at 1-800-544-8544 or by sending an e-mail to fidfunddocuments@fidelity.com.
What were your Fund costs for the last six months?(based on hypothetical $10,000 investment)
| | Costs of a $10,000 investment | Costs paid as a percentage of a $10,000 investment | |
| Fidelity® Municipal Income 2025 Fund | $ 20 | 0.40% | |
Key Fund Statistics(as of December 31, 2024)
KEY FACTS | | |
| Fund Size | $22,111,435 | |
| Number of Holdings | 118 | |
| Portfolio Turnover | 0% | |
What did the Fund invest in?
(as of December 31, 2024)
REVENUE SOURCES (% of Fund's net assets) |
| Health Care | 27.4 | |
| Transportation | 24.9 | |
| Education | 22.0 | |
| General Obligations | 11.0 | |
| Housing | 5.7 | |
| Others(Individually Less Than 5%) | 9.0 | |
| 100.0 | |
| |
| AAA | 9.8 |
| AA | 23.6 |
| A | 41.8 |
| BBB | 16.6 |
| BB | 3.1 |
| B | 0.5 |
| Not Rated | 4.0 |
| Short-Term Investments and Net Other Assets (Liabilities) | 0.6 |
QUALITY DIVERSIFICATION (% of Fund's net assets) |
| |
| | AAA - 9.8 |
| | AA - 23.6 |
| | A - 41.8 |
| | BBB - 16.6 |
| | BB - 3.1 |
| | B - 0.5 |
| | Not Rated - 4.0 |
| | Short-Term Investments and Net Other Assets (Liabilities) - 0.6 |
| |
| We have used ratings from Moody's Investors Service, Inc. Where Moody's® ratings are not available, we have used S&P® ratings. All ratings are as of the date indicated and do not reflect subsequent changes. |
TOP STATES (% of Fund's net assets) |
| Connecticut | 11.8 |
| Pennsylvania | 10.0 |
| Illinois | 8.2 |
| Massachusetts | 6.2 |
| Ohio | 5.4 |
| | |
| Fidelity, the Fidelity Investments Logo and all other Fidelity trademarks or service marks used herein are trademarks or service marks of FMR LLC. Any third-party marks that are used herein are trademarks or service marks of their respective owners. © 2025 FMR LLC. All rights reserved. |
| | For additional information about the Fund; including its prospectus, financial information, holdings and proxy information, scan the QR code or visit fundresearch.fidelity.com/prospectus/sec 1.9915163.100 2948-TSRS-0325 |
| |
| | SEMI-ANNUAL SHAREHOLDER REPORT | AS OF DECEMBER 31, 2024 | |
| | Fidelity® Municipal Bond Index Fund Fidelity® Municipal Bond Index Fund : FMBIX |
| | | |
This semi-annual shareholder report contains information about Fidelity® Municipal Bond Index Fund for the period July 1, 2024 to December 31, 2024. You can find additional information about the Fund at fundresearch.fidelity.com/prospectus/sec. You can also request this information by contacting us at 1-800-544-8544 or by sending an e-mail to fidfunddocuments@fidelity.com.
What were your Fund costs for the last six months?(based on hypothetical $10,000 investment)
| | Costs of a $10,000 investment | Costs paid as a percentage of a $10,000 investment | |
| Fidelity® Municipal Bond Index Fund | $ 4 | 0.07% | |
Key Fund Statistics(as of December 31, 2024)
KEY FACTS | | |
| Fund Size | $178,603,670 | |
| Number of Holdings | 1,757 | |
| Portfolio Turnover | 14% | |
What did the Fund invest in?
(as of December 31, 2024)
REVENUE SOURCES (% of Fund's net assets) |
| General Obligations | 36.7 | |
| Transportation | 15.0 | |
| Special Tax | 12.6 | |
| Water & Sewer | 9.7 | |
| Health Care | 8.2 | |
| Education | 6.5 | |
| Others(Individually Less Than 5%) | 11.3 | |
| 100.0 | |
| |
| AAA | 17.5 |
| AA | 55.5 |
| A | 22.1 |
| BBB | 3.7 |
| BB | 0.0 |
| B | 0.0 |
| Not Rated | 0.8 |
| Short-Term Investments and Net Other Assets (Liabilities) | 0.4 |
QUALITY DIVERSIFICATION (% of Fund's net assets) |
| |
| | AAA - 17.5 |
| | AA - 55.5 |
| | A - 22.1 |
| | BBB - 3.7 |
| | BB - 0.0 |
| | B - 0.0 |
| | Not Rated - 0.8 |
| | Short-Term Investments and Net Other Assets (Liabilities) - 0.4 |
| |
| We have used ratings from Moody's Investors Service, Inc. Where Moody's® ratings are not available, we have used S&P® ratings. All ratings are as of the date indicated and do not reflect subsequent changes. |
TOP STATES (% of Fund's net assets) |
| California | 21.8 |
| New York | 16.9 |
| Texas | 8.2 |
| Florida | 4.2 |
| Illinois | 4.1 |
| | |
| Fidelity, the Fidelity Investments Logo and all other Fidelity trademarks or service marks used herein are trademarks or service marks of FMR LLC. Any third-party marks that are used herein are trademarks or service marks of their respective owners. © 2025 FMR LLC. All rights reserved. |
| | For additional information about the Fund; including its prospectus, financial information, holdings and proxy information, scan the QR code or visit fundresearch.fidelity.com/prospectus/sec 1.9915170.100 3469-TSRS-0325 |
Item 2.
Code of Ethics
Not applicable.
Item 3.
Audit Committee Financial Expert
Not applicable.
Item 4.
Principal Accountant Fees and Services
Not applicable.
Item 5.
Audit Committee of Listed Registrants
Not applicable.
Item 6.
Investments
(a)
Not applicable.
(b)
Not applicable
Item 7.
Financial Statements and Financial Highlights for Open-End Management Investment Companies
Fidelity® Defined Maturity Funds
Fidelity® Municipal Income 2025 Fund
Semi-Annual Report
December 31, 2024
Includes Fidelity and Fidelity Advisor share classes
Contents
To view a fund's proxy voting guidelines and proxy voting record for the 12-month period ended June 30, visit http://www.fidelity.com/proxyvotingresults or visit the Securities and Exchange Commission's (SEC) web site at http://www.sec.gov.
You may also call 1-800-544-8544 if you're an individual investing directly with Fidelity, call 1-800-835-5092 if you're a plan sponsor or participant with Fidelity as your recordkeeper or call 1-877-208-0098 on institutional accounts or if you're an advisor or invest through one to request a free copy of the proxy voting guidelines.
Standard & Poor's, S&P and S&P 500 are registered service marks of The McGraw-Hill Companies, Inc. and have been licensed for use by Fidelity Distributors Corporation.
Other third-party marks appearing herein are the property of their respective owners.
All other marks appearing herein are registered or unregistered trademarks or service marks of FMR LLC or an affiliated company. © 2025 FMR LLC. All rights reserved.
This report and the financial statements contained herein are submitted for the general information of the shareholders of the Fund. This report is not authorized for distribution to prospective investors in the Fund unless preceded or accompanied by an effective prospectus.
A fund files its complete schedule of portfolio holdings with the SEC for the first and third quarters of each fiscal year on Form N-PORT. Forms N-PORT are available on the SEC's web site at http://www.sec.gov. A fund's Forms N-PORT may be reviewed and copied at the SEC's Public Reference Room in Washington, DC. Information regarding the operation of the SEC's Public Reference Room may be obtained by calling 1-800-SEC-0330.
For a complete list of a fund's portfolio holdings, view the most recent holdings listing, semiannual report, or annual report on Fidelity's web site at http://www.fidelity.com, http://www.institutional.fidelity.com, or http://www.401k.com, as applicable.
NOT FDIC INSURED •MAY LOSE VALUE •NO BANK GUARANTEE
Neither the Fund nor Fidelity Distributors Corporation is a bank.
Item 7: Financial Statements and Financial Highlights for Open-End Management Investment Companies (Semi-Annual Report)
Fidelity® Municipal Income 2025 Fund
Schedule of Investments December 31, 2024 (Unaudited)
Showing Percentage of Net Assets
| Municipal Securities - 99.4% |
| | | Principal Amount (a) | Value ($) |
| Alabama - 2.3% | | | |
| General Obligations - 2.3% | | | |
| Black Belt Energy Gas District 5.25% 6/1/2025 (Morgan Stanley Guaranteed) | | 500,000 | 502,812 |
| Arizona - 2.3% | | | |
| Transportation - 2.3% | | | |
| Phoenix AZ Cvc Imp Crp Apr Rev 5% 7/1/2025 (b) | | 250,000 | 251,901 |
| Phoenix AZ Cvc Imp Crp Apr Rev 5% 7/1/2025 | | 250,000 | 252,296 |
| | | | 504,197 |
TOTAL ARIZONA | | | 504,197 |
| California - 2.3% | | | |
| General Obligations - 0.4% | | | |
| Poway CA Unified Sch Dist 0% 8/1/2025 (c) | | 90,000 | 88,329 |
| Health Care - 1.2% | | | |
| Washington Twp CA Health Care Dist Rev (Washington Twp CA Health Care Dist Proj.) Series 2017 B, 5% 7/1/2025 | | 270,000 | 271,125 |
| Transportation - 0.7% | | | |
| San Diego Cnty CA Reg Arpt Auth Arpt Rev Series B, 5% 7/1/2025 (b) | | 150,000 | 151,067 |
TOTAL CALIFORNIA | | | 510,521 |
| Colorado - 0.9% | | | |
| Transportation - 0.9% | | | |
| E-470 Pub Hwy Auth Colo Rev 0% 9/1/2025 (National Public Finance Guarantee Corporation Insured) (c) | | 200,000 | 195,623 |
| Connecticut - 11.8% | | | |
| Education - 4.4% | | | |
| Connecticut St Health & Edl Facs Auth Revenue (Univ of Hartford, CT Proj.) Series N, 5% 7/1/2025 | | 50,000 | 49,978 |
| Connecticut State Health & Educational Facilities Authority (Quinnipiac University, CT Proj.) Series M, 5% 7/1/2025 | | 40,000 | 40,316 |
| Connecticut State Health & Educational Facilities Authority (Sacred Heart University, CT Proj.) 5% 7/1/2025 | | 400,000 | 403,181 |
| Connecticut State Health & Educational Facilities Authority (University of New Haven, CT Proj.) 5% 7/1/2025 | | 200,000 | 200,540 |
| Connecticut State Health & Educational Facilities Authority (University of New Haven, CT Proj.) Series K 1, 5% 7/1/2025 | | 280,000 | 280,757 |
| | | | 974,772 |
| General Obligations - 2.3% | | | |
| Connecticut St Gen. Oblig. Series 2015B, 5% 6/15/2025 | | 175,000 | 176,542 |
| Connecticut St Gen. Oblig. Series 2016 D, 5% 8/15/2025 | | 330,000 | 334,024 |
| | | | 510,566 |
| Health Care - 0.8% | | | |
| Connecticut St Health & Edl Facs Auth Revenue (Stamford Hospital, CT Proj.) 5% 7/1/2025 | | 175,000 | 175,815 |
| Housing - 4.3% | | | |
| Connecticut St Hsg Fin Auth Hsg Mtg Fin Prog (CT Hsg Mortgage Proj.) 5% 5/15/2025 (b) | | 935,000 | 939,318 |
TOTAL CONNECTICUT | | | 2,600,471 |
| District Of Columbia - 1.5% | | | |
| Education - 0.3% | | | |
| District Columbia Rev (Catholic Univ of Amer WA DC Proj.) Series 2018, 5% 10/1/2025 | | 75,000 | 75,788 |
| Special Tax - 1.2% | | | |
| Washington DC Met Area Tran Auth Rev Series 2017B, 5% 7/1/2025 | | 250,000 | 252,384 |
TOTAL DISTRICT OF COLUMBIA | | | 328,172 |
| Florida - 5.2% | | | |
| Escrowed/Pre-Refunded - 1.0% | | | |
| Greater Orlando Aviation Auth Series 2017A, 5% 10/1/2025 (Escrowed to Maturity) (b) | | 205,000 | 206,931 |
| General Obligations - 0.1% | | | |
| Seminole Cnty FL Sch Brd Ctfs (Seminole Cnty FL Sch Dist Proj.) 5% 7/1/2025 | | 40,000 | 40,378 |
| Health Care - 1.4% | | | |
| City of Tampa FL (H Lee Moffitt Cancer Ctr Proj.) Series 2016 B, 5% 7/1/2025 | | 100,000 | 100,687 |
| South Miami FL Hlth Fcs Hsp Rv (Baptist Health Sys of So FL Proj.) Series 2017, 5% 8/15/2025 | | 200,000 | 201,773 |
| | | | 302,460 |
| Transportation - 2.7% | | | |
| Broward Cnty FL Arpt Sys Rev Series 2017, 5% 10/1/2025 (b) | | 500,000 | 505,438 |
| Greater Orlando Aviation Auth Series 2017A, 5% 10/1/2025 (b) | | 95,000 | 96,061 |
| | | | 601,499 |
TOTAL FLORIDA | | | 1,151,268 |
| Georgia - 3.9% | | | |
| Transportation - 3.9% | | | |
| Atlanta GA Arpt Rev 5% 7/1/2025 (b) | | 50,000 | 50,324 |
| Atlanta GA Arpt Rev Series 2023G, 5% 7/1/2025 (b) | | 800,000 | 805,178 |
| | | | 855,502 |
TOTAL GEORGIA | | | 855,502 |
| Illinois - 8.2% | | | |
| Education - 0.9% | | | |
| Illinois Fin Auth Rev (Illinois Institute of Tech, IL Proj.) Series 2019, 5% 9/1/2025 | | 200,000 | 200,156 |
| Escrowed/Pre-Refunded - 0.7% | | | |
| Illinois Fin Auth Rev Series 2017 A, 5% 1/1/2025 | | 145,000 | 145,007 |
| General Obligations - 1.7% | | | |
| Illinois St Gen. Oblig. Series MAY 2023D, 5% 7/1/2025 | | 200,000 | 201,531 |
| Kendall Kane & Will Cnty IL Uni Sch Dist No 308 0% 2/1/2025 (Assured Guaranty Municipal Corp Insured) (c) | | 185,000 | 184,453 |
| | | | 385,984 |
| Health Care - 2.1% | | | |
| Illinois Fin Auth Rev (Northwestern Memorial Hosp,Il Proj.) 5% 7/15/2025 | | 200,000 | 201,835 |
| Illinois Fin Auth Rev (Osf Healthcare System Proj.) Series 2016, 5% 5/15/2025 | | 250,000 | 251,259 |
| | | | 453,094 |
| Special Tax - 1.7% | | | |
| Illinois St Sales Tax Rev Series SEPTEMBER 2016 D, 5% 6/15/2025 | | 100,000 | 100,594 |
| Metropolitan Pier & Exposition Auth Ill Dedicated St Tax Rev Series 1994 A &B, 0% 6/15/2025 (c) | | 270,000 | 265,890 |
| | | | 366,484 |
| Transportation - 1.1% | | | |
| Chicago IL Tran Auth Cap Grnt Rcpts Rev Series 5337, 5% 6/1/2025 | | 250,000 | 251,611 |
TOTAL ILLINOIS | | | 1,802,336 |
| Indiana - 1.7% | | | |
| Health Care - 0.3% | | | |
| Indiana Fin Auth Health Sys Rev (Indiana University Health Proj.) Series 2019 B, 2.25% tender 12/1/2058 (d) | | 55,000 | 54,531 |
| Indiana St Fin Auth Rev (Community Foundation of Northwest Indiana Inc Proj.) 5% 9/1/2025 | | 25,000 | 25,263 |
| | | | 79,794 |
| Housing - 1.4% | | | |
| Indiana St Hsg & Cmnty Dev Single Fam Hsg Rev (IN Sfm Revenue Bonds 6/1/2016 Proj.) Series 2021 A, 5% 7/1/2025 | | 300,000 | 302,247 |
TOTAL INDIANA | | | 382,041 |
| Kentucky - 1.4% | | | |
| General Obligations - 1.4% | | | |
| Kentucky St Pty & Bldgs Commn (Kentucky St Proj.) Series 2018, 5% 4/1/2025 | | 300,000 | 301,268 |
| Louisiana - 0.5% | | | |
| Transportation - 0.5% | | | |
| New Orleans LA Aviation Board 5% 1/1/2025 (b) | | 100,000 | 100,003 |
| Maine - 2.6% | | | |
| Education - 2.6% | | | |
| Maine Health & Higher Edl Facs Auth Rev (University of New England Proj.) Series 2017 A, 4% 7/1/2025 | | 465,000 | 466,035 |
| Maine Health & Higher Edl Facs Auth Rev (University of New England Proj.) Series 2017 B, 4% 7/1/2025 | | 100,000 | 100,223 |
| | | | 566,258 |
TOTAL MAINE | | | 566,258 |
| Maryland - 0.7% | | | |
| Health Care - 0.7% | | | |
| Maryland St Hlth & HI Ed Facs (Lifebridge Health Proj.) Series 2017, 5% 7/1/2025 | | 150,000 | 151,096 |
| Massachusetts - 6.2% | | | |
| Education - 3.6% | | | |
| Massachusetts Development Finance Agency (Fisher College Proj.) Series 2017, 5% 4/1/2025 | | 250,000 | 250,496 |
| Massachusetts Development Finance Agency (Merrimack College, MA Proj.) 5% 7/1/2025 | | 125,000 | 125,521 |
| Massachusetts Development Finance Agency (Suffolk Univ, MA Proj.) Series 2019, 5% 7/1/2025 | | 170,000 | 170,551 |
| Massachusetts Ed Ln Auth Ed Ln (Mefa Issue K Proj.) Series 2017 A, 5% 7/1/2025 (b) | | 250,000 | 252,042 |
| | | | 798,610 |
| Escrowed/Pre-Refunded - 0.5% | | | |
| Massachusetts Development Finance Agency 5% 7/1/2025 (Escrowed to Maturity) | | 110,000 | 110,919 |
| Health Care - 0.7% | | | |
| Massachusetts Development Finance Agency (Beth Israel Lahey Health Proj.) 5% 7/1/2025 | | 40,000 | 40,323 |
| Massachusetts Development Finance Agency (Beth Israel Lahey Health Proj.) Series 2019 K, 5% 7/1/2025 | | 50,000 | 50,405 |
| Massachusetts St Dev Fin Agy Rev (Mass General Brigham Inc Proj.) 5% tender 7/1/2038 (d) | | 10,000 | 10,010 |
| Massachusetts St Dev Fin Agy Rev (South Shore Hospital, MA Proj.) 5% 7/1/2025 | | 50,000 | 50,294 |
| | | | 151,032 |
| Transportation - 1.4% | | | |
| Massachusetts St Port Auth Rev Series 2019 C, 5% 7/1/2025 (b) | | 300,000 | 301,914 |
TOTAL MASSACHUSETTS | | | 1,362,475 |
| Michigan - 3.6% | | | |
| General Obligations - 1.1% | | | |
| Warren MI Cons Sch Dist Series 2017, 4% 5/1/2025 (Assured Guaranty Municipal Corp Insured) | | 250,000 | 250,618 |
| Health Care - 2.5% | | | |
| Flint MI Hosp Bldg Auth Rev (Hurley Medical Center, MI Proj.) Series 2020, 5% 7/1/2025 | | 300,000 | 300,416 |
| Grand Traverse Cnty MI Hosp (Munson Healthcare Proj.) Series A, 5% 7/1/2025 | | 150,000 | 151,141 |
| Saginaw MI Hosp Fin Auth Hosp (Covenant Medical Center Inc Proj.) Series 2020 J, 5% 7/1/2025 | | 100,000 | 100,554 |
| | | | 552,111 |
TOTAL MICHIGAN | | | 802,729 |
| Missouri - 4.1% | | | |
| Transportation - 4.1% | | | |
| St Louis MO Arpt Rev Series 2017 A, 5% 7/1/2025 (Assured Guaranty Municipal Corp Insured) | | 370,000 | 373,380 |
| St Louis MO Arpt Rev Series 2017 B, 5% 7/1/2025 (Assured Guaranty Municipal Corp Insured) (b) | | 250,000 | 251,814 |
| St Louis MO Arpt Rev Series 2019C, 5% 7/1/2025 | | 290,000 | 292,420 |
| | | | 917,614 |
TOTAL MISSOURI | | | 917,614 |
| Nevada - 0.2% | | | |
| General Obligations - 0.2% | | | |
| Clark Cnty NV School Dist Series 2017 A, 5% 6/15/2025 | | 60,000 | 60,471 |
| New Hampshire - 1.5% | | | |
| Health Care - 1.5% | | | |
| New Hampshire Health and Education Facilities Authority Act (Dartmouth-Hitchcock Oblgtd Grp Proj.) Series 2018 A 1, 5% 8/1/2025 | | 50,000 | 50,363 |
| New Hampshire Health and Education Facilities Authority Act (Mass General Brigham Inc Proj.) 5% 7/1/2025 | | 200,000 | 201,866 |
| NH Health & Ed Facs Auth Rev (Elliot Health System Proj.) Series 2016, 5% 10/1/2025 | | 70,000 | 70,735 |
| | | | 322,964 |
TOTAL NEW HAMPSHIRE | | | 322,964 |
| New Jersey - 4.6% | | | |
| Education - 0.8% | | | |
| New Jersey Educational Facilities Authority (Stevens Institute of Technolgy Proj.) Series 2017 A, 5% 7/1/2025 | | 105,000 | 105,721 |
| New Jersey Educational Facilities Authority (Stockton University Proj.) Series 2016A, 5% 7/1/2025 | | 15,000 | 15,121 |
| New Jersey Educational Facilities Authority (William Paterson College, NJ Proj.) Series 2016 E, 5% 7/1/2025 | | 50,000 | 50,361 |
| | | | 171,203 |
| General Obligations - 1.1% | | | |
| New Jersey Eda St Lease Rev (New Jersey St Proj.) Series 2015A, 5% 6/15/2025 | | 200,000 | 201,557 |
| New Jersey Trans Trust Fund Auth Series 2016 A 1, 5% 6/15/2025 | | 40,000 | 40,313 |
| | | | 241,870 |
| Health Care - 1.8% | | | |
| New Jersey Health Care (St Joseph Hosp & Med Ctr, NJ Proj.) Series 2016, 5% 7/1/2025 | | 400,000 | 401,374 |
| Tobacco Bonds - 0.9% | | | |
| Tobacco Settlement Fin Corp NJ 5% 6/1/2025 | | 200,000 | 201,024 |
TOTAL NEW JERSEY | | | 1,015,471 |
| New York - 1.8% | | | |
| Education - 0.5% | | | |
| Onondaga NY Civic Dev Corp (Le Moyne College Proj.) Series 2015, 5% 7/1/2025 | | 100,000 | 100,442 |
| Onondaga NY Civic Dev Corp (Le Moyne College Proj.) Series 2018, 5% 1/1/2025 | | 15,000 | 15,000 |
| | | | 115,442 |
| Health Care - 0.1% | | | |
| Dutchess Cnty NY Loc Dev Corp Rev (Nuvance Health Proj.) Series 2016 A, 5% 7/1/2025 | | 30,000 | 30,069 |
| Transportation - 1.2% | | | |
| Niagara NY Frontier Trans Auth Arpt Rev (Buffalo Niagara Intl Airport Proj.) 5% 4/1/2025 (b) | | 255,000 | 255,632 |
TOTAL NEW YORK | | | 401,143 |
| Ohio - 5.4% | | | |
| Education - 2.3% | | | |
| Ohio St Higher Edl Fac Commn (Kenyon College, OH Proj.) 5% 7/1/2025 | | 200,000 | 201,620 |
| Ohio St Higher Edl Fac Commn (Xavier Univ, OH Proj.) Series 2015C, 5% 5/1/2025 | | 190,000 | 191,121 |
| Ohio St Higher Edl Fac Commn (Xavier Univ, OH Proj.) Series 2016 - XAVIER UNIV, 5% 5/1/2025 | | 100,000 | 100,456 |
| | | | 493,197 |
| Escrowed/Pre-Refunded - 0.9% | | | |
| Lancaster Port Auth OH Gas Rev Series 2019, 5% 2/1/2025 | | 200,000 | 200,268 |
| Health Care - 2.2% | | | |
| Akron Bath Copley Hsp Dist OH (Summa Health System Proj.) 5% 11/15/2025 | | 150,000 | 151,547 |
| Hamilton Cnty OH Hosp Facs Rev (TriHealth Inc Proj.) Series 2017A, 5% 8/15/2025 | | 140,000 | 141,447 |
| Montgomery Cnty OH Health Care (Solvita Proj.) Series 2024, 5% 9/1/2025 | | 200,000 | 201,919 |
| | | | 494,913 |
TOTAL OHIO | | | 1,188,378 |
| Oregon - 2.8% | | | |
| Health Care - 0.9% | | | |
| Clackamas Cnty OR Hsp Fac Auth (Williamette View Inc Proj.) 4% 5/15/2025 | | 200,000 | 199,739 |
| Transportation - 1.9% | | | |
| Port of Portland Arpt Rev Series TWENTY FOUR B, 5% 7/1/2025 (b) | | 420,000 | 422,677 |
TOTAL OREGON | | | 622,416 |
| Pennsylvania - 10.0% | | | |
| Education - 2.7% | | | |
| Pennsylvania Higher Educational Facilities Authority 5% 6/15/2025 (Escrowed to Maturity) | | 5,000 | 5,041 |
| Pennsylvania Higher Educational Facilities Authority Series AQ, 5% 6/15/2025 | | 160,000 | 161,251 |
| Pennsylvania St Higher Edl Rev (Drexel University, PA Proj.) Series 2016, 5% 5/1/2025 | | 445,000 | 446,958 |
| | | | 613,250 |
| Escrowed/Pre-Refunded - 0.3% | | | |
| Doylestown PA Hosp Auth Hosp 5% 7/1/2025 (Escrowed to Maturity) | | 20,000 | 20,167 |
| Pennsylvania Higher Educational Facilities Authority Series AQ, 5% 6/15/2025 (Escrowed to Maturity) | | 35,000 | 35,287 |
| | | | 55,454 |
| General Obligations - 0.3% | | | |
| Philadelphia PA Sch Dist 5% 9/1/2025 | | 50,000 | 50,556 |
| Philadelphia PA Sch Dist Series A, 5% 9/1/2025 | | 20,000 | 20,222 |
| | | | 70,778 |
| Health Care - 5.5% | | | |
| Alleg Cnty PA Dev Auth (UPMC Proj.) Series 2019 A, 5% 7/15/2025 | | 600,000 | 605,473 |
| Butler Cnty PA Hosp Auth Rev (Butler Memorial Hospital,Pa Proj.) Series 2015A, 5% 7/1/2025 | | 30,000 | 29,986 |
| Doylestown PA Hosp Auth Hosp 5% 7/1/2025 | | 105,000 | 105,357 |
| Dubois PA Hosp Auth Hosp Rev (Penn Highlands Healthcare Proj.) 5% 7/15/2025 | | 110,000 | 110,653 |
| Monroe Cnty PA Hosp Auth Rev (Lehigh Valley Health Proj.) Series 2016, 5% 7/1/2025 | | 50,000 | 50,343 |
| Southcentral PA Gen Auth Rev (Wellspan Health Group Proj.) Series 2019A, 5% 6/1/2025 | | 300,000 | 301,956 |
| | | | 1,203,768 |
| Transportation - 1.2% | | | |
| Philadelphia PA Airport Rev 5% 7/1/2025 (b) | | 210,000 | 211,535 |
| Philadelphia PA Airport Rev 5% 7/1/2025 | | 50,000 | 50,442 |
| | | | 261,977 |
TOTAL PENNSYLVANIA | | | 2,205,227 |
| Puerto Rico - 0.1% | | | |
| General Obligations - 0.1% | | | |
| Puerto Rico Comwlth Gen. Oblig. Series 2022 A 1, 5.375% 7/1/2025 | | 49,931 | 50,223 |
| Rhode Island - 0.3% | | | |
| Education - 0.3% | | | |
| Rhode Island Health & Edl Bldg Corp Higher Ed Fac Rev (Bryant University Proj.) Series 2024, 5% 6/1/2025 | | 65,000 | 65,464 |
| Tennessee - 2.4% | | | |
| Health Care - 2.4% | | | |
| Chatanooga TN Health Ed & Hsg Fac Brd Rev (CommonSpirit Health Proj.) Series 2019A 1, 5% 8/1/2025 | | 250,000 | 252,301 |
| Knox Cnty TN Health Edl & Hsg Fac Rev (Univ Health System, TN Proj.) 5% 4/1/2025 | | 265,000 | 265,591 |
| Knox Cnty TN Health Edl & Hsg Fac Rev (Univ Health System, TN Proj.) Series 2016 A, 5% 9/1/2025 | | 15,000 | 15,100 |
| | | | 532,992 |
TOTAL TENNESSEE | | | 532,992 |
| Texas - 0.9% | | | |
| Transportation - 0.9% | | | |
| City of Houston TX Airport System Revenue Series 2018 C, 5% 7/1/2025 (b) | | 200,000 | 201,275 |
| Utah - 0.0% | | | |
| Transportation - 0.0% | | | |
| Salt Lake City UT Arpt Rev Series 2017A, 5% 7/1/2025 (b) | | 30,000 | 30,184 |
| Vermont - 3.0% | | | |
| Education - 3.0% | | | |
| Vermont St Stud Assit Corp 5% 6/15/2025 (b) | | 250,000 | 251,498 |
| Vermont St Stud Assit Corp Series 2015A, 5% 6/15/2025 (b) | | 300,000 | 301,797 |
| Vermont St Stud Assit Corp Series 2019 A, 5% 6/15/2025 (b) | | 105,000 | 105,629 |
| | | | 658,924 |
TOTAL VERMONT | | | 658,924 |
| Virginia - 0.6% | | | |
| Education - 0.6% | | | |
| Salem Economic Development Authority (Roanoke College Proj.) 5% 4/1/2025 | | 125,000 | 125,248 |
| Washington - 4.4% | | | |
| Health Care - 1.6% | | | |
| Washington St Health Care Facs Auth Rev (Multicare Medical Ctr,Tacom,Wa Proj.) Series B, 5% 8/15/2025 | | 355,000 | 358,081 |
| Special Tax - 0.7% | | | |
| Washington St Convention Ctr Pub Facs Dist 5% 7/1/2025 | | 155,000 | 155,935 |
| Transportation - 2.1% | | | |
| Port Seattle WA Rev Series C, 5% 5/1/2025 (b) | | 465,000 | 466,846 |
TOTAL WASHINGTON | | | 980,862 |
| Wisconsin - 2.2% | | | |
| Escrowed/Pre-Refunded - 0.5% | | | |
| Wisconsin Health & Educational Facilities Authority Series 2016, 5% 2/15/2027 (Pre-refunded to 8/15/2025 at 100) | | 10,000 | 10,083 |
| Wisconsin Health & Educational Facilities Authority Series 2017 A, 5% 9/1/2025 (Escrowed to Maturity) | | 100,000 | 101,093 |
| | | | 111,176 |
| Health Care - 1.7% | | | |
| Public Fin Auth WI Hosp Rev (Renown Regional Medical Center Proj.) Series 2016 A, 5% 6/1/2025 | | 180,000 | 180,862 |
| Wisconsin Health & Educational Facilities Authority (Advocate Health Care Network Proj.) Series 2018 B 4, 5% tender 8/15/2054 (d) | | 40,000 | 40,044 |
| Wisconsin Health & Educational Facilities Authority (Froedtert Thedacare Proj.) Series 2017 A, 5% 4/1/2025 | | 155,000 | 155,597 |
| | | | 376,503 |
TOTAL WISCONSIN | | | 487,679 |
| TOTAL MUNICIPAL SECURITIES (Cost $22,114,178) | | | 21,983,307 |
| | | | |
| TOTAL INVESTMENT IN SECURITIES - 99.4% (Cost $22,114,178) | 21,983,307 |
NET OTHER ASSETS (LIABILITIES) - 0.6% | 128,128 |
| NET ASSETS - 100.0% | 22,111,435 |
| | |
Legend
| (a) | Amount is stated in United States dollars unless otherwise noted. |
| (b) | Private activity obligations whose interest is subject to the federal alternative minimum tax for individuals. |
| (c) | Security initially issued in zero coupon form which converts to coupon form at a specified rate and date. The rate shown is the rate at period end. |
| (d) | Coupon rates for floating and adjustable rate securities reflect the rates in effect at period end. |
Affiliated Central Funds
Fiscal year to date information regarding the Fund's investments in Fidelity Central Funds, including the ownership percentage, is presented below.
| Affiliate | Value, beginning of period ($) | Purchases ($) | Sales Proceeds ($) | Dividend Income ($) | Realized Gain (loss) ($) | Change in Unrealized appreciation (depreciation) ($) | Value, end of period ($) | Shares, end of period | % ownership, end of period |
| Fidelity Municipal Cash Central Fund | 289,026 | 457,000 | 746,026 | 8,392 | - | - | - | - | 0.0% |
| Total | 289,026 | 457,000 | 746,026 | 8,392 | - | - | - | - | |
| | | | | | | | | | |
Amounts in the dividend income column in the above table include any capital gain distributions from underlying funds, which are presented in the corresponding line item in the Statement of Operations, if applicable.
Amounts included in the purchases and sales proceeds columns may include in-kind transactions, if applicable.
Investment Valuation
The following is a summary of the inputs used, as of December 31, 2024, involving the Fund's assets and liabilities carried at fair value. The inputs or methodology used for valuing securities may not be an indication of the risk associated with investing in those securities. For more information on valuation inputs, and their aggregation into the levels used below, please refer to the Investment Valuation section in the accompanying Notes to Financial Statements.
| Valuation Inputs at Reporting Date: |
| Description | Total ($) | Level 1 ($) | Level 2 ($) | Level 3 ($) |
Investments in Securities: | | | | |
|
| Municipal Securities | | | | |
Education | 4,858,312 | - | 4,858,312 | - |
Escrowed/Pre-Refunded | 829,755 | - | 829,755 | - |
General Obligations | 2,503,297 | - | 2,503,297 | - |
Health Care | 6,056,930 | - | 6,056,930 | - |
Housing | 1,241,565 | - | 1,241,565 | - |
Special Tax | 774,803 | - | 774,803 | - |
Tobacco Bonds | 201,024 | - | 201,024 | - |
Transportation | 5,517,621 | - | 5,517,621 | - |
| | | | | |
| Total Investments in Securities: | 21,983,307 | - | 21,983,307 | - |
Financial Statements (Unaudited)
| Statement of Assets and Liabilities |
| As of December 31, 2024 (Unaudited) |
| Assets | | | | |
Investment in securities, at value - See accompanying schedule Unaffiliated issuers (cost $22,114,178): | | | $ | 21,983,307 |
| Interest receivable | | | | 363,332 |
| Distributions receivable from Fidelity Central Funds | | | | 962 |
Total assets | | | | 22,347,601 |
| Liabilities | | | | |
| Payable to custodian bank | $ | 220,556 | | |
| Payable for fund shares redeemed | | 685 | | |
| Distributions payable | | 6,704 | | |
| Accrued management fee | | 5,631 | | |
| Distribution and service plan fees payable | | 711 | | |
| Other affiliated payables | | 1,879 | | |
| Total liabilities | | | | 236,166 |
| Net Assets | | | $ | 22,111,435 |
| Net Assets consist of: | | | | |
| Paid in capital | | | $ | 22,439,154 |
| Total accumulated earnings (loss) | | | | (327,719) |
| Net Assets | | | $ | 22,111,435 |
| | | | | |
| Net Asset Value and Maximum Offering Price | | | | |
| Class A : | | | | |
Net Asset Value and redemption price per share ($3,353,253 ÷ 335,343 shares)(a) | | | $ | 10.00 |
| Maximum offering price per share (100/97.25 of $10.00) | | | $ | 10.28 |
| Municipal Income 2025 : | | | | |
Net Asset Value, offering price and redemption price per share ($14,334,067 ÷ 1,433,407 shares) | | | $ | 10.00 |
| Class I : | | | | |
Net Asset Value, offering price and redemption price per share ($4,424,115 ÷ 442,380 shares) | | | $ | 10.00 |
(a)Redemption price per share is equal to net asset value less any applicable contingent deferred sales charge. |
| Statement of Operations |
Six months ended December 31, 2024 (Unaudited) |
| Investment Income | | | | |
| Interest | | | $ | 268,788 |
| Income from Fidelity Central Funds | | | | 8,392 |
| Total income | | | | 277,180 |
| Expenses | | | | |
| Management fee | $ | 34,982 | | |
| Transfer agent fees | | 11,661 | | |
| Distribution and service plan fees | | 4,304 | | |
| Custodian fees and expenses | | 2 | | |
| Independent trustees' fees and expenses | | 30 | | |
| Total expenses | | | | 50,979 |
| Net Investment income (loss) | | | | 226,201 |
| Realized and Unrealized Gain (Loss) | | | | |
| Net realized gain (loss) on: | | | | |
| Investment Securities: | | | | |
| Unaffiliated issuers | | (8,728) | | |
| Total net realized gain (loss) | | | | (8,728) |
| Change in net unrealized appreciation (depreciation) on investment securities | | | | 199,070 |
| Net gain (loss) | | | | 190,342 |
| Net increase (decrease) in net assets resulting from operations | | | $ | 416,543 |
| Statement of Changes in Net Assets |
| |
| | Six months ended December 31, 2024 (Unaudited) | | Year ended June 30, 2024 |
| Increase (Decrease) in Net Assets | | | | |
| Operations | | | | |
| Net investment income (loss) | $ | 226,201 | $ | 462,497 |
| Net realized gain (loss) | | (8,728) | | (31,492) |
| Change in net unrealized appreciation (depreciation) | | 199,070 | | 330,097 |
| Net increase (decrease) in net assets resulting from operations | | 416,543 | | 761,102 |
| Distributions to shareholders | | (226,161) | | (462,511) |
| | | | | |
| Share transactions - net increase (decrease) | | (1,806,382) | | (1,596,350) |
| Total increase (decrease) in net assets | | (1,616,000) | | (1,297,759) |
| | | | | |
| Net Assets | | | | |
| Beginning of period | | 23,727,435 | | 25,025,194 |
| End of period | $ | 22,111,435 | $ | 23,727,435 |
| | | | | |
| | | | | |
Financial Highlights
Fidelity Advisor® Municipal Income 2025 Fund Class A |
| |
| | Six months ended (Unaudited) December 31, 2024 | | Years ended June 30, 2024 | | 2023 | | 2022 | | 2021 | | 2020 |
Selected Per-Share Data | | | | | | | | | | | | |
| Net asset value, beginning of period | $ | 9.92 | $ | 9.80 | $ | 9.91 | $ | 10.59 | $ | 10.35 | $ | 10.29 |
| Income from Investment Operations | | | | | | | | | | | | |
Net investment income (loss) A,B | | .086 | | .166 | | .150 | | .135 | | .146 | | .166 |
| Net realized and unrealized gain (loss) | | .080 | | .120 | | (.110) | | (.680) | | .241 | | .060 |
| Total from investment operations | | .166 | | .286 | | .040 | | (.545) | | .387 | | .226 |
| Distributions from net investment income | | (.086) | | (.166) | | (.150) | | (.135) | | (.147) | | (.166) |
| Total distributions | | (.086) | | (.166) | | (.150) | | (.135) | | (.147) | | (.166) |
| Net asset value, end of period | $ | 10.00 | $ | 9.92 | $ | 9.80 | $ | 9.91 | $ | 10.59 | $ | 10.35 |
Total Return C,D,E | | | | 2.94% | | .41% | | (5.18)% | | 3.75% | | 2.21% |
Ratios to Average Net Assets B,F,G | | | | | | | | | | | | |
| Expenses before reductions | | .65% H | | .65% | | .65% | | .65% | | .65% | | .65% |
| Expenses net of fee waivers, if any | | | | .65% | | .65% | | .65% | | .65% | | .65% |
| Expenses net of all reductions | | .65% H | | .65% | | .65% | | .65% | | .65% | | .65% |
| Net investment income (loss) | | 1.71% H | | 1.68% | | 1.52% | | 1.31% | | 1.39% | | 1.61% |
| Supplemental Data | | | | | | | | | | | | |
| Net assets, end of period (000 omitted) | $ | 3,353 | $ | 3,421 | $ | 3,367 | $ | 3,309 | $ | 3,550 | $ | 3,510 |
Portfolio turnover rate I | | | | 6% | | 6% | | 7% | | 6% | | 23% |
ACalculated based on average shares outstanding during the period.
BNet investment income (loss) is affected by the timing of the declaration of dividends by any underlying mutual funds or exchange-traded funds (ETFs). Net investment income (loss) of any mutual funds or ETFs is not included in the Fund's net investment income (loss) ratio.
CTotal returns for periods of less than one year are not annualized.
DTotal returns would have been lower if certain expenses had not been reduced during the applicable periods shown.
ETotal returns do not include the effect of the sales charges.
FFees and expenses of any underlying mutual funds or exchange-traded funds (ETFs) are not included in the Fund's expense ratio. The Fund indirectly bears its proportionate share of these expenses. For additional expense information related to investments in Fidelity Central Funds, please refer to the "Investments in Fidelity Central Funds" note found in the Notes to Financial Statements section of the most recent Annual or Semi-Annual report.
GExpense ratios reflect operating expenses of the class. Expenses before reductions do not reflect amounts reimbursed, waived, or reduced through arrangements with the investment adviser, brokerage services, or other offset arrangements, if applicable, and do not represent the amount paid by the class during periods when reimbursements, waivers or reductions occur.
HAnnualized.
IAmount does not include the portfolio activity of any underlying mutual funds or exchange-traded funds (ETFs), derivatives or securities that mature within one year from acquisition.
Fidelity® Municipal Income 2025 Fund |
| |
| | Six months ended (Unaudited) December 31, 2024 | | Years ended June 30, 2024 | | 2023 | | 2022 | | 2021 | | 2020 |
Selected Per-Share Data | | | | | | | | | | | | |
| Net asset value, beginning of period | $ | 9.92 | $ | 9.80 | $ | 9.91 | $ | 10.59 | $ | 10.35 | $ | 10.29 |
| Income from Investment Operations | | | | | | | | | | | | |
Net investment income (loss) A,B | | .099 | | .190 | | .174 | | .161 | | .173 | | .193 |
| Net realized and unrealized gain (loss) | | .080 | | .120 | | (.110) | | (.680) | | .240 | | .059 |
| Total from investment operations | | .179 | | .310 | | .064 | | (.519) | | .413 | | .252 |
| Distributions from net investment income | | (.099) | | (.190) | | (.174) | | (.161) | | (.173) | | (.192) |
| Total distributions | | (.099) | | (.190) | | (.174) | | (.161) | | (.173) | | (.192) |
| Net asset value, end of period | $ | 10.00 | $ | 9.92 | $ | 9.80 | $ | 9.91 | $ | 10.59 | $ | 10.35 |
Total Return C,D | | | | 3.20% | | .66% | | (4.95)% | | 4.01% | | 2.47% |
Ratios to Average Net Assets B,E,F | | | | | | | | | | | | |
| Expenses before reductions | | .40% G | | .40% | | .40% | | .40% | | .40% | | .40% |
| Expenses net of fee waivers, if any | | | | .40% | | .40% | | .40% | | .40% | | .40% |
| Expenses net of all reductions | | .40% G | | .40% | | .40% | | .40% | | .40% | | .40% |
| Net investment income (loss) | | 1.96% G | | 1.93% | | 1.77% | | 1.56% | | 1.64% | | 1.86% |
| Supplemental Data | | | | | | | | | | | | |
| Net assets, end of period (000 omitted) | $ | 14,334 | $ | 15,954 | $ | 16,925 | $ | 15,820 | $ | 17,136 | $ | 14,596 |
Portfolio turnover rate H | | | | 6% | | 6% | | 7% | | 6% | | 23% |
ACalculated based on average shares outstanding during the period.
BNet investment income (loss) is affected by the timing of the declaration of dividends by any underlying mutual funds or exchange-traded funds (ETFs). Net investment income (loss) of any mutual funds or ETFs is not included in the Fund's net investment income (loss) ratio.
CTotal returns for periods of less than one year are not annualized.
DTotal returns would have been lower if certain expenses had not been reduced during the applicable periods shown.
EFees and expenses of any underlying mutual funds or exchange-traded funds (ETFs) are not included in the Fund's expense ratio. The Fund indirectly bears its proportionate share of these expenses. For additional expense information related to investments in Fidelity Central Funds, please refer to the "Investments in Fidelity Central Funds" note found in the Notes to Financial Statements section of the most recent Annual or Semi-Annual report.
FExpense ratios reflect operating expenses of the class. Expenses before reductions do not reflect amounts reimbursed, waived, or reduced through arrangements with the investment adviser, brokerage services, or other offset arrangements, if applicable, and do not represent the amount paid by the class during periods when reimbursements, waivers or reductions occur.
GAnnualized.
HAmount does not include the portfolio activity of any underlying mutual funds or exchange-traded funds (ETFs), derivatives or securities that mature within one year from acquisition.
Fidelity Advisor® Municipal Income 2025 Fund Class I |
| |
| | Six months ended (Unaudited) December 31, 2024 | | Years ended June 30, 2024 | | 2023 | | 2022 | | 2021 | | 2020 |
Selected Per-Share Data | | | | | | | | | | | | |
| Net asset value, beginning of period | $ | 9.92 | $ | 9.80 | $ | 9.91 | $ | 10.59 | $ | 10.36 | $ | 10.29 |
| Income from Investment Operations | | | | | | | | | | | | |
Net investment income (loss) A,B | | .099 | | .190 | | .175 | | .161 | | .173 | | .192 |
| Net realized and unrealized gain (loss) | | .080 | | .120 | | (.111) | | (.680) | | .230 | | .070 |
| Total from investment operations | | .179 | | .310 | | .064 | | (.519) | | .403 | | .262 |
| Distributions from net investment income | | (.099) | | (.190) | | (.174) | | (.161) | | (.173) | | (.192) |
| Total distributions | | (.099) | | (.190) | | (.174) | | (.161) | | (.173) | | (.192) |
| Net asset value, end of period | $ | 10.00 | $ | 9.92 | $ | 9.80 | $ | 9.91 | $ | 10.59 | $ | 10.36 |
Total Return C,D | | | | 3.20% | | .66% | | (4.95)% | | 3.91% | | 2.57% |
Ratios to Average Net Assets B,E,F | | | | | | | | | | | | |
| Expenses before reductions | | .40% G | | .40% | | .40% | | .40% | | .40% | | .40% |
| Expenses net of fee waivers, if any | | | | .40% | | .40% | | .40% | | .40% | | .40% |
| Expenses net of all reductions | | .40% G | | .40% | | .40% | | .40% | | .40% | | .40% |
| Net investment income (loss) | | 1.96% G | | 1.93% | | 1.77% | | 1.56% | | 1.64% | | 1.86% |
| Supplemental Data | | | | | | | | | | | | |
| Net assets, end of period (000 omitted) | $ | 4,424 | $ | 4,352 | $ | 4,733 | $ | 5,284 | $ | 5,827 | $ | 5,512 |
Portfolio turnover rate H | | | | 6% | | 6% | | 7% | | 6% | | 23% |
ACalculated based on average shares outstanding during the period.
BNet investment income (loss) is affected by the timing of the declaration of dividends by any underlying mutual funds or exchange-traded funds (ETFs). Net investment income (loss) of any mutual funds or ETFs is not included in the Fund's net investment income (loss) ratio.
CTotal returns for periods of less than one year are not annualized.
DTotal returns would have been lower if certain expenses had not been reduced during the applicable periods shown.
EFees and expenses of any underlying mutual funds or exchange-traded funds (ETFs) are not included in the Fund's expense ratio. The Fund indirectly bears its proportionate share of these expenses. For additional expense information related to investments in Fidelity Central Funds, please refer to the "Investments in Fidelity Central Funds" note found in the Notes to Financial Statements section of the most recent Annual or Semi-Annual report.
FExpense ratios reflect operating expenses of the class. Expenses before reductions do not reflect amounts reimbursed, waived, or reduced through arrangements with the investment adviser, brokerage services, or other offset arrangements, if applicable, and do not represent the amount paid by the class during periods when reimbursements, waivers or reductions occur.
GAnnualized.
HAmount does not include the portfolio activity of any underlying mutual funds or exchange-traded funds (ETFs), derivatives or securities that mature within one year from acquisition.
Notes to Financial Statements
(Unaudited)For the period ended December 31, 2024
1. Organization.
Fidelity Municipal Income 2025 Fund (the Fund) is a fund of Fidelity Salem Street Trust (the Trust) and is authorized to issue an unlimited number of shares. The Trust is registered under the Investment Company Act of 1940, as amended (the 1940 Act), as an open-end management investment company organized as a Massachusetts business trust. The Fund offers Class A, Municipal Income 2025 and Class I shares, each of which has equal rights as to assets and voting privileges. Class A and Class I are Fidelity Advisor classes. Each class has exclusive voting rights with respect to matters that affect that class.
2. Investments in Fidelity Central Funds.
Funds may invest in Fidelity Central Funds, which are open-end investment companies generally available only to other investment companies and accounts managed by the investment adviser and its affiliates. The Schedule of Investments lists any Fidelity Central Funds held as an investment as of period end, but does not include the underlying holdings of each Fidelity Central Fund. An investing fund indirectly bears its proportionate share of the expenses of the underlying Fidelity Central Funds.
Based on its investment objective, each Fidelity Central Fund may invest or participate in various investment vehicles or strategies that are similar to those of the investing fund. These strategies are consistent with the investment objectives of the investing fund and may involve certain economic risks which may cause a decline in value of each of the Fidelity Central Funds and thus a decline in the value of the investing fund.
| Fidelity Central Fund | Investment Manager | Investment Objective | Investment Practices | Expense RatioA |
| Fidelity Money Market Central Funds | Fidelity Management & Research Company LLC (FMR) | Each fund seeks to obtain a high level of current income consistent with the preservation of capital and liquidity. | Short-term Investments | Less than .005% |
A Expenses expressed as a percentage of average net assets and are as of each underlying Central Fund's most recent annual or semi-annual shareholder report.
A complete unaudited list of holdings for each Fidelity Central Fund is available upon request or at the Securities and Exchange Commission website at www.sec.gov. In addition, the financial statements of the Fidelity Central Funds which contain the significant accounting policies (including investment valuation policies) of those funds, and are not covered by the Report of Independent Registered Public Accounting Firm, are available on the Securities and Exchange Commission website or upon request.
3. Significant Accounting Policies.
The Fund is an investment company and applies the accounting and reporting guidance of the Financial Accounting Standards Board (FASB) Accounting Standards Codification Topic 946 Financial Services - Investment Companies. The financial statements have been prepared in conformity with accounting principles generally accepted in the United States of America (GAAP), which require management to make certain estimates and assumptions at the date of the financial statements. Actual results could differ from those estimates. The Fund operates as a single operating segment. The Fund's income, expenses, assets, and performance are regularly monitored and assessed as a whole by the investment adviser and other individuals responsible for oversight functions of the Trust, using the information presented in the financial statements and financial highlights. Subsequent events, if any, through the date that the financial statements were issued have been evaluated in the preparation of the financial statements. The Fund's Schedule of Investments lists any underlying mutual funds or exchange-traded funds (ETFs) but does not include the underlying holdings of these funds. The following summarizes the significant accounting policies of the Fund:
Investment Valuation. Investments are valued as of 4:00 p.m. Eastern time on the last calendar day of the period. The Board of Trustees (the Board) has designated the Fund's investment adviser as the valuation designee responsible for the fair valuation function and performing fair value determinations as needed. The investment adviser has established a Fair Value Committee (the Committee) to carry out the day-to-day fair valuation responsibilities and has adopted policies and procedures to govern the fair valuation process and the activities of the Committee. In accordance with these fair valuation policies and procedures, which have been approved by the Board, the Fund attempts to obtain prices from one or more third party pricing services or brokers to value its investments. When current market prices, quotations or currency exchange rates are not readily available or reliable, investments will be fair valued in good faith by the Committee, in accordance with the policies and procedures. Factors used in determining fair value vary by investment type and may include market or investment specific events, transaction data, estimated cash flows, and market observations of comparable investments. The frequency that the fair valuation procedures are used cannot be predicted and they may be utilized to a significant extent. The Committee manages the Fund's fair valuation practices and maintains the fair valuation policies and procedures. The Fund's investment adviser reports to the Board information regarding the fair valuation process and related material matters.
The Fund categorizes the inputs to valuation techniques used to value its investments into a disclosure hierarchy consisting of three levels as shown below:
Level 1 - unadjusted quoted prices in active markets for identical investments
Level 2 - other significant observable inputs (including quoted prices for similar investments, interest rates, prepayment speeds, etc.)
Level 3 - unobservable inputs (including the Fund's own assumptions based on the best information available)
Valuation techniques used to value the Fund's investments by major category are as follows:
Debt securities, including restricted securities, are valued based on evaluated prices received from third party pricing services or from brokers who make markets in such securities. Municipal securities are valued by pricing services who utilize matrix pricing which considers yield or price of bonds of comparable quality, coupon, maturity and type or by broker-supplied prices. When independent prices are unavailable or unreliable, debt securities may be valued utilizing pricing methodologies which consider similar factors that would be used by third party pricing services. Debt securities are generally categorized as Level 2 in the hierarchy but may be Level 3 depending on the circumstances.
Investments in open-end mutual funds, including the Fidelity Central Funds, are valued at their closing net asset value (NAV) each business day and are categorized as Level 1 in the hierarchy.
Changes in valuation techniques may result in transfers in or out of an assigned level within the disclosure hierarchy. The aggregate value of investments by input level as of December 31, 2024 is included at the end of the Fund's Schedule of Investments.
Investment Transactions and Income. For financial reporting purposes, the Fund's investment holdings and NAV include trades executed through the end of the last business day of the period. The NAV per share for processing shareholder transactions is calculated as of the close of business of the New York Stock Exchange (NYSE), normally 4:00 p.m. Eastern time and includes trades executed through the end of the prior business day. Gains and losses on securities sold are determined on the basis of identified cost. Income and capital gain distributions from Fidelity Central Funds, if any, are recorded on the ex-dividend date. Interest income is accrued as earned and includes coupon interest and amortization of premium and accretion of discount on debt securities as applicable. Debt obligations may be placed on non-accrual status and related interest income may be reduced by ceasing current accruals and writing off interest receivables when the collection of all or a portion of interest has become doubtful based on consistently applied procedures. A debt obligation is removed from non-accrual status when the issuer resumes interest payments or when collectability of interest is reasonably assured.
Class Allocations and Expenses. Investment income, realized and unrealized capital gains and losses, common expenses of a fund, and certain fund-level expense reductions, if any, are allocated daily on a pro-rata basis to each class based on the relative net assets of each class to the total net assets of a fund. Each class differs with respect to transfer agent and distribution and service plan fees incurred, as applicable. Certain expense reductions may also differ by class, if applicable. For the reporting period, the allocated portion of income and expenses to each class as a percent of its average net assets may vary due to the timing of recording these transactions in relation to fluctuating net assets of the classes. Expenses directly attributable to a fund are charged to that fund. Expenses attributable to more than one fund are allocated among the respective funds on the basis of relative net assets or other appropriate methods. Expenses included in the accompanying financial statements reflect the expenses of that fund and do not include any expenses associated with any underlying mutual funds or exchange-traded funds (ETFs). Although not included in a fund's expenses, a fund indirectly bears its proportionate share of these expenses through the net asset value of each underlying mutual fund or exchange-traded fund (ETF). Expense estimates are accrued in the period to which they relate and adjustments are made when actual amounts are known.
Income Tax Information and Distributions to Shareholders. Each year, the Fund intends to qualify as a regulated investment company under Subchapter M of the Internal Revenue Code, including distributing substantially all of its taxable income and realized gains. As a result, no provision for U.S. Federal income taxes is required. The Fund files a U.S. federal tax return, in addition to state and local tax returns as required. The Fund's federal income tax returns are subject to examination by the Internal Revenue Service (IRS) for a period of three fiscal years after they are filed. State and local tax returns may be subject to examination for an additional fiscal year depending on the jurisdiction.
Distributions are declared and recorded daily and paid monthly from net investment income. Distributions from realized gains, if any, are declared and recorded on the ex-dividend date. Income and capital gain distributions are declared separately for each class. Income and capital gain distributions are determined in accordance with income tax regulations, which may differ from GAAP.
Capital accounts within the financial statements are adjusted for permanent book-tax differences. These adjustments have no impact on net assets or the results of operations. Capital accounts are not adjusted for temporary book-tax differences which will reverse in a subsequent period.
Book-tax differences are primarily due to capital loss carryforwards.
The Fund purchases municipal securities whose interest, in the opinion of the issuer, is free from federal income tax. There is no assurance that the IRS will agree with this opinion. In the event the IRS determines that the issuer does not comply with relevant tax requirements, interest payments from a security could become federally taxable, possibly retroactively to the date the security was issued.
As of period end, the cost and unrealized appreciation (depreciation) in securities, and derivatives if applicable, for federal income tax purposes were as follows:
| Gross unrealized appreciation | $4,152 |
| Gross unrealized depreciation | (135,023) |
| Net unrealized appreciation (depreciation) | $(130,871) |
| Tax cost | $22,114,178 |
Capital loss carryforwards are only available to offset future capital gains of the Fund to the extent provided by regulations and may be limited. The capital loss carryforward information presented below, including any applicable limitation, is estimated as of prior fiscal period end and is subject to adjustment.
Short-term | $(75,156) |
Long-term | (113,041) |
| Total capital loss carryforward | $(188,197) |
New Accounting Pronouncement. FASB Accounting Standards Update (ASU) 2023-07 Segment Reporting (Topic 280): Improvements to Reportable Segment Disclosures became effective in this reporting period. ASU 2023-07 enhances segment information disclosure in the notes to financial statements.
4. Purchases and Sales of Investments.
Purchases and sales of securities, other than short-term securities and in-kind transactions, as applicable, are noted in the table below.
| | Purchases ($) | Sales ($) |
| Fidelity Municipal Income 2025 Fund | - | 1,053,103 |
5. Fees and Other Transactions with Affiliates.
Management Fee. Fidelity Management & Research Company LLC (the investment adviser) and its affiliates provide the Fund with investment management related services for which the Fund pays a monthly management fee that is based on an annual rate of .30% of the Fund's average net assets. Under the management contract, the investment adviser pays all other fund-level expenses, except the compensation of the independent Trustees and certain other expenses such as interest expense.
Distribution and Service Plan Fees. In accordance with Rule 12b-1 of the 1940 Act, the Fund has adopted separate Distribution and Service Plans for each class of shares. The Fund's Class A pays Fidelity Distributors Company (FDC), an affiliate of the investment adviser, a Service Fee based on an annual percentage of Class A's average net assets. In addition, FDC may pay financial intermediaries for selling shares of the Fund and providing shareholder support services. For the period, the Service Fee rate, total service fees and amounts retained by FDC were as follows:
| | Service Fee | Total Fees ($) | Retained by FDC ($) |
| Fidelity Municipal Income 2025 Fund | | | |
Class A | .25% | 4,304 | 3,510 |
| | | | |
Sales Load. FDC may receive a front-end sales charge of up to 2.75% for selling Class A shares, some of which is paid to financial intermediaries for selling shares of the Fund. Depending on the holding period, FDC may receive a contingent deferred sales charge levied on Class A redemptions. The deferred sales charges are .75% or .50% for certain purchases of Class A shares.
For the period, there were no sales charge amounts retained by FDC.
Transfer Agent Fees. Fidelity Investments Institutional Operations Company LLC (FIIOC), an affiliate of the investment adviser, is the transfer, dividend disbursing and shareholder servicing agent for each class of the Fund. FIIOC receives asset-based fees of class-level average net assets for each class of the Fund. FIIOC pays for typesetting, printing and mailing of shareholder reports, except proxy statements.
For the period, transfer agent fees for each class were as follows: | Amount ($) | % of Class-Level Average Net Assets |
| Class A | 1,722 | .10 |
| Municipal Income 2025 | 7,743 | .10 |
| Class I | 2,196 | .10 |
| | 11,661 | |
Interfund Trades. Funds may purchase from or sell securities to other Fidelity Funds under procedures adopted by the Board. The procedures have been designed to ensure these interfund trades are executed in accordance with Rule 17a-7 of the 1940 Act. Any interfund trades are included within the respective purchases and sales amounts shown in the Purchases and Sales of Investments note. During the period, there were no interfund trades.
6. Committed Line of Credit.
Certain Funds participate with other funds managed by the investment adviser or an affiliate in a $4.25 billion credit facility (the "line of credit") to be utilized for temporary or emergency purposes to fund shareholder redemptions or for other short-term liquidity purposes.
Commitment fees are charged based on the unused amount of the line of credit at an annual rate of .10%, and then allocated to each participating fund based on its pro-rata portion of the line of credit. The commitment fees are borne by the investment adviser.
Interest is charged to a participating fund based on its borrowings at an annual rate of .75% plus the highest of (i) daily SOFR plus a .10% spread adjustment, (ii) Federal Funds Effective Rate, or (iii) Overnight Bank Funding Rate. During the period, there were no borrowings on this line of credit.
The line of credit agreement will expire in March 2025 unless extended or renewed.
7. Distributions to Shareholders.
Distributions to shareholders of each class were as follows:
| | Six months ended December 31, 2024 | Year ended June 30, 2024 |
| Fidelity Municipal Income 2025 Fund | | |
| Distributions to shareholders | | |
| Class A | $29,713 | $56,895 |
| Municipal Income 2025 | 153,037 | 318,052 |
| Class I | 43,411 | 87,564 |
Total | $226,161 | $462,511 |
8. Share Transactions.
Share transactions for each class were as follows and may contain in-kind transactions, automatic conversions between classes or exchanges between affiliated funds:
| | Shares | Shares | Dollars | Dollars |
| | Six months ended December 31, 2024 | Year ended June 30, 2024 | Six months ended December 31, 2024 | Year ended June 30, 2024 |
| Fidelity Municipal Income 2025 Fund | | | | |
| Class A | | | | |
| Shares sold | - | 8,930 | $ - | $87,693 |
| Reinvestment of distributions | 2,968 | 5,768 | 29,626 | 56,795 |
| Shares redeemed | (12,502) | (13,456) | (125,019) | (131,235) |
| Net increase (decrease) | (9,534) | 1,242 | $(95,393) | $13,253 |
| Municipal Income 2025 | | | | |
| Shares sold | - | 139,265 | $ - | $1,370,484 |
| Reinvestment of distributions | 11,049 | 21,705 | 110,304 | 213,747 |
| Shares redeemed | (186,052) | (279,813) | (1,858,029) | (2,758,178) |
| Net increase (decrease) | (175,003) | (118,843) | $(1,747,725) | $(1,173,947) |
| Class I | | | | |
| Shares sold | - | 6,191 | $ - | $61,159 |
| Reinvestment of distributions | 4,087 | 8,372 | 40,806 | 82,428 |
| Shares redeemed | (408) | (58,818) | (4,070) | (579,243) |
| Net increase (decrease) | 3,679 | (44,255) | $36,736 | $(435,656) |
9. Other.
A fund's organizational documents provide former and current trustees and officers with a limited indemnification against liabilities arising in connection with the performance of their duties to the fund. In the normal course of business, a fund may also enter into contracts that provide general indemnifications. A fund's maximum exposure under these arrangements is unknown as this would be dependent on future claims that may be made against a fund. The risk of material loss from such claims is considered remote.
At the end of the period, the investment adviser or its affiliates were owners of record of more than 10% of the outstanding shares as follows:
| Fund | Affiliated % |
| | |
| Fidelity Municipal Income 2025 Fund. | 52% |
10. Risk and Uncertainties.
Many factors affect a fund's performance. Developments that disrupt global economies and financial markets, such as pandemics, epidemics, outbreaks of infectious diseases, war, terrorism, and environmental disasters, may significantly affect a fund's investment performance. The effects of these developments to a fund will be impacted by the types of securities in which a fund invests, the financial condition, industry, economic sector, and geographic location of an issuer, and a fund's level of investment in the securities of that issuer. Significant concentrations in security types, issuers, industries, sectors, and geographic locations may magnify the factors that affect a fund's performance.
Item 8: Changes in and Disagreements with Accountants for Open-End Management Investment Companies
(Unaudited)
Note: This is not applicable for any fund included in this document.
Item 9: Proxy Disclosures for Open-End Management Investment Companies
(Unaudited)
Note: This is not applicable for any fund included in this document.
Item 10: Remuneration Paid to Directors, Officers, and others of Open-End Management Investment Companies
(Unaudited)
Note: This information is disclosed as part of the financial statements for each Fund as part of Item 7: Financial Statements and Financial Highlights for Open-End Management Investment companies.
Item 11: Statement Regarding Basis for Approval of Investment Advisory Contract
(Unaudited)
Board Approval of Investment Advisory Contracts and Management Fees
Fidelity Municipal Income 2025 Fund
Each year, the Board of Trustees, including the Independent Trustees (together, the Board), considers the renewal of the fund's management contract with Fidelity Management & Research Company LLC (FMR) and the sub-advisory agreements (together, the Advisory Contracts) for the fund. FMR and the sub-advisers are referred to herein as the Investment Advisers. The Board, assisted by the advice of fund counsel and Independent Trustees' counsel, requests and considers a broad range of information relevant to the renewal of the Advisory Contracts throughout the year.
The Board meets regularly and, at each of its meetings, covers an extensive agenda of topics and materials and considers factors that are relevant to its annual consideration of the renewal of the fund's Advisory Contracts, including the services and support provided to the fund and its shareholders. The Board's Operations Committee, of which all the Independent Trustees are members, meets regularly throughout the year and requests, receives and considers, among other matters, information related to the annual consideration of the renewal of the fund's Advisory Contracts before making its recommendation to the Board. The Board also meets as needed to review matters specifically related to the Board's annual consideration of the renewal of the Advisory Contracts. Members of the Board may also meet from time to time with trustees of other Fidelity funds through joint ad hoc committees to discuss certain matters relevant to all of the Fidelity funds.
At its September 2024 meeting, the Board unanimously determined to renew the fund's Advisory Contracts. In reaching its determination, the Board considered all factors it believed relevant, including (i) the nature, extent, and quality of the services provided to the fund and its shareholders (including the investment performance of the fund); (ii) the competitiveness relative to peer funds of the fund's management fee and the total expense ratio of a representative class (the retail class, which was selected because it was the largest class without 12b-1 fees); (iii) the total costs of the services provided by and the profits realized by FMR and its affiliates (Fidelity) from its relationships with the fund; and (iv) the extent to which, if any, economies of scale exist and are realized as the fund grows, and whether any economies of scale are appropriately shared with fund shareholders. The Board also considered the broad range of investment choices available to shareholders from FMR's competitors and that the fund's shareholders have chosen to invest in the fund, which is part of the Fidelity family of funds. The Board's decision to renew the Advisory Contracts was not based on any single factor and the factors may have been weighed differently by different Trustees.
The Board reached a determination, with the assistance of fund counsel and Independent Trustees' counsel and through the exercise of its business judgment, that the renewal of the Advisory Contracts was in the best interests of the fund and its shareholders and that the compensation payable under the Advisory Contracts was fair and reasonable in light of all of the surrounding circumstances.
Nature, Extent, and Quality of Services Provided. The Board considered the Investment Advisers' staffing as it relates to the fund, including the backgrounds and experience of investment personnel, and also considered the Investment Advisers' implementation of the fund's investment program. The Independent Trustees also had discussions with senior management of Fidelity's investment operations and investment groups. The Board considered the structure of the investment personnel compensation program and whether this structure provides appropriate incentives to act in the best interests of the fund. Additionally, the Board considered the portfolio managers' investments, if any, in the funds that they manage.
Resources Dedicated to Investment Management and Support Services. The Board reviewed the general qualifications and capabilities of Fidelity's investment staff, including its size, education, experience, and resources, as well as Fidelity's approach to recruiting, managing, training, and compensating investment personnel. The Board noted the resources devoted to Fidelity's global investment organization, and that Fidelity's analysts have extensive resources, tools and capabilities that allow them to conduct quantitative and fundamental analysis, as well as credit analysis of issuers, counterparties and guarantors. Further, the Board considered that Fidelity's investment professionals have sufficient access to global information and data so as to provide competitive investment results over time, and that those professionals also have access to sophisticated tools that permit them to assess portfolio construction and risk and performance attribution characteristics continuously, as well as to transmit new information and research conclusions rapidly around the world. Additionally, in its deliberations, the Board considered Fidelity's trading, risk management, compliance, cybersecurity, and technology and operations capabilities and resources, which are integral parts of the investment management process.
Shareholder and Administrative Services. The Board considered (i) the nature, extent, quality, and cost of advisory, administrative, and shareholder services performed by the Investment Advisers and their affiliates under the Advisory Contracts and under separate agreements covering transfer agency and pricing and bookkeeping services for the fund; (ii) the nature and extent of Fidelity's supervision of third party service providers, principally custodians, subcustodians, and pricing vendors; and (iii) the resources devoted by Fidelity to, and the record of compliance with, the fund's compliance policies and procedures, including with respect to liquidity risk management.
The Board noted that the growth of fund assets over time across the complex allows Fidelity to reinvest in the development of services designed to enhance the value and convenience of the Fidelity funds as investment vehicles. These services include 24-hour access to account information and market information over the Internet and through telephone representatives, investor education materials and asset allocation tools. The Board also considered that it reviews customer service metrics such as telephone response times, continuity of services on the website and metrics addressing services at Fidelity Investor Centers.
Investment in a Large Fund Family. The Board considered the benefits to shareholders of investing in a fund that is part of a large family of funds offering a variety of investment disciplines and providing a large variety of fund investor services. The Board noted that Fidelity had taken, or had made recommendations to the Board that resulted in the Fidelity funds taking, a number of actions over the previous year that benefited particular funds and/or the Fidelity funds in general.
Investment Performance. The Board took into account discussions that occur with representatives of the Investment Advisers, and reports that it receives, at Board meetings throughout the year relating to fund investment performance. In this regard the Board noted that as part of regularly scheduled fund reviews and other reports to the Board on fund performance, the Board considered annualized return information for the fund for different time periods, measured against an appropriate securities market index (benchmark index). The Board also considered information about performance attribution. In its evaluation of fund investment performance at meetings throughout the year, the Board gave particular attention to information indicating underperformance of certain Fidelity funds over different time periods and discussed with the Investment Advisers the reasons for such underperformance.
In addition to reviewing absolute and relative fund performance, the Independent Trustees periodically consider the appropriateness of fund performance metrics in evaluating the results achieved. The Independent Trustees generally give greater weight to fund performance over longer time periods than over shorter time periods. Depending on the circumstances, the Independent Trustees may be satisfied with a fund's performance notwithstanding that it lags its benchmark index for certain periods.
Based on its review, the Board concluded that the nature, extent, and quality of services provided to the fund under the Advisory Contracts should continue to benefit the shareholders of the fund.
Competitiveness of Management Fee and Total Expense Ratio. The Board was provided with information regarding industry trends in management fees and expenses. In its review of the fund's management fee and total expense ratio of the retail class, the Board considered the fund's management fee rate as well as other "fund-level" expenses, such as pricing and bookkeeping fees and custodial, legal, and audit fees, paid by FMR under the fund's management contract. The Board also considered other "class-level" expenses, such as transfer agent fees and fund-paid 12b-1 fees. The Board also noted that Fidelity may agree to waive fees or reimburse expenses from time to time, and the extent to which, if any, it has done so for the fund.
Comparisons of Management Fees and Total Expense Ratios. Among other things, the Board reviewed data for selected groups of competitive funds and classes (referred to as "mapped groups") that were compiled by Fidelity based on combining similar investment objective categories (as classified by Morningstar) that have comparable investment mandates. The data reviewed by the Board included (i) gross management fee comparisons (before taking into account expense reimbursements or caps) relative to the total universe of funds within the mapped group; (ii) gross management fee comparisons relative to a subset of non-Fidelity funds in the mapped group that are similar in size and management fee structure to the fund (referred to as the "asset size peer group"); (iii) total expense comparisons of the retail class of the fund relative to funds and classes in the mapped group that have a similar sales load structure to the retail class of the fund (referred to as the "similar sales load structure group"); and (iv) total expense comparisons of the retail class of the fund relative to funds and classes in the similar sales load structure group that are similar in size and management fee structure to the fund (referred to as the "total expense asset size peer group"). The total expense asset size peer group comparison excludes performance adjustments and fund-paid 12b-1 fees to eliminate variability in fee structures.
The information provided to the Board indicated that the fund's management fee rate ranked below the competitive median of the mapped group for 2023 and below the competitive median of the asset size peer group for 2023. Further, the information provided to the Board indicated that the total expense ratio of the fund's retail class ranked below the competitive median of the similar sales load structure group for 2023 and below the competitive median of the total expense asset size peer group for 2023.
Fees Charged to Other Fidelity Clients. The Board also considered Fidelity fee structures and other information with respect to clients of Fidelity, such as other funds advised or subadvised by Fidelity, pension plan clients, and other institutional clients with similar mandates. The Board noted that a joint ad hoc committee created by it and the boards of other Fidelity funds periodically reviews and compares Fidelity's institutional investment advisory business with its business of providing services to the Fidelity funds and also noted the most recent findings of the committee. The Board noted that the committee's review included a consideration of the differences in services provided, fees charged, and costs incurred, as well as competition in the markets serving the different categories of clients.
Based on its review, the Board concluded that the fund's management fee is fair and reasonable in light of the services that the fund receives and the other factors considered. Further, based on its review of total expense ratios and fees charged to other Fidelity clients, the Board concluded that the fund's total expense ratio was reasonable in light of the services that the fund and its shareholders receive and the other factors considered.
Costs of the Services and Profitability. The Board considered the revenues earned and the expenses incurred by Fidelity in conducting the business of developing, marketing, distributing, managing, administering and servicing the fund and servicing the fund's shareholders. The Board also considered the level of Fidelity's profits in respect of all the Fidelity funds.
On an annual basis, Fidelity presents to the Board information about the profitability of its relationships with the fund. Fidelity calculates profitability information for each Fidelity fund, as well as aggregate profitability information for groups of Fidelity funds and all Fidelity funds, using a series of detailed revenue and cost allocation methodologies which originate with the books and records of Fidelity on which Fidelity's audited financial statements are based. The Audit Committee of the Board reviews any significant changes from the prior year's methodologies.
A public accounting firm has been engaged annually by the Board as part of the Board's assessment of Fidelity's profitability analysis. The engagement includes the review and assessment of the methodologies used by Fidelity in determining the revenues and expenses attributable to Fidelity's fund business. After considering the reports issued under the engagement and information provided by Fidelity, the Board concluded that while other allocation methods may also be reasonable, Fidelity's profitability methodologies are reasonable in all material respects.
The Board also reviewed Fidelity's non-fund businesses and potential indirect benefits such businesses may have received as a result of their association with Fidelity's fund business (i.e., fall-out benefits) as well as cases where Fidelity's affiliates may benefit from the funds' business. The Board considered areas where potential indirect benefits to the Fidelity funds from their relationships with Fidelity may exist. The Board's consideration of these matters was informed by the findings of a joint ad hoc committee created by it and the boards of other Fidelity funds to evaluate potential fall-out benefits.
The Board considered the costs of the services provided by and the profits realized by Fidelity in connection with the operation of the fund and was satisfied that the profitability was not excessive.
Economies of Scale. The Board considered whether there have been economies of scale in respect of the management of the Fidelity funds, whether the Fidelity funds (including the fund) have appropriately benefited from any such economies of scale, and whether there is potential for realization of any further economies of scale. The Board considered the extent to which the fund will benefit from economies of scale as assets grow through increased services to the fund, through waivers or reimbursements, or through fee or expense ratio reductions. The Board also noted that a committee created by it and the boards of other Fidelity funds periodically analyzes whether Fidelity attains economies of scale in respect of the management and servicing of the Fidelity funds, whether the Fidelity funds have appropriately benefited from such economies of scale, and whether there is potential for realization of any further economies of scale.
The Board concluded, taking into account the analysis of the committee, that economies of scale, if any, are being appropriately shared between fund shareholders and Fidelity.
Additional Information Requested by the Board. In order to develop fully the factual basis for consideration of the Fidelity funds' advisory contracts, the Board requested and received additional information on certain topics, including: (i) portfolio manager changes that have occurred during the past year; (ii) hiring, training, compensating, and retaining adviser and sub-adviser personnel; (iii) the terms of the funds' various management fee structures and arrangements for transfer agent and pricing and bookkeeping services; (iv) Fidelity's fund profitability methodology, profitability trends for certain funds, the allocation of various costs to different funds, and the impact of certain factors on fund profitability results; (v) the impact on fund profitability of recent industry trends, such as the growth in passively managed funds and the changes in flows for different types of funds; (vi) the types of management fee and total expense comparisons provided, and the challenges and limitations associated with such information; (vii) explanations regarding the relative total expense ratios and management fees of certain funds and classes, total expense and management fee competitive trends, and methodologies for total expense and management fee competitive comparisons; (viii) matters related to money market funds, exchange-traded funds, and target date funds; (ix) the arrangements with and compensation paid to certain fund sub-advisers and the treatment of such compensation within Fidelity's fund profitability methodology; and (x) the terms of management contracts between Fidelity and other funds and products not overseen by the Board.
Conclusion. Based on its evaluation of all of the conclusions noted above, and after considering all factors it believed relevant, the Board, including the Independent Trustees, concluded that the advisory and sub-advisory fee arrangements are fair and reasonable in light of all of the surrounding circumstances and that the fund's Advisory Contracts should be renewed through September 30, 2025.
1.926263.113
DMI-SANN-0325
Fidelity® Mid Cap Growth Index Fund
Fidelity® Mid Cap Value Index Fund
Fidelity® Small Cap Growth Index Fund
Fidelity® Small Cap Value Index Fund
Semi-Annual Report
December 31, 2024
Contents
To view a fund's proxy voting guidelines and proxy voting record for the 12-month period ended June 30, visit http://www.fidelity.com/proxyvotingresults or visit the Securities and Exchange Commission's (SEC) web site at http://www.sec.gov.
You may also call 1-800-544-8544 to request a free copy of the proxy voting guidelines.
A fund is not in any way connected to or sponsored, endorsed, sold or promoted by the London Stock Exchange Group plc and its group undertakings (collectively, the "LSE Group"). The LSE Group does not accept any liability whatsoever to any person arising out of the use of a fund or the underlying data.
Standard & Poor's, S&P and S&P 500 are registered service marks of The McGraw-Hill Companies, Inc. and have been licensed for use by Fidelity Distributors Corporation.
Other third-party marks appearing herein are the property of their respective owners.
All other marks appearing herein are registered or unregistered trademarks or service marks of FMR LLC or an affiliated company. © 2025 FMR LLC. All rights reserved.
This report and the financial statements contained herein are submitted for the general information of the shareholders of the Funds. This report is not authorized for distribution to prospective investors in the Funds unless preceded or accompanied by an effective prospectus.
A fund files its complete schedule of portfolio holdings with the SEC for the first and third quarters of each fiscal year on Form N-PORT. Forms N-PORT are available on the SEC's web site at http://www.sec.gov. A fund's Forms N-PORT may be reviewed and copied at the SEC's Public Reference Room in Washington, DC. Information regarding the operation of the SEC's Public Reference Room may be obtained by calling 1-800-SEC-0330.
For a complete list of a fund's portfolio holdings, view the most recent holdings listing, semiannual report, or annual report on Fidelity's web site at http://www.fidelity.com, http://www.institutional.fidelity.com, or http://www.401k.com, as applicable.
NOT FDIC INSURED •MAY LOSE VALUE •NO BANK GUARANTEE
Neither the Funds nor Fidelity Distributors Corporation is a bank.
Item 7: Financial Statements and Financial Highlights for Open-End Management Investment Companies (Semi-Annual Report)
Fidelity® Mid Cap Growth Index Fund
Schedule of Investments December 31, 2024 (Unaudited)
Showing Percentage of Net Assets
| Common Stocks - 99.7% |
| | | Shares | Value ($) |
| BRAZIL - 1.1% | | | |
| Financials - 1.1% | | | |
| Banks - 1.1% | | | |
| NU Holdings Ltd/Cayman Islands Class A (b) | | 1,628,267 | 16,868,846 |
| Capital Markets - 0.0% | | | |
| XP Inc Class A | | 21,080 | 249,798 |
| TOTAL BRAZIL | | | 17,118,644 |
| KOREA (SOUTH) - 0.8% | | | |
| Consumer Discretionary - 0.8% | | | |
| Broadline Retail - 0.8% | | | |
| Coupang Inc Class A (b) | | 592,614 | 13,025,656 |
| PUERTO RICO - 0.0% | | | |
| Financials - 0.0% | | | |
| Banks - 0.0% | | | |
| Popular Inc | | 3,757 | 353,383 |
| UNITED STATES - 97.8% | | | |
| Communication Services - 4.5% | | | |
| Diversified Telecommunication Services - 0.0% | | | |
| Iridium Communications Inc | | 5,229 | 151,746 |
| Entertainment - 2.0% | | | |
| Liberty Media Corp-Liberty Formula One Class A (b) | | 4,239 | 356,245 |
| Liberty Media Corp-Liberty Formula One Class C (b) | | 38,183 | 3,538,037 |
| Live Nation Entertainment Inc (b) | | 80,792 | 10,462,564 |
| Madison Square Garden Sports Corp Class A (b) | | 761 | 171,742 |
| ROBLOX Corp Class A (b) | | 268,725 | 15,548,429 |
| Roku Inc Class A (b) | | 9,697 | 720,875 |
| TKO Group Holdings Inc Class A (b) | | 5,529 | 785,726 |
| | | | 31,583,618 |
| Interactive Media & Services - 0.6% | | | |
| Pinterest Inc Class A (b) | | 307,681 | 8,922,749 |
| TripAdvisor Inc Class A (b) | | 2,907 | 42,936 |
| Trump Media & Technology Group Corp (b)(c) | | 23,858 | 813,558 |
| | | | 9,779,243 |
| Media - 1.9% | | | |
| Liberty Broadband Corp Class A (b) | | 2,119 | 157,569 |
| Liberty Broadband Corp Class C (b) | | 13,783 | 1,030,417 |
| Nexstar Media Group Inc | | 6,102 | 963,933 |
| Trade Desk Inc (The) Class A (b) | | 228,455 | 26,850,316 |
| | | | 29,002,235 |
TOTAL COMMUNICATION SERVICES | | | 70,516,842 |
| | | | |
| Consumer Discretionary - 13.9% | | | |
| Broadline Retail - 0.1% | | | |
| Etsy Inc (b) | | 37,206 | 1,967,825 |
| Distributors - 0.4% | | | |
| Pool Corp | | 19,071 | 6,502,067 |
| Diversified Consumer Services - 0.5% | | | |
| Bright Horizons Family Solutions Inc (b) | | 4,422 | 490,179 |
| Duolingo Inc Class A (b) | | 19,018 | 6,166,206 |
| Grand Canyon Education Inc (b) | | 4,777 | 782,473 |
| H&R Block Inc | | 13,843 | 731,464 |
| | | | 8,170,322 |
| Hotels, Restaurants & Leisure - 7.1% | | | |
| Cava Group Inc (b) | | 38,598 | 4,353,854 |
| Choice Hotels International Inc | | 11,881 | 1,686,864 |
| Churchill Downs Inc | | 35,643 | 4,759,766 |
| Darden Restaurants Inc | | 31,657 | 5,910,045 |
| Domino's Pizza Inc | | 6,208 | 2,605,870 |
| DraftKings Inc Class A (b) | | 231,651 | 8,617,417 |
| Dutch Bros Inc Class A (b) | | 22,080 | 1,156,550 |
| Expedia Group Inc Class A (b) | | 63,528 | 11,837,173 |
| Hilton Worldwide Holdings Inc | | 62,880 | 15,541,422 |
| Hyatt Hotels Corp Class A (c) | | 3,041 | 477,376 |
| Las Vegas Sands Corp | | 178,253 | 9,155,074 |
| Light & Wonder Inc Class A (b) | | 45,318 | 3,914,569 |
| Norwegian Cruise Line Holdings Ltd (b) | | 224,432 | 5,774,635 |
| Planet Fitness Inc Class A (b) | | 23,477 | 2,321,171 |
| Royal Caribbean Cruises Ltd | | 42,093 | 9,710,435 |
| Texas Roadhouse Inc | | 34,111 | 6,154,648 |
| Vail Resorts Inc | | 16,100 | 3,017,945 |
| Wendy's Co/The | | 43,414 | 707,648 |
| Wingstop Inc | | 15,010 | 4,265,842 |
| Wyndham Hotels & Resorts Inc | | 3,370 | 339,662 |
| Wynn Resorts Ltd | | 3,920 | 337,747 |
| Yum! Brands Inc | | 55,363 | 7,427,500 |
| | | | 110,073,213 |
| Household Durables - 0.4% | | | |
| SharkNinja Inc | | 6,704 | 652,701 |
| Tempur Sealy International Inc | | 85,830 | 4,865,703 |
| TopBuild Corp (b) | | 1,232 | 383,571 |
| | | | 5,901,975 |
| Leisure Products - 0.3% | | | |
| Hasbro Inc | | 62,181 | 3,476,540 |
| YETI Holdings Inc (b) | | 12,984 | 500,014 |
| | | | 3,976,554 |
| Specialty Retail - 4.0% | | | |
| Burlington Stores Inc (b) | | 32,441 | 9,247,632 |
| CarMax Inc (b) | | 5,541 | 453,032 |
| Carvana Co Class A (b) | | 19,375 | 3,940,100 |
| Dick's Sporting Goods Inc | | 2,606 | 596,357 |
| Five Below Inc (b) | | 22,135 | 2,323,290 |
| Floor & Decor Holdings Inc Class A (b) | | 19,602 | 1,954,319 |
| Murphy USA Inc | | 9,371 | 4,701,899 |
| RH (b) | | 1,492 | 587,236 |
| Ross Stores Inc | | 38,477 | 5,820,416 |
| Tractor Supply Co (c) | | 275,957 | 14,642,279 |
| Ulta Beauty Inc (b) | | 20,838 | 9,063,071 |
| Valvoline Inc (b) | | 66,076 | 2,390,630 |
| Williams-Sonoma Inc | | 37,897 | 7,017,766 |
| | | | 62,738,027 |
| Textiles, Apparel & Luxury Goods - 1.1% | | | |
| Crocs Inc (b) | | 5,257 | 575,799 |
| Deckers Outdoor Corp (b) | | 77,608 | 15,761,409 |
| Skechers USA Inc Class A (b) | | 5,864 | 394,295 |
| | | | 16,731,503 |
TOTAL CONSUMER DISCRETIONARY | | | 216,061,486 |
| | | | |
| Consumer Staples - 2.3% | | | |
| Beverages - 0.2% | | | |
| Boston Beer Co Inc/The Class A (b) | | 899 | 269,682 |
| Celsius Holdings Inc (b) | | 90,094 | 2,373,076 |
| | | | 2,642,758 |
| Consumer Staples Distribution & Retail - 0.9% | | | |
| Casey's General Stores Inc | | 3,275 | 1,297,653 |
| Performance Food Group Co (b) | | 11,179 | 945,184 |
| Sysco Corp | | 156,180 | 11,941,524 |
| | | | 14,184,361 |
| Food Products - 0.3% | | | |
| Freshpet Inc (b) | | 7,595 | 1,124,895 |
| Hershey Co/The | | 10,358 | 1,754,128 |
| Lamb Weston Holdings Inc | | 23,335 | 1,559,478 |
| Pilgrim's Pride Corp (b) | | 1,983 | 90,008 |
| | | | 4,528,509 |
| Household Products - 0.7% | | | |
| Clorox Co/The | | 63,516 | 10,315,634 |
| Personal Care Products - 0.2% | | | |
| elf Beauty Inc (b)(c) | | 27,497 | 3,452,248 |
TOTAL CONSUMER STAPLES | | | 35,123,510 |
| | | | |
| Energy - 4.0% | | | |
| Energy Equipment & Services - 0.1% | | | |
| Weatherford International PLC | | 36,915 | 2,644,221 |
| Oil, Gas & Consumable Fuels - 3.9% | | | |
| Antero Midstream Corp | | 66,237 | 999,516 |
| Cheniere Energy Inc | | 58,410 | 12,550,557 |
| Civitas Resources Inc | | 13,813 | 633,602 |
| Eqt Corp | | 18,695 | 862,026 |
| Hess Corp | | 92,490 | 12,302,095 |
| Matador Resources Co | | 4,570 | 257,108 |
| New Fortress Energy Inc Class A (c) | | 21,606 | 326,683 |
| Permian Resources Corp Class A | | 71,308 | 1,025,409 |
| Targa Resources Corp | | 110,689 | 19,757,988 |
| Texas Pacific Land Corp | | 9,608 | 10,626,064 |
| Viper Energy Inc Class A | | 15,361 | 753,764 |
| | | | 60,094,812 |
TOTAL ENERGY | | | 62,739,033 |
| | | | |
| Financials - 11.7% | | | |
| Capital Markets - 7.2% | | | |
| Ameriprise Financial Inc | | 45,363 | 24,152,622 |
| Ares Management Corp Class A | | 94,668 | 16,759,076 |
| Blue Owl Capital Inc Class A | | 264,727 | 6,157,550 |
| Coinbase Global Inc Class A (b) | | 87,085 | 21,623,206 |
| FactSet Research Systems Inc | | 6,888 | 3,308,169 |
| Houlihan Lokey Inc Class A | | 2,467 | 428,419 |
| Jefferies Financial Group Inc | | 25,181 | 1,974,190 |
| Lazard Inc Class A | | 52,410 | 2,698,067 |
| LPL Financial Holdings Inc | | 38,088 | 12,436,113 |
| Morningstar Inc | | 13,655 | 4,598,458 |
| MSCI Inc | | 22,519 | 13,511,625 |
| TPG Inc Class A | | 10,659 | 669,812 |
| Tradeweb Markets Inc Class A | | 23,457 | 3,070,990 |
| | | | 111,388,297 |
| Consumer Finance - 0.2% | | | |
| Ally Financial Inc | | 19,096 | 687,646 |
| Credit Acceptance Corp (b)(c) | | 2,506 | 1,176,467 |
| SoFi Technologies Inc Class A (b) | | 85,464 | 1,316,146 |
| | | | 3,180,259 |
| Financial Services - 2.7% | | | |
| Block Inc Class A (b) | | 119,950 | 10,194,551 |
| Corpay Inc (b) | | 34,524 | 11,683,613 |
| Equitable Holdings Inc | | 161,690 | 7,626,917 |
| Shift4 Payments Inc Class A (b)(c) | | 31,348 | 3,253,295 |
| Toast Inc Class A (b) | | 231,787 | 8,448,636 |
| UWM Holdings Corp Class A | | 33,147 | 194,573 |
| Western Union Co/The | | 30,439 | 322,653 |
| WEX Inc (b) | | 1,885 | 330,478 |
| | | | 42,054,716 |
| Insurance - 1.6% | | | |
| Allstate Corp/The | | 20,969 | 4,042,614 |
| Arthur J Gallagher & Co | | 8,680 | 2,463,818 |
| Brown & Brown Inc | | 53,766 | 5,485,207 |
| Everest Group Ltd | | 3,588 | 1,300,506 |
| Kinsale Capital Group Inc | | 11,266 | 5,240,155 |
| Markel Group Inc (b) | | 1,529 | 2,639,406 |
| RLI Corp | | 1,292 | 212,960 |
| Ryan Specialty Holdings Inc Class A | | 52,344 | 3,358,391 |
| | | | 24,743,057 |
TOTAL FINANCIALS | | | 181,366,329 |
| | | | |
| Health Care - 12.5% | | | |
| Biotechnology - 3.2% | | | |
| Alnylam Pharmaceuticals Inc (b) | | 58,529 | 13,772,459 |
| Apellis Pharmaceuticals Inc (b) | | 53,423 | 1,704,728 |
| Exact Sciences Corp (b) | | 36,864 | 2,071,388 |
| Exelixis Inc (b) | | 119,733 | 3,987,109 |
| Incyte Corp (b) | | 4,800 | 331,536 |
| Ionis Pharmaceuticals Inc (b) | | 74,442 | 2,602,492 |
| Natera Inc (b) | | 58,585 | 9,274,006 |
| Neurocrine Biosciences Inc (b) | | 51,023 | 6,964,640 |
| Sarepta Therapeutics Inc (b) | | 46,332 | 5,633,508 |
| Ultragenyx Pharmaceutical Inc (b) | | 45,430 | 1,911,240 |
| Viking Therapeutics Inc (b)(c) | | 54,372 | 2,187,929 |
| | | | 50,441,035 |
| Health Care Equipment & Supplies - 4.1% | | | |
| Align Technology Inc (b) | | 22,468 | 4,684,803 |
| Dexcom Inc (b) | | 199,642 | 15,526,158 |
| GE HealthCare Technologies Inc | | 21,870 | 1,709,796 |
| IDEXX Laboratories Inc (b) | | 41,588 | 17,194,143 |
| Inspire Medical Systems Inc (b) | | 14,985 | 2,777,919 |
| Insulet Corp (b) | | 35,733 | 9,328,814 |
| Masimo Corp (b) | | 11,545 | 1,908,389 |
| Penumbra Inc (b) | | 18,862 | 4,479,348 |
| ResMed Inc | | 20,310 | 4,644,694 |
| | | | 62,254,064 |
| Health Care Providers & Services - 2.4% | | | |
| Cardinal Health Inc | | 74,028 | 8,755,292 |
| Cencora Inc | | 84,986 | 19,094,654 |
| Chemed Corp | | 774 | 410,065 |
| DaVita Inc (b) | | 24,118 | 3,606,847 |
| Molina Healthcare Inc (b) | | 18,301 | 5,326,506 |
| | | | 37,193,364 |
| Health Care Technology - 1.0% | | | |
| Doximity Inc Class A (b) | | 4,707 | 251,306 |
| Veeva Systems Inc Class A (b) | | 75,470 | 15,867,568 |
| | | | 16,118,874 |
| Life Sciences Tools & Services - 1.5% | | | |
| 10X Genomics Inc Class A (b) | | 36,127 | 518,783 |
| Bruker Corp | | 35,411 | 2,075,793 |
| Fortrea Holdings Inc (b)(c) | | 4,621 | 86,181 |
| IQVIA Holdings Inc (b) | | 10,421 | 2,047,831 |
| Medpace Holdings Inc (b) | | 13,000 | 4,318,990 |
| Repligen Corp (b) | | 4,075 | 586,556 |
| Waters Corp (b) | | 18,394 | 6,823,806 |
| West Pharmaceutical Services Inc | | 22,546 | 7,385,168 |
| | | | 23,843,108 |
| Pharmaceuticals - 0.3% | | | |
| Intra-Cellular Therapies Inc (b) | | 52,656 | 4,397,829 |
TOTAL HEALTH CARE | | | 194,248,274 |
| | | | |
| Industrials - 17.3% | | | |
| Aerospace & Defense - 2.5% | | | |
| Axon Enterprise Inc (b) | | 36,738 | 21,834,128 |
| BWX Technologies Inc | | 9,515 | 1,059,876 |
| HEICO Corp | | 22,549 | 5,360,799 |
| HEICO Corp Class A | | 41,554 | 7,732,369 |
| Howmet Aerospace Inc | | 12,647 | 1,383,202 |
| Loar Holdings Inc | | 14,005 | 1,035,110 |
| Spirit AeroSystems Holdings Inc Class A (b) | | 7,414 | 252,669 |
| Standardaero Inc (c) | | 11,329 | 280,506 |
| | | | 38,938,659 |
| Air Freight & Logistics - 0.1% | | | |
| Expeditors International of Washington Inc | | 11,772 | 1,303,984 |
| Building Products - 1.6% | | | |
| AAON Inc | | 34,473 | 4,056,783 |
| Advanced Drainage Systems Inc | | 13,592 | 1,571,235 |
| Armstrong World Industries Inc | | 7,490 | 1,058,562 |
| AZEK Co Inc/The Class A (b) | | 51,555 | 2,447,316 |
| Builders FirstSource Inc (b) | | 5,334 | 762,388 |
| Carlisle Cos Inc | | 3,116 | 1,149,305 |
| Lennox International Inc | | 16,399 | 9,991,911 |
| Simpson Manufacturing Co Inc | | 2,038 | 337,961 |
| Trex Co Inc (b) | | 54,657 | 3,772,973 |
| | | | 25,148,434 |
| Commercial Services & Supplies - 0.9% | | | |
| Rollins Inc | | 142,964 | 6,626,381 |
| Tetra Tech Inc | | 29,309 | 1,167,671 |
| Veralto Corp | | 56,865 | 5,791,700 |
| | | | 13,585,752 |
| Construction & Engineering - 1.3% | | | |
| Comfort Systems USA Inc | | 17,980 | 7,624,600 |
| EMCOR Group Inc | | 9,196 | 4,174,064 |
| Quanta Services Inc | | 22,742 | 7,187,609 |
| WillScot Holdings Corp (b) | | 26,925 | 900,641 |
| | | | 19,886,914 |
| Electrical Equipment - 1.6% | | | |
| Generac Holdings Inc (b) | | 14,758 | 2,288,228 |
| Rockwell Automation Inc | | 5,395 | 1,541,837 |
| Vertiv Holdings Co Class A | | 183,183 | 20,811,421 |
| | | | 24,641,486 |
| Ground Transportation - 2.1% | | | |
| Avis Budget Group Inc (c) | | 3,456 | 278,588 |
| Lyft Inc Class A (b) | | 129,514 | 1,670,731 |
| Old Dominion Freight Line Inc | | 98,974 | 17,459,014 |
| Saia Inc (b) | | 7,912 | 3,605,736 |
| U-Haul Holding Co (b)(c) | | 1,792 | 123,809 |
| U-Haul Holding Co Class N | | 22,122 | 1,416,914 |
| XPO Inc (b) | | 58,482 | 7,669,914 |
| | | | 32,224,706 |
| Machinery - 0.1% | | | |
| Lincoln Electric Holdings Inc | | 7,877 | 1,476,701 |
| Passenger Airlines - 0.0% | | | |
| American Airlines Group Inc (b)(c) | | 24,110 | 420,237 |
| Professional Services - 3.9% | | | |
| Booz Allen Hamilton Holding Corp Class A | | 64,514 | 8,302,952 |
| Broadridge Financial Solutions Inc | | 54,701 | 12,367,349 |
| Dayforce Inc (b)(c) | | 8,168 | 593,324 |
| Equifax Inc | | 12,633 | 3,219,520 |
| KBR Inc | | 5,855 | 339,180 |
| Paychex Inc | | 59,079 | 8,284,057 |
| Paycom Software Inc | | 16,412 | 3,363,968 |
| Paycor HCM Inc (b) | | 4,035 | 74,930 |
| Paylocity Holding Corp (b) | | 22,194 | 4,427,037 |
| TransUnion | | 5,659 | 524,646 |
| Verisk Analytics Inc | | 72,100 | 19,858,503 |
| | | | 61,355,466 |
| Trading Companies & Distributors - 3.2% | | | |
| Core & Main Inc Class A (b) | | 64,485 | 3,282,931 |
| Fastenal Co | | 246,916 | 17,755,730 |
| Ferguson Enterprises Inc | | 6,935 | 1,203,708 |
| SiteOne Landscape Supply Inc (b) | | 8,417 | 1,109,107 |
| United Rentals Inc | | 8,108 | 5,711,600 |
| WW Grainger Inc | | 19,350 | 20,395,868 |
| | | | 49,458,944 |
TOTAL INDUSTRIALS | | | 268,441,283 |
| | | | |
| Information Technology - 27.4% | | | |
| Communications Equipment - 0.0% | | | |
| Ubiquiti Inc | | 954 | 316,661 |
| Electronic Equipment, Instruments & Components - 0.6% | | | |
| CDW Corp/DE | | 34,577 | 6,017,781 |
| Cognex Corp | | 4,752 | 170,407 |
| Ingram Micro Holding Corp | | 2,275 | 44,111 |
| Jabil Inc | | 4,635 | 666,977 |
| Zebra Technologies Corp Class A (b) | | 5,599 | 2,162,446 |
| | | | 9,061,722 |
| IT Services - 4.3% | | | |
| Cloudflare Inc Class A (b)(c) | | 153,434 | 16,521,773 |
| EPAM Systems Inc (b) | | 1,760 | 411,523 |
| Gartner Inc (b) | | 38,565 | 18,683,586 |
| Globant SA (b) | | 16,179 | 3,469,101 |
| GoDaddy Inc Class A (b) | | 71,533 | 14,118,468 |
| MongoDB Inc Class A (b) | | 36,631 | 8,528,063 |
| Okta Inc Class A (b) | | 37,021 | 2,917,255 |
| Twilio Inc Class A (b) | | 15,496 | 1,674,808 |
| VeriSign Inc (b) | | 2,768 | 572,865 |
| | | | 66,897,442 |
| Semiconductors & Semiconductor Equipment - 2.7% | | | |
| Astera Labs Inc (b) | | 2,766 | 366,357 |
| Enphase Energy Inc (b) | | 67,413 | 4,629,925 |
| Entegris Inc | | 77,038 | 7,631,384 |
| Lattice Semiconductor Corp (b) | | 60,333 | 3,417,864 |
| MKS Instruments Inc | | 2,017 | 210,555 |
| Monolithic Power Systems Inc | | 24,031 | 14,219,143 |
| Onto Innovation Inc (b) | | 6,439 | 1,073,188 |
| Teradyne Inc | | 72,797 | 9,166,598 |
| Universal Display Corp | | 12,027 | 1,758,347 |
| | | | 42,473,361 |
| Software - 18.2% | | | |
| Appfolio Inc Class A (b) | | 11,590 | 2,859,485 |
| AppLovin Corp Class A (b) | | 134,199 | 43,457,663 |
| Bentley Systems Inc Class B | | 71,689 | 3,347,876 |
| BILL Holdings Inc (b) | | 12,841 | 1,087,761 |
| Confluent Inc Class A (b) | | 126,656 | 3,541,302 |
| Datadog Inc Class A (b) | | 152,952 | 21,855,311 |
| DocuSign Inc (b) | | 103,942 | 9,348,543 |
| DoubleVerify Holdings Inc (b) | | 41,812 | 803,209 |
| Dropbox Inc Class A (b) | | 36,919 | 1,109,047 |
| Dynatrace Inc (b) | | 150,859 | 8,199,187 |
| Elastic NV (b) | | 44,538 | 4,412,825 |
| Fair Isaac Corp (b) | | 10,270 | 20,446,851 |
| Five9 Inc (b) | | 37,941 | 1,541,922 |
| Gitlab Inc Class A (b) | | 62,421 | 3,517,423 |
| Guidewire Software Inc (b) | | 19,052 | 3,211,786 |
| HashiCorp Inc Class A (b) | | 58,095 | 1,987,430 |
| HubSpot Inc (b) | | 25,004 | 17,422,037 |
| Manhattan Associates Inc (b) | | 31,335 | 8,467,970 |
| MicroStrategy Inc Class A (b)(c) | | 5,307 | 1,537,013 |
| nCino Inc (b) | | 26,412 | 886,915 |
| Nutanix Inc Class A (b) | | 36,360 | 2,224,505 |
| Palantir Technologies Inc Class A (b) | | 1,029,539 | 77,864,036 |
| Pegasystems Inc | | 22,805 | 2,125,426 |
| Procore Technologies Inc (b) | | 54,730 | 4,100,919 |
| PTC Inc (b) | | 36,766 | 6,760,164 |
| RingCentral Inc Class A (b) | | 42,031 | 1,471,505 |
| SentinelOne Inc Class A (b) | | 22,979 | 510,134 |
| Smartsheet Inc Class A (b) | | 69,337 | 3,884,952 |
| Teradata Corp (b) | | 48,837 | 1,521,273 |
| Tyler Technologies Inc (b) | | 18,437 | 10,631,512 |
| UiPath Inc Class A (b) | | 187,475 | 2,382,807 |
| Unity Software Inc (b) | | 68,617 | 1,541,824 |
| Zscaler Inc (b) | | 47,662 | 8,598,701 |
| | | | 282,659,314 |
| Technology Hardware, Storage & Peripherals - 1.6% | | | |
| HP Inc | | 119,281 | 3,892,139 |
| NetApp Inc | | 47,228 | 5,482,226 |
| Pure Storage Inc Class A (b) | | 136,943 | 8,412,409 |
| Super Micro Computer Inc (b)(c) | | 253,506 | 7,726,863 |
| | | | 25,513,637 |
TOTAL INFORMATION TECHNOLOGY | | | 426,922,137 |
| | | | |
| Materials - 1.1% | | | |
| Chemicals - 0.2% | | | |
| Celanese Corp | | 14,230 | 984,858 |
| Chemours Co/The | | 5,678 | 95,958 |
| RPM International Inc | | 14,696 | 1,808,490 |
| | | | 2,889,306 |
| Construction Materials - 0.6% | | | |
| Eagle Materials Inc | | 12,884 | 3,179,256 |
| Martin Marietta Materials Inc | | 1,756 | 906,974 |
| Vulcan Materials Co | | 17,469 | 4,493,551 |
| | | | 8,579,781 |
| Containers & Packaging - 0.2% | | | |
| Avery Dennison Corp | | 15,452 | 2,891,533 |
| Sealed Air Corp | | 4,029 | 136,301 |
| | | | 3,027,834 |
| Metals & Mining - 0.0% | | | |
| Cleveland-Cliffs Inc (b) | | 80,604 | 757,677 |
| Paper & Forest Products - 0.1% | | | |
| Louisiana-Pacific Corp | | 22,354 | 2,314,756 |
TOTAL MATERIALS | | | 17,569,354 |
| | | | |
| Real Estate - 1.3% | | | |
| Real Estate Management & Development - 0.1% | | | |
| Jones Lang LaSalle Inc (b) | | 7,493 | 1,896,778 |
| Retail REITs - 0.5% | | | |
| Simon Property Group Inc | | 42,380 | 7,298,260 |
| Specialized REITs - 0.7% | | | |
| Iron Mountain Inc | | 85,062 | 8,940,867 |
| Lamar Advertising Co Class A | | 11,226 | 1,366,653 |
| | | | 10,307,520 |
TOTAL REAL ESTATE | | | 19,502,558 |
| | | | |
| Utilities - 1.8% | | | |
| Electric Utilities - 0.2% | | | |
| NRG Energy Inc | | 43,006 | 3,880,001 |
| Independent Power and Renewable Electricity Producers - 1.6% | | | |
| Vistra Corp | | 173,605 | 23,934,922 |
TOTAL UTILITIES | | | 27,814,923 |
| | | | |
| TOTAL UNITED STATES | | | 1,520,305,729 |
| TOTAL COMMON STOCKS (Cost $1,244,943,043) | | | 1,550,803,412 |
| | | | |
| U.S. Treasury Obligations - 0.0% |
| | | Yield (%) (d) | Principal Amount (a) | Value ($) |
US Treasury Bills 0% 2/20/2025 (e) (Cost $190,823) | | 4.46 | 192,000 | 190,908 |
| | | | | |
| Money Market Funds - 2.9% |
| | | Yield (%) | Shares | Value ($) |
| Fidelity Cash Central Fund (f) | | 4.36 | 7,047,738 | 7,049,148 |
| Fidelity Securities Lending Cash Central Fund (f)(g) | | 4.35 | 38,315,418 | 38,319,250 |
| TOTAL MONEY MARKET FUNDS (Cost $45,368,398) | | | | 45,368,398 |
| | | | | |
| TOTAL INVESTMENT IN SECURITIES - 102.6% (Cost $1,290,502,264) | 1,596,362,718 |
NET OTHER ASSETS (LIABILITIES) - (2.6)% | (40,394,489) |
| NET ASSETS - 100.0% | 1,555,968,229 |
| | |
| Futures Contracts |
| | Number of contracts | Expiration Date | Notional Amount ($) | Value ($) | Unrealized Appreciation/ (Depreciation) ($) |
| Purchased | | | | | |
| | | | | | |
| Equity Contracts | | | | | |
| CME E-mini S&P MidCap 400 Index Contracts (United States) | 13 | Mar 2025 | 4,090,710 | 27,900 | 27,900 |
| | | | | | |
| The notional amount of futures purchased as a percentage of Net Assets is 0.3% |
Legend
| (a) | Amount is stated in United States dollars unless otherwise noted. |
| (c) | Security or a portion of the security is on loan at period end. |
| (d) | Yield represents either the annualized yield at the date of purchase, or the stated coupon rate, or, for floating and adjustable rate securities, the rate at period end. |
| (e) | Security or a portion of the security was pledged to cover margin requirements for futures contracts. At period end, the value of securities pledged amounted to $190,908. |
| (f) | Affiliated fund that is generally available only to investment companies and other accounts managed by Fidelity Investments. The rate quoted is the annualized seven-day yield of the fund at period end. A complete unaudited listing of the fund's holdings as of its most recent quarter end is available upon request. In addition, each Fidelity Central Fund's financial statements are available on the SEC's website or upon request. |
| (g) | Investment made with cash collateral received from securities on loan. |
Affiliated Central Funds
Fiscal year to date information regarding the Fund's investments in Fidelity Central Funds, including the ownership percentage, is presented below.
| Affiliate | Value, beginning of period ($) | Purchases ($) | Sales Proceeds ($) | Dividend Income ($) | Realized Gain (loss) ($) | Change in Unrealized appreciation (depreciation) ($) | Value, end of period ($) | Shares, end of period | % ownership, end of period |
| Fidelity Cash Central Fund | 4,427,315 | 133,353,132 | 130,731,316 | 102,562 | 17 | - | 7,049,148 | 7,047,738 | 0.0% |
| Fidelity Securities Lending Cash Central Fund | 14,176,950 | 187,861,837 | 163,719,537 | 55,272 | - | - | 38,319,250 | 38,315,418 | 0.2% |
| Total | 18,604,265 | 321,214,969 | 294,450,853 | 157,834 | 17 | - | 45,368,398 | 45,363,156 | |
| | | | | | | | | | |
Amounts in the dividend income column in the above table include any capital gain distributions from underlying funds, which are presented in the corresponding line item in the Statement of Operations, if applicable.
Amounts in the dividend income column for Fidelity Securities Lending Cash Central Fund represents the income earned on investing cash collateral, less rebates paid to borrowers and any lending agent fees associated with the loan, plus any premium payments received for lending certain types of securities.
Amounts included in the purchases and sales proceeds columns may include in-kind transactions, if applicable.
Investment Valuation
The following is a summary of the inputs used, as of December 31, 2024, involving the Fund's assets and liabilities carried at fair value. The inputs or methodology used for valuing securities may not be an indication of the risk associated with investing in those securities. For more information on valuation inputs, and their aggregation into the levels used below, please refer to the Investment Valuation section in the accompanying Notes to Financial Statements.
| Valuation Inputs at Reporting Date: |
| Description | Total ($) | Level 1 ($) | Level 2 ($) | Level 3 ($) |
Investments in Securities: | | | | |
|
| Common Stocks | | | | |
Communication Services | 70,516,842 | 70,516,842 | - | - |
Consumer Discretionary | 229,087,142 | 229,087,142 | - | - |
Consumer Staples | 35,123,510 | 35,123,510 | - | - |
Energy | 62,739,033 | 62,739,033 | - | - |
Financials | 198,838,356 | 198,838,356 | - | - |
Health Care | 194,248,274 | 194,248,274 | - | - |
Industrials | 268,441,283 | 268,441,283 | - | - |
Information Technology | 426,922,137 | 426,922,137 | - | - |
Materials | 17,569,354 | 17,569,354 | - | - |
Real Estate | 19,502,558 | 19,502,558 | - | - |
Utilities | 27,814,923 | 27,814,923 | - | - |
|
| U.S. Treasury Obligations | 190,908 | - | 190,908 | - |
|
| Money Market Funds | 45,368,398 | 45,368,398 | - | - |
| Total Investments in Securities: | 1,596,362,718 | 1,596,171,810 | 190,908 | - |
Derivative Instruments: Assets | | | | |
Futures Contracts | 27,900 | 27,900 | - | - |
| Total Assets | 27,900 | 27,900 | - | - |
| Total Derivative Instruments: | 27,900 | 27,900 | - | - |
Value of Derivative Instruments
The following table is a summary of the Fund's value of derivative instruments by primary risk exposure as of December 31, 2024. For additional information on derivative instruments, please refer to the Derivative Instruments section in the accompanying Notes to Financial Statements.
Primary Risk Exposure / Derivative Type | Value |
| Asset ($) | Liability ($) |
| Equity Risk | | |
Futures Contracts (a) | 27,900 | 0 |
| Total Equity Risk | 27,900 | 0 |
| Total Value of Derivatives | 27,900 | 0 |
(a)Reflects gross cumulative appreciation (depreciation) on futures contracts as presented in the Schedule of Investments. In the Statement of Assets and Liabilities, the period end daily variation margin is included in receivable or payable for daily variation margin on futures contracts, and the net cumulative appreciation (depreciation) is included in Total accumulated earnings (loss).
Fidelity® Mid Cap Growth Index Fund
Financial Statements (Unaudited)
| Statement of Assets and Liabilities |
| As of December 31, 2024 (Unaudited) |
| Assets | | | | |
| Investment in securities, at value (including securities loaned of $37,313,559) - See accompanying schedule: | | | | |
Unaffiliated issuers (cost $1,245,133,866) | $ | 1,550,994,320 | | |
Fidelity Central Funds (cost $45,368,398) | | 45,368,398 | | |
| | | | | |
| | | | | |
| Total Investment in Securities (cost $1,290,502,264) | | | $ | 1,596,362,718 |
| Segregated cash with brokers for derivative instruments | | | | 226,077 |
| Foreign currency held at value (cost $301) | | | | 283 |
| Receivable for fund shares sold | | | | 8,842,532 |
| Dividends receivable | | | | 308,151 |
| Distributions receivable from Fidelity Central Funds | | | | 32,337 |
| Receivable for daily variation margin on futures contracts | | | | 13,526 |
Total assets | | | | 1,605,785,624 |
| Liabilities | | | | |
| Payable for investments purchased | $ | 9,934,876 | | |
| Payable for fund shares redeemed | | 1,497,911 | | |
| Accrued management fee | | 65,358 | | |
| Collateral on securities loaned | | 38,319,250 | | |
| Total liabilities | | | | 49,817,395 |
| Net Assets | | | $ | 1,555,968,229 |
| Net Assets consist of: | | | | |
| Paid in capital | | | $ | 1,291,413,186 |
| Total accumulated earnings (loss) | | | | 264,555,043 |
| Net Assets | | | $ | 1,555,968,229 |
Net Asset Value, offering price and redemption price per share ($1,555,968,229 ÷ 47,323,109 shares) | | | $ | 32.88 |
| Statement of Operations |
Six months ended December 31, 2024 (Unaudited) |
| Investment Income | | | | |
| Dividends | | | $ | 3,680,790 |
| Interest | | | | 5,995 |
| Income from Fidelity Central Funds (including $55,272 from security lending) | | | | 157,834 |
| Total income | | | | 3,844,619 |
| Expenses | | | | |
| Management fee | $ | 320,474 | | |
| Independent trustees' fees and expenses | | 1,478 | | |
| Total expenses before reductions | | 321,952 | | |
| Expense reductions | | (587) | | |
| Total expenses after reductions | | | | 321,365 |
| Net Investment income (loss) | | | | 3,523,254 |
| Realized and Unrealized Gain (Loss) | | | | |
| Net realized gain (loss) on: | | | | |
| Investment Securities: | | | | |
| Unaffiliated issuers | | (2,277,921) | | |
| Fidelity Central Funds | | 17 | | |
| Futures contracts | | 2,110 | | |
| Total net realized gain (loss) | | | | (2,275,794) |
| Change in net unrealized appreciation (depreciation) on: | | | | |
| Investment Securities: | | | | |
| Unaffiliated issuers | | 164,686,545 | | |
| Assets and liabilities in foreign currencies | | (15) | | |
| Futures contracts | | 21,658 | | |
| Total change in net unrealized appreciation (depreciation) | | | | 164,708,188 |
| Net gain (loss) | | | | 162,432,394 |
| Net increase (decrease) in net assets resulting from operations | | | $ | 165,955,648 |
| Statement of Changes in Net Assets |
| |
| | Six months ended December 31, 2024 (Unaudited) | | Year ended June 30, 2024 |
| Increase (Decrease) in Net Assets | | | | |
| Operations | | | | |
| Net investment income (loss) | $ | 3,523,254 | $ | 6,027,043 |
| Net realized gain (loss) | | (2,275,794) | | 59,775,978 |
| Change in net unrealized appreciation (depreciation) | | 164,708,188 | | 52,331,475 |
| Net increase (decrease) in net assets resulting from operations | | 165,955,648 | | 118,134,496 |
| Distributions to shareholders | | (6,611,674) | | (5,052,417) |
| | | | | |
| Share transactions | | | | |
| Proceeds from sales of shares | | 493,039,102 | | 649,400,298 |
| Reinvestment of distributions | | 5,324,590 | | 3,453,892 |
| Cost of shares redeemed | | (208,014,408) | | (369,176,470) |
| | | | | |
Net increase (decrease) in net assets resulting from share transactions | | 290,349,284 | | 283,677,720 |
| Total increase (decrease) in net assets | | 449,693,258 | | 396,759,799 |
| | | | | |
| Net Assets | | | | |
| Beginning of period | | 1,106,274,971 | | 709,515,172 |
| End of period | $ | 1,555,968,229 | $ | 1,106,274,971 |
| | | | | |
| Other Information | | | | |
| Shares | | | | |
| Sold | | 15,420,735 | | 23,879,699 |
| Issued in reinvestment of distributions | | 171,202 | | 133,872 |
| Redeemed | | (6,816,873) | | (13,714,932) |
| Net increase (decrease) | | 8,775,064 | | 10,298,639 |
| | | | | |
Financial Highlights
Fidelity® Mid Cap Growth Index Fund |
| |
| | Six months ended (Unaudited) December 31, 2024 | | Years ended June 30, 2024 | | 2023 | | 2022 | | 2021 | | 2020 A |
Selected Per-Share Data | | | | | | | | | | | | |
| Net asset value, beginning of period | $ | 28.70 | $ | 25.12 | $ | 20.56 | $ | 31.08 | $ | 21.71 | $ | 20.00 |
| Income from Investment Operations | | | | | | | | | | | | |
Net investment income (loss) B,C | | .09 | | .19 | | .18 | | .17 | | .13 | | .15 |
| Net realized and unrealized gain (loss) | | 4.24 | | 3.56 | | 4.56 | | (8.78) | | 9.34 | | 1.62 |
| Total from investment operations | | 4.33 | | 3.75 | | 4.74 | | (8.61) | | 9.47 | | 1.77 |
| Distributions from net investment income | | (.15) | | (.17) | | (.18) | | (.12) | | (.10) | | (.06) |
| Distributions from net realized gain | | - | | - | | - | | (1.79) | | - | | - D |
| Total distributions | | (.15) | | (.17) | | (.18) | | (1.91) | | (.10) | | (.06) |
| Net asset value, end of period | $ | 32.88 | $ | 28.70 | $ | 25.12 | $ | 20.56 | $ | 31.08 | $ | 21.71 |
Total Return E,F | | | | 15.01% | | 23.13% | | (29.57)% | | 43.70% | | 8.86% |
Ratios to Average Net Assets C,G,H | | | | | | | | | | | | |
| Expenses before reductions | | .05% I | | .05% | | .05% | | .05% | | .05% | | .05% I |
| Expenses net of fee waivers, if any | | | | .05% | | .05% | | .05% | | .05% | | .05% I |
| Expenses net of all reductions | | .05% I | | .05% | | .05% | | .05% | | .05% | | .05% I |
| Net investment income (loss) | | .55% I | | .72% | | .81% | | .62% | | .47% | | .76% I |
| Supplemental Data | | | | | | | | | | | | |
| Net assets, end of period (000 omitted) | $ | 1,555,968 | $ | 1,106,275 | $ | 709,515 | $ | 457,328 | $ | 653,513 | $ | 208,955 |
Portfolio turnover rate J | | | | 54% K | | 46% | | 62% | | 54% | | 109% I |
AFor the period July 11, 2019 (commencement of operations) through June 30, 2020.
BCalculated based on average shares outstanding during the period.
CNet investment income (loss) is affected by the timing of the declaration of dividends by any underlying mutual funds or exchange-traded funds (ETFs). Net investment income (loss) of any mutual funds or ETFs is not included in the Fund's net investment income (loss) ratio.
DAmount represents less than $.005 per share.
ETotal returns for periods of less than one year are not annualized.
FTotal returns would have been lower if certain expenses had not been reduced during the applicable periods shown.
GFees and expenses of any underlying mutual funds or exchange-traded funds (ETFs) are not included in the Fund's expense ratio. The Fund indirectly bears its proportionate share of these expenses. For additional expense information related to investments in Fidelity Central Funds, please refer to the "Investments in Fidelity Central Funds" note found in the Notes to Financial Statements section of the most recent Annual or Semi-Annual report.
HExpense ratios reflect operating expenses of the class. Expenses before reductions do not reflect amounts reimbursed, waived, or reduced through arrangements with the investment adviser, brokerage services, or other offset arrangements, if applicable, and do not represent the amount paid by the class during periods when reimbursements, waivers or reductions occur.
IAnnualized.
JAmount does not include the portfolio activity of any underlying mutual funds or exchange-traded funds (ETFs), derivatives or securities that mature within one year from acquisition.
KPortfolio turnover rate excludes securities received or delivered in-kind.
Fidelity® Mid Cap Value Index Fund
Schedule of Investments December 31, 2024 (Unaudited)
Showing Percentage of Net Assets
| Common Stocks - 99.8% |
| | | Shares | Value ($) |
| BAILIWICK OF JERSEY - 0.3% | | | |
| Consumer Discretionary - 0.3% | | | |
| Automobile Components - 0.3% | | | |
| Aptiv PLC | | 25,541 | 1,544,720 |
| BELGIUM - 0.0% | | | |
| Communication Services - 0.0% | | | |
| Diversified Telecommunication Services - 0.0% | | | |
| Liberty Global Ltd Class A (b) | | 18,090 | 230,829 |
| Liberty Global Ltd Class C (b) | | 16,602 | 218,150 |
| | | | |
| TOTAL BELGIUM | | | 448,979 |
| BERMUDA - 0.1% | | | |
| Financials - 0.1% | | | |
| Insurance - 0.1% | | | |
| RenaissanceRe Holdings Ltd | | 5,583 | 1,389,106 |
| BRAZIL - 0.0% | | | |
| Financials - 0.0% | | | |
| Capital Markets - 0.0% | | | |
| XP Inc Class A | | 39,854 | 472,270 |
| CANADA - 0.3% | | | |
| Industrials - 0.3% | | | |
| Commercial Services & Supplies - 0.3% | | | |
| RB Global Inc (United States) | | 19,925 | 1,797,434 |
| Utilities - 0.0% | | | |
| Independent Power and Renewable Electricity Producers - 0.0% | | | |
| Brookfield Renewable Corp (United States) | | 14,691 | 406,353 |
| TOTAL CANADA | | | 2,203,787 |
| FINLAND - 0.0% | | | |
| Consumer Discretionary - 0.0% | | | |
| Textiles, Apparel & Luxury Goods - 0.0% | | | |
| Amer Sports Inc | | 6,351 | 177,574 |
| GERMANY - 0.0% | | | |
| Consumer Discretionary - 0.0% | | | |
| Textiles, Apparel & Luxury Goods - 0.0% | | | |
| Birkenstock Holding Plc (b) | | 4,268 | 241,825 |
| JAPAN - 0.0% | | | |
| Information Technology - 0.0% | | | |
| Semiconductors & Semiconductor Equipment - 0.0% | | | |
| Allegro MicroSystems Inc (b) | | 13,364 | 292,137 |
| PUERTO RICO - 0.1% | | | |
| Financials - 0.1% | | | |
| Banks - 0.1% | | | |
| Popular Inc | | 6,962 | 654,846 |
| UNITED KINGDOM - 0.1% | | | |
| Energy - 0.1% | | | |
| Energy Equipment & Services - 0.1% | | | |
| TechnipFMC PLC | | 46,065 | 1,333,121 |
| UNITED STATES - 98.9% | | | |
| Communication Services - 3.3% | | | |
| Diversified Telecommunication Services - 0.1% | | | |
| Frontier Communications Parent Inc (b) | | 26,711 | 926,872 |
| GCI Liberty Inc Class A (b)(c)(d) | | 9,740 | 0 |
| Iridium Communications Inc | | 11,135 | 323,137 |
| | | | 1,250,009 |
| Entertainment - 1.6% | | | |
| Electronic Arts Inc | | 28,762 | 4,207,881 |
| Liberty Media Corp-Liberty Formula One Class A (b) | | 1,694 | 142,364 |
| Liberty Media Corp-Liberty Formula One Class C (b) | | 14,635 | 1,356,079 |
| Liberty Media Corp-Liberty Live Class A (b) | | 2,123 | 141,307 |
| Liberty Media Corp-Liberty Live Class C (b) | | 5,053 | 343,907 |
| Madison Square Garden Sports Corp Class A (b) | | 1,863 | 420,442 |
| Playtika Holding Corp | | 7,571 | 52,542 |
| Roku Inc Class A (b) | | 11,679 | 868,217 |
| Take-Two Interactive Software Inc (b) | | 18,763 | 3,453,893 |
| TKO Group Holdings Inc Class A (b) | | 7,409 | 1,052,893 |
| Warner Bros Discovery Inc (b) | | 264,158 | 2,792,150 |
| | | | 14,831,675 |
| Interactive Media & Services - 0.2% | | | |
| IAC Inc Class A (b) | | 8,090 | 349,003 |
| Match Group Inc | | 27,963 | 914,670 |
| TripAdvisor Inc Class A (b) | | 11,168 | 164,951 |
| Trump Media & Technology Group Corp (b)(e) | | 3,020 | 102,982 |
| ZoomInfo Technologies Inc (b) | | 32,882 | 345,590 |
| | | | 1,877,196 |
| Media - 1.4% | | | |
| Charter Communications Inc Class A (b) | | 10,213 | 3,500,710 |
| Fox Corp Class A | | 24,078 | 1,169,709 |
| Fox Corp Class B | | 14,386 | 658,016 |
| Interpublic Group of Cos Inc/The | | 40,463 | 1,133,773 |
| Liberty Broadband Corp Class A (b) | | 1,371 | 101,947 |
| Liberty Broadband Corp Class C (b) | | 9,056 | 677,027 |
| New York Times Co/The Class A | | 17,495 | 910,615 |
| News Corp Class A | | 41,443 | 1,141,340 |
| News Corp Class B | | 12,346 | 375,689 |
| Nexstar Media Group Inc | | 2,022 | 319,415 |
| Omnicom Group Inc | | 21,069 | 1,812,777 |
| Paramount Global Class A | | 1,211 | 27,005 |
| Paramount Global Class B | | 63,906 | 668,457 |
| Sirius XM Holdings Inc (e) | | 23,390 | 533,292 |
| | | | 13,029,772 |
| Consumer Discretionary - 9.0% | | | |
| Automobile Components - 0.2% | | | |
| BorgWarner Inc | | 23,694 | 753,233 |
| Gentex Corp | | 25,165 | 722,990 |
| Lear Corp | | 5,876 | 556,457 |
| QuantumScape Corp Class A (b)(e) | | 39,485 | 204,927 |
| | | | 2,237,607 |
| Automobiles - 0.3% | | | |
| Harley-Davidson Inc | | 12,878 | 388,014 |
| Lucid Group Inc Class A (b)(e) | | 107,892 | 325,833 |
| Rivian Automotive Inc Class A (b)(e) | | 90,645 | 1,205,579 |
| Thor Industries Inc | | 5,529 | 529,181 |
| | | | 2,448,607 |
| Broadline Retail - 0.6% | | | |
| Dillard's Inc Class A | | 336 | 145,064 |
| eBay Inc | | 52,098 | 3,227,471 |
| Etsy Inc (b) | | 4,240 | 224,254 |
| Kohl's Corp (e) | | 12,059 | 169,308 |
| Macy's Inc | | 29,815 | 504,768 |
| Nordstrom Inc | | 10,865 | 262,390 |
| Ollie's Bargain Outlet Holdings Inc (b) | | 6,627 | 727,181 |
| | | | 5,260,436 |
| Distributors - 0.3% | | | |
| Genuine Parts Co | | 15,131 | 1,766,696 |
| LKQ Corp | | 28,209 | 1,036,680 |
| | | | 2,803,376 |
| Diversified Consumer Services - 0.3% | | | |
| ADT Inc | | 36,018 | 248,884 |
| Bright Horizons Family Solutions Inc (b) | | 5,330 | 590,831 |
| Grand Canyon Education Inc (b) | | 2,133 | 349,385 |
| H&R Block Inc | | 12,157 | 642,376 |
| Service Corp International/US | | 15,295 | 1,220,847 |
| | | | 3,052,323 |
| Hotels, Restaurants & Leisure - 2.3% | | | |
| Aramark | | 28,494 | 1,063,111 |
| Boyd Gaming Corp | | 6,900 | 500,526 |
| Caesars Entertainment Inc (b) | | 22,952 | 767,056 |
| Carnival Corp (b) | | 111,680 | 2,783,066 |
| Choice Hotels International Inc | | 453 | 64,316 |
| Darden Restaurants Inc | | 6,019 | 1,123,687 |
| Domino's Pizza Inc | | 2,463 | 1,033,869 |
| Dutch Bros Inc Class A (b) | | 7,203 | 377,293 |
| Hilton Worldwide Holdings Inc | | 12,699 | 3,138,685 |
| Hyatt Hotels Corp Class A (e) | | 3,810 | 598,094 |
| Marriott Vacations Worldwide Corp | | 3,778 | 339,264 |
| MGM Resorts International (b) | | 24,923 | 863,582 |
| Penn Entertainment Inc (b) | | 16,377 | 324,592 |
| Planet Fitness Inc Class A (b) | | 4,195 | 414,760 |
| Royal Caribbean Cruises Ltd | | 16,849 | 3,886,896 |
| Travel + Leisure Co | | 7,149 | 360,667 |
| Vail Resorts Inc | | 655 | 122,780 |
| Wendy's Co/The | | 9,574 | 156,056 |
| Wyndham Hotels & Resorts Inc | | 7,526 | 758,546 |
| Wynn Resorts Ltd | | 10,285 | 886,156 |
| Yum! Brands Inc | | 18,898 | 2,535,356 |
| | | | 22,098,358 |
| Household Durables - 2.2% | | | |
| DR Horton Inc | | 31,758 | 4,440,405 |
| Garmin Ltd | | 16,854 | 3,476,306 |
| Leggett & Platt Inc | | 14,547 | 139,651 |
| Lennar Corp Class A | | 25,581 | 3,488,481 |
| Lennar Corp Class B | | 1,222 | 161,487 |
| Mohawk Industries Inc (b) | | 5,707 | 679,875 |
| Newell Brands Inc | | 45,070 | 448,897 |
| NVR Inc (b) | | 313 | 2,559,996 |
| PulteGroup Inc | | 22,193 | 2,416,818 |
| SharkNinja Inc | | 5,768 | 561,572 |
| Toll Brothers Inc | | 10,939 | 1,377,767 |
| TopBuild Corp (b) | | 3,015 | 938,690 |
| Whirlpool Corp | | 5,757 | 659,061 |
| | | | 21,349,006 |
| Leisure Products - 0.2% | | | |
| Brunswick Corp/DE | | 7,138 | 461,686 |
| Hasbro Inc | | 1,896 | 106,005 |
| Mattel Inc (b) | | 36,784 | 652,180 |
| Polaris Inc (e) | | 5,616 | 323,594 |
| YETI Holdings Inc (b) | | 6,537 | 251,740 |
| | | | 1,795,205 |
| Specialty Retail - 1.9% | | | |
| Advance Auto Parts Inc | | 6,493 | 307,054 |
| AutoNation Inc (b) | | 2,767 | 469,947 |
| Bath & Body Works Inc | | 23,837 | 924,160 |
| Best Buy Co Inc | | 23,456 | 2,012,525 |
| CarMax Inc (b) | | 15,658 | 1,280,198 |
| Carvana Co Class A (b) | | 7,653 | 1,556,314 |
| Dick's Sporting Goods Inc | | 5,535 | 1,266,629 |
| Five Below Inc (b) | | 1,219 | 127,946 |
| Floor & Decor Holdings Inc Class A (b) | | 7,256 | 723,423 |
| GameStop Corp Class A (b)(e) | | 42,706 | 1,338,406 |
| Gap Inc/The | | 22,069 | 521,490 |
| Lithia Motors Inc Class A | | 2,852 | 1,019,390 |
| Penske Automotive Group Inc | | 2,006 | 305,795 |
| RH (b) | | 1,303 | 512,848 |
| Ross Stores Inc | | 27,244 | 4,121,201 |
| Ulta Beauty Inc (b) | | 689 | 299,667 |
| Wayfair Inc Class A (b)(e) | | 10,381 | 460,086 |
| Williams-Sonoma Inc | | 5,556 | 1,028,860 |
| | | | 18,275,939 |
| Textiles, Apparel & Luxury Goods - 0.7% | | | |
| Capri Holdings Ltd (b) | | 12,467 | 262,555 |
| Carter's Inc (e) | | 3,860 | 209,173 |
| Columbia Sportswear Co | | 3,557 | 298,539 |
| Crocs Inc (b) | | 5,089 | 557,398 |
| PVH Corp | | 6,034 | 638,096 |
| Ralph Lauren Corp Class A | | 4,298 | 992,752 |
| Skechers USA Inc Class A (b) | | 13,089 | 880,104 |
| Tapestry Inc | | 25,287 | 1,652,000 |
| Under Armour Inc Class A (b) | | 20,602 | 170,585 |
| Under Armour Inc Class C (b) | | 20,716 | 154,541 |
| VF Corp | | 38,100 | 817,626 |
| | | | 6,633,369 |
TOTAL CONSUMER DISCRETIONARY | | | 85,954,226 |
| | | | |
| Consumer Staples - 5.7% | | | |
| Beverages - 0.3% | | | |
| Boston Beer Co Inc/The Class A (b) | | 755 | 226,485 |
| Brown-Forman Corp Class A | | 5,289 | 199,342 |
| Brown-Forman Corp Class B | | 18,759 | 712,467 |
| Coca-Cola Consolidated Inc | | 657 | 827,813 |
| Molson Coors Beverage Co Class B | | 18,594 | 1,065,808 |
| | | | 3,031,915 |
| Consumer Staples Distribution & Retail - 1.8% | | | |
| Albertsons Cos Inc | | 45,474 | 893,109 |
| BJ's Wholesale Club Holdings Inc (b) | | 14,352 | 1,282,351 |
| Casey's General Stores Inc | | 3,330 | 1,319,446 |
| Dollar General Corp | | 23,908 | 1,812,705 |
| Dollar Tree Inc (b) | | 22,004 | 1,648,980 |
| Grocery Outlet Holding Corp (b) | | 10,386 | 162,125 |
| Kroger Co/The | | 72,213 | 4,415,825 |
| Maplebear Inc (b) | | 18,093 | 749,412 |
| Performance Food Group Co (b) | | 14,247 | 1,204,584 |
| Sysco Corp | | 20,274 | 1,550,150 |
| US Foods Holding Corp (b) | | 24,923 | 1,681,306 |
| Walgreens Boots Alliance Inc | | 77,797 | 725,846 |
| | | | 17,445,839 |
| Food Products - 2.7% | | | |
| Archer-Daniels-Midland Co | | 51,900 | 2,621,989 |
| Bunge Global SA | | 15,113 | 1,175,187 |
| Conagra Brands Inc | | 51,855 | 1,438,976 |
| Darling Ingredients Inc (b) | | 17,235 | 580,647 |
| Flowers Foods Inc | | 20,392 | 421,299 |
| Freshpet Inc (b) | | 3,452 | 511,276 |
| General Mills Inc | | 60,781 | 3,876,005 |
| Hershey Co/The | | 13,646 | 2,310,950 |
| Hormel Foods Corp | | 31,552 | 989,786 |
| Ingredion Inc | | 7,130 | 980,803 |
| JM Smucker Co | | 11,229 | 1,236,537 |
| Kellanova | | 28,541 | 2,310,965 |
| Lamb Weston Holdings Inc | | 10,489 | 700,980 |
| McCormick & Co Inc/MD | | 27,414 | 2,090,043 |
| Pilgrim's Pride Corp (b) | | 4,105 | 186,326 |
| Post Holdings Inc (b) | | 5,177 | 592,559 |
| Seaboard Corp | | 28 | 68,030 |
| The Campbell's Company | | 20,891 | 874,915 |
| Tyson Foods Inc Class A | | 30,616 | 1,758,583 |
| | | | 24,725,856 |
| Household Products - 0.3% | | | |
| Church & Dwight Co Inc | | 26,550 | 2,780,051 |
| Reynolds Consumer Products Inc | | 5,939 | 160,293 |
| Spectrum Brands Holdings Inc | | 2,951 | 249,330 |
| | | | 3,189,674 |
| Personal Care Products - 0.6% | | | |
| BellRing Brands Inc (b) | | 13,993 | 1,054,233 |
| Coty Inc Class A (b) | | 41,407 | 288,192 |
| Kenvue Inc | | 208,440 | 4,450,194 |
| | | | 5,792,619 |
TOTAL CONSUMER STAPLES | | | 54,185,903 |
| | | | |
| Energy - 5.6% | | | |
| Energy Equipment & Services - 0.8% | | | |
| Baker Hughes Co Class A | | 108,637 | 4,456,290 |
| Halliburton Co | | 95,935 | 2,608,473 |
| NOV Inc | | 42,157 | 615,492 |
| | | | 7,680,255 |
| Oil, Gas & Consumable Fuels - 4.8% | | | |
| Antero Midstream Corp | | 22,797 | 344,007 |
| Antero Resources Corp (b) | | 31,560 | 1,106,178 |
| APA Corp | | 39,348 | 908,545 |
| Cheniere Energy Inc | | 11,891 | 2,555,019 |
| Chord Energy Corp | | 6,684 | 781,493 |
| Civitas Resources Inc | | 7,754 | 355,676 |
| Coterra Energy Inc | | 79,450 | 2,029,153 |
| Devon Energy Corp | | 67,785 | 2,218,603 |
| Diamondback Energy Inc | | 20,526 | 3,362,775 |
| DT Midstream Inc | | 10,568 | 1,050,776 |
| Eqt Corp | | 60,157 | 2,773,839 |
| Expand Energy Corp | | 25,103 | 2,499,004 |
| Hess Corp | | 10,733 | 1,427,596 |
| HF Sinclair Corp | | 16,821 | 589,576 |
| Kinder Morgan Inc | | 211,021 | 5,781,975 |
| Matador Resources Co | | 11,807 | 664,262 |
| New Fortress Energy Inc Class A (e) | | 4,218 | 63,776 |
| ONEOK Inc | | 63,514 | 6,376,806 |
| Ovintiv Inc | | 28,653 | 1,160,447 |
| Permian Resources Corp Class A | | 56,029 | 805,697 |
| Range Resources Corp | | 25,791 | 927,960 |
| Viper Energy Inc Class A | | 7,959 | 390,548 |
| Williams Cos Inc/The | | 132,472 | 7,169,385 |
| | | | 45,343,096 |
TOTAL ENERGY | | | 53,023,351 |
| | | | |
| Financials - 17.8% | | | |
| Banks - 3.4% | | | |
| Bank OZK | | 11,542 | 513,965 |
| BOK Financial Corp | | 2,468 | 262,718 |
| Citizens Financial Group Inc | | 48,643 | 2,128,618 |
| Columbia Banking System Inc | | 22,638 | 611,452 |
| Comerica Inc | | 14,428 | 892,372 |
| Commerce Bancshares Inc/MO | | 13,429 | 836,761 |
| Cullen/Frost Bankers Inc | | 6,403 | 859,603 |
| East West Bancorp Inc | | 15,006 | 1,436,975 |
| Fifth Third Bancorp | | 73,549 | 3,109,652 |
| First Citizens BancShares Inc/NC Class A | | 1,304 | 2,755,378 |
| First Hawaiian Inc | | 13,853 | 359,485 |
| First Horizon Corp | | 57,972 | 1,167,556 |
| FNB Corp/PA | | 38,714 | 572,193 |
| Huntington Bancshares Inc/OH | | 157,135 | 2,556,586 |
| KeyCorp | | 100,711 | 1,726,187 |
| M&T Bank Corp | | 18,089 | 3,400,913 |
| Pinnacle Financial Partners Inc | | 8,249 | 943,603 |
| Prosperity Bancshares Inc | | 9,770 | 736,170 |
| Regions Financial Corp | | 100,012 | 2,352,282 |
| Synovus Financial Corp | | 15,639 | 801,186 |
| TFS Financial Corp | | 5,469 | 68,690 |
| Webster Financial Corp | | 18,566 | 1,025,215 |
| Western Alliance Bancorp | | 11,686 | 976,248 |
| Wintrust Financial Corp | | 7,059 | 880,328 |
| Zions Bancorp NA | | 15,738 | 853,787 |
| | | | 31,827,923 |
| Capital Markets - 4.6% | | | |
| Affiliated Managers Group Inc | | 3,194 | 590,634 |
| Ameriprise Financial Inc | | 931 | 495,692 |
| Bank of New York Mellon Corp/The | | 80,448 | 6,180,820 |
| Carlyle Group Inc/The | | 23,819 | 1,202,621 |
| Cboe Global Markets Inc | | 11,480 | 2,243,192 |
| Coinbase Global Inc Class A (b) | | 3,526 | 875,506 |
| Evercore Inc Class A | | 3,903 | 1,081,873 |
| FactSet Research Systems Inc | | 2,673 | 1,283,788 |
| Franklin Resources Inc | | 31,000 | 628,990 |
| Houlihan Lokey Inc Class A | | 5,181 | 899,732 |
| Interactive Brokers Group Inc Class A | | 11,488 | 2,029,585 |
| Invesco Ltd | | 39,756 | 694,935 |
| Janus Henderson Group PLC | | 13,867 | 589,764 |
| Jefferies Financial Group Inc | | 13,640 | 1,069,376 |
| Lazard Inc Class A | | 757 | 38,969 |
| MarketAxess Holdings Inc | | 4,018 | 908,229 |
| MSCI Inc | | 3,483 | 2,089,835 |
| Nasdaq Inc | | 44,836 | 3,466,271 |
| Northern Trust Corp | | 21,327 | 2,186,018 |
| Raymond James Financial Inc | | 20,014 | 3,108,775 |
| Robinhood Markets Inc Class A (b) | | 73,118 | 2,724,377 |
| SEI Investments Co | | 10,874 | 896,888 |
| State Street Corp | | 31,870 | 3,128,041 |
| Stifel Financial Corp | | 10,802 | 1,145,876 |
| T Rowe Price Group Inc | | 23,872 | 2,699,684 |
| TPG Inc Class A | | 6,881 | 432,402 |
| Tradeweb Markets Inc Class A | | 7,643 | 1,000,622 |
| Virtu Financial Inc Class A | | 8,717 | 311,022 |
| | | | 44,003,517 |
| Consumer Finance - 1.2% | | | |
| Ally Financial Inc | | 25,807 | 929,310 |
| Credit Acceptance Corp (b) | | 143 | 67,133 |
| Discover Financial Services | | 27,215 | 4,714,454 |
| OneMain Holdings Inc | | 12,283 | 640,313 |
| SLM Corp | | 22,937 | 632,602 |
| SoFi Technologies Inc Class A (b) | | 96,859 | 1,491,629 |
| Synchrony Financial | | 42,316 | 2,750,540 |
| | | | 11,225,981 |
| Financial Services - 1.9% | | | |
| Affirm Holdings Inc Class A (b) | | 28,205 | 1,717,685 |
| Block Inc Class A (b) | | 34,942 | 2,969,721 |
| Corebridge Financial Inc | | 32,162 | 962,609 |
| Euronet Worldwide Inc (b) | | 4,604 | 473,475 |
| Fidelity National Information Services Inc | | 59,443 | 4,801,211 |
| Global Payments Inc | | 27,701 | 3,104,174 |
| Jack Henry & Associates Inc | | 7,891 | 1,383,292 |
| MGIC Investment Corp | | 27,999 | 663,856 |
| Rocket Cos Inc Class A (b) | | 15,133 | 170,398 |
| UWM Holdings Corp Class A | | 3,450 | 20,251 |
| Voya Financial Inc | | 10,697 | 736,275 |
| Western Union Co/The | | 30,287 | 321,042 |
| WEX Inc (b) | | 3,906 | 684,800 |
| | | | 18,008,789 |
| Insurance - 6.4% | | | |
| AFLAC Inc | | 60,740 | 6,282,946 |
| Allstate Corp/The | | 24,131 | 4,652,215 |
| American Financial Group Inc/OH | | 7,809 | 1,069,286 |
| Arch Capital Group Ltd | | 39,262 | 3,625,846 |
| Arthur J Gallagher & Co | | 24,912 | 7,071,272 |
| Assurant Inc | | 5,660 | 1,206,825 |
| Assured Guaranty Ltd | | 5,470 | 492,355 |
| Axis Capital Holdings Ltd | | 8,345 | 739,534 |
| Brighthouse Financial Inc (b) | | 6,508 | 312,644 |
| Brown & Brown Inc | | 14,548 | 1,484,187 |
| Cincinnati Financial Corp | | 16,663 | 2,394,473 |
| CNA Financial Corp | | 2,408 | 116,475 |
| Everest Group Ltd | | 3,919 | 1,420,481 |
| Fidelity National Financial Inc/US | | 28,241 | 1,585,450 |
| First American Financial Corp | | 10,874 | 678,973 |
| Globe Life Inc | | 9,662 | 1,077,506 |
| Hanover Insurance Group Inc/The | | 3,883 | 600,545 |
| Hartford Financial Services Group Inc/The | | 31,506 | 3,446,756 |
| Kemper Corp | | 6,599 | 438,438 |
| Lincoln National Corp | | 18,511 | 586,984 |
| Loews Corp | | 19,501 | 1,651,540 |
| Markel Group Inc (b) | | 1,054 | 1,819,446 |
| Old Republic International Corp | | 25,739 | 931,494 |
| Primerica Inc | | 3,666 | 995,026 |
| Principal Financial Group Inc | | 24,693 | 1,911,485 |
| Prudential Financial Inc | | 39,124 | 4,637,368 |
| Reinsurance Group of America Inc | | 7,147 | 1,526,814 |
| RLI Corp | | 4,233 | 697,725 |
| Unum Group | | 19,764 | 1,443,365 |
| W R Berkley Corp | | 31,968 | 1,870,767 |
| White Mountains Insurance Group Ltd | | 271 | 527,111 |
| Willis Towers Watson PLC | | 10,960 | 3,433,110 |
| | | | 60,728,442 |
| Mortgage Real Estate Investment Trusts (REITs) - 0.3% | | | |
| AGNC Investment Corp | | 88,566 | 815,693 |
| Annaly Capital Management Inc | | 61,012 | 1,116,520 |
| Rithm Capital Corp | | 56,452 | 611,375 |
| Starwood Property Trust Inc | | 34,051 | 645,266 |
| | | | 3,188,854 |
TOTAL FINANCIALS | | | 168,983,506 |
| | | | |
| Health Care - 8.2% | | | |
| Biotechnology - 0.9% | | | |
| Alnylam Pharmaceuticals Inc (b) | | 1,571 | 369,672 |
| Biogen Inc (b) | | 15,857 | 2,424,852 |
| BioMarin Pharmaceutical Inc (b) | | 20,550 | 1,350,752 |
| Exact Sciences Corp (b) | | 11,998 | 674,168 |
| Exelixis Inc (b) | | 5,050 | 168,165 |
| GRAIL Inc (e) | | 2,874 | 51,300 |
| Incyte Corp (b) | | 16,283 | 1,124,667 |
| Ionis Pharmaceuticals Inc (b) | | 1,185 | 41,427 |
| Roivant Sciences Ltd (b)(e) | | 46,306 | 547,800 |
| United Therapeutics Corp (b) | | 4,753 | 1,677,049 |
| | | | 8,429,852 |
| Health Care Equipment & Supplies - 2.2% | | | |
| Align Technology Inc (b) | | 3,374 | 703,513 |
| Baxter International Inc | | 55,419 | 1,616,018 |
| Cooper Cos Inc/The (b) | | 21,243 | 1,952,869 |
| DENTSPLY SIRONA Inc | | 21,975 | 417,086 |
| Enovis Corp (b) | | 6,014 | 263,893 |
| Envista Holdings Corp (b) | | 18,675 | 360,241 |
| GE HealthCare Technologies Inc | | 44,839 | 3,505,513 |
| Globus Medical Inc Class A (b) | | 12,183 | 1,007,656 |
| Hologic Inc (b) | | 24,893 | 1,794,536 |
| Masimo Corp (b) | | 2,267 | 374,735 |
| QuidelOrtho Corp (b) | | 6,761 | 301,203 |
| ResMed Inc | | 11,504 | 2,630,850 |
| Solventum Corp | | 15,085 | 996,515 |
| STERIS PLC | | 10,727 | 2,205,042 |
| Teleflex Inc | | 5,053 | 899,333 |
| Zimmer Biomet Holdings Inc | | 21,562 | 2,277,594 |
| | | | 21,306,597 |
| Health Care Providers & Services - 2.0% | | | |
| Acadia Healthcare Co Inc (b) | | 9,896 | 392,376 |
| Amedisys Inc (b) | | 3,485 | 316,403 |
| Cardinal Health Inc | | 10,761 | 1,272,703 |
| Centene Corp (b) | | 54,929 | 3,327,599 |
| Chemed Corp | | 1,451 | 768,740 |
| Encompass Health Corp | | 10,769 | 994,517 |
| Henry Schein Inc (b) | | 13,707 | 948,524 |
| Humana Inc | | 13,121 | 3,328,930 |
| Labcorp Holdings Inc | | 9,148 | 2,097,819 |
| Molina Healthcare Inc (b) | | 2,277 | 662,721 |
| Premier Inc Class A | | 10,496 | 222,515 |
| Quest Diagnostics Inc | | 12,081 | 1,822,540 |
| Tenet Healthcare Corp (b) | | 10,348 | 1,306,228 |
| Universal Health Services Inc Class B | | 6,233 | 1,118,325 |
| | | | 18,579,940 |
| Health Care Technology - 0.1% | | | |
| Certara Inc (b) | | 13,260 | 141,219 |
| Doximity Inc Class A (b) | | 12,365 | 660,167 |
| | | | 801,386 |
| Life Sciences Tools & Services - 2.5% | | | |
| 10X Genomics Inc Class A (b) | | 3,902 | 56,033 |
| Agilent Technologies Inc | | 31,256 | 4,198,932 |
| Avantor Inc (b) | | 73,801 | 1,554,987 |
| Azenta Inc (b) | | 5,248 | 262,400 |
| Bio-Rad Laboratories Inc Class A (b) | | 2,053 | 674,431 |
| Bio-Techne Corp | | 16,899 | 1,217,235 |
| Bruker Corp | | 4,356 | 255,349 |
| Charles River Laboratories International Inc (b) | | 5,556 | 1,025,638 |
| Fortrea Holdings Inc (b) | | 8,781 | 163,766 |
| Illumina Inc (b) | | 17,334 | 2,316,342 |
| IQVIA Holdings Inc (b) | | 17,399 | 3,419,078 |
| Mettler-Toledo International Inc (b) | | 2,296 | 2,809,569 |
| QIAGEN NV (United States) | | 24,316 | 1,082,791 |
| Repligen Corp (b) | | 5,194 | 747,624 |
| Revvity Inc | | 13,387 | 1,494,123 |
| Sotera Health Co (b) | | 16,380 | 224,078 |
| Waters Corp (b) | | 2,501 | 927,821 |
| West Pharmaceutical Services Inc | | 3,103 | 1,016,419 |
| | | | 23,446,616 |
| Pharmaceuticals - 0.5% | | | |
| Elanco Animal Health Inc (b) | | 53,560 | 648,612 |
| Jazz Pharmaceuticals PLC (b) | | 6,559 | 807,741 |
| Organon & Co | | 28,001 | 417,775 |
| Perrigo Co PLC | | 14,744 | 379,068 |
| Royalty Pharma PLC Class A | | 42,605 | 1,086,854 |
| Viatris Inc | | 129,163 | 1,608,079 |
| | | | 4,948,129 |
TOTAL HEALTH CARE | | | 77,512,520 |
| | | | |
| Industrials - 16.8% | | | |
| Aerospace & Defense - 1.7% | | | |
| BWX Technologies Inc | | 7,897 | 879,647 |
| Curtiss-Wright Corp | | 4,149 | 1,472,356 |
| Hexcel Corp | | 8,848 | 554,770 |
| Howmet Aerospace Inc | | 41,409 | 4,528,902 |
| Huntington Ingalls Industries Inc | | 4,244 | 801,989 |
| L3Harris Technologies Inc | | 20,612 | 4,334,291 |
| Loar Holdings Inc | | 320 | 23,651 |
| Spirit AeroSystems Holdings Inc Class A (b) | | 11,053 | 376,686 |
| Standardaero Inc (e) | | 5,101 | 126,301 |
| Textron Inc | | 20,335 | 1,555,424 |
| Woodward Inc | | 6,405 | 1,065,920 |
| | | | 15,719,937 |
| Air Freight & Logistics - 0.3% | | | |
| CH Robinson Worldwide Inc | | 12,637 | 1,305,655 |
| Expeditors International of Washington Inc | | 12,861 | 1,424,613 |
| GXO Logistics Inc (b) | | 12,748 | 554,538 |
| | | | 3,284,806 |
| Building Products - 1.2% | | | |
| A O Smith Corp | | 12,902 | 880,045 |
| Advanced Drainage Systems Inc | | 4,738 | 547,713 |
| Allegion plc | | 9,518 | 1,243,812 |
| Armstrong World Industries Inc | | 3,134 | 442,928 |
| AZEK Co Inc/The Class A (b) | | 4,689 | 222,587 |
| Builders FirstSource Inc (b) | | 11,330 | 1,619,397 |
| Carlisle Cos Inc | | 4,247 | 1,566,463 |
| Fortune Brands Innovations Inc | | 13,400 | 915,622 |
| Hayward Holdings Inc (b) | | 15,506 | 237,087 |
| Masco Corp | | 23,462 | 1,702,638 |
| Owens Corning | | 9,386 | 1,598,624 |
| Simpson Manufacturing Co Inc | | 4,180 | 693,169 |
| | | | 11,670,085 |
| Commercial Services & Supplies - 0.5% | | | |
| Clean Harbors Inc (b) | | 5,540 | 1,274,976 |
| MSA Safety Inc | | 4,026 | 667,390 |
| Tetra Tech Inc | | 22,758 | 906,679 |
| Veralto Corp | | 14,785 | 1,505,852 |
| Vestis Corp | | 14,322 | 218,267 |
| | | | 4,573,164 |
| Construction & Engineering - 1.0% | | | |
| AECOM | | 14,559 | 1,555,192 |
| API Group Corp (b) | | 24,744 | 890,042 |
| EMCOR Group Inc | | 2,997 | 1,360,338 |
| Everus Construction Group Inc | | 5,532 | 363,729 |
| MasTec Inc (b) | | 6,817 | 928,066 |
| Quanta Services Inc | | 10,971 | 3,467,386 |
| Valmont Industries Inc | | 2,166 | 664,247 |
| WillScot Holdings Corp (b) | | 13,747 | 459,837 |
| | | | 9,688,837 |
| Electrical Equipment - 1.5% | | | |
| Acuity Brands Inc | | 3,350 | 978,636 |
| AMETEK Inc | | 25,130 | 4,529,934 |
| Generac Holdings Inc (b) | | 3,262 | 505,773 |
| Hubbell Inc | | 5,827 | 2,440,872 |
| nVent Electric PLC | | 17,970 | 1,224,835 |
| Regal Rexnord Corp | | 7,222 | 1,120,349 |
| Rockwell Automation Inc | | 11,326 | 3,236,858 |
| Sensata Technologies Holding PLC | | 16,255 | 445,386 |
| | | | 14,482,643 |
| Ground Transportation - 0.5% | | | |
| Avis Budget Group Inc (e) | | 1,149 | 92,620 |
| JB Hunt Transport Services Inc | | 8,817 | 1,504,709 |
| Knight-Swift Transportation Holdings Inc | | 17,019 | 902,688 |
| Landstar System Inc | | 3,820 | 656,505 |
| Lyft Inc Class A (b) | | 12,513 | 161,418 |
| Ryder System Inc | | 4,522 | 709,321 |
| Saia Inc (b) | | 1,201 | 547,332 |
| Schneider National Inc Class B | | 5,045 | 147,718 |
| U-Haul Holding Co (b)(e) | | 498 | 34,407 |
| U-Haul Holding Co Class N | | 6,164 | 394,804 |
| | | | 5,151,522 |
| Machinery - 5.0% | | | |
| AGCO Corp | | 6,776 | 633,420 |
| Allison Transmission Holdings Inc | | 9,407 | 1,016,520 |
| CNH Industrial NV Class A | | 95,005 | 1,076,407 |
| Crane Co | | 5,321 | 807,462 |
| Cummins Inc | | 14,871 | 5,184,031 |
| Donaldson Co Inc | | 13,070 | 880,265 |
| Dover Corp | | 14,925 | 2,799,930 |
| Esab Corp | | 6,153 | 737,991 |
| Flowserve Corp | | 14,300 | 822,536 |
| Fortive Corp | | 37,746 | 2,830,950 |
| Gates Industrial Corp PLC (b) | | 25,732 | 529,307 |
| Graco Inc | | 18,204 | 1,534,415 |
| IDEX Corp | | 8,244 | 1,725,387 |
| Ingersoll Rand Inc | | 43,923 | 3,973,275 |
| ITT Inc | | 8,964 | 1,280,776 |
| Lincoln Electric Holdings Inc | | 4,326 | 810,995 |
| Middleby Corp/The (b) | | 5,789 | 784,120 |
| Nordson Corp | | 6,175 | 1,292,057 |
| Oshkosh Corp | | 7,094 | 674,427 |
| Otis Worldwide Corp | | 43,447 | 4,023,627 |
| Pentair PLC | | 17,966 | 1,808,098 |
| RBC Bearings Inc (b) | | 3,092 | 924,941 |
| Snap-on Inc | | 5,631 | 1,911,612 |
| Stanley Black & Decker Inc | | 16,723 | 1,342,690 |
| Timken Co/The | | 7,036 | 502,159 |
| Toro Co/The | | 11,168 | 894,557 |
| Westinghouse Air Brake Technologies Corp | | 18,555 | 3,517,842 |
| Xylem Inc/NY | | 26,300 | 3,051,326 |
| | | | 47,371,123 |
| Marine Transportation - 0.1% | | | |
| Kirby Corp (b) | | 6,314 | 668,021 |
| Passenger Airlines - 1.3% | | | |
| Alaska Air Group Inc (b)(e) | | 13,654 | 884,096 |
| American Airlines Group Inc (b)(e) | | 66,102 | 1,152,158 |
| Delta Air Lines Inc | | 70,112 | 4,241,776 |
| Southwest Airlines Co | | 65,020 | 2,185,972 |
| United Airlines Holdings Inc (b) | | 35,627 | 3,459,382 |
| | | | 11,923,384 |
| Professional Services - 2.3% | | | |
| Amentum Holdings Inc | | 14,154 | 297,659 |
| Broadridge Financial Solutions Inc | | 1,108 | 250,508 |
| CACI International Inc (b) | | 2,403 | 970,956 |
| Clarivate PLC (b)(e) | | 44,466 | 225,887 |
| Concentrix Corp (e) | | 5,111 | 221,153 |
| Dayforce Inc (b)(e) | | 14,649 | 1,064,103 |
| Dun & Bradstreet Holdings Inc | | 32,855 | 409,373 |
| Equifax Inc | | 10,681 | 2,722,053 |
| FTI Consulting Inc (b) | | 3,826 | 731,263 |
| Genpact Ltd | | 18,882 | 810,982 |
| Jacobs Solutions Inc | | 13,413 | 1,792,245 |
| KBR Inc | | 13,221 | 765,893 |
| Leidos Holdings Inc | | 14,477 | 2,085,557 |
| ManpowerGroup Inc | | 5,152 | 297,373 |
| Parsons Corp (b) | | 4,987 | 460,051 |
| Paychex Inc | | 22,436 | 3,145,977 |
| Paycom Software Inc | | 2,057 | 421,623 |
| Paycor HCM Inc (b) | | 8,108 | 150,566 |
| Robert Half Inc | | 11,001 | 775,130 |
| Science Applications International Corp | | 5,367 | 599,923 |
| SS&C Technologies Holdings Inc | | 23,386 | 1,772,191 |
| TransUnion | | 19,909 | 1,845,763 |
| | | | 21,816,229 |
| Trading Companies & Distributors - 1.4% | | | |
| Air Lease Corp Class A | | 11,354 | 547,376 |
| Core & Main Inc Class A (b) | | 7,169 | 364,974 |
| Fastenal Co | | 9,785 | 703,639 |
| Ferguson Enterprises Inc | | 20,542 | 3,565,475 |
| MSC Industrial Direct Co Inc Class A | | 4,982 | 372,106 |
| SiteOne Landscape Supply Inc (b) | | 3,062 | 403,480 |
| United Rentals Inc | | 5,401 | 3,804,680 |
| Watsco Inc | | 3,763 | 1,783,248 |
| Wesco International Inc | | 4,575 | 827,892 |
| WW Grainger Inc | | 621 | 654,565 |
| | | | 13,027,435 |
TOTAL INDUSTRIALS | | | 159,377,186 |
| | | | |
| Information Technology - 9.1% | | | |
| Communications Equipment - 0.5% | | | |
| Ciena Corp (b) | | 15,660 | 1,328,125 |
| F5 Inc (b) | | 6,356 | 1,598,343 |
| Juniper Networks Inc | | 35,458 | 1,327,902 |
| Lumentum Holdings Inc (b) | | 7,396 | 620,894 |
| Ubiquiti Inc | | 249 | 82,651 |
| | | | 4,957,915 |
| Electronic Equipment, Instruments & Components - 2.3% | | | |
| Arrow Electronics Inc (b) | | 5,710 | 645,915 |
| Avnet Inc | | 9,452 | 494,529 |
| CDW Corp/DE | | 7,266 | 1,264,575 |
| Cognex Corp | | 17,698 | 634,650 |
| Coherent Corp (b) | | 13,570 | 1,285,486 |
| Corning Inc | | 83,422 | 3,964,213 |
| Crane NXT Co | | 5,329 | 310,254 |
| Ingram Micro Holding Corp | | 1,449 | 28,096 |
| IPG Photonics Corp (b) | | 2,934 | 213,360 |
| Jabil Inc | | 11,037 | 1,588,224 |
| Keysight Technologies Inc (b) | | 18,963 | 3,046,027 |
| Littelfuse Inc | | 2,655 | 625,651 |
| TD SYNNEX Corp | | 8,202 | 961,931 |
| Teledyne Technologies Inc (b) | | 5,039 | 2,338,751 |
| Trimble Inc (b) | | 26,504 | 1,872,773 |
| Vontier Corp | | 16,322 | 595,263 |
| Zebra Technologies Corp Class A (b) | | 4,375 | 1,689,713 |
| | | | 21,559,411 |
| IT Services - 1.4% | | | |
| Akamai Technologies Inc (b) | | 16,199 | 1,549,434 |
| Amdocs Ltd | | 12,215 | 1,039,985 |
| Cognizant Technology Solutions Corp Class A | | 54,167 | 4,165,443 |
| DXC Technology Co (b) | | 19,431 | 388,231 |
| EPAM Systems Inc (b) | | 5,568 | 1,301,910 |
| Globant SA (b) | | 1,142 | 244,868 |
| Kyndryl Holdings Inc (b) | | 24,744 | 856,142 |
| Okta Inc Class A (b) | | 9,741 | 767,591 |
| Twilio Inc Class A (b) | | 13,351 | 1,442,976 |
| VeriSign Inc (b) | | 8,470 | 1,752,951 |
| | | | 13,509,531 |
| Semiconductors & Semiconductor Equipment - 1.7% | | | |
| Amkor Technology Inc | | 12,257 | 314,882 |
| Astera Labs Inc (b) | | 11,177 | 1,480,394 |
| Cirrus Logic Inc (b) | | 5,853 | 582,842 |
| First Solar Inc (b) | | 11,603 | 2,044,913 |
| GlobalFoundries Inc (b)(e) | | 10,695 | 458,922 |
| Lattice Semiconductor Corp (b) | | 2,013 | 114,036 |
| MACOM Technology Solutions Holdings Inc (b) | | 6,069 | 788,424 |
| Microchip Technology Inc | | 57,706 | 3,309,439 |
| MKS Instruments Inc | | 6,840 | 714,028 |
| ON Semiconductor Corp (b) | | 46,236 | 2,915,180 |
| Onto Innovation Inc (b) | | 3,961 | 660,180 |
| Qorvo Inc (b) | | 10,299 | 720,209 |
| Skyworks Solutions Inc | | 17,476 | 1,549,772 |
| Teradyne Inc | | 1,525 | 192,028 |
| Universal Display Corp | | 2,512 | 367,254 |
| Wolfspeed Inc (b)(e) | | 13,684 | 91,135 |
| | | | 16,303,638 |
| Software - 2.2% | | | |
| ANSYS Inc (b) | | 9,493 | 3,202,274 |
| Aspen Technology Inc (b) | | 2,925 | 730,168 |
| BILL Holdings Inc (b) | | 8,238 | 697,841 |
| Ccc Intelligent Solutions Holdings Inc Class A (b) | | 49,167 | 576,729 |
| Dolby Laboratories Inc Class A | | 6,357 | 496,482 |
| DoubleVerify Holdings Inc (b) | | 6,913 | 132,799 |
| Dropbox Inc Class A (b) | | 17,872 | 536,875 |
| Fair Isaac Corp (b) | | 397 | 790,399 |
| Gen Digital Inc | | 59,155 | 1,619,664 |
| Guidewire Software Inc (b) | | 4,849 | 817,444 |
| HashiCorp Inc Class A (b) | | 3,468 | 118,640 |
| Informatica Inc Class A (b) | | 8,749 | 226,862 |
| MicroStrategy Inc Class A (b)(e) | | 16,790 | 4,862,720 |
| nCino Inc (b) | | 3,504 | 117,664 |
| Nutanix Inc Class A (b) | | 19,487 | 1,192,215 |
| PTC Inc (b) | | 5,059 | 930,198 |
| SentinelOne Inc Class A (b) | | 25,506 | 566,233 |
| Tyler Technologies Inc (b) | | 692 | 399,035 |
| UiPath Inc Class A (b) | | 6,731 | 85,550 |
| Unity Software Inc (b) | | 18,330 | 411,875 |
| Zoom Communications Inc Class A (b) | | 28,692 | 2,341,554 |
| | | | 20,853,221 |
| Technology Hardware, Storage & Peripherals - 1.0% | | | |
| Hewlett Packard Enterprise Co | | 141,210 | 3,014,834 |
| HP Inc | | 79,461 | 2,592,812 |
| NetApp Inc | | 12,371 | 1,436,026 |
| Pure Storage Inc Class A (b) | | 4,306 | 264,517 |
| Western Digital Corp (b) | | 37,595 | 2,241,790 |
| | | | 9,549,979 |
TOTAL INFORMATION TECHNOLOGY | | | 86,733,695 |
| | | | |
| Materials - 6.7% | | | |
| Chemicals - 3.1% | | | |
| Albemarle Corp | | 12,760 | 1,098,381 |
| Ashland Inc | | 5,301 | 378,809 |
| Axalta Coating Systems Ltd (b) | | 23,661 | 809,679 |
| Celanese Corp | | 8,837 | 611,609 |
| CF Industries Holdings Inc | | 18,884 | 1,611,183 |
| Chemours Co/The | | 15,028 | 253,973 |
| Corteva Inc | | 76,137 | 4,336,765 |
| Dow Inc | | 76,597 | 3,073,838 |
| DuPont de Nemours Inc | | 45,520 | 3,470,900 |
| Eastman Chemical Co | | 12,725 | 1,162,047 |
| Element Solutions Inc | | 24,343 | 619,042 |
| FMC Corp | | 13,555 | 658,909 |
| Huntsman Corp | | 17,764 | 320,285 |
| International Flavors & Fragrances Inc | | 27,829 | 2,352,942 |
| LyondellBasell Industries NV Class A1 | | 28,335 | 2,104,440 |
| Mosaic Co/The | | 34,807 | 855,556 |
| NewMarket Corp | | 732 | 386,752 |
| Olin Corp | | 12,781 | 431,998 |
| PPG Industries Inc | | 25,165 | 3,005,959 |
| RPM International Inc | | 10,706 | 1,317,480 |
| Scotts Miracle-Gro Co/The | | 4,639 | 307,751 |
| Westlake Corp | | 3,647 | 418,129 |
| | | | 29,586,427 |
| Construction Materials - 0.7% | | | |
| Eagle Materials Inc | | 884 | 218,135 |
| Martin Marietta Materials Inc | | 6,298 | 3,252,917 |
| Vulcan Materials Co | | 10,685 | 2,748,503 |
| | | | 6,219,555 |
| Containers & Packaging - 1.8% | | | |
| Amcor PLC | | 156,521 | 1,472,863 |
| AptarGroup Inc | | 7,185 | 1,128,764 |
| Avery Dennison Corp | | 5,431 | 1,016,303 |
| Ball Corp | | 32,122 | 1,770,886 |
| Berry Global Group Inc | | 12,464 | 806,047 |
| Crown Holdings Inc | | 12,722 | 1,051,982 |
| Graphic Packaging Holding CO | | 32,312 | 877,594 |
| International Paper Co | | 37,699 | 2,028,960 |
| Packaging Corp of America | | 9,649 | 2,172,279 |
| Sealed Air Corp | | 14,970 | 506,435 |
| Silgan Holdings Inc | | 9,022 | 469,595 |
| Smurfit WestRock PLC | | 56,255 | 3,029,894 |
| Sonoco Products Co | | 10,659 | 520,692 |
| | | | 16,852,294 |
| Metals & Mining - 1.1% | | | |
| Alcoa Corp | | 26,829 | 1,013,600 |
| ATI Inc (b) | | 13,428 | 739,077 |
| Cleveland-Cliffs Inc (b) | | 35,328 | 332,083 |
| MP Materials Corp (b)(e) | | 14,300 | 223,080 |
| Nucor Corp | | 25,802 | 3,011,351 |
| Reliance Inc | | 5,857 | 1,577,056 |
| Royal Gold Inc | | 7,147 | 942,332 |
| Steel Dynamics Inc | | 15,801 | 1,802,420 |
| United States Steel Corp | | 24,247 | 824,156 |
| | | | 10,465,155 |
| Paper & Forest Products - 0.0% | | | |
| Louisiana-Pacific Corp | | 2,055 | 212,795 |
TOTAL MATERIALS | | | 63,336,226 |
| | | | |
| Real Estate - 9.8% | | | |
| Diversified REITs - 0.1% | | | |
| WP Carey Inc | | 23,593 | 1,285,346 |
| Health Care REITs - 0.9% | | | |
| Alexandria Real Estate Equities Inc | | 18,853 | 1,839,110 |
| Healthcare Realty Trust Inc | | 38,433 | 651,439 |
| Healthpeak Properties Inc | | 76,036 | 1,541,250 |
| Medical Properties Trust Inc (e) | | 64,549 | 254,969 |
| Omega Healthcare Investors Inc | | 29,366 | 1,111,503 |
| Ventas Inc | | 45,567 | 2,683,441 |
| | | | 8,081,712 |
| Hotel & Resort REITs - 0.2% | | | |
| Host Hotels & Resorts Inc | | 75,841 | 1,328,735 |
| Park Hotels & Resorts Inc | | 22,149 | 311,636 |
| | | | 1,640,371 |
| Industrial REITs - 0.4% | | | |
| Americold Realty Trust Inc | | 30,935 | 662,009 |
| EastGroup Properties Inc | | 5,346 | 857,980 |
| First Industrial Realty Trust Inc | | 14,375 | 720,619 |
| Lineage Inc | | 6,691 | 391,891 |
| Rexford Industrial Realty Inc | | 23,954 | 926,062 |
| STAG Industrial Inc Class A | | 19,703 | 666,355 |
| | | | 4,224,916 |
| Office REITs - 0.4% | | | |
| BXP Inc | | 17,090 | 1,270,812 |
| Cousins Properties Inc | | 17,527 | 537,027 |
| Highwoods Properties Inc | | 11,341 | 346,808 |
| Kilroy Realty Corp | | 12,717 | 514,403 |
| Vornado Realty Trust | | 19,050 | 800,862 |
| | | | 3,469,912 |
| Real Estate Management & Development - 1.1% | | | |
| CBRE Group Inc Class A (b) | | 33,293 | 4,371,038 |
| CoStar Group Inc (b) | | 44,172 | 3,162,273 |
| Howard Hughes Holdings Inc (b) | | 3,369 | 259,143 |
| Jones Lang LaSalle Inc (b) | | 3,548 | 898,141 |
| Seaport Entertainment Group Inc (e) | | 839 | 23,450 |
| Zillow Group Inc Class A (b) | | 4,944 | 350,282 |
| Zillow Group Inc Class C (b) | | 16,963 | 1,256,111 |
| | | | 10,320,438 |
| Residential REITs - 2.1% | | | |
| American Homes 4 Rent Class A | | 36,753 | 1,375,297 |
| AvalonBay Communities Inc | | 15,445 | 3,397,437 |
| Camden Property Trust | | 11,263 | 1,306,959 |
| Equity LifeStyle Properties Inc | | 20,547 | 1,368,430 |
| Equity Residential | | 41,125 | 2,951,130 |
| Essex Property Trust Inc | | 6,949 | 1,983,523 |
| Invitation Homes Inc | | 66,611 | 2,129,554 |
| Mid-America Apartment Communities Inc | | 12,642 | 1,954,074 |
| Sun Communities Inc | | 13,422 | 1,650,503 |
| UDR Inc | | 35,740 | 1,551,473 |
| | | | 19,668,380 |
| Retail REITs - 1.7% | | | |
| Agree Realty Corp | | 11,637 | 819,827 |
| Brixmor Property Group Inc | | 32,635 | 908,558 |
| Federal Realty Investment Trust | | 9,194 | 1,029,268 |
| Kimco Realty Corp | | 71,726 | 1,680,540 |
| NNN REIT Inc | | 20,320 | 830,072 |
| Realty Income Corp | | 94,888 | 5,067,968 |
| Regency Centers Corp | | 19,661 | 1,453,538 |
| Simon Property Group Inc | | 26,204 | 4,512,591 |
| | | | 16,302,362 |
| Specialized REITs - 2.9% | | | |
| Crown Castle Inc | | 47,323 | 4,295,035 |
| CubeSmart | | 24,351 | 1,043,440 |
| Digital Realty Trust Inc | | 36,069 | 6,396,117 |
| EPR Properties | | 8,131 | 360,041 |
| Extra Space Storage Inc | | 22,764 | 3,405,494 |
| Gaming and Leisure Properties Inc | | 28,370 | 1,366,299 |
| Iron Mountain Inc | | 13,590 | 1,428,445 |
| Lamar Advertising Co Class A | | 7,092 | 863,380 |
| National Storage Affiliates Trust | | 7,596 | 287,964 |
| Rayonier Inc | | 15,988 | 417,287 |
| SBA Communications Corp Class A | | 11,679 | 2,380,180 |
| VICI Properties Inc | | 113,525 | 3,316,065 |
| Weyerhaeuser Co | | 79,345 | 2,233,562 |
| | | | 27,793,309 |
TOTAL REAL ESTATE | | | 92,786,746 |
| | | | |
| Utilities - 6.9% | | | |
| Electric Utilities - 3.6% | | | |
| Alliant Energy Corp | | 27,888 | 1,649,296 |
| Edison International | | 41,404 | 3,305,695 |
| Entergy Corp | | 46,403 | 3,518,275 |
| Evergy Inc | | 24,246 | 1,492,341 |
| Eversource Energy | | 38,947 | 2,236,726 |
| Exelon Corp | | 108,928 | 4,100,050 |
| FirstEnergy Corp | | 62,684 | 2,493,570 |
| IDACORP Inc | | 5,783 | 631,966 |
| NRG Energy Inc | | 13,215 | 1,192,257 |
| OGE Energy Corp | | 21,760 | 897,600 |
| PG&E Corp | | 232,666 | 4,695,201 |
| Pinnacle West Capital Corp | | 12,356 | 1,047,418 |
| PPL Corp | | 80,379 | 2,609,102 |
| Xcel Energy Inc | | 62,565 | 4,224,390 |
| | | | 34,093,887 |
| Gas Utilities - 0.4% | | | |
| Atmos Energy Corp | | 16,852 | 2,346,978 |
| MDU Resources Group Inc | | 22,090 | 398,062 |
| National Fuel Gas Co | | 9,912 | 601,460 |
| UGI Corp | | 23,387 | 660,215 |
| | | | 4,006,715 |
| Independent Power and Renewable Electricity Producers - 0.1% | | | |
| AES Corp/The | | 77,155 | 992,985 |
| Clearway Energy Inc Class A | | 3,803 | 92,982 |
| Clearway Energy Inc Class C | | 8,876 | 230,776 |
| | | | 1,316,743 |
| Multi-Utilities - 2.4% | | | |
| Ameren Corp | | 28,960 | 2,581,494 |
| CenterPoint Energy Inc | | 70,227 | 2,228,303 |
| CMS Energy Corp | | 32,394 | 2,159,060 |
| Consolidated Edison Inc | | 37,695 | 3,363,525 |
| DTE Energy Co | | 22,501 | 2,716,996 |
| NiSource Inc | | 50,833 | 1,868,621 |
| Public Service Enterprise Group Inc | | 54,273 | 4,585,526 |
| WEC Energy Group Inc | | 34,425 | 3,237,327 |
| | | | 22,740,852 |
| Water Utilities - 0.4% | | | |
| American Water Works Co Inc | | 21,228 | 2,642,674 |
| Essential Utilities Inc | | 27,406 | 995,386 |
| | | | 3,638,060 |
TOTAL UTILITIES | | | 65,796,257 |
| | | | |
| TOTAL UNITED STATES | | | 938,678,268 |
| TOTAL COMMON STOCKS (Cost $730,283,951) | | | 947,436,633 |
| | | | |
| U.S. Treasury Obligations - 0.0% |
| | | Yield (%) (f) | Principal Amount (a) | Value ($) |
US Treasury Bills 0% 2/20/2025 (g) (Cost $170,945) | | 4.46 | 172,000 | 171,022 |
| | | | | |
| Money Market Funds - 1.8% |
| | | Yield (%) | Shares | Value ($) |
| Fidelity Cash Central Fund (h) | | 4.36 | 1,799,087 | 1,799,446 |
| Fidelity Securities Lending Cash Central Fund (h)(i) | | 4.35 | 15,963,479 | 15,965,075 |
| TOTAL MONEY MARKET FUNDS (Cost $17,764,521) | | | | 17,764,521 |
| | | | | |
| TOTAL INVESTMENT IN SECURITIES - 101.6% (Cost $748,219,417) | 965,372,176 |
NET OTHER ASSETS (LIABILITIES) - (1.6)% | (15,594,485) |
| NET ASSETS - 100.0% | 949,777,691 |
| | |
| Futures Contracts |
| | Number of contracts | Expiration Date | Notional Amount ($) | Value ($) | Unrealized Appreciation/ (Depreciation) ($) |
| Purchased | | | | | |
| | | | | | |
| Equity Contracts | | | | | |
| CME E-mini S&P MidCap 400 Index Contracts (United States) | 6 | Mar 2025 | 1,888,020 | 4,332 | 4,332 |
| | | | | | |
| The notional amount of futures purchased as a percentage of Net Assets is 0.2% |
Legend
| (a) | Amount is stated in United States dollars unless otherwise noted. |
| (c) | Restricted securities (including private placements) - Investment in securities not registered under the Securities Act of 1933 (excluding 144A issues). At the end of the period, the value of restricted securities (excluding 144A issues) amounted to $0 or 0.0% of net assets. |
| (e) | Security or a portion of the security is on loan at period end. |
| (f) | Yield represents either the annualized yield at the date of purchase, or the stated coupon rate, or, for floating and adjustable rate securities, the rate at period end. |
| (g) | Security or a portion of the security was pledged to cover margin requirements for futures contracts. At period end, the value of securities pledged amounted to $158,096. |
| (h) | Affiliated fund that is generally available only to investment companies and other accounts managed by Fidelity Investments. The rate quoted is the annualized seven-day yield of the fund at period end. A complete unaudited listing of the fund's holdings as of its most recent quarter end is available upon request. In addition, each Fidelity Central Fund's financial statements are available on the SEC's website or upon request. |
| (i) | Investment made with cash collateral received from securities on loan. |
| Additional information on each restricted holding is as follows: |
| Security | Acquisition Date | Acquisition Cost ($) |
| GCI Liberty Inc Class A | 5/23/23 | 0 |
| | | |
Affiliated Central Funds
Fiscal year to date information regarding the Fund's investments in Fidelity Central Funds, including the ownership percentage, is presented below.
| Affiliate | Value, beginning of period ($) | Purchases ($) | Sales Proceeds ($) | Dividend Income ($) | Realized Gain (loss) ($) | Change in Unrealized appreciation (depreciation) ($) | Value, end of period ($) | Shares, end of period | % ownership, end of period |
| Fidelity Cash Central Fund | 1,855,884 | 83,327,196 | 83,383,625 | 50,909 | (9) | - | 1,799,446 | 1,799,087 | 0.0% |
| Fidelity Securities Lending Cash Central Fund | 9,733,032 | 59,658,202 | 53,426,159 | 77,107 | - | - | 15,965,075 | 15,963,479 | 0.1% |
| Total | 11,588,916 | 142,985,398 | 136,809,784 | 128,016 | (9) | - | 17,764,521 | 17,762,566 | |
| | | | | | | | | | |
Amounts in the dividend income column in the above table include any capital gain distributions from underlying funds, which are presented in the corresponding line item in the Statement of Operations, if applicable.
Amounts in the dividend income column for Fidelity Securities Lending Cash Central Fund represents the income earned on investing cash collateral, less rebates paid to borrowers and any lending agent fees associated with the loan, plus any premium payments received for lending certain types of securities.
Amounts included in the purchases and sales proceeds columns may include in-kind transactions, if applicable.
Investment Valuation
The following is a summary of the inputs used, as of December 31, 2024, involving the Fund's assets and liabilities carried at fair value. The inputs or methodology used for valuing securities may not be an indication of the risk associated with investing in those securities. For more information on valuation inputs, and their aggregation into the levels used below, please refer to the Investment Valuation section in the accompanying Notes to Financial Statements.
| Valuation Inputs at Reporting Date: |
| Description | Total ($) | Level 1 ($) | Level 2 ($) | Level 3 ($) |
Investments in Securities: | | | | |
|
| Common Stocks | | | | |
Communication Services | 31,437,631 | 31,437,631 | - | - |
Consumer Discretionary | 87,918,345 | 87,918,345 | - | - |
Consumer Staples | 54,185,903 | 54,185,903 | - | - |
Energy | 54,356,472 | 54,356,472 | - | - |
Financials | 171,499,728 | 171,499,728 | - | - |
Health Care | 77,512,520 | 77,512,520 | - | - |
Industrials | 161,174,620 | 161,174,620 | - | - |
Information Technology | 87,025,832 | 87,025,832 | - | - |
Materials | 63,336,226 | 63,336,226 | - | - |
Real Estate | 92,786,746 | 92,786,746 | - | - |
Utilities | 66,202,610 | 66,202,610 | - | - |
|
| U.S. Treasury Obligations | 171,022 | - | 171,022 | - |
|
| Money Market Funds | 17,764,521 | 17,764,521 | - | - |
| Total Investments in Securities: | 965,372,176 | 965,201,154 | 171,022 | - |
Derivative Instruments: Assets | | | | |
Futures Contracts | 4,332 | 4,332 | - | - |
| Total Assets | 4,332 | 4,332 | - | - |
| Total Derivative Instruments: | 4,332 | 4,332 | - | - |
Value of Derivative Instruments
The following table is a summary of the Fund's value of derivative instruments by primary risk exposure as of December 31, 2024. For additional information on derivative instruments, please refer to the Derivative Instruments section in the accompanying Notes to Financial Statements.
Primary Risk Exposure / Derivative Type | Value |
| Asset ($) | Liability ($) |
| Equity Risk | | |
Futures Contracts (a) | 4,332 | 0 |
| Total Equity Risk | 4,332 | 0 |
| Total Value of Derivatives | 4,332 | 0 |
(a)Reflects gross cumulative appreciation (depreciation) on futures contracts as presented in the Schedule of Investments. In the Statement of Assets and Liabilities, the period end daily variation margin is included in receivable or payable for daily variation margin on futures contracts, and the net cumulative appreciation (depreciation) is included in Total accumulated earnings (loss).
Fidelity® Mid Cap Value Index Fund
Financial Statements (Unaudited)
| Statement of Assets and Liabilities |
| As of December 31, 2024 (Unaudited) |
| Assets | | | | |
| Investment in securities, at value (including securities loaned of $15,289,583) - See accompanying schedule: | | | | |
Unaffiliated issuers (cost $730,454,896) | $ | 947,607,655 | | |
Fidelity Central Funds (cost $17,764,521) | | 17,764,521 | | |
| | | | | |
| | | | | |
| Total Investment in Securities (cost $748,219,417) | | | $ | 965,372,176 |
| Cash | | | | 48 |
| Receivable for fund shares sold | | | | 1,019,636 |
| Dividends receivable | | | | 1,098,276 |
| Distributions receivable from Fidelity Central Funds | | | | 9,632 |
| Receivable for daily variation margin on futures contracts | | | | 5,441 |
| Other receivables | | | | 12,438 |
Total assets | | | | 967,517,647 |
| Liabilities | | | | |
| Payable for fund shares redeemed | $ | 1,733,217 | | |
| Accrued management fee | | 40,862 | | |
| Other payables and accrued expenses | | 802 | | |
| Collateral on securities loaned | | 15,965,075 | | |
| Total liabilities | | | | 17,739,956 |
| Net Assets | | | $ | 949,777,691 |
| Net Assets consist of: | | | | |
| Paid in capital | | | $ | 737,660,073 |
| Total accumulated earnings (loss) | | | | 212,117,618 |
| Net Assets | | | $ | 949,777,691 |
Net Asset Value, offering price and redemption price per share ($949,777,691 ÷ 34,977,358 shares) | | | $ | 27.15 |
| Statement of Operations |
Six months ended December 31, 2024 (Unaudited) |
| Investment Income | | | | |
| Dividends | | | $ | 8,475,276 |
| Interest | | | | 4,735 |
| Income from Fidelity Central Funds (including $77,107 from security lending) | | | | 128,016 |
| Total income | | | | 8,608,027 |
| Expenses | | | | |
| Management fee | $ | 228,712 | | |
| Independent trustees' fees and expenses | | 1,124 | | |
| Interest | | 3,530 | | |
| Total expenses before reductions | | 233,366 | | |
| Expense reductions | | (250) | | |
| Total expenses after reductions | | | | 233,116 |
| Net Investment income (loss) | | | | 8,374,911 |
| Realized and Unrealized Gain (Loss) | | | | |
| Net realized gain (loss) on: | | | | |
| Investment Securities: | | | | |
| Unaffiliated issuers | | 1,808,244 | | |
| Redemptions in-kind | | 1,935,119 | | |
| Fidelity Central Funds | | (9) | | |
| Futures contracts | | 245,369 | | |
| Total net realized gain (loss) | | | | 3,988,723 |
| Change in net unrealized appreciation (depreciation) on: | | | | |
| Investment Securities: | | | | |
| Unaffiliated issuers | | 52,794,216 | | |
| Futures contracts | | 4,332 | | |
| Total change in net unrealized appreciation (depreciation) | | | | 52,798,548 |
| Net gain (loss) | | | | 56,787,271 |
| Net increase (decrease) in net assets resulting from operations | | | $ | 65,162,182 |
| Statement of Changes in Net Assets |
| |
| | Six months ended December 31, 2024 (Unaudited) | | Year ended June 30, 2024 |
| Increase (Decrease) in Net Assets | | | | |
| Operations | | | | |
| Net investment income (loss) | $ | 8,374,911 | $ | 16,868,326 |
| Net realized gain (loss) | | 3,988,723 | | 52,510,040 |
| Change in net unrealized appreciation (depreciation) | | 52,798,548 | | 24,212,717 |
| Net increase (decrease) in net assets resulting from operations | | 65,162,182 | | 93,591,083 |
| Distributions to shareholders | | (39,898,493) | | (16,377,481) |
| | | | | |
| Share transactions | | | | |
| Proceeds from sales of shares | | 202,655,798 | | 311,731,686 |
| Reinvestment of distributions | | 20,715,309 | | 6,481,804 |
| Cost of shares redeemed | | (153,102,964) | | (387,519,440) |
| | | | | |
Net increase (decrease) in net assets resulting from share transactions | | 70,268,143 | | (69,305,950) |
| Total increase (decrease) in net assets | | 95,531,832 | | 7,907,652 |
| | | | | |
| Net Assets | | | | |
| Beginning of period | | 854,245,859 | | 846,338,207 |
| End of period | $ | 949,777,691 | $ | 854,245,859 |
| | | | | |
| Other Information | | | | |
| Shares | | | | |
| Sold | | 7,278,422 | | 12,544,889 |
| Issued in reinvestment of distributions | | 789,487 | | 264,647 |
| Redeemed | | (5,597,666) | | (15,670,880) |
| Net increase (decrease) | | 2,470,243 | | (2,861,344) |
| | | | | |
Financial Highlights
Fidelity® Mid Cap Value Index Fund |
| |
| | Six months ended (Unaudited) December 31, 2024 | | Years ended June 30, 2024 | | 2023 | | 2022 | | 2021 | | 2020 A |
Selected Per-Share Data | | | | | | | | | | | | |
| Net asset value, beginning of period | $ | 26.28 | $ | 23.93 | $ | 22.23 | $ | 26.19 | $ | 17.36 | $ | 20.00 |
| Income from Investment Operations | | | | | | | | | | | | |
Net investment income (loss) B,C | | .25 | | .49 | | .50 | | .43 | | .41 | | .46 |
| Net realized and unrealized gain (loss) | | 1.83 | | 2.34 | | 1.82 | | (2.90) | | 8.69 | | (2.97) |
| Total from investment operations | | 2.08 | | 2.83 | | 2.32 | | (2.47) | | 9.10 | | (2.51) |
| Distributions from net investment income | | (.48) | | (.48) | | (.45) | | (.39) | | (.27) | | (.13) |
| Distributions from net realized gain | | (.72) | | - | | (.17) | | (1.11) | | - | | - |
| Total distributions | | (1.21) D | | (.48) | | (.62) | | (1.49) D | | (.27) | | (.13) |
| Net asset value, end of period | $ | 27.15 | $ | 26.28 | $ | 23.93 | $ | 22.23 | $ | 26.19 | $ | 17.36 |
Total Return E,F | | | | 11.96% | | 10.56% | | (10.08)% | | 52.83% | | (12.65)% |
Ratios to Average Net Assets C,G,H | | | | | | | | | | | | |
| Expenses before reductions | | .05% I | | .06% | | .05% | | .05% | | .05% | | .05% I |
| Expenses net of fee waivers, if any | | | | .06% | | .05% | | .05% | | .05% | | .05% I |
| Expenses net of all reductions | | .05% I | | .06% | | .05% | | .05% | | .05% | | .05% I |
| Net investment income (loss) | | 1.83% I | | 1.98% | | 2.17% | | 1.70% | | 1.80% | | 2.82% I |
| Supplemental Data | | | | | | | | | | | | |
| Net assets, end of period (000 omitted) | $ | 949,778 | $ | 854,246 | $ | 846,338 | $ | 797,093 | $ | 908,686 | $ | 249,744 |
Portfolio turnover rate J | | | | 38% K | | 30% | | 41% | | 32% | | 89% I |
AFor the period July 11, 2019 (commencement of operations) through June 30, 2020.
BCalculated based on average shares outstanding during the period.
CNet investment income (loss) is affected by the timing of the declaration of dividends by any underlying mutual funds or exchange-traded funds (ETFs). Net investment income (loss) of any mutual funds or ETFs is not included in the Fund's net investment income (loss) ratio.
DTotal distributions per share do not sum due to rounding.
ETotal returns for periods of less than one year are not annualized.
FTotal returns would have been lower if certain expenses had not been reduced during the applicable periods shown.
GFees and expenses of any underlying mutual funds or exchange-traded funds (ETFs) are not included in the Fund's expense ratio. The Fund indirectly bears its proportionate share of these expenses. For additional expense information related to investments in Fidelity Central Funds, please refer to the "Investments in Fidelity Central Funds" note found in the Notes to Financial Statements section of the most recent Annual or Semi-Annual report.
HExpense ratios reflect operating expenses of the class. Expenses before reductions do not reflect amounts reimbursed, waived, or reduced through arrangements with the investment adviser, brokerage services, or other offset arrangements, if applicable, and do not represent the amount paid by the class during periods when reimbursements, waivers or reductions occur.
IAnnualized.
JAmount does not include the portfolio activity of any underlying mutual funds or exchange-traded funds (ETFs), derivatives or securities that mature within one year from acquisition.
KPortfolio turnover rate excludes securities received or delivered in-kind.
Fidelity® Small Cap Growth Index Fund
Schedule of Investments December 31, 2024 (Unaudited)
Showing Percentage of Net Assets
| Common Stocks - 99.8% |
| | | Shares | Value ($) |
| ARGENTINA - 0.0% | | | |
| Consumer Discretionary - 0.0% | | | |
| Hotels, Restaurants & Leisure - 0.0% | | | |
| Despegar.com Corp (b) | | 5,224 | 100,562 |
| AUSTRALIA - 0.0% | | | |
| Materials - 0.0% | | | |
| Metals & Mining - 0.0% | | | |
| MAC Copper Ltd Class A (b) | | 9,073 | 96,355 |
| AUSTRIA - 0.0% | | | |
| Materials - 0.0% | | | |
| Metals & Mining - 0.0% | | | |
| Critical Metals Corp | | 4,960 | 33,678 |
| BAHAMAS (NASSAU) - 0.1% | | | |
| Consumer Discretionary - 0.1% | | | |
| Diversified Consumer Services - 0.1% | | | |
| OneSpaWorld Holdings Ltd | | 61,217 | 1,218,218 |
| BAILIWICK OF GUERNSEY - 0.1% | | | |
| Consumer Discretionary - 0.1% | | | |
| Hotels, Restaurants & Leisure - 0.1% | | | |
| Super Group SGHC Ltd | | 91,296 | 568,774 |
| BERMUDA - 0.0% | | | |
| Industrials - 0.0% | | | |
| Marine Transportation - 0.0% | | | |
| Himalaya Shipping Ltd (United States) | | 16,973 | 82,489 |
| BRAZIL - 0.1% | | | |
| Financials - 0.1% | | | |
| Financial Services - 0.1% | | | |
| Pagseguro Digital Ltd Class A (b) | | 60,078 | 376,088 |
| StoneCo Ltd Class A (b) | | 90,628 | 722,305 |
| | | | |
| TOTAL BRAZIL | | | 1,098,393 |
| CANADA - 0.3% | | | |
| Consumer Staples - 0.1% | | | |
| Food Products - 0.1% | | | |
| Sunopta Inc (United States) (b) | | 57,497 | 442,727 |
| Energy - 0.0% | | | |
| Oil, Gas & Consumable Fuels - 0.0% | | | |
| Encore Energy Corp (United States) (b)(c) | | 81,126 | 276,640 |
| Financials - 0.0% | | | |
| Insurance - 0.0% | | | |
| Kingsway Financial Services Inc (b) | | 7,802 | 65,303 |
| Health Care - 0.2% | | | |
| Biotechnology - 0.2% | | | |
| Aurinia Pharmaceuticals Inc (b) | | 59,838 | 537,346 |
| Fennec Pharmaceuticals Inc (United States) (b)(c) | | 3,120 | 19,718 |
| | | | 557,064 |
| Information Technology - 0.0% | | | |
| Software - 0.0% | | | |
| D-Wave Quantum Inc (b)(c) | | 32,716 | 274,814 |
| Real Estate - 0.0% | | | |
| Real Estate Management & Development - 0.0% | | | |
| Real Brokerage Inc/The (b) | | 61,213 | 281,580 |
| TOTAL CANADA | | | 1,898,128 |
| CHINA - 0.0% | | | |
| Information Technology - 0.0% | | | |
| Semiconductors & Semiconductor Equipment - 0.0% | | | |
| indie Semiconductor Inc Class A (b)(c) | | 30,946 | 125,331 |
| GERMANY - 0.1% | | | |
| Materials - 0.1% | | | |
| Chemicals - 0.1% | | | |
| Orion SA | | 35,084 | 553,976 |
| GHANA - 0.1% | | | |
| Energy - 0.1% | | | |
| Oil, Gas & Consumable Fuels - 0.1% | | | |
| Kosmos Energy Ltd (b) | | 285,077 | 974,963 |
| GIBRALTAR - 0.0% | | | |
| Consumer Staples - 0.0% | | | |
| Food Products - 0.0% | | | |
| Forafric Global PLC (b)(c) | | 3,368 | 34,522 |
| GRAND CAYMAN (UK OVERSEAS TER) - 0.0% | | | |
| Financials - 0.0% | | | |
| Capital Markets - 0.0% | | | |
| Patria Investments Ltd Class A | | 34,032 | 395,792 |
| HONG KONG - 0.0% | | | |
| Consumer Discretionary - 0.0% | | | |
| Distributors - 0.0% | | | |
| GigaCloud Technology Inc Class A (b)(c) | | 14,468 | 267,947 |
| INDIA - 0.1% | | | |
| Industrials - 0.1% | | | |
| Professional Services - 0.1% | | | |
| WNS Holdings Ltd ADR | | 26,160 | 1,239,722 |
| IRELAND - 0.1% | | | |
| Health Care - 0.0% | | | |
| Biotechnology - 0.0% | | | |
| Prothena Corp PLC (b) | | 15,099 | 209,121 |
| Industrials - 0.1% | | | |
| Commercial Services & Supplies - 0.1% | | | |
| Cimpress PLC (b) | | 7,061 | 506,415 |
| TOTAL IRELAND | | | 715,536 |
| ISRAEL - 0.1% | | | |
| Communication Services - 0.0% | | | |
| Media - 0.0% | | | |
| Innovid Corp Class A (b) | | 7,552 | 23,336 |
| Health Care - 0.0% | | | |
| Health Care Providers & Services - 0.0% | | | |
| Nano-X Imaging Ltd (b)(c) | | 31,704 | 228,269 |
| Pharmaceuticals - 0.0% | | | |
| MediWound Ltd (b)(c) | | 4,784 | 85,155 |
| Information Technology - 0.1% | | | |
| Software - 0.1% | | | |
| Sapiens International Corp NV | | 18,776 | 504,511 |
| TOTAL ISRAEL | | | 841,271 |
| KOREA (SOUTH) - 0.0% | | | |
| Communication Services - 0.0% | | | |
| Interactive Media & Services - 0.0% | | | |
| Webtoon Entertainment Inc | | 4,191 | 56,914 |
| Health Care - 0.0% | | | |
| Biotechnology - 0.0% | | | |
| Artiva Biotherapeutics Inc (b)(c) | | 5,051 | 50,914 |
| TOTAL KOREA (SOUTH) | | | 107,828 |
| MALTA - 0.0% | | | |
| Communication Services - 0.0% | | | |
| Media - 0.0% | | | |
| Gambling.com Group Ltd (b) | | 10,603 | 149,290 |
| MONACO - 0.0% | | | |
| Industrials - 0.0% | | | |
| Marine Transportation - 0.0% | | | |
| Costamare Inc | | 1,835 | 23,580 |
| NORWAY - 0.1% | | | |
| Energy - 0.1% | | | |
| Energy Equipment & Services - 0.1% | | | |
| Seadrill Ltd (b) | | 12,475 | 485,652 |
| Oil, Gas & Consumable Fuels - 0.0% | | | |
| FLEX LNG Ltd (United States) | | 11,108 | 254,818 |
| SFL Corp Ltd | | 16,684 | 170,510 |
| | | | 425,328 |
| TOTAL NORWAY | | | 910,980 |
| PUERTO RICO - 0.2% | | | |
| Financials - 0.2% | | | |
| Banks - 0.0% | | | |
| First BanCorp/Puerto Rico | | 7,758 | 144,221 |
| Financial Services - 0.2% | | | |
| EVERTEC Inc | | 39,288 | 1,356,615 |
| TOTAL PUERTO RICO | | | 1,500,836 |
| SINGAPORE - 0.3% | | | |
| Communication Services - 0.0% | | | |
| Interactive Media & Services - 0.0% | | | |
| Grindr Inc Class A (b) | | 14,964 | 266,958 |
| Health Care - 0.0% | | | |
| Pharmaceuticals - 0.0% | | | |
| Scilex Holding Co (b)(d) | | 2,699 | 921 |
| Information Technology - 0.3% | | | |
| Semiconductors & Semiconductor Equipment - 0.3% | | | |
| Kulicke & Soffa Industries Inc | | 32,323 | 1,508,191 |
| TOTAL SINGAPORE | | | 1,776,070 |
| SWEDEN - 0.0% | | | |
| Financials - 0.0% | | | |
| Insurance - 0.0% | | | |
| SiriusPoint Ltd (b) | | 4,980 | 81,622 |
| SWITZERLAND - 0.0% | | | |
| Health Care - 0.0% | | | |
| Biotechnology - 0.0% | | | |
| ADC Therapeutics SA (b) | | 30,044 | 59,788 |
| THAILAND - 0.7% | | | |
| Energy - 0.0% | | | |
| Oil, Gas & Consumable Fuels - 0.0% | | | |
| BKV Corp (b) | | 1,916 | 45,563 |
| Information Technology - 0.7% | | | |
| Electronic Equipment, Instruments & Components - 0.7% | | | |
| Fabrinet (b) | | 22,213 | 4,884,195 |
| TOTAL THAILAND | | | 4,929,758 |
| UNITED KINGDOM - 0.0% | | | |
| Health Care - 0.0% | | | |
| Biotechnology - 0.0% | | | |
| Zura Bio Ltd Class A (b)(c) | | 30,064 | 75,160 |
| UNITED STATES - 97.4% | | | |
| Communication Services - 2.1% | | | |
| Diversified Telecommunication Services - 0.4% | | | |
| Anterix Inc (b) | | 5,527 | 169,512 |
| Bandwidth Inc Class A (b) | | 13,627 | 231,932 |
| Cogent Communications Holdings Inc | | 26,826 | 2,067,480 |
| Globalstar Inc (b) | | 375,537 | 777,362 |
| IDT Corp Class B | | 6,680 | 317,434 |
| | | | 3,563,720 |
| Entertainment - 0.5% | | | |
| Atlanta Braves Holdings Inc Class A (b)(c) | | 5,204 | 212,323 |
| Atlanta Braves Holdings Inc Class C (b) | | 31,595 | 1,208,825 |
| Cinemark Holdings Inc (b) | | 53,314 | 1,651,668 |
| Eventbrite Inc Class A (b) | | 42,868 | 144,036 |
| Golden Matrix Group Inc (b)(c) | | 12,706 | 25,158 |
| IMAX Corp (b) | | 26,132 | 668,979 |
| LiveOne Inc (b) | | 39,860 | 58,594 |
| Madison Square Garden Entertainment Corp Class A (b) | | 2,360 | 84,016 |
| Reservoir Media Inc (b)(c) | | 859 | 7,774 |
| Vivid Seats Inc Class A (b)(c) | | 47,111 | 218,124 |
| | | | 4,279,497 |
| Interactive Media & Services - 0.7% | | | |
| Bumble Inc Class A (b) | | 5,492 | 44,705 |
| Cargurus Inc Class A (b) | | 52,829 | 1,930,372 |
| EverQuote Inc Class A (b) | | 15,315 | 306,147 |
| fuboTV Inc (b) | | 15,381 | 19,380 |
| Getty Images Holdings Inc Class A (b)(c) | | 61,130 | 132,041 |
| MediaAlpha Inc Class A (b) | | 18,218 | 205,681 |
| QuinStreet Inc (b) | | 32,829 | 757,365 |
| Shutterstock Inc | | 11,661 | 353,911 |
| System1 Inc Class A (b)(c) | | 14,162 | 12,721 |
| Yelp Inc Class A (b) | | 39,404 | 1,524,935 |
| ZipRecruiter Inc Class A (b) | | 43,736 | 316,649 |
| | | | 5,603,907 |
| Media - 0.5% | | | |
| Boston Omaha Corp (b) | | 924 | 13,101 |
| Cardlytics Inc (b)(c) | | 25,256 | 93,700 |
| Clear Channel Outdoor Holdings Inc (b) | | 27,913 | 38,241 |
| Entravision Communications Corp Class A | | 5,771 | 13,562 |
| Ibotta Inc Class A (b)(c) | | 9,522 | 619,692 |
| Integral Ad Science Holding Corp (b) | | 5,206 | 54,351 |
| John Wiley & Sons Inc Class A | | 12,736 | 556,691 |
| Magnite Inc (b) | | 68,197 | 1,085,696 |
| PubMatic Inc Class A (b) | | 25,485 | 374,375 |
| Sinclair Inc Class A | | 19,495 | 314,649 |
| Stagwell Inc Class A (b) | | 9,147 | 60,187 |
| TechTarget Inc/old | | 16,126 | 319,617 |
| Thryv Holdings Inc (b) | | 22,742 | 336,582 |
| Townsquare Media Inc Class A | | 8,202 | 74,556 |
| | | | 3,955,000 |
| Wireless Telecommunication Services - 0.0% | | | |
| Gogo Inc (b)(c) | | 16,839 | 136,228 |
TOTAL COMMUNICATION SERVICES | | | 17,538,352 |
| | | | |
| Consumer Discretionary - 9.9% | | | |
| Automobile Components - 1.4% | | | |
| Dorman Products Inc (b) | | 15,748 | 2,040,153 |
| Gentherm Inc (b) | | 18,730 | 747,795 |
| Holley Inc Class A (b) | | 12,725 | 38,429 |
| LCI Industries | | 15,104 | 1,561,603 |
| Luminar Technologies Inc Class A (b)(c) | | 11,831 | 63,651 |
| Modine Manufacturing Co (b) | | 31,461 | 3,647,274 |
| Patrick Industries Inc | | 19,728 | 1,639,002 |
| Visteon Corp (b) | | 16,618 | 1,474,349 |
| XPEL Inc (b)(c)(e) | | 15,386 | 614,517 |
| | | | 11,826,773 |
| Automobiles - 0.0% | | | |
| Livewire Group Inc (b)(c) | | 11,132 | 53,545 |
| Broadline Retail - 0.0% | | | |
| 1stdibs.Com Inc (b) | | 3,451 | 12,217 |
| Groupon Inc (b)(c) | | 7,050 | 85,658 |
| Qurate Retail Inc Class B (b) | | 563 | 1,626 |
| Savers Value Village Inc (b)(c) | | 14,262 | 146,186 |
| | | | 245,687 |
| Diversified Consumer Services - 1.1% | | | |
| Adtalem Global Education Inc (b) | | 4,198 | 381,388 |
| American Public Education Inc (b) | | 831 | 17,925 |
| Carriage Services Inc | | 6,275 | 250,059 |
| Coursera Inc (b) | | 83,828 | 712,538 |
| European Wax Center Inc Class A (b) | | 18,790 | 125,329 |
| Frontdoor Inc (b) | | 46,909 | 2,564,515 |
| KinderCare Learning Cos Inc (b) | | 8,558 | 152,332 |
| Laureate Education Inc | | 64,055 | 1,171,566 |
| Mister Car Wash Inc (b) | | 50,001 | 364,507 |
| Nerdy Inc Class A (b)(c) | | 46,285 | 74,982 |
| Stride Inc (b) | | 25,936 | 2,695,529 |
| Udemy Inc (b) | | 55,465 | 456,477 |
| Universal Technical Institute Inc (b) | | 24,073 | 618,917 |
| | | | 9,586,064 |
| Hotels, Restaurants & Leisure - 2.8% | | | |
| Accel Entertainment Inc Class A (b) | | 31,456 | 335,950 |
| BJ's Restaurants Inc (b) | | 6,280 | 220,648 |
| Bloomin' Brands Inc | | 24,826 | 303,125 |
| Brinker International Inc (b) | | 24,216 | 3,203,536 |
| Cheesecake Factory Inc/The (c) | | 29,404 | 1,394,926 |
| Cracker Barrel Old Country Store Inc | | 2,977 | 157,364 |
| Dave & Buster's Entertainment Inc (b)(c) | | 19,690 | 574,751 |
| Denny's Corp (b) | | 22,099 | 133,699 |
| Dine Brands Global Inc | | 1,173 | 35,307 |
| Empire Resorts Inc (b)(f) | | 24 | 0 |
| Everi Holdings Inc (b) | | 26,805 | 362,136 |
| First Watch Restaurant Group Inc (b)(c) | | 18,486 | 344,024 |
| Global Business Travel Group I Class A (b) | | 65,743 | 610,095 |
| Hilton Grand Vacations Inc (b) | | 43,539 | 1,695,844 |
| Inspired Entertainment Inc (b) | | 13,387 | 121,152 |
| International Game Technology PLC | | 9,168 | 161,907 |
| Jack in the Box Inc (c) | | 11,711 | 487,646 |
| Krispy Kreme Inc (c) | | 52,129 | 517,641 |
| Kura Sushi USA Inc Class A (b)(c) | | 3,607 | 326,722 |
| Lindblad Expeditions Holdings Inc (b) | | 15,484 | 183,640 |
| Monarch Casino & Resort Inc | | 7,814 | 616,525 |
| Nathan's Famous Inc | | 1,510 | 118,701 |
| ONE Group Hospitality Inc/The (b) | | 12,721 | 36,891 |
| Papa John's International Inc | | 14,667 | 602,374 |
| PlayAGS Inc (b) | | 23,886 | 275,406 |
| Portillo's Inc Class A (b)(c) | | 26,141 | 245,725 |
| Potbelly Corp (b) | | 16,699 | 157,305 |
| Rci Hospitality Holdings Inc | | 2,639 | 151,663 |
| Red Rock Resorts Inc Class A | | 13,613 | 629,465 |
| Rush Street Interactive Inc Class A (b) | | 46,311 | 635,387 |
| Sabre Corp (b) | | 49,089 | 179,175 |
| Shake Shack Inc Class A (b) | | 23,156 | 3,005,649 |
| Six Flags Entertainment Corp | | 41,994 | 2,023,691 |
| Sweetgreen Inc Class A (b) | | 61,006 | 1,955,852 |
| Target Hospitality Corp (b) | | 20,104 | 194,305 |
| United Parks & Resorts Inc (b)(c) | | 18,707 | 1,051,146 |
| Xponential Fitness Inc Class A (b)(c) | | 14,854 | 199,786 |
| | | | 23,249,159 |
| Household Durables - 1.2% | | | |
| Cavco Industries Inc (b) | | 5,043 | 2,250,338 |
| Century Communities Inc | | 2,102 | 154,203 |
| Champion Homes Inc (b) | | 15,451 | 1,361,233 |
| Cricut Inc Class A | | 23,231 | 132,417 |
| Dream Finders Homes Inc Class A (b)(c) | | 17,034 | 396,381 |
| Green Brick Partners Inc (b) | | 5,212 | 294,426 |
| Hovnanian Enterprises Inc Class A (b) | | 190 | 25,426 |
| Installed Building Products Inc | | 14,595 | 2,557,774 |
| KB Home | | 5,446 | 357,911 |
| Landsea Homes Corp Class A (b) | | 1,318 | 11,189 |
| LGI Homes Inc (b) | | 882 | 78,851 |
| Lovesac Co/The (b)(c) | | 4,572 | 108,174 |
| Sonos Inc (b) | | 65,860 | 990,534 |
| Tri Pointe Homes Inc (b) | | 16,437 | 596,006 |
| United Homes Group Inc Class A (b) | | 2,532 | 10,709 |
| Worthington Enterprises Inc | | 17,062 | 684,357 |
| | | | 10,009,929 |
| Leisure Products - 0.4% | | | |
| Acushnet Holdings Corp (c) | | 17,227 | 1,224,495 |
| Marine Products Corp | | 2,471 | 22,659 |
| Peloton Interactive Inc Class A (b) | | 199,265 | 1,733,606 |
| Smith & Wesson Brands Inc | | 2,226 | 22,493 |
| Sturm Ruger & Co Inc | | 2,796 | 98,895 |
| | | | 3,102,148 |
| Specialty Retail - 2.0% | | | |
| 1-800-Flowers.com Inc Class A (b) | | 3,744 | 30,588 |
| Abercrombie & Fitch Co Class A (b) | | 30,635 | 4,579,013 |
| Academy Sports & Outdoors Inc | | 10,903 | 627,250 |
| American Eagle Outfitters Inc | | 85,919 | 1,432,270 |
| Arhaus Inc Class A (c) | | 26,697 | 250,952 |
| Arko Corp | | 4,957 | 32,667 |
| Boot Barn Holdings Inc (b) | | 18,023 | 2,736,252 |
| Buckle Inc/The | | 18,810 | 955,736 |
| Build-A-Bear Workshop Inc | | 7,614 | 350,549 |
| Caleres Inc | | 6,310 | 146,140 |
| Camping World Holdings Inc Class A | | 34,158 | 720,051 |
| EVgo Inc Class A (b)(c) | | 7,668 | 31,055 |
| Genesco Inc (b) | | 1,754 | 74,984 |
| GrowGeneration Corp (b)(c) | | 2,338 | 3,950 |
| J Jill Inc | | 3,293 | 90,953 |
| Leslie's Inc (b) | | 66,519 | 148,337 |
| National Vision Holdings Inc (b) | | 3,113 | 32,437 |
| RealReal Inc/The (b)(c) | | 42,790 | 467,695 |
| Revolve Group Inc Class A (b)(c) | | 23,364 | 782,460 |
| Sonic Automotive Inc Class A | | 2,580 | 163,443 |
| ThredUp Inc Class A (b) | | 7,403 | 10,290 |
| Tile Shop Holdings Inc (b) | | 6,073 | 42,086 |
| Torrid Holdings Inc (b) | | 12,322 | 64,444 |
| Upbound Group Inc | | 32,677 | 953,188 |
| Urban Outfitters Inc (b) | | 10,845 | 595,174 |
| Victoria's Secret & Co (b) | | 11,186 | 463,324 |
| Warby Parker Inc Class A (b) | | 53,946 | 1,306,033 |
| | | | 17,091,321 |
| Textiles, Apparel & Luxury Goods - 1.0% | | | |
| Figs Inc Class A (b)(c) | | 4,350 | 26,927 |
| Hanesbrands Inc (b) | | 215,185 | 1,751,606 |
| Kontoor Brands Inc | | 33,525 | 2,863,370 |
| Oxford Industries Inc | | 6,285 | 495,132 |
| Rocky Brands Inc | | 1,582 | 36,070 |
| Steven Madden Ltd | | 44,136 | 1,876,663 |
| Superior Group of Cos Inc | | 1,222 | 20,199 |
| Wolverine World Wide Inc | | 48,351 | 1,073,392 |
| | | | 8,143,359 |
TOTAL CONSUMER DISCRETIONARY | | | 83,307,985 |
| | | | |
| Consumer Staples - 3.3% | | | |
| Beverages - 0.3% | | | |
| MGP Ingredients Inc (c) | | 8,628 | 339,684 |
| National Beverage Corp | | 14,313 | 610,736 |
| Primo Brands Corp Class A | | 11,745 | 361,394 |
| Vita Coco Co Inc/The (b) | | 23,918 | 882,813 |
| | | | 2,194,627 |
| Consumer Staples Distribution & Retail - 1.2% | | | |
| Andersons Inc/The | | 2,420 | 98,058 |
| Chefs' Warehouse Inc/The (b) | | 21,315 | 1,051,257 |
| Guardian Pharmacy Services Inc Class A (b) | | 1,965 | 39,811 |
| Natural Grocers by Vitamin Cottage Inc | | 1,459 | 57,951 |
| PriceSmart Inc | | 9,652 | 889,625 |
| Sprouts Farmers Market Inc (b) | | 61,359 | 7,796,889 |
| | | | 9,933,591 |
| Food Products - 1.1% | | | |
| Beyond Meat Inc (b)(c) | | 36,308 | 136,518 |
| BRC Inc Class A (b) | | 29,172 | 92,475 |
| Cal-Maine Foods Inc | | 1,477 | 152,013 |
| Calavo Growers Inc | | 1,628 | 41,514 |
| J & J Snack Foods Corp | | 9,289 | 1,441,003 |
| John B Sanfilippo & Son Inc | | 5,464 | 475,969 |
| Lancaster Colony Corp | | 11,917 | 2,063,309 |
| Lifeway Foods Inc (b) | | 2,746 | 68,101 |
| Mama's Creations Inc (b) | | 20,071 | 159,765 |
| Mission Produce Inc (b) | | 3,257 | 46,803 |
| Simply Good Foods Co/The (b) | | 55,595 | 2,167,094 |
| Utz Brands Inc Class A | | 27,390 | 428,927 |
| Vital Farms Inc (b) | | 20,306 | 765,333 |
| Westrock Coffee Co (b)(c) | | 20,655 | 132,605 |
| WK Kellogg Co (c) | | 39,969 | 719,042 |
| | | | 8,890,471 |
| Household Products - 0.5% | | | |
| Central Garden & Pet Co (b)(c) | | 1,843 | 71,508 |
| Central Garden & Pet Co Class A | | 4,588 | 151,634 |
| Energizer Holdings Inc | | 43,796 | 1,528,042 |
| Oil-Dri Corp of America | | 653 | 57,229 |
| WD-40 Co | | 8,296 | 2,013,273 |
| | | | 3,821,686 |
| Personal Care Products - 0.2% | | | |
| Beauty Health Co/The Class A (b) | | 45,387 | 72,165 |
| Herbalife Ltd (b) | | 41,077 | 274,805 |
| Honest Co Inc/The (b) | | 20,650 | 143,105 |
| Interparfums Inc | | 11,098 | 1,459,498 |
| Nature's Sunshine Products Inc (b) | | 1,624 | 23,807 |
| Veru Inc (b)(c) | | 59,895 | 38,962 |
| | | | 2,012,342 |
| Tobacco - 0.0% | | | |
| Ispire Technology Inc (b)(c) | | 11,753 | 59,117 |
| Turning Point Brands Inc | | 8,967 | 538,917 |
| | | | 598,034 |
TOTAL CONSUMER STAPLES | | | 27,450,751 |
| | | | |
| Energy - 3.0% | | | |
| Energy Equipment & Services - 2.0% | | | |
| Archrock Inc | | 101,638 | 2,529,770 |
| Atlas Energy Solutions Inc (c) | | 41,389 | 918,008 |
| Cactus Inc Class A | | 40,592 | 2,368,949 |
| ChampionX Corp | | 116,167 | 3,158,581 |
| Core Laboratories Inc (c) | | 28,637 | 495,706 |
| DMC Global Inc (b) | | 3,107 | 22,836 |
| Drilling Tools International Corp (b) | | 3,765 | 12,312 |
| Helix Energy Solutions Group Inc (b) | | 16,733 | 155,952 |
| Kodiak Gas Services Inc | | 5,437 | 221,993 |
| Liberty Energy Inc Class A | | 5,510 | 109,594 |
| Nabors Industries Ltd (b) | | 1,726 | 98,675 |
| Natural Gas Services Group Inc (b) | | 1,409 | 37,761 |
| Noble Corp PLC | | 54,804 | 1,720,846 |
| Oceaneering International Inc (b) | | 61,568 | 1,605,693 |
| TETRA Technologies Inc (b) | | 76,642 | 274,378 |
| Tidewater Inc (b) | | 29,703 | 1,625,051 |
| Valaris Ltd (b) | | 23,994 | 1,061,495 |
| | | | 16,417,600 |
| Oil, Gas & Consumable Fuels - 1.0% | | | |
| Berry Corp | | 14,245 | 58,832 |
| Centrus Energy Corp Class A (b)(c) | | 6,277 | 418,111 |
| Crescent Energy Co Class A (c) | | 25,434 | 371,591 |
| CVR CHC LP | | 18,641 | 349,332 |
| Delek US Holdings Inc | | 10,617 | 196,415 |
| Diversified Energy Co PLC (United States) (e) | | 1,542 | 25,905 |
| Dorian LPG Ltd | | 11,080 | 270,020 |
| Empire Petroleum Corp (b)(c) | | 9,079 | 69,000 |
| Evolution Petroleum Corp | | 5,325 | 27,850 |
| Gulfport Energy Corp (b) | | 4,085 | 752,457 |
| Kinetik Holdings Inc Class A | | 2,213 | 125,499 |
| Magnolia Oil & Gas Corp Class A (c) | | 97,475 | 2,278,966 |
| NextDecade Corp (b)(c) | | 70,443 | 543,116 |
| Northern Oil & Gas Inc | | 3,623 | 134,631 |
| REX American Resources Corp (b) | | 2,028 | 84,547 |
| Riley Exploration Permian Inc | | 1,028 | 32,814 |
| Sable Offshore Corp (b)(c) | | 30,743 | 704,015 |
| SM Energy Co | | 11,777 | 456,477 |
| Ur-Energy Inc (United States) (b) | | 196,403 | 225,863 |
| Uranium Energy Corp (b)(c) | | 242,981 | 1,625,543 |
| VAALCO Energy Inc | | 6,283 | 27,456 |
| Verde Clean Fuels Inc Class A (b) | | 2,083 | 8,466 |
| W&T Offshore Inc | | 60,269 | 100,047 |
| World Kinect Corp | | 3,589 | 98,733 |
| | | | 8,985,686 |
TOTAL ENERGY | | | 25,403,286 |
| | | | |
| Financials - 8.2% | | | |
| Banks - 1.1% | | | |
| Axos Financial Inc (b) | | 3,560 | 248,666 |
| BancFirst Corp | | 1,464 | 171,552 |
| Bancorp Inc/The (b) | | 27,090 | 1,425,748 |
| Bank7 Corp | | 153 | 7,139 |
| Citizens Financial Services Inc | | 188 | 11,902 |
| City Holding Co | | 674 | 79,856 |
| Coastal Financial Corp/WA Class A (b) | | 6,531 | 554,547 |
| Columbia Financial Inc (b) | | 960 | 15,178 |
| Esquire Financial Holdings Inc | | 3,696 | 293,832 |
| First Business Financial Services Inc | | 252 | 11,665 |
| First Financial Bankshares Inc | | 79,227 | 2,856,134 |
| First Foundation Inc | | 11,029 | 68,490 |
| First Interstate Bank of Calif | | 1,969 | 70,864 |
| First Western Financial Inc (b) | | 1,406 | 27,487 |
| Greene County Bancorp Inc | | 4,281 | 118,669 |
| Lakeland Financial Corp | | 923 | 63,465 |
| Live Oak Bancshares Inc | | 18,348 | 725,663 |
| Metrocity Bankshares Inc | | 896 | 28,627 |
| Nicolet Bankshares Inc | | 1,896 | 198,909 |
| Pathward Financial Inc | | 4,304 | 316,688 |
| Peoples Financial Services Corp | | 1,345 | 68,837 |
| ServisFirst Bancshares Inc | | 8,742 | 740,797 |
| Shore Bancshares Inc | | 2,398 | 38,008 |
| Triumph Financial Inc (b) | | 12,316 | 1,119,278 |
| USCB Financial Holdings Inc | | 1,817 | 32,252 |
| | | | 9,294,253 |
| Capital Markets - 2.9% | | | |
| Artisan Partners Asset Management Inc Class A | | 38,350 | 1,650,968 |
| B Riley Financial Inc (c) | | 12,448 | 57,136 |
| Brightsphere Investment Group Inc | | 16,492 | 434,399 |
| Cohen & Steers Inc (c) | | 16,745 | 1,546,233 |
| Diamond Hill Investment Group Inc | | 1,372 | 212,797 |
| DigitalBridge Group Inc Class A | | 25,668 | 289,535 |
| Donnelley Financial Solutions Inc (b) | | 10,126 | 635,204 |
| GCM Grosvenor Inc Class A | | 22,522 | 276,345 |
| Hamilton Lane Inc Class A | | 23,394 | 3,463,483 |
| MarketWise Inc Class A | | 3,045 | 1,728 |
| Moelis & Co Class A | | 43,036 | 3,179,500 |
| Open Lending Corp (b) | | 62,253 | 371,650 |
| P10 Inc Class A | | 21,338 | 269,072 |
| Perella Weinberg Partners Class A | | 31,517 | 751,365 |
| Piper Sandler Cos | | 10,573 | 3,171,371 |
| PJT Partners Inc Class A | | 14,193 | 2,239,797 |
| StepStone Group Inc Class A | | 39,979 | 2,313,985 |
| StoneX Group Inc (b) | | 1,652 | 161,846 |
| Value Line Inc | | 461 | 24,341 |
| Victory Capital Holdings Inc Class A | | 25,056 | 1,640,166 |
| Virtus Invt Partners Inc | | 3,405 | 751,075 |
| WisdomTree Inc (c) | | 85,030 | 892,815 |
| | | | 24,334,811 |
| Consumer Finance - 0.8% | | | |
| Atlanticus Holdings Corp (b) | | 184 | 10,263 |
| Dave Inc Class A (b) | | 4,887 | 424,778 |
| FirstCash Holdings Inc | | 23,458 | 2,430,249 |
| Lendingtree Inc (b) | | 5,646 | 218,783 |
| Moneylion Inc Class A (b) | | 5,264 | 452,757 |
| NerdWallet Inc Class A (b) | | 21,398 | 284,593 |
| OppFi Inc Class A (c) | | 11,576 | 88,672 |
| PROG Holdings Inc | | 4,086 | 172,674 |
| Regional Management Corp | | 614 | 20,864 |
| Upstart Holdings Inc (b)(c) | | 47,822 | 2,944,401 |
| World Acceptance Corp (b) | | 1,935 | 217,571 |
| | | | 7,265,605 |
| Financial Services - 1.8% | | | |
| Alerus Financial Corp | | 743 | 14,295 |
| AvidXchange Holdings Inc (b) | | 105,879 | 1,094,789 |
| Cantaloupe Inc (b) | | 33,794 | 321,381 |
| Cass Information Systems Inc | | 7,030 | 287,597 |
| Federal Agricultural Mortgage Corp Class C | | 4,938 | 972,539 |
| Flywire Corp (b) | | 73,559 | 1,516,787 |
| I3 Verticals Inc Class A (b) | | 853 | 19,653 |
| International Money Express Inc (b) | | 19,323 | 402,498 |
| Marqeta Inc Class A (b) | | 249,526 | 945,704 |
| Mr Cooper Group Inc (b) | | 14,062 | 1,350,093 |
| NCR Atleos Corp (b) | | 43,949 | 1,490,750 |
| NMI Holdings Inc (b) | | 3,539 | 130,094 |
| Payoneer Global Inc (b) | | 134,651 | 1,351,896 |
| Paysign Inc (b) | | 20,207 | 61,025 |
| PennyMac Financial Services Inc | | 8,945 | 913,642 |
| Priority Technology Holdings Inc (b) | | 11,223 | 131,870 |
| Remitly Global Inc (b) | | 90,929 | 2,052,268 |
| Sezzle Inc (b) | | 1,263 | 323,075 |
| Walker & Dunlop Inc | | 14,196 | 1,379,993 |
| | | | 14,759,949 |
| Insurance - 1.6% | | | |
| American Coastal Insurance Corp | | 6,414 | 86,332 |
| Amerisafe Inc | | 4,993 | 257,339 |
| Baldwin Insurance Group Inc/The Class A (b) | | 40,589 | 1,573,230 |
| Bowhead Specialty Holdings Inc | | 1,874 | 66,564 |
| Crawford & Co Class A | | 9,262 | 107,069 |
| F&G Annuities & Life Inc | | 612 | 25,361 |
| Goosehead Insurance Inc Class A (b) | | 13,692 | 1,468,056 |
| HCI Group Inc | | 5,044 | 587,777 |
| Investors Title Co | | 134 | 31,726 |
| Lemonade Inc (b)(c) | | 26,177 | 960,172 |
| Mercury General Corp | | 2,029 | 134,888 |
| Oscar Health Inc Class A (b) | | 121,327 | 1,630,635 |
| Palomar Hldgs Inc (b) | | 15,670 | 1,654,595 |
| Root Inc/OH Class A (b) | | 5,260 | 381,823 |
| Selective Insurance Group Inc | | 31,529 | 2,948,593 |
| Skyward Specialty Insurance Group Inc (b) | | 5,353 | 270,541 |
| Tiptree Inc Class A | | 3,563 | 74,324 |
| Trupanion Inc (b)(c) | | 20,070 | 967,374 |
| Universal Insurance Holdings Inc | | 2,675 | 56,336 |
| | | | 13,282,735 |
| Mortgage Real Estate Investment Trusts (REITs) - 0.0% | | | |
| AG Mortgage Investment Trust Inc | | 2,799 | 18,613 |
| Angel Oak Mortgage REIT Inc | | 2,537 | 23,543 |
| Kkr Real Estate Finance Trust Inc | | 9,468 | 95,628 |
| | | | 137,784 |
TOTAL FINANCIALS | | | 69,075,137 |
| | | | |
| Health Care - 23.3% | | | |
| Biotechnology - 12.3% | | | |
| 4D Molecular Therapeutics Inc (b) | | 19,884 | 110,754 |
| Absci Corp (b)(c) | | 35,613 | 93,306 |
| ACADIA Pharmaceuticals Inc (b) | | 72,882 | 1,337,385 |
| Achieve Life Sciences Inc (b) | | 12,670 | 44,598 |
| Actinium Pharmaceuticals Inc (b) | | 19,152 | 24,132 |
| ADMA Biologics Inc (b) | | 137,173 | 2,352,517 |
| Aerovate Therapeutics Inc (b)(c) | | 8,176 | 21,666 |
| Agenus Inc (b) | | 1,727 | 4,732 |
| Akebia Therapeutics Inc (b) | | 11,771 | 22,365 |
| Akero Therapeutics Inc (b) | | 6,930 | 192,793 |
| Aldeyra Therapeutics Inc (b) | | 3,091 | 15,424 |
| Alector Inc (b) | | 49,057 | 92,718 |
| Alkermes PLC (b) | | 98,089 | 2,821,040 |
| Altimmune Inc (b)(c) | | 23,524 | 169,608 |
| ALX Oncology Holdings Inc (b) | | 21,053 | 35,159 |
| Amicus Therapeutics Inc (b) | | 178,665 | 1,683,024 |
| AnaptysBio Inc (b) | | 13,165 | 174,305 |
| Anavex Life Sciences Corp (b)(c) | | 12,074 | 129,675 |
| Anika Therapeutics Inc (b) | | 1,509 | 24,838 |
| Apogee Therapeutics Inc (b) | | 23,073 | 1,045,207 |
| Applied Therapeutics Inc (b)(c) | | 35,484 | 30,381 |
| Arbutus Biopharma Corp (b)(c) | | 83,283 | 272,335 |
| Arcellx Inc (b) | | 26,248 | 2,012,959 |
| Arcturus Therapeutics Holdings Inc (b)(c) | | 12,427 | 210,886 |
| Arcus Biosciences Inc (b) | | 33,106 | 492,948 |
| Arcutis Biotherapeutics Inc (b)(c) | | 65,470 | 911,997 |
| Ardelyx Inc (b) | | 143,256 | 726,308 |
| ArriVent Biopharma Inc | | 10,409 | 277,296 |
| Arrowhead Pharmaceuticals Inc (b) | | 72,698 | 1,366,722 |
| ARS Pharmaceuticals Inc (b)(c) | | 29,987 | 316,363 |
| Astria Therapeutics Inc (b) | | 23,968 | 214,274 |
| Atossa Therapeutics Inc (b)(c) | | 12,917 | 12,195 |
| Avid Bioservices Inc (b)(c) | | 35,702 | 440,920 |
| Avidity Biosciences Inc (b) | | 67,599 | 1,965,779 |
| Avita Medical Inc (b) | | 15,558 | 199,142 |
| Bicara Therapeutics Inc (c) | | 6,630 | 115,495 |
| BioCryst Pharmaceuticals Inc (b) | | 125,857 | 946,445 |
| Biohaven Ltd (b) | | 52,301 | 1,953,442 |
| Biomea Fusion Inc (b)(c) | | 16,835 | 65,320 |
| Black Diamond Therapeutics Inc (b)(c) | | 16,460 | 35,224 |
| Blueprint Medicines Corp (b) | | 38,721 | 3,377,246 |
| Boundless Bio Inc (b) | | 6,199 | 17,977 |
| Bridgebio Pharma Inc (b) | | 53,334 | 1,463,485 |
| Cabaletta Bio Inc (b)(c) | | 6,081 | 13,804 |
| CAMP4 Therapeutics Corp | | 2,366 | 12,351 |
| Candel Therapeutics Inc (b) | | 13,196 | 114,541 |
| Capricor Therapeutics Inc (b)(c) | | 18,934 | 261,289 |
| Cardiff Oncology Inc (b)(c) | | 9,537 | 41,391 |
| CareDx Inc (b)(c) | | 6,800 | 145,588 |
| Cargo Therapeutics Inc (b)(c) | | 2,090 | 30,138 |
| Cartesian Therapeutics Inc (b)(c) | | 6,281 | 112,493 |
| Cartesian Therapeutics Inc rights (b)(f) | | 12,935 | 5,562 |
| Catalyst Pharmaceuticals Inc (b) | | 68,086 | 1,420,955 |
| Celcuity Inc (b) | | 18,717 | 245,006 |
| Celldex Therapeutics Inc (b) | | 32,106 | 811,319 |
| CervoMed Inc (b)(c) | | 3,328 | 7,788 |
| CG oncology Inc | | 17,508 | 502,129 |
| Chinook Therapeutics Inc rights (b)(f) | | 985 | 0 |
| Climb Bio Inc (b)(c) | | 1,088 | 1,957 |
| Cogent Biosciences Inc (b) | | 51,984 | 405,475 |
| Coherus Biosciences Inc (b)(c) | | 17,641 | 24,345 |
| Corbus Pharmaceuticals Holdings Inc (b)(c) | | 4,298 | 50,716 |
| Crinetics Pharmaceuticals Inc (b) | | 53,407 | 2,730,700 |
| Cullinan Therapeutics Inc (b)(c) | | 27,983 | 340,833 |
| Cytokinetics Inc (b) | | 6,470 | 304,349 |
| Day One Biopharmaceuticals Inc (b) | | 28,295 | 358,498 |
| Denali Therapeutics Inc (b) | | 43,355 | 883,575 |
| Dianthus Therapeutics Inc (b) | | 1,083 | 23,609 |
| Disc Medicine Inc (b) | | 1,325 | 84,005 |
| Dynavax Technologies Corp (b) | | 64,261 | 820,613 |
| Dyne Therapeutics Inc (b) | | 50,224 | 1,183,277 |
| Elevation Oncology Inc (b) | | 20,683 | 11,636 |
| Fibrobiologics Inc (c) | | 16,679 | 33,358 |
| Foghorn Therapeutics Inc (b) | | 9,311 | 43,948 |
| Galectin Therapeutics Inc (b)(c) | | 7,605 | 9,810 |
| Geron Corp (b) | | 250,688 | 887,436 |
| Greenwich Lifesciences Inc (b)(c) | | 3,718 | 41,753 |
| Gyre Therapeutics Inc (b)(c) | | 397 | 4,804 |
| Halozyme Therapeutics Inc (b) | | 75,977 | 3,632,460 |
| Heron Therapeutics Inc (b)(c) | | 6,651 | 10,176 |
| HilleVax Inc (b) | | 3,812 | 7,891 |
| Humacyte Inc Class A (b)(c) | | 53,552 | 270,438 |
| Ideaya Biosciences Inc (b) | | 51,437 | 1,321,931 |
| IGM Biosciences Inc (b) | | 8,570 | 52,363 |
| ImmunityBio Inc (b)(c) | | 68,393 | 175,086 |
| Immunome Inc (b) | | 31,310 | 332,512 |
| Immunovant Inc (b) | | 35,357 | 875,793 |
| Inhibrx Biosciences Inc | | 4,120 | 63,448 |
| Inmune Bio Inc (b)(c) | | 8,244 | 38,499 |
| Insmed Inc (b) | | 105,008 | 7,249,752 |
| Iovance Biotherapeutics Inc (b)(c) | | 167,238 | 1,237,561 |
| Ironwood Pharmaceuticals Inc Class A (b) | | 29,288 | 129,746 |
| Janux Therapeutics Inc (b) | | 17,076 | 914,249 |
| Jasper Therapeutics Inc Class A (b) | | 6,901 | 147,543 |
| KalVista Pharmaceuticals Inc (b) | | 20,780 | 176,007 |
| Keros Therapeutics Inc (b) | | 18,679 | 295,689 |
| Kiniksa Pharmaceuticals International Plc Class A (b) | | 23,430 | 463,445 |
| Korro Bio Inc (b) | | 995 | 37,880 |
| Krystal Biotech Inc (b) | | 15,107 | 2,366,663 |
| Kura Oncology Inc (b) | | 44,134 | 384,407 |
| Kymera Therapeutics Inc (b) | | 28,584 | 1,149,934 |
| Kyverna Therapeutics Inc | | 9,493 | 35,504 |
| Larimar Therapeutics Inc (b) | | 25,612 | 99,118 |
| Lexeo Therapeutics Inc (b)(c) | | 13,618 | 89,606 |
| Lexicon Pharmaceuticals Inc (b) | | 26,004 | 19,204 |
| Lineage Cell Therapeutics Inc (b) | | 90,447 | 45,450 |
| MacroGenics Inc (b) | | 31,779 | 103,282 |
| Madrigal Pharmaceuticals Inc (b) | | 10,949 | 3,378,533 |
| MannKind Corp (b) | | 125,951 | 809,865 |
| MeiraGTx Holdings plc (b)(c) | | 19,049 | 116,008 |
| Mersana Therapeutics Inc (b) | | 36,106 | 51,632 |
| Metagenomi Inc | | 10,108 | 36,490 |
| MiMedx Group Inc (b) | | 34,203 | 329,033 |
| Mineralys Therapeutics Inc (b) | | 3,770 | 46,409 |
| Mirum Pharmaceuticals Inc (b)(c) | | 24,198 | 1,000,587 |
| Neurogene Inc (b) | | 3,314 | 75,758 |
| Novavax Inc (b)(c) | | 72,665 | 584,227 |
| Nurix Therapeutics Inc (b) | | 29,499 | 555,761 |
| Nuvalent Inc Class A (b) | | 21,402 | 1,675,349 |
| Ocugen Inc (b)(c) | | 174,194 | 140,226 |
| Olema Pharmaceuticals Inc (b)(c) | | 6,434 | 37,510 |
| OmniAb Operations Inc (b)(f) | | 191 | 364 |
| OmniAb Operations Inc (b)(f) | | 191 | 410 |
| Organogenesis Holdings Inc Class A (b) | | 4,575 | 14,640 |
| ORIC Pharmaceuticals Inc (b)(c) | | 8,535 | 68,877 |
| Outlook Therapeutics Inc (b)(c) | | 5,646 | 10,671 |
| Ovid therapeutics Inc (b) | | 36,160 | 33,763 |
| PepGen Inc (b) | | 8,422 | 31,919 |
| Perspective Therapeutics Inc (b) | | 26,770 | 85,396 |
| Poseida Therapeutics Inc (b) | | 11,915 | 114,384 |
| Praxis Precision Medicines Inc (b) | | 10,505 | 808,465 |
| Precigen Inc (b)(c) | | 5,932 | 6,644 |
| Prime Medicine Inc (b)(c) | | 34,547 | 100,877 |
| ProKidney Corp Class A (b) | | 52,453 | 88,646 |
| Protagonist Therapeutics Inc (b) | | 35,597 | 1,374,044 |
| PTC Therapeutics Inc (b) | | 35,249 | 1,591,140 |
| Puma Biotechnology Inc (b) | | 9,141 | 27,880 |
| Recursion Pharmaceuticals Inc Class A (b)(c) | | 151,521 | 1,024,282 |
| Regulus Therapeutics Inc (b) | | 9,780 | 15,452 |
| Renovaro Inc (b)(c) | | 44,681 | 37,331 |
| REVOLUTION Medicines Inc (b) | | 66,463 | 2,907,092 |
| Rhythm Pharmaceuticals Inc (b) | | 33,345 | 1,866,653 |
| Rigel Pharmaceuticals Inc (b) | | 8,205 | 138,008 |
| Rocket Pharmaceuticals Inc (b) | | 40,065 | 503,617 |
| Sana Biotechnology Inc (b)(c) | | 80,556 | 131,306 |
| Savara Inc (b) | | 56,366 | 173,044 |
| Scholar Rock Holding Corp (b) | | 42,487 | 1,836,288 |
| Sera Prognostics Inc Class A (b) | | 17,219 | 140,163 |
| Shattuck Labs Inc (b) | | 15,900 | 19,239 |
| Skye Bioscience Inc (b)(c) | | 1,833 | 5,187 |
| Soleno Therapeutics Inc (b) | | 15,583 | 700,456 |
| Solid Biosciences Inc (b) | | 1,293 | 5,172 |
| SpringWorks Therapeutics Inc (b) | | 41,872 | 1,512,835 |
| Spyre Therapeutics Inc (b) | | 1,963 | 45,699 |
| Stoke Therapeutics Inc (b) | | 21,886 | 241,403 |
| Summit Therapeutics Inc (b)(c) | | 53,045 | 946,588 |
| Syndax Pharmaceuticals Inc (b) | | 50,022 | 661,291 |
| Tango Therapeutics Inc (b) | | 29,094 | 89,900 |
| Taysha Gene Therapies Inc (b) | | 106,755 | 184,686 |
| Tenaya Therapeutics Inc (b)(c) | | 9,212 | 13,173 |
| Tevogen Bio Holdings Inc Class A (b)(c) | | 7,804 | 8,038 |
| TG Therapeutics Inc (b)(c) | | 85,030 | 2,559,403 |
| TScan Therapeutics Inc (b)(c) | | 15,323 | 46,582 |
| Twist Bioscience Corp (b) | | 35,489 | 1,649,174 |
| Tyra Biosciences Inc (b) | | 12,379 | 172,068 |
| Upstream Bio Inc | | 5,979 | 98,295 |
| UroGen Pharma Ltd (b)(c) | | 18,252 | 194,384 |
| Vaxcyte Inc (b) | | 75,624 | 6,190,581 |
| Vera Therapeutics Inc Class A (b) | | 27,007 | 1,142,126 |
| Verastem Inc (b)(c) | | 23,644 | 122,239 |
| Vericel Corp (b) | | 29,909 | 1,642,303 |
| Viridian Therapeutics Inc (b) | | 32,660 | 626,092 |
| Werewolf Therapeutics Inc (b) | | 4,623 | 6,842 |
| X4 Pharmaceuticals Inc (b)(c) | | 102,578 | 75,251 |
| Xencor Inc (b) | | 18,823 | 432,553 |
| XOMA Royalty Corp (b) | | 3,077 | 80,864 |
| Y-mAbs Therapeutics Inc (b) | | 22,772 | 178,305 |
| Zenas Biopharma Inc (c) | | 5,284 | 43,276 |
| | | | 103,177,822 |
| Health Care Equipment & Supplies - 4.3% | | | |
| Accuray Inc Del (b) | | 55,396 | 109,684 |
| Alphatec Holdings Inc (b) | | 63,417 | 582,168 |
| Artivion Inc (b) | | 18,393 | 525,856 |
| AtriCure Inc (b) | | 18,797 | 574,436 |
| Axogen Inc (b) | | 25,837 | 425,794 |
| Bioventus Inc (b) | | 8,422 | 88,431 |
| Ceribell Inc | | 5,047 | 130,616 |
| Cerus Corp (b) | | 110,006 | 169,409 |
| CONMED Corp | | 18,788 | 1,285,851 |
| CVRx Inc (b) | | 8,100 | 102,627 |
| Embecta Corp | | 3,390 | 70,004 |
| Fractyl Health Inc (c) | | 12,558 | 25,869 |
| Glaukos Corp (b) | | 29,800 | 4,468,213 |
| Haemonetics Corp (b) | | 30,566 | 2,386,593 |
| Inari Medical Inc (b) | | 32,238 | 1,645,750 |
| Inmode Ltd (b) | | 5,519 | 92,167 |
| Integer Holdings Corp (b) | | 14,234 | 1,886,290 |
| iRadimed Corp | | 4,901 | 269,555 |
| iRhythm Technologies Inc (b) | | 19,040 | 1,716,837 |
| Lantheus Holdings Inc (b) | | 41,941 | 3,752,042 |
| LeMaitre Vascular Inc | | 12,352 | 1,138,113 |
| LivaNova PLC (b) | | 1,993 | 92,296 |
| Merit Medical Systems Inc (b) | | 34,849 | 3,370,595 |
| NeuroPace Inc (b) | | 8,457 | 94,634 |
| Novocure Ltd (b) | | 64,858 | 1,932,768 |
| Orchestra BioMed Holdings Inc (b) | | 6,409 | 25,636 |
| Paragon 28 Inc (b)(c) | | 28,706 | 296,533 |
| PROCEPT BioRobotics Corp (b) | | 27,136 | 2,184,991 |
| Pulmonx Corp (b) | | 23,034 | 156,401 |
| Pulse Biosciences Inc (b)(c) | | 11,149 | 194,104 |
| Pulse Biosciences Inc warrants 6/26/2029 (b)(c) | | 278 | 1,433 |
| Pulse Biosciences Inc warrants 6/26/2030 (b)(c) | | 278 | 1,432 |
| RxSight Inc (b) | | 22,119 | 760,451 |
| Sanara Medtech Inc (b) | | 2,474 | 82,137 |
| Semler Scientific Inc (b)(c) | | 2,893 | 156,222 |
| SI-BONE Inc (b) | | 20,346 | 285,251 |
| Sight Sciences Inc (b) | | 21,551 | 78,446 |
| STAAR Surgical Co (b) | | 30,132 | 731,906 |
| Stereotaxis Inc (b) | | 31,964 | 72,878 |
| Surmodics Inc (b) | | 5,379 | 213,008 |
| Tandem Diabetes Care Inc (b)(c) | | 39,988 | 1,440,368 |
| TransMedics Group Inc (b)(c) | | 19,970 | 1,245,130 |
| Treace Medical Concepts Inc (b) | | 29,687 | 220,871 |
| UFP Technologies Inc (b) | | 4,423 | 1,081,468 |
| Zynex Inc (b)(c) | | 9,342 | 74,829 |
| | | | 36,240,093 |
| Health Care Providers & Services - 3.9% | | | |
| Accolade Inc (b) | | 14,802 | 50,623 |
| AdaptHealth Corp (b) | | 26,953 | 256,593 |
| Addus HomeCare Corp (b) | | 4,203 | 526,846 |
| agilon health Inc (b) | | 187,947 | 357,099 |
| AirSculpt Technologies Inc (b)(c) | | 8,086 | 41,966 |
| Alignment Healthcare Inc (b) | | 60,969 | 685,901 |
| AMN Healthcare Services Inc (b) | | 23,086 | 552,217 |
| Ardent Health Partners Inc (c) | | 5,169 | 88,287 |
| Astrana Health Inc (b) | | 26,235 | 827,190 |
| Aveanna Healthcare Holdings Inc (b) | | 21,889 | 100,033 |
| BrightSpring Health Services Inc (b)(c) | | 32,799 | 558,567 |
| Brookdale Senior Living Inc (b) | | 99,898 | 502,487 |
| Castle Biosciences Inc (b) | | 5,077 | 135,302 |
| Community Health Systems Inc (b) | | 41,474 | 124,007 |
| Concentra Group Holdings Parent Inc (c) | | 46,280 | 915,418 |
| CorVel Corp (b) | | 16,203 | 1,802,746 |
| DocGo Inc Class A (b) | | 11,390 | 48,294 |
| Enhabit Inc (b) | | 2,963 | 23,141 |
| Ensign Group Inc/The | | 33,803 | 4,491,067 |
| GeneDx Holdings Corp Class A (b) | | 995 | 76,476 |
| Guardant Health Inc (b) | | 71,872 | 2,195,690 |
| HealthEquity Inc (b) | | 52,270 | 5,015,307 |
| Hims & Hers Health Inc Class A (b)(c) | | 115,585 | 2,794,845 |
| Infusystem Holdings Inc (b) | | 12,120 | 102,414 |
| Innovage Holding Corp (b) | | 3,632 | 14,273 |
| Joint Corp/The (b) | | 6,628 | 70,456 |
| LifeStance Health Group Inc (b) | | 38,932 | 286,929 |
| Modivcare Inc (b)(c) | | 3,388 | 40,114 |
| National Research Corp Class A | | 9,197 | 162,235 |
| NeoGenomics Inc (b) | | 6,188 | 101,978 |
| Option Care Health Inc (b) | | 49,014 | 1,137,125 |
| Owens & Minor Inc (b) | | 6,979 | 91,216 |
| PACS Group Inc | | 23,480 | 307,823 |
| Patterson Cos Inc | | 8,831 | 272,525 |
| Pennant Group Inc/The (b) | | 19,887 | 527,403 |
| Performant Healthcare Inc (b) | | 29,569 | 89,298 |
| Privia Health Group Inc (b) | | 62,127 | 1,214,583 |
| Progyny Inc (b) | | 48,329 | 833,675 |
| Quipt Home Medical Corp (United States) (b) | | 2,247 | 6,852 |
| RadNet Inc (b) | | 40,270 | 2,812,457 |
| Select Medical Holdings Corp | | 45,078 | 849,720 |
| Sonida Senior Living Inc (b) | | 1,541 | 35,566 |
| Talkspace Inc Class A (b) | | 75,027 | 231,833 |
| US Physical Therapy Inc | | 9,108 | 807,971 |
| Viemed Healthcare Inc (b) | | 20,922 | 167,794 |
| | | | 32,334,342 |
| Health Care Technology - 0.4% | | | |
| Evolent Health Inc Class A (b) | | 70,325 | 791,156 |
| Health Catalyst Inc (b) | | 3,240 | 22,906 |
| HealthStream Inc | | 5,102 | 162,244 |
| LifeMD Inc (b)(c) | | 13,870 | 68,657 |
| OptimizeRx Corp (b) | | 10,722 | 52,109 |
| Phreesia Inc (b) | | 33,703 | 847,967 |
| Schrodinger Inc/United States (b)(c) | | 33,861 | 653,179 |
| Simulations Plus Inc | | 9,676 | 269,864 |
| Teladoc Health Inc (b) | | 16,367 | 148,776 |
| Waystar Holding Corp (b) | | 17,154 | 629,552 |
| | | | 3,646,410 |
| Life Sciences Tools & Services - 0.2% | | | |
| Akoya Biosciences Inc (b)(c) | | 16,190 | 37,075 |
| BioLife Solutions Inc (b)(c) | | 19,628 | 509,543 |
| ChromaDex Corp (b) | | 30,195 | 160,184 |
| Codexis Inc (b) | | 5,458 | 26,035 |
| Conduit Pharmaceuticals Inc Class A (b) | | 10,839 | 743 |
| CryoPort Inc (b)(c) | | 21,757 | 169,269 |
| Harvard Bioscience Inc (b) | | 6,315 | 13,325 |
| Maravai LifeSciences Holdings Inc Class A (b) | | 67,273 | 366,638 |
| Mesa Laboratories Inc (c) | | 1,040 | 137,145 |
| OmniAb Inc (b)(c) | | 6,545 | 23,169 |
| Quanterix Corp (b) | | 3,030 | 32,209 |
| Standard BioTools Inc (b)(c) | | 40,501 | 70,877 |
| | | | 1,546,212 |
| Pharmaceuticals - 2.2% | | | |
| Alto Neuroscience Inc | | 7,904 | 33,434 |
| Alumis Inc (c) | | 4,825 | 37,925 |
| Amneal Intermediate Inc Class A (b) | | 81,323 | 644,078 |
| Amphastar Pharmaceuticals Inc (b) | | 23,436 | 870,179 |
| ANI Pharmaceuticals Inc (b) | | 7,995 | 441,964 |
| Aquestive Therapeutics Inc (b)(c) | | 12,358 | 43,994 |
| Arvinas Inc (b) | | 39,124 | 750,007 |
| Avadel Pharmaceuticals PLC Class A (b) | | 56,307 | 591,787 |
| Axsome Therapeutics Inc (b) | | 22,425 | 1,897,379 |
| BioAge Labs Inc | | 4,167 | 24,127 |
| Biote Corp Class A (b) | | 15,563 | 96,179 |
| Cassava Sciences Inc (b)(c) | | 24,749 | 58,408 |
| Collegium Pharmaceutical Inc (b) | | 19,539 | 559,792 |
| Contineum Therapeutics Inc Class A | | 3,878 | 56,813 |
| Corcept Therapeutics Inc (b) | | 49,246 | 2,481,507 |
| CorMedix Inc (b)(c) | | 33,713 | 273,075 |
| Edgewise Therapeutics Inc (b) | | 44,214 | 1,180,514 |
| Enliven Therapeutics Inc (b) | | 20,330 | 457,425 |
| Esperion Therapeutics Inc New (b)(c) | | 31,346 | 68,961 |
| Evolus Inc (b) | | 33,655 | 371,551 |
| EyePoint Pharmaceuticals Inc (b)(c) | | 18,189 | 135,508 |
| Fulcrum Therapeutics Inc (b) | | 16,046 | 75,416 |
| Harmony Biosciences Holdings Inc (b) | | 23,211 | 798,691 |
| Harrow Inc (b) | | 18,607 | 624,265 |
| Innoviva Inc (b) | | 2,922 | 50,697 |
| Liquidia Corp (b) | | 38,615 | 454,112 |
| Lyra Therapeutics Inc (b)(c) | | 15,791 | 3,259 |
| MBX Biosciences Inc | | 3,866 | 71,250 |
| Mind Medicine MindMed Inc (b)(c) | | 49,091 | 341,673 |
| Neumora Therapeutics Inc (b) | | 51,228 | 543,017 |
| Novartis AG rights (b)(f) | | 7,324 | 0 |
| Ocular Therapeutix Inc (b) | | 94,769 | 809,327 |
| Omeros Corp (b) | | 11,622 | 114,825 |
| Pacira BioSciences Inc (b) | | 2,080 | 39,187 |
| Phathom Pharmaceuticals Inc (b) | | 5,160 | 41,899 |
| Phibro Animal Health Corp Class A | | 2,994 | 62,874 |
| Rapport Therapeutics Inc (b) | | 3,199 | 56,750 |
| Revance Therapeutics Inc (b) | | 63,391 | 192,709 |
| scPharmaceuticals Inc (b)(c) | | 23,986 | 84,910 |
| Septerna Inc | | 6,378 | 146,056 |
| SIGA Technologies Inc | | 20,787 | 124,930 |
| Supernus Pharmaceuticals Inc (b) | | 2,200 | 79,552 |
| Tarsus Pharmaceuticals Inc (b) | | 22,410 | 1,240,842 |
| Telomir Pharmaceuticals Inc (b)(c) | | 6,662 | 27,447 |
| Terns Pharmaceuticals Inc (b) | | 2,268 | 12,565 |
| Trevi Therapeutics Inc (b) | | 22,639 | 93,273 |
| Verrica Pharmaceuticals Inc (b) | | 11,421 | 7,995 |
| WaVe Life Sciences Ltd (b) | | 48,054 | 594,428 |
| Xeris Biopharma Holdings Inc (b) | | 85,377 | 289,428 |
| Zevra Therapeutics Inc (b)(c) | | 17,039 | 142,105 |
| | | | 18,198,089 |
TOTAL HEALTH CARE | | | 195,142,968 |
| | | | |
| Industrials - 22.4% | | | |
| Aerospace & Defense - 2.0% | | | |
| AAR Corp (b) | | 4,299 | 263,443 |
| AeroVironment Inc (b) | | 17,083 | 2,628,903 |
| Archer Aviation Inc Class A (b) | | 134,377 | 1,310,176 |
| Byrna Technologies Inc (b) | | 10,542 | 303,715 |
| Cadre Holdings Inc | | 15,856 | 512,149 |
| Eve Holding Inc Class A (b)(c) | | 31,125 | 169,320 |
| Intuitive Machines Inc Class A (b) | | 932 | 16,924 |
| Kratos Defense & Security Solutions Inc (b) | | 40,023 | 1,055,807 |
| Leonardo DRS Inc (b) | | 44,850 | 1,449,104 |
| Moog Inc Class A | | 17,300 | 3,405,332 |
| Park Aerospace Corp | | 4,854 | 71,111 |
| Redwire Corp Class A (b)(c) | | 3,755 | 61,807 |
| Rocket Lab USA Inc Class A (b)(c) | | 211,910 | 5,397,348 |
| Virgin Galactic Holdings Inc Class A (b)(c) | | 1,248 | 7,337 |
| VirTra Inc (b)(c) | | 6,682 | 45,104 |
| | | | 16,697,580 |
| Building Products - 1.8% | | | |
| American Woodmark Corp (b) | | 575 | 45,729 |
| Apogee Enterprises Inc | | 4,256 | 303,921 |
| AZZ Inc | | 14,790 | 1,211,597 |
| CSW Industrials Inc | | 10,202 | 3,599,266 |
| Gibraltar Industries Inc (b) | | 8,874 | 522,679 |
| Griffon Corp | | 22,900 | 1,632,083 |
| Insteel Industries Inc | | 5,156 | 139,263 |
| Janus International Group Inc (b) | | 86,442 | 635,349 |
| JELD-WEN Holding Inc (b) | | 17,802 | 145,797 |
| Tecnoglass Inc | | 13,680 | 1,085,098 |
| UFP Industries Inc | | 20,818 | 2,345,148 |
| Zurn Elkay Water Solutions Corp | | 83,085 | 3,099,071 |
| | | | 14,765,001 |
| Commercial Services & Supplies - 1.5% | | | |
| ACV Auctions Inc Class A (b) | | 90,111 | 1,946,398 |
| Aris Water Solutions Inc Class A | | 1,043 | 24,980 |
| Bridger Aerospace Group Holdings Inc (b)(c) | | 1,681 | 3,580 |
| Brink's Co/The | | 27,003 | 2,505,068 |
| Casella Waste Systems Inc Class A (b) | | 38,030 | 4,023,954 |
| CECO Environmental Corp (b) | | 17,827 | 538,910 |
| CompX International Inc Class A | | 539 | 14,095 |
| Driven Brands Holdings Inc (b) | | 36,497 | 589,062 |
| HNI Corp | | 13,828 | 696,516 |
| Interface Inc | | 3,425 | 83,399 |
| LanzaTech Global Inc Class A (b)(c) | | 68,183 | 93,411 |
| Liquidity Services Inc (b) | | 13,077 | 422,256 |
| Montrose Environmental Group Inc (b) | | 19,365 | 359,221 |
| Perma-Fix Environmental Services Inc (b)(c) | | 8,880 | 98,302 |
| Pitney Bowes Inc | | 29,249 | 211,763 |
| Quad/Graphics Inc Class A | | 11,718 | 81,674 |
| Quest Resource Holding Corp (b) | | 10,673 | 69,375 |
| Viad Corp (b) | | 12,455 | 529,462 |
| Virco Mfg. Corp | | 461 | 4,724 |
| VSE Corp | | 1,717 | 163,287 |
| | | | 12,459,437 |
| Construction & Engineering - 2.6% | | | |
| Ameresco Inc Class A (b)(c) | | 6,549 | 153,771 |
| Argan Inc | | 7,698 | 1,054,934 |
| Bowman Consulting Group Ltd (b) | | 8,378 | 209,031 |
| Centuri Holdings Inc | | 10,371 | 200,264 |
| Construction Partners Inc Class A (b) | | 26,150 | 2,313,229 |
| Dycom Industries Inc (b) | | 17,301 | 3,011,412 |
| Fluor Corp (b) | | 95,365 | 4,703,402 |
| Granite Construction Inc | | 22,096 | 1,938,040 |
| IES Holdings Inc (b) | | 5,011 | 1,007,011 |
| Limbach Holdings Inc (b) | | 6,223 | 532,315 |
| MYR Group Inc (b) | | 9,749 | 1,450,359 |
| Northwest Pipe Co (b) | | 934 | 45,075 |
| Orion Group Holdings Inc (b) | | 3,356 | 24,599 |
| Primoris Services Corp | | 30,018 | 2,293,375 |
| Sterling Infrastructure Inc (b) | | 18,171 | 3,060,905 |
| | | | 21,997,722 |
| Electrical Equipment - 1.9% | | | |
| 374Water Inc (b) | | 40,183 | 27,429 |
| Allient Inc | | 505 | 12,261 |
| American Superconductor Corp (b)(c) | | 21,289 | 524,348 |
| Amprius Technologies Inc (b)(c) | | 9,559 | 26,765 |
| Array Technologies Inc (b)(c) | | 93,061 | 562,088 |
| Atkore Inc | | 21,817 | 1,820,629 |
| Blink Charging Co (b)(c) | | 26,219 | 36,444 |
| Bloom Energy Corp Class A (b)(c) | | 111,889 | 2,485,055 |
| ChargePoint Holdings Inc Class A (b)(c) | | 133,797 | 143,163 |
| EnerSys | | 22,344 | 2,065,256 |
| Enovix Corp Class B (b)(c) | | 100,163 | 1,088,772 |
| Fluence Energy Inc Class A (b)(c) | | 37,620 | 597,406 |
| GrafTech International Ltd (b) | | 145,277 | 251,329 |
| LSI Industries Inc | | 12,192 | 236,769 |
| NANO Nuclear Energy Inc (c) | | 442 | 11,004 |
| NEXTracker Inc Class A (b) | | 65,356 | 2,387,455 |
| NuScale Power Corp Class A (b)(c) | | 51,600 | 925,188 |
| Plug Power Inc (b)(c) | | 39,249 | 83,600 |
| Powell Industries Inc | | 5,693 | 1,261,853 |
| Preformed Line Products Co | | 94 | 12,012 |
| SES AI Corp Class A (b)(c) | | 6,191 | 13,558 |
| Shoals Technologies Group Inc (b) | | 102,169 | 564,995 |
| SolarMax Technology Inc (b)(c) | | 7,766 | 12,581 |
| Solidion Technology Inc Class A (b)(c) | | 23,742 | 16,541 |
| Thermon Group Holdings Inc (b) | | 2,100 | 60,417 |
| Ultralife Corp (b) | | 759 | 5,654 |
| Vicor Corp (b) | | 7,661 | 370,180 |
| | | | 15,602,752 |
| Ground Transportation - 0.5% | | | |
| ArcBest Corp | | 14,336 | 1,337,836 |
| Covenant Logistics Group Inc Class A | | 856 | 46,661 |
| Heartland Express Inc | | 11,598 | 130,130 |
| Marten Transport Ltd | | 7,391 | 115,374 |
| PAMT CORP (b) | | 430 | 7,042 |
| Proficient Auto Logistics Inc | | 2,836 | 22,886 |
| RXO Inc (b) | | 97,117 | 2,315,269 |
| Universal Logistics Holdings Inc | | 1,473 | 67,670 |
| Werner Enterprises Inc | | 4,783 | 171,805 |
| | | | 4,214,673 |
| Machinery - 5.1% | | | |
| Alamo Group Inc | | 6,239 | 1,159,892 |
| Albany International Corp Class A | | 4,632 | 370,421 |
| Atmus Filtration Technologies Inc | | 51,048 | 2,000,061 |
| Blue Bird Corp (b) | | 19,580 | 756,375 |
| Chart Industries Inc (b) | | 26,179 | 4,996,001 |
| Douglas Dynamics Inc | | 11,495 | 271,627 |
| Energy Recovery Inc (b) | | 34,589 | 508,458 |
| Enerpac Tool Group Corp Class A | | 33,127 | 1,361,188 |
| Enpro Inc | | 1,351 | 232,980 |
| ESCO Technologies Inc | | 7,721 | 1,028,514 |
| Federal Signal Corp | | 36,620 | 3,383,322 |
| Franklin Electric Co Inc | | 27,588 | 2,688,451 |
| Gorman-Rupp Co/The | | 12,763 | 483,973 |
| Graham Corp (b) | | 6,257 | 278,249 |
| Helios Technologies Inc | | 13,833 | 617,505 |
| Hillenbrand Inc | | 14,341 | 441,416 |
| Hillman Solutions Corp Class A (b) | | 20,450 | 199,183 |
| Hyster-Yale Inc Class A | | 4,242 | 216,045 |
| John Bean Technologies Corp | | 2,002 | 254,454 |
| Kadant Inc | | 7,139 | 2,462,884 |
| Lindsay Corp | | 3,280 | 388,057 |
| Mayville Engineering Co Inc (b) | | 655 | 10,297 |
| Miller Industries Inc/TN | | 410 | 26,798 |
| Mueller Industries Inc | | 62,961 | 4,996,586 |
| Mueller Water Products Inc Class A1 | | 94,636 | 2,129,310 |
| Omega Flex Inc | | 2,168 | 90,991 |
| REV Group Inc | | 24,435 | 778,743 |
| Shyft Group Inc/The | | 1,250 | 14,675 |
| SPX Technologies Inc (b) | | 27,420 | 3,990,158 |
| Standex International Corp | | 5,415 | 1,012,551 |
| Taylor Devices Inc (b) | | 1,771 | 73,709 |
| Tennant CO | | 5,128 | 418,086 |
| Trinity Industries Inc | | 45,691 | 1,603,754 |
| Watts Water Technologies Inc Class A | | 16,680 | 3,391,044 |
| | | | 42,635,758 |
| Passenger Airlines - 0.3% | | | |
| Frontier Group Holdings Inc (b)(c) | | 25,690 | 182,656 |
| Joby Aviation Inc Class A (b)(c) | | 263,206 | 2,139,865 |
| Sun Country Airlines Holdings Inc (b) | | 11,344 | 165,396 |
| Wheels Up Experience Inc Class A (b)(c) | | 54,589 | 90,071 |
| | | | 2,577,988 |
| Professional Services - 3.2% | | | |
| Barrett Business Services Inc | | 14,204 | 617,022 |
| Cbiz Inc (b) | | 29,192 | 2,388,781 |
| CRA International Inc | | 4,019 | 752,357 |
| CSG Systems International Inc | | 18,032 | 921,616 |
| DLH Holdings Corp (b) | | 1,844 | 14,807 |
| ExlService Holdings Inc (b) | | 95,738 | 4,248,852 |
| Exponent Inc | | 30,783 | 2,742,765 |
| First Advantage Corp (b) | | 21,758 | 407,527 |
| FiscalNote Holdings Inc Class A (b) | | 38,329 | 41,012 |
| Franklin Covey Co (b) | | 6,856 | 257,648 |
| HireQuest Inc | | 2,777 | 39,322 |
| Huron Consulting Group Inc (b) | | 10,702 | 1,329,831 |
| ICF International Inc | | 11,363 | 1,354,583 |
| Innodata Inc (b)(c) | | 16,478 | 651,211 |
| Insperity Inc | | 21,872 | 1,695,299 |
| Kforce Inc | | 11,109 | 629,880 |
| Legalzoom.com Inc (b) | | 78,067 | 586,283 |
| Maximus Inc | | 36,624 | 2,733,982 |
| NV5 Global Inc (b) | | 6,380 | 120,199 |
| Spire Global Inc Class A (b)(c) | | 13,595 | 191,282 |
| TriNet Group Inc | | 19,467 | 1,767,020 |
| Upwork Inc (b) | | 75,873 | 1,240,524 |
| Verra Mobility Corp Class A (b) | | 100,368 | 2,426,898 |
| | | | 27,158,701 |
| Trading Companies & Distributors - 3.5% | | | |
| Alta Equipment Group Inc Class A (c) | | 16,364 | 107,021 |
| Applied Industrial Technologies Inc | | 23,423 | 5,609,106 |
| Beacon Roofing Supply Inc (b) | | 35,231 | 3,578,765 |
| Boise Cascade Co | | 11,317 | 1,345,139 |
| Custom Truck One Source Inc Class A (b)(c) | | 19,959 | 96,003 |
| Distribution Solutions Group Inc (b) | | 5,646 | 194,222 |
| DXP Enterprises Inc/TX (b) | | 663 | 54,777 |
| EVI Industries Inc | | 2,530 | 41,366 |
| FTAI Aviation Ltd | | 61,868 | 8,911,467 |
| Global Industrial Co | | 8,294 | 205,608 |
| GMS Inc (b) | | 21,639 | 1,835,636 |
| H&E Equipment Services Inc | | 18,081 | 885,246 |
| Herc Holdings Inc | | 17,141 | 3,245,306 |
| Hudson Technologies Inc (b) | | 3,871 | 21,600 |
| Karat Packaging Inc | | 4,166 | 126,063 |
| McGrath RentCorp | | 14,865 | 1,662,204 |
| Transcat Inc (b) | | 5,502 | 581,781 |
| Xometry Inc Class A (b) | | 25,884 | 1,104,211 |
| | | | 29,605,521 |
| Transportation Infrastructure - 0.0% | | | |
| Sky Harbour Group Corp Class A (b)(c) | | 6,904 | 82,365 |
TOTAL INDUSTRIALS | | | 187,797,498 |
| | | | |
| Information Technology - 19.8% | | | |
| Communications Equipment - 0.3% | | | |
| Calix Inc (b) | | 26,749 | 932,738 |
| Extreme Networks Inc (b) | | 42,028 | 703,548 |
| Harmonic Inc (b) | | 67,277 | 890,075 |
| Infinera Corp (b)(c) | | 123,272 | 809,897 |
| | | | 3,336,258 |
| Electronic Equipment, Instruments & Components - 2.9% | | | |
| 908 Devices Inc (b) | | 1,024 | 2,253 |
| Advanced Energy Industries Inc | | 22,791 | 2,635,323 |
| Arlo Technologies Inc (b) | | 59,552 | 666,387 |
| Badger Meter Inc | | 17,904 | 3,797,797 |
| Belden Inc | | 13,185 | 1,484,763 |
| Climb Global Solutions Inc | | 2,563 | 324,860 |
| CTS Corp | | 14,269 | 752,404 |
| Daktronics Inc (b) | | 3,501 | 59,027 |
| ePlus Inc (b) | | 10,788 | 797,017 |
| Evolv Technologies Holdings Inc Class A (b)(c) | | 80,578 | 318,283 |
| Insight Enterprises Inc (b) | | 16,583 | 2,522,274 |
| Itron Inc (b) | | 24,870 | 2,700,385 |
| Lightwave Logic Inc (b)(c) | | 73,217 | 153,756 |
| MicroVision Inc (b)(c) | | 69,170 | 90,613 |
| Mirion Technologies Inc Class A (b) | | 16,376 | 285,761 |
| Napco Security Technologies Inc | | 21,452 | 762,833 |
| nLight Inc (b) | | 1,600 | 16,784 |
| Novanta Inc (b) | | 21,849 | 3,337,872 |
| OSI Systems Inc (b) | | 9,103 | 1,524,115 |
| Ouster Inc Class A (b) | | 4,890 | 59,756 |
| PAR Technology Corp (b)(c) | | 19,296 | 1,402,240 |
| Plexus Corp (b) | | 4,884 | 764,248 |
| | | | 24,458,751 |
| IT Services - 0.8% | | | |
| Applied Digital Corp (b)(c) | | 80,818 | 617,450 |
| ASGN Inc (b) | | 5,868 | 489,039 |
| Backblaze Inc Class A (b) | | 24,312 | 146,358 |
| BigBear.ai Holdings Inc (b)(c) | | 47,054 | 209,390 |
| BigCommerce Holdings Inc (b) | | 43,484 | 266,122 |
| Core Scientific Inc | | 85,277 | 1,198,142 |
| Couchbase Inc (b) | | 24,255 | 378,135 |
| DigitalOcean Holdings Inc (b) | | 39,974 | 1,361,915 |
| Fastly Inc Class A (b) | | 63,389 | 598,392 |
| Grid Dynamics Holdings Inc (b) | | 26,402 | 587,180 |
| Hackett Group Inc/The | | 13,954 | 428,667 |
| Tucows Inc Class A (b)(c) | | 4,870 | 83,472 |
| | | | 6,364,262 |
| Semiconductors & Semiconductor Equipment - 3.7% | | | |
| ACM Research Inc Class A (b) | | 21,290 | 321,479 |
| Aehr Test Systems (b)(c) | | 17,271 | 287,217 |
| Ambarella Inc (b) | | 12,113 | 881,100 |
| Axcelis Technologies Inc (b) | | 19,845 | 1,386,570 |
| CEVA Inc (b) | | 12,045 | 380,020 |
| Credo Technology Group Holding Ltd (b) | | 85,326 | 5,734,760 |
| Diodes Inc (b) | | 2,940 | 181,310 |
| Everspin Technologies Inc (b) | | 10,177 | 65,031 |
| FormFactor Inc (b) | | 47,150 | 2,074,600 |
| GCT Semiconductor Holding Inc Class A (b)(c) | | 4,764 | 11,099 |
| Ichor Holdings Ltd (b) | | 6,340 | 204,275 |
| Impinj Inc (b) | | 13,968 | 2,028,992 |
| MaxLinear Inc Class A (b) | | 45,942 | 908,733 |
| Navitas Semiconductor Corp Class A (b)(c) | | 10,569 | 37,731 |
| NVE Corp | | 2,920 | 237,776 |
| PDF Solutions Inc (b) | | 18,954 | 513,274 |
| Photronics Inc (b) | | 12,790 | 301,332 |
| Power Integrations Inc (c) | | 34,468 | 2,126,676 |
| QuickLogic Corp (b)(c) | | 8,417 | 95,112 |
| Rambus Inc (b) | | 65,081 | 3,440,182 |
| Semtech Corp (b) | | 44,249 | 2,736,801 |
| Silicon Laboratories Inc (b) | | 19,518 | 2,424,526 |
| SiTime Corp (b) | | 11,322 | 2,428,909 |
| SkyWater Technology Inc (b) | | 16,584 | 228,859 |
| Synaptics Inc (b) | | 1,781 | 135,926 |
| Ultra Clean Holdings Inc (b) | | 26,952 | 968,924 |
| Veeco Instruments Inc (b) | | 28,616 | 766,909 |
| | | | 30,908,123 |
| Software - 11.4% | | | |
| 8x8 Inc (b) | | 77,982 | 208,212 |
| A10 Networks Inc | | 43,255 | 795,892 |
| ACI Worldwide Inc (b) | | 64,253 | 3,335,373 |
| Adeia Inc | | 55,981 | 782,614 |
| Agilysys Inc (b) | | 13,729 | 1,808,247 |
| Airship AI Holdings Inc Class A (b)(c) | | 4,926 | 30,837 |
| Alarm.com Holdings Inc (b) | | 28,855 | 1,754,384 |
| Alkami Technology Inc (b) | | 32,349 | 1,186,561 |
| Altair Engineering Inc Class A (b) | | 33,093 | 3,610,777 |
| Amplitude Inc Class A (b) | | 47,658 | 502,792 |
| Appian Corp Class A (b)(c) | | 24,544 | 809,461 |
| Arteris Inc (b) | | 17,213 | 175,400 |
| Asana Inc Class A (b) | | 49,498 | 1,003,324 |
| AudioEye Inc (b) | | 4,350 | 66,164 |
| Aurora Innovation Inc Class A (b)(c) | | 315,757 | 1,989,269 |
| AvePoint Inc Class A (b) | | 78,532 | 1,296,563 |
| Blackbaud Inc (b) | | 24,699 | 1,825,750 |
| BlackLine Inc (b) | | 35,161 | 2,136,382 |
| Blend Labs Inc Class A (b) | | 144,564 | 608,614 |
| Box Inc Class A (b) | | 85,807 | 2,711,501 |
| Braze Inc Class A (b) | | 40,167 | 1,682,194 |
| C3.ai Inc Class A (b)(c) | | 67,385 | 2,320,066 |
| Cipher Mining Inc (b)(c) | | 83,013 | 385,180 |
| Cleanspark Inc (b)(c) | | 151,563 | 1,395,895 |
| Clear Secure Inc Class A | | 53,487 | 1,424,894 |
| Clearwater Analytics Holdings Inc Class A (b) | | 108,940 | 2,998,029 |
| Commvault Systems Inc (b) | | 24,810 | 3,744,077 |
| CS Disco Inc (b) | | 11,301 | 56,392 |
| Daily Journal Corp (b)(c) | | 606 | 344,202 |
| Digimarc Corp (b)(c) | | 8,755 | 327,875 |
| Domo Inc Class B (b) | | 20,909 | 148,036 |
| eGain Corp (b) | | 10,798 | 67,272 |
| Enfusion Inc Class A (b) | | 30,318 | 312,275 |
| EverCommerce Inc (b) | | 9,450 | 104,045 |
| Freshworks Inc Class A (b) | | 125,998 | 2,037,388 |
| Intapp Inc (b) | | 32,491 | 2,082,348 |
| InterDigital Inc | | 15,411 | 2,985,419 |
| Jamf Holding Corp (b) | | 49,926 | 701,460 |
| Kaltura Inc (b) | | 59,542 | 130,992 |
| Life360 Inc (b) | | 5,132 | 211,798 |
| LiveRamp Holdings Inc (b) | | 40,237 | 1,221,998 |
| MARA Holdings Inc (b)(c) | | 142,020 | 2,381,675 |
| Matterport Inc Class A (b) | | 161,759 | 766,738 |
| Meridianlink Inc (b) | | 12,069 | 249,225 |
| Mitek Systems Inc (b) | | 27,871 | 310,204 |
| N-able Inc/US (b) | | 43,657 | 407,756 |
| NCR Voyix Corp (b) | | 80,391 | 1,112,611 |
| NextNav Inc Class A (b)(c) | | 47,176 | 734,059 |
| Olo Inc Class A (b) | | 31,199 | 239,608 |
| OneSpan Inc | | 21,018 | 389,674 |
| Ooma Inc (b) | | 2,162 | 30,398 |
| PagerDuty Inc (b) | | 54,576 | 996,558 |
| Porch Group Inc (b) | | 48,109 | 236,696 |
| Prairie Operating Co (b)(c) | | 2,396 | 16,580 |
| Progress Software Corp | | 25,913 | 1,688,232 |
| PROS Holdings Inc (b) | | 27,894 | 612,552 |
| Q2 Holdings Inc (b) | | 35,843 | 3,607,598 |
| Qualys Inc (b) | | 22,619 | 3,171,636 |
| Rapid7 Inc (b) | | 37,725 | 1,517,677 |
| Red Violet Inc | | 6,741 | 244,024 |
| Rekor Systems Inc (b)(c) | | 40,480 | 63,149 |
| ReposiTrak Inc | | 7,186 | 159,026 |
| Rimini Street Inc (b) | | 4,665 | 12,456 |
| Riot Platforms Inc (b)(c) | | 23,105 | 235,902 |
| Roadzen Inc (b) | | 1,565 | 3,412 |
| SEMrush Holdings Inc Class A (b) | | 22,450 | 266,706 |
| Silvaco Group Inc (b)(c) | | 3,053 | 24,668 |
| SoundHound AI Inc Class A (b)(c) | | 187,878 | 3,727,500 |
| SoundThinking Inc (b) | | 5,477 | 71,530 |
| Sprinklr Inc Class A (b) | | 71,169 | 601,378 |
| Sprout Social Inc Class A (b) | | 30,493 | 936,440 |
| SPS Commerce Inc (b) | | 22,961 | 4,224,594 |
| Tenable Holdings Inc (b) | | 71,854 | 2,829,611 |
| Terawulf Inc (b)(c) | | 152,210 | 861,509 |
| Varonis Systems Inc (b) | | 67,160 | 2,983,919 |
| Vertex Inc Class A (b) | | 33,074 | 1,764,498 |
| Viant Technology Inc Class A (b) | | 9,361 | 177,765 |
| Weave Communications Inc (b) | | 24,166 | 384,723 |
| Workiva Inc Class A (b) | | 30,767 | 3,368,987 |
| Yext Inc (b) | | 64,890 | 412,700 |
| Zeta Global Holdings Corp Class A (b) | | 108,867 | 1,958,517 |
| Zuora Inc Class A (b) | | 85,091 | 844,103 |
| | | | 95,946,546 |
| Technology Hardware, Storage & Peripherals - 0.7% | | | |
| CompoSecure Inc Class A (c) | | 13,018 | 199,566 |
| Corsair Gaming Inc (b) | | 5,849 | 38,662 |
| CPI Card Group Inc (b) | | 2,968 | 88,714 |
| IonQ Inc (b)(c) | | 122,459 | 5,115,112 |
| Turtle Beach Corp (b) | | 5,969 | 103,323 |
| | | | 5,545,377 |
TOTAL INFORMATION TECHNOLOGY | | | 166,559,317 |
| | | | |
| Materials - 3.6% | | | |
| Chemicals - 1.8% | | | |
| Arq Inc (b) | | 2,049 | 15,511 |
| ASP Isotopes Inc (b)(c) | | 31,922 | 144,607 |
| Aspen Aerogels Inc (b) | | 8,263 | 98,164 |
| Balchem Corp | | 19,685 | 3,208,557 |
| Cabot Corp | | 32,656 | 2,981,819 |
| Hawkins Inc | | 11,781 | 1,445,175 |
| HB Fuller Co | | 9,388 | 633,502 |
| Ingevity Corp (b) | | 22,176 | 903,672 |
| Innospec Inc | | 12,947 | 1,424,947 |
| Northern Technologies International Corp | | 4,840 | 65,292 |
| PureCycle Technologies Inc (b)(c) | | 14,119 | 144,720 |
| Quaker Chemical Corp | | 8,417 | 1,184,777 |
| Sensient Technologies Corp | | 24,314 | 1,732,616 |
| Stepan Co | | 1,339 | 86,633 |
| | | | 14,069,992 |
| Construction Materials - 0.5% | | | |
| Knife River Corp (b) | | 34,597 | 3,516,439 |
| Smith-Midland Corp (b)(c) | | 2,788 | 123,954 |
| United States Lime & Minerals Inc | | 6,412 | 851,129 |
| | | | 4,491,522 |
| Containers & Packaging - 0.1% | | | |
| Ardagh Metal Packaging SA | | 88,133 | 265,280 |
| Myers Industries Inc | | 22,363 | 246,888 |
| Pactiv Evergreen Inc | | 2,895 | 50,576 |
| | | | 562,744 |
| Metals & Mining - 1.2% | | | |
| Alpha Metallurgical Resources Inc | | 6,694 | 1,339,603 |
| Carpenter Technology Corp | | 28,987 | 4,919,385 |
| Century Aluminum Co (b) | | 32,159 | 585,937 |
| Constellium SE (b) | | 78,885 | 810,149 |
| Contango ORE Inc (b) | | 2,591 | 25,962 |
| Dakota Gold Corp (b) | | 25,526 | 56,157 |
| Ivanhoe Electric Inc / US (b)(c) | | 50,906 | 384,340 |
| Kaiser Aluminum Corp | | 9,131 | 641,635 |
| Materion Corp | | 11,814 | 1,168,168 |
| Perpetua Resources Corp (United States) (b)(c) | | 23,471 | 250,436 |
| Piedmont Lithium Inc (b)(c) | | 3,130 | 27,356 |
| Ramaco Resources Inc Class A | | 15,672 | 160,795 |
| Ramaco Resources Inc Class B | | 3,597 | 35,538 |
| | | | 10,405,461 |
| Paper & Forest Products - 0.0% | | | |
| Sylvamo Corp | | 4,596 | 363,175 |
TOTAL MATERIALS | | | 29,892,894 |
| | | | |
| Real Estate - 1.4% | | | |
| Diversified REITs - 0.0% | | | |
| Armada Hoffler Properties Inc Class A | | 3,375 | 34,526 |
| Gladstone Commercial Corp | | 3,887 | 63,125 |
| | | | 97,651 |
| Health Care REITs - 0.1% | | | |
| CareTrust REIT Inc | | 9,384 | 253,838 |
| Community Healthcare Trust Inc | | 1,307 | 25,107 |
| Strawberry Fields REIT Ltd | | 3,817 | 40,231 |
| Universal Health Realty Income Trust | | 6,514 | 242,386 |
| | | | 561,562 |
| Hotel & Resort REITs - 0.4% | | | |
| Ryman Hospitality Properties Inc | | 35,718 | 3,726,816 |
| Office REITs - 0.0% | | | |
| Postal Realty Trust Inc Class A | | 5,058 | 66,007 |
| Real Estate Management & Development - 0.4% | | | |
| Compass Inc Class A (b) | | 222,034 | 1,298,899 |
| eXp World Holdings Inc (c) | | 49,871 | 574,015 |
| Forestar Group Inc (b) | | 1,365 | 35,381 |
| Maui Land & Pineapple Co Inc (b) | | 4,336 | 95,305 |
| Offerpad Solutions Inc Class A (b) | | 885 | 2,522 |
| Opendoor Technologies Inc Class A (b) | | 19,012 | 30,419 |
| Redfin Corp (b) | | 72,749 | 572,535 |
| St Joe Co/The | | 21,954 | 986,393 |
| | | | 3,595,469 |
| Residential REITs - 0.1% | | | |
| Apartment Investment and Management Co Class A | | 40,635 | 369,372 |
| Clipper Realty Inc | | 6,270 | 28,717 |
| UMH Properties Inc | | 6,516 | 123,022 |
| | | | 521,111 |
| Retail REITs - 0.3% | | | |
| Alexander's Inc | | 1,307 | 261,478 |
| CBL & Associates Properties Inc | | 9,166 | 269,572 |
| NETSTREIT Corp | | 9,328 | 131,991 |
| Phillips Edison & Co Inc | | 10,969 | 410,899 |
| Saul Centers Inc | | 5,762 | 223,566 |
| Tanger Inc | | 25,407 | 867,141 |
| | | | 2,164,647 |
| Specialized REITs - 0.1% | | | |
| Outfront Media Inc | | 35,281 | 625,885 |
TOTAL REAL ESTATE | | | 11,359,148 |
| | | | |
| Utilities - 0.4% | | | |
| Electric Utilities - 0.2% | | | |
| Genie Energy Ltd Class B | | 3,430 | 53,474 |
| MGE Energy Inc | | 9,498 | 892,432 |
| Otter Tail Corp | | 11,261 | 831,512 |
| | | | 1,777,418 |
| Independent Power and Renewable Electricity Producers - 0.0% | | | |
| Montauk Renewables Inc (b) | | 40,153 | 159,809 |
| Water Utilities - 0.2% | | | |
| American States Water Co | | 12,748 | 990,775 |
| Cadiz Inc (b)(c) | | 25,692 | 133,598 |
| California Water Service Group | | 9,596 | 434,987 |
| Consolidated Water Co Ltd | | 2,250 | 58,253 |
| Global Water Resources Inc | | 7,050 | 81,075 |
| Middlesex Water Co | | 1,356 | 71,366 |
| York Water Co/The | | 1,111 | 36,351 |
| | | | 1,806,405 |
TOTAL UTILITIES | | | 3,743,632 |
| | | | |
| TOTAL UNITED STATES | | | 817,270,968 |
| TOTAL COMMON STOCKS (Cost $703,572,967) | | | 837,131,537 |
| | | | |
| U.S. Treasury Obligations - 0.0% |
| | | Yield (%) (g) | Principal Amount (a) | Value ($) |
US Treasury Bills 0% 2/20/2025 (h) (Cost $272,320) | | 4.46 | 274,000 | 272,442 |
| | | | | |
| Money Market Funds - 8.9% |
| | | Yield (%) | Shares | Value ($) |
| Fidelity Cash Central Fund (i) | | 4.36 | 2,517,677 | 2,518,180 |
| Fidelity Securities Lending Cash Central Fund (i)(j) | | 4.35 | 72,348,041 | 72,355,276 |
| TOTAL MONEY MARKET FUNDS (Cost $74,873,456) | | | | 74,873,456 |
| | | | | |
| TOTAL INVESTMENT IN SECURITIES - 108.7% (Cost $778,718,743) | 912,277,435 |
NET OTHER ASSETS (LIABILITIES) - (8.7)% | (72,671,673) |
| NET ASSETS - 100.0% | 839,605,762 |
| | |
| Futures Contracts |
| | Number of contracts | Expiration Date | Notional Amount ($) | Value ($) | Unrealized Appreciation/ (Depreciation) ($) |
| Purchased | | | | | |
| | | | | | |
| Equity Contracts | | | | | |
| CME E-mini Russell 2000 Index Contracts (United States) | 26 | Mar 2025 | 2,924,740 | (56,782) | (56,782) |
| | | | | | |
| The notional amount of futures purchased as a percentage of Net Assets is 0.3% |
Legend
| (a) | Amount is stated in United States dollars unless otherwise noted. |
| (c) | Security or a portion of the security is on loan at period end. |
| (d) | Equity security is subject to lock-up or market standoff agreement and valued at a discount to the market price of the equivalent equity security. As of period end, the total fair value of equity securities discounted due to contractual sale restrictions is $921 and all restrictions are set to expire on or before January 31, 2025. Under normal market conditions, there are no circumstances that could cause the restrictions to lapse. |
| (e) | Security is exempt from registration under Regulation S of the Securities Act of 1933 and may be resold to qualified foreign investors outside of the United States. At the end of the period, the value of securities amounted to $640,422 or 0.1% of net assets. |
| (g) | Yield represents either the annualized yield at the date of purchase, or the stated coupon rate, or, for floating and adjustable rate securities, the rate at period end. |
| (h) | Security or a portion of the security was pledged to cover margin requirements for futures contracts. At period end, the value of securities pledged amounted to $272,442. |
| (i) | Affiliated fund that is generally available only to investment companies and other accounts managed by Fidelity Investments. The rate quoted is the annualized seven-day yield of the fund at period end. A complete unaudited listing of the fund's holdings as of its most recent quarter end is available upon request. In addition, each Fidelity Central Fund's financial statements are available on the SEC's website or upon request. |
| (j) | Investment made with cash collateral received from securities on loan. |
Affiliated Central Funds
Fiscal year to date information regarding the Fund's investments in Fidelity Central Funds, including the ownership percentage, is presented below.
| Affiliate | Value, beginning of period ($) | Purchases ($) | Sales Proceeds ($) | Dividend Income ($) | Realized Gain (loss) ($) | Change in Unrealized appreciation (depreciation) ($) | Value, end of period ($) | Shares, end of period | % ownership, end of period |
| Fidelity Cash Central Fund | 3,708,509 | 99,418,460 | 100,608,687 | 94,709 | (102) | - | 2,518,180 | 2,517,677 | 0.0% |
| Fidelity Securities Lending Cash Central Fund | 43,017,692 | 155,484,512 | 126,146,928 | 595,085 | - | - | 72,355,276 | 72,348,041 | 0.3% |
| Total | 46,726,201 | 254,902,972 | 226,755,615 | 689,794 | (102) | - | 74,873,456 | 74,865,718 | |
| | | | | | | | | | |
Amounts in the dividend income column in the above table include any capital gain distributions from underlying funds, which are presented in the corresponding line item in the Statement of Operations, if applicable.
Amounts in the dividend income column for Fidelity Securities Lending Cash Central Fund represents the income earned on investing cash collateral, less rebates paid to borrowers and any lending agent fees associated with the loan, plus any premium payments received for lending certain types of securities.
Amounts included in the purchases and sales proceeds columns may include in-kind transactions, if applicable.
Investment Valuation
The following is a summary of the inputs used, as of December 31, 2024, involving the Fund's assets and liabilities carried at fair value. The inputs or methodology used for valuing securities may not be an indication of the risk associated with investing in those securities. For more information on valuation inputs, and their aggregation into the levels used below, please refer to the Investment Valuation section in the accompanying Notes to Financial Statements.
| Valuation Inputs at Reporting Date: |
| Description | Total ($) | Level 1 ($) | Level 2 ($) | Level 3 ($) |
Investments in Securities: | | | | |
|
| Common Stocks | | | | |
Communication Services | 18,034,850 | 18,034,850 | - | - |
Consumer Discretionary | 85,463,486 | 85,463,486 | - | - |
Consumer Staples | 27,928,000 | 27,928,000 | - | - |
Energy | 27,611,432 | 27,611,432 | - | - |
Financials | 72,217,083 | 72,217,083 | - | - |
Health Care | 196,409,360 | 196,399,238 | 3,786 | 6,336 |
Industrials | 189,649,704 | 189,649,704 | - | - |
Information Technology | 173,856,359 | 173,856,359 | - | - |
Materials | 30,576,903 | 30,576,903 | - | - |
Real Estate | 11,640,728 | 11,640,728 | - | - |
Utilities | 3,743,632 | 3,743,632 | - | - |
|
| U.S. Treasury Obligations | 272,442 | - | 272,442 | - |
|
| Money Market Funds | 74,873,456 | 74,873,456 | - | - |
| Total Investments in Securities: | 912,277,435 | 911,994,871 | 276,228 | 6,336 |
Derivative Instruments: Liabilities | | | | |
Futures Contracts | (56,782) | (56,782) | - | - |
| Total Liabilities | (56,782) | (56,782) | - | - |
| Total Derivative Instruments: | (56,782) | (56,782) | - | - |
Value of Derivative Instruments
The following table is a summary of the Fund's value of derivative instruments by primary risk exposure as of December 31, 2024. For additional information on derivative instruments, please refer to the Derivative Instruments section in the accompanying Notes to Financial Statements.
Primary Risk Exposure / Derivative Type | Value |
| Asset ($) | Liability ($) |
| Equity Risk | | |
Futures Contracts (a) | 0 | (56,782) |
| Total Equity Risk | 0 | (56,782) |
| Total Value of Derivatives | 0 | (56,782) |
(a)Reflects gross cumulative appreciation (depreciation) on futures contracts as presented in the Schedule of Investments. In the Statement of Assets and Liabilities, the period end daily variation margin is included in receivable or payable for daily variation margin on futures contracts, and the net cumulative appreciation (depreciation) is included in Total accumulated earnings (loss).
Fidelity® Small Cap Growth Index Fund
Financial Statements (Unaudited)
| Statement of Assets and Liabilities |
| As of December 31, 2024 (Unaudited) |
| Assets | | | | |
| Investment in securities, at value (including securities loaned of $69,024,464) - See accompanying schedule: | | | | |
Unaffiliated issuers (cost $703,845,287) | $ | 837,403,979 | | |
Fidelity Central Funds (cost $74,873,456) | | 74,873,456 | | |
| | | | | |
| | | | | |
| Total Investment in Securities (cost $778,718,743) | | | $ | 912,277,435 |
| Segregated cash with brokers for derivative instruments | | | | 37,597 |
| Foreign currency held at value (cost $378) | | | | 352 |
| Receivable for fund shares sold | | | | 762,278 |
| Dividends receivable | | | | 207,130 |
| Distributions receivable from Fidelity Central Funds | | | | 70,825 |
| Receivable for daily variation margin on futures contracts | | | | 3,473 |
| Other receivables | | | | 5,235 |
Total assets | | | | 913,364,325 |
| Liabilities | | | | |
| Payable to custodian bank | $ | 12,192 | | |
| Payable for fund shares redeemed | | 1,354,828 | | |
| Accrued management fee | | 36,267 | | |
| Collateral on securities loaned | | 72,355,276 | | |
| Total liabilities | | | | 73,758,563 |
| Net Assets | | | $ | 839,605,762 |
| Net Assets consist of: | | | | |
| Paid in capital | | | $ | 775,659,521 |
| Total accumulated earnings (loss) | | | | 63,946,241 |
| Net Assets | | | $ | 839,605,762 |
Net Asset Value, offering price and redemption price per share ($839,605,762 ÷ 30,301,129 shares) | | | $ | 27.71 |
| Statement of Operations |
Six months ended December 31, 2024 (Unaudited) |
| Investment Income | | | | |
| Dividends | | | $ | 2,116,794 |
| Interest | | | | 7,585 |
| Income from Fidelity Central Funds (including $595,085 from security lending) | | | | 689,794 |
| Total income | | | | 2,814,173 |
| Expenses | | | | |
| Management fee | $ | 189,975 | | |
| Independent trustees' fees and expenses | | 898 | | |
| Interest | | 2,835 | | |
| Total expenses before reductions | | 193,708 | | |
| Expense reductions | | (8,478) | | |
| Total expenses after reductions | | | | 185,230 |
| Net Investment income (loss) | | | | 2,628,943 |
| Realized and Unrealized Gain (Loss) | | | | |
| Net realized gain (loss) on: | | | | |
| Investment Securities: | | | | |
| Unaffiliated issuers | | (875,127) | | |
| Fidelity Central Funds | | (102) | | |
| Futures contracts | | 620,832 | | |
| Total net realized gain (loss) | | | | (254,397) |
| Change in net unrealized appreciation (depreciation) on: | | | | |
| Investment Securities: | | | | |
| Unaffiliated issuers | | 62,757,269 | | |
| Assets and liabilities in foreign currencies | | (18) | | |
| Futures contracts | | (109,439) | | |
| Total change in net unrealized appreciation (depreciation) | | | | 62,647,812 |
| Net gain (loss) | | | | 62,393,415 |
| Net increase (decrease) in net assets resulting from operations | | | $ | 65,022,358 |
| Statement of Changes in Net Assets |
| |
| | Six months ended December 31, 2024 (Unaudited) | | Year ended June 30, 2024 |
| Increase (Decrease) in Net Assets | | | | |
| Operations | | | | |
| Net investment income (loss) | $ | 2,628,943 | $ | 4,385,652 |
| Net realized gain (loss) | | (254,397) | | 15,324,286 |
| Change in net unrealized appreciation (depreciation) | | 62,647,812 | | 31,613,062 |
| Net increase (decrease) in net assets resulting from operations | | 65,022,358 | | 51,323,000 |
| Distributions to shareholders | | (9,619,315) | | (4,416,179) |
| | | | | |
| Share transactions | | | | |
| Proceeds from sales of shares | | 245,731,654 | | 352,653,267 |
| Reinvestment of distributions | | 8,395,178 | | 3,894,236 |
| Cost of shares redeemed | | (124,651,324) | | (269,202,210) |
| | | | | |
Net increase (decrease) in net assets resulting from share transactions | | 129,475,508 | | 87,345,293 |
| Total increase (decrease) in net assets | | 184,878,551 | | 134,252,114 |
| | | | | |
| Net Assets | | | | |
| Beginning of period | | 654,727,211 | | 520,475,097 |
| End of period | $ | 839,605,762 | $ | 654,727,211 |
| | | | | |
| Other Information | | | | |
| Shares | | | | |
| Sold | | 8,791,122 | | 14,713,757 |
| Issued in reinvestment of distributions | | 316,747 | | 165,518 |
| Redeemed | | (4,533,156) | | (11,308,549) |
| Net increase (decrease) | | 4,574,713 | | 3,570,726 |
| | | | | |
Financial Highlights
Fidelity® Small Cap Growth Index Fund |
| |
| | Six months ended (Unaudited) December 31, 2024 | | Years ended June 30, 2024 | | 2023 | | 2022 | | 2021 | | 2020 A |
Selected Per-Share Data | | | | | | | | | | | | |
| Net asset value, beginning of period | $ | 25.45 | $ | 23.49 | $ | 19.93 | $ | 30.90 | $ | 20.66 | $ | 20.00 |
| Income from Investment Operations | | | | | | | | | | | | |
Net investment income (loss) B,C | | .10 | | .19 | | .23 | | .17 | | .14 | | .15 |
| Net realized and unrealized gain (loss) | | 2.51 | | 1.97 | | 3.50 | | (10.17) | | 10.38 | | .57 |
| Total from investment operations | | 2.61 | | 2.16 | | 3.73 | | (10.00) | | 10.52 | | .72 |
| Distributions from net investment income | | (.35) | | (.20) | | (.17) | | (.16) | | (.11) | | (.05) |
| Distributions from net realized gain | | - | | - | | - | | (.81) | | (.18) | | (.01) |
| Total distributions | | (.35) | | (.20) | | (.17) | | (.97) | | (.28) D | | (.06) |
| Net asset value, end of period | $ | 27.71 | $ | 25.45 | $ | 23.49 | $ | 19.93 | $ | 30.90 | $ | 20.66 |
Total Return E,F | | | | 9.26% | | 18.78% | | (33.33)% | | 51.31% | | 3.59% |
Ratios to Average Net Assets C,G,H | | | | | | | | | | | | |
| Expenses before reductions | | .05% I | | .05% | | .05% | | .05% | | .05% | | .05% I |
| Expenses net of fee waivers, if any | | | | .05% | | .05% | | .05% | | .05% | | .05% I |
| Expenses net of all reductions | | .05% I | | .05% | | .05% | | .05% | | .05% | | .05% I |
| Net investment income (loss) | | .69% I | | .78% | | 1.05% | | .64% | | .49% | | .78% I |
| Supplemental Data | | | | | | | | | | | | |
| Net assets, end of period (000 omitted) | $ | 839,606 | $ | 654,727 | $ | 520,475 | $ | 274,753 | $ | 336,925 | $ | 54,213 |
Portfolio turnover rate J | | | | 48% K | | 42% | | 51% | | 62% | | 69% I |
AFor the period July 11, 2019 (commencement of operations) through June 30, 2020.
BCalculated based on average shares outstanding during the period.
CNet investment income (loss) is affected by the timing of the declaration of dividends by any underlying mutual funds or exchange-traded funds (ETFs). Net investment income (loss) of any mutual funds or ETFs is not included in the Fund's net investment income (loss) ratio.
DTotal distributions per share do not sum due to rounding.
ETotal returns for periods of less than one year are not annualized.
FTotal returns would have been lower if certain expenses had not been reduced during the applicable periods shown.
GFees and expenses of any underlying mutual funds or exchange-traded funds (ETFs) are not included in the Fund's expense ratio. The Fund indirectly bears its proportionate share of these expenses. For additional expense information related to investments in Fidelity Central Funds, please refer to the "Investments in Fidelity Central Funds" note found in the Notes to Financial Statements section of the most recent Annual or Semi-Annual report.
HExpense ratios reflect operating expenses of the class. Expenses before reductions do not reflect amounts reimbursed, waived, or reduced through arrangements with the investment adviser, brokerage services, or other offset arrangements, if applicable, and do not represent the amount paid by the class during periods when reimbursements, waivers or reductions occur.
IAnnualized.
JAmount does not include the portfolio activity of any underlying mutual funds or exchange-traded funds (ETFs), derivatives or securities that mature within one year from acquisition.
KPortfolio turnover rate excludes securities received or delivered in-kind.
Fidelity® Small Cap Value Index Fund
Schedule of Investments December 31, 2024 (Unaudited)
Showing Percentage of Net Assets
| Common Stocks - 99.7% |
| | | Shares | Value ($) |
| ARGENTINA - 0.5% | | | |
| Consumer Discretionary - 0.1% | | | |
| Hotels, Restaurants & Leisure - 0.1% | | | |
| Despegar.com Corp (b) | | 53,271 | 1,025,467 |
| Materials - 0.4% | | | |
| Chemicals - 0.4% | | | |
| Arcadium Lithium PLC | | 1,086,462 | 5,573,550 |
| TOTAL ARGENTINA | | | 6,599,017 |
| AUSTRALIA - 0.0% | | | |
| Materials - 0.0% | | | |
| Metals & Mining - 0.0% | | | |
| MAC Copper Ltd Class A (b) | | 38,871 | 412,810 |
| BERMUDA - 0.2% | | | |
| Energy - 0.0% | | | |
| Oil, Gas & Consumable Fuels - 0.0% | | | |
| Teekay Corp Ltd | | 54,971 | 380,949 |
| Financials - 0.2% | | | |
| Banks - 0.1% | | | |
| Bank of Nt Butterfield & Son Ltd/The (United States) | | 44,588 | 1,629,691 |
| Insurance - 0.1% | | | |
| Hamilton Insurance Group Ltd Class B (b) | | 39,655 | 754,635 |
TOTAL FINANCIALS | | | 2,384,326 |
| | | | |
| Industrials - 0.0% | | | |
| Marine Transportation - 0.0% | | | |
| Himalaya Shipping Ltd (United States) | | 1,914 | 9,302 |
| TOTAL BERMUDA | | | 2,774,577 |
| BRAZIL - 0.1% | | | |
| Financials - 0.1% | | | |
| Financial Services - 0.1% | | | |
| Pagseguro Digital Ltd Class A (b) | | 90,195 | 564,621 |
| StoneCo Ltd Class A (b) | | 138,455 | 1,103,486 |
| | | | |
| TOTAL BRAZIL | | | 1,668,107 |
| CAMEROON - 0.3% | | | |
| Energy - 0.3% | | | |
| Oil, Gas & Consumable Fuels - 0.3% | | | |
| Golar LNG Ltd | | 99,272 | 4,201,191 |
| CANADA - 1.0% | | | |
| Energy - 0.1% | | | |
| Oil, Gas & Consumable Fuels - 0.1% | | | |
| Encore Energy Corp (United States) (b) | | 47,449 | 161,801 |
| Teekay Tankers Ltd Class A | | 24,043 | 956,671 |
| | | | 1,118,472 |
| Health Care - 0.0% | | | |
| Biotechnology - 0.0% | | | |
| Aurinia Pharmaceuticals Inc (b) | | 36,634 | 328,974 |
| Fennec Pharmaceuticals Inc (United States) (b) | | 18,298 | 115,643 |
| | | | 444,617 |
| Industrials - 0.0% | | | |
| Industrial Conglomerates - 0.0% | | | |
| Brookfield Business Corp Class A (United States) | | 25,255 | 612,686 |
| Information Technology - 0.2% | | | |
| Software - 0.2% | | | |
| D-Wave Quantum Inc (b)(c) | | 45,319 | 380,679 |
| Hut 8 Corp (United States) (b) | | 81,238 | 1,664,567 |
| | | | 2,045,246 |
| Materials - 0.2% | | | |
| Metals & Mining - 0.2% | | | |
| i-80 Gold Corp (United States) (b)(c) | | 322,340 | 156,335 |
| Novagold Resources Inc (United States) (b) | | 244,594 | 814,498 |
| Ssr Mining Inc (United States) | | 203,097 | 1,413,555 |
| | | | 2,384,388 |
| Utilities - 0.5% | | | |
| Gas Utilities - 0.5% | | | |
| Brookfield Infrastructure Corp (United States) | | 120,408 | 4,817,524 |
| TOTAL CANADA | | | 11,422,933 |
| CHINA - 0.0% | | | |
| Information Technology - 0.0% | | | |
| Semiconductors & Semiconductor Equipment - 0.0% | | | |
| indie Semiconductor Inc Class A (b)(c) | | 114,350 | 463,118 |
| IRELAND - 0.1% | | | |
| Energy - 0.1% | | | |
| Oil, Gas & Consumable Fuels - 0.1% | | | |
| Ardmore Shipping Corp | | 41,957 | 509,778 |
| Health Care - 0.0% | | | |
| Biotechnology - 0.0% | | | |
| Prothena Corp PLC (b) | | 17,801 | 246,543 |
| Industrials - 0.0% | | | |
| Commercial Services & Supplies - 0.0% | | | |
| Cimpress PLC (b) | | 5,444 | 390,444 |
| TOTAL IRELAND | | | 1,146,765 |
| ISLE OF MAN - 0.0% | | | |
| Materials - 0.0% | | | |
| Metals & Mining - 0.0% | | | |
| Lifezone Metals Ltd (b) | | 36,195 | 251,555 |
| ISRAEL - 0.0% | | | |
| Communication Services - 0.0% | | | |
| Media - 0.0% | | | |
| Innovid Corp Class A (b) | | 96,567 | 298,392 |
| Health Care - 0.0% | | | |
| Health Care Providers & Services - 0.0% | | | |
| Nano-X Imaging Ltd (b)(c) | | 2,942 | 21,182 |
| TOTAL ISRAEL | | | 319,574 |
| KOREA (SOUTH) - 0.0% | | | |
| Communication Services - 0.0% | | | |
| Interactive Media & Services - 0.0% | | | |
| Webtoon Entertainment Inc | | 8,731 | 118,567 |
| Health Care - 0.0% | | | |
| Biotechnology - 0.0% | | | |
| Artiva Biotherapeutics Inc (b)(c) | | 6,479 | 65,308 |
| TOTAL KOREA (SOUTH) | | | 183,875 |
| MEXICO - 0.1% | | | |
| Energy - 0.1% | | | |
| Energy Equipment & Services - 0.1% | | | |
| Borr Drilling Ltd (United States) (c) | | 237,279 | 925,388 |
| MONACO - 0.2% | | | |
| Energy - 0.2% | | | |
| Oil, Gas & Consumable Fuels - 0.2% | | | |
| Scorpio Tankers Inc | | 44,724 | 2,222,336 |
| Industrials - 0.0% | | | |
| Marine Transportation - 0.0% | | | |
| Costamare Inc | | 39,844 | 511,995 |
| Safe Bulkers Inc | | 59,063 | 210,855 |
| | | | 722,850 |
| TOTAL MONACO | | | 2,945,186 |
| NORWAY - 0.4% | | | |
| Energy - 0.3% | | | |
| Energy Equipment & Services - 0.2% | | | |
| Seadrill Ltd (b) | | 49,176 | 1,914,422 |
| Oil, Gas & Consumable Fuels - 0.1% | | | |
| FLEX LNG Ltd (United States) | | 12,272 | 281,519 |
| SFL Corp Ltd | | 103,881 | 1,061,664 |
| | | | 1,343,183 |
| Industrials - 0.1% | | | |
| Electrical Equipment - 0.0% | | | |
| Freyr Battery Inc (c) | | 111,868 | 288,619 |
| Marine Transportation - 0.1% | | | |
| Golden Ocean Group Ltd | | 123,190 | 1,103,783 |
TOTAL INDUSTRIALS | | | 1,392,402 |
| | | | |
| TOTAL NORWAY | | | 4,650,007 |
| PANAMA - 0.1% | | | |
| Financials - 0.1% | | | |
| Financial Services - 0.1% | | | |
| Banco Latinoamericano de Comercio Exterior SA Class E | | 27,605 | 981,910 |
| PUERTO RICO - 0.4% | | | |
| Communication Services - 0.0% | | | |
| Diversified Telecommunication Services - 0.0% | | | |
| Liberty Latin America Ltd Class A (b) | | 22,045 | 140,206 |
| Liberty Latin America Ltd Class C (b) | | 138,155 | 875,903 |
| | | | 1,016,109 |
| Financials - 0.4% | | | |
| Banks - 0.4% | | | |
| First BanCorp/Puerto Rico | | 150,103 | 2,790,415 |
| Ofg Bancorp | | 46,207 | 1,955,480 |
| | | | 4,745,895 |
| TOTAL PUERTO RICO | | | 5,762,004 |
| SINGAPORE - 0.0% | | | |
| Health Care - 0.0% | | | |
| Pharmaceuticals - 0.0% | | | |
| Scilex Holding Co (b)(d) | | 41,080 | 14,013 |
| SOUTH AFRICA - 0.0% | | | |
| Materials - 0.0% | | | |
| Metals & Mining - 0.0% | | | |
| Caledonia Mining Corp PLC | | 16,960 | 159,594 |
| SWEDEN - 0.1% | | | |
| Financials - 0.1% | | | |
| Insurance - 0.1% | | | |
| SiriusPoint Ltd (b) | | 86,341 | 1,415,129 |
| SWITZERLAND - 0.0% | | | |
| Health Care - 0.0% | | | |
| Biotechnology - 0.0% | | | |
| ADC Therapeutics SA (b) | | 32,439 | 64,554 |
| THAILAND - 0.0% | | | |
| Energy - 0.0% | | | |
| Oil, Gas & Consumable Fuels - 0.0% | | | |
| BKV Corp (b) | | 11,169 | 265,599 |
| UNITED KINGDOM - 0.1% | | | |
| Financials - 0.1% | | | |
| Insurance - 0.1% | | | |
| Fidelis Insurance Holdings Ltd | | 51,635 | 936,143 |
| Industrials - 0.0% | | | |
| Machinery - 0.0% | | | |
| Luxfer Holdings PLC | | 27,154 | 355,445 |
| TOTAL UNITED KINGDOM | | | 1,291,588 |
| UNITED STATES - 96.1% | | | |
| Communication Services - 3.1% | | | |
| Diversified Telecommunication Services - 0.7% | | | |
| Anterix Inc (b) | | 1,336 | 40,974 |
| AST SpaceMobile Inc Class A (b)(c) | | 134,332 | 2,834,405 |
| Atn International Inc | | 10,560 | 177,514 |
| Bandwidth Inc Class A (b) | | 2,789 | 47,469 |
| Globalstar Inc (b) | | 114,356 | 236,717 |
| IDT Corp Class B | | 4,441 | 211,036 |
| Lumen Technologies Inc (b) | | 1,014,673 | 5,387,914 |
| Shenandoah Telecommunications Co | | 49,024 | 618,193 |
| | | | 9,554,222 |
| Entertainment - 0.5% | | | |
| AMC Entertainment Holdings Inc Class A (b)(c) | | 349,839 | 1,392,359 |
| Cinemark Holdings Inc (b) | | 22,841 | 707,614 |
| Eventbrite Inc Class A (b) | | 9,307 | 31,272 |
| Lions Gate Entertainment Corp Class A (b)(c) | | 63,770 | 544,596 |
| Lions Gate Entertainment Corp Class B (b) | | 119,958 | 905,683 |
| LiveOne Inc (b) | | 10,187 | 14,975 |
| Madison Square Garden Entertainment Corp Class A (b) | | 35,722 | 1,271,703 |
| Marcus Corp/The | | 23,490 | 505,035 |
| Playstudios Inc Class A (b) | | 89,184 | 165,882 |
| Reservoir Media Inc (b) | | 17,263 | 156,230 |
| Sphere Entertainment Co Class A (b)(c) | | 27,141 | 1,094,325 |
| | | | 6,789,674 |
| Interactive Media & Services - 0.5% | | | |
| Bumble Inc Class A (b)(c) | | 86,908 | 707,431 |
| Cars.com Inc (b) | | 65,868 | 1,141,492 |
| fuboTV Inc (b) | | 300,158 | 378,199 |
| Nextdoor Holdings Inc Class A (b) | | 172,168 | 408,038 |
| Outbrain Inc (b) | | 39,428 | 283,093 |
| Shutterstock Inc | | 5,398 | 163,829 |
| TrueCar Inc (b) | | 85,735 | 319,792 |
| Vimeo Inc Class A (b) | | 145,813 | 933,203 |
| Ziff Davis Inc (b) | | 44,173 | 2,400,362 |
| | | | 6,735,439 |
| Media - 1.1% | | | |
| Advantage Solutions Inc Class A (b)(c) | | 105,937 | 309,336 |
| AMC Networks Inc Class A (b) | | 31,773 | 314,553 |
| Boston Omaha Corp (b) | | 22,606 | 320,553 |
| Cable One Inc | | 5,658 | 2,048,875 |
| Clear Channel Outdoor Holdings Inc (b) | | 305,602 | 418,675 |
| EchoStar Corp Class A (b) | | 122,017 | 2,794,189 |
| Emerald Holding Inc (c) | | 15,795 | 76,131 |
| Entravision Communications Corp Class A | | 51,670 | 121,425 |
| EW Scripps Co/The Class A (b) | | 61,418 | 135,734 |
| Gannett Co Inc (b) | | 141,773 | 717,371 |
| Gray Television Inc | | 87,067 | 274,261 |
| iHeartMedia Inc Class A (b) | | 105,018 | 207,936 |
| Integral Ad Science Holding Corp (b) | | 64,974 | 678,329 |
| John Wiley & Sons Inc Class A | | 18,939 | 827,824 |
| Magnite Inc (b) | | 13,944 | 221,988 |
| National CineMedia Inc (b) | | 70,306 | 466,832 |
| Scholastic Corp | | 23,285 | 496,669 |
| Stagwell Inc Class A (b) | | 70,735 | 465,436 |
| TEGNA Inc | | 165,845 | 3,033,305 |
| WideOpenWest Inc (b) | | 49,594 | 245,986 |
| | | | 14,175,408 |
| Wireless Telecommunication Services - 0.3% | | | |
| Gogo Inc (b)(c) | | 37,026 | 299,540 |
| Spok Holdings Inc | | 18,921 | 303,682 |
| Telephone and Data Systems Inc | | 98,830 | 3,371,092 |
| | | | 3,974,314 |
TOTAL COMMUNICATION SERVICES | | | 41,229,057 |
| | | | |
| Consumer Discretionary - 9.1% | | | |
| Automobile Components - 0.8% | | | |
| Adient PLC (b) | | 86,909 | 1,497,442 |
| American Axle & Manufacturing Holdings Inc (b) | | 113,321 | 660,661 |
| Cooper-Standard Holdings Inc (b) | | 16,900 | 229,164 |
| Dana Inc | | 130,957 | 1,513,863 |
| Fox Factory Holding Corp (b) | | 42,262 | 1,279,271 |
| Goodyear Tire & Rubber Co/The (b) | | 284,908 | 2,564,172 |
| Holley Inc Class A (b) | | 23,595 | 71,257 |
| Luminar Technologies Inc Class A (b)(c) | | 2,740 | 14,741 |
| Phinia Inc | | 41,881 | 2,017,408 |
| Solid Power Inc (b)(c) | | 153,939 | 290,945 |
| Standard Motor Products Inc | | 21,094 | 653,492 |
| Stoneridge Inc (b) | | 26,555 | 166,500 |
| | | | 10,958,916 |
| Automobiles - 0.1% | | | |
| Canoo Inc Class A (b)(c) | | 3,281 | 4,626 |
| Winnebago Industries Inc | | 28,506 | 1,362,017 |
| Workhorse Group Inc (b) | | 1 | 1 |
| | | | 1,366,644 |
| Broadline Retail - 0.0% | | | |
| 1stdibs.Com Inc (b) | | 19,878 | 70,367 |
| Groupon Inc (b)(c) | | 11,538 | 140,187 |
| | | | 210,554 |
| Distributors - 0.1% | | | |
| A-Mark Precious Metals Inc | | 18,050 | 494,570 |
| Weyco Group Inc | | 6,186 | 232,284 |
| | | | 726,854 |
| Diversified Consumer Services - 0.9% | | | |
| Adtalem Global Education Inc (b) | | 30,685 | 2,787,732 |
| American Public Education Inc (b) | | 14,280 | 308,020 |
| Carriage Services Inc | | 3,410 | 135,889 |
| Chegg Inc (b) | | 101,483 | 163,388 |
| European Wax Center Inc Class A (b) | | 3,184 | 21,236 |
| Graham Holdings Co Class B | | 3,196 | 2,786,656 |
| KinderCare Learning Cos Inc (b) | | 13,902 | 247,456 |
| Laureate Education Inc | | 25,431 | 465,133 |
| Lincoln Educational Services Corp (b) | | 25,711 | 406,748 |
| Mister Car Wash Inc (b) | | 13,230 | 96,447 |
| Perdoceo Education Corp | | 65,853 | 1,743,129 |
| Strategic Education Inc | | 22,235 | 2,077,194 |
| | | | 11,239,028 |
| Hotels, Restaurants & Leisure - 1.0% | | | |
| Bally's Corp (b)(c) | | 23,432 | 419,198 |
| Biglari Holdings Inc Class B (b) | | 721 | 183,343 |
| BJ's Restaurants Inc (b) | | 8,634 | 303,356 |
| Bloomin' Brands Inc | | 36,820 | 449,572 |
| Brinker International Inc (b) | | 4,346 | 574,932 |
| Cracker Barrel Old Country Store Inc | | 17,375 | 918,443 |
| Denny's Corp (b) | | 14,345 | 86,787 |
| Dine Brands Global Inc | | 13,462 | 405,206 |
| El Pollo Loco Holdings Inc (b) | | 25,128 | 289,977 |
| Empire Resorts Inc (b)(e) | | 41 | 0 |
| Everi Holdings Inc (b) | | 36,772 | 496,790 |
| Full House Resorts Inc (b) | | 30,750 | 125,460 |
| Global Business Travel Group I Class A (b) | | 17,467 | 162,094 |
| Golden Entertainment Inc | | 19,756 | 624,290 |
| International Game Technology PLC | | 98,959 | 1,747,616 |
| Life Time Group Holdings Inc (b) | | 62,239 | 1,376,727 |
| Lindblad Expeditions Holdings Inc (b) | | 10,617 | 125,918 |
| Nathan's Famous Inc | | 237 | 18,630 |
| Papa John's International Inc | | 9,262 | 380,390 |
| Portillo's Inc Class A (b)(c) | | 11,083 | 104,180 |
| Rci Hospitality Holdings Inc | | 4,008 | 230,340 |
| Red Rock Resorts Inc Class A | | 26,625 | 1,231,140 |
| Sabre Corp (b) | | 302,450 | 1,103,943 |
| Six Flags Entertainment Corp (c) | | 23,720 | 1,143,067 |
| United Parks & Resorts Inc (b)(c) | | 1,860 | 104,513 |
| Vacasa Inc Class A (b)(c) | | 9,166 | 44,913 |
| | | | 12,650,825 |
| Household Durables - 2.7% | | | |
| Beazer Homes USA Inc (b) | | 29,004 | 796,450 |
| Century Communities Inc | | 24,562 | 1,801,868 |
| Champion Homes Inc (b) | | 28,302 | 2,493,406 |
| Cricut Inc Class A | | 9,284 | 52,919 |
| Ethan Allen Interiors Inc | | 23,154 | 650,859 |
| Flexsteel Industries Inc | | 4,654 | 252,898 |
| Gopro Inc Class A (b) | | 126,113 | 137,463 |
| Green Brick Partners Inc (b) | | 22,718 | 1,283,340 |
| Hamilton Beach Brands Holding Co Class A | | 8,326 | 140,127 |
| Helen of Troy Ltd (b) | | 22,834 | 1,366,158 |
| Hooker Furnishings Corp | | 10,600 | 148,506 |
| Hovnanian Enterprises Inc Class A (b) | | 4,678 | 626,010 |
| iRobot Corp (b)(c) | | 30,111 | 233,360 |
| KB Home | | 56,367 | 3,704,439 |
| La-Z-Boy Inc | | 42,337 | 1,844,623 |
| Landsea Homes Corp Class A (b) | | 15,429 | 130,992 |
| Legacy Housing Corp (b) | | 11,231 | 277,181 |
| LGI Homes Inc (b) | | 19,458 | 1,739,545 |
| Lifetime Brands Inc | | 11,742 | 69,395 |
| Lovesac Co/The (b)(c) | | 6,752 | 159,752 |
| M/I Homes Inc (b) | | 26,739 | 3,554,950 |
| Meritage Homes Corp | | 36,080 | 5,549,826 |
| Purple Innovation Inc Class A (b) | | 54,999 | 42,899 |
| Sonos Inc (b) | | 12,526 | 188,391 |
| Taylor Morrison Home Corp (b) | | 102,494 | 6,273,659 |
| Traeger Inc (b) | | 34,266 | 81,896 |
| Tri Pointe Homes Inc (b) | | 65,192 | 2,363,862 |
| United Homes Group Inc Class A (b) | | 839 | 3,549 |
| Worthington Enterprises Inc | | 3,419 | 137,136 |
| | | | 36,105,459 |
| Leisure Products - 0.4% | | | |
| AMMO Inc (b) | | 86,183 | 94,801 |
| Clarus Corp | | 30,080 | 135,661 |
| Escalade Inc | | 10,068 | 143,771 |
| Funko Inc Class A (b)(c) | | 31,193 | 417,674 |
| JAKKS Pacific Inc (b) | | 8,289 | 233,335 |
| Johnson Outdoors Inc Class A | | 4,754 | 156,882 |
| Latham Group Inc (b) | | 40,637 | 282,834 |
| Malibu Boats Inc Class A (b) | | 19,602 | 736,839 |
| Marine Products Corp | | 5,270 | 48,326 |
| MasterCraft Boat Holdings Inc (b) | | 16,237 | 309,640 |
| Peloton Interactive Inc Class A (b) | | 25,295 | 220,067 |
| Revelyst Inc | | 58,252 | 1,120,186 |
| Smith & Wesson Brands Inc | | 41,600 | 420,368 |
| Solo Brands Inc Class A (b)(c) | | 29,543 | 33,678 |
| Sturm Ruger & Co Inc | | 11,961 | 423,061 |
| Topgolf Callaway Brands Corp (b) | | 142,252 | 1,118,101 |
| | | | 5,895,224 |
| Specialty Retail - 2.9% | | | |
| 1-800-Flowers.com Inc Class A (b)(c) | | 18,955 | 154,862 |
| Academy Sports & Outdoors Inc | | 51,225 | 2,946,974 |
| aka Brands Holding Corp (b)(c) | | 679 | 12,711 |
| America's Car-Mart Inc/TX (b) | | 7,157 | 366,796 |
| American Eagle Outfitters Inc | | 36,973 | 616,340 |
| Arhaus Inc Class A (c) | | 7,617 | 71,600 |
| Arko Corp | | 71,895 | 473,788 |
| Asbury Automotive Group Inc (b) | | 19,700 | 4,787,691 |
| BARK Inc (b) | | 130,118 | 239,417 |
| Beyond Inc (b)(c) | | 46,436 | 228,929 |
| Caleres Inc | | 24,069 | 557,438 |
| Citi Trends Inc (b)(c) | | 6,410 | 168,263 |
| Designer Brands Inc Class A | | 40,775 | 217,739 |
| Destination XL Group Inc (b)(c) | | 54,233 | 145,887 |
| EVgo Inc Class A (b)(c) | | 88,866 | 359,907 |
| Foot Locker Inc (b) | | 83,558 | 1,818,222 |
| Genesco Inc (b) | | 7,654 | 327,209 |
| Group 1 Automotive Inc | | 13,268 | 5,592,198 |
| GrowGeneration Corp (b) | | 53,413 | 90,268 |
| Haverty Furniture Cos Inc | | 15,007 | 334,056 |
| J Jill Inc | | 551 | 15,219 |
| Lands' End Inc (b) | | 14,219 | 186,838 |
| Leslie's Inc (b) | | 71,126 | 158,611 |
| MarineMax Inc (b) | | 21,557 | 624,075 |
| Monro Inc | | 30,157 | 747,894 |
| National Vision Holdings Inc (b) | | 72,895 | 759,566 |
| ODP Corp/The (b) | | 32,803 | 745,940 |
| OneWater Marine Inc Class A (b)(c) | | 11,827 | 205,553 |
| Petco Health & Wellness Co Inc Class A (b) | | 84,906 | 323,492 |
| RealReal Inc/The (b)(c) | | 29,983 | 327,714 |
| RumbleON Inc Class B (b) | | 17,152 | 93,135 |
| Sally Beauty Holdings Inc (b) | | 103,369 | 1,080,206 |
| Shoe Carnival Inc | | 18,052 | 597,160 |
| Signet Jewelers Ltd | | 42,416 | 3,423,395 |
| Sleep Number Corp (b) | | 21,614 | 329,397 |
| Sonic Automotive Inc Class A | | 10,531 | 667,139 |
| Stitch Fix Inc Class A (b) | | 101,536 | 437,620 |
| ThredUp Inc Class A (b) | | 65,418 | 90,931 |
| Tile Shop Holdings Inc (b) | | 17,922 | 124,199 |
| Tilly's Inc Class A (b) | | 13,981 | 59,419 |
| Urban Outfitters Inc (b) | | 45,703 | 2,508,181 |
| Victoria's Secret & Co (b) | | 60,272 | 2,496,466 |
| Winmark Corp | | 2,891 | 1,136,365 |
| Zumiez Inc (b) | | 15,410 | 295,410 |
| | | | 36,944,220 |
| Textiles, Apparel & Luxury Goods - 0.2% | | | |
| Figs Inc Class A (b)(c) | | 123,510 | 764,527 |
| G-III Apparel Group Ltd (b) | | 39,076 | 1,274,659 |
| Movado Group Inc | | 15,070 | 296,578 |
| Oxford Industries Inc | | 4,536 | 357,346 |
| Rocky Brands Inc | | 4,680 | 106,704 |
| Superior Group of Cos Inc | | 11,068 | 182,954 |
| Vera Bradley Inc (b)(c) | | 23,680 | 93,062 |
| | | | 3,075,830 |
TOTAL CONSUMER DISCRETIONARY | | | 119,173,554 |
| | | | |
| Consumer Staples - 2.3% | | | |
| Beverages - 0.3% | | | |
| Primo Brands Corp Class A | | 139,122 | 4,280,784 |
| Consumer Staples Distribution & Retail - 0.5% | | | |
| Andersons Inc/The | | 28,626 | 1,159,926 |
| Guardian Pharmacy Services Inc Class A (b) | | 5,435 | 110,113 |
| HF Foods Group Inc (b) | | 40,776 | 130,891 |
| Ingles Markets Inc Class A | | 14,529 | 936,249 |
| Natural Grocers by Vitamin Cottage Inc | | 6,885 | 273,472 |
| PriceSmart Inc | | 9,285 | 855,798 |
| SpartanNash Co | | 33,848 | 620,095 |
| United Natural Foods Inc (b) | | 58,800 | 1,605,828 |
| Village Super Market Inc Class A | | 8,681 | 276,837 |
| Weis Markets Inc | | 16,575 | 1,122,459 |
| | | | 7,091,668 |
| Food Products - 0.9% | | | |
| Alico Inc | | 6,918 | 179,384 |
| B&G Foods Inc | | 79,364 | 546,818 |
| BRC Inc Class A (b) | | 4,784 | 15,164 |
| Cal-Maine Foods Inc | | 38,683 | 3,981,254 |
| Calavo Growers Inc | | 14,251 | 363,401 |
| Dole PLC | | 75,389 | 1,020,767 |
| Fresh Del Monte Produce Inc | | 34,174 | 1,134,919 |
| Hain Celestial Group Inc (b) | | 90,386 | 555,874 |
| Limoneira Co | | 16,850 | 412,151 |
| Mission Produce Inc (b) | | 37,762 | 542,640 |
| Seneca Foods Corp Class A (b) | | 4,574 | 362,535 |
| TreeHouse Foods Inc (b) | | 47,437 | 1,666,462 |
| Utz Brands Inc Class A | | 21,529 | 337,144 |
| | | | 11,118,513 |
| Household Products - 0.2% | | | |
| Central Garden & Pet Co (b)(c) | | 16,154 | 626,775 |
| Central Garden & Pet Co Class A | | 33,987 | 1,123,271 |
| Oil-Dri Corp of America | | 3,900 | 341,796 |
| | | | 2,091,842 |
| Personal Care Products - 0.3% | | | |
| Edgewell Personal Care Co | | 48,394 | 1,626,038 |
| Herbalife Ltd (b) | | 33,179 | 221,968 |
| Honest Co Inc/The (b) | | 49,207 | 341,005 |
| Medifast Inc (b) | | 10,750 | 189,415 |
| Nature's Sunshine Products Inc (b) | | 9,768 | 143,199 |
| Nu Skin Enterprises Inc Class A | | 49,279 | 339,532 |
| Olaplex Holdings Inc (b) | | 140,617 | 243,267 |
| USANA Health Sciences Inc (b) | | 11,334 | 406,777 |
| Veru Inc (b) | | 31,753 | 20,655 |
| Waldencast plc Class A (b) | | 25,038 | 100,653 |
| | | | 3,632,509 |
| Tobacco - 0.1% | | | |
| Turning Point Brands Inc | | 2,415 | 145,142 |
| Universal Corp/VA | | 24,293 | 1,332,228 |
| | | | 1,477,370 |
TOTAL CONSUMER STAPLES | | | 29,692,686 |
| | | | |
| Energy - 6.0% | | | |
| Energy Equipment & Services - 1.8% | | | |
| Bristow Group Inc (b) | | 24,315 | 834,005 |
| DMC Global Inc (b) | | 14,578 | 107,148 |
| Drilling Tools International Corp (b) | | 5,126 | 16,761 |
| Expro Group Holdings NV (b) | | 94,616 | 1,179,862 |
| Forum Energy Technologies Inc (b) | | 10,791 | 167,153 |
| Geospace Technologies Corp (b) | | 12,293 | 123,176 |
| Helix Energy Solutions Group Inc (b) | | 115,973 | 1,080,868 |
| Helmerich & Payne Inc | | 96,994 | 3,105,748 |
| Innovex International Inc (b) | | 34,352 | 479,897 |
| Kodiak Gas Services Inc | | 23,616 | 964,241 |
| Liberty Energy Inc Class A | | 149,971 | 2,982,923 |
| Mammoth Energy Services Inc (b) | | 24,771 | 74,313 |
| Nabors Industries Ltd (b) | | 6,261 | 357,941 |
| Natural Gas Services Group Inc (b) | | 8,338 | 223,458 |
| Noble Corp PLC | | 48,515 | 1,523,371 |
| NPK International Inc (b) | | 84,157 | 645,484 |
| Oil States International Inc (b) | | 59,389 | 300,508 |
| Patterson-UTI Energy Inc | | 390,019 | 3,221,557 |
| ProFrac Holding Corp Class A (b)(c) | | 22,026 | 170,922 |
| ProPetro Holding Corp (b) | | 86,620 | 808,165 |
| Ranger Energy Services Inc Class A | | 15,681 | 242,742 |
| RPC Inc (c) | | 86,708 | 515,046 |
| SEACOR Marine Holdings Inc (b) | | 22,784 | 149,463 |
| Select Water Solutions Inc Class A | | 91,632 | 1,213,208 |
| Solaris Energy Infrastructure Inc Class A | | 25,225 | 725,976 |
| Transocean Ltd (b)(c) | | 728,873 | 2,733,274 |
| Valaris Ltd (b) | | 22,379 | 990,047 |
| | | | 24,937,257 |
| Oil, Gas & Consumable Fuels - 4.2% | | | |
| Aemetis Inc (b)(c) | | 35,187 | 94,653 |
| Amplify Energy Corp (b) | | 38,023 | 228,138 |
| Berry Corp | | 55,375 | 228,699 |
| California Resources Corp | | 69,111 | 3,586,170 |
| Centrus Energy Corp Class A (b)(c) | | 4,185 | 278,763 |
| Chord Energy Corp warrants 9/1/2025 (b) | | 405 | 1,376 |
| Clean Energy Fuels Corp (b) | | 169,825 | 426,261 |
| CNX Resources Corp (b) | | 146,190 | 5,360,787 |
| Comstock Resources Inc | | 92,386 | 1,683,273 |
| CONSOL Energy Inc | | 29,322 | 3,128,071 |
| Crescent Energy Co Class A (c) | | 121,011 | 1,767,971 |
| CVR CHC LP | | 3,750 | 70,275 |
| Delek US Holdings Inc | | 45,871 | 848,614 |
| DHT Holdings Inc | | 136,264 | 1,265,893 |
| Diversified Energy Co PLC (United States) (f) | | 44,944 | 755,059 |
| Dorian LPG Ltd | | 18,244 | 444,606 |
| Energy Fuels Inc/Canada (United States) (b)(c) | | 188,351 | 966,241 |
| Evolution Petroleum Corp | | 23,229 | 121,488 |
| Excelerate Energy Inc Class A | | 17,159 | 519,060 |
| FutureFuel Corp | | 26,894 | 142,269 |
| Granite Ridge Resources Inc | | 53,147 | 343,330 |
| Green Plains Inc (b) | | 64,036 | 607,061 |
| Gulfport Energy Corp (b) | | 6,234 | 1,148,303 |
| Hallador Energy Co (b) | | 25,578 | 292,868 |
| HighPeak Energy Inc Class A (c) | | 14,514 | 213,356 |
| International Seaways Inc | | 41,135 | 1,478,392 |
| Kinetik Holdings Inc Class A | | 34,845 | 1,976,060 |
| Magnolia Oil & Gas Corp Class A | | 13,330 | 311,655 |
| Murphy Oil Corp | | 143,882 | 4,353,869 |
| NACCO Industries Inc Class A | | 3,925 | 117,044 |
| Nordic American Tankers Ltd | | 206,997 | 517,493 |
| Northern Oil & Gas Inc | | 93,627 | 3,479,179 |
| Par Pacific Holdings Inc (b) | | 54,231 | 888,846 |
| PBF Energy Inc Class A | | 100,291 | 2,662,726 |
| Peabody Energy Corp | | 126,903 | 2,657,349 |
| PrimeEnergy Resources Corp (b) | | 686 | 150,639 |
| REX American Resources Corp (b) | | 12,030 | 501,531 |
| Riley Exploration Permian Inc | | 9,807 | 313,039 |
| Ring Energy Inc (b) | | 148,501 | 201,961 |
| SandRidge Energy Inc | | 31,934 | 373,947 |
| Sitio Royalties Corp Class A | | 81,584 | 1,564,781 |
| SM Energy Co | | 95,277 | 3,692,937 |
| Talos Energy Inc (b) | | 144,844 | 1,406,435 |
| Ur-Energy Inc (United States) (b) | | 33,491 | 38,514 |
| VAALCO Energy Inc | | 95,358 | 416,714 |
| Vital Energy Inc (b)(c) | | 28,347 | 876,489 |
| Vitesse Energy Inc | | 25,182 | 629,550 |
| World Kinect Corp | | 51,179 | 1,407,934 |
| | | | 54,539,669 |
TOTAL ENERGY | | | 79,476,926 |
| | | | |
| Financials - 28.2% | | | |
| Banks - 19.3% | | | |
| 1st Source Corp | | 18,459 | 1,077,636 |
| ACNB Corp | | 8,256 | 328,836 |
| Amalgamated Financial Corp | | 18,017 | 603,029 |
| Amerant Bancorp Inc Class A | | 36,836 | 825,495 |
| Ameris Bancorp | | 66,010 | 4,130,246 |
| Ames National Corp | | 8,724 | 143,335 |
| Arrow Financial Corp | | 16,552 | 475,208 |
| Associated Banc-Corp | | 161,748 | 3,865,777 |
| Atlantic Union Bankshares Corp | | 89,934 | 3,406,700 |
| Axos Financial Inc (b) | | 48,924 | 3,417,341 |
| Banc of California Inc | | 139,242 | 2,152,681 |
| BancFirst Corp | | 17,614 | 2,064,009 |
| Bancorp Inc/The (b) | | 2,469 | 129,942 |
| Bank First Corp | | 9,611 | 952,354 |
| Bank of Hawaii Corp | | 39,379 | 2,805,360 |
| Bank of Marin Bancorp | | 15,721 | 373,688 |
| Bank7 Corp | | 3,822 | 178,335 |
| BankUnited Inc | | 74,891 | 2,858,589 |
| Bankwell Financial Group Inc | | 6,520 | 203,098 |
| Banner Corp | | 34,515 | 2,304,567 |
| Bar Harbor Bankshares | | 15,038 | 459,862 |
| BayCom Corp | | 10,212 | 274,090 |
| BCB Bancorp Inc | | 14,585 | 172,686 |
| Berkshire Hills Bancorp Inc | | 43,170 | 1,227,323 |
| Blue Foundry Bancorp (b) | | 18,543 | 181,907 |
| Bridgewater Bancshares Inc (b) | | 19,159 | 258,838 |
| Brookline Bancorp Inc | | 88,677 | 1,046,389 |
| Burke & Herbert Financial Services Corp | | 13,564 | 845,851 |
| Business First Bancshares Inc | | 24,091 | 619,139 |
| Byline Bancorp Inc | | 30,923 | 896,767 |
| Cadence Bank | | 182,535 | 6,288,331 |
| California BanCorp (b) | | 24,118 | 398,912 |
| Camden National Corp | | 14,517 | 620,457 |
| Capital Bancorp Inc | | 9,098 | 259,293 |
| Capital City Bank Group Inc | | 13,834 | 507,016 |
| Capitol Federal Financial Inc | | 124,176 | 733,880 |
| Carter Bankshares Inc (b) | | 22,608 | 397,675 |
| Cathay General Bancorp | | 69,961 | 3,330,843 |
| Central Pacific Financial Corp | | 26,823 | 779,208 |
| Chemung Financial Corp | | 3,211 | 156,729 |
| ChoiceOne Financial Services Inc | | 8,399 | 299,340 |
| Citizens & Northern Corp | | 14,919 | 277,493 |
| Citizens Financial Services Inc | | 4,248 | 268,941 |
| City Holding Co | | 13,477 | 1,596,755 |
| Civista Bancshares Inc | | 15,155 | 318,861 |
| CNB Financial Corp/PA | | 20,664 | 513,707 |
| Coastal Financial Corp/WA Class A (b) | | 625 | 53,068 |
| Colony Bankcorp Inc | | 16,240 | 262,114 |
| Columbia Financial Inc (b) | | 25,138 | 397,432 |
| Community Financial System Inc | | 52,569 | 3,242,456 |
| Community Trust Bancorp Inc | | 15,482 | 821,010 |
| Community West Bancshares | | 16,959 | 328,496 |
| Connectone Bancorp Inc | | 36,416 | 834,291 |
| CrossFirst Bankshares Inc (b) | | 45,242 | 685,416 |
| Customers Bancorp Inc (b) | | 29,592 | 1,440,539 |
| CVB Financial Corp | | 132,919 | 2,845,796 |
| Dime Community Bancshares Inc | | 35,666 | 1,096,195 |
| Eagle Bancorp Inc | | 29,694 | 772,935 |
| Eastern Bankshares Inc | | 193,290 | 3,334,253 |
| Enterprise Bancorp Inc/MA | | 9,847 | 389,350 |
| Enterprise Financial Services Corp | | 37,253 | 2,101,069 |
| Equity Bancshares Inc Class A | | 14,253 | 604,612 |
| Esquire Financial Holdings Inc | | 1,004 | 79,817 |
| ESSA Bancorp Inc | | 8,447 | 164,717 |
| Farmers & Merchants Bancorp Inc/Archbold OH | | 12,759 | 375,753 |
| Farmers National Banc Corp | | 37,000 | 526,140 |
| FB Financial Corp | | 35,591 | 1,833,292 |
| Fidelity D&D Bancorp Inc | | 4,823 | 235,362 |
| Financial Institutions Inc | | 15,235 | 415,763 |
| First Bancorp Inc/The | | 10,960 | 299,756 |
| First Bancorp/Southern Pines NC | | 40,323 | 1,773,002 |
| First Bancshares Inc/The | | 30,648 | 1,072,680 |
| First Bank/Hamilton NJ | | 20,743 | 291,854 |
| First Busey Corp | | 53,609 | 1,263,564 |
| First Business Financial Services Inc | | 7,380 | 341,620 |
| First Commonwealth Financial Corp | | 101,581 | 1,718,751 |
| First Community Bankshares Inc | | 17,001 | 707,922 |
| First Financial Bancorp | | 95,072 | 2,555,535 |
| First Financial Corp/IN | | 11,467 | 529,661 |
| First Financial Northwest Inc | | 6,579 | 142,764 |
| First Foundation Inc | | 45,350 | 281,624 |
| First Interstate BancSystem Inc Class A | | 80,225 | 2,604,906 |
| First Interstate Bank of Calif | | 4,751 | 170,988 |
| First Merchants Corp | | 58,466 | 2,332,209 |
| First Mid Bancshares Inc | | 22,936 | 844,504 |
| First of Long Island Corp/The | | 21,329 | 249,123 |
| First Western Financial Inc (b) | | 5,454 | 106,625 |
| Five Star Bancorp | | 16,728 | 503,346 |
| Flagstar Financial Inc (c) | | 254,129 | 2,371,024 |
| Flushing Financial Corp | | 27,442 | 391,872 |
| FS Bancorp Inc | | 6,711 | 275,554 |
| Fulton Financial Corp | | 181,898 | 3,506,993 |
| FVCBankcorp Inc (b) | | 16,676 | 209,617 |
| German American Bancorp Inc | | 28,439 | 1,143,817 |
| Glacier Bancorp Inc | | 114,272 | 5,738,740 |
| Great Southern Bancorp Inc | | 8,549 | 510,375 |
| Guaranty Bancshares Inc/TX | | 7,884 | 272,786 |
| Hancock Whitney Corp | | 87,132 | 4,767,863 |
| Hanmi Financial Corp | | 30,385 | 717,694 |
| Harborone Northeast Bancorp Inc | | 37,645 | 445,340 |
| HBT Financial Inc | | 12,939 | 283,364 |
| Heartland Financial USA Inc | | 42,564 | 2,609,386 |
| Heritage Commerce Corp | | 59,831 | 561,215 |
| Heritage Financial Corp Wash | | 34,132 | 836,234 |
| Hilltop Holdings Inc | | 46,281 | 1,325,025 |
| Hingham Institution For Savings The (c) | | 1,559 | 396,204 |
| Home Bancorp Inc | | 6,968 | 321,991 |
| Home BancShares Inc/AR | | 186,721 | 5,284,204 |
| HomeStreet Inc (b) | | 17,726 | 202,431 |
| HomeTrust Bancshares Inc | | 14,616 | 492,267 |
| Hope Bancorp Inc | | 115,674 | 1,421,633 |
| Horizon Bancorp Inc/IN | | 43,180 | 695,630 |
| Independent Bank Corp | | 42,667 | 2,738,795 |
| Independent Bank Corp/MI | | 20,001 | 696,635 |
| Independent Bank Group Inc | | 36,241 | 2,198,741 |
| International Bancshares Corp | | 54,261 | 3,427,125 |
| Investar Holding Corp | | 8,870 | 194,785 |
| John Marshall Bancorp Inc | | 12,307 | 247,125 |
| Kearny Financial Corp/MD | | 54,470 | 385,648 |
| Lakeland Financial Corp | | 23,581 | 1,621,430 |
| LCNB Corp | | 12,806 | 193,755 |
| LINKBANCORP Inc | | 23,205 | 173,573 |
| Live Oak Bancshares Inc | | 4,564 | 180,506 |
| Mercantile Bank Corp | | 15,737 | 700,139 |
| Metrocity Bankshares Inc | | 16,920 | 540,594 |
| Metropolitan Bank Holding Corp (b) | | 10,579 | 617,814 |
| Mid Penn Bancorp Inc | | 15,080 | 434,907 |
| Middlefield Banc Corp | | 7,210 | 202,241 |
| Midland States Bancorp Inc | | 20,596 | 502,542 |
| MidWestOne Financial Group Inc | | 18,394 | 535,633 |
| MVB Financial Corp | | 11,425 | 236,498 |
| National Bank Holdings Corp Class A | | 37,094 | 1,597,268 |
| National Bankshares Inc VA | | 5,805 | 166,662 |
| NB Bancorp Inc | | 38,867 | 701,938 |
| Nbt Bancorp Inc | | 46,229 | 2,207,897 |
| Nicolet Bankshares Inc | | 10,397 | 1,090,749 |
| Northeast Bank | | 6,986 | 640,826 |
| Northeast Community Bancorp Inc | | 12,369 | 302,546 |
| Northfield Bancorp Inc | | 37,794 | 439,166 |
| Northrim BanCorp Inc | | 5,347 | 416,745 |
| Northwest Bancshares Inc | | 129,049 | 1,702,156 |
| Norwood Financial Corp | | 7,430 | 202,133 |
| Oak Valley Bancorp | | 6,920 | 202,410 |
| OceanFirst Financial Corp | | 57,268 | 1,036,551 |
| Old National Bancorp/IN | | 315,263 | 6,842,783 |
| Old Second Bancorp Inc | | 43,370 | 771,119 |
| Orange County Bancorp Inc | | 5,131 | 285,130 |
| Origin Bancorp Inc | | 29,366 | 977,594 |
| Orrstown Financial Services Inc | | 18,631 | 682,081 |
| Pacific Premier Bancorp Inc | | 96,205 | 2,397,429 |
| Park National Corp | | 14,482 | 2,482,649 |
| Parke Bancorp Inc | | 10,452 | 214,371 |
| Pathward Financial Inc | | 18,102 | 1,331,945 |
| PCB Bancorp | | 10,762 | 217,823 |
| Peapack-Gladstone Financial Corp | | 16,615 | 532,511 |
| Peoples Bancorp Inc/OH | | 34,779 | 1,102,147 |
| Peoples Bancorp of North Carolina Inc | | 4,454 | 139,188 |
| Peoples Financial Services Corp | | 7,024 | 359,488 |
| Pioneer Bancorp Inc/NY (b) | | 11,518 | 132,687 |
| Plumas Bancorp | | 5,522 | 260,970 |
| Ponce Financial Group Inc (b) | | 18,807 | 244,491 |
| Preferred Bank/Los Angeles CA | | 12,474 | 1,077,504 |
| Premier Financial Corp | | 35,703 | 912,926 |
| Primis Financial Corp | | 19,515 | 227,545 |
| Princeton Bancorp Inc | | 5,481 | 188,711 |
| Provident Bancorp Inc (b) | | 15,265 | 174,021 |
| Provident Financial Services Inc | | 126,357 | 2,384,357 |
| QCR Holdings Inc | | 16,249 | 1,310,319 |
| RBB Bancorp | | 15,905 | 325,893 |
| Red River Bancshares Inc | | 4,397 | 237,350 |
| Renasant Corp | | 62,644 | 2,239,523 |
| Republic Bancorp Inc/KY Class A | | 8,319 | 581,249 |
| S&T Bancorp Inc | | 38,387 | 1,467,151 |
| Sandy Spring Bancorp Inc | | 44,069 | 1,485,566 |
| Seacoast Banking Corp of Florida | | 84,763 | 2,333,525 |
| ServisFirst Bancshares Inc | | 36,537 | 3,096,145 |
| Shore Bancshares Inc | | 27,134 | 430,074 |
| Sierra Bancorp | | 13,090 | 378,563 |
| Simmons First National Corp Class A | | 124,394 | 2,759,059 |
| SmartFinancial Inc | | 15,759 | 488,214 |
| South Plains Financial Inc | | 11,653 | 404,942 |
| Southern First Bancshares Inc (b) | | 7,484 | 297,489 |
| Southern Missouri Bancorp Inc | | 9,541 | 547,367 |
| Southern States Bancshares Inc | | 8,362 | 278,538 |
| Southside Bancshares Inc | | 28,910 | 918,182 |
| SouthState Corp | | 76,321 | 7,592,413 |
| Stellar Bancorp Inc | | 49,456 | 1,402,078 |
| Sterling Bancorp Inc/MI (b) | | 20,570 | 97,912 |
| Stock Yards Bancorp Inc | | 25,740 | 1,843,241 |
| Texas Capital Bancshares Inc (b) | | 46,385 | 3,627,307 |
| Third Coast Bancshares Inc (b) | | 11,290 | 383,296 |
| Timberland Bancorp Inc/WA | | 7,583 | 231,357 |
| Tompkins Financial Corp | | 12,854 | 871,887 |
| Towne Bank/Portsmouth VA | | 70,683 | 2,407,463 |
| TriCo Bancshares | | 32,216 | 1,407,839 |
| Triumph Financial Inc (b) | | 1,859 | 168,946 |
| TrustCo Bank Corp NY | | 18,584 | 619,033 |
| Trustmark Corp | | 60,685 | 2,146,428 |
| UMB Financial Corp | | 44,938 | 5,071,703 |
| United Bankshares Inc/WV | | 132,766 | 4,985,363 |
| United Community Banks Inc/GA | | 120,214 | 3,884,114 |
| Unity Bancorp Inc | | 7,008 | 305,619 |
| Univest Financial Corp | | 28,937 | 853,931 |
| USCB Financial Holdings Inc | | 7,342 | 130,321 |
| Valley National Bancorp | | 469,607 | 4,254,639 |
| Veritex Holdings Inc | | 52,774 | 1,433,342 |
| Virginia National Bankshares Corp | | 4,733 | 180,801 |
| WaFd Inc | | 67,071 | 2,162,369 |
| Washington Trust Bancorp Inc | | 17,093 | 535,866 |
| WesBanco Inc | | 57,623 | 1,875,052 |
| West BanCorp Inc | | 16,230 | 351,380 |
| Westamerica BanCorp | | 25,929 | 1,360,235 |
| WSFS Financial Corp | | 59,191 | 3,144,818 |
| | | | 253,820,993 |
| Capital Markets - 0.7% | | | |
| AlTi Global Inc Class A (b) | | 35,096 | 154,773 |
| BGC Group Inc Class A | | 365,440 | 3,310,887 |
| Diamond Hill Investment Group Inc | | 456 | 70,726 |
| DigitalBridge Group Inc Class A | | 117,068 | 1,320,527 |
| Donnelley Financial Solutions Inc (b) | | 9,162 | 574,732 |
| Forge Global Holdings Inc Class A (b) | | 118,412 | 110,230 |
| GCM Grosvenor Inc Class A | | 5,489 | 67,350 |
| MarketWise Inc Class A | | 44,744 | 25,392 |
| P10 Inc Class A | | 5,916 | 74,601 |
| Silvercrest Asset Management Group Inc Class A | | 9,762 | 179,523 |
| StoneX Group Inc (b) | | 24,753 | 2,425,051 |
| Value Line Inc | | 131 | 6,917 |
| Virtus Invt Partners Inc | | 1,143 | 252,123 |
| | | | 8,572,832 |
| Consumer Finance - 1.1% | | | |
| Atlanticus Holdings Corp (b) | | 5,185 | 289,219 |
| Bread Financial Holdings Inc | | 49,822 | 3,042,131 |
| Consumer Portfolio Services Inc (b) | | 7,863 | 85,392 |
| Encore Capital Group Inc (b)(c) | | 23,278 | 1,111,990 |
| Enova International Inc (b) | | 25,486 | 2,443,598 |
| Green Dot Corp Class A (b) | | 54,268 | 577,412 |
| LendingClub Corp (b) | | 111,129 | 1,799,179 |
| Lendingtree Inc (b) | | 776 | 30,070 |
| Medallion Financial Corp | | 18,787 | 176,410 |
| Navient Corp | | 76,109 | 1,011,489 |
| Nelnet Inc Class A | | 14,170 | 1,513,498 |
| PRA Group Inc (b) | | 38,724 | 808,944 |
| PROG Holdings Inc | | 34,246 | 1,447,236 |
| Regional Management Corp | | 7,333 | 249,175 |
| World Acceptance Corp (b) | | 226 | 25,411 |
| | | | 14,611,154 |
| Financial Services - 3.1% | | | |
| Acacia Research Corp (b) | | 38,084 | 165,285 |
| Alerus Financial Corp | | 21,464 | 412,967 |
| Burford Capital Ltd (United States) | | 201,100 | 2,564,025 |
| Cannae Holdings Inc | | 56,010 | 1,112,359 |
| Cantaloupe Inc (b) | | 3,099 | 29,471 |
| Cass Information Systems Inc | | 2,238 | 91,557 |
| Compass Diversified Holdings | | 67,208 | 1,551,161 |
| Enact Holdings Inc | | 29,082 | 941,675 |
| Essent Group Ltd | | 104,718 | 5,700,849 |
| Federal Agricultural Mortgage Corp Class C | | 980 | 193,011 |
| HA Sustainable Infrastructure Capital Inc | | 116,213 | 3,117,995 |
| I3 Verticals Inc Class A (b) | | 22,053 | 508,101 |
| Jackson Financial Inc | | 75,104 | 6,540,057 |
| Marqeta Inc Class A (b) | | 64,773 | 245,490 |
| Merchants Bancorp/IN | | 18,232 | 664,921 |
| Mr Cooper Group Inc (b) | | 39,948 | 3,835,407 |
| NewtekOne Inc | | 24,973 | 318,905 |
| NMI Holdings Inc (b) | | 72,990 | 2,683,112 |
| Onity Group Inc (b) | | 6,159 | 189,143 |
| Payoneer Global Inc (b) | | 69,732 | 700,109 |
| Paysafe Ltd (b) | | 32,288 | 552,125 |
| PennyMac Financial Services Inc | | 12,009 | 1,226,599 |
| Radian Group Inc | | 152,106 | 4,824,802 |
| Repay Holdings Corp Class A (b) | | 87,063 | 664,291 |
| Sezzle Inc (b) | | 248 | 63,438 |
| SWK Holdings Corp (b) | | 3,033 | 48,103 |
| Velocity Financial Inc (b)(c) | | 8,159 | 159,590 |
| Walker & Dunlop Inc | | 8,952 | 870,224 |
| Waterstone Financial Inc | | 15,975 | 214,704 |
| | | | 40,189,476 |
| Insurance - 2.2% | | | |
| Ambac Financial Group Inc/Old (b) | | 44,715 | 565,645 |
| American Coastal Insurance Corp | | 13,908 | 187,202 |
| Amerisafe Inc | | 10,991 | 566,476 |
| Bowhead Specialty Holdings Inc | | 8,699 | 308,988 |
| CNO Financial Group Inc | | 105,355 | 3,920,260 |
| Donegal Group Inc Class A | | 15,698 | 242,848 |
| Employers Holdings Inc | | 24,719 | 1,266,354 |
| Enstar Group Ltd (b) | | 12,660 | 4,077,153 |
| F&G Annuities & Life Inc | | 17,447 | 723,004 |
| Genworth Financial Inc Class A (b) | | 427,679 | 2,989,476 |
| GoHealth Inc Class A (b) | | 4,502 | 60,281 |
| Greenlight Capital Re Ltd Class A (b) | | 27,460 | 384,440 |
| Heritage Insurance Holdings Inc (b) | | 23,145 | 280,055 |
| Hippo Holdings Inc (b) | | 20,238 | 541,771 |
| Horace Mann Educators Corp | | 41,194 | 1,616,041 |
| Investors Title Co | | 1,192 | 282,218 |
| James River Group Holdings Ltd | | 37,586 | 183,044 |
| Lemonade Inc (b)(c) | | 9,326 | 342,078 |
| Maiden Holdings Ltd (b) | | 85,226 | 144,031 |
| MBIA Inc (c) | | 43,953 | 283,936 |
| Mercury General Corp | | 23,564 | 1,566,535 |
| NI Holdings Inc (b) | | 7,545 | 118,456 |
| ProAssurance Corp (b) | | 50,846 | 808,960 |
| Safety Insurance Group Inc | | 14,754 | 1,215,730 |
| Selective Insurance Group Inc | | 9,112 | 852,154 |
| Selectquote Inc (b) | | 136,088 | 506,247 |
| Skyward Specialty Insurance Group Inc (b) | | 28,578 | 1,444,332 |
| Stewart Information Services Corp | | 27,170 | 1,833,703 |
| Tiptree Inc Class A | | 19,353 | 403,704 |
| United Fire Group Inc | | 21,006 | 597,621 |
| Universal Insurance Holdings Inc | | 19,744 | 415,809 |
| | | | 28,728,552 |
| Mortgage Real Estate Investment Trusts (REITs) - 1.8% | | | |
| AG Mortgage Investment Trust Inc | | 24,367 | 162,041 |
| Angel Oak Mortgage REIT Inc | | 9,501 | 88,169 |
| Apollo Commercial Real Estate Finance Inc | | 141,311 | 1,223,753 |
| Arbor Realty Trust Inc (c) | | 185,973 | 2,575,726 |
| Ares Commercial Real Estate Corp | | 54,667 | 321,989 |
| ARMOUR Residential REIT Inc | | 57,695 | 1,088,128 |
| Blackstone Mortgage Trust Inc Class A | | 175,478 | 3,055,072 |
| Brightspire Capital Inc Class A | | 133,192 | 751,203 |
| Chimera Investment Corp | | 81,048 | 1,134,672 |
| Claros Mortgage Trust Inc | | 88,961 | 402,104 |
| Dynex Capital Inc | | 79,823 | 1,009,761 |
| Ellington Financial Inc | | 85,356 | 1,034,515 |
| Franklin BSP Realty Trust Inc | | 85,341 | 1,070,176 |
| Granite Point Mortgage Trust Inc | | 51,318 | 143,177 |
| Invesco Mortgage Capital Inc | | 58,103 | 467,729 |
| Kkr Real Estate Finance Trust Inc | | 44,469 | 449,137 |
| Ladder Capital Corp Class A | | 116,183 | 1,300,088 |
| MFA Financial Inc | | 105,798 | 1,078,082 |
| New York Mortgage Trust Inc | | 93,056 | 563,919 |
| Nexpoint Real Estate Finance Inc | | 8,208 | 128,784 |
| Orchid Island Capital Inc | | 80,071 | 622,952 |
| Pennymac Mortgage Investment Trust | | 88,520 | 1,114,467 |
| Ready Capital Corp | | 164,953 | 1,124,979 |
| Redwood Trust Inc | | 132,270 | 863,723 |
| Seven Hills Realty Trust | | 14,680 | 192,014 |
| Sunrise Realty Trust Inc | | 6,113 | 86,071 |
| TPG RE Finance Trust Inc | | 61,718 | 524,603 |
| Two Harbors Investment Corp | | 105,427 | 1,247,201 |
| | | | 23,824,235 |
TOTAL FINANCIALS | | | 369,747,242 |
| | | | |
| Health Care - 8.7% | | | |
| Biotechnology - 3.9% | | | |
| 2seventy bio Inc (b) | | 48,864 | 143,660 |
| 4D Molecular Therapeutics Inc (b) | | 18,170 | 101,207 |
| 89bio Inc (b) | | 84,123 | 657,842 |
| Absci Corp (b)(c) | | 22,318 | 58,473 |
| ACELYRIN Inc (b) | | 72,641 | 228,093 |
| Achieve Life Sciences Inc (b) | | 14,213 | 50,030 |
| Acrivon Therapeutics Inc (b) | | 11,585 | 69,742 |
| Acumen Pharmaceuticals Inc (b) | | 41,152 | 70,781 |
| Adverum Biotechnologies Inc (b) | | 21,186 | 98,939 |
| Agenus Inc (b) | | 19,220 | 52,663 |
| Agios Pharmaceuticals Inc (b) | | 56,669 | 1,862,143 |
| Akebia Therapeutics Inc (b) | | 186,653 | 354,641 |
| Akero Therapeutics Inc (b) | | 56,618 | 1,575,113 |
| Aldeyra Therapeutics Inc (b) | | 44,646 | 222,784 |
| Allogene Therapeutics Inc (b) | | 128,886 | 274,527 |
| Altimmune Inc (b)(c) | | 32,190 | 232,090 |
| Anavex Life Sciences Corp (b)(c) | | 55,606 | 597,208 |
| Anika Therapeutics Inc (b) | | 10,288 | 169,340 |
| Annexon Inc (b) | | 98,201 | 503,771 |
| Applied Therapeutics Inc (b) | | 37,850 | 32,407 |
| Arbutus Biopharma Corp (b) | | 9,978 | 32,628 |
| Arcturus Therapeutics Holdings Inc (b) | | 2,860 | 48,534 |
| ArriVent Biopharma Inc | | 11,207 | 298,554 |
| Astria Therapeutics Inc (b) | | 6,881 | 61,516 |
| Atossa Therapeutics Inc (b)(c) | | 103,648 | 97,854 |
| Aura Biosciences Inc (b) | | 46,433 | 381,679 |
| Avid Bioservices Inc (b)(c) | | 3,422 | 42,262 |
| Beam Therapeutics Inc (b) | | 76,738 | 1,903,102 |
| Bicara Therapeutics Inc (c) | | 8,530 | 148,593 |
| Black Diamond Therapeutics Inc (b) | | 13,236 | 28,325 |
| Bluebird Bio Inc (b)(c) | | 9,971 | 83,158 |
| Boundless Bio Inc (b) | | 6,383 | 18,511 |
| Bridgebio Pharma Inc (b) | | 53,071 | 1,456,268 |
| C4 Therapeutics Inc (b) | | 60,748 | 218,693 |
| Cabaletta Bio Inc (b)(c) | | 35,168 | 79,831 |
| CAMP4 Therapeutics Corp | | 3,009 | 15,707 |
| Capricor Therapeutics Inc (b)(c) | | 5,693 | 78,563 |
| Cardiff Oncology Inc (b)(c) | | 25,338 | 109,967 |
| CareDx Inc (b) | | 39,623 | 848,328 |
| Cargo Therapeutics Inc (b)(c) | | 30,905 | 445,650 |
| Caribou Biosciences Inc (b) | | 82,255 | 130,785 |
| Cartesian Therapeutics Inc rights (b)(e) | | 65,209 | 28,040 |
| Celcuity Inc (b) | | 1,423 | 18,627 |
| Celldex Therapeutics Inc (b) | | 12,015 | 303,619 |
| Century Therapeutics Inc (b)(c) | | 45,928 | 46,387 |
| CG oncology Inc | | 18,622 | 534,079 |
| Chinook Therapeutics Inc rights (b)(e) | | 488 | 0 |
| Cibus Inc Class A (b) | | 18,196 | 50,585 |
| Climb Bio Inc (b)(c) | | 27,113 | 48,803 |
| Cogent Biosciences Inc (b) | | 6,587 | 51,379 |
| Coherus Biosciences Inc (b)(c) | | 84,060 | 116,003 |
| Compass Therapeutics Inc (b) | | 104,332 | 151,281 |
| Corbus Pharmaceuticals Holdings Inc (b)(c) | | 4,677 | 55,189 |
| Cullinan Therapeutics Inc (b) | | 5,734 | 69,840 |
| Cytokinetics Inc (b) | | 103,739 | 4,879,884 |
| Day One Biopharmaceuticals Inc (b) | | 5,418 | 68,646 |
| Denali Therapeutics Inc (b) | | 53,319 | 1,086,641 |
| Design Therapeutics Inc (b)(c) | | 31,352 | 193,442 |
| Dianthus Therapeutics Inc (b) | | 22,177 | 483,459 |
| Disc Medicine Inc (b) | | 17,575 | 1,114,255 |
| Dynavax Technologies Corp (b) | | 26,580 | 339,427 |
| Editas Medicine Inc (b)(c) | | 81,260 | 103,200 |
| Elevation Oncology Inc (b) | | 19,883 | 11,186 |
| Enanta Pharmaceuticals Inc (b) | | 19,642 | 112,942 |
| Entrada Therapeutics Inc (b) | | 24,541 | 424,314 |
| Erasca Inc (b)(c) | | 184,517 | 463,138 |
| Fate Therapeutics Inc (b) | | 102,446 | 169,036 |
| Foghorn Therapeutics Inc (b) | | 10,874 | 51,325 |
| Galectin Therapeutics Inc (b)(c) | | 6,940 | 8,953 |
| Generation Bio CO (b) | | 49,901 | 52,895 |
| Geron Corp (b) | | 181,074 | 641,002 |
| Gyre Therapeutics Inc (b)(c) | | 6,298 | 76,206 |
| Heron Therapeutics Inc (b)(c) | | 108,733 | 166,361 |
| HilleVax Inc (b) | | 22,190 | 45,933 |
| IGM Biosciences Inc (b)(c) | | 1,325 | 8,096 |
| ImmunityBio Inc (b)(c) | | 33,007 | 84,498 |
| Inhibrx Biosciences Inc | | 4,778 | 73,581 |
| Inovio Pharmaceuticals Inc (b)(c) | | 25,748 | 47,119 |
| Inozyme Pharma Inc (b) | | 52,601 | 145,705 |
| Intellia Therapeutics Inc (b) | | 101,816 | 1,187,175 |
| Invivyd Inc (b) | | 77,343 | 34,271 |
| Ironwood Pharmaceuticals Inc Class A (b) | | 92,593 | 410,187 |
| iTeos Therapeutics Inc (b) | | 26,197 | 201,193 |
| Kodiak Sciences Inc (b) | | 32,639 | 324,758 |
| Korro Bio Inc (b) | | 4,446 | 169,259 |
| Kyverna Therapeutics Inc | | 10,179 | 38,069 |
| LENZ Therapeutics Inc (c) | | 12,594 | 363,589 |
| Lexeo Therapeutics Inc (b) | | 1,149 | 7,560 |
| Lexicon Pharmaceuticals Inc (b) | | 70,867 | 52,335 |
| Lyell Immunopharma Inc (b) | | 165,998 | 106,239 |
| MacroGenics Inc (b) | | 9,038 | 29,374 |
| MannKind Corp (b) | | 62,073 | 399,129 |
| MeiraGTx Holdings plc (b) | | 15,382 | 93,676 |
| Mersana Therapeutics Inc (b) | | 53,593 | 76,638 |
| Metagenomi Inc | | 10,825 | 39,078 |
| MiMedx Group Inc (b) | | 62,519 | 601,433 |
| Mineralys Therapeutics Inc (b) | | 22,288 | 274,365 |
| Monte Rosa Therapeutics Inc (b) | | 41,216 | 286,039 |
| Myriad Genetics Inc (b) | | 89,682 | 1,229,540 |
| Neurogene Inc (b) | | 4,833 | 110,482 |
| Nkarta Inc (b) | | 54,199 | 134,956 |
| Novavax Inc (b)(c) | | 35,125 | 282,405 |
| Nurix Therapeutics Inc (b) | | 21,942 | 413,387 |
| Olema Pharmaceuticals Inc (b) | | 30,202 | 176,078 |
| OmniAb Operations Inc (b)(e) | | 3,625 | 6,924 |
| OmniAb Operations Inc (b)(e) | | 3,625 | 7,794 |
| Organogenesis Holdings Inc Class A (b) | | 64,082 | 205,062 |
| ORIC Pharmaceuticals Inc (b)(c) | | 47,895 | 386,513 |
| Outlook Therapeutics Inc (b)(c) | | 5,727 | 10,824 |
| PepGen Inc (b) | | 1,856 | 7,034 |
| Perspective Therapeutics Inc (b) | | 10,021 | 31,967 |
| Poseida Therapeutics Inc (b) | | 49,262 | 472,915 |
| Precigen Inc (b)(c) | | 123,532 | 138,356 |
| Prelude Therapeutics Inc (b)(c) | | 13,269 | 16,918 |
| ProKidney Corp Class A (b) | | 25,768 | 43,548 |
| PTC Therapeutics Inc (b) | | 18,267 | 824,572 |
| Puma Biotechnology Inc (b) | | 27,889 | 85,061 |
| Pyxis Oncology Inc (b) | | 47,984 | 74,855 |
| Q32 Bio Inc (b)(c) | | 6,039 | 20,774 |
| RAPT Therapeutics Inc (b) | | 27,958 | 44,174 |
| REGENXBIO Inc (b) | | 46,037 | 355,866 |
| Regulus Therapeutics Inc (b) | | 45,656 | 72,136 |
| Relay Therapeutics Inc (b) | | 122,489 | 504,655 |
| Renovaro Inc (b) | | 42,513 | 35,520 |
| Replimune Group Inc (b) | | 61,106 | 739,994 |
| REVOLUTION Medicines Inc (b) | | 58,429 | 2,555,684 |
| Rigel Pharmaceuticals Inc (b) | | 3,833 | 64,471 |
| Sage Therapeutics Inc (b) | | 54,393 | 295,354 |
| Savara Inc (b)(c) | | 22,535 | 69,182 |
| Scholar Rock Holding Corp (b) | | 7,829 | 338,369 |
| Shattuck Labs Inc (b) | | 12,746 | 15,423 |
| Skye Bioscience Inc (b) | | 16,936 | 47,929 |
| Solid Biosciences Inc (b) | | 20,733 | 82,932 |
| Spyre Therapeutics Inc (b) | | 31,565 | 734,833 |
| Summit Therapeutics Inc (b)(c) | | 4,947 | 88,279 |
| Sutro Biopharma Inc (b) | | 81,396 | 149,769 |
| Tenaya Therapeutics Inc (b)(c) | | 39,981 | 57,173 |
| Tevogen Bio Holdings Inc Class A (b)(c) | | 8,341 | 8,591 |
| Tourmaline Bio Inc (b) | | 23,113 | 468,732 |
| Travere Therapeutics Inc (b) | | 75,693 | 1,318,572 |
| TScan Therapeutics Inc (b) | | 12,966 | 39,417 |
| Upstream Bio Inc | | 7,616 | 125,207 |
| UroGen Pharma Ltd (b)(c) | | 8,616 | 91,760 |
| Vanda Pharmaceuticals Inc (b) | | 55,864 | 267,589 |
| Veracyte Inc (b) | | 77,091 | 3,052,804 |
| Verve Therapeutics Inc (b)(c) | | 71,394 | 402,662 |
| Vir Biotechnology Inc (b) | | 90,007 | 660,651 |
| Viridian Therapeutics Inc (b) | | 19,562 | 375,004 |
| Voyager Therapeutics Inc (b) | | 45,981 | 260,712 |
| Werewolf Therapeutics Inc (b) | | 22,326 | 33,042 |
| XBiotech Inc (b) | | 19,490 | 76,986 |
| Xencor Inc (b) | | 36,511 | 839,023 |
| XOMA Royalty Corp (b) | | 2,867 | 75,345 |
| Zenas Biopharma Inc (c) | | 6,768 | 55,430 |
| Zentalis Pharmaceuticals Inc (b) | | 57,588 | 174,492 |
| Zymeworks Inc (b) | | 54,885 | 803,516 |
| | | | 50,964,648 |
| Health Care Equipment & Supplies - 1.6% | | | |
| Accuray Inc Del (b) | | 4,092 | 8,101 |
| AngioDynamics Inc (b) | | 39,058 | 357,771 |
| Artivion Inc (b) | | 9,289 | 265,573 |
| AtriCure Inc (b) | | 16,548 | 505,707 |
| Avanos Medical Inc (b) | | 45,627 | 726,382 |
| Bioventus Inc (b) | | 24,698 | 259,329 |
| Ceribell Inc | | 4,029 | 104,271 |
| Embecta Corp | | 52,522 | 1,084,579 |
| Fractyl Health Inc | | 12,708 | 26,178 |
| ICU Medical Inc (b) | | 21,500 | 3,336,155 |
| Inmode Ltd (b) | | 63,295 | 1,057,027 |
| Inogen Inc (b) | | 23,299 | 213,652 |
| Integer Holdings Corp (b) | | 9,993 | 1,324,272 |
| Integra LifeSciences Holdings Corp (b) | | 67,770 | 1,537,024 |
| LivaNova PLC (b) | | 51,375 | 2,379,176 |
| Neogen Corp (b)(c) | | 218,823 | 2,656,511 |
| Nevro Corp (b) | | 36,919 | 137,339 |
| Omnicell Inc (b) | | 45,869 | 2,042,088 |
| OraSure Technologies Inc (b) | | 72,132 | 260,397 |
| Orchestra BioMed Holdings Inc (b) | | 14,463 | 57,852 |
| Orthofix Medical Inc (b) | | 34,421 | 600,991 |
| OrthoPediatrics Corp (b) | | 16,901 | 391,765 |
| Pulse Biosciences Inc warrants 6/26/2029 (b)(c) | | 1,203 | 6,199 |
| Pulse Biosciences Inc warrants 6/26/2030 (b)(c) | | 1,203 | 6,199 |
| SI-BONE Inc (b) | | 7,988 | 111,992 |
| Stereotaxis Inc (b) | | 4,228 | 9,639 |
| Surmodics Inc (b) | | 4,713 | 186,635 |
| Tactile Systems Technology Inc (b) | | 23,789 | 407,506 |
| Utah Medical Products Inc | | 3,234 | 198,794 |
| Varex Imaging Corp (b) | | 38,615 | 563,393 |
| Zimvie Inc (b) | | 27,145 | 378,673 |
| | | | 21,201,170 |
| Health Care Providers & Services - 1.5% | | | |
| Accolade Inc (b) | | 48,204 | 164,858 |
| AdaptHealth Corp (b) | | 57,587 | 548,228 |
| Addus HomeCare Corp (b) | | 10,552 | 1,322,693 |
| Ardent Health Partners Inc | | 3,928 | 67,090 |
| Aveanna Healthcare Holdings Inc (b) | | 16,169 | 73,892 |
| Brookdale Senior Living Inc (b) | | 27,037 | 135,996 |
| Castle Biosciences Inc (b) | | 17,586 | 468,667 |
| Community Health Systems Inc (b) | | 58,623 | 175,283 |
| Concentra Group Holdings Parent Inc (c) | | 33,874 | 670,028 |
| Cross Country Healthcare Inc (b) | | 32,662 | 593,142 |
| DocGo Inc Class A (b) | | 83,005 | 351,941 |
| Enhabit Inc (b) | | 44,386 | 346,655 |
| Fulgent Genetics Inc (b) | | 20,663 | 381,646 |
| GeneDx Holdings Corp Class A (b) | | 11,183 | 859,525 |
| Innovage Holding Corp (b) | | 13,140 | 51,640 |
| LifeStance Health Group Inc (b) | | 76,477 | 563,635 |
| Modivcare Inc (b) | | 5,714 | 67,654 |
| National HealthCare Corp | | 12,507 | 1,345,253 |
| NeoGenomics Inc (b) | | 117,679 | 1,939,350 |
| OPKO Health Inc (b)(c) | | 328,165 | 482,403 |
| Option Care Health Inc (b) | | 91,375 | 2,119,901 |
| Owens & Minor Inc (b) | | 64,076 | 837,473 |
| Patterson Cos Inc | | 64,626 | 1,994,358 |
| Pediatrix Medical Group Inc (b) | | 86,231 | 1,131,351 |
| Performant Healthcare Inc (b) | | 22,458 | 67,823 |
| Quipt Home Medical Corp (United States) (b) | | 38,215 | 116,556 |
| Select Medical Holdings Corp | | 34,052 | 641,880 |
| Sonida Senior Living Inc (b) | | 2,227 | 51,399 |
| Surgery Partners Inc (b) | | 77,173 | 1,633,752 |
| | | | 19,204,072 |
| Health Care Technology - 0.1% | | | |
| Definitive Healthcare Corp Class A (b) | | 54,052 | 222,153 |
| Health Catalyst Inc (b) | | 55,046 | 389,175 |
| HealthStream Inc | | 16,047 | 510,295 |
| LifeMD Inc (b)(c) | | 14,253 | 70,551 |
| Teladoc Health Inc (b) | | 145,751 | 1,324,877 |
| Waystar Holding Corp (b) | | 15,025 | 551,418 |
| | | | 3,068,469 |
| Life Sciences Tools & Services - 0.4% | | | |
| Adaptive Biotechnologies Corp (b) | | 116,323 | 697,356 |
| BioLife Solutions Inc (b) | | 3,803 | 98,726 |
| Codexis Inc (b) | | 71,888 | 342,906 |
| Conduit Pharmaceuticals Inc Class A (b) | | 8,420 | 577 |
| CryoPort Inc (b) | | 7,632 | 59,377 |
| Cytek Biosciences Inc (b) | | 122,031 | 791,981 |
| Harvard Bioscience Inc (b) | | 30,823 | 65,037 |
| Lifecore Biomedical Inc (b) | | 22,053 | 163,854 |
| MaxCyte Inc (United States) (b) | | 105,222 | 437,724 |
| Mesa Laboratories Inc | | 3,442 | 453,897 |
| Nautilus Biotechnology Inc Class A (b) | | 47,505 | 79,808 |
| OmniAb Inc (b)(c) | | 81,045 | 286,899 |
| Pacific Biosciences of California Inc (b)(c) | | 275,929 | 504,950 |
| Quanterix Corp (b) | | 31,087 | 330,455 |
| Quantum-Si Inc Class A (b)(c) | | 102,846 | 277,684 |
| Standard BioTools Inc (b)(c) | | 230,893 | 404,063 |
| | | | 4,995,294 |
| Pharmaceuticals - 1.2% | | | |
| Alto Neuroscience Inc | | 8,160 | 34,517 |
| Alumis Inc (c) | | 6,389 | 50,218 |
| Amneal Intermediate Inc Class A (b) | | 24,305 | 192,496 |
| ANI Pharmaceuticals Inc (b) | | 5,391 | 298,014 |
| Aquestive Therapeutics Inc (b)(c) | | 54,138 | 192,731 |
| Atea Pharmaceuticals Inc (b) | | 74,381 | 249,176 |
| BioAge Labs Inc | | 5,407 | 31,307 |
| Biote Corp Class A (b) | | 1,082 | 6,687 |
| Contineum Therapeutics Inc Class A | | 4,235 | 62,043 |
| CorMedix Inc (b)(c) | | 5,828 | 47,207 |
| Enliven Therapeutics Inc (b) | | 1,790 | 40,275 |
| Esperion Therapeutics Inc New (b)(c) | | 138,806 | 305,373 |
| EyePoint Pharmaceuticals Inc (b) | | 35,830 | 266,934 |
| Fulcrum Therapeutics Inc (b) | | 35,984 | 169,125 |
| Innoviva Inc (b)(c) | | 49,830 | 864,551 |
| Ligand Pharmaceuticals Inc (b) | | 17,356 | 1,859,695 |
| Lyra Therapeutics Inc (b) | | 18,727 | 3,865 |
| MBX Biosciences Inc | | 5,011 | 92,353 |
| Nektar Therapeutics (b) | | 180,100 | 167,493 |
| Novartis AG rights (b)(e) | | 31,059 | 0 |
| Nuvation Bio Inc Class A (b) | | 181,745 | 483,442 |
| Omeros Corp (b) | | 36,946 | 365,026 |
| Pacira BioSciences Inc (b) | | 42,569 | 802,000 |
| Phathom Pharmaceuticals Inc (b) | | 30,776 | 249,901 |
| Phibro Animal Health Corp Class A | | 15,729 | 330,309 |
| Pliant Therapeutics Inc (b) | | 57,386 | 755,774 |
| Prestige Consumer Healthcare Inc (b) | | 49,567 | 3,870,687 |
| Rapport Therapeutics Inc (b) | | 4,287 | 76,051 |
| Septerna Inc | | 8,127 | 186,108 |
| SIGA Technologies Inc | | 12,209 | 73,376 |
| Supernus Pharmaceuticals Inc (b) | | 46,637 | 1,686,394 |
| Telomir Pharmaceuticals Inc (b) | | 8,617 | 35,502 |
| Terns Pharmaceuticals Inc (b) | | 66,913 | 370,698 |
| Theravance Biopharma Inc (b) | | 36,736 | 345,686 |
| Third Harmonic Bio Inc (b)(c) | | 19,866 | 204,421 |
| Trevi Therapeutics Inc (b) | | 23,560 | 97,067 |
| Ventyx Biosciences Inc (b) | | 61,768 | 135,272 |
| WaVe Life Sciences Ltd (b) | | 13,485 | 166,809 |
| Zevra Therapeutics Inc (b) | | 25,165 | 209,876 |
| | | | 15,378,459 |
TOTAL HEALTH CARE | | | 114,812,112 |
| | | | |
| Industrials - 12.5% | | | |
| Aerospace & Defense - 0.9% | | | |
| AAR Corp (b) | | 27,871 | 1,707,935 |
| AerSale Corp (b) | | 33,341 | 210,048 |
| Archer Aviation Inc Class A (b) | | 12,853 | 125,317 |
| Astronics Corp (b) | | 28,853 | 460,494 |
| Ducommun Inc (b) | | 13,525 | 861,002 |
| Intuitive Machines Inc Class A (b) | | 28,974 | 526,168 |
| Kratos Defense & Security Solutions Inc (b) | | 82,445 | 2,174,899 |
| Mercury Systems Inc (b) | | 52,057 | 2,186,394 |
| National Presto Industries Inc | | 5,231 | 514,835 |
| Park Aerospace Corp | | 10,299 | 150,880 |
| Redwire Corp Class A (b)(c) | | 16,732 | 275,409 |
| Triumph Group Inc (b) | | 73,367 | 1,369,028 |
| V2X Inc (b) | | 14,216 | 679,951 |
| Virgin Galactic Holdings Inc Class A (b)(c) | | 24,589 | 144,583 |
| | | | 11,386,943 |
| Air Freight & Logistics - 0.4% | | | |
| Air Transport Services Group Inc (b) | | 51,349 | 1,128,651 |
| Forward Air Corp Class A (c) | | 25,082 | 808,895 |
| Hub Group Inc Class A | | 60,073 | 2,676,853 |
| Radiant Logistics Inc (b) | | 35,864 | 240,288 |
| | | | 4,854,687 |
| Building Products - 1.1% | | | |
| American Woodmark Corp (b) | | 14,625 | 1,163,126 |
| Apogee Enterprises Inc | | 14,955 | 1,067,937 |
| AZZ Inc | | 5,054 | 414,024 |
| Caesarstone Ltd (b) | | 20,800 | 88,400 |
| Gibraltar Industries Inc (b) | | 16,082 | 947,230 |
| Insteel Industries Inc | | 10,191 | 275,259 |
| JELD-WEN Holding Inc (b) | | 55,065 | 450,982 |
| Masterbrand Inc (b) | | 127,000 | 1,855,470 |
| Quanex Building Products Corp | | 45,250 | 1,096,860 |
| Resideo Technologies Inc (b) | | 146,160 | 3,368,988 |
| UFP Industries Inc | | 26,445 | 2,979,029 |
| Zurn Elkay Water Solutions Corp (c) | | 7,486 | 279,228 |
| | | | 13,986,533 |
| Commercial Services & Supplies - 2.1% | | | |
| ABM Industries Inc | | 63,268 | 3,238,057 |
| ACCO Brands Corp | | 93,205 | 489,326 |
| Aris Water Solutions Inc Class A | | 25,024 | 599,325 |
| Bridger Aerospace Group Holdings Inc (b)(c) | | 7,872 | 16,767 |
| BrightView Holdings Inc (b) | | 58,235 | 931,178 |
| CompX International Inc Class A | | 678 | 17,730 |
| CoreCivic Inc (b) | | 109,029 | 2,370,290 |
| Deluxe Corp | | 44,137 | 997,055 |
| Ennis Inc | | 25,511 | 538,027 |
| Enviri Corp (b) | | 78,689 | 605,905 |
| GEO Group Inc/The (b) | | 127,448 | 3,565,996 |
| Healthcare Services Group Inc (b) | | 74,060 | 860,207 |
| HNI Corp | | 24,784 | 1,248,370 |
| Interface Inc | | 52,014 | 1,266,541 |
| Matthews International Corp Class A | | 29,765 | 823,895 |
| MillerKnoll Inc | | 70,053 | 1,582,497 |
| NL Industries Inc | | 8,922 | 69,324 |
| OPENLANE Inc (b) | | 106,985 | 2,122,582 |
| Pitney Bowes Inc | | 114,210 | 826,880 |
| Quad/Graphics Inc Class A | | 11,935 | 83,187 |
| Steelcase Inc Class A | | 92,861 | 1,097,617 |
| UniFirst Corp/MA | | 15,059 | 2,576,444 |
| Virco Mfg. Corp | | 10,237 | 104,929 |
| VSE Corp | | 14,789 | 1,406,434 |
| | | | 27,438,563 |
| Construction & Engineering - 0.7% | | | |
| Ameresco Inc Class A (b) | | 21,817 | 512,263 |
| Arcosa Inc | | 48,536 | 4,695,373 |
| Concrete Pumping Holdings Inc (b) | | 23,590 | 157,109 |
| Fluor Corp (b) | | 14,277 | 704,142 |
| Granite Construction Inc | | 7,801 | 684,226 |
| Great Lakes Dredge & Dock Corp (b) | | 65,658 | 741,279 |
| Matrix Service Co (b) | | 26,120 | 312,656 |
| Northwest Pipe Co (b) | | 8,227 | 397,035 |
| Orion Group Holdings Inc (b) | | 30,869 | 226,270 |
| Primoris Services Corp | | 4,089 | 312,400 |
| Southland Holdings Inc (b) | | 10,306 | 33,494 |
| Tutor Perini Corp (b) | | 43,171 | 1,044,738 |
| | | | 9,820,985 |
| Electrical Equipment - 0.7% | | | |
| Allient Inc | | 13,562 | 329,285 |
| Blink Charging Co (b)(c) | | 56,891 | 79,078 |
| Bloom Energy Corp Class A (b)(c) | | 17,476 | 388,142 |
| ChargePoint Holdings Inc Class A (b)(c) | | 177,544 | 189,972 |
| Energy Vault Holdings Inc Class A (b)(c) | | 104,979 | 239,352 |
| EnerSys | | 3,317 | 306,590 |
| FuelCell Energy Inc (b)(c) | | 18,830 | 170,223 |
| GrafTech International Ltd (b) | | 19,748 | 34,164 |
| LSI Industries Inc | | 8,451 | 164,118 |
| NANO Nuclear Energy Inc (c) | | 3,753 | 93,431 |
| Net Power Inc Class A (b)(c) | | 21,708 | 229,888 |
| NEXTracker Inc Class A (b) | | 37,086 | 1,354,752 |
| Plug Power Inc (b)(c) | | 735,834 | 1,567,327 |
| Preformed Line Products Co | | 2,308 | 294,939 |
| SES AI Corp Class A (b)(c) | | 117,886 | 258,170 |
| SolarMax Technology Inc (b)(c) | | 17,670 | 28,625 |
| Solidion Technology Inc Class A (b)(c) | | 12,300 | 8,569 |
| Stem Inc Class A (b)(c) | | 149,920 | 90,402 |
| Sunrun Inc (b)(c) | | 219,416 | 2,029,599 |
| Thermon Group Holdings Inc (b) | | 29,870 | 859,360 |
| TPI Composites Inc (b)(c) | | 49,113 | 92,824 |
| Ultralife Corp (b) | | 8,803 | 65,582 |
| Vicor Corp (b) | | 10,286 | 497,020 |
| | | | 9,371,412 |
| Ground Transportation - 0.4% | | | |
| Covenant Logistics Group Inc Class A | | 6,553 | 357,204 |
| Ftai Infrastructure Inc | | 100,663 | 730,814 |
| Heartland Express Inc | | 26,601 | 298,463 |
| Hertz Global Holdings Inc (b)(c) | | 122,722 | 449,163 |
| Marten Transport Ltd | | 45,938 | 717,092 |
| PAMT CORP (b) | | 5,264 | 86,224 |
| Proficient Auto Logistics Inc | | 11,106 | 89,625 |
| Universal Logistics Holdings Inc | | 4,328 | 198,828 |
| Werner Enterprises Inc | | 53,961 | 1,938,280 |
| | | | 4,865,693 |
| Machinery - 2.8% | | | |
| 3D Systems Corp (b)(c) | | 128,427 | 421,241 |
| Albany International Corp Class A | | 23,702 | 1,895,449 |
| Astec Industries Inc | | 22,789 | 765,710 |
| Barnes Group Inc | | 46,487 | 2,196,976 |
| Columbus McKinnon Corp/NY | | 28,415 | 1,058,175 |
| Commercial Vehicle Group Inc (b) | | 33,514 | 83,114 |
| Douglas Dynamics Inc | | 4,092 | 96,693 |
| Eastern Co/The | | 5,269 | 139,839 |
| Enpro Inc | | 18,821 | 3,245,681 |
| ESCO Technologies Inc | | 13,270 | 1,767,697 |
| Gencor Industries Inc (b) | | 10,404 | 183,631 |
| Greenbrier Cos Inc/The | | 30,746 | 1,875,199 |
| Helios Technologies Inc | | 10,586 | 472,559 |
| Hillenbrand Inc | | 46,897 | 1,443,490 |
| Hillman Solutions Corp Class A (b) | | 164,232 | 1,599,620 |
| Hyliion Holdings Corp Class A (b)(c) | | 141,671 | 369,761 |
| Hyster-Yale Inc Class A | | 4,630 | 235,806 |
| John Bean Technologies Corp | | 43,806 | 5,567,743 |
| Kennametal Inc | | 78,398 | 1,883,120 |
| L B Foster Co Class A (b) | | 8,901 | 239,437 |
| Lindsay Corp | | 5,497 | 650,350 |
| Manitowoc Co Inc/The (b) | | 34,017 | 310,575 |
| Mayville Engineering Co Inc (b) | | 12,002 | 188,671 |
| Miller Industries Inc/TN | | 10,555 | 689,875 |
| Mueller Industries Inc | | 8,442 | 669,957 |
| Nikola Corp (b) | | 1 | 1 |
| NN Inc (b) | | 46,013 | 150,463 |
| Park-Ohio Holdings Corp | | 8,927 | 234,512 |
| Proto Labs Inc (b) | | 25,302 | 989,055 |
| REV Group Inc | | 11,349 | 361,693 |
| Shyft Group Inc/The | | 31,748 | 372,722 |
| Standex International Corp | | 2,754 | 514,970 |
| Tennant CO | | 10,595 | 863,810 |
| Terex Corp | | 66,894 | 3,091,841 |
| Titan International Inc (b) | | 50,198 | 340,844 |
| Trinity Industries Inc | | 6,753 | 237,030 |
| Twin Disc Inc | | 11,667 | 137,087 |
| Wabash National Corp | | 43,020 | 736,933 |
| | | | 36,081,330 |
| Marine Transportation - 0.4% | | | |
| Genco Shipping & Trading Ltd | | 42,962 | 598,890 |
| Matson Inc | | 32,790 | 4,421,404 |
| Pangaea Logistics Solutions Ltd | | 32,068 | 171,884 |
| | | | 5,192,178 |
| Passenger Airlines - 0.6% | | | |
| Allegiant Travel Co | | 15,559 | 1,464,413 |
| Blade Air Mobility Inc (b) | | 58,714 | 249,534 |
| JetBlue Airways Corp (b) | | 312,975 | 2,459,984 |
| SkyWest Inc (b) | | 39,715 | 3,976,663 |
| Sun Country Airlines Holdings Inc (b) | | 21,248 | 309,796 |
| | | | 8,460,390 |
| Professional Services - 1.0% | | | |
| Alight Inc Class A | | 420,129 | 2,907,293 |
| Asure Software Inc (b) | | 24,308 | 228,738 |
| Barrett Business Services Inc | | 2,249 | 97,697 |
| BlackSky Technology Inc Class A (b) | | 25,146 | 271,325 |
| Conduent Inc (b) | | 158,279 | 639,447 |
| DLH Holdings Corp (b) | | 5,011 | 40,238 |
| First Advantage Corp (b) | | 24,160 | 452,517 |
| Forrester Research Inc (b) | | 11,714 | 183,558 |
| Heidrick & Struggles International Inc | | 20,255 | 897,499 |
| HireQuest Inc | | 1,387 | 19,640 |
| IBEX Holdings Ltd (b) | | 8,403 | 180,580 |
| Kelly Services Inc Class A | | 30,793 | 429,254 |
| Korn Ferry | | 52,138 | 3,516,709 |
| Mistras Group Inc (b) | | 21,209 | 192,154 |
| NV5 Global Inc (b) | | 46,755 | 880,864 |
| Planet Labs PBC Class A (b) | | 215,674 | 871,323 |
| Resources Connection Inc | | 34,047 | 290,421 |
| TrueBlue Inc (b) | | 28,912 | 242,861 |
| TTEC Holdings Inc | | 19,121 | 95,414 |
| Willdan Group Inc (b) | | 12,810 | 487,933 |
| | | | 12,925,465 |
| Trading Companies & Distributors - 1.4% | | | |
| Beacon Roofing Supply Inc (b) | | 4,101 | 416,580 |
| BlueLinx Holdings Inc (b) | | 8,147 | 832,298 |
| Boise Cascade Co | | 20,442 | 2,429,736 |
| Custom Truck One Source Inc Class A (b) | | 16,400 | 78,884 |
| Distribution Solutions Group Inc (b) | | 1,174 | 40,385 |
| DNOW Inc (b) | | 105,815 | 1,376,653 |
| DXP Enterprises Inc/TX (b) | | 11,391 | 941,124 |
| EVI Industries Inc | | 1,154 | 18,867 |
| GATX Corp | | 35,731 | 5,536,876 |
| GMS Inc (b) | | 3,930 | 333,382 |
| H&E Equipment Services Inc | | 2,458 | 120,344 |
| Hudson Technologies Inc (b) | | 38,189 | 213,095 |
| Mrc Global Inc (b) | | 84,607 | 1,081,277 |
| Rush Enterprises Inc Class A | | 60,832 | 3,332,985 |
| Rush Enterprises Inc Class B | | 9,097 | 495,241 |
| Titan Machinery Inc (b) | | 20,763 | 293,381 |
| Willis Lease Finance Corp | | 2,881 | 597,952 |
| | | | 18,139,060 |
TOTAL INDUSTRIALS | | | 162,523,239 |
| | | | |
| Information Technology - 6.3% | | | |
| Communications Equipment - 0.9% | | | |
| ADTRAN Holdings Inc (b) | | 78,868 | 656,970 |
| Applied Optoelectronics Inc (b)(c) | | 40,886 | 1,507,058 |
| Aviat Networks Inc (b) | | 11,672 | 211,380 |
| Calix Inc (b) | | 15,737 | 548,749 |
| Clearfield Inc (b) | | 12,187 | 377,797 |
| CommScope Holding Co Inc (b) | | 215,426 | 1,122,369 |
| Digi International Inc (b) | | 35,747 | 1,080,632 |
| Extreme Networks Inc (b) | | 60,013 | 1,004,618 |
| Netgear Inc (b) | | 27,966 | 779,412 |
| NetScout Systems Inc (b) | | 69,170 | 1,498,222 |
| Ribbon Communications Inc (b) | | 91,698 | 381,464 |
| Viasat Inc (b)(c) | | 124,000 | 1,055,240 |
| Viavi Solutions Inc (b) | | 221,036 | 2,232,464 |
| | | | 12,456,375 |
| Electronic Equipment, Instruments & Components - 2.5% | | | |
| 908 Devices Inc (b) | | 21,950 | 48,290 |
| Aeva Technologies Inc (b) | | 24,257 | 115,221 |
| Bel Fuse Inc Class A | | 2,404 | 216,552 |
| Bel Fuse Inc Class B | | 9,764 | 805,237 |
| Belden Inc | | 18,935 | 2,132,270 |
| Benchmark Electronics Inc | | 35,876 | 1,628,770 |
| CTS Corp | | 6,695 | 353,027 |
| Daktronics Inc (b) | | 34,440 | 580,658 |
| ePlus Inc (b) | | 8,622 | 636,993 |
| FARO Technologies Inc (b) | | 19,433 | 492,821 |
| Itron Inc (b) | | 4,386 | 476,232 |
| Kimball Electronics Inc (b) | | 24,389 | 456,806 |
| Knowles Corp (b) | | 87,315 | 1,740,188 |
| Methode Electronics Inc | | 35,156 | 414,489 |
| MicroVision Inc (b)(c) | | 99,991 | 130,988 |
| Mirion Technologies Inc Class A (b) | | 180,227 | 3,144,962 |
| nLight Inc (b) | | 43,545 | 456,787 |
| OSI Systems Inc (b) | | 915 | 153,198 |
| Ouster Inc Class A (b) | | 38,587 | 471,533 |
| PAR Technology Corp (b)(c) | | 1,923 | 139,744 |
| PC Connection Inc | | 11,625 | 805,264 |
| Plexus Corp (b) | | 18,871 | 2,952,934 |
| Powerfleet Inc NJ (b) | | 95,159 | 633,759 |
| Richardson Electronics Ltd/United States | | 12,290 | 172,429 |
| Rogers Corp (b) | | 18,843 | 1,914,637 |
| Sanmina Corp (b) | | 53,825 | 4,072,939 |
| ScanSource Inc (b) | | 23,875 | 1,132,869 |
| SmartRent Inc Class A (b) | | 190,924 | 334,117 |
| TTM Technologies Inc (b) | | 101,163 | 2,503,784 |
| Vishay Intertechnology Inc | | 126,870 | 2,149,178 |
| Vishay Precision Group Inc (b) | | 12,129 | 284,668 |
| | | | 31,551,344 |
| IT Services - 0.4% | | | |
| Applied Digital Corp (b)(c) | | 59,232 | 452,532 |
| ASGN Inc (b) | | 33,655 | 2,804,809 |
| BigBear.ai Holdings Inc (b)(c) | | 26,810 | 119,305 |
| Core Scientific Inc | | 38,429 | 539,927 |
| Fastly Inc Class A (b) | | 26,802 | 253,011 |
| Grid Dynamics Holdings Inc (b) | | 14,208 | 315,986 |
| Hackett Group Inc/The | | 2,545 | 78,182 |
| Information Services Group Inc | | 36,912 | 123,286 |
| Rackspace Technology Inc (b) | | 67,926 | 150,116 |
| Unisys Corp (b) | | 66,169 | 418,850 |
| | | | 5,256,004 |
| Semiconductors & Semiconductor Equipment - 1.1% | | | |
| ACM Research Inc Class A (b) | | 15,950 | 240,845 |
| Alpha & Omega Semiconductor Ltd (b) | | 23,891 | 884,684 |
| Ambarella Inc (b) | | 18,049 | 1,312,884 |
| CEVA Inc (b) | | 3,496 | 110,299 |
| Cohu Inc (b) | | 46,240 | 1,234,608 |
| Diodes Inc (b) | | 40,914 | 2,523,166 |
| Everspin Technologies Inc (b) | | 3,237 | 20,684 |
| Ichor Holdings Ltd (b) | | 22,582 | 727,592 |
| MaxLinear Inc Class A (b) | | 4,514 | 89,287 |
| Navitas Semiconductor Corp Class A (b)(c) | | 109,505 | 390,933 |
| Penguin Solutions Inc (b) | | 52,073 | 999,281 |
| Photronics Inc (b) | | 40,571 | 955,853 |
| Rigetti Computing Inc Class A (b)(c) | | 158,033 | 2,411,584 |
| Synaptics Inc (b) | | 36,707 | 2,801,478 |
| Veeco Instruments Inc (b) | | 8,419 | 225,629 |
| | | | 14,928,807 |
| Software - 1.2% | | | |
| Adeia Inc | | 16,763 | 234,347 |
| Aurora Innovation Inc Class A (b)(c) | | 442,938 | 2,790,510 |
| Bit Digital Inc (b)(c) | | 120,901 | 354,240 |
| Cerence Inc (b) | | 41,303 | 324,229 |
| Cipher Mining Inc (b) | | 66,624 | 309,135 |
| Commvault Systems Inc (b) | | 2,937 | 443,223 |
| Consensus Cloud Solutions Inc (b) | | 18,000 | 429,480 |
| CS Disco Inc (b) | | 10,734 | 53,563 |
| Daily Journal Corp (b) | | 402 | 228,332 |
| Digimarc Corp (b)(c) | | 921 | 34,491 |
| Digital Turbine Inc (b) | | 97,906 | 165,461 |
| E2open Parent Holdings Inc Class A (b) | | 203,735 | 541,935 |
| EverCommerce Inc (b) | | 5,740 | 63,197 |
| Life360 Inc (b) | | 1,933 | 79,775 |
| Logility Supply Chain Solutions Inc Class A | | 32,122 | 355,912 |
| MARA Holdings Inc (b)(c) | | 51,733 | 867,562 |
| Meridianlink Inc (b) | | 13,101 | 270,536 |
| NCR Voyix Corp (b) | | 12,949 | 179,214 |
| Olo Inc Class A (b) | | 54,012 | 414,812 |
| ON24 Inc (b) | | 26,805 | 173,160 |
| OneSpan Inc | | 3,555 | 65,910 |
| Ooma Inc (b) | | 21,971 | 308,912 |
| Pagaya Technologies Ltd Class A (b)(c) | | 36,056 | 334,960 |
| Prairie Operating Co (b) | | 471 | 3,259 |
| Rekor Systems Inc (b)(c) | | 13,749 | 21,448 |
| Rimini Street Inc (b) | | 47,264 | 126,195 |
| Riot Platforms Inc (b)(c) | | 248,028 | 2,532,367 |
| Roadzen Inc (b) | | 35,766 | 77,970 |
| Silvaco Group Inc (b)(c) | | 1,167 | 9,429 |
| SolarWinds Corp | | 54,384 | 774,972 |
| SoundThinking Inc (b) | | 1,015 | 13,256 |
| Telos Corp (b) | | 55,604 | 190,166 |
| Terawulf Inc (b)(c) | | 18,002 | 101,891 |
| Verint Systems Inc (b) | | 61,336 | 1,683,673 |
| Xperi Inc (b) | | 46,070 | 473,139 |
| | | | 15,030,661 |
| Technology Hardware, Storage & Peripherals - 0.2% | | | |
| CompoSecure Inc Class A | | 3,326 | 50,988 |
| Corsair Gaming Inc (b) | | 35,155 | 232,375 |
| Diebold Nixdorf Inc (b) | | 25,417 | 1,093,948 |
| Eastman Kodak Co (b) | | 60,778 | 399,311 |
| Immersion Corp | | 31,393 | 274,061 |
| Turtle Beach Corp (b) | | 6,833 | 118,279 |
| Xerox Holdings Corp | | 117,194 | 987,945 |
| | | | 3,156,907 |
TOTAL INFORMATION TECHNOLOGY | | | 82,380,098 |
| | | | |
| Materials - 4.2% | | | |
| Chemicals - 1.5% | | | |
| AdvanSix Inc | | 25,783 | 734,558 |
| American Vanguard Corp | | 25,236 | 116,843 |
| Arq Inc (b) | | 24,602 | 186,237 |
| Aspen Aerogels Inc (b) | | 48,456 | 575,657 |
| Avient Corp | | 90,605 | 3,702,121 |
| Core Molding Technologies Inc (b) | | 7,460 | 123,388 |
| Danimer Scientific Inc warrants 7/15/2025 (b) | | 26,058 | 938 |
| Ecovyst Inc (b) | | 116,012 | 886,332 |
| HB Fuller Co | | 39,342 | 2,654,798 |
| Innospec Inc | | 3,719 | 409,313 |
| Intrepid Potash Inc (b) | | 10,759 | 235,837 |
| Koppers Holdings Inc | | 19,753 | 639,997 |
| Kronos Worldwide Inc | | 22,195 | 216,401 |
| LSB Industries Inc (b) | | 52,525 | 398,665 |
| Mativ Holdings Inc | | 54,449 | 593,494 |
| Minerals Technologies Inc | | 31,758 | 2,420,277 |
| Perimeter Solutions Inc | | 134,404 | 1,717,683 |
| PureCycle Technologies Inc (b)(c) | | 100,382 | 1,028,916 |
| Rayonier Advanced Materials Inc (b) | | 63,724 | 525,723 |
| Sensient Technologies Corp | | 2,298 | 163,755 |
| Stepan Co | | 19,129 | 1,237,646 |
| Tronox Holdings PLC | | 119,280 | 1,201,150 |
| Valhi Inc | | 2,479 | 57,984 |
| | | | 19,827,713 |
| Construction Materials - 0.5% | | | |
| Summit Materials Inc Class A (b) | | 121,271 | 6,136,313 |
| Containers & Packaging - 0.4% | | | |
| Greif Inc Class A | | 24,870 | 1,520,054 |
| Greif Inc Class B | | 5,270 | 357,570 |
| O-I Glass Inc (b) | | 154,827 | 1,678,325 |
| Pactiv Evergreen Inc | | 35,821 | 625,793 |
| Ranpak Holdings Corp Class A (b) | | 42,841 | 294,746 |
| TriMas Corp | | 40,655 | 999,706 |
| | | | 5,476,194 |
| Metals & Mining - 1.6% | | | |
| Arch Resources Inc Class A | | 17,605 | 2,486,178 |
| Coeur Mining Inc (b) | | 396,654 | 2,268,861 |
| Commercial Metals Co | | 114,107 | 5,659,708 |
| Compass Minerals International Inc | | 34,475 | 387,844 |
| Contango ORE Inc (b) | | 6,495 | 65,080 |
| Dakota Gold Corp (b) | | 28,974 | 63,743 |
| Hecla Mining Co | | 590,258 | 2,898,167 |
| Kaiser Aluminum Corp | | 1,035 | 72,729 |
| Materion Corp | | 1,194 | 118,063 |
| Metallus Inc (b) | | 42,961 | 607,039 |
| Olympic Steel Inc | | 9,817 | 322,096 |
| Piedmont Lithium Inc (b)(c) | | 12,964 | 113,305 |
| Radius Recycling Inc Class A | | 26,294 | 400,195 |
| Ryerson Holding Corp | | 26,846 | 496,919 |
| SunCoke Energy Inc | | 83,916 | 897,901 |
| Tredegar Corp (b) | | 26,598 | 204,273 |
| Universal Stainless & Alloy Products Inc (b) | | 8,881 | 391,030 |
| Warrior Met Coal Inc | | 51,997 | 2,820,317 |
| Worthington Steel Inc | | 32,598 | 1,037,268 |
| | | | 21,310,716 |
| Paper & Forest Products - 0.2% | | | |
| Clearwater Paper Corp (b) | | 16,141 | 480,517 |
| Sylvamo Corp | | 27,320 | 2,158,826 |
| | | | 2,639,343 |
TOTAL MATERIALS | | | 55,390,279 |
| | | | |
| Real Estate - 11.0% | | | |
| Diversified REITs - 1.3% | | | |
| Alexander & Baldwin Inc | | 75,942 | 1,347,211 |
| Alpine Income Property Trust Inc | | 14,329 | 240,584 |
| American Assets Trust Inc | | 49,826 | 1,308,431 |
| Armada Hoffler Properties Inc Class A | | 76,628 | 783,904 |
| Broadstone Net Lease Inc Class A | | 194,018 | 3,077,125 |
| CTO Realty Growth Inc | | 30,550 | 602,141 |
| Empire State Realty Trust Inc Class A | | 139,316 | 1,437,741 |
| Essential Properties Realty Trust Inc | | 178,043 | 5,569,186 |
| Gladstone Commercial Corp | | 37,808 | 614,002 |
| Global Net Lease Inc | | 208,350 | 1,520,955 |
| NexPoint Diversified Real Estate Trust | | 35,520 | 216,672 |
| One Liberty Properties Inc | | 17,589 | 479,124 |
| | | | 17,197,076 |
| Health Care REITs - 1.5% | | | |
| American Healthcare REIT Inc | | 153,380 | 4,359,060 |
| CareTrust REIT Inc | | 172,411 | 4,663,718 |
| Community Healthcare Trust Inc | | 25,995 | 499,363 |
| Diversified Healthcare Trust | | 220,972 | 508,236 |
| Global Medical REIT Inc | | 66,770 | 515,464 |
| LTC Properties Inc | | 46,201 | 1,596,245 |
| National Health Investors Inc | | 42,670 | 2,957,031 |
| Sabra Health Care REIT Inc | | 239,858 | 4,154,341 |
| Universal Health Realty Income Trust | | 3,157 | 117,471 |
| | | | 19,370,929 |
| Hotel & Resort REITs - 1.1% | | | |
| Apple Hospitality REIT Inc | | 231,630 | 3,555,521 |
| Braemar Hotels & Resorts Inc | | 66,981 | 200,942 |
| Chatham Lodging Trust | | 49,583 | 443,768 |
| DiamondRock Hospitality Co | | 210,310 | 1,899,099 |
| Pebblebrook Hotel Trust | | 120,471 | 1,632,382 |
| RLJ Lodging Trust | | 155,329 | 1,585,909 |
| Service Properties Trust | | 169,446 | 430,393 |
| Summit Hotel Properties Inc | | 108,480 | 743,088 |
| Sunstone Hotel Investors Inc | | 206,378 | 2,443,516 |
| Xenia Hotels & Resorts Inc | | 103,679 | 1,540,670 |
| | | | 14,475,288 |
| Industrial REITs - 0.6% | | | |
| Industrial Logistics Properties Trust | | 65,420 | 238,782 |
| LXP Industrial Trust | | 297,684 | 2,417,194 |
| Plymouth Industrial REIT Inc | | 42,422 | 755,112 |
| Terreno Realty Corp | | 96,561 | 5,710,618 |
| | | | 9,121,706 |
| Office REITs - 1.4% | | | |
| Brandywine Realty Trust | | 172,932 | 968,419 |
| City Office Reit Inc | | 41,270 | 227,810 |
| COPT Defense Properties | | 114,389 | 3,540,340 |
| Douglas Emmett Inc | | 163,023 | 3,025,707 |
| Easterly Government Properties Inc | | 102,343 | 1,162,616 |
| Franklin Street Properties Corp | | 100,221 | 183,404 |
| Hudson Pacific Properties Inc | | 139,042 | 421,297 |
| JBG SMITH Properties | | 82,749 | 1,271,852 |
| NET Lease Office Properties | | 14,938 | 466,215 |
| Orion Office REIT Inc | | 60,468 | 224,336 |
| Paramount Group Inc | | 185,974 | 918,712 |
| Peakstone Realty Trust | | 37,252 | 412,380 |
| Piedmont Office Realty Trust Inc Class A1 | | 126,231 | 1,155,014 |
| Postal Realty Trust Inc Class A | | 17,555 | 229,093 |
| SL Green Realty Corp | | 70,898 | 4,815,392 |
| | | | 19,022,587 |
| Real Estate Management & Development - 0.8% | | | |
| American Realty Investors Inc (b)(c) | | 1,486 | 21,814 |
| Anywhere Real Estate Inc (b) | | 97,544 | 321,895 |
| Cushman & Wakefield PLC (b) | | 230,207 | 3,011,108 |
| Forestar Group Inc (b) | | 16,955 | 439,474 |
| FRP Holdings Inc (b) | | 13,200 | 404,316 |
| Kennedy-Wilson Holdings Inc | | 114,026 | 1,139,120 |
| Marcus & Millichap Inc | | 23,976 | 917,322 |
| Maui Land & Pineapple Co Inc (b) | | 597 | 13,121 |
| Newmark Group Inc Class A | | 132,810 | 1,701,296 |
| Offerpad Solutions Inc Class A (b) | | 9,792 | 27,907 |
| Opendoor Technologies Inc Class A (b) | | 600,646 | 961,034 |
| RE/MAX Holdings Inc Class A (b) | | 17,898 | 190,972 |
| RMR Group Inc/The Class A | | 16,371 | 337,897 |
| Star Holdings (b) | | 11,852 | 115,320 |
| Stratus Properties Inc (b) | | 5,601 | 116,277 |
| Tejon Ranch Co (b) | | 20,614 | 327,763 |
| Transcontinental Realty Investors Inc (b) | | 1,020 | 30,406 |
| | | | 10,077,042 |
| Residential REITs - 0.9% | | | |
| Apartment Investment and Management Co Class A | | 72,803 | 661,779 |
| BRT Apartments Corp | | 12,182 | 219,641 |
| Centerspace | | 17,006 | 1,124,947 |
| Clipper Realty Inc | | 3,134 | 14,354 |
| Elme Communities | | 90,326 | 1,379,278 |
| Independence Realty Trust Inc | | 228,575 | 4,534,928 |
| NexPoint Residential Trust Inc | | 23,034 | 961,670 |
| UMH Properties Inc | | 63,696 | 1,202,580 |
| Veris Residential Inc | | 79,876 | 1,328,338 |
| | | | 11,427,515 |
| Retail REITs - 2.6% | | | |
| Acadia Realty Trust | | 119,718 | 2,892,387 |
| CBL & Associates Properties Inc | | 7,828 | 230,221 |
| Curbline Properties Corp | | 95,702 | 2,222,200 |
| FrontView REIT Inc | | 14,675 | 266,058 |
| Getty Realty Corp | | 52,667 | 1,586,857 |
| InvenTrust Properties Corp | | 79,204 | 2,386,417 |
| Kite Realty Group Trust | | 220,369 | 5,562,114 |
| Macerich Co/The | | 238,223 | 4,745,402 |
| NETSTREIT Corp | | 65,154 | 921,929 |
| Phillips Edison & Co Inc | | 106,816 | 4,001,327 |
| Retail Opportunity Investments Corp | | 126,196 | 2,190,763 |
| Saul Centers Inc | | 1,885 | 73,137 |
| SITE Centers Corp | | 49,273 | 753,384 |
| Tanger Inc | | 65,891 | 2,248,860 |
| Urban Edge Properties | | 129,331 | 2,780,617 |
| Whitestone REIT | | 51,203 | 725,547 |
| | | | 33,587,220 |
| Specialized REITs - 0.8% | | | |
| Farmland Partners Inc | | 45,610 | 536,374 |
| Four Corners Property Trust Inc | | 99,382 | 2,697,227 |
| Gladstone Land Corp | | 35,987 | 390,459 |
| Outfront Media Inc | | 91,364 | 1,620,797 |
| PotlatchDeltic Corp | | 80,722 | 3,168,339 |
| Safehold Inc | | 53,486 | 988,421 |
| Uniti Group Inc | | 245,663 | 1,351,147 |
| | | | 10,752,764 |
TOTAL REAL ESTATE | | | 145,032,127 |
| | | | |
| Utilities - 4.7% | | | |
| Electric Utilities - 1.4% | | | |
| ALLETE Inc | | 58,086 | 3,763,973 |
| Genie Energy Ltd Class B | | 7,158 | 111,593 |
| Hawaiian Electric Industries Inc (b)(c) | | 166,410 | 1,619,169 |
| MGE Energy Inc | | 20,974 | 1,970,717 |
| Otter Tail Corp | | 22,977 | 1,696,622 |
| Portland General Electric Co | | 104,594 | 4,562,391 |
| TXNM Energy Inc | | 90,184 | 4,434,347 |
| | | | 18,158,812 |
| Gas Utilities - 1.6% | | | |
| Chesapeake Utilities Corp | | 22,265 | 2,701,858 |
| New Jersey Resources Corp | | 98,764 | 4,607,341 |
| Northwest Natural Holding Co | | 38,974 | 1,541,811 |
| ONE Gas Inc | | 56,467 | 3,910,340 |
| RGC Resources Inc | | 8,592 | 172,356 |
| Southwest Gas Holdings Inc | | 61,119 | 4,321,724 |
| Spire Inc | | 57,147 | 3,876,281 |
| | | | 21,131,711 |
| Independent Power and Renewable Electricity Producers - 0.3% | | | |
| Altus Power Inc Class A (b)(c) | | 75,639 | 307,850 |
| Ormat Technologies Inc | | 57,874 | 3,919,227 |
| Sunnova Energy International Inc (b)(c) | | 108,545 | 372,309 |
| | | | 4,599,386 |
| Multi-Utilities - 0.9% | | | |
| Avista Corp | | 78,875 | 2,889,191 |
| Black Hills Corp | | 70,287 | 4,113,196 |
| NorthWestern Corp | | 61,901 | 3,309,227 |
| Unitil Corp | | 15,947 | 864,168 |
| | | | 11,175,782 |
| Water Utilities - 0.5% | | | |
| American States Water Co | | 16,466 | 1,279,738 |
| California Water Service Group | | 44,088 | 1,998,509 |
| Consolidated Water Co Ltd | | 11,255 | 291,392 |
| Middlesex Water Co | | 15,655 | 823,923 |
| Pure Cycle Corp (b) | | 20,599 | 261,195 |
| SJW Group | | 33,688 | 1,658,123 |
| York Water Co/The | | 12,428 | 406,644 |
| | | | 6,719,524 |
TOTAL UTILITIES | | | 61,785,215 |
| | | | |
| TOTAL UNITED STATES | | | 1,261,242,535 |
| TOTAL COMMON STOCKS (Cost $1,182,279,231) | | | 1,309,161,029 |
| | | | |
| U.S. Treasury Obligations - 0.0% |
| | | Yield (%) (g) | Principal Amount (a) | Value ($) |
US Treasury Bills 0% 2/20/2025 (h) (Cost $256,418) | | 4.46 | 258,000 | 256,533 |
| | | | | |
| Money Market Funds - 4.3% |
| | | Yield (%) | Shares | Value ($) |
| Fidelity Cash Central Fund (i) | | 4.36 | 1,369,649 | 1,369,923 |
| Fidelity Securities Lending Cash Central Fund (i)(j) | | 4.35 | 55,178,886 | 55,184,404 |
| TOTAL MONEY MARKET FUNDS (Cost $56,554,327) | | | | 56,554,327 |
| | | | | |
| TOTAL INVESTMENT IN SECURITIES - 104.0% (Cost $1,239,089,976) | 1,365,971,889 |
NET OTHER ASSETS (LIABILITIES) - (4.0)% | (52,190,526) |
| NET ASSETS - 100.0% | 1,313,781,363 |
| | |
| Futures Contracts |
| | Number of contracts | Expiration Date | Notional Amount ($) | Value ($) | Unrealized Appreciation/ (Depreciation) ($) |
| Purchased | | | | | |
| | | | | | |
| Equity Contracts | | | | | |
| CME E-mini Russell 2000 Index Contracts (United States) | 47 | Mar 2025 | 5,287,030 | (9,229) | (9,229) |
| | | | | | |
| The notional amount of futures purchased as a percentage of Net Assets is 0.4% |
Legend
| (a) | Amount is stated in United States dollars unless otherwise noted. |
| (c) | Security or a portion of the security is on loan at period end. |
| (d) | Equity security is subject to lock-up or market standoff agreement and valued at a discount to the market price of the equivalent equity security. As of period end, the total fair value of equity securities discounted due to contractual sale restrictions is $14,013 and all restrictions are set to expire on or before January 31, 2025. Under normal market conditions, there are no circumstances that could cause the restrictions to lapse. |
| (f) | Security is exempt from registration under Regulation S of the Securities Act of 1933 and may be resold to qualified foreign investors outside of the United States. At the end of the period, the value of securities amounted to $755,059 or 0.1% of net assets. |
| (g) | Yield represents either the annualized yield at the date of purchase, or the stated coupon rate, or, for floating and adjustable rate securities, the rate at period end. |
| (h) | Security or a portion of the security was pledged to cover margin requirements for futures contracts. At period end, the value of securities pledged amounted to $256,533. |
| (i) | Affiliated fund that is generally available only to investment companies and other accounts managed by Fidelity Investments. The rate quoted is the annualized seven-day yield of the fund at period end. A complete unaudited listing of the fund's holdings as of its most recent quarter end is available upon request. In addition, each Fidelity Central Fund's financial statements are available on the SEC's website or upon request. |
| (j) | Investment made with cash collateral received from securities on loan. |
Affiliated Central Funds
Fiscal year to date information regarding the Fund's investments in Fidelity Central Funds, including the ownership percentage, is presented below.
| Affiliate | Value, beginning of period ($) | Purchases ($) | Sales Proceeds ($) | Dividend Income ($) | Realized Gain (loss) ($) | Change in Unrealized appreciation (depreciation) ($) | Value, end of period ($) | Shares, end of period | % ownership, end of period |
| Fidelity Cash Central Fund | 4,792,321 | 114,553,775 | 117,976,205 | 82,096 | 32 | - | 1,369,923 | 1,369,649 | 0.0% |
| Fidelity Securities Lending Cash Central Fund | 39,995,498 | 144,910,710 | 129,721,804 | 467,422 | - | - | 55,184,404 | 55,178,886 | 0.2% |
| Total | 44,787,819 | 259,464,485 | 247,698,009 | 549,518 | 32 | - | 56,554,327 | 56,548,535 | |
| | | | | | | | | | |
Amounts in the dividend income column in the above table include any capital gain distributions from underlying funds, which are presented in the corresponding line item in the Statement of Operations, if applicable.
Amounts in the dividend income column for Fidelity Securities Lending Cash Central Fund represents the income earned on investing cash collateral, less rebates paid to borrowers and any lending agent fees associated with the loan, plus any premium payments received for lending certain types of securities.
Amounts included in the purchases and sales proceeds columns may include in-kind transactions, if applicable.
Investment Valuation
The following is a summary of the inputs used, as of December 31, 2024, involving the Fund's assets and liabilities carried at fair value. The inputs or methodology used for valuing securities may not be an indication of the risk associated with investing in those securities. For more information on valuation inputs, and their aggregation into the levels used below, please refer to the Investment Valuation section in the accompanying Notes to Financial Statements.
| Valuation Inputs at Reporting Date: |
| Description | Total ($) | Level 1 ($) | Level 2 ($) | Level 3 ($) |
Investments in Securities: | | | | |
|
| Common Stocks | | | | |
Communication Services | 42,662,125 | 42,662,125 | - | - |
Consumer Discretionary | 120,199,021 | 120,199,021 | - | - |
Consumer Staples | 29,692,686 | 29,692,686 | - | - |
Energy | 92,358,244 | 92,358,244 | - | - |
Financials | 381,878,752 | 381,878,752 | - | - |
Health Care | 115,668,329 | 115,599,160 | 26,411 | 42,758 |
Industrials | 166,006,368 | 166,006,368 | - | - |
Information Technology | 84,888,462 | 84,888,462 | - | - |
Materials | 64,172,176 | 64,172,176 | - | - |
Real Estate | 145,032,127 | 145,032,127 | - | - |
Utilities | 66,602,739 | 66,602,739 | - | - |
|
| U.S. Treasury Obligations | 256,533 | - | 256,533 | - |
|
| Money Market Funds | 56,554,327 | 56,554,327 | - | - |
| Total Investments in Securities: | 1,365,971,889 | 1,365,646,187 | 282,944 | 42,758 |
Derivative Instruments: Liabilities | | | | |
Futures Contracts | (9,229) | (9,229) | - | - |
| Total Liabilities | (9,229) | (9,229) | - | - |
| Total Derivative Instruments: | (9,229) | (9,229) | - | - |
Value of Derivative Instruments
The following table is a summary of the Fund's value of derivative instruments by primary risk exposure as of December 31, 2024. For additional information on derivative instruments, please refer to the Derivative Instruments section in the accompanying Notes to Financial Statements.
Primary Risk Exposure / Derivative Type | Value |
| Asset ($) | Liability ($) |
| Equity Risk | | |
Futures Contracts (a) | 0 | (9,229) |
| Total Equity Risk | 0 | (9,229) |
| Total Value of Derivatives | 0 | (9,229) |
(a)Reflects gross cumulative appreciation (depreciation) on futures contracts as presented in the Schedule of Investments. In the Statement of Assets and Liabilities, the period end daily variation margin is included in receivable or payable for daily variation margin on futures contracts, and the net cumulative appreciation (depreciation) is included in Total accumulated earnings (loss).
Fidelity® Small Cap Value Index Fund
Financial Statements (Unaudited)
| Statement of Assets and Liabilities |
| As of December 31, 2024 (Unaudited) |
| Assets | | | | |
| Investment in securities, at value (including securities loaned of $52,239,347) - See accompanying schedule: | | | | |
Unaffiliated issuers (cost $1,182,535,649) | $ | 1,309,417,562 | | |
Fidelity Central Funds (cost $56,554,327) | | 56,554,327 | | |
| | | | | |
| | | | | |
| Total Investment in Securities (cost $1,239,089,976) | | | $ | 1,365,971,889 |
| Segregated cash with brokers for derivative instruments | | | | 9,072 |
| Receivable for fund shares sold | | | | 1,875,349 |
| Dividends receivable | | | | 2,495,730 |
| Distributions receivable from Fidelity Central Funds | | | | 61,149 |
| Receivable for daily variation margin on futures contracts | | | | 1,781 |
Total assets | | | | 1,370,414,970 |
| Liabilities | | | | |
| Payable to custodian bank | $ | 32,825 | | |
| Payable for fund shares redeemed | | 1,347,948 | | |
| Accrued management fee | | 56,973 | | |
| Other payables and accrued expenses | | 11,457 | | |
| Collateral on securities loaned | | 55,184,404 | | |
| Total liabilities | | | | 56,633,607 |
| Net Assets | | | $ | 1,313,781,363 |
| Net Assets consist of: | | | | |
| Paid in capital | | | $ | 1,219,386,159 |
| Total accumulated earnings (loss) | | | | 94,395,204 |
| Net Assets | | | $ | 1,313,781,363 |
Net Asset Value, offering price and redemption price per share ($1,313,781,363 ÷ 51,315,014 shares) | | | $ | 25.60 |
| Statement of Operations |
Six months ended December 31, 2024 (Unaudited) |
| Investment Income | | | | |
| Dividends | | | $ | 12,348,458 |
| Interest | | | | 8,437 |
| Income from Fidelity Central Funds (including $467,422 from security lending) | | | | 549,518 |
| Total income | | | | 12,906,413 |
| Expenses | | | | |
| Management fee | $ | 325,651 | | |
| Independent trustees' fees and expenses | | 1,575 | | |
| Total expenses before reductions | | 327,226 | | |
| Expense reductions | | (1,449) | | |
| Total expenses after reductions | | | | 325,777 |
| Net Investment income (loss) | | | | 12,580,636 |
| Realized and Unrealized Gain (Loss) | | | | |
| Net realized gain (loss) on: | | | | |
| Investment Securities: | | | | |
| Unaffiliated issuers | | (2,572,542) | | |
| Fidelity Central Funds | | 32 | | |
| Futures contracts | | 207,279 | | |
| Total net realized gain (loss) | | | | (2,365,231) |
| Change in net unrealized appreciation (depreciation) on: | | | | |
| Investment Securities: | | | | |
| Unaffiliated issuers | | 92,436,795 | | |
| Futures contracts | | (72,668) | | |
| Total change in net unrealized appreciation (depreciation) | | | | 92,364,127 |
| Net gain (loss) | | | | 89,998,896 |
| Net increase (decrease) in net assets resulting from operations | | | $ | 102,579,532 |
| Statement of Changes in Net Assets |
| |
| | Six months ended December 31, 2024 (Unaudited) | | Year ended June 30, 2024 |
| Increase (Decrease) in Net Assets | | | | |
| Operations | | | | |
| Net investment income (loss) | $ | 12,580,636 | $ | 21,199,767 |
| Net realized gain (loss) | | (2,365,231) | | 35,604,809 |
| Change in net unrealized appreciation (depreciation) | | 92,364,127 | | 45,533,065 |
| Net increase (decrease) in net assets resulting from operations | | 102,579,532 | | 102,337,641 |
| Distributions to shareholders | | (21,949,757) | | (20,400,767) |
| | | | | |
| Share transactions | | | | |
| Proceeds from sales of shares | | 266,320,969 | | 585,215,613 |
| Reinvestment of distributions | | 19,395,609 | | 16,744,037 |
| Cost of shares redeemed | | (204,678,296) | | (431,989,211) |
| | | | | |
Net increase (decrease) in net assets resulting from share transactions | | 81,038,282 | | 169,970,439 |
| Total increase (decrease) in net assets | | 161,668,057 | | 251,907,313 |
| | | | | |
| Net Assets | | | | |
| Beginning of period | | 1,152,113,306 | | 900,205,993 |
| End of period | $ | 1,313,781,363 | $ | 1,152,113,306 |
| | | | | |
| Other Information | | | | |
| Shares | | | | |
| Sold | | 10,113,613 | | 25,464,870 |
| Issued in reinvestment of distributions | | 771,909 | | 720,127 |
| Redeemed | | (7,831,839) | | (18,850,764) |
| Net increase (decrease) | | 3,053,683 | | 7,334,233 |
| | | | | |
Financial Highlights
Fidelity® Small Cap Value Index Fund |
| |
| | Six months ended (Unaudited) December 31, 2024 | | Years ended June 30, 2024 | | 2023 | | 2022 | | 2021 | | 2020 A |
Selected Per-Share Data | | | | | | | | | | | | |
| Net asset value, beginning of period | $ | 23.87 | $ | 22.00 | $ | 21.46 | $ | 28.18 | $ | 16.52 | $ | 20.00 |
| Income from Investment Operations | | | | | | | | | | | | |
Net investment income (loss) B,C | | .25 | | .50 | | .52 | | .44 | | .37 | | .37 |
| Net realized and unrealized gain (loss) | | 1.91 | | 1.87 | | .81 | | (4.69) | | 11.59 | | (3.72) |
| Total from investment operations | | 2.16 | | 2.37 | | 1.33 | | (4.25) | | 11.96 | | (3.35) |
| Distributions from net investment income | | (.43) | | (.50) | | (.42) | | (.44) D | | (.30) | | (.12) |
| Distributions from net realized gain | | - | | - | | (.38) | | (2.03) D | | - | | (.02) |
| Total distributions | | (.43) | | (.50) | | (.79) E | | (2.47) | | (.30) | | (.13) E |
| Net asset value, end of period | $ | 25.60 | $ | 23.87 | $ | 22.00 | $ | 21.46 | $ | 28.18 | $ | 16.52 |
Total Return F,G | | | | 10.83% | | 6.14% | | (16.30)% | | 73.10% | | (16.89)% |
Ratios to Average Net Assets C,H,I | | | | | | | | | | | | |
| Expenses before reductions | | .05% J | | .05% | | .05% | | .05% | | .05% | | .05% J |
| Expenses net of fee waivers, if any | | | | .05% | | .05% | | .05% | | .05% | | .05% J |
| Expenses net of all reductions | | .05% J | | .05% | | .05% | | .05% | | .05% | | .05% J |
| Net investment income (loss) | | 1.94% J | | 2.18% | | 2.37% | | 1.77% | | 1.56% | | 2.24% J |
| Supplemental Data | | | | | | | | | | | | |
| Net assets, end of period (000 omitted) | $ | 1,313,781 | $ | 1,152,113 | $ | 900,206 | $ | 808,483 | $ | 736,509 | $ | 139,586 |
Portfolio turnover rate K | | | | 37% L | | 33% | | 38% | | 60% | | 74% J |
AFor the period July 11, 2019 (commencement of operations) through June 30, 2020.
BCalculated based on average shares outstanding during the period.
CNet investment income (loss) is affected by the timing of the declaration of dividends by any underlying mutual funds or exchange-traded funds (ETFs). Net investment income (loss) of any mutual funds or ETFs is not included in the Fund's net investment income (loss) ratio.
DThe amount shown reflects reclassifications related to book to tax differences that were made in the year shown.
ETotal distributions per share do not sum due to rounding.
FTotal returns for periods of less than one year are not annualized.
GTotal returns would have been lower if certain expenses had not been reduced during the applicable periods shown.
HFees and expenses of any underlying mutual funds or exchange-traded funds (ETFs) are not included in the Fund's expense ratio. The Fund indirectly bears its proportionate share of these expenses. For additional expense information related to investments in Fidelity Central Funds, please refer to the "Investments in Fidelity Central Funds" note found in the Notes to Financial Statements section of the most recent Annual or Semi-Annual report.
IExpense ratios reflect operating expenses of the class. Expenses before reductions do not reflect amounts reimbursed, waived, or reduced through arrangements with the investment adviser, brokerage services, or other offset arrangements, if applicable, and do not represent the amount paid by the class during periods when reimbursements, waivers or reductions occur.
JAnnualized.
KAmount does not include the portfolio activity of any underlying mutual funds or exchange-traded funds (ETFs), derivatives or securities that mature within one year from acquisition.
LPortfolio turnover rate excludes securities received or delivered in-kind.
Notes to Financial Statements
(Unaudited)For the period ended December 31, 2024
1. Organization.
Fidelity Mid Cap Growth Index Fund, Fidelity Mid Cap Value Index Fund, Fidelity Small Cap Growth Index Fund and Fidelity Small Cap Value Index Fund (the Funds) are funds of Fidelity Salem Street Trust (the Trust). Each Fund is authorized to issue an unlimited number of shares. Share transactions on the Statement of Changes in Net Assets may contain exchanges between affiliated funds. The Trust is registered under the Investment Company Act of 1940, as amended (the 1940 Act), as an open-end management investment company organized as a Massachusetts business trust.
2. Investments in Fidelity Central Funds.
Funds may invest in Fidelity Central Funds, which are open-end investment companies generally available only to other investment companies and accounts managed by the investment adviser and its affiliates. The Schedule of Investments lists any Fidelity Central Funds held as an investment as of period end, but does not include the underlying holdings of each Fidelity Central Fund. An investing fund indirectly bears its proportionate share of the expenses of the underlying Fidelity Central Funds.
Based on its investment objective, each Fidelity Central Fund may invest or participate in various investment vehicles or strategies that are similar to those of the investing fund. These strategies are consistent with the investment objectives of the investing fund and may involve certain economic risks which may cause a decline in value of each of the Fidelity Central Funds and thus a decline in the value of the investing fund.
| Fidelity Central Fund | Investment Manager | Investment Objective | Investment Practices | Expense RatioA |
| Fidelity Money Market Central Funds | Fidelity Management & Research Company LLC (FMR) | Each fund seeks to obtain a high level of current income consistent with the preservation of capital and liquidity. | Short-term Investments | Less than .005% |
A Expenses expressed as a percentage of average net assets and are as of each underlying Central Fund's most recent annual or semi-annual shareholder report.
A complete unaudited list of holdings for each Fidelity Central Fund is available upon request or at the Securities and Exchange Commission website at www.sec.gov. In addition, the financial statements of the Fidelity Central Funds which contain the significant accounting policies (including investment valuation policies) of those funds, and are not covered by the Report of Independent Registered Public Accounting Firm, are available on the Securities and Exchange Commission website or upon request.
3. Significant Accounting Policies.
Each Fund is an investment company and applies the accounting and reporting guidance of the Financial Accounting Standards Board (FASB) Accounting Standards Codification Topic 946 Financial Services - Investment Companies. The financial statements have been prepared in conformity with accounting principles generally accepted in the United States of America (GAAP), which require management to make certain estimates and assumptions at the date of the financial statements. Actual results could differ from those estimates. Each Fund operates as a single operating segment. Each Fund's income, expenses, assets, and performance are regularly monitored and assessed as a whole by the investment adviser and other individuals responsible for oversight functions of the Trust, using the information presented in the financial statements and financial highlights. Subsequent events, if any, through the date that the financial statements were issued have been evaluated in the preparation of the financial statements. Each Fund's Schedule of Investments lists any underlying mutual funds or exchange-traded funds (ETFs) but does not include the underlying holdings of these funds. The following summarizes the significant accounting policies of each Fund:
Investment Valuation. Investments are valued as of 4:00 p.m. Eastern time on the last calendar day of the period. The Board of Trustees (the Board) has designated each Fund's investment adviser as the valuation designee responsible for the fair valuation function and performing fair value determinations as needed. The investment adviser has established a Fair Value Committee (the Committee) to carry out the day-to-day fair valuation responsibilities and has adopted policies and procedures to govern the fair valuation process and the activities of the Committee. In accordance with these fair valuation policies and procedures, which have been approved by the Board, each Fund attempts to obtain prices from one or more third party pricing services or brokers to value its investments. When current market prices, quotations or currency exchange rates are not readily available or reliable, investments will be fair valued in good faith by the Committee, in accordance with the policies and procedures. Factors used in determining fair value vary by investment type and may include market or investment specific events, transaction data, estimated cash flows, and market observations of comparable investments. The frequency that the fair valuation procedures are used cannot be predicted and they may be utilized to a significant extent. The Committee manages each Fund's fair valuation practices and maintains the fair valuation policies and procedures. Each Fund's investment adviser reports to the Board information regarding the fair valuation process and related material matters.
Each Fund categorizes the inputs to valuation techniques used to value its investments into a disclosure hierarchy consisting of three levels as shown below:
Level 1 - unadjusted quoted prices in active markets for identical investments
Level 2 - other significant observable inputs (including quoted prices for similar investments, interest rates, prepayment speeds, etc.)
Level 3 - unobservable inputs (including the Fund's own assumptions based on the best information available)
Valuation techniques used to value each Fund's investments by major category are as follows:
Equity securities, including restricted securities, for which market quotations are readily available, are valued at the last reported sale price or official closing price as reported by a third party pricing service on the primary market or exchange on which they are traded and are categorized as Level 1 in the hierarchy. In the event there were no sales during the day or closing prices are not available, securities are valued at the last quoted bid price or may be valued using the last available price and are generally categorized as Level 2 in the hierarchy. For foreign equity securities, when market or security specific events arise, comparisons to the valuation of American Depositary Receipts (ADRs), futures contracts, Exchange-Traded Funds (ETFs) and certain indexes as well as quoted prices for similar securities may be used and would be categorized as Level 2 in the hierarchy. For equity securities, including restricted securities, where observable inputs are limited, assumptions about market activity and risk are used and these securities may be categorized as Level 3 in the hierarchy.
Debt securities, including restricted securities, are valued based on evaluated prices received from third party pricing services or from brokers who make markets in such securities. U.S. government and government agency obligations are valued by pricing services who utilize matrix pricing which considers yield or price of bonds of comparable quality, coupon, maturity and type or by broker-supplied prices. When independent prices are unavailable or unreliable, debt securities may be valued utilizing pricing methodologies which consider similar factors that would be used by third party pricing services. Debt securities are generally categorized as Level 2 in the hierarchy but may be Level 3 depending on the circumstances.
Futures contracts are valued at the settlement price established each day by the board of trade or exchange on which they are traded and are categorized as Level 1 in the hierarchy. Investments in open-end mutual funds, including the Fidelity Central Funds, are valued at their closing net asset value (NAV) each business day and are categorized as Level 1 in the hierarchy.
Changes in valuation techniques may result in transfers in or out of an assigned level within the disclosure hierarchy. The aggregate value of investments by input level as of December 31, 2024 is included at the end of each Fund's Schedule of Investments.
Foreign Currency. Certain Funds may use foreign currency contracts to facilitate transactions in foreign-denominated securities. Gains and losses from these transactions may arise from changes in the value of the foreign currency or if the counterparties do not perform under the contracts' terms.
Foreign-denominated assets, including investment securities, and liabilities are translated into U.S. dollars at the exchange rates at period end. Purchases and sales of investment securities, income and dividends received, and expenses denominated in foreign currencies are translated into U.S. dollars at the exchange rate in effect on the transaction date.
The effects of exchange rate fluctuations on investments are included with the net realized and unrealized gain (loss) on investment securities. Other foreign currency transactions resulting in realized and unrealized gain (loss) are disclosed separately.
Investment Transactions and Income. For financial reporting purposes, the Funds' investment holdings and NAV include trades executed through the end of the last business day of the period. The NAV per share for processing shareholder transactions is calculated as of the close of business of the New York Stock Exchange (NYSE), normally 4:00 p.m. Eastern time and includes trades executed through the end of the prior business day. Gains and losses on securities sold are determined on the basis of identified cost and for certain Funds include proceeds received from litigation. Commissions paid to certain brokers with whom the investment adviser, or its affiliates, places trades on behalf of a fund include an amount in addition to trade execution, which may be rebated back to a fund. Any such rebates are included in net realized gain (loss) on investments in the Statement of Operations. Dividend income is recorded on the ex-dividend date, except for certain dividends from foreign securities where the ex-dividend date may have passed, which are recorded as soon as the Funds are informed of the ex-dividend date. Non-cash dividends included in dividend income, if any, are recorded at the fair market value of the securities received. Income and capital gain distributions from Fidelity Central Funds, if any, are recorded on the ex-dividend date. Certain distributions received by the Funds represent a return of capital or capital gain. The Funds determine the components of these distributions subsequent to the ex-dividend date, based upon receipt of tax filings or other correspondence relating to the underlying investment. These distributions are recorded as a reduction of cost of investments and/or as a realized gain. Interest income is accrued as earned and includes coupon interest and amortization of premium and accretion of discount on debt securities as applicable. Investment income is recorded net of foreign taxes withheld where recovery of such taxes is uncertain.
Expenses. Expenses directly attributable to a fund are charged to that fund. Expenses attributable to more than one fund are allocated among the respective funds on the basis of relative net assets or other appropriate methods. Expenses included in the accompanying financial statements reflect the expenses of that fund and do not include any expenses associated with any underlying mutual funds or exchange-traded funds. Although not included in a fund's expenses, a fund indirectly bears its proportionate share of these expenses through the net asset value of each underlying mutual fund or exchange-traded fund. Expense estimates are accrued in the period to which they relate and adjustments are made when actual amounts are known.
Income Tax Information and Distributions to Shareholders. Each year, each Fund intends to qualify as a regulated investment company under Subchapter M of the Internal Revenue Code, including distributing substantially all of its taxable income and realized gains. As a result, no provision for U.S. Federal income taxes is required. Each Fund files a U.S. federal tax return, in addition to state and local tax returns as required. Each Fund's federal income tax returns are subject to examination by the Internal Revenue Service (IRS) for a period of three fiscal years after they are filed. State and local tax returns may be subject to examination for an additional fiscal year depending on the jurisdiction. Foreign taxes are provided for based on each Fund's understanding of the tax rules and rates that exist in the foreign markets in which it invests.
Distributions are declared and recorded on the ex-dividend date. Income and capital gain distributions are determined in accordance with income tax regulations, which may differ from GAAP.
Capital accounts within the financial statements are adjusted for permanent book-tax differences. These adjustments have no impact on net assets or the results of operations. Capital accounts are not adjusted for temporary book-tax differences which will reverse in a subsequent period.
Book-tax differences are primarily due to futures contracts, foreign currency transactions, passive foreign investment companies (PFIC), redemptions in-kind, partnerships, capital loss carryforwards and losses deferred due to wash sales and excise tax regulations.
As of period end, the cost and unrealized appreciation (depreciation) in securities, and derivatives if applicable, for federal income tax purposes were as follows for each Fund:
| | Tax cost ($) | Gross unrealized appreciation ($) | Gross unrealized depreciation ($) | Net unrealized appreciation (depreciation)($) |
| Fidelity Mid Cap Growth Index Fund | 1,304,006,136 | 382,669,297 | (90,284,815) | 292,384,482 |
| Fidelity Mid Cap Value Index Fund | 754,789,011 | 264,280,676 | (53,693,179) | 210,587,497 |
| Fidelity Small Cap Growth Index Fund | 799,187,508 | 205,400,524 | (92,367,379) | 113,033,145 |
| Fidelity Small Cap Value Index Fund | 1,253,514,794 | 267,190,371 | (154,742,505) | 112,447,866 |
Capital loss carryforwards are only available to offset future capital gains of the Funds to the extent provided by regulations and may be limited. The capital loss carryforward information presented below, including any applicable limitation, is estimated as of prior fiscal period end and is subject to adjustment.
| | Short-term ($) | Long-term ($) | Total capital loss carryforward ($) |
| Fidelity Mid Cap Growth Index Fund | (27,948,481) | - | (27,948,481) |
| Fidelity Small Cap Growth Index Fund | (32,301,193) | (17,064,320) | (49,365,513) |
| Fidelity Small Cap Value Index Fund | - | (14,822,209) | (14,822,209) |
Due to large subscriptions in a prior period, Fidelity Small Cap Growth Index Fund is subject to an annual limit on its use of some of its unrealized capital losses to offset capital gains in future periods. If those losses are realized and the limitation prevents the Fund from using any of those losses in a future period, those capital losses will be available to offset capital gains in subsequent periods.
New Accounting Pronouncement. FASB Accounting Standards Update (ASU) 2023-07 Segment Reporting (Topic 280): Improvements to Reportable Segment Disclosures became effective in this reporting period. ASU 2023-07 enhances segment information disclosure in the notes to financial statements.
4. Derivative Instruments.
Risk Exposures and the Use of Derivative Instruments. Each Fund's investment objectives allow for various types of derivative instruments, including futures contracts. Derivatives are investments whose value is primarily derived from underlying assets, indices or reference rates and may be transacted on an exchange or over-the-counter (OTC). Derivatives may involve a future commitment to buy or sell a specified asset based on specified terms, to exchange future cash flows at periodic intervals based on a notional principal amount, or for one party to make one or more payments upon the occurrence of specified events in exchange for periodic payments from the other party.
Derivatives were used to increase returns and to manage exposure to certain risks as defined below. The success of any strategy involving derivatives depends on analysis of numerous economic factors, and if the strategies for investment do not work as intended, the objectives may not be achieved.
Derivatives were used to increase or decrease exposure to the following risk(s):
| | |
| Equity Risk | Equity risk relates to the fluctuations in the value of financial instruments as a result of changes in market prices (other than those arising from interest rate risk or foreign exchange risk), whether caused by factors specific to an individual investment, its issuer, or all factors affecting all instruments traded in a market or market segment. |
Funds are also exposed to additional risks from investing in derivatives, such as liquidity risk and counterparty credit risk. Liquidity risk is the risk that a fund will be unable to close out the derivative in the open market in a timely manner. Counterparty credit risk is the risk that the counterparty will not be able to fulfill its obligation to a fund. Counterparty credit risk related to exchange-traded contracts may be mitigated by the protection provided by the exchange on which they trade.
Investing in derivatives may involve greater risks than investing in the underlying assets directly and, to varying degrees, may involve risk of loss in excess of any initial investment and collateral received and amounts recognized in the Statement of Assets and Liabilities. In addition, there may be the risk that the change in value of the derivative contract does not correspond to the change in value of the underlying instrument.
Futures Contracts. A futures contract is an agreement between two parties to buy or sell a specified underlying instrument for a fixed price at a specified future date. Futures contracts were used to manage exposure to the stock market.
Upon entering into a futures contract, a fund is required to deposit either cash or securities (initial margin) with a clearing broker in an amount equal to a certain percentage of the face value of the contract. Futures contracts are marked-to-market daily and subsequent daily payments are made or received by a fund depending on the daily fluctuations in the value of the futures contracts and are recorded as unrealized appreciation or (depreciation). This receivable and/or payable, if any, is included in daily variation margin on futures contracts in the Statement of Assets and Liabilities. Realized gain or (loss) is recorded upon the expiration or closing of a futures contract. The net realized gain (loss) and change in net unrealized appreciation (depreciation) on futures contracts during the period is presented in the Statement of Operations.
Any open futures contracts at period end are presented in the Schedule of Investments under the caption "Futures Contracts". The notional amount at value reflects each contract's exposure to the underlying instrument or index at period end, and is representative of volume of activity during the period.
Any securities deposited to meet initial margin requirements are identified in the Schedule of Investments. Any cash deposited to meet initial margin requirements is presented as segregated cash with brokers for derivative instruments in the Statement of Assets and Liabilities.
5. Purchases and Sales of Investments.
Purchases and sales of securities, other than short-term securities, U.S. government securities and in-kind transactions, as applicable, are noted in the table below.
| | Purchases ($) | Sales ($) |
| Fidelity Mid Cap Growth Index Fund | 358,322,824 | 60,866,374 |
| Fidelity Mid Cap Value Index Fund | 143,645,940 | 116,571,203 |
| Fidelity Small Cap Growth Index Fund | 177,340,811 | 50,120,100 |
| Fidelity Small Cap Value Index Fund | 170,370,021 | 83,824,333 |
Unaffiliated Redemptions In-Kind. Shares that were redeemed in-kind for investments, including accrued interest and cash, if any, are shown in the table below. The net realized gain or loss on investments delivered through in-kind redemptions is included in the "Net realized gain (loss) on: Redemptions in-kind" line in the accompanying Statement of Operations. The amount of the in-kind redemptions is included in share transactions in the accompanying Statement of Changes in Net Assets. There was no gain or loss for federal income tax purposes.
| | Shares | Total net realized gain or loss ($) | Total Proceeds ($) |
| Fidelity Mid Cap Value Index Fund | 146,843 | 1,935,119 | 4,004,405 |
Prior Fiscal Year Unaffiliated Redemptions In-Kind. Shares that were redeemed in-kind for investments, including accrued interest and cash, if any, are shown in the table below; along with realized gain or loss on investments delivered through in-kind redemptions. The amount of the in-kind redemptions is included in share transactions in the accompanying Statement of Changes in Net Assets. There was no gain or loss for federal income tax purposes.
| | Shares | Total net realized gain or loss ($) | Total Proceeds ($) |
| Fidelity Mid Cap Growth Index Fund | 1,781,348 | 26,543,179 | 51,124,694 |
| Fidelity Mid Cap Value Index Fund | 1,606,118 | 28,625,666 | 42,208,795 |
| Fidelity Small Cap Growth Index Fund | 715,990 | 13,238,375 | 18,221,957 |
| Fidelity Small Cap Value Index Fund | 2,260,128 | 33,642,050 | 53,949,254 |
6. Fees and Other Transactions with Affiliates.
Management Fee. Fidelity Management & Research Company LLC (the investment adviser) and its affiliates provide the Funds with investment management related services for which each Fund pays a monthly management fee. The management fee is based on the annual rates of each Fund's average net assets as noted in the table below. Under the management contract, the investment adviser pays all other operating expenses, except the compensation of the independent Trustees and certain miscellaneous expenses such as proxy and shareholder meeting expenses.
| | % of Average Net Assets |
| Fidelity Mid Cap Growth Index Fund | .05% |
| Fidelity Mid Cap Value Index Fund | .05% |
| Fidelity Small Cap Growth Index Fund | .05% |
| Fidelity Small Cap Value Index Fund | .05% |
Sub-Adviser. Geode Capital Management, LLC (Geode), serves as sub-adviser for the Funds. Geode provides discretionary investment advisory services to the Funds and is paid by the investment adviser for providing these services.
Interfund Lending Program. Pursuant to an Exemptive Order issued by the Securities and Exchange Commission (the SEC), each Fund, along with other registered investment companies having management contracts with Fidelity Management & Research Company LLC (FMR), or other affiliated entities of FMR, may participate in an interfund lending program. This program provides an alternative credit facility allowing each Fund to borrow from, or lend money to, other participating affiliated funds at rates that are beneficial to both the borrowing and lending fund. Borrowings under the program are generally for temporary or emergency purposes, including meeting fund shareholder redemptions. The interfund loan rate is determined, as specified in the Exemptive Order, by averaging, (1) the higher of the overnight time deposit rate and the current overnight repurchase agreement rate, and (2) a benchmark rate representing the lowest bank loan rate available to the funds. At period end, there were no interfund loans outstanding. Activity in this program during the period for which loans were outstanding was as follows:
| | Borrower or Lender | Average Loan Balance ($) | Weighted Average Interest Rate | Interest Expense ($) |
| Fidelity Mid Cap Value Index Fund | Borrower | 3,068,571 | 5.58% | 3,331 |
| Fidelity Small Cap Growth Index Fund | Borrower | 18,271,000 | 5.59% | 2,835 |
Interfund Trades. Funds may purchase from or sell securities to other Fidelity Funds under procedures adopted by the Board. The procedures have been designed to ensure these interfund trades are executed in accordance with Rule 17a-7 of the 1940 Act. Any interfund trades are included within the respective purchases and sales amounts shown in the Purchases and Sales of Investments note. Interfund trades during the period are noted in the table below.
| | Purchases ($) | Sales ($) | Realized Gain (Loss) ($) |
| Fidelity Mid Cap Growth Index Fund | - | 745 | (100) |
7. Committed Line of Credit.
Certain Funds participate with other funds managed by the investment adviser or an affiliate in a $4.25 billion credit facility (the "line of credit") to be utilized for temporary or emergency purposes to fund shareholder redemptions or for other short-term liquidity purposes.
Commitment fees are charged based on the unused amount of the line of credit at an annual rate of .10%, and then allocated to each participating fund based on its pro-rata portion of the line of credit. The commitment fees are borne by the investment adviser.
Interest is charged to a participating fund based on its borrowings at an annual rate of .75% plus the highest of (i) daily SOFR plus a .10% spread adjustment, (ii) Federal Funds Effective Rate, or (iii) Overnight Bank Funding Rate. During the period, there were no borrowings on this line of credit.
The line of credit agreement will expire in March 2025 unless extended or renewed.
8. Security Lending.
Funds lend portfolio securities from time to time in order to earn additional income. Lending agents are used, including National Financial Services (NFS), an affiliate of the investment adviser. Pursuant to a securities lending agreement, NFS will receive a fee, which is capped at 9.9% of a fund's daily lending revenue, for its services as lending agent. A fund may lend securities to certain qualified borrowers, including NFS. On the settlement date of the loan, a fund receives collateral (in the form of U.S. Treasury obligations, letters of credit and/or cash) against the loaned securities and maintains collateral in an amount not less than 100% of the market value of the loaned securities during the period of the loan. The market value of the loaned securities is determined at the close of business of a fund and any additional required collateral is delivered to a fund on the next business day. A fund or borrower may terminate the loan at any time, and if the borrower defaults on its obligation to return the securities loaned because of insolvency or other reasons, a fund may apply collateral received from the borrower against the obligation. A fund may experience delays and costs in recovering the securities loaned. Any cash collateral received is invested in the Fidelity Securities Lending Cash Central Fund. Any loaned securities are identified as such in the Schedule of Investments, and the value of loaned securities and cash collateral at period end, as applicable, are presented in the Statement of Assets and Liabilities. Security lending income represents the income earned on investing cash collateral, less rebates paid to borrowers and any lending agent fees associated with the loan, plus any premium payments received for lending certain types of securities. Security lending income is presented in the Statement of Operations as a component of income from Fidelity Central Funds. Affiliated security lending activity, if any, was as follows:
| | Total Security Lending Fees Paid to NFS ($) | Security Lending Income From Securities Loaned to NFS ($) | Value of Securities Loaned to NFS at Period End ($) |
| Fidelity Mid Cap Growth Index Fund | 5,774 | 30 | - |
| Fidelity Mid Cap Value Index Fund | 8,122 | 205 | 17,316 |
| Fidelity Small Cap Growth Index Fund | 61,459 | 4,166 | 367,549 |
| Fidelity Small Cap Value Index Fund | 48,270 | 7,272 | 98,862 |
9. Bank Borrowings.
Each Fund is permitted to have bank borrowings for temporary or emergency purposes to fund shareholder redemptions or for other short-term liquidity requirements. Each Fund has established borrowing arrangements with certain banks. The interest rate on the borrowings is the bank's base rate, as revised from time to time. Any open loans, including accrued interest, at period end are presented under the caption "Notes payable" in the Statement of Assets and Liabilities, if applicable. Activity in this program during the period for which loans were outstanding was as follows:
| | Average Loan Balance ($) | Weighted Average Interest Rate | Interest Expense ($) |
| Fidelity Mid Cap Value Index Fund | 614,000 | 5.83% | 199 |
10. Expense Reductions.
Through arrangements with each applicable Fund's custodian, credits realized as a result of certain uninvested cash balances were used to reduce each applicable Fund's expenses. All of the applicable expense reductions are noted in the table below.
| | Custodian credits ($) |
Fidelity Mid Cap Growth Index Fund. | 587 |
| Fidelity Mid Cap Value Index Fund | 250 |
Fidelity Small Cap Growth Index Fund | 8,478 |
| Fidelity Small Cap Value Index Fund | 1,449 |
11. Other.
A fund's organizational documents provide former and current trustees and officers with a limited indemnification against liabilities arising in connection with the performance of their duties to the fund. In the normal course of business, a fund may also enter into contracts that provide general indemnifications. A fund's maximum exposure under these arrangements is unknown as this would be dependent on future claims that may be made against a fund. The risk of material loss from such claims is considered remote.
12. Risk and Uncertainties.
Many factors affect a fund's performance. Developments that disrupt global economies and financial markets, such as pandemics, epidemics, outbreaks of infectious diseases, war, terrorism, and environmental disasters, may significantly affect a fund's investment performance. The effects of these developments to a fund will be impacted by the types of securities in which a fund invests, the financial condition, industry, economic sector, and geographic location of an issuer, and a fund's level of investment in the securities of that issuer. Significant concentrations in security types, issuers, industries, sectors, and geographic locations may magnify the factors that affect a fund's performance.
Item 8: Changes in and Disagreements with Accountants for Open-End Management Investment Companies
(Unaudited)
Note: This is not applicable for any fund included in this document.
Item 9: Proxy Disclosures for Open-End Management Investment Companies
(Unaudited)
Note: This is not applicable for any fund included in this document.
Item 10: Remuneration Paid to Directors, Officers, and others of Open-End Management Investment Companies
(Unaudited)
Note: This information is disclosed as part of the financial statements for each Fund as part of Item 7: Financial Statements and Financial Highlights for Open-End Management Investment companies.
Item 11: Statement Regarding Basis for Approval of Investment Advisory Contract
(Unaudited)
Board Approval of Investment Advisory Contracts and Management Fees
Fidelity Mid Cap Growth Index Fund
Fidelity Mid Cap Value Index Fund
Fidelity Small Cap Growth Index Fund
Fidelity Small Cap Value Index Fund
Each year, the Board of Trustees, including the Independent Trustees (together, the Board), considers the renewal of each fund's management contract with Fidelity Management & Research Company LLC (FMR) and the sub-advisory agreement (Sub-Advisory Agreement) for each fund with Geode Capital Management, LLC (Geode) (together, the Advisory Contracts). FMR and Geode are referred to herein as the Investment Advisers. The Board, assisted by the advice of fund counsel and Independent Trustees' counsel, requests and considers a broad range of information relevant to the renewal of the Advisory Contracts throughout the year.
The Board meets regularly and, at each of its meetings, covers an extensive agenda of topics and materials and considers factors that are relevant to its annual consideration of the renewal of each fund's Advisory Contracts, including the services and support provided to each fund and its shareholders. The Board's Operations Committee, of which all the Independent Trustees are members, meets regularly throughout the year and requests, receives and considers, among other matters, information related to the annual consideration of the renewal of each fund's Advisory Contracts before making its recommendation to the Board. The Board also meets as needed to review matters specifically related to the Board's annual consideration of the renewal of the Advisory Contracts. Members of the Board may also meet from time to time with trustees of other Fidelity funds through joint ad hoc committees to discuss certain matters relevant to all of the Fidelity funds.
At its September 2024 meeting, the Board unanimously determined to renew each fund's Advisory Contracts. In reaching its determination, the Board considered all factors it believed relevant, including (i) the nature, extent, and quality of the services provided to each fund and its shareholders (including the investment performance of each fund); (ii) the competitiveness relative to peer funds of each fund's management fee and total expense ratio; (iii) the total costs of the services provided by and the profits realized by FMR and its affiliates (Fidelity) and Geode from their respective relationships with each fund; and (iv) the extent to which, if any, economies of scale exist and are realized as each fund grows, and whether any economies of scale are appropriately shared with fund shareholders. The Board also considered the broad range of investment choices available to shareholders from FMR's competitors and that each fund's shareholders have chosen to invest in that fund, which is part of the Fidelity family of funds. The Board's decision to renew the Advisory Contracts was not based on any single factor and the factors may have been weighed differently by different Trustees.
The Board reached a determination, with the assistance of fund counsel and Independent Trustees' counsel and through the exercise of its business judgment, that the renewal of the Advisory Contracts was in the best interests of each fund and its shareholders and that the compensation payable under the Advisory Contracts was fair and reasonable in light of all of the surrounding circumstances.
Nature, Extent, and Quality of Services Provided. The Board considered the Investment Advisers' staffing as it relates to the funds, including the backgrounds and experience of investment personnel, and also considered the Investment Advisers' implementation of each fund's investment program. The Independent Trustees also had discussions with senior management of Fidelity's investment operations and investment groups and with senior management of Geode. The Board considered the structure of the investment personnel compensation programs and whether the structures provide appropriate incentives to act in the best interests of each fund.
The Trustees also discussed with representatives of Fidelity, at meetings throughout the year, Fidelity's role in, among other things, overseeing compliance with federal securities laws and other applicable requirements by Geode with respect to the funds and monitoring and overseeing the performance and investment capabilities of Geode. The Trustees considered that the Board had received from Fidelity periodic reports about its oversight and due diligence processes, as well as periodic reports regarding the performance of Geode.
The Board also considered the nature, extent and quality of services provided by Geode. The Trustees noted that under the Sub-Advisory Agreement, subject to oversight by Fidelity, Geode is responsible for, among other things, identifying investments and arranging for execution of portfolio transactions to implement each fund's investment strategy. In addition, the Trustees noted that Geode is responsible for providing such reporting as may be requested by Fidelity to fulfill its oversight responsibilities discussed above.
Resources Dedicated to Investment Management and Support Services. The Board reviewed the general qualifications and capabilities of Fidelity's and Geode's investment staffs, including their size, education, experience, and resources, as well as Fidelity's and Geode's approach to recruiting, training, managing, and compensating investment personnel. The Board noted the resources devoted to Fidelity's global investment organization and that Fidelity's and Geode's analysts have extensive resources, tools and capabilities that allow them to conduct quantitative and fundamental analysis, as well as credit analysis of issuers, counterparties, and guarantors. Further, the Board considered that Fidelity's and Geode's investment professionals have sufficient access to information and data so as to provide competitive investment results over time, and that those professionals also have access to sophisticated tools that permit them to assess portfolio construction and risk and performance attribution characteristics continuously. Additionally, in its deliberations, the Board considered Fidelity's and Geode's trading, risk management, compliance, cybersecurity, and technology and operations capabilities and resources, which are integral parts of the investment management process.
Shareholder and Administrative Services. The Board considered (i) the nature, extent, quality, and cost of advisory, administrative, and shareholder services performed by the Investment Advisers and their affiliates under the Advisory Contracts and by FMR's affiliates under separate agreements covering transfer agency and pricing and bookkeeping services for each fund; (ii) the nature and extent of Fidelity's supervision of third party service providers, principally custodians, subcustodians, and pricing vendors; and (iii) the resources devoted by Fidelity to, and the record of compliance with, each fund's compliance policies and procedures, including with respect to liquidity risk management. The Board also reviewed the allocation of fund brokerage, including allocations to brokers affiliated with the Investment Advisers. The Board also considered each fund's securities lending activities and any payments made to Fidelity relating to securities lending under a separate agreement.
The Board noted that the growth of fund assets over time across the complex allows Fidelity to reinvest in the development of services designed to enhance the value and convenience of the Fidelity funds as investment vehicles. These services include 24-hour access to account information and market information over the Internet and through telephone representatives, investor education materials and asset allocation tools. The Board also considered that it reviews customer service metrics such as telephone response times, continuity of services on the website and metrics addressing services at Fidelity Investor Centers.
Investment in a Large Fund Family. The Board considered the benefits to shareholders of investing in a fund that is part of a large family of funds offering a variety of investment disciplines and providing a large variety of fund investor services. The Board noted that Fidelity had taken, or had made recommendations to the Board that resulted in the Fidelity funds taking, a number of actions over the previous year that benefited particular funds and/or the Fidelity funds in general.
Investment Performance. The Board took into account discussions that occur with representatives of the Investment Advisers, and reports that it receives, at Board meetings throughout the year relating to fund investment performance. In this regard the Board noted that as part of regularly scheduled fund reviews and other reports to the Board on fund performance, the Board considered annualized return information for each fund for different time periods, measured against the securities market index each fund seeks to track (benchmark index). The Board also periodically considers each fund's tracking error versus its benchmark index. In its evaluation of fund investment performance at meetings throughout the year, the Board gave particular attention to information indicating underperformance of certain Fidelity funds over different time periods and discussed with the Investment Advisers the reasons for such underperformance.
In addition to reviewing absolute and relative fund performance, the Independent Trustees periodically consider the appropriateness of fund performance metrics in evaluating the results achieved. In general, the Independent Trustees believe that an index fund's performance should be evaluated based on gross performance (before fees and expenses but after transaction costs) of the fund compared to the fund's benchmark index, over appropriate time periods.
Based on its review, the Board concluded that the nature, extent, and quality of services provided to each fund under the Advisory Contracts should continue to benefit the shareholders of each fund.
Competitiveness of Management Fee and Total Expense Ratio. The Board was provided with information regarding industry trends in management fees and expenses. In its review of each fund's management fee and total expense ratio, the Board considered each fund's unitary (subject to certain limited exceptions) fee rate as well as fund expenses paid by FMR under each fund's management contract, such as transfer agent fees, pricing and bookkeeping fees, and custodial, legal, and audit fees. The Board noted that Fidelity may agree to waive fees or reimburse expenses from time to time, and the extent to which, if any, it has done so for each fund.
Comparisons of Management Fees and Total Expense Ratios. Among other things, the Board reviewed data for selected groups of competitive funds and classes (referred to as "mapped groups") that were compiled by Fidelity based on combining similar investment objective categories (as classified by Morningstar) that have comparable investment mandates. The data reviewed by the Board included (i) gross management fee comparisons (before taking into account expense reimbursements or caps) relative to the total universe of funds within the mapped group; (ii) gross management fee comparisons relative to a subset of non-Fidelity funds in the mapped group that are similar in size and management fee structure to each fund (referred to as the "asset size peer group"); (iii) total expense comparisons of each fund relative to funds and classes in the mapped group that have a similar sales load structure to each fund (referred to as the "similar sales load structure group"); and (iv) total expense comparisons of each fund relative to funds and classes in the similar sales load structure group that are similar in size and management fee structure to each fund (referred to as the "total expense asset size peer group"). The total expense asset size peer group comparison excludes performance adjustments and fund-paid 12b-1 fees to eliminate variability in fee structures.
The information provided to the Board indicated that each fund's management fee rate ranked below the competitive median of the mapped group for 2023 and below the competitive median of the asset size peer group for 2023. Further, the information provided to the Board indicated that the total expense ratio of each fund ranked below the competitive median of the similar sales load structure group for 2023 and below the competitive median of the total expense asset size peer group for 2023.
Fees Charged to Other Clients. The Board also considered fee structures and other information with respect to clients of Fidelity and Geode, such as other funds advised or subadvised by Fidelity or Geode, pension plan clients, and other institutional clients with similar mandates. The Board noted that a joint ad hoc committee created by it and the boards of other Fidelity funds periodically reviews and compares Fidelity's institutional investment advisory business with its business of providing services to the Fidelity funds and also noted the most recent findings of the committee. The Board noted that the committee's review included a consideration of the differences in services provided, fees charged, and costs incurred, as well as competition in the markets serving the different categories of clients.
Based on its review, the Board concluded that each fund's management fee is fair and reasonable in light of the services that each fund receives and the other factors considered. Further, based on its review of total expense ratios and fees charged to other Fidelity clients, the Board concluded that each fund's total expense ratio was reasonable in light of the services that the fund and its shareholders receive and the other factors considered.
Costs of the Services and Profitability. The Board considered the revenues earned and the expenses incurred by Fidelity in conducting the business of developing, marketing, distributing, managing, administering and servicing each fund and servicing each fund's shareholders. The Board also considered the level of Fidelity's profits in respect of all the Fidelity funds.
On an annual basis, Fidelity presents to the Board information about the profitability of its relationships with each fund. Fidelity calculates profitability information for each Fidelity fund, as well as aggregate profitability information for groups of Fidelity funds and all Fidelity funds, using a series of detailed revenue and cost allocation methodologies which originate with the books and records of Fidelity on which Fidelity's audited financial statements are based. The Audit Committee of the Board reviews any significant changes from the prior year's methodologies.
A public accounting firm has been engaged annually by the Board as part of the Board's assessment of Fidelity's profitability analysis. The engagement includes the review and assessment of the methodologies used by Fidelity in determining the revenues and expenses attributable to Fidelity's fund business. After considering the reports issued under the engagement and information provided by Fidelity, the Board concluded that while other allocation methods may also be reasonable, Fidelity's profitability methodologies are reasonable in all material respects.
The Board also reviewed Fidelity's and Geode's non-fund businesses and potential indirect benefits such businesses may have received as a result of their association with Fidelity's fund business (i.e., fall-out benefits) as well as cases where Fidelity's and Geode's affiliates may benefit from the funds' business. The Board considered areas where potential indirect benefits to the Fidelity funds from their relationships with Fidelity may exist. The Board's consideration of these matters was informed by the findings of a joint ad hoc committee created by it and the boards of other Fidelity funds to evaluate potential fall-out benefits.
The Board considered the costs of the services provided by and the profits realized by Fidelity in connection with the operation of each fund and was satisfied that the profitability was not excessive.
The Board also considered information regarding the profitability of Geode's relationship with each fund.
Economies of Scale. The Board considered whether there have been economies of scale in respect of the management of the Fidelity funds, whether the Fidelity funds (including each fund) have appropriately benefited from any such economies of scale, and whether there is potential for realization of any further economies of scale. The Board considered the extent to which each fund will benefit from economies of scale as assets grow through increased services to the fund, through waivers or reimbursements, or through fee or expense ratio reductions. The Board recognized that, due to each fund's current contractual arrangements, its expense ratio will not decline if the fund's operating costs decrease as assets grow, or rise as assets decrease. The Board also noted that a committee created by it and the boards of other Fidelity funds periodically analyzes whether Fidelity attains economies of scale in respect of the management and servicing of the Fidelity funds, whether the Fidelity funds have appropriately benefited from such economies of scale, and whether there is potential for realization of any further economies of scale.
The Board concluded, taking into account the analysis of the committee, that economies of scale, if any, are being appropriately shared between fund shareholders and Fidelity.
Additional Information Requested by the Board. In order to develop fully the factual basis for consideration of the Fidelity funds' advisory contracts, the Board requested and received additional information on certain topics, including: (i) portfolio manager changes that have occurred during the past year; (ii) hiring, training, compensating, and retaining adviser and sub-adviser personnel; (iii) the terms of the funds' various management fee structures and arrangements for transfer agent and pricing and bookkeeping services; (iv) Fidelity's fund profitability methodology, profitability trends for certain funds, the allocation of various costs to different funds, and the impact of certain factors on fund profitability results; (v) the impact on fund profitability of recent industry trends, such as the growth in passively managed funds and the changes in flows for different types of funds; (vi) the types of management fee and total expense comparisons provided, and the challenges and limitations associated with such information; (vii) explanations regarding the relative total expense ratios and management fees of certain funds and classes, total expense and management fee competitive trends, and methodologies for total expense and management fee competitive comparisons; (viii) matters related to money market funds, exchange-traded funds, and target date funds; (ix) the arrangements with and compensation paid to certain fund sub-advisers and the treatment of such compensation within Fidelity's fund profitability methodology; and (x) the terms of management contracts between Fidelity and other funds and products not overseen by the Board.
Conclusion. Based on its evaluation of all of the conclusions noted above, and after considering all factors it believed relevant, the Board, including the Independent Trustees, concluded that the advisory and sub-advisory fee arrangements are fair and reasonable in light of all of the surrounding circumstances and that each fund's Advisory Contracts should be renewed through September 30, 2025.
1.9896343.105
C06-SANN-0325
Fidelity® SAI Municipal Bond Index Fund
Semi-Annual Report
December 31, 2024
Offered exclusively to certain clients of the Adviser, or its affiliates, including Strategic Advisers LLC (Strategic Advisers) - not available for sale to the general public. Fidelity® SAI is a product name of Fidelity® funds dedicated to certain programs affiliated with Strategic Advisers.
Contents
To view a fund's proxy voting guidelines and proxy voting record for the 12-month period ended June 30, visit http://www.fidelity.com/proxyvotingresults or visit the Securities and Exchange Commission's (SEC) web site at http://www.sec.gov.
You may also call 1-800-544-3455 to request a free copy of the proxy voting guidelines.
BLOOMBERG ® is a trademark and service mark of Bloomberg Finance L.P. and its affiliates (collectively "Bloomberg"). Bloomberg or Bloomberg's licensors own all proprietary rights in the Bloomberg Indices. Neither Bloomberg nor Bloomberg's licensors approves or endorses this material, or guarantees the accuracy or completeness of any information herein, or makes any warranty, express or implied, as to the results to be obtained therefrom and, to the maximum extent allowed by law, neither shall have any liability or responsibility for injury or damages arising in connection therewith.
Standard & Poor's, S&P and S&P 500 are registered service marks of The McGraw-Hill Companies, Inc. and have been licensed for use by Fidelity Distributors Corporation.
Other third-party marks appearing herein are the property of their respective owners.
All other marks appearing herein are registered or unregistered trademarks or service marks of FMR LLC or an affiliated company. © 2025 FMR LLC. All rights reserved.
This report and the financial statements contained herein are submitted for the general information of the shareholders of the Fund. This report is not authorized for distribution to prospective investors in the Fund unless preceded or accompanied by an effective prospectus.
A fund files its complete schedule of portfolio holdings with the SEC for the first and third quarters of each fiscal year on Form N-PORT. Forms N-PORT are available on the SEC's web site at http://www.sec.gov. A fund's Forms N-PORT may be reviewed and copied at the SEC's Public Reference Room in Washington, DC. Information regarding the operation of the SEC's Public Reference Room may be obtained by calling 1-800-SEC-0330.
For a complete list of a fund's portfolio holdings, view the most recent holdings listing, semiannual report, or annual report on Fidelity's web site at http://www.fidelity.com, http://www.institutional.fidelity.com, or http://www.401k.com, as applicable.
NOT FDIC INSURED •MAY LOSE VALUE •NO BANK GUARANTEE
Neither the Fund nor Fidelity Distributors Corporation is a bank.
Item 7: Financial Statements and Financial Highlights for Open-End Management Investment Companies (Semi-Annual Report)
Fidelity® SAI Municipal Bond Index Fund
Schedule of Investments December 31, 2024 (Unaudited)
Showing Percentage of Net Assets
| Municipal Securities - 100.2% |
| | | Principal Amount (a) | Value ($) |
| Alabama - 1.0% | | | |
| Education - 0.0% | | | |
| University AL Gen Rev Series 2017B, 3% 7/1/2035 | | 30,000 | 27,352 |
| Escrowed/Pre-Refunded - 0.1% | | | |
| Alabama Fed Aid Hwy Fin Auth Spl Oblig Rev Series 2017A, 4% 6/1/2037 (Pre-refunded to 9/1/2027 at 100) | | 25,000 | 25,519 |
| Birmingham Ala Wtrwks Brd Wtr Rev Series 2016 B, 3% 1/1/2043 (Pre-refunded to 1/1/2027 at 100) | | 30,000 | 30,044 |
| | | | 55,563 |
| General Obligations - 0.7% | | | |
| Black Belt Energy Gas District Series 2024 C, 5% tender 5/1/2055 (Pacific Life Insurance Co Guaranteed) (b) | | 300,000 | 316,820 |
| Southeast Energy Auth Coop Dist Ala Commodity Supply Rev Series 2023 B, 5% tender 1/1/2054 (Liquidity Facility Royal Bank of Canada), (Royal Bank of Canada Guaranteed) (b) | | 220,000 | 231,452 |
| | | | 548,272 |
| Health Care - 0.1% | | | |
| UAB Medicine Fin Auth Rev (University AL At Birmingham Hosp Rev Proj.) Series 2016 B, 5% 9/1/2034 | | 50,000 | 50,976 |
| UAB Medicine Fin Auth Rev (University AL At Birmingham Hosp Rev Proj.) Series 2017B1, 3.25% 9/1/2031 | | 45,000 | 43,122 |
| | | | 94,098 |
| Water & Sewer - 0.1% | | | |
| Decatur Ala Wtr & Swr Rev Series 2021 A, 2.125% 2/15/2051 | | 90,000 | 53,782 |
TOTAL ALABAMA | | | 779,067 |
| Arizona - 1.6% | | | |
| Education - 0.2% | | | |
| Arizona St Univ Revs Series 2019 B, 4% 7/1/2049 | | 70,000 | 68,083 |
| University AZ Univ Revs Series 2016B, 5% 6/1/2042 | | 95,000 | 96,613 |
| | | | 164,696 |
| Electric Utilities - 0.6% | | | |
| Salt River Proj AZ Agric & Pwr Series 2015A, 5% 12/1/2032 | | 25,000 | 25,175 |
| Salt River Proj AZ Agric & Pwr Series 2016 A, 5% 1/1/2038 | | 145,000 | 149,160 |
| Salt River Proj AZ Agric & Pwr Series 2017A, 5% 1/1/2028 | | 55,000 | 58,342 |
| Salt River Proj AZ Agric & Pwr Series 2022A, 5% 1/1/2032 | | 145,000 | 163,390 |
| | | | 396,067 |
| General Obligations - 0.0% | | | |
| Salt Verde Finl Corp Gas Rev AZ 5% 12/1/2032 (Citigroup Inc Guaranteed) | | 20,000 | 21,265 |
| Salt Verde Finl Corp Gas Rev AZ 5.25% 12/1/2026 (Citigroup Inc Guaranteed) | | 15,000 | 15,421 |
| | | | 36,686 |
| Health Care - 0.0% | | | |
| Maricopa Cnty AZ Ida Rev (Banner Health System Proj.) Series 2016 A, 5% 1/1/2038 | | 40,000 | 40,817 |
| Special Tax - 0.3% | | | |
| Bullhead City Ariz Excise Taxes Rev 2.7% 7/1/2051 | | 90,000 | 61,641 |
| Phoenix Ariz Civic Impt Corp Distr Rev 5.5% 7/1/2036 (National Public Finance Guarantee Corporation Insured) (c) | | 25,000 | 29,742 |
| Phoenix Ariz Civic Impt Corp Distr Rev 5.5% 7/1/2041 (National Public Finance Guarantee Corporation Insured) (c) | | 80,000 | 96,684 |
| Phoenix AZ Civic Impt Corp Series 2015A, 5% 7/1/2031 | | 25,000 | 25,201 |
| | | | 213,268 |
| Transportation - 0.3% | | | |
| Phoenix AZ Cvc Imp Crp Apr Rev 5% 7/1/2045 | | 95,000 | 95,335 |
| Phoenix AZ Cvc Imp Crp Apr Rev Series 2019 B, 5% 7/1/2033 (d) | | 110,000 | 115,195 |
| Phoenix AZ Cvc Imp Crp Apr Rev Series 2019 B, 5% 7/1/2044 (d) | | 40,000 | 40,911 |
| | | | 251,441 |
| Water & Sewer - 0.2% | | | |
| Lake Havasu City AZ Wastewater System Revenue Series B, 4% 7/1/2045 (Assured Guaranty Municipal Corp Insured) | | 60,000 | 57,287 |
| Mesa AZ Util Sys Rev Series 2016, 3% 7/1/2038 | | 125,000 | 110,929 |
| | | | 168,216 |
TOTAL ARIZONA | | | 1,271,191 |
| Arkansas - 0.2% | | | |
| Water & Sewer - 0.2% | | | |
| Fort Smith AR Wtr & Swr Rev Series 2018, 5% 10/1/2034 | | 145,000 | 152,931 |
| California - 19.0% | | | |
| Education - 1.4% | | | |
| California Edl Facs Auth Rev (Loyola Marymount University Proj.) 0% 10/1/2034 (National Public Finance Guarantee Corporation Insured) (e) | | 25,000 | 17,293 |
| California Edl Facs Auth Rev (Loyola Marymount University Proj.) Series 2001A, 0% 10/1/2030 (e) | | 15,000 | 12,225 |
| California Edl Facs Auth Rev (Stanford University Proj.) 5% 3/15/2039 | | 20,000 | 23,929 |
| California St Univ Rev Series 2015A, 5% 11/1/2026 | | 15,000 | 15,261 |
| California St Univ Rev Series 2016A, 3.2% 11/1/2037 | | 15,000 | 14,166 |
| California St Univ Rev Series 2016A, 5% 11/1/2026 | | 40,000 | 41,162 |
| California St Univ Rev Series 2020C, 3% 11/1/2040 | | 100,000 | 87,252 |
| University CA Revs 5% 5/15/2035 | | 50,000 | 52,041 |
| University CA Revs Series 2015 I, 5% 5/15/2028 | | 10,000 | 10,066 |
| University CA Revs Series 2016AR, 5% 5/15/2035 | | 15,000 | 15,363 |
| University CA Revs Series 2017AV, 5% 5/15/2047 | | 110,000 | 113,277 |
| University CA Revs Series 2017M, 5% 5/15/2031 | | 140,000 | 146,756 |
| University CA Revs Series 2017M, 5% 5/15/2032 | | 35,000 | 36,601 |
| University CA Revs Series 2017M, 5% 5/15/2036 | | 20,000 | 20,778 |
| University CA Revs Series 2020 BE, 4% 5/15/2047 | | 115,000 | 115,195 |
| University CA Revs Series 2020 BE, 5% 5/15/2043 | | 15,000 | 16,151 |
| University CA Revs Series 2022 BK, 5% 5/15/2032 | | 115,000 | 132,697 |
| University CA Revs Series 2022 S, 5% 5/15/2036 | | 125,000 | 141,699 |
| University CA Revs Series 2023 BM, 5% 5/15/2027 | | 100,000 | 105,568 |
| | | | 1,117,480 |
| Electric Utilities - 0.8% | | | |
| Imperial CA Irr Dist Elec Rev Series C, 5% 11/1/2038 | | 85,000 | 86,831 |
| Los Angeles CA Wtr & Pwr Rev Series 2017C, 5% 7/1/2036 | | 50,000 | 52,187 |
| Los Angeles CA Wtr & Pwr Rev Series 2019 B, 5% 7/1/2035 | | 90,000 | 96,794 |
| Los Angeles CA Wtr & Pwr Rev Series 2019 D, 5% 7/1/2044 | | 150,000 | 158,101 |
| Los Angeles CA Wtr & Pwr Rev Series 2022 A, 5% 7/1/2040 | | 105,000 | 115,878 |
| Riverside CA Elec Rev Series 2019 A, 5% 10/1/2026 | | 50,000 | 51,898 |
| Southern CA Pub Pwr Auth Southn Trans Sys Renewal Proj Rev (Southern CA Pub Pwr Auth Proj.) Series 2023 1, 5% 7/1/2035 | | 100,000 | 115,775 |
| | | | 677,464 |
| Escrowed/Pre-Refunded - 0.2% | | | |
| Anaheim CA Pub Fin Auth Lease Rev 0% 9/1/2036 (Escrowed to Maturity) (e) | | 90,000 | 59,967 |
| Anaheim CA Pub Fin Auth Lease Rev Series 1997 C, 0% 9/1/2035 (e) | | 45,000 | 31,207 |
| California Health Facilities Financing Authority Series 2016B, 5% 11/15/2046 (Pre-refunded to 11/15/2026 at 100) | | 10,000 | 10,406 |
| California Statewide Community Development Authority Rev Series 2015, 3% 8/15/2029 (Pre-refunded to 2/15/2026 at 100) | | 50,000 | 50,085 |
| Foothill/Estrn Transn CA Toll 0% 1/1/2029 (e) | | 30,000 | 26,500 |
| Golden State Tobacco Securitization Corp. Tobacco Settlement Series 2015A, 5% 6/1/2035 (Pre-refunded to 6/1/2025 at 100) | | 10,000 | 10,089 |
| Golden State Tobacco Securitization Corp. Tobacco Settlement Series 2015A, 5% 6/1/2040 (Pre-refunded to 6/1/2025 at 100) | | 10,000 | 10,088 |
| San Diego CA Comm Coll Dist Gen. Oblig. Series 2016, 5% 8/1/2041 (Pre-refunded to 8/1/2026 at 100) | | 5,000 | 5,179 |
| Solano Calif Cmnty College Dist Gen. Oblig. Series 2013 A, 5.125% 8/1/2041 (Pre-refunded to 8/1/2028 at 100) (c) | | 10,000 | 10,697 |
| | | | 214,218 |
| General Obligations - 9.2% | | | |
| Alameda Calif Uni Sch Dist Series B, 4% 8/1/2052 | | 35,000 | 34,907 |
| Alameda Cnty Calif Jt Pwrs Auth Lease Rev (Alameda County CA Proj.) Series 2023 A, 5% 12/1/2033 | | 160,000 | 186,913 |
| Berkley CA Alameda County Uni Sch Dist Series 2018E, 3.5% 8/1/2045 | | 100,000 | 90,262 |
| California Community Choice Financing Authority Series 2021B 1, 4% tender 2/1/2052 (Morgan Stanley Guaranteed) (b) | | 635,000 | 634,405 |
| Chaffey CA Unified Hsd Series D, 4% 8/1/2049 | | 30,000 | 29,476 |
| Chino Valley CA Uni Sch Dist Series 2017A, 5.25% 8/1/2047 | | 25,000 | 25,948 |
| Compton CA Uni Sch Dist Series 2019 B, 3% 6/1/2049 | | 75,000 | 60,320 |
| Contra Costa CA Community College Dist Gen. Oblig. Series 2014A, 4% 8/1/2039 | | 5,000 | 4,994 |
| Corona-Norco Calif Uni Sch Dis Series C, 3% 8/1/2044 | | 125,000 | 103,427 |
| El Camino CA Cmty College Dist Series 2012C, 0% 8/1/2034 (e) | | 60,000 | 43,044 |
| El Camino CA Cmty College Dist Series 2012C, 0% 8/1/2038 (e) | | 85,000 | 50,298 |
| Elk Grove Calif Uni Sch Dist Ctfs Partn (Elk Grove CA Uni Sch Dist Proj.) 3% 2/1/2035 | | 65,000 | 60,641 |
| Foothill-De Anza CA Cmty College Dist Gen. Oblig. Series 2003 B, 0% 8/1/2033 (e) | | 85,000 | 64,073 |
| Fremont Union High Sch Dist Santa Clara Series 2019 A, 4% 8/1/2046 | | 30,000 | 30,022 |
| Grossmont CA Union High School Dist 0% 8/1/2030 (e) | | 40,000 | 33,409 |
| Grossmont CA Union High School Dist Series 2016B, 3% 8/1/2045 | | 30,000 | 23,950 |
| Grossmont-Cuyamaca Ccd Gen. Oblig. Series 2018 B, 4% 8/1/2047 | | 200,000 | 198,411 |
| Livermore Valley CA Jt Uni Sch Series 2016A, 3% 8/1/2046 | | 155,000 | 124,618 |
| Long Beach CA Bd Fin Auth Nat Gas Pur Rev 5% 11/15/2035 (Merrill Lynch & Co Inc Guaranteed) | | 25,000 | 27,154 |
| Long Beach CA Bd Fin Auth Nat Gas Pur Rev 5.5% 11/15/2037 (Merrill Lynch & Co Inc Guaranteed) | | 30,000 | 34,300 |
| Long Beach CA Uni Sch Dist 0% 8/1/2035 (e) | | 90,000 | 61,666 |
| Long Beach CA Uni Sch Dist Series 2016, 3% 8/1/2032 | | 80,000 | 77,729 |
| Los Angeles CA Ccd Gen. Oblig. Series 2024, 5% 8/1/2033 | | 30,000 | 35,200 |
| Los Angeles CA Ccd Gen. Oblig. Series 2024, 5% 8/1/2039 | | 15,000 | 17,239 |
| Los Angeles CA Ccd Gen. Oblig. Series J, 5% 8/1/2028 | | 20,000 | 21,173 |
| Los Angeles CA Mun Imp Crp Lse (Los Angeles CA Proj.) Series 2016 B, 4% 11/1/2037 | | 40,000 | 40,233 |
| Los Angeles Unified School District/CA Series 2016A, 5% 7/1/2029 | | 80,000 | 80,767 |
| Los Angeles Unified School District/CA Series 2016B, 5% 7/1/2025 | | 15,000 | 15,167 |
| Los Angeles Unified School District/CA Series 2019A, 5% 7/1/2028 | | 20,000 | 21,617 |
| Los Angeles Unified School District/CA Series 2019A, 5% 7/1/2029 | | 45,000 | 49,584 |
| Los Angeles Unified School District/CA Series 2019A, 5% 7/1/2030 | | 75,000 | 82,096 |
| Los Angeles Unified School District/CA Series 2023 QRR, 5% 7/1/2037 | | 40,000 | 46,177 |
| Los Angeles Unified School District/CA Series 2024A, 5% 7/1/2034 | | 200,000 | 236,035 |
| Los Angeles Unified School District/CA Series A, 5% 7/1/2040 | | 75,000 | 75,431 |
| M-S-R Energy Auth Calif Gas Rev 6.5% 11/1/2039 (Citigroup Inc Guaranteed) | | 25,000 | 31,139 |
| Marin Healthcare District Gen. Oblig. Series 2017A, 3% 8/1/2037 | | 5,000 | 4,446 |
| Monterey Peninsula CA Cmnty College Dist Gen. Oblig. Series 2016, 0% 8/1/2030 (e) | | 20,000 | 16,270 |
| Newport Mesa CA Uni Sch Dist 0% 8/1/2036 (e) | | 70,000 | 47,006 |
| Newport Mesa CA Uni Sch Dist Series 2017, 0% 8/1/2039 (e) | | 5,000 | 2,821 |
| North Orange Cnty Calif Cmnty College Dist Gen. Oblig. Series 2016A, 3% 8/1/2040 | | 25,000 | 21,725 |
| Palo Alto Calif Uni Sch Dist 0% 8/1/2030 (e) | | 50,000 | 41,899 |
| Palo Alto Calif Uni Sch Dist 0% 8/1/2032 (e) | | 100,000 | 78,085 |
| Palo Alto Calif Uni Sch Dist 0% 8/1/2033 (e) | | 15,000 | 11,278 |
| Peralta Calif Cmnty College Dist Gen. Oblig. Series 2016A, 4% 8/1/2039 | | 130,000 | 129,849 |
| Perris Calif Un High Sch Dist Series 2019 A, 3% 9/1/2044 (Assured Guaranty Municipal Corp Insured) | | 25,000 | 20,668 |
| Poway CA Unified Sch Dist 0% 8/1/2034 (e) | | 50,000 | 35,829 |
| Poway CA Unified Sch Dist 0% 8/1/2041 (e) | | 190,000 | 99,359 |
| San Bernardino CA Cmnty College Dist Gen. Oblig. 0% 8/1/2048 (e) | | 45,000 | 16,322 |
| San Diego CA Uni Sch Dist 0% 7/1/2030 (e) | | 35,000 | 29,270 |
| San Diego CA Uni Sch Dist 0% 7/1/2043 (e) | | 40,000 | 19,281 |
| San Diego CA Uni Sch Dist 5.25% 7/1/2027 (Assured Guaranty Municipal Corp Insured) | | 10,000 | 10,664 |
| San Diego CA Uni Sch Dist Series 2019B, 3.25% 7/1/2048 | | 80,000 | 67,448 |
| San Diego CA Uni Sch Dist Series 2021 N2, 4% 7/1/2046 | | 25,000 | 25,073 |
| San Diego CA Uni Sch Dist Series 2024 ZR 5A, 5% 7/1/2039 | | 20,000 | 23,194 |
| San Diego CA Uni Sch Dist Series 2025 SR 4C, 5% 7/1/2034 (f) | | 115,000 | 134,219 |
| San Diego CA Uni Sch Dist Series G 1, 5.25% 7/1/2028 (Assured Guaranty Municipal Corp Insured) | | 10,000 | 10,919 |
| San Diego CA Uni Sch Dist Series I, 4% 7/1/2047 | | 15,000 | 14,903 |
| San Diego CA Uni Sch Dist Series J, 5% 7/1/2030 | | 80,000 | 84,061 |
| San Fran CA Bay Area Rpd Trans Dist Gen. Oblig. Series 2020 C 1, 4% 8/1/2030 | | 125,000 | 131,515 |
| San Fran CA Bay Area Rpd Trans Dist Gen. Oblig. Series A 1, 5% 8/1/2047 | | 45,000 | 46,388 |
| San Francisco CA City & Cnty Ctfs Partn (San Francisco CA City & Cnty Proj.) Series 2019 A, 4% 4/1/2041 | | 35,000 | 35,097 |
| San Francisco CA City & Cnty Gen. Oblig. Series 2022 R1, 5% 6/15/2032 | | 75,000 | 86,478 |
| San Francisco CA City & Cnty Gen. Oblig. Series 2022 R1, 5% 6/15/2034 | | 85,000 | 97,212 |
| San Mateo CA Unified Sch Dist 6.45% 9/1/2033 (c) | | 50,000 | 48,642 |
| San Mateo CA Unified Sch Dist 6.7% 9/1/2041 (c) | | 10,000 | 10,557 |
| Santa Clara CA Uni Sch Dist Series 2019, 4% 7/1/2048 | | 35,000 | 35,015 |
| Santa Clara Cnty CA Fing Lease (Santa Clara Cnty CA Proj.) Series 2018 A, 3.5% 4/1/2039 | | 40,000 | 38,686 |
| Santa Clara Cnty CA Fing Lease (Santa Clara Cnty CA Proj.) Series 2019 A, 3% 5/1/2042 | | 100,000 | 85,459 |
| Santa Clara Cnty CA Fing Lease (Santa Clara Cnty CA Proj.) Series 2021 A, 3% 5/1/2039 | | 100,000 | 89,499 |
| Sequoia Calif Un High Sch Dist Series 2016, 3% 7/1/2031 | | 55,000 | 54,560 |
| Southern California Pub Pwr Auth Nat Gas Proj Rev 5.25% 11/1/2026 (Goldman Sachs Group Inc/The Guaranteed) | | 30,000 | 30,599 |
| State of California Gen. Oblig. 3% 10/1/2036 | | 50,000 | 47,763 |
| State of California Gen. Oblig. 3% 11/1/2035 | | 220,000 | 214,764 |
| State of California Gen. Oblig. 4% 10/1/2037 | | 80,000 | 82,622 |
| State of California Gen. Oblig. 4% 11/1/2044 | | 10,000 | 9,816 |
| State of California Gen. Oblig. 4% 3/1/2028 | | 60,000 | 61,975 |
| State of California Gen. Oblig. 4% 3/1/2037 | | 85,000 | 87,484 |
| State of California Gen. Oblig. 4% 3/1/2050 | | 95,000 | 95,036 |
| State of California Gen. Oblig. 4% 4/1/2043 | | 40,000 | 39,419 |
| State of California Gen. Oblig. 4% 4/1/2049 | | 100,000 | 99,480 |
| State of California Gen. Oblig. 4% 8/1/2037 | | 25,000 | 25,242 |
| State of California Gen. Oblig. 5% 10/1/2039 | | 110,000 | 112,056 |
| State of California Gen. Oblig. 5% 11/1/2027 | | 90,000 | 95,266 |
| State of California Gen. Oblig. 5% 11/1/2031 | | 80,000 | 88,612 |
| State of California Gen. Oblig. 5% 11/1/2034 | | 80,000 | 85,103 |
| State of California Gen. Oblig. 5% 4/1/2027 | | 5,000 | 5,233 |
| State of California Gen. Oblig. 5% 4/1/2032 | | 205,000 | 231,819 |
| State of California Gen. Oblig. 5% 4/1/2045 | | 60,000 | 63,389 |
| State of California Gen. Oblig. 5% 8/1/2026 | | 20,000 | 20,221 |
| State of California Gen. Oblig. 5% 8/1/2029 | | 20,000 | 20,219 |
| State of California Gen. Oblig. 5% 8/1/2036 | | 200,000 | 229,700 |
| State of California Gen. Oblig. 5% 8/1/2045 | | 30,000 | 30,156 |
| State of California Gen. Oblig. 5% 9/1/2026 | | 15,000 | 15,540 |
| State of California Gen. Oblig. Series 2016, 3% 9/1/2033 | | 30,000 | 29,157 |
| State of California Gen. Oblig. Series 2016, 4% 9/1/2036 | | 100,000 | 100,472 |
| State of California Gen. Oblig. Series 2016, 5% 9/1/2045 | | 10,000 | 10,205 |
| State of California Gen. Oblig. Series 2016B, 5% 9/1/2030 | | 20,000 | 20,623 |
| State of California Gen. Oblig. Series 2017, 4% 11/1/2036 | | 20,000 | 20,261 |
| State of California Gen. Oblig. Series 2017, 4% 8/1/2027 | | 55,000 | 55,902 |
| State of California Gen. Oblig. Series 2017, 5% 11/1/2027 | | 150,000 | 158,777 |
| State of California Gen. Oblig. Series 2017, 5% 8/1/2026 | | 65,000 | 67,219 |
| State of California Gen. Oblig. Series 2017, 5% 8/1/2027 | | 30,000 | 31,603 |
| State of California Gen. Oblig. Series A, 4% 3/1/2045 | | 100,000 | 98,038 |
| State of California Gen. Oblig. Series C, 5% 9/1/2026 | | 40,000 | 40,507 |
| State of California Gen. Oblig. Series C, 5% 9/1/2028 | | 50,000 | 50,628 |
| West Contra Costa Calif Uni Sch Dist (West Contra Costa Unified School District Proj.) 0% 8/1/2027 (Assured Guaranty Inc Insured) (e) | | 70,000 | 64,488 |
| West Contra Costa Calif Uni Sch Dist (West Contra Costa Unified School District Proj.) Series 2020 E, 4% 8/1/2049 (Assured Guaranty Municipal Corp Insured) | | 75,000 | 74,849 |
| West Hollywood Public Financing Authority Series 2016, 3% 4/1/2041 | | 75,000 | 62,955 |
| William S Hart Uni High School Dist 0% 9/1/2028 (Assured Guaranty Municipal Corp Insured) (e) | | 140,000 | 124,551 |
| Yosemite CA Cmnty College Dist Gen. Oblig. 0% 8/1/2031 (e) | | 100,000 | 80,204 |
| Yuba CA Gen. Oblig. Series 2016, 3% 8/1/2036 | | 150,000 | 137,319 |
| Yuba CA Gen. Oblig. Series 2016, 3% 8/1/2037 | | 30,000 | 27,118 |
| | | | 7,501,912 |
| Health Care - 0.8% | | | |
| California Health Facilities Financing Authority (Childrens Hospital Los Ang CA Proj.) Series 2017A, 5% 8/15/2047 | | 15,000 | 15,140 |
| California Health Facilities Financing Authority (Stanford Health Care Proj.) 4% 8/15/2050 | | 185,000 | 184,278 |
| California Health Facilities Financing Authority (Sutter Health Systems CA Proj.) Series 2016B, 5% 11/15/2046 | | 15,000 | 15,287 |
| California Health Facilities Financing Authority (Sutter Health Systems CA Proj.) Series 2018 A, 4% 11/15/2042 | | 20,000 | 19,849 |
| California Health Facilities Financing Authority (Sutter Health Systems CA Proj.) Series 2018 A, 5% 11/15/2033 | | 35,000 | 36,881 |
| California Hlth Facs Fin Auth (Adventist Health System-West Proj.) Series 2013 A, 4% 3/1/2043 | | 40,000 | 37,541 |
| California Statewide Communities Development Authority (University of Southern California Proj.) Series 2018, 4.375% 1/1/2048 | | 10,000 | 10,014 |
| California Statewide Communities Development Authority (University of Southern California Proj.) Series 2018, 5% 1/1/2032 | | 30,000 | 31,584 |
| California Statewide Community Development Authority Rev (Adventist Health System-West Proj.) Series 2018 A, 3.5% 3/1/2038 | | 155,000 | 146,300 |
| Univ CA Regts Med Ctr Pooled Rev Series 2022 P, 5% 5/15/2041 | | 135,000 | 148,359 |
| Upland CA Ctfs Partn (San Antonio Community Hosp,Ca Proj.) 4% 1/1/2042 | | 10,000 | 9,440 |
| | | | 654,673 |
| Lease Revenue - 0.3% | | | |
| California St Pub Wks Brd Lse 5% 11/1/2035 | | 200,000 | 231,204 |
| Other - 0.4% | | | |
| California Infrastructure & Economic Development Bank (CA Academy of Science Proj.) Series 2021 B, 4% 5/1/2046 | | 100,000 | 96,922 |
| California Infrastructure & Economic Development Bank (J Paul Getty Trust/The Proj.) Series 2020 A 1, 5% 4/1/2033 | | 90,000 | 105,041 |
| California Infrastructure & Economic Development Bank (J Paul Getty Trust/The Proj.) Series 2023A, 5% 4/1/2033 | | 90,000 | 105,041 |
| | | | 307,004 |
| Resource Recovery - 0.0% | | | |
| Los Angeles CA Sld Wst Res Rev Series 2018 A, 4% 2/1/2032 | | 35,000 | 35,833 |
| Special Tax - 1.0% | | | |
| Irvine Calif Facs Fing Auth Spl Tax Rev Series 2023A, 4% 9/1/2058 (Build America Mutual Assurance Co Insured) | | 135,000 | 130,834 |
| Los Angeles Cnty CA Metro Trans Auth Sales Tax Rev Series 2019 A, 5% 7/1/2044 | | 45,000 | 47,325 |
| Los Angeles Cnty CA Metro Trans Auth Sales Tax Rev Series 2021 A, 4% 6/1/2038 | | 95,000 | 99,177 |
| Los Angeles Cnty CA Metro Trans Auth Sales Tax Rev Series 2023 A, 5% 7/1/2036 | | 75,000 | 86,702 |
| Los Angeles Cnty CA Metro Trans Auth Sales Tax Rev Series 2024A, 5% 7/1/2035 | | 30,000 | 35,353 |
| Sacramento Calif Transient Occupancy Tax Rev Series 2018 A, 5% 6/1/2043 | | 100,000 | 104,480 |
| San Francisco CA BART Dist Tax Series 2019 A, 3% 7/1/2044 | | 50,000 | 41,459 |
| San Francisco County Transportation Authority Series 2017, 3% 2/1/2033 | | 155,000 | 149,913 |
| San Mateo Cnty CA Trans Dist Sales Tax Rev Series 2015A, 3.25% 6/1/2033 | | 60,000 | 59,306 |
| Westminster Calif Redev Agy Successor Agy Tax Allocation Series 2016, 3% 11/1/2041 | | 25,000 | 21,434 |
| Westminster Calif Redev Agy Successor Agy Tax Allocation Series 2016, 3% 11/1/2045 | | 75,000 | 61,039 |
| | | | 837,022 |
| Transportation - 2.4% | | | |
| Bay Area Toll Au CA Bridge Rev Series 2017 S 7, 4% 4/1/2034 | | 50,000 | 50,600 |
| Bay Area Toll Au CA Bridge Rev Series 2017 S 7, 4% 4/1/2042 | | 10,000 | 9,926 |
| Bay Area Toll Au CA Bridge Rev Series 2017 S 7, 4% 4/1/2047 | | 45,000 | 44,645 |
| Bay Area Toll Au CA Bridge Rev Series 2018 A, 2.625% tender 4/1/2045 (b) | | 70,000 | 69,294 |
| Bay Area Toll Au CA Bridge Rev Series 2024 S 11, 5% 4/1/2035 | | 95,000 | 111,088 |
| California Mun Fn Auth Rev (Linxs Apm Project Proj.) Series 2018 A, 3.25% 12/31/2032 (Assured Guaranty Municipal Corp Insured) (d) | | 30,000 | 27,981 |
| Foothill/Estrn Transn CA Toll Series 2021 A, 4% 1/15/2046 | | 15,000 | 14,772 |
| Foothill/Estrn Transn CA Toll Series B 1, 3.95% 1/15/2053 (b) | | 65,000 | 61,168 |
| Los Angeles CA Dept Arpts Rev 4% 5/15/2041 (d) | | 50,000 | 49,065 |
| Los Angeles CA Dept Arpts Rev Series 2018 C, 5% 5/15/2033 (d) | | 155,000 | 159,878 |
| Los Angeles CA Dept Arpts Rev Series 2018 C, 5% 5/15/2036 (d) | | 80,000 | 82,106 |
| Los Angeles CA Dept Arpts Rev Series 2018 D, 5% 5/15/2026 (d) | | 5,000 | 5,124 |
| Los Angeles CA Dept Arpts Rev Series 2020 A, 5% 5/15/2038 | | 85,000 | 92,587 |
| Los Angeles CA Dept Arpts Rev Series 2021B, 5% 5/15/2037 | | 50,000 | 55,638 |
| Los Angeles CA Dept Arpts Rev Series 2021B, 5% 5/15/2048 | | 90,000 | 96,340 |
| Port Oakland Calif Rev Series 2017E, 5% 11/1/2026 | | 30,000 | 31,072 |
| San Diego Cnty CA Reg Arpt Auth Arpt Rev Series 2019 A, 5% 7/1/2034 | | 75,000 | 81,418 |
| San Diego Cnty CA Reg Arpt Auth Arpt Rev Series B, 5% 7/1/2042 (d) | | 175,000 | 177,088 |
| San Francisco CA City & County Airports Commission International Airport Revenue Series 2016A, 5% 5/1/2026 | | 20,000 | 20,576 |
| San Francisco CA City & County Airports Commission International Airport Revenue Series 2019 A, 5% 5/1/2049 (d) | | 25,000 | 25,531 |
| San Francisco CA City & County Airports Commission International Airport Revenue Series SECOND 2019E, 5% 5/1/2034 (d) | | 125,000 | 131,118 |
| San Francisco CA City & County Airports Commission International Airport Revenue Series SECOND 2020 A, 4% 5/1/2039 (d) | | 35,000 | 34,360 |
| San Francisco CA City & County Airports Commission International Airport Revenue Series SECOND 2020 B, 4% 5/1/2039 | | 100,000 | 101,530 |
| San Francisco Municipal Transportation Agency Series 2021 C, 4% 3/1/2046 | | 200,000 | 200,114 |
| San Joaquin Hills CA Transn Corridor Agy Toll Rd Rev 0% 1/15/2029 (National Public Finance Guarantee Corporation Insured) (e) | | 50,000 | 43,366 |
| San Joaquin Hills CA Transn Corridor Agy Toll Rd Rev 0% 1/15/2031 (National Public Finance Guarantee Corporation Insured) (e) | | 90,000 | 71,895 |
| San Joaquin Hills CA Transn Corridor Agy Toll Rd Rev 0% 1/15/2032 (National Public Finance Guarantee Corporation Insured) (e) | | 5,000 | 3,820 |
| San Joaquin Hills CA Transn Corridor Agy Toll Rd Rev Series 2021 A, 4% 1/15/2050 | | 30,000 | 28,892 |
| San Jose Calif Arpt Rev Series 2017B, 5% 3/1/2042 | | 25,000 | 25,758 |
| | | | 1,906,750 |
| Water & Sewer - 2.5% | | | |
| Bay Area Water Supply & Conservation Agency Series 2023 A, 5% 10/1/2032 | | 95,000 | 109,250 |
| California Infrastructure & Economic Development Bank (CA St Clean Water Revolving Fund Proj.) 5% 10/1/2035 | | 90,000 | 103,401 |
| California St Dept Wtr Res Cen Series 2016, 4% 12/1/2031 | | 10,000 | 10,151 |
| California St Dept Wtr Res Cen Series BA, 5% 12/1/2032 | | 5,000 | 5,467 |
| California St Dept Wtr Res Cen Series BA, 5% 12/1/2034 | | 90,000 | 97,858 |
| City of Los Angeles CA Wastewater System Revenue Series 2022 A, 5% 6/1/2047 | | 85,000 | 91,911 |
| East Bay CA Mun Util Dist Wtr Sys Rev Series 2015A, 5% 6/1/2037 | | 65,000 | 65,445 |
| East Bay CA Mun Util Dist Wtr Sys Rev Series 2017B, 5% 6/1/2032 | | 45,000 | 47,326 |
| Los Angeles CA Dep Wtr & Pwr Wtrwks Rev 5% 7/1/2033 | | 190,000 | 218,696 |
| Los Angeles CA Dep Wtr & Pwr Wtrwks Rev Series 2017A, 5% 7/1/2033 | | 55,000 | 57,186 |
| Los Angeles CA Dep Wtr & Pwr Wtrwks Rev Series 2018 A, 5% 7/1/2033 | | 5,000 | 5,298 |
| Los Angeles CA Dep Wtr & Pwr Wtrwks Rev Series 2018 B, 5% 7/1/2037 | | 100,000 | 106,059 |
| Metropolitan Wtr Dist Southn Calif Series 2020 A, 5% 10/1/2036 | | 85,000 | 92,376 |
| Sacramento Cnty CA Santn Dist Series 2021, 5% 12/1/2032 | | 100,000 | 116,160 |
| San Diego CA Pub Facs Fing Auth Swr Rev Series 2016A, 5% 5/15/2039 | | 100,000 | 102,227 |
| San Diego CA Pub Facs Fing Auth Wtr Rev 5.25% 8/1/2047 | | 10,000 | 10,497 |
| San Diego CA Pub Facs Fing Auth Wtr Rev Series 2018A, 5% 8/1/2043 | | 325,000 | 340,001 |
| San Francisco CA Pub Util Comm Wstwtr Rev Series 2021A, 4% 10/1/2048 | | 100,000 | 100,137 |
| San Francisco CA Pub Util Comm Wstwtr Rev Series 2021A, 4% 10/1/2051 | | 100,000 | 100,010 |
| San Francisco CA Pub Util Comm Wtr Rev Series 2015A, 5% 11/1/2029 | | 20,000 | 20,135 |
| San Francisco CA Pub Util Comm Wtr Rev Series 2016A, 5% 11/1/2031 | | 100,000 | 103,473 |
| San Francisco CA Pub Util Comm Wtr Rev Series 2020 SUB A, 5% 11/1/2050 | | 30,000 | 31,832 |
| San Mateo Foster City Calif Pub Fing Auth Wastewater Rev (City of San Mateo CA Sewer Revenue Proj.) Series 2019, 5% 8/1/2049 | | 45,000 | 47,184 |
| West Cnty Facs Fing Auth CA Wstwtr Rev Series 2021, 4% 6/1/2046 | | 85,000 | 85,052 |
| | | | 2,067,132 |
TOTAL CALIFORNIA | | | 15,550,692 |
| Colorado - 2.1% | | | |
| Education - 0.0% | | | |
| University Colo Enterprise Sys Series 2016 B, 2.75% 6/1/2030 | | 15,000 | 13,972 |
| Electric Utilities - 0.2% | | | |
| Colorado Springs Colo Utils Series 2018A 2, 5% 11/15/2048 | | 25,000 | 25,867 |
| Colorado Springs Colo Utils Series 2021 B, 4% 11/15/2040 | | 100,000 | 100,657 |
| | | | 126,524 |
| General Obligations - 0.6% | | | |
| Colorado Ctfs of Prtn (Colorado St Proj.) Series 2018 A, 3.625% 12/15/2036 | | 200,000 | 196,562 |
| County of Pueblo CO Series 2022A, 5% 7/1/2049 | | 135,000 | 141,799 |
| El Paso Cnty Colo Sch Dist No 2 Harrison Series 2019, 5% 12/1/2037 | | 155,000 | 163,593 |
| | | | 501,954 |
| Health Care - 0.6% | | | |
| Colorado Health Facilities Authority (Advent Health Proj.) Series 2018A, 4% 11/15/2048 | | 5,000 | 4,781 |
| Colorado Health Facilities Authority (Advent Health Proj.) Series 2021 A, 4% 11/15/2046 | | 100,000 | 96,105 |
| Colorado Health Facilities Authority (CommonSpirit Health Proj.) Series 2019 A 1, 4% 8/1/2037 | | 90,000 | 89,067 |
| Colorado Health Facilities Authority (CommonSpirit Health Proj.) Series 2019 A 1, 4% 8/1/2044 | | 10,000 | 9,330 |
| Colorado Health Facilities Authority (CommonSpirit Health Proj.) Series 2019 A 1, 5% 8/1/2032 | | 120,000 | 127,573 |
| Colorado Health Facilities Authority (IHC Health Services Inc Proj.) Series 2019 A, 5% 1/1/2030 | | 105,000 | 114,346 |
| | | | 441,202 |
| Special Tax - 0.1% | | | |
| Denver Colo City & Cnty Dedicated Tax Rev Series 2021 A, 4% 8/1/2042 | | 100,000 | 98,818 |
| Transportation - 0.5% | | | |
| Denver CO City & Cnty Arpt Series 2017 A, 5% 11/15/2026 (d) | | 55,000 | 56,534 |
| Denver CO City & Cnty Arpt Series 2017 A, 5% 11/15/2028 (d) | | 30,000 | 31,063 |
| Denver CO City & Cnty Arpt Series 2017 A, 5% 11/15/2029 (d) | | 20,000 | 20,705 |
| Denver CO City & Cnty Arpt Series 2018 B, 3.5% 12/1/2035 | | 10,000 | 9,367 |
| Denver CO City & Cnty Arpt Series 2019 C, 5% 11/15/2031 | | 20,000 | 21,663 |
| Denver CO City & Cnty Arpt Series 2022A, 5% 11/15/2041 (d) | | 195,000 | 204,043 |
| E-470 Pub Hwy Auth Colo Rev 0% 9/1/2031 (National Public Finance Guarantee Corporation Insured) (e) | | 30,000 | 23,640 |
| E-470 Pub Hwy Auth Colo Rev 0% 9/1/2032 (National Public Finance Guarantee Corporation Insured) (e) | | 50,000 | 37,821 |
| | | | 404,836 |
| Water & Sewer - 0.1% | | | |
| Denver CO City & Cnty Brd Wtr Series 2022 A, 5% 12/15/2045 | | 100,000 | 108,363 |
TOTAL COLORADO | | | 1,695,669 |
| Connecticut - 1.8% | | | |
| Education - 0.0% | | | |
| Connecticut State Health & Educational Facilities Authority (Fairfield Univ, CT Proj.) Series R, 3.375% 7/1/2037 | | 10,000 | 9,256 |
| General Obligations - 0.6% | | | |
| Connecticut St Gen. Oblig. 3% 6/1/2039 | | 115,000 | 101,098 |
| Connecticut St Gen. Oblig. 4% 6/1/2030 | | 120,000 | 125,658 |
| Connecticut St Gen. Oblig. 4% 6/1/2031 | | 25,000 | 26,064 |
| Connecticut St Gen. Oblig. Series 2015A, 5% 3/15/2028 | | 15,000 | 15,051 |
| Connecticut St Gen. Oblig. Series 2015B, 3.375% 6/15/2029 | | 25,000 | 24,945 |
| Connecticut St Gen. Oblig. Series 2015B, 4% 6/15/2033 | | 110,000 | 110,162 |
| Connecticut St Gen. Oblig. Series 2016 A, 5% 3/15/2026 | | 15,000 | 15,365 |
| Connecticut St Gen. Oblig. Series 2016 D, 4% 8/15/2031 | | 45,000 | 45,294 |
| Connecticut St Gen. Oblig. Series 2018 D, 5% 4/15/2026 | | 25,000 | 25,648 |
| Connecticut St Gen. Oblig. Series 2019 A, 5% 4/15/2027 | | 15,000 | 15,694 |
| Connecticut St Gen. Oblig. Series E, 3.375% 10/15/2036 | | 20,000 | 19,248 |
| University Connecticut (Connecticut St Proj.) Series 2018 A, 5% 4/15/2029 | | 25,000 | 26,500 |
| | | | 550,727 |
| Health Care - 0.1% | | | |
| Connecticut St Health & Edl Facs Auth Revenue (Nuvance Health Proj.) Series 2019 A, 4% 7/1/2034 | | 45,000 | 44,535 |
| Housing - 0.3% | | | |
| Conn St Hsg Fin Auth (CT Hsg Mortgage Proj.) Series D 1, 3.2% 11/15/2032 | | 10,000 | 9,587 |
| Conn St Hsg Fin Auth Series 2020 A 1, 3.5% 11/15/2045 | | 125,000 | 123,500 |
| Connecticut St Hsg Fin Auth Hsg Mtg Fin Prog (CT Hsg Mortgage Proj.) Series 2022A1, 3.5% 11/15/2051 | | 90,000 | 88,662 |
| | | | 221,749 |
| Special Tax - 0.8% | | | |
| Connecticut St Spl Tax Oblig 5% 5/1/2028 | | 135,000 | 143,820 |
| Connecticut St Spl Tax Oblig Series 2018 A, 5% 1/1/2027 | | 20,000 | 20,804 |
| Connecticut St Spl Tax Oblig Series 2018 B, 5% 10/1/2033 | | 15,000 | 15,919 |
| Connecticut St Spl Tax Oblig Series 2018 B, 5% 10/1/2035 | | 175,000 | 184,549 |
| Connecticut St Spl Tax Oblig Series A, 4% 9/1/2035 | | 55,000 | 54,941 |
| Connecticut St Spl Tax Oblig Series A, 5% 8/1/2028 | | 60,000 | 60,596 |
| Connecticut St Spl Tax Oblig Series A, 5% 8/1/2033 | | 95,000 | 95,728 |
| Connecticut St Spl Tax Oblig Series A, 5% 9/1/2031 | | 25,000 | 25,627 |
| Connecticut St Spl Tax Oblig Series B, 5% 8/1/2027 | | 55,000 | 55,584 |
| | | | 657,568 |
TOTAL CONNECTICUT | | | 1,483,835 |
| Delaware - 0.9% | | | |
| General Obligations - 0.4% | | | |
| Delaware St Gen. Oblig. 3.25% 3/1/2037 | | 6,000 | 5,643 |
| Delaware St Gen. Oblig. Series 2020 A, 5% 1/1/2030 | | 115,000 | 126,585 |
| Delaware St Gen. Oblig. Series 2023A, 5% 5/1/2032 | | 85,000 | 96,811 |
| Delaware St Gen. Oblig. Series 2023A, 5% 5/1/2035 | | 100,000 | 113,824 |
| | | | 342,863 |
| Health Care - 0.2% | | | |
| Delaware St Hlth Facs Auth Rev (Christiana Health Svcs Proj.) Series 2020 A, 4% 10/1/2049 | | 60,000 | 56,689 |
| Delaware St Hlth Facs Auth Rev (Christiana Health Svcs Proj.) Series 2020 A, 5% 10/1/2032 | | 65,000 | 69,990 |
| | | | 126,679 |
| Special Tax - 0.3% | | | |
| Delaware Trans Auth Tran Sys Rev Series 2020, 5% 7/1/2031 | | 210,000 | 231,789 |
TOTAL DELAWARE | | | 701,331 |
| Delaware,New Jersey - 0.0% | | | |
| Transportation - 0.0% | | | |
| Delaware River & Bay Auth Series 2021, 4% 1/1/2046 | | 65,000 | 63,783 |
| District Of Columbia - 1.5% | | | |
| Education - 0.2% | | | |
| District Columbia Univ Rev (Georgetown Univ, DC Proj.) Series 2017, 5% 4/1/2031 | | 25,000 | 25,696 |
| District Columbia Univ Rev (Georgetown Univ, DC Proj.) Series 2017, 5% 4/1/2032 | | 120,000 | 123,245 |
| | | | 148,941 |
| General Obligations - 0.4% | | | |
| District Columbia Gen. Oblig. Series 2017 A, 5% 6/1/2029 | | 10,000 | 10,466 |
| District Columbia Gen. Oblig. Series 2019 A, 5% 10/15/2028 | | 90,000 | 96,812 |
| District Columbia Gen. Oblig. Series 2021 D, 4% 2/1/2040 | | 110,000 | 111,437 |
| District Columbia Gen. Oblig. Series 2021 D, 5% 2/1/2031 | | 95,000 | 105,779 |
| | | | 324,494 |
| Special Tax - 0.6% | | | |
| District Columbia Income Tax Rev Series 2020 A, 4% 3/1/2045 | | 50,000 | 48,631 |
| District Columbia Income Tax Rev Series 2020 B, 5% 10/1/2031 | | 90,000 | 101,089 |
| District Columbia Income Tax Rev Series 2023C, 5% 10/1/2032 | | 110,000 | 125,021 |
| Washington DC Met Area Tran Auth Rev Series 2017B, 5% 7/1/2026 | | 50,000 | 51,497 |
| Washington DC Met Area Tran Auth Rev Series 2017B, 5% 7/1/2042 | | 50,000 | 51,286 |
| Washington DC Met Area Tran Auth Rev Series 2018, 5% 7/1/2030 | | 35,000 | 36,445 |
| Washington DC Met Area Tran Auth Rev Series A 1, 5% 7/1/2029 | | 40,000 | 41,635 |
| | | | 455,604 |
| Transportation - 0.3% | | | |
| Metropolitan Wash DC Arpts Ath Series 2018 A, 5% 10/1/2027 (d) | | 40,000 | 41,531 |
| Metropolitan Wash DC Arpts Ath Series 2019A, 5% 10/1/2039 (d) | | 60,000 | 61,859 |
| Metropolitan Wash DC Arpts Auth Dulles Toll Rd Rev 0% 10/1/2030 (Assured Guaranty Inc Insured) (e) | | 65,000 | 53,334 |
| Metropolitan Wash DC Arpts Auth Dulles Toll Rd Rev 0% 10/1/2031 (Assured Guaranty Inc Insured) (e) | | 15,000 | 11,846 |
| Metropolitan Wash DC Arpts Auth Dulles Toll Rd Rev 0% 10/1/2034 (Assured Guaranty Inc Insured) (e) | | 35,000 | 24,322 |
| Metropolitan Wash DC Arpts Auth Dulles Toll Rd Rev 0% 10/1/2036 (Assured Guaranty Inc Insured) (e) | | 5,000 | 3,163 |
| Metropolitan Wash DC Arpts Auth Dulles Toll Rd Rev Series 2019 B, 3% 10/1/2050 (Assured Guaranty Municipal Corp Insured) | | 10,000 | 7,499 |
| Metropolitan Wash DC Arpts Auth Dulles Toll Rd Rev Series 2019 B, 4% 10/1/2053 | | 95,000 | 86,316 |
| | | | 289,870 |
| Water & Sewer - 0.0% | | | |
| District Columbia Wtr & Swr Auth Pub Util Rev Series 2019 A, 5% 10/1/2044 | | 30,000 | 31,478 |
TOTAL DISTRICT OF COLUMBIA | | | 1,250,387 |
| Florida - 3.4% | | | |
| Education - 0.2% | | | |
| Florida Higher Edl Facs Fing Auth Rev (Nova Southeastern University Proj.) Series 2016, 5% 4/1/2035 | | 60,000 | 60,636 |
| Florida Higher Edl Facs Fing Auth Rev (Ringling College of Art Design Proj.) Series 2017, 4% 3/1/2047 | | 70,000 | 60,191 |
| Miami-Dade Cnty FL Edl Fac Rev (University of Miami, FL Proj.) Series 2015A, 4% 4/1/2045 | | 10,000 | 9,502 |
| Miami-Dade Cnty FL Edl Fac Rev (University of Miami, FL Proj.) Series 2018 A, 4% 4/1/2053 | | 25,000 | 23,283 |
| | | | 153,612 |
| Electric Utilities - 0.1% | | | |
| Putnam Cnty Fla Dev Auth Pcr (Seminole Electric Coop Inc Proj.) Series 2018 A, 5% 3/15/2042 | | 60,000 | 61,660 |
| Escrowed/Pre-Refunded - 0.1% | | | |
| Greater Orlando Aviation Auth 5% 10/1/2030 (Pre-refunded to 10/1/2027 at 100) (d) | | 30,000 | 31,105 |
| Halifax Hosp Med Ctr FL Hosp Series 2015, 4% 6/1/2038 (Pre-refunded to 6/1/2025 at 100) | | 25,000 | 25,090 |
| Orange Cnty FL Sch Brd Ctf Par Series 2015D, 5% 8/1/2028 (Pre-refunded to 8/1/2025 at 100) | | 50,000 | 50,547 |
| Palm Beach Cnty FL Pub Impt Rev Series D, 5% 12/1/2040 (Pre-refunded to 12/1/2025 at 100) | | 10,000 | 10,181 |
| | | | 116,923 |
| General Obligations - 1.0% | | | |
| Florida St (Florida St Proj.) Gen. Oblig. Series 2021 A, 5% 7/1/2029 | | 95,000 | 103,496 |
| Florida St Brd Ed Pub Ed (Florida St Proj.) Gen. Oblig. Series 2016D, 4% 6/1/2032 | | 50,000 | 50,462 |
| Florida St Brd Ed Pub Ed (Florida St Proj.) Gen. Oblig. Series 2018 A, 4% 6/1/2037 | | 55,000 | 55,922 |
| Florida St Brd Ed Pub Ed (Florida St Proj.) Gen. Oblig. Series 2019 D, 4% 6/1/2030 | | 65,000 | 67,732 |
| Florida St Dept Mgmt Svcs Ctfs Partn (Florida St Proj.) Series 2021 A, 2% 11/1/2038 | | 190,000 | 139,939 |
| Jacksonville Fla Spl Rev (Jacksonville FL Proj.) Series 2019 A, 5% 10/1/2027 | | 20,000 | 21,017 |
| Jacksonville Fla Spl Rev (Jacksonville FL Proj.) Series 2019 A, 5% 10/1/2032 | | 10,000 | 10,781 |
| Miami Beach FL Gen. Oblig. Series 2019, 3.25% 5/1/2049 | | 25,000 | 21,028 |
| Miami Dade Cnty FL Pub Fac Rev (Miami-Dade Cnty Fla Proj.) Series 2015A, 5% 6/1/2028 | | 120,000 | 120,760 |
| Miami-Dade Cnty FL Sch Brd Ctf (Miami-Dade Cnty FL Sch Dist Proj.) Series 2015D, 5% 2/1/2030 | | 85,000 | 86,420 |
| Miami-Dade Cnty FL Sch Brd Ctf (Miami-Dade Cnty FL Sch Dist Proj.) Series 2016C, 5% 2/1/2032 | | 90,000 | 91,360 |
| Miami-Dade Cnty Fla Gen. Oblig. Series 2013 A, 5% 7/1/2026 | | 5,000 | 5,046 |
| Miami-Dade Cnty Fla Gen. Oblig. Series 2015 D, 3% 7/1/2039 | | 5,000 | 4,398 |
| Miami-Dade Cnty Fla Gen. Oblig. Series 2016 A, 5% 7/1/2029 | | 70,000 | 72,055 |
| Miami-Dade Cnty Fla Gen. Oblig. Series 2019 A, 5% 7/1/2043 | | 10,000 | 10,551 |
| | | | 860,967 |
| Health Care - 0.5% | | | |
| Alachua Cnty FL Hlth Fac Rev (Shands Teaching Hosp & Clinics Inc Proj.) Series 2019 A, 3% 12/1/2046 | | 15,000 | 11,657 |
| Escambia Cnty FL Hlth Fac Rev (Baptist Health Care Pensacola Proj.) Series 2020 A, 3% 8/15/2050 (Assured Guaranty Municipal Corp Insured) | | 115,000 | 84,319 |
| Lakeland FL Hosp Sys Rev Series 2016, 3% 11/15/2032 | | 30,000 | 27,874 |
| Miami-Dade Cty FL Hlth Hsp Rev (Nicklaus Childrens Hospital,Fl Proj.) Series 2017, 5% 8/1/2047 | | 85,000 | 85,734 |
| North Broward Cnty Hospital FL Series 2017B, 5% 1/1/2032 | | 50,000 | 51,743 |
| Orange Cnty FL Health Facs Auth Rev (Orange County Health Facilities Authority Proj.) Series 2016B, 5% 10/1/2044 | | 35,000 | 35,422 |
| Palm Beach Cnty FL Health Facs Auth Retirement Cmnty Rev (Acts Ret-Life Cmntys Inc Proj.) Series 2016, 5% 11/15/2032 | | 25,000 | 25,516 |
| South Broward Hosp Dist FL Rev Series 2016 A, 3.5% 5/1/2039 | | 15,000 | 13,926 |
| Tampa FL Health Sys Rev (Baycare Health System Proj.) Series 2016 A, 4% 11/15/2046 | | 125,000 | 121,343 |
| | | | 457,534 |
| Housing - 0.0% | | | |
| Florida Hsg Fin Corp Rev Series 2017 1, 3.6% 7/1/2037 | | 20,000 | 18,925 |
| Special Tax - 0.4% | | | |
| Florida St Dep Envirn Prot Rev Series 2016 A, 2% 7/1/2028 | | 50,000 | 46,411 |
| Miami-Dade Cnty FL Spl Oblig 0% 10/1/2041 (e) | | 20,000 | 9,731 |
| Miami-Dade Cnty FL Spl Oblig Series 2016, 0% 10/1/2031 (e) | | 35,000 | 26,563 |
| Miami-Dade Cnty FL Spl Oblig Series 2016, 0% 10/1/2032 (e) | | 25,000 | 18,118 |
| Miami-Dade Cnty FL Tran Sys Sales Surtax Rev Series 2019, 5% 7/1/2031 | | 25,000 | 26,945 |
| Miami-Dade Cty FL Sports Fac Tax 0% 10/1/2048 (Assured Guaranty Inc Insured) (e) | | 60,000 | 20,254 |
| Miami-Dade Cty FL Sports Fac Tax 6.875% 10/1/2034 (Assured Guaranty Inc Insured) (c) | | 70,000 | 80,977 |
| Orange Cnty FL Tourist Dev Tax Series 2016 A, 4% 10/1/2034 | | 20,000 | 20,002 |
| Orange Cnty FL Tourist Dev Tax Series 2017, 5% 10/1/2027 | | 25,000 | 26,271 |
| Tampa FL Tax Alloc 0% 9/1/2053 (e) | | 195,000 | 47,951 |
| | | | 323,223 |
| Transportation - 0.4% | | | |
| Broward Cnty FL Arpt Sys Rev Series 2017, 5% 10/1/2047 (d) | | 70,000 | 70,631 |
| Broward Cnty FL Arpt Sys Rev Series A, 5% 10/1/2033 (d) | | 35,000 | 35,225 |
| Broward Cnty FL Prt Facs Rev Series 2019 B, 4% 9/1/2044 (d) | | 75,000 | 70,455 |
| Greater Orlando Aviation Auth Series 2019 A, 5% 10/1/2027 (d) | | 10,000 | 10,382 |
| Miami-Dade Cnty Fla Aviat Rev 4% 10/1/2039 | | 70,000 | 69,455 |
| Orlando-Orange County Expressway Authority (Central Florida Expressway Authority Proj.) Series 2016 B, 4% 7/1/2040 | | 5,000 | 4,971 |
| Orlando-Orange County Expressway Authority (Central Florida Expressway Authority Proj.) Series 2017, 3.25% 7/1/2039 | | 70,000 | 64,939 |
| | | | 326,058 |
| Water & Sewer - 0.7% | | | |
| JEA FL Wtr & Swr Sys Rev Series 2020 A, 3% 10/1/2036 | | 120,000 | 110,014 |
| Miami Beach Fla Wtr & Swr Rev Series 2017, 5% 9/1/2047 | | 125,000 | 128,147 |
| Miami-Dade Cnty FL Wtr & Swr Rev Series 2017 B, 3.125% 10/1/2039 | | 20,000 | 18,197 |
| Miami-Dade Cnty FL Wtr & Swr Rev Series 2017A, 4% 10/1/2039 | | 35,000 | 35,230 |
| Miami-Dade Cnty FL Wtr & Swr Rev Series 2019 B, 3% 10/1/2049 | | 40,000 | 30,940 |
| Miami-Dade Cnty FL Wtr & Swr Rev Series 2021, 3% 10/1/2040 | | 100,000 | 87,648 |
| Port St Lucie FL Util Rev 5.25% 9/1/2026 (National Public Finance Guarantee Corporation Insured) | | 45,000 | 46,695 |
| | | | 456,871 |
TOTAL FLORIDA | | | 2,775,773 |
| Georgia - 2.3% | | | |
| Education - 0.2% | | | |
| Fulton Cnty GA Dev Auth Rev (University System of GA Proj.) 5% 6/15/2044 | | 30,000 | 31,190 |
| Private Colgs & Unvs Ath GA Rv (Emory University GA Proj.) Series 2020 B, 5% 9/1/2030 | | 5,000 | 5,521 |
| Private Colgs & Unvs Ath GA Rv (Emory University GA Proj.) Series 2023B, 5% 9/1/2033 | | 110,000 | 125,518 |
| | | | 162,229 |
| Electric Utilities - 0.2% | | | |
| Georgia Mun Elec Auth Pwr Rev 5% 1/1/2056 | | 80,000 | 82,200 |
| Georgia Mun Elec Auth Pwr Rev Series HH, 4.125% 1/1/2049 (Assured Guaranty Municipal Corp Insured) | | 110,000 | 105,490 |
| | | | 187,690 |
| Escrowed/Pre-Refunded - 0.0% | | | |
| Atlanta GA Wtr & Wastewtr Rev Series 2015, 5% 11/1/2043 (Pre-refunded to 5/1/2025 at 100) | | 50,000 | 50,325 |
| General Obligations - 1.1% | | | |
| Georgia St Gen. Oblig. 4% 7/1/2042 | | 100,000 | 102,017 |
| Georgia St Gen. Oblig. 5% 2/1/2027 | | 10,000 | 10,436 |
| Georgia St Gen. Oblig. Series 2017 C, 5% 7/1/2027 | | 5,000 | 5,260 |
| Georgia St Gen. Oblig. Series 2017 C, 5% 7/1/2030 | | 25,000 | 26,232 |
| Georgia St Gen. Oblig. Series 2018A, 3% 7/1/2033 | | 25,000 | 24,202 |
| Georgia St Gen. Oblig. Series 2018A, 5% 7/1/2027 | | 20,000 | 21,044 |
| Georgia St Gen. Oblig. Series 2018A, 5% 7/1/2029 | | 50,000 | 53,526 |
| Georgia St Gen. Oblig. Series 2020 A, 5% 8/1/2031 | | 50,000 | 55,414 |
| Georgia St Gen. Oblig. Series 2021 A, 5% 7/1/2033 | | 100,000 | 111,937 |
| Gwinnett Cnty GA Sch Dist Series 2022 B, 5% 8/1/2026 | | 55,000 | 56,833 |
| Main Street Natural Gas Inc 5% tender 12/1/2054 (Royal Bank of Canada Guaranteed) (b) | | 350,000 | 372,423 |
| | | | 839,324 |
| Health Care - 0.3% | | | |
| Brookhaven Development Authority (Childrens Healthcare of Atlanta Proj.) Series 2019 A, 5% 7/1/2026 | | 10,000 | 10,286 |
| Gainesville & Hall Cnty GA Hsp Ath Rev (Northeast Georgia Healthcare Proj.) Series 2020 A, 3% 2/15/2047 | | 65,000 | 51,244 |
| Gainesville & Hall Cnty GA Hsp Ath Rev (Northeast Georgia Healthcare Proj.) Series 2020 A, 5% 2/15/2031 | | 40,000 | 43,117 |
| Gainesville & Hall Cnty GA Hsp Ath Rev (Northeast Georgia Healthcare Proj.) Series A, 4% 2/15/2042 | | 20,000 | 18,964 |
| Glynn Brunswick Mem Hosp Auth GA Rev (Southeast GA Health System Proj.) Series 2015, 5% 8/1/2034 | | 60,000 | 60,188 |
| Griffin-Spalding Cnty GA Hosp Rev (Wellstar Health System Inc Proj.) 3.75% 4/1/2047 | | 30,000 | 26,791 |
| | | | 210,590 |
| Housing - 0.1% | | | |
| Georgia Hsg & Fin Auth Rev (GA Single Family Mortgage Proj.) Series 2017 C, 3.65% 12/1/2042 | | 15,000 | 13,777 |
| Georgia Hsg & Fin Auth Rev (GA Single Family Mortgage Proj.) Series 2020 A, 3.15% 12/1/2044 | | 15,000 | 12,485 |
| Georgia Hsg & Fin Auth Rev Series 2017 A, 3.65% 12/1/2032 | | 15,000 | 15,011 |
| Georgia Hsg & Fin Auth Rev Series 2017 B, 3.2% 12/1/2032 | | 20,000 | 19,256 |
| Georgia Hsg & Fin Auth Rev Series A 1, 3.35% 12/1/2041 | | 20,000 | 17,710 |
| | | | 78,239 |
| Industrial Development - 0.1% | | | |
| Geo L Smith II GA World Congress Ctr Auth Convention Ctr Hotel Rev (Georgia Wcca Hotel Proj.) Series 2021 A, 2.375% 1/1/2031 | | 135,000 | 122,746 |
| Special Tax - 0.0% | | | |
| Metro Atlanta Rapid Tran Sales Series 2017 C, 3.5% 7/1/2038 | | 30,000 | 28,655 |
| Metro Atlanta Rapid Tran Sales Series 2019 A, 3.125% 7/1/2046 | | 5,000 | 4,092 |
| | | | 32,747 |
| Transportation - 0.2% | | | |
| Atlanta GA Arpt Rev Series 2019 B, 4% 7/1/2049 (d) | | 50,000 | 46,639 |
| Georgia Port Authority Series 2021, 2.625% 7/1/2051 | | 120,000 | 82,848 |
| | | | 129,487 |
| Water & Sewer - 0.1% | | | |
| Atlanta GA Wtr & Wastewtr Rev Series 2015, 5% 11/1/2032 | | 30,000 | 30,146 |
| Atlanta GA Wtr & Wastewtr Rev Series 2015, 5% 11/1/2040 | | 20,000 | 20,058 |
| County of Paulding GA Water & Sewerage Revenue Series 2016, 3% 12/1/2048 | | 15,000 | 11,468 |
| Fulton Cnty GA Wtr & Sew Rev Series 2020 A, 3% 1/1/2045 | | 5,000 | 3,979 |
| | | | 65,651 |
TOTAL GEORGIA | | | 1,879,028 |
| Hawaii - 0.3% | | | |
| General Obligations - 0.3% | | | |
| Hawaii St Gen. Oblig. Series 2018 FT, 5% 1/1/2028 | | 100,000 | 106,077 |
| Hawaii St Gen. Oblig. Series 2019 FW, 3.5% 1/1/2038 | | 5,000 | 4,884 |
| Hawaii St Gen. Oblig. Series FG, 5% 10/1/2030 | | 30,000 | 30,955 |
| Hawaii St Gen. Oblig. Series FH, 5% 10/1/2029 | | 25,000 | 25,835 |
| | | | 167,751 |
| Health Care - 0.0% | | | |
| Hawaii Dpt Bg & Fin Spl Pur Rev (Queens Health System Proj.) Series 2015A, 4% 7/1/2040 | | 20,000 | 19,557 |
| Transportation - 0.0% | | | |
| Hawaii St Arpts Sys Rev Series 2020 D, 4% 7/1/2039 | | 10,000 | 9,945 |
| Water & Sewer - 0.0% | | | |
| Honolulu HI Cty & Cnty Wastewtr Sys Rev Series 2018 A, 3.375% 7/1/2042 | | 5,000 | 4,524 |
| Honolulu HI Cty & Cnty Wastewtr Sys Rev Series B, 4% 7/1/2033 | | 15,000 | 15,109 |
| | | | 19,633 |
TOTAL HAWAII | | | 216,886 |
| Idaho - 0.0% | | | |
| Health Care - 0.0% | | | |
| Idaho Health Facs Auth Rev (St Lukes Regional Med Ctr, ID Proj.) Series 2018 A, 5% 3/1/2027 | | 25,000 | 25,922 |
| Idaho Health Facs Auth Rev (St Lukes Regional Med Ctr, ID Proj.) Series 2018 A, 5% 3/1/2028 | | 10,000 | 10,526 |
| Idaho Health Facs Auth Rev (Trinity Health Proj.) Series 2015ID, 5.5% 12/1/2029 | | 25,000 | 25,219 |
| | | | 61,667 |
TOTAL IDAHO | | | 61,667 |
| Illinois - 4.5% | | | |
| Education - 0.1% | | | |
| Illinois Fin Auth Rev (Univ of Chicago, IL Proj.) Series 2018 A, 5% 10/1/2041 | | 10,000 | 10,236 |
| Illinois Fin Auth Rev (Univ of Chicago, IL Proj.) Series 2018 A, 5% 10/1/2048 | | 30,000 | 30,492 |
| Illinois Finance Authority Rev (Univ of Chicago, IL Proj.) Series 2020 A, 4% 4/1/2050 | | 35,000 | 33,298 |
| | | | 74,026 |
| Electric Utilities - 0.2% | | | |
| Illinois Mun Elec Agy Pwr Supp Series 2015A, 4% 2/1/2033 | | 70,000 | 69,331 |
| Northern Ill Mun Pwr Agy Pwr Proj Rev Series 2016 A, 4% 12/1/2041 | | 135,000 | 131,019 |
| Northern Ill Mun Pwr Agy Pwr Proj Rev Series 2016 A, 5% 12/1/2028 | | 25,000 | 25,903 |
| | | | 226,253 |
| Escrowed/Pre-Refunded - 0.0% | | | |
| Chicago IL Gen. Oblig. 5% 1/1/2026 (Pre-refunded to 1/1/2025 at 100) | | 20,000 | 20,000 |
| General Obligations - 1.5% | | | |
| Chicago IL Gen. Oblig. Series 1999, 0% 1/1/2033 (e) | | 70,000 | 50,047 |
| Chicago IL Gen. Oblig. Series 2000A, 0% 1/1/2029 (e) | | 55,000 | 47,062 |
| Illinois St Gen. Oblig. Series 2017 A, 4.5% 12/1/2041 | | 15,000 | 15,050 |
| Illinois St Gen. Oblig. Series 2017C, 5% 11/1/2029 | | 65,000 | 67,748 |
| Illinois St Gen. Oblig. Series 2017D, 3.25% 11/1/2026 | | 10,000 | 9,977 |
| Illinois St Gen. Oblig. Series 2017D, 5% 11/1/2028 | | 60,000 | 62,575 |
| Illinois St Gen. Oblig. Series 2018B, 5% 10/1/2030 | | 100,000 | 105,395 |
| Illinois St Gen. Oblig. Series 2019 A, 5% 11/1/2025 | | 50,000 | 50,647 |
| Illinois St Gen. Oblig. Series 2022A, 5.25% 3/1/2038 | | 110,000 | 119,313 |
| Illinois St Gen. Oblig. Series 2022A, 5.5% 3/1/2047 | | 320,000 | 344,243 |
| Illinois St Gen. Oblig. Series NOVEMBER 2016, 4.125% 11/1/2031 | | 10,000 | 10,034 |
| Rosemont Ill Gen. Oblig. Series 2016 A, 5% 12/1/2046 (Assured Guaranty Municipal Corp Insured) | | 335,000 | 342,458 |
| | | | 1,224,549 |
| Health Care - 0.3% | | | |
| Illinois Fin Auth Rev (Ascension Health Credit Group Proj.) Series 2016 C, 5% 2/15/2034 | | 60,000 | 61,703 |
| Illinois Fin Auth Rev (Mercy Alliance Inc Proj.) Series 2016, 4% 12/1/2031 | | 25,000 | 25,076 |
| Illinois Fin Auth Rev (Mercy Alliance Inc Proj.) Series 2016, 4% 12/1/2035 | | 50,000 | 49,664 |
| Illinois Fin Auth Rev (Riverside Health System, IL Proj.) Series 2016, 3.25% 11/15/2045 | | 20,000 | 16,146 |
| Illinois Fin Auth Rev (Silver Cross Health System IL Proj.) Series 2015 C, 4.125% 8/15/2037 | | 65,000 | 61,274 |
| | | | 213,863 |
| Special Tax - 0.6% | | | |
| Illinois St Sales Tax Rev Series SEPTEMBER 2016 A, 3% 6/15/2033 | | 25,000 | 22,692 |
| Illinois St Sales Tax Rev Series SEPTEMBER 2016 A, 3% 6/15/2034 | | 75,000 | 67,049 |
| Illinois St Sales Tax Rev Series SEPTEMBER 2016 D, 3% 6/15/2031 | | 15,000 | 14,047 |
| Illinois St Sales Tax Rev Series SEPTEMBER 2016 D, 3% 6/15/2032 | | 20,000 | 18,426 |
| Metropolitan Pier & Exposition Auth Ill Dedicated St Tax Rev 0% 12/15/2030 (National Public Finance Guarantee Corporation Insured) (e) | | 70,000 | 56,825 |
| Metropolitan Pier & Exposition Auth Ill Dedicated St Tax Rev 0% 12/15/2031 (National Public Finance Guarantee Corporation Insured) (e) | | 20,000 | 15,609 |
| Metropolitan Pier & Exposition Auth Ill Dedicated St Tax Rev 0% 12/15/2033 (National Public Finance Guarantee Corporation Insured) (e) | | 50,000 | 35,850 |
| Metropolitan Pier & Exposition Auth Ill Dedicated St Tax Rev 0% 12/15/2034 (National Public Finance Guarantee Corporation Insured) (e) | | 10,000 | 6,854 |
| Metropolitan Pier & Exposition Auth Ill Dedicated St Tax Rev 0% 6/15/2032 (National Public Finance Guarantee Corporation Insured) (e) | | 30,000 | 22,915 |
| Metropolitan Pier & Exposition Auth Ill Dedicated St Tax Rev 0% 6/15/2036 (National Public Finance Guarantee Corporation Insured) (e) | | 30,000 | 19,250 |
| Metropolitan Pier & Exposition Auth Ill Dedicated St Tax Rev 0% 6/15/2043 (Assured Guaranty Municipal Corp Insured) (e) | | 70,000 | 31,337 |
| Metropolitan Pier & Exposition Auth Ill Dedicated St Tax Rev 0% 6/15/2045 (Assured Guaranty Municipal Corp Insured) (e) | | 345,000 | 138,453 |
| Metropolitan Pier & Exposition Auth Ill Dedicated St Tax Rev Series 2017 B, 0% 12/15/2056 (Assured Guaranty Municipal Corp Insured) (e) | | 50,000 | 11,118 |
| Sales Tax Securitization Corp Series 2017 A, 5% 1/1/2028 | | 50,000 | 52,623 |
| | | | 513,048 |
| Transportation - 1.6% | | | |
| Chicago IL O'Hare Intl Arpt Rev 5% 1/1/2037 | | 15,000 | 15,800 |
| Chicago IL O'Hare Intl Arpt Rev 5% 1/1/2038 | | 140,000 | 143,159 |
| Chicago IL O'Hare Intl Arpt Rev Series 2018 B, 5% 1/1/2038 | | 180,000 | 189,197 |
| Chicago IL O'Hare Intl Arpt Rev Series 2018A, 4% 1/1/2043 (d) | | 45,000 | 42,977 |
| Chicago IL O'Hare Intl Arpt Rev Series A, 5% 1/1/2027 | | 20,000 | 20,744 |
| Chicago IL O'Hare Intl Arpt Rev Series B, 5% 1/1/2029 | | 95,000 | 95,000 |
| Chicago IL O'Hare Intl Arpt Rev Series B, 5% 1/1/2033 | | 90,000 | 92,512 |
| Chicago IL O'Hare Intl Arpt Rev Series C, 5% 1/1/2041 | | 100,000 | 101,827 |
| Chicago IL O'Hare Intl Arpt Rev Series D, 4% 1/1/2035 | | 85,000 | 85,000 |
| Chicago IL O'Hare Intl Arpt Rev Series D, 5% 1/1/2042 (d) | | 55,000 | 55,426 |
| Illinois St Toll Hwy Auth Hwy Rev 5% 1/1/2040 | | 25,000 | 25,089 |
| Illinois St Toll Hwy Auth Hwy Rev 5% 1/1/2040 | | 55,000 | 55,424 |
| Illinois St Toll Hwy Auth Hwy Rev 5% 12/1/2031 | | 60,000 | 60,972 |
| Illinois St Toll Hwy Auth Hwy Rev Series 2017 A, 5% 1/1/2042 | | 50,000 | 51,413 |
| Illinois St Toll Hwy Auth Hwy Rev Series 2019 B, 5% 1/1/2027 | | 35,000 | 36,296 |
| Illinois St Toll Hwy Auth Hwy Rev Series 2019 B, 5% 1/1/2030 | | 5,000 | 5,439 |
| Illinois St Toll Hwy Auth Hwy Rev Series 2019 C, 5% 1/1/2030 | | 30,000 | 32,640 |
| Illinois St Toll Hwy Auth Hwy Rev Series 2020 A, 5% 1/1/2045 | | 100,000 | 106,234 |
| | | | 1,215,149 |
| Water & Sewer - 0.2% | | | |
| Chicago IL Wtr Rev Series 2000, 5% 11/1/2030 | | 35,000 | 35,980 |
| Illinois Fin Auth Rev (IL Wtr State Rev Fund Proj.) Series 2019, 5% 1/1/2031 | | 115,000 | 124,473 |
| Illinois Fin Auth Rev (IL Wtr State Rev Fund Proj.) Series 2019, 5% 7/1/2027 | | 15,000 | 15,764 |
| | | | 176,217 |
TOTAL ILLINOIS | | | 3,663,105 |
| Indiana - 0.4% | | | |
| Education - 0.1% | | | |
| Indiana Univ Lease Purch Oblig (Indiana Univ Revs Proj.) Series 2020A, 4% 6/1/2045 | | 5,000 | 4,937 |
| Purdue University Series EE, 5% 7/1/2036 | | 80,000 | 86,949 |
| | | | 91,886 |
| Escrowed/Pre-Refunded - 0.0% | | | |
| Indiana Bond Bank Series 2008 B, 0% 6/1/2032 (Escrowed to Maturity) (e) | | 70,000 | 54,575 |
| Special Tax - 0.1% | | | |
| Carmel Ind Loc Pub Impt Bd Bank (Carmel Ind Proj.) Series 2016, 5% 7/15/2030 | | 10,000 | 10,254 |
| Indianapolis Ind Loc Pub Impt Bd Bank Series 2017 C, 5% 1/1/2033 | | 15,000 | 15,753 |
| Indianapolis Ind Loc Pub Impt Bd Bank Series 2019A, 5% 2/1/2033 | | 15,000 | 15,974 |
| Indianapolis Ind Loc Pub Impt Bd Bank Series 2019A, 5% 2/1/2054 | | 25,000 | 25,691 |
| | | | 67,672 |
| Water & Sewer - 0.2% | | | |
| Indiana Finance Authority Series 2021 1, 5% 10/1/2027 | | 55,000 | 58,005 |
| Indiana St Fin Auth Rev (Indiana State Revolving Fund Program Proj.) Series 2019E, 5% 2/1/2036 | | 25,000 | 26,584 |
| Indianapolis IN Loc Pub Impt Bond Bank 0% 2/1/2028 (Ambac Assurance Corp Insured) (e) | | 50,000 | 44,754 |
| | | | 129,343 |
TOTAL INDIANA | | | 343,476 |
| Iowa - 0.4% | | | |
| Tobacco Bonds - 0.1% | | | |
| Tobacco Settlement Auth Iowa Tobacco Settlement Rev Series 2021A 2 CL 1, 4% 6/1/2040 | | 100,000 | 97,292 |
| Water & Sewer - 0.3% | | | |
| Iowa Fin Auth Rev (Iowa State Revolving Fund Program Proj.) Series 2016, 5% 8/1/2026 | | 30,000 | 30,963 |
| Iowa Fin Auth Rev (Iowa State Revolving Fund Program Proj.) Series 2017, 5% 8/1/2037 | | 50,000 | 51,936 |
| Iowa Fin Auth Rev (Iowa State Revolving Fund Program Proj.) Series 2020 A, 5% 8/1/2028 | | 165,000 | 176,806 |
| | | | 259,705 |
TOTAL IOWA | | | 356,997 |
| Kansas - 0.2% | | | |
| General Obligations - 0.0% | | | |
| Johnson & Miami Cntys Kans Uni Sch Dist No 230 Series B, 3% 9/1/2037 | | 20,000 | 18,046 |
| Health Care - 0.2% | | | |
| University Kansas Hosp Auth Hlth Fac Rev (University of Kansas Hospital Authority Proj.) Series 2017 A, 5% 3/1/2047 | | 85,000 | 86,011 |
| University Kansas Hosp Auth Hlth Fac Rev (University of Kansas Hospital Authority Proj.) Series 2019A, 4% 9/1/2048 | | 25,000 | 23,473 |
| | | | 109,484 |
TOTAL KANSAS | | | 127,530 |
| Kentucky - 0.4% | | | |
| Education - 0.0% | | | |
| University of Kentucky Series 2018 A, 3.5% 10/1/2047 | | 25,000 | 21,258 |
| Electric Utilities - 0.1% | | | |
| Kentucky St Mun Pwr Agy Pwr Sys Rev Series 2015A, 4% 9/1/2039 | | 75,000 | 72,568 |
| Kentucky St Mun Pwr Agy Pwr Sys Rev Series 2015A, 5% 9/1/2042 | | 25,000 | 25,098 |
| | | | 97,666 |
| General Obligations - 0.0% | | | |
| Kentucky St Pty & Bldgs Commn (Kentucky St Proj.) Series B, 5% 11/1/2028 | | 30,000 | 30,926 |
| Health Care - 0.2% | | | |
| Kentucky Eco Dev Fa Hlth Rev (Norton Healthcare Inc Proj.) 0% 10/1/2027 (National Public Finance Guarantee Corporation Insured) (e) | | 45,000 | 39,977 |
| Kentucky Econ Dev Fin Auth Hosp Sys Rev (Owensboro KY Hosp Rev Proj.) Series 2017 A, 5.25% 6/1/2041 | | 100,000 | 101,353 |
| | | | 141,330 |
| Water & Sewer - 0.1% | | | |
| Louisville & Jefferson KY Swr Sys Rev Series 2016 A, 3% 5/15/2046 | | 60,000 | 47,995 |
TOTAL KENTUCKY | | | 339,175 |
| Louisiana - 0.3% | | | |
| Education - 0.1% | | | |
| Louisiana Pub Facs Auth Lease (Provident Properties Proj.) Series 2017, 5% 7/1/2057 | | 50,000 | 50,255 |
| Escrowed/Pre-Refunded - 0.0% | | | |
| New Orl LA Wtr Series 2015, 5% 12/1/2040 (Pre-refunded to 12/1/2025 at 100) | | 20,000 | 20,375 |
| General Obligations - 0.2% | | | |
| Louisiana St Gen. Oblig. Series 2021 A, 5% 3/1/2041 | | 115,000 | 123,550 |
| Health Care - 0.0% | | | |
| Louisiana Pub Fac Auth Hsp Rev (Franciscan Missionaries Proj.) Series 2017 A, 3.75% 7/1/2047 | | 25,000 | 22,442 |
| Louisiana Pub Facs Rev (Ochsner Clinic Foundation Proj.) Series 2016, 4% 5/15/2041 | | 20,000 | 19,481 |
| | | | 41,923 |
| Transportation - 0.0% | | | |
| Louisiana St Grnt Antic Rev Series 2019A, 5% 9/1/2029 | | 20,000 | 21,306 |
| Water & Sewer - 0.0% | | | |
| Shreveport LA Wtr & Swr Rev Series 2014B, 4% 12/1/2038 | | 25,000 | 23,989 |
TOTAL LOUISIANA | | | 281,398 |
| Maine - 0.1% | | | |
| Health Care - 0.1% | | | |
| Maine Health & Higher Edl Facs Auth Rev (Mainehealth Proj.) Series 2021 A, 4% 7/1/2050 (Assured Guaranty Municipal Corp Insured) | | 75,000 | 70,956 |
| Maryland - 1.7% | | | |
| Education - 0.1% | | | |
| University MD Sys Auxiliary Fac & Tuition Series 2018 A, 3.25% 4/1/2036 | | 50,000 | 48,303 |
| General Obligations - 1.1% | | | |
| Anne Arundel Cnty MD Gen. Oblig. Series 2021, 5% 4/1/2029 | | 150,000 | 162,797 |
| Prince Georges County MD Gen. Oblig. Series 2018 A, 3.25% 7/15/2036 | | 155,000 | 145,937 |
| State of Maryland Gen. Oblig. Series 2018 A, 5% 3/15/2030 | | 30,000 | 31,812 |
| State of Maryland Gen. Oblig. Series 2018, 5% 8/1/2031 | | 100,000 | 106,619 |
| State of Maryland Gen. Oblig. Series 2020 SECOND A, 5% 8/1/2029 | | 150,000 | 163,706 |
| State of Maryland Gen. Oblig. Series FIRST, 5% 3/15/2030 | | 30,000 | 32,443 |
| State of Maryland Gen. Oblig. Series FIRST, 5% 3/15/2031 | | 55,000 | 59,375 |
| Washington Suburban San Dist MD Series 2016 SECOND, 5% 6/1/2034 | | 65,000 | 66,586 |
| Washington Suburban San Dist MD Series 2016, 3% 6/1/2046 | | 150,000 | 119,942 |
| | | | 889,217 |
| Health Care - 0.0% | | | |
| Maryland St Hlth & HI Ed Facs (MedStar Health Inc Proj.) Series 2017 A, 4% 5/15/2047 | | 50,000 | 47,650 |
| Housing - 0.0% | | | |
| Maryland Community Development Administration (Residential Revenue Bonds Proj.) Series 2019 C, 3% 3/1/2042 | | 20,000 | 16,642 |
| Special Tax - 0.2% | | | |
| State of Maryland Built to Learn Revenue Series 2021, 2.75% 6/1/2051 | | 205,000 | 145,855 |
| Transportation - 0.3% | | | |
| Maryland St Transn Auth Transn 2.25% 7/1/2039 | | 185,000 | 142,529 |
| Maryland St Transn Auth Transn 4% 7/1/2040 | | 85,000 | 84,995 |
| | | | 227,524 |
TOTAL MARYLAND | | | 1,375,191 |
| Maryland,Virginia - 0.2% | | | |
| Special Tax - 0.2% | | | |
| Washington Metropolitan Area Transit Authority Series 2021 A, 3% 7/15/2036 | | 150,000 | 133,978 |
| Massachusetts - 2.4% | | | |
| Education - 0.1% | | | |
| Massachusetts St Dev Fin Agy Rev (Boston University Mass Proj.) Series BB 1, 4% 10/1/2046 | | 30,000 | 29,013 |
| Massachusetts St Dev Fin Agy Rev (President and Fellows of Harvard College Proj.) Series 2016 A, 5% 7/15/2040 | | 40,000 | 47,834 |
| | | | 76,847 |
| General Obligations - 1.4% | | | |
| Massachusetts St Gen. Oblig. 5% 1/1/2049 | | 70,000 | 72,449 |
| Massachusetts St Gen. Oblig. 5% 10/1/2047 | | 100,000 | 106,848 |
| Massachusetts St Gen. Oblig. 5% 11/1/2032 | | 150,000 | 171,545 |
| Massachusetts St Gen. Oblig. Series 2016A, 5% 7/1/2031 | | 30,000 | 30,836 |
| Massachusetts St Gen. Oblig. Series 2016B, 4% 7/1/2033 | | 25,000 | 25,120 |
| Massachusetts St Gen. Oblig. Series 2016B, 5% 7/1/2026 | | 25,000 | 25,782 |
| Massachusetts St Gen. Oblig. Series 2016G, 3% 9/1/2046 | | 110,000 | 87,808 |
| Massachusetts St Gen. Oblig. Series 2017D, 5% 7/1/2026 | | 30,000 | 30,938 |
| Massachusetts St Gen. Oblig. Series 2017F, 5% 11/1/2044 | | 5,000 | 5,151 |
| Massachusetts St Gen. Oblig. Series 2019 A, 5% 1/1/2038 | | 60,000 | 63,524 |
| Massachusetts St Gen. Oblig. Series 2019 C, 5% 5/1/2030 | | 40,000 | 44,271 |
| Massachusetts St Gen. Oblig. Series 2019 C, 5% 5/1/2031 | | 85,000 | 95,536 |
| Massachusetts St Gen. Oblig. Series 2019 C, 5% 5/1/2041 | | 35,000 | 36,820 |
| Massachusetts St Gen. Oblig. Series 2020 D, 5% 7/1/2041 | | 55,000 | 58,701 |
| Massachusetts St Gen. Oblig. Series 2020 E, 5% 11/1/2045 | | 55,000 | 58,289 |
| Massachusetts St Gen. Oblig. Series 2021 B, 3% 4/1/2047 | | 150,000 | 118,242 |
| Massachusetts St Gen. Oblig. Series 2023A, 5% 5/1/2048 | | 140,000 | 149,872 |
| | | | 1,181,732 |
| Health Care - 0.0% | | | |
| Massachusetts St Dev Fin Agy Rev (Beth Israel Lahey Health Proj.) Series 2016 I, 3% 7/1/2032 | | 25,000 | 23,575 |
| Housing - 0.1% | | | |
| Massachusetts St Hsg Fin Agy (Housing Bond Resolution 12/10/02 Proj.) Series A, 4.5% 12/1/2048 (d) | | 5,000 | 4,630 |
| Massachusetts St Hsg Fin Agy Series 2019 B 1, 2.75% 12/1/2034 | | 80,000 | 69,004 |
| | | | 73,634 |
| Special Tax - 0.6% | | | |
| Mass Bay Tran Auth Sls Tax 5.25% 7/1/2028 | | 10,000 | 10,831 |
| Mass Bay Tran Auth Sls Tax Series B, 5% 7/1/2033 | | 85,000 | 85,641 |
| Massachusetts St Sch Bldg Auth Dedicated Sales Tax Rev 5% 8/15/2050 | | 10,000 | 10,513 |
| Massachusetts St Sch Bldg Auth Dedicated Sales Tax Rev Series 2016B, 5% 11/15/2046 | | 20,000 | 20,364 |
| Massachusetts St Sch Bldg Auth Dedicated Sales Tax Rev Series 2016C, 5% 11/15/2034 | | 20,000 | 20,586 |
| Massachusetts St Sch Bldg Auth Dedicated Sales Tax Rev Series 2018 B, 4% 2/15/2040 | | 85,000 | 84,041 |
| Massachusetts St Spl Oblig Dedicated Tax Rev 5.5% 1/1/2030 (National Public Finance Guarantee Corporation Insured) | | 65,000 | 71,995 |
| Massachusetts St Transn Fd Rev 5% 6/1/2047 | | 145,000 | 148,421 |
| | | | 452,392 |
| Transportation - 0.2% | | | |
| Massachusetts St Fed Hwy Series 2016A, 5% 6/15/2027 | | 55,000 | 56,447 |
| Massachusetts St Port Auth Rev 5% 7/1/2034 (d) | | 70,000 | 74,900 |
| | | | 131,347 |
TOTAL MASSACHUSETTS | | | 1,939,527 |
| Michigan - 1.0% | | | |
| Education - 0.1% | | | |
| Michigan St Univ Revs Series 2019 B, 4% 2/15/2037 | | 60,000 | 60,633 |
| Escrowed/Pre-Refunded - 0.0% | | | |
| Michigan St Hosp Fin Auth Rev 4% 11/15/2047 (Pre-refunded to 11/15/2026 at 100) | | 20,000 | 20,321 |
| General Obligations - 0.2% | | | |
| Michigan St Bldg Auth Rev (State of Michigan Proj.) Series 2015 I, 5% 4/15/2026 | | 10,000 | 10,138 |
| Michigan St Bldg Auth Rev (State of Michigan Proj.) Series 2015 I, 5% 4/15/2038 | | 50,000 | 50,435 |
| Michigan St Bldg Auth Rev (State of Michigan Proj.) Series 2016 I, 5% 10/15/2028 | | 20,000 | 20,685 |
| Michigan St Bldg Auth Rev (State of Michigan Proj.) Series 2016 I, 5% 10/15/2030 | | 35,000 | 36,131 |
| | | | 117,389 |
| Health Care - 0.2% | | | |
| Michigan Fin Auth Rev (Henry Ford Health Care Corp,Mi Proj.) Series 2016, 3.25% 11/15/2042 | | 25,000 | 20,033 |
| Michigan St Hosp Fin Auth Rev (Trinity Health Proj.) Series 2008C, 5% 12/1/2026 | | 70,000 | 72,449 |
| Michigan St Hosp Fin Auth Rev (Trinity Health Proj.) Series 2008C, 5% 12/1/2027 | | 25,000 | 26,304 |
| | | | 118,786 |
| Housing - 0.1% | | | |
| Michigan Hsg Dev Auth Rent Hsg Rev Series 2023 B, 5.75% 6/1/2054 | | 95,000 | 100,762 |
| Michigan Hsg Dev Rental Hsg (Rental Hsg Rev Bonds 11/15/1990 Proj.) Series 2020 A 1, 2.7% 10/1/2045 | | 40,000 | 29,278 |
| Michigan St Hsg Dev Auth Sfmr Series 2016, 3.35% 12/1/2031 | | 10,000 | 9,814 |
| | | | 139,854 |
| Special Tax - 0.1% | | | |
| Michigan Fin Auth Rev (Wayne Cnty MI Proj.) Series 2018, 5% 11/1/2029 | | 55,000 | 58,624 |
| Michigan St Trunk Line Fd 4% 11/15/2037 | | 10,000 | 10,217 |
| | | | 68,841 |
| Transportation - 0.2% | | | |
| Michigan St Strategic Fd Ltd Oblig Rev (Oakland Corridor Partners LLC Proj.) Series 2018, 5% 12/31/2026 (d) | | 50,000 | 50,945 |
| Michigan St Strategic Fd Ltd Oblig Rev (Oakland Corridor Partners LLC Proj.) Series 2018, 5% 12/31/2031 (d) | | 15,000 | 15,516 |
| Michigan St Strategic Fd Ltd Oblig Rev (Oakland Corridor Partners LLC Proj.) Series 2018, 5% 6/30/2028 (d) | | 45,000 | 46,424 |
| Wayne Cnty Mich Arpt Auth Rev Series 2021 B, 5% 12/1/2035 (d) | | 100,000 | 106,011 |
| | | | 218,896 |
| Water & Sewer - 0.1% | | | |
| Great Lakes Sewer Auth Mich Series C, 5% 7/1/2036 | | 35,000 | 35,621 |
| Great Lakes Wtr Auth Mich Wtr Supply Sys Rev Series 2018 A, 5% 7/1/2027 | | 35,000 | 36,661 |
| Great Lakes Wtr Auth Mich Wtr Supply Sys Rev Series 2023A, 5% 7/1/2038 | | 35,000 | 38,871 |
| | | | 111,153 |
TOTAL MICHIGAN | | | 855,873 |
| Minnesota - 1.0% | | | |
| General Obligations - 0.7% | | | |
| Minnesota Housing Finance Agency (Minnesota St Proj.) Series 2021 C, 4% 8/1/2043 | | 75,000 | 72,596 |
| Minnesota St Gen. Oblig. Series 2017 A, 5% 10/1/2028 | | 30,000 | 31,620 |
| Minnesota St Gen. Oblig. Series 2018 B, 3.25% 8/1/2036 | | 55,000 | 53,265 |
| Minnesota St Gen. Oblig. Series 2022B, 5% 8/1/2032 | | 90,000 | 102,627 |
| Owatonna MN Ind Sch Dist 761 Series 2020 A, 2.125% 2/1/2040 (Minnesota St Guaranteed) | | 90,000 | 65,430 |
| Rochester MN Ind Sch Dst No535 Series 2020A, 2% 2/1/2033 (Minnesota St Guaranteed) | | 210,000 | 175,864 |
| Virginia MN Series 2019A, 3% 2/1/2036 (Minnesota St Guaranteed) | | 85,000 | 77,487 |
| | | | 578,889 |
| Health Care - 0.2% | | | |
| Minneapolis MN Health Care Sys Rev (Fairview Hsp & Hltcare Srv Sys Proj.) Series 2018 A, 4% 11/15/2037 | | 95,000 | 92,048 |
| Rochester MN Health Care Facs (Mayo Clinic Proj.) Series 2016B, 5% 11/15/2029 | | 25,000 | 27,221 |
| St Cloud Minn Health Care Rv (Centracare Health System Proj.) Series 2016A, 3.25% 5/1/2039 | | 15,000 | 13,029 |
| St Cloud Minn Health Care Rv (Centracare Health System Proj.) Series 2019, 5% 5/1/2048 | | 20,000 | 20,505 |
| | | | 152,803 |
| Housing - 0.1% | | | |
| Minnesota Housing Finance Agency (MN Residential Hsg 1995 Proj.) Series 2021 D, 2.45% 1/1/2052 | | 100,000 | 65,339 |
| Minnesota Housing Finance Agency (MN Residential Hsg Proj.) Series 2019 F, 3.75% 1/1/2050 | | 20,000 | 19,914 |
| | | | 85,253 |
| Transportation - 0.0% | | | |
| Minneapolis Met Airport Commis Series 2019 A, 5% 1/1/2049 | | 35,000 | 36,204 |
TOTAL MINNESOTA | | | 853,149 |
| Mississippi - 0.4% | | | |
| Escrowed/Pre-Refunded - 0.3% | | | |
| Mississippi St Gen. Oblig. Series 2016 B, 5% 12/1/2031 (Pre-refunded to 12/1/2026 at 100) | | 75,000 | 77,840 |
| Mississippi St Gen. Oblig. Series 2016 B, 5% 12/1/2035 (Pre-refunded to 12/1/2026 at 100) | | 55,000 | 57,082 |
| West Rankin Miss Util Auth Rev Series 2018, 5% 1/1/2048 (Pre-refunded to 1/1/2028 at 100) | | 100,000 | 106,064 |
| | | | 240,986 |
| Special Tax - 0.1% | | | |
| Mississippi Dev Bank Spl Oblg Series A, 5% 8/1/2026 | | 45,000 | 46,149 |
| Mississippi Gaming Tax Rev Series 2019 A, 5% 10/15/2028 | | 5,000 | 5,299 |
| | | | 51,448 |
TOTAL MISSISSIPPI | | | 292,434 |
| Missouri - 0.7% | | | |
| Electric Utilities - 0.2% | | | |
| City of Springfield MO Public Utility Revenue Series 2015, 4% 8/1/2031 | | 35,000 | 35,046 |
| Missouri Joint Muni Elec Util Comm Pwr Proj Rev Series 2016 A, 5% 12/1/2040 | | 150,000 | 151,881 |
| | | | 186,927 |
| Escrowed/Pre-Refunded - 0.1% | | | |
| Metropolitian St Louis MO Swr Dist Wastewtr Sys Rev Series 2015 B, 5% 5/1/2045 (Pre-refunded to 5/1/2025 at 100) | | 80,000 | 80,406 |
| General Obligations - 0.0% | | | |
| Missouri St Brd Pub Bldgs Spl (Missouri St Proj.) Series 2014A, 3% 10/1/2029 | | 15,000 | 14,575 |
| Health Care - 0.4% | | | |
| Missouri Hlth & Edl Facs Rev (Mercy Health Proj.) Series 2012, 4% 11/15/2042 | | 85,000 | 80,599 |
| Missouri Hlth & Edl Facs Rev (Mercy Health Proj.) Series 2014F, 4.25% 11/15/2048 | | 15,000 | 14,341 |
| Missouri Hlth & Edl Facs Rev (Mercy Health Proj.) Series 2017 C, 3.625% 11/15/2047 | | 25,000 | 22,083 |
| Missouri Hlth & Edl Facs Rev (Mercy Health Proj.) Series 2017 C, 4% 11/15/2049 | | 55,000 | 51,906 |
| Missouri Hlth & Edl Facs Rev (St Lukes Hospital,Kan City, MO Proj.) Series 2016, 5% 11/15/2028 | | 30,000 | 30,712 |
| Missouri St Health & Edl Facs (Lutheran Senior Services Proj.) Series 2019 A, 5% 2/1/2042 | | 125,000 | 127,213 |
| | | | 326,854 |
TOTAL MISSOURI | | | 608,762 |
| Montana - 0.1% | | | |
| Health Care - 0.1% | | | |
| Montana Facility Fin Auth Rev (Benefis Health System Proj.) Series 2016, 5% 2/15/2028 | | 20,000 | 20,573 |
| Montana Facility Finance Authority (Logan Health Proj.) Series 2018 B, 4.125% 7/1/2038 | | 75,000 | 74,241 |
| | | | 94,814 |
TOTAL MONTANA | | | 94,814 |
| Nebraska - 0.3% | | | |
| Education - 0.0% | | | |
| University NE Facs Corp Rev Series 2021A, 4% 7/15/2062 | | 40,000 | 38,341 |
| Electric Utilities - 0.2% | | | |
| Omaha Public Power District Series 2021 B, 4% 2/1/2046 | | 125,000 | 122,788 |
| Escrowed/Pre-Refunded - 0.0% | | | |
| University NE Univ Revs Series 2016A, 3% 7/1/2039 (Pre-refunded to 7/1/2026 at 100) | | 5,000 | 5,002 |
| Health Care - 0.1% | | | |
| Douglas Cnty NE Hosp Auth #2 (Nebraska Methodist Hospital Proj.) Series 2015, 4.25% 11/1/2045 | | 35,000 | 33,048 |
| Nebraska Edl Health Cultural & Social Svcs Fin Auth Rev (Immanuel Retirement Communitis Proj.) Series 2019 A, 4% 1/1/2049 | | 85,000 | 75,530 |
| | | | 108,578 |
TOTAL NEBRASKA | | | 274,709 |
| Nevada - 0.5% | | | |
| Electric Utilities - 0.1% | | | |
| Clark NV Pollutn Ctl Rev (Southern California Edison Co Proj.) Series 2010, 2.1% 6/1/2031 | | 100,000 | 87,410 |
| General Obligations - 0.2% | | | |
| Clark Cnty NV Gen. Oblig. Series 2017, 3% 11/1/2038 | | 15,000 | 13,394 |
| Clark Cnty NV Gen. Oblig. Series 2018 A, 5% 6/1/2043 | | 100,000 | 103,349 |
| Clark Cnty NV Gen. Oblig. Series 2019 A, 5% 12/1/2028 | | 15,000 | 16,165 |
| Clark Cnty NV School Dist Series 2019 A, 3% 6/15/2039 (Assured Guaranty Municipal Corp Insured) | | 30,000 | 26,142 |
| Washoe Cnty Nev Sch Dist Series 2017 C, 3.25% 10/1/2042 (Assured Guaranty Municipal Corp Insured) | | 50,000 | 42,717 |
| | | | 201,767 |
| Special Tax - 0.2% | | | |
| Clark Cnty NV Hwy Impt Rev Series 2017, 5% 7/1/2030 | | 50,000 | 52,174 |
| Las Vegas Nev Redev Agy Tax Increment Rev Series 2016, 5% 6/15/2040 | | 100,000 | 100,673 |
| | | | 152,847 |
TOTAL NEVADA | | | 442,024 |
| New Jersey - 3.7% | | | |
| Education - 0.4% | | | |
| Higher Ed Student Assistance Auth NJ Student Ln Rev (NJ Stud Loan 2019 Proj.) Series 2019 B, 3.25% 12/1/2039 (d) | | 20,000 | 18,720 |
| Higher Ed Student Assistance Auth NJ Student Ln Rev (NJ Stud Loan 2019 Proj.) Series 2019A, 5% 12/1/2027 | | 35,000 | 36,597 |
| New Jersey Educational Facilities Authority (Stevens Institute of Technolgy Proj.) Series 2017 A, 4% 7/1/2047 | | 40,000 | 37,610 |
| New Jersey St Edl Facs Auth Rev (Princeton Univ Proj.) Series 2024 C, 5% 3/1/2028 | | 210,000 | 224,175 |
| | | | 317,102 |
| Electric Utilities - 0.0% | | | |
| NJ Econ Dev Auth (New Jersey Natural Gas Co Proj.) Series 2011 C, 3% 8/1/2041 (d) | | 20,000 | 16,209 |
| General Obligations - 2.5% | | | |
| New Jersey Econom Dev Auth Rev (New Jersey St Proj.) Series 2019 LLL, 5% 6/15/2030 | | 80,000 | 86,397 |
| New Jersey Econom Dev Auth Rev (New Jersey St Proj.) Series B, 5% 11/1/2026 | | 5,000 | 5,146 |
| New Jersey Econom Dev Auth Rev (New Jersey St Proj.) Series WW, 5.25% 6/15/2028 | | 45,000 | 45,337 |
| New Jersey Econom Dev Auth Rev (New Jersey St Proj.) Series XX, 4.375% 6/15/2027 | | 15,000 | 15,045 |
| New Jersey Economic Dev Auth Rev (New Jersey St Proj.) 4% 11/1/2037 | | 60,000 | 60,086 |
| New Jersey Economic Dev Auth Rev (New Jersey St Proj.) 5% 11/1/2031 | | 105,000 | 112,986 |
| New Jersey Eda St Lease Rev (New Jersey St Proj.) Series 2017 B, 5% 6/15/2026 | | 20,000 | 20,522 |
| New Jersey St Gen. Oblig. 3% 6/1/2032 | | 200,000 | 193,138 |
| New Jersey St Gen. Oblig. 4% 6/1/2034 (Pre-refunded to 6/1/2025 at 100) | | 15,000 | 15,051 |
| New Jersey Trans Trust Fund Auth 0% 12/15/2026 (e) | | 70,000 | 65,638 |
| New Jersey Trans Trust Fund Auth 0% 12/15/2027 (e) | | 30,000 | 27,197 |
| New Jersey Trans Trust Fund Auth 0% 12/15/2029 (Assured Guaranty Municipal Corp Insured) (e) | | 5,000 | 4,224 |
| New Jersey Trans Trust Fund Auth 0% 12/15/2032 (e) | | 35,000 | 26,152 |
| New Jersey Trans Trust Fund Auth 0% 12/15/2032 (Assured Guaranty Municipal Corp Insured) (e) | | 385,000 | 290,382 |
| New Jersey Trans Trust Fund Auth 0% 12/15/2033 (e) | | 110,000 | 78,732 |
| New Jersey Trans Trust Fund Auth 0% 12/15/2033 (e) | | 90,000 | 64,417 |
| New Jersey Trans Trust Fund Auth 0% 12/15/2037 (e) | | 5,000 | 2,985 |
| New Jersey Trans Trust Fund Auth 0% 12/15/2038 (e) | | 65,000 | 37,028 |
| New Jersey Trans Trust Fund Auth 4.5% 6/15/2049 | | 5,000 | 5,017 |
| New Jersey Trans Trust Fund Auth 5% 6/15/2028 | | 85,000 | 90,224 |
| New Jersey Trans Trust Fund Auth 5% 6/15/2030 | | 50,000 | 54,550 |
| New Jersey Trans Trust Fund Auth 5% 6/15/2034 | | 85,000 | 89,599 |
| New Jersey Trans Trust Fund Auth Series 2015AA, 5.25% 6/15/2027 (Pre-refunded to 6/15/2025 at 100) | | 30,000 | 30,279 |
| New Jersey Trans Trust Fund Auth Series 2015AA, 5.25% 6/15/2029 (Pre-refunded to 6/15/2025 at 100) | | 45,000 | 45,419 |
| New Jersey Trans Trust Fund Auth Series 2015AA, 5.25% 6/15/2032 | | 5,000 | 5,037 |
| New Jersey Trans Trust Fund Auth Series 2018 A, 4% 12/15/2031 | | 80,000 | 81,678 |
| New Jersey Trans Trust Fund Auth Series 2018 A, 4.25% 12/15/2038 | | 95,000 | 96,087 |
| New Jersey Trans Trust Fund Auth Series 2019 BB, 4% 6/15/2037 | | 160,000 | 160,206 |
| New Jersey Trans Trust Fund Auth Series 2019 BB, 5% 6/15/2032 | | 80,000 | 84,793 |
| NJ Health Care Facs Fing Auth St Contract (New Jersey St Proj.) Series 2017, 5% 10/1/2026 | | 90,000 | 92,830 |
| NJ Health Care Facs Fing Auth St Contract (New Jersey St Proj.) Series 2017, 5% 10/1/2027 | | 10,000 | 10,492 |
| | | | 1,996,674 |
| Health Care - 0.0% | | | |
| New Jersey Health Care (Hackensack Meridian Health Inc Proj.) Series 2017A, 4% 7/1/2052 | | 25,000 | 23,465 |
| New Jersey Health Care (St Joseph Hosp & Med Ctr, NJ Proj.) Series 2016, 3% 7/1/2032 | | 25,000 | 22,593 |
| | | | 46,058 |
| Housing - 0.1% | | | |
| New Jersey St Hsg & Mtg Fin Agy Rev (NJ Single Family Mortgage Proj.) Series 2018 A, 3.75% 10/1/2035 | | 70,000 | 67,613 |
| Tobacco Bonds - 0.0% | | | |
| Tobacco Settlement Fin Corp NJ Series 2018 A, 5% 6/1/2029 | | 30,000 | 31,400 |
| Transportation - 0.7% | | | |
| New Jersey Trans Trust Fund Auth (New Jersey St Grant Anticipati Proj.) Series 2016 A 1, 4.1% 6/15/2031 | | 55,000 | 55,377 |
| New Jersey Trans Trust Fund Auth (New Jersey St Grant Anticipati Proj.) Series 2016 A 1, 5% 6/15/2030 | | 25,000 | 25,501 |
| New Jersey Trans Trust Fund Auth (New Jersey St Grant Anticipati Proj.) Series 2018 A, 5% 6/15/2031 | | 75,000 | 76,482 |
| New Jersey Turnpike Authority 5% 1/1/2033 | | 100,000 | 113,366 |
| New Jersey Turnpike Authority Series 2016A, 5% 1/1/2033 | | 30,000 | 30,461 |
| New Jersey Turnpike Authority Series 2017 A, 5% 1/1/2033 | | 70,000 | 72,282 |
| New Jersey Turnpike Authority Series 2017B, 4% 1/1/2035 | | 5,000 | 5,070 |
| New Jersey Turnpike Authority Series 2017E, 5% 1/1/2029 | | 10,000 | 10,581 |
| New Jersey Turnpike Authority Series 2021 A, 4% 1/1/2051 | | 190,000 | 189,063 |
| | | | 578,183 |
TOTAL NEW JERSEY | | | 3,053,239 |
| New Jersey,New York - 1.5% | | | |
| Transportation - 1.5% | | | |
| Port Auth NY & NJ 5% 11/15/2026 | | 110,000 | 114,303 |
| Port Auth NY & NJ 5% 9/15/2026 (d) | | 5,000 | 5,117 |
| Port Auth NY & NJ 5.25% 11/15/2057 | | 175,000 | 181,293 |
| Port Auth NY & NJ Series 175TH, 3.25% 12/1/2042 | | 130,000 | 108,614 |
| Port Auth NY & NJ Series 189, 5% 5/1/2027 | | 60,000 | 60,355 |
| Port Auth NY & NJ Series 189, 5% 5/1/2030 | | 80,000 | 80,434 |
| Port Auth NY & NJ Series 189, 5% 5/1/2031 | | 50,000 | 50,266 |
| Port Auth NY & NJ Series 194, 4% 10/15/2045 | | 105,000 | 102,297 |
| Port Auth NY & NJ Series 194, 5% 10/15/2030 | | 15,000 | 15,194 |
| Port Auth NY & NJ Series 194, 5% 10/15/2034 | | 55,000 | 55,622 |
| Port Auth NY & NJ Series 198, 5% 11/15/2046 | | 50,000 | 50,798 |
| Port Auth NY & NJ Series 202, 5% 10/15/2030 (d) | | 30,000 | 30,765 |
| Port Auth NY & NJ Series 209, 5% 7/15/2031 | | 30,000 | 31,747 |
| Port Auth NY & NJ Series 209, 5% 7/15/2036 | | 115,000 | 120,235 |
| Port Auth NY & NJ Series TWO HUNDRED ELEVENTH, 4% 9/1/2043 | | 55,000 | 54,743 |
| Port Auth NY & NJ Series TWO HUNDRED THIRTEEN, 5% 9/1/2030 | | 70,000 | 76,160 |
| Port Auth NY & NJ Series TWO HUNDREDSEVENTEEN, 5% 11/1/2032 | | 50,000 | 54,315 |
| | | | 1,192,258 |
TOTAL NEW JERSEY,NEW YORK | | | 1,192,258 |
| New Jersey,Pennsylvania - 0.0% | | | |
| Transportation - 0.0% | | | |
| Delaware Rvr Jt Toll Brg PA NJ Series 2017, 5% 7/1/2036 | | 65,000 | 67,448 |
| New Mexico - 0.4% | | | |
| Health Care - 0.0% | | | |
| New Mexico St Hosp Equip Ln Council Hosp Rev (Presbyterian Hlthcare Serv Sys Proj.) Series 2019 A, 3% 8/1/2048 | | 10,000 | 7,668 |
| Housing - 0.4% | | | |
| New Mexico Mtg Fin Auth (NM Sf Mortgage 2005 Proj.) Series 2021 C CL I, 3% 1/1/2052 | | 85,000 | 82,508 |
| New Mexico Mtg Fin Auth (NM Sf Mortgage 2005 Proj.) Series 2021 D CL I, 3% 7/1/2052 | | 125,000 | 120,521 |
| New Mexico Mtg Fin Auth (NM Sf Mortgage 2005 Proj.) Series 2022 C, 3.95% 9/1/2047 | | 165,000 | 149,212 |
| | | | 352,241 |
TOTAL NEW MEXICO | | | 359,909 |
| New York - 19.0% | | | |
| Education - 1.0% | | | |
| New York St Dorm Auth Revs Non St Supportd Debt (Columbia Univ, NY Proj.) Series 2018B, 5% 10/1/2038 | | 45,000 | 47,404 |
| New York St Dorm Auth Revs Non St Supportd Debt (New School (The) Proj.) Series 2016 A, 4% 7/1/2043 | | 55,000 | 53,411 |
| New York St Dorm Auth Revs Non St Supportd Debt (New School (The) Proj.) Series 2016 A, 5% 7/1/2037 | | 5,000 | 5,106 |
| New York St Dorm Auth Revs Non St Supportd Debt (New York Univ, NY Proj.) Series 2016 A, 5% 7/1/2026 | | 65,000 | 67,052 |
| New York St Dorm Auth Revs Non St Supported Debt (Barnard College, NY Proj.) Series 2015 A, 3.75% 7/1/2046 | | 55,000 | 48,236 |
| New York St Dorm Auth Revs Non St Supported Debt (Cornell University Proj.) Series 2020 A2, 5% 7/1/2031 | | 25,000 | 27,889 |
| New York St Dorm Auth Revs Non St Supported Debt (Cornell University Proj.) Series 2020A, 4% 7/1/2050 | | 95,000 | 94,666 |
| New York St Dorm Auth Revs Non St Supported Debt (New York Univ, NY Proj.) Series 2019A, 4% 7/1/2045 | | 30,000 | 29,080 |
| New York St Dorm Auth Revs Non St Supported Debt (St Johns Univ, NY Proj.) 5% 7/1/2026 | | 100,000 | 102,577 |
| New York State Dormitory Authority (New York Univ, NY Proj.) Series 2015A, 3% 7/1/2029 | | 50,000 | 50,031 |
| Onondaga Cnty NY Tr Cultural Res Rev (Syracuse University, NY Proj.) Series 2019, 5% 12/1/2039 | | 75,000 | 79,977 |
| Onondaga Cnty NY Tr Cultural Res Rev (Syracuse University, NY Proj.) Series 2019, 5% 12/1/2040 | | 65,000 | 69,079 |
| Troy NY Cap Resource Corp Rev (Rensselaer Polytechnic Institute Proj.) Series 2020A, 5% 9/1/2037 | | 135,000 | 144,397 |
| | | | 818,905 |
| Electric Utilities - 0.5% | | | |
| Long Island Pwr Auth NY Elec Series 1998 A, 0% 12/1/2026 (Assured Guaranty Municipal Corp Insured) (e) | | 125,000 | 117,487 |
| Long Island Pwr Auth NY Elec Series 2016 B, 5% 9/1/2046 | | 10,000 | 10,147 |
| Long Island Pwr Auth NY Elec Series 2017, 5% 9/1/2047 | | 20,000 | 20,513 |
| Long Island Pwr Auth NY Elec Series 2018, 5% 9/1/2035 | | 30,000 | 31,629 |
| Long Island Pwr Auth NY Elec Series 2024A, 5% 9/1/2034 | | 130,000 | 151,012 |
| Utility Debt Securitization Authority Series 2015, 3% 12/15/2032 | | 15,000 | 14,690 |
| Utility Debt Securitization Authority Series 2017, 5% 12/15/2041 | | 50,000 | 51,861 |
| | | | 397,339 |
| Escrowed/Pre-Refunded - 0.0% | | | |
| New York St Dorm Auth St Pers Income Tax Rev Series 2016 D, 5% 2/15/2026 (Escrowed to Maturity) | | 35,000 | 35,743 |
| General Obligations - 2.8% | | | |
| City of New York NY Gen. Oblig. 4% 8/1/2050 | | 140,000 | 134,341 |
| City of New York NY Gen. Oblig. Series 2018 1, 5% 8/1/2028 | | 30,000 | 31,455 |
| City of New York NY Gen. Oblig. Series 2018 E 1, 5% 3/1/2044 | | 385,000 | 397,171 |
| City of New York NY Gen. Oblig. Series 2018 F 1, 3.5% 4/1/2046 | | 200,000 | 174,122 |
| City of New York NY Gen. Oblig. Series 2019 D1, 5% 12/1/2034 | | 25,000 | 26,454 |
| City of New York NY Gen. Oblig. Series 2019 E, 5% 8/1/2034 | | 70,000 | 74,399 |
| City of New York NY Gen. Oblig. Series A(A 1), 5% 8/1/2035 | | 150,000 | 160,179 |
| City of New York NY Gen. Oblig. Series C, 3% 8/1/2029 | | 50,000 | 49,229 |
| City of New York NY Gen. Oblig. Series E, 5% 8/1/2026 | | 25,000 | 25,774 |
| City of New York NY Gen. Oblig. Series F 1, 3.5% 3/1/2038 | | 120,000 | 111,739 |
| City of New York NY Gen. Oblig. Series FISCAL 2008 J 9, 3% 8/1/2026 | | 45,000 | 44,979 |
| City of New York NY Gen. Oblig. Series FISCAL 2020 D 1, 3% 3/1/2045 | | 100,000 | 79,644 |
| City of New York NY Gen. Oblig. Series FISCAL 2020 SUB B 1, 5% 10/1/2032 | | 55,000 | 59,275 |
| City of New York NY Gen. Oblig. Series FISCAL 2020 SUB B 1, 5% 10/1/2034 | | 95,000 | 101,825 |
| Nassau Cnty NY Gen. Oblig. Series 2016 A, 3.5% 1/1/2037 | | 130,000 | 126,907 |
| New York NY City Transitional Fin Auth Bldg Aid Rev (New York St Proj.) Series 2015 IS S 1, 5% 7/15/2026 | | 100,000 | 100,161 |
| New York NY City Transitional Fin Auth Bldg Aid Rev (New York St Proj.) Series 2015 S 2, 5% 7/15/2040 | | 80,000 | 80,494 |
| New York NY City Transitional Fin Auth Bldg Aid Rev (New York St Proj.) Series 2018 S 3, 3.625% 7/15/2047 | | 125,000 | 112,607 |
| New York NY City Transitional Fin Auth Bldg Aid Rev (New York St Proj.) Series 2018 S 4A, 5% 7/15/2031 | | 10,000 | 10,593 |
| New York NY City Transitional Fin Auth Bldg Aid Rev (New York St Proj.) Series 2018 S 4A, 5.25% 7/15/2035 | | 35,000 | 37,103 |
| New York NY City Transitional Fin Auth Bldg Aid Rev (New York St Proj.) Series FISCAL 2020S1 SUBS1B, 3% 7/15/2049 | | 50,000 | 38,902 |
| New York NY City Transitional Fin Auth Bldg Aid Rev (New York St Proj.) Series FISCAL 2023 SUB S 1A, 5% 7/15/2032 | | 100,000 | 114,040 |
| New York St Dorm Auth Revs Non St Supportd Debt (Scio N Y Cent Sch Dist Proj.) Series A, 5% 10/1/2029 | | 35,000 | 36,925 |
| New York St Dorm Auth Revs Non St Supported Debt (NY School Bond Program Proj.) Series 2023 A, 5% 10/1/2032 | | 90,000 | 102,156 |
| New York St Gen. Oblig. Series 2013A, 3.5% 3/1/2043 | | 10,000 | 9,063 |
| Suffolk Cnty NY Gen. Oblig. Series 2015 C, 5% 5/1/2027 | | 10,000 | 10,015 |
| Westchester Cnty NY Gen. Oblig. Series 2021 A, 5% 10/15/2029 | | 65,000 | 71,477 |
| | | | 2,321,029 |
| Health Care - 0.2% | | | |
| New York St Dorm Auth Revs Non St Supported Debt (Memorial Sloan-Kettering Cancer Center Proj.) Series 2019 1, 3% 7/1/2034 | | 25,000 | 22,949 |
| New York St Dorm Auth Revs Non St Supported Debt (Memorial Sloan-Kettering Cancer Center Proj.) Series 2019 1, 5% 7/1/2030 | | 30,000 | 32,565 |
| New York St Dorm Auth Revs Non St Supported Debt (Memorial Sloan-Kettering Cancer Center Proj.) Series 2022 1 A, 4% 7/1/2051 | | 90,000 | 87,151 |
| New York State Dormitory Authority (Northwell Health Proj.) Series 2015A, 5% 5/1/2033 | | 35,000 | 35,161 |
| Westchester County Local Development Corp (Westchester Cnty NY Healthcare Proj.) Series 2016, 3.75% 11/1/2037 | | 30,000 | 25,799 |
| | | | 203,625 |
| Housing - 0.8% | | | |
| New York City Housing Development Corp (New York Mhsg 7/27/1993 Proj.) Series C 1, 3.65% 11/1/2047 | | 100,000 | 85,665 |
| New York City Housing Development Corp (New York Mhsg 7/27/1993 Proj.) Series H, 2.95% tender 11/1/2045 (Liquidity Facility Fannie Mae) (b) | | 60,000 | 59,593 |
| New York City Housing Development Corp (New York Mhsg 7/27/1993 Proj.) Series I 1, 3.95% 11/1/2036 | | 10,000 | 9,854 |
| New York NY City Hsg Dev Corp Rev (NY City Mhsg Rev 2019 Proj.) Series 2020 A, 2.55% 8/1/2040 | | 110,000 | 83,056 |
| New York St Hsg Fin Agy (Affordable Housing Revenue Bonds 8/22/2007 Proj.) Series 2017 L, 3.45% 11/1/2042 | | 15,000 | 13,242 |
| New York St Hsg Fin Agy (Affordable Housing Revenue Bonds 8/22/2007 Proj.) Series 2019 N, 3.05% 11/1/2052 | | 65,000 | 48,868 |
| New York St Hsg Fin Agy Series 2019 P, 3.15% 11/1/2054 | | 5,000 | 3,828 |
| New York St Mtg Agy Rev (NY Mortgage Proj.) Series FORTY EIGHTH, 3.45% 10/1/2033 | | 15,000 | 14,299 |
| NY City Hsg Dev Corp Multifamily Hsg Rev (New York Mhsg 7/27/1993 Proj.) Series 2019 E 1, 3.25% 11/1/2049 | | 30,000 | 23,915 |
| NY City Hsg Dev Corp Multifamily Hsg Rev (New York Mhsg 7/27/1993 Proj.) Series 2021 G 1, 2.15% 11/1/2036 | | 165,000 | 129,319 |
| NY City Hsg Dev Corp Multifamily Hsg Rev (New York Mhsg 7/27/1993 Proj.) Series 2021 K 1, 2.45% 11/1/2041 | | 130,000 | 98,439 |
| State of New York Mortgage Agency (NY Mortgage Proj.) Series 220, 2.4% 10/1/2034 | | 75,000 | 62,830 |
| State of New York Mortgage Agency (NY Mortgage Proj.) Series 220, 2.85% 10/1/2044 | | 15,000 | 11,471 |
| | | | 644,379 |
| Industrial Development - 0.2% | | | |
| Liberty NY Dev Corp Rev (Goldman Sachs Group Inc/The Proj.) 5.25% 10/1/2035 | | 75,000 | 85,315 |
| New York Liberty Dev Corp Series 2021, 2.75% 2/15/2044 | | 55,000 | 41,425 |
| | | | 126,740 |
| Other - 0.1% | | | |
| New York City Trust Cultural Resources Rev (Museum of Modern Art, NY Proj.) Series 2016 ONE E, 4% 4/1/2026 | | 50,000 | 50,661 |
| New York City Trust Cultural Resources Rev (Museum of Modern Art, NY Proj.) Series 2016 ONE E, 4% 4/1/2028 | | 40,000 | 40,865 |
| New York St Dorm Auth Revs Non St Supported Debt (Rockefeller Univ, NY Proj.) 4% 7/1/2049 | | 30,000 | 28,690 |
| | | | 120,216 |
| Special Tax - 8.8% | | | |
| Battery Pk City Auth NY Rev Series 2019 B, 5% 11/1/2034 | | 190,000 | 207,010 |
| Battery Pk City Auth NY Rev Series 2019 B, 5% 11/1/2039 | | 60,000 | 64,600 |
| Battery Pk City Auth NY Rev Series 2019A, 5% 11/1/2049 | | 80,000 | 84,545 |
| Brooklyn Arena Local Dev Corp N Y Series A, 3% 7/15/2043 (Assured Guaranty Municipal Corp Insured) | | 25,000 | 19,646 |
| Hudson Yds Infrastructure Corp NY Rev Series 2017 A, 5% 2/15/2030 | | 320,000 | 332,264 |
| Hudson Yds Infrastructure Corp NY Rev Series 2017 A, 5% 2/15/2039 | | 70,000 | 71,864 |
| Hudson Yds Infrastructure Corp NY Rev Series FISCAL 2022 A, 4% 2/15/2039 | | 50,000 | 51,128 |
| New York NY City Ida Rev (Queens Ballpark Company LLC Proj.) Series 2021A, 3% 1/1/2037 (Assured Guaranty Inc Insured), (Assured Guaranty Municipal Corp Insured) | | 145,000 | 129,323 |
| New York NY City Ida Rev (Yankees Hldgs LP Proj.) 0% 3/1/2039 (Assured Guaranty Inc Insured) (e) | | 20,000 | 10,487 |
| New York NY City Ida Rev (Yankees Hldgs LP Proj.) 0% 3/1/2045 (Assured Guaranty Inc Insured) (e) | | 15,000 | 5,636 |
| New York NY City Ida Rev (Yankees Hldgs LP Proj.) 0% 3/1/2046 (Assured Guaranty Inc Insured) (e) | | 25,000 | 8,884 |
| New York NY City Ida Rev (Yankees Hldgs LP Proj.) Series 2009A, 0% 3/1/2044 (e) | | 90,000 | 35,752 |
| New York NY City Transitional Fin Auth Rev Series 2016 F 3, 3.25% 2/1/2042 | | 50,000 | 43,111 |
| New York NY City Transitional Fin Auth Rev Series 2016, 5% 2/1/2035 | | 120,000 | 121,854 |
| New York NY City Transitional Fin Auth Rev Series 2016, 5% 2/1/2037 | | 130,000 | 131,773 |
| New York NY City Transitional Fin Auth Rev Series 2017 B, 4% 8/1/2037 | | 50,000 | 50,107 |
| New York NY City Transitional Fin Auth Rev Series 2017, 5% 5/1/2040 | | 105,000 | 106,609 |
| New York NY City Transitional Fin Auth Rev Series 2018 A 2, 5% 8/1/2039 | | 55,000 | 56,824 |
| New York NY City Transitional Fin Auth Rev Series 2018 B 1, 3.375% 8/1/2045 | | 65,000 | 55,523 |
| New York NY City Transitional Fin Auth Rev Series 2019 A 1, 5% 8/1/2040 | | 75,000 | 77,828 |
| New York NY City Transitional Fin Auth Rev Series 2019 C 1, 3.25% 11/1/2043 | | 40,000 | 34,299 |
| New York NY City Transitional Fin Auth Rev Series 2019 C 1, 4% 11/1/2037 | | 70,000 | 70,660 |
| New York NY City Transitional Fin Auth Rev Series 2022 F 1, 5% 2/1/2026 | | 50,000 | 51,074 |
| New York NY City Transitional Fin Auth Rev Series B 1, 4% 8/1/2039 | | 5,000 | 5,001 |
| New York NY City Transitional Fin Auth Rev Series B1, 5% 11/1/2037 | | 100,000 | 101,096 |
| New York NY City Transitional Fin Auth Rev Series C 3, 4% 5/1/2044 | | 10,000 | 9,722 |
| New York NY City Transitional Fin Auth Rev Series FISCAL 2017 E, 5% 2/1/2040 | | 115,000 | 117,964 |
| New York NY City Transitional Fin Auth Rev Series FISCAL 2020 B 1, 4% 11/1/2043 | | 50,000 | 48,932 |
| New York NY City Transitional Fin Auth Rev Series FISCAL 2021 A, 3% 11/1/2037 | | 115,000 | 101,517 |
| New York NY City Transitional Fin Auth Rev Series FISCAL 2021 A, 4% 11/1/2035 | | 45,000 | 46,272 |
| New York NY City Transitional Fin Auth Rev Series FISCAL 2021 A, 5% 11/1/2031 | | 80,000 | 87,943 |
| New York NY City Transitional Fin Auth Rev Series FISCAL 2021C SUB C 1, 4% 5/1/2044 | | 120,000 | 117,552 |
| New York NY City Transitional Fin Auth Rev Series FISCAL 2022 A 1, 5% 11/1/2028 | | 175,000 | 187,994 |
| New York NY City Transitional Fin Auth Rev Series FISCAL 2022 A 1, 5% 11/1/2032 | | 200,000 | 222,416 |
| New York NY City Transitional Fin Auth Rev Series FISCAL 2023 SUB E1, 5% 11/1/2032 | | 105,000 | 118,744 |
| New York NY City Transitional Fin Auth Rev Series FISCAL 2023F SUB F 1, 4% 2/1/2051 | | 200,000 | 190,902 |
| New York NY City Transitional Fin Auth Rev Series FISCAL 2023F SUB F 1, 5.25% 2/1/2047 | | 255,000 | 277,336 |
| New York St Dorm Auth Sales Tax Rev St Supported (New York State Sales Tax Rev Proj.) 5% 3/15/2048 (Pre-refunded to 3/15/2048 at 100) | | 25,000 | 25,811 |
| New York St Dorm Auth Sales Tax Rev St Supported (New York State Sales Tax Rev Proj.) Series 2016 A, 5% 3/15/2029 (Pre-refunded to 9/15/2026 at 100) | | 70,000 | 72,353 |
| New York St Dorm Auth Sales Tax Rev St Supported (New York State Sales Tax Rev Proj.) Series 2017 A, 5% 3/15/2043 | | 75,000 | 76,923 |
| New York St Dorm Auth Sales Tax Rev St Supported (New York State Sales Tax Rev Proj.) Series 2017 A, 5% 3/15/2044 | | 15,000 | 15,368 |
| New York St Dorm Auth St Pers Income Tax Rev (New York State Pit Proj.) Series 2015B GROUP C, 5% 2/15/2042 | | 35,000 | 35,076 |
| New York St Dorm Auth St Pers Income Tax Rev (New York State Pit Proj.) Series 2016 D, 5% 2/15/2026 (Escrowed to Maturity) | | 5,000 | 5,112 |
| New York St Dorm Auth St Pers Income Tax Rev (New York State Pit Proj.) Series 2019 A, 5% 3/15/2040 | | 15,000 | 15,773 |
| New York St Dorm Auth St Pers Income Tax Rev (New York State Pit Proj.) Series 2021 A, 4% 3/15/2037 | | 165,000 | 168,122 |
| New York St Dorm Auth St Pers Income Tax Rev (New York State Pit Proj.) Series 2024A, 5% 3/15/2033 | | 240,000 | 272,961 |
| New York St Urban Dev Corp Rev (New York State Pit Proj.) Series 2017 A, 3.5% 3/15/2039 | | 100,000 | 95,693 |
| New York St Urban Dev Corp Rev (New York State Pit Proj.) Series 2019 A, 5% 3/15/2042 | | 10,000 | 10,403 |
| New York St Urban Dev Corp Rev (New York State Pit Proj.) Series 2019 A, 5% 3/15/2044 | | 25,000 | 25,935 |
| New York State Dormitory Authority (New York State Pit Proj.) 5% 2/15/2039 | | 110,000 | 113,996 |
| New York State Dormitory Authority 5% 3/15/2042 | | 100,000 | 104,768 |
| New York State Urban Development Corp (New York State Pit Proj.) 3% 3/15/2040 | | 180,000 | 155,468 |
| New York State Urban Development Corp (New York State Pit Proj.) Series 2020 A, 3% 3/15/2050 | | 250,000 | 190,479 |
| New York State Urban Development Corp (New York State Pit Proj.) Series 2023B, 5% 3/15/2037 | | 300,000 | 336,383 |
| New York Twy Auth Pers Income Tax Rev (New York State Pit Proj.) Series 2021A 1, 5% 3/15/2031 | | 190,000 | 212,015 |
| New York Urban Eev Corp Sales Tax Rev (New York State Sales Tax Rev Proj.) 5% 3/15/2054 | | 330,000 | 353,527 |
| New York Urban Eev Corp Sales Tax Rev (New York State Sales Tax Rev Proj.) Series 2021 A, 3% 3/15/2041 | | 50,000 | 42,660 |
| NY Convention Ctr Dev Corp Rev Series B, 0% 11/15/2032 (e) | | 135,000 | 98,509 |
| NY Convention Ctr Dev Corp Rev Series B, 0% 11/15/2038 (e) | | 105,000 | 56,261 |
| NY Convention Ctr Dev Corp Rev Series B, 0% 11/15/2044 (e) | | 25,000 | 9,488 |
| NY Mta Dedicated Tax Fund 5% 11/15/2047 | | 165,000 | 167,811 |
| NY Mta Dedicated Tax Fund Series 2012A, 0% 11/15/2032 (e) | | 60,000 | 44,738 |
| NY Mta Dedicated Tax Fund Series 2016 A, 5% 11/15/2026 | | 35,000 | 36,332 |
| NY Payroll Mobility Tax Series 2021 B 1, 5% 5/15/2056 | | 80,000 | 82,010 |
| NY Payroll Mobility Tax Series 2021 C 2, 3% 5/15/2032 | | 325,000 | 317,081 |
| NY Payroll Mobility Tax Series 2021 C 2, 3% 5/15/2033 | | 230,000 | 222,547 |
| Triborough Brdg & Tunl Auth NY Sales Tax Rev Series 2023A, 4% 5/15/2048 | | 130,000 | 126,108 |
| Triborough Brdg & Tunl Auth NY Sales Tax Rev Series 2023A, 4.125% 5/15/2053 | | 150,000 | 146,550 |
| | | | 7,090,453 |
| Transportation - 2.8% | | | |
| Metropolitan Transn Auth NY Rv 5% 11/15/2028 | | 50,000 | 53,290 |
| Metropolitan Transn Auth NY Rv Series 2015 F, 3.25% 11/15/2031 | | 160,000 | 152,322 |
| Metropolitan Transn Auth NY Rv Series 2015B, 4% 11/15/2045 | | 50,000 | 46,440 |
| Metropolitan Transn Auth NY Rv Series 2016 B, 5% 11/15/2029 | | 115,000 | 118,060 |
| Metropolitan Transn Auth NY Rv Series 2016 D, 5% 11/15/2027 | | 30,000 | 30,814 |
| Metropolitan Transn Auth NY Rv Series 2017 B, 5% 11/15/2026 | | 95,000 | 98,143 |
| Metropolitan Transn Auth NY Rv Series 2017 D, 4% 11/15/2042 | | 15,000 | 14,440 |
| Metropolitan Transn Auth NY Rv Series 2017 D, 5% 11/15/2027 | | 50,000 | 52,510 |
| Metropolitan Transn Auth NY Rv Series 2017C 1, 3.25% 11/15/2036 | | 260,000 | 232,059 |
| Metropolitan Transn Auth NY Rv Series 2017C 1, 5% 11/15/2028 | | 35,000 | 37,044 |
| Metropolitan Transn Auth NY Rv Series 2018 B, 5% 11/15/2026 | | 80,000 | 82,647 |
| Metropolitan Transn Auth NY Rv Series 2020 E, 5% 11/15/2027 | | 130,000 | 136,526 |
| Metropolitan Transn Auth NY Rv Series C 1, 4% 11/15/2026 | | 65,000 | 65,968 |
| Metropolitan Transn Auth NY Rv Series D 1, 5% 11/15/2031 | | 130,000 | 131,598 |
| New York St Twy Auth Gen Rev Series 2016 A, 5% 1/1/2051 | | 35,000 | 35,249 |
| New York St Twy Auth Gen Rev Series 2019 B, 4% 1/1/2045 (Assured Guaranty Municipal Corp Insured) | | 125,000 | 122,703 |
| New York Transportation Development Corp (Delta Air Lines Inc Proj.) Series 2018, 5% 1/1/2030 (d) | | 15,000 | 15,423 |
| New York Transportation Development Corp (Jfk International Air Terminal Proj.) Series 2020C, 5% 12/1/2030 | | 100,000 | 108,424 |
| New York Transportation Development Corp (Jfk International Air Terminal Proj.) Series 2022, 5% 12/1/2032 (d) | | 80,000 | 85,171 |
| New York Transportation Development Corp (Jfk Intl New Terminal One Proj.) 5.5% 6/30/2060 (d) | | 265,000 | 277,793 |
| New York Transportation Development Corp (Laguardia Gateway Prtnrs Terminal B Proj.) Series 2016 A, 4% 1/1/2051 (Assured Guaranty Municipal Corp Insured) (d) | | 20,000 | 17,891 |
| Triborough Brdg & Tunl NY Revs Series 2002 F, 5% 11/1/2027 | | 65,000 | 68,893 |
| Triborough Brdg & Tunl NY Revs Series 2002 F, 5% 11/1/2031 | | 75,000 | 84,677 |
| Triborough Brdg & Tunl NY Revs Series 2008B 3, 5% 11/15/2037 | | 60,000 | 60,719 |
| Triborough Brdg & Tunl NY Revs Series 2013A, 0% 11/15/2030 (e) | | 85,000 | 68,690 |
| Triborough Brdg & Tunl NY Revs Series 2013A, 0% 11/15/2032 (e) | | 90,000 | 66,952 |
| Triborough Brdg & Tunl NY Revs Series 2016A, 5% 11/15/2041 | | 25,000 | 25,400 |
| Triborough Brdg & Tunl NY Revs Series 2016A, 5% 11/15/2046 | | 50,000 | 50,687 |
| | | | 2,340,533 |
| Water & Sewer - 1.8% | | | |
| New York Envir Fac Corp Clean Wtr & Drinking Wtr Series 2017 A, 3.5% 6/15/2036 | | 40,000 | 39,458 |
| New York Envir Fac Corp Clean Wtr & Drinking Wtr Series 2018 A, 5% 6/15/2030 | | 30,000 | 32,171 |
| New York Envir Fac Corp Clean Wtr & Drinking Wtr Series 2019 B, 5% 6/15/2031 | | 25,000 | 27,254 |
| New York NY Cty Muni Wtr Fin Auth 5.25% 6/15/2047 | | 60,000 | 61,577 |
| New York NY Cty Muni Wtr Fin Auth Series 2015HH, 5% 6/15/2029 | | 5,000 | 5,042 |
| New York NY Cty Muni Wtr Fin Auth Series 2016, 4% 6/15/2038 | | 25,000 | 25,056 |
| New York NY Cty Muni Wtr Fin Auth Series 2018 AA, 5% 6/15/2037 | | 25,000 | 25,907 |
| New York NY Cty Muni Wtr Fin Auth Series 2018 EE, 5% 6/15/2034 | | 45,000 | 45,689 |
| New York NY Cty Muni Wtr Fin Auth Series 2018 FF, 5% 6/15/2040 | | 210,000 | 218,752 |
| New York NY Cty Muni Wtr Fin Auth Series 2020 BB1, 3% 6/15/2049 | | 105,000 | 81,296 |
| New York NY Cty Muni Wtr Fin Auth Series 2020 BB1, 5% 6/15/2049 | | 90,000 | 94,239 |
| New York NY Cty Muni Wtr Fin Auth Series FISCAL 2020 CC 1, 4% 6/15/2042 | | 15,000 | 15,018 |
| New York NY Cty Muni Wtr Fin Auth Series FISCAL 2020 CC 1, 5% 6/15/2030 | | 25,000 | 27,298 |
| New York NY Cty Muni Wtr Fin Auth Series FISCAL 2020 SUB GG 2, 5% 6/15/2029 | | 135,000 | 142,473 |
| New York NY Cty Muni Wtr Fin Auth Series FISCAL 2024 SUB BB2, 5% 6/15/2035 | | 260,000 | 297,474 |
| New York NY Cty Muni Wtr Fin Auth Series FISCAL 2024 SUB BB2, 5% 6/15/2039 | | 200,000 | 225,335 |
| New York St Env Facs Corp Rev Series 2019 A, 5% 2/15/2049 | | 30,000 | 31,356 |
| Suffolk Cnty NY Wtr Auth Wtrwk Series 2018 A, 4% 6/1/2041 | | 45,000 | 45,009 |
| | | | 1,440,404 |
TOTAL NEW YORK | | | 15,539,366 |
| North Carolina - 1.0% | | | |
| Escrowed/Pre-Refunded - 0.0% | | | |
| North Carolina Cap Fac Fin Agy Rev Series 2015 B, 5% 10/1/2041 (Pre-refunded to 10/1/2025 at 100) | | 10,000 | 10,141 |
| General Obligations - 0.4% | | | |
| Mecklenburg Cnty NC Gen. Oblig. Series 2018, 3.25% 3/1/2034 | | 65,000 | 62,972 |
| North Carolina St Gen. Oblig. Series 2016 A, 5% 6/1/2027 | | 40,000 | 41,170 |
| North Carolina St Gen. Oblig. Series 2018 A, 5% 6/1/2029 | | 75,000 | 80,121 |
| State of North Carolina (North Carolina St Proj.) Series 2020 B, 5% 5/1/2028 | | 50,000 | 53,365 |
| State of North Carolina (North Carolina St Proj.) Series 2020 B, 5% 5/1/2029 | | 35,000 | 37,964 |
| Wake Cnty NC (Wake Cnty NC Proj.) Series 2021, 5% 3/1/2031 | | 85,000 | 94,851 |
| | | | 370,443 |
| Health Care - 0.3% | | | |
| Atrium Health Series 2016 A, 4% 1/15/2045 | | 150,000 | 142,879 |
| North Carolina Med Care Commn Health Care Facs Rev (Wake Baptist Proj.) Series 2012 A, 4% 12/1/2045 | | 10,000 | 9,583 |
| | | | 152,462 |
| Transportation - 0.2% | | | |
| Charlotte NC Arpt Rev Series A, 5% 7/1/2047 | | 55,000 | 56,172 |
| North Carolina St Grant Antic Rev Series 2019, 5% 3/1/2031 | | 5,000 | 5,364 |
| North Carolina St Grant Antic Rev Series 2019, 5% 3/1/2032 | | 40,000 | 42,855 |
| North Carolina Tpk Auth Triangle Expwy Sys Rev Series 2018, 5% 1/1/2030 | | 55,000 | 58,085 |
| | | | 162,476 |
| Water & Sewer - 0.1% | | | |
| Charlotte NC Wtr & Swr Sys Rev Series 2018, 4% 7/1/2047 | | 25,000 | 24,549 |
| Union Cnty NC Enterprise Sys Rev Series 2021, 3% 6/1/2037 | | 80,000 | 71,672 |
| | | | 96,221 |
TOTAL NORTH CAROLINA | | | 791,743 |
| North Dakota - 0.2% | | | |
| Health Care - 0.1% | | | |
| Grand Forks ND Health Care Sys Rev (Altru Health System Proj.) 5% 12/1/2027 | | 85,000 | 87,474 |
| Housing - 0.1% | | | |
| North Dakota St Hsg Fin Agy (ND Single Family Hsg Proj.) 2.25% 7/1/2041 | | 50,000 | 35,640 |
| North Dakota St Hsg Fin Agy Series 2019 C, 3.35% 7/1/2042 | | 20,000 | 17,435 |
| | | | 53,075 |
TOTAL NORTH DAKOTA | | | 140,549 |
| Ohio - 2.5% | | | |
| Electric Utilities - 0.0% | | | |
| Cleveland OH Pub Pwr Sys Rev 0% 11/15/2038 (National Public Finance Guarantee Corporation Insured) (e) | | 45,000 | 23,600 |
| General Obligations - 0.8% | | | |
| City of Columbus OH Gen. Oblig. Series 2016 A, 4% 8/15/2027 | | 30,000 | 30,159 |
| City of Columbus OH Gen. Oblig. Series 2018 A, 5% 4/1/2030 | | 30,000 | 32,162 |
| Gahanna-Jefferson OH Sch Dist Series 2021, 2% 12/1/2050 (Assured Guaranty Municipal Corp Insured) | | 100,000 | 56,344 |
| Northeastern OH Local Sch Dist Clark Cnty Series 2018, 4% 12/1/2055 (Assured Guaranty Municipal Corp Insured) | | 100,000 | 92,619 |
| Ohio St Parks & Rec Cap Facs (State of Ohio Proj.) Series 2017A, 5% 12/1/2031 | | 40,000 | 42,100 |
| Ohio St Spl Oblig (State of Ohio Proj.) Series A, 5% 4/1/2029 | | 40,000 | 40,174 |
| Southwest Licking OH Local Sch Dist Series 2017 A, 3.375% 11/1/2047 | | 15,000 | 12,812 |
| State of Ohio Gen. Oblig. Series 2015A, 5% 9/15/2026 | | 35,000 | 36,231 |
| State of Ohio Gen. Oblig. Series 2015C, 5% 11/1/2028 | | 25,000 | 25,150 |
| State of Ohio Gen. Oblig. Series 2017B, 5% 9/1/2028 | | 60,000 | 64,385 |
| State of Ohio Gen. Oblig. Series 2017C, 5% 8/1/2026 | | 20,000 | 20,651 |
| State of Ohio Gen. Oblig. Series 2018 A, 5% 2/1/2029 | | 15,000 | 15,319 |
| State of Ohio Gen. Oblig. Series 2021 A, 4% 3/1/2038 | | 55,000 | 56,305 |
| Willoughby-Eastlake Ohio Csd Series 2016, 4% 12/1/2050 | | 160,000 | 144,248 |
| | | | 668,659 |
| Health Care - 0.6% | | | |
| Akron Bath Copley Hsp Dist OH (Summa Health System Proj.) Series 2020, 4% 11/15/2037 | | 5,000 | 4,783 |
| Allen Cnty OH Hosp Facs Rev (Mercy Health/OH Proj.) 5% 12/1/2035 | | 60,000 | 64,622 |
| Chillicothe Ohio Hosp Facs Rev (Adena Health Sys Proj.) Series 2017, 4% 12/1/2042 | | 100,000 | 91,808 |
| Cuyahoga Cnty Ohio Hosp Rev (Metro Health System, OH Proj.) Series 2017, 5% 2/15/2052 | | 5,000 | 5,009 |
| Franklin Cnty OH Rev (Trinity Health Proj.) Series 2017 OH, 5% 12/1/2046 | | 85,000 | 86,237 |
| Ohio St Hosp Rev (University Hosp Hlth Sys, OH Proj.) Series 2021 A, 3% 1/15/2046 | | 50,000 | 38,907 |
| Ohio St Hsg Fin Agy Res Mtg Rev (Cleveland Clinic Foundation/The Proj.) Series 2017A, 5% 1/1/2028 | | 145,000 | 153,377 |
| Ohio St Hsg Fin Agy Res Mtg Rev (Cleveland Clinic Foundation/The Proj.) Series 2017A, 5% 1/1/2033 | | 40,000 | 42,076 |
| | | | 486,819 |
| Housing - 0.1% | | | |
| Ohio St Hsg Fin Agy Residential Mtg Rev (OH Residential Mortgage Proj.) Series 2022 A, 3.25% 9/1/2052 | | 95,000 | 93,326 |
| Ohio St Hsg Fin Agy Residential Mtg Rev Series 2019A, 3.5% 9/1/2034 | | 5,000 | 4,761 |
| Ohio St Hsg Fin Agy Residential Mtg Rev Series 2019A, 4% 3/1/2049 | | 10,000 | 9,464 |
| | | | 107,551 |
| Special Tax - 0.1% | | | |
| Franklin Cnty Ohio Sales Tax Rev Series 2018, 5% 6/1/2048 | | 30,000 | 30,993 |
| Hamilton OH Sales Tax Series 2016 A, 5% 12/1/2027 | | 55,000 | 58,167 |
| | | | 89,160 |
| Transportation - 0.1% | | | |
| Ohio St Tpk Commn Tpk Rev Series 2013 A 2, 0% 2/15/2037 (e) | | 80,000 | 50,068 |
| Ohio St Tpk Commn Tpk Rev Series 2013 A 2, 0% 2/15/2043 (e) | | 30,000 | 13,699 |
| | | | 63,767 |
| Water & Sewer - 0.8% | | | |
| Hamilton Cnty OH Swr Sys Rev Series 2019A, 5% 12/1/2029 | | 150,000 | 164,081 |
| Northeast OH Regl Swr Wstwtr Rev Series 2019, 3% 11/15/2040 | | 100,000 | 85,766 |
| Ohio St Wtr Dev Ath Wtr Poll Ctl Rev Series 2020 A, 5% 12/1/2038 | | 65,000 | 70,227 |
| Ohio St Wtr Dev Ath Wtr Poll Ctl Rev Series 2020B, 4% 12/1/2038 | | 260,000 | 264,637 |
| | | | 584,711 |
TOTAL OHIO | | | 2,024,267 |
| Oklahoma - 0.5% | | | |
| Education - 0.0% | | | |
| University of Oklahoma/The Series 2015C, 5% 7/1/2036 | | 5,000 | 5,027 |
| Electric Utilities - 0.0% | | | |
| Oklahoma St Mun Pwr Auth Pwr Series 2016 A, 5% 1/1/2047 | | 10,000 | 10,091 |
| General Obligations - 0.3% | | | |
| Oklahoma Cap Imp Auth St Hwy Cap Impt Rev (Oklahoma St Proj.) Series 2016, 4% 7/1/2033 | | 40,000 | 40,308 |
| Oklahoma Development Finance Authority (Oklahoma St Proj.) Series 2016 D, 4% 6/1/2036 | | 200,000 | 200,215 |
| | | | 240,523 |
| Transportation - 0.2% | | | |
| Oklahoma St Tpk Auth Tpk Rev Series 2017C, 4% 1/1/2042 | | 30,000 | 30,000 |
| Oklahoma St Tpk Auth Tpk Rev Series 2017C, 5% 1/1/2047 | | 30,000 | 30,606 |
| Oklahoma St Tpk Auth Tpk Rev Series 2017E, 4% 1/1/2031 | | 100,000 | 101,234 |
| | | | 161,840 |
TOTAL OKLAHOMA | | | 417,481 |
| Oregon - 0.9% | | | |
| Education - 0.0% | | | |
| Oregon St Facs Auth Rev (University of Portland Proj.) Series 2015A, 5% 4/1/2045 | | 35,000 | 35,065 |
| General Obligations - 0.5% | | | |
| Clackamas & Wash Cnty OR Sch Dist No 3 Series 2020 A, 0% 6/15/2035 (e) | | 165,000 | 107,400 |
| Clackamas Cnty Ore Sch Dis No 46 Oregon Trail 0% 6/15/2032 (Oregon St Guaranteed) (e) | | 50,000 | 38,276 |
| Clackamas Cnty Ore Sch Dis No 46 Oregon Trail 0% 6/15/2034 (Oregon St Guaranteed) (e) | | 20,000 | 14,036 |
| Clackamas Cnty Ore Sch Dis No 46 Oregon Trail 0% 6/15/2039 (Oregon St Guaranteed) (e) | | 10,000 | 5,461 |
| Deschutes & Jefferson Cnties School District #2 0% 6/15/2026 (Oregon St Guaranteed) (e) | | 10,000 | 9,518 |
| Washington Clackamas & Yamhill Cntys OR Sch Dist No 88j Series 2018 A, 0% 6/15/2048 (Oregon St Guaranteed) (e) | | 255,000 | 79,611 |
| Washington Cnty OR Sch Dist 48j Beaverton 0% 6/15/2039 (Oregon St Guaranteed) (e) | | 200,000 | 105,588 |
| | | | 359,890 |
| Health Care - 0.4% | | | |
| Medford OR Hosp Facs Auth Rev (Asante Health System Proj.) Series 2020 A, 2.5% 8/15/2035 (Assured Guaranty Municipal Corp Insured) | | 190,000 | 164,143 |
| Oregon Hlth Sciences Univ Rev Series 2016 B, 5% 7/1/2039 | | 35,000 | 35,550 |
| Oregon St Facs Auth Rev (Legacy Health System, or Proj.) Series 2022 A, 5% 6/1/2052 | | 110,000 | 114,114 |
| | | | 313,807 |
TOTAL OREGON | | | 708,762 |
| Pennsylvania - 3.7% | | | |
| Electric Utilities - 0.2% | | | |
| Philadelphia PA Gas Wks Rev Series 15TH, 5% 8/1/2042 | | 150,000 | 154,178 |
| General Obligations - 0.7% | | | |
| Allegheny County PA Gen. Oblig. Series C 77, 5% 11/1/2043 | | 25,000 | 26,031 |
| Commonwealth Financing Authority (Pennsylvania St Proj.) Series 2018, 4% 6/1/2039 (Assured Guaranty Municipal Corp Insured) | | 15,000 | 14,924 |
| Pennsylvania St Ctfs Partn (Pennsylvania St Proj.) Series 2018 A, 4% 7/1/2046 | | 55,000 | 52,355 |
| Pennsylvania St Gen. Oblig. 5% 9/1/2031 | | 155,000 | 173,223 |
| Pennsylvania St Gen. Oblig. Series 2015, 4% 8/15/2034 | | 25,000 | 25,048 |
| Pennsylvania St Gen. Oblig. Series 2015, 5% 8/15/2032 | | 60,000 | 60,554 |
| Pennsylvania St Gen. Oblig. Series 2016, 3% 9/15/2036 | | 15,000 | 13,837 |
| Pennsylvania St Gen. Oblig. Series 2016, 5% 9/15/2027 | | 10,000 | 10,326 |
| Pennsylvania St Gen. Oblig. Series FIRST 2021, 5% 5/15/2031 | | 60,000 | 66,809 |
| Philadelphia PA Sch Dist 5% 6/1/2027 (National Public Finance Guarantee Corporation Insured) | | 10,000 | 10,431 |
| Philadelphia PA Sch Dist Series 2019 A, 5% 9/1/2044 | | 25,000 | 26,001 |
| State Pub Sch Bldg Auth PA Lease Rev (Philadelphia PA Sch Dist Proj.) Series 2016 A, 5% 6/1/2033 | | 90,000 | 92,355 |
| State Pub Sch Bldg Auth PA Sch Rev (Harrisburg PA Sch Dist Proj.) Series 2016 A, 5% 12/1/2027 | | 50,000 | 51,589 |
| | | | 623,483 |
| Health Care - 1.5% | | | |
| Alleg Cnty PA Dev Auth (Allegheny Health System Proj.) Series 2018A, 4% 4/1/2038 | | 30,000 | 28,872 |
| Chester Cnty PA Hlth & Ed Facs Auth (Main Line Health Inc Proj.) Series 2020A, 4% 9/1/2050 | | 100,000 | 93,368 |
| Cumberland Cnty PA Mun Auth Rv (Penn State Hlth System Proj.) Series 2019, 3% 11/1/2039 | | 170,000 | 145,280 |
| Geisinger Auth PA Hlth Sys Rev (Kaiser Permanente Hlth System Proj.) Series 2017 A 2, 4% 2/15/2039 | | 100,000 | 97,833 |
| Lancaster Cnty PA Hosp Aut Rev (Univ of Penn Health Systems Proj.) Series 2016 A, 5% 8/15/2042 | | 10,000 | 10,146 |
| Lehigh Cnty PA Gen Purp Auth Hosp Rev (Lehigh Valley Health Proj.) Series 2015 A, 4.125% 7/1/2040 | | 90,000 | 87,116 |
| Monroeville PA Fin Auth UPMC Rev (UPMC Proj.) Series 2022B, 4% 2/15/2040 | | 105,000 | 102,904 |
| Northampton Cnty PA Gen Purp Auth Hosp Rev (St Lukes Hospital & Health Ntw Proj.) Series 2016 A, 3.125% 8/15/2035 | | 10,000 | 9,212 |
| Pennsylvania Econ Dev Fing Auth UPMC Rev (UPMC Proj.) Series 2017 A, 5% 11/15/2028 | | 85,000 | 88,930 |
| Pennsylvania St Higher Edl Rev (Thomas Jefferson Univ-Abiington Proj.) Series 2015A, 5% 9/1/2039 | | 135,000 | 135,340 |
| Pennsylvania St Higher Edl Rev (Thomas Jefferson Univ-Abiington Proj.) Series 2015A, 5% 9/1/2045 | | 135,000 | 135,340 |
| Pennsylvania St Higher Edl Rev (Thomas Jefferson Univ-Abiington Proj.) Series 2015A, 5.25% 9/1/2050 | | 70,000 | 70,204 |
| Pennsylvania St Higher Edl Rev (Univ of Penn Health Systems Proj.) Series 2016 C, 3% 8/15/2041 | | 35,000 | 30,226 |
| Philadelphia PA Auth For Indl Dev Hosp Rev (Childrens Hosp of Phil, PA Proj.) Series 2017, 4% 7/1/2037 | | 45,000 | 44,901 |
| Philadelphia PA Auth For Indl Dev Revs (Thomas Jefferson Univ-Abiington Proj.) Series 2017 A, 4% 9/1/2042 | | 25,000 | 23,913 |
| Pocono Mtns PA Indl Pk Auth Hosp Rev (St Lukes Hospital & Health Ntw Proj.) Series 2015A, 4% 8/15/2045 | | 110,000 | 102,862 |
| | | | 1,206,447 |
| Housing - 0.1% | | | |
| Pennsylvania Hsg Fin Agy Single Family Mtg (PA Single Family Mortgage Proj.) Series 2017 125 B, 3.65% 10/1/2042 | | 20,000 | 17,830 |
| Pennsylvania Hsg Fin Agy Single Family Mtg (PA Single Family Mortgage Proj.) Series B, 3.45% 10/1/2032 | | 15,000 | 14,677 |
| Pennsylvania Hsg Fin Agy Single Family Mtg Rev (PA Single Family Mortgage Proj.) Series 2021 134 A, 1.85% 4/1/2036 | | 100,000 | 74,533 |
| | | | 107,040 |
| Other - 0.1% | | | |
| Chester Cnty PA Indl Dev Auth (Longwood Gardens Proj.) Series 2021, 4% 12/1/2046 | | 110,000 | 104,643 |
| Transportation - 1.0% | | | |
| Delaware Riv Port Auth PA & NJ Series 2018 A, 5% 1/1/2032 | | 10,000 | 10,670 |
| Pennslyvania Dev Fing Auth Rev (Plenary Walsh Keystone Partners LLC Proj.) Series 2015, 4.125% 12/31/2038 (d) | | 20,000 | 19,235 |
| Pennslyvania Dev Fing Auth Rev (Plenary Walsh Keystone Partners LLC Proj.) Series 2015, 5% 12/31/2028 (d) | | 70,000 | 71,088 |
| Pennsylvania Econ Dev Fing Auth Private Activity Rev (PA Dot Major Bridges I Proj.) 5.25% 6/30/2053 (d) | | 110,000 | 112,888 |
| Pennsylvania Turnpike Commission Series 2014 A 2, 5.125% 12/1/2039 (c) | | 35,000 | 37,255 |
| Pennsylvania Turnpike Commission Series 2016, 5% 6/1/2036 | | 50,000 | 50,861 |
| Pennsylvania Turnpike Commission Series 2017, 5% 12/1/2030 | | 10,000 | 10,506 |
| Pennsylvania Turnpike Commission Series 2017, 5% 12/1/2040 | | 10,000 | 10,371 |
| Pennsylvania Turnpike Commission Series 2019 A, 4% 12/1/2049 | | 100,000 | 95,850 |
| Pennsylvania Turnpike Commission Series 2019 A, 4% 12/1/2049 (Assured Guaranty Municipal Corp Insured) | | 100,000 | 95,862 |
| Pennsylvania Turnpike Commission Series 2019 A, 5% 12/1/2034 | | 30,000 | 32,170 |
| Pennsylvania Turnpike Commission Series 2019 A, 5% 12/1/2035 | | 35,000 | 37,604 |
| Pennsylvania Turnpike Commission Series 2019, 5% 12/1/2032 | | 10,000 | 10,677 |
| Pennsylvania Turnpike Commission Series A 2, 5% 12/1/2028 | | 115,000 | 120,600 |
| Pennsylvania Turnpike Commission Series B 2, 0% 12/1/2041 (c) | | 20,000 | 18,815 |
| Philadelphia PA Airport Rev Series 2020 A, 4% 7/1/2038 | | 60,000 | 60,027 |
| | | | 794,479 |
| Water & Sewer - 0.1% | | | |
| Pittsburgh PA Wtr & Swr Auth 0% 9/1/2028 (Financial Guaranty Ins CO Insured) (e) | | 15,000 | 13,156 |
| Westmoreland Cnty PA Mun Auth Series 2016, 3% 8/15/2042 | | 50,000 | 42,679 |
| | | | 55,835 |
TOTAL PENNSYLVANIA | | | 3,046,105 |
| Rhode Island - 0.4% | | | |
| General Obligations - 0.2% | | | |
| Rhode Island & Providence Plantations (Rhode Island St Proj.) Gen. Oblig. Series 2019C, 3% 1/15/2036 | | 95,000 | 87,396 |
| Rhode Island St Gen. Oblig. Series 2021 E, 2% 8/1/2038 | | 70,000 | 51,332 |
| Rhode Island St Gen. Oblig. Series 2021 E, 2% 8/1/2039 | | 50,000 | 35,749 |
| | | | 174,477 |
| Housing - 0.2% | | | |
| Rhode Island Hsg & Mtg Fin Cp Series 70, 2.8% 10/1/2034 | | 145,000 | 128,293 |
TOTAL RHODE ISLAND | | | 302,770 |
| South Carolina - 0.6% | | | |
| Electric Utilities - 0.4% | | | |
| South Carolina St Svc Auth Rev 3% 12/1/2041 | | 20,000 | 15,928 |
| South Carolina St Svc Auth Rev 5.75% 12/1/2047 | | 200,000 | 221,763 |
| South Carolina St Svc Auth Rev Series 2016 A, 3.25% 12/1/2035 | | 10,000 | 9,090 |
| South Carolina St Svc Auth Rev Series 2016 A, 5% 12/1/2030 | | 80,000 | 81,679 |
| | | | 328,460 |
| General Obligations - 0.1% | | | |
| Lexington County School District No 1/SC Series 2019 B, 2.25% 2/1/2034 | | 85,000 | 73,478 |
| Lexington County School District No 2 Series 2016, 3% 3/1/2038 | | 20,000 | 17,746 |
| | | | 91,224 |
| Health Care - 0.0% | | | |
| South Carolina Jobs-Economic Development Authority (Carealliance Health Svcs Proj.) Series 2016 A, 3% 8/15/2038 | | 25,000 | 19,538 |
| Special Tax - 0.1% | | | |
| South Carolina Trans Infrastructure Bank Rev Series 2017 A, 5% 10/1/2038 | | 45,000 | 46,663 |
TOTAL SOUTH CAROLINA | | | 485,885 |
| Tennessee - 1.0% | | | |
| Electric Utilities - 0.1% | | | |
| Tennessee Engy Acq Crp Gas Rev 5.625% 9/1/2026 (Goldman Sachs Group Inc/The Guaranteed) | | 50,000 | 51,410 |
| General Obligations - 0.6% | | | |
| Memphis TN Gen. Oblig. Series 2021, 4% 5/1/2046 | | 50,000 | 48,952 |
| Memphis TN Gen. Oblig. Series 2021, 5% 5/1/2030 | | 80,000 | 87,958 |
| Metropolitan Govt Nashville & Davidson Cnty TN Gen. Oblig. 5% 1/1/2029 | | 200,000 | 215,837 |
| Tennessee Engy Acq Crp Gas Rev 5% 2/1/2027 (Goldman Sachs Group Inc/The Guaranteed) | | 15,000 | 15,186 |
| Tennessee Engy Acq Crp Gas Rev 5.25% 9/1/2026 (Goldman Sachs Group Inc/The Guaranteed) | | 20,000 | 20,283 |
| Tennessee St Gen. Oblig. Series A, 5% 8/1/2035 | | 50,000 | 51,384 |
| Tennessee St Sch Bd Auth (Tennessee St Proj.) Series 2017A, 5% 11/1/2042 | | 50,000 | 51,391 |
| | | | 490,991 |
| Health Care - 0.0% | | | |
| Chatanooga TN Health Ed & Hsg Fac Brd Rev (CommonSpirit Health Proj.) Series 2019A 1, 3% 8/1/2039 | | 20,000 | 16,364 |
| Knox Cnty Tenn Health Edl & Hsg Fac Brd Hosp Rev (Covenant Health TN Proj.) Series 2016 A, 4% 1/1/2042 | | 15,000 | 14,495 |
| Knox Cnty Tenn Health Edl & Hsg Fac Brd Hosp Rev (East Tenn Children's Hospital Proj.) Series 2019, 4% 11/15/2043 | | 5,000 | 4,720 |
| | | | 35,579 |
| Housing - 0.0% | | | |
| Tennessee Housing Development Agency Series 2016 2B, 3.5% 1/1/2047 | | 30,000 | 29,915 |
| Tennessee Housing Development Agency Series 2020 1A, 2.4% 1/1/2044 | | 10,000 | 7,188 |
| | | | 37,103 |
| Transportation - 0.3% | | | |
| Metro Nashville Arpt Auth Rev Series 2019A, 4% 7/1/2054 | | 35,000 | 33,360 |
| Metro Nashville Arpt Auth Rev Series 2019A, 5% 7/1/2054 | | 140,000 | 144,814 |
| | | | 178,174 |
TOTAL TENNESSEE | | | 793,257 |
| Texas - 8.4% | | | |
| Education - 0.8% | | | |
| Arlington Higher Education Finance Corp Series 2018, 4% 8/15/2048 (Permanent Sch Fund of Texas Guaranteed) | | 80,000 | 75,344 |
| Board of Regents of the University of Texas System Series 2016 J, 5% 8/15/2026 | | 20,000 | 20,639 |
| Board of Regents of the University of Texas System Series 2017 B, 3.375% 8/15/2044 | | 15,000 | 13,086 |
| Board of Regents of the University of Texas System Series 2019 A, 5% 8/15/2031 | | 15,000 | 16,225 |
| Board of Regents of the University of Texas System Series 2021 A, 5% 8/15/2031 | | 165,000 | 184,583 |
| Board of Regents of the University of Texas System Series 2022A, 4% 8/15/2042 | | 65,000 | 65,122 |
| Texas A&M Univ Revs Series 2017E, 5% 5/15/2035 | | 50,000 | 51,864 |
| Texas A&M Univ Revs Series 2021 A, 3% 5/15/2037 | | 115,000 | 103,685 |
| University Houston TX Univ Rev Series 2017 C, 3.25% 2/15/2041 | | 165,000 | 145,869 |
| | | | 676,417 |
| Electric Utilities - 0.9% | | | |
| Austin TX Elec Util Sys Rev Series 2015A, 5% 11/15/2045 | | 100,000 | 100,737 |
| Lower Colorado River Authority (Lcra Transmission Services Corp Proj.) 5% 5/15/2044 | | 260,000 | 264,431 |
| Lower Colorado River Authority (Lcra Transmission Services Corp Proj.) Series 2020 A, 5% 5/15/2050 | | 55,000 | 56,950 |
| Matagorda Cnty TX Nav Dist No1 (AEP Texas Central Co Proj.) 4.4% 5/1/2030 (Ambac Assurance Corp Insured) | | 10,000 | 10,355 |
| Matagorda Cnty TX Nav Dist No1 (AEP Texas Central Co Proj.) 4.55% 5/1/2030 (b)(d) | | 50,000 | 51,353 |
| San Antonio TX Elec & Gas Rev Series 2015, 5% 2/1/2027 | | 30,000 | 30,606 |
| San Antonio TX Elec & Gas Rev Series 2015, 5% 2/1/2032 | | 45,000 | 45,780 |
| San Antonio TX Elec & Gas Rev Series 2019, 4% 2/1/2028 | | 110,000 | 112,906 |
| San Antonio TX Elec & Gas Rev Series 2024D, 5% 2/1/2036 | | 110,000 | 124,847 |
| | | | 797,965 |
| Escrowed/Pre-Refunded - 0.3% | | | |
| Denton Independent School District Series 2015 A, 5% 8/15/2045 (Pre-refunded to 8/15/2025 at 100) | | 100,000 | 101,167 |
| Houston TX Wtr & Swr Sys Rev 0% 12/1/2027 (e) | | 50,000 | 45,398 |
| Leander Independent School District Series 2016 A, 0% 8/16/2044 (Pre-refunded to 8/16/2026 at 48.51) (e) | | 10,000 | 4,598 |
| Midland County Fresh Water Supply District No 1 Series 2012 A, 0% 9/15/2033 (Pre-refunded to 9/15/2027 at 75.85) (e) | | 150,000 | 103,384 |
| Midland County Fresh Water Supply District No 1 Series 2012 A, 0% 9/15/2035 (Pre-refunded to 9/15/2027 at 68.05) (e) | | 50,000 | 30,916 |
| | | | 285,463 |
| General Obligations - 3.0% | | | |
| Aldine TX Indpt Sch Dist Series 2017 A, 5% 2/15/2030 (Permanent Sch Fund of Texas Guaranteed) | | 50,000 | 51,909 |
| Alvin Tex Indpt Sch Dist Series 2019, 3.375% 2/15/2040 (Permanent Sch Fund of Texas Guaranteed) | | 15,000 | 13,722 |
| Alvin Tex Indpt Sch Dist Series 2020, 4% 2/15/2048 (Permanent Sch Fund of Texas Guaranteed) | | 100,000 | 95,805 |
| Austin TX Indpt Sch Dist Series 2017, 4% 8/1/2033 (Permanent Sch Fund of Texas Guaranteed) | | 5,000 | 5,035 |
| Austin TX Indpt Sch Dist Series 2019, 4% 8/1/2035 (Permanent Sch Fund of Texas Guaranteed) | | 25,000 | 25,411 |
| Bexar Cnty TX Hosp Dist Gen. Oblig. Series 2020, 3% 2/15/2036 | | 15,000 | 13,651 |
| College of the Mainland Gen. Oblig. Series 2019, 3.75% 8/15/2049 | | 50,000 | 45,281 |
| Collin Cnty TX Cmnty Coll Dist Gen. Oblig. Series 2018, 3.25% 8/15/2033 | | 40,000 | 38,286 |
| Conroe TX Isd Series 2020 A, 2.25% 2/15/2046 (Permanent Sch Fund of Texas Guaranteed) | | 85,000 | 55,771 |
| Cypress-Fairbanks TX Isd Series 2019, 5% 2/15/2030 (Permanent Sch Fund of Texas Guaranteed) | | 45,000 | 48,615 |
| Cypress-Fairbanks TX Isd Series 2020A, 3% 2/15/2035 (Permanent Sch Fund of Texas Guaranteed) | | 180,000 | 164,150 |
| Dallas Cnty Tex Hosp Dist Gen. Oblig. Series 2019, 5% 8/15/2030 | | 75,000 | 79,546 |
| Dallas TX Isd Series 2019 B, 3% 2/15/2037 (Permanent Sch Fund of Texas Guaranteed) | | 20,000 | 18,026 |
| Dallas TX Isd Series 2024, 5% 2/15/2032 (Permanent Sch Fund of Texas Guaranteed) | | 115,000 | 129,121 |
| Del Mar TX College Dist Gen. Oblig. Series 2018 B, 4% 8/15/2048 | | 150,000 | 138,421 |
| Eagle Mtn & Saginaw TX Isd Series 2019, 4% 8/15/2050 (Permanent Sch Fund of Texas Guaranteed) | | 20,000 | 18,968 |
| Frisco Tex Indpt Sch Dis Series 2017, 4% 8/15/2035 (Permanent Sch Fund of Texas Guaranteed) | | 30,000 | 30,152 |
| Frisco Tex Indpt Sch Dis Series 2019, 4% 8/15/2039 (Permanent Sch Fund of Texas Guaranteed) | | 35,000 | 35,210 |
| Harris Cnty TX Flood Ctl Dist (Harris Cnty TX Proj.) Gen. Oblig. Series 2017 A, 4% 10/1/2038 | | 200,000 | 200,684 |
| Harris Cnty TX Series 2016 A, 5% 8/15/2033 | | 35,000 | 35,861 |
| Houston TX Indpt Sch Dist Series 2016, 5% 2/15/2031 (Permanent Sch Fund of Texas Guaranteed) | | 55,000 | 56,056 |
| Houston TX Indpt Sch Dist Series 2017, 5% 2/15/2027 (Permanent Sch Fund of Texas Guaranteed) | | 30,000 | 31,292 |
| Katy TX Ind Sch Dist Series 2019, 4% 2/15/2040 (Permanent Sch Fund of Texas Guaranteed) | | 35,000 | 35,037 |
| Katy TX Ind Sch Dist Series 2022, 4% 2/15/2041 (Permanent Sch Fund of Texas Guaranteed) | | 125,000 | 125,254 |
| Keller Texas Indpt School Dist Series 2020, 4% 2/15/2044 (Permanent Sch Fund of Texas Guaranteed) | | 100,000 | 97,753 |
| Lamar TX Isd Series 2018, 4% 2/15/2050 | | 75,000 | 72,496 |
| Leander Independent School District Series 2016 A, 0% 8/16/2044 (Permanent Sch Fund of Texas Guaranteed) (e) | | 130,000 | 52,488 |
| Northside TX Indpt Sch Dist Series 2019A, 4% 8/15/2036 (Permanent Sch Fund of Texas Guaranteed) | | 190,000 | 192,099 |
| Northwest Tex Indpt Sch Dist Series 2024 A, 5% 2/15/2034 (Permanent Sch Fund of Texas Guaranteed) | | 100,000 | 112,451 |
| San Antonio TX Indpt Sch Dist Series 2019, 5% 8/15/2030 (Permanent Sch Fund of Texas Guaranteed) | | 20,000 | 21,347 |
| San Jacinto TX Cmnty College Dist Gen. Oblig. Series 2019A, 5% 2/15/2044 | | 20,000 | 20,652 |
| Sherman TX Indpt Sch Dist Series 2018 A, 5% 2/15/2041 (Permanent Sch Fund of Texas Guaranteed) | | 50,000 | 51,898 |
| Texas State Gen. Oblig. Series 2016 A, 5% 4/1/2030 | | 50,000 | 51,109 |
| Texas State Gen. Oblig. Series 2018A, 5% 10/1/2026 | | 65,000 | 67,348 |
| Texas State Gen. Oblig. Series B, 5% 10/1/2033 | | 35,000 | 36,474 |
| Tomball TX Indpt Sch Dist Series 2018, 5% 2/15/2041 (Permanent Sch Fund of Texas Guaranteed) | | 125,000 | 129,707 |
| Waller TX Indpt Sch Dist Series 2020, 4% 2/15/2050 (Permanent Sch Fund of Texas Guaranteed) | | 15,000 | 14,210 |
| | | | 2,411,296 |
| Health Care - 0.2% | | | |
| Harris Cnty Tex Cultural Ed Facs Fin Corp Thermal Util Rev (Texas Medical Center,Tx Proj.) Series 2017, 4% 11/15/2037 | | 55,000 | 54,469 |
| Harris Cnty TX Cultural Ed Facs Fin Corp Rev (Texas Childrens Hospital, TX Proj.) Series 2019 A, 3% 10/1/2039 | | 55,000 | 49,448 |
| Harris Cnty TX Hosp Dist Rev Series 2016, 3.25% 2/15/2042 | | 60,000 | 49,519 |
| | | | 153,436 |
| Housing - 0.0% | | | |
| Texas St Dept Hsg & Cmnty Sfr (TX Single Family Mortgage Proj.) 3% 3/1/2050 | | 35,000 | 25,636 |
| Special Tax - 0.3% | | | |
| Denton TX Gen. Oblig. Series 2017, 4% 2/15/2047 | | 15,000 | 13,953 |
| El Paso Tex Gen. Oblig. Series 2020, 4% 8/15/2045 | | 100,000 | 97,257 |
| Harris Cnty Houston Tex Sports Auth Rev Series A, 0% 11/15/2048 (Assured Guaranty Municipal Corp Insured) (e) | | 40,000 | 12,233 |
| Harris Cnty Houston Tex Sports Auth Rev Series A, 0% 11/15/2049 (Assured Guaranty Municipal Corp Insured) (e) | | 35,000 | 10,141 |
| Houston TX Hotel Occ Tx & Spl Rev 0% 9/1/2033 (Ambac Assurance Corp Insured) (e) | | 120,000 | 83,816 |
| | | | 217,400 |
| Transportation - 1.6% | | | |
| Central TX Regl Mobility Auth Rev Series 2016, 3.375% 1/1/2041 | | 45,000 | 39,325 |
| City of Houston TX Airport System Revenue 4% 7/1/2041 (d) | | 110,000 | 105,647 |
| City of Houston TX Airport System Revenue Series 2018D, 5% 7/1/2038 | | 20,000 | 20,851 |
| Dallas Fort Worth International Airport 5% 11/1/2032 | | 215,000 | 241,878 |
| Grand Parkway Transportation Corp (Grand Parkway Trans Corp Tela Proj.) Series 2013 B, 5.3% 10/1/2032 (c) | | 35,000 | 37,674 |
| Grand Parkway Transportation Corp (Grand Parkway Trans Corp Tela Proj.) Series 2013 B, 5.85% 10/1/2048 (c) | | 70,000 | 74,815 |
| Grand Parkway Transportation Corp (Grand Parkway Trans Corp Tela Proj.) Series 2018 A, 5% 10/1/2037 | | 40,000 | 41,858 |
| Harris Cnty Tex Toll Rd Rev (Harris County Toll Road Auth Proj.) Series 2018 A, 4% 8/15/2048 | | 105,000 | 99,778 |
| North East Texas Regional Mobility Authority Series B, 5% 1/1/2041 | | 40,000 | 40,259 |
| North TX Twy Auth Rev 0% 1/1/2034 (Assured Guaranty Inc Insured) (e) | | 75,000 | 53,439 |
| North TX Twy Auth Rev 0% 1/1/2036 (Assured Guaranty Inc Insured) (e) | | 25,000 | 16,294 |
| North TX Twy Auth Rev 0% 1/1/2038 (Assured Guaranty Inc Insured) (e) | | 100,000 | 59,417 |
| North TX Twy Auth Rev Series 2018, 4.25% 1/1/2049 | | 5,000 | 4,806 |
| North TX Twy Auth Rev Series 2018, 5% 1/1/2048 | | 70,000 | 71,277 |
| Port of Houston Auth 4% 10/1/2039 | | 115,000 | 115,343 |
| Texas Private Activity Bd Surface Transn Corp Rev (Lbj Infrastructure Group LLC Proj.) 4% 12/31/2031 | | 65,000 | 65,694 |
| Texas Private Activity Bd Surface Transn Corp Rev (Nte Mobility Partners Segments 3 LLC Proj.) Series 2019, 5% 6/30/2058 (d) | | 105,000 | 106,483 |
| Texas Private Activity Bd Surface Transn Corp Rev Series 2019 A, 5% 12/31/2032 | | 55,000 | 58,284 |
| Texas St Tpk Auth Cent TX Tpk Sys Rev (Central Texas Turnpike Proj.) 0% 8/15/2029 (Ambac Assurance Corp Insured) (e) | | 15,000 | 12,636 |
| | | | 1,265,758 |
| Water & Sewer - 1.3% | | | |
| Dallas TX Wtrwks & Swr Sys Rev Series 2018 C, 4% 10/1/2043 | | 100,000 | 98,807 |
| Dallas TX Wtrwks & Swr Sys Rev Series 2020 C, 4% 10/1/2049 | | 75,000 | 71,070 |
| Houston TX Util Sys Rev 4% 11/15/2049 | | 155,000 | 147,403 |
| Texas Wtr Dev Brd 3% 10/15/2034 | | 10,000 | 9,453 |
| Texas Wtr Dev Brd 3% 8/1/2039 | | 300,000 | 259,142 |
| Texas Wtr Dev Brd 5% 8/1/2033 | | 55,000 | 60,172 |
| Texas Wtr Dev Brd Series 2017 A, 5% 10/15/2047 | | 60,000 | 61,361 |
| Texas Wtr Dev Brd Series 2018 B, 4% 10/15/2034 | | 5,000 | 5,053 |
| Texas Wtr Dev Brd Series 2018A, 4% 10/15/2037 | | 10,000 | 10,033 |
| Texas Wtr Dev Brd Series 2019 A, 4% 10/15/2049 | | 200,000 | 189,478 |
| Texas Wtr Dev Brd Series 2022, 5% 10/15/2034 | | 125,000 | 140,101 |
| | | | 1,052,073 |
TOTAL TEXAS | | | 6,885,444 |
| Utah - 0.8% | | | |
| Education - 0.4% | | | |
| University UT Univ Revs (University UT Univ Revs Proj.) Series 2021 A 1, 4% 8/1/2041 | | 80,000 | 80,499 |
| University UT Univ Revs Series 2017 A, 5% 8/1/2029 | | 20,000 | 20,971 |
| University UT Univ Revs Series 2020 A, 4% 8/1/2039 | | 65,000 | 65,694 |
| University UT Univ Revs Series 2020 A, 5% 8/1/2037 | | 60,000 | 64,906 |
| | | | 232,070 |
| Electric Utilities - 0.1% | | | |
| Intermountain Pwr Agy UT Pwr Series 2023 A, 5% 7/1/2033 | | 50,000 | 56,249 |
| Escrowed/Pre-Refunded - 0.0% | | | |
| Utah Tran Auth Sales Tax Rev Series 2015 A, 5% 6/15/2026 (Pre-refunded to 6/15/2025 at 100) | | 10,000 | 10,087 |
| Utah Tran Auth Sales Tax Rev Series 2015 A, 5% 6/15/2029 (Pre-refunded to 6/15/2025 at 100) | | 20,000 | 20,173 |
| | | | 30,260 |
| Health Care - 0.1% | | | |
| Utah Cnty Utah Hosp Rev (IHC Health Services Inc Proj.) Series 2018 A, 5% 5/15/2041 | | 120,000 | 121,558 |
| Special Tax - 0.0% | | | |
| Utah Tran Auth Sales Tax Rev 4% 12/15/2029 | | 25,000 | 25,220 |
| Transportation - 0.1% | | | |
| Salt Lake City UT Arpt Rev 4% 7/1/2038 (d) | | 90,000 | 88,333 |
| Water & Sewer - 0.1% | | | |
| Salt Lake City Utah Pub Util Rev Series 2020, 4% 2/1/2044 | | 100,000 | 98,186 |
TOTAL UTAH | | | 651,876 |
| Virginia - 2.0% | | | |
| Education - 0.1% | | | |
| University VA Univ Revs Series 2015 A 1, 4% 4/1/2045 | | 55,000 | 53,540 |
| Virginia Small Business Fing Auth Rev (Hampton Univ, VA Proj.) Series 2014, 4% 10/1/2038 | | 5,000 | 4,823 |
| | | | 58,363 |
| Escrowed/Pre-Refunded - 0.1% | | | |
| Fairfax Cnty VA Economic Dev Auth Transn Contract Rev Series A, 3% 4/1/2036 (Pre-refunded to 4/1/2026 at 100) | | 30,000 | 29,970 |
| Henrico Cnty VA Wtr & Swr Rev Series 2016, 5% 5/1/2046 (Pre-refunded to 5/1/2026 at 100) | | 30,000 | 30,778 |
| Virginia Port Auth Port Fac Rev Series 2015A, 5% 7/1/2033 (Pre-refunded to 7/1/2025 at 100) (d) | | 35,000 | 35,250 |
| | | | 95,998 |
| General Obligations - 1.4% | | | |
| Chesterfield Cnty VA Economic Dev Auth Rev (Chesterfield Cnty VA Proj.) 4% 4/1/2050 | | 20,000 | 19,402 |
| County of Loudoun VA Gen. Oblig. Series 2023A, 5% 12/1/2029 | | 155,000 | 170,079 |
| Fairfax Cnty VA Gen. Oblig. Series 2020A, 5% 10/1/2036 | | 270,000 | 292,709 |
| Richmond VA Series 2019 A, 3% 7/15/2034 | | 40,000 | 37,785 |
| Virginia College Bldg Auth Edl (Virginia St Proj.) Series 2019 C, 5% 2/1/2030 | | 45,000 | 48,392 |
| Virginia College Bldg Auth Edl (Virginia St Proj.) Series 2020 A, 5% 2/1/2031 | | 100,000 | 109,259 |
| Virginia College Bldg Auth Edl (Virginia St Proj.) Series 2022A, 5% 2/1/2026 | | 100,000 | 102,178 |
| Virginia Comwlth Transn Brd Tr (Virginia St Proj.) Series 2017, 3% 5/15/2036 | | 125,000 | 115,960 |
| Virginia St Gen. Oblig. Series 2018A, 3% 6/1/2032 | | 5,000 | 4,900 |
| Virginia St Pub Bldg Auth Pub (Virginia St Proj.) Series 2013A, 3% 8/1/2030 | | 100,000 | 95,914 |
| Virginia St Pub Bldg Auth Pub (Virginia St Proj.) Series 2019A, 5% 8/1/2029 | | 60,000 | 65,239 |
| Virginia St Pub Bldg Auth Pub (Virginia St Proj.) Series A, 3% 8/1/2035 | | 15,000 | 13,938 |
| Virginia St Pub Bldg Auth Pub Facs Rev (Virginia St Proj.) Series 2022 A, 5% 8/1/2031 | | 80,000 | 89,565 |
| | | | 1,165,320 |
| Health Care - 0.1% | | | |
| Lynchburg Economic Development Authority (Centra Health Proj.) Series 2017 A, 4% 1/1/2047 | | 35,000 | 33,237 |
| Lynchburg Economic Development Authority (Centra Health Proj.) Series 2021, 3% 1/1/2051 | | 50,000 | 37,370 |
| Roanoke VA Economic Dev Auth Hosp Rev (Carilion Health System Proj.) Series 2020 D, 5% tender 7/1/2053 (b) | | 30,000 | 32,248 |
| | | | 102,855 |
| Special Tax - 0.2% | | | |
| Fairfax Cnty VA Economic Dev Auth Transn Contract Rev (Fairfax County Economic Development Authority Proj.) 2.875% 4/1/2035 | | 45,000 | 40,553 |
| Fairfax Cnty VA Economic Dev Auth Transn Contract Rev 3% 4/1/2036 | | 125,000 | 115,084 |
| | | | 155,637 |
| Transportation - 0.1% | | | |
| VA Commlth Trn Bd Grnt Antic Rev Series 2017, 5% 3/15/2027 | | 15,000 | 15,685 |
| Virginia Small Business Fing Auth Rev (Elizabeth River Crossings Opco LLC Proj.) Series 2022, 3% 1/1/2041 (d) | | 50,000 | 40,377 |
| | | | 56,062 |
TOTAL VIRGINIA | | | 1,634,235 |
| Washington - 4.1% | | | |
| Education - 0.3% | | | |
| University Wash Univ Revs Series 2012C, 3.25% 7/1/2043 | | 135,000 | 113,785 |
| Washington St Higher Ed Facs (Gonzaga University Proj.) Series 2019 A, 3% 4/1/2049 | | 40,000 | 30,886 |
| Washington St Higher Ed Facs (Seattle Pacific Univ Proj.) Series 2020 A, 5% 10/1/2042 | | 75,000 | 71,228 |
| Washington St Univ Revs Series 2015, 5% 4/1/2040 | | 35,000 | 35,143 |
| | | | 251,042 |
| Electric Utilities - 1.1% | | | |
| Energy Norwthwest WA Elec Rev Series 2015 A, 5% 7/1/2028 (Bonneville Power Administration Guaranteed) | | 75,000 | 75,670 |
| Energy Norwthwest WA Elec Rev Series 2016 A, 5% 7/1/2028 (Bonneville Power Administration Guaranteed) | | 55,000 | 56,458 |
| Energy Norwthwest WA Elec Rev Series 2017 A, 5% 7/1/2028 (Bonneville Power Administration Guaranteed) | | 95,000 | 99,620 |
| Energy Norwthwest WA Elec Rev Series 2018 C, 5% 7/1/2033 (Bonneville Power Administration Guaranteed) | | 65,000 | 68,814 |
| Energy Norwthwest WA Elec Rev Series 2024A, 5% 7/1/2032 (Bonneville Power Administration Guaranteed) | | 140,000 | 158,081 |
| Seattle WA Mun Lt & Pwr Rev Series 2019 A, 5% 4/1/2042 | | 100,000 | 104,723 |
| Seattle WA Mun Lt & Pwr Rev Series 2020 A, 5% 7/1/2027 | | 90,000 | 94,567 |
| Seattle WA Mun Lt & Pwr Rev Series 2021 A, 4% 7/1/2043 | | 100,000 | 99,521 |
| Tacoma WA Elec Sys Rev Series 2021, 4% 1/1/2051 | | 135,000 | 129,089 |
| | | | 886,543 |
| General Obligations - 1.6% | | | |
| Clark Cnty WA Sch Dist 114 Evergreen Series 2019, 3% 12/1/2038 (State of Washington Guaranteed) | | 20,000 | 17,685 |
| King Cnty WA Sch Dist #403 Renton Series 2020, 4% 12/1/2035 (State of Washington Guaranteed) | | 100,000 | 102,307 |
| King Cnty Wash Hsg Auth Rev Series 2018, 3.5% 5/1/2038 (King County WA Guaranteed) | | 35,000 | 31,980 |
| King County WA Gen. Oblig. Series 2015E, 5% 12/1/2029 | | 45,000 | 45,741 |
| State of Washington Gen. Oblig. Series 2015B, 5% 2/1/2028 | | 40,000 | 40,055 |
| State of Washington Gen. Oblig. Series 2016C, 5% 2/1/2035 | | 30,000 | 30,485 |
| State of Washington Gen. Oblig. Series 2020 E, 5% 6/1/2045 | | 55,000 | 57,729 |
| State of Washington Gen. Oblig. Series 2020A, 5% 8/1/2028 | | 230,000 | 246,632 |
| State of Washington Gen. Oblig. Series 2021 A, 5% 8/1/2029 | | 75,000 | 81,718 |
| State of Washington Gen. Oblig. Series 2021 A, 5% 8/1/2043 | | 175,000 | 185,979 |
| State of Washington Gen. Oblig. Series R 2015C, 5% 7/1/2027 | | 25,000 | 25,000 |
| State of Washington Gen. Oblig. Series R 2015H, 5% 7/1/2026 | | 25,000 | 25,000 |
| State of Washington Gen. Oblig. Series R 2015H, 5% 7/1/2029 | | 15,000 | 14,999 |
| State of Washington Gen. Oblig. Series R 2016B, 5% 7/1/2032 | | 50,000 | 50,810 |
| State of Washington Gen. Oblig. Series R 2018 D, 5% 8/1/2028 | | 30,000 | 31,517 |
| State of Washington Gen. Oblig. Series R 2020A, 5% 1/1/2026 | | 20,000 | 20,410 |
| State of Washington Gen. Oblig. Series R 2022A, 5% 2/1/2031 | | 100,000 | 111,114 |
| State of Washington Gen. Oblig. Series R 2023 B, 5% 7/1/2033 | | 95,000 | 108,497 |
| Thurston & Pierce Cntys WA Sch Series 2019, 4% 12/1/2035 (State of Washington Guaranteed) | | 50,000 | 50,861 |
| | | | 1,278,519 |
| Health Care - 0.5% | | | |
| Washington St Health Care Facs Auth Rev (Multicare Medical Ctr,Tacom,Wa Proj.) Series 2017B, 3.5% 8/15/2038 | | 125,000 | 111,320 |
| Washington St Health Care Facs Auth Rev (Providence Health Systems Proj.) Series 2014C, 4% 10/1/2044 | | 55,000 | 50,610 |
| Washington St Health Care Facs Auth Rev (Providence Health Systems Proj.) Series 2014D, 5% 10/1/2038 | | 5,000 | 5,010 |
| Washington St Health Care Facs Auth Rev (Seattle Cancer Care Proj.) 4% 9/1/2050 | | 115,000 | 103,064 |
| Washington St Health Care Facs Auth Rev (Virginia Mason Medical Ctr WA Proj.) Series 2017, 5% 8/15/2037 | | 125,000 | 127,157 |
| | | | 397,161 |
| Special Tax - 0.1% | | | |
| Central Puget Sound WA Regl Tran Auth Sales & Use Tax Rev Series 2016 S 1, 5% 11/1/2027 | | 45,000 | 46,557 |
| Central Puget Sound WA Regl Tran Auth Sales & Use Tax Rev Series 2016 S 1, 5% 11/1/2035 | | 65,000 | 66,736 |
| | | | 113,293 |
| Transportation - 0.2% | | | |
| Port Seattle WA Rev Series 2019, 5% 4/1/2034 (d) | | 150,000 | 155,746 |
| Water & Sewer - 0.3% | | | |
| King Cnty WA Swr Rev Series 2020 A, 4% 1/1/2044 | | 225,000 | 222,820 |
| Seattle WA Wtr Sys Rev Series 2015, 4% 5/1/2045 | | 50,000 | 47,855 |
| | | | 270,675 |
TOTAL WASHINGTON | | | 3,352,979 |
| West Virginia - 0.2% | | | |
| Health Care - 0.0% | | | |
| West Virginia St Hosp Fin Auth Hosp Rev (West Virginia United Health Sy Stem Proj.) Series 2016A, 3% 6/1/2033 | | 20,000 | 18,746 |
| Transportation - 0.2% | | | |
| West Virginia Parkways Authority Series 2021, 4% 6/1/2051 | | 145,000 | 138,844 |
TOTAL WEST VIRGINIA | | | 157,590 |
| Wisconsin - 0.6% | | | |
| Education - 0.0% | | | |
| Public Fin Auth WI Lease Dev Rev (University Kans Univ Revs Proj.) Series 2016, 5% 3/1/2029 | | 40,000 | 40,812 |
| Escrowed/Pre-Refunded - 0.1% | | | |
| Wisconsin General Fund Annual Appropiation Series 2017 B, 5% 5/1/2036 | | 35,000 | 35,931 |
| Wisconsin Health & Educational Facilities Authority Series 2016 A, 3.125% 11/15/2036 (Pre-refunded to 5/15/2026 at 100) | | 50,000 | 49,900 |
| | | | 85,831 |
| General Obligations - 0.5% | | | |
| Milwaukee WI Gen. Oblig. Series 2016 B3, 3% 3/1/2031 | | 50,000 | 46,834 |
| Wisconsin St Gen. Oblig. 5% 5/1/2031 | | 95,000 | 105,945 |
| Wisconsin St Gen. Oblig. Series 2016 2, 5% 11/1/2029 | | 65,000 | 66,622 |
| Wisconsin St Gen. Oblig. Series 2017 3, 5% 11/1/2031 | | 25,000 | 26,125 |
| Wisconsin St Gen. Oblig. Series 2017, 5% 11/1/2026 | | 40,000 | 41,539 |
| Wisconsin St Gen. Oblig. Series 2019 A, 4% 5/1/2027 | | 20,000 | 20,222 |
| | | | 307,287 |
| Health Care - 0.0% | | | |
| Public Fin Auth WI Hosp Rev (Renown Regional Medical Center Proj.) Series 2016 A, 3% 6/1/2036 | | 5,000 | 4,352 |
| Wisconsin Health & Educational Facilities Authority (Froedtert Thedacare Proj.) Series 2017 A, 5% 4/1/2028 | | 5,000 | 5,177 |
| Wisconsin Health & Educational Facilities Authority (Hospital Sisters Svcs Inc Proj.) Series 2014A, 5% 11/15/2025 | | 10,000 | 10,010 |
| | | | 19,539 |
| Housing - 0.0% | | | |
| Wisconsin Hsg & Economic Dev Auth Home Ownership Mtg Rev 2.69% 7/1/2047 | | 7,996 | 6,910 |
| Special Tax - 0.0% | | | |
| Public Fin Auth WI Revenue Series 2021, 4% 3/31/2056 (d) | | 5,000 | 4,178 |
| Wisconsin St Transn Rev Series 2017 1, 5% 7/1/2028 | | 10,000 | 10,502 |
| | | | 14,680 |
TOTAL WISCONSIN | | | 475,059 |
| Wyoming - 0.0% | | | |
| Electric Utilities - 0.0% | | | |
| Campbell Cnty WY Solid Waste Facs Rev (County of Mercer ND Proj.) Series 2019 A, 3.625% 7/15/2039 | | 30,000 | 27,103 |
| TOTAL MUNICIPAL SECURITIES (Cost $85,254,703) | | | 82,042,663 |
| | | | |
| TOTAL INVESTMENT IN SECURITIES - 100.2% (Cost $85,254,703) | 82,042,663 |
NET OTHER ASSETS (LIABILITIES) - (0.2)% | (150,816) |
| NET ASSETS - 100.0% | 81,891,847 |
| | |
Legend
| (a) | Amount is stated in United States dollars unless otherwise noted. |
| (b) | Coupon rates for floating and adjustable rate securities reflect the rates in effect at period end. |
| (c) | Security initially issued at one coupon which converts to a higher coupon at a specified date. The rate shown is the rate at period end. |
| (d) | Private activity obligations whose interest is subject to the federal alternative minimum tax for individuals. |
| (e) | Security initially issued in zero coupon form which converts to coupon form at a specified rate and date. The rate shown is the rate at period end. |
| (f) | Security or a portion of the security purchased on a delayed delivery or when-issued basis. |
Affiliated Central Funds
Fiscal year to date information regarding the Fund's investments in Fidelity Central Funds, including the ownership percentage, is presented below.
| Affiliate | Value, beginning of period ($) | Purchases ($) | Sales Proceeds ($) | Dividend Income ($) | Realized Gain (loss) ($) | Change in Unrealized appreciation (depreciation) ($) | Value, end of period ($) | Shares, end of period | % ownership, end of period |
| Fidelity Municipal Cash Central Fund | - | 4,702,697 | 4,702,697 | 2,854 | - | - | - | - | 0.0% |
| Total | - | 4,702,697 | 4,702,697 | 2,854 | - | - | - | - | |
| | | | | | | | | | |
Amounts in the dividend income column in the above table include any capital gain distributions from underlying funds, which are presented in the corresponding line item in the Statement of Operations, if applicable.
Amounts included in the purchases and sales proceeds columns may include in-kind transactions, if applicable.
Investment Valuation
The following is a summary of the inputs used, as of December 31, 2024, involving the Fund's assets and liabilities carried at fair value. The inputs or methodology used for valuing securities may not be an indication of the risk associated with investing in those securities. For more information on valuation inputs, and their aggregation into the levels used below, please refer to the Investment Valuation section in the accompanying Notes to Financial Statements.
| Valuation Inputs at Reporting Date: |
| Description | Total ($) | Level 1 ($) | Level 2 ($) | Level 3 ($) |
Investments in Securities: | | | | |
|
| Municipal Securities | | | | |
Education | 4,693,890 | - | 4,693,890 | - |
Electric Utilities | 4,919,596 | - | 4,919,596 | - |
Escrowed/Pre-Refunded | 1,422,130 | - | 1,422,130 | - |
General Obligations | 28,555,405 | - | 28,555,405 | - |
Health Care | 6,974,740 | - | 6,974,740 | - |
Housing | 2,164,137 | - | 2,164,137 | - |
Industrial Development | 249,486 | - | 249,486 | - |
Lease Revenue | 231,204 | - | 231,204 | - |
Other | 531,863 | - | 531,863 | - |
Resource Recovery | 35,833 | - | 35,833 | - |
Special Tax | 12,188,626 | - | 12,188,626 | - |
Tobacco Bonds | 128,692 | - | 128,692 | - |
Transportation | 12,476,497 | - | 12,476,497 | - |
Water & Sewer | 7,470,564 | - | 7,470,564 | - |
| | | | | |
| Total Investments in Securities: | 82,042,663 | - | 82,042,663 | - |
Financial Statements (Unaudited)
| Statement of Assets and Liabilities |
| As of December 31, 2024 (Unaudited) |
| Assets | | | | |
Investment in securities, at value - See accompanying schedule Unaffiliated issuers (cost $85,254,703): | | | $ | 82,042,663 |
| Receivable for fund shares sold | | | | 52,427 |
| Interest receivable | | | | 974,170 |
| Distributions receivable from Fidelity Central Funds | | | | 306 |
| Prepaid expenses | | | | 70 |
| Receivable from investment adviser for expense reductions | | | | 4,957 |
| Other receivables | | | | 12 |
Total assets | | | | 83,074,605 |
| Liabilities | | | | |
| Payable to custodian bank | $ | 424,134 | | |
| Payable for investments purchased | | | | |
Regular delivery | | 353,962 | | |
Delayed delivery | | 137,563 | | |
| Payable for fund shares redeemed | | 31,762 | | |
| Distributions payable | | 198,402 | | |
| Accrued management fee | | 3,463 | | |
| Other payables and accrued expenses | | 33,472 | | |
| Total liabilities | | | | 1,182,758 |
| Net Assets | | | $ | 81,891,847 |
| Net Assets consist of: | | | | |
| Paid in capital | | | $ | 88,375,076 |
| Total accumulated earnings (loss) | | | | (6,483,229) |
| Net Assets | | | $ | 81,891,847 |
Net Asset Value, offering price and redemption price per share ($81,891,847 ÷ 4,444,359 shares) | | | $ | 18.43 |
| Statement of Operations |
Six months ended December 31, 2024 (Unaudited) |
| Investment Income | | | | |
| Interest | | | $ | 1,185,990 |
| Income from Fidelity Central Funds | | | | 2,854 |
| Total income | | | | 1,188,844 |
| Expenses | | | | |
| Management fee | $ | 20,268 | | |
| Custodian fees and expenses | | 1,222 | | |
| Independent trustees' fees and expenses | | 101 | | |
| Registration fees | | 8,786 | | |
| Audit fees | | 32,261 | | |
| Legal | | 63 | | |
| Miscellaneous | | 125 | | |
| Total expenses before reductions | | 62,826 | | |
| Expense reductions | | (34,135) | | |
| Total expenses after reductions | | | | 28,691 |
| Net Investment income (loss) | | | | 1,160,153 |
| Realized and Unrealized Gain (Loss) | | | | |
| Net realized gain (loss) on: | | | | |
| Investment Securities: | | | | |
| Unaffiliated issuers | | (60,716) | | |
| Total net realized gain (loss) | | | | (60,716) |
| Change in net unrealized appreciation (depreciation) on investment securities | | | | 186,943 |
| Net gain (loss) | | | | 126,227 |
| Net increase (decrease) in net assets resulting from operations | | | $ | 1,286,380 |
| Statement of Changes in Net Assets |
| |
| | Six months ended December 31, 2024 (Unaudited) | | Year ended June 30, 2024 |
| Increase (Decrease) in Net Assets | | | | |
| Operations | | | | |
| Net investment income (loss) | $ | 1,160,153 | $ | 2,265,630 |
| Net realized gain (loss) | | (60,716) | | (1,027,813) |
| Change in net unrealized appreciation (depreciation) | | 186,943 | | 563,471 |
| Net increase (decrease) in net assets resulting from operations | | 1,286,380 | | 1,801,288 |
| Distributions to shareholders | | (1,142,739) | | (2,222,794) |
| | | | | |
| Share transactions | | | | |
| Proceeds from sales of shares | | 14,391,350 | | 59,628,992 |
| Reinvestment of distributions | | 175 | | 289 |
| Cost of shares redeemed | | (13,390,887) | | (67,272,229) |
| | | | | |
Net increase (decrease) in net assets resulting from share transactions | | 1,000,638 | | (7,642,948) |
| Total increase (decrease) in net assets | | 1,144,279 | | (8,064,454) |
| | | | | |
| Net Assets | | | | |
| Beginning of period | | 80,747,568 | | 88,812,022 |
| End of period | $ | 81,891,847 | $ | 80,747,568 |
| | | | | |
| Other Information | | | | |
| Shares | | | | |
| Sold | | 773,738 | | 3,336,429 |
| Issued in reinvestment of distributions | | 9 | | 16 |
| Redeemed | | (722,085) | | (3,783,308) |
| Net increase (decrease) | | 51,662 | | (446,863) |
| | | | | |
Financial Highlights
Fidelity® SAI Municipal Bond Index Fund |
| |
| | Six months ended (Unaudited) December 31, 2024 | | Years ended June 30, 2024 | | 2023 | | 2022 | | 2021 | | 2020 A |
Selected Per-Share Data | | | | | | | | | | | | |
| Net asset value, beginning of period | $ | 18.38 | $ | 18.35 | $ | 18.33 | $ | 20.65 | $ | 20.26 | $ | 20.00 |
| Income from Investment Operations | | | | | | | | | | | | |
Net investment income (loss) B,C | | .266 | | .501 | | .470 | | .330 | | .314 | | .333 |
| Net realized and unrealized gain (loss) | | .046 | | .021 D | | .012 | | (2.320) | | .391 | | .254 |
| Total from investment operations | | .312 | | .522 | | .482 | | (1.990) | | .705 | | .587 |
| Distributions from net investment income | | (.260) | | (.492) | | (.462) | | (.330) | | (.315) | | (.327) |
| Distributions from net realized gain | | (.002) | | - | | - | | - | | - | | - |
| Total distributions | | (.262) | | (.492) | | (.462) | | (.330) | | (.315) | | (.327) |
| Net asset value, end of period | $ | 18.43 | $ | 18.38 | $ | 18.35 | $ | 18.33 | $ | 20.65 | $ | 20.26 |
Total Return E,F | | | | 2.90% | | 2.68% | | (9.74)% | | 3.50% | | 2.96% |
Ratios to Average Net Assets C,G,H | | | | | | | | | | | | |
| Expenses before reductions | | .15% I | | .17% | | .18% | | .20% | | .17% | | .45% I |
| Expenses net of fee waivers, if any | | | | .07% | | .07% | | .07% | | .07% | | .07% I |
| Expenses net of all reductions | | .07% I | | .07% | | .07% | | .07% | | .07% | | .07% I |
| Net investment income (loss) | | 2.84% I | | 2.75% | | 2.57% | | 1.65% | | 1.53% | | 1.72% I |
| Supplemental Data | | | | | | | | | | | | |
| Net assets, end of period (000 omitted) | $ | 81,892 | $ | 80,748 | $ | 88,812 | $ | 86,256 | $ | 90,154 | $ | 54,824 |
Portfolio turnover rate J | | | | 17% | | 17% | | 59% | | 13% | | 8% I |
AFor the period July 11, 2019 (commencement of operations) through June 30, 2020.
BCalculated based on average shares outstanding during the period.
CNet investment income (loss) is affected by the timing of the declaration of dividends by any underlying mutual funds or exchange-traded funds (ETFs). Net investment income (loss) of any mutual funds or ETFs is not included in the Fund's net investment income (loss) ratio.
DThe amount shown for a share outstanding does not correspond with the aggregate net gain (loss) on investments for the period due to the timing of sales and repurchases of shares in relation to fluctuating market values of the investments of the Fund.
ETotal returns for periods of less than one year are not annualized.
FTotal returns would have been lower if certain expenses had not been reduced during the applicable periods shown.
GFees and expenses of any underlying mutual funds or exchange-traded funds (ETFs) are not included in the Fund's expense ratio. The Fund indirectly bears its proportionate share of these expenses.
HExpense ratios reflect operating expenses of the class. Expenses before reductions do not reflect amounts reimbursed, waived, or reduced through arrangements with the investment adviser, brokerage services, or other offset arrangements, if applicable, and do not represent the amount paid by the class during periods when reimbursements, waivers or reductions occur.
IAnnualized.
JAmount does not include the portfolio activity of any underlying mutual funds or exchange-traded funds (ETFs), derivatives or securities that mature within one year from acquisition.
Notes to Financial Statements
(Unaudited)For the period ended December 31, 2024
1. Organization.
Fidelity SAI Municipal Bond Index Fund (the Fund) is a fund of Fidelity Salem Street Trust (the Trust) and is authorized to issue an unlimited number of shares. Shares are offered exclusively to certain clients of Fidelity Management & Research Company LLC (FMR) or its affiliates. The Trust is registered under the Investment Company Act of 1940, as amended (the 1940 Act), as an open-end management investment company organized as a Massachusetts business trust.
2. Investments in Fidelity Central Funds.
Funds may invest in Fidelity Central Funds, which are open-end investment companies generally available only to other investment companies and accounts managed by the investment adviser and its affiliates. The Schedule of Investments lists any Fidelity Central Funds held as an investment as of period end, but does not include the underlying holdings of each Fidelity Central Fund. An investing fund indirectly bears its proportionate share of the expenses of the underlying Fidelity Central Funds.
Based on its investment objective, each Fidelity Central Fund may invest or participate in various investment vehicles or strategies that are similar to those of the investing fund. These strategies are consistent with the investment objectives of the investing fund and may involve certain economic risks which may cause a decline in value of each of the Fidelity Central Funds and thus a decline in the value of the investing fund.
| Fidelity Central Fund | Investment Manager | Investment Objective | Investment Practices | Expense RatioA |
| Fidelity Money Market Central Funds | Fidelity Management & Research Company LLC (FMR) | Each fund seeks to obtain a high level of current income consistent with the preservation of capital and liquidity. | Short-term Investments | Less than .005% |
A Expenses expressed as a percentage of average net assets and are as of each underlying Central Fund's most recent annual or semi-annual shareholder report.
A complete unaudited list of holdings for each Fidelity Central Fund is available upon request or at the Securities and Exchange Commission website at www.sec.gov. In addition, the financial statements of the Fidelity Central Funds which contain the significant accounting policies (including investment valuation policies) of those funds, and are not covered by the Report of Independent Registered Public Accounting Firm, are available on the Securities and Exchange Commission website or upon request.
3. Significant Accounting Policies.
The Fund is an investment company and applies the accounting and reporting guidance of the Financial Accounting Standards Board (FASB) Accounting Standards Codification Topic 946 Financial Services - Investment Companies. The financial statements have been prepared in conformity with accounting principles generally accepted in the United States of America (GAAP), which require management to make certain estimates and assumptions at the date of the financial statements. Actual results could differ from those estimates. The Fund operates as a single operating segment. The Fund's income, expenses, assets, and performance are regularly monitored and assessed as a whole by the investment adviser and other individuals responsible for oversight functions of the Trust, using the information presented in the financial statements and financial highlights. Subsequent events, if any, through the date that the financial statements were issued have been evaluated in the preparation of the financial statements. The Fund's Schedule of Investments lists any underlying mutual funds or exchange-traded funds (ETFs) but does not include the underlying holdings of these funds. The following summarizes the significant accounting policies of the Fund:
Investment Valuation. Investments are valued as of 4:00 p.m. Eastern time on the last calendar day of the period. The Board of Trustees (the Board) has designated the Fund's investment adviser as the valuation designee responsible for the fair valuation function and performing fair value determinations as needed. The investment adviser has established a Fair Value Committee (the Committee) to carry out the day-to-day fair valuation responsibilities and has adopted policies and procedures to govern the fair valuation process and the activities of the Committee. In accordance with these fair valuation policies and procedures, which have been approved by the Board, the Fund attempts to obtain prices from one or more third party pricing services or brokers to value its investments. When current market prices, quotations or currency exchange rates are not readily available or reliable, investments will be fair valued in good faith by the Committee, in accordance with the policies and procedures. Factors used in determining fair value vary by investment type and may include market or investment specific events, transaction data, estimated cash flows, and market observations of comparable investments. The frequency that the fair valuation procedures are used cannot be predicted and they may be utilized to a significant extent. The Committee manages the Fund's fair valuation practices and maintains the fair valuation policies and procedures. The Fund's investment adviser reports to the Board information regarding the fair valuation process and related material matters.
The Fund categorizes the inputs to valuation techniques used to value its investments into a disclosure hierarchy consisting of three levels as shown below:
Level 1 - unadjusted quoted prices in active markets for identical investments
Level 2 - other significant observable inputs (including quoted prices for similar investments, interest rates, prepayment speeds, etc.)
Level 3 - unobservable inputs (including the Fund's own assumptions based on the best information available)
Valuation techniques used to value the Fund's investments by major category are as follows:
Debt securities, including restricted securities, are valued based on evaluated prices received from third party pricing services or from brokers who make markets in such securities. Municipal securities are valued by pricing services who utilize matrix pricing which considers yield or price of bonds of comparable quality, coupon, maturity and type or by broker-supplied prices. When independent prices are unavailable or unreliable, debt securities may be valued utilizing pricing methodologies which consider similar factors that would be used by third party pricing services. Debt securities are generally categorized as Level 2 in the hierarchy but may be Level 3 depending on the circumstances.
Changes in valuation techniques may result in transfers in or out of an assigned level within the disclosure hierarchy. The aggregate value of investments by input level as of December 31, 2024 is included at the end of the Fund's Schedule of Investments.
Investment Transactions and Income. For financial reporting purposes, the Fund's investment holdings and NAV include trades executed through the end of the last business day of the period. The NAV per share for processing shareholder transactions is calculated as of the close of business of the New York Stock Exchange (NYSE), normally 4:00 p.m. Eastern time and includes trades executed through the end of the prior business day. Gains and losses on securities sold are determined on the basis of identified cost. Income and capital gain distributions from Fidelity Central Funds, if any, are recorded on the ex-dividend date. Interest income is accrued as earned and includes coupon interest and amortization of premium and accretion of discount on debt securities as applicable. Debt obligations may be placed on non-accrual status and related interest income may be reduced by ceasing current accruals and writing off interest receivables when the collection of all or a portion of interest has become doubtful based on consistently applied procedures. A debt obligation is removed from non-accrual status when the issuer resumes interest payments or when collectability of interest is reasonably assured.
Expenses. Expenses directly attributable to a fund are charged to that fund. Expenses attributable to more than one fund are allocated among the respective funds on the basis of relative net assets or other appropriate methods. Expenses included in the accompanying financial statements reflect the expenses of that fund and do not include any expenses associated with any underlying mutual funds or exchange-traded funds. Although not included in a fund's expenses, a fund indirectly bears its proportionate share of these expenses through the net asset value of each underlying mutual fund or exchange-traded fund. Expense estimates are accrued in the period to which they relate and adjustments are made when actual amounts are known.
Income Tax Information and Distributions to Shareholders. Each year, the Fund intends to qualify as a regulated investment company under Subchapter M of the Internal Revenue Code, including distributing substantially all of its taxable income and realized gains. As a result, no provision for U.S. Federal income taxes is required. The Fund files a U.S. federal tax return, in addition to state and local tax returns as required. The Fund's federal income tax returns are subject to examination by the Internal Revenue Service (IRS) for a period of three fiscal years after they are filed. State and local tax returns may be subject to examination for an additional fiscal year depending on the jurisdiction.
Distributions are declared and recorded daily and paid monthly from net investment income. Distributions from realized gains, if any, are declared and recorded on the ex-dividend date. Income and capital gain distributions are determined in accordance with income tax regulations, which may differ from GAAP.
Capital accounts within the financial statements are adjusted for permanent book-tax differences. These adjustments have no impact on net assets or the results of operations. Capital accounts are not adjusted for temporary book-tax differences which will reverse in a subsequent period.
Book-tax differences are primarily due to market discount and capital loss carryforwards.
The Fund purchases municipal securities whose interest, in the opinion of the issuer, is free from federal income tax. There is no assurance that the IRS will agree with this opinion. In the event the IRS determines that the issuer does not comply with relevant tax requirements, interest payments from a security could become federally taxable, possibly retroactively to the date the security was issued.
As of period end, the cost and unrealized appreciation (depreciation) in securities, and derivatives if applicable, for federal income tax purposes were as follows:
| Gross unrealized appreciation | $203,870 |
| Gross unrealized depreciation | (3,309,251) |
| Net unrealized appreciation (depreciation) | $(3,105,381) |
| Tax cost | $85,148,044 |
Capital loss carryforwards are only available to offset future capital gains of the Fund to the extent provided by regulations and may be limited. The capital loss carryforward information presented below, including any applicable limitation, is estimated as of prior fiscal period end and is subject to adjustment.
Short-term | $(1,214,161) |
Long-term | (2,085,361) |
| Total capital loss carryforward | $(3,299,522) |
Delayed Delivery Transactions and When-Issued Securities. During the period, certain Funds transacted in securities on a delayed delivery or when-issued basis. Payment and delivery may take place after the customary settlement period for that security. The price of the underlying securities and the date when the securities will be delivered and paid for are fixed at the time the transaction is negotiated. Securities purchased on a delayed delivery or when-issued basis are identified as such in the Schedule of Investments. Compensation for interest forgone in the purchase of a delayed delivery or when-issued debt security may be received. With respect to purchase commitments, each applicable Fund identifies securities as segregated in its records with a value at least equal to the amount of the commitment. Payables and receivables associated with the purchases and sales of delayed delivery securities having the same coupon, settlement date and broker are offset. Delayed delivery or when-issued securities that have been purchased from and sold to different brokers are reflected as both payables and receivables in the Statement of Assets and Liabilities under the caption "Delayed delivery", as applicable. Losses may arise due to changes in the value of the underlying securities or if the counterparty does not perform under the contract's terms, or if the issuer does not issue the securities due to political, economic, or other factors.
New Accounting Pronouncement. FASB Accounting Standards Update (ASU) 2023-07 Segment Reporting (Topic 280): Improvements to Reportable Segment Disclosures became effective in this reporting period. ASU 2023-07 enhances segment information disclosure in the notes to financial statements.
4. Purchases and Sales of Investments.
Purchases and sales of securities, other than short-term securities and in-kind transactions, as applicable, are noted in the table below.
| | Purchases ($) | Sales ($) |
| Fidelity SAI Municipal Bond Index Fund | 9,794,338 | 7,890,073 |
5. Fees and Other Transactions with Affiliates.
Management Fee. Fidelity Management & Research Company LLC (the investment adviser) and its affiliates provide the Fund with investment management related services for which the Fund pays a monthly management fee that is based on an annual rate of .05% of the Fund's average net assets.
Interfund Trades. Funds may purchase from or sell securities to other Fidelity Funds under procedures adopted by the Board. The procedures have been designed to ensure these interfund trades are executed in accordance with Rule 17a-7 of the 1940 Act. Any interfund trades are included within the respective purchases and sales amounts shown in the Purchases and Sales of Investments note. During the period, there were no interfund trades.
6. Committed Line of Credit.
Certain Funds participate with other funds managed by the investment adviser or an affiliate in a $4.25 billion credit facility (the "line of credit") to be utilized for temporary or emergency purposes to fund shareholder redemptions or for other short-term liquidity purposes.
Commitment fees are charged based on the unused amount of the line of credit at an annual rate of .10%, and then allocated to each participating fund based on its pro-rata portion of the line of credit. The commitment fees are reflected in Miscellaneous expenses on the Statement of Operations, and are listed below.
Interest is charged to a participating fund based on its borrowings at an annual rate of .75% plus the highest of (i) daily SOFR plus a .10% spread adjustment, (ii) Federal Funds Effective Rate, or (iii) Overnight Bank Funding Rate. During the period, there were no borrowings on this line of credit.
The line of credit agreement will expire in March 2025 unless extended or renewed.
| | Amount ($) |
| Fidelity SAI Municipal Bond Index Fund | 55 |
7. Expense Reductions.
The investment adviser contractually agreed to reimburse the Fund to the extent annual operating expenses exceeded .07% of average net assets. This reimbursement will remain in place through October 31, 2025. Some expenses, for example the compensation of the independent Trustees, and certain miscellaneous expenses such as proxy and shareholder meeting expenses, are excluded from this reimbursement. During the period this reimbursement reduced the Fund's expenses by $34,119.
Through arrangements with the Fund's custodian, credits realized as a result of certain uninvested cash balances were used to reduce the Fund's expenses by $16.
8. Other.
A fund's organizational documents provide former and current trustees and officers with a limited indemnification against liabilities arising in connection with the performance of their duties to the fund. In the normal course of business, a fund may also enter into contracts that provide general indemnifications. A fund's maximum exposure under these arrangements is unknown as this would be dependent on future claims that may be made against a fund. The risk of material loss from such claims is considered remote.
9. Risk and Uncertainties.
Many factors affect a fund's performance. Developments that disrupt global economies and financial markets, such as pandemics, epidemics, outbreaks of infectious diseases, war, terrorism, and environmental disasters, may significantly affect a fund's investment performance. The effects of these developments to a fund will be impacted by the types of securities in which a fund invests, the financial condition, industry, economic sector, and geographic location of an issuer, and a fund's level of investment in the securities of that issuer. Significant concentrations in security types, issuers, industries, sectors, and geographic locations may magnify the factors that affect a fund's performance.
Item 8: Changes in and Disagreements with Accountants for Open-End Management Investment Companies
(Unaudited)
Note: This is not applicable for any fund included in this document.
Item 9: Proxy Disclosures for Open-End Management Investment Companies
(Unaudited)
Note: This is not applicable for any fund included in this document.
Item 10: Remuneration Paid to Directors, Officers, and others of Open-End Management Investment Companies
(Unaudited)
Note: This information is disclosed as part of the financial statements for each Fund as part of Item 7: Financial Statements and Financial Highlights for Open-End Management Investment companies.
Item 11: Statement Regarding Basis for Approval of Investment Advisory Contract
(Unaudited)
Board Approval of Investment Advisory Contracts and Management Fees
Fidelity SAI Municipal Bond Index Fund
Each year, the Board of Trustees, including the Independent Trustees (together, the Board), considers the renewal of the fund's management contract with Fidelity Management & Research Company LLC (FMR) and the sub-advisory agreements (together, the Advisory Contracts) for the fund. FMR and the sub-advisers are referred to herein as the Investment Advisers. The Board, assisted by the advice of fund counsel and Independent Trustees' counsel, requests and considers a broad range of information relevant to the renewal of the Advisory Contracts throughout the year.
The Board meets regularly and, at each of its meetings, covers an extensive agenda of topics and materials and considers factors that are relevant to its annual consideration of the renewal of the fund's Advisory Contracts, including the services and support provided to the fund and its shareholders. The Board's Operations Committee, of which all the Independent Trustees are members, meets regularly throughout the year and requests, receives and considers, among other matters, information related to the annual consideration of the renewal of the fund's Advisory Contracts before making its recommendation to the Board. The Board also meets as needed to review matters specifically related to the Board's annual consideration of the renewal of the Advisory Contracts. Members of the Board may also meet from time to time with trustees of other Fidelity funds through joint ad hoc committees to discuss certain matters relevant to all of the Fidelity funds.
At its September 2024 meeting, the Board unanimously determined to renew the fund's Advisory Contracts. In reaching its determination, the Board considered all factors it believed relevant, including (i) the nature, extent, and quality of the services provided to the fund and its shareholders (including the investment performance of the fund); (ii) the competitiveness relative to peer funds of the fund's management fee and total expense ratio; (iii) the total costs of the services provided by and the profits realized by FMR and its affiliates (Fidelity) from its relationships with the fund; and (iv) the extent to which, if any, economies of scale exist and are realized as the fund grows, and whether any economies of scale are appropriately shared with fund shareholders. The Board also considered the broad range of investment choices available to shareholders from FMR's competitors and that the fund's shareholders have chosen to invest in the fund, which is part of the Fidelity family of funds. The Board's decision to renew the Advisory Contracts was not based on any single factor and the factors may have been weighed differently by different Trustees.
The Board reached a determination, with the assistance of fund counsel and Independent Trustees' counsel and through the exercise of its business judgment, that the renewal of the Advisory Contracts was in the best interests of the fund and its shareholders and that the compensation payable under the Advisory Contracts was fair and reasonable in light of all of the surrounding circumstances.
Nature, Extent, and Quality of Services Provided. The Board considered Fidelity's staffing as it relates to the fund, including the backgrounds and experience of investment personnel, and also considered the Investment Advisers' implementation of the fund's investment program. The Independent Trustees also had discussions with senior management of Fidelity's investment operations and investment groups. The Board considered the structure of the investment personnel compensation program and whether this structure provides appropriate incentives to act in the best interests of the fund. Additionally, the Board considered the portfolio managers' investments, if any, in the funds that they manage.
Resources Dedicated to Investment Management and Support Services. The Board reviewed the general qualifications and capabilities of Fidelity's investment staff, including its size, education, experience, and resources, as well as Fidelity's approach to recruiting, training, managing, and compensating investment personnel. The Board noted the resources devoted to Fidelity's global investment organization, and that Fidelity's analysts have extensive resources, tools and capabilities that allow them to conduct quantitative and fundamental analysis, as well as credit analysis of issuers, counterparties and guarantors. Further, the Board considered that Fidelity's investment professionals have sufficient access to global information and data so as to provide competitive investment results over time, and that those professionals also have access to sophisticated tools that permit them to assess portfolio construction and risk and performance attribution characteristics continuously, as well as to transmit new information and research conclusions rapidly around the world. Additionally, in its deliberations, the Board considered Fidelity's trading, risk management, compliance, cybersecurity, and technology and operations capabilities and resources, which are integral parts of the investment management process.
Shareholder and Administrative Services. The Board considered (i) the nature, extent, quality, and cost of advisory, administrative, and shareholder services performed by the Investment Advisers and their affiliates under the Advisory Contracts and under separate agreements covering transfer agency and pricing and bookkeeping services for the fund; (ii) the nature and extent of Fidelity's supervision of third party service providers, principally custodians, subcustodians, and pricing vendors; and (iii) the resources devoted by Fidelity to, and the record of compliance with, the fund's compliance policies and procedures, including with respect to liquidity risk management.
The Board noted that the growth of fund assets over time across the complex allows Fidelity to reinvest in the development of services designed to enhance the value and convenience of the Fidelity funds as investment vehicles. These services include 24-hour access to account information and market information over the Internet and through telephone representatives, investor education materials and asset allocation tools. The Board also considered that it reviews customer service metrics such as telephone response times, continuity of services on the website and metrics addressing services at Fidelity Investor Centers.
Investment in a Large Fund Family. The Board considered the benefits to shareholders of investing in a fund that is part of a large family of funds offering a variety of investment disciplines and providing a large variety of fund investor services. The Board noted that Fidelity had taken, or had made recommendations to the Board that resulted in the Fidelity funds taking, a number of actions over the previous year that benefited particular funds and/or the Fidelity funds in general.
Investment Performance. The Board took into account discussions that occur with representatives of the Investment Advisers, and reports that it receives, at Board meetings throughout the year relating to fund investment performance. In this regard the Board noted that as part of regularly scheduled fund reviews and other reports to the Board on fund performance, the Board considered annualized return information for the fund for different time periods, measured against the securities market index the fund seeks to track (benchmark index). The Board also periodically considers the fund's tracking error versus its benchmark index. In its evaluation of fund investment performance at meetings throughout the year, the Board gave particular attention to information indicating underperformance of certain Fidelity funds over different time periods and discussed with the Investment Advisers the reasons for such underperformance.
In addition to reviewing absolute and relative fund performance, the Independent Trustees periodically consider the appropriateness of fund performance metrics in evaluating the results achieved. In general, the Independent Trustees believe that an index fund's performance should be evaluated based on gross performance (before fees and expenses but after transaction costs) of the fund compared to the fund's benchmark index, over appropriate time periods.
Based on its review, the Board concluded that the nature, extent, and quality of services provided to the fund under the Advisory Contracts should continue to benefit the shareholders of the fund.
Competitiveness of Management Fee and Total Expense Ratio. The Board was provided with information regarding industry trends in management fees and expenses. In its review of the fund's management fee and total expense ratio, the Board considered the fund's management fee rate as well as other fund expenses, such as custodial, legal, and audit fees. The Board noted that Fidelity may agree to waive fees or reimburse expenses from time to time, and the extent to which, if any, it has done so for the fund.
Comparisons of Management Fees and Total Expense Ratios. Among other things, the Board reviewed data for selected groups of competitive funds and classes (referred to as "mapped groups") that were compiled by Fidelity based on combining similar investment objective categories (as classified by Morningstar) that have comparable investment mandates. The data reviewed by the Board included (i) gross management fee comparisons (before taking into account expense reimbursements or caps) relative to the total universe of funds within the mapped group; (ii) gross management fee comparisons relative to a subset of non-Fidelity funds in the mapped group that are similar in size and management fee structure to the fund (referred to as the "asset size peer group"); (iii) total expense comparisons of the fund relative to funds and classes in the mapped group that have a similar sales load structure to the fund (referred to as the "similar sales load structure group"); and (iv) total expense comparisons of the fund relative to funds and classes in the similar sales load structure group that are similar in size and management fee structure to the fund (referred to as the "total expense asset size peer group"). The total expense asset size peer group comparison excludes performance adjustments and fund-paid 12b-1 fees to eliminate variability in fee structures.
The information provided to the Board indicated that the fund's management fee rate ranked below the competitive median of the mapped group for 2023 and below the competitive median of the asset size peer group for 2023. Further, the information provided to the Board indicated that the total expense ratio of the fund ranked below the competitive median of the similar sales load structure group for 2023 and below the competitive median of the total expense asset size peer group for 2023.
Fees Charged to Other Fidelity Clients. The Board also considered Fidelity fee structures and other information with respect to clients of Fidelity, such as other funds advised or subadvised by Fidelity, pension plan clients, and other institutional clients with similar mandates. The Board noted that a joint ad hoc committee created by it and the boards of other Fidelity funds periodically reviews and compares Fidelity's institutional investment advisory business with its business of providing services to the Fidelity funds and also noted the most recent findings of the committee. The Board noted that the committee's review included a consideration of the differences in services provided, fees charged, and costs incurred, as well as competition in the markets serving the different categories of clients.
Based on its review, the Board concluded that the fund's management fee is fair and reasonable in light of the services that the fund receives and the other factors considered. Further, based on its review of total expense ratios and fees charged to other Fidelity clients, the Board concluded that the fund's total expense ratio was reasonable in light of the services that the fund and its shareholders receive and the other factors considered.
Costs of the Services and Profitability. The Board considered the revenues earned and the expenses incurred by Fidelity in conducting the business of developing, marketing, distributing, managing, administering and servicing the fund and servicing the fund's shareholders. The Board also considered the level of Fidelity's profits in respect of all the Fidelity funds.
On an annual basis, Fidelity presents to the Board information about the profitability of its relationships with the fund. Fidelity calculates profitability information for each Fidelity fund, as well as aggregate profitability information for groups of Fidelity funds and all Fidelity funds, using a series of detailed revenue and cost allocation methodologies which originate with the books and records of Fidelity on which Fidelity's audited financial statements are based. The Audit Committee of the Board reviews any significant changes from the prior year's methodologies.
A public accounting firm has been engaged annually by the Board as part of the Board's assessment of Fidelity's profitability analysis. The engagement includes the review and assessment of the methodologies used by Fidelity in determining the revenues and expenses attributable to Fidelity's fund business. After considering the reports issued under the engagement and information provided by Fidelity, the Board concluded that while other allocation methods may also be reasonable, Fidelity's profitability methodologies are reasonable in all material respects.
The Board also reviewed Fidelity's non-fund businesses and potential indirect benefits such businesses may have received as a result of their association with Fidelity's fund business (i.e., fall-out benefits) as well as cases where Fidelity's affiliates may benefit from the funds' business. The Board considered areas where potential indirect benefits to the Fidelity funds from their relationships with Fidelity may exist. The Board's consideration of these matters was informed by the findings of a joint ad hoc committee created by it and the boards of other Fidelity funds to evaluate potential fall-out benefits.
The Board considered the costs of the services provided by and the profits realized by Fidelity in connection with the operation of the fund and was satisfied that the profitability was not excessive.
Economies of Scale. The Board considered whether there have been economies of scale in respect of the management of the Fidelity funds, whether the Fidelity funds (including the fund) have appropriately benefited from any such economies of scale, and whether there is potential for realization of any further economies of scale. The Board considered the extent to which the fund will benefit from economies of scale as assets grow through increased services to the fund, through waivers or reimbursements, or through fee or expense ratio reductions. The Board also noted that a committee created by it and the boards of other Fidelity funds periodically analyzes whether Fidelity attains economies of scale in respect of the management and servicing of the Fidelity funds, whether the Fidelity funds have appropriately benefited from such economies of scale, and whether there is potential for realization of any further economies of scale.
The Board concluded, taking into account the analysis of the committee, that economies of scale, if any, are being appropriately shared between fund shareholders and Fidelity.
Additional Information Requested by the Board. In order to develop fully the factual basis for consideration of the Fidelity funds' advisory contracts, the Board requested and received additional information on certain topics, including: (i) portfolio manager changes that have occurred during the past year; (ii) hiring, training, compensating, and retaining adviser and sub-adviser personnel; (iii) the terms of the funds' various management fee structures and arrangements for transfer agent and pricing and bookkeeping services; (iv) Fidelity's fund profitability methodology, profitability trends for certain funds, the allocation of various costs to different funds, and the impact of certain factors on fund profitability results; (v) the impact on fund profitability of recent industry trends, such as the growth in passively managed funds and the changes in flows for different types of funds; (vi) the types of management fee and total expense comparisons provided, and the challenges and limitations associated with such information; (vii) explanations regarding the relative total expense ratios and management fees of certain funds and classes, total expense and management fee competitive trends, and methodologies for total expense and management fee competitive comparisons; (viii) matters related to money market funds, exchange-traded funds, and target date funds; (ix) the arrangements with and compensation paid to certain fund sub-advisers and the treatment of such compensation within Fidelity's fund profitability methodology; and (x) the terms of management contracts between Fidelity and other funds and products not overseen by the Board.
Conclusion. Based on its evaluation of all of the conclusions noted above, and after considering all factors it believed relevant, the Board, including the Independent Trustees, concluded that the advisory and sub-advisory fee arrangements are fair and reasonable in light of all of the surrounding circumstances and that the fund's Advisory Contracts should be renewed through September 30, 2025.
1.9894030.105
MBX-SANN-0325
Fidelity® Municipal Bond Index Fund
Semi-Annual Report
December 31, 2024
Contents
To view a fund's proxy voting guidelines and proxy voting record for the 12-month period ended June 30, visit http://www.fidelity.com/proxyvotingresults or visit the Securities and Exchange Commission's (SEC) web site at http://www.sec.gov.
You may also call 1-800-544-8544 to request a free copy of the proxy voting guidelines.
BLOOMBERG ® is a trademark and service mark of Bloomberg Finance L.P. and its affiliates (collectively "Bloomberg"). Bloomberg or Bloomberg's licensors own all proprietary rights in the Bloomberg Indices. Neither Bloomberg nor Bloomberg's licensors approves or endorses this material, or guarantees the accuracy or completeness of any information herein, or makes any warranty, express or implied, as to the results to be obtained therefrom and, to the maximum extent allowed by law, neither shall have any liability or responsibility for injury or damages arising in connection therewith.
Standard & Poor's, S&P and S&P 500 are registered service marks of The McGraw-Hill Companies, Inc. and have been licensed for use by Fidelity Distributors Corporation.
Other third-party marks appearing herein are the property of their respective owners.
All other marks appearing herein are registered or unregistered trademarks or service marks of FMR LLC or an affiliated company. © 2025 FMR LLC. All rights reserved.
This report and the financial statements contained herein are submitted for the general information of the shareholders of the Fund. This report is not authorized for distribution to prospective investors in the Fund unless preceded or accompanied by an effective prospectus.
A fund files its complete schedule of portfolio holdings with the SEC for the first and third quarters of each fiscal year on Form N-PORT. Forms N-PORT are available on the SEC's web site at http://www.sec.gov. A fund's Forms N-PORT may be reviewed and copied at the SEC's Public Reference Room in Washington, DC. Information regarding the operation of the SEC's Public Reference Room may be obtained by calling 1-800-SEC-0330.
For a complete list of a fund's portfolio holdings, view the most recent holdings listing, semiannual report, or annual report on Fidelity's web site at http://www.fidelity.com, http://www.institutional.fidelity.com, or http://www.401k.com, as applicable.
NOT FDIC INSURED •MAY LOSE VALUE •NO BANK GUARANTEE
Neither the Fund nor Fidelity Distributors Corporation is a bank.
Item 7: Financial Statements and Financial Highlights for Open-End Management Investment Companies (Semi-Annual Report)
Fidelity® Municipal Bond Index Fund
Schedule of Investments December 31, 2024 (Unaudited)
Showing Percentage of Net Assets
| Municipal Securities - 99.6% |
| | | Principal Amount (a) | Value ($) |
| Alabama - 1.8% | | | |
| Education - 0.0% | | | |
| University AL Gen Rev Series 2017B, 3% 7/1/2035 | | 10,000 | 9,117 |
| University of Ala At Birmingham Gen Rev Series 2019B, 3% 10/1/2041 | | 50,000 | 42,431 |
| | | | 51,548 |
| Escrowed/Pre-Refunded - 0.1% | | | |
| Alabama Fed Aid Hwy Fin Auth Spl Oblig Rev Series 2017A, 4% 6/1/2037 (Pre-refunded to 9/1/2027 at 100) | | 25,000 | 25,519 |
| Alabama Fed Aid Hwy Fin Auth Spl Oblig Rev Series 2017B, 5% 9/1/2026 (Escrowed to Maturity) | | 75,000 | 77,145 |
| Birmingham Ala Wtrwks Brd Wtr Rev Series 2016 B, 3% 1/1/2043 (Pre-refunded to 1/1/2027 at 100) | | 5,000 | 5,007 |
| Birmingham Ala Wtrwks Brd Wtr Rev Series 2016 B, 5% 1/1/2030 (Pre-refunded to 1/1/2027 at 100) | | 135,000 | 140,481 |
| Tuscaloosa Cnty AL Brd Ed Spl Tax Sch Dist Series 2017, 5% 2/1/2043 (Pre-refunded to 2/1/2027 at 100) | | 45,000 | 46,938 |
| | | | 295,090 |
| General Obligations - 1.2% | | | |
| Alabama St Corrections Instn Fin Auth Rev (Alabama St Proj.) 5.25% 7/1/2047 | | 150,000 | 159,902 |
| Black Belt Energy Gas District Series 2024 B, 5% tender 10/1/2055 (b) | | 240,000 | 253,082 |
| Black Belt Energy Gas District Series 2024 C, 5% tender 5/1/2055 (Pacific Life Insurance Co Guaranteed) (b) | | 680,000 | 718,125 |
| Energy Southeast Ala Coop Dist Energy Supply Rev Series 2024B, 5.25% tender 7/1/2054 (b) | | 200,000 | 215,827 |
| Southeast Energy Auth Commodity Supply Rev Ala 5.5% tender 1/1/2053 (Morgan Stanley Guaranteed) (b) | | 345,000 | 367,476 |
| Southeast Energy Authority A Cooperative District Series 2024C, 5% tender 11/1/2055 (Pacific Life Insurance Co Guaranteed) (b) | | 200,000 | 212,614 |
| | | | 1,927,026 |
| Health Care - 0.2% | | | |
| Infirmary Hlth Sys Spl Care Series 2016A, 3% 2/1/2030 | | 40,000 | 38,078 |
| UAB Medicine Fin Auth Rev (University AL At Birmingham Hosp Rev Proj.) Series 2016 B, 3.625% 9/1/2041 | | 195,000 | 184,425 |
| UAB Medicine Fin Auth Rev (University AL At Birmingham Hosp Rev Proj.) Series 2016 B, 5% 9/1/2034 | | 130,000 | 132,538 |
| UAB Medicine Fin Auth Rev (University AL At Birmingham Hosp Rev Proj.) Series 2017B1, 3.25% 9/1/2031 | | 5,000 | 4,791 |
| | | | 359,832 |
| Special Tax - 0.3% | | | |
| Alabama St Pub Sch & Coll Auth Series 2020 A, 4% 11/1/2040 | | 100,000 | 100,357 |
| Alabama St Pub Sch & Coll Auth Series 2020 A, 5% 11/1/2039 | | 320,000 | 343,874 |
| Birmingham Jeffrsn AL Cvc Ctr Series 2018 B, 4% 7/1/2048 | | 30,000 | 27,560 |
| | | | 471,791 |
| Water & Sewer - 0.0% | | | |
| Decatur Ala Wtr & Swr Rev Series 2021 A, 2.125% 2/15/2051 | | 35,000 | 20,915 |
TOTAL ALABAMA | | | 3,126,202 |
| Alaska - 0.1% | | | |
| General Obligations - 0.0% | | | |
| Alaska St Gen. Oblig. Series 2015B, 5% 8/1/2027 | | 50,000 | 50,533 |
| Housing - 0.1% | | | |
| Alaska St Hsg Fin Corp Series 2017 A, 5% 12/1/2030 | | 75,000 | 78,117 |
TOTAL ALASKA | | | 128,650 |
| Arizona - 1.0% | | | |
| Education - 0.1% | | | |
| Arizona Indl Dev Auth Student Hsg Rev (Provident Properties Proj.) Series 2019A, 5% 6/1/2058 | | 65,000 | 66,806 |
| Arizona St Univ Revs Series 2019 B, 4% 7/1/2049 | | 15,000 | 14,589 |
| University AZ Univ Revs Series 2016B, 5% 6/1/2042 | | 45,000 | 45,764 |
| University AZ Univ Revs Series 2020 A, 4% 8/1/2044 | | 100,000 | 97,892 |
| | | | 225,051 |
| Electric Utilities - 0.5% | | | |
| Salt River Proj AZ Agric & Pwr Series 2016 A, 5% 1/1/2027 | | 50,000 | 52,084 |
| Salt River Proj AZ Agric & Pwr Series 2016 A, 5% 1/1/2031 | | 45,000 | 46,643 |
| Salt River Proj AZ Agric & Pwr Series 2016 A, 5% 1/1/2036 | | 40,000 | 41,226 |
| Salt River Proj AZ Agric & Pwr Series 2017A, 5% 1/1/2028 | | 100,000 | 106,077 |
| Salt River Proj AZ Agric & Pwr Series 2017A, 5% 1/1/2031 | | 40,000 | 42,258 |
| Salt River Proj AZ Agric & Pwr Series 2017A, 5% 1/1/2033 | | 130,000 | 136,861 |
| Salt River Proj AZ Agric & Pwr Series 2019 A, 4% 1/1/2041 | | 175,000 | 175,467 |
| Salt River Proj AZ Agric & Pwr Series 2022A, 5% 1/1/2032 | | 255,000 | 287,340 |
| | | | 887,956 |
| General Obligations - 0.0% | | | |
| Maricopa County Special Health Care District Gen. Oblig. Series C, 4% 7/1/2038 | | 55,000 | 55,300 |
| Salt Verde Finl Corp Gas Rev AZ 5% 12/1/2032 (Citigroup Inc Guaranteed) | | 50,000 | 53,163 |
| Salt Verde Finl Corp Gas Rev AZ 5.25% 12/1/2026 (Citigroup Inc Guaranteed) | | 15,000 | 15,420 |
| | | | 123,883 |
| Health Care - 0.1% | | | |
| Maricopa Cnty Ariz Indl Dev Auth Hosp Rev (Honorhealth Proj.) Series 2021 A, 4% 9/1/2051 | | 135,000 | 124,698 |
| Maricopa Cnty AZ Ida Rev (Banner Health System Proj.) Series 2016 A, 5% 1/1/2038 | | 40,000 | 40,816 |
| | | | 165,514 |
| Special Tax - 0.1% | | | |
| Phoenix Ariz Civic Impt Corp Distr Rev 5.5% 7/1/2036 (National Public Finance Guarantee Corporation Insured) (c) | | 75,000 | 89,226 |
| Phoenix AZ Civic Impt Corp Series 2015A, 5% 7/1/2031 | | 25,000 | 25,201 |
| | | | 114,427 |
| Transportation - 0.1% | | | |
| Phoenix AZ Cvc Imp Crp Apr Rev 5% 7/1/2045 | | 175,000 | 175,618 |
| Water & Sewer - 0.1% | | | |
| Mesa AZ Util Sys Rev Series 2020, 4% 7/1/2043 | | 180,000 | 177,751 |
TOTAL ARIZONA | | | 1,870,200 |
| Arkansas - 0.1% | | | |
| Water & Sewer - 0.1% | | | |
| Fort Smith AR Wtr & Swr Rev Series 2018, 5% 10/1/2034 | | 110,000 | 116,017 |
| California - 21.8% | | | |
| Education - 2.3% | | | |
| California Edl Facs Auth Rev (Loyola Marymount University Proj.) 0% 10/1/2029 (National Public Finance Guarantee Corporation Insured) (d) | | 165,000 | 139,657 |
| California Edl Facs Auth Rev (Loyola Marymount University Proj.) 0% 10/1/2034 (National Public Finance Guarantee Corporation Insured) (d) | | 15,000 | 10,375 |
| California Edl Facs Auth Rev (Loyola Marymount University Proj.) Series 2001A, 0% 10/1/2030 (d) | | 70,000 | 57,052 |
| California Edl Facs Auth Rev (Stanford University Proj.) 5% 3/15/2039 | | 60,000 | 71,788 |
| California Edl Facs Auth Rev (Stanford University Proj.) Series U 6, 5% 5/1/2045 | | 35,000 | 41,883 |
| California Educational Facilities Authority (Loyola Marymount University Proj.) Series 2018 B, 5% 10/1/2043 | | 100,000 | 104,812 |
| California Educational Facilities Authority (Stanford University Proj.) Series V3, 5% 6/1/2033 | | 175,000 | 205,080 |
| California St Univ Rev Series 2015A, 5% 11/1/2027 | | 20,000 | 20,353 |
| California St Univ Rev Series 2015A, 5% 11/1/2033 | | 105,000 | 106,519 |
| California St Univ Rev Series 2015A, 5% 11/1/2043 | | 40,000 | 40,428 |
| California St Univ Rev Series 2016A, 3.125% 11/1/2036 | | 155,000 | 146,808 |
| California St Univ Rev Series 2016A, 5% 11/1/2026 | | 45,000 | 46,308 |
| California St Univ Rev Series 2016A, 5% 11/1/2045 | | 125,000 | 127,061 |
| California Stwd Cmnty Dev Auth Student Hsg Rev (Chf Irvine LLC Proj.) Series 2017, 5% 5/15/2042 | | 100,000 | 101,670 |
| University CA Revs 5% 5/15/2035 | | 250,000 | 279,929 |
| University CA Revs Series 2015 AO, 5% 5/15/2040 | | 125,000 | 125,657 |
| University CA Revs Series 2015 I, 5% 5/15/2028 | | 40,000 | 40,262 |
| University CA Revs Series 2016AR, 5% 5/15/2035 | | 135,000 | 138,270 |
| University CA Revs Series 2017 AY, 5% 5/15/2028 | | 20,000 | 21,036 |
| University CA Revs Series 2017M, 5% 5/15/2032 | | 75,000 | 78,431 |
| University CA Revs Series 2017M, 5% 5/15/2036 | | 80,000 | 83,113 |
| University CA Revs Series 2018 O, 4% 5/15/2029 | | 25,000 | 25,849 |
| University CA Revs Series 2018 O, 4% 5/15/2048 | | 165,000 | 163,367 |
| University CA Revs Series 2018 O, 5% 5/15/2058 | | 105,000 | 109,076 |
| University CA Revs Series 2020 BE, 5% 5/15/2031 | | 235,000 | 262,499 |
| University CA Revs Series 2023 BN, 5% 5/15/2030 | | 150,000 | 167,707 |
| University CA Revs Series 2023 BQ, 5% 5/15/2035 | | 50,000 | 57,729 |
| University CA Revs Series 2024 BS, 5% 5/15/2044 | | 20,000 | 22,402 |
| University CA Revs Series 2024 BV, 5% 5/15/2038 | | 20,000 | 23,114 |
| University CA Revs Series 2024 BW, 5% 5/15/2031 | | 1,000,000 | 1,137,048 |
| | | | 3,955,283 |
| Electric Utilities - 1.0% | | | |
| Glendale CA Elec Series 2024, 5% 2/1/2049 | | 85,000 | 92,096 |
| Imperial CA Irr Dist Elec Rev Series 2016B 1, 5% 11/1/2046 | | 140,000 | 143,089 |
| Los Angeles CA Wtr & Pwr Rev Series 2016 A, 5% 7/1/2040 | | 125,000 | 126,797 |
| Los Angeles CA Wtr & Pwr Rev Series 2016 A, 5% 7/1/2046 | | 70,000 | 70,815 |
| Los Angeles CA Wtr & Pwr Rev Series 2017A, 5% 7/1/2028 | | 5,000 | 5,218 |
| Los Angeles CA Wtr & Pwr Rev Series 2018 A, 5% 7/1/2031 | | 15,000 | 15,960 |
| Los Angeles CA Wtr & Pwr Rev Series 2019 B, 5% 7/1/2030 | | 55,000 | 59,874 |
| Los Angeles CA Wtr & Pwr Rev Series 2019 C, 5% 7/1/2037 | | 25,000 | 26,940 |
| Los Angeles CA Wtr & Pwr Rev Series 2020 A, 5% 7/1/2027 | | 135,000 | 142,721 |
| Los Angeles CA Wtr & Pwr Rev Series 2022 A, 5% 7/1/2040 | | 275,000 | 303,490 |
| Los Angeles CA Wtr & Pwr Rev Series 2023 B, 5% 7/1/2036 | | 30,000 | 34,298 |
| Los Angeles CA Wtr & Pwr Rev Series 2023E, 5% 7/1/2038 | | 35,000 | 40,129 |
| Los Angeles CA Wtr & Pwr Rev Series 2023E, 5% 7/1/2039 | | 35,000 | 39,905 |
| Los Angeles CA Wtr & Pwr Rev Series 2024 B, 5% 7/1/2038 | | 140,000 | 161,567 |
| Sacramento CA Muni Util Dist Elec Rev Series 2019 G, 5% 8/15/2032 | | 245,000 | 268,036 |
| Sacramento CA Muni Util Dist Elec Rev Series 2020 H, 5% 8/15/2039 | | 70,000 | 76,430 |
| Turlock CA Series 2016, 5% 1/1/2046 | | 205,000 | 210,250 |
| | | | 1,817,615 |
| Escrowed/Pre-Refunded - 0.8% | | | |
| Anaheim CA Pub Fin Auth Lease Rev 0% 9/1/2036 (Escrowed to Maturity) (d) | | 170,000 | 113,271 |
| California Health Facilities Financing Authority Series 2016A, 3.25% 11/15/2036 (Pre-refunded to 11/15/2025 at 100) | | 110,000 | 110,523 |
| California Health Facilities Financing Authority Series 2016B, 5% 11/15/2046 (Pre-refunded to 11/15/2026 at 100) | | 10,000 | 10,405 |
| California Infra & Econ Dev Bank 5% 7/1/2029 (Pre-refunded to 1/1/2028 at 100) | | 165,000 | 174,906 |
| Foothill/Estrn Transn CA Toll 0% 1/1/2027 (d) | | 40,000 | 37,610 |
| Foothill/Estrn Transn CA Toll 0% 1/1/2029 (d) | | 195,000 | 172,249 |
| Golden State Tobacco Securitization Corp. Tobacco Settlement Series 2015A, 4% 6/1/2031 (Pre-refunded to 6/1/2025 at 100) | | 100,000 | 100,477 |
| Golden State Tobacco Securitization Corp. Tobacco Settlement Series 2015A, 5% 6/1/2035 (Pre-refunded to 6/1/2025 at 100) | | 20,000 | 20,177 |
| Golden State Tobacco Securitization Corp. Tobacco Settlement Series 2015A, 5% 6/1/2040 (Pre-refunded to 6/1/2025 at 100) | | 10,000 | 10,088 |
| Golden State Tobacco Securitization Corp. Tobacco Settlement Series 2015A, 5% 6/1/2040 (Pre-refunded to 6/1/2025 at 100) | | 10,000 | 10,088 |
| Golden State Tobacco Securitization Corp. Tobacco Settlement Series 2015A, 5% 6/1/2045 (Pre-refunded to 6/1/2025 at 100) | | 140,000 | 141,239 |
| Riverside County Public Financing Authority Series 2015, 4.125% 11/1/2040 (Pre-refunded to 11/1/2025 at 100) | | 100,000 | 101,167 |
| Riverside County Public Financing Authority Series 2015, 5.25% 11/1/2045 (Pre-refunded to 11/1/2025 at 100) | | 180,000 | 183,751 |
| San Diego CA Comm Coll Dist Gen. Oblig. Series 2016, 5% 8/1/2041 (Pre-refunded to 8/1/2026 at 100) | | 5,000 | 5,179 |
| San Diego CA Uni Sch Dist Series 2009 1, 0% 7/1/2030 (Escrowed to Maturity) (d) | | 20,000 | 16,798 |
| San Diego CA Uni Sch Dist Series G 1, 5.25% 7/1/2028 (Escrowed to Maturity) | | 5,000 | 5,400 |
| San Joaquin Hills CA Transn Corridor Agy Toll Rd Rev 0% 1/1/2026 (d) | | 30,000 | 29,135 |
| San Joaquin Hills CA Transn Corridor Agy Toll Rd Rev 0% 1/1/2028 (d) | | 200,000 | 183,468 |
| San Joaquin Hills CA Transn Corridor Agy Toll Rd Rev Series 1993 CABS, 0% 1/1/2028 (Escrowed to Maturity) (d) | | 35,000 | 32,107 |
| San Joaquin Hills CA Transn Corridor Agy Toll Rd Rev Series 2014A, 5% 1/15/2044 (Pre-refunded to 1/15/2025 at 100) | | 95,000 | 95,067 |
| Solano Calif Cmnty College Dist Gen. Oblig. Series 2013 A, 5.125% 8/1/2041 (Pre-refunded to 8/1/2028 at 100) (c) | | 40,000 | 42,787 |
| | | | 1,595,892 |
| General Obligations - 10.4% | | | |
| Anaheim City School District/CA Series 2016, 3% 8/1/2046 | | 50,000 | 40,010 |
| Antelope Valley CA Cmnty College Dist Gen. Oblig. Series B, 3% 8/1/2050 | | 55,000 | 43,138 |
| California Community Choice Financing Authority 5% tender 1/1/2055 (Athene Annuity And Life Company Guaranteed) (b) | | 810,000 | 854,269 |
| California Community Choice Financing Authority Series 2022A 1, 4% tender 5/1/2053 (Morgan Stanley Guaranteed) (b) | | 670,000 | 672,327 |
| California St Pub Wks Brd Lse 5% 8/1/2028 | | 50,000 | 53,651 |
| California St Pub Wks Brd Lse Series 2020 B, 4% 3/1/2045 | | 175,000 | 175,039 |
| California St Pub Wks Brd Lse Series 2021 C, 4% 11/1/2038 | | 260,000 | 266,415 |
| Carlsbad CA Unified School Dis 0% 8/1/2035 (c) | | 180,000 | 207,035 |
| Cerritos CA Cmnty College Dist Gen. Oblig. Series 2019 C, 3% 8/1/2044 | | 25,000 | 20,810 |
| Chaffey CA Unified Hsd Series D, 4% 8/1/2049 | | 20,000 | 19,651 |
| Chino Valley CA Uni Sch Dist Series 2017A, 5.25% 8/1/2047 | | 25,000 | 25,948 |
| City of Fresno Unified School Series 2016A, 4% 8/1/2041 | | 150,000 | 149,845 |
| Compton CA Uni Sch Dist Series 2019 B, 3% 6/1/2049 | | 10,000 | 8,043 |
| Desert Calif Cmty College Dist Gen. Oblig. Series 2024, 4% 8/1/2042 | | 90,000 | 91,506 |
| Downey CA Uni Sch Dist Series B, 3.625% 8/1/2042 | | 355,000 | 337,884 |
| El Camino CA Cmty College Dist Series 2012C, 0% 8/1/2034 (d) | | 165,000 | 118,372 |
| El Camino CA Cmty College Dist Series 2012C, 0% 8/1/2038 (d) | | 65,000 | 38,463 |
| Elk Grove Calif Uni Sch Dist Ctfs Partn (Elk Grove CA Uni Sch Dist Proj.) 3% 2/1/2035 | | 60,000 | 55,976 |
| Foothill-De Anza CA Cmty College Dist Gen. Oblig. 0% 8/1/2025 (d) | | 5,000 | 4,911 |
| Foothill-De Anza CA Cmty College Dist Gen. Oblig. 0% 8/1/2036 (Ambac Assurance Corp Insured) (d) | | 200,000 | 133,085 |
| Fremont Union High Sch Dist Santa Clara Series 2019 A, 4% 8/1/2046 | | 30,000 | 30,022 |
| Grossmont CA Union High School Dist 0% 8/1/2030 (d) | | 10,000 | 8,352 |
| Grossmont CA Union High School Dist Series 2016B, 3% 8/1/2045 | | 20,000 | 15,967 |
| Hayward CA Uni Sch Dist Series 2019 A, 4% 8/1/2048 | | 200,000 | 200,077 |
| Livermore Valley CA Jt Uni Sch Series 2019, 4% 8/1/2046 | | 190,000 | 188,112 |
| Long Beach CA Bd Fin Auth Nat Gas Pur Rev 5% 11/15/2035 (Merrill Lynch & Co Inc Guaranteed) | | 25,000 | 27,153 |
| Long Beach CA Uni Sch Dist 0% 8/1/2035 (d) | | 150,000 | 102,777 |
| Long Beach CA Uni Sch Dist Series 2016, 3% 8/1/2032 | | 35,000 | 34,006 |
| Los Angeles CA Ccd Gen. Oblig. Series 2024, 5% 8/1/2030 | | 15,000 | 16,833 |
| Los Angeles CA Ccd Gen. Oblig. Series J, 4% 8/1/2036 | | 30,000 | 30,370 |
| Los Angeles CA Ccd Gen. Oblig. Series J, 5% 8/1/2028 | | 30,000 | 31,760 |
| Los Angeles CA Ccd Gen. Oblig. Series L 1, 5% 8/1/2031 | | 100,000 | 114,137 |
| Los Angeles CA Ccd Gen. Oblig. Series L 1, 5% 8/1/2036 | | 10,000 | 11,378 |
| Los Angeles CA Mun Imp Crp Lse (Los Angeles CA Proj.) Series 2016 B, 4% 11/1/2037 | | 490,000 | 492,853 |
| Los Angeles CA Uni Sch Dist Cp (Los Angeles Unified School District/CA Proj.) Series 2023 A, 5% 10/1/2033 | | 85,000 | 97,766 |
| Los Angeles CA Uni Sch Dist Cp (Los Angeles Unified School District/CA Proj.) Series 2023 A, 5% 10/1/2034 | | 15,000 | 17,207 |
| Los Angeles Unified School District/CA 5% 7/1/2035 | | 55,000 | 63,180 |
| Los Angeles Unified School District/CA 5% 7/1/2042 | | 15,000 | 16,847 |
| Los Angeles Unified School District/CA Series 2017A, 5% 7/1/2026 | | 175,000 | 181,085 |
| Los Angeles Unified School District/CA Series 2018 B 1, 5% 7/1/2033 | | 125,000 | 132,275 |
| Los Angeles Unified School District/CA Series 2018 B 1, 5.25% 7/1/2042 | | 50,000 | 52,630 |
| Los Angeles Unified School District/CA Series 2019A, 5% 7/1/2028 | | 130,000 | 140,508 |
| Los Angeles Unified School District/CA Series 2019A, 5% 7/1/2029 | | 15,000 | 16,527 |
| Los Angeles Unified School District/CA Series 2019A, 5% 7/1/2030 | | 50,000 | 54,731 |
| Los Angeles Unified School District/CA Series 2020 C, 4% 7/1/2032 | | 25,000 | 26,415 |
| Los Angeles Unified School District/CA Series 2020 C, 5% 7/1/2030 | | 60,000 | 67,335 |
| Los Angeles Unified School District/CA Series 2020 RYQ, 5% 7/1/2027 | | 65,000 | 68,798 |
| Los Angeles Unified School District/CA Series 2021 RYRR, 5% 7/1/2031 | | 15,000 | 17,119 |
| Los Angeles Unified School District/CA Series 2023 QRR, 5% 7/1/2033 | | 110,000 | 128,492 |
| Los Angeles Unified School District/CA Series 2023 QRR, 5% 7/1/2036 | | 15,000 | 17,384 |
| Los Angeles Unified School District/CA Series 2023 QRR, 5% 7/1/2043 | | 25,000 | 28,196 |
| Los Angeles Unified School District/CA Series A, 5% 7/1/2040 | | 30,000 | 30,172 |
| M-S-R Energy Auth Calif Gas Rev 6.125% 11/1/2029 (Citigroup Inc Guaranteed) | | 45,000 | 47,748 |
| M-S-R Energy Auth Calif Gas Rev 6.5% 11/1/2039 (Citigroup Inc Guaranteed) | | 25,000 | 31,139 |
| M-S-R Energy Auth Calif Gas Rev 6.5% 11/1/2039 (Citigroup Inc Guaranteed) | | 30,000 | 37,367 |
| Marin Healthcare District Gen. Oblig. Series 2017A, 3% 8/1/2037 | | 170,000 | 151,163 |
| Marin Healthcare District Gen. Oblig. Series 2017A, 4% 8/1/2047 | | 135,000 | 131,176 |
| Montebello CA Unified Sch Dist Series 2016A, 5% 8/1/2041 | | 50,000 | 51,058 |
| Mt Diablo CA Unified Sch Dist 4% 8/1/2036 | | 250,000 | 260,307 |
| Napa Valley CA Uni Sch Dist 4% 8/1/2044 (Assured Guaranty Municipal Corp Insured) | | 175,000 | 173,683 |
| Newport Mesa CA Uni Sch Dist 0% 8/1/2036 (d) | | 230,000 | 154,447 |
| Newport Mesa CA Uni Sch Dist Series 2017, 0% 8/1/2039 (d) | | 495,000 | 279,287 |
| North Orange Cnty Calif Cmnty College Dist Gen. Oblig. Series 2016A, 3% 8/1/2040 | | 15,000 | 13,035 |
| Norwalk-Mirada CA Uni Sch Dist 0% 8/1/2028 (National Public Finance Guarantee Corporation Insured) (d) | | 70,000 | 62,273 |
| Oakland CA Uni Sch Dist Alameda Cnty Series 2021 A, 4% 8/1/2046 | | 205,000 | 203,841 |
| Palo Alto Calif Uni Sch Dist 0% 8/1/2033 (d) | | 35,000 | 26,316 |
| Palomar Calif Cmnty College Dist Gen. Oblig. 0% 8/1/2045 (c) | | 65,000 | 60,430 |
| Palomar Pomerado Health Calif (Palomar Health Calif Proj.) Gen. Oblig. 0% 8/1/2028 (Assured Guaranty Inc Insured) (d) | | 200,000 | 174,267 |
| Poway CA Unified Sch Dist 0% 8/1/2046 (d) | | 190,000 | 73,149 |
| Riverside CA Cmnty College Dst Gen. Oblig. Series 2019, 3% 8/1/2036 | | 200,000 | 186,824 |
| San Bernardino CA Cmnty College Dist Gen. Oblig. 0% 8/1/2048 (d) | | 5,000 | 1,813 |
| San Bernardino CA Cmnty College Dist Gen. Oblig. Series E, 4.125% 8/1/2049 | | 40,000 | 40,324 |
| San Diego CA Uni Sch Dist 0% 7/1/2030 (d) | | 5,000 | 4,202 |
| San Diego CA Uni Sch Dist 0% 7/1/2030 (d) | | 35,000 | 29,270 |
| San Diego CA Uni Sch Dist 0% 7/1/2030 (Escrowed to Maturity) (d) | | 25,000 | 20,998 |
| San Diego CA Uni Sch Dist 0% 7/1/2031 (Escrowed to Maturity) (d) | | 15,000 | 12,180 |
| San Diego CA Uni Sch Dist 0% 7/1/2043 (d) | | 10,000 | 4,820 |
| San Diego CA Uni Sch Dist 0% 7/1/2049 (d) | | 125,000 | 44,361 |
| San Diego CA Uni Sch Dist 5.25% 7/1/2027 (Assured Guaranty Municipal Corp Insured) | | 5,000 | 5,332 |
| San Diego CA Uni Sch Dist 5.5% 7/1/2026 (Assured Guaranty Municipal Corp Insured) | | 80,000 | 83,413 |
| San Diego CA Uni Sch Dist Series 2016 R 5, 5% 7/1/2026 | | 50,000 | 51,731 |
| San Diego CA Uni Sch Dist Series 2017 K 2, 0% 7/1/2031 (d) | | 430,000 | 341,757 |
| San Diego CA Uni Sch Dist Series 2022 F 2, 5% 7/1/2042 | | 90,000 | 100,407 |
| San Diego CA Uni Sch Dist Series 2023 SR 3A, 5% 7/1/2035 | | 25,000 | 28,964 |
| San Diego CA Uni Sch Dist Series 2025 SR 4C, 5% 7/1/2034 (e) | | 255,000 | 297,614 |
| San Diego CA Uni Sch Dist Series G 1, 5.25% 7/1/2028 (Assured Guaranty Municipal Corp Insured) | | 25,000 | 27,299 |
| San Diego CA Uni Sch Dist Series R 4, 5% 7/1/2028 | | 70,000 | 70,694 |
| San Fran CA Bay Area Rpd Trans Dist Gen. Oblig. Series 2019 B 1, 3% 8/1/2049 | | 200,000 | 158,085 |
| San Fran CA Bay Area Rpd Trans Dist Gen. Oblig. Series 2022D 1, 4.125% 8/1/2052 | | 195,000 | 196,295 |
| San Fran CA Bay Area Rpd Trans Dist Gen. Oblig. Series A 1, 4% 8/1/2042 | | 10,000 | 9,988 |
| San Fran CA Bay Area Rpd Trans Dist Gen. Oblig. Series A 1, 5% 8/1/2047 | | 80,000 | 82,467 |
| San Francisco CA City & Cnty Ctfs Partn (San Francisco CA City & Cnty Proj.) Series 2019 A, 4% 4/1/2041 | | 30,000 | 30,082 |
| San Jose California Gen. Oblig. Series 2019 C, 5% 9/1/2030 | | 265,000 | 288,943 |
| San Mateo CA Unified Sch Dist 6.7% 9/1/2041 (c) | | 50,000 | 52,786 |
| San Mateo Cnty Calif Cmnty Col Dist Gen. Oblig. 0% 9/1/2033 (National Public Finance Guarantee Corporation Insured) (d) | | 130,000 | 97,098 |
| San Mateo Cnty Calif Cmnty Col Dist Gen. Oblig. 0% 9/1/2035 (National Public Finance Guarantee Corporation Insured) (d) | | 200,000 | 137,856 |
| Santa Clara CA Uni Sch Dist 4% 7/1/2040 | | 160,000 | 164,422 |
| Santa Clara CA Uni Sch Dist Series 2019, 4% 7/1/2048 | | 35,000 | 35,015 |
| Santa Clara Cnty CA Fing Lease (Santa Clara Cnty CA Proj.) 3% 5/15/2037 | | 200,000 | 182,714 |
| Santa Clara Cnty CA Fing Lease (Santa Clara Cnty CA Proj.) Series 2019 A, 3.125% 5/1/2047 | | 225,000 | 184,638 |
| Saugus Union School District School Facilities Improvement District No 2014-1 Series C, 2.375% 8/1/2044 | | 150,000 | 107,026 |
| Sequoia Calif Un High Sch Dist Series 2016, 3% 7/1/2031 | | 145,000 | 143,840 |
| Sierra CA Jt Cmty College Dist Gen. Oblig. Series B, 2% 8/1/2046 | | 100,000 | 62,875 |
| Sonoma Cnty Calif Jr College Gen. Oblig. Series B, 3% 8/1/2036 | | 200,000 | 186,824 |
| Sonoma Cnty Calif Jr College Gen. Oblig. Series B, 3% 8/1/2041 | | 5,000 | 4,306 |
| Southern California Pub Pwr Auth Nat Gas Proj Rev 5.25% 11/1/2026 (Goldman Sachs Group Inc/The Guaranteed) | | 30,000 | 30,599 |
| Southwestern Cmnty College Dist CA Gen. Oblig. Series 2021 C, 2.375% 8/1/2046 | | 100,000 | 68,130 |
| State Center CA Cmnty College Dist Gen. Oblig. Series 2020 B, 2.25% 8/1/2045 | | 250,000 | 170,665 |
| State of California Gen. Oblig. 2% 11/1/2036 | | 60,000 | 48,477 |
| State of California Gen. Oblig. 3% 10/1/2033 | | 70,000 | 69,249 |
| State of California Gen. Oblig. 3% 10/1/2034 | | 50,000 | 49,165 |
| State of California Gen. Oblig. 3% 10/1/2037 | | 190,000 | 178,200 |
| State of California Gen. Oblig. 3% 11/1/2035 | | 250,000 | 244,050 |
| State of California Gen. Oblig. 3% 11/1/2041 | | 185,000 | 161,609 |
| State of California Gen. Oblig. 3% 11/1/2050 | | 25,000 | 19,513 |
| State of California Gen. Oblig. 3% 3/1/2028 | | 50,000 | 50,040 |
| State of California Gen. Oblig. 4% 3/1/2028 | | 40,000 | 41,317 |
| State of California Gen. Oblig. 4% 3/1/2029 | | 175,000 | 182,351 |
| State of California Gen. Oblig. 4% 3/1/2050 | | 40,000 | 40,015 |
| State of California Gen. Oblig. 4% 8/1/2037 | | 25,000 | 25,242 |
| State of California Gen. Oblig. 5% 10/1/2048 | | 100,000 | 104,270 |
| State of California Gen. Oblig. 5% 11/1/2027 | | 50,000 | 52,926 |
| State of California Gen. Oblig. 5% 11/1/2031 | | 295,000 | 326,758 |
| State of California Gen. Oblig. 5% 12/1/2031 | | 265,000 | 298,292 |
| State of California Gen. Oblig. 5% 3/1/2032 | | 50,000 | 54,731 |
| State of California Gen. Oblig. 5% 3/1/2032 | | 50,000 | 54,731 |
| State of California Gen. Oblig. 5% 3/1/2035 | | 220,000 | 239,300 |
| State of California Gen. Oblig. 5% 4/1/2027 | | 10,000 | 10,465 |
| State of California Gen. Oblig. 5% 4/1/2029 | | 140,000 | 151,769 |
| State of California Gen. Oblig. 5% 4/1/2030 | | 100,000 | 108,589 |
| State of California Gen. Oblig. 5% 8/1/2026 | | 5,000 | 5,007 |
| State of California Gen. Oblig. 5% 8/1/2026 | | 65,000 | 65,720 |
| State of California Gen. Oblig. 5% 8/1/2026 | | 70,000 | 70,111 |
| State of California Gen. Oblig. 5% 8/1/2029 | | 20,000 | 20,219 |
| State of California Gen. Oblig. 5% 8/1/2045 | | 40,000 | 40,208 |
| State of California Gen. Oblig. 5% 9/1/2026 | | 160,000 | 165,757 |
| State of California Gen. Oblig. 5% 9/1/2031 | | 230,000 | 258,073 |
| State of California Gen. Oblig. 5% 9/1/2033 | | 145,000 | 166,674 |
| State of California Gen. Oblig. 5.25% 8/1/2030 | | 95,000 | 96,163 |
| State of California Gen. Oblig. Series 2016, 3% 9/1/2033 | | 355,000 | 345,027 |
| State of California Gen. Oblig. Series 2016, 4% 9/1/2028 | | 110,000 | 111,620 |
| State of California Gen. Oblig. Series 2016, 4% 9/1/2036 | | 200,000 | 200,944 |
| State of California Gen. Oblig. Series 2016, 5% 8/1/2027 | | 45,000 | 46,442 |
| State of California Gen. Oblig. Series 2016, 5% 9/1/2045 | | 10,000 | 10,204 |
| State of California Gen. Oblig. Series 2016B, 4% 9/1/2035 | | 50,000 | 50,276 |
| State of California Gen. Oblig. Series 2016B, 5% 9/1/2030 | | 15,000 | 15,467 |
| State of California Gen. Oblig. Series 2016B, 5% 9/1/2032 | | 50,000 | 51,480 |
| State of California Gen. Oblig. Series 2017, 3.5% 8/1/2027 | | 25,000 | 25,353 |
| State of California Gen. Oblig. Series 2017, 5% 11/1/2027 | | 75,000 | 79,389 |
| State of California Gen. Oblig. Series 2017, 5% 11/1/2027 | | 65,000 | 68,804 |
| State of California Gen. Oblig. Series 2017, 5% 11/1/2031 | | 100,000 | 105,067 |
| State of California Gen. Oblig. Series 2017, 5% 8/1/2026 | | 80,000 | 82,731 |
| State of California Gen. Oblig. Series 2017, 5% 8/1/2033 | | 100,000 | 102,669 |
| State of California Gen. Oblig. Series 2024, 5% 9/1/2031 | | 300,000 | 336,617 |
| State of California Gen. Oblig. Series C, 5% 9/1/2026 | | 20,000 | 20,253 |
| State of California Gen. Oblig. Series C, 5% 9/1/2028 | | 50,000 | 50,628 |
| Sunnyvale CA Fin Auth Lease Rev Series 2020, 4% 4/1/2050 | | 380,000 | 377,542 |
| Sweetwater CA Un High Sch Dist Series 2016, 4% 8/1/2042 | | 350,000 | 348,761 |
| Twin Rivers Uni Sch Dist Calif 0% 8/1/2041 (Assured Guaranty Municipal Corp Insured) (d) | | 135,000 | 63,960 |
| Twin Rivers Uni Sch Dist Calif 4% 8/1/2043 (Assured Guaranty Municipal Corp Insured) | | 400,000 | 400,035 |
| West Contra Costa Calif Uni Sch Dist (West Contra Costa Unified School District Proj.) 0% 8/1/2027 (Assured Guaranty Inc Insured) (d) | | 15,000 | 13,818 |
| West Contra Costa Calif Uni Sch Dist (West Contra Costa Unified School District Proj.) Series C 1, 0% 8/1/2028 (d) | | 60,000 | 53,490 |
| West Hollywood Public Financing Authority Series 2016, 3% 4/1/2041 | | 140,000 | 117,517 |
| William S Hart Uni High School Dist 0% 8/1/2033 (d) | | 50,000 | 37,311 |
| Yuba CA Gen. Oblig. Series 2016, 3% 8/1/2036 | | 165,000 | 151,051 |
| Yuba CA Gen. Oblig. Series 2016, 3% 8/1/2037 | | 35,000 | 31,638 |
| | | | 18,151,270 |
| Health Care - 0.8% | | | |
| California Health Facilities Financing Authority (Cedars-Sinai Medical Center,Ca Proj.) Series 2015, 5% 11/15/2026 | | 50,000 | 50,865 |
| California Health Facilities Financing Authority (Kaiser Permanente Hlth System Proj.) Series A 1, 5% 11/1/2027 | | 40,000 | 42,608 |
| California Health Facilities Financing Authority (Kaiser Permanente Hlth System Proj.) Series A 2, 5% 11/1/2047 | | 70,000 | 81,172 |
| California Health Facilities Financing Authority (Providence Health Systems Proj.) 2% tender 10/1/2036 (b) | | 150,000 | 148,353 |
| California Health Facilities Financing Authority (Providence Health Systems Proj.) Series 2016A, 3% 10/1/2041 | | 50,000 | 42,868 |
| California Health Facilities Financing Authority (Stanford Health Care Proj.) Series 2017 A, 5% 11/15/2026 | | 275,000 | 286,423 |
| California Health Facilities Financing Authority (Sutter Health Systems CA Proj.) Series 2016B, 5% 11/15/2046 | | 15,000 | 15,287 |
| California Health Facilities Financing Authority (Sutter Health Systems CA Proj.) Series 2018 A, 4% 11/15/2042 | | 65,000 | 64,510 |
| California Health Facilities Financing Authority (Sutter Health Systems CA Proj.) Series 2018 A, 5% 11/15/2026 | | 35,000 | 36,369 |
| California Health Facilities Financing Authority (Sutter Health Systems CA Proj.) Series 2018 A, 5% 11/15/2033 | | 25,000 | 26,343 |
| California Hlth Facs Fin Auth (Adventist Health System-West Proj.) Series 2013 A, 4% 3/1/2043 | | 35,000 | 32,848 |
| California Statewide Communities Development Authority (University of Southern California Proj.) Series 2018, 4.375% 1/1/2048 | | 40,000 | 40,055 |
| California Statewide Communities Development Authority (University of Southern California Proj.) Series 2018, 5% 1/1/2032 | | 20,000 | 21,056 |
| California Statewide Community Development Authority Rev (Adventist Health System-West Proj.) Series 2018 A, 3.5% 3/1/2038 | | 125,000 | 117,984 |
| California Statewide Community Development Authority Rev (Front Porch Community CA Proj.) Series 2017A, 5% 4/1/2047 | | 55,000 | 55,459 |
| California Statewide Community Development Authority Rev (Kaiser Permanente Hlth System Proj.) Series 2004 J, 5% tender 4/1/2036 (b) | | 25,000 | 27,120 |
| Univ CA Regts Med Ctr Pooled Rev Series 2022 P, 4% 5/15/2053 | | 235,000 | 230,479 |
| Upland CA Ctfs Partn (San Antonio Community Hosp,Ca Proj.) 5% 1/1/2047 | | 80,000 | 81,639 |
| | | | 1,401,438 |
| Lease Revenue - 0.1% | | | |
| California Infrastructure & Economic Dev Bank Lease Rev (California State Teachers' Retirement System Proj.) 5% 8/1/2044 | | 170,000 | 178,822 |
| Garden Grove Calif Pub Fing Auth Lease Rev Series 2024A, 4% 4/1/2054 | | 65,000 | 64,210 |
| | | | 243,032 |
| Other - 0.4% | | | |
| California Infrastructure & Economic Development Bank (Academy of Motion Picture Arts and Sciences Proj.) Series 2023 A, 5% 11/1/2036 | | 65,000 | 74,967 |
| California Infrastructure & Economic Development Bank (Academy of Motion Picture Arts and Sciences Proj.) Series 2023 A, 5% 11/1/2038 | | 55,000 | 62,981 |
| California Infrastructure & Economic Development Bank (CA Academy of Science Proj.) Series 2021 B, 4% 5/1/2046 | | 200,000 | 193,846 |
| California Infrastructure & Economic Development Bank (J Paul Getty Trust/The Proj.) Series 2020 A 1, 5% 4/1/2032 | | 225,000 | 259,336 |
| California Infrastructure & Economic Development Bank (J Paul Getty Trust/The Proj.) Series 2023A, 5% 4/1/2033 | | 30,000 | 35,014 |
| | | | 626,144 |
| Resource Recovery - 0.0% | | | |
| Los Angeles CA Sld Wst Res Rev Series 2023 A, 5% 2/1/2033 | | 35,000 | 40,741 |
| Los Angeles CA Sld Wst Res Rev Series 2023 A, 5% 2/1/2037 | | 25,000 | 28,502 |
| | | | 69,243 |
| Special Tax - 0.7% | | | |
| Anaheim CA Pub Fin Auth Lease Rev (Anaheim CA Lpmr Disney Proj.) Series 1997 C, 0% 9/1/2028 (Assured Guaranty Municipal Corp Insured) (d) | | 95,000 | 84,061 |
| Brea California Redev Agy 0% 8/1/2029 (Ambac Assurance Corp Insured) (d) | | 105,000 | 88,943 |
| Irvine Calif Facs Fing Auth Spl Tax Rev Series 2023A, 4% 9/1/2058 (Build America Mutual Assurance Co Insured) | | 160,000 | 155,063 |
| Los Angeles Cnty CA Metro Trans Auth Sales Tax Rev Series 2019 A, 5% 7/1/2044 | | 45,000 | 47,325 |
| Los Angeles Cnty CA Metro Trans Auth Sales Tax Rev Series 2021 A, 5% 7/1/2044 | | 190,000 | 206,958 |
| Riverside Cnty CA Transn Commn Series 2017B, 5% 6/1/2027 | | 40,000 | 42,230 |
| Sacramento CA Fin Auth 0% 12/1/2029 (National Public Finance Guarantee Corporation Insured) (d) | | 80,000 | 66,872 |
| Sacramento CA Fin Auth 0% 12/1/2034 (Financial Guaranty Ins CO Insured) (d) | | 100,000 | 67,802 |
| Sacramento CA Transn Auth Sales Tax Rev Series 2023, 5% 10/1/2033 | | 140,000 | 164,459 |
| Sacramento Calif Transient Occupancy Tax Rev Series 2018 A, 5% 6/1/2043 | | 55,000 | 57,464 |
| San Francisco CA BART Dist Tax Series 2019 A, 3% 7/1/2044 | | 5,000 | 4,146 |
| Santa Clara Valley CA Trans Auth Sales Tax Rev 5% 4/1/2033 | | 185,000 | 216,065 |
| Westminster Calif Redev Agy Successor Agy Tax Allocation Series 2016, 3% 11/1/2041 | | 125,000 | 107,753 |
| | | | 1,309,141 |
| Transportation - 2.1% | | | |
| Bay Area Toll Au CA Bridge Rev 2.95% tender 4/1/2047 (b) | | 110,000 | 109,323 |
| Bay Area Toll Au CA Bridge Rev Series 2017 S 7, 4% 4/1/2034 | | 95,000 | 96,140 |
| Bay Area Toll Au CA Bridge Rev Series 2017 S 7, 4% 4/1/2038 | | 275,000 | 275,995 |
| Bay Area Toll Au CA Bridge Rev Series 2017 S 7, 4% 4/1/2047 | | 5,000 | 4,961 |
| Bay Area Toll Au CA Bridge Rev Series 2018 A, 2.625% tender 4/1/2045 (b) | | 130,000 | 128,689 |
| Burbank Glendale Pasadena Arpt Auth Calif Arpt Rev Series 2024A, 4% 7/1/2054 (Assured Guaranty Municipal Corp Insured) | | 205,000 | 199,416 |
| California Mun Fn Auth Rev (Linxs Apm Project Proj.) Series 2018 A, 3.25% 12/31/2032 (Assured Guaranty Municipal Corp Insured) (f) | | 20,000 | 18,654 |
| California Mun Fn Auth Rev (Linxs Apm Project Proj.) Series 2018 A, 5% 12/31/2028 (f) | | 60,000 | 62,062 |
| California Mun Fn Auth Rev (Linxs Apm Project Proj.) Series 2018 A, 5% 12/31/2047 (f) | | 100,000 | 100,528 |
| Foothill/Estrn Transn CA Toll Series B 1, 3.95% 1/15/2053 (b) | | 80,000 | 75,284 |
| Los Angeles CA Dept Arpts Rev Series 2018 A, 5% 5/15/2035 (f) | | 390,000 | 402,838 |
| Los Angeles CA Dept Arpts Rev Series 2018 B, 5% 5/15/2034 (f) | | 10,000 | 10,348 |
| Los Angeles CA Dept Arpts Rev Series 2018 C, 5% 5/15/2033 (f) | | 90,000 | 92,832 |
| Los Angeles CA Dept Arpts Rev Series 2018 C, 5% 5/15/2037 (f) | | 75,000 | 76,870 |
| Los Angeles CA Dept Arpts Rev Series 2018 D, 5% 5/15/2026 (f) | | 65,000 | 66,621 |
| Los Angeles CA Dept Arpts Rev Series 2018 D, 5% 5/15/2031 (f) | | 80,000 | 84,563 |
| Los Angeles CA Dept Arpts Rev Series 2018 D, 5% 5/15/2034 (f) | | 120,000 | 125,909 |
| Los Angeles CA Dept Arpts Rev Series 2019 A, 5% 5/15/2036 (f) | | 50,000 | 52,233 |
| Los Angeles CA Dept Arpts Rev Series 2020 A, 5% 5/15/2040 | | 20,000 | 21,667 |
| Los Angeles CA Dept Arpts Rev Series 2021B, 5% 5/15/2040 | | 15,000 | 16,508 |
| Los Angeles CA Dept Arpts Rev Series 2021B, 5% 5/15/2048 | | 65,000 | 69,579 |
| Los Angeles CA Dept Arpts Rev Series 2022 I, 5% 5/15/2042 | | 285,000 | 312,722 |
| Port Oakland Calif Rev Series 2017E, 5% 11/1/2026 | | 30,000 | 31,072 |
| San Diego Cnty CA Reg Arpt Auth Arpt Rev Series A, 5% 7/1/2047 | | 50,000 | 51,496 |
| San Francisco CA City & County Airports Commission International Airport Revenue Series 2016A, 5% 5/1/2026 | | 25,000 | 25,720 |
| San Francisco CA City & County Airports Commission International Airport Revenue Series 2017A, 5% 5/1/2047 (f) | | 40,000 | 40,309 |
| San Francisco CA City & County Airports Commission International Airport Revenue Series 2019 A, 5% 5/1/2049 (f) | | 25,000 | 25,531 |
| San Francisco CA City & County Airports Commission International Airport Revenue Series 2019D, 5% 5/1/2026 | | 135,000 | 138,891 |
| San Francisco CA City & County Airports Commission International Airport Revenue Series 2019D, 5% 5/1/2034 | | 325,000 | 351,976 |
| San Francisco CA City & County Airports Commission International Airport Revenue Series 2019D, 5% 5/1/2039 | | 30,000 | 32,103 |
| San Francisco CA City & County Airports Commission International Airport Revenue Series 2023 C, 5.75% 5/1/2048 (f) | | 275,000 | 303,145 |
| San Francisco CA City & County Airports Commission International Airport Revenue Series SECOND 2019E, 5% 5/1/2034 (f) | | 175,000 | 183,564 |
| San Francisco CA City & County Airports Commission International Airport Revenue Series SECOND 2020 A, 4% 5/1/2039 (f) | | 15,000 | 14,725 |
| San Francisco Municipal Transportation Agency Series 2017, 4% 3/1/2042 | | 135,000 | 134,834 |
| San Joaquin Hills CA Transn Corridor Agy Toll Rd Rev 0% 1/15/2031 (National Public Finance Guarantee Corporation Insured) (d) | | 90,000 | 71,895 |
| San Joaquin Hills CA Transn Corridor Agy Toll Rd Rev 0% 1/15/2032 (National Public Finance Guarantee Corporation Insured) (d) | | 30,000 | 22,924 |
| San Jose Calif Arpt Rev Series 2017B, 5% 3/1/2042 | | 20,000 | 20,606 |
| | | | 3,852,533 |
| Water & Sewer - 3.2% | | | |
| Anaheim Housing & Public Improvements Authority (Anaheim CA Water Rev Proj.) Series 2022 A, 5% 10/1/2052 | | 525,000 | 538,830 |
| California Infrastructure & Economic Development Bank (CA St Clean Water Revolving Fund Proj.) 5% 10/1/2032 | | 25,000 | 29,013 |
| California Infrastructure & Economic Development Bank (CA St Clean Water Revolving Fund Proj.) 5% 10/1/2035 | | 15,000 | 17,234 |
| California Infrastructure & Economic Development Bank (CA St Clean Water Revolving Fund Proj.) 5% 10/1/2052 | | 20,000 | 21,692 |
| California Infrastructure & Economic Development Bank (CA St Clean Water Revolving Fund Proj.) Series 2016, 5% 10/1/2026 | | 15,000 | 15,434 |
| California Infrastructure & Economic Development Bank (CA St Clean Water Revolving Fund Proj.) Series 2016, 5% 10/1/2029 | | 25,000 | 25,661 |
| California Infrastructure & Economic Development Bank (CA St Clean Water Revolving Fund Proj.) Series 2017, 5% 10/1/2029 | | 405,000 | 425,023 |
| California Infrastructure & Economic Development Bank (CA St Clean Water Revolving Fund Proj.) Series 2018, 5% 10/1/2026 | | 25,000 | 26,029 |
| California Infrastructure & Economic Development Bank (CA St Clean Water Revolving Fund Proj.) Series 2024, 5% 10/1/2035 | | 15,000 | 17,485 |
| California St Dept Wtr Res Cen Series 2016, 4% 12/1/2031 | | 40,000 | 40,603 |
| California St Dept Wtr Res Cen Series AW, 4% 12/1/2034 | | 235,000 | 238,695 |
| California St Dept Wtr Res Cen Series AX, 5% 12/1/2031 | | 435,000 | 462,642 |
| California St Dept Wtr Res Cen Series BA, 5% 12/1/2032 | | 65,000 | 71,077 |
| California St Dept Wtr Res Cen Series BB, 5% 12/1/2035 | | 200,000 | 223,186 |
| County of Orange CA Series 2017A, 5% 8/15/2029 | | 75,000 | 78,471 |
| County of Orange CA Series 2019C, 5% 8/15/2032 | | 150,000 | 165,151 |
| East Bay CA Mun Util Dist Wtr Sys Rev Series 2015A, 5% 6/1/2037 | | 65,000 | 65,445 |
| East Bay CA Mun Util Dist Wtr Sys Rev Series 2017B, 5% 6/1/2027 | | 5,000 | 5,281 |
| Long Beach CA Wtr Rev Series 2024, 4% 5/1/2054 | | 155,000 | 154,431 |
| Los Angeles CA Dep Wtr & Pwr Wtrwks Rev Series 2016B, 5% 7/1/2029 | | 50,000 | 51,012 |
| Los Angeles CA Dep Wtr & Pwr Wtrwks Rev Series 2017A, 5% 7/1/2033 | | 20,000 | 20,795 |
| Los Angeles CA Dep Wtr & Pwr Wtrwks Rev Series 2018 A, 5% 7/1/2033 | | 25,000 | 26,492 |
| Los Angeles CA Dep Wtr & Pwr Wtrwks Rev Series 2022 B, 4% 7/1/2049 | | 140,000 | 140,140 |
| Los Angeles CA Dep Wtr & Pwr Wtrwks Rev Series 2022 B, 5% 7/1/2028 | | 430,000 | 464,307 |
| Los Angeles CA Dep Wtr & Pwr Wtrwks Rev Series 2023 A, 5% 7/1/2042 | | 15,000 | 16,841 |
| Los Angeles CA Dep Wtr & Pwr Wtrwks Rev Series 2024 A, 5% 7/1/2035 | | 15,000 | 17,475 |
| Metropolitan Wtr Dist Southn Calif Series 2020 A, 5% 10/1/2033 | | 55,000 | 60,477 |
| Metropolitan Wtr Dist Southn Calif Series 2020 C, 5% 7/1/2039 | | 225,000 | 246,928 |
| Metropolitan Wtr Dist Southn Calif Series 2020A, 5% 7/1/2027 | | 140,000 | 148,390 |
| Metropolitan Wtr Dist Southn Calif Series 2022A, 5% 10/1/2034 | | 200,000 | 230,490 |
| Rancho CA Wtr Dist Fing Auth Series 2019 A, 4% 8/1/2039 | | 50,000 | 51,611 |
| Sacramento Cnty CA Santn Dist Series 2021, 5% 12/1/2031 | | 200,000 | 229,160 |
| Sacramento Cnty CA Santn Dist Series 2021, 5% 12/1/2032 | | 235,000 | 272,976 |
| Sacramento Cnty CA Santn Dist Series 2021, 5% 12/1/2033 | | 15,000 | 17,083 |
| San Diego CA Pub Facs Fing Auth Wtr Rev 5.25% 8/1/2047 | | 30,000 | 31,490 |
| San Diego County Water Authority 5% 5/1/2047 | | 140,000 | 152,049 |
| San Francisco CA Pub Util Comm Wstwtr Rev Series 2023A, 5% 10/1/2032 | | 190,000 | 220,219 |
| San Francisco CA Pub Util Comm Wstwtr Rev Series 2023A, 5% 10/1/2034 | | 230,000 | 264,332 |
| San Francisco CA Pub Util Comm Wtr Rev Series 2015A, 5% 11/1/2029 | | 15,000 | 15,101 |
| San Francisco CA Pub Util Comm Wtr Rev Series 2020 SUB A, 5% 11/1/2050 | | 185,000 | 196,297 |
| San Mateo Foster City Calif Pub Fing Auth Wastewater Rev (City of San Mateo CA Sewer Revenue Proj.) Series 2019, 5% 8/1/2049 | | 15,000 | 15,727 |
| Santa Clara Valley Water District Public Facilities Financing Corp Series A, 5% 6/1/2033 | | 75,000 | 76,319 |
| Upper Santa Clara Vy Jt Pwrs Auth Calif Rev Series 2020 A, 4% 8/1/2050 | | 85,000 | 83,384 |
| | | | 5,670,478 |
TOTAL CALIFORNIA | | | 38,692,069 |
| Colorado - 1.6% | | | |
| Education - 0.0% | | | |
| University Colo Enterprise Sys Series 2016 B, 2.75% 6/1/2030 | | 85,000 | 79,173 |
| Electric Utilities - 0.0% | | | |
| Colorado Springs Colo Utils Series 2018A 2, 5% 11/15/2048 | | 25,000 | 25,867 |
| Colorado Springs Colo Utils Series 2021 B, 4% 11/15/2040 | | 20,000 | 20,131 |
| | | | 45,998 |
| Escrowed/Pre-Refunded - 0.1% | | | |
| Colorado Health Facilities Authority Series B, 5% 11/15/2030 | | 150,000 | 153,597 |
| General Obligations - 0.5% | | | |
| Colorado Ctfs of Prtn (Colorado St Proj.) Series 2020 A, 3% 12/15/2036 | | 105,000 | 95,252 |
| Colorado Ctfs of Prtn (Colorado St Proj.) Series 2021A, 4% 12/15/2038 | | 285,000 | 287,342 |
| Park Creek Met Dist Colo Rev Series 2015 A, 5% 12/1/2045 | | 445,000 | 447,168 |
| | | | 829,762 |
| Health Care - 0.4% | | | |
| Colorado Health Facilities Authority (Advent Health Proj.) Series 2018A, 4% 11/15/2048 | | 100,000 | 95,646 |
| Colorado Health Facilities Authority (Advent Health Proj.) Series 2021 A, 4% 11/15/2050 | | 20,000 | 18,534 |
| Colorado Health Facilities Authority (Bethesda Living Ctr Proj.) Series 2018 B, 5% 9/15/2053 | | 90,000 | 78,315 |
| Colorado Health Facilities Authority (CommonSpirit Health Proj.) Series 2019 A 1, 4% 8/1/2037 | | 75,000 | 74,222 |
| Colorado Health Facilities Authority (CommonSpirit Health Proj.) Series 2019 A 1, 4% 8/1/2039 | | 85,000 | 82,969 |
| Colorado Health Facilities Authority (CommonSpirit Health Proj.) Series 2019 A 1, 4% 8/1/2044 | | 55,000 | 51,316 |
| Colorado Health Facilities Authority (CommonSpirit Health Proj.) Series 2019 A 1, 5% 8/1/2026 | | 60,000 | 61,578 |
| Colorado Health Facilities Authority (IHC Health Services Inc Proj.) Series 2022 A, 4% 5/15/2052 | | 190,000 | 181,740 |
| Colorado Health Facilities Authority (Sanford Health, SD Proj.) Series 2019A, 5% 11/1/2029 | | 35,000 | 37,708 |
| | | | 682,028 |
| Special Tax - 0.0% | | | |
| Denver Colo Convention Ctr Hotel Auth Rev Series 2016, 5% 12/1/2026 | | 50,000 | 51,133 |
| Transportation - 0.5% | | | |
| Denver CO City & Cnty Arpt 5% 11/15/2042 (f) | | 165,000 | 172,863 |
| Denver CO City & Cnty Arpt Series 2017 A, 5% 11/15/2028 (f) | | 30,000 | 31,063 |
| Denver CO City & Cnty Arpt Series 2018 A, 5% 12/1/2036 (f) | | 60,000 | 65,089 |
| Denver CO City & Cnty Arpt Series 2018 B, 3.5% 12/1/2035 | | 15,000 | 14,050 |
| Denver CO City & Cnty Arpt Series 2019 C, 5% 11/15/2031 | | 30,000 | 32,494 |
| Denver CO City & Cnty Arpt Series 2022A, 5% 11/15/2041 (f) | | 245,000 | 256,362 |
| E-470 Pub Hwy Auth Colo Rev 0% 9/1/2030 (National Public Finance Guarantee Corporation Insured) (d) | | 25,000 | 20,482 |
| E-470 Pub Hwy Auth Colo Rev 0% 9/1/2031 (National Public Finance Guarantee Corporation Insured) (d) | | 20,000 | 15,760 |
| E-470 Pub Hwy Auth Colo Rev 0% 9/1/2032 (National Public Finance Guarantee Corporation Insured) (d) | | 25,000 | 18,910 |
| E-470 Pub Hwy Auth Colo Rev 0% 9/1/2037 (National Public Finance Guarantee Corporation Insured) (d) | | 100,000 | 53,716 |
| E-470 Pub Hwy Auth Colo Rev 5% 9/1/2035 | | 15,000 | 16,243 |
| | | | 697,032 |
| Water & Sewer - 0.1% | | | |
| Denver CO City & Cnty Brd Wtr Series 2022 A, 5% 12/15/2045 | | 165,000 | 178,799 |
| Metro Wastewtr Reclamation Dist Cnty Swr Rev Series 2020A, 2% 4/1/2039 | | 100,000 | 72,941 |
| | | | 251,740 |
TOTAL COLORADO | | | 2,790,463 |
| Connecticut - 1.4% | | | |
| Education - 0.1% | | | |
| Connecticut State Health & Educational Facilities Authority (Yale University Proj.) Series A 2, 2% tender 7/1/2042 (b) | | 225,000 | 220,482 |
| General Obligations - 0.6% | | | |
| Connecticut St Gen. Oblig. 3% 6/1/2029 | | 90,000 | 89,100 |
| Connecticut St Gen. Oblig. 3% 6/1/2039 | | 440,000 | 386,812 |
| Connecticut St Gen. Oblig. 3% 6/1/2040 | | 100,000 | 87,071 |
| Connecticut St Gen. Oblig. 4% 6/1/2031 | | 30,000 | 31,277 |
| Connecticut St Gen. Oblig. 4% 6/1/2031 | | 65,000 | 68,499 |
| Connecticut St Gen. Oblig. Series 2015A, 5% 3/15/2028 | | 35,000 | 35,120 |
| Connecticut St Gen. Oblig. Series 2015B, 3.375% 6/15/2029 | | 25,000 | 24,945 |
| Connecticut St Gen. Oblig. Series 2016 A, 5% 3/15/2026 | | 30,000 | 30,729 |
| Connecticut St Gen. Oblig. Series 2016 D, 4% 8/15/2031 | | 15,000 | 15,098 |
| Connecticut St Gen. Oblig. Series 2018 D, 5% 4/15/2026 | | 25,000 | 25,648 |
| Connecticut St Gen. Oblig. Series 2018 D, 5% 4/15/2027 | | 105,000 | 109,855 |
| Connecticut St Gen. Oblig. Series 2019 A, 5% 4/15/2027 | | 25,000 | 26,156 |
| Connecticut St Gen. Oblig. Series A, 5% 4/15/2027 | | 25,000 | 26,156 |
| Connecticut St Gen. Oblig. Series E, 3.375% 10/15/2036 | | 30,000 | 28,871 |
| University Connecticut (Connecticut St Proj.) Series 2018 A, 5% 4/15/2029 | | 25,000 | 26,500 |
| | | | 1,011,837 |
| Health Care - 0.1% | | | |
| Connecticut St Health & Edl Facs Auth Revenue (Hartford HealthCare Corp Proj.) 5% 7/1/2030 | | 50,000 | 53,051 |
| Connecticut St Health & Edl Facs Auth Revenue (Nuvance Health Proj.) Series 2019 A, 4% 7/1/2034 | | 30,000 | 29,690 |
| Connecticut St Health & Edl Facs Auth Revenue (Nuvance Health Proj.) Series 2019 A, 5% 7/1/2033 | | 135,000 | 140,075 |
| | | | 222,816 |
| Housing - 0.0% | | | |
| Conn St Hsg Fin Auth (CT Hsg Mortgage Proj.) Series A 1, 3.5% 5/15/2033 | | 5,000 | 4,911 |
| Conn St Hsg Fin Auth (CT Hsg Mortgage Proj.) Series B 1, 3.45% 11/15/2041 | | 5,000 | 4,503 |
| Conn St Hsg Fin Auth (CT Hsg Mortgage Proj.) Series D 1, 3.2% 11/15/2032 | | 15,000 | 14,382 |
| Connecticut St Hsg Fin Auth Hsg Mtg Fin Prog (CT Hsg Mortgage Proj.) Series 2020C 1, 2.05% 5/15/2037 | | 75,000 | 57,073 |
| | | | 80,869 |
| Special Tax - 0.6% | | | |
| Connecticut St Spl Tax Oblig 4% 5/1/2037 | | 35,000 | 35,831 |
| Connecticut St Spl Tax Oblig Series 2018 A, 5% 1/1/2027 | | 35,000 | 36,406 |
| Connecticut St Spl Tax Oblig Series 2018 B, 5% 10/1/2028 | | 120,000 | 128,735 |
| Connecticut St Spl Tax Oblig Series 2018 B, 5% 10/1/2033 | | 10,000 | 10,613 |
| Connecticut St Spl Tax Oblig Series 2018 B, 5% 10/1/2036 | | 85,000 | 89,466 |
| Connecticut St Spl Tax Oblig Series 2020 A, 5% 5/1/2026 | | 150,000 | 153,771 |
| Connecticut St Spl Tax Oblig Series 2020 A, 5% 5/1/2030 | | 200,000 | 219,384 |
| Connecticut St Spl Tax Oblig Series A, 4% 9/1/2035 | | 145,000 | 144,844 |
| Connecticut St Spl Tax Oblig Series A, 5% 9/1/2030 | | 60,000 | 61,644 |
| Connecticut St Spl Tax Oblig Series A, 5% 9/1/2031 | | 5,000 | 5,125 |
| Connecticut St Spl Tax Oblig Series B, 5% 8/1/2026 | | 110,000 | 111,111 |
| | | | 996,930 |
TOTAL CONNECTICUT | | | 2,532,934 |
| Delaware - 0.4% | | | |
| General Obligations - 0.3% | | | |
| Delaware St Gen. Oblig. 3.25% 3/1/2037 | | 4,000 | 3,762 |
| Delaware St Gen. Oblig. Series 2020 A, 5% 1/1/2030 | | 255,000 | 280,689 |
| Delaware St Gen. Oblig. Series 2021, 5% 2/1/2029 | | 45,000 | 48,774 |
| Delaware St Gen. Oblig. Series 2023A, 5% 5/1/2034 | | 150,000 | 171,681 |
| Delaware St Gen. Oblig. Series 2024A, 5% 5/1/2035 | | 45,000 | 51,866 |
| | | | 556,772 |
| Health Care - 0.1% | | | |
| Delaware St Hlth Facs Auth Rev (Christiana Health Svcs Proj.) Series 2020 A, 4% 10/1/2049 | | 155,000 | 146,447 |
| Delaware St Hlth Facs Auth Rev (Christiana Health Svcs Proj.) Series 2020 A, 5% 10/1/2032 | | 15,000 | 16,151 |
| | | | 162,598 |
| Transportation - 0.0% | | | |
| Delaware Trans Auth US 301 Rev Series 2015, 4% 6/1/2045 (DE TT Trust 301 Project Guaranteed) | | 50,000 | 48,490 |
TOTAL DELAWARE | | | 767,860 |
| District Of Columbia - 1.6% | | | |
| Education - 0.0% | | | |
| District Columbia Univ Rev (Georgetown Univ, DC Proj.) Series 2017, 5% 4/1/2031 | | 25,000 | 25,697 |
| General Obligations - 0.7% | | | |
| District Columbia Gen. Oblig. 5% 10/15/2044 | | 15,000 | 15,696 |
| District Columbia Gen. Oblig. Series 2016 A, 4% 6/1/2036 | | 400,000 | 401,450 |
| District Columbia Gen. Oblig. Series 2017 A, 5% 6/1/2029 | | 45,000 | 47,097 |
| District Columbia Gen. Oblig. Series 2017D, 5% 6/1/2028 | | 100,000 | 104,797 |
| District Columbia Gen. Oblig. Series 2017D, 5% 6/1/2042 | | 35,000 | 35,988 |
| District Columbia Gen. Oblig. Series 2019 A, 5% 10/15/2031 | | 80,000 | 86,414 |
| District Columbia Gen. Oblig. Series 2019 A, 5% 10/15/2040 | | 295,000 | 310,825 |
| District Columbia Gen. Oblig. Series 2021 D, 5% 2/1/2031 | | 60,000 | 66,808 |
| | | | 1,069,075 |
| Special Tax - 0.5% | | | |
| District Columbia Income Tax Rev Series 2019 C, 5% 10/1/2029 | | 180,000 | 196,725 |
| District Columbia Income Tax Rev Series 2019 C, 5% 10/1/2033 | | 205,000 | 221,711 |
| District Columbia Income Tax Rev Series 2020 C, 4% 5/1/2040 | | 195,000 | 196,603 |
| Washington DC Met Area Tran Auth Rev Series 2017B, 5% 7/1/2042 | | 70,000 | 71,800 |
| Washington DC Met Area Tran Auth Rev Series A 1, 5% 7/1/2029 | | 10,000 | 10,409 |
| Washington Metropolitan Area Transit Authority Series 2023 A, 5% 7/15/2037 | | 200,000 | 222,769 |
| | | | 920,017 |
| Transportation - 0.3% | | | |
| District Columbia Rev (DC Garvee Proj.) Series 2020, 5% 12/1/2027 | | 180,000 | 190,267 |
| Metropolitan Wash DC Arpts Ath Series 2018 A, 5% 10/1/2027 (f) | | 65,000 | 67,487 |
| Metropolitan Wash DC Arpts Ath Series 2021 A, 4% 10/1/2041 (f) | | 205,000 | 198,693 |
| Metropolitan Wash DC Arpts Auth Dulles Toll Rd Rev 0% 10/1/2025 (Assured Guaranty Inc Insured) (d) | | 5,000 | 4,879 |
| Metropolitan Wash DC Arpts Auth Dulles Toll Rd Rev 0% 10/1/2031 (Assured Guaranty Inc Insured) (d) | | 35,000 | 27,640 |
| Metropolitan Wash DC Arpts Auth Dulles Toll Rd Rev 0% 10/1/2034 (Assured Guaranty Inc Insured) (d) | | 70,000 | 48,643 |
| Metropolitan Wash DC Arpts Auth Dulles Toll Rd Rev 0% 10/1/2036 (Assured Guaranty Inc Insured) (d) | | 20,000 | 12,654 |
| Metropolitan Wash DC Arpts Auth Dulles Toll Rd Rev Series 2019 B, 3% 10/1/2050 (Assured Guaranty Municipal Corp Insured) | | 20,000 | 14,998 |
| Metropolitan Wash DC Arpts Auth Dulles Toll Rd Rev Series 2019 B, 4% 10/1/2044 | | 100,000 | 94,552 |
| Metropolitan Wash DC Arpts Auth Dulles Toll Rd Rev Series 2019 B, 4% 10/1/2053 | | 45,000 | 40,887 |
| | | | 700,700 |
| Water & Sewer - 0.1% | | | |
| District Columbia Wtr & Swr Auth Pub Util Rev Series 2019 A, 5% 10/1/2044 | | 130,000 | 136,406 |
TOTAL DISTRICT OF COLUMBIA | | | 2,851,895 |
| Florida - 4.2% | | | |
| Education - 0.3% | | | |
| Cap Proj Fin Auth FL Student Hsg Rev (Capfa Capital Corp 2000 F Proj.) 5% 10/1/2034 | | 215,000 | 222,900 |
| Florida Higher Edl Facs Fing Auth Rev (Nova Southeastern University Proj.) Series 2016, 5% 4/1/2035 | | 40,000 | 40,424 |
| Miami-Dade Cnty FL Edl Fac Rev (University of Miami, FL Proj.) Series 2015A, 4% 4/1/2045 | | 100,000 | 95,017 |
| Volusia Cnty FL Edl Fac Ath Rv (Stetson University, FL Proj.) Series 2015, 5% 6/1/2045 | | 305,000 | 301,580 |
| | | | 659,921 |
| Electric Utilities - 0.2% | | | |
| Gainesville FL Utils Sys Rev Series 2021 A 1, 5% 10/1/2046 | | 100,000 | 106,174 |
| Jacksonville FL Elec Auth Sys Rev Series 2017B, 5% 10/1/2027 | | 125,000 | 131,118 |
| Orlando Fla Utils Commn Util Sys Rev Series 2018 A, 5% 10/1/2034 | | 5,000 | 5,228 |
| Putnam Cnty Fla Dev Auth Pcr (Seminole Electric Coop Inc Proj.) Series 2018 A, 5% 3/15/2042 | | 90,000 | 92,489 |
| | | | 335,009 |
| Escrowed/Pre-Refunded - 0.2% | | | |
| Greater Orlando Aviation Auth 5% 10/1/2030 (Pre-refunded to 10/1/2027 at 100) (f) | | 60,000 | 62,209 |
| Jacksonville Transportation Authority Series 2015, 5% 8/1/2035 | | 150,000 | 151,340 |
| Palm Beach Cnty FL Pub Impt Rev Series D, 5% 12/1/2040 (Pre-refunded to 12/1/2025 at 100) | | 40,000 | 40,722 |
| Palm Beach Cnty FL Pub Impt Rev Series D, 5% 12/1/2045 (Pre-refunded to 12/1/2025 at 100) | | 100,000 | 101,806 |
| | | | 356,077 |
| General Obligations - 0.7% | | | |
| Florida St Brd Ed Pub Ed (Florida St Proj.) Gen. Oblig. Series 2016D, 4% 6/1/2032 | | 25,000 | 25,231 |
| Florida St Brd Ed Pub Ed (Florida St Proj.) Gen. Oblig. Series 2018 A, 4% 6/1/2037 | | 55,000 | 55,922 |
| Florida St Brd Ed Pub Ed (Florida St Proj.) Gen. Oblig. Series 2019 D, 4% 6/1/2030 | | 35,000 | 36,471 |
| Florida St Gen. Oblig. Series 2021 B, 5% 7/1/2032 | | 190,000 | 216,167 |
| Hillsborough Cnty FL Sch Brd 5% 7/1/2029 | | 75,000 | 80,625 |
| Jacksonville Fla Spl Rev (Jacksonville FL Proj.) Series 2019 A, 5% 10/1/2027 | | 80,000 | 84,066 |
| Jacksonville Fla Spl Rev (Jacksonville FL Proj.) Series 2019 A, 5% 10/1/2029 | | 25,000 | 27,103 |
| Jacksonville Fla Spl Rev (Jacksonville FL Proj.) Series 2019 A, 5% 10/1/2032 | | 60,000 | 64,691 |
| Jacksonville Fla Spl Rev (Jacksonville FL Proj.) Series 2019 A, 5% 10/1/2034 | | 100,000 | 107,332 |
| Miami-Dade Cnty FL Sch Brd Ctf (Miami-Dade Cnty FL Sch Dist Proj.) Series 2015A, 5% 5/1/2026 | | 100,000 | 100,614 |
| Miami-Dade Cnty Fla Gen. Oblig. Series 2013 A, 5% 7/1/2026 | | 55,000 | 55,503 |
| Miami-Dade Cnty Fla Gen. Oblig. Series 2015 D, 3% 7/1/2039 | | 10,000 | 8,796 |
| Miami-Dade Cnty Fla Seaport Rev (Miami-Dade Cnty Fla Proj.) Series SUB 2021 B2, 4% 10/1/2043 | | 420,000 | 408,093 |
| | | | 1,270,614 |
| Health Care - 0.5% | | | |
| Brevard Cnty FL Health Facs Au Th Health Care Facs Rev (Health First Inc Proj.) Series 2014, 4% 4/1/2036 | | 180,000 | 177,979 |
| Florida Development Finance Corp (Lakeland FL Hosp Sys Rev Proj.) Series 2021, 5% 11/15/2026 | | 100,000 | 103,137 |
| Lakeland FL Hosp Sys Rev Series 2016, 3% 11/15/2032 | | 10,000 | 9,291 |
| Miami Beach FL Hlth Facs Auth Hosp Rev (MT Sinai Hospital Proj.) Series 2014, 5% 11/15/2039 | | 25,000 | 25,005 |
| North Broward Cnty Hospital FL Series 2017B, 5% 1/1/2032 | | 10,000 | 10,349 |
| Orange Cnty FL Health Facs Auth Rev (Orange County Health Facilities Authority Proj.) Series 2016B, 4% 10/1/2045 | | 65,000 | 62,089 |
| Orange Cnty FL Health Facs Auth Rev (Orange County Health Facilities Authority Proj.) Series 2022, 4% 10/1/2052 | | 85,000 | 77,851 |
| Palm Beach Cnty FL Health Facs Auth Retirement Cmnty Rev (Acts Ret-Life Cmntys Inc Proj.) Series 2016, 5% 11/15/2032 | | 25,000 | 25,516 |
| South Broward Hosp Dist FL Rev Series 2017, 5% 5/1/2028 | | 55,000 | 57,161 |
| South Broward Hosp Dist FL Rev Series 2021 A, 2.375% 5/1/2045 | | 375,000 | 266,583 |
| Tampa FL Health Sys Rev (Baycare Health System Proj.) Series 2016 A, 4% 11/15/2046 | | 140,000 | 135,903 |
| | | | 950,864 |
| Special Tax - 0.5% | | | |
| County of Broward FL Tourist Development Tax Revenue Series 2021, 4% 9/1/2051 | | 225,000 | 213,022 |
| Florida St Brd of Ed Lottery Rev Series 2016 B, 5% 7/1/2026 | | 65,000 | 66,993 |
| Hillsborough Cnty FL Cap Impt Non-Ad Valorem Rev Series 2019, 3.125% 8/1/2046 | | 50,000 | 41,883 |
| Hillsborough Cnty FL Cap Impt Non-Ad Valorem Rev Series 2019, 3.25% 8/1/2049 | | 20,000 | 16,662 |
| Miami-Dade Cnty FL Spl Oblig 0% 10/1/2044 (d) | | 155,000 | 63,679 |
| Miami-Dade Cnty FL Spl Oblig 0% 10/1/2046 (d) | | 10,000 | 3,673 |
| Miami-Dade Cnty FL Spl Oblig Series 2009, 0% 10/1/2047 (d) | | 50,000 | 17,403 |
| Miami-Dade Cnty FL Spl Oblig Series 2016, 0% 10/1/2031 (d) | | 5,000 | 3,795 |
| Miami-Dade Cnty FL Spl Oblig Series 2016, 0% 10/1/2032 (d) | | 15,000 | 10,871 |
| Miami-Dade Cnty FL Spl Oblig Series 2016, 5% 10/1/2026 | | 145,000 | 149,908 |
| Miami-Dade Cnty FL Tran Sys Sales Surtax Rev Series 2019, 5% 7/1/2031 | | 20,000 | 21,556 |
| Miami-Dade Cty FL Sports Fac Tax 0% 10/1/2048 (Assured Guaranty Inc Insured) (d) | | 15,000 | 5,063 |
| Miami-Dade Cty FL Sports Fac Tax 6.875% 10/1/2034 (Assured Guaranty Inc Insured) (c) | | 255,000 | 294,987 |
| Orange Cnty FL Tourist Dev Tax Series 2016 A, 4% 10/1/2034 | | 20,000 | 20,002 |
| Orange Cnty FL Tourist Dev Tax Series 2016 B, 4% 10/1/2036 | | 30,000 | 30,006 |
| Tampa FL Tax Alloc 0% 9/1/2053 (d) | | 5,000 | 1,230 |
| | | | 960,733 |
| Transportation - 0.8% | | | |
| Broward Cnty FL Arpt Sys Rev Series 2019 A, 5% 10/1/2049 (f) | | 100,000 | 101,667 |
| Broward Cnty FL Arpt Sys Rev Series A, 5% 10/1/2033 (f) | | 35,000 | 35,224 |
| Broward Cnty FL Prt Facs Rev Series 2019 B, 4% 9/1/2038 (f) | | 75,000 | 72,094 |
| Florida Dev Fin Corp Rev (Brightline FL Proj.) Series 2024, 5% 7/1/2041 (f) | | 205,000 | 200,088 |
| Florida St Dept Transn Tpk Rev Series 2016 B, 2.625% 7/1/2027 | | 60,000 | 58,484 |
| Greater Orlando Aviation Auth Series 2022 A, 4% 10/1/2052 (f) | | 200,000 | 184,950 |
| Miami-Dade Cnty Fla Aviat Rev 4% 10/1/2039 | | 130,000 | 128,987 |
| Miami-Dade Cnty Fla Aviat Rev 5% 10/1/2041 | | 20,000 | 20,253 |
| Orlando-Orange County Expressway Authority (Central Florida Expressway Authority Proj.) Series 2016 B, 3% 7/1/2037 (Assured Guaranty Municipal Corp Insured) | | 50,000 | 45,191 |
| Orlando-Orange County Expressway Authority (Central Florida Expressway Authority Proj.) Series 2016 B, 4% 7/1/2040 | | 20,000 | 19,885 |
| Orlando-Orange County Expressway Authority (Central Florida Expressway Authority Proj.) Series 2017, 3.375% 7/1/2042 | | 70,000 | 63,543 |
| Orlando-Orange County Expressway Authority (Central Florida Expressway Authority Proj.) Series 2019 B, 5% 7/1/2044 | | 125,000 | 130,257 |
| Orlando-Orange County Expressway Authority (Central Florida Expressway Authority Proj.) Series 2021, 5% 7/1/2026 (Assured Guaranty Municipal Corp Insured) | | 265,000 | 272,808 |
| Osceola Cnty Fla Transn Rev (Osceola Parkway Proj.) Series 2019 A 2, 0% 10/1/2038 (d) | | 55,000 | 29,967 |
| | | | 1,363,398 |
| Water & Sewer - 1.0% | | | |
| Broward Cnty FL Wtr & Swr Util Series 2019 A, 4% 10/1/2043 | | 200,000 | 199,729 |
| City of North Miami Beach FL Series 2020A, 5% 8/1/2044 | | 60,000 | 62,899 |
| JEA FL Wtr & Swr Sys Rev Series 2017A, 4% 10/1/2034 | | 15,000 | 15,202 |
| JEA FL Wtr & Swr Sys Rev Series 2020 A, 3% 10/1/2036 | | 475,000 | 435,471 |
| Miami Beach Fla Wtr & Swr Rev Series 2017, 5% 9/1/2047 | | 115,000 | 117,895 |
| Miami-Dade Cnty FL Wtr & Swr Rev Series 2017 B, 3.125% 10/1/2039 | | 5,000 | 4,549 |
| Miami-Dade Cnty FL Wtr & Swr Rev Series 2017A, 4% 10/1/2039 | | 75,000 | 75,493 |
| Miami-Dade Cnty FL Wtr & Swr Rev Series 2019 B, 3% 10/1/2049 | | 10,000 | 7,735 |
| Miami-Dade Cnty FL Wtr & Swr Rev Series 2019, 5% 10/1/2046 | | 165,000 | 170,200 |
| Miami-Dade Cnty FL Wtr & Swr Rev Series 2024A, 4.125% 10/1/2050 | | 160,000 | 156,843 |
| Tampa Fla Wtr & Wastewtr Sys Series 2020 A, 4% 10/1/2038 | | 100,000 | 102,585 |
| Tampa Fla Wtr & Wastewtr Sys Series 2020 A, 5% 10/1/2054 | | 260,000 | 272,985 |
| | | | 1,621,586 |
TOTAL FLORIDA | | | 7,518,202 |
| Georgia - 2.3% | | | |
| Education - 0.2% | | | |
| Fulton Cnty GA Dev Auth Rev (University System of GA Proj.) 5% 6/15/2044 | | 20,000 | 20,794 |
| Private Colgs & Unvs Ath GA Rv (Emory University GA Proj.) Series 2020 B, 4% 9/1/2041 | | 245,000 | 247,724 |
| Private Colgs & Unvs Ath GA Rv (Emory University GA Proj.) Series 2020 B, 5% 9/1/2030 | | 100,000 | 110,431 |
| | | | 378,949 |
| Electric Utilities - 0.2% | | | |
| Burke Cnty GA Dev Auth Pcr (Oglethorpe Power Corp Proj.) Series 2017 D, 4.125% 11/1/2045 | | 20,000 | 18,468 |
| Georgia Mun Elec Auth Pwr Rev Series 2024A, 5% 1/1/2035 | | 225,000 | 251,863 |
| Georgia Mun Elec Auth Pwr Rev Series HH, 4.125% 1/1/2049 (Assured Guaranty Municipal Corp Insured) | | 65,000 | 62,335 |
| | | | 332,666 |
| Escrowed/Pre-Refunded - 0.0% | | | |
| Atlanta GA Wtr & Wastewtr Rev Series 2015, 5% 11/1/2035 (Pre-refunded to 5/1/2025 at 100) | | 30,000 | 30,195 |
| Atlanta GA Wtr & Wastewtr Rev Series 2015, 5% 11/1/2043 (Pre-refunded to 5/1/2025 at 100) | | 25,000 | 25,162 |
| Metro Atlanta Rapid Tran Sales 5.25% 7/1/2027 (Escrowed to Maturity) | | 65,000 | 68,681 |
| | | | 124,038 |
| General Obligations - 1.1% | | | |
| Georgia St Gen. Oblig. Series 2016 F, 5% 1/1/2026 | | 25,000 | 25,522 |
| Georgia St Gen. Oblig. Series 2018A, 3% 7/1/2033 | | 25,000 | 24,202 |
| Georgia St Gen. Oblig. Series 2018A, 4% 7/1/2034 | | 155,000 | 158,433 |
| Georgia St Gen. Oblig. Series 2018A, 5% 7/1/2027 | | 5,000 | 5,261 |
| Georgia St Gen. Oblig. Series 2021 A, 4% 7/1/2035 | | 105,000 | 110,568 |
| Georgia St Gen. Oblig. Series 2022C, 5% 7/1/2031 | | 205,000 | 230,689 |
| Gwinnett Cnty GA Sch Dist Series 2019, 5% 2/1/2039 | | 100,000 | 105,888 |
| Main Street Natural Gas Inc 4% tender 5/1/2052 (Citigroup Inc Guaranteed) (b) | | 200,000 | 200,888 |
| Main Street Natural Gas Inc Series 2019 A, 4% 5/15/2039 (Macquarie Group Ltd Guaranteed) | | 100,000 | 94,946 |
| Main Street Natural Gas Inc Series 2024 A 1, 5% tender 5/1/2054 (Royal Bank of Canada Guaranteed) (b) | | 690,000 | 731,433 |
| Main Street Natural Gas Inc Series 2024E, 5% tender 5/1/2055 (b) | | 230,000 | 242,729 |
| | | | 1,930,559 |
| Health Care - 0.6% | | | |
| Brookhaven Development Authority (Childrens Healthcare of Atlanta Proj.) Series 2019 A, 4% 7/1/2049 | | 105,000 | 101,811 |
| Brookhaven Development Authority (Childrens Healthcare of Atlanta Proj.) Series 2019 A, 5% 7/1/2026 | | 20,000 | 20,571 |
| Cobb Cnty GA Kennestone Hosp Series 2022A, 4% 4/1/2052 | | 70,000 | 64,829 |
| Gainesville & Hall Cnty GA Hsp Ath Rev (Northeast Georgia Healthcare Proj.) Series 2020 A, 5% 2/15/2031 | | 50,000 | 53,896 |
| Gainesville & Hall Cnty GA Hsp Ath Rev (Northeast Georgia Healthcare Proj.) Series A, 5% 2/15/2045 | | 255,000 | 258,665 |
| Griffin-Spalding Cnty GA Hosp Rev (Wellstar Health System Inc Proj.) 3.75% 4/1/2047 | | 275,000 | 245,586 |
| Richmond Cnty GA Hosp Auth Rev Anticipation Ctfs (University Health Services Inc Proj.) Series 2016, 4% 1/1/2035 | | 70,000 | 69,725 |
| Richmond Cnty GA Hosp Auth Rev Anticipation Ctfs (University Health Services Inc Proj.) Series 2016, 5% 1/1/2027 | | 105,000 | 107,687 |
| Savannah GA Candler Hosp (St Joseph Candler Health Proj.) Series 2019A, 3.125% 7/1/2044 | | 110,000 | 89,669 |
| | | | 1,012,439 |
| Housing - 0.1% | | | |
| Georgia Hsg & Fin Auth Rev (GA Single Family Mortgage Proj.) Series 2017 C, 3.75% 6/1/2048 | | 110,000 | 95,392 |
| Georgia Hsg & Fin Auth Rev (GA Single Family Mortgage Proj.) Series 2018 A, 3.95% 12/1/2043 | | 50,000 | 46,955 |
| | | | 142,347 |
| Special Tax - 0.0% | | | |
| Metro Atlanta Rapid Tran Sales Series 2019 A, 3.125% 7/1/2046 | | 25,000 | 20,457 |
| Transportation - 0.0% | | | |
| Atlanta GA Arpt Rev Series 2019 B, 4% 7/1/2049 (f) | | 125,000 | 116,599 |
| Water & Sewer - 0.1% | | | |
| Atlanta GA Wtr & Wastewtr Rev 5% 11/1/2028 | | 25,000 | 25,146 |
| Atlanta GA Wtr & Wastewtr Rev 5% 11/1/2029 | | 5,000 | 5,027 |
| Atlanta GA Wtr & Wastewtr Rev Series 2015, 5% 11/1/2040 | | 40,000 | 40,116 |
| Atlanta GA Wtr & Wastewtr Rev Series 2017 A, 5% 11/1/2032 (Pre-refunded to 11/1/2027 at 100) | | 25,000 | 26,432 |
| Atlanta GA Wtr & Wastewtr Rev Series 2018 C, 4% 11/1/2037 | | 15,000 | 14,990 |
| County of Paulding GA Water & Sewerage Revenue Series 2016, 3% 12/1/2048 | | 20,000 | 15,290 |
| | | | 127,001 |
TOTAL GEORGIA | | | 4,185,055 |
| Hawaii - 0.9% | | | |
| General Obligations - 0.3% | | | |
| Hawaii St Gen. Oblig. Series 2018 FT, 5% 1/1/2027 | | 50,000 | 52,078 |
| Hawaii St Gen. Oblig. Series 2018 FT, 5% 1/1/2032 | | 65,000 | 68,509 |
| Hawaii St Gen. Oblig. Series 2019 FW, 3.5% 1/1/2038 | | 35,000 | 34,188 |
| Hawaii St Gen. Oblig. Series EY, 5% 10/1/2026 | | 130,000 | 131,872 |
| Hawaii St Gen. Oblig. Series FG, 5% 10/1/2030 | | 30,000 | 30,954 |
| Honolulu HI City & Cnty Gen. Oblig. Series A, 5% 10/1/2039 | | 100,000 | 100,902 |
| Honolulu HI City & Cnty Gen. Oblig. Series C, 3% 10/1/2028 | | 135,000 | 133,416 |
| | | | 551,919 |
| Health Care - 0.0% | | | |
| Hawaii Dpt Bg & Fin Spl Pur Rev (Queens Health System Proj.) Series 2015A, 4% 7/1/2040 | | 35,000 | 34,225 |
| Transportation - 0.4% | | | |
| Hawaii St Arpts Sys Rev Series 2020 A, 4% 7/1/2035 (f) | | 80,000 | 79,507 |
| Hawaii St Arpts Sys Rev Series 2020 D, 4% 7/1/2039 | | 100,000 | 99,453 |
| Hawaii St Hbr Sys Rev Series 2020 C, 4% 7/1/2032 | | 470,000 | 486,514 |
| | | | 665,474 |
| Water & Sewer - 0.2% | | | |
| Honolulu HI Cty & Cnty Wastewtr Sys Rev Series 2018 A, 3.375% 7/1/2042 | | 40,000 | 36,196 |
| Honolulu HI Cty & Cnty Wastewtr Sys Rev Series 2019A, 4% 7/1/2037 | | 100,000 | 101,263 |
| Honolulu HI Cty & Cnty Wastewtr Sys Rev Series B, 4% 7/1/2033 | | 235,000 | 236,707 |
| | | | 374,166 |
TOTAL HAWAII | | | 1,625,784 |
| Idaho - 0.1% | | | |
| Health Care - 0.1% | | | |
| Idaho Health Facs Auth Rev (St Lukes Regional Med Ctr, ID Proj.) Series 2018 A, 5% 3/1/2027 | | 25,000 | 25,922 |
| Idaho Health Facs Auth Rev (Trinity Health Proj.) 5.5% 12/1/2027 | | 60,000 | 60,545 |
| Idaho Health Facs Auth Rev (Trinity Health Proj.) Series 2015ID, 5.5% 12/1/2029 | | 20,000 | 20,175 |
| | | | 106,642 |
| Transportation - 0.0% | | | |
| Idaho Hsg & Fin Assn (Idaho St Garvee Proj.) Series 2021A, 4% 7/15/2038 | | 105,000 | 105,395 |
TOTAL IDAHO | | | 212,037 |
| Illinois - 4.1% | | | |
| Education - 0.2% | | | |
| Illinois Fin Auth Rev (Rosalind Franklin University Proj.) Series A, 5% 8/1/2042 | | 105,000 | 105,868 |
| Illinois Fin Auth Rev (Univ of Chicago, IL Proj.) Series 2018 A, 5% 10/1/2041 | | 25,000 | 25,591 |
| Illinois Fin Auth Rev (Univ of Chicago, IL Proj.) Series 2018 A, 5% 10/1/2048 | | 20,000 | 20,327 |
| Illinois Finance Authority Rev (Bradley University Proj.) Series 2021 A, 4% 8/1/2043 | | 80,000 | 72,110 |
| Illinois Finance Authority Rev (Univ of Chicago, IL Proj.) Series 2021 A, 5% 10/1/2032 | | 60,000 | 67,696 |
| Illinois Finance Authority Rev (Univ of Chicago, IL Proj.) Series 2024 A, 5% 4/1/2033 | | 35,000 | 39,680 |
| Illinois Finance Authority Rev (Univ of Chicago, IL Proj.) Series 2024 A, 5.25% 4/1/2045 | | 20,000 | 21,990 |
| Illinois Finance Authority Rev (Univ of Chicago, IL Proj.) Series 2024B, 5% 4/1/2034 | | 15,000 | 17,132 |
| | | | 370,394 |
| Electric Utilities - 0.1% | | | |
| Northern Ill Mun Pwr Agy Pwr Proj Rev Series 2016 A, 5% 12/1/2029 | | 45,000 | 46,489 |
| Springfield IL Elec Rev Series 2015, 4% 3/1/2040 (Assured Guaranty Municipal Corp Insured) | | 35,000 | 35,037 |
| Springfield IL Elec Rev Series 2015, 5% 3/1/2031 | | 60,000 | 60,161 |
| Springfield IL Elec Rev Series 2015, 5% 3/1/2032 | | 115,000 | 115,309 |
| | | | 256,996 |
| Escrowed/Pre-Refunded - 0.0% | | | |
| Chicago IL Gen. Oblig. 5% 1/1/2026 (Pre-refunded to 1/1/2025 at 100) | | 10,000 | 9,999 |
| Chicago IL Gen. Oblig. Series 2008C, 0% 1/1/2026 (Escrowed to Maturity) (d) | | 85,000 | 82,073 |
| | | | 92,072 |
| General Obligations - 1.5% | | | |
| Chicago IL Gen. Oblig. Series 1999, 0% 1/1/2031 (d) | | 40,000 | 31,424 |
| Chicago IL Gen. Oblig. Series 1999, 0% 1/1/2033 (d) | | 50,000 | 35,748 |
| Chicago IL Gen. Oblig. Series 2008C, 0% 1/1/2030 (d) | | 85,000 | 69,384 |
| Chicago IL Gen. Oblig. Series 2015 C, 5% 1/1/2027 | | 195,000 | 197,125 |
| Chicago IL Gen. Oblig. Series 2019A, 5% 1/1/2040 | | 15,000 | 15,222 |
| Chicago IL Gen. Oblig. Series 2021 A, 4% 1/1/2035 | | 35,000 | 34,293 |
| Cook Cnty IL Gen. Oblig. Series 2018, 5% 11/15/2034 | | 100,000 | 102,791 |
| Illinois St Gen. Oblig. 5% 12/1/2036 | | 25,000 | 27,322 |
| Illinois St Gen. Oblig. 5% 2/1/2027 | | 140,000 | 144,677 |
| Illinois St Gen. Oblig. Series 2016, 4% 1/1/2031 | | 70,000 | 70,137 |
| Illinois St Gen. Oblig. Series 2017 A, 4.5% 12/1/2041 | | 35,000 | 35,117 |
| Illinois St Gen. Oblig. Series 2017C, 5% 11/1/2029 | | 10,000 | 10,422 |
| Illinois St Gen. Oblig. Series 2017D, 3.25% 11/1/2026 | | 40,000 | 39,910 |
| Illinois St Gen. Oblig. Series 2017D, 5% 11/1/2026 | | 190,000 | 195,541 |
| Illinois St Gen. Oblig. Series 2017D, 5% 11/1/2028 | | 140,000 | 146,008 |
| Illinois St Gen. Oblig. Series 2019 C, 4% 11/1/2044 | | 25,000 | 23,590 |
| Illinois St Gen. Oblig. Series DECEMBER 2021 A, 5% 12/1/2031 | | 20,000 | 21,910 |
| Illinois St Gen. Oblig. Series DECEMBER 2021 B, 3% 12/1/2041 | | 245,000 | 203,697 |
| Illinois St Gen. Oblig. Series JUNE 2016, 3.5% 6/1/2030 | | 210,000 | 208,431 |
| Illinois St Gen. Oblig. Series JUNE 2016, 3.5% 6/1/2031 | | 70,000 | 68,700 |
| Illinois St Gen. Oblig. Series MARCH 2021 A, 5% 3/1/2027 | | 50,000 | 51,747 |
| Illinois St Gen. Oblig. Series MARCH 2021 A, 5% 3/1/2030 | | 160,000 | 172,090 |
| Illinois St Gen. Oblig. Series MAY 2023D, 5% 7/1/2032 | | 160,000 | 176,142 |
| Illinois St Gen. Oblig. Series MAY 2024 B, 5.25% 5/1/2049 | | 100,000 | 106,744 |
| Illinois St Gen. Oblig. Series NOVEMBER 2016, 4.125% 11/1/2031 | | 40,000 | 40,135 |
| Illinois St Gen. Oblig. Series NOVEMBER 2016, 5% 11/1/2036 | | 100,000 | 101,708 |
| Illinois St Gen. Oblig. Series OCT 2020 C, 4% 10/1/2040 | | 85,000 | 82,889 |
| Kendall Kane & Will Cnty IL Uni Sch Dist No 308 Series 2016, 5% 2/1/2031 | | 65,000 | 65,906 |
| | | | 2,478,810 |
| Health Care - 0.7% | | | |
| Illinois Fin Auth Rev (Lurie Childrens Hospital Proj.) Series 2017, 5% 8/15/2026 | | 135,000 | 138,922 |
| Illinois Fin Auth Rev (Mercy Alliance Inc Proj.) Series 2016, 4% 12/1/2031 | | 25,000 | 25,076 |
| Illinois Fin Auth Rev (Mercy Alliance Inc Proj.) Series 2016, 4% 12/1/2040 | | 210,000 | 202,102 |
| Illinois Fin Auth Rev (Osf Healthcare System Proj.) Series 2016, 3.25% 5/15/2039 | | 160,000 | 134,765 |
| Illinois Fin Auth Rev (Riverside Health System, IL Proj.) Series 2016, 3.25% 11/15/2045 | | 15,000 | 12,109 |
| Illinois Fin Auth Rev (Rush University Medical Center Proj.) Series 2015A, 4% 11/15/2039 | | 565,000 | 533,539 |
| Illinois Finance Authority Rev (Advocate Aurora Health Inc Proj.) Series 2015, 4.125% 5/1/2045 | | 125,000 | 118,652 |
| Illinois Finance Authority Rev (Osf Healthcare System Proj.) Series 2020 A, 3% 5/15/2050 | | 80,000 | 61,169 |
| | | | 1,226,334 |
| Housing - 0.0% | | | |
| Illinois Housing Dev Auth (IL Hsg Revenue Bonds 3/1/2016 Proj.) Series 2018A, 4.125% 10/1/2038 | | 15,000 | 14,924 |
| Special Tax - 0.5% | | | |
| Chicago IL Board of Education Series 2016, 5.75% 4/1/2035 | | 100,000 | 103,528 |
| Illinois St Sales Tax Rev Series 2021 A, 4% 6/15/2030 | | 60,000 | 62,280 |
| Illinois St Sales Tax Rev Series SEPTEMBER 2016 A, 3% 6/15/2033 | | 25,000 | 22,692 |
| Illinois St Sales Tax Rev Series SEPTEMBER 2016 D, 3% 6/15/2031 | | 35,000 | 32,778 |
| Metropolitan Pier & Exposition Auth Ill Dedicated St Tax Rev 0% 12/15/2031 (National Public Finance Guarantee Corporation Insured) (d) | | 30,000 | 23,414 |
| Metropolitan Pier & Exposition Auth Ill Dedicated St Tax Rev 0% 12/15/2034 (National Public Finance Guarantee Corporation Insured) (d) | | 20,000 | 13,707 |
| Metropolitan Pier & Exposition Auth Ill Dedicated St Tax Rev 0% 12/15/2038 (National Public Finance Guarantee Corporation Insured) (d) | | 10,000 | 5,697 |
| Metropolitan Pier & Exposition Auth Ill Dedicated St Tax Rev 0% 6/15/2032 (National Public Finance Guarantee Corporation Insured) (d) | | 20,000 | 15,277 |
| Metropolitan Pier & Exposition Auth Ill Dedicated St Tax Rev 0% 6/15/2036 (National Public Finance Guarantee Corporation Insured) (d) | | 35,000 | 22,459 |
| Metropolitan Pier & Exposition Auth Ill Dedicated St Tax Rev 0% 6/15/2037 (National Public Finance Guarantee Corporation Insured) (d) | | 170,000 | 104,273 |
| Metropolitan Pier & Exposition Auth Ill Dedicated St Tax Rev 0% 6/15/2038 (National Public Finance Guarantee Corporation Insured) (d) | | 90,000 | 52,487 |
| Metropolitan Pier & Exposition Auth Ill Dedicated St Tax Rev 0% 6/15/2047 (Assured Guaranty Municipal Corp Insured) (d) | | 600,000 | 216,880 |
| Metropolitan Pier & Exposition Auth Ill Dedicated St Tax Rev Series 2002 A, 0% 12/15/2026 (d) | | 95,000 | 89,012 |
| Metropolitan Pier & Exposition Auth Ill Dedicated St Tax Rev Series 2017 B, 0% 12/15/2056 (Assured Guaranty Municipal Corp Insured) (d) | | 15,000 | 3,334 |
| Sales Tax Securitization Corp Series 2017 A, 5% 1/1/2028 | | 50,000 | 52,623 |
| | | | 820,441 |
| Transportation - 1.1% | | | |
| Chicago IL O'Hare Intl Arpt Rev 5% 1/1/2029 | | 60,000 | 64,260 |
| Chicago IL O'Hare Intl Arpt Rev 5% 1/1/2030 | | 125,000 | 128,699 |
| Chicago IL O'Hare Intl Arpt Rev 5% 1/1/2037 (f) | | 225,000 | 227,868 |
| Chicago IL O'Hare Intl Arpt Rev 5% 1/1/2037 | | 45,000 | 47,400 |
| Chicago IL O'Hare Intl Arpt Rev Series 2018 B, 5% 1/1/2038 | | 20,000 | 21,022 |
| Chicago IL O'Hare Intl Arpt Rev Series 2018 B, 5% 1/1/2048 | | 10,000 | 10,319 |
| Chicago IL O'Hare Intl Arpt Rev Series 2018A, 4% 1/1/2043 (f) | | 35,000 | 33,426 |
| Chicago IL O'Hare Intl Arpt Rev Series 2024 A, 5% 1/1/2036 (f) | | 200,000 | 214,200 |
| Chicago IL O'Hare Intl Arpt Rev Series B, 5% 1/1/2033 | | 30,000 | 30,837 |
| Chicago IL O'Hare Intl Arpt Rev Series C, 5% 1/1/2037 | | 100,000 | 101,010 |
| Chicago IL O'Hare Intl Arpt Rev Series D, 5% 1/1/2046 | | 110,000 | 110,000 |
| Chicago IL O'Hare Intl Arpt Rev Series D, 5.25% 1/1/2042 | | 250,000 | 255,944 |
| Illinois St Toll Hwy Auth Hwy Rev 5% 1/1/2040 | | 25,000 | 25,089 |
| Illinois St Toll Hwy Auth Hwy Rev 5% 12/1/2031 | | 50,000 | 50,810 |
| Illinois St Toll Hwy Auth Hwy Rev Series 2014C, 5% 1/1/2030 | | 100,000 | 100,196 |
| Illinois St Toll Hwy Auth Hwy Rev Series 2017 A, 5% 1/1/2036 | | 50,000 | 51,968 |
| Illinois St Toll Hwy Auth Hwy Rev Series 2019 B, 5% 1/1/2027 | | 25,000 | 25,926 |
| Illinois St Toll Hwy Auth Hwy Rev Series 2019 B, 5% 1/1/2030 | | 50,000 | 54,399 |
| Illinois St Toll Hwy Auth Hwy Rev Series 2019 C, 5% 1/1/2030 | | 95,000 | 103,359 |
| Illinois St Toll Hwy Auth Hwy Rev Series 2019 C, 5% 1/1/2031 | | 120,000 | 130,382 |
| Illinois St Toll Hwy Auth Hwy Rev Series 2020 A, 5% 1/1/2045 | | 145,000 | 154,039 |
| Illinois St Toll Hwy Auth Hwy Rev Series 2023 A, 5% 1/1/2044 | | 40,000 | 43,345 |
| Illinois St Toll Hwy Auth Hwy Rev Series 2024 A, 5% 1/1/2033 | | 35,000 | 39,488 |
| | | | 2,023,986 |
| Water & Sewer - 0.0% | | | |
| Chicago IL Wtr Rev Series 2000, 5% 11/1/2030 | | 15,000 | 15,420 |
| Illinois Fin Auth Rev (IL Wtr State Rev Fund Proj.) Series 2016, 4% 7/1/2030 | | 60,000 | 60,349 |
| | | | 75,769 |
TOTAL ILLINOIS | | | 7,359,726 |
| Indiana - 0.8% | | | |
| Electric Utilities - 0.1% | | | |
| Indiana Mun Pwr Agy Pwr Supply Series 2016 C, 5% 1/1/2039 | | 230,000 | 233,673 |
| Escrowed/Pre-Refunded - 0.0% | | | |
| Indiana Bond Bank Series 2008 B, 0% 6/1/2032 (Escrowed to Maturity) (d) | | 70,000 | 54,574 |
| General Obligations - 0.3% | | | |
| Fishers Town Hall Bldg Corp Ind Lease Rent Rev Series 2023 A, 5.75% 7/15/2058 | | 345,000 | 391,489 |
| Health Care - 0.1% | | | |
| Indiana Fin Auth Health Sys Rev (Franciscan Alliance Proj.) Series 2017 C, 5% 11/1/2032 | | 70,000 | 73,025 |
| Indiana Health & Edl Fac Fing Auth Rev (Ascension Health Credit Group Proj.) Series 2006B 8, 5% 11/15/2046 | | 100,000 | 101,086 |
| | | | 174,111 |
| Special Tax - 0.1% | | | |
| Carmel Ind Loc Pub Impt Bd Bank (Carmel Ind Proj.) Series 2016, 5% 7/15/2030 | | 45,000 | 46,143 |
| Indianapolis Ind Loc Pub Impt Bd Bank Series 2017 C, 5% 1/1/2033 | | 40,000 | 42,007 |
| Indianapolis Ind Loc Pub Impt Bd Bank Series 2019A, 5% 2/1/2033 | | 100,000 | 106,496 |
| Indianapolis Ind Loc Pub Impt Bd Bank Series 2019A, 5% 2/1/2054 | | 25,000 | 25,691 |
| | | | 220,337 |
| Water & Sewer - 0.2% | | | |
| Indiana Finance Authority (Citizens Energy Group Water Proj.) Series 2021 A, 4% 10/1/2051 | | 20,000 | 19,210 |
| Indiana Finance Authority Series 2021 1, 3% 10/1/2040 | | 45,000 | 39,561 |
| Indiana St Fin Auth Rev (Indiana State Revolving Fund Program Proj.) Series 2019E, 5% 2/1/2036 | | 25,000 | 26,584 |
| Indiana St Fin Auth Rev (Indiana State Revolving Fund Program Proj.) Series 2019E, 5% 2/1/2040 | | 65,000 | 68,357 |
| Indiana St Fin Auth Rev (Indiana State Revolving Fund Program Proj.) Series 2021 B, 5% 2/1/2041 | | 150,000 | 160,484 |
| Indianapolis IN Loc Pub Impt Bond Bank 0% 2/1/2028 (Ambac Assurance Corp Insured) (d) | | 5,000 | 4,474 |
| Indianapolis Ind Wtr Sys Rev (Citizens Energy Group Water Proj.) Series 2018 A, 5% 10/1/2030 | | 55,000 | 58,489 |
| | | | 377,159 |
TOTAL INDIANA | | | 1,451,343 |
| Iowa - 0.3% | | | |
| General Obligations - 0.0% | | | |
| Iowa St Spl Oblig (Iowa St Proj.) Series 2019 A, 5% 6/1/2033 | | 30,000 | 32,298 |
| Housing - 0.0% | | | |
| Iowa Fin Auth Single Family Mtg Rev Series 2019 A, 4% 7/1/2047 | | 55,000 | 55,159 |
| Tobacco Bonds - 0.1% | | | |
| Tobacco Settlement Auth Iowa Tobacco Settlement Rev Series 2021A 2 CL 1, 4% 6/1/2040 | | 215,000 | 209,177 |
| Water & Sewer - 0.2% | | | |
| Iowa Fin Auth Rev (Iowa State Revolving Fund Program Proj.) Series 2017, 5% 8/1/2037 | | 115,000 | 119,453 |
| Iowa Fin Auth Rev (Iowa State Revolving Fund Program Proj.) Series 2020 A, 5% 8/1/2036 | | 105,000 | 114,730 |
| Iowa Fin Auth Rev Series 2023 C, 5% 8/1/2035 | | 40,000 | 45,434 |
| | | | 279,617 |
TOTAL IOWA | | | 576,251 |
| Kansas - 0.0% | | | |
| General Obligations - 0.0% | | | |
| Johnson & Miami Cntys Kans Uni Sch Dist No 230 Series B, 3% 9/1/2037 | | 30,000 | 27,070 |
| Health Care - 0.0% | | | |
| University Kansas Hosp Auth Hlth Fac Rev (University of Kansas Hospital Authority Proj.) Series 2019A, 4% 9/1/2048 | | 50,000 | 46,945 |
TOTAL KANSAS | | | 74,015 |
| Kentucky - 0.5% | | | |
| Electric Utilities - 0.1% | | | |
| Kentucky St Mun Pwr Agy Pwr Sys Rev Series 2015A, 4% 9/1/2039 | | 160,000 | 154,811 |
| Kentucky St Mun Pwr Agy Pwr Sys Rev Series 2015A, 5% 9/1/2042 | | 5,000 | 5,019 |
| | | | 159,830 |
| General Obligations - 0.0% | | | |
| Kentucky Inc KY Pub Energy Auth Gas Supply Rev Series 2019C 1, 4% 8/1/2027 (Morgan Stanley Guaranteed) | | 50,000 | 50,220 |
| Kentucky St Pty & Bldgs Commn (Kentucky St Proj.) Series B, 5% 11/1/2028 | | 30,000 | 30,926 |
| | | | 81,146 |
| Health Care - 0.1% | | | |
| Kentucky Eco Dev Fa Hlth Rev (Norton Healthcare Inc Proj.) 0% 10/1/2026 (National Public Finance Guarantee Corporation Insured) (d) | | 100,000 | 92,776 |
| Louisville & Jefferson Cnty KY Metro Govt Health Sys Rev (Norton Healthcare Inc Proj.) Series 2016 A, 3% 10/1/2037 | | 95,000 | 81,386 |
| | | | 174,162 |
| Resource Recovery - 0.2% | | | |
| Carroll Cnty KY Environmental Facs Rev (Kentucky Utilities Co Proj.) Series 2008 A, 2% 2/1/2032 (f) | | 365,000 | 301,680 |
| Water & Sewer - 0.1% | | | |
| Louisville & Jefferson KY Swr Sys Rev Series 2016 A, 3% 5/15/2046 | | 70,000 | 55,994 |
| Louisville & Jefferson KY Swr Sys Rev Series 2017 A, 3.25% 5/15/2046 | | 100,000 | 84,067 |
| | | | 140,061 |
TOTAL KENTUCKY | | | 856,879 |
| Louisiana - 0.3% | | | |
| Education - 0.0% | | | |
| Louisiana Pub Facs Auth Rev (Loyola University, LA Proj.) Series 2017, 5.25% 10/1/2046 (c) | | 35,000 | 36,306 |
| Escrowed/Pre-Refunded - 0.0% | | | |
| New Orl LA Wtr Series 2015, 5% 12/1/2040 (Pre-refunded to 12/1/2025 at 100) | | 25,000 | 25,470 |
| General Obligations - 0.0% | | | |
| Louisiana St Gen. Oblig. Series 2021 A, 5% 3/1/2032 | | 25,000 | 27,726 |
| Louisiana St Gen. Oblig. Series 2023 A, 5% 4/1/2036 | | 15,000 | 16,964 |
| | | | 44,690 |
| Health Care - 0.0% | | | |
| Louisiana Loc Govt Environmental Facs & Cmnty Dv Auth (Womens Hospital Foundation Proj.) Series 2017 A, 4% 10/1/2041 | | 50,000 | 48,635 |
| Louisiana Pub Fac Auth Hsp Rev (Franciscan Missionaries Proj.) Series 2017 A, 3.75% 7/1/2047 | | 30,000 | 26,929 |
| | | | 75,564 |
| Special Tax - 0.0% | | | |
| Jefferson LA Sales Tax Dist Series 2019 B, 4% 12/1/2042 (Assured Guaranty Municipal Corp Insured) | | 5,000 | 4,889 |
| Transportation - 0.3% | | | |
| Louisiana St Grnt Antic Rev Series 2019A, 5% 9/1/2029 | | 80,000 | 85,227 |
| Louisiana St Grnt Antic Rev Series 2021, 5% 9/1/2033 | | 100,000 | 109,423 |
| New Orleans Aviation Board Series 2018A, 4% 10/1/2043 (Assured Guaranty Municipal Corp Insured) | | 150,000 | 142,940 |
| | | | 337,590 |
TOTAL LOUISIANA | | | 524,509 |
| Maryland - 1.4% | | | |
| Education - 0.2% | | | |
| University MD Sys Auxiliary Fac & Tuition Series 2021 A, 4% 4/1/2047 | | 290,000 | 283,088 |
| Escrowed/Pre-Refunded - 0.0% | | | |
| Maryland St Hlth & HI Ed Facs Series 2015, 4% 7/1/2035 (Pre-refunded to 7/1/2025 at 100) | | 100,000 | 100,444 |
| General Obligations - 0.7% | | | |
| Baltimore Cnty MD Gen. Oblig. Series 2019, 4% 3/1/2035 | | 40,000 | 40,792 |
| Baltimore Cnty MD Gen. Oblig. Series 2022, 5% 3/1/2028 | | 295,000 | 314,209 |
| Montgomery Cnty MD Gen. Oblig. Series 2020 B, 4% 11/1/2031 | | 100,000 | 106,176 |
| State of Maryland Gen. Oblig. Series 2018 A, 5% 3/15/2030 | | 30,000 | 31,812 |
| State of Maryland Gen. Oblig. Series 2020 SECOND A, 5% 8/1/2029 | | 150,000 | 163,707 |
| State of Maryland Gen. Oblig. Series FIRST, 5% 3/15/2030 | | 50,000 | 54,071 |
| State of Maryland Gen. Oblig. Series FIRST, 5% 3/15/2031 | | 70,000 | 75,568 |
| State of Maryland Gen. Oblig. Series SECOND 2021 A, 5% 8/1/2028 | | 120,000 | 128,762 |
| State of Maryland Gen. Oblig. Series SECOND 2021 A, 5% 8/1/2032 | | 130,000 | 145,561 |
| State of Maryland Gen. Oblig. Series SECOND 2020A, 5% 8/1/2035 | | 55,000 | 59,941 |
| Washington Suburban San Dist MD Series 2016 SECOND, 4% 6/1/2042 | | 10,000 | 9,852 |
| Washington Suburban San Dist MD Series 2016 SECOND, 5% 6/1/2034 | | 65,000 | 66,586 |
| Washington Suburban San Dist MD Series 2023, 5% 6/1/2036 | | 45,000 | 50,898 |
| | | | 1,247,935 |
| Health Care - 0.0% | | | |
| Maryland Health & Higher Educational Facilities Authority (Greater Baltimore Med Ctr, MD Proj.) Series 2021 A, 2.5% 7/1/2051 | | 90,000 | 59,256 |
| Maryland St Hlth & HI Ed Facs (MedStar Health Inc Proj.) Series 2017 A, 4% 5/15/2047 | | 55,000 | 52,415 |
| Maryland St Hlth & HI Ed Facs (Trinity Health Proj.) Series 2017 MD, 4% 12/1/2046 | | 15,000 | 14,310 |
| | | | 125,981 |
| Special Tax - 0.2% | | | |
| Maryland St Dept Transn Cons Series 2018, 3% 5/1/2031 | | 40,000 | 38,756 |
| State of Maryland Built to Learn Revenue Series 2021, 2.75% 6/1/2051 | | 190,000 | 135,183 |
| State of Maryland Built to Learn Revenue Series 2021, 4% 6/1/2037 | | 115,000 | 116,475 |
| | | | 290,414 |
| Transportation - 0.3% | | | |
| Maryland St Dept Transn Spl Transn Proj Rev (Bwi Airport Proj.) 4% 8/1/2051 (f) | | 100,000 | 92,181 |
| Maryland St Transn Auth Transn 2.25% 7/1/2039 | | 65,000 | 50,078 |
| Maryland St Transn Auth Transn 3% 7/1/2047 | | 145,000 | 114,353 |
| Maryland St Transn Auth Transn 4% 7/1/2040 | | 180,000 | 179,989 |
| Maryland Trans Auth Psngr Fac Chrg Rev (Bwi Passenger Facilities Chrge Proj.) Series 2012B, 2.625% 6/1/2027 (f) | | 40,000 | 38,345 |
| | | | 474,946 |
TOTAL MARYLAND | | | 2,522,808 |
| Maryland,Virginia - 0.1% | | | |
| Special Tax - 0.1% | | | |
| Washington Metropolitan Area Transit Authority Series 2021 A, 5% 7/15/2046 | | 150,000 | 158,124 |
| Massachusetts - 3.2% | | | |
| Education - 0.2% | | | |
| Massachusetts Development Finance Agency (Springfield College, MA Proj.) Series 2021 B, 4% 6/1/2050 | | 35,000 | 28,833 |
| Massachusetts Development Finance Agency (Wellesley College, MA Proj.) Series 2018 L, 4% 7/1/2044 | | 165,000 | 165,510 |
| Massachusetts St Dev Fin Agy Rev (Boston University Mass Proj.) Series BB 1, 4% 10/1/2046 | | 25,000 | 24,177 |
| Massachusetts St Hlth & Ed Fac (Boston College Proj.) 5.5% 6/1/2035 | | 65,000 | 75,946 |
| | | | 294,466 |
| Escrowed/Pre-Refunded - 0.1% | | | |
| Massachusetts St Sch Bldg Auth Dedicated Sales Tax Rev 4.75% 8/15/2032 (Pre-refunded to 8/15/2025 at 100) | | 185,000 | 186,877 |
| General Obligations - 1.9% | | | |
| Boston Mass Gen. Oblig. Series 2017A, 5% 4/1/2026 | | 40,000 | 41,059 |
| Massachusetts St Gen. Oblig. 5% 1/1/2049 | | 70,000 | 72,449 |
| Massachusetts St Gen. Oblig. 5% 9/1/2029 | | 150,000 | 164,202 |
| Massachusetts St Gen. Oblig. Series 2016A, 5% 7/1/2029 | | 70,000 | 71,987 |
| Massachusetts St Gen. Oblig. Series 2016A, 5% 7/1/2031 | | 45,000 | 46,254 |
| Massachusetts St Gen. Oblig. Series 2016B, 4% 7/1/2033 | | 75,000 | 75,361 |
| Massachusetts St Gen. Oblig. Series 2016B, 5% 7/1/2026 | | 40,000 | 41,251 |
| Massachusetts St Gen. Oblig. Series 2016B, 5% 7/1/2027 | | 5,000 | 5,265 |
| Massachusetts St Gen. Oblig. Series 2016B, 5% 7/1/2028 | | 200,000 | 214,571 |
| Massachusetts St Gen. Oblig. Series 2016G, 3% 9/1/2046 | | 10,000 | 7,982 |
| Massachusetts St Gen. Oblig. Series 2016G, 4% 9/1/2032 | | 75,000 | 75,446 |
| Massachusetts St Gen. Oblig. Series 2017 E, 5% 11/1/2026 | | 20,000 | 20,769 |
| Massachusetts St Gen. Oblig. Series 2017D, 5% 7/1/2026 | | 40,000 | 41,251 |
| Massachusetts St Gen. Oblig. Series 2017F, 5% 11/1/2040 | | 15,000 | 15,539 |
| Massachusetts St Gen. Oblig. Series 2017F, 5% 11/1/2041 | | 200,000 | 206,871 |
| Massachusetts St Gen. Oblig. Series 2017F, 5% 11/1/2044 | | 20,000 | 20,607 |
| Massachusetts St Gen. Oblig. Series 2018 B, 5% 7/1/2027 | | 20,000 | 21,064 |
| Massachusetts St Gen. Oblig. Series 2018C, 5% 9/1/2030 | | 150,000 | 166,912 |
| Massachusetts St Gen. Oblig. Series 2019 C, 5% 5/1/2030 | | 35,000 | 38,737 |
| Massachusetts St Gen. Oblig. Series 2019 C, 5% 5/1/2041 | | 25,000 | 26,300 |
| Massachusetts St Gen. Oblig. Series 2019 G, 3% 9/1/2039 | | 200,000 | 176,138 |
| Massachusetts St Gen. Oblig. Series 2020 A, 5% 3/1/2029 | | 175,000 | 189,951 |
| Massachusetts St Gen. Oblig. Series 2020 B, 2% 3/1/2034 | | 170,000 | 144,215 |
| Massachusetts St Gen. Oblig. Series 2020 D, 4% 11/1/2041 | | 150,000 | 149,295 |
| Massachusetts St Gen. Oblig. Series 2020 D, 5% 7/1/2028 | | 205,000 | 219,935 |
| Massachusetts St Gen. Oblig. Series 2020 E, 5% 11/1/2033 | | 165,000 | 181,745 |
| Massachusetts St Gen. Oblig. Series 2021 B, 3% 4/1/2047 | | 140,000 | 110,360 |
| Massachusetts St Gen. Oblig. Series 2021 C, 5% 9/1/2029 | | 50,000 | 54,734 |
| Massachusetts St Gen. Oblig. Series 2023B, 5% 5/1/2034 | | 20,000 | 22,828 |
| Massachusetts St Gen. Oblig. Series 2024 I, 5% 12/1/2049 | | 220,000 | 237,227 |
| Massachusetts St Gen. Oblig. Series 2024B, 5% 11/1/2032 | | 55,000 | 62,900 |
| Massachusetts St Gen. Oblig. Series A, 5% 4/1/2035 | | 100,000 | 103,717 |
| Massachusetts St Gen. Oblig. Series A, 5% 4/1/2047 | | 155,000 | 158,378 |
| Massachusetts St Gen. Oblig. Series A, 5% 7/1/2026 | | 130,000 | 134,064 |
| | | | 3,319,364 |
| Health Care - 0.1% | | | |
| Massachusetts Development Finance Agency (Tufts Medicine Proj.) Series 2020 C, 3% 10/1/2045 (Assured Guaranty Municipal Corp Insured) | | 10,000 | 7,942 |
| Massachusetts St Dev Fin Agy Rev (Beth Israel Lahey Health Proj.) Series 2016 I, 3% 7/1/2032 | | 25,000 | 23,575 |
| Massachusetts St Dev Fin Agy Rev (Boston Medical Center Proj.) Series 2015D, 4% 7/1/2045 | | 25,000 | 22,565 |
| Massachusetts St Dev Fin Agy Rev (Mass General Brigham Inc Proj.) Series 2016Q, 4% 7/1/2036 | | 200,000 | 200,188 |
| | | | 254,270 |
| Housing - 0.0% | | | |
| Massachusetts St Hsg Fin Agy (Housing Bond Resolution 12/10/02 Proj.) Series A, 4.5% 12/1/2048 (f) | | 10,000 | 9,260 |
| Special Tax - 0.7% | | | |
| Mass Bay Tran Auth Assemnt Series 2022 A 2, 5% 7/1/2052 | | 200,000 | 212,766 |
| Mass Bay Tran Auth Sls Tax 5.25% 7/1/2028 | | 40,000 | 43,326 |
| Mass Bay Tran Auth Sls Tax 5.25% 7/1/2028 | | 20,000 | 21,663 |
| Mass Bay Tran Auth Sls Tax Series 2023 A SUB A 1, 5.25% 7/1/2053 | | 200,000 | 217,794 |
| Mass Bay Tran Auth Sls Tax Series B, 5% 7/1/2033 | | 5,000 | 5,038 |
| Massachusetts St Sch Bldg Auth Dedicated Sales Tax Rev 5% 8/15/2037 | | 15,000 | 16,310 |
| Massachusetts St Sch Bldg Auth Dedicated Sales Tax Rev 5% 8/15/2039 | | 15,000 | 16,209 |
| Massachusetts St Sch Bldg Auth Dedicated Sales Tax Rev 5% 8/15/2045 | | 50,000 | 52,945 |
| Massachusetts St Sch Bldg Auth Dedicated Sales Tax Rev Series 2016B, 5% 11/15/2046 | | 30,000 | 30,545 |
| Massachusetts St Sch Bldg Auth Dedicated Sales Tax Rev Series 2016C, 5% 11/15/2034 | | 35,000 | 36,025 |
| Massachusetts St Spl Oblig Dedicated Tax Rev 5.5% 1/1/2030 (National Public Finance Guarantee Corporation Insured) | | 10,000 | 11,076 |
| Massachusetts St Transn Fd Rev 5% 6/1/2047 | | 20,000 | 20,472 |
| Massachusetts St Transn Fd Rev 5% 6/1/2048 | | 130,000 | 134,081 |
| Massachusetts St Transn Fd Rev Series 2015 A, 3.25% 6/1/2035 | | 150,000 | 142,573 |
| Massachusetts St Transn Fd Rev Series 2016B, 4% 6/1/2045 | | 175,000 | 170,600 |
| Massachusetts St Transn Fd Rev Series 2021A, 3% 6/1/2050 | | 185,000 | 141,231 |
| | | | 1,272,654 |
| Transportation - 0.0% | | | |
| Massachusetts St Port Auth Rev Series 2019 B, 3% 7/1/2049 | | 70,000 | 53,537 |
| Water & Sewer - 0.2% | | | |
| Massachusetts St Wtr Res Auth 5.25% 8/1/2030 (Assured Guaranty Municipal Corp Insured) | | 145,000 | 163,780 |
| Massachusetts St Wtr Res Auth 5.25% 8/1/2032 (Assured Guaranty Municipal Corp Insured) | | 25,000 | 29,130 |
| Massachusetts St Wtr Res Auth Series 2020 B, 5% 8/1/2043 | | 140,000 | 149,726 |
| | | | 342,636 |
TOTAL MASSACHUSETTS | | | 5,733,064 |
| Michigan - 1.5% | | | |
| Escrowed/Pre-Refunded - 0.1% | | | |
| University MI Univ Revs Series 2015, 5% 4/1/2032 (Pre-refunded to 4/1/2026 at 100) | | 125,000 | 128,032 |
| General Obligations - 0.5% | | | |
| Detroit Mich Sch Dist Series 2005A, 5.25% 5/1/2029 (Assured Guaranty Municipal Corp Insured), (State of Michigan Guaranteed) | | 180,000 | 195,672 |
| Lincoln MI Cons Sch Dist Series 2016 A, 5% 5/1/2040 (Assured Guaranty Municipal Corp Insured), (State of Michigan Guaranteed) | | 330,000 | 333,670 |
| Michigan St Bldg Auth Rev (State of Michigan Proj.) 3% 10/15/2045 | | 60,000 | 50,130 |
| Michigan St Bldg Auth Rev (State of Michigan Proj.) Series 2015 I, 5% 4/15/2026 | | 40,000 | 40,553 |
| Michigan St Bldg Auth Rev (State of Michigan Proj.) Series 2016 I, 5% 10/15/2028 | | 25,000 | 25,856 |
| Michigan St Bldg Auth Rev (State of Michigan Proj.) Series 2016 I, 5% 10/15/2030 | | 15,000 | 15,485 |
| Michigan St Bldg Auth Rev (State of Michigan Proj.) Series 2016 I, 5% 4/15/2036 | | 115,000 | 118,133 |
| Muskegon MI Pub Schs Series 2021 II, 5% 5/1/2051 (State of Michigan Guaranteed) | | 60,000 | 62,797 |
| | | | 842,296 |
| Health Care - 0.2% | | | |
| Michigan Fin Auth Rev (Henry Ford Health Care Corp,Mi Proj.) Series 2016, 3% 11/15/2033 | | 240,000 | 224,647 |
| Michigan Fin Auth Rev (Henry Ford Health Care Corp,Mi Proj.) Series 2016, 3.25% 11/15/2042 | | 25,000 | 20,033 |
| Michigan Fin Auth Rev (Henry Ford Health Care Corp,Mi Proj.) Series 2016, 4% 11/15/2046 | | 50,000 | 45,137 |
| Michigan Fin Auth Rev (Mclaren Hlth Care Corp Proj.) Series 2019 A, 4% 2/15/2047 | | 40,000 | 37,195 |
| Michigan Fin Auth Rev (Mclaren Hlth Care Corp Proj.) Series 2019 A, 5% 2/15/2034 | | 55,000 | 58,166 |
| Michigan Fin Auth Rev (Trinity Health Proj.) Series 2019 A, 4% 12/1/2049 | | 20,000 | 18,564 |
| Michigan St Hosp Fin Auth Rev (Trinity Health Proj.) Series 2008C, 5% 12/1/2027 | | 35,000 | 36,825 |
| | | | 440,567 |
| Housing - 0.2% | | | |
| Michigan Hsg Dev Auth Rent Hsg Rev (MI Single Family Mortgage Proj.) Series 2019B, 3.1% 12/1/2044 | | 210,000 | 169,753 |
| Michigan Hsg Dev Rental Hsg (Rental Hsg Rev Bonds 11/15/1990 Proj.) Series 2020 A 1, 2.7% 10/1/2045 | | 160,000 | 117,114 |
| Michigan Hsg Dev Rental Hsg Series 2018 A, 4.05% 10/1/2048 | | 100,000 | 92,114 |
| Michigan St Hsg Dev Auth Sfmr (MI Single Family Mortgage Proj.) Series B, 3.1% 12/1/2031 | | 50,000 | 47,711 |
| | | | 426,692 |
| Special Tax - 0.1% | | | |
| Michigan Fin Auth Rev (Wayne Cnty MI Proj.) Series 2018, 4% 11/1/2048 | | 10,000 | 9,450 |
| Michigan St Trunk Line Fd 4% 11/15/2037 | | 25,000 | 25,541 |
| Michigan St Trunk Line Fd Series 2021 A, 4% 11/15/2040 | | 80,000 | 81,100 |
| | | | 116,091 |
| Transportation - 0.2% | | | |
| Michigan St Strategic Fd Ltd Oblig Rev (Oakland Corridor Partners LLC Proj.) Series 2018, 5% 12/31/2026 (f) | | 35,000 | 35,662 |
| Michigan St Strategic Fd Ltd Oblig Rev (Oakland Corridor Partners LLC Proj.) Series 2018, 5% 12/31/2028 (f) | | 55,000 | 56,953 |
| Michigan St Strategic Fd Ltd Oblig Rev (Oakland Corridor Partners LLC Proj.) Series 2018, 5% 12/31/2031 (f) | | 20,000 | 20,688 |
| Michigan St Strategic Fd Ltd Oblig Rev (Oakland Corridor Partners LLC Proj.) Series 2018, 5% 6/30/2028 (f) | | 15,000 | 15,474 |
| Michigan St Strategic Fd Ltd Oblig Rev (Oakland Corridor Partners LLC Proj.) Series 2018, 5% 6/30/2029 (f) | | 60,000 | 62,113 |
| Michigan St Strategic Fd Ltd Oblig Rev (Oakland Corridor Partners LLC Proj.) Series 2018, 5% 6/30/2031 (f) | | 70,000 | 72,452 |
| Wayne Cnty Mich Arpt Auth Rev Series 2018A, 5% 12/1/2034 | | 50,000 | 52,814 |
| Wayne Cnty Mich Arpt Auth Rev Series 2021 B, 5% 12/1/2035 (f) | | 50,000 | 53,005 |
| | | | 369,161 |
| Water & Sewer - 0.2% | | | |
| Great Lakes Sewer Auth Mich Series 2023A, 5% 7/1/2038 | | 25,000 | 27,908 |
| Great Lakes Sewer Auth Mich Series C, 5% 7/1/2036 | | 15,000 | 15,266 |
| Great Lakes Wtr Auth Mich Wtr Supply Sys Rev Series 2018 A, 5% 7/1/2027 | | 65,000 | 68,087 |
| Great Lakes Wtr Auth Mich Wtr Supply Sys Rev Series 2022 A, 5% 7/1/2035 | | 50,000 | 55,605 |
| Great Lakes Wtr Auth Mich Wtr Supply Sys Rev Series 2022 B, 5% 7/1/2035 | | 15,000 | 16,650 |
| Great Lakes Wtr Auth Mich Wtr Supply Sys Rev Series 2023A, 5% 7/1/2038 | | 15,000 | 16,659 |
| Great Lakes Wtr Auth Mich Wtr Supply Sys Rev Series C, 5% 7/1/2033 | | 50,000 | 50,979 |
| Michigan Fin Auth Rev (MI St Clean Wtr Revolving Fnd Proj.) Series 2018B, 5% 10/1/2028 | | 130,000 | 139,546 |
| | | | 390,700 |
TOTAL MICHIGAN | | | 2,713,539 |
| Minnesota - 1.1% | | | |
| General Obligations - 1.0% | | | |
| Forest Lake Minn Inpt Sch Dist Series 2016 A, 3.25% 2/1/2046 (Minnesota St Guaranteed) | | 200,000 | 169,320 |
| Hennepin Cnty Minn Gen. Oblig. Series 2019 B, 5% 12/15/2029 | | 120,000 | 129,614 |
| Hennepin Cnty Minn Gen. Oblig. Series 2020 C, 5% 12/15/2035 | | 250,000 | 272,032 |
| Minnesota St Gen. Oblig. Series 2015 A, 5% 8/1/2028 | | 110,000 | 111,250 |
| Minnesota St Gen. Oblig. Series 2015B, 2.95% 8/1/2027 | | 40,000 | 39,443 |
| Minnesota St Gen. Oblig. Series 2017 A, 5% 10/1/2028 | | 25,000 | 26,350 |
| Minnesota St Gen. Oblig. Series 2018 B, 3.25% 8/1/2036 | | 5,000 | 4,842 |
| Minnesota St Gen. Oblig. Series 2019 B, 5% 8/1/2027 | | 100,000 | 105,368 |
| Minnesota St Gen. Oblig. Series 2020 A, 5% 8/1/2033 | | 100,000 | 110,222 |
| Minnesota St Gen. Oblig. Series 2021 A, 4% 9/1/2039 | | 455,000 | 465,255 |
| Minnesota St Gen. Oblig. Series 2021 A, 5% 9/1/2029 | | 125,000 | 136,663 |
| Owatonna MN Ind Sch Dist 761 Series 2020 A, 2.125% 2/1/2040 (Minnesota St Guaranteed) | | 145,000 | 105,415 |
| | | | 1,675,774 |
| Health Care - 0.0% | | | |
| Apple Vy Minn Sr Living Rev (Minnesota Senior Living Proj.) Series 2016 A 1, 4.25% 1/1/2037 | | 30,000 | 26,958 |
| St Cloud Minn Health Care Rv (Centracare Health System Proj.) Series 2019, 5% 5/1/2048 | | 15,000 | 15,378 |
| | | | 42,336 |
| Housing - 0.1% | | | |
| Minnesota Housing Finance Agency (MN Residential Hsg 1995 Proj.) Series 2021 H, 2.55% 1/1/2046 | | 285,000 | 202,997 |
| Minnesota Housing Finance Agency (MN Residential Hsg Proj.) Series 2019 F, 3.75% 1/1/2050 | | 95,000 | 94,591 |
| | | | 297,588 |
| Transportation - 0.0% | | | |
| Minneapolis Met Airport Commis Series 2019 A, 5% 1/1/2049 | | 35,000 | 36,204 |
TOTAL MINNESOTA | | | 2,051,902 |
| Mississippi - 0.1% | | | |
| General Obligations - 0.0% | | | |
| Mississippi Dev Bank Spl Oblig (Mississippi St Proj.) Series 2013C, 5% 1/1/2027 | | 15,000 | 15,561 |
| Mississippi St Gen. Oblig. Series 2017 A, 5% 10/1/2030 | | 65,000 | 68,327 |
| | | | 83,888 |
| Special Tax - 0.1% | | | |
| Mississippi Dev Bank Spl Oblg Series A, 5% 8/1/2026 | | 65,000 | 66,659 |
| Mississippi Dev Bank Spl Oblg Series A, 5% 8/1/2027 | | 50,000 | 52,048 |
| Mississippi Gaming Tax Rev Series 2019 A, 5% 10/15/2028 | | 25,000 | 26,495 |
| | | | 145,202 |
TOTAL MISSISSIPPI | | | 229,090 |
| Missouri - 0.3% | | | |
| Electric Utilities - 0.0% | | | |
| City of Springfield MO Public Utility Revenue Series 2015, 4% 8/1/2031 | | 50,000 | 50,065 |
| Missouri Joint Muni Elec Util Comm Pwr Proj Rev Series 2016 A, 4% 12/1/2036 | | 40,000 | 39,805 |
| | | | 89,870 |
| General Obligations - 0.0% | | | |
| Missouri St Brd Pub Bldgs Spl (Missouri St Proj.) Series 2014A, 3% 10/1/2029 | | 30,000 | 29,151 |
| Health Care - 0.1% | | | |
| Missouri Hlth & Edl Facs Rev (Mercy Health Proj.) Series 2017 C, 3.625% 11/15/2047 | | 60,000 | 53,001 |
| Missouri Hlth & Edl Facs Rev (Mosaic Health Proj.) Series 2019A, 4% 2/15/2049 | | 140,000 | 134,139 |
| Missouri Hlth & Edl Facs Rev (St Lukes Hospital,Kan City, MO Proj.) Series 2016, 5% 11/15/2028 | | 10,000 | 10,237 |
| | | | 197,377 |
| Housing - 0.0% | | | |
| Missouri St Hsg Dev Com Sf Mtg (MO Hsg First Place Loan Prog 5/1/15 Proj.) Series 2019B, 3.35% 11/1/2049 | | 30,000 | 24,685 |
| Special Tax - 0.1% | | | |
| Bi-State Dev Agy MO Tran Sales Tax Approp Rev Series 2019, 4% 10/1/2048 | | 180,000 | 171,223 |
| Transportation - 0.1% | | | |
| Kansas City MO Indl Dev Auth Arpt Spl Oblig (Kansas City MO Arpt Rev Proj.) 5% 3/1/2057 (Assured Guaranty Municipal Corp Insured) (f) | | 90,000 | 91,462 |
TOTAL MISSOURI | | | 603,768 |
| Montana - 0.2% | | | |
| Health Care - 0.2% | | | |
| Montana Facility Fin Auth Rev (Benefis Health System Proj.) Series 2016, 5% 2/15/2028 | | 65,000 | 66,863 |
| Montana Facility Fin Auth Rev (IHC Health Services Inc Proj.) Series 2019A, 4% 1/1/2036 | | 110,000 | 111,184 |
| Montana Facility Fin Auth Rev (IHC Health Services Inc Proj.) Series 2019A, 5% 1/1/2030 | | 150,000 | 163,351 |
| | | | 341,398 |
TOTAL MONTANA | | | 341,398 |
| Nebraska - 0.4% | | | |
| Education - 0.0% | | | |
| University NE Facs Corp Rev Series 2021A, 4% 7/15/2062 | | 85,000 | 81,474 |
| Electric Utilities - 0.3% | | | |
| Omaha Public Power District Series 2022 A, 4% 2/1/2042 | | 40,000 | 40,087 |
| Omaha Public Power District Series 2024 B, 5% 2/1/2035 | | 325,000 | 367,787 |
| | | | 407,874 |
| Escrowed/Pre-Refunded - 0.0% | | | |
| University NE Univ Revs Series 2016A, 3% 7/1/2039 (Pre-refunded to 7/1/2026 at 100) | | 45,000 | 45,025 |
| Health Care - 0.1% | | | |
| Sarpy Cnty NE Hosp Auth No 1 Series 2016, 4% 5/15/2051 | | 140,000 | 128,903 |
TOTAL NEBRASKA | | | 663,276 |
| Nevada - 0.5% | | | |
| General Obligations - 0.2% | | | |
| Clark Cnty NV Gen. Oblig. Series 2016B, 5% 11/1/2027 | | 50,000 | 51,741 |
| Clark Cnty NV Gen. Oblig. Series 2019 A, 5% 12/1/2028 | | 40,000 | 43,107 |
| Clark Cnty NV Gen. Oblig. Series 2019, 3% 6/1/2038 | | 65,000 | 57,981 |
| Clark Cnty NV School Dist 5.25% 6/15/2035 | | 205,000 | 231,001 |
| Clark Cnty NV School Dist Series 2019 A, 3% 6/15/2039 (Assured Guaranty Municipal Corp Insured) | | 20,000 | 17,428 |
| Washoe Cnty Nev Sch Dist Series 2017 C, 3.125% 10/1/2040 (Assured Guaranty Municipal Corp Insured) | | 50,000 | 43,160 |
| | | | 444,418 |
| Special Tax - 0.1% | | | |
| Clark Cnty NV Hwy Impt Rev Series 2017, 5% 7/1/2030 | | 10,000 | 10,434 |
| Las Vegas Convention & Visitors Authority Series 2018 B, 4% 7/1/2049 | | 95,000 | 89,751 |
| Las Vegas Convention & Visitors Authority Series 2018 C, 4% 7/1/2048 | | 50,000 | 47,547 |
| | | | 147,732 |
| Transportation - 0.0% | | | |
| Clark Cnty NV Arpt Rev Series 2019B, 5% 7/1/2042 | | 40,000 | 41,985 |
| Water & Sewer - 0.2% | | | |
| Clark Cnty NV Wtr Reclamation Dist Gen. Oblig. Series 2016, 3% 7/1/2030 | | 75,000 | 73,428 |
| Las Vegas Valley NV Gen. Oblig. Series 2022A, 4% 6/1/2041 | | 215,000 | 215,080 |
| | | | 288,508 |
TOTAL NEVADA | | | 922,643 |
| New Jersey - 3.5% | | | |
| Education - 0.0% | | | |
| Higher Ed Student Assistance Auth NJ Student Ln Rev (NJ Stud Loan 2019 Proj.) Series 2019 B, 3.25% 12/1/2039 (f) | | 20,000 | 18,720 |
| Higher Ed Student Assistance Auth NJ Student Ln Rev (NJ Stud Loan 2019 Proj.) Series 2019A, 5% 12/1/2027 | | 35,000 | 36,597 |
| New Jersey Educational Facilities Authority (Stevens Institute of Technolgy Proj.) Series 2017 A, 4% 7/1/2047 | | 40,000 | 37,610 |
| | | | 92,927 |
| Electric Utilities - 0.1% | | | |
| New Jersey Eda Wtr Facs Rev (New Jersey American Wtr Co Inc Proj.) Series 2019 B, 2.05% tender 10/1/2039 (b) | | 75,000 | 66,256 |
| NJ Econ Dev Auth (New Jersey Natural Gas Co Proj.) Series 2011 C, 3% 8/1/2041 (f) | | 205,000 | 166,157 |
| | | | 232,413 |
| Escrowed/Pre-Refunded - 0.2% | | | |
| New Jersey Bldg Auth St Bldg Series 2016A, 5% 6/15/2029 (Pre-refunded to 6/15/2026 at 100) | | 225,000 | 231,226 |
| New Jersey Econom Dev Auth Rev Series 2016 AAA, 5% 6/15/2041 (Pre-refunded to 12/15/2026 at 100) | | 55,000 | 57,220 |
| New Jersey Econom Dev Auth Rev Series 2018EEE, 5% 6/15/2033 | | 80,000 | 86,260 |
| New Jersey Econom Dev Auth Rev Series WW, 5% 6/15/2037 (Pre-refunded to 6/15/2025 at 100) | | 30,000 | 30,265 |
| | | | 404,971 |
| General Obligations - 2.2% | | | |
| Edison Twp NJ Gen. Oblig. 2% 3/15/2037 | | 100,000 | 76,338 |
| New Jersey Econom Dev Auth Rev (New Jersey St Proj.) Series WW, 5.25% 6/15/2028 | | 30,000 | 30,225 |
| New Jersey Econom Dev Auth Rev (New Jersey St Proj.) Series XX, 4.375% 6/15/2027 | | 60,000 | 60,178 |
| New Jersey Economic Dev Auth Rev (New Jersey St Proj.) 4% 11/1/2037 | | 40,000 | 40,057 |
| New Jersey Economic Dev Auth Rev (New Jersey St Proj.) 5% 11/1/2031 | | 35,000 | 37,662 |
| New Jersey Eda St Lease Rev (New Jersey St Proj.) Series 2017 B, 5% 6/15/2026 | | 15,000 | 15,391 |
| New Jersey St Gen. Oblig. 2% 6/1/2037 | | 105,000 | 79,968 |
| New Jersey St Gen. Oblig. 3% 6/1/2032 | | 90,000 | 86,913 |
| New Jersey St Gen. Oblig. 4% 6/1/2034 (Pre-refunded to 6/1/2025 at 100) | | 10,000 | 10,034 |
| New Jersey Trans Trust Fund Auth 0% 12/15/2025 (d) | | 60,000 | 58,158 |
| New Jersey Trans Trust Fund Auth 0% 12/15/2025 (d) | | 40,000 | 38,772 |
| New Jersey Trans Trust Fund Auth 0% 12/15/2026 (d) | | 90,000 | 84,392 |
| New Jersey Trans Trust Fund Auth 0% 12/15/2027 (d) | | 30,000 | 27,197 |
| New Jersey Trans Trust Fund Auth 0% 12/15/2029 (d) | | 20,000 | 16,856 |
| New Jersey Trans Trust Fund Auth 0% 12/15/2029 (Assured Guaranty Municipal Corp Insured) (d) | | 45,000 | 38,018 |
| New Jersey Trans Trust Fund Auth 0% 12/15/2031 (d) | | 510,000 | 397,218 |
| New Jersey Trans Trust Fund Auth 0% 12/15/2032 (d) | | 65,000 | 48,568 |
| New Jersey Trans Trust Fund Auth 0% 12/15/2032 (Assured Guaranty Municipal Corp Insured) (d) | | 40,000 | 30,169 |
| New Jersey Trans Trust Fund Auth 0% 12/15/2033 (d) | | 15,000 | 10,736 |
| New Jersey Trans Trust Fund Auth 0% 12/15/2034 (d) | | 140,000 | 95,764 |
| New Jersey Trans Trust Fund Auth 0% 12/15/2037 (d) | | 45,000 | 26,862 |
| New Jersey Trans Trust Fund Auth 0% 12/15/2038 (d) | | 35,000 | 19,938 |
| New Jersey Trans Trust Fund Auth 4% 6/15/2050 | | 200,000 | 190,150 |
| New Jersey Trans Trust Fund Auth 5% 6/15/2030 | | 305,000 | 332,759 |
| New Jersey Trans Trust Fund Auth 5% 6/15/2038 | | 250,000 | 275,796 |
| New Jersey Trans Trust Fund Auth 5% 6/15/2048 (Pre-refunded to 12/15/2032 at 100) | | 230,000 | 262,500 |
| New Jersey Trans Trust Fund Auth 5% 6/15/2050 (Pre-refunded to 12/15/2030 at 100) | | 45,000 | 49,828 |
| New Jersey Trans Trust Fund Auth Series 2015AA, 4.625% 6/15/2030 | | 165,000 | 165,815 |
| New Jersey Trans Trust Fund Auth Series 2015AA, 5.25% 6/15/2027 (Pre-refunded to 6/15/2025 at 100) | | 20,000 | 20,186 |
| New Jersey Trans Trust Fund Auth Series 2015AA, 5.25% 6/15/2031 | | 135,000 | 136,041 |
| New Jersey Trans Trust Fund Auth Series 2015AA, 5.25% 6/15/2032 | | 70,000 | 70,512 |
| New Jersey Trans Trust Fund Auth Series 2018 A, 5% 12/15/2034 | | 250,000 | 263,045 |
| New Jersey Trans Trust Fund Auth Series 2019 AA, 4% 6/15/2036 | | 20,000 | 20,086 |
| New Jersey Trans Trust Fund Auth Series 2019 BB, 3.25% 6/15/2039 | | 25,000 | 22,546 |
| New Jersey Trans Trust Fund Auth Series 2019 BB, 5% 6/15/2033 | | 75,000 | 79,305 |
| New Jersey Trans Trust Fund Auth Series 2020 AA, 5% 6/15/2050 | | 160,000 | 165,987 |
| New Jersey Trans Trust Fund Auth Series 2022 BB, 4% 6/15/2040 | | 250,000 | 246,589 |
| NJ Health Care Facs Fing Auth St Contract (New Jersey St Proj.) Series 2017, 5% 10/1/2026 | | 135,000 | 139,245 |
| NJ Health Care Facs Fing Auth St Contract (New Jersey St Proj.) Series 2017, 5% 10/1/2027 | | 15,000 | 15,738 |
| South Jersey Port Corp NJ Rev (New Jersey St Proj.) Series 2017B, 5% 1/1/2037 (f) | | 25,000 | 25,652 |
| | | | 3,811,194 |
| Health Care - 0.2% | | | |
| New Jersey Health Care (Hackensack Meridian Health Inc Proj.) Series 2017A, 4% 7/1/2052 | | 125,000 | 117,322 |
| New Jersey Health Care (St Joseph Hosp & Med Ctr, NJ Proj.) Series 2016, 3% 7/1/2032 | | 25,000 | 22,593 |
| New Jersey Health Care (St Joseph Hosp & Med Ctr, NJ Proj.) Series 2016, 3.125% 7/1/2033 | | 150,000 | 134,824 |
| | | | 274,739 |
| Tobacco Bonds - 0.1% | | | |
| Tobacco Settlement Fin Corp NJ Series 2018 A, 4% 6/1/2037 | | 30,000 | 29,697 |
| Tobacco Settlement Fin Corp NJ Series 2018 A, 5% 6/1/2029 | | 130,000 | 136,066 |
| | | | 165,763 |
| Transportation - 0.7% | | | |
| New Jersey Trans Trust Fund Auth (New Jersey St Grant Anticipati Proj.) Series 2016 A 1, 4.1% 6/15/2031 | | 15,000 | 15,102 |
| New Jersey Trans Trust Fund Auth (New Jersey St Grant Anticipati Proj.) Series 2016 A 1, 5% 6/15/2030 | | 25,000 | 25,502 |
| New Jersey Trans Trust Fund Auth (New Jersey St Grant Anticipati Proj.) Series 2018 A, 5% 6/15/2030 | | 50,000 | 50,996 |
| New Jersey Turnpike Authority 4.25% 1/1/2043 | | 50,000 | 50,781 |
| New Jersey Turnpike Authority 5% 1/1/2046 | | 225,000 | 244,208 |
| New Jersey Turnpike Authority 5.25% 1/1/2026 (Assured Guaranty Municipal Corp Insured) | | 30,000 | 30,697 |
| New Jersey Turnpike Authority Series 2016A, 5% 1/1/2033 | | 50,000 | 50,768 |
| New Jersey Turnpike Authority Series 2017 A, 5% 1/1/2035 | | 110,000 | 113,081 |
| New Jersey Turnpike Authority Series 2017B, 4% 1/1/2035 | | 30,000 | 30,419 |
| New Jersey Turnpike Authority Series 2017B, 5% 1/1/2030 | | 255,000 | 269,182 |
| New Jersey Turnpike Authority Series 2017B, 5% 1/1/2032 | | 200,000 | 210,567 |
| New Jersey Turnpike Authority Series 2017E, 5% 1/1/2029 | | 15,000 | 15,872 |
| New Jersey Turnpike Authority Series 2017E, 5% 1/1/2031 | | 155,000 | 163,345 |
| | | | 1,270,520 |
TOTAL NEW JERSEY | | | 6,252,527 |
| New Jersey,New York - 1.1% | | | |
| Transportation - 1.1% | | | |
| Port Auth NY & NJ 5% 9/15/2026 (f) | | 185,000 | 189,331 |
| Port Auth NY & NJ Series 177TH, 3% 7/15/2028 (f) | | 50,000 | 48,194 |
| Port Auth NY & NJ Series 177TH, 4% 1/15/2043 (f) | | 195,000 | 178,912 |
| Port Auth NY & NJ Series 189, 5% 5/1/2030 | | 20,000 | 20,109 |
| Port Auth NY & NJ Series 189, 5% 5/1/2045 | | 140,000 | 140,357 |
| Port Auth NY & NJ Series 194, 5% 10/15/2030 | | 35,000 | 35,453 |
| Port Auth NY & NJ Series 194, 5% 10/15/2032 | | 55,000 | 55,665 |
| Port Auth NY & NJ Series 194, 5% 10/15/2035 | | 100,000 | 101,092 |
| Port Auth NY & NJ Series 194, 5.25% 10/15/2055 | | 50,000 | 50,405 |
| Port Auth NY & NJ Series 198, 5% 11/15/2046 | | 15,000 | 15,238 |
| Port Auth NY & NJ Series 202, 5% 10/15/2030 (f) | | 20,000 | 20,510 |
| Port Auth NY & NJ Series 202, 5% 10/15/2034 (f) | | 580,000 | 592,874 |
| Port Auth NY & NJ Series 209, 5% 7/15/2031 | | 30,000 | 31,747 |
| Port Auth NY & NJ Series 209, 5% 7/15/2034 | | 70,000 | 73,530 |
| Port Auth NY & NJ Series 222, 5% 7/15/2031 | | 75,000 | 82,947 |
| Port Auth NY & NJ Series 223, 5% 7/15/2031 (f) | | 55,000 | 59,437 |
| Port Auth NY & NJ Series 244, 5% 7/15/2045 | | 225,000 | 246,159 |
| Port Auth NY & NJ Series TWO HUNDREDSEVENTEEN, 5% 11/1/2030 | | 100,000 | 109,140 |
| | | | 2,051,100 |
TOTAL NEW JERSEY,NEW YORK | | | 2,051,100 |
| New Jersey,Pennsylvania - 0.0% | | | |
| Transportation - 0.0% | | | |
| Delaware Rvr Jt Toll Brg PA NJ Series 2017, 5% 7/1/2036 | | 5,000 | 5,188 |
| New Mexico - 0.4% | | | |
| Escrowed/Pre-Refunded - 0.0% | | | |
| New Mexico St Hosp Equip Ln Council Hosp Rev Series 2015A, 4.125% 8/1/2044 (Pre-refunded to 8/1/2025 at 100) | | 40,000 | 40,158 |
| Housing - 0.3% | | | |
| New Mexico Mtg Fin Auth (NM Sf Mortgage 2005 Proj.) Series 2021 C CL I, 3% 1/1/2052 | | 295,000 | 286,356 |
| New Mexico Mtg Fin Auth (NM Sf Mortgage 2005 Proj.) Series 2022 C, 3.95% 9/1/2047 | | 195,000 | 176,341 |
| New Mexico Mtg Fin Auth Series 2019 F, 3.05% 7/1/2044 | | 100,000 | 79,445 |
| New Mexico Mtg Fin Auth Series 2019 F, 3.5% 7/1/2050 | | 40,000 | 39,666 |
| | | | 581,808 |
| Special Tax - 0.1% | | | |
| New Mexico St Severance Tax Series 2022B, 5% 7/1/2031 | | 135,000 | 150,145 |
TOTAL NEW MEXICO | | | 772,111 |
| New York - 16.9% | | | |
| Education - 1.1% | | | |
| Monroe Cnty NY Indl Dev Corp (University of Rochester, NY Proj.) Series 2015A, 5% 7/1/2027 | | 105,000 | 105,944 |
| New York St Dorm Auth Revs Non St Supportd Debt (Columbia Univ, NY Proj.) Series 2018B, 5% 10/1/2038 | | 45,000 | 47,404 |
| New York St Dorm Auth Revs Non St Supportd Debt (Columbia Univ, NY Proj.) Series A, 5% 10/1/2047 | | 30,000 | 34,876 |
| New York St Dorm Auth Revs Non St Supportd Debt (New School (The) Proj.) Series 2016 A, 4% 7/1/2043 | | 165,000 | 160,234 |
| New York St Dorm Auth Revs Non St Supportd Debt (New School (The) Proj.) Series 2016 A, 5% 7/1/2037 | | 100,000 | 102,116 |
| New York St Dorm Auth Revs Non St Supportd Debt (New York Univ, NY Proj.) Series 2016 A, 4% 7/1/2043 | | 100,000 | 97,614 |
| New York St Dorm Auth Revs Non St Supportd Debt (New York Univ, NY Proj.) Series 2016 A, 5% 7/1/2029 | | 60,000 | 61,691 |
| New York St Dorm Auth Revs Non St Supportd Debt (New York Univ, NY Proj.) Series 2018 A, 5% 7/1/2040 | | 30,000 | 31,625 |
| New York St Dorm Auth Revs Non St Supported Debt (Cornell University Proj.) Series 2020 A2, 5% 7/1/2031 | | 25,000 | 27,890 |
| New York St Dorm Auth Revs Non St Supported Debt (Cornell University Proj.) Series 2020A, 4% 7/1/2050 | | 130,000 | 129,543 |
| New York St Dorm Auth Revs Non St Supported Debt (Cornell University Proj.) Series 2020A, 5% 7/1/2030 | | 190,000 | 212,294 |
| New York St Dorm Auth Revs Non St Supported Debt (New York Univ, NY Proj.) Series 2019A, 5% 7/1/2027 | | 20,000 | 21,038 |
| New York St Dorm Auth Revs Non St Supported Debt (St Johns Univ, NY Proj.) 5% 7/1/2026 | | 100,000 | 102,577 |
| New York St Dorm Auth Revs Non St Supported Debt (State University of New York Proj.) Series 2021 B, 3% 7/1/2045 | | 100,000 | 78,418 |
| New York State Dormitory Authority (MT Sinai - Icahn Sch of Medicine Proj.) Series 2015A, 5% 7/1/2040 | | 235,000 | 234,616 |
| Onondaga Cnty NY Tr Cultural Res Rev (Syracuse University, NY Proj.) Series 2019, 5% 12/1/2039 | | 25,000 | 26,659 |
| Onondaga Cnty NY Tr Cultural Res Rev (Syracuse University, NY Proj.) Series 2019, 5% 12/1/2040 | | 160,000 | 170,041 |
| Troy NY Cap Resource Corp Rev (Rensselaer Polytechnic Institute Proj.) Series 2020A, 5% 9/1/2037 | | 375,000 | 401,103 |
| | | | 2,045,683 |
| Electric Utilities - 0.6% | | | |
| Long Island Pwr Auth NY Elec 0% 6/1/2029 (Assured Guaranty Municipal Corp Insured) (d) | | 90,000 | 76,572 |
| Long Island Pwr Auth NY Elec 5% 9/1/2030 | | 120,000 | 133,188 |
| Long Island Pwr Auth NY Elec Series 2016 B, 5% 9/1/2046 | | 40,000 | 40,589 |
| Long Island Pwr Auth NY Elec Series 2017, 5% 9/1/2047 | | 30,000 | 30,769 |
| Long Island Pwr Auth NY Elec Series 2018, 5% 9/1/2035 | | 20,000 | 21,086 |
| Long Island Pwr Auth NY Elec Series 2019 A, 5% 9/1/2026 | | 150,000 | 155,321 |
| Long Island Pwr Auth NY Elec Series 2024A, 5% 9/1/2034 | | 220,000 | 255,559 |
| New York St Pwr Auth Series 2024A, 5% 11/15/2035 | | 200,000 | 233,133 |
| Utility Debt Securitization Authority Series 2015, 3% 12/15/2032 | | 80,000 | 78,349 |
| Utility Debt Securitization Authority Series 2017, 5% 12/15/2038 | | 25,000 | 26,047 |
| Utility Debt Securitization Authority Series 2017, 5% 12/15/2041 | | 50,000 | 51,860 |
| | | | 1,102,473 |
| Escrowed/Pre-Refunded - 0.1% | | | |
| New York St Dorm Auth St Pers Income Tax Rev Series 2016 D, 5% 2/15/2026 (Escrowed to Maturity) | | 105,000 | 107,230 |
| New York St Dorm Auth St Pers Income Tax Rev Series 2017 A, 5% 2/15/2027 | | 110,000 | 114,754 |
| | | | 221,984 |
| General Obligations - 2.8% | | | |
| City of New York NY Gen. Oblig. Series 2008 L 6, 5% 4/1/2031 | | 50,000 | 53,641 |
| City of New York NY Gen. Oblig. Series 2017, 5% 12/1/2037 | | 760,000 | 780,899 |
| City of New York NY Gen. Oblig. Series 2018 1, 5% 8/1/2028 | | 10,000 | 10,485 |
| City of New York NY Gen. Oblig. Series 2018 B 1, 4% 10/1/2040 | | 260,000 | 256,100 |
| City of New York NY Gen. Oblig. Series 2018 C, 5% 8/1/2027 | | 25,000 | 26,316 |
| City of New York NY Gen. Oblig. Series 2018 E 1, 5% 3/1/2031 | | 240,000 | 253,035 |
| City of New York NY Gen. Oblig. Series 2019 D1, 4% 12/1/2041 | | 50,000 | 49,163 |
| City of New York NY Gen. Oblig. Series 2021 C, 5% 8/1/2026 | | 200,000 | 206,190 |
| City of New York NY Gen. Oblig. Series 2021 C, 5% 8/1/2029 | | 260,000 | 282,592 |
| City of New York NY Gen. Oblig. Series A(A 1), 4% 8/1/2044 | | 20,000 | 19,402 |
| City of New York NY Gen. Oblig. Series A(A 1), 5% 8/1/2035 | | 120,000 | 128,143 |
| City of New York NY Gen. Oblig. Series A, 5% 8/1/2026 | | 150,000 | 151,512 |
| City of New York NY Gen. Oblig. Series B 1, 3.25% 10/1/2042 | | 55,000 | 47,481 |
| City of New York NY Gen. Oblig. Series C, 3% 8/1/2034 | | 25,000 | 23,656 |
| City of New York NY Gen. Oblig. Series E, 5% 8/1/2026 | | 75,000 | 77,321 |
| City of New York NY Gen. Oblig. Series FISCAL 2008 J 9, 5% 8/1/2026 | | 250,000 | 257,738 |
| City of New York NY Gen. Oblig. Series FISCAL 2020 D 1, 4% 3/1/2042 | | 125,000 | 123,319 |
| City of New York NY Gen. Oblig. Series FISCAL 2020 SUB B 1, 5% 10/1/2032 | | 70,000 | 75,441 |
| City of New York NY Gen. Oblig. Series FISCAL 2023B SUB B 1, 5.25% 10/1/2047 | | 235,000 | 254,326 |
| City of New York NY Gen. Oblig. Series FISCAL 2025 A, 5% 8/1/2035 | | 115,000 | 130,666 |
| City of New York NY Gen. Oblig. Series FISCAL 2025 SUB C1, 5% 9/1/2048 | | 365,000 | 392,914 |
| Hempstead Town New York Gen. Oblig. Series 2021, 2.125% 6/15/2040 | | 250,000 | 185,303 |
| New York NY City Transitional Fin Auth Bldg Aid Rev (New York St Proj.) Series 2016 S 1, 5% 7/15/2026 | | 50,000 | 51,033 |
| New York NY City Transitional Fin Auth Bldg Aid Rev (New York St Proj.) Series 2018 S 3, 3.625% 7/15/2047 | | 155,000 | 139,633 |
| New York NY City Transitional Fin Auth Bldg Aid Rev (New York St Proj.) Series 2018 S 4A, 5% 7/15/2031 | | 30,000 | 31,778 |
| New York NY City Transitional Fin Auth Bldg Aid Rev (New York St Proj.) Series 2018 S 4A, 5% 7/15/2034 | | 5,000 | 5,266 |
| New York NY City Transitional Fin Auth Bldg Aid Rev (New York St Proj.) Series FISCAL 2023 SUB S 1A, 5% 7/15/2028 | | 400,000 | 429,847 |
| New York NY City Transitional Fin Auth Bldg Aid Rev (New York St Proj.) Series S 1, 5% 7/15/2035 | | 35,000 | 36,336 |
| New York St Dorm Auth Revs Non St Supportd Debt (Scio N Y Cent Sch Dist Proj.) Series A, 5% 10/1/2029 | | 15,000 | 15,825 |
| New York St Dorm Auth Revs Non St Supported Debt (NY School Bond Program Proj.) 5% 10/1/2031 (Assured Guaranty Municipal Corp Insured) | | 225,000 | 238,934 |
| New York St Gen. Oblig. Series 2013A, 3.5% 3/1/2043 | | 40,000 | 36,252 |
| Westchester Cnty NY Gen. Oblig. Series 2018 A, 4% 12/1/2027 | | 50,000 | 51,308 |
| Westchester Cnty NY Gen. Oblig. Series 2019 D, 4% 12/15/2028 | | 20,000 | 20,654 |
| | | | 4,842,509 |
| Health Care - 0.3% | | | |
| Dutchess Cnty NY Loc Dev Corp Rev (Nuvance Health Proj.) Series 2016 B, 3% 7/1/2029 | | 150,000 | 139,302 |
| Dutchess Cnty NY Loc Dev Corp Rev (Nuvance Health Proj.) Series 2016 B, 4% 7/1/2041 | | 40,000 | 37,494 |
| New York St Dorm Auth Revs Non St Supported Debt (Maimonides Medical Center Proj.) Series 2020, 3% 2/1/2050 | | 55,000 | 42,845 |
| New York St Dorm Auth Revs Non St Supported Debt (Memorial Sloan-Kettering Cancer Center Proj.) Series 2019 1, 3% 7/1/2034 | | 120,000 | 110,154 |
| New York St Dorm Auth Revs Non St Supported Debt (Memorial Sloan-Kettering Cancer Center Proj.) Series 2019 1, 5% 7/1/2030 | | 20,000 | 21,710 |
| New York St Dorm Auth Revs Non St Supported Debt (Montefiore Medical Center Proj.) Series 2018 A, 4% 8/1/2038 | | 60,000 | 57,842 |
| New York St Dorm Auth Revs Non St Supported Debt (Northwell Health Proj.) Series 2022 A, 4.25% 5/1/2052 | | 40,000 | 38,605 |
| New York State Dormitory Authority (Northwell Health Proj.) Series 2015A, 4.125% 5/1/2042 | | 50,000 | 50,088 |
| New York State Dormitory Authority (Northwell Health Proj.) Series 2015A, 5% 5/1/2033 | | 40,000 | 40,184 |
| Westchester County Local Development Corp (Westchester Cnty NY Healthcare Proj.) Series 2016, 3.75% 11/1/2037 | | 45,000 | 38,699 |
| | | | 576,923 |
| Housing - 0.6% | | | |
| New York City Housing Development Corp (New York Mhsg 7/27/1993 Proj.) Series H, 2.95% tender 11/1/2045 (Liquidity Facility Fannie Mae) (b) | | 15,000 | 14,898 |
| New York City Housing Development Corp (New York Mhsg 7/27/1993 Proj.) Series I 1, 3.95% 11/1/2036 | | 70,000 | 68,980 |
| New York St Hsg Fin Agy (Affordable Housing Revenue Bonds 8/22/2007 Proj.) Series 2017 L, 3.45% 11/1/2042 | | 25,000 | 22,071 |
| New York St Hsg Fin Agy (Affordable Housing Revenue Bonds 8/22/2007 Proj.) Series 2019 N, 3.05% 11/1/2052 | | 55,000 | 41,350 |
| New York St Hsg Fin Agy Series 2019 P, 3.15% 11/1/2054 | | 25,000 | 19,138 |
| New York St Hsg Fin Agy Series 2021G, 2.4% 11/1/2041 | | 210,000 | 156,733 |
| New York St Mtg Agy Rev (NY Mortgage Proj.) Series FORTY EIGHTH, 3.45% 10/1/2033 | | 5,000 | 4,766 |
| NY City Hsg Dev Corp Multifamily Hsg Rev (New York Mhsg 7/27/1993 Proj.) Series 2019 E 1, 3.25% 11/1/2049 | | 30,000 | 23,915 |
| NY City Hsg Dev Corp Multifamily Hsg Rev (New York Mhsg 7/27/1993 Proj.) Series 2019 E 1, 3.45% 5/1/2059 | | 10,000 | 7,959 |
| NY City Hsg Dev Corp Multifamily Hsg Rev (New York Mhsg 7/27/1993 Proj.) Series 2020 D 1B, 2.4% 11/1/2050 | | 75,000 | 47,923 |
| NY City Hsg Dev Corp Multifamily Hsg Rev (New York Mhsg 7/27/1993 Proj.) Series 2021 A 1, 2.05% 11/1/2033 | | 135,000 | 111,504 |
| NY City Hsg Dev Corp Multifamily Hsg Rev (New York Mhsg 7/27/1993 Proj.) Series 2021 C 1, 2.25% 11/1/2041 | | 110,000 | 79,182 |
| NY City Hsg Dev Corp Multifamily Hsg Rev (New York Mhsg 7/27/1993 Proj.) Series 2021 G 1, 2.15% 11/1/2036 | | 205,000 | 160,668 |
| NY City Hsg Dev Corp Multifamily Hsg Rev (New York Mhsg 7/27/1993 Proj.) Series 2021 K 1, 2.45% 11/1/2041 | | 160,000 | 121,156 |
| State of New York Mortgage Agency (NY Homeowner Mortgage Proj.) Series 225, 2.3% 10/1/2040 | | 155,000 | 115,434 |
| State of New York Mortgage Agency (NY Mortgage Proj.) Series 220, 2.85% 10/1/2044 | | 25,000 | 19,118 |
| | | | 1,014,795 |
| Industrial Development - 0.2% | | | |
| Liberty NY Dev Corp Rev (Goldman Sachs Group Inc/The Proj.) 5.25% 10/1/2035 | | 135,000 | 153,567 |
| Liberty NY Dev Corp Rev (Goldman Sachs Group Inc/The Proj.) 5.5% 10/1/2037 | | 25,000 | 29,145 |
| New York Liberty Dev Corp Series 2019 CL 2, 2.625% 9/15/2069 | | 150,000 | 139,635 |
| | | | 322,347 |
| Other - 0.1% | | | |
| New York City Trust Cultural Resources Rev (Museum of Modern Art, NY Proj.) Series 2016 ONE E, 4% 4/1/2027 | | 15,000 | 15,306 |
| New York City Trust Cultural Resources Rev (Museum of Modern Art, NY Proj.) Series 2016 ONE E, 4% 4/1/2028 | | 75,000 | 76,622 |
| New York St Dorm Auth Revs Non St Supported Debt (Rockefeller Univ, NY Proj.) 4% 7/1/2049 | | 45,000 | 43,035 |
| | | | 134,963 |
| Special Tax - 6.7% | | | |
| Battery Pk City Auth NY Rev Series 2019A, 5% 11/1/2049 | | 190,000 | 200,795 |
| Battery Pk City Auth NY Rev Series 2023 A, 5% 11/1/2053 | | 145,000 | 156,201 |
| Brooklyn Arena Local Dev Corp N Y Series A, 3% 7/15/2043 (Assured Guaranty Municipal Corp Insured) | | 25,000 | 19,646 |
| Hudson Yds Infrastructure Corp NY Rev Series 2017 A, 4% 2/15/2036 | | 120,000 | 121,092 |
| Hudson Yds Infrastructure Corp NY Rev Series 2017 A, 4% 2/15/2044 | | 35,000 | 34,316 |
| Hudson Yds Infrastructure Corp NY Rev Series 2017 A, 5% 2/15/2030 | | 55,000 | 57,108 |
| Hudson Yds Infrastructure Corp NY Rev Series 2017 A, 5% 2/15/2039 | | 40,000 | 41,065 |
| Hudson Yds Infrastructure Corp NY Rev Series FISCAL 2022 A, 4% 2/15/2039 | | 95,000 | 97,143 |
| New York City Transitional Finance Authority (New York NY City Transitional Fin Auth Rev Proj.) Series FISCAL 2024D SUB D 1, 5% 11/1/2041 | | 20,000 | 22,054 |
| New York NY City Ida Rev (Yankees Hldgs LP Proj.) 0% 3/1/2039 (Assured Guaranty Inc Insured) (d) | | 10,000 | 5,243 |
| New York NY City Ida Rev (Yankees Hldgs LP Proj.) 0% 3/1/2045 (Assured Guaranty Inc Insured) (d) | | 25,000 | 9,393 |
| New York NY City Ida Rev (Yankees Hldgs LP Proj.) Series 2009A, 0% 3/1/2027 (d) | | 90,000 | 83,144 |
| New York NY City Ida Rev (Yankees Hldgs LP Proj.) Series 2009A, 0% 3/1/2037 (d) | | 50,000 | 29,459 |
| New York NY City Ida Rev (Yankees Hldgs LP Proj.) Series 2009A, 0% 3/1/2044 (d) | | 45,000 | 17,876 |
| New York NY City Transitional Fin Auth Rev 5% 11/1/2032 | | 170,000 | 187,793 |
| New York NY City Transitional Fin Auth Rev 5% 8/1/2045 | | 50,000 | 51,294 |
| New York NY City Transitional Fin Auth Rev Series 2017, 3% 5/1/2034 | | 50,000 | 47,297 |
| New York NY City Transitional Fin Auth Rev Series 2017, 4% 5/1/2037 | | 80,000 | 80,321 |
| New York NY City Transitional Fin Auth Rev Series 2017, 5% 5/1/2040 | | 15,000 | 15,229 |
| New York NY City Transitional Fin Auth Rev Series 2018 A 2, 5% 8/1/2038 | | 55,000 | 56,914 |
| New York NY City Transitional Fin Auth Rev Series 2018 B 1, 5% 8/1/2029 | | 150,000 | 156,945 |
| New York NY City Transitional Fin Auth Rev Series 2018 C 2, 5% 5/1/2033 | | 360,000 | 377,733 |
| New York NY City Transitional Fin Auth Rev Series 2018 C 2, 5% 5/1/2036 | | 240,000 | 250,374 |
| New York NY City Transitional Fin Auth Rev Series 2019 A 1, 5% 8/1/2036 | | 465,000 | 486,299 |
| New York NY City Transitional Fin Auth Rev Series 2019 C 1, 3.25% 11/1/2043 | | 140,000 | 120,046 |
| New York NY City Transitional Fin Auth Rev Series 2019 C 1, 4% 11/1/2036 | | 50,000 | 50,785 |
| New York NY City Transitional Fin Auth Rev Series 2019 C 1, 4% 11/1/2037 | | 30,000 | 30,283 |
| New York NY City Transitional Fin Auth Rev Series B 1, 4% 8/1/2038 | | 100,000 | 100,333 |
| New York NY City Transitional Fin Auth Rev Series B 1, 4% 8/1/2039 | | 20,000 | 20,003 |
| New York NY City Transitional Fin Auth Rev Series B1, 5% 11/1/2028 | | 30,000 | 30,457 |
| New York NY City Transitional Fin Auth Rev Series B1, 5% 11/1/2035 | | 105,000 | 106,168 |
| New York NY City Transitional Fin Auth Rev Series C, 5% 11/1/2026 | | 40,000 | 41,386 |
| New York NY City Transitional Fin Auth Rev Series FISCAL 2001 C, 4% 2/1/2027 | | 70,000 | 71,502 |
| New York NY City Transitional Fin Auth Rev Series FISCAL 2020 B 1, 4% 11/1/2045 | | 415,000 | 403,088 |
| New York NY City Transitional Fin Auth Rev Series FISCAL 2020A SUB A 3, 4% 5/1/2042 | | 260,000 | 255,341 |
| New York NY City Transitional Fin Auth Rev Series FISCAL 2020C SUB C 1, 4% 5/1/2040 | | 10,000 | 10,010 |
| New York NY City Transitional Fin Auth Rev Series FISCAL 2020C SUB C 1, 5% 5/1/2041 | | 100,000 | 106,820 |
| New York NY City Transitional Fin Auth Rev Series FISCAL 2021 A, 4% 11/1/2035 | | 80,000 | 82,262 |
| New York NY City Transitional Fin Auth Rev Series FISCAL 2021 A, 5% 11/1/2031 | | 150,000 | 164,892 |
| New York NY City Transitional Fin Auth Rev Series FISCAL 2021C SUB C 1, 4% 5/1/2038 | | 100,000 | 101,245 |
| New York NY City Transitional Fin Auth Rev Series FISCAL 2021C SUB C 1, 4% 5/1/2044 | | 30,000 | 29,388 |
| New York NY City Transitional Fin Auth Rev Series FISCAL 2022C SUB C 1, 5% 2/1/2037 | | 100,000 | 110,110 |
| New York NY City Transitional Fin Auth Rev Series FISCAL 2023B SUB B 1, 5% 11/1/2033 | | 445,000 | 499,773 |
| New York NY City Transitional Fin Auth Rev Series FISCAL 2023F SUB F 1, 5.25% 2/1/2047 | | 190,000 | 206,642 |
| New York St Dorm Auth Sales Tax Rev St Supported (New York State Sales Tax Rev Proj.) 5% 3/15/2038 | | 235,000 | 262,665 |
| New York St Dorm Auth Sales Tax Rev St Supported (New York State Sales Tax Rev Proj.) 5% 3/15/2048 (Pre-refunded to 3/15/2048 at 100) | | 75,000 | 77,434 |
| New York St Dorm Auth Sales Tax Rev St Supported (New York State Sales Tax Rev Proj.) Series 2016 A, 5% 3/15/2029 (Pre-refunded to 9/15/2026 at 100) | | 80,000 | 82,689 |
| New York St Dorm Auth Sales Tax Rev St Supported (New York State Sales Tax Rev Proj.) Series 2017 A, 5% 3/15/2043 | | 75,000 | 76,923 |
| New York St Dorm Auth Sales Tax Rev St Supported (New York State Sales Tax Rev Proj.) Series 2017 A, 5% 3/15/2044 | | 210,000 | 215,150 |
| New York St Dorm Auth Sales Tax Rev St Supported (New York State Sales Tax Rev Proj.) Series 2024A, 5% 3/15/2051 | | 200,000 | 214,486 |
| New York St Dorm Auth St Pers Income Tax Rev (New York State Pit Proj.) Series 2016 D, 5% 2/15/2026 (Escrowed to Maturity) | | 10,000 | 10,223 |
| New York St Dorm Auth St Pers Income Tax Rev (New York State Pit Proj.) Series 2018A, 5% 3/15/2032 | | 50,000 | 53,337 |
| New York St Dorm Auth St Pers Income Tax Rev (New York State Pit Proj.) Series 2019 A, 5% 3/15/2039 | | 100,000 | 105,492 |
| New York St Dorm Auth St Pers Income Tax Rev (New York State Pit Proj.) Series 2019 A, 5% 3/15/2040 | | 90,000 | 94,636 |
| New York St Dorm Auth St Pers Income Tax Rev (New York State Pit Proj.) Series 2019 D, 3% 2/15/2049 | | 120,000 | 91,908 |
| New York St Dorm Auth St Pers Income Tax Rev (New York State Pit Proj.) Series 2022 A, 4% 3/15/2039 | | 220,000 | 221,998 |
| New York St Dorm Auth St Pers Income Tax Rev (New York State Pit Proj.) Series 2024A, 4% 3/15/2054 | | 595,000 | 565,091 |
| New York St Dorm Auth St Pers Income Tax Rev (New York State Pit Proj.) Series 2024A, 5% 3/15/2037 | | 500,000 | 563,615 |
| New York St Dorm Auth St Pers Income Tax Rev (New York State Pit Proj.) Series 2024A, 5.25% 3/15/2048 | | 600,000 | 655,024 |
| New York St Urban Dev Corp Rev (New York State Pit Proj.) Series 2019 A, 5% 3/15/2042 | | 15,000 | 15,604 |
| New York St Urban Dev Corp Rev (New York State Pit Proj.) Series 2019 A, 5% 3/15/2044 | | 25,000 | 25,935 |
| New York State Dormitory Authority (New York State Pit Proj.) 5% 2/15/2039 | | 15,000 | 15,545 |
| New York State Dormitory Authority 3% 3/15/2049 | | 105,000 | 80,759 |
| New York State Dormitory Authority 5% 2/15/2043 | | 50,000 | 51,563 |
| New York State Urban Development Corp (New York State Pit Proj.) Series 2016 A, 5% 3/15/2026 (Escrowed to Maturity) | | 20,000 | 20,505 |
| New York State Urban Development Corp (New York State Pit Proj.) Series 2020 A, 4% 3/15/2045 | | 65,000 | 63,812 |
| New York State Urban Development Corp (New York State Pit Proj.) Series 2020 A, 4% 3/15/2049 | | 85,000 | 82,914 |
| New York State Urban Development Corp (New York State Pit Proj.) Series 2020 A, 5% 3/15/2036 | | 500,000 | 543,016 |
| New York Twy Auth Pers Income Tax Rev (New York State Pit Proj.) Series 2021A 1, 4% 3/15/2058 | | 135,000 | 127,613 |
| New York Urban Eev Corp Sales Tax Rev (New York State Sales Tax Rev Proj.) 5% 3/15/2048 | | 355,000 | 380,031 |
| New York Urban Eev Corp Sales Tax Rev (New York State Sales Tax Rev Proj.) Series 2019 A, 4% 3/15/2046 | | 75,000 | 72,298 |
| NY Convention Ctr Dev Corp Rev Series B, 0% 11/15/2032 (d) | | 90,000 | 65,673 |
| NY Convention Ctr Dev Corp Rev Series B, 0% 11/15/2036 (d) | | 100,000 | 59,786 |
| NY Convention Ctr Dev Corp Rev Series B, 0% 11/15/2038 (d) | | 75,000 | 40,186 |
| NY Convention Ctr Dev Corp Rev Series B, 0% 11/15/2044 (d) | | 75,000 | 28,465 |
| NY Mta Dedicated Tax Fund Series 2012A, 0% 11/15/2032 (d) | | 225,000 | 167,769 |
| NY Mta Dedicated Tax Fund Series 2012A, 3% 11/15/2028 | | 190,000 | 186,444 |
| NY Mta Dedicated Tax Fund Series 2016 A, 5% 11/15/2026 | | 90,000 | 93,426 |
| NY Mta Dedicated Tax Fund Series 2016 A, 5.25% 11/15/2028 | | 150,000 | 155,924 |
| NY Payroll Mobility Tax Series 2021 C 2, 3% 5/15/2033 | | 390,000 | 377,363 |
| NY Payroll Mobility Tax Series 2021 SUB C 3, 4% 5/15/2051 | | 540,000 | 518,731 |
| Triborough Brdg & Tunl Auth NY Sales Tax Rev Series 2022 A, 5.25% 5/15/2057 | | 230,000 | 247,768 |
| | | | 11,857,069 |
| Tobacco Bonds - 0.0% | | | |
| Tobacco Settlement Asset Securitization Corp NY Rev Series A, 5% 6/1/2032 | | 75,000 | 77,000 |
| Transportation - 2.9% | | | |
| Metropolitan Transn Auth NY Rv 4% 11/15/2049 | | 25,000 | 23,481 |
| Metropolitan Transn Auth NY Rv Series 2015 F, 3.25% 11/15/2031 | | 35,000 | 33,320 |
| Metropolitan Transn Auth NY Rv Series 2015B, 4% 11/15/2045 | | 250,000 | 232,200 |
| Metropolitan Transn Auth NY Rv Series 2016 B, 5% 11/15/2037 | | 325,000 | 330,369 |
| Metropolitan Transn Auth NY Rv Series 2016 D, 3% 11/15/2032 | | 50,000 | 46,212 |
| Metropolitan Transn Auth NY Rv Series 2016 D, 5% 11/15/2027 | | 10,000 | 10,271 |
| Metropolitan Transn Auth NY Rv Series 2017 D, 4% 11/15/2042 | | 95,000 | 91,455 |
| Metropolitan Transn Auth NY Rv Series 2017 D, 5% 11/15/2027 | | 100,000 | 105,020 |
| Metropolitan Transn Auth NY Rv Series 2017C 1, 4% 11/15/2034 | | 55,000 | 55,327 |
| Metropolitan Transn Auth NY Rv Series 2017C 1, 4% 11/15/2035 | | 245,000 | 246,329 |
| Metropolitan Transn Auth NY Rv Series 2017C 1, 5% 11/15/2028 | | 25,000 | 26,460 |
| Metropolitan Transn Auth NY Rv Series 2018 B, 5% 11/15/2027 | | 20,000 | 21,004 |
| Metropolitan Transn Auth NY Rv Series 2019 B, 4% 11/15/2049 (Assured Guaranty Municipal Corp Insured) | | 40,000 | 37,859 |
| Metropolitan Transn Auth NY Rv Series 2020 A 1, 4% 11/15/2052 | | 20,000 | 18,671 |
| Metropolitan Transn Auth NY Rv Series 2021 A 1, 4% 11/15/2049 | | 25,000 | 23,352 |
| Metropolitan Transn Auth NY Rv Series 2024A, 5% 11/15/2044 | | 25,000 | 26,660 |
| Metropolitan Transn Auth NY Rv Series C 1, 4% 11/15/2046 | | 120,000 | 111,555 |
| Metropolitan Transn Auth NY Rv Series C 1, 5% 11/15/2030 | | 395,000 | 404,856 |
| Metropolitan Transn Auth NY Rv Series C 1, 5% 11/15/2034 | | 80,000 | 80,893 |
| Metropolitan Transn Auth NY Rv Series C 2, 3% 11/15/2038 | | 25,000 | 20,520 |
| New York St Twy Auth Gen Rev 5.25% 1/1/2056 | | 250,000 | 252,508 |
| New York St Twy Auth Gen Rev Series 2016 A, 5% 1/1/2051 | | 30,000 | 30,214 |
| New York St Twy Auth Gen Rev Series 2019 B, 3% 1/1/2046 | | 50,000 | 39,418 |
| New York St Twy Auth Gen Rev Series K, 5% 1/1/2026 | | 80,000 | 80,000 |
| New York St Twy Auth Gen Rev Series L, 5% 1/1/2034 | | 70,000 | 73,463 |
| New York St Twy Auth Gen Rev Series N, 4% 1/1/2047 | | 200,000 | 193,491 |
| New York St Twy Auth Gen Rev Series P, 5% 1/1/2031 | | 25,000 | 27,862 |
| New York St Twy Auth Gen Rev Series P, 5% 1/1/2033 | | 10,000 | 11,412 |
| New York Transportation Development Corp (Delta Air Lines Inc Proj.) Series 2018, 5% 1/1/2030 (f) | | 30,000 | 30,847 |
| New York Transportation Development Corp (Jfk International Air Terminal Proj.) 4% 12/1/2040 (f) | | 50,000 | 47,124 |
| New York Transportation Development Corp (Jfk International Air Terminal Proj.) Series 2022, 5% 12/1/2035 (f) | | 150,000 | 157,937 |
| New York Transportation Development Corp (Jfk Intl New Terminal One Proj.) 5.375% 6/30/2060 (f) | | 500,000 | 514,721 |
| New York Transportation Development Corp (Jfk Intl Terminal 6 Proj.) 5.25% 12/31/2054 (Assured Guaranty Municipal Corp Insured) (f) | | 210,000 | 222,722 |
| New York Transportation Development Corp (Laguardia Gateway Prtnrs Terminal B Proj.) Series 2016 A, 4% 1/1/2051 (Assured Guaranty Municipal Corp Insured) (f) | | 30,000 | 26,836 |
| New York Transportation Development Corp (Laguardia Gateway Prtnrs Terminal B Proj.) Series 2016 A, 4% 7/1/2041 (f) | | 30,000 | 27,516 |
| Port Auth NY & NJ Series 245, 5% 9/1/2038 | | 235,000 | 266,996 |
| Triborough Brdg & Tunl NY Revs 5% 11/15/2031 | | 200,000 | 225,920 |
| Triborough Brdg & Tunl NY Revs 5% 11/15/2034 | | 150,000 | 164,783 |
| Triborough Brdg & Tunl NY Revs Series 2008B 3, 5% 11/15/2037 | | 40,000 | 40,479 |
| Triborough Brdg & Tunl NY Revs Series 2012B, 0% 11/15/2032 (d) | | 290,000 | 217,407 |
| Triborough Brdg & Tunl NY Revs Series 2013A, 0% 11/15/2030 (d) | | 105,000 | 84,852 |
| Triborough Brdg & Tunl NY Revs Series 2013A, 0% 11/15/2032 (d) | | 35,000 | 26,037 |
| Triborough Brdg & Tunl NY Revs Series 2016A, 5% 11/15/2031 | | 100,000 | 102,396 |
| Triborough Brdg & Tunl NY Revs Series 2016A, 5% 11/15/2041 | | 25,000 | 25,400 |
| Triborough Brdg & Tunl NY Revs Series 2018 C, 5% 11/15/2037 | | 25,000 | 26,309 |
| Triborough Brdg & Tunl NY Revs Series 2019A, 5% 11/15/2049 | | 45,000 | 46,585 |
| Triborough Brdg & Tunl NY Revs Series A, 5% 11/15/2026 | | 50,000 | 51,864 |
| Triborough Brdg & Tunl NY Revs Series B, 5% 11/15/2036 | | 90,000 | 93,475 |
| | | | 5,054,388 |
| Water & Sewer - 1.5% | | | |
| New York Envir Fac Corp Clean Wtr & Drinking Wtr Series 2017 A, 3.5% 6/15/2036 | | 10,000 | 9,864 |
| New York Envir Fac Corp Clean Wtr & Drinking Wtr Series 2018 A, 5% 6/15/2030 | | 50,000 | 53,618 |
| New York Envir Fac Corp Clean Wtr & Drinking Wtr Series 2019 B, 5% 6/15/2031 | | 25,000 | 27,254 |
| New York Envir Fac Corp Clean Wtr & Drinking Wtr Series 2023 B, 5% 6/15/2032 | | 210,000 | 238,941 |
| New York Envir Fac Corp Clean Wtr & Drinking Wtr Series 2024A, 5% 6/15/2037 | | 15,000 | 17,301 |
| New York Envir Fac Corp Clean Wtr & Drinking Wtr Series 2024A, 5% 6/15/2038 | | 85,000 | 97,626 |
| New York NY Cty Muni Wtr Fin Auth 4% 6/15/2052 | | 150,000 | 143,455 |
| New York NY Cty Muni Wtr Fin Auth 5.25% 6/15/2047 | | 60,000 | 61,577 |
| New York NY Cty Muni Wtr Fin Auth 5.25% 6/15/2049 | | 65,000 | 67,854 |
| New York NY Cty Muni Wtr Fin Auth Series 2015HH, 5% 6/15/2029 | | 65,000 | 65,546 |
| New York NY Cty Muni Wtr Fin Auth Series 2017 EE, 5% 6/15/2036 | | 60,000 | 62,252 |
| New York NY Cty Muni Wtr Fin Auth Series 2018 AA, 5% 6/15/2037 | | 5,000 | 5,180 |
| New York NY Cty Muni Wtr Fin Auth Series 2018 EE, 5% 6/15/2032 | | 10,000 | 10,162 |
| New York NY Cty Muni Wtr Fin Auth Series 2018 FF, 5% 6/15/2040 | | 135,000 | 140,626 |
| New York NY Cty Muni Wtr Fin Auth Series 2019 FF 2, 4% 6/15/2037 | | 80,000 | 81,114 |
| New York NY Cty Muni Wtr Fin Auth Series 2020 AA, 5% 6/15/2027 | | 150,000 | 157,801 |
| New York NY Cty Muni Wtr Fin Auth Series 2020 BB1, 5% 6/15/2049 | | 195,000 | 204,183 |
| New York NY Cty Muni Wtr Fin Auth Series BB 1, 5% 6/15/2046 | | 40,000 | 40,206 |
| New York NY Cty Muni Wtr Fin Auth Series DD, 5% 6/15/2048 | | 15,000 | 15,432 |
| New York NY Cty Muni Wtr Fin Auth Series FISCAL 2020 CC 1, 4% 6/15/2039 | | 100,000 | 100,958 |
| New York NY Cty Muni Wtr Fin Auth Series FISCAL 2020 CC 1, 4% 6/15/2042 | | 90,000 | 90,111 |
| New York NY Cty Muni Wtr Fin Auth Series FISCAL 2020 CC 1, 4% 6/15/2049 | | 35,000 | 33,788 |
| New York NY Cty Muni Wtr Fin Auth Series FISCAL 2020 CC 1, 5% 6/15/2030 | | 25,000 | 27,298 |
| New York NY Cty Muni Wtr Fin Auth Series FISCAL 2020 FF, 5% 6/15/2041 | | 190,000 | 202,785 |
| New York NY Cty Muni Wtr Fin Auth Series FISCAL2025AA SUB AA1, 5% 6/15/2051 | | 255,000 | 274,515 |
| New York NY Cty Muni Wtr Fin Auth Series FISCAL2025AA SUB AA1, 5.25% 6/15/2053 | | 230,000 | 251,938 |
| New York St Env Facs Corp Rev Series 2017 C, 5% 8/15/2047 | | 175,000 | 180,253 |
| New York St Env Facs Corp Rev Series 2019 A, 5% 2/15/2049 | | 30,000 | 31,356 |
| Suffolk Cnty NY Wtr Auth Wtrwk Series 2018 A, 4% 6/1/2041 | | 45,000 | 45,009 |
| | | | 2,738,003 |
TOTAL NEW YORK | | | 29,988,137 |
| North Carolina - 1.0% | | | |
| General Obligations - 0.5% | | | |
| Charlotte NC Gen. Oblig. Series 2023B, 5% 7/1/2028 | | 25,000 | 26,804 |
| Mecklenburg Cnty NC Gen. Oblig. Series 2019, 4% 3/1/2034 | | 210,000 | 215,229 |
| Mecklenburg Cnty NC Series 2017 A, 3% 4/1/2037 | | 50,000 | 45,442 |
| Mecklenburg Cnty NC Series 2022, 5% 9/1/2032 | | 130,000 | 148,379 |
| North Carolina St Gen. Oblig. Series 2016 A, 5% 6/1/2027 | | 70,000 | 72,048 |
| North Carolina St Gen. Oblig. Series 2018 A, 5% 6/1/2029 | | 45,000 | 48,072 |
| State of North Carolina (North Carolina St Proj.) Series 2020 B, 5% 5/1/2029 | | 20,000 | 21,694 |
| Wake Cnty NC Gen. Oblig. Series 2019 A, 3% 3/1/2036 | | 50,000 | 46,359 |
| Wake Cnty NC Gen. Oblig. Series 2022A, 5% 2/1/2031 | | 100,000 | 111,819 |
| | | | 735,846 |
| Health Care - 0.0% | | | |
| North Carolina Med Care Commn Health Care Facs Rev (Duke Univ Health System Inc Proj.) Series 2016 A, 5% 6/1/2028 | | 65,000 | 69,059 |
| North Carolina Med Care Commn Health Care Facs Rev (Presbyterian Homes Inc Proj.) Series 2020A, 4% 10/1/2045 | | 55,000 | 49,471 |
| | | | 118,530 |
| Transportation - 0.4% | | | |
| Charlotte NC Arpt Rev Series 2021A, 4% 7/1/2041 | | 150,000 | 149,311 |
| North Carolina St Grant Antic Rev Series 2015, 5% 3/1/2027 | | 30,000 | 30,079 |
| North Carolina St Grant Antic Rev Series 2015, 5% 3/1/2028 | | 50,000 | 50,128 |
| North Carolina St Grant Antic Rev Series 2019, 5% 3/1/2031 | | 45,000 | 48,277 |
| North Carolina St Grant Antic Rev Series 2019, 5% 3/1/2033 | | 75,000 | 80,194 |
| North Carolina St Grant Antic Rev Series 2019, 5% 3/1/2034 | | 40,000 | 42,682 |
| North Carolina Tpk Auth Triangle Expwy Sys Rev 0% 1/1/2037 (Assured Guaranty Inc Insured) (d) | | 275,000 | 170,252 |
| North Carolina Tpk Auth Triangle Expwy Sys Rev Series 2009B, 0% 1/1/2038 (d) | | 110,000 | 64,696 |
| North Carolina Tpk Auth Triangle Expwy Sys Rev Series 2018, 5% 1/1/2031 | | 85,000 | 89,539 |
| | | | 725,158 |
| Water & Sewer - 0.1% | | | |
| Greensboro NC Ent Sys Rev Series A, 4% 6/1/2047 | | 95,000 | 93,287 |
| Union Cnty NC Enterprise Sys Rev Series 2021, 3% 6/1/2037 | | 80,000 | 71,672 |
| | | | 164,959 |
TOTAL NORTH CAROLINA | | | 1,744,493 |
| North Dakota - 0.0% | | | |
| Housing - 0.0% | | | |
| North Dakota St Hsg Fin Agy (ND Single Family Hsg Proj.) 2.25% 7/1/2041 | | 50,000 | 35,640 |
| Ohio - 2.4% | | | |
| Electric Utilities - 0.0% | | | |
| Cleveland OH Pub Pwr Sys Rev 0% 11/15/2038 (National Public Finance Guarantee Corporation Insured) (d) | | 55,000 | 28,846 |
| General Obligations - 0.5% | | | |
| City of Columbus OH Gen. Oblig. Series 2016 A, 4% 8/15/2027 | | 45,000 | 45,239 |
| City of Columbus OH Gen. Oblig. Series 2018 A, 5% 4/1/2030 | | 120,000 | 128,647 |
| City of Columbus OH Gen. Oblig. Series 2024 A, 5% 8/15/2040 | | 65,000 | 73,013 |
| Gahanna-Jefferson OH Sch Dist Series 2021, 2% 12/1/2050 (Assured Guaranty Municipal Corp Insured) | | 45,000 | 25,355 |
| Northeastern OH Local Sch Dist Clark Cnty Series 2018, 4% 12/1/2055 (Assured Guaranty Municipal Corp Insured) | | 65,000 | 60,202 |
| Ohio St Parks & Rec Cap Facs (State of Ohio Proj.) Series 2017A, 5% 12/1/2031 | | 20,000 | 21,050 |
| Ohio St Spl Oblig (State of Ohio Proj.) Series A, 5% 4/1/2029 | | 40,000 | 40,174 |
| Southwest Licking OH Local Sch Dist Series 2017 A, 3.375% 11/1/2047 | | 10,000 | 8,542 |
| State of Ohio Gen. Oblig. Series 2015A, 5% 9/15/2026 | | 20,000 | 20,703 |
| State of Ohio Gen. Oblig. Series 2015C, 5% 11/1/2028 | | 35,000 | 35,210 |
| State of Ohio Gen. Oblig. Series 2015C, 5% 11/1/2030 | | 50,000 | 50,264 |
| State of Ohio Gen. Oblig. Series 2016, 5% 5/1/2029 | | 50,000 | 51,268 |
| State of Ohio Gen. Oblig. Series 2017C, 5% 8/1/2026 | | 25,000 | 25,814 |
| State of Ohio Gen. Oblig. Series 2018 A, 5% 2/1/2029 | | 25,000 | 25,532 |
| State of Ohio Gen. Oblig. Series 2019 A, 5% 5/1/2027 | | 60,000 | 62,908 |
| State of Ohio Gen. Oblig. Series 2021 B, 5% 9/15/2031 | | 120,000 | 134,546 |
| State of Ohio Gen. Oblig. Series 2024A, 5% 3/1/2039 | | 65,000 | 72,740 |
| | | | 881,207 |
| Health Care - 0.5% | | | |
| Allen Cnty OH Hosp Facs Rev (Mercy Health/OH Proj.) Series 2015A, 4% 11/1/2044 | | 245,000 | 226,214 |
| Chillicothe Ohio Hosp Facs Rev (Adena Health Sys Proj.) Series 2017, 5% 12/1/2037 | | 100,000 | 102,489 |
| Cuyahoga Cnty Ohio Hosp Rev (Metro Health System, OH Proj.) Series 2017, 5% 2/15/2052 | | 55,000 | 55,099 |
| Franklin Cnty OH Rev (Trinity Health Proj.) Series 2017 OH, 4% 12/1/2046 | | 70,000 | 66,781 |
| Franklin Cnty OH Rev (Trinity Health Proj.) Series 2017 OH, 5% 12/1/2046 | | 65,000 | 65,946 |
| Hamilton Cnty OH Hosp Facs Rev (TriHealth Inc Proj.) Series 2020 A, 4% 8/15/2050 | | 20,000 | 18,632 |
| Ohio St Hosp Rev (University Hosp Hlth Sys, OH Proj.) 5% 1/15/2041 | | 20,000 | 20,170 |
| Ohio St Hsg Fin Agy Res Mtg Rev (Cleveland Clinic Foundation/The Proj.) 5% 1/1/2028 | | 100,000 | 105,777 |
| Ohio St Hsg Fin Agy Res Mtg Rev (Cleveland Clinic Foundation/The Proj.) Series 2017A, 5% 1/1/2033 | | 40,000 | 42,076 |
| Scioto Cnty OH Hsp Facs Rev (Southern OH Medical Center Proj.) Series 2016, 3.5% 2/15/2038 | | 285,000 | 259,851 |
| | | | 963,035 |
| Housing - 0.3% | | | |
| Ohio St Hsg Fin Agy Residential Mtg Rev (OH Residential Mortgage Proj.) Series 2021A, 3% 3/1/2052 | | 115,000 | 112,462 |
| Ohio St Hsg Fin Agy Residential Mtg Rev Series 2021 C, 2.7% 9/1/2046 | | 485,000 | 350,857 |
| | | | 463,319 |
| Special Tax - 0.2% | | | |
| Cleveland Ohio Income Tax Rev Series 2017B 1, 5% 10/1/2028 | | 115,000 | 121,842 |
| Franklin Cnty Ohio Sales Tax Rev Series 2018, 5% 6/1/2048 | | 30,000 | 30,993 |
| Hamilton OH Sales Tax 0% 12/1/2028 (Ambac Assurance Corp Insured) (d) | | 235,000 | 204,479 |
| | | | 357,314 |
| Tobacco Bonds - 0.1% | | | |
| Buckeye OH Tobacco Settlement Fing Auth Series 2020A 2 CL 1, 5% 6/1/2034 | | 240,000 | 252,001 |
| Transportation - 0.1% | | | |
| Ohio St Tpk Commn Tpk Rev 5% 2/15/2051 | | 50,000 | 52,656 |
| Ohio St Tpk Commn Tpk Rev Series 2013 A 2, 0% 2/15/2037 (d) | | 20,000 | 12,517 |
| Ohio St Tpk Commn Tpk Rev Series 2013 A 2, 0% 2/15/2041 (d) | | 60,000 | 30,373 |
| Ohio St Tpk Commn Tpk Rev Series 2013 A 2, 0% 2/15/2043 (d) | | 25,000 | 11,416 |
| | | | 106,962 |
| Water & Sewer - 0.7% | | | |
| Northeast OH Regl Swr Wstwtr Rev Series 2019, 3% 11/15/2033 | | 285,000 | 270,764 |
| Ohio St Wtr Dev Ath Wtr Poll Ctl Rev 5% 12/1/2033 | | 30,000 | 34,326 |
| Ohio St Wtr Dev Ath Wtr Poll Ctl Rev Series 2017 A, 5% 12/1/2028 | | 30,000 | 31,393 |
| Ohio St Wtr Dev Ath Wtr Poll Ctl Rev Series 2019 B, 3% 6/1/2046 | | 90,000 | 72,510 |
| Ohio St Wtr Dev Ath Wtr Poll Ctl Rev Series 2020 A, 5% 12/1/2040 | | 80,000 | 85,727 |
| Ohio St Wtr Dev Ath Wtr Poll Ctl Rev Series 2020 A, 5% 6/1/2033 | | 90,000 | 98,614 |
| Ohio St Wtr Dev Ath Wtr Poll Ctl Rev Series 2020B, 4% 12/1/2038 | | 490,000 | 498,739 |
| Ohio Water Dev Authority (Ohio St Wtr Dev Ath Wtr Poll Ctl Rev Proj.) Series 2019A, 5% 6/1/2027 | | 55,000 | 57,697 |
| | | | 1,149,770 |
TOTAL OHIO | | | 4,202,454 |
| Oklahoma - 0.3% | | | |
| Education - 0.0% | | | |
| University of Oklahoma/The Series 2015C, 5% 7/1/2036 | | 85,000 | 85,463 |
| Electric Utilities - 0.0% | | | |
| Oklahoma St Mun Pwr Auth Pwr Series 2016 A, 5% 1/1/2047 | | 15,000 | 15,137 |
| General Obligations - 0.0% | | | |
| Oklahoma Cap Imp Auth St Hwy Cap Impt Rev (Oklahoma St Proj.) Series 2016, 4% 7/1/2033 | | 10,000 | 10,077 |
| Health Care - 0.1% | | | |
| OK Dev Fin Auth Health Sys Rev (OU Medicine Inc Proj.) Series 2018 B, 4% 8/15/2048 (Assured Guaranty Municipal Corp Insured) | | 140,000 | 127,420 |
| Special Tax - 0.1% | | | |
| Edmond OK Pub Wks Auth Sales Tax & Util Sys Rev Series 2017, 4% 7/1/2047 | | 145,000 | 140,985 |
| Transportation - 0.1% | | | |
| Oklahoma St Tpk Auth Tpk Rev Series 2017 A, 4% 1/1/2047 | | 35,000 | 33,426 |
| Oklahoma St Tpk Auth Tpk Rev Series 2017 D, 5% 1/1/2026 | | 65,000 | 66,223 |
| | | | 99,649 |
| Water & Sewer - 0.0% | | | |
| Oklahoma St Wtr Res Brd Rev Fd Series 2023 A, 4.125% 4/1/2053 | | 20,000 | 19,791 |
TOTAL OKLAHOMA | | | 498,522 |
| Oregon - 0.9% | | | |
| Education - 0.0% | | | |
| Oregon St Facs Auth Rev (University of Portland Proj.) Series 2015A, 5% 4/1/2045 | | 15,000 | 15,028 |
| General Obligations - 0.4% | | | |
| Clackamas Cnty Ore Sch Dis No 46 Oregon Trail 0% 6/15/2033 (Oregon St Guaranteed) (d) | | 60,000 | 44,033 |
| Clackamas Cnty Ore Sch Dis No 46 Oregon Trail 0% 6/15/2034 (Oregon St Guaranteed) (d) | | 35,000 | 24,562 |
| Clackamas Cnty Ore Sch Dis No 46 Oregon Trail 0% 6/15/2036 (Oregon St Guaranteed) (d) | | 85,000 | 54,298 |
| Clackamas Cnty Ore Sch Dis No 46 Oregon Trail 0% 6/15/2039 (Oregon St Guaranteed) (d) | | 155,000 | 84,640 |
| Deschutes & Jefferson Cnties School District #2 0% 6/15/2026 (Oregon St Guaranteed) (d) | | 40,000 | 38,072 |
| Deschutes Cnty OR Admin Sch Dist No 1 Series 2017, 5% 6/15/2026 (Oregon St Guaranteed) | | 10,000 | 10,291 |
| Deschutes Ore Pub Libr Dist Gen. Oblig. Series 2021, 3% 12/1/2041 | | 205,000 | 173,934 |
| Greater Albany Sch Dist No 8j or Series 2017, 5% 6/15/2027 (Oregon St Guaranteed) | | 15,000 | 15,730 |
| Oregon St Gen. Oblig. Series 2019 A, 4% 5/1/2037 | | 110,000 | 112,198 |
| Oregon St Gen. Oblig. Series 2021A, 4% 5/1/2038 | | 195,000 | 198,778 |
| | | | 756,536 |
| Health Care - 0.4% | | | |
| Medford OR Hosp Facs Auth Rev (Asante Health System Proj.) Series 2020 A, 4% 8/15/2050 | | 100,000 | 92,442 |
| Medford OR Hosp Facs Auth Rev (Asante Health System Proj.) Series 2020 A, 5% 8/15/2045 | | 50,000 | 51,844 |
| Oregon Hlth Sciences Univ Rev Series 2016 B, 5% 7/1/2039 | | 15,000 | 15,236 |
| Oregon Hlth Sciences Univ Rev Series 2019 A, 5% 7/1/2030 | | 100,000 | 108,121 |
| Oregon St Facs Auth Rev (Legacy Health System, or Proj.) Series 2022 A, 5% 6/1/2052 | | 230,000 | 238,601 |
| Salem OR Hosp Fac Auth Rev (Salem Health Proj.) Series 2019 A, 3% 5/15/2049 | | 45,000 | 34,844 |
| Salem OR Hosp Fac Auth Rev (Salem Health Proj.) Series 2019 A, 5% 5/15/2029 | | 100,000 | 106,746 |
| | | | 647,834 |
| Transportation - 0.1% | | | |
| Port of Portland Arpt Rev 5% 7/1/2030 (f) | | 155,000 | 165,027 |
| Tri County Met Dist Series 2018 A, 3.25% 10/1/2034 | | 50,000 | 47,826 |
| | | | 212,853 |
TOTAL OREGON | | | 1,632,251 |
| Pennsylvania - 3.3% | | | |
| Education - 0.1% | | | |
| Delaware Cnty PA College Rev (Haverford College Proj.) Series 2017 A, 5% 10/1/2042 | | 5,000 | 5,100 |
| Delaware Cnty PA College Rev (Haverford College Proj.) Series 2017 A, 5% 10/1/2046 | | 135,000 | 137,248 |
| Northampton Cnty PA Gp College (Lafayette College Proj.) Series 2017, 3.125% 11/1/2034 | | 60,000 | 55,711 |
| | | | 198,059 |
| General Obligations - 0.9% | | | |
| Allegheny County PA Gen. Oblig. Series C 77, 5% 11/1/2043 | | 25,000 | 26,031 |
| Commonwealth Financing Authority (Pennsylvania St Proj.) Series 2018, 4% 6/1/2039 (Assured Guaranty Municipal Corp Insured) | | 60,000 | 59,697 |
| Pennsylvania St Gen. Oblig. 5% 9/1/2032 | | 15,000 | 16,945 |
| Pennsylvania St Gen. Oblig. 5% 9/15/2029 | | 100,000 | 103,054 |
| Pennsylvania St Gen. Oblig. Series 2015, 4% 8/15/2034 | | 175,000 | 175,338 |
| Pennsylvania St Gen. Oblig. Series 2015, 5% 8/15/2032 | | 60,000 | 60,554 |
| Pennsylvania St Gen. Oblig. Series 2016, 3% 9/15/2036 | | 45,000 | 41,512 |
| Pennsylvania St Gen. Oblig. Series 2018, 3.75% 3/1/2039 (Assured Guaranty Municipal Corp Insured) | | 200,000 | 198,793 |
| Pennsylvania St Gen. Oblig. Series FIRST 2015, 5% 3/15/2026 | | 55,000 | 55,194 |
| Pennsylvania St Gen. Oblig. Series FIRST 2015, 5% 3/15/2029 | | 60,000 | 60,211 |
| Pennsylvania St Gen. Oblig. Series FIRST 2020, 5% 5/1/2028 | | 195,000 | 208,125 |
| Pennsylvania St Gen. Oblig. Series FIRST 2021, 2% 5/15/2039 | | 200,000 | 141,890 |
| Pennsylvania St Gen. Oblig. Series FIRST 2022, 5% 10/1/2032 | | 40,000 | 45,227 |
| Pennsylvania St Gen. Oblig. Series FIRST 2022, 5% 10/1/2038 | | 20,000 | 22,100 |
| Pennsylvania St Gen. Oblig. Series SECOND 2016, 5% 1/15/2028 | | 145,000 | 150,357 |
| Philadelphia PA Sch Dist 5% 6/1/2027 (National Public Finance Guarantee Corporation Insured) | | 50,000 | 52,155 |
| Philadelphia PA Sch Dist Series 2018 B, 4% 9/1/2043 (Assured Guaranty Municipal Corp Insured) | | 30,000 | 29,704 |
| Philadelphia PA Sch Dist Series 2019 A, 5% 9/1/2044 | | 30,000 | 31,201 |
| Philadelphia PA Sch Dist Series F, 5% 9/1/2026 | | 110,000 | 113,198 |
| State Pub Sch Bldg Auth PA Sch Rev (Harrisburg PA Sch Dist Proj.) Series 2016 A, 4% 12/1/2031 | | 110,000 | 111,782 |
| | | | 1,703,068 |
| Health Care - 0.7% | | | |
| Alleg Cnty PA Dev Auth (Allegheny Health System Proj.) Series 2018A, 4% 4/1/2038 | | 5,000 | 4,812 |
| Alleg Cnty PA Dev Auth (Allegheny Health System Proj.) Series 2018A, 5% 4/1/2027 | | 100,000 | 103,520 |
| Alleg Cnty PA Dev Auth (UPMC Proj.) Series 2019 A, 5% 7/15/2033 | | 110,000 | 117,141 |
| Geisinger Auth PA Hlth Sys Rev (Kaiser Permanente Hlth System Proj.) Series 2017 A 2, 4% 2/15/2039 | | 200,000 | 195,665 |
| Lancaster Cnty PA Hosp Aut Rev (Univ of Penn Health Systems Proj.) Series 2016 A, 5% 8/15/2042 | | 10,000 | 10,146 |
| Lehigh Cnty PA Gen Purp Auth Hosp Rev (Lehigh Valley Health Proj.) Series 2012B, 4% 7/1/2043 | | 40,000 | 37,053 |
| Montgomery Cnty PA Higher Ed & Health Auth Rev (Thomas Jefferson Univ-Abiington Proj.) Series 2019, 4% 9/1/2044 | | 90,000 | 84,492 |
| Northampton Cnty PA Gen Purp Auth Hosp Rev (St Lukes Hospital & Health Ntw Proj.) Series 2016 A, 3.125% 8/15/2035 | | 35,000 | 32,242 |
| Pennsylvania Econ Dev Fing Auth UPMC Rev (Univ of Penn Health Systems Proj.) Series 2017 A, 5% 11/15/2027 | | 40,000 | 42,085 |
| Pennsylvania Econ Dev Fing Auth UPMC Rev (UPMC Proj.) Series 2017 A, 5% 11/15/2028 | | 90,000 | 94,161 |
| Pennsylvania Econ Dev Fing Auth UPMC Rev (UPMC Proj.) Series 2020 A, 4% 4/15/2050 | | 25,000 | 23,383 |
| Pennsylvania St Higher Edl Rev (Thomas Jefferson Univ-Abiington Proj.) Series 2015A, 5.25% 9/1/2050 | | 215,000 | 215,628 |
| Pennsylvania St Higher Edl Rev (Univ of Penn Health Systems Proj.) Series 2016 C, 3% 8/15/2041 | | 120,000 | 103,633 |
| Philadelphia PA Auth For Indl Dev Hosp Rev (Childrens Hosp of Phil, PA Proj.) Series 2017, 4% 7/1/2037 | | 5,000 | 4,989 |
| Pocono Mtns PA Indl Pk Auth Hosp Rev (St Lukes Hospital & Health Ntw Proj.) Series 2015A, 4% 8/15/2045 | | 105,000 | 98,187 |
| | | | 1,167,137 |
| Housing - 0.3% | | | |
| Pennsylvania Hsg Fin Agy Single Family Mtg (PA Single Family Mortgage Proj.) Series 124A, 4% 10/1/2038 (f) | | 60,000 | 59,930 |
| Pennsylvania Hsg Fin Agy Single Family Mtg (PA Single Family Mortgage Proj.) Series 2017 125 B, 3.65% 10/1/2042 | | 80,000 | 71,319 |
| Pennsylvania Hsg Fin Agy Single Family Mtg (PA Single Family Mortgage Proj.) Series B, 3.45% 10/1/2032 | | 5,000 | 4,892 |
| Pennsylvania Hsg Fin Agy Single Family Mtg Rev (PA Single Family Mortgage Proj.) Series 2019 129, 3.15% 10/1/2039 | | 195,000 | 168,723 |
| Pennsylvania Hsg Fin Agy Single Family Mtg Rev (PA Single Family Mortgage Proj.) Series 2021 136, 2.07% 10/1/2036 | | 200,000 | 155,116 |
| Pennsylvania Hsg Fin Agy Single Family Mtg Rev Series 2024 144A, 4.05% 10/1/2039 | | 35,000 | 34,465 |
| | | | 494,445 |
| Other - 0.1% | | | |
| Chester Cnty PA Indl Dev Auth (Longwood Gardens Proj.) Series 2021, 4% 12/1/2046 | | 165,000 | 156,964 |
| Special Tax - 0.1% | | | |
| Pennsylvania Economic Development Fing Parking System Rev Series 2024 B, 4.25% 1/1/2050 | | 230,000 | 223,662 |
| Transportation - 1.0% | | | |
| Allegheny County Airport Authority (Pittsburgh Intl Airport Proj.) Series 2021 A, 5% 1/1/2051 (f) | | 465,000 | 475,202 |
| Delaware Riv Port Auth PA & NJ Series 2018 A, 5% 1/1/2032 | | 30,000 | 32,013 |
| Pennslyvania Dev Fing Auth Rev (Plenary Walsh Keystone Partners LLC Proj.) Series 2015, 4.125% 12/31/2038 (f) | | 25,000 | 24,044 |
| Pennslyvania Dev Fing Auth Rev (Plenary Walsh Keystone Partners LLC Proj.) Series 2015, 5% 12/31/2028 (f) | | 160,000 | 162,486 |
| Pennsylvania Turnpike Commission 5% 12/1/2030 | | 40,000 | 41,908 |
| Pennsylvania Turnpike Commission 5% 12/1/2030 | | 25,000 | 27,657 |
| Pennsylvania Turnpike Commission 5% 12/1/2031 | | 30,000 | 33,570 |
| Pennsylvania Turnpike Commission Series 2014 A 2, 5.125% 12/1/2039 (c) | | 5,000 | 5,322 |
| Pennsylvania Turnpike Commission Series 2016, 5% 6/1/2027 | | 160,000 | 163,659 |
| Pennsylvania Turnpike Commission Series 2017, 5% 12/1/2040 | | 50,000 | 51,855 |
| Pennsylvania Turnpike Commission Series 2019 A, 5% 12/1/2035 | | 35,000 | 37,604 |
| Pennsylvania Turnpike Commission Series 2019 A, 5% 12/1/2049 | | 200,000 | 209,006 |
| Pennsylvania Turnpike Commission Series 2019, 5% 12/1/2032 | | 30,000 | 32,032 |
| Pennsylvania Turnpike Commission Series 2021 A, 4% 12/1/2045 | | 180,000 | 173,734 |
| Pennsylvania Turnpike Commission Series A 1, 4% 12/1/2041 | | 60,000 | 60,001 |
| Pennsylvania Turnpike Commission Series B 1, 5.25% 6/1/2047 | | 55,000 | 56,459 |
| Pennsylvania Turnpike Commission Series B 2, 0% 12/1/2037 (c) | | 100,000 | 95,632 |
| Pennsylvania Turnpike Commission Series B 2, 0% 12/1/2041 (c) | | 40,000 | 37,629 |
| Philadelphia PA Airport Rev Series 2021, 5% 7/1/2031 (f) | | 100,000 | 107,558 |
| | | | 1,827,371 |
| Water & Sewer - 0.1% | | | |
| Allegheny Cnty PA San Auth Swr Series 2020 B, 4% 6/1/2050 | | 185,000 | 178,621 |
| Pittsburgh PA Wtr & Swr Auth 0% 9/1/2028 (Financial Guaranty Ins CO Insured) (d) | | 20,000 | 17,542 |
| | | | 196,163 |
TOTAL PENNSYLVANIA | | | 5,966,869 |
| Rhode Island - 0.3% | | | |
| Education - 0.2% | | | |
| Rhode Island Health & Edl Bldg Corp Higher Ed Fac Rev (Brown University Proj.) Series 2022A, 5% 9/1/2033 | | 260,000 | 294,190 |
| General Obligations - 0.1% | | | |
| Rhode Island & Providence Plantations (Rhode Island St Proj.) Gen. Oblig. Series 2019C, 3% 1/15/2036 | | 30,000 | 27,599 |
| Rhode Island & Providence Plantations (Rhode Island St Proj.) Gen. Oblig. Series 2019C, 4% 1/15/2033 | | 200,000 | 205,297 |
| | | | 232,896 |
| Health Care - 0.0% | | | |
| Rhode Island Health & Edl Bldg Corp Rev (Lifespan Corp Obligated Group Proj.) Series 2016, 5% 5/15/2031 | | 50,000 | 50,732 |
TOTAL RHODE ISLAND | | | 577,818 |
| South Carolina - 0.9% | | | |
| Electric Utilities - 0.4% | | | |
| South Carolina St Svc Auth Rev 3% 12/1/2041 | | 30,000 | 23,891 |
| South Carolina St Svc Auth Rev 4% 12/1/2037 | | 265,000 | 263,379 |
| South Carolina St Svc Auth Rev Series 2014C, 5% 12/1/2029 | | 40,000 | 40,024 |
| South Carolina St Svc Auth Rev Series 2016 A, 3.25% 12/1/2035 | | 55,000 | 49,999 |
| South Carolina St Svc Auth Rev Series 2016 A, 5% 12/1/2027 | | 50,000 | 51,113 |
| South Carolina St Svc Auth Rev Series 2021B, 4% 12/1/2047 | | 45,000 | 42,086 |
| South Carolina St Svc Auth Rev Series 2022 A, 5% 12/1/2044 | | 125,000 | 132,241 |
| South Carolina St Svc Auth Rev Series B, 5% 12/1/2033 | | 55,000 | 56,319 |
| | | | 659,052 |
| Health Care - 0.3% | | | |
| South Carolina Jobs-Economic Dev Auth Health Care Facs Rev (Novant Health Inc Proj.) Series 2024 A, 5.5% 11/1/2050 | | 200,000 | 220,200 |
| South Carolina Jobs-Economic Dev Auth Hosp Rev (Anmed Health Proj.) Series 2023, 4% 2/1/2043 | | 200,000 | 196,834 |
| South Carolina Jobs-Economic Development Authority (Carealliance Health Svcs Proj.) Series 2016 A, 3% 8/15/2038 | | 40,000 | 31,262 |
| | | | 448,296 |
| Special Tax - 0.0% | | | |
| South Carolina Trans Infrastructure Bank Rev Series 2017 A, 5% 10/1/2038 | | 85,000 | 88,141 |
| Transportation - 0.0% | | | |
| South Carolina St Ports Auth Series 2019 A, 5% 7/1/2054 | | 115,000 | 117,125 |
| Water & Sewer - 0.2% | | | |
| Charleston SC Wtrwks & Swr Series 2022, 5% 1/1/2042 | | 150,000 | 163,901 |
| Charleston SC Wtrwks & Swr Series 2022, 5% 1/1/2047 | | 130,000 | 139,797 |
| | | | 303,698 |
TOTAL SOUTH CAROLINA | | | 1,616,312 |
| Tennessee - 1.0% | | | |
| Education - 0.0% | | | |
| Metropolitan Government Nashville & Davidson County Health & Educational Facs Bd (Belmont University Proj.) Series 2021, 4% 5/1/2051 | | 30,000 | 27,107 |
| General Obligations - 0.7% | | | |
| Memphis-Shelby County Industrial Development Board (Memphis TN Proj.) Series 2017B, 5% 11/1/2030 | | 80,000 | 82,317 |
| Metropolitan Govt Nashville & Davidson Cnty TN Gen. Oblig. 5% 1/1/2029 | | 225,000 | 242,816 |
| New Memphis Arena Bldg Auth Memphis & Sheby Cnty Tenn (Memphis TN Proj.) Gen. Oblig. Series 2021, 0% 4/1/2037 (d) | | 500,000 | 286,067 |
| Tennessee Engy Acq Crp Gas Rev 5% 2/1/2027 (Goldman Sachs Group Inc/The Guaranteed) | | 15,000 | 15,185 |
| Tennessee Engy Acq Crp Gas Rev 5.25% 9/1/2026 (Goldman Sachs Group Inc/The Guaranteed) | | 30,000 | 30,425 |
| Tennessee Engy Acq Crp Gas Rev Series 2018, 4% tender 11/1/2049 (Goldman Sachs Group Inc/The Guaranteed) (b) | | 30,000 | 30,076 |
| Tennessee St Gen. Oblig. Series 2021 A, 5% 11/1/2031 | | 290,000 | 327,607 |
| Tennessee St Gen. Oblig. Series A, 5% 8/1/2035 | | 50,000 | 51,385 |
| Tennessee St Sch Bd Auth (Tennessee St Proj.) Series 2017A, 5% 11/1/2042 | | 105,000 | 107,920 |
| | | | 1,173,798 |
| Health Care - 0.2% | | | |
| Chatanooga TN Health Ed & Hsg Fac Brd Rev (CommonSpirit Health Proj.) Series 2019A 1, 3% 8/1/2039 | | 20,000 | 16,364 |
| Chatanooga TN Health Ed & Hsg Fac Brd Rev (CommonSpirit Health Proj.) Series 2019A 1, 3.25% 8/1/2044 | | 30,000 | 24,575 |
| Chatanooga TN Health Ed & Hsg Fac Brd Rev (CommonSpirit Health Proj.) Series 2019A 1, 4% 8/1/2038 | | 100,000 | 97,843 |
| Knox Cnty Tenn Health Edl & Hsg Fac Brd Hosp Rev (Covenant Health TN Proj.) Series 2016 A, 4% 1/1/2042 | | 10,000 | 9,663 |
| Knox Cnty Tenn Health Edl & Hsg Fac Brd Hosp Rev (East Tenn Children's Hospital Proj.) Series 2019, 4% 11/15/2043 | | 55,000 | 51,917 |
| Metro Gov Nashville & Davidson Cnty Tenn Hlth & Edl Facs Brd Rev (Vanderbilt Hospital, TN Proj.) Series 2016 A, 5% 7/1/2040 | | 70,000 | 70,954 |
| | | | 271,316 |
| Housing - 0.0% | | | |
| Tennessee Housing Development Agency Series 2018 1, 3.85% 7/1/2038 | | 45,000 | 43,884 |
| Tennessee Housing Development Agency Series 2018 3, 3.75% 7/1/2038 | | 30,000 | 28,687 |
| Tennessee Housing Development Agency Series 2020 1A, 2.4% 1/1/2044 | | 15,000 | 10,783 |
| Tennessee Housing Development Agency Series 2B, 3.875% 7/1/2035 | | 5,000 | 4,916 |
| | | | 88,270 |
| Transportation - 0.1% | | | |
| Metro Nashville Arpt Auth Rev Series 2019A, 4% 7/1/2049 | | 55,000 | 52,649 |
| Metro Nashville Arpt Auth Rev Series 2019A, 4% 7/1/2054 | | 35,000 | 33,360 |
| Metro Nashville Arpt Auth Rev Series 2019A, 5% 7/1/2044 | | 65,000 | 68,193 |
| | | | 154,202 |
TOTAL TENNESSEE | | | 1,714,693 |
| Texas - 8.2% | | | |
| Education - 0.6% | | | |
| Arlington Higher Education Finance Corp Series 2019 A, 3% 8/15/2054 (Permanent Sch Fund of Texas Guaranteed) | | 60,000 | 44,140 |
| Arlington Higher Education Finance Corp Series 2021 A, 3% 2/15/2046 (Permanent Sch Fund of Texas Guaranteed) | | 210,000 | 166,969 |
| Board of Regents of the University of Texas System Series 2016 J, 5% 8/15/2026 | | 105,000 | 108,353 |
| Board of Regents of the University of Texas System Series 2017 B, 3.375% 8/15/2044 | | 40,000 | 34,897 |
| Board of Regents of the University of Texas System Series 2019 A, 5% 8/15/2031 | | 85,000 | 91,941 |
| Board of Regents of the University of Texas System Series 2020 A, 3.5% 8/15/2050 | | 35,000 | 29,724 |
| Board of Regents of the University of Texas System Series 2024B, 5% 8/15/2035 | | 255,000 | 295,237 |
| Clifton Higher Education Finance Corp (IDEA Public Schools Proj.) Series 2021 T, 4% 8/15/2047 | | 25,000 | 24,056 |
| El Paso Cnty Tex Cmnty College Dist Rev Series 2016, 5% 4/1/2038 (Assured Guaranty Municipal Corp Insured) | | 70,000 | 71,067 |
| Waco Texas Educat Fin Corp Rev (Baylor University Proj.) 4% 3/1/2046 | | 205,000 | 197,699 |
| | | | 1,064,083 |
| Electric Utilities - 0.6% | | | |
| Lower Colorado River Authority (Lcra Transmission Services Corp Proj.) 5% 5/15/2034 | | 90,000 | 95,654 |
| Lower Colorado River Authority (Lcra Transmission Services Corp Proj.) Series 2016, 4% 5/15/2035 | | 265,000 | 265,204 |
| Matagorda Cnty TX Nav Dist No1 (AEP Texas Central Co Proj.) 4.4% 5/1/2030 (Ambac Assurance Corp Insured) | | 20,000 | 20,709 |
| San Antonio TX Elec & Gas Rev 4% 2/1/2043 | | 35,000 | 34,137 |
| San Antonio TX Elec & Gas Rev Series 2015, 5% 2/1/2027 | | 40,000 | 40,809 |
| San Antonio TX Elec & Gas Rev Series 2015, 5% 2/1/2032 | | 5,000 | 5,087 |
| San Antonio TX Elec & Gas Rev Series 2017, 5% 2/1/2029 | | 60,000 | 62,294 |
| San Antonio TX Elec & Gas Rev Series 2019, 4% 2/1/2028 | | 10,000 | 10,264 |
| San Antonio TX Elec & Gas Rev Series 2019, 5% 2/1/2035 | | 140,000 | 150,148 |
| San Antonio TX Elec & Gas Rev Series 2023 C, 5% 2/1/2042 | | 15,000 | 16,322 |
| San Antonio TX Elec & Gas Rev Series 2023A, 5% 2/1/2032 | | 140,000 | 156,181 |
| San Antonio TX Elec & Gas Rev Series 2024D, 5% 2/1/2036 | | 240,000 | 272,394 |
| | | | 1,129,203 |
| Escrowed/Pre-Refunded - 0.0% | | | |
| Leander Independent School District Series 2016 A, 0% 8/16/2044 (Pre-refunded to 8/16/2026 at 48.51) (d) | | 5,000 | 2,299 |
| Midland County Fresh Water Supply District No 1 Series 2012 A, 0% 9/15/2035 (Pre-refunded to 9/15/2027 at 68.05) (d) | | 5,000 | 3,092 |
| | | | 5,391 |
| General Obligations - 3.7% | | | |
| Aldine TX Indpt Sch Dist Series 2017 A, 5% 2/15/2030 (Permanent Sch Fund of Texas Guaranteed) | | 50,000 | 51,908 |
| Aldine TX Indpt Sch Dist Series 2024, 5% 2/15/2035 (Permanent Sch Fund of Texas Guaranteed) | | 175,000 | 199,678 |
| Alvin Tex Indpt Sch Dist Series 2019, 3.375% 2/15/2040 (Permanent Sch Fund of Texas Guaranteed) | | 120,000 | 109,774 |
| Austin TX Indpt Sch Dist 5% 8/1/2041 | | 220,000 | 237,445 |
| Austin TX Indpt Sch Dist Series 2017, 4% 8/1/2033 (Permanent Sch Fund of Texas Guaranteed) | | 20,000 | 20,142 |
| Austin TX Indpt Sch Dist Series 2019, 4% 8/1/2035 (Permanent Sch Fund of Texas Guaranteed) | | 25,000 | 25,411 |
| Bexar Cnty TX Hosp Dist Gen. Oblig. Series 2020, 3% 2/15/2036 | | 55,000 | 50,054 |
| Cleveland TX Indpt Sch Dist Series 2020 A, 4% 2/15/2052 (Permanent Sch Fund of Texas Guaranteed) | | 150,000 | 141,667 |
| College of the Mainland Gen. Oblig. Series 2019, 3.75% 8/15/2049 | | 20,000 | 18,112 |
| Collin Cnty TX Cmnty Coll Dist Gen. Oblig. Series 2018, 3.25% 8/15/2033 | | 10,000 | 9,572 |
| Conroe TX Isd Series 2020 A, 2.25% 2/15/2046 (Permanent Sch Fund of Texas Guaranteed) | | 115,000 | 75,455 |
| Cypress-Fairbanks TX Isd Series 2019, 5% 2/15/2030 (Permanent Sch Fund of Texas Guaranteed) | | 45,000 | 48,615 |
| Cypress-Fairbanks TX Isd Series 2020A, 3% 2/15/2035 (Permanent Sch Fund of Texas Guaranteed) | | 120,000 | 109,434 |
| Cypress-Fairbanks TX Isd Series 2023, 4% 2/15/2048 (Permanent Sch Fund of Texas Guaranteed) | | 415,000 | 399,877 |
| Dallas TX Gen. Oblig. Series 2013 A, 4% 2/15/2032 | | 105,000 | 109,465 |
| Dallas TX Isd Series 2019 B, 4% 2/15/2032 (Permanent Sch Fund of Texas Guaranteed) | | 160,000 | 164,772 |
| Eagle Mtn & Saginaw TX Isd Series 2019, 4% 8/15/2050 (Permanent Sch Fund of Texas Guaranteed) | | 105,000 | 99,584 |
| Eagle Mtn & Saginaw TX Isd Series 2021, 3% 8/15/2040 (Permanent Sch Fund of Texas Guaranteed) | | 150,000 | 126,779 |
| Fort Bend TX Indpt Sch Dist Series 2021A, 2.3% 8/15/2046 (Permanent Sch Fund of Texas Guaranteed) | | 150,000 | 98,416 |
| Fort Worth Tex Indpt Sch Dist Series 2016, 4% 2/15/2039 (Permanent Sch Fund of Texas Guaranteed) | | 130,000 | 128,680 |
| Frisco Tex Indpt Sch Dis Series 2012 B, 3% 8/15/2042 (Permanent Sch Fund of Texas Guaranteed) | | 200,000 | 164,185 |
| Frisco Tex Indpt Sch Dis Series 2017, 4% 8/15/2035 (Permanent Sch Fund of Texas Guaranteed) | | 110,000 | 110,559 |
| Harris Cnty TX Flood Ctl Dist (Harris Cnty TX Proj.) Gen. Oblig. Series 2017 A, 4% 10/1/2038 | | 75,000 | 75,256 |
| Harris Cnty TX Flood Ctl Dist (Harris Cnty TX Proj.) Gen. Oblig. Series 2021 A, 4% 10/1/2033 | | 150,000 | 154,620 |
| Harris Cnty TX Flood Ctl Dist (Harris Cnty TX Proj.) Gen. Oblig. Series 2021 A, 4% 10/1/2046 | | 100,000 | 97,438 |
| Harris Cnty TX Series 2016 A, 5% 8/15/2033 | | 15,000 | 15,369 |
| Houston TX Gen. Oblig. Series 2017 A, 4% 3/1/2037 | | 270,000 | 270,645 |
| Houston TX Indpt Sch Dist Series 2017, 5% 2/15/2027 (Permanent Sch Fund of Texas Guaranteed) | | 50,000 | 52,152 |
| Houston TX Indpt Sch Dist Series 2018, 5% 7/15/2027 | | 55,000 | 57,710 |
| Humble TX Indpt Sch Dist Series 2020 A, 2% 2/15/2042 (Permanent Sch Fund of Texas Guaranteed) | | 25,000 | 16,779 |
| Katy TX Ind Sch Dist Series 2022, 4% 2/15/2041 (Permanent Sch Fund of Texas Guaranteed) | | 350,000 | 350,709 |
| Klein TX Indpt Sch Dist Series 2017, 4% 8/1/2046 | | 215,000 | 207,470 |
| Lamar TX Isd Series 2023 A, 5% 2/15/2053 (Permanent Sch Fund of Texas Guaranteed) | | 200,000 | 211,903 |
| Leander Independent School District Series 2016 A, 0% 8/16/2044 (Permanent Sch Fund of Texas Guaranteed) (d) | | 10,000 | 4,038 |
| Northside TX Indpt Sch Dist Series 2016, 4% 6/15/2035 (Permanent Sch Fund of Texas Guaranteed) | | 400,000 | 400,661 |
| Northside TX Indpt Sch Dist Series 2019, 4% 8/15/2049 (Permanent Sch Fund of Texas Guaranteed) | | 125,000 | 118,897 |
| Northside TX Indpt Sch Dist Series 2019A, 4% 8/15/2036 (Permanent Sch Fund of Texas Guaranteed) | | 120,000 | 121,326 |
| Northwest Tex Indpt Sch Dist Series 2024 A, 5% 2/15/2034 (Permanent Sch Fund of Texas Guaranteed) | | 205,000 | 230,525 |
| Prosper Tex Indpt Sch Dist Series 2023, 4% 2/15/2053 | | 20,000 | 19,001 |
| San Antonio TX Indpt Sch Dist Series 2019, 5% 8/15/2030 (Permanent Sch Fund of Texas Guaranteed) | | 50,000 | 53,368 |
| San Jacinto TX Cmnty College Dist Gen. Oblig. Series 2019A, 5% 2/15/2044 | | 175,000 | 180,705 |
| Socorro TX Indpt Sch Dist Series 2019, 5% 8/15/2038 (Permanent Sch Fund of Texas Guaranteed) | | 50,000 | 52,570 |
| Tarrant Cnty Tex College Dist Gen. Oblig. Series 2020, 5% 8/15/2030 | | 130,000 | 143,135 |
| Texas City Tex Indpt Sch Dist Series 2023, 4% 8/15/2048 | | 25,000 | 23,841 |
| Texas Mun Gas Acquisition & Supply Corp IV Gas Supply Rev Series 2023A, 5.5% tender 1/1/2054 (BP PLC Guaranteed) (b) | | 200,000 | 212,903 |
| Texas State Gen. Oblig. Series 2015 A, 5% 10/1/2026 | | 100,000 | 101,380 |
| Texas State Gen. Oblig. Series 2016 A, 5% 4/1/2030 | | 50,000 | 51,109 |
| Texas State Gen. Oblig. Series A, 5% 10/1/2033 | | 50,000 | 52,106 |
| Texas State Gen. Oblig. Series B, 5% 10/1/2029 | | 100,000 | 104,719 |
| Texas State Gen. Oblig. Series B, 5% 10/1/2033 | | 25,000 | 26,053 |
| Waller TX Indpt Sch Dist Series 2020, 4% 2/15/2050 (Permanent Sch Fund of Texas Guaranteed) | | 100,000 | 94,731 |
| Williamson Cnty TX (Williamson Cnty Tex Proj.) Gen. Oblig. Series 2022, 4% 2/15/2042 | | 395,000 | 394,739 |
| | | | 6,395,442 |
| Health Care - 0.2% | | | |
| Harris Cnty TX Cultural Ed Facs Fin Corp Rev (Memorial Hermann Hosp System Proj.) Series 2016 A, 3.125% 7/1/2038 | | 210,000 | 187,416 |
| Harris Cnty TX Cultural Ed Facs Fin Corp Rev (Methodist Healthcare Sys, TX Proj.) Series 2015, 4% 12/1/2045 | | 75,000 | 70,814 |
| Tarrant Cnty TX Cultural Ed Facs Fin Corp Hosp Rev (Baylor Scott & White Health Proj.) Series 2016 A, 4% 11/15/2036 | | 140,000 | 140,032 |
| | | | 398,262 |
| Housing - 0.1% | | | |
| Texas Dept Hsg & Cmnty Affrs Res Mtg Rev (TX Residential Mortgage Proj.) Series 2023B, 4.8% 7/1/2043 | | 200,000 | 202,770 |
| Texas St Dept Hsg & Cmnty Sfr (TX Single Family Mortgage Proj.) 3% 3/1/2050 | | 30,000 | 21,973 |
| | | | 224,743 |
| Lease Revenue - 0.0% | | | |
| Austin Tex Convention Enterprises Inc Convention Center Series A, 5% 1/1/2025 | | 80,000 | 80,000 |
| Special Tax - 0.4% | | | |
| Dallas TX Rapid Transit Sales Tax Rev Series 2016 B, 4% 12/1/2036 | | 200,000 | 200,420 |
| Dallas TX Rapid Transit Sales Tax Rev Series 2016 B, 4% 12/1/2038 | | 350,000 | 350,029 |
| Denton TX Gen. Oblig. Series 2017, 4% 2/15/2047 | | 50,000 | 46,510 |
| Harris Cnty Houston Tex Sports Auth Rev Series A, 0% 11/15/2048 (Assured Guaranty Municipal Corp Insured) (d) | | 10,000 | 3,057 |
| Harris Cnty Houston Tex Sports Auth Rev Series A, 0% 11/15/2049 (Assured Guaranty Municipal Corp Insured) (d) | | 25,000 | 7,244 |
| Hidalgo Cnty Tex Regl Mobility Auth Toll & Veh Reg Fee Rev Series 2022 A, 4% 12/1/2041 | | 80,000 | 75,296 |
| Houston TX Hotel Occ Tx & Spl Rev 0% 9/1/2033 (Ambac Assurance Corp Insured) (d) | | 80,000 | 55,878 |
| | | | 738,434 |
| Transportation - 1.5% | | | |
| Central TX Regl Mobility Auth Rev Series 2016, 3.375% 1/1/2041 | | 20,000 | 17,478 |
| City of Houston TX Airport System Revenue 4% 7/1/2040 (f) | | 175,000 | 169,489 |
| City of Houston TX Airport System Revenue Series 2018D, 5% 7/1/2038 | | 55,000 | 57,342 |
| City of Houston TX Airport System Revenue Series 2023A, 5% 7/1/2035 (Assured Guaranty Municipal Corp Insured) (f) | | 345,000 | 371,639 |
| Dallas Fort Worth International Airport Series 2020 A, 5% 11/1/2030 | | 55,000 | 60,648 |
| Dallas Fort Worth International Airport Series 2020 B, 5% 11/1/2033 | | 35,000 | 38,104 |
| Dallas Fort Worth International Airport Series 2021 A, 3% 11/1/2040 | | 315,000 | 264,779 |
| Dallas Fort Worth International Airport Series 2022B, 4% 11/1/2045 | | 20,000 | 19,599 |
| Grand Parkway Transportation Corp (Grand Parkway Trans Corp Tela Proj.) Series 2013 B, 5.3% 10/1/2032 (c) | | 40,000 | 43,056 |
| Grand Parkway Transportation Corp (Grand Parkway Trans Corp Tela Proj.) Series 2013 B, 5.8% 10/1/2046 (c) | | 40,000 | 42,748 |
| Grand Parkway Transportation Corp (Grand Parkway Trans Corp Tela Proj.) Series 2013 B, 5.85% 10/1/2048 (c) | | 30,000 | 32,063 |
| Grand Parkway Transportation Corp (Grand Parkway Trans Corp Tela Proj.) Series 2018 A, 5% 10/1/2037 | | 40,000 | 41,858 |
| Harris Cnty Tex Toll Rd Rev (Harris County Toll Road Auth Proj.) Series 2018 A, 4% 8/15/2048 | | 40,000 | 38,011 |
| Harris Cnty Tex Toll Rd Rev (Harris County Toll Road Auth Proj.) Series 2019 A, 3% 8/15/2044 | | 120,000 | 96,322 |
| Harris Cnty TX (Harris County Toll Road Auth Proj.) Series 2015 B, 5% 8/15/2028 | | 100,000 | 101,004 |
| Harris Cnty TX (Harris County Toll Road Auth Proj.) Series 2016 A, 5% 8/15/2035 | | 140,000 | 143,109 |
| North East Texas Regional Mobility Authority Series B, 5% 1/1/2041 | | 60,000 | 60,389 |
| North TX Twy Auth Rev 0% 1/1/2030 (Assured Guaranty Inc Insured) (d) | | 35,000 | 29,250 |
| North TX Twy Auth Rev 0% 1/1/2035 (Assured Guaranty Inc Insured) (d) | | 5,000 | 3,407 |
| North TX Twy Auth Rev 0% 1/1/2036 (Assured Guaranty Inc Insured) (d) | | 65,000 | 42,366 |
| North TX Twy Auth Rev 5% 1/1/2031 | | 100,000 | 110,113 |
| North TX Twy Auth Rev Series 2015A, 5% 1/1/2027 | | 100,000 | 100,000 |
| North TX Twy Auth Rev Series 2018, 4.25% 1/1/2049 | | 55,000 | 52,865 |
| North TX Twy Auth Rev Series 2018, 5% 1/1/2048 | | 20,000 | 20,365 |
| North TX Twy Auth Rev Series B, 4% 1/1/2036 (Assured Guaranty Municipal Corp Insured) | | 185,000 | 185,166 |
| Port of Houston Auth 4% 10/1/2039 | | 85,000 | 85,253 |
| Texas Private Activity Bd Surface Transn Corp Rev (Lbj Infrastructure Group LLC Proj.) 4% 6/30/2037 | | 40,000 | 39,318 |
| Texas Private Activity Bd Surface Transn Corp Rev (Lbj Infrastructure Group LLC Proj.) 4% 6/30/2040 | | 100,000 | 96,741 |
| Texas Private Activity Bd Surface Transn Corp Rev (Nte Mobility Partners Segments 3 LLC Proj.) Series 2019, 5% 6/30/2058 (f) | | 170,000 | 172,400 |
| Texas Private Activity Bd Surface Transn Corp Rev Series 2019 A, 5% 12/31/2032 | | 75,000 | 79,480 |
| Texas St Tpk Auth Cent TX Tpk Sys Rev (Central Texas Turnpike Proj.) 0% 8/15/2029 (Ambac Assurance Corp Insured) (d) | | 35,000 | 29,483 |
| | | | 2,643,845 |
| Water & Sewer - 1.1% | | | |
| Houston TX Util Sys Rev 3% 11/15/2047 | | 50,000 | 38,757 |
| Houston TX Util Sys Rev 4% 11/15/2049 | | 25,000 | 23,775 |
| Houston TX Util Sys Rev Series 2017 B, 5% 11/15/2029 | | 45,000 | 47,201 |
| Houston TX Util Sys Rev Series 2019B, 4% 11/15/2044 | | 55,000 | 53,294 |
| Houston TX Util Sys Rev Series 2024 A, 5% 11/15/2036 | | 20,000 | 22,509 |
| San Antonio TX Wtr Rev Series 2021 A, 4% 5/15/2051 | | 300,000 | 284,950 |
| Texas Wtr Dev Brd 3% 10/15/2034 | | 130,000 | 122,889 |
| Texas Wtr Dev Brd 3% 10/15/2040 | | 100,000 | 86,044 |
| Texas Wtr Dev Brd 5% 8/1/2033 | | 15,000 | 16,411 |
| Texas Wtr Dev Brd Series 2017 A, 5% 10/15/2047 | | 60,000 | 61,361 |
| Texas Wtr Dev Brd Series 2018, 5% 8/1/2032 | | 130,000 | 135,417 |
| Texas Wtr Dev Brd Series 2018A, 4% 10/15/2032 | | 50,000 | 50,725 |
| Texas Wtr Dev Brd Series 2018A, 4% 10/15/2037 | | 40,000 | 40,133 |
| Texas Wtr Dev Brd Series 2019 A, 3% 10/15/2039 | | 125,000 | 107,811 |
| Texas Wtr Dev Brd Series 2019 A, 4% 10/15/2049 | | 355,000 | 336,324 |
| Texas Wtr Dev Brd Series 2021, 5% 10/15/2033 | | 170,000 | 188,769 |
| Texas Wtr Dev Brd Series 2021, 5% 8/1/2026 | | 125,000 | 128,915 |
| Trinity River Auth TX Regl Wastewtr Sys Rev Series 2017, 5% 8/1/2033 | | 115,000 | 119,509 |
| West Harris Cnty TX Regl Wtr Series 2021, 3% 12/15/2051 | | 25,000 | 18,638 |
| | | | 1,883,432 |
TOTAL TEXAS | | | 14,562,835 |
| Utah - 0.8% | | | |
| Education - 0.2% | | | |
| University UT Univ Revs (University UT Univ Revs Proj.) Series 2021 A 1, 4% 8/1/2041 | | 145,000 | 145,902 |
| University UT Univ Revs Series 2017 A, 5% 8/1/2029 | | 45,000 | 47,185 |
| University UT Univ Revs Series 2017 B1, 5% 8/1/2026 | | 200,000 | 206,511 |
| | | | 399,598 |
| Electric Utilities - 0.1% | | | |
| Intermountain Pwr Agy UT Pwr Series 2023 A, 5% 7/1/2033 | | 145,000 | 163,123 |
| Escrowed/Pre-Refunded - 0.1% | | | |
| Utah Tran Auth Sales Tax Rev Series 2015 A, 5% 6/15/2026 (Pre-refunded to 6/15/2025 at 100) | | 15,000 | 15,130 |
| Utah Tran Auth Sales Tax Rev Series 2015 A, 5% 6/15/2029 (Pre-refunded to 6/15/2025 at 100) | | 15,000 | 15,129 |
| Utah Tran Auth Sales Tax Rev Series 2015 A, 5% 6/15/2037 (Pre-refunded to 6/15/2025 at 100) | | 155,000 | 156,341 |
| | | | 186,600 |
| Health Care - 0.0% | | | |
| Utah Cnty Utah Hosp Rev (IHC Health Services Inc Proj.) Series 2016B, 5% 5/15/2046 | | 35,000 | 35,366 |
| Special Tax - 0.0% | | | |
| Utah Tran Auth Sales Tax Rev 4% 12/15/2029 | | 25,000 | 25,220 |
| Transportation - 0.4% | | | |
| Salt Lake City UT Arpt Rev Series 2017A, 5% 7/1/2029 (f) | | 525,000 | 539,928 |
TOTAL UTAH | | | 1,349,835 |
| Virginia - 2.4% | | | |
| Education - 0.2% | | | |
| University VA Univ Revs Series 2017 A, 5% 4/1/2042 | | 225,000 | 232,496 |
| Virginia College Bldg Auth VA Edl Facs Rev Pub Higher Ed Fing Prog (Virginia College Bldg Auth Edl Proj.) Series 2016 A, 3% 9/1/2026 | | 55,000 | 54,733 |
| Virginia Small Business Fing Auth Rev (Hampton Univ, VA Proj.) Series 2014, 4% 10/1/2038 | | 35,000 | 33,765 |
| | | | 320,994 |
| Escrowed/Pre-Refunded - 0.5% | | | |
| Fairfax Cnty VA Economic Dev Auth Transn Contract Rev Series A, 3% 4/1/2036 (Pre-refunded to 4/1/2026 at 100) | | 25,000 | 24,975 |
| Henrico Cnty VA Wtr & Swr Rev Series 2016, 5% 5/1/2046 (Pre-refunded to 5/1/2026 at 100) | | 170,000 | 174,410 |
| Loudoun Cnty VA Santn Auth Wtr & Swr Rev Series 2015 A, 4% 1/1/2042 | | 745,000 | 745,000 |
| Virginia Port Auth Port Fac Rev Series 2015A, 5% 7/1/2033 (Pre-refunded to 7/1/2025 at 100) (f) | | 5,000 | 5,035 |
| | | | 949,420 |
| General Obligations - 1.1% | | | |
| Alexandria VA Gen. Oblig. Series 2023, 5% 12/15/2031 | | 170,000 | 192,129 |
| Arlington Cnty VA Gen. Oblig. Series 2019, 4% 6/15/2035 | | 5,000 | 5,116 |
| Chesterfield Cnty VA Economic Dev Auth Rev (Chesterfield Cnty VA Proj.) 4% 4/1/2050 | | 80,000 | 77,608 |
| Chesterfield Cnty VA Economic Dev Auth Rev (Chesterfield Cnty VA Proj.) Series 2020F, 2% 4/1/2041 | | 100,000 | 69,849 |
| County of Loudoun VA Gen. Oblig. Series 2022A, 4% 12/1/2041 | | 145,000 | 146,727 |
| Fairfax Cnty VA 4% 10/1/2031 | | 465,000 | 493,764 |
| Norfolk VA Gen. Oblig. Series 2021 A, 4% 3/1/2040 | | 170,000 | 173,027 |
| Virginia College Bldg Auth Edl (Virginia St Proj.) Series 2019 C, 5% 2/1/2030 | | 15,000 | 16,130 |
| Virginia College Bldg Auth Edl (Virginia St Proj.) Series 2019A, 5% 2/1/2029 | | 75,000 | 80,951 |
| Virginia College Bldg Auth Edl (Virginia St Proj.) Series 2021 A, 3% 2/1/2036 | | 55,000 | 50,078 |
| Virginia College Bldg Auth Edl (Virginia St Proj.) Series 2021 A, 5% 2/1/2030 | | 160,000 | 175,226 |
| Virginia College Bldg Auth Edl (Virginia St Proj.) Series 2023 A, 5% 2/1/2030 | | 235,000 | 257,364 |
| Virginia Comwlth Transn Brd Tr (Virginia St Proj.) Series 2016, 3% 5/15/2040 | | 105,000 | 91,207 |
| Virginia Comwlth Transn Brd Tr Series 2022, 4% 5/15/2047 | | 50,000 | 49,501 |
| | | | 1,878,677 |
| Health Care - 0.3% | | | |
| Lynchburg Economic Development Authority (Centra Health Proj.) Series 2017 A, 4% 1/1/2047 | | 90,000 | 85,467 |
| Roanoke VA Economic Dev Auth Hosp Rev (Carilion Health System Proj.) Series 2020 D, 5% tender 7/1/2053 (b) | | 70,000 | 75,246 |
| Virginia Small Business Fing Auth Healthcare Facs Rev (Sentara Hlth Sys Obl Group Proj.) Series 2020, 4% 11/1/2036 | | 400,000 | 407,133 |
| | | | 567,846 |
| Pooled Loans - 0.1% | | | |
| Virginia Resources Auth Infrastructure Rev Series 2016 C, 4% 11/1/2036 | | 195,000 | 195,421 |
| Special Tax - 0.1% | | | |
| Fairfax Cnty VA Economic Dev Auth Transn Contract Rev (Fairfax County Economic Development Authority Proj.) 2.875% 4/1/2035 | | 15,000 | 13,518 |
| Fairfax Cnty VA Economic Dev Auth Transn Contract Rev (Fairfax County Economic Development Authority Proj.) 3% 4/1/2036 | | 100,000 | 92,067 |
| Fairfax Cnty VA Economic Dev Auth Transn Contract Rev 3% 4/1/2036 | | 130,000 | 119,688 |
| Hampton Roads Transportation Accountability Commission (Hampton Rds VA Transn Accountability Commn Rev Proj.) 5.25% 7/1/2060 | | 25,000 | 26,438 |
| | | | 251,711 |
| Transportation - 0.1% | | | |
| Virginia Small Business Fing Auth Rev (95 Express Lanes LLC Proj.) Series 2022, 4% 7/1/2039 (f) | | 110,000 | 104,636 |
TOTAL VIRGINIA | | | 4,268,705 |
| Washington - 2.7% | | | |
| Education - 0.2% | | | |
| University Wash Univ Revs Series 2024B, 5% 7/1/2033 | | 185,000 | 210,650 |
| Washington Biomedical Research Pptys Lease Rev (University Wash Univ Revs Proj.) Series A, 4% 1/1/2048 | | 150,000 | 143,808 |
| Washington St Higher Ed Facs (Gonzaga University Proj.) Series 2019 A, 3% 4/1/2049 | | 65,000 | 50,190 |
| Washington St Higher Ed Facs (Seattle Pacific Univ Proj.) Series 2020 A, 5% 10/1/2042 | | 25,000 | 23,743 |
| Washington St Univ Revs Series 2015, 5% 4/1/2040 | | 35,000 | 35,144 |
| | | | 463,535 |
| Electric Utilities - 0.6% | | | |
| Energy Norwthwest WA Elec Rev Series 2016 A, 5% 7/1/2028 (Bonneville Power Administration Guaranteed) | | 215,000 | 220,700 |
| Energy Norwthwest WA Elec Rev Series 2018 C, 5% 7/1/2033 (Bonneville Power Administration Guaranteed) | | 30,000 | 31,760 |
| Energy Norwthwest WA Elec Rev Series 2020 A, 5% 7/1/2028 (Bonneville Power Administration Guaranteed) | | 70,000 | 74,787 |
| Energy Norwthwest WA Elec Rev Series 2021 A, 4% 7/1/2042 (Bonneville Power Administration Guaranteed) | | 175,000 | 174,571 |
| Energy Norwthwest WA Elec Rev Series 2024A, 5% 7/1/2032 (Bonneville Power Administration Guaranteed) | | 125,000 | 141,143 |
| Seattle WA Mun Lt & Pwr Rev Series 2020 A, 4% 7/1/2031 | | 205,000 | 213,858 |
| Seattle WA Mun Lt & Pwr Rev Series 2020 A, 5% 7/1/2026 | | 75,000 | 77,239 |
| | | | 934,058 |
| General Obligations - 1.4% | | | |
| King Cnty WA Sch Dist 210 Fed Series 2018, 5% 12/1/2030 (State of Washington Guaranteed) | | 80,000 | 84,247 |
| King Cnty Wash Hsg Auth Rev Series 2018, 3.5% 5/1/2038 (King County WA Guaranteed) | | 15,000 | 13,706 |
| King County WA Gen. Oblig. Series 2015E, 5% 12/1/2029 | | 55,000 | 55,905 |
| Spokane Cnty WA Sch Dist 81 Series 2021, 4% 12/1/2028 (State of Washington Guaranteed) | | 155,000 | 161,042 |
| State of Washington Gen. Oblig. Series 2016A 1, 5% 8/1/2029 | | 10,000 | 10,099 |
| State of Washington Gen. Oblig. Series 2016C, 5% 2/1/2033 | | 200,000 | 203,445 |
| State of Washington Gen. Oblig. Series 2016C, 5% 2/1/2035 | | 20,000 | 20,323 |
| State of Washington Gen. Oblig. Series 2018 A, 5% 8/1/2041 | | 195,000 | 200,645 |
| State of Washington Gen. Oblig. Series 2020 E, 5% 6/1/2045 | | 15,000 | 15,744 |
| State of Washington Gen. Oblig. Series 2020B, 5% 6/1/2037 | | 55,000 | 58,608 |
| State of Washington Gen. Oblig. Series 2020C, 5% 2/1/2041 | | 150,000 | 159,484 |
| State of Washington Gen. Oblig. Series 2021 A, 5% 8/1/2042 | | 165,000 | 175,938 |
| State of Washington Gen. Oblig. Series 2022 A, 5% 8/1/2043 | | 100,000 | 107,278 |
| State of Washington Gen. Oblig. Series 2023A, 5% 8/1/2031 | | 225,000 | 251,625 |
| State of Washington Gen. Oblig. Series 2023A, 5% 8/1/2046 | | 260,000 | 278,881 |
| State of Washington Gen. Oblig. Series R 2015H, 5% 7/1/2026 | | 30,000 | 30,000 |
| State of Washington Gen. Oblig. Series R 2015H, 5% 7/1/2029 | | 40,000 | 40,000 |
| State of Washington Gen. Oblig. Series R 2017B, 5% 8/1/2029 | | 150,000 | 154,142 |
| State of Washington Gen. Oblig. Series R 2018 D, 5% 8/1/2028 | | 30,000 | 31,517 |
| State of Washington Gen. Oblig. Series R 2018C, 5% 8/1/2028 | | 55,000 | 57,794 |
| State of Washington Gen. Oblig. Series R 2020A, 5% 1/1/2026 | | 30,000 | 30,615 |
| State of Washington Gen. Oblig. Series R 2021 D, 4% 7/1/2041 | | 215,000 | 215,612 |
| State of Washington Gen. Oblig. Series R 2021A, 5% 6/1/2041 | | 125,000 | 133,313 |
| | | | 2,489,963 |
| Health Care - 0.1% | | | |
| Washington St Health Care Facs Auth Rev (Multicare Medical Ctr,Tacom,Wa Proj.) Series 2017B, 3.5% 8/15/2038 | | 60,000 | 53,434 |
| Washington St Health Care Facs Auth Rev (Overlake Hospital Med Ctr, WA Proj.) Series 2017 A, 4% 7/1/2042 | | 85,000 | 77,530 |
| Washington St Health Care Facs Auth Rev (Providence Health Systems Proj.) Series 2014D, 5% 10/1/2038 | | 40,000 | 40,078 |
| | | | 171,042 |
| Special Tax - 0.2% | | | |
| Central Puget Sound WA Regl Tran Auth Sales & Use Tax Rev Series 2016 S 1, 5% 11/1/2027 | | 45,000 | 46,558 |
| Central Puget Sound WA Regl Tran Auth Sales & Use Tax Rev Series 2016 S 1, 5% 11/1/2033 | | 155,000 | 159,416 |
| Central Puget Sound WA Regl Tran Auth Sales & Use Tax Rev Series 2016 S 1, 5% 11/1/2036 | | 30,000 | 30,769 |
| Central Puget Sound WA Regl Tran Auth Sales & Use Tax Rev Series 2016 S 1, 5% 11/1/2041 | | 85,000 | 86,739 |
| Washington St Convention Ctr Pub Facs Dist Series 2018, 4% 7/1/2058 | | 130,000 | 115,882 |
| | | | 439,364 |
| Transportation - 0.2% | | | |
| Port Seattle WA Rev Series 2024B, 5% 7/1/2033 (f) | | 310,000 | 334,078 |
TOTAL WASHINGTON | | | 4,832,040 |
| West Virginia - 0.3% | | | |
| Education - 0.2% | | | |
| West Virginia Univ Revs Series 2019 A, 4% 10/1/2047 | | 225,000 | 215,961 |
| General Obligations - 0.0% | | | |
| West Virginia St Gen. Oblig. Series 2018 B, 5% 12/1/2041 | | 80,000 | 82,624 |
| Health Care - 0.0% | | | |
| West Virginia St Hosp Fin Auth Hosp Rev (West Virginia United Health Sy Stem Proj.) Series 2016A, 3% 6/1/2033 | | 30,000 | 28,119 |
| Transportation - 0.1% | | | |
| West VA Commr of Hwys Spl Oblig Series 2017A, 5% 9/1/2029 | | 65,000 | 67,947 |
| West Virginia Parkways Authority Series 2021, 4% 6/1/2051 | | 100,000 | 95,754 |
| | | | 163,701 |
TOTAL WEST VIRGINIA | | | 490,405 |
| Wisconsin - 1.1% | | | |
| Education - 0.1% | | | |
| Public Fin Auth WI Lease Dev Rev (University Kans Univ Revs Proj.) Series 2016, 5% 3/1/2029 | | 40,000 | 40,812 |
| Public Fin Auth WI Lease Dev Rev (University Kans Univ Revs Proj.) Series 2016, 5% 3/1/2046 | | 50,000 | 50,433 |
| | | | 91,245 |
| Escrowed/Pre-Refunded - 0.1% | | | |
| Wisconsin General Fund Annual Appropiation Series 2017 B, 5% 5/1/2035 | | 215,000 | 220,719 |
| Wisconsin General Fund Annual Appropiation Series 2017 B, 5% 5/1/2036 | | 25,000 | 25,665 |
| | | | 246,384 |
| General Obligations - 0.5% | | | |
| Wisconsin St Gen. Oblig. 5% 5/1/2031 | | 135,000 | 150,553 |
| Wisconsin St Gen. Oblig. Series 2016 2, 5% 11/1/2029 | | 70,000 | 71,747 |
| Wisconsin St Gen. Oblig. Series 2017 3, 5% 11/1/2031 | | 30,000 | 31,350 |
| Wisconsin St Gen. Oblig. Series 2017 A, 5% 5/1/2034 | | 120,000 | 120,648 |
| Wisconsin St Gen. Oblig. Series 2019 A, 4% 5/1/2027 | | 30,000 | 30,332 |
| Wisconsin St Gen. Oblig. Series 2019 A, 5% 5/1/2030 | | 125,000 | 128,384 |
| Wisconsin St Gen. Oblig. Series 2021 B, 5% 5/1/2035 | | 85,000 | 91,213 |
| Wisconsin St Gen. Oblig. Series 2023 2, 5% 5/1/2035 | | 215,000 | 243,675 |
| | | | 867,902 |
| Health Care - 0.4% | | | |
| Public Fin Auth WI Hosp Rev (Renown Regional Medical Center Proj.) Series 2016 A, 3% 6/1/2036 | | 45,000 | 39,173 |
| Wisconsin Health & Edl Facs Auth Sr Living Rev (Covenant Communities Inc Proj.) Series 2018A 1, 4.125% 7/1/2053 | | 135,000 | 107,166 |
| Wisconsin Health & Educational Facilities Authority (Ascension Health Credit Group Proj.) Series 2016 A, 4% 11/15/2039 | | 40,000 | 38,708 |
| Wisconsin Health & Educational Facilities Authority (Ascension Health Credit Group Proj.) Series 2016 A, 5% 11/15/2036 | | 55,000 | 55,819 |
| Wisconsin Health & Educational Facilities Authority (Froedtert Thedacare Proj.) Series 2017 A, 5% 4/1/2028 | | 35,000 | 36,237 |
| Wisconsin Health & Educational Facilities Authority (Hospital Sisters Svcs Inc Proj.) Series 2014A, 5% 11/15/2025 | | 40,000 | 40,040 |
| Wisconsin Health & Educational Facilities Authority (Marshfield Clinic Proj.) Series 2016 A, 3.5% 2/15/2046 | | 195,000 | 146,167 |
| Wisconsin St Health & Edl Facs Auth Rev (Medical College of WI Inc Proj.) Series 2022, 4% 12/1/2051 | | 255,000 | 240,234 |
| | | | 703,544 |
| Housing - 0.0% | | | |
| Wisconsin Hsg & Economic Dev Auth Home Ownership Mtg Rev 2.69% 7/1/2047 | | 57,571 | 49,752 |
| Special Tax - 0.0% | | | |
| Ashwaubenon WI Cmnty Dev Auth Lease Rev (Brown County Wisconsin Proj.) Series 2019, 0% 6/1/2049 (d) | | 160,000 | 50,697 |
| Public Fin Auth WI Revenue Series 2021, 4% 3/31/2056 (f) | | 10,000 | 8,356 |
| Wisconsin Ctr Dist Wis Tax Rv Series 2020 C, 0% 12/15/2050 (Assured Guaranty Municipal Corp Insured) (d) | | 70,000 | 19,773 |
| | | | 78,826 |
| Water & Sewer - 0.0% | | | |
| State of Wisconsin (Wisconsin State Clean Water Fund Proj.) Series 2017 A, 5% 6/1/2029 | | 10,000 | 10,076 |
TOTAL WISCONSIN | | | 2,047,729 |
| Wyoming - 0.0% | | | |
| Education - 0.0% | | | |
| University WY Univ Revs (University WY Univ Revs Proj.) Series 2021 C, 4% 6/1/2051 (Assured Guaranty Municipal Corp Insured) | | 25,000 | 24,016 |
| Electric Utilities - 0.0% | | | |
| Campbell Cnty WY Solid Waste Facs Rev (County of Mercer ND Proj.) Series 2019 A, 3.625% 7/15/2039 | | 25,000 | 22,585 |
TOTAL WYOMING | | | 46,601 |
| TOTAL MUNICIPAL SECURITIES (Cost $185,054,612) | | | 177,855,968 |
| | | | |
| Money Market Funds - 0.7% |
| | | Yield (%) | Shares | Value ($) |
Fidelity Municipal Cash Central Fund (g)(h) (Cost $1,233,723) | | 3.99 | 1,233,476 | 1,233,723 |
| | | | | |
| TOTAL INVESTMENT IN SECURITIES - 100.3% (Cost $186,288,335) | 179,089,691 |
NET OTHER ASSETS (LIABILITIES) - (0.3)% | (486,021) |
| NET ASSETS - 100.0% | 178,603,670 |
| | |
Legend
| (a) | Amount is stated in United States dollars unless otherwise noted. |
| (b) | Coupon rates for floating and adjustable rate securities reflect the rates in effect at period end. |
| (c) | Security initially issued at one coupon which converts to a higher coupon at a specified date. The rate shown is the rate at period end. |
| (d) | Security initially issued in zero coupon form which converts to coupon form at a specified rate and date. The rate shown is the rate at period end. |
| (e) | Security or a portion of the security purchased on a delayed delivery or when-issued basis. |
| (f) | Private activity obligations whose interest is subject to the federal alternative minimum tax for individuals. |
| (g) | Information in this report regarding holdings by state and security types does not reflect the holdings of the Fidelity Central Fund. |
| (h) | Affiliated fund that is generally available only to investment companies and other accounts managed by Fidelity Investments. The rate quoted is the annualized seven-day yield of the fund at period end. A complete unaudited listing of the fund's holdings as of its most recent quarter end is available upon request. In addition, each Fidelity Central Fund's financial statements are available on the SEC's website or upon request. |
Affiliated Central Funds
Fiscal year to date information regarding the Fund's investments in Fidelity Central Funds, including the ownership percentage, is presented below.
| Affiliate | Value, beginning of period ($) | Purchases ($) | Sales Proceeds ($) | Dividend Income ($) | Realized Gain (loss) ($) | Change in Unrealized appreciation (depreciation) ($) | Value, end of period ($) | Shares, end of period | % ownership, end of period |
| Fidelity Municipal Cash Central Fund | 396,887 | 15,002,670 | 14,165,834 | 15,796 | - | - | 1,233,723 | 1,233,476 | 0.0% |
| Total | 396,887 | 15,002,670 | 14,165,834 | 15,796 | - | - | 1,233,723 | 1,233,476 | |
| | | | | | | | | | |
Amounts in the dividend income column in the above table include any capital gain distributions from underlying funds, which are presented in the corresponding line item in the Statement of Operations, if applicable.
Amounts included in the purchases and sales proceeds columns may include in-kind transactions, if applicable.
Investment Valuation
The following is a summary of the inputs used, as of December 31, 2024, involving the Fund's assets and liabilities carried at fair value. The inputs or methodology used for valuing securities may not be an indication of the risk associated with investing in those securities. For more information on valuation inputs, and their aggregation into the levels used below, please refer to the Investment Valuation section in the accompanying Notes to Financial Statements.
| Valuation Inputs at Reporting Date: |
| Description | Total ($) | Level 1 ($) | Level 2 ($) | Level 3 ($) |
Investments in Securities: | | | | |
|
| Municipal Securities | | | | |
Education | 11,999,721 | - | 11,999,721 | - |
Electric Utilities | 8,854,377 | - | 8,854,377 | - |
Escrowed/Pre-Refunded | 5,212,096 | - | 5,212,096 | - |
General Obligations | 64,033,318 | - | 64,033,318 | - |
Health Care | 14,876,485 | - | 14,876,485 | - |
Housing | 4,082,413 | - | 4,082,413 | - |
Industrial Development | 322,347 | - | 322,347 | - |
Lease Revenue | 323,032 | - | 323,032 | - |
Other | 918,071 | - | 918,071 | - |
Pooled Loans | 195,421 | - | 195,421 | - |
Resource Recovery | 370,923 | - | 370,923 | - |
Special Tax | 22,542,607 | - | 22,542,607 | - |
Tobacco Bonds | 703,941 | - | 703,941 | - |
Transportation | 26,564,814 | - | 26,564,814 | - |
Water & Sewer | 16,856,402 | - | 16,856,402 | - |
|
| Money Market Funds | 1,233,723 | 1,233,723 | - | - |
| Total Investments in Securities: | 179,089,691 | 1,233,723 | 177,855,968 | - |
Financial Statements (Unaudited)
| Statement of Assets and Liabilities |
| As of December 31, 2024 (Unaudited) |
| Assets | | | | |
| Investment in securities, at value - See accompanying schedule: | | | | |
Unaffiliated issuers (cost $185,054,612) | $ | 177,855,968 | | |
Fidelity Central Funds (cost $1,233,723) | | 1,233,723 | | |
| | | | | |
| | | | | |
| Total Investment in Securities (cost $186,288,335) | | | $ | 179,089,691 |
| Cash | | | | 190,576 |
| Receivable for fund shares sold | | | | 630,907 |
| Interest receivable | | | | 2,093,059 |
| Distributions receivable from Fidelity Central Funds | | | | 428 |
| Other receivables | | | | 27 |
Total assets | | | | 182,004,688 |
| Liabilities | | | | |
| Payable for investments purchased | | | | |
Regular delivery | $ | 2,647,643 | | |
Delayed delivery | | 305,031 | | |
| Payable for fund shares redeemed | | 292,116 | | |
| Distributions payable | | 145,854 | | |
| Accrued management fee | | 10,374 | | |
| Total liabilities | | | | 3,401,018 |
| Net Assets | | | $ | 178,603,670 |
| Net Assets consist of: | | | | |
| Paid in capital | | | $ | 189,401,917 |
| Total accumulated earnings (loss) | | | | (10,798,247) |
| Net Assets | | | $ | 178,603,670 |
Net Asset Value, offering price and redemption price per share ($178,603,670 ÷ 9,670,238 shares) | | | $ | 18.47 |
| Statement of Operations |
Six months ended December 31, 2024 (Unaudited) |
| Investment Income | | | | |
| Interest | | | $ | 2,402,031 |
| Income from Fidelity Central Funds | | | | 15,796 |
| Total income | | | | 2,417,827 |
| Expenses | | | | |
| Management fee | $ | 60,842 | | |
| Independent trustees' fees and expenses | | 214 | | |
| Total expenses before reductions | | 61,056 | | |
| Expense reductions | | (42) | | |
| Total expenses after reductions | | | | 61,014 |
| Net Investment income (loss) | | | | 2,356,813 |
| Realized and Unrealized Gain (Loss) | | | | |
| Net realized gain (loss) on: | | | | |
| Investment Securities: | | | | |
| Unaffiliated issuers | | (117,804) | | |
| Total net realized gain (loss) | | | | (117,804) |
| Change in net unrealized appreciation (depreciation) on investment securities | | | | 463,876 |
| Net gain (loss) | | | | 346,072 |
| Net increase (decrease) in net assets resulting from operations | | | $ | 2,702,885 |
| Statement of Changes in Net Assets |
| |
| | Six months ended December 31, 2024 (Unaudited) | | Year ended June 30, 2024 |
| Increase (Decrease) in Net Assets | | | | |
| Operations | | | | |
| Net investment income (loss) | $ | 2,356,813 | $ | 3,886,835 |
| Net realized gain (loss) | | (117,804) | | (909,259) |
| Change in net unrealized appreciation (depreciation) | | 463,876 | | 1,162,499 |
| Net increase (decrease) in net assets resulting from operations | | 2,702,885 | | 4,140,075 |
| Distributions to shareholders | | (2,322,821) | | (3,821,144) |
| | | | | |
| Share transactions | | | | |
| Proceeds from sales of shares | | 36,236,237 | | 65,069,600 |
| Reinvestment of distributions | | 1,465,321 | | 2,412,193 |
| Cost of shares redeemed | | (24,290,920) | | (58,877,357) |
| | | | | |
Net increase (decrease) in net assets resulting from share transactions | | 13,410,638 | | 8,604,436 |
| Total increase (decrease) in net assets | | 13,790,702 | | 8,923,367 |
| | | | | |
| Net Assets | | | | |
| Beginning of period | | 164,812,968 | | 155,889,601 |
| End of period | $ | 178,603,670 | $ | 164,812,968 |
| | | | | |
| Other Information | | | | |
| Shares | | | | |
| Sold | | 1,947,084 | | 3,556,452 |
| Issued in reinvestment of distributions | | 78,714 | | 132,431 |
| Redeemed | | (1,306,693) | | (3,246,568) |
| Net increase (decrease) | | 719,105 | | 442,315 |
| | | | | |
Financial Highlights
Fidelity® Municipal Bond Index Fund |
| |
| | Six months ended (Unaudited) December 31, 2024 | | Years ended June 30, 2024 | | 2023 | | 2022 | | 2021 | | 2020 A |
Selected Per-Share Data | | | | | | | | | | | | |
| Net asset value, beginning of period | $ | 18.41 | $ | 18.32 | $ | 18.24 | $ | 20.39 | $ | 19.97 | $ | 20.00 |
| Income from Investment Operations | | | | | | | | | | | | |
Net investment income (loss) B,C | | .252 | | .459 | | .402 | | .281 | | .309 | | .324 |
| Net realized and unrealized gain (loss) | | .057 | | .082 | | .073 | | (2.152) | | .421 | | (.035) |
| Total from investment operations | | .309 | | .541 | | .475 | | (1.871) | | .730 | | .289 |
| Distributions from net investment income | | (.248) | | (.451) | | (.395) | | (.279) | | (.310) | | (.319) |
| Distributions from net realized gain | | (.001) | | - | | - | | - | | - | | - |
| Total distributions | | (.249) | | (.451) | | (.395) | | (.279) | | (.310) | | (.319) |
| Net asset value, end of period | $ | 18.47 | $ | 18.41 | $ | 18.32 | $ | 18.24 | $ | 20.39 | $ | 19.97 |
Total Return D,E | | | | 3.01% | | 2.64% | | (9.26)% | | 3.68% | | 1.46% |
Ratios to Average Net Assets C,F,G | | | | | | | | | | | | |
| Expenses before reductions | | .07% H | | .07% | | .07% | | .07% | | .07% | | .07% H |
| Expenses net of fee waivers, if any | | | | .07% | | .07% | | .07% | | .07% | | .07% H |
| Expenses net of all reductions | | .07% H | | .07% | | .07% | | .07% | | .07% | | .07% H |
| Net investment income (loss) | | 2.69% H | | 2.52% | | 2.21% | | 1.43% | | 1.53% | | 1.67% H |
| Supplemental Data | | | | | | | | | | | | |
| Net assets, end of period (000 omitted) | $ | 178,604 | $ | 164,813 | $ | 155,890 | $ | 124,941 | $ | 106,786 | $ | 60,060 |
Portfolio turnover rate I | | | | 15% | | 18% | | 30% | | 8% | | 76% H |
AFor the period July 11, 2019 (commencement of operations) through June 30, 2020.
BCalculated based on average shares outstanding during the period.
CNet investment income (loss) is affected by the timing of the declaration of dividends by any underlying mutual funds or exchange-traded funds (ETFs). Net investment income (loss) of any mutual funds or ETFs is not included in the Fund's net investment income (loss) ratio.
DTotal returns for periods of less than one year are not annualized.
ETotal returns would have been lower if certain expenses had not been reduced during the applicable periods shown.
FFees and expenses of any underlying mutual funds or exchange-traded funds (ETFs) are not included in the Fund's expense ratio. The Fund indirectly bears its proportionate share of these expenses.
GExpense ratios reflect operating expenses of the class. Expenses before reductions do not reflect amounts reimbursed, waived, or reduced through arrangements with the investment adviser, brokerage services, or other offset arrangements, if applicable, and do not represent the amount paid by the class during periods when reimbursements, waivers or reductions occur.
HAnnualized.
IAmount does not include the portfolio activity of any underlying mutual funds or exchange-traded funds (ETFs), derivatives or securities that mature within one year from acquisition.
Notes to Financial Statements
(Unaudited)For the period ended December 31, 2024
1. Organization.
Fidelity Municipal Bond Index Fund (the Fund) is a fund of Fidelity Salem Street Trust (the Trust) and is authorized to issue an unlimited number of shares. Share transactions on the Statement of Changes in Net Assets may contain exchanges between affiliated funds. The Trust is registered under the Investment Company Act of 1940, as amended (the 1940 Act), as an open-end management investment company organized as a Massachusetts business trust.
Effective the close of business on February 18, 2025, new positions to the fund may no longer be opened.
2. Investments in Fidelity Central Funds.
Funds may invest in Fidelity Central Funds, which are open-end investment companies generally available only to other investment companies and accounts managed by the investment adviser and its affiliates. The Schedule of Investments lists any Fidelity Central Funds held as an investment as of period end, but does not include the underlying holdings of each Fidelity Central Fund. An investing fund indirectly bears its proportionate share of the expenses of the underlying Fidelity Central Funds.
Based on its investment objective, each Fidelity Central Fund may invest or participate in various investment vehicles or strategies that are similar to those of the investing fund. These strategies are consistent with the investment objectives of the investing fund and may involve certain economic risks which may cause a decline in value of each of the Fidelity Central Funds and thus a decline in the value of the investing fund.
| Fidelity Central Fund | Investment Manager | Investment Objective | Investment Practices | Expense RatioA |
| Fidelity Money Market Central Funds | Fidelity Management & Research Company LLC (FMR) | Each fund seeks to obtain a high level of current income consistent with the preservation of capital and liquidity. | Short-term Investments | Less than .005% |
A Expenses expressed as a percentage of average net assets and are as of each underlying Central Fund's most recent annual or semi-annual shareholder report.
A complete unaudited list of holdings for each Fidelity Central Fund is available upon request or at the Securities and Exchange Commission website at www.sec.gov. In addition, the financial statements of the Fidelity Central Funds which contain the significant accounting policies (including investment valuation policies) of those funds, and are not covered by the Report of Independent Registered Public Accounting Firm, are available on the Securities and Exchange Commission website or upon request.
3. Significant Accounting Policies.
The Fund is an investment company and applies the accounting and reporting guidance of the Financial Accounting Standards Board (FASB) Accounting Standards Codification Topic 946 Financial Services - Investment Companies. The financial statements have been prepared in conformity with accounting principles generally accepted in the United States of America (GAAP), which require management to make certain estimates and assumptions at the date of the financial statements. Actual results could differ from those estimates. The Fund operates as a single operating segment. The Fund's income, expenses, assets, and performance are regularly monitored and assessed as a whole by the investment adviser and other individuals responsible for oversight functions of the Trust, using the information presented in the financial statements and financial highlights. Subsequent events, if any, through the date that the financial statements were issued have been evaluated in the preparation of the financial statements. The Fund's Schedule of Investments lists any underlying mutual funds or exchange-traded funds (ETFs) but does not include the underlying holdings of these funds. The following summarizes the significant accounting policies of the Fund:
Investment Valuation. Investments are valued as of 4:00 p.m. Eastern time on the last calendar day of the period. The Board of Trustees (the Board) has designated the Fund's investment adviser as the valuation designee responsible for the fair valuation function and performing fair value determinations as needed. The investment adviser has established a Fair Value Committee (the Committee) to carry out the day-to-day fair valuation responsibilities and has adopted policies and procedures to govern the fair valuation process and the activities of the Committee. In accordance with these fair valuation policies and procedures, which have been approved by the Board, the Fund attempts to obtain prices from one or more third party pricing services or brokers to value its investments. When current market prices, quotations or currency exchange rates are not readily available or reliable, investments will be fair valued in good faith by the Committee, in accordance with the policies and procedures. Factors used in determining fair value vary by investment type and may include market or investment specific events, transaction data, estimated cash flows, and market observations of comparable investments. The frequency that the fair valuation procedures are used cannot be predicted and they may be utilized to a significant extent. The Committee manages the Fund's fair valuation practices and maintains the fair valuation policies and procedures. The Fund's investment adviser reports to the Board information regarding the fair valuation process and related material matters.
The Fund categorizes the inputs to valuation techniques used to value its investments into a disclosure hierarchy consisting of three levels as shown below:
Level 1 - unadjusted quoted prices in active markets for identical investments
Level 2 - other significant observable inputs (including quoted prices for similar investments, interest rates, prepayment speeds, etc.)
Level 3 - unobservable inputs (including the Fund's own assumptions based on the best information available)
Valuation techniques used to value the Fund's investments by major category are as follows:
Debt securities, including restricted securities, are valued based on evaluated prices received from third party pricing services or from brokers who make markets in such securities. Municipal securities are valued by pricing services who utilize matrix pricing which considers yield or price of bonds of comparable quality, coupon, maturity and type or by broker-supplied prices. When independent prices are unavailable or unreliable, debt securities may be valued utilizing pricing methodologies which consider similar factors that would be used by third party pricing services. Debt securities are generally categorized as Level 2 in the hierarchy but may be Level 3 depending on the circumstances.
Investments in open-end mutual funds including the Fidelity Central Funds, are valued at their closing net asset value (NAV) each business day and are categorized as Level 1 in the hierarchy.
Changes in valuation techniques may result in transfers in or out of an assigned level within the disclosure hierarchy. The aggregate value of investments by input level as of December 31, 2024 is included at the end of the Fund's Schedule of Investments.
Investment Transactions and Income. For financial reporting purposes, the Fund's investment holdings and NAV include trades executed through the end of the last business day of the period. The NAV per share for processing shareholder transactions is calculated as of the close of business of the New York Stock Exchange (NYSE), normally 4:00 p.m. Eastern time and includes trades executed through the end of the prior business day. Gains and losses on securities sold are determined on the basis of identified cost. Income and capital gain distributions from Fidelity Central Funds, if any, are recorded on the ex-dividend date. Interest income is accrued as earned and includes coupon interest and amortization of premium and accretion of discount on debt securities as applicable. Debt obligations may be placed on non-accrual status and related interest income may be reduced by ceasing current accruals and writing off interest receivables when the collection of all or a portion of interest has become doubtful based on consistently applied procedures. A debt obligation is removed from non-accrual status when the issuer resumes interest payments or when collectability of interest is reasonably assured.
Expenses. Expenses directly attributable to a fund are charged to that fund. Expenses attributable to more than one fund are allocated among the respective funds on the basis of relative net assets or other appropriate methods. Expenses included in the accompanying financial statements reflect the expenses of that fund and do not include any expenses associated with any underlying mutual funds or exchange-traded funds. Although not included in a fund's expenses, a fund indirectly bears its proportionate share of these expenses through the net asset value of each underlying mutual fund or exchange-traded fund. Expense estimates are accrued in the period to which they relate and adjustments are made when actual amounts are known.
Income Tax Information and Distributions to Shareholders. Each year, the Fund intends to qualify as a regulated investment company under Subchapter M of the Internal Revenue Code, including distributing substantially all of its taxable income and realized gains. As a result, no provision for U.S. Federal income taxes is required. The Fund files a U.S. federal tax return, in addition to state and local tax returns as required. The Fund's federal income tax returns are subject to examination by the Internal Revenue Service (IRS) for a period of three fiscal years after they are filed. State and local tax returns may be subject to examination for an additional fiscal year depending on the jurisdiction.
Distributions are declared and recorded daily and paid monthly from net investment income. Distributions from realized gains, if any, are declared and recorded on the ex-dividend date. Income and capital gain distributions are determined in accordance with income tax regulations, which may differ from GAAP.
Capital accounts within the financial statements are adjusted for permanent book-tax differences. These adjustments have no impact on net assets or the results of operations. Capital accounts are not adjusted for temporary book-tax differences which will reverse in a subsequent period.
Book-tax differences are primarily due to market discount, capital loss carryforwards and losses deferred due to wash sales.
The Fund purchases municipal securities whose interest, in the opinion of the issuer, is free from federal income tax. There is no assurance that the IRS will agree with this opinion. In the event the IRS determines that the issuer does not comply with relevant tax requirements, interest payments from a security could become federally taxable, possibly retroactively to the date the security was issued.
As of period end, the cost and unrealized appreciation (depreciation) in securities, and derivatives if applicable, for federal income tax purposes were as follows:
| Gross unrealized appreciation | $523,425 |
| Gross unrealized depreciation | (7,529,559) |
| Net unrealized appreciation (depreciation) | $(7,006,134) |
| Tax cost | $186,095,825 |
Capital loss carryforwards are only available to offset future capital gains of the Fund to the extent provided by regulations and may be limited. The capital loss carryforward information presented below, including any applicable limitation, is estimated as of prior fiscal period end and is subject to adjustment.
Short-term | $(1,850,933) |
Long-term | (1,747,082) |
| Total capital loss carryforward | $(3,598,015) |
Delayed Delivery Transactions and When-Issued Securities. During the period, certain Funds transacted in securities on a delayed delivery or when-issued basis. Payment and delivery may take place after the customary settlement period for that security. The price of the underlying securities and the date when the securities will be delivered and paid for are fixed at the time the transaction is negotiated. Securities purchased on a delayed delivery or when-issued basis are identified as such in the Schedule of Investments. Compensation for interest forgone in the purchase of a delayed delivery or when-issued debt security may be received. With respect to purchase commitments, each applicable Fund identifies securities as segregated in its records with a value at least equal to the amount of the commitment. Payables and receivables associated with the purchases and sales of delayed delivery securities having the same coupon, settlement date and broker are offset. Delayed delivery or when-issued securities that have been purchased from and sold to different brokers are reflected as both payables and receivables in the Statement of Assets and Liabilities under the caption "Delayed delivery", as applicable. Losses may arise due to changes in the value of the underlying securities or if the counterparty does not perform under the contract's terms, or if the issuer does not issue the securities due to political, economic, or other factors.
New Accounting Pronouncement. FASB Accounting Standards Update (ASU) 2023-07 Segment Reporting (Topic 280): Improvements to Reportable Segment Disclosures became effective in this reporting period. ASU 2023-07 enhances segment information disclosure in the notes to financial statements.
4. Purchases and Sales of Investments.
Purchases and sales of securities, other than short-term securities and in-kind transactions, as applicable, are noted in the table below.
| | Purchases ($) | Sales ($) |
| Fidelity Municipal Bond Index Fund | 27,542,906 | 11,934,793 |
5. Fees and Other Transactions with Affiliates.
Management Fee. Fidelity Management & Research Company LLC (the investment adviser) and its affiliates provide the Fund with investment management related services for which the Fund pays a monthly management fee. The management fee is based on an annual rate of .07% of the Fund's average net assets. Under the management contract, the investment adviser pays all other operating expenses, except the compensation of the independent Trustees and certain miscellaneous expenses such as proxy and shareholder meeting expenses.
Interfund Trades. Funds may purchase from or sell securities to other Fidelity Funds under procedures adopted by the Board. The procedures have been designed to ensure these interfund trades are executed in accordance with Rule 17a-7 of the 1940 Act. Any interfund trades are included within the respective purchases and sales amounts shown in the Purchases and Sales of Investments note. During the period, there were no interfund trades.
6. Committed Line of Credit.
Certain Funds participate with other funds managed by the investment adviser or an affiliate in a $4.25 billion credit facility (the "line of credit") to be utilized for temporary or emergency purposes to fund shareholder redemptions or for other short-term liquidity purposes.
Commitment fees are charged based on the unused amount of the line of credit at an annual rate of .10%, and then allocated to each participating fund based on its pro-rata portion of the line of credit. The commitment fees are borne by the investment adviser.
Interest is charged to a participating fund based on its borrowings at an annual rate of .75% plus the highest of (i) daily SOFR plus a .10% spread adjustment, (ii) Federal Funds Effective Rate, or (iii) Overnight Bank Funding Rate. During the period, there were no borrowings on this line of credit.
The line of credit agreement will expire in March 2025 unless extended or renewed.
7. Expense Reductions.
Through arrangements with the Fund's custodian, credits realized as a result of certain uninvested cash balances were used to reduce the Fund's expenses by $42.
8. Other.
A fund's organizational documents provide former and current trustees and officers with a limited indemnification against liabilities arising in connection with the performance of their duties to the fund. In the normal course of business, a fund may also enter into contracts that provide general indemnifications. A fund's maximum exposure under these arrangements is unknown as this would be dependent on future claims that may be made against a fund. The risk of material loss from such claims is considered remote.
9. Risk and Uncertainties.
Many factors affect a fund's performance. Developments that disrupt global economies and financial markets, such as pandemics, epidemics, outbreaks of infectious diseases, war, terrorism, and environmental disasters, may significantly affect a fund's investment performance. The effects of these developments to a fund will be impacted by the types of securities in which a fund invests, the financial condition, industry, economic sector, and geographic location of an issuer, and a fund's level of investment in the securities of that issuer. Significant concentrations in security types, issuers, industries, sectors, and geographic locations may magnify the factors that affect a fund's performance.
10. Proposed Reorganization.
The Board of Trustees of the Fund approved an Agreement and Plan of Reorganization (the Agreement) to reorganize the Fund (Target Fund) into a newly created exchange traded fund ("ETF"), as noted in the below table. The Agreement provides for shareholders of the Target Fund to receive ETF shares equal in value to the number of shares of the Target Fund shares they own on the day the reorganization is effective. The Target Fund will be the accounting survivor after the reorganization. As such, performance and financial history prior to the reorganization will be that of the Target Fund (Predecessor Fund). Historical share transactions and per share information for the Predecessor Fund will be retroactively adjusted to reflect the change in capital structure due to the reorganization. The reorganization does not require shareholder approval and is expected to become effective on April 4, 2025. The reorganization will qualify as a tax-free reorganization for federal income tax purposes with no gain or loss to be recognized by the fund or its shareholders.
| Current Mutual Fund (Target and Predecessor Fund) | New ETF |
| Fidelity Municipal Bond Index Fund | Fidelity Systematic Municipal Bond Index ETF |
Item 8: Changes in and Disagreements with Accountants for Open-End Management Investment Companies
(Unaudited)
Note: This is not applicable for any fund included in this document.
Item 9: Proxy Disclosures for Open-End Management Investment Companies
(Unaudited)
Note: This is not applicable for any fund included in this document.
Item 10: Remuneration Paid to Directors, Officers, and others of Open-End Management Investment Companies
(Unaudited)
Note: This information is disclosed as part of the financial statements for each Fund as part of Item 7: Financial Statements and Financial Highlights for Open-End Management Investment companies.
Item 11: Statement Regarding Basis for Approval of Investment Advisory Contract
(Unaudited)
Board Approval of Investment Advisory Contracts and Management Fees
Fidelity Municipal Bond Index Fund
Each year, the Board of Trustees, including the Independent Trustees (together, the Board), considers the renewal of the fund's management contract with Fidelity Management & Research Company LLC (FMR) and the sub-advisory agreements (together, the Advisory Contracts) for the fund. FMR and the sub-advisers are referred to herein as the Investment Advisers. The Board, assisted by the advice of fund counsel and Independent Trustees' counsel, requests and considers a broad range of information relevant to the renewal of the Advisory Contracts throughout the year.
The Board meets regularly and, at each of its meetings, covers an extensive agenda of topics and materials and considers factors that are relevant to its annual consideration of the renewal of the fund's Advisory Contracts, including the services and support provided to the fund and its shareholders. The Board's Operations Committee, of which all the Independent Trustees are members, meets regularly throughout the year and requests, receives and considers, among other matters, information related to the annual consideration of the renewal of the fund's Advisory Contracts before making its recommendation to the Board. The Board also meets as needed to review matters specifically related to the Board's annual consideration of the renewal of the Advisory Contracts. Members of the Board may also meet from time to time with trustees of other Fidelity funds through joint ad hoc committees to discuss certain matters relevant to all of the Fidelity funds.
At its September 2024 meeting, the Board unanimously determined to renew the fund's Advisory Contracts. In reaching its determination, the Board considered all factors it believed relevant, including (i) the nature, extent, and quality of the services provided to the fund and its shareholders (including the investment performance of the fund); (ii) the competitiveness relative to peer funds of the fund's management fee and total expense ratio; (iii) the total costs of the services provided by and the profits realized by FMR and its affiliates (Fidelity) from its relationships with the fund; and (iv) the extent to which, if any, economies of scale exist and are realized as the fund grows, and whether any economies of scale are appropriately shared with fund shareholders. The Board also considered the broad range of investment choices available to shareholders from FMR's competitors and that the fund's shareholders have chosen to invest in the fund, which is part of the Fidelity family of funds. The Board's decision to renew the Advisory Contracts was not based on any single factor and the factors may have been weighed differently by different Trustees.
The Board reached a determination, with the assistance of fund counsel and Independent Trustees' counsel and through the exercise of its business judgment, that the renewal of the Advisory Contracts was in the best interests of the fund and its shareholders and that the compensation payable under the Advisory Contracts was fair and reasonable in light of all of the surrounding circumstances.
Nature, Extent, and Quality of Services Provided. The Board considered Fidelity's staffing as it relates to the fund, including the backgrounds and experience of investment personnel, and also considered the Investment Advisers' implementation of the fund's investment program. The Independent Trustees also had discussions with senior management of Fidelity's investment operations and investment groups. The Board considered the structure of the investment personnel compensation program and whether this structure provides appropriate incentives to act in the best interests of the fund. Additionally, the Board considered the portfolio managers' investments, if any, in the funds that they manage.
Resources Dedicated to Investment Management and Support Services. The Board reviewed the general qualifications and capabilities of Fidelity's investment staff, including its size, education, experience, and resources, as well as Fidelity's approach to recruiting, training, managing, and compensating investment personnel. The Board noted the resources devoted to Fidelity's global investment organization, and that Fidelity's analysts have extensive resources, tools and capabilities that allow them to conduct quantitative and fundamental analysis, as well as credit analysis of issuers, counterparties and guarantors. Further, the Board considered that Fidelity's investment professionals have sufficient access to global information and data so as to provide competitive investment results over time, and that those professionals also have access to sophisticated tools that permit them to assess portfolio construction and risk and performance attribution characteristics continuously, as well as to transmit new information and research conclusions rapidly around the world. Additionally, in its deliberations, the Board considered Fidelity's trading, risk management, compliance, cybersecurity, and technology and operations capabilities and resources, which are integral parts of the investment management process.
Shareholder and Administrative Services. The Board considered (i) the nature, extent, quality, and cost of advisory, administrative, and shareholder services performed by the Investment Advisers and their affiliates under the Advisory Contracts and under separate agreements covering transfer agency and pricing and bookkeeping services for the fund; (ii) the nature and extent of Fidelity's supervision of third party service providers, principally custodians, subcustodians, and pricing vendors; and (iii) the resources devoted by Fidelity to, and the record of compliance with, the fund's compliance policies and procedures, including with respect to liquidity risk management.
The Board noted that the growth of fund assets over time across the complex allows Fidelity to reinvest in the development of services designed to enhance the value and convenience of the Fidelity funds as investment vehicles. These services include 24-hour access to account information and market information over the Internet and through telephone representatives, investor education materials and asset allocation tools. The Board also considered that it reviews customer service metrics such as telephone response times, continuity of services on the website and metrics addressing services at Fidelity Investor Centers.
Investment in a Large Fund Family. The Board considered the benefits to shareholders of investing in a fund that is part of a large family of funds offering a variety of investment disciplines and providing a large variety of fund investor services. The Board noted that Fidelity had taken, or had made recommendations to the Board that resulted in the Fidelity funds taking, a number of actions over the previous year that benefited particular funds and/or the Fidelity funds in general.
Investment Performance. The Board took into account discussions that occur with representatives of the Investment Advisers, and reports that it receives, at Board meetings throughout the year relating to fund investment performance. In this regard the Board noted that as part of regularly scheduled fund reviews and other reports to the Board on fund performance, the Board considered annualized return information for the fund for different time periods, measured against the securities market index the fund seeks to track (benchmark index). The Board also periodically considers the fund's tracking error versus its benchmark index. In its evaluation of fund investment performance at meetings throughout the year, the Board gave particular attention to information indicating underperformance of certain Fidelity funds over different time periods and discussed with the Investment Advisers the reasons for such underperformance.
In addition to reviewing absolute and relative fund performance, the Independent Trustees periodically consider the appropriateness of fund performance metrics in evaluating the results achieved. In general, the Independent Trustees believe that an index fund's performance should be evaluated based on gross performance (before fees and expenses but after transaction costs) of the fund compared to the fund's benchmark index, over appropriate time periods.
Based on its review, the Board concluded that the nature, extent, and quality of services provided to the fund under the Advisory Contracts should continue to benefit the shareholders of the fund.
Competitiveness of Management Fee and Total Expense Ratio. The Board was provided with information regarding industry trends in management fees and expenses. In its review of the fund's management fee and total expense ratio, the Board considered the fund's unitary (subject to certain limited exceptions) fee rate as well as fund expenses paid by FMR under the fund's management contract, such as transfer agent fees, pricing and bookkeeping fees, and custodial, legal, and audit fees. The Board noted that Fidelity may agree to waive fees or reimburse expenses from time to time, and the extent to which, if any, it has done so for the fund.
Comparisons of Management Fees and Total Expense Ratios. Among other things, the Board reviewed data for selected groups of competitive funds and classes (referred to as "mapped groups") that were compiled by Fidelity based on combining similar investment objective categories (as classified by Morningstar) that have comparable investment mandates. The data reviewed by the Board included (i) gross management fee comparisons (before taking into account expense reimbursements or caps) relative to the total universe of funds within the mapped group; (ii) gross management fee comparisons relative to a subset of non-Fidelity funds in the mapped group that are similar in size and management fee structure to the fund (referred to as the "asset size peer group"); (iii) total expense comparisons of the fund relative to funds and classes in the mapped group that have a similar sales load structure to the fund (referred to as the "similar sales load structure group"); and (iv) total expense comparisons of the fund relative to funds and classes in the similar sales load structure group that are similar in size and management fee structure to the fund (referred to as the "total expense asset size peer group"). The total expense asset size peer group comparison excludes performance adjustments and fund-paid 12b-1 fees to eliminate variability in fee structures.
The information provided to the Board indicated that the fund's management fee rate ranked above the competitive median of the mapped group for 2023 and above the competitive median of the asset size peer group for 2023. Further, the information provided to the Board indicated that the total expense ratio of the fund ranked equal to the competitive median of the similar sales load structure group for 2023 and below the competitive median of the total expense asset size peer group for 2023.
The Board noted that the fund has a unitary fee that covers expenses beyond portfolio management, unlike the majority of funds within the mapped group. The total expense ratio for the fund was below the competitive medians.
Fees Charged to Other Fidelity Clients. The Board also considered Fidelity fee structures and other information with respect to clients of Fidelity, such as other funds advised or subadvised by Fidelity, pension plan clients, and other institutional clients with similar mandates. The Board noted that a joint ad hoc committee created by it and the boards of other Fidelity funds periodically reviews and compares Fidelity's institutional investment advisory business with its business of providing services to the Fidelity funds and also noted the most recent findings of the committee. The Board noted that the committee's review included a consideration of the differences in services provided, fees charged, and costs incurred, as well as competition in the markets serving the different categories of clients.
Based on its review, the Board concluded that the fund's management fee is fair and reasonable in light of the services that the fund receives and the other factors considered. Further, based on its review of total expense ratios and fees charged to other Fidelity clients, the Board concluded that the fund's total expense ratio was reasonable in light of the services that the fund and its shareholders receive and the other factors considered.
Costs of the Services and Profitability. The Board considered the revenues earned and the expenses incurred by Fidelity in conducting the business of developing, marketing, distributing, managing, administering and servicing the fund and servicing the fund's shareholders. The Board also considered the level of Fidelity's profits in respect of all the Fidelity funds.
On an annual basis, Fidelity presents to the Board information about the profitability of its relationships with the fund. Fidelity calculates profitability information for each Fidelity fund, as well as aggregate profitability information for groups of Fidelity funds and all Fidelity funds, using a series of detailed revenue and cost allocation methodologies which originate with the books and records of Fidelity on which Fidelity's audited financial statements are based. The Audit Committee of the Board reviews any significant changes from the prior year's methodologies.
A public accounting firm has been engaged annually by the Board as part of the Board's assessment of Fidelity's profitability analysis. The engagement includes the review and assessment of the methodologies used by Fidelity in determining the revenues and expenses attributable to Fidelity's fund business. After considering the reports issued under the engagement and information provided by Fidelity, the Board concluded that while other allocation methods may also be reasonable, Fidelity's profitability methodologies are reasonable in all material respects.
The Board also reviewed Fidelity's non-fund businesses and potential indirect benefits such businesses may have received as a result of their association with Fidelity's fund business (i.e., fall-out benefits) as well as cases where Fidelity's affiliates may benefit from the funds' business. The Board considered areas where potential indirect benefits to the Fidelity funds from their relationships with Fidelity may exist. The Board's consideration of these matters was informed by the findings of a joint ad hoc committee created by it and the boards of other Fidelity funds to evaluate potential fall-out benefits.
The Board considered the costs of the services provided by and the profits realized by Fidelity in connection with the operation of the fund and was satisfied that the profitability was not excessive.
Economies of Scale. The Board considered whether there have been economies of scale in respect of the management of the Fidelity funds, whether the Fidelity funds (including the fund) have appropriately benefited from any such economies of scale, and whether there is potential for realization of any further economies of scale. The Board considered the extent to which the fund will benefit from economies of scale as assets grow through increased services to the fund, through waivers or reimbursements, or through fee or expense ratio reductions. The Board recognized that, due to the fund's current contractual arrangements, its expense ratio will not decline if the fund's operating costs decrease as assets grow, or rise as assets decrease. The Board also noted that a committee created by it and the boards of other Fidelity funds periodically analyzes whether Fidelity attains economies of scale in respect of the management and servicing of the Fidelity funds, whether the Fidelity funds have appropriately benefited from such economies of scale, and whether there is potential for realization of any further economies of scale.
The Board concluded, taking into account the analysis of the committee, that economies of scale, if any, are being appropriately shared between fund shareholders and Fidelity.
Additional Information Requested by the Board. In order to develop fully the factual basis for consideration of the Fidelity funds' advisory contracts, the Board requested and received additional information on certain topics, including: (i) portfolio manager changes that have occurred during the past year; (ii) hiring, training, compensating, and retaining adviser and sub-adviser personnel; (iii) the terms of the funds' various management fee structures and arrangements for transfer agent and pricing and bookkeeping services; (iv) Fidelity's fund profitability methodology, profitability trends for certain funds, the allocation of various costs to different funds, and the impact of certain factors on fund profitability results; (v) the impact on fund profitability of recent industry trends, such as the growth in passively managed funds and the changes in flows for different types of funds; (vi) the types of management fee and total expense comparisons provided, and the challenges and limitations associated with such information; (vii) explanations regarding the relative total expense ratios and management fees of certain funds and classes, total expense and management fee competitive trends, and methodologies for total expense and management fee competitive comparisons; (viii) matters related to money market funds, exchange-traded funds, and target date funds; (ix) the arrangements with and compensation paid to certain fund sub-advisers and the treatment of such compensation within Fidelity's fund profitability methodology; and (x) the terms of management contracts between Fidelity and other funds and products not overseen by the Board.
Conclusion. Based on its evaluation of all of the conclusions noted above, and after considering all factors it believed relevant, the Board, including the Independent Trustees, concluded that the advisory and sub-advisory fee arrangements are fair and reasonable in light of all of the surrounding circumstances, and that the fund's Advisory Contracts should be renewed through September 30, 2025.
1.9894015.105
MBL-SANN-0325
Item 8.
Changes in and Disagreements with Accountants for Open-End Management Investment Companies
See Item 7.
Item 9.
Proxy Disclosures for Open-End Management Investment Companies
See Item 7.
Item 10.
Remuneration Paid to Directors, Officers, and Others of Open-End Management Investment Companies
See Item 7.
Item 11.
Statement Regarding Basis for Approval of Investment Advisory Contract
See Item 7.
Item 12.
Disclosure of Proxy Voting Policies and Procedures for Closed-End Management Investment Companies
Not applicable.
Item 13.
Portfolio Managers of Closed-End Management Investment Companies
Not applicable.
Item 14.
Purchases of Equity Securities by Closed-End Management Investment Company and Affiliated Purchasers
Not applicable.
Item 15.
Submission of Matters to a Vote of Security Holders
There were no material changes to the procedures by which shareholders may recommend nominees to the Fidelity Salem Street Trust’s Board of Trustees.
Item 16.
Controls and Procedures
(a)(i) The President and Treasurer and the Chief Financial Officer have concluded that the Fidelity Salem Street Trust’s (the “Trust”) disclosure controls and procedures (as defined in Rule 30a-3(c) under the Investment Company Act) provide reasonable assurances that material information relating to the Trust is made known to them by the appropriate persons, based on their evaluation of these controls and procedures as of a date within 90 days of the filing date of this report.
(a)(ii) There was no change in the Trust’s internal control over financial reporting (as defined in Rule 30a-3(d) under the Investment Company Act) that occurred during the period covered by this report that has materially affected, or is reasonably likely to materially affect, the Trust’s internal control over financial reporting.
Item 17.
Disclosure of Securities Lending Activities for Closed-End Management Investment Companies
Not applicable.
Item 18.
Recovery of Erroneously Awarded Compensation
(a)
Not applicable.
(b)
Not applicable.
Item 19.
Exhibits
SIGNATURES
Pursuant to the requirements of the Securities Exchange Act of 1934 and the Investment Company Act of 1940, the registrant has duly caused this report to be signed on its behalf by the undersigned, thereunto duly authorized.
Fidelity Salem Street Trust
|
By: | /s/Laura M. Del Prato |
| Laura M. Del Prato |
| President and Treasurer (Principal Executive Officer) |
|
|
Date: | February 21, 2025 |
Pursuant to the requirements of the Securities Exchange Act of 1934 and the Investment Company Act of 1940, this report has been signed below by the following persons on behalf of the registrant and in the capacities and on the dates indicated.
|
By: | /s/Laura M. Del Prato |
| Laura M. Del Prato |
| President and Treasurer (Principal Executive Officer) |
|
|
Date: | February 21, 2025 |
|
By: | /s/Stephanie Caron |
| Stephanie Caron |
| Chief Financial Officer (Principal Financial Officer) |
|
|
Date: | February 21, 2025 |