UNITED STATES SECURITIES AND EXCHANGE COMMISSION
Washington, D.C. 20549
FORM 10-K
(Mark One)
x ANNUAL REPORT PURSUANT TO SECTION 13 OR 15(d) OF THE SECURITIES EXCHANGE ACT OF 1934
For the fiscal year endedDecember 31, 2011
o TRANSITION REPORT PURSUANT TO SECTION 13 OR 15(d) OF THE SECURITIES EXCHANGE ACT OF 1934
For the transition period from______________ to _______________.
Commission file number 0-10652
NORTH VALLEY BANCORP
(Exact name of registrant as specified in its charter)
| California | | 94-2751350 |
| (State or other jurisdiction | | (IRS Employer |
| of incorporation or organization) | | Identification No.) |
| | | |
| 300 Park Marina Circle, Redding, California | | 96001 |
| (Address of principal executive offices) | | (Zip code) |
Registrant’s telephone number, including area code (530) 226-2900
Securities registered pursuant to Section 12(b) of the Act:
| Title of class: | | Name of each exchange on which registered: |
| Common Stock, no par value | | The NASDAQ Global Select Stock Market |
Securities registered pursuant to Section 12(g) of the Act:None
Indicate by check mark if the registrant is a well-known seasoned issuer, as defined in Rule 405 of the Securities Act.
Yeso Nox
Indicate by check mark if the registrant is not required to file reports pursuant to Section 13 or Section 15(d) of the Act.
Yeso Nox
Indicate by check mark whether the registrant (1) has filed all reports required to be filed by Section 13 or 15(d) of the Securities Exchange Act during the preceding 12 months (or for such shorter period that the registrant was required to file such reports), and (2) has been subject to such filing requirements for the past 90 days. Yesx Noo
Indicate by check mark whether the registrant has submitted electronically and posted on its corporate Web site, if any, every Interactive Data File required to be submitted and posted pursuant to Rule 405 of Regulation S-T (§232.405 of this chapter) during the preceding 12 months (or for such shorter period that the registrant was required to submit and post such files).
Yesx Noo
Indicate by check mark if disclosure of delinquent filers pursuant to Item 405 of Regulation S-K is not contained herein, and will not be contained, to the best of registrant’s knowledge, in definitive proxy or information statements incorporated by reference in Part III of this Form 10-K or any amendment to this Form 10-K.o
Indicate by check mark whether the registrant is a large accelerated filer, an accelerated filer, a non-accelerated filer, or a smaller reporting company. See definitions of “large accelerated filer,” “accelerated filer” and “smaller reporting company” in Rule 12b-2 of the Exchange Act (Check one):
| | Large accelerated filero | | Accelerated filero |
| | | | |
| | Non-accelerated filerx | | Smaller reporting companyo |
Indicate by check mark whether the registrant is a shell company (as defined in Rule 12b-2 of the Act). Yeso Nox
The aggregate market value of the voting common equity held by non-affiliates computed by reference to the price at which the common equity was last sold was $66,371,000 as of June 30, 2011.
The number of shares outstanding of common stock as of March 14, 2012, were 6,833,752.
DOCUMENTS INCORPORATED BY REFERENCE
Portions of Registrant’s Definitive Proxy Statement for the 2012 Annual Meeting of Shareholders are incorporated by reference in Part III, Items 10, 11, 12, 13 and 14 of this Form 10-K.
Table of Contents
PART I
ITEM 1. BUSINESS
Certain matters discussed or incorporated by reference in this Annual Report on Form 10-K including, but not limited to, matters described in Item 7, “Management’s Discussion and Analysis of Financial Condition and Results of Operations,” are “forward-looking statements” within the meaning of Section 21E of the Securities Exchange Act of 1934, as amended, and Section 27A of the Securities Act of 1933, as amended, and subject to the safe-harbor provisions of the Private Securities Litigation Reform Act of 1995. Such forward-looking statements may contain words related to future projections including, but not limited to, words such as “believe,” “expect,” “anticipate,” “intend,” “may,” “will,” “should,” “could,” “would,” and variations of those words and similar words that are subject to risks, uncertainties and other factors that could cause actual results to differ materially from those projected. Factors that could cause or contribute to such differences include, but are not limited to, the following: (1) the duration of financial and economic volatility and actions taken by the United States Congress and governmental agencies, including the United States Department of the Treasury, to deal with challenges to the U.S. financial system; (2) variances in the actual versus projected growth in assets and return on assets; (3) loan losses; (4) expenses; (5) changes in the interest rate environment including interest rates charged on loans, earned on securities investments and paid on deposits and other borrowed funds; (6) competition effects; (7) fee and other noninterest income earned; (8) general economic conditions nationally, regionally, and in the operating market areas of the Company and its subsidiaries including State and local budget issues being addressed in California; (9) changes in the regulatory environment including government intervention in the U.S. financial system; (10) changes in business conditions and inflation; (11) changes in securities markets, public debt markets, and other capital markets; (12) data processing and other operational systems failures or fraud; (13) a further decline in real estate values in the Company’s operating market areas; (14) the effects of uncontrollable events such as terrorism, the threat of terrorism or the impact of the current military conflicts in Afghanistan and Iraq and the conduct of the war on terrorism by the United States and its allies, worsening financial and economic conditions, natural disasters, and disruption of power supplies and communications; and (15) changes in accounting standards, tax laws or regulations and interpretations of such standards, laws or regulations, as well as other factors. The factors set forth under Item 1A, “Risk Factors”, in this report and other cautionary statements and information set forth in this report should be carefully considered and understood as being applicable to all related forward-looking statements contained in this report when evaluating the business prospects of the Company and its subsidiaries.
Forward-looking statements are not guarantees of performance. By their nature, they involve risks, uncertainties and assumptions. Actual results and shareholder values in the future may differ significantly from those expressed in forward-looking statements. You are cautioned not to put undue reliance on any forward-looking statement. Any such statement speaks only as of the date of the report, and in the case of any documents that may be incorporated by reference, as of the date of those documents. We do not undertake any obligation to update or release any revisions to any forward-looking statements, or to report any new information, future event or other circumstances after the date of this report or to reflect the occurrence of unanticipated events, except as required by law. However, your attention is directed to any further disclosures made on related subjects in our subsequent reports filed with the Securities and Exchange Commission on Forms 10-K, 10-Q and 8-K.
General
North Valley Bancorp (the “Company”) is a bank holding company registered with and subject to regulation and supervision by the Board of Governors of the Federal Reserve System (“FRB” or the “Board of Governors”). The Company was incorporated in 1980 in the State of California. The Company owns 100% of its principal subsidiaries, North Valley Bank (“NVB” or the “Bank”), North Valley Trading Company (“Trading Company”), which is inactive, North Valley Capital Trust I, North Valley Capital Trust II, North Valley Capital Trust III, and North Valley Capital Statutory Trust IV.The Company acquired Six Rivers National Bank (based in Eureka, California) in 2000, and Yolo Community Bank (based in Woodland, California) in 2004. Over time, the former branches and operations of Six Rivers National Bank and Yolo Community Bank were combined with the branches and operations of North Valley Bank and the information contained in this report reflects their combined results of operations.
At December 31, 2011 the Company had $904,966,000 in total assets, $456,215,000 in total loans and $766,239,000 in total deposits. The Company does not hold deposits of any one customer or group of customers where the loss of such deposits would have a material adverse effect on the Company. The Company’s business is not seasonal.
NVB was organized in September 1972, under the laws of the State of California, and commenced operations in February 1973. NVB is principally supervised and regulated by the California Commissioner of Financial Institutions (the “Commissioner”) and conducts a commercial and retail banking business, which includes accepting demand, savings, and money market rate deposit accounts and time deposits, and making commercial, real estate and consumer loans. It also issues cashier’s checks and money orders, sells travelers’ checks and provides safe deposit boxes and other customary banking services. As a state-chartered insured member bank, NVB is also subject to regulation by the Board of Governors of the Federal Reserve System (the “Board of Governors”) and its deposits are insured by the Federal Deposit Insurance Corporation (“FDIC”) up to the maximum amount which is $250,000 per separately insured depositor. FDIC-insured deposits are our primary source of funds. As part of our asset-liability management, we analyze the maturities and interest rates of our retail deposits in order to promote stability in our supply of funds, to the extent feasible under changing market conditions. For more deposit information, see Item 7 “Management’s Discussion and Analysis of Financial Condition and Results of Operations – Balance Sheet Analysis – Deposits.”
NVB has signed agreements with Essex National Securities, Inc., a registered broker-dealer, (“ENSI”) whereby ENSI provides broker/dealer services and standardized investment advice to NVB customers. NVB shares in the fees and commissions paid to ENSI on a pre-determined schedule. Majority ownership of ENSI is held by Addison Avenue Financial Partners, LLC, a subsidiary of the First Tech Federal Credit Union, headquartered in Palo Alto, California.
NVB operates twenty-four banking offices in Shasta, Trinity, Humboldt, Del Norte, Yolo, Sonoma, Placer, and Mendocino Counties, for which it has received all of the requisite regulatory approvals. The headquarters office in Redding opened in February 1973. In October 1973, NVB opened its Weaverville Office; in October 1974, its Hayfork Office; in January 1978, its Anderson Office; and in September 1979, its Enterprise Office (East Redding). On December 20, 1982, NVB acquired the assets of two branches of the Bank of California: one located in Shasta Lake and the other in Redding, California. On June 1, 1985, NVB opened its Westwood Village Office in South Redding. On November 27, 1995, NVB opened a branch located in Palo Cedro, California. On October 14, 1997, NVB relocated its branch in Shasta Lake to a new facility. NVB opened two super-market branches in 1998 located in Cottonwood, California and Redding, California. On May 11, 1998, NVB opened a Business Banking Center in Redding, California, to provide banking services to business and professional clients. On August 13, 2001, the Business Banking Center and the Company’s Administrative offices moved to a new location at 300 Park Marina Circle in Redding, California. On August 5, 2002, NVB opened an Express Banking Center located at 2245 Churn Creek Road in Redding.
Markets We Serve
The Company is headquartered in Redding and operates twenty-four commercial banking offices in eight counties in Northern California. The Company views its service area as having four distinct markets:
| | · | The Redding market – NVB was founded in Redding, California, which is located in Shasta County, and has grown organically there since 1973. Shasta County is a mature, slow growth market that has a population of roughly 177,000. The median household income is $44,000 and the median age is 41.8 years. The unemployment rate in Shasta County as of December 2011 was 13.4%. The primary employment types are the Services Industry and Government. The major employers are the State of California – local government offices, Sierra Pacific Industries, Mercy Hospital, and Shasta Regional Medical Facility. |
| | | |
| | · | The Coastal market – the Company acquired its presence in the coastal market (which includes Humboldt, Del Norte, Trinity, and Mendocino Counties) through the acquisition of Six Rivers National Bank in 2000. The Coastal market is a mature, slow growth market. Most of the NVB branches are small retail facilities located in rural towns, with the exception of Eureka, which is located in Humboldt County and has a population of approximately 27,000. Humboldt County has a population of approximately 135,000, median household income of $40,000, and the median age is 37.1 years. The unemployment rate in Humboldt County as of December 2011 was 10.6%. Employment has traditionally been fishing and timber resource based. The major employers are various seafood-related companies and the State of California – local government offices. |
| | | |
| | · | The I-80 Corridor market – the Company has a business banking office located in each of Roseville, California and Woodland, California along Interstate 80. This market is a growth market and the Company acquired its presence in this market through the acquisition of Yolo Community Bank in 2004. Roseville, which is located in Placer County, has a population of 119,000 and the county population is approximately 348,000. The county’s median household income is $74,400 and the median age 40.3 years. The unemployment rate in Placer County as of December 2011 was 9.5%. The local economy provides many employment types and some major employers are Hewlett-Packard, Telefunken Semiconductors USA, Kaiser Permanente and the Union Pacific Railroad. Woodland, which is located in Yolo County, has a population of approximately 55,000 and the county population is approximately 200,000. The county’s median household income is $57,000 and the median age 30.4 years. The unemployment rate in Yolo County as of December 2011 was 13.2%. The primary employment types are agriculture, manufacturing, technology companies, services, merchants, and tourism. The major employers are University of California at Davis, Cache Creek Casino Resort, and the US Postal Service. |
| | · | The Santa Rosa market – the Company established its presence in the Santa Rosa market through de novo branching when it opened a business banking office in 2005. Santa Rosa, which is located in Sonoma County, is a growth market. Santa Rosa has a population of 168,000 and the county population is approximately 484,000. The county’s median household income is $63,200 and the median age 39.9 years. The unemployment rate in Sonoma County as of December 2011 was 8.9%. The primary employment types are education and health services, retail trade, tourism and the wine industry. The major employers are Kaiser Permanente, St. Joseph Health System, Agilent Technologies, and Medtronic Cardio Vascular. |
Subordinated Debentures
The Company owns the common stock of four business trusts that have issued an aggregate of $31.0 million in trust preferred securities fully and unconditionally guaranteed by the Company. The entire proceeds of each respective issuance of trust preferred securities were invested by the separate business trusts into junior subordinated debentures issued by the Company, with identical maturity, repricing and payment terms as the respective issuance of trust preferred securities. The aggregate amount of junior subordinated debentures issued by the Company is $32.0 million, with the maturity dates for the respective debentures ranging from 2031 through 2036. Subject to regulatory approval, the Company may redeem the respective junior subordinated debentures earlier than the maturity date, with certain of the debentures being redeemable beginning in July 2006 and others being redeemable beginning in April 2008, July 2009 and March 2011. On November 9, 2009, the Company elected to defer the payment of interest on these securities. The Company is allowed to defer the payment of interest for up to 20 consecutive quarterly periods without triggering an event of default. The obligation to pay interest is cumulative and will continue to accrue. For more information about the trust preferred securities and the debentures and certain regulatory restrictions on the payment of interest, see Notes 10 and 18 to the Notes to Consolidated Financial Statements.
Supervision and Regulation
The common stock of the Company is subject to the registration requirements of the Securities Act of 1933, as amended, and the qualification requirements of the California Corporate Securities Law of 1968, as amended. The Company is also subject to the periodic reporting requirements of Section 13 of the Securities Exchange Act of 1934, as amended, which include, but are not limited to, the filing of annual, quarterly and current reports with the Securities and Exchange Commission.
NVB is chartered by the California Department of Financial Institutions (“DFI”), and subject to the rules and regulations of the Commissioner. NVB’s deposits are insured by the FDIC, and NVB is a member of the Federal Reserve System. Consequently, NVB is subject to the supervision of, and is regularly examined by, the Commissioner and the Board of Governors. Such supervision and regulation includes comprehensive reviews of all major aspects of the Bank’s business and condition, including its capital ratios, allowance for loan losses and other factors. However, no inference should be drawn that such authorities have approved any such factors. NVB is required to file reports with the Commissioner and the Board of Governors and provide such additional information as the Commissioner and the Board of Governors may require.
The Company is a bank holding company within the meaning of the Bank Holding Company Act of 1956, as amended (the “Bank Holding Company Act”), and is registered as such with, and subject to the supervision of, the Board of Governors. The Company is required to obtain the approval of the Board of Governors before it may acquire all or substantially all of the assets of any bank, or ownership or control of the voting shares of any bank if, after giving effect to such acquisition of shares, the Company would own or control more than 5% of the voting shares of such bank. The Bank Holding Company Act prohibits the Company from acquiring any voting shares of, or interest in, all or substantially all of the assets of, a bank located outside the State of California unless such an acquisition is specifically authorized by the laws of the state in which such bank is located. Any such interstate acquisition is also subject to the provisions of the Riegle-Neal Interstate Banking and Branching Efficiency Act of 1994.
The Company, and its subsidiary, NVB, are deemed to be “affiliates” within the meaning of that term as defined in the Federal Reserve Act. This means, for example, that there are limitations (a) on loans between affiliates, and (b) on investments by NVB in affiliates’ stock as collateral for loans to any borrower. The Company and its subsidiaries are also subject to certain restrictions with respect to engaging in the underwriting, public sale and distribution of securities.
Capital Adequacy. The Board of Governors and the FDIC have adopted risk-based capital guidelines for evaluating the capital adequacy of bank holding companies and banks. The guidelines are designed to make capital requirements sensitive to differences in risk profiles among banking organizations, to take into account off-balance sheet exposures and to aid in making the definition of bank capital uniform internationally. Under the guidelines, the Company and its banking subsidiaries are required to maintain capital equal to at least 8% of its assets and commitments to extend credit, weighted by risk, of which at least 4% must consist primarily of common equity (including retained earnings) and the remainder may consist of subordinated debt, cumulative preferred stock, or a limited amount of loan loss reserves.The Company and NVB are subject to regulations issued by the Board of Governors and the FDIC, which require maintenance of a certain level of capital. These regulations impose two capital standards: a risk-based capital standard and a leverage capital standard.
Assets, commitments to extend credit and off-balance sheet items are categorized according to risk and certain assets considered to present less risk than others permit maintenance of capital at less than the 8% ratio. For example, most home mortgage loans are placed in a 50% risk category and therefore require maintenance of capital equal to 4% of such loans, while commercial loans are placed in a 100% risk category and therefore require maintenance of capital equal to 8% of such loans.
Under the Board of Governors’ risk-based capital guidelines, assets reported on an institution’s balance sheet and certain off-balance sheet items are assigned to risk categories, each of which has an assigned risk weight. Capital ratios are calculated by dividing the institution’s qualifying capital by its period-end risk-weighted assets. The guidelines establish two categories of qualifying capital: Tier 1 capital (defined to include common stockholders’ equity and noncumulative perpetual preferred stock) and Tier 2 capital which includes, among other items, limited life (and in case of banks, cumulative) preferred stock, mandatory convertible securities, subordinated debt and a limited amount of reserve for loan losses. Tier 2 capital may also include up to 45% of the pretax net unrealized gains on certain available-for-sale equity securities having readily determinable fair values (i.e. the excess, if any, of fair market value over the book value or historical cost of the investment security). The federal regulatory agencies reserve the right to exclude all or a portion of the unrealized gains upon a determination that the equity securities are not prudently valued. Unrealized gains and losses on other types of assets, such as bank premises and available-for-sale debt securities, are not included in Tier 2 capital, but may be taken into account in the evaluation of overall capital adequacy and net unrealized losses on available-for-sale equity securities will continue to be deducted from Tier 1 capital as a cushion against risk. Each institution is required to maintain a risk-based capital ratio (including Tier 1 and Tier 2 capital) of 8%, of which at least half must be Tier 1 capital.
Under the Board of Governors’ leverage capital standard, an institution is required to maintain a minimum ratio of Tier 1 capital to the sum of its quarterly average total assets and quarterly average reserve for loan losses, less intangibles not included in Tier 1 capital. Period-end assets may be used in place of quarterly average total assets on a case-by-case basis. The Board of Governors and the FDIC have adopted a minimum leverage ratio for bank holding companies as a supplement to the risk-weighted capital guidelines. The leverage ratio establishes a minimum Tier 1 ratio of 3% (Tier 1 capital to total assets) for the highest rated bank holding companies or those that have implemented the risk-based capital market risk measure. All other bank holding companies must maintain a minimum Tier 1 leverage ratio of 4% with higher leverage capital ratios required for bank holding companies that have significant financial and/or operational weakness, a high risk profile, or are undergoing or anticipating rapid growth.
At December 31, 2011, the Company and the Bank were in compliance with the risk-based capital and leverage ratios described above. See Item 8, “Financial Statements and Supplementary Data”, and Note 18 to the Financial Statements incorporated by reference therein, for a listing of the Company’s and Bank’s risk-based capital ratios at December 31, 2011 and 2010.
FDICIA. The Board of Governors, the Comptroller of the Currency (“OCC”) and the FDIC have adopted regulations implementing a system of prompt corrective action for insured financial institutions pursuant to Section 38 of the Federal Deposit Insurance Act and Section 131 of the Federal Deposit Insurance Corporation Improvement Act of 1991 (“FDICIA”). These regulations establish five capital categories with the following characteristics: (1) “Well capitalized” - consisting of institutions with a total risk-based capital ratio of 10% or greater, a Tier 1 risk-based capital ratio of 6% or greater and a leverage ratio of 5% or greater, and the institution is not subject to any written agreement, order, capital directive, or prompt corrective action directive to meet and maintain a specific capital level for any capital measure; (2) “Adequately capitalized” - consisting of institutions with a total risk-based capital ratio of 8% or greater, a Tier 1 risk-based capital ratio of 4% or greater and a leverage ratio of 4% or greater, and the institution does not meet the definition of a “well capitalized” institution; (3) “Undercapitalized” - consisting of institutions with a total risk-based capital ratio less than 8%, a Tier 1 risk-based capital ratio of less than 4%, or a leverage ratio of less than 4%; (4) “Significantly undercapitalized” - consisting of institutions with a total risk-based capital ratio of less than 6%, a Tier 1 risk-based capital ratio of less than 3%, or a leverage ratio of less than 3%; and (5) “Critically undercapitalized” - consisting of an institution with a ratio of tangible equity to total assets that is equal to or less than 2%. NVB is considered “well capitalized” under the framework for prompt corrective action.
The regulations established procedures for classification of financial institutions within the capital categories, filing and reviewing capital restoration plans required under the regulations and procedures for issuance of directives by the appropriate regulatory agency, among other matters. The regulations impose restrictions upon all institutions to refrain from certain actions which would cause an institution to be classified within any one of the three “undercapitalized” categories, such as declaration of dividends or other capital distributions or payment of management fees, if following the distribution or payment the institution would be classified within one of the “undercapitalized” categories. In addition, institutions which are classified in one of the three “undercapitalized” categories are subject to certain mandatory and discretionary supervisory actions. Mandatory supervisory actions include (1) increased monitoring and review by the appropriate federal banking agency; (2) implementation of a capital restoration plan; (3) total asset growth restrictions; and (4) limitation upon acquisitions, branch expansion, and new business activities without prior approval of the appropriate federal banking agency. Discretionary supervisory actions may include (1) requirements to augment capital; (2) restrictions upon affiliate transactions; (3) restrictions upon deposit gathering activities and interest rates paid; (4) replacement of senior executive officers and directors; (5) restrictions upon activities of the institution and its affiliates; (6) requiring divestiture or sale of the institution; and (7) any other supervisory action that the appropriate federal banking agency determines is necessary to further the purposes of the regulations. Further, the federal banking agencies may not accept a capital restoration plan without determining, among other things, that the plan is based on realistic assumptions and is likely to succeed in restoring the depository institution’s capital. In addition, for a capital restoration plan to be acceptable, the depository institution’s parent holding company must guarantee that the institution will comply with such capital restoration plan. The aggregate liability of the parent holding company under the guaranty is limited to the lesser of (i) an amount equal to 5 percent of the depository institution’s total assets at the time it became undercapitalized, and (ii) the amount that is necessary (or would have been necessary) to bring the institution into compliance with all capital standards applicable with respect to such institution as of the time it fails to comply with the plan. If a depository institution fails to submit an acceptable plan, it is treated as if it were “significantly undercapitalized.” FDICIA also restricts the solicitation and acceptance of and interest rates payable on brokered deposits by insured depository institutions that are not “well capitalized.” An “undercapitalized” institution is not allowed to solicit deposits by offering rates of interest that are significantly higher than the prevailing rates of interest on insured deposits in the particular institution’s normal market areas or in the market areas in which such deposits would otherwise be accepted.
Any financial institution which is classified as “critically undercapitalized” must be placed in conservatorship or receivership within 90 days of such determination unless it is also determined that some other course of action would better serve the purposes of the regulations. Critically undercapitalized institutions are also prohibited from making (but not accruing) any payment of principal or interest on subordinated debt without the prior approval of the FDIC and the FDIC must prohibit a critically undercapitalized institution from taking certain other actions without its prior approval, including (1) entering into any material transaction other than in the usual course of business, including investment expansion, acquisition, sale of assets or other similar actions; (2) extending credit for any highly leveraged transaction; (3) amending articles or bylaws unless required to do so to comply with any law, regulation or order; (4) making any material change in accounting methods; (5) engaging in certain affiliate transactions; (6) paying excessive compensation or bonuses; and (7) paying interest on new or renewed liabilities at rates which would increase the weighted average costs of funds beyond prevailing rates in the institution’s normal market areas.
Under FDICIA, the federal financial institution agencies have adopted regulations which require institutions to establish and maintain comprehensive written real estate lending policies which address certain lending considerations, including loan-to-value limits, loan administrative policies, portfolio diversification standards, and documentation, approval and reporting requirements. FDICIA further generally prohibits an insured state bank from engaging as a principal in any activity that is impermissible for a national bank, absent an FDIC determination that the activity would not pose a significant risk to the Bank Insurance Fund, and that the bank is, and will continue to be, within applicable capital standards. Similar restrictions apply to subsidiaries of insured state banks. The Company does not currently intend to engage in any activities which would be restricted or prohibited under FDICIA.
Rating System. The Federal Financial Institution Examination Counsel (“FFIEC”) on December 13, 1996, approved an updated Uniform Financial Institutions Rating System (“UFIRS”). In addition to the five components traditionally included in the so-called “CAMEL” rating system which has been used by bank examiners for a number of years to classify and evaluate the soundness of financial institutions (including capital adequacy, asset quality, management, earnings and liquidity), UFIRS includes for all bank regulatory examinations conducted on or after January 1, 1997, a new rating for a sixth category identified as sensitivity to market risk. Ratings in this category are intended to reflect the degree to which changes in interest rates, foreign exchange rates, commodity prices or equity prices may adversely affect an institution’s earnings and capital. The revised rating system is identified as the “CAMELS” system.
CRA Compliance. Community Reinvestment Act (“CRA”) regulations evaluate banks’ lending to low and moderate income individuals and businesses across a four-point scale from “outstanding” to “substantial noncompliance,” and are a factor in regulatory review of applications to merge, establish new branches or form bank holding companies. In addition, any bank rated in “substantial noncompliance” with the CRA regulations may be subject to enforcement proceedings. NVB currently has a rating of “satisfactory” for CRA compliance.
Regulatory Compliance.The Bank is subject to periodic regulatory examinations in the ordinary course of business which are conducted by the Federal Reserve Bank of San Francisco and the California Department of Financial Institutions. Currently there remains pending a compliance examination of the Bank conducted by the Federal Reserve Bank of San Francisco and, therefore, the Bank has not received the final report of examination.
Dividends. The Company’s ability to pay cash dividends is subject to restrictions set forth in the California General Corporation Law. Funds for payment of any cash dividends by the Company would be obtained from its investments as well as dividends from NVB. The ability of NVB to pay cash dividends is subject to restrictions set forth in the California Financial Code as well as restrictions established by the FDIC and the FRB. See Items 1A, “Risk Factors” and 5, “Market for Registrant’s Common Equity, Related Stockholder Matters and Issuer Purchases of Equity Securities,” below for further information regarding the payment of cash dividends by the Company and NVB.
The Board of Directors of the Company decides whether to declare and pay dividends after consideration of the Company’s earnings, financial condition, future capital needs, regulatory requirements and other factors as the Board of Directors may deem relevant. On January 29, 2009, primarily as a result of the Company’s operating performance for 2008, the Board of Directors determined that it was in the best interest of the Company to suspend indefinitely the payment of quarterly cash dividends on its common stock, beginning in 2009.
The Company relies upon distributions from NVB in the form of cash dividends in order to pay dividends to its shareholders. The Board of Governors of the Federal Reserve System generally prohibits a bank holding company from declaring or paying a cash dividend which would impose undue pressure on the capital of a subsidiary bank or would be funded only through borrowing or other arrangements that might adversely affect a bank holding company’s financial position. The Federal Reserve Board policy is that a bank holding company should not continue its existing rate of cash dividends on its common stock unless its net income is sufficient to fully fund each dividend and its prospective rate of earnings retention appears consistent with its capital needs, asset quality and overall financial condition.
Regulatory Agreement
A written agreement was signed on January 6, 2010 among the Company, NVB and the Federal Reserve Bank of San Francisco (the final written agreement, as executed by the parties, is herein called the “Written Agreement”). Among other things, the Written Agreement provides that the Company and NVB shall submit to the Federal Reserve Bank of San Francisco (the “Reserve Bank”) their continuing plans to enhance lending and credit administration functions, to maintain policies and procedures for the maintenance of an adequate allowance for loan losses, to strengthen the management of commercial real estate concentrations and to update its capital plan in order to maintain capital ratios at or above the required minimums. The Written Agreement also restricts the payment of dividends, any payments on trust preferred securities, certain indemnification and severance payments, and any reduction in capital or the purchase or redemption of stock without the prior approval of the Reserve Bank. Progress reports detailing the form and manner of all actions taken to secure compliance with the Written Agreement must be submitted to the Reserve Bank at least quarterly. This description of the Written Agreement is a summary and does not purport to be a complete description of all of the terms of such agreement and is qualified in its entirety by reference to the copy of the Written Agreement filed with the Securities and Exchange Commission on January 8, 2010 as an exhibit to the Company’s Current Report on Form 8-K.
The Directors and senior management of the Company and NVB agree with the goal of financial soundness represented by the Written Agreement and have taken appropriate action to comply with all requirements (including timelines) specified in the Written Agreement, as follows:
Capital Plan.Within 60 days of signing the Written Agreement, the Company was required to submit to the Reserve Bank a plan to maintain sufficient capital, on a consolidated basis, and the Company and NVB were required to jointly submit to the Reserve Bank a plan to maintain sufficient capital at NVB, as a separate entity. These plans were submitted to the Reserve Bank within the 60-day period, addressing among other things, the Company’s current and future capital needs, including compliance with capital adequacy guidelines for bank holding companies; NVB’s current and future capital needs, including compliance with the capital adequacy guidelines for state member banks; the adequacy of NVB’s capital, taking into account the volume of classified credits, concentrations of credit, the allowance for loan losses, current and projected asset growth and projected retained earnings; the source and timing of additional funds to fulfill the Company’s and NVB’s future capital requirements; and the requirements of Regulation Y, that the Company serve as a source of strength to NVB. The Reserve Bank accepted these plans and the Company completed a capital raise of $40,000,000, (net $37,500,000 after costs) on April 22, 2010 and contributed $33,500,000 of the net proceeds to the capital of NVB.
Strategic Plan and Budget.Within 60 days of signing the Written Agreement, NVB was also required to submit a business plan for 2010 to improve NVB’s earnings and overall condition. That plan was submitted to the Reserve Bank within the 60-day period and is being implemented as agreed. NVB is also required to submit a business plan and budget for each calendar year subsequent to 2010 at least 30 days prior to the beginning of that calendar year.
Concentrations of Credit.Within 45 days of signing the Written Agreement, NVB was required to submit a plan to strengthen NVB’s management of commercial real estate concentrations, including steps to reduce or mitigate the risk of concentrations. That plan was submitted to the Reserve Bank within the 45-day period and was accepted by the Reserve Bank and is being implemented by NVB as agreed.
Lending and Credit Administration.Within 60 days of signing the Written Agreement, NVB was required to submit a program to enhance lending and credit administration that addresses, considers and includes, at a minimum, work-out strategies for problem loans and loans on the NVB watch list; standards for interest-only loans; and standards for the timely movement of loans to nonaccrual status. Such a program was submitted to the Reserve Bank within the 60-day period and was accepted by the Reserve Bank and is being implemented by NVB as agreed.
Asset Improvement.Within 60 days of signing the Written Agreement, NVB was required to submit a plan designed to improve NVB’s position through repayment, amortization, liquidation, additional collateral or other means on loans in excess of $1,000,000 which may be past due or on NVB’s problem loan list or otherwise adversely classified. Also, for any such loan NVB is required to submit a plan to improve NVB’s position on such loan and must submit a progress report updating each improvement plan within 30 days after the end of each calendar quarter. Such a plan was submitted to and accepted by the Reserve Bank and implemented within the 60-day period and NVB has timely submitted all related plans and progress reports to date.
Allowance for Loan Losses.Within 60 days of signing the Written Agreement, NVB was required to submit an acceptable program for the maintenance of an adequate Allowance for Loan Losses, to be reviewed by NVB’s Board of Directors on at least a quarterly calendar basis with reports regarding such review submitted to the Reserve Bank within 30 days after the end of each calendar quarter. Such a program was submitted to the Reserve Bank within the 60-day period and has been accepted by the Reserve Bank. Quarterly reports have also been timely filed with the Reserve Bank.
Debt and Stock Redemption. The Company may not, directly or indirectly, incur, increase or guarantee any debt, and may not, directly or indirectly, purchase or redeem any shares of its stock, without the prior written approval of the Reserve Bank. The Company has not undertaken any of the aforementioned items.
Progress Reports.Within 30 days after the end of each calendar quarter following the date of the Written Agreement, the Company and NVB are required to submit to the Reserve Bank written progress reports detailing the actions taken to secure compliance with the Written Agreement and the results of such actions. All plans, reports and other information required by the Written Agreement are being submitted to the Reserve Bank within the requisite timeframes stipulated in the Written Agreement. The same or similar plans, reports and information are being submitted to the California Department of Financial Institutions.
Communications from the Reserve Bank have continued to confirm that the Company and NVB are currently in compliance with all provisions of the Written Agreement.
The Patriot Act
On October 26, 2001, President Bush signed the USA Patriot Act (the “Patriot Act”), which includes provisions pertaining to domestic security, surveillance procedures, border protection, and terrorism laws to be administered by the Secretary of the Treasury. Title III of the Patriot Act entitled, “International Money Laundering Abatement and Anti-Terrorist Financing Act of 2001” includes amendments to the Bank Secrecy Act which expand the responsibilities of financial institutions in regard to anti-money laundering activities with particular emphasis upon international money laundering and terrorism financing activities through designated correspondent and private banking accounts.
Effective December 25, 2001, Section 313(a) of the Patriot Act prohibits any insured financial institution such as North Valley Bank, from providing correspondent accounts to foreign banks which do not have a physical presence in any country (designated as “shell banks”), subject to certain exceptions for regulated affiliates of foreign banks. Section 313(a) also requires financial institutions to take reasonable steps to ensure that foreign bank correspondent accounts are not being used to indirectly provide banking services to foreign shell banks, and Section 319(b) requires financial institutions to maintain records of the owners and agent for service of process of any such foreign banks with whom correspondent accounts have been established.
Effective July 23, 2002, Section 312 of the Patriot Act created a requirement for special due diligence for correspondent accounts and private banking accounts. Under Section 312, each financial institution that establishes, maintains, administers, or manages a private banking account or a correspondent account in the United States for a non-United States person, including a foreign individual visiting the United States, or a representative of a non-United States person shall establish appropriate, specific, and, where necessary, enhanced, due diligence policies, procedures, and controls that are reasonably designed to detect and record instances of money laundering through those accounts.
The Patriot Act contains various provisions in addition to Sections 313(a) and 312 that affect the operations of financial institutions by encouraging cooperation among financial institutions, regulatory authorities and law enforcement authorities with respect to individuals, entities and organizations engaged in, or reasonably suspected of engaging in, terrorist acts or money laundering activities. The Company and North Valley Bank are not currently aware of any account relationships between North Valley Bank and any foreign bank or other person or entity as described above under Sections 313(a) or 312 of the Patriot Act.
Certain surveillance provisions of the Patriot Act were scheduled to expire on December 31, 2005, and actions to restrict the use of the Patriot Act surveillance provisions were filed by the ACLU and other organizations. On March 9, 2006, after temporary extensions of the Patriot Act, President Bush signed the “USA Patriot Improvement and Reauthorization Act of 2005” and the “USA Patriot Act Additional Reauthorizing Amendments Act of 2006,” which reauthorized all expiring provisions of the Patriot Act and extended certain provisions related to surveillance and production of business records until December 31, 2009. The extended deadline for those provisions was subsequently further extended at various times during 2010 and 2011 and on May 26, 2011, President Obama signed a further four-year extension of the surveillance provisions.
The effects which the Patriot Act and any additional legislation enacted by Congress may have upon financial institutions is uncertain; however, such legislation could increase compliance costs and thereby potentially may have an adverse effect upon the Company’s results of operations.
The Sarbanes-Oxley Act of 2002
On July 30, 2002, President George W. Bush signed into law the Sarbanes-Oxley Act of 2002 (the “Act”), legislation designed to address certain issues of corporate governance and accountability. The key provisions of the Act and the rules promulgated by the SEC pursuant to the Act include the following:
| | · | Expanded oversight of the accounting profession by creating a new independent public company oversight board to be monitored by the SEC. |
| | · | Revised rules on auditor independence to restrict the nature of non-audit services provided to audit clients and to require such services to be pre-approved by the audit committee. |
| | · | Improved corporate responsibility through mandatory listing standards relating to audit committees, certifications of periodic reports by the CEO and CFO and making issuer interference with an audit a crime. |
| | · | Enhanced financial disclosures, including periodic reviews for largest issuers and real time disclosure of material company information. |
| | · | Enhanced criminal penalties for a broad array of white collar crimes and increases in the statute of limitations for securities fraud lawsuits. |
| | · | Disclosure of whether a company has adopted a code of ethics that applies to the company’s principal executive officer, principal financial officer, principal accounting officer or controller, or persons performing similar functions, and disclosure of any amendments or waivers to such code of ethics. |
| | · | Disclosure of whether a company’s audit committee of its board of directors has a member of the audit committee who qualifies as an “audit committee financial expert.” |
| | · | A prohibition on insider trading during pension plan black-out periods. |
| | · | Disclosure of off-balance sheet transactions. |
| | · | A prohibition on personal loans to directors and officers. |
| | · | Conditions on the use of non-GAAP (generally accepted accounting principles) financial measures. |
| | · | Standards of professional conduct for attorneys, requiring attorneys having an attorney-client relationship with a company, among other matters, to report “up the ladder” to the audit committee, to another board committee or to the entire board of directors regarding certain material violations. |
| | · | Expedited filing requirements for Form 4 reports of changes in beneficial ownership of securities, reducing the filing deadline to within 2 business days of the date on which an obligation to report is triggered. |
| | · | Accelerated filing requirements for reports on Forms 10-K and 10-Q by public companies which qualify as “accelerated filers,” with a phased-in reduction of the filing deadline for Form 10-K and Form 10-Q. |
| | · | Disclosure concerning website access to reports on Forms 10-K, 10-Q and 8-K, and any amendments to those reports, by “accelerated filers” as soon as reasonably practicable after such reports and material are filed with or furnished to the SEC. |
| | · | Rules requiring national securities exchanges and national securities associations to prohibit the listing of any security whose issuer does not meet audit committee standards established pursuant to the Act. |
The Company’s securities are listed on the NASDAQ Global Select Market. Consequently, in addition to the rules promulgated by the SEC pursuant to the Act, the Company must also comply with the listing standards applicable to all NASDAQ listed companies. The NASDAQ listing standards applicable to the Company include standards related to (i) director independence, (ii) executive session meetings of the board, (iii) requirements for audit, nominating and compensation committee charters, membership qualifications and procedures, (iv) shareholder approval of equity compensation arrangements, and (v) code of conduct requirements.
The Company has incurred and it is anticipated that it will continue to incur increased costs to comply with the Act and the rules and regulations promulgated pursuant to the Act by the Securities and Exchange Commission, NASDAQ and other regulatory agencies having jurisdiction over the Company or the issuance and listing of its securities. The Company does not currently anticipate that compliance with the Act and such rules and regulations will have a material adverse effect upon its financial position or results of its operations or its cash flows. Management is required to report on the effectiveness of internal control over financial reporting, but an external attestation report of the Company’s independent registered public accounting firm regarding internal control over financial reporting was not required for the year ended December 31, 2011 and 2010. See Item 9A, “Controls and Procedures,” below.
The California Corporate Disclosure Act
Effective January 1, 2003, the California Corporate Disclosure Act (the “CCD Act”) required publicly traded corporations incorporated or qualified to do business in California to disclose information about their past history, auditors, directors and officers. Effective September 28, 2004, the CCD Act, as currently in effect and codified at California Corporations Code Section 1502.1, requires the Company to file with the California Secretary of State and disclose within 150 days after the end of its fiscal year certain information including the following:
| | · | The name of the company’s independent registered accounting firm and a description of services, if any, performed for a company during the previous two fiscal years and the period from the end of the most recent fiscal year to the date of filing; |
| | · | The annual compensation paid to each director and the five most highly compensated non-director executive officers (including the CEO and CFO) during the most recent fiscal year, including all plan and non-plan compensation for all services rendered to a company as specified in Item 402 of Regulation S-K such as grants, awards or issuance of stock, stock options and similar equity-based compensation; |
| | · | A description of any loans made to a director at a “preferential” loan rate during the company’s two most recent fiscal years, including the amount and terms of the loans; |
| | · | Whether any bankruptcy was filed by a company or any of its directors or executive officers within the previous 10 years; |
| | · | Whether any director or executive officer of a company has been convicted of fraud during the previous 10 years; and |
| | · | A description of any material pending legal proceedings other than ordinary routine litigation as specified in Item 103 of Regulation S-K and a description of such litigation where the company was found legally liable by a final judgment or order. |
The Company does not currently anticipate that compliance with the CCD Act will have a material adverse effect upon its financial position or results of its operations or its cash flows.
Competition
At June 30, 2011, commercial and savings banks in competition with the Company had 394 banking offices in the counties of Del Norte, Humboldt, Mendocino, Placer, Shasta, Sonoma, Trinity and Yolo where the Company operates. In those 394 banking offices (which include the Company’s 24), there were $25.0 billion in total deposits of which the Company had an overall share of 3.0%. Additionally, the Company competes with thrifts and, to a lesser extent, credit unions, finance companies and other financial service providers for deposit and loan customers.
Larger banks may have a competitive advantage over the Company because of higher lending limits and major advertising and marketing campaigns. They also perform services, such as trust services and international banking which the Company is not authorized nor prepared to offer currently. The Company has arranged with correspondent banks and with others to provide some of these services for their customers. As of December 31, 2011, NVB’s lending limit to any one borrower is $33,489,000 on a fully secured basis and $20,093,000 on an unsecured basis. These limits are adequate in most instances to compete for lending relationships within the markets we currently serve.
In order to compete with the major financial institutions in its primary service areas, the Company, through NVB, utilizes to the fullest extent possible, the flexibility which is accorded by its independent status. This includes an emphasis on specialized services, local promotional activity, and personal contacts by the officers, directors and employees of the Company. NVB also seeks to provide special services and programs for individuals in its primary service area who are employed in the agricultural, professional and business fields, such as loans for equipment, furniture, tools of the trade or expansion of practices or businesses.
Banking is a business that depends heavily on net interest income. Net interest income is defined as the difference between the interest rate paid to obtain deposits and other borrowings and the interest rate received on loans extended to customers and on securities held in the Bank’s investment portfolio. Commercial banks compete with savings and loan associations, credit unions, other financial institutions and other entities for funds. For instance, yields on corporate and government debt securities and other commercial paper affect the ability of commercial banks to attract and hold deposits. Commercial banks also compete for loans with savings and loan associations, credit unions, consumer finance companies, mortgage companies and other lending institutions.
Monetary and Fiscal Policies
The net interest income of the Company, and to a large extent, its earnings, are affected not only by general economic conditions, both domestic and foreign, but also by the monetary and fiscal policies of the United States as set by statutes and as implemented by federal agencies, particularly the Board of Governors of the Federal Reserve System. The Board of Governors can and does implement national monetary policy, such as seeking to curb inflation and combat recession by its open market operations in United States government securities, adjustments in the amount of interest free reserves that banks and other financial institutions are required to maintain, and adjustments to the discount rates applicable to borrowing by banks from the Federal Reserve System. These activities influence the growth of bank loans, investments and deposits and also affect interest rates charged on loans and paid on deposits. The nature and timing of any future changes in monetary policies and their impact on the Company are not predictable.
Deposit Insurance
The FDIC is an independent federal agency that insures deposits of federally insured banks (such as North Valley Bank) and savings institutions up to prescribed limits through the Deposit Insurance Fund (“DIF”). The Emergency Economic Stabilization Act of 2008 (“EESA”) temporarily raised the limit on federal deposit insurance coverage provided by the FDIC from $100,000 to $250,000 per depositor. The Dodd-Frank Act (described in more detail below) made the $250,000 amount permanent.
In addition, on November 9, 2010, the FDIC issued a final rule (implementing the Dodd-Frank Act) which provides temporary unlimited deposit insurance coverage for non-interest bearing transaction accounts, through December 31, 2012.
The amount of FDIC assessments paid by each DIF member institution is based on its risk profile as measured by regulatory capital ratios and other supervisory factors. Under the assessment rate system established in 2006, the FDIC increased the assessment rates (effective January 1, 2007) for most institutions from $0.05 to $0.07 per $100 of insured deposits and established a Designated Reserve Ratio (“DRR”) for the DIF during 2007 at 1.25% of insured deposits. Since 2008, due to higher levels of bank failures and the need to maintain a strong DIF, the FDIC has increased the assessment rates of insured institutions and may continue to do so in the future. On November 17, 2009, the FDIC amended its regulations and required all insured financial institutions to prepay their estimated quarterly risk-based assessments for the fourth quarter of 2009, and for all of 2010, 2011 and 2012, unless they were notified they were exempt from the prepayment. The FDIC exempted North Valley Bank from the requirement to prepay. For the year ended December 31, 2011, the assessment rate for North Valley Bank averaged $0.18 per $100 in assessable deposits, compared to $0.28 per $100 in assessable deposits for the year ended December 31, 2010.
As required by the Dodd-Frank Act, the FDIC has revised the assessment rates, to be effective on April 1, 2011, and the deposit insurance assessment base used to calculate premiums paid to DIF, substituting the average consolidated total assets less average tangible equity of an institution in place of deposits. Also pursuant to the Dodd-Frank Act, the FDIC increased the DRR to 2.0 percent, effective January 1, 2011. If economic conditions continue to impact financial institutions and there are additional bank and other financial institution failures, or if the FDIC otherwise determines, North Valley Bank may be required to pay higher FDIC premiums than the recently increased levels, which could have a material and adverse effect on the earnings of the Company.
Interstate Banking
Since 1996, California law implementing certain provisions of prior federal law has (1) permitted interstate merger transactions; (2) prohibited interstate branching through the acquisition of a branch business unit located in California without acquisition of the whole business unit of the California bank; and (3) prohibited interstate branching through de novo establishment of California branch offices. Initial entry into California by an out-of-state institution must be accomplished by acquisition of or merger with an existing whole bank, which has been in existence for at least five years. The Dodd-Frank Act authorizes national and state banks to establish branches in other states to the same extent as a bank chartered by that state would be permitted to branch.
Glass-Steagall Act
The Financial Services Modernization Act of 1999 (the “FSMA”) eliminated most of the remaining depression-era “firewalls” between banks, securities firms and insurance companies which was established by the Banking Act of 1933, also known as the Glass-Steagall Act (“Glass-Steagall). Glass-Steagall sought to insulate banks as depository institutions from the perceived risks of securities dealing and underwriting, and related activities. The FSMA repealed Section 20 of Glass-Steagall, which prohibited banks from affiliating with securities firms. Bank holding companies that can qualify as “financial holding companies” can now acquire securities firms or create them as subsidiaries, and securities firms can now acquire banks or start banking activities through a financial holding company. The FSMA includes provisions which permit national banks to conduct financial activities through a subsidiary that are permissible for a national bank to engage in directly, as well as certain activities authorized by statute, or that are financial in nature or incidental to financial activities to the same extent as permitted to a “financial holding company” or its affiliates. This liberalization of United States banking and financial services regulation applies both to domestic institutions and foreign institutions conducting business in the United States. Consequently, the common ownership of banks, securities firms and insurance firms is now possible, as is the conduct of commercial banking, merchant banking, investment management, securities underwriting and insurance within a single financial institution using a “financial holding company” structure authorized by the FSMA.
Prior to the FSMA, significant restrictions existed on the affiliation of banks with securities firms and on the direct conduct by banks of securities dealing and underwriting and related securities activities. Banks were also (with minor exceptions) prohibited from engaging in insurance activities or affiliating with insurers. The FSMA removed these restrictions and substantially eliminated the prohibitions under the Bank Holding Company Act on affiliations between banks and insurance companies. Bank holding companies, which qualify as financial holding companies through an application process, can now insure, guarantee, or indemnify against loss, harm, damage, illness, disability, or death; issue annuities; and act as a principal, agent, or broker regarding such insurance services.
In order for a commercial bank to affiliate with a securities firm or an insurance company pursuant to the FSMA, its bank holding company must qualify as a financial holding company. A bank holding company will qualify if (i) its banking subsidiaries are “well capitalized” and “well managed” and (ii) it files with the Board of Governors a certification to such effect and a declaration that it elects to become a financial holding company. The amendment of the Bank Holding Company Act now permits financial holding companies to engage in activities, and acquire companies engaged in activities, that are financial in nature or incidental to such financial activities. Financial holding companies are also permitted to engage in activities that are complementary to financial activities if the Board of Governors determines that the activity does not pose a substantial risk to the safety or soundness of depository institutions or the financial system in general. These standards expand upon the list of activities “closely related to banking” which to date have defined the permissible activities of bank holding companies under the Bank Holding Company Act.
One further effect of FSMA was to require that federal financial institution and securities regulatory agencies prescribe regulations to implement the policy that financial institutions must respect the privacy of their customers and protect the security and confidentiality of customers’ non-public personal information. These regulations will require, in general, that financial institutions (1) may not disclose non-public personal information of customers to non-affiliated third parties without notice to their customers, who must have opportunity to direct that such information not be disclosed; (2) may not disclose customer account numbers except to consumer reporting agencies; and (3) must give prior disclosure of their privacy policies before establishing new customer relationships.
Discharge of Materials into the Environment
Compliance with federal, state and local regulations regarding the discharge of materials into the environment may have a substantial effect on the capital expenditure, earnings and competitive position of the Company in the event of lender liability or environmental lawsuits. Under federal law, liability for environmental damage and the cost of cleanup may be imposed upon any person or entity that is an “owner” or “operator” of contaminated property. State law provisions, which were modeled after federal law, are substantially similar. Congress established an exemption under Federal law for lenders from “owner” and/or “operator” liability, which provides that “owner” and/or “operator” do not include “a person, who, without participating in the management of a vessel or facility, holds indicia of ownership primarily to protect his security interests in the vessel or facility.”
In the event that the Company was held liable as an owner or operator of a toxic property, it could be responsible for the entire cost of environmental damage and cleanup. Such an outcome could have a serious effect on the Company’s consolidated financial condition depending upon the amount of liability assessed and the amount of cleanup required.
The Company takes reasonable steps to avoid loaning against property that may be contaminated. In order to identify possible hazards, the Company requires that all fee appraisals contain a reference to a visual assessment of hazardous waste by the appraiser. Further, on loans proposed to be secured by industrial, commercial or agricultural real estate, an Environmental Questionnaire must be completed by the borrower and any areas of concern addressed. Additionally, the borrower is required to review and sign a Hazardous Substance Certificate and Indemnity at the time the note is signed.
If the investigation reveals and if certain warning signs are discovered, but it cannot be easily ascertained, that an actual environmental hazard exists, the Company may require that the owner/buyer of the property, at his/her expense, have an Environmental Inspection performed by an insured, bonded environmental engineering firm acceptable to the Company.
Recent Regulatory Developments
In response to global credit and liquidity issues involving a number of financial institutions, the United States government, particularly the United States Department of the Treasury (the “U.S. Treasury”) and the Federal financial institution regulatory agencies, have taken a variety of extraordinary measures designed to restore confidence in the financial markets and to strengthen financial institutions, including capital injections, guarantees of bank liabilities and the acquisition of illiquid assets from banks.
TARP and the CPP. On October 3, 2008, the EESA was signed into law. Pursuant to the EESA, the U.S. Treasury was granted the authority to take a range of actions for the purpose of stabilizing and providing liquidity to the U.S. financial markets and has implemented several programs, including the purchase by the U.S. Treasury of certain troubled assets from financial institutions under the Troubled Asset Relief Program” (the “TARP”) and the direct purchase by the U.S. Treasury of equity securities of financial institutions under the Capital Purchase Program (the “CPP”). On October 24, 2008, the U.S. Treasury announced plans to direct $250 billion of the TARP funding into the CPP to acquire preferred stock investments in bank holding companies and banks. Bank holding companies and banks desiring to participate in the CPP as a Qualifying Financial Institution (“QFI”) must agree to comply with certain standardized terms and conditions specified by the U.S. Treasury. The Company did not participate in the CPP.
Financial Stability Plan. On February 10, 2009, the U.S. Treasury announced a Financial Stability Plan (the “FSP”) as a comprehensive approach to strengthening the financial system and addressing the credit crisis. The Plan includes a Capital Assistance Program (the “CAP”) that is intended to serve as a bridge to raising private capital and to ensure sufficient capital to preserve or increase lending in a worse-than-expected economic deterioration. Eligibility to participate in the CAP will be consistent with the criteria for QFI’s under the CPP. Eligible institutions with consolidated assets in excess of $100 billion will be able to obtain capital under the CAP, subject to a supervisory review process and comprehensive stress test assessment of the losses that could occur over a two year period in the future across a range of economic scenarios, including conditions more severe than anticipated or as typically used in capital planning processes. Eligible institutions with consolidated assets below $100 billion will be able to obtain capital under the CAP after a supervisory review. As announced, the CAP includes issuance of a convertible preferred security to the U.S. Treasury at a discount to the participating institution’s stock price as of February 9, 2009, subject to a dividend to be determined. The security instrument was designed to incentivize institutions to replace the CAP capital with private capital or redeem it. Institutions participating in the CPP under TARP may also be permitted to exchange their CPP preferred stock for the convertible preferred CAP security. The Company did not participate in the CAP.
American Recovery and Reinvestment Act. On February 17, 2009, the American Recovery and Reinvestment Act of 2009 (the “ARRA”) was signed into law. Section 7001 of the ARRA amended Section 111 of the EESA in its entirety. While the U.S. Treasury must promulgate regulations to implement the restrictions and standards set forth in Section 7001, the ARRA, among other things, significantly expands the executive compensation restrictions previously imposed by the EESA. Such restrictions apply to any entity that has received or will receive financial assistance under the TARP, and shall generally continue to apply for as long as any obligation arising from financial assistance provided under the TARP, including preferred stock issued under the CPP, remains outstanding. These ARRA restrictions do not apply to any TARP recipient during such time when the federal government (i) only holds any warrants to purchase common stock of such recipient or (ii) holds no preferred stock or warrants to purchase common stock of such recipient. The Company is not subject to these restrictions because it did not participate in TARP.
The Small Business Jobs Act of 2010
On September 27, 2010, President Obama signed into law the Small Business Jobs Act of 2010 (the “SBJ Act”), which, among other matters, authorizes the U.S. Treasury to buy up to $30 billion in preferred stock or subordinated debt issued by community banks (or their bank holding companies provided 90% of the funds received are downstreamed to the bank subsidiary) with assets less that $10 billion pursuant to the Small Business Lending Fund (the “SBLF”) created under the SBJ Act. Funds received as capital investments will qualify as Tier 1 capital. The SBLF investments are intended to increase the availability of credit for small businesses and thereby induce the creation of jobs in support of economic recovery.
The participating banks (or bank holding companies) will pay an annual dividend on the preferred stock or subordinated debt purchased by the U.S. Treasury in an amount which ranges between 5% and 1% during the initial measurement period of approximately two years determined by reducing the dividend rate 1% for every 2.5% increase in the bank’s small business lending up to a lending increase of 10%. The dividend rate will be adjusted quarterly during the initial period. If a participant’s lending activity does not increase in the initial period, the dividend rate will increase thereafter to 7%. After 4.5 years, the dividend rate increases to 9% until the SBLF funds are repaid.
On December 23, 2010, the federal banking agencies jointly issued guidance on underwriting standards for small business loans originated under the SBLF which require adherence to safe and sound credit standards and risk management processes. It is uncertain whether the SBLF will have the intended effect of creating jobs in sufficient numbers to positively impact the economic recovery. The Company did not participate in the SBLF.
The Dodd-Frank Wall Street Reform and Consumer Protection Act of 2010
On July 21, 2010, President Obama signed into law the Dodd-Frank Wall Street Reform and Consumer Protection Act of 2010 (the “Dodd-Frank Act”). The Dodd-Frank Act is intended to restructure the regulation of the financial services sector by, among other things, (i) establishing a framework to identify systemic risks in the financial system implemented by a newly created Financial Stability Oversight Council and other federal banking agencies; (ii) expanding the resolution authority of the federal banking agencies over troubled financial institutions; (iii) authorizing changes to capital and liquidity requirements; (iv) changing deposit insurance assessments; and (v) enhancing regulatory supervision to improve the safety and soundness of the financial services sector. The Dodd-Frank Act is expected to have a significant impact upon our business as its provisions are implemented over time. Below is a summary of certain provisions of the Dodd-Frank Act which, directly or indirectly, may affect us.
| | · | Changes to Capital Requirements. The federal banking agencies are required to establish minimum leverage and risk-based capital requirements for banks and bank holding companies which will not be lower and could be higher than current regulatory capital and leverage standards for insured depository institutions. Under these requirements, trust preferred securities will be excluded from Tier 1 capital unless such securities were issued prior to May 19, 2010 by a bank holding company with less than $15 billion in assets. The Dodd-Frank Act requires capital requirements to be countercyclical so that the required amount of capital increases in times of economic expansion and decreases in times of economic contraction consistent with safety and soundness. |
| | | |
| | · | Enhanced Regulatory Supervision. The Dodd-Frank Act increases regulatory oversight, supervision and examination of banks, bank holding companies and their respective subsidiaries by the appropriate regulatory agency. |
| | · | Consumer Protection. The Dodd-Frank Act creates the Consumer Financial Protection Bureau (“CFPB”) within the Federal Reserve System. The CFPB is responsible for establishing and implementing rules and regulations under various federal consumer protection laws governing certain consumer products and services. The CFPB has primary enforcement authority over large financial institutions with assets of $10 billion or more, while smaller institutions will be subject to the CFPB’s rules and regulations through the enforcement authority of the federal banking agencies. States are permitted to adopt consumer protection laws and regulations that are more stringent than those laws and regulations adopted by the CFPB and state attorneys general are permitted to enforce consumer protection laws and regulations adopted by the CFPB. |
| | | |
| | · | Deposit Insurance. The Dodd-Frank Act permanently increases the deposit insurance limit for insured deposits to $250,000 per depositor and extends unlimited deposit insurance to non-interest bearing transaction accounts through December 31, 2012. Other deposit insurance changes under the Dodd-Frank Act include (i) amendment of the assessment base used to calculate an insured depository institution’s deposit insurance premiums paid to the Deposit Insurance Fund (“DIF”) by elimination of deposits and substitution of average consolidated total assets less average tangible equity during the assessment period as the revised assessment base; (ii) increasing the minimum designated reserve ratio of the DIF from 1.15 percent to 1.35 percent of the estimated amount of total insured deposits; (iii) eliminating the requirement that the FDIC pay dividends to depository institutions when the reserve ratio exceeds certain thresholds; and (iv) repeal of the prohibition upon the payment of interest on demand deposits to be effective one year after the date of enactment of the Dodd-Frank Act. In December 2010, pursuant to the Dodd-Frank Act, the FDIC increased the reserve ratio of the DIF to 2.0 percent effective January 1, 2011. |
| | | |
| | · | Transactions with Affiliates. The Dodd-Frank Act enhances the requirements for certain transactions with affiliates under Section 23A and 23B of the Federal Reserve Act, including an expansion of the definition of “covered transactions” and increasing the amount of time for which collateral requirements regarding covered transactions must be maintained. |
| | | |
| | · | Transactions with Insiders. Insider transaction limitations are expanded through the strengthening of loan restrictions to insiders and the expansion of the types of transactions subject to the various limits, including derivative transactions, repurchase agreements, reverse repurchase agreements and securities lending or borrowing transactions. Restrictions are also placed on certain asset sales to and from an insider to an institution, including requirements that such sales be on market terms and, in certain circumstances, approved by the institution’s board of directors. |
| | | |
| | · | Enhanced Lending Limitations. The Dodd-Frank Act strengthens the existing limits on a depository institution’s credit exposure to include credit exposure arising from derivative transactions, repurchase agreements, and securities lending and borrowing transactions. |
| | | |
| | · | Debit Card Interchange Fees. The Dodd-Frank Act requires that the amount of any interchange fee charged by a debit card issuer with respect to a debit card transaction must be reasonable and proportional to the cost incurred by the issuer. Within nine months of enactment of the Dodd-Frank Act, the Federal Reserve Board is required to establish standards for reasonable and proportional fees which may take into account the costs of preventing fraud. The restrictions on interchange fees, however, do not apply to banks that, together with their affiliates, have assets of less than $10 billion. |
| | | |
| | · | Interstate Branching. The Dodd-Frank Act authorizes national and state banks to establish branches in other states to the same extent as a bank chartered by that state would be permitted to branch. Previously, banks could only establish branches in other states if the host state expressly permitted out-of-state banks to establish branches in that state. Accordingly, banks will be able to enter new markets more freely. |
| | | |
| | · | Charter Conversions. Effective one year after enactment of the Dodd-Frank Act, depository institutions that are subject to a cease and desist order or certain other enforcement actions issued with respect to a significant supervisory matter are prohibited from changing their federal or state charters, except in accordance with certain notice, application and other procedures involving the applicable regulatory agencies. |
| | · | Compensation Practices. The Dodd-Frank Act provides that the appropriate federal banking regulators must establish standards prohibiting as an unsafe and unsound practice any compensation plan of a bank holding company or other “covered financial institution” that provides an insider or other employee with “excessive compensation” or could lead to a material financial loss to such firm. In June 2010, prior to the enactment of the Dodd-Frank Act, the federal bank regulatory agencies jointly issued the Interagency Guidance on Sound Incentive Compensation Policies (“Guidance”), which requires that financial institutions establish metrics for measuring the risk to the financial institution of such loss from incentive compensation arrangements and implement policies to prohibit inappropriate risk taking that may lead to material financial loss to the institution. Together, the Dodd-Frank Act and the Guidance may impact our compensation policies and arrangements. |
| | | |
| | · | Corporate Governance. The Dodd-Frank Act will enhance corporate governance requirements to include (i) requiring publicly traded companies to give shareholders a non-binding vote on executive compensation at their first annual meeting taking place six months after the date of enactment and at least every three years thereafter and on so-called “golden parachute” payments in connection with approvals of mergers and acquisitions unless previously voted on by shareholders; (ii) authorizing the SEC to promulgate rules that would allow shareholders to nominate their own candidates for election as directors using a company’s proxy materials; (iii) directing the federal banking regulators to promulgate rules prohibiting excessive compensation paid to executives of depository institutions and their holding companies with assets in excess of $1.0 billion, regardless of whether or not the company is publicly traded; and (iv) authorizing the SEC to prohibit broker discretionary voting on the election of directors and on executive compensation matters. |
Many of the requirements under the Dodd-Frank Act will be implemented over an extended period of time. Therefore, the nature and extent of regulations that will be issued by various regulatory agencies and the impact such regulations will have on the operations of financial institutions such as ours is unclear. Such regulations resulting from the Dodd-Frank Act may impact the profitability of our business activities, require changes to certain of our business practices, impose upon us more stringent capital, liquidity and leverage ratio requirements or otherwise adversely affect our business. These changes may also require us to invest significant management attention and resources to evaluate and make necessary changes in order to comply with new statutory and regulatory requirements.
Future Legislation and Regulation
Certain legislative and regulatory proposals that could affect the Company and banking business in general are periodically introduced before the United States Congress, the California State Legislature and federal and state government agencies. It is not known to what extent, if any, legislative proposals will be enacted and what effect such legislation would have on the structure, regulation and competitive relationships of financial institutions. It is likely, however, that such legislation could subject the Company and NVB to increased regulation, disclosure and reporting requirements and increase competition and the Company’s cost of doing business.
In addition to legislative changes, the various federal and state financial institution regulatory agencies frequently propose rules and regulations to implement and enforce already existing legislation. It cannot be predicted whether or in what form any such rules or regulations will be enacted or the effect that such and regulations may have on the Company and NVB.
Employees
At December 31, 2011, the Company had approximately 334 employees, (which includes 315 full-time equivalent employees). None of the Company’s employees are represented by a labor union, and management considers its relations with employees to be good.
Website Access
Information on the Company and its subsidiary NVB may be obtained from the Company’swebsite www.novb.com. Copies of the Company’s annual report on Form 10-K, quarterly reports on Form 10-Q, current reports on Form 8-K, and all amendments thereto are available free of charge on the website as soon as they are published by the SEC through a link to the Edgar reporting system maintained by the SEC. Simply select the “NOVB Investors” menu item, then click on “Shareholder Relations” and then select the “SEC Filings” link. Also made available through the “SEC Filings” link are the Section 16 reports of ownership and changes in ownership of the Company’s common stock which are filed with the Securities and Exchange Commission by the directors and executive officers of the Company and by any persons who own more than ten percent of the outstanding shares of such stock. Information on the Company website is not incorporated by reference into this report.
ITEM 1A. RISK FACTORS
In addition to the risks associated with the business of banking generally, as described above under Item 1 “Description of Business”, the Company’s business, financial condition, operating results, future prospects and stock price can be adversely impacted by certain risk factors, as set forth below, any one of which could cause the Company’s actual results to vary materially from recent results or from the Company’s anticipated future results.
Extensive Regulation of Banking. The operations of the Company and its subsidiary, North Valley Bank, are subject to extensive regulation by federal, state and local governmental authorities and are subject to various laws and judicial and administrative decisions imposing requirements and restrictions on part or all of such operations. The Company and North Valley Bank believe they are in substantial compliance in all material respects with laws, rules and regulations applicable to the conduct of their banking business. Because the banking business is highly regulated, the laws, rules and regulations applicable to the Company are subject to regular modification and change. These laws, rules and regulations, or any other laws, rules or regulations adopted in the future, could make compliance more difficult or expensive, restrict the Company’s ability to originate, broker or sell loans, further limit or restrict the amount of commissions, interest or other charges earned on loans originated or sold by the Company, or otherwise adversely affect the Company’s results of operations, financial condition, or future prospects. The Dodd-Frank Act, signed into law on July 21, 2010, is expected to have a broad impact on the financial services sector, including significant regulatory and compliance changes. Many of the Dodd-Frank Act requirements will be implemented over time and, given the uncertainty associated with the manner in which they will be implemented by the various regulatory agencies, the full extent of the impact such requirements will have on the Company’s operations is not clear. Changes resulting from the Dodd-Frank Act may impact the profitability of business activities, require changes to certain business practices, impose more stringent capital, liquidity and leverage requirements or otherwise adversely affect our business, results of operations or financial condition.
Competition. An economy characterized by a decline in real estate values, high unemployment and general uncertainty has increased competition for good quality loans among depository institutions operating in the Company’s market areas. Ultimately, the Company and North Valley Bank may not be able to compete successfully against current and future competitors. Many competitors offer the banking services that are offered by North Valley Bank. These competitors include national and super-regional banks, finance companies, investment banking and brokerage firms, credit unions, government-assisted farm credit programs, other community banks and technology-oriented financial institutions offering online services. In particular, North Valley Bank’s competitors include several major financial companies whose greater resources may afford them a marketplace advantage by enabling them to maintain numerous banking locations and mount extensive promotional and advertising campaigns. Additionally, banks and other financial institutions with larger capitalization and financial intermediaries not subject to bank regulatory restrictions have larger lending limits and are thereby able to serve the credit needs of larger customers. Areas of competition include interest rates for loans and deposits, efforts to obtain deposits, and range and quality of products and services provided, including new technology-driven products and services. Technological innovation continues to contribute to greater competition in domestic and international financial services markets as technological advances, such as Internet-based banking services that cross traditional geographic bounds, enable more companies to provide financial services. If North Valley Bank is unable to attract and retain banking customers, it may be unable to continue its level of loans and deposits, which may adversely affect its and the Company’s results of operations, financial condition and future prospects.
Dependence on Key Employees.The Company and North Valley Bank are dependent on the successful recruitment and retention of highly qualified personnel. Our ability to implement our business strategies is closely tied to the strengths of our chief executive officer and other key officers. Our key officers have extensive experience in the banking industry which is not easily replaced. Business banking, one of the Company’s principal lines of business, is dependent on relationship banking, in which Company personnel develop professional relationships with small business owners and officers of larger business customers who are responsible for the financial management of the companies they represent. If these employees were to leave the Company and become employed by a competing bank, the Company could potentially lose business customers. In addition, the Company relies on its customer service staff to effectively serve the needs of its consumer customers. The Company very actively recruits for all open positions and management believes that its employee relations are good.
Growth Strategy. The Company has pursued and continues to pursue a growth strategy which depends primarily on generating an increasing level of loans and deposits at acceptable risk levels. The Company may not be able to sustain this growth strategy without establishing new branches or new products. Therefore, the Company may expand in its current markets by opening or acquiring branch offices or may expand into new markets or make strategic acquisitions of other financial institutions or branch offices. This expansion may require significant investments in equipment, technology, personnel and site locations. Our success in implementing our growth strategy may not be possible without corresponding increases in our noninterest expenses. In addition, growth through acquisitions represents a component of our business strategy. The need to integrate the operations and personnel of acquired banks and branches may not always be successfully accomplished. Any inability to improve operating performance through integration and/or merger of operations, functions or banks could increase expenses and impact the Company’s performance.
Governmental Fiscal and Monetary Policies. The business of banking is affected significantly by the fiscal and monetary policies of the federal government and its agencies. Such policies are beyond the control of the Company. The Company is particularly affected by the policies established by the Board of Governors in relation to the supply of money and credit in the United States. The instruments of monetary policy available to the Board of Governors can be used in varying degrees and combinations to directly affect the availability of bank loans and deposits, as well as the interest rates charged on loans and paid on deposits, and this can and does have a material effect on the Company’s business, results of operations and financial condition.
Geographic Concentration. All of the business of the Company is located in the State of California and the banking offices of the Company are located in the Northern California Counties of Shasta, Trinity, Humboldt, Del Norte, Yolo, Sonoma, Placer and Mendocino. As a result, our financial condition, results of operations and cash flows are subject to changes in the economic conditions in those counties. Our success depends upon the business activity, population, employment and income levels, deposits and real estate activity in these markets. Adverse economic conditions and unemployment trends in those markets are affecting the ability of our customers to repay their loans which has reduced our growth rate and impacted our financial condition and results of operations. Economic conditions in the State of California are subject to various uncertainties at this time, including the budgetary and fiscal difficulties facing the California State Government. Conditions in the California economy may deteriorate and such deterioration would adversely affect the Company.
Commercial Loans.As of December 31, 2011, approximately 10% of our loan portfolio consisted of commercial business loans. The credit risk for commercial loans is a result of several factors, including the concentration of principal in a limited number of loans and borrowers, the mobility of collateral, the effect of general economic conditions and the increased difficulty of evaluating and monitoring these types of loans. In addition, unlike residential mortgage loans, which generally are made on the basis of the borrower’s ability to make repayment from his or her employment and other income and which are secured by real property whose value tends to be more easily ascertainable, commercial business loans typically are made on the basis of the borrower’s ability to make repayment from the cash flow of the borrower’s business. As a result, the availability of funds for the repayment of commercial business loans may be substantially dependent on the success of the business itself and the general economic environment. If the cash flow from business operations is reduced, the borrower’s ability to repay the loan may be impaired.
Real Estate Values.A large portion of the loan portfolio of the Company is dependent on real estate. At December 31, 2011, real estate served as the principal source of collateral with respect to approximately 77% of the Company’s loan portfolio. A continuing substantial decline in the economy in general, or a continuing decline in real estate values in the Company’s primary operating market areas in particular, could have an adverse effect on the demand for new loans, the ability of borrowers to repay outstanding loans, the value of real estate and other collateral securing loans and the value of mortgage-backed securities included in the available-for-sale investment portfolio, as well as the Company’s financial condition and results of operations in general and the market value for Company common stock. Acts of nature, including fires, earthquakes and floods, which may cause uninsured damage and other loss of value to real estate that secures these loans, may also negatively impact the Company’s financial condition. In considering whether to make a loan secured by real property, we generally require an appraisal of the property. However, an appraisal is only an estimate of the value of the property at the time the appraisal is made. If the appraisal does not reflect the amount that may be obtained upon any sale or foreclosure of the property, we may not realize the amount equal to the indebtedness secured by the property in the event of foreclosure.
Construction and Development Loans. At December 31, 2011, real estate construction loans totaled $27.4 million, or 6.0% of our total loan portfolio. Residential construction loans, including land acquisition and development, totaled $23.8 million or 87% of the Company’s real estate construction portfolio, and 5.2% of the total loan portfolio. Construction, land acquisition and development lending involve additional risks because funds are advanced on the security of the project, which is of uncertain value prior to its completion. Because of the uncertainties inherent in estimating construction costs, as well as the market value of the completed project and the effects of governmental regulation on real property, it is relatively difficult to evaluate accurately the total funds required to complete a project and the related loan-to-value ratio. As a result, speculative construction loans often involve the disbursement of substantial funds with repayment dependent, in part, on the completion of the project and the ability of the borrower to sell the property, rather than the ability of the borrower or the guarantor to repay the principal and interest. If our appraisal of the value of the completed project proves to be overstated, we may have inadequate security for the repayment of the loan upon completion of construction of the project. If we are forced to foreclose on a project prior to or at completion due to a default, we may not be able to recover all of the unpaid balance of, and accrued interest on, the loan, as well as related foreclosure and holding costs. In addition, we may be required to fund additional amounts to complete the project and may have to hold the property for an unspecified period of time.
Other Real Estate Owned (“OREO”). Real estate acquired through, or in lieu of, loan foreclosures is expected to be sold and is recorded at its fair value less estimated costs to sell (fair value). The amount, if any, by which the recorded amount of the loan exceeds the fair value (less estimated costs to sell) are charged to the allowance for loan losses, if necessary. The Company’s earnings could be materially and adversely affected by various expenses associated with OREO, including personnel costs, insurance and taxes, completion and repair costs, valuation adjustments, and other expenses associated with property ownership. Also, any further decrease in market prices of real estate in our market areas may lead to additional OREO write downs, with a corresponding expense in our income statement. Our OREO totaled $20,106,000 at December 31, 2011, $25,784,000 at December 31, 2010 and $12,377,000 at December 31, 2009.
Allowance for Loan Losses.Like all financial institutions, the Company maintains an allowance for loan losses to provide for loan defaults and non-performance, but the allowance for loan losses may not be adequate to cover actual loan losses. In addition, future provisions for loan losses could materially and adversely affect the Company and therefore the Company’s operating results. The Company’s allowance for loan losses is based on prior experience, as well as an evaluation of the risks in the current portfolio. The amount of future losses is susceptible to changes in economic, operating and other conditions, including changes in interest rates that may be beyond the Company’s control, and these losses may exceed current estimates. Federal regulatory agencies, as an integral part of their examination process, review the Company’s loans and allowance for loan losses. We believe that the Company’s allowance for loan losses is adequate to cover current losses, but a continuing decline in real estate values combined with higher rates of unemployment or under-employment in our operating markets could result in an increase in classified loans and the allowance for loan losses. These occurrences could materially and adversely affect the Company’s earnings.
Nonperforming Loans. In recent years, we have experienced significant declines in the performance of loans, particularly construction, development and land loans, and unsecured commercial and consumer loans. At December 31, 2011, the Company’s nonperforming loans (defined as nonaccrual loans and loans 90 days or more past due and still accruing interest) were approximately $18,411,000, compared to approximately $20,065,000 at December 31, 2010. Nonperforming loans at December 31, 2009 were approximately $46,598,000. Nonperforming loans as a percentage of the Company’s total loans were 4.04% at December 31, 2011, 3.91% at December 31, 2010, and 7.74% at December 31, 2009. Nonperforming loans adversely affect the Company’s net income in various ways. We do not record interest income on nonaccrual loans; the costs of reappraising adversely classified assets, legal and other costs associated with loan collections, and other operating costs related to foreclosed assets have increased our noninterest expense; and upon taking collateral through foreclosure or similar proceedings, we are required to mark the related loan to the then fair market value of the collateral, less estimated selling costs, which may result in a loss. Until economic and market conditions improve, we expect that our level of nonperforming loans will continue to impact our earnings, and could have a substantial adverse impact if conditions deteriorate further.
Regulatory Agreement. On January 6, 2010, the Company and North Valley Bank entered into a Written Agreement with the Federal Reserve Bank. A copy of the Written Agreement was filed with the Securities and Exchange Commission on January 8, 2010, as an exhibit to the Company’s Current Report on Form 8-K. Among other things, the Written Agreement provides that the Company and North Valley Bank shall submit to the Federal Reserve Bank their plans to enhance lending and credit administration functions, to maintain policies and procedures for the maintenance of an adequate allocation for loan losses, to strengthen the management of commercial real estate concentrations and to update its capital plan in order to maintain capital ratios at or above the required minimums. The Written Agreement also restricts the payment of dividends and any payments on trust preferred securities, certain indemnification and severance payments, and any reduction in capital and the purchase or redemption of stock without the prior approval of the Federal Reserve Bank. Progress reports detailing the form and manner of all actions taken to secure compliance with the Written Agreement must be submitted to the Federal Reserve Bank at least quarterly. The failure of the Company or North Valley Bank to comply with the Written Agreement may subject the Company and North Valley Bank to additional regulatory restrictions. Each provision of the Written Agreement will remain effective and enforceable until stayed, modified, terminated or suspended by the Federal Reserve Bank.Communications from the Reserve Bank have continued to confirm that the Company and NVB are currently in compliance with all provisions of the Written Agreement.
The Effects of Legislation in Response to Current Credit Conditions. Legislation passed at the federal level and/or by the State of California in response to current conditions affecting credit markets could cause the Company to experience higher loan losses if such legislation reduces the amount that borrowers are otherwise contractually required to pay under existing loan contracts with North Valley Bank. Such legislation could also result in the imposition of limitations upon North Valley Bank’s ability to foreclose on property or other collateral or make foreclosure less economically feasible. Such events could result in increased loan losses and require a material increase in the allowance for loan losses and thereby adversely affect the Company’s results of operations, financial condition, future prospects, profitability and stock price.
Dilution of Common Stock.On April 22, 2010, the Company raised $40 million (in gross proceeds) in a private placement of 40,000 shares of its Mandatorily Convertible Cumulative Perpetual Preferred Stock, Series A (“Series A Preferred Stock”) to a limited number of institutional and other accredited investors, including certain directors and executive officers of the Company. The shares of Series A Preferred Stock were convertible into shares of the Company’s common stock and, on July 21, 2010, with the prior approval of the Company shareholders, all 40,000 shares of Series A Preferred Stock were converted into a 26,666,646 shares of Company common stock (resulting in a total of 34,162,463 shares of common stock outstanding on such date). Shares of the Company’s common stock remaining eligible for future sale could have a further dilutive effect on the market for the common stock and could adversely affect the market price. The Amended and Restated Articles of Incorporation of the Company currently authorize the issuance of 60,000,000 shares of common stock, of which 6,833,752 were outstanding at December 31, 2011 (after a one-for-five reverse stock split effective on December 28, 2010). Pursuant to Company stock option plans, at December 31, 2011, employees and directors of the Company had outstanding options to purchase 184,070 shares of common stock. As of December 31, 2011, 161,095 shares of common stock remained available for grants under the Company’s stock option plans. Sales of substantial amounts of the Company common stock in public or private offerings could adversely affect the market price of common stock.
Operations Risks.The Company is subject to a variety of operations risks, including, but not limited to, reputational risk, legal risk and compliance risk, data processing system failures and errors, operational errors resulting from faulty or disabled computer or telecommunications systems and the risk of fraud or theft by employees or outsiders, any of which may adversely affect our business and results of operations. The Company maintains a system of internal controls to mitigate against such occurrences and maintains insurance coverage for such risks, but should such an event occur that is not prevented or detected by the Company’s internal controls, uninsured or in excess of applicable insurance limits, it could have a significant adverse impact on the Company’s business, financial condition or results of operations. The Bank is subject to periodic regulatory examinations in the ordinary course of business which are conducted by the Federal Reserve Bank of San Francisco and the California Department of Financial Institutions. Currently there remains pending a compliance examination of the Bank conducted by the Federal Reserve Bank of San Francisco and, therefore, the Bank has not received the final report of examination.
Business Confidence and International Uncertainty.The terrorist actions on September 11, 2001, and thereafter, plus military actions taken by the United States in Afghanistan, Iraq and elsewhere, have had significant adverse effects upon the United States economy. Whether terrorist activities in the future and the actions taken by the United States and its allies in combating terrorism on a worldwide basis will adversely impact the Company, and the extent of such impact, is uncertain. However, such events have had and may continue to have an adverse effect on the United States economy and by extension, the California economy including business activity in the Company’s market areas. Further economic deterioration and a loss of business confidence, whether at the national, state or local level, could adversely affect the Company’s future results of operations by, among other matters, reducing the demand for loans and other products and services offered by the Company, increasing nonperforming loans and the amounts required to be reserved for loan losses, reducing the value of collateral held as security for the Company’s loans, and causing a decline in the Company’s stock price.
The Effects of Changes to FDIC Insurance Coverage Limits and Assessments.FDIC insurance assessments are uncertain and increased premiums may adversely affect the Company’s earnings. The FDIC charges insured financial institutions premiums to maintain the DIF. Current economic conditions have increased expectations for additional bank failures and, in such event, the FDIC would take control of the failed banks and guarantee payment of deposits up to applicable insured limits from the DIF. Insurance premium assessments to insured financial institutions may increase as necessary to maintain adequate funding of the DIF. The EESA of 2008 included a provision for an increase in the amount of deposits insured by the FDIC to $250,000, which was scheduled to remain in effect through December 31, 2013. With enactment of the Dodd-Frank Act on July 21, 2010, the $250,000 per depositor insurance limit was made permanent and, among other matters, unlimited deposit insurance for noninterest bearing transaction accounts was extended through December 31, 2012. It is not clear how depositors may respond regarding the permanent increase in insurance coverage to $250,000. Despite the increase, some depositors may reduce the amount of deposits held at North Valley Bank if concerns regarding bank failures persist, which could affect the level and composition of North Valley Bank’s deposit portfolio and thereby directly impact its funding costs and net interest margin. North Valley Bank’s funding costs may also be adversely affected in the event that activities of the Federal Reserve Board and the U.S. Department of the Treasury to provide liquidity for the banking system and improvement in capital markets are curtailed or are unsuccessful. Such events could reduce liquidity in the markets, thereby increasing funding costs to North Valley Bank or reducing the availability of funds to finance its existing operations and thereby adversely affect the Company’s results of operations, financial condition, future prospects, profitability and stock price.
ITEM 1B. UNRESOLVED STAFF COMMENTS
None.
ITEM 2. DESCRIPTION OF PROPERTIES
At December 31, 2011, the net book value of the Company’s properties (including land and buildings) and its furniture, fixtures and equipment was $8,661,000. The Company’s principal executive and administrative office is located in a leased building at 300 Park Marina Circle, Redding, Shasta County, California.
The following table sets forth information about the Company’s premises, both owned and leased. The leases indicated below expire between February 2013 and September, 2023. The Company believes that it will be able to renew the leases or obtain comparable premises as and when they expire.
| Description | | Office Type | | Owned/Leased |
| | | | | |
| Redding | | Branch | | Owned |
| Westwood | | Branch | | Leased |
| Shasta Lake | | Branch | | Owned |
| Country Club | | Branch | | Owned |
| Weaverville | | Branch | | Owned |
| Hayfork | | Branch | | Owned |
| Buenaventura | | Supermarket Branch | | Leased |
| Anderson | | Branch | | Owned |
| Enterprise | | Branch | | Owned |
| Cottonwood | | Supermarket Branch | | Leased |
| Palo Cedro | | Branch | | Leased |
| Churn Creek | | Branch | | Owned |
| Redding Warehouse | | Storage Facility | | Leased |
| Park Marina Circle | | Administrative/ Branch | | Leased |
| Cypress Center | | Administrative | | Leased |
| Real Estate | | Administrative | | Owned |
| Eureka Mall | | Branch | | Leased |
| McKinleyville | | Branch | | Leased |
| Crescent City | | Branch | | Owned |
| Eureka Downtown | | Branch | | Owned |
| Ferndale | | Branch | | Owned |
| Garberville | | Branch | | Leased |
| Willits | | Branch | | Owned |
| Woodland | | Administrative/ Branch | | Leased |
| Roseville | | Branch | | Leased |
| Santa Rosa | | Branch | | Leased |
| Ukiah | | Branch | | Leased |
From time to time, the Company, through NVB, acquires real property through foreclosure of defaulted loans. The policy of the Company is not to use or permanently retain any such properties but to resell them when practicable.
ITEM 3. LEGAL PROCEEDINGS
There are no material legal proceedings pending against the Company or against any of its property. The Company, because of the nature of its business, is generally subject to various legal actions, threatened or filed, which involve ordinary, routine litigation incidental to its business. Although the amount of the ultimate exposure, if any, cannot be determined at this time, the Company, based on the advice of counsel, does not expect that the final outcome of threatened or filed suits will have a materially adverse effect on its consolidated financial position.
ITEM 4. MINE SAFETY DISCLOSURES
None.
PART II
ITEM 5. MARKET FOR REGISTRANT’S COMMON EQUITY, RELATED STOCKHOLDER MATTERS AND ISSUER PURCHASES OF EQUITY SECURITIES
Market Information
The North Valley Bancorp common stock is listed and trades on the NASDAQ Global Select Market under the symbol “NOVB.” The shares were first listed with the NASDAQ Stock Market in April 1998. The table below summarizes the Common Stock high and low trading prices traded during the two-year period ended December 31, 2011 as reported on the NASDAQ Global Select Market. The Company did not declare any cash dividends on its common stock for the years ended 2011 and 2010. A one-for-five reverse stock split was effective on December 28, 2010, and all share prices have been adjusted to reflect that split.
| | | Year Ended December 31, | |
| | | 2011 | | | 2010 | |
| | | High | | | Low | | | High | | | Low | |
| First Quarter | | $ | 12.99 | | | $ | 8.10 | | | $ | 10.50 | | | $ | 7.25 | |
| Second Quarter | | $ | 10.86 | | | $ | 9.61 | | | $ | 14.80 | | | $ | 8.75 | |
| Third Quarter | | $ | 10.90 | | | $ | 9.02 | | | $ | 11.65 | | | $ | 6.65 | |
| Fourth Quarter | | $ | 10.45 | | | $ | 8.25 | | | $ | 9.50 | | | $ | 6.30 | |
Holders
The Company had approximately 745 registered shareholders of record as of December 31, 2011.
Dividends
As a California corporation, the Company’s ability to pay cash dividends is subject to restrictions set forth in the California General Corporation Law (the CGCL”). The CGCL provides that a corporation may make a distribution to its shareholders if the corporation’s retained earnings equal at least the amount of the proposed distribution. The CGCL further provides that, in the event sufficient retained earnings are not available for the proposed distribution, a corporation may nevertheless make a distribution to its shareholders if, after giving effect to the distribution, it meets two conditions, which generally stated are as follows: (i) the corporation’s assets must equal at least 125% of its liabilities; and (ii) the corporation’s current assets must equal at least its current liabilities or, if the average of the corporation’s earnings before taxes on income and before interest expense for the two preceding fiscal years was less than the average of the corporation’s interest expense for those fiscal years, then the corporation’s current assets must equal at least 125% of its current liabilities.
Funds for payment of any cash dividends by the Company would be obtained from its investments as well as dividends and/or management fees from NVB. As a California banking corporation, the ability of NVB to pay cash dividends and/or management fees is subject to restrictions set forth in the California Financial Code (the “Financial Code”). The Financial Code provides that a bank may not make a cash distribution to its shareholders in excess of the lesser of (a) the bank’s retained earnings; or (b) the bank’s net income for its last three fiscal years, less the amount of any distributions made by the bank or by any majority-owned subsidiary of the bank to the shareholders of the bank during such period. However, a bank may, with the approval of the Commissioner, make a distribution to its shareholders in an amount not exceeding the greater of (a) its retained earnings; (b) its net income for its last fiscal year; or (c) its net income for its current fiscal year. In the event that the Commissioner determines that the stockholders’ equity of a bank is inadequate or that the making of a distribution by the bank would be unsafe or unsound, the Commissioner may order the bank to refrain from making a proposed distribution.
The Board of Governors generally prohibits a bank holding company from declaring or paying a cash dividend which would impose undue pressure on the capital of subsidiary banks or would be funded only through borrowing or other arrangements that might adversely affect a bank holding company’s financial position. The policy of the Board of Governors is that a bank holding company should not continue its existing rate of cash dividends on its common stock unless its net income is sufficient to fully fund each dividend and its prospective rate of earnings retention appears consistent with its capital needs, asset quality and overall financial condition. Such policy also applies to the payment of cash dividends by state member banks such as NVB.
The FDIC may also restrict the payment of dividends by a subsidiary bank if such payment would be deemed unsafe or unsound or if after the payment of such dividends, the bank would be included in one of the “undercapitalized” categories for capital adequacy purposes pursuant to the FDIC Improvement Act of 1991.
The Board of Directors of the Company decides whether to declare and pay dividends after consideration of the Company’s earnings, financial condition, future capital needs, regulatory requirements and other factors as the Board of Directors may deem relevant. On January 29, 2009, primarily as a result of the Company’s operating performance for 2008, the Board of Directors determined that it was in the best interest of the Company to suspend indefinitely the payment of quarterly cash dividends on its common stock, beginning in 2009. As a result, no cash dividends were declared or paid during 2010 and 2011.
See Note 18 to the Consolidated Financial Statements for additional information regarding the payment of dividends, including information regarding certain limitations on the payment of dividends or distributions by the Company or NVB which are specified in the Written Agreement dated January 6, 2010, executed by and among the Company, NVB and the Federal Reserve Bank. At present, neither the Company nor NVB may declare or pay any dividends without the prior written approval of the Federal Reserve Bank and the Board of Governors.
Performance Graph
The following graph compares our cumulative total shareholder return since December 31, 2006 with the NASDAQ Composite Index, the SNL $500 million - $1 billion Bank Index, and SNL Western Bank Index. The graph assumes that the value of the investment in our common stock and each index (including reinvestment of dividends) was $100.00 on December 31, 2006.
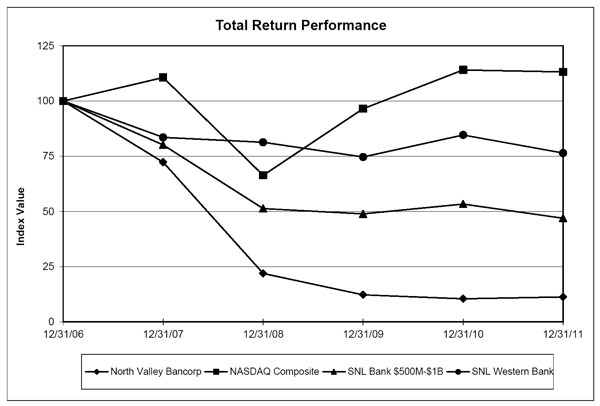
| | | Period Ending | |
| Index | | 12/31/06 | | | 12/31/07 | | | 12/31/08 | | | 12/31/09 | | | 12/31/10 | | | 12/31/11 | |
| North Valley Bancorp | | | 100.00 | | | | 72.29 | | | | 21.98 | | | | 12.29 | | | | 10.52 | | | | 11.30 | |
| NASDAQ Composite | | | 100.00 | | | | 110.66 | | | | 66.42 | | | | 96.54 | | | | 114.06 | | | | 113.16 | |
| SNL Bank $500M-$1B | | | 100.00 | | | | 80.13 | | | | 51.35 | | | | 48.90 | | | | 53.38 | | | | 46.96 | |
| SNL Western Bank | | | 100.00 | | | | 83.53 | | | | 81.33 | | | | 74.68 | | | | 84.62 | | | | 76.45 | |
ITEM 6. SELECTED FINANCIAL DATA
The following table presents our selected historical consolidated financial data, and is derived in part from our audited consolidated financial statements. The selected historical consolidated financial data should be read in conjunction with the Consolidated Financial Statements and the Notes thereto, which are included in this Annual Report on Form 10-K as well as Item 7, “Management’s Discussion and Analysis of Financial Condition and Results of Operations.”
| | | Year ended December 31, | |
| | | 2011 | | | 2010 | | | 2009 | | | 2008 | | | 2007 | |
| | | (Dollars in thousands, except per share data) | |
| Income Statement | | | | | | | | | | | | | | | | | | | | |
| Total interest income | | $ | 37,145 | | | $ | 38,922 | | | $ | 43,955 | | | $ | 52,091 | | | $ | 59,524 | |
| Total interest expense | | | 5,786 | | | | 8,985 | | | | 12,721 | | | | 16,954 | | | | 18,638 | |
| Net interest income | | | 31,359 | | | | 29,937 | | | | 31,234 | | | | 35,137 | | | | 40,886 | |
| Provision for loan losses | | | 2,650 | | | | 7,970 | | | | 26,500 | | | | 12,100 | | | | 2,050 | |
| | | | | | | | | | | | | | | | | | | | | |
| Net interest income after provision for loan losses | | | 28,709 | | | | 21,967 | | | | 4,734 | | | | 23,037 | | | | 38,836 | |
| Total noninterest income | | | 14,365 | | | | 12,944 | | | | 14,010 | | | | 10,152 | | | | 11,159 | |
| Total noninterest expense | | | 39,715 | | | | 42,144 | | | | 53,990 | | | | 38,658 | | | | 40,386 | |
| Income (loss) before provision (benefit) for income taxes | | | 3,359 | | | | (7,233 | ) | | | (35,246 | ) | | | (5,469 | ) | | | 9,609 | |
| Provision (benefit) for income taxes | | | 312 | | | | (985 | ) | | | (9,394 | ) | | | (3,675 | ) | | | 3,075 | |
| Net income (loss) | | | 3,047 | | | | (6,248 | ) | | | (25,852 | ) | | | (1,794 | ) | | | 6,534 | |
| Preferred stock discount | | | — | | | | (18,667 | ) | | | — | | | | — | | | | — | |
| Net income (loss) available to common stockholders | | $ | 3,047 | | | $ | (24,915 | ) | | $ | (25,852 | ) | | $ | (1,794 | ) | | $ | 6,534 | |
| Income (loss) per share (1) | | | | | | | | | | | | | | | | | | | | |
| Basic | | $ | 0.45 | | | $ | (6.42 | ) | | $ | (17.24 | ) | | $ | (1.20 | ) | | $ | 4.45 | |
| Diluted | | $ | 0.45 | | | $ | (6.42 | ) | | $ | (17.24 | ) | | $ | (1.20 | ) | | $ | 4.30 | |
| | | | | | | | | | | | | | | | | | | | | |
| Statement of Condition | | | | | | | | | | | | | | | | | | | | |
| Total assets | | $ | 904,966 | | | $ | 884,941 | | | $ | 884,362 | | | $ | 879,551 | | | $ | 949,019 | |
| Investment securities and federal funds sold | | $ | 352,421 | | | $ | 274,655 | | | $ | 194,594 | | | $ | 76,366 | | | $ | 104,372 | |
| Net loans | | $ | 443,559 | | | $ | 498,473 | | | $ | 583,878 | | | $ | 682,095 | | | $ | 735,498 | |
| Deposits | | $ | 766,239 | | | $ | 753,790 | | | $ | 787,809 | | | $ | 754,944 | | | $ | 736,739 | |
| Stockholder's equity | | $ | 89,465 | | | $ | 83,978 | | | $ | 52,302 | | | $ | 77,258 | | | $ | 81,471 | |
| | | | | | | | | | | | | | | | | | | | | |
| Common Stock Data | | | | | | | | | | | | | | | | | | | | |
| Shares outstanding | | | 6,833,752 | | | | 6,832,492 | | | | 1,499,163 | | | | 1,499,163 | | | | 1,482,613 | |
| Book value per share (2) | | $ | 13.09 | | | $ | 12.29 | | | $ | 34.89 | | | $ | 51.53 | | | $ | 54.95 | |
| Cash dividends per share | | $ | — | | | $ | — | | | $ | — | | | $ | 2.00 | | | $ | 2.00 | |
| Dividend payout ratio | | | — | | | | — | | | | — | | | | (166.56 | %) | | | 45.12 | % |
| | | | | | | | | | | | | | | | | | | | | |
| Performance Ratios | | | | | | | | | | | | | | | | | | | | |
| Return (loss) on average assets | | | 0.34 | % | | | (0.69 | %) | | | (2.85 | %) | | | (0.20 | %) | | | 0.72 | % |
| Return (loss) on average equity | | | 3.54 | % | | | (8.03 | %) | | | (34.92 | %) | | | (2.23 | %) | | | 8.31 | % |
| | | | | | | | | | | | | | | | | | | | | |
| Capital Ratios | | | | | | | | | | | | | | | | | | | | |
| Risk based capital: | | | | | | | | | | | | | | | | | | | | |
| Total (8% minimum ratio) | | | 19.53 | % | | | 17.63 | % | | | 12.19 | % | | | 12.75 | % | | | 12.00 | % |
| Tier I (4% minimum ratio) | | | 17.99 | % | | | 15.94 | % | | | 9.09 | % | | | 10.93 | % | | | 10.43 | % |
| Leverage ratio | | | 11.82 | % | | | 11.48 | % | | | 7.16 | % | | | 10.36 | % | | | 10.29 | % |
(1) Earnings per share amounts have been adjusted to give effect to a one for five reverse stock split on December 28, 2010.
(2) Represents stockholders' equity divided by the number of shares of common stock outstanding at the end of the period indicated.
ITEM 7. MANAGEMENT’S DISCUSSION AND ANALYSIS OF FINANCIAL CONDITION AND RESULTS OF OPERATIONS
Certain matters discussed or incorporated by reference in this Annual Report on Form 10-K including, but not limited to, matters described in Item 7, “Management’s Discussion and Analysis of Financial Condition and Results of Operations,” are “forward-looking statements” within the meaning of Section 21E of the Securities Exchange Act of 1934, as amended, and Section 27A of the Securities Act of 1933, as amended, and subject to the safe-harbor provision of the Private Securities Litigation Reform Act of 1995. Such forward-looking statements may contain words related to future projections including, but not limited to, words such as “believe,” “expect,” “anticipate,” “intend,” “may,” “will,” “should,” “could,” “would,” and variations of those words and similar words that are subject to risks, uncertainties and other factors that could cause actual results to differ materially from those projected. Factors that could cause or contribute to such differences include, but are not limited to, the following: (1) the duration of financial and economic volatility and actions taken by the United States Congress and governmental agencies, including the United States Department of the Treasury, to deal with challenges to the U.S. financial system; (2) variances in the actual versus projected growth in assets and return on assets; (3) loan losses; (4) expenses; (5) changes in the interest rate environment including interest rates charged on loans, earned on securities investments and paid on deposits and other borrowed funds; (6) competition effects; (7) fee and other noninterest income earned; (8) general economic conditions nationally, regionally, and in the operating market areas of the Company and its subsidiaries, including State and local budget issues being addressed in California; (9) changes in the regulatory environment including government intervention in the U.S. financial system; (10) changes in business conditions and inflation; (11) changes in securities markets, public debt markets, and other capital markets; (12) data processing and other operational systems failures or fraud; (13) a further decline in real estate values in the Company’s operating market areas; (14) the effects of uncontrollable events such as terrorism, the threat of terrorism or the impact of the current military conflicts in Afghanistan and Iraq and the conduct of the war on terrorism by the United States and its allies, worsening financial and economic conditions, natural disasters, and disruption of power supplies and communications; and (15) changes in accounting standards, tax laws or regulations and interpretations of such standards, laws or regulations, as well as other factors. The factors set forth under Item 1A, “Risk Factors,” in this report and other cautionary statements and information set forth in this report should be carefully considered and understood as being applicable to all related forward-looking statements contained in this report when evaluating the business prospects of the Company and its subsidiaries.
Forward-looking statements are not guarantees of performance. By their nature, they involve risks, uncertainties and assumptions. Actual results and shareholder values in the future may differ significantly from those expressed in forward-looking statements. You are cautioned not to put undue reliance on any forward-looking statement. Any such statement speaks only as of the date of the report, and in the case of any documents that may be incorporated by reference, as of the date of those documents. We do not undertake any obligation to update or release any revisions to any forward-looking statements, or to report any new information, future event or other circumstances after the date of this report or to reflect the occurrence of unanticipated events, except as required by law. However, your attention is directed to any further disclosures made on related subjects in our subsequent reports filed with the Securities and Exchange Commission on Forms 10-K, 10-Q and 8-K.
Critical Accounting Policies
General. The Company’s financial statements are prepared in accordance with accounting principles generally accepted in the United States of America (GAAP). The financial information contained within our financial statements is, to a significant extent, financial information that is based on measures of the financial effects of transactions and events that have already occurred. A variety of factors could affect the ultimate value that is obtained either when earning income, recognizing an expense, recovering an asset or relieving a liability. We use historical loss factors as one factor in determining the inherent loss that may be present in our loan portfolio. Actual losses could differ significantly from the historical factors that we use. Other estimates that we use are related to the expected useful lives of our depreciable assets. In addition, GAAP itself may change from one previously acceptable method to another method. Although the economics of our transactions would be the same, the timing of events that would impact the accounting for such transactions could change.
A summary of the Company’s most significant accounting policies and accounting estimates is contained in Note 1 to the Consolidated Financial Statements. An accounting estimate recognized in the financial statements is a critical accounting estimate if the accounting estimate requires management to make assumptions about matters that are highly uncertain at the time the accounting estimate is made and different estimates that management could reasonably have used in the current period, or changes in the accounting estimate that are reasonably likely to occur from period to period, would have a material impact on the presentation of the Company’s financial condition, changes in financial condition, or results of operations. Management considers the Company’s allowance for loan losses, initial and subsequent valuation of other real estate owned, expenses related to the Company’s share-based payments programs, valuation of deferred tax assets and liabilities and investment impairment to be critical accounting policies.
Loans and Allowance for Loan Losses. The allowance for loan losses is an estimate of loan losses inherent in the Company’s loan portfolio as of the balance-sheet date. The allowance is established through a provision for loan losses which is charged to expense. Additions to the allowance are expected to maintain the adequacy of the total allowance after loan losses and loan growth. Credit exposures determined to be uncollectible are charged against the allowance. Cash received on previously charged off amounts is recorded as a recovery to the allowance. The overall allowance consists of two primary components, specific reserves related to impaired loans and general reserves for inherent losses related to loans that are evaluated collectively for impairment.
A loan is considered impaired when, based on current information and events, it is probable that the Company will be unable to collect all amounts due, including principal and interest, according to the contractual terms of the original agreement. Loans determined to be impaired are individually evaluated for impairment. When a loan is impaired, the Company measures impairment based on the present value of expected future cash flows discounted at the loan’s effective interest rate, except that as a practical expedient, it may measure impairment based on a loan’s observable market price, or the fair value of the collateral if the loan is collateral dependent. A loan is collateral dependent if the repayment of the loan is expected to be provided solely by the underlying collateral.
A restructuring of a debt constitutes a troubled debt restructuring (“TDR”) if the Company for economic or legal reasons related to the debtor’s financial difficulties grants a concession to the debtor that it would not otherwise consider. Restructured workout loans typically present an elevated level of credit risk as the borrowers are not able to perform according to the original contractual terms. Loans that are reported as TDRs are considered impaired and measured for impairment as described above.
The determination of the general reserve for loans that are collectively evaluated for impairment is based on estimates made by management, to include, but not limited to, consideration of historical losses by portfolio segment, internal asset classifications, and qualitative factors to include economic trends in the Company’s service areas, industry experience and trends, geographic concentrations, estimated collateral values, the Company’s underwriting policies, the character of the loan portfolio, and probable losses inherent in the portfolio taken as a whole.
The Company maintains a separate allowance for each portfolio segment (loan type). These portfolio segments include commercial, real estate commercial, real estate construction (including land and development loans), real estate mortgage, installment and other loans (principally home equity loans). The allowance for loan losses attributable to each portfolio segment, which includes both individually impaired loans and loans that are collectively evaluated for impairment, is combined to determine the Company’s overall allowance, which is included on the consolidated balance sheet.
The Company assigns a risk rating to all loans except pools of homogeneous loans and periodically performs detailed reviews of all such loans over a certain threshold to identify credit risks and to assess the overall collectability of the portfolio. These risk ratings are also subject to examination by independent specialists engaged by the Company and the Company’s regulators. During these internal reviews, management monitors and analyzes the financial condition of borrowers and guarantors, trends in the industries in which borrowers operate and the fair values of collateral securing these loans. These credit quality indicators are used to assign a risk rating to each individual loan. The risk ratings can be grouped into five major categories, defined as follows:
Pass – A pass loan is a credit with no existing or known potential weaknesses deserving of management’s close attention.
Special Mention – A special mention loan has potential weaknesses that deserve management’s close attention. If left uncorrected, these potential weaknesses may result in deterioration of the repayment prospects for the loan or in the Company’s credit position at some future date. Special Mention loans are not adversely classified and do not expose the Company to sufficient risk to warrant adverse classification.
Substandard – A substandard loan is not adequately protected by the current sound worth and paying capacity of the borrower or the value of the collateral pledged, if any. Loans classified as substandard have a well-defined weakness or weaknesses that jeopardize the liquidation of the debt. Well defined weaknesses include a project’s lack of marketability, inadequate cash flow or collateral support, failure to complete construction on time or the project’s failure to fulfill economic expectations. They are characterized by the distinct possibility that the Company will sustain some loss if the deficiencies are not corrected.
Doubtful – Loans classified doubtful have all the weaknesses inherent in those classified as substandard with the added characteristic that the weaknesses make collection or liquidation in full, on the basis of currently known facts, conditions and values, highly questionable and improbable.
Loss – Loans classified as loss are considered uncollectible and charged off immediately.
The general reserve component of the allowance for loan losses also consists of reserve factors that are based on management’s assessment of the following for each portfolio segment: (1) inherent credit risk, (2) historical losses and (3) other qualitative factors. These reserve factors are inherently subjective and are driven by the repayment risk associated with each portfolio segment described below.
Commercial.Commercial loans generally possess a lower inherent risk of loss than real estate portfolio segments because these loans are generally underwritten to existing cash flows of operating businesses. Debt coverage is provided by business cash flows and economic trends influenced by unemployment rates and other key economic indicators are closely correlated to the credit quality of these loans.
Real Estate Commercial.Real estate commercial loans generally possess a higher inherent risk of loss than other real estate portfolio segments, except land and construction loans. Adverse economic developments or an overbuilt market impact commercial real estate projects and may result in troubled loans. Trends in vacancy rates of commercial properties impact the credit quality of these loans. High vacancy rates reduce operating revenues and the ability for properties to produce sufficient cash flow to service debt obligations.
Real Estate Construction. Real estate construction loans generally possess a higher inherent risk of loss than other real estate portfolio segments. A major risk arises from the necessity to complete projects within specified cost and time lines. Trends in the construction industry significantly impact the credit quality of these loans, as demand drives construction activity. In addition, trends in real estate values significantly impact the credit quality of these loans, as property values determine the economic viability of construction projects.
Real Estate Mortgage. The degree of risk in real estate mortgage lending depends primarily on the loan amount in relation to collateral value, the interest rate and the borrower’s ability to repay in an orderly fashion. These loans generally possess a lower inherent risk of loss than other real estate portfolio segments. Economic trends determined by unemployment rates and other key economic indicators are closely correlated to the credit quality of these loans. Weak economic trends indicate that the borrowers’ capacity to repay their obligations may be deteriorating.
Individual loans and receivables in homogeneous loan portfolio segments are not evaluated for specific impairment. Rather, the sole component of the allowance for these loan types is determined by collectively measuring impairment reserve factors based on management’s assessment of the following for each homogeneous loan portfolio segment: (1) inherent credit risk, (2) delinquencies, (3) historical losses and (4) other qualitative factors. The homogenous loan portfolio segments are described in further detail below.
Installment – An installment loan portfolio is usually comprised of a large number of small loans scheduled to be amortized over a specific period. Most installment loans are made directly for consumer purchases. Economic trends determined by unemployment rates and other key economic indicators are closely correlated to the credit quality of these loans. Weak economic trends indicate that the borrowers’ capacity to repay their obligations may be deteriorating.
Other (principally home equity loans) – The degree of risk in home equity loans depends primarily on the loan amount in relation to collateral value, the interest rate and the borrower’s ability to repay in an orderly fashion. These loans generally possess a lower inherent risk of loss than other real estate portfolio segments. Economic trends determined by unemployment rates and other key economic indicators are closely correlated to the credit quality of these loans. Weak economic trends indicate that the borrowers’ capacity to repay their obligations may be deteriorating.
Although management believes the allowance to be adequate, ultimate losses may vary from its estimates. At least quarterly, the Board of Directors reviews the adequacy of the allowance, including consideration of the relative risks in the portfolio, current economic conditions and other factors. If the Board of Directors and management determine that changes are warranted based on those reviews, the allowance is adjusted. In addition, the Company’s primary regulators, the Federal Reserve Bank of San Francisco and the California Department of Financial Institutions, as an integral part of their examination process, review the adequacy of the allowance. These regulatory agencies may require additions to the allowance based on their judgment about information available at the time of their examinations.
Other Real Estate Owned (“OREO”).OREO represents properties acquired through foreclosure or physical possession. Write-downs to fair value at the time of transfer to OREO is charged to allowance for loan losses. Subsequent to foreclosure, management periodically evaluate the value of OREO held for sale and record a valuation allowance for any subsequent declines in fair value less selling costs. Subsequent declines in value are charged to operations. Fair value is based on our assessment of information available to us and depends upon a number of factors, including our historical experience, economic conditions, and issues specific to individual properties. Management’s evaluation of these factors involves subjective estimates and judgments that may change.
Share Based Compensation. At December 31, 2011, the Company had two stock-based compensation plans: the 1998 Employee Stock Incentive Plan and the 2008 Stock Incentive Plan, which are described more fully in Note 1 and 13 to the Consolidated Financial Statements included herein in Item 8, “Financial Statements and Supplementary Data”. Compensation cost is recognized on all share-based payments over the requisite service periods of the awards based on the grant-date fair value of the options determined using the Black-Scholes-Merton based option valuation model. Critical assumptions that are assessed in computing the fair value of share-based payments include stock price volatility, expected dividend rates, the risk free interest rate and the expected lives of such options. Compensation cost recorded is net of estimated forfeitures expected to occur prior to vesting. For further information on the computation of the fair value of share-based payments, see Note 1 and 13 to the Consolidated Financial Statements.
Impairment of Investment Securities. An investment security is impaired when its carrying value is greater than its fair value. Investment securities that are impaired are evaluated on at least a quarterly basis and more frequently when economic or market conditions warrant such an evaluation to determine whether such a decline in their fair value is other than temporary. Management utilizes criteria such as the magnitude and duration of the decline and the intent and ability of the Company to retain its investment in the securities for a period of time sufficient to allow for an anticipated recovery in fair value, in addition to the reasons underlying the decline, to determine whether the loss in value is other than temporary. The term “other than temporary” is not intended to indicate that the decline is permanent, but indicates that the prospects for a near-term recovery of value is not necessarily favorable, or that there is a lack of evidence to support a realizable value equal to or greater than the carrying value of the investment. Once a decline in value is determined to be other than temporary, and management does not intend to sell the security or it is more likely than not that the Company will not be required to sell the security before recovery, only the portion of the impairment loss representing credit exposure is recognized as a charge to earnings, with the balance recognized as a charge to other comprehensive income. If management intends to sell the security or it is more likely than not that the Company will be required to sell the security before recovering its forecasted cost, the entire impairment loss is recognized as a charge to earnings.
Accounting for Income Taxes.The Company files its income taxes on a consolidated basis with its subsidiary. The allocation of income tax expense (benefit) represents each entity’s proportionate share of the consolidated provision for income taxes.
The Company applies the asset and liability method to account for income taxes. Deferred tax assets and liabilities are calculated by applying applicable tax laws to the differences between the financial statement basis and the tax basis of assets and liabilities. The effect on deferred taxes of changes in tax laws and rates is recognized in income in the period that includes the enactment date. On the consolidated balance sheet, net deferred tax assets are included in other assets.
The Company accounts for uncertainty in income taxes by recording onlytax positions that met the more likely than not recognition threshold, that the tax position would be sustained in a tax examination.
When tax returns are filed, it is highly certain that some positions taken would be sustained upon examination by the taxing authorities, while others are subject to uncertainty about the merits of the position taken or the amount of the position that would be ultimately sustained. The benefit of a tax position is recognized in the financial statements in the period during which, based on all available evidence, management believes it is more likely than not that the position will be sustained upon examination, including the resolution of appeals or litigation processes, if any. Tax positions taken are not offset or aggregated with other positions. Tax positions that meet the more-likely-than-not recognition threshold are measured as the largest amount of tax benefit that is more than 50 percent likely of being realized upon settlement with the applicable taxing authority. The portion of the benefits associated with tax positions taken that exceeds the amount measured as described above is reflected as a liability for unrecognized tax benefits in the accompanying balance sheet along with any associated interest and penalties that would be payable to the taxing authorities upon examination.
The Company evaluates deferred income tax assets for recoverability based on all available evidence. This process involves significant management judgment about assumptions that are subject to change from period to period based on changes in tax laws, our ability to successfully implement tax planning strategies, or variances between our future projected operating performance and our actual results. The Company is required to establish a valuation allowance for deferred tax assets if we determine, based on available evidence at the time the determination is made, that it is more likely than not that some portion or all of the deferred tax assets will not be realized. In determining the more-likely-than-not criterion, we evaluate all positive and negative available evidence as of the end of each reporting period. Future adjustments to the deferred tax asset valuation allowance, if any, will be determined based upon changes in the expected realization of net deferred tax assets. The realization of deferred tax assets ultimately depends on the existence of sufficient taxable income in the carry back and carry forward periods under the tax law. Due to the Company’s cumulative tax losses in 2009 and 2010, it was determined that as of December 31, 2010, the Company was not able to meet the ‘more likely than not” standard as to realization of a portion of its deferred tax assets and accordingly established a partial valuation allowance of $4,500,000 against such assets. During the quarter ended December 31, 2011, the Company reversed the Federal portion of its valuation allowance in the amount of $223,000, and at December 31, 2011 had a remaining valuation allowance of $4,277,000.
Business Organization
North Valley Bancorp (the “Company”) is a California corporation and a bank holding company for NVB, a state-chartered, Federal Reserve Member bank. NVB operates out of its main office located at 300 Park Marina Circle, Redding, California 96001, with twenty-four branches, including two supermarket branches. The Company’s principal business consists of attracting deposits from the general public and using the funds to originate commercial, real estate and installment loans to customers, who are predominately small and middle market businesses and middle income individuals. The Company’s primary source of revenues is interest income from its loan and investment securities portfolios. The Company is not dependent on any single customer for more than ten percent of its revenues.
Overview
Financial Results
For the year ended December 31, 2011, the Company recorded net operating income of $3,047,000, compared to a net operating loss of $6,248,000, for the year ended December 31, 2010. For 2011, the Company realized a return on average stockholders’ equity of 3.54% and a return on average assets of 0.34%, as compared to a loss on average stockholders’ equity of 8.03% and a loss on average assets of 0.69%, for 2010.
On April 22, 2010, the Company completed a $40,000,000 private placement of Series A Preferred Stock, with net proceeds of $37,500,000, which further strengthened the Company’s and Bank’s capital levels and ratios. On July 16, 2010, the Company received approval at the Annual Meeting of Shareholders to convert the 40,000 shares of Series A Preferred Stock into 26,666,646 shares of common stock. At July 21, 2010, a total of 34,162,463 shares of common stock were issued and outstanding. Under generally accepted accounting principles (“GAAP”), the conversion feature of the preferred stock had an intrinsic value of $0.70 per share, or $18,667,000, based on the difference between the conversion price of $1.50 per share and the market value of $2.20 for the Company’s common stock at the commitment date, April 22, 2010. As required by GAAP, the Company recognized this difference of $18,667,000 as a beneficial conversion discount on the preferred stock as of the July 21, 2010 conversion date. After combining this implied dividend on the preferred stock with operating results for the year ended December 31, 2010, the Company reported a loss available to common shareholders of $24,915,000, or ($6.42) per diluted share. The Company completed its 1-for-5 reverse stock split on December 28, 2010, and the Company had 6,833,752 and 6,832,492 common shares outstanding at December 31, 2011 and 2010, respectively. All common stock and EPS have been restated on an equivalent basis throughout this filing, retrospectively.
During 2011, total assets increased $20,025,000, or 2.3%, to $904,966,000 at year end. The loan portfolio decreased $57,251,000, or 11.2%, and totaled $456,215,000 at December 31, 2011 compared to $513,466,000 at December 31, 2010. The primary reason for the decrease was the Company’s decision to decrease its Real Estate – Construction portfolio to reduce the Company’s exposure to this lending segment. See “Loan Portfolio” for further information. This portfolio decreased $27,718,000 from $55,181,000 at December 31, 2010 to $27,463,000 at December 31, 2011. This reduction was primarily from principal reductions and pay-offs but was also a result of certain charge-offs and properties taken into OREO. Available-for-sale investment securities increased $46,561,000 to $312,205,000 at December 31, 2011 from $265,644,000 at December 31, 2010, as proceeds and paydowns on loans were reinvested into government sponsored agency mortgage-backed securities in order to maintain liquidity and contribute to the level of earning assets which help to support the Company’s net interest margin. The loan to deposit ratio at December 31, 2011 was 59.5% as compared to 68.1% at December 31, 2010. Total deposits increased $12,449,000, or 1.7%, to $766,239,000 at December 31, 2011 compared to $753,790,000 at December 31, 2010. The overall increase in deposits was due to the increase in non-maturity deposits of $28,713,000. This was offset by a decrease in time certificates of $16,264,000 due to a reduction in rates on those deposits.
Nonperforming loans (defined as nonaccrual loans and loans 90 days or more past due and still accruing interest) decreased $1,654,000, or 8.2%, to $18,411,000 at December 31, 2011 from $20,065,000 at December 31, 2010. Nonperforming loans as a percentage of total loans were 4.04% at December 31, 2011, compared to 3.91% at December 31, 2010.
Nonperforming assets (defined as nonperforming loans and OREO) totaled $38,517,000 at December 31, 2011, a decrease of $7,332,000 from the December 31, 2010 balance of $45,849,000. Nonperforming assets as a percentage of total assets were 4.26% at December 31, 2011 compared to 5.18% at December 31, 2010.
Gross charge-offs for the year ended December 31, 2011 were $5,525,000 and recoveries for the same year totaled $538,000 resulting in net charge-offs of $4,987,000, compared to gross charge-offs for the year ended December 31, 2010 of $12,515,000 and recoveries of $999,000 resulting in net charge-offs of $11,516,000.
Regulatory Matters
A written agreement (the final written agreement, as executed by the parties, is herein called the “Written Agreement”) was signed on January 6, 2010 among the Company, NVB and the Federal Reserve Bank of San Francisco (the “Reserve Bank”). Among other things, the Written Agreement provides that the Company and NVB shall submit to the Reserve Bank their continuing plans to enhance lending and credit administration functions, to maintain policies and procedures for the maintenance of an adequate allowance for loan losses, to strengthen the management of commercial real estate concentrations and to update its capital plan in order to maintain capital ratios at or above the required minimums. The Written Agreement also restricts the payment of dividends, any payments on trust preferred securities, certain indemnification and severance payments, and any reduction in capital or the purchase or redemption of stock without the prior approval of the Reserve Bank. Progress reports detailing the form and manner of all actions taken to secure compliance with the Written Agreement must be submitted to the Reserve Bank at least quarterly. This description of the Written Agreement is a summary and does not purport to be a complete description of all of the terms of such agreement and is qualified in its entirety by reference to the copy of the Written Agreement filed with the Securities and Exchange Commission on January 8, 2010 as an exhibit to the Company’s Current Report on Form 8-K.
The Directors and senior management of the Company and NVB agree with the goal of financial soundness represented by the Written Agreement and have taken appropriate action to comply with all requirements (including timelines) specified in the Written Agreement, as follows:
Capital Plan.Within 60 days of signing the Written Agreement, the Company was required to submit to the Reserve Bank a plan to maintain sufficient capital, on a consolidated basis, and the Company and NVB were required to jointly submit to the Reserve Bank a plan to maintain sufficient capital at NVB, as a separate entity. These plans were submitted to the Reserve Bank within the 60-day period, addressing among other things, the Company’s current and future capital needs, including compliance with capital adequacy guidelines for bank holding companies; NVB’s current and future capital needs, including compliance with the capital adequacy guidelines for state member banks; the adequacy of NVB’s capital, taking into account the volume of classified credits, concentrations of credit, the allowance for loan losses, current and projected asset growth and projected retained earnings; the source and timing of additional funds to fulfill the Company’s and NVB’s future capital requirements; and the requirements of Regulation Y, that the Company serve as a source of strength to NVB. The Reserve Bank accepted these plans and the Company completed a capital raise of $40,000,000, (net $37,500,000 after costs) on April 22, 2010 and contributed $33,500,000 of the net proceeds to the capital of NVB.
Strategic Plan and Budget.Within 60 days of signing the Written Agreement, NVB was also required to submit a business plan for 2010 to improve NVB’s earnings and overall condition. That plan was submitted to the Reserve Bank within the 60-day period and is being implemented as agreed. NVB is also required to submit a business plan and budget for each calendar year subsequent to 2010 at least 30 days prior to the beginning of that calendar year.
Concentrations of Credit.Within 45 days of signing the Written Agreement, NVB was required to submit a plan to strengthen NVB’s management of commercial real estate concentrations, including steps to reduce or mitigate the risk of concentrations. That plan was submitted to the Reserve Bank within the 45-day period and was accepted by the Reserve Bank and is being implemented by NVB as agreed.
Lending and Credit Administration.Within 60 days of signing the Written Agreement, NVB was required to submit a program to enhance lending and credit administration that addresses, considers and includes, at a minimum, work-out strategies for problem loans and loans on the NVB watch list; standards for interest-only loans; and standards for the timely movement of loans to non-accrual status. Such a program was submitted to the Reserve Bank within the 60-day period and was accepted by the Reserve Bank and is being implemented by NVB as agreed.
Asset Improvement.Within 60 days of signing the Written Agreement, NVB was required to submit a plan designed to improve NVB’s position through repayment, amortization, liquidation, additional collateral or other means on loans in excess of $1,000,000 which may be past due or on NVB’s problem loan list or otherwise adversely classified. Also, for any such loan NVB is required to submit a plan to improve NVB’s position on such loan and must submit a progress report updating each improvement plan within 30 days after the end of each calendar quarter. Such a plan was submitted to and accepted by the Reserve Bank and implemented within the 60-day period and NVB has timely submitted all related plans and progress reports to date.
Allowance for Loan losses.Within 60 days of signing the Written Agreement, NVB was required to submit an acceptable program for the maintenance of an adequate Allowance for Loan losses, to be reviewed by NVB’s Board of Directors on at least a quarterly calendar basis with reports regarding such review submitted to the Reserve Bank within 30 days after the end of each calendar quarter. Such a program was submitted to the Reserve Bank within the 60-day period and has been accepted by the Reserve Bank. Quarterly reports have also been timely filed with the Reserve Bank.
Debt and Stock Redemption. The Company may not, directly or indirectly, incur, increase or guarantee any debt, and may not, directly or indirectly, purchase or redeem any shares of its stock, without the prior written approval of the Reserve Bank.
Progress Reports.Within 30 days after the end of each calendar quarter following the date of the Written Agreement, the Company and NVB are required to submit to the Reserve Bank written progress reports detailing the actions taken to secure compliance with the Written Agreement and the results of such actions. All plans, reports and other information required by the Written Agreement are being submitted to the Reserve Bank within the requisite timeframes stipulated in the Written Agreement. The same or similar plans, reports and information are being submitted to the California Commissioner of Financial Institutions.
Communications from the Reserve Bank have continued to confirm that the Company and NVB are currently in compliance with all provisions of the Written Agreement.
Results of Operations
Net Interest Income and Net Interest Margin (fully taxable equivalent basis): Net interest income is the difference between interest earned on loans and investments and interest paid on deposits and borrowings, and is the primary revenue source for the Company. Net interest margin is net interest income expressed as a percentage of average earning assets. These items have been adjusted to give effect to $324,000, $360,000 and $345,000 in taxable-equivalent interest income on tax-free investments for the years ending December 31, 2011, 2010 and 2009.
Net interest income for 2011 was $31,683,000, a $1,386,000, or 4.57%, increase from net interest income of $30,297,000 in 2010. Interest income decreased $1,813,000, or 4.62%, to $37,469,000 in 2011 due primarily to a decrease in average loans. The Company also had $1,039,000 in foregone interest income for the loans placed on nonaccrual status during the year ended December 31, 2011 compared to $2,096,000 and $2,143,000 for the years ended December 31, 2010 and 2009, respectively. The average loans outstanding decreased $77,018,000, or 13.76%, to $482,845,000. This lower loan volume decreased interest income by $4,575,000 in 2011. The average yield earned on the loan portfolio increased 4 basis points to 5.98% for 2011. This increase in yield increased interest income by $162,000 in 2011. The net decrease to interest income from the loan portfolio was $4,413,000. The 2011 average balance of the investment portfolio increased $93,432,000, or 46.37%, compared to 2010, which accounted for a $2,365,000 increase in interest income, an increase in average yield of taxable securities of 12 basis points increased interest income by $333,000, and a decrease in average yield of nontaxable securities of 23 basis points decreased interest income by $33,000.
Interest expense in 2011 decreased $3,199,000, or 35.6%, to $5,786,000. The decrease was primarily related to the average rates paid on time deposits which decreased 73 basis points to 1.21% and reduced interest expense by $1,569,000 along with a decrease in average time deposits of $43,160,000 which reduced interest expense by $837,000 during 2011. The average rate paid on savings and money market accounts decreased 24 basis points to 0.44% for 2011 compared to 0.68% for 2010, resulting in a decrease to interest expense of $529,000. This decrease was offset partially by higher average balances in savings and money market accounts of $9,846,000 in 2011, resulting in a $67,000 increase in interest expense compared to 2010. The average rate paid on other borrowed funds decreased 74 basis points to 5.91% for 2011 compared to 6.65% for 2010, resulting in a decrease to interest expense of $234,000.
Net interest margin for 2011 increased 23 basis points to 3.92% from 3.69% in 2010. The net interest margin for the fourth quarter of 2011 was 3.68%, which was an 8 basis point decrease from 3.76% in the fourth quarter of 2010 and a 22 basis point decrease from 3.90% in the third quarter of 2011. The decline in the net interest margin in the fourth quarter of 2011 compared to the third quarter of 2011 is primarily due to a decrease in average loan balances. The continued decrease in average loan balance during the three year period ended December 31, 2011 is due to loan pay offs or principal repayments of $147,019,000, charge-offs of $38,784,000 and transfers to other real estate owned of $51,404,000.
Net interest income for 2010 was $30,297,000, a $1,282,000, or 4.06%, decrease from net interest income of $31,579,000 in 2009. Interest income decreased $5,018,000, or 11.3%, to $39,282,000 in 2010 due primarily to a decrease in average loans. The Company also had $2,096,000 in foregone interest income for the loans placed on nonaccrual status. The average loans outstanding decreased $89,943,000, or 13.8%, to $559,863,000. This lower loan volume decreased interest income by $5,433,000. The average yield earned on the loan portfolio decreased 10 basis points to 5.94% for 2010. This decrease in yield reduced interest income by $524,000. The total decrease to interest income from the loan portfolio was $5,957,000. The average balance of the investment portfolio increased $71,945,000, or 55.5%, which accounted for a $2,464,000 increase in interest income and a decrease in average yield of the investment portfolio of 94 basis points reduced interest income by $1,587,000.
Interest expense in 2010 decreased $3,736,000, or 29.4%, to $8,985,000. The decrease was primarily related to the average rates paid on time deposits which decreased 81 basis points to 1.94% and reduced interest expense by $2,118,000 along with a decrease in average time deposits of $48,851,000 which reduced interest expense by $1,343,000. The average rate paid on savings and money market accounts decreased 24 basis points to 0.68% for 2010 compared to 0.92% for 2009, resulting in a decrease to interest expense of $514,000. This decrease was offset partially by higher average balances in savings and money market accounts of $32,915,000 in 2010, resulting in a $303,000 increase in interest expense compared to 2009.
Net interest margin for 2010 decreased 19 basis points to 3.69% from 3.88% in 2009. The net interest margin for the fourth quarter of 2010 was 3.76%, which was an 8 basis point increase from 3.68% in the fourth quarter of 2009 and an 11 basis point increase from 3.65% in the third quarter of 2010.
The following table sets forth the Company’s consolidated condensed average daily balances and the corresponding average yields received and average rates paid of each major category of assets, liabilities, and stockholders’ equity for each of the past three years.
| Average Daily Balance Sheets | | | | | | | | | | | | | | | | | | | | | | | | | | | |
| (Dollars in thousands) | | | | | | | | | | | | | | | | | | | | | | | | | | | |
| | | 2011 | | | 2010 | | | 2009 | |
| | | Average | | | Yield/ | | | Interest | | | Average | | | Yield/ | | | Interest | | | Average | | | Yield/ | | | Interest | |
| | | Balance | | | Rate | | | Amount | | | Balance | | | Rate | | | Amount | | | Balance | | | Rate | | | Amount | |
| Assets | | | | | | | | | | | | | | | | | | | | | | | | | | | | | | | | | | | | |
| Federal funds sold | | $ | 31,103 | | | | 0.23 | % | | $ | 73 | | | $ | 59,446 | | | | 0.23 | % | | $ | 138 | | | $ | 33,587 | | | | 0.23 | % | | $ | 76 | |
| Investments: | | | | | | | | | | | | | | | | | | | | | | | | | | | | | | | | | | | | |
| Taxable securities | | | 280,708 | | | | 2.70 | % | | | 7,580 | | | | 186,220 | | | | 2.58 | % | | | 4,809 | | | | 113,711 | | | | 3.45 | % | | | 3,926 | |
| Nontaxable securities(1) | | | 14,205 | | | | 6.71 | % | | | 953 | | | | 15,261 | | | | 6.94 | % | | | 1,059 | | | | 15,825 | | | | 6.73 | % | | | 1,065 | |
| Total investments | | | 294,913 | | | | 2.89 | % | | | 8,533 | | | | 201,481 | | | | 2.91 | % | | | 5,868 | | | | 129,536 | | | | 3.85 | % | | | 4,991 | |
| Total loans (2)(3) | | | 482,845 | | | | 5.98 | % | | | 28,863 | | | | 559,863 | | | | 5.94 | % | | | 33,276 | | | | 649,806 | | | | 6.04 | % | | | 39,233 | |
| Total earning assets/interest income | | | 808,861 | | | | 4.63 | % | | | 37,469 | | | | 820,790 | | | | 4.79 | % | | | 39,282 | | | | 812,929 | | | | 5.45 | % | | | 44,300 | |
| Nonearning assets | | | 106,836 | | | | | | | | | | | | 101,192 | | | | | | | | | | | | 110,782 | | | | | | | | | |
| Allowance for loan losses | | | (14,426 | ) | | | | | | | | | | | (17,294 | ) | | | | | | | | | | | (17,249 | ) | | | | | | | | |
| Net nonearning assets | | | 92,410 | | | | | | | | | | | | 83,898 | | | | | | | | | | | | 93,533 | | | | | | | | | |
| Total assets | | $ | 901,271 | | | | | | | | | | | $ | 904,688 | | | | | | | | | | | $ | 906,462 | | | | | | | | | |
| | | | | | | | | | | | | | | | | | | | | | | | | | | | | | | | | | | | | |
| Liabilities and Stockholders' Equity | | | | | | | | | | | | | | | | | | | | | | | | | | | | | | | | | | | | |
| | | | | | | | | | | | | | | | | | | | | | | | | | | | | | | | | | | | | |
| Transaction accounts | | $ | 164,616 | | | | 0.18 | % | | $ | 293 | | | $ | 158,169 | | | | 0.25 | % | | $ | 393 | | | $ | 154,763 | | | | 0.32 | % | | $ | 493 | |
| Savings and money market | | | 220,501 | | | | 0.44 | % | | | 971 | | | | 210,655 | | | | 0.68 | % | | | 1,433 | | | | 177,740 | | | | 0.92 | % | | | 1,644 | |
| Time deposits | | | 216,408 | | | | 1.21 | % | | | 2,629 | | | | 259,568 | | | | 1.94 | % | | | 5,035 | | | | 308,419 | | | | 2.75 | % | | | 8,496 | |
| Other borrowed funds | | | 32,012 | | | | 5.91 | % | | | 1,893 | | | | 31,961 | | | | 6.65 | % | | | 2,124 | | | | 32,298 | | | | 6.46 | % | | | 2,088 | |
| Total interest bearing liabilities/interest expense | | | 633,537 | | | | 0.91 | % | | | 5,786 | | | | 660,353 | | | | 1.36 | % | | | 8,985 | | | | 673,220 | | | | 1.89 | % | | | 12,721 | |
| Noninterest bearing deposits | | | 159,242 | | | | | | | | | | | | 149,696 | | | | | | | | | | | | 147,266 | | | | | | | | | |
| Other liabilities | | | 22,386 | | | | | | | | | | | | 16,789 | | | | | | | | | | | | 11,937 | | | | | | | | | |
| Total liabilities | | | 815,165 | | | | | | | | | | | | 826,838 | | | | | | | | | | | | 832,423 | | | | | | | | | |
| Stockholders' equity | | | 86,106 | | | | | | | | | | | | 77,850 | | | | | | | | | | | | 74,039 | | | | | | | | | |
| Total liabilities and stockholders' equity | | $ | 901,271 | | | | | | | | | | | $ | 904,688 | | | | | | | | | | | $ | 906,462 | | | | | | | | | |
| Net interest income | | | | | | | | | | $ | 31,683 | | | | | | | | | | | $ | 30,297 | | | | | | | | | | | $ | 31,579 | |
| Net interest spread | | | | | | | 3.72 | % | | | | | | | | | | | 3.43 | % | | | | | | | | | | | 3.56 | % | | | | |
| Net interest margin (4) | | | | | | | 3.92 | % | | | | | | | | | | | 3.69 | % | | | | | | | | | | | 3.88 | % | | | | |
(1) Tax-equivalent basis; nontaxable securities are exempt from federal taxation.
(2) Loans on nonaccrual status have been included in the computations of average balances.
(3) Includes loan fees of $234, $428 and $802 for years ended December 31, 2011, 2010 and 2009.
(4) Net interest margin is determined by dividing net interest income by total average earning assets.
The following table summarizes changes in net interest income resulting from changes in average asset and liability balances (volume) and changes in average interest rates. The change in interest due to both rate and volume has been allocated to the change in rate (in thousands).
| | | 2011 Compared to 2010 | | | 2010 Compared to 2009 | |
| | | | | | | | | Total | | | | | | | | | Total | |
| | | Average | | | Average | | | Increase | | | Average | | | Average | | | Increase | |
| | | Volume | | | Rate | | | (Decrease) | | | Volume | | | Rate | | | (Decrease) | |
| Interest Income | | | | | | | | | | | | | | | | | | | | | | | | |
| Interest on federal funds sold | | $ | (65 | ) | | $ | — | | | $ | (65 | ) | | $ | 59 | | | $ | 3 | | | $ | 62 | |
| Interest on investments: | | | | | | | | | | | | | | | | | | | | | | | | |
| Taxable securities | | | 2,438 | | | | 333 | | | | 2,771 | | | | 2,502 | | | | (1,619 | ) | | | 883 | |
| Nontaxable securities | | | (73 | ) | | | (33 | ) | | | (106 | ) | | | (38 | ) | | | 32 | | | | (6 | ) |
| Total investments | | | 2,365 | | | | 300 | | | | 2,665 | | | | 2,464 | | | | (1,587 | ) | | | 877 | |
| Interest on loans | | | (4,575 | ) | | | 162 | | | | (4,413 | ) | | | (5,433 | ) | | | (524 | ) | | | (5,957 | ) |
| Total interest income | | | (2,275 | ) | | | 462 | | | | (1,813 | ) | | | (2,910 | ) | | | (2,108 | ) | | | (5,018 | ) |
| | | | | | | | | | | | | | | | | | | | | | | | | |
| Interest Expense | | | | | | | | | | | | | | | | | | | | | | | | |
| Transaction accounts | | | 16 | | | | (116 | ) | | | (100 | ) | | | 11 | | | | (111 | ) | | | (100 | ) |
| Savings and money market | | | 67 | | | | (529 | ) | | | (462 | ) | | | 303 | | | | (514 | ) | | | (211 | ) |
| Time deposits | | | (837 | ) | | | (1,569 | ) | | | (2,406 | ) | | | (1,343 | ) | | | (2,118 | ) | | | (3,461 | ) |
| Other borrowed funds | | | 3 | | | | (234 | ) | | | (231 | ) | | | (22 | ) | | | 58 | | | | 36 | |
| Total interest expense | | | (751 | ) | | | (2,448 | ) | | | (3,199 | ) | | | (1,051 | ) | | | (2,685 | ) | | | (3,736 | ) |
| Total change in net interest income | | $ | (1,524 | ) | | $ | 2,910 | | | $ | 1,386 | | | $ | (1,859 | ) | | $ | 577 | | | $ | (1,282 | ) |
Provision for Loan losses. The provision for loan losses reflects changes in the credit quality of the entire loan portfolio. The provision for loan losses corresponds to management’s assessment as to the inherent risk in the portfolio for potential losses. The provision adjusts the balance in the allowance for loan losses so that the allowance is adequate to provide for the potential losses based upon historical experience, current economic conditions, the mix in the portfolio and other factors necessary in estimating these inherent losses. For further information, see discussion under “Loan Portfolio” on page 37 and “Allowance for Loan losses” on page 42.
The Company provided $2,650,000 for loan losses in 2011 as compared to $7,970,000 in 2010 and $26,500,000 in 2009. The decrease in the provision for loan losses is due primarily to a decrease in the level of charge-offs experienced of $6,990,000 from $12,515,000 for the year ended December 31, 2010 to $5,525,000 for the year ended December 31, 2011 and the decrease in the level of nonperforming loans to $18,411,000 at December 31, 2011, down from $20,065,000 at December 31, 2010. Loan charge-offs, net of recoveries were $4,987,000 in 2011, $11,516,000 in 2010 and $19,288,000 in 2009. The ratio of net charge-offs to average loans outstanding were 1.03% in 2011, 2.06% in 2010 and 2.97% in 2009. The ratio of the allowance for loan losses to total loans was 2.77% in 2011, 2.92% in 2010 and 3.08% in 2009. The provision of $2,650,000 for the year ended December 31, 2011 reflects management’s assessment of the required provision to maintain the overall adequacy of the allowance for loan losses. This assessment includes the consideration of the increase in nonperforming loans and the overall effect of the slowing economy, particularly in real estate. Management believes that the current level of allowance for loan losses as of December 31, 2011 of $12,656,000, or 2.77% of total loans, is adequate at this time.
Noninterest Income.The following table is a summary of the Company’s noninterest income for the years ended December 31 (in thousands):
| | | 2011 | | | 2010 | | | 2009 | |
| Service charges on deposit accounts | | $ | 4,635 | | | $ | 5,864 | | | $ | 6,483 | |
| Other fees and charges | | | 4,663 | | | | 4,566 | | | | 4,265 | |
| Earnings on cash surrender value of life insurance policies | | | 1,359 | | | | 1,376 | | | | 1,371 | |
| Gain on sale of loans | | | 1,172 | | | | 241 | | | | 346 | |
| Gain on sale of securities | | | 1,677 | | | | — | | | | 655 | |
| Other | | | 859 | | | | 897 | | | | 890 | |
| Total | | $ | 14,365 | | | $ | 12,944 | | | $ | 14,010 | |
Noninterest income for the year ended December 31, 2011 increased by $1,421,000, or 11.0%, to $14,365,000 from $12,944,000 for the year ended December 31, 2010. The primary reason for the increase in noninterest income in 2011 compared to 2010 was due to gains on the sale of investment securities of $1,677,000. Gain on sale of loans increased $931,000 in 2011 compared to 2010, primarily due to the gain on sale of SBA loans of $680,000. Service charges on deposit accounts decreased $1,229,000 to $4,635,000 for the year ended December 31, 2011 compared to $5,864,000 for the year ended December 31, 2010 due primarily as a result of implementing the FDIC guidance on overdraft programs in the second quarter of 2011, while other fees and charges increased $97,000 to $4,663,000 for the year ended December 31, 2011 compared to $4,566,000 for the year ended December 31, 2010. Other noninterest income decreased $38,000 to $859,000 for the year ended December 31, 2011 compared to $897,000 for the year ended December 31, 2010.
Noninterest income for the year ended December 31, 2010 decreased $1,066,000, or 7.6%, to $12,944,000 from $14,010,000 for the year ended December 31, 2009. The primary reason for the decrease in noninterest income in 2010 compared to 2009 was due to a decrease in service charges on deposit accounts of $619,000 and a gain on sale of investment securities of $655,000 that occurred in 2009. Service charges on deposit accounts decreased due to a decline in fee-based transaction activity in deposit account services and overdraft transactions. Other fees and charges increased $301,000 to $4,566,000 for the year ended December 31, 2010 compared to $4,265,000 for the year ended December 31, 2009. Other fees and charges increased due to higher interchange rates for ATM transactions and was offset by a decrease in income related to residential mortgage loan sales of $105,000.
Noninterest Expense.The following table is a summary of the Company’s noninterest expense for the years ended December 31 (in thousands):
| | | 2011 | | | 2010 | | | 2009 | |
| Salaries and benefits | | $ | 18,657 | | | $ | 16,873 | | | $ | 18,500 | |
| Other real estate owned expense | | | 4,804 | | | | 6,522 | | | | 2,119 | |
| Occupancy | | | 2,786 | | | | 2,850 | | | | 3,079 | |
| Data processing | | | 2,507 | | | | 2,206 | | | | 2,165 | |
| FDIC and state assessments | | | 1,355 | | | | 2,368 | | | | 2,307 | |
| ATM and online banking | | | 1,182 | | | | 1,120 | | | | 1,107 | |
| Professional services | | | 1,090 | | | | 1,704 | | | | 1,212 | |
| Furniture and equipment | | | 1,062 | | | | 1,434 | | | | 1,847 | |
| Operations expense | | | 652 | | | | 601 | | | | 580 | |
| Messenger | | | 608 | | | | 570 | | | | 551 | |
| Marketing | | | 607 | | | | 615 | | | | 573 | |
| Printing and supplies | | | 542 | | | | 422 | | | | 524 | |
| Postage | | | 537 | | | | 524 | | | | 591 | |
| Director expense | | | 420 | | | | 458 | | | | 457 | |
| Loan expense | | | 337 | | | | 621 | | | | 870 | |
| Amortization of intangibles | | | 146 | | | | 146 | | | | 146 | |
| Impairment of goodwill | | | — | | | | — | | | | 15,187 | |
| Other | | | 2,423 | | | | 3,110 | | | | 2,175 | |
| Total | | $ | 39,715 | | | $ | 42,144 | | | $ | 53,990 | |
Noninterest expenses for the year ended December 31, 2011 decreased $2,429,000 to $39,715,000 compared to $42,144,000 for the year ended December 31, 2010. The reason for the decrease was due primarily to decreases in other real estate owned expense and FDIC and state assessments of $1,718,000 and $1,013,000, respectively, for the year ended December 31, 2011 compared to the year ended December 31, 2010. The decrease in FDIC and state regulatory assessments is primarily due to a reduction in our insurance premium assessment rate in 2011. Additionally, the Company experienced decreases in occupancy expense and furniture and equipment expense of $436,000 and a decrease in professional services of $614,000. These decreases were partially offset by an increase in salaries and employee benefits of $1,784,000 to $18,657,000 for the year ended December 31, 2011 compared to $16,873,000 for the year ended December 31, 2010. The Company’s ratio of noninterest expense to average assets was 4.41% for 2011 compared to 4.63% for 2010.
Noninterest expenses for the year ended December 31, 2010 decreased $12,076,000 to $41,914,000 compared to $53,990,000 for the year ended December 31, 2009. The reason for the decrease was due to a goodwill impairment charge of $15,187,000 during the fourth quarter of 2009. Salaries and employee benefits decreased $1,627,000 for the year ended December 31, 2010 from the year ended December 31, 2009 due to several cost cutting initiatives implemented by the Company during 2009. Occupancy expense and furniture and equipment expense decreased $642,000 for the year ended December 31, 2010 compared to the year ended December 31, 2009, while FDIC deposit insurance assessments increased $61,000 for the year ended December 31, 2010 when compared to 2009. Other real estate owned expense increased $4,403,000 to $6,522,000 for the year ended December 31, 2010 compared to $2,119,000 for 2009 due primarily to OREO expenses and valuation adjustments. The Company’s ratio of noninterest expense to average assets was 4.63% for 2010 compared to 5.96% for 2009.
Income Taxes. The provision for income taxes for the year ended December 31, 2011 was $312,000, compared to a benefit for income taxes of $985,000 and $9,394,000 for the same periods in 2010 and 2009, respectively. Due to the Company’s previous tax losses, management conducts an analysis to assess the need for a valuation allowance on its deferred tax assets quarterly. During 2010, it was determined that the Company was not able to meet the ‘more likely than not” standard as to realization of a portion of its deferred tax asset and accordingly establisheda valuation allowance of $4,500,000, or approximately 26.5% of its net deferred tax asset. The valuation allowance was booked as a provision for income tax in 2010. The effective tax rate for state and federal income taxes was 9.3% for the year ended December 31, 2011, compared to an effective tax benefit rate of 13.6% for the year ended December 31, 2010, and 26.7% for 2009. The Company’s tax rate of 9.3% was driven by the amount of permanent differences the Company has that adjusts pre-tax income or pre-benefit loss, as well as the reversal of the Federal valuation allowance of $223,000 during the fourth quarter of 2011. Excluding the partial reversal of the valuation allowance against the deferred tax assets, the Company’s effective tax benefit rate would have been 15.9% in 2011. At December 31, 2011, the Company has a valuation allowance in the amount of $4,277,000.
The difference in the effective tax rate compared to the combined Federal and State statutory tax rate of 42.05% is primarily the result of California interest and jobs credits resulting from hiring and lending in California “Enterprise Zones,” the Company’s investment in municipal securities and other equity securities that qualify for the dividend received deduction and the earnings from the cash surrender value of life insurance policies. Interest earned on municipal securities and the dividends received deduction are exempt from federal income tax. Earnings on life insurance policies are exempt from both federal income and California franchise tax. As such, all of these investment strategies lower the Company’s effective tax rate.
As of December 31, 2011, the Company had recorded net deferred income tax assets (which are included in other assets in the accompanying condensed consolidated balance sheet of approximately $10,721,000. For discussion of the Company’s deferred income tax assets see “Critical Accounting Policies — Accounting for Income Tax” above and Note 11 of the Consolidated Financial Statements.
Balance Sheet Analysis
North Valley Bancorp’s total assets increased $20,025,000, or 2.3%, to $904,966,000 at December 31, 2011 compared to $884,941,000 at December 31, 2010 with an increase in investment securities offset by decreases in the loan portfolio.
Investment Securities. During 2011, the Company used liquidity from the reduction in the loan portfolio to increase the investment securities portfolio. The investment securities portfolio increased $46,561,000 from year end 2010 to a total of $312,211,000 at December 31, 2011. The increase was primarily due to purchase of U.S government sponsored agency securities and government sponsored agency mortgage-backed securities.
The policy of the Company requires that management determine the appropriate classification of securities at the time of purchase. If management has the intent and the Company has the ability at the time of purchase to hold debt securities until maturity, they are classified as investments held-to-maturity, and carried at amortized cost. Debt securities to be held for indefinite periods of time and not intended to be held-to-maturity and equity securities are classified as available-for-sale and carried at market value. Securities held for indefinite periods of time include securities that management intends to use as part of its asset/liability management strategy and that may be sold in response to changes in interest rates, resultant prepayment risk, and other related factors.
The amortized cost of securities and their approximate fair value are summarized in the following table for the years ended December 31 (in thousands):
| | | 2011 | | | 2010 | | | 2009 | |
| | | Amortized | | | Fair | | | Amortized | | | Fair | | | Amortized | | | Fair | |
| | | Cost | | | Value | | | Cost | | | Value | | | Cost | | | Value | |
| Available-for-Sale: | | | | | | | | | | | | | | | | | | | | | | | | |
| Obligations of U.S. government sponsored agencies | | $ | 15,042 | | | $ | 15,234 | | | $ | 21,096 | | | $ | 21,221 | | | $ | 11,507 | | | $ | 11,471 | |
| Obligations of states and political subdivisions | | | 13,811 | | | | 14,455 | | | | 14,342 | | | | 14,551 | | | | 15,633 | | | | 15,989 | |
| Government sponsored agency mortgage-backed securities | | | 270,337 | | | | 275,204 | | | | 221,807 | | | | 222,569 | | | | 111,182 | | | | 111,777 | |
| Corporate securities | | | 6,000 | | | | 4,232 | | | | 6,000 | | | | 4,303 | | | | 6,000 | | | | 4,098 | |
| Equity securities | | | 3,000 | | | | 3,080 | | | | 3,000 | | | | 3,000 | | | | 3,000 | | | | 3,000 | |
| Total available-for-sale | | $ | 308,190 | | | $ | 312,205 | | | $ | 266,245 | | | $ | 265,644 | | | $ | 147,322 | | | $ | 146,335 | |
| Held-to-Maturity: | | | | | | | | | | | | | | | | | | | | | | | | |
| Government sponsored agency mortgage-backed securities | | $ | 6 | | | $ | 6 | | | $ | 6 | | | $ | 6 | | | $ | 9 | | | $ | 9 | |
| Total investment securities | | $ | 308,196 | | | $ | 312,211 | | | $ | 266,251 | | | $ | 265,650 | | | $ | 147,331 | | | $ | 146,344 | |
The following table shows estimated fair value of our investment securities, exclusive of equity securities with a fair value of $3,080,000, by year of maturity as of December 31, 2011. Expected maturities, specifically of government sponsored agency mortgage-backed securities, may differ significantly from contractual maturities because borrowers may have the right to prepay with or without penalty. Tax-equivalent adjustments have been made in calculating yields on tax exempt securities.
Contractual Maturity Distribution and Yields of Investment Securities (in thousands):
| | | Within | | | After One But Within | | | After Five But Within | | | After Ten | | | | | | | |
| | | One Year | | | Five Years | | | Ten Years | | | Years | | | Total | |
| | | Amount | | | Yield | | | Amount | | | Yield | | | Amount | | | Yield | | | Amount | | | Yield | | | Amount | | | Yield | |
| Available-for-sale securities: | | | | | | | | | | | | | | | | | | | | | | | | | | | | | | | | | | | | | | | | |
| Obligations of U.S. government sponsored agencies | | $ | 5,062 | | | | 1.21 | % | | $ | 10,172 | | | | 1.42 | % | | $ | — | | | | — | | | $ | — | | | | — | | | $ | 15,234 | | | | 1.35 | % |
| Obligations of states and political subdivisions | | | 641 | | | | 8.04 | % | | | 10,656 | | | | 6.95 | % | | | 2,032 | | | | 7.53 | % | | | 1,126 | | | | 7.30 | % | | | 14,455 | | | | 7.10 | % |
| Government sponsored agency mortgage-backed securities | | | 11,455 | | | | 0.69 | % | | | 80,695 | | | | 3.46 | % | | | 90,891 | | | | 2.72 | % | | | 92,163 | | | | 2.47 | % | | | 275,204 | | | | 2.77 | % |
| Corporate securities | | | — | | | | — | | | | — | | | | — | | | | — | | | | — | | | | 4,232 | | | | 2.29 | % | | | 4,232 | | | | 2.29 | % |
| Total securities available-for-sale | | $ | 17,158 | | | | 1.12 | % | | $ | 101,523 | | | | 3.62 | % | | $ | 92,923 | | | | 2.82 | % | | $ | 97,521 | | | | 2.52 | % | | $ | 309,125 | | | | 2.89 | % |
| | | | | | | | | | | | | | | | | | | | | | | | | | | | | | | | | | | | | | | | | |
| Held-to-maturity securities: | | | | | | | | | | | | | | | | | | | | | | | | | | | | | | | | | | | | | | | | |
| Government sponsored agency mortgage-back securities | | $ | — | | | | | | | $ | — | | | | | | | $ | — | | | | | | | $ | 6 | | | | 2.13 | % | | $ | 6 | | | | 2.13 | % |
An investment security is impaired when its carrying value is greater than its fair value. Investment securities that are impaired are evaluated on at least a quarterly basis and more frequently when economic or market conditions warrant such an evaluation to determine whether such a decline in their fair value is other than temporary. Management utilizes criteria such as the magnitude and duration of the decline and the intent and ability of the Company to retain its investment in the securities for a period of time sufficient to allow for an anticipated recovery in fair value, in addition to the reasons underlying the decline, to determine whether the loss in value is other than temporary. The term “other than temporary” is not intended to indicate that the decline is permanent, but indicates that the prospects for a near-term recovery of value is not necessarily favorable, or that there is a lack of evidence to support a realizable value equal to or greater than the carrying value of the investment. Once a decline in value is determined to be other than temporary, and management does not intend to sell the security or it is more likely than not that the Company will not be required to sell the security before recovery, only the portion of the impairment loss representing credit exposure is recognized as a charge to earnings, with the balance recognized as a charge to other comprehensive income. If management intends to sell the security or it is more likely than not that the Company will be required to sell the security before recovering its forecasted cost, the entire impairment loss is recognized as a charge to earnings.
Loan Portfolio.The loan portfolio decreased $57,251,000, or 11.2%, in 2011 and totaled $456,215,000 at December 31, 2011. During 2011, the Company decided to reduce its loan portfolio, specifically construction loans, as they posed the highest level of risk in the current real estate market and economic environment. The loan to deposit ratio at December 31, 2011 was 59.5%, as compared to 68.1% at December 31, 2010 and 76.5% at December 31, 2009.
The Company originates loans for business, consumer and real estate activities for equipment purchases. Such loans are concentrated in the primary markets in which the Company operates. Substantially all loans are collateralized. Generally, real estate loans are secured by real property. Commercial and other loans are secured by bank deposits or business or personal assets and leases are generally secured by equipment. The Company’s policy for requiring collateral is through analysis of the borrower, the borrower’s industry and the economic environment in which the loan would be granted. The loans are expected to be repaid from cash flows or proceeds from the sale of selected assets of the borrower.
Major classifications of loans for the years ended December 31 are summarized as follows (in thousands):
| | | 2011 | | | 2010 | | | 2009 | | | 2008 | | | 2007 | |
| Commercial | | $ | 46,160 | | | $ | 54,639 | | | $ | 66,513 | | | $ | 92,029 | | | $ | 92,419 | |
| Real estate - commercial | | | 276,644 | | | | 291,514 | | | | 313,917 | | | | 327,098 | | | | 297,272 | |
| Real estate - construction | | | 27,463 | | | | 55,181 | | | | 92,111 | | | | 136,755 | | | | 225,758 | |
| Real estate - mortgage | | | 47,362 | | | | 49,726 | | | | 59,816 | | | | 62,155 | | | | 50,131 | |
| Installment | | | 10,925 | | | | 14,690 | | | | 22,289 | | | | 29,945 | | | | 41,161 | |
| Other | | | 47,965 | | | | 48,292 | | | | 48,478 | | | | 46,459 | | | | 40,604 | |
| Total loans receivable | | | 456,519 | | | | 514,042 | | | | 603,124 | | | | 694,441 | | | | 747,345 | |
| Deferred loan fees, net | | | (304 | ) | | | (576 | ) | | | (707 | ) | | | (1,019 | ) | | | (1,092 | ) |
| Allowance for loan losses | | | (12,656 | ) | | | (14,993 | ) | | | (18,539 | ) | | | (11,327 | ) | | | (10,755 | ) |
| Net loans | | $ | 443,559 | | | $ | 498,473 | | | $ | 583,878 | | | $ | 682,095 | | | $ | 735,498 | |
Commercial loans decreased $8,479,000, or 15.5% in 2011 due to reduced loan originations and an increase in loan pay-offs and charge-offs. The Company decreased its Real Estate – Construction portfolio during the year by $27,718,000, or 50.2%, from $55,181,000 at December 31, 2010 to $27,463,000 at December 31, 2011. This reduction was primarily from principal reductions and pay-offs but was also a result of certain charge-offs and properties taken into OREO. Real Estate – Commercial loans decreased $14,870,000, or 5.1%, during 2011 from $291,514,000 at December 31, 2010 to $276,644,000 at December 31, 2011. Real Estate Mortgage loans decreased $2,364,000, or 4.8%. In January 2009, with mortgage rates reaching historical lows, the Company decided to not retain any real estate mortgage loans with fixed rates below 5.0% and to sell them to Freddie Mac. Installment loans decreased $3,765,000, or 25.6%, due to the Company’s decision in January 2008 to discontinue its purchases of indirect auto contracts. Other loans decreased $327,000, or 0.7%, from 2010.
At December 31, 2011 and 2010, the Company serviced real estate - mortgage loans and loans guaranteed by the Small Business Administration which it had sold to the secondary market of approximately $130,876,000 and $122,795,000, respectively.
The Company was contingently liable under letters of credit issued on behalf of its customers for $4,946,000 and $8,741,000 at December 31, 2011 and 2010, respectively. At December 31, 2011, commercial and consumer lines of credit, and real estate loans of approximately $45,033,000 and $41,077,000, respectively, were undisbursed. At December 31, 2010, commercial and consumer lines of credit, and real estate loans of approximately $47,650,000 and $44,169,000, respectively, were undisbursed. These instruments involve, to varying degrees, elements of credit and market risk more than the amounts recognized in the balance sheet. The contractual or notional amounts of these transactions express the extent of the Company’s involvement in these instruments and do not necessarily represent the actual amount subject to credit loss.
Maturity Distribution and Interest Rate Sensitivity of Loans and Commitments.The following table shows the maturity of certain loan categories and commitments. Also provided with respect to such loans and commitments are the amounts due after one year, classified according to the sensitivity to changes in interest rates (in thousands):
| ` | | | | | After One | | | | | | | |
| | | Within | | | Through | | | After | | | | |
| | | One Year | | | Five Years | | | Five Years | | | Total | |
| | | | | | | | | | | | | | | | | |
| Commercial | | $ | 20,193 | | | $ | 12,081 | | | $ | 13,886 | | | $ | 46,160 | |
| Real estate - commercial | | | 8,205 | | | | 55,465 | | | | 212,974 | | | | 276,644 | |
| Real estate - construction | | | 11,587 | | | | 14,763 | | | | 1,113 | | | | 27,463 | |
| Real estate - mortgage | | | 607 | | | | 7,430 | | | | 39,325 | | | | 47,362 | |
| Installment | | | 3,485 | | | | 4,882 | | | | 2,558 | | | | 10,925 | |
| Other | | | — | | | | 835 | | | | 47,130 | | | | 47,965 | |
| | | $ | 44,077 | | | $ | 95,456 | | | $ | 316,986 | | | $ | 456,519 | |
| | | | | | | | | | | | | | | | | |
| Loans maturing after one year with: | | | | | | | | | | | | | | | | |
| Fixed interest rates | | | | | | $ | 59,740 | | | $ | 300,704 | | | $ | 360,444 | |
| Variable interest rates | | | | | | $ | 35,716 | | | $ | 16,282 | | | $ | 51,998 | |
Impaired, Nonaccrual, Past Due, Troubled Debt Restructuring and Other Nonperforming Assets. The Company considers a loan impaired if, based on current information and events, it is probable that the Company will be unable to collect the scheduled payments of principal or interest when due according to the contractual terms of the loan agreement. The measurement of impaired loans is generally based on the present value of expected future cash flows discounted at the historical effective interest rate, except that all collateral-dependent loans are measured for impairment based on the fair value of the collateral.
During the portion of the year that the loans were impaired, the Company did not recognize any interest income in 2011 and 2010, and recognized interest income of approximately $130,000 for cash payments received in 2009. The following table shows information related to impaired loans at and for the period ended (in thousands):
| As of December 31, 2011 | |
| | | | | | Unpaid | | | | | | Average | |
| | | Recorded | | | Principal | | | Related | | | Recorded | |
| | | Investment | | | Balance | | | Allowance | | | Investment | |
| With no allocated allowance | | | | | | | | | | | | | | | | |
| Commercial | | $ | — | | | $ | — | | | $ | — | | | $ | — | |
| Real estate - commercial | | | 1,502 | | | | 1,556 | | | | — | | | | 1,820 | |
| Real estate - construction | | | 4,128 | | | | 4,153 | | | | — | | | | 4,142 | |
| Real estate - mortgage | | | 643 | | | | 751 | | | | — | | | | 689 | |
| Installment | | | 70 | | | | 75 | | | | — | | | | 72 | |
| Other | | | 88 | | | | 91 | | | | — | | | | 91 | |
| Subtotal | | | 6,431 | | | | 6,626 | | | | — | | | | 6,814 | |
| | | | | | | | | | | | | | | | | |
| With allocated allowance | | | | | | | | | | | | | | | | |
| Commercial | | | 1,788 | | | | 1,849 | | | | 450 | | | | 2,056 | |
| Real estate - commercial | | | 4,496 | | | | 5,302 | | | | 606 | | | | 4,534 | |
| Real estate - construction | | | 5,312 | | | | 5,312 | | | | 504 | | | | 5,311 | |
| Real estate - mortgage | | | 295 | | | | 314 | | | | 37 | | | | 302 | |
| Installment | | | 37 | | | | 39 | | | | 13 | | | | 38 | |
| Subtotal | | | 11,928 | | | | 12,816 | | | | 1,610 | | | | 12,241 | |
| Total Impaired Loans | | $ | 18,359 | | | $ | 19,442 | | | $ | 1,610 | | | $ | 19,055 | |
| As of December 31, 2010 | |
| | | | | | Unpaid | | | | | | Average | |
| | | Recorded | | | Principal | | | Related | | | Recorded | |
| | | Investment | | | Balance | | | Allowance | | | Investment | |
| With no allocated allowance | | | | | | | | | | | | | | | | |
| Commercial | | $ | 1,121 | | | $ | 1,466 | | | $ | — | | | $ | 1,531 | |
| Real estate - commercial | | | 2,602 | | | | 2,794 | | | | — | | | | 2,793 | |
| Real estate - construction | | | 9,016 | | | | 13,599 | | | | — | | | | 13,572 | |
| Real estate - mortgage | | | 1,557 | | | | 1,611 | | | | — | | | | 1,679 | |
| Installment | | | 67 | | | | 67 | | | | — | | | | 68 | |
| Subtotal | | | 14,363 | | | | 19,537 | | | | — | | | | 19,643 | |
| | | | | | | | | | | | | | | | | |
| With allocated allowance | | | | | | | | | | | | | | | | |
| Commercial | | | 349 | | | | 363 | | | | 327 | | | | 370 | |
| Real estate - commercial | | | 4,090 | | | | 4,178 | | | | 563 | | | | 4,252 | |
| Real estate - mortgage | | | 1,263 | | | | 1,265 | | | | 153 | | | | 1,563 | |
| Subtotal | | | 5,702 | | | | 5,806 | | | | 1,043 | | | | 6,185 | |
| Total Impaired Loans | | $ | 20,065 | | | $ | 25,343 | | | $ | 1,043 | | | $ | 25,828 | |
Loans on which the accrual of interest has been discontinued are designated as nonaccrual loans. Accrual of interest on loans is discontinued either when reasonable doubt exists as to the full and timely collection of interest or principal, or when a loan becomes contractually past due by 90 days or more with respect to interest or principal (except that when management believes a loan is well secured and in the process of collection, interest accruals are continued on loans deemed by management to be fully collectible). When a loan is placed on nonaccrual status, all interest previously accrued but not collected is reversed against current period interest income. Income on such loans is then recognized only to the extent that cash is received and where the future collection of principal is probable. Interest accruals are resumed on such loans when, in the judgment of management, the loans are estimated to be fully collectible as to both principal and interest.
Nonperforming assets for the years ended December 31 are summarized as follows (in thousands):
| | | 2011 | | | 2010 | | | 2009 | | | 2008 | | | 2007 | |
| Nonaccrual loans | | $ | 18,359 | | | $ | 20,065 | | | $ | 46,598 | | | $ | 18,936 | | | $ | 1,608 | |
| Loans past due 90 days or more and still accruing interest | | | 52 | | | | — | | | | — | | | | — | | | | 156 | |
| Total nonperforming loans | | | 18,411 | | | | 20,065 | | | | 46,598 | | | | 18,936 | | | | 1,764 | |
| Other real estate owned | | | 20,106 | | | | 25,784 | | | | 12,377 | | | | 10,408 | | | | 902 | |
| Total nonperforming assets | | $ | 38,517 | | | $ | 45,849 | | | $ | 58,975 | | | $ | 29,344 | | | $ | 2,666 | |
At December 31, 2011 and December 31, 2010, the recorded investment in nonperforming loans (defined as nonaccrual loans and loans 90 days or more past due and still accruing interest) was approximately $18,411,000 and $20,065,000, respectively. The Company had $1,610,000 of specific allowance for loan losses on impaired loans of $11,929,000 at December 31, 2011 as compared to $1,043,000 of specific allowance for loan losses on impaired loans of $6,103,000 at December 31, 2010. Nonperforming loans as a percentage of total loans were 4.04% at December 31, 2011, compared to 3.19% at December 31, 2010. Although nonperforming loans decreased in 2011 as compared to 2010, the percentage of nonperforming loans to total loans increased as the overall balance of loans declined. Nonperforming assets (nonperforming loans and OREO) totaled $38,517,000 at December 31, 2011, a decrease of $7,332,000 from the total at December 31, 2010. Nonperforming assets as a percentage of total assets were 4.26% at December 31, 2011 compared to 5.18% at December 31, 2010.
If interest on nonaccrual loans had been accrued, such income would have approximated $1,039,000 in 2011, $2,096,000 in 2010 and $2,143,000 in 2009.
At December 31, 2011 there were no commitments to lend additional funds to borrowers whose loans were classified as nonaccrual.
At December 31, 2011, net carrying value of other real estate owned decreased $5,678,000 to $20,106,000 from $25,784,000 at December 31, 2010. During the year 2011, the Company transferred seventeen properties into OREO totaling $10,454,000, sold twenty-six properties totaling $12,036,000, had write-downs of OREO of $4,002,000, and recorded loss on sale of OREO of $94,000. At December 31, 2011, OREO was comprised of twenty-seven properties which consisted of the following: four residential construction properties totaling $4,384,000, twelve residential land parcels totaling $9,809,000, one commercial land parcel for $382,000, five non-farm non-residential properties totaling $3,077,000 and five residential properties of $2,454,000. As of December 31, 2011 there were two OREO properties totaling $375,000, which were in escrow and pending sale.
The composition of nonperforming loans as of December 31, 2011, September 30, 2011, June 30, 2011, March 31, 2011 and December 31, 2010 was as follows (in thousands):
| | | December | | | September | | | June | | | March | | | December | |
| | | 2011 | | | 2011 | | | 2011 | | | 2011 | | | 2010 | |
| | | | | | % of | | | | | | % of | | | | | | % of | | | | | | % of | | | | | | % of | |
| | | Amount | | | total | | | Amount | | | total | | | Amount | | | total | | | Amount | | | total | | | Amount | | | total | |
| Commercial | | $ | 1,788 | | | | 9.7 | % | | $ | 1,993 | | | | 16.7 | % | | $ | 2,273 | | | | 12.9 | % | | $ | 544 | | | | 3.8 | % | | $ | 1,470 | | | | 7.3 | % |
| Real estate - commercial | | | 5,998 | | | | 32.7 | % | | | 5,068 | | | | 42.4 | % | | | 9,846 | | | | 56.0 | % | | | 9,078 | | | | 62.7 | % | | | 6,692 | | | | 33.4 | % |
| Real estate - construction | | | 9,440 | | | | 51.4 | % | | | 3,387 | | | | 28.3 | % | | | 4,247 | | | | 24.2 | % | | | 3,189 | | | | 22.0 | % | | | 9,016 | | | | 44.9 | % |
| Real estate - mortgage | | | 938 | | | | 5.1 | % | | | 1,281 | | | | 10.7 | % | | | 1,146 | | | | 6.5 | % | | | 1,633 | | | | 11.3 | % | | | 2,820 | | | | 14.1 | % |
| Installment | | | 107 | | | | 0.6 | % | | | 111 | | | | 0.9 | % | | | 23 | | | | 0.1 | % | | | 40 | | | | 0.3 | % | | | 67 | | | | 0.3 | % |
| Other | | | 88 | | | | 0.5 | % | | | 113 | | | | 0.9 | % | | | 50 | | | | 0.3 | % | | | — | | | | — | | | | — | | | | — | |
| Total nonaccrual loans | | $ | 18,359 | | | | 100.0 | % | | $ | 11,953 | | | | 100.0 | % | | $ | 17,585 | | | | 100.0 | % | | $ | 14,484 | | | | 100.0 | % | | $ | 20,065 | | | | 100.0 | % |
At December 31, 2011, real-estate-construction loans totaled $9,440,000, or 51.4%, of the nonperforming loans. There are eleven loans that make up the balance. Three of the eleven loans are residential land loans totaling $2,983,000. No charge-offs have been taken on these loans and a $3,000 specific reserves have been established for these loans at December 31, 2011. There are two loans for residential construction development projects totaling $346,000. No charge-offs have been taken on these loans and no specific reserves have been established for these loans at December 31, 2011. The remaining six loans are residential development loans totaling $6,111,000. Charge-offs of $49,000 have been taken on these loans and $501,000 of specific reserves has been established for these loans at December 31, 2011.
At December 31, 2011, there were six real-estate-commercial loans totaling $5,998,000, or 32.7%, of the nonperforming loans. The largest real estate-commercial loan is for a commercial real estate building located in Sacramento County for $3,500,000. Charge-offs of $693,000 have been taken on this loan and a $371,000 specific reserve has been established for this loan at December 31, 2011. The remaining five real estate-commercial loans total $2,498,000 (approximate average loan balance of $500,000). Charge-offs of $904,000 have been taken on these loans and specific reserves of $235,000 have been established for these loans at December 31, 2011.
The following table shows an aging analysis of the loan portfolio by the amount of time past due (in thousands):
| | | As of December 31, 2011 | |
| | | Accruing Interest | | | | | | | |
| | | | | | Greater than | | | | | | | |
| | | | | | 30-89 Days | | | 90 Days | | | | | | | |
| | | Current | | | Past Due | | | Past Due | | | Nonaccrual | | | Total | |
| | | | | | | | | | | | | | | | |
| Commercial | | $ | 44,325 | | | $ | 47 | | | $ | — | | | $ | 1,788 | | | $ | 46,160 | |
| Real estate - commercial | | | 264,143 | | | | 6,503 | | | | — | | | | 5,998 | | | | 276,644 | |
| Real estate - construction | | | 18,023 | | | | — | | | | — | | | | 9,440 | | | | 27,463 | |
| Real estate - mortgage | | | 45,170 | | | | 1,254 | | | | — | | | | 938 | | | | 47,362 | |
| Installment | | | 10,614 | | | | 152 | | | | 52 | | | | 107 | | | | 10,925 | |
| Other | | | 47,877 | | | | — | | | | — | | | | 88 | | | | 47,965 | |
| Total | | $ | 430,152 | | | $ | 7,956 | | | $ | 52 | | | $ | 18,359 | | | $ | 456,519 | |
| | | As of December 31, 2010 | |
| | | Accruing Interest | | | | | | | |
| | | | | | Greater than | | | | | | | |
| | | | | | 30-89 Days | | | 90 Days | | | | | | | |
| | | Current | | | Past Due | | | Past Due | | | Nonaccrual | | | Total | |
| | | | | | | | | | | | | | | | |
| Commercial | | $ | 53,010 | | | $ | 159 | | | $ | — | | | $ | 1,470 | | | $ | 54,639 | |
| Real estate - commercial | | | 284,788 | | | | 34 | | | | — | | | | 6,692 | | | | 291,514 | |
| Real estate - construction | | | 46,165 | | | | — | | | | — | | | | 9,016 | | | | 55,181 | |
| Real estate - mortgage | | | 46,068 | | | | 838 | | | | — | | | | 2,820 | | | | 49,726 | |
| Installment | | | 14,450 | | | | 173 | | | | — | | | | 67 | | | | 14,690 | |
| Other | | | 48,258 | | | | 34 | | | | — | | | | — | | | | 48,292 | |
| Total | | $ | 492,739 | | | $ | 1,238 | | | $ | — | | | $ | 20,065 | | | $ | 514,042 | |
During the period ending December 31, 2011, the terms of certain loans were modified as troubled debt restructurings. The modification of the terms of such loans included one or a combination of the following: a reduction of the stated interest rate of the loan; an extension of the maturity date at a stated rate of interest lower than the current market rate for new debt with similar risk; or a permanent reduction of the recorded investment in the loan. The following table shows information related to Troubled Debt Restructurings as of December 31, 2011 (in thousands):
| | | Accruing TDRs | | | Non Accruing TDRs | |
| | | | | | Pre-
Modification | | | Post-
Modification | | | | | | Pre-
Modification | | | Post-
Modification | |
| | | Number | | | Outstanding | | | Outstanding | | | Number | | | Outstanding | | | Outstanding | |
| | | of | | | Recorded | | | Recorded | | | of | | | Recorded | | | Recorded | |
| | | Contracts | | | Investment | | | Investment | | | Contracts | | | Investment | | | Investment | |
| Real estate - commercial | | | 3 | | | $ | 1,097 | | | $ | 1,097 | | | | — | | | $ | — | | | $ | — | |
| Real estate - construction | | | — | | | $ | — | | | $ | — | | | | 3 | | | $ | 1,179 | | | $ | 1,179 | |
| Real estate - mortgage | | | 2 | | | $ | 660 | | | $ | 660 | | | | 2 | | | $ | 415 | | | $ | 415 | |
At December 31, 2011, there are no specific reserves allocated to customers whose loan terms were modified in troubled debt restructurings. There are no commitments to lend additional amounts at December 31, 2011 to customers with outstanding loans that are classified as troubled debt restructurings.
There were no modifications involving a reduction of the stated interest rate. There were three modifications involving an extension of the maturity dates; one for 12 months, one for 36 months, and one for 42 months. The recorded investment in three loans was reduced in the aggregate amount of $86,423 during the year.
Allowance for Loan losses.A summary of the allowance for loan losses for the years ended December 31 were as follows (in thousands):
| | | 2011 | | | 2010 | | | 2009 | |
| Allowance for loan losses at beginning of period | | $ | 14,993 | | | $ | 18,539 | | | $ | 11,327 | |
| Loans charged-off | | | (5,525 | ) | | | (12,515 | ) | | | (20,744 | ) |
| Recoveries on loans previously charged-off | | | 538 | | | | 999 | | | | 1,456 | |
| Provisions for loan losses | | | 2,650 | | | | 7,970 | | | | 26,500 | |
| Balance of allowance for loan losses at end of period | | $ | 12,656 | | | $ | 14,993 | | | $ | 18,539 | |
The following table shows the changes in the allowance for loan losses (in thousands):
| | | As of December 31, 2011 | |
| | | | | | Real
Estate | | | Real
Estate | | | Real Estate | | | | | | | | | | | | | |
| | | Commercial | | | Commercial | | | Construction | | | Mortgage | | | Installment | | | Other | | | Unallocated | | | Total | |
| | | | | | | | | | | | | | | | | | | | | | | | | | | | | | | | | |
| Allowance for Loan Losses | | | | | | | | | | | | | | | | | | | | | | | | | | | | | | | | |
| Balance December 31, 2010 | | $ | 1,517 | | | $ | 8,439 | | | $ | 1,936 | | | $ | 956 | | | $ | 339 | | | $ | 666 | | | $ | 1,140 | | | $ | 14,993 | |
| Charge-offs | | | (928 | ) | | | (2,917 | ) | | | (405 | ) | | | (440 | ) | | | (345 | ) | | | (490 | ) | | | | | | | (5,525 | ) |
| Recoveries | | | 212 | | | | 108 | | | | 10 | | | | 2 | | | | 206 | | | | — | | | | | | | | 538 | |
| Provisions for loan losses | | | 532 | | | | 1,898 | | | | (502 | ) | | | 417 | | | | (15 | ) | | | 560 | | | | (240 | ) | | | 2,650 | |
| Balance December 31, 2011 | | $ | 1,333 | | | $ | 7,528 | | | $ | 1,039 | | | $ | 935 | | | $ | 185 | | | $ | 736 | | | $ | 900 | | | $ | 12,656 | |
| Reserve to impaired loans | | $ | 450 | | | $ | 606 | | | $ | 504 | | | $ | 37 | | | $ | 13 | | | $ | — | | | $ | — | | | $ | 1,610 | |
| Reserve to non-impaired loans | | $ | 883 | | | $ | 6,922 | | | $ | 535 | | | $ | 898 | | | $ | 172 | | | $ | 736 | | | $ | 900 | | | $ | 11,046 | |
| | | | | | | | | | | | | | | | | | | | | | | | | | | | | | | | | |
| Loans | | | | | | | | | | | | | | | | | | | | | | | | | | | | | | | | |
| Balance December 31, 2011 | | $ | 46,160 | | | $ | 276,644 | | | $ | 27,463 | | | $ | 47,362 | | | $ | 10,925 | | | $ | 47,965 | | | | | | | $ | 456,519 | |
| Impaired Loans | | $ | 1,788 | | | $ | 5,998 | | | $ | 9,440 | | | $ | 938 | | | $ | 107 | | | $ | 88 | | | | | | | $ | 18,359 | |
| Non-impaired loans | | $ | 44,372 | | | $ | 270,646 | | | $ | 18,023 | | | $ | 46,424 | | | $ | 10,818 | | | $ | 47,877 | | | | | | | $ | 438,160 | |
| | | As of December 31, 2010 | |
| | | | | | Real
Estate | | | Real
Estate | | | Real
Estate | | | | | | | | | | | | | |
| | | Commercial | | | Commercial | | | Construction | | | Mortgage | | | Installment | | | Other | | | Unallocated | | | Total | |
| | | | | | | | | | | | | | | | | | | | | | | | | | | | | | | | | |
| Allowance for Loan Losses | | | | | | | | | | | | | | | | | | | | | | | | | | | | | | | | |
| Balance December 31, 2009 | | $ | 2,018 | | | $ | 8,702 | | | $ | 3,800 | | | $ | 737 | | | $ | 391 | | | $ | 451 | | | $ | 2,440 | | | $ | 18,539 | |
| Charge-offs | | | (862 | ) | | | (3,400 | ) | | | (6,663 | ) | | | (704 | ) | | | (732 | ) | | | (154 | ) | | | | | | | (12,515 | ) |
| Recoveries | | | 76 | | | | 391 | | | | 40 | | | | — | | | | 490 | | | | 2 | | | | | | | | 999 | |
| Provisions for loan losses | | | 285 | | | | 2,746 | | | | 4,759 | | | | 923 | | | | 190 | | | | 367 | | | | (1,300 | ) | | | 7,970 | |
| Balance December 31, 2011 | | $ | 1,517 | | | $ | 8,439 | | | $ | 1,936 | | | $ | 956 | | | $ | 339 | | | $ | 666 | | | $ | 1,140 | | | $ | 14,993 | |
| Reserve to impaired loans | | $ | 327 | | | $ | 563 | | | $ | — | | | $ | 153 | | | $ | — | | | $ | — | | | $ | — | | | $ | 1,043 | |
| Reserve to non-impaired loans | | $ | 1,190 | | | $ | 7,876 | | | $ | 1,936 | | | $ | 803 | | | $ | 339 | | | $ | 666 | | | $ | 1,140 | | | $ | 13,950 | |
| | | | | | | | | | | | | | | | | | | | | | | | | | | | | | | | | |
| Loans | | | | | | | | | | | | | | | | | | | | | | | | | | | | | | | | |
| Balance December 31, 2010 | | $ | 54,639 | | | $ | 291,514 | | | $ | 55,181 | | | $ | 49,726 | | | $ | 14,690 | | | $ | 48,292 | | | | | | | $ | 514,042 | |
| Impaired Loans | | $ | 1,470 | | | $ | 6,692 | | | $ | 9,016 | | | $ | 2,820 | | | $ | 67 | | | $ | — | | | | | | | $ | 20,065 | |
| Non-impaired loans | | $ | 53,169 | | | $ | 284,822 | | | $ | 46,165 | | | $ | 46,906 | | | $ | 14,623 | | | $ | 48,292 | | | | | | | $ | 493,977 | |
The following table shows the loan portfolio allocated by management’s internal risk ratings (in thousands):
| | | As of December 31, 2011 | |
| | | Pass | | | Special Mention | | | Substandard | | | Doubtful | | | Total | |
| Commercial | | $ | 39,319 | | | $ | 3,067 | | | $ | 3,774 | | | $ | — | | | $ | 46,160 | |
| Real estate - commercial | | | 248,696 | | | | 5,055 | | | | 22,893 | | | | — | | | | 276,644 | |
| Real estate - construction | | | 17,624 | | | | 167 | | | | 9,672 | | | | — | | | | 27,463 | |
| Real estate - mortgage | | | 43,760 | | | | 886 | | | | 2,716 | | | | — | | | | 47,362 | |
| Installment | | | 10,702 | | | | — | | | | 223 | | | | — | | | | 10,925 | |
| Other | | | 47,638 | | | | — | | | | 327 | | | | — | | | | 47,965 | |
| Total | | $ | 407,739 | | | $ | 9,175 | | | $ | 39,605 | | | $ | — | | | $ | 456,519 | |
| | | As of December 31, 2010 | |
| | | Pass | | | Special Mention | | | Substandard | | | Doubtful | | | Total | |
| Commercial | | $ | 43,773 | | | $ | 3,531 | | | $ | 7,203 | | | $ | 132 | | | $ | 54,639 | |
| Real estate - commercial | | | 259,929 | | | | 2,214 | | | | 29,371 | | | | — | | | | 291,514 | |
| Real estate - construction | | | 23,542 | | | | 10,171 | | | | 21,468 | | | | — | | | | 55,181 | |
| Real estate - mortgage | | | 43,655 | | | | 482 | | | | 5,589 | | | | — | | | | 49,726 | |
| Installment | | | 14,499 | | | | — | | | | 191 | | | | — | | | | 14,690 | |
| Other | | | 47,790 | | | | — | | | | 502 | | | | — | | | | 48,292 | |
| Total | | $ | 433,188 | | | $ | 16,398 | | | $ | 64,324 | | | $ | 132 | | | $ | 514,042 | |
The allowance for loan losses is established through a provision for loan losses based on management’s evaluation of the risks inherent in the loan portfolio. In determining levels of risk, management considers a variety of factors, including, but not limited to, asset classifications, economic trends, industry experience and trends, geographic concentrations, estimated collateral values, historical loan loss experience, and the Company’s underwriting policies. The allowance for loan losses is maintained at an amount management considers adequate to cover the probable losses in loans receivable. While management uses the best information available to make these estimates, future adjustments to allowances may be necessary due to economic, operating, regulatory, and other conditions that may be beyond the Company’s control. The Company also engages a third party credit review consultant to analyze the Company’s loan loss adequacy each calendar quarter. In addition, the regulatory agencies, as an integral part of their examination process, periodically review the Company’s allowance for loan losses. Such agencies may require the Company to recognize additions to the allowance based on judgments different from those of management.
The allowance for loan losses is comprised of several components including the specific, formula and unallocated allowance relating to loans in the loan portfolio. Our methodology for determining the allowance for loan losses consists of several key elements, which include:
| | · | Specific Allowances. A specific allowance is established when management has identified unique or particular risks that were related to a specific loan that demonstrated risk characteristics consistent with impairment. Specific allowances are established when management can estimate the amount of an impairment of a loan. |
| | | |
| | · | Formula Allowance. The formula allowance is calculated by applying loss factors through the assignment of loss factors to homogenous pools of loans. Changes in risk grades of both performing and nonperforming loans affect the amount of the formula allowance. Loss factors are based on our historical loss experience and such other data as management believes to be pertinent. Management, also, considers a variety of subjective factors, including regional economic and business conditions that impact important segments of our portfolio, loan growth rates, the depth and skill of lending staff, the interest rate environment, and the results of bank regulatory examinations and findings of our internal credit examiners to establish the formula allowance. |
| | | |
| | · | Unallocated Allowance. The unallocated loan loss allowance represents an amount for imprecision or uncertainty that is inherent in estimates used to determine the allowance. |
The Company also maintains a separate allowance for off-balance-sheet commitments. A reserve for unfunded commitments is maintained at a level that, in the opinion of management, is adequate to absorb probable losses associated with commitments to lend funds under existing agreements, for example, the Bank’s commitment to fund advances under lines of credit. The reserve amount for unfunded commitments is determined based on our methodologies described above with respect to the formula allowance. The allowance for off-balance-sheet commitments is included in accrued interest payable and other liabilities on the consolidated balance sheet. At December 31, 2011 and 2010, the reserve for unfunded commitments totaled $161,000 and $230,000, respectively.
Management anticipates modest growth in commercial lending and commercial real estate and to a lesser extent consumer and real estate mortgage lending, while it anticipates a further decline in construction lending. As a result, future provisions may be required and the ratio of the allowance for loan losses to loans outstanding may increase to reflect portfolio risk, increasing concentrations, loan type and changes in economic conditions. In addition, the regulatory agencies, as an integral part of their examination process, periodically review the Company’s allowance for loan losses, and may require the Company to make additions to the allowance based on their judgment about information available to them at the time of their examinations.
Deposits.Deposits represent the Company’s primary source of funds. They are primarily core deposits in that they are demand, savings and money market, and time deposits generated from local businesses and individuals. These sources are considered to be relatively stable as they are mostly derived from long-term banking relationships. During 2011, total deposits increased $12,449,000, or 1.7%, to $766,239,000 compared to $753,790,000 at December 31, 2010. Noninterest-bearing demand deposits increased $12,007,000, or 7.7%, interest-bearing demand deposits increased $8,883,000, or 5.5% and savings and money market deposits increased $7,823,000, or 3.8% during 2011. This increase was partially offset by a decrease in deposits from time certificates of $16,264,000, or 7.1% during 2011 as it reduced the rates paid on time certificates. The shift in deposit mix has resulted in noninterest-bearing demand deposits representing 21.9% of total deposits at December 31, 2011 compared to 20.6% of total deposits at December 31, 2010.
During 2010, total deposits decreased $34,019,000, or 4.3%, to $753,790,000 compared to $787,809,000 at December 31, 2009. The decrease in deposits was due primarily to a decrease in time certificates of $56,816,000, or 19.9%. The Company experienced a decrease in deposits from time certificates during 2010 as it reduced the rates paid on time certificates, while it experienced an increase in non-maturity deposits. Savings and money market deposits increased $18,694,000, or 9.9%, noninterest-bearing demand deposits increased $3,078,000, or 2.0%, and interest-bearing demand increased $1,025,000, or 0.6%, during 2010. The shift in deposit mix has resulted in noninterest-bearing demand deposits representing 20.6% of total deposits at December 31, 2010 compared to 19.3% of total deposits at December 31, 2009.
The following table summarizes the Company’s deposits at the indicated dates for the years ended December 31 (in thousands):
| | | 2011 | | | 2010 | | | 2009 | |
| Noninterest-bearing demand | | $ | 167,506 | | | $ | 155,499 | | | $ | 152,421 | |
| Interest-bearing demand | | | 170,124 | | | | 161,241 | | | | 160,216 | |
| Savings and money market | | | 216,299 | | | | 208,476 | | | | 189,782 | |
| Time certificates | | | 212,310 | | | | 228,574 | | | | 285,390 | |
| Total deposits | | $ | 766,239 | | | $ | 753,790 | | | $ | 787,809 | |
Capital Resources. The Company maintains capital to support future growth and maintain financial strength while trying to effectively manage the capital on hand. From the depositor standpoint, a greater amount of capital on hand relative to total assets is generally viewed as positive. At the same time, from the standpoint of the shareholder, a greater amount of capital on hand may not be viewed as positive because it limits the Company’s ability to earn a high rate of return on stockholders’ equity (ROE). Stockholders’ equity increased $5,487,000 to $89,465,000 as of December 31, 2011, as compared to $83,978,000 at December 31, 2010. The increase was due to net income of $3,047,000 and a change in accumulated other comprehensive gain of $2,283,000. Under current regulations, management believes that the Company meets all capital adequacy requirements. The Company suspended indefinitely the payment of quarterly cash dividends on its common stock beginning in 2009.
The following table displays the Company’s and Bank’s capital ratios at December 31, 2011 (dollars in thousands).
| | | | | | | | | Minimum | | | | |
| | | | | | | | | for Capital | | | Well- | |
| | | | | | | | | Adequacy | | | capitalized | |
| | | Capital | | | Ratio | | | Purposes | | | Ratios | |
| Company: | | | | | | | | | | | | | | | | |
| Total capital (to risk weighted assets) | | $ | 116,464 | | | | 19.53 | % | | | 8.00 | % | | | N/A | |
| Tier 1 capital (to risk weighted assets) | | $ | 107,240 | | | | 17.99 | % | | | 4.00 | % | | | N/A | |
| Tier 1 capital (to average assets) | | $ | 107,240 | | | | 11.82 | % | | | 4.00 | % | | | N/A | |
| | | | | | | | | | | | | | | | | |
| Bank: | | | | | | | | | | | | | | | | |
| Total capital (to risk weighted assets) | | $ | 121,221 | | | | 20.33 | % | | | 8.00 | % | | | 10.00 | % |
| Tier 1 capital (to risk weighted assets) | | $ | 113,666 | | | | 19.06 | % | | | 4.00 | % | | | 6.00 | % |
| Tier 1 capital (to average assets) | | $ | 113,666 | | | | 12.54 | % | | | 4.00 | % | | | 5.00 | % |
Impact of Inflation. Impact of inflation on a financial institution differs significantly from that exerted on an industrial concern, primarily because a financial institution’s assets and liabilities consist largely of monetarily based items. The relatively low proportion of the Company’s fixed assets (approximately 1.0% at December 31, 2011) reduces both the potential of inflated earnings resulting from understated depreciation and the potential understatement of absolute asset values.
ITEM 7A. QUANTITATIVE AND QUALITATIVE DISCLOSURES ABOUT MARKET RISK
Overview. The Company constantly monitors earning asset and deposit levels, developments and trends in interest rates, liquidity, capital adequacy and marketplace opportunities with the view towards maximizing shareholder value and earnings while maintaining a high quality balance sheet without exposing the Company to undue market risk. Management responds to all of these to protect and possibly enhance net interest income while managing risks within acceptable levels as set forth in the Company’s policies. In addition, alternative business plans and contemplated transactions are also analyzed for their impact. This process, known as asset/liability management is carried out by changing the maturities and relative proportions of the various types of loans, investments, deposits and other borrowings.
Market Risk. Market risk results from the fact that the market values of assets or liabilities on which the interest rate is fixed will increase or decrease with changes in market interest rates. If the Company invests in a fixed-rate, long term security and then interest rates rise, the security is worth less than a comparable security just issued because the older security pays less interest than the newly issued security. If the security had to be sold before maturity, then the Company would incur a loss on the sale. Conversely, if interest rates fall after a fixed-rate security is purchased, its value increases, because it is paying at a higher rate than newly issued securities. The fixed rate liabilities of the Company, like certificates of deposit and fixed-rate borrowings, also change in value with changes in interest rates. As rates drop, they become more valuable to the depositor and hence more costly to the Company. As rates rise, they become more valuable to the Company. Therefore, while the value changes when rates move in either direction, the adverse impacts of market risk to the Company’s fixed-rate assets are due to rising rates and for the Company’s fixed-rate liabilities, they are due to falling rates. In general, the change in market value due to changes in interest rates is greater in financial instruments that have longer remaining maturities. Therefore, the exposure to market risk of assets is lessened by managing the amount of fixed-rate assets and by keeping maturities relatively short. These steps, however, must be balanced against the need for adequate interest income because variable-rate and shorter-term assets generally yield less interest than longer-term or fixed-rate assets.
Mismatch Risk. The second interest-related risk, mismatched risk, arises from the fact that when interest rates change, the changes do not occur equally in the rates of interest earned and paid because of differences in the contractual terms of the assets and liabilities held. A difference in the contractual terms, a mismatch, can cause adverse impacts on net interest income.
The Company has a certain portion of its loan portfolio tied to the national prime rate. If these rates are lowered because of general market conditions, e.g., the prime rate decreases in response to a rate decrease by the Federal Reserve Open Market Committee (“FOMC”), these loans will be repriced. If the Company were at the same time to have a large proportion of its deposits in long-term fixed-rate certificates, interest earned on loans would decline while interest paid on the certificates would remain at higher levels for a period of time until they mature. Therefore, net interest income would decrease immediately. A decrease in net interest income could also occur with rising interest rates if the Company had a large portfolio of fixed-rate loans and securities that was funded by deposit accounts on which the rate is steadily rising.
This exposure to mismatch risk is managed by attempting to match the maturities and repricing opportunities of assets and liabilities. This may be done by varying the terms and conditions of the products that are offered to depositors and borrowers. For example, if many depositors want shorter-term certificates while most borrowers are requesting longer-term fixed rate loans, the Company will adjust the interest rates on the certificates and loans to try to match up demand for similar maturities. The Company can then partially fill in mismatches by purchasing securities or borrowing funds from the Federal Home Loan Bank (“FHLB”) with the appropriate maturity or repricing characteristics.
Basis Risk. The third interest-related risk, basis risk, arises from the fact that interest rates rarely change in a parallel or equal manner. The interest rates associated with the various assets and liabilities differ in how often they change, the extent to which they change, and whether they change sooner or later than other interest rates. For example, while the repricing of a specific asset and a specific liability may occur at roughly the same time, the interest rate on the liability may rise one percent in response to rising market rates while the asset increases only one-half percent. While the Company would appear to be evenly matched with respect to mismatch risk, it would suffer a decrease in net interest income. This exposure to basis risk is the type of interest risk least able to be managed, but is also the least dramatic. Avoiding concentrations in only a few types of assets or liabilities is the best means of increasing the chance that the average interest received and paid will move in tandem. The wider diversification means that many different rates, each with their own volatility characteristics, will come into play.
Net Interest Income and Net Economic Value Simulations. The tool used to manage and analyze the interest rate sensitivity of a financial institution is known as a simulation model and is performed with specialized software built for this specific purpose for financial institutions. This model allows management to analyze the three specific types of risks; market risk, mismatch risk, and basis risk.
To quantify the extent of all of these risks both in its current position and in transactions it might make in the future, the Company uses computer modeling to simulate the impact of different interest rate scenarios on net interest income and on net economic value. Net economic value or the market value of portfolio equity is defined as the difference between the market value of financial assets and liabilities. These hypothetical scenarios include both sudden and gradual interest rate changes, and interest rate changes in both directions. This modeling is the primary means the Company uses for interest rate risk management decisions.
The hypothetical impact of sudden interest rate shocks applied to the Company’s asset and liability balances are modeled quarterly. The results of this modeling indicate how much of the Company’s net interest income and net economic value are “at risk” (deviation from the base level) from various sudden rate changes. Although interest rates normally would not change in this sudden manner, this exercise is valuable in identifying risk exposures. The results for the Company’s December 31, 2011 analysis indicates the following results for changes in net economic value and changes in net interest income over a one-year period given the interest rate shocks listed in the table below. Management believes that short and medium term interest rates will continue to remain at historical lows throughout the year.
| | | Shocked | | | Shocked | |
| | | by -1% | | | by +2% | |
| | | | | | | | | |
| Net interest income | | | -0.6 | % | | | -1.0 | % |
| Net economic value | | | -8.9 | % | | | -0.6 | % |
For the modeling, the Company has made certain assumptions about the duration of its non-maturing deposits that are based on an analysis performed on the Company’s database to determine average length of deposit accounts. This assumption is important to determining net economic value at risk. The Company has compared its assumptions with those used by other financial institutions.
Liquidity.The objective of liquidity management is to ensure the continuous availability of funds to meet the demands of depositors and borrowers. Collection of principal and interest on loans, the pay-downs and maturities of investment securities, deposits with other banks, customer deposits and short term borrowing, when needed, are primary sources of funds that contribute to liquidity. Unused lines of credit from correspondent banks to provide secured federal funds for $10,000,000 as of December 31, 2011 were available to provide liquidity. In addition, NVB is a member of the FHLB providing an additional available line of credit of $300,615,000 secured by first deeds of trust on eligible 1-4 unit residential loans and qualifying investment securities. The Company also had a line of credit with the Federal Reserve Bank of $7,121,000 secured by qualifying investment securities. As of December 31, 2011, borrowings of $31,961,000 were outstanding in the form of Subordinated Debentures.
The Company manages both assets and liabilities by monitoring asset and liability mixes, volumes, maturities, yields and rates in order to preserve liquidity and earnings stability. Total liquid assets (cash and due from banks, federal funds sold, and available-for-sale investment securities) totaled $371,173,000 and $289,278,000, or 41.0% and 32.7% of total assets at December 31, 2011 and December 31, 2010, respectively.
Core deposits, defined as demand deposits, interest bearing demand deposits, regular savings, money market deposit accounts and time deposits of less than $100,000, continue to provide a relatively stable and low cost source of funds. Core deposits totaled $669,342,000 and $656,513,000 at December 31, 2011 and December 31, 2010, respectively.
In assessing liquidity, historical information such as seasonal loan demand, local economic cycles and the economy in general are considered along with current ratios, management goals and unique characteristics of the Company. Management believes the Company is in compliance with its policies relating to liquidity.
Certificates of Deposit. Maturities of time certificates of deposit outstanding of less than $100,000 and $100,000 or more at December 31, 2011 are summarized as follows (in thousands):
| | | $ 100,000 | | | Under | |
| | | and over | | | $ 100,000 | |
| Three Months or Less | | $ | 21,992 | | | $ | 31,347 | |
| Over Three Months Through Twelve Months | | | 58,655 | | | | 70,986 | |
| Over One Year Through Three Years | | | 14,239 | | | | 11,606 | |
| Over Three Years | | | 2,011 | | | | 1,474 | |
| Total | | $ | 96,897 | | | $ | 115,413 | |
As of December 31, 2011, the Company had $1,693,000 in brokered deposits consisting solely of customers’ time certificates of deposits that utilized the CDARs program. The Company’s policy limits the use of brokered deposits to 10% of total assets.
Other Borrowed Funds. The Company did not have outstanding balances for Federal Home Loan Bank advances or Federal funds purchased at December 31, 2011, 2010 and 2009.
Certain Contractual Obligations.The following chart summarizes certain contractual obligations of the Company as of December 31, 2011 (in thousands):
| | | Total | | | Less than one year | | | 1-3 years | | | 3-5 years | | | More than 5 years | |
| Subordinated Debentures, fixed rate of 10.25% payable on 2031 | | $ | 10,310 | | | $ | — | | | $ | — | | | $ | — | | | $ | 10,310 | |
| Subordinated Debentures, floating rate of 3.53% payable on 2033 | | | 6,186 | | | | — | | | | — | | | | — | | | | 6,186 | |
| Subordinated Debentures, floating rate of 3.08% payable on 2034 | | | 5,155 | | | | — | | | | — | | | | — | | | | 5,155 | |
| Subordinated Debentures, floating rate of 6.16% payable on 2036 | | | 10,310 | | | | — | | | | — | | | | — | | | | 10,310 | |
| Operating lease obligations | | | 4,618 | | | | 1,097 | | | | 1,922 | | | | 895 | | | | 704 | |
| Certificates of deposits | | | 212,310 | | | | 182,980 | | | | 25,845 | | | | 3,485 | | | | — | |
| Deferred compensation(1) | | | 1,653 | | | | 209 | | | | 349 | | | | 137 | | | | 958 | |
| Supplemental retirement plans(1) | | | 7,397 | | | | 250 | | | | 584 | | | | 2,343 | | | | 4,220 | |
| Total | | $ | 257,939 | | | $ | 184,536 | | | $ | 28,700 | | | $ | 6,860 | | | $ | 37,843 | |
(1) These amounts represent known certain payments to participants under the Company’s deferred compensation and supplemental retirement plans. See Note 12 in the financial statements at Item 15 of this report for additional information related to the Company’s deferred compensation and supplemental retirement plan liabilities.
In addition, liabilities related to income taxes are not included in the table because the amount and timing of any cash payments cannot be reasonably estimated. Further discussion of income taxes and liabilities recorded is included in Note 11 to the consolidated financial statements.
ITEM 8. FINANCIAL STATEMENTS AND SUPPLEMENTARY DATA
The Financial Statements required by this item are set forth following Item 15 of this Form 10-K, and are incorporated herein by reference.
The following table discloses the Company’s condensed selected unaudited quarterly financial data for each of the quarters in the two-year period ended December 31, 2011.
| | | For the Quarter Ended | |
| (In thousands except | | December | | | September | | | June | | | March | | | December | | | September | | | June | | | March | |
| per share data) | | 2011 | | | 2011 | | | 2011 | | | 2011 | | | 2010 | | | 2010 | | | 2010 | | | 2010 | |
| | | | | | | | | | | | | | | | | | | | | | | | | |
| Interest income | | $ | 8,879 | | | $ | 9,238 | | | $ | 9,610 | | | $ | 9,418 | | | $ | 9,437 | | | $ | 9,773 | | | $ | 9,837 | | | $ | 9,875 | |
| Interest expense | | | 1,331 | | | | 1,391 | | | | 1,452 | | | | 1,612 | | | | 1,818 | | | | 2,183 | | | | 2,451 | | | | 2,533 | |
| Net interest income | | | 7,548 | | | | 7,847 | | | | 8,158 | | | | 7,806 | | | | 7,619 | | | | 7,590 | | | | 7,386 | | | | 7,342 | |
| Provision for loan losses | | | — | | | | 400 | | | | 1,250 | | | | 1,000 | | | | — | | | | 4,370 | | | | 2,600 | | | | 1,000 | |
| Noninterest income | | | 3,717 | | | | 4,012 | | | | 3,483 | | | | 3,153 | | | | 3,192 | | | | 3,363 | | | | 3,377 | | | | 3,012 | |
| Noninterest expense | | | 10,912 | | | | 9,597 | | | | 9,735 | | | | 9,471 | | | | 10,244 | | | | 12,009 | | | | 9,872 | | | | 10,019 | |
| Income (loss) before (benefit) provision for income taxes | | | 353 | | | | 1,862 | | | | 656 | | | | 488 | | | | 567 | | | | (5,426 | ) | | | (1,709 | ) | | | (665 | ) |
| (Benefit) provision for income taxes | | | (456 | ) | | | 542 | | | | 137 | | | | 89 | | | | (1,702 | ) | | | 2,207 | | | | (1,137 | ) | | | (353 | ) |
| Net income (loss) | | | 809 | | | | 1,320 | | | | 519 | | | | 399 | | | | 2,269 | | | | (7,633 | ) | | | (572 | ) | | | (312 | ) |
| Preferred stock discount | | | — | | | | | | | | — | | | | — | | | | — | | | | (18,667 | ) | | | — | | | | — | |
| Net income (loss) available to common shareholder | | $ | 809 | | | $ | 1,320 | | | $ | 519 | | | $ | 399 | | | $ | 2,269 | | | $ | (26,300 | ) | | $ | (572 | ) | | $ | (312 | ) |
| | | | | | | | | | | | | | | | | | | | | | | | | | | | | | | | | |
| Earnings (loss) per share: | | | | | | | | | | | | | | | | | | | | | | | | | | | | | | | | |
| Basic | | $ | 0.12 | | | $ | 0.19 | | | $ | 0.08 | | | $ | 0.06 | | | $ | 0.33 | | | $ | (4.70 | ) | | $ | (0.40 | ) | | $ | (0.20 | ) |
| Diluted | | $ | 0.12 | | | $ | 0.19 | | | $ | 0.08 | | | $ | 0.06 | | | $ | 0.33 | | | $ | (4.70 | ) | | $ | (0.40 | ) | | $ | (0.20 | ) |
ITEM 9. CHANGES IN AND DISAGREEMENTS WITH ACCOUNTANTS ON ACCOUNTING AND FINANCIAL DISCLOSURE
As previously reported by the Company, Perry-Smith LLP has been replaced by Crowe Horwath LLP as the Company’s independent registered public accounting firm for the year ended December 31, 2011. This change in accountants was the result of a transaction consummated on November 1, 2011 whereby Crowe Horwath LLP acquired certain assets of Perry-Smith LLP and certain Perry-Smith LLP personnel became associated with Crowe Horwath LLP. Except as described in the Company’s Current Report on Form 8-K, as filed with the Commission on November 4, 2011, there has been no change in the independent accountants engaged to audit the financial statements of the Company during the two fiscal years ended December 31, 2011. There have been no disagreements with such independent registered public accountants during the two fiscal years ended December 31, 2011 on any matter of accounting principles or practices, financial statement disclosure, or auditing scope or procedure.
ITEM 9A. CONTROLS AND PROCEDURES
Disclosure Controls and Procedures. Disclosure controls and procedures are designed with the objective of ensuring that information required to be disclosed in reports filed by the Company under the Exchange Act, such as this Annual Report, is recorded, processed, summarized and reported within the time periods specified in the rules and forms of the Securities and Exchange Commission. Disclosure controls and procedures are also designed with the objective of ensuring that such information is accumulated and communicated to management, including the Chief Executive Officer and the Chief Financial Officer, as appropriate to allow timely decisions regarding required disclosure.
Evaluation of Disclosure Controls and Procedures.The Company’s management, including the Chief Executive Officer and the Chief Financial Officer, evaluated the Company’s disclosure controls and procedures (as defined in Rule 13a-15(e) under the Exchange Act) as of December 31, 2011. Based on this evaluation, the Chief Executive Officer and the Chief Financial Officer concluded that the Company’s disclosure controls and procedures are effective.
Internal Control over Financial Reporting.Management of the Company is responsible for establishing and maintaining adequate internal control over financial reporting for the Company. Management’s statement as to the framework used to evaluate the effectiveness of, and management’s assessment of the effectiveness of, the Company’s internal control over financial reporting as of December 31, 2011, appears below and is incorporated here by this reference. There was no change in the Company’s internal control over financial reporting that occurred during the quarter ended December 31, 2011 that has materially affected or is reasonable likely to materially affect, the Company’s internal control over financial reporting.
Report of Management on Internal Control Over Financial Reporting
Financial Statements
Management of North Valley Bancorp and its subsidiaries (the “Company”) is responsible for the preparation, integrity and fair presentation of its published consolidated financial statements as of December 31, 2011, and for the year then ended. The consolidated financial statements have been prepared in accordance with accounting principles generally accepted in the United States of America and, as such, include amounts based on informed judgments and estimates made by management.
The consolidated financial statements have been audited by an independent accounting firm registered with the Public Company Accounting Oversight Board, which was given unrestricted access to all financial records and related data, including minutes of all meetings of the Board of Directors and committees of the Board. Management believes that all representations made to the independent auditors during their audit were valid and appropriate.
Internal Control over Financial Reporting
Management is also responsible for establishing and maintaining adequate internal control over financial reporting for the Company, as such term is defined in Rule 13a-15(f) under the Securities Exchange Act of 1934.
The Company’s management, including the Chief Executive Officer and Chief Financial Officer, has assessed the effectiveness of the Company’s internal control over financial reporting presented in conformity with accounting principles generally accepted in the United States of America. In making this assessment, management used the criteria set forth by the Committee of Sponsoring Organizations of the Treadway Commission inInternal Control – Integrated Framework. Based on this assessment, management believes that, as of December 31, 2011, the Company’s internal control over financial reporting is effective based on those criteria.
This Annual Report does not include an attestation report of the Company’s independent registered public accounting firm regarding internal control over financial reporting. Management’s report was not subject to attestation by the Company’s independent registered public accounting firm pursuant to the rules of the Securities and Exchange Commission that permit the Company to provide only management’s report in this Annual Report.
ITEM 9B. OTHER INFORMATION
None.
PART III
ITEM 10. DIRECTORS, EXECUTIVE OFFICERS AND CORPORATE GOVERNANCE
The information concerning directors and executive officers required by this item is incorporated by reference from the section of the Company’s Definitive Proxy Statement for the 2012 Annual Meeting of Shareholders of the Company to be filed with the Securities and Exchange Commission (the “Commission”) entitled “Election of Directors” (not including the share information included in the beneficial ownership tables nor the footnotes thereto nor the subsections entitled “Committees of the Board of Directors,” “Compensation Committee Interlocks and Insider Participation” and “Meetings of the Board of Directors”) and the section entitled “Section 16(a) Beneficial Ownership Reporting Compliance.”
ITEM 11. EXECUTIVE COMPENSATION
The information required by this item is incorporated by reference from the section of the Company’s Definitive Proxy Statement for the 2012 Annual Meeting of Shareholders of the Company to be filed with the Commission entitled “Executive Compensation” and the subsection entitled “Election of Directors - Compensation Committee Interlocks and Insider Participation.”
ITEM 12. SECURITY OWNERSHIP OF CERTAIN BENEFICIAL OWNERS AND MANAGEMENT
The information required by this item is incorporated by reference from sections of the Company’s Definitive Proxy Statement for the 2012 Annual Meeting of Shareholders of the Company to be filed with the Commission, entitled “Election of Directors - Security Ownership of Certain Beneficial Owners and Management,” as to share information in the tables of beneficial ownership and footnotes thereto and “Securities Authorized for Issuance Under Equity Compensation Plan.”
ITEM 13. CERTAIN RELATIONSHIPS AND RELATED TRANSACTIONS, AND DIRECTOR INDEPENDENCE
The information required by this item is incorporated by reference from the section of the Company’s Definitive Proxy Statement for the 2012 Annual Meeting of Shareholders of the Company to be filed with the Commission, entitled “Certain Relationships and Related Transactions.”
ITEM 14. PRINCIPAL ACCOUNTING FEES AND SERVICES
The information required by this item is incorporated by reference from the section of the Company’s Definitive Proxy Statement for the 2012 Annual Meeting of Shareholders of the Company to be filed with the Commission, entitled “Principal Accounting Fees and Services.”
PART IV
ITEM 15. EXHIBITS AND, FINANCIAL STATEMENT SCHEDULES
Documents Filed as Part of this Report
(a)(1) Financial Statements
(a)(2) Financial Statement Schedules
Not applicable
(b) Exhibits
See Index to Exhibits at page 91 of this Annual Report on Form 10-K, which is incorporated herein by reference.
REPORT OF INDEPENDENT REGISTERED PUBLIC ACCOUNTING FIRM
To the Board of Directors and Stockholders
North Valley Bancorp
Redding, California
We have audited the accompanying consolidated balance sheet of North Valley Bancorp and subsidiaries (the “Company”) as of December 31, 2011, and the related consolidated statements of operations, changes in stockholders’ equity and cash flows for the year then ended. These financial statements are the responsibility of the Company’s management. Our responsibility is to express an opinion on these consolidated financial statements based on our audit.
We conducted our audit in accordance with the standards of the Public Company Accounting Oversight Board (United States). Those standards require that we plan and perform the audit to obtain reasonable assurance about whether the financial statements are free of material misstatement. The Company is not required to have, nor were we engaged to perform, an audit of its internal control over financial reporting. Our audit included consideration of internal control over financial reporting as a basis for designing audit procedures that are appropriate in the circumstances, but not for the purpose of expressing an opinion on the effectiveness of the Company’s internal control over financial reporting. Accordingly, we express no such opinion. An audit includes examining, on a test basis, evidence supporting the amounts and disclosures in the financial statements. An audit includes assessing the accounting principles used and significant estimates made by management, as well as evaluating the overall financial statement presentation. We believe that our audit provides a reasonable basis for our opinion.
In our opinion, the consolidated financial statements referred to above present fairly, in all material respects, the financial position of North Valley Bancorp and subsidiaries as of December 31, 2011, and the results of their operations and their cash flows for the year then ended in conformity with U.S. generally accepted accounting principles.
| | /s/ Crowe Horwath LLP |
| | |
| Sacramento, California | |
| March 27, 2012 | |
REPORT OF INDEPENDENT REGISTERED PUBLIC ACCOUNTING FIRM
To the Board of Directors and Stockholders
North Valley Bancorp
Redding, California
We have audited the accompanying consolidated balance sheet of North Valley Bancorp and subsidiaries (the “Company”) as of December 31, 2010 and the related consolidated statements of operations, changes in stockholders’ equity and cash flows for each of the two years in the period ended December 31, 2010. These consolidated financial statements are the responsibility of the Company’s management. Our responsibility is to express an opinion on these consolidated financial statements based on our audits.
We conducted our audits in accordance with the standards of the Public Company Accounting Oversight Board (United States). Those standards require that we plan and perform the audit to obtain reasonable assurance about whether the consolidated financial statements are free of material misstatement. An audit includes examining, on a test basis, evidence supporting the amounts and disclosures in the consolidated financial statements, assessing the accounting principles used and significant estimates made by management, as well as evaluating the overall financial statement presentation. We believe that our audits provide a reasonable basis for our opinion.
In our opinion, the consolidated financial statements referred to above present fairly, in all material respects, the consolidated financial position of North Valley Bancorp and subsidiaries as of December 31, 2010, and the consolidated results of their operations and their cash flows for each of the two years in the period ended December 31, 2010, in conformity with accounting principles generally accepted in the United States of America.
| | /s/ Perry-Smith LLP |
| | |
| Sacramento, California | |
| March 14, 2011 | |
NORTH VALLEY BANCORP AND SUBSIDIARIES
CONSOLIDATED BALANCE SHEETS
(In thousands, except share data)
| | | As of December 31, | |
| | | 2011 | | | 2010 | |
| ASSETS | | | | | | | | |
| Cash and cash equivalents: | | | | | | | | |
| Cash and due from banks | | $ | 18,758 | | | $ | 14,629 | |
| Federal funds sold | | | 40,210 | | | | 9,005 | |
| Total cash and cash equivalents | | | 58,968 | | | | 23,634 | |
| | | | | | | | | |
| Time deposits at other financial institutions | | | 1,959 | | | | 459 | |
| Investment securities available-for-sale, at fair value | | | 312,205 | | | | 265,644 | |
| Investment securities held-to-maturity, at amortized cost | | | 6 | | | | 6 | |
| | | | | | | | | |
| Loans | | | 456,215 | | | | 513,466 | |
| Less: Allowance for loan losses | | | (12,656 | ) | | | (14,993 | ) |
| Net loans | | | 443,559 | | | | 498,473 | |
| | | | | | | | | |
| Premises and equipment, net | | | 8,661 | | | | 8,799 | |
| Accrued interest receivable | | | 2,557 | | | | 2,713 | |
| Other real estate owned | | | 20,106 | | | | 25,784 | |
| FHLB and FRB stock and other nonmarketable securities | | | 8,044 | | | | 7,141 | |
| Bank-owned life insurance policies | | | 34,972 | | | | 33,871 | |
| Core deposit intangibles, net | | | 401 | | | | 546 | |
| Other assets | | | 13,528 | | | | 17,871 | |
| | | | | | | | | |
| TOTAL ASSETS | | $ | 904,966 | | | $ | 884,941 | |
| | | | | | | | | |
| LIABILITIES AND STOCKHOLDERS’ EQUITY | | | | | | | | |
| | | | | | | | | |
| LIABILITIES: | | | | | | | | |
| Deposits: | | | | | | | | |
| Noninterest-bearing | | $ | 167,506 | | | $ | 155,499 | |
| Interest-bearing | | | 598,733 | | | | 598,291 | |
| Total deposits | | | 766,239 | | | | 753,790 | |
| | | | | | | | | |
| Accrued interest payable and other liabilities | | | 17,301 | | | | 15,212 | |
| Subordinated debentures | | | 31,961 | | | | 31,961 | |
| Total liabilities | | | 815,501 | | | | 800,963 | |
| | | | | | | | | |
| STOCKHOLDERS’ EQUITY: | | | | | | | | |
| Preferred stock, no par value: authorized 5,000,000 shares; no shares outstanding at December 31, 2011 and 2010 | | | — | | | | — | |
| Common stock, no par value: authorized 60,000,000 shares; outstanding 6,833,752 and 6,832,492 at December 31, 2011 and 2010, respectively | | | 98,285 | | | | 98,128 | |
| Accumulated deficit | | | (10,290 | ) | | | (13,337 | ) |
| Accumulated other comprehensive income (loss), net of tax | | | 1,470 | | | | (813 | ) |
| Total stockholders’ equity | | | 89,465 | | | | 83,978 | |
| | | | | | | | | |
| TOTAL LIABILITIES AND STOCKHOLDERS’ EQUITY | | $ | 904,966 | | | $ | 884,941 | |
The accompanying notes are an integral part of these consolidated financial statements.
NORTH VALLEY BANCORP AND SUBSIDIARIES
CONSOLIDATED STATEMENT OF OPERATIONS
(In thousands, except per share data)
| | | Year Ended December 31, | |
| | | 2011 | | | 2010 | | | 2009 | |
| INTEREST INCOME: | | | | | | | | | | | | |
| Interest and fees on loans | | $ | 28,863 | | | $ | 33,276 | | | $ | 39,233 | |
| Interest on investments: | | | | | | | | | | | | |
| Taxable interest income | | | 7,580 | | | | 4,809 | | | | 3,926 | |
| Nontaxable interest income | | | 629 | | | | 699 | | | | 720 | |
| Interest on federal funds sold and repurchase agreements | | | 73 | | | | 138 | | | | 76 | |
| Total interest income | | | 37,145 | | | | 38,922 | | | | 43,955 | |
| | | | | | | | | | | | | |
| INTEREST EXPENSE: | | | | | | | | | | | | |
| Deposits | | | 3,893 | | | | 6,861 | | | | 10,633 | |
| Subordinated debentures | | | 1,892 | | | | 2,124 | | | | 2,087 | |
| Other borrowings | | | 1 | | | | — | | | | 1 | |
| Total interest expense | | | 5,786 | | | | 8,985 | | | | 12,721 | |
| | | | | | | | | | | | | |
| NET INTEREST INCOME | | | 31,359 | | | | 29,937 | | | | 31,234 | |
| | | | | | | | | | | | | |
| PROVISION FOR LOAN LOSSES | | | 2,650 | | | | 7,970 | | | | 26,500 | |
| | | | | | | | | | | | | |
| NET INTEREST INCOME AFTER PROVISION FOR LOAN LOSSES | | | 28,709 | | | | 21,967 | | | | 4,734 | |
| | | | | | | | | | | | | |
| NONINTEREST INCOME: | | | | | | | | | | | | |
| Service charges on deposit accounts | | | 4,635 | | | | 5,864 | | | | 6,483 | |
| Other fees and charges | | | 4,663 | | | | 4,566 | | | | 4,265 | |
| Earnings on cash surrender value of life insurance policies | | | 1,359 | | | | 1,376 | | | | 1,371 | |
| Gain on sale of loans, net | | | 1,172 | | | | 241 | | | | 346 | |
| Gain on sales and calls of securities, net | | | 1,677 | | | | — | | | | 655 | |
| Other | | | 859 | | | | 897 | | | | 890 | |
| Total noninterest income | | | 14,365 | | | | 12,944 | | | | 14,010 | |
| | | | | | | | | | | | | |
| NONINTEREST EXPENSES: | | | | | | | | | | | | |
| Salaries and employee benefits | | | 18,657 | | | | 16,873 | | | | 18,500 | |
| Occupancy expense | | | 2,786 | | | | 2,850 | | | | 3,079 | |
| Furniture and equipment expense | | | 1,062 | | | | 1,434 | | | | 1,847 | |
| FDIC and state assessments | | | 1,355 | | | | 2,368 | | | | 2,307 | |
| Impairment of goodwill | | | — | | | | — | | | | 15,187 | |
| Other real estate owned expense | | | 4,804 | | | | 6,522 | | | | 2,119 | |
| Other | | | 11,051 | | | | 12,097 | | | | 10,951 | |
| Total noninterest expenses | | | 39,715 | | | | 42,144 | | | | 53,990 | |
| | | | | | | | | | | | | |
| INCOME (LOSS) BEFORE PROVISION (BENEFIT) FOR INCOME TAXES | | | 3,359 | | | | (7,233 | ) | | | (35,246 | ) |
| | | | | | | | | | | | | |
| PROVISION (BENEFIT) FOR INCOME TAXES | | | 312 | | | | (985 | ) | | | (9,394 | ) |
| | | | | | | | | | | | | |
| NET INCOME (LOSS) | | | 3,047 | | | | (6,248 | ) | | | (25,852 | ) |
| | | | | | | | | | | | | |
| Preferred stock discount | | | — | | | | (18,667 | ) | | | — | |
| | | | | | | | | | | | | |
| NET INCOME (LOSS) AVAILABLE TO COMMON SHAREHOLDERS | | $ | 3,047 | | | $ | (24,915 | ) | | $ | (25,852 | ) |
| | | | | | | | | | | | | |
| Per Share Amounts | | | | | | | | | | | | |
| Basic and Diluted Income (Loss) Per Share | | $ | 0.45 | | | $ | (6.42 | ) | | $ | (17.24 | ) |
The accompanying notes are an integral part of these consolidated financial statements.
NORTH VALLEY BANCORP AND SUBSIDIARIES
CONSOLIDATED STATEMENTS OF CHANGES IN STOCKHOLDERS’ EQUITY
YEARS ENDED DECEMBER 31, 2011, 2010 AND 2009
(In thousands, except share data)
| | | | | | | | | | | | | | | | | | Accumulated
Other | | | | |
| | | | | | | | | | | | | | | | | | Comprehensive | | | | |
| | | Preferred Stock | | | Common Stock | | | Retained | | | Income | | | | |
| | | Shares | | | Amount | | | Shares | | | Amount | | | Earnings | | | (Loss) | | | Total | |
| | | | | | | | | | | | | | | | | | | | | | |
| Balance January 1, 2009 | | | — | | | $ | — | | | | 1,499,163 | | | $ | 41,553 | | | $ | 37,430 | | | $ | (1,725 | ) | | $ | 77,258 | |
| Other comprehensive loss: | | | | | | | | | | | | | | | | | | | | | | | | | | | | |
| Change in unrealized loss on available-for-sale securities, net of income tax | | | | | | | | | | | | | | | | | | | | | | | 650 | | | | | |
| Adjustment for the change in the unfunded status of the supplemental retirement plan, net of income tax | | | | | | | | | | | | | | | | | | | | | | | 18 | | | | | |
| Total other comprehensive loss, net | | | | | | | | | | | | | | | | | | | | | | | 668 | | | | 668 | |
| Equity based compensation | | | | | | | | | | | | | | | 228 | | | | | | | | | | | | 228 | |
| Net loss | | | | | | | | | | | | | | | | | | | (25,852 | ) | | | | | | | (25,852 | ) |
| Balance December 31, 2009 | | | — | | | | — | | | | 1,499,163 | | | | 41,781 | | | | 11,578 | | | | (1,057 | ) | | | 52,302 | |
| Shares issued of Series A preferred stock , net of costs | | | 40,000 | | | | 37,500 | | | | | | | | | | | | | | | | | | | | 37,500 | |
| Series A preferred stock conversion into common stock | | | (40,000 | ) | | | (37,500 | ) | | | 5,333,329 | | | | 37,500 | | | | | | | | | | | | — | |
| Accretion of preferred stock discount | | | | | | | | | | | | | | | 18,667 | | | | (18,667 | ) | | | | | | | — | |
| Other comprehensive loss: | | | | | | | | | | | | | | | | | | | | | | | | | | | | |
| Change in unrealized loss on available-for-sale securities, net of income tax | | | | | | | | | | | | | | | | | | | | | | | 227 | | | | | |
| Adjustment for the change in the unfunded status of the supplemental retirement plan, net of income tax | | | | | | | | | | | | | | | | | | | | | | | 17 | | | | | |
| Total other comprehensive loss, net | | | | | | | | | | | | | | | | | | | | | | | 244 | | | | 244 | |
| Equity based compensation | | | | | | | | | | | | | | | 180 | | | | | | | | | | | | 180 | |
| Net loss | | | | | | | | | | | | | | | | | | | (6,248 | ) | | | | | | | (6,248 | ) |
| Balance December 31, 2010 | | | — | | | | — | | | | 6,832,492 | | | | 98,128 | | | | (13,337 | ) | | | (813 | ) | | | 83,978 | |
| Other comprehensive income: | | | | | | | | | | | | | | | | | | | | | | | | | | | | |
| Change in unrealized gain on available-for-sale securities, net of income tax | | | | | | | | | | | | | | | | | | | | | | | 2,724 | | | | | |
| Adjustment for the change in the unfunded status of the supplemental retirement plan, net of income tax | | | | | | | | | | | | | | | | | | | | | | | (441 | ) | | | | |
| Total other comprehensive income, net | | | | | | | | | | | | | | | | | | | | | | | 2,283 | | | | 2,283 | |
| Equity based compensation | | | | | | | | | | | 1,260 | | | | 157 | | | | | | | | | | | | 157 | |
| Net income | | | | | | | | | | | | | | | | | | | 3,047 | | | | | | | | 3,047 | |
| Balance December 31, 2011 | | | — | | | $ | — | | | | 6,833,752 | | | $ | 98,285 | | | $ | (10,290 | ) | | $ | 1,470 | | | $ | 89,465 | |
The accompanying notes are an integral part of these consolidated financial statements.
NORTH VALLEY BANCORP AND SUBSIDIARIES
CONSOLIDATED STATEMENTS OF CASH FLOWS
(In thousands)
| | | Year Ended December 31, | |
| | | 2011 | | | 2010 | | | 2009 | |
| Cash Flows From Operating Activities: | | | | | | | | | | | | |
| Net income (loss) | | $ | 3,047 | | | $ | (6,248 | ) | | $ | (25,852 | ) |
| Adjustments to reconcile net income (loss) to net cash provided by operating activities: | | | | | | | | | | | | |
| Depreciation and amortization | | | 1,197 | | | | 1,535 | | | | 1,950 | |
| Amortization (accretion) of premium on securities, net | | | 1,637 | | | | 1,448 | | | | 672 | |
| Amortization of core deposit intangible | | | 145 | | | | 146 | | | | 146 | |
| Provision for loan losses | | | 2,650 | | | | 7,970 | | | | 26,500 | |
| Net losses on sale and write-down of other real estate owned | | | 4,096 | | | | 5,735 | | | | 1,723 | |
| Gain on sale of loans | | | (1,172 | ) | | | (241 | ) | | | (346 | ) |
| Gain on sale and calls of securities | | | (1,677 | ) | | | — | | | | (655 | ) |
| Loss (gain) on sale of premises and equipment | | | 289 | | | | 312 | | | | (28 | ) |
| Write-down of impaired goodwill | | | — | | | | — | | | | 15,187 | |
| Deferred tax expense (benefit) | | | 202 | | | | (760 | ) | | | (3,929 | ) |
| Stock-based compensation expense | | | 157 | | | | 180 | | | | 228 | |
| Effect of changes in: | | | | | | | | | | | | |
| Accrued interest receivable | | | 156 | | | | (148 | ) | | | 177 | |
| Other assets | | | 1,454 | | | | 3,148 | | | | (3,317 | ) |
| Accrued interest payable and other liabilities | | | 1,342 | | | | 2,951 | | | | 449 | |
| Net cash provided by operating activities | | | 13,523 | | | | 16,028 | | | | 12,905 | |
| | | | | | | | | | | | | |
| Cash Flows From Investing Activities: | | | | | | | | | | | | |
| Purchases of time deposits at other financial institutions | | | (1,500 | ) | | | (34 | ) | | | (425 | ) |
| Purchases of available-for-sale securities | | | (188,190 | ) | | | (184,089 | ) | | | (117,847 | ) |
| Proceeds from sales of available-for-sale securities | | | 95,940 | | | | — | | | | 18,957 | |
| Proceeds from maturities/calls of available-for-sale securities | | | 50,345 | | | | 63,718 | | | | 29,984 | |
| Proceeds from maturities/calls of held-to-maturity securities | | | — | | | | 3 | | | | 12 | |
| Purchases of FHLB and FRB stock and other securities | | | (903 | ) | | | (1,308 | ) | | | (8 | ) |
| Net decrease in loans | | | 42,982 | | | | 47,960 | | | | 60,828 | |
| Proceeds from sales of other real estate owned | | | 12,036 | | | | 10,574 | | | | 7,543 | |
| Proceeds from sales of premises and equipment | | | — | | | | — | | | | 53 | |
| Purchases of premises and equipment | | | (1,348 | ) | | | (327 | ) | | | (876 | ) |
| Net cash provided by (used in) investing activities | | | 9,362 | | | | (63,503 | ) | | | (1,779 | ) |
| | | | | | | | | | | | | |
| Cash Flows from Financing Activities: | | | | | | | | | | | | |
| Net increase (decrease) in deposits | | | 12,449 | | | | (34,019 | ) | | | 32,865 | |
| Net change in other borrowed funds | | | — | | | | — | | | | (3,516 | ) |
| Proceeds from issuance of preferred stock, net of costs | | | — | | | | 37,500 | | | | — | |
| Net cash provided by financing activities | | | 12,449 | | | | 3,481 | | | | 29,349 | |
| | | | | | | | | | | | | |
| Net increase (decrease) in cash and cash equivalents | | | 35,334 | | | | (43,994 | ) | | | 40,475 | |
| Cash and cash equivalents, beginning of year | | | 23,634 | | | | 67,628 | | | | 27,153 | |
| Cash and cash equivalents, end of year | | $ | 58,968 | | | $ | 23,634 | | | $ | 67,628 | |
| | | | | | | | | | | | | |
| Supplemental Disclosure of Cash Flow Information | | | | | | | | | | | | |
| Cash paid during the year for: | | | | | | | | | | | | |
| Interest | | $ | 3,840 | | | $ | 7,033 | | | $ | 12,864 | |
| Income taxes (refunded) paid | | $ | 44 | | | $ | (4,734 | ) | | $ | (4,152 | ) |
| | | | | | | | | | | | | |
| Noncash investing and financing activities: | | | | | | | | | | | | |
| Net change in unrealized gain on available-for-sale investment securities | | $ | 2,724 | | | $ | 227 | | | $ | 650 | |
| Transfer from loans to other real estate owned | | $ | 10,454 | | | $ | 29,716 | | | $ | 11,234 | |
| Conversion of preferred stock to common stock | | $ | — | | | $ | 37,500 | | | $ | — | |
The accompanying notes are an integral part of these consolidated financial statements.
NORTH VALLEY BANCORP AND SUBSIDIARIES
NOTES TO CONSOLIDATED FINANCIAL STATEMENTS
YEARS ENDED DECEMBER 31, 2011, 2010 and 2009
1. NATURE OF OPERATIONS AND SIGNIFICANT ACCOUNTING POLICIES
Nature of Operations. The accounting and reporting practices of North Valley Bancorp (the “Company”) and its wholly owned subsidiary, North Valley Bank (“NVB”), conform to accounting principles generally accepted in the United States of America and prevailing practices within the banking industry. The operations of the Company are comprised predominately of NVB. NVB is a commercial banking institution with twenty-four banking offices in Shasta, Trinity, Humboldt, Del Norte, Yolo, Sonoma, Placer and Mendocino Counties located in California. Between 2001 to 2005, the Company formed North Valley Capital Trust I, North Valley Capital Trust II, North Valley Capital Trust III, and North Valley Capital Statutory Trust IV (collectively, the Trusts) which Trust I, II, and III are Delaware statutory business trusts and Trust IV is a Connecticut statutory business trust formed for the exclusive purpose of issuing and selling Trust Preferred Securities.
NVB’s principal business consists of attracting deposits from the general public and using the funds to originate commercial, real estate and installment loans to customers, who are predominately small and middle market businesses and middle income individuals. The Company’s primary source of revenues is interest income from its loan and investment securities portfolios. The Company is not dependent on any single customer for more than ten percent of the Company’s revenues. The deposits of NVB are insured by the Federal Deposit Insurance Corporation (“FDIC”) up to applicable legal limits.
Use of Estimates in the Preparation of Financial Statements.The preparation of financial statements in conformity with accounting principles generally accepted in the United States of America requires management to make estimates and assumptions that affect the reported amounts of assets and liabilities and disclosure of contingent assets and liabilities at the date of the financial statements and the reported amounts of revenues and expenses during the reporting period. Actual results could differ from those estimates.The allowance for loan losses, loan servicing rights, deferred tax assets, and fair values of financial instruments are particularly subject to change.
Consolidationand Basis of Presentation.The consolidated financial statements include the Company and its wholly owned subsidiary NVB. NVB has one wholly owned inactive subsidiary, North Valley Trading Company. All material intercompany accounts and transactions have been eliminated in consolidation.
For financial reporting purposes, the Company’s investments in the Trusts of $961,000 are accounted for under the equity method and, accordingly, are not consolidated and are included in other assets on the consolidated balance sheet. The subordinated debentures issued and guaranteed by the Company and held by the Trusts are reflected as debt on the Company’s consolidated balance sheet.
Disclosures About Segments of an Enterprise.The Company uses the “management approach” for reporting business segment information. The management approach is based on the segments within a company used by the chief operating decision-maker for making operating decisions and assessing performance. Reportable segments are based on such factors as products and services, geography, legal structure or any other manner by which a company’s management distinguishes major operating units. Utilizing this approach, management has determined that the Company has only one reportable segment.
Reclassifications.Certain amounts in 2010 and 2009 have been reclassified to conform with the 2011 consolidated financial statement presentation.
Cash and Cash Equivalents.For the purposes of the consolidated statement of cash flows, cash and cash equivalents have been defined as cash, demand deposits with correspondent banks, cash items, settlements in transit, and federal funds sold and repurchase agreements. Generally, federal funds are sold for one-day periods and repurchase agreements are sold for eight to fourteen-day periods. Cash equivalents have remaining terms to maturity of three months or less from the date of acquisition.Net cash flows are reported for customer loan and deposit transactions and time deposits in other financial institutions.
Reserve Requirements.The Company is subject to regulation by the Federal Reserve Board. The regulations require the Company to maintain certain cash reserve balances on hand or at the Federal Reserve Bank (“FRB”). At December 31, 2011 and 2010, the Company had no reserve requirement.
Investment Securities. The Company accounts for its investment securities as follows:
Trading securities are carried at fair value. Changes in fair value are included in noninterest income. The Company did not have any securities classified as trading at or during the years ended December 31, 2011, 2010 and 2009.
Available-for-sale securities are carried at estimated fair value and represent securities not classified as trading securities nor as held-to-maturity securities. Unrealized gains and losses resulting from changes in fair value are recorded, net of tax, as a net amount within accumulated other comprehensive loss, which is a separate component of stockholders’ equity.
Held-to-maturity securitiesare carried at cost adjusted for amortization of premiums and accretion of discounts, which are recognized as adjustments to interest income. The Company’s policy of carrying such investment securities at amortized cost is based upon its ability and management’s intent to hold such securities to maturity.
Management determines the appropriate classification of its investments at the time of purchase and may only change the classification in certain limited circumstances. All transfers between categories are accounted for at fair value. As of and for the years ended December 31, 2011 and 2010, there were no transfers of securities between categories.
Gains or losses on disposition are recorded in noninterest income based on the net proceeds received and the carrying amount of the securities sold, using the specific identification method. Interest earned on investment securities is reported in interest income, net of applicable adjustments for accretion of discounts and amortization of premiums which are accounted for using thelevel-yield method without anticipating prepayments.
An investment security is impaired when its carrying value is greater than its fair value. Investment securities that are impaired are evaluated on at least a quarterly basis and more frequently when economic or market conditions warrant such an evaluation to determine whether such a decline in their fair value is other than temporary. Management utilizes criteria such as the magnitude and duration of the decline and the intent and ability of the Company to retain its investment in the securities for a period of time sufficient to allow for an anticipated recovery in fair value, in addition to the reasons underlying the decline, to determine whether the loss in value is other than temporary. The term “other than temporary” is not intended to indicate that the decline is permanent, but indicates that the prospects for a near-term recovery of value is not necessarily favorable, or that there is a lack of evidence to support a realizable value equal to or greater than the carrying value of the investment. Once a decline in value is determined to be other than temporary, and management does not intend to sell the security or it is more likely than not that the Company will not be required to sell the security before recovery, only the portion of the impairment loss representing credit exposure is recognized as a charge to earnings, with the balance recognized as a charge to other comprehensive income. If management intends to sell the security or it is more likely than not that the Company will be required to sell the security before recovering its forecasted cost, the entire impairment loss is recognized as a charge to earnings.
Loans.Loans are reported at the principal amount outstanding, net of unearned income, including net deferred loan fees, and the allowance for loan losses.
Interest on loans is calculated using the simple interest method on the daily balance of the principal amount outstanding.
A loan is considered impaired when, based on current information and events, it is probable that the Company will be unable to collect all amounts due, including principal and interest, according to the contractual terms of the original agreement. Loans determined to be impaired are individually evaluated for impairment. When a loan is impaired, the Company measures impairment based on the present value of expected future cash flows discounted at the original interest rate, except that as a practical expedient, it may measure impairment based on an observable market price, or the fair value of the collateral if collateral dependent. A loan is collateral dependent if the repayment is expected to be provided solely by the underlying collateral.
The determination of the general reserve for loans that are collectively evaluated for impairment is based on estimates made by management, to include, but not limited to, consideration of historical losses by portfolio segment, internal asset classifications, and qualitative factors to include economic trends in the Company’s service areas, industry experience and trends, geographic concentrations, estimated collateral values, the Company’s underwriting policies, the character of the loan portfolio, and probable losses inherent in the portfolio taken as a whole.
Loans on which the accrual of interest has been discontinued are designated as nonaccrual loans. Accrual of interest on loans is discontinued either when reasonable doubt exists as to the full and timely collection of interest or principal, or when a loan becomes contractually past due by 90 days or more with respect to interest or principal. When a loan is placed on nonaccrual status, all interest previously accrued but not collected is reversed against current period interest income. Income on such loans is then recognized only to the extent that cash is received and where the future collection of principal is probable. Interest accruals are resumed on such loans when, in the judgment of management, the loans are estimated to be fully collectible as to both principal and interest.
A restructuring of a debt constitutes a troubled debt restructuring (“TDR”) if the Company for economic or legal reasons related to the borrower’s financial difficulties grants a concession to the borrower that it would not otherwise consider. Restructured loans typically present an elevated level of credit risk as the borrowers are not able to perform according to the original contractual terms. Loans that are reported as TDRs are considered impaired and measured for impairment as described above.
Deferred Loan Fees.Loan fees and certain related direct costs to originate loans are deferred and amortized to income by a method that approximates a level yield over the contractual life of the underlying loans. The unamortized balance of deferred fees and costs is reported as a component of net loans.
Loan Sales and Servicing.The Company originates and sells residential mortgage loans to Freddie Mac and others. The Company retains the servicing on certain loans that are sold. Deferred origination fees and expenses are recognized at the time of sale in the determination of the gain or loss.When loans are sold with servicing retained, servicing rights are initially recorded at fair value with the income statement effect recorded in gains on sales of loans. Fair value is based on market prices for comparable mortgage servicing contracts, when available, or alternatively, is based on a valuation model that calculates the present value of estimated future net servicing income.The gain (loss) is recognized at the time of sale or when all recourse provisions, if any, have lapsed based on the difference between the sale proceeds and the allocated carrying value of the related loans sold. The fair value of the contractual servicing is reflected as a servicing asset, which is amortized over the period of estimated net servicing income using a method approximating the interest method. The servicing asset is included in other assets on the consolidated balance sheet, and is evaluated for impairment on a periodic basis.
Allowance for Loan losses.The allowance for loan losses is an estimate of loan losses inherent in the Company’s loan portfolio as of the balance-sheet date. The allowance is established through a provision for loan losses which is charged to expense. Additions to the allowance are expected to maintain the adequacy of the total allowance after loan losses and loan growth. Credit exposures determined to be uncollectible are charged against the allowance. Cash received on previously charged off amounts is recorded as a recovery to the allowance. The overall allowance consists of two primary components, specific reserves related to impaired loans and general reserves for inherent losses related to loans that are evaluated collectively for impairment.
The Company maintains a separate allowance for each portfolio segment. These portfolio segments include commercial, real estate commercial, real estate construction (including land and development loans), real estate mortgage, installment, and other loans (principally home equity loans). The allowance for loan losses attributable to each portfolio segment, which includes both individually impaired and loans that are collectively evaluated for impairment, is combined to determine the Company’s overall allowance, which is included on the consolidated balance sheet.
The general reserve component of the allowance for loan losses also consists of reserve factors that are based on management’s assessment of the following for each portfolio segment: (1) inherent credit risk, (2) historical losses over the past eight quarters and (3) other qualitative factors. These reserve factors are inherently subjective and are driven by the repayment risk associated with each portfolio segment described below.
Commercial.Commercial loans generally possess a lower inherent risk of loss than real estate portfolio segments because these loans are generally underwritten to existing cash flows of operating businesses. Debt coverage is provided by business cash flows and economic trends influenced by unemployment rates and other key economic indicators are closely correlated to the credit quality of these loans.
Real Estate Commercial.Real estate commercial loans generally possess a higher inherent risk of loss than other real estate portfolio segments, except land and construction loans. Adverse economic developments or an overbuilt market impact commercial real estate projects and may result in troubled loans. Trends in vacancy rates of commercial properties impact the credit quality of these loans. High vacancy rates reduce operating revenues and the ability for properties to produce sufficient cash flow to service debt obligations.
Real Estate Construction.Real estate construction loans generally possess a higher inherent risk of loss than other real estate portfolio segments. A major risk arises from the necessity to complete projects within specified cost and time lines. Trends in the construction industry significantly impact the credit quality of these loans, as demand drives construction activity. In addition, trends in real estate values significantly impact the credit quality of these loans, as property values determine the economic viability of construction projects.
Real Estate Mortgage.The degree of risk in real estate mortgage lending depends primarily on the loan amount in relation to collateral value, the interest rate and the borrower’s ability to repay in an orderly fashion. These loans generally possess a lower inherent risk of loss than other real estate portfolio segments. Economic trends determined by unemployment rates and other key economic indicators are closely correlated to the credit quality of these loans. Weak economic trends indicate that the borrowers’ capacity to repay their obligations may be deteriorating.
Individual loans and receivables in homogeneous loan portfolio segments are not evaluated for specific impairment. Rather, the sole component of the allowance for these loan types is determined by collectively measuring impairment reserve factors based on management’s assessment of the following for each homogeneous loan portfolio segment: (1) inherent credit risk, (2) delinquencies, (3) historical losses and (4) other qualitative factors. The homogenous loan portfolio segments are described in further detail below.
Installment – An installment loan portfolio is usually comprised of a large number of small loans scheduled to be amortized over a specific period. Most installment loans are made directly for consumer purchases. Economic trends determined by unemployment rates and other key economic indicators are closely correlated to the credit quality of these loans. Weak economic trends indicate that the borrowers’ capacity to repay their obligations may be deteriorating.
Other (principally home equity loans) – The degree of risk in home equity depends primarily on the loan amount in relation to collateral value, the interest rate and the borrower’s ability to repay in an orderly fashion. These loans generally possess a lower inherent risk of loss than other real estate portfolio segments. Economic trends determined by unemployment rates and other key economic indicators are closely correlated to the credit quality of these loans. Weak economic trends indicate that the borrowers’ capacity to repay their obligations may be deteriorating.
The Company assigns a risk rating to all loans except pools of homogeneous loans and periodically, but not less than annually, performs detailed reviews of all such individual loans over $250,000 to identify credit risks and to assess the overall collectability of the portfolio. Large groups of smaller balance homogeneous loans, such as consumer and residential real estate loans, are collectively evaluated for impairment, and accordingly, they are not separately identified for impairment disclosures. These risk ratings are also subject to examination by independent specialists engaged by the Company and the Company’s regulators. During these internal reviews, management monitors and analyzes the financial condition of borrowers and guarantors, trends in the industries in which borrowers operate and the fair values of collateral securing these loans. These credit quality indicators are used to assign a risk rating to each individual loan. The risk ratings can be grouped into five major categories, defined as follows:
Pass.A pass loan is a credit with no existing or known potential weaknesses deserving of management’s close attention.
Special Mention.A special mention loan has potential weaknesses that deserve management’s close attention. If left uncorrected, these potential weaknesses may result in deterioration of the repayment prospects for the loan or in the Company’s credit position at some future date. Special Mention loans are not adversely classified and do not expose the Company to sufficient risk to warrant adverse classification.
Substandard. A substandard loan is not adequately protected by the current sound worth and paying capacity of the borrower or the value of the collateral pledged, if any. Loans classified as substandard have a well-defined weakness or weaknesses that jeopardize the liquidation of the debt. Well defined weaknesses include a project’s lack of marketability, inadequate cash flow or collateral support, failure to complete construction on time or the project’s failure to fulfill economic expectations. They are characterized by the distinct possibility that the Company will sustain some loss if the deficiencies are not corrected.
Doubtful. Loans classified doubtful have all the weaknesses inherent in those classified as substandard with the added characteristic that the weaknesses make collection or liquidation in full, on the basis of currently known facts, conditions and values, highly questionable and improbable.
Loss. Loans classified as loss are considered uncollectible and charged off immediately.
Although management believes the allowance to be adequate, ultimate losses may vary from its estimates. At least quarterly, the Board of Directors and management review the adequacy of the allowance, including consideration of the relative risks in the portfolio, current economic conditions and other factors. If the Board of Directors and management determine that changes are warranted based on those reviews, the allowance is adjusted. In addition, the Company’s primary regulators, the FRB and the California Department of Financial Institutions, as an integral part of their examination process, review the adequacy of the allowance. These regulatory agencies may require additions to the allowance based on their judgment about information available at the time of their examinations.
Allowance for Loan losses on Off-Balance-Sheet Credit Exposures. The Company also maintains a separate allowance for off-balance-sheet commitments. Management estimates anticipated losses using historical data and utilization assumptions. The allowance for off-balance-sheet commitments is included in accrued interest payable and other liabilities on the consolidated balance sheet.
Premises and Equipment.Premises and equipment are stated at cost less accumulated depreciation, which is computed principally on the straight-line method over the estimated useful lives of the respective assets. Leasehold improvements are amortized on the straight-line method over the shorter of the estimated useful lives of the improvements or the terms of the respective leases. The Company evaluates premises and equipment for financial impairment as events or changes in circumstances indicate that the carrying amount of such assets may not be fully recoverable.
Other Real Estate Owned (“OREO”).Real estate acquired through, or in lieu of, loan foreclosures is expected to be sold and is recorded at its fair value less estimated costs to sell (fair value). The amount, if any, by which the recorded amount of the loan exceeds the fair value less estimated costs to sell are charged to the allowance for loan losses, if necessary. After foreclosure, valuations are periodically performed by management with any subsequent write-downs recorded as a valuation allowance and charged against operating expenses. Operating expenses of such properties, net of related income, are included in noninterest expenses and gains and losses on their disposition are included in other income or noninterest expenses.
FHLB and FRB Stock and Other Securities.The Company purchases restricted stock in the Federal Home Loan Bank of San Francisco (FHLB), the FRB and others as required to participate in various programs offered by these institutions. These investments are carried at cost and may be redeemed at par with certain restrictions.
Core Deposit Intangibles.These assets represent the estimated fair value of the deposit relationship acquired in acquisitions and is being amortized by the straight-line method. The core deposit intangible was recorded at $1,421,000 in August, 2004 with accumulated amortization of $1,020,000 at December 31, 2011. It is being amortized at $146,000 per year over an estimated life of ten years with a remaining amortization period of approximately three years. Amortization expense on these intangibles was $146,000 for the years ended December 31, 2011, 2010 and 2009, respectively. Amortization expense over the next three years is expected to be approximately $146,000 in years 2012 and 2013 and $109,000 in year 2014. Management evaluates the recoverability and remaining useful life annually to determine whether events or circumstances warrant a revision to the intangible asset or the remaining period of amortization. There were no revisions resulting from management’s assessment in 2011, 2010 or 2009.
Goodwill.Business combinations involving the Company’s acquisition of the equity interests or net assets of another enterprise may give rise to goodwill. Goodwill represents the excess of the cost of an acquired entity over the net of the fair values assigned to assets acquired and liabilities assumed in transactions accounted for under the acquisition method of accounting. Goodwill was recorded in the Company’s acquisition of Yolo Community Bank. The Company engaged the assistance of an independent consulting firm since the end of 2008 to assist with its annual goodwill impairment test. During the 2009 test, the comparison of the fair value of the reporting unit to its carrying value and the recent decline in the Company’s stock price and market capitalization indicated that impairment existed. As a result of this analysis, the Company recorded an impairment charge of $15,187,000, the entire amount of its goodwill, for the year ended December 31, 2009.
Defined Benefit Pension and Other Post Retirement Plans.Since December 31, 2006, the Company has recognized the funded status of its defined benefit plan in the accompanying consolidated balance sheet with gains or losses and prior service costs or credits that arise during the period that are not recognized as net period benefit expenses recorded in other comprehensive income. The Company has recognized the underfunded status of its supplemental retirement plan as a liability in the consolidated balance sheet and recognizes subsequent changes in that unfunded status through other comprehensive income. For the years ended December 31, 2011, 2010 and 2009, the amount recognized through other comprehensive (loss) income was ($441,000), $17,000 and $18,000, respectively.
Income Taxes.Income tax expense is the total of the current year income tax due or refundable and the change in deferred tax assets and liabilities.The Company files its income taxes on a consolidated basis with its subsidiaries. The allocation of income tax expense (benefit) represents each entity’s proportionate share of the consolidated provision for income taxes.
The Company applies the asset and liability method to account for income taxes. Deferred tax assets and liabilities are calculated by applying enacted tax laws and tax rates applicable at the time of the calculation to the differences between the financial statement basis and the tax basis of assets and liabilities. The effect on deferred taxes of changes in tax laws and rates is recognized in income in the period that includes the enactment date. On the consolidated balance sheet, net deferred tax assets are included in other assets.
The Company uses a comprehensive model for recognizing, measuring, presenting and disclosing in the financial statements tax positions taken or expected to be taken on a tax return. A tax position is recognized as a benefit only if it is “more likely than not” that the tax position would be sustained in a tax examination, with a tax examination being presumed to occur. The amount recognized is the largest amount of tax benefit that is greater than 50% likely of being realized on examination. For tax positions not meeting the “more likely than not” test, no tax benefit is recorded.
When tax returns are filed, it is highly certain that some positions taken would be sustained upon examination by the taxing authorities, while others are subject to uncertainty about the merits of the position taken or the amount of the position that would be ultimately sustained. The benefit of a tax position is recognized in the financial statements in the period during which, based on all available evidence, management believes it is more likely than not that the position will be sustained upon examination, including the resolution of appeals or litigation processes, if any. Tax positions taken are not offset or aggregated with other positions. Tax positions that meet the more-likely-than-not recognition threshold are measured as the largest amount of tax benefit that is more than 50 percent likely of being realized upon settlement with the applicable taxing authority. The portion of the benefits associated with tax positions taken that exceeds the amount measured as described above is reflected as a liability for unrecognized tax benefits in the accompanying balance sheet along with any associated interest and penalties that would be payable to the taxing authorities upon examination.
Interest expense associated with unrecognized tax benefits is classified as interest expense in the consolidated statement of income.Penalties associated with unrecognized tax benefits are classified as other expense in the consolidated statement of income.
Earnings (Loss) per Share.Basic earnings (loss) per share (EPS), which excludes dilution, is computed by dividing income or loss available to common shareholders by the weighted-average number of common shares outstanding for the period. Diluted EPS reflects the potential dilution that could occur if securities or other contracts to issue common stock, such as stock options, result in the issuance of common stock which shares in the earnings of the Company. The treasury stock method has been applied to determine the dilutive effect of stock options in computing diluted EPS. Diluted EPS are not presented when a net loss occurs because the conversion of potential common stock is antidilutive. Earnings per share is retroactively adjusted for stock dividends and stock splits for all periods presented.
Stock-Based Compensation.At December 31, 2011, the Company had two shareholder approved stock-based compensation plans: the 1998 Employee Stock Incentive Plan and the 2008 Stock Incentive Plan. The plans do not provide for the settlement of awards in cash and new shares are issued upon exercise of the options. The North Valley Bancorp 1998 Employee Stock Incentive Plan provides for awards in the form of options (which may constitute incentive stock options (“ISOs”) or non-statutory stock options (“NSOs”) to key employees) and also provides for the award of shares of Common Stock to outside directors. As provided in the 1998 Employee Stock Incentive Plan, the authorization to award incentive stock options terminated on February 19, 2008. As of December 31, 2011, a total of 161,095 shares of Common Stock were available for future grants under the 2008 Stock Incentive Plan.
The North Valley Bancorp 2008 Stock Incentive Plan was adopted by the Company’s Board of Directors on February 27, 2008, effective that date, and was approved by the Company’s shareholders at the annual meeting, May 22, 2008. The terms of the 2008 Stock Incentive Plan are substantially the same as the North Valley Bancorp 1998 Employee Stock Incentive Plan. The 2008 Stock Incentive Plan provides for the grant to key employees of stock options, which may consist of NSOs and ISOs. The 2008 Stock Incentive Plan also provides for the grant to outside directors, and to consultants and advisers to the Company, of stock options, all of which must be NSOs. A total of 347,865 shares were authorized under all plans at December 31, 2011. Pursuant to the 1998 Employee Stock Incentive Plan there were outstanding options to purchase 71,250 shares of Common Stock at December 31, 2011. The shares of Common Stock authorized to be granted as options under the 2008 Stock Incentive Plan consist 276,615 shares of Common Stock reserved for issuance under the terms of the 2008 Stock Incentive Plan, consisting of 112,820 shares to be issued upon the exercise of options granted and still outstanding as of that date, 2,700 shares issued as stock awards and 161,095 shares reserved for future stock option grants and director stock awards at December 31, 2011. Effective January 1, 2009, and on each January 1 thereafter for the remaining term of the 2008 Stock Incentive Plan, the aggregate number of shares of Common Stock which are reserved for issuance pursuant to options granted under the terms of the 2008 Stock Incentive Plan shall be increased by a number of shares of Common Stock equal to 2% of the total number of the shares of Common Stock of the Company outstanding at the end of the most recently concluded calendar year. Any shares of Common Stock that have been reserved but not issued as options during any calendar year shall remain available for grant during any subsequent calendar year. Each outside director of the Company shall also be eligible to receive a stock award of 180 shares of Common Stock as part of his or her annual retainer paid by the Company for his or her services as a director. Each stock award shall be fully vested when granted to the outside director. On July 28, 2011, each director was awarded 180 shares for their retainer grant. On July 29, 2010, the Board of Directors elected to forego their 180 share retainer grant for 2010. The number of shares of Common Stock available as stock awards to outside directors shall equal the number of shares of Common Stock to be awarded to such outside directors. Outstanding options under the plans are exercisable until their expiration.
Cash flows resulting from the tax benefits from tax deductions in excess of the compensation cost recognized for those options (excess tax benefits) is to be classified as a cash flow from financing activities in the statement of cash flows.
Determining Fair Value.The fair value of each option award is estimated on the date of grant using a Black-Scholes-Merton based option valuation model that uses the assumptions discussed below. This fair value is then amortized on a straight-line basis over the requisite service periods of the awards, which is generally the vesting period.
Expected Term – The Company’s expected term represents the period that the Company’s stock-based awards are expected to be outstanding and was determined based on the Company’s historical option activity.
Expected Volatility - The Company uses the trading history of the common stock of the Company in determining an estimated volatility factor when using the Black-Scholes-Merton option-pricing formula to determine the fair value of options granted.
Expected Dividend – The Company estimates the expected dividend based on its historical experience of dividends declared per year, giving consideration to any anticipated changes and the estimated stock price over the expected term based on historical experience when using the Black-Scholes-Merton option-pricing formula.
Risk-Free Interest Rate - The Company bases the risk-free interest rate used in the Black-Scholes-Merton option-pricing formula on the implied yield currently available on U.S. Treasury zero-coupon issues with the same or substantially equivalent remaining term as the expected term of the options.
Estimated Forfeitures - When estimating forfeitures, the Company considers voluntary and involuntary termination behavior as well as analysis of actual option forfeitures.
There were 66,000 and 3,900 options granted in 2011 and 2009, respectively. There were no options granted in 2010. The fair value of each option is estimated on the date of grant with the following assumptions:
| | | 2011 | | | 2009 | |
| Weighted average dividend yield | | | 0.00% | | | | 0.00% | |
| Weighted average expected volatility | | | 53.60% | | | | 37.78% | |
| Weighted average risk-free interest rate | | | 2.27% | | | | 2.36% | |
| Weighted average expected option life | | | 7.67 years | | | | 6.84 years | |
| Weighted average grant date fair value | | | $6.07 | | | | $1.52 | |
Comprehensive Income (Loss). Comprehensive income (loss) includes net income (loss) and other comprehensive income or loss, which represents the change in its net assets during the period from nonowner sources. The components of other comprehensive income or loss for the Company include the unrealized gain or loss on available-for-sale securities and changes in the funded status of the pension liability and are presented net of tax. Comprehensive income (loss) is reported on the consolidated statement of changes in stockholders’ equity.
Conversion of Series A Preferred Stock, Increase in Authorized Common Shares. On April 22, 2010, the Company completed a $40,000,000 private placement capital raise (net $37,500,000 after costs) whereby the Company sold a total of 40,000 shares of Mandatorily Convertible Cumulative Perpetual Preferred Stock, Series A, without par value (the “Series A Preferred Stock”) at a price of $1,000 per share.
At the Annual Meeting of Shareholders held on July 16, 2010, the Company received shareholder approval to amend its Articles of Incorporation and increase the number of authorized common shares to 60 million from 20 million. An amendment was filed with the California Secretary of State on July 19, 2010, effective on that date.
Additionally, on July 16, 2010, the Company received shareholder approval at its 2010 Annual Meeting of Shareholders to convert the 40,000 shares of Series A Preferred Stock into 26,666,646 shares of common stock. The conversion of the Series A Preferred Stock took effect on July 21, 2010 at the conversion price of $1.50 per share. At July 21, 2010, the conversion date, a total of 34,162,463 shares of common stock were issued and outstanding.
The Series A Preferred Stock was mandatorily convertible into shares of common stock on the third business day following the approval by the holders of common stock of the conversion at an initial conversion price of $1.50 per share. The conversion price was less than the fair value of $2.20 per share of our common stock on April 22, 2010. Under generally accepted accounting principles (“GAAP”), the Series A Preferred Stock was deemed to include a beneficial conversion feature with an intrinsic value of $0.70 per share (a total discount of $18,667,000).
On the date of conversion, the discount due to the beneficial conversion feature was recognized for accounting purposes as a preferred stock dividend. This non-cash implied dividend increases common stock, decreases retained earnings and decreases net income available to common shareholders in the earnings per share computation.
One for Five Reverse Stock Split. On December 3, 2010, the Board of Directors approved a 1-for-5 reverse stock split of its shares of common stock, effective at the close of business on December 28, 2010 (the “Effective Date”). As of the Effective Date, in accordance with an amendment of the Company’s Amended and Restated Articles of Incorporation filed with the California Secretary of State, each five (5) outstanding shares of common stock was exchanged and combined, automatically, without further action, into one (1) share of common stock. The reverse stock split reduced the number of issued and outstanding shares of common stock from 34,162,463 shares to 6,832,492 shares. In accordance with accounting principles generally accepted in the United States, shares of common stock and EPS have been restated on an equivalent basis throughout the consolidated financial statements have been adjusted retrospectively for all periods presented.
Adoption of New Financial Accounting Standards
Goodwill impairment. In December 2010, the FASB amended existing guidance relating to goodwill impairment testing. This guidance requires that if the carrying amount of a reporting unit is zero or negative, a qualitative assessment be performed to determine if it is more likely than not that goodwill is impaired. Step 2 of the impairment test shall be performed if it is determined that it is more likely than not that goodwill is impaired. The amendments in this guidance were effective for fiscal years, and interim periods within those years, beginning after December 15, 2010. Additionally, in September 2011, the FASB amended existing guidance relating to goodwill impairment testing. The amendment permits an assessment of qualitative factors to determine whether the existence of events or circumstances leads to a determination that it is more likely than not that the fair value of a reporting unit is less than its carrying amount. If, after assessing these events or circumstances, it is concluded that it is not more likely than not that the fair value of a reporting unit is less than its carrying amount, then performing the two-step impairment test is unnecessary. The amendments in this guidance are effective for annual and interim goodwill impairment tests performed for fiscal years beginning after December 15, 2011. Early adoption of these standards is permitted. The effect of adopting the 2010 portion of these standards did not, and the adoption of the 2011 portion of these standards is not expected to have a material effect on the Company’s operating results or financial condition.
Troubled debt restructurings.In April 2011, the FASB amended existing guidance for assisting a creditor in determining whether a restructuring is a troubled debt restructuring. The amendments clarify the guidance for a creditor’s evaluation of whether it has granted a concession and whether a debtor is experiencing financial difficulties. With regard to determining whether a concession has been granted, the ASU clarifies that creditors are precluded from using the effective interest method to determine whether a concession has been granted. In the absence of using the effective interest method, a creditor must now focus on other considerations such as the value of the underlying collateral, evaluation of other collateral or guarantees, the debtor’s ability to access other funds at market rates, interest rate increases and whether the restructuring results in a delay in payment that is insignificant. This guidance is effective for interim and annual reporting periods beginning after June 15, 2011, and should be applied retrospectively to the beginning of the annual period of adoption. For purposes of measuring impairment on newly identified troubled debt restructurings, the amendments should be applied prospectively for the first interim or annual period beginning on or after June 15, 2011. The adoption of this guidance created additional disclosure requirements for the Company but did not have an impact on its operating results or financial condition.
Fair value measurement.In May, 2011, the FASB issued an amendment to achieve common fair value measurement and disclosure requirements between U.S. and International accounting principles. Overall, the guidance is consistent with existing U.S. accounting principles; however, there are some amendments that change a particular principle or requirement for measuring fair value or for disclosing information about fair value measurements. The amendments in this guidance are effective for interim and annual reporting periods beginning after December 15, 2011. The Company is currently evaluating the impact of this amendment on the consolidated financial statements.
Comprehensive income. In June 2011, the FASB amended existing guidance and eliminated the option to present the components of other comprehensive income as part of the statement of changes in shareholder’s equity. The amendment requires that comprehensive income be presented in either a single continuous statement or in two separate consecutive statements. Public Companies: The amendments in this guidance are effective as of the beginning of a fiscal reporting year, and interim periods within that year, that begins after December 15, 2011. Early adoption is permitted. The adoption of this amendment will change the presentation of the components of comprehensive income for the Company as part of the consolidated statement of shareholder’s equity.
2. INVESTMENT SECURITIES
The amortized cost of investment securities and their estimated fair value were as follows (in thousands):
| | | As of December 31, 2011 | |
| | | | | | Gross | | | Gross | | | Estimated | |
| | | Amortized | | | Unrealized | | | Unrealized | | | Fair | |
| | | Cost | | | Gains | | | Losses | | | Value | |
| Available-for-Sale: | | | | | | | | | | | | | | | | |
| Obligations of U.S. government sponsored agencies | | $ | 15,042 | | | $ | 192 | | | $ | — | | | $ | 15,234 | |
| Obligations of state and political subdivisions | | | 13,811 | | | | 696 | | | | (52 | ) | | | 14,455 | |
| Government sponsored agency mortgage-backed securities | | | 270,337 | | | | 5,212 | | | | (345 | ) | | | 275,204 | |
| Corporate debt securities | | | 6,000 | | | | — | | | | (1,768 | ) | | | 4,232 | |
| Equity securities | | | 3,000 | | | | 80 | | | | — | | | | 3,080 | |
| | | $ | 308,190 | | | $ | 6,180 | | | $ | (2,165 | ) | | $ | 312,205 | |
| Held-to-Maturity: | | | | | | | | | | | | | | | | |
| Government sponsored agency mortgage-backed securities | | $ | 6 | | | $ | — | | | $ | — | | | $ | 6 | |
| | | As of December 31, 2010 | |
| Available-for-Sale: | | | | | | | | | | | | | | | | |
| Obligations of U.S. government sponsored agencies | | $ | 21,096 | | | $ | 135 | | | $ | (10 | ) | | $ | 21,221 | |
| Obligations of state and political subdivisions | | | 14,342 | | | | 435 | | | | (226 | ) | | | 14,551 | |
| Government sponsored agency mortgage-backed securities | | | 221,807 | | | | 2,729 | | | | (1,967 | ) | | | 222,569 | |
| Corporate debt securities | | | 6,000 | | | | — | | | | (1,697 | ) | | | 4,303 | |
| Equity securities | | | 3,000 | | | | — | | | | — | | | | 3,000 | |
| | | $ | 266,245 | | | $ | 3,299 | | | $ | (3,900 | ) | | $ | 265,644 | |
| Held-to-Maturity: | | | | | | | | | | | | | | | | |
| Government sponsored agency mortgage-backed securities | | $ | 6 | | | $ | — | | | $ | — | | | $ | 6 | |
Net unrealized gains (losses) on available-for-sale securities totaling $4,015,000 and ($601,000) were recorded, net of $1,647,000 and $246,000 in tax benefits, as accumulated other comprehensive gain (loss) within stockholders’ equity at December 31, 2011 and 2010, respectively.
Proceeds on sales, calls or maturities of securities categorized as available-for-sale were $146,285,000, $63,718,000 and $48,941,000 in 2011, 2010 and 2009, respectively. Gross realized gains on sales or calls of securities categorized as available-for-sale securities were $1,687,000 and $655,000 in 2011 and 2009, respectively. There were no gross realized gains on sales or calls of securities categorized as available-for-sale securities in 2010. Gross realized losses on sales, impairment or calls of securities categorized as available-for-sale securities were $10,000 in 2011. There were no gross realized losses on sale, impairment or calls of securities categorized as available-for-sale securities in 2010 and 2009.
There were no sales or gross realized gains or losses on calls of held-to-maturity securities in 2011, 2010 and 2009. There were no transfers between available-for-sale and held-to-maturity investment securities in 2011, 2010 and 2009.
The following tables show gross unrealized losses and the estimated fair value of available-for-sale investment securities, aggregated by investment category, for investment securities that are in an unrealized loss position (in thousands). Unrealized losses for held-to-maturity investment securities during the same period were not significant.
| | | As of December 31, 2011 | |
| | | Less than 12 Months | | | 12 Months or Longer | | | Total | |
| | | Estimated | | | Unrealized | | | Estimated | | | Unrealized | | | Estimated | | | Unrealized | |
| | | Fair Value | | | Losses | | | Fair Value | | | Losses | | | Fair Value | | | Losses | |
| Description of Securities | | | | | | | | | | | | | | | | | | | | | | | | |
| Obligations of U.S. government sponsored agencies | | $ | — | | | $ | — | | | $ | — | | | $ | — | | | $ | — | | | $ | — | |
| Obligations of states and political subdivisions | | | 714 | | | | (4 | ) | | | 572 | | | | (48 | ) | | | 1,286 | | | | (52 | ) |
| Government sponsored agency mortgage-backed securities | | | 96,629 | | | | (336 | ) | | | 16,858 | | | | (9 | ) | | | 113,487 | | | | (345 | ) |
| Corporate debt securities | | | — | | | | — | | | | 4,232 | | | | (1,768 | ) | | | 4,232 | | | | (1,768 | ) |
| Total impaired securities | | $ | 97,343 | | | $ | (340 | ) | | $ | 21,662 | | | $ | (1,825 | ) | | $ | 119,005 | | | $ | (2,165 | ) |
| | | As of December 31, 2010 | |
| | | Less than 12 Months | | | 12 Months or Longer | | | Total | |
| | | Estimated | | | Unrealized | | | Estimated | | | Unrealized | | | Estimated | | | Unrealized | |
| | | Fair Value | | | Losses | | | Fair Value | | | Losses | | | Fair Value | | | Losses | |
| Description of Securities | | | | | | | | | | | | | | | | | | | | | | | | |
| Obligations of U.S. government sponsored agencies | | $ | 6,004 | | | $ | (10 | ) | | $ | — | | | $ | — | | | $ | 6,004 | | | $ | (10 | ) |
| Obligations of states and political subdivisions | | | 2,067 | | | | (37 | ) | | | 851 | | | | (189 | ) | | | 2,918 | | | | (226 | ) |
| Government sponsored agency mortgage-backed securities | | | 107,697 | | | | (1,964 | ) | | | 33 | | | | (3 | ) | | | 107,730 | | | | (1,967 | ) |
| Corporate debt securities | | | — | | | | — | | | | 4,303 | | | | (1,697 | ) | | | 4,303 | | | | (1,697 | ) |
| Total impaired securities | | $ | 115,768 | | | $ | (2,011 | ) | | $ | 5,187 | | | $ | (1,889 | ) | | $ | 120,955 | | | $ | (3,900 | ) |
Obligations of U.S. Government Sponsored Agencies.Management believes that the unrealized losses on the Company’s investment in obligations of U.S. government sponsored agencies is caused by interest rate changes, and is not attributable to changes in credit quality. The Company’s investments in obligations of U.S. government sponsored agencies include one security which was in a loss position for less than twelve months, none of which are individually significant. The Company has the ability and intent to hold these investments until at least a recovery of fair value or to maturity or call and expects to collect all amounts due. The Company does not consider these securities to be other-than-temporarily impaired at December 31, 2011.
Obligations of States and Political Subdivisions.Management believes that the unrealized losses on the Company’s investment in obligations of states and political subdivisions is caused by interest rate changes and other market conditions, and is not attributable to changes in credit quality. The Company’s investments in obligations of states and political subdivisions include one security which were in a loss position for twelve months or more and three in a loss position for less than twelve months, none of which are individually significant. The Company has the ability and intent to hold these investments until at least a recovery of fair value or to maturity or call and expects to collect all amounts due. The Company does not consider these securities to be other-than-temporarily impaired at December 31, 2011.
Government Sponsored Agency Mortgage Backed Securities.Management believes that the unrealized losses on the Company’s investment in government sponsored agency mortgage-backed securities is caused by interest rate changes and other market conditions and is not attributable to changes in credit quality. These investments include three securities which were in a loss position for twelve months or more and eight in a loss position for less than twelve months, none of which are individually significant. Additionally, the contractual cash flows of these investments are guaranteed by an agency of the U.S. government and thus it is expected that the securities would not be settled at any price less than the amortized cost of the Company’s investment. The Company has the ability and intent to hold those investments until at least a recovery of fair value or until maturity. The Company does not consider these investments to be other-than-temporarily impaired at December 31, 2011.
Corporate Debt Securities. As of December 31, 2011, there were two corporate debt securities in a loss position for twelve months or more. There is a current active market for these securities and management believes that the unrealized losses on the Company’s investment in these corporate debt securities is due to the yield of the securities and is not attributable to changes in credit quality. The two corporate debt securities are each a $3,000,000 single-issuer trust preferred security issued by two separate large publicly-traded financial institutions. The securities are tied to the front-end of the yield curve, three-month LIBOR (a short-term interest rate) and have a spread over that. The Company has the ability and intent to hold these securities and expects a full recovery of value. The Company does not consider these investments to be other-than-temporarily impaired at December 31, 2011.
Maturities.The Company invests in government sponsored agency mortgage-backed securities (“MBSs”) and collateralized mortgage obligations (“CMOs”) issued by the FNMA, the Federal Home Loan Mortgage Corporation and Government National Mortgage Association. Actual maturities of the MBSs and CMOs and other securities may differ from contractual maturities because borrowers have the right to prepay mortgages without penalty or call obligations with or without call penalties. The Company uses the “Wall Street” consensus average life at the time the security is purchased to schedule maturities of these MBSs and CMOs and adjusts scheduled maturities periodically based upon changes in the Wall Street estimates.
Contractual maturities of held-to-maturity and available-for-sale securities (other than equity securities with an amortized cost and fair value of approximately $3,000,000 and $3,080,000) at December 31, 2011, are shown below (in thousands).
| | | Held-to-Maturity | | | Available-for-Sale | |
| | | Amortized Cost | | | Estimated | | | | | | Estimated | |
| | | (Carrying | | | Fair | | | Amortized | | | Fair Value | |
| | | Amount) | | | Value | | | Costs | | | (Carrying Amount) | |
| Due in 1 year or less | | $ | — | | | $ | — | | | $ | 16,951 | | | $ | 17,158 | |
| Due after 1 year through 5 years | | | — | | | | — | | | | 97,463 | | | | 101,522 | |
| Due after 5 years through 10 years | | | — | | | | — | | | | 91,509 | | | | 92,923 | |
| Due after 10 years | | | 6 | | | | 6 | | | | 99,267 | | | | 97,522 | |
| | | $ | 6 | | | $ | 6 | | | $ | 305,190 | | | $ | 309,125 | |
At December 31, 2011 and 2010, securities having fair value amounts of approximately $302,852,000 and $255,199,000, respectively, were pledged to secure public deposits, short-term borrowings, treasury tax and loan balances and for other purposes required by law or contract.
3. LOANS
The Company originates loans for business, consumer and real estate activities for equipment purchases. Such loans are concentrated in Yolo, Placer, Sonoma, Shasta, Humboldt, Mendocino, Trinity and Del Norte Counties and neighboring communities. Substantially all loans are collateralized. Generally, real estate loans are secured by real property. Commercial and other loans are secured by bank deposits, real estate or business or personal assets. Leases are generally secured by equipment. The Company’s policy for requiring collateral reflects the Company’s analysis of the borrower, the borrower’s industry and the economic environment in which the loan would be granted. The loans are expected to be repaid from cash flows or proceeds from the sale of selected assets of the borrower.
Major classifications of loans at December 31 were as follows (in thousands):
| | | 2011 | | | 2010 | |
| Commercial | | $ | 46,160 | | | $ | 54,639 | |
| Real estate - commercial | | | 276,644 | | | | 291,514 | |
| Real estate - construction | | | 27,463 | | | | 55,181 | |
| Real estate - mortgage | | | 47,362 | | | | 49,726 | |
| Installment | | | 10,925 | | | | 14,690 | |
| Other | | | 47,965 | | | | 48,292 | |
| | | | 456,519 | | | | 514,042 | |
| Deferred loan fees, net | | | (304 | ) | | | (576 | ) |
| Allowance for loan losses | | | (12,656 | ) | | | (14,993 | ) |
| | | $ | 443,559 | | | $ | 498,473 | |
At December 31, 2011 and 2010, the Company serviced real estate loans and loans guaranteed by the Small Business Administration which it had sold to the secondary market of approximately $130,876,000 and $122,795,000, respectively.
Salaries and employee benefits totaling $800,000, $465,000 and $605,000 have been deferred as loan origination costs for the years ended December 31, 2011, 2010 and 2009, respectively.
Certain real estate loans receivable are pledged as collateral for available borrowings with the FHLB, FRB, and certain correspondent banks. Pledged loans totaled $137,528,000 and $164,669,000 at December 31, 2011 and 2010, respectively (see Note 9).
The Company did not recognize any interest income on impaired loans for the years ending December 31, 2011 and 2010. The following table shows information related to impaired loans at and for the period ended (in thousands):
| | | As of December 31, 2011 | |
| | | | | | Unpaid | | | | | | Average | |
| | | Recorded | | | Principal | | | Related | | | Recorded | |
| | | Investment | | | Balance | | | Allowance | | | Investment | |
| With no allocated allowance | | | | | | | | | | | | | | | | |
| Commercial | | $ | — | | | $ | — | | | $ | — | | | $ | — | |
| Real estate - commercial | | | 1,502 | | | | 1,556 | | | | — | | | | 1,820 | |
| Real estate - construction | | | 4,128 | | | | 4,153 | | | | — | | | | 4,142 | |
| Real estate - mortgage | | | 643 | | | | 751 | | | | — | | | | 689 | |
| Installment | | | 70 | | | | 75 | | | | — | | | | 72 | |
| Other | | | 88 | | | | 91 | | | | — | | | | 91 | |
| Subtotal | | | 6,431 | | | | 6,626 | | | | — | | | | 6,814 | |
| | | | | | | | | | | | | | | | | |
| With allocated allowance | | | | | | | | | | | | | | | | |
| Commercial | | | 1,788 | | | | 1,849 | | | | 450 | | | | 2,056 | |
| Real estate - commercial | | | 4,496 | | | | 5,302 | | | | 606 | | | | 4,534 | |
| Real estate - construction | | | 5,312 | | | | 5,312 | | | | 504 | | | | 5,311 | |
| Real estate - mortgage | | | 295 | | | | 314 | | | | 37 | | | | 302 | |
| Installment | | | 37 | | | | 39 | | | | 13 | | | | 38 | |
| Subtotal | | | 11,928 | | | | 12,816 | | | | 1,610 | | | | 12,241 | |
| Total Impaired Loans | | $ | 18,359 | | | $ | 19,442 | | | $ | 1,610 | | | $ | 19,055 | |
| | | As of December 31, 2010 | |
| | | | | | Unpaid | | | | | | Average | |
| | | Recorded | | | Principal | | | Related | | | Recorded | |
| | | Investment | | | Balance | | | Allowance | | | Investment | |
| With no allocated allowance | | | | | | | | | | | | | | | | |
| Commercial | | $ | 1,121 | | | $ | 1,466 | | | $ | — | | | $ | 1,531 | |
| Real estate - commercial | | | 2,602 | | | | 2,794 | | | | — | | | | 2,793 | |
| Real estate - construction | | | 9,016 | | | | 13,599 | | | | — | | | | 13,572 | |
| Real estate - mortgage | | | 1,557 | | | | 1,611 | | | | — | | | | 1,679 | |
| Installment | | | 67 | | | | 67 | | | | — | | | | 68 | |
| Subtotal | | | 14,363 | | | | 19,537 | | | | — | | | | 19,643 | |
| | | | | | | | | | | | | | | | | |
| With allocated allowance | | | | | | | | | | | | | | | | |
| Commercial | | | 349 | | | | 363 | | | | 327 | | | | 370 | |
| Real estate - commercial | | | 4,090 | | | | 4,178 | | | | 563 | | | | 4,252 | |
| Real estate - mortgage | | | 1,263 | | | | 1,265 | | | | 153 | | | | 1,563 | |
| Subtotal | | | 5,702 | | | | 5,806 | | | | 1,043 | | | | 6,185 | |
| Total Impaired Loans | | $ | 20,065 | | | $ | 25,343 | | | $ | 1,043 | | | $ | 25,828 | |
Nonperforming loans include all such loans that are either on nonaccrual status or are 90 days past due as to principal or interest but still accrue interest because such loans are well-secured and in the process of collection. Nonperforming loans at December 31 are summarized as follows (in thousands):
| | | 2011 | | | 2010 | |
| Nonaccrual loans | | $ | 18,359 | | | $ | 20,065 | |
| Loans 90 days past due but still accruing interest | | | 52 | | | | — | |
| Total nonperforming loans | | $ | 18,411 | | | $ | 20,065 | |
If interest on nonaccrual loans had been accrued, such income would have approximated $1,039,000 in 2011, $2,096,000 in 2010 and $2,143,000 in 2009.
At December 31, 2011 there were no commitments to lend additional funds to borrowers whose loans were classified as nonaccrual.
The following table shows an aging analysis of the loan portfolio by the amount of time past due (in thousands):
| | | As of December 31, 2011 | |
| | | Accruing Interest | | | | | | | |
| | | | | | Greater than | | | | | | | |
| | | | | | 30-89 Days | | | 90 Days | | | | | | | |
| | | Current | | | Past Due | | | Past Due | | | Nonaccrual | | | Total | |
| | | | | | | | | | | | | | | | | | | | | |
| Commercial | | $ | 44,325 | | | $ | 47 | | | $ | — | | | $ | 1,788 | | | $ | 46,160 | |
| Real estate - commercial | | | 264,143 | | | | 6,503 | | | | — | | | | 5,998 | | | | 276,644 | |
| Real estate - construction | | | 18,023 | | | | — | | | | — | | | | 9,440 | | | | 27,463 | |
| Real estate - mortgage | | | 45,170 | | | | 1,254 | | | | — | | | | 938 | | | | 47,362 | |
| Installment | | | 10,614 | | | | 152 | | | | 52 | | | | 107 | | | | 10,925 | |
| Other | | | 47,877 | | | | — | | | | — | | | | 88 | | | | 47,965 | |
| Total | | $ | 430,152 | | | $ | 7,956 | | | $ | 52 | | | $ | 18,359 | | | $ | 456,519 | |
| | | As of December 31, 2010 | |
| | | Accruing Interest | | | | | | | |
| | | | | | Greater than | | | | | | | |
| | | | | | 30-89 Days | | | 90 Days | | | | | | | |
| | | Current | | | Past Due | | | Past Due | | | Nonaccrual | | | Total | |
| | | | | | | | | | | | | | | | | | | | | |
| Commercial | | $ | 53,010 | | | $ | 159 | | | $ | — | | | $ | 1,470 | | | $ | 54,639 | |
| Real estate - commercial | | | 284,788 | | | | 34 | | | | — | | | | 6,692 | | | | 291,514 | |
| Real estate - construction | | | 46,165 | | | | — | | | | — | | | | 9,016 | | | | 55,181 | |
| Real estate - mortgage | | | 46,068 | | | | 838 | | | | — | | | | 2,820 | | | | 49,726 | |
| Installment | | | 14,450 | | | | 173 | | | | — | | | | 67 | | | | 14,690 | |
| Other | | | 48,258 | | | | 34 | | | | — | | | | — | | | | 48,292 | |
| Total | | $ | 492,739 | | | $ | 1,238 | | | $ | — | | | $ | 20,065 | | | $ | 514,042 | |
During the year ending December 31, 2011, the terms of certain loans were modified as troubled debt restructurings. The modification of the terms of such loans included one or a combination of the following: a reduction of the stated interest rate of the loan; an extension of the maturity date at a stated rate of interest lower than the current market rate for new debt with similar risk; or a permanent reduction of the recorded investment in the loan The following table shows information related to Troubled Debt Restructurings as of December 31, 2011 (in thousands):
| | | Accruing TDRs | | | Non Accruing TDRs | |
| | | | | | Pre-
Modification | | | Post-
Modification | | | | | | Pre-
Modification | | | Post-
Modification | |
| | | Number | | | Outstanding | | | Outstanding | | | Number | | | Outstanding | | | Outstanding | |
| | | of | | | Recorded | | | Recorded | | | of | | | Recorded | | | Recorded | |
| | | Contracts | | | Investment | | | Investment | | | Contracts | | | Investment | | | Investment | |
| Real estate - commercial | | | 3 | | | $ | 1,097 | | | $ | 1,097 | | | | — | | | $ | — | | | $ | — | |
| Real estate - construction | | | — | | | $ | — | | | $ | — | | | | 3 | | | $ | 1,179 | | | $ | 1,179 | |
| Real estate - mortgage | | | 2 | | | $ | 660 | | | $ | 660 | | | | 2 | | | $ | 415 | | | $ | 415 | |
There were no modifications involving a reduction of the stated interest rate. There were three modifications involving an extension of the maturity dates; one for 12 months, one for 36 months, and one for 42 months. The recorded investment in three loans was reduced in the aggregate amount of $86,423 during the year. During 2011, one borrower whose loan was classified as a Troubled Debt Restructuring defaulted on loan payments. The loan was in the amount of $1,994,058 and was secured by a First Deed of Trust for light industrial/retail property located in Shasta County. Prior to the borrower’s payment default, the loan was considered an “impaired” asset and subject to individual review for a specific ALLL allocation under ASC 310-10. The net value of the collateral exceeded the loan balance, therefore; there was no specific ALLL allocation for the loan. During the fourth quarter of 2011, the loan collateral was the subject of foreclosure. The collateral property was transferred to OREO with no loan loss and no impact on ALLL.
At December 31, 2011, there are no specific reserves allocated to customers whose loan terms were modified in troubled debt restructurings. There are no commitments to lend additional amounts at December 31, 2011 to customers with outstanding loans that are classified as troubled debt restructurings.
4. ALLOWANCE FOR LOAN LOSSES
The following table shows the changes in the allowance for loan losses (in thousands):
| | | As of December 31, 2011 | |
| | | | | | Real Estate | | | Real Estate | | | Real Estate | | | | | | | | | | | | | |
| | | Commercial | | | Commercial | | | Construction | | | Mortgage | | | Installment | | | Other | | | Unallocated | | | Total | |
| | | | | | | | | | | | | | | | | | | | | | | | | | | | | | | | | |
| Allowance for Loan Losses | | | | | | | | | | | | | | | | | | | | | | | | | | | | | | | | |
| Balance December 31, 2010 | | $ | 1,517 | | | $ | 8,439 | | | $ | 1,936 | | | $ | 956 | | | $ | 339 | | | $ | 666 | | | $ | 1,140 | | | $ | 14,993 | |
| Charge-offs | | | (928 | ) | | | (2,917 | ) | | | (405 | ) | | | (440 | ) | | | (345 | ) | | | (490 | ) | | | | | | | (5,525 | ) |
| Recoveries | | | 212 | | | | 108 | | | | 10 | | | | 2 | | | | 206 | | | | — | | | | | | | | 538 | |
| Provisions for loan losses | | | 532 | | | | 1,898 | | | | (502 | ) | | | 417 | | | | (15 | ) | | | 560 | | | | (240 | ) | | | 2,650 | |
| Balance December 31, 2011 | | $ | 1,333 | | | $ | 7,528 | | | $ | 1,039 | | | $ | 935 | | | $ | 185 | | | $ | 736 | | | $ | 900 | | | $ | 12,656 | |
| Reserve to impaired loans | | $ | 450 | | | $ | 606 | | | $ | 504 | | | $ | 37 | | | $ | 13 | | | $ | — | | | $ | — | | | $ | 1,610 | |
| Reserve to non-impaired loans | | $ | 883 | | | $ | 6,922 | | | $ | 535 | | | $ | 898 | | | $ | 172 | | | $ | 736 | | | $ | 900 | | | $ | 11,046 | |
| | | | | | | | | | | | | | | | | | | | | | | | | | | | | | | | | |
| Loans | | | | | | | | | | | | | | | | | | | | | | | | | | | | | | | | |
| Balance December 31, 2011 | | $ | 46,160 | | | $ | 276,644 | | | $ | 27,463 | | | $ | 47,362 | | | $ | 10,925 | | | $ | 47,965 | | | | | | | $ | 456,519 | |
| Impaired Loans | | $ | 1,788 | | | $ | 5,998 | | | $ | 9,440 | | | $ | 938 | | | $ | 107 | | | $ | 88 | | | | | | | $ | 18,359 | |
| Non-impaired loans | | $ | 44,372 | | | $ | 270,646 | | | $ | 18,023 | | | $ | 46,424 | | | $ | 10,818 | | | $ | 47,877 | | | | | | | $ | 438,160 | |
| | | As of December 31, 2010 | |
| | | | | | Real Estate | | | Real Estate | | | Real Estate | | | | | | | | | | | | | |
| | | Commercial | | | Commercial | | | Construction | | | Mortgage | | | Installment | | | Other | | | Unallocated | | | Total | |
| | | | | | | | | | | | | | | | | | | | | | | | | | | | | | | | | |
| Allowance for Loan Losses | | | | | | | | | | | | | | | | | | | | | | | | | | | | | | | | |
| Balance December 31, 2009 | | $ | 2,018 | | | $ | 8,702 | | | $ | 3,800 | | | $ | 737 | | | $ | 391 | | | $ | 451 | | | $ | 2,440 | | | $ | 18,539 | |
| Charge-offs | | | (862 | ) | | | (3,400 | ) | | | (6,663 | ) | | | (704 | ) | | | (732 | ) | | | (154 | ) | | | | | | | (12,515 | ) |
| Recoveries | | | 76 | | | | 391 | | | | 40 | | | | — | | | | 490 | | | | 2 | | | | | | | | 999 | |
| Provisions for loan losses | | | 285 | | | | 2,746 | | | | 4,759 | | | | 923 | | | | 190 | | | | 367 | | | | (1,300 | ) | | | 7,970 | |
| Balance December 31, 2011 | | $ | 1,517 | | | $ | 8,439 | | | $ | 1,936 | | | $ | 956 | | | $ | 339 | | | $ | 666 | | | $ | 1,140 | | | $ | 14,993 | |
| Reserve to impaired loans | | $ | 327 | | | $ | 563 | | | $ | — | | | $ | 153 | | | $ | — | | | $ | — | | | $ | — | | | $ | 1,043 | |
| Reserve to non-impaired loans | | $ | 1,190 | | | $ | 7,876 | | | $ | 1,936 | | | $ | 803 | | | $ | 339 | | | $ | 666 | | | $ | 1,140 | | | $ | 13,950 | |
| | | | | | | | | | | | | | | | | | | | | | | | | | | | | | | | | |
| Loans | | | | | | | | | | | | | | | | | | | | | | | | | | | | | | | | |
| Balance December 31, 2010 | | $ | 54,639 | | | $ | 291,514 | | | $ | 55,181 | | | $ | 49,726 | | | $ | 14,690 | | | $ | 48,292 | | | | | | | $ | 514,042 | |
| Impaired Loans | | $ | 1,470 | | | $ | 6,692 | | | $ | 9,016 | | | $ | 2,820 | | | $ | 67 | | | $ | — | | | | | | | $ | 20,065 | |
| Non-impaired loans | | $ | 53,169 | | | $ | 284,822 | | | $ | 46,165 | | | $ | 46,906 | | | $ | 14,623 | | | $ | 48,292 | | | | | | | $ | 493,977 | |
The following table shows the loan portfolio allocated by management’s internal risk ratings (in thousands):
| | | As of December 31, 2011 | |
| | | Pass | | | Special Mention | | | Substandard | | | Doubtful | | | Total | |
| Commercial | | $ | 39,319 | | | $ | 3,067 | | | $ | 3,774 | | | $ | — | | | $ | 46,160 | |
| Real estate - commercial | | | 248,696 | | | | 5,055 | | | | 22,893 | | | | — | | | | 276,644 | |
| Real estate - construction | | | 17,624 | | | | 167 | | | | 9,672 | | | | — | | | | 27,463 | |
| Real estate - mortgage | | | 43,760 | | | | 886 | | | | 2,716 | | | | — | | | | 47,362 | |
| Installment | | | 10,702 | | | | — | | | | 223 | | | | — | | | | 10,925 | |
| Other | | | 47,638 | | | | — | | | | 327 | | | | — | | | | 47,965 | |
| Total | | $ | 407,739 | | | $ | 9,175 | | | $ | 39,605 | | | $ | — | | | $ | 456,519 | |
| | | As of December 31, 2010 | |
| | | Pass | | | Special Mention | | | Substandard | | | Doubtful | | | Total | |
| Commercial | | $ | 43,773 | | | $ | 3,531 | | | $ | 7,203 | | | $ | 132 | | | $ | 54,639 | |
| Real estate - commercial | | | 259,929 | | | | 2,214 | | | | 29,371 | | | | — | | | | 291,514 | |
| Real estate - construction | | | 23,542 | | | | 10,171 | | | | 21,468 | | | | — | | | | 55,181 | |
| Real estate - mortgage | | | 43,655 | | | | 482 | | | | 5,589 | | | | — | | | | 49,726 | |
| Installment | | | 14,499 | | | | — | | | | 191 | | | | — | | | | 14,690 | |
| Other | | | 47,790 | | | | — | | | | 502 | | | | — | | | | 48,292 | |
| Total | | $ | 433,188 | | | $ | 16,398 | | | $ | 64,324 | | | $ | 132 | | | $ | 514,042 | |
The allowance for loan losses is established through a provision for loan losses based on management’s evaluation of the risks inherent in the loan portfolio. In determining levels of risk, management considers a variety of factors, including, but not limited to, asset classifications, economic trends, industry experience and trends, geographic concentrations, estimated collateral values, historical loan loss experience, and the Company’s underwriting policies. The allowance for loan losses is maintained at an amount management considers adequate to cover the probable losses in loans receivable. While management uses the best information available to make these estimates, future adjustments to allowances may be necessary due to economic, operating, regulatory, and other conditions that may be beyond the Company’s control. The Company also engages a third party credit review consultant to analyze the Company’s loan loss adequacy each calendar quarter. In addition, the regulatory agencies, as an integral part of their examination process, periodically review the Company’s allowance for loan losses. Such agencies may require the Company to recognize additions to the allowance based on judgments different from those of management.
The allowance for loan losses is comprised of several components including the specific, formula and unallocated allowance relating to loans in the loan portfolio. Our methodology for determining the allowance for loan losses consists of several key elements, which include:
| | · | Specific Allowances. A specific allowance is established when management has identified unique or particular risks that were related to a specific loan that demonstrated risk characteristics consistent with impairment. Specific allowances are established when management can estimate the amount of an impairment of a loan. |
| | | |
| | · | Formula Allowance. The formula allowance is calculated by applying loss factors through the assignment of loss factors to homogenous pools of loans. Changes in risk grades of both performing and nonperforming loans affect the amount of the formula allowance. Loss factors are based on our historical loss experience and such other data as management believes to be pertinent. Management, also, considers a variety of subjective factors, including regional economic and business conditions that impact important segments of our portfolio, loan growth rates, the depth and skill of lending staff, the interest rate environment, and the results of bank regulatory examinations and findings of our internal credit examiners to establish the formula allowance. |
| | | |
| | · | Unallocated Allowance. The unallocated loan loss allowance represents an amount for imprecision or uncertainty that is inherent in estimates used to determine the allowance. |
The Company also maintains a separate allowance for off-balance-sheet commitments. A reserve for unfunded commitments is maintained at a level that, in the opinion of management, is adequate to absorb probable losses associated with commitments to lend funds under existing agreements, for example, the Bank’s commitment to fund advances under lines of credit. The reserve amount for unfunded commitments is determined based on our methodologies described above with respect to the formula allowance. The allowance for off-balance-sheet commitments is included in accrued interest payable and other liabilities on the consolidated balance sheet and was $161,000 and $230,000, as of December 31, 2011 and 2010, respectively.
Management anticipates modest growth in commercial lending and commercial real estate and to a lesser extent consumer and real estate mortgage lending, while it anticipates a further decline in construction lending. As a result, future provisions may be required and the ratio of the allowance for loan losses to loans outstanding may increase to reflect portfolio risk, increasing concentrations, loan type and changes in economic conditions. In addition, the regulatory agencies, as an integral part of their examination process, periodically review the Company’s allowance for loan losses, and may require the Company to make additions to the allowance based on their judgment about information available to them at the time of their examinations.
5. PREMISES AND EQUIPMENT
Major classifications of premises and equipment at December 31 are summarized as follows (in thousands):
| | | 2011 | | | 2010 | |
| Land | | $ | 2,366 | | | $ | 2,309 | |
| Building and building improvements | | | 8,657 | | | | 8,022 | |
| Furniture, fixtures and equipment | | | 12,514 | | | | 12,790 | |
| Leasehold improvements | | | 2,995 | | | | 3,497 | |
| Construction in process | | | 33 | | | | 30 | |
| | | | 26,565 | | | | 26,648 | |
| Less: Accumulated depreciation/amortization | | | 17,904 | | | | 17,849 | |
| Premises and equipment, net | | $ | 8,661 | | | $ | 8,799 | |
Depreciation and amortization included in occupancy and equipment expense totaled $1,197,000, $1,535,000 and $1,950,000 for the years ended December 31, 2011, 2010 and 2009, respectively.
6. OTHER REAL ESTATE OWNED
The table shows the changes in other real estate owned (OREO) during the years ended December 31 as follows (in thousands):
| | | 2011 | | | 2010 | |
| Balance, beginning of year | | $ | 25,784 | | | $ | 12,377 | |
| Properties transferred in | | | 10,454 | | | | 29,716 | |
| Sales of property | | | (12,036 | ) | | | (10,574 | ) |
| Loss on sale or writedown of property | | | (4,096 | ) | | | (5,735 | ) |
| Balance, end of year | | $ | 20,106 | | | $ | 25,784 | |
7. OTHER ASSETS
Major classifications of other assets at December 31 were as follows (in thousands):
| | | 2011 | | | 2010 | |
| Deferred taxes, net | | $ | 10,721 | | | $ | 12,511 | |
| Federal and state tax receivable | | | 250 | | | | 1,950 | |
| Prepaid expenses | | | 623 | | | | 1,038 | |
| Mortgage servicing asset | | | 696 | | | | 708 | |
| Other | | | 1,238 | | | | 1,664 | |
| Total other assets | | $ | 13,528 | | | $ | 17,871 | |
Originated mortgage servicing assets totaling $248,000, $313,000 and $544,000 were recognized during the years ended December 31, 2011, 2010 and 2009, respectively. Amortization of mortgage servicing assets totaled $260,000, $317,000 and $374,000 for the years ended December 31, 2011, 2010 and 2009, respectively. There were no impairment charges to mortgage servicing assets during the years ended December 31, 2011, 2010 and 2009.
8. DEPOSITS
The aggregate amount of time certificates of deposit in denominations of $100,000 or more was $96,897,000 and $97,277,000 at December 31, 2011 and 2010, respectively. Interest expense incurred on such time certificates of deposit was $1,245,000, $2,250,000 and $3,886,000 for the years ended December 31, 2011, 2010 and 2009. At December 31, 2011, the scheduled maturities of all time deposits were as follows (in thousands):
| Years | | Amount | |
| 2012 | | $ | 182,980 | |
| 2013 | | | 19,857 | |
| 2014 | | | 5,988 | |
| 2015 | | | 3,485 | |
| | | $ | 212,310 | |
9. LINES OF CREDIT
At December 31, 2011, the Company had the following lines of credit with correspondent banks to purchase federal funds (in thousands):
| Description | | Amount | | | Expiration | |
| Secured: | | | | | | | | |
| Secured fed funds | | $ | 10,000 | | | | 6/30/2012 | |
| First deeds of trust on eligible 1-4 unit residential loans | | $ | 70,356 | | | | Monthly | |
| Securities backed credit program | | $ | 230,259 | | | | Monthly | |
| Loans and discount -securities | | $ | 7,121 | | | | Monthly | |
The Company did not have outstanding balances for FHLB advances or Federal Funds purchased at December 31, 2011 and 2010.
10. SUBORDINATED DEBENTURES
The Company owns the common stock of four business trusts that have issued an aggregate of $31.0 million in trust preferred securities fully and unconditionally guaranteed by the Company. The entire proceeds of each respective issuance of trust preferred securities were invested by the separate business trusts into junior subordinated debentures issued by the Company, with identical maturity, repricing and payment terms as the respective issuance of trust preferred securities. The aggregate amount of junior subordinated debentures issued by the Company is $32.0 million, with the maturity dates for the respective debentures ranging from 2031 through 2036. The Indentures provide generally that the payment of interest is deferrable, at the option of the Company, for up to 20 consecutive quarters (or 10 consecutive semi-annual periods). Nonpayment of interest for more than 20 consecutive quarters (or 10 semi-annual periods) is an event of default pursuant to which the payment of principal and interest may be accelerated by the Indenture Trustee.
On November 9, 2009, the Company elected to defer the payment of interest on the Company’s Junior Subordinated Deferrable Interest Debentures Due 2031 (the “2031 Debentures”) issued to North Valley Capital Trust I in 2001; the Company’s Floating Rate Junior Subordinated Debt Securities Due 2033 (the “2033 Debentures”) issued to North Valley Capital Trust II in 2003; the Company’s Floating Rate Junior Subordinated Debt Securities Due 2034 (the “2034 Debentures”) issued to North Valley Capital Trust III in 2004; and the Company’s Junior Subordinated Debt Securities Due 2036 (the “2036 Debentures”) issued to North Valley Capital Statutory Trust IV in 2005. The 2031, 2033, 2034 and 2036 Debentures are administered under the terms and conditions of four separate Indentures and the Company gave notice of deferral to each Indenture Trustee on November 12, 2009, and has given proper notice of deferral each of the eight subsequent quarterly payment periods.
The obligation to pay interest on the Debentures is cumulative and will continue to accrue, currently at a fixed rate of 10.25% on the 2031 Debentures, variable rate of 3.54% on the 2033 Debentures, variable rate of 3.09% on the 2034 Debentures and a variable rate of 1.88% on the 2036 Debentures. Interest is generally set at variable rates based on the three-month LIBOR, reset and payable quarterly, plus 3.25% for the 2033Debentures, plus 2.80% for the 2034 Debentures, and plus 1.33% for the 2036 Debentures. At December 31, 2011 and 2010, the Company had recorded accrued and unpaid interest payments of $4,854,000 and $2,904,000, respectively.
The trust preferred securities issued by the trusts are currently included in Tier 1 capital in the amount of $29,331,000 and in Tier 2 capital in the amount of $1,669,000 for purposes of determining Leverage, Tier 1 and Total Risk-Based capital ratios for the year ending December 31, 2011. The trust preferred securities issued by the trusts are currently included in Tier 1 capital in the amount of $28,263,000 and in Tier 2 capital in the amount of $2,737,000 for purposes of determining Leverage, Tier 1 and Total Risk-Based capital ratios for the year ending December 31, 2010.
The following table summarizes the terms of each subordinated debenture issuance (dollars in thousands):
| | | Date | | | | Fixed or
Variable | | Current | | Rate | | Redemption | | Amount at
December 31, |
| Series | | Issued | | Maturity | | Rate | | Rate | | Index | | Date | | 2011 | | 2010 |
| North Valley Capital Trust I | | 7/16/01 | | 7/25/31 | | Fixed | | 10.25% | | N/A | | 7/25/11 | | $ | 10,310 | | $ | 10,310 |
| North Valley Capital Trust II | | 4/10/03 | | 4/24/33 | | Variable | | 3.68% | | LIBOR + 3.25% | | 4/24/08 | | | 6,186 | | | 6,186 |
| North Valley Capital Trust III | | 5/5/04 | | 4/24/34 | | Variable | | 3.22% | | LIBOR + 2.80% | | 7/23/09 | | | 5,155 | | | 5,155 |
| North Valley Capital Statutory Trust IV | | 12/29/05 | | 3/15/36 | | Variable | | 1.88% | | LIBOR + 1.33% | | 3/15/11 | | | 10,310 | | | 10,310 |
| | | | | | | | | | | | | | | $ | 31,961 | | $ | 31,961 |
Deferred costs related to the Subordinated Debentures, which are included in other assets in the accompanying consolidated balance sheet, totaled $26,000 and $68,000 at December 31, 2011 and 2010, respectively. Amortization of the deferred costs was $42,000, $65,000 and $73,000 for the years ended December 31, 2011, 2010 and 2009, respectively.
11. INCOME TAXES
The provision (benefit) for income taxes for the years ended December 31, was as follows (in thousands):
| | | 2011 | | | 2010 | | | 2009 | |
| Current tax provision (benefit): | | | | | | | | | | | | |
| Federal | | $ | 63 | | | $ | (228 | ) | | $ | (5,275 | ) |
| State | | | 46 | | | | 3 | | | | (190 | ) |
| Total | | | 109 | | | | (225 | ) | | | (5,465 | ) |
| Deferred tax provision (benefit): | | | | | | | | | | | | |
| Federal | | | 695 | | | | (3,862 | ) | | | (997 | ) |
| State | | | (269 | ) | | | (1,398 | ) | | | (2,932 | ) |
| Impact of valuation allowance | | | (223 | ) | | | 4,500 | | | | — | |
| Total | | | 203 | | | | (760 | ) | | | (3,929 | ) |
| Total provision (benefit) for income taxes | | $ | 312 | | | $ | (985 | ) | | $ | (9,394 | ) |
Current and deferred tax provision (benefit) for the years ended December 31, 2011, 2010, and 2009 was $312,000, ($985,000), and ($9,394,000), respectively. During 2010, the Company recorded a valuation allowance of $4,500,000 against the Company’s deferred tax asset which reduced the tax benefit recognized in 2010.During the quarter ended December 31, 2011, the Company reversed the Federal portion of its valuation allowance in the amount of $223,000, and at December 31, 2011 had a remaining valuation allowance of $4,277,000.At December 31, 2011, the Bank had Federal and State net operating loss carryforwards (NOLs) for tax purposes of approximately $6,543,000 and $27,283,000, respectively. The State of California has suspended the utilization of NOLs for all businesses with taxable income of $300,000 or more in 2011. The Company’s Federal NOLs will expire in 2031 and its California NOLs will expire in 2032 if not fully utilized.
A deferred tax asset or liability is recognized for the tax consequences of temporary differences in the recognition of revenue and expense, and unrealized gains and losses, for financial and tax reporting purposes. Deferred tax assets are reduced by a valuation allowance when, in the opinion of management, it is more likely than not that some or all of the deferred tax assets will not be realized. The Company conducted an analysis to assess the need for a valuation allowance at December 31, 2011. As part of this assessment, all available evidence, including both positive and negative, was considered to determine whether based on the weight of such evidence, a valuation allowance on the Company’s deferred tax assets was needed. A valuation allowance is deemed to be needed when, based on the weight of the available evidence, it is more likely than not (a likelihood of more than 50%) that some portion or all of a deferred tax asset will not be realized. The future realization of the deferred tax asset depends on the existence of sufficient taxable income within the carryback and carryforward periods.
As part of its analysis, the Company considered the following positive evidence:
| | · | The Company had a long history of earnings profitability prior to the current economic downturn. |
| | · | The Company has had five consecutive quarters of positive earnings. |
| | · | The Company is projecting future taxable income sufficient to utilize all its Federal net operating loss carryforwards prior to expiration. |
| | · | The size of loan credits in the Company’s pipeline of potential problem loans has significantly decreased. |
| | · | Certain tax planning strategies are available to the Company that, if implemented, would generate additional taxable income. |
As part of its analysis, the Company considered the following negative evidence:
| | · | The Company recorded a net loss in 2010 and a cumulative loss for the three year period ended December 31, 2011. |
| | · | The Company did not meet its financial goals in 2010 or 2009. |
| | · | The Company had higher than expected OREO expenses in 2011 and 2010. |
| | · | The Company may not meet its projections concerning future taxable income. |
For purposes of establishing a deferred tax valuation allowance, the Company considers its inability to meet its financial goals in years 2011 and 2010, and its pre-tax loss in the prior year as significant, objective evidence that the Company may not be able to realize some portion of its deferred tax assets in the future. Higher than expected OREO expenses in 2011 and 2010 provided further evidence that some of the tax benefits had met the “more likely than not” standard and may not be realized. Management also considered available tax planning strategies, the scheduled reversal of deferred tax assets and liabilities, and the nature and amount of historical and projected future taxable income that provide positive evidence that some of the tax benefits will be realizable. Accordingly, the Company established a partial valuation allowance in 2010 of $4,500,000 to reflect the portion of the deferred tax assets that the Company determined to be more likely than not that it will not be realized.During the quarter ended December 31, 2011, the Company reversed the Federal portion of its valuation allowance in the amount of $223,000, and at December 31, 2011 had a remaining valuation allowance of $4,277,000.
The effective federal tax rate for the years ended December 31, differs from the statutory tax rate as follows:
| | | 2011 | | | 2010 | | | 2009 | |
| Federal statutory income tax rate | | | 35.0 | % | | | (35.0 | %) | | | (35.0 | %) |
| State income taxes net of Federal income tax benefit | | | (4.3 | %) | | | 25.9 | % | | | (5.8 | %) |
| Tax exempt income | | | (6.5 | %) | | | (8.9 | %) | | | (1.8 | %) |
| Impact of valuation allowance | | | (6.6 | %) | | | 3.1 | % | | | — | |
| Increase in FIN 48 reserve | | | 1.2 | % | | | — | | | | — | |
| Impairment of goodwill | | | — | | | | — | | | | 15.1 | % |
| Other | | | (9.5 | %) | | | 1.3 | % | | | 0.8 | % |
| Effective tax (benefit) rate | | | 9.3 | % | | | (13.6 | %) | | | (26.7 | %) |
Deferred income taxes reflect the net tax effects of temporary differences between the carrying amounts of assets and liabilities for financial reporting purposes and the amounts used for income tax purposes. Significant components of the Company’s net deferred tax asset at December 31 are as follows (in thousands):
| | | 2011 | | | 2010 | |
| Deferred tax assets: | | | | | | | | |
| Allowance for loan losses | | $ | 5,802 | | | $ | 6,873 | |
| Accrued pension obligation | | | 2,693 | | | | 2,354 | |
| Underfunded pension obligation | | | 625 | | | | 319 | |
| Deferred compensation | | | 758 | | | | 812 | |
| Deferred loan fees and costs | | | 84 | | | | 152 | |
| Discount on acquired loans | | | 39 | | | | 64 | |
| Unrealized loss on available-for-sale securities | | | — | | | | 246 | |
| Stock based compensation | | | 135 | | | | 113 | |
| Tax credits | | | 1,656 | | | | 1,309 | |
| Net operating loss | | | 5,248 | | | | 5,715 | |
| Capital loss | | | 489 | | | | 489 | |
| Other real estate owned | | | 2,193 | | | | 1,790 | |
| Other | | | 376 | | | | 376 | |
| Total deferred tax assets before valuation allowance | | | 20,098 | | | | 20,612 | |
| Valuation allowance | | | 4,277 | | | | 4,500 | |
| Total deferred tax assets | | $ | 15,821 | | | $ | 16,112 | |
| Deferred tax liabilities: | | | | | | | | |
| Tax depreciation in excess of book depreciation | | | 1,195 | | | | 1,191 | |
| FHLB stock dividend | | | 410 | | | | 410 | |
| Originated mortgage servicing rights | | | 319 | | | | 324 | |
| Core deposit intangibles | | | 79 | | | | 21 | |
| Unrealized gain on available-for-sale securities | | | 1,647 | | | | — | |
| Market to market adjustment | | | 152 | | | | 275 | |
| California franchise tax | | | 1,030 | | | | 951 | |
| Other | | | 268 | | | | 429 | |
| Total deferred tax liabilities | | $ | 5,100 | | | $ | 3,601 | |
| Net deferred tax asset | | $ | 10,721 | | | $ | 12,511 | |
The Company and its subsidiaries file income tax returns in the United States and California jurisdictions. There are currently no pending federal tax examinations by tax authorities. With few exceptions, the Company is no longer subject to examination by federal taxing authorities for the years ended before December 31, 2007 and by state and local taxing authorities for years before December 31, 2006. The Company’s primary market areas are designated as “Enterprise Zones” and the Company receives tax credits for hiring individuals in these markets and receives an interest deduction for loans made in designated enterprise zones. The tax credits and interest deductions are significant to the Company in reducing its effective tax rate. These positions could be challenged by the California Franchise Tax Board, and an unfavorable adjustment could occur. The California Franchise Tax Board is currently conducting examinations of the State of California returns for 2003, 2004, 2007 and 2008.
The Company determined its unrecognized tax benefit to be $519,000 and $480,000 at December 31, 2011 and 2010, respectively. A reconciliation of the beginning and ending amount of unrecognized tax benefits is as follows (in thousands):
| | | 2011 | | | 2010 | |
| Beginning balance | | $ | 480 | | | $ | 480 | |
| Additions based on tax positions related to the current year | | | 39 | | | | — | |
| Additions for tax positions of prior years | | | — | | | | — | |
| Reductions for tax positions of prior years | | | — | | | | — | |
| Settlements | | | — | | | | — | |
| Ending balance | | $ | 519 | | | $ | 480 | |
Of this total, the amount of unrecognized tax benefits that, if recognized, would favorably affect the effective income tax rate in future periods is not considered significant for disclosure purposes. The Company does not expect the total amount of unrecognized tax benefits to significantly increase or decrease in the next twelve months.
During the year ended December 31, 2011, the Company was not assessed any interest and penalties. The Company had approximately $18,000 and $22,000 for the payment of interest and penalties accrued at December 31, 2011 and 2010, respectively.
12. RETIREMENT AND DEFERRED COMPENSATION PLANS
Substantially all employees with at least one year of service participate in a Company-sponsored employee stock ownership plan (ESOP). The Company made discretionary contributions to the ESOP of $40,000 for the years ended December 31, 2011, 2010 and 2009, respectively. At December 31, 2011 and 2010, the ESOP owned approximately 43,061and 40,410, respectively, shares of the Company’s common stock.
The Company maintains a 401(k) plan covering employees who have completed 1,000 hours of service during a 12-month period and are age 21 or older. Voluntary employee contributions are partially matched by the Company. The Company made contributions to the plan for the year ended December 31, 2011 of $69,000. On September 30, 2009, the Company elected to suspend the Company match to the employee 401(k) plan and did not make a contribution in 2010.
The Company has a nonqualified executive deferred compensation plan for key executives and directors. Under this plan, participants voluntarily elect to defer a portion of their salary, bonus or fees and the Company is required to credit these deferrals with interest. The Company’s deferred compensation obligation of $1,653,000 and$1,771,000 as of December 31, 2011 and 2010, respectively, is included in accrued interest payable and other liabilities. The interest cost for this plan was $141,000, $150,000 and $190,000 for the years ended December 31, 2011, 2010 and 2009, respectively.
The Company has a supplemental retirement plan for key executives, certain retired key executives and directors. These plans are nonqualified defined benefit plans and are unsecured and unfunded. The Company has purchased insurance on the lives of the participants and holds policies with cash surrender values of $34,972,000 and $33,871,000 at December 31, 2011 and 2010, respectively. The related accrued pension obligation of $7,397,000 and $5,910,000 as of December 31, 2011 and 2010, respectively, is included in accrued interest payable and other liabilities.
The following tables set forth the status of the nonqualified supplemental retirement defined benefit pension plans at or for the year ended December 31 (in thousands):
| | | Pension Benefits | |
| | | 2011 | | | 2010 | |
| Change in projected benefit obligation (PBO) | | | | | | | | |
| Benefit obligation at the beginning of the year | | $ | 5,910 | | | $ | 5,795 | |
| Service cost | | | 549 | | | | — | |
| Interest cost | | | 333 | | | | 340 | |
| Benefit payments | | | (250 | ) | | | (243 | ) |
| Actuarial loss | | | 306 | | | | 18 | |
| Plan amendments | | | 549 | | | | — | |
| Projected benefit obligation at end of year | | $ | 7,397 | | | $ | 5,910 | |
| Accumulated benefit obligation at end of year | | $ | 5,621 | | | $ | 4,553 | |
| Change in plan assets: | | | | | | | | |
| Employer contributions | | $ | 250 | | | $ | 243 | |
| Benefit payments | | | (250 | ) | | | (243 | ) |
| Fair value of plan assets at end of year | | $ | — | | | $ | — | |
| | | | | | | | | |
| Funded status | | $ | (7,397 | ) | | $ | (5,910 | ) |
| | | | | | | | | |
| Amounts recognized in statements of financial position | | | | | | | | |
| Current liability | | | (250 | ) | | | (250 | ) |
| Noncurrent liability | | | (7,147 | ) | | | (5,660 | ) |
| Net amount recognized | | $ | (7,397 | ) | | $ | (5,910 | ) |
| | | | | | | | | |
| Amounts recognized in accumulated other comprehensive income | | | | | | | | |
| Prior service cost (credit) | | | 502 | | | | 51 | |
| Net (gain) loss | | | 1,022 | | | | 725 | |
| Net amount recognized | | $ | 1,524 | | | $ | 776 | |
| | | | | | | | | |
| Total amount recognized | | | (5,874 | ) | | | (5,134 | ) |
| | | | | | | | | |
| Assumptions used to determine benefit obligations as of the end of fiscal year |
| Measurement Date | | | 12/31/2011 | | | | 12/31/2010 | |
| Discount rate | | | 4.60 | % | | | 5.25 | % |
| Expected return on assets | | | N/A | | | | N/A | |
| Rate of compensation increase | | | 8.00 | % | | | 8.00 | % |
| Components of net periodic benefits cost | | 2011 | | | 2010 | | | 2009 | |
| Service cost | | $ | 549 | | | $ | — | | | $ | 405 | |
| Interest cost | | | 333 | | | | 340 | | | | 335 | |
| Amortization of prior service cost | | | 98 | | | | 31 | | | | 31 | |
| Amortization of actuarial loss | | | 10 | | | | 16 | | | | 19 | |
| Net periodic benefit cost | | $ | 990 | | | $ | 387 | | | $ | 790 | |
| | | | | | | | | | | | | |
| Other comprehensive loss | | $ | 748 | | | $ | (28 | ) | | $ | (31 | ) |
| | | | | | | | | | | | | |
| Amounts included in accumulated other comprehensive income expected to be recognized during the next fiscal year |
| Prior service cost | | $ | 98 | | | $ | 31 | | | $ | 31 | |
| Actuarial loss | | $ | 39 | | | $ | 16 | | | $ | 14 | |
| | | | | | | | | | | | | |
| Assumptions used in computing net periodic benefit cost |
| Measurement Date | | | 12/31/2011 | | | | 12/31/2010 | | | | 12/31/2009 | |
| Discount rate | | | 5.25 | % | | | 6.00 | % | | | 6.00 | % |
| Expected return on assets | | | N/A | | | | N/A | | | | N/A | |
| Rate of compensation increase | | | 8.00 | % | | | 8.00 | % | | | 8.00 | % |
Effective October 1, 2009, the Company entered into an agreement to “freeze” the vested benefits under the North Valley Bancorp Salary Continuation Plan (amended and restated effective January 1, 2007) with each active officer currently participating in the Plan. Each agreement provided that vested accrued benefits under the Plan would remain fixed at the amount determined as of September 30, 2009 until such time as the Board of Directors might elect to recommence accruals. On July 28, 2011, the Board of Directors determined that Plan accruals should recommence, with retroactive effect to September 30, 2009. As a result, the Company has entered into agreements with the officers whose Plan benefits have been “frozen” since 2009. Estimated costs expected to be accrued in 2012 are $1,074,000. The following table presents the benefits expected to be paid under the plan in the periods indicated (in thousands):
| Year | | Pension Benefits | |
| 2012 | | $ | 250 | |
| 2013 | | | 284 | |
| 2014 | | | 300 | |
| 2015 | | | 346 | |
| 2016 | | | 1,997 | |
| 2017 - 2021 | | | 5,931 | |
13. STOCK-BASED COMPENSATION
During 2011 each director was awarded 180 shares of common stock for their share retainer grant. Total common stock grants were 1,260 during 2011. During 2010 and 2009, the Board of Directors elected to forego their 180 share retainer grant. Compensation cost related to these awards was recognized based on the fair value of the shares at the date of the award which equaled $10.40 per share or a total expense of $13,000 for the year ended December 31, 2011.
Under the Company’s stock option plans as of December 31, 2011, 161,095 shares of the Company’s common stock are available for future grants to directors and employees of the Company. Under the Director Plan, options may not be granted at a price less than 85% of fair market value at the date of the grant. Under the Employee Plan, options may not be granted at a price less than the fair market value at the date of the grant. Under both plans, options may be exercised over a ten year term. The vesting period is generally four years; however the vesting period can be modified at the discretion of the Company’s Board of Directors, and for all options granted in the fourth quarter in 2008 the vesting period is five years. A summary of outstanding stock options follows:
| | | | | | | | | Weighted | | | | |
| | | | | | Weighted | | | Average | | | | |
| | | | | | Average | | | Remaining | | | Aggregate | |
| | | | | | Exercise | | | Contractual | | | Intrinsic | |
| | | Options | | | Price | | | Term | | | Value ($000) | |
| Outstanding January 1, 2009 | | | 197,461 | | | $ | 48.69 | | | | | | | | | |
| Granted | | | 3,900 | | | | 17.75 | | | | | | | | | |
| Exercised | | | — | | | | — | | | | | | | | | |
| Expired or canceled | | | (47,586 | ) | | | 39.30 | | | | | | | | | |
| Outstanding December 31, 2009 | | | 153,775 | | | | 50.81 | | | | | | | | | |
| Granted | | | — | | | | — | | | | | | | | | |
| Exercised | | | — | | | | — | | | | | | | | | |
| Expired or canceled | | | (1,680 | ) | | | 31.59 | | | | | | | | | |
| Outstanding December 31, 2010 | | | 152,095 | | | | 51.02 | | | | | | | | | |
| Granted | | | 66,000 | | | | 10.38 | | | | | | | | | |
| Exercised | | | — | | | | — | | | | | | | | | |
| Expired or canceled | | | (34,025 | ) | | | 39.66 | | | | | | | | | |
| Outstanding December 31, 2011 | | | 184,070 | | | $ | 38.55 | | | | 7 years | | | $ | 1 | |
| Fully vested and exercisable at December 31, 2011 | | | 94,069 | | | $ | 60.04 | | | | 5 years | | | $ | — | |
| Options expected to vest | | | 90,001 | | | $ | 16.09 | | | | 9 years | | | $ | 1 | |
Information about stock options outstanding at December 31, 2011 is summarized as follows:
| | | | | | | | | Average | | | | | Average |
| | | | | | Average | | | Exercise | | | | | Exercise |
| | | | | | Remaining | | | Price of | | | | | Price of |
| | Range of | | Options | | Contractual | | | Options | | Options | | | Options |
| | Exercise Prices | | Outstanding | | Life (Years) | | | Outstanding | | Exercisable | | | Exercisable |
| | | | | | | | | | | | | | |
| $ | 47.00-51.20 | | 9,676 | | 1 | | $ | 49.83 | | 9,676 | | $ | 49.83 |
| $ | 65.30 | | 6,704 | | 2 | | $ | 65.30 | | 6,704 | | $ | 65.30 |
| $ | 78.60-80.90 | | 5,012 | | 3 | | $ | 78.97 | | 5,012 | | $ | 78.97 |
| $ | 85.00-99.30 | | 7,504 | | 4 | | $ | 94.75 | | 7,504 | | $ | 94.75 |
| $ | 81.00-89.75 | | 8,014 | | 5 | | $ | 86.74 | | 8,014 | | $ | 86.74 |
| $ | 100.15-103.10 | | 9,871 | | 6 | | $ | 100.46 | | 9,871 | | $ | 100.46 |
| $ | 23.95-65.05 | | 68,589 | | 7 | | $ | 38.61 | | 46,208 | | $ | 41.44 |
| $ | 17.85-18.20 | | 2,700 | | 8 | | $ | 17.98 | | 1,080 | | $ | 17.98 |
| $ | 8.99-10.40 | | 66,000 | | 10 | | $ | 10.38 | | — | | $ | — |
The aggregate intrinsic value is calculated as the difference between the exercise price of the underlying awards and the quoted price of the Company’s common stock for options that were in-the-money at December 31, 2011. There were no options exercised during the years ended December 31, 2011, 2010 and 2009. The total fair value of the options that vested during the years ended December 31, 2011, 2010 and 2009 totaled $144,000, $181,000 and $227,000, respectively.
The compensation cost that has been charged against income for stock based compensation was $157,000, $180,000 and $228,000 for the years ended December 31, 2011, 2010 and 2009, respectively.
At December 31, 2011, the total unrecognized compensation cost related to stock-based awards granted to employees under the Company’s stock option plans was $427,000. This cost will be amortized on a straight-line basis over a weighted average period of approximately 4.1 years and will be adjusted for subsequent changes in estimated forfeitures.
14. EARNINGS (LOSS) PER SHARE
Basic earnings (loss) per share is computed by dividing net income (loss) available to common shareholders by the weighted average common shares outstanding for the period. Diluted earnings (loss) per share reflect the potential dilution that could occur if options or other contracts to issue common stock were exercised and converted into common stock.
There was no difference in the numerator used in the calculation of basic earnings (loss) per share and diluted earnings (loss) per share, and there was no difference in the denominator used in the calculation of basic earnings (loss) per share and diluted earnings (loss) per share in 2011, 2010 and 2009 (in thousands except share data):
| | | 2011 | | | 2010 | | | 2009 | |
| Calculation of Basic and Diluted Earnings (Loss) Per Share: | | | | | | | | | | | | |
| Numerator - net income (loss) available to common shareholders | | $ | 3,047 | | | $ | (24,915 | ) | | $ | (25,852 | ) |
| Denominator: | | | | | | | | | | | | |
| Weighted average common shares outstanding | | | 6,833 | | | | 3,881 | | | | 1,499 | |
| Dilutive effect of outstanding options | | | — | | | | — | | | | — | |
| Weighted average common shares outstanding and common share equivalents | | | 6,833 | | | | 3,881 | | | | 1,499 | |
| Basic and diluted earnings (loss) per share | | $ | 0.45 | | | $ | (6.42 | ) | | $ | (17.25 | ) |
Stock options for 183,070, 152,095 and 153,775 shares of common stock were not considered in computing diluted earnings per common share for 2011, 2010 and 2009, respectively, because they were antidilutive.
15. COMPREHENSIVE INCOME (LOSS)
Comprehensive income (loss) includes net income (loss) and other comprehensive income (loss). The Company’s sources of other comprehensive income (loss) is derived from unrealized gains and income (losses) on investment securities available-for-sale and adjustments to the minimum pension liability. Comprehensive income (loss) is reported on the consolidated statement of changes in stockholders’ equity.
At December 31, the Company’s other comprehensive income (loss) was as follows (in thousands):
| 2011 | | Before Tax | | | Tax Benefit | | | After Tax | |
| Other comprehensive income (loss): | | | | | | | | | | | | |
| Unrealized holding gains | | $ | 6,293 | | | $ | (2,579 | ) | | $ | 3,714 | |
| Less: reclassification adjustment for realized gains included in net income | | | 1,677 | | | | (687 | ) | | $ | 990 | |
| Other comprehensive income on investment securities | | $ | 4,616 | | | $ | (1,892 | ) | | $ | 2,724 | |
| Adjustment to pension plan | | $ | (748 | ) | | $ | 307 | | | $ | (441 | ) |
| 2010 | | Before Tax | | | Tax Benefit | | | After Tax | |
| Other comprehensive loss: | | | | | | | | | | | | |
| Unrealized holding gains | | $ | 386 | | | $ | (159 | ) | | $ | 227 | |
| Adjustment on pension plan | | $ | 28 | | | $ | (11 | ) | | $ | 17 | |
| 2009 | | Before Tax | | | Tax Benefit | | | After Tax | |
| Other comprehensive loss: | | | | | | | | | | | | |
| Unrealized holding gains | | $ | 1,756 | | | $ | (720 | ) | | $ | 1,036 | |
| Less: reclassification adjustment for realized gains included in net loss | | | 655 | | | | (269 | ) | | $ | 386 | |
| Other comprehensive income on investment securities | | $ | 1,101 | | | $ | (451 | ) | | $ | 650 | |
| Adjustment to pension plan | | $ | 28 | | | $ | (10 | ) | | $ | 18 | |
16. COMMITMENTS AND CONTINGENCIES
The Company is involved in legal actions arising from normal business activities. Management, based upon the advice of legal counsel, believes that the ultimate resolution of all pending legal actions will not have a material effect on the Company’s financial position or results of its operations or its cash flows.
The Company has operating leases for certain premises and equipment. These leases expire on various dates through 2023 and have various renewal options ranging from 2 to 15 years. Rent expense for such leases for the years ended December 31, 2011, 2010 and 2009 was $1,252,000, $1,319,000 and $1,512,000, respectively.
The following schedule represents the Company’s noncancelable future minimum scheduled lease payments at December 31, 2011 (in thousands):
| 2012 | | $ | 1,097 | |
| 2013 | | | 1,030 | |
| 2014 | | | 892 | |
| 2015 | | | 612 | |
| 2016 | | | 283 | |
| Thereafter | | | 704 | |
| Total | | $ | 4,618 | |
The Company was contingently liable under letters of credit issued on behalf of its customers in the amount of $4,946,000 and $8,741,000 at December 31, 2011 and 2010, respectively. At December 31, 2011, commercial and consumer lines of credit and real estate loans of approximately $45,033,000 and $41,077,000, respectively, were undisbursed. At December 31, 2010, commercial and consumer lines of credit and real estate loans of approximately $47,650,000 and $44,169,000, respectively, were undisbursed.
Loan commitments are typically contingent upon the borrower meeting certain financial and other covenants and such commitments typically have fixed expiration dates and require payment of a fee. As many of these commitments are expected to expire without being drawn upon, the total commitments do not necessarily represent future cash requirements. The Company evaluates each potential borrower and the necessary collateral on an individual basis. Collateral varies, but may include real property, bank deposits, debt securities, equity securities or business or personal assets.
Standby letters of credit are conditional commitments written by the Company to guarantee the performance of a customer to a third party. These guarantees are issued primarily relating to inventory purchases by the Company’s commercial customers and such guarantees are typically short term. Credit risk is similar to that involved in extending loan commitments to customers and the Company, accordingly, uses evaluation and collateral requirements similar to those for loan commitments. Virtually all of such commitments are collateralized. The fair value of the liability related to these standby letters of credit, which represents the fees received for issuing the guarantees, was not significant at December 31, 2011 and 2010. The Company recognizes these fees as revenues over the term of the commitment or when the commitment is used.
Loan commitments and standby letters of credit involve, to varying degrees, elements of credit and market risk in excess of the amounts recognized in the balance sheet and do not necessarily represent the actual amount subject to credit loss. However, at December 31, 2011 and 2010, no losses are anticipated as a result of these commitments.
In management’s opinion, a concentration exists in real estate-related loans which represent approximately 77% of the Company’s loan portfolio for years ended December 31, 2011 and 2010. Although management believes such concentrations to have no more than the normal risk of collectibility, a continued substantial decline in the economy in general, or a continued decline in real estate values in the Company’s primary market areas in particular, could have an adverse impact on collectibility of these loans. However, personal and business income represents the primary source of repayment for a majority of these loans.
17. RELATED PARTY TRANSACTIONS
At December 31, 2011 and 2010 the Company provided loans or had commitments to lend to, certain officers, directors and their associates and principal shareholders.
A summary of activity for the years ended December 31 were as follows (in thousands; renewals are not reflected as either new loans or repayments):
| | | 2011 | | | 2010 | |
| Beginning balance | | $ | 5,647 | | | $ | 5,424 | |
| Borrowings | | | 189 | | | | 943 | |
| Repayments | | | (1,155 | ) | | | (720 | ) |
| | | $ | 4,681 | | | $ | 5,647 | |
| | | | | | | | | |
| Undisbursed commitments | | $ | 316 | | | $ | 1,081 | |
18. REGULATORY MATTERS
The Company and NVB are subject to various regulatory capital requirements administered by federal banking agencies. Failure to meet minimum capital requirements can initiate certain mandatory and, possibly, additional discretionary actions by regulators that, if undertaken, could have a direct material effect on the Company’s consolidated financial statements. Under capital adequacy guidelines, the Company and NVB must meet specific capital guidelines that involve quantitative measures of their assets, liabilities and certain off-balance sheet items as calculated under regulatory accounting practices. These quantitative measures are established by regulation and require that minimum amounts and ratios of total and Tier 1 capital (as defined in the regulations) to risk-weighted assets (as defined) and of Tier 1 capital (as defined) to average assets (as defined) are maintained. Capital amounts and classifications are also subject to qualitative judgments by the regulators about components, risk weightings and other factors.
NVB is also subject to additional capital guidelines under the regulatory framework for prompt corrective action. To be categorized as well capitalized, NVB must maintain minimum total risk-based, Tier 1 risk-based and Tier 1 leverage ratios as set forth in the table below. The most recent notifications from the FDIC for NVB as of December 31, 2011 categorized NVB as well-capitalized under these guidelines. There are no conditions or events since that notification that management believes have changed NVB’s category.
Management believes, as of December 31, 2011 and 2010, that the Company and NVB met all capital adequacy requirements to which they are subject. There are no conditions or events since that management believes have changed the categories.
The Company’s and NVB’s actual capital amounts (in thousands) and ratios are also presented in the following tables.
| | | | | | | | | | | | | | | To be Well Capitalized | |
| | | | | | | | | For Capital | | | Under Prompt Corrective | |
| | | | | | | | | Adequacy Purposes | | | Action Provisions | |
| | | Actual | | | Minimum | | | Minimum | | | Minimum | | | Minimum | |
| | | Amount | | | Ratio | | | Amount | | | Ratio | | | Amount | | | Ratio | |
| Company | | | | | | | | | | | | | | | | | | | | | | | | |
| As of December 31, 2011: | | | | | | | | | | | | | | | | | | | | | | | | |
| Total capital (to risk weighted assets) | | $ | 116,464 | | | | 19.53 | % | | $ | 47,707 | | | | 8.00 | % | | | N/A | | | | N/A | |
| Tier 1 capital (to risk weighted assets) | | $ | 107,240 | | | | 17.99 | % | | $ | 23,844 | | | | 4.00 | % | | | N/A | | | | N/A | |
| Tier 1 capital (to average assets) | | $ | 107,240 | | | | 11.82 | % | | $ | 36,291 | | | | 4.00 | % | | | N/A | | | | N/A | |
| | | | | | | | | | | | | | | | | | | | | | | | | |
| As of December 31, 2010: | | | | | | | | | | | | | | | | | | | | | | | | |
| Total capital (to risk weighted assets) | | $ | 113,279 | | | | 17.63 | % | | $ | 51,403 | | | | 8.00 | % | | | N/A | | | | N/A | |
| Tier 1 capital (to risk weighted assets) | | $ | 102,422 | | | | 15.94 | % | | $ | 25,702 | | | | 4.00 | % | | | N/A | | | | N/A | |
| Tier 1 capital (to average assets) | | $ | 102,422 | | | | 11.48 | % | | $ | 35,687 | | | | 4.00 | % | | | N/A | | | | N/A | |
| | | | | | | | | | | | | | | | | | | | | | | | | |
| North Valley Bank | | | | | | | | | | | | | | | | | | | | | | | | |
| As of December 31, 2011: | | | | | | | | | | | | | | | | | | | | | | | | |
| Total capital (to risk weighted assets) | | $ | 121,221 | | | | 20.33 | % | | $ | 47,701 | | | | 8.00 | % | | $ | 59,627 | | | | 10.00 | % |
| Tier 1 capital (to risk weighted assets) | | $ | 113,666 | | | | 19.06 | % | | $ | 23,854 | | | | 4.00 | % | | $ | 35,782 | | | | 6.00 | % |
| Tier 1 capital (to average assets) | | $ | 113,666 | | | | 12.54 | % | | $ | 36,257 | | | | 4.00 | % | | $ | 45,321 | | | | 5.00 | % |
| | | | | | | | | | | | | | | | | | | | | | | | | |
| As of December 31, 2010: | | | | | | | | | | | | | | | | | | | | | | | | |
| Total capital (to risk weighted assets) | | $ | 116,217 | | | | 18.08 | % | | $ | 51,423 | | | | 8.00 | % | | $ | 64,279 | | | | 10.00 | % |
| Tier 1 capital (to risk weighted assets) | | $ | 108,092 | | | | 16.82 | % | | $ | 25,706 | | | | 4.00 | % | | $ | 38,558 | | | | 6.00 | % |
| Tier 1 capital (to average assets) | | $ | 108,092 | | | | 12.11 | % | | $ | 35,703 | | | | 4.00 | % | | $ | 44,629 | | | | 5.00 | % |
A written agreement (the final written agreement, as executed by the parties, is herein called the “Written Agreement”) was signed on January 6, 2010 among the Company, NVB and the Federal Reserve Bank of San Francisco (the “Reserve Bank”). Among other things, the Written Agreement provides that the Company and NVB shall submit to the Reserve Bank their continuing plans to enhance lending and credit administration functions, to maintain policies and procedures for the maintenance of an adequate allowance for loan losses, to strengthen the management of commercial real estate concentrations and to update its capital plan in order to maintain capital ratios at or above the required minimums. The Written Agreement also restricts the payment of dividends, any payments on trust preferred securities, certain indemnification and severance payments, and any reduction in capital or the purchase or redemption of stock without the prior approval of the Reserve Bank. Progress reports detailing the form and manner of all actions taken to secure compliance with the Written Agreement must be submitted to the Reserve Bank at least quarterly. This description of the Written Agreement is a summary and does not purport to be a complete description of all of the terms of such agreement and is qualified in its entirety by reference to the copy of the Written Agreement filed with the Securities and Exchange Commission on January 8, 2010 as an exhibit to the Company’s Current Report on Form 8-K. NVB, based on the California Financial Code, is restricted in the total dividend payment allowed in any calender year to the lesser of (1) the bank’s retained earnings or (2) the bank’s net income for its last three fiscal years, less distributions made to shareholders during the same three-year period.
The Directors and senior management of the Company and NVB agree with the goal of financial soundness represented by the Written Agreement and have taken appropriate action to comply with all requirements (including timelines) specified in the Written Agreement, as follows:
Capital Plan.Within 60 days of signing the Written Agreement, the Company was required to submit to the Reserve Bank a plan to maintain sufficient capital, on a consolidated basis, and the Company and NVB were required to jointly submit to the Reserve Bank a plan to maintain sufficient capital at NVB, as a separate entity. These plans were submitted to the Reserve Bank within the 60-day period, addressing among other things, the Company’s current and future capital needs, including compliance with capital adequacy guidelines for bank holding companies; NVB’s current and future capital needs, including compliance with the capital adequacy guidelines for state member banks; the adequacy of NVB’s capital, taking into account the volume of classified credits, concentrations of credit, the allowance for loan losses, current and projected asset growth and projected retained earnings; the source and timing of additional funds to fulfill the Company’s and NVB’s future capital requirements; and the requirements of Regulation Y, that the Company serve as a source of strength to NVB. The Reserve Bank accepted these plans and the Company completed a capital raise of $40,000,000, (net $37,500,000 after costs) on April 22, 2010 and contributed $33,500,000 of the net proceeds to the capital of NVB.
Strategic Plan and Budget.Within 60 days of signing the Written Agreement, NVB was also required to submit a business plan for 2010 to improve NVB’s earnings and overall condition. That plan was submitted to the Reserve Bank within the 60-day period and is being implemented as agreed. NVB is also required to submit a business plan and budget for each calendar year subsequent to 2010 at least 30 days prior to the beginning of that calendar year.
Concentrations of Credit.Within 45 days of signing the Written Agreement, NVB was required to submit a plan to strengthen NVB’s management of commercial real estate concentrations, including steps to reduce or mitigate the risk of concentrations. That plan was submitted to the Reserve Bank within the 45-day period and was accepted by the Reserve Bank and is being implemented by NVB as agreed.
Lending and Credit Administration.Within 60 days of signing the Written Agreement, NVB was required to submit a program to enhance lending and credit administration that addresses, considers and includes, at a minimum, work-out strategies for problem loans and loans on the NVB watch list; standards for interest-only loans; and standards for the timely movement of loans to non-accrual status. Such a program was submitted to the Reserve Bank within the 60-day period and was accepted by the Reserve Bank and is being implemented by NVB as agreed.
Asset Improvement.Within 60 days of signing the Written Agreement, NVB was required to submit a plan designed to improve NVB’s position through repayment, amortization, liquidation, additional collateral or other means on loans in excess of $1,000,000 which may be past due or on NVB’s problem loan list or otherwise adversely classified. Also, for any such loan NVB is required to submit a plan to improve NVB’s position on such loan and must submit a progress report updating each improvement plan within 30 days after the end of each calendar quarter. Such a plan was submitted to and accepted by the Reserve Bank and implemented within the 60-day period and NVB has timely submitted all related plans and progress reports to date.
Allowance for Loan losses.Within 60 days of signing the Written Agreement, NVB was required to submit an acceptable program for the maintenance of an adequate Allowance for Loan losses, to be reviewed by NVB’s Board of Directors on at least a quarterly calendar basis with reports regarding such review submitted to the Reserve Bank within 30 days after the end of each calendar quarter. Such a program was submitted to the Reserve Bank within the 60-day period and has been accepted by the Reserve Bank. Quarterly reports have also been timely filed with the Reserve Bank.
Debt and Stock Redemption. The Company may not, directly or indirectly, incur, increase or guarantee any debt, and may not, directly or indirectly, purchase or redeem any shares of its stock, without the prior written approval of the Reserve Bank.
Progress Reports.Within 30 days after the end of each calendar quarter following the date of the Written Agreement, the Company and NVB are required to submit to the Reserve Bank written progress reports detailing the actions taken to secure compliance with the Written Agreement and the results of such actions. All plans, reports and other information required by the Written Agreement are being submitted to the Reserve Bank within the requisite timeframes stipulated in the Written Agreement. The same or similar plans, reports and information are being submitted to the California Commissioner of Financial Institutions.
Communications from the Reserve Bank have continued to confirm that the Company and NVB are currently in compliance with all provisions of the Written Agreement.
The Company’s ability to pay cash dividends is dependent on dividends paid to it by NVB and limited by California law. Under California law, the holders of common stock of the Company are entitled to receive dividends when and as declared by the Board of Directors, out of funds legally available, subject to certain restrictions. California General Corporation Law prohibits the Company from paying dividends on its common stock unless: (i) its retained earnings, immediately prior to the dividend payment, equals or exceeds the amount of the dividend or (ii) immediately after giving effect to the dividend, the sum of the Company’s assets (exclusive of goodwill and deferred charges) would be at least equal to 125% of its liabilities (not including deferred taxes, deferred income and other deferred liabilities) and the current assets of the Company would be at least equal to its current liabilities, or, if the average of its earnings before taxes on income and before interest expense for the two preceding fiscal years was less than the average of its interest expense for the two preceding fiscal years, at least equal to 125% of its current liabilities. On January 29, 2009 the Company’s Board of Directors determined that it was in the best interest of the Company to suspend indefinitely the payment of quarterly cash dividends on its common stock beginning in 2009. NVB, based on the California Financial Code, is restricted in the total dividend payment allowed in any calender year to the lesser of (1) the bank’s retained earnings or (2) the bank’s net income for its last three fiscal years, less distributions made to shareholders during the same three-year period.
The Company’s ability to pay dividends is also limited by certain covenants contained in the indentures relating to trust preferred securities that have been issued by four business trusts and corresponding junior subordinated debentures. The Company owns the common stock of the four business trusts. The indentures provide that if an Event of Default (as defined in the indentures) has occurred and is continuing, or if the Company is in default with respect to any obligations under our guarantee agreement which covers payments of the obligations on the trust preferred securities, or if the Company gives notice of any intention to defer payments of interest on the debentures underlying the trust preferred securities, then the Company may not, among other restrictions, declare or pay any dividends
19. FAIR VALUE MEASUREMENTS
The Company groups its assets and liabilities measured at fair value in three levels, based on the markets in which the assets and liabilities are traded and the reliability of the assumptions used to determine fair value. These levels are:
•Quoted prices in active markets for identical assets (Level 1): Inputs that are quoted unadjusted prices in active markets for identical assets that the Company has the ability to access at the measurement date. An active market for the asset is a market in which transactions for the asset or liability occur with sufficient frequency and volume to provide pricing information on an ongoing basis.
•Significant other observable inputs (Level 2): Inputs that reflect the assumptions market participants would use in pricing the asset or liability developed based on market data obtained from sources independent of the reporting entity including quoted prices for similar assets or liabilities, quoted prices for securities in inactive markets and inputs derived principally from, or corroborated by, observable market data by correlation or other means.
•Significant unobservable inputs (Level 3): Inputs that reflect the reporting entity’s own assumptions about the assumptions market participants would use in pricing the asset or liability developed based on the best information available in the circumstances.
Management monitors the availability of observable market data to assess the appropriate classification of financial instruments within the fair value hierarchy. Changes in economic conditions or model-based valuation techniques may require the transfer of financial instruments from one fair value level to another. In such instances, the transfer is reported at the beginning of the reporting period.
Management evaluates the significance of transfers between levels based upon the nature of the financial instrument and size of the transfer relative to total assets, total liabilities or total earnings.
The following tables present information about the Company’s assets and liabilities measured at fair value on a recurring and nonrecurring basis (in thousands):
Recurring Basis
| | | At December 31, 2011 | |
| | | Fair Value | | | Level 1 | | | Level 2 | | | Level 3 | |
| Available-for-sale securities: | | | | | | | | | | | | | | | | |
| Obligations of U.S. government sponsored agencies | | $ | 15,234 | | | $ | — | | | $ | 15,234 | | | $ | — | |
| Obligations of state and political subdivisions | | | 14,455 | | | | — | | | | 14,455 | | | | — | |
| Government sponsored agency mortgage-backed securities | | | 275,204 | | | | — | | | | 275,204 | | | | — | |
| Corporate debt securities | | | 4,232 | | | | — | | | | 4,232 | | | | — | |
| Equity securities | | | 3,080 | | | | — | | | | 3,080 | | | | — | |
| | | $ | 312,205 | | | $ | — | | | $ | 312,205 | | | $ | — | |
| | | At December 31, 2010 | |
| | | Fair Value | | | Level 1 | | | Level 2 | | | Level 3 | |
| Available-for-sale securities: | | | | | | | | | | | | | | | | |
| Obligations of U.S. government sponsored agencies | | $ | 21,221 | | | $ | — | | | $ | 21,221 | | | $ | — | |
| Obligations of state and political subdivisions | | | 14,551 | | | | — | | | | 14,551 | | | | — | |
| Government sponsored agency mortgage-backed securities | | | 222,569 | | | | — | | | | 222,569 | | | | — | |
| Corporate debt securities | | | 4,303 | | | | — | | | | 4,303 | | | | — | |
| Equity securities | | | 3,000 | | | | — | | | | 3,000 | | | | — | |
| | | $ | 265,644 | | | $ | — | | | $ | 265,644 | | | $ | — | |
Fair values for Level 2 available-for-sale investment securities are based on quoted market prices for similar securities. During the year ended December 31, 2011, there were no transfers between Levels 1 and 2.
Nonrecurring Basis
| | | At December 31, 2011 | |
| | | Fair Value | | | Level 1 | | | Level 2 | | | Level 3 | |
| Impaired loans: | | | | | | | | | | | | | | | | |
| Commercial | | $ | 1,338 | | | $ | — | | | $ | — | | | $ | 1,338 | |
| Real estate - commercial | | | 4,811 | | | | — | | | | — | | | | 4,811 | |
| Real estate - construction | | | 5,223 | | | | — | | | | — | | | | 5,223 | |
| Real estate - mortgage | | | 268 | | | | — | | | | — | | | | 268 | |
| Installment | | | 37 | | | | — | | | | — | | | | 37 | |
| Other real estate owned: | | | | | | | | | | | | | | | | |
| Real estate - commercial | | | 1,270 | | | | — | | | | — | | | | 1,270 | |
| Real estate - construction | | | 14,575 | | | | — | | | | — | | | | 14,575 | |
| Real estate - mortgage | | | 1,276 | | | | — | | | | — | | | | 1,276 | |
| Total assets measured at fair value on a nonrecurring basis | | $ | 28,798 | | | $ | — | | | $ | — | | | $ | 28,798 | |
| | | At December 31, 2010 | |
| | | Fair Value | | | Level 1 | | | Level 2 | | | Level 3 | |
| | | | | | | | | | | | | |
| Impaired loans: | | | | | | | | | | | | | | | | |
| Commercial | | $ | 1,097 | | | $ | — | | | $ | — | | | $ | 1,097 | |
| Real estate - commercial | | | 3,527 | | | | — | | | | — | | | | 3,527 | |
| Real estate - construction | | | 4,114 | | | | — | | | | — | | | | 4,114 | |
| Real estate - mortgage | | | 1,507 | | | | — | | | | — | | | | 1,507 | |
| Installment | | | 16 | | | | — | | | | — | | | | 16 | |
| Other real estate owned: | | | | | | | | | | | | | | | | |
| Real estate - commercial | | | 4,711 | | | | — | | | | — | | | | 4,711 | |
| Real estate - construction | | | 19,371 | | | | — | | | | — | | | | 19,371 | |
| Real estate - mortgage | | | 1,702 | | | | — | | | | — | | | | 1,702 | |
| Total assets measured at fair value on a nonrecurring basis | | $ | 36,045 | | | $ | — | | | $ | — | | | $ | 36,045 | |
Impaired loans - The fair value of impaired loans with specific allocations of the allowance for loan losses is generally based on recent real estate appraisals. These appraisals may utilize a single valuation approach or a combination of approaches including comparable sales and the income approach. Adjustments are routinely made in the appraisal process by the independent appraisers to adjust for differences between the comparable sales and income data available. Such adjustments are usually significant and typically result in a Level 3 classification of the inputs for determining fair value.
Other Real Estate Owned – Nonrecurring adjustments to certain commercial and residential real estate properties classified as other real estate owned (OREO) are measured at fair value, less costs to sell. Fair values are based on recent real estate appraisals. These appraisals may use a single valuation approach or a combination of approaches including comparable sales and the income approach. Adjustments are routinely made in the appraisal process by the independent appraisers to adjust for differences between the comparable sales and income data available. Such adjustments are usually significant and typically result in a Level 3 classification of the inputs for determining fair value.
Disclosures about Fair Value of Financial Instruments
The fair values presented represent the Company’s best estimate of fair value using the methodologies discussed below. The fair values of financial instruments which have a relatively short period of time between their origination and their expected realization were valued using historical cost. The values assigned do not necessarily represent amounts which ultimately may be realized. In addition, these values do not give effect to discounts to fair value which may occur when financial instruments are sold in larger quantities.
The following assumptions were used as of December 31, 2011 and December 31, 2010 to estimate the fair value of each class of financial instruments for which it is practicable to estimate that value.
| | a) | Cash and Due From Banks - The carrying amount represents a reasonable estimate of fair value. |
| | | |
| | b) | Federal Funds Sold - The carrying amount represents a reasonable estimate of fair value. |
| | | |
| | c) | Time deposits at other financial institutions - The carrying amount represents a reasonable estimate of fair value due to the short-term nature of such deposits. |
| | | |
| | d) | FHLB, FRB Stock and Other Securities - It was not practicable to determine the fair value of FHLB or FRB stock due to restrictions placed on its transferability. |
| | | |
| | e) | Investment Securities – The fair value of investment securities are based on quoted market prices, if available. If a quoted market price is not available, fair value is estimated using quoted market prices for similar securities. Available-for-sale securities are carried at fair value. |
| | | |
| | f) | Loans - Commercial loans, residential mortgages and construction loans are segmented by fixed and adjustable rate interest terms, by maturity, and by performing and nonperforming categories. |
| | | |
| | | The fair value of performing loans is estimated by discounting contractual cash flows using the current interest rates at which similar loans would be made to borrowers with similar credit ratings and for the same remaining maturities. Assumptions regarding credit risk, cash flow, and discount rates are determined using available market information. |
| | | |
| | | The fair value of nonperforming loans is estimated by discounting estimated future cash flows using current interest rates with an additional risk adjustment reflecting the individual characteristics of the loans, or using the fair value of underlying collateral for collateral dependent loans as a practical expedient. |
| | | |
| | g) | Deposits – Noninterest-bearing and interest-bearing demand deposits and savings accounts are payable on demand and their carrying values are assumed to be at fair value. The fair value of the core deposit intangible has not been included as a component of the fair value estimate. The fair value of time deposits is based on the discounted value of contractual cash flows. The discount rate is based on rates currently offered for deposits of similar size and remaining maturities. |
| | | |
| | h) | Subordinated Debentures - The fair value of the subordinated debentures is estimated by discounting the contractual cash flows using the current interest rate at which similar securities with the same remaining expected life could be made. |
| | | |
| | i) | Commitments to Fund Loans/Standby Letters of Credit - The fair values of commitments are estimated using the fees currently charged to enter into similar agreements, taking into account the remaining terms of the agreements and the present creditworthiness of the counterparties. The differences between the carrying value of commitments to fund loans or stand by letters of credit and their fair value are not significant and therefore not included in the following table. |
| | | |
| | j) | Accrued Interest Receivable/Payable – The carrying amount of accrued interest receivable and accrued interest payable represents a reasonable estimate of fair value. |
The carrying amounts and estimated fair values of the Company’s financial instruments are as follows (in thousands):
| | | December 31, 2011 | | | December 31, 2010 | |
| | | Carrying | | | Fair | | | Carrying | | | Fair | |
| | | Amount | | | Value | | | Amount | | | Value | |
| FINANCIAL ASSETS | | | | | | | | | | | | | | | | |
| Cash and due from banks | | $ | 18,758 | | | $ | 18,758 | | | $ | 14,629 | | | $ | 14,629 | |
| Federal funds sold | | | 40,210 | | | | 40,210 | | | | 9,005 | | | | 9,005 | |
| Time deposits at other financial institutions | | | 1,959 | | | | 1,959 | | | | 459 | | | | 459 | |
| FHLB, FRB and other securities | | | 8,044 | | | | N/A | | | | 7,141 | | | | N/A | |
| Securities: | | | | | | | | | | | | | | | — | |
| Available-for-sale | | | 312,205 | | | | 312,205 | | | | 265,644 | | | | 265,644 | |
| Held-to-maturity | | | 6 | | | | 6 | | | | 6 | | | | 6 | |
| Loans | | | 443,559 | | | | 461,205 | | | | 498,473 | | | | 514,284 | |
| Accrued interest receivable | | | 2,557 | | | | 2,557 | | | | 2,713 | | | | 2,713 | |
| | | | | | | | | | | | | | | | | |
| FINANCIAL LIABILITIES | | | | | | | | | | | | | | | | |
| Deposits | | $ | 766,239 | | | $ | 767,487 | | | $ | 753,790 | | | $ | 755,514 | |
| Subordinated debentures | | | 31,961 | | | | 21,420 | | | | 31,961 | | | | 18,178 | |
| Accrued interest payable | | | 4,998 | | | | 4,998 | | | | 3,052 | | | | 3,052 | |
20. OTHER NONINTEREST EXPENSES
The major classifications of other noninterest expenses for the years ended December 31 were as follows (in thousands):
| | | 2011 | | | 2010 | | | 2009 | |
| Data processing | | $ | 2,507 | | | $ | 2,206 | | | $ | 2,165 | |
| Professional services | | | 1,090 | | | | 1,704 | | | | 1,212 | |
| ATM and on-line banking | | | 1,182 | | | | 1,120 | | | | 1,107 | |
| Loan expense | | | 337 | | | | 621 | | | | 870 | |
| Marketing expense | | | 607 | | | | 615 | | | | 573 | |
| Operations expense | | | 652 | | | | 601 | | | | 580 | |
| Messenger | | | 608 | | | | 570 | | | | 551 | |
| Postage | | | 537 | | | | 524 | | | | 591 | |
| Director expense | | | 420 | | | | 458 | | | | 457 | |
| Printing and supplies | | | 542 | | | | 422 | | | | 524 | |
| Amortization of intangibles | | | 146 | | | | 146 | | | | 146 | |
| Other | | | 2,423 | | | | 3,110 | | | | 2,175 | |
| | | $ | 11,051 | | | $ | 12,097 | | | $ | 10,951 | |
21. PARENT COMPANY ONLY - CONDENSED FINANCIAL INFORMATION
The condensed financial statements of the Company are presented below (in thousands):
| CONDENSED BALANCE SHEET | |
| | | As of December 31, | |
| | | 2011 | | | 2010 | |
| Assets | | | | | | | | |
| Cash and cash equivalents | | $ | 1,256 | | | $ | 3,092 | |
| Investments in banking subsidiaries | | | 121,299 | | | | 113,655 | |
| Investments in other subsidiaries | | | 2 | | | | 2 | |
| Investment in unconsolidated subsidiary grantor trusts | | | 961 | | | | 961 | |
| Other assets | | | 3,009 | | | | 3,028 | |
| Total assets | | $ | 126,527 | | | $ | 120,738 | |
| | | | | | | | | |
| Liabilities and stockholders’ equity | | | | | | | | |
| Subordinated debentures | | $ | 31,961 | | | $ | 31,961 | |
| Other liabilities | | | 5,101 | | | | 4,799 | |
| Stockholders’ equity | | | 89,465 | | | | 83,978 | |
| Total liabilities and stockholders’ equity | | $ | 126,527 | | | $ | 120,738 | |
| CONDENSED STATEMENT OF INCOME (LOSS) | | As of December 31, | |
| | | 2011 | | | 2010 | | | 2009 | |
| Income: | | | | | | | | | | | | |
| Dividends from subsidiaries | | $ | — | | | $ | — | | | $ | 3,000 | |
| | | | | | | | | | | | | |
| Expense: | | | | | | | | | | | | |
| Interest on subordinated debentures | | | 1,892 | | | | 2,124 | | | | 2,087 | |
| Legal and accounting | | | 470 | | | | 722 | | | | 543 | |
| Other | | | 1,466 | | | | 1,573 | | | | 1,630 | |
| Tax benefit | | | (1,609 | ) | | | (1,965 | ) | | | (1,753 | ) |
| Total expense | | | 2,219 | | | | 2,454 | | | | 2,507 | |
| (Loss) income before equity in undistributed income (loss) of subsidiaries | | | (2,219 | ) | | | (2,454 | ) | | | 493 | |
| Equity in undistributed income (loss) of subsidiaries | | | 5,266 | | | | (3,794 | ) | | | (26,345 | ) |
| Net income (loss) | | | 3,047 | | | | (6,248 | ) | | | (25,852 | ) |
| Preferred stock discount | | | — | | | | (18,667 | ) | | | — | |
| Net income (loss) available to common shareholders | | $ | 3,047 | | | $ | (24,915 | ) | | $ | (25,852 | ) |
| CONDENSED STATEMENT OF CASH FLOWS | | As of December 31, | |
| | | 2011 | | | 2010 | | | 2009 | |
| Cash flows from operating activities: | | | | | | | | | | | | |
| Net income (loss) | | $ | 3,047 | | | $ | (6,248 | ) | | $ | (25,852 | ) |
| Adjustments to reconcile net income (loss) to net cash (used in) provided by provided by operating activities: | | | | | | | | | | | | |
| Equity in undistributed (income) loss of subsidiaries | | | (5,266 | ) | | | 3,794 | | | | 26,345 | |
| Stock-based compensation expense | | | 62 | | | | 36 | | | | 228 | |
| Effect of changes in: | | | | | | | | | | | | |
| Other assets | | | 19 | | | | (2,080 | ) | | | 982 | |
| Other liabilities | | | 302 | | | | 2,437 | | | | (1,612 | ) |
| Net cash (used in) provided by operating activities | | | (1,836 | ) | | | (2,061 | ) | | | 91 | |
| Cash flows from investing activities | | | | | | | | | | | | |
| Investments in subsidiaries | | | — | | | | (33,500 | ) | | | (2,000 | ) |
| Net cash used in investing activities | | | | | | | | | | | | |
| Cash flows from financing activities | | | | | | | | | | | | |
| Proceeds from issuance of preferred stock, net of costs | | | | | | | 37,500 | | | | — | |
| Net cash provided by financing activities | | | — | | | | 37,500 | | | | — | |
| (Increase) decrease in cash and cash equivalents | | | (1,836 | ) | | | 1,939 | | | | (1,909 | ) |
| Cash and cash equivalents, beginning of year | | | 3,092 | | | | 1,153 | | | | 3,062 | |
| Cash and cash equivalents, end of year | | $ | 1,256 | | | $ | 3,092 | | | $ | 1,153 | |
INDEX OF EXHIBITS
| Exhibit No. | | Exhibit Name | | Sequential Page No |
| | | | | |
| 2(a) | | Agreement and Plan of Reorganization and Merger, dated as of October 3, 1999 (incorporated by reference from Exhibit 2.1 to the Company’s Current Report on Form 8-K filed with the Commission on October 12, 1999). | | * |
| | | | | |
| 2(b) | | Addendum to Agreement and Plan of Reorganization and Merger dated as of September 25, 2000 (incorporated by reference from Exhibit 2.7 to the Company’s Current Report on Form 8-K filed with the Commission on September 29, 2000). | | * |
| | | | | |
| 2(c) | | Agreement and Plan of Merger dated April 23, 2004, by and between North Valley Bancorp and Yolo Community Bank (incorporated by reference from Exhibit 99.54 to the Company’s Current Report on Form 8-K filed with the Commission on April 26, 2004). | | * |
| | | | | |
| 2(d) | | Agreement and Plan of Reorganization dated April 10, 2007, between Sterling Financial Corporation and North Valley Bancorp (incorporated by reference from Exhibit 99.128 to the Company’s Current Report on Form 8-K filed with the Commission on April 11, 2007). Terminated effective December 1, 2007. | | * |
| | | | | |
| 3(a) | | Amended and Restated Articles of Incorporation of North Valley Bancorp (incorporated by reference from Exhibit 3(i) to the Company’s Quarterly Report on Form 10-Q filed with the Commission for the period ended June 30, 1998). | | * |
| | | | | |
| 3(b) | | Certificate of Amendment of Amended and Restated Articles of Incorporation of North Valley Bancorp (incorporated by reference from Exhibit 99.108 to the Company’s Current Report on Form 8-K filed with the Commission on April 5, 2006). | | * |
| | | | | |
| 3(c) | | Certificate of Amendment of the Amended and Restated Articles of Incorporation of North Valley Bancorp (incorporated by reference from Exhibit 99.177 on the Company’s Report on Form 8-K filed with the Commission on July 20, 2010). | | * |
| | | | | |
| 3(d) | | Certificate of Amendment of the Amended and Restated Articles of Incorporation re one-for-five reverse stock split effective December 28, 2010 (incorporated by reference from Exhibit 99.181 on the Company’s Report on Form 8-K filed with the Commission on December 29, 2010). | | * |
| | | | | |
| 3(e) | | Certificate of Determination of Mandatorily Convertible Cumulative Perpetual Preferred Stock, Series A (incorporated by reference from Exhibit 4.1 to the Company’s Report on Form 8-K filed with the Commission on April 22, 2010). | | * |
| | | | | |
| 3(f) | | By-laws of North Valley Bancorp, as amended and restated as of January 26, 2012. | | |
| | | | | |
| 4(a) | | Amended and Restated Declaration of Trust (North Valley Capital Trust I) dated July 16, 2001 (incorporated by reference from Exhibit 4(a) to the Company’s Annual Report on Form 10-K filed with the Commission for the year ended December 31, 2001). | | * |
| | | | | |
| 4(b) | | Indenture (North Valley Capital Trust I) dated July 16, 2001 (incorporated by reference from Exhibit 4(b) to the Company’s Annual Report on Form 10-K filed with the Commission for the year ended December 31, 2001). | | * |
| | | | | |
| 4(c) | | Junior Subordinated Debt security of North Valley Bancorp (incorporated by reference from Exhibit 4(c) to the Company’s Annual Report on Form 10-K filed with the Commission for the year ended December 31, 2001). | | * |
| 4(d) | | Guarantee Agreement for North Valley Capital Trust I (North Valley Bancorp) dated July 16, 2001 (incorporated by reference from Exhibit 4(d) to the Company’s Annual Report on Form 10-K filed with the Commission for the year ended December 31, 2001). | | * |
| | | | | |
| 4(e) | | Amended and Restated Declaration of Trust (North Valley Capital Trust II) dated April 10, 2003 (incorporated by reference from Exhibit 4(e) to the Company’s Quarterly Report on Form 10-Q filed with the Commission for the period ended March 31, 2004). | | * |
| | | | | |
| 4(f) | | Indenture (North Valley Capital Trust II) dated April 10, 2003 (incorporated by reference from Exhibit 4(f) to the Company’s Quarterly Report on Form 10-Q filed with the Commission for the period ended March 31, 2004). | | * |
| | | | | |
| 4(g) | | Guarantee Agreement for North Valley Capital Trust II (North Valley Bancorp) dated April 10, 2003 (incorporated by reference from Exhibit 4(g) to the Company’s Quarterly Report on Form 10-Q filed with the Commission for the period ended March 31, 2004). | | * |
| | | | | |
| 4(h) | | Amended and Restated Declaration of Trust (North Valley Capital Trust III) dated May 5, 2004 (incorporated by reference from Exhibit 4(h) to the Company’s Quarterly Report on Form 10-Q filed with the Commission for the period ended March 31, 2005). | | * |
| | | | | |
| 4(i) | | Indenture (North Valley Capital Trust III) dated May 5, 2004 (incorporated by reference from Exhibit 4(i) to the Company’s Quarterly Report on Form 10-Q filed with the Commission for the period ended March 31, 2005). | | * |
| | | | | |
| 4(j) | | Guarantee Agreement for North Valley Capital Trust III (North Valley Bancorp) dated May 5, 2004 (incorporated by reference from Exhibit 4(j) to the Company’s Quarterly Report on Form 10-Q filed with the Commission for the period ended March 31, 2005). | | * |
| | | | | |
| 4(k) | | Amended and Restated Declaration of Trust (North Valley Capital Statutory Trust IV) dated December 29, 2005 (incorporated by reference from Exhibit 99.94 to the Company’s Current Report on Form 8-K filed with the Commission on January 5, 2006). | | * |
| | | | | |
| 4(l) | | Indenture (North Valley Capital Statutory Trust IV) dated December 29, 2005 (incorporated by reference from Exhibit 99.95 to the Company’s Current Report on Form 8-K filed with the Commission on January 5, 2006). | | * |
| | | | | |
| 4(m) | | Guarantee Agreement for North Valley Capital Statutory Trust IV (North Valley Bancorp) dated December 29, 2005 (incorporated by reference from Exhibit 99.96 to the Company’s Current Report on Form 8-K filed with the Commission on January 5, 2006). | | * |
| | | | | |
| 4(n) | | Junior Subordinated Debt Security Due 2036 (North Valley Capital Statutory Trust IV) (incorporated by reference from Exhibit 99.96 to the Company’s Current Report on Form 8-K filed with the Commission on January 5, 2006). | | * |
| | | | | |
| 4(o) | | Capital Security Certificate (North Valley Capital Statutory Trust IV) (incorporated by reference from Exhibit 99.96 to the Company’s Current Report on Form 8-K filed with the Commission on January 5, 2006). | | * |
| | | | | |
| 10(a) | | Shareholder Protection Rights Agreement, dated September 9, 1999 (incorporated by reference from Exhibit 4 to the Company’s Current Report on Form 8-K filed with the Commission on September 23, 1999). | | * |
| | | | | |
| 10(b) | | North Valley Bancorp 1989 Employee Stock Option Plan, as amended (incorporated by reference from Exhibit 4.1 to Post-Effective Amendment No. One to the Company’s Registration Statement on Form S-8 (No. 33-32787) filed with the Commission on December 26, 1989).** | | * |
| 10(c) | | North Valley Bancorp 1989 Employee Nonstatutory Stock Option Agreement (incorporated by reference from Exhibit 4.3 to Post-Effective Amendment No. One to the Company’s Registration Statement on Form S-8 (No. 33-32787) filed with the Commission on December 26, 1989).** | | * |
| 10(d) | | North Valley Bancorp 1989 Director Stock Option Plan, as amended (incorporated by reference from Exhibit 4.2 to Post-Effective Amendment No. One to the Company’s Registration Statement on Form S-8 (No. 33-32787) filed with the Commission on December 26, 1989).** | | * |
| | | | | |
| 10(e) | | North Valley Bancorp 1989 Director Nonstatutory Stock Option Agreement (incorporated by reference from Exhibit 4.4 to Post-Effective Amendment No. One to the Company’s Registration Statement on Form S-8 (No. 33-32787) filed with the Commission on December 26, 1989).** | | * |
| | | | | |
| 10(f) | | North Valley Bancorp Employee Stock Ownership Plan, amended and restated as of January 1, 1999 (incorporated by reference from Exhibit10 (f) to the Company’s Quarterly Report on Form 10-Q filed with the Commission for the period ended March 31, 2005).** | | * |
| | | | | |
| 10(g) | | First Amendment to North Valley Bancorp Employee Stock Ownership Plan, dated October 24, 2002 (incorporated by reference from Exhibit10 (f) to the Company’s Quarterly Report on Form 10-Q filed with the Commission for the period ended March 31, 2005).** . | | * |
| | | | | |
| 10(h) | | Second Amendment to North Valley Bancorp Employee Stock Ownership Plan, dated November 17, 2003 (incorporated by reference from Exhibit10 (f) to the Company’s Quarterly Report on Form 10-Q filed with the Commission for the period ended March 31, 2005).** | | * |
| | | | | |
| 10(i) | | Third Amendment to North Valley Bancorp Employee Stock Ownership Plan, effective September 1, 2004 (incorporated by reference from Exhibit10 (f) to the Company’s Quarterly Report on Form 10-Q filed with the Commission for the period ended March 31, 2005).** | | * |
| | | | | |
| 10(j) | | Supplemental Executive Retirement Plan (incorporated by reference from Exhibit 10(i) to the Company’s Annual Report on Form 10-K filed with the Commission for the year ended December 31, 1988).** | | * |
| | | | | |
| 10(k) | | Executive Deferred Compensation Plan (incorporated by reference from Exhibit 10(j) to the Company’s Annual Report on Form 10-K filed with the Commission for the year ended December 31, 1988).** | | * |
| | | | | |
| 10(l) | | Supplemental Retirement Plan for Directors (incorporated by reference from Exhibit 10(k) to the Company’s Annual Report on Form 10-K filed with the Commission for the year ended December 31, 1988).** | | * |
| | | | | |
| 10(m) | | Deleted. | | |
| | | | | |
| 10(n) | | Executive Deferred Compensation Plan, effective January 1, 1989, restated April 1, 1995 (incorporated by reference from Exhibit 10(dd) to the Company’s Annual Report on Form 10-KSB filed with the Commission for the year ended December 31, 1997).** | | * |
| | | | | |
| 10(o) | | Directors’ Deferred Compensation Plan, effective April 1, 1995 (incorporated by reference from Exhibit 10(ee) to the Company’s Annual Report on Form 10-KSB filed with the Commission for the year ended December 31, 1997).** | | * |
| | | | | |
| 10(p) | | Umbrella TrustTM for Directors, effective April 1, 1995 (incorporated by reference from Exhibit 10(ff) to the Company’s Annual Report on Form 10-KSB filed with the Commission for the year ended December 31 1997).** | | * |
| | | | | |
| 10(q) | | Umbrella TrustTM for Executives, effective April 1, 1995 (incorporated by reference from Exhibit 10(gg) to the Company’s Annual Report on Form 10-KSB filed with the Commission for the year ended December 31, 1997).** | | * |
| 10(r) | | Indemnification Agreement (incorporated by reference from Exhibit 10 to the Company’s Quarterly Report filed with the Commission for the period ended June 30, 1998). | | * |
| | | | | |
| 10(s) | | North Valley Bancorp 1998 Employee Stock Incentive Plan, as amended through July 26, 2001 (incorporated by reference from Exhibit 99.1 to the Company’s Registration Statement on Form S-8 (No. 333-65950) filed with the Commission on July 26, 2001).** | | * |
| | | | | |
| 10(t) | | North Valley Bancorp 1999 Director Stock Option Plan (incorporated by reference from Exhibit 99.1 to the Company’s Registration Statement on Form S-8 (No. 333-65948) filed with the Commission on July 26, 2001).** | | * |
| | | | | |
| 10(u) | | Amendment No. Two to the North Valley Bancorp 1989 Director Stock Option Plan (incorporated by reference from Exhibit 10(v) to the Company’s Annual Report on Form 10-K filed with the Commission for the year ended December 31, 1998).** | | * |
| | | | | |
| 10(v) | | Branch Purchase and Assumption Agreement dated as of September 15, 2000, between North Valley Bancorp and Scott Valley Bank (incorporated by reference from Exhibit 99.19 to the Company’s Current Report on Form 8-K filed with the Commission on September 29, 2000). | | * |
| | | | | |
| 10(w) | | Form of Executive Deferred Compensation Agreement executed in December 2000 between North Valley Bank and each of Michael J. Cushman, Sharon L. Benson, Jack R. Richter and Eric J. Woodstrom (incorporated by reference from Exhibit 10(y) to the Company’s Annual Report on Form 10-K filed with the Commission for the year ended December 31, 2001).** | | * |
| | | | | |
| 10(x) | | Form of Director Deferred Fee Agreement executed in December 2000 between North Valley Bank and each of Rudy V. Balma, William W. Cox, Royce L. Friesen, Dan W. Ghidinelli, Thomas J. Ludden, Douglas M. Treadway and J.M. Wells, Jr. (incorporated by reference from Exhibit 10(aa) to the Company’s Annual Report on Form 10-K filed with the Commission for the year ended December 31, 2001).** | | * |
| | | | | |
| 10(y) | | Form of Director Deferred Fee Agreement executed in December 2000 between Six Rivers National Bank and each of Kevin D. Hartwick, William T. Kay, Jr., J. Michael McGowan, Warren L. Murphy and Dolores M. Vellutini (incorporated by reference from Exhibit 10(bb) to the Company’s Annual Report on Form 10-K filed with the Commission for the year ended December 31, 2001).** | | * |
| | | | | |
| 10(z) | | Form of Employment Agreement executed in January 2001 between North Valley Bancorp and each of Michael J. Cushman, Jack R. Richter, Eric J. Woodstrom, Edward J. Czajka and Sharon L. Benson (incorporated by reference from Exhibit 10(cc) to the Company’s Annual Report on Form 10-K filed with the Commission for the year ended December 31, 2001).** | | * |
| | | | | |
| 10(aa) | | Deleted. | | |
| | | | | |
| 10(bb) | | Form of Salary Continuation Agreement executed in October 2001 between North Valley Bancorp and each of Michael J. Cushman, Jack R. Richter, Eric J. Woodstrom, Edward J. Czajka and Sharon L. Benson (incorporated by reference from Exhibit 10(ee) to the Company’s Annual Report on Form 10-K filed with the Commission for the year ended December 31, 2001).** | | * |
| | | | | |
| 10(cc) | | Park Marina Lease dated July 23, 2001, between The McConnell Foundation and North Valley Bancorp for 300 Park Marina Circle, Redding, California 96001 (incorporated by reference from Exhibit 10(ff) to the Company’s Annual Report on Form 10-K filed with the Commission for the year ended December 31, 2001). | | * |
| | | | | |
| 10(dd) | | Form of Salary Continuation Agreement executed in October 2001 between Six Rivers National Bank and each of Russell Harris and Margie L. Plum (incorporated by reference from Exhibit 10(gg) to the Company’s Annual Report on Form 10-K filed with the Commission for the year ended December 31, 2001).** | | * |
| 10(ee) | | Form of Executive Deferred Compensation Agreement executed in January 2001 between North Valley Bank and Edward J. Czajka (incorporated by reference from Exhibit 10(hh) to the Company’s Annual Report on Form 10-K filed with the Commission for the year ended December 31, 2001).** | | * |
| | | | | |
| 10(ff) | | Form of Executive Deferred Compensation Agreement executed in December 2001 between North Valley Bank and each of Michael J. Cushman, Sharon L. Benson, Jack R. Richter, Edward J. Czajka and Eric J. Woodstrom (incorporated by reference from Exhibit 10(ii) to the Company’s Annual Report on Form 10-K filed with the Commission for the year ended December 31, 2001).** | | * |
| | | | | |
| 10(gg) | | Form of Executive Deferred Compensation Agreement executed in January 2002 between Six Rivers National Bank and Russell Harris (incorporated by reference from Exhibit 10(jj) to the Company’s Annual Report on Form 10-K filed with the Commission for the year ended December 31, 2001).** | | * |
| | | | | |
| 10(hh) | | Form of Director Deferred Fee Agreement executed in December 2001 between North Valley Bank and each of Rudy V. Balma, William W. Cox, Royce L. Friesen, Dan W. Ghidinelli, Thomas J. Ludden, Douglas W. Treadway and J.M. Wells, Jr. (incorporated by reference from Exhibit 10(kk) to the Company’s Annual Report on Form 10-K filed with the Commission for the year ended December 31, 2001).** | | * |
| | | | | |
| 10(ii) | | Director Deferred Fee Agreement executed in December 2001 between Six Rivers National Bank and each of Kevin D. Hartwick, William T. Kay, Jr., John J. Gierek, Jr., Warren L. Murphy and Dolores M. Vellutini (incorporated by reference from Exhibit 10(ll) to the Company’s Annual Report on Form 10-K filed with the Commission for the year ended December 31, 2001).** | | * |
| | | | | |
| 10(jj) | | Deleted. | | * |
| | | | | |
| 10(kk) | | Form of Employment Agreement executed in March 2004 between North Valley Bancorp and Russell Harris (incorporated by reference from Exhibit 10(jj) to the Company’s Annual Report on Form 10-K filed with the Commission for the year ended December 31, 2003).** | | * |
| | | | | |
| 10(ll) | | Form of Employment Agreement dated August 31, 2004 between North Valley Bancorp and Yolo Community Bank and John A. DiMichele (incorporated by reference from Exhibit 99.71 to the Company’s Quarterly Report on Form 10-Q filed with the Commission for the period ended September 30, 2004).** | | * |
| | | | | |
| 10(mm) | | Executive Deferred Compensation Agreement dated December 31, 2004 between North Valley Bancorp and John A. DiMichele (incorporated by reference from Exhibit 10(nn) to the Company’s Current Report on Form 8-K filed with the Commission on January 4, 2005).** | | * |
| | | | | |
| 10(nn) | | Severance and Release Agreement (effective as of February 4, 2005) between John A. DiMichele and North Valley Bancorp and NVB Business Bank, formerly named Yolo Community Bank (incorporated by reference from Exhibit 99.78 to the Company’s Current Report on Form 8-K filed with the Commission on March 9, 2005).** | | * |
| | | | | |
| 10(oo) | | Executive Deferred Compensation Agreement dated December 31, 2004 between North Valley Bancorp and Leo J. Graham (incorporated by reference from Exhibit 10(oo) to the Company’s Current Report on Form 8-K filed with the Commission on January 4, 2005).** | | * |
| | | | | |
| 10(pp) | | Director Deferred Fee Agreement dated December 31, 2004 between North Valley Bancorp and Martin Mariani (incorporated by reference from Exhibit 10(pp) to the Company’s Current Report on Form 8-K filed with the Commission on January 4, 2005).** | | * |
| | | | | |
| 10(qq) | | Deleted | | * |
| 10(rr) | | Cottonwood Branch sublease extension agreement dated August 7, 2003, between North Valley Bank and North State Grocery, Inc. (incorporated by reference from Exhibit 10(ll) to the Company’s Annual Report on Form 10-K filed with the Commission for the year ended December 31, 2003). | | * |
| | | | | |
| 10(ss) | | Westwood Branch lease agreement dated December 1, 2003, between North Valley Bank and Daha Investments (incorporated by reference from Exhibit 10(mm) to the Company’s Annual Report on Form 10-K filed with the Commission for the year ended December 31, 2003). | | * |
| | | | | |
| 10(tt) | | Lease Agreement for 618 Main Street, Woodland, California, dated February 26, 2004, between Yolo Community Bank and Thomas and Margaret Stallard (incorporated by reference from Exhibit 10(mm) to the Company’s Annual Report on Form 10-K filed with the Commission for the year ended December 31, 2004). | | * |
| | | | | |
| 10(uu) | | Lease Agreement for 626, 628 Main Street, 400 Second Street, Woodland, California, dated February 26, 2004, between Yolo Community Bank and Thomas and Margaret Stallard (incorporated by reference from Exhibit 10(mm) to the Company’s Annual Report on Form 10-K filed with the Commission for the year ended December 31, 2004). | | * |
| | | | | |
| 10(vv) | | Lease for 100 B Street, Suite 110, Santa Rosa, California, dated October 19, 2004, between North Valley Bank and Sonja Valentina LLC (incorporated by reference from Exhibit 10(mm) to the Company’s Annual Report on Form 10-K filed with the Commission for the year ended December 31, 2004). | | * |
| | | | | |
| 10(ww) | | Deleted. | | * |
| | | | | |
| 10(xx) | | Office Building Lease for 101 North State Street, Suite A, Ukiah, California, dated November 3, 2004, between North Valley Bank and Southport Land & Commercial Company, Inc (incorporated by reference from Exhibit 10(mm) to the Company’s Annual Report on Form 10-K filed with the Commission for the year ended December 31, 2004). | | * |
| | | | | |
| 10(yy) | | Deleted. | | * |
| | | | | |
| 10(zz) | | North Valley Bancorp 401(k) Plan, amended and restated effective September 1, 2004 (incorporated by reference from Exhibit 10(mm) to the Company’s Annual Report on Form 10-K filed with the Commission for the year ended December 31, 2004).** | | * |
| | | | | |
| 10(aaa) | | Fourth Amendment to North Valley Bancorp Employee Stock Ownership Plan, effective March 28, 2005 (incorporated by reference from Exhibit 10(aaa) to the Company’s Quarterly Report on Form 10-Q filed with the Commission for the period ended March 31, 2005).** | | * |
| | | | | |
| 10(bbb) | | Deleted. | | |
| | | | | |
| 10(ccc) | | Deleted. | | |
| | | | | |
| 10(ddd) | | Severance and Release Agreement (effective as of May 31, 2005) between Edward J. Czajka, Executive Vice President and Chief Financial Officer of the North Valley Bancorp (incorporated by reference from Exhibit 99.83 to the Company’s Current Report on Form 8-K filed with the Commission on June 8, 2005).** | | * |
| | | | | |
| 10(eee) | | Form of Executive Employment Agreement between North Valley Bancorp for Scott Louis, Roger Nash, and Gary Litzsinger (incorporated by reference from Exhibit 99.91 to the Company’s Quarterly Report on Form 10-Q filed with the Commission for the period ended September 30, 2005).** | | * |
| | | | | |
| 10(fff) | | Deleted. | | * |
| 10(ggg) | | North Valley Bancorp Salary Continuation Plan with Jack R. Richter, dated December 31, 2005 (incorporated by reference from Exhibit 99.102 to the Company’s Current Report on Form 8-K filed with the Commission on January 6, 2006).** | | * |
| | | | | |
| 10(hhh) | | Employment Agreement between North Valley Bancorp and Kevin R. Watson (incorporated by reference from Exhibit 99.91 to the Company’s Quarterly Report on Form 10-Q filed with the Commission on November 9, 2005 and from Exhibit 99.106 to the Company’s Current Report on Form 8-K filed with the Commission on March 8, 2006).** | | * |
| | | | | |
| 10(iii) | | Employment Agreement between North Valley Bancorp and Leo J. Graham (incorporated by reference from Exhibit 99.115 to the Company’s Current Report on Form 8-K filed with the Commission on August 4, 2006).** | | * |
| | | | | |
| 10(jjj) | | First Amendment to North Valley Bancorp Employee (401k) Plan, effective April 28, 2005 (incorporated by reference from Exhibit 10(hhh) to the Company’s Annual Report on Form 10-K filed with the Commission for the year ended December 31, 2005).** | | * |
| | | | | |
| 10(kkk) | | Second Amendment to North Valley Bancorp Employee (401k) Plan, effective April 28, 2005 (incorporated by reference from Exhibit 10(iii) to the Company’s Annual Report on Form 10-K filed with the Commission for the year ended December 31, 2005).** | | * |
| | | | | |
| 10(lll) | | Third Amendment to North Valley Bancorp Employee (401k) Plan, effective December 30, 2005 (incorporated by reference from Exhibit 10(jjj) to the Company’s Annual Report on Form 10-K filed with the Commission for the year ended December 31, 2005).** | | * |
| | | | | |
| 10(mmm) | | Fourth Amendment to North Valley Bancorp Employee (401k) Plan, effective January 1, 2006 (incorporated by reference from Exhibit 10(kkk) to the Company’s Annual Report on Form 10-K filed with the Commission for the year ended December 31, 2008).** | | * |
| | | | | |
| 10(nnn) | | Fifth Amendment to North Valley Bancorp Employee (401k) Plan, effective as of September 1, 2004 (incorporated by reference from Exhibit 10(ooo) to the Company’s Annual Report on Form 10-K filed with the Commission for the year ended December 31, 2007).** | | * |
| | | | | |
| 10(ooo) | | Sixth Amendment to North Valley Bancorp Employee (401k) Plan, effective January 1, 2008 (incorporated by reference from Exhibit 99.162 to the Company’s Current Report on Form 8-K filed with the Commission on November 25, 2008).** | | * |
| | | | | |
| 10(ppp) | | Seventh Amendment to North Valley Bancorp Employee (401k) Plan, effective February 16, 2009 (incorporated by reference from Exhibit 10(nnn) to the Company’s Annual Report on Form 10-K filed with the Commission for the year ended December 31, 2008).** | | * |
| | | | | |
| 10(qqq) | | Fifth Amendment to North Valley Bancorp Employee Stock Ownership Plan, effective June 4, 2005 (incorporated by reference from Exhibit 10(kkk) to the Company’s Annual Report on Form 10-K filed with the Commission for the year ended December 31, 2007).** | | * |
| | | | | |
| 10(rrr) | | North Valley Bancorp Director Deferred Fee Plan, Amended and Restated effective January 1, 2007 (incorporated by reference from Exhibit 10(lll) to the Company’s Annual Report on Form 10-K filed with the Commission for the year ended December 31, 2007).** | | * |
| | | | | |
| 10(sss) | | North Valley Bancorp Executive Deferred Compensation Plan, Amended and Restated effective January 1, 2007 (incorporated by reference from Exhibit 10(mmm) to the Company’s Annual Report on Form 10-K filed with the Commission for the year ended December 31, 2007).** | | * |
| | | | | |
| 10(ttt) | | North Valley Bancorp Salary Continuation Plan, Amended and Restated effective January 1, 2007 (incorporated by reference from Exhibit 10(nnn) to the Company’s Annual Report on Form 10-K filed with the Commission for the year ended December 31, 2007).** | | * |
| | | | | |
| 10(uuu) | | First Amendment to the North Valley Bancorp Employee Stock Ownership Plan, as Amended and Restated effective January 1, 2006 (incorporated by reference from Exhibit 10(ppp) to the Company’s Annual Report on Form 10-K filed with the Commission for the year ended December 31, 2007).** | | * |
| | | | | |
| 10(vvv) | | North Valley Bancorp Salary Continuation Plan, Amended and Restated effective January 1, 2007 (incorporated by reference from Exhibit 10(qqq) to the Company’s Annual Report on Form 10-K filed with the Commission for the year ended December 31, 2007).** | | * |
| | | | | |
| 10(www) | | Form of Amendment of the North Valley Bancorp Employee Stock Ownership Plan (incorporated by reference from Exhibit 10(rrr) to the Company’s Annual Report on Form 10-K filed with the Commission for the year ended December 31, 2007).** | | * |
| 10(xxx) | | Deleted | | * |
| | | | | |
| 10(yyy) | | North Valley Bancorp Salary Continuation Plan, Amended and Restated effective January 1, 2007 (incorporated by reference from Exhibit 99.146 to the Company’s Current Report on Form 8-K filed with the Commission on January 7, 2008).** | | * |
| | | | | |
| 10(zzz) | | North Valley Bancorp Executive Deferred Compensation Plan, Amended and Restated effective January 1, 2007 (incorporated by reference from Exhibit 99.147 to the Company’s Current Report on Form 8-K filed with the Commission on January 7, 2008).** | | * |
| | | | | |
| 10(aaaa) | | First Amendment to North Valley Bancorp Employee Stock Ownership Plan, effective January 1, 2008 (incorporated by reference from Exhibit 99.163 to the Company’s Current Report on Form 8-K filed with the Commission on November 25, 2008).** | | * |
| | | | | |
| 10(bbbb) | | North Valley Bancorp Director Deferred Fee Plan, Amended and Restated effective January 1, 2008 (incorporated by reference from Exhibit 99.164 to the Company’s Current Report on Form 8-K filed with the Commission on November 25, 2008).** | | * |
| | | | | |
| 10(cccc) | | Lease for 837 Harris Street, Eureka, California, dated March 5, 2008, between North Valley Bank and L & H Properties, LLC. (incorporated by reference from Exhibit 99.156 to the Company’s Quarterly Report on Form 10-Q filed with the Commission for the period ended September 30, 2007). | | * |
| | | | | |
| 10(dddd) | | Deleted. | | |
| | | | | |
| 10(eeee) | | Extension and First Amendment to Lease for 100 “B” Street, Suite 100, Santa Rosa, California, dated November 15, 2008, between North Valley Bank and Sonya Valentina LLC (incorporated by reference from Exhibit 10(cccc) to the Company’s Annual Report on Form 10-K filed with the Commission for the year ended December 31, 2008). | | * |
| | | | | |
| 10(ffff) | | Lease for 793 Redwood Drive, Garberville, California, dated March 1, 2007, between North Valley Bank and Bank of the West and Charles S. Wagner, co-trustees of the Edward H. Wagner Trust and Bank of the West, sole trustee of the Wagner Trust of 1979 (incorporated by reference from Exhibit 10(dddd) to the Company’s Annual Report on Form 10-K filed with the Commission for the year ended December 31, 2008). | | * |
| | | | | |
| 10(gggg) | | Lease for 1640 Central Avenue, McKinleyville, California, dated March 24, 1994, between Six Rivers National Bank and William P. Gross & Ruth R. Gross, as co-trustees of the William P. Gross & Ruth R. Gross 1990 Trust, UTD 10/06/90 (incorporated by reference from Exhibit 10(eeee) to the Company’s Annual Report on Form 10-K filed with the Commission for the year ended December 31, 2008). | | * |
| | | | | |
| 10(hhhh) | | Lease for 9934A Deschutes Road, Palo Cedro, California, dated August 15, 1995, between North Valley Bank and Donlon H. Gabrielsen and Agnes H. Gabrielsen as Co-Trustees under the Gabrielsen Family Trust dated October 20, 1992 (incorporated by reference from Exhibit 10(ffff) to the Company’s Annual Report on Form 10-K filed with the Commission for the year ended December 31, 2008). | | * |
| | | | | |
| 10(iiii) | | Sub-Sublease for 3315 Placer Street, Redding, California, dated August 14, 1998, between North Valley Bank and North State Grocery, Inc (incorporated by reference from Exhibit 10(gggg) to the Company’s Annual Report on Form 10-K filed with the Commission for the year ended December 31, 2008). | | * |
| 10(jjjj) | | North Valley Bancorp 2008 Stock Incentive Plan (incorporated by reference from the Company’s Definitive Proxy Statement for its 2008 Annual Meeting of Shareholders, filed with the Commission on April 22, 2008).** | | * |
| | | | | |
| 10(kkkk) | | Written Agreement among North Valley Bank and Federal Reserve Bank of San Francisco, dated January 6, 2010 (incorporated by reference from Exhibit 10(iiii) to the Company’s Report on Form 8-K filed with the Commission on January 8, 2010). | | * |
| | | | | |
| 10(llll) | | North Valley Bancorp Amended and Restated Shareholder Protection Rights Agreement, dated March 26, 2009 (incorporated by reference from Exhibit 4.1 to the Company’s Report on Form 8-K filed with the Commission on April 1, 2009). | | * |
| | | | | |
| 10(mmmm) | | Securities Purchase Agreement dated April 20, 2010 (incorporated by reference from Exhibit 10.1 to the Company’s Report on Form 8-K filed with the Commission on April 22, 2010). | | * |
| | | | | |
| 10(nnnn) | | Written Agreement between Fiserv Solutions, Inc. and North Valley Bank dated July 1, 2010 (incorporated by reference from Exhibit 99.176 to the Company’s Report on Form 8-K filed with the Commission on July 2, 2010). | | * |
| | | | | |
| 10(oooo) | | North Valley Bancorp 401(k) Plan Restated Effective January 1, 2011, (incorporated by reference from Exhibit 10(mmmm) to the Company’s Annual Report on Form 10-Q filed with the Commission on March 14, 2011). | | * |
| | | | | |
| 10(pppp) | | Lease for 2999 Douglas Avenue, Roseville, California, dated April 29, 2011, between North Valley Bank and Hines Douglas Corporate Center LP (incorporated by reference from Exhibit 10(nnnn) to the Company’s Quarterly Report on Form 10-Q filed with the Commission on November 14, 2011). | | |
| | | | | |
| 14 | | North Valley Bancorp Corporate Governance Code of Ethics (incorporated by reference from Exhibit 14 to the Company’s Quarterly Report on Form 10-Q filed with the Commission for the period ended March 31, 2004). | | * |
| | | | | |
| 21 | | List of Subsidiaries. | | |
| | | | | |
| 23.1 | | Consent of Crowe Horwath LLP | | |
| | | | | |
| 23.2 | | Consent of Perry-Smith LLP | | |
| | | | | |
| 31 | | Rule 13a-14(a) / 15d-14(a) Certifications | | |
| | | | | |
| 32 | | Section 1350 Certifications | | |
| | | | | |
| 101.INS | | XBRL Instance Document (furnished herewith)*** | | |
| | | | | |
| 101.SCH | | XBRL Taxonomy Extension Schema Document (furnished herewith)*** | | |
| | | | | |
| 101.CAL | | XBRL Taxonomy Extension Calculation Linkbase Document (furnished herewith)*** | | |
| | | | | |
| 101.DEF | | XBRL Taxonomy Extension Definition Linkbase Document (furnished herewith)*** | | |
| | | | | |
| 101.LAB | | XBRL Taxonomy Extension Label Linkbase Document (furnished herewith)*** | | |
| | | | | |
| 101.PRE | | XBRL Taxonomy Extension Presentation Linkbase Document (furnished herewith)*** | | |
* Previously filed.
** Indicates management contract or compensatory plan or arrangement.
*** The interactive data files listed above shall not be deemed filed for purposes of Section 11 or 12 of the Securities Act of 1933, as amended, or Section 18 of the Securities Exchange Act of 1934, as amended, or otherwise subject to liability under those sections.
SIGNATURES
Pursuant to the requirements of Section 13 or 15(d) of the Securities Exchange Act of 1934, the registrant has duly caused this report to be signed on its behalf by the undersigned, thereunto duly authorized.
| NORTH VALLEY BANCORP | |
| By: | |
| | |
| /s/ MICHAEL J. CUSHMAN | |
| Michael J. Cushman | |
| President and Chief Executive Officer | |
| | |
| /s/ KEVIN R. WATSON | |
| Kevin R. Watson | |
| Executive Vice President and Chief Financial Officer | |
| | |
| DATE: March 27, 2012 | |
Pursuant to the requirements of the Securities Exchange Act of 1934, this report has been signed below by the following persons on behalf of the registrant and in the capacities and on the dates indicated.
| NAME AND SIGNATURE | | TITLE | | DATE |
| | | | | |
| /s/ J. M. Wells, Jr. | | Director | | March 27, 2012 |
| J. M. Wells, Jr. | | | | |
| | | | | |
| /s/ Michael J. Cushman | | Director, President and Chief Executive | | March 27, 2012 |
| Michael J. Cushman | | Officer (Principal Executive Officer) | | |
| | | | | |
| /s/ Dan W. Ghidinelli | | Director | | March 27, 2012 |
| Dan W. Ghidinelli | | | | |
| | | | | |
| /s/ Kevin D. Hartwick | | Director | | March 27, 2012 |
| Kevin D. Hartwick | | | | |
| | | | | |
| /s/ Patrick W. Kilkenny | | Director | | March 27, 2012 |
| Patrick W. Kilkenny | | | | |
| | | | | |
| /s/ Roger B. Kohlmeier | | Director | | March 27, 2012 |
| Roger B. Kohlmeier | | | | |
| | | | | |
| /s/ Timothy R. Magill | | Director | | March 27, 2012 |
| Timothy R. Magill | | | | |
| | | | | |
| /s/ Martin A. Mariani | | Director | | March 27, 2012 |
| Martin A. Mariani | | | | |
| | | | | |
| /s/ Dolores M. Vellutini | | Director | | March 27, 2012 |
| Dolores M. Vellutini | | | | |
| | | | | |
| /s/ Kevin R. Watson | | Executive Vice President and | | March 27, 2012 |
| Kevin R. Watson | | Chief Financial Officer (Principal Financial Officer & Principal Accounting Officer) | | |
101