
Omnicare Specialty Summit September 18, 2012
Forward-Looking Statement Certain of the statements made today and listed within the following presentation slides are forward-looking statements within the meaning of the Private Securities Litigation Reform Act of 1995. These forward- looking statements include, but are not limited to, all statements regarding the intent, belief or current expectations regarding the matters discussed in this presentation. Such forward-looking statements are based on management’s current expectations and involve known and unknown risks, uncertainties, contingencies and other factors that could cause results, performance or achievements to differ materially from those stated. The most significant of these risks and uncertainties are described in the Company’s Form 10-K, Form 10-Q and Form 8-K reports filed with the Securities and Exchange Commission. Investors are cautioned that such statements are only predictions and that actual events or results may differ materially. These forward-looking statements speak only as of the date this presentation was originally given. We undertake no obligation to publicly release the results of any revisions to the forward-looking statements made today, to reflect events or circumstances after today or to reflect the occurrence of unanticipated events. Non GAAP Financial Measures: To facilitate comparisons and enhance understanding of core operating performance, certain financial measures have been adjusted from the comparable amount under Generally Accepted Accounting Principles (GAAP). A detailed reconciliation of adjusted numbers to the most comparable GAAP numbers and related definitions is posted under “Supplemental Financial Data” in the Investors section of our website at http://ir.omnicare.com. Additionally, all amounts are presented on a continuing operations basis, unless otherwise stated. 2
Agenda • Welcome • Introductions and Overview • Specialty Care Group - Integrated Services • Specialty Market Dynamics • Brand Support Services • Closing Remarks • Tour 3
Introduction John L. Workman Chief Executive Officer 4
Recent Changes • John L. Workman, Chief Executive Officer • Nitin Sahney, President and Chief Operating Officer • Rocky Kraft, Chief Financial Officer 5
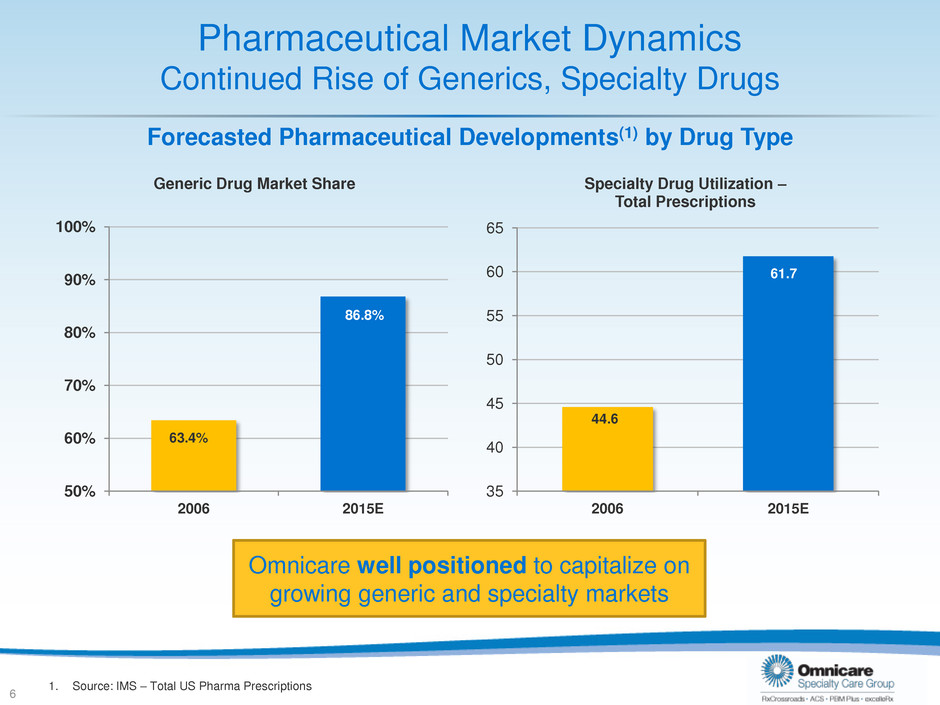
Pharmaceutical Market Dynamics Continued Rise of Generics, Specialty Drugs 63.4% 86.8% 50% 60% 70% 80% 90% 100% 2006 2015E Generic Drug Market Share 44.6 61.7 35 40 45 50 55 60 65 2006 2015E Specialty Drug Utilization – Total Prescriptions 6 1. Source: IMS – Total US Pharma Prescriptions Omnicare well positioned to capitalize on growing generic and specialty markets Forecasted Pharmaceutical Developments(1) by Drug Type
Overview Nitin Sahney Chief Operating Officer 7
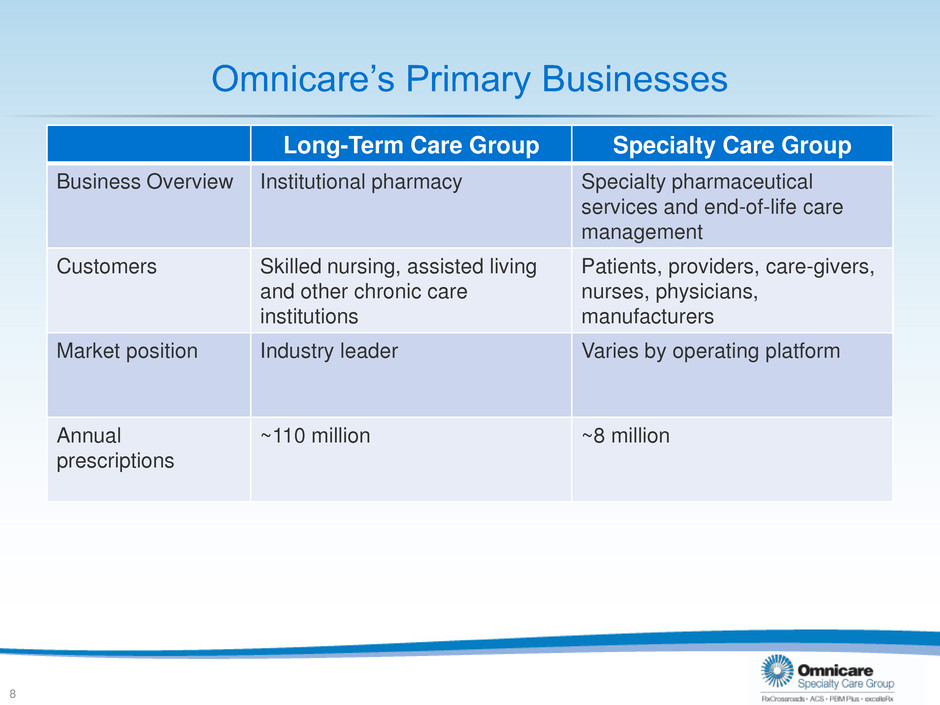
Omnicare’s Primary Businesses Long-Term Care Group Specialty Care Group Business Overview Institutional pharmacy Specialty pharmaceutical services and end-of-life care management Customers Skilled nursing, assisted living and other chronic care institutions Patients, providers, care-givers, nurses, physicians, manufacturers Market position Industry leader Varies by operating platform Annual prescriptions ~110 million ~8 million 8
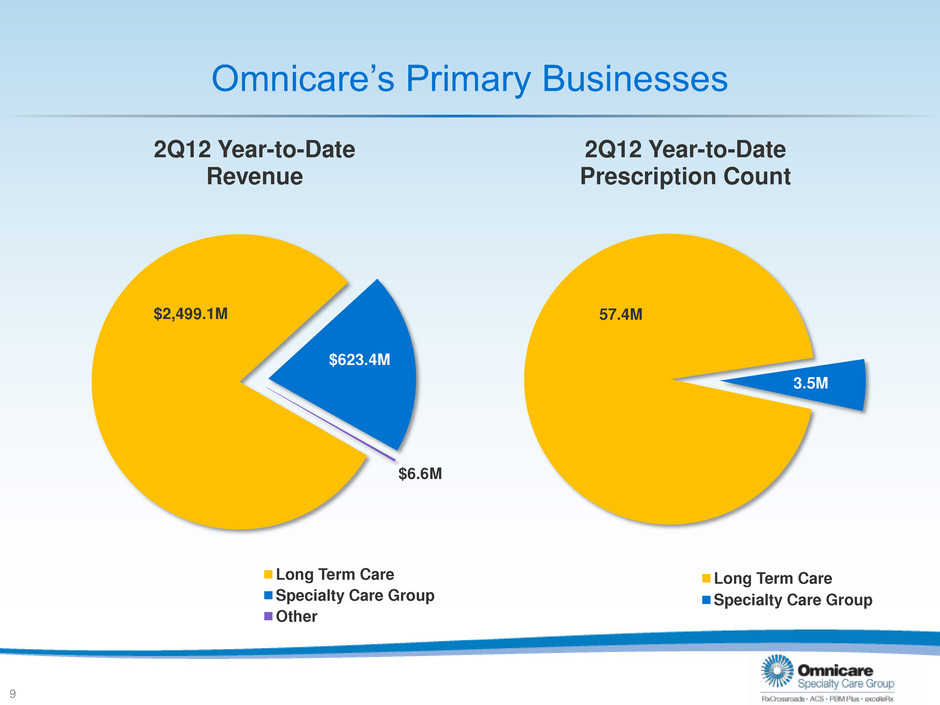
Omnicare’s Primary Businesses $2,499.1M $623.4M $6.6M 2Q12 Year-to-Date Revenue Long Term Care Specialty Care Group Other 57.4M 3.5M 2Q12 Year-to-Date Prescription Count Long Term Care Specialty Care Group 9
Specialty Care Group Strategic Significance • Increase utilization of specialty products reshaping patient care • Extension of pharmaceutical services core competency • Diversification benefits provide for greater stability • Opportunity to better leverage both assets collectively 10
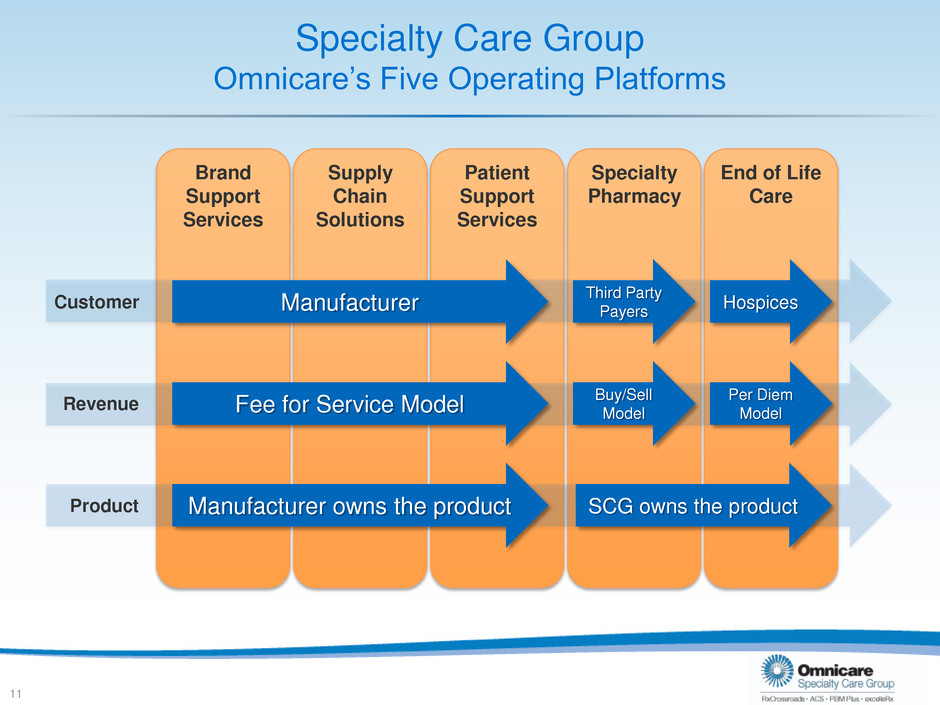
End of Life Care Brand Support Services Supply Chain Solutions Patient Support Services Specialty Pharmacy Specialty Care Group Omnicare’s Five Operating Platforms 11 Manufacturer Fee for Service Model Manufacturer owns the product Third Party Payers Buy/Sell Model Hospices Per Diem Model SCG owns the product Customer Revenue Product
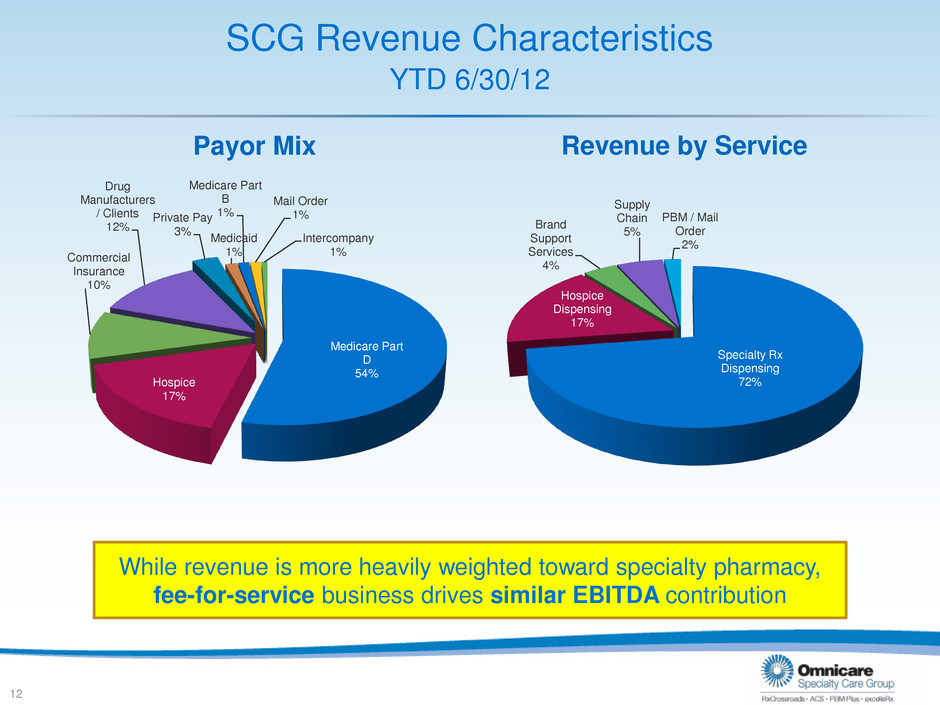
SCG Revenue Characteristics YTD 6/30/12 12 Payor Mix Revenue by Service Medicare Part D 54% Hospice 17% Commercial Insurance 10% Drug Manufacturers / Clients 12% Private Pay 3% Medicaid 1% Medicare Part B 1% Mail Order 1% Intercompany 1% Specialty Rx Dispensing 72% Hospice Dispensing 17% Brand Support Services 4% Supply Chain 5% PBM / Mail Order 2% While revenue is more heavily weighted toward specialty pharmacy, fee-for-service business drives similar EBITDA contribution
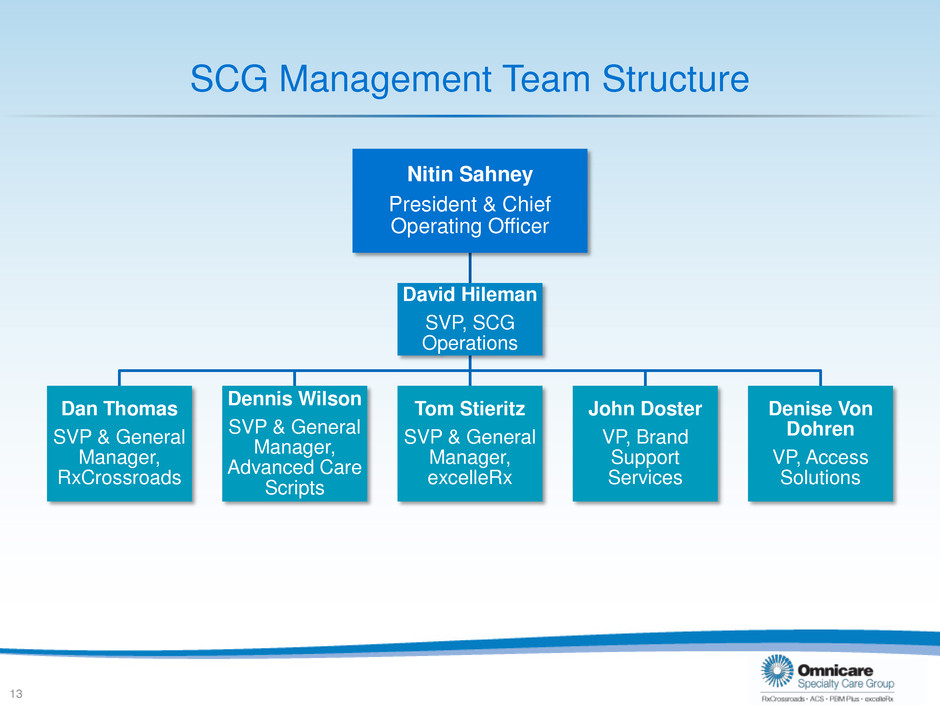
SCG Management Team Structure Nitin Sahney President & Chief Operating Officer David Hileman SVP, SCG Operations Denise Von Dohren VP, Access Solutions John Doster VP, Brand Support Services Tom Stieritz SVP & General Manager, excelleRx Dennis Wilson SVP & General Manager, Advanced Care Scripts Dan Thomas SVP & General Manager, RxCrossroads 13
SCG Integrated Services David Hileman SVP, Omnicare Specialty Care Group Operations 14
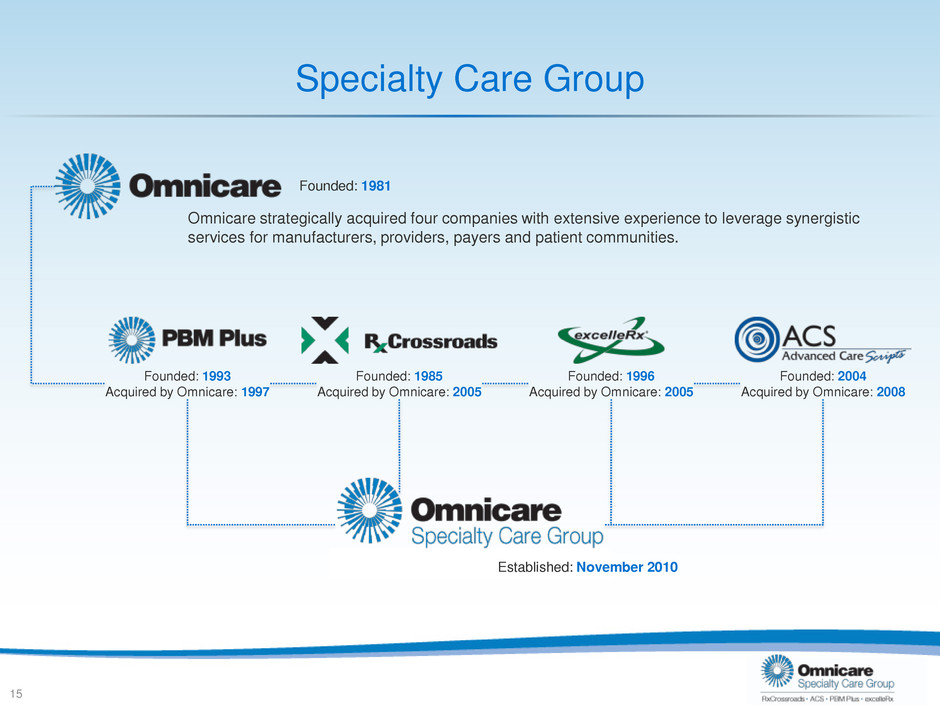
Specialty Care Group 15 Founded: 1981 Omnicare strategically acquired four companies with extensive experience to leverage synergistic services for manufacturers, providers, payers and patient communities. Founded: 1993 Acquired by Omnicare: 1997 Founded: 1985 Acquired by Omnicare: 2005 Founded: 1996 Acquired by Omnicare: 2005 Founded: 2004 Acquired by Omnicare: 2008 Established: November 2010
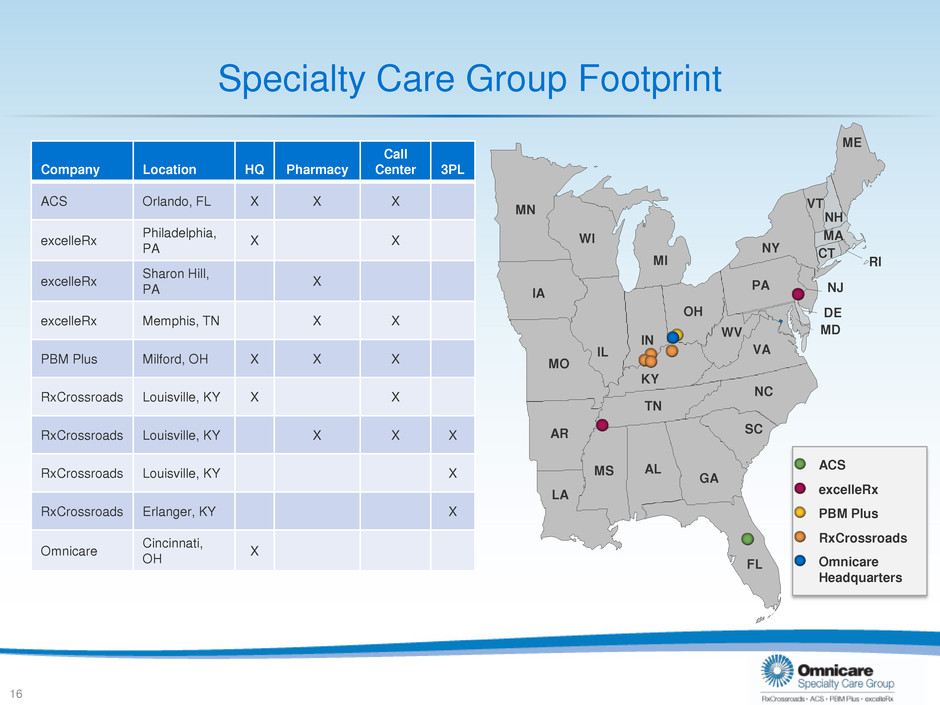
MS AL WI WV GA TN MI OH MN IN NC SC IL MD DE LA AR FL ME NJ RI VT NH MA CT IA PA VA NY MO KY Specialty Care Group Footprint Company Location HQ Pharmacy Call Center 3PL ACS Orlando, FL X X X excelleRx Philadelphia, PA X X excelleRx Sharon Hill, PA X excelleRx Memphis, TN X X PBM Plus Milford, OH X X X RxCrossroads Louisville, KY X X RxCrossroads Louisville, KY X X X RxCrossroads Louisville, KY X RxCrossroads Erlanger, KY X Omnicare Cincinnati, OH X ACS RxCrossroads excelleRx PBM Plus Omnicare Headquarters 16
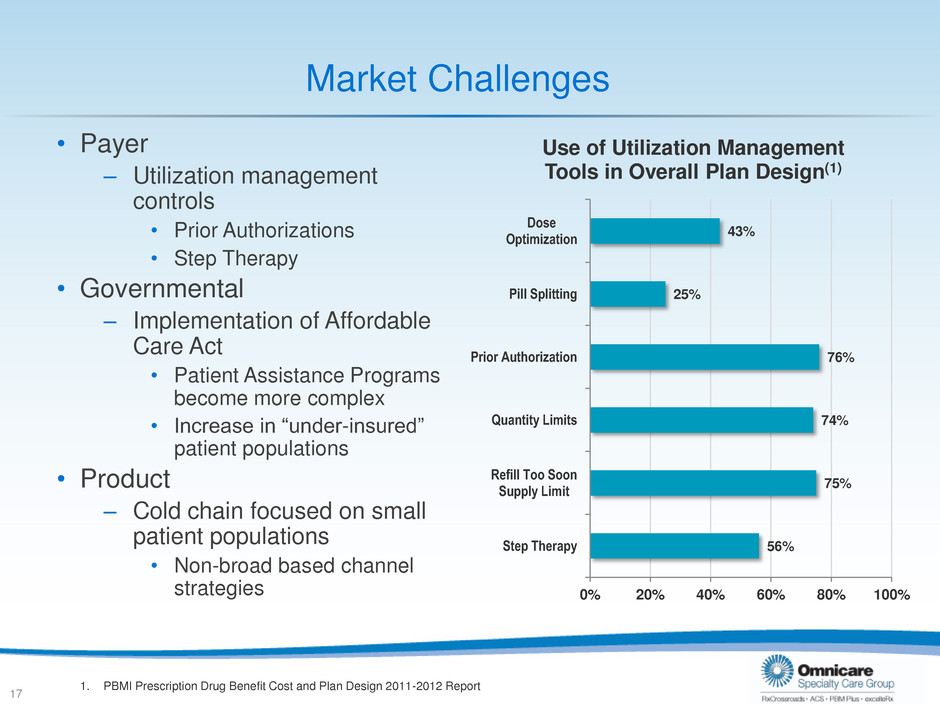
Market Challenges • Payer – Utilization management controls • Prior Authorizations • Step Therapy • Governmental – Implementation of Affordable Care Act • Patient Assistance Programs become more complex • Increase in “under-insured” patient populations • Product – Cold chain focused on small patient populations • Non-broad based channel strategies 56% 75% 74% 76% 25% 43% 0% 20% 40% 60% 80% 100% Step Therapy Refill Too Soon Supply Limit Quantity Limits Prior Authorization Pill Splitting Dose Optimization Use of Utilization Management Tools in Overall Plan Design(1) 17 1. PBMI Prescription Drug Benefit Cost and Plan Design 2011-2012 Report
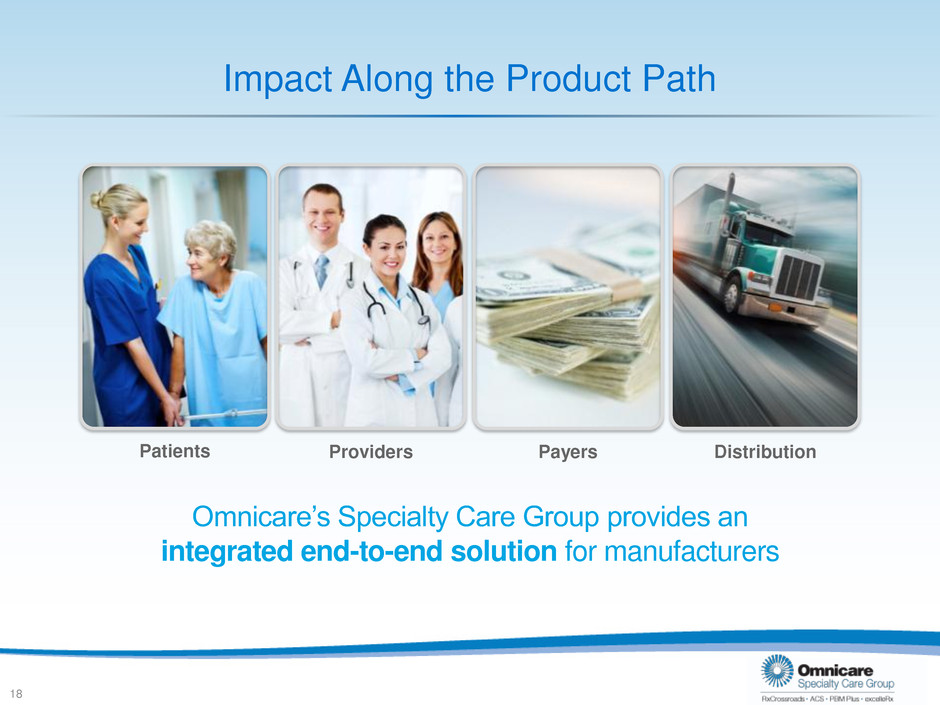
Impact Along the Product Path 18 Providers Payers Distribution Patients Omnicare’s Specialty Care Group provides an integrated end-to-end solution for manufacturers
Integration Goals Leverage Customized Distribution Capabilities • Direct to physician and patient • Institutional pharmacy expertise 19 1 2 3 Simplify Provider’s Involvement • Reduce barriers to prescribing • Overcome burdensome processes Engage the Patient • Web-tools • Social Media • Targeted Patient Education • Nurse Counseling
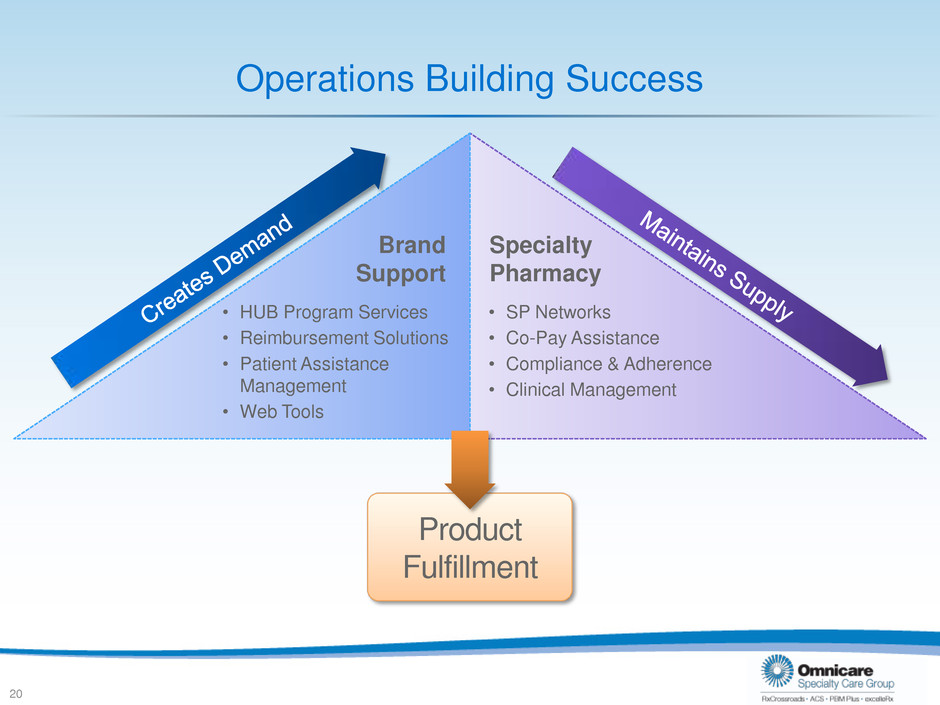
Operations Building Success 20 • HUB Program Services • Reimbursement Solutions • Patient Assistance Management • Web Tools • SP Networks • Co-Pay Assistance • Compliance & Adherence • Clinical Management Product Fulfillment Brand Support Specialty Pharmacy
Integrated Service Example Manufacturer Direct to Patient Programs • Challenge – Product/Market characteristics have or will impact product sales • Lack of payer coverage • Distribution channel challenges • Increased brand competition • Patent expiration • Objectives – Enable patients to purchase product “directly” from manufacturer – Cost effective – Simple process for health care providers – Ease of use for patients 21
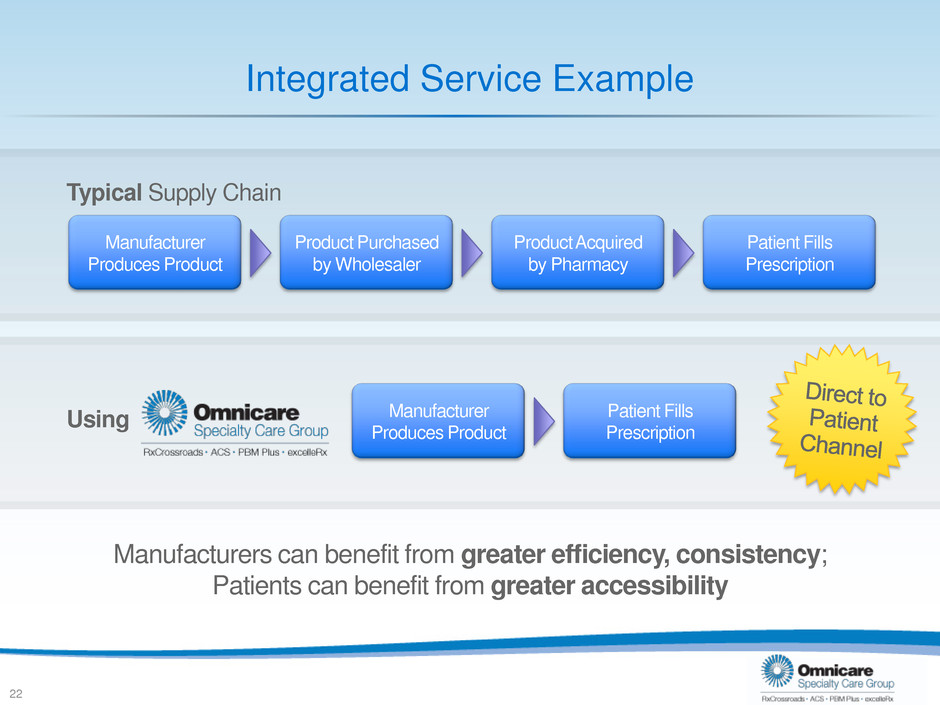
Integrated Service Example Typical Supply Chain 22 Manufacturer Produces Product Product Purchased by Wholesaler Product Acquired by Pharmacy Patient Fills Prescription Using Manufacturer Produces Product Patient Fills Prescription Manufacturers can benefit from greater efficiency, consistency; Patients can benefit from greater accessibility
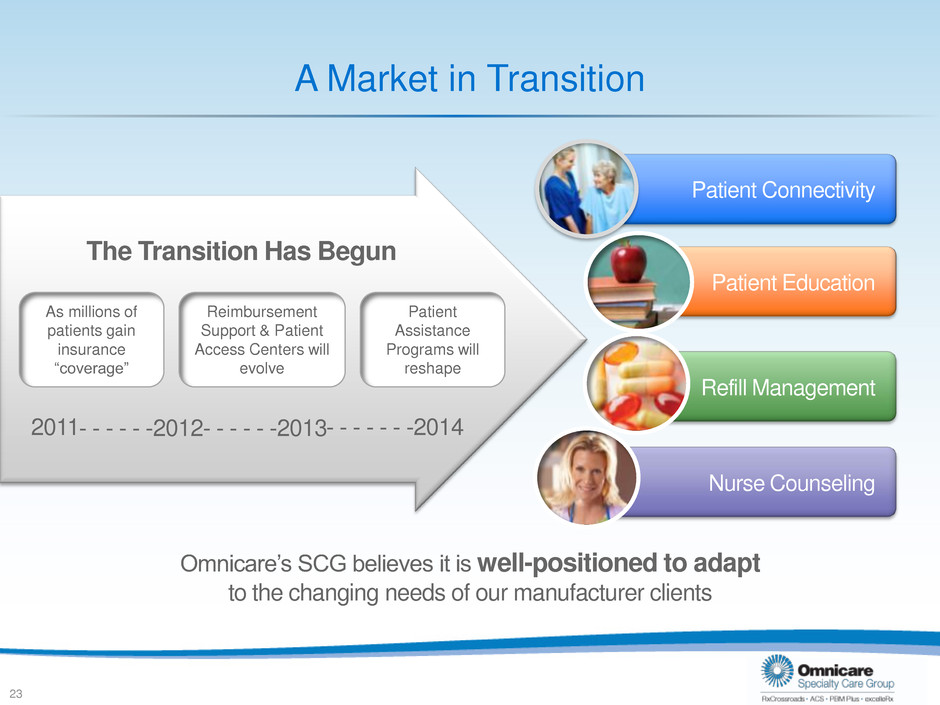
A Market in Transition 23 As millions of patients gain insurance “coverage” Omnicare’s SCG believes it is well-positioned to adapt to the changing needs of our manufacturer clients The Transition Has Begun Reimbursement Support & Patient Access Centers will evolve - - - - - -2012- - - - - -2013 2011 Nurse Counseling Patient Connectivity Patient Education Refill Management Patient Assistance Programs will reshape - - - - - - -2014
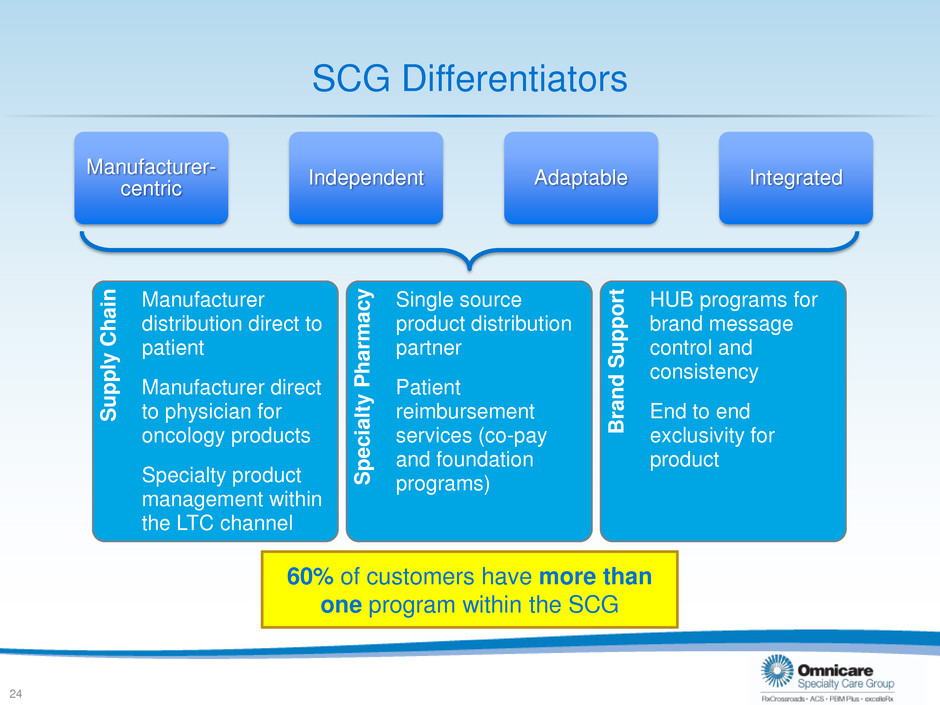
Sup p ly Chai n Manufacturer distribution direct to patient Manufacturer direct to physician for oncology products Specialty product management within the LTC channel Specialt y Pharmac y Single source product distribution partner Patient reimbursement services (co-pay and foundation programs) Brand Su p p o rt HUB programs for brand message control and consistency End to end exclusivity for product SCG Differentiators Manufacturer- centric Independent Adaptable Integrated 24 60% of customers have more than one program within the SCG
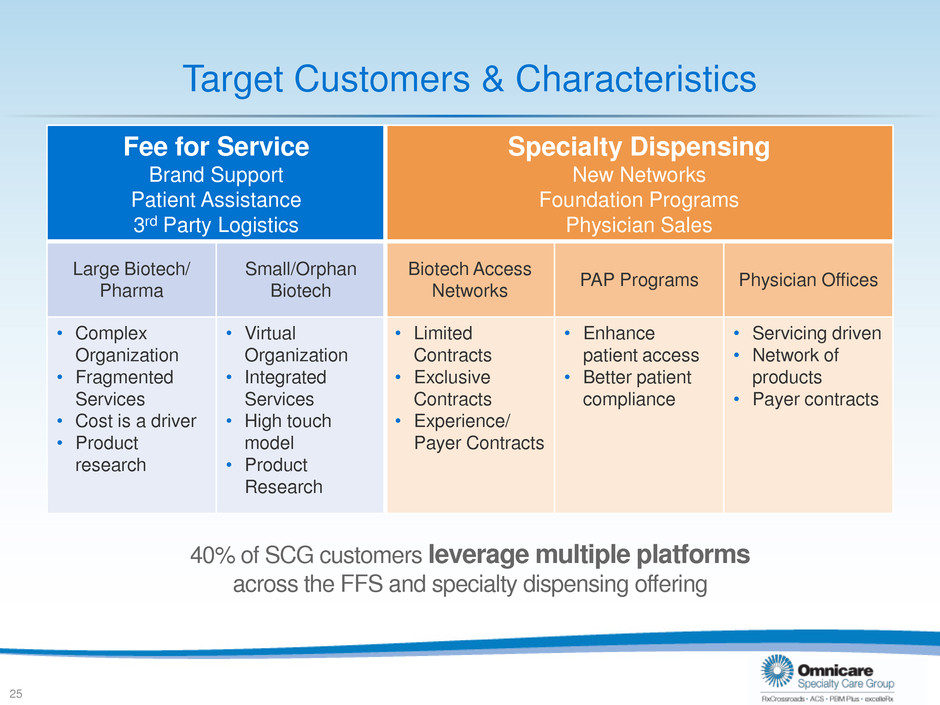
Target Customers & Characteristics Fee for Service Brand Support Patient Assistance 3rd Party Logistics Specialty Dispensing New Networks Foundation Programs Physician Sales Large Biotech/ Pharma Small/Orphan Biotech Biotech Access Networks PAP Programs Physician Offices • Complex Organization • Fragmented Services • Cost is a driver • Product research • Virtual Organization • Integrated Services • High touch model • Product Research • Limited Contracts • Exclusive Contracts • Experience/ Payer Contracts • Enhance patient access • Better patient compliance • Servicing driven • Network of products • Payer contracts 25 40% of SCG customers leverage multiple platforms across the FFS and specialty dispensing offering
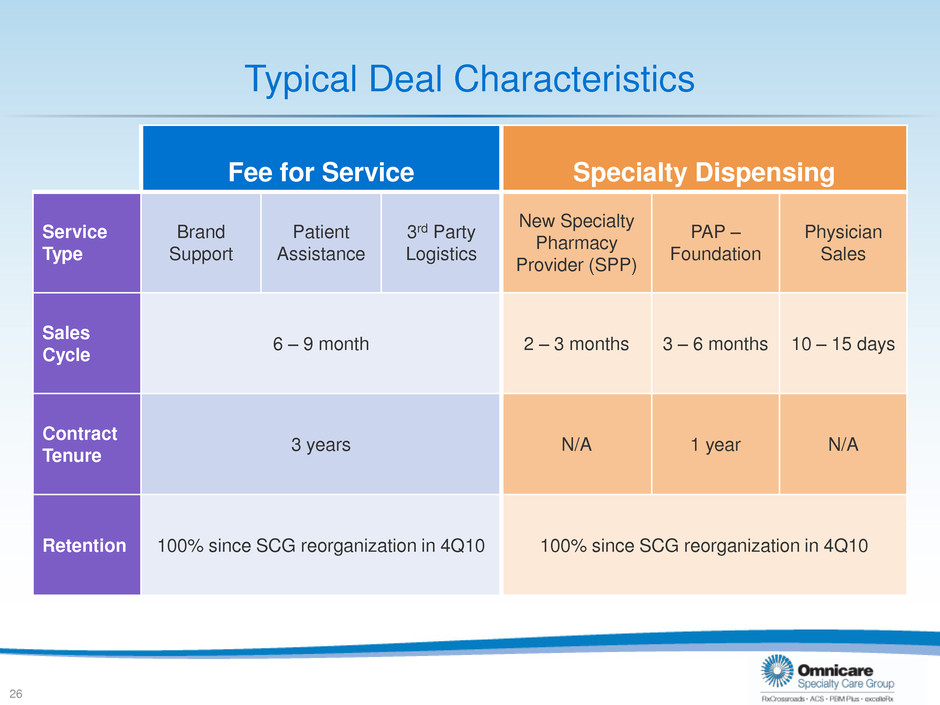
Typical Deal Characteristics Fee for Service Specialty Dispensing Service Type Brand Support Patient Assistance 3rd Party Logistics New Specialty Pharmacy Provider (SPP) PAP – Foundation Physician Sales Sales Cycle 6 – 9 month 2 – 3 months 3 – 6 months 10 – 15 days Contract Tenure 3 years N/A 1 year N/A Retention 100% since SCG reorganization in 4Q10 100% since SCG reorganization in 4Q10 26
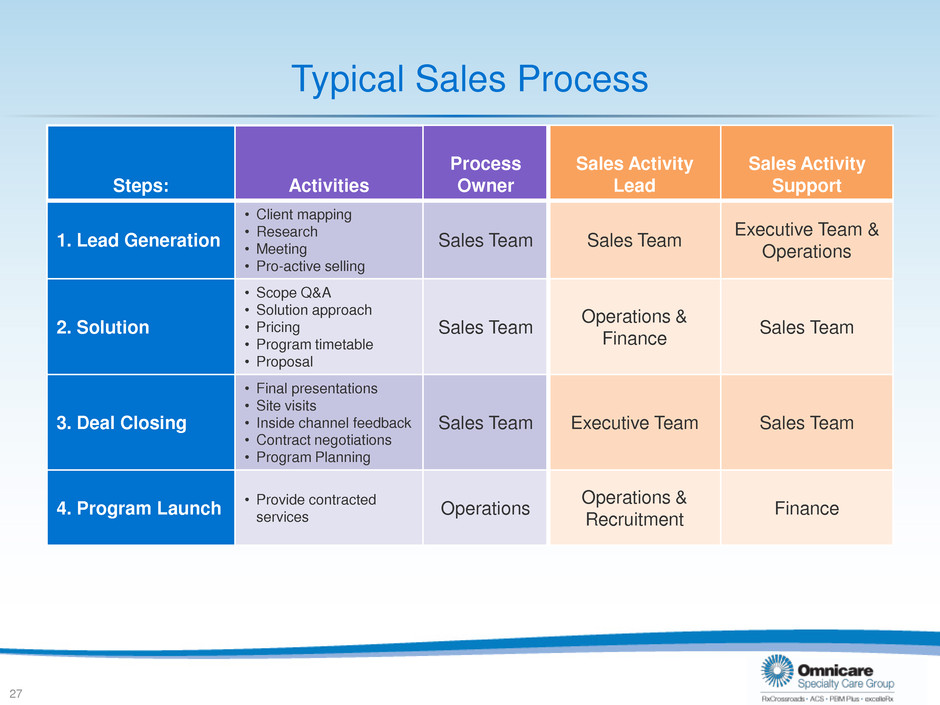
Typical Sales Process Steps: Activities Process Owner Sales Activity Lead Sales Activity Support 1. Lead Generation • Client mapping • Research • Meeting • Pro-active selling Sales Team Sales Team Executive Team & Operations 2. Solution • Scope Q&A • Solution approach • Pricing • Program timetable • Proposal Sales Team Operations & Finance Sales Team 3. Deal Closing • Final presentations • Site visits • Inside channel feedback • Contract negotiations • Program Planning Sales Team Executive Team Sales Team 4. Program Launch • Provide contracted services Operations Operations & Recruitment Finance 27
Specialty Market Denise Von Dohren Vice President, Access Solutions, SCG 28
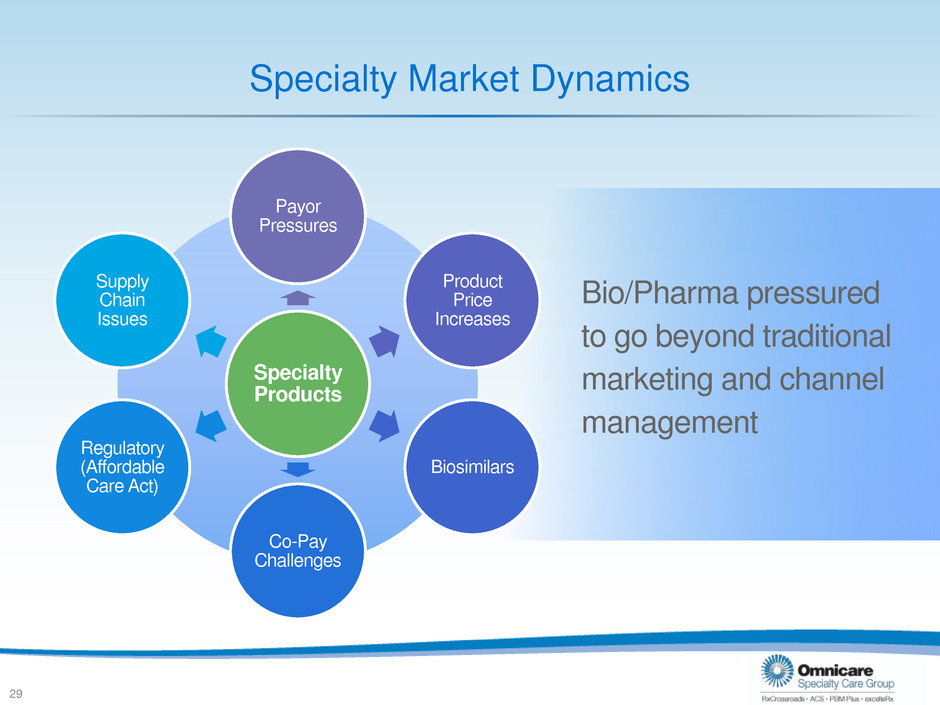
Specialty Market Dynamics Specialty Products Payor Pressures Product Price Increases Biosimilars Co-Pay Challenges Regulatory (Affordable Care Act) Supply Chain Issues 29 Bio/Pharma pressured to go beyond traditional marketing and channel management
Specialty Market Dynamics • Robust pipeline – More than 900 specialty products in the pipeline (1) – Many therapy categories, oncology representing nearly half of the pipeline • Routes of administration (ROAs) – Benefits patients by improving access to specialty products – Does not address adherence issues In 2011 the specialty drug market grew >17%(2); pipeline indication of continued rapid growth 30 1. Source: PhRMA, Biotechnology Medicines in Development – 2011 2. Source: 2011 Express Scripts Drug Trend Report
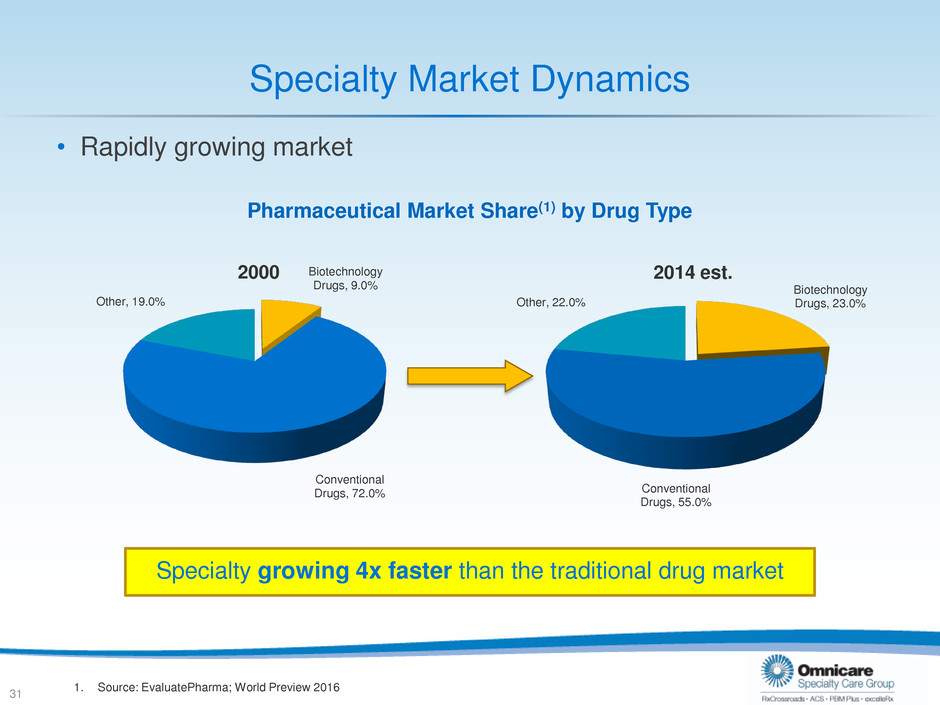
Specialty Market Dynamics • Rapidly growing market 31 Biotechnology Drugs, 9.0% Conventional Drugs, 72.0% Other, 19.0% 2000 Biotechnology Drugs, 23.0% Conventional Drugs, 55.0% Other, 22.0% 2014 est. Pharmaceutical Market Share(1) by Drug Type Specialty growing 4x faster than the traditional drug market 1. Source: EvaluatePharma; World Preview 2016
Specialty Market Dynamics “Small is the New Big” • Orphan Drugs – Targeting rare conditions – 7 years exclusivity – Clinical trial awards of $200 to $400K per year – Lower risk associated with discovery – Smaller infrastructure to support Orphan drugs target 6,000-8,000 conditions that affect populations of 200,000 or less 32
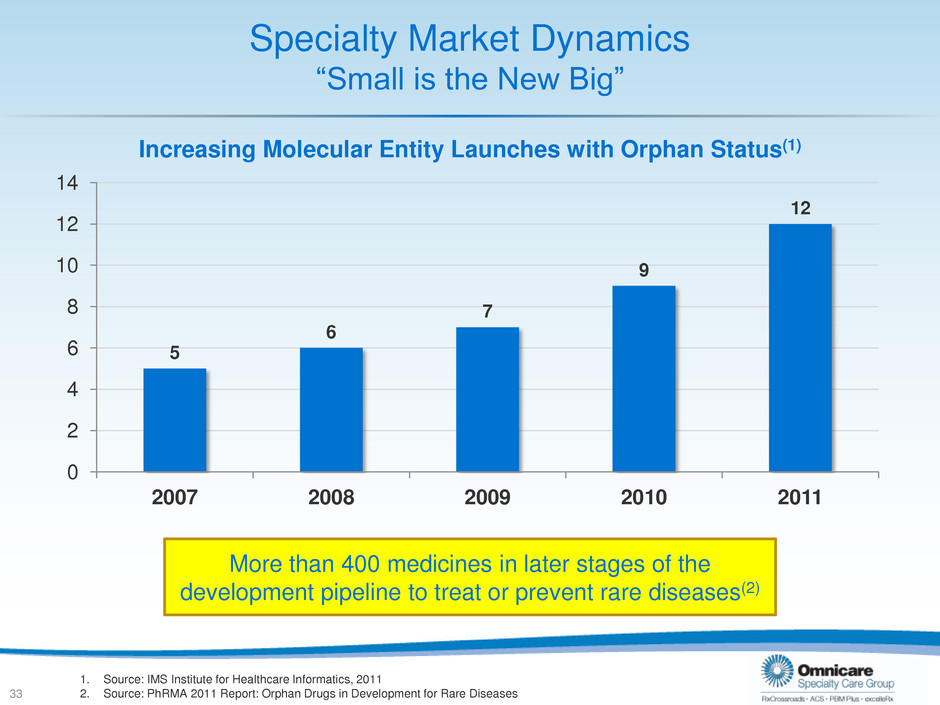
Specialty Market Dynamics “Small is the New Big” 5 6 7 9 12 0 2 4 6 8 10 12 14 2007 2008 2009 2010 2011 Increasing Molecular Entity Launches with Orphan Status(1) More than 400 medicines in later stages of the development pipeline to treat or prevent rare diseases(2) 33 1. Source: IMS Institute for Healthcare Informatics, 2011 2. Source: PhRMA 2011 Report: Orphan Drugs in Development for Rare Diseases
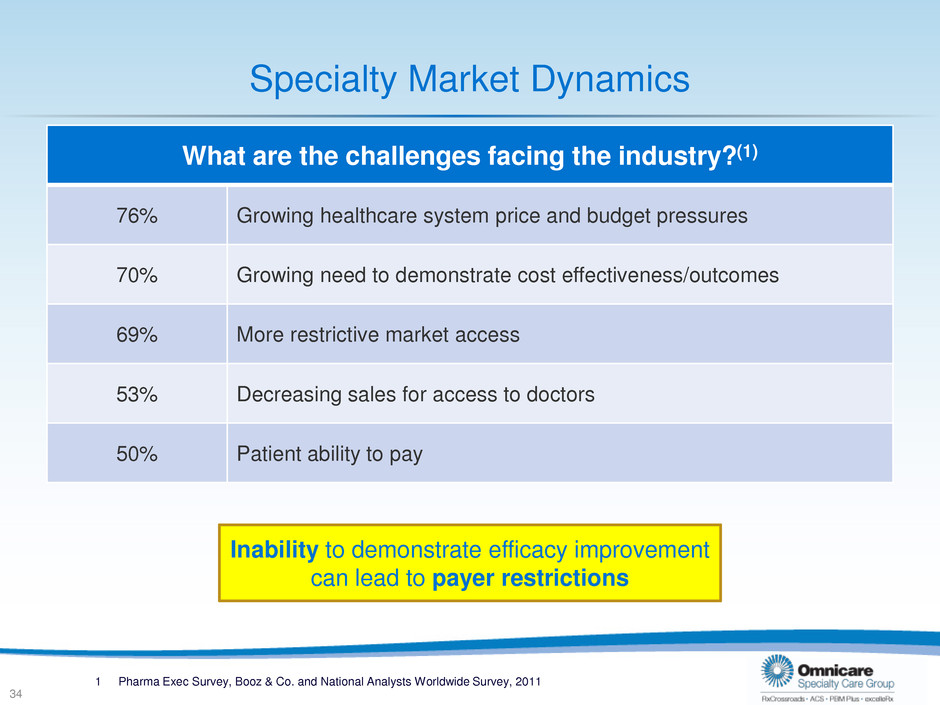
1 Pharma Exec Survey, Booz & Co. and National Analysts Worldwide Survey, 2011 Specialty Market Dynamics What are the challenges facing the industry?(1) 76% Growing healthcare system price and budget pressures 70% Growing need to demonstrate cost effectiveness/outcomes 69% More restrictive market access 53% Decreasing sales for access to doctors 50% Patient ability to pay Inability to demonstrate efficacy improvement can lead to payer restrictions 34
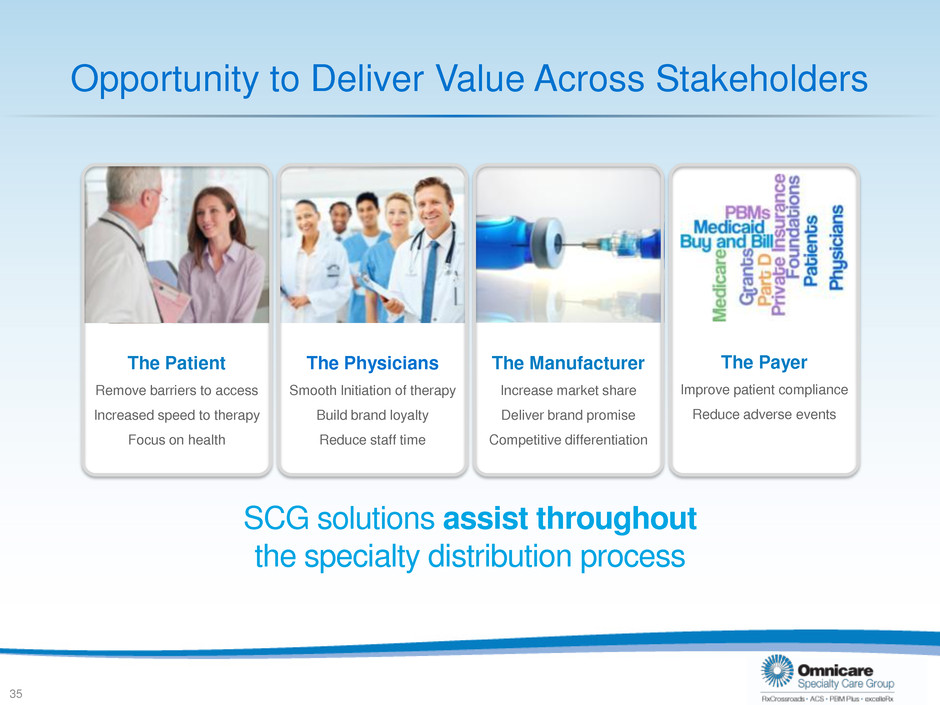
Opportunity to Deliver Value Across Stakeholders The Physicians Smooth Initiation of therapy Build brand loyalty Reduce staff time The Manufacturer Increase market share Deliver brand promise Competitive differentiation The Patient Remove barriers to access Increased speed to therapy Focus on health The Payer Improve patient compliance Reduce adverse events 35 SCG solutions assist throughout the specialty distribution process
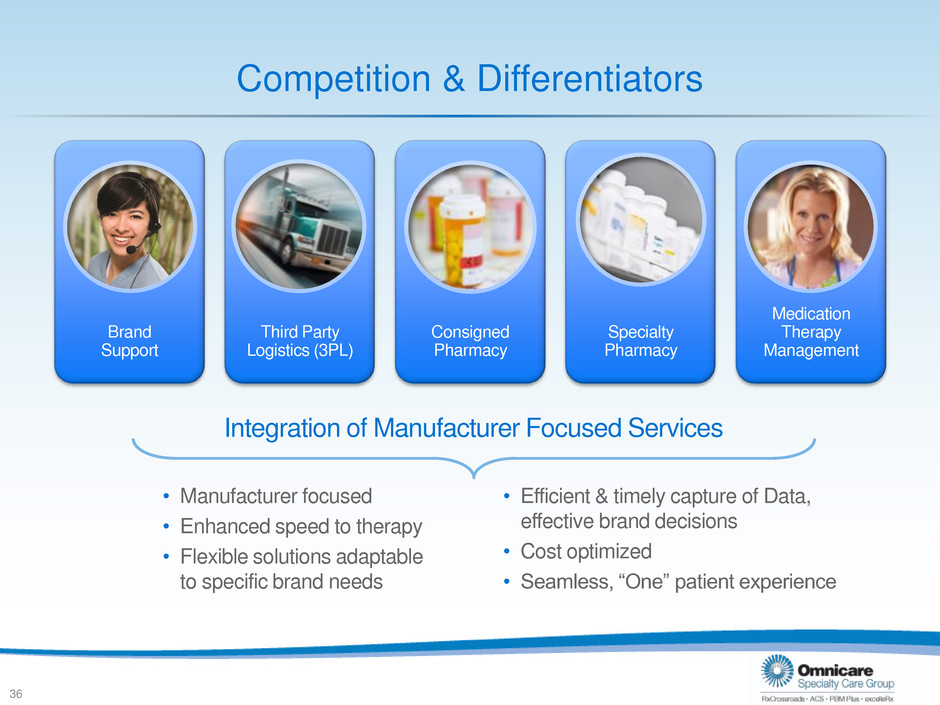
Third Party Logistics (3PL) Brand Support Consigned Pharmacy Specialty Pharmacy Medication Therapy Management Competition & Differentiators Integration of Manufacturer Focused Services • Manufacturer focused • Enhanced speed to therapy • Flexible solutions adaptable to specific brand needs • Efficient & timely capture of Data, effective brand decisions • Cost optimized • Seamless, “One” patient experience 36
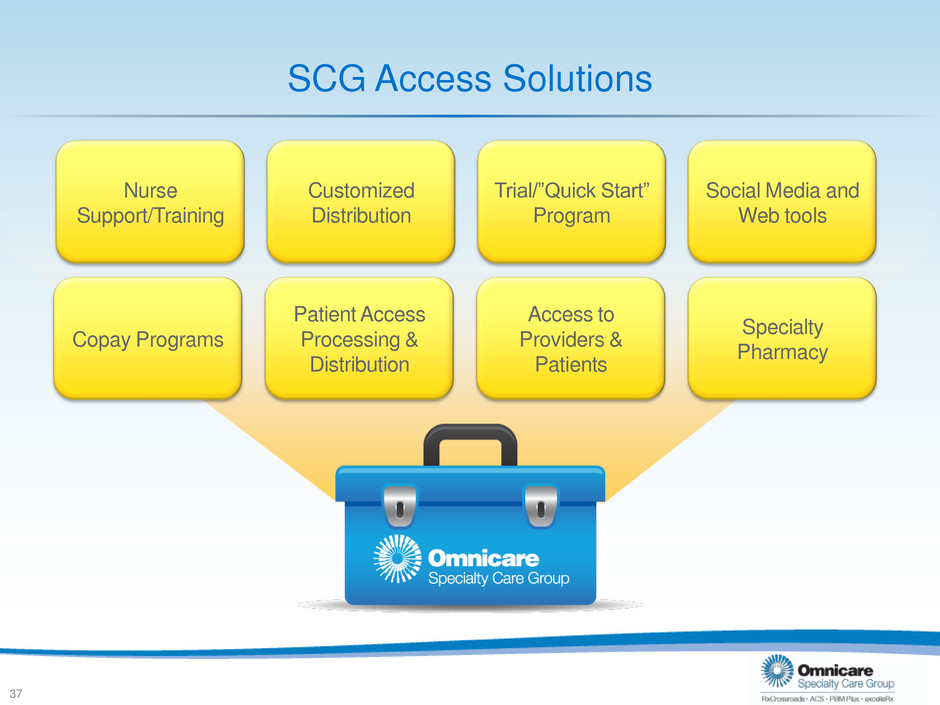
Nurse Support/Training Customized Distribution Patient Access Processing & Distribution Copay Programs Trial/”Quick Start” Program Specialty Pharmacy Social Media and Web tools Access to Providers & Patients SCG Access Solutions 37
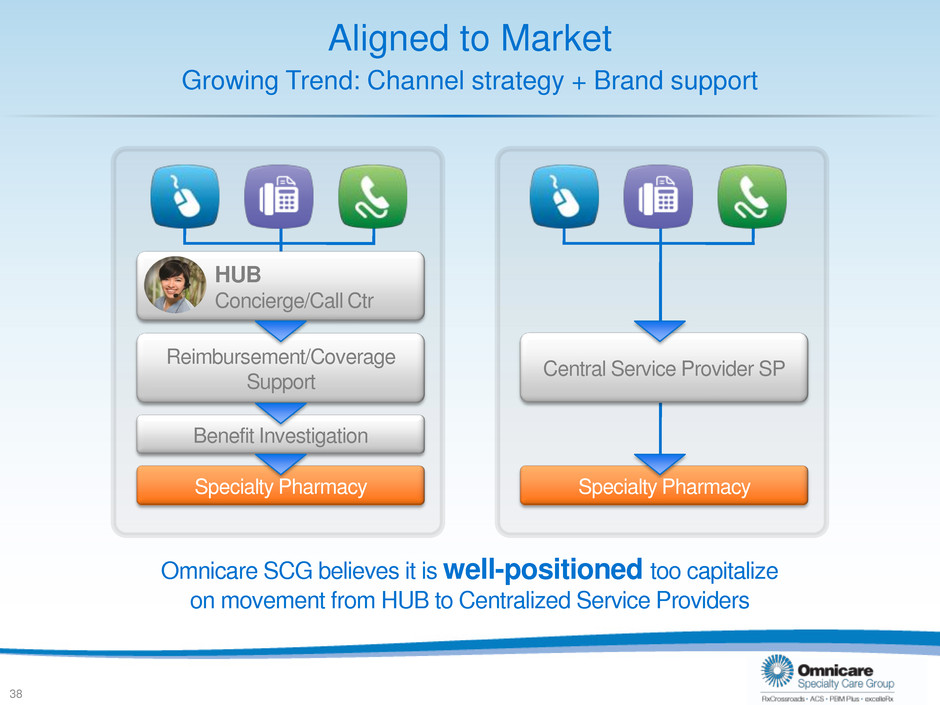
Aligned to Market Growing Trend: Channel strategy + Brand support 38 Omnicare SCG believes it is well-positioned too capitalize on movement from HUB to Centralized Service Providers HUB Concierge/Call Ctr Reimbursement/Coverage Support Benefit Investigation Specialty Pharmacy Central Service Provider SP Specialty Pharmacy
Summary • Rapidly changing market dynamics • SCG integrated platforms enable customization to drive differentiation • Innovative programs to improve potential for commercial success 39
Brand Support Services John Doster Vice President, Brand Support Services, SCG 40
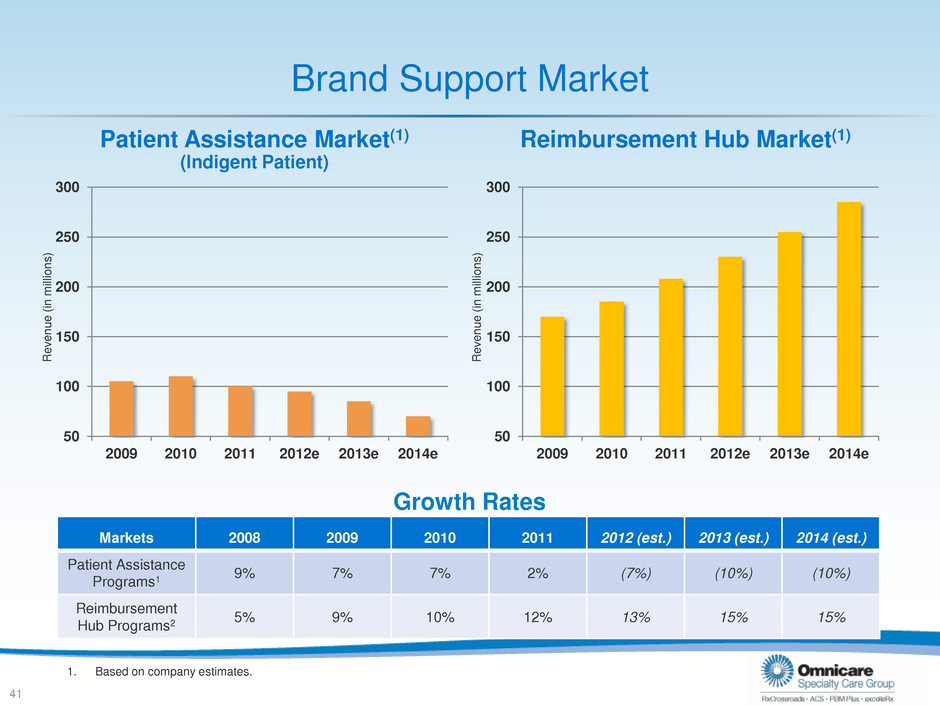
Brand Support Market 50 100 150 200 250 300 2009 2010 2011 2012e 2013e 2014e Reimbursement Hub Market(1) Patient Assistance Market(1) (Indigent Patient) Markets 2008 2009 2010 2011 2012 (est.) 2013 (est.) 2014 (est.) Patient Assistance Programs1 9% 7% 7% 2% (7%) (10%) (10%) Reimbursement Hub Programs2 5% 9% 10% 12% 13% 15% 15% Growth Rates 1. Based on company estimates. Re v e n u e ( in m ill io n s ) 50 100 150 200 250 300 2009 2010 2011 2012e 2013e 2014e Re v e n u e ( in m ill io n s ) 41
Market Conditions • Shifting corporate strategy and spend toward specialty products • Cost cutting within non-specialty product programs • Vendor consolidation – Cost considerations driving companies to consolidate patient support vendors • Competitor consolidation – Requires challenging integration of services and personnel • Enhancing use of technology – Streamline programs – Opportunities to increase provider / patient utilization and satisfaction 42 42
The Need for an External Partner • Economies of scale – Phone systems and patient management systems are expensive to build and maintain – Vendor can more effectively spread costs across customer base – Vendor gains insight and knowledge across programs that can be leveraged by individual company • Maintaining technology in-house is challenging • Test claims capability important in streamlining process • Distribution and pharmacy connectivity 43
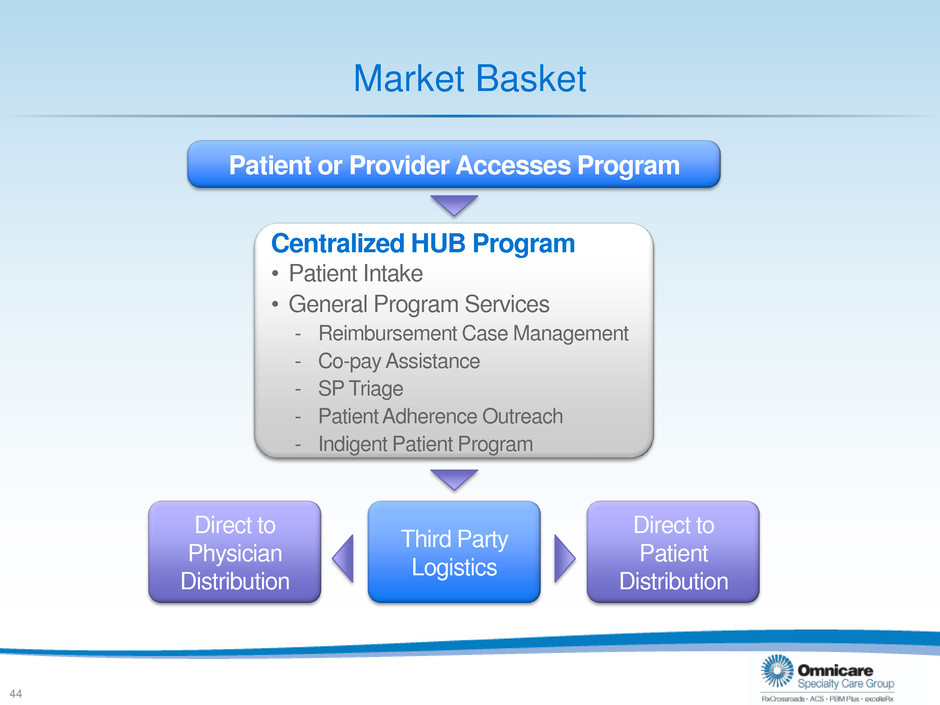
Third Party Logistics Market Basket 44 Centralized HUB Program • Patient Intake • General Program Services - Reimbursement Case Management - Co-pay Assistance - SP Triage - Patient Adherence Outreach - Indigent Patient Program Patient or Provider Accesses Program Direct to Physician Distribution Direct to Patient Distribution
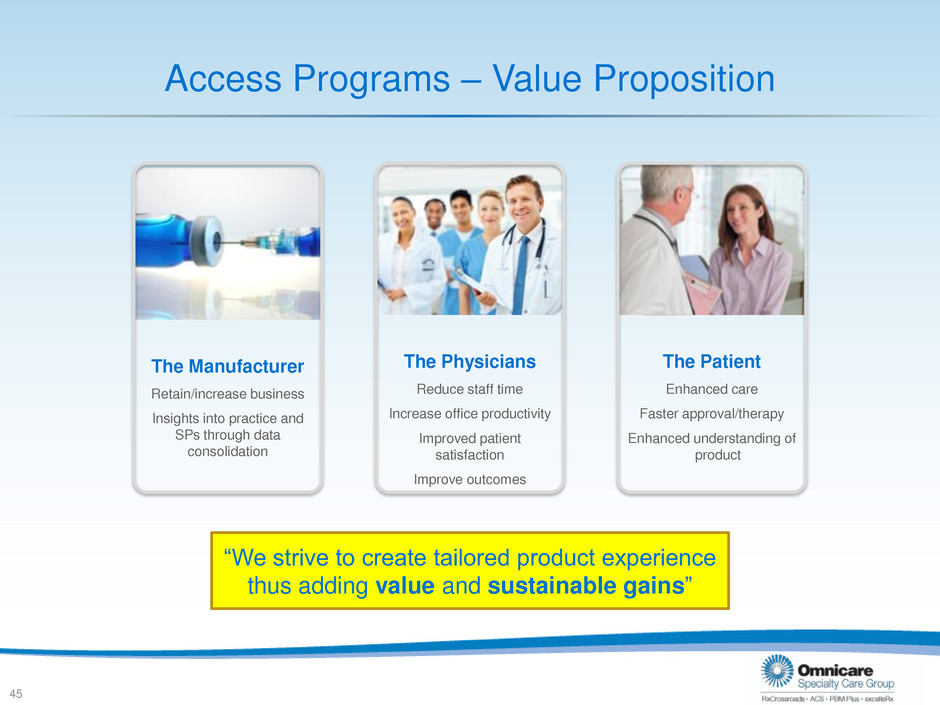
Access Programs – Value Proposition The Physicians Reduce staff time Increase office productivity Improved patient satisfaction Improve outcomes The Manufacturer Retain/increase business Insights into practice and SPs through data consolidation The Patient Enhanced care Faster approval/therapy Enhanced understanding of product “We strive to create tailored product experience thus adding value and sustainable gains” 45
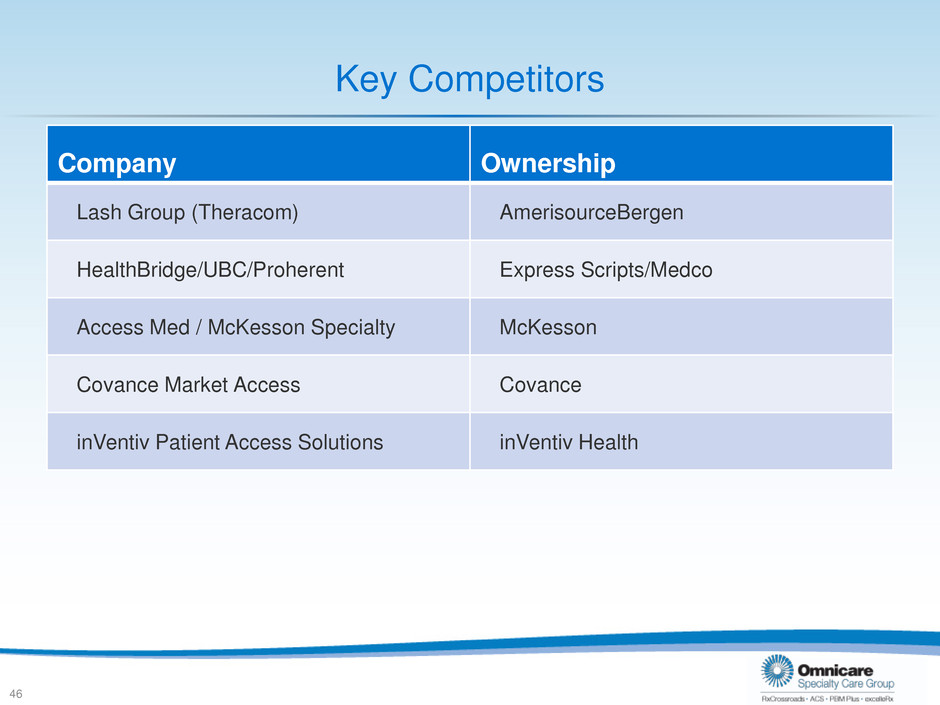
Key Competitors Company Ownership Lash Group (Theracom) AmerisourceBergen HealthBridge/UBC/Proherent Express Scripts/Medco Access Med / McKesson Specialty McKesson Covance Market Access Covance inVentiv Patient Access Solutions inVentiv Health 46
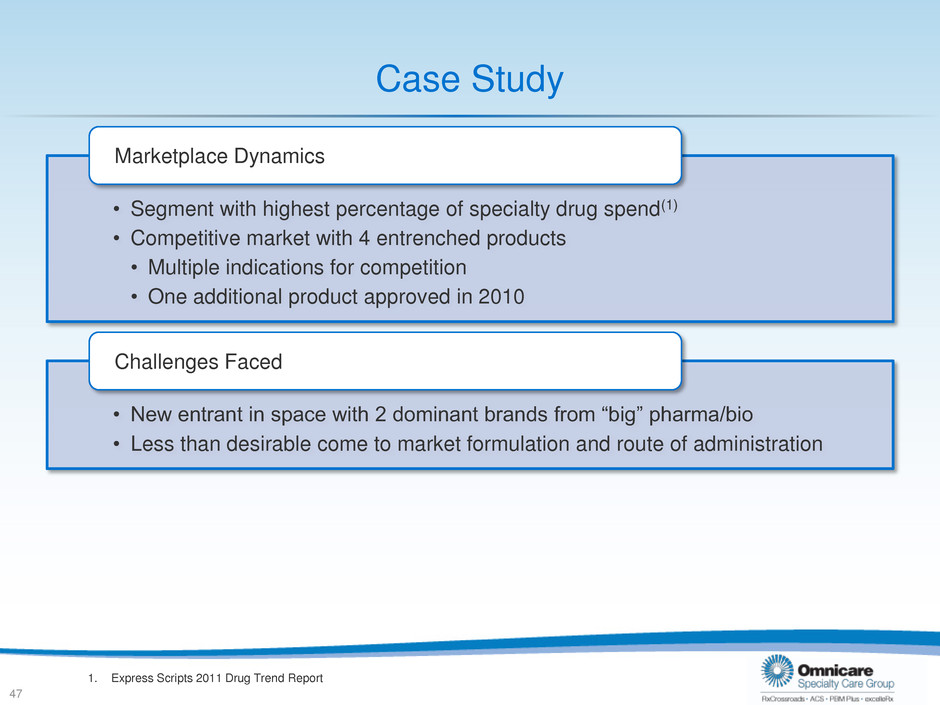
Case Study • Segment with highest percentage of specialty drug spend(1) • Competitive market with 4 entrenched products • Multiple indications for competition • One additional product approved in 2010 Marketplace Dynamics • New entrant in space with 2 dominant brands from “big” pharma/bio • Less than desirable come to market formulation and route of administration Challenges Faced 1. Express Scripts 2011 Drug Trend Report 47
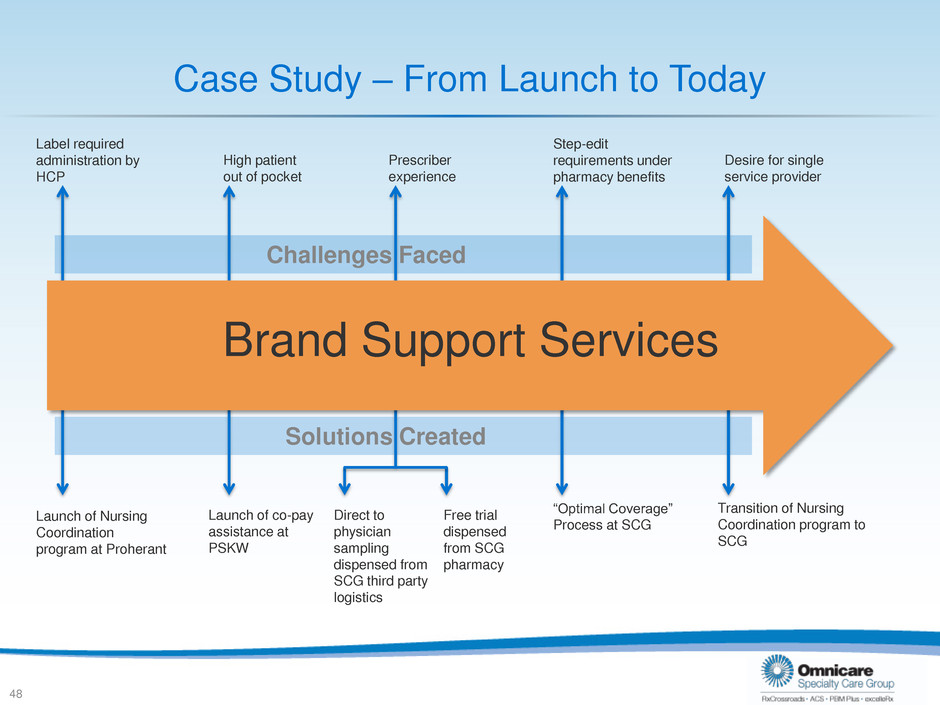
Brand Support Services Case Study – From Launch to Today 48 Label required administration by HCP Launch of Nursing Coordination program at Proherant High patient out of pocket Launch of co-pay assistance at PSKW Prescriber experience Direct to physician sampling dispensed from SCG third party logistics Free trial dispensed from SCG pharmacy Step-edit requirements under pharmacy benefits “Optimal Coverage” Process at SCG Transition of Nursing Coordination program to SCG Desire for single service provider Challenges Faced Solutions Created
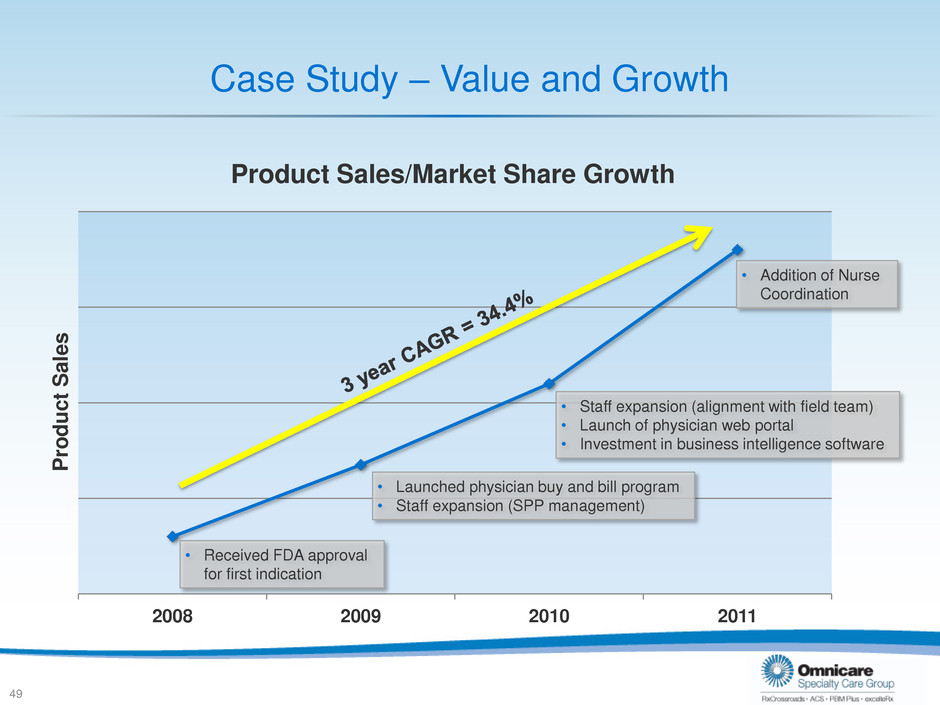
Case Study – Value and Growth 2008 2009 2010 2011 Product Sales/Market Share Growth 49 P ro d uc t Sal e s • Addition of Nurse Coordination • Staff expansion (alignment with field team) • Launch of physician web portal • Investment in business intelligence software • Launched physician buy and bill program • Staff expansion (SPP management) • Received FDA approval for first indication
Closing Remarks Nitin Sahney Chief Operating Officer 50
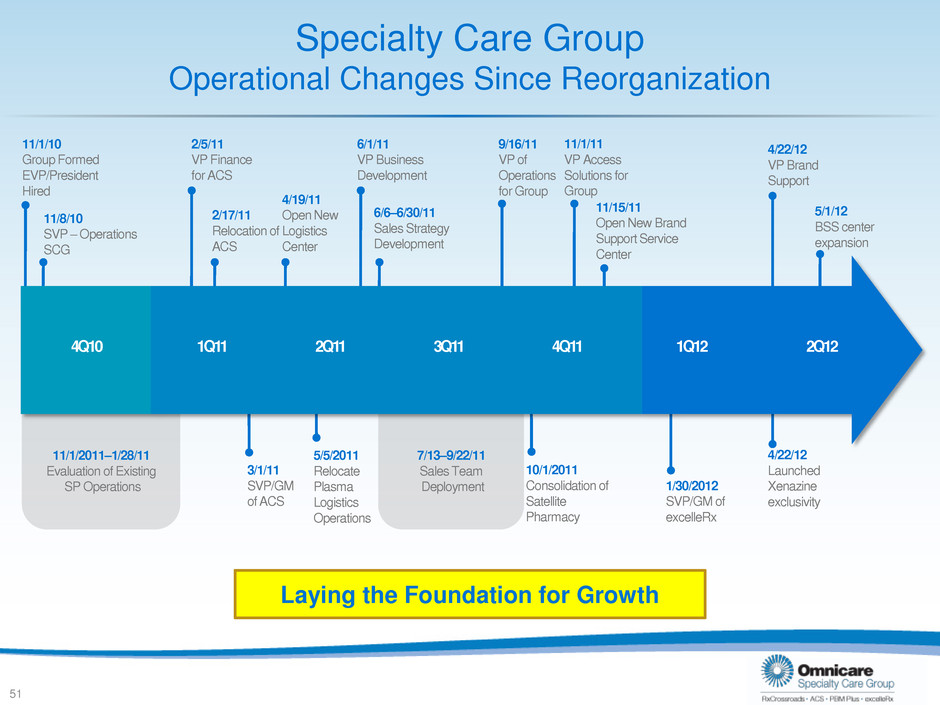
Specialty Care Group Operational Changes Since Reorganization 51 11/1/10 Group Formed EVP/President Hired 11/8/10 SVP – Operations SCG 11/1/2011–1/28/11 Evaluation of Existing SP Operations 1Q11 2Q11 3Q11 4Q11 2/5/11 VP Finance for ACS 2/17/11 Relocation of ACS 3/1/11 SVP/GM of ACS 4/19/11 Open New Logistics Center 5/5/2011 Relocate Plasma Logistics Operations 6/1/11 VP Business Development 6/6–6/30/11 Sales Strategy Development 7/13–9/22/11 Sales Team Deployment 9/16/11 VP of Operations for Group 10/1/2011 Consolidation of Satellite Pharmacy 11/1/11 VP Access Solutions for Group 11/15/11 Open New Brand Support Service Center Laying the Foundation for Growth 1/30/2012 SVP/GM of excelleRx 4/22/12 Launched Xenazine exclusivity 4/22/12 VP Brand Support 5/1/12 BSS center expansion 4Q10 1Q12 2Q12
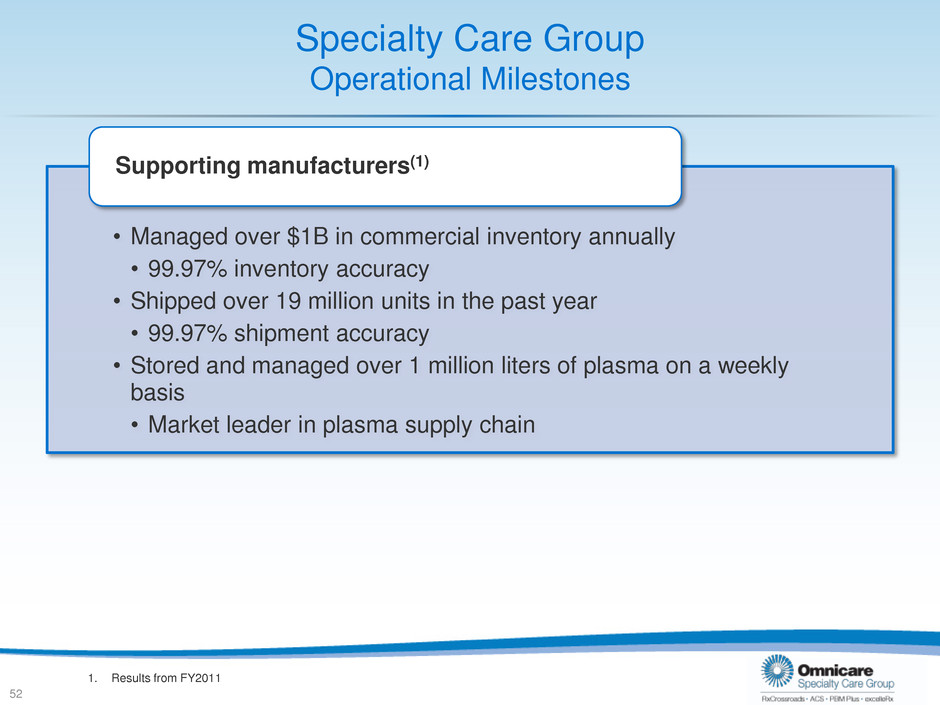
Specialty Care Group Operational Milestones • Managed over $1B in commercial inventory annually • 99.97% inventory accuracy • Shipped over 19 million units in the past year • 99.97% shipment accuracy • Stored and managed over 1 million liters of plasma on a weekly basis • Market leader in plasma supply chain Supporting manufacturers(1) 52 1. Results from FY2011
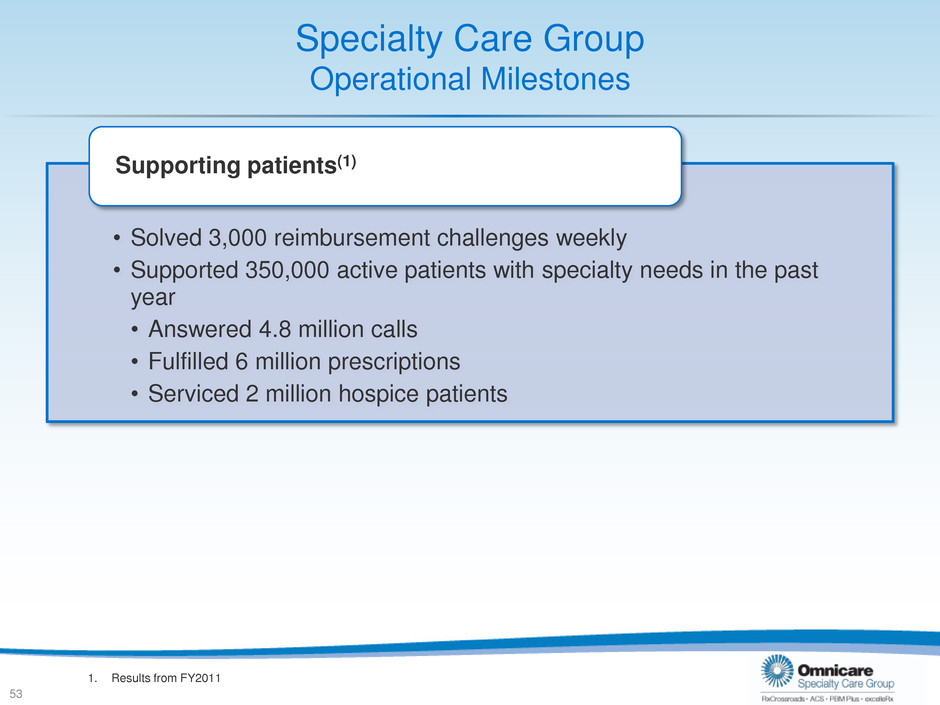
Specialty Care Group Operational Milestones • Solved 3,000 reimbursement challenges weekly • Supported 350,000 active patients with specialty needs in the past year • Answered 4.8 million calls • Fulfilled 6 million prescriptions • Serviced 2 million hospice patients Supporting patients(1) 53 1. Results from FY2011
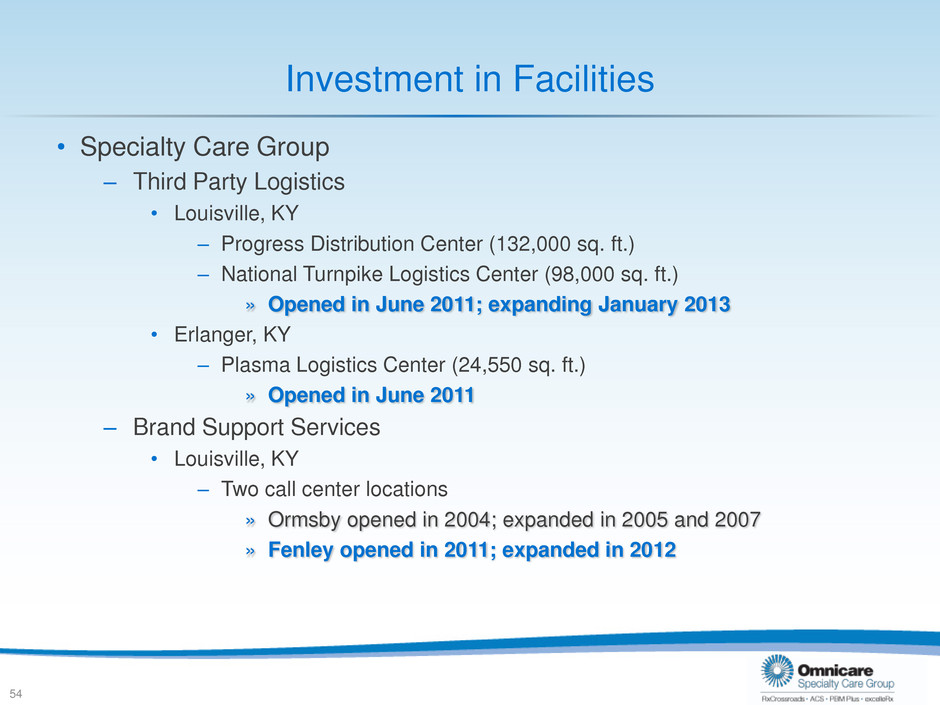
Investment in Facilities • Specialty Care Group – Third Party Logistics • Louisville, KY – Progress Distribution Center (132,000 sq. ft.) – National Turnpike Logistics Center (98,000 sq. ft.) » Opened in June 2011; expanding January 2013 • Erlanger, KY – Plasma Logistics Center (24,550 sq. ft.) » Opened in June 2011 – Brand Support Services • Louisville, KY – Two call center locations » Ormsby opened in 2004; expanded in 2005 and 2007 » Fenley opened in 2011; expanded in 2012 54
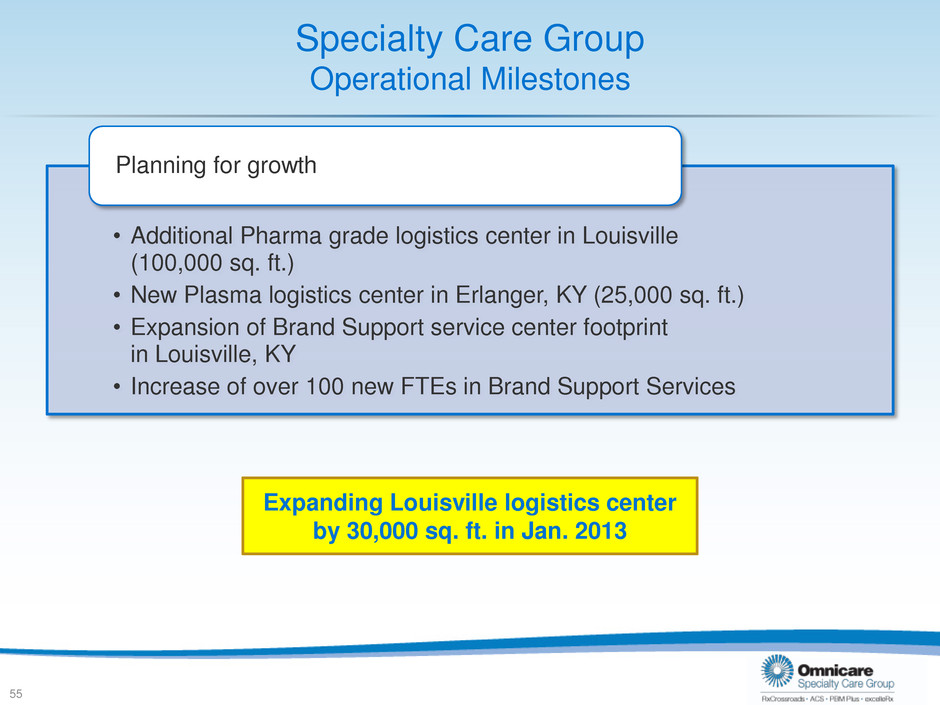
Specialty Care Group Operational Milestones • Additional Pharma grade logistics center in Louisville (100,000 sq. ft.) • New Plasma logistics center in Erlanger, KY (25,000 sq. ft.) • Expansion of Brand Support service center footprint in Louisville, KY • Increase of over 100 new FTEs in Brand Support Services Planning for growth 55 Expanding Louisville logistics center by 30,000 sq. ft. in Jan. 2013
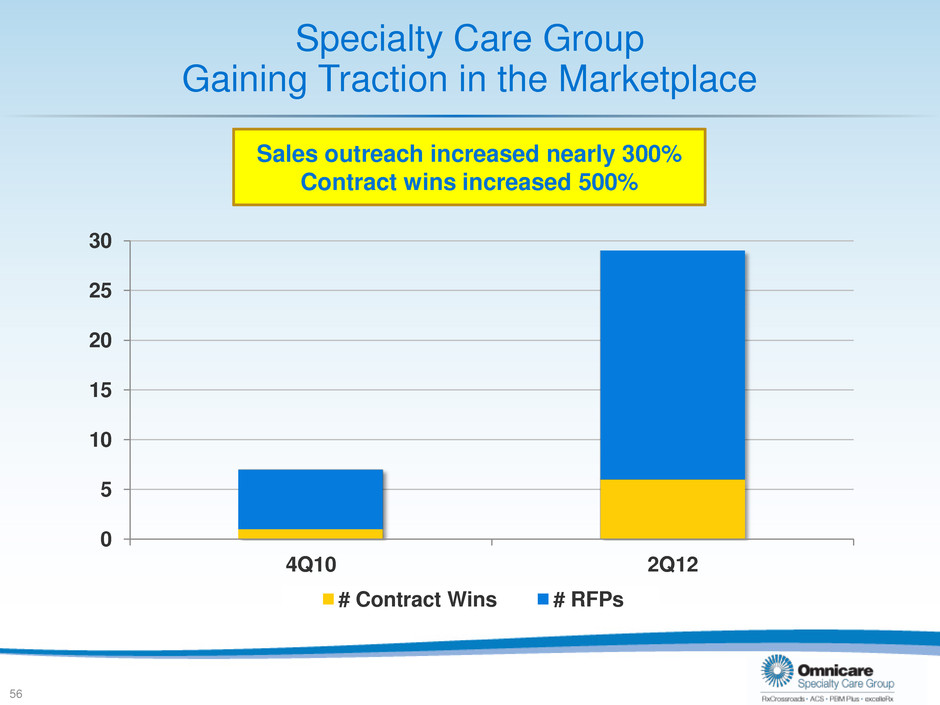
Specialty Care Group Gaining Traction in the Marketplace 0 5 10 15 20 25 30 4Q10 2Q12 # Contract Wins # RFPs Sales outreach increased nearly 300% Contract wins increased 500% 56
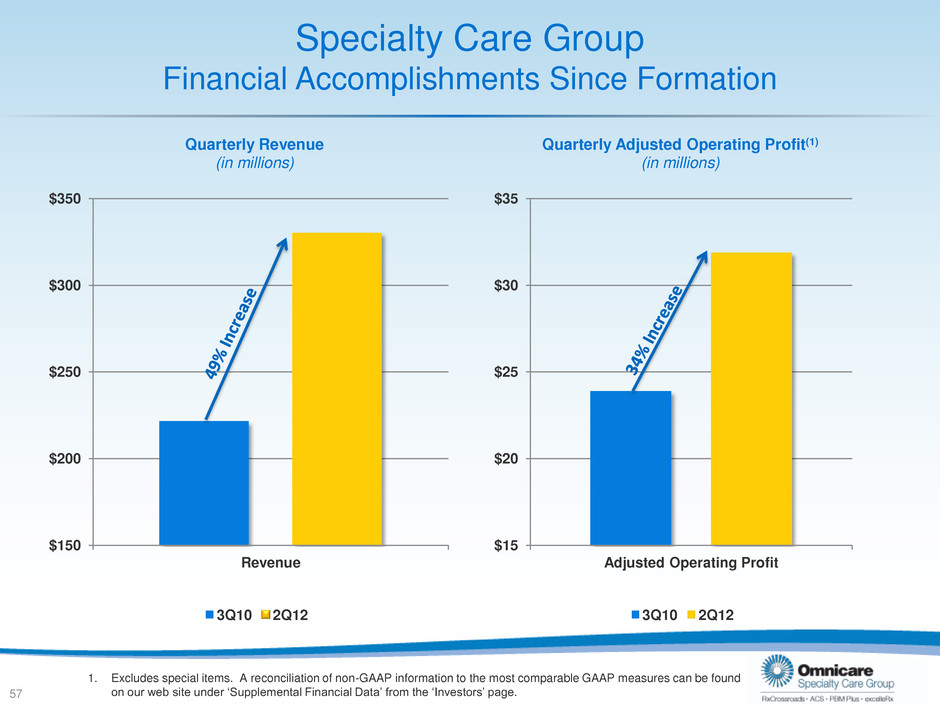
Specialty Care Group Financial Accomplishments Since Formation $150 $200 $250 $300 $350 Revenue Quarterly Revenue (in millions) 3Q10 2Q12 57 $15 $20 $25 $30 $35 Adjusted Operating Profit Quarterly Adjusted Operating Profit(1) (in millions) 3Q10 2Q12 1. Excludes special items. A reconciliation of non-GAAP information to the most comparable GAAP measures can be found on our web site under ‘Supplemental Financial Data’ from the ‘Investors’ page.
Specialty Care Group Maximizing Internal and External Opportunities Omnicare specialty care growth has been robust… and opportunities exist to further accelerate growth through: • Continued improvements to the organizational structure – Investments made to support solutions sales process – Platform-specific experts added to expand capabilities • Penetrating additional disease states in specialty pharmacy platform – Primary disease states currently multiple sclerosis and oncology • Leveraging long-term care business to create new opportunities • Biosimilars’ pathway to market 58 Annual revenue growth rate for Omnicare’s specialty care businesses exceeds 20%(1) 1. Year-over-year revenue growth based on June 30, 2012 YTD results vs. June 30, 2011.
Specialty Care Group Benefits SCG Brings to Omnicare • Rapidly growing market • We believe our integrated offering has broad appeal with manufacturers • Diversifies Omnicare’s payer mix • SCG aligned with country’s efforts to improve healthcare efficiencies 59 Formation of Specialty Care Group has benefited Omnicare and provided additional platform for growth

Omnicare Specialty Summit September 18, 2012


