ITEM 3. - LEGAL PROCEEDINGS
On May 18, 2006, an antitrust and fraud action entitledOmnicare, Inc. v. UnitedHealth Group, Inc., et al., 2:06-cv-00103-WOB, was filed by the Company in the United States District Court for the Eastern District of Kentucky against UnitedHealth Group, Inc., PacifiCare Health Systems, Inc., and RxSolutions, Inc. d/b/a Prescription Solutions, asserting claims of violations of federal and state antitrust laws, civil conspiracy and common law fraud arising out of an alleged conspiracy by defendants to illegally and fraudulently coordinate their negotiations with the Company for Medicare Part D contracts as part of an effort to defraud the Company and fix prices. The complaint seeks, among other things, damages, injunctive relief and reformation of certain contracts. On June 5, 2006, the Company filed a first supplemental and amended complaint in which it asserted the identical claims. In an order dated November 9, 2006, a motion by defendants to transfer venue to the United States District Court for the Northern District of Illinois was granted, but a motion to dismiss the antitrust claims was denied without prejudice, with leave to refile in the transferee court. In the United States District Court for the Northern District of Illinois, the defendants renewed their motion to dismiss the Company’s antitrust claims on December 22, 2006, and on September 28, 2007 their motion was denied. On March 7, 2007, the Court entered a Minute Order setting a discovery schedule for the litigation. Under the Order, fact discovery is to be completed by January 31, 2008, and expert discovery is to be completed by May 1, 2008. These dates, among others, were extended one month by agreement to February 29, 2008 and June 2, 2008, respectively. At the present time, both parties are engaged in fact discovery and related motion practice and the parties have engaged in extensive documentary and deposition discovery. On May 22, 2007, the Court entered a Minute Order setting a trial date of October 14, 2008.
The United States Attorney’s Office, District of Massachusetts, is conducting an investigation relating to the Company’s relationships with certain manufacturers and distributors of pharmaceutical products and certain customers, as well as with respect to contracts with certain companies acquired by the Company. Any action by the U.S. Attorney’s Office, District of Massachusetts, could result in civil or criminal proceedings against the Company. The Company believes that it has complied with all applicable laws and regulations with respect to these matters.
On February 2 and February 13, 2006, respectively, two substantially similar putative class action lawsuits, entitledIndiana State Dist. Council of Laborers & HOD Carriers Pension & Welfare Fund v. Omnicare, Inc., et al., No. 2:06cv26 (“HOD Carriers”), andChi v. Omnicare, Inc., et al., No. 2:06cv31 (“Chi”), were filed against Omnicare and two of its officers in the United States District Court for the Eastern District of Kentucky purporting to assert claims for violation of §§10(b) and 20(a) of the Securities Exchange Act of 1934 and Rule 10b-5 promulgated thereunder, and seeking, among other things, compensatory damages and injunctive relief. The complaints, which purported to be brought on behalf of all open-market purchasers of Omnicare common stock from August 3, 2005 through January 27, 2006, alleged that Omnicare had artificially inflated its earnings by engaging in improper generic drug substitution and that defendants had made false and misleading statements regarding the Company’s business and prospects. On April 3, 2006, plaintiffs in theHOD Carriers case formally moved for consolidation and the appointment of lead plaintiff and lead counsel pursuant to the Private
42
Securities Litigation Reform Act of 1995. On May 22, 2006, that motion was granted, the cases were consolidated, and a lead plaintiff and lead counsel were appointed. On July 20, 2006, plaintiffs filed a consolidated amended complaint, adding a third officer as a defendant and new factual allegations primarily relating to revenue recognition, the valuation of receivables and the valuation of inventories. On October 31, 2006, plaintiffs moved for leave to file a second amended complaint, which was granted on January 26, 2007, on the condition that no further amendments would be permitted absent extraordinary circumstances. Plaintiffs thereafter filed their second amended complaint on January 29, 2007. The second amended complaint (i) expands the putative class to include all purchasers of Omnicare common stock from August 3, 2005 through July 27, 2006, (ii) names two members of the Company’s board of directors as additional defendants, (iii) adds a new plaintiff and a new claim for violation of Section 11 of the Securities Act of 1933 based on alleged false and misleading statements in the registration statement filed in connection with the Company’s December 2005 public offering, (iv) alleges that the Company failed to timely disclose its contractual dispute with UnitedHealth Group (see discussion of theUnitedHealth Group matter above), and (v) alleges that the Company failed to timely record certain special litigation reserves. Defendants filed a motion to dismiss the second amended complaint on March 12, 2007, claiming that plaintiffs had failed adequately to plead loss causation, scienter or any actionable misstatement or omission. That motion was fully briefed as of May 1, 2007. In response to certain arguments relating to the individual claims of the named plaintiffs that were raised in defendants’ pending motion to dismiss, plaintiffs filed a motion to add, or in the alternative, to intervene an additional named plaintiff, Alaska Electrical Pension Fund, on July 27, 2007. Oral argument was held on defendants’ motion to dismiss on August 2, 2007. On October 12, 2007, the court issued an opinion and order dismissing the case and denying plaintiffs’ motion to add an additional named plaintiff. On November 9, 2007, plaintiffs filed a notice of appeal with the United States Court of Appeals for the Sixth Circuit and in a subsequent filing expressed an intention to appeal all aspects of the lower court’s decision. The appellate court has issued a briefing schedule, plaintiffs obtained a 30-day extension of time to file their brief, and all briefs are now due by May 30, 2008.
On February 13, 2006, two substantially similar shareholder derivative actions, entitledIsak v. Gemunder, et al., Case No. 06-CI-390, andFragnoli v. Hutton, et al., Case No. 06-CI-389, were filed in Kentucky State Circuit Court, Kenton Circuit, against the members of Omnicare’s board of directors, individually, purporting to assert claims for breach of fiduciary duty, abuse of control, gross mismanagement, waste of corporate assets and unjust enrichment arising out of the Company’s alleged violations of federal and state health care laws based upon the same purportedly improper generic drug substitution that is the subject of the federal purported class action lawsuits. The complaints seek, among other things, damages, restitution and injunctive relief. TheIsak andFragnoli actions were later consolidated by agreement of the parties. On January 12, 2007, the defendants filed a motion to dismiss the consolidated action on the grounds that the dismissal of the substantially identical shareholder derivative action,Irwin v. Gemunder, et al.,2:06cv62, by the United States District Court for the Eastern District of Kentucky on November 20, 2006 should be given preclusive effect and thus bars re-litigation of the issues already decided inIrwin. Instead of opposing that motion, on March 16, 2007, the plaintiffs filed an amended consolidated complaint, which continues to name all of the directors as defendants and asserts the same claims, but attempts to bolster those claims by adding nearly all of the substantive allegations from the most recent complaint in the federal securities class action (see
43
discussion ofHOD Carriersabove) and an amended complaint in Irwin that added the same factual allegations that were added to the consolidated amended complaint in theHOD Carriersaction. On April 16, 2007, defendants filed a supplemental memorandum of law in further support of their pending motion to dismiss contending that the amended complaint should be dismissed on the same grounds previously articulated for dismissal, namely, the preclusive effect of the dismissal of the Irwin action. That motion has been fully briefed, oral argument was held on August 21, 2007, and the court reserved decision.
The Company believes the above-described purported class and derivative actions are without merit and will be vigorously defended.
Although the Company cannot predict the ultimate outcome of the matters described in the preceding paragraphs, there can be no assurance that the resolution of these matters will not have a material adverse impact on the Company’s consolidated results of operations, financial position or cash flows.
As part of its ongoing operations, the Company is subject to various inspections, audits, inquiries and similar actions by governmental/regulatory authorities responsible for enforcing laws and regulations to which the Company is subject, including reviews of individual Omnicare pharmacy’s reimbursement documentation and administrative practices.
44
ITEM 4. - SUBMISSION OF MATTERS TO A VOTE OF SECURITY HOLDERS
None.
ADDITIONAL ITEM - EXECUTIVE OFFICERS OF THE COMPANY
Our executive officers of the Company at the time of this Filing are as follows:
| | | | | | |
Name | | Age | | Office(1) | | First Elected to
Present Office |
| |
| |
| |
|
| | | | | | |
Joel F. Gemunder | | 68 | | President and | | May 20, 1981 |
| | | | Chief Executive Officer(2) | | |
| | | | | | |
Patrick E. Keefe | | 62 | | Executive Vice President | | January 16, 2007 |
| | | | and Chief Operating Officer(3) | | |
| | | | | | |
W. Gary Erwin | | 55 | | Senior Vice President - | | September 28, 2006 |
| | | | Professional Services(5) | | |
| | | | | | |
Leo P. Finn III | | 49 | | Senior Vice President - Strategic | | August 15, 2005 |
| | | | Planning and Development(4) | | |
| | | | | | |
David W. Froesel, Jr. | | 56 | | Senior Vice President | | March 4, 1996 |
| | | | and Chief Financial Officer | | |
| | | | | | |
Cheryl D. Hodges | | 55 | | Senior Vice President | | February 8, 1994 |
| | | | and Secretary | | |
| | | | | | |
Mark G. Kobasuk | | 50 | | Vice President – General | | June 20, 2006 |
| | | | Counsel(6) | | |
| | | | | | |
Jeffrey M. Stamps | | 48 | | Vice President and Senior | | February 27, 2007 |
| | | | Vice President – Field | | |
| | | | Operations / Director of | | |
| | | | Field Operations(7) | | |
| |
(1) | Executive officers are elected for one-year terms at the annual organizational meeting of the Board of Directors, which follows the annual meeting of stockholders. |
| |
(2) | Mr. Gemunder was appointed Chief Executive Officer of the Company on May 21, 2001, having served as the President and a principal executive officer of the Company since 1981. |
| |
(3) | Mr. Keefe was appointed Executive Vice President and Chief Operating Officer on January 16, 2007. From August 2005 – January 2007, Mr. Keefe served as Executive Vice President – Global Markets. From February 1997 until August 2005, he served as Executive Vice President – Operations, and from 1994 to 1997 as Senior Vice President of Operations. Prior to that time, Mr. Keefe joined Omnicare in 1993 as Vice President of Operations. |
45
| |
(4) | Mr. Finn was appointed Senior Vice President – Strategic Planning and Development on August 15, 2005. From May 1997 – August 2005, Mr. Finn served as Vice President – Strategic Planning and Development. From 1995 to 1997, he served as Regional Vice President of Operations for the Company’s Illinois, Iowa, and Wisconsin pharmacy operations. Prior to that time, Mr. Finn joined Omnicare in 1990 as Vice President of Business Development. |
| |
(5) | Dr. Erwin was appointed Senior Vice President – Professional Services on September 28, 2006. From July 2000 – September 2006, Dr. Erwin served as Vice President – Health Care Systems Programs and President of Omnicare Senior Health Outcomes. Prior to that time, Dr. Erwin served Omnicare as Vice President – Health Systems Programs. Before joining Omnicare in 1997, Dr. Erwin served as Vice President for Professional Programs, and Professor of Clinical Pharmacy, Philadelphia College of Pharmacy and Science. In addition, he was on the faculty at the University of Georgia, where he specialized in geriatric pharmacotherapy and long-term care. |
| |
(6) | Mr. Kobasuk was appointed Vice President – General Counsel on June 20, 2006. Mr. Kobasuk was a partner of Taft, Stettinius and Hollister LLP from 1998 until June 2006. |
| |
(7) | Mr. Stamps was appointed corporate Vice President and Senior Vice President – Field Operations for the Company’s Pharmacy Operations Group in February 2007. From August 2005 until February 2007, he was corporate Vice President and Senior Vice President of the Central Division of the Pharmacy Operations Group. From 2001 until August 2005, he was Senior Regional Vice President – Eastern Region of the Pharmacy Operations Group. |
46
PART II
ITEM 5. - MARKET FOR THE REGISTRANT’S COMMON EQUITY, RELATED STOCKHOLDER MATTERS AND ISSUER PURCHASES OF EQUITY SECURITIES
Price Range of Common Stock; Holders of Record
Our Common Stock is listed on the New York Stock Exchange, and the following table sets forth the ranges of high and low closing prices during each of the calendar quarters of 2007 and 2006.
| | | | | | | | | | | | | |
| | 2007 | | 2006 | |
| |
| |
| |
| | High | | Low | | High | | Low | |
| |
| |
| |
| |
| |
First Quarter | | $ | 44.59 | | $ | 38.00 | | $ | 61.81 | | $ | 48.96 | |
Second Quarter | | $ | 41.40 | | $ | 33.17 | | $ | 57.80 | | $ | 41.95 | |
Third Quarter | | $ | 37.31 | | $ | 29.30 | | $ | 48.77 | | $ | 42.56 | |
Fourth Quarter | | $ | 35.11 | | $ | 22.18 | | $ | 45.62 | | $ | 37.13 | |
The number of holders of record of our Common Stock on January 31, 2008 was 2,440. This amount does not include stockholders with shares held under beneficial ownership in nominee name or within clearinghouse positions of brokerage firms and banks.
Stock Performance Graph
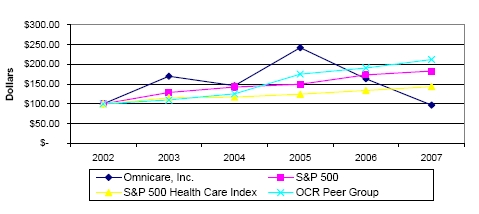
The following graph compares the cumulative total return for the last five years on a $100 investment (assuming dividend reinvestment) on December 31, 2002 in each of the Common Stock of the Company, the Standard & Poor’s 500 Stock Index, the OCR Peer Group Index and the S&P 500 Health Care Index.
47
| | | | | | | | | | | | | | | | | | | |
| | December 31, | |
| |
| |
| | 2002 | | 2003 | | 2004 | | 2005 | | 2006 | | 2007 | |
| |
| |
| |
| |
| |
| |
| |
Omnicare, Inc. | | $ | 100.00 | | $ | 169.97 | | $ | 146.05 | | $ | 241.85 | | $ | 163.62 | | $ | 96.89 | |
S&P 500 | | | 100.00 | | | 128.68 | | | 142.67 | | | 149.65 | | | 173.28 | | | 182.81 | |
S&P 500 Health Care Index | | | 100.00 | | | 115.05 | | | 116.98 | | | 124.54 | | | 133.90 | | | 143.69 | |
OCR Peer Group | | | 100.00 | | | 109.84 | | | 125.34 | | | 175.24 | | | 190.68 | | | 211.93 | |
The OCR Peer Group Index includes the following companies: AmerisourceBergen Corporation, Parexel International Corp., Pharmaceutical Product Development, Inc., PSS World Medical Inc., and Sunrise Senior Living, Inc. Beverly Enterprises, Inc. and Manor Care, Inc. have been excluded from the OCR Peer Group as they are no longer publicly traded companies. SEC Rules require that if an index is selected which is different from the index used in the immediately preceding fiscal year, the total return must be compared with both the newly selected index and the index used in the prior year. In the past, Omnicare has used a customized peer group index for this comparison. However, many of the companies included in the OCR Peer Group Index over time are no longer publicly traded companies. We believe the Standard and Poor’s 500 Health Care Index is a more appropriate index to compare us with other companies in our industry. After this year, the OCR Peer Group Index will no longer be included in the Stock Performance Graph.
Dividends
On February 14, 2008, the Board of Directors approved a quarterly cash dividend of $0.0225, for an indicated annual rate of $0.09 per common share for 2008, which is consistent with annual dividends paid per common share for the 2007 and 2006 years. It is presently intended that cash dividends on common shares will continue to be paid on a quarterly basis; however, there can be no assurances as future dividends are necessarily dependent upon our future earnings and financial condition and other factors not currently determinable.
Stock Repurchases
A summary of Omnicare’s repurchases of the Company’s common stock during the quarter ended December 31, 2007 is as follows (in thousands, except per share data):
| | | | | | | | | | |
Period | | Total Number
of Shares
Purchased(a) | | Average Price
Paid per
Share | | Total Number of
Shares Purchased as
Part of Publicly
Announced Plans or
Programs | | Maximum Number (or
Approximate Dollar Value)
of Shares that Must Yet
Be Purchased Under the
Plans or Programs | |
| |
| |
| |
| |
| |
October 1 - 31, 2007 | | 0 | | $ | — | | — | | — | |
November 1 - 30, 2007 | | 22 | | | 29.10 | | — | | — | |
December 1 - 31, 2007 | | 16 | | | 22.31 | | — | | — | |
| |
| |
|
| |
| |
| |
Total | | 38 | | $ | 26.19 | | — | | — | |
| |
| |
|
| |
| |
| |
| |
(a) | During the fourth quarter of 2007, the Company purchased 38 shares of Omnicare common stock in connection with its employee benefit plans, including purchases associated with the vesting of restricted stock awards. These purchases were not made pursuant to a publicly announced repurchase plan or program. |
Additional information regarding our equity compensation plans is included at Items 8 and 12 of this Filing.
48
ITEM 6. - SELECTED FINANCIAL DATA
The following table summarizes certain selected financial data and should be read in conjunction with our consolidated financial statements and related notes thereto and “Management’s Discussion and Analysis of Financial Condition and Results of Operations” included at Items 8 and 7, respectively, of this Filing.
Five-Year Summary of Selected Financial Data
Omnicare, Inc. and Subsidiary Companies
(in thousands, except per share data)
| | | | | | | | | | | | | | | | |
| | For the years ended and at December 31, | |
| |
| |
| | 2007 | | 2006 | | 2005 | | 2004 | | 2003 | |
| |
| |
| |
| |
| |
| |
INCOME STATEMENT DATA:(a)(b) | | | | | | | | | | | | | | | | |
| | | | | | | | | | | | | | | | |
Net sales(c) | | $ | 6,220,010 | | $ | 6,492,993 | | $ | 5,292,782 | | $ | 4,119,891 | | $ | 3,499,174 | |
| |
|
| |
|
| |
|
| |
|
| |
|
| |
Net income | | $ | 114,056 | | $ | 183,572 | | $ | 226,491 | | $ | 236,011 | | $ | 194,368 | |
| |
|
| |
|
| |
|
| |
|
| |
|
| |
Earnings per common share data: | | | | | | | | | | | | | | | | |
Basic | | $ | 0.96 | | $ | 1.55 | | $ | 2.19 | | $ | 2.29 | | $ | 1.97 | |
| |
|
| |
|
| |
|
| |
|
| |
|
| |
Diluted | | $ | 0.94 | | $ | 1.50 | | $ | 2.10 | | $ | 2.17 | (d) | $ | 1.89 | (d) |
| |
|
| |
|
| |
|
| |
|
| |
|
| |
| | | | | | | | | | | | | | | | |
Dividends per common share | | $ | 0.09 | | $ | 0.09 | | $ | 0.09 | | $ | 0.09 | | $ | 0.09 | |
| |
|
| |
|
| |
|
| |
|
| |
|
| |
Weighted average number of common shares outstanding: | | | | | | | | | | | | | | | | |
Basic | | | 119,380 | | | 118,480 | | | 103,551 | | | 103,238 | | | 98,800 | |
| |
|
| |
|
| |
|
| |
|
| |
|
| |
Diluted | | | 121,258 | | | 122,536 | | | 108,804 | | | 112,819 | (d) | | 107,896 | (d) |
| |
|
| |
|
| |
|
| |
|
| |
|
| |
| | | | | | | | | | | | | | | | |
BALANCE SHEET DATA
(at end of period):(a) | | | | | | | | | | | | | | | | |
| | | | | | | | | | | | | | | | |
Cash and cash equivalents | | $ | 274,448 | | $ | 138,034 | | $ | 215,421 | | $ | 84,169 | | $ | 187,413 | |
Working capital (current assets less current liabilities) | | | 1,803,990 | | | 1,872,427 | | | 1,360,391 | | | 1,082,297 | | | 920,328 | |
Goodwill | | | 4,342,169 | | | 4,225,011 | | | 4,029,482 | | | 2,003,223 | | | 1,690,558 | |
Total assets | | | 7,593,779 | | | 7,398,471 | | | 7,157,405 | | | 3,899,181 | | | 3,395,021 | |
Long-term debt (excluding current portion), net of swap(e)(f) | | | 2,820,751 | | | 2,955,120 | | | 2,719,392 | | | 1,234,067 | | | 1,082,677 | |
Stockholders’ equity(e) | | | 3,291,703 | | | 3,163,451 | | | 2,942,046 | | | 1,927,108 | | | 1,676,024 | |
| | | | | | | | | | | | | | | | |
OTHER FINANCIAL DATA:(a) | | | | | | | | | | | | | | | | |
Net cash flows from operating activities | | $ | 505,529 | | $ | 108,520 | | $ | 263,539 | | $ | 168,858 | | $ | 174,066 | |
EBITDA(g) | | | 455,346 | | | 599,991 | | | 601,951 | | | 498,732 | | | 440,603 | |
Net cash flows used by investing activities | | | (196,888 | ) | | (126,872 | ) | | (2,646,103 | ) | | (415,973 | ) | | (678,049 | ) |
Capital expenditures(h) | | | (45,270 | ) | | (31,251 | ) | | (24,239 | ) | | (17,926 | ) | | (17,115 | ) |
Net cash flows from financing activities | | | (175,139 | ) | | (60,114 | ) | | 2,514,759 | | | 144,442 | | | 549,902 | |
See the related notes to Five-Year Summary of Selected Financial Data on the following pages.
| |
(a) | Omnicare, Inc. (“Omnicare” or the “Company”) has had an active acquisition program in effect since 1989. See the “Acquisitions” note of the Notes to Consolidated Financial Statements for additional information concerning acquisitions that impact the comparability of our results. |
49
| |
(b) | The following aftertax charges are included in net income for the years ended December 31 (in thousands): |
| | | | | | | | | | | | | | | | |
| | 2007 | | 2006 | | 2005 | | 2004 | | 2003 | |
| |
| |
| |
| |
| |
| |
Call premium and write-off of unamortized debt issuance costs | | $ | — | | $ | — | | $ | 20,364 | (1) | $ | — | | $ | 7,853 | |
Restructuring and other related charges | | | 17,300 | (2) | | 18,758 | (2) | | 11,760 | (2) | | — | | | — | |
Litigation and other related professional fees | | | 26,380 | (3) | | 100,507 | (3) | | — | | | — | | | — | |
Heartland matters | | | 10,669 | (3) | | 21,232 | (3) | | — | | | — | | | — | |
Other expense | | | — | | | 3,918 | (2) | | — | | | — | | | — | |
| |
|
| |
|
| |
|
| |
|
| |
|
| |
Total | | $ | 54,349 | | $ | 144,415 | | $ | 32,124 | | $ | — | | $ | 7,853 | |
| |
|
| |
|
| |
|
| |
|
| |
|
| |
(1) See the “Debt” note of the Notes to Consolidated Financial Statements.
(2) See the “Restructuring and Other Related Charges” note of the Notes to Consolidated Financial Statements.
(3) See the “Commitments and Contingencies” note of the Notes to the Consolidated Financial Statements.
| |
(c) | In accordance with Emerging Issues Task Force (“EITF”) Issue No. 01-14, “Income Statement Characterization of Reimbursements Received for “Out-of-Pocket” Expenses Incurred” (“EITF No. 01-14”), Omnicare has recorded reimbursements received for “out-of-pocket” expenses on a grossed-up basis in the income statement as net sales and cost of sales. EITF No. 01-14 relates solely to the Company’s contract research services business. |
| |
(d) | In connection with the adoption of EITF Issue No. 04-8, “The Effect of Contingently Convertible Instruments on Diluted Earnings per Share” (“EITF No. 04-8”) in the fourth quarter of 2004, the Company restated previously reported diluted earnings per share and the diluted weighted average number of common shares outstanding for all periods since the second quarter of 2003, the period during which the 4.00% junior subordinated convertible debentures were outstanding. |
| |
(e) | During the fourth quarter of 2005, the Company completed its offerings of $225 million aggregate principal amount of 6.75% senior subordinated notes due 2013, $525 million aggregate principal amount of 6.875% senior subordinated notes due 2015, $977.5 million aggregate principal amount of 3.25% convertible senior debentures due 2035 (including the exercise in full by the underwriters of their option to purchase additional debentures), and 12,825,000 shares of common stock (not including the underwriters’ option to purchase additional shares), $1 par value, at $59.72 per share. During January 2006, the underwriters of the common stock offering completed by the Company in December 2005 exercised their option, in part, to purchase an additional 850,000 shares of common stock, $1 par value, at $59.72 per share. See the “Debt” and “Public Offering of Common Stock” notes of the Notes to Consolidated Financial Statements for further information on these transactions. |
| |
(f) | In 2003, the Company completed a refinancing plan in which it raised $1,033.6 million. |
| |
(g) | “EBITDA” represents earnings before interest (net of investment income), income taxes, depreciation and amortization. Omnicare uses EBITDA primarily as an indicator of the Company’s ability to service its debt, and believes that certain investors find EBITDA to be a useful financial measure for the same purpose. However, EBITDA does not represent net cash flows from operating activities, as defined by United States Generally Accepted Accounting Principles (“U.S. GAAP”), and should not be considered as a substitute for operating cash flows as a measure of liquidity. Omnicare’s calculation of EBITDA may differ from the calculation of EBITDA by others. The following is a reconciliation of EBITDA to net cash flow from operating activities for the years ended December 31 (in thousands): |
50
| | | | | | | | | | | | | | | | |
| | 2007 | | 2006 | | 2005 | | 2004 | | 2003 | |
| |
| |
| |
| |
| |
| |
EBITDA | | $ | 455,346 | | $ | 599,991 | | $ | 601,951 | | $ | 498,732 | | $ | 440,603 | |
(Subtract)/Add: | | | | | | | | | | | | | | | | |
| | | | | | | | | | | | | | | | |
Interest expense, net of investment income | | | (155,445 | ) | | (159,830 | ) | | (159,823 | ) | | (67,237 | ) | | (77,134 | ) |
Income tax provision | | | (72,442 | ) | | (136,924 | ) | | (135,315 | ) | | (139,188 | ) | | (116,081 | ) |
| | | | | | | | | | | | | | | | |
| | | | | | | | | | | | | | | | |
Changes in assets and liabilities, net of effects from acquisition of businesses | | | 23,301 | | | (358,528 | ) | | (219,333 | ) | | (226,715 | ) | | (165,442 | ) |
| | | | | | | | | | | | | | | | |
Provision for doubtful accounts | | | 213,560 | | | 82,209 | | | 58,024 | | | 45,112 | | | 44,680 | |
Deferred tax provision | | | 41,209 | | | 81,602 | | | 110,280 | | | 58,154 | | | 43,685 | |
Write-off of debt issuance costs | | | — | | | — | | | 7,755 | | | — | | | 3,755 | |
| |
|
| |
|
| |
|
| |
|
| |
|
| |
Net cash flows from operating activities | | $ | 505,529 | | $ | 108,520 | | $ | 263,539 | | $ | 168,858 | | $ | 174,066 | |
| |
|
| |
|
| |
|
| |
|
| |
|
| |
| |
(h) | Primarily represents the purchase of computer equipment and software; machinery and equipment; and furniture, fixtures and leasehold improvements. |
51
ITEM 7. - MANAGEMENT’S DISCUSSION AND ANALYSIS OF FINANCIAL CONDITION AND RESULTS OF OPERATIONS (“MD&A”)
The following discussion should be read in conjunction with the Consolidated Financial Statements, related notes and other financial information appearing elsewhere in this report. In addition, see the “Safe Harbor Statement under the Private Securities Litigation Reform Act of 1995 Regarding Forward-Looking Information” caption below, as well as the “Risk Factors” previously discussed at Item 1A of this Filing.
|
Overview of 2007 and Consolidated Results of Operations |
|
Omnicare, Inc. (“Omnicare” or the “Company”) is a leading geriatric pharmaceutical services company. Omnicare is the nation’s largest provider of pharmaceuticals and related pharmacy and ancillary services to long-term healthcare institutions. Omnicare’s clients include primarily skilled nursing facilities (“SNFs”), assisted living facilities, retirement centers, independent living communities, hospitals, hospice, and other healthcare settings and service providers. Omnicare provides its pharmacy services to long-term care facilities and other chronic care settings comprising approximately 1,392,000 beds in 47 states in the United States (“U.S.”), the District of Columbia and Canada at December 31, 2007. As well, Omnicare provides operational software and support systems to long-term care pharmacy providers across the U.S. Omnicare’s pharmacy services also include distribution and product support services for specialty pharmaceuticals. Omnicare provides comprehensive product development and research services for the pharmaceutical, biotechnology, medical device and diagnostic industries in 30 countries worldwide.
The following summary table presents consolidated net sales and results of operations of Omnicare for each of the years ended December 31, 2007, 2006 and 2005 (in thousands, except per share amounts). In accordance with the Securities and Exchange Commission (“SEC”) release entitled “Conditions for Use of Non-GAAP Financial Measures,” the Company has disclosed in this MD&A, with the exception of EBITDA (discussed below), only those measures that are in accordance with U.S. Generally Accepted Accounting Principles (“GAAP”).
52
| | | | | | | | | | |
| | For the years ended December 31, | |
| |
| |
| | 2007 | | 2006 | | 2005 | |
| |
| |
| |
| |
Net sales | | $ | 6,220,010 | | $ | 6,492,993 | | $ | 5,292,782 | |
| |
|
| |
|
| |
|
| |
Net income | | $ | 114,056 | | $ | 183,572 | | $ | 226,491 | |
| |
|
| |
|
| |
|
| |
Earnings per share: | | | | | | | | | | |
Basic | | $ | 0.96 | | $ | 1.55 | | $ | 2.19 | |
| |
|
| |
|
| |
|
| |
Diluted | | $ | 0.94 | | $ | 1.50 | | $ | 2.10 | |
| |
|
| |
|
| |
|
| |
EBITDA(a) | | $ | 455,346 | | $ | 599,991 | | $ | 601,951 | |
| |
|
| |
|
| |
|
| |
| |
(a) | “EBITDA” represents earnings before interest (net of investment income), income taxes, depreciation and amortization. Omnicare uses EBITDA primarily as an indicator of the Company’s ability to service its debt, and believes that certain investors find EBITDA to be a useful financial measure for the same purpose. However, EBITDA does not represent net cash flows from operating activities, as defined by U.S. GAAP, and should not be considered as a substitute for operating cash flows as a measure of liquidity. The Company’s calculation of EBITDA may differ from the calculation of EBITDA by others. See Five-Year Summary of Selected Financial Data for a reconciliation of EBITDA to net cash flows from operating activities, at Part II, Item 6 of this Filing. |
The results for the year ended December 31, 2007 continued to be impacted by the unilateral reduction by UnitedHealth Group and its Affiliates (“United”) in the reimbursement rates paid by United to Omnicare by switching to its PacifiCare pharmacy network contract for services rendered by Omnicare to beneficiaries of United’s drug benefit plans under the Medicare Part D program. The differential in rates that resulted from United’s action reduced sales and operating profit for the year ended December 31, 2007 by approximately $131 million (approximately $81 million aftertax). The unilateral reduction in reimbursement rates began in April 2006; the impact on the year ended December 31, 2006 was approximately $68 million (approximately $43 million aftertax). This matter is currently the subject of litigation initiated by Omnicare and is before the federal court in the Northern District of Illinois. See further discussion at the “Legal Proceedings” section at Part I, Item 3 of this Filing.
Financial results for the year ended December 31, 2007 also reflects a change to the equity method of accounting for certain pharmacy joint venture operations in which the Company owns less than a 100% interest, which was effective in the third quarter of 2006. Accordingly, the deconsolidation of these operations excluded net sales of approximately $112 million and $48 million for the years ended December 31, 2007 and 2006, respectively, but had no impact on earnings.
53
Total net sales for the year ended December 31, 2007 decreased to $6,220.0 million from $6,493.0 million in the comparable prior year period. Diluted earnings per share for the year ended December 31, 2007 were $0.94 versus $1.50 in the same prior year period. Net income for the year ended December 31, 2006 was $114.1 million versus $183.6 million earned in the comparable 2006 period. EBITDA totaled $455.3 million for the year ended December 31, 2007 as compared with $600 million for the same period of 2006.
Net sales for the year were unfavorably impacted by a lower number of beds served, the increased availability and utilization of generic drugs, the impact of the reduction in reimbursement under the United Part D contract, the deconsolidation of the pharmacy joint-venture operations and a shift in mix towards assisted living, partially offset by the favorable impact of drug price inflation, acquisitions, and growth in hospice and specialty pharmacy services as well as CRO Services revenues. See discussion of sales and operating profit results in more detail at the “Pharmacy Services Segment” and “CRO Services Segment” captions below.
The Company’s consolidated gross profit of $1,538.6 million decreased $61.8 million for the full year 2007 from the same prior-year period amount of $1,600.4 million. Gross profit as a percentage of total net sales of 24.7% in the year ended December 31, 2007, increased from the 24.6% experienced during 2006.
Gross profit was favorably impacted in the 2007 period largely as a result of the increased availability and utilization of higher margin generic drugs, the continued integration of prior-period acquisitions, drug purchasing improvements, and year-over-year growth in specialty pharmacy services and CRO services, as well as the favorable year-over-year gross profit impact of the reduction in special items. Specifically, gross profit for the year ended December 31, 2007 included $14.8 million of incremental costs associated with the closure of the Company’s Heartland repackaging facility as compared to $27.7 million for the year ended December 31, 2006, as further described below. In addition, gross profit for the year ended December 31, 2006 included $10.3 million related to the Michigan Medicaid matter, as further discussed in the “Special Items” caption below. Offsetting these factors was the unfavorable gross profit impact of the aforementioned reduction in net sales, including the lower number of beds served, a reduction in reimbursement under the United Part D contract, as well as an increase in direct payroll costs.
Increased leverage in purchasing favorably impacts gross profit and is primarily derived through discounts, rebates and other price concessions from suppliers. Leveraging of fixed and variable overhead costs primarily relates to generating higher sales volumes from pharmacy facilities with no or limited increases in fixed costs (e.g., rent, depreciation, etc.) and negligible to moderate increases in variable costs (e.g., utilities, labor, etc.), as well as the elimination of pharmacies through the Company’s productivity and consolidation initiatives, further discussed below. The Company believes it will be able to continue to leverage fixed and variable overhead costs through both internal and acquired growth.
54
Government and other reimbursement formulas generally adjust to take into account drug price inflation or deflation. In order to enhance its gross profit margins, the Company strategically allocates its resources to those activities that will increase internal sales growth and favorably impact sales mix, or will lower costs. In addition, through the ongoing development of its pharmaceutical purchasing programs, the Company is able to obtain volume discounts and thereby manage its pharmaceutical costs.
Omnicare’s consolidated selling, general and administrative (“operating”) expenses for the year ended December 31, 2007 of $910.3 million were higher than the comparable prior-year amount of $887.4 million, by $22.9 million. Operating expenses as a percentage of net sales amounted to 14.6% in 2007, representing an increase from the 13.7% experienced in the comparable prior- year period. Operating expenses for the year ended December 31, 2007 were unfavorably impacted primarily by a $13.4 million increase in periodic pension costs, increased legal costs of $5.9 million, as well as the impact of recent acquisitions. Partially offsetting the increased operating expenses were the favorable impact of the Company’s continued integration of prior period acquisitions, and productivity enhancements, including the restructuring program relating to the NeighborCare, Inc. (“NeighborCare”) acquisition and the “Omnicare Full Potential” Plan, as further discussed in the “Restructuring and Other Related Charges” section of this MD&A.
The provision for doubtful accounts for the year ended December 31, 2007 of $213.6 million was higher than the comparable prior year amount of $82.2 million, by $131.4 million. The year ended 2007 includes an incremental charge taken in the fourth quarter relating to customer bankruptcies and other legal action against a group of customers for, among other things, the collection of past due receivables, a revised assessment of the administrative and payment issues associated with Prescription Drug Plans under Medicare Part D, particularly relating to the aging of copays and rejected claims, and the resultant adoption by the Company of a modification in its policy with respect to payment authorization for dispensed prescriptions under Medicare Part D and other payors.
Investment income for the year ended December 31, 2007 of $8.7 million was lower than the $10.5 million earned in the comparable prior year period, primarily due to lower average invested balances versus the prior year.
Interest expense for the year ended December 31, 2007 of $164.2 million is lower than the $170.3 million in the comparable prior-year period, primarily due to lower debt outstanding resulting from payments aggregating $250 million on the Company’s senior term A loan facility, maturing on July 28, 2010 (the “Term Loans”), in the latter half of 2006 and throughout 2007, partially offset by increased interest rates for variable rate loans.
The effective income tax rate was 38.8% in 2007, significantly lower than the prior-year rate of 42.7%, due primarily to certain nondeductible litigation costs recognized in the 2006 period. The effective tax rates in 2007 and 2006 are higher than the federal statutory rate largely as a result of the impact of state and local income taxes and various nondeductible expenses (including a portion of the aforementioned litigation costs).
55
Special Items
The year ended December 31, 2007 included the following charges, which primarily impacted the Pharmacy Services segment, and that management considers to be special items, as they are not related to Omnicare’s ordinary course of business:
(i) Operating income included restructuring and other related charges of approximately $27.9 million pretax ($17.3 million aftertax), $29.5 million of which related to the implementation of the “Omnicare Full Potential” Plan, a major initiative primarily designed to re-engineer the pharmacy operating model to increase efficiency and enhance customer growth, partially offset by a ($1.6) million credit adjustment to the previously disclosed consolidation and productivity initiatives related, in part, to the integration of the NeighborCare acquisition and other related activities. See further discussion at the “Restructuring and Other Related Charges” note of the Notes to Consolidated Financial Statements and the “Restructuring and Other Related Charges” section of this MD&A.
(ii) During 2006, the Company experienced certain quality control and product recall issues, as well as fire damage, at one of its repackaging facilities, Heartland Repack Services (“Heartland”), as described in further detail at the “Commitments and Contingencies” note of the Notes to Consolidated Financial Statements. In addressing and resolving these issues, the Company continues to experience increased costs and as a result, the year ended December 31, 2007 included special charges of $17.2 million pretax (approximately $14.8 million and $2.4 million was recorded in the cost of sales and operating expense sections of the Consolidated Statements of Income, respectively) ($10.7 million aftertax) for these increased costs. The Company maintains product recall, property and casualty and business interruption insurance, and the extent of insurance recovery for these expenses is currently being reviewed by its outside advisors. As of December 31, 2007, no receivables for insurance recoveries have been recorded by the Company.
(iii) Operating income included special litigation charges of $42.5 million pretax ($26.4 million aftertax) for litigation-related professional fees in connection with the administrative subpoenas from the United States Attorney’s Office, District of Massachusetts, the purported class and derivative actions, the Company’s lawsuit against United, the inquiry conducted by the Attorney General’s office in Michigan relating to certain billing issues under the Michigan Medicaid program, the investigation by the federal government and certain states relating to drug substitutions, the Company’s response to subpoenas it received relating to other legal proceedings to which the Company is not a party, and certain other larger customer disputes. With respect to these proceedings to which the Company is a party, see further discussion at the “Commitments and Contingencies” note of the Notes to Consolidated Financial Statements, and the “Legal Proceedings” section at Part I, Item 3 of this Filing.
56
Restructuring and Other Related Charges
Omnicare Full Potential Program
In the second quarter of 2006, the Company commenced the implementation of the “Omnicare Full Potential” Plan, a major initiative primarily designed to re-engineer the Company’s pharmacy operating model to increase efficiency and enhance customer growth. The Omnicare Full Potential Plan is expected to optimize resources across the entire organization by implementing best practices, including the realignment and right-sizing of functions, and a “hub-and-spoke” model whereby certain key support and production functions will be transferred to regional support centers (“hubs”) specifically designed and managed to perform these tasks, with local pharmacies (“spokes”) focusing on time-sensitive services and customer-facing processes.
This program is expected to be completed over a multi-year period and is estimated to generate pretax savings in the range of $100 million to $120 million annually upon completion of the initiative. It is anticipated that approximately one-half of these savings will be realized in cost of sales, with the remainder being realized in operating expenses. The program is estimated to result in total pretax restructuring and other related charges of approximately $93 million over this implementation period. The charges primarily include severance pay, employment agreement buy-outs, excess lease costs and professional fees, as well as other related costs. The Company recorded restructuring and other related charges for the Omnicare Full Potential Plan of approximately $29 million and $17 million pretax (approximately $18 million and $11 million aftertax) during the years ended December 31, 2007 and 2006, respectively. The remainder of the overall restructuring charge will be recognized and disclosed prospectively as various phases of the project are finalized and implemented. Incremental capital expenditures related to this program are expected to total approximately $45 million to $50 million over the implementation period. The Company estimates that the initial phase of the program has led to a reduction in force of approximately 1,200 positions as of December 31, 2007, associated primarily with pharmacy operations. While the Company is working diligently to achieve the estimated savings as discussed above, there can be no assurances as to the ultimate outcome of the program, including the related timing thereof, due to the inherent risks associated with the implementation of a project of this magnitude and the related new technologies. Specifically, the potential inability to successfully mitigate implementation risks, including but not necessarily limited to, dependence on third-party suppliers and consultants for the timely delivery of technology as well as its performance at expected capacities, compliance with federal, state and local regulatory requirements; reliance on information technology and telecommunications support, timely completion of facility lease transactions and/or leasehold improvements, and the ability to obtain adequate staffing levels, individually or in the aggregate could affect the overall success of the program from a savings and/or timing standpoint.
See further discussion at the “Restructuring and Other Related Charges” note of the Notes to Consolidated Financial Statements.
2005 Program
In the third quarter of 2005, the Company announced the implementation of consolidation plans and other productivity initiatives to streamline pharmacy services and contract research organization operations, including maximizing workforce and operating asset utilization, and
57
producing a more cost-efficient, operating infrastructure (the “2005 Program”). These consolidation and productivity initiatives were related, in part, to the integration of NeighborCare. Given the geographic overlap of the NeighborCare and Omnicare pharmacies, substantial opportunities for consolidation existed at the time of acquisition. While the majority of consolidations resulted in NeighborCare pharmacies being consolidated into Omnicare pharmacies, depending on location, capacity and operating performance, certain Omnicare pharmacies were also identified for consolidation into NeighborCare locations. Additionally, as part of the evaluation process on how best to integrate the two organizations, the Company also focused broadly on ways to lower operating infrastructure costs to maximize efficiencies and asset utilization and identified opportunities to right-size the business, streamline operations and eliminate redundant assets. The consolidation activity and other productivity initiatives of the 2005 program resulted in the closure of 29 Omnicare facilities, of which 26 were pharmacy operations. Additionally, there was a net reduction in force of approximately 900 positions relating to the 2005 Program. Of this reduction in force, approximately 96% were in the pharmacy operations and the remaining reductions were at the corporate headquarters or the Company’s contract research operations. Restructuring activities in the contract research organization segment related primarily to facility lease obligations.
The Company generated in excess of $40 million in pretax savings from pharmacy closures and other consolidation and productivity initiatives implemented in connection with these activities. The 2005 Program initiatives required cumulative restructuring and other related charges of approximately $31 million before taxes through the third quarter of 2006, which related to the costs associated with the consolidation of Omnicare pharmacies and the other consolidation and productivity initiatives described above. Specifically, the Company recorded restructuring and other related charges of approximately $12 million and $19 million pretax during the years ended December 31, 2006 and 2005, respectively (approximately $8 million and $12 million aftertax, respectively). The restructuring liabilities associated with the 2005 Program were evaluated by the Company during the 2007 year, at which time it was determined that certain liabilities were no longer expected to be utilized as part of the activities remaining under the 2005 Program. In accordance with SFAS No. 146 “Accounting for Costs Associated with Exit or Disposal Activities,” the Company recorded adjustments in 2007 to reduce the employee severance and employee agreement buy-out liabilities by approximately $1.2 million and $0.4 million pretax, respectively.
See further discussion at the “Restructuring and Other Related Charges” note of the Notes to Consolidated Financial Statements.
For a discussion regarding the Company’s outlook, please see the “Outlook” section of this MD&A.
58
Pharmacy Services Segment
| | | | | | | | | | |
| | For the years ended December 31, | |
| |
| |
| | 2007 | | 2006 | | 2005 | |
| |
| |
| |
| |
Net sales | | $ | 6,024,871 | | $ | 6,321,141 | | $ | 5,110,414 | |
| |
|
| |
|
| |
|
| |
Operating income | | $ | 439,148 | | $ | 560,991 | | $ | 583,954 | |
| |
|
| |
|
| |
|
| |
2007 vs. 2006
Omnicare’s Pharmacy Services segment recorded sales of $6,024.9 million for the year ended December 31, 2007, down from the 2006 amount of $6,321.1 million by $296.2 million, or 4.7%. At December 31, 2007, Omnicare served long-term care facilities and other chronic care settings comprising approximately 1,392,000 beds as compared with approximately 1,406,000 beds served at December 31, 2006. Pharmacy Services sales were unfavorably impacted by a lower number of beds served, the increased availability and utilization of generic drugs, the effects of the reduction in reimbursement under the United Part D contract, the aforementioned deconsolidation of the pharmacy joint-venture operations, and the impact of a bed mix shift toward assisted living, which typically has lower penetration rates than skilled nursing facilities. Partially offsetting these factors were drug price inflation, the impact of acquisitions, and year-over-year growth in hospice pharmacy and specialty pharmacy services. The company estimates that drug price inflation for its highest dollar volume products in 2007 was approximately 5% to 6%. While the Company is focused on reducing its costs to mitigate the impact of drug pricing and reimbursement issues, there can be no assurance that such issues or other pricing and reimbursement pressures will not adversely impact the Pharmacy Services segment.
Operating income of the Pharmacy Services segment was $439.1 million in 2007, a $121.9 million decrease as compared with the $561.0 million earned in 2006. As a percentage of the segment’s sales, operating income of 7.3% in 2007 was lower than the 8.9% in 2006. The decrease in operating income in 2007 is primarily attributable to a lower number of beds served, the unfavorable impact of the aforementioned reduction in the reimbursement rates under the United Part D contract, and the previously discussed increase in the provision for doubtful accounts of $131.4 million pretax. Partially offsetting these factors was the increased availability and utilization of higher margin generic drugs, drug purchasing improvements, the Company’s continued integration of prior-period acquisitions and productivity enhancements, including the restructuring program relating, in part, to the NeighborCare acquisition and the “Omnicare Full Potential” Plan, as further discussed in the “Restructuring and Other Related Charges” section of this MD&A, as well as the favorable year-over-year impact of the special items discussed below. Specifically, operating income of the Pharmacy Services segment included special pretax items of $79.8 million and $187.6 million in the years ended December 31, 2007 and December 31, 2006, respectively. Operating income in 2007 included the aforementioned special litigation charges of $42.5 million, restructuring and other related charges of approximately $20.1 million, and incremental costs associated with the closure of the Company’s Heartland repackaging facility of $17.2 million. Operating income in 2006 included
59
the aforementioned special litigation charges of $125.1 million, a $6.1 million charge associated with retention payments for certain NeighborCare employees as required under the acquisition agreement, restructuring and other related charges of approximately $22.6 million, and incremental costs associated with the closure of the Company’s Heartland repackaging facility of $33.7 million.
CRO Services Segment
| | | | | | | | | | |
| | For the years ended December 31, | |
| |
| |
| | 2007 | | 2006 | | 2005 | |
| |
| |
| |
| |
Net sales | | $ | 195,139 | | $ | 171,852 | | $ | 182,368 | |
| |
|
| |
|
| |
|
| |
Operating income | | $ | 10,378 | | $ | 5,340 | | $ | 1,561 | |
| |
|
| |
|
| |
|
| |
2007 vs. 2006
Omnicare’s CRO Services segment recorded revenues of $195.1 million for the year ended December 31, 2007, an increase of $23.2 million, or 13.5%, from the $171.9 million recorded in the same prior year period. In accordance with EITF Issue No. 01-14, the Company included $31.7 million and $25.6 million of reimbursable out-of-pockets in its CRO Services segment reported revenue and direct cost amounts for the years ended December 31, 2007 and 2006, respectively. Revenues for 2007 were higher than in the same prior year period primarily due to the commencement and ramp-up of projects that were awarded in 2006 and in the first half of 2007, exceeding project terminations and cancellations.
Operating income in the CRO Services segment was $10.4 million in 2007 compared with $5.3 million in 2006, an increase of $5.1 million. As a percentage of the segment’s revenue, operating income was 5.3% in 2007 compared with 3.1% in 2006. This increase is primarily attributable to the favorable impact of the aforementioned increase in revenues and cost reduction efforts. Backlog at December 31, 2007 of $314.3 million was $12.4 million higher than the December 31, 2006 backlog of $301.9 million.
Total net sales for the year ended December 31, 2006 rose to $6,493.0 million from $5,292.8 million in the comparable prior year period. Diluted earnings per share for the year ended December 31, 2006 were $1.50 versus $2.10 in the same prior year period. Net income for the year ended December 31, 2006 was $183.6 million versus $226.5 million earned in the comparable 2005 period. EBITDA totaled $600 million for the year ended December 31, 2006 as compared with $602.0 million for the same period of 2005.
Sales and profitability results are discussed in more detail at the “Pharmacy Services Segment” and “CRO Services Segment” captions below.
60
The new prescription drug benefit under Medicare Part D (“Part D”) became effective on January 1, 2006. As a result, Omnicare experienced a significant shift in payor mix (as a % of annual sales) during the year ended December 31, 2006. The payor mix for the 2006 full year was approximately 42% Medicare, 12% Medicaid, 43% private pay, third-party and facility, and 3% other sources. Prior to the implementation of the new Medicare Part D program, most of the Part D residents served by the Company were reimbursed under state Medicaid programs and, to a lesser extent, private pay sources. As expected with such a significant change in payor source and reimbursement system, the year ended December 31, 2006 was a transition period as the Company devoted considerable time, effort and resources to addressing certain administrative, operational and payment issues associated with the implementation of Part D. As a result, the Company incurred incremental expenses of approximately $27.3 million pretax (approximately $17.4 million aftertax) during the year ended December 31, 2006 comprising temporary labor, administrative and operating costs incurred in connection with the implementation of the new Medicare Part D drug benefit. These expenditures were necessary to support the billing and cash collection functions, as well as handle the disruption in the timing of work flow and delivery of medications created by these implementation issues. While considerable progress has been made in addressing many of the Part D implementation issues, Omnicare continues to devote resources to the ongoing resolution of these matters and expects incremental Part D transition expenses to continue until such time that the various implementation issues are resolved.
The results for the year ended December 31, 2006 were also impacted by the unilateral reduction by United in the reimbursement rates paid by United to Omnicare under its pharmacy network contract for services rendered by Omnicare to beneficiaries of United’s drug benefit plans under the Medicare Part D program. The differential in rates that resulted from United’s action reduced sales and operating profit for the year ended December 31, 2006 by approximately $68.2 million (approximately $43.3 million aftertax). This matter is currently the subject of litigation initiated by Omnicare in federal court. See further discussion at the “Legal Proceedings” section at Part I, Item 3 of this Filing.
The Company’s consolidated gross profit of $1,600.4 million increased $301.3 million for the full year 2006 from the same prior-year period amount of $1,299.1 million, due primarily to the increase in sales discussed in the “Pharmacy Services Segment” and “CRO Services Segment” captions below. Gross profit as a percentage of total net sales of 24.6% in the year ended December 31, 2006, was slightly higher than the 24.5% experienced during 2005. Positively impacting overall gross profit margin were the Company’s purchasing leverage associated with the procurement of pharmaceuticals, the increased use of generic drugs, the impact of productivity enhancements, a favorable payor mix shift (offset in large measure by the aforementioned United reimbursement rate reduction), cost savings associated with the integration of NeighborCare, and the addition of the higher-margin RxCrossroads, LLC (“RxCrossroads”) and excelleRx, Inc. (“excelleRx”) businesses. These favorable year-over-year factors were offset by competitive pricing pressures, Medicaid reimbursement reductions in late 2005 (although the impact from Medicaid reimbursement cuts now is much lower than seen historically due to the shift in payor mix largely from Medicaid to Medicare Part D), Part D transition expenses and special charges. Specifically, gross profit for the year ended December 31, 2006 was impacted by a special charge related to the quality control, product recall and fire issues at its Heartland repackaging facility, of which $27.7 million impacted gross profit, and the
61
Michigan Medicaid matter, of which $10.3 million impacted gross profit, as further discussed in “Special Charges” caption below. While progress has been made in addressing many of the Heartland matters, Omnicare continues to devote resources to the ongoing resolution of these matters and expects incremental expenses to continue until such time that the various matters are resolved. In order to replace the repackaging capacity of the Heartland facility, on February 27, 2007, Omnicare entered into an agreement for the Repackaging Services division of Cardinal Health to serve as the contract repackager for pharmaceutical volumes previously repackaged at the Heartland facility. The agreement initially extends through October 2010.
Increased leverage in purchasing favorably impacts gross profit and is primarily derived through discounts, rebates and other price concessions from suppliers. Leveraging of fixed and variable overhead costs primarily relates to generating higher sales volumes from pharmacy facilities with no or limited increases in fixed costs (e.g., rent, depreciation, etc.) and negligible to moderate increases in variable costs (e.g., utilities, labor, etc.), as well as the elimination of pharmacies through the Company’s productivity and consolidation initiatives, further discussed below. The Company believes it will be able to continue to leverage fixed and variable overhead costs through both internal and acquired growth.
Government and other reimbursement formulas generally adjust to take into account drug price inflation or deflation. In order to enhance its gross profit margins, the Company strategically allocates its resources to those activities that will increase internal sales growth and favorably impact sales mix, or will lower costs. In addition, through the ongoing development of its pharmaceutical purchasing programs, the Company is able to obtain volume discounts and thereby manage its pharmaceutical costs.
Omnicare’s operating expenses for the year ended December 31, 2006 of $887.4 million were higher than the comparable year amount of $700.6 million by $186.8 million, due primarily to the overall growth of the business, including the full year impact of the 2005 acquisitions, including NeighborCare, excelleRx and RxCrossroads. Operating expenses as a percentage of total net sales were 13.7% in 2006, representing an increase from the 13.2% experienced in the comparable prior-year period. Operating expenses for the year ended December 31, 2006 were unfavorably impacted by a $24.5 million increase in amortization and depreciation expenses, largely related to the 2005 acquisitions, $6.1 million pretax charge associated with retention payments for certain NeighborCare employees, $7.1 million pretax of additional equity-based compensation expense for stock options and stock awards related to the adoption of Statement of Accounting Standards (“SFAS”) No. 123 (revised 2004), “Share-Based Payment” (“SFAS 123R”), increased legal and professional costs and the previously discussed temporary costs associated with the implementation of the new Medicare Part D drug benefit. The provision for doubtful accounts as a percent of net sales amounted to 1.3% in 2006, modestly higher than the 1.1% in the comparable prior-year period. Partially offsetting the increased operating expenses were the favorable impact of leveraging of fixed (e.g., rents) and variable (e.g., utilities) overhead costs over a larger sales base in 2006 than that which existed in 2005 and the Company’s continued productivity enhancements, including the ongoing restructuring program commenced in connection with the NeighborCare acquisition and the commencement of the “Omnicare Full Potential” Plan, as further discussed in “Restructuring and Other Related Charges” caption below. In addition, the year ended December 31, 2005 included $4.9 million
62
pretax charge in connection with the legal settlement of certain contractual issues with two vendors, $3.0 million pretax charge for professional fees and expenses related to the first quarter 2005 trust PIERS exchange offering and the purchase of the Company’s 8.125% senior subordinated notes due 2011, and $1.1 million pretax charge for acquisition-related expenses.
Effective January 1, 2006, the Company adopted SFAS 123R, which requires the Company to record compensation costs relating to equity-based payments in its financial statements. As previously mentioned, operating income for the year ended December 31, 2006 includes additional equity-based compensation expense for stock options and stock awards of approximately $7.1 million pretax (approximately $4.5 million aftertax) related to the adoption of SFAS 123R. See additional discussion at the “Critical Accounting Policies” section of this MD&A.
Investment income for the year ended December 31, 2006 of $10.5 million was approximately $4.7 million higher than the $5.8 million earned in the comparable prior year period, primarily due to higher interest rates and average invested cash and retirement plan asset balances versus the prior year.
Interest expense for the year ended December 31, 2006 of $170.3 million was approximately $4.7 million higher than the $165.6 million in the comparable prior-year period, primarily due to increased overall borrowings resulting from the new debt issuances completed in the latter half of 2005 in connection with the previously mentioned acquisitions, and increased interest rates for variable rate loans. In addition, interest expense for the year ended December 31, 2005 included special charges of approximately $35.0 million, primarily related to the debt extinguishment and new debt issuance costs in connection with the Company’s financing plan.
The effective income tax rate was 42.7% in 2006, significantly higher than the prior-year rate of 37.4% due primarily to certain nondeductible litigation costs recognized in the 2006 period, partially offset by the favorable effect of a fourth quarter 2006 increase in tax benefits associated primarily with certain state income tax net operating losses totaling approximately $5.0 million aftertax, as well as an overall reduction of the Company’s ongoing state effective tax rate in 2006. The effective tax rates in 2006 and 2005 are higher than the federal statutory rate largely as a result of the combined impact of state and local income taxes, and various nondeductible expenses (including a portion of the aforementioned litigation costs).
Special Charges
The year ended December 31, 2006 included the following charges, which primarily impacted the Pharmacy Services segment, that management considers to be special charges, and not related to Omnicare’s ordinary course of business:
(i) Operating income included a special litigation charge of $57.5 million pretax ($45.3 million aftertax) to establish a settlement reserve relating to previously disclosed inquiries by the federal government and certain states relating to three generic pharmaceuticals provided by the Company, based on discussions between these government representatives, the Company and its legal counsel. As previously disclosed, the inquiries relate to the substitution of capsules for tablets (Ranitidine), tablets for capsules (Fluoxetine) and two 7.5 mg tablets for one 15 mg tablet
63
(Buspirone). The Company made settlement payments of approximately $51.0 million in the fourth quarter of 2006 related to these matters. This special litigation charge represented the Company’s best estimate of the settlement amounts and associated costs under SFAS No. 5, “Accounting for Contingencies” (“SFAS 5”). See further discussion at the “Commitments and Contingencies” note of the Notes to Consolidated Financial Statements, and the “Legal Proceedings” section at Part I, Item 3 of this Filing.
(ii) On October 5, 2006, the Company announced it had reached a voluntary Settlement Agreement with the State of Michigan to resolve certain billing issues under the Michigan Medicaid program. The Company also announced that it reached an agreement in principle with the State of Michigan with respect to certain hospice claims. The year ended December 31, 2006 included a special litigation charge of $54.0 million pretax, including $10.3 million and $43.7 million recorded in the net sales and litigation charges lines of the Consolidated Statements of Income, respectively ($46.7 million aftertax), based on the terms of the settlement agreements. The Company paid $43.0 million related to the Michigan settlement in the fourth quarter of 2006. See further discussion at the “Commitments and Contingencies” note of the Notes to Consolidated Financial Statements, and the “Legal Proceedings” section at Part I, Item 3 of this Filing.
(iii) Operating income included a special litigation charge of $13.6 million pretax ($8.6 million aftertax) for litigation-related professional expenses in connection with the administrative subpoenas from the United States Attorney’s Office, District of Massachusetts, the purported class and derivative actions and the Company’s lawsuit against United. See further discussion at the “Commitments and Contingencies” note of the Notes to Consolidated Financial Statements, and the “Legal Proceedings” section at Part I, Item 3 of this Filing.
(iv) Operating income included restructuring and other related charges of approximately $29.6 million pretax ($18.8 million aftertax). Approximately $17.5 million of the pretax charge ($11.1 million aftertax) relates to the implementation of the “Omnicare Full Potential” Plan, a major initiative primarily designed to re-engineer the pharmacy operating model to increase efficiency and enhance customer growth. The remaining $12.1 million of the pretax charge ($7.7 million aftertax) relates to the previously disclosed consolidation and productivity initiatives related, in part, to the integration of the NeighborCare acquisition, as well as initiatives intended to streamline pharmacy services and contract research organization operations. See further discussion at the “Restructuring and Other Related Charges” note of the Notes to Consolidated Financial Statements and the “Restructuring and Other Related Charges” section of this MD&A.
(v) During 2006, the Company experienced certain quality control and product recall issues, as well as fire damage, at one of its repackaging facilities, Heartland, as described in further detail at the “Commitments and Contingencies” note of the Notes to Consolidated Financial Statements. Addressing these issues served to increase costs and, as a result, the year ended December 31, 2006 included special charges of $33.7 million pretax (approximately $27.7 million and $6.1 million was recorded in the cost of sales and operating expense sections of the Consolidated Statements of Income, respectively) ($21.2 million aftertax) for these increased costs, particularly relating to the write-off of inventory totaling $18.9 million pretax, as well as
64
$14.8 million pretax for the incremental costs associated with the quality control, product recall and fire damage issues at Heartland. The Company maintains product recall, property and casualty, and business interruption insurance and the extent of insurance recovery for these expenses is currently being reviewed by its outside advisors. As of December 31, 2006, no receivables for insurance recoveries have been recorded by the Company.
(vi) Operating income included a special charge of approximately $6.1 million pretax ($3.9 million after tax) associated with retention payments for certain NeighborCare employees as required under the acquisition agreement.
For a discussion regarding the Company’s outlook, please see the “Outlook” section of this MD&A.
Pharmacy Services Segment
2006 vs. 2005
Omnicare’s Pharmacy Services segment recorded sales of $6,321.1 million for the year ended December 31, 2006, exceeding the 2005 amount of $5,110.4 million by $1,210.7 million, or 23.7%. At December 31, 2006, Omnicare served long-term care facilities and other chronic care settings comprising approximately 1,406,000 beds as compared with approximately 1,452,000 beds served at December 31, 2005. Contributing in large measure to the year-over-year increase in sales was the completion of several acquisitions in 2005 and 2006, in particular, the acquisition of NeighborCare completed in the third quarter of 2005. Further, the acquisitions of excelleRx and RxCrossroads in August 2005 and the completion of 17 acquisitions in 2006 also contributed to the year-over-year sales increase. In addition, Pharmacy Services sales increased due to a favorable payor mix shift (offset in large measure by the aforementioned second quarter reduction in reimbursement rates under the United Part D contract) and drug price inflation. The Company estimates that drug price inflation for its highest dollar volume products in 2006 was approximately 5%. These positive factors were partially offset by a marked increase in the use of generic drugs, a lower number of beds served along with a bed mix shift, Medicaid reimbursement reductions in late 2005 (although the impact from Medicaid reimbursement cuts now is much lower than seen historically due to the shift in payor mix largely from Medicaid to Medicare Part D) and competitive pricing pressures. Also unfavorably impacting sales for the year ended December 31, 2006, was a change to the equity method of accounting for certain pharmacy joint venture operations in which the Company owns less than a 100% interest. Accordingly, the deconsolidation of these operations excluded net sales of approximately $48 million but had no impact on earnings. While the Company is focused on reducing the impact of competitive pricing and reimbursement issues, there can be no assurance that such issues or other pricing and reimbursement pressures will not continue to impact the Pharmacy Services segment.
Operating income of the Pharmacy Services segment was $561.0 million in 2006, a $23.0 million decrease as compared with the $584.0 million earned in 2005. As a percentage of the segment’s sales, operating income was 8.9% in 2006, compared with 11.4% in 2005. Operating income in 2006 benefited from the increased sales discussed above, including the addition of NeighborCare, excelleRx and RxCrossroads, the increased use of generic drugs, the impact of productivity enhancement initiatives, as well as the overall synergies from the integration of
65
prior-period acquisitions, particularly the NeighborCare acquisition. Although operating margins are generally unfavorably impacted by the initial addition of lower-margin institutional pharmacy acquisitions, the integration efforts have historically resulted in drug purchasing improvements, the consolidation of redundant pharmacy locations and other economies of scale, which serve to leverage the Company’s operating cost structure and have historically resulted in improved operating margins in the long-term as cost synergies are realized. Pharmacy Services operating income in the year ended December 31, 2005 included an expected benefit of $8.1 million attributable to the medication management performance provisions associated with a previously announced agreement with a third party under which Omnicare provided certain services to a now completed disease management demonstration project. The aforementioned positive factors in 2006 were more than offset by the special charges discussed below, as well as the Part D transition expenses and previously mentioned intensified competitive pricing and prior period Medicaid reimbursement reductions (although the impact from Medicaid reimbursement cuts now is much lower than seen historically due to the shift in payor mix largely from Medicaid to Medicare Part D). Specifically, operating income of the Pharmacy Services segment in the year ended December 31, 2006, was impacted by special pretax charges of approximately $187.6 million, including the aforementioned special litigation charges of $125.1 million, a $6.1 million charge associated with retention payments for certain NeighborCare employees as required under the acquisition agreement and the previously mentioned restructuring and other related charges, of which approximately $22.6 million was included in the Pharmacy Services segment and the previously mentioned $33.7 million in charges related to the quality control, product recall and fire issues at Heartland. In addition, operating income of the Pharmacy Services segment in the year ended December 31, 2005, was impacted by special pretax charges of approximately $11.3 million, including a $4.9 million charge for the settlement of litigation relating to certain contractual issues with two vendors, a charge for $1.1 million for acquisition-related expenses pertaining to a proposed transaction that was not consummated and the previously mentioned restructuring and other related charges, of which approximately $5.2 million was included in the Pharmacy Services segment.
On July 28, 2005, Omnicare completed its acquisition of NeighborCare. The acquisition, accounted for as a purchase business combination, included cash consideration of approximately $1.9 billion. The cash consideration included the pay off of certain NeighborCare debt totaling approximately $328 million, of which $78 million was retired by the Company immediately following the acquisition. In addition, the Company completed a tender offer for and subsequently purchased all of the $250 million outstanding principal amount of NeighborCare’s 6.875% senior subordinated notes, due 2013 (the “NeighborCare Notes”). The total consideration, excluding accrued and unpaid interest, paid for the NeighborCare Notes was approximately $274.2 million.
At the time of the acquisition, NeighborCare was an institutional pharmacy provider serving long-term care and skilled nursing facilities, specialty hospitals and assisted and independent living communities comprising approximately 295,000 beds in 34 states and the District of Columbia. NeighborCare also provided infusion therapy services, home medical equipment, respiratory therapy services, community-based retail pharmacies and group purchasing.
66
The NeighborCare acquisition provided opportunities to achieve economies of scale and cost synergies. The Company implemented an integration plan under which the processes have been put in place to achieve such savings in the purchasing of pharmaceuticals, the elimination of redundant functions and the consolidation of facilities in overlapping geographic territories.
CRO Services Segment
2006 vs. 2005
Omnicare’s CRO Services segment recorded revenues of $171.9 million for the year ended December 31, 2006, which decreased by $10.5 million, or 5.8% from the $182.4 million recorded in the same prior year period. In accordance with EITF Issue No. 01-14, the Company included $25.6 million and $28.5 million of reimbursable out-of-pockets in its CRO Services segment reported revenue and direct cost amounts for the years ended December 31, 2006 and 2005, respectively. Revenues for 2006 were lower than in the same prior year period primarily due to the aforementioned decrease in reimbursable out-of-pockets of $2.9 million and the early termination and client-driven delays in the commencement of certain projects during 2006.
Operating income in the CRO Services segment was $5.3 million in 2006 compared with $1.6 million in 2005, an increase of $3.7 million. As a percentage of the segment’s revenue, operating income was 3.1% in 2006 compared with 0.9% in 2005. This increase is primarily attributable to the CRO Services segment including pretax restructuring and other related charges of approximately $10.8 million in 2005 while the 2006 year only included pretax restructuring and other related charges of approximately $2.4 million. Operating income was unfavorably impacted by the reduction in revenues discussed above. Backlog at December 31, 2006 of $301.9 million was $33.0 million higher than the December 31, 2005 backlog of $268.9 million.
As previously mentioned, the Company estimates that drug price inflation for its highest dollar volume products in each of the three years ended December 31, 2007 approximated 5% to 6%, which tends to impact sales and costs of sales at approximately the same level. Therefore, inflation has not materially affected Omnicare’s net income, inasmuch as government and other reimbursement formulas generally adjust to take into account drug price inflation or deflation.
|
Financial Condition, Liquidity and Capital Resources |
|
Cash and cash equivalents at December 31, 2007 were $277.6 million compared with $141.8 million at December 31, 2006 (including restricted cash amounts of $3.2 million and $3.8 million, respectively).
The Company generated positive net cash flows from operating activities of $505.5 million during the year ended December 31, 2007, compared with net cash flows from operating activities of $108.5 million and $263.5 million during the years ended December 31, 2006 and 2005, respectively. Partially contributing to net cash flows from operating activities during the year ended December 31, 2007 were operating results during the period. Further, year-over-year
67
cash flow was impacted by the favorable cash flow trend in accounts receivable and accounts payable on operating cash flows. Cash flow from operations for 2006 was impacted by cash payments of $104.2 million related to the litigation matters and $12.5 million related to the Heartland matters. See further discussion of these matters at the “Commitments and Contingencies” note of the Notes to Consolidated Financial Statements. This unfavorable 2006 impact was partially offset by the first quarter of 2006 return of a deposit of approximately $38.3 million from one of the Company’s drug wholesalers. Cash flow from operations for 2006 also included the return of a $44.0 million deposit from another of the Company’s drug wholesalers in connection with a change in terms to more frequent, weekly payments. The impact of these more frequent payments on cash flow in 2006 slightly more than offset the $44.0 million return of the deposit. Operating cash flows in 2007 were used primarily for acquisition-related payments, debt payments, capital expenditures, dividend payments, and to increase the Company’s cash position as compared with December 31, 2006.
Net cash used by investing activities was $196.9 million, $126.9 million and $2.6 billion in 2007, 2006 and 2005, respectively. Acquisitions of businesses required outlays of $151.1 million (including amounts payable pursuant to acquisition agreements relating to pre-2007 acquisitions) in 2007 relating to 20 acquisitions, which were primarily funded by operating cash flows. Acquisitions of businesses during 2006 and 2005 required cash payments of $94.3 million and $2.6 billion, respectively, (including amounts payable pursuant to acquisition agreements relating to pre-2006 and pre-2005 acquisitions, respectively), which were primarily funded by proceeds from long-term debt borrowings, proceeds from the issuance of common stock, invested cash and operating cash flows. Omnicare’s capital requirements, in addition to the payment of debt and dividends, are primarily comprised of its acquisition program, as well as capital expenditures, largely relating to investments in the Company’s information technology systems and the implementation of the “Omnicare Full Potential” Plan.
Net cash used in financing activities was $175.1 million for the year ended December 31, 2007, as compared to $60.1 million for the year ended December 31, 2006. During 2007, the Company paid down $150.0 million on the Term Loans. Borrowings on the revolving credit facility totaled approximately $95 million during 2007 and were completely repaid prior to the end of the period. During 2006, the Company paid down $100 million on the Term Loans. Net cash provided by financing activities was $2.5 billion for the year ended December 31, 2005. Borrowings during 2005 were primarily related to the Company entering into the new $3.4 billion Credit Agreement (“Credit Agreement”) during the third quarter of 2005, primarily to provide interim financing for the NeighborCare, excelleRx and RxCrossroads transactions. The Credit Agreement consisted of a $1.9 billion 364-day loan facility, a five year $800 million revolving credit facility due 2010 and a five year $700 million senior term A loan facility due 2010. Proceeds from the Credit Agreement were also utilized to retire the Company’s old revolving credit facility and old term A loan, resulting in net payments on these two borrowings of $305.4 million during the year ended December 31, 2005. On December 15, 2005, the Company completed a major refinancing undertaken primarily to provide long-term financing for the NeighborCare, excelleRx and RxCrossroads transactions. Total gross proceeds from the refinancing were approximately $2.5 billion from the issuance of $225 million of 6.75% senior subordinated notes due 2013, $525 million of 6.875% senior subordinated notes due 2015, $977.5 million of 3.25% convertible senior debentures due 2035, and $765.9 million of
68
Omnicare common stock (excluding gross proceeds of approximately $51 million received in January 2006 from the underwriters of the common stock offering exercising their option in part to purchase an additional 850,000 shares of common stock at $59.72 per share). The net proceeds from the refinancing were primarily utilized to pay off the interim financing provided by the $1.9 billion 364-day loan facility and the purchase of approximately $366 million of the Company’s 8.125% senior subordinated notes due 2011 pursuant to a tender offer and consent solicitation. See further discussion of the Company’s financing activities at the “Debt” note of the Notes to Consolidated Financial Statements.
At December 31, 2007, there were no outstanding borrowings on the $800 million revolving credit facility, and $450 million in borrowings were outstanding on the Term Loans. As of December 31, 2007, the Company had approximately $24.2 million outstanding relating to standby letters of credit, substantially all of which are subject to automatic annual renewals.
On February 14, 2008, the Company’s Board of Directors declared a quarterly cash dividend of 2.25 cents per share for an indicated annual rate of 9 cents per common share for 2008, which is consistent with annual dividends paid per common share for the 2007, 2006 and 2005 years. Aggregate dividends of $11.0 million paid during 2007 were consistent with the $10.9 million paid in 2006, and modestly higher than the $9.5 million paid in 2005, due to the late 2005 and early 2006 common stock offering, as further discussed at the “Public Offering of Common Stock” note of the Notes to Consolidated Financial Statements.
There were no known material commitments and contingencies outstanding at December 31, 2007, other than the contractual obligations summarized in the “Disclosures About Aggregate Contractual Obligations and Off-Balance Sheet Arrangements” caption below, certain acquisition-related payments potentially due in the future, including deferred payments, indemnification payments and payments originating from earnout and other provisions that may become payable, as well as the matters discussed in the “Commitments and Contingencies” note of the Notes to Consolidated Financial Statements, and the “Legal Proceedings” section at Part I, Item 3 of this Filing.
The Company believes that net cash flows from operating activities, credit facilities and other short- and long-term debt financings will be sufficient to satisfy its future working capital needs, acquisition contingency commitments, debt servicing, capital expenditures and other financing requirements for the foreseeable future. The Company believes that external sources of financing are readily available and will access them as deemed appropriate (although no assurances can be given regarding the Company’s ability to obtain additional financing in the future on acceptable terms and conditions).
69
Disclosures About Aggregate Contractual Obligations and Off-Balance Sheet Arrangements
Aggregate Contractual Obligations:
The following summarizes the Company’s aggregate contractual obligations as of December 31, 2007, and the effect such obligations are expected to have on the Company’s liquidity and cash flows in future periods (in thousands):
| | | | | | | | | | | | | | | | |
| | Total | | Less Than 1
Year | | 1-3 Years | | 4-5 Years | | After 5
Years | |
| |
| |
| |
| |
| |
| |
Debt obligations(a) | | $ | 2,823,102 | | $ | — | | $ | 500,602 | | $ | — | | $ | 2,322,500 | |
Capital lease obligations(a) | | | 8,831 | | | 3,192 | | | 4,273 | | | 906 | | | 460 | |
Operating lease obligations | | | 170,495 | | | 47,835 | | | 62,413 | | | 26,015 | | | 34,232 | |
Purchase obligations(b) | | | 93,494 | | | 72,924 | | | 11,220 | | | 9,350 | | | — | |
Other current obligations(c) | | | 378,054 | | | 378,054 | | | — | | | — | | | — | |
Other long-term obligations(d) | | | 379,376 | | | — | | | 149,334 | | | 22,018 | | | 208,024 | |
| |
|
| |
|
| |
|
| |
|
| |
|
| |
Subtotal | | | 3,853,352 | | | 502,005 | | | 727,842 | | | 58,289 | | | 2,565,216 | |
Future interest relating to debt and capital lease obligations(e) | | | 1,779,445 | | | 143,727 | | | 271,867 | | | 224,438 | | | 1,139,413 | |
| |
|
| |
|
| |
|
| |
|
| |
|
| |
Total contractual cash obligations | | $ | 5,632,797 | | $ | 645,732 | | $ | 999,709 | | $ | 282,727 | | $ | 3,704,629 | |
| |
|
| |
|
| |
|
| |
|
| |
|
| |
| |
(a) | The noted obligation amounts represent the principal portion of the associated debt obligations. Details of the Company’s outstanding debt instruments can be found in the “Debt” note of the Notes to Consolidated Financial Statements. |
| |
(b) | Purchase obligations primarily consist of open inventory purchase orders, as well as obligations for other goods and services, at period end. |
| |
(c) | Other current obligations primarily consist of accounts payable at period end. |
| |
(d) | Other long-term obligations are largely comprised of pension and excess benefit plan obligations, acquisition-related liabilities, the obligation associated with the interest rate Swap Agreement discussed below, as well as accruals relating to uncertain tax positions. |
| |
(e) | Represents estimated future pretax interest costs based on the stated fixed interest rate of the debt, or the variable interest rate in effect at period end for variable interest rate debt. The estimated future interest costs presented in this table do not include any amounts potentially payable associated with the contingent interest and interest reset provisions of the Company’s convertible debentures. To the extent that any debt would be paid off by Omnicare prior to the stated due date or refinanced, the estimated future interest costs would change accordingly. Further, these analyses do not consider the effects of potential changes, if any, in the Company’s credit rating. |
As of December 31, 2007, the Company had approximately $24.2 million outstanding relating to standby letters of credit, substantially all of which are subject to automatic annual renewals.
70
Off-Balance Sheet Arrangements:
As of December 31, 2007, the Company had two unconsolidated entities, Omnicare Capital Trust I, a statutory trust formed by the Company (the “Old Trust”) and Omnicare Capital Trust II (the “New Trust”), which were established for the purpose of facilitating the offerings of the 4.00% Trust Preferred Income Equity Redeemable Securities due 2033 (the “Old Trust PIERS”) and the Series B 4.00% Trust Preferred Income Equity Redeemable Securities (the “New Trust PIERS”), respectively. For financial reporting purposes, the Old Trust and New Trust are treated as equity method investments of the Company. The Old Trust and New Trust are 100%-owned finance subsidiaries of the Company. The Company has fully and unconditionally guaranteed the securities of the Old Trust and New Trust. The Old 4.00% Debentures issued by the Company to the Old Trust and the New 4.00% Debentures issued by the Company to the New Trust in connection with the issuance of the Old Trust PIERS and the New Trust PIERS, respectively, are presented as a single line item in Omnicare’s consolidated balance sheets and debt footnote disclosures. Additionally, the related disclosures concerning the Old Trust PIERS and the New Trust PIERS, the guarantees, and the Old 4.00% Debentures and New 4.00% Debentures are included in the “Debt” note of the Notes to Consolidated Financial Statements. Omnicare records interest payable to the Old Trust and New Trust as interest expense in its consolidated statement of income.
As of December 31, 2007, the Company had no other unconsolidated entities, or any financial partnerships, such as entities often referred to as structured finance or special purpose entities, which might have been established for the purpose of facilitating off-balance sheet arrangements.
|
Quantitative and Qualitative Disclosures about Market Risk |
|
Omnicare’s primary market risk exposure relates to variable interest rate risk through its borrowings. Accordingly, market risk loss is primarily defined as the potential loss in earnings due to higher interest rates on variable-rate debt of the Company. The modeling technique used by Omnicare for evaluating interest rate risk exposure involves performing sensitivity analysis on the variable-rate debt, assuming a change in interest rates of 100 basis-points. The Company’s debt obligations at December 31, 2007 include $450.0 million outstanding under the variable-rate Senior term A loan, due 2010, at an interest rate of 6.1% at December 31, 2007 (a 100 basis-point change in the interest rate would increase or decrease pretax interest expense by approximately $4.5 million per year); $50.6 million borrowed on a variable-rate term loan, due 2010, at an interest rate of 7.03% at December 31, 2007 (a 100 basis-point change in the interest rate would increase or decrease pretax interest expense by approximately $0.5 million per year); $250.0 million outstanding under its fixed-rate 6.125% Senior Notes, due 2013; $225.0 million outstanding under its fixed-rate 6.75% Senior Notes, due 2013; $525 million outstanding under its fixed-rate 6.875% Senior Notes, due 2015; $345.0 million outstanding under its fixed-rate 4.00% Convertible Debentures, due 2033; and $977.5 million outstanding under its fixed-rate 3.25% Convertible Debentures, due 2035 (with an optional repurchase right of holders on December 15, 2015). In connection with its offering of $250.0 million of 6.125% Senior Notes, during the second quarter of 2003, the Company entered into a Swap Agreement on all $250.0 million of its aggregate principal amount of the 6.125% Senior Notes. Under the Swap Agreement, which hedges against exposure to long-term U.S. dollar interest rates, the Company receives a fixed rate of 6.125% and pays a floating rate based on LIBOR with a maturity of six
71
months, plus a spread of 2.27%. The estimated LIBOR-based floating rate (including the 2.27% spread) was 6.74% at December 31, 2007 (a 100 basis-point change in the interest rate would increase or decrease pretax interest expense by approximately $2.5 million per year). The Swap Agreement, which matches the terms of the 6.125% Senior Notes, is designated and accounted for as a fair value hedge. The Company is accounting for the Swap Agreement in accordance with SFAS No. 133, as amended, so changes in the fair value of the Swap Agreement are offset by changes in the recorded carrying value of the related 6.125% Senior Notes. The fair value of the Swap Agreement of approximately $8 million at December 31, 2007, based on an estimate obtained from an outside advisor, is recorded as a noncurrent liability and a reduction to the book carrying value of the related 6.125% Senior Notes. At December 31, 2007, the fair value of Omnicare’s variable rate debt facilities approximates the carrying value, as the effective interest rates fluctuate with changes in market rates.
The fair value of the Company’s fixed-rate debt facilities is based on quoted market prices and is summarized as follows (in thousands):
Fair Value of Financial Instruments
| | | | | | | | | | | | | |
| | December 31, | |
| |
| |
| | 2007 | | 2006 | |
| |
| |
| |
Financial Instrument: | | Book Value | | Market Value | | Book Value | | Market Value | |
| |
| |
| |
| |
| |
6.125% senior subordinated notes, due 2013, gross | | $ | 250,000 | | $ | 230,000 | | $ | 250,000 | | $ | 241,300 | |
6.75% senior subordinated notes, due 2013 | | | 225,000 | | | 212,600 | | | 225,000 | | | 221,900 | |
6.875% senior subordinated notes, due 2015 | | | 525,000 | | | 486,900 | | | 525,000 | | | 520,400 | |
4.00% junior subordinated convertible debentures, due 2033 | | | 345,000 | | | 246,700 | | | 345,000 | | | 372,200 | |
3.25% convertible senior debentures, due 2035 | | | 977,500 | | | 703,800 | | | 977,500 | | | 830,900 | |
Embedded in the Old Trust PIERS, the New Trust PIERS and the 3.25% Convertible Debentures are two derivative instruments, specifically, a contingent interest provision and a contingent conversion parity provision. In addition, the 3.25% Convertible Debentures include an interest reset provision. The embedded derivatives are periodically valued by a third-party advisor, and at period end, the values of the derivatives embedded in the Old Trust PIERS, the New Trust PIERS and the 3.25% Convertible Debentures were not material. However, the values are subject to change, based on market conditions, which could affect the Company’s future consolidated results of operations, financial position or cash flows.
The Company has operations and revenue that occur outside of the U.S. and transactions that are settled in currencies other than the U.S. dollar, exposing it to market risk related to changes in foreign currency exchange rates. However, the substantial portion of the Company’s operations and revenues and the substantial portion of the Company’s cash settlements are exchanged in U.S. dollars. Therefore, changes in foreign currency exchange rates do not represent a substantial market risk exposure to the Company.
The Company does not have any financial instruments held for trading purposes.
72
|
Critical Accounting Policies |
|
The Company’s consolidated financial statements are prepared in accordance with U.S. GAAP. In connection with the preparation of these financial statements, Omnicare management is required to make assumptions, estimates and judgments that affect the reported amounts of assets, liabilities, stockholders’ equity, revenues and expenses and the related disclosure of commitments and contingencies. On a regular basis, the Company evaluates the estimates used, including those related to its provision for doubtful accounts, contractual allowances, inventory valuation, impairment of goodwill, insurance accruals, pension obligations, income taxes, stock-based compensation, legal and regulatory contingencies, and other operating allowances and accruals. Management bases its estimates on a combination of factors, including historical experience, current conditions, feedback from outside advisors where feasible, and on various other assumptions that are believed to be reasonable at the time and under the current circumstances. The Company’s significant accounting policies are summarized in the “Description of Business and Summary of Significant Accounting Policies” note of the Notes to Consolidated Financial Statements.
In many cases, the accounting treatment of a particular transaction is specifically dictated by U.S. GAAP and does not require significant management judgment in its application. There are also areas in which management’s judgment in selecting among available alternatives would not produce a materially different result. An accounting policy is considered to be critical if it is important to the determination of the registrant’s financial position and operating results, and requires significant judgment and estimates on the part of management in its application. Omnicare’s critical accounting estimates and the related assumptions are evaluated periodically as conditions require revision. Application of the critical accounting policies requires management’s significant judgments, often as the result of the need to make estimates of matters that are inherently and highly uncertain, including those matters further discussed below. If actual results were to differ materially from the judgments and estimates made, the Company’s reported financial position and/or operating results could be materially affected. Omnicare management continually reviews these estimates and assumptions in preparing the financial statements. The Company believes the following critical accounting policies and estimates involve more significant judgments and estimates used in the preparation of the consolidated financial statements.
Revenue Recognition
Omnicare recognizes revenue when products or services are delivered or provided to the customer.
Pharmacy Services Segment
A significant portion of the Company’s Pharmacy Services segment revenues from sales of pharmaceutical and medical products have been reimbursed by the federal Medicare Part D plan and, to a lesser extent, state Medicaid programs. Payments for services rendered to patients covered by these programs are generally less than billed charges. The Company monitors its revenues and receivables from these reimbursement sources, as well as other third-party
73
insurance payors, and records an estimated contractual allowance for certain sales and receivable balances at the revenue recognition date, to properly account for anticipated differences between billed and reimbursed amounts. Accordingly, the total net sales and receivables reported in the Company’s financial statements are recorded at the amount ultimately expected to be received from these payors. Since billing functions for a portion of the Company's revenue systems are largely computerized, enabling on-line adjudication (i.e., submitting charges to Medicare, Medicaid or other third-party payors electronically, with simultaneous feedback of the amount to be paid) at the time of sale to record net revenues, exposure to estimating contractual allowance adjustments is limited primarily to unbilled and/or initially rejected Medicare, Medicaid and third-party claims (oftentimes approved for reimbursement once additional information is provided to the payor). For the remaining portion of the Company's revenue systems, the contractual allowance is estimated for all billed, unbilled and/or initially rejected Medicare, Medicaid and third-party claims. The Company evaluates several criteria in developing the estimated contractual allowances for billed, unbilled and/or initially rejected claims on a monthly basis, including historical trends based on actual claims paid, current contract and reimbursement terms, and changes in customer base and payor/product mix. Contractual allowance estimates are adjusted to actual amounts as cash is received and claims are settled, and the aggregate impact of these resulting adjustments were not significant to the Company’s operations for any of the periods presented. Further, Omnicare does not expect the reasonably possible effects of a change in estimate related to unsettled December 31, 2007 contractual allowance amounts from Medicare, Medicaid and third-party payors to be significant to its future consolidated results of operations, financial position and cash flows.
Patient co-payments are associated with Medicare Part D (see further discussion below), certain state Medicaid programs, Medicare Part B and certain third-party payors and are typically not collected at the time products are delivered or services are rendered, but are billed to the individual as part of the Company’s normal billing procedures. These co-payments are subject to the Company’s normal accounts receivable collections procedures.
A patient may be dispensed prescribed medications (typically no more than a 2-3 day supply) prior to insurance being verified in emergency situations, or for new facility admissions after hours or on weekends. As soon as practicable (typically the following business day), specific payor information is obtained so that the proper payor can be billed for reimbursement.
Under certain circumstances, the Company accepts returns of medications and issues a credit memo to the applicable payor. The Company estimates and accrues for sales returns based on historical return experience, giving consideration to the Company’s return policies. Product returns are processed in the period received and are not significant when compared to the overall sales and gross profit of the Company.
Contract Research Services Segment
A portion of the Company’s overall revenues relates to the Contract Research Services (“CRO”) segment, and is earned by performing services under contracts with various pharmaceutical, biotechnology, medical device and diagnostics companies, based on contract terms. Most of the contracts provide for services to be performed on a units-of-service basis. These contracts specifically identify the units-of-service and unit pricing. Under these contracts, revenue is generally recognized upon completion of the units-of-service. For time-and-materials contracts, revenue is recognized at contractual hourly rates, and for fixed-price contracts, revenue is
74
recognized using a method similar to that used for units-of-service. The Company’s contracts provide for additional service fees for scope of work changes. The Company recognizes revenue related to these scope changes when underlying services are performed and realization is assured. In a number of cases, clients are required to make termination payments in addition to payments for services already rendered. Any anticipated losses resulting from contract performance are charged to earnings in the period identified. Billings and payments are specified in each contract. Revenue recognized in excess of billings is classified as unbilled receivables, while billings in excess of revenue are classified as deferred revenue, on the respective lines of the Consolidated Balance Sheets.
Allowance for Doubtful Accounts
Collection of accounts receivable from customers is the Company’s primary source of operating cash flow and is critical to Omnicare’s operating performance, cash flows and financial condition. Omnicare’s primary collection risk relates to facility, private pay and Part D customers. The Company provides a reserve for accounts receivable that could become uncollectible by establishing an allowance to reduce the carrying value of such receivables to their estimated net realizable value. Omnicare establishes this allowance for doubtful accounts using the specific identification approach, and considering such factors as historical collection experience (i.e., payment history and credit losses) and creditworthiness, specifically identified credit risks, aging of accounts receivable by payor category, current and expected economic conditions and other relevant factors. Management reviews this allowance for doubtful accounts on an ongoing basis for appropriateness. Judgment is used to assess the collectibility of account balances and the economic ability of customers to pay.
The Company computes and monitors its accounts receivable days sales outstanding (“DSO”), a non-GAAP measure, in order to evaluate the liquidity and collection patterns of its accounts receivable. DSO is calculated by averaging the beginning and end of quarter accounts receivable, less contractual allowances and the allowance for doubtful accounts, to derive “average accounts receivable”; and dividing average accounts receivable by the sales amount (excluding reimbursable out-of-pockets) for the related quarter. The resultant percentage is multiplied by 92 days to derive the DSO amount. Omnicare’s DSO approximated 84 days at December 31, 2007, which was lower than the December 31, 2006 DSO of approximately 86 days. As previously disclosed, the Company has experienced on-going administrative and payment issues associated with the Medicare Part D implementation, resulting in outstanding gross accounts receivables (net of allowances for contractual adjustments, and prior to any allowance for doubtful accounts) for copays and rejected claims. As of December 31, 2007, copays outstanding from Part D Plans were approximately $39 million, of which approximately $19 million relates to 2006. Additionally, as of December 31, 2007, Part D rejected claims outstanding from Part D Plans for the 2006 transitional year were approximately $21 million. Unfavorably impacting the overall DSO, as well as the increase in the 181 days and over past due accounts receivable balance, is the aging in accounts receivable relating to several of the Company’s larger nursing home chain customers. On July 11, 2007, the Company commenced legal action against a group of its customers for, among other things, the collection of past-due receivables that are owed to the Company. Specifically, approximately $83 million (excluding interest and prior to any allowance for doubtful accounts) is owed to the Company by this group of customers as of December 31, 2007, of which approximately $75 million is past
75
due based on applicable payment terms (a significant portion of which is not reserved). The $83 million represents approximately five days of the overall DSO at December 31, 2007. Until all administrative and payment issues relating to the Part D Drug Benefit as well as the aforementioned legal action against a group of Omnicare’s customers are fully resolved, there can be no assurance that the impact of these matters on the Company’s consolidated results of operations, financial position or cash flows will not change based on the outcome of any unforeseen future developments.
The allowance for doubtful accounts as of December 31, 2007 was $334.1 million, compared with $191.0 million at December 31, 2006. These allowances for doubtful accounts represented 19.5% and 11.2% of gross receivables (net of contractual allowances) as of December 31, 2007 and 2006, respectively. Unforeseen future developments could lead to changes in the Company’s provision for doubtful accounts levels and future allowance for doubtful accounts percentages, which could materially impact the overall consolidated results of operations, financial position or cash flows of the Company. For example, a one percentage point increase in the allowance for doubtful accounts as a percentage of gross receivables (net of allowances for contractual adjustments, and prior to allowances for doubtful accounts) as of December 31, 2007 would result in an increase to the provision for doubtful accounts and related allowance for doubtful accounts on the balance sheet of approximately $17.1 million pretax.
The following table is an aging of the Company’s December 31, 2007 and 2006 gross accounts receivable (net of allowances for contractual adjustments, and prior to allowances for doubtful accounts), aged based on payment terms and categorized based on the four primary overall types of accounts receivable characteristics (in thousands):
| | | | | | | | | | |
| | December 31, 2007 | |
| |
| |
| | Current and
0-180 Days
Past Due | | 181 Days and
Over
Past Due | | Total | |
| |
| |
| |
| |
Medicare (Part D and Part B), Medicaid and Third-Party payors | | $ | 390,663 | | $ | 167,116 | | $ | 557,779 | |
Facility payors | | | 527,879 | | | 347,551 | | | 875,430 | |
Private Pay payors | | | 126,480 | | | 124,958 | | | 251,438 | |
CRO | | | 25,702 | | | — | | | 25,702 | |
| |
|
| |
|
| |
|
| |
Total gross accounts receivable (net of contractual allowance adjustments) | | $ | 1,070,724 | | $ | 639,625 | | $ | 1,710,349 | |
| |
|
| |
|
| |
|
| |
76
| | | | | | | | | | |
| | December 31, 2006 | |
| |
| |
| | Current and
0-180 Days
Past Due | | 181 Days and
Over
Past Due | | Total | |
| |
| |
| |
| |
Medicare (Part D and Part B), Medicaid and Third-Party payors | | $ | 538,950 | | $ | 95,910 | | $ | 634,860 | |
Facility payors | | | 556,881 | | | 244,731 | | | 801,612 | |
Private Pay payors | | | 160,503 | | | 98,179 | | | 258,682 | |
CRO | | | 18,160 | | | — | | | 18,160 | |
| |
|
| |
|
| |
|
| |
Total gross accounts receivable (net of contractual allowance adjustments) | | $ | 1,274,494 | | $ | 438,820 | | $ | 1,713,314 | |
| |
|
| |
|
| |
|
| |
Patient charges pending approval from Medicare, Medicaid and third-party payors are primarily billed as private pay and, where applicable, are recorded net of an estimated contractual allowance at period end. Once an approval to bill Medicare, Medicaid and/or third-party payors has been obtained, the private pay balance is reversed and a corresponding Medicare, Medicaid or third-party receivable amount is recorded. The Company’s policy is to resolve accounts receivable with pending status as soon as practicable. Pending accounts receivable balances were not a significant component of the overall accounts receivable balance at December 31, 2007.
Omnicare has standard policies and procedures for collection of its accounts receivable. The Company’s collection efforts generally include the mailing of statements, followed up when necessary with delinquency notices, personal and other contacts, the use of an in-house national collections department or outside collection agencies, and potentially mediation/arbitration or litigation when accounts are considered unresponsive. Omnicare’s collection efforts primarily relate to its facility and private pay customers, as well as efforts to collect/rework Medicare Part D copays and rejected claims. When Omnicare becomes aware that a specific customer is potentially unable to meet part or all of its financial obligations, for example, as a result of bankruptcy or deterioration in the customer’s operating results or financial position, the national credit and collections department includes the exposed balance in its allowance for doubtful accounts requirements. At such time that a balance is definitively deemed to be uncollectible by Omnicare management (including the national credit and collections department), collections agencies and/or outside legal counsel, the balance is manually written off against the allowance for doubtful accounts. At December 31, 2007, except for the accounts receivable matters separately disclosed in this Filing, the Company does not have a significant portion of its overall accounts receivable balance placed in mediation/arbitration, litigation or with outside collection agencies.
Given the Company’s experience, management believes that the aggregate reserves for potential losses are adequate, but if any of the Company’s larger customers were to unexpectedly default on their obligations to Omnicare, the Company’s overall allowances for doubtful accounts may prove to be inadequate. In particular, if economic conditions worsen, the payor mix shifts significantly, additional Part D payment issues arise, or the Company’s customers’ reimbursement rates are adversely affected, impacting
77
Omnicare’s customers’ ability to pay their bills, management may adjust the allowance for doubtful accounts accordingly, and the Company’s accounts receivable collections, cash flows, financial position and results of operations would then be, potentially, adversely affected.
Inventories
The Company maintains inventory at lower of cost or market, with cost determined on the basis of the first-in, first-out method. There are not any significant obsolescence reserves recorded since the Company has not historically experienced (nor does it expect to experience) significant levels of inventory obsolescence write-offs. Physical inventories are typically performed on a monthly basis at all pharmacy sites, and in all cases the Company’s policy is to perform them at least once a quarter. Cost of goods sold is recorded based on the actual results of the physical inventory counts, and is estimated when a physical inventory is not performed in a particular month.
Goodwill
SFAS No. 142, “Goodwill and Other Intangible Assets” (“SFAS 142”) requires that goodwill and other indefinite-lived intangible assets be reviewed for impairment using a fair value based approach at least annually. SFAS 142 requires the Company to assess whether there is an indication that goodwill is impaired, and requires goodwill to be tested between annual tests if events occur or circumstances change that would, more likely than not, reduce the fair value of a reporting unit below its book carrying amount. The Company’s assessments to date have indicated that goodwill has not been impaired.
The Company’s assessment of goodwill impairment is largely dependent on estimates of future cash flows at the aggregated reporting unit level, and a weighted-average cost of capital. The estimates of these future cash flows are based on assumptions and projections with respect to future revenues and expenses believed to be reasonable and supportable at the time the annual impairment analysis is performed. Further, they require management’s subjective judgments and take into account assumptions about overall growth rates and increases in expenses. To the extent the book carrying value of the assets would exceed their fair value; an impairment loss may be necessary. Changes in the estimates of future cash flows or weighted-average cost of capital due to unforeseen events and circumstances could cause Omnicare’s analysis to indicate that goodwill is impaired in subsequent periods, and could result in the write-off of a portion or all of the Company’s goodwill, which could be material to the Company’s financial position, results of operations or cash flows.
Insurance Accruals
Omnicare is self-insured for certain employee health insurance claims. The Company manages its health insurance risk by obtaining individual and aggregate stop-loss coverage in the amount of $150,000 per claim and 125% of expected aggregate claims, or approximately $47 million for the 2007 year. Additionally, Omnicare insures all of its property and casualty programs (including worker’s compensation and professional liability) in excess of self-insured retentions, or deductibles, on the various policies of insurance (which range from between $50,000 and $1,000,000 per claim, depending on the type of coverage). Omnicare closely monitors and continually evaluates its historical claims experience, and obtains input from third-party insurance and valuation professionals, to estimate the appropriate level of accrual for its self-
78
insured programs, including the aforementioned deductibles. These accruals include provision for incurred, as well as incurred but not yet reported, claims. In developing its self-insurance accrual estimates, the Company’s liability calculation also considers the historical claim lag periods and current payment trends of insurance claims (generally approximately 2 months for health, and 48-60 months for all other coverages). A change in the historical claim lag period assumption by one month for health insurance claims would affect health insurance expense by approximately $3.2 million pretax. A change in the historical claim lag period by one month for property and casualty insurance claims would affect property and casualty insurance expense by approximately $0.7 million pretax.
Although significant fluctuations may occur in the short-term due to unforeseen events potentially resulting in atypical claims experience, the Company’s historical claims experience, coupled with its stop-loss coverages, has consistently supported management’s assumption that this methodology provides for reasonable insurance expense estimates and accruals over a long-term period.
Employee Benefit Plans
For certain of its employee benefit plans, the Company utilizes estimates in developing its actuarial assumptions (including such items as the expected rate of return on plan assets, discount rate, mortality rates, and the assumed rate of compensation increase, among other items), and relies on actuarial computations to estimate the future potential liability, expense and funding requirements associated with these benefits. While it is required that the actuarial assumptions be reviewed each year as of the measurement date of December 31, the actuarial assumptions generally do not change between measurement dates. During Omnicare’s annual review, generally near the beginning of the fiscal year, the Company reviews and updates these assumptions, and considers historical experience, current market conditions and input from its third-party advisors, including any changes in interest rates, in making these assumptions. These actuarial assumptions and estimates attempt to anticipate future events, and if assessed differently, or if they materially vary from actual results due to changing market and economic conditions, could have a significant impact on the Company’s consolidated financial position, results of operations or cash flows. However, a one percentage point change in any of the individual aforementioned assumptions used to calculate the Company’s pension obligation, holding all other assumptions constant, is not expected to have a material impact on the Company’s consolidated operating results.
Taxes
In accordance with SFAS No. 109, “Accounting for Income Taxes,” (“SFAS 109”), the Company estimates its current and deferred tax assets and liabilities, including those relating to acquired subsidiaries, based on current tax laws in the statutory jurisdictions in which it operates. These estimates include judgments about deferred tax assets and liabilities resulting from temporary differences between the financial statement carrying amounts and the tax basis of assets and liabilities, as well as the realization of deferred tax assets (including those relating to net operating losses). The deferred tax assets and liabilities are determined based on the enacted tax rates expected to apply in the periods in which the deferred tax assets or liabilities are expected to be settled or realized.
79
Omnicare periodically reviews its deferred tax assets for recoverability and establishes a valuation allowance if it is more likely than not that some portion or all of a deferred tax asset will not be realized. The determination as to whether a deferred tax asset will be realized is made on a jurisdictional basis and is based on the evaluation of positive and negative evidence. This evidence includes historical taxable income, projected future taxable income, the expected timing of the reversal of existing temporary differences and the implementation of tax planning strategies. Projected future taxable income is based on the Company’s expected results and assumptions as to the jurisdiction in which the income will be earned. The expected timing of the reversals of existing temporary differences is based on current tax law and Omnicare’s tax methods of accounting. If the Company is unable to generate sufficient future taxable income by jurisdiction, or if there is a material change in the actual effective tax rates or the time period within which the underlying temporary differences become taxable or deductible, or if the tax laws change unfavorably, then the Company could be required to increase its valuation allowance against its deferred tax assets, resulting in an increase in the effective tax rate and related tax expense.
The Company also reviews its tax liabilities, including those relating to acquired subsidiaries, giving consideration to the relevant authoritative guidance, including SFAS 109 and FASB Interpretation No. 48 “Accounting for Uncertainty in Income Taxes (“FIN 48”). FIN 48 provides guidance for the financial statement recognition and measurement of income tax positions taken or expected to be taken in a tax return. Under FIN 48, recognition and measurement are considered discrete events. The recognition threshold is met when it is determined a tax position, based solely on its technical merits, is more likely than not to be sustained upon examination by the relevant taxing authority. If a tax position does not meet the more likely than not recognition threshold, the benefit of that position is not recognized in the financial statements. A tax position that meets the more likely than not recognition threshold is measured to determine the amount of benefit to recognize in the financial statements. The tax position is measured as the largest amount of benefit that is 50 percent likely of being realized upon ultimate resolution with a taxing authority.
Omnicare operates in a significant number of states and tax jurisdictions with varying tax laws. The Company is subject to both federal and state audits of tax returns in the normal course of business. While the Company believes it has provided adequately for tax liabilities in its consolidated financial statements, adverse determinations by applicable taxing authorities could have a material adverse effect on Omnicare’s consolidated financial position, results of operations or cash flows. If the provisions for current or deferred taxes are not adequate, if the Company is unable to realize certain deferred tax assets or if the tax laws change unfavorably, the Company could potentially experience tax losses. Likewise, if provisions for current and deferred taxes are in excess of those eventually needed, if the Company is able to realize additional deferred tax assets or if tax laws change favorably, the Company could experience potential tax gains. A one percentage point change in the Company’s overall 2007, 2006 and 2005 effective tax rates would impact tax expense and net income by $1.9 million, $3.2 million and $3.6 million, respectively.
80
Stock-Based Compensation
Effective January 1, 2006, the Company adopted the provisions of SFAS 123R, which replaced SFAS No. 123, “Accounting for Stock-Based Compensation” (“SFAS 123”) and supersedes APB Opinion No. 25, “Accounting for Stock Issued to Employees” (“APB 25”). Prior to the adoption of SFAS 123R, the Company accounted for stock incentive plans under the recognition and measurement principles of APB 25, and related Interpretations (intrinsic value method). Historically, stock option awards have been granted with an exercise price at least equal to the fair market value of Company stock upon grant. As a result, no stock-based employee compensation cost for stock options was reflected in net income. As further described in the “Recently Issued Accounting Standards” section of the “Description of Business and Summary of Significant Accounting Policies,” and “Stock-Based Employee Compensation,” notes of the Notes to the Consolidated Financial Statements, SFAS 123R requires the Company to record compensation costs relating to share-based payment transactions in its financial statements. Under the fair value recognition provisions of SFAS 123R, share-based compensation cost is measured at the grant date based on the fair value of the award and is recognized as expense ratably over the requisite service period of the award (usually the vesting period).
The Company uses the Black-Scholes options pricing model to determine the fair value of stock options on the grant date, which is affected by Omnicare’s stock price as well as assumptions regarding a number of complex and subjective variables, as further discussed below. These variables include Omnicare’s expected stock price volatility over the expected term of the awards, actual and projected employee exercise behaviors, the risk-free interest rate and the stock’s dividend yield. The expected term of stock options granted represents the period of time that stock options granted are expected to be outstanding and is estimated giving consideration primarily to historical stock option exercise experience. The expected volatility is based on the historical volatility of the Company’s stock over a period generally commensurate with the expected term of the stock options. The risk-free interest rate used in the option valuation model is based on United States Treasury Strip (“stripped coupon interest”) issues with remaining terms similar to the expected term of the stock options. The expected dividend yield is based on the current Omnicare stock yield. The Company is required to estimate forfeitures at the time of the grant and revise those estimates in subsequent periods as necessary to reflect any changes in actual forfeiture experience. Omnicare uses historical data to estimate pre-vesting forfeitures and records stock-based compensation expense only for those awards that are expected to vest. All stock option awards are amortized on a straight-line basis over the requisite service periods of the awards, which are generally the vesting period. Considering the importance of each of the above assumptions in the calculation of fair value, the Company re-evaluates the estimate of these assumptions on a quarterly basis. While the Company believes its stock option fair value calculations are materially accurate, a one percentage point change in any of the individual aforementioned assumptions, holding all other assumptions constant, is not expected to have a material impact on the fair value calculated by the Company.
Legal Contingencies
As part of its ongoing operations, the Company is subject to various inspections, audits, inquiries and similar actions by third parties, as well as governmental/regulatory authorities responsible for enforcing the laws and regulations to which the Company is subject (and including reviews of individual Omnicare pharmacy’s reimbursement documentation and administrative practices).
81
Oftentimes, these inspections, audits and inquiries relate to prior periods, including periods predating Omnicare’s actual ownership of a particular acquired unit. The Company is also involved with various legal actions arising in the normal course of business. Each quarter, the Company reviews, including consultation with its outside legal advisors where applicable, the status of inspections, audits, inquiries, legal claims and legal proceedings and assesses its potential financial exposure. If the potential loss from any of these is considered probable and the amount can be reasonably estimated, the Company accrues a liability for the estimated loss, in accordance with SFAS 5. To the extent the amount of a probable loss is estimable only by reference to a range of equally probable outcomes, and no amount within the range appears to be a better estimate than any other amount, the low end of the range is accrued, as required by GAAP. Because of inherent uncertainties related to these matters, the use of estimates, assumptions, judgments and external factors beyond the Company’s control, accruals are based on the best information available at the time. As additional information becomes available, Omnicare reassesses the potential liability related to any pending inspections, audits, inquiries, claims and litigation and may revise its estimated exposure upward or downward accordingly. Such revisions in the estimates of the potential liabilities could have a material impact on the Company’s consolidated financial statements.
Information pertaining to legal proceedings is further discussed at the “Commitments and Contingencies” note of the Notes to Consolidated Financial Statements.
Recently Issued Accounting Standards
Information pertaining to recently issued accounting standards is further discussed at the “Recently Issued Accounting Standards” section of the “Description of Business and Summary of Significant Accounting Policies” note of the Notes to Consolidated Financial Statements.
Historically, the Company has derived approximately one-half of its revenues directly from government sources and one-half from the private sector (including individual residents, third-party insurers, long-term care and other institutional health care facilities and its contract research organization business).
As part of ongoing operations, the Company and its customers are subject to regulatory changes in the level of reimbursement received from the Medicare and Medicaid programs. Since 1997, Congress has passed a number of federal laws that have effected major changes in the healthcare system and payments to certain providers.
The Balanced Budget Act of 1997 (the “BBA”) mandated a prospective payment system (“PPS”) for Medicare-eligible residents of skilled nursing facilities (“SNFs”). Under PPS, Medicare pays SNFs a fixed fee per patient per day based upon the acuity level of the resident, covering substantially all items and services furnished during a Medicare-covered stay, including pharmacy services. PPS initially resulted in a significant reduction of reimbursement to SNFs. Congress subsequently sought to restore some of the reductions in reimbursement resulting from PPS. One provision gave SNFs a temporary rate increase for certain specific high-acuity patients beginning
82
April 1, 2000, and ending when the Centers for Medicare & Medicaid Services (“CMS”) implemented a refined patient classification system under PPS. For several years, CMS did not implement such refinements, thus continuing the additional rate increase for certain high-acuity patients through federal fiscal year 2005.
On August 4, 2005, CMS issued its final SNF PPS rule for fiscal year 2006. Under the rule, CMS added nine patient classification categories to the PPS patient classification system, thus triggering the expiration of the high-acuity payments add-ons. However, CMS estimated that the rule would have a slightly positive financial impact on SNFs in fiscal year 2006 because the $1.02 billion reduction from the expiration of the add-on payments would be more than offset by a $510 million increase in the nursing case-mix weight for all of the resource utilization group categories and a $530 million increase associated with various updates to the payment rates (including updates to the wage and market basket indexes), resulting in a $20 million overall increase in payments for fiscal year 2006. The new patient classification refinements became effective on January 1, 2006, and the market basket increase became effective October 1, 2005. On July 31, 2006, CMS issued the update to the SNF PPS rates for fiscal year 2007. Effective October 1, 2006, SNFs receive the full 3.1 percent market basket increase to rates, increasing payments to SNFs by approximately $560 million for fiscal year 2007. On August 3, 2007, CMS published its final SNF PPS update for fiscal year 2008. Effective October 1, 2007, SNFs receive a 3.3 percent market basket increase, which increases Medicare payments to SNFs by approximately $690 million in fiscal year 2008. The final rule also includes several policy and payment provisions, including rebasing the market basket, which currently reflects data from fiscal 1997, to a base year of fiscal year 2004; revisions to the calculation of the SNF market basket (including revising the pharmacy component); changing the threshold for forecast error adjustments from the current 0.25 percentage point to 0.5 percentage point; and continuing a special adjustment made to cover the additional services required by nursing home residents with HIV/AIDS. While the fiscal year 2007 and 2008 SNF PPS rates do not decrease payments to SNFs, the loss of revenues associated with future changes in SNF payments could, in the future, have an adverse effect on the financial condition of the Company’s SNF clients which could, in turn, adversely affect the timing or level of their payments to Omnicare.
Moreover, on February 8, 2006, the President signed into law the Deficit Reduction Act (“DRA”), which will reduce net Medicare and Medicaid spending by approximately $11 billion over five years. Among other things, the legislation reduces Medicare SNF bad debt payments by 30 percent for those individuals who are not dually eligible for Medicare and Medicaid. This provision is expected to reduce payments to SNFs by $100 million over five years (fiscal years 2006-2010). On February 4, 2008, the Bush Administration released its fiscal year 2009 budget proposal, which includes legislative and administrative proposals that would reduce Medicare spending by approximately $12.2 billion in fiscal year 2009 and $178 billion over five years. Among other things, the budget would provide no annual update for SNFs in 2009 through 2011 and a -0.65 percent adjustment to the update annually thereafter. In addition, the budget would apply a “sequester” of -0.4 percent to all Medicare provider payments when general fund contributions exceed 45 percent of program spending. The sequester order would increase each year by -0.4 percent until general revenue funding is brought back to 45 percent. The budget also would move toward site-neutral post-hospital payments to limit perceived inappropriate incentives for five conditions commonly treated in both SNFs and inpatient rehabilitation
83
facilities. The Administration also proposes to achieve savings by issuing regulations to adjust for case mix distribution in the SNF payment system. In addition, the budget proposal would eliminate all bad debt reimbursements for unpaid beneficiary cost-sharing over four years. Many provisions of the proposed Bush budget would require Congressional action to implement. In addition, on August 1, 2007, the House of Representatives approved H.R. 3162, the Children’s Health and Medicare Protection Act of 2007, that included a number of Medicare policy changes, including a freeze in fiscal year 2008 SNF PPS rates at fiscal year 2007 levels. Note that while the version of the bill that ultimately passed Congress did not include Medicare provisions impacting SNF reimbursement, Congress may yet consider these and other proposals in the future that would further restrict Medicare funding for SNFs.
In December 2003, Congress enacted the Medicare Prescription Drug, Improvement, and Modernization Act of 2003 (“MMA”), which included a major expansion of the Medicare prescription drug benefit under a new Medicare Part D.
Under the Medicare Part D prescription drug benefit, Medicare beneficiaries may enroll in prescription drug plans offered by private entities (or in a “fallback” plan offered on behalf of the government through a contractor, to the extent private entities fail to offer a plan in a given area), which provide coverage of outpatient prescription drugs (collectively, “Part D Plans”). Part D Plans include both plans providing the drug benefit on a stand-alone basis and Medicare Advantage plans providing drug coverage as a supplement to an existing medical benefit under that Medicare Advantage plan, most commonly a health maintenance organization plan. Medicare beneficiaries generally have to pay a premium to enroll in a Part D Plan, with the premium amount varying from plan to plan, although CMS provides various federal subsidies to Part D Plans to reduce the cost to beneficiaries. Effective January 1, 2006, Medicare beneficiaries who are also entitled to benefits under a state Medicaid program (so-called “dual eligibles”) now have their prescription drug costs covered by the new Medicare drug benefit. Many nursing home residents Omnicare serves are dual eligibles, whose drug costs were previously covered by state Medicaid programs. In 2007, approximately 42% of Omnicare’s revenue was derived from beneficiaries covered under the federal Medicare Part D program.
CMS provides premium and cost-sharing subsidies to Part D Plans with respect to dual eligible residents of nursing homes. Such dual eligibles are not required to pay a premium for enrollment in a Part D Plan, so long as the premium for the Part D Plan in which they are enrolled is at or below the premium subsidy, nor are they required to meet deductibles or pay copayment amounts. Further, all dual eligibles who do not affirmatively enroll in a Part D Plan are automatically enrolled into a Prescription Drug Plan (“PDP”) by CMS on a random basis from among those PDPs meeting CMS criteria for low-income premiums in the PDP region. As is the case for any nursing home beneficiary, such dual eligible beneficiaries may select a different Part D Plan at any time through the Part D enrollment process. In sum, dual eligible residents of nursing homes are entitled to have their prescription drug costs covered by a Part D Plan, provided that the prescription drugs which they are taking are either on the Part D Plan’s formulary, or an exception to the plan’s formulary is granted. CMS requires the formularies of Part D Plans to include the types of drugs most commonly needed by Medicare beneficiaries and to offer an exceptions process to provide coverage for medically necessary drugs.
84
Pursuant to the final Part D rule, effective January 1, 2006, the Company obtains reimbursement for drugs it provides to enrollees of a given Part D Plan in accordance with the terms of agreements negotiated between it and that Part D Plan. The Company has entered into such agreements with nearly all Part D Plan sponsors under which it will provide drugs and associated services to their enrollees. The Company continues to have ongoing discussions with Part D Plans in the ordinary course. Moreover, the Company may as appropriate, renegotiate agreements. Further, the proportion of the Company’s Part D business serviced under specific agreements may change over time. Consequently, there can be no assurance that the reimbursement terms which currently apply to the Company’s Part D business will not change. Moreover, as expected in the transition to a new program of this magnitude, certain administrative and payment issues have arisen, resulting in higher operating expenses, as well as outstanding gross accounts receivable (net of allowances for contractual adjustments, and prior to any allowance for doubtful accounts) for copays and rejected claims. As of December 31, 2007, copays outstanding from Part D Plans were approximately $39 million, of which approximately $19 million relates to 2006. Additionally, as of December 31, 2007, Part D rejected claims outstanding from Part D Plans for the 2006 transitional year were approximately $21 million. Participants in the long-term care pharmacy industry continue to address these issues with CMS and the Part D Plans and attempt to develop solutions. The Company is also pursuing legal actions against certain Part D payors to collect outstanding copays. However, until all administrative and payment issues are fully resolved, there can be no assurance that the impact of the Part D drug benefit on the Company’s results of operations, financial position or cash flows will not change based on the outcome of any unforeseen future developments.
The MMA does not change the manner in which Medicare pays for drugs for Medicare beneficiaries covered under a Medicare Part A stay. The Company continues to receive reimbursement for drugs provided to such residents from the SNFs, in accordance with the terms of the agreements it has negotiated with each SNF. The Company also continues to receive reimbursement from the state Medicaid programs, albeit to a greatly reduced extent, for those Medicaid beneficiaries not eligible for the Part D program, including those under age 65, and for certain drugs specifically excluded from Medicare Part D.
CMS has issued subregulatory guidance on many aspects of the final Part D rule, including the provision of pharmaceutical services to long-term care residents. CMS has also expressed some concerns about pharmacies’ receipt of discounts, rebates and other price concessions from drug manufacturers. Specifically, in a finalized “Call Letter” for the 2007 calendar year, CMS indicated that, beginning in 2007, Part D sponsors must have policies and systems in place, as part of their drug utilization management programs, to protect beneficiaries and reduce costs when long-term care pharmacies are subject to incentives to move market share through access/performance rebates from drug manufacturers. For the purposes of managing and monitoring drug utilization, especially where such rebates exist, CMS instructs Part D Plan sponsors to require pharmacies to disclose to the Part D Plan sponsor any discounts, rebates and other direct or indirect remuneration designed to directly or indirectly influence or impact utilization of Part D drugs. CMS stated that Plan sponsors should provide assurances that such information will remain confidential. CMS has issued subregulatory guidelines specifying the information that CMS is requiring from Plan sponsors with respect to rebates paid to long-term care pharmacies. CMS has also issued reporting requirements for 2008 which, among other
85
things, require disclosure of rebates provided to long-term care pharmacies at a more detailed level. The Company has agreed with various Plan sponsors and their agents with respect to the format, terms and conditions for providing such information and the Company intends to continue to work with other sponsors with respect to providing such information.
CMS continues to issue guidance on and make revisions to the Part D program. The Company is continuing to monitor issues relating to implementation of the Part D benefit, and until further agency guidance is known and until all administrative and payment issues associated with the transition to this massive program are fully resolved, there can be no assurance that the impact of the final rule or the outcome of other potential developments relating to its implementation on our business, results of operations, financial position or cash flows will not change based on the outcome of any unforeseen future developments.
The MMA also changed the Medicare payment methodology and conditions for coverage of certain items of durable medical equipment prosthetics, orthotics, and supplies (“DMEPOS”) under Medicare Part B. Approximately 1% of the Company’s revenue is derived from beneficiaries covered under Medicare Part B. The changes include a temporary freeze in annual increases in payments for durable medical equipment from 2004 through 2008, new clinical conditions for payment, quality standards (applied by CMS-approved accrediting organizations), and competitive bidding requirements. On April 10, 2007, CMS issued a final rule establishing the Medicare competitive bidding program. Only suppliers that are winning bidders will be eligible to provide competitively-bid items to Medicare beneficiaries in the selected areas. Enteral nutrients, equipment and supplies and oxygen equipment and supplies are among the 10 categories of DMEPOS included in the first round of the competitive bidding program for 10 geographic areas beginning July 1, 2008 (a delay from the previously-announced implementation date of April 1, 2008). The Company has submitted bids for nine competitive bidding areas. Awards are expected to be announced in February 2008. In addition, in January 2008, CMS announced the 70 locations in which the second round of competitive bidding will be conducted later in 2008. The expanded program will apply to eight product categories, again including oxygen supplies and equipment and enteral nutrients, equipment and supplies. Bid prices will take effect sometime in 2009. CMS also has announced that all existing DMEPOS suppliers will need to submit proof of accreditation by a deemed accreditation organization by September 30, 2009, although suppliers in the competitive bidding regions and new suppliers are subject to earlier accreditation deadlines. The Company intends to comply with all accreditation requirements for DMEPOS suppliers by the applicable deadline.
With respect to Medicaid, the BBA repealed the “Boren Amendment” federal payment standard for Medicaid payments to nursing facilities, giving states greater latitude in setting payment rates for such facilities. The law also granted states greater flexibility to establish Medicaid managed care programs without the need to obtain a federal waiver. Although these waiver programs generally exempt institutional care, including nursing facilities and institutional pharmacy services, some states do use managed care principles in their long-term care programs. Likewise, the DRA includes several changes to the Medicaid program designed to rein in program spending. These include, among others, strengthening the Medicaid asset transfer restrictions for persons seeking to qualify for Medicaid long-term care coverage, which could, due to the timing of the penalty period, increase facilities’ exposure to uncompensated care. This provision is expected to
86
reduce Medicaid spending by an estimated $2.4 billion over five years. The law also gives states greater flexibility to expand access to home and community based services by allowing states to provide these services as an optional benefit without undergoing the waiver approval process, and includes a new demonstration to encourage states to provide long-term care services in a community setting to individuals who currently receive Medicaid services in nursing homes. Together, these provisions could increase state funding for home and community-based services, while prompting states to cut funding for nursing facilities. No assurances can be given that state Medicaid programs ultimately will not change the reimbursement system for long-term care or pharmacy services.
The DRA also changed the so-called federal upper limit payment rules for multiple source prescription drugs covered under Medicaid. Like the current upper limit, it only applies to drug ingredient costs and does not include dispensing fees, which will continue to be determined by the states. First, the DRA redefined a multiple source drug subject to the upper limit rules to be a covered outpatient drug that has at least one other drug product that is therapeutically equivalent. Thus, the federal upper limit is triggered when there are two or more therapeutic equivalents, instead of three or more as was previously the case. Second, effective January 1, 2007, the DRA changed the federal upper payment limit from 150 percent of the lowest published price for a drug (which is usually the average wholesale price) to 250 percent of the lowest average manufacturer price (“AMP”). Congress expected these DRA provisions to reduce federal and state Medicaid spending by $8.4 billion over five years. On July 17, 2007, CMS issued a final rule with comment period to implement changes to the upper limit rules. Among other things, the final rule establishes a new federal upper limit calculation for multiple source drugs that is based on 250 percent of the lowest AMP in a drug class; promotes transparency in drug pricing by requiring CMS to post AMP amounts on its web site; and establishes a uniform definition for AMP. Additionally, the final rule provides that sales of drugs to long-term care pharmacies for supply to nursing homes and assisted living facilities (as well as associated discounts, rebates or other price concessions) are not to be taken into account in determining AMP where such sales can be identified with adequate documentation, and that any AMPs which are not at least 40% of the next highest AMP will not be taken into account in determining the upper limit amount (the so-called “outlier” test). However, on December 19, 2007, the United States District Court for the District of Columbia issued a preliminary injunction that enjoins CMS from implementing provisions of the July 17, 2007 rule to the extent that it affects Medicaid reimbursement rates for retail pharmacies under the Medicaid program. The order also enjoins CMS from posting AMP data on a public website or disclosing it to states. As a result of this preliminary injunction, CMS did not post AMPs or new upper limit prices in late December 2007 based upon the July 17, 2007 final rule despite its earlier planned timetable, and the schedule for states to implement the new upper limits will be delayed until further notice. With the advent of Medicare Part D, the Company’s revenues from state Medicaid programs are substantially lower than has been the case previously. However, some of the Company’s agreements with Part D Plans and other payors have incorporated the Medicaid upper limit rules into the pricing mechanisms for prescription drugs. Until the new upper limit amounts are published by CMS, the Company cannot predict the impact of the final rule on the Company’s business. There can be no assurance, however, that the changes under the DRA or other efforts by payors to limit reimbursement for certain drugs will not have an adverse impact on the Company’s business.
87
President Bush’s fiscal year 2009 budget proposal includes a series of proposals impacting Medicaid, including legislative and administrative changes that would reduce Medicaid payments by more than $18 billion over five years. Among other things, the proposed budget would further reduce the federal upper limit reimbursement for multiple source drugs to 150 percent of the AMP and replace the “best price” component of the Medicaid drug rebate formula with a budget-neutral flat rebate. Many of the proposed policy changes would require congressional approval to implement. While the Company has endeavored to adjust to these types of funding pressures in the past, there can be no assurance that these or future changes in Medicaid payments to nursing facilities, pharmacies, or managed care systems, or their potential impact on payments under agreements with Part D Plans, will not have an adverse impact on its business.
Two recent actions at the federal level could impact Medicaid payments to nursing facilities. The Tax Relief and Health Care Act of 2006 modified several Medicaid policies including, among other things, reducing the limit on Medicaid provider taxes from 6 percent to 5.5 percent from January 1, 2008 through September 30, 2011. The Bush Administration had been expected to issue regulations calling for deeper cuts in this funding. On March 23, 2007, CMS published a proposed rule that would implement this legislation, and make other clarifications to the standards for determining the permissibility of provider tax arrangements. Second, on January 18, 2007, CMS published a proposed rule designed to ensure that Medicaid payments to governmentally-operated nursing facilities and certain other health care providers are based on actual costs and that state financing arrangements are consistent with the Medicaid statute. CMS estimates that the rule, if finalized, would save $120 million during the first year and $3.87 billion over five years. On May 29, 2007, CMS published a final rule to implement this provision, but Congress blocked the rule for one year in an emergency fiscal year 2007 spending bill, H.R. 2206.
On October 4, 2006, the plaintiffs inNew England Carpenters Health Benefits Fund et al. v. First DataBank, Inc. and McKesson Corporation, CA No. 1:05-CV-11148-PBS (United District Court for the District of Massachusetts) and defendant First DataBank, Inc. (“First DataBank”) entered into a settlement agreement relating to First DataBank’s publication of average wholesale price (“AWP”). AWP is a pricing benchmark that is widely used to calculate a portion of the reimbursement payable to pharmacy providers for the drugs and biologicals they provide, including under State Medicaid programs, Medicare Part D Plans and certain of the Company’s contracts with long-term care facilities. The settlement agreement would require First DataBank to cease publishing AWP two years after the settlement becomes effective unless a competitor of First DataBank is then publishing AWP, and would require that First DataBank modify the manner in which it calculates AWP until First DataBank ceases publishing same. On June 6, 2007 the Court granted preliminary approval to an amended settlement agreement. In a related case,District Council 37 Health and Security Plan v. Medi-Span,CA No. 1:07-CV-10988-PBS (United States District Court for the District of Massachusetts), in which Medi-Span is accused of misrepresenting pharmaceutical prices by relying on and publishing First Databank’s price list, the parties entered into a similar settlement agreement, and the Court granted preliminary approval of the agreement on June 21, 2007, and granted amended preliminary approval of the agreement on August 21, 2007. On January 22, 2008, the court held a hearing on a motion for final approval of the proposed settlement. The court heard various objections to the proposed settlement and indicated that it would not approve the settlement as proposed. The court asked the parties to report back to it by February 5, 2008 with respect to
88
various of the issues raised, and whether the settlement might be revised and additional evidence might be introduced to address these issues. As of February 27, 2008, the case docket did not indicate that any such reports have been provided by the parties to the court. The Company is monitoring these cases for further developments and evaluating potential implications and/or actions that may be required. If a revised settlement or other resolution of the cases is proposed, the Company will evaluate the potential impact of such settlement or other resolution on the Company at that time, including any adverse effect on the Company’s reimbursement for drugs and biologicals and any actions that may be taken to offset or otherwise mitigate such impact.
Longer term, funding for federal and state healthcare programs must consider the aging of the population and the growth in enrollees as eligibility is expanded; the escalation in drug costs owing to higher drug utilization among seniors and the introduction of new, more efficacious but also more expensive medications; the impact of the Medicare Part D program; and the long-term financing of the Medicare and Medicaid programs. Given competing national priorities, it remains difficult to predict the outcome and impact on the Company of any changes in healthcare policy relating to the future funding of the Medicare and Medicaid programs.
Demographic trends indicate that demand for long-term care will increase well into the middle of this century as the elderly population grows significantly. Moreover, those over 65 consume a disproportionately high level of healthcare services, including prescription drugs, when compared with the under-65 population. There is widespread consensus that appropriate pharmaceutical care is generally considered the most cost-effective form of treatment for the chronic ailments afflicting the elderly and also one that is able to improve the quality of life. These trends not only support long-term growth for the geriatric pharmaceutical industry but also containment of healthcare costs and the well-being of the nation’s growing elderly population.
In order to fund this growing demand, the Company anticipates that the government and the private sector will continue to review, assess and possibly alter healthcare delivery systems and payment methodologies. While it cannot at this time predict the ultimate effect of the Medicare Part D drug benefit or any further initiatives on Omnicare’s business, management believes that the Company’s expertise in geriatric pharmaceutical care and pharmaceutical cost management position Omnicare to help meet the challenges of today’s healthcare environment. Further, while volatility can occur from time to time in the contract research business owing to factors such as the success or failure of its clients’ compounds, the timing or budgetary constraints of its clients, or consolidation within our client base, new drug discovery remains an important priority of drug manufacturers. Drug manufacturers, in order to optimize their research and development efforts, will continue to turn to contract research organizations to assist them in accelerating drug research development and commercialization.
|
Safe Harbor Statement under the Private Securities Litigation Reform Act of 1995 Regarding Forward-Looking Information |
|
In addition to historical information, this report contains certain statements that constitute “forward-looking statements” within the meaning of the Private Securities Litigation Reform Act of 1995. These forward-looking statements include, but are not limited to, all statements regarding the intent, belief or current expectations regarding the matters discussed or incorporated by reference in this document (including statements as to “beliefs,” “expectations,”
89
“anticipations,” “intentions” or similar words) and all statements which are not statements of historical fact. Such forward-looking statements, together with other statements that are not historical, are based on management’s current expectations and involve known and unknown risks, uncertainties, contingencies and other factors that could cause results, performance or achievements to differ materially from those stated. The most significant of these risks and uncertainties are described in the Company’s Form 10-K, Form 10-Q and Form 8-K reports filed with the Securities and Exchange Commission and include, but are not limited to: overall economic, financial, political and business conditions; trends in the long-term healthcare, pharmaceutical and contract research industries; the ability to attract new clients and service contracts and retain existing clients and service contracts; the ability to consummate pending acquisitions; trends for the continued growth of the Company’s businesses; trends in drug pricing; delays and reductions in reimbursement by the government and other payors to customers and to the Company; the overall financial condition of the Company’s customers and the ability of the Company to assess and react to such financial condition of its customers; the ability of vendors and business partners to continue to provide products and services to the Company; the continued successful integration of acquired companies; the continued availability of suitable acquisition candidates; the ability to attract and retain needed management; competition for qualified staff in the healthcare industry; the demand for the Company’s products and services; variations in costs or expenses; the ability to implement productivity, consolidation and cost reduction efforts and to realize anticipated benefits; the ability of clinical research projects to produce revenues in future periods; the potential impact of legislation, government regulations, and other government action and/or executive orders, including those relating to Medicare Part D, including its implementing regulations and any subregulatory guidance, reimbursement and drug pricing policies and changes in the interpretation and application of such policies; government budgetary pressures and shifting priorities; federal and state budget shortfalls; efforts by payors to control costs; changes to or termination of the Company’s contracts with Medicare Part D plan sponsors or to the proportion of the Company’s Part D business covered by specific contracts; the outcome of litigation; potential liability for losses not covered by, or in excess of, insurance; the impact of differences in actuarial assumptions and estimates as compared to eventual outcomes; events or circumstances which result in an impairment of assets, including but not limited to, goodwill; market conditions; the outcome of audit, compliance, administrative, regulatory, or investigatory reviews; volatility in the market for the Company’s stock and in the financial markets generally; access to adequate capital and financing; changes in international economic and political conditions and currency fluctuations between the U.S. dollar and other currencies; changes in tax laws and regulations; changes in accounting rules and standards; and costs to comply with our Corporate Integrity Agreements. Should one or more of these risks or uncertainties materialize or should underlying assumptions prove incorrect, the Company’s actual results, performance or achievements could differ materially from those expressed in, or implied by, such forward-looking statements. Readers are cautioned not to place undue reliance on these forward-looking statements, which speak only as of the date hereof. Except as otherwise required by law, the Company does not undertake any obligation to publicly release any revisions to these forward-looking statements to reflect events or circumstances after the date hereof or to reflect the occurrence of unanticipated events.
90
| |
ITEM 7A. - | QUANTITATIVE AND QUALITATIVE DISCLOSURES ABOUT MARKET RISK |
Information required under this Item is set forth in the “Quantitative and Qualitative Disclosures about Market Risk” caption at Part II, Item 7, of this Filing.
| |
ITEM 8. - | FINANCIAL STATEMENTS AND SUPPLEMENTARY DATA |
Index to Consolidated Financial Statements and Financial Statement Schedule
All other financial statement schedules are omitted because they are not applicable or because the required information is shown elsewhere in the Consolidated Financial Statements or Notes thereto.
91
Report of Independent Registered Public Accounting Firm
To the Stockholders and
Board of Directors of Omnicare, Inc.
In our opinion, the consolidated financial statements listed in the accompanying index present fairly, in all material respects, the financial position of Omnicare, Inc. and its subsidiaries at December 31, 2007 and 2006 and the results of their operations and their cash flows for each of the three years in the period ended December 31, 2007 in conformity with accounting principles generally accepted in the United States of America. In addition, in our opinion, the financial statement schedule listed in the accompanying index presents fairly, in all material respects, the information set forth therein when read in conjunction with the related consolidated financial statements. Also in our opinion, the Company maintained, in all material respects, effective internal control over financial reporting as of December 31, 2007, based on criteria established inInternal Control - Integrated Framework issued by the Committee of Sponsoring Organizations of the Treadway Commission (COSO). The Company’s management is responsible for these financial statements and financial statement schedule, for maintaining effective internal control over financial reporting and for its assessment of the effectiveness of internal control over financial reporting, included in Management’s Report on Internal Control Over Financial Reporting appearing under Item 9A. Our responsibility is to express opinions on these financial statements, on the financial statement schedule, and on the Company’s internal control over financial reporting based on our integrated audits. We conducted our audits in accordance with the standards of the Public Company Accounting Oversight Board (United States). Those standards require that we plan and perform the audits to obtain reasonable assurance about whether the financial statements are free of material misstatement and whether effective internal control over financial reporting was maintained in all material respects. Our audits of the financial statements included examining, on a test basis, evidence supporting the amounts and disclosures in the financial statements, assessing the accounting principles used and significant estimates made by management, and evaluating the overall financial statement presentation. Our audit of internal control over financial reporting included obtaining an understanding of internal control over financial reporting, assessing the risk that a material weakness exists, and testing and evaluating the design and operating effectiveness of internal control based on the assessed risk. Our audits also included performing such other procedures as we considered necessary in the circumstances. We believe that our audits provide a reasonable basis for our opinions.
As discussed in Note 11 to the consolidated financial statements, the Company changed the manner in which it accounts for uncertain tax positions in 2007. Furthermore, as discussed in Note 1 to the consolidated financial statements, the Company changed the manner in which it accounts for share-based compensation and defined benefit pension and other postretirement plans in 2006.
A company’s internal control over financial reporting is a process designed to provide reasonable assurance regarding the reliability of financial reporting and the preparation of financial statements for external purposes in accordance with generally accepted accounting principles. A company’s internal control over financial reporting includes those policies and procedures that (i) pertain to the maintenance of records that, in reasonable detail, accurately and fairly reflect
92
the transactions and dispositions of the assets of the company; (ii) provide reasonable assurance that transactions are recorded as necessary to permit preparation of financial statements in accordance with generally accepted accounting principles, and that receipts and expenditures of the company are being made only in accordance with authorizations of management and directors of the company; and (iii) provide reasonable assurance regarding prevention or timely detection of unauthorized acquisition, use, or disposition of the company’s assets that could have a material effect on the financial statements.
Because of its inherent limitations, internal control over financial reporting may not prevent or detect misstatements. Also, projections of any evaluation of effectiveness to future periods are subject to the risk that controls may become inadequate because of changes in conditions, or that the degree of compliance with the policies or procedures may deteriorate.
PricewaterhouseCoopers LLP
Cincinnati, Ohio
February 27, 2008
93
CONSOLIDATED STATEMENTS OF INCOME
OMNICARE, INC. AND SUBSIDIARY COMPANIES
(in thousands, except per share data)
| | | | | | | | | | |
| | For the years ended December 31, | |
| |
| |
| | 2007 | | 2006 | | 2005 | |
| |
| |
| |
| |
Net sales | | $ | 6,220,010 | | $ | 6,492,993 | | $ | 5,292,782 | |
|
Cost of sales | | | 4,666,621 | | | 4,864,966 | | | 3,993,717 | |
Heartland matters (Note 15) | | | 14,788 | | | 27,663 | | | — | |
| |
|
| |
|
| |
|
| |
|
Gross profit | | | 1,538,601 | | | 1,600,364 | | | 1,299,065 | |
Selling, general and administrative expenses | | | 910,294 | | | 887,426 | | | 700,633 | |
Provision for doubtful accounts (Note 1) | | | 213,560 | | | 82,209 | | | 58,024 | |
Restructuring and other related charges (Note 13) | | | 27,883 | | | 29,562 | | | 18,779 | |
Litigation and other related professional fees (Note 15) | | | 42,516 | | | 114,778 | | | — | |
Heartland matters (Note 15) | | | 2,405 | | | 6,063 | | | — | |
| |
|
| |
|
| |
|
| |
Operating income | | | 341,943 | | | 480,326 | | | 521,629 | |
| | | | | | | | | | |
Investment income | | | 8,715 | | | 10,453 | | | 5,787 | |
Interest expense | | | (164,160 | ) | | (170,283 | ) | | (165,610 | ) |
| |
|
| |
|
| |
|
| |
Income before income taxes | | | 186,498 | | | 320,496 | | | 361,806 | |
| | | | | | | | | | |
Income tax provision | | | 72,442 | | | 136,924 | | | 135,315 | |
| |
|
| |
|
| |
|
| |
|
Net income | | $ | 114,056 | | $ | 183,572 | | $ | 226,491 | |
| |
|
| |
|
| |
|
| |
|
Earnings per share: | | | | | | | | | | |
Basic | | $ | 0.96 | | $ | 1.55 | | $ | 2.19 | |
| |
|
| |
|
| |
|
| |
|
Diluted | | $ | 0.94 | | $ | 1.50 | | $ | 2.10 | |
| |
|
| |
|
| |
|
| |
|
Weighted average number of common shares outstanding: | | | | | | | | | | |
Basic | | | 119,380 | | | 118,480 | | | 103,551 | |
| |
|
| |
|
| |
|
| |
|
Diluted | | | 121,258 | | | 122,536 | | | 108,804 | |
| |
|
| |
|
| |
|
| |
The Notes to Consolidated Financial Statements are an integral part of these statements.
94
CONSOLIDATED BALANCE SHEETS
OMNICARE, INC. AND SUBSIDIARY COMPANIES
(in thousands, except share data)
| | | | | | | |
| | December 31, | |
| |
| |
| | 2007 | | 2006 | |
| |
| |
| |
ASSETS | | | | | | | |
Current assets: | | | | | | | |
Cash and cash equivalents | | $ | 274,448 | | $ | 138,034 | |
Restricted cash | | | 3,155 | | | 3,777 | |
Accounts receivable, less allowances of $334,061 (2006-$191,048) | | | 1,376,288 | | | 1,522,266 | |
Unbilled receivables, CRO | | | 24,855 | | | 21,949 | |
Inventories | | | 448,183 | | | 449,671 | |
Deferred income tax benefits | | | 126,239 | | | 94,231 | |
Other current assets | | | 202,982 | | | 194,900 | |
| |
|
| |
|
| |
Total current assets | | | 2,456,150 | | | 2,424,828 | |
| |
|
| |
|
| |
Properties and equipment, at cost less accumulated depreciation of $311,422 (2006-$286,157) | | | 199,449 | | | 200,425 | |
Goodwill | | | 4,342,169 | | | 4,225,011 | |
Identifiable intangible assets, less accumulated amortization of $115,042 (2006-$80,095) | | | 323,637 | | | 319,588 | |
Rabbi trust assets for settlement of pension obligations | | | 123,035 | | | 83,184 | |
Other noncurrent assets | | | 149,339 | | | 145,435 | |
| |
|
| |
|
| |
Total noncurrent assets | | | 5,137,629 | | | 4,973,643 | |
| |
|
| |
|
| |
Total assets | | $ | 7,593,779 | | $ | 7,398,471 | |
| |
|
| |
|
| |
LIABILITIES AND STOCKHOLDERS’ EQUITY | | | | | | | |
Current liabilities: | | | | | | | |
Accounts payable | | $ | 371,020 | | $ | 262,918 | |
Accrued employee compensation | | | 32,696 | | | 33,864 | |
Deferred revenue, CRO | | | 22,068 | | | 26,434 | |
Current debt | | | 3,192 | | | 5,371 | |
Other current liabilities and income taxes payable | | | 223,184 | | | 223,814 | |
| |
|
| |
|
| |
Total current liabilities | | | 652,160 | | | 552,401 | |
| |
|
| |
|
| |
Long-term debt, notes and convertible debentures | | | 2,820,751 | | | 2,955,120 | |
Deferred income tax liabilities | | | 449,789 | | | 384,989 | |
Other noncurrent liabilities | | | 379,376 | | | 342,510 | |
| |
|
| |
|
| |
Total noncurrent liabilities | | | 3,649,916 | | | 3,682,619 | |
| |
|
| |
|
| |
Total liabilities | | | 4,302,076 | | | 4,235,020 | |
| |
|
| |
|
| |
Commitments and contingencies (Note 15) | | | | | | | |
|
Stockholders’ equity: | | | | | | | |
Preferred stock, no par value, 1,000,000 shares authorized, none issued and outstanding | | | — | | | — | |
Common stock, $1 par value, 200,000,000 shares authorized, 124,599,300 shares issued (2006-124,269,500 shares issued) | | | 124,599 | | | 124,269 | |
Paid-in capital | | | 1,917,062 | | | 1,885,529 | |
Retained earnings | | | 1,397,831 | | | 1,300,550 | |
Treasury stock, at cost-2,827,300 shares (2006-2,805,000 shares) | | | (89,791 | ) | | (86,755 | ) |
Accumulated other comprehensive income | | | (57,998 | ) | | (60,142 | ) |
| |
|
| |
|
| |
Total stockholders’ equity | | | 3,291,703 | | | 3,163,451 | |
| |
|
| |
|
| |
|
Total liabilities and stockholders’ equity | | $ | 7,593,779 | | $ | 7,398,471 | |
| |
|
| |
|
| |
The Notes to Consolidated Financial Statements are an integral part of these statements.
95
CONSOLIDATED STATEMENTS OF CASH FLOWS
OMNICARE, INC. AND SUBSIDIARY COMPANIES
(in thousands)
| | | | | | | | | | |
| | For the years ended December 31, | |
| |
| |
| | 2007 | | 2006 | | 2005 | |
| |
| |
| |
| |
Cash flows from operating activities: | | | | | | | | | | |
Net income | | $ | 114,056 | | $ | 183,572 | | $ | 226,491 | |
Adjustments to reconcile net income to net cash flows from operating activities: | | | | | | | | | | |
Depreciation | | | 54,857 | | | 57,110 | | | 44,741 | |
Amortization | | | 58,546 | | | 62,555 | | | 35,581 | |
Provision for doubtful accounts | | | 213,560 | | | 82,209 | | | 58,024 | |
Deferred tax provision | | | 41,209 | | | 81,602 | | | 110,280 | |
Write-off of debt issuance costs | | | — | | | — | | | 7,755 | |
Changes in assets and liabilities, net of effects from acquisition of businesses: | | | | | | | | | | |
Accounts receivable and unbilled receivables | | | (41,381 | ) | | (361,538 | ) | | (163,126 | ) |
Inventories | | | 13,391 | | | 24,023 | | | (70,797 | ) |
Deposits with drug wholesalers | | | 617 | | | 82,418 | | | (4,063 | ) |
Other current and noncurrent assets | | | (64,853 | ) | | (1,685 | ) | | (27,951 | ) |
Accounts payable | | | 107,383 | | | (144,893 | ) | | 36,958 | |
Accrued employee compensation | | | (808 | ) | | 360 | | | (748 | ) |
Deferred revenue | | | (4,366 | ) | | 1,577 | | | 612 | |
Current and noncurrent liabilities and income taxes payable | | | 13,318 | | | 41,210 | | | 9,782 | |
| |
|
| |
|
| |
|
| |
Net cash flows from operating activities | | | 505,529 | | | 108,520 | | | 263,539 | |
| |
|
| |
|
| |
|
| |
|
Cash flows from investing activities: | | | | | | | | | | |
Acquisition of businesses, net of cash received | | | (151,135 | ) | | (94,346 | ) | | (2,620,380 | ) |
Capital expenditures | | | (45,270 | ) | | (31,251 | ) | | (24,239 | ) |
Transfer of cash to trusts for employee health and severance costs, net of payments out of the trust | | | 291 | | | (1,321 | ) | | (1,523 | ) |
Other | | | (774 | ) | | 46 | | | 39 | |
| |
|
| |
|
| |
|
| |
Net cash flows used by investing activities | | | (196,888 | ) | | (126,872 | ) | | (2,646,103 | ) |
| |
|
| |
|
| |
|
| |
|
Cash flows from financing activities: | | | | | | | | | | |
Borrowings on line of credit facilities and term A loan | | | 95,000 | | | 158,000 | | | 3,560,000 | |
Payments on line of credit facilities and term A loan | | | (245,000 | ) | | (258,000 | ) | | (3,165,385 | ) |
Proceeds from long-term borrowings and obligations | | | — | | | 63 | | | 1,769,084 | |
Payments on long-term borrowings and obligations | | | (5,734 | ) | | (14,921 | ) | | (369,034 | ) |
Fees paid for financing arrangements | | | — | | | (3,482 | ) | | (51,743 | ) |
Change in cash overdraft balance | | | (3,580 | ) | | 12,264 | | | 4,999 | |
Proceeds from stock offering, net of issuance costs | | | — | | | 49,239 | | | 742,932 | |
(Payments) for and proceeds from stock awards and exercise of stock options and warrants, net of stock tendered in payment | | | (8,966 | ) | | (2,751 | ) | | 33,455 | |
Excess tax benefits from stock-based compensation | | | 4,112 | | | 10,411 | | | — | |
Dividends paid | | | (10,971 | ) | | (10,937 | ) | | (9,549 | ) |
| |
|
| |
|
| |
|
| |
Net cash flows from financing activities | | | (175,139 | ) | | (60,114 | ) | | 2,514,759 | |
| |
|
| |
|
| |
|
| |
| | | | | | | | | | |
Effect of exchange rate changes on cash | | | 2,912 | | | 1,079 | | | (943 | ) |
| |
|
| |
|
| |
|
| |
Net increase (decrease) in cash and cash equivalents | | | 136,414 | | | (77,387 | ) | | 131,252 | |
Cash and cash equivalents at beginning of year | | | 138,034 | | | 215,421 | | | 84,169 | |
| |
|
| |
|
| |
|
| |
| | | | | | | | | | |
Cash and cash equivalents at end of year | | $ | 274,448 | | $ | 138,034 | | $ | 215,421 | |
| |
|
| |
|
| |
|
| |
The Notes to Consolidated Financial Statements are an integral part of these statements.
96
CONSOLIDATED STATEMENTS OF STOCKHOLDERS’ EQUITY
OMNICARE, INC. AND SUBSIDIARY COMPANIES
(in thousands, except per share data)
| | | | | | | | | | | | | | | | | | | | | | |
| | Common
Stock | | Paid-in
Capital | | Retained
Earnings | | Treasury
Stock | | Deferred
Compensation | | Accumulated
Other
Comprehensive
Income | | Total
Stockholders’
Equity | |
| |
| |
| |
| |
| |
| |
| |
| |
Balance at January 1, 2005 | | $ | 106,580 | | $ | 1,038,671 | | $ | 910,973 | | $ | (54,931 | ) | $ | (65,591 | ) | $ | (8,594 | ) | $ | 1,927,108 | |
Dividends paid ($0.09 per share) | | | — | | | — | | | (9,549 | ) | | — | | | — | | | — | | | (9,549 | ) |
Stock acquired/issued for benefit plans | | | — | | | 600 | | | — | | | 487 | | | — | | | — | | | 1,087 | |
Issuance of common stock | | | 12,825 | | | 727,876 | | | — | | | — | | | — | | | — | | | 740,701 | |
Exercise of stock options and warrants | | | 2,680 | | | 70,377 | | | — | | | (16,993 | ) | | — | | | — | | | 56,064 | |
Stock awards, net of amortization/forfeitures | | | 534 | | | 23,959 | | | — | | | (6,981 | ) | | (11,313 | ) | | — | | | 6,199 | |
| |
|
| |
|
| |
|
| |
|
| |
|
| |
|
| |
|
| |
Subtotal | | | 122,619 | | | 1,861,483 | | | 901,424 | | | (78,418 | ) | | (76,904 | ) | | (8,594 | ) | | 2,721,610 | |
| |
|
| |
|
| |
|
| |
|
| |
|
| |
|
| |
|
| |
Net income | | | — | | | — | | | 226,491 | | | — | | | — | | | — | | | 226,491 | |
Other comprehensive income (loss), net of tax: | | | | | | | | | | | | | | | | | | | | | | |
Cumulative translation adjustment | | | — | | | — | | | — | | | — | | | — | | | (1,735 | ) | | (1,735 | ) |
Unrealized depreciation in fair value of investments | | | — | | | — | | | — | | | — | | | — | | | (1,317 | ) | | (1,317 | ) |
Equity adjustment for minimum pension liability | | | — | | | — | | | — | | | — | | | — | | | (3,003 | ) | | (3,003 | ) |
| |
|
| |
|
| |
|
| |
|
| |
|
| |
|
| |
|
| |
Comprehensive income (loss) | | | — | | | — | | | 226,491 | | | — | | | — | | | (6,055 | ) | | 220,436 | |
| |
|
| |
|
| |
|
| |
|
| |
|
| |
|
| |
|
| |
Balance at December 31, 2005 | | | 122,619 | | | 1,861,483 | | | 1,127,915 | | | (78,418 | ) | | (76,904 | ) | | (14,649 | ) | | 2,942,046 | |
Deferred compensation adjustment per adoption of SFAS 123R (Note 9) | | | — | | | (76,904 | ) | | — | | | — | | | 76,904 | | | — | | | — | |
Dividends paid ($0.09 per share) | | | — | | | — | | | (10,937 | ) | | — | | | — | | | — | | | (10,937 | ) |
Stock acquired/issued for benefit plans | | | — | | | 3,596 | | | — | | | 6,743 | | | — | | | — | | | 10,339 | |
Issuance of common stock | | | 850 | | | 48,793 | | | — | | | — | | | — | | | — | | | 49,643 | |
Stock option and warrant exercises and amortization/forfeitures | | | 453 | | | 20,600 | | | — | | | (572 | ) | | — | | | — | | | 20,481 | |
Stock awards, net of amortization/forfeitures | | | 347 | | | 27,961 | | | — | | | (14,508 | ) | | — | | | — | | | 13,800 | |
| |
|
| |
|
| |
|
| |
|
| |
|
| |
|
| |
|
| |
Subtotal | | | 124,269 | | | 1,885,529 | | | 1,116,978 | | | (86,755 | ) | | — | | | (14,649 | ) | | 3,025,372 | |
| |
|
| |
|
| |
|
| |
|
| |
|
| |
|
| |
|
| |
Net income | | | — | | | — | | | 183,572 | | | — | | | — | | | — | | | 183,572 | |
Other comprehensive income (loss), net of tax: | | | | | | | | | | | | | | | | | | | | | | |
Cumulative translation adjustment | | | — | | | — | | | — | | | — | | | — | | | 1,188 | | | 1,188 | |
Unrealized depreciation in fair value of investments | | | — | | | — | | | — | | | — | | | — | | | (713 | ) | | (713 | ) |
Equity adjustment for minimum pension and long-term care plan liabilities | | | — | | | — | | | — | | | — | | | — | | | (8,902 | ) | | (8,902 | ) |
| |
|
| |
|
| |
|
| |
|
| |
|
| |
|
| |
|
| |
Comprehensive income (loss) | | | — | | | — | | | 183,572 | | | — | | | — | | | (8,427 | ) | | 175,145 | |
| |
|
| |
|
| |
|
| |
|
| |
|
| |
|
| |
|
| |
Adjustment to initially apply SFAS No. 158, net of tax (Note 10) | | | — | | | — | | | — | | | — | | | — | | | (37,066 | ) | | (37,066 | ) |
| |
|
| |
|
| |
|
| |
|
| |
|
| |
|
| |
|
| |
Balance at December 31, 2006 | | | 124,269 | | | 1,885,529 | | | 1,300,550 | | | (86,755 | ) | | — | | | (60,142 | ) | | 3,163,451 | |
97
CONSOLIDATED STATEMENTS OF STOCKHOLDERS’ EQUITY (Continued)
OMNICARE, INC. AND SUBSIDIARY COMPANIES
(in thousands, except per share data)
| | | | | | | | | | | | | | | | | | | | | | |
| | Common
Stock | | Paid-in
Capital | | Retained
Earnings | | Treasury
Stock | | Deferred
Compensation | | Accumulated
Other
Comprehensive
Income | | Total
Stockholders’
Equity | |
| |
| |
| |
| |
| |
| |
| |
| |
Balance at December 31, 2006 | | | 124,269 | | | 1,885,529 | | | 1,300,550 | | | (86,755 | ) | | — | | | (60,142 | ) | | 3,163,451 | |
Cumulative FIN 48 adjustment
(Note 11) | | | | | | | | | (5,804 | ) | | | | | | | | | | | (5,804 | ) |
Dividends paid ($0.09 per share) | | | — | | | — | | | (10,971 | ) | | — | | | — | | | — | | | (10,971 | ) |
Stock acquired/issued for benefit plans | | | — | | | 292 | | | — | | | 9,248 | | | — | | | — | | | 9,540 | |
Stock option exercises and amortization/forfeitures | | | 85 | | | 6,509 | | | — | | | — | | | — | | | — | | | 6,594 | |
Stock awards, net of amortization/forfeitures | | | 245 | | | 24,732 | | | — | | | (12,284 | ) | | — | | | — | | | 12,693 | |
| |
|
| |
|
| |
|
| |
|
| |
|
| |
|
| |
|
| |
Subtotal | | | 124,599 | | | 1,917,062 | | | 1,283,775 | | | (89,791 | ) | | — | | | (60,142 | ) | | 3,175,503 | |
| |
|
| |
|
| |
|
| |
|
| |
|
| |
|
| |
|
| |
Net income | | | — | | | — | | | 114,056 | | | — | | | — | | | — | | | 114,056 | |
Other comprehensive income (loss), net of tax: | | | | | | | | | | | | | | | | | | | | | | |
Cumulative translation adjustment | | | — | | | — | | | — | | | — | | | — | | | 2,183 | | | 2,183 | |
Unrealized appreciation in fair value of investments | | | — | | | — | | | — | | | — | | | — | | | 3,823 | | | 3,823 | |
Amortization of pension benefit costs | | | — | | | — | | | — | | | — | | | — | | | 7,085 | | | 7,085 | |
Actuarial loss on pension obligations | | | — | | | — | | | — | | | — | | | — | | | (10,552 | ) | | (10,552 | ) |
Equity adjustment for long-term care plan liabilities | | | — | | | — | | | — | | | — | | | — | | | (395 | ) | | (395 | ) |
| |
|
| |
|
| |
|
| |
|
| |
|
| |
|
| |
|
| |
Comprehensive income | | | — | | | — | | | 114,056 | | | — | | | — | | | 2,144 | | | 116,200 | |
| |
|
| |
|
| |
|
| |
|
| |
|
| |
|
| |
|
| |
Balance at December 31, 2007 | | $ | 124,599 | | $ | 1,917,062 | | $ | 1,397,831 | | $ | (89,791 | ) | $ | — | | $ | (57,998 | ) | $ | 3,291,703 | |
| |
|
| |
|
| |
|
| |
|
| |
|
| |
|
| |
|
| |
The Notes to Consolidated Financial Statements are an integral part of these statements.
98
Notes to Consolidated Financial Statements
Note 1 – Description of Business and Summary of Significant Accounting Policies
Description of Business
Omnicare, Inc. (“Omnicare” or the “Company”) is a leading geriatric pharmaceutical services company. Omnicare is the nation’s largest provider of pharmaceuticals and related ancillary pharmacy services to long-term healthcare institutions. Omnicare’s clients include primarily skilled nursing facilities (“SNFs”), assisted living facilities (“ALFs”), retirement centers, independent living communities, hospitals, hospice, and other healthcare settings and service providers. Omnicare provides its pharmacy services to long-term care facilities and other chronic care settings comprising approximately 1,392,000 beds in 47 states in the United States (“U.S.”), the District of Columbia and Canada at December 31, 2007. As well, Omnicare provides operational software and support systems to long-term care pharmacy providers across the U.S. Omnicare’s pharmacy services also include distribution and product support services for specialty pharmaceuticals. Omnicare provides comprehensive product development and research services for the pharmaceutical, biotechnology, medical device and diagnostic industries in 30 countries worldwide.
Principles of Consolidation
The accompanying consolidated financial statements include the accounts of the Company and its wholly-owned and majority-owned subsidiaries as of December 31, 2007 and 2006, and for the years ended December 31, 2007, 2006 and 2005. Omnicare consolidates entities in which the Company is the primary beneficiary, in accordance with Financial Accounting Standards Board (“FASB”) Interpretation No. 46 “Consolidation of Variable Interest Entities,” as amended (“FIN 46R”). FIN 46R requires variable interest entities to be consolidated if the Company is subject to a majority of the risk of loss from the entity’s activities or entitled to receive a majority of the entity’s returns, including residual returns. All significant intercompany accounts and transactions have been eliminated in consolidation.
Translation of Foreign Financial Statements
Assets and liabilities of the Company’s foreign operations are translated at the year-end rate of exchange, and the income statements are translated at average rates of exchange. Gains or losses from translating foreign currency financial statements are accumulated in a separate component of stockholders’ equity.
Cash Equivalents
Cash equivalents include all investments in highly liquid instruments with original maturities of three months or less.
99
Restricted Cash
Restricted cash primarily represents cash transferred to separate irrevocable trusts for settlement of employee health and severance costs, and cash collected on behalf of a third party.
Fair Value of Financial Instruments
For cash and cash equivalents, restricted cash, accounts receivable and unbilled receivables, the net carrying value of these items approximates their fair value. The fair value of restricted funds held in trust for settlement of the Company’s employee benefit obligations is based on quoted market prices of the investments held by the trustee. For accounts payable, the carrying value approximates fair value. At December 31, 2007, the fair value of Omnicare’s variable rate debt facilities approximates the carrying value, as the effective interest rates fluctuate with changes in market rates. The fair value of the Company’s fixed-rate debt facilities is based on quoted market prices and is summarized as follows (in thousands):
Fair Value of Financial Instruments
| | | | | | | | | | | | | |
| | December 31, | |
| |
| |
| | 2007 | | 2006 | |
| |
| |
| |
Financial Instrument: | | Book Value | | Market Value | | Book Value | | Market Value | |
| |
| |
| |
| |
| |
| | | | | | | | | |
6.125% senior subordinated notes, due 2013, gross | | $ | 250,000 | | $ | 230,000 | | $ | 250,000 | | $ | 241,300 | |
6.75% senior subordinated notes, due 2013 | | | 225,000 | | | 212,600 | | | 225,000 | | | 221,900 | |
6.875% senior subordinated notes, due 2015 | | | 525,000 | | | 486,900 | | | 525,000 | | | 520,400 | |
4.00% junior subordinated convertible debentures, due 2033 | | | 345,000 | | | 246,700 | | | 345,000 | | | 372,200 | |
3.25% convertible senior debentures, due 2035 | | | 977,500 | | | 703,800 | | | 977,500 | | | 830,900 | |
During 2003, the Company entered into an interest rate swap agreement on all $250.0 million of its aggregate principal amount of the 6.125% senior subordinated notes. The fair value of the interest rate swap agreement of approximately $8 million and $19 million at December 31, 2007 and 2006, respectively, reduced the book carrying value of the 6.125% senior subordinated notes. The interest rate swap agreement obligation is recorded in the “Other noncurrent liabilities” line in the Consolidated Balance Sheets.
Concentration of Credit Risk
Financial instruments that potentially subject the Company to credit risk consist primarily of interest-bearing cash and cash equivalents, assets invested for settlement of the Company’s employee benefit obligations, and accounts receivable.
The Company is exposed to credit risk in the event of default by the financial institutions or issuers of cash and cash equivalents to the extent recorded on the Consolidated Balance Sheets. Specifically, at any given point in time, the Company has cash on deposit with financial institutions, and cash invested in high quality short-term money market funds and/or U.S.
100
government-backed repurchase agreements, generally having original maturities of three months or less, in order to minimize its credit risk.
The Company establishes allowances for doubtful accounts based on various factors, including historical credit losses and specifically identified credit risks. Management reviews the allowances for doubtful accounts on an ongoing basis for appropriateness. For the years ended December 31, 2007, 2006 and 2005, no single customer accounted for 10% or more of revenues. The Company generally does not require collateral from its customers relating to the extension of credit in the form of accounts receivable balances.
The prescription drug benefit under Medicare Part D (“Part D”) became effective on January 1, 2006. As a result, providers of long-term care pharmacy services, including Omnicare, experienced a significant shift in payor mix beginning in 2006. Approximately 42% of the Company’s revenues in 2007 were generated under the Part D program. The Company estimates that approximately 35% of these Part D revenues relate to patients enrolled in Part D prescription drug plans sponsored by United Health Group and its affiliates (“United”). Prior to the implementation of the new Medicare Part D program, most of the Part D residents served by the Company were reimbursed under state Medicaid programs and, to a lesser extent, private pay sources.
Under the Part D benefit, payment is determined in accordance with the agreements Omnicare has negotiated with the Part D Plans. The remainder of Omnicare’s billings are paid or reimbursed primarily by long-term care facilities (including revenues for residents funded under Medicare Part A) and other third party payors, including private insurers, state Medicaid programs, as well as individual residents.
The Medicaid and Medicare programs are highly regulated. The failure, even if inadvertent, of Omnicare and/or client facilities to comply with applicable reimbursement regulations could adversely affect Omnicare’s reimbursement under these programs and Omnicare’s ability to continue to participate in these programs. In addition, failure to comply with these regulations could subject the Company to other penalties.
As noted, the Company obtains reimbursement for drugs it provides to enrollees of a given Part D Plan in accordance with the terms of the agreement negotiated between it and that Part D Plan. The Company has entered into such agreements with nearly all Part D Plan sponsors under which it will provide drugs and associated services to their enrollees. The Company continues to have ongoing discussions with Part D Plans in the ordinary course. The Company may, as appropriate, renegotiate agreements. Moreover, as expected in the transition to a new program of this magnitude, certain administrative and payment issues have arisen, resulting in higher operating expenses, as well as outstanding gross accounts receivable (net of allowances for contractual adjustments, and prior to any allowance for doubtful accounts) for copays and rejected claims. As of December 31, 2007, copays outstanding from Part D Plans were approximately $39 million, of which approximately $19 million relates to 2006. Additionally, as of December 31, 2007, Part D rejected claims outstanding from Part D Plans for the 2006 transitional year were approximately $21 million.
101
On July 11, 2007, the Company commenced legal action against a group of its customers for, among other things, the collection of past-due receivables that are owed to the Company. Specifically, approximately $83 million (excluding interest, and prior to any allowances for doubtful accounts) is owed to the Company by this group of customers as of December 31, 2007, of which approximately $75 million is past due based on applicable payment terms (a significant portion of which is not reserved).
The provision for doubtful accounts for the year ended December 31, 2007 of $213.6 million was higher than the comparable prior year amount of $82.2 million, by $131.4 million. The year ended 2007 includes an incremental charge taken in the fourth quarter relating to customer bankruptcies and other legal action against a group of customers for, among other things, the collection of past due receivables, a revised assessment of the administrative and payment issues associated with Prescription Drug Plans under Medicare Part D, particularly relating to the aging of copays and rejected claims, and the resultant adoption by the Company of a modification in its policy with respect to payment authorization for dispensed prescriptions under Medicare Part D and other payors.
Until these administrative and payment issues relating to the Part D Drug Benefit as well as the aforementioned legal action against a group of Omnicare’s customers are fully resolved, there can be no assurance that the impact of these matters on the Company’s results of operations, financial position or cash flows will not change based on the outcome of any unforeseen future developments.
In 2007, approximately one-half of Omnicare’s pharmacy services billings were directly reimbursed by government-sponsored programs. These programs include primarily federal Medicare Part D and, to a lesser extent, the state Medicaid programs. The remainder of Omnicare’s billings were paid or reimbursed by individual residents or their responsible parties (private pay), facilities and other third-party payors, including private insurers. A portion of these revenues also was indirectly dependent on government programs. The table below represents the Company’s approximated payor mix (as a % of annual sales) for the last three years ended December 31,:
| | | | | | | | | | |
| | 2007 | | 2006 | | 2005 | |
| |
| |
| |
| |
Private pay, third-party and facilities(a) | | | 43 | % | | 43 | % | | 47 | % |
Federal Medicare program (Part D & Part B)(b) | | | 43 | % | | 42 | % | | 1 | % |
State Medicaid programs | | | 10 | % | | 12 | % | | 46 | % |
Other sources(c) | | | 4 | % | | 3 | % | | 6 | % |
| |
|
| |
|
| |
|
| |
Totals | | | 100 | % | | 100 | % | | 100 | % |
| |
|
| |
|
| |
|
| |
| |
(a) | Includes payments from SNFs on behalf of their federal Medicare program-eligible residents (Medicare Part A) and for other services and supplies, as well as payments from third-party insurers and private pay. |
| |
(b) | Includes direct billing for medical supplies under Part B totaling 1% in each of the 2007, 2006 and 2005 years. |
| |
(c) | Includes our contract research organization. |
102
Inventories
Inventories consist primarily of purchased pharmaceuticals and medical supplies held for sale to customers and are stated at the lower of cost or market. Cost is determined using the first-in, first-out method. Physical inventories are typically performed on a monthly basis at all pharmacy sites, and in all cases the Company’s policy is to perform them at least once a quarter. Cost of goods sold is recorded based on the actual results of the physical inventory counts, and is estimated when a physical inventory is not performed in a particular month.
Properties and Equipment
Properties and equipment are stated at cost less accumulated depreciation. Expenditures for maintenance, repairs, renewals and betterments that do not materially prolong the useful lives of the assets are charged to expense as incurred. Depreciation of properties and equipment is computed using the straight-line method over the estimated useful lives of the assets, which range from five to 10 years for computer equipment and software, machinery and equipment, and furniture and fixtures. Buildings and building improvements are depreciated over 40 years, and leasehold improvements are amortized over the lesser of the initial lease terms or their useful lives. The Company capitalizes certain costs that are directly associated with the development of internally developed software, representing the historical cost of these assets. Once the software is completed and placed into service, such costs are amortized over the estimated useful lives, ranging from five to 10 years.
Leases
Rental payments under operating leases are expensed in accordance with U.S. Generally Accepted Accounting Principles (“U.S. GAAP”). Leases that substantially transfer all of the benefits and risks of ownership of property to Omnicare or otherwise meet the criteria for capitalization under U.S. GAAP are accounted for as capital leases. An asset is recorded at the time a capital lease is entered into together with its related long-term obligation to reflect its purchase and financing. Property and equipment recorded under capital leases are depreciated on the same basis as previously described.
Valuation of Long-Lived Assets
In accordance with Statement of Financial Accounting Standards (“SFAS”) No. 144, “Accounting for the Impairment or Disposal of Long-Lived Assets,” long-lived assets such as property and equipment, software (acquired and internally developed) and investments are reviewed for impairment when events or changes in circumstances indicate that the book carrying amount of the assets may not be recoverable. An impairment loss would be recognized when estimated future undiscounted cash flows expected to result from the use of the asset and its eventual disposition are less than its book carrying amount.
103
Goodwill, Intangibles and Other Assets
Intangible assets are comprised primarily of goodwill, customer relationship assets, noncompete agreements, technology assets, and trademarks and trade names, all originating from business combinations accounted for as purchase transactions. In accordance with SFAS No. 142, “Goodwill and Other Intangible Assets” (“SFAS 142”), goodwill is no longer amortized but is instead reviewed at the aggregate reporting unit level for impairment using a fair value based approach at least annually. SFAS 142 requires the Company to assess whether there is an indication that goodwill is impaired, and requires goodwill to be tested between annual tests if events occur or circumstances change that would, more likely than not, reduce the fair value of a reporting unit below its book carrying amount. The Company’s assessments to date have indicated that goodwill has not been impaired. Intangible assets that are being amortized under SFAS 142 are amortized over their useful lives, ranging from three to 15 years.
Debt issuance costs are included in the “Other noncurrent assets” line of the Consolidated Balance Sheets and are amortized over the life of the related debt, and to the put date of December 15, 2015 in the case of the 3.25% convertible senior debentures due 2035.
Insurance Accruals
The Company is self-insured for certain employee health, property and casualty insurance claims. The Company carries a stop-loss umbrella policy for health insurance to limit the maximum potential liability for both individual and aggregate claims for a plan year. Claims are paid as they are submitted to the respective plan administrators. The Company records monthly expense for the self-insurance plans in its financial statements for incurred claims, based on historical claims experience and input from third-party insurance professionals in order to determine the appropriate accrual level. The accrual gives consideration to claims that have been incurred but not yet paid and/or reported to the plan administrator. The Company establishes the accruals based on the historical claim lag periods, current payment trends for similar insurance claims and input from third-party insurance and valuation professionals.
The book carrying amount of the Company’s property and casualty accrual available for self-insured retentions and deductibles, at December 31, 2007 and 2006, was $14.5 million and $14.1 million, respectively. The discount rate utilized in the computation of the property and casualty accrual balance at December 31, 2007 and 2006, based on consultation with the Company’s valuation advisors and giving consideration to anticipated claim lag periods, was 5.0% and 4.7%, respectively.
Revenue Recognition
Revenue is recognized by Omnicare when products or services are delivered or provided to the customer.
104
Pharmacy Services Segment
A significant portion of the Company’s Pharmacy Services segment revenues from sales of pharmaceutical and medical products have been reimbursed by the federal Medicare Part D plan and, to a lesser extent, state Medicaid programs. Payments for services rendered to patients covered by these programs are generally less than billed charges. The Company monitors its revenues and receivables from these reimbursement sources, as well as other third-party insurance payors, and records an estimated contractual allowance for certain sales and receivable balances at the revenue recognition date, to properly account for anticipated differences between billed and reimbursed amounts. Accordingly, the total net sales and receivables reported in the Company’s financial statements are recorded at the amount ultimately expected to be received from these payors. Since billing functions for a portion of the Company's revenue systems are largely computerized, enabling on-line adjudication (i.e., submitting charges to Medicare, Medicaid or other third-party payors electronically, with simultaneous feedback of the amount to be paid) at the time of sale to record net revenues, exposure to estimating contractual allowance adjustments is limited primarily to unbilled and/or initially rejected Medicare, Medicaid and third-party claims (oftentimes approved for reimbursement once additional information is provided to the payor). For the remaining portion of the Company's revenue systems, the contractual allowance is estimated for all billed, unbilled and/or initially rejected Medicare, Medicaid and third-party claims. The Company evaluates several criteria in developing the estimated contractual allowances for billed, unbilled and/or initially rejected claims on a monthly basis, including historical trends based on actual claims paid, current contract and reimbursement terms, and changes in customer base and payor/product mix. Contractual allowance estimates are adjusted to actual amounts as cash is received and claims are settled, and the aggregate impact of these resulting adjustments were not significant to the Company’s operations for any of the periods presented. Further, Omnicare does not expect the reasonably possible effects of a change in estimate related to unsettled December 31, 2007 contractual allowance amounts from Medicare, Medicaid and third-party payors to be significant to its future consolidated results of operations, financial position or cash flows.
Patient co-payments are associated with certain state Medicaid programs, Medicare Part B, Medicare Part D and certain third-party payors and are typically not collected at the time products are delivered or services are rendered, but are billed to the individual as part of the Company’s normal billing procedures. These co-payments are subject to the Company’s normal accounts receivable collections procedures.
A patient may be dispensed prescribed medications (typically no more than a 2-3 day supply) prior to insurance being verified in emergency situations, or for new facility admissions after hours or on weekends. As soon as practicable (typically the following business day), specific payor information is obtained so that the proper payor can be billed for reimbursement.
Under certain circumstances, the Company accepts returns of medications and issues a credit memo to the applicable payor. The Company estimates and accrues for sales returns based on historical return experience, giving consideration to the Company’s return policies. Product returns are processed in the period received, and are not significant when compared to the overall sales and gross profit of the Company.
105
Contract Research Services Segment
A portion of the Company’s overall revenues relates to the Contract Research Services (“CRO” or “CRO Services”) segment, and is earned by performing services under contracts with various pharmaceutical, biotechnology, medical device and diagnostics companies, based on contract terms. Most of the contracts provide for services to be performed on a units-of-service basis. These contracts specifically identify the units-of-service and unit pricing. Under these contracts, revenue is generally recognized upon completion of the units-of-service. For time-and-materials contracts, revenue is recognized at contractual hourly rates, and for fixed-price contracts, revenue is recognized using a method similar to that used for units-of-service. The Company’s contracts provide for additional service fees for scope of work changes. The Company recognizes revenue related to these scope changes when underlying services are performed and realization is assured. In a number of cases, clients are required to make termination payments in addition to payments for services already rendered. Any anticipated losses resulting from contract performance are charged to earnings in the period identified. Billings and payments are specified in each contract. Revenue recognized in excess of billings is classified as unbilled receivables, while billings in excess of revenue are classified as deferred revenue, on the respective lines of the Consolidated Balance Sheets.
Stock-Based Compensation
Effective January 1, 2006, the Company adopted the provisions of SFAS No. 123 (revised 2004), “Share-Based Payment” (“SFAS 123R”), which replaced SFAS No. 123, “Accounting for Stock-Based Compensation” (“SFAS 123”) and supersedes APB Opinion No. 25, “Accounting for Stock Issued to Employees” (“APB 25”). Prior to the adoption of SFAS 123R, the Company accounted for stock incentive plans under the recognition and measurement principles of APB 25, and related Interpretations (intrinsic value method). Historically, stock option awards have been granted with an exercise price at least equal to the fair market value of Company stock upon grant. As a result, no stock-based employee compensation cost for stock options was reflected in net income prior to the adoption of SFAS 123R.
SFAS 123R requires the Company to record compensation costs relating to share-based payment transactions in its financial statements under a fair value recognition model. Under the provisions of SFAS 123R, share-based compensation cost is measured at the grant date based on the fair value of the award and is recognized as expense ratably over the requisite service period of the award (usually the vesting period). The Company elected the “modified prospective method” of implementing SFAS 123R, which requires that SFAS 123R be applied to all new awards whose inception date follows the effective date of January 1, 2006, and all existing awards modified, repurchased or cancelled after January 1, 2006. In addition, this method requires compensation cost for the portion of awards for which service has not been rendered (i.e., nonvested portion) and were outstanding as of January 1, 2006. Estimated compensation cost for awards that were outstanding as of January 1, 2006 is being recognized over the remaining service period using the compensation cost estimate included in the SFAS 123 pro forma disclosures at the time the awards were issued. In accordance with the modified
106
prospective method, the Company’s consolidated financial statements for prior periods have not been restated to reflect the adoption of SFAS 123R.
Operating income for the year ended December 31, 2007 and 2006 includes additional share-based compensation expense of approximately $4.1 million and $4.3 million before taxes for stock options, and $2.7 million and $2.8 million before taxes for stock awards, respectively. See the “Stock-Based Employee Compensation” note for further information regarding the stock-based compensation assumptions and expenses, including pro forma disclosures for the comparable prior-year period as if the Company had recorded stock-based compensation expense under SFAS 123.
Delivery Expenses
Omnicare incurred expenses totaling approximately $196.9 million, $190.2 million and $142.2 million for the years ended December 31, 2007, 2006 and 2005, respectively, to deliver the products sold to its customers. Delivery expenses are included in the “Selling, general and administrative expenses” line of the Consolidated Statements of Income.
Income Taxes
The Company accounts for income taxes using the asset and liability method in accordance with SFAS No. 109, “Accounting for Income Taxes,” under which deferred income taxes are recognized for the tax consequences of temporary differences by applying enacted statutory tax rates to differences between the tax bases of assets and liabilities and their reported amounts in the consolidated financial statements.
Future tax benefits are recognized to the extent that realization of those benefits is considered to be more likely than not, and a valuation allowance is established for deferred tax assets which do not meet this threshold.
107
Accumulated Other Comprehensive Income (Loss)
The accumulated other comprehensive income (loss) adjustments at December 31, 2007 and 2006, net of aggregate applicable tax benefits of $40.2 million and $34.9 million, respectively, by component and in the aggregate, follow (in thousands):
| | | | | | | |
| | December 31, | |
| |
| |
| | 2007 | | 2006 | |
| |
| |
| |
Cumulative foreign currency translation adjustments | | $ | 3,888 | | $ | 1,705 | |
Unrealized gain (loss) on fair value of investments | | | 2,400 | | | (1,423 | ) |
Pension and post employment benefits | | | (64,286 | ) | | (60,424 | ) |
| |
|
| |
|
| |
Total accumulated other comprehensive loss adjustments, net | | $ | (57,998 | ) | $ | (60,142 | ) |
| |
|
| |
|
| |
Use of Estimates in the Preparation of Financial Statements
The preparation of the Company’s consolidated financial statements in accordance with U.S. GAAP requires management to make estimates, assumptions and judgments that affect the reported amounts of assets, liabilities and stockholders’ equity at the date of the financial statements, the reported amounts of revenues and expenses during the reporting periods and amounts reported in the accompanying notes to consolidated financial statements. Significant estimates underlying the accompanying consolidated financial statements include the allowance for doubtful accounts and contractual allowance reserve; the net carrying value of inventories; acquisition-related accounting including goodwill and other indefinite-lived intangible assets, and the related annual impairment assessments; accruals pursuant to the Company’s restructuring initiatives; employee benefit plan assumptions and reserves; stock-based compensation; various other operating allowances and accruals (including employee health, property and casualty insurance accruals and related assumptions); and current and deferred tax assets, liabilities and provisions. Actual results could differ from those estimates depending upon the resolution of certain risks and uncertainties.
Potential risks and uncertainties, many of which are beyond the control of Omnicare, include, but are not necessarily limited to, such factors as overall economic, financial and business conditions; delays and reductions in reimbursement by the government and other payors to Omnicare and/or its customers; the overall financial condition of Omnicare’s customers; the effect of new government regulations, executive orders and/or legislative initiatives, including those relating to reimbursement and drug pricing policies and changes in the interpretation and application of such policies; efforts by payors to control costs; the outcome of litigation; the outcome of audit, compliance, administrative or investigatory reviews, including governmental/ regulatory inquiries; other contingent liabilities; loss or delay of contracts pertaining to the Company’s CRO Services segment for regulatory or other reasons; currency fluctuations between the U.S. dollar and other currencies; changes in international economic and political conditions; changes in interest rates; changes in the valuation of the Company’s financial
108
instruments, including the swap agreement and other derivative instruments; changes in employee benefit plan assumptions and reserves; changes in tax laws and regulations; access to capital and financing; the demand for Omnicare’s products and services; pricing and other competitive factors in the industry; changes in insurance claims experience and related assumptions; the outcome of the Company’s annual goodwill and other identifiable intangible assets assessments; variations in costs or expenses; and changes in accounting rules and standards.
Recently Issued Accounting Standards
In September 2006, the FASB issued Statement of Financial Accounting Standards (“SFAS”) No. 157, “Fair Value Measurements” (“SFAS 157”). SFAS 157 defines fair value, establishes a framework for measuring fair value in U.S. GAAP and expands disclosures about fair value measurements. SFAS 157 applies under other accounting pronouncements that require or permit fair value measurements, the FASB having previously concluded in those accounting pronouncements that fair value is the relevant measurement attribute. Accordingly, SFAS 157 does not require any new fair value measurements. SFAS 157 is effective for fiscal years beginning after November 15, 2007, and interim periods within those fiscal years, with earlier adoption permitted. On February 6, 2008, the FASB decided to defer the effective date of SFAS 157 for one year for nonfinancial assets and nonfinancial liabilities that are recognized or disclosed at fair value in the financial statements on a nonrecurring basis. The FASB also decided to amend SFAS 157 to exclude SFAS No. 13, “Accounting for Leases” and its related interpretive accounting pronouncements that address leasing transactions. The Company does not expect SFAS 157 to have a material impact on its consolidated results of operations, financial position or cash flows.
In February 2007, the FASB issued SFAS No. 159, “The Fair Value Option for Financial Assets and Financial Liabilities, including an amendment of FASB Statement No. 115” (“SFAS 159”). SFAS No. 159 permits entities to choose to measure many financial instruments and certain other items at fair value that are not currently required to be measure at fair value. Unrealized gains and losses on items for which the fair value option has been elected are reported in earnings. SFAS No. 159 does not affect any existing accounting literature that requires certain assets and liabilities to be carried at fair value. SFAS No. 159 is effective for fiscal years beginning after November 15, 2007. The Company does not expect SFAS 159 to have a material impact on its consolidated results of operations, financial position or cash flows.
In December 2007, the FASB issued SFAS No. 141 (revised 2007), “Business Combinations” (“SFAS 141R”). Among other changes, SFAS 141R requires the acquiring entity in a business combination to recognize all (and only) the assets acquired and liabilities assumed in the transaction at fair value; establishes the acquisition-date fair value as the measurement objective for all assets acquired and liabilities assumed, including earn-out provisions; and requires the acquirer to disclose to investors and all other users all of the information they need to evaluate and understand the nature and financial effect of the business combination. SFAS 141R is generally effective for business combinations occurring in the first annual reporting period beginning after December 15, 2008. The Company is evaluating the effect of this recently issued standard on its future consolidated results of operations, financial position and cash flows.
109
In December 2007, the FASB issued SFAS No. 160, “Noncontrolling Interests in Consolidated Financial Statements, and amendment of ARB No. 51” (“SFAS 160”). Among other items, SFAS 160 requires all entities to report noncontrolling (minority) interests in subsidiaries in the same way as equity in the consolidated financial statements. SFAS 160 is effective for the first annual reporting period beginning after December 15, 2008. The Company is evaluating the effect of this recently issued standard on its consolidated results of operations, financial position and cash flows.
Reclassifications
Certain reclassifications of prior-year amounts have been made to conform with the current-year presentation.
Note 2 – Acquisitions
Since 1989, the Company has been involved in a program to acquire providers of pharmaceutical products and related pharmacy management services and medical supplies to long-term care facilities and their residents. The Company’s strategy has included the acquisition of freestanding institutional pharmacy businesses as well as other assets, generally insignificant in size, which have been combined with existing pharmacy operations to augment their internal growth. From time-to-time the Company may acquire other businesses, such as pharmacy consulting companies, specialty pharmacy companies, medical supply and service companies, hospice pharmacy companies and companies providing distribution and product support services for specialty pharmaceuticals, as well as contract research organizations, which complement the Company’s core businesses.
During 2007, the Company completed 20 acquisitions (all of which were in the Pharmacy Services segment) of businesses, none of which were, individually or in the aggregate, significant to the Company. Acquisitions of businesses required cash payments of approximately $151 million (including amounts payable pursuant to acquisition agreements relating to pre-2007 acquisitions) in 2007. During 2006, the Company completed 17 acquisitions (all of which were in the Pharmacy Services segment) of businesses, none of which were individually significant to the Company. Acquisitions of businesses required cash payments of approximately $94 million (including amounts payable pursuant to acquisition agreements relating to pre-2006 acquisitions) in 2006. During 2005, the Company completed 18 acquisitions (all of which were in the Pharmacy Services segment) of businesses. Acquisitions of businesses required cash payments of approximately $2.6 billion (including amounts payable pursuant to acquisition agreements relating to pre-2005 acquisitions) in 2005. The impact of these aggregate acquisitions on the Company’s overall goodwill balance has been reflected in the disclosures at the “Goodwill and Other Intangible Assets” note. Omnicare engages an independent valuation firm to assist with the identification and valuation of other identifiable intangible assets in connection with the purchase price allocation of certain acquisitions. The Company continues to evaluate the tax effects and other pre-acquisition contingencies relating to certain acquisitions. Omnicare is in the process of completing its allocation of the purchase price for certain acquisitions, and accordingly, the goodwill balance is preliminary and subject to change. The
110
net assets and operating results of acquisitions have been included in the Company’s consolidated financial statements from their respective dates of acquisition.
On July 28, 2005, Omnicare closed its $34.75 per share cash tender offer (the “Offer”) for all of the issued and outstanding shares of the common stock (the “Shares”) of NeighborCare, Inc. (“NeighborCare”). Approximately 42,897,600 Shares were tendered in the Offer, representing 97.2% of the then-outstanding Shares. On July 28, 2005, Omnicare accepted for payment all Shares validly tendered and not properly withdrawn. In the Offer, after giving effect to the settlement of Shares tendered that were subject to guaranteed delivery, the Company acquired the aggregate of 42,011,760 Shares, representing approximately 95.2% of the outstanding Shares. All Shares not tendered in the Offer were converted into the right to receive the same consideration per Share paid in the Offer.
The acquisition of NeighborCare was accounted for as a purchase business combination and included cash consideration of approximately $1.9 billion. The cash consideration included the pay off of certain NeighborCare debt totaling approximately $328 million, of which $78 million was retired by Omnicare immediately following the acquisition. In addition, on August 27, 2005 the Company closed its tender offer for cash to purchase all of the $250 million outstanding principal amount of NeighborCare’s 6.875% senior subordinated notes due 2013 (the “NeighborCare Notes”). All of the NeighborCare Notes were validly tendered in the offer. The total consideration, excluding accrued and unpaid interest, for each $1,000 principal amount of NeighborCare Notes validly tendered was $1,096.85. The Company financed the acquisition of NeighborCare with proceeds from a new $3.4 billion credit agreement, as further discussed at the “Debt” note.
At the time of the acquisition, NeighborCare was an institutional pharmacy provider serving long-term care and SNFs, specialty hospitals and assisted and independent living communities comprising approximately 295,000 beds in 34 states and the District of Columbia. NeighborCare also provided infusion therapy services, home medical equipment, respiratory therapy services, community-based retail pharmacies and group purchasing.
In connection with the purchase of NeighborCare, the Company acquired amortizable intangible assets comprised of customer relationship and non-compete agreement assets totaling $134 million and $4.4 million, respectively. Amortization periods for customer relationship and non-compete agreement intangible assets are 11.0 years and 2.6 years, respectively, and 10.7 years on a weighted-average basis. As of December 31, 2007, the Company has recorded goodwill totaling approximately $1.8 billion (of which approximately $404 million is tax deductible) in connection with the NeighborCare acquisition. During the years ended December 31, 2007, 2006 and 2005, the Company paid approximately $6 million, $35 million and $11 million, respectively, related to NeighborCare exit and employee termination costs. Further discussion of goodwill and other intangible assets is included in the “Goodwill and Other Intangible Assets” note below.
Unaudited pro forma combined results of operations of the Company and NeighborCare for the year ended December 31, 2005 are presented below. Such pro forma presentation has been prepared assuming that the NeighborCare acquisition had been made as of January 1, 2005.
111
The unaudited pro forma combined financial information of the Company and NeighborCare follows (in thousands, except per share data):
| | | | |
| | | | |
| | Year ended
December 31,
2005 | |
| |
| |
Pro forma net sales | | $ | 6,220,431 | |
Pro forma net income from continuing operations | | | 207,937 | |
Pro forma earnings per share: | | | | |
Basic | | $ | 2.01 | |
| |
|
| |
Diluted | | $ | 1.93 | |
| |
|
| |
The pro forma information is presented for illustration purposes only and does not purport to be indicative of the combined results of operations that actually would have occurred if the acquisition of NeighborCare had been effected at the date indicated, or to project future financial condition or results of operations for any future period. The pro forma information presented above gives effect only to historical results and certain estimated historical adjustments (primarily interest costs and intangible asset amortization expense, net of taxes), and does not reflect any pro forma synergies not yet realized subsequent to the acquisition date.
The purchase agreements for acquisitions generally include clauses whereby the seller will or may be paid additional consideration at a future date depending on the passage of time and/or whether or not certain future events occur. The agreements also typically include provisions containing a number of representations and covenants by the seller, and provide that if those representations are found not to have been true or if those covenants are violated, Omnicare may offset any payments required to be made at a future date against any claims it may have under indemnity provisions in the related agreement. Amounts contingently payable through 2008, primarily representing payments originating from earnout provisions, total approximately $55 million as of December 31, 2007 and, if paid, will be recorded as additional purchase price, serving to increase goodwill in the period in which the contingencies are resolved and payment is made. The amount of cash paid for acquisitions of businesses in the Consolidated Statements of Cash Flows represents acquisition-related payments made in each of the years of acquisition, as well as acquisition-related payments made during each of the years pursuant to acquisition transactions entered into in prior years.
112
Note 3 – Cash and Cash Equivalents
A summary of cash and cash equivalents follows (in thousands):
| | | | | | | |
| | December 31, | |
| |
| |
| | 2007 | | 2006 | |
| |
| |
| |
Cash | | $ | 109,630 | | $ | 109,682 | |
Money market funds | | | 12,134 | | | 6,526 | |
U.S. government-backed repurchase agreements | | | 152,684 | | | 21,826 | |
| |
|
| |
|
| |
| | $ | 274,448 | | $ | 138,034 | |
| |
|
| |
|
| |
Repurchase agreements represent investments in U.S. government-backed treasury issues at December 31, 2007 and 2006, under agreements to resell the securities to the counterparty. The term of the repurchase agreements usually span overnight, but in no case is longer than 30 days. The Company has a collateralized interest in the underlying securities of repurchase agreements, which are segregated in the accounts of the counterparty.
Note 4 – Properties and Equipment
A summary of properties and equipment follows (in thousands):
| | | | | | | |
| | December 31, | |
| |
| |
| | 2007 | | 2006 | |
| |
| |
| |
Land | | $ | 3,646 | | $ | 3,646 | |
Buildings and building improvements | | | 13,424 | | | 10,864 | |
Computer equipment and software | | | 250,714 | | | 239,126 | |
Machinery and equipment | | | 140,305 | | | 134,699 | |
Furniture, fixtures and leasehold improvements | | | 102,782 | | | 98,247 | |
| |
|
| |
|
| |
| | | 510,871 | | | 486,582 | |
Accumulated depreciation | | | (311,422 | ) | | (286,157 | ) |
| |
|
| |
|
| |
| | $ | 199,449 | | $ | 200,425 | |
| |
|
| |
|
| |
113
Note 5 – Goodwill and Other Intangible Assets
Changes in the carrying amount of goodwill for the years ended December 31, 2007 and 2006, by business segment, are as follows (in thousands):
| | | | | | | | | | |
| | Pharmacy
Services | | CRO
Services | | Total | |
| |
| |
| |
| |
Balance as of January 1, 2006 | | $ | 3,952,472 | | $ | 77,010 | | $ | 4,029,482 | |
Goodwill acquired in the year ended December 31, 2006 | | | 17,905 | | | — | | | 17,905 | |
Other | | | 163,858 | | | 13,766 | | | 177,624 | |
| |
|
| |
|
| |
|
| |
Balance as of December 31, 2006 | | | 4,134,235 | | | 90,776 | | | 4,225,011 | |
Goodwill acquired in the year ended December 31, 2007 | | | 102,238 | | | — | | | 102,238 | |
Other | | | 13,641 | | | 1,279 | | | 14,920 | |
| |
|
| |
|
| |
|
| |
Balance as of December 31, 2007 | | $ | 4,250,114 | | $ | 92,055 | | $ | 4,342,169 | |
| |
|
| |
|
| |
|
| |
The “Other” captions above include the settlement of acquisition matters relating to prior-year acquisitions, (including, where applicable, payments pursuant to acquisition agreements such as deferred payments, indemnification payments and payments originating from earnout provisions, as well as adjustments for the finalization of purchase price allocations, including identifiable intangible asset valuations). “Other” also includes the effect of adjustments due to foreign currency translations, which relate solely to the CRO Services segment and one pharmacy located in Canada that is included in the Pharmacy Services segment. During the year ended December 31, 2006, the Company recorded an increase in goodwill and a corresponding increase in deferred tax liabilities in the amount of approximately $135 million related to book and tax basis differences in the stock of subsidiaries acquired in the acquisition of NeighborCare (Pharmacy Services segment), as required under SFAS No. 109 (reflected in Other above).
The Company performed its annual goodwill impairment assessment for the years ended December 31, 2007 and 2006 and concluded that goodwill had not been impaired.
114
The table below presents the Company’s other identifiable intangible assets at December 31, 2007 and 2006, all of which are subject to amortization, except trademark and trade names as described below (in thousands):
| | | | | | | | | | |
| | December 31, 2007 | |
| |
| |
| | Gross
Carrying
Amount | | Accumulated
Amortization | | Net
Carrying
Amount | |
| |
| |
| |
| |
Customer relationship assets | | $ | 350,753 | | $ | (90,369 | ) | $ | 260,384 | |
Trademark and trade names | | | 29,580 | | | — | | | 29,580 | |
Non-compete agreements | | | 41,041 | | | (19,331 | ) | | 21,710 | |
Technology assets | | | 16,900 | | | (5,054 | ) | | 11,846 | |
Other | | | 405 | | | (288 | ) | | 117 | |
| |
|
| |
|
| |
|
| |
Total | | $ | 438,679 | | $ | (115,042 | ) | $ | 323,637 | |
| |
|
| |
|
| |
|
| |
| | | | | | | | | | |
| | December 31, 2006 | |
| |
| |
| | Gross
Carrying
Amount | | Accumulated
Amortization | | Net
Carrying
Amount | |
| |
| |
| |
| |
Customer relationship assets | | $ | 327,086 | | $ | (60,462 | ) | $ | 266,624 | |
Trademark and trade names | | | 29,300 | | | — | | | 29,300 | |
Non-compete agreements | | | 31,292 | | | (16,364 | ) | | 14,928 | |
Technology assets | | | 11,600 | | | (2,994 | ) | | 8,606 | |
Other | | | 405 | | | (275 | ) | | 130 | |
| |
|
| |
|
| |
|
| |
Total | | $ | 399,683 | | $ | (80,095 | ) | $ | 319,588 | |
| |
|
| |
|
| |
|
| |
Pretax amortization expense related to identifiable intangible assets was $35.1 million, $34.9 million and $22.4 million for the years ended December 31, 2007, 2006 and 2005, respectively. Omnicare’s trademark and trade names constitute identifiable intangible assets with indefinite useful lives based upon their expected useful lives and the anticipated effects of obsolescence, demand, competition and other factors per the requirements of SFAS 142. Accordingly, these trademarks and trade names are not amortized, but are reviewed annually for impairment. The Company performed its annual assessment for the years ended December 31, 2007 and 2006, and concluded that these assets had not been impaired.
115
Estimated annual pretax amortization expense for intangible assets subject to amortization at December 31, 2007 for the next five fiscal years is as follows (in thousands):
| | | | | |
Year ended
December 31, | | Amortization
Expense | |
| |
| |
2008 | | | $ | 35,651 | |
2009 | | | | 35,451 | |
2010 | | | | 35,342 | |
2011 | | | | 34,207 | |
2012 | | | | 32,394 | |
Note 6 – Leasing Arrangements
The Company has operating leases that cover various operating and administrative facilities and certain operating equipment. In most cases, the Company expects that these leases will be renewed, or replaced by other operating leases, in the normal course of business. There are no significant contingent rentals in the Company’s operating leases. Omnicare, Inc. routinely guarantees many of the lease obligations of its subsidiaries in the normal course of business.
The following is a schedule of future minimum rental payments required under operating leases that have initial or remaining noncancellable terms in excess of one year as of December 31, 2007 (in thousands):
| | | | |
Year ended
December 31, | | | |
| | | | |
2008 | | $ | 47,835 | |
2009 | | | 36,595 | |
2010 | | | 25,818 | |
2011 | | | 14,613 | |
2012 | | | 11,402 | |
Later years | | | 34,232 | |
| |
|
| |
Total minimum
payments required | | $ | 170,495 | |
| |
|
| |
Total rent expense under operating leases for the years ended December 31, 2007, 2006 and 2005 were $74.7 million, $70.8 million and $58.7 million, respectively.
116
Note 7 – Debt
A summary of debt follows (in thousands):
| | | | | | | |
| | December 31, | |
| |
| |
| | 2007 | | 2006 | |
| |
| |
| |
Revolving loans, due 2010 | | $ | — | | $ | — | |
Term loan, due 2010 | | | 50,602 | | | 42,911 | |
Senior term A loan, due 2010 | | | 450,000 | | | 600,000 | |
6.125% senior subordinated notes, due 2013 | | | 250,000 | | | 250,000 | |
6.75% senior subordinated notes, due 2013 | | | 225,000 | | | 225,000 | |
6.875% senior subordinated notes, due 2015 | | | 525,000 | | | 525,000 | |
4.00% junior subordinated convertible debentures, due 2033 | | | 345,000 | | | 345,000 | |
3.25% convertible senior debentures, due 2035 | | | 977,500 | | | 977,500 | |
Capitalized lease and other debt obligations | | | 8,831 | | | 14,127 | |
| |
|
| |
|
| |
Subtotal | | | 2,831,933 | | | 2,979,538 | |
Less interest rate swap agreement | | | (7,990 | ) | | (19,047 | ) |
Less current portion of debt | | | (3,192 | ) | | (5,371 | ) |
| |
|
| |
|
| |
Total long-term debt, net | | $ | 2,820,751 | | $ | 2,955,120 | |
| |
|
| |
|
| |
The following is a schedule of required debt payments due during each of the next five years and thereafter, as of December 31, 2007 (in thousands):
| | | | |
Year ended
December 31, | | | |
| | | |
2008 | | $ | 3,192 | |
2009 | | | 3,044 | |
2010 | | | 501,831 | |
2011 | | | 869 | |
2012 | | | 37 | |
Later years | | | 2,322,960 | |
| |
|
| |
Total debt payments | | $ | 2,831,933 | |
| |
|
| |
Total cash interest payments made for the years ended December 31, 2007, 2006 and 2005 were $156.0 million, $162.4 million and $129.8 million (which excludes early redemption fees of $17.9 million paid in 2005 in connection with the repurchase of approximately 98% of the 8.125% senior subordinated notes, due 2011, as discussed below), respectively. As of December 31, 2007, the Company had approximately $24.2 million outstanding relating to standby letters of credit, substantially all of which are subject to automatic annual renewals.
117
2005 Refinancing Transactions
As part of a major refinancing completed during the fourth quarter of 2005, the Company completed its offering of $225 million aggregate principal amount of 6.75% senior subordinated notes due 2013 (the “6.75% Senior Notes”), $525 million aggregate principal amount of 6.875% senior subordinated notes due 2015 (the “6.875% Senior Notes”), $977.5 million aggregate principal amount of 3.25% convertible senior debentures due 2035 (the “3.25% Convertible Debentures”), and 12,825,000 shares of common stock, $1 par value, at $59.72 per share for gross proceeds of approximately $766 million (the “2005 Common Stock Offering”) (excluding gross proceeds of approximately $51 million received in January 2006 from the underwriters of the common stock offering exercising their option in part to purchase an additional 850,000 shares of common stock at $59.72 per share).
The net proceeds from the refinancing were primarily utilized to pay off an interim financing provided by a $1.9 billion 364-day loan facility, discussed below, and the purchase of approximately $366 million of the Company’s 8.125% senior subordinated notes due 2011 (the “8.125% Senior Notes”) pursuant to a tender offer and consent solicitation.
See the additional discussion included below for more details regarding the various senior notes and convertible debentures.
During the third quarter of 2005, the Company entered into a $3.4 billion Credit Agreement (the “Credit Agreement”) consisting of the aforementioned $1.9 billion 364-day loan facility, with original maturity dates spanning from July 26, 2006 through August 17, 2006 (the “364-Day Loans”), an $800 million revolving credit facility, maturing on July 28, 2010 (the “Revolving Loans”), and a $700 million senior term A loan facility, maturing on July 28, 2010 (the “Term Loans”). Interest on the outstanding balances of the 364-Day Loans was payable, at the Company’s option, (i) at a Eurodollar Base Rate (as defined in the Credit Agreement) plus a margin of 0.75% or (ii) at an Alternate Base Rate (as defined in the Credit Agreement). The 364-Day Loans were drawn at various intervals during the third quarter of 2005, with each separate borrowing having a slightly different interest rate based on the timing of the borrowing. The 364-Day Loans were repaid in full in late 2005 with proceeds from the 2005 Common Stock Offering, the 6.75% Senior Notes, the 6.875% Senior Notes, and the 3.25% Convertible Debentures, as further described below. Interest on the outstanding balances of the Revolving Loans and the Term Loans is payable, at the Company’s option, (i) at a Eurodollar Base Rate plus a margin based on the Company’s senior unsecured long-term debt securities rating and the Company’s Capitalization Ratio (as defined in the Credit Agreement), that can range from 0.50% to 1.75% or (ii) at an Alternate Base Rate. The interest rate on the Revolving Loans and the Term Loans was 6.1% at December 31, 2007. The Credit Agreement requires the Company to comply with certain financial covenants, including a minimum consolidated net worth and a minimum fixed charges coverage ratio, and customary affirmative and negative covenants.
The Company primarily used the net proceeds from the Credit Agreement to repay outstanding borrowings, as of July 28, 2005, under a former 2003 credit facility totaling $123.1 million for a term A loan and $181 million for revolving credit facility loans (the “2003 Credit Facilities”), and for certain acquisitions, primarily NeighborCare (see the “Acquisitions” note for additional
118
discussion). As of December 31, 2007, there was $450 million outstanding under the Term Loans, and no amount was drawn under the Revolving Loans.
In connection with the execution of the Credit Agreement, the Company has deferred debt issuance costs of $11.7 million. Interest expense in 2005 included a pretax charge of approximately $8.7 million ($5.5 million aftertax) in connection with the write-off of certain deferred financing fees related to the refinancing of the Company’s 2003 term A loan and revolving credit facility, the expensing of certain debt issuance costs related to the Term Loans and the Revolving Loans, and debt costs related to the 364-Day loans. The Company amortized to expense approximately $2.6 million of the $11.7 million deferred debt issuance costs during each of the years ended December 31, 2007 and 2006, and approximately $1.0 million during the year ended December 31, 2005. Also, during the year ended December 31, 2005, the Company amortized to expense approximately $1.4 million of deferred debt issuance costs related to the 2003 Credit Facilities.
In addition to the new Credit Agreement, the Company had additional borrowings in 2005 of approximately $43 million, primarily consisting of a note payable carrying a five-year term and a variable interest rate of 7.03% per annum as of December 31, 2007.
8.125% Senior Subordinated Notes
During 2001, the Company completed the issuance, at par value, of $375 million of 8.125% senior subordinated notes due 2011. In connection with the issuance of the 8.125% Senior Notes, the Company deferred $11.1 million in debt issuance costs, of which approximately $0.03 million and $1.1 million was amortized to expense during the years ended December 31, 2006 and 2005, respectively.
On December 5, 2005, Omnicare commenced a tender offer (the “Tender Offer”) for cash to purchase any and all of the $375 million outstanding principal amount of its 8.125% Senior Notes. In connection with the Tender Offer, the Company solicited consents to effect certain proposed amendments to the indenture governing the 8.125% Senior Notes. On December 16, 2005 (the “Consent Payment Deadline”), tenders and consents had been received with respect to $366.2 million aggregate principal amount of the 8.125% Senior Notes (approximately 98% of the total outstanding principal amount). The total consideration, excluding accrued and unpaid interest, for each $1,000 principal amount of 8.125% Senior Notes validly tendered prior to December 16, 2005 was $1,048.91, which included a $20 consent payment. As of December 31, 2005, approximately $8.8 million of the 8.125% Senior Notes remained outstanding. Subsequent to the Consent Payment Deadline and December 31, 2005, and prior to the Tender Offer expiration at midnight, New York City time, on January 3, 2006, an additional $0.6 million aggregate principal amount was validly tendered. The total consideration, excluding accrued and unpaid interest, for each $1,000 principal amount of 8.125% Senior Notes validly tendered subsequent to the Consent Payment Deadline and prior to expiration was $1,028.91, which did not include the $20 consent payment. During October 2006, the Company purchased all of the remaining $8.2 million of the 8.125% Senior Notes. In connection with the initial 2005 purchase of the 8.125% Senior Notes, the Company incurred early redemption fees, resulting in a $17.9 million pretax charge ($11.2 million aftertax) and the write-off of debt issuance costs resulting in a $5.8 million pretax charge ($3.7 million aftertax), both of which were recorded in interest
119
expense for the year ended December 31, 2005. Additionally, the Company incurred approximately $1.1 million ($0.7 million aftertax) of professional fees associated with the purchase of the 8.125% Senior Notes, which were recorded in selling, general and administrative expenses for the year ended December 31, 2005.
6.125% Senior Subordinated Notes
The Company completed, during the second quarter of 2003, its offering of $250 million of 6.125% senior subordinated notes due 2013. In connection with the issuance of the 6.125% Senior Notes, the Company deferred $6.6 million in debt issuance costs, of which approximately $0.7 million was amortized to expense in each of the three years ended December 31, 2007, 2006 and 2005, respectively. The 6.125% Senior Notes contain certain affirmative and negative covenants and events of default customary for such instruments.
In connection with its offering of the 6.125% Senior Notes, the Company entered into an interest rate swap agreement (the “Swap Agreement”) with respect to all $250 million of the aggregate principal amount of the 6.125% Senior Notes. Under the Swap Agreement, which hedges against exposure to long-term U.S. dollar interest rates, the Company receives a fixed rate of 6.125% and pays a floating rate based on LIBOR with an interest period of six months, plus a spread of 2.27%. The floating rate is determined semi-annually, in arrears, two London Banking Days prior to the first of each December and June. The Company records interest expense on the 6.125% Senior Notes at the floating rate. The estimated LIBOR-based floating rate (including the 2.27% spread) was 6.74% as of December 31, 2007. The Swap Agreement, which matches the terms of the 6.125% Senior Notes, is designated and accounted for as a fair value hedge. The Company is accounting for the Swap Agreement in accordance with SFAS No. 133, “Accounting for Derivative Instruments and Hedging Activities,” as amended, so changes in the fair value of the Swap Agreement are offset by changes in the recorded carrying value of the related 6.125% Senior Notes. The fair value of the Swap Agreement of approximately $8 million at December 31, 2007, based on an estimate received from an outside advisor, is recorded in the “Other noncurrent liabilities” line of the Consolidated Balance Sheets, and as a reduction to the book carrying value of the related 6.125% Senior Notes.
6.75% Senior Subordinated Notes
On December 15, 2005, Omnicare completed its offering of $225 million aggregate principal amount of 6.75% senior subordinated notes due 2013. In connection with the issuance of the 6.75% Senior Notes, the Company deferred $4.6 million in debt issuance costs, of which approximately $0.6 million was amortized to expense in each of the years ended December 31, 2007 and 2006, and $0.02 million for the year ended December 31, 2005. The 6.75% Senior Notes contain certain affirmative and negative covenants and events of default customary for such instruments.
6.875% Senior Subordinated Notes
On December 15, 2005, Omnicare completed its offering of $525 million aggregate principal amount of 6.875% senior subordinated notes due 2015. In connection with the issuance of the 6.875% Senior Notes, the Company deferred $10.7 million in debt issuance costs, of which approximately $1.0 million was amortized to expense in each of the years ended December 31, 2007 and 2006, and $0.04 million for the year ended December 31, 2005. The 6.875% Senior
120
Notes contain certain affirmative and negative covenants and events of default customary for such instruments.
4.00% Junior Subordinated Convertible Debentures:
During the first quarter of 2005, the Company completed its offer to exchange up to $345 million aggregate liquidation amount of 4.00% Trust Preferred Income Equity Redeemable Securities due 2033 (the “Old Trust PIERS”) of Omnicare Capital Trust I (the “Old Trust”), for an equal amount of Series B 4.00% Trust Preferred Income Equity Redeemable Securities (the “New Trust PIERS”) of Omnicare Capital Trust II (the “New Trust”). The New Trust PIERS have substantially similar terms to the Old Trust PIERS, except that the New Trust PIERS have a net share settlement feature. In connection with the exchange offer, the composition of the Company’s 4.00% junior subordinated convertible debentures underlying the trust PIERS was impacted. Additional information regarding the 4.00% junior subordinated convertible debentures underlying the Old Trust PIERS and the New Trust PIERS is summarized below.
Original 4.00% Junior Subordinated Convertible Debentures
In connection with the offering of the Old Trust PIERS in the second quarter of 2003, the Company issued a corresponding amount of 4.00% junior subordinated convertible debentures (the “Old 4.00% Debentures”) due 2033 to the Old Trust. The Old Trust is a 100%-owned finance subsidiary of the Company. The Company has fully and unconditionally guaranteed the securities of the Old Trust. The Old Trust PIERS offer fixed cash distributions at a rate of 4.00% per annum payable quarterly, and a fixed conversion price of $40.82 under a contingent conversion feature whereby the holders may convert their Old Trust PIERS if the closing sales price of Company common stock for a predetermined period, beginning with the quarter ending September 30, 2003, is more than 130% of the then-applicable conversion price or, during a predetermined period, if the daily average of the trading prices for the Old Trust PIERS is less than 105% of the average of the conversion values for the Old Trust PIERS through 2028 (98% for any period thereafter through maturity). The Old Trust PIERS also will pay contingent distributions, commencing with the quarterly distribution period beginning June 15, 2009, if the average trading prices of the Old Trust PIERS for a predetermined period equals 115% or more of the stated liquidation amount of the Old Trust PIERS. In this circumstance, the holder of the convertible debenture will receive 0.125 percent of the average trading price during the predetermined period. Embedded in the Old Trust PIERS are two derivative instruments, specifically, a contingent interest provision and a contingent conversion parity provision. The embedded derivatives are periodically valued by a third-party advisor, and at December 31, 2007, the values of both derivatives embedded in the Old Trust PIERS were not material. However, the values are subject to change, based on market conditions, which could affect the Company’s future results of operations, financial position or cash flows. Omnicare irrevocably and unconditionally guarantees, on a subordinated basis, certain payments to be made by the Old Trust in connection with the Old Trust PIERS. Subsequent to the first quarter 2005 exchange offer discussed in further detail at the Series B 4.00% Junior Subordinated Convertible Debentures caption below, the Company has $11,233,050 aggregate liquidation amount of the Old Trust PIERS and underlying Old 4.00% Debentures remaining outstanding at period end.
121
Series B 4.00% Junior Subordinated Convertible Debentures
On March 8, 2005, the Company completed the exchange of $333,766,950 aggregate liquidation amount of the Old Trust PIERS (representing 96.7% of the total liquidation amount of the Old Trust PIERS outstanding) for an equal amount of the New Trust PIERS, plus an exchange fee of $0.125 per $50 stated liquidation amount of Old Trust PIERS. Each New Trust PIERS represents an undivided beneficial interest in the assets of the New Trust, which assets consist solely of a corresponding amount of Series B 4.00% junior subordinated convertible debentures (the “New 4.00% Debentures”) issued by the Company with a stated maturity of June 15, 2033. The Company has fully and unconditionally guaranteed the securities of the New Trust. Subsequent to the completion of the exchange offering and at period end, the Company has $333,766,950 of New 4.00% Debentures outstanding.
The terms of the New Trust PIERS are substantially identical to the terms of the Old Trust PIERS, except that the New Trust PIERS are convertible into cash and, if applicable, shares of Company common stock, whereas the outstanding Old Trust PIERS are convertible only into Company common stock (except for cash in lieu of fractional shares).
The purpose of the exchange offer was to change the conversion settlement provisions of the Old Trust PIERS. By committing to pay up to the stated liquidation amount of the New Trust PIERS to be converted in cash upon conversion, the Company is able to account for the New Trust PIERS under the treasury stock method.
As of December 31, 2007 and 2006, the aforementioned contingent threshold had not been met and, accordingly, the Old 4.00% Debentures and the New 4.00% Debentures have been classified as long-term debt on the December 31, 2007 and 2006 Consolidated Balance Sheets.
In connection with the issuance of the Old 4.00% Debentures and the New 4.00% Debentures, the Company has deferred $11.1 million in debt issuance costs, of which approximately $0.4 million was amortized to expense in each of the years ended December 31, 2007, 2006 and 2005. The year ended December 31, 2005 included a special charge to operating expenses totaling $1.8 million pretax in connection with the issuance of the New Trust PIERS.
3.25% Convertible Senior Debentures
On December 15, 2005, Omnicare completed its offering of $977.5 million aggregate principal amount of 3.25% convertible senior debentures due 2035, including the exercise in full by the underwriters of their option to purchase additional debentures. The 3.25% Convertible Debentures have an initial conversion price of approximately $79.73 per share under a contingent conversion feature whereby the holders may convert their 3.25% Convertible Debentures, prior to December 15, 2033, on any date during any fiscal quarter beginning after March 31, 2006 (and only during such fiscal quarter) if the closing sales price of the Company’s common stock was more than 130% of the then current conversion price for at least 20 trading days in the period of the 30 consecutive trading days ending on the last trading day of the previous fiscal quarter or during any five consecutive trading days period if, during each of the previous five consecutive trading days, the trading price of the convertible debentures for each day was less than 98 percent of the then current conversion price. The 3.25% Convertible
122
Debentures bear interest at a rate of 3.25% per year, subject to an upward adjustment on and after December 15, 2015 in certain circumstances, up to a rate not to exceed 1.99 times the original 3.25 percent interest rate per year. The 3.25% Convertible Debentures also will pay contingent interest in cash, beginning with the six-month interest period commencing December 15, 2015, during any six-month period in which the trading price of the 3.25% Convertible Debentures for each of the five trading days ending on the second trading day immediately preceding the first day of the applicable six-month interest period equals or exceeds 120% of the principal amount of the 3.25% Convertible Debentures. Embedded in the 3.25% Convertible Debentures are three derivative instruments, specifically, a contingent interest provision, an interest reset provision and a contingent conversion parity provision. The embedded derivatives are periodically valued by a third-party advisor, and at December 31, 2007, the values of the derivatives embedded in the 3.25% Convertible Debentures were not material. However, the values are subject to change, based on market conditions, which could affect the Company’s future results of operations, financial position or cash flows. In connection with the issuance of the 3.25% Convertible Debentures, the Company has deferred approximately $26.9 million in debt issuance costs, of which approximately $2.7 million was amortized to expense for the years ended December 31, 2007 and 2006, and $0.1 million in the year ended December 31, 2005.
Note 8 – Public Offering of Common Stock
During the fourth quarter of 2005, the Company completed the offering of 12,825,000 shares of its common stock (excluding the underwriters’ option to purchase additional shares), $1 par value, at $59.72 per share. Gross proceeds, before underwriting discount, commission and expenses, were approximately $766 million. On January 12, 2006, underwriters of the common stock offering exercised their option, in part, to purchase an additional 850,000 shares of common stock at $59.72 per share, for gross cash proceeds of approximately $51 million. The sale of these additional shares closed on January 17, 2006.
Note 9 – Stock-Based Compensation
At December 31, 2007, the Company had four stock-based employee compensation plans under which incentive awards were outstanding, which are described more fully below.
Omnicare believes that the incentive awards issued under these plans serve to better align the interests of its employees with those of its stockholders.
Stock-Based Compensation Plans
During 2004, stockholders of the Company approved the 2004 Stock and Incentive Plan, under which the Company is authorized to grant equity-based and other incentive compensation to employees, officers, directors, consultants and advisors of the Company in an amount aggregating up to 10.0 million shares of Company common stock. Beginning May 18, 2004, stock-based incentive awards are made only from the 2004 Stock and Incentive Plan.
During 1998, the Company’s Board of Directors approved the 1998 Long-Term Employee Incentive Plan (the “1998 Plan”), under which the Company was authorized to grant stock-based
123
incentives to a broad base of employees (excluding executive officers and directors of the Company) in an amount initially aggregating up to 1.0 million shares of Company common stock for non-qualified options, stock awards and stock appreciation rights. In March 2000 and November 2002, the Company’s Board of Directors amended the 1998 Plan to increase the shares available for granting to 3.5 million and 6.3 million, respectively.
During 1995, the Company’s Board of Directors and stockholders approved the 1995 Premium-Priced Stock Option Plan, providing options to purchase 2.5 million shares of Company common stock available for grant at an exercise price of 125% of the stock’s fair market value at the date of grant.
Under the 1992 Long-Term Stock Incentive Plan, the Company granted stock awards and stock options at not less than fair market value of the Company’s common stock on the date of grant.
The Company also had a Director Stock Plan, which allowed for stock options and stock awards to be granted to certain non-employee directors. As of May 18, 2004, this plan was terminated. Consequentially, awards are no longer made from this plan.
Under these plans, stock options vest and become exercisable at varying points in time, ranging up to four years in length, and have terms that generally span ten years from the grant date. Stock option awards are granted with an exercise price at least equal to the fair market value of Company stock upon grant. Omnicare’s policy is to issue new shares upon stock option exercise. Certain stock option and share awards provide for accelerated vesting if there is a change in control, as defined in the plans.
Employee Stock Purchase Plan
In November 1999, the Company’s Board of Directors adopted the Omnicare StockPlus Program, a non-compensatory employee stock purchase plan (the “ESPP”). Under the ESPP, employees and non-employee directors of the Company who elect to participate may contribute up to 6% of eligible compensation (or an amount not to exceed $20,000 for non-employee directors) to purchase shares of the Company’s common stock. For each share of stock purchased, the participant also receives two options to purchase additional shares of the Company’s stock. The stock options are subject to a four-year vesting period and are generally subject to forfeiture in the event the related shares purchased are not held by the participant for a minimum of two years. The stock options have a ten-year life from the date of issuance. Amounts contributed to the ESPP are used by the plan administrator to purchase the Company’s stock on the open market or for shares issued by Omnicare.
Stock Awards
Non-vested stock awards are granted to key employees at the discretion of the Compensation and Incentive Committee of the Board of Directors. These awards are restricted as to the transfer of ownership and generally vest over the requisite service periods, typically a seven-year period (with a greater proportion vesting in the latter years), or five to ten-year periods (vesting on a straight-line basis). Unrestricted stock awards are granted annually to all members of the Board of Directors, and non-employee directors also receive non-vested stock awards that generally
124
vest on the third anniversary of the date of grant. The fair value of a stock award is equal to the fair market value of a share of Company stock on the grant date.
Stock-Based Compensation
As discussed in the “Description of Business and Summary of Significant Accounting Policies” note of the Notes to Consolidated Financial Statements, effective January 1, 2006, the Company adopted the provisions of SFAS 123R, which requires the Company to record compensation costs relating to share-based payment transactions, including stock options, in its consolidated financial statements, based on estimated fair values. The Company currently uses the Black-Scholes options pricing model to determine the fair value of stock options on the grant date, which is affected by Omnicare’s stock price as well as assumptions regarding a number of complex and subjective variables, as further discussed below. These variables include Omnicare’s expected stock price volatility over the expected term of the awards, actual and projected employee exercise behaviors, the risk-free interest rate and the stock’s dividend yield.
The expected term of stock options granted represents the period of time that the stock options are expected to be outstanding and is estimated based primarily on historical stock option exercise experience. The expected volatility is based primarily on the historical volatility of the Company’s stock over a period generally commensurate with the expected term of the stock options. The risk-free interest rate used in the option valuation model is based on United States Treasury Strip (“stripped coupon interest”) issues with remaining terms similar to the expected term of the stock options. The expected dividend yield is based on the current Omnicare stock yield. The Company is required to estimate forfeitures at the time of the grant and revise those estimates in subsequent periods as necessary to reflect any changes in actual forfeiture experience. Omnicare uses historical data to estimate pre-vesting stock option forfeitures and records stock-based compensation expense only for those awards that are expected to vest. All stock option awards are amortized on a straight-line basis over the requisite service periods of the awards, which are generally the vesting period.
The assumptions used to value stock options granted during the years ended December 31, 2007, 2006 and 2005 are as follows:
| | | | | | | | | | |
| | 2007 | | 2006 | | 2005 | |
| |
| |
| |
| |
Expected volatility | | | 30 | % | | 30 | % | | 31 | % |
Risk-free interest rate | | | 3.5 | % | | 4.6 | % | | 4.2 | % |
Expected dividend yield | | | 0.2 | % | | 0.2 | % | | 0.2 | % |
Expected term of options (in years) | | | 4.7 | | | 4.6 | | | 5.0 | |
Weighted average fair value per option | | $ | 10.93 | | $ | 13.25 | | $ | 18.88 | |
Prior to the adoption of SFAS 123R, the Company recognized the estimated compensation cost of restricted stock awards over the vesting term in accordance with the vesting schedule. Unrestricted stock awards were expensed during the period granted. The estimated compensation cost was based on the fair market value of Omnicare’s common stock on the date of the grant. Effective January 1, 2006, the Company recognizes the compensation cost of restricted stock awards on a straight-line basis over the requisite service periods of the awards,
125
which are generally the vesting period, with the amount of stock award compensation cost recognized as of any balance sheet date being at least equal to the portion of the grant-date value of the award that is vested at that date.
Total pretax stock-based compensation expense recognized in the Consolidated Statement of Income as part of S,G&A expense for stock options and stock awards for the year ended December 31, 2007 is approximately $4.1 million and $19.9 million, respectively, and $4.3 million and $20.7 million before taxes for the year ended December 31, 2006, respectively.
The following table illustrates the effect on net income and earnings per share, for the year ended December 31, 2005, as if the Company had accounted for share-based payment transactions under the fair value recognition provisions of SFAS 123, as amended by SFAS No. 148, “Accounting for Stock-Based Compensation-Transition and Disclosure-an amendment of SFAS 123” (“SFAS 148”) (in thousands, except per share data):
| | | | |
| | For the year
ended
December 31,
2005 | |
| |
| |
Net income, as reported | | $ | 226,491 | |
Add: Stock-based compensation expense (stock awards) included in reported net income, net of related tax effects | | | 7,277 | |
Deduct: Total stock-based compensation expense (stock options and awards) determined under fair value based method, net of related tax effects | | | (34,023 | ) |
| |
|
| |
Pro forma net income | | $ | 199,745 | |
| |
|
| |
| | | | |
Earnings per share: | | | | |
Basic – as reported | | $ | 2.19 | |
| |
|
| |
Basic – pro forma | | $ | 1.93 | |
| |
|
| |
| | | | |
Diluted – as reported | | $ | 2.10 | |
| |
|
| |
Diluted – pro forma | | $ | 1.85 | |
| |
|
| |
Prior to the adoption of SFAS 123R, the Company presented all tax benefits for deductions resulting from the exercise of stock options and disqualifying dispositions as operating cash flows on the Consolidated Statements of Cash Flows. SFAS 123R requires the benefits of tax deductions in excess of recognized compensation expense to be reported as a financing cash flow rather than an operating cash flow, totaling approximately $4.1 million and $10.4 million for the year ended December 31, 2007 and 2006. This requirement serves to reduce net operating cash flows and increase net financing cash flows in the period of adoption and thereafter. Total
126
overall cash flows remain unchanged from what would have otherwise been reported prior to this change in classification.
Prior to the adoption of SFAS 123R, the Company recorded a contra-equity balance for the unearned (deferred) compensation cost related to nonvested restricted stock awards. SFAS 123R required that this balance be charged against additional paid-in capital upon adoption. As a result, the December 31, 2005 balance in deferred compensation of $76.9 million was charged against paid-in capital upon adoption of SFAS 123R effective January 1, 2006, with no overall change to total stockholders’ equity.
As of December 31, 2007, there was approximately $70 million of total unrecognized compensation cost related to nonvested stock awards and stock options granted to Omnicare employees, which is expected to be recognized over a remaining weighted-average period of approximately 4.2 years. The total grant date fair value of shares vested during the year ended December 31, 2007 related to stock awards and stock options was approximately $18.9 million and $3.6 million, respectively.
General Stock Option Information
A summary of stock option activity under the plans for the years ended December 31, 2007, 2006 and 2005 is presented below (in thousands, except exercise price data):
| | | | | | | | | | | | | | | | | | | | | | | | | |
| | 2007 | | 2006 | | 2005 | |
| |
| |
| |
| |
| | Shares | | Weighted
Average
Exercise
Price | | Shares | | Weighted
Average
Exercise
Price | | Shares | | Weighted
Average
Exercise
Price | |
| |
| |
| |
| |
| |
| |
| |
Options outstanding, beginning of year | | 7,663 | | | | $ | 31.34 | | | 7,309 | | | | $ | 29.84 | | | 8,413 | | | | $ | 24.99 | | |
Options granted | | 125 | | | | | 33.40 | | | 878 | | | | | 40.94 | | | 1,192 | | | | | 52.77 | | |
Options exercised | | (85 | ) | | | | 23.66 | | | (449 | ) | | | | 24.77 | | | (2,194 | ) | | | | 24.05 | | |
Options forfeited | | (444 | ) | | | | 42.63 | | | (75 | ) | | | | 37.13 | | | (102 | ) | | | | 28.86 | | |
| |
|
| | | | | | |
|
| | | | | | |
|
| | | | | | |
Options outstanding, end of year | | 7,259 | | | | | 30.78 | | | 7,663 | | | | | 31.34 | | | 7,309 | | | | | 29.84 | | |
| |
|
| | | | | | |
|
| | | | | | |
|
| | | | | | |
Options exercisable, end of year | | 5,952 | | | | $ | 27.74 | | | 5,627 | | | | $ | 26.17 | | | 5,148 | | | | $ | 24.11 | | |
| |
|
| | | | | | |
|
| | | | | | |
|
| | | | | | |
The total exercise date intrinsic value of options exercised during the years ended December 31, 2007, 2006 and 2005 was approximately $1.3 million, $13.6 million and $38.9 million, respectively.
127
The following summarizes information about stock options outstanding and exercisable as of December 31, 2007 (in thousands, except exercise price and remaining life data):
| | | | | | | | | | | | | | | | | | | | | | | |
OPTIONS OUTSTANDING | | OPTIONS EXERCISABLE | |
| |
| |
Range of Exercise
Prices | | Number
Outstanding at
December 31,
2007 | | Weighted
Average
Remaining
Contractual
Life (in years) | | Weighted
Average
Exercise
Price | | Number
Exercisable at
December 31,
2007 | | Weighted
Average
Remaining
Contractual
Life (in years) | | Weighted
Average
Exercise
Price | |
| |
| |
| |
| |
| |
| |
| |
$7.72-$15.45 | | 1,284 | | | 1.51 | | | | $ | 15.31 | | | 1,284 | | | 1.51 | | | | $ | 15.31 | | |
15.46-23.17 | | 1,057 | | | 3.32 | | | | | 18.72 | | | 1,057 | | | 3.32 | | | | | 18.72 | | |
23.18-30.90 | | 2,054 | | | 5.55 | | | | | 27.24 | | | 1,961 | | | 5.44 | | | | | 27.24 | | |
30.91-38.61 | | 504 | | | 2.50 | | | | | 36.29 | | | 403 | | | 0.90 | | | | | 36.58 | | |
38.62-61.79 | | 2,360 | | | 7.69 | | | | | 46.50 | | | 1,247 | | | 7.06 | | | | | 46.15 | | |
| |
| | | | | | | | | | |
| | | | | | | | | | |
$7.72-$61.79 | | 7,259 | | | 4.99 | | | | $ | 30.78 | | | 5,952 | | | 4.25 | | | | $ | 27.74 | | |
| |
| | | | | | | | | | |
| | | | | | | | | | |
General Restricted Stock Award Information
A summary of nonvested restricted stock awards for the years ended December 31, 2007, 2006 and 2005 is presented below (in thousands, except fair value data):
| | | | | | | | | | | | | | | | | | | | | | | | | |
| | 2007 | | 2006 | | 2005 | |
| |
| |
| |
| |
| | Shares | | Weighted
Average
Grant
Date Price | | Shares | | Weighted
Average
Grant
Date Price | | Shares | | Weighted
Average
Grant
Date Price | |
| |
| |
| |
| |
| |
| |
| |
|
Nonvested shares, beginning of year | | 2,617 | | | | $ | 34.56 | | | 2,967 | | | | $ | 29.80 | | | 3,031 | | | | $ | 26.04 | | |
Shares awarded | | 239 | | | | | 38.70 | | | 344 | | | | | 56.15 | | | 530 | | | | | 41.84 | | |
Shares vested | | (699 | ) | | | | 27.01 | | | (659 | ) | | | | 24.43 | | | (579 | ) | | | | 21.18 | | |
Shares forfeited | | (54 | ) | | | | 44.74 | | | (35 | ) | | | | 33.60 | | | (15 | ) | | | | 27.59 | | |
| |
| | | | | | | |
| | | | | | | |
| | | | | | | |
Nonvested shares, end of year | | 2,103 | | | | $ | 37.27 | | | 2,617 | | | | $ | 34.56 | | | 2,967 | | | | $ | 29.80 | | |
| |
| | | | | | | |
| | | | | | | |
| | | | | | | |
When granted, the cost of nonvested stock awards is deferred and amortized to expense over the requisite service period (generally the vesting period). Unrestricted stock awards are expensed during the year granted. During 2007, 2006 and 2005, the amount of pretax compensation expense related to stock awards was $19.9 million, $20.7 million and $11.6 million, respectively.
Note 10 – Employee Benefit Plans
The Company has various defined contribution savings plans under which eligible employees can participate by contributing a portion of their salary for investment, at the direction of each employee, in one or more investment funds. Several of the plans were adopted in connection with certain of the Company’s acquisitions. The plans are primarily tax-deferred arrangements pursuant to Internal Revenue Code (“IRC”) Section 401(k) and are subject to the provisions of
128
the Employee Retirement Income Security Act (“ERISA”). The Company matches employee contributions in varying degrees (either in shares of the Company’s common stock or cash, in accordance with the applicable plan provisions) based on the contribution levels of the employees, as specified in the respective plan documents. Expense relating primarily to the Company’s matching contributions for these defined contribution plans for the years ended December 31, 2007, 2006 and 2005 was $6.8 million, $6.9 million and $6.0 million, respectively.
The Company has a non-contributory, defined benefit pension plan covering certain corporate headquarters employees and the employees of several companies sold by the Company in 1992, for which benefits ceased accruing upon the sale (the “Qualified Plan”). Benefits accruing under this plan to corporate headquarters employees were fully vested and frozen as of January 1, 1994.
The Company also has an excess benefit plan (“EBP”) that provides retirement payments to certain headquarters employees in amounts generally consistent with what they would have received under the Qualified Plan. The retirement benefits provided by the EBP are generally comparable to those that would have been earned in the Qualified Plan, if payments under the Qualified Plan were not limited by the IRC.
In addition, the Company has a supplemental pension plan (“SPP”) in which certain of its officers participate. Retirement benefits under the SPP are calculated on the basis of a specified percentage of the officers’ covered compensation, years of credited service and a vesting schedule, as specified in the plan document.
The Qualified Plan is funded with an irrevocable trust, which consists of assets held in the Vanguard Intermediate Term Treasury Fund Admiral Shares fund (“Vanguard Fund”), a mutual fund holding U.S. Treasury obligations. In addition, the Company has established rabbi trusts, which are also held in the Vanguard Fund, to provide for retirement obligations under the EBP and SPP. The Company’s general approach is to fund its pension obligations in accordance with the funding provisions of ERISA.
129
Components of Net Periodic Pension Cost and Other Amounts
Recognized in Other Comprehensive Income (Pre-tax)
(in thousands):
| | | | | | | | | | |
| | For the years ended December 31, | |
| |
| |
| | 2007 | | 2006 | | 2005 | |
| |
| |
| |
| |
Net Periodic Pension Cost (Pre-tax): | | | | | | | | | | |
Service cost | | $ | 4,348 | | $ | 2,245 | | $ | 1,788 | |
Interest cost | | | 8,204 | | | 4,173 | | | 3,190 | |
Amortization of deferred amounts (primarily prior actuarial losses) | | | 11,607 | | | 4,362 | | | 3,266 | |
Return on assets | | | (189 | ) | | (176 | ) | | (204 | ) |
| |
|
| |
|
| |
|
| |
Net periodic pension cost | | | 23,970 | | | 10,604 | | | 8,040 | |
| |
|
| |
|
| |
|
| |
| | | | | | | | | | |
Other Changes in Plan Assets and Benefit Obligations | | | | | | | | | | |
Recognized in Other Comprehensive Income (Pre-tax): | | | | | | | | | | |
Net loss (gain) | | | 17,002 | | | N/A | | | N/A | |
Amortization of net gain (loss) | | | (11,583 | ) | | N/A | | | N/A | |
Amortization of prior service cost | | | (24 | ) | | N/A | | | N/A | |
Adjustment for minimum pension liability included in other comprehensive income (pre-FAS 158) | | | N/A | | | 13,099 | | | 7,647 | |
| |
|
| |
|
| |
|
| |
Total recognized in other comprehensive income | | | 5,395 | | | 13,099 | | | 7,647 | |
| |
|
| |
|
| |
|
| |
| | | | | | | | | | |
Total recognized in net periodic pension cost and other comprehensive income | | $ | 29,365 | | $ | 23,703 | | $ | 15,687 | |
| |
|
| |
|
| |
|
| |
The estimated amount of net loss in accumulated other comprehensive income expected to be recognized as a component of net periodic pension cost during the 2008 year is approximately $14.7 million.
The actuarial assumptions used to calculate net periodic pension costs for years ended December 31 were as follows:
| | | | | | | | | | |
| | 2007 | | 2006 | | 2005 | |
| |
| |
| |
| |
Discount rate | | | 5.80% | | | 5.50% | | | 5.75% | |
Rate of increase in compensation levels | | | 23.00% | | | 13.00% | | | 10.00% | |
Expected rate of return on assets | | | 6.00% | | | 6.00% | | | 7.00% | |
The actuarial assumptions used to calculate the benefit obligations at the end of plan year were as follows:
| | | | | | | | | | |
| | 2007 | | 2006 | | 2005 | |
| |
| |
| |
| |
Discount rate | | | 5.80% | | | 5.80% | | | 5.50% | |
Rate of increase in compensation levels | | | 25.00% | | | 23.00% | | | 13.00% | |
Expected rate of return on assets | | | 6.00% | | | 6.00% | | | 6.00% | |
The discount rate assumption was determined giving consideration primarily to the Citigroup Pension Liability Index (as well as the Moody’s Aa Corporate Bond Index in prior years), and consultation with the Company’s outside employee benefit plan actuary professionals. It should
130
be noted that the actuarial calculation is highly dependent upon the stock price on the date(s) of stock award vesting and, accordingly, can fluctuate significantly with changes in Omnicare’s stock price. For example, the rate of increase in compensation levels actuarial assumption was impacted in 2006 largely as a result of the timing of certain restricted stock award grant annual vestings which occurred earlier in the 2006 year at a time when Omnicare’s stock price was trading near the higher end of the calendar year trading range. The expected rate of return on assets was estimated based primarily on the historical rate of return on intermediate-term U.S. Government securities.
On December 31, 2006, the Company adopted the recognition and disclosure provisions of SFAS 158, which required the Company to recognize the funded status (i.e., the difference between the fair value of plan assets and the projected benefit obligations) of its pension plans in the December 31, 2006 statement of financial position, with a corresponding adjustment to accumulated other comprehensive income. The adjustment to accumulated other comprehensive income at adoption represents the net unrecognized actuarial losses and unrecognized prior service costs, which were previously netted against the plan’s funded status in the Company’s statement of financial position pursuant to the provisions of SFAS No. 87, “Employers’ Accounting for Pensions” (“SFAS 87”). These amounts will be subsequently recognized as net periodic pension cost pursuant to the Company’s historical accounting policy for amortizing such amounts. Further, actuarial gains and losses that arise in subsequent periods and are not recognized as net periodic pension cost in the same periods will be recognized as a component of other comprehensive income. Those amounts will be subsequently recognized as a component of net periodic pension cost on the same basis as the amounts recognized in accumulated other comprehensive income at adoption of SFAS 158.
131
Obligations and Funded Status
(in thousands):
| | | | | | | |
| | For the years ended December 31, | |
| |
| |
| | 2007 | | 2006 | |
| |
| |
| |
Change in Plan Assets: | | | | | | | |
Fair value of plan assets at end of prior year | | $ | 3,179 | | $ | 2,983 | |
Actual return on plan assets | | | 314 | | | 85 | |
Employer contributions | | | 167 | | | 202 | |
Benefits paid | | | (99 | ) | | (91 | ) |
| |
|
| |
|
| |
Fair value of plan assets at end of year | | $ | 3,561 | (1) | $ | 3,179 | (1) |
| |
|
| |
|
| |
| | | | | | | |
Change in Projected Benefit Obligation: | | | | | | | |
Projected benefit obligation at end of prior year | | $ | 144,335 | | $ | 77,835 | |
Service cost | | | 4,348 | | | 2,245 | |
Interest cost | | | 8,204 | | | 4,173 | |
Actuarial loss | | | 17,127 | | | 60,173 | |
Benefits paid | | | (99 | ) | | (91 | ) |
| |
|
| |
|
| |
Projected benefit obligation at end of year | | $ | 173,915 | | $ | 144,335 | |
| |
|
| |
|
| |
| | | | | | | |
Funded Status: | | | | | | | |
Projected benefit obligation in excess of plan assets | | $ | (170,354 | )(1) | $ | (141,156 | )(1) |
| |
|
| |
|
| |
| | | | | | | |
Accumulated Benefit Obligation at end of year | | $ | 106,243 | | $ | 86,798 | |
| |
|
| |
|
| |
| |
(1) | In addition to the irrevocable trust assets presented in the table above, the Company has invested additional funds for settlement of the Company’s pension obligations in rabbi trusts, which totaled $123.0 million and $83.2 million as of December 31, 2007 and 2006, respectively. Since rabbi trust assets do not serve to offset the Company’s pension obligation for accounting purposes per U.S. GAAP, the funded status above has been reflected as the difference between the projected benefit obligation for all plans and the irrevocable trust plan assets of the Qualified Plan. |
The Company’s investment strategy generally targets investing in intermediate U.S. government and agency securities funds, seeking a moderate and sustainable level of current income by investing primarily in intermediate-term U.S. Treasury obligations with a low credit default risk.
132
Amounts Recognized in the Consolidated Balance
Sheets Consist of (in thousands):
| | | | | | | | |
| | | For the years ended December 31, | |
| | |
| |
| | | 2007 | | 2006 | |
| | |
| |
| |
| Current liabilities | | $ | 8,805 | | $ | 6,103 | |
| Noncurrent liabilities | | | 161,549 | | | 135,053 | |
| | |
|
| |
|
| |
| Total | | $ | 170,354 | | $ | 141,156 | |
| | |
|
| |
|
| |
Amounts Recognized in Accumulated Other
Comprehensive Income (Pretax) Consist of:
| | | | | | | | |
| Net loss | | $ | 102,303 | | $ | 96,884 | |
| Prior service cost | | | 14 | | | 38 | |
| | |
|
| |
|
| |
| Total | | $ | 102,317 | | $ | 96,922 | |
| | |
|
| |
|
| |
Information for Pension Plans with an Accumulated
Benefit Obligation in excess of Plan Assets
(in thousands):
| | | | | | | |
| | For the years ended December 31, | |
| |
| |
| | 2007 | | 2006 | |
| |
| |
| |
Qualified Plan: | | | | | | | |
Projected benefit obligation | | $ | 4,215 | | $ | 4,062 | |
Accumulated benefit obligation | | | 4,215 | | | 4,062 | |
Fair value of plan assets(1) | | | 3,561 | | | 3,179 | |
| | | | | | | |
EBP Plan: | | | | | | | |
Projected benefit obligation | | | 162,196 | | | 134,196 | |
Accumulated benefit obligation | | | 94,524 | | | 76,659 | |
Fair value of plan assets(1) | | | — | | | — | |
| | | | | | | |
SPP Plan: | | | | | | | |
Projected benefit obligation | | | 7,504 | | | 6,077 | |
Accumulated benefit obligation | | | 7,504 | | | 6,077 | |
Fair value of plan assets(1) | | | — | | | — | |
| | | | | | | |
Grand Totals: | | | | | | | |
Projected benefit obligation | | | 173,915 | | | 144,335 | |
Accumulated benefit obligation | | | 106,243 | | | 86,798 | |
Fair value of plan assets(1) | | | 3,561 | | | 3,179 | |
| |
(1) | See “Obligations and Funded Status” table of this note for further discussion. |
The estimated aggregate contributions to the rabbi trusts expected to be funded during the year ended December 31, 2008, relating to the Company’s pension obligations and based on the
133
actuarial assumptions in place at year end 2007, are not anticipated to be significant. Additionally, no funding is anticipated to be necessary relating to the Qualified Plan.
Projected benefit payments, which reflect expected future service, as appropriate, for each of the next five fiscal years and in the aggregate for the five fiscal years thereafter as of December 31, 2007 are estimated as follows (in thousands):
| | | | |
2008 | | $ | 8,805 | |
2009 | | | 5,316 | |
2010 | | | 115,645 | |
2011 | | | 2,666 | |
2012 | | | 5,523 | |
Years 2013 - 2017 | | | 55,374 | |
The Company also has a Long-Term Care Insurance Policy that provides post retirement health care benefits for certain headquarters employees. The plan expense for the year ended December 31, 2007 and 2006 was $0.1 million and $0.1 million, respectively, and the related liability as of December 31, 2007 is $0.7 million. Adjustments to other comprehensive income for the year ended December 31, 2007 totaled $0.4 million.
Note 11 – Income Taxes
Provision
The provision for income taxes is comprised of the following (in thousands):
| | | | | | | | | | |
| | For the years ended December 31, | |
| |
| |
| | 2007 | | 2006 | | 2005 | |
| |
| |
| |
| |
Current provision: | | | | | | | |
Federal | | $ | 28,477 | | $ | 53,178 | | $ | 21,883 | |
State, local and foreign | | | 2,756 | | | 2,144 | | | 3,152 | |
| |
|
| |
|
| |
|
| |
| | | 31,233 | | | 55,322 | | | 25,035 | |
| |
|
| |
|
| |
|
| |
Deferred provision: | | | | | | | | | | |
Federal | | | 35,244 | | | 76,806 | | | 100,066 | |
State and foreign | | | 5,965 | | | 4,796 | | | 10,214 | |
| |
|
| |
|
| |
|
| |
| | | 41,209 | | | 81,602 | | | 110,280 | |
| |
|
| |
|
| |
|
| |
Total income tax provision | | $ | 72,442 | | $ | 136,924 | | $ | 135,315 | |
| |
|
| |
|
| |
|
| |
Tax benefits related to the exercise of stock options and stock awards have been credited to paid-in capital in amounts of $3.3 million, $11.2 million and $17.4 million for 2007, 2006 and 2005, respectively.
134
Effective Income Tax Rate
The difference between the Company’s reported income tax expense and the federal income tax expense computed at the statutory rate of 35% is explained in the following table (in thousands):
| | | | | | | | | | | | | | | | | | | |
| | For the years ended December 31, | |
| |
| |
| | 2007 | | 2006 | | 2005 | |
| |
| |
| |
| |
Federal income tax at the statutory rate | | $ | 65,274 | | | 35.0 | % | $ | 112,174 | | | 35.0 | % | $ | 126,632 | | | 35.0 | % |
State, local and foreign income taxes, net | | | | | | | | | | | | | | | | | | | |
of federal income tax benefit | | | 4,260 | | | 2.3 | | | 5,640 | | | 1.8 | | | 10,111 | | | 2.8 | |
Litigation settlements (non-deductible portion) | | | — | | | — | | | 20,582 | | | 6.4 | | | — | | | — | |
Other, net (including tax accrual | | | | | | | | | | | | | | | | | | | |
adjustments) | | | 2,908 | | | 1.5 | | | (1,472 | ) | | (0.5 | ) | | (1,428 | ) | | (0.4 | ) |
| |
|
| |
|
| |
|
| |
|
| |
|
| |
|
| |
Total income tax provision | | $ | 72,442 | | | 38.8 | % | $ | 136,924 | | | 42.7 | % | $ | 135,315 | | | 37.4 | % |
| |
|
| |
|
| |
|
| |
|
| |
|
| |
|
| |
Income tax payments, net, amounted to $30.1 million, $16.7 million and $43.5 million in 2007, 2006 and 2005, respectively.
Deferred income taxes reflect the net tax effects of temporary differences between the carrying amounts of assets and liabilities for financial reporting purposes and the amounts used for income tax purposes.
135
Significant components of the Company’s deferred tax assets and liabilities are as follows (in thousands):
| | | | | | | |
| | December 31, | |
| |
| |
| | 2007 | | 2006 | |
| |
| |
| |
Accrued liabilities | | $ | 122,913 | | $ | 152,900 | |
Net operating loss (“NOL”) carryforwards | | | 98,248 | | | 101,613 | |
Accounts receivable reserves | | | 109,160 | | | 55,398 | |
Pension obligations | | | 63,714 | | | 49,071 | |
Other | | | 27,817 | | | 23,358 | |
| |
|
| |
|
| |
Gross deferred tax assets, before valuation allowances | | | 421,852 | | | 382,340 | |
Valuation allowances | | | (30,221 | ) | | (33,506 | ) |
| |
|
| |
|
| |
Gross deferred tax assets, net of valuation allowances | | $ | 391,631 | | $ | 348,834 | |
| |
|
| |
|
| |
|
Amortization of intangibles | | $ | 407,959 | | $ | 356,583 | |
Subsidiary stock basis | | | 206,885 | | | 199,716 | |
Contingent convertible debentures interest | | | 62,689 | | | 37,051 | |
Fixed assets and depreciation methods | | | 21,266 | | | 26,704 | |
Current and noncurrent assets | | | 13,371 | | | 17,907 | |
Other | | | 3,011 | | | 1,631 | |
| |
|
| |
|
| |
Gross deferred tax liabilities | | $ | 715,181 | | $ | 639,592 | |
| |
|
| |
|
| |
As of December 31, 2007, the Company has remaining deferred tax benefits related to its federal, state and foreign net operating losses totaling $98.2 million ($44.0 million federal, $52.1 million state and $2.1 million foreign). These NOLs will expire, in varying amounts, beginning in 2008 through 2027. The potential future tax benefits of the NOLs have been offset by $30.2 million of valuation allowance based on the Company’s analysis of the likelihood of generating sufficient taxable income in the various jurisdictions to utilize the benefits before expiration.
Uncertain Tax Positions
FASB Interpretation (“FIN”) No. 48 “Accounting for Uncertainty in Income Taxes” became effective on January 1, 2007. FIN 48 provides guidance for the financial statement recognition and measurement of income tax positions taken or expected to be taken in a tax return. Under FIN 48, recognition and measurement are considered discrete events. The recognition threshold is met when it is determined a tax position, based solely on its technical merits, is more likely than not to be sustained upon examination by the relevant taxing authority. If a tax position does not meet the more likely than not recognition threshold, the benefit of that position is not recognized in the financial statements. A tax position that meets the more likely than not recognition threshold is measured to determine the amount of benefit to be recognized in the financial statements. The tax position is measured as the largest amount of benefit that is 50 percent likely of being realized upon ultimate resolution with a taxing authority.
136
Upon adoption of FIN 48, the Company recognized an increase of approximately $17.9 million in the liability for unrecognized tax benefits. Of this amount, approximately $5.8 million was accounted for as a reduction to beginning retained earnings and approximately $12.1 million as an increase to goodwill. At adoption, the Company had a $60.3 million liability, net of federal income tax benefits, or $77.2 million gross of federal income tax benefits, recorded for unrecognized tax benefits, principally for U.S. federal and state jurisdictions. A reconciliation of the beginning and ending amount of gross unrecognized tax benefits is as follows (in thousands):
| | | | |
Balance at January 1, 2007 | | $ | 77,151 | |
Additions based on tax positions related to the current year | | | 5,700 | |
Additions for tax positions of prior years | | | 888 | |
Reductions for tax positions of prior years | | | (1,543 | ) |
Settlement reductions | | | (2,257 | ) |
Reductions for tax positions settled through the expirations of the statute of limitations | | | (1,740 | ) |
| |
|
| |
Balance at December 31, 2007 | | $ | 78,199 | |
| |
|
| |
Included in the balance at December 31, 2007 are $13.4 million of unrecognized tax benefits that, if recognized under existing business combination standards, would affect the effective tax rate. The liabilities for unrecognized tax benefits are carried in “Other noncurrent liabilities” on the Consolidated Balance Sheets, as payment of cash is not anticipated within one year of the most recent balance sheet date for any significant amounts. The Company recognizes interest and penalties accrued related to unrecognized tax benefits in tax expenses. During the year ended December 31, 2007, the Company recognized approximately $2.5 million in interest and penalties. The Company had approximately $9 million for the payment of interest and penalties accrued at December 31, 2007.
The Company files income tax returns in the U.S. federal jurisdiction, and various states and foreign jurisdictions. With few exceptions, the Company is no longer subject to U.S. federal examinations by tax authorities for years before 2004, and state and local, or non-U.S. income tax examinations, by tax authorities for years before 2003.
Note 12 - Earnings Per Share Data
Basic earnings per share are computed based on the weighted-average number of shares of common stock outstanding during the period. Diluted earnings per share include the dilutive effect of stock options, warrants and restricted stock awards, as well as convertible debentures.
137
The following is a reconciliation of the basic and diluted earnings per share (“EPS”) computations for both the numerator and denominator (in thousands, except per share data):
| | | | | | | | | | |
| | For the years ended December 31, | |
| |
| |
2007: | | Income
(Numerator) | | Common
Shares
(Denominator) | | Per
Common
Share
Amounts | |
| |
| |
| |
| |
Basic EPS | | | | | | | | | | |
Net income | | $ | 114,056 | | | 119,380 | | $ | 0.96 | |
| | | | | | | |
|
| |
Effect of Dilutive Securities | | | | | | | | | | |
4.00% junior subordinated convertible debentures | | | 284 | | | 295 | | | | |
Stock options, warrants and awards | | | — | | | 1,583 | | | | |
| |
|
| |
|
| | | | |
Diluted EPS | | | | | | | | | | |
Net income plus assumed conversions | | $ | 114,340 | | | 121,258 | | $ | 0.94 | |
| |
|
| |
|
| |
|
| |
| | | | | | | | | | |
2006: | | | | | | | | | | |
|
|
|
|
|
|
|
|
|
| |
Basic EPS | | | | | | | | | | |
Net income | | $ | 183,572 | | | 118,480 | | $ | 1.55 | |
| | | | | | | |
|
| |
Effect of Dilutive Securities | | | | | | | | | | |
4.00% junior subordinated convertible debentures | | | 289 | | | 1,480 | | | | |
Stock options, warrants and awards | | | — | | | 2,576 | | | | |
| |
|
| |
|
| | | | |
Diluted EPS | | | | | | | | | | |
Net income plus assumed conversions | | $ | 183,861 | | | 122,536 | | $ | 1.50 | |
| |
|
| |
|
| |
|
| |
| | | | | | | | | | |
2005: | | | | | | | | | | |
|
|
|
|
|
|
|
|
|
| |
Basic EPS | | | | | | | | | | |
Net income | | $ | 226,491 | | | 103,551 | | $ | 2.19 | |
| | | | | | | |
|
| |
Effect of Dilutive Securities | | | | | | | | | | |
4.00% junior subordinated convertible debentures | | | 1,959 | | | 2,702 | | | | |
Stock options, warrants and awards | | | — | | | 2,551 | | | | |
| |
|
| |
|
| | | | |
Diluted EPS | | | | | | | | | | |
Net income plus assumed conversions | | $ | 228,450 | | | 108,804 | | $ | 2.10 | |
| |
|
| |
|
| |
|
| |
During the years ended December 31, 2007, 2006 and 2005, the anti-dilutive effect associated with certain stock options, warrants and stock awards was excluded from the computation of diluted EPS, since the exercise price was greater than the average market price of the Company’s common stock during these periods. The aggregate number of stock options, warrants and stock awards excluded from the computation of the diluted EPS for those years totaled approximately 4.3 million, 1.6 million and 0.2 million, respectively.
138
Note 13 – Restructuring and Other Related Charges
Omnicare Full Potential Program
In the second quarter of 2006, the Company commenced the implementation of the “Omnicare Full Potential” Plan, a major initiative primarily designed to re-engineer the Company’s pharmacy operating model to increase efficiency and enhance customer growth. The Omnicare Full Potential Plan is expected to optimize resources across the entire organization by implementing best practices, including the realignment and right-sizing of functions, and a “hub-and-spoke” model, whereby certain key administrative and production functions will be transferred to regional support centers (“hubs”) specifically designed and managed to perform these tasks, with local pharmacies (“spokes”) focusing on time-sensitive services and customer-facing processes.
This program is expected to be completed over a multi-year period and is estimated to result in total pretax restructuring and other related charges of approximately $93 million. The charges primarily include severance pay, employment agreement buy-outs, excess lease costs and professional fees, as well as other related costs. The Company recorded restructuring and other related charges for the Omnicare Full Potential Program of approximately $29 million and $17 million pretax during the years ended December 31, 2007 and 2006, respectively (approximately $18 and $11 million aftertax, respectively). The remainder of the overall restructuring charge will continue to be recognized and disclosed prospectively as various phases of the project are finalized and implemented. The Company estimates that the initial phase of the program has led to a reduction in force of approximately 1,200 positions as of December 31, 2007, associated primarily with its pharmacy operations.
The restructuring charges primarily include severance pay, the buy-out of employment agreements, lease terminations, and other exit-related asset disposals, professional fees and facility exit costs. The other related charges are primarily comprised of professional fees. Details of the Omnicare Full Potential Plan restructuring and other related charges follow (pretax, in thousands):
139
| | | | | | | | | | |
| | 2006
Provision/
Accrual | | Utilized
during
2006 | | Balance at
December 31,
2006 | |
| |
| |
| |
| |
Restructuring charges: | | | | | | | | | | |
Employee severance | | $ | 6,465 | | $ | (3,775 | ) | $ | 2,690 | |
Lease terminations | | | 383 | | | (309 | ) | | 74 | |
Other assets, fees and facility exit costs | | | 3,859 | | | (2,690 | ) | | 1,169 | |
| |
|
| |
|
| |
|
| |
Total restructuring charges | | | 10,707 | | $ | (6,774 | ) | $ | 3,933 | |
| | | | |
|
| |
|
| |
|
Other related charges | | | 6,759 | | | | | | | |
| |
|
| | | | | | | |
Total restructuring and other related charges | | $ | 17,466 | | | | | | | |
| |
|
| | | | | | | |
| | | | | | | | | | |
| | 2007
Provision/
Accrual | | Utilized
during
2007 | | Balance at
December 31,
2007 | |
| |
| |
| |
| |
Restructuring charges: | | | | | | | | | | |
Employee severance | | $ | 2,300 | | $ | (4,955 | ) | $ | 35 | |
Employment agreement buy-outs | | | 2,546 | | | (1,347 | ) | | 1,199 | |
Lease terminations | | | 5,389 | | | (2,335 | ) | | 3,128 | |
Other assets, fees and facility exit costs | | | 8,992 | | | (8,303 | ) | | 1,858 | |
| |
|
| |
|
| |
|
| |
Total restructuring charges | | | 19,227 | | $ | (16,940 | ) | $ | 6,220 | |
| | | | |
|
| |
|
| |
|
Other related charges | | | 10,235 | | | | | | | |
| |
|
| | | | | | | |
Total restructuring and other related charges | | $ | 29,462 | | | | | | | |
| |
|
| | | | | | | |
As of December 31, 2007, the Company has made cumulative payments of approximately $10 million of severance and other employee-related costs for the Omnicare Full Potential Plan. The remaining liabilities at December 31, 2007 represent amounts not yet paid relating to actions taken in connection with the program (primarily employment agreement buy-out related payments, lease payments and professional fees) and will be settled as these matters are finalized. The provision/accrual and corresponding payment amounts relating to employee severance are being accounted for in accordance with SFAS No. 112 “Employers’ Accounting for Postemployment Benefits;” and the provision/accrual and corresponding payment amounts relating to employment agreement buy-outs are being accounted for primarily in accordance with
140
SFAS No. 146 “Accounting for Costs Associated with Exit or Disposal Activities” (“SFAS 146”).
2005 Program
In the third quarter of 2005, the Company announced the implementation of certain consolidation plans and other productivity initiatives to streamline pharmacy services and contract research organization operations, including maximizing workforce and operating asset utilization, and producing a more cost-efficient, operating infrastructure (the “2005 Program”). These consolidation and productivity initiatives were related, in part, to the integration of NeighborCare. Given the geographic overlap of the NeighborCare and Omnicare pharmacies, substantial opportunities for consolidation existed at the time of acquisition. While the majority of consolidations resulted in NeighborCare pharmacies being consolidated into Omnicare pharmacies, depending on location, capacity and operating performance, certain Omnicare pharmacies were also identified for consolidation into NeighborCare locations. Additionally, as part of the evaluation process on how best to integrate the two organizations, the Company also focused broadly on ways to lower operating infrastructure costs to maximize efficiencies and asset utilization and identified opportunities to right-size the business, streamline operations and eliminate redundant assets. The consolidation activity and other productivity initiatives of the 2005 Program resulted in the closure of 29 Omnicare facilities, of which 26 were pharmacy operations. Additionally, there was a net reduction in force of approximately 900 positions relating to the 2005 Program. Of this reduction in force, approximately 96% were in the pharmacy operations and the remaining reductions were at the corporate headquarters or the Company’s contract research operations. Restructuring activities in the contract research organization segment related primarily to facility lease obligations. In addition, S,G&A expenses for the year ended December 31, 2006 included a $6.1 million charge associated with retention payments for certain NeighborCare employees as required under the acquisition agreement.
The 2005 Program initiatives required cumulative restructuring and other related charges of approximately $31 million before taxes through the third quarter of 2006, which related to the costs associated with the consolidation of Omnicare pharmacies and the other consolidation and productivity initiatives described above. Specifically, the Company recorded restructuring and other related charges of approximately $12 million and $19 million pretax during the years ended December 31, 2006 and 2005, respectively (approximately $8 million and $12 million aftertax, respectively). The restructuring liabilities associated with the 2005 Program were evaluated by the Company during 2007. As a result of this review, it was determined that certain liabilities were no longer expected to be utilized as part of the activities remaining under the 2005 Program. In accordance with SFAS 146, the Company recorded adjustments in 2007 to reduce the employee severance and employee agreement buy-out liabilities by approximately $1.2 million and $0.4 million pretax, respectively.
The restructuring charges primarily included severance pay, the buy-out of employment agreements, lease terminations and other assets, professional fees and facility exit costs. Details of the 2005 Program restructuring charge liabilities follow (pretax, in thousands):
141
| | | | | | | | | | | | | | | | | | | | |
| | 2005
Provision/
Accrual | | Utilized
during
2005 | | Balance at
December 31,
2005 | | 2006
Provision/
Accrual | | Utilized
during
2006 | |
| |
| |
| |
| |
| |
| |
Restructuring charges: | | | | | | | | | | | | | | | | | | | | |
Employee severance | | $ | 4,364 | | | $ | (1,555 | ) | | | $ | 2,809 | | | $ | 2,027 | | $ | (3,246 | ) |
Employment agreement buy-outs | | | 1,666 | | | | (932 | ) | | | | 734 | | | | 1,459 | | | (1,982 | ) |
Lease terminations | | | 11,187 | | | | (1,354 | ) | | | | 9,833 | | | | 3,077 | | | (5,346 | ) |
Other assets, fees and facility exit costs | | | 1,562 | | | | (227 | ) | | | | 1,335 | | | | 3,003 | | | (3,393 | ) |
| |
|
| | |
|
| | | |
|
| | |
|
| |
|
| |
Total restructuring charges | | $ | 18,779 | | | $ | (4,068 | ) | | | $ | 14,711 | | | | 9,566 | | $ | (13,967 | ) |
| |
|
| | |
|
| | | |
|
| | | | | |
|
| |
| | | | | | | | | | | | | | | | | | | | |
Other Related Charges | | | | | | | | | | | | | | | | 2,530 | | | | |
| | | | | | | | | | | | | | |
|
| | | | |
Total Restructuring and other related charges | | | | | | | | | | | | | $ | 12,096 | | | | |
| | | | | | | | | | | | | | |
|
| | | | |
| | | | | | | | | | | | | | | | | | | | | | | | |
| | Balance at
December 31,
2006 | | Adjustments
during
2007 | | Utilized
during
2007 | | Balance at
December 31,
2007 | | | | |
| |
| |
| |
| |
| | | | |
Restructuring charges: | | | | | | | | | | | | | | | | | | | | | | | | |
Employee severance | | | $ | 1,590 | | | | $ | (1,218 | ) | | | $ | (70 | ) | | | $ | 302 | | | | | |
Employment agreement buy-outs | | | | 211 | | | | | (361 | ) | | | | 150 | | | | | — | | | | | |
Lease terminations | | | | 7,564 | | | | | — | | | | | (2,585 | ) | | | | 4,979 | | | | | |
Other assets, fees and facility exit costs | | | | 945 | | | | | — | | | | | (931 | ) | | | | 14 | | | | | |
| | |
|
| | | |
|
| | | |
|
| | | |
|
| | | | | |
Total restructuring charges | | | $ | 10,310 | | | | $ | (1,579 | ) | | | $ | (3,436 | ) | | | $ | 5,295 | | | | | |
| | |
|
| | | |
|
| | | |
|
| | | |
|
| | | | | |
As of December 31, 2007, the Company has made cumulative payments of approximately $7.6 million of severance and other employee-related costs. The remaining liabilities at December 31, 2007 represent amounts not yet paid relating to actions taken in connection with the program (primarily lease payments) and will be settled as these matters are finalized.
Note 14 – Shareholders’ Rights Plan
In May 1999, the Company’s Board of Directors declared a dividend, payable on June 2, 1999, of one preferred share purchase right (a “Right”) for each outstanding share of the Company’s $1.00 per share par value common stock, that, when exercisable, entitles the registered holder to purchase from the Company one ten-thousandth of a share of Series A Junior Participating Preferred Stock of the Company, without par value, at a price of $135 per one ten-thousandth of a share, subject to adjustment. Upon certain events relating to the acquisition of, commencement or announcement of, or announcement of an intention to make a tender offer or exchange offer that would result in the beneficial ownership of 15% or more of the Company’s outstanding common stock by an individual or group of individuals (the “Distribution Date”), the Rights not owned by the 15% stockholder will entitle its holder to purchase, at the Right’s then current exercise price, common shares having a market value of twice such exercise price. Additionally, if after any person has become a 15% stockholder, the Company is involved in a merger or other business combination with any other person, each Right will entitle its holder (other than the 15% stockholder) to purchase, at the Right’s then current exercise price, common shares of the acquiring company having a value of twice the Right’s then current exercise price. The Rights
142
will expire on June 2, 2009, unless redeemed earlier by the Company at $0.01 per Right until the Distribution Date.
Note 15 – Commitments and Contingencies
Omnicare continuously evaluates contingencies based upon the best available information. The Company believes that liabilities have been provided to the extent necessary in cases where the outcome is considered probable and reasonably estimable. To the extent that resolution of contingencies results in amounts that vary from the Company’s recorded liabilities, future earnings will be charged or credited accordingly.
The United States Attorney’s Office, District of Massachusetts, is conducting an investigation relating to the Company’s relationships with certain manufacturers and distributors of pharmaceutical products and certain customers, as well as with respect to contracts with certain companies acquired by the Company. Any action by the U.S. Attorney’s Office, District of Massachusetts, could result in civil or criminal proceedings against the Company. The Company believes that it has complied with all applicable laws and regulations with respect to these matters.
The federal government and certain states had been investigating allegations relating to three generic pharmaceuticals provided by the Company in connection with the substitution of capsules for tablets (Ranitidine), tablets for capsules (Fluoxetine) and two 7.5 mg tablets for one 15 mg tablet (Buspirone). On November 14, 2006, the Company entered into a civil settlement agreement, under which the Company paid the federal government and participating state governments $51 million to satisfy all of the federal and state civil claims and related plaintiff legal fees. The Company recorded a special litigation charge, for the settlement and related legal fees, of $57.5 million pretax ($45.3 million aftertax) in its financial results for 2006 to establish a reserve relating to the aforementioned investigation. The settlement agreement also resulted in the dismissal, with prejudice, of a number of other allegations included in complaints filed by twoqui tam relators. Another issue alleged by one of thequi tam relators remains under seal and was not resolved by the settlement. As part of the settlement agreement, on November 9, 2006, the Company entered into a Corporate Integrity Agreement with the Department of Health and Human Services Office of the Inspector General with a term of five years from November 9, 2006. The Corporate Integrity Agreement requires that the Company maintain its compliance program in accordance with the terms of the Corporate Integrity Agreement. The agreement contains specific requirements regarding the development and implementation of therapeutic interchange programs and the general training of certain Company employees as to the requirements of the Company’s compliance program and the Corporate Integrity Agreement. The requirements of the Corporate Integrity Agreement have resulted in increased costs to maintain the Company’s compliance program and could result in greater scrutiny by federal regulatory authorities. Violations of the Corporate Integrity Agreement could subject the Company to significant monetary and/or administrative penalties.
On July 11, 2006, the Attorney General’s Office in Michigan provided the Company’s legal counsel with information concerning its investigation relating to certain billing issues under the Michigan Medicaid program at Specialized Pharmacy Services, a subsidiary of the Company located in Michigan. On October 5, 2006, the Company entered into a voluntary settlement
143
agreement and a two-year Corporate Integrity Agreement with the State of Michigan to resolve the Michigan Attorney General’s investigation relating to certain billing issues under the Michigan Medicaid program at Specialized Pharmacy Services. Under the terms of the settlement agreement, the Company paid the State of Michigan approximately $43 million, with an additional amount of approximately $6 million to be paid over the following three years. The Company also reached an agreement in principle with the State of Michigan to resolve claims relating to billing by Specialized Pharmacy Services for drugs provided to hospice patients for a settlement amount of approximately $3.5 million. On October 26, 2007, the Company entered into settlement agreements with the federal government and the State of Michigan to resolve these hospice claims. Under the terms of the October 26, 2007 settlement agreements, the Company paid the federal government and the State of Michigan an aggregate amount of approximately $3.5 million. In connection with the settlements, the November 9, 2006 Corporate Integrity Agreement with the Department of Health and Human Services Office of the Inspector General was also amended to cover certain hospice billing matters. The settlement agreements do not include any finding of wrongdoing or any admission of liability. The Company recorded a special litigation charge of $54.0 million pretax ($46.7 million aftertax) in its financial results for 2006 based on the terms of the settlement agreement. The Corporate Integrity Agreement with the State of Michigan requires that the Company and Specialized Pharmacy Services maintain Specialized Pharmacy Services’ compliance program in accordance with the terms of the Corporate Integrity Agreement. The agreement contains specific requirements regarding compliance with Medicaid policies governing access to pharmacy facilities and records, unit dose billing agreements, consumption billing, hospice patient terminal illness prescriptions and prescriptions dispensed after a patient’s death. The requirements of the Corporate Integrity Agreement have resulted in increased costs to maintain Specialized Pharmacy Services’ compliance program and could result in greater scrutiny by Michigan regulatory authorities. Violations of the Corporate Integrity Agreement could subject the Company to significant monetary and/or administrative penalties.
On February 2 and February 13, 2006, respectively, two substantially similar putative class action lawsuits, entitledIndiana State Dist. Council of Laborers & HOD Carriers Pension & Welfare Fund v. Omnicare, Inc., et al., No. 2:06cv26 (“HOD Carriers”), andChi v. Omnicare, Inc., et al., No. 2:06cv31 (“Chi”), were filed against Omnicare and two of its officers in the United States District Court for the Eastern District of Kentucky purporting to assert claims for violation of §§10(b) and 20(a) of the Securities Exchange Act of 1934 and Rule 10b-5 promulgated thereunder, and seeking, among other things, compensatory damages and injunctive relief. The complaints, which purported to be brought on behalf of all open-market purchasers of Omnicare common stock from August 3, 2005 through January 27, 2006, alleged that Omnicare had artificially inflated its earnings by engaging in improper generic drug substitution and that defendants had made false and misleading statements regarding the Company’s business and prospects. On April 3, 2006, plaintiffs in theHOD Carriers case formally moved for consolidation and the appointment of lead plaintiff and lead counsel pursuant to the Private Securities Litigation Reform Act of 1995. On May 22, 2006, that motion was granted, the cases were consolidated, and a lead plaintiff and lead counsel were appointed. On July 20, 2006, plaintiffs filed a consolidated amended complaint, adding a third officer as a defendant and new factual allegations primarily relating to revenue recognition, the valuation of receivables and the valuation of inventories. On October 31, 2006, plaintiffs moved for leave to file a second
144
amended complaint, which was granted on January 26, 2007, on the condition that no further amendments would be permitted absent extraordinary circumstances. Plaintiffs thereafter filed their second amended complaint on January 29, 2007. The second amended complaint (i) expands the putative class to include all purchasers of Omnicare common stock from August 3, 2005 through July 27, 2006, (ii) names two members of the Company’s board of directors as additional defendants, (iii) adds a new plaintiff and a new claim for violation of Section 11 of the Securities Act of 1933 based on alleged false and misleading statements in the registration statement filed in connection with the Company’s December 2005 public offering, (iv) alleges that the Company failed to timely disclose its contractual dispute with UnitedHealth, and (v) alleges that the Company failed to timely record certain special litigation reserves. Defendants filed a motion to dismiss the second amended complaint on March 12, 2007, claiming that plaintiffs had failed adequately to plead loss causation, scienter or any actionable misstatement or omission. That motion was fully briefed as of May 1, 2007. In response to certain arguments relating to the individual claims of the named plaintiffs that were raised in defendants’ pending motion to dismiss, plaintiffs filed a motion to add, or in the alternative, to intervene an additional named plaintiff, Alaska Electrical Pension Fund, on July 27, 2007. Oral argument was held on defendants’ motion to dismiss on August 2, 2007. On October 12, 2007, the court issued an opinion and order dismissing the case and denying plaintiffs’ motion to add an additional named plaintiff. On November 9, 2007, plaintiffs filed a notice of appeal with the United States Court of Appeals for the Sixth Circuit and in a subsequent filing expressed an intention to appeal all aspects of the lower court’s decision. The appellate court has issued a briefing schedule, plaintiffs obtained a 30-day extension of time to file their briefs, and all briefs are now due by May 30, 2008.
On February 13, 2006, two substantially similar shareholder derivative actions, entitledIsak v. Gemunder, et al., Case No. 06-CI-390, andFragnoli v. Hutton, et al., Case No. 06-CI-389, were filed in Kentucky State Circuit Court, Kenton Circuit, against the members of Omnicare’s board of directors, individually, purporting to assert claims for breach of fiduciary duty, abuse of control, gross mismanagement, waste of corporate assets and unjust enrichment arising out of the Company’s alleged violations of federal and state health care laws based upon the same purportedly improper generic drug substitution that is the subject of the federal purported class action lawsuits. The complaints seek, among other things, damages, restitution and injunctive relief. TheIsak andFragnoli actions were later consolidated by agreement of the parties. On January 12, 2007, the defendants filed a motion to dismiss the consolidated action on the grounds that the dismissal of the substantially identical shareholder derivative action, Irwin v. Gemunder, et al., 2:06cv62, by the United States District Court for the Eastern District of Kentucky on November 20, 2006 should be given preclusive effect and thus bars re-litigation of the issues already decided inIrwin. Instead of opposing that motion, on March 16, 2007, the plaintiffs filed an amended consolidated complaint, which continues to name all of the directors as defendants and asserts the same claims, but attempts to bolster those claims by adding nearly all of the substantive allegations from the most recent complaint in the federal securities class action (seediscussion ofHOD Carriers above) and an amended complaint inIrwin that added the same factual allegations that were added to the consolidated amended complaint in the HOD Carriers action. On April 16, 2007, defendants filed a supplemental memorandum of law in further support of their pending motion to dismiss contending that the amended complaint should be dismissed on the same grounds previously articulated for dismissal, namely, the preclusive effect
145
of the dismissal of theIrwin action. That motion has been fully briefed, oral argument was held on August 21, 2007, and the court reserved decision.
The Company believes the above-described purported class and derivative actions are without merit and will be vigorously defended.
The years ended 2007 and 2006 included a $42.5 million and $13.6 million pretax charge ($26.4 million and $8.6 million after taxes), respectively, reflected in the “Litigation and other related professional fees” line of the Consolidated Statements of Income, for litigation-related professional expenses in connection with the administrative subpoenas from the United States Attorney’s Office, District of Massachusetts; the purported class and derivative actions; the Company’s lawsuit against United; the inquiry conducted by the Attorney General’s Office in Michigan relating to certain billing issues under the Michigan Medicaid program; the investigation by the federal government and certain states relating to drug substitutions; the Company’s response to subpoenas it received relating to other legal proceedings to which the Company is not a party; and certain other larger customer disputes.
During 2006, the Company experienced certain quality control and product recall issues, as well as fire damage, at one of its repackaging facilities, Heartland Repack Services (“Heartland”). As a precautionary measure, the Company voluntarily and temporarily suspended operations at Heartland. During the time that the Heartland facility was closed, the Company conducted certain environmental tests at the facility. Based on the results of these tests, which showed very low levels of beta lactam residue, and the time and expense associated with completing the necessary remediation procedures, as well as the short remaining term on the lease for the current facility, the Company decided not to reopen the Heartland facility. The Company continues to work to address and resolve all issues, and restore centralized repackaging to full capacity. In order to temporarily replace the capacity of the Heartland facility, the Company ramped up production in its other repackaging facility, as well as onsite in its individual pharmacies for use by their patients. As a result, the Company has been and continues to be able to meet the needs of all of its client facilities and their residents. Addressing these issues served to increase costs and as a result, the year ended 2007 included special charges of approximately $17.2 million pretax ($14.8 million and $2.4 million was recorded in the cost of sales and operating expenses sections of the Consolidated Statements of Income, respectively) ($10.7 million after taxes) for costs associated with the quality control, product recall and fire damage issues at Heartland. Beginning in the third quarter, the year ended 2006 included special charges of $33.7 million pretax ($27.7 million and $6.1 million was recorded in the cost of sales and operating expense sections of the Consolidated Statements of Income, respectively) ($21.2 million after taxes) for these increased costs, particularly relating to the write-off of inventory totaling $18.9 million pretax, as well as $14.8 million pretax for the incremental costs associated with the quality control, product recall and fire damage issues at Heartland. The Company maintains product recall, property and casualty and business interruption insurance and the extent of insurance recovery for these expenses is currently being reviewed by its outside advisors. As of December 31, 2007, no receivables for insurance recoveries have been recorded by the Company. Further in order to replace the repackaging capacity of the Heartland facility, on February 27, 2007, Omnicare entered into an agreement for the Repackaging Services division of Cardinal Health to
146
serve as the contract repackager for pharmaceutical volumes previously repackaged at the Heartland facility. The agreement initially extends through October 2010.
Although the Company cannot know with certainty the ultimate outcome of the matters described in the preceding paragraphs, there can be no assurance that the resolution of these matters will not have a material adverse impact on the Company’s consolidated results of operations, financial position or cash flows or, in the case of the investigations regarding certain drug substitutions and the matters relating to the Heartland facility, that these matters will be resolved in an amount that would not exceed the amount of the pretax charges recorded by the Company.
As part of its ongoing operations, the Company is subject to various inspections, audits, inquiries and similar actions by third parties, as well as governmental/regulatory authorities responsible for enforcing the laws and regulations to which the Company is subject. The Company is also involved in various legal actions arising in the normal course of business. These matters are continuously being evaluated and, in many cases, are being contested by the Company and the outcome is not predictable. Consequently, an estimate of the possible loss or range of loss associated with certain actions cannot be made. Although occasional adverse outcomes (or settlements) may occur and could possibly have an adverse effect on the results of operations and cash flows in any one accounting period, outside of the matters described in the preceding paragraphs, the Company is not aware of any such matters whereby it is presently believed that the final disposition will have a material adverse affect on the Company’s overall consolidated financial position.
The Company indemnifies the directors and officers of the Company for certain liabilities that might arise from the performance of their job responsibilities for the Company. Additionally, in the normal course of business, the Company enters into contracts that contain a variety of representations and warranties and which provide general indemnifications. The Company’s maximum exposure under these arrangements is unknown, as this involves the resolution of claims made, or future claims that may be made, against the Company, its directors and/or officers, the outcomes of which is unknown and not currently predictable. Accordingly, no liabilities have been recorded for the indemnifications.
Note 16 – Segment Information
Based on the “management approach” as defined by SFAS No. 131, “Disclosures about Segments of an Enterprise and Related Information,” Omnicare has two operating segments. The Company’s larger segment is Pharmacy Services. Pharmacy Services primarily provides distribution of pharmaceuticals, related pharmacy consulting and other ancillary services, data management services, medical supplies, and distribution and product support services for specialty pharmaceuticals. The Company’s customers are primarily skilled nursing, assisted living, hospice and other providers of healthcare services in 47 states in the United States of America (“USA”), the District of Columbia and in Canada at December 31, 2007. The Company’s other segment is CRO Services, which provides comprehensive product development and research services to client companies in pharmaceutical, biotechnology, medical devices and diagnostics industries in 30 countries around the world at December 31, 2007,
147
including the USA. Certain reclassifications of prior-year depreciation and amortization amounts have been made to conform with the current-year presentation.
The table below presents information about the segments as of and for the years ended December 31, 2007, 2006 and 2005, and should be read in connection with the paragraphs that follow (in thousands):
| | | | | | | | | | | | | |
| | For the years ended December 31, | |
| |
| |
2007: | | Pharmacy
Services | | CRO
Services | | Corporate
and
Consolidating | | Consolidated
Totals | |
| |
| |
| |
| |
| |
Net sales | | $ | 6,024,871 | | $ | 195,139 | | $ | — | | $ | 6,220,010 | |
Depreciation and amortization expense | | | (83,818 | ) | | (1,867 | ) | | (27,718 | ) | | (113,403 | ) |
Restructuring and other related charges | | | (20,065 | ) | | (2,767 | ) | | (5,051 | ) | | (27,883 | ) |
Litigation and other related professional fees | | | (42,516 | ) | | — | | | — | | | (42,516 | ) |
Heartland matters | | | (17,193 | ) | | — | | | — | | | (17,193 | ) |
Operating income (expense) | | | 439,148 | | | 10,378 | | | (107,583 | ) | | 341,943 | |
Total assets | | | 6,971,072 | | | 188,116 | | | 434,591 | | | 7,593,779 | |
Capital expenditures | | | (41,370 | ) | | (1,819 | ) | | (2,081 | ) | | (45,270 | ) |
| | | | | | | | | | | | | |
2006: | | | | | | | | | | | | | |
|
|
|
|
|
|
|
|
|
|
|
|
| |
Net sales | | $ | 6,321,141 | | $ | 171,852 | | $ | — | | $ | 6,492,993 | |
Depreciation and amortization expense | | | (86,559 | ) | | (1,956 | ) | | (31,150 | ) | | (119,665 | ) |
Restructuring and other related charges | | | (22,565 | ) | | (2,374 | ) | | (4,623 | ) | | (29,562 | ) |
Litigation and other related professional fees | | | (114,778 | ) | | — | | | — | | | (114,778 | ) |
Heartland matters | | | (33,726 | ) | | — | | | — | | | (33,726 | ) |
Operating income (expense) | | | 560,991 | | | 5,340 | | | (86,005 | ) | | 480,326 | |
Total assets | | | 6,962,764 | | | 168,853 | | | 266,854 | | | 7,398,471 | |
Capital expenditures | | | (28,810 | ) | | (763 | ) | | (1,678 | ) | | (31,251 | ) |
| | | | | | | | | | | | | |
2005: | | | | | | | | | | | | | |
|
|
|
|
|
|
|
|
|
|
|
|
| |
Net sales | | $ | 5,110,414 | | $ | 182,368 | | $ | — | | $ | 5,292,782 | |
Depreciation and amortization expense | | | (61,497 | ) | | (1,989 | ) | | (16,836 | ) | | (80,322 | ) |
Restructuring and other related charges | | | (5,245 | ) | | (10,790 | ) | | (2,744 | ) | | (18,779 | ) |
Operating income (expense) | | | 583,954 | | | 1,561 | | | (63,886 | ) | | 521,629 | |
Total assets | | | 6,591,859 | | | 147,164 | | | 418,382 | | | 7,157,405 | |
Capital expenditures | | | (21,764 | ) | | (1,027 | ) | | (1,448 | ) | | (24,239 | ) |
148
The following summarizes net sales and long-lived assets, by geographic area, as of and for the years ended December 31, 2007, 2006 and 2005 (in thousands):
| | | | | | | | | | | | | | | | | | | |
| | Net Sales | | Long-Lived Assets | |
| |
| |
| |
| | 2007 | | 2006 | | 2005 | | 2007 | | 2006 | | 2005 | |
| |
| |
| |
| |
| |
| |
| |
United States | | $ | 6,154,377 | | $ | 6,428,533 | | $ | 5,205,760 | | $ | 195,859 | | $ | 196,866 | | $ | 227,931 | |
Foreign | | | 65,633 | | | 64,460 | | | 87,022 | | | 3,590 | | | 3,559 | | | 3,803 | |
| |
|
| |
|
| |
|
| |
|
| |
|
| |
|
| |
Total | | $ | 6,220,010 | | $ | 6,492,993 | | $ | 5,292,782 | | $ | 199,449 | | $ | 200,425 | | $ | 231,734 | |
| |
|
| |
|
| |
|
| |
|
| |
|
| |
|
| |
The determination of foreign sales is based on the country in which the sales originate. No individual foreign country’s sales were material to the consolidated sales of Omnicare. In accordance with EITF No. 01-14, Omnicare included in its net sales, during the years ended December 31, 2007, 2006 and 2005, reimbursable out-of-pockets totaling $20.4 million, $17.2 million and $18.3 million, respectively, for the United States geographic area; $11.3 million, $8.4 million and $10.2 million, respectively, for the foreign geographic area; and $31.7 million, $25.6 million and $28.5 million, respectively, for the total net sales.
149
Note 17 – Summary of Quarterly Results (Unaudited)
The following table presents the Company’s quarterly financial information for 2007 and 2006 (in thousands, except per share data):
| | | | | | | | | | | | | | | | |
| | First
Quarter | | Second
Quarter | | Third
Quarter | | Fourth
Quarter | | Full
Year | |
| |
| |
| |
| |
| |
| |
2007 | | | | | | | | | | | | | | | | |
| | | | | | | | | | | | | | | | |
Net sales(a) | | $ | 1,577,065 | | $ | 1,549,157 | | $ | 1,536,989 | | $ | 1,556,799 | | $ | 6,220,010 | |
Cost of sales(a) | | | 1,190,993 | | | 1,150,109 | | | 1,151,327 | | | 1,174,192 | | | 4,666,621 | |
Heartland matters | | | 4,296 | | | 4,015 | | | 3,320 | | | 3,157 | | | 14,788 | |
| |
|
| |
|
| |
|
| |
|
| |
|
| |
Gross profit | | | 381,776 | | | 395,033 | | | 382,342 | | | 379,450 | | | 1,538,601 | |
Selling, general and administrative expenses | | | 225,609 | | | 228,008 | | | 229,683 | | | 226,994 | | | 910,294 | |
Provision for doubtful accounts | | | 28,904 | | | 29,899 | | | 30,362 | | | 124,395 | | | 213,560 | |
| | | | | | | | | | | | | | | | |
Restructuring and other related charges | | | 9,174 | | | 6,250 | | | 4,957 | | | 7,502 | | | 27,883 | |
| | | | | | | | | | | | | | | | |
Litigation and other related professional fees | | | 6,907 | | | 9,010 | | | 9,192 | | | 17,407 | | | 42,516 | |
Heartland matters | | | 1,496 | | | 896 | | | 328 | | | (315 | ) | | 2,405 | |
| |
|
| |
|
| |
|
| |
|
| |
|
| |
Operating income | | | 109,686 | | | 120,970 | | | 107,820 | | | 3,467 | | | 341,943 | |
Investment income | | | 1,921 | | | 2,102 | | | 2,369 | | | 2,323 | | | 8,715 | |
Interest expense | | | (42,048 | ) | | (41,718 | ) | | (40,925 | ) | | (39,469 | ) | | (164,160 | ) |
| |
|
| |
|
| |
|
| |
|
| |
|
| |
Income (loss) before income taxes | | | 69,559 | | | 81,354 | | | 69,264 | | | (33,679 | ) | | 186,498 | |
Income tax provision | | | 26,572 | | | 32,113 | | | 26,667 | | | (12,910 | ) | | 72,442 | |
| |
|
| |
|
| |
|
| |
|
| |
|
| |
Net income (loss) | | $ | 42,987 | | $ | 49,241 | | $ | 42,597 | | $ | (20,769 | ) | $ | 114,056 | |
| |
|
| |
|
| |
|
| |
|
| |
|
| |
Earnings (loss) per share:(b) | | | | | | | | | | | | | | | | |
Basic | | $ | 0.36 | | $ | 0.41 | | $ | 0.36 | | $ | (0.17 | ) | $ | 0.96 | |
| |
|
| |
|
| |
|
| |
|
| |
|
| |
Diluted | | $ | 0.35 | | $ | 0.41 | | $ | 0.35 | | $ | (0.17 | ) | $ | 0.94 | |
| |
|
| |
|
| |
|
| |
|
| |
|
| |
Dividends per common share | | $ | 0.0225 | | $ | 0.0225 | | $ | 0.0225 | | $ | 0.0225 | | $ | 0.09 | |
| |
|
| |
|
| |
|
| |
|
| |
|
| |
Weighted average number of common shares outstanding: | | | | | | | | | | | | | | | | |
Basic | | | 119,077 | | | 119,389 | | | 119,466 | | | 119,585 | | | 119,380 | |
| |
|
| |
|
| |
|
| |
|
| |
|
| |
Diluted | | | 121,378 | | | 121,371 | | | 121,229 | | | 119,585 | | | 121,258 | |
| |
|
| |
|
| |
|
| |
|
| |
|
| |
| | | | | | | | | | | | | | | | |
Comprehensive income (loss) | | $ | 45,375 | | $ | 49,831 | | $ | 47,334 | | $ | (26,340 | ) | $ | 116,200 | |
| |
|
| |
|
| |
|
| |
|
| |
|
| |
| | | | | | | | | | | | | | | | |
150
Note 17 – Summary of Quarterly Results (Unaudited)-Continued
| | | | | | | | | | | | | | | | |
| | First
Quarter | | Second
Quarter | | Third
Quarter | | Fourth
Quarter | | Full
Year | |
| |
| |
| |
| |
| |
| |
2006 | | | | | | | | | | | | | | | | |
| | | | | | | | | | | | | | | | |
Net sales(a) | | $ | 1,658,598 | | $ | 1,641,110 | | $ | 1,593,866 | | $ | 1,599,419 | | $ | 6,492,993 | |
Cost of sales(a) | | | 1,242,083 | | | 1,240,819 | | | 1,193,234 | | | 1,188,830 | | | 4,864,966 | |
Heartland matters | | | — | | | — | | | 22,769 | | | 4,894 | | | 27,663 | |
| |
|
| |
|
| |
|
| |
|
| |
|
| |
Gross profit | | | 416,515 | | | 400,291 | | | 377,863 | | | 405,695 | | | 1,600,364 | |
| | | | | | | | | | | | | | | | |
Selling, general and administrative expenses | | | 230,248 | | | 221,685 | | | 216,760 | | | 218,733 | | | 887,426 | |
Provision for doubtful accounts | | | 17,094 | | | 18,066 | | | 19,339 | | | 27,710 | | | 82,209 | |
| | | | | | | | | | | | | | | | |
Restructuring and other related charges | | | 7,713 | | | 11,889 | | | 5,119 | | | 4,841 | | | 29,562 | |
| | | | | | | | | | | | | | | | |
Litigation and other related professional fees | | | 34,100 | | | 64,482 | | | 9,886 | | | 6,310 | | | 114,778 | |
Heartland matters | | | — | | | — | | | 2,216 | | | 3,847 | | | 6,063 | |
| |
|
| |
|
| |
|
| |
|
| |
|
| |
Operating income | | | 127,360 | | | 84,169 | | | 124,543 | | | 144,254 | | | 480,326 | |
Investment income | | | 1,799 | | | 3,049 | | | 3,407 | | | 2,198 | | | 10,453 | |
Interest expense | | | (42,412 | ) | | (43,069 | ) | | (43,368 | ) | | (41,434 | ) | | (170,283 | ) |
| |
|
| |
|
| |
|
| |
|
| |
|
| |
Income before income taxes | | | 86,747 | | | 44,149 | | | 84,582 | | | 105,018 | | | 320,496 | |
Income tax provision | | | 33,516 | | | 35,770 | | | 32,352 | | | 35,286 | | | 136,924 | |
| |
|
| |
|
| |
|
| |
|
| |
|
| |
Net income | | $ | 53,231 | | $ | 8,379 | | $ | 52,230 | | $ | 69,732 | | $ | 183,572 | |
| |
|
| |
|
| |
|
| |
|
| |
|
| |
Earnings per share:(b) | | | | | | | | | | | | | | | | |
Basic | | $ | 0.45 | | $ | 0.07 | | $ | 0.44 | | $ | 0.59 | | $ | 1.55 | |
| |
|
| |
|
| |
|
| |
|
| |
|
| |
Diluted | | $ | 0.43 | | $ | 0.07 | | $ | 0.43 | | $ | 0.58 | | $ | 1.50 | |
| |
|
| |
|
| |
|
| |
|
| |
|
| |
Dividends per common share | | $ | 0.0225 | | $ | 0.0225 | | $ | 0.0225 | | $ | 0.0225 | | $ | 0.09 | |
| |
|
| |
|
| |
|
| |
|
| |
|
| |
Weighted average number of common shares outstanding: | | | | | | | | | | | | | | | | |
Basic | | | 117,911 | | | 118,544 | | | 118,667 | | | 118,784 | | | 118,480 | |
| |
|
| |
|
| |
|
| |
|
| |
|
| |
Diluted | | | 123,595 | | | 123,016 | | | 122,114 | | | 121,378 | | | 122,536 | |
| |
|
| |
|
| |
|
| |
|
| |
|
| |
Comprehensive income | | $ | 50,879 | | $ | 8,597 | | $ | 53,839 | | $ | 24,764 | | $ | 138,079 | |
| |
|
| |
|
| |
|
| |
|
| |
|
| |
Notes to Summary of Quarterly Results:
| |
(a) | In accordance with EITF No. 01-14, Omnicare has recorded reimbursements received for “out-of-pocket” expenses on a grossed-up basis in total net sales and total direct costs for both the 2007 and 2006 periods. EITF No. 01-14 relates solely to the Company’s CRO Services business. |
| |
(b) | Earnings per share is calculated independently for each separately reported quarterly and full year period. Accordingly, the sum of the separately reported quarters may not necessarily be equal to the per share amount for the corresponding full year period, as independently calculated. Further, the fourth quarter of 2007 loss per share has been computed using basic weighted average shares outstanding only, as the impact of the Company’s potentially dilutive instruments was anti-dilutive during this period, due to the net loss incurred. |
151
Note 18 – Guarantor Subsidiaries
The Company’s 6.125% Senior Notes due 2013, the 6.75% Senior Notes due 2013 and the 6.875% Senior Notes due 2015 are fully and unconditionally guaranteed on an unsecured, joint and several basis by certain wholly-owned subsidiaries of the Company (the “Guarantor Subsidiaries”). The following condensed consolidating financial data illustrates the composition of Omnicare, Inc. (“Parent”), the Guarantor Subsidiaries and the Non-Guarantor Subsidiaries as of December 31, 2007 and 2006 for the balance sheets, as well as the statements of income and the statements of cash flows for each of the three years in the period ended December 31, 2007. Separate complete financial statements of the respective Guarantor Subsidiaries would not provide information that would be necessary for evaluating the sufficiency of the Guarantor Subsidiaries, and thus are not presented. No consolidating/eliminating adjustments column is presented for the condensed consolidating statements of cash flows since there were no significant consolidating/eliminating adjustment amounts during the periods presented.
152
Note 18 – Guarantor Subsidiaries – Continued
Summary Consolidating Statements of Income
| | | | | | | | | | | | | | | | |
(in thousands) | | For the years ended December 31, | |
| |
| |
2007: | | Parent | | Guarantor
Subsidiaries | | Non-Guarantor
Subsidiaries | | Consolidating/
Eliminating
Adjustments | | Omnicare, Inc.
and
Subsidiaries | |
| |
| |
| |
| |
| |
| |
|
Net sales | | $ | — | | $ | 5,990,685 | | $ | 229,325 | | $ | — | | $ | 6,220,010 | |
Cost of sales | | | — | | | 4,493,146 | | | 173,475 | | | — | | | 4,666,621 | |
Heartland matters | | | — | | | 14,788 | | | — | | | — | | | 14,788 | |
| |
|
| |
|
| |
|
| |
|
| |
|
| |
Gross profit | | | — | | | 1,482,751 | | | 55,850 | | | — | | | 1,538,601 | |
Selling, general and administrative expenses | | | 8,453 | | | 859,689 | | | 42,152 | | | — | | | 910,294 | |
Provision for doubtful accounts | | | — | | | 210,787 | | | 2,773 | | | — | | | 213,560 | |
Restructuring and other related charges | | | — | | | 26,075 | | | 1,808 | | | — | | | 27,883 | |
Litigation and other related professional fees | | | — | | | 42,516 | | | — | | | — | | | 42,516 | |
Heartland matters | | | — | | | 2,405 | | | — | | | — | | | 2,405 | |
| |
|
| |
|
| |
|
| |
|
| |
|
| |
Operating income (loss) | | | (8,453 | ) | | 341,279 | | | 9,117 | | | — | | | 341,943 | |
Investment income | | | 3,355 | | | 5,360 | | | — | | | — | | | 8,715 | |
Interest expense | | | (159,506 | ) | | (1,173 | ) | | (3,481 | ) | | — | | | (164,160 | ) |
| |
|
| |
|
| |
|
| |
|
| |
|
| |
Income (loss) before income taxes | | | (164,604 | ) | | 345,466 | | | 5,636 | | | — | | | 186,498 | |
Income tax (benefit) expense | | | (62,467 | ) | | 132,770 | | | 2,139 | | | — | | | 72,442 | |
Equity in net income of subsidiaries | | | 216,193 | | | — | | | — | | | (216,193 | ) | | — | |
| |
|
| |
|
| |
|
| |
|
| |
|
| |
Net income | | $ | 114,056 | | $ | 212,696 | | $ | 3,497 | | $ | (216,193 | ) | $ | 114,056 | |
| |
|
| |
|
| |
|
| |
|
| |
|
| |
| | | | | | | | | | | | | | | | |
2006: | | | | | | | | | | | | | | | | |
|
|
|
|
|
|
|
|
|
|
|
|
|
|
|
| |
|
Net sales | | $ | — | | $ | 6,194,318 | | $ | 298,675 | | $ | — | | $ | 6,492,993 | |
Cost of sales | | | — | | | 4,639,740 | | | 225,226 | | | — | | | 4,864,966 | |
Heartland matters | | | — | | | 27,663 | | | — | | | — | | | 27,663 | |
| |
|
| |
|
| |
|
| |
|
| |
|
| |
Gross profit | | | — | | | 1,526,915 | | | 73,449 | | | — | | | 1,600,364 | |
Selling, general and administrative expenses | | | 8,250 | | | 832,493 | | | 46,683 | | | — | | | 887,426 | |
Provision for doubtful accounts | | | — | | | 81,180 | | | 1,029 | | | — | | | 82,209 | |
Restructuring and other related charges | | | — | | | 28,755 | | | 807 | | | — | | | 29,562 | |
Litigation and other related professional fees | | | — | | | 114,778 | | | — | | | — | | | 114,778 | |
Heartland matters | | | — | | | 6,063 | | | — | | | — | | | 6,063 | |
| |
|
| |
|
| |
|
| |
|
| |
|
| |
Operating income (loss) | | | (8,250 | ) | | 463,646 | | | 24,930 | | | — | | | 480,326 | |
Investment income | | | 6,625 | | | 3,828 | | | — | | | — | | | 10,453 | |
Interest expense | | | (165,819 | ) | | (1,924 | ) | | (2,540 | ) | | — | | | (170,283 | ) |
| |
|
| |
|
| |
|
| |
|
| |
|
| |
Income (loss) before income taxes | | | (167,444 | ) | | 465,550 | | | 22,390 | | | — | | | 320,496 | |
Income tax (benefit) expense | | | (60,816 | ) | | 189,608 | | | 8,132 | | | — | | | 136,924 | |
Equity in net income of subsidiaries | | | 290,200 | | | — | | | — | | | (290,200 | ) | | — | |
| |
|
| |
|
| |
|
| |
|
| |
|
| |
Net income | | $ | 183,572 | | $ | 275,942 | | $ | 14,258 | | $ | (290,200 | ) | $ | 183,572 | |
| |
|
| |
|
| |
|
| |
|
| |
|
| |
| | | | | | | | | | | | | | | | |
2005: | | | | | | | | | | | | | | | | |
|
|
|
|
|
|
|
|
|
|
|
|
|
|
|
| |
|
Net sales | | $ | — | | $ | 5,045,135 | | $ | 247,647 | | $ | — | | $ | 5,292,782 | |
Cost of sales | | | — | | | 3,813,998 | | | 179,719 | | | — | | | 3,993,717 | |
| |
|
| |
|
| |
|
| |
|
| |
|
| |
Gross profit | | | — | | | 1,231,137 | | | 67,928 | | | — | | | 1,299,065 | |
Selling, general and administrative expenses | | | 9,631 | | | 657,335 | | | 33,667 | | | — | | | 700,633 | |
Provision for doubtful accounts | | | — | | | 57,010 | | | 1,014 | | | — | | | 58,024 | |
Restructuring and other related charges | | | — | | | 18,023 | | | 756 | | | — | | | 18,779 | |
| |
|
| |
|
| |
|
| |
|
| |
|
| |
Operating income (loss) | | | (9,631 | ) | | 498,769 | | | 32,491 | | | — | | | 521,629 | |
Investment income | | | 1,857 | | | 3,930 | | | — | | | — | | | 5,787 | |
Interest expense | | | (158,935 | ) | | (4,866 | ) | | (1,809 | ) | | — | | | (165,610 | ) |
| |
|
| |
|
| |
|
| |
|
| |
|
| |
Income (loss) before income taxes | | | (166,709 | ) | | 497,833 | | | 30,682 | | | — | | | 361,806 | |
Income tax (benefit) expense | | | (62,349 | ) | | 186,189 | | | 11,475 | | | — | | | 135,315 | |
Equity in net income of subsidiaries | | | 330,851 | | | — | | | — | | | (330,851 | ) | | — | |
| |
|
| |
|
| |
|
| |
|
| |
|
| |
Net income | | $ | 226,491 | | $ | 311,644 | | $ | 19,207 | | $ | (330,851 | ) | $ | 226,491 | |
| |
|
| |
|
| |
|
| |
|
| |
|
| |
153
Note 18 – Guarantor Subsidiaries – Continued
Condensed Consolidating Balance Sheets
(in thousands)
| | | | | | | | | | | | | | | | |
As of December 31, 2007: | | Parent | | Guarantor
Subsidiaries | | Non-Guarantor
Subsidiaries | | Consolidating/
Eliminating
Adjustments | | Omnicare, Inc.
and Subsidiaries | |
| |
| |
| |
| |
| |
| |
| | | | | | | | | | | |
ASSETS | | | | | | | | | | | |
Cash and cash equivalents | | $ | 171,779 | | $ | 70,088 | | $ | 32,581 | | $ | — | | $ | 274,448 | |
Restricted cash | | | — | | | 3,155 | | | — | | | — | | | 3,155 | |
Accounts receivable, net (including intercompany) | | | — | | | 1,348,504 | | | 30,386 | | | (2,602 | ) | | 1,376,288 | |
Unbilled receivables, CRO | | | — | | | 24,855 | | | — | | | — | | | 24,855 | |
Inventories | | | — | | | 436,639 | | | 11,544 | | | — | | | 448,183 | |
Deferred income tax benefits (liabilities),
net-current | | | 878 | | | 125,474 | | | (113 | ) | | — | | | 126,239 | |
Other current assets | | | 1,336 | | | 196,474 | | | 5,172 | | | — | | | 202,982 | |
| |
|
| |
|
| |
|
| |
|
| |
|
| |
Total current assets | | | 173,993 | | | 2,205,189 | | | 79,570 | | | (2,602 | ) | | 2,456,150 | |
| |
|
| |
|
| |
|
| |
|
| |
|
| |
Properties and equipment, net | | | — | | | 188,340 | | | 11,109 | | | — | | | 199,449 | |
Goodwill | | | — | | | 4,238,547 | | | 103,622 | | | — | | | 4,342,169 | |
Identifiable intangible assets, net | | | — | | | 318,255 | | | 5,382 | | | — | | | 323,637 | |
Other noncurrent assets | | | 52,135 | | | 219,906 | | | 333 | | | — | | | 272,374 | |
Investment in subsidiaries | | | 5,939,714 | | | — | | | — | | | (5,939,714 | ) | | — | |
| |
|
| |
|
| |
|
| |
|
| |
|
| |
Total assets | | $ | 6,165,842 | | $ | 7,170,237 | | $ | 200,016 | | $ | (5,942,316 | ) | $ | 7,593,779 | |
| |
|
| |
|
| |
|
| |
|
| |
|
| |
| | | | | | | | | | | | | | | | |
LIABILITIES AND STOCKHOLDERS’ EQUITY | | | | | | | | | | | | | | | | |
Current liabilities (including intercompany) | | $ | 33,105 | | $ | 600,095 | | $ | 21,562 | | $ | (2,602 | ) | $ | 652,160 | |
Long-term debt, notes and convertible debentures | | | 2,764,510 | | | 4,505 | | | 51,736 | | | — | | | 2,820,751 | |
Deferred income tax liabilities, net-noncurrent | | | 68,534 | | | 372,110 | | | 9,145 | | | — | | | 449,789 | |
Other noncurrent liabilities | | | 7,990 | | | 370,352 | | | 1,034 | | | — | | | 379,376 | |
Stockholders’ equity | | | 3,291,703 | | | 5,823,175 | | | 116,539 | | | (5,939,714 | ) | | 3,291,703 | |
| |
|
| |
|
| |
|
| |
|
| |
|
| |
Total liabilities and stockholders’ equity | | $ | 6,165,842 | | $ | 7,170,237 | | $ | 200,016 | | $ | (5,942,316 | ) | $ | 7,593,779 | |
| |
|
| |
|
| |
|
| |
|
| |
|
| |
154
Note 18 – Guarantor Subsidiaries – Continued
Condensed Consolidating Balance Sheets (Continued)
(in thousands)
| | | | | | | | | | | | | | | | |
As of December 31, 2006: | | Parent | | Guarantor
Subsidiaries | | Non-Guarantor
Subsidiaries | | Consolidating/
Eliminating
Adjustments | | Omnicare, Inc.
and Subsidiaries | |
| |
| |
| |
| |
| |
| |
| | | | | | | | | | | |
ASSETS | | | | | | | | | | | | | | | | |
Cash and cash equivalents | | $ | 43,494 | | $ | 74,262 | | $ | 20,278 | | $ | — | | $ | 138,034 | |
Restricted cash | | | — | | | 3,777 | | | — | | | — | | | 3,777 | |
Accounts receivable, net (including intercompany) | | | — | | | 1,481,994 | | | 45,370 | | | (5,098 | ) | | 1,522,266 | |
Unbilled receivables, CRO | | | — | | | 21,949 | | | — | | | — | | | 21,949 | |
Inventories | | | — | | | 435,669 | | | 14,002 | | | — | | | 449,671 | |
Deferred income tax benefits (liabilities),
net-current | | | (1,095 | ) | | 95,255 | | | 71 | | | — | | | 94,231 | |
Other current assets | | | 2,516 | | | 188,954 | | | 3,430 | | | — | | | 194,900 | |
| |
|
| |
|
| |
|
| |
|
| |
|
| |
Total current assets | | | 44,915 | | | 2,301,860 | | | 83,151 | | | (5,098 | ) | | 2,424,828 | |
| |
|
| |
|
| |
|
| |
|
| |
|
| |
Properties and equipment, net | | | — | | | 187,594 | | | 12,831 | | | — | | | 200,425 | |
Goodwill | | | — | | | 4,129,247 | | | 95,764 | | | — | | | 4,225,011 | |
Identifiable intangible assets, net | | | — | | | 314,516 | | | 5,072 | | | — | | | 319,588 | |
Other noncurrent assets | | | 60,045 | | | 168,166 | | | 408 | | | — | | | 228,619 | |
Investment in subsidiaries | | | 6,062,799 | | | — | | | — | | | (6,062,799 | ) | | — | |
| |
|
| |
|
| |
|
| |
|
| |
|
| |
Total assets | | $ | 6,167,759 | | $ | 7,101,383 | | $ | 197,226 | | $ | (6,067,897 | ) | $ | 7,398,471 | |
| |
|
| |
|
| |
|
| |
|
| |
|
| |
| | | | | | | | | | | | | | | | |
LIABILITIES AND STOCKHOLDERS’ EQUITY | | | | | | | | | | | | | | | | |
Current liabilities (including intercompany) | | $ | 31,123 | | $ | 510,471 | | $ | 15,905 | | $ | (5,098 | ) | $ | 552,401 | |
Long-term debt, notes and convertible debentures | | | 2,903,453 | | | 5,872 | | | 45,795 | | | — | | | 2,955,120 | |
Deferred income tax liabilities, net-noncurrent | | | 50,685 | | | 326,766 | | | 7,538 | | | — | | | 384,989 | |
Other noncurrent liabilities | | | 19,047 | | | 322,161 | | | 1,302 | | | — | | | 342,510 | |
Stockholders’ equity | | | 3,163,451 | | | 5,936,113 | | | 126,686 | | | (6,062,799 | ) | | 3,163,451 | |
| |
|
| |
|
| |
|
| |
|
| |
|
| |
Total liabilities and stockholders’ equity | | $ | 6,167,759 | | $ | 7,101,383 | | $ | 197,226 | | $ | (6,067,897 | ) | $ | 7,398,471 | |
| |
|
| |
|
| |
|
| |
|
| |
|
| |
155
Note 18 – Guarantor Subsidiaries – Continued
Condensed Consolidating Statements of Cash Flows
| | | | | | | | | | | | | |
(in thousands) | | For the year ended December 31, | |
| |
| |
2007 | | Parent | | Guarantor
Subsidiaries | | Non-Guarantor
Subsidiaries | | Omnicare, Inc.
and
Subsidiaries | |
| |
| |
| |
| |
| |
|
Cash flows from operating activities: | | | | | | | | | | | | | |
Net cash flows from operating activities | | $ | (91,730 | ) | $ | 587,462 | | $ | 9,797 | | $ | 505,529 | |
| |
|
| |
|
| |
|
| |
|
| |
| | | | | | | | | | | | | |
Cash flows from investing activities: | | | | | | | | | | | | | |
Acquisition of businesses, net of cash received | | | — | | | (151,135 | ) | | — | | | (151,135 | ) |
Capital expenditures | | | — | | | (44,864 | ) | | (406 | ) | | (45,270 | ) |
Transfer of cash to trusts for employee health and severance costs, net of payments out of the trust | | | — | | | 291 | | | — | | | 291 | |
Other | | | — | | | (774 | ) | | — | | | (774 | ) |
| |
|
| |
|
| |
|
| |
|
| |
Net cash flows used by investing activities | | | — | | | (196,482 | ) | | (406 | ) | | (196,888 | ) |
| |
|
| |
|
| |
|
| |
|
| |
| | | | | | | | | | | | | |
Cash flows from financing activities: | | | | | | | | | | | | | |
Borrowings on line of credit facilities and term A loan | | | 95,000 | | | — | | | — | | | 95,000 | |
Payments on line of credit facilities and term A loan | | | (245,000 | ) | | — | | | — | | | (245,000 | ) |
Payments on long-term borrowings and obligations | | | (5,734 | ) | | — | | | — | | | (5,734 | ) |
Change in cash overdraft balance | | | 3,511 | | | (7,091 | ) | | — | | | (3,580 | ) |
(Payments) for stock awards and exercise of stock options, net of stock tendered in payment | | | (8,966 | ) | | — | | | — | | | (8,966 | ) |
Excess tax benefits from stock-based compensation | | | 4,112 | | | — | | | — | | | 4,112 | |
Dividends paid | | | (10,971 | ) | | — | | | — | | | (10,971 | ) |
Other | | | 388,063 | | | (388,063 | ) | | — | | | — | |
| |
|
| |
|
| |
|
| |
|
| |
Net cash flows from financing activities | | | 220,015 | | | (395,154 | ) | | — | | | (175,139 | ) |
| |
|
| |
|
| |
|
| |
|
| |
| | | | | | | | | | | | | |
Effect of exchange rate changes on cash | | | — | | | — | | | 2,912 | | | 2,912 | |
| |
|
| |
|
| |
|
| |
|
| |
| | | | | | | | | | | | | |
Net increase (decrease) in cash and cash equivalents | | | 128,285 | | | (4,174 | ) | | 12,303 | | | 136,414 | |
Cash and cash equivalents at beginning of year | | | 43,494 | | | 74,262 | | | 20,278 | | | 138,034 | |
| |
|
| |
|
| |
|
| |
|
| |
Cash and cash equivalents at end of year | | $ | 171,779 | | $ | 70,088 | | $ | 32,581 | | $ | 274,448 | |
| |
|
| |
|
| |
|
| |
|
| |
156
Note 18 – Guarantor Subsidiaries – Continued
| | | | | | | | | | | | | |
(in thousands) | | For the year ended December 31, | |
| |
| |
2006 | | Parent | | Guarantor
Subsidiaries | | Non-Guarantor
Subsidiaries | | Omnicare, Inc.
and
Subsidiaries | |
| |
| |
| |
| |
| |
|
Cash flows from operating activities: | | | | | | | | | | | | | |
Net cash flows from operating activities | | $ | (82,220 | ) | $ | 205,435 | | $ | (14,695 | ) | $ | 108,520 | |
| |
|
| |
|
| |
|
| |
|
| |
| | | | | | | | | | | | | |
Cash flows from investing activities: | | | | | | | | | | | | | |
Acquisition of businesses, net of cash received | | | — | | | (93,540 | ) | | (806 | ) | | (94,346 | ) |
Capital expenditures | | | — | | | (30,733 | ) | | (518 | ) | | (31,251 | ) |
Transfer of cash to trusts for employee health and severance costs, net of payments out of the trust | | | — | | | (1,321 | ) | | — | | | (1,321 | ) |
Other | | | — | | | 46 | | | — | | | 46 | |
| |
|
| |
|
| |
|
| |
|
| |
Net cash flows used by investing activities | | | — | | | (125,548 | ) | | (1,324 | ) | | (126,872 | ) |
| |
|
| |
|
| |
|
| |
|
| |
| | | | | | | | | | | | | |
Cash flows from financing activities: | | | | | | | | | | | | | |
Borrowings on line of credit facilities and term A loan | | | 158,000 | | | — | | | — | | | 158,000 | |
Payments on line of credit facilities and term A loan | | | (258,000 | ) | | — | | | — | | | (258,000 | ) |
Proceeds from long-term borrowings and obligations | | | 63 | | | — | | | — | | | 63 | |
Payments on long-term borrowings and obligations | | | (14,921 | ) | | — | | | — | | | (14,921 | ) |
Fees paid for financing arrangements | | | (3,482 | ) | | — | | | — | | | (3,482 | ) |
Change in cash overdraft balance | | | 5,101 | | | 7,163 | | | — | | | 12,264 | |
Proceeds from stock offering, net of issuance costs | | | 49,239 | | | — | | | — | | | 49,239 | |
(Payments) for stock awards and exercise of stock options and warrants, net of stock tendered in payment | | | (2,751 | ) | | — | | | — | | | (2,751 | ) |
Excess tax benefits from stock-based compensation | | | 10,411 | | | — | | | — | | | 10,411 | |
Dividends paid | | | (10,937 | ) | | — | | | — | | | (10,937 | ) |
Other | | | 49,764 | | | (51,787 | ) | | 2,023 | | | — | |
| |
|
| |
|
| |
|
| |
|
| |
Net cash flows from financing activities | | | (17,513 | ) | | (44,624 | ) | | 2,023 | | | (60,114 | ) |
| |
|
| |
|
| |
|
| |
|
| |
| | | | | | | | | | | | | |
Effect of exchange rate changes on cash | | | — | | | — | | | 1,079 | | | 1,079 | |
| |
|
| |
|
| |
|
| |
|
| |
| | | | | | | | | | | | | |
Net increase (decrease) in cash and cash equivalents | | | (99,733 | ) | | 35,263 | | | (12,917 | ) | | (77,387 | ) |
Cash and cash equivalents at beginning of year | | | 143,227 | | | 38,999 | | | 33,195 | | | 215,421 | |
| |
|
| |
|
| |
|
| |
|
| |
Cash and cash equivalents at end of year | | $ | 43,494 | | $ | 74,262 | | $ | 20,278 | | $ | 138,034 | |
| |
|
| |
|
| |
|
| |
|
| |
157
Note 18 – Guarantor Subsidiaries – Continued
Condensed Consolidating Statements of Cash Flows - Continued
| | | | | | | | | | | | | |
(in thousands) | | For the year ended December 31, | |
| |
| |
2005: | | Parent | | Guarantor
Subsidiaries | | Non-Guarantor
Subsidiaries | | Omnicare, Inc.
and
Subsidiaries | |
| |
| |
| |
| |
| |
|
Cash flows from operating activities: | | | | | | | | | | | | | |
Net cash flows from operating activities | | $ | (24,967 | ) | $ | 298,610 | | $ | (10,104 | ) | $ | 263,539 | |
| |
|
| |
|
| |
|
| |
|
| |
| | | | | | | | | | | | | |
Cash flows from investing activities: | | | | | | | | | | | | | |
Acquisition of businesses, net of cash received | | | — | | | (2,615,671 | ) | | (4,709 | ) | | (2,620,380 | ) |
Capital expenditures | | | — | | | (23,153 | ) | | (1,086 | ) | | (24,239 | ) |
Transfer of cash to trusts for employee health and severance costs, net of payments out of the trust | | | — | | | (1,523 | ) | | — | | | (1,523 | ) |
Other | | | — | | | 39 | | | — | | | 39 | |
| |
|
| |
|
| |
|
| |
|
| |
Net cash flows used by investing activities | | | — | | | (2,640,308 | ) | | (5,795 | ) | | (2,646,103 | ) |
| |
|
| |
|
| |
|
| |
|
| |
| | | | | | | | | | | | | |
Cash flows from financing activities: | | | | | | | | | | | | | |
Borrowings on line of credit facilities and term A loan | | | 3,560,000 | | | — | | | — | | | 3,560,000 | |
Payments on line of credit facilities and term A loan | | | (3,165,385 | ) | | — | | | — | | | (3,165,385 | ) |
Proceeds from long-term borrowings and obligations | | | 1,724,194 | | | — | | | 44,890 | | | 1,769,084 | |
Payments on long-term borrowings and obligations | | | (369,034 | ) | | — | | | — | | | (369,034 | ) |
Fees paid for financing arrangements | | | (51,743 | ) | | — | | | — | | | (51,743 | ) |
Change in cash overdraft balance | | | 2,228 | | | 2,771 | | | — | | | 4,999 | |
Proceeds from stock offering, net of issuance costs | | | 742,932 | | | — | | | — | | | 742,932 | |
Proceeds from stock awards and exercise of stock options and warrants, net of stock tendered in payment | | | 33,455 | | | — | | | — | | | 33,455 | |
Dividends paid | | | (9,549 | ) | | — | | | — | | | (9,549 | ) |
Other | | | (2,345,473 | ) | | 2,345,473 | | | — | | | — | |
| |
|
| |
|
| |
|
| |
|
| |
Net cash flows from financing activities | | | 121,625 | | | 2,348,244 | | | 44,890 | | | 2,514,759 | |
| |
|
| |
|
| |
|
| |
|
| |
| | | | | | | | | | | | | |
Effect of exchange rate changes on cash | | | — | | | — | | | (943 | ) | | (943 | ) |
| |
|
| |
|
| |
|
| |
|
| |
| | | | | | | | | | | | | |
Net increase in cash and cash equivalents | | | 96,658 | | | 6,546 | | | 28,048 | | | 131,252 | |
Cash and cash equivalents at beginning of year | | | 46,569 | | | 32,453 | | | 5,147 | | | 84,169 | |
| |
|
| |
|
| |
|
| |
|
| |
Cash and cash equivalents at end of year | | $ | 143,227 | | $ | 38,999 | | $ | 33,195 | | $ | 215,421 | |
| |
|
| |
|
| |
|
| |
|
| |
158
Note 18 – Guarantor Subsidiaries – Continued
The Company’s 3.25% Convertible Debentures due 2035 are fully and unconditionally guaranteed on an unsecured basis by Omnicare Purchasing Company, LP, a wholly-owned subsidiary of the Company (the “Guarantor Subsidiary”). The following condensed consolidating financial data illustrates the composition of Omnicare, Inc. (“Parent”), the Guarantor Subsidiary and the Non-Guarantor Subsidiaries as of December 31, 2007 and 2006 for the balance sheets, as well as the statements of income and the statements of cash flows for each of the three years in the period ended December 31, 2007. Separate complete financial statements of the respective Guarantor Subsidiary would not provide information that would be necessary for evaluating the sufficiency of the Guarantor Subsidiary, and thus are not presented. The Guarantor Subsidiary does not have any material net cash flows in the condensed consolidating statements of cash flows. No consolidating/eliminating adjustments column is presented for the condensed consolidating statements of cash flows since there were no significant consolidating/eliminating adjustment amounts during the periods presented.
159
Note 18 – Guarantor Subsidiaries – Continued
Summary Consolidating Statements of Income
| | | | | | | | | | | | | | | | |
(in thousands) | | For the years ended December 31, | |
| |
| |
2007: | | Parent | | Guarantor
Subsidiary | | Non-Guarantor
Subsidiaries | | Consolidating/
Eliminating
Adjustments | | Omnicare, Inc.
and
Subsidiaries | |
| |
| |
| |
| |
| |
| |
|
Net sales | | $ | — | | $ | — | | $ | 6,220,010 | | $ | — | | $ | 6,220,010 | |
Cost of sales | | | — | | | — | | | 4,666,621 | | | — | | | 4,666,621 | |
Heartland matters | | | — | | | — | | | 14,788 | | | — | | | 14,788 | |
| |
|
| |
|
| |
|
| |
|
| |
|
| |
Gross profit | | | — | | | — | | | 1,538,601 | | | — | | | 1,538,601 | |
Selling, general and administrative expenses | | | 8,453 | | | 1,093 | | | 900,748 | | | — | | | 910,294 | |
Provision for doubtful accounts | | | — | | | — | | | 213,560 | | | — | | | 213,560 | |
Restructuring and other related charges | | | — | | | — | | | 27,883 | | | — | | | 27,883 | |
Litigation and other related professional fees | | | — | | | — | | | 42,516 | | | — | | | 42,516 | |
Heartland matters | | | — | | | — | | | 2,405 | | | — | | | 2,405 | |
| |
|
| |
|
| |
|
| |
|
| |
|
| |
Operating income (loss) | | | (8,453 | ) | | (1,093 | ) | | 351,489 | | | — | | | 341,943 | |
Investment income | | | 3,355 | | | — | | | 5,360 | | | — | | | 8,715 | |
Interest expense | | | (159,506 | ) | | — | | | (4,654 | ) | | — | | | (164,160 | ) |
| |
|
| |
|
| |
|
| |
|
| |
|
| |
Income (loss) before income taxes | | | (164,604 | ) | | (1,093 | ) | | 352,195 | | | — | | | 186,498 | |
Income tax (benefit) expense | | | (62,467 | ) | | (415 | ) | | 135,324 | | | — | | | 72,442 | |
Equity in net income of subsidiaries | | | 216,193 | | | — | | | — | | | (216,193 | ) | | — | |
| |
|
| |
|
| |
|
| |
|
| |
|
| |
Net income (loss) | | $ | 114,056 | | $ | (678 | ) | $ | 216,871 | | $ | (216,193 | ) | $ | 114,056 | |
| |
|
| |
|
| |
|
| |
|
| |
|
| |
| | | | | | | | | | | | | | | | |
2006: | | | | | | | | | | | | | | | | |
| |
|
| |
|
| |
|
| |
|
| |
|
| |
|
Net sales | | $ | — | | $ | — | | $ | 6,492,993 | | $ | — | | $ | 6,492,993 | |
Cost of sales | | | — | | | — | | | 4,864,966 | | | — | | | 4,864,966 | |
Heartland matters | | | — | | | — | | | 27,663 | | | — | | | 27,663 | |
| |
|
| |
|
| |
|
| |
|
| |
|
| |
Gross profit | | | — | | | — | | | 1,600,364 | | | — | | | 1,600,364 | |
Selling, general and administrative expenses | | | 8,250 | | | 1,020 | | | 878,156 | | | — | | | 887,426 | |
Provision for doubtful accounts | | | — | | | — | | | 82,209 | | | — | | | 82,209 | |
Restructuring and other related charges | | | — | | | — | | | 29,562 | | | — | | | 29,562 | |
Litigation and other related professional fees | | | — | | | — | | | 114,778 | | | — | | | 114,778 | |
Heartland matters | | | — | | | — | | | 6,063 | | | — | | | 6,063 | |
| |
|
| |
|
| |
|
| |
|
| |
|
| |
Operating income (loss) | | | (8,250 | ) | | (1,020 | ) | | 489,596 | | | — | | | 480,326 | |
Investment income | | | 6,625 | | | — | | | 3,828 | | | — | | | 10,453 | |
Interest expense | | | (165,819 | ) | | — | | | (4,464 | ) | | — | | | (170,283 | ) |
| |
|
| |
|
| |
|
| |
|
| |
|
| |
Income (loss) before income taxes | | | (167,444 | ) | | (1,020 | ) | | 488,960 | | | — | | | 320,496 | |
Income tax (benefit) expense | | | (60,816 | ) | | (343 | ) | | 198,083 | | | — | | | 136,924 | |
Equity in net income of subsidiaries | | | 290,200 | | | — | | | — | | | (290,200 | ) | | — | |
| |
|
| |
|
| |
|
| |
|
| |
|
| |
Net income (loss) | | $ | 183,572 | | $ | (677 | ) | $ | 290,877 | | $ | (290,200 | ) | $ | 183,572 | |
| |
|
| |
|
| |
|
| |
|
| |
|
| |
| | | | | | | | | | | | | | | | |
2005: | | | | | | | | | | | | | | | | |
| |
|
| |
|
| |
|
| |
|
| |
|
| |
| | | | | | | | | | | | | | | | |
Net sales | | $ | — | | $ | — | | $ | 5,292,782 | | $ | — | | $ | 5,292,782 | |
Cost of sales | | | — | | | — | | | 3,993,717 | | | — | | | 3,993,717 | |
| |
|
| |
|
| |
|
| |
|
| |
|
| |
Gross profit | | | — | | | — | | | 1,299,065 | | | — | | | 1,299,065 | |
Selling, general and administrative expenses | | | 9,631 | | | 930 | | | 690,072 | | | — | | | 700,633 | |
Provision for doubtful accounts | | | — | | | — | | | 58,024 | | | — | | | 58,024 | |
Restructuring and other related charges | | | — | | | — | | | 18,779 | | | — | | | 18,779 | |
| |
|
| |
|
| |
|
| |
|
| |
|
| |
Operating income (loss) | | | (9,631 | ) | | (930 | ) | | 532,190 | | | — | | | 521,629 | |
Investment income | | | 1,857 | | | — | | | 3,930 | | | — | | | 5,787 | |
Interest expense | | | (158,935 | ) | | — | | | (6,675 | ) | | — | | | (165,610 | ) |
| |
|
| |
|
| |
|
| |
|
| |
|
| |
Income (loss) before income taxes | | | (166,709 | ) | | (930 | ) | | 529,445 | | | — | | | 361,806 | |
Income tax (benefit) expense | | | (62,349 | ) | | (348 | ) | | 198,012 | | | — | | | 135,315 | |
Equity in net income of subsidiaries | | | 330,851 | | | — | | | — | | | (330,851 | ) | | — | |
| |
|
| |
|
| |
|
| |
|
| |
|
| |
Net income (loss) | | $ | 226,491 | | $ | (582 | ) | $ | 331,433 | | $ | (330,851 | ) | $ | 226,491 | |
| |
|
| |
|
| |
|
| |
|
| |
|
| |
160
Note 18 –Guarantor Subsidiaries – Continued
Condensed Consolidating Balance Sheets
(in thousands)
| | | | | | | | | | | | | | | | |
As of December 31, 2007: | | Parent | | Guarantor
Subsidiary | | Non-Guarantor
Subsidiaries | | Consolidating/
Eliminating
Adjustments | | Omnicare, Inc.
and
Subsidiaries | |
| |
| |
| |
| |
| |
| |
|
ASSETS | | | | | | | | | | | | | | | | |
Cash and cash equivalents | | $ | 171,779 | | $ | — | | $ | 102,669 | | $ | — | | $ | 274,448 | |
Restricted cash | | | — | | | — | | | 3,155 | | | — | | | 3,155 | |
Accounts receivable, net (including intercompany) | | | — | | | 43 | | | 1,376,288 | | | (43 | ) | | 1,376,288 | |
Unbilled receivables, CRO | | | — | | | — | | | 24,855 | | | — | | | 24,855 | |
Inventories | | | — | | | — | | | 448,183 | | | — | | | 448,183 | |
Deferred income tax benefits (liabilities), net-current | | | 878 | | | — | | | 125,361 | | | — | | | 126,239 | |
Other current assets | | | 1,336 | | | — | | | 201,646 | | | — | | | 202,982 | |
| |
|
| |
|
| |
|
| |
|
| |
|
| |
Total current assets | | | 173,993 | | | 43 | | | 2,282,157 | | | (43 | ) | | 2,456,150 | |
| |
|
| |
|
| |
|
| |
|
| |
|
| |
Properties and equipment, net | | | — | | | 28 | | | 199,421 | | | — | | | 199,449 | |
Goodwill | | | — | | | — | | | 4,342,169 | | | — | | | 4,342,169 | |
Identifiable intangible assets, net | | | — | | | — | | | 323,637 | | | — | | | 323,637 | |
Other noncurrent assets | | | 52,135 | | | 19 | | | 220,220 | | | — | | | 272,374 | |
Investment in subsidiaries | | | 5,939,714 | | | — | | | — | | | (5,939,714 | ) | | — | |
| |
|
| |
|
| |
|
| |
|
| |
|
| |
Total assets | | $ | 6,165,842 | | $ | 90 | | $ | 7,367,604 | | $ | (5,939,757 | ) | $ | 7,593,779 | |
| |
|
| |
|
| |
|
| |
|
| |
|
| |
|
LIABILITIES AND STOCKHOLDERS’ EQUITY | | | | | | | | | | | | | | | | |
Current liabilities (including intercompany) | | $ | 33,105 | | $ | — | | $ | 619,098 | | $ | (43 | ) | $ | 652,160 | |
Long-term debt, notes and convertible debentures | | | 2,764,510 | | | — | | | 56,241 | | | — | | | 2,820,751 | |
Deferred income tax liabilities, net-noncurrent | | | 68,534 | | | — | | | 381,255 | | | — | | | 449,789 | |
Other noncurrent liabilities | | | 7,990 | | | — | | | 371,386 | | | — | | | 379,376 | |
Stockholders’ equity | | | 3,291,703 | | | 90 | | | 5,939,624 | | | (5,939,714 | ) | | 3,291,703 | |
| |
|
| |
|
| |
|
| |
|
| |
|
| |
Total liabilities and stockholders’ equity | | $ | 6,165,842 | | $ | 90 | | $ | 7,367,604 | | $ | (5,939,757 | ) | $ | 7,593,779 | |
| |
|
| |
|
| |
|
| |
|
| |
|
| |
161
Note 18 – Guarantor Subsidiaries – Continued
Condensed Consolidating Balance Sheets
(in thousands)
| | | | | | | | | | | | | | | | |
As of December 31, 2006: | | Parent | | Guarantor
Subsidiary | | Non-Guarantor
Subsidiaries | | Consolidating/
Eliminating
Adjustments | | Omnicare, Inc.
and
Subsidiaries | |
| |
| |
| |
| |
| |
| |
|
ASSETS | | | | | | | | | | | | | | | | |
Cash and cash equivalents | | $ | 43,494 | | $ | — | | $ | 94,540 | | $ | — | | $ | 138,034 | |
Restricted cash | | | — | | | — | | | 3,777 | | | — | | | 3,777 | |
Accounts receivable, net (including intercompany) | | | — | | | — | | | 1,522,283 | | | (17 | ) | | 1,522,266 | |
Unbilled receivables, CRO | | | — | | | — | | | 21,949 | | | — | | | 21,949 | |
Inventories | | | — | | | — | | | 449,671 | | | — | | | 449,671 | |
Deferred income tax benefits (liabilities), net-current | | | (1,095 | ) | | — | | | 95,326 | | | — | | | 94,231 | |
Other current assets | | | 2,516 | | | — | | | 192,384 | | | — | | | 194,900 | |
| |
|
| |
|
| |
|
| |
|
| |
|
| |
Total current assets | | | 44,915 | | | — | | | 2,379,930 | | | (17 | ) | | 2,424,828 | |
| |
|
| |
|
| |
|
| |
|
| |
|
| |
Properties and equipment, net | | | — | | | 31 | | | 200,394 | | | — | | | 200,425 | |
Goodwill | | | — | | | — | | | 4,225,011 | | | — | | | 4,225,011 | |
Identifiable intangible assets, net | | | — | | | — | | | 319,588 | | | — | | | 319,588 | |
Other noncurrent assets | | | 60,045 | | | 19 | | | 168,555 | | | — | | | 228,619 | |
Investment in subsidiaries | | | 6,062,799 | | | — | | | — | | | (6,062,799 | ) | | — | |
| |
|
| |
|
| |
|
| |
|
| |
|
| |
Total assets | | $ | 6,167,759 | | $ | 50 | | $ | 7,293,478 | | $ | (6,062,816 | ) | $ | 7,398,471 | |
| |
|
| |
|
| |
|
| |
|
| |
|
| |
|
LIABILITIES AND STOCKHOLDERS’ EQUITY | | | | | | | | | | | | | | | | |
Current liabilities (including intercompany) | | $ | 31,123 | | $ | 17 | | $ | 521,278 | | $ | (17 | ) | $ | 552,401 | |
Long-term debt, notes and convertible debentures | | | 2,903,453 | | | — | | | 51,667 | | | — | | | 2,955,120 | |
Deferred income tax liabilities, net-noncurrent | | | 50,685 | | | — | | | 334,304 | | | — | | | 384,989 | |
Other noncurrent liabilities | | | 19,047 | | | — | | | 323,463 | | | — | | | 342,510 | |
Stockholders’ equity | | | 3,163,451 | | | 33 | | | 6,062,766 | | | (6,062,799 | ) | | 3,163,451 | |
| |
|
| |
|
| |
|
| |
|
| |
|
| |
Total liabilities and stockholders’ equity | | $ | 6,167,759 | | $ | 50 | | $ | 7,293,478 | | $ | (6,062,816 | ) | $ | 7,398,471 | |
| |
|
| |
|
| |
|
| |
|
| |
|
| |
162
Note 18 – Guarantor Subsidiaries – Continued
Condensed Consolidating Statements of Cash Flows
(in thousands)
| | | | | | | | | | | | | |
| | For the year ended December 31, | |
| |
| |
2007: | | Parent | | Guarantor
Subsidiary | | Non-Guarantor
Subsidiaries | | Omnicare, Inc.
and Subsidiaries | |
| |
| |
| |
| |
| |
|
Cash flows from operating activities: | | | | | | | | | | | | | |
Net cash flows from operating activities | | $ | (91,730 | ) | $ | — | | $ | 597,259 | | $ | 505,529 | |
| |
|
| |
|
| |
|
| |
|
| |
Cash flows from investing activities: | | | | | | | | | | | | | |
Acquisition of businesses, net of cash received | | | — | | | — | | | (151,135 | ) | | (151,135 | ) |
Capital expenditures | | | — | | | — | | | (45,270 | ) | | (45,270 | ) |
Transfer of cash to trusts for employee health and severance costs, net of payments out of the trust | | | — | | | — | | | 291 | | | 291 | |
Other | | | — | | | — | | | (774 | ) | | (774 | ) |
| |
|
| |
|
| |
|
| |
|
| |
Net cash flows used by investing activities | | | — | | | — | | | (196,888 | ) | | (196,888 | ) |
| |
|
| |
|
| |
|
| |
|
| |
|
Cash flows from financing activities: | | | | | | | | | | | | | |
Borrowings on line of credit facilities and term A loan | | | 95,000 | | | — | | | — | | | 95,000 | |
Payments on line of credit facilities and term A loan | | | (245,000 | ) | | — | | | — | | | (245,000 | ) |
Payments on long-term borrowings and obligations | | | (5,734 | ) | | — | | | — | | | (5,734 | ) |
Change in cash overdraft balance | | | 3,511 | | | — | | | (7,091 | ) | | (3,580 | ) |
(Payments) for stock awards and exercise of stock options, net of stock tendered in payment | | | (8,966 | ) | | — | | | — | | | (8,966 | ) |
Excess tax benefits from stock-based compensation | | | 4,112 | | | — | | | — | | | 4,112 | |
Dividends paid | | | (10,971 | ) | | — | | | — | | | (10,971 | ) |
Other | | | 388,063 | | | — | | | (388,063 | ) | | — | |
| |
|
| |
|
| |
|
| |
|
| |
Net cash flows from financing activities | | | 220,015 | | | — | | | (395,154 | ) | | (175,139 | ) |
| |
|
| |
|
| |
|
| |
|
| |
|
Effect of exchange rate changes on cash | | | — | | | — | | | 2,912 | | | 2,912 | |
| |
|
| |
|
| |
|
| |
|
| |
|
Net increase in cash and cash equivalents | | | 128,285 | | | — | | | 8,129 | | | 136,414 | |
Cash and cash equivalents at beginning of year | | | 43,494 | | | — | | | 94,540 | | | 138,034 | |
| |
|
| |
|
| |
|
| |
|
| |
Cash and cash equivalents at end of year | | $ | 171,779 | | $ | — | | $ | 102,669 | | $ | 274,448 | |
| |
|
| |
|
| |
|
| |
|
| |
163
Note 18 – Guarantor Subsidiaries – Continued
(in thousands)
| | | | | | | | | | | | | |
| | For the year ended December 31, | |
| |
| |
2006: | | Parent | | Guarantor
Subsidiary | | Non-Guarantor
Subsidiaries | | Omnicare, Inc.
and Subsidiaries | |
| |
| |
| |
| |
| |
|
Cash flows from operating activities: | | | | | | | | | | | | | |
Net cash flows from operating activities | | $ | (82,220 | ) | $ | — | | $ | 190,740 | | $ | 108,520 | |
| |
|
| |
|
| |
|
| |
|
| |
|
Cash flows from investing activities: | | | | | | | | | | | | | |
Acquisition of businesses, net of cash received | | | — | | | — | | | (94,346 | ) | | (94,346 | ) |
Capital expenditures | | | — | | | — | | | (31,251 | ) | | (31,251 | ) |
Transfer of cash to trusts for employee health and severance costs, net of payments out of the trust | | | — | | | — | | | (1,321 | ) | | (1,321 | ) |
Other | | | — | | | — | | | 46 | | | 46 | |
| |
|
| |
|
| |
|
| |
|
| |
Net cash flows used by investing activities | | | — | | | — | | | (126,872 | ) | | (126,872 | ) |
| |
|
| |
|
| |
|
| |
|
| |
|
Cash flows from financing activities: | | | | | | | | | | | | | |
Borrowings on line of credit facilities and term A loan | | | 158,000 | | | — | | | — | | | 158,000 | |
Payments on line of credit facilities and term A loan | | | (258,000 | ) | | — | | | — | | | (258,000 | ) |
Proceeds from long-term borrowings and obligations | | | 63 | | | — | | | — | | | 63 | |
Payments on long-term borrowings and obligations | | | (14,921 | ) | | — | | | — | | | (14,921 | ) |
Fees paid for financing arrangements | | | (3,482 | ) | | — | | | — | | | (3,482 | ) |
Change in cash overdraft balance | | | 5,101 | | | — | | | 7,163 | | | 12,264 | |
Proceeds from stock offering, net of issuance costs | | | 49,239 | | | — | | | — | | | 49,239 | |
(Payments) for stock awards and exercise of stock options and warrants, net of stock tendered in payment | | | (2,751 | ) | | — | | | — | | | (2,751 | ) |
Excess tax benefits from stock-based compensation | | | 10,411 | | | — | | | — | | | 10,411 | |
Dividends paid | | | (10,937 | ) | | — | | | — | | | (10,937 | ) |
Other | | | 49,764 | | | — | | | (49,764 | ) | | — | |
| |
|
| |
|
| |
|
| |
|
| |
Net cash flows from financing activities | | | (17,513 | ) | | — | | | (42,601 | ) | | (60,114 | ) |
| |
|
| |
|
| |
|
| |
|
| |
|
Effect of exchange rate changes on cash | | | — | | | — | | | 1,079 | | | 1,079 | |
| |
|
| |
|
| |
|
| |
|
| |
| | | | | | | | | | | | | |
Net increase (decrease) in cash and cash equivalents | | | (99,733 | ) | | — | | | 22,346 | | | (77,387 | ) |
Cash and cash equivalents at beginning of year | | | 143,227 | | | — | | | 72,194 | | | 215,421 | |
| |
|
| |
|
| |
|
| |
|
| |
Cash and cash equivalents at end of year | | $ | 43,494 | | $ | — | | $ | 94,540 | | $ | 138,034 | |
| |
|
| |
|
| |
|
| |
|
| |
164
Note 18 – Guarantor Subsidiaries – Continued
(in thousands)
| | | | | | | | | | | | | |
| | For the year ended December 31, | |
| |
| |
2005: | | Parent | | Guarantor
Subsidiary | | Non-Guarantor
Subsidiaries | | Omnicare, Inc.
and Subsidiaries | |
| |
| |
| |
| |
| |
|
Cash flows from operating activities: | | | | | | | | | | | | | |
Net cash flows from operating activities | | $ | (24,967 | ) | $ | — | | $ | 288,506 | | $ | 263,539 | |
| |
|
| |
|
| |
|
| |
|
| |
|
Cash flows from investing activities: | | | | | | | | | | | | | |
Acquisition of businesses, net of cash received | | | — | | | — | | | (2,620,380 | ) | | (2,620,380 | ) |
Capital expenditures | | | — | | | — | | | (24,239 | ) | | (24,239 | ) |
Transfer of cash to trusts for employee health and severance costs, net of payments out of the trust | | | — | | | — | | | (1,523 | ) | | (1,523 | ) |
Other | | | — | | | — | | | 39 | | | 39 | |
| |
|
| |
|
| |
|
| |
|
| |
Net cash flows used by investing activities | | | — | | | — | | | (2,646,103 | ) | | (2,646,103 | ) |
| |
|
| |
|
| |
|
| |
|
| |
|
Cash flows from financing activities: | | | | | | | | | | | | | |
Borrowings on line of credit facilities and term A loan | | | 3,560,000 | | | — | | | — | | | 3,560,000 | |
Payments on line of credit facilities and term A loan | | | (3,165,385 | ) | | — | | | — | | | (3,165,385 | ) |
Proceeds from long-term borrowings and obligations | | | 1,724,194 | | | — | | | 44,890 | | | 1,769,084 | |
Payments on long-term borrowings and obligations | | | (369,034 | ) | | — | | | — | | | (369,034 | ) |
Fees paid for financing arrangements | | | (51,743 | ) | | — | | | — | | | (51,743 | ) |
Change in cash overdraft balance | | | 2,228 | | | — | | | 2,771 | | | 4,999 | |
Proceeds from stock offering, net of issuance costs | | | 742,932 | | | — | | | — | | | 742,932 | |
Proceeds from stock awards and exercise of stock options and warrants, net of stock tendered in payment | | | 33,455 | | | — | | | — | | | 33,455 | |
Dividends paid | | | (9,549 | ) | | — | | | — | | | (9,549 | ) |
Other | | | (2,345,473 | ) | | — | | | 2,345,473 | | | — | |
| |
|
| |
|
| |
|
| |
|
| |
Net cash flows from financing activities | | | 121,625 | | | — | | | 2,393,134 | | | 2,514,759 | |
| |
|
| |
|
| |
|
| |
|
| |
| | | | | | | | | | | | | |
Effect of exchange rate changes on cash | | | — | | | — | | | (943 | ) | | (943 | ) |
| |
|
| |
|
| |
|
| |
|
| |
| | | | | | | | | | | | | |
Net increase in cash and cash equivalents | | | 96,658 | | | — | | | 34,594 | | | 131,252 | |
Cash and cash equivalents at beginning of year | | | 46,569 | | | — | | | 37,600 | | | 84,169 | |
| |
|
| |
|
| |
|
| |
|
| |
Cash and cash equivalents at end of year | | $ | 143,227 | | $ | — | | $ | 72,194 | | $ | 215,421 | |
| |
|
| |
|
| |
|
| |
|
| |
165
ITEM 9. - CHANGES IN AND DISAGREEMENTS WITH ACCOUNTANTS ON ACCOUNTING AND FINANCIAL DISCLOSURE
None.
ITEM 9A. - CONTROLS AND PROCEDURES
Evaluation of Disclosure Controls and Procedures. Based on an evaluation, as of the end of the period covered by this Annual Report on Form 10-K, our Chief Executive Officer and Chief Financial Officer have concluded that our disclosure controls and procedures (as defined in the Exchange Act Rule 13a-15(e)) are effective to ensure that information required to be disclosed in the reports that the Company files under the Securities Exchange Act of 1934 is recorded, processed, summarized and reported, within the time periods specified in the SEC’s rules and forms and are also effective to ensure that information required to be disclosed in the reports that the Company files or submits under the Securities Exchange Act of 1934 is accumulated and communicated to the Company’s management, including its Chief Executive Officer and Chief Financial Officer, to allow timely decisions regarding required disclosure.
Changes in Internal Control. There were no changes in the Company’s internal control over financial reporting that occurred during the Company’s fourth quarter ended December 31, 2007 that have materially affected, or are reasonably likely to materially affect, the Company’s internal control over financial reporting.
Management’s Report on Internal Control Over Financial Reporting
Our management is responsible for establishing and maintaining adequate internal control over financial reporting, as such term is defined in Exchange Act Rule 13a-15(f). The Company’s internal control over financial reporting is a process that is designed under the supervision of the Chief Executive Officer and the Chief Financial Officer to provide reasonable assurance regarding the reliability of financial reporting and the preparation of financial statements for external purposes in accordance with accounting principles generally accepted in the United States. Our management conducted an assessment of the effectiveness of our internal control over financial reporting based on the framework inInternal Control – Integrated Framework issued by the Committee of Sponsoring Organizations of the Treadway Commission. Based on our assessment under the framework inInternal Control – Integrated Framework, our management concluded that, as of December 31, 2007, our internal control over financial reporting was effective.
Because of its inherent limitations, internal control over financial reporting may not prevent or detect misstatements. Also, projections of any evaluation of effectiveness to future periods are subject to the risk that controls may become inadequate because of changes in conditions, or that the degree of compliance with the policies or procedures may deteriorate.
166
ITEM 9B. - OTHER INFORMATION
None.
PART III
| |
ITEM 10. - | DIRECTORS, EXECUTIVE OFFICERS AND CORPORATE GOVERNANCE |
The information required by this Item 10 regarding our directors and executive officers, our audit committee and Section 16(a) compliance is included under the captions “Election of Directors,” “Governance of the Company and Board Matters” and “Section 16(A) Beneficial Ownership Reporting Compliance” in our proxy statement for our 2008 annual meeting of stockholders and is incorporated herein by reference. Information concerning our executive officers is also included under the caption “Executive Officers of the Company” in Part I of this Report. There have been no material changes to the procedures by which stockholders may recommend nominees to the board of directors as described in the Company’s Proxy Statement dated April 27, 2007.
Audit Committee Financial Expert. The information required by this Item 10 disclosure requirement is included in our proxy statement for our 2008 annual meeting of stockholders and is incorporated herein by reference.
Codes of Ethics. We expect all of our employees to act in accordance with and to abide by the Omnicare “Corporate Compliance Program – It’s About Integrity” (the “Omnicare Integrity Code”). The Omnicare Integrity Code is a set of business values and procedures that provides guidance to Omnicare employees with respect to compliance with the law in all of their business dealings and decisions on behalf of Omnicare and with respect to the maintenance of ethical standards, which are a vital and integral part of Omnicare’s business.
The Omnicare Integrity Code applies to all employees including the Chief Executive Officer, the Chief Financial Officer, the Principal Accounting Officer and other senior financial officers (the “Covered Officers”). In addition to being bound by the Omnicare Integrity Code’s provisions about ethical conduct, conflicts of interest and compliance with law, Omnicare has adopted a Code of Ethics for the Covered Officers. The Company will furnish any person, without charge, a copy of the Code of Ethics for the Covered Officers upon written request addressed to Omnicare, Inc., 1600 RiverCenter II, 100 East RiverCenter Boulevard, Covington, KY 41011, Attn.: Corporate Secretary. A copy of the Code of Ethics for the Covered Officers can also be found on our web site atwww.omnicare.com. Any waiver of any provision of the Code granted to a Covered Officer may only be granted by our Board of Directors or its Audit Committee. If a waiver is granted, information concerning the waiver will be posted on our web site atwww.omnicare.com for a period of 12 months.
ITEM 11. - EXECUTIVE COMPENSATION
The information required by this Item 11 is included in our proxy statement for our 2008 annual meeting of stockholders and is incorporated herein by reference.
167
ITEM 12. - SECURITY OWNERSHIP OF CERTAIN BENEFICIAL OWNERS AND MANAGEMENT AND RELATED STOCKHOLDER MATTERS
Equity Compensation Plan Information
The following table sets forth certain information regarding our equity compensation plans as of December 31, 2007 (in thousands, except exercise price data):
| | | | | | | | | | |
Plan Category | | Number of Securities to
be issued Upon
Exercise of
Outstanding Options
and Warrants | | Weighted Average
Exercise Price of
Outstanding Options
and Warrants | | Number of Securities
Remaining Available
for Future Issuance
Under Equity
Compensation Plans(c) | |
| |
|
| |
|
| |
|
| |
Equity compensation plans approved by stockholders(a) | | | 6,825 | | $ | 31.79 | | | 5,637 | |
Equity compensation plans not approved by stockholders(b) | | | 638 | | | 27.83 | | | — | |
| |
|
| | | | |
|
| |
| | | 7,463 | | $ | 31.45 | | | 5,637 | |
| |
|
| |
|
| |
|
| |
| |
(a) | Includes the 1992 Long-Term Stock Incentive Plan, the 1995 Premium-Priced Stock Option Plan and the 2004 Stock and Incentive Plan. |
| |
(b) | Includes the 1998 Long-Term Employee Incentive Plan and Director Stock Plan, as further discussed in the “Stock-Based Employee Compensation” note of the Notes to Consolidated Financial Statements included at Item 8 of this Filing. Additionally, at December 31, 2007, the outstanding amount includes 10 compensation related warrants issued in 2003 at an exercise price of $33.08 per share. |
| |
(c) | Excludes securities listed in the first column of the table. |
The remaining information required by this Item 12 is included in our proxy statement for our 2008 annual meeting of stockholders and is incorporated herein by reference.
| |
ITEM 13. - | CERTAIN RELATIONSHIPS AND RELATED TRANSACTIONS, AND DIRECTOR INDEPENDENCE |
The information required by this Item 13 is included in our proxy statement for our 2008 annual meeting of stockholders and is incorporated herein by reference.
ITEM 14. - PRINCIPAL ACCOUNTANT FEES AND SERVICES
The information required by this Item 14 is included in our proxy statement for our 2008 annual meeting of stockholders and is incorporated herein by reference.
168
PART IV
ITEM 15. - EXHIBITS AND FINANCIAL STATEMENT SCHEDULES
| | |
| (a)(1) | Financial Statements |
| | |
| | Our 2007 Consolidated Financial Statements are included in Part II, Item 8, of this Filing. |
| | |
| (a)(2) | Financial Statement Schedule |
| | |
| | See Index to Financial Statements and Financial Statement Schedule at Part II, Item 8, of this Filing. |
| | |
| (a)(3) | Exhibits |
| | |
| | See Index of Exhibits. |
169
SIGNATURES
Pursuant to the requirements of Section l3 or l5(d) of the Securities Exchange Act of l934, the Company has duly caused this report to be signed on its behalf by the undersigned thereunto duly authorized, on this 28th day of February 2008.
| | |
| OMNICARE, INC. | |
| | |
| /s/David W. Froesel, Jr. | |
|
| |
| David W. Froesel, Jr. | |
| Senior Vice President and | |
| Chief Financial Officer | |
| | |
Pursuant to the requirements of the Securities Exchange Act of l934, this Report has been signed below by the following persons on behalf of the Company and in the capacities and on the dates indicated.
| | |
Signature | Title | Date |
|
|
|
| | |
/s/Joel F. Gemunder | President, Chief Executive Officer and Director | |
| (Principal Executive Officer) | |
Joel F. Gemunder | | |
| | |
/s/David W. Froesel, Jr. | Senior Vice President and | |
| Chief Financial Officer | |
David W. Froesel, Jr. | (Principal Financial and | |
| Accounting Officer) | |
| | February 28, 2008 |
| | |
John T. Crotty, Director* | | |
Charles H. Erhart, Director* | | |
Sandra E. Laney, Director* | | |
Andrea R. Lindell, Ph. D, RN, Director* | | |
John H. Timoney, Director* | | |
Jeffrey W. Ubben, Director* | | |
Amy Wallman, Director* | | |
* Cheryl D. Hodges, by signing her name hereto, signs this document on behalf of herself and on behalf of each person indicated above pursuant to a power of attorney duly executed by such person and filed with the Securities and Exchange Commission.
| /s/Cheryl D. Hodges |
|
|
| Cheryl D. Hodges |
| (Attorney-in-Fact) |
SCHEDULE II
OMNICARE, INC. AND SUBSIDIARY COMPANIES
Valuation and Qualifying Accounts
(in thousands)
| | | | | | | | | | | | | | | | |
Year ended
December 31, | | Balance at
beginning of
period | | Additions
charged
to cost
and expenses | | Acquisitions | | Write-offs,
net of
recoveries | | Balance
at end
of period | |
|
|
|
|
|
|
|
|
|
|
|
|
| | | | | | | | | | | | | | | | |
Allowance for uncollectible accounts receivable: | | | | | | | | | | | | | | |
| | | | | | | | | | | | | | | | |
| | | | | | | | | | | | | | | | |
2007 | | $ | 191,048 | | $ | 213,560 | | $ | 1,536 | | $ | (72,083 | ) | $ | 334,061 | |
| | | | | | | | | | | | | | | | |
2006 | | | 169,390 | | | 82,209 | | | 1,694 | | | (62,245 | ) | | 191,048 | |
| | | | | | | | | | | | | | | | |
2005 | | | 123,288 | | | 58,024 | | | 41,441 | | | (53,363 | ) | | 169,390 | |
S-1
INDEX OF EXHIBITS
| | | | |
Number and Description of Exhibit
(Numbers Coincide with Item 601 of Regulation S-K) | | Document Incorporated by Reference
from a Previous Filing, Filed Herewith
or Furnished Herewith, as Indicated
Below |
| |
|
| | | | |
(2) | | Agreement and Plan of Merger, by and
among Omnicare, Inc., NCS Acquisition
Corp. and NCS HealthCare, Inc., dated
as of December 17, 2002 | | Exhibit (a) (5)(E) to NCS Acquisition
Corp.’s Schedule TO-T, as amended
and filed with the Securities and
Exchange Commission on December
18, 2002 |
| | | | |
(2.1) | | Agreement and Plan of Merger, by and
among Omnicare, Inc., Nectarine
Acquisition Corp. and NeighborCare,
Inc., dated as of July 6, 2005 | | Form 8-K
July 7, 2005 |
| | | | |
(2.2) | | Asset Purchase Agreement, by and
among Omnicare, Inc., RxCrossroads,
L.L.C., RxInnovations, L.L.C., Making
Distribution Intelligent, L.L.C. and
Louisville Public Warehouse Company,
dated as of July 1, 2005 | | Form 8-K
July 8, 2005 |
| | | | |
(2.3) | | Agreement and Plan of Merger, dated as
of July 9, 2005, by and between
Omnicare, Inc., Hospice Acquisition
Corp., excelleRx, Inc. and certain of the
stockholders and option holders of
excelleRx, Inc. | | Form 8-K
July 14, 2005 |
| | | | |
(3.1) | | Restated Certificate of Incorporation of
Omnicare, Inc. (as amended) | | Form 10-K
March 27, 2003 |
| | | | |
(3.2) | | Certificate of Designations of Series A
Junior Participating Preferred Stock of
Omnicare, Inc., dated as of May 18, 1999 | | Form 10-K
March 27, 2003 |
| | | | |
(3.3) | | Second Amended and Restated By-Laws
of Omnicare, Inc. | | Form 10-Q
November 14, 2003 |
E-1
INDEX OF EXHIBITS
| | | | |
Number and Description of Exhibit
(Numbers Coincide with Item 601 of Regulation S-K) | | Document Incorporated by Reference
from a Previous Filing, Filed Herewith
or Furnished Herewith, as Indicated
Below |
| |
|
| | | | |
(4.1) | | Rights Agreement, and related Exhibits,
dated as of May 17, 1999 between
Omnicare, Inc. and First Chicago Trust
Company of New York, as Rights Agent | | Form 8-K
May 18, 1999 |
| | | | |
(4.2) | | Subordinated Debt Securities Indenture,
dated as of June 13, 2003, between
Omnicare, Inc. and SunTrust Bank, as
Trustee | | Form 8-K
June 16, 2003 |
| | | | |
(4.3) | | First Supplemental Indenture, dated as of
June 13, 2003, between Omnicare, Inc.
and SunTrust Bank, as Trustee | | Form 8-K
June 16, 2003 |
| | | | |
(4.4) | | Second Supplemental Indenture, dated as
of June 13, 2003, between Omnicare,
Inc. and SunTrust Bank, as Trustee | | Form 8-K
June 16, 2003 |
| | | | |
(4.5) | | Third Supplemental Indenture, dated as
of March 8, 2005, between Omnicare,
Inc. & SunTrust Bank, as Trustee | | Form 8-K
March 9, 2005 |
| | | | |
(4.6) | | Fourth Supplemental Indenture, dated as
of December 15, 2005, by and among the
Company, the guarantors named therein
and the Trustee (including the Form of
2013 Note) | | Form 8-K
December 16, 2005 |
| | | | |
(4.7) | | Fifth Supplemental Indenture, dated as of
December 15, 2005, by and among the
Company, the guarantors named therein
and the Trustee (including the Form of
2015 Note) | | Form 8-K
December 16, 2005 |
E-2
INDEX OF EXHIBITS
| | | | |
Number and Description of Exhibit
(Numbers Coincide with Item 601 of Regulation S-K) | | Document Incorporated by Reference
from a Previous Filing, Filed Herewith
or Furnished Herewith, as Indicated
Below |
| |
|
| | | | |
(4.8) | | Indenture, dated as of December 15,
2005, by and among the Company,
Omnicare Purchasing Company, LP, as
guarantor and the Trustee (including the
Form of Convertible Debenture) | | Form 8-K
December 16, 2005 |
| | | | |
(4.9) | | Guarantee Agreement of Omnicare, Inc.
relating to the Trust Preferred Income
Equity Redeemable Securities of
Omnicare Capital Trust I, dated as of
June 13, 2003 | | Form 8-K
June 16, 2003 |
| | | | |
(4.10) | | Amended and Restated Trust Agreement
of Omnicare Capital Trust II, dated as of
March 8, 2005 | | Form 8-K
March 9, 2005 |
| | | | |
(4.11) | | Guarantee Agreement of Omnicare, Inc.
relating to the Series B 4.00% Trust
Preferred Income Equity Redeemable
Securities of Omnicare Capital Trust II,
dated as of March 8, 2005 | | Form 8-K
March 9, 2005 |
| | | | |
(10.1) | | Executive Salary Protection Plan, as
amended, July 1, 1981* | | Form 10-K
March 25, 1996 |
| | | | |
(10.2) | | Annual Incentive Plan for Senior
Executive Officers* | | Appendix B to Proxy Statement for
2001 Annual Meeting of Stockholders
dated April 10, 2001 |
| | | | |
(10.3) | | 1992 Long-Term Stock Incentive Plan* | | Appendix A to Proxy Statement for
2002 Annual Meeting of Stockholders
dated April 10, 2002
|
(10.4) | | 1995 Premium-Priced Stock Option
Plan* | | Exhibit A to Proxy Statement for 1995
Annual Meeting of Stockholders dated
April 10, 1995 |
E-3
INDEX OF EXHIBITS
| | | | |
Number and Description of Exhibit
(Numbers Coincide with Item 601 of Regulation S-K) | | Document Incorporated by Reference
from a Previous Filing, Filed Herewith
or Furnished Herewith, as Indicated
Below |
| |
|
| | | | |
(10.5) | | 1998 Long-Term Employee Incentive
Plan* | | Form 10-K
March 30, 1999 |
| | | | |
(10.6) | | Amendment to 1998 Long-Term
Employee Incentive Plan, effective
November 26, 2002* | | Form 10-K
March 27, 2003 |
| | | | |
(10.7) | | Director Stock Plan for Members of the
Compensation and Incentive Committee* | | Form S-8
December 14, 2001 |
| | | | |
(10.8) | | Director Compensation Program Update* | | Form 8-K
May 20, 2005 |
| | | | |
(10.9) | | Omnicare, Inc. 2004 Stock and Incentive
Plan* | | Appendix B to the Company’s
Definitive Proxy Statement for 2004
Annual Meeting of Stockholders, filed
on April 9, 2004 |
| | | | |
(10.10) | | Form of Indemnification Agreement with
Directors and Officers* | | Form 10-K
March 30, 1999 |
| | | | |
(10.11) | | Employment Agreement with J.F.
Gemunder, dated August 4, 1988* | | Form 10-K
March 27, 2003 |
| | | | |
(10.12) | | Employment Agreement with C.D.
Hodges, dated August 4, 1988* | | Form 10-K
March 27, 2003 |
| | | | |
(10.13) | | Employment Agreement with
P.E. Keefe, dated March 4, 1993* | | Form 10-K
March 25, 1994 |
| | | | |
(10.14) | | Split Dollar Agreement with
E.L. Hutton, dated June 1, 1995,
(Agreement in the same form exists with
J.F. Gemunder)* | | Form 10-K
March 25, 1996 |
E-4
INDEX OF EXHIBITS
| | | | |
Number and Description of Exhibit
(Numbers Coincide with Item 601 of Regulation S-K) | | Document Incorporated by Reference
from a Previous Filing, Filed Herewith
or Furnished Herewith, as Indicated
Below |
| |
|
| | | | |
(10.15) | | Split Dollar Agreement, dated
June 1, 1995 (Agreements in the same
form exist with the following Executive
Officers: T.E. Bien, C.D. Hodges and
P.E. Keefe)* | | Form 10-K
March 25, 1996 |
| | | | |
(10.16) | | Retirement Plan for E.L. Hutton* | | Form 10-K
March 30, 2001 |
| | | | |
(10.17) | | Omnicare, Inc. Excess Benefit Plan* | | Form 10-K
March 15, 2004 |
| | | | |
(10.18) | | Description of 2002 Supplemental
Benefit Plan* | | Form 10-K
March 15, 2004 |
| | | | |
(10.19) | | Employment Agreement with D.W.
Froesel, Jr., dated February 17, 1996* | | Form 10-K
March 31, 1997 |
| | | | |
(10.20) | | Form of Amendment to Employment
Agreements with J.F. Gemunder, P.E.
Keefe and C.D. Hodges, dated as of
February 25, 2000* | | Form 10-K
March 30, 2000 |
| | | | |
(10.21) | | Form of Amendment to Employment
Agreements with D.W. Froesel, Jr., dated
as of February 25, 2000* | | Form 10-K
March 30, 2000 |
| | | | |
(10.22) | | Amendment to Employment Agreement
with J.F. Gemunder, dated as of
September 25, 2002* | | Form 10-K
March 27, 2003 |
| | | | |
(10.23) | | Amendment to Employment Agreement
with J.F. Gemunder, dated as of April 6,
2006* | | Form 8-K
April 12, 2006 |
E-5
INDEX OF EXHIBITS
| | | | |
Number and Description of Exhibit
(Numbers Coincide with Item 601 of Regulation S-K) | | Document Incorporated by Reference
from a Previous Filing, Filed Herewith
or Furnished Herewith, as Indicated
Below |
| |
|
| | | | |
(10.24) | | Amendment to Employment Agreement
with P. E. Keefe, dated as of April 6,
2006* | | Form 8-K
April 12, 2006 |
| | | | |
(10.25) | | Amendment to Employment Agreement
with C.D. Hodges, dated as of April 6,
2006* | | Form 8-K
April 12, 2006 |
| | | | |
(10.26) | | Form of Stock Option Award Letter* | | Form 8-K
December 1, 2004 |
| | | | |
(10.27) | | Form of Restricted Stock Award Letter
(Executive Officers)* | | Form 8-K
March 29, 2005 |
| | | | |
(10.28) | | Form of Restricted Stock Award Letter
(Employees Other Than Executive
Officers)* | | Form 8-K
March 29, 2005 |
| | | | |
(10.29) | | Prime Vendor Agreement with
McKesson, dated as of
December 23, 2003** | | Form 10-K
March 15, 2004 |
| | | | |
(10.30) | | Summary of Non-Employee Director
Compensation* | | Form 10-K
March 16, 2005 |
E-6
INDEX OF EXHIBITS
| | | | |
Number and Description of Exhibit
(Numbers Coincide with Item 601 of Regulation S-K) | | Document Incorporated by Reference
from a Previous Filing, Filed Herewith
or Furnished Herewith, as Indicated
Below |
| |
|
| | | | |
(10.31) | | Credit Agreement, dated as of July 28,
2005, among Omnicare, Inc., as
borrower, the lenders named therein,
JPMorgan Chase Bank, N.A., as a joint
syndication agent, Lehman Brothers
Inc., as a joint syndication agent, CIBC
World Markets Corp., as a co-
documentation agent, Merrill Lynch,
Pierce, Fenner & Smith Incorporated, as
a co-documentation agent, Wachovia
Capital Markets, LLC, as a co-
documentation agent, and SunTrust
Bank, as administrative agent. | | Form 8-K
August 3, 2005 |
| | | | |
(10.32) | | Employment Agreement with G. C.
Laschober, dated as of August 5, 2005* | | Form 8-K
August 11, 2005 |
| | | | |
(10.33) | | Form of Amended and Restated
Employment Agreement with T.E. Bien,
dated as of February 17, 2006* | | Form 10-K
March 16, 2006 |
| | | | |
(10.34) | | Employment Agreement with L.P. Finn
III, dated as of August 21, 1997* | | Form 10-K
March 1, 2007 |
| | | | |
(10.35) | | Letter Agreement, dated February 21,
2008, by and among Omnicare, Inc.,
ValueAct Capital Master Fund, L.P. and
ValueAct Capital Master Fund III, L.P. | | Form 8-K
February 22, 2008 |
| | | | |
(12) | | Statement of Computation of Ratio of
Earnings to Fixed Charges | | Filed Herewith |
| | | | |
(21) | | Subsidiaries of Omnicare, Inc. | | Filed Herewith |
| | | | |
(23) | | Consent of Independent Registered
Public Accounting Firm
(PricewaterhouseCoopers LLP) | | Filed Herewith |
E-7
INDEX OF EXHIBITS
| | | | |
Number and Description of Exhibit
(Numbers Coincide with Item 601 of Regulation S-K) | | Document Incorporated by Reference
from a Previous Filing, Filed Herewith
or Furnished Herewith, as Indicated
Below |
| |
|
| | | | |
(24) | | Powers of Attorney | | Filed Herewith |
| | | | |
(31.1) | | Rule 13a-14(a) Certification of Chief
Executive Officer of Omnicare, Inc. in
accordance with Section 302 of the
Sarbanes-Oxley Act of 2002 | | Filed Herewith |
| | | | |
(31.2) | | Rule 13a-14(a) Certification of Chief
Financial Officer of Omnicare, Inc. in
accordance with Section 302 of the
Sarbanes-Oxley Act of 2002 | | Filed Herewith |
| | | | |
(32.1) | | Section 1350 Certification of Chief
Executive Officer of Omnicare, Inc. in
accordance with Section 906 of the
Sarbanes-Oxley Act of 2002*** | | Furnished Herewith |
| | | | |
(32.2) | | Section 1350 Certification of Chief
Financial Officer of Omnicare, Inc. in
accordance with Section 906 of the
Sarbanes-Oxley Act of 2002*** | | Furnished Herewith |
|
* Indicates management contract or compensatory arrangement. |
|
** Confidential treatment requested as to certain portions, which portions have been filed separately with the Securities and Exchange Commission. |
|
*** A signed original of this written statement required by Section 906 has been provided to Omnicare, Inc. and will be retained by Omnicare, Inc. and furnished to the Securities and Exchange Commission or its staff upon request. |
E-8