UNITED STATES
SECURITIES AND EXCHANGE COMMISSION
Washington, D.C. 20549
FORM N-CSR
CERTIFIED SHAREHOLDER REPORT OF REGISTERED
MANAGEMENT INVESTMENT COMPANIES
Investment Company Act file number 811-2460
Fidelity Union Street Trust
(Exact name of registrant as specified in charter)
82 Devonshire St., Boston, Massachusetts 02109
(Address of principal executive offices) (Zip code)
Eric D. Roiter, Secretary
82 Devonshire St.
Boston, Massachusetts 02109
(Name and address of agent for service)
Registrant's telephone number, including area code: 617-563-7000
Date of fiscal year end: | August 31 |
| |
Date of reporting period: | August 31, 2004 |
Item 1. Reports to Stockholders
Fidelity®
Export and Multinational
Fund
Annual Report
August 31, 2004
(2_fidelity_logos) (Registered_Trademark)
Contents
Chairman's Message | <Click Here> | Ned Johnson's message to shareholders. |
Performance | <Click Here> | How the fund has done over time. |
Management's Discussion | <Click Here> | The manager's review of fund performance, strategy and outlook. |
Shareholder Expense Example | <Click Here> | An example of shareholder expenses. |
Investment Changes | <Click Here> | A summary of the major shifts in the fund's investments over the past six months. |
Investments | <Click Here> | A complete list of the fund's investments with their market values. |
Financial Statements | <Click Here> | Statements of assets and liabilities, operations, and changes in net assets,
as well as financial highlights. |
Notes | <Click Here> | Notes to the financial statements. |
Report of Independent Registered Public Accounting Firm | <Click Here> | |
Trustees and Officers | <Click Here> | |
Distributions | <Click Here> | |
To view a fund's proxy voting guidelines and proxy voting record for the 12-month period ended June 30, visit www.fidelity.com/proxyvotingresults or visit the Securities and Exchange Commission's (SEC) web site at www.sec.gov. You may also call 1-800-544-8544 to request a free copy of the proxy voting guidelines.
Standard & Poor's, S&P and S&P 500 are registered service marks of The McGraw-Hill Companies, Inc. and have been licensed for use by Fidelity Distributors Corporation.
Other third party marks appearing herein are the property of their respective owners.
All other marks appearing herein are registered or unregistered trademarks or service marks of FMR Corp. or an affiliated company.
(Recycle graphic) This report is printed on recycled paper using soy-based inks.
Annual Report
This report and the financial statements contained herein are submitted for the general information of the shareholders of the fund. This report is not authorized for distribution to prospective investors in the fund unless preceded or accompanied by an effective prospectus.
Commencing with the fiscal quarter ending November 30, 2004, the fund files its complete schedule of portfolio holdings with the SEC for the first and third quarters of each fiscal year on Form N-Q. Forms N-Q are available on the SEC's web site at http://www.sec.gov. The fund's Forms N-Q may be reviewed and copied at the SEC's Public Reference Room in Washington, DC. Information regarding the operation of the SEC's Public Reference Room may be obtained by calling 1-800-SEC-0330. For a complete list of the fund's portfolio holdings, view the fund's most recent quarterly holdings report, semiannual report, or annual report on Fidelity's web site at http://www.fidelity.com/holdings.
NOT FDIC INSURED · MAY LOSE VALUE · NO BANK GUARANTEE
Neither the fund nor Fidelity Distributors Corporation is a bank.
Annual Report
Chairman's Message
(photo_of_Edward_C_Johnson_3d)
Dear Shareholder:
Many of you have read or heard news stories recently that were critical of mutual funds and made allegations that the mutual fund industry has been less than forthright. I find these reports unsettling and not necessarily an accurate picture of the overall industry, and I would like you to know where we at Fidelity stand.
With specific regard to allegations that certain mutual fund companies were violating the Securities and Exchange Commission's forward pricing rules or were involved in so-called "market timing" activities, I want to say two things:
First, Fidelity does not have agreements that permit customers who buy fund shares after 4 p.m. to obtain the 4 p.m. price. This is not to say that someone could not deceive the company through fraudulent acts. But I underscore that we have no so-called "agreements" which would permit this illegal practice.
Second, Fidelity has been on record for years opposing predatory short-term trading which adversely affects other shareholders in a mutual fund. In fact, in the 1980s, we began charging a fee - which is returned to the fund and, therefore, to investors - to discourage this activity. What's more, several years ago we took the industry lead in developing a Fair Value Pricing Policy to prevent market timing on foreign securities in our funds. It is reasonable to assume that another structure can be developed that would alter the system to make it much more difficult for predatory traders to operate. This, however, will only be achieved through close cooperation among regulators, legislators and the industry.
Certainly no industry is perfect, and there have been instances of unethical and illegal activity from time to time within the mutual fund industry. When this occurs, confessed or convicted offenders should be dealt with appropriately. Clearly, every system can be improved. We applaud well thought out improvements by regulators, legislators and industry representatives that achieve the common goal of building and protecting the value of investors' holdings. But we remain concerned about the risk of over-regulation and the quick application of simplistic solutions to intricate problems.
For more than 57 years, Fidelity Investments has worked very hard to improve its products and service to justify your trust. When our family founded this company in 1946, we had only a few hundred customers. Many of them were family and friends. Today, we serve more than 18 million customers including individual investors and participants in retirement plans across America.
Let me close by saying that we do not take your trust in us for granted, and we realize that we must always work to improve all aspects of our service to you. In turn, we urge you to continue your active participation with your financial matters, so that your interests can be well served.
Best regards,
/s/Edward C. Johnson 3d
Edward C. Johnson 3d
Annual Report
Performance: The Bottom Line
Average annual total return reflects the change in the value of an investment, assuming reinvestment of the fund's dividend income and capital gains (the profits earned upon the sale of securities that have grown in value) and assuming a constant rate of performance each year. The $10,000 table and the fund's returns do not reflect the deduction of taxes that a shareholder would pay on fund distributions or the redemption of fund shares. During periods of reimbursement by Fidelity, a fund's total return will be greater than it would be had the reimbursement not occurred. How a fund did yesterday is no guarantee of how it will do tomorrow.
Average Annual Total Returns
Periods ended August 31, 2004 | Past 1
year | Past 5
years | Life of
fund A |
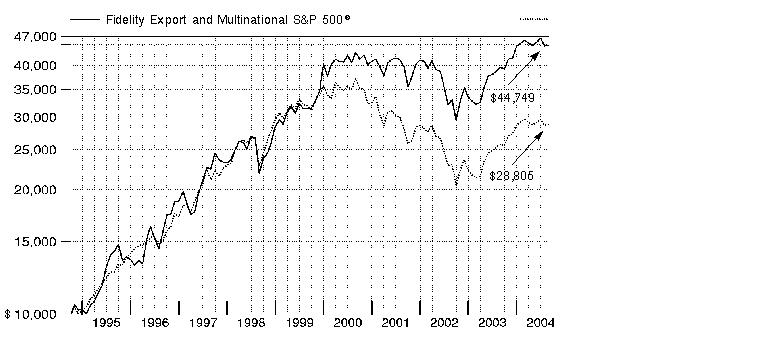
Fidelity® Export and Multinational Fund | 13.03% | 7.26% | 16.32% |
A From October 4, 1994
$10,000 Over Life of Fund
Let's say hypothetically that $10,000 was invested in Fidelity® Export and Multinational Fund on October 4, 1994, when the fund started. The chart shows how the value of your investment would have grown, and also shows how the Standard & Poor's 500SM Index did over the same period.
Annual Report
Management's Discussion of Fund Performance
Comments from Tim Cohen, Portfolio Manager of Fidelity® Export and Multinational Fund
Oil prices, employment data, the economy and corporate earnings shaped the equity markets' erratic behavior during the 12-month period ending August 31, 2004. Stocks overall, as measured by the Standard & Poor's 500SM Index, had seven months of gains and five months of losses for the year. Most of the advances came in the period's first half, when the S&P 500® registered five consecutive months of positive returns from October 2003 through February 2004. An improving domestic economy and better corporate profits were key contributors to the broad equity market rally. However, the markets see-sawed in the period's second half - three months up, three months down - and generally finished with losses in that time frame. Record-high oil prices shook investors, as did two Federal Reserve Board interest rate hikes and the disappointing earnings of several major technology companies. Still, for the year overall, the S&P 500 gained 11.46%, the Dow Jones Industrial AverageSM rose 10.33% and the tech-heavy NASDAQ Composite® Index returned 2.05%.
Fidelity Export and Multinational Fund returned 13.03% during the 12-month period ending August 31, 2004, outperforming the 11.46% return for the S&P 500 and the 6.55% advance of the LipperSM Growth Funds Average. The largest contributors to the fund's relative performance came from an overweighting and better stock selection in two sectors that were among the market's best-performing groups during the past year: materials and energy. Major contributors to the fund's performance from these two sectors included steel producer Nucor, copper producer Phelps Dodge, energy services company National-Oilwell, and oil and gas producer Burlington Resources. Overweighting selected insurance stocks that produced double-digit returns, such as American International Group and ACE Ltd., also worked out favorably. In terms of disappointments, overweighting information technology stocks was the fund's biggest setback. Semiconductor giant Intel, semiconductor equipment manufacturer Teradyne and disk-drive maker Western Digital were notable detractors. The portfolio's lack of exposure to utilities and telecommunications stocks also held back its relative results, as these two sectors performed quite well.
The views expressed in this statement reflect those of the portfolio manager only through the end of the period of the report as stated on the cover and do not necessarily represent the views of Fidelity or any other person in the Fidelity organization. Any such views are subject to change at any time based upon market or other conditions and Fidelity disclaims any responsibility to update such views. These views may not be relied on as investment advice and, because investment decisions for a Fidelity fund are based on numerous factors, may not be relied on as an indication of trading intent on behalf of any Fidelity fund.
Annual Report
Shareholder Expense Example
As a shareholder of the Fund, you incur two types of costs: (1) transaction costs, including redemption fees, and (2) ongoing costs, including management fees and other Fund expenses. This Example is intended to help you understand your ongoing costs (in dollars) of investing in the Fund and to compare these costs with the ongoing costs of investing in other mutual funds.
The Example is based on an investment of $1,000 invested at the beginning of the period and held for the entire period (March 1, 2004 to August 31, 2004).
Actual Expenses
The first line of the table below provides information about actual account values and actual expenses. You may use the information in this line, together with the amount you invested, to estimate the expenses that you paid over the period. Simply divide your account value by $1,000.00 (for example, an $8,600 account value divided by $1,000.00 = 8.6), then multiply the result by the number in the first line under the heading entitled "Expenses Paid During Period" to estimate the expenses you paid on your account during this period. A small balance maintenance fee of $12.00 that is charged once a year may apply for certain accounts with a value of less than $2,000. This fee is not included in the table below. If it was, the estimate of expenses you paid during the period would be higher, and your ending account value lower, by this amount.
Hypothetical Example for Comparison Purposes
The second line of the table below provides information about hypothetical account values and hypothetical expenses based on the Fund's actual expense ratio and an assumed rate of return of 5% per year before expenses, which is not the Fund's actual return. The hypothetical account values and expenses may not be used to estimate the actual ending account balance or expenses you paid for the period. You may use this information to compare the ongoing costs of investing in the Fund and other funds. To do so, compare this 5% hypothetical example with the 5% hypothetical examples that appear in the shareholder reports of the other funds. A small balance maintenance fee of $12.00 that is charged once a year may apply for certain accounts with a value of less than $2,000. This fee is not included in the table below. If it was, the estimate of expenses you paid during the period would be higher, and your ending account value lower, by this amount.
Please note that the expenses shown in the table are meant to highlight your ongoing costs only and do not reflect any transaction costs. Therefore, the second line of the table is useful in comparing ongoing costs only, and will not help you determine the relative total costs of owning different funds. In addition, if these transactional costs were included, your costs would have been higher.
| Beginning
Account Value
March 1, 2004 | Ending
Account Value
August 31, 2004 | Expenses Paid
During Period *
March 1, 2004
to August 31, 2004 |
Actual | $ 1,000.00 | $ 971.30 | $ 4.26 |
Hypothetical (5% return per year before expenses) | $ 1,000.00 | $ 1,020.62 | $ 4.38 |
* Expenses are equal to the Fund's annualized expense ratio of .86%; multiplied by the average account value over the period, multiplied by 184/366 (to reflect the one-half year period).
Annual Report
Investment Changes
Top Ten Stocks as of August 31, 2004 |
| % of fund's
net assets | % of fund's net assets
6 months ago |
American International Group, Inc. | 5.6 | 5.8 |
Microsoft Corp. | 4.7 | 4.7 |
UnitedHealth Group, Inc. | 3.5 | 2.1 |
Pfizer, Inc. | 3.0 | 3.1 |
Home Depot, Inc. | 2.8 | 1.8 |
AMBAC Financial Group, Inc. | 2.6 | 2.2 |
Morgan Stanley | 2.5 | 1.6 |
Procter & Gamble Co. | 2.4 | 2.3 |
ACE Ltd. | 2.2 | 1.7 |
Intel Corp. | 2.1 | 2.4 |
| 31.4 | |
Top Five Market Sectors as of August 31, 2004 |
| % of fund's
net assets | % of fund's net assets
6 months ago |
Financials | 26.5 | 20.3 |
Information Technology | 19.9 | 22.0 |
Health Care | 14.4 | 11.7 |
Industrials | 9.8 | 9.9 |
Consumer Discretionary | 9.3 | 10.9 |
Asset Allocation (% of fund's net assets) |
As of August 31, 2004 * | As of February 29, 2004 ** |
 | Stocks 99.2% | | | Stocks 99.2% | |
 | Short-Term
Investments and
Net Other Assets 0.8% | | | Short-Term
Investments and
Net Other Assets 0.8% | |
* Foreign
investments | 8.1% | | ** Foreign
investments | 11.1% | |

Annual Report
Investments August 31, 2004
Showing Percentage of Net Assets
Common Stocks - 99.2% |
| Shares | | Value (Note 1) (000s) |
CONSUMER DISCRETIONARY - 9.3% |
Hotels, Restaurants & Leisure - 0.1% |
Starbucks Corp. (a) | 33,800 | | $ 1,462 |
Household Durables - 1.7% |
D.R. Horton, Inc. | 265,100 | | 8,202 |
KB Home | 94,870 | | 6,524 |
Toll Brothers, Inc. (a) | 153,540 | | 6,816 |
| | 21,542 |
Internet & Catalog Retail - 0.8% |
Amazon.com, Inc. (a) | 246,000 | | 9,382 |
Media - 3.3% |
ADVO, Inc. | 37,100 | | 1,097 |
Emmis Communications Corp. Class A (a) | 244,100 | | 4,699 |
Fox Entertainment Group, Inc. Class A (a) | 140,500 | | 3,813 |
Lamar Advertising Co. Class A (a) | 131,900 | | 5,763 |
News Corp. Ltd. ADR | 206,100 | | 6,441 |
Univision Communications, Inc. Class A (a) | 604,100 | | 19,935 |
| | 41,748 |
Specialty Retail - 3.4% |
Aeropostale, Inc. (a) | 175,160 | | 5,456 |
Home Depot, Inc. | 968,800 | | 35,419 |
Ross Stores, Inc. | 101,500 | | 2,147 |
| | 43,022 |
TOTAL CONSUMER DISCRETIONARY | | 117,156 |
CONSUMER STAPLES - 4.3% |
Food & Staples Retailing - 0.5% |
Safeway, Inc. (a) | 309,400 | | 6,250 |
Food Products - 0.3% |
Bunge Ltd. | 96,400 | | 3,845 |
Household Products - 3.2% |
Colgate-Palmolive Co. | 189,300 | | 10,222 |
Procter & Gamble Co. | 531,900 | | 29,770 |
| | 39,992 |
Personal Products - 0.3% |
Estee Lauder Companies, Inc. Class A | 83,540 | | 3,672 |
TOTAL CONSUMER STAPLES | | 53,759 |
Common Stocks - continued |
| Shares | | Value (Note 1) (000s) |
ENERGY - 6.7% |
Energy Equipment & Services - 5.4% |
BJ Services Co. (d) | 100,200 | | $ 4,815 |
Cooper Cameron Corp. (a) | 89,300 | | 4,548 |
Grant Prideco, Inc. (a) | 274,100 | | 5,008 |
Halliburton Co. | 325,300 | | 9,489 |
Nabors Industries Ltd. (a) | 109,600 | | 4,833 |
National-Oilwell, Inc. (a) | 229,700 | | 6,868 |
Noble Corp. (a) | 152,200 | | 6,121 |
Pride International, Inc. (a) | 187,900 | | 3,450 |
Schlumberger Ltd. (NY Shares) | 60,500 | | 3,739 |
Smith International, Inc. (a) | 127,600 | | 7,271 |
Transocean, Inc. (a) | 133,600 | | 4,102 |
Varco International, Inc. (a) | 181,650 | | 4,410 |
Weatherford International Ltd. (a) | 80,150 | | 3,714 |
| | 68,368 |
Oil & Gas - 1.3% |
BP PLC sponsored ADR | 72,100 | | 3,872 |
Burlington Resources, Inc. | 103,700 | | 3,757 |
Occidental Petroleum Corp. | 98,400 | | 5,082 |
Total SA sponsored ADR | 38,400 | | 3,763 |
| | 16,474 |
TOTAL ENERGY | | 84,842 |
FINANCIALS - 26.5% |
Capital Markets - 7.0% |
E*TRADE Financial Corp. (a) | 570,600 | | 6,722 |
Goldman Sachs Group, Inc. | 272,500 | | 24,430 |
Lehman Brothers Holdings, Inc. | 112,300 | | 8,298 |
Merrill Lynch & Co., Inc. | 323,600 | | 16,526 |
Morgan Stanley | 629,790 | | 31,949 |
| | 87,925 |
Commercial Banks - 1.2% |
Bank of America Corp. | 322,720 | | 14,516 |
Consumer Finance - 1.0% |
MBNA Corp. | 537,500 | | 12,975 |
Insurance - 14.5% |
ACE Ltd. | 710,880 | | 27,404 |
AMBAC Financial Group, Inc. | 444,200 | | 33,537 |
American International Group, Inc. | 992,000 | | 70,672 |
Common Stocks - continued |
| Shares | | Value (Note 1) (000s) |
FINANCIALS - continued |
Insurance - continued |
PartnerRe Ltd. | 218,600 | | $ 11,221 |
W.R. Berkley Corp. | 487,900 | | 19,701 |
XL Capital Ltd. Class A | 298,155 | | 20,930 |
| | 183,465 |
Thrifts & Mortgage Finance - 2.8% |
Fannie Mae | 352,500 | | 26,244 |
Golden West Financial Corp., Delaware | 87,400 | | 9,459 |
| | 35,703 |
TOTAL FINANCIALS | | 334,584 |
HEALTH CARE - 14.4% |
Biotechnology - 2.2% |
Cephalon, Inc. (a) | 120,000 | | 5,641 |
Genentech, Inc. (a) | 344,200 | | 16,790 |
Millennium Pharmaceuticals, Inc. (a) | 179,900 | | 2,139 |
OSI Pharmaceuticals, Inc. (a) | 56,900 | | 3,391 |
| | 27,961 |
Health Care Equipment & Supplies - 1.4% |
Kinetic Concepts, Inc. | 103,700 | | 5,161 |
Medtronic, Inc. | 259,200 | | 12,895 |
| | 18,056 |
Health Care Providers & Services - 5.3% |
Caremark Rx, Inc. (a) | 191,000 | | 5,482 |
Covance, Inc. (a) | 170,500 | | 6,385 |
PacifiCare Health Systems, Inc. (a) | 128,600 | | 4,194 |
Pediatrix Medical Group, Inc. (a) | 90,900 | | 6,372 |
UnitedHealth Group, Inc. | 665,400 | | 44,003 |
| | 66,436 |
Pharmaceuticals - 5.5% |
Barr Pharmaceuticals, Inc. (a) | 332,900 | | 13,073 |
Johnson & Johnson | 95,300 | | 5,537 |
Pfizer, Inc. | 1,139,167 | | 37,217 |
Wyeth | 373,100 | | 13,644 |
| | 69,471 |
TOTAL HEALTH CARE | | 181,924 |
Common Stocks - continued |
| Shares | | Value (Note 1) (000s) |
INDUSTRIALS - 9.8% |
Aerospace & Defense - 2.2% |
Embraer - Empresa Brasileira de Aeronautica SA sponsored ADR | 174,700 | | $ 4,638 |
Honeywell International, Inc. | 625,700 | | 22,513 |
| | 27,151 |
Commercial Services & Supplies - 4.6% |
Apollo Group, Inc. Class A (a) | 91,990 | | 7,175 |
Bright Horizons Family Solutions, Inc. (a) | 128,821 | | 6,375 |
Cintas Corp. | 296,200 | | 12,147 |
Education Management Corp. (a) | 176,900 | | 5,141 |
Robert Half International, Inc. | 959,100 | | 23,498 |
Strayer Education, Inc. | 33,700 | | 3,505 |
| | 57,841 |
Construction & Engineering - 1.0% |
Chicago Bridge & Iron Co. NV | 252,600 | | 7,487 |
Fluor Corp. | 127,200 | | 5,438 |
| | 12,925 |
Industrial Conglomerates - 2.0% |
Tyco International Ltd. | 809,800 | | 25,363 |
TOTAL INDUSTRIALS | | 123,280 |
INFORMATION TECHNOLOGY - 19.9% |
Communications Equipment - 2.5% |
Cisco Systems, Inc. (a) | 1,281,100 | | 24,033 |
Emulex Corp. (a) | 244,400 | | 2,593 |
QLogic Corp. (a) | 116,400 | | 3,039 |
Scientific-Atlanta, Inc. | 83,400 | | 2,272 |
| | 31,937 |
Computers & Peripherals - 3.0% |
Dell, Inc. (a) | 670,595 | | 23,364 |
Diebold, Inc. | 157,000 | | 7,676 |
EMC Corp. (a) | 653,300 | | 7,036 |
| | 38,076 |
Electronic Equipment & Instruments - 0.6% |
Amphenol Corp. Class A (a) | 228,400 | | 6,866 |
Internet Software & Services - 0.6% |
Google, Inc. Class A | 72,000 | | 7,376 |
Common Stocks - continued |
| Shares | | Value (Note 1) (000s) |
INFORMATION TECHNOLOGY - continued |
IT Services - 1.6% |
Affiliated Computer Services, Inc. Class A (a) | 232,100 | | $ 12,610 |
Paychex, Inc. | 243,600 | | 7,228 |
| | 19,838 |
Semiconductors & Semiconductor Equipment - 5.2% |
Agere Systems, Inc.: | | | |
Class A (a) | 824,700 | | 998 |
Class B (a) | 1,145,000 | | 1,363 |
Analog Devices, Inc. | 214,200 | | 7,437 |
Axcelis Technologies, Inc. (a) | 306,400 | | 2,390 |
FormFactor, Inc. (a) | 217,600 | | 3,808 |
Intel Corp. | 1,263,500 | | 26,900 |
KLA-Tencor Corp. (a) | 341,100 | | 12,743 |
National Semiconductor Corp. (a) | 553,000 | | 7,371 |
Teradyne, Inc. (a) | 232,400 | | 2,991 |
| | 66,001 |
Software - 6.4% |
BEA Systems, Inc. (a) | 521,400 | | 3,441 |
Concur Technologies, Inc. (a) | 664,322 | | 6,975 |
Microsoft Corp. | 2,191,600 | | 59,831 |
Oracle Corp. (a) | 1,053,200 | | 10,500 |
| | 80,747 |
TOTAL INFORMATION TECHNOLOGY | | 250,841 |
MATERIALS - 8.3% |
Chemicals - 2.8% |
Dow Chemical Co. | 460,100 | | 19,697 |
Lyondell Chemical Co. | 330,200 | | 6,502 |
Millennium Chemicals, Inc. (a) | 314,100 | | 5,858 |
Olin Corp. | 213,100 | | 3,599 |
| | 35,656 |
Metals & Mining - 5.5% |
Alcoa, Inc. | 433,900 | | 14,050 |
Freeport-McMoRan Copper & Gold, Inc. Class B | 129,400 | | 4,869 |
Gerdau SA sponsored ADR | 540,200 | | 8,886 |
Inmet Mining Corp. (a) | 392,400 | | 5,515 |
Nucor Corp. | 241,000 | | 18,868 |
Common Stocks - continued |
| Shares | | Value (Note 1) (000s) |
MATERIALS - continued |
Metals & Mining - continued |
Phelps Dodge Corp. | 102,700 | | $ 8,376 |
Rio Tinto PLC sponsored ADR | 82,250 | | 8,355 |
| | 68,919 |
TOTAL MATERIALS | | 104,575 |
TOTAL COMMON STOCKS (Cost $1,169,768) | 1,250,961 |
Money Market Funds - 1.1% |
| | | |
Fidelity Cash Central Fund, 1.53% (b) | 12,104,416 | | 12,104 |
Fidelity Securities Lending Cash Central Fund, 1.49% (b)(c) | 1,504,125 | | 1,504 |
TOTAL MONEY MARKET FUNDS (Cost $13,608) | 13,608 |
TOTAL INVESTMENT PORTFOLIO - 100.3% (Cost $1,183,376) | | 1,264,569 |
NET OTHER ASSETS - (0.3)% | | (3,439) |
NET ASSETS - 100% | $ 1,261,130 |
Legend |
(a) Non-income producing |
(b) Affiliated fund that is available only to investment companies and other accounts managed by Fidelity Investments. The rate quoted is the annualized seven-day yield of the fund at period end. A complete listing of the fund's holdings as of its most recent fiscal year end is available upon request. |
(c) Includes investment made with cash collateral received from securities on loan. |
(d) Security or a portion of the security is on loan at period end. |
Income Tax Information |
The fund hereby designates approximately $168,000 as a capital gain dividend for the purpose of the dividend paid deduction. |
See accompanying notes which are an integral part of the financial statements.
Annual Report
Financial Statements
Statement of Assets and Liabilities
Amounts in thousands (except per-share amount) | August 31, 2004 |
| | |
Assets | | |
Investment in securities, at value (including securities loaned of $1,514) (cost $1,183,376) - See accompanying schedule | | $ 1,264,569 |
Receivable for investments sold | | 909 |
Receivable for fund shares sold | | 2,580 |
Dividends receivable | | 1,452 |
Interest receivable | | 13 |
Prepaid expenses | | 1 |
Other receivables | | 179 |
Total assets | | 1,269,703 |
| | |
Liabilities | | |
Payable for investments purchased | $ 5,527 | |
Payable for fund shares redeemed | 603 | |
Accrued management fee | 589 | |
Other affiliated payables | 272 | |
Other payables and accrued expenses | 78 | |
Collateral on securities loaned, at value | 1,504 | |
Total liabilities | | 8,573 |
| | |
Net Assets | | $ 1,261,130 |
Net Assets consist of: | | |
Paid in capital | | $ 1,142,821 |
Undistributed net investment income | | 411 |
Accumulated undistributed net realized gain (loss) on investments and foreign currency transactions | | 36,705 |
Net unrealized appreciation (depreciation) on investments | | 81,193 |
Net Assets, for 69,025 shares outstanding | | $ 1,261,130 |
Net Asset Value, offering price and redemption price per share ($1,261,130 ÷ 69,025 shares) | | $ 18.27 |
See accompanying notes which are an integral part of the financial statements.
Annual Report
Financial Statements - continued
Statement of Operations
Amounts in thousands | Year ended August 31, 2004 |
| | |
Investment Income | | |
Dividends | | $ 10,628 |
Interest | | 131 |
Security lending | | 41 |
Total income | | 10,800 |
| | |
Expenses | | |
Management fee | $ 6,343 | |
Transfer agent fees | 2,577 | |
Accounting and security lending fees | 331 | |
Non-interested trustees' compensation | 6 | |
Custodian fees and expenses | 41 | |
Registration fees | 134 | |
Audit | 47 | |
Legal | 8 | |
Interest | 1 | |
Miscellaneous | 6 | |
Total expenses before reductions | 9,494 | |
Expense reductions | (369) | 9,125 |
Net investment income (loss) | | 1,675 |
Realized and Unrealized Gain (Loss) Net realized gain (loss) on: | | |
Investment securities | 104,902 | |
Foreign currency transactions | 49 | |
Total net realized gain (loss) | | 104,951 |
Change in net unrealized appreciation (depreciation) on investment securities | | 7,945 |
Net gain (loss) | | 112,896 |
Net increase (decrease) in net assets resulting from operations | | $ 114,571 |
See accompanying notes which are an integral part of the financial statements.
Annual Report
Statement of Changes in Net Assets
Amounts in thousands | Year ended
August 31,
2004 | Year ended
August 31,
2003 |
Increase (Decrease) in Net Assets | | |
Operations | | |
Net investment income (loss) | $ 1,675 | $ 4,314 |
Net realized gain (loss) | 104,951 | 6,754 |
Change in net unrealized appreciation (depreciation) | 7,945 | 125,534 |
Net increase (decrease) in net assets resulting
from operations | 114,571 | 136,602 |
Distributions to shareholders from net investment income | (3,865) | (2,415) |
Share transactions
Net proceeds from sales of shares | 540,782 | 315,638 |
Reinvestment of distributions | 3,734 | 2,328 |
Cost of shares redeemed | (266,094) | (183,685) |
Net increase (decrease) in net assets resulting from share transactions | 278,422 | 134,281 |
Redemption fees | 66 | 43 |
Total increase (decrease) in net assets | 389,194 | 268,511 |
| | |
Net Assets | | |
Beginning of period | 871,936 | 603,425 |
End of period (including undistributed net investment income of $411 and undistributed net investment income of $2,564, respectively) | $ 1,261,130 | $ 871,936 |
Other Information Shares | | |
Sold | 29,976 | 22,128 |
Issued in reinvestment of distributions | 220 | 178 |
Redeemed | (14,906) | (12,979) |
Net increase (decrease) | 15,290 | 9,327 |
See accompanying notes which are an integral part of the financial statements.
Annual Report
Financial Highlights
Years ended August 31, | 2004 | 2003 | 2002 | 2001 | 2000 |
Selected Per-Share Data | | | | | |
Net asset value, beginning of period | $ 16.23 | $ 13.59 | $ 16.39 | $ 23.45 | $ 22.03 |
Income from Investment Operations | | | | | |
Net investment income (loss) C | .03 | .09 | .03 | .04 | .08 |
Net realized and unrealized gain (loss) | 2.08 | 2.60 | (2.80) | (1.79) | 6.19 |
Total from investment operations | 2.11 | 2.69 | (2.77) | (1.75) | 6.27 |
Distributions from net investment income | (.07) | (.05) | (.03) | (.10) | (.05) |
Distributions from net realized gain | - | - | - | (5.21) | (4.80) |
Total distributions | (.07) | (.05) | (.03) | (5.31) | (4.85) |
Redemption fees added to
paid in capital C, E | - | - | - | - | - |
Net asset value, end of period | $ 18.27 | $ 16.23 | $ 13.59 | $ 16.39 | $ 23.45 |
Total Return A, B | 13.03% | 19.88% | (16.93)% | (7.69)% | 36.58% |
Ratios to Average Net Assets D | | | | | |
Expenses before expense reductions | .86% | .91% | .89% | .86% | .86% |
Expenses net of voluntary waivers, if any | .86% | .91% | .89% | .86% | .86% |
Expenses net of all reductions | .83% | .84% | .78% | .81% | .77% |
Net investment income (loss) | .15% | .60% | .19% | .21% | .38% |
Supplemental Data | | | | | |
Net assets, end of period
(in millions) | $ 1,261 | $ 872 | $ 603 | $ 565 | $ 538 |
Portfolio turnover rate | 96% | 139% | 228% | 170% | 380% |
A Total returns would have been lower had certain expenses not been reduced during the periods shown.
B Total returns do not include the effect of the former sales charges.
C Calculated based on average shares outstanding during the period.
D Expense ratios reflect operating expenses of the fund. Expenses before reductions do not reflect amounts reimbursed by the investment adviser or reductions from brokerage service arrangements or other expense offset arrangements and do not represent the amount paid by the fund during periods when reimbursements or reductions occur. Expenses net of any voluntary waivers reflect expenses after reimbursement by the investment adviser but prior to reductions from brokerage service arrangements or other expense offset arrangements. Expenses net of all reductions represent the net expenses paid by the fund.
E Amount represents less than $.01 per share.
See accompanying notes which are an integral part of the financial statements.
Annual Report
Notes to Financial Statements
For the period ended August 31, 2004
(Amounts in thousands except ratios)
1. Significant Accounting Policies.
Fidelity Export and Multinational Fund (the fund) is a fund of Fidelity Union Street Trust (the trust) and is authorized to issue an unlimited number of shares. The trust is registered under the Investment Company Act of 1940, as amended (the 1940 Act), as an open-end management investment company organized as a Massachusetts business trust. The financial statements have been prepared in conformity with accounting principles generally accepted in the United States of America, which require management to make certain estimates and assumptions at the date of the financial statements. The following summarizes the significant accounting policies of the fund:
Security Valuation. Net asset value per share (NAV calculation) is calculated as of the close of business of the New York Stock Exchange, normally 4:00 p.m. Eastern time. Equity securities, including restricted securities, for which market quotations are available are valued at the last sale price or official closing price (closing bid price or last evaluated quote if no sale has occurred) on the primary market or exchange on which they trade. If prices are not readily available or do not accurately reflect fair value for a security, or if a security's value has been materially affected by events occurring after the close of the exchange or market on which the security is principally traded, that security may be valued by another method that the Board of Trustees believes accurately reflects fair value. A security's valuation may differ depending on the method used for determining value. Price movements in futures contracts and ADRs, market and trading trends, the bid/ask quotes of brokers and off-exchange institutional trading may be reviewed in the course of making a good faith determination of a security's fair value. Short-term securities with remaining maturities of sixty days or less for which quotations are not readily available are valued on the basis of amortized cost. Investments in open-end investment companies are valued at their net asset value each business day.
Foreign Currency. The fund uses foreign currency contracts to facilitate transactions in foreign-denominated securities. Losses from these transactions may arise from changes in the value of the foreign currency or if the counterparties do not perform under the contracts' terms.
Foreign-denominated assets, including investment securities, and liabilities are translated into U.S. dollars at the exchange rate at period end. Purchases and sales of investment securities, income and dividends received and expenses denominated in foreign currencies are translated into U.S. dollars at the exchange rate in effect on the transaction date.
The effects of exchange rate fluctuations on investments are included with the net realized and unrealized gain (loss) on investment securities. Other foreign currency transactions resulting in realized and unrealized gain (loss) are disclosed separately.
Annual Report
Notes to Financial Statements - continued
(Amounts in thousands except ratios)
1. Significant Accounting Policies - continued
Investment Transactions and Income. Security transactions are accounted for as of trade date. Gains and losses on securities sold are determined on the basis of identified cost and may include proceeds received from litigation. Dividend income is recorded on the ex-dividend date, except for certain dividends from foreign securities where the ex-dividend date may have passed, which are recorded as soon as the fund is informed of the ex-dividend date. Non-cash dividends included in dividend income, if any, are recorded at the fair market value of the securities received. Distributions received on securities that represent a return of capital or capital gain are recorded as a reduction of cost of investments and/or as a realized gain. The fund estimates the components of distributions received that may be considered nontaxable distributions or capital gain distributions for income tax purposes. Interest income is accrued as earned. Interest income includes coupon interest and amortization of premium and accretion of discount on debt securities. Investment income is recorded net of foreign taxes withheld where recovery of such taxes is uncertain.
Expenses. Most expenses of the trust can be directly attributed to a fund. Expenses which cannot be directly attributed are apportioned among the funds in the trust.
Income Tax Information and Distributions to Shareholders. Each year, the fund intends to qualify as a regulated investment company by distributing all of its taxable income and realized gains under Subchapter M of the Internal Revenue Code. As a result, no provision for income taxes is required in the accompanying financial statements. Foreign taxes are provided for based on the fund's understanding of the tax rules and rates that exist in the foreign markets in which it invests.
Distributions are recorded on the ex-dividend date. Income and capital gain distributions are determined in accordance with income tax regulations, which may differ from generally accepted accounting principles. In addition, the fund will treat a portion of the proceeds from shares redeemed as a distribution from net investment income and realized gain for income tax purposes.
Capital accounts within the financial statements are adjusted for permanent book-tax differences. These adjustments have no impact on net assets or the results of operations. Temporary book-tax differences will reverse in a subsequent period.
Book-tax differences are primarily due to foreign currency transactions, capital loss carryforwards and losses deferred due to wash sales.
Annual Report
1. Significant Accounting Policies - continued
Income Tax Information and Distributions to Shareholders - continued
The tax-basis components of distributable earnings and the federal tax cost as of period end were as follows:
Unrealized appreciation | $ 132,616 | |
Unrealized depreciation | (55,457) | |
Net unrealized appreciation (depreciation) | 77,159 | |
Undistributed ordinary income | 4,897 | |
Undistributed long-term capital gain | 34,292 | |
Cost for federal income tax purposes | $ 1,187,410 | |
The tax character of distributions paid was as follows:
| August 31, 2004 | August 31, 2003 |
Ordinary Income | $ 3,865 | $ 2,415 |
Short-Term Trading (Redemption) Fees. Shares held in the fund less than 30 days are subject to a redemption fee equal to .75% of the proceeds of the redeemed shares. All redemption fees, including any estimated redemption fees paid by Fidelity Management & Research Company (FMR), are retained by the fund and accounted for as an addition to paid in capital.
2. Operating Policies.
Repurchase Agreements. FMR has received an Exemptive Order from the Securities and Exchange Commission (the SEC) which permits the fund and other affiliated entities of FMR to transfer uninvested cash balances into joint trading accounts. These accounts are then invested in repurchase agreements that are collateralized by U.S. Treasury or Government obligations. The fund may also invest directly with institutions, in repurchase agreements that are collateralized by commercial paper obligations and corporate obligations. Collateral is held in segregated accounts with custodian banks and may be obtained in the event of a default of the counterparty. Collateral is marked-to-market daily and maintained at a value at least equal to the principal amount of the repurchase agreement (including accrued interest).
3. Purchases and Sales of Investments.
Purchases and sales of securities, other than short-term securities and U.S. government securities, aggregated $1,306,372 and $1,038,783, respectively.
Annual Report
Notes to Financial Statements - continued
(Amounts in thousands except ratios)
4. Fees and Other Transactions with Affiliates.
Management Fee. FMR and its affiliates provide the fund with investment management related services for which the fund pays a monthly management fee. The management fee is the sum of an individual fund fee rate that is based on an annual rate of .30% of the fund's average net assets and a group fee rate that averaged .28% during the period. The group fee rate is based upon the average net assets of all the mutual funds advised by FMR. The group fee rate decreases as assets under management increase and increases as assets under management decrease. For the period, the total annual management fee rate was .58% of the fund's average net assets.
Transfer Agent Fees. Fidelity Service Company, Inc. (FSC), an affiliate of FMR, is the fund's transfer, dividend disbursing and shareholder servicing agent. FSC receives account fees and asset-based fees that vary according to account size and type of account. FSC pays for typesetting, printing and mailing of shareholder reports, except proxy statements. For the period, the transfer agent fees were equivalent to an annual rate of .23% of average net assets.
Accounting and Security Lending Fees. FSC maintains the fund's accounting records. The accounting fee is based on the level of average net assets for the month. Under a separate contract, FSC administers the security lending program. The security lending fee is based on the number and duration of lending transactions.
Central Funds. The fund may invest in affiliated Central Funds managed by Fidelity Investments Money Management, Inc. (FIMM), an affiliate of FMR. The Central Funds are open-end investment companies available only to investment companies and other accounts managed by FMR and its affiliates. The Central Funds seek preservation of capital and current income and do not pay a management fee. Income distributions earned by the fund are recorded as income in the accompanying financial statements and totaled $131 for the period.
Brokerage Commissions. The fund placed a portion of its portfolio transactions with brokerage firms which are affiliates of the investment adviser. The commissions paid to these affiliated firms were $35 for the period.
Interfund Lending Program. Pursuant to an Exemptive Order issued by the SEC, the fund, along with other registered investment companies having management contracts with FMR, may participate in an interfund lending program. This program provides an alternative credit facility allowing the funds to borrow from, or lend money to, other
Annual Report
4. Fees and Other Transactions with Affiliates - continued
Interfund Lending Program - continued
participating funds. At period end, there were no interfund loans outstanding. The fund's activity in this program during the period was as follows:
Borrower or Lender | Average Daily
Loan Balance | Weighted
Average Interest
Rate | Interest Earned
(included in
interest income) | Interest
Expense |
Borrower | $ 9,643 | 1.12% | - | $ 1 |
5. Committed Line of Credit.
The fund participates with other funds managed by FMR in a $4.2 billion credit facility (the "line of credit") to be utilized for temporary or emergency purposes to fund shareholder redemptions or for other short-term liquidity purposes. The fund has agreed to pay commitment fees on its pro rata portion of the line of credit. During the period, there were no borrowings on this line of credit.
6. Security Lending.
The fund lends portfolio securities from time to time in order to earn additional income. The fund receives collateral (in the form of U.S. Treasury obligations, letters of credit and/or cash) against the loaned securities and maintains collateral in an amount not less than 100% of the market value of the loaned securities during the period of the loan. The market value of the loaned securities is determined at the close of business of the fund and any additional required collateral is delivered to the fund on the next business day. If the borrower defaults on its obligation to return the securities loaned because of insolvency or other reasons, a fund could experience delays and costs in recovering the securities loaned or in gaining access to the collateral. Cash collateral is invested in cash equivalents. The value of loaned securities and cash collateral at period end are disclosed on the fund's Statement of Assets and Liabilities.
7. Expense Reductions.
Many of the brokers with whom FMR places trades on behalf of the fund provided services to the fund in addition to trade execution. These services included payments of certain expenses on behalf of the fund totaling $368 for the period. In addition, through arrangements with the fund's transfer agent, credits realized as a result of uninvested cash balances were used to reduce the fund's expenses. During the period, these credits reduced the fund's transfer agent expenses by $1.
Annual Report
Report of Independent Registered Public Accounting Firm
To the Trustees of Fidelity Union Street Trust and the Shareholders of Fidelity Export and Multinational Fund:
In our opinion, the accompanying statement of assets and liabilities, including the schedule of investments, and the related statements of operations and of changes in net assets and the financial highlights present fairly, in all material respects, the financial position of Fidelity Export and Multinational Fund (a fund of Fidelity Union Street Trust) at August 31, 2004 and the results of its operations, the changes in its net assets and the financial highlights for the periods indicated, in conformity with accounting principles generally accepted in the United States of America. These financial statements and financial highlights (hereafter referred to as "financial statements") are the responsibility of the Fidelity Export and Multinational Fund's management; our responsibility is to express an opinion on these financial statements based on our audits. We conducted our audits of these financial statements in accordance with the standards of the Public Company Accounting Oversight Board (United States), which require that we plan and perform the audit to obtain reasonable assurance about whether the financial statements are free of material misstatement. An audit includes examining, on a test basis, evidence supporting the amounts and disclosures in the financial statements, assessing the accounting principles used and significant estimates made by management, and evaluating the overall financial statement presentation. We believe that our audits, which included confirmation of securities at August 31, 2004 by correspondence with the custodian and brokers, provide a reasonable basis for our opinion.
/s/PricewaterhouseCoopers LLP
PricewaterhouseCoopers LLP
Boston, Massachusetts
October 7, 2004
Annual Report
Trustees and Officers
The Trustees, Members of the Advisory Board, and executive officers of the trust and fund, as applicable, are listed below. The Board of Trustees governs the fund and is responsible for protecting the interests of shareholders. The Trustees are experienced executives who meet periodically throughout the year to oversee the fund's activities, review contractual arrangements with companies that provide services to the fund, and review the fund's performance. Except for William O. McCoy, each of the Trustees oversees 295 funds advised by FMR or an affiliate. Mr. McCoy oversees 297 funds advised by FMR or an affiliate.
The Trustees hold office without limit in time except that (a) any Trustee may resign; (b) any Trustee may be removed by written instrument, signed by at least two-thirds of the number of Trustees prior to such removal; (c) any Trustee who requests to be retired or who has become incapacitated by illness or injury may be retired by written instrument signed by a majority of the other Trustees; and (d) any Trustee may be removed at any special meeting of shareholders by a two-thirds vote of the outstanding voting securities of the trust. In any event, each non-interested Trustee shall retire not later than the last day of the calendar year in which his or her 72nd birthday occurs. The executive officers and Advisory Board Members hold office without limit in time, except that any officer and Advisory Board Member may resign or may be removed by a vote of a majority of the Trustees at any regular meeting or any special meeting of the Trustees. Except as indicated, each individual has held the office shown or other offices in the same company for the past five years.
The fund's Statement of Additional Information (SAI) includes more information about the Trustees. To request a free copy, call Fidelity at 1-800-544-8544.
Interested Trustees*:
Correspondence intended for each Trustee who is an "interested person" (as defined in the 1940 Act) may be sent to Fidelity Investments, 82 Devonshire Street, Boston, Massachusetts 02109.
Name, Age; Principal Occupation |
Edward C. Johnson 3d (74)** |
| Year of Election or Appointment: 1974 Mr. Johnson is Chairman of the Board of Trustees. Mr. Johnson serves as Chief Executive Officer, Chairman, and a Director of FMR Corp.; a Director and Chairman of the Board and of the Executive Committee of FMR; Chairman and a Director of Fidelity Management & Research (Far East) Inc.; Chairman (1998) and a Director of Fidelity Investments Money Management, Inc.; and Chairman (2001) and a Director (2000) of FMR Co., Inc. |
Abigail P. Johnson (42)** |
| Year of Election or Appointment: 2001 Senior Vice President of Export and Multinational (2001). Ms. Johnson also serves as Senior Vice President of other Fidelity funds (2001). She is President and a Director of FMR (2001), Fidelity Investments Money Management, Inc. (2001), FMR Co., Inc. (2001), and a Director of FMR Corp. Previously, Ms. Johnson managed a number of Fidelity funds. |
Laura B. Cronin (50) |
| Year of Election or Appointment: 2003 Ms. Cronin is an Executive Vice President (2002) and Chief Financial Officer (2002) of FMR Corp. and is a member of the Fidelity Management Committee (2003). Previously, Ms. Cronin served as Vice President of Finance of FMR (1997-1999), and Chief Financial Officer of FMR (1999-2001), Fidelity Personal Investments (2001), and Fidelity Brokerage Company (2001-2002). |
Robert L. Reynolds (52) |
| Year of Election or Appointment: 2003 Mr. Reynolds is a Director (2003) and Chief Operating Officer (2002) of FMR Corp. and is the head of the Fidelity Management Committee (2003). He also serves on the Board at Fidelity Investments Canada, Ltd. (2000). Previously, Mr. Reynolds served as President of Fidelity Investments Institutional Retirement Group (1996-2000). |
* Trustees have been determined to be "Interested Trustees" by virtue of, among other things, their affiliation with the trust or various entities under common control with FMR.
** Edward C. Johnson 3d, Trustee, is Abigail P. Johnson's father.
Annual Report
Non-Interested Trustees:
Correspondence intended for each non-interested Trustee (that is, the Trustees other than the Interested Trustees) may be sent to Fidelity Investments, P.O. Box 55235, Boston, Massachusetts 02205-5235.
Name, Age; Principal Occupation |
J. Michael Cook (61) |
| Year of Election or Appointment: 2001 Prior to Mr. Cook's retirement in May 1999, he served as Chairman and Chief Executive Officer of Deloitte & Touche LLP (accounting/consulting), Chairman of the Deloitte & Touche Foundation, and a member of the Board of Deloitte Touche Tohmatsu. He currently serves as a Director of Comcast (telecommunications, 2002), International Flavors & Fragrances, Inc. (2000), The Dow Chemical Company (2000), and Northrop Grumman Corporation (global defense technology, 2003). He is a Member of the Diversity Advisory Council of Marakon (2003) and the Advisory Council of the Public Company Accounting Oversight Board (PCAOB), Chairman Emeritus of the Board of Catalyst (a leading organization for the advancement of women in business), and is Chairman of the Accountability Advisory Council to the Comptroller General of the United States. He also serves as a Member of the Advisory Board of the Graduate School of Business of the University of Florida, his alma mater. |
Ralph F. Cox (72) |
| Year of Election or Appointment: 1991 Mr. Cox is President of RABAR Enterprises (management consulting for the petroleum industry). Prior to February 1994, he was President of Greenhill Petroleum Corporation (petroleum exploration and production). Until March 1990, Mr. Cox was President and Chief Operating Officer of Union Pacific Resources Company (exploration and production). He is a Director of CH2M Hill Companies (engineering), and Abraxas Petroleum (petroleum exploration and production, 1999). In addition, he is a member of advisory boards of Texas A&M University and the University of Texas at Austin. |
Robert M. Gates (60) |
| Year of Election or Appointment: 1997 Dr. Gates is President of Texas A&M University (2002). He was Director of the Central Intelligence Agency (CIA) from 1991 to 1993. From 1989 to 1991, Dr. Gates served as Assistant to the President of the United States and Deputy National Security Advisor. Dr. Gates is a Director of NACCO Industries, Inc. (mining and manufacturing), Parker Drilling Co., Inc. (drilling and rental tools for the energy industry, 2001), and Brinker International (restaurant management, 2003). He also serves as a member of the Advisory Board of VoteHere.net (secure Internet voting, 2001). Previously, Dr. Gates served as a Director of LucasVarity PLC (automotive components and diesel engines), a Director of TRW Inc. (automotive, space, defense, and information technology), and Dean of the George Bush School of Government and Public Service at Texas A&M University (1999-2001). Dr. Gates also is a Trustee of the Forum for International Policy. |
George H. Heilmeier (68) |
| Year of Election or Appointment: 2004 Dr. Heilmeier is Chairman Emeritus of Telcordia Technologies (communication software and systems), where prior to his retirement, he served as company Chairman and Chief Executive Officer. He currently serves on the Boards of Directors of The Mitre Corporation (systems engineering and information technology support for the government), INET Technologies Inc. (telecommunications network surveillance, 2001) and Teletech Holdings (customer management services, 1998). He is Chairman of the General Motors Technology Advisory Committee and a Life Fellow of the IEEE (2000). Dr. Heilmeier is a member of the Defense Science Board and the National Security Agency Advisory Board. He is also a member of the National Academy of Engineering, the American Academy of Arts and Sciences and The Board of Overseers of the School of Engineering and Applied Science of the University of Pennsylvania. Previously, Dr. Heilmeier served as a Director of TRW Inc. (automotive, space, defense, and information technology, 1992-2002), Compaq (1994-2002), and Automatic Data Processing, Inc. (ADP) (technology-based business outsourcing, 1995-2002). |
Donald J. Kirk (71) |
| Year of Election or Appointment: 1987 Mr. Kirk is a Governor of the American Stock Exchange (2001), a Trustee and former Chairman of the Board of Trustees of the Greenwich Hospital Association, a Director of the Yale-New Haven Health Services Corp. (1998), and a Director Emeritus and former Chairman of the Board of Directors of National Arts Strategies Inc. (leadership education for arts and culture). Mr. Kirk was an Executive-in-Residence (1995-2000) and a Professor (1987-1995) at Columbia University Graduate School of Business. Prior to 1987, he was Chairman of the Financial Accounting Standards Board. Previously, Mr. Kirk served as a Governor of the National Association of Securities Dealers, Inc. (1996-2002), a member and Vice Chairman of the Public Oversight Board of the American Institute of Certified Public Accountants' SEC Practice Section (1995-2002), a Director of General Re Corporation (reinsurance, 1987-1998) and as a Director of Valuation Research Corp. (appraisals and valuations). |
Marie L. Knowles (57) |
| Year of Election or Appointment: 2001 Prior to Ms. Knowles' retirement in June 2000, she served as Executive Vice President and Chief Financial Officer of Atlantic Richfield Company (ARCO) (diversified energy, 1996-2000). From 1993 to 1996, she was a Senior Vice President of ARCO and President of ARCO Transportation Company. She served as a Director of ARCO from 1996 to 1998. She currently serves as a Director of Phelps Dodge Corporation (copper mining and manufacturing) and McKesson Corporation (healthcare service, 2002). Ms. Knowles is a Trustee of the Brookings Institution and the Catalina Island Conservancy and also serves as a member of the Advisory Board for the School of Engineering of the University of Southern California. |
Ned C. Lautenbach (60) |
| Year of Election or Appointment: 2000 Mr. Lautenbach has been a partner of Clayton, Dubilier & Rice, Inc. (private equity investment firm) since September 1998. Previously, Mr. Lautenbach was with the International Business Machines Corporation (IBM) from 1968 until his retirement in 1998. He was most recently Senior Vice President and Group Executive of Worldwide Sales and Services. From 1993 to 1995, he was Chairman of IBM World Trade Corporation, and from 1994 to 1998 was a member of IBM's Corporate Executive Committee. Mr. Lautenbach serves as Co-Chairman and a Director of Covansys, Inc. (global provider of business and technology solutions, 2000). In addition, he is a Director of Italtel Holding S.p.A. (telecommunications (Milan, Italy), 2004) and Eaton Corporation (diversified industrial) as well as the Philharmonic Center for the Arts in Naples, Florida (1999). He also is a member of the Council on Foreign Relations. |
Marvin L. Mann (71) |
| Year of Election or Appointment: 1993 Mr. Mann is Chairman of the non-interested Trustees (2001). He is Chairman Emeritus of Lexmark International, Inc. (computer peripherals), where he served as CEO until April 1998, retired as Chairman May 1999, and remains a member of the Board. Prior to 1991, he held the positions of Vice President of International Business Machines Corporation (IBM) and President and General Manager of various IBM divisions and subsidiaries. He is a member of the Executive Committee of the Independent Director's Council of the Investment Company Institute. In addition, Mr. Mann is a member of the President's Cabinet at the University of Alabama and the Board of Visitors of the Culverhouse College of Commerce and Business Administration at the University of Alabama. |
William O. McCoy (70) |
| Year of Election or Appointment: 1997 Prior to his retirement in December 1994, Mr. McCoy was Vice Chairman of the Board of BellSouth Corporation (telecommunications) and President of BellSouth Enterprises. He is currently a Director of Liberty Corporation (holding company), Duke Realty Corporation (real estate), and Progress Energy, Inc. (electric utility). He is also a partner of Franklin Street Partners (private investment management firm) and a member of the Research Triangle Foundation Board. In addition, Mr. McCoy served as the Interim Chancellor (1999-2000) and a member of the Board of Visitors (1994-1998) for the University of North Carolina at Chapel Hill and currently serves on the Board of Directors of the University of North Carolina Health Care System and the Board of Visitors of the Kenan-Flagler Business School (University of North Carolina at Chapel Hill). He also served as Vice President of Finance for the University of North Carolina (16-school system, 1995-1998). |
William S. Stavropoulos (65) |
| Year of Election or Appointment: 2002 Mr. Stavropoulos is Chairman of the Board (2000), CEO (2002), a position he previously held from 1995-2000, Chairman of the Executive Committee (2000), and a Member of the Board of Directors of The Dow Chemical Company. Since joining The Dow Chemical Company in 1967, Mr. Stavropoulos served in numerous senior management positions, including President (1993-2000; 2002-2003). Currently, he is a Director of NCR Corporation (data warehousing and technology solutions), BellSouth Corporation (telecommunications), Chemical Financial Corporation, and Maersk Inc. (industrial conglomerate, 2002). He also serves as a member of the Board of Trustees of the American Enterprise Institute for Public Policy Research. In addition, Mr. Stavropoulos is a member of The Business Council, J.P. Morgan International Council and the University of Notre Dame Advisory Council for the College of Science. |
Annual Report
Trustees and Officers - continued
Advisory Board Members and Executive Officers:
Correspondence intended for Mr. Dirks, Ms. Small, and Mr. Wolfe may be sent to Fidelity Investments, P.O. Box 55235, Boston, Massachusetts 02205-5235. Correspondence intended for each executive officer and Mr. Lynch may be sent to Fidelity Investments, 82 Devonshire Street, Boston, Massachusetts 02109.
Name, Age; Principal Occupation |
Dennis J. Dirks (56) |
| Year of Election or Appointment: 2004 Member of the Advisory Board of Fidelity Union Street Trust. Prior to his retirement in May 2003, Mr. Dirks was Chief Operating Officer and a member of the Board of The Depository Trust & Clearing Corporation (DTCC) (1999-2003). He also served as President, Chief Operating Officer, and Board member of The Depository Trust Company (DTC) (1999-2003) and President and Board member of the National Securities Clearing Corporation (NSCC) (1999-2003). In addition, Mr. Dirks served as Chief Executive Officer and Board member of the Government Securities Clearing Corporation (2001-2003) and Chief Executive Officer and Board member of the Mortgage-Backed Securities Clearing Corporation (2001-2003). |
Peter S. Lynch (61) |
| Year of Election or Appointment: 2003 Member of the Advisory Board of Fidelity Union Street Trust. Vice Chairman and a Director of FMR, and Vice Chairman (2001) and a Director (2000) of FMR Co., Inc. Previously, Mr. Lynch served as a Trustee of the Fidelity funds (1990-2003). Prior to May 31, 1990, he was a Director of FMR and Executive Vice President of FMR (a position he held until March 31, 1991), Vice President of Fidelity® Magellan® Fund and FMR Growth Group Leader, and Managing Director of FMR Corp. Mr. Lynch was also Vice President of Fidelity Investments Corporate Services. In addition, he serves as a Trustee of Boston College, Massachusetts Eye & Ear Infirmary, Historic Deerfield, John F. Kennedy Library, and the Museum of Fine Arts of Boston. |
Cornelia M. Small (60) |
| Year of Election or Appointment: 2004 Member of the Advisory Board of Fidelity Union Street Trust. Ms. Small is a member (2000) and Chairperson (2002) of the Investment Committee, and a member (2002) of the Board of Trustees of Smith College. Previously, she served as Chief Investment Officer (1999-2000), Director of Global Equity Investments (1996-1999), and a member of the Board of Directors of Scudder, Stevens & Clark (1990-1997) and Scudder Kemper Investments (1997-1998). In addition, Ms. Small served as Co-Chair (2000-2003) of the Annual Fund for the Fletcher School of Law and Diplomacy. |
Kenneth L. Wolfe (65) |
| Year of Election or Appointment: 2004 Member of the Advisory Board of Fidelity Union Street Trust. Prior to his retirement in 2001, Mr. Wolfe was Chairman and Chief Executive Officer of Hershey Foods Corporation (1993-2001). He currently serves as a member of the boards of Adelphia Communications Corporation (2003), Revlon Inc. (2004), Bausch & Lomb, Inc., and Carpenter Technology Corporation. |
John B. McDowell (45) |
| Year of Election or Appointment: 2002 Vice President of Export and Multinational. Mr. McDowell also serves as Vice President of certain Equity Funds (2002). He is Senior Vice President of FMR (1999), FMR Co., Inc. (2001), and Fidelity Management Trust Company (FMTC). Since joining Fidelity Investments in 1985, Mr. McDowell has worked as a research analyst and manager. |
Timothy M. Cohen (35) |
| Year of Election or Appointment: 2003 Vice President of Export and Multinational. Prior to assuming his current responsibilities, Mr. Cohen managed a variety of Fidelity funds. Mr. Cohen also serves as Vice President of FMR (2003) and FMR Co., Inc. (2003). |
Eric D. Roiter (55) |
| Year of Election or Appointment: 1998 Secretary of Export and Multinational. He also serves as Secretary of Fidelity funds (1998); Vice President, General Counsel, and Clerk of FMR Co., Inc. (2001) and FMR (1998); Vice President and Clerk of FDC (1998); Assistant Clerk of Fidelity Management & Research (U.K.) Inc. (2001) and Fidelity Management & Research (Far East) Inc. (2001); and Assistant Secretary of Fidelity Investments Money Management, Inc. (2001). Prior to joining Fidelity, Mr. Roiter was with the law firm of Debevoise & Plimpton, as an associate (1981-1984) and as a partner (1985-1997), and served as an Assistant General Counsel of the U.S. Securities and Exchange Commission (1979-1981). Mr. Roiter is an Adjunct Member, Faculty of Law, at Boston College Law School (2003). |
Stuart Fross (45) |
| Year of Election or Appointment: 2003 Assistant Secretary of Export and Multinational. Mr. Fross also serves as Assistant Secretary of other Fidelity funds (2003) and is an employee of FMR. |
Christine Reynolds (45) |
| Year of Election or Appointment: 2004 President, Treasurer, and Anti-Money Laundering (AML) officer of Export and Multinational. Ms. Reynolds also serves as President, Treasurer, and AML officer of other Fidelity funds (2004) and is a Vice President (2003) and an employee (2002) of FMR. Before joining Fidelity Investments, Ms. Reynolds worked at PricewaterhouseCoopers LLP (PwC) (1980-2002), where she was most recently an audit partner with PwC's investment management practice. |
Timothy F. Hayes (53) |
| Year of Election or Appointment: 2002 Chief Financial Officer of Export and Multinational. Mr. Hayes also serves as Chief Financial Officer of other Fidelity funds (2002). Recently he was appointed President of Fidelity Service Company (2003) where he also serves as a Director. Mr. Hayes also serves as President of Fidelity Investments Operations Group (FIOG, 2002), which includes Fidelity Pricing and Cash Management Services Group (FPCMS), where he was appointed President in 1998. Previously, Mr. Hayes served as Chief Financial Officer of Fidelity Investments Corporate Systems and Service Group (1998) and Fidelity Systems Company (1997-1998). |
Kenneth A. Rathgeber (57) |
| Year of Election or Appointment: 2004 Chief Compliance Officer of Export and Multinational. Mr. Rathgeber also serves as Chief Compliance Officer of other Fidelity funds (2004) and Executive Vice President of Risk Oversight for Fidelity Investments (2002). Previously, he served as Executive Vice President and Chief Operating Officer for Fidelity Investments Institutional Services Company, Inc. (1998-2002). |
John R. Hebble (46) |
| Year of Election or Appointment: 2003 Deputy Treasurer of Export and Multinational. Mr. Hebble also serves as Deputy Treasurer of other Fidelity funds (2003), and is an employee of FMR. Before joining Fidelity Investments, Mr. Hebble worked at Deutsche Asset Management where he served as Director of Fund Accounting (2002-2003) and Assistant Treasurer of the Scudder Funds (1998-2003). |
Kimberley H. Monasterio (40) |
| Year of Election or Appointment: 2004 Deputy Treasurer of Export and Multinational. Ms. Monasterio also serves as Deputy Treasurer of other Fidelity funds (2004) and is an employee of FMR (2004). Before joining Fidelity Investments, Ms. Monasterio served as Treasurer (2000-2004) and Chief Financial Officer (2002-2004) of the Franklin Templeton Funds and Senior Vice President of Franklin Templeton Services, LLC (2000-2004). |
John H. Costello (58) |
| Year of Election or Appointment: 1994 Assistant Treasurer of Export and Multinational. Mr. Costello also serves as Assistant Treasurer of other Fidelity funds and is an employee of FMR. |
Francis V. Knox, Jr. (57) |
| Year of Election or Appointment: 2002 Assistant Treasurer of Export and Multinational. Mr. Knox also serves as Assistant Treasurer of other Fidelity funds (2002), and is a Vice President and an employee of FMR. Previously, Mr. Knox served as Vice President of Investment & Advisor Compliance (1990-2001), and Compliance Officer of Fidelity Management & Research (U.K.) Inc. (1992-2002), Fidelity Management & Research (Far East) Inc. (1991-2002), and FMR Corp. (1995-2002). |
Peter L. Lydecker (50) |
| Year of Election or Appointment: 2004 Assistant Treasurer of Export and Multinational. Mr. Lydecker also serves as Assistant Treasurer of other Fidelity funds (2004) and is an employee of FMR. |
Mark Osterheld (49) |
| Year of Election or Appointment: 2002 Assistant Treasurer of Export and Multinational. Mr. Osterheld also serves as Assistant Treasurer of other Fidelity funds (2002) and is an employee of FMR. |
Kenneth B. Robins (35) |
| Year of Election or Appointment: 2004 Assistant Treasurer of Export and Multinational. Mr. Robins also serves as Assistant Treasurer of other Fidelity funds (2004) and is an employee of FMR (2004). Before joining Fidelity Investments, Mr. Robins worked at KPMG LLP, where he was a partner in KPMG's department of professional practice (2002-2004) and a Senior Manager (1999-2000). In addition, Mr. Robins served as Assistant Chief Accountant, United States Securities and Exchange Commission (2000-2002). |
Thomas J. Simpson (46) |
| Year of Election or Appointment: 2000 Assistant Treasurer of Export and Multinational. Mr. Simpson is Assistant Treasurer of other Fidelity funds (2000) and an employee of FMR (1996). Prior to joining FMR, Mr. Simpson was Vice President and Fund Controller of Liberty Investment Services (1987-1995). |
Annual Report
Distributions
The Board of Trustees of Fidelity Export and Multinational voted to pay on October 11, 2004, to shareholders of record at the opening of business on October 8, 2004, a distribution of $0.54 per share derived from capital gains realized from sales of portfolio securities and a dividend of $0.01 per share from net investment income.
The fund designates 100% of the dividends distributed during the fiscal year as qualifying for the dividends-received deduction for corporate shareholders.
The fund designates 100% of each dividend distributed during the fiscal year as amounts which may be taken into account as a dividend for purposes of the maximum rate under section 1(h)(11) of the Internal Revenue Code.
The fund will notify shareholders in January 2005 of amounts for use in preparing 2004 income tax returns.
Annual Report
Managing Your Investments
Fidelity offers several ways to conveniently manage your personal investments via your telephone or PC. You can access your account information, conduct trades and research your investments 24 hours a day.
By Phone
Fidelity Automated Service Telephone provides a single toll-free number to access account balances, positions, quotes and trading. It's easy to navigate the service, and on your first call, the system will help you create a personal identification number (PIN) for security.
(phone_graphic)Fidelity Automated
Service Telephone (FAST®)
1-800-544-5555
Press
1 For mutual fund and brokerage trading.
2 For quotes.*
3 For account balances and holdings.
4 To review orders and mutual
fund activity.
5 To change your PIN.
*0 To speak to a Fidelity representative.
By PC
Fidelity's web site on the Internet provides a wide range of information, including daily financial news, fund performance, interactive planning tools and news about Fidelity products and services.
(computer_graphic)Fidelity's Web Site
www.fidelity.com
* When you call the quotes line, please remember that a fund's yield and return will vary and, except for money market funds, share price will also vary. This means that you may have a gain or loss when you sell your shares. There is no assurance that money market funds will be able to maintain a stable $1 share price; an investment in a money market fund is not insured or guaranteed by the U.S. government. Total returns are historical and include changes in share price, reinvestment of dividends and capital gains, and the effects of any sales charges.
Annual Report
To Write Fidelity
We'll give your correspondence immediate attention and send you written confirmation upon completion of your request.
(letter_graphic)Making Changes
To Your Account
(such as changing name, address, bank, etc.)
Fidelity Investments
P.O. Box 770001
Cincinnati, OH 45277-0002
(letter_graphic)For Non-Retirement
Accounts
Buying shares
Fidelity Investments
P.O. Box 770001
Cincinnati, OH 45277-0003
Overnight Express
Fidelity Investments
Attn: Distribution Services
100 Crosby Parkway - KC1H
Covington, KY 41015
Selling shares
Fidelity Investments
P.O. Box 770001
Cincinnati, OH 45277-0035
Overnight Express
Fidelity Investments
Attn: Distribution Services
100 Crosby Parkway - KC1H
Covington, KY 41015
General Correspondence
Fidelity Investments
P.O. Box 500
Merrimack, NH 03054-0500
(letter_graphic)For Retirement
Accounts
Buying shares
Fidelity Investments
P.O. Box 770001
Cincinnati, OH 45277-0003
Selling shares
Fidelity Investments
P.O. Box 770001
Cincinnati, OH 45277-0035
Overnight Express
Fidelity Investments
Attn: Distribution Services
100 Crosby Parkway - KC1H
Covington, KY 41015
General Correspondence
Fidelity Investments
P.O. Box 500
Merrimack, NH 03054-0500
Annual Report
Investment Adviser
Fidelity Management & Research Company
Boston, MA
Investment Sub-Advisers
FMR Co., Inc.
Fidelity Management & Research
(U.K.) Inc.
Fidelity Management & Research
(Far East) Inc.
Fidelity Investments Japan Limited
Fidelity International Investment Advisors
Fidelity International Investment Advisors
(U.K.) Limited
General Distributor
Fidelity Distributors Corporation
Transfer and Shareholder
Servicing Agent
Fidelity Service Company, Inc.
Boston, MA
Custodian
JPMorgan Chase Bank
New York, NY
Fidelity's Growth Funds
Aggressive Growth Fund
Blue Chip Growth Fund
Blue Chip Value Fund
Capital Appreciation Fund
Contrafund®
Disciplined Equity Fund
Discovery Fund
Dividend Growth Fund
Export and Multinational Fund
Fidelity Fifty®
Fidelity Value Discovery Fund
Focused Stock Fund
Growth Company Fund
Independence Fund
Large Cap Stock Fund
Leveraged Company Stock Fund
Low-Priced Stock Fund
Magellan® Fund
Mid-Cap Stock Fund
New Millennium Fund®
OTC Portfolio
Small Cap Independence Fund
Small Cap Stock Fund
Stock Selector
Structured Large Cap Growth Fund
Structured Large Cap Value Fund
Structured Mid Cap Growth Fund
Structured Mid Cap Value Fund
Tax Managed Stock Fund
Trend Fund
Value Fund
Please carefully consider the funds' investment objectives, risks, charges and expenses before investing. For this and other information, call 1-800-544-6666 for a free prospectus. Read it carefully before you invest or send any money.
The Fidelity Telephone Connection
Mutual Fund 24-Hour Service
Exchanges/Redemptions
and Account Assistance 1-800-544-6666
Product Information 1-800-544-6666
Retirement Accounts 1-800-544-4774
(8 a.m. - 9 p.m.)
TDD Service 1-800-544-0118
for the deaf and hearing impaired
(9 a.m. - 9 p.m. Eastern time)
Fidelity Automated Service
Telephone (FAST®) (automated graphic) 1-800-544-5555
(automated graphic) Automated line for quickest service
(Fidelity Investment logo)(registered trademark)
Corporate Headquarters
82 Devonshire St., Boston, MA 02109
www.fidelity.com
EXF-UANN-1004
1.790907.101
Spartan®
Arizona Municipal
Income Fund
and
Fidelity®
Arizona Municipal
Money Market Fund
Annual Report
August 31, 2004
(2_fidelity_logos) (Registered_Trademark)
Contents
Chairman's Message | <Click Here> | Ned Johnson's message to shareholders. |
Shareholder Expense Example | <Click Here> | An example of shareholder expenses. |
Spartan Arizona Municipal Income Fund |
Performance | <Click Here> | How the fund has done over time. |
Management's Discussion | <Click Here> | The manager's review of fund performance, strategy and outlook. |
Investment Changes | <Click Here> | A summary of major shifts in the fund's investments over the past six months. |
Investments | <Click Here> | A complete list of the fund's investments with their market values. |
Financial Statements | <Click Here> | Statements of assets and liabilities, operations, and changes in net assets,
as well as financial highlights. |
Fidelity Arizona Municipal Money Market Fund |
Investment Changes/
Performance | <Click Here> | A summary of major shifts in the fund's investments over the past six months
and one year. |
Investments | <Click Here> | A complete list of the fund's investments. |
Financial Statements | <Click Here> | Statements of assets and liabilities, operations, and changes in net assets,
as well as financial highlights. |
Notes | <Click Here> | Notes to the financial statements. |
Report of Independent Registered Public Accounting Firm | <Click Here> | |
Trustees and Officers | <Click Here> | |
Distributions | <Click Here> | |
To view a fund's proxy voting guidelines and proxy voting record for the 12-month period ended June 30, visit www.fidelity.com/proxyvotingresults or visit the Securities and Exchange Commission's (SEC) web site at www.sec.gov. You may also call 1-800-544-8544 to request a free copy of the proxy voting guidelines.
Standard & Poor's, S&P and S&P 500 are registered service marks of The McGraw-Hill Companies, Inc. and have been licensed for use by Fidelity Distributors Corporation.
Other third party marks appearing herein are the property of their respective owners.
All other marks appearing herein are registered or unregistered trademarks or service marks of FMR Corp. or an affiliated company.
(Recycle graphic) This report is printed on recycled paper using soy-based inks.
Annual Report
This report and the financial statements contained herein are submitted for the general information of the shareholders of the funds. This report is not authorized for distribution to prospective investors in the funds unless preceded or accompanied by an effective prospectus.
Commencing with the fiscal quarter ending November 30, 2004, each fund files its complete schedule of portfolio holdings with the SEC for the first and third quarters of each fiscal year on Form N-Q. Forms N-Q are available on the SEC's web site at http://www.sec.gov. Each fund's Forms N-Q may be reviewed and copied at the SEC's Public Reference Room in Washington, DC. Information regarding the operation of the SEC's Public Reference Room may be obtained by calling 1-800-SEC-0330. For a complete list of each fund's portfolio holdings, view each fund's most recent quarterly holdings report, semiannual report, or annual report on Fidelity's web site at http://www.fidelity.com/holdings.
Mutual fund shares are not deposits or obligations of, or guaranteed by, any depository institution. Shares are not insured by the FDIC, Federal Reserve Board or any other agency, and are subject to investment risks, including possible loss of principal amount invested.
Neither the funds nor Fidelity Distributors Corporation is a bank.
For more information on any Fidelity fund, including charges and expenses, call 1-800-544-6666 for a free prospectus. Read it carefully before you invest or send money.
Annual Report
Chairman's Message
(photo_of_Edward_C_Johnson_3d)
Dear Shareholder:
Many of you have read or heard news stories recently that were critical of mutual funds and made allegations that the mutual fund industry has been less than forthright. I find these reports unsettling and not necessarily an accurate picture of the overall industry, and I would like you to know where we at Fidelity stand.
With specific regard to allegations that certain mutual fund companies were violating the Securities and Exchange Commission's forward pricing rules or were involved in so-called "market timing" activities, I want to say two things:
First, Fidelity does not have agreements that permit customers who buy fund shares after 4 p.m. to obtain the 4 p.m. price. This is not to say that someone could not deceive the company through fraudulent acts. But I underscore that we have no so-called "agreements" which would permit this illegal practice.
Second, Fidelity has been on record for years opposing predatory short-term trading which adversely affects other shareholders in a mutual fund. In fact, in the 1980s, we began charging a fee - which is returned to the fund and, therefore, to investors - to discourage this activity. What's more, several years ago we took the industry lead in developing a Fair Value Pricing Policy to prevent market timing on foreign securities in our funds. It is reasonable to assume that another structure can be developed that would alter the system to make it much more difficult for predatory traders to operate. This, however, will only be achieved through close cooperation among regulators, legislators and the industry.
Certainly no industry is perfect, and there have been instances of unethical and illegal activity from time to time within the mutual fund industry. When this occurs, confessed or convicted offenders should be dealt with appropriately. Clearly, every system can be improved. We applaud well thought out improvements by regulators, legislators and industry representatives that achieve the common goal of building and protecting the value of investors' holdings. But we remain concerned about the risk of over-regulation and the quick application of simplistic solutions to intricate problems.
For more than 57 years, Fidelity Investments has worked very hard to improve its products and service to justify your trust. When our family founded this company in 1946, we had only a few hundred customers. Many of them were family and friends. Today, we serve more than 18 million customers including individual investors and participants in retirement plans across America.
Let me close by saying that we do not take your trust in us for granted, and we realize that we must always work to improve all aspects of our service to you. In turn, we urge you to continue your active participation with your financial matters, so that your interests can be well served.
Best regards,
/s/Edward C. Johnson 3d
Edward C. Johnson 3d
Annual Report
Shareholder Expense Example
As a shareholder of a Fund, you incur two types of costs: (1) transaction costs, including redemption fees, and (2) ongoing costs, including management fees and other Fund expenses. This Example is intended to help you understand your ongoing costs (in dollars) of investing in the Funds and to compare these costs with the ongoing costs of investing in other mutual funds.
The Example is based on an investment of $1,000 invested at the beginning of the period and held for the entire period (March 1, 2004 to August 31, 2004).
Actual Expenses
The first line of the table below for each fund provides information about actual account values and actual expenses. You may use the information in this line, together with the amount you invested, to estimate the expenses that you paid over the period. Simply divide your account value by $1,000.00 (for example, an $8,600 account value divided by $1,000.00 = 8.6), then multiply the result by the number in the first line for a fund under the heading entitled "Expenses Paid During Period" to estimate the expenses you paid on your account during this period. A small balance maintenance fee of $12.00 that is charged once a year may apply for certain accounts with a value of less than $2,000. This fee is not included in the table below. If it was, the estimate of expenses you paid during the period would be higher, and your ending account value lower, by this amount.
Hypothetical Example for Comparison Purposes
The second line of the table below for each fund provides information about hypothetical account values and hypothetical expenses based on a fund's actual expense ratio and an assumed rate of return of 5% per year before expenses, which is not the Fund's actual return. The hypothetical account values and expenses may not be used to estimate the actual ending account balance or expenses you paid for the period. You may use this information to compare the ongoing costs of investing in the Fund and other funds. To do so, compare this 5% hypothetical example with the 5% hypothetical examples that appear in the shareholder reports of the other funds. A small balance maintenance fee of $12.00 that is charged once a year may apply for certain accounts with a value of less than $2,000. This fee is not included in the table below. If it was, the estimate of expenses you paid during the period would be higher, and your ending account value lower, by this amount.
Annual Report
Please note that the expenses shown in the table are meant to highlight your ongoing costs only and do not reflect any transaction costs. Therefore, the second line of the table is useful in comparing ongoing costs only, and will not help you determine the relative total costs of owning different funds. In addition, if these transactional costs were included, your costs would have been higher.
| Beginning
Account Value
March 1, 2004 | Ending
Account Value
August 31, 2004 | Expenses Paid
During Period*
March 1, 2004
to August 31, 2004 |
Spartan Arizona Municipal Income Fund | | | |
Actual | $ 1,000.00 | $ 999.20 | $ 2.76 |
HypotheticalA | $ 1,000.00 | $ 1,022.20 | $ 2.80 |
Fidelity Arizona Municipal Money Market Fund | | | |
Actual | $ 1,000.00 | $ 1,003.10 | $ 2.52 |
HypotheticalA | $ 1,000.00 | $ 1,022.45 | $ 2.55 |
A 5% return per year before expenses
* Expenses are equal to each Fund's annualized expense ratio (shown in the table below); multiplied by the average account value over the period, multiplied by 184/366 (to reflect the one-half year period).
| Annualized
Expense Ratio |
Spartan Arizona Municipal Income Fund | .55% |
Fidelity Arizona Municipal Money Market Fund | .50% |
Annual Report
Spartan Arizona Municipal Income Fund
Performance: The Bottom Line
Average annual total return reflects the change in the value of an investment, assuming reinvestment of the fund's dividend income and capital gains (the profits earned upon the sale of securities that have grown in value) and assuming a constant rate of performance each year. The $10,000 table and the fund's returns do not reflect the deduction of taxes that a shareholder would pay on fund distributions or the redemption of fund shares. During periods of reimbursement by Fidelity, a fund's total return will be greater than it would be had the reimbursement not occurred. How a fund did yesterday is no guarantee of how it will do tomorrow.
Average Annual Total Returns
Periods ended August 31, 2004 | Past 1
year | Past 5
years | Life of
fundA |
Spartan Arizona Municipal Income Fund | 6.58% | 6.45% | 6.48% |
A From October 11, 1994.
$10,000 Over Life of Fund
Let's say hypothetically that $10,000 was invested in Spartan® Arizona Municipal Income Fund on October 31, 1994, shortly after the fund started. The chart shows how the value of your investment would have grown, and also shows how the Lehman Brothers Municipal Bond Index did over the same period.
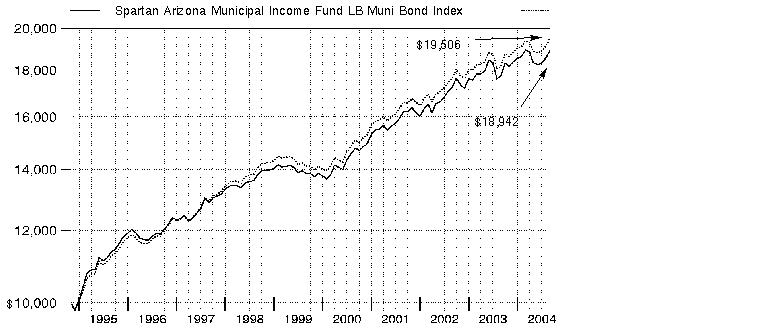
Annual Report
Management's Discussion of Fund Performance
Spartan® Arizona Municipal Income Fund
Municipal bonds were among the fixed-income market's best performers for the year ending August 31, 2004. In that time, the Lehman Brothers® Municipal Bond Index rose 7.11%. In comparison, the taxable bond market - as measured by the Lehman Brothers Aggregate Bond Index - returned 6.13%. Munis had a strong first half of the period, as weak employment levels, low inflation and the Federal Reserve Board's accommodative monetary policy kept demand high for tax-exempt bonds. However, the Lehman Brothers muni index lost more than 3.00% between March and May when labor markets and the economy heated up, leading many to believe that rate hikes were imminent. Although the Fed did hike rates by 0.25 percentage points in June and again in August, munis rallied throughout the summer when the domestic and global economic outlook darkened. Record-high oil prices, geopolitical discord and terrorism concerns resulted in a flight to safety in the bond markets, and the Lehman Brothers muni index gained 3.72% in the final three months of the period.
For the 12 months ending August 31, 2004, the fund returned 6.58%. During the same period, the LipperSM Arizona Municipal Debt Funds Average returned 6.33% and the Lehman Brothers Arizona 4 Plus Year Enhanced Municipal Bond Index gained 7.14%. Arizona's municipal bond market performed in line with the national municipal market, as the state's stronger economic conditions helped boost revenues for many municipal issuers, but detracted from bond returns as interest rates rose. Aiding the fund's performance was good sector selection. For instance, the fund benefited from its overweighting in bonds issued by Arizona public universities, which performed well due to strong demand for college degrees. Security selection across most sectors also helped the fund to be concentrated in strong performers and avoid credit blowups. Detracting from performance was an underweighting in par bonds, which sell at or near face value and performed well due to strong demand from individual investors. At the end of the period, 12.9% of the fund's investments were in Puerto Rico bonds, which are free from taxes in all 50 states and were included in the fund given their attractive prices and structural characteristics relative to Arizona bonds.
The views expressed in this statement reflect those of the portfolio manager only through the end of the period of the report as stated on the cover and do not necessarily represent the views of Fidelity or any other person in the Fidelity organization. Any such views are subject to change at any time based upon market or other conditions and Fidelity disclaims any responsibility to update such views. These views may not be relied on as investment advice and, because investment decisions for a Fidelity fund are based on numerous factors, may not be relied on as an indication of trading intent on behalf of any Fidelity fund.
Annual Report
Spartan Arizona Municipal Income Fund
Investment Changes
Top Five Sectors as of August 31, 2004 |
| % of fund's net assets | % of fund's net assets
6 months ago |
Special Tax | 26.8 | 29.3 |
General Obligations | 22.4 | 19.6 |
Education | 11.6 | 13.0 |
Electric Utilities | 11.2 | 10.4 |
Escrowed/Pre-Refunded | 8.8 | 8.9 |
Average Years to Maturity as of August 31, 2004 |
| | 6 months ago |
Years | 13.8 | 13.6 |
Average years to maturity is based on the average time remaining until principal payments are expected from each of the fund's bonds, weighted by dollar amount. |
Duration as of August 31, 2004 |
| | 6 months ago |
Years | 7.3 | 7.3 |
Duration shows how much a bond fund's price fluctuates with changes in comparable interest rates. If rates rise 1%, for example, a fund with a five-year duration is likely to lose about 5% of its value. Other factors also can influence a bond fund's performance and share price. Accordingly, a bond fund's actual performance may differ from this example. |
Quality Diversification (% of fund's net assets) |
As of August 31, 2004 | As of February 29, 2004 |
| AAA 55.7% | | | AAA 55.4% | |
 | AA,A 35.9% | | | AA,A 35.0% | |
 | BBB 4.7% | | | BBB 6.2% | |
 | Not Rated 0.4% | | | Not Rated 0.4% | |
| Short-Term
Investments and
Net Other Assets 3.3% | | | Short-Term
Investments and
Net Other Assets 3.0% | |

We have used ratings from Moody's® Investors Services, Inc. Where Moody's ratings are not available, we have used S&P® ratings. |
Annual Report
Spartan Arizona Municipal Income Fund
Investments August 31, 2004
Showing Percentage of Net Assets
Municipal Bonds - 96.7% |
| Principal
Amount | | Value
(Note 1) |
Arizona - 83.8% |
Arizona Health Facilities Auth. Rev. (Catholic Health Care West Proj.) Series A, 6.125% 7/1/09 | | $ 550,000 | | $ 591,927 |
Arizona Pwr. Auth. Pwr. Resource Rev. (Hoover Uprating Proj.) 5% 10/1/09 | | 1,160,000 | | 1,280,849 |
Arizona School Facilities Board State School Impt. Rev.: | | | | |
5.25% 7/1/18 | | 1,000,000 | | 1,093,250 |
5.25% 7/1/20 | | 1,500,000 | | 1,626,135 |
Arizona State Univ. Revs.: | | | | |
5.25% 7/1/09 (FSA Insured) | | 1,260,000 | | 1,404,711 |
5.5% 7/1/21 (FGIC Insured) | | 1,150,000 | | 1,260,205 |
5.75% 7/1/27 (FGIC Insured) | | 1,500,000 | | 1,651,770 |
Arizona Student Ln. Acquisition Auth. Student Ln. Rev. Sub Series B1, 6.15% 5/1/29 (c) | | 500,000 | | 525,905 |
Arizona Trans. Board Hwy. Rev.: | | | | |
Series B, 5.25% 7/1/19 | | 2,500,000 | | 2,726,050 |
5.25% 7/1/13 | | 1,500,000 | | 1,666,845 |
Arizona Wtr. Infrastructure Fin. Auth. Rev. (Wtr. Quality Proj.) Series A, 5.375% 10/1/11 | | 2,000,000 | | 2,277,800 |
Central Arizona Wtr. Conservation District Contract Rev. (Central Arizona Proj.) Series A: | | | | |
5.5% 11/1/09 | | 1,000,000 | | 1,127,110 |
5.5% 11/1/10 | | 375,000 | | 423,964 |
Chandler Gen. Oblig.: | | | | |
5.7% 7/1/15 | | 75,000 | | 84,866 |
6.25% 7/1/10 | | 500,000 | | 577,185 |
6.5% 7/1/10 (MBIA Insured) | | 200,000 | | 237,854 |
6.5% 7/1/11 (MBIA Insured) | | 225,000 | | 270,230 |
Maricopa County Hosp. Rev. (Sun Health Corp. Proj.) 6.125% 4/1/18 | | 300,000 | | 313,560 |
Maricopa County Indl. Dev. Auth. Health Facilities Rev. (Catholic Health Care West Proj.) Series 1998 A, 5% 7/1/16 | | 730,000 | | 743,074 |
Maricopa County Indl. Dev. Auth. Hosp. Facilities Rev. (Mayo Clinic Hosp. Proj.) 5.25% 11/15/37 | | 1,000,000 | | 1,014,410 |
Maricopa County School District #28 Kyrene Elementary Series C: | | | | |
0% 7/1/07 (FGIC Insured) | | 955,000 | | 893,699 |
0% 1/1/10 (FGIC Insured) | | 1,425,000 | | 1,196,444 |
Maricopa County Unified School District #48 Scottsdale 7.4% 7/1/10 | | 1,000,000 | | 1,231,140 |
Maricopa County Unified School District #80 Chandler: | | | | |
(2002 Proj.) Series A, 5% 7/1/17 (FSA Insured) | | 500,000 | | 541,260 |
6.25% 7/1/11 (Escrowed to Maturity) (d) | | 405,000 | | 484,870 |
Municipal Bonds - continued |
| Principal
Amount | | Value
(Note 1) |
Arizona - continued |
Mesa Indl. Dev. Auth. Rev. (Discovery Health Sys. Proj.) Series A: | | | | |
5.375% 1/1/14 (MBIA Insured) | | $ 500,000 | | $ 547,180 |
5.625% 1/1/29 (MBIA Insured) | | 400,000 | | 426,476 |
Mesa Street & Hwy. Rev. 6.5% 7/1/11 (FSA Insured) | | 1,500,000 | | 1,801,530 |
Mesa Util. Sys. Rev. 5.75% 7/1/14 (FGIC Insured) | | 1,000,000 | | 1,174,430 |
Northern Arizona Univ. Sys. Rev.: | | | | |
5.5% 6/1/23 (FGIC Insured) | | 530,000 | | 584,383 |
5.5% 6/1/26 (FGIC Insured) | | 1,305,000 | | 1,405,302 |
Phoenix Arpt. Rev. Series D, 6.4% 7/1/12 (MBIA Insured) (c) | | 810,000 | | 830,493 |
Phoenix Civic Impt. Board Arpt. Rev. Series B, 5.25% 7/1/27 (FGIC Insured) (c) | | 1,000,000 | | 1,029,730 |
Phoenix Civic Impt. Corp. Arpt. Excise Tax Rev. 5.25% 7/1/09 (c) | | 400,000 | | 434,052 |
Phoenix Civic Impt. Corp. Excise Tax Rev. (Muni. Courthouse Proj.) Series A: | | | | |
5.375% 7/1/29 | | 560,000 | | 588,241 |
5.5% 7/1/11 | | 200,000 | | 225,234 |
5.75% 7/1/15 | | 675,000 | | 763,148 |
Phoenix Civic Impt. Corp. Muni. Facilities Excise Tax Rev.: | | | | |
5.75% 7/1/10 (FGIC Insured) | | 340,000 | | 390,779 |
5.75% 7/1/12 (FGIC Insured) | | 1,250,000 | | 1,433,475 |
5.75% 7/1/14 (FGIC Insured) | | 1,000,000 | | 1,139,890 |
Phoenix Civic Impt. Corp. Wtr. Sys. Rev. Series 2001, 5.5% 7/1/24 (FGIC Insured) | | 1,000,000 | | 1,144,640 |
Phoenix Gen. Oblig.: | | | | |
Series 1995 A, 6% 7/1/11 | | 1,485,000 | | 1,742,247 |
Series A, 6.25% 7/1/17 | | 1,000,000 | | 1,244,460 |
Series B, 5.375% 7/1/20 | | 1,000,000 | | 1,100,210 |
Phoenix Indl. Dev. Auth. Single Family Mtg. Rev. 0% 12/1/14 (Escrowed to Maturity) (d) | | 1,250,000 | | 836,463 |
Phoenix Street & Hwy. User Rev. 6.25% 7/1/11 (MBIA Insured) | | 35,000 | | 36,288 |
Pima County Indl. Dev. Auth. Rev. (HealthPartners Proj.) Series A, 5.625% 4/1/14 (MBIA Insured) | | 200,000 | | 218,254 |
Pima County Unified School District #1 Tucson: | | | | |
7.5% 7/1/08 (FGIC Insured) | | 1,000,000 | | 1,182,190 |
7.5% 7/1/10 (FGIC Insured) | | 250,000 | | 310,625 |
Pima County Unified School District #12 Sunnyside 5% 7/1/11 (FSA Insured) | | 855,000 | | 948,725 |
Municipal Bonds - continued |
| Principal
Amount | | Value
(Note 1) |
Arizona - continued |
Salt River Proj. Agric. Impt. & Pwr. District Elec. Sys. Rev.: | | | | |
Series A: | | | | |
5.25% 1/1/18 | | $ 1,000,000 | | $ 1,095,580 |
5.25% 1/1/19 | | 1,615,000 | | 1,765,034 |
Series B: | | | | |
5% 1/1/20 | | 1,500,000 | | 1,590,300 |
5% 1/1/21 | | 255,000 | | 268,510 |
Scottsdale Gen. Oblig.: | | | | |
(1999 & 2000 Projs.) 5% 7/1/21 | | 1,000,000 | | 1,053,470 |
5.5% 7/1/09 | | 100,000 | | 112,707 |
Scottsdale Indl. Dev. Auth. Hosp. Rev. (Scottsdale Health Care Proj.) 5.8% 12/1/31 | | 250,000 | | 256,415 |
Scottsdale Wtr. & Swr. Rev. (1989 Proj.) Series E, 7% 7/1/07 | | 150,000 | | 170,027 |
Tempe Gen. Oblig.: | | | | |
Series 2001 A, 6% 7/1/10 | | 600,000 | | 697,944 |
5% 7/1/19 | | 1,680,000 | | 1,793,988 |
5.5% 7/1/17 | | 1,035,000 | | 1,176,826 |
Tempe Union High School District #213 7% 7/1/08 (FGIC Insured) | | 310,000 | | 362,089 |
Tucson Gen. Oblig. Series A, 6% 7/1/13 | | 800,000 | | 952,392 |
Tucson Street & Hwy. User Rev.: | | | | |
Series 1994 B, 7.5% 7/1/11 (MBIA Insured) | | 1,015,000 | | 1,280,879 |
Series 1994 C, 7% 7/1/11 (FGIC Insured) | | 500,000 | | 615,740 |
Series A, 7% 7/1/11 (MBIA Insured) | | 300,000 | | 369,444 |
6% 7/1/10 (MBIA Insured) | | 400,000 | | 465,064 |
Tucson Wtr. Rev.: | | | | |
Series 1994 C, 6.75% 7/1/07 (FGIC Insured) | | 200,000 | | 225,102 |
5.5% 7/1/14 | | 425,000 | | 490,790 |
Univ. Med. Ctr. Corp. Hosp. Rev. 5.25% 7/1/15 | | 1,000,000 | | 1,058,540 |
Univ. of Arizona Ctfs. of Prtn. (Univ. of Arizona
Parking & Student Hsg. Proj.) 5.75% 6/1/24
(AMBAC Insured) | | 500,000 | | 550,430 |
Univ. of Arizona Univ. Revs.: | | | | |
5.25% 6/1/11 (FSA Insured) | | 1,000,000 | | 1,123,470 |
5.25% 6/1/13 (FSA Insured) | | 500,000 | | 544,540 |
Municipal Bonds - continued |
| Principal
Amount | | Value
(Note 1) |
Arizona - continued |
Yavapai County Indl. Dev. Auth. Solid Waste Disp. Rev. (Waste Mgmt., Inc. Proj.) 4.625%, tender 6/1/05 (b)(c) | | $ 500,000 | | $ 507,100 |
Yuma County Hosp. District #1 6.35% 11/15/07 (Escrowed to Maturity) (d) | | 265,000 | | 282,797 |
| | 65,592,736 |
Puerto Rico - 12.9% |
Puerto Rico Commonwealth Hwy. & Trans. Auth. Hwy. Rev.: | | | | |
Series 1996 Y, 5% 7/1/36 (FSA Insured) | | 1,000,000 | | 1,030,250 |
Series Y, 5.5% 7/1/36 (FSA Insured) | | 500,000 | | 544,810 |
Puerto Rico Commonwealth Hwy. & Trans. Auth. Trans. Rev.: | | | | |
Series 1998, 5.75% 7/1/22 (CIFG North America Insured) | | 700,000 | | 796,698 |
Series 2000 C, 6% 7/1/29 | | 500,000 | | 551,270 |
Series D, 5.25% 7/1/38 | | 1,000,000 | | 1,023,170 |
5.75% 7/1/19 (FGIC Insured) | | 700,000 | | 809,746 |
Puerto Rico Commonwealth Infrastructure Fing. Auth. Series 2000 A: | | | | |
5.5% 10/1/32 (Escrowed to Maturity) (d) | | 2,675,000 | | 2,890,629 |
5.5% 10/1/40 (Escrowed to Maturity) (d) | | 2,195,000 | | 2,363,335 |
Puerto Rico Elec. Pwr. Auth. Pwr. Rev. Series QQ, 5.5% 7/1/18 (XL Cap. Assurance, Inc. Insured) (a) | | 100,000 | | 112,535 |
| | 10,122,443 |
TOTAL INVESTMENT PORTFOLIO - 96.7% (Cost $72,321,580) | | | 75,715,179 |
NET OTHER ASSETS - 3.3% | | | 2,573,691 |
NET ASSETS - 100% | | $ 78,288,870 |
Legend |
(a) Security or a portion of the security purchased on a delayed delivery or when-issued basis. |
(b) The coupon rate shown on floating or adjustable rate securities represents the rate at period end. |
(c) Private activity obligations whose interest is subject to the federal alternative minimum tax for individuals. |
(d) Security collateralized by an amount sufficient to pay interest and principal. |
Other Information |
The distribution of municipal securities by revenue source, as a percentage of total net assets, is as follows: |
Special Tax | 26.8% |
General Obligations | 22.4% |
Education | 11.6% |
Electric Utilities | 11.2% |
Escrowed/Pre-Refunded | 8.8% |
Health Care | 6.7% |
Water & Sewer | 5.5% |
Others* (individually less than 5%) | 7.0% |
| 100.0% |
*Includes net other assets |
Income Tax Information |
The fund hereby designates approximately $511,000 as a capital gain dividend for the purpose of the dividend paid deduction. |
See accompanying notes which are an integral part of the financial statements.
Annual Report
Spartan Arizona Municipal Income Fund
Financial Statements
Statement of Assets and Liabilities
| August 31, 2004 |
| | |
Assets | | |
Investment in securities, at value (cost $72,321,580) - See accompanying schedule | | $ 75,715,179 |
Cash | | 2,029,473 |
Receivable for fund shares sold | | 17,716 |
Interest receivable | | 781,874 |
Other receivables | | 1,651 |
Total assets | | 78,545,893 |
| | |
Liabilities | | |
Payable for investments purchased on a delayed delivery basis | $ 111,476 | |
Payable for fund shares redeemed | 10,000 | |
Distributions payable | 100,205 | |
Accrued management fee | 35,295 | |
Other affiliated payables | 47 | |
Total liabilities | | 257,023 |
| | |
Net Assets | | $ 78,288,870 |
Net Assets consist of: | | |
Paid in capital | | $ 74,476,042 |
Undistributed net investment income | | 18,878 |
Accumulated undistributed net realized gain (loss) on investments | | 400,351 |
Net unrealized appreciation (depreciation) on investments | | 3,393,599 |
Net Assets, for 6,774,133 shares outstanding | | $ 78,288,870 |
Net Asset Value, offering price and redemption price per share ($78,288,870 ÷ 6,774,133 shares) | | $ 11.56 |
See accompanying notes which are an integral part of the financial statements.
Annual Report
Spartan Arizona Municipal Income Fund
Financial Statements - continued
Statement of Operations
| Year ended August 31, 2004 |
| | |
Investment Income | | |
Interest | | $ 3,200,959 |
| | |
Expenses | | |
Management fee | $ 413,925 | |
Non-interested trustees' compensation | 424 | |
Miscellaneous | 56 | |
Total expenses before reductions | 414,405 | |
Expense reductions | (15,932) | 398,473 |
Net investment income (loss) | | 2,802,486 |
Realized and Unrealized Gain (Loss) Net realized gain (loss) on investment securities | | 463,856 |
Change in net unrealized appreciation (depreciation) on investment securities | | 1,209,249 |
Net gain (loss) | | 1,673,105 |
Net increase (decrease) in net assets resulting from operations | | $ 4,475,591 |
See accompanying notes which are an integral part of the financial statements.
Annual Report
Statement of Changes in Net Assets
| Year ended
August 31,
2004 | Year ended
August 31,
2003 |
Increase (Decrease) in Net Assets | | |
Operations | | |
Net investment income (loss) | $ 2,802,486 | $ 2,786,103 |
Net realized gain (loss) | 463,856 | 416,580 |
Change in net unrealized appreciation (depreciation) | 1,209,249 | (1,307,922) |
Net increase (decrease) in net assets resulting
from operations | 4,475,591 | 1,894,761 |
Distributions to shareholders from net investment income | (2,795,363) | (2,784,432) |
Distributions to shareholders from net realized gain | (406,255) | (564,965) |
Total distributions | (3,201,618) | (3,349,397) |
Share transactions
Net proceeds from sales of shares | 29,031,760 | 31,267,183 |
Reinvestment of distributions | 2,011,588 | 2,423,677 |
Cost of shares redeemed | (22,721,013) | (29,654,545) |
Net increase (decrease) in net assets resulting from share transactions | 8,322,335 | 4,036,315 |
Redemption fees | 3,125 | 2,384 |
Total increase (decrease) in net assets | 9,599,433 | 2,584,063 |
| | |
Net Assets | | |
Beginning of period | 68,689,437 | 66,105,374 |
End of period (including undistributed net investment income of $18,878 and undistributed net investment income of $15,694, respectively) | $ 78,288,870 | $ 68,689,437 |
Other Information Shares | | |
Sold | 2,514,738 | 2,704,416 |
Issued in reinvestment of distributions | 174,888 | 210,082 |
Redeemed | (1,985,119) | (2,591,010) |
Net increase (decrease) | 704,507 | 323,488 |
See accompanying notes which are an integral part of the financial statements.
Annual Report
Financial Highlights
Years ended August 31, | 2004 | 2003 | 2002 | 2001 | 2000 |
Selected Per-Share Data | | | | | |
Net asset value,
beginning of period | $ 11.32 | $ 11.50 | $ 11.26 | $ 10.72 | $ 10.53 |
Income from Investment Operations | | | | | |
Net investment income (loss) B | .427 | .435 | .444 D | .472 | .486 |
Net realized and unrealized gain (loss) | .306 | (.090) | .254 D | .542 | .189 |
Total from investment operations | .733 | .345 | .698 | 1.014 | .675 |
Distributions from net investment income | (.427) | (.435) | (.443) | (.475) | (.485) |
Distributions from net realized gain | (.066) | (.090) | (.015) | (.001) | (.001) |
Distributions in excess of net realized gain | - | - | - | - | (.003) |
Total distributions | (.493) | (.525) | (.458) | (.476) | (.489) |
Redemption fees added to paid in capital B | - E | - E | - E | .002 | .004 |
Net asset value, end of period | $ 11.56 | $ 11.32 | $ 11.50 | $ 11.26 | $ 10.72 |
Total Return A | 6.58% | 3.01% | 6.38% | 9.70% | 6.69% |
Ratios to Average Net Assets C | | | | | |
Expenses before expense reductions | .55% | .55% | .55% | .55% | .55% |
Expenses net of voluntary waivers, if any | .55% | .55% | .55% | .55% | .55% |
Expenses net of all reductions | .53% | .52% | .48% | .41% | .48% |
Net investment income (loss) | 3.72% | 3.77% | 3.96% D | 4.32% | 4.67% |
Supplemental Data | | | | | |
Net assets, end of period (000 omitted) | $ 78,289 | $ 68,689 | $ 66,105 | $ 50,716 | $ 34,221 |
Portfolio turnover rate | 14% | 19% | 30% | 24% | 37% |
A Total returns would have been lower had certain expenses not been reduced during the periods shown.
B Calculated based on average shares outstanding during the period.
C Expense ratios reflect operating expenses of the fund. Expenses before reductions do not reflect amounts reimbursed by the investment adviser or reductions from brokerage service arrangements or other expense offset arrangements and do not represent the amount paid by the fund during periods when reimbursements or reductions occur. Expenses net of any voluntary waivers reflect expenses after reimbursement by the investment adviser but prior to reductions from brokerage service arrangements or other expense offset arrangements. Expenses net of all reductions represent the net expenses paid by the fund.
D Effective September 1, 2001, the fund adopted the provisions of the AICPA Audit and Accounting Guide for Investment Companies and began amortizing premium and discount on all debt securities. Per-share data and ratios for periods prior to adoption have not been restated to reflect this change.
E Amount represents less than $.001 per share.
See accompanying notes which are an integral part of the financial statements.
Annual Report
Fidelity Arizona Municipal Money Market Fund
Investment Changes/Performance
Maturity Diversification |
Days | % of fund's
investments
8/31/04 | % of fund's
investments
2/29/04 | % of fund's
investments
8/31/03 |
0 - 30 | 92.7 | 69.0 | 76.0 |
31 - 90 | 0.0 | 6.5 | 4.6 |
91 - 180 | 4.1 | 22.9 | 4.1 |
181 - 397 | 3.2 | 1.6 | 15.3 |
Weighted Average Maturity |
| 8/31/04 | 2/29/04 | 8/31/03 |
Spartan Arizona Municipal Money Market Fund | 18 Days | 40 Days | 57 Days |
All Tax Free Money Market
Funds Average* | 36 Days | 39 Days | 48 Days |
Asset Allocation (% of fund's net assets) |
As of August 31, 2004 | As of February 29, 2004 |
| Variable Rate Demand Notes (VRDNs) 70.9% | | | Variable Rate Demand Notes (VRDNs) 56.4% | |
 | Commercial
Paper (including
CP Mode) 12.0% | | | Commercial
Paper (including
CP Mode) 17.8% | |
 | Tender Bonds 4.5% | | | Tender Bonds 4.8% | |
 | Fidelity Municipal
Cash Central Fund 9.5% | | | Fidelity Municipal
Cash Central Fund 3.8% | |
 | Other Investments 2.4% | | | Other Investments 19.5% | |
| Net Other Assets 0.7% | |  | Net Other Assets** (2.3)% | |

Current and Historical Seven-Day Yields
| 8/30/04 | 5/31/04 | 3/1/04 | 12/1/03 | 9/1/03 |
Fidelity Arizona Municipal
Money Market Fund | 0.85% | 0.63% | 0.53% | 0.64% | 0.45% |
Yield refers to the income paid by the fund over a given period. Yields for money market funds are usually for seven-day periods, as they are here, though they are expressed as annual percentage rates. Past performance is no guarantee of future results. Yield will vary and it is possible to lose money by investing in the fund.
*Source: iMoneyNet, Inc.
**Net Other Assets are not included in the pie chart.
Annual Report
Fidelity Arizona Municipal Money Market Fund
Investments August 31, 2004
Showing Percentage of Net Assets
Municipal Securities - 99.3% |
| Principal
Amount | | Value
(Note 1) |
Arizona - 82.8% |
Apache County Indl. Dev. Auth. (Imperial Components, Inc. Proj.) Series 1996, 1.4%, LOC Harris Trust & Savings Bank, Chicago, VRDN (a)(d) | $ 1,375,000 | | $ 1,375,000 |
Arizona Ctfs. of Prtn. Bonds 5% 9/1/04 (MBIA Insured) | 2,325,000 | | 2,325,000 |
Arizona School Facilities Board Ctfs. of Prtn. Participating VRDN Series RF 04 2, 1.4% (Liquidity Facility Bank of New York, New York) (a)(e) | 1,400,000 | | 1,400,000 |
Arizona School Facilities Board State School Impt. Rev. Participating VRDN: | | | |
Series MS 00 497, 1.36% (Liquidity Facility Morgan Stanley) (a)(e) | 1,062,000 | | 1,062,000 |
Series Putters 483, 1.36% (Liquidity Facility PNC Bank NA, Pittsburgh) (a)(e) | 1,500,000 | | 1,500,000 |
Series Putters 484, 1.36% (Liquidity Facility JPMorgan Chase Bank) (a)(e) | 1,500,000 | | 1,500,000 |
Arizona State Univ. Revs. Participating VRDN: | | | |
Series Putters 270, 1.36% (Liquidity Facility JPMorgan Chase Bank) (a)(e) | 1,200,000 | | 1,200,000 |
Series ROC II R174, 1.38% (Liquidity Facility Citigroup Global Markets Hldgs., Inc.) (a)(e) | 2,600,000 | | 2,600,000 |
Arizona Tourism & Sports Auth. Tax Rev. Participating VRDN Series PT 2312, 1.36% (Liquidity Facility Merrill Lynch & Co., Inc.) (a)(e) | 1,600,000 | | 1,600,000 |
Arizona Trans. Board Hwy. Rev. Participating VRDN Series ROC II R1038, 1.38% (Liquidity Facility Citigroup Global Markets Hldgs., Inc.) (a)(e) | 1,285,000 | | 1,285,000 |
Arizona Wtr. Infrastructure Fin. Auth. Rev. Participating VRDN Series PT 2237, 1.36% (Liquidity Facility Merrill Lynch & Co., Inc.) (a)(e) | 1,500,000 | | 1,500,000 |
Casa Grande Indl. Dev. Auth. Indl. Dev. Rev. (Price Companies, Inc. Proj.) Series A, 1.38%, LOC Bank of America NA, VRDN (a)(d) | 2,255,000 | | 2,255,000 |
Chandler Indl. Dev. Auth. Indl. Dev. Rev. (Red Rock Stamping Co. Proj.) Series 2000, 1.46%, LOC Key Bank NA, VRDN (a)(d) | 2,360,000 | | 2,360,000 |
Cochise County Poll. Cont. Rev. Solid Waste Disp. Rev. Bonds (Arizona Elec. Pwr. Coop. Proj.) 1%, tender 9/1/04 (Nat'l. Rural Utils. Coop. Fin. Corp. Guaranteed) (a)(d) | 7,100,000 | | 7,100,000 |
Flagstaff Indl. Dev. Auth. Solid Waste Disp. Rev. (Norton Envir., Inc. Proj.) Series 1997, 1.46%, LOC Key Bank NA, VRDN (a)(d) | 2,300,000 | | 2,300,000 |
Glendale Indl. Dev. Auth. Indl. Dev. Rev. (Superior Bedding Co. Proj.) Series 1994, 1.4%, LOC Harris Trust & Savings Bank, Chicago, VRDN (a)(d) | 900,000 | | 900,000 |
Municipal Securities - continued |
| Principal
Amount | | Value
(Note 1) |
Arizona - continued |
Maricopa County Indl. Dev. Auth. Indl. Dev. Rev.: | | | |
Bonds (American Wtr. Cap. Corp. Proj.) Series 1988, 1.2% tender 9/1/04, CP mode (d) | $ 1,300,000 | | $ 1,300,000 |
(Clayton Homes, Inc. Proj.) Series 1998, 1.4%, LOC Wachovia Bank NA, VRDN (a)(d) | 1,000,000 | | 1,000,000 |
Maricopa County Indl. Dev. Auth. Multi-family Hsg. Rev.: | | | |
(Glenn Oaks Apts. Proj.) Series 2001, 1.42%, LOC Fannie Mae, VRDN (a)(d) | 3,299,675 | | 3,299,675 |
(Ranchwood Apt. Proj.) Series 2001 A, 1.37%, LOC Fannie Mae, VRDN (a)(d) | 5,000,000 | | 5,000,000 |
(San Angelin Apts. Proj.) 1.39%, LOC Fannie Mae, VRDN (a)(d) | 1,500,000 | | 1,500,000 |
(San Martin Apts. Proj.) Series A1, 1.38%, LOC Fannie Mae, VRDN (a)(d) | 2,700,000 | | 2,700,000 |
(San Miguel Apts. Proj.) 1.39%, LOC Fannie Mae, VRDN (a)(d) | 1,300,000 | | 1,300,000 |
(San Remo Apts. Proj.) 1.38%, LOC Fannie Mae, VRDN (a)(d) | 2,100,000 | | 2,100,000 |
Maricopa County Indl. Dev. Auth. Single Family Mtg. Rev. Participating VRDN Series Merlots 01 A126, 1.45% (Liquidity Facility Wachovia Bank NA) (a)(d)(e) | 935,000 | | 935,000 |
Mesa Indl. Dev. Auth. Rev. (Discovery Health Sys. Proj.)
Series B, 1.3% (MBIA Insured), VRDN (a) | 1,000,000 | | 1,000,000 |
Phoenix Arpt. Rev. 1.35% 9/24/04, LOC Bank of America NA, CP (d) | 1,600,000 | | 1,600,000 |
Phoenix Civic Impt. Board Arpt. Rev. Participating VRDN Series Merlots 02 A28, 1.45% (Liquidity Facility Wachovia Bank NA) (a)(d)(e) | 1,285,000 | | 1,285,000 |
Phoenix Civic Impt. Corp. 1.17% 9/8/04, LOC Bank of America NA, CP | 1,000,000 | | 1,000,000 |
Phoenix Civic Impt. Corp. Excise Tax Rev.: | | | |
Participating VRDN Series EGL 03 28, 1.38% (Liquidity Facility Citibank NA, New York) (a)(e) | 1,300,000 | | 1,300,000 |
Series 1995, 1.37%, LOC Landesbank Hessen-Thuringen, VRDN (a)(d) | 6,000,000 | | 6,000,000 |
Phoenix Civic Impt. Corp. Wastewtr. Sys. Rev. Series 2003 B: | | | |
1.35% 1/5/05, LOC Dexia Cr. Local de France, CP | 5,000,000 | | 5,000,000 |
1.5% 3/3/05, LOC Dexia Cr. Local de France, CP | 2,000,000 | | 2,000,000 |
1.5% 3/10/05, LOC Dexia Cr. Local de France, CP | 1,600,000 | | 1,600,000 |
1.6% 4/1/05, LOC Dexia Cr. Local de France, CP | 1,300,000 | | 1,300,000 |
Phoenix Indl. Dev. Auth. Multi-family Hsg. Rev.: | | | |
(Bell Square Apt. Proj.) Series 1995, 1.35%, LOC Gen. Elec. Cap. Corp., VRDN (a) | 1,000,000 | | 1,000,000 |
Municipal Securities - continued |
| Principal
Amount | | Value
(Note 1) |
Arizona - continued |
Phoenix Indl. Dev. Auth. Multi-family Hsg. Rev.: - continued | | | |
(Westward Ho Apts. Proj.): | | | |
Series 2003 A, 1.47%, LOC Fleet Nat'l. Bank, VRDN (a)(d) | $ 2,000,000 | | $ 2,000,000 |
Series 2003 B, 1.42%, LOC Fed. Home Ln. Bank, Cincinnati, VRDN (a)(d) | 2,000,000 | | 2,000,000 |
Phoenix Indl. Dev. Auth. Rev.: | | | |
(Desert Botanical Garden Proj.) Series 2000, 1.35%, LOC Bank One NA, Chicago, VRDN (a) | 2,300,000 | | 2,300,000 |
(Independent Newspaper, Inc. Proj.) Series 2000, 1.5%, LOC Wachovia Bank NA, VRDN (a)(d) | 900,000 | | 900,000 |
(Laura Dozer Ctr. Proj.) 1.5%, LOC Bank One NA, Chicago, VRDN (a) | 1,200,000 | | 1,200,000 |
(Phoenix Expansion Proj.) 1.6%, LOC Bank One NA, Chicago, VRDN (a)(d) | 2,390,000 | | 2,390,000 |
(Plastican Proj.) Series 1997, 1.38%, LOC Fleet Bank NA, VRDN (a)(d) | 2,965,000 | | 2,965,000 |
(Swift Aviation Svcs., Inc. Proj.) 1.45%, LOC U.S. Bank NA, Minnesota, VRDN (a)(d) | 5,620,000 | | 5,620,000 |
Phoenix Indl. Dev. Auth. Single Family Mtg. Rev. Participating VRDN: | | | |
Series Merlots 01 A23, 1.45% (Liquidity Facility Wachovia Bank NA) (a)(d)(e) | 345,000 | | 345,000 |
Series PT 1082, 1.41% (Liquidity Facility Merrill Lynch & Co., Inc.) (a)(d)(e) | 1,360,000 | | 1,360,000 |
Pima County Indl. Dev. Auth. Multi-family Hsg. Rev.: | | | |
(La Cholla Apt. Proj.) Series 1996, 1.38%, LOC JPMorgan Chase Bank, VRDN (a) | 4,225,000 | | 4,225,000 |
(River Point Proj.) Series 2001, 1.37%, LOC Fannie Mae, VRDN (a)(d) | 6,000,000 | | 6,000,000 |
Pima County Indl. Dev. Auth. Single Family Hsg. Rev. Participating VRDN Series RF 99 5, 1.47% (Liquidity Facility Bank of New York, New York) (a)(d)(e) | 3,490,000 | | 3,490,000 |
Salt River Proj. Agric. Impt. & Pwr. District Elec. Sys. Rev.: | | | |
Bonds Series A, 5% 1/1/05 | 1,400,000 | | 1,417,526 |
Participating VRDN: | | | |
Series PT 1512, 1.36% (Liquidity Facility Merrill Lynch & Co., Inc.) (a)(e) | 1,200,000 | | 1,200,000 |
Series ROC II R1002, 1.38% (Liquidity Facility Citigroup Global Markets Hldgs., Inc.) (a)(e) | 1,295,000 | | 1,295,000 |
Series ROC II R1003, 1.38% (Liquidity Facility Citigroup Global Markets Hldgs., Inc.) (a)(e) | 1,290,000 | | 1,290,000 |
Municipal Securities - continued |
| Principal
Amount | | Value
(Note 1) |
Arizona - continued |
Salt River Proj. Agric. Impt. & Pwr. District Elec. Sys. Rev.: - continued | | | |
Participating VRDN: | | | |
Series SG 03 160, 1.36% (Liquidity Facility Societe Generale) (a)(e) | $ 1,390,000 | | $ 1,390,000 |
Series 1997 B: | | | |
1.15% 9/8/04, CP | 3,100,000 | | 3,100,000 |
1.36% 9/21/04, CP | 2,000,000 | | 2,000,000 |
Tempe Indl. Dev. Auth. Rev. (ASUF Brickyard Proj.) Series 2004 A, 1.33%, LOC Bank of America NA, VRDN (a) | 5,210,000 | | 5,210,000 |
Tucson Arpt. Auth. Spl. Facility Rev. (LearJet, Inc. Proj.) Series 1998 A, 1.43%, LOC Bank of America NA, VRDN (a)(d) | 1,300,000 | | 1,300,000 |
Tucson Indl. Dev. Auth. Rev. (Clarion Santa Rita Hotel Proj.) Series 2002, 1.42%, LOC Bank One NA, Chicago, VRDN (a)(d) | 1,400,000 | | 1,400,000 |
Yavapai County Indl. Dev. Auth. Indl. Dev. Rev. (Oxycal Lab. Proj.) Series 1999 A, 1.55%, LOC Wells Fargo Bank NA, San Francisco, VRDN (a)(d) | 1,000,000 | | 1,000,000 |
| | 129,879,201 |
Puerto Rico - 7.0% |
Puerto Rico Commonwealth Gen. Oblig. Participating VRDN: | | | |
Series PA 774R, 1.31% (Liquidity Facility Merrill Lynch & Co., Inc.) (a)(e) | 3,810,000 | | 3,810,000 |
Series PT 1837, 1.31% (Liquidity Facility Merrill Lynch & Co., Inc.) (a)(e) | 2,570,000 | | 2,570,000 |
Puerto Rico Elec. Pwr. Auth. Pwr. Rev. Participating VRDN Series PA 778R, 1.31% (Liquidity Facility Merrill Lynch & Co., Inc.) (a)(e) | 4,625,000 | | 4,625,000 |
| | 11,005,000 |
Municipal Securities - continued |
| Shares | | Value
(Note 1) |
Other - 9.5% |
Fidelity Municipal Cash Central Fund, 1.36% (b)(c) | 14,916,533 | | $ 14,916,533 |
TOTAL INVESTMENT PORTFOLIO - 99.3% | | 155,800,734 |
NET OTHER ASSETS - 0.7% | | 1,153,933 |
NET ASSETS - 100% | $ 156,954,667 |
Total Cost for Federal Income Tax Purposes $ 155,800,734 |
Security Type Abbreviations |
CP - COMMERCIAL PAPER |
VRDN - VARIABLE RATE DEMAND NOTE |
Legend |
(a) The coupon rate shown on floating or adjustable rate securities represents the rate at period end. |
(b) Information in this report regarding holdings by state and security types does not reflect the holdings of the Fidelity Municipal Cash Central Fund. |
(c) Affiliated fund that is available only to investment companies and other accounts managed by Fidelity Investments. The rate quoted is the annualized seven-day yield of the fund at period end. A complete listing of the fund's holdings as of its most recent fiscal year end is available upon request. |
(d) Private activity obligations whose interest is subject to the federal alternative minimum tax for individuals. |
(e) Provides evidence of ownership in one or more underlying municipal bonds. |
Income Tax Information |
The fund hereby designates approximately $13,000 as a capital gain dividend for the purpose of the dividend paid deduction. |
See accompanying notes which are an integral part of the financial statements.
Annual Report
Fidelity Arizona Municipal Money Market Fund
Financial Statements
Statement of Assets and Liabilities
| August 31, 2004 |
| | |
Assets | | |
Investment in securities, at value (cost $155,800,734) - See accompanying schedule | | $ 155,800,734 |
Cash | | 1,472,601 |
Receivable for investments sold | | 2,000,142 |
Receivable for fund shares sold | | 727,400 |
Interest receivable | | 308,535 |
Other receivables | | 20,752 |
Total assets | | 160,330,164 |
| | |
Liabilities | | |
Payable for investments purchased | $ 2,700,000 | |
Payable for fund shares redeemed | 609,031 | |
Distributions payable | 1,225 | |
Accrued management fee | 65,150 | |
Other affiliated payables | 91 | |
Total liabilities | | 3,375,497 |
| | |
Net Assets | | $ 156,954,667 |
Net Assets consist of: | | |
Paid in capital | | $ 156,921,370 |
Accumulated net realized gain (loss) on investments | | 33,297 |
Net Assets, for 156,837,628 shares outstanding | | $ 156,954,667 |
Net Asset Value, offering price and redemption price per share ($156,954,667 ÷ 156,837,628 shares) | | $ 1.00 |
See accompanying notes which are an integral part of the financial statements.
Annual Report
Fidelity Arizona Municipal Money Market Fund
Financial Statements - continued
Statement of Operations
| Year ended August 31, 2004 |
| | |
Investment Income | | |
Interest | | $ 1,558,623 |
| | |
Expenses | | |
Management fee | $ 714,892 | |
Non-interested trustees' compensation | 801 | |
Total expenses before reductions | 715,693 | |
Expense reductions | (13,378) | 702,315 |
Net investment income | | 856,308 |
Net realized gain (loss) on investment securities | | 43,224 |
Net increase in net assets resulting from operations | | $ 899,532 |
See accompanying notes which are an integral part of the financial statements.
Annual Report
Statement of Changes in Net Assets
| Year ended
August 31,
2004 | Year ended
August 31,
2003 |
Increase (Decrease) in Net Assets | | |
Operations | | |
Net investment income | $ 856,308 | $ 1,094,676 |
Net realized gain (loss) | 43,224 | 28,773 |
Net increase (decrease) in net assets resulting
from operations | 899,532 | 1,123,449 |
Distributions to shareholders from net investment income | (856,308) | (1,094,676) |
Distributions to shareholders from net realized gain | - | (54,921) |
Total distributions | (856,308) | (1,149,597) |
Share transactions at net asset value of $1.00 per share
Proceeds from sales of shares | 284,737,103 | 187,828,510 |
Reinvestment of distributions | 847,210 | 1,135,330 |
Cost of shares redeemed | (262,790,710) | (187,027,524) |
Net increase (decrease) in net assets and shares resulting from share transactions | 22,793,603 | 1,936,316 |
Total increase (decrease) in net assets | 22,836,827 | 1,910,168 |
| | |
Net Assets | | |
Beginning of period | 134,117,840 | 132,207,672 |
End of period | $ 156,954,667 | $ 134,117,840 |
See accompanying notes which are an integral part of the financial statements.
Annual Report
Financial Highlights
Years ended August 31, | 2004 | 2003 | 2002 | 2001 | 2000 |
Selected Per-Share Data | | | | | |
Net asset value,
beginning of period | $ 1.00 | $ 1.00 | $ 1.00 | $ 1.00 | $ 1.00 |
Income from Investment Operations | | | | | |
Net investment income | .006 | .008 | .013 | .032 | .034 |
Net realized and unrealized gain (loss) D | - | - | - | - | - |
Total from investment operations | .006 | .008 | .013 | .032 | .034 |
Distributions from net investment income | (.006) | (.008) | (.013) | (.032) | (.034) |
Distributions from net realized gain | - | - D | - | - | - |
Total distributions | (.006) | (.008) | (.013) | (.032) | (.034) |
Net asset value, end of period | $ 1.00 | $ 1.00 | $ 1.00 | $ 1.00 | $ 1.00 |
Total Return A, B | .60% | .86% | 1.30% | 3.23% | 3.50% |
Ratios to Average Net Assets C | | | | | |
Expenses before expense reductions | .50% | .50% | .50% | .50% | .50% |
Expenses net of voluntary waivers, if any | .50% | .50% | .50% | .50% | .50% |
Expenses net of all reductions | .49% | .48% | .45% | .47% | .50% |
Net investment income | .60% | .82% | 1.27% | 3.19% | 3.46% |
Supplemental Data | | | | | |
Net assets, end of period (000 omitted) | $ 156,955 | $ 134,118 | $ 132,208 | $ 101,853 | $ 105,704 |
A Total returns would have been lower had certain expenses not been reduced during the periods shown.
B Total returns do not include the effect of the former account closeout fee.
C Expense ratios reflect operating expenses of the fund. Expenses before reductions do not reflect amounts reimbursed by the investment adviser or reductions from brokerage service arrangements or other expense offset arrangements and do not represent the amount paid by the fund during periods when reimbursements or reductions occur. Expenses net of any voluntary waivers reflect expenses after reimbursement by the investment adviser but prior to reductions from brokerage service arrangements or other expense offset arrangements. Expenses net of all reductions represent the net expenses paid by the fund.
D Amount represents less than $.001 per share.
See accompanying notes which are an integral part of the financial statements.
Annual Report
Notes to Financial Statements
For the period ended August 31, 2004
1. Significant Accounting Policies.
Spartan Arizona Municipal Income Fund (the income fund) is a fund of Fidelity Union Street Trust. Fidelity Arizona Municipal Money Market Fund (the money market fund) is a fund of Fidelity Union Street Trust II. Each trust is registered under the Investment Company Act of 1940, as amended (the 1940 Act), as an open-end management investment company. Fidelity Union Street Trust and Fidelity Union Street Trust II (the trusts) are organized as a Massachusetts business trust and a Delaware statutory trust, respectively. Each fund is authorized to issue an unlimited number of shares. Each fund may be affected by economic and political developments in the state of Arizona. The financial statements have been prepared in conformity with accounting principles generally accepted in the United States of America, which require management to make certain estimates and assumptions at the date of the financial statements. The following summarizes the significant accounting policies of the income fund and the money market fund:
Security Valuation. Net asset value per share (NAV calculation) is calculated as of the close of business of the New York Stock Exchange, normally 4:00 p.m. Eastern time. Debt securities, including restricted securities, are valued on the basis of information provided by a pricing service. Pricing services use valuation matrices that incorporate both dealer-supplied valuations and valuation models. If prices are not readily available or do not accurately reflect fair value for a security, or if a security's value has been materially affected by events occurring after the close of the exchange or market on which the security is principally traded, that security may be valued by another method that the Board of Trustees believes accurately reflects fair value. A security's valuation may differ depending on the method used for determining value. Price movements in futures contracts and ADRs, market and trading trends, the bid/ask quotes of brokers and off-exchange institutional trading may be reviewed in the course of making a good faith determination of a security's fair value. Short-term securities with remaining maturities of sixty days or less for which quotations are not readily available are valued on the basis of amortized cost. Investments in open-end investment companies are valued at their net asset value each business day.
As permitted under Rule 2a-7 of the 1940 Act, and certain conditions therein, securities owned by the money market funds are valued initially at cost and thereafter assume a constant amortization to maturity of any discount or premium.
Investment Transactions and Income. Security transactions are accounted for as of trade date. Gains and losses on securities sold are determined on the basis of identified cost. Interest income is accrued as earned. Interest income includes coupon interest and amortization of premium and accretion of discount on debt securities.
Expenses. Most expenses of each trust can be directly attributed to a fund. Expenses which cannot be directly attributed are apportioned among the funds in the trust.
Annual Report
Notes to Financial Statements - continued
1. Significant Accounting Policies - continued
Income Tax Information and Distributions to Shareholders. Each year, each fund intends to qualify as a regulated investment company by distributing all of its taxable income and realized gains under Subchapter M of the Internal Revenue Code. As a result, no provision for income taxes is required in the accompanying financial statements.
Dividends are declared daily and paid monthly from net investment income. Distributions from realized gains, if any, are recorded on the ex-dividend date. Income and capital gain distributions are determined in accordance with income tax regulations, which may differ from generally accepted accounting principles. In addition, the income fund will treat a portion of the proceeds from shares redeemed as a distribution from net investment income and realized gain for income tax purposes. There were no significant book-to-tax differences during the period for the money market fund.
Capital accounts within the income fund's financial statements are adjusted for permanent book-tax differences. These adjustments have no impact on net assets or the results of operations. Temporary book-tax differences will reverse in a subsequent period.
Book-tax differences are primarily due to market discount and losses deferred due to wash sales and futures transactions.
The funds purchase municipal securities whose interest, in the opinion of the issuer, is free from federal income tax. There is no assurance that the Internal Revenue Service (IRS) will agree with this opinion. In the event the IRS determines that the issuer does not comply with relevant tax requirements, interest payments from a security could become federally taxable, possibly retroactively to the date the security was issued.
The tax-basis components of distributable earnings and the federal tax cost for the income fund as of period end were as follows:
Unrealized appreciation | $ 3,494,529 | |
Unrealized depreciation | (80,631) | |
Net unrealized appreciation (depreciation) | 3,413,898 | |
Undistributed ordinary income | 255,611 | |
Undistributed long-term capital gain | 352,841 | |
| | |
Cost for federal income tax purposes | $ 72,301,281 | |
Annual Report
1. Significant Accounting Policies - continued
Income Tax Information and Distributions to Shareholders - continued
The tax character of distributions paid for the income fund was as follows:
| August 31, 2004 | August 31, 2003 |
Tax-exempt Income | $ 2,795,363 | $ 2,784,432 |
Ordinary Income | - | 243,567 |
Long-term Capital Gains | 406,255 | 321,398 |
Total | $ 3,201,618 | $ 3,349,397 |
Short-Term Trading (Redemption) Fees. Shares held in the income fund less than 30 days are subject to a redemption fee equal to .50% of the proceeds of the redeemed shares. All redemption fees, including any estimated redemption fees paid by Fidelity Management & Research Company (FMR), are retained by the fund and accounted for as an addition to paid in capital.
2. Operating Policies.
Delayed Delivery Transactions and When-Issued Securities. Each fund may purchase or sell securities on a delayed delivery or when-issued basis. Payment and delivery may take place after the customary settlement period for that security. The price of the underlying securities and the date when the securities will be delivered and paid for are fixed at the time the transaction is negotiated. During the time a delayed delivery sell is outstanding, the contract is marked-to-market daily and equivalent deliverable securities are held for the transaction. The value of the securities purchased on a delayed delivery or when-issued basis are identified as such in each applicable fund's Schedule of Investments. Each fund may receive compensation for interest forgone in the purchase of a delayed delivery or when-issued security. With respect to purchase commitments, each fund identifies securities as segregated in its records with a value at least equal to the amount of the commitment. Losses may arise due to changes in the value of the underlying securities or if the counterparty does not perform under the contract's terms, or if the issuer does not issue the securities due to political, economic, or other factors.
3. Purchases and Sales of Investments.
Purchases and sales of securities, other than short-term securities and U.S. government securities, for the income fund aggregated $16,518,137 and $10,105,677, respectively.
Annual Report
Notes to Financial Statements - continued
4. Fees and Other Transactions with Affiliates.
Management Fee. FMR and its affiliates provides the funds with investment management related services for which the funds pay a monthly management fee. FMR pays all other expenses, except the compensation of the non-interested Trustees and certain exceptions such as interest expense. The management fee paid to FMR by the funds is reduced by an amount equal to the fees and expenses paid by the funds to the non-interested Trustees. Each fund's management fee is equal to the following annual rate of average net assets:
Spartan Arizona Municipal Income Fund | .55% | | |
Fidelity Arizona Municipal Money Market Fund | .50% | |
Central Funds. The funds may invest in affiliated Central Funds managed by Fidelity Investments Money Management, Inc. (FIMM), an affiliate of FMR. The Central Funds are open-end investment companies available only to investment companies and other accounts managed by FMR and its affiliates. The Central Funds seek preservation of capital and current income and do not pay a management fee. Income distributions earned by the funds are recorded as income in the accompanying financial statements. Distributions from the Central Funds are noted in the table below:
| Income
Distributions |
Fidelity Arizona Municipal Money Market Fund | $ 66,068 |
5. Committed Line of Credit.
The income fund participates with other funds managed by FMR in a $4.2 billion credit facility (the "line of credit") to be utilized for temporary or emergency purposes to fund shareholder redemptions or for other short-term liquidity purposes. The participating funds have agreed to pay commitment fees on their pro rata portion of the line of credit, which is included in Miscellaneous Expense on the Statement of Operations. During the period, there were no borrowings on this line of credit.
6. Expense Reductions.
Through arrangements with each applicable fund's custodian and transfer agent, credits realized as a result of uninvested cash balances were used to reduce each applicable fund's expenses. During the period, these credits reduced expenses by the following amounts:
Spartan Arizona Municipal Income Fund | $ 15,932 | | |
Fidelity Arizona Municipal Money Market Fund | 13,378 | |
Annual Report
Report of Independent Registered Public Accounting Firm
To the Trustees of Fidelity Union Street Trust and Fidelity Union Street Trust II and the Shareholders of Spartan Arizona Municipal Income Fund and Fidelity Arizona Municipal Money Market Fund:
In our opinion, the accompanying statements of assets and liabilities, including the schedules of investments, and the related statements of operations and of changes in net assets and the financial highlights present fairly, in all material respects, the financial position of Spartan Arizona Municipal Income Fund (a fund of Fidelity Union Street Trust) and Fidelity Arizona Municipal Money Market Fund (a fund of Fidelity Union Street Trust II) at August 31, 2004 and the results of their operations, the changes in their net assets and the financial highlights for the periods indicated, in conformity with accounting principles generally accepted in the United States of America. These financial statements and financial highlights (hereafter referred to as "financial statements") are the responsibility of the Fidelity Union Street Trust's and Fidelity Union Street Trust II's management; our responsibility is to express an opinion on these financial statements based on our audits. We conducted our audits of these financial statements in accordance with the standards of the Public Company Accounting Oversight Board (United States), which require that we plan and perform the audit to obtain reasonable assurance about whether the financial statements are free of material misstatement. An audit includes examining, on a test basis, evidence supporting the amounts and disclosures in the financial statements, assessing the accounting principles used and significant estimates made by management, and evaluating the overall financial statement presentation. We believe that our audits, which included confirmation of securities at August 31, 2004 by correspondence with the custodian and brokers, provide a reasonable basis for our opinion.
/s/PricewaterhouseCoopers LLP
PricewaterhouseCoopers LLP
Boston, Massachusetts
October 7, 2004
Annual Report
Trustees and Officers
The Trustees, Members of the Advisory Board, and executive officers of the trusts and funds, as applicable, are listed below. The Board of Trustees governs each fund and is responsible for protecting the interests of shareholders. The Trustees are experienced executives who meet periodically throughout the year to oversee each fund's activities, review contractual arrangements with companies that provide services to each fund, and review each fund's performance. Except for William O. McCoy, each of the Trustees oversees 295 funds advised by FMR or an affiliate. Mr. McCoy oversees 297 funds advised by FMR or an affiliate.
The Trustees hold office without limit in time except that (a) any Trustee may resign; (b) any Trustee may be removed by written instrument, signed by at least two-thirds of the number of Trustees prior to such removal; (c) any Trustee who requests to be retired or who has become incapacitated by illness or injury may be retired by written instrument signed by a majority of the other Trustees; and (d) any Trustee may be removed at any special meeting of shareholders by a two-thirds vote of the outstanding voting securities of the trust. In any event, each non-interested Trustee shall retire not later than the last day of the calendar year in which his or her 72nd birthday occurs. The executive officers and Advisory Board Members hold office without limit in time, except that any officer and Advisory Board Member may resign or may be removed by a vote of a majority of the Trustees at any regular meeting or any special meeting of the Trustees. Except as indicated, each individual has held the office shown or other offices in the same company for the past five years.
The fund's Statement of Additional Information (SAI) includes more information about the Trustees. To request a free copy, call Fidelity at 1-800-544-8544.
Interested Trustees*:
Correspondence intended for each Trustee who is an "interested person" (as defined in the 1940 Act) may be sent to Fidelity Investments, 82 Devonshire Street, Boston, Massachusetts 02109.
Name, Age; Principal Occupation |
Edward C. Johnson 3d (74)** |
| Year of Election or Appointment: 1974 or 1991 Trustee of Fidelity Union Street Trust (1974) and Fidelity Union Street Trust II (1991). Mr. Johnson is Chairman of the Board of Trustees. Mr. Johnson serves as Chief Executive Officer, Chairman, and a Director of FMR Corp.; a Director and Chairman of the Board and of the Executive Committee of FMR; Chairman and a Director of Fidelity Management & Research (Far East) Inc.; Chairman (1998) and a Director of Fidelity Investments Money Management, Inc.; and Chairman (2001) and a Director (2000) of FMR Co., Inc. |
Abigail P. Johnson (42)** |
| Year of Election or Appointment: 2001 Senior Vice President of Arizona Municipal Money Market (2001) and Spartan Arizona Municipal Income (2001). Ms. Johnson also serves as Senior Vice President of other Fidelity funds (2001). She is President and a Director of FMR (2001), Fidelity Investments Money Management, Inc. (2001), FMR Co., Inc. (2001), and a Director of FMR Corp. Previously, Ms. Johnson managed a number of Fidelity funds. |
Laura B. Cronin (50) |
| Year of Election or Appointment: 2003 Ms. Cronin is an Executive Vice President (2002) and Chief Financial Officer (2002) of FMR Corp. and is a member of the Fidelity Management Committee (2003). Previously, Ms. Cronin served as Vice President of Finance of FMR (1997-1999), and Chief Financial Officer of FMR (1999-2001), Fidelity Personal Investments (2001), and Fidelity Brokerage Company (2001-2002). |
Robert L. Reynolds (52) |
| Year of Election or Appointment: 2003 Mr. Reynolds is a Director (2003) and Chief Operating Officer (2002) of FMR Corp. and is the head of the Fidelity Management Committee (2003). He also serves on the Board at Fidelity Investments Canada, Ltd. (2000). Previously, Mr. Reynolds served as President of Fidelity Investments Institutional Retirement Group (1996-2000). |
* Trustees have been determined to be "Interested Trustees" by virtue of, among other things, their affiliation with the trusts or various entities under common control with FMR.
** Edward C. Johnson 3d, Trustee, is Abigail P. Johnson's father.
Annual Report
Non-Interested Trustees:
Correspondence intended for each non-interested Trustee (that is, the Trustees other than the Interested Trustees) may be sent to Fidelity Investments, P.O. Box 55235, Boston, Massachusetts 02205-5235.
Name, Age; Principal Occupation |
J. Michael Cook (61) |
| Year of Election or Appointment: 2001 Prior to Mr. Cook's retirement in May 1999, he served as Chairman and Chief Executive Officer of Deloitte & Touche LLP (accounting/consulting), Chairman of the Deloitte & Touche Foundation, and a member of the Board of Deloitte Touche Tohmatsu. He currently serves as a Director of Comcast (telecommunications, 2002), International Flavors & Fragrances, Inc. (2000), The Dow Chemical Company (2000), and Northrop Grumman Corporation (global defense technology, 2003). He is a Member of the Diversity Advisory Council of Marakon (2003) and the Advisory Council of the Public Company Accounting Oversight Board (PCAOB), Chairman Emeritus of the Board of Catalyst (a leading organization for the advancement of women in business), and is Chairman of the Accountability Advisory Council to the Comptroller General of the United States. He also serves as a Member of the Advisory Board of the Graduate School of Business of the University of Florida, his alma mater. |
Ralph F. Cox (72) |
| Year of Election or Appointment: 1991 Mr. Cox is President of RABAR Enterprises (management consulting for the petroleum industry). Prior to February 1994, he was President of Greenhill Petroleum Corporation (petroleum exploration and production). Until March 1990, Mr. Cox was President and Chief Operating Officer of Union Pacific Resources Company (exploration and production). He is a Director of CH2M Hill Companies (engineering), and Abraxas Petroleum (petroleum exploration and production, 1999). In addition, he is a member of advisory boards of Texas A&M University and the University of Texas at Austin. |
Robert M. Gates (60) |
| Year of Election or Appointment: 1997 Dr. Gates is President of Texas A&M University (2002). He was Director of the Central Intelligence Agency (CIA) from 1991 to 1993. From 1989 to 1991, Dr. Gates served as Assistant to the President of the United States and Deputy National Security Advisor. Dr. Gates is a Director of NACCO Industries, Inc. (mining and manufacturing), Parker Drilling Co., Inc. (drilling and rental tools for the energy industry, 2001), and Brinker International (restaurant management, 2003). He also serves as a member of the Advisory Board of VoteHere.net (secure internet voting, 2001). Previously, Dr. Gates served as a Director of LucasVarity PLC (automotive components and diesel engines), a Director of TRW Inc. (automotive, space, defense, and information technology), and Dean of the George Bush School of Government and Public Service at Texas A&M University (1999-2001). Dr. Gates also is a Trustee of the Forum for International Policy. |
George H. Heilmeier (68) |
| Year of Election or Appointment: 2004 Dr. Heilmeier is Chairman Emeritus of Telcordia Technologies (communication software and systems), where prior to his retirement, he served as company Chairman and Chief Executive Officer. He currently serves on the Boards of Directors of The Mitre Corporation (systems engineering and information technology support for the government), INET Technologies Inc. (telecommunications network surveillance, 2001) and Teletech Holdings (customer management services, 1998). He is Chairman of the General Motors Technology Advisory Committee and a Life Fellow of the IEEE (2000). Dr. Heilmeier is a member of the Defense Science Board and the National Security Agency Advisory Board. He is also a member of the National Academy of Engineering, the American Academy of Arts and Sciences and The Board of Overseers of the School of Engineering and Applied Science of the University of Pennsylvania. Previously, Dr. Heilmeier served as a Director of TRW Inc. (automotive, space, defense, and information technology, 1992-2002), Compaq (1994-2002), and Automatic Data Processing, Inc. (ADP) (technology-based business outsourcing, 1995-2002). |
Donald J. Kirk (71) |
| Year of Election or Appointment: 1987 or 1991 Trustee of Fidelity Union Street Trust (1987) and Fidelity Union Street Trust II (1991). Mr. Kirk is a Governor of the American Stock Exchange (2001), a Trustee and former Chairman of the Board of Trustees of the Greenwich Hospital Association, a Director of the Yale-New Haven Health Services Corp. (1998), and a Director Emeritus and former Chairman of the Board of Directors of National Arts Strategies Inc. (leadership education for arts and culture). Mr. Kirk was an Executive-in-Residence (1995-2000) and a Professor (1987-1995) at Columbia University Graduate School of Business. Prior to 1987, he was Chairman of the Financial Accounting Standards Board. Previously, Mr. Kirk served as a Governor of the National Association of Securities Dealers, Inc. (1996-2002), a member and Vice Chairman of the Public Oversight Board of the American Institute of Certified Public Accountants' SEC Practice Section (1995-2002), a Director of General Re Corporation (reinsurance, 1987-1998) and as a Director of Valuation Research Corp. (appraisals and valuations). |
Marie L. Knowles (57) |
| Year of Election or Appointment: 2001 Prior to Ms. Knowles' retirement in June 2000, she served as Executive Vice President and Chief Financial Officer of Atlantic Richfield Company (ARCO) (diversified energy, 1996-2000). From 1993 to 1996, she was a Senior Vice President of ARCO and President of ARCO Transportation Company. She served as a Director of ARCO from 1996 to 1998. She currently serves as a Director of Phelps Dodge Corporation (copper mining and manufacturing) and McKesson Corporation (healthcare service, 2002). Ms. Knowles is a Trustee of the Brookings Institution and the Catalina Island Conservancy and also serves as a member of the Advisory Board for the School of Engineering of the University of Southern California. |
Ned C. Lautenbach (60) |
| Year of Election or Appointment: 2000 Mr. Lautenbach has been a partner of Clayton, Dubilier & Rice, Inc. (private equity investment firm) since September 1998. Previously, Mr. Lautenbach was with the International Business Machines Corporation (IBM) from 1968 until his retirement in 1998. He was most recently Senior Vice President and Group Executive of Worldwide Sales and Services. From 1993 to 1995, he was Chairman of IBM World Trade Corporation, and from 1994 to 1998 was a member of IBM's Corporate Executive Committee. Mr. Lautenbach serves as Co-Chairman and a Director of Covansys, Inc. (global provider of business and technology solutions, 2000). In addition, he is a Director of Italtel Holding S.p.A. (telecommunications (Milan, Italy), 2004) and Eaton Corporation (diversified industrial) as well as the Philharmonic Center for the Arts in Naples, Florida (1999). He also is a member of the Council on Foreign Relations. |
Marvin L. Mann (71) |
| Year of Election or Appointment: 1993 Mr. Mann is Chairman of the non-interested Trustees (2001). He is Chairman Emeritus of Lexmark International, Inc. (computer peripherals), where he served as CEO until April 1998, retired as Chairman May 1999, and remains a member of the Board. Prior to 1991, he held the positions of Vice President of International Business Machines Corporation (IBM) and President and General Manager of various IBM divisions and subsidiaries. He is a member of the Executive Committee of the Independent Director's Council of the Investment Company Institute. In addition, Mr. Mann is a member of the President's Cabinet at the University of Alabama and the Board of Visitors of the Culverhouse College of Commerce and Business Administration at the University of Alabama. |
William O. McCoy (70) |
| Year of Election or Appointment: 1997 Prior to his retirement in December 1994, Mr. McCoy was Vice Chairman of the Board of BellSouth Corporation (telecommunications) and President of BellSouth Enterprises. He is currently a Director of Liberty Corporation (holding company), Duke Realty Corporation (real estate), and Progress Energy, Inc. (electric utility). He is also a partner of Franklin Street Partners (private investment management firm) and a member of the Research Triangle Foundation Board. In addition, Mr. McCoy served as the Interim Chancellor (1999-2000) and a member of the Board of Visitors (1994-1998) for the University of North Carolina at Chapel Hill and currently serves on the Board of Directors of the University of North Carolina Health Care System and the Board of Visitors of the Kenan-Flagler Business School (University of North Carolina at Chapel Hill). He also served as Vice President of Finance for the University of North Carolina (16-school system, 1995-1998). |
William S. Stavropoulos (65) |
| Year of Election or Appointment: 2002 Mr. Stavropoulos is Chairman of the Board (2000), CEO (2002), a position he previously held from 1995-2000, Chairman of the Executive Committee (2000), and a Member of the Board of Directors of The Dow Chemical Company. Since joining The Dow Chemical Company in 1967, Mr. Stavropoulos served in numerous senior management positions, including President (1993-2000; 2002-2003). Currently, he is a Director of NCR Corporation (data warehousing and technology solutions), BellSouth Corporation (telecommunications), Chemical Financial Corporation, and Maersk Inc. (industrial conglomerate, 2002). He also serves as a member of the Board of Trustees of the American Enterprise Institute for Public Policy Research. In addition, Mr. Stavropoulos is a member of The Business Council, J.P. Morgan International Council and the University of Notre Dame Advisory Council for the College of Science. |
Annual Report
Trustees and Officers - continued
Advisory Board Members and Executive Officers:
Correspondence intended for Mr. Dirks, Ms. Small, and Mr. Wolfe may be sent to Fidelity Investments, P.O. Box 55235, Boston, Massachusetts 02205-5235. Correspondence intended for each executive officer and Mr. Lynch may be sent to Fidelity Investments, 82 Devonshire Street, Boston, Massachusetts 02109.
Name, Age; Principal Occupation |
Dennis J. Dirks (56) |
| Year of Election or Appointment: 2004 Member of the Advisory Board of Fidelity Union Street Trust and Fidelity Union Street Trust II. Prior to his retirement in May 2003, Mr. Dirks was Chief Operating Officer and a member of the Board of The Depository Trust & Clearing Corporation (DTCC) (1999-2003). He also served as President, Chief Operating Officer, and Board member of The Depository Trust Company (DTC) (1999-2003) and President and Board member of the National Securities Clearing Corporation (NSCC) (1999-2003). In addition, Mr. Dirks served as Chief Executive Officer and Board member of the Government Securities Clearing Corporation (2001-2003) and Chief Executive Officer and Board member of the Mortgage-Backed Securities Clearing Corporation (2001-2003). |
Peter S. Lynch (61) |
| Year of Election or Appointment: 2003 Member of the Advisory Board of Fidelity Union Street Trust and Fidelity Union Street Trust II. Vice Chairman and a Director of FMR, and Vice Chairman (2001) and a Director (2000) of FMR Co., Inc. Previously, Mr. Lynch served as a Trustee of the Fidelity funds (1990-2003). Prior to May 31, 1990, he was a Director of FMR and Executive Vice President of FMR (a position he held until March 31, 1991), Vice President of Fidelity® Magellan® Fund and FMR Growth Group Leader, and Managing Director of FMR Corp. Mr. Lynch was also Vice President of Fidelity Investments Corporate Services. In addition, he serves as a Trustee of Boston College, Massachusetts Eye & Ear Infirmary, Historic Deerfield, John F. Kennedy Library, and the Museum of Fine Arts of Boston. |
Cornelia M. Small (60) |
| Year of Election or Appointment: 2004 Member of the Advisory Board of Fidelity Union Street Trust and Fidelity Union Street Trust II. Ms. Small is a member (2000) and Chairperson (2002) of the Investment Committee, and a member (2002) of the Board of Trustees of Smith College. Previously, she served as Chief Investment Officer (1999-2000), Director of Global Equity Investments (1996-1999), and a member of the Board of Directors of Scudder, Stevens & Clark (1990-1997) and Scudder Kemper Investments (1997-1998). In addition, Ms. Small served as Co-Chair (2000-2003) of the Annual Fund for the Fletcher School of Law and Diplomacy. |
Kenneth L. Wolfe (65) |
| Year of Election or Appointment: 2004 Member of the Advisory Board of Fidelity Union Street Trust and Fidelity Union Street Trust II. Prior to his retirement in 2001, Mr. Wolfe was Chairman and Chief Executive Officer of Hershey Foods Corporation (1993-2001). He currently serves as a member of the boards of Adelphia Communications Corporation (2003), Revlon Inc. (2004), Bausch & Lomb, Inc., and Carpenter Technology Corporation. |
Dwight D. Churchill (50) |
| Year of Election or Appointment: 1997 or 2000 Vice President of Arizona Municipal Money Market (2000) and Spartan Arizona Municipal Income (1997). He serves as Head of Fidelity's Fixed-Income Division (2000), Vice President of Fidelity's Money Market Funds (2000), Vice President of Fidelity's Bond Funds (1997), and Senior Vice President of FIMM (2000) and FMR (1997). Mr. Churchill joined Fidelity in 1993 as Vice President and Group Leader of Taxable Fixed-Income Investments. |
Charles S. Morrison (43) |
| Year of Election or Appointment: 2002 Vice President of Spartan Arizona Municipal Income. Mr. Morrison also serves as Vice President of Fidelity's Bond Funds (2002), and Vice President of certain Asset Allocation and Balanced Funds (2002). He serves as Vice President (2002) and Bond Group Leader (2002) of Fidelity Investments Fixed Income Division. Mr. Morrison is also Vice President of FIMM (2002) and FMR (2002). Mr. Morrison joined Fidelity in 1987 as a Corporate Bond Analyst in the Fixed Income Research Division. |
David L. Murphy (56) |
| Year of Election or Appointment: 2002 Vice President of Arizona Municipal Money Market. Mr. Murphy also serves as Vice President of Fidelity's Money Market Funds (2002) and Vice President of certain Asset Allocation Funds (2003). He serves as Senior Vice President (2000) and Money Market Group Leader (2002) of the Fidelity Investments Fixed Income Division. Mr. Murphy is also a Senior Vice President of FIMM (2003) and a Vice President of FMR (2000). Previously, Mr. Murphy served as Bond Group Leader (2000-2002) and Vice President of Fidelity's Taxable Bond Funds (2000-2002) and Fidelity's Municipal Bond Funds (2001-2002). Mr. Murphy joined Fidelity in 1989 as a portfolio manager in the Bond Group. |
Christine J. Thompson (46) |
| Year of Election or Appointment: 1998 Vice President of Spartan Arizona Municipal Income. Ms. Thompson is also serves as Vice President of other funds advised by FMR. |
Michael Widrig (41) |
| Year of Election or Appointment: 2004 Vice President of Arizona Municipal Money Market. Mr. Widrig also serves as Vice President of other funds advised by FMR. Prior to assuming her current responsibilities, Mr. Widrig managed a variety of Fidelity funds (2003) and worked as an analyst in the Fixed-Income Group. |
Eric D. Roiter (55) |
| Year of Election or Appointment: 1998 Secretary of Arizona Municipal Money Market and Spartan Arizona Municipal Income. He also serves as Secretary of other Fidelity funds (1998); Vice President, General Counsel, and Clerk of FMR Co., Inc. (2001) and FMR (1998); Vice President and Clerk of FDC (1998); Assistant Clerk of Fidelity Management & Research (U.K.) Inc. (2001) and Fidelity Management & Research (Far East) Inc. (2001); and Assistant Secretary of Fidelity Investments Money Management, Inc. (2001). Prior to joining Fidelity, Mr. Roiter was with the law firm of Debevoise & Plimpton, as an associate (1981-1984) and as a partner (1985-1997), and served as an Assistant General Counsel of the U.S. Securities and Exchange Commission (1979-1981). Mr. Roiter is an Adjunct Member, Faculty of Law, at Boston College Law School (2003). |
Stuart Fross (45) |
| Year of Election or Appointment: 2003 Assistant Secretary of Arizona Municipal Money Market and Spartan Arizona Municipal Income. Mr. Fross also serves as Assistant Secretary of other Fidelity funds (2003) and is an employee of FMR. |
Christine Reynolds (45) |
| Year of Election or Appointment: 2004 President, Treasurer, and Anti-Money Laundering (AML) officer of Arizona Municipal Money Market and Spartan Arizona Municipal Income. Ms. Reynolds also serves as President, Treasurer, and AML officer of other Fidelity funds (2004) and is a Vice President (2003) and an employee (2002) of FMR. Before joining Fidelity Investments, Ms. Reynolds worked at PricewaterhouseCoopers LLP (PwC) (1980-2002), where she was most recently an audit partner with PwC's investment management practice. |
Timothy F. Hayes (53) |
| Year of Election or Appointment: 2002 Chief Financial Officer of Arizona Municipal Money Market and Spartan Arizona Municipal Income. Mr. Hayes also serves as Chief Financial Officer of other Fidelity funds (2002). Recently he was appointed President of Fidelity Service Company (2003) where he also serves as a Director. Mr. Hayes also serves as President of Fidelity Investments Operations Group (FIOG, 2002), which includes Fidelity Pricing and Cash Management Services Group (FPCMS), where he was appointed President in 1998. Previously, Mr. Hayes served as Chief Financial Officer of Fidelity Investments Corporate Systems and Service Group (1998) and Fidelity Systems Company (1997-1998). |
Kenneth A. Rathgeber (57) |
| Year of Election or Appointment: 2004 Mr. Rathgeber also serves as Chief Compliance Officer of other Fidelity funds (2004) and Executive Vice President of Risk Oversight for Fidelity Investments (2002). Previously, he served as Executive Vice President and Chief Operating Officer for Fidelity Investments Institutional Services Company, Inc. (1998-2002). |
John R. Hebble (46) |
| Year of Election or Appointment: 2003 Deputy Treasurer of Arizona Municipal Money Market and Spartan Arizona Municipal Income. Mr. Hebble also serves as Deputy Treasurer of other Fidelity funds (2003), and is an employee of FMR. Before joining Fidelity Investments, Mr. Hebble worked at Deutsche Asset Management where he served as Director of Fund Accounting (2002-2003) and Assistant Treasurer of the Scudder Funds (1998-2003). |
Kimberley H. Monasterio (40) |
| Year of Election or Appointment: 2004 Deputy Treasurer of Arizona Municipal Money Market and Spartan Arizona Municipal Income. Ms. Monasterio also serves as Deputy Treasurer of other Fidelity funds (2004) and is an employee of FMR (2004). Before joining Fidelity Investments, Ms. Monasterio served as Treasurer (2000-2004) and Chief Financial Officer (2002-2004) of the Franklin Templeton Funds and Senior Vice President of Franklin Templeton Services, LLC (2000-2004). |
John H. Costello (58) |
| Year of Election or Appointment: 1994 Assistant Treasurer of Arizona Municipal Money Market and Spartan Arizona Municipal Income. Mr. Costello also serves as Assistant Treasurer of other Fidelity funds and is an employee of FMR. |
Francis V. Knox, Jr. (57) |
| Year of Election or Appointment: 2002 Assistant Treasurer of Arizona Municipal Money Market and Spartan Arizona Municipal Income. Mr. Knox also serves as Assistant Treasurer of other Fidelity funds (2002), and is a Vice President and an employee of FMR. Previously, Mr. Knox served as Vice President of Investment & Advisor Compliance (1990-2001), and Compliance Officer of Fidelity Management & Research (U.K.) Inc. (1992-2002), Fidelity Management & Research (Far East) Inc. (1991-2002), and FMR Corp. (1995-2002). |
Peter L. Lydecker (50) |
| Year of Election or Appointment: 2004 Assistant Treasurer of Arizona Municipal Money Market and Spartan Arizona Municipal Income. Mr. Lydecker also serves as Assistant Treasurer of other Fidelity funds (2004) and is an employee of FMR. |
Mark Osterheld (49) |
| Year of Election or Appointment: 2002 Assistant Treasurer of Arizona Municipal Money Market and Spartan Arizona Municipal Income. Mr. Osterheld also serves as Assistant Treasurer of other Fidelity funds (2002) and is an employee of FMR. |
Kenneth B. Robins (35) |
| Year of Election or Appointment:2004 Assistant Treasurer of Arizona Municipal Money Market and Spartan Arizona Municipal Income. Mr. Robins also serves as Assistant Treasurer of other Fidelity funds (2004) and is an employee of FMR (2004). Before joining Fidelity Investments, Mr. Robins worked at KPMG LLP, where he was a partner in KPMG's department of professional practice (2002-2004) and a Senior Manager (1999-2000). In addition, Mr. Robins served as Assistant Chief Accountant, United States Securities and Exchange Commission (2000-2002). |
Thomas J. Simpson (46) |
| Year of Election or Appointment: 1996 Assistant Treasurer of Arizona Municipal Money Market and Spartan Arizona Municipal Income. Mr. Simpson is Assistant Treasurer of other Fidelity funds (2000) and an employee of FMR (1996). Prior to joining FMR, Mr. Simpson was Vice President and Fund Controller of Liberty Investment Services (1987-1995). |
Annual Report
Distributions
The Board of Trustees of Spartan Arizona Municipal Income Fund voted to pay on October 11, 2004, to shareholders of record at the opening of business on October 8, 2004, a distribution of $.055 per share derived from capital gains realized from sales of portfolio securities.
During fiscal year ended 2004, for the income fund 100% of the income dividends was free from federal income tax, and 5.46% of the fund's income dividends was subject to the federal alternative minimum tax. For the money market fund, 100% of the income dividends was free from federal income tax, and 59.50% of the fund's income dividends was subject to the federal alternative minimum tax.
The funds will notify shareholders in January 2005 of amounts for use in preparing 2004 income tax returns.
Annual Report
Managing Your Investments
Fidelity offers several ways to conveniently manage your personal investments via your telephone or PC. You can access your account information, conduct trades and research your investments 24 hours a day.
By Phone
Fidelity Automated Service Telephone provides a single toll-free number to access account balances, positions, quotes and trading. It's easy to navigate the service, and on your first call, the system will help you create a personal identification number (PIN) for security.
(phone_graphic)Fidelity Automated
Service Telephone (FAST®)
1-800-544-5555
Press
1 For mutual fund and brokerage trading.
2 For quotes.*
3 For account balances and holdings.
4 To review orders and mutual
fund activity.
5 To change your PIN.
*0 To speak to a Fidelity representative.
By PC
Fidelity's web site on the Internet provides a wide range of information, including daily financial news, fund performance, interactive planning tools and news about Fidelity products and services.
(computer_graphic)Fidelity's Web Site
www.fidelity.com
* When you call the quotes line, please remember that a fund's yield and return will vary and, except for money market funds, share price will also vary. This means that you may have a gain or loss when you sell your shares. There is no assurance that money market funds will be able to maintain a stable $1 share price; an investment in a money market fund is not insured or guaranteed by the U.S. government. Total returns are historical and include changes in share price, reinvestment of dividends and capital gains, and the effects of any sales charges.
Annual Report
To Visit Fidelity
For directions and hours,
please call 1-800-544-9797.
Arizona
7001 West Ray Road
Chandler, AZ
7373 N. Scottsdale Road
Scottsdale, AZ
California
815 East Birch Street
Brea, CA
1411 Chapin Avenue
Burlingame, CA
851 East Hamilton Avenue
Campbell, CA
527 North Brand Boulevard
Glendale, CA
19200 Von Karman Avenue
Irvine, CA
601 Larkspur Landing Circle
Larkspur, CA
10100 Santa Monica Blvd.
Los Angeles, CA
27101 Puerta Real
Mission Viejo, CA
73-575 El Paseo
Palm Desert, CA
251 University Avenue
Palo Alto, CA
1760 Challenge Way
Sacramento, CA
7676 Hazard Center Drive
San Diego, CA
8 Montgomery Street
San Francisco, CA
21701 Hawthorne Boulevard
Torrance, CA
2001 North Main Street
Walnut Creek, CA
6300 Canoga Avenue
Woodland Hills, CA
Colorado
1625 Broadway
Denver, CO
9185 East Westview Road
Littleton, CO
Connecticut
48 West Putnam Avenue
Greenwich, CT
265 Church Street
New Haven, CT
300 Atlantic Street
Stamford, CT
29 South Main Street
West Hartford, CT
Delaware
222 Delaware Avenue
Wilmington, DE
Florida
4400 N. Federal Highway
Boca Raton, FL
121 Alhambra Plaza
Coral Gables, FL
2948 N. Federal Highway
Ft. Lauderdale, FL
1907 West State Road 434
Longwood, FL
8880 Tamiami Trail, North
Naples, FL
3501 PGA Boulevard
West Palm Beach, FL
8065 Beneva Road
Sarasota, FL
1502 N. Westshore Blvd.
Tampa, FL
Georgia
3445 Peachtree Road, N.E.
Atlanta, GA
1000 Abernathy Road
Atlanta, GA
Illinois
One North LaSalle Street
Chicago, IL
1415 West 22nd Street
Oak Brook, IL
1700 East Golf Road
Schaumburg, IL
3232 Lake Avenue
Wilmette, IL
Indiana
4729 East 82nd Street
Indianapolis, IN
Kansas
5400 College Boulevard
Overland Park, KS
Maine
Three Canal Plaza
Portland, ME
Maryland
7401 Wisconsin Avenue
Bethesda, MD
One W. Pennsylvania Ave.
Towson, MD
Massachusetts
801 Boylston Street
Boston, MA
155 Congress Street
Boston, MA
300 Granite Street
Braintree, MA
44 Mall Road
Burlington, MA
405 Cochituate Road
Framingham, MA
416 Belmont Street
Worcester, MA
Annual Report
Michigan
280 Old N. Woodward Ave.
Birmingham, MI
43420 Grand River Avenue
Novi, MI
29155 Northwestern Hwy.
Southfield, MI
Minnesota
7600 France Avenue South
Edina, MN
Missouri
8885 Ladue Road
Ladue, MO
New Jersey
150 Essex Street
Millburn, NJ
56 South Street
Morristown, NJ
501 Route 17, South
Paramus, NJ
3518 Route 1 North
Princeton, NJ
New York
1055 Franklin Avenue
Garden City, NY
37 West Jericho Turnpike
Huntington Station, NY
1271 Avenue of the Americas
New York, NY
61 Broadway
New York, NY
350 Park Avenue
New York, NY
North Carolina
4611 Sharon Road
Charlotte, NC
Ohio
3805 Edwards Road
Cincinnati, OH
28699 Chagrin Boulevard
Woodmere Village, OH
1324 Polaris Parkway
Columbus, OH
Oregon
16850 SW 72nd Avenue
Tigard, OR
Pennsylvania
600 West DeKalb Pike
King of Prussia, PA
1735 Market Street
Philadelphia, PA
12001 Perry Highway
Wexford, PA
Rhode Island
47 Providence Place
Providence, RI
Tennessee
6150 Poplar Avenue
Memphis, TN
Texas
10000 Research Boulevard
Austin, TX
4017 Northwest Parkway
Dallas, TX
12532 Memorial Drive
Houston, TX
2701 Drexel Drive
Houston, TX
400 East Las Colinas Blvd.
Irving, TX
14100 San Pedro
San Antonio, TX
19740 IH 45 North
Spring, TX
6005 West Park Boulevard
Plano, TX
Utah
215 South State Street
Salt Lake City, UT
Virginia
1861 International Drive
McLean, VA
Washington
411 108th Avenue, N.E.
Bellevue, WA
1518 6th Avenue
Seattle, WA
Washington, DC
1900 K Street, N.W.
Washington, DC
Wisconsin
595 North Barker Road
Brookfield, WI
Fidelity Brokerage Services, Inc., 100 Summer St., Boston, MA 02110 Member NYSE/SIPC
Annual Report
Investment Adviser
Fidelity Management & Research Company
Boston, MA
Sub-Advisers
Fidelity Investments
Money Management, Inc.
Fidelity International Investment Advisors
Fidelity International Investment Advisors
(U.K.) Limited
General Distributor
Fidelity Distributors Corporation
Boston, MA
Transfer and Shareholder
Servicing Agents
Citibank, N.A.
New York, NY
and
Fidelity Service Company, Inc.
Boston, MA
Custodian
Citibank, N.A.
New York, NY
The Fidelity Telephone Connection
Mutual Fund 24-Hour Service
Exchanges/Redemptions
and Account Assistance 1-800-544-6666
Product Information 1-800-544-6666
Retirement Accounts 1-800-544-4774 (8 a.m. - 9 p.m.)
TDD Service 1-800-544-0118
for the deaf and hearing impaired
(9 a.m. - 9 p.m. Eastern time)
Fidelity Automated Service
Telephone (FAST®) (automated graphic) 1-800-544-5555
(automated graphic) Automated line for quickest service
(Fidelity Investment logo)(registered trademark)
Corporate Headquarters
82 Devonshire St., Boston, MA 02109
www.fidelity.com
AZI/SPZ-UANN-1004
1.790910.101
Spartan®
Maryland
Municipal Income
Fund
Annual Report
August 31, 2004
(2_fidelity_logos) (Registered_Trademark)
Contents
Chairman's Message | <Click Here> | Ned Johnson's message to shareholders. |
Performance | <Click Here> | How the fund has done over time. |
Management's Discussion | <Click Here> | The manager's review of fund performance, strategy and outlook. |
Shareholder Expense Example | <Click Here> | An example of shareholder expenses. |
Investment Changes | <Click Here> | A summary of major shifts in the fund's investments over the past six months. |
Investments | <Click Here> | A complete list of the fund's investments with their market values. |
Financial Statements | <Click Here> | Statements of assets and liabilities, operations, and changes in net assets,
as well as financial highlights. |
Notes | <Click Here> | Notes to the financial statements. |
Report of Independent Registered Public Accounting Firm | <Click Here> | |
Trustees and Officers | <Click Here> | |
Distributions | <Click Here> | |
To view a fund's proxy voting guidelines and proxy voting record for the 12-month period ended June 30, visit www.fidelity.com/proxyvotingresults or visit the Securities and Exchange Commission's (SEC) web site at www.sec.gov. You may also call 1-800-544-8544 to request a free copy of the proxy voting guidelines.
Standard & Poor's, S&P and S&P 500 are registered service marks of The McGraw-Hill Companies, Inc. and have been licensed for use by Fidelity Distributors Corporation.
Other third party marks appearing herein are the property of their respective owners.
All other marks appearing herein are registered or unregistered trademarks or service marks of FMR Corp. or an affiliated company.
(Recycle graphic) This report is printed on recycled paper using soy-based inks.
Annual Report
This report and the financial statements contained herein are submitted for the general information of the shareholders of the fund. This report is not authorized for distribution to prospective investors in the fund unless preceded or accompanied by an effective prospectus.
Commencing with the fiscal quarter ending November 30, 2004, the fund files its complete schedule of portfolio holdings with the SEC for the first and third quarters of each fiscal year on Form N-Q. Forms N-Q are available on the SEC's web site at http://www.sec.gov. The fund's Forms N-Q may be reviewed and copied at the SEC's Public Reference Room in Washington, DC. Information regarding the operation of the SEC's Public Reference Room may be obtained by calling 1-800-SEC-0330. For a complete list of the fund's portfolio holdings, view the fund's most recent quarterly holdings report, semiannual report, or annual report on Fidelity's web site at http://www.fidelity.com/holdings.
NOT FDIC INSURED · MAY LOSE VALUE · NO BANK GUARANTEE
Neither the fund nor Fidelity Distributors Corporation is a bank.
Annual Report
Chairman's Message
(photo_of_Edward_C_Johnson_3d)
Dear Shareholder:
Many of you have read or heard news stories recently that were critical of mutual funds and made allegations that the mutual fund industry has been less than forthright. I find these reports unsettling and not necessarily an accurate picture of the overall industry, and I would like you to know where we at Fidelity stand.
With specific regard to allegations that certain mutual fund companies were violating the Securities and Exchange Commission's forward pricing rules or were involved in so-called "market timing" activities, I want to say two things:
First, Fidelity does not have agreements that permit customers who buy fund shares after 4 p.m. to obtain the 4 p.m. price. This is not to say that someone could not deceive the company through fraudulent acts. But I underscore that we have no so-called "agreements" which would permit this illegal practice.
Second, Fidelity has been on record for years opposing predatory short-term trading which adversely affects other shareholders in a mutual fund. In fact, in the 1980s, we began charging a fee - which is returned to the fund and, therefore, to investors - to discourage this activity. What's more, several years ago we took the industry lead in developing a Fair Value Pricing Policy to prevent market timing on foreign securities in our funds. It is reasonable to assume that another structure can be developed that would alter the system to make it much more difficult for predatory traders to operate. This, however, will only be achieved through close cooperation among regulators, legislators and the industry.
Certainly no industry is perfect, and there have been instances of unethical and illegal activity from time to time within the mutual fund industry. When this occurs, confessed or convicted offenders should be dealt with appropriately. Clearly, every system can be improved. We applaud well thought out improvements by regulators, legislators and industry representatives that achieve the common goal of building and protecting the value of investors' holdings. But we remain concerned about the risk of over-regulation and the quick application of simplistic solutions to intricate problems.
For more than 57 years, Fidelity Investments has worked very hard to improve its products and service to justify your trust. When our family founded this company in 1946, we had only a few hundred customers. Many of them were family and friends. Today, we serve more than 18 million customers including individual investors and participants in retirement plans across America.
Let me close by saying that we do not take your trust in us for granted, and we realize that we must always work to improve all aspects of our service to you. In turn, we urge you to continue your active participation with your financial matters, so that your interests can be well served.
Best regards,
/s/Edward C. Johnson 3d
Edward C. Johnson 3d
Annual Report
Performance: The Bottom Line
Average annual total return reflects the change in the value of an investment, assuming reinvestment of the fund's dividend income and capital gains (the profits earned upon the sale of securities that have grown in value) and assuming a constant rate of performance each year. The $10,000 table and the fund's returns do not reflect the deduction of taxes that a shareholder would pay on fund distributions or the redemption of fund shares. During periods of reimbursement by Fidelity, a fund's total return will be greater than it would be had the reimbursement not occurred. How a fund did yesterday is no guarantee of how it will do tomorrow.
Average Annual Total Returns
Periods ended August 31, 2004 | Past 1
year | Past 5
years | Past 10
years |
Spartan® MD Municipal Income Fund | 6.46% | 6.23% | 6.05% |
$10,000 Over 10 Years
Let's say hypothetically that $10,000 was invested in Spartan® Maryland Municipal Income Fund on August 31, 1994. The chart shows how the value of your investment would have grown, and also shows how the Lehman Brothers® Municipal Bond Index did over the same period.
Annual Report
Management's Discussion of Fund Performance
Comments from Mark Sommer, Portfolio Manager of Spartan® Maryland Municipal Income Fund
Municipal bonds were among the fixed-income market's best performers for the year ending August 31, 2004. In that time, the Lehman Brothers® Municipal Bond Index rose 7.11%. In comparison, the taxable bond market - as measured by the Lehman Brothers Aggregate Bond Index - returned 6.13%. Munis had a strong first half of the period, as weak employment levels, low inflation and the Federal Reserve Board's accommodative monetary policy kept demand high for tax-exempt bonds. However, the Lehman Brothers muni index lost more than 3.00% between March and May when labor markets and the economy heated up, leading many to believe that rate hikes were imminent. Although the Fed did hike rates by 0.25 percentage points in June and again in August, munis rallied throughout the summer when the domestic and global economic outlook dimmed. Record-high oil prices, geopolitical discord and terrorism concerns resulted in a flight to safety in the bond markets, and the Lehman Brothers muni index gained 3.72% in the final three months of the period.
For the 12 months ending August 31, 2004, the fund returned 6.46%. During the same period, the LipperSM Maryland Municipal Debt Funds Average returned 5.57% and the Lehman Brothers Maryland 4 Plus Year Enhanced Municipal Bond Index gained 6.90%. Maryland's municipal bond market performed in line with the national municipal market, with stronger economic conditions helping to boost revenues for many municipal issuers, including the state of Maryland. Aiding the fund's outperformance of its Lipper peer group average was advantageous structural positioning, meaning the fund was invested in bonds with different combinations of maturities, coupons and call features that performed better than other structural characteristics during the year. Detracting from performance in the second half was the fund's underweighting in housing bonds, which rebounded as mortgage prepayments declined. At the end of the period, roughly 9% of the fund's investments were in bonds issued by Puerto Rico, most of which were insured or backed by U.S. Treasury securities. Puerto Rico bonds are free from taxes in all 50 states and were included in the fund given their attractive prices and structural characteristics relative to Maryland bonds.
The views expressed in this statement reflect those of the portfolio manager only through the end of the period of the report as stated on the cover and do not necessarily represent the views of Fidelity or any other person in the Fidelity organization. Any such views are subject to change at any time based upon market or other conditions and Fidelity disclaims any responsibility to update such views. These views may not be relied on as investment advice and, because investment decisions for a Fidelity fund are based on numerous factors, may not be relied on as an indication of trading intent on behalf of any Fidelity fund.
Annual Report
Shareholder Expense Example
As a shareholder of the Fund, you incur two types of costs: (1) transaction costs, including redemption fees, and (2) ongoing costs, including management fees and other Fund expenses. This Example is intended to help you understand your ongoing costs (in dollars) of investing in the Fund and to compare these costs with the ongoing costs of investing in other mutual funds.
The Example is based on an investment of $1,000 invested at the beginning of the period and held for the entire period (March 1, 2004 to August 31, 2004).
Actual Expenses
The first line of the table below provides information about actual account values and actual expenses. You may use the information in this line, together with the amount you invested, to estimate the expenses that you paid over the period. Simply divide your account value by $1,000.00 (for example, an $8,600 account value divided by $1,000.00 = 8.6), then multiply the result by the number in the first line under the heading entitled "Expenses Paid During Period" to estimate the expenses you paid on your account during this period. A small balance maintenance fee of $12.00 that is charged once a year may apply for certain accounts with a value of less than $2,000. This fee is not included in the table below. If it was, the estimate of expenses you paid during the period would be higher, and your ending account value lower, by this amount.
Hypothetical Example for Comparison Purposes
The second line of the table below provides information about hypothetical account values and hypothetical expenses based on the Fund's actual expense ratio and an assumed rate of return of 5% per year before expenses, which is not the Fund's actual return. The hypothetical account values and expenses may not be used to estimate the actual ending account balance or expenses you paid for the period. You may use this information to compare the ongoing costs of investing in the Fund and other funds. To do so, compare this 5% hypothetical example with the 5% hypothetical examples that appear in the shareholder reports of the other funds. A small balance maintenance fee of $12.00 that is charged once a year may apply for certain accounts with a value of less than $2,000. This fee is not included in the table below. If it was, the estimate of expenses you paid during the period would be higher, and your ending account value lower, by this amount.
Please note that the expenses shown in the table are meant to highlight your ongoing costs only and do not reflect any transaction costs. Therefore, the second line of the table is useful in comparing ongoing costs only, and will not help you determine the relative total costs of owning different funds. In addition, if these transactional costs were included, your costs would have been higher.
| Beginning
Account Value
March 1, 2004 | Ending
Account Value
August 31, 2004 | Expenses Paid
During Period*
March 1, 2004
to August 31, 2004 |
Actual | $ 1,000.00 | $ 1,001.80 | $ 2.77 |
Hypothetical (5% return per year
before expenses) | $ 1,000.00 | $ 1,022.20 | $ 2.80 |
* Expenses are equal to the Fund's annualized expense ratio of .55%; multiplied by the average account value over the period, multiplied by 184/366 (to reflect the one-half year period).
Annual Report
Investment Changes
Top Five Sectors as of August 31, 2004 |
| % of fund's
net assets | % of fund's net assets
6 months ago |
General Obligations | 34.7 | 35.8 |
Escrowed/Pre-Refunded | 15.2 | 16.3 |
Health Care | 13.3 | 12.5 |
Education | 10.2 | 8.4 |
Resource Recovery | 4.3 | 4.4 |
Average Years to Maturity as of August 31, 2004 |
| | 6 months ago |
Years | 15.2 | 14.9 |
Average years to maturity is based on the average time remaining until principal payments are expected from each of the fund's bonds, weighted by dollar amount. |
Duration as of August 31, 2004 |
| | 6 months ago |
Years | 7.2 | 7.1 |
Duration shows how much a bond fund's price fluctuates with changes in comparable interest rates. If rates rise 1%, for example, a fund with a five-year duration is likely to lose about 5% of its value. Other factors also can influence a bond fund's performance and share price. Accordingly, a bond fund's actual performance may differ from this example. |
Quality Diversification (% of fund's net assets) |
As of August 31, 2004 | As of February 29, 2004 |
| AAA 57.6% | | | AAA 59.2% | |
| AA,A 33.8% | | | AA,A 34.0% | |
| BBB 3.2% | | | BBB 2.1% | |
| Not Rated 1.6% | | | Not Rated 1.4% | |
| Short-Term
Investments and
Net Other Assets 3.8% | | | Short-Term
Investments and
Net Other Assets 3.3% | |

We have used ratings from Moody's® Investors Services, Inc. Where Moody's ratings are not available, we have used S&P® ratings. |
Annual Report
Investments August 31, 2004
Showing Percentage of Net Assets
Municipal Bonds - 96.2% |
| Principal
Amount | | Value
(Note 1) |
Maryland - 87.3% |
Anne Arundel County Gen. Oblig. 5.375% 3/1/15 | | $ 2,000,000 | | $ 2,248,440 |
Baltimore Board of School Commissioners School Sys. Rev. 5% 5/1/11 | | 2,545,000 | | 2,829,098 |
Baltimore County Ctfs. Prtn. (Equip. Acquisition Prog.) 5% 6/1/13 (MBIA Insured) | | 1,500,000 | | 1,667,475 |
Baltimore County Gen. Oblig.: | | | | |
5.25% 9/1/11 | | 2,000,000 | | 2,272,760 |
5.25% 8/1/19 (Pre-Refunded to 8/1/12 @ 100) (c) | | 2,000,000 | | 2,283,000 |
Baltimore Gen. Oblig. (Consolidated Pub. Impt. Proj.) Series A: | | | | |
0% 10/15/06 (FGIC Insured) | | 2,000,000 | | 1,839,120 |
5.5% 10/15/14 (Pre-Refunded to 4/15/08 @ 101) (c) | | 500,000 | | 560,925 |
7% 10/15/09 (MBIA Insured) | | 1,000,000 | | 1,203,980 |
Baltimore Port Facilities Rev. (Consolidated Coal Sales Co. Proj.) 6.5% 12/1/10 | | 2,000,000 | | 2,105,200 |
Baltimore Proj. Rev.: | | | | |
(Wastewtr. Projs.) Series A: | | | | |
5.125% 7/1/42 (FGIC Insured) | | 2,315,000 | | 2,366,625 |
5.2% 7/1/32 (FGIC Insured) | | 250,000 | | 260,608 |
(Wtr. Projs.) Series A: | | | | |
5% 7/1/24 (Escrowed to Maturity) (c) | | 730,000 | | 784,232 |
5% 7/1/24 (FGIC Insured) | | 370,000 | | 398,682 |
Carroll County Gen. Oblig. 5% 11/1/11 | | 500,000 | | 559,945 |
Howard County Gen. Oblig.: | | | | |
Series 2003 A, 5% 8/15/17 | | 1,000,000 | | 1,124,700 |
Series 2004 A, 5% 8/15/14 | | 1,000,000 | | 1,126,540 |
Series A: | | | | |
5.25% 8/15/14 | | 2,395,000 | | 2,683,071 |
5.25% 8/15/14 (Pre-Refunded to 2/15/12 @ 100) (c) | | 605,000 | | 686,191 |
Maryland Cmnty. Dev. Administration Dept. of Hsg. & Cmnty. Dev. (Residential Proj.) Series B, 5.05% 9/1/19 (b) | | 335,000 | | 336,853 |
Maryland Econ. Dev. Corp. Lease Rev. (Maryland Aviation Administration Facilities Proj.) 5.5% 6/1/18 (FSA Insured) (b) | | 1,500,000 | | 1,644,105 |
Maryland Gen. Oblig. (State & Local Facilities Ln. Prog.): | | | | |
First Series: | | | | |
5.5% 3/1/08 | | 300,000 | | 332,589 |
5.75% 8/1/14 | | 5,000,000 | | 5,745,897 |
Second Series: | | | | |
5% 7/15/11 | | 1,500,000 | | 1,639,920 |
Municipal Bonds - continued |
| Principal
Amount | | Value
(Note 1) |
Maryland - continued |
Maryland Gen. Oblig. (State & Local Facilities Ln. Prog.): - continued | | | | |
Second Series: | | | | |
5% 8/1/12 | | $ 1,000,000 | | $ 1,074,660 |
5.25% 7/15/12 | | 2,000,000 | | 2,200,160 |
5.25% 7/15/13 | | 1,500,000 | | 1,650,690 |
Series 1997 2, 5% 8/1/10 | | 1,000,000 | | 1,083,470 |
Maryland Health & Higher Edl. Facilities Auth. Rev.: | | | | |
(Adventist Health Mid Atlantic Proj.) Series A, 5.75% 1/1/15 | | 1,000,000 | | 1,068,660 |
(Anne Arundel Med. Ctr. Proj.) Series 1998, 5.125% 7/1/33 (FSA Insured) | | 2,000,000 | | 2,044,360 |
(Good Samaritan Hosp. Proj.): | | | | |
5.7% 7/1/09 (Escrowed to Maturity) (c) | | 1,000,000 | | 1,111,300 |
5.75% 7/1/13 (Escrowed to Maturity) (c) | | 385,000 | | 441,610 |
(Hebrew Home of Greater Washington Proj.) 5.8% 1/1/32 | | 1,000,000 | | 1,039,780 |
(Helix Health Proj.) 5% 7/1/17 (Escrowed to Maturity) (c) | | 1,000,000 | | 1,104,230 |
(Howard County Gen. Hosp. Proj.) 5.5% 7/1/13 (Escrowed to Maturity) (c) | | 925,000 | | 938,644 |
(Johns Hopkins Health Sys. Proj.) 5% 5/15/34 | | 1,500,000 | | 1,508,205 |
(Johns Hopkins Univ. Issue Proj.): | | | | |
Series A: | | | | |
5% 7/1/38 | | 2,000,000 | | 2,036,280 |
5% 7/1/41 | | 3,590,000 | | 3,637,101 |
5% 7/1/32 | | 1,000,000 | | 1,018,140 |
5.125% 7/1/20 | | 500,000 | | 532,765 |
6% 7/1/10 | | 500,000 | | 582,205 |
6% 7/1/39 (Pre-Refunded to 7/1/09 @ 101) (c) | | 1,000,000 | | 1,162,110 |
(LifeBridge Health Proj.) Series 2004 A, 5% 7/1/11 | | 1,000,000 | | 1,086,570 |
(Loyola College Issue Proj.) 5% 10/1/39 | | 2,000,000 | | 2,012,000 |
(North Arundel Hosp. Proj.) 6.5% 7/1/31 | | 1,320,000 | | 1,455,313 |
(Univ. of Maryland Med. Sys. Proj.): | | | | |
5.25% 7/1/34 | | 1,000,000 | | 1,011,260 |
6.75% 7/1/30 | | 500,000 | | 564,690 |
Maryland Indl. Dev. Fing. Auth. Rev.: | | | | |
(American Ctr. for Physics Proj.): | | | | |
5.25% 12/15/13 | | 1,100,000 | | 1,224,377 |
5.25% 12/15/15 | | 320,000 | | 352,070 |
(Holy Cross Health Sys. Corp. Proj.) 5.7% 12/1/10 | | 1,000,000 | | 1,137,970 |
Maryland Trans. Auth. Rev. (Trans. Facilities Projs.): | | | | |
5.8% 7/1/06 | | 500,000 | | 536,725 |
Municipal Bonds - continued |
| Principal
Amount | | Value
(Note 1) |
Maryland - continued |
Maryland Trans. Auth. Rev. (Trans. Facilities Projs.): - continued | | | | |
6.8% 7/1/16 (Escrowed to Maturity) (c) | | $ 965,000 | | $ 1,155,636 |
Montgomery County Econ. Dev. Rev. (Trinity Health Care Group Proj.) 5.125% 12/1/22 | | 2,300,000 | | 2,362,077 |
Morgan State Univ. Academic & Auxiliary Facilities Fees Rev. Series A, 5% 7/1/20 (FGIC Insured) | | 500,000 | | 530,495 |
Northeast Maryland Waste Disp. Auth. Resource Recovery Rev. (Southwest Resource Recovery Facilities Proj.) 7.2% 1/1/05 (MBIA Insured) | | 1,235,000 | | 1,259,218 |
Northeast Maryland Waste Disp. Auth. Solid Waste Rev.: | | | | |
(Montgomery County Resource Recovery Proj.)
Series A: | | | | |
5.9% 7/1/05 (b) | | 760,000 | | 782,595 |
6% 7/1/07 (b) | | 500,000 | | 541,340 |
5.5% 4/1/12 (AMBAC Insured) (b) | | 1,500,000 | | 1,666,695 |
Prince Georges County Ctfs. of Prtn. Series A, 0% 6/30/11 (MBIA Insured) | | 2,400,000 | | 1,775,688 |
Prince Georges County Gen. Oblig.: | | | | |
Series A, 5% 10/1/19 | | 2,000,000 | | 2,150,000 |
5.5% 5/15/11 (FSA Insured) | | 2,000,000 | | 2,288,400 |
5.5% 3/15/16 (Pre-Refunded to 3/15/06 @ 101) (c) | | 465,000 | | 496,969 |
Washington D.C. Metropolitan Area Trans. Auth. Gross Rev. 6% 7/1/10 (FGIC Insured) | | 1,570,000 | | 1,831,782 |
| | 87,156,196 |
Puerto Rico - 8.9% |
Puerto Rico Commonwealth Gen. Oblig. Series A, 5.25% 7/1/18 | | 1,000,000 | | 1,080,070 |
Puerto Rico Commonwealth Hwy. & Trans. Auth. Hwy. Rev. Series Y, 5.5% 7/1/36 (FSA Insured) | | 1,000,000 | | 1,089,620 |
Puerto Rico Commonwealth Infrastructure Fing. Auth. Series 2000 A: | | | | |
5.5% 10/1/32 (Escrowed to Maturity) (c) | | 750,000 | | 810,458 |
5.5% 10/1/40 (Escrowed to Maturity) (c) | | 3,350,000 | | 3,606,912 |
Municipal Bonds - continued |
| Principal
Amount | | Value
(Note 1) |
Puerto Rico - continued |
Puerto Rico Elec. Pwr. Auth. Pwr. Rev.: | | | | |
Series HH, 5.25% 7/1/29 (FSA Insured) | | $ 2,000,000 | | $ 2,084,700 |
Series QQ, 5.5% 7/1/16 (XL Cap. Assurance, Inc. Insured) (a) | | 200,000 | | 224,754 |
| | 8,896,514 |
TOTAL INVESTMENT PORTFOLIO - 96.2% (Cost $91,357,023) | | | | 96,052,710 |
NET OTHER ASSETS - 3.8% | | | | 3,814,295 |
NET ASSETS - 100% | | | $ 99,867,005 |
Swap Agreements |
| Expiration
Date | | Notional
Amount | | Value |
Interest Rate Swap |
Receive quarterly a fixed rate equal to 4.165% and pay quarterly a floating rate based on BMA Municipal Swap Index with JPMorgan Chase, Inc. | March 2025 | | $ 500,000 | | $ 0 |
Receive quarterly a fixed rate equal to 4.522% and pay quarterly a floating rate based on BMA Municipal Swap Index with JPMorgan Chase, Inc. | Nov. 2024 | | 500,000 | | 25,966 |
| | $ 1,000,000 | | $ 25,966 |
Legend |
(a) Security or a portion of the security purchased on a delayed delivery or when-issued basis. |
(b) Private activity obligations whose interest is subject to the federal alternative minimum tax for individuals. |
(c) Security collateralized by an amount sufficient to pay interest and principal. |
Other Information |
The distribution of municipal securities by revenue source, as a percentage of total net assets, is as follows: |
General Obligations | 34.7% |
Escrowed/Pre-Refunded | 15.2% |
Health Care | 13.3% |
Education | 10.2% |
Others* (individually less than 5%) | 26.6% |
| 100.0% |
*Includes net other assets |
Income Tax Information |
The fund hereby designates approximately $153,000 as a capital gain dividend for the purpose of the dividend paid deduction. |
See accompanying notes which are an integral part of the financial statements.
Annual Report
Financial Statements
Statement of Assets and Liabilities
| August 31, 2004 |
| | |
Assets | | |
Investment in securities, at value (cost $91,357,023) - See accompanying schedule | | $ 96,052,710 |
Cash | | 2,132,186 |
Receivable for fund shares sold | | 1,020,000 |
Interest receivable | | 1,007,048 |
Swap agreements, at value | | 25,966 |
Other receivables | | 2,764 |
Total assets | | 100,240,674 |
| | |
Liabilities | | |
Payable for investments purchased on a delayed delivery basis | $ 222,902 | |
Payable for fund shares redeemed | 10,000 | |
Distributions payable | 96,417 | |
Accrued management fee | 44,289 | |
Other affiliated payables | 61 | |
Total liabilities | | 373,669 |
| | |
Net Assets | | $ 99,867,005 |
Net Assets consist of: | | |
Paid in capital | | $ 94,919,756 |
Undistributed net investment income | | 6,475 |
Accumulated undistributed net realized gain (loss) on investments | | 219,121 |
Net unrealized appreciation (depreciation) on investments | | 4,721,653 |
Net Assets, for 9,047,225 shares outstanding | | $ 99,867,005 |
Net Asset Value, offering price and redemption price per share ($99,867,005 ÷ 9,047,225 shares) | | $ 11.04 |
See accompanying notes which are an integral part of the financial statements.
Annual Report
Financial Statements - continued
Statement of Operations
| Year ended August 31, 2004 |
| | |
Investment Income | | |
Interest | | $ 4,252,183 |
| | |
Expenses | | |
Management fee | $ 528,440 | |
Non-interested trustees' compensation | 325 | |
Miscellaneous | 71 | |
Total expenses before reductions | 528,836 | |
Expense reductions | (17,042) | 511,794 |
Net investment income (loss) | | 3,740,389 |
Realized and Unrealized Gain (Loss) Net realized gain (loss) on: | | |
Investment securities | 401,148 | |
Swap agreements | 34,020 | |
Total net realized gain (loss) | | 435,168 |
Change in net unrealized appreciation (depreciation) on: Investment securities | 1,596,621 | |
Swap agreements | 25,966 | |
Total change in net unrealized appreciation (depreciation) | | 1,622,587 |
Net gain (loss) | | 2,057,755 |
Net increase (decrease) in net assets resulting from operations | | $ 5,798,144 |
See accompanying notes which are an integral part of the financial statements.
Annual Report
Statement of Changes in Net Assets
| Year ended
August 31,
2004 | Year ended
August 31,
2003 |
Increase (Decrease) in Net Assets | | |
Operations | | |
Net investment income (loss) | $ 3,740,389 | $ 3,912,345 |
Net realized gain (loss) | 435,168 | 837,284 |
Change in net unrealized appreciation
(depreciation) | 1,622,587 | (2,064,182) |
Net increase (decrease) in net assets resulting
from operations | 5,798,144 | 2,685,447 |
Distributions to shareholders from net investment income | (3,739,941) | (3,913,658) |
Share transactions
Net proceeds from sales of shares | 22,593,643 | 26,861,754 |
Reinvestment of distributions | 2,609,274 | 2,902,727 |
Cost of shares redeemed | (20,880,179) | (31,894,619) |
Net increase (decrease) in net assets resulting from share transactions | 4,322,738 | (2,130,138) |
Redemption fees | 1,122 | 4,101 |
Total increase (decrease) in net assets | 6,382,063 | (3,354,248) |
| | |
Net Assets | | |
Beginning of period | 93,484,942 | 96,839,190 |
End of period (including undistributed net investment income of $6,475 and undistributed net investment income of $5,535, respectively) | $ 99,867,005 | $ 93,484,942 |
Other Information Shares | | |
Sold | 2,050,086 | 2,441,286 |
Issued in reinvestment of distributions | 237,457 | 264,811 |
Redeemed | (1,915,093) | (2,913,928) |
Net increase (decrease) | 372,450 | (207,831) |
See accompanying notes which are an integral part of the financial statements.
Annual Report
Financial Highlights
Years ended August 31, | 2004 | 2003 | 2002 | 2001 | 2000 |
Selected Per-Share Data | | | | | |
Net asset value, beginning of period | $ 10.78 | $ 10.90 | $ 10.77 | $ 10.25 | $ 10.09 |
Income from Investment Operations | | | | | |
Net investment income (loss)B | .427 | .433 | .444 | .470 | .474 |
Net realized and unrealized gain (loss) | .260 | (.120) | .130 | .523 | .161 |
Total from investment operations | .687 | .313 | .574 | .993 | .635 |
Distributions from net investment income | (.427) | (.433) | (.444) | (.473) | (.476) |
Redemption fees added to paid in capitalB | -D | -D | -D | -D | .001 |
Net asset value, end of period | $ 11.04 | $ 10.78 | $ 10.90 | $ 10.77 | $ 10.25 |
Total ReturnA | 6.46% | 2.88% | 5.49% | 9.92% | 6.53% |
Ratios to Average Net AssetsC | | | | |
Expenses before expense reductions | .55% | .55% | .55% | .55% | .55% |
Expenses net of voluntary waivers, if any | .55% | .55% | .55% | .55% | .55% |
Expenses net of all
reductions | .53% | .52% | .47% | .40% | .45% |
Net investment income (loss) | 3.89% | 3.94% | 4.15% | 4.48% | 4.76% |
Supplemental Data | | | | | |
Net assets, end of
period (000 omitted) | $ 99,867 | $ 93,485 | $ 96,839 | $ 76,256 | $ 54,595 |
Portfolio turnover rate | 14% | 30% | 5% | 11% | 27% |
A Total returns would have been lower had certain expenses not been reduced during the periods shown.
B Calculated based on average shares outstanding during the period.
C Expense ratios reflect operating expenses of the fund. Expenses before reductions do not reflect amounts reimbursed by the investment adviser or reductions from brokerage service arrangements or other expense offset arrangements and do not represent the amount paid by the fund during periods when reimbursements or reductions occur. Expenses net of any voluntary waivers reflect expenses after reimbursement by the investment adviser but prior to reductions from brokerage service arrangements or other expense offset arrangements. Expenses net of all reductions represent the net expenses paid by the fund.
D Amount represents less than $.001 per share.
See accompanying notes which are an integral part of the financial statements.
Annual Report
Notes to Financial Statements
For the period ended August 31, 2004
1. Significant Accounting Policies.
Spartan Maryland Municipal Income Fund (the fund) is a fund of Fidelity Union Street Trust (the trust) and is authorized to issue an unlimited number of shares. The trust is registered under the Investment Company Act of 1940, as amended (the 1940 Act), as an open-end management investment company organized as a Massachusetts business trust. The fund may be affected by economic and political developments in the state of Maryland. The financial statements have been prepared in conformity with accounting principles generally accepted in the United States of America, which require management to make certain estimates and assumptions at the date of the financial statements. The following summarizes the significant accounting policies of the fund:
Security Valuation. Net asset value per share (NAV calculation) is calculated as of the close of business of the New York Stock Exchange, normally 4:00 p.m. Eastern time. Debt securities, including restricted securities, are valued on the basis of information provided by a pricing service. Pricing services use valuation matrices that incorporate both dealer-supplied valuations and valuation models. If prices are not readily available or do not accurately reflect fair value for a security, or if a security's value has been materially affected by events occurring after the close of the exchange or market on which the security is principally traded, that security may be valued by another method that the Board of Trustees believes accurately reflects fair value. A security's valuation may differ depending on the method used for determining value. Price movements in futures contracts and ADRs, market and trading trends, the bid/ask quotes of brokers and off-exchange institutional trading may be reviewed in the course of making a good faith determination of a security's fair value. Short-term securities with remaining maturities of sixty days or less for which quotations are not readily available are valued on the basis of amortized cost. Investments in open-end investment companies are valued at their net asset value each business day.
Investment Transactions and Income. Security transactions are accounted for as of trade date. Gains and losses on securities sold are determined on the basis of identified cost. Interest income is accrued as earned. Interest income includes coupon interest and amortization of premium and accretion of discount on debt securities.
Expenses. Most expenses of the trust can be directly attributed to a fund. Expenses which cannot be directly attributed are apportioned among the funds in the trust.
Income Tax Information and Distributions to Shareholders. Each year, the fund intends to qualify as a regulated investment company by distributing all of its taxable income and realized gains under Subchapter M of the Internal Revenue Code. As a result, no provision for income taxes is required in the accompanying financial statements. Dividends are declared daily and paid monthly from net investment income. Distributions from realized gains, if any, are recorded on the ex-dividend date.
Annual Report
Notes to Financial Statements - continued
1. Significant Accounting Policies - continued
Income Tax Information and Distributions to Shareholders - continued
Income and capital gain distributions are determined in accordance with income tax regulations, which may differ from generally accepted accounting principles. In addition, the fund will treat a portion of the proceeds from shares redeemed as a distribution from realized gain for income tax purposes. Capital accounts within the financial statements are adjusted for permanent book-tax differences. These adjustments have no impact on net assets or the results of operations. Temporary book-tax differences will reverse in a subsequent period. Book-tax differences are primarily due to market discount and capital loss carryforwards.
The fund purchases municipal securities whose interest, in the opinion of the issuer, is free from federal income tax. There is no assurance that the Internal Revenue Service (IRS) will agree with this opinion. In the event the IRS determines that the issuer does not comply with relevant tax requirements, interest payments from a security could become federally taxable, possibly retroactively to the date the security was issued.
The tax-basis components of distributable earnings and the federal tax cost as of period end were as follows:
Unrealized appreciation | $ 4,852,900 |
Unrealized depreciation | (124,754) |
Net unrealized appreciation (depreciation) | 4,728,146 |
Undistributed ordinary income | 319,163 |
Undistributed long-term capital gain | 153,227 |
Cost for federal income tax purposes | $ 91,324,564 |
The tax character of distributions paid was as follows:
| August 31, 2004 | August 31, 2003 |
Tax-exempt Income | $ 3,739,941 | $ 3,913,658 |
Short-Term Trading (Redemption) Fees. Shares held in the fund less than 30 days are subject to a redemption fee equal to .50% of the proceeds of the redeemed shares. All redemption fees, including any estimated redemption fees paid by Fidelity Management & Research Company (FMR), are retained by the fund and accounted for as an addition to paid in capital.
Annual Report
2. Operating Policies.
Delayed Delivery Transactions and When-Issued Securities. The fund may purchase or sell securities on a delayed delivery or when-issued basis. Payment and delivery may take place after the customary settlement period for that security. The price of the underlying securities and the date when the securities will be delivered and paid for are fixed at the time the transaction is negotiated. During the time a delayed delivery sell is outstanding, the contract is marked-to-market daily and equivalent deliverable securities are held for the transaction. The value of the securities purchased on a delayed delivery or when-issued basis are identified as such in the fund's Schedule of Investments. The fund may receive compensation for interest forgone in the purchase of a delayed delivery or when-issued security. With respect to purchase commitments, the fund identifies securities as segregated in its records with a value at least equal to the amount of the commitment. Losses may arise due to changes in the value of the underlying securities or if the counterparty does not perform under the contract's terms, or if the issuer does not issue the securities due to political, economic, or other factors.
Swap Agreements. The fund may invest in swaps for the purpose of managing its exposure to interest rate, credit or market risk.
Interest rate swaps are agreements to exchange cash flows periodically based on a notional principal amount, for example, the exchange of fixed rate interest payments for floating rate interest payments. Periodic payments received or made by the fund are recorded in the accompanying Statement of Operations as realized gains or losses, respectively. The primary risk associated with interest rate swaps is that unfavorable changes in the fluctuation of interest rates could adversely impact the fund.
Swaps are marked-to-market daily based on dealer-supplied valuations and changes in value are recorded as unrealized appreciation (depreciation). Gains or losses are realized upon early termination of the swap agreement. Collateral, in the form of cash or securities, may be required to be held in segregated accounts with the fund's custodian in compliance with swap contracts. Risks may exceed amounts recognized on the Statement of Assets and Liabilities. These risks include changes in the returns of the underlying instruments, failure of the counterparties to perform under the contracts' terms and the possible lack of liquidity with respect to the swap agreements. Details of swap agreements open at period end are included in the fund's Schedule of Investments under the caption "Swap Agreements."
3. Purchases and Sales of Investments.
Purchases and sales of securities, other than short-term securities and U.S. government securities, aggregated $15,984,850 and $13,213,146, respectively.
Annual Report
Notes to Financial Statements - continued
4. Fees and Other Transactions with Affiliates.
Management Fee. FMR and its affiliates provide the fund with investment management related services for which the fund pays a monthly management fee that is based on an annual rate of .55% of the fund's average net assets. FMR pays all other expenses, except the compensation of the non-interested Trustees and certain exceptions such as interest expense. The management fee paid to FMR by the fund is reduced by an amount equal to the fees and expenses paid by the fund to the non-interested Trustees.
5. Committed Line of Credit.
The fund participates with other funds managed by FMR in a $4.2 billion credit facility (the "line of credit") to be utilized for temporary or emergency purposes to fund shareholder redemptions or for other short-term liquidity purposes. The fund has agreed to pay commitment fees on its pro rata portion of the line of credit, which is included in Miscellaneous Expense on the Statement of Operations. During the period, there were no borrowings on this line of credit.
6. Expense Reductions.
Through arrangements with the fund's custodian and transfer agent, credits realized as a result of uninvested cash balances were used to reduce the fund's expenses. During the period, these credits reduced the fund's expenses by $17,042.
Annual Report
Report of Independent Registered Public Accounting Firm
To the Trustees of Fidelity Union Street Trust and the Shareholders of Spartan Maryland Municipal Income Fund:
In our opinion, the accompanying statement of assets and liabilities, including the schedule of investments, and the related statements of operations and of changes in net assets and the financial highlights present fairly, in all material respects, the financial position of Spartan Maryland Municipal Income Fund (a fund of Fidelity Union Street Trust) at August 31, 2004 and the results of its operations, the changes in its net assets and the financial highlights for the periods indicated, in conformity with accounting principles generally accepted in the United States of America. These financial statements and financial highlights (hereafter referred to as "financial statements") are the responsibility of the Spartan Maryland Municipal Income Fund's management; our responsibility is to express an opinion on these financial statements based on our audits. We conducted our audits of these financial statements in accordance with the standards of the Public Company Accounting Oversight Board (United States), which require that we plan and perform the audit to obtain reasonable assurance about whether the financial statements are free of material misstatement. An audit includes examining, on a test basis, evidence supporting the amounts and disclosures in the financial statements, assessing the accounting principles used and significant estimates made by management, and evaluating the overall financial statement presentation. We believe that our audits, which included confirmation of securities at August 31, 2004 by correspondence with the custodian and brokers, provide a reasonable basis for our opinion.
/s/PricewaterhouseCoopers LLP
PricewaterhouseCoopers LLP
Boston, Massachusetts
October 7, 2004
Annual Report
Trustees and Officers
The Trustees, Members of the Advisory Board, and executive officers of the trust and fund, as applicable, are listed below. The Board of Trustees governs the fund and is responsible for protecting the interests of shareholders. The Trustees are experienced executives who meet periodically throughout the year to oversee the fund's activities, review contractual arrangements with companies that provide services to the fund, and review the fund's performance. Except for William O. McCoy, each of the Trustees oversees 295 funds advised by FMR or an affiliate. Mr. McCoy oversees 297 funds advised by FMR or an affiliate.
The Trustees hold office without limit in time except that (a) any Trustee may resign; (b) any Trustee may be removed by written instrument, signed by at least two-thirds of the number of Trustees prior to such removal; (c) any Trustee who requests to be retired or who has become incapacitated by illness or injury may be retired by written instrument signed by a majority of the other Trustees; and (d) any Trustee may be removed at any special meeting of shareholders by a two-thirds vote of the outstanding voting securities of the trust. In any event, each non-interested Trustee shall retire not later than the last day of the calendar year in which his or her 72nd birthday occurs. The executive officers and Advisory Board Members hold office without limit in time, except that any officer and Advisory Board Member may resign or may be removed by a vote of a majority of the Trustees at any regular meeting or any special meeting of the Trustees. Except as indicated, each individual has held the office shown or other offices in the same company for the past five years.
The fund's Statement of Additional Information (SAI) includes more information about the Trustees. To request a free copy, call Fidelity at 1-800-544-8544.
Interested Trustees*:
Correspondence intended for each Trustee who is an "interested person" (as defined in the 1940 Act) may be sent to Fidelity Investments, 82 Devonshire Street, Boston, Massachusetts 02109.
Name, Age; Principal Occupation |
Edward C. Johnson 3d (74)** |
| Year of Election or Appointment: 1974 Mr. Johnson is Chairman of the Board of Trustees. Mr. Johnson serves as Chief Executive Officer, Chairman, and a Director of FMR Corp.; a Director and Chairman of the Board and of the Executive Committee of FMR; Chairman and a Director of Fidelity Management & Research (Far East) Inc.; Chairman (1998) and a Director of Fidelity Investments Money Management, Inc.; and Chairman (2001) and a Director (2000) of FMR Co., Inc. |
Abigail P. Johnson (42)** |
| Year of Election or Appointment: 2001 Senior Vice President of Spartan Maryland Municipal Income (2001). Ms. Johnson also serves as Senior Vice President of other Fidelity funds (2001). She is President and a Director of FMR (2001), Fidelity Investments Money Management, Inc. (2001), FMR Co., Inc. (2001), and a Director of FMR Corp. Previously, Ms. Johnson managed a number of Fidelity funds. |
Laura B. Cronin (50) |
| Year of Election or Appointment: 2003 Ms. Cronin is an Executive Vice President (2002) and Chief Financial Officer (2002) of FMR Corp. and is a member of the Fidelity Management Committee (2003). Previously, Ms. Cronin served as Vice President of Finance of FMR (1997-1999), and Chief Financial Officer of FMR (1999-2001), Fidelity Personal Investments (2001), and Fidelity Brokerage Company (2001-2002). |
Robert L. Reynolds (52) |
| Year of Election or Appointment: 2003 Mr. Reynolds is a Director (2003) and Chief Operating Officer (2002) of FMR Corp. and is the head of the Fidelity Management Committee (2003). He also serves on the Board at Fidelity Investments Canada, Ltd. (2000). Previously, Mr. Reynolds served as President of Fidelity Investments Institutional Retirement Group (1996-2000). |
* Trustees have been determined to be "Interested Trustees" by virtue of, among other things, their affiliation with the trust or various entities under common control with FMR.
** Edward C. Johnson 3d, Trustee, is Abigail P. Johnson's father.
Annual Report
Non-Interested Trustees:
Correspondence intended for each non-interested Trustee (that is, the Trustees other than the Interested Trustees) may be sent to Fidelity Investments, P.O. Box 55235, Boston, Massachusetts 02205-5235.
Name, Age; Principal Occupation |
J. Michael Cook (61) |
| Year of Election or Appointment: 2001 Prior to Mr. Cook's retirement in May 1999, he served as Chairman and Chief Executive Officer of Deloitte & Touche LLP (accounting/consulting), Chairman of the Deloitte & Touche Foundation, and a member of the Board of Deloitte Touche Tohmatsu. He currently serves as a Director of Comcast (telecommunications, 2002), International Flavors & Fragrances, Inc. (2000), The Dow Chemical Company (2000), and Northrop Grumman Corporation (global defense technology, 2003). He is a Member of the Diversity Advisory Council of Marakon (2003) and the Advisory Council of the Public Company Accounting Oversight Board (PCAOB), Chairman Emeritus of the Board of Catalyst (a leading organization for the advancement of women in business), and is Chairman of the Accountability Advisory Council to the Comptroller General of the United States. He also serves as a Member of the Advisory Board of the Graduate School of Business of the University of Florida, his alma mater. |
Ralph F. Cox (72) |
| Year of Election or Appointment: 1991 Mr. Cox is President of RABAR Enterprises (management consulting for the petroleum industry). Prior to February 1994, he was President of Greenhill Petroleum Corporation (petroleum exploration and production). Until March 1990, Mr. Cox was President and Chief Operating Officer of Union Pacific Resources Company (exploration and production). He is a Director of CH2M Hill Companies (engineering), and Abraxas Petroleum (petroleum exploration and production, 1999). In addition, he is a member of advisory boards of Texas A&M University and the University of Texas at Austin. |
Robert M. Gates (60) |
| Year of Election or Appointment: 1997 Dr. Gates is President of Texas A&M University (2002). He was Director of the Central Intelligence Agency (CIA) from 1991 to 1993. From 1989 to 1991, Dr. Gates served as Assistant to the President of the United States and Deputy National Security Advisor. Dr. Gates is a Director of NACCO Industries, Inc. (mining and manufacturing), Parker Drilling Co., Inc. (drilling and rental tools for the energy industry, 2001), and Brinker International (restaurant management, 2003). He also serves as a member of the Advisory Board of VoteHere.net (secure internet voting, 2001). Previously, Dr. Gates served as a Director of LucasVarity PLC (automotive components and diesel engines), a Director of TRW Inc. (automotive, space, defense, and information technology), and Dean of the George Bush School of Government and Public Service at Texas A&M University (1999-2001). Dr. Gates also is a Trustee of the Forum for International Policy. |
George H. Heilmeier (68) |
| Year of Election or Appointment: 2004 Dr. Heilmeier is Chairman Emeritus of Telcordia Technologies (communication software and systems), where prior to his retirement, he served as company Chairman and Chief Executive Officer. He currently serves on the Boards of Directors of The Mitre Corporation (systems engineering and information technology support for the government), INET Technologies Inc. (telecommunications network surveillance, 2001) and Teletech Holdings (customer management services, 1998). He is Chairman of the General Motors Technology Advisory Committee and a Life Fellow of the IEEE (2000). Dr. Heilmeier is a member of the Defense Science Board and the National Security Agency Advisory Board. He is also a member of the National Academy of Engineering, the American Academy of Arts and Sciences and The Board of Overseers of the School of Engineering and Applied Science of the University of Pennsylvania. Previously, Dr. Heilmeier served as a Director of TRW Inc. (automotive, space, defense, and information technology, 1992-2002), Compaq (1994-2002), and Automatic Data Processing, Inc. (ADP) (technology-based business outsourcing, 1995-2002). |
Donald J. Kirk (71) |
| Year of Election or Appointment: 1987 Mr. Kirk is a Governor of the American Stock Exchange (2001), a Trustee and former Chairman of the Board of Trustees of the Greenwich Hospital Association, a Director of the Yale-New Haven Health Services Corp. (1998), and a Director Emeritus and former Chairman of the Board of Directors of National Arts Strategies Inc. (leadership education for arts and culture). Mr. Kirk was an Executive-in-Residence (1995-2000) and a Professor (1987-1995) at Columbia University Graduate School of Business. Prior to 1987, he was Chairman of the Financial Accounting Standards Board. Previously, Mr. Kirk served as a Governor of the National Association of Securities Dealers, Inc. (1996-2002), a member and Vice Chairman of the Public Oversight Board of the American Institute of Certified Public Accountants' SEC Practice Section (1995-2002), a Director of General Re Corporation (reinsurance, 1987-1998) and as a Director of Valuation Research Corp. (appraisals and valuations). |
Marie L. Knowles (57) |
| Year of Election or Appointment: 2001 Prior to Ms. Knowles' retirement in June 2000, she served as Executive Vice President and Chief Financial Officer of Atlantic Richfield Company (ARCO) (diversified energy, 1996-2000). From 1993 to 1996, she was a Senior Vice President of ARCO and President of ARCO Transportation Company. She served as a Director of ARCO from 1996 to 1998. She currently serves as a Director of Phelps Dodge Corporation (copper mining and manufacturing) and McKesson Corporation (healthcare service, 2002). Ms. Knowles is a Trustee of the Brookings Institution and the Catalina Island Conservancy and also serves as a member of the Advisory Board for the School of Engineering of the University of Southern California. |
Ned C. Lautenbach (60) |
| Year of Election or Appointment: 2000 Mr. Lautenbach has been a partner of Clayton, Dubilier & Rice, Inc. (private equity investment firm) since September 1998. Previously,
Mr. Lautenbach was with the International Business Machines Corporation (IBM) from 1968 until his retirement in 1998. He was most recently Senior Vice President and Group Executive of Worldwide Sales and Services. From 1993 to 1995, he was Chairman of IBM World Trade Corporation, and from 1994 to 1998 was a member of IBM's Corporate Executive Committee. Mr. Lautenbach serves as Co-Chairman and a Director of Covansys, Inc. (global provider of business and technology solutions, 2000). In addition, he is a Director of Italtel Holding S.p.A. (telecommunications (Milan, Italy), 2004) and Eaton Corporation (diversified industrial) as well as the Philharmonic Center for the Arts in Naples, Florida (1999). He also is a member of the Council on Foreign Relations. |
Marvin L. Mann (71) |
| Year of Election or Appointment: 1993 Mr. Mann is Chairman of the non-interested Trustees (2001). He is Chairman Emeritus of Lexmark International, Inc. (computer peripherals), where he served as CEO until April 1998, retired as Chairman May 1999, and remains a member of the Board. Prior to 1991, he held the positions of Vice President of International Business Machines Corporation (IBM) and President and General Manager of various IBM divisions and subsidiaries. He is a member of the Executive Committee of the Independent Director's Council of the Investment Company Institute. In addition, Mr. Mann is a member of the President's Cabinet at the University of Alabama and the Board of Visitors of the Culverhouse College of Commerce and Business Administration at the University of Alabama. |
William O. McCoy (70) |
| Year of Election or Appointment: 1997 Prior to his retirement in December 1994, Mr. McCoy was Vice Chairman of the Board of BellSouth Corporation (telecommunications) and President of BellSouth Enterprises. He is currently a Director of Liberty Corporation (holding company), Duke Realty Corporation (real estate), and Progress Energy, Inc. (electric utility). He is also a partner of Franklin Street Partners (private investment management firm) and a member of the Research Triangle Foundation Board. In addition, Mr. McCoy served as the Interim Chancellor (1999-2000) and a member of the Board of Visitors (1994-1998) for the University of North Carolina at Chapel Hill and currently serves on the Board of Directors of the University of North Carolina Health Care System and the Board of Visitors of the Kenan-Flagler Business School (University of North Carolina at Chapel Hill). He also served as Vice President of Finance for the University of North Carolina (16-school system, 1995-1998). |
William S. Stavropoulos (65) |
| Year of Election or Appointment: 2002 Mr. Stavropoulos is Chairman of the Board (2000), CEO (2002), a position he previously held from 1995-2000, Chairman of the Executive Committee (2000), and a Member of the Board of Directors of The Dow Chemical Company. Since joining The Dow Chemical Company in 1967, Mr. Stavropoulos served in numerous senior management positions, including President (1993-2000; 2002-2003). Currently, he is a Director of NCR Corporation (data warehousing and technology solutions), BellSouth Corporation (telecommunications), Chemical Financial Corporation, and Maersk Inc. (industrial conglomerate, 2002). He also serves as a member of the Board of Trustees of the American Enterprise Institute for Public Policy Research. In addition, Mr. Stavropoulos is a member of The Business Council, J.P. Morgan International Council and the University of Notre Dame Advisory Council for the College of Science. |
Annual Report
Trustees and Officers - continued
Advisory Board Members and Executive Officers:
Correspondence intended for Mr. Dirks, Ms. Small, and Mr. Wolfe may be sent to Fidelity Investments, P.O. Box 55235, Boston, Massachusetts 02205-5235. Correspondence intended for each executive officer and Mr. Lynch may be sent to Fidelity Investments, 82 Devonshire Street, Boston, Massachusetts 02109.
Name, Age; Principal Occupation |
Dennis J. Dirks (56) |
| Year of Election or Appointment: 2004 Member of the Advisory Board of Fidelity Union Street Trust. Prior to his retirement in May 2003, Mr. Dirks was Chief Operating Officer and a member of the Board of The Depository Trust & Clearing Corporation (DTCC) (1999-2003). He also served as President, Chief Operating Officer, and Board member of The Depository Trust Company (DTC) (1999-2003) and President and Board member of the National Securities Clearing Corporation (NSCC) (1999-2003). In addition, Mr. Dirks served as Chief Executive Officer and Board member of the Government Securities Clearing Corporation (2001-2003) and Chief Executive Officer and Board member of the Mortgage-Backed Securities Clearing Corporation (2001-2003). |
Peter S. Lynch (61) |
| Year of Election or Appointment: 2003 Member of the Advisory Board of Fidelity Union Street Trust. Vice Chairman and a Director of FMR, and Vice Chairman (2001) and a Director (2000) of FMR Co., Inc. Previously, Mr. Lynch served as a Trustee of the Fidelity funds (1990-2003). Prior to May 31, 1990, he was a Director of FMR and Executive Vice President of FMR (a position he held until March 31, 1991), Vice President of Fidelity® Magellan® Fund and FMR Growth Group Leader, and Managing Director of FMR Corp. Mr. Lynch was also Vice President of Fidelity Investments Corporate Services. In addition, he serves as a Trustee of Boston College, Massachusetts Eye & Ear Infirmary, Historic Deerfield, John F. Kennedy Library, and the Museum of Fine Arts of Boston. |
Cornelia M. Small (60) |
| Year of Election or Appointment: 2004 Member of the Advisory Board of Fidelity Union Street Trust. Ms. Small is a member (2000) and Chairperson (2002) of the Investment Committee, and a member (2002) of the Board of Trustees of Smith College. Previously, she served as Chief Investment Officer (1999-2000), Director of Global Equity Investments (1996-1999), and a member of the Board of Directors of Scudder, Stevens & Clark (1990-1997) and Scudder Kemper Investments (1997-1998). In addition, Ms. Small served as Co-Chair (2000-2003) of the Annual Fund for the Fletcher School of Law and Diplomacy. |
Kenneth L. Wolfe (65) |
| Year of Election or Appointment: 2004 Member of the Advisory Board of Fidelity Union Street Trust. Prior to his retirement in 2001, Mr. Wolfe was Chairman and Chief Executive Officer of Hershey Foods Corporation (1993-2001). He currently serves as a member of the boards of Adelphia Communications Corporation (2003), Revlon Inc. (2004), Bausch & Lomb, Inc., and Carpenter Technology Corporation. |
Dwight D. Churchill (50) |
| Year of Election or Appointment: 1997 Vice President of Spartan Maryland Municipal Income. He serves as Head of Fidelity's Fixed-Income Division (2000), Vice President of Fidelity's Money Market Funds (2000), Vice President of Fidelity's Bond Funds (1997), and Senior Vice President of FIMM (2000) and FMR (1997). Mr. Churchill joined Fidelity in 1993 as Vice President and Group Leader of Taxable Fixed-Income Investments. |
Charles S. Morrison (43) |
| Year of Election or Appointment: 2002 Vice President of Spartan Maryland Municipal Income. Mr. Morrison also serves as Vice President of Fidelity's Bond Funds (2002), and Vice President of certain Asset Allocation and Balanced Funds (2002). He serves as Vice President (2002) and Bond Group Leader (2002) of Fidelity Investments Fixed Income Division. Mr. Morrison is also Vice President of FIMM (2002) and FMR (2002). Mr. Morrison joined Fidelity in 1987 as a Corporate Bond Analyst in the Fixed Income Research Division. |
Mark Sommer (44) |
| Year of Election or Appointment: 2004 Vice President of Spartan Maryland Municipal Income. Mr. Sommer also serves as Vice President of other funds advised by FMR. Prior to assuming his current responsibilities, Mr. Sommer managed a variety of Fidelity funds. |
Eric D. Roiter (55) |
| Year of Election or Appointment: 1998 Secretary of Spartan Maryland Municipal Income. He also serves as Secretary of other Fidelity funds (1998); Vice President, General Counsel, and Clerk of FMR Co., Inc. (2001) and FMR (1998); Vice President and Clerk of FDC (1998); Assistant Clerk of Fidelity Management & Research (U.K.) Inc. (2001) and Fidelity Management & Research (Far East) Inc. (2001); and Assistant Secretary of Fidelity Investments Money Management, Inc. (2001). Prior to joining Fidelity, Mr. Roiter was with the law firm of Debevoise & Plimpton, as an associate (1981-1984) and as a partner (1985-1997), and served as an Assistant General Counsel of the U.S. Securities and Exchange Commission (1979-1981).
Mr. Roiter is an Adjunct Member, Faculty of Law, at Boston College Law School (2003). |
Stuart Fross (45) |
| Year of Election or Appointment: 2003 Assistant Secretary of Spartan Maryland Municipal Income. Mr. Fross also serves as Assistant Secretary of other Fidelity funds (2003) and is an employee of FMR. |
Christine Reynolds (45) |
| Year of Election or Appointment: 2004 President, Treasurer, and Anti-Money Laundering (AML) officer of Spartan Maryland Municipal Income. Ms. Reynolds also serves as President, Treasurer, and AML officer of other Fidelity funds (2004) and is a Vice President (2003) and an employee (2002) of FMR. Before joining Fidelity Investments, Ms. Reynolds worked at PricewaterhouseCoopers LLP (PwC) (1980-2002), where she was most recently an audit partner with PwC's investment management practice. |
Timothy F. Hayes (53) |
| Year of Election or Appointment: 2002 Chief Financial Officer of Spartan Maryland Municipal Income. Mr. Hayes also serves as Chief Financial Officer of other Fidelity funds (2002). Recently he was appointed President of Fidelity Service Company (2003) where he also serves as a Director. Mr. Hayes also serves as President of Fidelity Investments Operations Group (FIOG, 2002), which includes Fidelity Pricing and Cash Management Services Group (FPCMS), where he was appointed President in 1998. Previously, Mr. Hayes served as Chief Financial Officer of Fidelity Investments Corporate Systems and Service Group (1998) and Fidelity Systems Company (1997-1998). |
Kenneth A. Rathgeber (57) |
| Year of Election or Appointment: 2004 Chief Compliance Officer of Spartan Maryland Municipal Income.
Mr. Rathgeber also serves as Chief Compliance Officer of other Fidelity funds (2004) and Executive Vice President of Risk Oversight for Fidelity Investments (2002). Previously, he served as Executive Vice President and Chief Operating Officer for Fidelity Investments Institutional Services Company, Inc. (1998-2002). |
John R. Hebble (46) |
| Year of Election or Appointment: 2003 Deputy Treasurer of Spartan Maryland Municipal Income. Mr. Hebble also serves as Deputy Treasurer of other Fidelity funds (2003), and is an employee of FMR. Before joining Fidelity Investments, Mr. Hebble worked at Deutsche Asset Management where he served as Director of Fund Accounting (2002-2003) and Assistant Treasurer of the Scudder Funds (1998-2003). |
Kimberley H. Monasterio (40) |
| Year of Election or Appointment: 2004 Deputy Treasurer of Spartan Maryland Municipal Income. Ms. Monasterio also serves as Deputy Treasurer of other Fidelity funds (2004) and is an employee of FMR (2004). Before joining Fidelity Investments, Ms. Monasterio served as Treasurer (2000-2004) and Chief Financial Officer (2002-2004) of the Franklin Templeton Funds and Senior Vice President of Franklin Templeton Services, LLC (2000-2004). |
John H. Costello (58) |
| Year of Election or Appointment: 1993 Assistant Treasurer of Spartan Maryland Municipal Income. Mr. Costello also serves as Assistant Treasurer of other Fidelity funds and is an employee of FMR. |
Francis V. Knox, Jr. (57) |
| Year of Election or Appointment: 2002 Assistant Treasurer of Spartan Maryland Municipal Income. Mr. Knox also serves as Assistant Treasurer of other Fidelity funds (2002), and is a Vice President and an employee of FMR. Previously, Mr. Knox served as Vice President of Investment & Advisor Compliance (1990-2001), and Compliance Officer of Fidelity Management & Research (U.K.) Inc. (1992-2002), Fidelity Management & Research (Far East) Inc. (1991-2002), and FMR Corp. (1995-2002). |
Peter L. Lydecker (50) |
| Year of Election or Appointment: 2004 Assistant Treasurer of Spartan Maryland Municipal Income. Mr. Lydecker also serves as Assistant Treasurer of other Fidelity funds (2004) and is an employee of FMR. |
Mark Osterheld (49) |
| Year of Election or Appointment: 2002 Assistant Treasurer of Spartan Maryland Municipal Income. Mr. Osterheld also serves as Assistant Treasurer of other Fidelity funds (2002) and is an employee of FMR. |
Kenneth B. Robins (35) |
| Year of Election or Appointment: 2004 Assistant Treasurer of Spartan Maryland Municipal Income. Mr. Robins also serves as Assistant Treasurer of other Fidelity funds (2004) and is an employee of FMR (2004). Before joining Fidelity Investments, Mr. Robins worked at KPMG LLP, where he was a partner in KPMG's department of professional practice (2002-2004) and a Senior Manager (1999-2000). In addition, Mr. Robins served as Assistant Chief Accountant, United States Securities and Exchange Commission (2000-2002). |
Thomas J. Simpson (46) |
| Year of Election or Appointment: 1996 Assistant Treasurer of Spartan Maryland Municipal Income. Mr. Simpson is Assistant Treasurer of other Fidelity funds (2000) and an employee of FMR (1996). Prior to joining FMR, Mr. Simpson was Vice President and Fund Controller of Liberty Investment Services (1987-1995). |
Annual Report
Distributions
The Board of Trustees of Spartan Maryland Municipal Income Fund voted to pay on October 11, 2004, to shareholders of record at the opening of business on October 8, 2004, a distribution of $.02 per share derived from capital gains realized from sales of portfolio securities.
During fiscal year ended 2004, 100% of the fund's income dividends was free from federal income tax, and 6.47% of the fund's income dividends was subject to the federal alternative minimum tax.
The fund will notify shareholders in January 2005 of amounts for use in preparing 2004 income tax returns.
Annual Report
Managing Your Investments
Fidelity offers several ways to conveniently manage your personal investments via your telephone or PC. You can access your account information, conduct trades and research your investments 24 hours a day.
By Phone
Fidelity Automated Service Telephone provides a single toll-free number to access account balances, positions, quotes and trading. It's easy to navigate the service, and on your first call, the system will help you create a personal identification number (PIN) for security.
(phone_graphic)Fidelity Automated
Service Telephone (FAST®)
1-800-544-5555
Press
1 For mutual fund and brokerage trading.
2 For quotes.*
3 For account balances and holdings.
4 To review orders and mutual
fund activity.
5 To change your PIN.
*0 To speak to a Fidelity representative.
By PC
Fidelity's web site on the Internet provides a wide range of information, including daily financial news, fund performance, interactive planning tools and news about Fidelity products and services.
(computer_graphic)Fidelity's Web Site
www.fidelity.com
* When you call the quotes line, please remember that a fund's yield and return will vary and, except for money market funds, share price will also vary. This means that you may have a gain or loss when you sell your shares. There is no assurance that money market funds will be able to maintain a stable $1 share price; an investment in a money market fund is not insured or guaranteed by the U.S. government. Total returns are historical and include changes in share price, reinvestment of dividends and capital gains, and the effects of any sales charges.
Annual Report
To Write Fidelity
We'll give your correspondence immediate attention and send you written confirmation upon completion of your request.
(letter_graphic)Making Changes
To Your Account
(such as changing name, address, bank, etc.)
Fidelity Investments
P.O. Box 770001
Cincinnati, OH 45277-0002
(letter_graphic)For Non-Retirement
Accounts
Buying shares
Fidelity Investments
P.O. Box 770001
Cincinnati, OH 45277-0003
Overnight Express
Fidelity Investments
Attn: Distribution Services
100 Crosby Parkway - KC1H
Covington, KY 41015
Selling shares
Fidelity Investments
P.O. Box 770001
Cincinnati, OH 45277-0035
Overnight Express
Fidelity Investments
Attn: Distribution Services
100 Crosby Parkway - KC1H
Covington, KY 41015
General Correspondence
Fidelity Investments
P.O. Box 500
Merrimack, NH 03054-0500
(letter_graphic)For Retirement
Accounts
Buying shares
Fidelity Investments
P.O. Box 770001
Cincinnati, OH 45277-0003
Selling shares
Fidelity Investments
P.O. Box 770001
Cincinnati, OH 45277-0035
Overnight Express
Fidelity Investments
Attn: Distribution Services
100 Crosby Parkway - KC1H
Covington, KY 41015
General Correspondence
Fidelity Investments
P.O. Box 500
Merrimack, NH 03054-0500
Annual Report
Investment Adviser
Fidelity Management & Research Company
Boston, MA
Investment Sub-Adviser
Fidelity Investments
Money Management, Inc.
Fidelity International
Investment Advisors
Fidelity International Investment
Advisors (U.K.) Limited
General Distributor
Fidelity Distributors Corporation
Boston, MA
Transfer and Shareholder
Servicing Agents
Citibank, N.A.
New York, NY
and
Fidelity Service Company, Inc.
Boston, MA
Custodian
Citibank, N.A.
New York, NY
Fidelity's Municipal Bond Funds
Spartan®Arizona Municipal Income
Spartan California Municipal Income
Spartan Connecticut Municipal Income
Spartan Florida Municipal Income
Spartan Intermediate Municipal Income
Spartan Maryland Municipal Income
Spartan Massachusetts Municipal Income
Spartan Michigan Municipal Income
Spartan Minnesota Municipal Income
Spartan Municipal Income
Spartan New Jersey Municipal Income
Spartan New York Municipal Income
Spartan Ohio Municipal Income
Spartan Pennsylvania Municipal Income
Spartan Short-Intermediate
Municipal Income
Spartan Tax-Free Bond
Please carefully consider the funds' investment objectives, risks, charges and expenses before investing. For this and other information, call 1-800-544-6666 for a free prospectus. Read it carefully before you invest or send money.
The Fidelity Telephone Connection
Mutual Fund 24-Hour Service
Exchanges/Redemptions
and Account Assistance 1-800-544-6666
Product Information 1-800-544-6666
Retirement Accounts 1-800-544-4774 (8 a.m. - 9 p.m.)
TDD Service 1-800-544-0118
for the deaf and hearing impaired
(9 a.m. - 9 p.m. Eastern time)
Fidelity Automated Service
Telephone (FAST®) (automated graphic) 1-800-544-5555
(automated graphic) Automated line for quickest service
(Fidelity Investment logo)(registered trademark)
Corporate Headquarters
82 Devonshire St., Boston, MA 02109
www.fidelity.com
SMD-UANN-1004
1.790913.101
Item 2. Code of Ethics
As of the end of the period, August 31, 2004, Fidelity Union Street Trust (the trust) has adopted a code of ethics, as defined in Item 2 of Form N-CSR, that applies to its President and Treasurer and its Chief Financial Officer. A copy of the code of ethics is filed as an exhibit to this Form N-CSR.
Item 3. Audit Committee Financial Expert
The Board of Trustees of the trust has determined that Marie L. Knowles and Donald J. Kirk are each audit committee financial experts, as defined in Item 3 of Form N-CSR. Ms. Knowles and Mr. Kirk are each independent for purposes of Item 3 of Form N-CSR.
Item 4. Principal Accountant Fees and Services
(a) Audit Fees.
For the fiscal years ended August 31, 2004 and August 31, 2003, the aggregate Audit Fees billed by PricewaterhouseCoopers LLP (PwC) for professional services rendered for the audits of the financial statements, or services that are normally provided in connection with statutory and regulatory filings or engagements for those fiscal years, for the Fidelity Export and Multinational Fund, Spartan Maryland Municipal Income Fund and Spartan Arizona Municipal Income Fund (the funds) and for all funds in the Fidelity Group of Funds are shown in the table below.
Fund | 2004A | 2003A |
Fidelity Export and Multinational Fund | $39,000 | $33,000 |
Spartan Maryland Municipal Income Fund | $36,000 | $37,000 |
Spartan Arizona Municipal Income Fund | $38,000 | $38,000 |
All funds in the Fidelity Group of Funds audited by PwC | $10,600,000 | $9,600,000 |
A | Aggregate amounts may reflect rounding. |
(b) Audit-Related Fees.
In each of the fiscal years ended August 31, 2004 and August 31, 2003 the aggregate Audit-Related Fees billed by PwC for services rendered for assurance and related services to each fund that are reasonably related to the performance of the audit or review of the fund's financial statements, but not reported as Audit Fees, are shown in the table below.
Fund | 2004A | 2003A,B |
Fidelity Export and Multinational Fund | $0 | $0 |
Spartan Maryland Municipal Income Fund | $0 | $0 |
Spartan Arizona Municipal Income Fund | $0 | $0 |
A | Aggregate amounts may reflect rounding. |
B | Includes amounts related to non-audit services prior to May 6, 2003 that would have been subject to pre-approval if the SEC rules relating to the pre-approval of non-audit services had been in effect at that time. |
In each of the fiscal years ended August 31, 2004 and August 31, 2003, the aggregate Audit-Related Fees that were billed by PwC that were required to be approved by the Audit Committee for services rendered on behalf of Fidelity Management & Research Company (FMR) and entities controlling, controlled by, or under common control with FMR (not including any sub-adviser whose role is primarily portfolio management and is subcontracted with or overseen by another investment adviser) that provide ongoing services to the funds ("Fund Service Providers") for assurance and related services that relate directly to the operations and financial reporting of each fund that are reasonably related to the performance of the audit or review of the fund's financial statements, but not reported as Audit Fees, are shown in the table below.
Billed By | 2004A | 2003A,B |
PwC | $50,000 | $0 |
A | Aggregate amounts may reflect rounding. |
B | Includes amounts related to non-audit services prior to May 6, 2003 that would have been subject to pre-approval if the SEC rules relating to the pre-approval of non-audit services had been in effect at that time. |
Fees included in the audit-related category comprise assurance and related services (e.g., due diligence services) that are traditionally performed by the independent registered public accounting firm. These audit-related services include due diligence related to mergers and acquisitions, accounting consultations and audits in connection with acquisitions, internal control reviews, attest services that are not required by statute or regulation and consultation concerning financial accounting and reporting standards.
(c) Tax Fees.
In each of the fiscal years ended August 31, 2004 and August 31, 2003, the aggregate Tax Fees billed by PwC for professional services rendered for tax compliance, tax advice, and tax planning for each fund is shown in the table below.
Fund | 2004A | 2003A,B |
Fidelity Export and Multinational Fund | $2,400 | $2,200 |
Spartan Maryland Municipal Income Fund | $2,400 | $2,200 |
Spartan Arizona Municipal Income Fund | $2,400 | $2,200 |
A | Aggregate amounts may reflect rounding. |
B | Includes amounts related to non-audit services prior to May 6, 2003 that would have been subject to pre-approval if the SEC rules relating to the pre-approval of non-audit services had been in effect at that time. |
In each of the fiscal years ended August 31, 2004 and August 31, 2003, the aggregate Tax Fees billed by PwC that were required to be approved by the Audit Committee for professional services rendered on behalf of the Fund Service Providers for tax compliance, tax advice, and tax planning that relate directly to the operations and financial reporting of each fund is shown in the table below.
Billed By | 2004A | 2003A,B |
PwC | $0 | $0 |
A | Aggregate amounts may reflect rounding. |
B | Includes amounts related to non-audit services prior to May 6, 2003 that would have been subject to pre-approval if the SEC rules relating to the pre-approval of non-audit services had been in effect at that time. |
Fees included in the Tax Fees category comprise all services performed by professional staff in the independent registered public accounting firm's tax division except those services related to the audit. Typically, this category would include fees for tax compliance, tax planning, and tax advice. Tax compliance, tax advice, and tax planning services include preparation of original and amended tax returns, claims for refund and tax payment-planning services, assistance with tax audits and appeals, tax advice related to mergers and acquisitions and requests for rulings or technical advice from taxing authorities.
(d) All Other Fees.
In each of the fiscal years ended August 31, 2004 and August 31, 2003, the aggregate Other Fees billed by PwC for all other non-audit services rendered to the funds is shown in the table below.
Fund | 2004A | 2003A,B |
Fidelity Export and Multinational Fund | $2,100 | $1,900 |
Spartan Maryland Municipal Income Fund | $1,300 | $1,400 |
Spartan Arizona Municipal Income Fund | $1,300 | $1,300 |
A | Aggregate amounts may reflect rounding. |
B | Includes amounts related to non-audit services prior to May 6, 2003 that would have been subject to pre-approval if the SEC rules relating to the pre-approval of non-audit services had been in effect at that time. |
In each of the fiscal years ended August 31, 2004 and August 31, 2003, the aggregate Other Fees billed by PwC that were required to be approved by the Audit Committee for all other non-audit services rendered on behalf of the Fund Service Providers that relate directly to the operations and financial reporting of each fund is shown in the table below.
Billed By | 2004A | 2003A,B |
PwC | $280,000 | $300,000 |
A | Aggregate amounts may reflect rounding. |
B | Includes amounts related to non-audit services prior to May 6, 2003 that would have been subject to pre-approval if the SEC rules relating to the pre-approval of non-audit services had been in effect at that time. |
Fees included in the All Other Fees category include services related to internal control reviews, strategy and other consulting, financial information systems design and implementation, consulting on other information systems, and other tax services unrelated to the fund.
(e) (1) | Audit Committee Pre-Approval Policies and Procedures: |
The trust's Audit Committee must pre-approve all audit and non-audit services provided by the independent registered public accounting firm relating to the operations or financial reporting of the funds. Prior to the commencement of any audit or non-audit services to a fund, the Audit Committee reviews the services to determine whether they are appropriate and permissible under applicable law.
The trust's Audit Committee has adopted policies and procedures to, among other purposes, provide a framework for the Committee's consideration of non-audit services by the audit firms that audit the Fidelity funds. The policies and procedures require that any non-audit service provided by a fund audit firm to a Fidelity Fund and any non-audit service provided by a fund auditor to a Fund Service Provider that relates directly to the operations and financial reporting of a Fidelity fund (Covered Service) are subject to approval by the Audit Committee before such service is provided. Non-audit services provided by a fund audit firm for a Fund Service Provider that do not relate directly to the operations and financial reporting of a Fidelity fund (Non-Covered Service) but that are expected to exceed $50,000 are also subject to pre-approval by the Audit Committee.
All Covered Services, as well as Non-Covered Services that are expected to exceed $50,000, must be approved in advance of provision of the service either: (i) by formal resolution of the Audit Committee, or (ii) by oral or written approval of the service by the Chair of the Audit Committee (or if the Chair is unavailable, such other member of the Audit Committee as may be designated by the Chair to act in the Chair's absence). The approval contemplated by (ii) above is permitted where the Treasurer determines that action on such an engagement is necessary before the next meeting of the Audit Committee. Neither pre-approval nor advance notice of Non-Covered Service engagements for which fees are not expected to exceed $50,000 is required; such engagements are to be reported to the Audit Committee monthly.
(e) (2) | Services approved pursuant to paragraph (c)(7)(i)(C) of Rule 2-01 of Regulation S-X: |
Audit-Related Fees:
There were no amounts, including amounts related to non-audit services prior to May 6, 2003 that would have been subject to pre-approval if the SEC rules relating to the pre-approval of non-audit services had been in effect at that time, that were approved by the Audit Committee pursuant to the de minimis exception for the fiscal years ended August 31, 2004 and August 31, 2003 on behalf of each fund.
There were no amounts, including amounts related to non-audit services prior to May 6, 2003 that would have been subject to pre-approval if the SEC rules relating to the pre-approval of non-audit services had been in effect at that time, that were required to be approved by the Audit Committee pursuant to the de minimis exception for the fiscal years ended August 31, 2004 and August 31, 2003 on behalf of the Fund Service Providers that relate directly to the operations and financial reporting of each fund.
Tax Fees:
There were no amounts, including amounts related to non-audit services prior to May 6, 2003 that would have been subject to pre-approval if the SEC rules relating to the pre-approval of non-audit services had been in effect at that time, that were approved by the Audit Committee pursuant to the de minimis exception for the fiscal years ended August 31, 2004 and August 31, 2003 on behalf of each fund.
There were no amounts, including amounts related to non-audit services prior to May 6, 2003 that would have been subject to pre-approval if the SEC rules relating to the pre-approval of non-audit services had been in effect at that time, that were required to be approved by the Audit Committee pursuant to the de minimis exception for the fiscal years ended August 31, 2004 and August 31, 2003 on behalf of the Fund Service Providers that relate directly to the operations and financial reporting of each fund.
All Other Fees:
There were no amounts, including amounts related to non-audit services prior to May 6, 2003 that would have been subject to pre-approval if the SEC rules relating to the pre-approval of non-audit services had been in effect at that time, that were approved by the Audit Committee pursuant to the de minimis exception for the fiscal years ended August 31, 2004 and August 31, 2003 on behalf of each fund.
There were no amounts, including amounts related to non-audit services prior to May 6, 2003 that would have been subject to pre-approval if the SEC rules relating to the pre-approval of non-audit services had been in effect at that time, that were required to be approved by the Audit Committee pursuant to the de minimis exception for the fiscal years ended August 31, 2004 and August 31, 2003 on behalf of the Fund Service Providers that relate directly to the operations and financial reporting of each fund.
(f) According to PwC for the fiscal year ended August 31, 2004, the percentage of hours spent on the audit of each fund's financial statements for the most recent fiscal year that were attributed to work performed by persons who are not full-time, permanent employees of PwC is as follows:
Fund | 2004 |
Fidelity Export and Multinational Fund | 0% |
Spartan Maryland Municipal Income Fund | 0% |
Spartan Arizona Municipal Income Fund | 0% |
(g) For the fiscal years ended August 31, 2004 and August 31, 2003, the aggregate fees billed by PwC of $1,850,000A and $2,000,000A,B for non-audit services rendered on behalf of the funds, FMR (not including any sub-adviser whose role is primarily portfolio management and is subcontracted with or overseen by another investment adviser) and Fund Service Providers relating to Covered Services and Non-Covered Services are shown in the table below.
| 2004A | 2003A,B |
Covered Services | $350,000 | $300,000 |
Non-Covered Services | $1,500,000 | $1,700,000 |
A | Aggregate amounts may reflect rounding. |
B | Includes amounts related to non-audit services prior to May 6, 2003 that would have been subject to pre-approval if the SEC rules relating to the pre-approval of non-audit services had been in effect at that time. |
(h) The trust's Audit Committee has considered Non-Covered Services that were not pre-approved that were provided by PwC to Fund Service Providers to be compatible with maintaining the independence of PwC in its audit of the funds, taking into account representations from PwC, in accordance with Independence Standards Board Standard No.1, regarding its independence from the funds and their related entities.
Item 5. Audit Committee of Listed Registrants
Not applicable.
Item 6. Schedule of Investments
Not applicable.
Item 7. Disclosure of Proxy Voting Policies and Procedures for Closed-End Management Investment Companies
Not applicable.
Item 8. Purchase of Equity Securities by Closed-End Management Investment Company and Affiliated Purchasers
Not applicable.
Item 9. Submission of Matters to a Vote of Security Holders
There were no material changes to the procedures by which shareholders may recommend nominees to the trust's Board of Trustees.
Item 10. Controls and Procedures
(a)(i) The President and Treasurer and the Chief Financial Officer have concluded that the trust's disclosure controls and procedures (as defined in Rule 30a-3(c) under the Investment Company Act) provide reasonable assurances that material information relating to the trust is made known to them by the appropriate persons, based on their evaluation of these controls and procedures as of a date within 90 days of the filing date of this report.
(a)(ii) There was no change in the trust's internal control over financial reporting (as defined in Rule 30a-3(d) under the Investment Company Act) that occurred during the trust's second fiscal half-year that has materially affected, or is reasonably likely to materially affect, the trust's internal control over financial reporting.
Item 11. Exhibits
(a) | (1) | Code of Ethics pursuant to Item 2 of Form N-CSR is filed and attached hereto as EX-99.CODE ETH. |
(a) | (2) | Certification pursuant to Rule 30a-2(a) under the Investment Company Act of 1940 (17 CFR 270.30a-2(a)) is filed and attached hereto as Exhibit 99.CERT. |
(a) | (3) | Not applicable. |
(b) | | Certification pursuant to Rule 30a-2(b) under the Investment Company Act of 1940 (17 CFR 270.30a-2(b)) is furnished and attached hereto as Exhibit 99.906CERT. |
SIGNATURES
Pursuant to the requirements of the Securities Exchange Act of 1934 and the Investment Company Act of 1940, the registrant has duly caused this report to be signed on its behalf by the undersigned, thereunto duly authorized.
Fidelity Union Street Trust
By: | /s/Christine Reynolds |
| Christine Reynolds |
| President and Treasurer |
| |
Date: | October 19, 2004 |
Pursuant to the requirements of the Securities Exchange Act of 1934 and the Investment Company Act of 1940, this report has been signed below by the following persons on behalf of the registrant and in the capacities and on the dates indicated.
By: | /s/Christine Reynolds |
| Christine Reynolds |
| President and Treasurer |
| |
Date: | October 19, 2004 |
By: | /s/Timothy F. Hayes |
| Timothy F. Hayes |
| Chief Financial Officer |
| |
Date: | October 19, 2004 |