UNITED STATES
SECURITIES AND EXCHANGE COMMISSION
Washington, D.C. 20549
FORM N-CSR
CERTIFIED SHAREHOLDER REPORT OF REGISTERED
MANAGEMENT INVESTMENT COMPANIES
Investment Company Act file number 811-2460
Fidelity Union Street Trust
(Exact name of registrant as specified in charter)
82 Devonshire St., Boston, Massachusetts 02109
(Address of principal executive offices) (Zip code)
Eric D. Roiter, Secretary
82 Devonshire St.
Boston, Massachusetts 02109
(Name and address of agent for service)
Registrant's telephone number, including area code: 617-563-7000
Date of fiscal year end: | August 31 |
| |
Date of reporting period: | August 31, 2005 |
Item 1. Reports to Stockholders
Fidelity®
Export and Multinational
Fund
|
| | Annual Report
August 31, 2005
|


| Contents | | | | |
| |
| Chairman’s Message | | 4 | | Ned Johnson’s message to shareholders. |
| Performance | | 5 | | How the fund has done over time. |
| Management’s Discussion | | 6 | | The manager’s review of fund |
| | | | | performance, strategy and outlook. |
| Shareholder Expense | | 7 | | An example of shareholder expenses. |
| Example | | | | |
| Investment Changes | | 9 | | A summary of the major shifts in the fund’s |
| | | | | investments over the past six months. |
| Investments | | 10 | | A complete list of the fund’s investments |
| | | | | with their market values. |
| Financial Statements | | 15 | | Statements of assets and liabilities, |
| | | | | operations, and changes in net assets, |
| | | | | as well as financial highlights. |
| Notes | | 19 | | Notes to the financial statements. |
| Report of Independent | | 24 | | |
| Registered Public | | | | |
| Accounting Firm | | | | |
| Trustees and Officers | | 25 | | |
| Distributions | | 35 | | |
| Proxy Voting Results | | 36 | | |
| Board Approval of | | 37 | | |
| Investment Advisory | | | | |
| Contracts and | | | | |
| Management Fees | | | | |
To view a fund’s proxy voting guidelines and proxy voting record for the 12 month period ended June 30, visit www.fidelity.com/proxyvotingresults or visit the Securities and Exchange Commission’s (SEC) web site at www.sec.gov. You may also call 1-800-544-8544 to request a free copy of the proxy voting guidelines.
Standard & Poor’s, S&P and S&P 500 are registered service marks of The McGraw Hill Companies, Inc. and have been licensed for use by Fidelity Distributors Corporation.
Other third party marks appearing herein are the property of their respective owners. All other marks appearing herein are registered or unregistered trademarks or service marks of FMR Corp. or an affiliated company.
Annual Report
This report and the financial statements contained herein are submitted for the general information of the shareholders of the fund. This report is not authorized for distribution to prospective investors in the fund unless preceded or accompanied by an effective prospectus.
A fund files its complete schedule of portfolio holdings with the SEC for the first and third quarters of each fiscal year on Form N Q. Forms N Q are available on the SEC’s web site at http://www.sec.gov. A fund’s Forms N Q may be reviewed and copied at the SEC’s Public Reference Room in Washington, DC. Information regarding the operation of the SEC’s Public Reference Room may be obtained by calling 1 800 SEC 0330. For a complete list of a fund’s portfolio holdings, view the most recent quarterly holdings report, semiannual report, or annual report on Fidelity’s web site at http://www.fidelity.com/holdings.
NOT FDIC INSURED · MAY LOSE VALUE · NO BANK GUARANTEE
Neither the fund nor Fidelity Distributors Corporation is a bank.
3 Annual Report
3
Chairman’s Message
(photograph of Edward C Johnson 3d)
Dear Shareholder:
During the past year or so, much has been reported about the mutual fund industry, and much of it has been more critical than I believe is warranted. Allegations that some companies have been less than forthright with their shareholders have cast a shadow on the entire industry. I continue to find these reports disturbing, and assert that they do not create an ac curate picture of the industry overall. Therefore, I would like to remind every one where Fidelity stands on these issues. I will say two things specifically regarding allegations that some mutual fund companies were in violation of the Securities and Exchange Commission’s forward pricing rules or were involved in so called “market timing” activities.
First, Fidelity has no agreements that per mit customers who buy fund shares after 4 p.m. to obtain the 4 p.m. price. This is not a new policy. This is not to say that some one could not deceive the company through fraudulent acts. However, we are extremely diligent in preventing fraud from occurring in this manner and in every other. But I underscore again that Fidelity has no so called “agreements” that sanction illegal practices.
Second, Fidelity continues to stand on record, as we have for years, in opposition to predatory short term trading that adversely affects shareholders in a mutual fund. Back in the 1980s, we initiated a fee which is returned to the fund and, therefore, to investors to discourage this activity. Further, we took the lead several years ago in developing a Fair Value Pricing Policy to prevent market timing on foreign securities in our funds. I am confident we will find other ways to make it more difficult for predatory traders to operate. However, this will only be achieved through close cooperation among regulators, legislators and the industry.
Yes, there have been unfortunate instances of unethical and illegal activity within the mutual fund industry from time to time. That is true of any industry. When this occurs, confessed or convicted offenders should be dealt with appropriately. But we are still concerned about the risk of over regulation and the quick application of simplistic solutions to intricate problems. Every system can be improved, and we support and applaud well thought out improvements by regulators, legislators and industry representatives that achieve the common goal of building and protecting the value of investors’ holdings. For nearly 60 years, Fidelity has worked very hard to improve its products and service to justify your trust. When our family founded this company in 1946, we had only a few hundred customers. Today, we serve more than 18 million customers including individual investors and participants in retirement plans across America. Let me close by saying that we do not take your trust in us for granted, and we realize that we must always work to improve all aspects of our service to you. In turn, we urge you to continue your active participation with your financial matters, so that your interests can be well served.
Best regards,
/s/ Edward C. Johnson 3d
Edward C. Johnson 3d
Annual Report
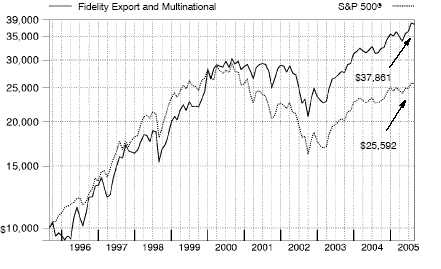
Performance: The Bottom Line
Average annual total return reflects the change in the value of an investment, assuming reinvestment of the fund’s dividend income and capital gains (the profits earned upon the sale of securities that have grown in value) and assuming a constant rate of perfor mance each year. The $10,000 table and the fund’s returns do not reflect the deduction of taxes that a shareholder would pay on fund distributions or the redemption of fund shares. During periods of reimbursement by Fidelity, a fund’s total return will be greater than it would be had the reimbursement not occurred. How a fund did yesterday is no guarantee of how it will do tomorrow.
| Average Annual Total Returns | | | | | | |
| Periods ended August 31, 2005 | | Past 1 | | Past 5 | | Past 10 |
| | | year | | years | | years |
| Fidelity® Export and Multinational Fund | | 20.43% | | 4.59% | | 14.24% |
| |
| $10,000 Over 10 Years | | | | | | |
Let’s say hypothetically that $10,000 was invested in Fidelity® Export and Multinational Fund on August 31, 1995. The chart shows how the value of your investment would have changed, and also shows how the Standard & Poor’s 500SM Index performed over the same period.
Annual Report
Management’s Discussion of Fund Performance
Comments from Tim Cohen, Portfolio Manager of Fidelity® Export and Multinational Fund
Most major U.S. equity benchmarks notched double digit returns during the 12 months ending August 31, 2005. Energy stocks, riding high on the strength of record setting oil prices, were generally the most lucrative investments. Utilities stocks also benefited from rising energy prices, while technology stocks snapped out of their recent doldrums. From a capitalization perspective, the Standard & Poor’s 100SM Index the 100 largest stocks in the S&P 500® gained only 6.96%, while the S&P 500 overall returned 12.56% . Further illustrating the large cap/small cap disparity, the Russell 2000® Index a proxy of small cap stock performance and the Russell Midcap® Index soared 23.10% and 27.47%, respectively. In another repeat of a recent trend, value stocks outpaced growth stocks, as the Russell 3000® Value Index advanced 17.33%, compared to 13.04% for the Russell 3000 Growth Index. In economic news, the Federal Reserve Board raised interest rates eight times to help cool the economy and the white hot U.S. housing market, but the effects of Hurricane Katrina at period end left the economy’s short term direction in doubt.
For the 12 months ending August 31, 2005, Fidelity Export and Multinational Fund gained 20.43%, outpacing the LipperSM Growth Funds Average, which returned 15.57% . The fund also beat the S&P 500. Favorable stock selection was the key factor in the fund’s robust performance versus the S&P 500 during the period, with astute stock picking in such sectors as energy, information technology and health care tendering the largest contribu tions. The return relative to the broad index was held back somewhat by the fund’s complete lack of exposure to utilities, which was the second best performing sector during the period. Such holdings as Google, maker of the popular Internet search engine, as well as independent oil refiner Valero Energy and global energy services giant Halliburton were among the fund’s top relative contributors. By contrast, the fund’s large stake in American International Group, the beleaguered financial services firm, and its position in the heavily scrutinized industrial conglomerate Tyco International created a head wind for overall fund performance.
The views expressed in this statement reflect those of the portfolio manager only through the end of the period of the report as stated on the cover and do not necessarily represent the views of Fidelity or any other person in the Fidelity organization. Any such views are subject to change at any time based upon market or other conditions and Fidelity disclaims any responsibility to update such views. These views may not be relied on as investment advice and, because investment decisions for a Fidelity fund are based on numerous factors, may not be relied on as an indication of trading intent on behalf of any Fidelity fund.
Shareholder Expense Example
As a shareholder of the Fund, you incur two types of costs: (1) transaction costs, including redemption fees, and (2) ongoing costs, including management fees and other Fund expenses. This Example is intended to help you understand your ongoing costs (in dollars) of investing in the Fund and to compare these costs with the ongoing costs of investing in other mutual funds.
The Example is based on an investment of $1,000 invested at the beginning of the period and held for the entire period (March 1, 2005 to August 31, 2005).
The first line of the table below provides information about actual account values and actual expenses. You may use the information in this line, together with the amount you invested, to estimate the expenses that you paid over the period. Simply divide your account value by $1,000.00 (for example, an $8,600 account value divided by $1,000.00 = 8.6), then multiply the result by the number in the first line under the heading entitled “Expenses Paid During Period” to estimate the expenses you paid on your account during this period. A small balance maintenance fee of $12.00 that is charged once a year may apply for certain accounts with a value of less than $2,000. This fee is not included in the table below. If it was, the estimate of expenses you paid during the period would be higher, and your ending account value lower, by this amount.
Hypothetical Example for Comparison Purposes
The second line of the table below provides information about hypothetical account values and hypothetical expenses based on the Fund’s actual expense ratio and an assumed rate of return of 5% per year before expenses, which is not the Fund’s actual return. The hypothetical account values and expenses may not be used to estimate the actual ending account balance or expenses you paid for the period. You may use this information to compare the ongoing costs of investing in the Fund and other funds. To do so, compare this 5% hypothetical example with the 5% hypothetical examples that appear in the share holder reports of the other funds. A small balance maintenance fee of $12.00 that is charged once a year may apply for certain accounts with a value of less than $2,000. This fee is not included in the table below. If it was, the estimate of expenses you paid during the period would be higher, and your ending account value lower, by this amount.
Please note that the expenses shown in the table are meant to highlight your ongoing costs only and do not reflect any transaction costs. Therefore, the second line of the table is useful in comparing ongoing costs only, and will not help you determine the relative total costs of owning different funds. In addition, if these transactional costs were included, your costs would have been higher.
7 Annual Report
| Shareholder Expense Example continued | | | | |
| |
| |
| | | | | | | | | | | Expenses Paid |
| | | | | Beginning | | Ending | | | | During Period* |
| | | | | Account Value | | Account Value | | | | March 1, 2005 |
| | | | | March 1, 2005 | | August 31, 2005 | | to August 31, 2005 |
| Actual | | $ | | 1,000.00 $ | | 1,049.10 | | $ | | 4.39 |
| Hypothetical (5% return per year | | | | | | | | | | |
| before expenses) | | $ | | 1,000.00 $ | | 1,020.92 | | $ | | 4.33 |
* Expenses are equal to the Fund’s annualized expense ratio of .85%; multiplied by the average account value over the period, multiplied by 184/365 (to reflect the one half year period).
Investment Changes
| Top Ten Stocks as of August 31, 2005 | | | | |
| | | % of fund’s | | % of fund’s net assets |
| | | net assets | | 6 months ago |
| American International Group, Inc. | | 6.8 | | 6.5 |
| General Electric Co. | | 5.4 | | 0.0 |
| Microsoft Corp. | | 3.8 | | 3.9 |
| Wal Mart Stores, Inc. | | 3.6 | | 0.0 |
| Home Depot, Inc. | | 3.3 | | 2.9 |
| Robert Half International, Inc. | | 3.0 | | 3.1 |
| UnitedHealth Group, Inc. | | 2.6 | | 3.9 |
| Goldman Sachs Group, Inc. | | 2.5 | | 2.5 |
| Dell, Inc. | | 2.5 | | 2.5 |
| eBay, Inc. | | 2.5 | | 2.1 |
| | | 36.0 | | |
| Top Five Market Sectors as of August 31, 2005 | | |
| | | % of fund’s | | % of fund’s net assets |
| | | net assets | | 6 months ago |
| Financials | | 25.8 | | 24.6 |
| Information Technology | | 16.9 | | 25.1 |
| Energy | | 14.9 | | 12.2 |
| Industrials | | 14.4 | | 13.0 |
| Consumer Discretionary | | 12.9 | | 6.3 |

Annual Report
| Investments August 31, 2005 | | | | |
| Showing Percentage of Net Assets | | | | | | | | |
| |
| Common Stocks 98.4% | | | | | | | | |
| | | | | Shares | | Value (Note 1) |
| | | | | | | | | (000s) |
| |
| CONSUMER DISCRETIONARY – 12.9% | | | | | | | | |
| Diversified Consumer Services – 2.8% | | | | | | | | |
| Apollo Group, Inc. Class A (a) | | | | 966,710 | | $ | | 76,041 |
| Bright Horizons Family Solutions, Inc. (a) | | | | 309,550 | | | | 12,172 |
| | | | | | | | | 88,213 |
| Hotels, Restaurants & Leisure 0.3% | | | | | | | | |
| Carnival Corp. unit | | | | 179,500 | | | | 8,857 |
| Internet & Catalog Retail 2.5% | | | | | | | | |
| eBay, Inc. (a) | | | | 1,928,740 | | | | 78,095 |
| Media – 1.9% | | | | | | | | |
| Lamar Advertising Co. Class A (a) | | | | 453,050 | | | | 18,222 |
| Univision Communications, Inc. Class A (a) | | | | 1,498,500 | | | | 40,310 |
| | | | | | | | | 58,532 |
| Specialty Retail – 5.1% | | | | | | | | |
| Aeropostale, Inc. (a) | | | | 732,160 | | | | 18,699 |
| Home Depot, Inc. | | | | 2,559,200 | | | | 103,187 |
| Staples, Inc. | | | | 1,780,700 | | | | 39,104 |
| | | | | | | | | 160,990 |
| Textiles, Apparel & Luxury Goods – 0.3% | | | | | | | | |
| Fossil, Inc. (a) | | | | 514,738 | | | | 11,319 |
| |
| TOTAL CONSUMER DISCRETIONARY | | | | | | | | 406,006 |
| |
| CONSUMER STAPLES 4.5% | | | | | | | | |
| Food & Staples Retailing – 3.6% | | | | | | | | |
| Wal-Mart Stores, Inc. | | | | 2,530,800 | | | | 113,785 |
| Food Products 0.9% | | | | | | | | |
| Nestle SA (Reg.) | | | | 102,713 | | | | 28,831 |
| |
| TOTAL CONSUMER STAPLES | | | | | | | | 142,616 |
| |
| ENERGY 14.9% | | | | | | | | |
| Energy Equipment & Services – 7.3% | | | | | | | | |
| BJ Services Co. | | | | 267,500 | | | | 16,874 |
| Grant Prideco, Inc. (a) | | | | 515,100 | | | | 18,987 |
| Halliburton Co. | | | | 1,234,600 | | | | 76,508 |
| National Oilwell Varco, Inc. (a) | | | | 454,622 | | | | 29,191 |
| Noble Corp. | | | | 243,900 | | | | 17,390 |
| Schlumberger Ltd. (NY Shares) | | | | 372,300 | | | | 32,103 |
See accompanying notes which are an integral part of the financial statements.
| Common Stocks continued | | | | | | |
| | | Shares | | Value (Note 1) |
| | | | | | | (000s) |
| |
| ENERGY – continued | | | | | | |
| Energy Equipment & Services – continued | | | | | | |
| Smith International, Inc. | | 345,400 | | $ | | 11,999 |
| Weatherford International Ltd. (a) | | 364,150 | | | | 24,657 |
| | | | | | | 227,709 |
| Oil, Gas & Consumable Fuels – 7.6% | | | | | | |
| Amerada Hess Corp. | | 142,400 | | | | 18,099 |
| Apache Corp. | | 430,850 | | | | 30,857 |
| ConocoPhillips | | 662,700 | | | | 43,698 |
| Forest Oil Corp. (a) | | 319,735 | | | | 14,372 |
| Occidental Petroleum Corp. | | 420,020 | | | | 34,874 |
| Total SA sponsored ADR | | 290,740 | | | | 38,331 |
| Valero Energy Corp. | | 553,680 | | | | 58,967 |
| | | | | | | 239,198 |
| |
| TOTAL ENERGY | | | | | | 466,907 |
| |
| FINANCIALS – 25.8% | | | | | | |
| Capital Markets 4.6% | | | | | | |
| Goldman Sachs Group, Inc. | | 714,660 | | | | 79,456 |
| Merrill Lynch & Co., Inc. | | 445,200 | | | | 25,448 |
| UBS AG (NY Shares) | | 485,050 | | | | 39,823 |
| | | | | | | 144,727 |
| Commercial Banks – 2.7% | | | | | | |
| Bank of America Corp. | | 1,646,800 | | | | 70,862 |
| Standard Chartered PLC (United Kingdom) | | 647,200 | | | | 13,828 |
| | | | | | | 84,690 |
| Diversified Financial Services – 2.0% | | | | | | |
| JPMorgan Chase & Co. | | 1,827,400 | | | | 61,931 |
| Insurance – 16.5% | | | | | | |
| ACE Ltd. | | 1,743,630 | | | | 77,435 |
| AMBAC Financial Group, Inc. | | 1,015,300 | | | | 69,629 |
| American International Group, Inc. | | 3,627,390 | | | | 214,738 |
| Hartford Financial Services Group, Inc. | | 484,880 | | | | 35,420 |
| W.R. Berkley Corp. | | 1,252,950 | | | | 44,467 |
| XL Capital Ltd. Class A | | 1,113,655 | | | | 77,399 |
| | | | | | | 519,088 |
| |
| TOTAL FINANCIALS | | | | | | 810,436 |
See accompanying notes which are an integral part of the financial statements.
11 Annual Report
| Investments continued | | | | | | |
| |
| |
| Common Stocks continued | | | | | | |
| | | Shares | | Value (Note 1) |
| | | | | | | (000s) |
| |
| HEALTH CARE – 7.5% | | | | | | |
| Biotechnology – 0.9% | | | | | | |
| Cephalon, Inc. (a) | | 737,600 | | $ | | 29,888 |
| Health Care Equipment & Supplies – 0.8% | | | | | | |
| Waters Corp. (a) | | 532,300 | | | | 24,204 |
| Health Care Providers & Services – 2.8% | | | | | | |
| Pediatrix Medical Group, Inc. (a) | | 64,990 | | | | 4,818 |
| UnitedHealth Group, Inc. | | 1,596,960 | | | | 82,243 |
| | | | | | | 87,061 |
| Pharmaceuticals – 3.0% | | | | | | |
| Allergan, Inc. | | 222,050 | | | | 20,440 |
| Roche Holding AG (participation certificate) | | 303,475 | | | | 41,914 |
| Teva Pharmaceutical Industries Ltd. sponsored ADR | | 952,600 | | | | 30,902 |
| | | | | | | 93,256 |
| |
| TOTAL HEALTH CARE | | | | | | 234,409 |
| |
| INDUSTRIALS – 14.4% | | | | | | |
| Aerospace & Defense – 2.0% | | | | | | |
| Honeywell International, Inc. | | 1,605,950 | | | | 61,476 |
| Commercial Services & Supplies – 3.0%�� | | | | | | |
| Robert Half International, Inc. | | 2,845,240 | | | | 95,828 |
| Construction & Engineering – 0.8% | | | | | | |
| Chicago Bridge & Iron Co. NV (NY Shares) | | 372,500 | | | | 11,555 |
| Fluor Corp. | | 241,310 | | | | 14,940 |
| | | | | | | 26,495 |
| Industrial Conglomerates – 6.6% | | | | | | |
| General Electric Co. | | 5,078,400 | | | | 170,685 |
| Tyco International Ltd. | | 1,322,400 | | | | 36,802 |
| | | | | | | 207,487 |
| Road & Rail 2.0% | | | | | | |
| Burlington Northern Santa Fe Corp. | | 462,100 | | | | 24,501 |
| Norfolk Southern Corp. | | 1,036,600 | | | | 36,913 |
| | | | | | | 61,414 |
| |
| TOTAL INDUSTRIALS | | | | | | 452,700 |
| |
| INFORMATION TECHNOLOGY – 16.9% | | | | | | |
| Communications Equipment – 0.4% | | | | | | |
| Juniper Networks, Inc. (a) | | 577,100 | | | | 13,123 |
See accompanying notes which are an integral part of the financial statements.
| Common Stocks continued | | | | | | |
| | | Shares | | Value (Note 1) |
| | | | | | | (000s) |
| |
| INFORMATION TECHNOLOGY – continued | | | | | | |
| Computers & Peripherals – 2.5% | | | | | | |
| Dell, Inc. (a) | | 2,224,885 | | $ | | 79,206 |
| Electronic Equipment & Instruments – 1.7% | | | | | | |
| Amphenol Corp. Class A | | 326,000 | | | | 13,826 |
| CDW Corp. | | 282,640 | | | | 16,698 |
| National Instruments Corp. | | 797,950 | | | | 22,654 |
| | | | | | | 53,178 |
| Internet Software & Services – 3.9% | | | | | | |
| Google, Inc. Class A (sub. vtg.) | | 266,720 | | | | 76,282 |
| Yahoo!, Inc. (a) | | 1,334,300 | | | | 44,486 |
| | | | | | | 120,768 |
| IT Services – 0.5% | | | | | | |
| Affiliated Computer Services, Inc. Class A (a) | | 323,500 | | | | 16,806 |
| Office Electronics – 0.6% | | | | | | |
| Zebra Technologies Corp. Class A (a) | | 489,500 | | | | 18,288 |
| Semiconductors & Semiconductor Equipment – 2.9% | | | | | | |
| ARM Holdings PLC sponsored ADR (d) | | 3,356,769 | | | | 21,181 |
| FormFactor, Inc. (a) | | 383,200 | | | | 10,412 |
| Intel Corp. | | 2,358,600 | | | | 60,663 |
| | | | | | | 92,256 |
| Software 4.4% | | | | | | |
| Microsoft Corp. | | 4,363,170 | | | | 119,551 |
| Symantec Corp. (a) | | 869,400 | | | | 18,240 |
| | | | | | | 137,791 |
| |
| TOTAL INFORMATION TECHNOLOGY | | | | | | 531,416 |
| |
| TELECOMMUNICATION SERVICES – 1.5% | | | | | | |
| Diversified Telecommunication Services – 1.5% | | | | | | |
| SBC Communications, Inc. | | 1,963,900 | | | | 47,291 |
| TOTAL COMMON STOCKS | | | | | | |
| (Cost $2,778,948) | | | | | | 3,091,781 |
See accompanying notes which are an integral part of the financial statements.
13 Annual Report
| Investments continued | | | | | | |
| |
| Money Market Funds 2.1% | | | | | | |
| | | Shares | | Value (Note 1) |
| | | | | | | (000s) |
| Fidelity Cash Central Fund, 3.6% (b) | | 66,206,153 | | $ | | 66,206 |
| Fidelity Securities Lending Cash Central Fund, 3.61% (b)(c) | | 198,250 | | | | 198 |
| TOTAL MONEY MARKET FUNDS | | | | | | |
| (Cost $66,404) | | | | | | 66,404 |
| |
| TOTAL INVESTMENT PORTFOLIO 100.5% | | | | | | |
| (Cost $2,845,352) | | | | | | 3,158,185 |
| |
| NET OTHER ASSETS – (0.5)% | | | | | | (14,286) |
| NET ASSETS 100% | | | | $ | | 3,143,899 |
Legend
(a) Non-income producing
(b) Affiliated fund that is available only to investment companies and other accounts managed by Fidelity Investments. The rate quoted is the annualized seven-day yield of the fund at period end. A complete listing of the fund’s holdings as of its most recent quarter end is available upon request. (c) Investment made with cash collateral received from securities on loan. (d) Security or a portion of the security is on loan at period end.
| Distribution of investments by country of |
| issue, as a percentage of total net assets, is |
| as follows: | | |
| United States of America | | 88.5% |
| Switzerland | | 3.5% |
| Bermuda | | 2.5% |
| France | | 1.2% |
| United Kingdom | | 1.1% |
| Netherlands Antilles | | 1.0% |
| Israel | | 1.0% |
| Others (individually less than 1%) . | | 1.2% |
| | | 100.0% |
See accompanying notes which are an integral part of the financial statements.
Annual Report
| Financial Statements | | | | | | |
| |
| |
| Statement of Assets and Liabilities | | | | | | |
| Amounts in thousands (except per share amount) | | | | | | August 31, 2005 |
| |
| Assets | | | | | | | | |
| Investment in securities, at value (including securities | | | | | | |
| loaned of $192) (cost $2,845,352) | | | | | | | | |
| See accompanying schedule | | | | | | $ | | 3,158,185 |
| Receivable for investments sold | | | | | | | | 14,965 |
| Receivable for fund shares sold | | | | | | | | 8,882 |
| Dividends receivable | | | | | | | | 4,081 |
| Interest receivable | | | | | | | | 142 |
| Prepaid expenses | | | | | | | | 1 |
| Other receivables | | | | | | | | 80 |
| Total assets | | | | | | | | 3,186,336 |
| |
| Liabilities | | | | | | | | |
| Payable for investments purchased | | $ | | 36,714 | | | | |
| Payable for fund shares redeemed | | | | 3,132 | | | | |
| Accrued management fee | | | | 1,467 | | | | |
| Other affiliated payables | | | | 616 | | | | |
| Other payables and accrued expenses | | | | 310 | | | | |
| Collateral on securities loaned, at value | | | | 198 | | | | |
| Total liabilities | | | | | | | | 42,437 |
| |
| Net Assets | | | | | | $ | | 3,143,899 |
| Net Assets consist of: | | | | | | | | |
| Paid in capital | | | | | | $ | | 2,733,266 |
| Undistributed net investment income | | | | | | | | 5,250 |
| Accumulated undistributed net realized gain (loss) on | | | | | | |
| investments and foreign currency transactions | | | | | | 92,553 |
| Net unrealized appreciation (depreciation) on | | | | | | |
| investments and assets and liabilities in foreign | | | | | | |
| currencies | | | | | | | | 312,830 |
| Net Assets, for 150,065 shares outstanding | | | | $ | | 3,143,899 |
| Net Asset Value, offering price and redemption price per | | | | | | |
| share ($3,143,899 ÷ 150,065 shares) | | | | $ | | 20.95 |
See accompanying notes which are an integral part of the financial statements.
15 Annual Report
| Financial Statements continued | | | | |
| |
| |
| Statement of Operations | | | | | | |
| Amounts in thousands | | | | Year ended August 31, 2005 |
| |
| Investment Income | | | | | | |
| Dividends | | | | $ | | 22,434 |
| Special Dividends | | | | | | 7,337 |
| Interest | | | | | | 924 |
| Security lending | | | | | | 121 |
| Total income | | | | | | 30,816 |
| |
| Expenses | | | | | | |
| Management fee | | $ | | 12,123 | | |
| Transfer agent fees | | | | 4,831 | | |
| Accounting and security lending fees | | | | 617 | | |
| Independent trustees’ compensation | | | | 9 | | |
| Custodian fees and expenses | | | | 56 | | |
| Registration fees | | | | 368 | | |
| Audit | | | | 61 | | |
| Legal | | | | 16 | | |
| Miscellaneous | | | | 91 | | |
| Total expenses before reductions | | | | 18,172 | | |
| Expense reductions | | | | (734) | | 17,438 |
| |
| Net investment income (loss) | | | | | | 13,378 |
| Realized and Unrealized Gain (Loss) | | | | |
| Net realized gain (loss) on: | | | | | | |
| Investment securities | | | | 117,751 | | |
| Foreign currency transactions | | | | (232) | | |
| Total net realized gain (loss) | | | | | | 117,519 |
| Change in net unrealized appreciation (depreciation) on: | | | | |
| Investment securities | | | | 231,640 | | |
| Assets and liabilities in foreign currencies | | (3) | | |
| Total change in net unrealized appreciation | | | | |
| (depreciation) | | | | | | 231,637 |
| Net gain (loss) | | | | | | 349,156 |
| Net increase (decrease) in net assets resulting from | | | | |
| operations | | | | $ | | 362,534 |
See accompanying notes which are an integral part of the financial statements.
| Statement of Changes in Net Assets | | | | | | | | |
| | | | | Year ended | | | | Year ended |
| | | | | August 31, | | | | August 31, |
| Amounts in thousands | | | | 2005 | | | | 2004 |
| Increase (Decrease) in Net Assets | | | | | | | | |
| Operations | | | | | | | | |
| Net investment income (loss) | | $ | | 13,378 | | $ | | 1,675 |
| Net realized gain (loss) | | | | 117,519 | | | | 104,951 |
| Change in net unrealized appreciation (depreciation) . | | 231,637 | | | | 7,945 |
| Net increase (decrease) in net assets resulting | | | | | | | | |
| from operations | | | | 362,534 | | | | 114,571 |
| Distributions to shareholders from net investment income | | . | | (8,330) | | | | (3,865) |
| Distributions to shareholders from net realized gain | | | | (59,902) | | | | — |
| Total distributions | | | | (68,232) | | | | (3,865) |
| Share transactions | | | | | | | | |
| Proceeds from sales of shares | | | | 2,038,629 | | | | 540,782 |
| Reinvestment of distributions | | | | 65,863 | | | | 3,734 |
| Cost of shares redeemed | | | | (516,105) | | | | (266,094) |
| Net increase (decrease) in net assets resulting from | | | | | | | | |
| share transactions | | | | 1,588,387 | | | | 278,422 |
| Redemption fees | | | | 80 | | | | 66 |
| Total increase (decrease) in net assets | | | | 1,882,769 | | | | 389,194 |
| |
| Net Assets | | | | | | | | |
| Beginning of period | | | | 1,261,130 | | | | 871,936 |
| End of period (including undistributed net investment | | | | | | | | |
| income of $5,250 and undistributed net investment | | | | | | | | |
| income of $411, respectively) | | $ | | 3,143,899 | | $ | | 1,261,130 |
| |
| Other Information | | | | | | | | |
| Shares | | | | | | | | |
| Sold | | | | 103,832 | | | | 29,976 |
| Issued in reinvestment of distributions | | | | 3,515 | | | | 220 |
| Redeemed | | | | (26,307) | | | | (14,906) |
| Net increase (decrease) | | | | 81,040 | | | | 15,290 |
See accompanying notes which are an integral part of the financial statements.
17 Annual Report
| Financial Highlights | | | | | | | | | | | | | | | | | | | | |
| |
| Years ended August 31, | | | | 2005 | | | | 2004 | | | | 2003 | | | | 2002 | | | | 2001 |
| Selected Per Share Data | | | | | | | | | | | | | | | | | | | | |
| Net asset value, | | | | | | | | | | | | | | | | | | | | |
| beginning of period | | $ | | 18.27 | | $ | | 16.23 | | $ | | 13.59 | | $ | | 16.39 | | $ | | 23.45 |
| Income from Investment Operations | | | | | | | | | | | | | | | | | | | | |
| Net investment income (loss)B | | | | 12C | | | | .03 | | | | .09 | | | | .03 | | | | .04 |
| Net realized and unrealized | | | | | | | | | | | | | | | | | | | | |
| gain (loss) | | | | 3.49 | | | | 2.08 | | | | 2.60 | | | | (2.80) | | | | (1.79) |
| Total from investment operations . | | | | 3.61 | | | | 2.11 | | | | 2.69 | | | | (2.77) | | | | (1.75) |
| Distributions from net investment | | | | | | | | | | | | | | | | | | | | |
| income | | | | (.11) | | | | (.07) | | | | (.05) | | | | (.03) | | | | (.10) |
| Distributions from net realized gain | | | | (.82) | | | | — | | | | — | | | | | | | | (5.21) |
| Total distributions | | | | (.93) | | | | (.07) | | | | (.05) | | | | (.03) | | | | (5.31) |
| Redemption fees added to paid | | | | | | | | | | | | | | | | | | | | |
| in capitalB,E | | | | — | | | | — | | | | — | | | | — | | | | — |
| Net asset value, | | | | | | | | | | | | | | | | | | | | |
| end of period | | $ | | 20.95 | | $ | | 18.27 | | $ | | 16.23 | | $ | | 13.59 | | $ | | 16.39 |
| Total ReturnA | | | | 20.43% | | | | 13.03% | | | | 19.88% | | | | (16.93)% | | | | (7.69)% |
| Ratios to Average Net AssetsD | | | | | | | | | | | | | | | | | | | | |
| Expenses before expense | | | | | | | | | | | | | | | | | | | | |
| reductions | | | | 85% | | | | .86% | | | | .91% | | | | .89% | | | | .86% |
| Expenses net of voluntary | | | | | | | | | | | | | | | | | | | | |
| waivers, if any | | | | 85% | | | | .86% | | | | .91% | | | | .89% | | | | .86% |
| Expenses net of all reductions | | | | 82% | | | | .83% | | | | .84% | | | | .78% | | | | .81% |
| Net investment income (loss) | | | | 63% | | | | .15% | | | | .60% | | | | .19% | | | | .21% |
| Supplemental Data | | | | | | | | | | | | | | | | | | | | |
| Net assets, end of period | | | | | | | | | | | | | | | | | | | | |
| (in millions) | | $ | | 3,144 | | $ | | 1,261 | | $ | | 872 | | $ | | 603 | | $ | | 565 |
| Portfolio turnover rate | | | | 68% | | | | 96% | | | | 139% | | | | 228% | | | | 170% |
A Total returns would have been lower had certain expenses not been reduced during the periods shown.
B Calculated based on average shares outstanding during the period.
C Investment income per share reflects a special dividend which amounted to $.07 per share. Excluding the special dividend, the ratio of net
investment income to average net assets would have been .28%.
D Expense ratios reflect operating expenses of the fund. Expenses before reductions do not reflect amounts reimbursed by the investment adviser or
reductions from brokerage service arrangements or other expense offset arrangements and do not represent the amount paid by the fund during
periods when reimbursements or reductions occur. Expenses net of any voluntary waivers reflect expenses after reimbursement by the investment
adviser but prior to reductions from brokerage service arrangements or other expense offset arrangements. Expenses net of all reductions represent
the net expenses paid by the fund.
E Amount represents less than $.01 per share.
|
See accompanying notes which are an integral part of the financial statements.
Notes to Financial Statements
For the period ended August 31, 2005
(Amounts in thousands except ratios)
|
1. Significant Accounting Policies.
Fidelity Export and Multinational Fund (the fund) is a non diversified fund of Fidelity Union Street Trust (the trust) and is authorized to issue an unlimited number of shares. The trust is registered under the Investment Company Act of 1940, as amended (the 1940 Act), as an open end management investment company organized as a Massachusetts business trust. The financial statements have been prepared in conformity with account ing principles generally accepted in the United States of America, which require management to make certain estimates and assumptions at the date of the financial statements. The following summarizes the significant accounting policies of the fund:
Security Valuation. Net asset value per share (NAV calculation) is calculated as of the close of business of the New York Stock Exchange, normally 4:00 p.m. Eastern time. Equity securities, including restricted securities, for which market quotations are available are valued at the last sale price or official closing price (closing bid price or last evaluated quote if no sale has occurred) on the primary market or exchange on which they trade. If prices are not readily available or do not accurately reflect fair value for a security, or if a security’s value has been materially affected by events occurring after the close of the exchange or market on which the security is principally traded, that security may be valued by another method that the Board of Trustees believes accurately reflects fair value. A security’s valuation may differ depending on the method used for determin ing value. Price movements in futures contracts and ADRs, market and trading trends, the bid/ask quotes of brokers and off exchange institutional trading may be reviewed in the course of making a good faith determination of a security’s fair value. Short term securities with remaining maturities of sixty days or less for which quotations are not readily available are valued on the basis of amortized cost. Investments in open end investment companies are valued at their net asset value each business day.
Foreign Currency. The fund uses foreign currency contracts to facilitate transactions in foreign denominated securities. Losses from these transactions may arise from changes in the value of the foreign currency or if the counterparties do not perform under the contracts’ terms.
Foreign denominated assets, including investment securities, and liabilities are trans lated into U.S. dollars at the exchange rate at period end. Purchases and sales of invest ment securities, income and dividends received and expenses denominated in foreign currencies are translated into U.S. dollars at the exchange rate in effect on the trans action date.
The effects of exchange rate fluctuations on investments are included with the net realized and unrealized gain (loss) on investment securities. Other foreign currency transactions resulting in realized and unrealized gain (loss) are disclosed separately.
19 Annual Report
Notes to Financial Statements continued
(Amounts in thousands except ratios)
1. Significant Accounting Policies continued
|
Investment Transactions and Income. Security transactions are accounted for as of trade date. Gains and losses on securities sold are determined on the basis of identified cost and may include proceeds received from litigation. Dividend income is recorded on the ex dividend date, except for certain dividends from foreign securities where the ex dividend date may have passed, which are recorded as soon as the fund is informed of the ex dividend date. Non cash dividends included in dividend income, if any, are recorded at the fair market value of the securities received. Distributions received on securities that represent a return of capital or capital gain are recorded as a reduction of cost of investments and/or as a realized gain. The fund estimates the components of distributions received that may be considered return of capital distributions or capital gain distributions. Large, non recurring dividends recognized by the fund are presented separately on the Statement of Operations as “Special Dividends” and the impact of these dividends is presented in the Financial Highlights. Interest income is accrued as earned. Interest income includes coupon interest and amortization of premium and accretion of discount on debt securities. Investment income is recorded net of foreign taxes withheld where recovery of such taxes is uncertain.
Expenses. Most expenses of the trust can be directly attributed to a fund. Expenses which cannot be directly attributed are apportioned among each fund in the trust.
Income Tax Information and Distributions to Shareholders. Each year, the fund intends to qualify as a regulated investment company by distributing all of its taxable income and realized gains under Subchapter M of the Internal Revenue Code. As a result, no provision for income taxes is required in the accompanying financial statements. Foreign taxes are provided for based on the fund’s understanding of the tax rules and rates that exist in the foreign markets in which it invests.
Distributions are recorded on the ex dividend date. Income and capital gain distribu tions are determined in accordance with income tax regulations, which may differ from generally accepted accounting principles. In addition, the fund will claim a portion of the payment made to redeeming shareholders as a distribution for income tax purposes. Capital accounts within the financial statements are adjusted for permanent book tax differences. These adjustments have no impact on net assets or the results of operations. Temporary book tax differences will reverse in a subsequent period.
Book tax differences are primarily due to foreign currency transactions and losses deferred due to wash sales.
1. Significant Accounting Policies continued
Income Tax Information and Distributions to Shareholders continued
|
The tax basis components of distributable earnings and the federal tax cost as of period end were as follows:
| Unrealized appreciation | | $ | | 384,211 | | | | |
| Unrealized depreciation | | | | (77,479) | | | | |
| Net unrealized appreciation (depreciation) | | | | 306,732 | | | | |
| Undistributed ordinary income | | | | 39,131 | | | | |
| Undistributed long term capital gain | | | | 56,614 | | | | |
| |
| Cost for federal income tax purposes | | $ | | 2,851,453 | | | | |
| |
| The tax character of distributions paid was as follows: | | | | |
| |
| | | | | August 31, 2005 | | | | August 31, 2004 |
| Ordinary Income | | $ | | 25,563 | | $ | | 3,865 |
| Long term Capital Gains | | | | 42,669 | | | | — |
| Total | | $ | | 68,232 | | $ | | 3,865 |
Short Term Trading (Redemption) Fees. Shares held in the fund less than 30 days are subject to a redemption fee equal to .75% of the proceeds of the redeemed shares. All redemption fees, including any estimated redemption fees paid by Fidelity Management & Research Company (FMR), are retained by the fund and accounted for as an addition to paid in capital.
Repurchase Agreements. FMR has received an Exemptive Order from the Securities and Exchange Commission (the SEC) which permits the fund and other affiliated entities of FMR to transfer uninvested cash balances into joint trading accounts which are then invested in repurchase agreements. The fund may also invest directly with institutions in repurchase agreements. Repurchase agreements are collateralized by government or non government securities. Collateral is held in segregated accounts with custodian banks and may be obtained in the event of a default of the counterparty. The fund monitors, on a daily basis, the value of the collateral to ensure it is at least equal to the principal amount of the repurchase agreement (including accrued interest). In the event of a default by the counterparty, realization of the collateral proceeds could be delayed, during which time the value of the collateral may decline.
3. Purchases and Sales of Investments.
Purchases and sales of securities, other than short term securities and U.S. government securities, aggregated $2,906,882 and $1,415,587, respectively.
21 Annual Report
Notes to Financial Statements continued
(Amounts in thousands except ratios)
4. Fees and Other Transactions with Affiliates.
Management Fee. FMR and its affiliates provide the fund with investment manage ment related services for which the fund pays a monthly management fee. The manage ment fee is the sum of an individual fund fee rate that is based on an annual rate of .30% of the fund’s average net assets and a group fee rate that averaged .27% during the period. The group fee rate is based upon the average net assets of all the mutual funds advised by FMR. The group fee rate decreases as assets under management increase and increases as assets under management decrease. For the period, the total annual man agement fee rate was .57% of the fund’s average net assets.
Transfer Agent Fees. Fidelity Service Company, Inc. (FSC), an affiliate of FMR, is the fund’s transfer, dividend disbursing and shareholder servicing agent. FSC receives account fees and asset based fees that vary according to account size and type of ac count. FSC pays for typesetting, printing and mailing of shareholder reports, except proxy statements. For the period, the transfer agent fees were equivalent to an annual rate of .23% of average net assets.
Accounting and Security Lending Fees. FSC maintains the fund’s accounting re cords. The accounting fee is based on the level of average net assets for the month. Under a separate contract, FSC administers the security lending program. The security lending fee is based on the number and duration of lending transactions.
Affiliated Central Funds. The fund may invest in Money Market Central Funds which seek preservation of capital and current income and are managed by Fidelity Invest ments Money Management, Inc. (FIMM) an affiliate of FMR.
The Money Market Central Funds do not pay a management fee. Income distributions earned by the fund are recorded as income in the accompanying financial statements and totaled $1,034 for the period.
Brokerage Commissions. The fund placed a portion of its portfolio transactions with brokerage firms which are affiliates of the investment adviser. The commissions paid to these affiliated firms were $65 for the period.
5. Committed Line of Credit.
|
The fund participates with other funds managed by FMR in a $4.2 billion credit facility (the “line of credit”) to be utilized for temporary or emergency purposes to fund share holder redemptions or for other short term liquidity purposes. The fund has agreed to pay commitment fees on its pro rata portion of the line of credit. During the period, there were no borrowings on this line of credit.
The fund lends portfolio securities from time to time in order to earn additional income. The fund receives collateral (in the form of U.S. Treasury obligations, letters of credit and/or cash) against the loaned securities and maintains collateral in an amount not less than 100% of the market value of the loaned securities during the period of the loan. The market value of the loaned securities is determined at the close of business of the fund and any additional required collateral is delivered to the fund on the next business day. If the borrower defaults on its obligation to return the securities loaned because of insolvency or other reasons, a fund could experience delays and costs in recovering the securities loaned or in gaining access to the collateral. Cash collateral is invested in the Fidelity Securities Lending Cash Central Fund. The value of loaned securities and cash collateral at period end are disclosed on the fund’s Statement of Assets and Liabilities.
Many of the brokers with whom FMR places trades on behalf of the fund provided services to the fund in addition to trade execution. These services included payments of certain expenses on behalf of the fund totaling $715 for the period. In addition, through arrangements with the fund’s custodian and transfer agent, credits realized as a result of uninvested cash balances were used to reduce the fund’s expenses. During the period, these credits reduced the fund’s custody and transfer agent expenses by $1 and $18, respectively.
The fund’s organizational documents provide former and current trustees and officers with a limited indemnification against liabilities arising in connection with the perfor mance of their duties to the fund. In the normal course of business, the fund may also enter into contracts that provide general indemnifications. The fund’s maximum exposure under these arrangements is unknown as this would be dependent on future claims that may be made against the fund. The risk of material loss from such claims is considered remote.
23 Annual Report
Report of Independent Registered Public Accounting Firm
To the Trustees of Fidelity Union Street Trust and the Shareholders of Fidelity Export and Multinational Fund:
In our opinion, the accompanying statement of assets and liabilities, including the sched ule of investments, and the related statements of operations and of changes in net assets and the financial highlights present fairly, in all material respects, the financial position of Fidelity Export and Multinational Fund (a fund of Fidelity Union Street Trust) at August 31, 2005 and the results of its operations, the changes in its net assets and the financial highlights for the periods indicated, in conformity with accounting principles generally accepted in the United States of America. These financial statements and financial highlights (hereafter referred to as “financial statements”) are the responsibility of the Fidelity Export and Multinational Fund’s management; our responsibility is to express an opinion on these financial statements based on our audits. We conducted our audits of these financial statements in accordance with the standards of the Public Company Accounting Oversight Board (United States). Those standards require that we plan and perform the audit to obtain reasonable assurance about whether the financial statements are free of material misstatement. An audit includes examining, on a test basis, evidence supporting the amounts and disclosures in the financial statements, assessing the accounting principles used and significant estimates made by management, and evaluating the overall financial statement presentation. We believe that our audits, which included confirmation of securities at August 31, 2005 by correspondence with the custo dian and brokers, provide a reasonable basis for our opinion.
/s/ PricewaterhouseCoopers LLP
PricewaterhouseCoopers LLP
Boston, Massachusetts
October 10, 2005
|
Trustees and Officers
The Trustees, Members of the Advisory Board, and executive officers of the trust and fund, as applicable, are listed below. The Board of Trustees governs the fund and is responsible for protecting the interests of shareholders. The Trustees are experienced executives who meet periodically throughout the year to oversee the fund’s activities, review contractual arrangements with companies that provide services to the fund, and review the fund’s performance. Except for William O. McCoy, Stephen P. Jonas, and Kenneth L. Wolfe, each of the Trustees oversees 321 funds advised by FMR or an affiliate. Mr. McCoy oversees 323 funds advised by FMR or an affiliate. Mr. Jonas and Mr. Wolfe oversee 312 funds advised by FMR or an affiliate.
The Trustees hold office without limit in time except that (a) any Trustee may resign; (b) any Trustee may be removed by written instrument, signed by at least two thirds of the number of Trustees prior to such removal; (c) any Trustee who requests to be retired or who has become incapacitated by illness or injury may be retired by written instru ment signed by a majority of the other Trustees; and (d) any Trustee may be removed at any special meeting of shareholders by a two thirds vote of the outstanding voting securities of the trust. Each Trustee who is not an interested person (as defined in the 1940 Act) (Independent Trustee), shall retire not later than the last day of the calendar year in which his or her 72nd birthday occurs. The Independent Trustees may waive this mandatory retirement age policy with respect to individual Trustees. The executive officers and Advisory Board Members hold office without limit in time, except that any officer and Advisory Board Member may resign or may be removed by a vote of a majority of the Trustees at any regular meeting or any special meeting of the Trustees. Except as indicated, each individual has held the office shown or other offices in the same company for the past five years.
The fund’s Statement of Additional Information (SAI) includes more information about the Trustees. To request a free copy, call Fidelity at 1-800 544-8544.
Correspondence intended for each Trustee who is an interested person may be sent to Fidelity Investments, 82 Devonshire Street, Boston, Massachusetts 02109.
| | Name, Age; Principal Occupation
Edward C. Johnson 3d (75)**
|
Year of Election or Appointment: 1974
Mr. Johnson is Chairman of the Board of Trustees. Mr. Johnson serves as Chief Executive Officer, Chairman, and a Director of FMR Corp.; a Director and Chairman of the Board and of the Executive Committee of FMR; Chairman and a Director of Fidelity Management & Research (Far East) Inc.; Chairman and a Director of Fidelity Investments Money Management, Inc.; and Chairman (2001 present) and a Director (2000 present) of FMR Co., Inc.
25 Annual Report
Trustees and Officers - continued
| | Name, Age; Principal Occupation
Abigail P. Johnson (43)**
|
Year of Election or Appointment: 2001
Ms. Johnson serves as President of Fidelity Employer Services Company (FESCO) (2005 present). She is President and a Director of Fidelity Investments Money Management, Inc. (2001 present), FMR Co., Inc. (2001 present), and a Director of FMR Corp. Previously, Ms. Johnson served as President and a Director of FMR (2001 2005), Senior Vice President of the Fidelity funds (2001 2005), and managed a number of Fidelity funds.
Year of Election or Appointment: 2005
Mr. Jonas is Senior Vice President of International Discovery (2005 present). He also serves as Senior Vice President of other Fidelity funds (2005 present). Mr. Jonas is Executive Director of FMR (2005 present). Previously, Mr. Jonas served as President of Fidelity Enterprise Operations and Risk Services (2004 2005), Chief Adminis trative Officer (2002 2004), and Chief Financial Officer of FMR Co. (1998 2000). Mr. Jonas has been with Fidelity Investments since 1987 and has held various financial and management positions including Chief Financial Officer of FMR. In addition, he serves on the Boards of Boston Ballet (2003 present) and Simmons College (2003 present).
Year of Election or Appointment: 2003
Mr. Reynolds is a Director (2003 present) and Chief Operating Officer (2002 present) of FMR Corp. He also serves on the Board at Fidelity Investments Canada, Ltd. (2000 present). Previously, Mr. Reynolds served as President of Fidelity Investments Institutional Retirement Group (1996 2000).
* Trustees have been determined to be “Interested Trustees” by virtue of, among other things, their affiliation with the trust or various entities under common control with FMR.
** Edward C. Johnson 3d, Trustee, is Abigail P. Johnson’s father.
Correspondence intended for each Independent Trustee (that is, the Trustees other than the Interested Trustees) may be sent to Fidelity Investments, P.O. Box 55235, Boston, Massachusetts 02205 5235.
| | Name, Age; Principal Occupation
Dennis J. Dirks (57)
|
Year of Election or Appointment: 2005
Prior to his retirement in May 2003, Mr. Dirks was Chief Operating Officer and a member of the Board of The Depository Trust & Clearing Corporation (DTCC) (1999 2003). He also served as President, Chief Operating Officer, and Board member of The Depository Trust Company (DTC) (1999 2003) and President and Board member of the National Securities Clearing Corporation (NSCC) (1999 2003). In addition, Mr. Dirks served as Chief Executive Officer and Board member of the Government Securities Clearing Corporation (2001 2003) and Chief Executive Officer and Board member of the Mortgage Backed Securities Clearing Corporation (2001 2003). Mr. Dirks also serves as a Trustee of Manhattan College (2005 present).
Year of Election or Appointment: 1997
Dr. Gates is Vice Chairman of the Independent Trustees (2005 present). Dr. Gates is President of Texas A&M University (2002 present). He was Director of the Central Intelligence Agency (CIA) from 1991 to 1993. From 1989 to 1991, Dr. Gates served as Assistant to the President of the United States and Deputy National Security Advisor. Dr. Gates is a Director of NACCO Industries, Inc. (mining and manufacturing), Parker Drilling Co., Inc. (drilling and rental tools for the energy industry, 2001 present), and Brinker International (restaurant management, 2003 present). Previously, Dr. Gates served as a Director of LucasVarity PLC (automotive components and diesel engines), a Director of TRW Inc. (automotive, space, defense, and information technology), and Dean of the George Bush School of Government and Public Service at Texas A&M University (1999 2001). Dr. Gates also is a Trustee of the Forum for International Policy.
27 Annual Report
Trustees and Officers - continued
| | Name, Age; Principal Occupation
George H. Heilmeier (69)
|
Year of Election or Appointment: 2004
Dr. Heilmeier is Chairman Emeritus of Telcordia Technologies (commu nication software and systems), where prior to his retirement, he served as company Chairman and Chief Executive Officer. He currently serves on the Boards of Directors of The Mitre Corporation (systems engineer ing and information technology support for the government), and HRL Laboratories (private research and development, 2004 present). He is Chairman of the General Motors Science & Technology Advisory Board and a Life Fellow of the Institute of Electrical and Electronics Engineers (IEEE) (2000 present). Dr. Heilmeier is a member of the Defense Science Board and the National Security Agency Advisory Board. He is also a member of the National Academy of Engineering, the American Acad emy of Arts and Sciences, and the Board of Overseers of the School of Engineering and Applied Science of the University of Pennsylvania. Previously, Dr. Heilmeier served as a Director of TRW Inc. (automotive, space, defense, and information technology, 1992 2002), Compaq (1994 2002), Automatic Data Processing, Inc. (ADP) (technology based business outsourcing, 1995 2002), INET Technologies Inc. (telecommu nications network surveillance, 2001 2004), and Teletech Holdings (customer management services). He is the recipient of the 2005 Kyoto Prize in Advanced Technology for his invention of the liquid display.
Year of Election or Appointment: 2001
Prior to Ms. Knowles’ retirement in June 2000, she served as Executive Vice President and Chief Financial Officer of Atlantic Richfield Company (ARCO) (diversified energy, 1996 2000). From 1993 to 1996, she was a Senior Vice President of ARCO and President of ARCO Transportation Company. She served as a Director of ARCO from 1996 to 1998. She currently serves as a Director of Phelps Dodge Corporation (copper mining and manufacturing) and McKesson Corporation (healthcare service, 2002 present). Ms. Knowles is a Trustee of the Brookings Institu tion and the Catalina Island Conservancy and also serves as a member of the Advisory Board for the School of Engineering of the University of Southern California.
Name, Age; Principal Occupation
Ned C. Lautenbach (61)
|
Year of Election or Appointment: 2000
Mr. Lautenbach has been a partner of Clayton, Dubilier & Rice, Inc. (private equity investment firm) since September 1998. Previously, Mr. Lautenbach was with the International Business Machines Corpora tion (IBM) from 1968 until his retirement in 1998. Mr. Lautenbach serves as a Director of Italtel Holding S.p.A. (telecommunications (Milan, Italy), 2004 present) and Eaton Corporation (diversified industrial) as well as the Philharmonic Center for the Arts in Naples, Florida. He also is a member of the Board of Trustees of Fairfield University (2005 present), as well as a member of the Council on Foreign Relations.
Year of Election or Appointment: 1993
Mr. Mann is Chairman of the Independent Trustees (2001 present). He is Chairman Emeritus of Lexmark International, Inc. (computer peripherals), where he served as CEO until April 1998, retired as Chairman May 1999, and remains a member of the Board. Prior to 1991, he held the positions of Vice President of International Business Machines Corpora tion (IBM) and President and General Manager of various IBM divisions and subsidiaries. He is a member of the Executive Committee of the Independent Director’s Council of the Investment Company Institute. In addition, Mr. Mann is a member of the President’s Cabinet at the Uni versity of Alabama and the Board of Visitors of the Culverhouse College of Commerce and Business Administration at the University of Alabama.
Year of Election or Appointment: 1997
Prior to his retirement in December 1994, Mr. McCoy was Vice Chair man of the Board of BellSouth Corporation (telecommunications) and President of BellSouth Enterprises. He is currently a Director of Liberty Corporation (holding company), Duke Realty Corporation (real estate), and Progress Energy, Inc. (electric utility). He is also a partner of Frank lin Street Partners (private investment management firm) and a member of the Research Triangle Foundation Board. In addition, Mr. McCoy served as the Interim Chancellor (1999 2000) and a member of the Board of Visitors for the University of North Carolina at Chapel Hill and currently serves on the Board of Directors of the University of North Carolina Health Care System and the Board of Visitors of the Kenan Flagler Business School (University of North Carolina at Chapel Hill). He also served as Vice President of Finance for the University of North Carolina (16 school system).
29 Annual Report
Trustees and Officers - continued
| | Name, Age; Principal Occupation
Cornelia M. Small (61)
|
Year of Election or Appointment: 2005
Ms. Small is a member (2000 present) and Chairperson (2002 present) of the Investment Committee, and a member (2002 present) of the Board of Trustees of Smith College. Previously, she served as Chief Investment Officer (1999 2000), Director of Global Equity Investments (1996 1999), and a member of the Board of Directors of Scudder, Stevens & Clark (1990 1997) and Scudder Kemper Investments (1997 1998). In addition, Ms. Small served as Co Chair (2000 2003) of the Annual Fund for the Fletcher School of Law and Diplomacy.
| | William S. Stavropoulos (66)
|
Year of Election or Appointment: 2001
Mr. Stavropoulos is Chairman of the Board (2000 present) and a Member of the Board of Directors of The Dow Chemical Company. Since joining The Dow Chemical Company in 1967, Mr. Stavropoulos served in numerous senior management positions, including President (1993 2000; 2002 2003), CEO (1995 2000; 2000 2004), and Chair man of the Executive Committee (2000 2004). Currently, he is a Direc tor of NCR Corporation (data warehousing and technology solutions), BellSouth Corporation (telecommunications), Chemical Financial Corpo ration, Maersk Inc. (industrial conglomerate, 2002 present), and Metal mark Capital (private equity investment firm, 2005 present). He also serves as a member of the Board of Trustees of the American Enterprise Institute for Public Policy Research. In addition, Mr. Stavropoulos is a member of The Business Council, J.P. Morgan International Council and the University of Notre Dame Advisory Council for the College of Science.
Year of Election or Appointment: 2005
Mr. Wolfe also serves as a Trustee (2005 present) or Member of the Advisory Board (2004 present) of other investment companies advised by FMR. Prior to his retirement in 2001, Mr. Wolfe was Chairman and Chief Executive Officer of Hershey Foods Corporation (1993 2001). He currently serves as a member of the boards of Adelphia Communica tions Corporation (2003 present), Bausch & Lomb, Inc., and Revlon Inc. (2004 present).
Advisory Board Members and Executive Officers:
Correspondence intended for Mr. Gamper may be sent to Fidelity Investments, P.O. Box 55235, Boston, Massachusetts 02205 5235. Correspondence intended for each executive officer and Mr. Lynch may be sent to Fidelity Investments, 82 Devonshire Street, Boston, Massachusetts 02109.
| | Name, Age; Principal Occupation
Albert R. Gamper, Jr. (63)
|
Year of Election or Appointment: 2005
Member of the Advisory Board of Fidelity Union Street Trust. Prior to his retirement in December 2004, Mr. Gamper served as Chairman of the Board of CIT Group Inc. (commercial finance). During his tenure with CIT Group Inc. Mr. Gamper served in numerous senior management positions, including Chairman (1987 1989; 1999 2001; 2002 2004), Chief Executive Officer (1987 2004), and President (1989 2002). He currently serves as a member of the Board of Directors of Public Service Enterprise Group (utilities, 2001 present), Chairman of the Board of Governors, Rutgers University (2004 present), and Chairman of the Board of Saint Barnabas Health Care System.
Year of Election or Appointment: 2003
Member of the Advisory Board of Fidelity Union Street Trust. Vice Chairman and a Director of FMR, and Vice Chairman (2001 present) and a Director (2000 present) of FMR Co., Inc. Previously, Mr. Lynch served as a Trustee of the Fidelity funds (1990 2003). In addition, he serves as a Trustee of Boston College, Massachusetts Eye & Ear Infirmary, Historic Deerfield, John F. Kennedy Library, and the Museum of Fine Arts of Boston.
Year of Election or Appointment: 2005
Vice President of Export and Multinational. Mr. Churchill also serves as Vice President of certain Equity funds (2005 present) and certain High Income Funds (2005 present). Previously, he served as Head of Fidelity’s Fixed Income Division (2000 2005), Vice President of Fidelity’s Money Market Funds (2000 2005), Vice President of Fidelity’s Bond Funds, and Senior Vice President of FIMM (2000) and FMR. Mr. Churchill joined Fidelity in 1993 as Vice President and Group Leader of Taxable Fixed Income Investments.
Year of Election or Appointment: 2002
Vice President of Export and Multinational. Prior to assuming his current responsibilities, Mr. Cohen managed a variety of Fidelity funds. Mr. Cohen also serves as Vice President of FMR (2003) and FMR Co., Inc. (2003).
31 Annual Report
Trustees and Officers - continued
| | Name, Age; Principal Occupation
Eric D. Roiter (56)
|
Year of Election or Appointment: 1998
Secretary of Export and Multinational. He also serves as Secretary of other Fidelity funds; Vice President, General Counsel, and Secretary of FMR Co., Inc. (2001 present) and FMR; Assistant Secretary of Fidelity Management & Research (U.K.) Inc. (2001 present), Fidelity Manage ment & Research (Far East) Inc. (2001 present), and Fidelity Investments Money Management, Inc. (2001 present). Mr. Roiter is an Adjunct Member, Faculty of Law, at Boston College Law School (2003 present). Previously, Mr. Roiter served as Vice President and Secretary of Fidelity Distributors Corporation (FDC) (1998 2005).
Year of Election or Appointment: 2003
Assistant Secretary of Export and Multinational. Mr. Fross also serves as Assistant Secretary of other Fidelity funds (2003 present), Vice President and Secretary of FDC (2005 present), and is an employee of FMR.
Year of Election or Appointment: 2004
President, Treasurer, and Anti Money Laundering (AML) officer of Export and Multinational. Ms. Reynolds also serves as President, Treasurer, and AML officer of other Fidelity funds (2004) and is a Vice President (2003) and an employee (2002) of FMR. Before joining Fidelity Investments, Ms. Reynolds worked at PricewaterhouseCoopers LLP (PwC) (1980 2002), where she was most recently an audit partner with PwC’s investment management practice.
Year of Election or Appointment: 2002
Chief Financial Officer of Export and Multinational. Mr. Hayes also serves as Chief Financial Officer of other Fidelity funds (2002 present) and President of Fidelity Investment Operations (2005 present) which includes Fidelity Pricing and Cash Management Services Group (FPCMS), where he served as President (1998 2005). Mr. Hayes serves as President of Fidelity Service Company (2003 present) where he also serves as a Director. Mr. Hayes also served as President of Fidelity Investments Operations Group (FIOG, 2002 2005).
Name, Age; Principal Occupation
Kenneth A. Rathgeber (58)
|
Year of Election or Appointment: 2004
Chief Compliance Officer of Export and Multinational. Mr. Rathgeber also serves as Chief Compliance Officer of other Fidelity funds (2004) and Executive Vice President of Risk Oversight for Fidelity Investments (2002). Previously, he served as Executive Vice President and Chief Operating Officer for Fidelity Investments Institutional Services Company, Inc. (1998 2002).
Year of Election or Appointment: 2003
Deputy Treasurer of Export and Multinational. Mr. Hebble also serves as Deputy Treasurer of other Fidelity funds (2003), and is an employee of FMR. Before joining Fidelity Investments, Mr. Hebble worked at Deutsche Asset Management where he served as Director of Fund Accounting (2002 2003) and Assistant Treasurer of the Scudder Funds (1998 2003).
Year of Election or Appointment: 2005
Deputy Treasurer of Export and Multinational. Mr. Mehrmann also serves as Deputy Treasurer of other Fidelity funds (2005 present) and is an employee of FMR. Previously, Mr. Mehrmann served as Vice Presi dent of Fidelity Investments Institutional Services Group (FIIS)/Fidelity Investments Institutional Operations Corporation, Inc. (FIIOC) Client Services (1998 2004).
Kimberley H. Monasterio (41)
|
Year of Election or Appointment: 2004
Deputy Treasurer of Export and Multinational. Ms. Monasterio also serves as Deputy Treasurer of other Fidelity funds (2004) and is an employee of FMR (2004). Before joining Fidelity Investments, Ms. Monasterio served as Treasurer (2000 2004) and Chief Financial Officer (2002 2004) of the Franklin Templeton Funds and Senior Vice President of Franklin Templeton Services, LLC (2000 2004).
Year of Election or Appointment: 2005
Deputy Treasurer of Export and Multinational. Mr. Robins also serves as Deputy Treasurer of other Fidelity funds (2005 present) and is an employee of FMR (2004 present). Before joining Fidelity Investments, Mr. Robins worked at KPMG LLP, where he was a partner in KPMG’s department of professional practice (2002 2004) and a Senior Manager (1999 2000). In addition, Mr. Robins served as Assistant Chief Accountant, United States Securities and Exchange Commission (2000 2002).
33 Annual Report
Trustees and Officers - continued
| | Name, Age; Principal Occupation
Robert G. Byrnes (38)
|
Year of Election or Appointment: 2005
Assistant Treasurer of Export and Multinational. Mr. Byrnes also serves as Assistant Treasurer of other Fidelity funds (2005 present) and is an employee of FMR (2005 present). Previously, Mr. Byrnes served as Vice President of FPCMS (2003 2005). Before joining Fidelity Investments, Mr. Byrnes worked at Deutsche Asset Management where he served as Vice President of the Investment Operations Group (2000 2003).
Year of Election or Appointment: 1994
Assistant Treasurer of Export and Multinational. Mr. Costello also serves as Assistant Treasurer of other Fidelity funds and is an employee of FMR.
Year of Election or Appointment: 2004
Assistant Treasurer of Export and Multinational. Mr. Lydecker also serves as Assistant Treasurer of other Fidelity funds (2004) and is an employee of FMR.
Year of Election or Appointment: 2002
Assistant Treasurer of Export and Multinational. Mr. Osterheld also serves as Assistant Treasurer of other Fidelity funds (2002) and is an employee of FMR.
Year of Election or Appointment: 2005
Assistant Treasurer of Export and Multinational. Mr. Ryan also serves as Assistant Treasurer of other Fidelity funds (2005 present) and is an employee of FMR (2005 present). Previously, Mr. Ryan served as Vice President of Fund Reporting in FPCMS (1999 2005).
Year of Election or Appointment: 2005
Assistant Treasurer of Export and Multinational. Mr. Schiavone also serves as Assistant Treasurer of other Fidelity funds (2005 present) and is an employee of FMR (2005 present). Before joining Fidelity Invest ments, Mr. Schiavone worked at Deutsche Asset Management, where he most recently served as Assistant Treasurer (2003 2005) of the Scudder Funds and Vice President and Head of Fund Reporting (1996 2003).
The Board of Trustees of Export and Multinational voted to pay on October 10, 2005, to shareholders of record at the opening of business on October 7, 2005, a distribution of $0.58 per share derived from capital gains realized from sales of portfolio securities and a dividend of $0.03 per share from net investment income.
The fund hereby designates as capital gain dividends: For dividends with respect to the taxable year ended August 31, 2005, $65,043,000, or, if subsequently determined to be different, the net capital gain of such year, and for dividends with respect to the taxable year ended August 31, 2004, $34,241,000, or, if subsequently determined to be different, the excess of: (a) the net capital gain of such year, over (b) amounts pre viously designated as capital gain dividends with respect to such year.
The fund designates 100%, and 53% of the dividends distributed in October and December, respectively during the fiscal year as qualifying for the dividends received deduction for corporate shareholders.
The fund designates 100%, and 56% of the dividends distributed in October and December, respectively during the fiscal year as amounts which may be taken into account as a dividend for the purposes of the maximum rate under section 1(h)(11) of the Internal Revenue Code.
The fund will notify shareholders in January 2006 of amounts for use in preparing 2005 income tax returns.
35 Annual Report
Proxy Voting Results
A special meeting of the fund’s shareholders was held on February 16, 2005. The results of votes taken among shareholders on proposals before them are reported below. Each vote reported represents one dollar of net asset value held on the record date for the meeting.
PROPOSAL 1
To amend the Declaration of Trust to allow the Board of Trustees, if permitted by applicable law, to authorize fund mergers without shareholder approval.A
| | | Votes | | Votes |
| Affirmative | | 742,440,496.15 | | 73.879 |
| Against | | 196,006,999.93 | | 19.504 |
| Abstain | | 33,719,201.65 | | 3.356 |
| Broker | | | | |
| Non Votes . | | 32,776,930.05 | | 3.261 |
| TOTAL | | 1,004,943,627.78 | | 100.000 |
PROPOSAL 2
To elect a Board of Trustees.A
| | | # of | | % of |
| | | Votes | | Votes |
| Laura B. Cronin | | |
| Affirmative | | 948,588,595.83 | | 94.392 |
| Withheld | | 56,355,031.95 | | 5.608 |
| TOTAL | | 1,004,943,627.78 | | 100.000 |
| Dennis J. Dirks | | | | |
| Affirmative | | 950,698,349.04 | | 94.602 |
| Withheld | | 54,245,278.74 | | 5.398 |
| TOTAL | | 1,004,943,627.78 | | 100.000 |
| Robert M. Gates | | |
| Affirmative | | 947,567,913.72 | | 94.291 |
| Withheld | | 57,375,714.06 | | 5.709 |
| TOTAL | | 1,004,943,627.78 | | 100.000 |
| George H. Heilmeier | | |
| Affirmative | | 948,147,248.47 | | 94.348 |
| Withheld | | 56,796,379.31 | | 5.652 |
| TOTAL | | 1,004,943,627.78 | | 100.000 |
| Abigail P. Johnson | | |
| Affirmative | | 944,190,223.14 | | 93.955 |
| Withheld | | 60,753,404.64 | | 6.045 |
| TOTAL | | 1,004,943,627.78 | | 100.000 |
| Edward C. Johnson 3d | | |
| Affirmative | | 943,213,044.14 | | 93.857 |
| Withheld | | 61,730,583.64 | | 6.143 |
| TOTAL | | 1,004,943,627.78 | | 100.000 |
| Marie L. Knowles | | |
| Affirmative | | 949,452,954.58 | | 94.478 |
| Withheld | | 55,490,673.20 | | 5.522 |
| TOTAL | | 1,004,943,627.78 | | 100.000 |
| Ned C. Lautenbach | | |
| Affirmative | | 948,794,328.18 | | 94.413 |
| Withheld | | 56,149,299.60 | | 5.587 |
| TOTAL | | 1,004,943,627.78 | | 100.000 |
| Marvin L. Mann | | |
| Affirmative | | 946,649,510.40 | | 94.199 |
| Withheld | | 58,294,117.38 | | 5.801 |
| TOTAL | | 1,004,943,627.78 | | 100.000 |
| William O. McCoy | | |
| Affirmative | | 945,952,663.12 | | 94.130 |
| Withheld | | 58,990,964.66 | | 5.870 |
| TOTAL | | 1,004,943,627.78 | | 100.000 |
| Robert L. Reynolds | | |
| Affirmative | | 948,326,458.64 | | 94.366 |
| Withheld | | 56,617,169.14 | | 5.634 |
| TOTAL | | 1,004,943,627.78 | | 100.000 |
| Cornelia M. Small | | |
| Affirmative | | 949,307,587.45 | | 94.464 |
| Withheld | | 55,636,040.33 | | 5.536 |
| TOTAL | | 1,004,943,627.78 | | 100.000 |
| William S. Stavropoulos | | |
| Affirmative | | 947,525,611.83 | | 94.286 |
| Withheld | | 57,418,015.95 | | 5.714 |
| TOTAL | | 1,004,943,627.78 | | 100.000 |
| Kenneth L. Wolfe | | |
| Affirmative | | 949,176,424.38 | | 94.451 |
| Withheld | | 55,767,203.40 | | 5.549 |
| TOTAL | | 1,004,943,627.78 | | 100.000 |
A Denotes trust-wide proposals and voting results.
Annual Report
Board Approval of Investment Advisory Contracts and Management Fees
Fidelity Export and Multinational Fund
Each year, typically in July, the Board of Trustees, including the independent Trustees (together, the Board), votes on the renewal of the management contract and sub advisory agreements (together, the Advisory Contracts) for the fund. The Board, assisted by the advice of fund counsel and independent Trustees’ counsel, requests and considers a broad range of information throughout the year.
The Board meets regularly each month except August and takes into account throughout the year matters bearing on Advisory Contracts. The Board, acting directly and through its separate committees, considers at each of its meetings factors that are relevant to the annual renewal of the fund’s Advisory Contracts, including the services and support provided to the fund and its shareholders by Fidelity. At the time of the renewal, the Board had 11 standing committees, each composed of independent Trustees with varying backgrounds, to which the Board has assigned specific subject matter responsibilities in order to enhance effective decision making by the Board. Each committee has adopted a written charter outlining the structure and purposes of the committee. One such com mittee, the Equity Contract Committee, meets periodically during the first six months of each year and as necessary to consider matters specifically related to the annual renewal of Advisory Contracts. The committee requests and receives information on, and makes recommendations to the independent Trustees concerning, the approval and annual review of the Advisory Contracts.
At its July 2005 meeting, the Board of Trustees, including the independent Trustees, unanimously determined to renew the Advisory Contracts for the fund. In reaching its determination, the Board considered all factors it believed relevant, including (1) the nature, extent, and quality of the services to be provided to the fund and its shareholders by Fidelity (including the investment performance of the fund); (2) the competitiveness of the management fee and total expenses of the fund; (3) the total costs of the services to be provided by and the profits to be realized by the investment adviser and its affiliates from the relationship with the fund; (4) the extent to which economies of scale would be realized as the fund grows; and (5) whether fee levels reflect these economies of scale, if any, for the benefit of fund shareholders.
In determining whether to renew the Advisory Contracts for the fund, the Board ulti mately reached a determination, with the assistance of fund counsel and independent Trustees’ counsel, that the renewal of the Advisory Contracts and the compensation to be received by Fidelity under the management contract is consistent with Fidelity’s fidu ciary duty under applicable law. In addition to evaluating the specific factors noted above, the Board, in reaching its determination, is aware that shareholders in the fund have a broad range of investment choices available to them, including a wide choice among mutual funds offered by competitors to Fidelity, and that the fund’s shareholders, with the opportunity to review and weigh the disclosure provided by the fund in its
37 Annual Report
Board Approval of Investment Advisory Contracts and Management Fees continued
prospectus and other public disclosures, have chosen to invest in this fund, managed by Fidelity.
Nature, Extent, and Quality of Services Provided by Fidelity. The Board consid ered staffing within the investment adviser, FMR, and the sub advisers (together, the Investment Advisers), including the background of the fund’s portfolio manager and the fund’s investment objective and discipline. The independent Trustees also had discus sions with senior management of Fidelity’s investment operations and investment groups. The Board considered the structure of the portfolio manager compensation program and whether this structure provides appropriate incentives.
Fidelity Resources Dedicated to Investment Management and Support Services. The Board reviewed the size, education, and experience of the Investment Advisers’ invest ment staff, their use of technology, and the Investment Advisers’ approach to recruiting, training, and retaining portfolio managers and other research, advisory, and manage ment personnel. The Board considered Fidelity’s extensive global research capabilities that enable the Investment Advisers to aggregate data from various sources in an effort to produce positive investment results. The Board noted that Fidelity’s analysts have access to a variety of technological tools that enable them to perform both fundamental and quantitative analysis and to specialize in various disciplines. The Board also considered that Fidelity’s portfolio managers and analysts have access to daily portfolio attribution that allows for monitoring of a fund’s portfolio, as well as an electronic communication system that provides immediate real time access to research concerning issuers and credit enhancers.
Shareholder and Administrative Services. The Board considered the nature, extent, quality, and cost of administrative, distribution, and shareholder services performed by the Investment Advisers and their affiliates under the Advisory Contracts and under separate agreements covering transfer agency, pricing and bookkeeping, and securities lending services for the fund. The Board also considered the nature and extent of the Investment Advisers’ supervision of third party service providers, principally custodians and subcustodians. The Board reviewed the allocation of fund brokerage, including allocations to brokers affiliated with the Investment Advisers, the use of brokerage commissions to pay fund expenses, and the use of “soft” commission dollars to pay for research services. The Board also considered that Fidelity voluntarily decided in 2004 to stop using “soft” commission dollars to pay for market data and, instead, to pay for that data out of its own resources. The Board also considered the resources devoted to, and the record of compliance with, the fund’s compliance policies and procedures.
The Board noted that the growth of fund assets across the complex allows Fidelity to reinvest in the development of services designed to enhance the value or convenience of the Fidelity funds as investment vehicles. These services include 24 hour access to
account information and market information through phone representatives and over the Internet, and investor education materials and asset allocation tools.
Investment in a Large Fund Family. The Board considered the benefits to shareholders of investing in a Fidelity fund, including the benefits of investing in a fund that is part of a large family of funds offering a variety of investment disciplines and providing for a large variety of mutual fund investor services. For example, fund shareholders are offered the privilege of exchanging shares of the fund for shares of other Fidelity funds, as set forth in the fund’s prospectus, without paying a sales charge. The Board noted that, since the last Advisory Contract renewals in July 2004, Fidelity has taken a number of actions that benefited particular funds, including (i) voluntarily deciding in 2004 to stop using “soft” commission dollars to pay for market data and, instead, to pay for that data out of its own resources, (ii) contractually agreeing to impose management fee reductions and expense limitations on its five Spartan stock index funds and its stock index fund available through variable insurance products, (iii) contractually agreeing to eliminate the management fees on the Fidelity Freedom Funds and the Fidelity Advisor Freedom Funds, (iv) contractually agreeing to reduce the management fees on most of its investment grade taxable bond funds, and (v) contractually agreeing to impose expense limitations on its retail and Spartan investment grade taxable bond funds.
Investment Performance and Compliance. The Board considered whether the fund has operated within its investment objective, as well as its record of compliance with its investment restrictions. It also reviewed the fund’s absolute investment performance, as well as the fund’s relative investment performance measured against (i) a broad based securities market index, and (ii) a peer group of mutual funds deemed appropriate by the Board over multiple periods. The following charts considered by the Board show, over the one , three , and five year periods ended December 31, 2004, the fund’s returns, the returns of a broad based securities market index (“benchmark”), and a range of returns of a peer group of mutual funds identified by Lipper Inc. as having an investment objec tive similar to that of the fund. The box within each chart shows the 25th percentile return (bottom of box) and the 75th percentile return (top of box) of the Lipper peer group. Returns shown above the box are in the first quartile and returns shown below the box are in the fourth quartile. The percentage beaten number noted below each chart corresponds to the percentile box and represents the percentage of funds in the Lipper peer group whose performance was equal to or lower than that of the fund.
39 Annual Report
Board Approval of Investment Advisory Contracts and Management Fees continued

The Board reviewed the fund’s relative investment performance against its Lipper peer group and stated that the performance of the fund was in the first quartile for the one , three , and five year periods. The Board also stated that the relative investment perfor mance of the fund has compared favorably to its benchmark over time.
The Board has had thorough discussions with FMR throughout the year about the Board’s and FMR’s concerns about equity research, equity fund performance, and compliance with internal policies governing gifts and entertainment. FMR has taken steps that it believes will refocus and strengthen equity research and equity portfolio management and compliance. The Board noted with favor FMR’s recent reorganization of its senior management team and FMR’s plans to dedicate additional resources to investment research, and participated in the process that led to those changes.
Based on its review, and giving particular weight to the nature and quality of the resources dedicated by the Investment Advisers to maintain and improve relative performance, the Board concluded that the nature, extent, and quality of the services provided by Fidelity will benefit the fund’s shareholders, particularly in light of the Board’s view that the fund’s shareholders benefit from investing in a fund that is part of a large family of funds offering a variety of investment disciplines and services.
Competitiveness of Management Fee and Total Fund Expenses. The Board considered the fund’s management fee and total expenses compared to “mapped groups” of competitive funds and classes. Fidelity creates “mapped groups” by combining similar Lipper investment objective categories that have comparable management fee charac teristics. Combining Lipper investment objective categories aids the Board’s manage ment fee and total expense comparisons by broadening the competitive group used for
comparison and by reducing the number of universes to which various Fidelity funds are compared.
The Board considered two proprietary management fee comparisons for the 12 month periods shown in the chart below. The group of Lipper funds used by the Board for management fee comparisons is referred to below as the “Total Mapped Group” and, for the reasons explained above, is broader than the Lipper peer group used by the Board for performance comparisons. The Total Mapped Group comparison focuses on a fund’s standing relative to the total universe of comparable funds available to investors, in terms of gross management fees before expense reimbursements or caps. “TMG %” represents the percentage of funds in the Total Mapped Group that had management fees that were lower than the fund’s. For example, a TMG % of 15% means that 85% of the funds in the Total Mapped Group had higher management fees than the fund. The “Asset Size Peer Group” (ASPG) comparison focuses on a fund’s standing relative to non Fidelity funds similar in size to the fund within the Total Mapped Group. The ASPG represents at least 15% of the funds in the Total Mapped Group with comparable asset size and management fee characteristics, subject to a minimum of 50 funds (or all funds in the Total Mapped Group if fewer than 50). Additional information, such as the ASPG quartile (“quadrant”) in which the fund’s management fee ranked, is also included in the chart and considered by the Board.
The Board noted that the fund’s management fee ranked below the median of its Total Mapped Group and below the median of its ASPG for 2004.
41 Annual Report
Board Approval of Investment Advisory Contracts and Management Fees continued
Based on its review, the Board concluded that the fund’s management fee was fair and reasonable in light of the services that the fund receives and the other factors consid ered.
In its review of the fund’s total expenses, the Board considered the fund’s management fee as well as other fund expenses, such as transfer agent fees, pricing and bookkeeping fees, and custodial, legal, and audit fees. The Board also noted the effects of any waivers and reimbursements on fees and expenses. As part of its review, the Board also consid ered current and historical total expenses of the fund compared to competitive fund median expenses. The fund is compared to those funds and classes in the Total Mapped Group (used by the Board for management fee comparisons) that have a similar sales load structure.
The Board noted that the fund’s total expenses ranked below its competitive median for 2004.
In its review of total expenses, the Board also considered Fidelity fee structures and other information on clients that FMR and its affiliates service in other competitive markets, such as other mutual funds advised or subadvised by FMR or its affiliates, pension plan clients, and other institutional clients.
Based on its review, the Board concluded that the fund’s total expenses were reasonable in light of the services that the fund and its shareholders receive and the other factors considered.
Costs of the Services and Profitability. The Board considered the revenues earned and the expenses incurred by Fidelity in conducting the business of developing, market ing, distributing, managing, administering and servicing the fund and its shareholders. The Board also considered the level of Fidelity’s profits in respect of all the Fidelity funds.
On an annual basis, FMR presents to the Board Fidelity’s profitability for the fund. Fidelity calculates the profitability for each fund, as well as aggregate profitability for groups of Fidelity funds and all Fidelity funds, using a series of detailed revenue and cost allocation methodologies which originate with the audited books and records of Fidelity. The Audit Committee of the Board reviews any significant changes from the prior year’s methodologies.
PricewaterhouseCoopers LLP (PwC), independent registered accounting firm and auditor to Fidelity and certain Fidelity funds, has been engaged annually by the Board as part of the Board’s assessment of the results of Fidelity’s profitability analysis. PwC’s engagement includes the review and assessment of Fidelity’s methodologies used in determining the revenues and expenses attributable to Fidelity’s mutual fund business, and completion of agreed upon procedures surrounding the mathematical accuracy of fund profitability and its conformity to allocation methodologies. After considering PwC’s
reports issued under the engagement and information provided by Fidelity, the Board believes that while other allocation methods may also be reasonable, Fidelity’s profitabil ity methodologies are reasonable in all material respects.
The Board has also reviewed Fidelity’s non fund businesses and any fall out benefits related to the mutual fund business as well as cases where Fidelity’s affiliates may benefit from or be related to the fund’s business. In addition, a special committee of the Board reviewed services provided to Fidelity by its affiliates and determined that the fees that Fidelity paid for such services were reasonable.
The Board considered the costs of the services provided by and the profits realized by Fidelity in connection with the operation of the fund and determined that the amount of profit is a fair entrepreneurial profit for the management of the fund.
Economies of Scale. The Board considered whether there have been economies of scale in respect of the management of the Fidelity funds, whether the Fidelity funds (including the fund) have appropriately benefited from any such economies of scale, and whether there is potential for realization of any further economies of scale. The Board considered the extent to which the fund will benefit from economies of scale through increased services to the fund, through waivers or reimbursements, or through fee or expense reductions, including reductions that occur through operation of the transfer agent agreement. The transfer agent fee varies in part based on the number of accounts in the fund. If the number of accounts decreases or the average account size increases, the overall transfer agent fee rate decreases.
The Board recognized that the fund’s management contract incorporates a “group fee” structure, which provides for lower fee rates as total fund assets under FMR’s manage ment increase, and for higher fee rates as total fund assets under FMR’s management decrease. The Board considered that the group fee is designed to deliver the benefits of economies of scale to fund shareholders when total fund assets increase, even if assets of any particular fund are unchanged or have declined, because some portion of Fidelity’s costs are attributable to services provided to all Fidelity funds, and all funds benefit if those costs can be allocated among more assets. The Board concluded that, given the group fee structure, fund shareholders will achieve a certain level of economies of scale as assets under FMR’s management increase at the fund complex level, regardless of whether Fidelity achieves any such economies of scale.
The Board further concluded that any potential economies of scale are being shared between fund shareholders and Fidelity in an appropriate manner.
Additional Information Requested by the Board. In order to develop fully the factual basis for consideration of the Advisory Contracts, the Board requested additional information regarding (i) equity fund transfer agency fees; (ii) Fidelity’s fund profitabili ty methodology and the impact of various changes in the methodology over time; (iii)
43 Annual Report
Board Approval of Investment Advisory Contracts and Management Fees continued
benefits to shareholders from economies of scale; (iv) composition and characteristics of various fund and industry data used in comparisons; and (v) compensation of portfolio managers and research analysts.
Based on its evaluation of all of the conclusions noted above, and after considering all material factors, the Board ultimately concluded that the existing advisory fee structures are fair and reasonable, and that the fund’s existing Advisory Contracts should be renewed.
Managing Your Investments
Fidelity offers several ways to conveniently manage your personal investments via your telephone or PC. You can access your account information, conduct trades and research your investments 24 hours a day.
By Phone
Fidelity Automated Service Telephone provides a single toll free number to access account balances, positions, quotes and trading. It’s easy to navigate the service, and on your first call, the system will help you create a personal identification number (PIN) for security.


By PC
Fidelity’s web site on the Internet provides a wide range of information, including daily financial news, fund performance, interactive planning tools and news about Fidelity products and services.

* When you call the quotes line, please remember that a fund’s yield and return will vary and, except for money market funds, share price will also vary. This means that you may have a gain or loss when you sell your shares. There is no assurance that money market funds will be able to maintain a stable $1 share price; an investment in a money market fund is not insured or guar anteed by the U.S. government. Total returns are historical and include changes in share price, reinvestment of dividends and capital gains, and the effects of any sales charges.
Annual Report
To Visit Fidelity
For directions and hours,
please call 1 800 544 9797.
Arizona
7001 West Ray Road
Chandler, AZ
7373 N. Scottsdale Road
Scottsdale, AZ
California
815 East Birch Street
Brea, CA
1411 Chapin Avenue
Burlingame, CA
851 East Hamilton Avenue
Campbell, CA
19200 Von Karman Avenue
Irvine, CA
601 Larkspur Landing Circle
Larkspur, CA
10100 Santa Monica Blvd.
Los Angeles, CA
27101 Puerta Real
Mission Viejo, CA
73 575 El Paseo
Palm Desert, CA
251 University Avenue
Palo Alto, CA
123 South Lake Avenue
Pasadena, CA
16995 Bernardo Ctr. Drive
Rancho Bernardo, CA
1740 Arden Way
Sacramento, CA
7676 Hazard Center Drive
San Diego, CA
8 Montgomery Street
San Francisco, CA
3793 State Street
Santa Barbara, CA
21701 Hawthorne Boulevard
Torrance, CA
2001 North Main Street
Walnut Creek, CA
6300 Canoga Avenue
Woodland Hills, CA
|
Colorado
1625 Broadway
Denver, CO
9185 East Westview Road
Littleton, CO
Connecticut
48 West Putnam Avenue
Greenwich, CT
265 Church Street
New Haven, CT
300 Atlantic Street
Stamford, CT
29 South Main Street
West Hartford, CT
Delaware
222 Delaware Avenue
Wilmington, DE
Florida
4400 N. Federal Highway
Boca Raton, FL
121 Alhambra Plaza
Coral Gables, FL
2948 N. Federal Highway
Ft. Lauderdale, FL
1907 West State Road 434
Longwood, FL
8880 Tamiami Trail, North
Naples, FL
3550 Tamiami Trail, South
Sarasota, FL
1502 N. Westshore Blvd.
Tampa, FL
2465 State Road 7
Wellington, FL
3501 PGA Boulevard
West Palm Beach, FL
Georgia
3445 Peachtree Road, N.
Atlanta, GA
1000 Abernathy Road
Atlanta, GA
Illinois
One North LaSalle Street
Chicago, IL
875 North Michigan Ave.
Chicago, IL
1415 West 22nd Street
Oak Brook, IL
|
1700 East Golf Road
Schaumburg, IL
3232 Lake Avenue
Wilmette, IL
Indiana
4729 East 82nd Street
Indianapolis, IN
Kansas
5400 College Boulevard
Overland Park, KS
Maine
Three Canal Plaza
Portland, ME
Maryland
7315 Wisconsin Avenue
Bethesda, MD
One W. Pennsylvania Ave.
Towson, MD
Massachusetts
801 Boylston Street
Boston, MA
155 Congress Street
Boston, MA
300 Granite Street
Braintree, MA
44 Mall Road
Burlington, MA
405 Cochituate Road
Framingham, MA
416 Belmont Street
Worcester, MA
Michigan
500 E. Eisenhower Pkwy.
Ann Arbor, MI
280 Old N. Woodward Ave.
Birmingham, MI
43420 Grand River Avenue
Novi, MI
29155 Northwestern Hwy.
Southfield, MI
Minnesota
7600 France Avenue South
Edina, MN
Missouri
8885 Ladue Road
Ladue, MO
|
Annual Report
Nevada
2225 Village Walk Drive
Henderson, NV
New Jersey
150 Essex Street
Millburn, NJ
56 South Street
Morristown, NJ
396 Route 17, North
Paramus, NJ
3518 Route 1 North
Princeton, NJ
530 Highway 35
Shrewsbury, NJ
New York
1055 Franklin Avenue
Garden City, NY
37 West Jericho Turnpike
Huntington Station, NY
1271 Avenue of the Americas
New York, NY
61 Broadway
New York, NY
350 Park Avenue
New York, NY
200 Fifth Avenue
New York, NY
733 Third Avenue
New York, NY
11 Penn Plaza
New York, NY
2070 Broadway
New York, NY
1075 Northern Blvd.
Roslyn, NY
North Carolina
4611 Sharon Road
Charlotte, NC
Ohio
3805 Edwards Road
Cincinnati, OH
1324 Polaris Parkway
Columbus, OH
28699 Chagrin Boulevard
Woodmere Village, OH
Oregon
16850 SW 72nd Avenue
Tigard, OR
|
Pennsylvania
600 West DeKalb Pike
King of Prussia, PA
1735 Market Street
Philadelphia, PA
12001 Perry Highway
Wexford, PA
Rhode Island
47 Providence Place
Providence, RI
Tennessee
6150 Poplar Avenue
Memphis, TN
Texas
10000 Research Boulevard
Austin, TX
4001 Northwest Parkway
Dallas, TX
12532 Memorial Drive
Houston, TX
2701 Drexel Drive
Houston, TX
6500 N. MacArthur Blvd
Irving, TX
6005 West Park Boulevard
Plano, TX
14100 San Pedro
San Antonio, TX
1576 East Southlake
Southlake, TX
19740 IH 45 North
Spring, TX
Utah
215 South State Street
Salt Lake City, UT
Virginia
1861 International Drive
McLean, VA
Washington
411 108th Avenue, N.E
Bellevue, WA
1518 6th Avenue
Seattle, WA
Washington, DC
1900 K Street, N.W.
Washington, DC
Wisconsin
595 North Barker Road
Brookfield, WI
|
Fidelity Brokerage Services, Inc., 100 Summer St., Boston, MA 02110 Member NYSE/SIPC
Annual Report
Investment Adviser
Fidelity Management & Research Company
Boston, MA
Investment Sub Advisers
FMR Co., Inc.
Fidelity Management & Research
(U.K.) Inc.
Fidelity Management & Research
(Far East) Inc.
Fidelity Investments Japan Limited
Fidelity International Investment Advisors
Fidelity International Investment Advisors
(U.K.) Limited
General Distributor
Fidelity Distributors Corporation
Boston, MA
Transfer and Service Agent
Fidelity Service Company, Inc.
Boston, MA
Custodian
JPMorgan Chase Bank
New York, NY
|
| The Fidelity Telephone Connection |
| Mutual Fund 24 Hour Service |
| Exchanges/Redemptions | | |
| and Account Assistance | | 1-800-544-6666 |
| Product Information | | 1-800-544-6666 |
| Retirement Accounts | | 1-800-544-4774 |
| (8 a.m. - 9 p.m.) | | |
| TDD Service | | 1-800-544-0118 |
| for the deaf and hearing impaired |
| (9 a.m. - 9 p.m. Eastern time) |
| Fidelity Automated Service | | |
| Telephone (FAST®) | | (automated_phone_logo) 1-800-544-5555 |
(automated_phone_logo)
Automated line for quickest serviceEXF UANN-1005
1.790907.102
|

Fidelity®
Arizona Municipal
Income Fund
(formerly Spartan® Arizona Municipal
Income Fund)
and
Fidelity
Arizona Municipal
Money Market Fund
|
Annual Report
August 31, 2005
|


| Contents | | | | |
| |
| Chairman’s Message | | 4 | | Ned Johnson’s message to shareholders. |
| Shareholder Expense | | 5 | | An example of shareholder expenses. |
| Example | | | | |
| Fidelity Arizona Municipal Income Fund |
| Performance | | 7 | | How the fund has done over time. |
| Management’s Discussion | | 8 | | The manager’s review of fund |
| | | | | performance, strategy and outlook. |
| Investment Changes | | 9 | | A summary of major shifts in the fund’s |
| | | | | investments over the past six months. |
| Investments | | 10 | | A complete list of the fund’s |
| | | | | investments with their market values. |
| Financial Statements | | 15 | | Statements of assets and liabilities, |
| | | | | operations, and changes in net assets, |
| | | | | as well as financial highlights. |
| Fidelity Arizona Municipal Money Market Fund |
| Investment Changes/ | | 19 | | A summary of major shifts in the fund’s |
| Performance | | | | investments over the past six months |
| | | | | and one year. |
| Investments | | 20 | | A complete list of the fund’s |
| | | | | investments. |
| Financial Statements | | 26 | | Statements of assets and liabilities, |
| | | | | operations, and changes in net assets, |
| | | | | as well as financial highlights. |
| Notes | | 30 | | Notes to the financial statements. |
| Report of Independent | | 35 | | |
| Registered Public | | | | |
| Accounting Firm | | | | |
| Trustees and Officers | | 36 | | |
| Distributions | | 48 | | |
| Proxy Voting Results | | 49 | | |
| Board Approval of Investment | | 50 | | |
| Advisory Contracts and | | | | |
| Management Fees | | | | |
To view a fund’s proxy voting guidelines and proxy voting record for the 12 month period ended June 30, visit www.fidelity.com/proxyvotingresults or visit the Securities and Exchange Commission’s (SEC) web site at www.sec.gov. You may also call 1-800-544-8544 to request a free copy of the proxy voting guidelines.
Standard & Poor’s, S&P and S&P 500 are registered service marks of The McGraw Hill Companies, Inc. and have been licensed for use by Fidelity Distributors Corporation.
Other third party marks appearing herein are the property of their respective owners. All other marks appearing herein are registered or unregistered trademarks or service marks of FMR Corp. or an affiliated company.
Annual Report
This report and the financial statements contained herein are submitted for the general information of the shareholders of the funds. This report is not authorized for distribution to prospective investors in the funds unless preceded or accompanied by an effective prospectus. A fund files its complete schedule of portfolio holdings with the SEC for the first and third quarters of each fiscal year on Form N Q. Forms N Q are available on the SEC’s web site at http://www.sec.gov. A fund’s Forms N Q may be reviewed and copied at the SEC’s Public Refer ence Room in Washington, DC. Information regarding the operation of the SEC’s Public Reference Room may be obtained by calling 1 800 SEC 0330. For a complete list of a fund’s portfolio holdings, view the most recent quarterly holdings report, semiannual report, or annual report on Fidelity’s web site at http://www.fidelity.com/holdings.
NOT FDIC INSURED · MAY LOSE VALUE · NO BANK GUARANTEE
Neither the funds nor Fidelity Distributors Corporation is a bank.
3 Annual Report
Chairman’s Message
(photograph of Edward C Johnson 3d)
Dear Shareholder:
During the past year or so, much has been reported about the mutual fund industry, and much of it has been more critical than I believe is warranted. Allegations that some companies have been less than forthright with their shareholders have cast a shadow on the entire industry. I continue to find these reports disturbing, and assert that they do not create an accurate picture of the industry overall. Therefore, I would like to remind every one where Fidelity stands on these issues. I will say two things specifically regarding allegations that some mutual fund companies were in violation of the Securities and Exchange Commission’s forward pricing rules or were involved in so called “market timing” activities.
First, Fidelity has no agreements that permit customers who buy fund shares after 4 p.m. to obtain the 4 p.m. price. This is not a new policy. This is not to say that some one could not deceive the company through fraudulent acts. However, we are extremely diligent in preventing fraud from occurring in this manner and in every other. But I underscore again that Fidelity has no so called “agreements” that sanction illegal practices.
Second, Fidelity continues to stand on record, as we have for years, in opposition to predatory short term trading that adversely affects shareholders in a mutual fund. Back in the 1980s, we initiated a fee which is returned to the fund and, therefore, to investors to discourage this activity. Further, we took the lead several years ago in developing a Fair Value Pricing Policy to prevent market timing on foreign securities in our funds. I am confident we will find other ways to make it more difficult for predatory traders to operate. However, this will only be achieved through close cooperation among regulators, legislators and the industry.
Yes, there have been unfortunate instances of unethical and illegal activity within the mutual fund industry from time to time. That is true of any industry. When this occurs, confessed or convicted offenders should be dealt with appropriately. But we are still concerned about the risk of over regulation and the quick application of simplistic solutions to intricate problems. Every system can be improved, and we support and applaud well thought out improvements by regulators, legislators and industry representatives that achieve the common goal of building and protecting the value of investors’ holdings. For nearly 60 years, Fidelity has worked very hard to improve its products and service to justify your trust. When our family founded this company in 1946, we had only a few hundred customers. Today, we serve more than 18 million customers including individual investors and participants in retirement plans across America. Let me close by saying that we do not take your trust in us for granted, and we realize that we must always work to improve all aspects of our service to you. In turn, we urge you to continue your active participation with your financial matters, so that your interests can be well served.
Best regards,
/s/ Edward C. Johnson 3d
Edward C. Johnson 3d
Annual Report
Shareholder Expense Example
As a shareholder of a Fund, you incur two types of costs: (1) transaction costs, including redemption fees, and (2) ongoing costs, including management fees and other Fund expenses. This Example is intended to help you understand your ongoing costs (in dollars) of investing in the Funds and to compare these costs with the ongoing costs of investing in other mutual funds.
The Example is based on an investment of $1,000 invested at the beginning of the period and held for the entire period (March 1, 2005 to August 31, 2005).
The first line of the table below for each fund provides information about actual account values and actual expenses. You may use the information in this line, together with the amount you invested, to estimate the expenses that you paid over the period. Simply divide your account value by $1,000.00 (for example, an $8,600 account value divided by $1,000.00 = 8.6), then multiply the result by the number in the first line for a fund under the heading entitled “Expenses Paid During Period” to estimate the expenses you paid on your account during this period. A small balance maintenance fee of $12.00 that is charged once a year may apply for certain accounts with a value of less than $2,000. This fee is not included in the table below. If it was, the estimate of expenses you paid during the period would be higher, and your ending account value lower, by this amount.
Hypothetical Example for Comparison Purposes
The second line of the table below for each fund provides information about hypothetical account values and hypothetical expenses based on a fund’s actual expense ratio and an assumed rate of return of 5% per year before expenses, which is not the Fund’s actual return. The hypothetical account values and expenses may not be used to estimate the actual ending account balance or expenses you paid for the period. You may use this information to compare the ongoing costs of investing in the Fund and other funds. To do so, compare this 5% hypothetical example with the 5% hypothetical examples that appear in the shareholder reports of the other funds. A small balance maintenance fee of $12.00 that is charged once a year may apply for certain accounts with a value of less than $2,000. This fee is not included in the table below. If it was, the estimate of expenses you paid during the period would be higher, and your ending account value lower, by this amount. Please note that the expenses shown in the table are meant to highlight your ongoing costs only and do not reflect any transaction costs. Therefore, the second line of the table is useful in comparing ongoing costs only, and will not help you determine the relative total costs of owning different funds. In addition, if these transactional costs were included, your costs would have been higher.
5 Annual Report
| Shareholder Expense Example continued | | | | |
| |
| |
| | | | | | | | | | | | | Expenses Paid |
| | | | | Beginning | | | | Ending | | | | During Period* |
| | | | | Account Value | | | | Account Value | | | | March 1, 2005 |
| | | | | March 1, 2005 | | | | August 31, 2005 | | to August 31, 2005 |
| Fidelity Arizona Municipal | | | | | | | | | | | | |
| Income Fund | | | | | | | | | | | | |
| Actual | | $ | | 1,000.00 | | $ | | 1,024.60 | | $ | | 2.81 |
| HypotheticalA | | $ | | 1,000.00 | | $ | | 1,022.43 | | $ | | 2.80 |
| Fidelity Arizona Municipal | | | | | | | | | | | | |
| Money Market Fund | | | | | | | | | | | | |
| Actual | | $ | | 1,000.00 | | $ | | 1,010.00 | | $ | | 2.53 |
| HypotheticalA | | $ | | 1,000.00 | | $ | | 1,022.68 | | $ | | 2.55 |
| |
| A 5% return per year before expenses | | | | | | | | |
* Expenses are equal to each Fund’s annualized expense ratio (shown in the table below); multiplied by the average account value over the period, multiplied by 184/365 (to reflect the one half year period
| | | Annualized |
| | | Expense Ratio |
| Fidelity Arizona Municipal Income Fund | | 55% |
| Fidelity Arizona Municipal Money Market Fund | | 50% |
Fidelity Arizona Municipal Income Fund
Performance: The Bottom Line
Average annual total return reflects the change in the value of an investment, assuming reinvestment of the fund’s dividend income and capital gains (the profits earned upon the sale of securities that have grown in value) and assuming a constant rate of perfor mance each year. The $10,000 table and the fund’s returns do not reflect the deduction of taxes that a shareholder would pay on fund distributions or the redemption of fund shares. During periods of reimbursement by Fidelity, a fund’s total return will be greater than it would be had the reimbursement not occurred. How a fund did yesterday is no guarantee of how it will do tomorrow.
| Average Annual Total Returns | | | | | | |
| Periods ended August 31, 2005 | | Past 1 | | Past 5 | | Past 10 |
| | | year | | years | | years |
| Fidelity Arizona Municipal Income Fund | | 4.46% | | 6.00% | | 5.69% |
| |
| $10,000 Over 10 Years | | | | | | |
Let’s say hypothetically that $10,000 was invested in Fidelity® Arizona Municipal Income Fund on August 31, 1995. The chart shows how the value of your investment would have changed, and also shows how the Lehman Brothers Municipal Bond Index performed over the same period.

Annual Report
Fidelity Arizona Municipal Income Fund
Management’s Discussion of Fund Performance
Comments from Christine Thompson, Portfolio Manager of Fidelity® Arizona Municipal Income Fund
The municipal bond market had a solid advance during the past 12 months, and soundly outdistanced the taxable bond market. The Lehman Brothers® Municipal Bond Index a performance measure of approximately 34,000 investment grade, fixed rate, tax exempt bonds posted a total gain of 5.31% for the one year period ending August 31, 2005. In comparison, the Lehman Brothers Aggregate Bond Index, a proxy for the overall investment grade taxable bond market, rose a more modest 4.15% . The Federal Reserve Board raised interest rates eight times during the past 12 months, lifting the fed funds target rate from 1.50% to 3.50% . While rate action of this nature is often detrimental to muni returns, they weren’t affected as significantly this time around. Amid rising short term yields, the yields on longer term bonds declined and their prices rallied. Overall, heavy issuance was met with reasonably strong demand, particularly from institutional buyers. A narrowing yield gap relative to taxable bonds helped further highlight the attractive valuations of munis.
For the 12 months ending August 31, 2005, the fund returned 4.46% . During the same period, the LipperSM Arizona Municipal Debt Funds Average gained 4.07% and the Lehman Brothers Arizona 4 Plus Year Enhanced Municipal Bond Index returned 4.94% . Arizona’s municipal bond market performed in line with the national municipal market, helped in some ways by stronger economic conditions, though hurt in other ways. Likely aiding the fund’s outperformance of its Lipper peer group average was the fact that some of its holdings were prerefunded during the period, a process that enhanced the credit quality of the securities and pushed their prices higher. Weighing on the fund’s returns was my focus on high quality bonds, which generally lagged lower quality securities in response to strong demand for higher yielding bonds and investors’ growing comfort with risk. Although the fund did benefit from holding some lower quality investment grade securities, I believe its stake in them was relatively light compared to the Lipper peer group average. Additionally, my decision to avoid below investment grade munis altogether detracted from the fund’s relative returns, as these bonds were some of the market’s best performers. Among the fund’s high quality holdings were bonds issued in Puerto Rico, which are free from state taxes in all 50 states and at times offered what I believed were better values than bonds available in Arizona. In terms of sector positioning, fund performance was helped by an overweighting in local general obligation bonds, which performed well.
The views expressed in this statement reflect those of the portfolio manager only through the end of the period of the report as stated on the cover and do not necessarily represent the views of Fidelity or any other person in the Fidelity organization. Any such views are subject to change at any time based upon market or other conditions and Fidelity disclaims any responsibility to update such views. These views may not be relied on as investment advice and, because investment decisions for a Fidelity fund are based on numerous factors, may not be relied on as an indication of trading intent on behalf of any Fidelity fund.
| | Fidelity Arizona Municipal Income Fund
Investment Changes
|
| Top Five Sectors as of August 31, 2005 | | | | |
| | | % of fund’s | | % of fund’s net assets |
| | | net assets | | 6 months ago |
| General Obligations | | 21.3 | | 23.8 |
| Special Tax | | 20.0 | | 24.3 |
| Water & Sewer | | 17.8 | | 10.0 |
| Escrowed/Pre Refunded | | 15.5 | | 9.1 |
| Electric Utilities | | 10.5 | | 10.6 |
| Average Years to Maturity as of August 31, 2005 | | |
| | | | | 6 months ago |
| Years | | 13.4 | | 13.3 |
Average years to maturity is based on the average time remaining to the stated maturity date of each bond, weighted by the market value of each bond.
| Duration as of August | | 31, 2005 | | | | |
| | | | | | | 6 months ago |
| Years | | | | 6.8 | | 6.8 |
Duration shows how much a bond fund’s price fluctuates with changes in comparable interest rates. If rates rise 1%, for example, a fund with a five year duration is likely to lose about 5% of its value. Other factors also can influence a bond fund’s performance and share price. Accordingly, a bond fund’s actual performance may differ from this example.

We have used ratings from Moody’s® Investors Services, Inc. Where Moody’s ratings are not available, we have used S&P® ratings.
Annual Report
Fidelity Arizona Municipal Income Fund
Investments August 31, 2005
Showing Percentage of Net Assets
Municipal Bonds 98.8%
| | | | | Principal | | | | Value |
| | | | | Amount | | | | (Note 1) |
| Arizona – 87.9% | | | | | | | | |
| Arizona Health Facilities Auth. Rev. (Catholic Health Care West | | | | | | | | |
| Proj.) Series A, 6.125% 7/1/09 | | $ | | 455,000 | | $ | | 478,555 |
| Arizona Pwr. Auth. Pwr. Resource Rev. (Hoover Uprating Proj.) | | | | | | | | |
| 5% 10/1/09 | | | | 1,160,000 | | | | 1,239,970 |
| Arizona School Facilities Board Ctfs. of Prtn.: | | | | | | | | |
| Series A2, 5% 9/1/18 (FGIC Insured) | | | | 1,000,000 | | | | 1,093,720 |
| Series B, 5.25% 9/1/19 (Pre-Refunded to 9/1/14 @ | | | | | | | | |
| 100) (d) | | | | 1,000,000 | | | | 1,131,460 |
| Series C, 5% 9/1/11 (FSA Insured) | | | | 1,060,000 | | | | 1,151,160 |
| Arizona School Facilities Board State School Impt. Rev.: | | | | | | | | |
| 5.25% 7/1/18 (Pre-Refunded to 7/1/12 @ 100) (d) | | | | 1,000,000 | | | | 1,114,930 |
| 5.25% 7/1/20 (Pre-Refunded to 7/1/12 @ 100) (d) | | | | 1,500,000 | | | | 1,672,395 |
| Arizona State Univ. Revs.: | | | | | | | | |
| 5% 7/1/26 (AMBAC Insured) | | | | 1,000,000 | | | | 1,074,600 |
| 5.5% 7/1/21 (Pre-Refunded to 7/1/12 @ 100) (d) | | | | 1,150,000 | | | | 1,299,569 |
| 5.75% 7/1/27 (Pre-Refunded to 7/1/12 @ 100) (d) | | | | 1,500,000 | | | | 1,717,770 |
| Arizona Student Ln. Acquisition Auth. Student Ln. Rev. | | | | | | | | |
| Subseries B1, 6.15% 5/1/29 (c) | | | | 500,000 | | | | 536,450 |
| Arizona Trans. Board Hwy. Rev.: | | | | | | | | |
| Series B, 5.25% 7/1/19 | | | | 2,500,000 | | | | 2,748,925 |
| 5.25% 7/1/13 | | | | 1,500,000 | | | | 1,646,985 |
| Arizona Wtr. Infrastructure Fin. Auth. Rev. (Wtr. Quality Proj.) | | | | | | | | |
| Series A, 5.375% 10/1/11 | | | | 2,000,000 | | | | 2,228,860 |
| Central Arizona Wtr. Conservation District Contract Rev. | | | | | | | | |
| (Central Arizona Proj.) Series A, 5.5% 11/1/09 | | | | 1,000,000 | | | | 1,089,540 |
| Chandler Gen. Oblig.: | | | | | | | | |
| 5.7% 7/1/15 | | | | 75,000 | | | | 83,668 |
| 6.25% 7/1/10 | | | | 500,000 | | | | 566,865 |
| 6.5% 7/1/10 (MBIA Insured) | | | | 200,000 | | | | 229,152 |
| 6.5% 7/1/11 (MBIA Insured) | | | | 225,000 | | | | 262,827 |
| Gilbert Wtr. Resources Muni. Property Corp. Wastewtr. Sys. & | | | | | | | | |
| Util. Rev. 4.9% 4/1/19 | | | | 1,000,000 | | | | 1,007,660 |
| Glendale Indl. Dev. Auth. Hosp. Rev. (John C. Lincoln Health | | | | | | | | |
| Network Proj.) 5% 12/1/35 | | | | 1,000,000 | | | | 1,021,640 |
| Maricopa County Hosp. Rev. (Sun Health Corp. Proj.): | | | | | | | | |
| 5% 4/1/14 | | | | 1,000,000 | | | | 1,061,480 |
| 6.125% 4/1/18 | | | | 85,000 | | | | 90,067 |
| 6.125% 4/1/18 (Pre-Refunded to 4/1/07 @ 102) (d) | | | | 215,000 | | | | 229,530 |
| Maricopa County Indl. Dev. Auth. Health Facilities Rev. (Catholic | | | | | | | | |
| Health Care West Proj.) Series 1998 A, 5% 7/1/16 | | | | 730,000 | | | | 756,565 |
| Maricopa County Indl. Dev. Auth. Hosp. Facilities Rev. (Mayo | | | | | | | | |
| Clinic Hosp. Proj.) 5.25% 11/15/37 | | | | 1,000,000 | | | | 1,053,370 |
See accompanying notes which are an integral part of the financial statements.
| Municipal Bonds continued | | | | | | | | |
| | | | | Principal | | | | Value |
| | | | | Amount | | | | (Note 1) |
| Arizona – continued | | | | | | | | |
| Maricopa County School District #28 Kyrene Elementary | | | | | | | | |
| Series C, 0% 1/1/10 (FGIC Insured) | | $ | | 1,425,000 | | $ | | 1,223,021 |
| Maricopa County Unified School District #48 Scottsdale: | | | | | | | | |
| Series A, 5% 7/1/18 (FGIC Insured) | | | | 1,000,000 | | | | 1,096,670 |
| 7.4% 7/1/10 | | | | 1,000,000 | | | | 1,181,240 |
| Maricopa County Unified School District #80 Chandler: | | | | | | | | |
| (2002 Proj.) Series A, 5% 7/1/17 (FSA Insured) | | | | 500,000 | | | | 541,640 |
| 6.25% 7/1/11 (Escrowed to Maturity) (d) | | | | 405,000 | | | | 468,694 |
| Mesa Indl. Dev. Auth. Rev. (Discovery Health Sys. Proj.) Series A: | | | | | | | | |
| 5.375% 1/1/14 (Pre-Refunded to 1/1/10 @ 101) (d) | | | | 500,000 | | | | 549,160 |
| 5.625% 1/1/29 (Pre-Refunded to 1/1/10 @ 101) (d) | | | | 795,000 | | | | 881,130 |
| Mesa Street & Hwy. Rev. 6.5% 7/1/11 (FSA Insured) | | | | 1,500,000 | | | | 1,752,180 |
| Mesa Util. Sys. Rev. 5.75% 7/1/14 (FGIC Insured) | | | | 1,000,000 | | | | 1,165,290 |
| Northern Arizona Univ. Sys. Rev.: | | | | | | | | |
| 5.5% 6/1/23 (FGIC Insured) | | | | 530,000 | | | | 597,257 |
| 5.5% 6/1/26 (FGIC Insured) | | | | 1,305,000 | | | | 1,466,468 |
| Phoenix Arpt. Rev. Series D, 6.4% 7/1/12 (MBIA Insured) (c) . | | | | 810,000 | | | | 821,899 |
| Phoenix Civic Impt. Board Arpt. Rev. Series B, 5.25% 7/1/27 | | | | | | | | |
| (FGIC Insured) (c) | | | | 1,000,000 | | | | 1,058,000 |
| Phoenix Civic Impt. Corp. Arpt. Excise Tax Rev. 5.25% | | | | | | | | |
| 7/1/09 (c) | | | | 400,000 | | | | 422,688 |
| Phoenix Civic Impt. Corp. Excise Tax Rev.: | | | | | | | | |
| (Civic Plaza Expansion Proj.) Series A, 5% 7/1/30 | | | | | | | | |
| (FGIC Insured) (a) | | | | 1,000,000 | | | | 1,068,760 |
| (Muni. Courthouse Proj.) Series A: | | | | | | | | |
| 5.375% 7/1/29 | | | | 560,000 | | | | 603,568 |
| 5.5% 7/1/11 | | | | 200,000 | | | | 218,404 |
| 5.75% 7/1/15 | | | | 675,000 | | | | 743,391 |
| Phoenix Civic Impt. Corp. Muni. Facilities Excise Tax Rev.: | | | | | | | | |
| 5.75% 7/1/10 (FGIC Insured) | | | | 340,000 | | | | 378,260 |
| 5.75% 7/1/12 (FGIC Insured) | | | | 1,250,000 | | | | 1,395,663 |
| 5.75% 7/1/14 (FGIC Insured) | | | | 1,000,000 | | | | 1,117,780 |
| Phoenix Civic Impt. Corp. Wastewtr. Sys. Rev.: | | | | | | | | |
| 5% 7/1/29 (MBIA Insured) | | | | 770,000 | | | | 819,642 |
| 5.7% 7/1/09 (FGIC Insured) | | | | 1,275,000 | | | | 1,392,517 |
| Phoenix Civic Impt. Corp. Wtr. Sys. Rev.: | | | | | | | | |
| Series 2001, 5.5% 7/1/24 (FGIC Insured) | | | | 1,000,000 | | | | 1,194,020 |
| 4.75% 7/1/27 (MBIA Insured) | | | | 1,020,000 | | | | 1,063,034 |
| 5% 7/1/20 (MBIA Insured) | | | | 5,000,000 | | | | 5,440,597 |
| 5% 7/1/29 (MBIA Insured) | | | | 1,000,000 | | | | 1,074,600 |
See accompanying notes which are an integral part of the financial statements.
11 Annual Report
| Fidelity Arizona Municipal Income Fund | | | | | | | | |
| Investments continued | | | | | | | | |
| |
| Municipal Bonds continued | | | | | | | | |
| | | | | Principal | | | | Value |
| | | | | Amount | | | | (Note 1) |
| Arizona – continued | | | | | | | | |
| Phoenix Gen. Oblig.: | | | | | | | | |
| Series 1995 A, 6% 7/1/11 | | $ | | 1,485,000 | | $ | | 1,693,108 |
| Series A, 6.25% 7/1/17 | | | | 1,000,000 | | | | 1,240,120 |
| Series B, 5.375% 7/1/20 | | | | 1,000,000 | | | | 1,112,820 |
| Phoenix Indl. Dev. Auth. Single Family Mtg. Rev. 0% 12/1/14 | | | | | | | | |
| (Escrowed to Maturity) (d) | | | | 1,250,000 | | | | 874,150 |
| Phoenix Street & Hwy. User Rev. 6.25% 7/1/11 (MBIA | | | | | | | | |
| Insured) | | | | 35,000 | | | | 35,162 |
| Pima County Indl. Dev. Auth. Rev. (HealthPartners Proj.) | | | | | | | | |
| Series A, 5.625% 4/1/14 (MBIA Insured) | | | | 200,000 | | | | 210,882 |
| Pima County Unified School District #1 Tucson: | | | | | | | | |
| 7.5% 7/1/08 (FGIC Insured) | | | | 1,000,000 | | | | 1,114,700 |
| 7.5% 7/1/10 (FGIC Insured) | | | | 250,000 | | | | 296,905 |
| Salt River Proj. Agric. Impt. & Pwr. District Elec. Sys. Rev.: | | | | | | | | |
| Series 2005 A: | | | | | | | | |
| 4.75% 1/1/35 | | | | 1,000,000 | | | | 1,033,760 |
| 5% 1/1/35 | | | | 1,500,000 | | | | 1,608,660 |
| Series A: | | | | | | | | |
| 5.25% 1/1/18 | | | | 1,000,000 | | | | 1,097,470 |
| 5.25% 1/1/19 | | | | 1,615,000 | | | | 1,773,383 |
| Series B: | | | | | | | | |
| 5% 1/1/20 | | | | 1,500,000 | | | | 1,611,015 |
| 5% 1/1/21 | | | | 255,000 | | | | 274,041 |
| Scottsdale Indl. Dev. Auth. Hosp. Rev. (Scottsdale Health Care | | | | | | | | |
| Proj.) 5.8% 12/1/31 | | | | 250,000 | | | | 271,363 |
| Scottsdale Wtr. & Swr. Rev. (1989 Proj.) Series E, 7% 7/1/07 . | | | | 150,000 | | | | 160,731 |
| Sedona Excise Tax Rev. 5% 7/1/19 (MBIA Insured) | | | | 1,000,000 | | | | 1,092,380 |
| Tempe Gen. Oblig.: | | | | | | | | |
| Series 2001 A, 6% 7/1/10 | | | | 600,000 | | | | 673,596 |
| 5% 7/1/19 | | | | 1,680,000 | | | | 1,818,734 |
| 5.5% 7/1/17 | | | | 1,035,000 | | | | 1,183,253 |
| Tempe Union High School District #213 7% 7/1/08 (FGIC | | | | | | | | |
| Insured) | | | | 310,000 | | | | 342,736 |
| Tucson Gen. Oblig.: | | | | | | | | |
| Series A, 6% 7/1/13 | | | | 800,000 | | | | 934,544 |
| 5% 7/1/18 (FGIC Insured) | | | | 3,295,000 | | | | 3,613,528 |
| Tucson Street & Hwy. User Rev.: | | | | | | | | |
| Series 1994 B, 7.5% 7/1/11 (MBIA Insured) | | | | 1,015,000 | | | | 1,235,966 |
| Series 1994 C, 7% 7/1/11 (FGIC Insured) | | | | 500,000 | | | | 597,195 |
| Series A, 7% 7/1/11 (MBIA Insured) | | | | 300,000 | | | | 358,317 |
| 6% 7/1/10 (MBIA Insured) | | | | 400,000 | | | | 449,444 |
See accompanying notes which are an integral part of the financial statements.
| Municipal Bonds continued | | | | | | |
| | | | | Principal | | Value |
| | | | | Amount | | (Note 1) |
| Arizona – continued | | | | | | |
| Tucson Wtr. Rev.: | | | | | | |
| Series 1994 C, 6.75% 7/1/07 (FGIC Insured) | | $ | | 200,000 | | $ 213,430 |
| Series A, 5% 7/1/11 (FGIC Insured) | | | | 1,410,000 | | 1,528,144 |
| 5.5% 7/1/14 | | | | 425,000 | | 475,643 |
| Univ. Med. Ctr. Corp. Hosp. Rev. 5.25% 7/1/15 | | | | 1,000,000 | | 1,078,960 |
| Univ. of Arizona Ctfs. of Prtn. Series C, 5% 6/1/14 | | | | | | |
| (AMBAC Insured) | | | | 600,000 | | 655,398 |
| Univ. of Arizona Univ. Revs. 5.25% 6/1/13 (FSA Insured) | | | | 245,000 | | 257,520 |
| Yavapai County Indl. Dev. Auth. Solid Waste Disp. Rev. | | | | | | |
| (Waste Mgmt., Inc. Proj.) 4%, tender 6/1/10 (b)(c) | | | | 1,000,000 | | 1,006,480 |
| Yuma County Hosp. District #1 6.35% 11/15/07 | | | | | | |
| (Escrowed to Maturity) (d) | | | | 265,000 | | 272,110 |
| | | | | | | 88,518,934 |
| |
| Puerto Rico 10.9% | | | | | | |
| Puerto Rico Commonwealth Hwy. & Trans. Auth. Hwy. Rev.: | | | | | | |
| Series 1996 Y, 5% 7/1/36 (FSA Insured) | | | | 1,000,000 | | 1,080,680 |
| Series Y, 5.5% 7/1/36 (FSA Insured) | | | | 500,000 | | 574,800 |
| Puerto Rico Commonwealth Hwy. & Trans. Auth. Trans. Rev.: | | | | | | |
| Series 1998, 5.75% 7/1/22 (CIFG North America Insured) | | | | 700,000 | | 797,132 |
| Series 2000 C, 6% 7/1/29 | | | | 500,000 | | 564,420 |
| Series D, 5.25% 7/1/38 | | | | 1,000,000 | | 1,059,820 |
| 5.75% 7/1/19 (FGIC Insured) | | | | 700,000 | | 801,738 |
| Puerto Rico Commonwealth Infrastructure Fing. Auth. | | | | | | |
| Series 2000 A: | | | | | | |
| 5.5% 10/1/32 (Escrowed to Maturity) (d) | | | | 2,525,000 | | 2,790,554 |
| 5.5% 10/1/40 (Escrowed to Maturity) (d) | | | | 2,295,000 | | 2,519,474 |
| Puerto Rico Elec. Pwr. Auth. Pwr. Rev.: | | | | | | |
| Series HH, 5.25% 7/1/29 (FSA Insured) | | | | 200,000 | | 217,174 |
| Series QQ, 5.25% 7/1/14 (XL Cap. Assurance, Inc. Insured) | | | | 500,000 | | 565,070 |
| | | | | | | 10,970,862 |
| |
| |
| TOTAL INVESTMENT PORTFOLIO 98.8% | | | | | | |
| (Cost $95,651,840) | | | | | | 99,489,796 |
| |
| NET OTHER ASSETS – 1.2% | | | | | | 1,205,685 |
| NET ASSETS 100% | | | | | | $ 100,695,481 |
See accompanying notes which are an integral part of the financial statements.
13 Annual Report
Fidelity Arizona Municipal Income Fund
Investments continued
Legend
|
(a) Security or a portion of the security purchased on a delayed delivery or when-issued basis.
(b) The coupon rate shown on floating or adjustable rate securities represents the rate at period end.
(c) Private activity obligations whose interest is subject to the federal alternative minimum tax for individuals.
(d) Security collateralized by an amount sufficient to pay interest and principal.
|
The distribution of municipal securities by revenue source, as a percentage of total net assets, is as follows:
| General Obligations | | 21.3% |
| Special Tax | | 20.0% |
| Water & Sewer | | 17.8% |
| Escrowed/Pre Refunded | | 15.5% |
| Electric Utilities | | 10.5% |
| Health Care | | 5.9% |
| Others* (individually less than 5%) | | 9.0% |
| | | 100.0% |
| * Includes net other assets | | |
See accompanying notes which are an integral part of the financial statements.
| Fidelity Arizona Municipal Income Fund | | | | | | |
| |
| Financial Statements | | | | | | | | |
| |
| Statement of Assets and Liabilities | | | | | | | | |
| | | | | | | | | August 31, 2005 |
| |
| Assets | | | | | | | | |
| Investment in securities, at value (cost $95,651,840) | | | | | | | | |
| See accompanying schedule | | | | | | $ | | 99,489,796 |
| Cash | | | | | | | | 4,031,161 |
| Receivable for fund shares sold | | | | | | | | 21,243 |
| Interest receivable | | | | | | | | 1,059,231 |
| Other receivables | | | | | | | | 7,876 |
| Total assets | | | | | | | | 104,609,307 |
| |
| Liabilities | | | | | | | | |
| Payable for investments purchased on a delayed delivery | | | | | | |
| basis | | $ | | 3,678,860 | | | | |
| Payable for fund shares redeemed | | | | 62,415 | | | | |
| Distributions payable | | | | 127,293 | | | | |
| Accrued management fee | | | | 45,222 | | | | |
| Other affiliated payables | | | | 36 | | | | |
| Total liabilities | | | | | | | | 3,913,826 |
| |
| Net Assets | | | | | | $ | | 100,695,481 |
| Net Assets consist of: | | | | | | | | |
| Paid in capital | | | | | | $ | | 96,580,513 |
| Undistributed net investment income | | | | | | | | 16,823 |
| Accumulated undistributed net realized gain (loss) on | | | | | | | | |
| investments | | | | | | | | 260,189 |
| Net unrealized appreciation (depreciation) on | | | | | | | | |
| investments | | | | | | | | 3,837,956 |
| Net Assets, for 8,686,934 shares outstanding | | | | | | $ | | 100,695,481 |
| Net Asset Value, offering price and redemption price per | | | | | | |
| share ($100,695,481 ÷8,686,934 shares) | | | | | | $ | | 11.59 |
See accompanying notes which are an integral part of the financial statements.
15 Annual Report
| Fidelity Arizona Municipal Income Fund | | | | |
| Financial Statements continued | | | | |
| |
| Statement of Operations | | | | | | |
| | | | | Year ended August 31, 2005 |
| |
| Investment Income | | | | | | |
| Interest | | | | $ | | 3,677,329 |
| |
| Expenses | | | | | | |
| Management fee | | $ | | 490,000 | | |
| Independent trustees’ compensation | | | | 437 | | |
| Miscellaneous | | | | 170 | | |
| Total expenses before reductions | | | | 490,607 | | |
| Expense reductions | | | | (40,395) | | 450,212 |
| |
| Net investment income | | | | | | 3,227,117 |
| Realized and Unrealized Gain (Loss) | | | | |
| Net realized gain (loss) on: | | | | | | |
| Investment securities | | | | 285,147 | | |
| Futures contracts | | | | (5,166) | | |
| Total net realized gain (loss) | | | | | | 279,981 |
| Change in net unrealized appreciation (depreciation) on | | | | |
| investment securities | | | | | | 444,357 |
| Net gain (loss) | | | | | | 724,338 |
| Net increase (decrease) in net assets resulting from | | | | |
| operations | | | | $ | | 3,951,455 |
See accompanying notes which are an integral part of the financial statements.
| Statement of Changes in Net Assets | | | | | | | | |
| | | | | Year ended | | | | Year ended |
| | | | | August 31, | | | | August 31, |
| | | | | 2005 | | | | 2004 |
| Increase (Decrease) in Net Assets | | | | | | | | |
| Operations | | | | | | | | |
| Net investment income | | $ | | 3,227,117 | | $ | | 2,802,486 |
| Net realized gain (loss) | | | | 279,981 | | | | 463,856 |
| Change in net unrealized appreciation (depreciation) . | | | | 444,357 | | | | 1,209,249 |
| Net increase (decrease) in net assets resulting | | | | | | | | |
| from operations | | | | 3,951,455 | | | | 4,475,591 |
| Distributions to shareholders from net investment income . | | | | (3,235,508) | | | | (2,795,363) |
| Distributions to shareholders from net realized gain | | | | (377,090) | | | | (406,255) |
| Total distributions | | | | (3,612,598) | | | | (3,201,618) |
| Share transactions | | | | | | | | |
| Proceeds from sales of shares | | | | 34,309,224 | | | | 29,031,760 |
| Reinvestment of distributions | | | | 2,144,524 | | | | 2,011,588 |
| Cost of shares redeemed | | | | (14,386,971) | | | | (22,721,013) |
| Net increase (decrease) in net assets resulting from | | | | | | | | |
| share transactions | | | | 22,066,777 | | | | 8,322,335 |
| Redemption fees | | | | 977 | | | | 3,125 |
| Total increase (decrease) in net assets | | | | 22,406,611 | | | | 9,599,433 |
| |
| Net Assets | | | | | | | | |
| Beginning of period | | | | 78,288,870 | | | | 68,689,437 |
| End of period (including undistributed net investment | | | | | | | | |
| income of $16,823 and undistributed net investment | | | | | | | | |
| income of $18,878, respectively) | | $ | | 100,695,481 | | $ | | 78,288,870 |
| |
| Other Information | | | | | | | | |
| Shares | | | | | | | | |
| Sold | | | | 2,973,441 | | | | 2,514,738 |
| Issued in reinvestment of distributions | | | | 185,788 | | | | 174,888 |
| Redeemed | | | | (1,246,428) | | | | (1,985,119) |
| Net increase (decrease) | | | | 1,912,801 | | | | 704,507 |
See accompanying notes which are an integral part of the financial statements.
17 Annual Report
| Financial Highlights | | | | | | | | | | | | |
| |
| Years ended August 31, | | 2005 | | 2004 | | 2003 | | 2002 | | | | 2001 |
| Selected Per Share Data | | | | | | | | | | | | |
| Net asset value, | | | | | | | | | | | | |
| beginning of period | | $ 11.56 | | $ 11.32 | | $ 11.50 | | $ 11.26 | | | | $ 10.72 |
| Income from Investment | | | | | | | | | | | | |
| Operations | | | | | | | | | | | | |
| Net investment incomeB | | 417 | | .427 | | .435 | | .444D | | | | .472 |
| Net realized and unrealized | | | | | | | | | | | | |
| gain (loss) | | 087 | | .306 | | (.090) | | .254D | | | | .542 |
| Total from investment | | | | | | | | | | | | |
| operations | | 504 | | .733 | | .345 | | .698 | | | | 1.014 |
| Distributions from net investment | | | | | | | | | | | | |
| income | | (.419) | | (.427) | | (.435) | | (.443) | | | | (.475) |
| Distributions from net realized | | | | | | | | | | | | |
| gain | | (.055) | | (.066) | | (.090) | | (.015) | | | | (.001) |
| Total distributions | | (.474) | | (.493) | | (.525) | | (.458) | | | | (.476) |
| Redemption fees added to paid | | | | | | | | | | | | |
| in capitalB | | —E | | —E | | —E | | —E | | | | .002 |
| Net asset value, end of period . | | $ 11.59 | | $ 11.56 | | $ 11.32 | | $ 11.50 | | | | $ 11.26 |
| Total ReturnA | | 4.46% | | 6.58% | | 3.01% | | 6.38% | | | | 9.70% |
| Ratios to Average Net AssetsC | | | | | | | | | | | | |
| Expenses before expense | | | | | | | | | | | | |
| reductions | | 55% | | .55% | | .55% | | .55% | | | | .55% |
| Expenses net of voluntary | | | | | | | | | | | | |
| waivers, if any | | 55% | | .55% | | .55% | | .55% | | | | .55% |
| Expenses net of all reductions | | .50% | | .53% | | .52% | | .48% | | | | .41% |
| Net investment income | | 3.62% | | 3.72% | | 3.77% | | 3.96%D | | | | 4.32% |
| Supplemental Data | | | | | | | | | | | | |
| Net assets, end of period | | | | | | | | | | | | |
| (000 omitted) | | $100,695 | | $78,289 | | $68,689 | | $66,105 | | $50,716 |
| Portfolio turnover rate | | 13% | | 14% | | 19% | | 30% | | | | 24% |
A Total returns would have been lower had certain expenses not been reduced during the periods shown.
B Calculated based on average shares outstanding during the period.
C Expense ratios reflect operating expenses of the fund. Expenses before reductions do not reflect amounts reimbursed by the investment adviser or
reductions from brokerage service arrangements or other expense offset arrangements and do not represent the amount paid by the fund during
periods when reimbursements or reductions occur. Expenses net of any voluntary waivers reflect expenses after reimbursement by the investment
adviser but prior to reductions from brokerage service arrangements or other expense offset arrangements. Expenses net of all reductions represent
the net expenses paid by the fund.
D Effective September 1, 2001, the fund adopted the provisions of the AICPA Audit and Accounting Guide for Investment Companies and began
amortizing premium and discount on all debt securities. Per share data and ratios for periods prior to adoption have not been restated to reflect
this change.
E Amount represents less than $.001 per share.
|
See accompanying notes which are an integral part of the financial statements.
| | Fidelity Arizona Municipal Money Market Fund
Investment Changes/Performance
|
| Maturity Diversification | | | | | | |
| Days | | % of fund’s | | % of fund’s | | % of fund’s |
| | | investments | | investments | | investments |
| | | 8/31/05 | | 2/28/05 | | 8/31/04 |
| 0 – 30 | | 97.6 | | 88.5 | | 92.7 |
| 31 – 90 | | 1.7 | | 3.6 | | 0.0 |
| 91 – 180 | | 0.7 | | 2.8 | | 4.1 |
| 181 – 397 | | 0.0 | | 5.1 | | 3.2 |
| Weighted Average Maturity | | | | | | |
| | | 8/31/05 | | 2/28/05 | | 8/31/04 |
| Fidelity Arizona Municipal | | | | | | |
| Money Market Fund | | 9 Days | | 20 Days | | 18 Days |
| All Tax Free Money Market | | | | | | |
| Funds Average* | | 28 Days | | 28 Days | | 36 Days |

| Current and Historical Seven Day Yields | | | | | | |
| | | 8/29/05 | | 5/30/05 | | 2/28/05 | | 11/29/04 | | 8/30/04 |
| Fidelity Arizona Municipal | | | | | | | | | | |
| Money Market Fund | | 2.07% | | 2.44% | | 1.38% | | 1.19% | | 0.85% |
Yield refers to the income paid by the fund over a given period. Yields for money market funds are usually for seven day periods, as they are here, though they are expressed as annual percentage rates. Past performance is no guarantee of future results. Yield will vary and it is possible to lose money by investing in the fund.
*Source: iMoneyNet, Inc.
Annual Report
| Fidelity Arizona Municipal Money Market Fund | | | | |
| Investments August 31, 2005 | | | | |
| Showing Percentage of Net Assets | | | | | | |
| |
| Municipal Securities 95.1% | | | | | | |
| | | Principal | | | | Value |
| | | Amount | | | | (Note 1) |
| Arizona – 92.9% | | | | | | |
| Arizona Health Facilities Auth. Rev.: | | | | | | |
| (Banner Health Proj.): | | | | | | |
| Series 2005 B, 2.35% (FGIC Insured), VRDN (c) | | $ 4,500,000 | | $ | | 4,500,000 |
| Series 2005 C, 2.31% (FGIC Insured), VRDN (c) | | 3,000,000 | | | | 3,000,000 |
| (Royal Oaks Life Care Cmnty. Proj.) 2.49%, LOC Lasalle | | | | | | |
| Bank NA, VRDN (c) | | 5,000,000 | | | | 5,000,000 |
| (Southwest Behavioral Health Services, Inc. Proj.) 2.42%, | | | | | | |
| LOC JPMorgan Chase Bank, VRDN (c) | | 1,930,000 | | | | 1,930,000 |
| Series 2005 A, 2.35% (MBIA Insured), VRDN (c) | | 6,500,000 | | | | 6,500,000 |
| Arizona School Facilities Board Ctfs. of Prtn. Participating | | | | | | |
| VRDN: | | | | | | |
| Series IXIS 05 5, 2.53% (Liquidity Facility CDC Fin.-CDC | | | | | | |
| IXIS) (c)(f) | | 1,800,000 | | | | 1,800,000 |
| Series PT 2800, 2.53% (Liquidity Facility Merrill Lynch & Co., | | | | |
| Inc.) (c)(f) | | 3,000,000 | | | | 3,000,000 |
| Series Putters 735, 2.53% (Liquidity Facility Dresdner Bank | | | | |
| AG) (c)(f) | | 3,670,000 | | | | 3,670,000 |
| Series Putters 940, 2.53% (Liquidity Facility JPMorgan Chase | | | | |
| Bank) (c)(f) | | 2,000,000 | | | | 2,000,000 |
| Series RF 04 2, 2.57% (Liquidity Facility Bank of New York, | | | | |
| New York) (c)(f) | | 1,375,000 | | | | 1,375,000 |
| Series ROC II R 4069, 2.53% (Liquidity Facility Citigroup | | | | | | |
| Global Markets Hldgs., Inc.) (c)(f) | | 1,700,000 | | | | 1,700,000 |
| Arizona School Facilities Board State School Impt. Rev. | | | | | | |
| Participating VRDN: | | | | | | |
| Series MS 00 497, 2.52% (Liquidity Facility Morgan | | | | | | |
| Stanley) (c)(f) | | 1,047,000 | | | | 1,047,000 |
| Series Putters 483, 2.53% (Liquidity Facility PNC Bank NA, | | | | |
| Pittsburgh) (c)(f) | | 1,480,000 | | | | 1,480,000 |
| Series Putters 484, 2.53% (Liquidity Facility JPMorgan Chase | | | | |
| Bank) (c)(f) | | 1,480,000 | | | | 1,480,000 |
| Arizona State Univ. Ctfs. of Prtn. Participating VRDN Series | | | | | | |
| Putters 694, 2.53% (Liquidity Facility JPMorgan Chase & | | | | | | |
| Co.) (c)(f) | | 2,630,000 | | | | 2,630,000 |
| Arizona State Univ. Revs. Participating VRDN: | | | | | | |
| Series PT 2264, 2.53% (Liquidity Facility Merrill Lynch & Co., | | | | |
| Inc.) (c)(f) | | 4,000,000 | | | | 4,000,000 |
| Series ROC II R174, 2.53% (Liquidity Facility Citibank | | | | | | |
| NA) (c)(f) | | 3,700,000 | | | | 3,700,000 |
| Arizona Tourism & Sports Auth. Tax Rev. Participating VRDN: | | | | |
| Series PT 2312, 2.53% (Liquidity Facility Merrill Lynch & Co., | | | | |
| Inc.) (c)(f) | | 1,600,000 | | | | 1,600,000 |
See accompanying notes which are an integral part of the financial statements.
Annual Report
| Municipal Securities continued | | | | | | |
| | | Principal | | | | Value |
| | | Amount | | | | (Note 1) |
| Arizona – continued | | | | | | |
| Arizona Tourism & Sports Auth. Tax Rev. Participating VRDN: | | | | | | |
| – continued | | | | | | |
| Series Putters 690, 2.53% (Liquidity Facility JPMorgan Chase | | | | | | |
| & Co.) (c)(f) | | $ 1,700,000 | | $ | | 1,700,000 |
| Arizona Trans. Board Hwy. Rev. Participating VRDN Series | | | | | | |
| ROC II R1038, 2.53% (Liquidity Facility Citigroup Global | | | | | | |
| Markets Hldgs., Inc.) (c)(f) | | 2,030,000 | | | | 2,030,000 |
| Arizona Wtr. Infrastructure Fin. Auth. Rev. Participating VRDN | | | | | | |
| Series PT 2237, 2.53% (Liquidity Facility Merrill Lynch & Co., | | | | | | |
| Inc.) (c)(f) | | 1,500,000 | | | | 1,500,000 |
| Casa Grande Indl. Dev. Auth. Indl. Dev. Rev. (Price | | | | | | |
| Companies, Inc. Proj.) Series A, 2.55%, LOC Bank of | | | | | | |
| America NA, VRDN (c)(e) | | 2,060,000 | | | | 2,060,000 |
| Central Arizona Wtr. Conservation District Contract Rev. Bonds | | | | | | |
| (Central Arizona Proj.) Series A, 5.4% 11/1/05 | | 3,450,000 | | | | 3,465,342 |
| Chandler Indl. Dev. Auth. Indl. Dev. Rev. (Red Rock Stamping | | | | | | |
| Co. Proj.) Series 2000, 2.64%, LOC Key Bank NA, | | | | | | |
| VRDN (c)(e) | | 2,255,000 | | | | 2,255,000 |
| Cochise County Poll. Cont. Rev. Solid Waste Disp. Rev. Bonds | | | | | | |
| (Arizona Elec. Pwr. Coop. Proj.) 2.3%, tender 9/1/05 | | | | | | |
| (Nat’l. Rural Utils. Coop. Fin. Corp. Guaranteed) (c)(e) | | 4,000,000 | | | | 4,000,000 |
| Coconino County Poll. Cont. Corp. Rev. (Arizona Pub. Svc. Co. | | | | | | |
| Navajo Proj.) Series 1994 A, 2.41%, LOC KBC Bank NV, | | | | | | |
| VRDN (c)(e) | | 5,400,000 | | | | 5,400,000 |
| Flagstaff Indl. Dev. Auth. Solid Waste Disp. Rev. (Norton Envir., | | | | | | |
| Inc. Proj.) Series 1997, 2.64%, LOC Key Bank NA, | | | | | | |
| VRDN (c)(e) | | 2,200,000 | | | | 2,200,000 |
| Glendale Indl. Dev. Auth. Indl. Dev. Rev. (Superior Bedding Co. | | | | | | |
| Proj.) Series 1994, 2.66%, LOC Harris NA, VRDN (c)(e) | | 700,000 | | | | 700,000 |
| Maricopa County Indl. Dev. Auth. Indl. Dev. Rev.: | | | | | | |
| Bonds (American Wtr. Corp. Proj.) Series 1988, 2.8% tender | | | | | | |
| 9/7/05, CP mode (e) | | 1,600,000 | | | | 1,600,000 |
| (Clayton Homes, Inc. Proj.) Series 1998, 2.59%, LOC U.S. | | | | | | |
| Bank NA, Minnesota, VRDN (c)(e) | | 1,000,000 | | | | 1,000,000 |
| Maricopa County Indl. Dev. Auth. Multi-family Hsg. Rev.: | | | | | | |
| (Glenn Oaks Apts. Proj.) Series 2001, 2.6%, LOC Fannie | | | | | | |
| Mae, VRDN (c)(e) | | 3,299,675 | | | | 3,299,675 |
| (Ranchwood Apt. Proj.) Series 2001 A, 2.55%, LOC Fannie | | | | | | |
| Mae, VRDN (c)(e) | | 5,000,000 | | | | 5,000,000 |
| (San Angelin Apts. Proj.) 2.57%, LOC Fannie Mae, | | | | | | |
| VRDN (c)(e) | | 3,100,000 | | | | 3,100,000 |
| (San Lucas Apts. Proj.) 2.57%, LOC Fannie Mae, | | | | | | |
| VRDN (c)(e) | | 1,700,000 | | | | 1,700,000 |
See accompanying notes which are an integral part of the financial statements.
Annual Report
| Fidelity Arizona Municipal Money Market Fund | | | | | | |
| Investments continued | | | | | | | | | | |
| |
| Municipal Securities continued | | | | | | | | |
| | | | | | | Principal | | | | Value |
| | | | | | | Amount | | | | (Note 1) |
| Arizona – continued | | | | | | | | | | |
| Maricopa County Indl. Dev. Auth. Multi-family Hsg. Rev.: - | | | | | | | | |
| continued | | | | | | | | | | |
| (San Martin Apts. Proj.): | | | | | | | | | | |
| Series A1, 2.55%, LOC Fannie Mae, VRDN (c)(e) | | $ | | 2,700,000 | | $ | | 2,700,000 |
| Series A2, 2.55%, LOC Fannie Mae, VRDN (c)(e) | | | | 720,000 | | | | 720,000 |
| (San Miguel Apts. Proj.) 2.57%, LOC Fannie Mae, | | | | | | | | |
| VRDN (c)(e) | | | | | | 1,300,000 | | | | 1,300,000 |
| (San Remo Apts. Proj.) 2.55%, LOC Fannie Mae, | | | | | | | | |
| VRDN (c)(e) | | | | | | 3,400,000 | | | | 3,400,000 |
| (Village Square Apts. Proj.) 2.57%, LOC Fannie Mae, | | | | | | | | |
| VRDN (c)(e) | | | | | | 1,600,000 | | | | 1,600,000 |
| Maricopa County Indl. Dev. Auth. Single Family Mtg. Rev. | | | | | | | | |
| Participating VRDN: | | | | | | | | | | |
| Series Floaters 707, 2.57% (Liquidity Facility Morgan | | | | | | | | |
| Stanley) (c)(e)(f) | | | | | | 2,000,000 | | | | 2,000,000 |
| Series Merlots 01 A126, 2.45% (Liquidity Facility Wachovia | | | | | | |
| Bank NA) (c)(e)(f) | | | | | | 105,000 | | | | 105,000 |
| Series MS 1165, 2.57% (Liquidity Facility Morgan | | | | | | | | |
| Stanley) (c)(e)(f) | | | | | | 2,000,000 | | | | 2,000,000 |
| Maricopa County Indl. Dev. Auth. Solid Waste Disp. Rev. | | | | | | | | |
| Participating VRDN Series MT 48, 2.6% (Liquidity Facility | | | | | | |
| Lloyds TSB Bank PLC) (c)(e)(f) | | | | | | 1,770,000 | | | | 1,770,000 |
| McAllister Academic Village LLC Rev. (Arizona State Univ. | | | | | | | | |
| McAllister Academic Village Proj.) Series A, 2.35% (AMBAC | | | | | | |
| Insured), VRDN (c) | | | | | | 5,500,000 | | | | 5,500,000 |
| Phoenix Civic Impt. Board Arpt. Rev. Participating VRDN | | | | | | | | |
| Series Merlots 02 A28, 2.45% (Liquidity Facility Wachovia | | | | | | |
| Bank NA) (c)(e)(f) | | | | | | 1,280,000 | | | | 1,280,000 |
| Phoenix Civic Impt. Corp. Excise Tax Rev.: | | | | | | | | | | |
| Participating VRDN Series EGL 03 28, 2.53% (Liquidity | | | | | | | | |
| Facility Citibank NA, New York) (c)(f) | | | | | | 1,300,000 | | | | 1,300,000 |
| Series 1995, 2.39%, LOC Landesbank Hessen-Thuringen, | | | | | | |
| VRDN (c)(e) | | | | | | 17,200,000 | | | �� | 17,200,000 |
| Phoenix Civic Impt. Corp. Transit Excise Tax Rev. Participating | | | | | | |
| VRDN: | | | | | | | | | | |
| Series EGL 7050040, 2.53% (Liquidity Facility Citibank | | | | | | | | |
| NA) (c)(f) | | | | | | 1,800,000 | | | | 1,800,000 |
| Series EGL 720050020, 2.53% (Liquidity Facility Citibank | | | | | | |
| NA) (c)(f) | | | | | | 1,800,000 | | | | 1,800,000 |
| Series PT 2454, 2.53% (Liquidity Facility Merrill Lynch & Co., | | | | | | |
| Inc.) (c)(f) | | | | | | 5,420,000 | | | | 5,420,000 |
| |
| |
| |
| See accompanying notes which are an integral part of the financial statements. | | | | |
| |
| Annual Report | | 22 | | | | | | | | |
| Municipal Securities continued | | | | | | |
| | | Principal | | | | Value |
| | | Amount | | | | (Note 1) |
| Arizona – continued | | | | | | |
| Phoenix Civic Impt. Corp. Wastewtr. Sys. Rev. Participating | | | | | | |
| VRDN: | | | | | | |
| Series MS 991, 2.52% (Liquidity Facility Morgan | | | | | | |
| Stanley) (c)(f) | | $ 1,500,000 | | $ | | 1,500,000 |
| Series ROC II R6039, 2.53% (Liquidity Facility Citibank | | | | | | |
| NA) (c)(f) | | 3,070,000 | | | | 3,070,000 |
| Phoenix Civic Impt. Corp. Wtr. Sys. Rev. Participating VRDN: | | | | | | |
| Series BS 9063, 2.41% (Liquidity Facility Bear Stearns | | | | | | |
| Companies, Inc.) (c)(f) | | 2,000,000 | | | | 2,000,000 |
| Series EGL 7050056, 2.53% (Liquidity Facility Citibank | | | | | | |
| NA) (c)(f) | | 2,000,000 | | | | 2,000,000 |
| Phoenix Indl. Dev. Auth. Multi-family Hsg. Rev.: | | | | | | |
| (Bell Square Apt. Proj.) Series 1995, 2.45%, LOC Gen. Elec. | | | | | | |
| Cap. Corp., VRDN (c) | | 1,000,000 | | | | 1,000,000 |
| (Westward Ho Apts. Proj.) Series 2003 A, 2.59%, LOC Fleet | | | | | | |
| Nat’l. Bank, VRDN (c)(e) | | 1,700,000 | | | | 1,700,000 |
| Phoenix Indl. Dev. Auth. Rev.: | | | | | | |
| (Independent Newspaper, Inc. Proj.) Series 2000, 2.64%, | | | | | | |
| LOC Wachovia Bank NA, VRDN (c)(e) | | 900,000 | | | | 900,000 |
| (Laura Dozer Ctr. Proj.) 2.65%, LOC JPMorgan Chase Bank, | | | | | | |
| VRDN (c) | | 1,000,000 | | | | 1,000,000 |
| (Phoenix Expansion Proj.) 2.7%, LOC JPMorgan Chase | | | | | | |
| Bank, VRDN (c)(e) | | 2,340,000 | | | | 2,340,000 |
| (Plastican Proj.) Series 1997, 2.4%, LOC Fleet Bank NA, | | | | | | |
| VRDN (c)(e) | | 2,740,000 | | | | 2,740,000 |
| (Swift Aviation Svcs., Inc. Proj.) 2.42%, LOC U.S. Bank NA, | | | | | | |
| Minnesota, VRDN (c)(e) | | 5,395,000 | | | | 5,395,000 |
| Phoenix Indl. Dev. Auth. Single Family Mtg. Rev. Participating | | | | | | |
| VRDN: | | | | | | |
| Series Merlots 01 A23, 2.45% (Liquidity Facility Wachovia | | | | | | |
| Bank NA) (c)(e)(f) | | 220,000 | | | | 220,000 |
| Series PT 1082, 2.57% (Liquidity Facility Merrill Lynch & Co., | | | | | | |
| Inc.) (c)(e)(f) | | 840,000 | | | | 840,000 |
| Pima County Indl. Dev. Auth. Indl. Rev. Participating VRDN | | | | | | |
| Series LB 00 L21, 2.48% (Liquidity Facility Lehman Brothers | | | | | | |
| Hldgs., Inc.) (c)(f) | | 2,575,000 | | | | 2,575,000 |
| Pima County Indl. Dev. Auth. Multi-family Hsg. Rev. (River | | | | | | |
| Point Proj.) Series 2001, 2.55%, LOC Fannie Mae, | | | | | | |
| VRDN (c)(e) | | 6,000,000 | | | | 6,000,000 |
| Pima County Indl. Dev. Auth. Rev. (El Dorado Hosp. Proj.) | | | | | | |
| 2.52%, LOC Branch Banking & Trust Co., VRDN (c) | | 1,600,000 | | | | 1,600,000 |
See accompanying notes which are an integral part of the financial statements.
Annual Report
| Fidelity Arizona Municipal Money Market Fund | | | | | | |
| Investments continued | | | | | | | | |
| |
| Municipal Securities continued | | | | | | | | |
| | | | | Principal | | | | Value |
| | | | | Amount | | | | (Note 1) |
| Arizona – continued | | | | | | | | |
| Salt River Proj. Agric. Impt. & Pwr. District Elec. Sys. Rev.: | | | | | | | | |
| Participating VRDN: | | | | | | | | |
| Series MS 1172, 2.39% (Liquidity Facility Morgan | | | | | | | | |
| Stanley) (c)(f) | | $ | | 2,200,000 | | $ | | 2,200,000 |
| Series PT 1512, 2.53% (Liquidity Facility Merrill Lynch & | | | | | | | | |
| Co., Inc.) (c)(f) | | | | 1,200,000 | | | | 1,200,000 |
| Series ROC II R1002, 2.53% (Liquidity Facility Citigroup | | | | | | | | |
| Global Markets Hldgs., Inc.) (c)(f) | | | | 1,285,000 | | | | 1,285,000 |
| Series ROC II R1003, 2.53% (Liquidity Facility Citigroup | | | | | | | | |
| Global Markets Hldgs., Inc.) (c)(f) | | | | 1,280,000 | | | | 1,280,000 |
| Series SG 03 160, 2.53% (Liquidity Facility Societe | | | | | | | | |
| Generale) (c)(f) | | | | 1,390,000 | | | | 1,390,000 |
| Series 1997 B: | | | | | | | | |
| 2.5% 9/6/05, CP | | | | 3,300,000 | | | | 3,300,000 |
| 2.7% 9/7/05, CP | | | | 2,100,000 | | | | 2,100,000 |
| Series 2004 C: | | | | | | | | |
| 2.75% 9/15/05, CP | | | | 1,500,000 | | | | 1,500,000 |
| 2.8% 9/15/05, CP | | | | 1,900,000 | | | | 1,900,000 |
| Scottsdale Indl. Dev. Auth. Rev. (Notre Dame Preparatory | | | | | | | | |
| School and Foundation for Sr. Living Proj.) Series 2001 B, | | | | | | | | |
| 2.5%, LOC JPMorgan Chase Bank, VRDN (c) | | | | 1,400,000 | | | | 1,400,000 |
| Sun Devil Energy Ctr. LLC Rev. (Arizona State Univ. Proj.) | | | | | | | | |
| 2.37% (FGIC Insured), VRDN (c) | | | | 1,600,000 | | | | 1,600,000 |
| Tempe Indl. Dev. Auth. Rev. (ASUF Brickyard Proj.) Series 2004 | | | | | | |
| A, 2.5%, LOC Bank of America NA, VRDN (c) | | | | 3,640,000 | | | | 3,640,000 |
| Univ. of Arizona Ctfs. of Prtn. (Univ. of Arizona Projs.) | | | | | | | | |
| Series 2004 B, 2.36% (AMBAC Insured), VRDN (c) | | | | 2,300,000 | | | | 2,300,000 |
| Yavapai County Indl. Dev. Auth. Indl. Dev. Rev. (Oxycal Lab. | | | | | | | | |
| Proj.) Series 1999 A, 2.65%, LOC Wells Fargo Bank NA, | | | | | | | | |
| San Francisco, VRDN (c)(e) | | | | 1,000,000 | | | | 1,000,000 |
| | | | | | | | | 202,292,017 |
| |
| Puerto Rico 0.6% | | | | | | | | |
| Puerto Rico Govt. Dev. Bank 2.85% 1/30/06, LOC Societe | | | | | | | | |
| Generale, CP (b) | | | | 1,400,000 | | | | 1,400,000 |
See accompanying notes which are an integral part of the financial statements.
| Municipal Securities continued | | | | |
| | | Shares | | Value |
| | | | | (Note 1) |
| Other – 1.6% | | | | |
| Fidelity Municipal Cash Central Fund, 2.49% (a)(d) | | 3,410,333 | | $ 3,410,333 |
| |
| TOTAL INVESTMENT PORTFOLIO 95.1% | | | | |
| (Cost $207,102,350) | | | | 207,102,350 |
| |
| NET OTHER ASSETS – 4.9% | | | | 10,717,107 |
| NET ASSETS 100% | | $ | | 217,819,457 |
Security Type Abbreviations
CP COMMERCIAL PAPER
VRDN — VARIABLE RATE DEMAND NOTE
(a) Affiliated fund that is available only to investment companies and other accounts managed by Fidelity Investments. The rate quoted is the annualized seven-day yield of the fund at period end. A complete listing of the fund’s holdings as of its most recent quarter end is available upon request.
(b) Security exempt from registration under Rule 144A of the Securities Act of 1933. These securities may be resold in transactions exempt from registration, normally to qualified institutional buyers. At the period end, the value of these securities amounted to $1,400,000 or 0.6% of net assets.
(c) The coupon rate shown on floating or adjustable rate securities represents the rate at period end.
(d) Information in this report regarding holdings by state and security types does not reflect the holdings of the Fidelity Municipal Cash Central Fund.
(e) Private activity obligations whose interest is subject to the federal alternative minimum tax for individuals.
(f) Provides evidence of ownership in one or more underlying municipal bonds.
See accompanying notes which are an integral part of the financial statements.
25 Annual Report
| Fidelity Arizona Municipal Money Market Fund | | | | |
| |
| Financial Statements | | | | | | | | |
| |
| Statement of Assets and Liabilities | | | | | | | | |
| | | | | | | | | August 31, 2005 |
| |
| Assets | | | | | | | | |
| Investment in securities, at value (cost $207,102,350) | | | | | | | | |
| See accompanying schedule | | | | | | $ | | 207,102,350 |
| Cash | | | | | | | | 10,349,961 |
| Receivable for fund shares sold | | | | | | | | 2,862,515 |
| Interest receivable | | | | | | | | 756,512 |
| Other receivables | | | | | | | | 23,556 |
| Total assets | | | | | | | | 221,094,894 |
| |
| Liabilities | | | | | | | | |
| Payable for investments purchased | | $ | | 2,200,000 | | | | |
| Payable for fund shares redeemed | | | | 979,976 | | | | |
| Distributions payable | | | | 6,680 | | | | |
| Accrued management fee | | | | 88,712 | | | | |
| Other affiliated payables | | | | 69 | | | | |
| Total liabilities | | | | | | | | 3,275,437 |
| |
| Net Assets | | | | | | $ | | 217,819,457 |
| Net Assets consist of: | | | | | | | | |
| Paid in capital | | | | | | $ | | 217,793,383 |
| Undistributed net investment income | | | | | | | | 19,254 |
| Accumulated undistributed net realized gain (loss) on | | | | | | | | |
| investments | | | | | | | | 6,820 |
| Net Assets, for 217,693,823 shares outstanding | | | | | | $ | | 217,819,457 |
| Net Asset Value, offering price and redemption price per | | | | | | |
| share ($217,819,457 ÷ 217,693,823 shares) | | | | | | $ | | 1.00 |
See accompanying notes which are an integral part of the financial statements.
| Statement of Operations | | | | | | |
| | | | | Year ended August 31, 2005 |
| |
| Investment Income | | | | | | |
| Interest | | | | $ | | 3,700,633 |
| |
| Expenses | | | | | | |
| Management fee | | $ | | 899,281 | | |
| Independent trustees’ compensation | | | | 877 | | |
| Total expenses before reductions | | | | 900,158 | | |
| Expense reductions | | | | (133,335) | | 766,823 |
| |
| Net investment income | | | | | | 2,933,810 |
| |
| Net realized gain (loss) on investment securities | | | | | | 6,668 |
| Net increase in net assets resulting from operations | | | | $ | | 2,940,478 |
See accompanying notes which are an integral part of the financial statements.
27 Annual Report
| Fidelity Arizona Municipal Money Market Fund | | | | |
| Financial Statements continued | | | | | | | | |
| |
| Statement of Changes in Net Assets | | | | | | | | |
| | | | | Year ended | | | | Year ended |
| | | | | August 31, | | | | August 31, |
| | | | | 2005 | | | | 2004 |
| Increase (Decrease) in Net Assets | | | | | | | | |
| Operations | | | | | | | | |
| Net investment income | | $ | | 2,933,810 | | $ | | 856,308 |
| Net realized gain (loss) | | | | 6,668 | | | | 43,224 |
| Net increase in net assets resulting | | | | | | | | |
| from operations | | | | 2,940,478 | | | | 899,532 |
| Distributions to shareholders from net investment income . | | | | (2,931,883) | | | | (856,308) |
| Share transactions at net asset value of $1.00 per share | | | | | | | | |
| Proceeds from sales of shares | | | | 502,664,387 | | | | 284,737,103 |
| Reinvestment of distributions | | | | 2,899,293 | | | | 847,210 |
| Cost of shares redeemed | | | | (444,707,485) | | | | (262,790,710) |
| Net increase (decrease) in net assets and shares | | | | | | | | |
| resulting from share transactions | | | | 60,856,195 | | | | 22,793,603 |
| Total increase (decrease) in net assets | | | | 60,864,790 | | | | 22,836,827 |
| |
| Net Assets | | | | | | | | |
| Beginning of period | | | | 156,954,667 | | | | 134,117,840 |
| End of period (including undistributed net investment | | | | | | | | |
| income of $19,254 and undistributed net investment | | | | | | | | |
| income of $0, respectively) | | $ | | 217,819,457 | | $ | | 156,954,667 |
See accompanying notes which are an integral part of the financial statements.
| Financial Highlights | | | | | | | | | | | | | | | | | | | | |
| |
| Years ended August 31, | | | | 2005 | | | | 2004 | | | | 2003 | | | | 2002 | | | | 2001 |
| Selected Per Share Data | | | | | | | | | | | | | | | | | | | | |
| Net asset value, | | | | | | | | | | | | | | | | | | | | |
| beginning of period | | $ | | 1.00 | | $ | | 1.00 | | $ | | 1.00 | | $ | | 1.00 | | $ | | 1.00 |
| Income from Investment | | | | | | | | | | | | | | | | | | | | |
| Operations | | | | | | | | | | | | | | | | | | | | |
| Net investment income | | | | 016 | | | | .006 | | | | .008 | | | | .013 | | | | .032 |
| Net realized and unrealized | | | | | | | | | | | | | | | | | | | | |
| gain (loss)D | | | | — | | | | — | | | | — | | | | — | | | | — |
| Total from investment | | | | | | | | | | | | | | | | | | | | |
| operations | | | | 016 | | | | .006 | | | | .008 | | | | .013 | | | | .032 |
| Distributions from net investment | | | | | | | | | | | | | | | | | | | | |
| income | | | | (.016) | | | | (.006) | | | | (.008) | | | | (.013) | | | | (.032) |
| Distributions from net realized | | | | | | | | | | | | | | | | | | | | |
| gain | | | | — | | | | — | | | | —D | | | | — | | | | — |
| Total distributions | | | | (.016) | | | | (.006) | | | | (.008) | | | | (.013) | | | | (.032) |
| Net asset value, end of period . $ | | 1.00 | | $ | | 1.00 | | $ | | 1.00 | | $ | | 1.00 | | $ | | 1.00 |
| Total ReturnA,B | | | | 1.60% | | | | .60% | | | | .86% | | | | 1.30% | | | | 3.23% |
| Ratios to Average Net AssetsC | | | | | | | | | | | | | | | | | | | | |
| Expenses before expense | | | | | | | | | | | | | | | | | | | | |
| reductions | | | | 50% | | | | .50% | | | | .50% | | | | .50% | | | | .50% |
| Expenses net of voluntary | | | | | | | | | | | | | | | | | | | | |
| waivers, if any | | | | 50% | | | | .50% | | | | .50% | | | | .50% | | | | .50% |
| Expenses net of all reductions | | | | .43% | | | | .49% | | | | .48% | | | | .45% | | | | .47% |
| Net investment income | | | | 1.63% | | | | .60% | | | | .82% | | | | 1.27% | | | | 3.19% |
| Supplemental Data | | | | | | | | | | | | | | | | | | | | |
| Net assets, end of period | | | | | | | | | | | | | | | | | | | | |
| (000 omitted) | | $217,819 | | $156,955 | | $134,118 | | $132,208 | | $101,853 |
A Total returns would have been lower had certain expenses not been reduced during the periods shown.
B Total returns do not include the effect of the former account closeout fee.
C Expense ratios reflect operating expenses of the fund. Expenses before reductions do not reflect amounts reimbursed by the investment adviser or
reductions from brokerage service arrangements or other expense offset arrangements and do not represent the amount paid by the fund during
periods when reimbursements or reductions occur. Expenses net of any voluntary waivers reflect expenses after reimbursement by the investment
adviser but prior to reductions from brokerage service arrangements or other expense offset arrangements. Expenses net of all reductions represent
the net expenses paid by the fund.
D Amount represents less than $.001 per share.
|
See accompanying notes which are an integral part of the financial statements.
29 Annual Report
Notes to Financial Statements
For the period ended August 31, 2005
|
1. Significant Accounting Policies.
Fidelity Arizona Municipal Income Fund (the income fund) is a fund of Fidelity Union Street Trust. On July 21, 2005, the Board of Trustees approved a change in the name of Spartan Arizona Municipal Income Fund to Fidelity Arizona Municipal Income Fund effective August 15, 2005. Fidelity Arizona Municipal Money Market Fund (the money market fund) is a fund of Fidelity Union Street Trust II. Each trust is registered under the Investment Company Act of 1940, as amended (the 1940 Act), as an open end management investment company. Fidelity Union Street Trust and Fidelity Union Street Trust II (the trusts) are organized as a Massachusetts business trust and a Delaware statutory trust, respectively. The income fund is a non diversified fund. Each fund is authorized to issue an unlimited number of shares. Each fund may be affected by eco nomic and political developments in the state of Arizona. The financial statements have been prepared in conformity with accounting principles generally accepted in the United States of America, which require management to make certain estimates and assump tions at the date of the financial statements. The following summarizes the significant accounting policies of the income fund and the money market fund:
Security Valuation. Net asset value per share (NAV calculation) is calculated as of the close of business of the New York Stock Exchange, normally 4:00 p.m. Eastern time. For the income fund, debt securities, including restricted securities, are valued on the basis of information provided by a pricing service. Pricing services use valuation matrices that incorporate both dealer supplied valuations and valuation models. If prices are not readily available or do not accurately reflect fair value for a security, or if a security’s value has been materially affected by events occurring after the close of the exchange or market on which the security is principally traded, that security may be valued by another method that the Board of Trustees believes accurately reflects fair value. A security’s valuation may differ depending on the method used for determining value. Price movements in futures contracts and ADRs, market and trading trends, the bid/ask quotes of brokers and off exchange institutional trading may be reviewed in the course of making a good faith determination of a security’s fair value. Short term securities with remaining maturities of sixty days or less for which quotations are not readily available are valued on the basis of amortized cost. Investments in open end investment compa nies are valued at their net asset value each business day.
As permitted under Rule 2a 7 of the 1940 Act, and certain conditions therein, securities owned by the money market fund are valued initially at cost and thereafter assume a constant amortization to maturity of any discount or premium.
Investment Transactions and Income. Security transactions are accounted for as of trade date. Gains and losses on securities sold are determined on the basis of identified cost. Interest income is accrued as earned. Interest income includes coupon interest and amortization of premium and accretion of discount on debt securities.
1. Significant Accounting Policies continued
Expenses. Most expenses of each trust can be directly attributed to a fund. Expenses which cannot be directly attributed are apportioned among each fund in the trust.
Income Tax Information and Distributions to Shareholders. Each year, each fund intends to qualify as a regulated investment company by distributing all of its taxable income and realized gains under Subchapter M of the Internal Revenue Code. As a result, no provision for income taxes is required in the accompanying financial statements.
Dividends are declared daily and paid monthly from net investment income. Distribu tions from realized gains, if any, are recorded on the ex dividend date. Income and capital gain distributions are determined in accordance with income tax regulations, which may differ from generally accepted accounting principles. In addition, certain funds will claim a portion of the payment made to redeeming shareholders as a distribution for income tax purposes.
Capital accounts within the financial statements are adjusted for permanent book tax differences. These adjustments have no impact on net assets or the results of operations. Temporary book tax differences will reverse in a subsequent period.
Book tax differences are primarily due to futures transactions, market discount, deferred trustees compensation and losses deferred due to wash sales.
The funds purchase municipal securities whose interest, in the opinion of the issuer, is free from federal income tax. There is no assurance that the Internal Revenue Service (IRS) will agree with this opinion. In the event the IRS determines that the issuer does not comply with relevant tax requirements, interest payments from a security could become federally taxable, possibly retroactively to the date the security was issued.
The tax basis components of distributable earnings and the federal tax cost as of period end were as follows for each fund:
| | | Cost for Federal | | | | | | | | Net Unrealized |
| | | Income Tax | | Unrealized | | | | Unrealized | | | | Appreciation/ |
| | | Purposes | | Appreciation | | | | Depreciation | | | | (Depreciation) |
| Fidelity Arizona Municipal | | | | | | | | | | | | |
| Income Fund | | $ 95,633,620 | | $3,920,799 | | | | $ (64,623) | | | | $3,856,176 |
| Fidelity Arizona Municipal | | | | | | | | | | | | |
| Money Market Fund | | 207,102,350 | | — | | | | — | | | | — |
| |
| |
| | | | | | | | | | | | | Undistributed |
| | | | | | | Undistributed | | | | Long-term |
| | | | | | | Ordinary Income | | | | Capital Gain |
| Fidelity Arizona Municipal Income Fund | | | | | | $ — | | | | $ 244,988 |
| Fidelity Arizona Municipal Money Market Fund | | | | | | 19,322 | | | | — |
Annual Report
Notes to Financial Statements continued
1. Significant Accounting Policies continued
Income Tax Information and Distributions to Shareholders continued
The tax character of distributions paid was as follows:
| August 31, 2005 | | | | Tax-exempt | | | | Long-term | | | | Total |
| | | | | Income | | | | Capital Gains | | | | |
| Fidelity Arizona Municipal Income Fund | | $ | | 3,235,508 | | $ | | 377,090 | | $ | | 3,612,598 |
| Fidelity Arizona Municipal Money | | | | | | | | | | | | |
| Market Fund | | | | 2,931,883 | | | | | | | | 2,931,883 |
| |
| August 31, 2004 | | | | Tax-exempt | | | | Long-term | | | | Total |
| | | | | Income | | | | Capital Gains | | | | |
| Fidelity Arizona Municipal Income Fund | | $ | | 2,795,363 | | $ | | 406,255 | | $ | | 3,201,618 |
| Fidelity Arizona Municipal Money | | | | | | | | | | | | |
| Market Fund | | | | 846,776 | | | | 9,532 | | | | 856,308 |
Short Term Trading (Redemption) Fees. Shares held in the income fund less than 30 days are subject to a redemption fee equal to .50% of the proceeds of the redeemed shares. All redemption fees, including any estimated redemption fees paid by Fidelity Management & Research Company (FMR), are retained by the fund and accounted for as an addition to paid in capital.
Delayed Delivery Transactions and When Issued Securities. Certain funds may purchase or sell securities on a delayed delivery or when issued basis. Payment and delivery may take place after the customary settlement period for that security. The price of the underlying securities and the date when the securities will be delivered and paid for are fixed at the time the transaction is negotiated. During the time a delayed delivery sell is outstanding, the contract is marked to market daily and equivalent deliverable securities are held for the transaction. The value of the securities purchased on a delayed delivery or when issued basis are identified as such in each applicable fund’s Schedule of Investments. Certain funds may receive compensation for interest forgone in the purchase of a delayed delivery or when issued security. With respect to purchase commitments, each applicable fund identifies securities as segregated in its records with a value at least equal to the amount of the commitment. Losses may arise due to changes in the value of the underlying securities or if the counterparty does not perform under the contract’s terms, or if the issuer does not issue the securities due to political, economic, or other factors.
2. Operating Policies continued
Futures Contracts. The income fund may use futures contracts to manage its exposure to the bond market and to fluctuations in interest rates. Buying futures tends to increase a fund’s exposure to the underlying instrument, while selling futures tends to decrease a fund’s exposure to the underlying instrument or hedge other fund investments. Losses may arise from changes in the value of the underlying instruments or if the counterparties do not perform under the contracts’ terms. Gains (losses) are realized upon the expiration or closing of the futures contracts. Futures contracts are valued at the settlement price established each day by the board of trade or exchange on which they are traded.
3. Purchases and Sales of Investments.
Purchases and sales of securities, other than short term securities and U.S. government securities, for the income fund aggregated $35,129,244 and $11,542,560, respectively.
4. Fees and Other Transactions with Affiliates.
Management Fee. FMR and its affiliates provides the funds with investment manage ment related services for which the funds pay a monthly management fee. FMR pays all other expenses, except the compensation of the independent Trustees and certain exceptions such as interest expense. The management fee paid to FMR by the funds is reduced by an amount equal to the fees and expenses paid by the funds to the indepen dent Trustees. Each fund’s management fee is equal to the following annual rate of average net assets:
| Fidelity Arizona Municipal Income Fund | | 55% |
| Fidelity Arizona Municipal Money Market Fund | | 50% |
Affiliated Central Funds. Certain funds may invest in Money Market Central Funds which seek preservation of capital and current income and are managed by Fidelity Investments Money Management, Inc. (FIMM) an affiliate of FMR.
The Money Market Central Funds do not pay a management fee. Income distributions earned by the funds are recorded as income in the accompanying financial statements. Distributions from the Central Funds are noted in the table below:
| | | | | Income |
| | | | | Distributions |
| Fidelity Arizona Municipal Money Market Fund | | $ | | 136,797 |
Annual Report
Notes to Financial Statements continued
5. Committed Line of Credit.
|
The income fund participates with other funds managed by FMR in a $4.2 billion credit facility (the “line of credit”) to be utilized for temporary or emergency purposes to fund shareholder redemptions or for other short term liquidity purposes. The participating funds have agreed to pay commitment fees on their pro rata portion of the line of credit, which is included in Miscellaneous Expense on the Statement of Operations. During the period, there were no borrowings on this line of credit.
Through arrangements with each applicable fund’s custodian and transfer agent, credits realized as a result of uninvested cash balances were used to reduce each applicable fund’s management fee. During the period, these credits reduced the management fee by the following amounts:
| Fidelity Arizona Municipal Income Fund | | $ | | 40,395 |
| Fidelity Arizona Municipal Money Market Fund | | | | 133,335 |
| |
| 7. Other. | | | | |
The funds’ organizational documents provide former and current trustees and officers with a limited indemnification against liabilities arising in connection with the perfor mance of their duties to the funds. In the normal course of business, the funds may also enter into contracts that provide general indemnifications. The funds’ maximum exposure under these arrangements is unknown as this would be dependent on future claims that may be made against the funds. The risk of material loss from such claims is considered remote.
Report of Independent Registered Public Accounting Firm
To the Trustees of Fidelity Union Street Trust and Fidelity Union Street Trust II and the Shareholders of Fidelity Arizona Municipal Income Fund (formerly Spartan Arizona Municipal Income Fund) and Fidelity Arizona Municipal Money Market Fund:
In our opinion, the accompanying statements of assets and liabilities, including the schedules of investments, and the related statements of operations and of changes in net assets and the financial highlights present fairly, in all material respects, the financial position of Fidelity Arizona Municipal Income Fund (formerly Spartan Arizona Municipal Income Fund) (a fund of Fidelity Union Street Trust) and Fidelity Arizona Municipal Money Market Fund (a fund of Fidelity Union Street Trust II) at August 31, 2005 and the results of their operations, the changes in their net assets and the financial highlights for the periods indicated, in conformity with accounting principles generally accepted in the United States of America. These financial statements and financial highlights (hereafter referred to as “financial statements”) are the responsibility of the Fidelity Union Street Trust’s and Fidelity Union Street Trust II’s management; our responsibility is to express an opinion on these financial statements based on our audits. We conducted our audits of these financial statements in accordance with the standards of the Public Company Accounting Oversight Board (United States). Those standards require that we plan and perform the audit to obtain reasonable assurance about whether the financial statements are free of material misstatement. An audit includes examining, on a test basis, evidence supporting the amounts and disclosures in the financial statements, assessing the ac counting principles used and significant estimates made by management, and evaluating the overall financial statement presentation. We believe that our audits, which included confirmation of securities at August 31, 2005 by correspondence with the custodian and brokers, provide a reasonable basis for our opinion.
/s/ PricewaterhouseCoopers LLP
PricewaterhouseCoopers LLP
Boston, Massachusetts
October 10, 2005
|
35 Annual Report
Trustees and Officers
The Trustees, Members of the Advisory Board, and executive officers of the trusts and funds, as applicable, are listed below. The Board of Trustees governs each fund and is responsible for protecting the interests of shareholders. The Trustees are experienced executives who meet periodically throughout the year to oversee each fund’s activities, review contractual arrangements with companies that provide services to each fund, and review each fund’s performance. Except for William O. McCoy, Stephen P. Jonas, and Kenneth L. Wolfe, each of the Trustees oversees 321 funds advised by FMR or an affiliate. Mr. McCoy oversees 323 funds advised by FMR or an affiliate. Mr. Jonas and Mr. Wolfe oversee 312 funds advised by FMR or an affiliate.
The Trustees hold office without limit in time except that (a) any Trustee may resign; (b) any Trustee may be removed by written instrument, signed by at least two thirds of the number of Trustees prior to such removal; (c) any Trustee who requests to be retired or who has become incapacitated by illness or injury may be retired by written instru ment signed by a majority of the other Trustees; and (d) any Trustee may be removed at any special meeting of shareholders by a two thirds vote of the outstanding voting securities of the trust. Each Trustee who is not an interested person (as defined in the 1940 Act) (Independent Trustee), shall retire not later than the last day of the calendar year in which his or her 72nd birthday occurs. The Independent Trustees may waive this mandatory retirement age policy with respect to individual Trustees. The executive officers and Advisory Board Members hold office without limit in time, except that any officer and Advisory Board Member may resign or may be removed by a vote of a majority of the Trustees at any regular meeting or any special meeting of the Trustees. Except as indicated, each individual has held the office shown or other offices in the same company for the past five years.
The funds’ Statement of Additional Information (SAI) includes more information about the Trustees. To request a free copy, call Fidelity at 1-800 544-8544.
Interested Trustees*:
Correspondence intended for each Trustee who is an interested person may be sent to Fidelity Investments, 82 Devonshire Street, Boston, Massachusetts 02109.
| | Name, Age; Principal Occupation
Edward C. Johnson 3d (75)**
|
Year of Election or Appointment: 1974 or 1991
Trustee of Fidelity Union Street Trust (1974) and Fidelity Union Street Trust II (1991). Mr. Johnson is Chairman of the Board of Trustees. Mr. Johnson serves as Chief Executive Officer, Chairman, and a Director of FMR Corp.; a Director and Chairman of the Board and of the Executive Committee of FMR; Chairman and a Director of Fidelity Management & Research (Far East) Inc.; Chairman and a Director of Fidelity Investments Money Management, Inc.; and Chairman (2001 present) and a Director (2000 present) of FMR Co., Inc.
| | Name, Age; Principal Occupation
Abigail P. Johnson (43)**
|
Year of Election or Appointment: 2001
Ms. Johnson serves as President of Fidelity Employer Services Company (FESCO) (2005 present). She is President and a Director of Fidelity Investments Money Management, Inc. (2001 present), FMR Co., Inc. (2001 present), and a Director of FMR Corp. Previously, Ms. Johnson served as a President and a Director of FMR (2001 2005), Senior Vice President of the Fidelity funds (2001 2005), and managed a number of Fidelity funds.
Year of Election or Appointment: 2005
Mr. Jonas is Senior Vice President of Arizona Municipal Money Market and Fidelity Arizona Municipal Income (2005 present). He also serves as Senior Vice President of other Fidelity funds (2005 present). Mr. Jonas is Executive Director of FMR (2005 present). Previously, Mr. Jonas served as President of Fidelity Enterprise Operations and Risk Services (2004 2005), Chief Administrative Officer (2002 2004), and Chief Financial Officer of FMR Co. (1998 2000). Mr. Jonas has been with Fidelity Investments since 1987 and has held various financial and management positions including Chief Financial Officer of FMR. In addition, he serves on the Boards of Boston Ballet (2003 present) and Simmons College (2003 present).
Year of Election or Appointment: 2003
Mr. Reynolds is a Director (2003 present) and Chief Operating Officer (2002 present) of FMR Corp. He also serves on the Board at Fidelity Investments Canada, Ltd. (2000 present). Previously, Mr. Reynolds served as President of Fidelity Investments Institutional Retirement Group (1996 2000).
* Trustees have been determined to be “Interested Trustees” by virtue of, among other things, their affiliation with the trusts or various entities under common control with FMR.
** Edward C. Johnson 3d, Trustee, is Abigail P. Johnson’s father.
37 Annual Report
Trustees and Officers - continued
Independent Trustees:
Correspondence intended for each Independent Trustee (that is, the Trustees other than the Interested Trustees) may be sent to Fidelity Investments, P.O. Box 55235, Boston, Massachusetts 02205 5235.
| | Name, Age; Principal Occupation
Dennis J. Dirks (57)
|
Year of Election or Appointment: 2005
Prior to his retirement in May 2003, Mr. Dirks was Chief Operating Officer and a member of the Board of The Depository Trust & Clearing Corporation (DTCC) (1999 2003). He also served as President, Chief Operating Officer, and Board member of The Depository Trust Company (DTC) (1999 2003) and President and Board member of the National Securities Clearing Corporation (NSCC) (1999 2003). In addition, Mr. Dirks served as Chief Executive Officer and Board member of the Government Securities Clearing Corporation (2001 2003) and Chief Executive Officer and Board member of the Mortgage Backed Securities Clearing Corporation (2001 2003). Mr. Dirks also serves as a Trustee of Manhattan College (2005 present).
Year of Election or Appointment: 1997
Dr. Gates is Vice Chairman of the Independent Trustees (2005 present). Dr. Gates is President of Texas A&M University (2002 present). He was Director of the Central Intelligence Agency (CIA) from 1991 to 1993. From 1989 to 1991, Dr. Gates served as Assistant to the President of the United States and Deputy National Security Advisor. Dr. Gates is a Director of NACCO Industries, Inc. (mining and manufacturing), Parker Drilling Co., Inc. (drilling and rental tools for the energy industry, 2001 present), and Brinker International (restaurant management, 2003 present). Previously, Dr. Gates served as a Director of LucasVarity PLC (automotive components and diesel engines), a Director of TRW Inc. (automotive, space, defense, and information technology), and Dean of the George Bush School of Government and Public Service at Texas A&M University (1999 2001). Dr. Gates also is a Trustee of the Forum for International Policy.
Name, Age; Principal Occupation
George H. Heilmeier (69)
|
Year of Election or Appointment: 2004
Dr. Heilmeier is Chairman Emeritus of Telcordia Technologies (commu nication software and systems), where prior to his retirement, he served as company Chairman and Chief Executive Officer. He currently serves on the Boards of Directors of The Mitre Corporation (systems engineer ing and information technology support for the government), Teletech Holdings (customer management services), and HRL Laboratories (private research and development, 2004 present). He is Chairman of the General Motors Technology Advisory Committee and a Life Fellow of the Institute of Electrical and Electronics Engineers (IEEE) (2000 present). Dr. Heilmeier is a member of the Defense Science Board and the National Security Agency Advisory Board. He is also a member of the National Academy of Engineering, the American Academy of Arts and Sciences, and the Board of Overseers of the School of Engineering and Applied Science of the University of Pennsylvania. Previously, Dr. Heilmeier served as a Director of TRW Inc. (automotive, space, defense, and information technology, 1992 2002), Compaq (1994 2002), Automatic Data Processing, Inc. (ADP) (technology based business outsourcing, 1995 2002), and INET Technologies Inc. (telecom munications network surveillance, 2001 2004), and Teletech Holdings (customer management services). He is the recipient of the 2005 Kyoto Prize in Advanced Technology for his invention of the liquid display.
Year of Election or Appointment: 2001
Prior to Ms. Knowles’ retirement in June 2000, she served as Executive Vice President and Chief Financial Officer of Atlantic Richfield Company (ARCO) (diversified energy, 1996 2000). From 1993 to 1996, she was a Senior Vice President of ARCO and President of ARCO Transportation Company. She served as a Director of ARCO from 1996 to 1998. She currently serves as a Director of Phelps Dodge Corporation (copper mining and manufacturing) and McKesson Corporation (healthcare ser vice, 2002 present). Ms. Knowles is a Trustee of the Brookings Institution and the Catalina Island Conservancy and also serves as a member of the Advisory Board for the School of Engineering of the University of Southern California.
39 Annual Report
Trustees and Officers - continued
| | Name, Age; Principal Occupation
Ned C. Lautenbach (61)
|
Year of Election or Appointment: 2000
Mr. Lautenbach has been a partner of Clayton, Dubilier & Rice, Inc. (private equity investment firm) since September 1998. Previously, Mr. Lautenbach was with the International Business Machines Corpora tion (IBM) from 1968 until his retirement in 1998. Mr. Lautenbach serves as a Director of Italtel Holding S.p.A. (telecommunications (Milan, Italy), 2004 present) and Eaton Corporation (diversified industrial) as well as the Philharmonic Center for the Arts in Naples, Florida. He also is a member of the Board of Trustees of Fairfield University (2005 present), as well as a member of the Council on Foreign Relations.
Year of Election or Appointment: 1993
Mr. Mann is Chairman of the Independent Trustees (2001 present). He is Chairman Emeritus of Lexmark International, Inc. (computer peripherals), where he served as CEO until April 1998, retired as Chairman May 1999, and remains a member of the Board. Prior to 1991, he held the positions of Vice President of International Business Machines Corpora tion (IBM) and President and General Manager of various IBM divisions and subsidiaries. He is a member of the Executive Committee of the Independent Director’s Council of the Investment Company Institute. In addition, Mr. Mann is a member of the President’s Cabinet at the Uni versity of Alabama and the Board of Visitors of the Culverhouse College of Commerce and Business Administration at the University of Alabama.
Year of Election or Appointment: 1997
Prior to his retirement in December 1994, Mr. McCoy was Vice Chair man of the Board of BellSouth Corporation (telecommunications) and President of BellSouth Enterprises. He is currently a Director of Liberty Corporation (holding company), Duke Realty Corporation (real estate), and Progress Energy, Inc. (electric utility). He is also a partner of Frank lin Street Partners (private investment management firm) and a member of the Research Triangle Foundation Board. In addition, Mr. McCoy served as the Interim Chancellor (1999 2000) and a member of the Board of Visitors for the University of North Carolina at Chapel Hill and currently serves on the Board of Directors of the University of North Carolina Health Care System and the Board of Visitors of the Kenan Flagler Business School (University of North Carolina at Chapel Hill). He also served as Vice President of Finance for the University of North Carolina (16 school system).
Name, Age; Principal Occupation
Cornelia M. Small (61)
|
Year of Election or Appointment: 2005
Ms. Small is a member (2000 present) and Chairperson (2002 present) of the Investment Committee, and a member (2002 present) of the Board of Trustees of Smith College. Previously, she served as Chief Investment Officer (1999 2000), Director of Global Equity Investments (1996 1999), and a member of the Board of Directors of Scudder, Stevens & Clark (1990 1997) and Scudder Kemper Investments (1997 1998). In addition, Ms. Small served as Co Chair (2000 2003) of the Annual Fund for the Fletcher School of Law and Diplomacy.
William S. Stavropoulos (66)
|
Year of Election or Appointment: 2002
Mr. Stavropoulos is Chairman of the Board (2000 present) and a Member of the Board of Directors of The Dow Chemical Company. Since joining The Dow Chemical Company in 1967, Mr. Stavropoulos served in numerous senior management positions, including President (1993 2000; 2002 2003), CEO (1995 2000; 2002 2004), and Chair man of the Executive Committee (2000 2004). Currently, he is a Direc tor of NCR Corporation (data warehousing and technology solutions), BellSouth Corporation (telecommunications), Chemical Financial Corpo ration, Maersk Inc. (industrial conglomerate, 2002 present), and Metal mark Capital (private equity investment firm, 2005 present). He also serves as a member of the Board of Trustees of the American Enterprise Institute for Public Policy Research. In addition, Mr. Stavropoulos is a member of The Business Council, J.P. Morgan International Council and the University of Notre Dame Advisory Council for the College of Science.
Year of Election or Appointment: 2005
Mr. Wolfe also serves as a Trustee (2005 present) or Member of the Advisory Board (2004 present) of other investment companies advised by FMR. Prior to his retirement in 2001, Mr. Wolfe was Chairman and Chief Executive Officer of Hershey Foods Corporation (1993 2001). He currently serves as a member of the boards of Adelphia Communica tions Corporation (2003 present), Bausch & Lomb, Inc., and Revlon Inc. (2004 present).
41 Annual Report
Trustees and Officers - continued
Advisory Board Members and Executive Officers:
Correspondence intended for Mr. Gamper may be sent to Fidelity Investments, P.O. Box 55235, Boston, Massachusetts 02205 5235. Correspondence intended for each executive officer and Mr. Lynch may be sent to Fidelity Investments, 82 Devonshire Street, Boston, Massachusetts 02109.
| | Name, Age; Principal Occupation
Albert R. Gamper, Jr. (63)
|
Year of Election or Appointment: 2005
Member of the Advisory Board of Fidelity Union Street Trust and Fidelity Union Street Trust II. Prior to his retirement in December 2004, Mr. Gamper served as Chairman of the Board of CIT Group Inc. (commercial finance). During his tenure with CIT Group Inc. Mr. Gamper served in numerous senior management positions, including Chairman (1987 1989; 1999 2001; 2002 2004), Chief Executive Officer (1987 2004), and President (1989 2002). He currently serves as a member of the Board of Directors of Public Service Enterprise Group (utilities, 2001 present), Chairman of the Board of Governors, Rutgers University (2004 present), and Chairman of the Board of Saint Barnabas Health Care System.
Year of Election or Appointment: 2003
Member of the Advisory Board of Fidelity Union Street Trust and Fidelity Union Street Trust II. Vice Chairman and a Director of FMR, and Vice Chairman (2001 present) and a Director (2000 present) of FMR Co., Inc. Previously, Mr. Lynch served as a Trustee of the Fidelity funds (1990 2003). In addition, he serves as a Trustee of Boston College, Massachusetts Eye & Ear Infirmary, Historic Deerfield, John F. Kennedy Library, and the Museum of Fine Arts of Boston.
Year of Election or Appointment: 2005
Vice President of Arizona Municipal Money Market and Fidelity Arizona Municipal Income. Mr. Donovan also serves as Vice President of Fidelity’s High Income Funds (2005 present), Fidelity’s Fixed Income Funds (2005 present), certain Asset Allocation Funds (2005 present), and certain Balanced Funds (2005 present). Mr. Donovan also serves as Executive Vice President of FMR (2005 present) and FMRC (2005 present). Previously, Mr. Donovan served as Vice President and Director of Fidelity’s International Equity Trading group (1998 2005).
Name, Age; Principal Occupation
Charles S. Morrison (44)
|
Year of Election or Appointment: 2002
Vice President of Arizona Municipal Money Market. Mr. Morrison also serves as Vice President of Fidelity’s Money Market Funds (2005 present) and certain Asset Allocation Funds (2002 present). Previously, he served as Vice President of Fidelity’s Bond Funds (2002 2005) and certain Balanced Funds (2002 2005). He served as Vice President (2002 2005) and Bond Group Leader (2002 2005) of Fidelity Investments Fixed Income Division. Mr. Morrison is also Vice President of FIMM
(2002 present) and FMR (2002 present). Mr. Morrison joined Fidelity Investments in 1987 as a Corporate Bond Analyst in the Fixed Income Research Division.
Year of Election or Appointment: 2002
Vice President of Arizona Municipal Money Market and Fidelity Arizona Municipal Income. Mr. Murphy also serves as Vice President of Fidelity’s Money Market Funds (2002 present), certain Asset Allocation Funds (2003 present), Fidelity’s Investment Grade Bond Funds (2005 present), and Fidelity’s Balanced Funds (2005 present). He serves as Senior Vice President (2000 present) and Head (2004 present) of the Fidelity Investments Fixed Income Division. Mr. Murphy is also a Senior Vice President of FIMM (2003 present) and a Vice President of FMR
(2000 present). Previously, Mr. Murphy served as Money Market Group Leader (2002 2004), Bond Group Leader (2000 2002), and Vice President of Fidelity’s Taxable Bond Funds (2000 2002) and Fidelity’s Municipal Bond Funds (2001 2002). Mr. Murphy joined Fidelity Investments in 1989 as a portfolio manager in the Bond Group.
Year of Election or Appointment: 2005
Vice President of Fidelity Arizona Municipal Income. Mr. Silvia also serves as Vice President of Fidelity’s Bond Funds (2005 present) and Senior Vice President and Bond Group Leader of the Fidelity Investments Fixed Income Division (2005 present). Previously, Mr. Silvia served as Director of Fidelity’s Taxable Bond portfolio managers (2002 2004) and a portfolio manager in the Bond Group (1997 2004).
Christine J. Thompson (47)
|
Year of Election or Appointment: 1998
Vice President of Fidelity Arizona Municipal Income. Ms. Thompson also serves as Vice President of other funds advised by FMR.
43 Annual Report
Trustees and Officers - continued
| | Name, Age; Principal Occupation
Michael Widrig (42)
|
Year of Election or Appointment: 2003
Vice President of Arizona Municipal Money Market. Mr. Widrig also serves as Vice President of other funds advised by FMR. Prior to assuming his current responsibilities, Mr. Widrig managed a variety of Fidelity funds and worked as an analyst in the Fixed Income Group.
Year of Election or Appointment: 1998
Secretary of Arizona Municipal Money Market and Fidelity Arizona Municipal Income. He also serves as Secretary of other Fidelity funds; Vice President, General Counsel, and Secretary of FMR Co., Inc. (2001 present) and FMR; Assistant Secretary of Fidelity Management & Research (U.K.) Inc. (2001 present), Fidelity Management & Research (Far East) Inc. (2001 present), and Fidelity Investments Money Manage ment, Inc. (2001 present). Mr. Roiter is an Adjunct Member, Faculty of Law, at Boston College Law School (2003 present). Previously, Mr. Roiter served as Vice President and Secretary of FDC (1998 2005).
Year of Election or Appointment: 2003
Assistant Secretary of Arizona Municipal Money Market and Fidelity Arizona Municipal Income. Mr. Fross also serves as Assistant Secretary of other Fidelity funds (2003 present), Vice President and Secretary of FDC (2005 present), and is an employee of FMR.
Year of Election or Appointment: 2004
President, Treasurer, and Anti Money Laundering (AML) officer of Arizona Municipal Money Market and Fidelity Arizona Municipal Income. Ms. Reynolds also serves as President, Treasurer, and AML officer of other Fidelity funds (2004) and is a Vice President (2003) and an employee (2002) of FMR. Before joining Fidelity Investments, Ms. Reynolds worked at PricewaterhouseCoopers LLP (PwC) (1980 2002), where she was most recently an audit partner with PwC’s investment management practice.
Name, Age; Principal Occupation
Timothy F. Hayes (54)
|
Year of Election or Appointment: 2002
Chief Financial Officer of Arizona Municipal Money Market and Fidelity Arizona Municipal Income. Mr. Hayes also serves as Chief Financial Officer of other Fidelity funds (2002 present) and President of Fidelity Investment Operations (2005 present) which includes Fidelity Pricing and Cash Management Services Group (FPCMS), where he served as President (1998 2005). Mr. Hayes serves as President of Fidelity Service Company (2003 present) where he also serves as a Director. Mr. Hayes also served as President of Fidelity Investments Operations Group (FIOG, 2002 2005).
Kenneth A. Rathgeber (58)
|
Year of Election or Appointment: 2004
Chief Compliance Officer of Arizona Municipal Money Market and Fidelity Arizona Municipal Income.. Mr. Rathgeber also serves as Chief Compliance Officer of other Fidelity funds (2004) and Executive Vice President of Risk Oversight for Fidelity Investments (2002). Previously, he served as Executive Vice President and Chief Operating Officer for Fidelity Investments Institutional Services Company, Inc. (1998 2002).
Year of Election or Appointment: 2003
Deputy Treasurer of Arizona Municipal Money Market and Fidelity Arizona Municipal Income. Mr. Hebble also serves as Deputy Treasurer of other Fidelity funds (2003), and is an employee of FMR. Before joining Fidelity Investments, Mr. Hebble worked at Deutsche Asset Man agement where he served as Director of Fund Accounting (2002 2003) and Assistant Treasurer of the Scudder Funds (1998 2003).
Year of Election or Appointment: 2005
Deputy Treasurer of Arizona Municipal Money Market and Fidelity Arizona Municipal Income. Mr. Mehrmann also serves as Deputy Trea surer of other Fidelity funds (2005 present) and is an employee of FMR. Previously, Mr. Mehrmann served as Vice President of Fidelity Invest ments Institutional Services Group (FIIS)/Fidelity Investments Institutional Operations Corporation, Inc. (FIIOC) Client Services (1998 2004).
45 Annual Report
Trustees and Officers - continued
| | Name, Age; Principal Occupation
Kimberley H. Monasterio (41)
|
Year of Election or Appointment: 2004
Deputy Treasurer of Arizona Municipal Money Market and Fidelity Arizona Municipal Income. Ms. Monasterio also serves as Deputy Trea surer of other Fidelity funds (2004) and is an employee of FMR (2004). Before joining Fidelity Investments, Ms. Monasterio served as Treasurer (2000 2004) and Chief Financial Officer (2002 2004) of the Franklin Templeton Funds and Senior Vice President of Franklin Templeton Services, LLC (2000 2004).
Year of Election or Appointment: 2005
Deputy Treasurer of Arizona Municipal Money Market and Fidelity Arizona Municipal Income. Mr. Robins also serves as Deputy Treasurer of other Fidelity funds (2005 present) and is an employee of FMR (2004 present). Before joining Fidelity Investments, Mr. Robins worked at KPMG LLP, where he was a partner in KPMG’s department of profes sional practice (2002 2004) and a Senior Manager (1999 2000). In addition, Mr. Robins served as Assistant Chief Accountant, United States Securities and Exchange Commission (2000 2002).
Year of Election or Appointment: 2005
Assistant Treasurer of Arizona Municipal Money Market and Fidelity Arizona Municipal Income. Mr. Byrnes also serves as Assistant Treasurer of Fidelity funds (2005 present) and is an employee of FMR (2005 present). Previously, Mr. Byrnes served as Vice President of FPCMS (2003 2005). Before joining Fidelity Investments, Mr. Byrnes worked at Deutsche Asset Management where he served as Vice President of the Investment Operations Group (2000 2003).
Year of Election or Appointment: 1994
Assistant Treasurer of Arizona Municipal Money Market and Fidelity Arizona Municipal Income. Mr. Costello also serves as Assistant Treasurer of other Fidelity funds and is an employee of FMR.
Year of Election or Appointment: 2004
Assistant Treasurer of Arizona Municipal Money Market and Fidelity Arizona Municipal Income. Mr. Lydecker also serves as Assistant Treasurer of other Fidelity funds (2004) and is an employee of FMR.
Name, Age; Principal Occupation
Mark Osterheld (50)
|
Year of Election or Appointment: 2002
Assistant Treasurer of Arizona Municipal Money Market and Fidelity Arizona Municipal Income. Mr. Osterheld also serves as Assistant Treasurer of other Fidelity funds (2002) and is an employee of FMR.
Year of Election or Appointment: 2005
Assistant Treasurer of Arizona Municipal Money Market and Fidelity Arizona Municipal Income. Mr. Ryan also serves as Assistant Treasurer of other Fidelity funds (2005 present) and is an employee of FMR (2005 present). Previously, Mr. Ryan served as Vice President of Fund Reporting in FPCMS (1999 2005).
Year of Election or Appointment: 2005
Assistant Treasurer of Arizona Municipal Money Market and Fidelity Arizona Municipal Income. Mr. Schiavone also serves as Assistant Treasurer of other Fidelity funds (2005 present) and is an employee of FMR (2005 present). Before joining Fidelity Investments, Mr. Schiavone worked at Deutsche Asset Management, where he most recently served as Assistant Treasurer (2003 2005) of the Scudder Funds and Vice President and Head of Fund Reporting (1996 2003).
47 Annual Report
The Board of Trustees of Arizona Municipal Income Fund voted to pay on October 10, 2005, to shareholders of record at the opening of business on October 7, 2005, a dis tribution of $.03 per share derived from capital gains realized from sales of portfolio securities.
The funds hereby designate as capital gain dividends the amounts noted below for the taxable year indicated or for dividends for the taxable year ended 2005, if subsequently determined to be different, the net capital gain of such year; and for dividends for the taxable year ended 2004, if subsequently determined to be different, the excess of: (a) the net capital gain of such year, over (b) amounts previously designated as capital gain dividends with respect to such year.
| Fund | | 2005 | | 2004 |
| Fidelity Arizona Municipal Income Fund | | $278,356 | | $352,841 |
| Fidelity Arizona Municipal Money Market Fund | | $6,669 | | $— |
During fiscal year ended 2005, 100% of each fund’s income dividends were free from federal income tax, and 4.72% and 51.70% of Arizona Municipal Income Fund and Arizona Municipal Money Market Fund’s income dividends were subject to the federal alternative minimum tax.
The fund will notify shareholders in January 2006 of amounts for use in preparing 2005 income tax returns.
Proxy Voting Results
A special meeting of the fund’s shareholders was held on April 13, 2005. The results of votes taken among shareholders on proposals before them are reported below. Each vote reported represents one dollar of net asset value held on the record date for the meeting.
PROPOSAL 1
To amend the Trust Instrument to allow the Board of Trustees, if permitted by applicable law, to authorize fund mergers without shareholder approval.*
| | | # of | | % of |
| | | Votes | | Votes |
| Affirmative | | 7,963,915,275.00 | | 80.395 |
| Against | | 1,604,213,132.51 | | 16.194 |
| Abstain | | 331,409,117.16 | | 3.346 |
| Broker | | | | |
| Non Votes . | | 6,453,184.00 | | .065 |
| TOTAL | | 9,905,990,708.67 | | 100.000 |
PROPOSAL 2
To elect a Board of Trustees.*
| | | # of | | % of |
| | | Votes | | Votes |
| Laura B. Cronin | | |
| Affirmative | | 9,373,053,787.27 | | 94.620 |
| Withheld | | 532,936,921.40 | | 5.380 |
| TOTAL | | 9,905,990,708.67 | | 100.000 |
| Dennis J. Dirks | | | | |
| Affirmative | | 9,385,368,522.63 | | 94.744 |
| Withheld | | 520,622,186.04 | | 5.256 |
| TOTAL | | 9,905,990,708.67 | | 100.000 |
| Robert M. Gates | | |
| Affirmative | | 9,372,071,963.26 | | 94.610 |
| Withheld | | 533,918,745.41 | | 5.390 |
| TOTAL | | 9,905,990,708.67 | | 100.000 |
| George H. Heilmeier | | |
| Affirmative | | 9,374,826,621.61 | | 94.638 |
| Withheld | | 531,164,087.06 | | 5.362 |
| TOTAL | | 9,905,990,708.67 | | 100.000 |
| Abigail P. Johnson | | |
| Affirmative | | 9,349,225,683.70 | | 94.380 |
| Withheld | | 556,765,024.97 | | 5.620 |
| TOTAL | | 9,905,990,708.67 | | 100.000 |
| | | # of | | % of |
| | | Votes | | Votes |
| |
| Edward C. Johnson 3d | | |
| Affirmative | | 9,336,624,684.41 | | 94.252 |
| Withheld | | 569,366,024.26 | | 5.748 |
| TOTAL | | 9,905,990,708.67 | | 100.000 |
| |
| Marie L. Knowles | | |
| Affirmative | | 9,385,202,135.87 | | 94.743 |
| Withheld | | 520,788,572.80 | | 5.257 |
| TOTAL | | 9,905,990,708.67 | | 100.000 |
| Ned C. Lautenbach | | |
| Affirmative | | 9,376,788,549.33 | | 94.658 |
| Withheld | | 529,202,159.34 | | 5.342 |
| TOTAL | | 9,905,990,708.67 | | 100.000 |
| Marvin L. Mann | | |
| Affirmative | | 9,361,169,551.40 | | 94.500 |
| Withheld | | 544,821,157.27 | | 5.500 |
| TOTAL | | 9,905,990,708.67 | | 100.000 |
| William O. McCoy | | |
| Affirmative | | 9,363,552,602.29 | | 94.524 |
| Withheld | | 542,438,106.38 | | 5.476 |
| TOTAL | | 9,905,990,708.67 | | 100.000 |
| Robert L. Reynolds | | |
| Affirmative | | 9,372,289,526.22 | | 94.612 |
| Withheld | | 533,701,182.45 | | 5.388 |
| TOTAL | | 9,905,990,708.67 | | 100.000 |
| Cornelia M. Small | | |
| Affirmative | | 9,384,016,844.12 | | 94.731 |
| Withheld | | 521,973,864.55 | | 5.269 |
| TOTAL | | 9,905,990,708.67 | | 100.000 |
| William S. Stavropoulos | | |
| Affirmative | | 9,373,082,552.28 | | 94.620 |
| Withheld | | 532,908,156.39 | | 5.380 |
| TOTAL | | 9,905,990,708.67 | | 100.000 |
| Kenneth L. Wolfe | | |
| Affirmative | | 9,374,633,251.39 | | 94.636 |
| Withheld | | 531,357,457.28 | | 5.364 |
| TOTAL | | 9,905,990,708.67 | | 100.000 |
* Denotes trust-wide proposals and voting results.
Annual Report
Board Approval of Investment Advisory Contracts and Management Fees
Fidelity Arizona Municipal Income Fund (formerly Spartan Arizona Municipal Income Fund) / Fidelity Arizona Municipal Money Market Fund
Each year, typically in June, the Board of Trustees, including the independent Trustees (together, the Board), votes on the renewal of the management contract and sub advisory agreements (together, the Advisory Contracts) for each fund. The Board, assisted by the advice of fund counsel and independent Trustees’ counsel, requests and considers a broad range of information throughout the year.
The Board meets regularly each month except August and takes into account throughout the year matters bearing on Advisory Contracts. The Board, acting directly and through its separate committees, considers at each of its meetings factors that are relevant to the annual renewal of each fund’s Advisory Contracts, including the services and support provided to each fund and its shareholders by Fidelity. At the time of the renewal, the Board had 11 standing committees, each composed of independent Trustees with varying backgrounds, to which the Board has assigned specific subject matter responsibilities in order to enhance effective decision making by the Board. Each committee has adopted a written charter outlining the structure and purposes of the committee. One such com mittee, the Fixed Income Contract Committee, meets periodically during the first six months of each year and as necessary to consider matters specifically related to the annual renewal of Advisory Contracts. The committee requests and receives information on, and makes recommendations to the independent Trustees concerning, the approval and annual review of the Advisory Contracts.
At its June 2005 meeting, the Board of Trustees, including the independent Trustees, unanimously determined to renew the Advisory Contracts for each fund. In reaching its determination, the Board considered all factors it believed relevant, including (1) the nature, extent, and quality of the services to be provided to each fund and its sharehold ers by Fidelity (including the investment performance of each fund); (2) the competi tiveness of the management fee and total expenses of each fund; (3) the total costs of the services to be provided by and the profits to be realized by the investment adviser and its affiliates from the relationship with each fund; (4) the extent to which economies of scale would be realized as each fund grows; and (5) whether fee levels reflect these economies of scale, if any, for the benefit of fund shareholders.
In determining whether to renew the Advisory Contracts for each fund, the Board ultimately reached a determination, with the assistance of fund counsel and indepen dent Trustees’ counsel, that the renewal of the Advisory Contracts and the compensation to be received by Fidelity under the management contracts is consistent with Fidelity’s fiduciary duty under applicable law. In addition to evaluating the specific factors noted above, the Board, in reaching its determination, is aware that shareholders in each fund have a broad range of investment choices available to them, including a wide choice among mutual funds offered by competitors to Fidelity, and that each fund’s
shareholders, with the opportunity to review and weigh the disclosure provided by the fund in its prospectus and other public disclosures, have chosen to invest in that fund, managed by Fidelity.
Nature, Extent, and Quality of Services Provided by Fidelity. The Board consid ered staffing within the investment adviser, FMR, and the sub advisers (together, the Investment Advisers), including the backgrounds of the funds’ portfolio managers and the funds’ investment objectives and disciplines. The independent Trustees also had discussions with senior management of Fidelity’s investment operations and investment groups. The Board considered the structure of the portfolio manager compensation program and whether this structure provides appropriate incentives.
Fidelity Resources Dedicated to Investment Management and Support Services. The Board reviewed the size, education, and experience of the Investment Advisers’ invest ment staff, their use of technology, and the Investment Advisers’ approach to recruiting, training, and retaining portfolio managers and other research, advisory, and manage ment personnel. The Board considered Fidelity’s extensive global research capabilities that enable the Investment Advisers to aggregate data from various sources in an effort to produce positive investment results. The Board noted that Fidelity’s analysts have access to a variety of technological tools that enable them to perform both fundamental and quantitative analysis and to specialize in various disciplines. The Board also considered that Fidelity’s portfolio managers and analysts have access to daily portfolio attribution that allows for monitoring of a fund’s portfolio, as well as an electronic communication system that provides immediate real time access to research concerning issuers and credit enhancers.
Shareholder and Administrative Services. The Board considered the nature, extent, quality, and cost of administrative, distribution, and shareholder services performed by the Investment Advisers and their affiliates under the Advisory Contracts and under separate agreements covering transfer agency and pricing and bookkeeping services for each fund. The Board also considered the nature and extent of the Investment Advisers’ supervision of third party service providers, principally custodians and subcustodians. The Board reviewed the allocation of fund brokerage, including allocations to brokers affiliated with the Investment Advisers. The Board also considered the resources devoted to, and the record of compliance with, each fund’s compliance policies and procedures.
The Board noted that the growth of fund assets across the complex allows Fidelity to reinvest in the development of services designed to enhance the value or convenience of the Fidelity funds as investment vehicles. These services include 24 hour access to account information and market information through phone representatives and over the Internet, and investor education materials and asset allocation tools.
Investment in a Large Fund Family. The Board considered the benefits to shareholders of investing in a Fidelity fund, including the benefits of investing in a fund that is part of a
51 Annual Report
Board Approval of Investment Advisory Contracts and Management Fees continued
large family of funds offering a variety of investment disciplines and providing for a large variety of mutual fund investor services. For example, fund shareholders are offered the privilege of exchanging shares of a fund for shares of other Fidelity funds, as set forth in the fund’s prospectus, without paying a sales charge. The Board noted that, since the last Advisory Contract renewals in June 2004, Fidelity has taken a number of actions that benefited particular funds, including (i) voluntarily deciding in 2004 to stop using “soft” commission dollars to pay for market data and, instead, to pay for that data out of its own resources, (ii) contractually agreeing to impose management fee reductions and expense limitations on its five Spartan stock index funds and its stock index fund available through variable insurance products, (iii) contractually agreeing to eliminate the management fees on the Fidelity Freedom Funds and the Fidelity Advisor Freedom Funds, (iv) contractually agreeing to reduce the management fees on most of its investment grade taxable bond funds, and (v) contractually agreeing to impose expense limitations on its retail and Spartan investment grade taxable bond funds.
Investment Performance. The Board considered whether each fund has operated within its investment objective, as well as its record of compliance with its investment restric tions. It also reviewed each fund’s absolute investment performance, as well as each fund’s relative investment performance measured against (i) a broad based securities market index (bond fund only, as money market funds are typically not compared against a market index), and (ii) a peer group of mutual funds over multiple periods. For each fund, the following charts considered by the Board show, over the one , three , and five year periods ended December 31, 2004, the fund’s returns, the returns of a broad based securities market index (“benchmark”) (bond fund only), and a range of returns of a peer group of mutual funds identified by Lipper Inc. as having an investment objec tive similar to that of the fund. The Board did not consider that Lipper peer group to be a meaningful comparison for Fidelity Arizona Municipal Money Market Fund, however, because the peer group combines tax exempt money market funds from several different states. The box within each chart shows the 25th percentile return (bottom of box) and the 75th percentile return (top of box) of the Lipper peer group. The percentage beaten number noted below each chart corresponds to the percentile box and represents the percentage of funds in the Lipper peer group whose performance was equal to or lower than that of the fund.
The Board noted that the relative investment performance of the fund has compared favorably to its Lipper peer group over time. The Board also noted that the relative investment performance of the fund was lower than its benchmark over time.
The Board noted that the relative investment performance of the fund has compared favorably to its Lipper peer group over time.
Based on its review, and giving particular weight to the nature and quality of the resources dedicated by the Investment Advisers to maintain and improve relative
53 Annual Report
Board Approval of Investment Advisory Contracts and Management Fees continued
performance, the Board concluded that the nature, extent, and quality of the services provided by Fidelity will benefit each fund’s shareholders, particularly in light of the Board’s view that each fund’s shareholders benefit from investing in a fund that is part of a large family of funds offering a variety of investment disciplines and services.
Competitiveness of Management Fee and Total Fund Expenses. The Board considered each fund’s management fee and total expenses compared to “mapped groups” of competitive funds and classes. Fidelity creates “mapped groups” by combining similar Lipper investment objective categories that have comparable management fee characteristics. Combining Lipper investment objective categories aids the Board’s management fee and total expense comparisons by broadening the competitive group used for comparison and by reducing the number of universes to which various Fidelity funds are compared.
The Board considered two proprietary management fee comparisons for the 12 month periods shown in the charts below. The group of Lipper funds used by the Board for management fee comparisons is referred to below as the “Total Mapped Group” and, for the reasons explained above, is broader than the Lipper peer group used by the Board for performance comparisons. The Total Mapped Group comparison focuses on a fund’s standing relative to the total universe of comparable funds available to investors, in terms of gross management fees before expense reimbursements or caps. “TMG %” represents the percentage of funds in the Total Mapped Group that had management fees that were lower than a fund’s. For example, a TMG % of 17% would mean that 83% of the funds in the Total Mapped Group had higher management fees than a fund. The “Asset Size Peer Group” (ASPG) comparison focuses on a fund’s standing relative to non Fidelity funds similar in size to the fund within the Total Mapped Group. The ASPG represents at least 15% of the funds in the Total Mapped Group with comparable asset size and management fee characteristics, subject to a minimum of 50 funds (or all funds in the Total Mapped Group if fewer than 50). Additional information, such as the ASPG quartile (“quadrant”) in which a fund’s management fee ranked, is also included in the charts and considered by the Board. For a more meaningful comparison of management fees, each fund is compared on the basis of a hypothetical “net management fee,” which is derived by subtracting payments made by FMR for non management expenses (includ ing transfer agent fees, pricing and bookkeeping fees, and custody fees) from the fund’s all inclusive fee. In this regard, the Board realizes that net management fees can vary from year to year because of differences in non management expenses.
The Board noted that each fund’s management fee ranked below the median of its Total Mapped Group and below the median of its ASPG for 2004. Based on its review, the Board concluded that each fund’s management fee was fair and reasonable in light of the services that the fund receives and the other factors considered.
In its review of each fund’s total expenses, the Board considered the fund’s hypothetical net management fee as well as the fund’s all inclusive fee. The Board also considered other expenses, such as transfer agent fees, pricing and bookkeeping fees, and custodial, legal, and audit fees, paid by FMR under the all inclusive arrangement. The Board also
55 Annual Report
Board Approval of Investment Advisory Contracts and Management Fees continued
noted the effects of any waivers and reimbursements on fees and expenses. As part of its review, the Board also considered current and historical total expenses of each fund compared to competitive fund median expenses. Each fund is compared to those funds and classes in the Total Mapped Group (used by the Board for management fee compari sons) that have a similar sales load structure.
The Board noted that each fund’s total expenses ranked below its competitive median for 2004.
In its review of total expenses, the Board also considered Fidelity fee structures and other information on clients that FMR and its affiliates service in other competitive markets, such as other mutual funds advised or subadvised by FMR or its affiliates, pension plan clients, and other institutional clients.
Based on its review, the Board concluded that each fund’s total expenses were reason able in light of the services that the fund and its shareholders receive and the other factors considered.
Costs of the Services and Profitability. The Board considered the revenues earned and the expenses incurred by Fidelity in conducting the business of developing, market ing, distributing, managing, administering and servicing each fund and its shareholders. The Board also considered the level of Fidelity’s profits in respect of all the Fidelity funds.
On an annual basis, FMR presents to the Board Fidelity’s profitability for each fund. Fidelity calculates the profitability for each fund, as well as aggregate profitability for groups of Fidelity funds and all Fidelity funds, using a series of detailed revenue and cost allocation methodologies which originate with the audited books and records of Fidelity. The Audit Committee of the Board reviews any significant changes from the prior year’s methodologies.
PricewaterhouseCoopers LLP (PwC), independent registered accounting firm and auditor to Fidelity and certain Fidelity funds, has been engaged annually by the Board as part of the Board’s assessment of the results of Fidelity’s profitability analysis. PwC’s engagement includes the review and assessment of Fidelity’s methodologies used in determining the revenues and expenses attributable to Fidelity’s mutual fund business, and completion of agreed upon procedures surrounding the mathematical accuracy of fund profitability and its conformity to allocation methodologies. After considering PwC’s reports issued under the engagement and information provided by Fidelity, the Board believes that while other allocation methods may also be reasonable, Fidelity’s profitabil ity methodologies are reasonable in all material respects.
The Board has also reviewed Fidelity’s non fund businesses and any fall out benefits related to the mutual fund business as well as cases where Fidelity’s affiliates may benefit from or be related to the funds’ business. In addition, a special committee of the
Board reviewed services provided to Fidelity by its affiliates and determined that the fees that Fidelity paid for such services were reasonable.
The Board considered the costs of the services provided by and the profits realized by Fidelity in connection with the operation of each fund and determined that the amount of profit is a fair entrepreneurial profit for the management of each fund.
Economies of Scale. The Board considered whether there have been economies of scale in respect of the management of the Fidelity funds, whether the Fidelity funds (including each fund) have appropriately benefited from any such economies of scale, and whether there is potential for realization of any further economies of scale. The Board considered the extent to which each fund will benefit from economies of scale through increased services to the fund, through waivers or reimbursements, or through fee or expense reductions. The Board concluded that any potential economies of scale are being shared between fund shareholders and Fidelity in an appropriate manner.
Additional Information Requested by the Board. In order to develop fully the factual basis for consideration of the Advisory Contracts, the Board requested additional information regarding (i) Fidelity’s fund profitability methodology, including additional detail on various cost allocations; (ii) fall out benefits to Fidelity; and (iii) compensation of portfolio managers and research analysts.
Based on its evaluation of all of the conclusions noted above, and after considering all material factors, the Board ultimately concluded that the existing advisory fee structures are fair and reasonable, and that each fund’s existing Advisory Contracts should be renewed.
57 Annual Report
| | Investment Adviser
Fidelity Management & Research Company
Boston, MA
Sub Advisers
Fidelity Investments
Money Management, Inc.
Fidelity International Investment Advisors
Fidelity International Investment Advisors
(U.K.) Limited
General Distributor
Fidelity Distributors Corporation
Boston, MA
Transfer and Service Agents
Citibank, N.A.
New York, NY
and
Fidelity Service Company, Inc.
Boston, MA
Custodian
Citibank, N.A.
New York, NY
|
| The Fidelity Telephone Connection |
| Mutual Fund 24 Hour Service |
| Exchanges/Redemptions | | |
| and Account Assistance | | 1-800-544-6666 |
| Product Information | | 1-800-544-6666 |
| Retirement Accounts | | 1-800-544-4774 |
| (8 a.m. - 9 p.m.) | | |
| TDD Service | | 1-800-544-0118 |
| for the deaf and hearing impaired |
| (9 a.m. - 9 p.m. Eastern time) |
| Fidelity Automated Service | | |
| Telephone (FAST® ) | | (automated_phone_logo) 1-800-544-5555 |
(automated_phone_logo)
Automated line for quickest serviceAZI/SPZ-UANN-1005
1.790910.102
|

| | Fidelity®
Maryland Municipal Income
Fund
(formerly known as Spartan® Maryland
Municipal Income Fund)
|
| | Annual Report
August 31, 2005
|


| Contents | | | | |
| |
| Chairman’s Message | | 4 | | Ned Johnson’s message to shareholders. |
| Performance | | 5 | | How the fund has done over time. |
| Management’s Discussion | | 6 | | The manager’s review of fund |
| | | | | performance, strategy and outlook. |
| Shareholder Expense | | 7 | | An example of shareholder expenses. |
| Example | | | | |
| Investment Changes | | 9 | | A summary of major shifts in the fund’s |
| | | | | investments over the past six months. |
| Investments | | 10 | | A complete list of the fund’s investments |
| | | | | with their market values. |
| Financial Statements | | 14 | | Statements of assets and liabilities, |
| | | | | operations, and changes in net assets, |
| | | | | as well as financial highlights. |
| Notes | | 18 | | Notes to the financial statements. |
| Report of Independent | | 22 | | |
| Registered Public | | | | |
| Accounting Firm | | | | |
| Trustees and Officers | | 23 | | |
| Distributions | | 34 | | |
| Proxy Voting Results | | 35 | | |
| Board Approval of | | 37 | | |
| Investment Advisory | | | | |
| Contracts and | | | | |
| Management Fees | | | | |
To view a fund’s proxy voting guidelines and proxy voting record for the 12 month period ended June 30, visit www.fidelity.com/proxyvotingresults or visit the Securities and Exchange Commission’s (SEC) web site at www.sec.gov. You may also call 1-800-544-8544 to request a free copy of the proxy voting guidelines.
Standard & Poor’s, S&P and S&P 500 are registered service marks of The McGraw Hill Companies, Inc. and have been licensed for use by Fidelity Distributors Corporation.
Other third party marks appearing herein are the property of their respective owners. All other marks appearing herein are registered or unregistered trademarks or service marks of FMR Corp. or an affiliated company.
Annual Report
This report and the financial statements contained herein are submitted for the general informa tion of the shareholders of the fund. This report is not authorized for distribution to prospective investors in the fund unless preceded or accompanied by an effective prospectus.
A fund files its complete schedule of portfolio holdings with the SEC for the first and third quarters of each fiscal year on Form N Q. Forms N Q are available on the SEC’s web site at http://www.sec.gov. A fund’s Forms N Q may be reviewed and copied at the SEC’s Public Reference Room in Washington, DC. Information regarding the operation of the SEC’s Public Reference Room may be obtained by calling 1 800 SEC 0330. For a complete list of a fund’s portfolio holdings, view the most recent quarterly holdings report, semiannual report, or annual report on Fidelity’s web site at http://www.fidelity.com/holdings.
NOT FDIC INSURED · MAY LOSE VALUE · NO BANK GUARANTEE
Neither the fund nor Fidelity Distributors Corporation is a bank.
3 Annual Report
3
Chairman’s Message
(photograph of Edward C Johnson 3d)
Dear Shareholder:
During the past year or so, much has been reported about the mutual fund industry, and much of it has been more critical than I believe is warranted. Allegations that some companies have been less than forthright with their shareholders have cast a shadow on the entire industry. I continue to find these reports disturbing, and assert that they do not create an accurate picture of the industry overall. Therefore, I would like to remind every one where Fidelity stands on these issues. I will say two things specifically regarding allegations that some mutual fund companies were in violation of the Securities and Exchange Commission’s forward pricing rules or were involved in so called “market timing” activities.
First, Fidelity has no agreements that permit customers who buy fund shares after 4 p.m. to obtain the 4 p.m. price. This is not a new policy. This is not to say that some one could not deceive the company through fraudulent acts. However, we are extremely diligent in preventing fraud from occurring in this manner and in every other. But I underscore again that Fidelity has no so called “agreements” that sanction illegal practices.
Second, Fidelity continues to stand on record, as we have for years, in opposition to predatory short term trading that adversely affects shareholders in a mutual fund. Back in the 1980s, we initiated a fee which is returned to the fund and, therefore, to investors to discourage this activity. Further, we took the lead several years ago in developing a Fair Value Pricing Policy to prevent market timing on foreign securities in our funds. I am confident we will find other ways to make it more difficult for predatory traders to operate. However, this will only be achieved through close cooperation among regulators, legislators and the industry.
Yes, there have been unfortunate instances of unethical and illegal activity within the mutual fund industry from time to time. That is true of any industry. When this occurs, confessed or convicted offend ers should be dealt with appropriately. But we are still concerned about the risk of over regulation and the quick application of simplistic solutions to intricate problems. Every system can be improved, and we support and applaud well thought out improvements by regulators, legisla tors and industry representatives that achieve the common goal of building and protecting the value of investors’ holdings. For nearly 60 years, Fidelity has worked very hard to improve its products and service to justify your trust. When our family founded this company in 1946, we had only a few hundred customers. Today, we serve more than 18 million customers in cluding individual investors and partici pants in retirement plans across America. Let me close by saying that we do not take your trust in us for granted, and we realize that we must always work to improve all aspects of our service to you. In turn, we urge you to continue your active participation with your financial matters, so that your interests can be well served.
Best regards,
/s/ Edward C. Johnson 3d
Edward C. Johnson 3d
Annual Report
Performance: The Bottom Line
Average annual total return reflects the change in the value of an investment, assuming reinvestment of the fund’s dividend income and capital gains (the profits earned upon the sale of securities that have grown in value) and assuming a constant rate of perfor mance each year. The $10,000 table and the fund’s returns do not reflect the deduction of taxes that a shareholder would pay on fund distributions or the redemption of fund shares. During periods of reimbursement by Fidelity, a fund’s total return will be greater than it would be had the reimbursement not occurred. How a fund did yesterday is no guarantee of how it will do tomorrow.
| Average Annual Total Returns | | | | | | |
| Periods ended August 31, 2005 | | Past 1 | | Past 5 | | Past 10 |
| | | year | | years | | years |
| Fidelity® MD Municipal Income Fund | | 4.30% | | 5.78% | | 5.68% |
| |
| |
| $10,000 Over 10 Years | | | | | | |
Let’s say hypothetically that $10,000 was invested in Fidelity® Maryland Municipal Income Fund on August 31, 1995. The chart shows how the value of your investment would have changed, and also shows how the Lehman Brothers® Municipal Bond Index performed over the same period.

Annual Report
Management’s Discussion of Fund Performance
Comments from Mark Sommer, Portfolio Manager of Fidelity® Maryland Municipal Income Fund
The municipal bond market had a solid advance during the past 12 months, and soundly outdistanced the taxable bond market. The Lehman Brothers® Municipal Bond Index a performance measure of approximately 34,000 investment grade, fixed rate, tax exempt bonds posted a total gain of 5.31% for the one year period ending August 31, 2005. In comparison, the Lehman Brothers Aggregate Bond Index, a proxy for the overall investment grade taxable bond market, rose a more modest 4.15% . The Federal Reserve Board raised interest rates eight times during the past 12 months, lifting the fed funds target rate from 1.50% to 3.50% . While rate action of this nature is often detrimental to muni returns, they weren’t affected as significantly this time around. Amid rising short term yields, the yields on longer term bonds declined and their prices rallied. Overall, heavy issuance was met with reasonably strong demand, particularly from institutional buyers. A narrowing yield gap relative to taxable bonds helped further highlight the attractive valuations of munis.
For the 12 months ending August 31, 2005, the fund returned 4.30% . During the same period, the LipperSM Maryland Municipal Debt Funds Average gained 3.98% and the Lehman Brothers Maryland 4 Plus Year Enhanced Municipal Bond Index returned 4.91% . Maryland’s municipal bond market performed in line with most other state markets, bene fiting from strong demand for tax free investments, which helped offset the negative effects of rising short term interest rates. Likely aiding the fund’s performance relative to its Lip per peer group average was its relatively large stake in bonds that were prerefunded during the period, a process that helped boost the bonds’ returns. I believe that the way in which I allocated the fund’s investments across bonds of various maturities also helped relative to the Lehman Brothers index, although it’s difficult to know for certain how competitors were positioned. Solid security selection also likely helped, as Fidelity’s research team helped me to avoid deteriorating situations. In contrast, my decision to emphasize high quality secu rities in a period when lower quality munis performed best detracted from performance relative to the fund’s peer group average and the Lehman Brothers index. Among the fund’s high quality holdings were bonds issued in Puerto Rico mostly insured or backed by U.S. Treasury securities which are free from state taxes in all 50 states and offered what I felt were better values at times than bonds available in Maryland.
The views expressed in this statement reflect those of the portfolio manager only through the end of the period of the report as stated on the cover and do not necessarily represent the views of Fidelity or any other person in the Fidelity organization. Any such views are subject to change at any time based upon market or other conditions and Fidelity disclaims any responsibility to update such views. These views may not be relied on as investment advice and, because investment decisions for a Fidelity fund are based on numerous factors, may not be relied on as an indication of trading intent on behalf of any Fidelity fund.
Shareholder Expense Example
As a shareholder of the Fund, you incur two types of costs: (1) transaction costs, including redemption fees, and (2) ongoing costs, including management fees and other Fund expenses. This Example is intended to help you understand your ongoing costs (in dollars) of investing in the Fund and to compare these costs with the ongoing costs of investing in other mutual funds.
The Example is based on an investment of $1,000 invested at the beginning of the period and held for the entire period (March 1, 2005 to August 31, 2005).
The first line of the table below provides information about actual account values and actual expenses. You may use the information in this line, together with the amount you invested, to estimate the expenses that you paid over the period. Simply divide your account value by $1,000.00 (for example, an $8,600 account value divided by $1,000.00 = 8.6), then multiply the result by the number in the first line under the heading entitled “Expenses Paid During Period” to estimate the expenses you paid on your account during this period. A small balance maintenance fee of $12.00 that is charged once a year may apply for certain accounts with a value of less than $2,000. This fee is not included in the table below. If it was, the estimate of expenses you paid during the period would be higher, and your ending account value lower, by this amount.
Hypothetical Example for Comparison Purposes
The second line of the table below provides information about hypothetical account values and hypothetical expenses based on the Fund’s actual expense ratio and an assumed rate of return of 5% per year before expenses, which is not the Fund’s actual return. The hypothetical account values and expenses may not be used to estimate the actual ending account balance or expenses you paid for the period. You may use this information to compare the ongoing costs of investing in the Fund and other funds. To do so, compare this 5% hypothetical example with the 5% hypothetical examples that appear in the share holder reports of the other funds. A small balance maintenance fee of $12.00 that is charged once a year may apply for certain accounts with a value of less than $2,000. This fee is not included in the table below. If it was, the estimate of expenses you paid during the period would be higher, and your ending account value lower, by this amount.
Please note that the expenses shown in the table are meant to highlight your ongoing costs only and do not reflect any transaction costs. Therefore, the second line of the table is useful in comparing ongoing costs only, and will not help you determine the relative total costs of owning different funds. In addition, if these transactional costs were included, your costs would have been higher.
7 Annual Report
| Shareholder Expense Example continued | | | | |
| |
| |
| | | | | | | | | | | Expenses Paid |
| | | | | Beginning | | Ending | | | | During Period* |
| | | | | Account Value | | Account Value | | | | March 1, 2005 |
| | | | | March 1, 2005 | | August 31, 2005 | | to August 31, 2005 |
| Actual | | $ | | 1,000.00 $ | | 1,023.50 | | $ | | 2.81 |
| Hypothetical (5% return per year | | | | | | | | | | |
| before expenses) | | $ | | 1,000.00 $ | | 1,022.43 | | $ | | 2.80 |
* Expenses are equal to the Fund’s annualized expense ratio of .55%; multiplied by the average account value over the period, multiplied by 184/365 (to reflect the one half year period).
Investment Changes
| Top Five Sectors as of August 31, 2005 | | | | |
| | | % of fund’s | | % of fund’s net assets |
| | | net assets | | 6 months ago |
| General Obligations | | 32.8 | | 32.3 |
| Escrowed/Pre Refunded | | 17.7 | | 19.3 |
| Education | | 11.4 | | 10.1 |
| Health Care | | 11.2 | | 11.8 |
| Electric Utilities | | 5.9 | | 6.3 |
| Average Years to Maturity as of August 31, 2005 | | |
| | | | | 6 months ago |
| Years | | 14.8 | | 14.5 |
Average years to maturity is based on the average time remaining to the stated maturity date of each bond, weighted by the market value of each bond.
| Duration as of August | | 31, 2005 | | | | |
| | | | | | | 6 months ago |
| Years | | | | 6.6 | | 6.6 |
Duration shows how much a bond fund’s price fluctuates with changes in comparable interest rates. If rates rise 1%, for example, a fund with a five year duration is likely to lose about 5% of its value. Other factors also can influence a bond fund’s performance and share price. Accordingly, a bond fund’s actual performance may differ from this example.
We have used ratings from Moody’s® Investors Services, Inc. Where Moody’s ratings are not available, we have used S&P® ratings. Percentages are adjusted for the effect of futures contracts, if applicable.
Annual Report
| Investments August 31, 2005 | | | | |
| Showing Percentage of Net Assets | | | | | | |
| |
| Municipal Bonds 96.6% | | | | | | |
| | | Principal | | | | Value |
| | | Amount | | | | (Note 1) |
| Maryland – 82.7% | | | | | | |
| Anne Arundel County Gen. Oblig.: | | | | | | |
| 5% 3/1/13 | | $ 1,200,000 | | $ | | 1,324,284 |
| 5.375% 3/1/15 | | 2,010,000 | | | | 2,238,075 |
| Baltimore Board of School Commissioners School Sys. Rev. 5% | | | | |
| 5/1/11 | | 2,545,000 | | | | 2,760,867 |
| Baltimore County Ctfs. Prtn. (Equip. Acquisition Prog.) 5% | | | | | | |
| 6/1/13 (MBIA Insured) | | 1,500,000 | | | | 1,653,390 |
| Baltimore County Gen. Oblig.: | | | | | | |
| 5% 8/1/15 | | 2,385,000 | | | | 2,650,761 |
| 5.25% 8/1/19 (Pre-Refunded to 8/1/12 @ 100) (c) | | 2,000,000 | | | | 2,232,400 |
| Baltimore Gen. Oblig.: | | | | | | |
| (Consolidated Pub. Impt. Proj.) Series A: | | | | | | |
| 0% 10/15/06 (FGIC Insured) | | 2,000,000 | | | | 1,881,240 |
| 7% 10/15/09 (MBIA Insured) | | 1,000,000 | | | | 1,151,400 |
| Series A, 5% 10/15/18 (AMBAC Insured) | | 1,720,000 | | | | 1,894,872 |
| Baltimore Port Facilities Rev. (Consolidated Coal Sales Co. | | | | | | |
| Proj.) 6.5% 12/1/10 | | 2,000,000 | | | | 2,031,000 |
| Baltimore Proj. Rev.: | | | | | | |
| (Wastewtr. Projs.) Series A: | | | | | | |
| 5.125% 7/1/42 (FGIC Insured) (a) | | 2,315,000 | | | | 2,447,742 |
| 5.2% 7/1/32 (FGIC Insured) | | 250,000 | | | | 269,593 |
| (Wtr. Projs.) Series A: | | | | | | |
| 5% 7/1/22 (MBIA Insured) | | 2,250,000 | | | | 2,448,270 |
| 5% 7/1/24 (Escrowed to Maturity) (c) | | 730,000 | | | | 824,462 |
| 5% 7/1/24 (FGIC Insured) | | 370,000 | | | | 416,576 |
| Carroll County Gen. Oblig. 5% 11/1/11 | | 500,000 | | | | 546,085 |
| Howard County Gen. Oblig.: | | | | | | |
| Series 2003 A, 5% 8/15/17 (Pre-Refunded to 8/15/12 @ | | | | |
| 100) (c) | | 1,000,000 | | | | 1,101,420 |
| Series 2004 A, 5% 8/15/14 | | 1,000,000 | | | | 1,120,000 |
| Series A: | | | | | | |
| 5.25% 8/15/14 | | 2,395,000 | | | | 2,650,786 |
| 5.25% 8/15/14 (Pre-Refunded to 2/15/12 @ 100) (c) | | 605,000 | | | | 672,203 |
| Maryland Dept. of Trans. Consolidated Trans. Rev. 5% | | | | | | |
| 11/1/10 | | 3,000,000 | | | | 3,251,550 |
| Maryland Econ. Dev. Corp. Lease Rev. (Maryland Aviation | | | | | | |
| Administration Facilities Proj.) 5.5% 6/1/18 (FSA | | | | | | |
| Insured) (b) | | 1,500,000 | | | | 1,654,635 |
| Maryland Gen. Oblig.: | | | | | | |
| (State & Local Facilities Ln. Prog.) First Series, 5.75% 8/1/14 | | | | |
| (Pre-Refunded to 8/1/10 @ 101) (c) | | 5,000,000 | | | | 5,621,749 |
| Series 2002 A, 5.5% 3/1/17 | | 2,265,000 | | | | 2,662,258 |
See accompanying notes which are an integral part of the financial statements.
| Municipal Bonds continued | | | | | | | | |
| | | | | Principal | | | | Value |
| | | | | Amount | | | | (Note 1) |
| Maryland – continued | | | | | | | | |
| Maryland Health & Higher Edl. Facilities Auth. Rev.: | | | | | | | | |
| (Anne Arundel Med. Ctr. Proj.) Series 1998, 5.125% | | | | | | | | |
| 7/1/33 (FSA Insured) | | $ | | 2,000,000 | | $ | | 2,078,280 |
| (Good Samaritan Hosp. Proj.): | | | | | | | | |
| 5.7% 7/1/09 (Escrowed to Maturity) (c) | | | | 1,000,000 | | | | 1,071,530 |
| 5.75% 7/1/13 (Escrowed to Maturity) (c) | | | | 240,000 | | | | 270,511 |
| 5.75% 7/1/13 (Escrowed to Maturity) (c) | | | | 145,000 | | | | 163,434 |
| (Hebrew Home of Greater Washington Proj.) 5.8% 1/1/32 . | | | | 1,000,000 | | | | 1,071,310 |
| (Helix Health Proj.) 5% 7/1/17 (Escrowed to Maturity) (c) | | | | 1,000,000 | | | | 1,101,420 |
| (Howard County Gen. Hosp. Proj.) 5.5% 7/1/13 | | | | | | | | |
| (Escrowed to Maturity) (c) | | | | 840,000 | | | | 883,781 |
| (Johns Hopkins Health Sys. Proj.) 5% 5/15/34 | | | | 1,500,000 | | | | 1,553,955 |
| (Johns Hopkins Univ. Issue Proj.): | | | | | | | | |
| Series 2001 B, 5% 7/1/41 | | | | 3,590,000 | | | | 3,746,129 |
| Series A: | | | | | | | | |
| 5% 7/1/33 | | | | 2,000,000 | | | | 2,133,500 |
| 5% 7/1/38 | | | | 2,000,000 | | | | 2,110,760 |
| 5% 7/1/32 | | | | 1,015,000 | | | | 1,071,901 |
| 5.125% 7/1/20 | | | | 500,000 | | | | 532,070 |
| 6% 7/1/10 | | | | 500,000 | | | | 562,755 |
| (LifeBridge Health Proj.) Series 2004 A, 5% 7/1/11 | | | | 1,000,000 | | | | 1,071,240 |
| (Loyola College Issue Proj.) 5% 10/1/39 | | | | 2,000,000 | | | | 2,070,460 |
| (North Arundel Hosp. Proj.) 6.5% 7/1/31 | | | | 1,320,000 | | | | 1,491,508 |
| (Univ. of Maryland Med. Sys. Proj.): | | | | | | | | |
| 5.25% 7/1/34 | | | | 1,000,000 | | | | 1,043,160 |
| 6.75% 7/1/30 | | | | 500,000 | | | | 570,435 |
| Maryland Indl. Dev. Fing. Auth. Rev.: | | | | | | | | |
| (American Ctr. for Physics Proj.): | | | | | | | | |
| 5.25% 12/15/13 | | | | 1,100,000 | | | | 1,206,898 |
| 5.25% 12/15/15 | | | | 320,000 | | | | 349,779 |
| (Holy Cross Health Sys. Corp. Proj.) 5.7% 12/1/10 | | | | 1,000,000 | | | | 1,110,930 |
| Maryland Trans. Auth. Rev. (Trans. Facilities Projs.) 6.8% | | | | | | | | |
| 7/1/16 (Escrowed to Maturity) (c) | | | | 900,000 | | | | 1,049,103 |
| Montgomery County Econ. Dev. Rev. (Trinity Health Care | | | | | | | | |
| Group Proj.) 5.125% 12/1/22 | | | | 2,300,000 | | | | 2,432,319 |
| Montgomery County Gen. Oblig. Series 2004 A, 5% 4/1/11 . | | | | 3,430,000 | | | | 3,746,246 |
| Morgan State Univ. Academic & Auxiliary Facilities Fees Rev. | | | | | | | | |
| Series A, 5% 7/1/20 (FGIC Insured) | | | | 500,000 | | | | 539,180 |
See accompanying notes which are an integral part of the financial statements.
11 Annual Report
| Investments continued | | | | | | |
| |
| |
| Municipal Bonds continued | | | | | | |
| | | | | Principal | | Value |
| | | | | Amount | | (Note 1) |
| Maryland – continued | | | | | | |
| Northeast Maryland Waste Disp. Auth. Solid Waste Rev.: | | | | | | |
| (Montgomery County Resource Recovery Proj.) Series A, 6% | | | | | | |
| 7/1/07 (b) | | $ | | 500,000 | | $ 520,205 |
| 5.5% 4/1/12 (AMBAC Insured) (b) | | | | 1,500,000 | | 1,655,220 |
| Prince Georges County Ctfs. of Prtn. Series A, 0% 6/30/11 | | | | | | |
| (MBIA Insured) | | | | 2,400,000 | | 1,809,720 |
| Prince Georges County Gen. Oblig.: | | | | | | |
| Series A, 5% 10/1/19 | | | | 2,000,000 | | 2,179,900 |
| 5.5% 5/15/11 (FSA Insured) | | | | 2,000,000 | | 2,233,120 |
| Washington D.C. Metropolitan Area Trans. Auth. Gross Rev. | | | | | | |
| 6% 7/1/10 (FGIC Insured) | | | | 1,570,000 | | 1,769,296 |
| Washington D.C. Suburban Sanitation District 5% 6/1/13 | | | | 1,500,000 | | 1,664,130 |
| | | | | | | 92,369,803 |
| |
| Puerto Rico 13.9% | | | | | | |
| Puerto Rico Commonwealth Gen. Oblig.: | | | | | | |
| Series 2001 A, 5.5% 7/1/17 (XL Cap. Assurance, Inc. | | | | | | |
| Insured) | | | | 1,000,000 | | 1,166,840 |
| Series A, 5.5% 7/1/18 (MBIA Insured) | | | | 1,000,000 | | 1,177,880 |
| Puerto Rico Commonwealth Hwy. & Trans. Auth. Hwy. Rev. | | | | | | |
| Series Y, 5.5% 7/1/36 (FSA Insured) | | | | 1,000,000 | | 1,149,600 |
| Puerto Rico Commonwealth Infrastructure Fing. Auth.: | | | | | | |
| Series 2000 A: | | | | | | |
| 5.5% 10/1/32 (Escrowed to Maturity) (c) | | | | 805,000 | | 889,662 |
| 5.5% 10/1/40 (Escrowed to Maturity) (c) | | | | 3,700,000 | | 4,061,897 |
| Series C, 5.5% 7/1/17 (AMBAC Insured) | | | | 400,000 | | 468,824 |
| Puerto Rico Elec. Pwr. Auth. Pwr. Rev.: | | | | | | |
| Series 2002 KK, 5.5% 7/1/15 (MBIA Insured) | | | | 1,000,000 | | 1,159,530 |
| Series HH, 5.25% 7/1/29 (FSA Insured) | | | | 2,200,000 | | 2,388,914 |
| Series II, 5.375% 7/1/16 (MBIA Insured) | | | | 1,500,000 | | 1,678,170 |
| Series QQ: | | | | | | |
| 5.5% 7/1/16 (XL Cap. Assurance, Inc. Insured) | | | | 200,000 | | 232,234 |
| 5.5% 7/1/17 (XL Cap. Assurance, Inc. Insured) | | | | 1,000,000 | | 1,166,840 |
| | | | | | | 15,540,391 |
| |
| |
| TOTAL INVESTMENT PORTFOLIO 96.6% | | | | | | |
| (Cost $103,574,308) | | | | | | 107,910,194 |
| |
| NET OTHER ASSETS – 3.4% | | | | | | 3,788,282 |
| NET ASSETS 100% | | | | $ | | 111,698,476 |
See accompanying notes which are an integral part of the financial statements.
| Futures Contracts | | | | | | | | |
| | | Expiration | | Underlying | | | | Unrealized |
| | | Date | | Face Amount | | Appreciation/ |
| | | | | at Value | | (Depreciation) |
| Purchased | | | | | | | | |
| |
| Treasury Contracts | | | | | | | | |
| 20 U.S. Treasury 10-Year Bond Contracts | | Dec. 2005 | | $ 2,241,563 | | $ | | 24,449 |
Legend
(a) Security or a portion of the security was pledged to cover margin requirements for futures contracts. At the period end, the value of securities pledged amounted to $1,235,766.
(b) Private activity obligations whose interest is subject to the federal alternative minimum tax for individuals. (c) Security collateralized by an amount sufficient to pay interest and principal.
Other Information
The distribution of municipal securities by revenue source, as a percentage of total net assets, is as follows:
| General Obligations | | 32.8% |
| Escrowed/Pre Refunded | | 17.7% |
| Education | | 11.4% |
| Health Care | | 11.2% |
| Electric Utilities | | 5.9% |
| Water & Sewer | | 5.0% |
| Others* (individually less than 5%) | | 16.0% |
| | | 100.0% |
* Includes net other assets
See accompanying notes which are an integral part of the financial statements.
Annual Report
| Financial Statements | | | | | | | | |
| |
| |
| Statement of Assets and Liabilities | | | | | | | | |
| | | | | | | | | August 31, 2005 |
| |
| Assets | | | | | | | | |
| Investment in securities, at value (cost $103,574,308) | | | | | | | | |
| See accompanying schedule | | | | | | $ | | 107,910,194 |
| Cash | | | | | | | | 2,736,560 |
| Receivable for fund shares sold | | | | | | | | 9,478 |
| Interest receivable | | | | | | | | 1,202,602 |
| Receivable for daily variation on futures contracts | | | | | | | | 9,983 |
| Other receivables | | | | | | | | 4,409 |
| Total assets | | | | | | | | 111,873,226 |
| |
| Liabilities | | | | | | | | |
| Payable for investments purchased | | $ | | 15,671 | | | | |
| Distributions payable | | | | 108,656 | | | | |
| Accrued management fee | | | | 50,373 | | | | |
| Other affiliated payables | | | | 50 | | | | |
| Total liabilities | | | | | | | | 174,750 |
| |
| Net Assets | | | | | | $ | | 111,698,476 |
| Net Assets consist of: | | | | | | | | |
| Paid in capital | | | | | | $ | | 106,615,734 |
| Distributions in excess of net investment income | | | | | | | | (142) |
| Accumulated undistributed net realized gain (loss) on | | | | | | | | |
| investments | | | | | | | | 722,549 |
| Net unrealized appreciation (depreciation) on | | | | | | | | |
| investments | | | | | | | | 4,360,335 |
| Net Assets, for 10,097,305 shares outstanding | | | | | | $ | | 111,698,476 |
| Net Asset Value, offering price and redemption price per | | | | | | |
| share ($111,698,476 ÷ 10,097,305 shares) | | | | | | $ | | 11.06 |
See accompanying notes which are an integral part of the financial statements.
| Statement of Operations | | | | | | |
| | | | | Year ended August 31, 2005 |
| |
| Investment Income | | | | | | |
| Interest | | | | $ | | 4,447,028 |
| |
| Expenses | | | | | | |
| Management fee | | $ | | 576,340 | | |
| Independent trustees’ compensation | | | | 523 | | |
| Miscellaneous | | | | 205 | | |
| Total expenses before reductions | | | | 577,068 | | |
| Expense reductions | | | | (44,427) | | 532,641 |
| |
| Net investment income | | | | | | 3,914,387 |
| Realized and Unrealized Gain (Loss) | | | | | | |
| Net realized gain (loss) on: | | | | | | |
| Investment securities | | | | 810,360 | | |
| Futures contracts | | | | 35,843 | | |
| Swap agreements | | | | 16,889 | | |
| Total net realized gain (loss) | | | | | | 863,092 |
| Change in net unrealized appreciation (depreciation) on: | | | | |
| Investment securities | | | | (359,801) | | |
| Futures contracts | | | | 24,449 | | |
| Swap agreements | | | | (25,966) | | |
| Total change in net unrealized appreciation | | | | | | |
| (depreciation) | | | | | | (361,318) |
| Net gain (loss) | | | | | | 501,774 |
| Net increase (decrease) in net assets resulting from | | | | | | |
| operations | | | | $ | | 4,416,161 |
See accompanying notes which are an integral part of the financial statements.
15 Annual Report
| Financial Statements continued | | | | | | | | |
| |
| |
| Statement of Changes in Net Assets | | | | | | | | |
| | | | | Year ended | | | | Year ended |
| | | | | August 31, | | | | August 31, |
| | | | | 2005 | | | | 2004 |
| Increase (Decrease) in Net Assets | | | | | | | | |
| Operations | | | | | | | | |
| Net investment income | | $ | | 3,914,387 | | $ | | 3,740,389 |
| Net realized gain (loss) | | | | 863,092 | | | | 435,168 |
| Change in net unrealized appreciation (depreciation) . | | | | (361,318) | | | | 1,622,587 |
| Net increase (decrease) in net assets resulting | | | | | | | | |
| from operations | | | | 4,416,161 | | | | 5,798,144 |
| Distributions to shareholders from net investment income . | | | | (3,917,237) | | | | (3,739,941) |
| Distributions to shareholders from net realized gain | | | | (297,351) | | | | — |
| Total distributions | | | | (4,214,588) | | | | (3,739,941) |
| Share transactions | | | | | | | | |
| Proceeds from sales of shares | | | | 31,887,992 | | | | 22,593,643 |
| Reinvestment of distributions | | | | 2,864,903 | | | | 2,609,274 |
| Cost of shares redeemed | | | | (23,124,775) | | | | (20,880,179) |
| Net increase (decrease) in net assets resulting from | | | | | | | | |
| share transactions | | | | 11,628,120 | | | | 4,322,738 |
| Redemption fees | | | | 1,778 | | | | 1,122 |
| Total increase (decrease) in net assets | | | | 11,831,471 | | | | 6,382,063 |
| |
| Net Assets | | | | | | | | |
| Beginning of period | | | | 99,867,005 | | | | 93,484,942 |
| End of period (including distributions in excess of net | | | | | | | | |
| investment income of $142 and undistributed net | | | | | | | | |
| investment income of $6,475, respectively) | | $ | | 111,698,476 | | $ | | 99,867,005 |
| |
| Other Information | | | | | | | | |
| Shares | | | | | | | | |
| Sold | | | | 2,888,601 | | | | 2,050,086 |
| Issued in reinvestment of distributions | | | | 259,630 | | | | 237,457 |
| Redeemed | | | | (2,098,151) | | | | (1,915,093) |
| Net increase (decrease) | | | | 1,050,080 | | | | 372,450 |
See accompanying notes which are an integral part of the financial statements.
| Financial Highlights | | | | | | | | | | |
| |
| Years ended August 31, | | 2005 | | 2004 | | 2003 | | 2002 | | 2001 |
| Selected Per Share Data | | | | | | | | | | |
| Net asset value, | | | | | | | | | | |
| beginning of period | | $ 11.04 | | $ 10.78 | | $ 10.90 | | $ 10.77 | | $ 10.25 |
| Income from Investment | | | | | | | | | | |
| Operations | | | | | | | | | | |
| Net investment incomeB | | 412 | | .427 | | .433 | | .444 | | .470 |
| Net realized and unrealized | | | | | | | | | | |
| gain (loss) | | 053 | | .260 | | (.120) | | .130 | | .523 |
| Total from investment | | | | | | | | | | |
| operations | | 465 | | .687 | | .313 | | .574 | | .993 |
| Distributions from net investment | | | | | | | | | | |
| income | | (.412) | | (.427) | | (.433) | | (.444) | | (.473) |
| Distributions from net | | | | | | | | | | |
| realized gain | | (.033) | | — | | — | | — | | — |
| Total distributions | | (.445) | | (.427) | | (.433) | | (.444) | | (.473) |
| Redemption fees added to paid | | | | | | | | | | |
| in capitalB | | —D | | —D | | —D | | —D | | —D |
| Net asset value, | | | | | | | | | | |
| end of period | | $ 11.06 | | $ 11.04 | | $ 10.78 | | $ 10.90 | | $ 10.77 |
| Total ReturnA | | 4.30% | | 6.46% | | 2.88% | | 5.49% | | 9.92% |
| Ratios to Average Net AssetsC | | | | | | | | | | |
| Expenses before expense | | | | | | | | | | |
| reductions | | 55% | | .55% | | .55% | | .55% | | .55% |
| Expenses net of voluntary | | | | | | | | | | |
| waivers, if any | | 55% | | .55% | | .55% | | .55% | | .55% |
| Expenses net of all reductions | | .51% | | .53% | | .52% | | .47% | | .40% |
| Net investment income | | 3.73% | | 3.89% | | 3.94% | | 4.15% | | 4.48% |
| Supplemental Data | | | | | | | | | | |
| Net assets, end of period | | | | | | | | | | |
| (000 omitted) | | $111,698 | | $99,867 | | $93,485 | | $96,839 | | $76,256 |
| Portfolio turnover rate | | 17% | | 14% | | 30% | | 5% | | 11% |
A Total returns would have been lower had certain expenses not been reduced during the periods shown.
B Calculated based on average shares outstanding during the period.
C Expense ratios reflect operating expenses of the fund. Expenses before reductions do not reflect amounts reimbursed by the investment adviser or
reductions from brokerage service arrangements or other expense offset arrangements and do not represent the amount paid by the fund during
periods when reimbursements or reductions occur. Expenses net of any voluntary waivers reflect expenses after reimbursement by the investment
adviser but prior to reductions from brokerage service arrangements or other expense offset arrangements. Expenses net of all reductions represent
the net expenses paid by the fund.
D Amount represents less than $.001 per share.
|
See accompanying notes which are an integral part of the financial statements.
17 Annual Report
Notes to Financial Statements
For the period ended August 31, 2005
|
1. Significant Accounting Policies.
Fidelity Maryland Municipal Income Fund (the fund) (formerly Spartan Maryland Municipal Income Fund) is a non diversified fund of Fidelity Union Street Trust (the trust) and is authorized to issue an unlimited number of shares. On July 21, 2005, the Board of Trustees approved a change in the name of Spartan Maryland Municipal Income Fund to Fidelity Maryland Municipal Income Fund effective August 15, 2005. The trust is registered under the Investment Company Act of 1940, as amended (the 1940 Act), as an open end management investment company organized as a Massachusetts business trust. The fund may be affected by economic and political developments in the state of Maryland. The financial statements have been prepared in conformity with accounting principles generally accepted in the United States of America, which require manage ment to make certain estimates and assumptions at the date of the financial statements. The following summarizes the significant accounting policies of the fund:
Security Valuation. Net asset value per share (NAV calculation) is calculated as of the close of business of the New York Stock Exchange, normally 4:00 p.m. Eastern time. Debt securities, including restricted securities, are valued on the basis of information pro vided by a pricing service. Pricing services use valuation matrices that incorporate both dealer supplied valuations and valuation models. If prices are not readily available or do not accurately reflect fair value for a security, or if a security’s value has been materially affected by events occurring after the close of the exchange or market on which the security is principally traded, that security may be valued by another method that the Board of Trustees believes accurately reflects fair value. A security’s valuation may differ depending on the method used for determining value. Price movements in futures contracts and ADRs, market and trading trends, the bid/ask quotes of brokers and off exchange institutional trading may be reviewed in the course of making a good faith determination of a security’s fair value. Short term securities with remaining maturities of sixty days or less for which quotations are not readily available are valued on the basis of amortized cost. Investments in open end investment companies are valued at their net asset value each business day.
Investment Transactions and Income. Security transactions are accounted for as of trade date. Gains and losses on securities sold are determined on the basis of identified cost. Interest income is accrued as earned. Interest income includes coupon interest and amortization of premium and accretion of discount on debt securities.
Expenses. Most expenses of the trust can be directly attributed to a fund. Expenses which cannot be directly attributed are apportioned among each fund in the trust.
Income Tax Information and Distributions to Shareholders. Each year, the fund intends to qualify as a regulated investment company by distributing all of its taxable income and realized gains under Subchapter M of the Internal Revenue Code. As a result, no provision for income taxes is required in the accompanying financial statements.
1. Significant Accounting Policies continued
Income Tax Information and Distributions to Shareholders continued
|
Dividends are declared daily and paid monthly from net investment income. Distribu tions from realized gains, if any, are recorded on the ex dividend date. Income and capital gain distributions are determined in accordance with income tax regulations, which may differ from generally accepted accounting principles. In addition, the income fund will claim a portion of the payment made to redeeming shareholders as a distribu tion for income tax purposes.
Capital accounts within the financial statements are adjusted for permanent book tax differences. These adjustments have no impact on net assets or the results of operations. Temporary book tax differences will reverse in a subsequent period.
Book tax differences are primarily due to futures transactions and market discount.
The fund purchases municipal securities whose interest, in the opinion of the issuer, is free from federal income tax. There is no assurance that the Internal Revenue Service (IRS) will agree with this opinion. In the event the IRS determines that the issuer does not comply with relevant tax requirements, interest payments from a security could become federally taxable, possibly retroactively to the date the security was issued.
The tax basis components of distributable earnings and the federal tax cost as of period end were as follows:
| Unrealized appreciation | | $ | | 4,484,963 | | | | |
| Unrealized depreciation | | | | (145,493) | | | | |
| Net unrealized appreciation (depreciation) | | | | 4,339,470 | | | | |
| Undistributed long term capital gain | | | | 681,978 | | | | |
| |
| Cost for federal income tax purposes | | $ | | 103,570,724 | | | | |
| The tax character of distributions paid was as follows: | | | | |
| |
| | | | | August 31, 2005 | | | | August 31, 2004 |
| Tax exempt Income | | $ | | 3,917,237 | | $ | | 3,739,941 |
| Long term Capital Gains | | | | 297,351 | | | | — |
| Total | | $ | | 4,214,588 | | $ | | 3,739,941 |
Short Term Trading (Redemption) Fees. Shares held in the fund less than 30 days are subject to a redemption fee equal to .50% of the proceeds of the redeemed shares. All redemption fees, including any estimated redemption fees paid by Fidelity Management & Research Company (FMR), are retained by the fund and accounted for as an addition to paid in capital.
19 Annual Report
Notes to Financial Statements continued
2. Operating Policies.
|
Futures Contracts. The fund may use futures contracts to manage its exposure to the bond market and to fluctuations in interest rates. Buying futures tends to increase a fund’s exposure to the underlying instrument, while selling futures tends to decrease a fund’s exposure to the underlying instrument or hedge other fund investments. Futures contracts involve, to varying degrees, risk of loss in excess of any futures variation margin reflected in the Statement of Assets and Liabilities. The underlying face amount at value of any open futures contracts at period end is shown in the Schedule of Investments under the caption ”Futures Contracts.” This amount reflects each contract’s exposure to the underlying instrument at period end. Losses may arise from changes in the value of the underlying instruments or if the counterparties do not perform under the contracts’ terms. Gains (losses) are realized upon the expiration or closing of the futures contracts. Futures contracts are valued at the settlement price established each day by the board of trade or exchange on which they are traded.
Swap Agreements. The fund may invest in swaps for the purpose of managing its exposure to interest rate, credit or market risk.
Interest rate swaps are agreements to exchange cash flows periodically based on a notional principal amount, for example, the exchange of fixed rate interest payments for floating rate interest payments. Periodic payments received or made by the fund are recorded in the accompanying Statement of Operations as realized gains or losses, respectively. The primary risk associated with interest rate swaps is that unfavorable changes in the fluctuation of interest rates could adversely impact a fund.
Swaps are marked to market daily based on dealer supplied valuations and changes in value are recorded as unrealized appreciation (depreciation). Gains or losses are realized upon early termination of the swap agreement. Collateral, in the form of cash or securities, may be required to be held in segregated accounts with a fund’s custodian in compliance with swap contracts.
3. Purchases and Sales of Investments.
Purchases and sales of securities, other than short term securities and U.S. government securities, aggregated $29,313,799 and $17,533,280, respectively.
4. Fees and Other Transactions with Affiliates.
Management Fee. FMR and its affiliates provide the fund with investment manage ment related services for which the fund pays a monthly management fee that is based on an annual rate of .55% of the fund’s average net assets. FMR pays all other expenses, except the compensation of the independent Trustees and certain exceptions such as interest expense. The management fee paid to FMR by the fund is reduced by an amount equal to the fees and expenses paid by the fund to the independent Trustees.
5. Committed Line of Credit.
|
The fund participates with other funds managed by FMR in a $4.2 billion credit facility (the “line of credit”) to be utilized for temporary or emergency purposes to fund share holder redemptions or for other short term liquidity purposes. The fund has agreed to pay commitment fees on its pro rata portion of the line of credit, which is included in Miscellaneous Expense on the Statement of Operations. During the period, there were no borrowings on this line of credit.
Through arrangements with the fund’s custodian, credits realized as a result of unin vested cash balances were used to reduce the fund’s management fee. During the period, these credits reduced the fund’s management fee by $44,427.
The fund’s organizational documents provide former and current trustees and officers with a limited indemnification against liabilities arising in connection with the perfor mance of their duties to the fund. In the normal course of business, the fund may also enter into contracts that provide general indemnifications. The fund’s maximum exposure under these arrangements is unknown as this would be dependent on future claims that may be made against the fund. The risk of material loss from such claims is considered remote.
21 Annual Report
Report of Independent Registered Public Accounting Firm
To the Trustees of Fidelity Union Street Trust and the Shareholders of Fidelity Maryland Municipal Income Fund (formerly Spartan Maryland Municipal Income Fund):
In our opinion, the accompanying statement of assets and liabilities, including the sched ule of investments, and the related statements of operations and of changes in net assets and the financial highlights present fairly, in all material respects, the financial position of Fidelity Maryland Municipal Income Fund (formerly Spartan Maryland Municipal Income Fund) (a fund of Fidelity Union Street Trust) at August 31, 2005 and the results of its operations, the changes in its net assets and the financial highlights for the periods indicated, in conformity with accounting principles generally accepted in the United States of America. These financial statements and financial highlights (hereafter referred to as “financial statements”) are the responsibility of the Fidelity Maryland Municipal Income Fund’s management; our responsibility is to express an opinion on these financial statements based on our audits. We conducted our audits of these financial statements in accordance with the standards of the Public Company Accounting Oversight Board (United States). Those standards require that we plan and perform the audit to obtain reasonable assurance about whether the financial statements are free of material mis statement. An audit includes examining, on a test basis, evidence supporting the amounts and disclosures in the financial statements, assessing the accounting principles used and significant estimates made by management, and evaluating the overall financial statement presentation. We believe that our audits, which included confirmation of securities at August 31, 2005 by correspondence with the custodian and brokers, provide a reasonable basis for our opinion.
/s/ PricewaterhouseCoopers LLP
PricewaterhouseCoopers LLP
Boston, Massachusetts
October 10, 2005
|
Trustees and Officers
The Trustees, Members of the Advisory Board, and executive officers of the trust and fund, as applicable, are listed below. The Board of Trustees governs the fund and is responsible for protecting the interests of shareholders. The Trustees are experienced executives who meet periodically throughout the year to oversee the fund’s activities, review contractual arrangements with companies that provide services to the fund, and review the fund’s performance. Except for William O. McCoy, Stephen P. Jonas, and Kenneth L. Wolfe, each of the Trustees oversees 321 funds advised by FMR or an affiliate. Mr. McCoy oversees 323 funds advised by FMR or an affiliate. Mr. Jonas and Mr. Wolfe oversee 312 funds advised by FMR or an affiliate.
The Trustees hold office without limit in time except that (a) any Trustee may resign; (b) any Trustee may be removed by written instrument, signed by at least two thirds of the number of Trustees prior to such removal; (c) any Trustee who requests to be retired or who has become incapacitated by illness or injury may be retired by written instru ment signed by a majority of the other Trustees; and (d) any Trustee may be removed at any special meeting of shareholders by a two thirds vote of the outstanding voting securities of the trust. Each Trustee who is not an interested person (as defined in the 1940 Act) (Independent Trustee), shall retire not later than the last day of the calendar year in which his or her 72nd birthday occurs. The Independent Trustees may waive this mandatory retirement age policy with respect to individual Trustees. The executive officers and Advisory Board Members hold office without limit in time, except that any officer and Advisory Board Member may resign or may be removed by a vote of a majority of the Trustees at any regular meeting or any special meeting of the Trustees. Except as indicated, each individual has held the office shown or other offices in the same company for the past five years.
The fund’s Statement of Additional Information (SAI) includes more information about the Trustees. To request a free copy, call Fidelity at 1-800 544-8544.
Correspondence intended for each Trustee who is an interested person may be sent to Fidelity Investments, 82 Devonshire Street, Boston, Massachusetts 02109.
| | Name, Age; Principal Occupation
Edward C. Johnson 3d (75)**
|
Year of Election or Appointment: 1974
Mr. Johnson is Chairman of the Board of Trustees. Mr. Johnson serves as Chief Executive Officer, Chairman, and a Director of FMR Corp.; a Director and Chairman of the Board and of the Executive Committee of FMR; Chairman and a Director of Fidelity Management & Research (Far East) Inc.; Chairman and a Director of Fidelity Investments Money Management, Inc.; and Chairman (2001 present) and a Director (2000 present) of FMR Co., Inc.
23 Annual Report
Trustees and Officers - continued
| | Name, Age; Principal Occupation
Abigail P. Johnson (43)**
|
Year of Election or Appointment: 2001
Ms. Johnson serves as President of Fidelity Employer Services Company (FESCO) (2005 present). She is President and a Director of Fidelity Investments Money Management, Inc. (2001 present), FMR Co., Inc. (2001 present), and a Director of FMR Corp. Previously, Ms. Johnson served as President and a Director of FMR (2001 2005), Senior Vice President of the Fidelity funds (2001 2005), and managed a number of Fidelity funds.
Year of Election or Appointment: 2005
Mr. Jonas is Senior Vice President of Fidelity Maryland Municipal Income (2005 present). He also serves as Senior Vice President of other Fidelity funds (2005 present). Mr. Jonas is Executive Director of FMR (2005 present). Previously, Mr. Jonas served as President of Fidelity Enterprise Operations and Risk Services (2004 2005), Chief Adminis trative Officer (2002 2004), and Chief Financial Officer of FMR Co. (1998 2000). Mr. Jonas has been with Fidelity Investments since 1987 and has held various financial and management positions including Chief Financial Officer of FMR. In addition, he serves on the Boards of Boston Ballet (2003 present) and Simmons College (2003 present).
Year of Election or Appointment: 2003
Mr. Reynolds is a Director (2003 present) and Chief Operating Officer (2002 present) of FMR Corp. He also serves on the Board at Fidelity Investments Canada, Ltd. (2000 present). Previously, Mr. Reynolds served as President of Fidelity Investments Institutional Retirement Group (1996 2000).
* Trustees have been determined to be “Interested Trustees” by virtue of, among other things, their affiliation with the trust or various entities under common control with FMR.
** Edward C. Johnson 3d, Trustee, is Abigail P. Johnson’s father.
Correspondence intended for each Independent Trustee (that is, the Trustees other than the Interested Trustees) may be sent to Fidelity Investments, P.O. Box 55235, Boston, Massachusetts 02205 5235.
| | Name, Age; Principal Occupation
Dennis J. Dirks (57)
|
Year of Election or Appointment: 2005
Prior to his retirement in May 2003, Mr. Dirks was Chief Operating Officer and a member of the Board of The Depository Trust & Clearing Corporation (DTCC) (1999 2003). He also served as President, Chief Operating Officer, and Board member of The Depository Trust Company (DTC) (1999 2003) and President and Board member of the National Securities Clearing Corporation (NSCC) (1999 2003). In addition, Mr. Dirks served as Chief Executive Officer and Board member of the Government Securities Clearing Corporation (2001 2003) and Chief Executive Officer and Board member of the Mortgage Backed Securities Clearing Corporation (2001 2003). Mr. Dirks also serves as a Trustee of Manhattan College (2005 present).
Year of Election or Appointment: 1997
Dr. Gates is Vice Chairman of the Independent Trustees (2005 present). Dr. Gates is President of Texas A&M University (2002 present). He was Director of the Central Intelligence Agency (CIA) from 1991 to 1993. From 1989 to 1991, Dr. Gates served as Assistant to the President of the United States and Deputy National Security Advisor. Dr. Gates is a Director of NACCO Industries, Inc. (mining and manufacturing), Parker Drilling Co., Inc. (drilling and rental tools for the energy industry, 2001 present), and Brinker International (restaurant management, 2003 present). Previously, Dr. Gates served as a Director of LucasVarity PLC (automotive components and diesel engines), a Director of TRW Inc. (automotive, space, defense, and information technology), and Dean of the George Bush School of Government and Public Service at Texas A&M University (1999 2001). Dr. Gates also is a Trustee of the Forum for International Policy.
25 Annual Report
Trustees and Officers - continued
| | Name, Age; Principal Occupation
George H. Heilmeier (69)
|
Year of Election or Appointment: 2004
Dr. Heilmeier is Chairman Emeritus of Telcordia Technologies (commu nication software and systems), where prior to his retirement, he served as company Chairman and Chief Executive Officer. He currently serves on the Boards of Directors of The Mitre Corporation (systems engineer ing and information technology support for the government), and HRL Laboratories (private research and development, 2004 present). He is Chairman of the General Motors Science & Technology Advisory Board and a Life Fellow of the Institute of Electrical and Electronics Engineers (IEEE) (2000 present). Dr. Heilmeier is a member of the Defense Science Board and the National Security Agency Advisory Board. He is also a member of the National Academy of Engineering, the American Acad emy of Arts and Sciences, and the Board of Overseers of the School of Engineering and Applied Science of the University of Pennsylvania. Pre viously, Dr. Heilmeier served as a Director of TRW Inc. (automotive, space, defense, and information technology, 1992 2002), Compaq (1994 2002), Automatic Data Processing, Inc. (ADP) (technology based business outsourcing, 1995 2002), INET Technologies Inc. (telecommu nications network surveillance, 2001 2004), and Teletech Holdings (customer management services). He is the recipient of the 2005 Kyoto Prize in Advanced Technology for his invention of the liquid display.
Year of Election or Appointment: 2001
Prior to Ms. Knowles’ retirement in June 2000, she served as Executive Vice President and Chief Financial Officer of Atlantic Richfield Company (ARCO) (diversified energy, 1996 2000). From 1993 to 1996, she was a Senior Vice President of ARCO and President of ARCO Transportation Company. She served as a Director of ARCO from 1996 to 1998. She currently serves as a Director of Phelps Dodge Corporation (copper mining and manufacturing) and McKesson Corporation (healthcare ser vice, 2002 present). Ms. Knowles is a Trustee of the Brookings Institution and the Catalina Island Conservancy and also serves as a member of the Advisory Board for the School of Engineering of the University of Southern California.
Name, Age; Principal Occupation
Ned C. Lautenbach (61)
|
Year of Election or Appointment: 2000
Mr. Lautenbach has been a partner of Clayton, Dubilier & Rice, Inc. (private equity investment firm) since September 1998. Previously, Mr. Lautenbach was with the International Business Machines Corpora tion (IBM) from 1968 until his retirement in 1998. Mr. Lautenbach serves as a Director of Italtel Holding S.p.A. (telecommunications (Milan, Italy), 2004 present) and Eaton Corporation (diversified industrial) as well as the Philharmonic Center for the Arts in Naples, Florida. He also is a member of the Board of Trustees of Fairfield University (2005 present), as well as a member of the Council on Foreign Relations.
Year of Election or Appointment: 1993
Mr. Mann is Chairman of the Independent Trustees (2001 present). He is Chairman Emeritus of Lexmark International, Inc. (computer peripherals), where he served as CEO until April 1998, retired as Chairman May 1999, and remains a member of the Board. Prior to 1991, he held the positions of Vice President of International Business Machines Corpora tion (IBM) and President and General Manager of various IBM divisions and subsidiaries. He is a member of the Executive Committee of the Independent Director’s Council of the Investment Company Institute. In addition, Mr. Mann is a member of the President’s Cabinet at the Uni versity of Alabama and the Board of Visitors of the Culverhouse College of Commerce and Business Administration at the University of Alabama.
Year of Election or Appointment: 1997
Prior to his retirement in December 1994, Mr. McCoy was Vice Chair man of the Board of BellSouth Corporation (telecommunications) and President of BellSouth Enterprises. He is currently a Director of Liberty Corporation (holding company), Duke Realty Corporation (real estate), and Progress Energy, Inc. (electric utility). He is also a partner of Frank lin Street Partners (private investment management firm) and a member of the Research Triangle Foundation Board. In addition, Mr. McCoy served as the Interim Chancellor (1999 2000) and a member of the Board of Visitors for the University of North Carolina at Chapel Hill and currently serves on the Board of Directors of the University of North Carolina Health Care System and the Board of Visitors of the Kenan Flagler Business School (University of North Carolina at Chapel Hill). He also served as Vice President of Finance for the University of North Carolina (16 school system).
27 Annual Report
Trustees and Officers - continued
| | Name, Age; Principal Occupation
Cornelia M. Small (61)
|
Year of Election or Appointment: 2005
Ms. Small is a member (2000 present) and Chairperson (2002 present) of the Investment Committee, and a member (2002 present) of the Board of Trustees of Smith College. Previously, she served as Chief Investment Officer (1999 2000), Director of Global Equity Investments (1996 1999), and a member of the Board of Directors of Scudder, Stevens & Clark (1990 1997) and Scudder Kemper Investments (1997 1998). In addition, Ms. Small served as Co Chair (2000 2003) of the Annual Fund for the Fletcher School of Law and Diplomacy.
| | William S. Stavropoulos (66)
|
Year of Election or Appointment: 2002
Mr. Stavropoulos is Chairman of the Board (2000 present) and a Member of the Board of Directors of The Dow Chemical Company. Since joining The Dow Chemical Company in 1967, Mr. Stavropoulos served in numerous senior management positions, including President (1993 2000; 2002 2003), CEO (1995 2000; 2002 2004), and Chair man of the Executive Committee (2000 2004). Currently, he is a Direc tor of NCR Corporation (data warehousing and technology solutions), BellSouth Corporation (telecommunications), Chemical Financial Corpo ration, Maersk Inc. (industrial conglomerate, 2002 present), and Metal mark Capital (private equity investment firm, 2005 present). He also serves as a member of the Board of Trustees of the American Enterprise Institute for Public Policy Research. In addition, Mr. Stavropoulos is a member of The Business Council, J.P. Morgan International Council and the University of Notre Dame Advisory Council for the College of Science.
Year of Election or Appointment: 2005
Mr. Wolfe also serves as a Trustee (2005 present) or Member of the Advisory Board (2004 present) of other investment companies advised by FMR. Prior to his retirement in 2001, Mr. Wolfe was Chairman and Chief Executive Officer of Hershey Foods Corporation (1993 2001). He currently serves as a member of the boards of Adelphia Communica tions Corporation (2003 present), Bausch & Lomb, Inc., and Revlon Inc. (2004 present).
Advisory Board Members and Executive Officers:
Correspondence intended for Mr. Gamper may be sent to Fidelity Investments, P.O. Box 55235, Boston, Massachusetts 02205 5235. Correspondence intended for each executive officer and Mr. Lynch may be sent to Fidelity Investments, 82 Devonshire Street, Boston, Massachusetts 02109.
| | Name, Age; Principal Occupation
Albert R. Gamper, Jr. (63)
|
Year of Election or Appointment: 2005
Member of the Advisory Board of Fidelity Union Street Trust. Prior to his retirement in December 2004, Mr. Gamper served as Chairman of the Board of CIT Group Inc. (commercial finance). During his tenure with CIT Group Inc. Mr. Gamper served in numerous senior management positions, including Chairman (1987 1989; 1999 2001; 2002 2004), Chief Executive Officer (1987 2004), and President (1989 2002). He currently serves as a member of the Board of Directors of Public Service Enterprise Group (utilities, 2001 present), Chairman of the Board of Governors, Rutgers University (2004 present), and Chairman of the Board of Saint Barnabas Health Care System.
Year of Election or Appointment: 2003
Member of the Advisory Board of Fidelity Union Street Trust. Vice Chair man and a Director of FMR, and Vice Chairman (2001 present) and a Director (2000 present) of FMR Co., Inc. Previously, Mr. Lynch served as a Trustee of the Fidelity funds (1990 2003). In addition, he serves as a Trustee of Boston College, Massachusetts Eye & Ear Infirmary, Historic Deerfield, John F. Kennedy Library, and the Museum of Fine Arts of Boston.
Year of Election or Appointment: 2005
Vice President of Maryland Municipal Income. Mr. Donovan also serves as Vice President of Fidelity’s High Income Funds (2005 present), Fidelity’s Fixed Income Funds (2005 present), certain Asset Allocation Funds (2005 present), and certain Balanced Funds (2005 present). Mr. Donovan also serves as Executive Vice President of FMR (2005 present) and FMRC (2005 present). Previously, Mr. Donovan served as Vice President and Director of Fidelity’s International Equity Trading group (1998 2005).
29 Annual Report
Trustees and Officers - continued
| | Name, Age; Principal Occupation
David L. Murphy (57)
|
Year of Election or Appointment: 2005
Vice President of Maryland Municipal Income. Mr. Murphy also serves as Vice President of Fidelity’s Money Market Funds (2002 present), certain Asset Allocation Funds (2003 present), Fidelity’s Investment Grade Bond Funds (2005 present), and Fidelity’s Balanced Funds (2005 present). He serves as Senior Vice President (2000 present) and Head (2004 present) of the Fidelity Investments Fixed Income Division. Mr. Murphy is also a Senior Vice President of FIMM (2003 present) and a Vice President of FMR (2000 present). Previously, Mr. Murphy served as Money Market Group Leader (2002 2004), Bond Group Leader (2000 2002), and Vice President of Fidelity’s Taxable Bond Funds (2000 2002) and Fidelity’s Municipal Bond Funds (2001 2002). Mr. Murphy joined Fidelity Investments in 1989 as a portfolio manager in the Bond Group.
Year of Election or Appointment: 2005
Vice President of Maryland Municipal Income. Mr. Silvia also serves as Vice President of Fidelity’s Bond Funds (2005 present) and Senior Vice President and Bond Group Leader of the Fidelity Investments Fixed Income Division (2005 present). Previously, Mr. Silvia served as Director of Fidelity’s Taxable Bond portfolio managers (2002 2004) and a port folio manager in the Bond Group (1997 2004).
Year of Election or Appointment: 2004
Vice President of Maryland Municipal Income. Mr. Sommer also serves as Vice President of other funds advised by FMR. Prior to assuming his current responsibilities, Mr. Sommer managed a variety of Fidelity funds.
Year of Election or Appointment: 1998
Secretary of Maryland Municipal Income. He also serves as Secretary of other Fidelity funds; Vice President, General Counsel, and Secretary of FMR Co., Inc. (2001 present) and FMR; Assistant Secretary of Fidelity Management & Research (U.K.) Inc. (2001 present), Fidelity Manage ment & Research (Far East) Inc. (2001 present), and Fidelity Investments Money Management, Inc. (2001 present). Mr. Roiter is an Adjunct Member, Faculty of Law, at Boston College Law School (2003 present). Previously, Mr. Roiter served as Vice President and Secretary of Fidelity Distributors Corporation (FDC) (1998 2005).
Name, Age; Principal Occupation
|
Year of Election or Appointment: 2003
Assistant Secretary of Maryland Municipal Income. Mr. Fross also serves as Assistant Secretary of other Fidelity funds (2003 present), Vice Presi dent and Secretary of FDC (2005 present), and is an employee of FMR.
Year of Election or Appointment: 2004
President, Treasurer, and Anti Money Laundering (AML) officer of Mary land Municipal Income. Ms. Reynolds also serves as President, Treasurer, and AML officer of other Fidelity funds (2004) and is a Vice President (2003) and an employee (2002) of FMR. Before joining Fidelity Invest ments, Ms. Reynolds worked at PricewaterhouseCoopers LLP (PwC) (1980 2002), where she was most recently an audit partner with PwC’s investment management practice.
Year of Election or Appointment: 2002
Chief Financial Officer of Maryland Municipal Income. Mr. Hayes also serves as Chief Financial Officer of other Fidelity funds (2002 present) and President of Fidelity Investment Operations (2005 present) which includes Fidelity Pricing and Cash Management Services Group (FPCMS), where he served as President (1998 2005). Mr. Hayes serves as Presi dent of Fidelity Service Company (2003 present) where he also serves as a Director. Mr. Hayes also served as President of Fidelity Investments Operations Group (FIOG, 2002 2005).
Kenneth A. Rathgeber (58)
|
Year of Election or Appointment: 2004
Chief Compliance Officer of Maryland Municipal Income. Mr. Rathgeber also serves as Chief Compliance Officer of other Fidelity funds (2004) and Executive Vice President of Risk Oversight for Fidelity Investments (2002). Previously, he served as Executive Vice President and Chief Operating Officer for Fidelity Investments Institutional Services Company, Inc. (1998 2002).
Year of Election or Appointment: 2003
Deputy Treasurer of Maryland Municipal Income. Mr. Hebble also serves as Deputy Treasurer of other Fidelity funds (2003), and is an employee of FMR. Before joining Fidelity Investments, Mr. Hebble worked at Deutsche Asset Management where he served as Director of Fund Accounting (2002 2003) and Assistant Treasurer of the Scudder Funds (1998 2003).
31 Annual Report
Trustees and Officers - continued
| | Name, Age; Principal Occupation
Bryan A. Mehrmann (44)
|
Year of Election or Appointment: 2005
Deputy Treasurer of Maryland Municipal Income. Mr. Mehrmann also serves as Deputy Treasurer of other Fidelity funds (2005 present) and is an employee of FMR. Previously, Mr. Mehrmann served as Vice Presi dent of Fidelity Investments Institutional Services Group (FIIS)/Fidelity Investments Institutional Operations Corporation, Inc. (FIIOC) Client Services (1998 2004).
| | Kimberley H. Monasterio (41)
|
Year of Election or Appointment: 2004
Deputy Treasurer of Maryland Municipal Income. Ms. Monasterio also serves as Deputy Treasurer of other Fidelity funds (2004) and is an employee of FMR (2004). Before joining Fidelity Investments, Ms. Monasterio served as Treasurer (2000 2004) and Chief Financial Officer (2002 2004) of the Franklin Templeton Funds and Senior Vice President of Franklin Templeton Services, LLC (2000 2004).
Year of Election or Appointment: 2005
Deputy Treasurer of Maryland Municipal Income. Mr. Robins also serves as Deputy Treasurer of other Fidelity funds (2005 present) and is an employee of FMR (2004 present). Before joining Fidelity Investments, Mr. Robins worked at KPMG LLP, where he was a partner in KPMG’s department of professional practice (2002 2004) and a Senior Manager (1999 2000). In addition, Mr. Robins served as Assistant Chief Accoun tant, United States Securities and Exchange Commission (2000 2002).
Year of Election or Appointment: 2005
Assistant Treasurer of Maryland Municipal Income. Mr. Byrnes also serves as Assistant Treasurer of other Fidelity funds (2005 present) and is an employee of FMR (2005 present). Previously, Mr. Byrnes served as Vice President of FPCMS (2003 2005). Before joining Fidelity Investments, Mr. Byrnes worked at Deutsche Asset Management where he served as Vice President of the Investment Operations Group (2000 2003).
Year of Election or Appointment: 1993
Assistant Treasurer of Maryland Municipal Income. Mr. Costello also serves as Assistant Treasurer of other Fidelity funds and is an employee of FMR.
Name, Age; Principal Occupation
Peter L. Lydecker (51)
|
Year of Election or Appointment: 2004
Assistant Treasurer of Maryland Municipal Income. Mr. Lydecker also serves as Assistant Treasurer of other Fidelity funds (2004) and is an employee of FMR.
Year of Election or Appointment: 2002
Assistant Treasurer of Maryland Municipal Income. Mr. Osterheld also serves as Assistant Treasurer of other Fidelity funds (2002) and is an employee of FMR.
Year of Election or Appointment: 2005
Assistant Treasurer of Maryland Municipal Income. Mr. Ryan also serves as Assistant Treasurer of other Fidelity funds (2005 present) and is an employee of FMR (2005 present). Previously, Mr. Ryan served as Vice President of Fund Reporting in FPCMS (1999 2005).
Year of Election or Appointment: 2005
Assistant Treasurer of Maryland Municipal Income. Mr. Schiavone also serves as Assistant Treasurer of other Fidelity funds (2005 present) and is an employee of FMR (2005 present). Before joining Fidelity Invest ments, Mr. Schiavone worked at Deutsche Asset Management, where he most recently served as Assistant Treasurer (2003 2005) of the Scudder Funds and Vice President and Head of Fund Reporting (1996 2003).
33 Annual Report
The Board of Trustees of Fidelity Maryland Municipal Income Fund voted to pay on October 10, 2005, to shareholders of record at the opening of business on October 7, 2005, a distribution of $.07 per share derived from capital gains realized from sales of portfolio securities.
The fund hereby designates as capital gain dividends: For dividends with respect to the taxable year ended August 31, 2005, $881,241, or, if subsequently determined to be different, the net capital gain of such year, and for dividends with respect to the taxable year ended August 31, 2004, $153,227, or, if subsequently determined to be different, the excess of: (a) the net capital gain of such year, over (b) amounts pre viously designated as capital gain dividends with respect to such year.
During fiscal year ended 2005, 100% of the Fidelity Maryland Municipal Income Fund’s income dividends was free from federal income tax, and 4.61% of the fund’s income dividends was subject to the federal alternative minimum tax.
The fund will notify shareholders in January 2006 of amounts for use in preparing 2005 income tax returns.
Proxy Voting Results
A special meeting of the fund’s shareholders was held on February 16, 2005. The results of votes taken among shareholders on proposals before them are reported below. Each vote reported represents one dollar of net asset value held on the record date for the meeting.
PROPOSAL 1
To amend the Declaration of Trust to allow the Board of Trustees, if permitted by applicable law, to authorize fund mergers without shareholder approval.A
| | | # of | | % of |
| | | Votes | | Votes |
| Affirmative | | 742,440,496.15 | | 73.879 |
| Against | | 196,006,999.93 | | 19.504 |
| Abstain | | 33,719,201.65 | | 3.356 |
| Broker | | | | |
| Non Votes . | | 32,776,930.05 | | 3.261 |
| TOTAL | | 1,004,943,627.78 | | 100.000 |
PROPOSAL 2
To elect a Board of Trustees.A
| | | # of | | % of |
| | | Votes | | Votes |
| |
| Laura B. Cronin | | |
| Affirmative | | 948,588,595.83 | | 94.392 |
| Withheld | | 56,355,031.95 | | 5.608 |
| TOTAL | | 1,004,943,627.78 | | 100.000 |
| |
| Dennis J. Dirks | | | | |
| Affirmative | | 950,698,349.04 | | 94.602 |
| Withheld | | 54,245,278.74 | | 5.398 |
| TOTAL | | 1,004,943,627.78 | | 100.000 |
| |
| Robert M. Gates | | |
| Affirmative | | 947,567,913.72 | | 94.291 |
| Withheld | | 57,375,714.06 | | 5.709 |
| TOTAL | | 1,004,943,627.78 | | 100.000 |
| |
| George H. Heilmeier | | |
| Affirmative | | 948,147,248.47 | | 94.348 |
| Withheld | | 56,796,379.31 | | 5.652 |
| TOTAL | | 1,004,943,627.78 | | 100.000 |
| | | # of | | % of |
| | | Votes | | Votes |
| |
| Abigail P. Johnson | | |
| Affirmative | | 944,190,223.14 | | 93.955 |
| Withheld | | 60,753,404.64 | | 6.045 |
| TOTAL | | 1,004,943,627.78 | | 100.000 |
| |
| Edward C. Johnson 3d | | |
| Affirmative | | 943,213,044.14 | | 93.857 |
| Withheld | | 61,730,583.64 | | 6.143 |
| TOTAL | | 1,004,943,627.78 | | 100.000 |
| |
| Marie L. Knowles | | |
| Affirmative | | 949,452,954.58 | | 94.478 |
| Withheld | | 55,490,673.20 | | 5.522 |
| TOTAL | | 1,004,943,627.78 | | 100.000 |
| |
| Ned C. Lautenbach | | |
| Affirmative | | 948,794,328.18 | | 94.413 |
| Withheld | | 56,149,299.60 | | 5.587 |
| TOTAL | | 1,004,943,627.78 | | 100.000 |
| |
| Marvin L. Mann | | |
| Affirmative | | 946,649,510.40 | | 94.199 |
| Withheld | | 58,294,117.38 | | 5.801 |
| TOTAL | | 1,004,943,627.78 | | 100.000 |
| |
| William O. McCoy | | |
| Affirmative | | 945,952,663.12 | | 94.130 |
| Withheld | | 58,990,964.66 | | 5.870 |
| TOTAL | | 1,004,943,627.78 | | 100.000 |
| |
| Robert L. Reynolds | | |
| Affirmative | | 948,326,458.64 | | 94.366 |
| Withheld | | 56,617,169.14 | | 5.634 |
| TOTAL | | 1,004,943,627.78 | | 100.000 |
| |
| Cornelia M. Small | | |
| Affirmative | | 949,307,587.45 | | 94.464 |
| Withheld | | 55,636,040.33 | | 5.536 |
| TOTAL | | 1,004,943,627.78 | | 100.000 |
Annual Report
Proxy Voting Results - continued
| | | # of | | % of |
| | | Votes | | Votes |
| |
| William S. Stavropoulos | | |
| Affirmative | | 947,525,611.83 | | 94.286 |
| Withheld | | 57,418,015.95 | | 5.714 |
| TOTAL | | 1,004,943,627.78 | | 100.000 |
| |
| Kenneth L. Wolfe | | |
| Affirmative | | 949,176,424.38 | | 94.451 |
| Withheld | | 55,767,203.40 | | 5.549 |
| TOTAL | | 1,004,943,627.78 | | 100.000 |
A Denotes trust-wide proposals and voting results.
Board Approval of Investment Advisory Contracts and Management Fees
Fidelity Maryland Municipal Income Fund (formerly Spartan Maryland Municipal Income Fund)
Each year, typically in June, the Board of Trustees, including the independent Trustees (together, the Board), votes on the renewal of the management contract and sub advisory agreements (together, the Advisory Contracts) for the fund. The Board, assisted by the advice of fund counsel and independent Trustees’ counsel, requests and considers a broad range of information throughout the year.
The Board meets regularly each month except August and takes into account throughout the year matters bearing on Advisory Contracts. The Board, acting directly and through its separate committees, considers at each of its meetings factors that are relevant to the annual renewal of the fund’s Advisory Contracts, including the services and support provided to the fund and its shareholders by Fidelity. At the time of the renewal, the Board had 11 standing committees, each composed of independent Trustees with varying backgrounds, to which the Board has assigned specific subject matter responsibilities in order to enhance effective decision making by the Board. Each committee has adopted a written charter outlining the structure and purposes of the committee. One such com mittee, the Fixed Income Contract Committee, meets periodically during the first six months of each year and as necessary to consider matters specifically related to the annual renewal of Advisory Contracts. The committee requests and receives information on, and makes recommendations to the independent Trustees concerning, the approval and annual review of the Advisory Contracts.
At its June 2005 meeting, the Board of Trustees, including the independent Trustees, unanimously determined to renew the Advisory Contracts for the fund. In reaching its determination, the Board considered all factors it believed relevant, including (1) the nature, extent, and quality of the services to be provided to the fund and its shareholders by Fidelity (including the investment performance of the fund); (2) the competitiveness of the management fee and total expenses of the fund; (3) the total costs of the services to be provided by and the profits to be realized by the investment adviser and its affiliates from the relationship with the fund; (4) the extent to which economies of scale would be realized as the fund grows; and (5) whether fee levels reflect these economies of scale, if any, for the benefit of fund shareholders.
In determining whether to renew the Advisory Contracts for the fund, the Board ulti mately reached a determination, with the assistance of fund counsel and independent Trustees’ counsel, that the renewal of the Advisory Contracts and the compensation to be received by Fidelity under the management contract is consistent with Fidelity’s fidu ciary duty under applicable law. In addition to evaluating the specific factors noted above, the Board, in reaching its determination, is aware that shareholders in the fund have a broad range of investment choices available to them, including a wide choice among mutual funds offered by competitors to Fidelity, and that the fund’s shareholders,
37 Annual Report
Board Approval of Investment Advisory Contracts and Management Fees continued
with the opportunity to review and weigh the disclosure provided by the fund in its prospectus and other public disclosures, have chosen to invest in this fund, managed by Fidelity.
Nature, Extent, and Quality of Services Provided by Fidelity. The Board consid ered staffing within the investment adviser, FMR, and the sub advisers (together, the Investment Advisers), including the background of the fund’s portfolio manager and the fund’s investment objective and discipline. The independent Trustees also had discus sions with senior management of Fidelity’s investment operations and investment groups. The Board considered the structure of the portfolio manager compensation program and whether this structure provides appropriate incentives.
Fidelity Resources Dedicated to Investment Management and Support Services. The Board reviewed the size, education, and experience of the Investment Advisers’ invest ment staff, their use of technology, and the Investment Advisers’ approach to recruiting, training, and retaining portfolio managers and other research, advisory, and manage ment personnel. The Board considered Fidelity’s extensive global research capabilities that enable the Investment Advisers to aggregate data from various sources in an effort to produce positive investment results. The Board noted that Fidelity’s analysts have access to a variety of technological tools that enable them to perform both fundamental and quantitative analysis and to specialize in various disciplines. The Board also considered that Fidelity’s portfolio managers and analysts have access to daily portfolio attribution that allows for monitoring of a fund’s portfolio, as well as an electronic communication system that provides immediate real time access to research concerning issuers and credit enhancers.
Shareholder and Administrative Services. The Board considered the nature, extent, quality, and cost of administrative, distribution, and shareholder services performed by the Investment Advisers and their affiliates under the Advisory Contracts and under separate agreements covering transfer agency and pricing and bookkeeping services for the fund. The Board also considered the nature and extent of the Investment Advisers’ supervision of third party service providers, principally custodians and subcustodians. The Board reviewed the allocation of fund brokerage, including allocations to brokers affiliated with the Investment Advisers. The Board also considered the resources devoted to, and the record of compliance with, the fund’s compliance policies and procedures.
The Board noted that the growth of fund assets across the complex allows Fidelity to reinvest in the development of services designed to enhance the value or convenience of the Fidelity funds as investment vehicles. These services include 24 hour access to account information and market information through phone representatives and over the Internet, and investor education materials and asset allocation tools.
Investment in a Large Fund Family. The Board considered the benefits to shareholders of investing in a Fidelity fund, including the benefits of investing in a fund that is part of a
large family of funds offering a variety of investment disciplines and providing for a large variety of mutual fund investor services. For example, fund shareholders are offered the privilege of exchanging shares of the fund for shares of other Fidelity funds, as set forth in the fund’s prospectus, without paying a sales charge. The Board noted that, since the last Advisory Contract renewals in June 2004, Fidelity has taken a number of actions that benefited particular funds, including (i) voluntarily deciding in 2004 to stop using “soft” commission dollars to pay for market data and, instead, to pay for that data out of its own resources, (ii) contractually agreeing to impose management fee reductions and expense limitations on its five Spartan stock index funds and its stock index fund available through variable insurance products, (iii) contractually agreeing to eliminate the management fees on the Fidelity Freedom Funds and the Fidelity Advisor Freedom Funds, (iv) contractually agreeing to reduce the management fees on most of its investment grade taxable bond funds, and (v) contractually agreeing to impose expense limitations on its retail and Spartan investment grade taxable bond funds.
Investment Performance. The Board considered whether the fund has operated within its investment objective, as well as its record of compliance with its investment restric tions. It also reviewed the fund’s absolute investment performance, as well as the fund’s relative investment performance measured against (i) a broad based securities market index, and (ii) a peer group of mutual funds deemed appropriate by the Board over multiple periods. The following charts considered by the Board show, over the one , three , and five year periods ended December 31, 2004, the fund’s returns, the returns of a broad based securities market index (“benchmark”), and a range of returns of a peer group of mutual funds identified by Lipper Inc. as having an investment objective similar to that of the fund. The box within each chart shows the 25th percentile return (bottom of box) and the 75th percentile return (top of box) of the Lipper peer group. The per centage beaten number noted below each chart corresponds to the percentile box and represents the percentage of funds in the Lipper peer group whose performance was equal to or lower than that of the fund.
39 Annual Report
Board Approval of Investment Advisory Contracts and Management Fees continued

The Board noted that the relative investment performance of the fund has compared favorably to its Lipper peer group over time. The Board also noted that the relative investment performance of the fund was lower than its benchmark over time.
Based on its review, and giving particular weight to the nature and quality of the resources dedicated by the Investment Advisers to maintain and improve relative performance, the Board concluded that the nature, extent, and quality of the services provided by Fidelity will benefit the fund’s shareholders, particularly in light of the Board’s view that the fund’s shareholders benefit from investing in a fund that is part of a large family of funds offering a variety of investment disciplines and services.
Competitiveness of Management Fee and Total Fund Expenses. The Board considered the fund’s management fee and total expenses compared to “mapped groups” of competitive funds and classes. Fidelity creates “mapped groups” by combining similar Lipper investment objective categories that have comparable management fee charac teristics. Combining Lipper investment objective categories aids the Board’s manage ment fee and total expense comparisons by broadening the competitive group used for comparison and by reducing the number of universes to which various Fidelity funds are compared.
The Board considered two proprietary management fee comparisons for the 12 month periods shown in the chart below. The group of Lipper funds used by the Board for management fee comparisons is referred to below as the “Total Mapped Group” and, for the reasons explained above, is broader than the Lipper peer group used by the Board for performance comparisons. The Total Mapped Group comparison focuses on a fund’s standing relative to the total universe of comparable funds available to investors, in
terms of gross management fees before expense reimbursements or caps. “TMG %” represents the percentage of funds in the Total Mapped Group that had management fees that were lower than the fund’s. For example, a TMG % of 7% would mean that 93% of the funds in the Total Mapped Group had higher management fees than the fund. The “Asset Size Peer Group” (ASPG) comparison focuses on a fund’s standing relative to non Fidelity funds similar in size to the fund within the Total Mapped Group. The ASPG represents at least 15% of the funds in the Total Mapped Group with comparable asset size and management fee characteristics, subject to a minimum of 50 funds (or all funds in the Total Mapped Group if fewer than 50). Additional information, such as the ASPG quartile (“quadrant”) in which the fund’s management fee ranked, is also included in the chart and considered by the Board. For a more meaningful comparison of management fees, the fund is compared on the basis of a hypothetical “net management fee,” which is derived by subtracting payments made by FMR for non management expenses (includ ing transfer agent fees, pricing and bookkeeping fees, and custody fees) from the fund’s all inclusive fee. In this regard, the Board realizes that net management fees can vary from year to year because of differences in non management expenses.
The Board noted that the fund’s management fee ranked below the median of its Total Mapped Group and below the median of its ASPG for 2004. Based on its review, the Board concluded that the fund’s management fee was fair and reasonable in light of the ser vices that the fund receives and the other factors considered.
In its review of the fund’s total expenses, the Board considered the fund’s hypothetical net management fee as well as the fund’s all inclusive fee. The Board also considered other expenses, such as transfer agent fees, pricing and bookkeeping fees, and custodial, legal, and audit fees, paid by FMR under the all inclusive arrangement. The Board also
41 Annual Report
Board Approval of Investment Advisory Contracts and Management Fees continued
noted the effects of any waivers and reimbursements on fees and expenses. As part of its review, the Board also considered current and historical total expenses of the fund compared to competitive fund median expenses. The fund is compared to those funds and classes in the Total Mapped Group (used by the Board for management fee compari sons) that have a similar sales load structure.
The Board noted that the fund’s total expenses ranked below its competitive median for 2004.
In its review of total expenses, the Board also considered Fidelity fee structures and other information on clients that FMR and its affiliates service in other competitive markets, such as other mutual funds advised or subadvised by FMR or its affiliates, pension plan clients, and other institutional clients.
Based on its review, the Board concluded that the fund’s total expenses were reasonable in light of the services that the fund and its shareholders receive and the other factors considered.
Costs of the Services and Profitability. The Board considered the revenues earned and the expenses incurred by Fidelity in conducting the business of developing, market ing, distributing, managing, administering and servicing the fund and its shareholders. The Board also considered the level of Fidelity’s profits in respect of all the Fidelity funds.
On an annual basis, FMR presents to the Board Fidelity’s profitability for the fund. Fidelity calculates the profitability for each fund, as well as aggregate profitability for groups of Fidelity funds and all Fidelity funds, using a series of detailed revenue and cost allocation methodologies which originate with the audited books and records of Fidelity. The Audit Committee of the Board reviews any significant changes from the prior year’s methodologies.
PricewaterhouseCoopers LLP (PwC), independent registered accounting firm and auditor to Fidelity and certain Fidelity funds, has been engaged annually by the Board as part of the Board’s assessment of the results of Fidelity’s profitability analysis. PwC’s engagement includes the review and assessment of Fidelity’s methodologies used in determining the revenues and expenses attributable to Fidelity’s mutual fund business, and completion of agreed upon procedures surrounding the mathematical accuracy of fund profitability and its conformity to allocation methodologies. After considering PwC’s reports issued under the engagement and information provided by Fidelity, the Board believes that while other allocation methods may also be reasonable, Fidelity’s profitabil ity methodologies are reasonable in all material respects.
The Board has also reviewed Fidelity’s non fund businesses and any fall out benefits related to the mutual fund business as well as cases where Fidelity’s affiliates may benefit from or be related to the fund’s business. In addition, a special committee of the
Board reviewed services provided to Fidelity by its affiliates and determined that the fees that Fidelity paid for such services were reasonable.
The Board considered the costs of the services provided by and the profits realized by Fidelity in connection with the operation of the fund and determined that the amount of profit is a fair entrepreneurial profit for the management of the fund.
Economies of Scale. The Board considered whether there have been economies of scale in respect of the management of the Fidelity funds, whether the Fidelity funds (including the fund) have appropriately benefited from any such economies of scale, and whether there is potential for realization of any further economies of scale. The Board considered the extent to which the fund will benefit from economies of scale through increased services to the fund, through waivers or reimbursements, or through fee or expense reductions. The Board concluded that any potential economies of scale are being shared between fund shareholders and Fidelity in an appropriate manner.
Additional Information Requested by the Board. In order to develop fully the factual basis for consideration of the Advisory Contracts, the Board requested additional information regarding (i) Fidelity’s fund profitability methodology, including additional detail on various cost allocations; (ii) fall out benefits to Fidelity; and (iii) compensation of portfolio managers and research analysts.
Based on its evaluation of all of the conclusions noted above, and after considering all material factors, the Board ultimately concluded that the existing advisory fee structures are fair and reasonable, and that the fund’s existing Advisory Contracts should be renewed.
43 Annual Report
Managing Your Investments
Fidelity offers several ways to conveniently manage your personal investments via your telephone or PC. You can access your account information, conduct trades and research your investments 24 hours a day.
By Phone
Fidelity Automated Service Telephone provides a single toll free number to access account balances, positions, quotes and trading. It’s easy to navigate the service, and on your first call, the system will help you create a personal identification number (PIN) for security.


By PC
Fidelity’s web site on the Internet provides a wide range of information, including daily financial news, fund performance, interactive planning tools and news about Fidelity products and services.

* When you call the quotes line, please remember that a fund’s yield and return will vary and, except for money market funds, share price will also vary. This means that you may have a gain or loss when you sell your shares. There is no assurance that money market funds will be able to maintain a stable $1 share price; an investment in a money market fund is not insured or guar anteed by the U.S. government. Total returns are historical and include changes in share price, reinvestment of dividends and capital gains, and the effects of any sales charges.
Annual Report
To Write Fidelity
We’ll give your correspondence immediate attention and send you written confirmation upon completion of your request.

(such as changing name, address, bank, etc.)
| | Fidelity Investments
P.O. Box 770001
Cincinnati, OH 45277-0002
|

| | Buying shares
Fidelity Investments
P.O. Box 770001
Cincinnati, OH 45277-0003
Overnight Express
Fidelity Investments
Attn: Distribution Services
100 Crosby Parkway KC1H
Covington, KY 41015
Selling shares
Fidelity Investments
P.O. Box 770001
Cincinnati, OH 45277-0035
Overnight Express
Fidelity Investments
Attn: Distribution Services
100 Crosby Parkway KC1H
Covington, KY 41015
General Correspondence
Fidelity Investments
P.O. Box 500
Merrimack, NH 03054-0500
|

Fidelity Investments
P.O. Box 770001
Cincinnati, OH 45277-0003
Selling shares
Fidelity Investments
P.O. Box 770001
Cincinnati, OH 45277-0035
Overnight Express
Fidelity Investments
Attn: Distribution Services
100 Crosby Parkway KC1H
Covington, KY 41015
General Correspondence
Fidelity Investments
P.O. Box 500
Merrimack, NH 03054-0500
|
Annual Report
Investment Adviser
Fidelity Management & Research Company
Boston, MA
Investment Sub Advisers
Fidelity Investments
Money Management, Inc.
Fidelity International
Investment Advisors
Fidelity International Investment
Advisors (U.K.) Limited
General Distributor
Fidelity Distributors Corporation
Boston, MA
Transfer and Service Agents
Citibank, N.A.
New York, NY
and
Fidelity Service Company, Inc.
Boston, MA
Custodian
Citibank, N.A.
New York, NY
|
| The Fidelity Telephone Connection |
| Mutual Fund 24 Hour Service |
| Exchanges/Redemptions | | |
| and Account Assistance | | 1-800-544-6666 |
| Product Information | | 1-800-544-6666 |
| Retirement Accounts | | 1-800-544-4774 |
| (8 a.m. - 9 p.m.) | | |
| TDD Service | | 1-800-544-0118 |
| for the deaf and hearing impaired |
| (9 a.m. - 9 p.m. Eastern time) |
| Fidelity Automated Service | | |
| Telephone (FAST® ) | | (automated_phone_logo) 1-800-544-5555 |
(automated_phone_logo)
Automated line for quickest serviceSMD-UANN-1005
1.790913.102
|

Item 2. Code of Ethics
As of the end of the period, August 31, 2005, Fidelity Union Street Trust (the trust) has adopted a code of ethics, as defined in Item 2 of Form N-CSR, that applies to its President and Treasurer and its Chief Financial Officer. A copy of the code of ethics is filed as an exhibit to this Form N-CSR.
Item 3. Audit Committee Financial Expert
The Board of Trustees of the trust has determined that Marie L. Knowles is an audit committee financial expert, as defined in Item 3 of Form N-CSR. Ms. Knowles is independent for purposes of Item 3 of Form N-CSR.
Item 4. Principal Accountant Fees and Services
(a) Audit Fees.
For the fiscal years ended August 31, 2005 and August 31, 2004, the aggregate Audit Fees billed by PricewaterhouseCoopers LLP (PwC) for professional services rendered for the audits of the financial statements, or services that are normally provided in connection with statutory and regulatory filings or engagements for those fiscal years, for the Fidelity Export and Multinational Fund, Fidelity Arizona Municipal Income Fund and Fidelity Maryland Municipal Income Fund (the funds) and for all funds in the Fidelity Group of Funds are shown in the table below.
Fund | 2005A | 2004A |
Fidelity Export and Multinational Fund | $47,000 | $39,000 |
Fidelity Arizona Municipal Income Fund | $33,000 | $38,000 |
Fidelity Maryland Municipal Income Fund | $36,000 | $36,000 |
All funds in the Fidelity Group of Funds audited by PwC | $11,600,000 | $10,600,000 |
A | Aggregate amounts may reflect rounding. |
(b) Audit-Related Fees.
In each of the fiscal years ended August 31, 2005 and August 31, 2004 the aggregate Audit-Related Fees billed by PwC for services rendered for assurance and related services to each fund that are reasonably related to the performance of the audit or review of the fund's financial statements, but not reported as Audit Fees, are shown in the table below.
Fund | 2005A | 2004A |
Fidelity Export and Multinational Fund | $0 | $0 |
Fidelity Arizona Municipal Income Fund | $0 | $0 |
Fidelity Maryland Municipal Income Fund | $0 | $0 |
A | Aggregate amounts may reflect rounding. |
In each of the fiscal years ended August 31, 2005 and August 31, 2004, the aggregate Audit-Related Fees that were billed by PwC that were required to be approved by the Audit Committee for services rendered on behalf of Fidelity Management & Research Company (FMR) and entities controlling, controlled by, or under common control with FMR (not including any sub-adviser whose role is primarily portfolio management and is subcontracted with or overseen by another investment adviser) that provide ongoing services to the funds ("Fund Service Providers") for assurance and related services that relate directly to the operations and financial reporting of each fund that are reasonably related to the performance of the audit or review of the fund's financial statements, but not reported as Audit Fees, are shown in the table below.
Billed By | 2005A | 2004A |
PwC | $0 | $50,000 |
A | Aggregate amounts may reflect rounding. |
Fees included in the audit-related category comprise assurance and related services (e.g., due diligence services) that are traditionally performed by the independent registered public accounting firm. These audit-related services include due diligence related to mergers and acquisitions, accounting consultations and audits in connection with acquisitions, internal control reviews, attest services that are not required by statute or regulation and consultation concerning financial accounting and reporting standards.
(c) Tax Fees.
In each of the fiscal years ended August 31, 2005 and August 31, 2004, the aggregate Tax Fees billed by PwC for professional services rendered for tax compliance, tax advice, and tax planning for each fund is shown in the table below.
Fund | 2005A | 2004A |
Fidelity Export and Multinational Fund | $2,500 | $2,400 |
Fidelity Arizona Municipal Income Fund | $2,500 | $2,400 |
Fidelity Maryland Municipal Income Fund | $2,500 | $2,400 |
A | Aggregate amounts may reflect rounding. |
In each of the fiscal years ended August 31, 2005 and August 31, 2004, the aggregate Tax Fees billed by PwC that were required to be approved by the Audit Committee for professional services rendered on behalf of the Fund Service Providers for tax compliance, tax advice, and tax planning that relate directly to the operations and financial reporting of each fund is shown in the table below.
Billed By | 2005A | 2004A |
PwC | $0 | $0 |
A | Aggregate amounts may reflect rounding. |
Fees included in the Tax Fees category comprise all services performed by professional staff in the independent registered public accounting firm's tax division except those services related to the audit. Typically, this category would include fees for tax compliance, tax planning, and tax advice. Tax compliance, tax advice, and tax planning services include preparation of original and amended tax returns, claims for refund and tax payment-planning services, assistance with tax audits and appeals, tax advice related to mergers and acquisitions and requests for rulings or technical advice from taxing authorities.
(d) All Other Fees.
In each of the fiscal years ended August 31, 2005 and August 31, 2004, the aggregate Other Fees billed by PwC for all other non-audit services rendered to the funds is shown in the table below.
Fund | 2005A | 2004A |
Fidelity Export and Multinational Fund | $3,100 | $2,100 |
Fidelity Arizona Municipal Income Fund | $1,400 | $1,300 |
Fidelity Maryland Municipal Income Fund | $1,400 | $1,300 |
A | Aggregate amounts may reflect rounding. |
In each of the fiscal years ended August 31, 2005 and August 31, 2004, the aggregate Other Fees billed by PwC that were required to be approved by the Audit Committee for all other non-audit services rendered on behalf of the Fund Service Providers that relate directly to the operations and financial reporting of each fund is shown in the table below.
Billed By | 2005A | 2004A |
PwC | $280,000 | $280,000 |
A | Aggregate amounts may reflect rounding. |
Fees included in the All Other Fees category include services related to internal control reviews, strategy and other consulting, financial information systems design and implementation, consulting on other information systems, and other tax services unrelated to the fund.
(e) (1) | Audit Committee Pre-Approval Policies and Procedures: |
The trust's Audit Committee must pre-approve all audit and non-audit services provided by the independent registered public accounting firm relating to the operations or financial reporting of the funds. Prior to the commencement of any audit or non-audit services to a fund, the Audit Committee reviews the services to determine whether they are appropriate and permissible under applicable law.
The trust's Audit Committee has adopted policies and procedures to, among other purposes, provide a framework for the Committee's consideration of non-audit services by the audit firms that audit the Fidelity funds. The policies and procedures require that any non-audit service provided by a fund audit firm to a Fidelity Fund and any non-audit service provided by a fund auditor to a Fund Service Provider that relates directly to the operations and financial reporting of a Fidelity fund (Covered Service) are subject to approval by the Audit Committee before such service is provided. Non-audit services provided by a fund audit firm for a Fund Service Provider that do not relate directly to the operations and financial reporting of a Fidelity fund (Non-Covered Service) but that are expected to exceed $50,000 are also subject to pre-approval by the Audit Committee.
All Covered Services, as well as Non-Covered Services that are expected to exceed $50,000, must be approved in advance of provision of the service either: (i) by formal resolution of the Audit Committee, or (ii) by oral or written approval of the service by the Chair of the Audit Committee (or if the Chair is unavailable, such other member of the Audit Committee as may be designated by the Chair to act in the Chair's absence). The approval contemplated by (ii) above is permitted where the Treasurer determines that action on such an engagement is necessary before the next meeting of the Audit Committee. Neither pre-approval nor advance notice of Non-Covered Service engagements for which fees are not expected to exceed $50,000 is required; such engagements are to be reported to the Audit Committee monthly.
(e) (2) | Services approved pursuant to paragraph (c)(7)(i)(C) of Rule 2-01 of Regulation S-X: |
Audit-Related Fees:
There were no amounts that were approved by the Audit Committee pursuant to the de minimis exception for the fiscal years ended August 31, 2005 and August 31, 2004 on behalf of each fund.
There were no amounts that were required to be approved by the Audit Committee pursuant to the de minimis exception for the fiscal years ended August 31, 2005 and August 31, 2004 on behalf of the Fund Service Providers that relate directly to the operations and financial reporting of each fund.
Tax Fees:
There were no amounts that were approved by the Audit Committee pursuant to the de minimis exception for the fiscal years ended August 31, 2005 and August 31, 2004 on behalf of each fund.
There were no amounts that were required to be approved by the Audit Committee pursuant to the de minimis exception for the fiscal years ended August 31, 2005 and August 31, 2004 on behalf of the Fund Service Providers that relate directly to the operations and financial reporting of each fund.
All Other Fees:
There were no amounts that were approved by the Audit Committee pursuant to the de minimis exception for the fiscal years ended August 31, 2005 and August 31, 2004 on behalf of each fund.
There were no amounts that were required to be approved by the Audit Committee pursuant to the de minimis exception for the fiscal years ended August 31, 2005 and August 31, 2004 on behalf of the Fund Service Providers that relate directly to the operations and financial reporting of each fund.
(f) Not Applicable.
(g) For the fiscal years ended August 31, 2005 and August 31, 2004, the aggregate fees billed by PwC of $3,550,000A and $1,850,000A for non-audit services rendered on behalf of the funds, FMR (not including any sub-adviser whose role is primarily portfolio management and is subcontracted with or overseen by another investment adviser) and Fund Service Providers relating to Covered Services and Non-Covered Services are shown in the table below.
| 2005A | 2004A |
Covered Services | $300,000 | $350,000 |
Non-Covered Services | $3,250,000 | $1,500,000 |
A | Aggregate amounts may reflect rounding. |
(h) The trust's Audit Committee has considered Non-Covered Services that were not pre-approved that were provided by PwC to Fund Service Providers to be compatible with maintaining the independence of PwC in its audit of the funds, taking into account representations from PwC, in accordance with Independence Standards Board Standard No.1, regarding its independence from the funds and their related entities.
Item 5. Audit Committee of Listed Registrants
Not applicable.
Item 6. Schedule of Investments
Not applicable.
Item 7. Disclosure of Proxy Voting Policies and Procedures for Closed-End Management Investment Companies
Not applicable.
Item 8. Portfolio Managers of Closed-End Management Investment Companies
Not applicable.
Item 9. Purchase of Equity Securities by Closed-End Management Investment Company and Affiliated Purchasers
Not applicable.
Item 10. Submission of Matters to a Vote of Security Holders
There were no material changes to the procedures by which shareholders may recommend nominees to the trust's Board of Trustees.
Item 11. Controls and Procedures
(a)(i) The President and Treasurer and the Chief Financial Officer have concluded that the trust's disclosure controls and procedures (as defined in Rule 30a-3(c) under the Investment Company Act) provide reasonable assurances that material information relating to the trust is made known to them by the appropriate persons, based on their evaluation of these controls and procedures as of a date within 90 days of the filing date of this report.
(a)(ii) There was no change in the trust's internal control over financial reporting (as defined in Rule 30a-3(d) under the Investment Company Act) that occurred during the second fiscal quarter of the period covered by this report that has materially affected, or is reasonably likely to materially affect, the trust's internal control over financial reporting.
Item 12. Exhibits
(a) | (1) | Code of Ethics pursuant to Item 2 of Form N-CSR is filed and attached hereto as EX-99.CODE ETH. |
(a) | (2) | Certification pursuant to Rule 30a-2(a) under the Investment Company Act of 1940 (17 CFR 270.30a-2(a)) is filed and attached hereto as Exhibit 99.CERT. |
(a) | (3) | Not applicable. |
(b) | | Certification pursuant to Rule 30a-2(b) under the Investment Company Act of 1940 (17 CFR 270.30a-2(b)) is furnished and attached hereto as Exhibit 99.906CERT. |
SIGNATURES
Pursuant to the requirements of the Securities Exchange Act of 1934 and the Investment Company Act of 1940, the registrant has duly caused this report to be signed on its behalf by the undersigned, thereunto duly authorized.
Fidelity Union Street Trust
By: | /s/Christine Reynolds |
| Christine Reynolds |
| President and Treasurer |
| |
Date: | October 21, 2005 |
Pursuant to the requirements of the Securities Exchange Act of 1934 and the Investment Company Act of 1940, this report has been signed below by the following persons on behalf of the registrant and in the capacities and on the dates indicated.
By: | /s/Christine Reynolds |
| Christine Reynolds |
| President and Treasurer |
| |
Date: | October 21, 2005 |
By: | /s/Timothy F. Hayes |
| Timothy F. Hayes |
| Chief Financial Officer |
| |
Date: | October 21, 2005 |