UNITED STATES
SECURITIES AND EXCHANGE COMMISSION
Washington, D.C. 20549
FORM N-CSR
CERTIFIED SHAREHOLDER REPORT OF REGISTERED
MANAGEMENT INVESTMENT COMPANIES
Investment Company Act file number 811-2460
Fidelity Union Street Trust
(Exact name of registrant as specified in charter)
82 Devonshire St., Boston, Massachusetts 02109
(Address of principal executive offices) (Zip code)
Eric D. Roiter, Secretary
82 Devonshire St.
Boston, Massachusetts 02109
(Name and address of agent for service)
Registrant's telephone number, including area code: 617-563-7000
Date of fiscal year end: | August 31 |
| |
Date of reporting period: | February 28, 2005 |
Item 1. Reports to Stockholders
Fidelity®
Export and Multinational
Fund
Semiannual Report
February 28, 2005
(2_fidelity_logos)(Registered_Trademark)
Contents
Chairman's Message | <Click Here> | Ned Johnson's message to shareholders. |
Shareholder Expense Example | <Click Here> | An example of shareholder expenses. |
Investment Changes | <Click Here> | A summary of the major shifts in the fund's investments over the past six months. |
Investments | <Click Here> | A complete list of the fund's investments with their market values. |
Financial Statements | <Click Here> | Statements of assets and liabilities, operations, and changes in net assets, as well as financial highlights. |
Notes | <Click Here> | Notes to the financial statements. |
Proxy Voting Results | <Click Here> | |
| | |
| | |
| | |
To view a fund's proxy voting guidelines and proxy voting record for the 12-month period ended June 30, visit www.fidelity.com/proxyvotingresults or visit the Securities and Exchange Commission's (SEC) web site at www.sec.gov. You may also call 1-800-544-8544 to request a free copy of the proxy voting guidelines.
Standard & Poor's, S&P and S&P 500 are registered service marks of The McGraw-Hill Companies, Inc. and have been licensed for use by Fidelity Distributors Corporation.
Other third party marks appearing herein are the property of their respective owners.
All other marks appearing herein are registered or unregistered trademarks or service marks of FMR Corp. or an affiliated company.
This report and the financial statements contained herein are submitted for the general information of the shareholders of the fund. This report is not authorized for distribution to prospective investors in the fund unless preceded or accompanied by an effective prospectus.
A fund files its complete schedule of portfolio holdings with the SEC for the first and third quarters of each fiscal year on Form N-Q. Forms N-Q are available on the SEC's web site at http://www.sec.gov. A fund's Forms N-Q may be reviewed and copied at the SEC's Public Reference Room in Washington, DC. Information regarding the operation of the SEC's Public Reference Room may be obtained by calling 1-800-SEC-0330. For a complete list of a fund's portfolio holdings, view the most recent quarterly holdings report, semiannual report, or annual report on Fidelity's web site at http://www.fidelity.com/holdings.
NOT FDIC INSURED · MAY LOSE VALUE · NO BANK GUARANTEE
Neither the fund nor Fidelity Distributors Corporation is a bank.
Semiannual Report
Chairman's Message
(photo_of_Edward_C_Johnson_3d)
Dear Shareholder:
During the past year or so, much has been reported about the mutual fund industry, and much of it has been more critical than I believe is warranted. Allegations that some companies have been less than forthright with their shareholders have cast a shadow on the entire industry. I continue to find these reports disturbing, and assert that they do not create an accurate picture of the industry overall. Therefore, I would like to remind everyone where Fidelity stands on these issues. I will say two things specifically regarding allegations that some mutual fund companies were in violation of the Securities and Exchange Commission's forward pricing rules or were involved in so-called "market timing" activities.
First, Fidelity has no agreements that permit customers who buy fund shares after 4 p.m. to obtain the 4 p.m. price. This is not a new policy. This is not to say that someone could not deceive the company through fraudulent acts. However, we are extremely diligent in preventing fraud from occurring in this manner - and in every other. But I underscore again that Fidelity has no so-called "agreements" that sanction illegal practices.
Second, Fidelity continues to stand on record, as we have for years, in opposition to predatory short-term trading that adversely affects shareholders in a mutual fund. Back in the 1980s, we initiated a fee - which is returned to the fund and, therefore, to investors - to discourage this activity. Further, we took the lead several years ago in developing a Fair Value Pricing Policy to prevent market timing on foreign securities in our funds. I am confident we will find other ways to make it more difficult for predatory traders to operate. However, this will only be achieved through close cooperation among regulators, legislators and the industry.
Yes, there have been unfortunate instances of unethical and illegal activity within the mutual fund industry from time to time. That is true of any industry. When this occurs, confessed or convicted offenders should be dealt with appropriately. But we are still concerned about the risk of over-regulation and the quick application of simplistic solutions to intricate problems. Every system can be improved, and we support and applaud well thought out improvements by regulators, legislators and industry representatives that achieve the common goal of building and protecting the value of investors' holdings.
For nearly 60 years, Fidelity has worked very hard to improve its products and service to justify your trust. When our family founded this company in 1946, we had only a few hundred customers. Today, we serve more than 18 million customers including individual investors and participants in retirement plans across America.
Let me close by saying that we do not take your trust in us for granted, and we realize that we must always work to improve all aspects of our service to you. In turn, we urge you to continue your active participation with your financial matters, so that your interests can be well served.
Best regards,/s/Edward C. Johnson 3d
Edward C. Johnson 3d
Semiannual Report
Shareholder Expense Example
As a shareholder of the Fund, you incur two types of costs: (1) transaction costs, including redemption fees, and (2) ongoing costs, including management fees and other Fund expenses. This Example is intended to help you understand your ongoing costs (in dollars) of investing in the Fund and to compare these costs with the ongoing costs of investing in other mutual funds.
The Example is based on an investment of $1,000 invested at the beginning of the period and held for the entire period (September 1, 2004 to February 28, 2005).
Actual Expenses
The first line of the table below provides information about actual account values and actual expenses. You may use the information in this line, together with the amount you invested, to estimate the expenses that you paid over the period. Simply divide your account value by $1,000.00 (for example, an $8,600 account value divided by $1,000.00 = 8.6), then multiply the result by the number in the first line under the heading entitled "Expenses Paid During Period" to estimate the expenses you paid on your account during this period. A small balance maintenance fee of $12.00 that is charged once a year may apply for certain accounts with a value of less than $2,000. This fee is not included in the table below. If it was, the estimate of expenses you paid during the period would be higher, and your ending account value lower, by this amount.
Hypothetical Example for Comparison Purposes
The second line of the table below provides information about hypothetical account values and hypothetical expenses based on the Fund's actual expense ratio and an assumed rate of return of 5% per year before expenses, which is not the Fund's actual return. The hypothetical account values and expenses may not be used to estimate the actual ending account balance or expenses you paid for the period. You may use this information to compare the ongoing costs of investing in the Fund and other funds. To do so, compare this 5% hypothetical example with the 5% hypothetical examples that appear in the shareholder reports of the other funds. A small balance maintenance fee of $12.00 that is charged once a year may apply for certain accounts with a value of less than $2,000. This fee is not included in the table below. If it was, the estimate of expenses you paid during the period would be higher, and your ending account value lower, by this amount.
Please note that the expenses shown in the table are meant to highlight your ongoing costs only and do not reflect any transaction costs. Therefore, the second line of the table is useful in comparing ongoing costs only, and will not help you determine the relative total costs of owning different funds. In addition, if these transactional costs were included, your costs would have been higher.
| Beginning
Account Value
September 1, 2004 | Ending
Account Value
February 28, 2005 | Expenses Paid
During Period*
September 1, 2004
to February 28, 2005 |
Actual | $1,000.00 | $1,148.00 | $4.69 |
Hypothetical (5% return per year before expenses) | $1,000.00 | $1,020.43 | $4.41 |
* Expenses are equal to the Fund's annualized expense ratio of .88%; multiplied by the average account value over the period, multiplied by 181/365 (to reflect the one-half year period).
Semiannual Report
Investment Changes
Top Ten Stocks as of February 28, 2005 |
| % of fund's
net assets | % of fund's net assets
6 months ago |
American International Group, Inc. | 6.5 | 5.6 |
Microsoft Corp. | 3.9 | 4.7 |
UnitedHealth Group, Inc. | 3.9 | 3.5 |
Robert Half International, Inc. | 3.1 | 1.9 |
Home Depot, Inc. | 2.9 | 2.8 |
ACE Ltd. | 2.7 | 2.2 |
Intel Corp. | 2.6 | 2.1 |
Goldman Sachs Group, Inc. | 2.5 | 2.0 |
Dell, Inc. | 2.5 | 1.8 |
Tyco International Ltd. | 2.5 | 2.0 |
| 33.1 | |
Top Five Market Sectors as of February 28, 2005 |
| % of fund's
net assets | % of fund's net assets
6 months ago |
Information Technology | 25.1 | 19.9 |
Financials | 24.6 | 26.5 |
Health Care | 13.1 | 14.4 |
Industrials | 13.0 | 9.8 |
Energy | 12.2 | 6.7 |
Asset Allocation (% of fund's net assets) |
As of February 28, 2005 * | As of August 31, 2004 ** |
 | Stocks 98.3% | | | Stocks 99.2% | |
 | Short-Term
Investments and
Net Other Assets 1.7% | | | Short-Term
Investments and
Net Other Assets 0.8% | |
* Foreign investments | 11.3% | | ** Foreign investments | 8.1% | |

Semiannual Report
Investments February 28, 2005 (Unaudited)
Showing Percentage of Net Assets
Common Stocks - 98.3% |
| Shares | | Value (Note 1) (000s) |
CONSUMER DISCRETIONARY - 6.3% |
Internet & Catalog Retail - 2.1% |
eBay, Inc. (a) | 1,030,140 | | $44,131 |
Media - 0.8% |
Lamar Advertising Co. Class A (a) | 252,450 | | 9,919 |
News Corp. Class B | 460,700 | | 7,929 |
| | 17,848 |
Specialty Retail - 3.4% |
Aeropostale, Inc. (a) | 322,860 | | 10,299 |
Home Depot, Inc. | 1,567,900 | | 62,747 |
| | 73,046 |
TOTAL CONSUMER DISCRETIONARY | | 135,025 |
CONSUMER STAPLES - 1.7% |
Household Products - 0.7% |
Procter & Gamble Co. | 294,400 | | 15,630 |
Personal Products - 1.0% |
Estee Lauder Companies, Inc. Class A | 469,050 | | 20,629 |
TOTAL CONSUMER STAPLES | | 36,259 |
ENERGY - 12.2% |
Energy Equipment & Services - 6.9% |
BJ Services Co. | 237,100 | | 11,846 |
Grant Prideco, Inc. (a) | 491,900 | | 11,884 |
Halliburton Co. | 707,200 | | 31,096 |
National-Oilwell, Inc. (a) | 229,700 | | 10,415 |
Noble Corp. | 216,300 | | 12,344 |
Pride International, Inc. (a) | 497,800 | | 12,256 |
Schlumberger Ltd. (NY Shares) | 309,600 | | 23,359 |
Smith International, Inc. | 172,700 | | 11,098 |
Varco International, Inc. (a) | 268,950 | | 10,142 |
Weatherford International Ltd. (a) | 256,550 | | 15,293 |
| | 149,733 |
Oil & Gas - 5.3% |
Apache Corp. | 379,950 | | 23,891 |
Burlington Resources, Inc. | 151,500 | | 7,519 |
Forest Oil Corp. (a) | 196,835 | | 7,873 |
Occidental Petroleum Corp. | 274,820 | | 19,312 |
Common Stocks - continued |
| Shares | | Value (Note 1) (000s) |
ENERGY - continued |
Oil & Gas - continued |
Total SA sponsored ADR | 214,740 | | $25,597 |
Valero Energy Corp. | 409,380 | | 29,164 |
| | 113,356 |
TOTAL ENERGY | | 263,089 |
FINANCIALS - 24.6% |
Capital Markets - 6.8% |
Goldman Sachs Group, Inc. | 495,460 | | 53,906 |
Merrill Lynch & Co., Inc. | 414,400 | | 24,276 |
Morgan Stanley | 708,690 | | 40,020 |
UBS AG (NY Shares) | 334,550 | | 29,022 |
| | 147,224 |
Insurance - 17.8% |
ACE Ltd. | 1,302,230 | | 57,897 |
AMBAC Financial Group, Inc. | 569,200 | | 44,272 |
American International Group, Inc. | 2,093,990 | | 139,876 |
Hartford Financial Services Group, Inc. | 399,180 | | 28,721 |
The Chubb Corp. | 246,230 | | 19,479 |
W.R. Berkley Corp. | 810,000 | | 41,602 |
XL Capital Ltd. Class A | 680,855 | | 51,064 |
| | 382,911 |
TOTAL FINANCIALS | | 530,135 |
HEALTH CARE - 13.1% |
Biotechnology - 1.8% |
Cephalon, Inc. (a) | 247,800 | | 12,160 |
Genentech, Inc. (a) | 496,200 | | 23,421 |
OSI Pharmaceuticals, Inc. (a) | 63,200 | | 3,453 |
| | 39,034 |
Health Care Equipment & Supplies - 2.1% |
Kinetic Concepts, Inc. | 115,800 | | 7,554 |
Medtronic, Inc. | 533,000 | | 27,780 |
Waters Corp. (a) | 192,400 | | 9,399 |
| | 44,733 |
Health Care Providers & Services - 5.1% |
American Healthways, Inc. (a) | 158,300 | | 5,379 |
PacifiCare Health Systems, Inc. (a) | 101,700 | | 6,456 |
Common Stocks - continued |
| Shares | | Value (Note 1) (000s) |
HEALTH CARE - continued |
Health Care Providers & Services - continued |
Pediatrix Medical Group, Inc. (a) | 189,890 | | $13,013 |
UnitedHealth Group, Inc. | 922,930 | | 84,134 |
| | 108,982 |
Pharmaceuticals - 4.1% |
Allergan, Inc. | 165,350 | | 12,431 |
Barr Pharmaceuticals, Inc. (a) | 281,860 | | 13,456 |
Pfizer, Inc. | 977,567 | | 25,700 |
Roche Holding AG (participation certificate) (d) | 189,453 | | 19,983 |
Wyeth | 417,250 | | 17,032 |
| | 88,602 |
TOTAL HEALTH CARE | | 281,351 |
INDUSTRIALS - 13.0% |
Aerospace & Defense - 2.4% |
Honeywell International, Inc. | 1,349,450 | | 51,239 |
Commercial Services & Supplies - 6.9% |
Apollo Group, Inc. Class A (a) | 702,010 | | 51,696 |
Bright Horizons Family Solutions, Inc. (a) | 200,375 | | 13,802 |
Cintas Corp. | 276,490 | | 12,105 |
Education Management Corp. (a) | 197,100 | | 5,779 |
Robert Half International, Inc. | 2,266,730 | | 66,121 |
| | 149,503 |
Construction & Engineering - 1.2% |
Chicago Bridge & Iron Co. NV (NY Shares) | 386,300 | | 16,769 |
Fluor Corp. | 144,010 | | 9,037 |
| | 25,806 |
Industrial Conglomerates - 2.5% |
Tyco International Ltd. | 1,593,400 | | 53,347 |
TOTAL INDUSTRIALS | | 279,895 |
INFORMATION TECHNOLOGY - 25.1% |
Communications Equipment - 2.1% |
Cisco Systems, Inc. (a) | 1,677,200 | | 29,217 |
Juniper Networks, Inc. (a) | 782,600 | | 16,857 |
| | 46,074 |
Common Stocks - continued |
| Shares | | Value (Note 1) (000s) |
INFORMATION TECHNOLOGY - continued |
Computers & Peripherals - 3.2% |
Dell, Inc. (a) | 1,333,885 | | $53,475 |
EMC Corp. (a) | 1,182,100 | | 14,965 |
| | 68,440 |
Electronic Equipment & Instruments - 2.4% |
Amphenol Corp. Class A | 326,000 | | 13,007 |
CDW Corp. | 278,440 | | 16,002 |
Flextronics International Ltd. (a) | 611,500 | | 8,164 |
National Instruments Corp. | 504,750 | | 14,416 |
| | 51,589 |
Internet Software & Services - 2.0% |
Google, Inc. Class A (sub. vtg.) | 107,320 | | 20,175 |
Yahoo!, Inc. (a) | 693,500 | | 22,379 |
| | 42,554 |
IT Services - 0.7% |
Affiliated Computer Services, Inc. Class A (a) | 291,000 | | 15,045 |
Office Electronics - 0.6% |
Zebra Technologies Corp. Class A (a) | 256,900 | | 12,812 |
Semiconductors & Semiconductor Equipment - 7.3% |
Analog Devices, Inc. | 538,340 | | 19,768 |
ARM Holdings PLC sponsored ADR | 1,779,800 | | 10,999 |
Exar Corp. (a) | 274,000 | | 3,872 |
FormFactor, Inc. (a) | 328,200 | | 7,539 |
Freescale Semiconductor, Inc.: | | | |
Class A | 126,100 | | 2,383 |
Class B (a) | 281,300 | | 5,395 |
Intel Corp. | 2,369,800 | | 56,828 |
KLA-Tencor Corp. | 255,500 | | 12,624 |
Marvell Technology Group Ltd. (a) | 336,160 | | 12,300 |
Maxim Integrated Products, Inc. | 279,100 | | 12,007 |
National Semiconductor Corp. | 699,000 | | 13,945 |
| | 157,660 |
Software - 6.8% |
Macrovision Corp. (a) | 265,400 | | 6,436 |
Microsoft Corp. | 3,374,490 | | 84,970 |
Oracle Corp. (a) | 1,582,900 | | 20,435 |
Common Stocks - continued |
| Shares | | Value (Note 1) (000s) |
INFORMATION TECHNOLOGY - continued |
Software - continued |
Symantec Corp. (a) | 1,145,400 | | $25,210 |
TIBCO Software, Inc. (a) | 1,032,600 | | 10,078 |
| | 147,129 |
TOTAL INFORMATION TECHNOLOGY | | 541,303 |
MATERIALS - 2.3% |
Chemicals - 1.1% |
Dow Chemical Co. | 151,500 | | 8,355 |
Lyondell Chemical Co. | 462,055 | | 15,641 |
| | 23,996 |
Metals & Mining - 1.2% |
Gerdau SA sponsored ADR | 241,800 | | 4,773 |
Rio Tinto PLC sponsored ADR | 82,450 | | 11,672 |
Usinas Siderurgicas de Minas Gerais SA (Usiminas) (PN-A) | 324,000 | | 8,571 |
| | 25,016 |
TOTAL MATERIALS | | 49,012 |
TOTAL COMMON STOCKS (Cost $1,882,534) | 2,116,069 |
Money Market Funds - 2.1% |
| | | |
Fidelity Cash Central Fund, 2.51% (b) | 24,558,270 | | 24,558 |
Fidelity Securities Lending Cash Central Fund, 2.52% (b)(c) | 20,344,680 | | 20,345 |
TOTAL MONEY MARKET FUNDS (Cost $44,903) | 44,903 |
TOTAL INVESTMENT PORTFOLIO - 100.4% (Cost $1,927,437) | | 2,160,972 |
NET OTHER ASSETS - (0.4)% | | (9,430) |
NET ASSETS - 100% | $2,151,542 |
Legend |
(a)Non-income producing |
(b)Affiliated fund that is available only to investment companies and other accounts managed by Fidelity Investments. The rate quoted is the annualized seven-day yield of the fund at period end. A complete listing of the fund's holdings as of its most recent quarter end is available upon request. |
(c)Includes investment made with cash collateral received from securities on loan. |
(d)Security or a portion of the security is on loan at period end. |
Other Information |
Distribution of investments by country of issue, as a percentage of total net assets, is as follows: |
United States of America | 88.7% |
Bermuda | 3.3% |
Switzerland | 2.2% |
France | 1.2% |
Netherlands Antilles | 1.1% |
United Kingdom | 1.1% |
Others (individually less than 1%) | 2.4% |
| 100.0% |
See accompanying notes which are an integral part of the financial statements.
Semiannual Report
Financial Statements
Statement of Assets and Liabilities
Amounts in thousands (except per-share amount) | February 28, 2005 (Unaudited) |
| | |
Assets | | |
Investment in securities, at value (including securities loaned of $19,285) (cost $1,927,437) - See accompanying schedule | | $2,160,972 |
Cash | | 556 |
Receivable for investments sold | | 35,002 |
Receivable for fund shares sold | | 19,431 |
Dividends receivable | | 2,019 |
Interest receivable | | 78 |
Prepaid expenses | | 5 |
Other receivables | | 242 |
Total assets | | 2,218,305 |
| | |
Liabilities | | |
Payable for investments purchased | $42,201 | |
Payable for fund shares redeemed | 2,660 | |
Accrued management fee | 967 | |
Other affiliated payables | 397 | |
Other payables and accrued expenses | 193 | |
Collateral on securities loaned, at value | 20,345 | |
Total liabilities | | 66,763 |
| | |
Net Assets | | $2,151,542 |
Net Assets consist of: | | |
Paid in capital | | $1,891,359 |
Undistributed net investment income | | 239 |
Accumulated undistributed net realized gain (loss) on investments and foreign currency transactions | | 26,408 |
Net unrealized appreciation (depreciation) on investments and assets and liabilities in foreign currencies | | 233,536 |
Net Assets, for 107,752 shares outstanding | | $2,151,542 |
Net Asset Value, offering price and redemption price per share ($2,151,542 ÷ 107,752 shares) | | $19.97 |
See accompanying notes which are an integral part of the financial statements.
Semiannual Report
Statement of Operations
Amounts in thousands) | Six months ended February 28, 2005 (Unaudited) |
| | |
Investment Income | | |
Dividends | | $7,143 |
Special Dividends | | 7,337 |
Interest | | 311 |
Security lending | | 5 |
Total income | | 14,796 |
| | |
Expenses | | |
Management fee | $4,509 | |
Transfer agent fees | 1,800 | |
Accounting and security lending fees | 236 | |
Non-interested trustees' compensation | 4 | |
Custodian fees and expenses | 19 | |
Registration fees | 183 | |
Audit | 29 | |
Legal | 13 | |
Miscellaneous | 80 | |
Total expenses before reductions | 6,873 | |
Expense reductions | (255) | 6,618 |
Net investment income (loss) | | 8,178 |
Realized and Unrealized Gain (Loss) Net realized gain (loss) on: | | |
Investment securities | 51,589 | |
Foreign currency transactions | (42) | |
Total net realized gain (loss) | | 51,547 |
Change in net unrealized appreciation (depreciation) on: Investment securities | 152,342 | |
Assets and liabilities in foreign currencies | 1 | |
Total change in net unrealized appreciation (depreciation) | | 152,343 |
Net gain (loss) | | 203,890 |
Net increase (decrease) in net assets resulting from operations | | $212,068 |
See accompanying notes which are an integral part of the financial statements.
Semiannual Report
Financial Statements - continued
Statement of Changes in Net Assets
Amounts in thousands | Six months ended
February 28, 2005
(Unaudited) | Year ended
August 31,
2004 |
Increase (Decrease) in Net Assets | | |
Operations | | |
Net investment income (loss) | $8,178 | $1,675 |
Net realized gain (loss) | 51,547 | 104,951 |
Change in net unrealized appreciation (depreciation) | 152,343 | 7,945 |
Net increase (decrease) in net assets resulting
from operations | 212,068 | 114,571 |
Distributions to shareholders from net investment income | (8,330) | (3,865) |
Distributions to shareholders from net realized gain | (59,903) | - |
Total distributions | (68,233) | (3,865) |
Share transactions
Proceeds from sales of shares | 957,577 | 540,782 |
Reinvestment of distributions | 65,863 | 3,734 |
Cost of shares redeemed | (276,896) | (266,094) |
Net increase (decrease) in net assets resulting from share transactions | 746,544 | 278,422 |
Redemption fees | 33 | 66 |
Total increase (decrease) in net assets | 890,412 | 389,194 |
| | |
Net Assets | | |
Beginning of period | 1,261,130 | 871,936 |
End of period (including undistributed net investment income of $239 and undistributed net investment income of $411, respectively) | $2,151,542 | $1,261,130 |
Other Information Shares | | |
Sold | 49,487 | 29,976 |
Issued in reinvestment of distributions | 3,515 | 220 |
Redeemed | (14,275) | (14,906) |
Net increase (decrease) | 38,727 | 15,290 |
See accompanying notes which are an integral part of the financial statements.
Semiannual Report
Financial Highlights
| Six months ended
February 28
(Unaudited) | Years ended August 31, |
| 2005 | 2004 | 2003 | 2002 | 2001 | 2000 |
Selected Per-Share Data | | | | | |
Net asset value, beginning of period | $18.27 | $16.23 | $13.59 | $16.39 | $23.45 | $22.03 |
Income from Investment Operations | | | | | | |
Net investment
income (loss)D | .10E | .03 | .09 | .03 | .04 | .08 |
Net realized and unrealized gain (loss) | 2.53 | 2.08 | 2.60 | (2.80) | (1.79) | 6.19 |
Total from investment operations | 2.63 | 2.11 | 2.69 | (2.77) | (1.75) | 6.27 |
Distributions from net investment income | (.11) | (.07) | (.05) | (.03) | (.10) | (.05) |
Distributions from net realized gain | (.82) | - | - | - | (5.21) | (4.80) |
Total distributions | (.93) | (.07) | (.05) | (.03) | (5.31) | (4.85) |
Redemption fees added to paid in capitalD,G | - | - | - | - | - | - |
Net asset value, end of period | $19.97 | $18.27 | $16.23 | $13.59 | $16.39 | $23.45 |
Total ReturnB,C | 14.80% | 13.03% | 19.88% | (16.93)% | (7.69)% | 36.58% |
Ratios to Average Net AssetsF | | | | | |
Expenses before expense reductions | .88%A | .86% | .91% | .89% | .86% | .86% |
Expenses net of voluntary waivers, if any | .88%A | .86% | .91% | .89% | .86% | .86% |
Expenses net of all reductions | .85%A | .83% | .84% | .78% | .81% | .77% |
Net investment income (loss) | 1.05%A,E | .15% | .60% | .19% | .21% | .38% |
Supplemental Data | | | | | | |
Net assets, end of period (in millions) | $2,152 | $1,261 | $872 | $603 | $565 | $538 |
Portfolio turnover rate | 76%A | 96% | 139% | 228% | 170% | 380% |
AAnnualized
BTotal returns for periods of less than one year are not annualized.
CTotal returns would have been lower had certain expenses not been reduced during the periods shown.
DCalculated based on average shares outstanding during the period.
EInvestment income per share reflects a special dividend which amounted to $.09 per share. Excluding the special dividend, the ratio of net investment income to average net assets would have been .00%.
FExpense ratios reflect operating expenses of the fund. Expenses before reductions do not reflect amounts reimbursed by the investment adviser or reductions from brokerage service arrangements or other expense offset arrangements and do not represent the amount paid by the fund during periods when reimbursements or reductions occur. Expenses net of any voluntary waivers reflect expenses after reimbursement by the investment adviser but prior to reductions from brokerage service arrangements or other expense offset arrangements. Expenses net of all reductions represent the net expenses paid by the fund.
GAmount represents less than $.01 per share.
See accompanying notes which are an integral part of the financial statements.
Semiannual Report
Notes to Financial Statements
For the period ended February 28, 2005 (Unaudited)
(Amounts in thousands except ratios)
1. Significant Accounting Policies.
Fidelity Export and Multinational Fund (the fund) is a fund of Fidelity Union Street Trust (the trust) and is authorized to issue an unlimited number of shares. The trust is registered under the Investment Company Act of 1940, as amended (the 1940 Act), as an open-end management investment company organized as a Massachusetts business trust. The financial statements have been prepared in conformity with accounting principles generally accepted in the United States of America, which require management to make certain estimates and assumptions at the date of the financial statements. The following summarizes the significant accounting policies of the fund:
Security Valuation. Net asset value per share (NAV calculation) is calculated as of the close of business of the New York Stock Exchange, normally 4:00 p.m. Eastern time. Equity securities, including restricted securities, for which market quotations are available are valued at the last sale price or official closing price (closing bid price or last evaluated quote if no sale has occurred) on the primary market or exchange on which they trade. If prices are not readily available or do not accurately reflect fair value for a security, or if a security's value has been materially affected by events occurring after the close of the exchange or market on which the security is principally traded, that security may be valued by another method that the Board of Trustees believes accurately reflects fair value. A security's valuation may differ depending on the method used for determining value. Price movements in futures contracts and ADRs, market and trading trends, the bid/ask quotes of brokers and off-exchange institutional trading may be reviewed in the course of making a good faith determination of a security's fair value. Short-term securities with remaining maturities of sixty days or less for which quotations are not readily available are valued on the basis of amortized cost. Investments in open-end investment companies are valued at their net asset value each business day.
Foreign Currency. The fund uses foreign currency contracts to facilitate transactions in foreign-denominated securities. Losses from these transactions may arise from changes in the value of the foreign currency or if the counterparties do not perform under the contracts' terms.
Foreign-denominated assets, including investment securities, and liabilities are translated into U.S. dollars at the exchange rate at period end. Purchases and sales of investment securities, income and dividends received and expenses denominated in foreign currencies are translated into U.S. dollars at the exchange rate in effect on the transaction date.
The effects of exchange rate fluctuations on investments are included with the net realized and unrealized gain (loss) on investment securities. Other foreign currency transactions resulting in realized and unrealized gain (loss) are disclosed separately.
Semiannual Report
1. Significant Accounting Policies - continued
Investment Transactions and Income. Security transactions are accounted for as of trade date. Gains and losses on securities sold are determined on the basis of identified cost and may include proceeds received from litigation. Dividend income is recorded on the ex-dividend date, except for certain dividends from foreign securities where the ex-dividend date may have passed, which are recorded as soon as the fund is informed of the ex-dividend date. Non-cash dividends included in dividend income, if any, are recorded at the fair market value of the securities received. Distributions received on securities that represent a return of capital or capital gain are recorded as a reduction of cost of investments and/or as a realized gain. The fund estimates the components of distributions received that may be considered return of capital distributions or capital gain distributions. Large, non-recurring dividends recognized by the fund are presented separately on the Statement of Operations as "Special Dividends" and the impact of these dividends is presented in the Financial Highlights. Interest income is accrued as earned. Interest income includes coupon interest and amortization of premium and accretion of discount on debt securities. Investment income is recorded net of foreign taxes withheld where recovery of such taxes is uncertain.
Expenses. Most expenses of the trust can be directly attributed to a fund. Expenses which cannot be directly attributed are apportioned among the funds in the trust.
Income Tax Information and Distributions to Shareholders. Each year, the fund intends to qualify as a regulated investment company by distributing all of its taxable income and realized gains under Subchapter M of the Internal Revenue Code. As a result, no provision for income taxes is required in the accompanying financial statements. Foreign taxes are provided for based on the fund's understanding of the tax rules and rates that exist in the foreign markets in which it invests.
Distributions are recorded on the ex-dividend date. Income and capital gain distributions are determined in accordance with income tax regulations, which may differ from generally accepted accounting principles. In addition, the fund claimed a portion of the payment made to redeeming shareholders as a distribution for income tax purposes. Capital accounts within the financial statements are adjusted for permanent book-tax differences. These adjustments have no impact on net assets or the results of operations. Temporary book-tax differences will reverse in a subsequent period.
Book-tax differences are primarily due to foreign currency transactions, capital loss carryforwards and losses deferred due to wash sales.
Semiannual Report
Notes to Financial Statements (Unaudited) - continued
(Amounts in thousands except ratios)
1. Significant Accounting Policies - continued
Income Tax Information and Distributions to Shareholders - continued
The federal tax cost of investments and unrealized appreciation (depreciation) as of period end were as follows:
Unrealized appreciation | $275,510 | |
Unrealized depreciation | (47,887) | |
Net unrealized appreciation (depreciation) | $227,623 | |
Cost for federal income tax purposes | $1,933,349 | |
Short-Term Trading (Redemption) Fees. Shares held in the fund less than 30 days are subject to a redemption fee equal to .75% of the proceeds of the redeemed shares. All redemption fees, including any estimated redemption fees paid by Fidelity Management & Research Company (FMR), are retained by the fund and accounted for as an addition to paid in capital.
2. Operating Policies.
Repurchase Agreements. FMR has received an Exemptive Order from the Securities and Exchange Commission (the SEC) which permits the fund and other affiliated entities of FMR to transfer uninvested cash balances into joint trading accounts. These accounts are then invested in repurchase agreements that are collateralized by U.S. Treasury or Government obligations. The fund may also invest directly with institutions, in repurchase agreements that are collateralized by commercial paper obligations and corporate obligations. Collateral is held in segregated accounts with custodian banks and may be obtained in the event of a default of the counterparty. Collateral is marked-to-market daily and maintained at a value at least equal to the principal amount of the repurchase agreement (including accrued interest).
3. Purchases and Sales of Investments.
Purchases and sales of securities, other than short-term securities and U.S. government securities, aggregated $1,265,026 and $603,983, respectively.
4. Fees and Other Transactions with Affiliates.
Management Fee. FMR and its affiliates provide the fund with investment management related services for which the fund pays a monthly management fee. The management fee is the sum of an individual fund fee rate that is based on an annual rate of .30% of the fund's average net assets and a group fee rate that averaged .27% during the period. The group fee rate is based upon the average net assets of all the mutual funds advised by FMR. The group fee rate decreases as assets under management increase and increases as assets under management decrease. For the period, the total annualized management fee rate was .58% of the fund's average net assets.
Semiannual Report
Transfer Agent Fees. Fidelity Service Company, Inc. (FSC), an affiliate of FMR, is the fund's transfer, dividend disbursing and shareholder servicing agent. FSC receives account fees and asset-based fees that vary according to account size and type of account. FSC pays for typesetting, printing and mailing of shareholder reports, except proxy statements. For the period, the transfer agent fees were equivalent to an annualized rate of .23% of average net assets.
Accounting and Security Lending Fees. FSC maintains the fund's accounting records. The accounting fee is based on the level of average net assets for the month. Under a separate contract, FSC administers the security lending program. The security lending fee is based on the number and duration of lending transactions.
Central Funds. The fund may invest in affiliated Central Funds managed by Fidelity Investments Money Management, Inc. (FIMM), an affiliate of FMR. The Central Funds are open-end investment companies available only to investment companies and other accounts managed by FMR and its affiliates. The Central Funds seek preservation of capital and current income and do not pay a management fee. Income distributions earned by the fund are recorded as income in the accompanying financial statements and totaled $311 for the period.
Brokerage Commissions. The fund placed a portion of its portfolio transactions with brokerage firms which are affiliates of the investment adviser. The commissions paid to these affiliated firms were $21 for the period.
5. Committed Line of Credit.
The fund participates with other funds managed by FMR in a $4.2 billion credit facility (the "line of credit") to be utilized for temporary or emergency purposes to fund shareholder redemptions or for other short-term liquidity purposes. The fund has agreed to pay commitment fees on its pro rata portion of the line of credit. During the period, there were no borrowings on this line of credit.
6. Security Lending.
The fund lends portfolio securities from time to time in order to earn additional income. The fund receives collateral (in the form of U.S. Treasury obligations, letters of credit and/or cash) against the loaned securities and maintains collateral in an amount not less than 100% of the market value of the loaned securities during the period of the loan. The market value of the loaned securities is determined at the close of business of the fund and any additional required collateral is delivered to the fund on the next business day. If the borrower defaults on its obligation to return the securities loaned because of insolvency or other reasons, a fund could experience delays and costs in recovering the securities loaned or in gaining access to the collateral. Cash collateral is invested in cash equivalents. The value of loaned securities and cash collateral at period end are disclosed on the fund's Statement of Assets and Liabilities.
Semiannual Report
Notes to Financial Statements (Unaudited) - continued
(Amounts in thousands except ratios)
7. Expense Reductions.
Many of the brokers with whom FMR places trades on behalf of the fund provided services to the fund in addition to trade execution. These services included payments of certain expenses on behalf of the fund totaling $250 for the period. In addition, through arrangements with the fund's transfer agent, credits realized as a result of uninvested cash balances were used to reduce the fund's expenses. During the period, these credits reduced the fund's transfer agent expenses by $5.
8. Other.
The fund's organizational documents provide former and current trustees and officers with a limited indemnification against liabilities arising in connection with the performance of their duties to the fund. In the normal course of business, the fund may also enter into contracts that provide general indemnifications. The fund's maximum exposure under these arrangements is unknown as this would be dependent on future claims that may be made against the fund. The risk of material loss from such claims is considered remote.
Semiannual Report
Proxy Voting Results
A special meeting of the fund's shareholders was held on February 16, 2005. The results of votes taken among shareholders on proposals before them are reported below. Each vote reported represents one dollar of net asset value held on the record date for the meeting.
PROPOSAL 1 |
To amend the Declaration of Trust to allow the Board of Trustees, if permitted by applicable law, to authorize fund mergers without shareholder approval. A |
| # of
Votes | % of
Votes |
Affirmative | 742,440,496.15 | 73.879 |
Against | 196,006,999.93 | 19.504 |
Abstain | 33,719,201.65 | 3.356 |
Broker
Non-Votes | 32,776,930.05 | 3.261 |
TOTAL | 1,004,943,627.78 | 100.000 |
PROPOSAL 2 |
To elect a Board of Trustees. A |
| # of
Votes | % of
Votes |
Laura B. Cronin |
Affirmative | 948,588,595.83 | 94.392 |
Withheld | 56,355,031.95 | 5.608 |
TOTAL | 1,004,943,627.78 | 100.000 |
Dennis J. Dirks |
Affirmative | 950,698,349.04 | 94.602 |
Withheld | 54,245,278.74 | 5.398 |
TOTAL | 1,004,943,627.78 | 100.000 |
Robert M. Gates |
Affirmative | 947,567,913.72 | 94.291 |
Withheld | 57,375,714.06 | 5.709 |
TOTAL | 1,004,943,627.78 | 100.000 |
George H. Heilmeier |
Affirmative | 948,147,248.47 | 94.348 |
Withheld | 56,796,379.31 | 5.652 |
TOTAL | 1,004,943,627.78 | 100.000 |
Abigail P. Johnson |
Affirmative | 944,190,223.14 | 93.955 |
Withheld | 60,753,404.64 | 6.045 |
TOTAL | 1,004,943,627.78 | 100.000 |
Edward C. Johnson 3d |
Affirmative | 943,213,044.14 | 93.857 |
Withheld | 61,730,583.64 | 6.143 |
TOTAL | 1,004,943,627.78 | 100.000 |
Marie L. Knowles |
Affirmative | 949,452,954.58 | 94.478 |
Withheld | 55,490,673.20 | 5.522 |
TOTAL | 1,004,943,627.78 | 100.000 |
Ned C. Lautenbach |
Affirmative | 948,794,328.18 | 94.413 |
Withheld | 56,149,299.60 | 5.587 |
TOTAL | 1,004,943,627.78 | 100.000 |
Marvin L. Mann |
Affirmative | 946,649,510.40 | 94.199 |
Withheld | 58,294,117.38 | 5.801 |
TOTAL | 1,004,943,627.78 | 100.000 |
William O. McCoy |
Affirmative | 945,952,663.12 | 94.130 |
Withheld | 58,990,964.66 | 5.870 |
TOTAL | 1,004,943,627.78 | 100.000 |
Robert L. Reynolds |
Affirmative | 948,326,458.64 | 94.366 |
Withheld | 56,617,169.14 | 5.634 |
TOTAL | 1,004,943,627.78 | 100.000 |
Cornelia M. Small |
Affirmative | 949,307,587.45 | 94.464 |
Withheld | 55,636,040.33 | 5.536 |
TOTAL | 1,004,943,627.78 | 100.000 |
William S. Stavropoulos |
Affirmative | 947,525,611.83 | 94.286 |
Withheld | 57,418,015.95 | 5.714 |
TOTAL | 1,004,943,627.78 | 100.000 |
Kenneth L. Wolfe |
Affirmative | 949,176,424.38 | 94.451 |
Withheld | 55,767,203.40 | 5.549 |
TOTAL | 1,004,943,627.78 | 100.000 |
A Denotes trust-wide proposals and voting results. |
Semiannual Report
Managing Your Investments
Fidelity offers several ways to conveniently manage your personal investments via your telephone or PC. You can access your account information, conduct trades and research your investments 24 hours a day.
By Phone
Fidelity Automated Service Telephone provides a single toll-free number to access account balances, positions, quotes and trading. It's easy to navigate the service, and on your first call, the system will help you create a personal identification number (PIN) for security.
(phone_graphic)
Fidelity Automated
Service Telephone (FAST®)
1-800-544-5555
Press
1 For mutual fund and brokerage trading.
2 For quotes.*
3 For account balances and holdings.
4 To review orders and mutual
fund activity.
5 To change your PIN.
*0 To speak to a Fidelity representative.
By PC
Fidelity's web site on the Internet provides a wide range of information, including daily financial news, fund performance, interactive planning tools and news about Fidelity products and services.
(computer_graphic)
Fidelity's Web Site
www.fidelity.com
* When you call the quotes line, please remember that a fund's yield and return will vary and, except for money market funds, share price will also vary. This means that you may have a gain or loss when you sell your shares. There is no assurance that money market funds will be able to maintain a stable $1 share price; an investment in a money market fund is not insured or guaranteed by the U.S. government. Total returns are historical and include changes in share price, reinvestment of dividends and capital gains, and the effects of any sales charges.
Semiannual Report
To Write Fidelity
We'll give your correspondence immediate attention and send you written confirmation upon completion of your request.
(letter_graphic)
Making Changes
To Your Account
(such as changing name, address, bank, etc.)
Fidelity Investments
P.O. Box 770001
Cincinnati, OH 45277-0002
(letter_graphic)
For Non-Retirement
Accounts
Buying shares
Fidelity Investments
P.O. Box 770001
Cincinnati, OH 45277-0003
Overnight Express
Fidelity Investments
Attn: Distribution Services
100 Crosby Parkway - KC1H
Covington, KY 41015
Selling shares
Fidelity Investments
P.O. Box 770001
Cincinnati, OH 45277-0035
Overnight Express
Fidelity Investments
Attn: Distribution Services
100 Crosby Parkway - KC1H
Covington, KY 41015
General Correspondence
Fidelity Investments
P.O. Box 500
Merrimack, NH 03054-0500
(letter_graphic)
For Retirement
Accounts
Buying shares
Fidelity Investments
P.O. Box 770001
Cincinnati, OH 45277-0003
Selling shares
Fidelity Investments
P.O. Box 770001
Cincinnati, OH 45277-0035
Overnight Express
Fidelity Investments
Attn: Distribution Services
100 Crosby Parkway - KC1H
Covington, KY 41015
General Correspondence
Fidelity Investments
P.O. Box 500
Merrimack, NH 03054-0500
Semiannual Report
Investment Adviser
Fidelity Management & Research Company
Boston, MA
Investment Sub-Advisers
FMR Co., Inc.
Fidelity Management & Research
(U.K.) Inc.
Fidelity Management & Research
(Far East) Inc.
Fidelity Investments Japan Limited
Fidelity International Investment Advisors
Fidelity International Investment Advisors
(U.K.) Limited
General Distributor
Fidelity Distributors Corporation
Boston, MA
Transfer and Shareholder
Servicing Agent
Fidelity Service Company, Inc.
Boston, MA
Custodian
JPMorgan Chase Bank
New York, NY
The Fidelity Telephone Connection
Mutual Fund 24-Hour Service
Exchanges/Redemptions
and Account Assistance1-800-544-6666
Product Information1-800-544-6666
Retirement Accounts1-800-544-4774
(8 a.m. - 9 p.m.)
TDD Service1-800-544-0118
for the deaf and hearing impaired
(9 a.m. - 9 p.m. Eastern time)
Fidelity Automated Service
Telephone (FAST®) (automated graphic) 1-800-544-5555
(automated graphic) Automated line for quickest service
(Fidelity Investment logo)(registered trademark)
Corporate Headquarters
82 Devonshire St., Boston, MA 02109
www.fidelity.com
EXF-USAN-0405
1.790938.101
Spartan®
Arizona Municipal
Income Fund
and
Fidelity®
Arizona Municipal
Money Market Fund
Semiannual Report
February 28, 2005
(2_fidelity_logos)(Registered_Trademark)
Contents
Chairman's Message | <Click Here> | Ned Johnson's message to shareholders. |
Shareholder Expense Example | <Click Here> | An example of shareholder expenses. |
Spartan Arizona Municipal Income Fund |
Investment Changes | <Click Here> | A summary of major shifts in the fund's investments over the past six months. |
Investments | <Click Here> | A complete list of the fund's investments with their market values. |
Financial Statements | <Click Here> | Statements of assets and liabilities, operations, and changes in net assets,
as well as financial highlights. |
Fidelity Arizona Municipal Money Market Fund |
Investment Changes | <Click Here> | A summary of major shifts in the fund's investments over the past six months. |
Investments | <Click Here> | A complete list of the fund's investments. |
Financial Statements | <Click Here> | Statements of assets and liabilities, operations, and changes in net assets,
as well as financial highlights. |
Notes | <Click Here> | Notes to the financial statements. |
Proxy Voting Results | <Click Here> | |
| | |
| | |
To view a fund's proxy voting guidelines and proxy voting record for the 12-month period ended June 30, visit www.fidelity.com/proxyvotingresults or visit the Securities and Exchange Commission's (SEC) web site at www.sec.gov. You may also call 1-800-544-8544 to request a free copy of the proxy voting guidelines.
Standard & Poor's, S&P and S&P 500 are registered service marks of The McGraw-Hill Companies, Inc. and have been licensed for use by Fidelity Distributors Corporation.
Other third party marks appearing herein are the property of their respective owners.
All other marks appearing herein are registered or unregistered trademarks or service marks of FMR Corp. or an affiliated company.
This report and the financial statements contained herein are submitted for the general information of the shareholders of the funds. This report is not authorized for distribution to prospective investors in the funds unless preceded or accompanied by an effective prospectus.
A fund files its complete schedule of portfolio holdings with the SEC for the first and third quarters of each fiscal year on Form N-Q. Forms N-Q are available on the SEC's web site at http://www.sec.gov. A fund's Forms N-Q may be reviewed and copied at the SEC's Public Reference Room in Washington, DC. Information regarding the operation of the SEC's Public Reference Room may be obtained by calling 1-800-SEC-0330. For a complete list of a fund's portfolio holdings, view the most recent quarterly holdings report, semiannual report, or annual report on Fidelity's web site at http://www.fidelity.com/holdings.
NOT FDIC INSURED · MAY LOSE VALUE · NO BANK GUARANTEE
Neither the funds nor Fidelity Distributors Corporation is a bank.
Semiannual Report
Chairman's Message
(photo_of_Edward_C_Johnson_3d)
Dear Shareholder:
During the past year or so, much has been reported about the mutual fund industry, and much of it has been more critical than I believe is warranted. Allegations that some companies have been less than forthright with their shareholders have cast a shadow on the entire industry. I continue to find these reports disturbing, and assert that they do not create an accurate picture of the industry overall. Therefore, I would like to remind everyone where Fidelity stands on these issues. I will say two things specifically regarding allegations that some mutual fund companies were in violation of the Securities and Exchange Commission's forward pricing rules or were involved in so-called "market timing" activities.
First, Fidelity has no agreements that permit customers who buy fund shares after 4 p.m. to obtain the 4 p.m. price. This is not a new policy. This is not to say that someone could not deceive the company through fraudulent acts. However, we are extremely diligent in preventing fraud from occurring in this manner - and in every other. But I underscore again that Fidelity has no so-called "agreements" that sanction illegal practices.
Second, Fidelity continues to stand on record, as we have for years, in opposition to predatory short-term trading that adversely affects shareholders in a mutual fund. Back in the 1980s, we initiated a fee - which is returned to the fund and, therefore, to investors - to discourage this activity. Further, we took the lead several years ago in developing a Fair Value Pricing Policy to prevent market timing on foreign securities in our funds. I am confident we will find other ways to make it more difficult for predatory traders to operate. However, this will only be achieved through close cooperation among regulators, legislators and the industry.
Yes, there have been unfortunate instances of unethical and illegal activity within the mutual fund industry from time to time. That is true of any industry. When this occurs, confessed or convicted offenders should be dealt with appropriately. But we are still concerned about the risk of over-regulation and the quick application of simplistic solutions to intricate problems. Every system can be improved, and we support and applaud well thought out improvements by regulators, legislators and industry representatives that achieve the common goal of building and protecting the value of investors' holdings.
For nearly 60 years, Fidelity has worked very hard to improve its products and service to justify your trust. When our family founded this company in 1946, we had only a few hundred customers. Today, we serve more than 18 million customers including individual investors and participants in retirement plans across America.
Let me close by saying that we do not take your trust in us for granted, and we realize that we must always work to improve all aspects of our service to you. In turn, we urge you to continue your active participation with your financial matters, so that your interests can be well served.
Best regards,/s/Edward C. Johnson 3d
Edward C. Johnson 3d
Semiannual Report
Shareholder Expense Example
As a shareholder of a Fund, you incur two types of costs: (1) transaction costs, including redemption fees, and (2) ongoing costs, including management fees and other Fund expenses. This Example is intended to help you understand your ongoing costs (in dollars) of investing in the Funds and to compare these costs with the ongoing costs of investing in other mutual funds.
The Example is based on an investment of $1,000 invested at the beginning of the period and held for the entire period (September 1, 2004 to February 28, 2005).
Actual Expenses
The first line of the table below for each fund provides information about actual account values and actual expenses. You may use the information in this line, together with the amount you invested, to estimate the expenses that you paid over the period. Simply divide your account value by $1,000.00 (for example, an $8,600 account value divided by $1,000.00 = 8.6), then multiply the result by the number in the first line for a fund under the heading entitled "Expenses Paid During Period" to estimate the expenses you paid on your account during this period. A small balance maintenance fee of $12.00 that is charged once a year may apply for certain accounts with a value of less than $2,000. This fee is not included in the table below. If it was, the estimate of expenses you paid during the period would be higher, and your ending account value lower, by this amount.
Hypothetical Example for Comparison Purposes
The second line of the table below for each fund provides information about hypothetical account values and hypothetical expenses based on a fund's actual expense ratio and an assumed rate of return of 5% per year before expenses, which is not the Fund's actual return. The hypothetical account values and expenses may not be used to estimate the actual ending account balance or expenses you paid for the period. You may use this information to compare the ongoing costs of investing in the Fund and other funds. To do so, compare this 5% hypothetical example with the 5% hypothetical examples that appear in the shareholder reports of the other funds. A small balance maintenance fee of $12.00 that is charged once a year may apply for certain accounts with a value of less than $2,000. This fee is not included in the table below. If it was, the estimate of expenses you paid during the period would be higher, and your ending account value lower, by this amount.
Please note that the expenses shown in the table are meant to highlight your ongoing costs only and do not reflect any transaction costs. Therefore, the second line of the table is useful in comparing ongoing costs only, and will not help you determine the relative total costs of owning different funds. In addition, if these transactional costs were included, your costs would have been higher.
Semiannual Report
Shareholder Expense Example - continued
| Beginning
Account Value
September 1, 2004 | Ending
Account Value
February 28, 2005 | Expenses Paid
During Period*
September 1, 2004
to February 28, 2005 |
Spartan Arizona Municipal Income Fund | | | |
Actual | $1,000.00 | $1,019.50 | $2.75 |
HypotheticalA | $1,000.00 | $1,022.07 | $2.76 |
Fidelity Arizona Municipal Money Market Fund | | | |
Actual | $1,000.00 | $1,006.00 | $2.49 |
HypotheticalA | $1,000.00 | $1,022.32 | $2.51 |
A5% return per year before expenses
*Expenses are equal to each Fund's annualized expense ratio (shown in the table below); multiplied by the average account value over the period, multiplied by 181/365 (to reflect the one-half year period).
| Annualized
Expense Ratio |
Spartan Arizona Municipal Income Fund | .55% |
Fidelity Arizona Municipal Money Market Fund | .50% |
Semiannual Report
Spartan Arizona Municipal Income Fund
Investment Changes
Top Five Sectors as of February 28, 2005 |
| % of fund's
net assets | % of fund's net assets
6 months ago |
Special Tax | 24.3 | 26.8 |
General Obligations | 23.8 | 22.4 |
Education | 11.3 | 11.6 |
Electric Utilities | 10.6 | 11.2 |
Water & Sewer | 10.0 | 5.5 |
Average Years to Maturity as of February 28, 2005 |
| | 6 months ago |
Years | 13.3 | 13.8 |
Average years to maturity is based on the average time remaining to the stated maturity date of each bond, weighted by the market value of each bond. |
Duration as of February 28, 2005 |
| | 6 months ago |
Years | 6.8 | 7.3 |
Duration shows how much a bond fund's price fluctuates with changes in comparable interest rates. If rates rise 1%, for example, a fund with a five-year duration is likely to lose about 5% of its value. Other factors also can influence a bond fund's performance and share price. Accordingly, a bond fund's actual performance may differ from this example. |
Quality Diversification (% of fund's net assets) |
As of February 28, 2005 | As of August 31, 2004 |
| AAA59.5% | | | AAA55.7% | |
 | AA,A32.1% | | | AA,A35.9% | |
 | BBB4.1% | | | BBB4.7% | |
 | Not Rated2.5% | | | Not Rated0.4% | |
| Short-Term
Investments and
Net Other Assets1.8% | | | Short-Term
Investments and
Net Other Assets3.3% | |

We have used ratings from Moody's® Investors Services, Inc. Where Moody's ratings are not available, we have used S&P® ratings. |
Semiannual Report
Spartan Arizona Municipal Income Fund
Investments February 28, 2005 (Unaudited)
Showing Percentage of Net Assets
Municipal Bonds - 98.2% |
| Principal
Amount | | Value
(Note 1) |
Arizona - 86.0% |
Arizona Health Facilities Auth. Rev. (Catholic Health Care West Proj.) Series A, 6.125% 7/1/09 | | $550,000 | | $587,659 |
Arizona Pwr. Auth. Pwr. Resource Rev. (Hoover Uprating Proj.) 5% 10/1/09 | | 1,160,000 | | 1,252,846 |
Arizona School Facilities Board Ctfs. of Prtn.: | | | | |
Series A2, 5% 9/1/18 (FGIC Insured) (a) | | 1,000,000 | | 1,082,340 |
Series B, 5.25% 9/1/19 (FSA Insured) | | 1,000,000 | | 1,107,100 |
Series C, 5% 9/1/11 (FSA Insured) | | 1,060,000 | | 1,156,799 |
Arizona School Facilities Board State School Impt. Rev.: | | | | |
5.25% 7/1/18 | | 1,000,000 | | 1,100,660 |
5.25% 7/1/20 | | 1,500,000 | | 1,648,965 |
Arizona State Univ. Revs.: | | | | |
5.5% 7/1/17 (FGIC Insured) | | 2,540,000 | | 2,834,411 |
5.5% 7/1/21 (FGIC Insured) | | 1,150,000 | | 1,276,282 |
5.75% 7/1/27 (FGIC Insured) | | 1,500,000 | | 1,690,575 |
Arizona Student Ln. Acquisition Auth. Student Ln. Rev. Sub Series B1, 6.15% 5/1/29 (c) | | 500,000 | | 531,980 |
Arizona Trans. Board Hwy. Rev.: | | | | |
Series B, 5.25% 7/1/19 | | 2,500,000 | | 2,741,550 |
5.25% 7/1/13 | | 1,500,000 | | 1,650,450 |
Arizona Wtr. Infrastructure Fin. Auth. Rev. (Wtr. Quality Proj.) Series A, 5.375% 10/1/11 | | 2,000,000 | | 2,238,520 |
Central Arizona Wtr. Conservation District Contract Rev. (Central Arizona Proj.) Series A: | | | | |
5.5% 11/1/09 | | 1,000,000 | | 1,098,360 |
5.5% 11/1/10 | | 375,000 | | 414,818 |
Chandler Gen. Oblig.: | | | | |
5.7% 7/1/15 | | 75,000 | | 83,848 |
6.25% 7/1/10 | | 500,000 | | 564,860 |
6.5% 7/1/10 (MBIA Insured) | | 200,000 | | 232,614 |
6.5% 7/1/11 (MBIA Insured) | | 225,000 | | 265,520 |
Gilbert Wtr. Resources Muni. Property Corp. Wastewtr. Sys. & Util. Rev. 4.9% 4/1/19 | | 1,000,000 | | 1,000,770 |
Maricopa County Hosp. Rev. (Sun Health Corp. Proj.) 6.125% 4/1/18 | | 300,000 | | 313,560 |
Maricopa County Indl. Dev. Auth. Health Facilities Rev. (Catholic Health Care West Proj.) Series 1998 A, 5% 7/1/16 | | 730,000 | | 748,783 |
Maricopa County Indl. Dev. Auth. Hosp. Facilities Rev. (Mayo Clinic Hosp. Proj.) 5.25% 11/15/37 | | 1,000,000 | | 1,043,800 |
Maricopa County School District #28 Kyrene Elementary Series C, 0% 1/1/10 (FGIC Insured) | | 1,425,000 | | 1,204,082 |
Municipal Bonds - continued |
| Principal
Amount | | Value
(Note 1) |
Arizona - continued |
Maricopa County Unified School District #48 Scottsdale 7.4% 7/1/10 | | $1,000,000 | | $1,199,290 |
Maricopa County Unified School District #80 Chandler: | | | | |
(2002 Proj.) Series A, 5% 7/1/17 (FSA Insured) | | 500,000 | | 539,500 |
6.25% 7/1/11 (Escrowed to Maturity) (d) | | 405,000 | | 473,712 |
Mesa Indl. Dev. Auth. Rev. (Discovery Health Sys. Proj.) Series A: | | | | |
5.375% 1/1/14 (MBIA Insured) | | 500,000 | | 542,265 |
5.625% 1/1/29 (MBIA Insured) | | 585,000 | | 633,298 |
Mesa Street & Hwy. Rev. 6.5% 7/1/11 (FSA Insured) | | 1,500,000 | | 1,770,135 |
Mesa Util. Sys. Rev. 5.75% 7/1/14 (FGIC Insured) | | 1,000,000 | | 1,165,560 |
Northern Arizona Univ. Sys. Rev.: | | | | |
5.5% 6/1/23 (FGIC Insured) | | 530,000 | | 591,332 |
5.5% 6/1/26 (FGIC Insured) | | 1,305,000 | | 1,447,493 |
Phoenix Arpt. Rev. Series D, 6.4% 7/1/12 (MBIA Insured) (c) | | 810,000 | | 829,343 |
Phoenix Civic Impt. Board Arpt. Rev. Series B, 5.25% 7/1/27 (FGIC Insured) (c) | | 1,000,000 | | 1,046,310 |
Phoenix Civic Impt. Corp. Arpt. Excise Tax Rev. 5.25% 7/1/09 (c) | | 400,000 | | 427,176 |
Phoenix Civic Impt. Corp. Excise Tax Rev. (Muni. Courthouse Proj.) Series A: | | | | |
5.375% 7/1/29 | | 560,000 | | 597,307 |
5.5% 7/1/11 | | 200,000 | | 220,700 |
5.75% 7/1/15 | | 675,000 | | 750,769 |
Phoenix Civic Impt. Corp. Muni. Facilities Excise Tax Rev.: | | | | |
5.75% 7/1/10 (FGIC Insured) | | 340,000 | | 383,030 |
5.75% 7/1/12 (FGIC Insured) | | 1,250,000 | | 1,408,038 |
5.75% 7/1/14 (FGIC Insured) | | 1,000,000 | | 1,120,900 |
Phoenix Civic Impt. Corp. Transit Excise Tax Rev. (Lt. Rail Proj.) 5% 7/1/10 (AMBAC Insured) | | 1,000,000 | | 1,090,040 |
Phoenix Civic Impt. Corp. Wastewtr. Sys. Rev.: | | | | |
5% 7/1/29 (MBIA Insured) | | 770,000 | | 802,594 |
5.7% 7/1/09 (FGIC Insured) | | 1,275,000 | | 1,414,230 |
Phoenix Civic Impt. Corp. Wtr. Sys. Rev. Series 2001, 5.5% 7/1/24 (FGIC Insured) | | 1,000,000 | | 1,160,690 |
Phoenix Gen. Oblig.: | | | | |
Series 1995 A, 6% 7/1/11 | | 1,485,000 | | 1,707,631 |
Series A, 6.25% 7/1/17 | | 1,000,000 | | 1,235,960 |
Series B, 5.375% 7/1/20 | | 1,000,000 | | 1,111,340 |
Phoenix Indl. Dev. Auth. Single Family Mtg. Rev. 0% 12/1/14 (Escrowed to Maturity) (d) | | 1,250,000 | | 844,913 |
Municipal Bonds - continued |
| Principal
Amount | | Value
(Note 1) |
Arizona - continued |
Phoenix Street & Hwy. User Rev. 6.25% 7/1/11 (MBIA Insured) | | $35,000 | | $35,543 |
Pima County Indl. Dev. Auth. Rev. (HealthPartners Proj.) Series A, 5.625% 4/1/14 (MBIA Insured) | | 200,000 | | 214,002 |
Pima County Unified School District #1 Tucson: | | | | |
7.5% 7/1/08 (FGIC Insured) | | 1,000,000 | | 1,145,550 |
7.5% 7/1/10 (FGIC Insured) | | 250,000 | | 302,940 |
Salt River Proj. Agric. Impt. & Pwr. District Elec. Sys. Rev.: | | | | |
Series A: | | | | |
5.25% 1/1/18 | | 1,000,000 | | 1,099,230 |
5.25% 1/1/19 | | 1,615,000 | | 1,769,119 |
Series B: | | | | |
5% 1/1/20 | | 1,500,000 | | 1,600,920 |
5% 1/1/21 | | 255,000 | | 272,156 |
Scottsdale Gen. Oblig. (1999 & 2000 Projs.) 5% 7/1/21 (Pre-Refunded to 7/1/11 @ 100) (d) | | 1,000,000 | | 1,098,720 |
Scottsdale Indl. Dev. Auth. Hosp. Rev. (Scottsdale Health Care Proj.) 5.8% 12/1/31 | | 250,000 | | 268,295 |
Scottsdale Wtr. & Swr. Rev. (1989 Proj.) Series E, 7% 7/1/07 | | 150,000 | | 164,486 |
Tempe Gen. Oblig.: | | | | |
Series 2001 A, 6% 7/1/10 | | 600,000 | | 682,290 |
5% 7/1/19 | | 1,680,000 | | 1,810,234 |
5.5% 7/1/17 | | 1,035,000 | | 1,174,653 |
Tempe Union High School District #213 7% 7/1/08 (FGIC Insured) | | 310,000 | | 351,292 |
Tucson Gen. Oblig.: | | | | |
Series A, 6% 7/1/13 | | 800,000 | | 937,048 |
5% 7/1/18 (FGIC Insured) | | 3,295,000 | | 3,591,745 |
Tucson Street & Hwy. User Rev.: | | | | |
Series 1994 B, 7.5% 7/1/11 (MBIA Insured) | | 1,015,000 | | 1,255,281 |
Series 1994 C, 7% 7/1/11 (FGIC Insured) | | 500,000 | | 604,205 |
Series A, 7% 7/1/11 (MBIA Insured) | | 300,000 | | 362,523 |
6% 7/1/10 (MBIA Insured) | | 400,000 | | 455,492 |
Tucson Wtr. Rev.: | | | | |
Series 1994 C, 6.75% 7/1/07 (FGIC Insured) | | 200,000 | | 218,526 |
Series A, 5% 7/1/11 (FGIC Insured) | | 1,410,000 | | 1,535,730 |
5.5% 7/1/14 | | 425,000 | | 484,139 |
Univ. Med. Ctr. Corp. Hosp. Rev. 5.25% 7/1/15 | | 1,000,000 | | 1,067,550 |
Univ. of Arizona Ctfs. of Prtn. (Univ. of Arizona Parking & Student Hsg. Proj.) 5.75% 6/1/24 (AMBAC Insured) | | 500,000 | | 545,220 |
Municipal Bonds - continued |
| Principal
Amount | | Value
(Note 1) |
Arizona - continued |
Univ. of Arizona Univ. Revs.: | | | | |
5.25% 6/1/11 (FSA Insured) | | $1,000,000 | | $1,107,990 |
5.25% 6/1/13 (FSA Insured) | | 245,000 | | 258,798 |
5.25% 6/1/13 (Pre-Refunded to 6/1/08 @ 100) (d) | | 255,000 | | 274,977 |
Yavapai County Indl. Dev. Auth. Solid Waste Disp. Rev. (Waste Mgmt., Inc. Proj.) 4.625%, tender 6/1/05 (b)(c) | | 500,000 | | 501,435 |
Yuma County Hosp. District #1 6.35% 11/15/07 (Escrowed to Maturity) (d) | | 265,000 | | 276,236 |
| | 77,851,033 |
Puerto Rico - 12.2% |
Puerto Rico Commonwealth Hwy. & Trans. Auth. Hwy. Rev.: | | | | |
Series 1996 Y, 5% 7/1/36 (FSA Insured) | | 1,000,000 | | 1,056,670 |
Series Y, 5.5% 7/1/36 (FSA Insured) | | 500,000 | | 561,445 |
Puerto Rico Commonwealth Hwy. & Trans. Auth. Trans. Rev.: | | | | |
Series 1998, 5.75% 7/1/22 (CIFG North America Insured) | | 700,000 | | 793,947 |
Series 2000 C, 6% 7/1/29 | | 500,000 | | 565,970 |
Series D, 5.25% 7/1/38 | | 1,000,000 | | 1,045,040 |
5.75% 7/1/19 (FGIC Insured) | | 700,000 | | 797,692 |
Puerto Rico Commonwealth Infrastructure Fing. Auth. Series 2000 A: | | | | |
5.5% 10/1/32 (Escrowed to Maturity) (d) | | 2,675,000 | | 2,929,794 |
5.5% 10/1/40 (Escrowed to Maturity) (d) | | 2,195,000 | | 2,399,420 |
Puerto Rico Elec. Pwr. Auth. Pwr. Rev.: | | | | |
Series HH, 5.25% 7/1/29 (FSA Insured) | | 200,000 | | 215,594 |
Series QQ: | | | | |
5.25% 7/1/14 (XL Cap. Assurance, Inc. Insured) (a) | | 500,000 | | 558,090 |
5.5% 7/1/18 (XL Cap. Assurance, Inc. Insured) (a) | | 100,000 | | 116,081 |
| | 11,039,743 |
TOTAL INVESTMENT PORTFOLIO - 98.2% (Cost $85,518,083) | | | 88,890,776 |
NET OTHER ASSETS - 1.8% | | | 1,591,495 |
NET ASSETS - 100% | | $90,482,271 |
Legend |
(a)Security or a portion of the security purchased on a delayed delivery or when-issued basis. |
(b)The coupon rate shown on floating or adjustable rate securities represents the rate at period end. |
(c)Private activity obligations whose interest is subject to the federal alternative minimum tax for individuals. |
(d)Security collateralized by an amount sufficient to pay interest and principal. |
Other Information |
The distribution of municipal securities by revenue source, as a percentage of total net assets, is as follows: |
Special Tax | 24.3% |
General Obligations | 23.8% |
Education | 11.3% |
Electric Utilities | 10.6% |
Water & Sewer | 10.0% |
Escrowed/Pre-Refunded | 9.1% |
Health Care | 5.9% |
Others* (individually less than 5%) | 5.0% |
| 100.0% |
*Includes net other assets |
See accompanying notes which are an integral part of the financial statements.
Semiannual Report
Spartan Arizona Municipal Income Fund
Financial Statements
Statement of Assets and Liabilities
| February 28, 2005 (Unaudited) |
| | |
Assets | | |
Investment in securities, at value (cost $85,518,083) - See accompanying schedule | | $88,890,776 |
Cash | | 2,322,369 |
Receivable for fund shares sold | | 406,233 |
Interest receivable | | 870,498 |
Other receivables | | 8,235 |
Total assets | | 92,498,111 |
| | |
Liabilities | | |
Payable for investments purchased on a delayed delivery basis | $1,765,366 | |
Payable for fund shares redeemed | 112,265 | |
Distributions payable | 96,981 | |
Accrued management fee | 41,189 | |
Other affiliated payables | 39 | |
Total liabilities | | 2,015,840 |
| | |
Net Assets | | $90,482,271 |
Net Assets consist of: | | |
Paid in capital | | $86,994,197 |
Undistributed net investment income | | 8,508 |
Accumulated undistributed net realized gain (loss) on investments | | 106,873 |
Net unrealized appreciation (depreciation) on investments | | 3,372,693 |
Net Assets, for 7,854,435 shares outstanding | | $90,482,271 |
Net Asset Value, offering price and redemption price per share ($90,482,271 ÷ 7,854,435 shares) | | $11.52 |
See accompanying notes which are an integral part of the financial statements.
Semiannual Report
Spartan Arizona Municipal Income Fund
Financial Statements - continued
Statement of Operations
| Six months ended February 28, 2005 (Unaudited) |
| | |
Investment Income | | |
Interest | | $1,708,687 |
| | |
Expenses | | |
Management fee | $230,201 | |
Non-interested trustees' compensation | 234 | |
Miscellaneous | 80 | |
Total expenses before reductions | 230,515 | |
Expense reductions | (18,220) | 212,295 |
Net investment income | | 1,496,392 |
Realized and Unrealized Gain (Loss) Net realized gain (loss) on investment securities | | 119,876 |
Change in net unrealized appreciation (depreciation) on investment securities | | (20,906) |
Net gain (loss) | | 98,970 |
Net increase (decrease) in net assets resulting from operations | | $1,595,362 |
See accompanying notes which are an integral part of the financial statements.
Semiannual Report
Statement of Changes in Net Assets
| Six months ended
February 28, 2005
(Unaudited) | Year ended
August 31,
2004 |
Increase (Decrease) in Net Assets | | |
Operations | | |
Net investment income | $1,496,392 | $2,802,486 |
Net realized gain (loss) | 119,876 | 463,856 |
Change in net unrealized appreciation (depreciation) | (20,906) | 1,209,249 |
Net increase (decrease) in net assets resulting
from operations | 1,595,362 | 4,475,591 |
Distributions to shareholders from net investment income | (1,506,309) | (2,795,363) |
Distributions to shareholders from net realized gain | (377,090) | (406,255) |
Total distributions | (1,883,399) | (3,201,618) |
Share transactions
Proceeds from sales of shares | 17,483,850 | 29,031,760 |
Reinvestment of distributions | 1,142,655 | 2,011,588 |
Cost of shares redeemed | (6,145,597) | (22,721,013) |
Net increase (decrease) in net assets resulting from share transactions | 12,480,908 | 8,322,335 |
Redemption fees | 530 | 3,125 |
Total increase (decrease) in net assets | 12,193,401 | 9,599,433 |
| | |
Net Assets | | |
Beginning of period | 78,288,870 | 68,689,437 |
End of period (including undistributed net investment income of $8,508 and undistributed net investment income of $18,878, respectively) | $90,482,271 | $78,288,870 |
Other Information Shares | | |
Sold | 1,512,542 | 2,514,738 |
Issued in reinvestment of distributions | 98,999 | 174,888 |
Redeemed | (531,239) | (1,985,119) |
Net increase (decrease) | 1,080,302 | 704,507 |
See accompanying notes which are an integral part of the financial statements.
Semiannual Report
Financial Highlights
| Six months ended
February 28,
2005 | Years ended August 31, |
| (Unaudited) | 2004 | 2003 | 2002 | 2001 | 2000 |
Selected Per-Share Data | | | | | |
Net asset value, beginning of period | $11.56 | $11.32 | $11.50 | $11.26 | $10.72 | $10.53 |
Income from Investment Operations | | | | | | |
Net investment income D | .207 | .427 | .435 | .444 F | .472 | .486 |
Net realized and unrealized gain (loss) | .016 | .306 | (.090) | .254 F | .542 | .189 |
Total from investment operations | .223 | .733 | .345 | .698 | 1.014 | .675 |
Distributions from net investment income | (.208) | (.427) | (.435) | (.443) | (.475) | (.485) |
Distributions from net realized gain | (.055) | (.066) | (.090) | (.015) | (.001) | (.001) |
Distributions in excess of net realized gain | - | - | - | - | - | (.003) |
Total distributions | (.263) | (.493) | (.525) | (.458) | (.476) | (.489) |
Redemption fees added to paid in capital D | - G | - G | - G | - G | .002 | .004 |
Net asset value,
end of period | $11.52 | $11.56 | $11.32 | $11.50 | $11.26 | $10.72 |
Total Return B, C | 1.95% | 6.58% | 3.01% | 6.38% | 9.70% | 6.69% |
Ratios to Average Net Assets E | | | | | |
Expenses before expense reductions | .55% A | .55% | .55% | .55% | .55% | .55% |
Expenses net of voluntary waivers, if any | .55% A | .55% | .55% | .55% | .55% | .55% |
Expenses net of all reductions | .50% A | .53% | .52% | .48% | .41% | .48% |
Net investment income | 3.60% A | 3.72% | 3.77% | 3.96% F | 4.32% | 4.67% |
Supplemental Data | | | | | |
Net assets,
end of period
(000 omitted) | $90,482 | $78,289 | $68,689 | $66,105 | $50,716 | $34,221 |
Portfolio turnover rate | 8% A | 14% | 19% | 30% | 24% | 37% |
AAnnualized
BTotal returns for periods of less than one year are not annualized.
CTotal returns would have been lower had certain expenses not been reduced during the periods shown.
DCalculated based on average shares outstanding during the period.
EExpense ratios reflect operating expenses of the fund. Expenses before reductions do not reflect amounts reimbursed by the investment adviser or reductions from brokerage service arrangements or other expense offset arrangements and do not represent the amount paid by the fund during periods when reimbursements or reductions occur. Expenses net of any voluntary waivers reflect expenses after reimbursement by the investment adviser but prior to reductions from brokerage service arrangements or other expense offset arrangements. Expenses net of all reductions represent the net expenses paid by the fund.
FEffective September 1, 2001, the fund adopted the provisions of the AICPA Audit and Accounting Guide for Investment Companies and began amortizing premium and discount on all debt securities. Per-share data and ratios for periods prior to adoption have not been restated to reflect this change.
GAmount represents less than $.001 per share.
See accompanying notes which are an integral part of the financial statements.
Semiannual Report
Fidelity Arizona Municipal Money Market Fund
Investment Changes
Maturity Diversification |
Days | % of fund's investments 2/28/05 | % of fund's investments 8/31/04 | % of fund's investments 2/29/04 |
0 - 30 | 88.5 | 92.7 | 69.0 |
31 - 90 | 3.6 | 0.0 | 6.5 |
91 - 180 | 2.8 | 4.1 | 22.9 |
181 - 397 | 5.1 | 3.2 | 1.6 |
Weighted Average Maturity |
| 2/28/05 | 8/31/04 | 2/29/04 |
Fidelity Arizona Municipal Money
Market Fund | 20 Days | 18 Days | 40 Days |
All Tax Free Money Market
Funds Average* | 28 Days | 36 Days | 39 Days |
Asset Allocation (% of fund's net assets) |
As of February 28, 2005 | As of August 31, 2004 |
| Variable Rate
Demand Notes
(VRDNs)75.6% | | | Variable Rate
Demand Notes
(VRDNs)70.9% | |
| Commercial Paper (including
CP Mode)13.3% | | | Commercial Paper (including
CP Mode)12.0% | |
| Tender Bonds3.8% | | | Tender Bonds4.5% | |
 | Fidelity Municipal Cash Central Fund0.5% | | | Fidelity Municipal Cash Central Fund9.5% | |
| Other Investments3.9% | | | Other Investments2.4% | |
| Net Other Assets2.9% | | | Net Other Assets0.7% | |
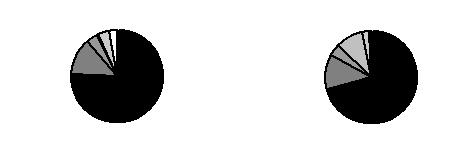
*Source: iMoneyNet, Inc.
Semiannual Report
Fidelity Arizona Municipal Money Market Fund
Investments February 28, 2005 (Unaudited)
Showing Percentage of Net Assets
Municipal Securities - 97.1% |
| Principal
Amount | | Value
(Note 1) |
Arizona - 94.6% |
Apache County Indl. Dev. Auth. (Imperial Components, Inc. Proj.) Series 1996, 1.95%, LOC Harris Trust & Savings Bank, Chicago, VRDN (a)(d) | $1,375,000 | | $1,375,000 |
Arizona Health Facilities Auth. Rev. (Southwest Behavioral Health Services, Inc. Proj.) 1.89%, LOC JPMorgan Chase Bank, VRDN (a) | 1,930,000 | | 1,930,000 |
Arizona School Facilities Board Ctfs. of Prtn.: | | | |
Bonds Series A, 4.5% 9/1/05 (MBIA Insured) | 2,155,000 | | 2,181,537 |
Participating VRDN Series RF 04 2, 1.94% (Liquidity Facility Bank of New York, New York) (a)(e) | 1,400,000 | | 1,400,000 |
Arizona School Facilities Board State School Impt. Rev. Participating VRDN: | | | |
Series MS 00 497, 1.9% (Liquidity Facility Morgan Stanley) (a)(e) | 1,054,500 | | 1,054,500 |
Series Putters 483, 1.9% (Liquidity Facility PNC Bank NA, Pittsburgh) (a)(e) | 1,490,000 | | 1,490,000 |
Series Putters 484, 1.9% (Liquidity Facility JPMorgan Chase Bank) (a)(e) | 1,490,000 | | 1,490,000 |
Arizona State Univ. Ctfs. of Prtn. Participating VRDN Series Putters 694, 1.9% (Liquidity Facility J.P. Morgan Chase & Co.) (a)(e) | 2,630,000 | | 2,630,000 |
Arizona State Univ. Revs. Participating VRDN: | | | |
Series Putters 270, 1.9% (Liquidity Facility JPMorgan Chase Bank) (a)(e) | 1,200,000 | | 1,200,000 |
Series ROC II R174, 1.9% (Liquidity Facility Citibank NA) (a)(e) | 2,600,000 | | 2,600,000 |
Arizona Tourism & Sports Auth. Tax Rev. Participating VRDN: | | | |
Series PT 2312, 1.9% (Liquidity Facility Merrill Lynch & Co., Inc.) (a)(e) | 1,600,000 | | 1,600,000 |
Series Puters 690, 1.9% (Liquidity Facility J.P. Morgan Chase & Co.) (a)(e) | 1,700,000 | | 1,700,000 |
Arizona Trans. Board Hwy. Rev. Participating VRDN Series ROC II R1038, 1.9% (Liquidity Facility Citigroup Global Markets Hldgs., Inc.) (a)(e) | 1,285,000 | | 1,285,000 |
Arizona Wtr. Infrastructure Fin. Auth. Rev. Participating VRDN Series PT 2237, 1.9% (Liquidity Facility Merrill Lynch & Co., Inc.) (a)(e) | 1,500,000 | | 1,500,000 |
Casa Grande Indl. Dev. Auth. Indl. Dev. Rev. (Price Companies, Inc. Proj.) Series A, 1.92%, LOC Bank of America NA, VRDN (a)(d) | 2,060,000 | | 2,060,000 |
Chandler Indl. Dev. Auth. Indl. Dev. Rev. (Red Rock Stamping Co. Proj.) Series 2000, 2.01%, LOC Key Bank NA, VRDN (a)(d) | 2,315,000 | | 2,315,000 |
Municipal Securities - continued |
| Principal
Amount | | Value
(Note 1) |
Arizona - continued |
Cochise County Poll. Cont. Rev. Solid Waste Disp. Rev. Bonds (Arizona Elec. Pwr. Coop. Proj.) 1.55%, tender 9/1/05 (Nat'l. Rural Utils. Coop. Fin. Corp. Guaranteed) (a)(d) | $6,700,000 | | $6,700,000 |
Coconino County Poll. Cont. Corp. Rev. (Arizona Pub. Svc. Co. Navajo Proj.) Series 1994 A, 1.83%, LOC KBC Bank NV, VRDN (a)(d) | 4,300,000 | | 4,300,000 |
Flagstaff Indl. Dev. Auth. Solid Waste Disp. Rev. (Norton Envir., Inc. Proj.) Series 1997, 2.01%, LOC Key Bank NA, VRDN (a)(d) | 2,200,000 | | 2,200,000 |
Glendale Indl. Dev. Auth. Indl. Dev. Rev. (Superior Bedding Co. Proj.) Series 1994, 1.95%, LOC Harris Trust & Savings Bank, Chicago, VRDN (a)(d) | 700,000 | | 700,000 |
Maricopa County Indl. Dev. Auth. Indl. Dev. Rev.: | | | |
Bonds (American Wtr. Corp. Proj.) Series 1988, 1.92% tender 3/1/05, CP mode (d) | 1,600,000 | | 1,600,000 |
(Clayton Homes, Inc. Proj.) Series 1998, 1.97%, LOC U.S. Bank NA, Minnesota, VRDN (a)(d) | 1,000,000 | | 1,000,000 |
Maricopa County Indl. Dev. Auth. Multi-family Hsg. Rev.: | | | |
(Glenn Oaks Apts. Proj.) Series 2001, 1.97%, LOC Fannie Mae, VRDN (a)(d) | 3,299,675 | | 3,299,675 |
(Ranchwood Apt. Proj.) Series 2001 A, 1.92%, LOC Fannie Mae, VRDN (a)(d) | 5,000,000 | | 5,000,000 |
(San Angelin Apts. Proj.) 1.91%, LOC Fannie Mae, VRDN (a)(d) | 3,100,000 | | 3,100,000 |
(San Martin Apts. Proj.): | | | |
Series A1, 1.89%, LOC Fannie Mae, VRDN (a)(d) | 2,700,000 | | 2,700,000 |
Series A2, 1.89%, LOC Fannie Mae, VRDN (a)(d) | 720,000 | | 720,000 |
(San Miguel Apts. Proj.) 1.91%, LOC Fannie Mae, VRDN (a)(d) | 1,300,000 | | 1,300,000 |
(San Remo Apts. Proj.) 1.89%, LOC Fannie Mae, VRDN (a)(d) | 2,100,000 | | 2,100,000 |
(Village Square Apts. Proj.) 1.91%, LOC Fannie Mae, VRDN (a)(d) | 1,600,000 | | 1,600,000 |
Maricopa County Indl. Dev. Auth. Single Family Mtg. Rev. Participating VRDN: | | | |
Series Floaters 707, 1.96% (Liquidity Facility Morgan Stanley) (a)(d)(e) | 2,000,000 | | 2,000,000 |
Series Merlots 01 A126, 1.96% (Liquidity Facility Wachovia Bank NA) (a)(d)(e) | 400,000 | | 400,000 |
Maricopa County Indl. Dev. Auth. Solid Waste Disp. Rev. Participating VRDN Series MT 48, 1.97%, LOC Lloyds TSB Bank PLC (a)(d)(e) | 1,770,000 | | 1,770,000 |
Phoenix Arpt. Rev. 1.97% 3/1/05, LOC Bank of America NA, CP (d) | 4,000,000 | | 4,000,000 |
Municipal Securities - continued |
| Principal
Amount | | Value
(Note 1) |
Arizona - continued |
Phoenix Civic Impt. Board Arpt. Rev.: | | | |
Bonds (Phoenix Arpt. Rev. Proj.) Series B, 5% 7/1/05
(FSA Insured) (d) | $4,745,000 | | $4,791,165 |
Participating VRDN Series Merlots 02 A28, 1.96% (Liquidity Facility Wachovia Bank NA) (a)(d)(e) | 1,285,000 | | 1,285,000 |
Phoenix Civic Impt. Corp. Excise Tax Rev.: | | | |
Participating VRDN Series EGL 03 28, 1.9% (Liquidity Facility Citibank NA, New York) (a)(e) | 1,300,000 | | 1,300,000 |
Series 1995, 1.9%, LOC Landesbank Hessen-Thuringen, VRDN (a)(d) | 6,000,000 | | 6,000,000 |
Phoenix Civic Impt. Corp. Transit Excise Tax Rev. Participating VRDN Series PT 2454, 1.9% (Liquidity Facility Merrill Lynch & Co., Inc.) (a)(e) | 5,445,000 | | 5,445,000 |
Phoenix Civic Impt. Corp. Wastewtr. Sys. Rev.: | | | |
Participating VRDN: | | | |
Series MS 991, 1.9% (Liquidity Facility Morgan Stanley) (a)(e) | 1,500,000 | | 1,500,000 |
Series ROC II R6039, 1.9% (Liquidity Facility Citibank NA) (a)(e) | 1,275,000 | | 1,275,000 |
(Phoenix Wtr. Sys. Rev. Proj.) Series 2004 A, 1.84%
(MBIA Insured), VRDN (a) | 5,000,000 | | 5,000,000 |
Series 2003 B: | | | |
1.5% 3/3/05, LOC Dexia Cr. Local de France, CP | 2,000,000 | | 2,000,000 |
1.5% 3/10/05, LOC Dexia Cr. Local de France, CP | 1,600,000 | | 1,600,000 |
1.6% 4/1/05, LOC Dexia Cr. Local de France, CP | 1,300,000 | | 1,300,000 |
1.75% 3/3/05, LOC Dexia Cr. Local de France, CP | 1,600,000 | | 1,600,000 |
1.9% 4/8/05, LOC Dexia Cr. Local de France, CP | 5,000,000 | | 5,000,000 |
Phoenix Indl. Dev. Auth. Multi-family Hsg. Rev.: | | | |
(Bell Square Apt. Proj.) Series 1995, 1.98%, LOC Gen. Elec. Cap. Corp., VRDN (a) | 1,000,000 | | 1,000,000 |
(Westward Ho Apts. Proj.) Series 2003 A, 1.95%, LOC Fleet Nat'l. Bank, VRDN (a)(d) | 1,700,000 | | 1,700,000 |
Phoenix Indl. Dev. Auth. Rev.: | | | |
(Independent Newspaper, Inc. Proj.) Series 2000, 2.01%, LOC Wachovia Bank NA, VRDN (a)(d) | 900,000 | | 900,000 |
(Laura Dozer Ctr. Proj.) 2.02%, LOC JPMorgan Chase Bank, VRDN (a) | 1,100,000 | | 1,100,000 |
(Phoenix Expansion Proj.) 2.12%, LOC JPMorgan Chase Bank, VRDN (a)(d) | 2,390,000 | | 2,390,000 |
(Plastican Proj.) Series 1997, 1.92%, LOC Fleet Bank NA, VRDN (a)(d) | 2,965,000 | | 2,965,000 |
(Swift Aviation Svcs., Inc. Proj.) 1.9%, LOC U.S. Bank NA, Minnesota, VRDN (a)(d) | 5,470,000 | | 5,470,000 |
Municipal Securities - continued |
| Principal
Amount | | Value
(Note 1) |
Arizona - continued |
Phoenix Indl. Dev. Auth. Single Family Mtg. Rev. Participating VRDN: | | | |
Series Merlots 01 A23, 1.96% (Liquidity Facility Wachovia Bank NA) (a)(d)(e) | $280,000 | | $280,000 |
Series PT 1082, 1.95% (Liquidity Facility Merrill Lynch & Co., Inc.) (a)(d)(e) | 1,060,000 | | 1,060,000 |
Pima County Indl. Dev. Auth. Multi-family Hsg. Rev.: | | | |
(La Cholla Apt. Proj.) Series 1996, 1.91%, LOC JPMorgan Chase Bank, VRDN (a) | 4,225,000 | | 4,225,000 |
(River Point Proj.) Series 2001, 1.92%, LOC Fannie Mae, VRDN (a)(d) | 6,000,000 | | 6,000,000 |
Pima County Indl. Dev. Auth. Rev. (El Dorado Hosp. Proj.) 1.9%, LOC Branch Banking & Trust Co., VRDN (a) | 1,600,000 | | 1,600,000 |
Pima County Indl. Dev. Auth. Single Family Hsg. Rev. Participating VRDN Series RF 99 5, 2.01% (Liquidity Facility Bank of New York, New York) (a)(d)(e) | 3,490,000 | | 3,490,000 |
Salt River Proj. Agric. Impt. & Pwr. District Elec. Sys. Rev.: | | | |
Participating VRDN: | | | |
Series PT 1512, 1.9% (Liquidity Facility Merrill Lynch & Co., Inc.) (a)(e) | 1,200,000 | | 1,200,000 |
Series ROC II R1002, 1.9% (Liquidity Facility Citigroup Global Markets Hldgs., Inc.) (a)(e) | 1,290,000 | | 1,290,000 |
Series ROC II R1003, 1.9% (Liquidity Facility Citigroup Global Markets Hldgs., Inc.) (a)(e) | 1,285,000 | | 1,285,000 |
Series SG 03 160, 1.9% (Liquidity Facility Societe Generale) (a)(e) | 1,390,000 | | 1,390,000 |
Series 2004 C: | | | |
1.85% 3/11/05, CP | 1,600,000 | | 1,600,000 |
1.95% 3/11/05, CP | 3,700,000 | | 3,700,000 |
Series 97B, 1.83% 3/11/05, CP | 1,500,000 | | 1,500,000 |
Sun Devil Energy Ctr. LLC Rev. (Arizona State Univ. Proj.) 1.89% (FGIC Insured), VRDN (a) | 1,600,000 | | 1,600,000 |
Tempe Indl. Dev. Auth. Rev. (ASUF Brickyard Proj.) Series 2004 A, 1.87%, LOC Bank of America NA, VRDN (a) | 10,210,000 | | 10,210,000 |
Tucson Indl. Dev. Auth. Rev. (Clarion Santa Rita Hotel Proj.) Series 2002, 1.94%, LOC JPMorgan Chase Bank, VRDN (a)(d) | 1,400,000 | | 1,400,000 |
Yavapai County Indl. Dev. Auth. Indl. Dev. Rev. (Oxycal Lab. Proj.) Series 1999 A, 2.02%, LOC Wells Fargo Bank NA, San Francisco, VRDN (a)(d) | 1,000,000 | | 1,000,000 |
| | 168,751,877 |
Municipal Securities - continued |
| Principal
Amount | | Value
(Note 1) |
Puerto Rico - 2.0% |
Puerto Rico Elec. Pwr. Auth. Pwr. Rev. Participating VRDN: | | | |
Series PA 561, 1.86% (Liquidity Facility Merrill Lynch & Co., Inc.) (a)(e) | $1,500,000 | | $1,500,000 |
Series PA 778R, 1.86% (Liquidity Facility Merrill Lynch & Co., Inc.) (a)(e) | 2,025,000 | | 2,025,000 |
| | 3,525,000 |
Other - 0.5% |
Fidelity Municipal Cash Central Fund, 1.83% (b)(c) | 891,433 | | 891,433 |
TOTAL INVESTMENT PORTFOLIO - 97.1% (Cost $173,168,310) | 173,168,310 |
NET OTHER ASSETS - 2.9% | | 5,218,221 |
NET ASSETS - 100% | $178,386,531 |
Security Type Abbreviations |
CP-COMMERCIAL PAPER |
VRDN-VARIABLE RATE DEMAND NOTE |
Legend |
(a)The coupon rate shown on floating or adjustable rate securities represents the rate at period end. |
(b)Information in this report regarding holdings by state and security types does not reflect the holdings of the Fidelity Municipal Cash Central Fund. |
(c)Affiliated fund that is available only to investment companies and other accounts managed by Fidelity Investments. The rate quoted is the annualized seven-day yield of the fund at period end. A complete listing of the fund's holdings as of its most recent quarter end is available upon request. |
(d)Private activity obligations whose interest is subject to the federal alternative minimum tax for individuals. |
(e)Provides evidence of ownership in one or more underlying municipal bonds. |
See accompanying notes which are an integral part of the financial statements.
Semiannual Report
Fidelity Arizona Municipal Money Market Fund
Financial Statements
Statement of Assets and Liabilities
| February 28, 2005 (Unaudited) |
| | |
Assets | | |
Investment in securities, at value (cost $173,168,310) - See accompanying schedule | | $173,168,310 |
Cash | | 9,086,226 |
Receivable for fund shares sold | | 2,068,318 |
Interest receivable | | 504,258 |
Other receivables | | 40,394 |
Total assets | | 184,867,506 |
| | |
Liabilities | | |
Payable for investments purchased | $4,000,000 | |
Payable for fund shares redeemed | 2,404,987 | |
Distributions payable | 2,434 | |
Accrued management fee | 73,476 | |
Other affiliated payables | 78 | |
Total liabilities | | 6,480,975 |
| | |
Net Assets | | $178,386,531 |
Net Assets consist of: | | |
Paid in capital | | $178,385,001 |
Undistributed net investment income | | 336 |
Accumulated undistributed net realized gain (loss) on investments | | 1,194 |
Net Assets, for 178,268,113 shares outstanding | | $178,386,531 |
Net Asset Value, offering price and redemption price per share ($178,386,531 ÷ 178,268,113 shares) | | $1.00 |
See accompanying notes which are an integral part of the financial statements.
Semiannual Report
Fidelity Arizona Municipal Money Market Fund
Financial Statements - continued
Statement of Operations
| Six months ended February 28, 2005 (Unaudited) |
| | |
Investment Income | | |
Interest | | $1,363,071 |
| | |
Expenses | | |
Management fee | $411,811 | |
Non-interested trustees' compensation | 464 | |
Total expenses before reductions | 412,275 | |
Expense reductions | (42,665) | 369,610 |
Net investment income | | 993,461 |
Net realized gain (loss) on investment securities | | 1,043 |
Net increase in net assets resulting from operations | | $994,504 |
See accompanying notes which are an integral part of the financial statements.
Semiannual Report
Statement of Changes in Net Assets
| Six months ended
February 28, 2005
(Unaudited) | Year ended
August 31,
2004 |
Increase (Decrease) in Net Assets | | |
Operations | | |
Net investment income | $993,461 | $856,308 |
Net realized gain (loss) | 1,043 | 43,224 |
Net increase in net assets resulting
from operations | 994,504 | 899,532 |
Distributions to shareholders from net investment income | (993,125) | (856,308) |
Share transactions at net asset value of $1.00 per share
Proceeds from sales of shares | 192,921,834 | 284,737,103 |
Reinvestment of distributions | 983,283 | 847,210 |
Cost of shares redeemed | (172,474,632) | (262,790,710) |
Net increase (decrease) in net assets and shares resulting from share transactions | 21,430,485 | 22,793,603 |
Total increase (decrease) in net assets | 21,431,864 | 22,836,827 |
| | |
Net Assets | | |
Beginning of period | 156,954,667 | 134,117,840 |
End of period (including undistributed net investment income of $336 and undistributed net investment income of $0, respectively) | $178,386,531 | $156,954,667 |
See accompanying notes which are an integral part of the financial statements.
Semiannual Report
Financial Highlights
| Six months ended
February 28,
2005 | Years ended August 31, |
| (Unaudited) | 2004 | 2003 | 2002 | 2001 | 2000 |
Selected Per-Share Data | | | | | |
Net asset value, beginning of period | $1.00 | $1.00 | $1.00 | $1.00 | $1.00 | $1.00 |
Income from Investment Operations | | | | | | |
Net investment income | .006 | .006 | .008 | .013 | .032 | .034 |
Net realized and unrealized gain (loss) F | - | - | - | - | - | - |
Total from investment operations | .006 | .006 | .008 | .013 | .032 | .034 |
Distributions from net investment income | (.006) | (.006) | (.008) | (.013) | (.032) | (.034) |
Distributions from net realized gain | - | - | - F | - | - | - |
Total distributions | (.006) | (.006) | (.008) | (.013) | (.032) | (.034) |
Net asset value,
end of period | $1.00 | $1.00 | $1.00 | $1.00 | $1.00 | $1.00 |
Total Return B, C, D | .60% | .60% | .86% | 1.30% | 3.23% | 3.50% |
Ratios to Average Net Assets E | | | | | |
Expenses before expense reductions | .50% A | .50% | .50% | .50% | .50% | .50% |
Expenses net of voluntary waivers, if any | .50% A | .50% | .50% | .50% | .50% | .50% |
Expenses net of all reductions | .45% A | .49% | .48% | .45% | .47% | .50% |
Net investment income | 1.22% A | .60% | .82% | 1.27% | 3.19% | 3.46% |
Supplemental Data | | | | | |
Net assets,
end of period (000 omitted) | $178,387 | $156,955 | $134,118 | $132,208 | $101,853 | $105,704 |
AAnnualized
BTotal returns for periods of less than one year are not annualized.
CTotal returns would have been lower had certain expenses not been reduced during the periods shown.
DTotal returns do not include the effect of the former account closeout fee.
EExpense ratios reflect operating expenses of the fund. Expenses before reductions do not reflect amounts reimbursed by the investment adviser or reductions from brokerage service arrangements or other expense offset arrangements and do not represent the amount paid by the fund during periods when reimbursements or reductions occur. Expenses net of any voluntary waivers reflect expenses after reimbursement by the investment adviser but prior to reductions from brokerage service arrangements or other expense offset arrangements. Expenses net of all reductions represent the net expenses paid by the fund.
FAmount represents less than $.001 per share.
See accompanying notes which are an integral part of the financial statements.
Semiannual Report
Notes to Financial Statements
For the period ended February 28, 2005 (Unaudited)
1. Significant Accounting Policies.
Spartan Arizona Municipal Income Fund (the income fund) is a fund of Fidelity Union Street Trust. Fidelity Arizona Municipal Money Market Fund (the money market fund) is a fund of Fidelity Union Street Trust II. Each trust is registered under the Investment Company Act of 1940, as amended (the 1940 Act), as an open-end management investment company. Fidelity Union Street Trust and Fidelity Union Street Trust II (the trusts) are organized as a Massachusetts business trust and a Delaware statutory trust, respectively. Each fund is authorized to issue an unlimited number of shares. Each fund may be affected by economic and political developments in the state of Arizona. The financial statements have been prepared in conformity with accounting principles generally accepted in the United States of America, which require management to make certain estimates and assumptions at the date of the financial statements. The following summarizes the significant accounting policies of the income fund and the money market fund:
Security Valuation. Net asset value per share (NAV calculation) is calculated as of the close of business of the New York Stock Exchange, normally 4:00 p.m. Eastern time. Debt securities, including restricted securities, are valued on the basis of information provided by a pricing service. Pricing services use valuation matrices that incorporate both dealer-supplied valuations and valuation models. If prices are not readily available or do not accurately reflect fair value for a security, or if a security's value has been materially affected by events occurring after the close of the exchange or market on which the security is principally traded, that security may be valued by another method that the Board of Trustees believes accurately reflects fair value. A security's valuation may differ depending on the method used for determining value. Price movements in futures contracts and ADRs, market and trading trends, the bid/ask quotes of brokers and off-exchange institutional trading may be reviewed in the course of making a good faith determination of a security's fair value. Short-term securities with remaining maturities of sixty days or less for which quotations are not readily available are valued on the basis of amortized cost. Investments in open-end investment companies are valued at their net asset value each business day.
As permitted under Rule 2a-7 of the 1940 Act, and certain conditions therein, securities owned by the money market fund are valued initially at cost and thereafter assume a constant amortization to maturity of any discount or premium.
Investment Transactions and Income. Security transactions are accounted for as of trade date. Gains and losses on securities sold are determined on the basis of identified cost. Interest income is accrued as earned. Interest income includes coupon interest and amortization of premium and accretion of discount on debt securities.
Semiannual Report
Notes to Financial Statements (Unaudited) - continued
1. Significant Accounting Policies - continued
Expenses. Most expenses of each trust can be directly attributed to a fund. Expenses which cannot be directly attributed are apportioned among the funds in the trust.
Income Tax Information and Distributions to Shareholders. Each year, each fund intends to qualify as a regulated investment company by distributing all of its taxable income and realized gains under Subchapter M of the Internal Revenue Code. As a result, no provision for income taxes is required in the accompanying financial statements.
Dividends are declared daily and paid monthly from net investment income. Distributions from realized gains, if any, are recorded on the ex-dividend date. Income and capital gain distributions are determined in accordance with income tax regulations, which may differ from generally accepted accounting principles. In addition, certain funds claimed a portion of the payment made to redeeming shareholders as a distribution for income tax purposes. Capital accounts within the financial statements are adjusted for permanent book-tax differences. These adjustments have no impact on net assets or the results of operations. Temporary book-tax differences will reverse in a subsequent period.
Book-tax differences are primarily due to market discount and losses deferred due to wash sales and futures transactions.
The funds purchase municipal securities whose interest, in the opinion of the issuer, is free from federal income tax. There is no assurance that the Internal Revenue Service (IRS) will agree with this opinion. In the event the IRS determines that the issuer does not comply with relevant tax requirements, interest payments from a security could become federally taxable, possibly retroactively to the date the security was issued.
The federal tax cost of investments and unrealized appreciation (depreciation) as of period end were as follows for each fund:
| Cost for Federal
Income Tax
Purposes | Unrealized
Appreciation | Unrealized
Depreciation | Net Unrealized
Appreciation/
(Depreciation) |
Spartan Arizona Municipal Income Fund | $85,498,660 | $3,519,345 | $(127,229) | $3,392,116 |
Fidelity Arizona Municipal Money Market Fund | 173,168,310 | - | - | - |
Short-Term Trading (Redemption) Fees. Shares held in the income fund less than 30 days are subject to a redemption fee equal to .50% of the proceeds of the redeemed shares. All redemption fees, including any estimated redemption fees paid by Fidelity Management & Research Company (FMR), are retained by the fund and accounted for as an addition to paid in capital.
Semiannual Report
2. Operating Policies.
Delayed Delivery Transactions and When-Issued Securities. Each fund may purchase or sell securities on a delayed delivery or when-issued basis. Payment and delivery may take place after the customary settlement period for that security. The price of the underlying securities and the date when the securities will be delivered and paid for are fixed at the time the transaction is negotiated. During the time a delayed delivery sell is outstanding, the contract is marked-to-market daily and equivalent deliverable securities are held for the transaction. The value of the securities purchased on a delayed delivery or when-issued basis are identified as such in each applicable fund's Schedule of Investments. Each fund may receive compensation for interest forgone in the purchase of a delayed delivery or when-issued security. With respect to purchase commitments, each fund identifies securities as segregated in its records with a value at least equal to the amount of the commitment. Losses may arise due to changes in the value of the underlying securities or if the counterparty does not perform under the contract's terms, or if the issuer does not issue the securities due to political, economic, or other factors.
3. Purchases and Sales of Investments.
Purchases and sales of securities, other than short-term securities and U.S. government securities, for the income fund aggregated $16,655,670 and $3,339,944, respectively.
4. Fees and Other Transactions with Affiliates.
Management Fee. FMR and its affiliates provides the funds with investment management related services for which the funds pay a monthly management fee. FMR pays all other expenses, except the compensation of the non-interested Trustees and certain exceptions such as interest expense. The management fee paid to FMR by the funds is reduced by an amount equal to the fees and expenses paid by the funds to the non-interested Trustees. Each fund's management fee is equal to the following annual rate of average net assets:
Spartan Arizona Municipal Income Fund | .55% | | |
Fidelity Arizona Municipal Money Market Fund | .50% | |
Central Funds. The funds may invest in affiliated Central Funds managed by Fidelity Investments Money Management, Inc. (FIMM), an affiliate of FMR. The Central Funds are open-end investment companies available only to investment companies and other accounts managed by FMR and its affiliates. The Central Funds seek preservation of capital and current income and do not pay a management fee. Income distributions earned by the funds are recorded as income in the accompanying financial statements. Distributions from the Central Funds are noted in the table below:
| Income
Distributions |
Fidelity Arizona Municipal Money Market Fund | $100,107 |
Semiannual Report
Notes to Financial Statements (Unaudited) - continued
5. Committed Line of Credit.
The income fund participates with other funds managed by FMR in a $4.2 billion credit facility (the "line of credit") to be utilized for temporary or emergency purposes to fund shareholder redemptions or for other short-term liquidity purposes. The participating funds have agreed to pay commitment fees on their pro rata portion of the line of credit, which is included in Miscellaneous Expense on the Statement of Operations. During the period, there were no borrowings on this line of credit.
6. Expense Reductions.
Through arrangements with each applicable fund's custodian and transfer agent, credits realized as a result of uninvested cash balances were used to reduce each applicable fund's management fee. During the period, these credits reduced management fee by the following amounts:
Spartan Arizona Municipal Income Fund | $18,220 | | |
Fidelity Arizona Municipal Money Market Fund | 42,665 | |
7. Other.
The funds' organizational documents provide former and current trustees and officers with a limited indemnification against liabilities arising in connection with the performance of their duties to the funds. In the normal course of business, the funds may also enter into contracts that provide general indemnifications. The funds' maximum exposure under these arrangements is unknown as this would be dependent on future claims that may be made against the funds. The risk of material loss from such claims is considered remote.
Semiannual Report
Proxy Voting Results
A special meeting of the shareholders of Spartan Arizona Municipal Income Fund was held on February 16, 2005. The results of votes taken among shareholders on proposals before them are reported below. Each vote reported represents one dollar of net asset value held on the record date for the meeting.
PROPOSAL 1 |
To amend the Declaration of Trust to allow the Board of Trustees, if permitted by applicable law, to authorize fund mergers without shareholder approval. A |
| # of
Votes | % of
Votes |
Affirmative | 742,440,496.15 | 73.879 |
Against | 196,006,999.93 | 19.504 |
Abstain | 33,719,201.65 | 3.356 |
Broker
Non-Votes | 32,776,930.05 | 3.261 |
TOTAL | 1,004,943,627.78 | 100.000 |
PROPOSAL 2 |
To elect a Board of Trustees. A |
| # of
Votes | % of
Votes |
Laura B. Cronin |
Affirmative | 948,588,595.83 | 94.392 |
Withheld | 56,355,031.95 | 5.608 |
TOTAL | 1,004,943,627.78 | 100.000 |
Dennis J. Dirks |
Affirmative | 950,698,349.04 | 94.602 |
Withheld | 54,245,278.74 | 5.398 |
TOTAL | 1,004,943,627.78 | 100.000 |
Robert M. Gates |
Affirmative | 947,567,913.72 | 94.291 |
Withheld | 57,375,714.06 | 5.709 |
TOTAL | 1,004,943,627.78 | 100.000 |
George H. Heilmeier |
Affirmative | 948,147,248.47 | 94.348 |
Withheld | 56,796,379.31 | 5.652 |
TOTAL | 1,004,943,627.78 | 100.000 |
| # of
Votes | % of
Votes |
Abigail P. Johnson |
Affirmative | 944,190,223.14 | 93.955 |
Withheld | 60,753,404.64 | 6.045 |
TOTAL | 1,004,943,627.78 | 100.000 |
Edward C. Johnson 3d |
Affirmative | 943,213,044.14 | 93.857 |
Withheld | 61,730,583.64 | 6.143 |
TOTAL | 1,004,943,627.78 | 100.000 |
Marie L. Knowles |
Affirmative | 949,452,954.58 | 94.478 |
Withheld | 55,490,673.20 | 5.522 |
TOTAL | 1,004,943,627.78 | 100.000 |
Ned C. Lautenbach |
Affirmative | 948,794,328.18 | 94.413 |
Withheld | 56,149,299.60 | 5.587 |
TOTAL | 1,004,943,627.78 | 100.000 |
Marvin L. Mann |
Affirmative | 946,649,510.40 | 94.199 |
Withheld | 58,294,117.38 | 5.801 |
TOTAL | 1,004,943,627.78 | 100.000 |
William O. McCoy |
Affirmative | 945,952,663.12 | 94.130 |
Withheld | 58,990,964.66 | 5.870 |
TOTAL | 1,004,943,627.78 | 100.000 |
Robert L. Reynolds |
Affirmative | 948,326,458.64 | 94.366 |
Withheld | 56,617,169.14 | 5.634 |
TOTAL | 1,004,943,627.78 | 100.000 |
Cornelia M. Small |
Affirmative | 949,307,587.45 | 94.464 |
Withheld | 55,636,040.33 | 5.536 |
TOTAL | 1,004,943,627.78 | 100.000 |
| # of
Votes | % of
Votes |
William S. Stavropoulos |
Affirmative | 947,525,611.83 | 94.286 |
Withheld | 57,418,015.95 | 5.714 |
TOTAL | 1,004,943,627.78 | 100.000 |
Kenneth L. Wolfe |
Affirmative | 949,176,424.38 | 94.451 |
Withheld | 55,767,203.40 | 5.549 |
TOTAL | 1,004,943,627.78 | 100.000 |
ADenotes trust-wide proposals and voting results. |
Semiannual Report
Managing Your Investments
Fidelity offers several ways to conveniently manage your personal investments via your telephone or PC. You can access your account information, conduct trades and research your investments 24 hours a day.
By Phone
Fidelity Automated Service Telephone provides a single toll-free number to access account balances, positions, quotes and trading. It's easy to navigate the service, and on your first call, the system will help you create a personal identification number (PIN) for security.
(phone_graphic)
Fidelity Automated
Service Telephone (FAST®)
1-800-544-5555
Press
1 For mutual fund and brokerage trading.
2 For quotes.*
3 For account balances and holdings.
4 To review orders and mutual
fund activity.
5 To change your PIN.
*0 To speak to a Fidelity representative.
By PC
Fidelity's web site on the Internet provides a wide range of information, including daily financial news, fund performance, interactive planning tools and news about Fidelity products and services.
(computer_graphic)
Fidelity's Web Site
www.fidelity.com
* When you call the quotes line, please remember that a fund's yield and return will vary and, except for money market funds, share price will also vary. This means that you may have a gain or loss when you sell your shares. There is no assurance that money market funds will be able to maintain a stable $1 share price; an investment in a money market fund is not insured or guaranteed by the U.S. government. Total returns are historical and include changes in share price, reinvestment of dividends and capital gains, and the effects of any sales charges.
Semiannual Report
Investment Adviser
Fidelity Management & Research Company
Boston, MA
Sub-Advisers
Fidelity Investments
Money Management, Inc.
Fidelity International Investment Advisors
Fidelity International Investment Advisors
(U.K.) Limited
General Distributor
Fidelity Distributors Corporation
Boston, MA
Transfer and Shareholder
Servicing Agents
Citibank, N.A.
New York, NY
and
Fidelity Service Company, Inc.
Boston, MA
Custodian
Citibank, N.A.
New York, NY
The Fidelity Telephone Connection
Mutual Fund 24-Hour Service
Exchanges/Redemptions
and Account Assistance1-800-544-6666
Product Information1-800-544-6666
Retirement Accounts1-800-544-4774 (8 a.m. - 9 p.m.)
TDD Service1-800-544-0118
for the deaf and hearing impaired
(9 a.m. - 9 p.m. Eastern time)
Fidelity Automated Service
Telephone (FAST®) (automated graphic) 1-800-544-5555
(automated graphic) Automated line for quickest service
(Fidelity Investment logo)(registered trademark)
Corporate Headquarters
82 Devonshire St., Boston, MA 02109
www.fidelity.com
AZI/SPZ-USAN-0405
1.790941.101
Spartan®
Maryland
Municipal Income
Fund
Semiannual Report
February 28, 2005
(2_fidelity_logos)(Registered_Trademark)
Contents
Chairman's Message | <Click Here> | Ned Johnson's message to shareholders. |
Shareholder Expense Example | <Click Here> | An example of shareholder expenses. |
Investment Changes | <Click Here> | A summary of major shifts in the fund's investments over the past six months. |
Investments | <Click Here> | A complete list of the fund's investments with their market values. |
Financial Statements | <Click Here> | Statements of assets and liabilities, operations, and changes in net assets,
as well as financial highlights. |
Notes | <Click Here> | Notes to the financial statements. |
Proxy Voting Results | <Click Here> | |
To view a fund's proxy voting guidelines and proxy voting record for the 12-month period ended June 30, visit www.fidelity.com/proxyvotingresults or visit the Securities and Exchange Commission's (SEC) web site at www.sec.gov. You may also call 1-800-544-8544 to request a free copy of the proxy voting guidelines.
Standard & Poor's, S&P and S&P 500 are registered service marks of The McGraw-Hill Companies, Inc. and have been licensed for use by Fidelity Distributors Corporation.
Other third party marks appearing herein are the property of their respective owners.
All other marks appearing herein are registered or unregistered trademarks or service marks of FMR Corp. or an affiliated company.
This report and the financial statements contained herein are submitted for the general information of the shareholders of the fund. This report is not authorized for distribution to prospective investors in the fund unless preceded or accompanied by an effective prospectus.
A fund files its complete schedule of portfolio holdings with the SEC for the first and third quarters of each fiscal year on Form N-Q. Forms N-Q are available on the SEC's web site at http://www.sec.gov. A fund's Forms N-Q may be reviewed and copied at the SEC's Public Reference Room in Washington, DC. Information regarding the operation of the SEC's Public Reference Room may be obtained by calling 1-800-SEC-0330. For a complete list of a fund's portfolio holdings, view the most recent quarterly holdings report, semiannual report, or annual report on Fidelity's web site at http://www.fidelity.com/holdings.
NOT FDIC INSURED · MAY LOSE VALUE · NO BANK GUARANTEE
Neither the fund nor Fidelity Distributors Corporation is a bank.
Semiannual Report
Chairman's Message
(photo_of_Edward_C_Johnson_3d)
Dear Shareholder:
During the past year or so, much has been reported about the mutual fund industry, and much of it has been more critical than I believe is warranted. Allegations that some companies have been less than forthright with their shareholders have cast a shadow on the entire industry. I continue to find these reports disturbing, and assert that they do not create an accurate picture of the industry overall. Therefore, I would like to remind everyone where Fidelity stands on these issues. I will say two things specifically regarding allegations that some mutual fund companies were in violation of the Securities and Exchange Commission's forward pricing rules or were involved in so-called "market timing" activities.
First, Fidelity has no agreements that permit customers who buy fund shares after 4 p.m. to obtain the 4 p.m. price. This is not a new policy. This is not to say that someone could not deceive the company through fraudulent acts. However, we are extremely diligent in preventing fraud from occurring in this manner - and in every other. But I underscore again that Fidelity has no so-called "agreements" that sanction illegal practices.
Second, Fidelity continues to stand on record, as we have for years, in opposition to predatory short-term trading that adversely affects shareholders in a mutual fund. Back in the 1980s, we initiated a fee - which is returned to the fund and, therefore, to investors - to discourage this activity. Further, we took the lead several years ago in developing a Fair Value Pricing Policy to prevent market timing on foreign securities in our funds. I am confident we will find other ways to make it more difficult for predatory traders to operate. However, this will only be achieved through close cooperation among regulators, legislators and the industry.
Yes, there have been unfortunate instances of unethical and illegal activity within the mutual fund industry from time to time. That is true of any industry. When this occurs, confessed or convicted offenders should be dealt with appropriately. But we are still concerned about the risk of over-regulation and the quick application of simplistic solutions to intricate problems. Every system can be improved, and we support and applaud well thought out improvements by regulators, legislators and industry representatives that achieve the common goal of building and protecting the value of investors' holdings.
For nearly 60 years, Fidelity has worked very hard to improve its products and service to justify your trust. When our family founded this company in 1946, we had only a few hundred customers. Today, we serve more than 18 million customers including individual investors and participants in retirement plans across America.
Let me close by saying that we do not take your trust in us for granted, and we realize that we must always work to improve all aspects of our service to you. In turn, we urge you to continue your active participation with your financial matters, so that your interests can be well served.
Best regards,/s/Edward C. Johnson 3d
Edward C. Johnson 3d
Semiannual Report
Shareholder Expense Example
As a shareholder of the Fund, you incur two types of costs: (1) transaction costs, including redemption fees, and (2) ongoing costs, including management fees and other Fund expenses. This Example is intended to help you understand your ongoing costs (in dollars) of investing in the Fund and to compare these costs with the ongoing costs of investing in other mutual funds.
The Example is based on an investment of $1,000 invested at the beginning of the period and held for the entire period (September 1, 2004 to February 28, 2005).
Actual Expenses
The first line of the table below provides information about actual account values and actual expenses. You may use the information in this line, together with the amount you invested, to estimate the expenses that you paid over the period. Simply divide your account value by $1,000.00 (for example, an $8,600 account value divided by $1,000.00 = 8.6), then multiply the result by the number in the first line under the heading entitled "Expenses Paid During Period" to estimate the expenses you paid on your account during this period. A small balance maintenance fee of $12.00 that is charged once a year may apply for certain accounts with a value of less than $2,000. This fee is not included in the table below. If it was, the estimate of expenses you paid during the period would be higher, and your ending account value lower, by this amount.
Hypothetical Example for Comparison Purposes
The second line of the table below provides information about hypothetical account values and hypothetical expenses based on the Fund's actual expense ratio and an assumed rate of return of 5% per year before expenses, which is not the Fund's actual return. The hypothetical account values and expenses may not be used to estimate the actual ending account balance or expenses you paid for the period. You may use this information to compare the ongoing costs of investing in the Fund and other funds. To do so, compare this 5% hypothetical example with the 5% hypothetical examples that appear in the shareholder reports of the other funds. A small balance maintenance fee of $12.00 that is charged once a year may apply for certain accounts with a value of less than $2,000. This fee is not included in the table below. If it was, the estimate of expenses you paid during the period would be higher, and your ending account value lower, by this amount.
Please note that the expenses shown in the table are meant to highlight your ongoing costs only and do not reflect any transaction costs. Therefore, the second line of the table is useful in comparing ongoing costs only, and will not help you determine the relative total costs of owning different funds. In addition, if these transactional costs were included, your costs would have been higher.
Semiannual Report
| Beginning
Account Value
September 1, 2004 | Ending
Account Value
February 28, 2005 | Expenses Paid
During Period*
September 1, 2004
to February 28, 2005 |
Actual | $1,000.00 | $1,019.10 | $2.75 |
Hypothetical (5% return per year before expenses) | $1,000.00 | $1,022.07 | $2.76 |
*Expenses are equal to the Fund's annualized expense ratio of .55%; multiplied by the average account value over the period, multiplied by 181/365 (to reflect the one-half year period).
Semiannual Report
Investment Changes
Top Five Sectors as of February 28, 2005 |
| % of fund's
net assets | % of fund's net assets
6 months ago |
General Obligations | 32.3 | 34.7 |
Escrowed/Pre-Refunded | 19.3 | 15.2 |
Health Care | 11.8 | 13.3 |
Education | 10.1 | 10.2 |
Electric Utilities | 6.3 | 2.3 |
Average Years to Maturity as of February 28, 2005 |
| | 6 months ago |
Years | 14.5 | 15.2 |
Average years to maturity is based on the average time remaining to the stated maturity date of each bond, weighted by the market value of each bond. |
Duration as of February 28, 2005 |
| | 6 months ago |
Years | 6.6 | 7.2 |
Duration shows how much a bond fund's price fluctuates with changes in comparable interest rates. If rates rise 1%, for example, a fund with a five-year duration is likely to lose about 5% of its value. Other factors also can influence a bond fund's performance and share price. Accordingly, a bond fund's actual performance may differ from this example. |
Quality Diversification (% of fund's net assets) |
As of February 28, 2005 | As of August 31, 2004 |
| AAA63.0% | | | AAA57.6% | |
| AA,A31.9% | | | AA,A33.8% | |
| BBB1.0% | | | BBB3.2% | |
| Not Rated2.6% | | | Not Rated1.6% | |
| Short-Term
Investments and
Net Other Assets1.5% | | | Short-Term
Investments and
Net Other Assets3.8% | |

We have used ratings from Moody's® Investors Services, Inc. Where Moody's ratings are not available, we have used S&P® ratings. |
Semiannual Report
Investments February 28, 2005 (Unaudited)
Showing Percentage of Net Assets
Municipal Bonds - 98.5% |
| Principal
Amount | | Value
(Note 1) |
Maryland - 85.5% |
Anne Arundel County Gen. Oblig. 5.375% 3/1/15 | | $2,000,000 | | $2,223,000 |
Baltimore Board of School Commissioners School Sys. Rev. 5% 5/1/11 | | 2,545,000 | | 2,784,306 |
Baltimore County Ctfs. Prtn. (Equip. Acquisition Prog.) 5% 6/1/13 (MBIA Insured) | | 1,500,000 | | 1,650,825 |
Baltimore County Gen. Oblig.: | | | | |
5% 8/1/15 | | 2,385,000 | | 2,633,422 |
5.25% 9/1/11 | | 2,000,000 | | 2,230,020 |
5.25% 8/1/19 (Pre-Refunded to 8/1/12 @ 100) (c) | | 2,000,000 | | 2,243,320 |
Baltimore Gen. Oblig. (Consolidated Pub. Impt. Proj.) Series A: | | | | |
0% 10/15/06 (FGIC Insured) | | 2,000,000 | | 1,852,680 |
7% 10/15/09 (MBIA Insured) | | 1,000,000 | | 1,169,800 |
Baltimore Port Facilities Rev. (Consolidated Coal Sales Co. Proj.) 6.5% 12/1/10 | | 2,000,000 | | 2,074,000 |
Baltimore Proj. Rev.: | | | | |
(Wastewtr. Projs.) Series A: | | | | |
5.125% 7/1/42 (FGIC Insured) | | 2,315,000 | | 2,416,073 |
5.2% 7/1/32 (FGIC Insured) | | 250,000 | | 265,938 |
(Wtr. Projs.) Series A: | | | | |
5% 7/1/24 (Escrowed to Maturity) (c) | | 730,000 | | 801,504 |
5% 7/1/24 (FGIC Insured) | | 370,000 | | 408,376 |
Carroll County Gen. Oblig. 5% 11/1/11 | | 500,000 | | 548,865 |
Howard County Gen. Oblig.: | | | | |
Series 2003 A, 5% 8/15/17 (Pre-Refunded to 8/15/12 @ 100) (c) | | 1,000,000 | | 1,105,890 |
Series 2004 A, 5% 8/15/14 | | 1,000,000 | | 1,111,290 |
Series A: | | | | |
5.25% 8/15/14 | | 2,395,000 | | 2,649,996 |
5.25% 8/15/14 (Pre-Refunded to 2/15/12 @ 100) (c) | | 605,000 | | 676,529 |
Maryland Cmnty. Dev. Administration Dept. of Hsg. & Cmnty. Dev. (Residential Proj.) Series B, 5.05% 9/1/19 (b) | | 200,000 | | 201,886 |
Maryland Dept. of Trans. Consolidated Trans. Rev. 5% 11/1/10 | | 3,000,000 | | 3,275,820 |
Maryland Econ. Dev. Corp. Lease Rev. (Maryland Aviation Administration Facilities Proj.) 5.5% 6/1/18 (FSA Insured) (b) | | 1,500,000 | | 1,642,260 |
Maryland Gen. Oblig. (State & Local Facilities Ln. Prog.): | | | | |
First Series, 5.75% 8/1/14 (Pre-Refunded to 8/1/10 @ 101) (c) | | 5,000,000 | | 5,692,198 |
Municipal Bonds - continued |
| Principal
Amount | | Value
(Note 1) |
Maryland - continued |
Maryland Gen. Oblig. (State & Local Facilities Ln. Prog.): - continued | | | | |
Second Series: | | | | |
5% 7/15/11 | | $1,500,000 | | $1,616,415 |
5.25% 7/15/12 | | 2,000,000 | | 2,173,860 |
5.25% 7/15/13 | | 1,500,000 | | 1,627,365 |
Maryland Health & Higher Edl. Facilities Auth. Rev.: | | | | |
(Anne Arundel Med. Ctr. Proj.) Series 1998, 5.125% 7/1/33 (FSA Insured) | | 2,000,000 | | 2,066,640 |
(Good Samaritan Hosp. Proj.): | | | | |
5.7% 7/1/09 (Escrowed to Maturity) (c) | | 1,000,000 | | 1,085,880 |
5.75% 7/1/13 (Escrowed to Maturity) (c) | | 240,000 | | 271,898 |
5.75% 7/1/13 (Escrowed to Maturity) (c) | | 145,000 | | 164,272 |
(Hebrew Home of Greater Washington Proj.) 5.8% 1/1/32 | | 1,000,000 | | 1,055,180 |
(Helix Health Proj.) 5% 7/1/17 (Escrowed to Maturity) (c) | | 1,000,000 | | 1,096,680 |
(Howard County Gen. Hosp. Proj.) 5.5% 7/1/13 (Escrowed to Maturity) (c) | | 925,000 | | 968,632 |
(Johns Hopkins Health Sys. Proj.) 5% 5/15/34 | | 1,500,000 | | 1,531,950 |
(Johns Hopkins Univ. Issue Proj.): | | | | |
Series A: | | | | |
5% 7/1/38 | | 2,000,000 | | 2,080,000 |
5% 7/1/41 | | 3,590,000 | | 3,697,628 |
5% 7/1/32 | | 1,000,000 | | 1,037,180 |
5.125% 7/1/20 | | 500,000 | | 532,080 |
6% 7/1/10 | | 500,000 | | 568,575 |
(LifeBridge Health Proj.) Series 2004 A, 5% 7/1/11 | | 1,000,000 | | 1,070,950 |
(Loyola College Issue Proj.) 5% 10/1/39 | | 2,000,000 | | 2,041,840 |
(North Arundel Hosp. Proj.) 6.5% 7/1/31 | | 1,320,000 | | 1,501,830 |
(Univ. of Maryland Med. Sys. Proj.): | | | | |
5.25% 7/1/34 | | 1,000,000 | | 1,026,980 |
6.75% 7/1/30 | | 500,000 | | 567,860 |
Maryland Indl. Dev. Fing. Auth. Rev.: | | | | |
(American Ctr. for Physics Proj.): | | | | |
5.25% 12/15/13 | | 1,100,000 | | 1,208,317 |
5.25% 12/15/15 | | 320,000 | | 349,094 |
(Holy Cross Health Sys. Corp. Proj.) 5.7% 12/1/10 | | 1,000,000 | | 1,120,150 |
Maryland Trans. Auth. Rev. (Trans. Facilities Projs.) 6.8% 7/1/16 (Escrowed to Maturity) (c) | | 960,000 | | 1,138,906 |
Municipal Bonds - continued |
| Principal
Amount | | Value
(Note 1) |
Maryland - continued |
Montgomery County Econ. Dev. Rev. (Trinity Health Care Group Proj.) 5.125% 12/1/22 | | $2,300,000 | | $2,415,414 |
Montgomery County Gen. Oblig. Series 2004 A, 5% 4/1/11 | | 3,430,000 | | 3,766,483 |
Morgan State Univ. Academic & Auxiliary Facilities Fees Rev. Series A, 5% 7/1/20 (FGIC Insured) | | 500,000 | | 533,265 |
Northeast Maryland Waste Disp. Auth. Solid Waste Rev.: | | | | |
(Montgomery County Resource Recovery Proj.) Series A: | | | | |
5.9% 7/1/05 (b) | | 760,000 | | 768,216 |
6% 7/1/07 (b) | | 500,000 | | 529,175 |
5.5% 4/1/12 (AMBAC Insured) (b) | | 1,500,000 | | 1,658,865 |
Prince Georges County Ctfs. of Prtn. Series A, 0% 6/30/11 (MBIA Insured) | | 2,400,000 | | 1,780,104 |
Prince Georges County Gen. Oblig.: | | | | |
Series A, 5% 10/1/19 | | 2,000,000 | | 2,169,660 |
5.5% 5/15/11 (FSA Insured) | | 2,000,000 | | 2,253,140 |
Washington D.C. Metropolitan Area Trans. Auth. Gross Rev. 6% 7/1/10 (FGIC Insured) | | 1,570,000 | | 1,791,119 |
| | 88,923,601 |
Puerto Rico - 13.0% |
Puerto Rico Commonwealth Gen. Oblig. Series 2001 A, 5.5% 7/1/17 (XL Cap. Assurance, Inc. Insured) | | 1,000,000 | | 1,158,550 |
Puerto Rico Commonwealth Hwy. & Trans. Auth. Hwy. Rev. Series Y, 5.5% 7/1/36 (FSA Insured) | | 1,000,000 | | 1,122,890 |
Puerto Rico Commonwealth Infrastructure Fing. Auth. Series 2000 A: | | | | |
5.5% 10/1/32 (Escrowed to Maturity) (c) | | 850,000 | | 930,963 |
5.5% 10/1/40 (Escrowed to Maturity) (c) | | 3,450,000 | | 3,771,299 |
Puerto Rico Elec. Pwr. Auth. Pwr. Rev.: | | | | |
Series 2002 KK, 5.5% 7/1/15 (MBIA Insured) | | 1,000,000 | | 1,157,940 |
Series HH, 5.25% 7/1/29 (FSA Insured) | | 2,200,000 | | 2,371,534 |
Series II, 5.375% 7/1/16 (MBIA Insured) | | 1,500,000 | | 1,682,655 |
Municipal Bonds - continued |
| Principal
Amount | | Value
(Note 1) |
Puerto Rico - continued |
Puerto Rico Elec. Pwr. Auth. Pwr. Rev.: - continued | | | | |
Series QQ: | | | | |
5.5% 7/1/16 (XL Cap. Assurance, Inc. Insured) (a) | | $200,000 | | $229,084 |
5.5% 7/1/17 (XL Cap. Assurance, Inc. Insured) (a) | | 1,000,000 | | 1,147,140 |
| | 13,572,055 |
TOTAL INVESTMENT PORTFOLIO - 98.5% (Cost $98,250,803) | | | 102,495,656 |
NET OTHER ASSETS - 1.5% | | | 1,529,898 |
NET ASSETS - 100% | | $104,025,554 |
Legend |
(a)Security or a portion of the security purchased on a delayed delivery or when-issued basis. |
(b)Private activity obligations whose interest is subject to the federal alternative minimum tax for individuals. |
(c)Security collateralized by an amount sufficient to pay interest and principal. |
Other Information |
The distribution of municipal securities by revenue source, as a percentage of total net assets, is as follows: |
General Obligations | 32.3% |
Escrowed/Pre-Refunded | 19.3% |
Health Care | 11.8% |
Education | 10.1% |
Electric Utilities | 6.3% |
Others* (individually less than 5%) | 20.2% |
| 100.0% |
*Includes net other assets |
See accompanying notes which are an integral part of the financial statements.
Semiannual Report
Financial Statements
Statement of Assets and Liabilities
| February 28, 2005 (Unaudited) |
| | |
Assets | | |
Investment in securities, at value (cost $98,250,803) - See accompanying schedule | | $102,495,656 |
Cash | | 2,511,668 |
Receivable for fund shares sold | | 72,300 |
Interest receivable | | 1,062,655 |
Other receivables | | 9,937 |
Total assets | | 106,152,216 |
| | |
Liabilities | | |
Payable for investments purchased on a delayed delivery basis | $1,391,222 | |
Payable for fund shares redeemed | 590,464 | |
Distributions payable | 96,534 | |
Accrued management fee | 48,386 | |
Other affiliated payables | 56 | |
Total liabilities | | 2,126,662 |
| | |
Net Assets | | $104,025,554 |
Net Assets consist of: | | |
Paid in capital | | $99,442,257 |
Undistributed net investment income | | 3,164 |
Accumulated undistributed net realized gain (loss) on investments | | 335,280 |
Net unrealized appreciation (depreciation) on investments | | 4,244,853 |
Net Assets, for 9,447,426 shares outstanding | | $104,025,554 |
Net Asset Value, offering price and redemption price per share ($104,025,554 ÷ 9,447,426 shares) | | $11.01 |
See accompanying notes which are an integral part of the financial statements.
Semiannual Report
Financial Statements - continued
Statement of Operations
| Six months ended February 28, 2005 (Unaudited) |
| | |
Investment Income | | |
Interest | | $2,153,038 |
| | |
Expenses | | |
Management fee | $279,951 | |
Non-interested trustees' compensation | 289 | |
Miscellaneous | 100 | |
Total expenses before reductions | 280,340 | |
Expense reductions | (18,738) | 261,602 |
Net investment income | | 1,891,436 |
Realized and Unrealized Gain (Loss) Net realized gain (loss) on: | | |
Investment securities | 458,935 | |
Swap agreements | 16,889 | |
Total net realized gain (loss) | | 475,824 |
Change in net unrealized appreciation (depreciation) on: Investment securities | (450,834) | |
Swap agreements | (25,966) | |
Total change in net unrealized appreciation (depreciation) | | (476,800) |
Net gain (loss) | | (976) |
Net increase (decrease) in net assets resulting from operations | | $1,890,460 |
See accompanying notes which are an integral part of the financial statements.
Semiannual Report
Statement of Changes in Net Assets
| Six months ended
February 28, 2005
(Unaudited) | Year ended
August 31,
2004 |
Increase (Decrease) in Net Assets | | |
Operations | | |
Net investment income | $1,891,436 | $3,740,389 |
Net realized gain (loss) | 475,824 | 435,168 |
Change in net unrealized appreciation (depreciation) | (476,800) | 1,622,587 |
Net increase (decrease) in net assets resulting
from operations | 1,890,460 | 5,798,144 |
Distributions to shareholders from net investment income | (1,894,747) | (3,739,941) |
Distributions to shareholders from net realized gain | (297,351) | - |
Total distributions | (2,192,098) | (3,739,941) |
Share transactions
Proceeds from sales of shares | 16,018,046 | 22,593,643 |
Reinvestment of distributions | 1,508,096 | 2,609,274 |
Cost of shares redeemed | (13,066,822) | (20,880,179) |
Net increase (decrease) in net assets resulting from share transactions | 4,459,320 | 4,322,738 |
Redemption fees | 867 | 1,122 |
Total increase (decrease) in net assets | 4,158,549 | 6,382,063 |
| | |
Net Assets | | |
Beginning of period | 99,867,005 | 93,484,942 |
End of period (including undistributed net investment income of $3,164 and undistributed net investment income of $6,475, respectively) | $104,025,554 | $99,867,005 |
Other Information Shares | | |
Sold | 1,446,522 | 2,050,086 |
Issued in reinvestment of distributions | 136,541 | 237,457 |
Redeemed | (1,182,862) | (1,915,093) |
Net increase (decrease) | 400,201 | 372,450 |
See accompanying notes which are an integral part of the financial statements.
Semiannual Report
Financial Highlights
| Six months ended
February 28, 2005 | Years ended August 31, |
| (Unaudited) | 2004 | 2003 | 2002 | 2001 | 2000 |
Selected Per-Share Data | | | | | |
Net asset value, beginning of period | $11.04 | $10.78 | $10.90 | $10.77 | $10.25 | $10.09 |
Income from Investment Operations | | | | | | |
Net investment income D | .205 | .427 | .433 | .444 | .470 | .474 |
Net realized and unrealized gain (loss) | .004 E | .260 | (.120) | .130 | .523 | .161 |
Total from investment operations | .209 | .687 | .313 | .574 | .993 | .635 |
Distributions from net investment income | (.206) | (.427) | (.433) | (.444) | (.473) | (.476) |
Distributions from net realized gain | (.033) | - | - | - | - | - |
Total distributions | (.239) | (.427) | (.433) | (.444) | (.473) | (.476) |
Redemption fees added to paid in capital D | - G | - G | - G | - G | - G | .001 |
Net asset value,
end of period | $11.01 | $11.04 | $10.78 | $10.90 | $10.77 | $10.25 |
Total Return B, C | 1.91% | 6.46% | 2.88% | 5.49% | 9.92% | 6.53% |
Ratios to Average Net Assets F | | | | | |
Expenses before expense reductions | .55% A | .55% | .55% | .55% | .55% | .55% |
Expenses net of voluntary waivers, if any | .55% A | .55% | .55% | .55% | .55% | .55% |
Expenses net of all reductions | .51% A | .53% | .52% | .47% | .40% | .45% |
Net investment income | 3.75% A | 3.89% | 3.94% | 4.15% | 4.48% | 4.76% |
Supplemental Data | | | | | |
Net assets,
end of period
(000 omitted) | $104,026 | $99,867 | $93,485 | $96,839 | $76,256 | $54,595 |
Portfolio turnover rate | 18% A | 14% | 30% | 5% | 11% | 27% |
AAnnualized
BTotal returns for periods of less than one year are not annualized.
CTotal returns would have been lower had certain expenses not been reduced during the periods shown.
DCalculated based on average shares outstanding during the period.
EThe amount shown for a share outstanding does not correspond with the aggregate net gain (loss) on investments for the period due to the timing of sales and repurchases of shares in relation to fluctuating market values of the investments of the fund.
FExpense ratios reflect operating expenses of the fund. Expenses before reductions do not reflect amounts reimbursed by the investment adviser or reductions from brokerage service arrangements or other expense offset arrangements and do not represent the amount paid by the fund during periods when reimbursements or reductions occur. Expenses net of any voluntary waivers reflect expenses after reimbursement by the investment adviser but prior to reductions from brokerage service arrangements or other expense offset arrangements. Expenses net of all reductions represent the net expenses paid by the fund.
GAmount represents less than $.001 per share.
See accompanying notes which are an integral part of the financial statements.
Semiannual Report
Notes to Financial Statements
For the period ended February 28, 2005 (Unaudited)
1. Significant Accounting Policies.
Spartan Maryland Municipal Income Fund (the fund) is a fund of Fidelity Union Street Trust (the trust) and is authorized to issue an unlimited number of shares. The trust is registered under the Investment Company Act of 1940, as amended (the 1940 Act), as an open-end management investment company organized as a Massachusetts business trust. The fund may be affected by economic and political developments in the state of Maryland. The financial statements have been prepared in conformity with accounting principles generally accepted in the United States of America, which require management to make certain estimates and assumptions at the date of the financial statements. The following summarizes the significant accounting policies of the fund:
Security Valuation. Net asset value per share (NAV calculation) is calculated as of the close of business of the New York Stock Exchange, normally 4:00 p.m. Eastern time. Debt securities, including restricted securities, are valued on the basis of information provided by a pricing service. Pricing services use valuation matrices that incorporate both dealer-supplied valuations and valuation models. If prices are not readily available or do not accurately reflect fair value for a security, or if a security's value has been materially affected by events occurring after the close of the exchange or market on which the security is principally traded, that security may be valued by another method that the Board of Trustees believes accurately reflects fair value. A security's valuation may differ depending on the method used for determining value. Price movements in futures contracts and ADRs, market and trading trends, the bid/ask quotes of brokers and off-exchange institutional trading may be reviewed in the course of making a good faith determination of a security's fair value. Short-term securities with remaining maturities of sixty days or less for which quotations are not readily available are valued on the basis of amortized cost. Investments in open-end investment companies are valued at their net asset value each business day.
Investment Transactions and Income. Security transactions are accounted for as of trade date. Gains and losses on securities sold are determined on the basis of identified cost. Interest income is accrued as earned. Interest income includes coupon interest and amortization of premium and accretion of discount on debt securities.
Expenses. Most expenses of the trust can be directly attributed to a fund. Expenses which cannot be directly attributed are apportioned among the funds in the trust.
Income Tax Information and Distributions to Shareholders. Each year, the fund intends to qualify as a regulated investment company by distributing all of its taxable income and realized gains under Subchapter M of the Internal Revenue Code. As a result, no provision for income taxes is required in the accompanying financial statements. Dividends are declared daily and paid monthly from net investment income. Distributions from realized gains, if any, are recorded on the ex-dividend date. Income and
Semiannual Report
Notes to Financial Statements (Unaudited) - continued
1. Significant Accounting Policies - continued
Income Tax Information and Distributions to Shareholders - continued
capital gain distributions are determined in accordance with income tax regulations, which may differ from generally accepted accounting principles. In addition, the fund claimed a portion of the payment made to redeeming shareholders as a distribution for income tax purposes. Capital accounts within the financial statements are adjusted for permanent book-tax differences. These adjustments have no impact on net assets or the results of operations. Temporary book-tax differences will reverse in a subsequent period. Book-tax differences are primarily due to market discount and capital loss carryforwards.
The fund purchases municipal securities whose interest, in the opinion of the issuer, is free from federal income tax. There is no assurance that the Internal Revenue Service (IRS) will agree with this opinion. In the event the IRS determines that the issuer does not comply with relevant tax requirements, interest payments from a security could become federally taxable, possibly retroactively to the date the security was issued.
The federal tax cost of investments and unrealized appreciation (depreciation) as of period end were as follows:
Unrealized appreciation | $4,478,449 | |
Unrealized depreciation | (229,856) | |
Net unrealized appreciation (depreciation) | $4,248,593 | |
Cost for federal income tax purposes | $98,247,063 | |
Short-Term Trading (Redemption) Fees. Shares held in the fund less than 30 days are subject to a redemption fee equal to .50% of the proceeds of the redeemed shares. All redemption fees, including any estimated redemption fees paid by Fidelity Management & Research Company (FMR), are retained by the fund and accounted for as an addition to paid in capital.
2. Operating Policies.
Delayed Delivery Transactions and When-Issued Securities. The fund may purchase or sell securities on a delayed delivery or when-issued basis. Payment and delivery may take place after the customary settlement period for that security. The price of the underlying securities and the date when the securities will be delivered and paid for are fixed at the time the transaction is negotiated. During the time a delayed delivery sell is outstanding, the contract is marked-to-market daily and equivalent deliverable securities are held for the transaction. The value of the securities purchased on a delayed delivery or when-issued basis are identified as such in the fund's Schedule of Investments. The fund may receive compensation for interest forgone in the purchase of
Semiannual Report
2. Operating Policies - continued
Delayed Delivery Transactions and When-Issued Securities - continued
a delayed delivery or when-issued security. With respect to purchase commitments, the fund identifies securities as segregated in its records with a value at least equal to the amount of the commitment. Losses may arise due to changes in the value of the underlying securities or if the counterparty does not perform under the contract's terms, or if the issuer does not issue the securities due to political, economic, or other factors.
Swap Agreements. The fund may invest in swaps for the purpose of managing its exposure to interest rate, credit or market risk.
Interest rate swaps are agreements to exchange cash flows periodically based on a notional principal amount, for example, the exchange of fixed rate interest payments for floating rate interest payments. Periodic payments received or made by the fund are recorded in the accompanying Statement of Operations as realized gains or losses, respectively. The primary risk associated with interest rate swaps is that unfavorable changes in the fluctuation of interest rates could adversely impact the fund.
Swaps are marked-to-market daily based on dealer-supplied valuations and changes in value are recorded as unrealized appreciation (depreciation). Gains or losses are realized upon early termination of the swap agreement. Collateral, in the form of cash or securities, may be required to be held in segregated accounts with the fund's custodian in compliance with swap contracts.
3. Purchases and Sales of Investments.
Purchases and sales of securities, other than short-term securities and U.S. government securities, aggregated $15,402,420 and $8,805,144, respectively.
4. Fees and Other Transactions with Affiliates.
Management Fee. FMR and its affiliates provide the fund with investment management related services for which the fund pays a monthly management fee that is based on an annual rate of .55% of the fund's average net assets. FMR pays all other expenses, except the compensation of the non-interested Trustees and certain exceptions such as interest expense. The management fee paid to FMR by the fund is reduced by an amount equal to the fees and expenses paid by the fund to the non-interested Trustees.
5. Committed Line of Credit.
The fund participates with other funds managed by FMR in a $4.2 billion credit facility (the "line of credit") to be utilized for temporary or emergency purposes to fund shareholder redemptions or for other short-term liquidity purposes. The fund has agreed to
Semiannual Report
Notes to Financial Statements (Unaudited) - continued
5. Committed Line of Credit - continued
pay commitment fees on its pro rata portion of the line of credit, which is included in Miscellaneous Expense on the Statement of Operations. During the period, there were no borrowings on this line of credit.
6. Expense Reductions.
Through arrangements with the fund's custodian and transfer agent, credits realized as a result of uninvested cash balances were used to reduce the fund's management fee. During the period, these credits reduced the fund's management fee by $18,738.
7. Other.
The fund's organizational documents provide former and current trustees and officers with a limited indemnification against liabilities arising in connection with the performance of their duties to the fund. In the normal course of business, the fund may also enter into contracts that provide general indemnifications. The fund's maximum exposure under these arrangements is unknown as this would be dependent on future claims that may be made against the fund. The risk of material loss from such claims is considered remote.
Semiannual Report
Proxy Voting Results
A special meeting of the fund's shareholders was held on February 16, 2005. The results of votes taken among shareholders on proposals before them are reported below. Each vote reported represents one dollar of net asset value held on the record date for the meeting.
PROPOSAL 1 |
To amend the Declaration of Trust to allow the Board of Trustees, if permitted by applicable law, to authorize fund mergers without shareholder approval. A |
| # of
Votes | % of
Votes |
Affirmative | 742,440,496.15 | 73.879 |
Against | 196,006,999.93 | 19.504 |
Abstain | 33,719,201.65 | 3.356 |
Broker
Non-Votes | 32,776,930.05 | 3.261 |
TOTAL | 1,004,943,627.78 | 100.000 |
PROPOSAL 2 |
To elect a Board of Trustees. A |
| # of
Votes | % of
Votes |
Laura B. Cronin |
Affirmative | 948,588,595.83 | 94.392 |
Withheld | 56,355,031.95 | 5.608 |
TOTAL | 1,004,943,627.78 | 100.000 |
Dennis J. Dirks |
Affirmative | 950,698,349.04 | 94.602 |
Withheld | 54,245,278.74 | 5.398 |
TOTAL | 1,004,943,627.78 | 100.000 |
Robert M. Gates |
Affirmative | 947,567,913.72 | 94.291 |
Withheld | 57,375,714.06 | 5.709 |
TOTAL | 1,004,943,627.78 | 100.000 |
George H. Heilmeier |
Affirmative | 948,147,248.47 | 94.348 |
Withheld | 56,796,379.31 | 5.652 |
TOTAL | 1,004,943,627.78 | 100.000 |
| # of
Votes | % of
Votes |
Abigail P. Johnson |
Affirmative | 944,190,223.14 | 93.955 |
Withheld | 60,753,404.64 | 6.045 |
TOTAL | 1,004,943,627.78 | 100.000 |
Edward C. Johnson 3d |
Affirmative | 943,213,044.14 | 93.857 |
Withheld | 61,730,583.64 | 6.143 |
TOTAL | 1,004,943,627.78 | 100.000 |
Marie L. Knowles |
Affirmative | 949,452,954.58 | 94.478 |
Withheld | 55,490,673.20 | 5.522 |
TOTAL | 1,004,943,627.78 | 100.000 |
Ned C. Lautenbach |
Affirmative | 948,794,328.18 | 94.413 |
Withheld | 56,149,299.60 | 5.587 |
TOTAL | 1,004,943,627.78 | 100.000 |
Marvin L. Mann |
Affirmative | 946,649,510.40 | 94.199 |
Withheld | 58,294,117.38 | 5.801 |
TOTAL | 1,004,943,627.78 | 100.000 |
William O. McCoy |
Affirmative | 945,952,663.12 | 94.130 |
Withheld | 58,990,964.66 | 5.870 |
TOTAL | 1,004,943,627.78 | 100.000 |
Robert L. Reynolds |
Affirmative | 948,326,458.64 | 94.366 |
Withheld | 56,617,169.14 | 5.634 |
TOTAL | 1,004,943,627.78 | 100.000 |
Cornelia M. Small |
Affirmative | 949,307,587.45 | 94.464 |
Withheld | 55,636,040.33 | 5.536 |
TOTAL | 1,004,943,627.78 | 100.000 |
| # of
Votes | % of
Votes |
William S. Stavropoulos |
Affirmative | 947,525,611.83 | 94.286 |
Withheld | 57,418,015.95 | 5.714 |
TOTAL | 1,004,943,627.78 | 100.000 |
Kenneth L. Wolfe |
Affirmative | 949,176,424.38 | 94.451 |
Withheld | 55,767,203.40 | 5.549 |
TOTAL | 1,004,943,627.78 | 100.000 |
ADenotes trust-wide proposals and voting results. |
Semiannual Report
Managing Your Investments
Fidelity offers several ways to conveniently manage your personal investments via your telephone or PC. You can access your account information, conduct trades and research your investments 24 hours a day.
By Phone
Fidelity Automated Service Telephone provides a single toll-free number to access account balances, positions, quotes and trading. It's easy to navigate the service, and on your first call, the system will help you create a personal identification number (PIN) for security.
(phone_graphic)
Fidelity Automated
Service Telephone (FAST®)
1-800-544-5555
Press
1 For mutual fund and brokerage trading.
2 For quotes.*
3 For account balances and holdings.
4 To review orders and mutual
fund activity.
5 To change your PIN.
*0 To speak to a Fidelity representative.
By PC
Fidelity's web site on the Internet provides a wide range of information, including daily financial news, fund performance, interactive planning tools and news about Fidelity products and services.
(computer_graphic)
Fidelity's Web Site
www.fidelity.com
* When you call the quotes line, please remember that a fund's yield and return will vary and, except for money market funds, share price will also vary. This means that you may have a gain or loss when you sell your shares. There is no assurance that money market funds will be able to maintain a stable $1 share price; an investment in a money market fund is not insured or guaranteed by the U.S. government. Total returns are historical and include changes in share price, reinvestment of dividends and capital gains, and the effects of any sales charges.
Semiannual Report
Investment Adviser
Fidelity Management & Research Company
Boston, MA
Investment Sub-Adviser
Fidelity Investments
Money Management, Inc.
Fidelity International
Investment Advisors
Fidelity International Investment
Advisors (U.K.) Limited
General Distributor
Fidelity Distributors Corporation
Boston, MA
Transfer and Shareholder
Servicing Agents
Citibank, N.A.
New York, NY
and
Fidelity Service Company, Inc.
Boston, MA
Custodian
Citibank, N.A.
New York, NY
The Fidelity Telephone Connection
Mutual Fund 24-Hour Service
Exchanges/Redemptions
and Account Assistance1-800-544-6666
Product Information1-800-544-6666
Retirement Accounts1-800-544-4774 (8 a.m. - 9 p.m.)
TDD Service1-800-544-0118
for the deaf and hearing impaired
(9 a.m. - 9 p.m. Eastern time)
Fidelity Automated Service
Telephone (FAST®) (automated graphic) 1-800-544-5555
(automated graphic) Automated line for quickest service
(Fidelity Investment logo)(registered trademark)
Corporate Headquarters
82 Devonshire St., Boston, MA 02109
www.fidelity.com
SMD-USAN-0405
1.790944.101
Item 2. Code of Ethics
Not applicable.
Item 3. Audit Committee Financial Expert
Not applicable.
Item 4. Principal Accountant Fees and Services
Not applicable.
Item 5. Audit Committee of Listed Registrants
Not applicable.
Item 6. Schedule of Investments
Not applicable.
Item 7. Disclosure of Proxy Voting Policies and Procedures for Closed-End Management Investment Companies
Not applicable.
Item 8. Portfolio Managers of Closed-End Management Investment Companies
Not applicable.
Item 9. Purchase of Equity Securities by Closed-End Management Investment Company and Affiliated Purchasers
Not applicable.
Item 10. Submission of Matters to a Vote of Security Holders
There were no material changes to the procedures by which shareholders may recommend nominees to the Fidelity Union Street Trust's Board of Trustees.
Item 11. Controls and Procedures
(a)(i) The President and Treasurer and the Chief Financial Officer have concluded that the Fidelity Union Street Trust's (the "Trust") disclosure controls and procedures (as defined in Rule 30a-3(c) under the Investment Company Act) provide reasonable assurances that material information relating to the Trust is made known to them by the appropriate persons, based on their evaluation of these controls and procedures as of a date within 90 days of the filing date of this report.
(a)(ii) There was no change in the Trust's internal control over financial reporting (as defined in Rule 30a-3(d) under the Investment Company Act) that occurred during the second fiscal quarter of the period covered by this report that has materially affected, or is reasonably likely to materially affect, the Trust's internal control over financial reporting.
Item 12. Exhibits
(a) | (1) | Not applicable. |
(a) | (2) | Certification pursuant to Rule 30a-2(a) under the Investment Company Act of 1940 (17 CFR 270.30a-2(a)) is filed and attached hereto as Exhibit 99.CERT. |
(a) | (3) | Not applicable. |
(b) | | Certification pursuant to Rule 30a-2(b) under the Investment Company Act of 1940 (17 CFR 270.30a-2(b)) is furnished and attached hereto as Exhibit 99.906CERT. |
SIGNATURES
Pursuant to the requirements of the Securities Exchange Act of 1934 and the Investment Company Act of 1940, the registrant has duly caused this report to be signed on its behalf by the undersigned, thereunto duly authorized.
Fidelity Union Street Trust
By: | /s/Christine Reynolds
Christine Reynolds
President and Treasurer |
| |
Date: | April 19, 2005 |
Pursuant to the requirements of the Securities Exchange Act of 1934 and the Investment Company Act of 1940, this report has been signed below by the following persons on behalf of the registrant and in the capacities and on the dates indicated.
By: | /s/Christine Reynolds
Christine Reynolds
President and Treasurer |
| |
Date: | April 19, 2005 |
By: | /s/Timothy F. Hayes
Timothy F. Hayes
Chief Financial Officer |
| |
Date: | April 19, 2005 |