UNITED STATES
SECURITIES AND EXCHANGE COMMISSION
Washington, D.C. 20549
FORM N-CSR
CERTIFIED SHAREHOLDER REPORT OF REGISTERED
MANAGEMENT INVESTMENT COMPANIES
Investment Company Act file number 811-2460
Fidelity Union Street Trust
(Exact name of registrant as specified in charter)
82 Devonshire St., Boston, Massachusetts 02109
(Address of principal executive offices) (Zip code)
Eric D. Roiter, Secretary
82 Devonshire St.
Boston, Massachusetts 02109
(Name and address of agent for service)
Registrant's telephone number, including area code: 617-563-7000
Date of fiscal year end: | August 31 |
| |
Date of reporting period: | February 28, 2006 |
Item 1. Reports to Stockholders
| | Fidelity®
Arizona Municipal
Income Fund
and
Fidelity
Arizona Municipal
Money Market Fund
|
| | Semiannual Report
February 28, 2006
|


| Contents | | | | |
| |
| Chairman’s Message | | 3 | | Ned Johnson’s message to shareholders. |
| Shareholder Expense | | 4 | | An example of shareholder expenses. |
| Example | | | | |
| Fidelity Arizona Municipal Income Fund |
| Investment Changes | | 6 | | A summary of major shifts in the fund’s |
| | | | | investments over the past six months. |
| Investments | | 7 | | A complete list of the fund’s investments |
| | | | | with their market values. |
| Financial Statements | | 12 | | Statements of assets and liabilities, |
| | | | | operations, and changes in net assets, |
| | | | | as well as financial highlights. |
| Fidelity Arizona Municipal Money Market Fund |
| Investment Changes | | 16 | | A summary of major shifts in the fund’s |
| | | | | investments over the past six months and |
| | | | | one year. |
| Investments | | 17 | | A complete list of the fund’s investments. |
| Financial Statements | | 23 | | Statements of assets and liabilities, |
| | | | | operations, and changes in net assets, |
| | | | | as well as financial highlights. |
| Notes | | 27 | | Notes to the financial statements. |
| Board Approval of | | 31 | | |
| Investment Advisory | | | | |
| Contracts and | | | | |
| Management Fees | | | | |
To view a fund’s proxy voting guidelines and proxy voting record for the 12 month period
ended June 30, visit www.fidelity.com/proxyvotingresults or visit the Securities and Exchange
Commission’s (SEC) web site at www.sec.gov. You may also call 1-800-544-8544 to request a free
copy of the proxy voting guidelines.
Standard & Poor’s, S&P and S&P 500 are registered service marks of The McGraw Hill Companies, Inc.
and have been licensed for use by Fidelity Distributors Corporation.
Other third party marks appearing herein are the property of their respective owners.
All other marks appearing herein are registered or unregistered trademarks or service marks
of FMR Corp. or an affiliated company.
|
| | This report and the financial statements contained herein are submitted for the general in-
formation of the shareholders of the funds. This report is not authorized for distribution to
prospective investors in the funds unless preceded or accompanied by an effective prospectus.
A fund files its complete schedule of portfolio holdings with the SEC for the first and third
quarters of each fiscal year on Form N Q. Forms N Q are available on the SEC’s web site at
http://www.sec.gov. A fund’s Forms N Q may be reviewed and copied at the SEC’s Public Refer
ence Room in Washington, DC. Information regarding the operation of the SEC’s Public Reference
Room may be obtained by calling 1-800-SEC-0330. For a complete list of a fund’s portfolio
holdings, view the most recent quarterly holdings report, semiannual report, or annual report
on Fidelity’s web site at http://www.fidelity.com/holdings.
NOT FDIC INSURED · MAY LOSE VALUE · NO BANK GUARANTEE
Neither the funds nor Fidelity Distributors Corporation is a bank.
|
Semiannual Report 2
Chairman’s Message
(photograph of Edward C. Johnson 3d)
Dear Shareholder:
Although many securities markets made gains in early 2006, there is only one certainty when it comes to investing: There is no sure thing. There are, however, a number of time tested, fundamental investment principles that can put the historical odds in your favor.
One of the basic tenets is to invest for the long term. Over time, riding out the markets’ inevitable ups and downs has proven much more effective than selling into panic or chasing the hottest trend. Even missing only a few of the markets’ best days can significantly diminish investor returns. Patience also affords the benefits of compounding of earning interest on additional income or reinvested dividends and capital gains. There are tax advantages and cost benefits to consider as well. The more you sell, the more taxes you pay, and the more you trade, the higher the costs. While staying the course doesn’t eliminate risk, it can considerably lessen the effect of short term declines.
You can further manage your investing risk through diversification. And today, more than ever, geographic diversifica tion should be taken into account. Studies indicate that asset allocation is the single most important determinant of a portfolio’s long term success. The right mix of stocks, bonds and cash aligned to your particular risk tolerance and investment objective is very important. Age appropriate rebalancing is also an essential aspect of asset allocation. For younger investors, an emphasis on equities which historically have been the best performing asset class over time is encouraged. As investors near their specific goal, such as retirement or sending a child to college, consideration may be given to replacing volatile assets (e.g. common stocks) with more stable fixed investments (bonds or savings plans).
A third investment principle investing regularly can help lower the average cost of your purchases. Investing a certain amount of money each month or quarter helps ensure you won’t pay for all your shares at market highs. This strategy known as dollar cost averaging also reduces unconstructive “emotion” from investing, helping shareholders avoid selling weak performers just prior to an upswing, or chasing a hot performer just before a correction.
We invite you to contact us via the Internet, through our Investor Centers or over the phone. It is our privilege to provide you the information you need to make the investments that are right for you.
Sincerely,
/s/ Edward C. Johnson 3d
Edward C. Johnson 3d
3 Semiannual Report
Shareholder Expense Example
As a shareholder of a Fund, you incur two types of costs: (1) transaction costs, including redemption fees, and (2) ongoing costs, including management fees and other Fund expenses. This Example is intended to help you understand your ongoing costs (in dollars) of investing in the Funds and to compare these costs with the ongoing costs of investing in other mutual funds.
The Example is based on an investment of $1,000 invested at the beginning of the period and held for the entire period (September 1, 2005 to February 28, 2006).
The first line of the table below for each fund provides information about actual account values and actual expenses. You may use the information in this line, together with the amount you invested, to estimate the expenses that you paid over the period. Simply divide your account value by $1,000.00 (for example, an $8,600 account value divided by $1,000.00 = 8.6), then multiply the result by the number in the first line for a fund under the heading entitled “Expenses Paid During Period” to estimate the expenses you paid on your account during this period. A small balance maintenance fee of $12.00 that is charged once a year may apply for certain accounts with a value of less than $2,000. This fee is not included in the table below. If it was, the estimate of expenses you paid during the period would be higher, and your ending account value lower, by this amount.
Hypothetical Example for Comparison Purposes
The second line of the table below for each fund provides information about hypothetical account values and hypothetical expenses based on a fund’s actual expense ratio and an assumed rate of return of 5% per year before expenses, which is not the Fund’s actual return. The hypothetical account values and expenses may not be used to estimate the actual ending account balance or expenses you paid for the period. You may use this information to compare the ongoing costs of investing in the Fund and other funds. To do so, compare this 5% hypothetical example with the 5% hypothetical examples that appear in the shareholder reports of the other funds. A small balance maintenance fee of $12.00 that is charged once a year may apply for certain accounts with a value of less than $2,000. This fee is not included in the table below. If it was, the estimate of expenses you paid during the period would be higher, and your ending account value lower, by this amount. Please note that the expenses shown in the table are meant to highlight your ongoing costs only and do not reflect any transaction costs. Therefore, the second line of the table is useful in comparing ongoing costs only, and will not help you determine the relative total costs of owning different funds. In addition, if these transactional costs were included, your costs would have been higher.
| | | | | | | | | | | Expenses Paid |
| | | Beginning | | Ending | | During Period* |
| | | Account Value | | Account Value | | September 1, 2005 |
| | | September 1, 2005 | | February 28, 2006 | | to February 28, 2006 |
| Fidelity Arizona Municipal | | | | | | | | | | | | |
| Income Fund | | | | | | | | | | | | |
| Actual | | $ | | 1,000.00 | | $ | | 1,006.00 | | $ | | 2.74 |
| HypotheticalA | | $ | | 1,000.00 | | $ | | 1,022.07 | | $ | | 2.76 |
| Fidelity Arizona Municipal | | | | | | | | | | | | |
| Money Market Fund | | | | | | | | | | | | |
| Actual | | $ | | 1,000.00 | | $ | | 1,012.20 | | $ | | 2.49 |
| HypotheticalA | | $ | | 1,000.00 | | $ | | 1,022.32 | | $ | | 2.51 |
A 5% return per year before expenses | | | | | | | | |
* Expenses are equal to each Fund’s annualized expense ratio (shown in the table below); multiplied by the average account value over the period, multiplied by 181/365 (to reflect the one half year period).
| | | Annualized |
| | | Expense Ratio |
| Fidelity Arizona Municipal Income Fund | | 55% |
| Fidelity Arizona Municipal Money Market Fund | | 50% |
| Fidelity Arizona Municipal Income Fund | | | | |
| Investment Changes | | | | |
| |
| Top Five Sectors as of February 28, 2006 | | | | |
| | | % of fund’s | | % of fund’s net assets |
| | | net assets | | 6 months ago |
| Water & Sewer | | 20.9 | | 17.8 |
| Special Tax | | 19.2 | | 20.0 |
| General Obligations | | 18.9 | | 21.3 |
| Escrowed/Pre Refunded | | 11.9 | | 15.5 |
| Electric Utilities | | 8.8 | | 10.5 |
Average Years to Maturity as of February 28, 2006 | | | | |
| | | | | 6 months ago |
| Years | | 13.5 | | 13.4 |
Average years to maturity is based on the average time remaining to the stated maturity date of each bond, weighted by the market value of each bond.
| Duration as of February 28, 2006 | | | | |
| | | | | | | 6 months ago |
| Years | | | | 6.7 | | 6.8 |
Duration shows how much a bond fund’s price fluctuates with changes in comparable interest rates. If rates rise 1%, for example, a fund with a five year duration is likely to lose about 5% of its value. Other factors also can influence a bond fund’s performance and share price. Accordingly, a bond fund’s actual performance may differ from this example.

We have used ratings from Moody’s® Investors Services, Inc. Where Moody’s ratings are not available, we have used S&P® ratings.
Semiannual Report 6
| Fidelity Arizona Municipal Income Fund | | | | |
| |
| Investments February 28, 2006 (Unaudited) |
| Showing Percentage of Net Assets | | | | |
| |
| Municipal Bonds 96.9% | | | | |
| | | Principal | | Value (Note 1) |
| | | Amount | | |
| Arizona – 88.3% | | | | |
| Arizona Health Facilities Auth. Rev. (Catholic Health Care West | | | | |
| Proj.): | | | | |
| Series A, 6.125% 7/1/09 | | $ 245,000 | | $ 255,381 |
| 6.125% 7/1/09 (c) | | 210,000 | | 218,898 |
| Arizona School Facilities Board Ctfs. of Prtn.: | | | | |
| Series A2, 5% 9/1/18 (FGIC Insured) | | 1,000,000 | | 1,074,260 |
| Series B, 5.25% 9/1/19 (Pre-Refunded to 9/1/14 @ | | | | |
| 100) (c) | | 1,000,000 | | 1,107,490 |
| Series C, 5% 9/1/11 (FSA Insured) | | 1,060,000 | | 1,131,751 |
| Arizona School Facilities Board State School Impt. Rev.: | | | | |
| 5.25% 7/1/18 (Pre-Refunded to 7/1/12 @ 100) (c) | | 1,000,000 | | 1,089,030 |
| 5.25% 7/1/20 (Pre-Refunded to 7/1/12 @ 100) (c) | | 1,000,000 | | 1,089,030 |
| Arizona State Univ. Revs.: | | | | |
| 5% 7/1/26 (AMBAC Insured) | | 1,000,000 | | 1,061,160 |
| 5.75% 7/1/27 (Pre-Refunded to 7/1/12 @ 100) (c) | | 1,500,000 | | 1,675,560 |
| Arizona Student Ln. Acquisition Auth. Student Ln. Rev. | | | | |
| Subseries B1, 6.15% 5/1/29 (b) | | 500,000 | | 531,130 |
| Arizona Trans. Board Hwy. Rev.: | | | | |
| Series B, 5.25% 7/1/19 | | 2,500,000 | | 2,709,375 |
| 5.25% 7/1/13 | | 1,500,000 | | 1,614,420 |
| Arizona Wtr. Infrastructure Fin. Auth. Rev. (Wtr. Quality Proj.) | | | | |
| Series A, 5.375% 10/1/11 | | 2,000,000 | | 2,180,000 |
| Central Arizona Wtr. Conservation District Contract Rev. | | | | |
| (Central Arizona Proj.) Series A, 5.5% 11/1/09 | | 1,000,000 | | 1,064,580 |
| Chandler Gen. Oblig.: | | | | |
| 5.7% 7/1/15 | | 75,000 | | 82,183 |
| 6.5% 7/1/10 (MBIA Insured) | | 200,000 | | 223,890 |
| 6.5% 7/1/11 (MBIA Insured) | | 225,000 | | 256,597 |
| Chandler Indl. Dev. Auth. Indl. Dev. Rev. (Intel Corp. Proj.) | | | | |
| 4.375%, tender 12/1/10 (a)(b) | | 1,000,000 | | 1,019,910 |
| Cottonwood Wtr. Sys. Rev.: | | | | |
| 5% 7/1/30 (XL Cap. Assurance, Inc. Insured) | | 825,000 | | 865,681 |
| 5% 7/1/35 (XL Cap. Assurance, Inc. Insured) | | 1,300,000 | | 1,358,604 |
| Downtown Phoenix Hotel Corp. Rev. Series A, 5.25% 7/1/23 | | | | |
| (FGIC Insured) | | 1,750,000 | | 1,903,965 |
| Gilbert Wtr. Resources Muni. Property Corp. Wastewtr. Sys. & | | | | |
| Util. Rev. 4.9% 4/1/19 | | 1,025,000 | | 1,033,323 |
| Glendale Indl. Dev. Auth. Hosp. Rev. (John C. Lincoln Health | | | | |
| Network Proj.): | | | | |
| Series 2005 B, 5.25% 12/1/19 | | 1,040,000 | | 1,090,034 |
| 5% 12/1/35 | | 1,000,000 | | 1,007,600 |
| |
| |
| See accompanying notes which are an integral part of the financial statements. | | |
| |
| 7 | | Semiannual Report |
| Fidelity Arizona Municipal Income Fund | | | | | | |
| Investments (Unaudited) continued | | | | | | |
| |
| Municipal Bonds continued | | | | | | |
| | | | | Principal | | Value (Note 1) |
| | | | | Amount | | |
| Arizona – continued | | | | | | |
| Maricopa County Hosp. Rev. (Sun Health Corp. Proj.): | | | | | | |
| 5% 4/1/14 | | | | $ 1,000,000 | | $ 1,043,150 |
| 6.125% 4/1/18 | | | | 85,000 | | 88,863 |
| 6.125% 4/1/18 (Pre-Refunded to 4/1/07 @ 102) (c) | | | | 215,000 | | 225,124 |
| Maricopa County Indl. Dev. Auth. Health Facilities Rev. | | | | | | |
| (Catholic Health Care West Proj.): | | | | | | |
| 5% 7/1/16 | | | | 680,000 | | 698,686 |
| 5% 7/1/16 (Pre-Refunded to 7/1/07 @ 100) (c) | | | | 50,000 | | 51,686 |
| Maricopa County Indl. Dev. Auth. Hosp. Facilities Rev. (Mayo | | | | | | |
| Clinic Hosp. Proj.) 5.25% 11/15/37 | | | | 1,000,000 | | 1,043,360 |
| Maricopa County School District #28 Kyrene Elementary | | | | | | |
| Series C, 0% 1/1/10 (FGIC Insured) | | | | 1,425,000 | | 1,234,706 |
| Maricopa County Unified School District #48 Scottsdale: | | | | | | |
| Series A, 5% 7/1/18 (FGIC Insured) | | | | 1,000,000 | | 1,081,210 |
| 7.4% 7/1/10 | | | | 1,000,000 | | 1,150,090 |
| Maricopa County Unified School District #80 Chandler (2002 | | | | | | |
| Proj.) Series A, 5% 7/1/17 (FSA Insured) | | | | 500,000 | | 534,410 |
| Mesa Indl. Dev. Auth. Rev. (Discovery Health Sys. Proj.) | | | | | | |
| Series A, 5.625% 1/1/29 (Pre-Refunded to 1/1/10 @ | | | | | | |
| 101) (c) | | | | 795,000 | | 859,570 |
| Mesa Street & Hwy. Rev. 6.5% 7/1/11 (FSA Insured) | | | | 1,500,000 | | 1,710,645 |
| Mesa Util. Sys. Rev. 5.75% 7/1/14 (FGIC Insured) | | | | 1,000,000 | | 1,137,270 |
| Northern Arizona Univ. Sys. Rev.: | | | | | | |
| 5.5% 6/1/23 (FGIC Insured) | | | | 530,000 | | 589,265 |
| 5.5% 6/1/26 (FGIC Insured) | | | | 1,305,000 | | 1,448,981 |
| Phoenix Arpt. Rev. Series D, 6.4% 7/1/12 (MBIA Insured) (b) . | | | | 810,000 | | 818,586 |
| Phoenix Civic Impt. Board Arpt. Rev. Series B, 5.25% 7/1/27 | | | | | | |
| (FGIC Insured) (b) | | | | 1,000,000 | | 1,048,690 |
| Phoenix Civic Impt. Corp. Arpt. Excise Tax Rev. 5.25% | | | | | | |
| 7/1/09 (b) | | | | 400,000 | | 416,540 |
| Phoenix Civic Impt. Corp. Excise Tax Rev.: | | | | | | |
| (Civic Plaza Expansion Proj.) Series A, 5% 7/1/30 (FGIC | | | | | | |
| Insured) | | | | 1,000,000 | | 1,057,200 |
| (Muni. Courthouse Proj.) Series A: | | | | | | |
| 5.375% 7/1/29 | | | | 560,000 | | 596,036 |
| 5.5% 7/1/11 | | | | 200,000 | | 214,430 |
| 5.75% 7/1/15 | | | | 675,000 | | 728,737 |
| Phoenix Civic Impt. Corp. Muni. Facilities Excise Tax Rev.: | | | | | | |
| 5.75% 7/1/12 (FGIC Insured) | | | | 1,250,000 | | 1,367,475 |
| 5.75% 7/1/14 (FGIC Insured) | | | | 1,000,000 | | 1,093,960 |
See accompanying notes which are an integral part of the financial statements.
| Municipal Bonds continued | | | | | | |
| | | | | Principal | | Value (Note 1) |
| | | | | Amount | | |
| Arizona – continued | | | | | | |
| Phoenix Civic Impt. Corp. Wastewtr. Sys. Rev. 5% 7/1/29 | | | | | | |
| (MBIA Insured) | | | | $ 770,000 | | $ 809,555 |
| Phoenix Civic Impt. Corp. Wtr. Sys. Rev.: | | | | | | |
| Series 2001, 5.5% 7/1/24 (FGIC Insured) | | | | 1,000,000 | | 1,174,840 |
| 4.75% 7/1/27 (MBIA Insured) | | | | 1,020,000 | | 1,049,376 |
| 5% 7/1/20 (MBIA Insured) | | | | 5,000,000 | | 5,373,696 |
| 5% 7/1/29 (MBIA Insured) | | | | 1,000,000 | | 1,057,200 |
| 5.5% 7/1/17 (FGIC Insured) | | | | 1,500,000 | | 1,650,120 |
| 5.5% 7/1/20 (FGIC Insured) | | | | 1,500,000 | | 1,643,910 |
| Phoenix Gen. Oblig.: | | | | | | |
| Series A, 6.25% 7/1/17 | | | | 1,000,000 | | 1,212,440 |
| Series B, 5.375% 7/1/20 | | | | 1,000,000 | | 1,097,220 |
| Phoenix Indl. Dev. Auth. Single Family Mtg. Rev. 0% 12/1/14 | | | | | | |
| (Escrowed to Maturity) (c) | | | | 1,250,000 | | 875,813 |
| Phoenix Street & Hwy. User Rev. 6.25% 7/1/11 (MBIA | | | | | | |
| Insured) | | | | 35,000 | | 35,056 |
| Pima County Indl. Dev. Auth. Rev. (HealthPartners Proj.) | | | | | | |
| Series A, 5.625% 4/1/14 (MBIA Insured) | | | | 200,000 | | 207,912 |
| Pima County Unified School District #1 Tucson: | | | | | | |
| 7.5% 7/1/08 (FGIC Insured) | | | | 1,000,000 | | 1,088,370 |
| 7.5% 7/1/10 (FGIC Insured) | | | | 250,000 | | 289,275 |
| Pinal County Indl. Dev. Auth. Corr Facilities Contract Rev. | | | | | | |
| (Florence West Prison Expansion, LLC Proj.) Series A, 5.25% | | | | | | |
| 10/1/12 (American Cap. Access Corp. Insured) | | | | 1,000,000 | | 1,063,900 |
| Salt River Proj. Agric. Impt. & Pwr. District Elec. Sys. Rev.: | | | | | | |
| Series 2005 A: | | | | | | |
| 4.75% 1/1/35 | | | | 1,000,000 | | 1,026,020 |
| 5% 1/1/35 | | | | 1,500,000 | | 1,580,895 |
| Series A: | | | | | | |
| 5.25% 1/1/18 | | | | 1,000,000 | | 1,082,590 |
| 5.25% 1/1/19 | | | | 1,615,000 | | 1,744,862 |
| Series B: | | | | | | |
| 5% 1/1/20 | | | | 1,500,000 | | 1,590,615 |
| 5% 1/1/21 | | | | 255,000 | | 270,560 |
| Scottsdale Indl. Dev. Auth. Hosp. Rev. (Scottsdale Health Care | | | | | | |
| Proj.) 5.8% 12/1/31 | | | | 250,000 | | 268,603 |
| Scottsdale Wtr. & Swr. Rev. (1989 Proj.) Series E, 7% 7/1/07 . | | | | 150,000 | | 156,903 |
| Sedona Excise Tax Rev. 5% 7/1/19 (MBIA Insured) | | | | 1,000,000 | | 1,077,970 |
| Tempe Gen. Oblig.: | | | | | | |
| 5% 7/1/19 | | | | 1,680,000 | | 1,794,509 |
See accompanying notes which are an integral part of the financial statements.
9 Semiannual Report
| Fidelity Arizona Municipal Income Fund | | | | | | |
| Investments (Unaudited) continued | | | | | | |
| |
| Municipal Bonds continued | | | | | | |
| | | | | Principal | | Value (Note 1) |
| | | | | Amount | | |
| Arizona – continued | | | | | | |
| Tempe Gen. Oblig.: – continued | | | | | | |
| 5.5% 7/1/17 | | | | $ 1,035,000 | | $ 1,161,115 |
| Tempe Union High School District #213 7% 7/1/08 (FGIC | | | | | | |
| Insured) | | | | 310,000 | | 333,960 |
| Tucson Gen. Oblig.: | | | | | | |
| Series 1995 A, 7.375% 7/1/11 | | | | 1,000,000 | | 1,176,160 |
| Series A, 6% 7/1/13 | | | | 800,000 | | 912,152 |
| 5% 7/1/18 (FGIC Insured) | | | | 3,295,000 | | 3,562,587 |
| Tucson Street & Hwy. User Rev.: | | | | | | |
| Series 1994 B, 7.5% 7/1/11 (MBIA Insured) | | | | 1,015,000 | | 1,203,658 |
| Series 1994 C, 7% 7/1/11 (FGIC Insured) | | | | 500,000 | | 580,925 |
| Series A, 7% 7/1/11 (MBIA Insured) | | | | 300,000 | | 348,555 |
| Tucson Wtr. Rev.: | | | | | | |
| Series A, 5% 7/1/11 (FGIC Insured) | | | | 1,410,000 | | 1,499,225 |
| 5.5% 7/1/14 | | | | 425,000 | | 464,869 |
| Univ. Med. Ctr. Corp. Hosp. Rev. 5.25% 7/1/15 | | | | 1,000,000 | | 1,060,820 |
| Univ. of Arizona Ctfs. of Prtn. Series C, 5% 6/1/14 (AMBAC | | | | | | |
| Insured) | | | | 600,000 | | 643,494 |
| Univ. of Arizona Univ. Revs.: | | | | | | |
| Series 2005 A, 5% 6/1/18 (AMBAC Insured) | | | | 1,000,000 | | 1,080,600 |
| 5.25% 6/1/13 (FSA Insured) | | | | 245,000 | | 253,896 |
| Yavapai County Indl. Dev. Auth. Solid Waste Disp. Rev. (Waste | | | | | | |
| Mgmt., Inc. Proj.) 4%, tender 6/1/10 (a)(b) | | | | 1,000,000 | | 995,320 |
| Yuma County Hosp. District #1 6.35% 11/15/07 (Escrowed to | | | | | | |
| Maturity) (c) | | | | 265,000 | | 268,723 |
| | | | | | | 90,650,791 |
| |
| Guam 0.1% | | | | | | |
| Guam Wtrwks. Auth. Wtr. and Wastewtr. Sys. Rev. 5.875% | | | | | | |
| 7/1/35 | | | | 125,000 | | 132,083 |
| Puerto Rico 8.5% | | | | | | |
| Puerto Rico Commonwealth Hwy. & Trans. Auth. Hwy. Rev.: | | | | | | |
| Series 1996 Y, 5% 7/1/36 (FSA Insured) | | | | 1,100,000 | | 1,166,429 |
| Series Y: | | | | | | |
| 5.5% 7/1/36 (FSA Insured) | | | | 500,000 | | 562,015 |
| 5.5% 7/1/36 (MBIA Insured) | | | | 100,000 | | 112,403 |
| Puerto Rico Commonwealth Hwy. & Trans. Auth. Trans. Rev.: | | | | | | |
| Series 1998, 5.75% 7/1/22 (CIFG North America Insured) | | | | 700,000 | | 778,036 |
| 5.75% 7/1/19 (FGIC Insured) | | | | 700,000 | | 782,278 |
See accompanying notes which are an integral part of the financial statements.
| Municipal Bonds continued | | | | | | |
| | | | | Principal | | Value (Note 1) |
| | | | | Amount | | |
| Puerto Rico continued | | | | | | |
| Puerto Rico Commonwealth Infrastructure Fing. Auth. | | | | | | |
| Series 2000 A: | | | | | | |
| 5.5% 10/1/32 (Escrowed to Maturity) (c) | | | | $ 2,525,000 | | $ 2,735,131 |
| 5.5% 10/1/40 (Escrowed to Maturity) (c) | | | | 1,685,000 | | 1,817,812 |
| Puerto Rico Elec. Pwr. Auth. Pwr. Rev.: | | | | | | |
| Series HH, 5.25% 7/1/29 (FSA Insured) | | | | 200,000 | | 214,820 |
| Series QQ, 5.25% 7/1/14 (XL Cap. Assurance, Inc. Insured) | | | | 500,000 | | 552,820 |
| | | | | | | 8,721,744 |
| |
| |
| TOTAL INVESTMENT PORTFOLIO 96.9% | | | | | | |
| (Cost $97,285,626) | | | | | | 99,504,618 |
| |
| |
| NET OTHER ASSETS – 3.1% | | | | | | 3,160,387 |
| NET ASSETS 100% | | | | | | $ 102,665,005 |
Legend
(a) The coupon rate shown on floating or
adjustable rate securities represents the
rate at period end.
(b) Private activity obligations whose
interest is subject to the federal
alternative minimum tax for individuals.
(c) Security collateralized by an amount
sufficient to pay interest and principal.
|
Other Information
The distribution of municipal securities by revenue source, as a percentage of total net assets, is as follows:
| Water & Sewer | | 20.9% |
| Special Tax | | 19.2% |
| General Obligations | | 18.9% |
| Escrowed/Pre Refunded | | 11.9% |
| Electric Utilities | | 8.8% |
| Health Care | | 6.6% |
| Education | | 5.4% |
| Others* (individually less than 5%) | | 8.3% |
| | | 100.0% |
| *Includes net other assets | | |
See accompanying notes which are an integral part of the financial statements.
11 Semiannual Report
| Fidelity Arizona Municipal Income Fund | | | | |
| Financial Statements | | | | | | |
| |
| Statement of Assets and Liabilities | | | | | | |
| | | | | February 28, 2006 (Unaudited) |
| |
| Assets | | | | | | |
| Investment in securities, at value See accompanying | | | | | | |
| schedule: | | | | | | |
| Unaffiliated issuers (cost $97,285,626) | | | | | | $ 99,504,618 |
| Cash | | | | | | 2,481,424 |
| Receivable for fund shares sold | | | | | | 10,059 |
| Interest receivable | | | | | | 1,003,178 |
| Other receivables | | | | | | 8,953 |
| Total assets | | | | | | 103,008,232 |
| |
| Liabilities | | | | | | |
| Payable for fund shares redeemed | | | | $ 182,434 | | |
| Distributions payable | | | | 114,643 | | |
| Accrued management fee | | | | 46,114 | | |
| Other affiliated payables | | | | 36 | | |
| Total liabilities | | | | | | 343,227 |
| |
| Net Assets | | | | | | $ 102,665,005 |
| Net Assets consist of: | | | | | | |
| Paid in capital | | | | | | $ 100,217,907 |
| Undistributed net investment income | | | | | | 11,946 |
| Accumulated undistributed net realized gain (loss) on | | | | | | |
| investments | | | | | | 216,160 |
| Net unrealized appreciation (depreciation) on | | | | | | |
| investments | | | | | | 2,218,992 |
| Net Assets, for 9,004,243 shares outstanding | | | | | | $ 102,665,005 |
| Net Asset Value, offering price and redemption price per | | | | | | |
| share ($102,665,005 ÷ 9,004,243 shares) | | | | | | $ 11.40 |
See accompanying notes which are an integral part of the financial statements.
| Statement of Operations | | | | | | |
| | | Six months ended February 28, 2006 (Unaudited) |
| |
| Investment Income | | | | | | |
| Interest | | | | | | $ 2,048,850 |
| |
| Expenses | | | | | | |
| Management fee | | | | $ 273,742 | | |
| Independent trustees’ compensation | | | | 212 | | |
| Miscellaneous | | | | 88 | | |
| Total expenses before reductions | | | | 274,042 | | |
| Expense reductions | | | | (21,917) | | 252,125 |
| |
| Net investment income | | | | | | 1,796,725 |
| Realized and Unrealized Gain (Loss) | | | | | | |
| Net realized gain (loss) on: | | | | | | |
| Investment securities: | | | | | | |
| Unaffiliated issuers | | | | 409,018 | | |
| Futures contracts | | | | 540 | | |
| Total net realized gain (loss) | | | | | | 409,558 |
| Change in net unrealized appreciation (depreciation) on | | | | | | |
| investment securities | | | | | | (1,618,964) |
| Net gain (loss) | | | | | | (1,209,406) |
| Net increase (decrease) in net assets resulting from | | | | | | |
| operations | | | | | | $ 587,319 |
See accompanying notes which are an integral part of the financial statements.
13 Semiannual Report
| Fidelity Arizona Municipal Income Fund | | | | | | | | |
| Financial Statements continued | | | | | | | | |
| |
| Statement of Changes in Net Assets | | | | | | | | |
| | | Six months ended | | | | Year ended |
| | | February 28, 2006 | | | | August 31, |
| | | (Unaudited) | | | | 2005 |
| Increase (Decrease) in Net Assets | | | | | | | | |
| Operations | | | | | | | | |
| Net investment income | | | | $ 1,796,725 | | | | $ 3,227,117 |
| Net realized gain (loss) | | | | 409,558 | | | | 279,981 |
| Change in net unrealized appreciation (depreciation) . | | | | (1,618,964) | | | | 444,357 |
| Net increase (decrease) in net assets resulting from | | | | | | | | |
| operations | | | | 587,319 | | | | 3,951,455 |
| Distributions to shareholders from net investment income . | | | | (1,794,049) | | | | (3,235,508) |
| Distributions to shareholders from net realized gain | | | | (444,779) | | | | (377,090) |
| Total distributions | | | | (2,238,828) | | | | (3,612,598) |
| Share transactions | | | | | | | | |
| Proceeds from sales of shares | | | | 16,776,046 | | | | 34,309,224 |
| Reinvestment of distributions | | | | 1,314,024 | | | | 2,144,524 |
| Cost of shares redeemed | | | | (14,469,815) | | | | (14,386,971) |
| Net increase (decrease) in net assets resulting from | | | | | | | | |
| share transactions | | | | 3,620,255 | | | | 22,066,777 |
| Redemption fees | | | | 778 | | | | 977 |
| Total increase (decrease) in net assets | | | | 1,969,524 | | | | 22,406,611 |
| |
| Net Assets | | | | | | | | |
| Beginning of period | | | | 100,695,481 | | | | 78,288,870 |
| End of period (including undistributed net investment | | | | | | | | |
| income of $11,946 and undistributed net investment | | | | | | | | |
| income of $16,823, respectively) | | | | $ 102,665,005 | | | | $ 100,695,481 |
| |
| Other Information | | | | | | | | |
| Shares | | | | | | | | |
| Sold | | | | 1,472,866 | | | | 2,973,441 |
| Issued in reinvestment of distributions | | | | 115,492 | | | | 185,788 |
| Redeemed | | | | (1,271,049) | | | | (1,246,428) |
| Net increase (decrease) | | | | 317,309 | | | | 1,912,801 |
See accompanying notes which are an integral part of the financial statements.
| Financial Highlights | | | | | | | | | | |
| | | Six months ended | | | | | | | | | | |
| | | February 28, 2006 | | Years ended August 31, |
| | | (Unaudited) | | 2005 | | 2004 | | 2003 | | 2002 | | 2001 |
| Selected PerShare Data | | | | | | | | | | |
| Net asset value, | | | | | | | | | | | | |
| beginning of period | | $ 11.59 | | $ 11.56 | | $ 11.32 | | $ 11.50 | | $ 11.26 | | $ 10.72 |
| Income from | | | | | | | | | | | | |
| Investment | | | | | | | | | | | | |
| Operations | | | | | | | | | | | | |
| Net investment | | | | | | | | | | | | |
| incomeD | | 205 | | .417 | | .427 | | .435 | | .444F | | .472 |
| Net realized and | | | | | | | | | | | | |
| unrealized gain | | | | | | | | | | | | |
| (loss) | | (.139) | | .087 | | .306 | | (.090) | | .254F | | .542 |
| Total from invest- | | | | | | | | | | | | |
| ment operations | | .066 | | .504 | | .733 | | .345 | | .698 | | 1.014 |
| Distributions from net | | | | | | | | | | | | |
| investment income | | (.205) | | (.419) | | (.427) | | (.435) | | (.443) | | (.475) |
| Distributions from net | | | | | | | | | | | | |
| realized gain | | (.051) | | (.055) | | (.066) | | (.090) | | (.015) | | (.001) |
| Total distributions . | | (.256) | | (.474) | | (.493) | | (.525) | | (.458) | | (.476) |
| Redemption fees | | | | | | | | | | | | |
| added to paid in | | | | | | | | | | | | |
| capitalD | | —G | | —G | | —G | | —G | | —G | | .002 |
| Net asset value, end | | | | | | | | | | | | |
| of period | | $ 11.40 | | $ 11.59 | | $ 11.56 | | $ 11.32 | | $ 11.50 | | $ 11.26 |
| Total ReturnB,C | | 60% | | 4.46% | | 6.58% | | 3.01% | | 6.38% | | 9.70% |
| Ratios to Average Net AssetsE | | | | | | | | | | | | |
| Expenses before | | | | | | | | | | | | |
| reductions | | 55%A | | .55% | | .55% | | .55% | | .55% | | .55% |
| Expenses net of fee | | | | | | | | | | | | |
| waivers, if any | | 55%A | | .55% | | .55% | | .55% | | .55% | | .55% |
| Expenses net of all | | | | | | | | | | | | |
| reductions | | 51%A | | .50% | | .53% | | .52% | | .48% | | .41% |
| Net investment | | | | | | | | | | | | |
| income | | 3.64%A | | 3.62% | | 3.72% | | 3.77% | | 3.96%F | | 4.32% |
| Supplemental Data | | | | | | | | | | | | |
| Net assets, end | | | | | | | | | | | | |
| of period | | | | | | | | | | | | |
| (000 omitted) | | $102,665 | | $100,695 | | $78,289 | | $68,689 | | $66,105 | | $50,716 |
| Portfolio turnover | | | | | | | | | | | | |
| rate | | 24%A | | 13% | | 14% | | 19% | | 30% | | 24% |
A Annualized
B Total returns for periods of less than one year are not annualized.
C Total returns would have been lower had certain expenses not been reduced during the periods shown.
D Calculated based on average shares outstanding during the period.
E Expense ratios reflect operating expenses of the fund. Expenses before reductions do not reflect amounts reimbursed by the investment adviser or
expense offset arrangements and do not represent the amount paid by the fund during periods when reimbursements or reductions occur. Ex
penses net of fee waivers reflect expenses after reimbursement by the investment adviser but prior to reductions from expense offset arrange
ments. Expenses net of all reductions represent the net expenses paid by the fund.
F Effective September 1, 2001, the fund adopted the provisions of the AICPA Audit and Accounting Guide for Investment Companies and began
amortizing premium and discount on all debt securities. Per share data and ratios for periods prior to adoption have not been restated to reflect
this change.
G Amount represents less than $.001 per share.
|
See accompanying notes which are an integral part of the financial statements.
15 Semiannual Report
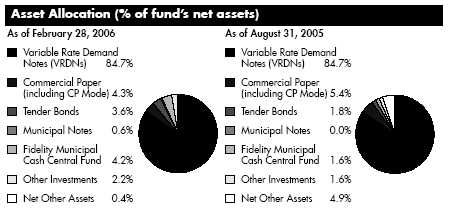
| Fidelity Arizona Municipal Money Market Fund | | | | |
| Investment Changes | | | | | | |
| |
| Maturity Diversification | | | | | | |
| Days | | % of fund’s | | % of fund’s | | % of fund’s |
| | | investments | | investments | | investments |
| | | 2/28/06 | | 8/31/05 | | 2/28/05 |
| 0 – 30 | | 92.0 | | 97.6 | | 88.5 |
| 31 – 90 | | 1.6 | | 1.7 | | 3.6 |
| 91 – 180 | | 2.8 | | 0.7 | | 2.8 |
| 181 – 397 | | 3.6 | | 0.0 | | 5.1 |
| Weighted Average Maturity | | | | | | |
| | | 2/28/06 | | 8/31/05 | | 2/28/05 |
| Fidelity Arizona Municipal Money | | | | | | |
| Market Fund | | 18 Days | | 9 Days | | 20 Days |
| All Tax Free Money Market Funds Average* | | 24 Days | | 28 Days | | 28 Days |
*Source: iMoneyNet, Inc.
Semiannual Report 16
| Fidelity Arizona Municipal Money Market Fund | | | | |
| |
| Investments February 28, 2006 (Unaudited) |
| Showing Percentage of Net Assets | | | | | | |
| |
| Municipal Securities 99.6% | | | | | | |
| | | | | Principal | | Value (Note 1) |
| | | | | Amount | | |
| Arizona – 92.0% | | | | | | |
| Arizona Health Facilities Auth. Rev. (Southwest Behavioral | | | | | | |
| Health Services, Inc. Proj.) 3.27%, LOC JPMorgan Chase | | | | | | |
| Bank, VRDN (b) | | | | $ 1,930,000 | | $ 1,930,000 |
| Arizona Muni. Fing. Prog. Defeased Ctfs. of Prtn. Bonds | | | | | | |
| Series 15: | | | | | | |
| 8.75% 8/1/06 (Escrowed to Maturity) (e) | | | | 2,115,000 | | 2,164,902 |
| 8.75% 8/1/06 (Escrowed to Maturity) (e) | | | | 1,410,000 | | 1,443,268 |
| Arizona School Facilities Board Ctfs. of Prtn. Participating | | | | | | |
| VRDN: | | | | | | |
| Series IXIS 05 5, 3.22% (Liquidity Facility CDC Fin.-CDC | | | | | | |
| IXIS) (b)(f) | | | | 1,800,000 | | 1,800,000 |
| Series PT 2800, 3.22% (Liquidity Facility Merrill Lynch & Co., | | | | | | |
| Inc.) (b)(f) | | | | 3,000,000 | | 3,000,000 |
| Series Putters 735, 3.22% (Liquidity Facility Dresdner Bank | | | | | | |
| AG) (b)(f) | | | | 3,660,000 | | 3,660,000 |
| Series Putters 940, 3.22% (Liquidity Facility JPMorgan Chase | | | | | | |
| Bank) (b)(f) | | | | 6,880,000 | | 6,880,000 |
| Series RF 04 2, 3.26% (Liquidity Facility Bank of New York, | | | | | | |
| New York) (b)(f) | | | | 1,375,000 | | 1,375,000 |
| Series ROC II R 4069, 3.22% (Liquidity Facility Citigroup | | | | | | |
| Global Markets Hldgs., Inc.) (b)(f) | | | | 1,695,000 | | 1,695,000 |
| Arizona School Facilities Board State School Impt. Rev. | | | | | | |
| Participating VRDN: | | | | | | |
| Series MS 00 497, 3.21% (Liquidity Facility Morgan | | | | | | |
| Stanley) (b)(f) | | | | 1,032,500 | | 1,032,500 |
| Series Putters 483, 3.22% (Liquidity Facility PNC Bank NA, | | | | | | |
| Pittsburgh) (b)(f) | | | | 2,455,000 | | 2,455,000 |
| Series Putters 484, 3.22% (Liquidity Facility JPMorgan Chase | | | | | | |
| Bank) (b)(f) | | | | 1,475,000 | | 1,475,000 |
| Arizona State Univ. Ctfs. of Prtn. Participating VRDN Series | | | | | | |
| Putters 694, 3.22% (Liquidity Facility JPMorgan Chase & | | | | | | |
| Co.) (b)(f) | | | | 2,620,000 | | 2,620,000 |
| Arizona State Univ. Revs. Participating VRDN: | | | | | | |
| Series PT 2264, 3.22% (Liquidity Facility Merrill Lynch & Co., | | | | | | |
| Inc.) (b)(f) | | | | 4,145,000 | | 4,145,000 |
| Series ROC II R174, 3.22% (Liquidity Facility Citibank | | | | | | |
| NA) (b)(f) | | | | 3,700,000 | | 3,700,000 |
| Arizona Tourism & Sports Auth. Tax Rev. Participating VRDN: | | | | | | |
| Series PT 2312, 3.22% (Liquidity Facility Merrill Lynch & Co., | | | | | | |
| Inc.) (b)(f) | | | | 1,600,000 | | 1,600,000 |
| Series Putters 690, 3.22% (Liquidity Facility JPMorgan Chase | | | | | | |
| & Co.) (b)(f) | | | | 1,695,000 | | 1,695,000 |
| |
| |
| See accompanying notes which are an integral part of the financial statements. | | |
| |
| 17 | | | | Semiannual Report |
| Fidelity Arizona Municipal Money Market Fund | | | | |
| Investments (Unaudited) continued | | | | | | |
| |
| Municipal Securities continued | | | | | | |
| | | | | Principal | | Value (Note 1) |
| | | | | Amount | | |
| |
| Arizona – continued | | | | | | |
| Arizona Trans. Board Hwy. Rev. Participating VRDN | | | | | | |
| Series ROC II R1038, 3.22% (Liquidity Facility Citigroup | | | | | | |
| Global Markets Hldgs., Inc.) (b)(f) | | | | $ 2,025,000 | | $ 2,025,000 |
| Arizona Wtr. Infrastructure Fin. Auth. Rev. Participating VRDN | | | | | | |
| Series PT 2237, 3.22% (Liquidity Facility Merrill Lynch & Co., | | | | | | |
| Inc.) (b)(f) | | | | 1,500,000 | | 1,500,000 |
| Casa Grande Indl. Dev. Auth. Indl. Dev. Rev. (Price | | | | | | |
| Companies, Inc. Proj.) Series A, 3.24%, LOC Bank of | | | | | | |
| America NA, VRDN (b)(d) | | | | 1,865,000 | | 1,865,000 |
| Chandler Indl. Dev. Auth. Indl. Dev. Rev. (Red Rock Stamping | | | | | | |
| Co. Proj.) Series 2000, 3.35%, LOC Key Bank NA, | | | | | | |
| VRDN (b)(d) | | | | 2,190,000 | | 2,190,000 |
| Cochise County Poll. Cont. Rev. Solid Waste Disp. Rev. Bonds | | | | | | |
| (Arizona Elec. Pwr. Coop. Proj.) 2.88%, tender 9/1/06 | | | | | | |
| (Nat’l. Rural Utils. Coop. Fin. Corp. Guaranteed) (b)(d) | | | | 8,900,000 | | 8,900,000 |
| Coconino County Poll. Cont. Corp. Rev. (Arizona Pub. Svc. Co. | | | | | | |
| Navajo Proj.) Series 1994 A, 3.13%, LOC KBC Bank NV, | | | | | | |
| VRDN (b)(d) | | | | 5,400,000 | | 5,400,000 |
| Downtown Phoenix Hotel Corp. Rev. Participating VRDN | | | | | | |
| Series LB 06 P3U, 3.23% (Liquidity Facility Lehman Brothers | | | | | | |
| Hldgs., Inc.) (b)(f) | | | | 2,250,000 | | 2,250,000 |
| Flagstaff Indl. Dev. Auth. Solid Waste Disp. Rev. (Norton Envir., | | | | | | |
| Inc. Proj.) Series 1997, 3.35%, LOC Key Bank NA, | | | | | | |
| VRDN (b)(d) | | | | 2,100,000 | | 2,100,000 |
| Maricopa County Indl. Dev. Auth. Indl. Dev. Rev.: | | | | | | |
| Bonds (American Wtr. Corp. Proj.) Series 1988, 3.24% | | | | | | |
| tender 4/13/06, CP mode (d) | | | | 1,600,000 | | 1,600,000 |
| (Clayton Homes, Inc. Proj.) Series 1998, 3.28%, LOC U.S. | | | | | | |
| Bank NA, Minnesota, VRDN (b)(d) | | | | 1,000,000 | | 1,000,000 |
| Maricopa County Indl. Dev. Auth. Multi-family Hsg. Rev.: | | | | | | |
| (Glenn Oaks Apts. Proj.) Series 2001, 3.3%, LOC Fannie | | | | | | |
| Mae, VRDN (b)(d) | | | | 3,299,675 | | 3,299,675 |
| (Ranchwood Apt. Proj.) Series 2001 A, 3.25%, LOC Fannie | | | | | | |
| Mae, VRDN (b)(d) | | | | 5,000,000 | | 5,000,000 |
| (San Angelin Apts. Proj.) 3.28%, LOC Fannie Mae, | | | | | | |
| VRDN (b)(d) | | | | 3,100,000 | | 3,100,000 |
| (San Lucas Apts. Proj.) 3.28%, LOC Fannie Mae, | | | | | | |
| VRDN (b)(d) | | | | 1,700,000 | | 1,700,000 |
| (San Martin Apts. Proj.): | | | | | | |
| Series A1, 3.22%, LOC Fannie Mae, VRDN (b)(d) | | | | 3,200,000 | | 3,200,000 |
| Series A2, 3.22%, LOC Fannie Mae, VRDN (b)(d) | | | | 720,000 | | 720,000 |
| (San Miguel Apts. Proj.) 3.28%, LOC Fannie Mae, | | | | | | |
| VRDN (b)(d) | | | | 1,300,000 | | 1,300,000 |
| (San Remo Apts. Proj.) 3.22%, LOC Fannie Mae, | | | | | | |
| VRDN (b)(d) | | | | 3,400,000 | | 3,400,000 |
See accompanying notes which are an integral part of the financial statements.
| Municipal Securities continued | | | | |
| | | Principal | | Value (Note 1) |
| | | Amount | | |
| |
| Arizona – continued | | | | |
| Maricopa County Indl. Dev. Auth. Multi-family Hsg. Rev.: - | | | | |
| continued | | | | |
| (Village Square Apts. Proj.) 3.28%, LOC Fannie Mae, | | | | |
| VRDN (b)(d) | | $ 1,600,000 | | $ 1,600,000 |
| Maricopa County Indl. Dev. Auth. Single Family Mtg. Rev. | | | | |
| Participating VRDN Series MS 1165, 3.25% (Liquidity | | | | |
| Facility Morgan Stanley) (b)(d)(f) | | 1,800,000 | | 1,800,000 |
| Maricopa County Indl. Dev. Auth. Solid Waste Disp. Rev. | | | | |
| Participating VRDN Series MT 48, 3.29% (Liquidity Facility | | | | |
| Lloyds TSB Bank PLC) (b)(d)(f) | | 1,770,000 | | 1,770,000 |
| Maricopa County Unified School District #48 Scottsdale Bonds | | | | |
| 4% 7/1/06 (FSA Insured) | | 1,735,000 | | 1,741,139 |
| Phoenix Civic Impt. Board Arpt. Rev. Participating VRDN | | | | |
| Series Merlots 02 A28, 3.28% (Liquidity Facility Wachovia | | | | |
| Bank NA) (b)(d)(f) | | 1,275,000 | | 1,275,000 |
| Phoenix Civic Impt. Corp. District Rev. Participating VRDN | | | | |
| Series PZ 85, 3.26% (Liquidity Facility Merrill Lynch & Co., | | | | |
| Inc.) (b)(f) | | 2,905,000 | | 2,905,000 |
| Phoenix Civic Impt. Corp. Excise Tax Rev.: | | | | |
| Participating VRDN: | | | | |
| Series EGL 03 28 Class A, 3.22% (Liquidity Facility | | | | |
| Citibank NA, New York) (b)(f) | | 1,300,000 | | 1,300,000 |
| Series MACN 05 L, 3.22% (Liquidity Facility Bank of | | | | |
| America NA) (b)(f) | | 2,100,000 | | 2,100,000 |
| Series 1995, 3.24%, LOC Landesbank Hessen-Thuringen, | | | | |
| VRDN (b)(d) | | 19,300,000 | | 19,300,000 |
| Phoenix Civic Impt. Corp. Transit Excise Tax Rev. Participating | | | | |
| VRDN: | | | | |
| Series EGL 7050040 Class A, 3.22% (Liquidity Facility | | | | |
| Citibank NA) (b)(f) | | 1,800,000 | | 1,800,000 |
| Series EGL 720050020, 3.22% (Liquidity Facility Citibank | | | | |
| NA) (b)(f) | | 1,800,000 | | 1,800,000 |
| Phoenix Civic Impt. Corp. Wastewtr. Sys. Rev. Participating | | | | |
| VRDN: | | | | |
| Series MS 991, 3.21% (Liquidity Facility Morgan | | | | |
| Stanley) (b)(f) | | 3,328,000 | | 3,328,000 |
| Series ROC II R6039, 3.22% (Liquidity Facility Citibank | | | | |
| NA) (b)(f) | | 3,065,000 | | 3,065,000 |
| Phoenix Civic Impt. Corp. Wtr. Sys. Rev. Participating VRDN | | | | |
| Series EGL 7050056, 3.22% (Liquidity Facility Citibank | | | | |
| NA) (b)(f) | | 2,000,000 | | 2,000,000 |
| Phoenix Indl. Dev. Auth. Multi-family Hsg. Rev.: | | | | |
| (Bell Square Apt. Proj.) Series 1995, 3.24%, LOC Bank of | | | | |
| America NA, VRDN (b) | | 2,000,000 | | 2,000,000 |
See accompanying notes which are an integral part of the financial statements.
19 Semiannual Report
| Fidelity Arizona Municipal Money Market Fund | | | | |
| Investments (Unaudited) continued | | | | |
| |
| Municipal Securities continued | | | | |
| | | | | Principal | | Value (Note 1) |
| | | | | Amount | | |
| Arizona – continued | | | | | | |
| Phoenix Indl. Dev. Auth. Multi-family Hsg. Rev.: – continued | | | | | | |
| (Paradise Lakes Apt. Proj.) Series 1995, 3.24%, LOC Bank | | | | | | |
| of America NA, VRDN (b) | | | | $ 6,000,000 | | $ 6,000,000 |
| (Westward Ho Apts. Proj.) Series 2003 A, 3.28%, LOC Fleet | | | | | | |
| Nat’l. Bank, VRDN (b)(d) | | | | 1,700,000 | | 1,700,000 |
| Phoenix Indl. Dev. Auth. Rev.: | | | | | | |
| (Independent Newspaper, Inc. Proj.) Series 2000, 3.35%, | | | | | | |
| LOC Wachovia Bank NA, VRDN (b)(d) | | | | 900,000 | | 900,000 |
| (Laura Dozer Ctr. Proj.) 3.43%, LOC JPMorgan Chase Bank, | | | | | | |
| VRDN (b) | | | | 1,000,000 | | 1,000,000 |
| (Phoenix Expansion Proj.) 3.48%, LOC JPMorgan Chase | | | | | | |
| Bank, VRDN (b)(d) | | | | 2,340,000 | | 2,340,000 |
| (Plastican Proj.) Series 1997, 3.24%, LOC Fleet Bank NA, | | | | | | |
| VRDN (b)(d) | | | | 2,740,000 | | 2,740,000 |
| (Swift Aviation Svcs., Inc. Proj.) 3.1%, LOC U.S. Bank NA, | | | | | | |
| Minnesota, VRDN (b)(d) | | | | 5,320,000 | | 5,320,000 |
| Phoenix Indl. Dev. Auth. Single Family Mtg. Rev. Participating | | | | | | |
| VRDN: | | | | | | |
| Series Merlots 01 A23, 3.28% (Liquidity Facility Wachovia | | | | | | |
| Bank NA) (b)(d)(f) | | | | 155,000 | | 155,000 |
| Series MT 156, 3.27% (Liquidity Facility Landesbank | | | | | | |
| Hessen-Thuringen) (b)(d)(f) | | | | 2,200,000 | | 2,200,000 |
| Pima County Indl. Dev. Auth. Indl. Rev. Participating VRDN | | | | | | |
| Series LB 00 L21, 3.23% (Liquidity Facility Lehman Brothers | | | | | | |
| Hldgs., Inc.) (b)(f) | | | | 4,340,000 | | 4,340,000 |
| Pima County Indl. Dev. Auth. Multi-family Hsg. Rev. (River | | | | | | |
| Point Proj.) Series 2001, 3.25%, LOC Fannie Mae, | | | | | | |
| VRDN (b)(d) | | | | 6,000,000 | | 6,000,000 |
| Pima County Indl. Dev. Auth. Rev. (El Dorado Hosp. Proj.) | | | | | | |
| 3.22%, LOC Branch Banking & Trust Co., VRDN (b) | | | | 1,600,000 | | 1,600,000 |
| Pima County Indl. Dev. Auth. Single Family Mortgage Rev. | | | | | | |
| Participating VRDN Series RF 05 17 Class A, 3.38% | | | | | | |
| (Liquidity Facility Bank of New York, New York) (b)(d)(f) | | | | 4,950,000 | | 4,950,000 |
| Salt River Proj. Agric. Impt. & Pwr. District Elec. Sys. Rev.: | | | | | | |
| Participating VRDN: | | | | | | |
| Series EGL 06 0014, 3.22% (Liquidity Facility Citibank | | | | | | |
| NA) (b)(f) | | | | 2,400,000 | | 2,400,000 |
| Series MS 04 1227, 3.21% (Liquidity Facility Morgan | | | | | | |
| Stanley) (b)(f) | | | | 2,100,000 | | 2,100,000 |
| Series PT 1512, 3.22% (Liquidity Facility Merrill Lynch & | | | | | | |
| Co., Inc.) (b)(f) | | | | 1,200,000 | | 1,200,000 |
| Series ROC II R1002, 3.22% (Liquidity Facility Citigroup | | | | | | |
| Global Markets Hldgs., Inc.) (b)(f) | | | | 1,280,000 | | 1,280,000 |
| |
| See accompanying notes which are an integral part of the financial statements. | | |
| |
| Semiannual Report | | 20 | | | | |
| Municipal Securities continued | | | | |
| | | Principal | | Value (Note 1) |
| | | Amount | | |
| Arizona – continued | | | | |
| Salt River Proj. Agric. Impt. & Pwr. District Elec. Sys. Rev.: - | | | | |
| continued | | | | |
| Participating VRDN: | | | | |
| Series ROC II R1003, 3.22% (Liquidity Facility Citigroup | | | | |
| Global Markets Hldgs., Inc.) (b)(f) | | $ 1,280,000 | | $ 1,280,000 |
| Series ROC II R455, 3.22% (Liquidity Facility Citibank | | | | |
| NA) (b)(f) | | 4,970,000 | | 4,970,000 |
| Series SG 03 160, 3.22% (Liquidity Facility Societe | | | | |
| Generale) (b)(f) | | 1,390,000 | | 1,390,000 |
| Series 1997 A: | | | | |
| 3.12% 3/7/06, CP | | 2,200,000 | | 2,200,000 |
| 3.15% 3/13/06, CP | | 2,100,000 | | 2,100,000 |
| 3.18% 4/7/06, CP | | 2,200,000 | | 2,200,000 |
| Series 1997 B, 3.17% 3/9/06, CP | | 2,200,000 | | 2,200,000 |
| Scottsdale Indl. Dev. Auth. Rev. (Notre Dame Preparatory | | | | |
| School and Foundation for Sr. Living Proj.) Series 2001 B, | | | | |
| 3.43%, LOC JPMorgan Chase Bank, VRDN (b) | | 1,400,000 | | 1,400,000 |
| Sun Devil Energy Ctr. LLC Rev. (Arizona State Univ. Proj.) | | | | |
| 3.22% (FGIC Insured), VRDN (b) | | 3,800,000 | | 3,800,000 |
| Tempe Indl. Dev. Auth. Rev. (ASUF Brickyard Proj.) Series 2004 | | | | |
| A, 3.19%, LOC Bank of America NA, VRDN (b) | | 6,590,000 | | 6,590,000 |
| Univ. of Arizona Ctfs. of Prtn. (Univ. of Arizona Projs.) | | | | |
| Series 2004 B, 3.19% (AMBAC Insured), VRDN (b) | | 8,865,000 | | 8,865,000 |
| Yavapai County Indl. Dev. Auth. Indl. Dev. Rev. (Oxycal Lab. | | | | |
| Proj.) Series 1999 A, 3.48%, LOC Wells Fargo Bank NA, | | | | |
| San Francisco, VRDN (b)(d) | | 1,000,000 | | 1,000,000 |
| | | | | 225,224,484 |
| |
| Puerto Rico 3.4% | | | | |
| Puerto Rico Commonwealth Gen. Oblig.: | | | | |
| Participating VRDN Series Putters 441, 3.17% (Liquidity | | | | |
| Facility JPMorgan Chase Bank) (b)(f) | | 1,595,000 | | 1,595,000 |
| TRAN 4.5% 7/28/06, LOC Bank of Nova Scotia, New York | | | | |
| Agcy., LOC BNP Paribas SA | | 1,500,000 | | 1,507,658 |
| Puerto Rico Commonwealth Hwy. & Trans. Auth. Trans. Rev. | | | | |
| Participating VRDN: | | | | |
| Series EGL 7053018, 3.21% (Liquidity Facility Citibank | | | | |
| NA) (b)(f) | | 2,200,000 | | 2,200,000 |
| Series MACN 05 N, 3.18% (Liquidity Facility Bank of | | | | |
| America NA) (b)(f) | | 600,000 | | 600,000 |
See accompanying notes which are an integral part of the financial statements.
21 Semiannual Report
| Fidelity Arizona Municipal Money Market Fund | | | | |
| Investments (Unaudited) continued | | | | |
| |
| Municipal Securities continued | | | | |
| | | Principal | | Value (Note 1) |
| | | Amount | | |
| Puerto Rico continued | | | | |
| Puerto Rico Commonwealth Hwy. & Trans. Auth. Trans. Rev. | | | | |
| Participating VRDN: – continued | | | | |
| Series ROC 2 98 1, 3.21% (Liquidity Facility Citibank NA) (b)(f) . | | $ 1,000,000 | | $ 1,000,000 |
| Puerto Rico Elec. Pwr. Auth. Pwr. Rev. Participating VRDN | | | | |
| Series ROC II R179, 3.21% (Liquidity Facility Citibank NA) (b)(f) | | 1,495,000 | | 1,495,000 |
| | | | | 8,397,658 |
| |
| | | Shares | | |
| Other – 4.2% | | | | |
| Fidelity Municipal Cash Central Fund, 3.16% (a)(c) | | 10,222,333 | | 10,222,333 |
| TOTAL INVESTMENT PORTFOLIO 99.6% | | | | |
| (Cost $243,844,475) | | | | 243,844,475 |
| |
| NET OTHER ASSETS – 0.4% | | | | 960,170 |
| NET ASSETS 100% | | | | $ 244,804,645 |
| Security Type Abbreviations |
| CP | | — | | COMMERCIAL PAPER |
| TRAN | | — | | TAX AND REVENUE |
| | | | | ANTICIPATION NOTE |
| VRDN | | — | | VARIABLE RATE DEMAND |
| | | | | NOTE |
Legend
(a) Affiliated fund that is available only to
investment companies and other
accounts managed by Fidelity
Investments. The rate quoted is the
annualized seven-day yield of the fund
at period end. A complete unaudited
listing of the fund’s holdings as of its
most recent quarter end is available
upon request.
|
(b) The coupon rate shown on floating or
adjustable rate securities represents the
rate at period end.
(c) Information in this report regarding
holdings by state and security types
does not reflect the holdings of the
Fidelity Municipal Cash Central Fund.
(d) Private activity obligations whose
interest is subject to the federal
alternative minimum tax for individuals.
(e) Security collateralized by an amount
sufficient to pay interest and principal.
(f) Provides evidence of ownership in one
or more underlying municipal bonds.
|
Affiliated Central Funds
Information regarding fiscal year to date income earned by the fund from the affiliated Central funds is as follows:
| Fund | | | | Income earned |
| Fidelity Municipal Cash Central Fund | | | | $ 30,013 |
See accompanying notes which are an integral part of the financial statements.
Semiannual Report 22
| Fidelity Arizona Municipal Money Market Fund | | |
| Financial Statements | | | | | | |
| |
| Statement of Assets and Liabilities | | | | | | |
| | | | | February 28, 2006 (Unaudited) |
| |
| Assets | | | | | | |
| Investment in securities, at value See accompanying | | | | | | |
| schedule: | | | | | | |
| Unaffiliated issuers (cost $233,622,142) | | | | $ 233,622,142 | | |
| Affiliated Central Funds (cost $10,222,333) | | | | 10,222,333 | | |
| Total Investments (cost $243,844,475) | | | | | | $ 243,844,475 |
| Cash | | | | | | 2,527,077 |
| Receivable for fund shares sold | | | | | | 5,288,225 |
| Interest receivable | | | | | | 1,105,847 |
| Other receivables | | | | | | 54,054 |
| Total assets | | | | | | 252,819,678 |
| |
| Liabilities | | | | | | |
| Payable for investments purchased | | | | $ 5,000,000 | | |
| Payable for fund shares redeemed | | | | 2,910,163 | | |
| Distributions payable | | | | 3,845 | | |
| Accrued management fee | | | | 100,967 | | |
| Other affiliated payables | | | | 58 | | |
| Total liabilities | | | | | | 8,015,033 |
| |
| Net Assets | | | | | | $ 244,804,645 |
| Net Assets consist of: | | | | | | |
| Paid in capital | | | | | | $ 244,786,965 |
| Undistributed net investment income | | | | | | 17,518 |
| Accumulated undistributed net realized gain (loss) on | | | | | | |
| investments | | | | | | 162 |
| Net Assets, for 244,680,736 shares outstanding | | | | | | $ 244,804,645 |
| Net Asset Value, offering price and redemption price per | | | | | | |
| share ($244,804,645 ÷ 244,680,736 shares) | | | | | | $ 1.00 |
See accompanying notes which are an integral part of the financial statements.
23 Semiannual Report
| Fidelity Arizona Municipal Money Market Fund | | |
| Financial Statements continued | | | | | | |
| |
| Statement of Operations | | | | | | |
| | | | | Six months ended February 28, 2006 (Unaudited) |
| |
| Investment Income | | | | | | |
| Interest | | | | | | $ 3,127,418 |
| Income from affiliated Central Funds | | | | | | 30,013 |
| Total income | | | | | | 3,157,431 |
| |
| Expenses | | | | | | |
| Management fee | | | | $ 560,512 | | |
| Independent trustees’ compensation | | | | 466 | | |
| Total expenses before reductions | | | | 560,978 | | |
| Expense reductions | | | | (130,950) | | 430,028 |
| |
| Net investment income | | | | | | 2,727,403 |
| Realized and Unrealized Gain (Loss) | | | | | | |
| Net realized gain (loss) on: | | | | | | |
| Investment securities: | | | | | | |
| Unaffiliated issuers | | | | | | 11 |
| Net increase in net assets resulting from operations | | | | | | $ 2,727,414 |
See accompanying notes which are an integral part of the financial statements.
Semiannual Report 24
| Statement of Changes in Net Assets | | | | | | | | | | |
| | | | | Six months ended | | | | Year ended |
| | | | | February 28, 2006 | | | | August 31, |
| | | | | (Unaudited) | | | | 2005 |
| Increase (Decrease) in Net Assets | | | | | | | | | | |
| Operations | | | | | | | | | | |
| Net investment income | | | | | | $ 2,727,403 | | | | $ 2,933,810 |
| Net realized gain (loss) | | | | | | 11 | | | | 6,668 |
| Net increase in net assets resulting from operations | | . | | | | 2,727,414 | | | | 2,940,478 |
| Distributions to shareholders from net investment income | | . | | | | (2,729,139) | | | | (2,931,883) |
| Share transactions at net asset value of $1.00 per share | | | | | | | | | | |
| Proceeds from sales of shares | | | | | | 356,405,546 | | | | 502,664,387 |
| Reinvestment of distributions | | | | | | 2,693,173 | | | | 2,899,293 |
| Cost of shares redeemed | | | | | | (332,111,806) | | | | (444,707,485) |
| Net increase (decrease) in net assets and shares re- | | | | | | | | | | |
| sulting from share transactions | | | | | | 26,986,913 | | | | 60,856,195 |
| Total increase (decrease) in net assets | | | | | | 26,985,188 | | | | 60,864,790 |
| |
| Net Assets | | | | | | | | | | |
| Beginning of period | | | | | | 217,819,457 | | | | 156,954,667 |
| End of period (including undistributed net investment | | | | | | | | | | |
| income of $17,518 and undistributed net investment | | | | | | | | |
| income of $19,254, respectively) | | | | | | $ 244,804,645 | | | | $ 217,819,457 |
See accompanying notes which are an integral part of the financial statements.
25 Semiannual Report
| Financial Highlights | | | | | | | | | | |
| | | Six months ended | | | | | | | | | | |
| | | February 28, 2006 | | Years ended August 31, |
| | | (Unaudited) | | 2005 | | 2004 | | 2003 | | 2002 | | 2001 |
| Selected Per Share Data | | | | | | | | | | | | |
| Net asset value, | | | | | | | | | | | | |
| beginning of | | | | | | | | | | | | |
| period | | $ 1.00 | | $ 1.00 | | $ 1.00 | | $ 1.00 | | $ 1.00 | | $ 1.00 |
| Income from | | | | | | | | | | | | |
| Investment | | | | | | | | | | | | |
| Operations | | | | | | | | | | | | |
| Net investment | | | | | | | | | | | | |
| income | | 012 | | .016 | | .006 | | .008 | | .013 | | .032 |
| Net realized and | | | | | | | | | | | | |
| unrealized | | | | | | | | | | | | |
| gain (loss)F | | — | | — | | — | | — | | — | | — |
| Total from invest | | | | | | | | | | | | |
| ment operations | | .012 | | .016 | | .006 | | .008 | | .013 | | .032 |
| Distributions from | | | | | | | | | | | | |
| net investment | | | | | | | | | | | | |
| income | | (.012) | | (.016) | | (.006) | | (.008) | | (.013) | | (.032) |
| Distributions from | | | | | | | | | | | | |
| net realized gain | | — | | — | | — | | —F | | — | | — |
| Total distributions | | (.012) | | (.016) | | (.006) | | (.008) | | (.013) | | (.032) |
| Net asset value, | | | | | | | | | | | | |
| end of period | | $ 1.00 | | $ 1.00 | | $ 1.00 | | $ 1.00 | | $ 1.00 | | $ 1.00 |
| Total ReturnB,C,D | | 1.22% | | 1.60% | | .60% | | .86% | | 1.30% | | 3.23% |
| Ratios to Average Net AssetsE | | | | | | | | | | | | |
| Expenses before | | | | | | | | | | | | |
| reductions | | 50%A | | .50% | | .50% | | .50% | | .50% | | .50% |
| Expenses net of | | | | | | | | | | | | |
| fee waivers, if | | | | | | | | | | | | |
| any | | 50%A | | .50% | | .50% | | .50% | | .50% | | .50% |
| Expenses net of | | | | | | | | | | | | |
| all reductions | | .39%A | | .43% | | .49% | | .48% | | .45% | | .47% |
| Net investment | | | | | | | | | | | | |
| income | | 2.45%A | | 1.63% | | .60% | | .82% | | 1.27% | | 3.19% |
| Supplemental Data | | | | | | | | | | | | |
| Net assets, end | | | | | | | | | | | | |
| of period | | | | | | | | | | | | |
| (000 omitted) | | $244,805 | | $217,819 | | $156,955 | | $134,118 | | $132,208 | | $101,853 |
A Annualized
B Total returns for periods of less than one year are not annualized.
C Total returns would have been lower had certain expenses not been reduced during the periods shown.
D Total returns do not include the effect of the former account closeout fee.
E Expense ratios reflect operating expenses of the fund. Expenses before reductions do not reflect amounts reimbursed by the investment adviser or
expense offset arrangements and do not represent the amount paid by the fund during periods when reimbursements or reductions occur. Ex
penses net of fee waivers reflect expenses after reimbursement by the investment adviser but prior to reductions from expense offset arrange
ments. Expenses net of all reductions represent the net expenses paid by the fund.
F Amount represents less than $.001 per share.
|
See accompanying notes which are an integral part of the financial statements.
Notes to Financial Statements
For the period ended February 28, 2006 (Unaudited)
1. Significant Accounting Policies.
Fidelity Arizona Municipal Income Fund (the income fund) is a fund of Fidelity Union Street Trust. Fidelity Arizona Municipal Money Market Fund (the money market fund) is a fund of Fidelity Union Street Trust II. Each trust is registered under the Investment Company Act of 1940, as amended (the 1940 Act), as an open end management invest ment company. Fidelity Union Street Trust and Fidelity Union Street Trust II (the trusts) are organized as a Massachusetts business trust and a Delaware statutory trust, respec tively. The income fund is a non diversified fund. Each fund is authorized to issue an unlimited number of shares. Each fund may be affected by economic and political developments in the state of Arizona. Certain funds may invest in affiliated money market central funds (Money Market Central Funds) which are open end investment companies available to investment companies and other accounts managed by Fidelity Management & Research Company (FMR) and its affiliates. The financial statements have been prepared in conformity with accounting principles generally accepted in the United States of America, which require management to make certain estimates and assumptions at the date of the financial statements. The following summarizes the significant accounting policies of the income fund and the money market fund:
Security Valuation. Investments are valued and net asset value per share is calculated (NAV calculation) as of the close of business of the New York Stock Exchange, normally 4:00 p.m. Eastern time. Wherever possible, each fund uses independent pricing services approved by the Board of Trustees to value their investments. For the income fund, debt securities, including restricted securities, for which quotes are readily available, are valued by independent pricing services or by dealers who make markets in such securi ties. Pricing services consider yield or price of bonds of comparable quality, coupon, maturity and type as well as dealer supplied prices. When current market prices or quotations are not readily available or do not accurately reflect fair value, valuations may be determined in accordance with procedures adopted by the Board of Trustees. The frequency of when fair value pricing is used is unpredictable. The value of securities used for NAV calculation under fair value pricing may differ from published prices for the same securities. Investments in open end mutual funds are valued at their closing net asset value each business day. Short term securities with remaining maturities of sixty days or less for which quotations are not readily available are valued at amortized cost, which approximates value.
As permitted by compliance with certain conditions under Rule 2a 7 of the 1940 Act, securi ties owned by the money market fund are valued at amortized cost which approximates value.
Investment Transactions and Income. Security transactions are accounted for as of trade date. Gains and losses on securities sold are determined on the basis of identified cost. Interest income is accrued as earned. Interest income includes coupon interest and amortization of premium and accretion of discount on debt securities.
27 Semiannual Report
| Notes to Financial Statements (Unaudited) continued |
1. Significant Accounting Policies continued |
Expenses. Most expenses of each trust can be directly attributed to a fund. Expenses which cannot be directly attributed are apportioned among each fund in the trust.
Income Tax Information and Distributions to Shareholders. Each year, each fund intends to qualify as a regulated investment company by distributing all of its taxable income and realized gains under Subchapter M of the Internal Revenue Code. As a result, no provision for income taxes is required in the accompanying financial statements.
Dividends are declared daily and paid monthly from net investment income. Distribu tions from realized gains, if any, are recorded on the ex dividend date. Income and capital gain distributions are determined in accordance with income tax regulations, which may differ from generally accepted accounting principles. In addition, certain funds claimed a portion of the payment made to redeeming shareholders as a distribu tion for income tax purposes.
Capital accounts within the financial statements are adjusted for permanent book tax differences. These adjustments have no impact on net assets or the results of operations. Temporary book tax differences will reverse in a subsequent period.
Book tax differences are primarily due to futures transactions, market discount, deferred trustees compensation and losses deferred due to wash sales.
The funds purchase municipal securities whose interest, in the opinion of the issuer, is free from federal income tax. There is no assurance that the Internal Revenue Service (IRS) will agree with this opinion. In the event the IRS determines that the issuer does not comply with relevant tax requirements, interest payments from a security could become federally taxable, possibly retroactively to the date the security was issued.
The federal tax cost of investments and unrealized appreciation (depreciation) as of period end were as follows for each fund:
| | | Cost for Federal | | | | | | | | Net | | Unrealized |
| | | Income Tax | | | | Unrealized | | | | Unrealized | | Appreciation/ |
| | | Purposes | | | | Appreciation | | | | Depreciation | | (Depreciation) |
| Fidelity Arizona Municipal | | | | | | | | | | | | |
| Income Fund | | $ 97,266,311 | | | | $ 2,457,777 | | | | $ (219,470) | | $ 2,238,307 |
| Fidelity Arizona Municipal | | | | | | | | | | | | |
| Money Market Fund | | 243,844,475 | | | | — | | | | — | | — |
Short Term Trading (Redemption) Fees. Shares held in the income fund less than 30 days are subject to a redemption fee equal to .50% of the proceeds of the redeemed shares. All redemption fees, including any estimated redemption fees paid by FMR, are retained by the fund and accounted for as an addition to paid in capital.
Futures Contracts. The income fund may use futures contracts to manage its exposure to the bond market and to fluctuations in interest rates. Buying futures tends to increase a fund’s exposure to the underlying instrument, while selling futures tends to decrease a fund’s exposure to the underlying instrument or hedge other fund investments. Upon entering into a futures contract, a fund is required to deposit with a clearing broker, no later than the following business day, an amount (“initial margin”) equal to a certain percentage of the face value of the contract. The initial margin may be in the form of cash or securities and is transferred to a segregated account on settlement date. Subsequent payments (“variation margin”) are made or received by a fund depending on the daily fluctuations in the value of the futures contract and are accounted for as unrealized gains or losses. Realized gains (losses) are recorded upon the expiration or closing of the futures contract. Securities deposited to meet margin requirements are identified in the income funds’ Schedule of Investments. Losses may arise from changes in the value of the underlying instruments or if the counterparties do not perform under the contract’s terms. Futures contracts are valued at the settlement price established each day by the board of trade or exchange on which they are traded.
3. Purchases and Sales of Investments.
Purchases and sales of securities, other than short term securities and U.S. government securities, for the income fund aggregated $13,185,478 and $11,642,065, respectively.
4. Fees and Other Transactions with Affiliates.
Management Fee. FMR and its affiliates provide the funds with investment manage ment related services for which the funds pay a monthly management fee. FMR pays all other expenses, except the compensation of the independent Trustees and certain exceptions such as interest expense. The management fee paid to FMR by the funds is reduced by an amount equal to the fees and expenses paid by the funds to the indepen dent Trustees. Each fund’s management fee is equal to the following annual rate of average net assets:
| Fidelity Arizona Municipal Income Fund | | 55% | | |
| Fidelity Arizona Municipal Money Market Fund | | 50% | | |
Affiliated Central Funds. Certain funds may invest in Money Market Central Funds which seek preservation of capital and current income and are managed by Fidelity Investments Money Management, Inc. (FIMM) an affiliate of FMR.
The Money Market Central Funds do not pay a management fee.
29 Semiannual Report
| Notes to Financial Statements (Unaudited) continued |
5. Committed Line of Credit. | | |
The income fund participates with other funds managed by FMR in a $4.2 billion credit facility (the “line of credit”) to be utilized for temporary or emergency purposes to fund shareholder redemptions or for other short term liquidity purposes. The participating funds have agreed to pay commitment fees on their pro rata portion of the line of credit, which is included in Miscellaneous Expense on the Statement of Operations. During the period, there were no borrowings on this line of credit.
Through arrangements with each applicable fund’s custodian and transfer agent, credits realized as a result of uninvested cash balances were used to reduce each applicable fund’s management fee. During the period, these credits reduced management fee by the following amounts:
| Fidelity Arizona Municipal Income Fund | | | | $ 21,917 | | |
| Fidelity Arizona Municipal Money Market Fund | | | | 130,950 | | |
| |
| 7. Other. | | | | | | |
The funds’ organizational documents provide former and current trustees and officers with a limited indemnification against liabilities arising in connection with the performance of their duties to the funds. In the normal course of business, the funds may also enter into contracts that provide general indemnifications. The funds’ maximum exposure under these arrangements is unknown as this would be dependent on future claims that may be made against the funds. The risk of material loss from such claims is considered remote.
Board Approval of Investment Advisory Contracts and Management Fees
Fidelity Arizona Municipal Income Fund / Fidelity Arizona Municipal Money Market Fund
On January 19, 2006, the Board of Trustees, including the Independent Trustees (together, the Board), voted to approve a general research services agreement (the Agreement) between FMR, FMR Co., Inc. (FMRC), Fidelity Investments Money Manage ment, Inc. (FIMM), and Fidelity Research & Analysis Company (FRAC) (together, the Investment Advisers) for each fund, effective January 20, 2006, pursuant to which FRAC may provide general research and investment advisory support services to FMRC and FIMM. The Board considered that it has approved previously various sub advisory agreements for each fund with affiliates of FMR that allow FMR to obtain research, non discretionary advice, or discretionary portfolio management at no additional expense to each fund. The Board, assisted by the advice of fund counsel and independent Trustees’ counsel, considered a broad range of information and determined that it would be beneficial for each fund to access the research and investment advisory support services supplied by FRAC at no additional expense to each fund.
The Board reached this determination in part because the new arrangement will involve no changes in (i) the contractual terms of and fees payable under each fund’s manage ment contract or sub advisory agreements; (ii) the investment process or strategies employed in the management of each fund’s assets; (iii) the nature or level of services provided under each fund’s management contract or sub advisory agreements; (iv) the day to day management of each fund or the persons primarily responsible for such management; or (v) the ultimate control or beneficial ownership of FMR, FMRC, or FIMM. The Board also considered that the establishment of each Agreement would not necessitate prior shareholder approval of the Agreement or result in an assignment and termination of each fund’s management contract or sub advisory agreements under the Investment Company Act of 1940.
Because the Board was approving an arrangement with FRAC under which each fund will not bear any additional management fees or expenses and under which each fund’s portfolio manager would not change, it did not consider each fund’s investment performance, competitiveness of management fee and total expenses, costs of services and profitability, or economies of scale to be significant factors in its decision.
In connection with its future renewal of each fund’s management contract and sub advisory agreements, the Board will consider: (i) the nature, extent, and quality of services provided to each fund, including shareholder and administrative services and investment performance; (ii) the competitiveness of each fund’s management fee and total expenses; (iii) the costs of the services and profitability, including the revenues earned and the expenses incurred by Fidelity in conducting the business of developing, marketing, distributing, managing, administering, and servicing each fund and its shareholders; and (iv) whether there have been economies of scale in respect of the
31 Semiannual Report
Board Approval of Investment Advisory Contracts and Management Fees continued
management of the Fidelity funds, whether the Fidelity funds (including each fund) have appropriately benefited from any such economies of scale, and whether there is potential for realization of any further economies.
Based on its evaluation of all of the conclusions noted above, and after considering all material factors, the Board ultimately concluded that each fund’s Agreement is fair and reasonable, and that each fund’s Agreement should be approved.
Managing Your Investments
Fidelity offers several ways to conveniently manage your personal investments via your telephone or PC. You can access your account information, conduct trades and research your investments 24 hours a day.
By Phone
Fidelity Automated Service Telephone provides a single toll free number to access account balances, positions, quotes and trading. It’s easy to navigate the service, and on your first call, the system will help you create a personal identification number (PIN) for security.


By PC
Fidelity’s web site on the Internet provides a wide range of information, including daily financial news, fund performance, interactive planning tools and news about Fidelity products and services.

* When you call the quotes line, please remember that a fund’s yield and return will vary and, except for money market funds, share price will also vary. This means that you may have a gain or loss when you sell your shares. There is no assurance that money market funds will be able to maintain a stable $1 share price; an investment in a money market fund is not insured or guar anteed by the U.S. government. Total returns are historical and include changes in share price, reinvestment of dividends and capital gains, and the effects of any sales charges.
33 Semiannual Report
| | Investment Adviser
Fidelity Management & Research Company
Boston, MA
Sub Advisers
Fidelity Investments
Money Management, Inc.
Fidelity Research & Analysis Company
(formerly Fidelity Management & Re
search (Far East) Inc.)
Fidelity International Investment Advisors
Fidelity International Investment Advisors
(U.K.) Limited
General Distributor
Fidelity Distributors Corporation
Boston, MA
Transfer and Service Agents
Citibank, N.A.
New York, NY
and
Fidelity Service Company, Inc.
Boston, MA
Custodian
Citibank, N.A.
New York, NY
|
| The Fidelity Telephone Connection |
| Mutual Fund 24-Hour Service |
| Exchanges/Redemptions | | |
| and Account Assistance | | 1-800-544-6666 |
| Product Information | | 1-800-544-6666 |
| Retirement Accounts | | 1-800-544-4774 |
| (8 a.m. - 9 p.m.) | | |
| TDD Service | | 1-800-544-0118 |
| for the deaf and hearing impaired |
| (9 a.m. - 9 p.m. Eastern time) |
| Fidelity Automated Service | | |
| Telephone (FAST® ) (automated phone logo) | | 1-800-544-5555 |
| (automated phone logo) Automated line for quickest service |
AZI/SPZ-USAN-0406
1.790941.102
|

| | Fidelity®
Export and Multinational
Fund
|
| | Semiannual Report
February 28, 2006
|


| Contents | | | | |
| |
| Chairman’s Message | | 3 | | Ned Johnson’s message to shareholders. |
| Shareholder Expense | | 4 | | An example of shareholder expenses. |
| Example | | | | |
| Investment Changes | | 6 | | A summary of the major shifts in the fund’s |
| | | | | investments over the past six months. |
| Investments | | 7 | | A complete list of the fund’s investments |
| | | | | with their market values. |
| Financial Statements | | 13 | | Statements of assets and liabilities, |
| | | | | operations, and changes in net assets, |
| | | | | as well as financial highlights. |
| Notes | | 17 | | Notes to the financial statements. |
| Board Approval of | | 22 | | |
| Investment Advisory | | | | |
| Contracts and | | | | |
| Management Fees | | | | |
To view a fund’s proxy voting guidelines and proxy voting record for the 12 month period
ended June 30, visit www.fidelity.com/proxyvotingresults or visit the Securities and Exchange
Commission’s (SEC) web site at www.sec.gov. You may also call 1-800-544-8544 to request a free
copy of the proxy voting guidelines.
Standard & Poor’s, S&P and S&P 500 are registered service marks of The McGraw Hill Companies, Inc.
and have been licensed for use by Fidelity Distributors Corporation.
Other third party marks appearing herein are the property of their respective owners.
All other marks appearing herein are registered or unregistered trademarks or service marks
of FMR Corp. or an affiliated company.
|
| | This report and the financial statements contained herein are submitted for the general information
of the shareholders of the fund. This report is not authorized for distribution to prospective investors
in the fund unless preceded or accompanied by an effective prospectus.
A fund files its complete schedule of portfolio holdings with the SEC for the first and third
quarters of each fiscal year on Form N Q. Forms N Q are available on the SEC’s web site at
http://www.sec.gov. A fund’s Forms N Q may be reviewed and copied at the SEC’s Public Reference
Room in Washington, DC. Information regarding the operation of the SEC’s Public Reference
Room may be obtained by calling 1-800-SEC-0330. For a complete list of a fund’s portfolio
holdings, view the most recent quarterly holdings report, semiannual report, or annual report
on Fidelity’s web site at http://www.fidelity.com/holdings.
NOT FDIC INSURED · MAY LOSE VALUE · NO BANK GUARANTEE
Neither the fund nor Fidelity Distributors Corporation is a bank.
|
Semiannual Report 2
2
Chairman’s Message
(photograph of Edward C. Johnson 3d)
Dear Shareholder:
Although many securities markets made gains in early 2006, there is only one certainty when it comes to investing: There is no sure thing. There are, however, a number of time tested, fundamental investment principles that can put the historical odds in your favor.
One of the basic tenets is to invest for the long term. Over time, riding out the markets’ inevitable ups and downs has proven much more effective than selling into panic or chasing the hottest trend. Even missing only a few of the markets’ best days can significantly diminish investor returns. Patience also affords the benefits of compounding of earning interest on additional income or reinvested dividends and capital gains. There are tax advantages and cost benefits to consider as well. The more you sell, the more taxes you pay, and the more you trade, the higher the costs. While staying the course doesn’t eliminate risk, it can considerably lessen the effect of short term declines.
You can further manage your investing risk through diversification. And today, more than ever, geographic diversification should be taken into account. Studies indicate that asset allocation is the single most important determinant of a portfolio’s long term success. The right mix of stocks, bonds and cash aligned to your particular risk tolerance and investment objective is very important. Age appropriate rebalancing is also an essential aspect of asset allocation. For younger investors, an emphasis on equities which historically have been the best performing asset class over time is encouraged. As investors near their specific goal, such as retirement or sending a child to college, consideration may be given to replacing volatile assets (e.g. common stocks) with more stable fixed investments (bonds or savings plans).
A third investment principle investing regularly can help lower the average cost of your purchases. Investing a certain amount of money each month or quarter helps ensure you won’t pay for all your shares at market highs. This strategy known as dollar cost averaging also reduces unconstructive “emotion” from investing, helping shareholders avoid selling weak performers just prior to an upswing, or chasing a hot performer just before a correction.
We invite you to contact us via the Internet, through our Investor Centers or over the phone. It is our privilege to provide you the information you need to make the investments that are right for you.
Sincerely,
/s/ Edward C. Johnson 3d
Edward C. Johnson 3d
3 Semiannual Report
Shareholder Expense Example
As a shareholder of the Fund, you incur two types of costs: (1) transaction costs, including redemption fees, and (2) ongoing costs, including management fees and other Fund expenses. This Example is intended to help you understand your ongoing costs (in dollars) of investing in the Fund and to compare these costs with the ongoing costs of investing in other mutual funds.
The Example is based on an investment of $1,000 invested at the beginning of the period and held for the entire period (September 1, 2005 to February 28, 2006).
The first line of the table below provides information about actual account values and actual expenses. You may use the information in this line, together with the amount you invested, to estimate the expenses that you paid over the period. Simply divide your account value by $1,000.00 (for example, an $8,600 account value divided by $1,000.00 = 8.6), then multiply the result by the number in the first line under the heading entitled “Expenses Paid During Period” to estimate the expenses you paid on your account during this period. A small balance maintenance fee of $12.00 that is charged once a year may apply for certain accounts with a value of less than $2,000. This fee is not included in the table below. If it was, the estimate of expenses you paid during the period would be higher, and your ending account value lower, by this amount.
Hypothetical Example for Comparison Purposes
The second line of the table below provides information about hypothetical account values and hypothetical expenses based on the Fund’s actual expense ratio and an assumed rate of return of 5% per year before expenses, which is not the Fund’s actual return. The hypothetical account values and expenses may not be used to estimate the actual ending account balance or expenses you paid for the period. You may use this information to compare the ongoing costs of investing in the Fund and other funds. To do so, compare this 5% hypothetical example with the 5% hypothetical examples that appear in the share holder reports of the other funds. A small balance maintenance fee of $12.00 that is charged once a year may apply for certain accounts with a value of less than $2,000. This fee is not included in the table below. If it was, the estimate of expenses you paid during the period would be higher, and your ending account value lower, by this amount.
Please note that the expenses shown in the table are meant to highlight your ongoing costs only and do not reflect any transaction costs. Therefore, the second line of the table is useful in comparing ongoing costs only, and will not help you determine the relative total costs of owning different funds. In addition, if these transactional costs were included, your costs would have been higher.
| | | | | | | | | | | Expenses Paid |
| | | | | | | | | | | During Period* |
| | | Beginning | | Ending | | September 1, 2005 |
| | | Account Value | | Account Value | | to February 28, |
| | | September 1, 2005 | | February 28, 2006 | | 2006 |
| Actual | | $ | | 1,000.00 | | $ | | 1,098.60 | | $ | | 4.37 |
| Hypothetical (5% return per year | | | | | | | | | | | | |
| before expenses) | | $ | | 1,000.00 | | $ | | 1,020.63 | | $ | | 4.21 |
* Expenses are equal to the Fund’s annualized expense ratio of .84%; multiplied by the average account value over the period, multiplied by 181/365 (to reflect the one half year period).
5 Semiannual Report
| Investment Changes | | | | |
| |
| |
| Top Ten Stocks as of February 28, 2006 | | | | |
| | | % of fund’s | | % of fund’s net assets |
| | | net assets | | 6 months ago |
| Google, Inc. Class A (sub. vtg.) | | 3.8 | | 2.5 |
| Bank of America Corp. | | 3.4 | | 2.3 |
| Crown Castle International Corp. | | 3.3 | | 0.0 |
| American International Group, Inc. | | 3.2 | | 6.8 |
| Valero Energy Corp. | | 3.1 | | 1.9 |
| UnitedHealth Group, Inc. | | 3.0 | | 2.6 |
| Halliburton Co. | | 3.0 | | 2.4 |
| eBay, Inc. | | 2.7 | | 2.5 |
| Honeywell International, Inc. | | 2.7 | | 2.0 |
| Ultra Petroleum Corp. | | 2.7 | | 0.0 |
| | | 30.9 | | |
Top Five Market Sectors as of February 28, 2006 | | | | |
| | | % of fund’s | | % of fund’s net assets |
| | | net assets | | 6 months ago |
| Financials | | 23.9 | | 25.8 |
| Information Technology | | 21.9 | | 16.9 |
| Energy | | 15.5 | | 14.9 |
| Health Care | | 10.4 | | 7.5 |
| Industrials | | 8.4 | | 14.4 |
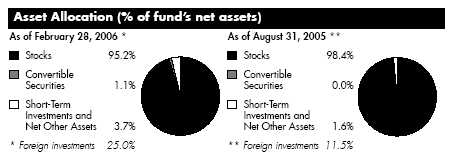
Semiannual Report 6
| Investments February 28, 2006 (Unaudited) |
| Showing Percentage of Net Assets | | | | | | |
| |
| Common Stocks 95.2% | | | | | | |
| | | Shares | | Value (Note 1) |
| | | | | (000s) |
| |
| CONSUMER DISCRETIONARY – 6.6% | | | | | | |
| Hotels, Restaurants & Leisure 1.3% | | | | | | |
| Kerzner International Ltd. (a) | | 375,200 | | | | $ 25,247 |
| Starbucks Corp. (a) | | 985,146 | | | | 35,781 |
| | | | | | | 61,028 |
| Media – 1.0% | | | | | | |
| Getty Images, Inc. (a) | | 593,000 | | | | 48,051 |
| Specialty Retail – 2.1% | | | | | | |
| Best Buy Co., Inc. | | 896,500 | | | | 48,285 |
| Chico’s FAS, Inc. (a) | | 1,130,500 | | | | 53,190 |
| | | | | | | 101,475 |
| Textiles, Apparel & Luxury Goods – 2.2% | | | | | | |
| Carter’s, Inc. (a) | | 833,400 | | | | 53,329 |
| Polo Ralph Lauren Corp. Class A | | 873,600 | | | | 50,634 |
| | | | | | | 103,963 |
| |
| TOTAL CONSUMER DISCRETIONARY | | | | | | 314,517 |
| |
| CONSUMER STAPLES 2.9% | | | | | | |
| Beverages – 0.2% | | | | | | |
| Hansen Natural Corp. (a) | | 125,000 | | | | 11,668 |
| Food & Staples Retailing – 1.7% | | | | | | |
| Walgreen Co. | | 1,783,200 | | | | 79,994 |
| Food Products 1.0% | | | | | | |
| Nestle SA (Reg.) | | 158,500 | | | | 46,603 |
| |
| TOTAL CONSUMER STAPLES | | | | | | 138,265 |
| |
| ENERGY 15.5% | | | | | | |
| Energy Equipment & Services – 6.0% | | | | | | |
| Halliburton Co. | | 2,098,800 | | | | 142,718 |
| National Oilwell Varco, Inc. (a) | | 676,022 | | | | 41,156 |
| Schlumberger Ltd. (NY Shares) | | 889,100 | | | | 102,247 |
| | | | | | | 286,121 |
| Oil, Gas & Consumable Fuels – 9.5% | | | | | | |
| Cameco Corp. | | 1,468,200 | | | | 54,598 |
| Canadian Natural Resources Ltd. | | 2,250,000 | | | | 122,961 |
| |
| |
| |
| |
| See accompanying notes which are an integral part of the financial statements. | | | | |
| |
| 7 | | Semiannual Report |
| Investments (Unaudited) continued | | | | | | |
| |
| |
| Common Stocks continued | | | | | | | | |
| | | | | Shares | | Value (Note 1) |
| | | | | | | (000s) |
| |
| ENERGY – continued | | | | | | | | |
| Oil, Gas & Consumable Fuels – continued | | | | | | |
| Ultra Petroleum Corp. (a) | | | | 2,478,200 | | | | $ 128,966 |
| Valero Energy Corp. | | | | 2,806,960 | | | | 150,986 |
| | | | | | | | | 457,511 |
| |
| TOTAL ENERGY | | | | | | | | 743,632 |
| |
| FINANCIALS – 23.9% | | | | | | | | |
| Capital Markets 3.8% | | | | | | | | |
| Goldman Sachs Group, Inc. | | | | 821,860 | | | | 116,121 |
| Lehman Brothers Holdings, Inc. | | | | 174,600 | | | | 25,483 |
| Merrill Lynch & Co., Inc. | | | | 504,300 | | | | 38,937 |
| | | | | | | | | 180,541 |
| Commercial Banks – 5.4% | | | | | | | | |
| Bank of America Corp. | | | | 3,545,500 | | | | 162,561 |
| Wells Fargo & Co. | | | | 1,506,400 | | | | 96,711 |
| | | | | | | | | 259,272 |
| Consumer Finance – 2.0% | | | | | | | | |
| American Express Co. | | | | 1,761,900 | | | | 94,931 |
| Insurance – 8.2% | | | | | | | | |
| ACE Ltd. | | | | 878,170 | | | | 48,940 |
| AMBAC Financial Group, Inc. | | | | 629,100 | | | | 47,277 |
| American International Group, Inc. | | | | 2,321,990 | | | | 154,087 |
| MetLife, Inc. (a) | | | | 980,600 | | | | 49,148 |
| W.R. Berkley Corp. | | | | 838,950 | | | | 48,567 |
| XL Capital Ltd. Class A | | | | 717,755 | | | | 48,484 |
| | | | | | | | | 396,503 |
| Real Estate 3.0% | | | | | | | | |
| General Growth Properties, Inc. | | | | 996,400 | | | | 50,209 |
| Mitsubishi Estate Co. Ltd. | | | | 1,125,000 | | | | 23,621 |
| Mitsui Fudosan Co. Ltd. | | | | 1,150,000 | | | | 23,804 |
| Vornado Realty Trust | | | | 553,500 | | | | 49,256 |
| | | | | | | | | 146,890 |
| Thrifts & Mortgage Finance – 1.5% | | | | | | | | |
| Golden West Financial Corp., Delaware | | | | 994,500 | | | | 70,639 |
| |
| TOTAL FINANCIALS | | | | | | | | 1,148,776 |
See accompanying notes which are an integral part of the financial statements.
| Common Stocks continued | | | | | | |
| | | Shares | | Value (Note 1) |
| | | | | (000s) |
| |
| HEALTH CARE – 9.5% | | | | | | |
| Biotechnology – 2.1% | | | | | | |
| Affymetrix, Inc. (a) | | 170,500 | | | | $ 6,054 |
| Genentech, Inc. (a) | | 1,101,000 | | | | 94,345 |
| | | | | | | 100,399 |
| Health Care Equipment & Supplies – 1.6% | | | | | | |
| Alcon, Inc. | | 601,600 | | | | 69,280 |
| Synthes, Inc. | | 78,000 | | | | 8,520 |
| | | | | | | 77,800 |
| Health Care Providers & Services – 3.0% | | | | | | |
| UnitedHealth Group, Inc. | | 2,478,165 | | | | 144,304 |
| Pharmaceuticals – 2.8% | | | | | | |
| Allergan, Inc. | | 446,000 | | | | 48,284 |
| Roche Holding AG (participation certificate) (d) | | 585,110 | | | | 86,476 |
| | | | | | | 134,760 |
| |
| TOTAL HEALTH CARE | | | | | | 457,263 |
| |
| INDUSTRIALS – 8.4% | | | | | | |
| Aerospace & Defense – 2.7% | | | | | | |
| Honeywell International, Inc. | | 3,168,430 | | | | 129,747 |
| Air Freight & Logistics – 1.4% | | | | | | |
| Expeditors International of Washington, Inc. | | 835,000 | | | | 64,955 |
| Airlines – 1.0% | | | | | | |
| Ryanair Holdings PLC sponsored ADR (a) | | 903,800 | | | | 47,983 |
| Commercial Services & Supplies – 1.1% | | | | | | |
| Robert Half International, Inc. | | 1,429,740 | | | | 51,356 |
| Construction & Engineering – 1.2% | | | | | | |
| SNC-Lavalin Group, Inc. | | 705,500 | | | | 58,761 |
| Road & Rail 1.0% | | | | | | |
| Canadian National Railway Co. | | 1,060,000 | | | | 49,634 |
| |
| TOTAL INDUSTRIALS | | | | | | 402,436 |
| |
| INFORMATION TECHNOLOGY – 21.9% | | | | | | |
| Communications Equipment – 0.9% | | | | | | |
| CSR PLC (a) | | 2,638,000 | | | | 41,878 |
| Computers & Peripherals – 1.9% | | | | | | |
| Apple Computer, Inc. (a) | | 1,317,600 | | | | 90,308 |
See accompanying notes which are an integral part of the financial statements.
| Investments (Unaudited) continued | | | | | | |
| |
| |
| Common Stocks continued | | | | | | |
| | | Shares | | Value (Note 1) |
| | | | | (000s) |
| |
| INFORMATION TECHNOLOGY – continued | | | | | | |
| Electronic Equipment & Instruments – 2.2% | | | | | | |
| Hon Hai Precision Industry Co. Ltd. (Foxconn) | | 12,258,000 | | | | $ 77,193 |
| National Instruments Corp. | | 957,450 | | | | 31,069 |
| | | | | | | 108,262 |
| Internet Software & Services – 9.8% | | | | | | |
| eBay, Inc. (a) | | 3,249,740 | | | | 130,185 |
| Equinix, Inc. (a) | | 1,047,000 | | | | 54,905 |
| Google, Inc. Class A (sub. vtg.) (a) | | 506,320 | | | | 183,604 |
| Yahoo!, Inc. (a) | | 3,182,500 | | | | 102,031 |
| | | | | | | 470,725 |
| Semiconductors & Semiconductor Equipment – 4.3% | | | | | | |
| FormFactor, Inc. (a) | | 508,200 | | | | 18,722 |
| Marvell Technology Group Ltd. (a) | | 1,456,000 | | | | 89,136 |
| Samsung Electronics Co. Ltd. | | 139,887 | | | | 98,082 |
| | | | | | | 205,940 |
| Software 2.8% | | | | | | |
| Convera Corp. (a)(e) | | 2,000,000 | | | | 17,640 |
| Microsoft Corp. | | 4,420,570 | | | | 118,913 |
| | | | | | | 136,553 |
| |
| TOTAL INFORMATION TECHNOLOGY | | | | | | 1,053,666 |
| |
| MATERIALS 1.3% | | | | | | |
| Chemicals – 1.3% | | | | | | |
| Monsanto Co. | | 726,800 | | | | 60,964 |
| TELECOMMUNICATION SERVICES – 3.3% | | | | | | |
| Wireless Telecommunication Services – 3.3% | | | | | | |
| Crown Castle International Corp. (a) | | 5,027,554 | | | | 157,614 |
| UTILITIES – 1.9% | | | | | | |
| Electric Utilities – 1.0% | | | | | | |
| Exelon Corp. | | 888,100 | | | | 50,719 |
| Multi-Utilities – 0.9% | | | | | | |
| CMS Energy Corp. (a) | | 2,966,500 | | | | 41,768 |
| |
| TOTAL UTILITIES | | | | | | 92,487 |
| |
| TOTAL COMMON STOCKS | | | | | | |
| (Cost $4,057,084) | | | | | | 4,569,620 |
See accompanying notes which are an integral part of the financial statements.
| Convertible Bonds 1.1% | | | | | | | | | | |
| | | Principal | | | | Value (Note 1) |
| | | Amount (000s) | | | | (000s) |
| |
| CONSUMER DISCRETIONARY – 0.2% | | | | | | | | | | |
| Hotels, Restaurants & Leisure 0.2% | | | | | | | | | | |
| Kerzner International Ltd. 2.375% 4/15/24 | | | | $ 8,525 | | | | | | $ 10,820 |
| HEALTH CARE – 0.9% | | | | | | | | | | |
| Pharmaceuticals – 0.9% | | | | | | | | | | |
| Allergan, Inc. 0% 11/6/22 | | | | 34,700 | | | | | | 42,910 |
| TOTAL CONVERTIBLE BONDS | | | | | | | | | | |
| (Cost $51,664) | | | | | | | | | | 53,730 |
| Money Market Funds 5.5% | | | | | | | | | | |
| | | | | Shares | | | | | | |
| Fidelity Cash Central Fund, 4.57% (b) | | | | 176,510,162 | | | | | | 176,510 |
| Fidelity Securities Lending Cash Central Fund, 4.58% (b)(c) | | | | 87,951,000 | | | | | | 87,951 |
| TOTAL MONEY MARKET FUNDS | | | | | | | | | | |
| (Cost $264,461) | | | | | | | | | | 264,461 |
| |
| TOTAL INVESTMENT PORTFOLIO 101.8% | | | | | | | | | | |
| (Cost $4,373,209) | | | | | | | | 4,887,811 |
| |
| NET OTHER ASSETS – (1.8)% | | | | | | | | | | (84,258) |
| NET ASSETS 100% | | | | | | | | $ 4,803,553 |
Legend
(a) Non-income producing
(b) Affiliated fund that is available only to
investment companies and other
accounts managed by Fidelity
Investments. The rate quoted is the
annualized seven-day yield of the fund
at period end. A complete unaudited
listing of the fund’s holdings as of its
most recent quarter end is available
upon request.
(c) Includes investment made with cash
collateral received from securities on
loan.
(d) Security or a portion of the security is on
loan at period end.
|
(e) Restricted securities – Investment in
securities not registered under the
Securities Act of 1933 (excluding 144A
issues). At the end of the period, the
value of restricted securities (excluding
144A issues) amounted to $17,640,000
or 0.4% of net assets.
|
Additional information on each holding is as follows:
| | | Acquisition | | | | Cost |
| Security | | Date | | | | (000s) |
| Convera Corp. | | 2/23/06 | | | | $ 15,000 |
See accompanying notes which are an integral part of the financial statements.
11 Semiannual Report
Investments (Unaudited) continued
Affiliated Central Funds
Information regarding fiscal year to date income earned by the fund from the affiliated Central funds is as follows:
| Fund | | | | Income earned |
| | | | | (Amounts in thousands) |
| Fidelity Cash Central Fund | | | | $ 2,796 |
| Fidelity Securities Lending Cash Central Fund | | | | 46 |
| Total | | | | $ 2,842 |
Distribution of investments by country of issue, as a percentage of total net assets, is as follows:
| United States of America | | 75.0% |
| Canada | | 8.6% |
| Switzerland | | 4.2% |
| Bermuda | | 2.9% |
| Netherlands Antilles | | 2.1% |
| Korea (South) | | 2.0% |
| Taiwan | | 1.6% |
| Ireland | | 1.0% |
| Japan | | 1.0% |
| Others (individually less than 1%) . | | 1.6% |
| | | 100.0% |
See accompanying notes which are an integral part of the financial statements.
Semiannual Report 12
| Financial Statements | | | | | | |
| |
| Statement of Assets and Liabilities | | | | | | |
| Amounts in thousands (except per share amount) | | | | February 28, 2006 (Unaudited) |
| |
| Assets | | | | | | |
| Investment in securities, at value (including securities | | | | | | |
| loaned of $84,263) See accompanying schedule: | | | | | | |
| Unaffiliated issuers (cost $4,108,748) | | | | $ 4,623,350 | | |
| Affiliated Central Funds (cost $264,461) | | | | 264,461 | | |
| Total Investments (cost $4,373,209) | | | | | | $ 4,887,811 |
| Receivable for investments sold | | | | | | 22,683 |
| Receivable for fund shares sold | | | | | | 17,174 |
| Dividends receivable | | | | | | 3,660 |
| Interest receivable | | | | | | 780 |
| Prepaid expenses | | | | | | 12 |
| Other receivables | | | | | | 339 |
| Total assets | | | | | | 4,932,459 |
| |
| Liabilities | | | | | | |
| Payable for investments purchased | | | | $ 25,499 | | |
| Payable for fund shares redeemed | | | | 12,055 | | |
| Accrued management fee | | | | 2,251 | | |
| Other affiliated payables | | | | 910 | | |
| Other payables and accrued expenses | | | | 240 | | |
| Collateral on securities loaned, at value | | | | 87,951 | | |
| Total liabilities | | | | | | 128,906 |
| |
| Net Assets | | | | | | $ 4,803,553 |
| Net Assets consist of: | | | | | | |
| Paid in capital | | | | | | $ 4,301,439 |
| Distributions in excess of net investment income | | | | | | (477) |
| Accumulated undistributed net realized gain (loss) on | | | | | | |
| investments and foreign currency transactions | | | | | | (12,032) |
| Net unrealized appreciation (depreciation) on | | | | | | |
| investments and assets and liabilities in foreign | | | | | | |
| currencies | | | | | | 514,623 |
| Net Assets, for 222,470 shares outstanding | | | | | | $ 4,803,553 |
| Net Asset Value, offering price and redemption price per | | | | | | |
| share ($4,803,553 ÷ 222,470 shares) | | | | | | $ 21.59 |
See accompanying notes which are an integral part of the financial statements.
13 Semiannual Report
| Financial Statements continued | | | | |
| |
| |
| Statement of Operations | | | | | | |
| Amounts in thousands | | Six months ended February 28, 2006 (Unaudited) |
| |
| Investment Income | | | | | | |
| Dividends | | | | | | $ 17,652 |
| Interest | | | | | | 45 |
| Income from affiliated Central Funds | | | | | | 2,842 |
| Total income | | | | | | 20,539 |
| |
| Expenses | | | | | | |
| Management fee | | | | $ 11,229 | | |
| Transfer agent fees | | | | 4,294 | | |
| Accounting and security lending fees | | | | 492 | | |
| Independent trustees’ compensation | | | | 8 | | |
| Custodian fees and expenses | | | | 106 | | |
| Registration fees | | | | 313 | | |
| Audit | | | | 35 | | |
| Legal | | | | 17 | | |
| Miscellaneous | | | | 20 | | |
| Total expenses before reductions | | | | 16,514 | | |
| Expense reductions | | | | (883) | | 15,631 |
| |
| Net investment income (loss) | | | | | | 4,908 |
| Realized and Unrealized Gain (Loss) | | | | | | |
| Net realized gain (loss) on: | | | | | | |
| Investment securities: | | | | | | |
| Unaffiliated issuers | | | | 126,916 | | |
| Foreign currency transactions | | | | (453) | | |
| Total net realized gain (loss) | | | | | | 126,463 |
| Change in net unrealized appreciation (depreciation) on: | | | | |
| Investment securities | | | | 201,769 | | |
| Assets and liabilities in foreign currencies | | | | 24 | | |
| Total change in net unrealized appreciation | | | | | | |
| (depreciation) | | | | | | 201,793 |
| Net gain (loss) | | | | | | 328,256 |
| Net increase (decrease) in net assets resulting from | | | | |
| operations | | | | | | $ 333,164 |
See accompanying notes which are an integral part of the financial statements.
| Statement of Changes in Net Assets | | | | | | | | |
| | | Six months ended | | | | Year ended |
| | | February 28, 2006 | | | | August 31, |
| Amounts in thousands | | (Unaudited) | | | | 2005 |
| Increase (Decrease) in Net Assets | | | | | | | | |
| Operations | | | | | | | | |
| Net investment income (loss) | | | | $ 4,908 | | | | $ 13,378 |
| Net realized gain (loss) | | | | 126,463 | | | | 117,519 |
| Change in net unrealized appreciation (depreciation) . | | | | 201,793 | | | | 231,637 |
| Net increase (decrease) in net assets resulting | | | | | | | | |
| from operations | | | | 333,164 | | | | 362,534 |
| Distributions to shareholders from net investment income . | | | | (10,223) | | | | (8,330) |
| Distributions to shareholders from net realized gain | | | | (223,304) | | | | (59,902) |
| Total distributions | | | | (233,527) | | | | (68,232) |
| Share transactions | | | | | | | | |
| Proceeds from sales of shares | | | | 1,749,199 | | | | 2,038,629 |
| Reinvestment of distributions | | | | 224,722 | | | | 65,863 |
| Cost of shares redeemed | | | | (413,971) | | | | (516,105) |
| Net increase (decrease) in net assets resulting from | | | | | | | | |
| share transactions | | | | 1,559,950 | | | | 1,588,387 |
| Redemption fees | | | | 67 | | | | 80 |
| Total increase (decrease) in net assets | | | | 1,659,654 | | | | 1,882,769 |
| |
| Net Assets | | | | | | | | |
| Beginning of period | | | | 3,143,899 | | | | 1,261,130 |
| End of period (including distributions in excess of net | | | | | | | | |
| investment income of $477 and undistributed net | | | | | | | | |
| investment income of $5,250, respectively) | | | | $ 4,803,553 | | | | $ 3,143,899 |
| |
| Other Information | | | | | | | | |
| Shares | | | | | | | | |
| Sold | | | | 80,860 | | | | 103,832 |
| Issued in reinvestment of distributions | | | | 10,709 | | | | 3,515 |
| Redeemed | | | | (19,164) | | | | (26,307) |
| Net increase (decrease) | | | | 72,405 | | | | 81,040 |
See accompanying notes which are an integral part of the financial statements.
15 Semiannual Report
| Financial Highlights | | | | | | | | | | | | | | | | | | |
| | | | | Six months ended | | | | | | | | | | | | | | | | | | |
| | | | | February 28, | | | | | | | | | | | | | | | | | | |
| | | | | 2006 | | | | Years ended August 31, |
| | | | | (Unaudited) | | | | 2005 | | | | 2004 | | 2003 | | | | 2002 | | | | 2001 |
| Selected Per Share Data | | | | | | | | | | | | | | | | | | | | | | |
| Net asset value, | | | | | | | | | | | | | | | | | | | | | | |
| beginning of period | | | | $ 20.95 | | | | $ 18.27 | | | | $ 16.23 | | $ 13.59 | | | | $ 16.39 | | | | $ 23.45 |
| Income from | | | | | | | | | | | | | | | | | | | | | | |
| Investment | | | | | | | | | | | | | | | | | | | | | | |
| Operations | | | | | | | | | | | | | | | | | | | | | | |
| Net investment | | | | | | | | | | | | | | | | | | | | | | |
| income (loss)D | | | | 03 | | | | .12E | | | | .03 | | .09 | | | | .03 | | | | .04 |
| Net realized and | | | | | | | | | | | | | | | | | | | | | | |
| unrealized gain | | | | | | | | | | | | | | | | | | | | | | |
| (loss) | | | | 1.97 | | | | 3.49 | | | | 2.08 | | 2.60 | | | | (2.80) | | | | (1.79) |
| Total from invest- | | | | | | | | | | | | | | | | | | | | | | |
| ment operations . | | | | 2.00 | | | | 3.61 | | | | 2.11 | | 2.69 | | | | (2.77) | | | | (1.75) |
| Distributions from net | | | | | | | | | | | | | | | | | | | | | | |
| investment income . | | | | (.06) | | | | (.11) | | | | (.07) | | (.05) | | | | (.03) | | | | (.10) |
| Distributions from net | | | | | | | | | | | | | | | | | | | | | | |
| realized gain | | | | (1.30) | | | | (.82) | | | | — | | — | | | | — | | | | (5.21) |
| Total distributions | | | | (1.36) | | | | (.93) | | | | (.07) | | (.05) | | | | (.03) | | | | (5.31) |
| Redemption fees | | | | | | | | | | | | | | | | | | | | | | |
| added to paid in | | | | | | | | | | | | | | | | | | | | | | |
| capitalD,G | | | | — | | | | — | | | | — | | — | | | | — | | | | — |
| Net asset value, | | | | | | | | | | | | | | | | | | | | | | |
| end of period | | | | $ 21.59 | | | | $ 20.95 | | | | $ 18.27 | | $ 16.23 | | | | $ 13.59 | | | | $ 16.39 |
| |
| Total ReturnB,C | | | | 9.86% | | | | 20.43% | | | | 13.03% | | 19.88% | | | | (16.93)% | | | | (7.69)% |
| Ratios to Average Net AssetsF | | | | | | | | | | | | | | | | | | | | | | |
| Expenses before | | | | | | | | | | | | | | | | | | | | | | |
| reductions | | | | 84%A | | | | .85% | | | | .86% | | .91% | | | | .89% | | | | .86% |
| Expenses net of fee | | | | | | | | | | | | | | | | | | | | | | |
| waivers, if any | | | | 84%A | | | | .85% | | | | .86% | | .91% | | | | .89% | | | | .86% |
| Expenses net of all | | | | | | | | | | | | | | | | | | | | | | |
| reductions | | | | 80%A | | | | .82% | | | | .83% | | .84% | | | | .78% | | | | .81% |
| Net investment | | | | | | | | | | | | | | | | | | | | | | |
| income (loss) | | | | 25%A | | | | .63% | | | | .15% | | .60% | | | | .19% | | | | .21% |
| Supplemental Data | | | | | | | | | | | | | | | | | | | | | | |
| Net assets, end of | | | | | | | | | | | | | | | | | | | | | | |
| period (in millions) | | | | $ 4,804 | | | | $ 3,144 | | | | $ 1,261 | | $ 872 | | | | $ 603 | | | | $ 565 |
| Portfolio turnover | | | | | | | | | | | | | | | | | | | | | | |
| rate | | | | 153%A | | | | 68% | | | | 96% | | 139% | | | | 228% | | | | 170% |
A Annualized
B Total returns for periods of less than one year are not annualized.
C Total returns would have been lower had certain expenses not been reduced during the periods shown.
D Calculated based on average shares outstanding during the period.
E Investment income per share reflects a special dividend which amounted to $.07 per share. Excluding the special dividend, the ratio of net
investment income (loss) to average net assets would have been .28%.
F Expense ratios reflect operating expenses of the fund. Expenses before reductions do not reflect amounts reimbursed by the investment adviser or
reductions from brokerage service arrangements or other expense offset arrangements and do not represent the amount paid by the fund during
periods when reimbursements or reductions occur. Expenses net of fee waivers reflect expenses after reimbursement by the investment adviser but
prior to reductions from brokerage service arrangements or other expense offset arrangements. Expenses net of all reductions represent the net
expenses paid by the fund.
G Amount represents less than $.01 per share.
|
See accompanying notes which are an integral part of the financial statements.
Notes to Financial Statements
For the period ended February 28, 2006 (Unaudited)
(Amounts in thousands except ratios)
1. Significant Accounting Policies.
Fidelity Export and Multinational Fund (the fund) is a non diversified fund of Fidelity Union Street Trust (the trust) and is authorized to issue an unlimited number of shares. The trust is registered under the Investment Company Act of 1940, as amended (the 1940 Act), as an open end management investment company organized as a Massachusetts business trust. The fund may invest in affiliated money market central funds (Money Market Central Funds) which are open end investment companies available to invest ment companies and other accounts managed by Fidelity Management & Research Company (FMR) and its affiliates. The financial statements have been prepared in conformity with accounting principles generally accepted in the United States of America, which require management to make certain estimates and assumptions at the date of the financial statements. The following summarizes the significant accounting policies of the fund:
Security Valuation. Investments are valued and net asset value (NAV) per share is calculated (NAV calculation) as of the close of business of the New York Stock Exchange (NYSE), normally 4:00 p.m. Eastern time. Wherever possible, the fund uses independent pricing services approved by the Board of Trustees to value its investments.
Equity securities, including restricted securities, for which market quotations are readily available, are valued at the last reported sale price or official closing price as reported by an independent pricing service on the primary market or exchange on which they are traded. In the event there were no sales during the day or closing prices are not available, securities are valued at the last quoted bid price. Investments in open end mutual funds, are valued at their closing net asset value each business day. Short term securities with remaining maturities of sixty days or less for which quotations are not readily available are valued at amortized cost, which approximates value.
When current market prices or quotations are not readily available or do not accurately reflect fair value, valuations may be determined in accordance with procedures adopted by the Board of Trustees. For example, when developments occur between the close of a market and the close of the NYSE that may materially affect the value of some or all of the securities, or when trading in a security is halted, those securities may be fair valued. Factors used in the determination of fair value may include monitoring news to identify significant market or security specific events such as changes in the value of U.S. securi ties markets, reviewing developments in foreign markets and evaluating the perfor mance of ADRs, futures contracts and exchange traded funds. Because the fund’s utilization of fair value pricing depends on market activity, the frequency with which fair value pricing is used can not be predicted and may be utilized to a significant extent. The value of securities used for NAV calculation under fair value pricing may differ from published prices for the same securities.
17 Semiannual Report
| Notes to Financial Statements (Unaudited) continued |
| (Amounts in thousands except ratios) |
| |
| 1. Significant Accounting Policies continued |
Foreign Currency. The fund uses foreign currency contracts to facilitate transactions in foreign denominated securities. Losses from these transactions may arise from changes in the value of the foreign currency or if the counterparties do not perform under the contracts’ terms.
Foreign denominated assets, including investment securities, and liabilities are translated into U.S. dollars at the exchange rate at period end. Purchases and sales of investment securities, income and dividends received and expenses denominated in foreign currencies are translated into U.S. dollars at the exchange rate in effect on the transaction date.
The effects of exchange rate fluctuations on investments are included with the net realized and unrealized gain (loss) on investment securities. Other foreign currency transactions resulting in realized and unrealized gain (loss) are disclosed separately.
Investment Transactions and Income. Security transactions are accounted for as of trade date. Gains and losses on securities sold are determined on the basis of identified cost and may include proceeds received from litigation. Dividend income is recorded on the ex dividend date, except for certain dividends from foreign securities where the ex dividend date may have passed, which are recorded as soon as the fund is informed of the ex dividend date. Non cash dividends included in dividend income, if any, are recorded at the fair market value of the securities received. Distributions received on securities that represent a return of capital or capital gain are recorded as a reduction of cost of investments and/or as a realized gain. The fund estimates the components of distributions received that may be considered return of capital distributions or capital gain distributions. Interest income is accrued as earned. Interest income includes coupon interest and amortization of premium and accretion of discount on debt securi ties. Investment income is recorded net of foreign taxes withheld where recovery of such taxes is uncertain.
Expenses. Most expenses of the trust can be directly attributed to a fund. Expenses which cannot be directly attributed are apportioned among each fund in the trust.
Income Tax Information and Distributions to Shareholders. Each year, the fund intends to qualify as a regulated investment company by distributing all of its taxable income and realized gains under Subchapter M of the Internal Revenue Code. As a result, no provision for income taxes is required in the accompanying financial statements. Foreign taxes are provided for based on the fund’s understanding of the tax rules and rates that exist in the foreign markets in which it invests.
Distributions are recorded on the ex dividend date. Income and capital gain distribu tions are determined in accordance with income tax regulations, which may differ from generally accepted accounting principles. In addition, the fund will claim a portion of the payment made to redeeming shareholders as a distribution for income tax purposes.
| 1. Significant Accounting Policies continued | | |
Income Tax Information and Distributions to Shareholders continued |
Capital accounts within the financial statements are adjusted for permanent book tax differences. These adjustments have no impact on net assets or the results of operations. Temporary book tax differences will reverse in a subsequent period.
Book tax differences are primarily due to foreign currency transactions and losses deferred due to wash sales.
The federal tax cost of investments and unrealized appreciation (depreciation) as of period end were as follows:
| Unrealized appreciation | | | | $ 586,073 |
| Unrealized depreciation | | | | (78,269) |
| Net unrealized appreciation (depreciation) | | | | $ 507,804 |
| Cost for federal income tax purposes | | | | $ 4,380,007 |
Short Term Trading (Redemption) Fees. Shares held in the fund less than 30 days are subject to a redemption fee equal to .75% of the proceeds of the redeemed shares. All redemption fees, including any estimated redemption fees paid by FMR, are retained by the fund and accounted for as an addition to paid in capital.
Repurchase Agreements. FMR has received an Exemptive Order from the Securities and Exchange Commission (the SEC) which permits the fund and other affiliated entities of FMR to transfer uninvested cash balances into joint trading accounts which are then invested in repurchase agreements. The fund may also invest directly with institutions in repurchase agreements. Repurchase agreements are collateralized by government or non government securities. Upon settlement date, collateral is held in segregated accounts with custodian banks and may be obtained in the event of a default of the counterparty. The fund monitors, on a daily basis, the value of the collateral to ensure it is at least equal to the principal amount of the repurchase agreement (includ ing accrued interest). In the event of a default by the counterparty, realization of the collateral proceeds could be delayed, during which time the value of the collateral may decline.
Restricted Securities. The fund may invest in securities that are subject to legal or contractual restrictions on resale. These securities generally may be resold in transac tions exempt from registration or to the public if the securities are registered. Disposal of these securities may involve time consuming negotiations and expense, and prompt sale at an acceptable price may be difficult. Information regarding restricted securities is included at the end of the fund’s Schedule of Investments.
19 Semiannual Report
| Notes to Financial Statements (Unaudited) continued |
| (Amounts in thousands except ratios) | | |
| |
| 3. Purchases and Sales of Investments. | | |
Purchases and sales of securities, other than short term securities and U.S. government securities, aggregated $4,096,288 and $2,893,224, respectively.
4. Fees and Other Transactions with Affiliates.
Management Fee. FMR and its affiliates provide the fund with investment manage ment related services for which the fund pays a monthly management fee. The manage ment fee is the sum of an individual fund fee rate that is based on an annual rate of .30% of the fund’s average net assets and a group fee rate that averaged .27% during the period. The group fee rate is based upon the average net assets of all the mutual funds advised by FMR. The group fee rate decreases as assets under management increase and increases as assets under management decrease. For the period, the total annualized management fee rate was .57% of the fund’s average net assets.
Transfer Agent Fees. Fidelity Service Company, Inc. (FSC), an affiliate of FMR, is the fund’s transfer, dividend disbursing and shareholder servicing agent. FSC receives account fees and asset based fees that vary according to account size and type of account. FSC pays for typesetting, printing and mailing of shareholder reports, except proxy statements. For the period, the transfer agent fees were equivalent to an annual ized rate of .22% of average net assets.
Accounting and Security Lending Fees. FSC maintains the fund’s accounting records. The accounting fee is based on the level of average net assets for the month. Under a separate contract, FSC administers the security lending program. The security lending fee is based on the number and duration of lending transactions.
Affiliated Central Funds. The fund may invest in Money Market Central Funds which seek preservation of capital and current income and are managed by Fidelity Invest ments Money Management, Inc. (FIMM), an affiliate of FMR.
The Central Funds do not pay a management fee.
Brokerage Commissions. The fund placed a portion of its portfolio transactions with brokerage firms which are affiliates of the investment adviser. The commissions paid to these affiliated firms were $14 for the period.
5. Committed Line of Credit.
|
The fund participates with other funds managed by FMR in a $4.2 billion credit facility (the “line of credit”) to be utilized for temporary or emergency purposes to fund share holder redemptions or for other short term liquidity purposes. The fund has agreed to pay commitment fees on its pro rata portion of the line of credit. During the period, there were no borrowings on this line of credit.
The fund lends portfolio securities from time to time in order to earn additional income. On the settlement date of the loan, the fund receives collateral (in the form of U.S. Treasury obligations, letters of credit and/or cash) against the loaned securities and maintains collateral in an amount not less than 100% of the market value of the loaned securities during the period of the loan. The market value of the loaned securities is determined at the close of business of the fund and any additional required collateral is delivered to the fund on the next business day. If the borrower defaults on its obligation to return the securities loaned because of insolvency or other reasons, a fund could experience delays and costs in recovering the securities loaned or in gaining access to the collateral. Any cash collateral received is invested in the Fidelity Securities Lending Cash Central Fund. The value of loaned securities and cash collateral at period end are disclosed on the fund’s Statement of Assets and Liabilities. Security lending income represents the income earned on investing cash collateral, less fees and expenses associated with the loan, plus any premium payments that may be received on the loan of certain types of securities. Security lending income is presented in the Statement of Operations as a component of income from affiliated central funds. Net income from lending portfolio securities during the period amounted to $46.
Many of the brokers with whom FMR places trades on behalf of the fund provided services to the fund in addition to trade execution. These services included payments of certain expenses on behalf of the fund totaling $856 for the period. In addition, through arrangements with the fund’s custodian and transfer agent, credits realized as a result of uninvested cash balances were used to reduce the fund’s expenses. During the period, these credits reduced the fund’s custody and transfer agent expenses by $1 and $26, respectively.
The fund’s organizational documents provide former and current trustees and officers with a limited indemnification against liabilities arising in connection with the perfor mance of their duties to the fund. In the normal course of business, the fund may also enter into contracts that provide general indemnifications. The fund’s maximum exposure under these arrangements is unknown as this would be dependent on future claims that may be made against the fund. The risk of material loss from such claims is considered remote.
21 Semiannual Report
Board Approval of Investment Advisory Contracts and Management Fees
Fidelity Export and Multinational Fund
On January 19, 2006, the Board of Trustees, including the Independent Trustees (together, the Board), voted to approve a general research services agreement (the Agreement) between FMR, FMR Co., Inc. (FMRC), Fidelity Investments Money Manage ment, Inc. (FIMM), and Fidelity Research & Analysis Company (FRAC) (together, the Investment Advisers) for the fund, effective January 20, 2006, pursuant to which FRAC may provide general research and investment advisory support services to FMRC and FIMM. The Board considered that it has approved previously various sub advisory agreements for the fund with affiliates of FMR that allow FMR to obtain research, non discretionary advice, or discretionary portfolio management at no additional expense to the fund. The Board, assisted by the advice of fund counsel and independent Trustees’ counsel, considered a broad range of information and determined that it would be beneficial for the fund to access the research and investment advisory support services supplied by FRAC at no additional expense to the fund.
The Board reached this determination in part because the new arrangement will involve no changes in (i) the contractual terms of and fees payable under the fund’s manage ment contract or sub advisory agreements; (ii) the investment process or strategies employed in the management of the fund’s assets; (iii) the nature or level of services provided under the fund’s management contract or sub advisory agreements; (iv) the day to day management of the fund or the persons primarily responsible for such man agement; or (v) the ultimate control or beneficial ownership of FMR, FMRC, or FIMM. The Board also considered that the establishment of the Agreement would not necessi tate prior shareholder approval of the Agreement or result in an assignment and termination of each fund’s management contract or sub advisory agreements under the Investment Company Act of 1940.
Because the Board was approving an arrangement with FRAC under which the fund will not bear any additional management fees or expenses and under which the fund’s portfolio manager would not change, it did not consider the fund’s investment perfor mance, competitiveness of management fee and total expenses, costs of services and profitability, or economies of scale to be significant factors in its decision.
In connection with its future renewal of the fund’s management contract and sub advisory agreements, the Board will consider: (i) the nature, extent, and quality of services provided to the fund, including shareholder and administrative services and investment performance; (ii) the competitiveness of the fund’s management fee and total expenses; (iii) the costs of the services and profitability, including the revenues earned and the expenses incurred by Fidelity in conducting the business of developing, marketing, distributing, managing, administering, and servicing the fund and its shareholders; and (iv) whether there have been economies of scale in respect of the management of the Fidelity funds, whether the Fidelity funds (including the fund) have
appropriately benefited from any such economies of scale, and whether there is potential for realization of any further economies.
Based on its evaluation of all of the conclusions noted above, and after considering all material factors, the Board ultimately concluded that the fund’s Agreement is fair and reasonable, and that the fund’s Agreement should be approved.
23 Semiannual Report
Investment Adviser
Fidelity Management & Research Company
Boston, MA
Investment Sub Advisers
FMR Co., Inc.
Fidelity Management & Research
(U.K.) Inc.
Fidelity Research & Analysis Company
(formerly Fidelity Management &
Research (Far East) Inc.)
Fidelity Investments Japan Limited
Fidelity International Investment Advisors
Fidelity International Investment Advisors
(U.K.) Limited
General Distributor
Fidelity Distributors Corporation
Boston, MA
Transfer and Service Agent
Fidelity Service Company, Inc.
Boston, MA
Custodian
JPMorgan Chase Bank
New York, NY
|
| The Fidelity Telephone Connection |
| Mutual Fund 24-Hour Service |
| Exchanges/Redemptions | | |
| and Account Assistance | | 1-800-544-6666 |
| Product Information | | 1-800-544-6666 |
| Retirement Accounts | | 1-800-544-4774 |
| (8 a.m. - 9 p.m.) | | |
| TDD Service | | 1-800-544-0118 |
| for the deaf and hearing impaired |
| (9 a.m. - 9 p.m. Eastern time) |
| Fidelity Automated Service | | |
| Telephone (FAST®) (automated phone logo) | | 1-800-544-5555 |
| (automated phone logo) Automated line for quickest service |
EXF USAN-0406
1.790938.102
|

| | Fidelity®
Maryland Municipal Income
Fund
|
| | Semiannual Report
February 28, 2006
|


| Contents | | | | |
| |
| |
| Chairman’s Message | | 3 | | Ned Johnson’s message to shareholders. |
| Shareholder Expense | | 4 | | An example of shareholder expenses. |
| Example | | | | |
| Investment Changes | | 6 | | A summary of major shifts in the fund’s |
| | | | | investments over the past six months. |
| Investments | | 7 | | A complete list of the fund’s investments |
| | | | | with their market values. |
| Financial Statements | | 12 | | Statements of assets and liabilities, |
| | | | | operations, and changes in net assets, |
| | | | | as well as financial highlights. |
| Notes | | 16 | | Notes to the financial statements. |
| Board Approval of | | 20 | | |
| Investment Advisory | | | | |
| Contracts and | | | | |
| Management Fees | | | | |
To view a fund’s proxy voting guidelines and proxy voting record for the 12 month period
ended June 30, visit www.fidelity.com/proxyvotingresults or visit the Securities and Exchange
Commission’s (SEC) web site at www.sec.gov. You may also call 1-800-544-8544 to request a free
copy of the proxy voting guidelines.
Standard & Poor’s, S&P and S&P 500 are registered service marks of The McGraw Hill Companies, Inc.
and have been licensed for use by Fidelity Distributors Corporation.
Other third party marks appearing herein are the property of their respective owners.
All other marks appearing herein are registered or unregistered trademarks or service marks
of FMR Corp. or an affiliated company.
|
| | This report and the financial statements contained herein are submitted for the general informa
tion of the shareholders of the fund. This report is not authorized for distribution to prospective
investors in the fund unless preceded or accompanied by an effective prospectus.
A fund files its complete schedule of portfolio holdings with the SEC for the first and third
quarters of each fiscal year on Form N Q. Forms N Q are available on the SEC’s web site at
http://www.sec.gov. A fund’s Forms N Q may be reviewed and copied at the SEC’s Public
Reference Room in Washington, DC. Information regarding the operation of the SEC’s Public
Reference Room may be obtained by calling 1-800-SEC-0330. For a complete list of a fund’s
portfolio holdings, view the most recent quarterly holdings report, semiannual report, or annual
report on Fidelity’s web site at http://www.fidelity.com/holdings.
NOT FDIC INSURED · MAY LOSE VALUE · NO BANK GUARANTEE
Neither the fund nor Fidelity Distributors Corporation is a bank.
|
Semiannual Report 2
Chairman’s Message
(photograph of Edward C. Johnson 3d)
Dear Shareholder:
Although many securities markets made gains in early 2006, there is only one certainty when it comes to investing: There is no sure thing. There are, however, a number of time tested, fundamental investment principles that can put the historical odds in your favor.
One of the basic tenets is to invest for the long term. Over time, riding out the markets’ inevitable ups and downs has proven much more effective than selling into panic or chasing the hottest trend. Even missing only a few of the markets’ best days can significantly diminish investor returns. Patience also affords the benefits of compounding of earning interest on additional income or reinvested dividends and capital gains. There are tax advantages and cost benefits to consider as well. The more you sell, the more taxes you pay, and the more you trade, the higher the costs. While staying the course doesn’t eliminate risk, it can considerably lessen the effect of short term declines.
You can further manage your investing risk through diversification. And today, more than ever, geographic diversification should be taken into account. Studies indicate that asset allocation is the single most important determinant of a portfolio’s long term success. The right mix of stocks, bonds and cash aligned to your particular risk tolerance and investment objective is very important. Age appropriate rebalancing is also an essential aspect of asset allocation. For younger investors, an emphasis on equities which historically have been the best performing asset class over time is encouraged. As investors near their specific goal, such as retirement or sending a child to college, consideration may be given to replacing volatile assets (e.g. common stocks) with more stable fixed investments (bonds or savings plans).
A third investment principle investing regularly can help lower the average cost of your purchases. Investing a certain amount of money each month or quarter helps ensure you won’t pay for all your shares at market highs. This strategy known as dollar cost averaging also reduces unconstructive “emotion” from investing, helping shareholders avoid selling weak performers just prior to an upswing, or chasing a hot performer just before a correction.
We invite you to contact us via the Internet, through our Investor Centers or over the phone. It is our privilege to provide you the information you need to make the investments that are right for you.
Sincerely,
/s/ Edward C. Johnson 3d
Edward C. Johnson 3d
3 Semiannual Report
Shareholder Expense Example
As a shareholder of the Fund, you incur two types of costs: (1) transaction costs, including redemption fees, and (2) ongoing costs, including management fees and other Fund expenses. This Example is intended to help you understand your ongoing costs (in dollars) of investing in the Fund and to compare these costs with the ongoing costs of investing in other mutual funds.
The Example is based on an investment of $1,000 invested at the beginning of the period and held for the entire period (September 1, 2005 to February 28, 2006).
The first line of the table below provides information about actual account values and actual expenses. You may use the information in this line, together with the amount you invested, to estimate the expenses that you paid over the period. Simply divide your account value by $1,000.00 (for example, an $8,600 account value divided by $1,000.00 = 8.6), then multiply the result by the number in the first line under the heading entitled “Expenses Paid During Period” to estimate the expenses you paid on your account during this period. A small balance maintenance fee of $12.00 that is charged once a year may apply for certain accounts with a value of less than $2,000. This fee is not included in the table below. If it was, the estimate of expenses you paid during the period would be higher, and your ending account value lower, by this amount.
Hypothetical Example for Comparison Purposes
The second line of the table below provides information about hypothetical account values and hypothetical expenses based on the Fund’s actual expense ratio and an assumed rate of return of 5% per year before expenses, which is not the Fund’s actual return. The hypothetical account values and expenses may not be used to estimate the actual ending account balance or expenses you paid for the period. You may use this information to compare the ongoing costs of investing in the Fund and other funds. To do so, compare this 5% hypothetical example with the 5% hypothetical examples that appear in the share holder reports of the other funds. A small balance maintenance fee of $12.00 that is charged once a year may apply for certain accounts with a value of less than $2,000. This fee is not included in the table below. If it was, the estimate of expenses you paid during the period would be higher, and your ending account value lower, by this amount.
Please note that the expenses shown in the table are meant to highlight your ongoing costs only and do not reflect any transaction costs. Therefore, the second line of the table is useful in comparing ongoing costs only, and will not help you determine the relative total costs of owning different funds. In addition, if these transactional costs were included, your costs would have been higher.
| | | | | | | | | | | Expenses Paid |
| | | | | | | | | | | During Period* |
| | | Beginning | | Ending | | September 1, 2005 |
| | | Account Value | | Account Value | | to February 28, |
| | | September 1, 2005 | | February 28, 2006 | | 2006 |
| Actual | | $ | | 1,000.00 | | $ | | 1,006.70 | | $ | | 2.74 |
| Hypothetical (5% return per year | | | | | | | | | | | | |
| before expenses) | | $ | | 1,000.00 | | $ | | 1,022.07 | | $ | | 2.76 |
* Expenses are equal to the Fund’s annualized expense ratio of .55%; multiplied by the average account value over the period, multiplied by 181/365 (to reflect the one half year period).
5 Semiannual Report
| Investment Changes | | | | |
| |
| Top Five Sectors as of February 28, 2006 | | | | |
| | | % of fund’s | | % of fund’s net assets |
| | | net assets | | 6 months ago |
| General Obligations | | 35.1 | | 32.8 |
| Escrowed/Pre Refunded | | 15.8 | | 17.7 |
| Education | | 12.4 | | 11.4 |
| Health Care | | 10.6 | | 11.2 |
| Electric Utilities | | 5.8 | | 5.9 |
Average Years to Maturity as of February 28, 2006 | | | | |
| | | | | 6 months ago |
| Years | | 13.9 | | 14.8 |
Average years to maturity is based on the average time remaining to the stated maturity date of each bond, weighted by the market value of each bond.
| Duration as of February 28, 2006 | | | | |
| | | | | | | 6 months ago |
| Years | | | | 6.4 | | 6.6 |
Duration shows how much a bond fund’s price fluctuates with changes in comparable interest rates. If rates rise 1%, for example, a fund with a five year duration is likely to lose about 5% of its value. Other factors also can influence a bond fund’s performance and share price. Accordingly, a bond fund’s actual performance may differ from this example.

We have used ratings from Moody’s® Investors Services, Inc. Where Moody’s ratings are not available, we have used S&P® ratings.
Semiannual Report 6
| Investments February 28, 2006 (Unaudited) |
| Showing Percentage of Net Assets | | | | |
| |
| Municipal Bonds 98.1% | | | | |
| | | Principal | | Value |
| | | Amount | | (Note 1) |
| Guam 0.1% | | | | |
| Guam Wtrwks. Auth. Wtr. and Wastewtr. Sys. Rev. 5.875% | | | | |
| 7/1/35 | | $ 125,000 | | $ 132,083 |
| Maryland – 85.2% | | | | |
| Anne Arundel County Gen. Oblig.: | | | | |
| 5% 3/1/13 | | 1,200,000 | | 1,296,132 |
| 5.375% 3/1/15 | | 2,010,000 | | 2,197,433 |
| Baltimore Board of School Commissioners School Sys. Rev. 5% | | | | |
| 5/1/11 | | 2,545,000 | | 2,702,714 |
| Baltimore Convention Ctr. Hotel Rev. 5.25% 9/1/17 (XL Cap. | | | | |
| Assurance, Inc. Insured) | | 1,500,000 | | 1,667,565 |
| Baltimore County Ctfs. Prtn. (Equip. Acquisition Prog.) 5% | | | | |
| 6/1/13 (MBIA Insured) | | 1,500,000 | | 1,614,945 |
| Baltimore County Gen. Oblig.: | | | | |
| 5% 8/1/15 | | 2,385,000 | | 2,596,478 |
| 5.25% 8/1/19 (Pre-Refunded to 8/1/12 @ 100) (d) | | 2,000,000 | | 2,180,200 |
| Baltimore Gen. Oblig.: | | | | |
| (Consolidated Pub. Impt. Proj.) Series A: | | | | |
| 0% 10/15/06 (FGIC Insured) | | 2,000,000 | | 1,930,100 |
| 7% 10/15/09 (MBIA Insured) | | 1,000,000 | | 1,120,410 |
| Series A, 5% 10/15/18 (AMBAC Insured) | | 1,720,000 | | 1,870,448 |
| Baltimore Port Facilities Rev. (Consolidated Coal Sales Co. | | | | |
| Proj.) 6.5% 12/1/10 | | 2,000,000 | | 2,119,880 |
| Baltimore Proj. Rev.: | | | | |
| (Wastewtr. Projs.) Series A: | | | | |
| 5.125% 7/1/42 (FGIC Insured) (b) | | 2,315,000 | | 2,420,981 |
| 5.2% 7/1/32 (FGIC Insured) | | 250,000 | | 266,610 |
| (Wtr. Projs.) Series A: | | | | |
| 5% 7/1/22 (MBIA Insured) | | 2,250,000 | | 2,410,943 |
| 5% 7/1/24 (Escrowed to Maturity) (d) | | 730,000 | | 805,343 |
| 5% 7/1/24 (FGIC Insured) | | 370,000 | | 407,481 |
| Frederick County Econ. Dev. Rev. 5% 8/1/15 | | | | |
| (MBIA Insured) | | 1,000,000 | | 1,097,490 |
| Frederick County Edl. Facilities Rev. (Mount Saint Mary’s Univ. | | | | |
| Proj.): | | | | |
| 4.5% 9/1/08 | | 165,000 | | 167,252 |
| 5% 9/1/09 | | 175,000 | | 180,423 |
| 5.5% 9/1/12 | | 195,000 | | 207,308 |
| Frederick County Gen. Oblig. 5% 12/1/15 | | 1,000,000 | | 1,096,910 |
| Howard County Gen. Oblig.: | | | | |
| Series 2003 A, 5% 8/15/17 (Pre-Refunded to 8/15/12 @ | | | | |
| 100) (d) | | 1,000,000 | | 1,076,350 |
| Series 2004 A, 5% 8/15/14 | | 1,000,000 | | 1,094,340 |
| |
| See accompanying notes which are an integral part of the financial statements. | | |
| |
| 7 | | Semiannual Report |
| Investments (Unaudited) continued | | | | | | | | |
| |
| |
| Municipal Bonds continued | | | | | | | | |
| | | | | Principal | | | | Value |
| | | | | Amount | | | | (Note 1) |
| Maryland – continued | | | | | | | | |
| Howard County Gen. Oblig.: – continued | | | | | | | | |
| Series A, 5.25% 8/15/14 | | | | $ 2,395,000 | | | | $ 2,596,899 |
| Maryland Dept. of Trans. Consolidated Trans. Rev. 5% | | | | | | | | |
| 11/1/10 | | | | 3,000,000 | | | | 3,190,530 |
| Maryland Econ. Dev. Corp. (Univ. of Maryland, Baltimore | | | | | | | | |
| County Student Hsg. Proj.) 5% 7/1/16 (a) | | | | 500,000 | | | | 544,585 |
| Maryland Econ. Dev. Corp. Lease Rev. (Maryland Aviation | | | | | | | | |
| Administration Facilities Proj.) 5.5% 6/1/18 (FSA | | | | | | | | |
| Insured) (c) | | | | 1,500,000 | | | | 1,624,500 |
| Maryland Gen. Oblig.: | | | | | | | | |
| (State & Local Facilities Ln. Prog.) First Series, 5.75% 8/1/14 | | | | | | | | |
| (Pre-Refunded to 8/1/10 @ 101) (d) | | | | 3,000,000 | | | | 3,296,760 |
| Second Series A, 5.5% 8/1/15 | | | | 740,000 | | | | 843,126 |
| Second Series, 5.5% 7/15/14 | | | | 2,000,000 | | | | 2,258,460 |
| Series 2002 A, 5.5% 3/1/17 | | | | 2,265,000 | | | | 2,610,616 |
| Maryland Health & Higher Edl. Facilities Auth. Rev.: | | | | | | | | |
| (Anne Arundel Med. Ctr. Proj.) Series 1998, 5.125% | | | | | | | | |
| 7/1/33 (FSA Insured) | | | | 2,000,000 | | | | 2,062,700 |
| (Good Samaritan Hosp. Proj.): | | | | | | | | |
| 5.7% 7/1/09 (Escrowed to Maturity) (d) | | | | 1,000,000 | | | | 1,050,670 |
| 5.75% 7/1/13 (Escrowed to Maturity) (d) | | | | 385,000 | | | | 424,262 |
| (Hebrew Home of Greater Washington Proj.) 5.8% 1/1/32 . | | | | 1,000,000 | | | | 1,060,660 |
| (Helix Health Proj.) 5% 7/1/17 (Escrowed to Maturity) (d) | | | | 1,010,000 | | | | 1,091,467 |
| (Howard County Gen. Hosp. Proj.) 5.5% 7/1/13 | | | | | | | | |
| (Escrowed to Maturity) (d) | | | | 840,000 | | | | 868,484 |
| (Johns Hopkins Health Sys. Proj.) 5% 5/15/34 | | | | 1,500,000 | | | | 1,542,030 |
| (Johns Hopkins Univ. Issue Proj.): | | | | | | | | |
| Series 2001 B, 5% 7/1/41 | | | | 3,590,000 | | | | 3,710,050 |
| Series A: | | | | | | | | |
| 5% 7/1/33 | | | | 2,000,000 | | | | 2,102,740 |
| 5% 7/1/38 | | | | 2,000,000 | | | | 2,094,160 |
| 5% 7/1/32 | | | | 1,015,000 | | | | 1,061,375 |
| 5.125% 7/1/20 | | | | 500,000 | | | | 528,250 |
| 6% 7/1/10 | | | | 500,000 | | | | 549,555 |
| (LifeBridge Health Proj.) Series 2004 A, 5% 7/1/11 | | | | 1,000,000 | | | | 1,057,330 |
| (Loyola College Issue Proj.) 5% 10/1/39 | | | | 2,000,000 | | | | 2,052,540 |
| (North Arundel Hosp. Proj.) 6.5% 7/1/31 (Pre-Refunded to | | | | | | | | |
| 7/1/10 @ 101) (d) | | | | 1,320,000 | | | | 1,485,066 |
| (Peninsula Reg’l. Med. Ctr. Proj.) 5% 7/1/15 | | | | 1,120,000 | | | | 1,204,616 |
See accompanying notes which are an integral part of the financial statements.
| Municipal Bonds continued | | | | | | | | |
| | | | | Principal | | | | Value |
| | | | | Amount | | | | (Note 1) |
| Maryland – continued | | | | | | | | |
| Maryland Health & Higher Edl. Facilities Auth. Rev.: - | | | | | | | | |
| continued | | | | | | | | |
| (Univ. of Maryland Med. Sys. Proj.): | | | | | | | | |
| 5.25% 7/1/34 | | | | $ 1,525,000 | | | | $ 1,577,826 |
| 6.75% 7/1/30 (Pre-Refunded to 7/1/10 @ 101) (d) | | | | 500,000 | | | | 566,420 |
| Maryland Indl. Dev. Fing. Auth. Rev.: | | | | | | | | |
| (American Ctr. for Physics Proj.): | | | | | | | | |
| 5.25% 12/15/13 | | | | 1,100,000 | | | | 1,180,872 |
| 5.25% 12/15/15 | | | | 320,000 | | | | 344,214 |
| (Holy Cross Health Sys. Corp. Proj.) 5.7% 12/1/10 | | | | 1,000,000 | | | | 1,087,590 |
| Maryland Nat’l. Cap. Park & Planning Commission Series | | | | | | | | |
| 2004 EE2, 5% 1/15/15 | | | | 2,000,000 | | | | 2,168,860 |
| Maryland Trans. Auth. Rev. (Trans. Facilities Projs.) 6.8% | | | | | | | | |
| 7/1/16 (Escrowed to Maturity) (d) | | | | 900,000 | | | | 1,036,359 |
| Montgomery County Econ. Dev. Rev. (Trinity Health Care | | | | | | | | |
| Group Proj.) 5.125% 12/1/22 | | | | 2,300,000 | | | | 2,402,672 |
| Morgan State Univ. Academic & Auxiliary Facilities Fees Rev. | | | | | | | | |
| Series A, 5% 7/1/20 (FGIC Insured) | | | | 500,000 | | | | 532,440 |
| Northeast Maryland Waste Disp. Auth. Solid Waste Rev.: | | | | | | | | |
| (Montgomery County Resource Recovery Proj.) Series A, 6% | | | | | | | | |
| 7/1/07 (c) | | | | 500,000 | | | | 512,055 |
| 5.5% 4/1/12 (AMBAC Insured) (c) | | | | 1,500,000 | | | | 1,622,805 |
| Prince Georges County Ctfs. of Prtn. Series A, 0% 6/30/11 | | | | | | | | |
| (MBIA Insured) | | | | 2,400,000 | | | | 1,820,856 |
| Prince Georges County Gen. Oblig.: | | | | | | | | |
| Series A, 5% 10/1/19 | | | | 2,000,000 | | | | 2,149,860 |
| 5.5% 5/15/11 (FSA Insured) | | | | 2,000,000 | | | | 2,187,560 |
| Washington D.C. Metropolitan Area Trans. Auth. Gross Rev. | | | | | | | | |
| 6% 7/1/10 (FGIC Insured) | | | | 1,570,000 | | | | 1,732,244 |
| Washington D.C. Suburban Sanitation District 5% 6/1/13 | | | | 1,500,000 | | | | 1,627,800 |
| | | | | | | | | 95,989,600 |
| |
| Puerto Rico 12.8% | | | | | | | | |
| Puerto Rico Commonwealth Gen. Oblig.: | | | | | | | | |
| Series 2001 A, 5.5% 7/1/17 (XL Cap. Assurance, Inc. | | | | | | | | |
| Insured) | | | | 1,500,000 | | | | 1,715,025 |
| Series A, 5.5% 7/1/18 (MBIA Insured) | | | | 1,000,000 | | | | 1,153,240 |
| Puerto Rico Commonwealth Hwy. & Trans. Auth. Hwy. Rev. | | | | | | | | |
| Series Y, 5.5% 7/1/36 (FSA Insured) | | | | 1,000,000 | | | | 1,124,030 |
| Puerto Rico Commonwealth Infrastructure Fing. Auth. | | | | | | | | |
| Series 2000 A: | | | | | | | | |
| 5.5% 10/1/32 (Escrowed to Maturity) (d) | | | | 805,000 | | | | 871,992 |
See accompanying notes which are an integral part of the financial statements.
9 Semiannual Report
| Investments (Unaudited) continued | | | | | | |
| |
| |
| Municipal Bonds continued | | | | | | |
| | | | | Principal | | Value |
| | | | | Amount | | (Note 1) |
| Puerto Rico continued | | | | | | |
| Puerto Rico Commonwealth Infrastructure Fing. Auth. Series | | | | | | |
| 2000 A: – continued | | | | | | |
| 5.5% 10/1/40 (Escrowed to Maturity) (d) | | | | $ 2,760,000 | | $ 2,977,543 |
| Puerto Rico Elec. Pwr. Auth. Pwr. Rev.: | | | | | | |
| Series 2002 KK, 5.5% 7/1/15 (MBIA Insured) | | | | 1,000,000 | | 1,134,930 |
| Series HH, 5.25% 7/1/29 (FSA Insured) | | | | 2,200,000 | | 2,363,020 |
| Series II, 5.375% 7/1/16 (MBIA Insured) | | | | 1,500,000 | | 1,650,615 |
| Series QQ: | | | | | | |
| 5.5% 7/1/16 (XL Cap. Assurance, Inc. Insured) | | | | 200,000 | | 227,526 |
| 5.5% 7/1/17 (XL Cap. Assurance, Inc. Insured) | | | | 1,000,000 | | 1,143,350 |
| | | | | | | 14,361,271 |
| |
| |
| TOTAL INVESTMENT PORTFOLIO 98.1% | | | | | | |
| (Cost $107,459,681) | | | | | | 110,482,954 |
| |
| NET OTHER ASSETS – 1.9% | | | | | | 2,173,625 |
| NET ASSETS 100% | | | | $ 112,656,579 |
| Futures Contracts | | | | | | | | |
| | | Expiration | | Underlying | | Unrealized |
| | | Date | | Face Amount | | Appreciation/ |
| | | | | at Value | | (Depreciation) |
| Purchased | | | | | | | | |
| Treasury Contracts | | | | | | | | |
| 8 U.S. Treasury 10-Year Bond Contracts | | March 2006 | | $ 864,000 | | | | $ (2,348) |
| 7 U.S. Treasury 10-Year Bond Contracts | | June 2006 | | 755,344 | | | | 296 |
| TOTAL TREASURY CONTRACTS | | | | $ 1,619,344 | | | | $ (2,052) |
The face value of futures purchased as a percentage of net assets 1.5% | | | | |
Legend
(a) Security or a portion of the security
purchased on a delayed delivery or
when-issued basis.
(b) Security or a portion of the security was
pledged to cover margin requirements
for futures contracts. At the period end,
the value of securities pledged
amounted to $1,222,256.
|
(c) Private activity obligations whose
interest is subject to the federal
alternative minimum tax for individuals.
(d) Security collateralized by an amount
sufficient to pay interest and principal.
|
See accompanying notes which are an integral part of the financial statements.
Semiannual Report 10
Other Information
The distribution of municipal securities by revenue source, as a percentage of total net assets, is as follows:
| General Obligations | | 35.1% |
| Escrowed/Pre Refunded | | 15.8% |
| Education | | 12.4% |
| Health Care | | 10.6% |
| Electric Utilities | | 5.8% |
| Water & Sewer | | 5.0% |
| Others* (individually less than 5%) | | 15.3% |
| | | 100.0% |
| * Includes net other assets | | |
See accompanying notes which are an integral part of the financial statements.
11 Semiannual Report
| Financial Statements | | | | | | |
| |
| Statement of Assets and Liabilities | | | | | | |
| | | | | February 28, 2006 (Unaudited) |
| |
| Assets | | | | | | |
| Investment in securities, at value | | | | | | |
| See accompanying schedule: | | | | | | |
| Unaffiliated issuers (cost $107,459,681) | | | | | | $ 110,482,954 |
| Cash | | | | | | 1,686,421 |
| Receivable for fund shares sold | | | | | | 117,706 |
| Interest receivable | | | | | | 1,124,527 |
| Receivable for daily variation on futures contracts | | | | | | 5,103 |
| Other receivables | | | | | | 12,574 |
| Total assets | | | | | | 113,429,285 |
| |
| Liabilities | | | | | | |
| Payable for investments purchased on a delayed delivery | | | | | | |
| basis | | | | $ 543,275 | | |
| Payable for fund shares redeemed | | | | 67,092 | | |
| Distributions payable | | | | 111,276 | | |
| Accrued management fee | | | | 51,024 | | |
| Other affiliated payables | | | | 39 | | |
| Total liabilities | | | | | | 772,706 |
| |
| Net Assets | | | | | | $ 112,656,579 |
| Net Assets consist of: | | | | | | |
| Paid in capital | | | | | | $ 109,693,356 |
| Undistributed net investment income | | | | | | 4,186 |
| Accumulated undistributed net realized gain (loss) on | | | | | | |
| investments | | | | | | (62,184) |
| Net unrealized appreciation (depreciation) on | | | | | | |
| investments | | | | | | 3,021,221 |
| Net Assets, for 10,376,185 shares outstanding | | | | | | $ 112,656,579 |
| Net Asset Value, offering price and redemption price per | | | | | | |
| share ($112,656,579 ÷ 10,376,185 shares) | | | | | | $ 10.86 |
See accompanying notes which are an integral part of the financial statements.
| Statement of Operations | | | | | | |
| | | Six months ended February 28, 2006 (Unaudited) |
| |
| Investment Income | | | | | | |
| Interest | | | | | | $ 2,328,157 |
| |
| Expenses | | | | | | |
| Management fee | | | | $ 302,894 | | |
| Independent trustees’ compensation | | | | 235 | | |
| Miscellaneous | | | | 98 | | |
| Total expenses before reductions | | | | 303,227 | | |
| Expense reductions | | | | (23,468)�� | | 279,759 |
| |
| Net investment income | | | | | | 2,048,398 |
| Realized and Unrealized Gain (Loss) | | | | | | |
| Net realized gain (loss) on: | | | | | | |
| Investment securities: | | | | | | |
| Unaffiliated issuers | | | | (5,911) | | |
| Futures contracts | | | | (11,048) | | |
| Total net realized gain (loss) | | | | | | (16,959) |
| Change in net unrealized appreciation (depreciation) on: | | | | | | |
| Investment securities | | | | (1,312,613) | | |
| Futures contracts | | | | (26,501) | | |
| Total change in net unrealized appreciation | | | | | | |
| (depreciation) | | | | | | (1,339,114) |
| Net gain (loss) | | | | | | (1,356,073) |
| Net increase (decrease) in net assets resulting from | | | | | | |
| operations | | | | | | $ 692,325 |
See accompanying notes which are an integral part of the financial statements.
13 Semiannual Report
| Financial Statements continued | | | | | | | | |
| |
| |
| Statement of Changes in Net Assets | | | | | | | | |
| | | Six months ended | | | | Year ended |
| | | February 28, 2006 | | | | August 31, |
| | | (Unaudited) | | | | 2005 |
| Increase (Decrease) in Net Assets | | | | | | | | |
| Operations | | | | | | | | |
| Net investment income | | | | $ 2,048,398 | | | | $ 3,914,387 |
| Net realized gain (loss) | | | | (16,959) | | | | 863,092 |
| Change in net unrealized appreciation (depreciation) . | | | | (1,339,114) | | | | (361,318) |
| Net increase (decrease) in net assets resulting | | | | | | | | |
| from operations | | | | 692,325 | | | | 4,416,161 |
| Distributions to shareholders from net investment income . | | | | (2,044,070) | | | | (3,917,237) |
| Distributions to shareholders from net realized gain | | | | (706,334) | | | | (297,351) |
| Total distributions | | | | (2,750,404) | | | | (4,214,588) |
| Share transactions | | | | | | | | |
| Proceeds from sales of shares | | | | 11,603,814 | | | | 31,887,992 |
| Reinvestment of distributions | | | | 1,874,595 | | | | 2,864,903 |
| Cost of shares redeemed | | | | (10,462,277) | | | | (23,124,775) |
| Net increase (decrease) in net assets resulting from | | | | | | | | |
| share transactions | | | | 3,016,132 | | | | 11,628,120 |
| Redemption fees | | | | 50 | | | | 1,778 |
| Total increase (decrease) in net assets | | | | 958,103 | | | | 11,831,471 |
| |
| Net Assets | | | | | | | | |
| Beginning of period | | | | 111,698,476 | | | | 99,867,005 |
| End of period (including undistributed net investment | | | | | | | | |
| income of $4,186 and distributions in excess of net | | | | | | | | |
| investment income of $142, respectively) | | | | $ 112,656,579 | | | | $ 111,698,476 |
| |
| Other Information | | | | | | | | |
| Shares | | | | | | | | |
| Sold | | | | 1,070,224 | | | | 2,888,601 |
| Issued in reinvestment of distributions | | | | 172,840 | | | | 259,630 |
| Redeemed | | | | (964,184) | | | | (2,098,151) |
| Net increase (decrease) | | | | 278,880 | | | | 1,050,080 |
See accompanying notes which are an integral part of the financial statements.
| Financial Highlights | | | | | | | | | | |
| | | Six months ended | | | | | | | | | | |
| | | February 28, 2006 | | Years ended August 31, |
| | | (Unaudited) | | 2005 | | 2004 | | 2003 | | 2002 | | 2001 |
| Selected Per Share Data | | | | | | | | | | | | |
| Net asset value, | | | | | | | | | | | | |
| beginning of period | | $ 11.06 | | $ 11.04 | | $ 10.78 | | $ 10.90 | | $ 10.77 | | $ 10.25 |
| Income from Investment | | | | | | | | | | | | |
| Operations | | | | | | | | | | | | |
| Net investment | | | | | | | | | | | | |
| incomeD | | 202 | | .412 | | .427 | | .433 | | .444 | | .470 |
| Net realized and un | | | | | | | | | | | | |
| realized gain (loss) | | (.131) | | .053 | | .260 | | (.120) | | .130 | | .523 |
| Total from investment | | | | | | | | | | | | |
| operations | | 071 | | .465 | | .687 | | .313 | | .574 | | .993 |
| Distributions from net | | | | | | | | | | | | |
| investment income | | (.201) | | (.412) | | (.427) | | (.433) | | (.444) | | (.473) |
| Distributions from net | | | | | | | | | | | | |
| realized gain | | (.070) | | (.033) | | — | | — | | — | | — |
| Total distributions | | (.271) | | (.445) | | (.427) | | (.433) | | (.444) | | (.473) |
| Redemption fees | | | | | | | | | | | | |
| added to paid in | | | | | | | | | | | | |
| capitalD,F | | — | | — | | — | | — | | — | | — |
| Net asset value, | | | | | | | | | | | | |
| end of period | | $ 10.86 | | $ 11.06 | | $ 11.04 | | $ 10.78 | | $ 10.90 | | $ 10.77 |
| Total ReturnB,C | | 67% | | 4.30% | | 6.46% | | 2.88% | | 5.49% | | 9.92% |
| Ratios to Average Net AssetsE | | | | | | | | | | | | |
| Expenses before | | | | | | | | | | | | |
| reductions | | 55%A | | .55% | | .55% | | .55% | | .55% | | .55% |
| Expenses net of fee | | | | | | | | | | | | |
| waivers, if any | | 55%A | | .55% | | .55% | | .55% | | .55% | | .55% |
| Expenses net of all | | | | | | | | | | | | |
| reductions | | 51%A | | .51% | | .53% | | .52% | | .47% | | .40% |
| Net investment | | | | | | | | | | | | |
| income | | 3.75%A | | 3.73% | | 3.89% | | 3.94% | | 4.15% | | 4.48% |
| Supplemental Data | | | | | | | | | | | | |
| Net assets, | | | | | | | | | | | | |
| end of period | | | | | | | | | | | | |
| (000 omitted) | | $112,657 | | $111,698 | | $99,867 | | $93,485 | | $96,839 | | $76,256 |
| Portfolio turnover | | | | | | | | | | | | |
| rate | | 16%A | | 17% | | 14% | | 30% | | 5% | | 11% |
A Annualized
B Total returns for periods of less than one year are not annualized.
C Total returns would have been lower had certain expenses not been reduced during the periods shown.
D Calculated based on average shares outstanding during the period.
E Expense ratios reflect operating expenses of the fund. Expenses before reductions do not reflect amounts reimbursed by the investment adviser or expense
offset arrangements and do not represent the amount paid by the fund during periods when reimbursements or reductions occur. Expenses net of fee
waivers reflect expenses after reimbursement by the investment adviser but prior to reductions from expense offset arrangements. Expenses net of all
reductions represent the net expenses paid by the fund.
F Amount represents less than $.001 per share.
|
See accompanying notes which are an integral part of the financial statements.
Notes to Financial Statements
For the period ended February 28, 2006 (Unaudited)
1. Significant Accounting Policies.
Fidelity Maryland Municipal Income Fund (the fund) is a non diversified fund of Fidelity Union Street Trust (the trust) and is authorized to issue an unlimited number of shares. The trust is registered under the Investment Company Act of 1940, as amended (the 1940 Act), as an open end management investment company organized as a Massachusetts business trust. The fund may be affected by economic and political developments in the state of Maryland. The financial statements have been prepared in conformity with accounting principles generally accepted in the United States of America, which require management to make certain estimates and assumptions at the date of the financial statements. The following summarizes the significant accounting policies of the fund:
Security Valuation. Investments are valued and net asset value per share is calculated (NAV calculation) as of the close of business of the New York Stock Exchange, normally 4:00 p.m. Eastern time. Wherever possible, the fund uses independent pricing services approved by the Board of Trustees to value its investments. Debt securities, including restricted securities, for which quotes are readily available, are valued by independent pricing services or by dealers who make markets in such securities. Pricing services consider yield or price of bonds of comparable quality, coupon, maturity and type as well as dealer supplied prices. When current market prices or quotations are not readily available or do not accurately reflect fair value, valuations may be determined in accor dance with procedures adopted by the Board of Trustees. The frequency of when fair value pricing is used is unpredictable. The value of securities used for NAV calculation under fair value pricing may differ from published prices for the same securities. Investments in open end mutual funds are valued at their closing net asset value each business day. Short term securities with remaining maturities of sixty days or less for which quotations are not readily available are valued at amortized cost, which approximates value.
Investment Transactions and Income. Security transactions are accounted for as of trade date. Gains and losses on securities sold are determined on the basis of identified cost. Interest income is accrued as earned. Interest income includes coupon interest and amortization of premium and accretion of discount on debt securities.
Expenses. Most expenses of the trust can be directly attributed to a fund. Expenses which cannot be directly attributed are apportioned among each fund in the trust.
Income Tax Information and Distributions to Shareholders. Each year, the fund intends to qualify as a regulated investment company by distributing all of its taxable income and realized gains under Subchapter M of the Internal Revenue Code. As a result, no provision for income taxes is required in the accompanying financial statements.
Dividends are declared daily and paid monthly from net investment income. Distribu tions from realized gains, if any, are recorded on the ex dividend date. Income and capital gain distributions are determined in accordance with income tax regulations,
| 1. Significant Accounting Policies continued | | |
Income Tax Information and Distributions to Shareholders continued |
which may differ from generally accepted accounting principles. In addition, the fund claimed a portion of the payment made to redeeming shareholders as a distribution for income tax purposes.
Capital accounts within the financial statements are adjusted for permanent book tax differences. These adjustments have no impact on net assets or the results of operations. Temporary book tax differences will reverse in a subsequent period.
Book tax differences are primarily due to futures transactions and market discount.
The fund purchases municipal securities whose interest, in the opinion of the issuer, is free from federal income tax. There is no assurance that the Internal Revenue Service (IRS) will agree with this opinion. In the event the IRS determines that the issuer does not comply with relevant tax requirements, interest payments from a security could become federally taxable, possibly retroactively to the date the security was issued.
The federal tax cost of investments and unrealized appreciation (depreciation) as of period end were as follows:
| Unrealized appreciation | | | | $ 3,409,027 |
| Unrealized depreciation | | | | (381,130) |
| Net unrealized appreciation (depreciation) | | | | $ 3,027,897 |
| Cost for federal income tax purposes | | | | $ 107,455,057 |
Short Term Trading (Redemption) Fees. Shares held in the fund less than 30 days are subject to a redemption fee equal to .50% of the proceeds of the redeemed shares. All redemption fees, including any estimated redemption fees paid by Fidelity Management & Research Company (FMR), are retained by the fund and accounted for as an addition to paid in capital.
Delayed Delivery Transactions and When Issued Securities. The fund may purchase or sell securities on a delayed delivery or when issued basis. Payment and delivery may take place after the customary settlement period for that security. The price of the underlying securities and the date when the securities will be delivered and paid for are fixed at the time the transaction is negotiated. During the time a delayed delivery sell is outstanding, the contract is marked to market daily and equivalent deliverable securities are held for the transaction. The value of the securities purchased on a delayed delivery or when issued basis are identified as such in the fund’s Schedule of Investments. The fund may receive compensation for interest forgone in the purchase of a delayed delivery or when issued security. With respect to purchase commitments, the
17 Semiannual Report
| Notes to Financial Statements (Unaudited) continued |
2. Operating Policies continued |
Delayed Delivery Transactions and When Issued Securities continued |
fund identifies securities as segregated in its records with a value at least equal to the amount of the commitment. Losses may arise due to changes in the value of the underlying securities or if the counterparty does not perform under the contract’s terms, or if the issuer does not issue the securities due to political, economic, or other factors.
Futures Contracts. The fund may use futures contracts to manage its exposure to the bond market and to fluctuations in interest rates. Buying futures tends to increase a fund’s exposure to the underlying instrument, while selling futures tends to decrease a fund’s exposure to the underlying instrument or hedge other fund investments. Upon entering into a futures contract, a fund is required to deposit with a clearing broker, no later than the following business day, an amount (“initial margin”) equal to a certain percentage of the face value of the contract. The initial margin may be in the form of cash or securities and is transferred to a segregated account on settlement date. Subsequent payments (“variation margin”) are made or received by a fund depending on the daily fluctuations in the value of the futures contract and are accounted for as unrealized gains or losses. Realized gains (losses) are recorded upon the expiration or closing of the futures contract. Securities deposited to meet margin requirements are identified in the Schedule of Investments. Futures contracts involve, to varying degrees, risk of loss in excess of any futures variation margin reflected in the Statement of Assets and Liabili ties. The underlying face amount at value of any open futures contracts at period end is shown in the Schedule of Investments under the caption “Futures Contracts.” This amount reflects each contract’s exposure to the underlying instrument at period end. Losses may arise from changes in the value of the underlying instruments or if the counterparties do not perform under the contract’s terms. Futures contracts are valued at the settlement price established each day by the board of trade or exchange on which they are traded.
3. Purchases and Sales of Investments.
Purchases and sales of securities, other than short term securities and U.S. government securities, aggregated $12,712,310 and $8,600,521, respectively.
4. Fees and Other Transactions with Affiliates.
Management Fee. FMR and its affiliates provide the fund with investment management related services for which the fund pays a monthly management fee that is based on an annual rate of .55% of the fund’s average net assets. FMR pays all other expenses, except the compensation of the independent Trustees and certain exceptions such as interest expense. The management fee paid to FMR by the fund is reduced by an amount equal to the fees and expenses paid by the fund to the independent Trustees.
5. Committed Line of Credit.
|
The fund participates with other funds managed by FMR in a $4.2 billion credit facility (the “line of credit”) to be utilized for temporary or emergency purposes to fund share holder redemptions or for other short term liquidity purposes. The fund has agreed to pay commitment fees on its pro rata portion of the line of credit, which is included in Miscellaneous Expense on the Statement of Operations. During the period, there were no borrowings on this line of credit.
Through arrangements with the fund’s custodian and transfer agent, credits realized as a result of uninvested cash balances were used to reduce the fund’s management fee. During the period, these credits reduced the fund’s management fee by $23,468.
The fund’s organizational documents provide former and current trustees and officers with a limited indemnification against liabilities arising in connection with the perfor mance of their duties to the fund. In the normal course of business, the fund may also enter into contracts that provide general indemnifications. The fund’s maximum exposure under these arrangements is unknown as this would be dependent on future claims that may be made against the fund. The risk of material loss from such claims is considered remote.
19 Semiannual Report
Board Approval of Investment Advisory Contracts and Management Fees
Fidelity Maryland Municipal Income Fund
On January 19, 2006, the Board of Trustees, including the Independent Trustees (together, the Board), voted to approve a general research services agreement (the Agreement) between FMR, FMR Co., Inc. (FMRC), Fidelity Investments Money Manage ment, Inc. (FIMM), and Fidelity Research & Analysis Company (FRAC) (together, the Investment Advisers) for the fund, effective January 20, 2006, pursuant to which FRAC may provide general research and investment advisory support services to FMRC and FIMM. The Board considered that it has approved previously various sub advisory agreements for the fund with affiliates of FMR that allow FMR to obtain research, non discretionary advice, or discretionary portfolio management at no additional expense to the fund. The Board, assisted by the advice of fund counsel and independent Trustees’ counsel, considered a broad range of information and determined that it would be beneficial for the fund to access the research and investment advisory support services supplied by FRAC at no additional expense to the fund.
The Board reached this determination in part because the new arrangement will involve no changes in (i) the contractual terms of and fees payable under the fund’s manage ment contract or sub advisory agreements; (ii) the investment process or strategies employed in the management of the fund’s assets; (iii) the nature or level of services provided under the fund’s management contract or sub advisory agreements; (iv) the day to day management of the fund or the persons primarily responsible for such man agement; or (v) the ultimate control or beneficial ownership of FMR, FMRC, or FIMM. The Board also considered that the establishment of the Agreement would not necessi tate prior shareholder approval of the Agreement or result in an assignment and termination of each fund’s management contract or sub advisory agreements under the Investment Company Act of 1940.
Because the Board was approving an arrangement with FRAC under which the fund will not bear any additional management fees or expenses and under which the fund’s portfolio manager would not change, it did not consider the fund’s investment perfor mance, competitiveness of management fee and total expenses, costs of services and profitability, or economies of scale to be significant factors in its decision.
In connection with its future renewal of the fund’s management contract and sub advisory agreements, the Board will consider: (i) the nature, extent, and quality of services provided to the fund, including shareholder and administrative services and investment performance; (ii) the competitiveness of the fund’s management fee and total expenses; (iii) the costs of the services and profitability, including the revenues earned and the expenses incurred by Fidelity in conducting the business of developing, marketing, distributing, managing, administering, and servicing the fund and its shareholders; and (iv) whether there have been economies of scale in respect of the management of the Fidelity funds, whether the Fidelity funds (including the fund) have
appropriately benefited from any such economies of scale, and whether there is potential for realization of any further economies.
Based on its evaluation of all of the conclusions noted above, and after considering all material factors, the Board ultimately concluded that the fund’s Agreement is fair and reasonable, and that the fund’s Agreement should be approved.
21 Semiannual Report
Investment Adviser
Fidelity Management & Research Company
Boston, MA
Investment Sub Advisers
Fidelity Investments
Money Management, Inc.
Fidelity Research & Analysis Company
(formerly Fidelity Management &
Research (Far East) Inc.)
Fidelity International
Investment Advisors
Fidelity International Investment
Advisors (U.K.) Limited
General Distributor
Fidelity Distributors Corporation
Boston, MA
Transfer and Service Agents
Citibank, N.A.
New York, NY
and
Fidelity Service Company, Inc.
Boston, MA
Custodian
Citibank, N.A.
New York, NY
|
| The Fidelity Telephone Connection |
| Mutual Fund 24-Hour Service |
| Exchanges/Redemptions | | |
| and Account Assistance | | 1-800-544-6666 |
| Product Information | | 1-800-544-6666 |
| Retirement Accounts | | 1-800-544-4774 |
| (8 a.m. - 9 p.m.) | | |
| TDD Service | | 1-800-544-0118 |
| for the deaf and hearing impaired |
| (9 a.m. - 9 p.m. Eastern time) |
| Fidelity Automated Service | | |
| Telephone (FAST® ) (automated phone logo) | | 1-800-544-5555 |
| (automated phone logo) Automated line for quickest service |
SMD-USAN-0406
1.790944.102
|

Item 2. Code of Ethics
Not applicable.
Item 3. Audit Committee Financial Expert
Not applicable.
Item 4. Principal Accountant Fees and Services
Not applicable.
Item 5. Audit Committee of Listed Registrants
Not applicable.
Item 6. Schedule of Investments
Not applicable.
Item 7. Disclosure of Proxy Voting Policies and Procedures for Closed-End Management Investment Companies
Not applicable.
Item 8. Portfolio Managers of Closed-End Management Investment Companies
Not applicable.
Item 9. Purchase of Equity Securities by Closed-End Management Investment Company and Affiliated Purchasers
Not applicable.
Item 10. Submission of Matters to a Vote of Security Holders
There were no material changes to the procedures by which shareholders may recommend nominees to the Fidelity Union Street Trust's Board of Trustees.
Item 11. Controls and Procedures
(a)(i) The President and Treasurer and the Chief Financial Officer have concluded that the Fidelity Union Street Trust's (the "Trust") disclosure controls and procedures (as defined in Rule 30a-3(c) under the Investment Company Act) provide reasonable assurances that material information relating to the Trust is made known to them by the appropriate persons, based on their evaluation of these controls and procedures as of a date within 90 days of the filing date of this report.
(a)(ii) There was no change in the Trust's internal control over financial reporting (as defined in Rule 30a-3(d) under the Investment Company Act) that occurred during the second fiscal quarter of the period covered by this report that has materially affected, or is reasonably likely to materially affect, the Trust's internal control over financial reporting.
Item 12. Exhibits
(a) | (1) | Not applicable. |
(a) | (2) | Certification pursuant to Rule 30a-2(a) under the Investment Company Act of 1940 (17 CFR 270.30a-2(a)) is filed and attached hereto as Exhibit 99.CERT. |
(a) | (3) | Not applicable. |
(b) | | Certification pursuant to Rule 30a-2(b) under the Investment Company Act of 1940 (17 CFR 270.30a-2(b)) is furnished and attached hereto as Exhibit 99.906CERT. |
SIGNATURES
Pursuant to the requirements of the Securities Exchange Act of 1934 and the Investment Company Act of 1940, the registrant has duly caused this report to be signed on its behalf by the undersigned, thereunto duly authorized.
Fidelity Union Street Trust
By: | /s/Christine Reynolds |
| Christine Reynolds |
| President and Treasurer |
| |
Date: | April 11, 2006 |
Pursuant to the requirements of the Securities Exchange Act of 1934 and the Investment Company Act of 1940, this report has been signed below by the following persons on behalf of the registrant and in the capacities and on the dates indicated.
By: | /s/Christine Reynolds |
| Christine Reynolds |
| President and Treasurer |
| |
Date: | April 11, 2006 |
By: | /s/Paul M. Murphy |
| Paul M. Murphy |
| Chief Financial Officer |
| |
Date: | April 11, 2006 |