UNITED STATES
SECURITIES AND EXCHANGE COMMISSION
Washington, D.C. 20549
FORM N-CSR
CERTIFIED SHAREHOLDER REPORT OF REGISTERED
MANAGEMENT INVESTMENT COMPANIES
Investment Company Act file number 811-2460
Fidelity Union Street Trust
(Exact name of registrant as specified in charter)
82 Devonshire St., Boston, Massachusetts 02109
(Address of principal executive offices) (Zip code)
Scott C. Goebel, Secretary
82 Devonshire St.
Boston, Massachusetts 02109
(Name and address of agent for service)
Registrant's telephone number, including area code: 617-563-7000
Date of fiscal year end: | August 31 |
| |
Date of reporting period: | August 31, 2010 |
Item 1. Reports to Stockholders
Fidelity®
Arizona Municipal
Income Fund
and
Fidelity
Arizona Municipal
Money Market Fund
Annual Report
August 31, 2010
(2_fidelity_logos) (Registered_Trademark)
Contents
Chairman's Message | <Click Here> | The Chairman's message to shareholders. |
Shareholder Expense Example | <Click Here> | An example of shareholder expenses. |
Fidelity Arizona Municipal Income Fund |
Performance | <Click Here> | How the fund has done over time. |
Management's
Discussion of Fund
Performance | <Click Here> | The Portfolio Manager's review of fund
performance and strategy. |
Investment Changes | <Click Here> | A summary of major shifts in the fund's investments over the past six months. |
Investments | <Click Here> | A complete list of the fund's investments with their market values. |
Financial Statements | <Click Here> | Statements of assets and liabilities, operations, and changes in net assets,
as well as financial highlights. |
Fidelity Arizona Municipal Money Market Fund |
Investment Changes/
Performance | <Click Here> | A summary of major shifts in the fund's investments over the past six months, and one year. |
Investments | <Click Here> | A complete list of the fund's investments with their market values. |
Financial Statements | <Click Here> | Statements of assets and liabilities, operations, and changes in net assets,
as well as financial highlights. |
Notes | <Click Here> | Notes to the financial statements. |
Report of Independent Registered Public Accounting Firm | <Click Here> | |
Trustees and Officers | <Click Here> | |
Distributions | <Click Here> | |
To view a fund's proxy voting guidelines and proxy voting record for the 12-month period ended June 30, visit http://www.fidelity.com/proxyvotingresults or visit the Securities and Exchange Commission's (SEC) web site at http://www.sec.gov. You may also call 1-800-544-8544 to request a free copy of the proxy voting guidelines.
Standard & Poor's, S&P and S&P 500 are registered service marks of The McGraw-Hill Companies, Inc. and have been licensed for use by Fidelity Distributors Corporation.
Other third party marks appearing herein are the property of their respective owners.
All other marks appearing herein are registered or unregistered trademarks or service marks of FMR LLC or an affiliated company.
Annual Report
This report and the financial statements contained herein are submitted for the general information of the shareholders of the funds. This report is not authorized for distribution to prospective investors in the funds unless preceded or accompanied by an effective prospectus.
A fund files its complete schedule of portfolio holdings with the SEC for the first and third quarters of each fiscal year on Form N-Q. Forms N-Q are available on the SEC's web site at http://www.sec.gov. A fund's Forms N-Q may be reviewed and copied at the SEC's Public Reference Room in Washington, DC. Information regarding the operation of the SEC's Public Reference Room may be obtained by calling 1-800-SEC-0330. For a complete list of a fund's portfolio holdings, view the most recent holdings listing, semiannual report, or annual report on Fidelity's web site at http://www.fidelity.com or http://www.advisor.fidelity.com, as applicable.
NOT FDIC INSURED • MAY LOSE VALUE • NO BANK GUARANTEE
Neither the funds nor Fidelity Distributors Corporation is a bank.
Annual Report
(photo_of_Abigail_P_Johnson)
Dear Shareholder:
A yearlong uptrend in global equity markets reversed course in late April 2010 when investor sentiment turned bearish due in great measure to concern that Europe's debt crisis would expand and slow or derail economic recovery. However, a bounceback in July helped to recover some of the ground that was lost. Financial markets are always unpredictable, of course, but there also are several time-tested investment principles that can help put the odds in your favor.
One of the basic tenets is to invest for the long term. Over time, riding out the markets' inevitable ups and downs has proven much more effective than selling into panic or chasing the hottest trend. Even missing only a few of the markets' best days can significantly diminish investor returns. Patience also affords the benefits of compounding - of earning interest on additional income or reinvested dividends and capital gains. There can be tax advantages and cost benefits to consider as well. While staying the course doesn't eliminate risk, it can considerably lessen the effect of short-term declines.
You can further manage your investing risk through diversification. And today, more than ever, geographic diversification should be taken into account. Studies indicate that asset allocation is the single most important determinant of a portfolio's long-term success. The right mix of stocks, bonds and cash - aligned to your particular risk tolerance and investment objective - is very important. Age-appropriate rebalancing is also an essential aspect of asset allocation. For younger investors, an emphasis on equities - which historically have been the best-performing asset class over time - is encouraged. As investors near their specific goal, such as retirement or sending a child to college, consideration may be given to replacing volatile assets (e.g. common stocks) with more-stable fixed investments (bonds or savings plans).
A third principle - investing regularly - can help lower the average cost of your purchases. Investing a certain amount of money each month or quarter helps ensure you won't pay for all your shares at market highs. This strategy - known as dollar cost averaging - also reduces "emotion" from investing, helping shareholders avoid selling weak performers just prior to an upswing, or chasing a hot performer just before a correction.
We invite you to contact us via the Internet, through our Investor Centers or by phone. It is our privilege to provide you the information you need to make the investments that are right for you.
Sincerely,
(The chairman's signature appears here.)
Abigail P. Johnson
Annual Report
Shareholder Expense Example
As a shareholder of a Fund, you incur two types of costs: (1) transaction costs, including redemption fees, and (2) ongoing costs, including management fees and other Fund expenses. This Example is intended to help you understand your ongoing costs (in dollars) of investing in the Funds and to compare these costs with the ongoing costs of investing in other mutual funds.
The Example is based on an investment of $1,000 invested at the beginning of the period and held for the entire period (March 1, 2010 to August 31, 2010).
Actual Expenses
The first line of the accompanying table for each fund provides information about actual account values and actual expenses. You may use the information in this line, together with the amount you invested, to estimate the expenses that you paid over the period. Simply divide your account value by $1,000.00 (for example, an $8,600 account value divided by $1,000.00 = 8.6), then multiply the result by the number in the first line for a fund under the heading entitled "Expenses Paid During Period" to estimate the expenses you paid on your account during this period. A small balance maintenance fee of $12.00 that is charged once a year may apply for certain accounts with a value of less than $2,000. This fee is not included in the table below. If it was, the estimate of expenses you paid during the period would be higher, and your ending account value lower, by this amount. In addition, each Fund, as a shareholder in the underlying Fidelity Central Funds, will indirectly bear its pro-rata share of the fees and expenses incurred by the underlying Fidelity Central Funds. These fees and expenses are not included in the Fund's annualized expense ratio used to calculate the expense estimate in the table below.
Hypothetical Example for Comparison Purposes
The second line of the accompanying table for each fund provides information about hypothetical account values and hypothetical expenses based on a fund's actual expense ratio and an assumed rate of return of 5% per year before expenses, which is not the Fund's actual return. The hypothetical account values and expenses may not be used to estimate the actual ending account balance or expenses you paid for the period. You may use this information to compare the ongoing costs of investing in the Fund and other funds. To do so, compare this 5% hypothetical example with the 5% hypothetical examples that appear in the shareholder reports of the other funds. A small balance maintenance fee of $12.00 that is charged once a year may apply for certain accounts with a value of less than $2,000. This fee is not included in the table below. If it was, the estimate of expenses you paid during the period would be higher, and your ending account value lower, by this amount. In addition, each Fund, as a shareholder in the underlying Fidelity Central Funds, will indirectly bear its pro-rata share of the fees and expenses incurred by the underlying Fidelity Central Funds. These fees and expenses are not included in the Fund's annualized expense ratio used to calculate the expense estimate in the table below.
Please note that the expenses shown in the table are meant to highlight your ongoing costs only and do not reflect any transaction costs. Therefore, the second line of the table is useful in comparing ongoing costs only, and will not help you determine the relative total costs of owning different funds. In addition, if these transactional costs were included, your costs would have been higher.
Annual Report
| Annualized Expense Ratio | Beginning
Account Value
March 1, 2010 | Ending
Account Value
August 31, 2010 | Expenses Paid
During Period*
March 1, 2010
to August 31, 2010 |
Fidelity Arizona Municipal Income Fund | .55% | | | |
Actual | | $ 1,000.00 | $ 1,056.20 | $ 2.85 |
HypotheticalA | | $ 1,000.00 | $ 1,022.43 | $ 2.80 |
Fidelity Arizona Municipal Money Market Fund | .32% | | | |
Actual | | $ 1,000.00 | $ 1,000.10 | $ 1.61** |
HypotheticalA | | $ 1,000.00 | $ 1,023.59 | $ 1.63** |
A 5% return per year before expenses
* Expenses are equal to each Fund's annualized expense ratio, multiplied by the average account value over the period, multiplied by 184/365 (to reflect the one-half year period).
** If certain fees were not voluntarily waived by FMR or its affiliates during the period, the annualized expenses ratio for the Arizona Municipal Money Market Fund would have been .50% and the expenses paid in the actual and hypothetical examples above would have been $2.52 and $2.55, respectively.
Annual Report
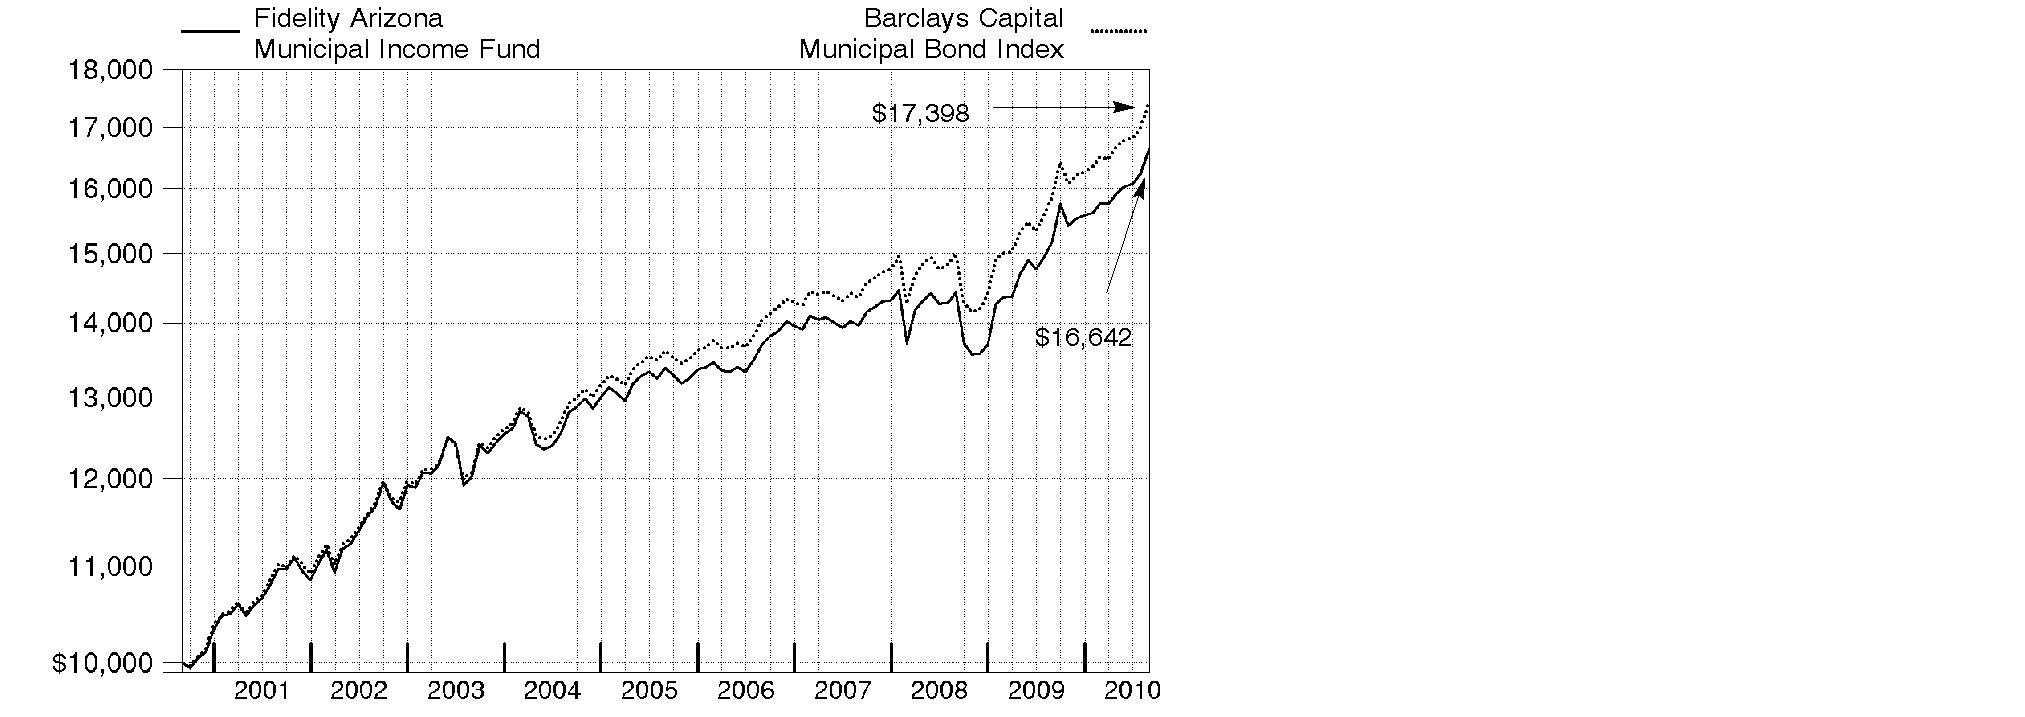
Fidelity Arizona Municipal Income Fund
Average annual total return reflects the change in the value of an investment, assuming reinvestment of the fund's distributions from dividend income and capital gains (the profits earned upon the sale of securities that have grown in value, if any) and assuming a constant rate of performance each year. The $10,000 table and the fund's returns do not reflect the deduction of taxes that a shareholder would pay on fund distributions or the redemption of fund shares. During periods of reimbursement by Fidelity, a fund's total return will be greater than it would be had the reimbursement not occurred. How a fund did yesterday is no guarantee of how it will do tomorrow.
Average Annual Total Returns
Periods ended August 31, 2010 | Past 1
year | Past 5
years | Past 10
years |
Fidelity Arizona Municipal Income Fund | 9.69% | 4.45% | 5.23% |
$10,000 Over 10 Years
Let's say hypothetically that $10,000 was invested in Fidelity ® Arizona Municipal Income Fund on August 31, 2000. The chart shows how the value of your investment would have changed, and also shows how the Barclays Capital Municipal Bond Index performed over the same period.
Annual Report
Fidelity Arizona Municipal Income Fund
Market Recap: Favorable supply/demand dynamics and a relatively benign interest rate environment helped municipal bonds generate strong gains during the 12-month period ending August 31, 2010. Demand for munis was quite robust during the year, as investors - some motivated to preserve wealth and others to capture higher-yielding alternatives to cash and money market investments - piled into fixed-income investments. The threat of higher tax rates also bolstered demand for munis, which generally are exempt from state and federal income taxes. At the same time, supply was muted due to the increased popularity of Build America Bonds - newer taxable securities that often allow municipal issuers to borrow more cheaply in the taxable market. Meanwhile, the Federal Reserve held short-term interest rates at a historically low level, providing a supportive backdrop for fixed-income securities. Although these developments collectively helped muni bond prices, they also masked growing concerns about muni bond fundamentals, as government revenue declined dramatically. For the 12 months, the Barclays Capital Municipal Bond Index - a measure of more than 46,000 investment-grade, fixed-rate tax-exempt bonds - gained 9.78%. By comparison, the investment-grade taxable debt market, as measured by the Barclays Capital U.S. Aggregate Bond Index, rose 9.18%.
Comments from Kevin Ramundo, who became Portfolio Manager of Fidelity® Arizona Municipal Income Fund on June 30, 2010: For the year, the fund returned 9.69% and the Barclays Capital Arizona 4+ Year Enhanced Index returned 10.64%. The fund's smaller-than-index exposure to non-callable par bonds and underweighting in three sectors that performed particularly well were the primary detractors from relative performance. Non-callable par bonds carry two features that were attractive to individual investors, who were major sources of muni demand during the period. The non-callable aspect means the bonds can't be redeemed by their issuers before maturity, and par means they sell at face value. In terms of sectors, the fund was hurt by its underweighting in some higher-yielding, lower-quality securities, specifically certain types of corporate-backed munis, investor-owned utilities and housing bonds. Each outpaced the benchmark in large measure due to robust demand for higher-yielding alternatives to cash, money markets and U.S. government securities. In contrast, overweighting two other recession-resistant sectors - bonds issued by higher education institutions and providers of water, sewer and other essential services - worked to the fund's advantage. Both performed comparatively well thanks to strong investor demand.
The views expressed above reflect those of the portfolio manager(s) only through the end of the period as stated on the cover of this report and do not necessarily represent the views of Fidelity or any other person in the Fidelity organization. Any such views are subject to change at any time based upon market or other conditions and Fidelity disclaims any responsibility to update such views. These views may not be relied on as investment advice and, because investment decisions for a Fidelity fund are based on numerous factors, may not be relied on as an indication of trading intent on behalf of any Fidelity fund.
Annual Report
Fidelity Arizona Municipal Income Fund
Investment Changes (Unaudited)
Top Five Sectors as of August 31, 2010 |
| % of fund's
net assets | % of fund's net assets
6 months ago |
General Obligations | 24.5 | 22.2 |
Special Tax | 17.0 | 17.9 |
Water & Sewer | 16.4 | 17.8 |
Electric Utilities | 15.0 | 13.4 |
Education | 9.3 | 9.9 |
Weighted Average Maturity as of August 31, 2010 |
| | 6 months ago |
Years | 7.0 | 7.8 |
Weighted Average Maturity (WAM) is a weighted average of all the maturities of the securities held in a fund. The weighted average maturity is based on the dollar-weighted average length of time until principal payments are expected or until securities reach maturity, taking into account any maturity shortening feature such as a call, refunding or redemption provision if it is probable that the issuer of the instrument will take advantage of such features. |
Duration as of August 31, 2010 |
| | 6 months ago |
Years | 8.1 | 8.3 |
Duration shows how much a bond fund's price fluctuates with changes in comparable interest rates. If rates rise 1%, for example, a fund with a five-year duration is likely to lose about 5% of its value. Other factors also can influence a bond fund's performance and share price. Accordingly, a bond fund's actual performance may differ from this example. |
Quality Diversification (% of fund's net assets) |
As of August 31, 2010 | As of February 28, 2010 |
 | AAA 6.3% | | | AAA 3.1% | |
 | AA,A 79.4% | | | AA,A 73.5% | |
 | BBB 11.8% | | | BBB 16.7% | |
 | BB and Below 0.0% | | | BB and Below 0.8% | |
 | Not Rated 0.0% | | | Not Rated 1.2% | |
 | Short-Term
Investments and
Net Other Assets 2.5% | | | Short-Term
Investments and
Net Other Assets 4.7% | |

We have used ratings from Moody's Investors Service, Inc. Where Moody's® ratings are not available, we have used S&P® ratings. All ratings are as of the report date and do not reflect subsequent downgrades. |
Annual Report
Fidelity Arizona Municipal Income Fund
Investments August 31, 2010
Showing Percentage of Net Assets
Municipal Bonds - 97.5% |
| Principal Amount | | Value |
Arizona - 92.6% |
Arizona Board of Regents Arizona State Univ. Rev. (Polytechnic Campus Proj.) Series 2008 C: | | | | |
5.75% 7/1/22 | | $ 1,500,000 | | $ 1,793,910 |
5.75% 7/1/23 | | 250,000 | | 296,678 |
Arizona Board of Regents Ctfs. of Prtn.: | | | | |
(Arizona Biomedical Research Collaborative Bldg. Proj.) Series 2006, 5% 6/1/19 (AMBAC Insured) | | 1,140,000 | | 1,267,064 |
(Univ. of Arizona Projs.) Series 2006 A, 5% 6/1/18 (AMBAC Insured) | | 1,000,000 | | 1,123,280 |
Arizona Ctfs. of Prtn.: | | | | |
Series 2008 A, 5% 9/1/20 (FSA Insured) | | 1,640,000 | | 1,827,239 |
Series 2010 A, 5% 10/1/29 (FSA Insured) | | 5,000,000 | | 5,314,700 |
Arizona Game and Fish Dept. and Commission (AGF Administration Bldg. Proj.) Series 2006: | | | | |
5% 7/1/21 | | 1,280,000 | | 1,385,984 |
5% 7/1/32 | | 470,000 | | 482,869 |
Arizona Health Facilities Auth. Rev. (Banner Health Sys. Proj.): | | | | |
Series 2007 A, 5% 1/1/21 | | 1,000,000 | | 1,066,880 |
Series 2007 B, 1.167% 1/1/37 (b) | | 1,000,000 | | 621,820 |
Series 2008 A, 5.25% 1/1/31 | | 1,000,000 | | 1,028,700 |
Series 2008 D, 6% 1/1/27 | | 1,000,000 | | 1,115,130 |
Arizona School Facilities Board Ctfs. of Prtn.: | | | | |
Series 2004 B, 5.25% 9/1/15 (FSA Insured) | | 2,800,000 | | 3,149,972 |
Series 2005 A2, 5% 9/1/16 (Nat'l. Pub. Fin. Guarantee Corp. Insured) | | 1,665,000 | | 1,866,781 |
Series 2008, 5.75% 9/1/22 | | 1,000,000 | | 1,149,710 |
Series A2, 5% 9/1/18 (Nat'l. Pub. Fin. Guarantee Corp. Insured) | | 1,000,000 | | 1,098,450 |
Arizona School Facilities Board Rev. Series 2005, 5% 7/1/13 | | 1,225,000 | | 1,377,733 |
Arizona State Lottery Rev. Series 2010 A, 5% 7/1/21 | | 1,000,000 | | 1,146,730 |
Arizona State Univ. Ctfs. of Prtn. (Research Infrastructure Proj.) Series 2004, 5.25% 9/1/24 | | 1,230,000 | | 1,319,077 |
Arizona State Univ. Nanotechnology LLC Lease Rev. Series 2009 A, 5% 3/1/34 (Assured Guaranty Corp. Insured) | | 1,000,000 | | 1,045,030 |
Arizona State Univ. Revs. Series 2005, 5% 7/1/26 (AMBAC Insured) | | 1,000,000 | | 1,036,340 |
Arizona Trans. Board Hwy. Rev.: | | | | |
Series 2006, 5% 7/1/22 | | 400,000 | | 455,532 |
Series 2008 A, 5% 7/1/33 | | 2,000,000 | | 2,166,720 |
Municipal Bonds - continued |
| Principal Amount | | Value |
Arizona - continued |
Arizona Wtr. Infrastructure Fin. Auth. Rev.: | | | | |
(Wtr. Quality Proj.) Series 2006 A, 5% 10/1/23 | | $ 500,000 | | $ 567,050 |
Series 2009 A, 5% 10/1/29 | | 1,000,000 | | 1,131,550 |
Series 2010 A, 5% 10/1/30 | | 2,000,000 | | 2,267,400 |
Avondale Muni. Dev. Corp. Excise Tax Rev. 5% 7/1/28 | | 500,000 | | 543,095 |
Cottonwood Wtr. Sys. Rev.: | | | | |
5% 7/1/26 (XL Cap. Assurance, Inc. Insured) | | 1,405,000 | | 1,442,022 |
5% 7/1/30 (XL Cap. Assurance, Inc. Insured) | | 1,125,000 | | 1,128,308 |
5% 7/1/35 (XL Cap. Assurance, Inc. Insured) | | 1,300,000 | | 1,292,590 |
Downtown Phoenix Hotel Corp. Rev. Series A, 5.25% 7/1/23 (FGIC Insured) | | 1,750,000 | | 1,659,053 |
Dysart Unified School District #89 Gen. Oblig. (School Impt. Proj.) Series 2007 A, 5% 7/1/26 (FGIC Insured) (FSA Insured) | | 1,325,000 | | 1,438,009 |
Glendale Indl. Dev. Auth. (Midwestern Univ. Proj.) Series 2007, 5.25% 5/15/19 | | 1,000,000 | | 1,132,630 |
Glendale Indl. Dev. Auth. Hosp. Rev. (John C. Lincoln Health Network Proj.): | | | | |
Series 2005 B, 5.25% 12/1/19 | | 1,040,000 | | 1,076,982 |
Series 2005, 5% 12/1/35 | | 1,000,000 | | 954,410 |
Series 2007, 5% 12/1/27 | | 1,000,000 | | 986,290 |
Glendale Western Loop 101 Pub. Facilities Corp. Series 2008 A: | | | | |
6.25% 7/1/38 | | 3,000,000 | | 3,198,540 |
7% 7/1/33 | | 1,000,000 | | 1,093,840 |
Goodyear McDowell Road Commercial Corridor Impt. District 5.25% 1/1/17 (AMBAC Insured) | | 1,580,000 | | 1,770,864 |
Goodyear Pub. Impt. Corp. Facilities Rev. Series 2008, 6% 7/1/31 | | 1,000,000 | | 1,107,710 |
Marana Muni. Property Corp. Facilities Rev. Series A, 5.25% 7/1/22 | | 1,620,000 | | 1,849,489 |
Maricopa County Indl. Dev. Auth. Health Facilities Rev.: | | | | |
(Catholic Healthcare West Proj.): | | | | |
Series 1998 A, 5% 7/1/16 | | 480,000 | | 480,792 |
Series 2007 A, 5% 7/1/16 | | 1,000,000 | | 1,116,360 |
Series 2009 A, 6% 7/1/39 | | 1,000,000 | | 1,086,950 |
Series A, 5.25% 7/1/32 | | 1,000,000 | | 1,027,040 |
(Mayo Clinic Proj.) 5% 11/15/36 | | 1,000,000 | | 1,035,500 |
Maricopa County Indl. Dev. Auth. Hosp. Facilities Rev. (Mayo Clinic Hosp. Proj.) 5.25% 11/15/37 | | 1,000,000 | | 1,000,820 |
Maricopa County Poll. Cont. Rev. (Southern California Edison Co. Proj.) Series 2000 A, 5% 6/1/35 | | 3,000,000 | | 3,097,950 |
Municipal Bonds - continued |
| Principal Amount | | Value |
Arizona - continued |
Maricopa County Unified School District #60 Higley (School Impt. Proj.) Series B, 5% 7/1/19 (FGIC Insured) | | $ 1,000,000 | | $ 1,123,920 |
McAllister Academic Village LLC Rev. (Arizona State Univ. Hassayampa Academic Village Proj.) Series 2008, 5% 7/1/38 | | 1,000,000 | | 1,022,680 |
Mesa Util. Sys. Rev. 5% 7/1/24 (FGIC Insured) | | 2,000,000 | | 2,350,600 |
Navajo County Poll. Cont. Corp. Rev. (Arizona Pub. Svc. Co. Cholla Proj.) Series 2009 A, 5%, tender 6/1/12 (b) | | 2,000,000 | | 2,101,940 |
North Campus Facilities LLC (Northern Arizona Univ. Sys. Rev. Proj.) 5% 6/1/31 (AMBAC Insured) | | 1,225,000 | | 1,264,384 |
Northern Arizona Univ. Revs. 5% 6/1/21 (AMBAC Insured) | | 1,085,000 | | 1,194,281 |
Phoenix Civic Impt. Board Arpt. Rev.: | | | | |
Series A, 5% 7/1/33 | | 1,000,000 | | 1,034,620 |
Series B, 5.25% 7/1/27 (Nat'l. Pub. Fin. Guarantee Corp. Insured) (c) | | 1,100,000 | | 1,119,470 |
Phoenix Civic Impt. Corp. District Rev. (Plaza Expansion Proj.) Series 2005 B, 0% 7/1/38 (a) | | 2,000,000 | | 1,926,100 |
Phoenix Civic Impt. Corp. Excise Tax Rev.: | | | | |
(Civic Plaza Expansion Proj.) Series 2005 A: | | | | |
5% 7/1/18 (FGIC Insured) | | 550,000 | | 615,868 |
5% 7/1/30 (Nat'l. Pub. Fin. Guarantee Corp. Insured) | | 1,000,000 | | 1,049,270 |
Series 2007 A, 5% 7/1/22 (Nat'l. Pub. Fin. Guarantee Corp. Insured) | | 1,250,000 | | 1,384,538 |
Phoenix Civic Impt. Corp. Transit Excise Tax Rev. (Lt. Rail Proj.) Series 2004, 5% 7/1/20 | | 1,000,000 | | 1,101,830 |
Phoenix Civic Impt. Corp. Wastewtr. Sys. Rev.: | | | | |
Series 2004: | | | | |
5% 7/1/24 | | 1,750,000 | | 1,892,730 |
5% 7/1/29 (Nat'l. Pub. Fin. Guarantee Corp. Insured) | | 770,000 | | 816,393 |
Series 2007, 5% 7/1/20 (Nat'l. Pub. Fin. Guarantee Corp. Insured) | | 1,000,000 | | 1,145,190 |
Phoenix Civic Impt. Corp. Wtr. Sys. Rev.: | | | | |
(Jr. Lien Wtr. Sys. Proj.) Series 2009 A, 5% 7/1/25 | | 1,650,000 | | 1,882,221 |
Series 2001, 5.5% 7/1/24 (Nat'l. Pub. Fin. Guarantee Corp. Insured) | | 1,000,000 | | 1,261,740 |
Series 2002, 5.5% 7/1/20 (Nat'l. Pub. Fin. Guarantee Corp. Insured) | | 1,500,000 | | 1,616,235 |
Municipal Bonds - continued |
| Principal Amount | | Value |
Arizona - continued |
Phoenix Civic Impt. Corp. Wtr. Sys. Rev.: - continued | | | | |
Series 2005: | | | | |
4.75% 7/1/27 (Nat'l. Pub. Fin. Guarantee Corp. Insured) | | $ 80,000 | | $ 85,208 |
5% 7/1/20 | | 5,000,000 | | 5,630,450 |
5% 7/1/29 | | 1,750,000 | | 1,879,255 |
Series 2009 A, 5% 7/1/39 | | 2,750,000 | | 2,940,025 |
Phoenix Gen. Oblig. Series 2002 B, 5.375% 7/1/20 | | 1,060,000 | | 1,124,459 |
Phoenix Street & Hwy. User Rev. Series 1992, 6.25% 7/1/11 (Nat'l. Pub. Fin. Guarantee Corp. Insured) | | 10,000 | | 10,041 |
Pima County Ctfs. of Prtn. (Justice Bldg. Proj.): | | | | |
Series 2007 A, 5% 7/1/19 (AMBAC Insured) | | 735,000 | | 818,878 |
Series A, 5% 7/1/21 (AMBAC Insured) | | 935,000 | | 1,020,665 |
Pima County Unified School District #1 Tucson (Proj. of 2004): | | | | |
Series 2007 C, 5% 7/1/23 (FGIC Insured) | | 1,000,000 | | 1,109,570 |
Series 2008 D, 5% 7/1/25 (FSA Insured) | | 1,000,000 | | 1,109,110 |
Pinal County Indl. Dev. Auth. Correctional Facilities Contract Rev. (Florence West Prison Proj.): | | | | |
Series 2006 A, 5.25% 10/1/12 (ACA Finl. Guaranty Corp. Insured) | | 1,000,000 | | 1,031,710 |
Series 2007 A, 5.25% 10/1/13 (ACA Finl. Guaranty Corp. Insured) | | 1,335,000 | | 1,387,145 |
Pinal County Unified School District #1 Florence (2006 School Impt. Proj.) Series 2007 A: | | | | |
5% 7/1/19 (FGIC Insured) | | 1,000,000 | | 1,123,920 |
5% 7/1/20 (FGIC Insured) | | 1,000,000 | | 1,112,170 |
Pinal County Unified School District #44 J.O. Combs (2006 School Impt. Proj.) Series B, 5% 7/1/21 (Nat'l. Pub. Fin. Guarantee Corp. Insured) | | 860,000 | | 949,242 |
Queen Creek Excise Tax & State Shared Rev. 5% 8/1/22 (Nat'l. Pub. Fin. Guarantee Corp. Insured) | | 1,125,000 | | 1,218,431 |
Salt River Proj. Agricultural Impt. & Pwr. District Elec. Sys. Rev.: | | | | |
Series 2002 B: | | | | |
5% 1/1/20 | | 1,500,000 | | 1,625,745 |
5% 1/1/21 | | 290,000 | | 313,615 |
5% 1/1/31 | | 1,995,000 | | 2,067,119 |
Series 2005 A, 5% 1/1/35 | | 3,000,000 | | 3,170,520 |
Series 2006 A, 5% 1/1/37 | | 5,690,000 | | 6,004,993 |
Series 2008 A: | | | | |
5% 1/1/24 | | 1,075,000 | | 1,226,070 |
5% 1/1/38 | | 5,400,000 | | 5,792,958 |
Municipal Bonds - continued |
| Principal Amount | | Value |
Arizona - continued |
Salt River Proj. Agricultural Impt. & Pwr. District Elec. Sys. Rev.: - continued | | | | |
Series 2009 A, 5% 1/1/39 | | $ 1,000,000 | | $ 1,080,480 |
Salt Verde Finl. Corp. Sr. Gas Rev. Series 2007, 5.5% 12/1/29 | | 3,000,000 | | 3,100,950 |
Scottsdale Indl. Dev. Auth. Hosp. Rev. (Scottsdale Healthcare Proj.): | | | | |
Series 2006 C, 5% 9/1/35 (Assured Guaranty Corp. Insured) | | 1,000,000 | | 1,026,920 |
Series 2008 A, 5% 9/1/23 | | 355,000 | | 368,983 |
Scottsdale Muni. Property Corp. Excise Tax Rev. (Wtr. and Swr. Impt. Proj.) Series 2008 A, 5% 7/1/28 | | 1,050,000 | | 1,166,855 |
Sedona Excise Tax Rev.: | | | | |
Series 2004, 5% 7/1/15 (Nat'l. Pub. Fin. Guarantee Corp. Insured) | | 2,120,000 | | 2,329,901 |
Series 2005, 5% 7/1/19 (Nat'l. Pub. Fin. Guarantee Corp. Insured) | | 1,000,000 | | 1,069,720 |
Tempe Gen. Oblig. Series 2006, 5% 7/1/20 | | 3,200,000 | | 3,678,016 |
Tempe Transit Excise Tax Rev. Series 2008, 4.75% 7/1/38 | | 85,000 | | 89,653 |
Tucson Ctfs. of Prtn.: | | | | |
Series 2006 A, 5% 7/1/18 (Nat'l. Pub. Fin. Guarantee Corp. Insured) | | 3,050,000 | | 3,415,360 |
Series 2007, 5% 7/1/18 (Nat'l. Pub. Fin. Guarantee Corp. Insured) | | 1,000,000 | | 1,131,840 |
Tucson Gen. Oblig. Series 2005: | | | | |
5% 7/1/16 (Nat'l. Pub. Fin. Guarantee Corp. Insured) | | 3,250,000 | | 3,759,698 |
5% 7/1/18 (Nat'l. Pub. Fin. Guarantee Corp. Insured) | | 2,295,000 | | 2,613,684 |
Tucson Street & Hwy. User Rev. Series 1994 B, 7.5% 7/1/11 (Nat'l. Pub. Fin. Guarantee Corp. Insured) | | 1,015,000 | | 1,071,333 |
Tucson Wtr. Rev. Series 2001 A, 5% 7/1/11 (Nat'l. Pub. Fin. Guarantee Corp. Insured) | | 1,095,000 | | 1,133,599 |
Univ. Med. Ctr. Corp. Hosp. Rev.: | | | | |
Series 2004: | | | | |
5.25% 7/1/11 | | 210,000 | | 215,481 |
5.25% 7/1/15 | | 1,000,000 | | 1,063,610 |
Series 2005, 5% 7/1/16 | | 1,515,000 | | 1,569,692 |
Univ. of Arizona Univ. Revs.: | | | | |
(Univ. of Arizona Projs.): | | | | |
Series 2003 B, 5% 6/1/31 (AMBAC Insured) | | 300,000 | | 306,843 |
Series 2005 A, 5% 6/1/24 (AMBAC Insured) | | 1,040,000 | | 1,112,290 |
Series 2005 C, 5% 6/1/14 (AMBAC Insured) | | 360,000 | | 407,675 |
Series 2008 A, 5% 6/1/22 | | 1,315,000 | | 1,502,322 |
Municipal Bonds - continued |
| Principal Amount | | Value |
Arizona - continued |
Univ. of Arizona Univ. Revs.: - continued | | | | |
Series 2009 A, 5% 6/1/39 | | $ 1,000,000 | | $ 1,060,990 |
Yavapai County Indl. Dev. Auth. Solid Waste Disp. Rev. (Waste Mgmt., Inc. Proj.) Series 2002, 3.5%, tender 6/3/13 (b)(c) | | 1,000,000 | | 1,006,740 |
| | 170,559,517 |
Guam - 0.3% |
Guam Ed. Fing. Foundation Ctfs. of Prtn. Series A, 5% 10/1/12 | | 500,000 | | 522,970 |
Puerto Rico - 3.6% |
Puerto Rico Commonwealth Hwy. & Trans. Auth. Trans. Rev.: | | | | |
Series 1998, 5.75% 7/1/22 (CIFG North America Insured) | | 700,000 | | 719,201 |
Series 2003, 5.75% 7/1/19 (FGIC Insured) | | 700,000 | | 729,736 |
Puerto Rico Commonwealth Pub. Impt. Gen. Oblig.: | | | | |
Series 2002 A, 5.5% 7/1/18 | | 700,000 | | 787,444 |
Series 2003 A, 5.25% 7/1/14 | | 275,000 | | 295,592 |
Puerto Rico Govt. Dev. Bank: | | | | |
Series 2006 B, 5% 12/1/12 | | 1,000,000 | | 1,067,540 |
Series 2006 C, 5.25% 1/1/15 (c) | | 500,000 | | 531,735 |
Puerto Rico Pub. Bldg. Auth. Rev.: | | | | |
Series G, 5.25% 7/1/13 | | 315,000 | | 330,429 |
Series M2, 5.75%, tender 7/1/17 (b) | | 200,000 | | 222,994 |
Puerto Rico Sales Tax Fing. Corp. Sales Tax Rev.: | | | | |
Series 2007 A, 0% 8/1/41 (FGIC Insured) | | 3,200,000 | | 536,768 |
Series 2009 A, 6% 8/1/42 | | 1,300,000 | | 1,439,789 |
| | 6,661,228 |
Virgin Islands - 1.0% |
Virgin Islands Pub. Fin. Auth. Series 2009 B, 5% 10/1/25 | | 300,000 | | 312,885 |
Municipal Bonds - continued |
| Principal Amount | | Value |
Virgin Islands - continued |
Virgin Islands Pub. Fin. Auth. Refinery Facilities Rev. Series 2007, 4.7% 7/1/22 (c) | | $ 500,000 | | $ 465,150 |
Virgin Islands Wtr. & Pwr. Auth. Elec. Sys. Rev. Series 2007 A, 5% 7/1/27 | | 1,000,000 | | 1,035,590 |
| | 1,813,625 |
TOTAL INVESTMENT PORTFOLIO - 97.5% (Cost $171,751,727) | | 179,557,340 |
NET OTHER ASSETS (LIABILITIES) - 2.5% | | 4,643,229 |
NET ASSETS - 100% | $ 184,200,569 |
Legend |
(a) Security initially issued in zero coupon form which converts to coupon form at a specified rate and date. The rate shown is the rate at period end. |
(b) The coupon rate shown on floating or adjustable rate securities represents the rate at period end. |
(c) Private activity obligations whose interest is subject to the federal alternative minimum tax for individuals. |
Other Information |
All investments are categorized as Level 2 under the Fair Value Hierarchy. The inputs or methodology used for valuing securities may not be an indication of the risk associated with investing in those securities. For more information on valuation inputs, please refer to the Security Valuation section in the accompanying Notes to Financial Statements. |
The distribution of municipal securities by revenue source, as a percentage of total net assets, is as follows: (Unaudited) |
General Obligations | 24.5% |
Special Tax | 17.0% |
Water & Sewer | 16.4% |
Electric Utilities | 15.0% |
Education | 9.3% |
Health Care | 9.2% |
Others* (Individually Less Than 5%) | 8.6% |
| 100.0% |
*Includes net other assets |
Income Tax Information |
At August 31, 2010, the Fund had a capital loss carryforward of approximately $276,075 all of which will expire on August 31, 2017. Capital loss carryforwards are only available to offset future capital gains of the Fund to the extent provided by regulations and may be limited. |
See accompanying notes which are an integral part of the financial statements.
Annual Report
Fidelity Arizona Municipal Income Fund
Statement of Assets and Liabilities
| August 31, 2010 |
| | |
Assets | | |
Investment in securities, at value - See accompanying schedule: Unaffiliated issuers (cost $171,751,727) | | $ 179,557,340 |
Cash | | 3,155,365 |
Receivable for fund shares sold | | 31,794 |
Interest receivable | | 1,826,391 |
Other receivables | | 2,036 |
Total assets | | 184,572,926 |
| | |
Liabilities | | |
Payable for fund shares redeemed | $ 54,462 | |
Distributions payable | 235,240 | |
Accrued management fee | 82,655 | |
Total liabilities | | 372,357 |
| | |
Net Assets | | $ 184,200,569 |
Net Assets consist of: | | |
Paid in capital | | $ 176,639,535 |
Undistributed net investment income | | 31,496 |
Accumulated undistributed net realized gain (loss) on investments | | (276,075) |
Net unrealized appreciation (depreciation) on investments | | 7,805,613 |
Net Assets, for 15,668,604 shares outstanding | | $ 184,200,569 |
Net Asset Value, offering price and redemption price per share ($184,200,569 ÷ 15,668,604 shares) | | $ 11.76 |
See accompanying notes which are an integral part of the financial statements.
Annual Report
Statement of Operations
| Year ended August 31, 2010 |
| | |
Investment Income | | |
Interest | | $ 7,162,220 |
| | |
Expenses | | |
Management fee | $ 934,974 | |
Independent trustees' compensation | 603 | |
Miscellaneous | 659 | |
Total expenses before reductions | 936,236 | |
Expense reductions | (5,059) | 931,177 |
Net investment income | | 6,231,043 |
Realized and Unrealized Gain (Loss) Net realized gain (loss) on: | | |
Investment securities: | | |
Unaffiliated issuers | | 261,192 |
Change in net unrealized appreciation (depreciation) on investment securities | | 9,261,589 |
Net gain (loss) | | 9,522,781 |
Net increase (decrease) in net assets resulting from operations | | $ 15,753,824 |
See accompanying notes which are an integral part of the financial statements.
Annual Report
Fidelity Arizona Municipal Income Fund
Financial Statements - continued
Statement of Changes in Net Assets
| Year ended
August 31,
2010 | Year ended
August 31,
2009 |
Increase (Decrease) in Net Assets | | |
Operations | | |
Net investment income | $ 6,231,043 | $ 5,302,836 |
Net realized gain (loss) | 261,192 | (538,126) |
Change in net unrealized appreciation (depreciation) | 9,261,589 | 1,113,163 |
Net increase (decrease) in net assets resulting
from operations | 15,753,824 | 5,877,873 |
Distributions to shareholders from net investment income | (6,226,317) | (5,294,897) |
Distributions to shareholders from net realized gain | - | (409,050) |
Total distributions | (6,226,317) | (5,703,947) |
Share transactions
Proceeds from sales of shares | 63,302,201 | 65,045,430 |
Reinvestment of distributions | 3,632,180 | 3,572,863 |
Cost of shares redeemed | (47,321,565) | (57,178,441) |
Net increase (decrease) in net assets resulting from share transactions | 19,612,816 | 11,439,852 |
Redemption fees | 7,644 | 7,310 |
Total increase (decrease) in net assets | 29,147,967 | 11,621,088 |
| | |
Net Assets | | |
Beginning of period | 155,052,602 | 143,431,514 |
End of period (including undistributed net investment income of $31,496 and undistributed net investment income of $26,262, respectively) | $ 184,200,569 | $ 155,052,602 |
Other Information Shares | | |
Sold | 5,576,691 | 6,083,801 |
Issued in reinvestment of distributions | 318,847 | 336,051 |
Redeemed | (4,168,259) | (5,472,354) |
Net increase (decrease) | 1,727,279 | 947,498 |
See accompanying notes which are an integral part of the financial statements.
Annual Report
Financial Highlights
Years ended August 31, | 2010 | 2009 | 2008 | 2007 | 2006 |
Selected Per-Share Data | | | | | |
Net asset value, beginning of period | $ 11.12 | $ 11.04 | $ 11.13 | $ 11.39 | $ 11.59 |
Income from Investment Operations | | | | | |
Net investment incomeB | .416 | .425 | .419 | .418 | .417 |
Net realized and unrealized gain (loss) | .639 | .112 | (.054) | (.205) | (.149) |
Total from investment operations | 1.055 | .537 | .365 | .213 | .268 |
Distributions from net investment income | (.416) | (.425) | (.418) | (.418) | (.417) |
Distributions from net realized gain | - | (.033) | (.037) | (.055) | (.051) |
Total distributions | (.416) | (.458) | (.455) | (.473) | (.468) |
Redemption fees added to paid in capitalB | .001 | .001 | -D | -D | -D |
Net asset value, end of period | $ 11.76 | $ 11.12 | $ 11.04 | $ 11.13 | $ 11.39 |
Total ReturnA | 9.69% | 5.15% | 3.33% | 1.87% | 2.41% |
Ratios to Average Net AssetsC | | | | | |
Expenses before reductions | .55% | .55% | .55% | .55% | .55% |
Expenses net of fee waivers, if any | .55% | .55% | .55% | .55% | .55% |
Expenses net of all reductions | .55% | .55% | .52% | .48% | .50% |
Net investment income | 3.66% | 3.97% | 3.76% | 3.70% | 3.69% |
Supplemental Data | | | | | |
Net assets, end of period
(000 omitted) | $ 184,201 | $ 155,053 | $ 143,432 | $ 129,125 | $ 107,024 |
Portfolio turnover rate | 10% | 19% | 22% | 15% | 22% |
A Total returns would have been lower had certain expenses not been reduced during the periods shown.
B Calculated based on average shares outstanding during the period.
C Expense ratios reflect operating expenses of the Fund. Expenses before reductions do not reflect amounts reimbursed by the investment adviser or reductions from expense offset arrangements and do not represent the amount paid by the Fund during periods when reimbursements or reductions occur. Expenses net of fee waivers reflect expenses after reimbursement by the investment adviser but prior to reductions from expense offset arrangements. Expenses net of all reductions represent the net expenses paid by the Fund.
D Amount represents less than $.001 per share.
See accompanying notes which are an integral part of the financial statements.
Annual Report
Fidelity Arizona Municipal Money Market Fund
Investment Changes/Performance (Unaudited)
Maturity Diversification |
Days | % of fund's investments 8/31/10 | % of fund's investments 2/28/10 | % of fund's
investments
8/31/09 |
0 - 30 | 93.9 | 90.5 | 89.8 |
31 - 90 | 1.0 | 0.0 | 0.8 |
91 - 180 | 0.9 | 8.9 | 2.4 |
181 - 397 | 4.2 | 0.6 | 7.0 |
Weighted Average Maturity |
| 8/31/10 | 2/28/10 | 8/31/09 |
Fidelity Arizona Municipal Money Market Fund | 20 Days | 18 Days | 30 Days |
All Tax Free Money Market Funds Average* | 30 Days | 27 Days | 32 Days |
Weighted Average Maturity (WAM) is a weighted average of all the maturities of the securities held in a fund. WAM for money market funds can be used as a measure of sensitivity to interest rate changes. Generally, the longer the maturity, the greater the sensitivity. WAM for money market funds is based on the dollar-weighted average length of time until principal payments must be paid, taking into account any call options exercised by the issuer and any permissible maturity shortening devices such as demand features and interest rate resets. |
Weighted Average Life |
| 8/31/10 | 2/28/10 | 8/31/09 |
Fidelity Arizona Municipal Money Market Fund | 20 Days | n/a** | n/a** |
Weighted Average Life (WAL) is the weighted average of the life of the securities held in a fund or portfolio and can be used as a measure of sensitivity to changes in liquidity and/or credit risk. Generally, the higher the value, the greater the sensitivity. WAL is based on the dollar-weighted average length of time until principal payments must be paid, taking into account any call options exercised by the issuer and any permissible maturity shortening features other than interest rate resets. The difference between WAM and WAL is that WAM takes into account interest rate resets and WAL does not. WAL for money market funds is not the same as WAL of a mortgage- or asset-backed security. |
Asset Allocation (% of fund's net assets) |
As of August 31, 2010 | As of February 28, 2010 |
| Variable Rate
Demand Notes
(VRDNs) 82.4% | | | Variable Rate
Demand Notes
(VRDNs) 88.1% | |
 | Commercial Paper (including
CP Mode) 4.5% | | | Commercial Paper (including
CP Mode) 1.1% | |
 | Fidelity Municipal
Cash Central Fund 7.9% | | | Fidelity Municipal
Cash Central Fund 1.1% | |
| Other Investments 5.2% | | | Other Investments 9.5% | |
 | Net Other Assets 0.0% | | | Net Other Assets 0.2% | |

* Source: iMoneyNet, Inc.
** Information not available
Annual Report
Current and Historical Seven-Day Yields
| 8/30/10 | 5/31/10 | 3/1/10 | 11/30/09 | 8/31/09 |
Fidelity Arizona Municipal Money Market Fund | 0.01% | 0.01% | 0.01% | 0.01% | 0.01% |
Yield refers to the income paid by the fund over a given period. Yields for money market funds are usually for seven-day periods, as they are here, though they are expressed as annual percentage rates. Past performance is no guarantee of future results. Yield will vary and it is possible to lose money by investing in the fund. A portion of the Fund's expenses were reimbursed and/or waived. Absent such reimbursements and/or waivers the Fund would have had a net investment loss for certain of the periods presented and the performance shown would have been lower.
Annual Report
Fidelity Arizona Municipal Money Market Fund
Investments August 31, 2010
Showing Percentage of Net Assets
Municipal Securities - 100.0% |
| Principal Amount | | Value |
Arizona - 87.2% |
Arizona Health Facilities Auth. Rev.: | | | |
Bonds (Banner Health Proj.) Series 2008 D, 5% 1/1/11 | $ 3,000,000 | | $ 3,044,641 |
(Banner Health Sys. Proj.): | | | |
Series 2008 B, 0.3%, LOC Bank of Nova Scotia New York Branch, VRDN (a) | 6,600,000 | | 6,600,000 |
Series 2008 C, 0.28%, LOC Bank of Nova Scotia New York Branch, VRDN (a) | 6,600,000 | | 6,600,000 |
Series 2008 E, 0.39%, LOC Landesbank Baden-Wuert, VRDN (a) | 21,100,000 | | 21,100,000 |
(Catholic Healthcare West Proj.) Series 2009 F, 0.28%, LOC Citibank NA, VRDN (a) | 11,000,000 | | 11,000,000 |
(Southwest Behavioral Health Svcs., Inc. Proj.) Series 2004, 0.3%, LOC JPMorgan Chase Bank, VRDN (a) | 2,960,000 | | 2,960,000 |
Arizona Hsg. Fin. Auth. Multi-family Hsg. Rev. (Santa Carolina Apts. Proj.) Series 2005, 0.36%, LOC Fannie Mae, VRDN (a)(d) | 3,645,000 | | 3,645,000 |
Arizona Trans. Board Hwy. Rev.: | | | |
Bonds Series 2004 A, 5% 7/1/11 | 2,000,000 | | 2,075,688 |
Participating VRDN Series PT 4605, 0.3% (Liquidity Facility Deutsche Postbank AG) (a)(e) | 4,000,000 | | 4,000,000 |
Casa Grande Indl. Dev. Auth. Indl. Dev. Rev. (Price Companies, Inc. Proj.) Series A, 0.5%, LOC Bank of America NA, VRDN (a)(d) | 1,930,000 | | 1,930,000 |
Chandler Gen. Oblig. Participating VRDN Series GS 07 49TP, 0.3% (Liquidity Facility Wells Fargo & Co.) (a)(e) | 4,635,000 | | 4,635,000 |
Glendale Indl. Dev. Auth. (Midwestern Univ. Proj.) Series 2008, 0.3%, LOC Bank of America NA, VRDN (a) | 3,600,000 | | 3,600,000 |
Maricopa County Indl. Dev. Auth. Multi-family Hsg. Rev.: | | | |
(Glenn Oaks Apts. Proj.) Series 2001, 0.37%, LOC Fannie Mae, VRDN (a)(d) | 3,299,675 | | 3,299,675 |
(Gran Victoria Hsg. LLC Proj.) Series 2000 A, 0.3%, LOC Fannie Mae, VRDN (a) | 500,000 | | 500,000 |
(Ranchwood Apts. Proj.) Series 2001 A, 0.35%, LOC Fannie Mae, VRDN (a)(d) | 5,000,000 | | 5,000,000 |
(San Angelin Apts. Proj.) Series 2004, 0.32%, LOC Fannie Mae, VRDN (a)(d) | 3,100,000 | | 3,100,000 |
(San Lucas Apts. Proj.) Series 2003, 0.32%, LOC Fannie Mae, VRDN (a)(d) | 1,700,000 | | 1,700,000 |
(San Martin Apts. Proj.) Series A1, 0.32%, LOC Fannie Mae, VRDN (a)(d) | 7,000,000 | | 7,000,000 |
(San Miguel Apts. Proj.) Series 2003, 0.32%, LOC Fannie Mae, VRDN (a)(d) | 1,300,000 | | 1,300,000 |
(San Remo Apts. Proj.) Series 2002, 0.32%, LOC Fannie Mae, VRDN (a)(d) | 10,800,000 | | 10,800,000 |
Municipal Securities - continued |
| Principal Amount | | Value |
Arizona - continued |
Maricopa County Indl. Dev. Auth. Multi-family Hsg. Rev.: - continued | | | |
(Village at Sun Valley Apts. Proj.) Series 2008, 0.32%, LOC Freddie Mac, VRDN (a)(d) | $ 3,500,000 | | $ 3,500,000 |
(Village Square Apts. Proj.) Series 2004, 0.36%, LOC Fannie Mae, VRDN (a)(d) | 1,000,000 | | 1,000,000 |
Maricopa County Indl. Dev. Auth. Rev. (Clayton Homes, Inc. Proj.) Series 1998, 0.42%, LOC U.S. Bank NA, Minnesota, VRDN (a)(d) | 1,000,000 | | 1,000,000 |
Maricopa County Unified School District #48 Scottsdale Bonds Series 2010, 2.5% 7/1/11 | 3,600,000 | | 3,659,506 |
Peoria Gen. Oblig. Bonds (Projects of 2000, 2005, & 2008) Series 2010, 3% 7/1/11 | 4,040,000 | | 4,120,818 |
Phoenix Civic Impt. Corp. Series 2009, 0.31% 9/8/10, LOC Bank of America NA, CP | 3,800,000 | | 3,800,000 |
Phoenix Civic Impt. Corp. Wtr. Sys. Rev. Participating VRDN Series Putters 3458, 0.3% (Liquidity Facility JPMorgan Chase Bank) (a)(e) | 6,000,000 | | 6,000,000 |
Phoenix Gen. Oblig. Participating VRDN Series BBT 2012, 0.29% (Liquidity Facility Branch Banking & Trust Co.) (a)(e) | 7,735,000 | | 7,735,000 |
Phoenix Indl. Dev. Auth. Cultural Facilities Rev. (Phoenix Art Museum Proj.) Series 2006, 0.39%, LOC Wells Fargo Bank NA, VRDN (a) | 200,000 | | 200,000 |
Phoenix Indl. Dev. Auth. Multi-family Hsg. Rev.: | | | |
(Del Mar Terrance Apts. Proj.) Series 1999 A, 0.3%, LOC Freddie Mac, VRDN (a) | 200,000 | | 200,000 |
(Paradise Lakes Apt. Proj.) Series 2007 B, 0.29%, LOC Wells Fargo Bank NA, VRDN (a)(d) | 18,800,000 | | 18,800,000 |
(Westward Ho Apts. Proj.) Series 2003 A, 0.34%, LOC Bank of America NA, VRDN (a)(d) | 1,300,000 | | 1,300,000 |
Phoenix Indl. Dev. Auth. Rev.: | | | |
(Independent Newspaper, Inc. Proj.) Series 2000, 0.51%, LOC Wells Fargo Bank NA, VRDN (a)(d) | 805,000 | | 805,000 |
(Phoenix Expansion Proj.) Series 2002, 0.8%, LOC JPMorgan Chase Bank, VRDN (a)(d) | 2,035,000 | | 2,035,000 |
(Plastican Proj.) Series 1997, 0.5%, LOC Bank of America NA, VRDN (a)(d) | 1,605,000 | | 1,605,000 |
(Swift Aviation Svcs., Inc. Proj.) Series 2002, 0.33%, LOC U.S. Bank NA, Minnesota, VRDN (a)(d) | 6,220,000 | | 6,220,000 |
Pima County Indl. Dev. Auth. Multi-family Hsg. Rev.: | | | |
(River Point Proj.) Series 2001, 0.35%, LOC Fannie Mae, VRDN (a)(d) | 6,000,000 | | 6,000,000 |
Series A, 0.35%, LOC Fannie Mae, VRDN (a)(d) | 3,500,000 | | 3,500,000 |
Municipal Securities - continued |
| Principal Amount | | Value |
Arizona - continued |
Pima County Indl. Dev. Auth. Rev. (Broadway Proper Congregate Proj.) Series 2000 A, 0.3%, LOC State Street Bank & Trust Co., Boston, VRDN (a) | $ 2,000,000 | | $ 2,000,000 |
Salt River Proj. Agricultural Impt. & Pwr. District Elec. Sys. Rev.: | | | |
Participating VRDN: | | | |
Series EGL 06 14 Class A, 0.3% (Liquidity Facility Citibank NA) (a)(e) | 3,400,000 | | 3,400,000 |
Series Putters 3708Z, 0.3% (Liquidity Facility JPMorgan Chase Bank) (a)(e) | 9,105,000 | | 9,105,000 |
Series ROC II R 11712, 0.3% (Liquidity Facility Citibank NA) (a)(e) | 3,635,000 | | 3,635,000 |
Series ROC II R 11862, 0.3% (Liquidity Facility Citibank NA) (a)(e) | 2,500,000 | | 2,500,000 |
Series WF 09 40C, 0.29% (Liquidity Facility Wells Fargo & Co.) (a)(e) | 3,300,000 | | 3,300,000 |
Series C: | | | |
0.34% 9/10/10, CP | 3,500,000 | | 3,500,000 |
0.35% 9/16/10, CP | 5,000,000 | | 5,000,000 |
0.36% 10/8/10, CP | 3,500,000 | | 3,500,000 |
Scottsdale Gen. Oblig. Participating VRDN Series BBT 08 20, 0.29% (Liquidity Facility Branch Banking & Trust Co.) (a)(e) | 11,175,000 | | 11,175,000 |
Scottsdale Indl. Dev. Auth. Rev. Series 2001 A, 0.3%, LOC JPMorgan Chase Bank, VRDN (a) | 13,353,000 | | 13,353,000 |
Show Low Indl. Dev. Auth. Solid Waste Disp. Rev. (Snowflake White Mountain Pwr. LLC Proj.) Series 2006, 0.41%, LOC JPMorgan Chase Bank, VRDN (a)(d) | 4,000,000 | | 4,000,000 |
Tempe Indl. Dev. Auth. Rev. (ASUF Brickyard Proj.) Series 2004 A, 0.31%, LOC Bank of America NA, VRDN (a) | 8,800,000 | | 8,800,000 |
Tempe Transit Excise Tax Rev. Series 2006, 0.28% (Liquidity Facility Royal Bank of Canada), VRDN (a) | 24,965,000 | | 24,965,000 |
Univ. of Arizona Univ. Revs. Bonds: | | | |
Series 1992 A, 6% 6/1/11 | 1,255,000 | | 1,306,321 |
Series 2004 A, 5.25% 6/1/11 | 3,225,000 | | 3,336,623 |
Yavapai County Indl. Dev. Auth.: | | | |
(Northern Arizona Healthcare Sys. Proj.) Series 2008 B, 0.35%, LOC Banco Bilbao Vizcaya Argentaria SA, VRDN (a) | 7,190,000 | | 7,190,000 |
(Yavapai Reg'l. Med. Ctr. Proj.) Series 2008A, 0.3%, LOC UBS AG, VRDN (a) | 5,500,000 | | 5,500,000 |
Yavapai County Indl. Dev. Auth. Solid Waste Disp. Rev. (Allied Waste North America, Inc. Proj.) Series 2008 A, 0.33%, LOC Bank of America NA, VRDN (a)(d) | 10,000,000 | | 10,000,000 |
| | 300,936,272 |
Municipal Securities - continued |
| Principal Amount | | Value |
Kentucky - 0.1% |
Carroll County Envir. Facilities Rev. (Kentucky Utils. Co. Proj.) Series 2006 B, 0.36%, LOC Commerzbank AG, VRDN (a)(d) | $ 400,000 | | $ 400,000 |
North Carolina - 1.4% |
New Hanover County Hosp. Rev. (New Hanover Reg'l. Med. Ctr. Proj.) Series 2008 A, 0.29%, LOC RBC Centura Bank, Rocky Mount, VRDN (a) | 4,900,000 | | 4,900,000 |
Ohio - 0.7% |
Dayton Montgomery County Port Auth. Spl. Arpt. Facilities Rev. (Wilmington Air Park, Inc. Proj.) Series 2007 B, 4% (Deutsche Post AG Guaranteed), VRDN (a)(d) | 1,400,000 | | 1,400,000 |
Ohio Higher Edl. Facility Commission Rev. (Univ. Hosp. Health Sys. Proj.) Series 2008 B, 0.4%, LOC RBS Citizens NA, VRDN (a) | 1,000,000 | | 1,000,000 |
| | 2,400,000 |
Pennsylvania - 0.8% |
Chester County Health & Ed. Auth. Rev. (Jenner's Pond Proj.) Series 2006, 0.49%, LOC Citizens Bank of Pennsylvania, VRDN (a) | 1,455,000 | | 1,455,000 |
Montgomery County Indl. Dev. Auth. Rev. (Haverford School Proj.) Series 2008, 0.35%, LOC Citizens Bank of Pennsylvania, VRDN (a) | 1,000,000 | | 1,000,000 |
Pennsylvania Higher Edl. Facilities Auth. Rev. (St. Joseph's Univ. Proj.) Series 2008 B, 0.32%, LOC Citizens Bank of Pennsylvania, VRDN (a) | 300,000 | | 300,000 |
| | 2,755,000 |
Puerto Rico - 1.1% |
Puerto Rico Commonwealth Hwy. & Trans. Auth. Trans. Rev. Series 1998 A, 0.3%, LOC Bank of Nova Scotia New York Branch, VRDN (a) | 3,900,000 | | 3,900,000 |
Texas - 0.8% |
Brazos River Auth. Poll. Cont. Rev. (Texas Utils. Energy Co. Proj.) Series 2002 A, 0.31%, LOC Citibank NA, VRDN (a)(d) | 1,800,000 | | 1,800,000 |
Greater East Texas Higher Ed. Auth. Student Ln. Rev. Series 1995 B, 0.3%, LOC State Street Bank & Trust Co., Boston, VRDN (a)(d) | 1,000,000 | | 1,000,000 |
| | 2,800,000 |
Municipal Securities - continued |
| Shares | | Value |
Other - 7.9% |
Fidelity Municipal Cash Central Fund, 0.32% (b)(c) | 27,366,000 | | $ 27,366,000 |
TOTAL INVESTMENT PORTFOLIO - 100.0% (Cost $345,457,272) | | 345,457,272 |
NET OTHER ASSETS (LIABILITIES) - 0.0% | | (95,475) |
NET ASSETS - 100% | $ 345,361,797 |
Security Type Abbreviations |
CP - COMMERCIAL PAPER |
VRDN - VARIABLE RATE DEMAND NOTE |
Legend |
(a) The coupon rate shown on floating or adjustable rate securities represents the rate at period end. |
(b) Information in this report regarding holdings by state and security types does not reflect the holdings of the Fidelity Municipal Cash Central Fund. |
(c) Affiliated fund that is available only to investment companies and other accounts managed by Fidelity Investments. The rate quoted is the annualized seven-day yield of the fund at period end. A complete unaudited listing of the fund's holdings as of its most recent quarter end is available upon request. |
(d) Private activity obligations whose interest is subject to the federal alternative minimum tax for individuals. |
(e) Provides evidence of ownership in one or more underlying municipal bonds. |
Affiliated Central Funds |
Information regarding fiscal year to date income earned by the Fund from investments in Fidelity Central Funds is as follows: |
Fund | Income earned |
Fidelity Municipal Cash Central Fund | $ 29,399 |
Other Information |
All investments are categorized as Level 2 under the Fair Value Hierarchy. The inputs or methodology used for valuing securities may not be an indication of the risk associated with investing in those securities. For more information on valuation inputs, please refer to the Security Valuation section in the accompanying Notes to Financial Statements. |
Income Tax Information |
At August 31, 2010, the Fund had a capital loss carryforward of approximately $5 all of which will expire on August 31, 2018. Capital loss carryforwards are only available to offset future capital gains of the Fund to the extent provided by regulations and may be limited. |
See accompanying notes which are an integral part of the financial statements.
Annual Report
Fidelity Arizona Municipal Money Market Fund
Statement of Assets and Liabilities
| August 31, 2010 |
| | |
Assets | | |
Investment in securities, at value - See accompanying schedule: Unaffiliated issuers (cost $318,091,272) | $ 318,091,272 | |
Fidelity Central Funds (cost $27,366,000) | 27,366,000 | |
Total Investments (cost $345,457,272) | | $ 345,457,272 |
Cash | | 131,187 |
Receivable for investments sold | | 400,003 |
Receivable for fund shares sold | | 2,003,876 |
Interest receivable | | 237,784 |
Distributions receivable from Fidelity Central Funds | | 7,676 |
Other receivables | | 547 |
Total assets | | 348,238,345 |
| | |
Liabilities | | |
Payable for fund shares redeemed | 2,783,052 | |
Distributions payable | 30 | |
Accrued management fee | 93,466 | |
Total liabilities | | 2,876,548 |
| | |
Net Assets | | $ 345,361,797 |
Net Assets consist of: | | |
Paid in capital | | $ 345,360,970 |
Accumulated undistributed net realized gain (loss) on investments | | 827 |
Net Assets, for 345,169,748 shares outstanding | | $ 345,361,797 |
Net Asset Value, offering price and redemption price per share ($345,361,797 ÷ 345,169,748 shares) | | $ 1.00 |
See accompanying notes which are an integral part of the financial statements.
Annual Report
Fidelity Arizona Municipal Money Market Fund
Financial Statements - continued
Statement of Operations
| Year ended August 31, 2010 |
| | |
Investment Income | | |
Interest | | $ 1,187,419 |
Income from Fidelity Central Funds | | 29,399 |
Total income | | 1,216,818 |
| | |
Expenses | | |
Management fee | $ 1,808,703 | |
Independent trustees' compensation | 1,314 | |
Miscellaneous | 7,674 | |
Total expenses before reductions | 1,817,691 | |
Expense reductions | (637,069) | 1,180,622 |
Net investment income | | 36,196 |
Realized and Unrealized Gain (Loss) Net realized gain (loss) on: | | |
Investment securities: | | |
Unaffiliated issuers | | (65) |
Net increase in net assets resulting from operations | | $ 36,131 |
See accompanying notes which are an integral part of the financial statements.
Annual Report
Statement of Changes in Net Assets
| Year ended
August 31,
2010 | Year ended
August 31,
2009 |
Increase (Decrease) in Net Assets | | |
Operations | | |
Net investment income | $ 36,196 | $ 2,560,639 |
Net realized gain (loss) | (65) | 17,595 |
Net increase in net assets resulting
from operations | 36,131 | 2,578,234 |
Distributions to shareholders from net investment income | (36,176) | (2,560,731) |
Share transactions at net asset value of $1.00 per share
Proceeds from sales of shares | 1,139,546,855 | 1,391,807,322 |
Reinvestment of distributions | 35,756 | 2,508,619 |
Cost of shares redeemed | (1,167,427,147) | (1,414,170,262) |
Net increase (decrease) in net assets and shares resulting from share transactions | (27,844,536) | (19,854,321) |
Total increase (decrease) in net assets | (27,844,581) | (19,836,818) |
| | |
Net Assets | | |
Beginning of period | 373,206,378 | 393,043,196 |
End of period | $ 345,361,797 | $ 373,206,378 |
See accompanying notes which are an integral part of the financial statements.
Annual Report
Financial Highlights
Years ended August 31, | 2010 | 2009 | 2008 | 2007 | 2006 |
Selected Per-Share Data | | | | | |
Net asset value, beginning of period | $ 1.00 | $ 1.00 | $ 1.00 | $ 1.00 | $ 1.00 |
Income from Investment Operations | | | | | |
Net investment income | -D | .006 | .022 | .032 | .027 |
Distributions from net investment income | (-)D | (.006) | (.022) | (.032) | (.027) |
Net asset value, end of period | $ 1.00 | $ 1.00 | $ 1.00 | $ 1.00 | $ 1.00 |
Total ReturnA | .01% | .64% | 2.25% | 3.26% | 2.78% |
Ratios to Average Net AssetsB,C | | | | | |
Expenses before reductions | .50% | .54% | .50% | .50% | .50% |
Expenses net of fee waivers, if any | .33% | .53% | .50% | .50% | .50% |
Expenses net of all reductions | .33% | .52% | .41% | .38% | .37% |
Net investment income | .01% | .64% | 2.20% | 3.22% | 2.77% |
Supplemental Data | | | | | |
Net assets, end of period
(000 omitted) | $ 345,362 | $ 373,206 | $ 393,043 | $ 340,848 | $ 267,738 |
A Total returns would have been lower had certain expenses not been reduced during the periods shown.
B Fees and expenses of the underlying Fidelity Central Funds are not included in the Fund's expense ratio. The Fund indirectly bears its proportionate share of the expenses of any underlying Fidelity Central Funds.
C Expense ratios reflect operating expenses of the Fund. Expenses before reductions do not reflect amounts reimbursed or waived or reductions from expense offset arrangements and do not represent the amount paid by the Fund during periods when reimbursements, waivers or reductions occur. Expenses net of fee waivers reflect expenses after reimbursement and waivers but prior to reductions from expense offset arrangements. Expenses net of all reductions represent the net expenses paid by the Fund.
D Amount represents less than $.001 per share.
See accompanying notes which are an integral part of the financial statements.
Annual Report
Notes to Financial Statements
For the period ended August 31, 2010
1. Organization.
Fidelity Arizona Municipal Income Fund (the Income Fund) is a fund of Fidelity Union Street Trust. Fidelity Arizona Municipal Money Market Fund (the Money Market Fund) is a fund of Fidelity Union Street Trust II. Each Trust is registered under the Investment Company Act of 1940, as amended (the 1940 Act), as an open-end management investment company. Fidelity Union Street Trust and Fidelity Union Street Trust II (the Trusts) are organized as a Massachusetts business trust and a Delaware statutory trust, respectively. The Income Fund is a non-diversified fund. Each Fund is authorized to issue an unlimited number of shares. Each Fund may be affected by economic and political developments in the state of Arizona.
2. Investments in Fidelity Central Funds.
The Funds may invest in Fidelity Central Funds, which are open-end investment companies available only to other investment companies and accounts managed by Fidelity Management & Research Company (FMR) and its affiliates. The Funds' Schedules of Investments list each of the Fidelity Central Funds held as of period end, if any, as an investment of each Fund, but does not include the underlying holdings of each Fidelity Central Fund. As an Investing Fund, the Funds indirectly bear their proportionate share of the expenses of the underlying Fidelity Central Funds.
The Money Market Central Funds seek preservation of capital and current income and are managed by Fidelity Investments Money Management, Inc. (FIMM), an affiliate of FMR.
A complete unaudited list of holdings for each Fidelity Central Fund is available upon request or at the Securities and Exchange Commission (the SEC) web site at www.sec.gov. In addition, the financial statements of the Fidelity Central Funds which are not covered by the Funds' Report of Independent Registered Public Accounting Firm, are available on the SEC web site or upon request.
3. Significant Accounting Policies.
The financial statements have been prepared in conformity with accounting principles generally accepted in the United States of America (GAAP), which require management to make certain estimates and assumptions at the date of the financial statements. Actual results could differ from those estimates. The following summarizes the significant accounting policies of the Funds:
Security Valuation. Investments are valued as of 4:00 p.m. Eastern time on the last calendar day of the period. The Income Fund uses independent pricing services approved by the Board of Trustees to value their investments. When current market prices or quotations are not readily available or reliable, valuations may be determined in good
Annual Report
Notes to Financial Statements - continued
3. Significant Accounting Policies - continued
Security Valuation - continued
faith in accordance with procedures adopted by the Board of Trustees. Factors used in determining value may include market or security specific events, changes in interest rates and credit quality. The frequency with which these procedures are used cannot be predicted and they may be utilized to a significant extent. The value used for net asset value (NAV) calculation under these procedures may differ from published prices for the same securities.
Each Fund categorizes the inputs to valuation techniques used to value their investments into a disclosure hierarchy consisting of three levels as shown below.
Level 1 - quoted prices in active markets for identical investments
Level 2 - other significant observable inputs (including quoted prices for similar investments, interest rates, prepayment speeds, etc.)
Level 3 - unobservable inputs (including the fund's own assumptions based on the best information available)
For the Income Fund, changes in valuation techniques may result in transfers in or out of an assigned level within the disclosure hierarchy. Valuation techniques used to value each Fund's investments by major category are as follows.
For the Income Fund, debt securities, including restricted securities, are valued based on evaluated prices received from independent pricing services or from dealers who make markets in such securities. For municipal securities, pricing services utilize matrix pricing which considers yield or price of bonds of comparable quality, coupon, maturity and type as well as dealer supplied prices and are generally categorized as Level 2 in the hierarchy. Short-term securities with remaining maturities of sixty days or less for which quotations are not readily available are valued at amortized cost, which approximates fair value and are categorized as Level 2 in the hierarchy.
When independent prices are unavailable or unreliable, debt securities may be valued utilizing pricing matrices which consider similar factors that would be used by independent pricing services. These are generally categorized as Level 2 in the hierarchy but may be Level 3 depending on the circumstances.
For the Money Market Fund, as permitted by compliance with certain conditions under Rule 2a-7 of the 1940 Act, securities are valued at amortized cost which approximates fair value and are categorized as Level 2 in the hierarchy.
Annual Report
3. Significant Accounting Policies - continued
Investment Transactions and Income. For financial reporting purposes, the Funds' investment holdings and NAV include trades executed through the end of the last business day of the period. The NAV per share for processing shareholder transactions is calculated as of the close of business of the New York Stock Exchange (NYSE), normally 4:00 p.m. Eastern time and includes trades executed through the end of the prior business day for the Income Fund and trades executed through the end of the current business day for the Money Market Fund. Gains and losses on securities sold are determined on the basis of identified cost. Interest income and distributions from the Fidelity Central Funds are accrued as earned. Interest income includes coupon interest and amortization of premium and accretion of discount on debt securities.
Expenses. Most expenses of each Trust can be directly attributed to a fund. Expenses which cannot be directly attributed are apportioned amongst each fund in the Trust. Expense estimates are accrued in the period to which they relate and adjustments are made when actual amounts are known.
The Money Market Fund participated in the U.S. Treasury Department's Temporary Guarantee Program for Money Market Funds (the "Program") through September 18, 2009. The Money Market Fund paid the U.S. Treasury Department fees equal to 0.04% based on the number of shares outstanding as of September 19, 2008 to participate in the Program through September 18, 2009. The expense was borne by the Money Market Fund without regard to any expense limitation in effect for the Money Market Fund.
Income Tax Information and Distributions to Shareholders. Each year each Fund intends to qualify as a regulated investment company, including distributing substantially all of its taxable income and realized gains under Subchapter M of the Internal Revenue Code and filing its U.S. federal tax return. As a result, no provision for income taxes is required. As of August 31, 2010, each Fund did not have any unrecognized tax benefits in the accompanying financial statements. A fund's federal tax return is subject to examination by the Internal Revenue Service (IRS) for a period of three years.
Dividends are declared daily and paid monthly from net investment income. Distributions from realized gains, if any, are recorded on the ex-dividend date. Income and capital gain distributions are determined in accordance with income tax regulations, which may differ from GAAP. In addition, certain Funds claimed a portion of the payment made to redeeming shareholders as a distribution for income tax purposes.
Capital accounts within the financial statements are adjusted for permanent book-tax differences. These adjustments have no impact on net assets or the results of operations. Temporary book-tax differences will reverse in a subsequent period.
Book-tax differences are primarily due to market discount, capital loss carryforwards and losses deferred due to excise tax regulations.
Annual Report
Notes to Financial Statements - continued
3. Significant Accounting Policies - continued
Income Tax Information and Distributions to Shareholders - continued
The Funds purchase municipal securities whose interest, in the opinion of the issuer, is free from federal income tax. There is no assurance that the IRS will agree with this opinion. In the event the IRS determines that the issuer does not comply with relevant tax requirements, interest payments from a security could become federally taxable, possibly retroactively to the date the security was issued.
The federal tax cost of investment securities and unrealized appreciation (depreciation) as of period end were as follows for each Fund:
| Tax cost | Gross unrealized appreciation | Gross unrealized depreciation | Net unrealized
appreciation
(depreciation) |
Fidelity Arizona Municipal Income Fund | $ 171,721,474 | $ 8,680,903 | $ (845,037) | $ 7,835,866 |
Fidelity Arizona Municipal Money Market Fund | $ 345,457,272 | - | - | - |
The tax-based components of distributable earnings as of period end were as follows for each Fund:
| Undistributed
tax-exempt income | Undistributed
ordinary
income | Capital loss
carryforward | Net unrealized
appreciation
(depreciation) |
Fidelity Arizona Municipal Income Fund | $ - | $ 2,566 | $ (276,075) | $ 7,835,866 |
Fidelity Arizona Municipal Money Market Fund | 892 | - | (5) | - |
The tax character of distributions paid was as follows:
August 31, 2010 | Tax-exempt
Income | Ordinary
Income | Long-term
Capital Gains | Total |
Fidelity Arizona Municipal Income Fund | $ 6,226,317 | $ - | $ - | $ 6,226,317 |
Fidelity Arizona Municipal Money Market Fund | 36,176 | - | - | 36,176 |
August 31, 2009 | Tax-exempt
Income | Ordinary
Income | Long-term
Capital Gains | Total |
Fidelity Arizona Municipal Income Fund | $ 5,294,897 | $ 35,148 | $ 373,902 | $ 5,703,947 |
Fidelity Arizona Municipal Money Market Fund | 2,560,731 | - | - | 2,560,731 |
Annual Report
3. Significant Accounting Policies - continued
Short-Term Trading (Redemption) Fees. Shares held by investors in the Income Fund less than 30 days are subject to a redemption fee equal to ..50% of the net asset value of shares redeemed. All redemption fees, which reduce the proceeds of the shareholder redemption, are retained by the Fund and accounted for as an addition to paid in capital.
4. Purchases and Sales of Investments.
Purchases and sales of securities, other than short-term securities, for the Income Fund aggregated $34,896,234 and $15,763,571, respectively.
5. Fees and Other Transactions with Affiliates.
Management Fee. FMR and its affiliates provides the Funds with investment management related services for which the Funds pay a monthly management fee. FMR pays all other expenses, except the compensation of the independent Trustees and certain exceptions such as interest expense, including commitment fees. The management fee paid to FMR by the Funds is reduced by an amount equal to the fees and expenses paid by the Fund to the independent Trustees. Each Fund's management fee is equal to the following annual rate of average net assets:
Fidelity Arizona Municipal Income Fund | .55% | | |
Fidelity Arizona Municipal Money Market Fund | .50% | |
6. Committed Line of Credit.
The Income Fund participates with other funds managed by FMR or an affiliate in a $3.75 billion credit facility (the "line of credit") to be utilized for temporary or emergency purposes to fund shareholder redemptions or for other short-term liquidity purposes. The participating funds have agreed to pay commitment fees on their pro-rata portion of the line of credit, which are reflected in Miscellaneous expenses on the Statement of Operations, and are as follows:
Fidelity Arizona Municipal Income Fund | $ 659 |
During the period, there were no borrowings on this line of credit.
7. Expense Reductions.
FMR or its affiliates voluntarily agreed to waive certain fees during the period for the Money Market fund. The amount of the waiver is $636,126.
In addition, through arrangements with each applicable Fund's custodian, credits realized as a result of uninvested cash balances were used to reduce each applicable
Annual Report
Notes to Financial Statements - continued
7. Expense Reductions - continued
Fund's management fee. During the period, these credits reduced management fee by the following amounts:
Fidelity Arizona Municipal Income Fund | $ 5,059 | | |
Fidelity Arizona Municipal Money Market Fund | 943 | |
8. Other.
The Funds' organizational documents provide former and current trustees and officers with a limited indemnification against liabilities arising in connection with the performance of their duties to the Funds. In the normal course of business, the Funds may also enter into contracts that provide general indemnifications. The Funds' maximum exposure under these arrangements is unknown as this would be dependent on future claims that may be made against the Funds. The risk of material loss from such claims is considered remote.
The supply of municipal money market securities has fluctuated significantly due to market volatility. As a result, the Money Market Fund's cash position may be significant during the period.
Annual Report
To the Trustees of Fidelity Union Street Trust and Fidelity Union Street Trust II and the Shareholders of Fidelity Arizona Municipal Income Fund and Fidelity Arizona Municipal Money Market Fund:
In our opinion, the accompanying statements of assets and liabilities, including the schedules of investments, and the related statements of operations and of changes in net assets and the financial highlights present fairly, in all material respects, the financial position of Fidelity Arizona Municipal Income Fund (a fund of Fidelity Union Street Trust) and Fidelity Arizona Municipal Money Market Fund (a fund of Fidelity Union Street Trust II) at August 31, 2010 the results of each of their operations for the year then ended, the changes in their net assets for each of the two years in the period then ended and the financial highlights for each of the five years in the period then ended, in conformity with accounting principles generally accepted in the United States of America. These financial statements and financial highlights (hereafter referred to as "financial statements") are the responsibility of the Fidelity Union Street Trust's and Fidelity Union Street Trust II's management. Our responsibility is to express an opinion on these financial statements based on our audits. We conducted our audits of these financial statements in accordance with the standards of the Public Company Accounting Oversight Board (United States). Those standards require that we plan and perform the audit to obtain reasonable assurance about whether the financial statements are free of material misstatement. An audit includes examining, on a test basis, evidence supporting the amounts and disclosures in the financial statements, assessing the accounting principles used and significant estimates made by management, and evaluating the overall financial statement presentation. We believe that our audits, which included confirmation of securities at August 31, 2010 by correspondence with the custodian and brokers, provide a reasonable basis for our opinion.
/s/ PricewaterhouseCoopers LLP
PricewaterhouseCoopers LLP
Boston, Massachusetts
October 12, 2010
Annual Report
The Trustees and executive officers of the trusts and funds, as applicable, are listed below. The Board of Trustees governs each fund and is responsible for protecting the interests of shareholders. The Trustees are experienced executives who meet periodically throughout the year to oversee each fund's activities, review contractual arrangements with companies that provide services to each fund, oversee management of the risks associated with such activities and contractual arrangements, and review each fund's performance. Except for James C. Curvey, each of the Trustees oversees 189 funds advised by FMR or an affiliate. Mr. Curvey oversees 411 funds advised by FMR or an affiliate.
The Trustees hold office without limit in time except that (a) any Trustee may resign; (b) any Trustee may be removed by written instrument, signed by at least two-thirds of the number of Trustees prior to such removal; (c) any Trustee who requests to be retired or who has become incapacitated by illness or injury may be retired by written instrument signed by a majority of the other Trustees; and (d) any Trustee may be removed at any special meeting of shareholders by a two-thirds vote of the outstanding voting securities of the trust. Each Trustee who is not an interested person (as defined in the 1940 Act) (Independent Trustee), shall retire not later than the last day of the calendar year in which his or her 75th birthday occurs. The Independent Trustees may waive this mandatory retirement age policy with respect to individual Trustees. The executive officers hold office without limit in time, except that any officer may resign or may be removed by a vote of a majority of the Trustees at any regular meeting or any special meeting of the Trustees. Except as indicated, each individual has held the office shown or other offices in the same company for the past five years.
The fund's Statement of Additional Information (SAI) includes more information about the Trustees. To request a free copy, call Fidelity at 1-800-544-8544.
Experience, Skills, Attributes, and Qualifications of the Funds' Trustees. The Governance and Nominating Committee has adopted a statement of policy that describes the experience, qualifications, attributes, and skills that are necessary and desirable for potential Independent Trustee candidates (Statement of Policy). The Board believes that each Trustee satisfied at the time he or she was initially elected or appointed a Trustee, and continues to satisfy, the standards contemplated by the Statement of Policy. The Governance and Nominating Committee also engages professional search firms to help identify potential Independent Trustee candidates who have the experience, qualifications, attributes, and skills consistent with the Statement of Policy. From time to time, additional criteria based on the composition and skills of the current Independent Trustees, as well as experience or skills that may be appropriate in light of future changes to board composition, business conditions, and regulatory or other developments, have also been considered by the professional search firms and the Governance and Nominating Committee. In addition, the Board takes into account the Trustees' commitment and participation in Board and committee meetings, as well as their leadership of standing and ad hoc committees throughout their tenure.
Annual Report
Trustees and Officers - continued
In determining that a particular Trustee was and continues to be qualified to serve as a Trustee, the Board has considered a variety of criteria, none of which, in isolation, was controlling. The Board believes that, collectively, the Trustees have balanced and diverse experience, qualifications, attributes, and skills, which allow the Board to operate effectively in governing each fund and protecting the interests of shareholders. Information about the specific experience, skills, attributes, and qualifications of each Trustee, which in each case led to the Board's conclusion that the Trustee should serve (or continue to serve) as a trustee of the funds, is provided below.
Board Structure and Oversight Function. Abigail P. Johnson is an interested person (as defined in the 1940 Act) and currently serves as Chairman. The Trustees have determined that an interested Chairman is appropriate and benefits shareholders because an interested Chairman has a personal and professional stake in the quality and continuity of services provided to the funds. Independent Trustees exercise their informed business judgment to appoint an individual of their choosing to serve as Chairman, regardless of whether the Trustee happens to be independent or a member of management. The Independent Trustees have determined that they can act independently and effectively without having an Independent Trustee serve as Chairman and that a key structural component for assuring that they are in a position to do so is for the Independent Trustees to constitute a substantial majority for the Board. The Independent Trustees also regularly meet in executive session. Kenneth L. Wolfe serves as Chairman of the Independent Trustees and as such (i) acts as a liaison between the Independent Trustees and management with respect to matters important to the Independent Trustees and (ii) with management prepares agendas for Board meetings.
Fidelity funds are overseen by different Boards of Trustees. The funds' Board oversees Fidelity's investment-grade bond, money market, and asset allocation funds and another Board oversees Fidelity's equity and high income funds. The asset allocation funds may invest in Fidelity funds that are overseen by such other Board. The use of separate Boards, each with its own committee structure, allows the Trustees of each group of Fidelity funds to focus on the unique issues of the funds they oversee, including common research, investment, and operational issues. On occasion, the separate Boards establish joint committees to address issues of overlapping consequences for the Fidelity funds overseen by each Board.
The Trustees operate using a system of committees to facilitate the timely and efficient consideration of all matters of importance to the Trustees, each fund, and fund shareholders and to facilitate compliance with legal and regulatory requirements and oversight of the funds' activities and associated risks. The Board, acting through its committees, has charged FMR and its affiliates with (i) identifying events or circumstances the occurrence of which could have demonstrably adverse effects on the funds' business and/or reputation; (ii) implementing processes and controls to lessen the possibility that such events or circumstances occur or to mitigate the effects of such events or circumstances if they do occur; and (iii) creating and maintaining a system designed to evaluate continuously business and market conditions in order to facilitate the identification and implementation processes described in (i) and (ii) above. Because the day-to-day operations and activities of the funds are carried out by or through FMR, its affiliates and other service providers, the funds' exposure to risks is mitigated but not eliminated by the processes overseen by the Trustees. While each of the Board's committees has responsibility for overseeing different aspects of the funds' activities, oversight is exercised primarily through the Operations and Audit Committees. Appropriate personnel, including but not limited to the funds' Chief Compliance Officer (CCO), FMR's internal auditor, the independent accountants, the funds' Treasurer and portfolio management personnel, make periodic reports to the Board's committees, as appropriate. The responsibilities of each committee, including their oversight responsibilities, are described further under "Standing Committees of the Funds' Trustees."
Annual Report
Interested Trustees*:
Correspondence intended for each Trustee who is an interested person may be sent to Fidelity Investments, 82 Devonshire Street, Boston, Massachusetts 02109.
Name, Age; Principal Occupations and Other Relevant Experience+ |
Abigail P. Johnson (48) |
| Year of Election or Appointment: 2009 Ms. Johnson is Trustee and Chairman of the Board of Trustees of certain Trusts. Ms. Johnson serves as President of Personal, Workplace and Institutional Services (2005-present). Ms. Johnson is the Vice Chairman and Director (2007-present) of FMR LLC. Previously, Ms. Johnson served as President and a Director of FMR (2001-2005), a Trustee of other investment companies advised by FMR, Fidelity Investments Money Management, Inc., and FMR Co., Inc. (2001-2005), Senior Vice President of the Fidelity funds (2001-2005), and managed a number of Fidelity funds. Ms. Abigail P. Johnson and Mr. Arthur E. Johnson are not related. |
James C. Curvey (75) |
| Year of Election or Appointment: 2007 Mr. Curvey also serves as Trustee (2007-present) of other investment companies advised by FMR. Mr. Curvey is a Director of Fidelity Investments Money Management, Inc. (2009-present), Director of Fidelity Research & Analysis Co. (2009-present) and Director of FMR and FMR Co., Inc. (2007-present). Mr. Curvey is also Vice Chairman (2007-present) and Director of FMR LLC. In addition, Mr. Curvey serves as an Overseer for the Boston Symphony Orchestra and a member of the Trustees of Villanova University. Previously, Mr. Curvey was the Vice Chairman (2006-2007) and Director (2000-2007) of FMR Corp. |
* Trustees have been determined to be "Interested Trustees" by virtue of, among other things, their affiliation with the trusts or various entities under common control with FMR.
Annual Report
Trustees and Officers - continued
+ The information above includes each Trustee's principal occupation during the last five years and other information relating to the experience, attributes, and skills relevant to each Trustee's qualifications to serve as a Trustee, which led to the conclusion that each Trustee should serve as a Trustee for each fund.
Independent Trustees:
Correspondence intended for each Independent Trustee (that is, the Trustees other than the Interested Trustees) may be sent to Fidelity Investments, P.O. Box 55235, Boston, Massachusetts 02205-5235.
Name, Age; Principal Occupations and Other Relevant Experience+ |
Albert R. Gamper, Jr. (68) |
| Year of Election or Appointment: 2006 Prior to his retirement in December 2004, Mr. Gamper served as Chairman of the Board of CIT Group Inc. (commercial finance). During his tenure with CIT Group Inc. Mr. Gamper served in numerous senior management positions, including Chairman (1987-1989; 1999-2001; 2002-2004), Chief Executive Officer (1987-2004), and President (2002-2003). He also served as President and Chief Executive Officer of Tyco Capital Corporation (2001-2002). Mr. Gamper currently serves as a member of the Board of Directors of Public Service Enterprise Group (utilities, 2000-present), a member of the Board of Trustees, Rutgers University (2004-present), and Chairman of the Board of Saint Barnabas Health Care System. Previously, Mr. Gamper served as Chairman of the Board of Governors, Rutgers University (2004-2007). |
Robert F. Gartland (58) |
| Year of Election or Appointment: 2010 Mr. Gartland is a partner and investor of Vietnam Partners LLC (investments and consulting, 2008-present) and is Chairman and an investor in Gartland and Mellina Group Corp. (consulting, 2009-present). Prior to his retirement, Mr. Gartland held a variety of positions at Morgan Stanley (financial services, 1979-2007) including Managing Director (1987-2007). |
Arthur E. Johnson (63) |
| Year of Election or Appointment: 2008 Mr. Johnson serves as a member of the Board of Directors of Eaton Corporation (diversified power management, 2009-present) and AGL Resources, Inc. (holding company). Prior to his retirement, Mr. Johnson served as Senior Vice President of Corporate Strategic Development of Lockheed Martin Corporation (defense contractor, 1999-2009). He previously served on the Board of Directors of IKON Office Solutions, Inc. (1999-2008) and Delta Airlines (2005-2007). Mr. Arthur E. Johnson and Ms. Abigail P. Johnson are not related. |
Michael E. Kenneally (56) |
| Year of Election or Appointment: 2009 Previously, Mr. Kenneally served as a Member of the Advisory Board for certain Fidelity Fixed Income and Asset Allocation Funds (2008-2009). Prior to his retirement, Mr. Kenneally served as Chairman and Global Chief Executive Officer of Credit Suisse Asset Management (2003-2005). Mr. Kenneally was a Director of the Credit Suisse Funds (U.S. mutual funds, 2004-2008) and certain other closed-end funds (2004-2005) and was awarded the Chartered Financial Analyst (CFA) designation in 1991. |
James H. Keyes (69) |
| Year of Election or Appointment: 2007 Mr. Keyes serves as a member of the Boards of Navistar International Corporation (manufacture and sale of trucks, buses, and diesel engines, since 2002) and Pitney Bowes, Inc. (integrated mail, messaging, and document management solutions, since 1998). Prior to his retirement, Mr. Keyes served as Chairman and Chief Executive Officer of Johnson Controls (automotive, building, and energy, 1998-2002) and as a member of the Board of LSI Logic Corporation (semiconductor technologies, 1984-2008). |
Marie L. Knowles (63) |
| Year of Election or Appointment: 2001 Prior to Ms. Knowles' retirement in June 2000, she served as Executive Vice President and Chief Financial Officer of Atlantic Richfield Company (ARCO) (diversified energy, 1996-2000). From 1993 to 1996, she was a Senior Vice President of ARCO and President of ARCO Transportation Company. She served as a Director of ARCO from 1996 to 1998. Ms. Knowles currently serves as a Director and Chairman of the Audit Committee of McKesson Corporation (healthcare service, since 2002). Ms. Knowles is an Honorary Trustee of the Brookings Institution and a member of the Board of the Catalina Island Conservancy and of the Santa Catalina Island Company (2009-present). She also serves as a member of the Advisory Board for the School of Engineering of the University of Southern California and the Foundation Board of the School of Architecture at the University of Virginia (2007-present). Previously, Ms. Knowles served as a Director of Phelps Dodge Corporation (copper mining and manufacturing, 1994-2007). |
Kenneth L. Wolfe (71) |
| Year of Election or Appointment: 2005 Mr. Wolfe is Chairman of the Independent Trustees of the Fixed Income and Asset Allocation Funds (2008-present). Prior to his retirement, Mr. Wolfe served as Chairman and a Director (2007-2009) and Chairman and Chief Executive Officer (1994-2001) of Hershey Foods Corporation. He also served as a member of the Boards of Adelphia Communications Corporation (telecommunications, 2003-2006), Bausch & Lomb, Inc. (medical/pharmaceutical, 1993-2007), and Revlon, Inc. (personal care products, 2004-2009). |
+ The information above includes each Trustee's principal occupation during the last five years and other information relating to the experience, attributes, and skills relevant to each Trustee's qualifications to serve as a Trustee, which led to the conclusion that each Trustee should serve as a Trustee for each fund.
Executive Officers:
Correspondence intended for each executive officer may be sent to Fidelity Investments, 82 Devonshire Street, Boston, Massachusetts 02109.
Name, Age; Principal Occupation |
John R. Hebble (52) |
| Year of Election or Appointment: 2008 President and Treasurer of Fidelity's Fixed Income and Asset Allocation Funds. Mr. Hebble also serves as Treasurer and Chief Financial Officer of The North Carolina Capital Management Trust: Cash and Term Portfolio (2008-present), Assistant Treasurer of other Fidelity funds (2009-present) and is an employee of Fidelity Investments. |
Boyce I. Greer (54) |
| Year of Election or Appointment: 2005 Vice President of Fidelity's Fixed Income Funds and Asset Allocation Funds (2005). Mr. Greer is also a Trustee of other investment companies advised by FMR. Mr. Greer is President of The North Carolina Capital Management Trust: Cash and Term Portfolio (2003-present), the Asset Allocation Division (2008-present), President and a Director of Strategic Advisers, Inc. (2008-present), President of FIMM 130/30 LLC (2008-present), Director of Ballyrock Investment Advisors LLC (2006-present), and an Executive Vice President of FMR (2005-present). Previously, Mr. Greer served as Executive Vice President of FMR Co., Inc. (2005-2009), President and Director of Fidelity Investments Money Management, Inc. (2007-2009) and as a Director and Managing Director of Strategic Advisers, Inc. (2002-2005). |
Christopher P. Sullivan (56) |
| Year of Election or Appointment: 2009 Vice President of Fidelity's Bond Funds. Mr. Sullivan also serves as President of Fidelity's Bond Division (2009-present). Mr. Sullivan is Executive Vice President of Fidelity Investments Money Management, Inc. (2009-present), and a Director of Fidelity Management & Research (U.K.) Inc. (2010-present). Previously, Mr. Sullivan served as Managing Director, Co-Head of U.S. Fixed Income at Goldman Sachs Asset Management (2001-2009). |
Christine J. Thompson (52) |
| Year of Election or Appointment: 2010 Vice President of Fidelity's Bond Funds. Ms. Thompson also serves as Chief Investment Officer of FMR's Bond Group (2010-present) and is an employee of Fidelity Investments. Previously, Ms. Thompson served as Director of Municipal Bond Portfolio Managers (2002-2010). |
Robert P. Brown (46) |
| Year of Election or Appointment: 2010 Vice President of Fidelity's Money Market Funds and Executive Vice President of Fidelity Investments Money Management, Inc. (2010-present). Mr. Brown also serves as President, Money Market Group of FMR (2010-present), Managing Director of Research, Director of Fidelity Management & Research (U.K.) Inc. (2008-present) and is an employee of Fidelity Investments. |
Scott C. Goebel (42) |
| Year of Election or Appointment: 2008 Secretary and Chief Legal Officer (CLO) of the Fidelity funds. Mr. Goebel also serves as Secretary and CLO of The North Carolina Capital Management Trust: Cash and Term Portfolio (2008-present); General Counsel, Secretary, and Senior Vice President of FMR (2008-present) and FMR Co., Inc. (2008-present); Deputy General Counsel of FMR LLC; Chief Legal Officer of Fidelity Management & Research (Hong Kong) Limited (2008-present) and Assistant Secretary of Fidelity Management & Research (Japan) Inc. (2008-present), Fidelity Investments Money Management, Inc. (2008-present), Fidelity Management & Research (U.K.) Inc. (2008-present), and Fidelity Research and Analysis Company (2008-present). Previously, Mr. Goebel served as Assistant Secretary of the Funds (2007-2008) and as Vice President and Secretary of Fidelity Distributors Corporation (FDC) (2005-2007). |
David J. Carter (37) |
| Year of Election or Appointment: 2010 Assistant Secretary of Fidelity's Fixed Income and Asset Allocation Funds. Mr. Carter also serves as Vice President, Associate General Counsel (2010-present) and is an employee of Fidelity Investments (2005-present). |
Holly C. Laurent (56) |
| Year of Election or Appointment: 2008 Anti-Money Laundering (AML) Officer of the Fidelity funds. Ms. Laurent also serves as AML Officer of The North Carolina Capital Management Trust: Cash and Term Portfolio (2008-present) and is an employee of Fidelity Investments. Previously, Ms. Laurent was Senior Vice President and Head of Legal for Fidelity Business Services India Pvt. Ltd. (2006-2008), and Senior Vice President, Deputy General Counsel and Group Head for FMR LLC (2005-2006). |
Christine Reynolds (51) |
| Year of Election or Appointment: 2008 Chief Financial Officer of the Fidelity funds. Ms. Reynolds became President of Fidelity Pricing and Cash Management Services (FPCMS) in August 2008. Ms. Reynolds served as Chief Operating Officer of FPCMS (2007-2008). Previously, Ms. Reynolds served as President, Treasurer, and Anti-Money Laundering officer of the Fidelity funds (2004-2007). |
Michael H. Whitaker (43) |
| Year of Election or Appointment: 2008 Chief Compliance Officer of Fidelity's Fixed Income and Asset Allocation Funds. Mr. Whitaker also serves as Chief Compliance Officer of The North Carolina Capital Management Trust: Cash and Term Portfolio (2008-present). Mr. Whitaker is an employee of Fidelity Investments (2007-present). Prior to joining Fidelity Investments, Mr. Whitaker worked at MFS Investment Management where he served as Senior Vice President and Chief Compliance Officer (2004-2006), and Assistant General Counsel. |
Jeffrey S. Christian (48) |
| Year of Election or Appointment: 2009 Deputy Treasurer of the Fidelity funds. Mr. Christian is an employee of Fidelity Investments. Previously, Mr. Christian served as Chief Financial Officer (2008-2009) of certain Fidelity funds and Senior Vice President of Fidelity Pricing and Cash Management Services (FPCMS) (2004-2009). |
Bryan A. Mehrmann (49) |
| Year of Election or Appointment: 2005 Deputy Treasurer of the Fidelity funds. Mr. Mehrmann is an employee of Fidelity Investments. |
Stephanie J. Dorsey (41) |
| Year of Election or Appointment: 2008 Deputy Treasurer of Fidelity's Fixed Income and Asset Allocation Funds. Ms. Dorsey also serves as Assistant Treasurer of other Fidelity funds (2010-present) and is an employee of Fidelity Investments (2008-present). Previously, Ms. Dorsey served as Treasurer (2004-2008) of the JPMorgan Mutual Funds and Vice President (2004-2008) of JPMorgan Chase Bank. |
Adrien E. Deberghes (43) |
| Year of Election or Appointment: 2010 Assistant Treasurer of Fidelity's Fixed Income and Asset Allocation Funds. Mr. Deberghes also serves as Deputy Treasurer of other Fidelity funds (2008-present) and is an employee of Fidelity Investments (2008-present). Previously, Mr. Deberghes served as Senior Vice President of Mutual Fund Administration at State Street Corporation (2007-2008), Senior Director of Mutual Fund Administration at Investors Bank & Trust (2005-2007), and Director of Finance for Dunkin' Brands (2000-2005). |
Kenneth B. Robins (41) |
| Year of Election or Appointment: 2009 Assistant Treasurer of the Fidelity Fixed Income and Asset Allocation Funds. Mr. Robins also serves as President and Treasurer of other Fidelity funds (2008-present; 2010-present) and is an employee of Fidelity Investments (2004-present). Previously, Mr. Robins served as Deputy Treasurer of the Fidelity funds (2005-2008) and Treasurer and Chief Financial Officer of The North Carolina Capital Management Trust: Cash and Term Portfolios (2006-2008). |
Gary W. Ryan (52) |
| Year of Election or Appointment: 2005 Assistant Treasurer of the Fidelity funds. Mr. Ryan is an employee of Fidelity Investments. Previously, Mr. Ryan served as Vice President of Fund Reporting in Fidelity Pricing and Cash Management Services (FPCMS) (1999-2005). |
Annual Report
During fiscal year ended 2010, 100% of each fund's income dividends were free from federal income tax, and 2.30% and 43.17% of Fidelity Arizona Municipal Income Fund and Fidelity Arizona Municipal Money Market Fund's income dividends were subject to the federal alternative minimum tax.
The fund will notify shareholders in January 2011 of amounts for use in preparing 2010 income tax returns.
Annual Report
Investment Adviser
Fidelity Management & Research Company
Boston, MA
Sub-Advisers
Fidelity Investments
Money Management, Inc.
Fidelity Research & Analysis Company
Fidelity Management & Research
(U.K.) Inc.
Fidelity Management & Research
(Hong Kong) Limited
Fidelity Management & Research
(Japan) Inc.
General Distributor
Fidelity Distributors Corporation
Boston, MA
Transfer and Service Agents
Citibank, N.A.
New York, NY
Fidelity Investments Institutional Operations Company, Inc.
Boston, MA
Fidelity Service Company, Inc.
Boston, MA
Custodian
Citibank, N.A.
New York, NY
The Fidelity Telephone Connection
Mutual Fund 24-Hour Service
Exchanges/Redemptions
and Account Assistance 1-800-544-6666
Product Information 1-800-544-6666
Retirement Accounts 1-800-544-4774 (8 a.m. - 9 p.m.)
TDD Service 1-800-544-0118
for the deaf and hearing impaired
(9 a.m. - 9 p.m. Eastern time)
Fidelity Automated Service
Telephone (FAST®) 1-800-544-5555
Automated line for quickest service
AZI/SPZ-UANN-1010
1.790910.107

Fidelity®
Maryland Municipal Income
Fund
Annual Report
August 31, 2010
(2_fidelity_logos) (Registered_Trademark)
Contents
Chairman's Message | <Click Here> | The Chairman's message to shareholders. |
Performance | <Click Here> | How the fund has done over time. |
Management's Discussion of Fund Performance | <Click Here> | The Portfolio Manager's review of fund
performance and strategy. |
Shareholder Expense Example | <Click Here> | An example of shareholder expenses. |
Investment Changes | <Click Here> | A summary of major shifts in the fund's investments over the past six months. |
Investments | <Click Here> | A complete list of the fund's investments with their market values. |
Financial Statements | <Click Here> | Statements of assets and liabilities, operations, and changes in net assets,
as well as financial highlights. |
Notes | <Click Here> | Notes to the financial statements. |
Report of Independent Registered Public Accounting Firm | <Click Here> | |
Trustees and Officers | <Click Here> | |
Distributions | <Click Here> | |
To view a fund's proxy voting guidelines and proxy voting record for the 12-month period ended June 30, visit http://www.fidelity.com/proxyvotingresults or visit the Securities and Exchange Commission's (SEC) web site at http://www.sec.gov. You may also call 1-800-544-8544 to request a free copy of the proxy voting guidelines.
Standard & Poor's, S&P and S&P 500 are registered service marks of The McGraw-Hill Companies, Inc. and have been licensed for use by Fidelity Distributors Corporation.
Other third party marks appearing herein are the property of their respective owners.
All other marks appearing herein are registered or unregistered trademarks or service marks of FMR LLC or an affiliated company.
Annual Report
This report and the financial statements contained herein are submitted for the general information of the shareholders of the fund. This report is not authorized for distribution to prospective investors in the fund unless preceded or accompanied by an effective prospectus.
A fund files its complete schedule of portfolio holdings with the SEC for the first and third quarters of each fiscal year on Form N-Q. Forms N-Q are available on the SEC's web site at http://www.sec.gov. A fund's Forms N-Q may be reviewed and copied at the SEC's Public Reference Room in Washington, DC. Information regarding the operation of the SEC's Public Reference Room may be obtained by calling 1-800-SEC-0330. For a complete list of a fund's portfolio holdings, view the most recent holdings listing, semiannual report, or annual report on Fidelity's web site at http://www.fidelity.com or http://www.advisor.fidelity.com, as applicable.
NOT FDIC INSURED • MAY LOSE VALUE • NO BANK GUARANTEE
Neither the fund nor Fidelity Distributors Corporation is a bank.
Annual Report
(photo_of_Abigail_P_Johnson)
Dear Shareholder:
A yearlong uptrend in global equity markets reversed course in late April 2010 when investor sentiment turned bearish due in great measure to concern that Europe's debt crisis would expand and slow or derail economic recovery. However, a bounceback in July helped to recover some of the ground that was lost. Financial markets are always unpredictable, of course, but there also are several time-tested investment principles that can help put the odds in your favor.
One of the basic tenets is to invest for the long term. Over time, riding out the markets' inevitable ups and downs has proven much more effective than selling into panic or chasing the hottest trend. Even missing only a few of the markets' best days can significantly diminish investor returns. Patience also affords the benefits of compounding - of earning interest on additional income or reinvested dividends and capital gains. There can be tax advantages and cost benefits to consider as well. While staying the course doesn't eliminate risk, it can considerably lessen the effect of short-term declines.
You can further manage your investing risk through diversification. And today, more than ever, geographic diversification should be taken into account. Studies indicate that asset allocation is the single most important determinant of a portfolio's long-term success. The right mix of stocks, bonds and cash - aligned to your particular risk tolerance and investment objective - is very important. Age-appropriate rebalancing is also an essential aspect of asset allocation. For younger investors, an emphasis on equities - which historically have been the best-performing asset class over time - is encouraged. As investors near their specific goal, such as retirement or sending a child to college, consideration may be given to replacing volatile assets (e.g. common stocks) with more-stable fixed investments (bonds or savings plans).
A third principle - investing regularly - can help lower the average cost of your purchases. Investing a certain amount of money each month or quarter helps ensure you won't pay for all your shares at market highs. This strategy - known as dollar cost averaging - also reduces "emotion" from investing, helping shareholders avoid selling weak performers just prior to an upswing, or chasing a hot performer just before a correction.
We invite you to contact us via the Internet, through our Investor Centers or by phone. It is our privilege to provide you the information you need to make the investments that are right for you.
Sincerely,
(The chairman's signature appears here.)
Abigail P. Johnson
Annual Report
Average annual total return reflects the change in the value of an investment, assuming reinvestment of the fund's distributions from dividend income and capital gains (the profits earned upon the sale of securities that have grown in value, if any) and assuming a constant rate of performance each year. The $10,000 table and the fund's returns do not reflect the deduction of taxes that a shareholder would pay on fund distributions or the redemption of fund shares. During periods of reimbursement by Fidelity, a fund's total return will be greater than it would be had the reimbursement not occurred. How a fund did yesterday is no guarantee of how it will do tomorrow.
Average Annual Total Returns
Periods ended August 31, 2010 | Past 1
year | Past 5
years | Past 10
years |
Fidelity® Maryland Municipal Income Fund | 8.46% | 4.44% | 5.11% |
$10,000 Over 10 Years
Let's say hypothetically that $10,000 was invested in Fidelity® Maryland Municipal Income Fund on August 31, 2000. The chart shows how the value of your investment would have changed, and also shows how the Barclays Capital Municipal Bond Index performed over the same period.
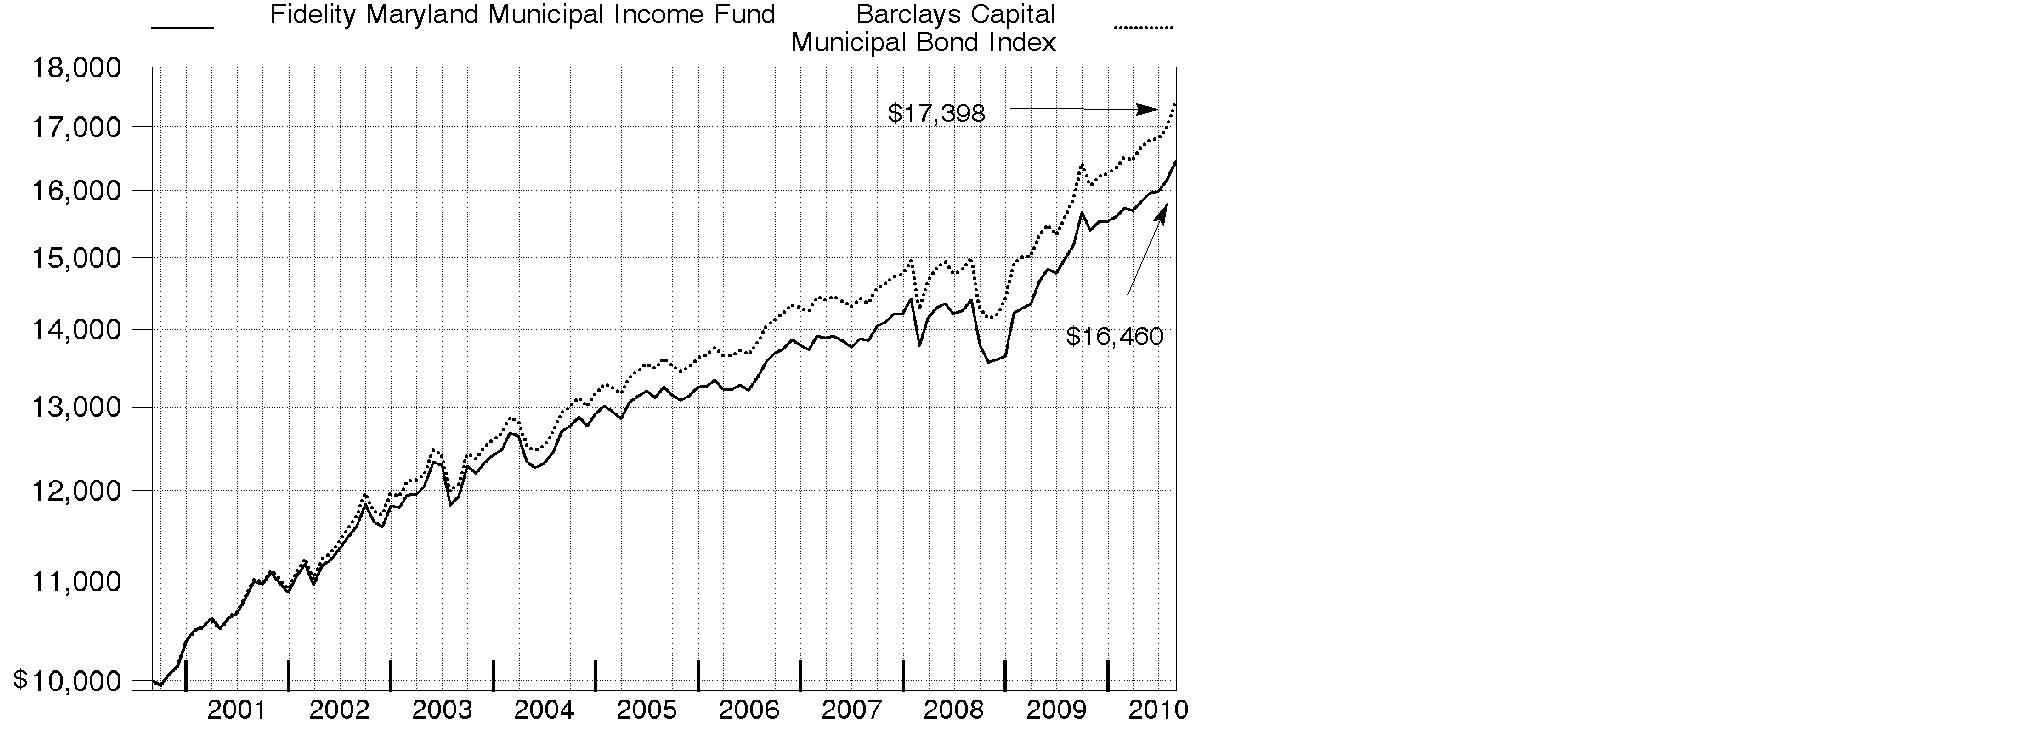
Annual Report
Market Recap: Favorable supply/demand dynamics and a relatively benign interest rate environment helped municipal bonds generate strong gains during the 12-month period ending August 31, 2010. Demand for munis was quite robust during the year, as investors - some motivated to preserve wealth and others to capture higher-yielding alternatives to cash and money market investments - piled into fixed-income investments. The threat of higher tax rates also bolstered demand for munis, which generally are exempt from state and federal income taxes. At the same time, supply was muted due to the increased popularity of Build America Bonds - newer taxable securities that often allow municipal issuers to borrow more cheaply in the taxable market. Meanwhile, the Federal Reserve held short-term interest rates at a historically low level, providing a supportive backdrop for fixed-income securities. Although these developments collectively helped muni bond prices, they also masked growing concerns about muni bond fundamentals, as government revenue declined dramatically. For the 12 months, the Barclays Capital Municipal Bond Index - a measure of more than 46,000 investment-grade, fixed-rate tax-exempt bonds - gained 9.78%. By comparison, the investment-grade taxable debt market, as measured by the Barclays Capital U.S. Aggregate Bond Index, rose 9.18%.
Comments from Mark Sommer, Portfolio Manager of Fidelity® Maryland Municipal Income Fund: For the year, the fund returned 8.46%, while the Barclays Capital Maryland 4+ Year Enhanced Municipal Bond Index returned 9.74%. The fund had less exposure to lower-quality investment-grade bonds than the benchmark, which put it at a disadvantage because these bonds rallied throughout most of the year due to strong investor demand. The housing and health care sectors, both of which the fund underweighted, outpaced the index due to these factors. The fund also was hurt by underweighting bonds that were prerefunded during the period, a process by which the bonds became backed by U.S. government securities. These bonds rose in value as their credit quality improved. Additionally, the fund's duration - which measures its sensitivity to changes in interest rates - was modestly lower, or shorter, than the index, which worked against it as interest rates declined. Aiding the fund's relative performance were out-of-index holdings in bonds issued within the Commonwealth of Puerto Rico, which are free from federal and Maryland income taxes and rebounded thanks to strong investor demand and better sentiment about the U.S. territory's fiscal prospects.
The views expressed above reflect those of the portfolio manager(s) only through the end of the period as stated on the cover of this report and do not necessarily represent the views of Fidelity or any other person in the Fidelity organization. Any such views are subject to change at any time based upon market or other conditions and Fidelity disclaims any responsibility to update such views. These views may not be relied on as investment advice and, because investment decisions for a Fidelity fund are based on numerous factors, may not be relied on as an indication of trading intent on behalf of any Fidelity fund.
Annual Report
Shareholder Expense Example
As a shareholder of the Fund, you incur two types of costs: (1) transaction costs, including redemption fees, and (2) ongoing costs, including management fees and other Fund expenses. This Example is intended to help you understand your ongoing costs (in dollars) of investing in the Fund and to compare these costs with the ongoing costs of investing in other mutual funds.
The Example is based on an investment of $1,000 invested at the beginning of the period and held for the entire period (March 1, 2010 to August 31, 2010).
Actual Expenses
The first line of the accompanying table provides information about actual account values and actual expenses. You may use the information in this line, together with the amount you invested, to estimate the expenses that you paid over the period. Simply divide your account value by $1,000.00 (for example, an $8,600 account value divided by $1,000.00 = 8.6), then multiply the result by the number in the first line under the heading entitled "Expenses Paid During Period" to estimate the expenses you paid on your account during this period. A small balance maintenance fee of $12.00 that is charged once a year may apply for certain accounts with a value of less than $2,000. This fee is not included in the table below. If it was, the estimate of expenses you paid during the period would be higher, and your ending account value lower, by this amount.
Hypothetical Example for Comparison Purposes
The second line of the accompanying table provides information about hypothetical account values and hypothetical expenses based on the Fund's actual expense ratio and an assumed rate of return of 5% per year before expenses, which is not the Fund's actual return. The hypothetical account values and expenses may not be used to estimate the actual ending account balance or expenses you paid for the period. You may use this information to compare the ongoing costs of investing in the Fund and other funds. To do so, compare this 5% hypothetical example with the 5% hypothetical examples that appear in the shareholder reports of the other funds. A small balance maintenance fee of $12.00 that is charged once a year may apply for certain accounts with a value of less than $2,000. This fee is not included in the table below. If it was, the estimate of expenses you paid during the period would be higher, and your ending account value lower, by this amount.
Please note that the expenses shown in the table are meant to highlight your ongoing costs only and do not reflect any transaction costs. Therefore, the second line of the table is useful in comparing ongoing costs only, and will not help you determine the relative total costs of owning different funds. In addition, if these transactional costs were included, your costs would have been higher.
Annual Report
Shareholder Expense Example - continued
| Annualized Expense Ratio | Beginning
Account Value
March 1, 2010 | Ending
Account Value
August 31, 2010 | Expenses Paid
During Period*
March 1, 2010
to August 31, 2010 |
Actual | .55% | $ 1,000.00 | $ 1,046.70 | $ 2.84 |
Hypothetical
(5% return per year before expenses) | | $ 1,000.00 | $ 1,022.43 | $ 2.80 |
* Expenses are equal to the Fund's annualized expense ratio, multiplied by the average account value over the period, multiplied by 184/365 (to reflect the one-half year period).
Annual Report
Investment Changes (Unaudited)
Top Five Sectors as of August 31, 2010 |
| % of fund's
net assets | % of fund's net assets
6 months ago |
General Obligations | 32.9 | 32.3 |
Health Care | 13.8 | 14.4 |
Water & Sewer | 11.3 | 12.2 |
Education | 9.8 | 10.6 |
Transportation | 8.7 | 6.6 |
Weighted Average Maturity as of August 31, 2010 |
| | 6 months ago |
Years | 6.0 | 7.4 |
Weighted Average Maturity (WAM) is a weighted average of all the maturities of the securities held in a fund. The weighted average maturity is based on the dollar-weighted average length of time until principal payments are expected or until securities reach maturity, taking into account any maturity shortening feature such as a call, refunding or redemption provision if it is probable that the issuer of the instrument will take advantage of such features. |
Duration as of August 31, 2010 |
| | 6 months ago |
Years | 7.0 | 7.2 |
Duration shows how much a bond fund's price fluctuates with changes in comparable interest rates. If rates rise 1%, for example, a fund with a five-year duration is likely to lose about 5% of its value. Other factors also can influence a bond fund's performance and share price. Accordingly, a bond fund's actual performance may differ from this example. |
Quality Diversification (% of fund's net assets) |
As of August 31, 2010 | As of February 28, 2010 |
| AAA 24.2% | | | AAA 21.8% | |
| AA,A 61.1% | | | AA,A 59.6% | |
| BBB 7.9% | | | BBB 12.3% | |
 | Not Rated 1.0% | | | Not Rated 1.1% | |
| Short-Term
Investments and
Net Other Assets 5.8% | | | Short-Term
Investments and
Net Other Assets 5.2% | |

We have used ratings from Moody's Investors Service, Inc. Where Moody's® ratings are not available, we have used S&P® ratings. All ratings are as of the report date and do not reflect subsequent downgrades. |
Annual Report
Investments August 31, 2010
Showing Percentage of Net Assets
Municipal Bonds - 94.2% |
| Principal Amount | | Value |
District Of Columbia - 2.3% |
Washington DC Metropolitan Transit Auth. Rev. Series 2009 A, 5% 7/1/19 | $ 3,780,000 | | $ 4,514,378 |
Guam - 0.3% |
Guam Ed. Fing. Foundation Ctfs. of Prtn. Series 2006 A, 5% 10/1/23 | 500,000 | | 512,345 |
Maryland - 84.6% |
Baltimore Convention Ctr. Hotel Rev. Series 2006 A: | | | |
5.25% 9/1/17 (XL Cap. Assurance, Inc. Insured) | 1,350,000 | | 1,386,977 |
5.25% 9/1/27 (XL Cap. Assurance, Inc. Insured) | 1,020,000 | | 971,519 |
Baltimore County Ctfs. of Prtn. (Equip. Acquisition Prog.)
Series 2004, 5% 6/1/13 (Nat'l. Pub. Fin. Guarantee Corp. Insured) | 1,500,000 | | 1,678,065 |
Baltimore County Gen. Oblig.: | | | |
(Consolidated Pub. Impt. Proj.) Series 2004, 5%
8/1/15 | 2,385,000 | | 2,739,101 |
(Metropolitan District Proj.) Series 71, 5% 2/1/38 | 1,930,000 | | 2,112,211 |
(Oak Crest Village, Inc. Proj.) Series 2007 A, 5%
1/1/22 | 500,000 | | 503,470 |
Series 2008, 5% 2/1/31 | 2,000,000 | | 2,228,820 |
Baltimore County Metropolitan District 4% 8/1/24 | 2,950,000 | | 3,273,350 |
Baltimore Ctfs. of Prtn. Series 2010 A, 5% 10/1/17 | 2,005,000 | | 2,365,299 |
Baltimore Gen. Oblig. (Consolidated Pub. Impt. Proj.): | | | |
Series 2005 A, 5% 10/15/18 (AMBAC Insured) | 1,720,000 | | 2,006,174 |
Series 2008 A, 5% 10/15/25 (FSA Insured) | 1,445,000 | | 1,659,640 |
Baltimore Port Facilities Rev. (Consolidated Coal Sales Co. Proj.) 6.5% 12/1/10 | 2,000,000 | | 2,007,500 |
Baltimore Proj. Rev.: | | | |
(Wastewtr. Proj.): | | | |
Series 2002 A: | | | |
5.125% 7/1/42 (Nat'l. Pub. Fin. Guarantee Corp. Insured) | 2,315,000 | | 2,361,971 |
5.2% 7/1/32 (Nat'l. Pub. Fin. Guarantee Corp.
Insured) | 250,000 | | 257,583 |
Series 2007 D: | | | |
5% 7/1/32 (FSA Insured) | 4,500,000 | | 4,929,480 |
5% 7/1/37 (AMBAC Insured) | 2,000,000 | | 2,150,520 |
5% 7/1/37 (FSA Insured) | 4,000,000 | | 4,301,040 |
Series 2008 A: | | | |
5% 7/1/33 (FSA Insured) | 2,000,000 | | 2,182,300 |
5% 7/1/38 (FSA Insured) | 3,000,000 | | 3,252,210 |
Series 2009 C, 5.625% 7/1/39 | 2,000,000 | | 2,230,160 |
Municipal Bonds - continued |
| Principal Amount | | Value |
Maryland - continued |
Baltimore Proj. Rev.: - continued | | | |
(Wtr. Proj.): | | | |
Series 1994 A, 5% 7/1/24 (FGIC Insured) | $ 370,000 | | $ 438,232 |
Series 2002 A, 5.125% 7/1/42 (Nat'l. Pub. Fin. Guarantee Corp. Insured) | 355,000 | | 362,203 |
City of Westminster (McDaniel College Proj.) Series 2006: | | | |
5% 11/1/12 | 500,000 | | 527,530 |
5% 11/1/13 | 350,000 | | 374,661 |
Frederick County Econ. Dev. Rev.: | | | |
Series 2005, 5% 8/1/15 (Nat'l. Pub. Fin. Guarantee Corp. Insured) | 1,000,000 | | 1,174,430 |
Series 2009 A: | | | |
5% 3/1/25 | 610,000 | | 710,327 |
5% 3/1/27 | 1,255,000 | | 1,441,982 |
Frederick County Edl. Facilities Rev. (Mount Saint Mary's Univ. Proj.) Series 2006, 5.5% 9/1/12 | 195,000 | | 203,406 |
Frederick County Gen. Oblig. Series 2005, 5% 12/1/15 | 1,000,000 | | 1,198,200 |
Howard County Gen. Oblig. (Consolidated Pub. Impt. Proj.) Series 2009 A, 5% 4/15/14 | 2,635,000 | | 3,054,308 |
Maryland Dept. of Trans. Consolidated Trans. Rev. Series 2009, 4% 5/15/20 | 3,000,000 | | 3,405,030 |
Maryland Econ. Dev. Corp. Lease Rev. (Maryland Aviation Administration Facilities Proj.) Series 2003, 5.5% 6/1/18 (FSA Insured) (b) | 1,500,000 | | 1,595,565 |
Maryland Econ. Dev. Corp. Poll. Cont. Rev. (Potomac Elec. Proj.) Series 2006, 6.2% 9/1/22 | 1,000,000 | | 1,184,010 |
Maryland Econ. Dev. Corp. Student Hsg. Rev.: | | | |
(Towson Univ. Proj.) Series 2007 A, 5.25% 7/1/17 | 500,000 | | 522,100 |
(Univ. of Maryland, Baltimore County Student Hsg. Proj.) Series 2006: | | | |
5% 6/1/14 (CIFG North America Insured) | 700,000 | | 753,578 |
5% 7/1/16 (XL Cap. Assurance, Inc. Insured) | 500,000 | | 515,505 |
5% 6/1/18 (CIFG North America Insured) | 2,000,000 | | 2,060,200 |
Maryland Gen. Oblig.: | | | |
(State & Local Facilities Ln. Prog.): | | | |
First Series 2002 A: | | | |
5.5% 3/1/15 | 1,850,000 | | 2,222,202 |
5.5% 3/1/17 | 2,265,000 | | 2,822,054 |
First Series 2003 A, 5.25% 3/1/17 | 4,295,000 | | 5,285,126 |
First Series 2009 A, 5% 3/1/21 (Pre-Refunded to 3/1/17 @ 100) (c) | 750,000 | | 912,900 |
First Series 2009 C, 5% 3/1/18 | 1,050,000 | | 1,293,684 |
Municipal Bonds - continued |
| Principal Amount | | Value |
Maryland - continued |
Maryland Gen. Oblig.: - continued | | | |
(State & Local Facilities Ln. Prog.): | | | |
Second Series 2009 B, 5% 8/15/21 | $ 3,000,000 | | $ 3,638,280 |
First Series 2009 C, 5% 3/1/21 | 2,000,000 | | 2,412,800 |
Third Series 2009 C, 5% 11/1/19 | 2,500,000 | | 3,127,275 |
Maryland Health & Higher Edl. Facilities Auth. Rev.: | | | |
(Anne Arundel Med. Ctr. Proj.) Series 1998, 5.125% 7/1/33 (FSA Insured) | 2,000,000 | | 2,002,000 |
(Carroll County Gen. Hosp. Proj.) Series 2006, 5% 7/1/40 | 1,500,000 | | 1,511,955 |
(Doctors Cmnty. Hosp. Proj.) Series 2010, 5.75%
7/1/38 | 1,000,000 | | 984,900 |
(Good Samaritan Hosp. Proj.) Series 1993: | | | |
5.75% 7/1/13 (Escrowed to Maturity) (c) | 240,000 | | 260,640 |
5.75% 7/1/13 (Escrowed to Maturity) (c) | 55,000 | | 59,730 |
(Hebrew Home of Greater Washington Proj.) Series 2002, 5.8% 1/1/32 | 1,000,000 | | 1,010,460 |
(Howard County Gen. Hosp. Proj.) 5.5% 7/1/13 (Escrowed to Maturity) (c) | 360,000 | | 379,840 |
(Johns Hopkins Health Sys. Obligated Group Proj.) Series 2008 B, 5%, tender 5/15/13 (a) | 1,400,000 | | 1,532,664 |
(Johns Hopkins Hosp. Proj.) Series 2001, 5% 5/15/34 | 1,500,000 | | 1,505,220 |
(Johns Hopkins Med. Institutions Utils. Proj.) Series 2005 B, 5% 5/15/35 | 1,475,000 | | 1,552,393 |
(Johns Hopkins Univ. Proj.): | | | |
Series 2001 B, 5% 7/1/41 | 3,590,000 | | 3,626,941 |
Series 2002 A, 5% 7/1/32 | 1,015,000 | | 1,040,416 |
Series 2004 A: | | | |
5% 7/1/24 | 1,000,000 | | 1,094,510 |
5% 7/1/33 | 2,000,000 | | 2,095,540 |
5% 7/1/38 | 2,000,000 | | 2,094,080 |
(LifeBridge Health Proj.): | | | |
Series 2004 A, 5% 7/1/11 (Escrowed to Maturity) (c) | 1,000,000 | | 1,038,740 |
Series 2008, 5% 7/1/19 (Assured Guaranty Corp. Insured) | 300,000 | | 341,148 |
(Loyola College Issue Proj.) Series 1999, 5% 10/1/39 | 2,000,000 | | 2,000,620 |
(MedStar Health Proj.) Series 2007, 5.25% 5/15/46 | 1,000,000 | | 1,020,140 |
(Mercy Med. Ctr. Proj.) Series 2007 A, 5.5% 7/1/42 | 1,000,000 | | 1,007,840 |
(Peninsula Reg'l. Med. Ctr. Proj.) Series 2006, 5%
7/1/15 | 1,120,000 | | 1,262,307 |
Municipal Bonds - continued |
| Principal Amount | | Value |
Maryland - continued |
Maryland Health & Higher Edl. Facilities Auth. Rev.: - continued | | | |
(Univ. of Maryland Med. Sys. Proj.): | | | |
Series 2001, 5.25% 7/1/34 (Pre-Refunded to 7/1/11 @ 100) (c) | $ 1,525,000 | | $ 1,587,220 |
Series 2006 A, 5% 7/1/41 | 1,000,000 | | 1,013,040 |
Series 2008 F, 5.25% 7/1/19 | 1,700,000 | | 1,872,720 |
Series 2010, 5.125% 7/1/39 | 1,700,000 | | 1,752,836 |
(Upper Chesapeake Hosp. Proj.) Series 2008 C, 5.5% 1/1/18 | 660,000 | | 749,654 |
(Washington County Health Sys. Proj.) Series 2008, 6% 1/1/43 | 400,000 | | 413,352 |
(Western Maryland Health Sys. Proj.) Series 2006 A: | | | |
5% 1/1/16 (Nat'l. Pub. Fin. Guarantee Corp. Insured) | 1,450,000 | | 1,585,024 |
5% 7/1/17 (Nat'l. Pub. Fin. Guarantee Corp. Insured) | 1,635,000 | | 1,773,076 |
Series 2008, 5% 7/1/14 | 1,845,000 | | 2,047,932 |
Maryland Indl. Dev. Fing. Auth. Rev.: | | | |
(American Ctr. for Physics Proj.) Series 2001: | | | |
5.25% 12/15/13 | 1,100,000 | | 1,165,428 |
5.25% 12/15/15 | 320,000 | | 337,293 |
(Holy Cross Health Sys. Corp. Proj.) 5.7% 12/1/10 | 1,000,000 | | 1,012,830 |
Maryland Nat'l. Cap. Park & Planning Commission Series 2004 EE2, 5% 1/15/15 | 2,000,000 | | 2,269,160 |
Maryland Trans. Auth. Grant Rev. Series 2007, 5%
3/1/16 | 2,000,000 | | 2,385,320 |
Maryland Trans. Auth. Trans. Facility Projects Rev.: | | | |
Series 2007: | | | |
5% 7/1/30 | 2,000,000 | | 2,210,100 |
5% 7/1/31 (FSA Insured) | 5,000,000 | | 5,496,350 |
Series 2008: | | | |
5% 7/1/35 | 880,000 | | 964,603 |
5% 7/1/37 (FSA Insured) | 4,485,000 | | 4,858,870 |
Series 2009 A, 5% 7/1/20 | 1,000,000 | | 1,219,930 |
6.8% 7/1/16 (Escrowed to Maturity) (c) | 570,000 | | 669,266 |
Montgomery County Econ. Dev. Rev. (Trinity Health Care Group Proj.) Series 2001, 5.125% 12/1/22 | 2,300,000 | | 2,336,294 |
Montgomery County Gen. Oblig.: | | | |
(Consolidated Pub. Impt. Proj.): | | | |
Series 2005 A, 5% 6/1/24 | 2,000,000 | | 2,212,860 |
Series 2007 A, 5% 5/1/25 | 1,000,000 | | 1,145,230 |
(Dept. of Liquor Cont. Proj.) Series 2009 A, 5% 4/1/14 | 1,000,000 | | 1,132,300 |
Municipal Bonds - continued |
| Principal Amount | | Value |
Maryland - continued |
Morgan State Univ. Academic & Auxiliary Facilities Fees Rev. Series 2003 A, 5% 7/1/20 (Nat'l. Pub. Fin. Guarantee Corp. Insured) | $ 500,000 | | $ 533,905 |
Northeast Maryland Waste Disp. Auth. Solid Waste Rev. Series 2003, 5.5% 4/1/12 (AMBAC Insured) (b) | 4,500,000 | | 4,820,580 |
Prince Georges County Ctfs. of Prtn. Series 1991 A, 0% 6/30/11 (Nat'l. Pub. Fin. Guarantee Corp. Insured) | 415,000 | | 408,978 |
Washington Suburban San. District Series 2009 A, 5% 6/1/17 | 5,000,000 | | 6,071,947 |
| | 167,301,160 |
Puerto Rico - 6.9% |
Puerto Rico Commonwealth Hwy. & Trans. Auth. Hwy. Rev.: | | | |
Series 1996 Z, 6.25% 7/1/15 (Nat'l. Pub. Fin. Guarantee Corp. Insured) | 1,000,000 | | 1,145,010 |
Series AA, 5.5% 7/1/19 (Nat'l. Pub. Fin. Guarantee Corp. Insured) | 1,500,000 | | 1,684,860 |
Series BB, 5.25% 7/1/18 (AMBAC Insured) | 600,000 | | 664,824 |
Puerto Rico Commonwealth Hwy. & Trans. Auth. Trans. Rev.: | | | |
Series E, 5.5% 7/1/17 (FSA Insured) | 1,000,000 | | 1,144,630 |
Series N, 5.25% 7/1/34 (Assured Guaranty Corp.
Insured) | 500,000 | | 556,785 |
Puerto Rico Commonwealth Infrastructure Fing. Auth. Series 2005 C, 5.5% 7/1/23 | 1,110,000 | | 1,230,946 |
Puerto Rico Commonwealth Pub. Impt. Gen. Oblig.: | | | |
Series 2002 A: | | | |
5.5% 7/1/18 | 700,000 | | 787,444 |
5.5% 7/1/18 (Nat'l. Pub. Fin. Guarantee Corp. Insured) | 240,000 | | 269,981 |
Series 2007 A, 5.5% 7/1/19 (Nat'l. Pub. Fin. Guarantee Corp. Insured) | 1,000,000 | | 1,119,260 |
Puerto Rico Elec. Pwr. Auth. Pwr. Rev.: | | | |
Series 2002 KK, 5.5% 7/1/15 (Nat'l. Pub. Fin. Guarantee Corp. Insured) | 1,000,000 | | 1,142,940 |
Series II, 5.375% 7/1/16 (Nat'l. Pub. Fin. Guarantee Corp. Insured) | 1,500,000 | | 1,595,310 |
Series QQ, 5.5% 7/1/17 (XL Cap. Assurance, Inc.
Insured) | 1,000,000 | | 1,161,300 |
Series VV, 5.25% 7/1/24 (FGIC Insured) | 1,000,000 | | 1,146,650 |
| | 13,649,940 |
Municipal Bonds - continued |
| Principal Amount | | Value |
Virgin Islands - 0.1% |
Virgin Islands Pub. Fin. Auth. Refinery Facilities Rev. Series 2007, 4.7% 7/1/22 (b) | $ 300,000 | | $ 279,090 |
TOTAL INVESTMENT PORTFOLIO - 94.2% (Cost $176,004,829) | | 186,256,913 |
NET OTHER ASSETS (LIABILITIES) - 5.8% | | 11,401,876 |
NET ASSETS - 100% | $ 197,658,789 |
Legend |
(a) The coupon rate shown on floating or adjustable rate securities represents the rate at period end. |
(b) Private activity obligations whose interest is subject to the federal alternative minimum tax for individuals. |
(c) Security collateralized by an amount sufficient to pay interest and principal. |
Other Information |
All investments are categorized as Level 2 under the Fair Value Hierarchy. The inputs or methodology used for valuing securities may not be an indication of the risk associated with investing in those securities. For more information on valuation inputs, please refer to the Security Valuation section in the accompanying Notes to Financial Statements. |
The distribution of municipal securities by revenue source, as a percentage of total net assets, is as follows: (Unaudited) |
General Obligations | 32.9% |
Health Care | 13.8% |
Water & Sewer | 11.3% |
Education | 9.8% |
Transportation | 8.7% |
Special Tax | 7.0% |
Others* (Individually Less Than 5%) | 16.5% |
| 100.0% |
*Includes net other assets |
Income Tax Information |
At August 31, 2010, the Fund had a capital loss carryforward of approximately $460,866 all of which will expire on August 31, 2017. Capital loss carryforwards are only available to offset future capital gains of the Fund to the extent provided by regulations and may be limited. |
See accompanying notes which are an integral part of the financial statements.
Annual Report
Statement of Assets and Liabilities
| August 31, 2010 |
| | |
Assets | | |
Investment in securities, at value - See accompanying schedule: Unaffiliated issuers (cost $176,004,829) | | $ 186,256,913 |
Cash | | 9,505,222 |
Receivable for fund shares sold | | 112,772 |
Interest receivable | | 2,043,617 |
Other receivables | | 2,397 |
Total assets | | 197,920,921 |
| | |
Liabilities | | |
Payable for fund shares redeemed | $ 12,278 | |
Distributions payable | 160,659 | |
Accrued management fee | 89,195 | |
Total liabilities | | 262,132 |
| | |
Net Assets | | $ 197,658,789 |
Net Assets consist of: | | |
Paid in capital | | $ 187,869,342 |
Distributions in excess of net investment income | | (1,771) |
Accumulated undistributed net realized gain (loss) on investments | | (460,866) |
Net unrealized appreciation (depreciation) on investments | | 10,252,084 |
Net Assets, for 17,486,380 shares outstanding | | $ 197,658,789 |
Net Asset Value, offering price and redemption price per share ($197,658,789 ÷ 17,486,380 shares) | | $ 11.30 |
See accompanying notes which are an integral part of the financial statements.
Annual Report
Statement of Operations
| Year ended August 31, 2010 |
| | |
Investment Income | | |
Interest | | $ 7,052,863 |
| | |
Expenses | | |
Management fee | $ 978,485 | |
Independent trustees' compensation | 16 | |
Miscellaneous | 689 | |
Total expenses before reductions | 979,190 | |
Expense reductions | (5,636) | 973,554 |
Net investment income | | 6,079,309 |
Realized and Unrealized Gain (Loss) Net realized gain (loss) on: | | |
Investment securities: | | |
Unaffiliated issuers | | 40,528 |
Change in net unrealized appreciation (depreciation) on investment securities | | 8,600,183 |
Net gain (loss) | | 8,640,711 |
Net increase (decrease) in net assets resulting from operations | | $ 14,720,020 |
See accompanying notes which are an integral part of the financial statements.
Annual Report
Financial Statements - continued
Statement of Changes in Net Assets
| Year ended
August 31,
2010 | Year ended
August 31,
2009 |
Increase (Decrease) in Net Assets | | |
Operations | | |
Net investment income | $ 6,079,309 | $ 5,495,735 |
Net realized gain (loss) | 40,528 | (502,923) |
Change in net unrealized appreciation (depreciation) | 8,600,183 | 1,760,782 |
Net increase (decrease) in net assets resulting
from operations | 14,720,020 | 6,753,594 |
Distributions to shareholders from net investment income | (6,077,794) | (5,494,669) |
Distributions to shareholders from net realized gain | - | (136,291) |
Total distributions | (6,077,794) | (5,630,960) |
Share transactions
Proceeds from sales of shares | 53,172,995 | 68,413,178 |
Reinvestment of distributions | 4,182,175 | 3,758,276 |
Cost of shares redeemed | (30,817,751) | (67,441,505) |
Net increase (decrease) in net assets resulting from share transactions | 26,537,419 | 4,729,949 |
Redemption fees | 1,295 | 2,743 |
Total increase (decrease) in net assets | 35,180,940 | 5,855,326 |
| | |
Net Assets | | |
Beginning of period | 162,477,849 | 156,622,523 |
End of period (including distributions in excess of
net investment income of $1,771 and $3,286, respectively) | $ 197,658,789 | $ 162,477,849 |
Other Information Shares | | |
Sold | 4,841,291 | 6,635,078 |
Issued in reinvestment of distributions | 379,893 | 364,000 |
Redeemed | (2,811,105) | (6,642,125) |
Net increase (decrease) | 2,410,079 | 356,953 |
See accompanying notes which are an integral part of the financial statements.
Annual Report
Financial Highlights
Years ended August 31, | 2010 | 2009 | 2008 | 2007 | 2006 |
Selected Per-Share Data | | | | | |
Net asset value, beginning of period | $ 10.78 | $ 10.64 | $ 10.64 | $ 10.85 | $ 11.06 |
Income from Investment Operations | | | | | |
Net investment income B | .375 | .392 | .397 | .403 | .409 |
Net realized and unrealized gain (loss) | .521 | .151 | .022 | (.189) | (.140) |
Total from investment operations | .896 | .543 | .419 | .214 | .269 |
Distributions from net investment income | (.376) | (.393) | (.397) | (.403) | (.409) |
Distributions from net realized gain | - | (.010) | (.022) | (.021) | (.070) |
Total distributions | (.376) | (.403) | (.419) | (.424) | (.479) |
Redemption fees added to paid in capital B, D | - | - | - | - | - |
Net asset value, end of period | $ 11.30 | $ 10.78 | $ 10.64 | $ 10.64 | $ 10.85 |
Total Return A | 8.46% | 5.34% | 4.00% | 1.98% | 2.54% |
Ratios to Average Net Assets C | | | | | |
Expenses before reductions | .55% | .55% | .55% | .55% | .55% |
Expenses net of fee waivers,
if any | .55% | .55% | .55% | .55% | .55% |
Expenses net of all reductions | .55% | .54% | .50% | .48% | .50% |
Net investment income | 3.42% | 3.79% | 3.71% | 3.73% | 3.79% |
Supplemental Data | | | | | |
Net assets, end of period
(000 omitted) | $ 197,659 | $ 162,478 | $ 156,623 | $ 131,645 | $ 111,373 |
Portfolio turnover rate | 2% | 23% | 12% | 18% | 22% |
A Total returns would have been lower had certain expenses not been reduced during the periods shown.
B Calculated based on average shares outstanding during the period.
C Expense ratios reflect operating expenses of the Fund. Expenses before reductions do not reflect amounts reimbursed by the investment adviser or reductions from expense offset arrangements and do not represent the amount paid by the Fund during periods when reimbursements or reductions occur. Expenses net of fee waivers reflect expenses after reimbursement by the investment adviser but prior to reductions from expense offset arrangements. Expenses net of all reductions represent the net expenses paid by the Fund.
D Amount represents less than $.001 per share.
See accompanying notes which are an integral part of the financial statements.
Annual Report
Notes to Financial Statements
For the period ended August 31, 2010
1. Organization.
Fidelity Maryland Municipal Income Fund (the Fund) is a non-diversified fund of Fidelity Union Street Trust (the Trust) and is authorized to issue an unlimited number of shares. The Trust is registered under the Investment Company Act of 1940, as amended (the 1940 Act), as an open-end management investment company organized as a Massachusetts business trust. The Fund may be affected by economic and political developments in the state of Maryland.
2. Significant Accounting Policies.
The financial statements have been prepared in conformity with accounting principles generally accepted in the United States of America (GAAP), which require management to make certain estimates and assumptions at the date of the financial statements. Actual results could differ from those estimates. The following summarizes the significant accounting policies of the Fund:
Security Valuation. Investments are valued as of 4:00 p.m. Eastern time on the last calendar day of the period. The Fund uses independent pricing services approved by the Board of Trustees to value its investments. When current market prices or quotations are not readily available or reliable, valuations may be determined in good faith in accordance with procedures adopted by the Board of Trustees. Factors used in determining value may include market or security specific events, changes in interest rates and credit quality. The frequency with which these procedures are used cannot be predicted and they may be utilized to a significant extent. The value used for net asset value (NAV) calculation under these procedures may differ from published prices for the same securities.
The Fund categorizes the inputs to valuation techniques used to value its investments into a disclosure hierarchy consisting of three levels as shown below.
Level 1 - quoted prices in active markets for identical investments
Level 2 - other significant observable inputs (including quoted prices for similar investments, interest rates, prepayment speeds, etc.)
Level 3 - unobservable inputs (including the fund's own assumptions based on the best information available)
Changes in valuation techniques may result in transfers in or out of an assigned level within the disclosure hierarchy. Valuation techniques used to value the Fund's investments by major category are as follows.
Annual Report
2. Significant Accounting Policies - continued
Security Valuation - continued
Debt securities, including restricted securities, are valued based on evaluated prices received from independent pricing services or from dealers who make markets in such securities. For municipal securities, pricing services utilize matrix pricing which considers yield or price of bonds of comparable quality, coupon, maturity and type as well as dealer supplied prices and are generally categorized as Level 2 in the hierarchy. Short-term securities with remaining maturities of sixty days or less for which quotations are not readily available are valued at amortized cost, which approximates fair value and are categorized as Level 2 in the hierarchy.
When independent prices are unavailable or unreliable, debt securities may be valued utilizing pricing matrices which consider similar factors that would be used by independent pricing services. These are generally categorized as Level 2 in the hierarchy but may be Level 3 depending on the circumstances.
Investment Transactions and Income. For financial reporting purposes, the Fund's investment holdings and NAV include trades executed through the end of the last business day of the period. The NAV per share for processing shareholder transactions is calculated as of the close of business of the New York Stock Exchange (NYSE), normally 4:00 p.m. Eastern time and includes trades executed through the end of the prior business day. Gains and losses on securities sold are determined on the basis of identified cost. Interest income is accrued as earned. Interest income includes coupon interest and amortization of premium and accretion of discount on debt securities.
Expenses. Most expenses of the Trust can be directly attributed to a fund. Expenses which cannot be directly attributed are apportioned amongst each fund in the Trust. Expense estimates are accrued in the period to which they relate and adjustments are made when actual amounts are known.
Income Tax Information and Distributions to Shareholders. Each year the Fund intends to qualify as a regulated investment company, including distributing substantially all of its taxable income and realized gains under Subchapter M of the Internal Revenue Code and filing its U.S. federal tax return. As a result, no provision for income taxes is required. As of August 31, 2010, the Fund did not have any unrecognized tax benefits in the accompanying financial statements. A fund's federal tax return is subject to examination by the Internal Revenue Service (IRS) for a period of three years.
Dividends are declared daily and paid monthly from net investment income. Distributions from realized gains, if any, are recorded on the ex-dividend date. Income and capital gain distributions are determined in accordance with income tax regulations, which may differ from GAAP.
Annual Report
Notes to Financial Statements - continued
2. Significant Accounting Policies - continued
Income Tax Information and Distributions to Shareholders - continued
Capital accounts within the financial statements are adjusted for permanent book-tax differences. These adjustments have no impact on net assets or the results of operations. Temporary book-tax differences will reverse in a subsequent period.
Book-tax differences are primarily due to market discount, capital loss carryforwards and losses deferred to excise tax regulations.
The Fund purchases municipal securities whose interest, in the opinion of the issuer, is free from federal income tax. There is no assurance that the IRS will agree with this opinion. In the event the IRS determines that the issuer does not comply with relevant tax requirements, interest payments from a security could become federally taxable, possibly retroactively to the date the security was issued.
The federal tax cost of investment securities and unrealized appreciation (depreciation) as of period end were as follows:
Gross unrealized appreciation | $ 10,513,458 |
Gross unrealized depreciation | (253,163) |
Net unrealized appreciation (depreciation) | $ 10,260,295 |
| |
Tax Cost | $ 175,996,618 |
The tax-based components of distributable earnings as of period end were as follows:
Capital loss carryforward | $ (460,866) |
Net unrealized appreciation (depreciation) | $ 10,260,295 |
The tax character of distributions paid was as follows:
| August 31, 2010 | August 31, 2009 |
Tax-exempt Income | 6,077,794 | 5,494,669 |
Long-term Capital Gains | - | 136,291 |
Total | $ 6,077,794 | $ 5,630,960 |
Short-Term Trading (Redemption) Fees. Shares held by investors in the Fund less than 30 days are subject to a redemption fee equal to .50% of the net asset value of shares redeemed. All redemption fees, which reduce the proceeds of the shareholder redemption, are retained by the Fund and accounted for as an addition to paid in capital.
3. Purchases and Sales of Investments.
Purchases and sales of securities, other than short-term securities, aggregated $27,180,645 and $3,689,636, respectively.
Annual Report
4. Fees and Other Transactions with Affiliates.
Management Fee. Fidelity Management & Research Company (FMR) and its affiliates provide the Fund with investment management related services for which the Fund pays a monthly management fee that is based on an annual rate of .55% of the Fund's average net assets. FMR pays all other expenses, except the compensation of the independent Trustees and certain exceptions such as interest expense, including commitment fees. The management fee paid to FMR by the Fund is reduced by an amount equal to the fees and expenses paid by the Fund to the independent Trustees.
5. Committed Line of Credit.
The Fund participates with other funds managed by FMR or an affiliate in a $3.75 billion credit facility (the "line of credit") to be utilized for temporary or emergency purposes to fund shareholder redemptions or for other short-term liquidity purposes. The Fund has agreed to pay commitment fees on its pro-rata portion of the line of credit, which amounted to $689 and is reflected in Miscellaneous expenses on the Statement of Operations. During the period, there were no borrowings on this line of credit.
6. Expense Reductions.
Through arrangements with the Fund's custodian and transfer agent, credits realized as a result of uninvested cash balances were used to reduce the Fund's management fee. During the period, these credits reduced the Fund's management fee by $5,636.
7. Other.
The Fund's organizational documents provide former and current trustees and officers with a limited indemnification against liabilities arising in connection with the performance of their duties to the Fund. In the normal course of business, the Fund may also enter into contracts that provide general indemnifications. The Fund's maximum exposure under these arrangements is unknown as this would be dependent on future claims that may be made against the Fund. The risk of material loss from such claims is considered remote.
Annual Report
To the Trustees of Fidelity Union Street Trust and the Shareholders of Fidelity Maryland Municipal Income Fund:
In our opinion, the accompanying statement of assets and liabilities, including the schedule of investments, and the related statements of operations and of changes in net assets and the financial highlights present fairly, in all material respects, the financial position of Fidelity Maryland Municipal Income Fund (a fund of Fidelity Union Street Trust) at August 31, 2010, the results of its operations for the year then ended, the changes in its net assets for each of the two years in the period then ended and the financial highlights for each of the five years in the period then ended, in conformity with accounting principles generally accepted in the United States of America. These financial statements and financial highlights (hereafter referred to as "financial statements") are the responsibility of the Fidelity Maryland Municipal Income Fund's management. Our responsibility is to express an opinion on these financial statements based on our audits. We conducted our audits of these financial statements in accordance with the standards of the Public Company Accounting Oversight Board (United States). Those standards require that we plan and perform the audit to obtain reasonable assurance about whether the financial statements are free of material misstatement. An audit includes examining, on a test basis, evidence supporting the amounts and disclosures in the financial statements, assessing the accounting principles used and significant estimates made by management, and evaluating the overall financial statement presentation. We believe that our audits, which included confirmation of securities at August 31, 2010 by correspondence with the custodian and brokers, provide a reasonable basis for our opinion.
/s/ PricewaterhouseCoopers LLP
PricewaterhouseCoopers LLP
Boston, Massachusetts
October 12, 2010
Annual Report
The Trustees and executive officers of the trust and fund, as applicable, are listed below. The Board of Trustees governs the fund and is responsible for protecting the interests of shareholders. The Trustees are experienced executives who meet periodically throughout the year to oversee the fund's activities, review contractual arrangements with companies that provide services to the fund, oversee management of the risks associated with such activities and contractual arrangements, and review the fund's performance. Except for James C. Curvey, each of the Trustees oversees 189 funds advised by FMR or an affiliate. Mr. Curvey oversees 410 funds advised by FMR or an affiliate.
The Trustees hold office without limit in time except that (a) any Trustee may resign; (b) any Trustee may be removed by written instrument, signed by at least two-thirds of the number of Trustees prior to such removal; (c) any Trustee who requests to be retired or who has become incapacitated by illness or injury may be retired by written instrument signed by a majority of the other Trustees; and (d) any Trustee may be removed at any special meeting of shareholders by a two-thirds vote of the outstanding voting securities of the trust. Each Trustee who is not an interested person (as defined in the 1940 Act) (Independent Trustee), shall retire not later than the last day of the calendar year in which his or her 75th birthday occurs. The Independent Trustees may waive this mandatory retirement age policy with respect to individual Trustees. The executive officers hold office without limit in time, except that any officer may resign or may be removed by a vote of a majority of the Trustees at any regular meeting or any special meeting of the Trustees. Except as indicated, each individual has held the office shown or other offices in the same company for the past five years.
Experience, Skills, Attributes, and Qualifications of the Fund's Trustees. The Governance and Nominating Committee has adopted a statement of policy that describes the experience, qualifications, attributes, and skills that are necessary and desirable for potential Independent Trustee candidates (Statement of Policy). The Board believes that each Trustee satisfied at the time he or she was initially elected or appointed a Trustee, and continues to satisfy, the standards contemplated by the Statement of Policy. The Governance and Nominating Committee also engages professional search firms to help identify potential Independent Trustee candidates who have the experience, qualifications, attributes, and skills consistent with the Statement of Policy. From time to time, additional criteria based on the composition and skills of the current Independent Trustees, as well as experience or skills that may be appropriate in light of future changes to board composition, business conditions, and regulatory or other developments, have also been considered by the professional search firms and the Governance and Nominating Committee. In addition, the Board takes into account the Trustees' commitment and participation in Board and committee meetings, as well as their leadership of standing and ad hoc committees throughout their tenure.
In determining that a particular Trustee was and continues to be qualified to serve as a Trustee, the Board has considered a variety of criteria, none of which, in isolation, was controlling. The Board believes that, collectively, the Trustees have balanced and diverse experience, qualifications, attributes, and skills, which allow the Board to operate effectively in governing the fund and protecting the interests of shareholders. Information about the specific experience, skills, attributes, and qualifications of each Trustee, which in each case led to the Board's conclusion that the Trustee should serve (or continue to serve) as a trustee of the fund, is provided below.
Annual Report
Board Structure and Oversight Function. Abigail P. Johnson is an interested person (as defined in the 1940 Act) and currently serves as Chairman. The Trustees have determined that an interested Chairman is appropriate and benefits shareholders because an interested Chairman has a personal and professional stake in the quality and continuity of services provided to the fund. Independent Trustees exercise their informed business judgment to appoint an individual of their choosing to serve as Chairman, regardless of whether the Trustee happens to be independent or a member of management. The Independent Trustees have determined that they can act independently and effectively without having an Independent Trustee serve as Chairman and that a key structural component for assuring that they are in a position to do so is for the Independent Trustees to constitute a substantial majority for the Board. The Independent Trustees also regularly meet in executive session. Kenneth L. Wolfe serves as Chairman of the Independent Trustees and as such (i) acts as a liaison between the Independent Trustees and management with respect to matters important to the Independent Trustees and (ii) with management prepares agendas for Board meetings.
Fidelity funds are overseen by different Boards of Trustees. The fund's Board oversees Fidelity's investment-grade bond, money market, and asset allocation funds and another Board oversees Fidelity's equity and high income funds. The asset allocation funds may invest in Fidelity funds that are overseen by such other Board. The use of separate Boards, each with its own committee structure, allows the Trustees of each group of Fidelity funds to focus on the unique issues of the funds they oversee, including common research, investment, and operational issues. On occasion, the separate Boards establish joint committees to address issues of overlapping consequences for the Fidelity funds overseen by each Board.
The Trustees operate using a system of committees to facilitate the timely and efficient consideration of all matters of importance to the Trustees, the fund, and fund shareholders and to facilitate compliance with legal and regulatory requirements and oversight of the fund's activities and associated risks. The Board, acting through its committees, has charged FMR and its affiliates with (i) identifying events or circumstances the occurrence of which could have demonstrably adverse effects on the fund's business and/or reputation; (ii) implementing processes and controls to lessen the possibility that such events or circumstances occur or to mitigate the effects of such events or circumstances if they do occur; and (iii) creating and maintaining a system designed to evaluate continuously business and market conditions in order to facilitate the identification and implementation processes described in (i) and (ii) above. Because the day-to-day operations and activities of the fund are carried out by or through FMR, its affiliates and other service providers, the fund's exposure to risks is mitigated but not eliminated by the processes overseen by the Trustees. While each of the Board's committees has responsibility for overseeing different aspects of the fund's activities, oversight is exercised primarily through the Operations and Audit Committees. Appropriate personnel, including but not limited to the fund's Chief Compliance Officer (CCO), FMR's internal auditor, the independent accountants, the fund's Treasurer and portfolio management personnel, make periodic reports to the Board's committees, as appropriate. The responsibilities of each committee, including their oversight responsibilities, are described further under "Standing Committees of the Fund's Trustees."
Annual Report
Trustees and Officers - continued
The fund's Statement of Additional Information (SAI) includes more information about the Trustees. To request a free copy, call Fidelity at 1-800-544-8544.
Interested Trustees*:
Correspondence intended for each Trustee who is an interested person may be sent to Fidelity Investments, 82 Devonshire Street, Boston, Massachusetts 02109.
Name, Age; Principal Occupations and Other Relevant Experience+ |
Abigail P. Johnson (48) |
| Year of Election or Appointment: 2009 Ms. Johnson is Trustee and Chairman of the Board of Trustees of certain Trusts. Ms. Johnson serves as President of Personal, Workplace and Institutional Services (2005-present). Ms. Johnson is the Vice Chairman and Director (2007-present) of FMR LLC. Previously, Ms. Johnson served as President and a Director of FMR (2001-2005), a Trustee of other investment companies advised by FMR, Fidelity Investments Money Management, Inc., and FMR Co., Inc. (2001-2005), Senior Vice President of the Fidelity funds (2001-2005), and managed a number of Fidelity funds. Ms. Abigail P. Johnson and Mr. Arthur E. Johnson are not related. |
James C. Curvey (75) |
| Year of Election or Appointment: 2007 Mr. Curvey also serves as Trustee (2007-present) of other investment companies advised by FMR. Mr. Curvey is a Director of Fidelity Investments Money Management, Inc. (2009-present), Director of Fidelity Research & Analysis Co. (2009-present) and Director of FMR and FMR Co., Inc. (2007-present). Mr. Curvey is also Vice Chairman (2007-present) and Director of FMR LLC. In addition, Mr. Curvey serves as an Overseer for the Boston Symphony Orchestra and a member of the Trustees of Villanova University. Previously, Mr. Curvey was the Vice Chairman (2006-2007) and Director (2000-2007) of FMR Corp. |
* Trustees have been determined to be "Interested Trustees" by virtue of, among other things, their affiliation with the trust or various entities under common control with FMR.
Annual Report
+ The information above includes each Trustee's principal occupation during the last five years and other information relating to the experience, attributes, and skills relevant to each Trustee's qualifications to serve as a Trustee, which led to the conclusion that each Trustee should serve as a Trustee for the fund.
Independent Trustees:
Correspondence intended for each Independent Trustee (that is, the Trustees other than the Interested Trustees) may be sent to Fidelity Investments, P.O. Box 55235, Boston, Massachusetts 02205-5235.
Name, Age; Principal Occupations and Other Relevant Experience+ |
Albert R. Gamper, Jr. (68) |
| Year of Election or Appointment: 2006 Prior to his retirement in December 2004, Mr. Gamper served as Chairman of the Board of CIT Group Inc. (commercial finance). During his tenure with CIT Group Inc. Mr. Gamper served in numerous senior management positions, including Chairman (1987-1989; 1999-2001; 2002-2004), Chief Executive Officer (1987-2004), and President (2002-2003). He also served as President and Chief Executive Officer of Tyco Capital Corporation (2001-2002). Mr. Gamper currently serves as a member of the Board of Directors of Public Service Enterprise Group (utilities, 2000-present), a member of the Board of Trustees, Rutgers University (2004-present), and Chairman of the Board of Saint Barnabas Health Care System. Previously, Mr. Gamper served as Chairman of the Board of Governors, Rutgers University (2004-2007). |
Robert F. Gartland (58) |
| Year of Election or Appointment: 2010 Mr. Gartland is a partner and investor of Vietnam Partners LLC (investments and consulting, 2008-present) and is Chairman and an investor in Gartland and Mellina Group Corp. (consulting, 2009-present). Prior to his retirement, Mr. Gartland held a variety of positions at Morgan Stanley (financial services, 1979-2007) including Managing Director (1987-2007). |
Arthur E. Johnson (63) |
| Year of Election or Appointment: 2008 Mr. Johnson serves as a member of the Board of Directors of Eaton Corporation (diversified power management, 2009-present) and AGL Resources, Inc. (holding company). Prior to his retirement, Mr. Johnson served as Senior Vice President of Corporate Strategic Development of Lockheed Martin Corporation (defense contractor, 1999-2009). He previously served on the Board of Directors of IKON Office Solutions, Inc. (1999-2008) and Delta Airlines (2005-2007). Mr. Arthur E. Johnson and Ms. Abigail P. Johnson are not related. |
Michael E. Kenneally (56) |
| Year of Election or Appointment: 2009 Previously, Mr. Kenneally served as a Member of the Advisory Board for certain Fidelity Fixed Income and Asset Allocation Funds (2008-2009). Prior to his retirement, Mr. Kenneally served as Chairman and Global Chief Executive Officer of Credit Suisse Asset Management (2003-2005). Mr. Kenneally was a Director of the Credit Suisse Funds (U.S. mutual funds, 2004-2008) and certain other closed-end funds (2004-2005) and was awarded the Chartered Financial Analyst (CFA) designation in 1991. |
James H. Keyes (69) |
| Year of Election or Appointment: 2007 Mr. Keyes serves as a member of the Boards of Navistar International Corporation (manufacture and sale of trucks, buses, and diesel engines, since 2002) and Pitney Bowes, Inc. (integrated mail, messaging, and document management solutions, since 1998). Prior to his retirement, Mr. Keyes served as Chairman and Chief Executive Officer of Johnson Controls (automotive, building, and energy, 1998-2002) and as a member of the Board of LSI Logic Corporation (semiconductor technologies, 1984-2008). |
Marie L. Knowles (63) |
| Year of Election or Appointment: 2001 Prior to Ms. Knowles' retirement in June 2000, she served as Executive Vice President and Chief Financial Officer of Atlantic Richfield Company (ARCO) (diversified energy, 1996-2000). From 1993 to 1996, she was a Senior Vice President of ARCO and President of ARCO Transportation Company. She served as a Director of ARCO from 1996 to 1998. Ms. Knowles currently serves as a Director and Chairman of the Audit Committee of McKesson Corporation (healthcare service, since 2002). Ms. Knowles is an Honorary Trustee of the Brookings Institution and a member of the Board of the Catalina Island Conservancy and of the Santa Catalina Island Company (2009-present). She also serves as a member of the Advisory Board for the School of Engineering of the University of Southern California and the Foundation Board of the School of Architecture at the University of Virginia (2007-present). Previously, Ms. Knowles served as a Director of Phelps Dodge Corporation (copper mining and manufacturing, 1994-2007). |
Kenneth L. Wolfe (71) |
| Year of Election or Appointment: 2005 Mr. Wolfe is Chairman of the Independent Trustees of the Fixed Income and Asset Allocation Funds (2008-present). Prior to his retirement, Mr. Wolfe served as Chairman and a Director (2007-2009) and Chairman and Chief Executive Officer (1994-2001) of Hershey Foods Corporation. He also served as a member of the Boards of Adelphia Communications Corporation (telecommunications, 2003-2006), Bausch & Lomb, Inc. (medical/pharmaceutical, 1993-2007), and Revlon, Inc. (personal care products, 2004-2009). |
+ The information above includes each Trustee's principal occupation during the last five years and other information relating to the experience, attributes, and skills relevant to each Trustee's qualifications to serve as a Trustee, which led to the conclusion that each Trustee should serve as a Trustee for the fund.
Executive Officers:
Correspondence intended for each executive officer may be sent to Fidelity Investments, 82 Devonshire Street, Boston, Massachusetts 02109.
Name, Age; Principal Occupation |
John R. Hebble (52) |
| Year of Election or Appointment: 2008 President and Treasurer of Fidelity's Fixed Income and Asset Allocation Funds. Mr. Hebble also serves as Treasurer and Chief Financial Officer of The North Carolina Capital Management Trust: Cash and Term Portfolio (2008-present), Assistant Treasurer of other Fidelity funds (2009-present) and is an employee of Fidelity Investments. |
Boyce I. Greer (54) |
| Year of Election or Appointment: 2005 Vice President of Fidelity's Fixed Income Funds and Asset Allocation Funds (2005). Mr. Greer is also a Trustee of other investment companies advised by FMR. Mr. Greer is President of The North Carolina Capital Management Trust: Cash and Term Portfolio (2003-present), the Asset Allocation Division (2008-present), President and a Director of Strategic Advisers, Inc. (2008-present), President of FIMM 130/30 LLC (2008-present), Director of Ballyrock Investment Advisors LLC (2006-present), and an Executive Vice President of FMR (2005-present). Previously, Mr. Greer served as Executive Vice President of FMR Co., Inc. (2005-2009), President and Director of Fidelity Investments Money Management, Inc. (2007-2009) and as a Director and Managing Director of Strategic Advisers, Inc. (2002-2005). |
Christopher P. Sullivan (56) |
| Year of Election or Appointment: 2009 Vice President of Fidelity's Bond Funds. Mr. Sullivan also serves as President of Fidelity's Bond Division (2009-present). Mr. Sullivan is Executive Vice President of Fidelity Investments Money Management, Inc. (2009-present), and a Director of Fidelity Management & Research (U.K.) Inc. (2010-present). Previously, Mr. Sullivan served as Managing Director, Co-Head of U.S. Fixed Income at Goldman Sachs Asset Management (2001-2009). |
Christine J. Thompson (52) |
| Year of Election or Appointment: 2010 Vice President of Fidelity's Bond Funds. Ms. Thompson also serves as Chief Investment Officer of FMR's Bond Group (2010-present) and is an employee of Fidelity Investments. Previously, Ms. Thompson served as Director of Municipal Bond Portfolio Managers (2002-2010). |
Scott C. Goebel (42) |
| Year of Election or Appointment: 2008 Secretary and Chief Legal Officer (CLO) of the Fidelity funds. Mr. Goebel also serves as Secretary and CLO of The North Carolina Capital Management Trust: Cash and Term Portfolio (2008-present); General Counsel, Secretary, and Senior Vice President of FMR (2008-present) and FMR Co., Inc. (2008-present); Deputy General Counsel of FMR LLC; Chief Legal Officer of Fidelity Management & Research (Hong Kong) Limited (2008-present) and Assistant Secretary of Fidelity Management & Research (Japan) Inc. (2008-present), Fidelity Investments Money Management, Inc. (2008-present), Fidelity Management & Research (U.K.) Inc. (2008-present), and Fidelity Research and Analysis Company (2008-present). Previously, Mr. Goebel served as Assistant Secretary of the Funds (2007-2008) and as Vice President and Secretary of Fidelity Distributors Corporation (FDC) (2005-2007). |
David J. Carter (37) |
| Year of Election or Appointment: 2010 Assistant Secretary of Fidelity's Fixed Income and Asset Allocation Funds. Mr. Carter also serves as Vice President, Associate General Counsel (2010-present) and is an employee of Fidelity Investments (2005-present). |
Holly C. Laurent (56) |
| Year of Election or Appointment: 2008 Anti-Money Laundering (AML) Officer of the Fidelity funds. Ms. Laurent also serves as AML Officer of The North Carolina Capital Management Trust: Cash and Term Portfolio (2008-present) and is an employee of Fidelity Investments. Previously, Ms. Laurent was Senior Vice President and Head of Legal for Fidelity Business Services India Pvt. Ltd. (2006-2008), and Senior Vice President, Deputy General Counsel and Group Head for FMR LLC (2005-2006). |
Christine Reynolds (51) |
| Year of Election or Appointment: 2008 Chief Financial Officer of the Fidelity funds. Ms. Reynolds became President of Fidelity Pricing and Cash Management Services (FPCMS) in August 2008. Ms. Reynolds served as Chief Operating Officer of FPCMS (2007-2008). Previously, Ms. Reynolds served as President, Treasurer, and Anti-Money Laundering officer of the Fidelity funds (2004-2007). |
Michael H. Whitaker (43) |
| Year of Election or Appointment: 2008 Chief Compliance Officer of Fidelity's Fixed Income and Asset Allocation Funds. Mr. Whitaker also serves as Chief Compliance Officer of The North Carolina Capital Management Trust: Cash and Term Portfolio (2008-present). Mr. Whitaker is an employee of Fidelity Investments (2007-present). Prior to joining Fidelity Investments, Mr. Whitaker worked at MFS Investment Management where he served as Senior Vice President and Chief Compliance Officer (2004-2006), and Assistant General Counsel. |
Jeffrey S. Christian (48) |
| Year of Election or Appointment: 2009 Deputy Treasurer of the Fidelity funds. Mr. Christian is an employee of Fidelity Investments. Previously, Mr. Christian served as Chief Financial Officer (2008-2009) of certain Fidelity funds and Senior Vice President of Fidelity Pricing and Cash Management Services (FPCMS) (2004-2009). |
Bryan A. Mehrmann (49) |
| Year of Election or Appointment: 2005 Deputy Treasurer of the Fidelity funds. Mr. Mehrmann is an employee of Fidelity Investments. |
Stephanie J. Dorsey (41) |
| Year of Election or Appointment: 2008 Deputy Treasurer of Fidelity's Fixed Income and Asset Allocation Funds. Ms. Dorsey also serves as Assistant Treasurer of other Fidelity funds (2010-present) and is an employee of Fidelity Investments (2008-present). Previously, Ms. Dorsey served as Treasurer (2004-2008) of the JPMorgan Mutual Funds and Vice President (2004-2008) of JPMorgan Chase Bank. |
Adrien E. Deberghes (43) |
| Year of Election or Appointment: 2010 Assistant Treasurer of Fidelity's Fixed Income and Asset Allocation Funds. Mr. Deberghes also serves as Deputy Treasurer of other Fidelity funds (2008-present) and is an employee of Fidelity Investments (2008-present). Previously, Mr. Deberghes served as Senior Vice President of Mutual Fund Administration at State Street Corporation (2007-2008), Senior Director of Mutual Fund Administration at Investors Bank & Trust (2005-2007), and Director of Finance for Dunkin' Brands (2000-2005). |
Kenneth B. Robins (41) |
| Year of Election or Appointment: 2009 Assistant Treasurer of the Fidelity Fixed Income and Asset Allocation Funds. Mr. Robins also serves as President and Treasurer of other Fidelity funds (2008-present; 2010-present) and is an employee of Fidelity Investments (2004-present). Previously, Mr. Robins served as Deputy Treasurer of the Fidelity funds (2005-2008) and Treasurer and Chief Financial Officer of The North Carolina Capital Management Trust: Cash and Term Portfolios (2006-2008). |
Gary W. Ryan (52) |
| Year of Election or Appointment: 2005 Assistant Treasurer of the Fidelity funds. Mr. Ryan is an employee of Fidelity Investments. Previously, Mr. Ryan served as Vice President of Fund Reporting in Fidelity Pricing and Cash Management Services (FPCMS) (1999-2005). |
Annual Report
During fiscal year ended 2010, 100% of the fund's income dividends was free from federal income tax, and 3.87% of the fund's income dividends was subject to the federal alternative minimum tax.
The fund will notify shareholders in January 2011 of amounts for use in preparing 2010 income tax returns.
Annual Report
Managing Your Investments
Fidelity offers several ways to conveniently manage your personal investments via your telephone or PC. You can access your account information, conduct trades and research your investments 24 hours a day.
By Phone
Fidelity Automated Service Telephone provides a single toll-free number to access account balances, positions, quotes and trading. It's easy to navigate the service, and on your first call, the system will help you create a personal identification number (PIN) for security.
(phone_graphic)
Fidelity Automated
Service Telephone (FAST®)
1-800-544-5555
Press
 For mutual fund and brokerage trading.
 For quotes.*
 For account balances and holdings.
 To review orders and mutual
fund activity.
 To change your PIN.

 To speak to a Fidelity representative.
By PC
Fidelity's web site on the Internet provides a wide range of information, including daily financial news, fund performance, interactive planning tools and news about Fidelity products and services.
(computer_graphic)
Fidelity's Web Site
www.fidelity.com
* When you call the quotes line, please remember that a fund's yield and return will vary and, except for money market funds, share price will also vary. This means that you may have a gain or loss when you sell your shares. There is no assurance that money market funds will be able to maintain a stable $1 share price; an investment in a money market fund is not insured or guaranteed by the U.S. government. Total returns are historical and include changes in share price, reinvestment of dividends and capital gains, and the effects of any sales charges.
Annual Report
To Visit Fidelity
For directions and hours,
please call 1-800-544-9797.
Arizona
7001 West Ray Road
Chandler, AZ
15445 N. Scottsdale Road
Scottsdale, AZ
17550 North 75th Avenue
Glendale, AZ
5330 E. Broadway Blvd
Tucson, AZ
California
815 East Birch Street
Brea, CA
1411 Chapin Avenue
Burlingame, CA
851 East Hamilton Avenue
Campbell, CA
601 Larkspur Landing Circle
Larkspur, CA
2000 Avenue of the Stars
Los Angeles, CA
27101 Puerta Real
Mission Viejo, CA
73575 El Paseo
Palm Desert, CA
251 University Avenue
Palo Alto, CA
123 South Lake Avenue
Pasadena, CA
16656 Bernardo Ctr. Drive
Rancho Bernardo, CA
1220 Roseville Parkway
Roseville, CA
1740 Arden Way
Sacramento, CA
7676 Hazard Center Drive
San Diego, CA
11943 El Camino Real
San Diego, CA
8 Montgomery Street
San Francisco, CA
3793 State Street
Santa Barbara, CA
1200 Wilshire Boulevard
Santa Monica, CA
398 West El Camino Real
Sunnyvale, CA
111 South Westlake Blvd
Thousand Oaks, CA
21701 Hawthorne Boulevard
Torrance, CA
2001 North Main Street
Walnut Creek, CA
6326 Canoga Avenue
Woodland Hills, CA
2211 Michelson Drive
Irvine, CA
Colorado
281 East Flatiron Circle
Broomfield, CO
1625 Broadway
Denver, CO
9185 Westview Road
Lone Tree, CO
Connecticut
48 West Putnam Avenue
Greenwich, CT
265 Church Street
New Haven, CT
300 Atlantic Street
Stamford, CT
29 South Main Street
West Hartford, CT
1261 Post Road
Fairfield, CT
Delaware
400 Delaware Avenue
Wilmington, DE
Florida
175 East Altamonte Drive
Altamonte Springs, FL
1400 Glades Road
Boca Raton, FL
121 Alhambra Plaza
Coral Gables, FL
2948 N. Federal Highway
Ft. Lauderdale, FL
4671 Town Center Parkway
Jacksonville, FL
8880 Tamiami Trail, North
Naples, FL
230 Royal Palm Way
Palm Beach, FL
3501 PGA Boulevard
Palm Beach Gardens, FL
3550 Tamiami Trail, South
Sarasota, FL
1502 N. Westshore Blvd.
Tampa, FL
2465 State Road 7
Wellington, FL
Georgia
3242 Peachtree Road
Atlanta, GA
1000 Abernathy Road
Atlanta, GA
Illinois
One North LaSalle Street
Chicago, IL
401 North Michigan Avenue
Chicago, IL
One Skokie Valley Road
Highland Park, IL
1415 West 22nd Street
Oak Brook, IL
15105 S LaGrange Road
Orland Park, IL
1572 East Golf Road
Schaumburg, IL
1823 Freedom Drive
Naperville, IL
Indiana
8480 Keystone Crossing
Indianapolis, IN
Kansas
5400 College Boulevard
Overland Park, KS
Maine
Three Canal Plaza
Portland, ME
Maryland
7315 Wisconsin Avenue
Bethesda, MD
610 York Road
Towson, MD
Massachusetts
801 Boylston Street
Boston, MA
155 Congress Street
Boston, MA
300 Granite Street
Braintree, MA
44 Mall Road
Burlington, MA
238 Main Street
Cambridge, MA
200 Endicott Street
Danvers, MA
Fidelity Brokerage Services, Inc., 100 Summer St., Boston, MA 02110 Member NYSE/SIPC
Annual Report
405 Cochituate Road
Framingham, MA
551 Boston Turnpike
Shrewsbury, MA
Michigan
500 E. Eisenhower Pkwy.
Ann Arbor, MI
280 N. Old Woodward Ave.
Birmingham, MI
30200 Northwestern Hwy.
Farmington Hills, MI
43420 Grand River Avenue
Novi, MI
3480 28th Street
Grand Rapids, MI
2425 S. Linden Road STE E
Flint, MI
Minnesota
7740 France Avenue South
Edina, MN
8342 3rd Street North
Oakdale, MN
Missouri
1524 South Lindbergh Blvd.
St. Louis, MO
Nevada
2225 Village Walk Drive
Henderson, NV
New Jersey
501 Route 73 South
Marlton, NJ
150 Essex Street
Millburn, NJ
35 Morris Street
Morristown, NJ
396 Route 17, North
Paramus, NJ
3518 Route 1 North
Princeton, NJ
530 Broad Street
Shrewsbury, NJ
New Mexico
2261 Q Street NE
Albuquerque, NM
New York
1130 Franklin Avenue
Garden City, NY
37 West Jericho Turnpike
Huntington Station, NY
1271 Avenue of the Americas
New York, NY
980 Madison Avenue
New York, NY
61 Broadway
New York, NY
350 Park Avenue
New York, NY
200 Fifth Avenue
New York, NY
733 Third Avenue
New York, NY
2070 Broadway
New York, NY
1075 Northern Blvd.
Roslyn, NY
799 Central Park Avenue
Scarsdale, NY
3349 Monroe Avenue
Rochester, NY
North Carolina
4611 Sharon Road
Charlotte, NC
7011 Fayetteville Road
Durham, NC
Ohio
3805 Edwards Road
Cincinnati, OH
1324 Polaris Parkway
Columbus, OH
1800 Crocker Road
Westlake, OH
28699 Chagrin Boulevard
Woodmere Village, OH
Oregon
7493 SW Bridgeport Road
Tigard, OR
Pennsylvania
600 West DeKalb Pike
King of Prussia, PA
1735 Market Street
Philadelphia, PA
12001 Perry Highway
Wexford, PA
Rhode Island
10 Memorial Boulevard
Providence, RI
Tennessee
3018 Peoples Street
Johnson City, TN
7628 West Farmington Blvd.
Germantown, TN
2035 Mallory Lane
Franklin, TN
Texas
10000 Research Boulevard
Austin, TX
4001 Northwest Parkway
Dallas, TX
12532 Memorial Drive
Houston, TX
2701 Drexel Drive
Houston, TX
6560 Fannin Street
Houston, TX
1701 Lake Robbins Drive
The Woodlands, TX
6500 N. MacArthur Blvd.
Irving, TX
6005 West Park Boulevard
Plano, TX
1576 East Southlake Blvd.
Southlake, TX
15600 Southwest Freeway
Sugar Land, TX
139 N. Loop 1604 East
San Antonio, TX
Utah
279 West South Temple
Salt Lake City, UT
Virginia
1861 International Drive
McLean, VA
11957 Democracy Drive
Reston, VA
Washington
10500 NE 8th Street
Bellevue, WA
1518 6th Avenue
Seattle, WA
304 Strander Blvd
Tukwila, WA
Washington, DC
1900 K Street, N.W.
Washington, DC
Wisconsin
16020 West Bluemound Road
Brookfield, WI
Annual Report
Investment Adviser
Fidelity Management & Research Company
Boston, MA
Investment Sub-Advisers
Fidelity Investments
Money Management, Inc.
Fidelity Research & Analysis Company
Fidelity Management & Research (U.K.) Inc.
Fidelity Management & Research
(Hong Kong) Limited
Fidelity Management & Research
(Japan) Inc.
General Distributor
Fidelity Distributors Corporation
Boston, MA
Transfer and Service Agents
Citibank, N.A.
New York, NY
Fidelity Service Company, Inc.
Boston, MA
Custodian
Citibank, N.A.
New York, NY
The Fidelity Telephone Connection
Mutual Fund 24-Hour Service
Exchanges/Redemptions
and Account Assistance 1-800-544-6666
Product Information 1-800-544-6666
Retirement Accounts 1-800-544-4774 (8 a.m. - 9 p.m.)
TDD Service 1-800-544-0118
for the deaf and hearing impaired
(9 a.m. - 9 p.m. Eastern time)
Fidelity Automated Service
Telephone (FAST®) 1-800-544-5555
Automated line for quickest service
SMD-UANN-1010
1.790913.107
Item 2. Code of Ethics
As of the end of the period, August 31, 2010, Fidelity Union Street Trust (the trust) has adopted a code of ethics, as defined in Item 2 of Form N-CSR, that applies to its President and Treasurer and its Chief Financial Officer. A copy of the code of ethics is filed as an exhibit to this Form N-CSR.
Item 3. Audit Committee Financial Expert
The Board of Trustees of the trust has determined that Marie L. Knowles is an audit committee financial expert, as defined in Item 3 of Form N-CSR. Ms. Knowles is independent for purposes of Item 3 of Form N-CSR.
Item 4. Principal Accountant Fees and Services
Fees and Services
The following table presents fees billed by PricewaterhouseCoopers LLP ("PwC") in each of the last two fiscal years for services rendered to Fidelity Arizona Municipal Income Fund and Fidelity Maryland Municipal Income Fund (the "Funds"):
Services Billed by PwC
August 31, 2010 FeesA
| Audit Fees | Audit-Related Fees | Tax Fees | All Other Fees |
Fidelity Arizona Municipal Income Fund | $44,000 | $- | $2,200 | $1,500 |
Fidelity Maryland Municipal Income Fund | $44,000 | $- | $2,200 | $1,500 |
August 31, 2009 FeesA
| Audit Fees | Audit-Related Fees | Tax Fees | All Other Fees |
Fidelity Arizona Municipal Income Fund | $44,000 | $- | $2,200 | $1,600 |
Fidelity Maryland Municipal Income Fund | $44,000 | $- | $2,200 | $1,600 |
A Amounts may reflect rounding.
The following table presents fees billed by PwC that were required to be approved by the Audit Committee for services that relate directly to the operations and financial reporting of the Funds and that are rendered on behalf of Fidelity Management & Research Company ("FMR") and entities controlling, controlled by, or under common control with FMR (not including any sub-adviser whose role is primarily portfolio management and is subcontracted with or overseen by another investment adviser) that provide ongoing services to the Funds ("Fund Service Providers"):
Services Billed by PwC
| August 31, 2010A | August 31, 2009A |
Audit-Related Fees | $2,130,000 | $3,015,000 |
Tax Fees | $- | $2,000 |
All Other Fees | $510,000 | $- |
A Amounts may reflect rounding.
"Audit-Related Fees" represent fees billed for assurance and related services that are reasonably related to the performance of the fund audit or the review of the fund's financial statements and that are not reported under Audit Fees.
"Tax Fees" represent fees billed for tax compliance, tax advice or tax planning that relate directly to the operations and financial reporting of the fund.
"All Other Fees" represent fees billed for assurance services provided to the fund or Fund Service Provider that relate directly to the operations and financial reporting of the fund, excluding those services that are reported under Audit Fees, Audit-Related Fees or Tax Fees.
Assurance services must be performed by an independent public accountant.
* * *
The aggregate non-audit fees billed by PwC for services rendered to the Funds, FMR (not including any sub-adviser whose role is primarily portfolio management and is subcontracted with or overseen by another investment adviser), and any Fund Service Provider for each of the last two fiscal years of the Funds are as follows:
Billed By | August 31, 2010 A | August 31, 2009 A |
PwC | $5,140,000 | $3,880,000 |
A Amounts may reflect rounding.
The trust's Audit Committee has considered non-audit services that were not pre-approved that were provided by PwC to Fund Service Providers to be compatible with maintaining the independence of PwC in its audit of the Funds, taking into account representations from PwC, in accordance with Public Company Accounting Oversight Board rules, regarding its independence from the Funds and their related entities and FMR's review of the appropriateness and permissibility under applicable law of such non-audit services prior to their provision to the Fund Service Providers.
Audit Committee Pre-Approval Policies and Procedures
The trust's Audit Committee must pre-approve all audit and non-audit services provided by a fund's independent registered public accounting firm relating to the operations or financial reporting of the fund. Prior to the commencement of any audit or non-audit services to a fund, the Audit Committee reviews the services to determine whether they are appropriate and permissible under applicable law.
The Audit Committee has adopted policies and procedures to, among other purposes, provide a framework for the Committee's consideration of non-audit services by the audit firms that audit the Fidelity funds. The policies and procedures require that any non-audit service provided by a fund audit firm to a Fidelity fund and any non-audit service provided by a fund auditor to a Fund Service Provider that relates directly to the operations and financial reporting of a Fidelity fund ("Covered Service") are subject to approval by the Audit Committee before such service is provided.
All Covered Services must be approved in advance of provision of the service either: (i) by formal resolution of the Audit Committee, or (ii) by oral or written approval of the service by the Chair of the Audit Committee (or if the Chair is unavailable, such other member of the Audit Committee as may be designated by the Chair to act in the Chair's absence). The approval contemplated by (ii) above is permitted where the Treasurer determines that action on such an engagement is necessary before the next meeting of the Audit Committee.
Non-audit services provided by a fund audit firm to a Fund Service Provider that do not relate directly to the operations and financial reporting of a Fidelity fund are reported to the Audit Committee on a periodic basis.
Non-Audit Services Approved Pursuant to Rule 2-01(c)(7)(i)(C) and (ii) of Regulation S-X ("De Minimis Exception")
There were no non-audit services approved or required to be approved by the Audit Committee pursuant to the De Minimis Exception during the Funds' last two fiscal years relating to services provided to (i) the Funds or (ii) any Fund Service Provider that relate directly to the operations and financial reporting of the Funds.
Item 5. Audit Committee of Listed Registrants
Not applicable.
Item 6. Investments
(a) Not applicable.
(b) Not applicable
Item 7. Disclosure of Proxy Voting Policies and Procedures for Closed-End Management Investment Companies
Not applicable.
Item 8. Portfolio Managers of Closed-End Management Investment Companies
Not applicable.
Item 9. Purchase of Equity Securities by Closed-End Management Investment Company and Affiliated Purchasers
Not applicable.
Item 10. Submission of Matters to a Vote of Security Holders
There were no material changes to the procedures by which shareholders may recommend nominees to the trust's Board of Trustees.
Item 11. Controls and Procedures
(a)(i) The President and Treasurer and the Chief Financial Officer have concluded that the trust's disclosure controls and procedures (as defined in Rule 30a-3(c) under the Investment Company Act) provide reasonable assurances that material information relating to the trust is made known to them by the appropriate persons, based on their evaluation of these controls and procedures as of a date within 90 days of the filing date of this report.
(a)(ii) There was no change in the trust's internal control over financial reporting (as defined in Rule 30a-3(d) under the Investment Company Act) that occurred during the second fiscal quarter of the period covered by this report that has materially affected, or is reasonably likely to materially affect, the trust's internal control over financial reporting.
Item 12. Exhibits
(a) | (1) | Code of Ethics pursuant to Item 2 of Form N-CSR is filed and attached hereto as EX-99.CODE ETH. |
(a) | (2) | Certification pursuant to Rule 30a-2(a) under the Investment Company Act of 1940 (17 CFR 270.30a-2(a)) is filed and attached hereto as Exhibit 99.CERT. |
(a) | (3) | Not applicable. |
(b) | | Certification pursuant to Rule 30a-2(b) under the Investment Company Act of 1940 (17 CFR 270.30a-2(b)) is furnished and attached hereto as Exhibit 99.906CERT. |
SIGNATURES
Pursuant to the requirements of the Securities Exchange Act of 1934 and the Investment Company Act of 1940, the registrant has duly caused this report to be signed on its behalf by the undersigned, thereunto duly authorized.
Fidelity Union Street Trust
By: | /s/John R. Hebble |
| John R. Hebble |
| President and Treasurer |
| |
Date: | October 20, 2010 |
Pursuant to the requirements of the Securities Exchange Act of 1934 and the Investment Company Act of 1940, this report has been signed below by the following persons on behalf of the registrant and in the capacities and on the dates indicated.
By: | /s/John R. Hebble |
| John R. Hebble |
| President and Treasurer |
| |
Date: | October 20, 2010 |
By: | /s/Christine Reynolds |
| Christine Reynolds |
| Chief Financial Officer |
| |
Date: | October 20, 2010 |