UNITED STATES
SECURITIES AND EXCHANGE COMMISSION
Washington, D.C. 20549
FORM N-CSR
CERTIFIED SHAREHOLDER REPORT OF REGISTERED
MANAGEMENT INVESTMENT COMPANIES
Investment Company Act file number 811-2460
Fidelity Union Street Trust
(Exact name of registrant as specified in charter)
245 Summer St., Boston, Massachusetts 02210
(Address of principal executive offices) (Zip code)
Marc Bryant, Secretary
245 Summer St.
Boston, Massachusetts 02210
(Name and address of agent for service)
Registrant's telephone number, including area code:
617-563-7000
| |
Date of fiscal year end: | August 31 |
| |
Date of reporting period: | August 31, 2015 |
Item 1.
Reports to Stockholders
Fidelity® Maryland Municipal Income Fund
Annual Report August 31, 2015 |
 |
Contents
To view a fund's proxy voting guidelines and proxy voting record for the 12-month period ended June 30, visit http://www.fidelity.com/proxyvotingresults or visit the Securities and Exchange Commission's (SEC) web site at http://www.sec.gov.
You may also call 1-800-544-8544 to request a free copy of the proxy voting guidelines.
Standard & Poor's, S&P and S&P 500 are registered service marks of The McGraw-Hill Companies, Inc. and have been licensed for use by Fidelity Distributors Corporation.
Other third-party marks appearing herein are the property of their respective owners.
All other marks appearing herein are registered or unregistered trademarks or service marks of FMR LLC or an affiliated company. © 2015 FMR LLC. All rights reserved.
This report and the financial statements contained herein are submitted for the general information of the shareholders of the Fund. This report is not authorized for distribution to prospective investors in the Fund unless preceded or accompanied by an effective prospectus.
A fund files its complete schedule of portfolio holdings with the SEC for the first and third quarters of each fiscal year on Form N-Q. Forms N-Q are available on the SEC’s web site at http://www.sec.gov. A fund's Forms N-Q may be reviewed and copied at the SEC’s Public Reference Room in Washington, DC. Information regarding the operation of the SEC's Public Reference Room may be obtained by calling 1-800-SEC-0330.
For a complete list of a fund's portfolio holdings, view the most recent holdings listing, semiannual report, or annual report on Fidelity's web site at http://www.fidelity.com, http://www.advisor.fidelity.com, or http://www.401k.com, as applicable.
NOT FDIC INSURED •MAY LOSE VALUE •NO BANK GUARANTEE
Neither the Fund nor Fidelity Distributors Corporation is a bank.
Performance: The Bottom Line
Average annual total return reflects the change in the value of an investment, assuming reinvestment of distributions from dividend income and capital gains (the profits earned upon the sale of securities that have grown in value, if any) and assuming a constant rate of performance each year.
The hypothetical investment and the average annual total returns do not reflect the deduction of taxes that a shareholder would pay on fund distributions or the redemption of fund shares.
During periods of reimbursement by Fidelity, a fund’s total return will be greater than it would be had the reimbursement not occurred.
How a fund did yesterday is no guarantee of how it will do tomorrow.
Average Annual Total Returns
| For the periods ended August 31, 2015 | Past 1 year | Past 5 years | Past 10 years |
| Fidelity® Maryland Municipal Income Fund | 2.66% | 3.33% | 3.88% |
$10,000 Over 10 Years
Let's say hypothetically that $10,000 was invested in Fidelity® Maryland Municipal Income Fund on August 31, 2005.
The chart shows how the value of your investment would have changed, and also shows how the Barclays® Municipal Bond Index performed over the same period.
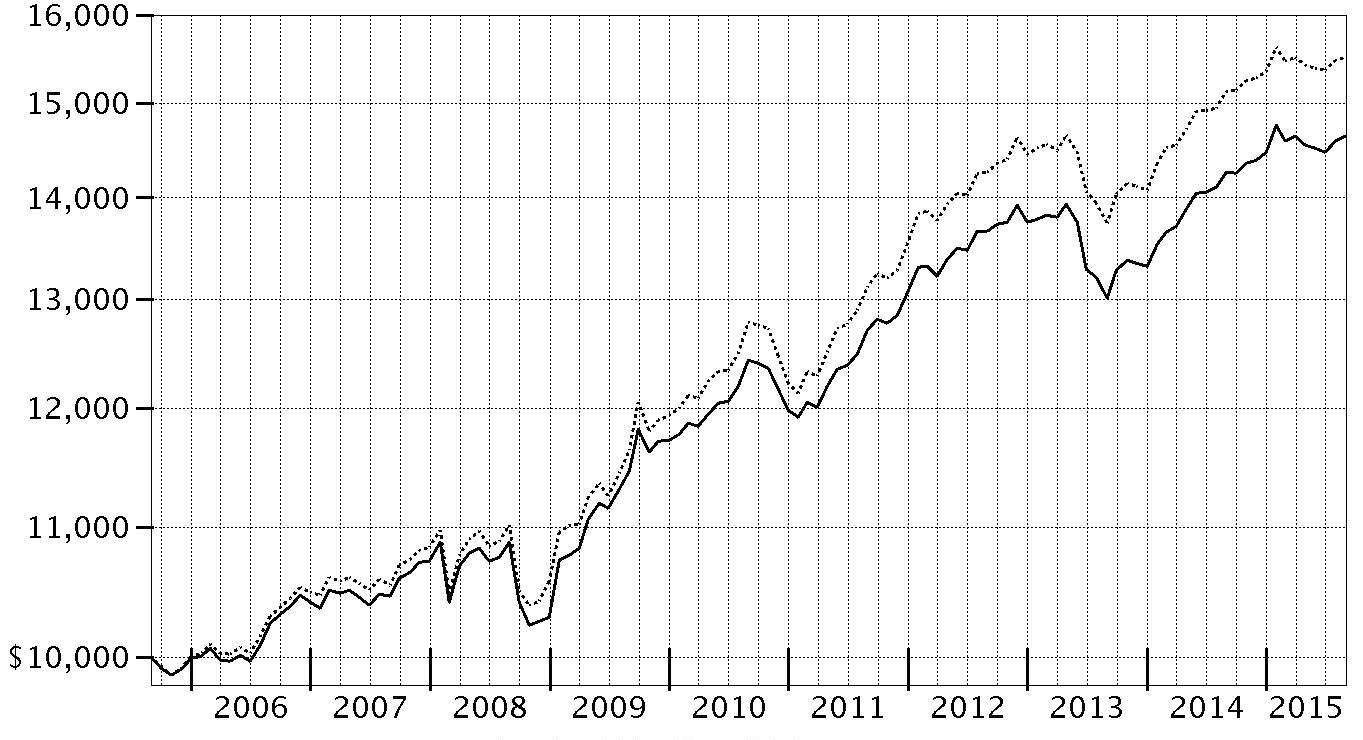
| Period Ending Values |
| $14,638 | Fidelity® Maryland Municipal Income Fund |
| $15,513 | Barclays® Municipal Bond Index |
Management's Discussion of Fund Performance
Market Recap: Tax-exempt municipal bonds posted a modestly positive return for the 12 months ending August 31, 2015, with the Barclays® Municipal Bond Index advancing 2.52%. The strongest performance occurred in the first half of the period, when many issuers exercised a level of fiscal conservatism that led to limited supply. Later in the period, new issuance increased strongly and negative headlines related to a few isolated issuers weighed on the market. Much of this new issuance was used for the purpose of refunding existing debt. Pension underfunding and partisan squabbling in Illinois, New Jersey and the city of Chicago, along with an evolving debt crisis in Puerto Rico, gave muni investors pause, despite a stable credit environment for U.S. states and local governments more broadly. Muni bonds still managed to outperform the broader taxable investment-grade bond market the past 12 months. The tax advantages of munis continued to appeal to investors, in light of higher federal income-tax rates for top earners that took effect in 2013, as well as the 3.8% Medicare tax on unearned, non-municipal investment income. At period end, investors continued to watch the flow of economic data, which the U.S. Federal Reserve has stated will help it determine the timing of any policy interest-rate increase.
Comments from Portfolio Manager Mark Sommer: For the year, the fund slightly lagged the 2.71% return of the Barclays
® Maryland 4+ Year Enhanced Municipal Bond Index. I based my investment decisions on longer-term objectives. I kept the fund’s sensitivity to interest rates, as measured by its duration, roughly in line with the index. I focused on bonds our research indicated offered a good balance between yield and risk, and that I believe had the potential outperform the muni market over time. The fund’s yield-curve positioning was the primary drag on relative performance. Due to a relative shortage of attractively priced long-maturity Maryland bonds, the fund was underweighted there. This worked against us, especially in late 2014 and early 2015 when bonds with maturities of 20 years or more outperformed. In contrast, my decision to overweight the health care sector was rewarded, as investors sought bonds with higher yields during the bulk of the past year. This “yield grab”– in addition to the supportive environment for health care providers in the state – bolstered the sector overall and the portfolio’s holdings in it. The fund’s underweighting in general obligation bonds issued by the state contributed, as they turned in below-average performance largely because they were viewed as expensive from the outset of the period and didn’t attract as much investor demand.
The views expressed above reflect those of the portfolio manager(s) only through the end of the period as stated on the cover of this report and do not necessarily represent the views of Fidelity or any other person in the Fidelity organization. Any such views are subject to change at any time based upon market or other conditions and Fidelity disclaims any responsibility to update such views. These views may not be relied on as investment advice and, because investment decisions for a Fidelity fund are based on numerous factors, may not be relied on as an indication of trading intent on behalf of any Fidelity fund.
Investment Summary (Unaudited)
Top Five Sectors as of August 31, 2015
| | % of fund's net assets | % of fund's net assets 6 months ago |
| General Obligations | 35.6 | 33.4 |
| Health Care | 31.5 | 28.9 |
| Water & Sewer | 13.8 | 12.6 |
| Transportation | 7.2 | 8.3 |
| Education | 7.0 | 8.6 |
Weighted Average Maturity as of August 31, 2015
| | | 6 months ago |
| Years | 6.5 | 6.1 |
This is a weighted average of all the maturities of the securities held in a fund. Weighted Average Maturity (WAM) can be used as a measure of sensitivity to interest rate changes and market changes. Generally, the longer the maturity, the greater the sensitivity to such changes. WAM is based on the dollar-weighted average length of time until principal payments must be paid. Depending on the types of securities held in a fund, certain maturity shortening devices (e.g., demand features, interest rate resets, and call options) may be taken into account when calculating the WAM.
Duration as of August 31, 2015
| | | 6 months ago |
| Years | 7.2 | 6.5 |
Duration is a measure of a security's price sensitivity to changes in interest rates. Duration differs from maturity in that it considers a security's interest payments in addition to the amount of time until the security reaches maturity, and also takes into account certain maturity shortening features (e.g., demand features, interest rate resets, and call options) when applicable. Securities with longer durations generally tend to be more sensitive to interest rate changes than securities with shorter durations. A fund with a longer average duration generally can be expected to be more sensitive to interest rate changes than a fund with a shorter average duration.
Quality Diversification (% of fund's net assets)
| As of August 31, 2015 |
| | AAA | 19.5% |
| | AA,A | 68.0% |
| | BBB | 9.5% |
| | BB and Below | 1.2% |
| | Not Rated | 0.3% |
| | Short-Term Investments and Net Other Assets | 1.5% |

| As of February 28, 2015 |
| | AAA | 22.1% |
| | AA,A | 67.5% |
| | BBB | 7.8% |
| | BB and Below | 1.2% |
| | Not Rated | 0.3% |
| | Short-Term Investments and Net Other Assets | 1.1% |

We have used ratings from Moody's Investors Service, Inc. Where Moody's® ratings are not available, we have used S&P® ratings. All ratings are as of the date indicated and do not reflect subsequent changes.
Investments August 31, 2015
Showing Percentage of Net Assets
| Municipal Bonds - 98.5% | | | |
| | | Principal Amount | Value |
| Guam - 0.9% | | | |
| Guam Ed. Fing. Foundation Ctfs. of Prtn. Series 2006 A, 5% 10/1/23 | | 500,000 | 512,420 |
| Guam Int'l. Arpt. Auth. Rev. Series 2013 C: | | | |
| 5% 10/1/16 (a) | | $300,000 | $311,781 |
| 6.25% 10/1/34 (a) | | 300,000 | 355,164 |
| Guam Pwr. Auth. Rev. Series 2012 A, 5% 10/1/24 (FSA Insured) | | 500,000 | 585,380 |
|
| TOTAL GUAM | | | 1,764,745 |
|
| Maryland - 97.6% | | | |
| Anne Arundel County Gen. Oblig.: | | | |
| Series 2012: | | | |
| 5% 4/1/22 | | 335,000 | 400,067 |
| 5% 4/1/23 | | 4,050,000 | 4,820,067 |
| Series 2014, 5% 4/1/25 | | 2,140,000 | 2,594,857 |
| Series 2015: | | | |
| 5% 4/1/30 | | 6,795,000 | 8,080,816 |
| 5% 4/1/33 | | 2,585,000 | 3,031,352 |
| Baltimore Convention Ctr. Hotel Rev. Series 2006 A: | | | |
| 5.25% 9/1/17 (XL Cap. Assurance, Inc. Insured) | | 1,350,000 | 1,405,674 |
| 5.25% 9/1/27 (XL Cap. Assurance, Inc. Insured) | | 1,020,000 | 1,042,420 |
| Baltimore County Gen. Oblig.: | | | |
| (Metropolitan District Proj.) Series 71, 5% 2/1/38 | | 1,930,000 | 2,099,898 |
| (Oak Crest Village, Inc. Proj.) Series 2007 A, 5% 1/1/22 | | 500,000 | 518,140 |
| Series 2012, 5% 8/1/23 | | 5,000,000 | 6,002,950 |
| Series 2014 B: | | | |
| 4.5% 9/1/23 | | 1,645,000 | 1,947,433 |
| 4.5% 9/1/24 | | 4,730,000 | 5,647,431 |
| 4% 8/1/24 | | 3,000,000 | 3,285,180 |
| Baltimore Ctfs. of Prtn. Series 2010 A, 5% 10/1/17 | | 2,005,000 | 2,175,565 |
| Baltimore Gen. Oblig.: | | | |
| Series 2013 B: | | | |
| 5% 10/15/23 | | 1,100,000 | 1,309,825 |
| 5% 10/15/24 | | 1,875,000 | 2,224,481 |
| 5% 6/15/23 | | 350,000 | 393,085 |
| 5% 6/15/24 | | 500,000 | 561,490 |
| Baltimore Proj. Rev.: | | | |
| (Wastewtr. Proj.): | | | |
| Series 2007 D, 5% 7/1/37 (FSA Insured) | | 4,000,000 | 4,249,920 |
| Series 2008 A, 5% 7/1/38 (FSA Insured) | | 2,000,000 | 2,185,480 |
| Series 2009 C, 5.625% 7/1/39 | | 2,000,000 | 2,313,820 |
| (Wastewtr. Projs.): | | | |
| Series 2014 C, 5% 7/1/27 | | 2,325,000 | 2,763,263 |
| Series 2014 D, 5% 7/1/28 | | 2,750,000 | 3,263,398 |
| (Wtr. Proj.) Series 1994 A, 5% 7/1/24 (FGIC Insured) | | 370,000 | 409,205 |
| (Wtr. Projs.): | | | |
| Series 2014 A: | | | |
| 5% 7/1/28 | | 2,825,000 | 3,329,460 |
| 5% 7/1/33 | | 3,000,000 | 3,437,580 |
| Series 2014 B, 5% 7/1/28 | | 1,580,000 | 1,874,970 |
| Waste Wtr. 2014C 5% 7/1/34 | | 1,285,000 | 1,469,089 |
| 5% 7/1/33 (FSA Insured) | | 1,260,000 | 1,383,833 |
| 5% 7/1/37 (AMBAC Insured) | | 1,260,000 | 1,338,952 |
| Frederick County Econ. Dev. Rev. Series 2009 A: | | | |
| 5% 3/1/25 | | 610,000 | 689,318 |
| 5% 3/1/27 | | 1,255,000 | 1,412,214 |
| Frederick County Gen. Oblig. Series 2014 A: | | | |
| 5% 8/1/23 | | 650,000 | 793,078 |
| 5% 8/1/24 | | 500,000 | 616,815 |
| Howard County Gen. Oblig. Series 2011 B: | | | |
| 5% 8/15/22 | | 3,285,000 | 3,893,908 |
| 5% 8/15/23 | | 5,000,000 | 5,917,500 |
| Maryland Dept. of Trans. Consolidated Trans. Rev. Series 2009, 4% 5/15/23 | | 1,390,000 | 1,511,444 |
| Maryland Econ. Dev. Corp. Student Hsg. Rev.: | | | |
| (Towson Univ. Proj.) Series 2007 A, 5.25% 7/1/17 | | 500,000 | 525,225 |
| (Univ. of Maryland, Baltimore County Student Hsg. Proj.) Series 2006, 5% 7/1/16 (XL Cap. Assurance, Inc. Insured) | | 500,000 | 507,805 |
| Maryland Gen. Oblig. Series B, 5% 8/1/25 | | 6,725,000 | 8,045,050 |
| Maryland Health & Higher Edl. Facilities Auth. Rev.: | | | |
| (Anne Arundel Health Sys. Proj.) Series 2010, 5% 7/1/28 | | 510,000 | 564,509 |
| (Doctors Cmnty. Hosp. Proj.) Series 2010, 5.75% 7/1/38 | | 3,970,000 | 4,205,858 |
| (Johns Hopkins Univ. Proj.) Series 2008 A, 5.25% 7/1/38 | | 5,000,000 | 5,523,000 |
| (LifeBridge Health Proj.) Series 2011, 6% 7/1/41 | | 1,500,000 | 1,761,675 |
| (Mercy Med. Ctr. Proj.) Series 2007 A, 5.5% 7/1/42 | | 1,000,000 | 1,049,570 |
| (Univ. of Maryland Med. Sys. Proj.) Series 2010, 5.125% 7/1/39 | | 1,700,000 | 1,848,903 |
| (Upper Chesapeake Hosp. Proj.) Series 2008 C, 5.5% 1/1/18 (Escrowed to Maturity) | | 285,000 | 302,205 |
| (Washington County Health Sys. Proj.) Series 2008, 6% 1/1/43 (Pre-Refunded to 1/1/18 @ 100) | | 405,000 | 450,376 |
| Series 2011 A, 5% 5/15/23 | | 1,500,000 | 1,741,245 |
| Series 2011, 5% 8/15/22 | | 1,000,000 | 1,161,400 |
| Series 2012 A: | | | |
| 5% 7/1/23 | | 400,000 | 462,396 |
| 5% 7/1/24 | | 700,000 | 805,399 |
| 5% 7/1/25 | | 900,000 | 1,037,952 |
| 5% 7/1/25 | | 1,000,000 | 1,133,170 |
| 5% 7/1/25 | | 2,000,000 | 2,361,500 |
| 5% 7/1/25 | | 1,120,000 | 1,249,270 |
| 5% 7/1/26 | | 300,000 | 333,261 |
| 5% 10/1/30 | | 750,000 | 834,878 |
| Series 2012 B, 5% 7/1/25 | | 1,135,000 | 1,326,792 |
| Series 2012: | | | |
| 5% 7/1/23 | | 850,000 | 992,469 |
| 5% 7/1/24 | | 1,100,000 | 1,274,581 |
| 5% 7/1/26 | | 1,080,000 | 1,170,752 |
| 5% 7/1/26 | | 1,400,000 | 1,596,686 |
| 5% 7/1/27 | | 300,000 | 340,749 |
| 5% 7/1/31 | | 2,500,000 | 2,651,025 |
| Series 2013 A: | | | |
| 5% 7/1/26 | | 1,045,000 | 1,183,463 |
| 5% 7/1/27 | | 1,185,000 | 1,337,308 |
| 5% 8/15/41 | | 3,000,000 | 3,247,110 |
| 5% 7/1/43 | | 3,495,000 | 3,801,931 |
| Series 2013 B, 5% 8/15/38 | | 2,000,000 | 2,180,500 |
| Series 2014: | | | |
| 5% 7/1/27 | | 3,495,000 | 3,983,985 |
| 5% 10/1/45 | | 2,500,000 | 2,777,100 |
| 5.25% 7/1/25 | | 3,000,000 | 3,499,710 |
| Series 2015 A: | | | |
| 5% 5/15/29 | | 2,000,000 | 2,352,820 |
| 5% 5/15/30 | | 1,000,000 | 1,169,030 |
| Series 2015: | | | |
| 5% 7/1/26 | | 1,000,000 | 1,168,420 |
| 5% 7/1/27 | | 1,000,000 | 1,159,110 |
| 5% 7/1/29 | | 600,000 | 684,990 |
| 5% 8/15/29 | | 2,000,000 | 2,281,040 |
| 5% 7/1/30 | | 1,075,000 | 1,219,545 |
| 5% 7/1/31 | | 2,200,000 | 2,454,870 |
| 5% 7/1/33 | | 1,200,000 | 1,298,688 |
| 5% 7/1/34 | | 1,200,000 | 1,294,632 |
| 5% 7/1/40 | | 1,350,000 | 1,481,760 |
| 5% 7/1/19 (FSA Insured) | | 260,000 | 279,180 |
| 5% 7/1/19 (Pre-Refunded to 7/1/17 @ 100) | | 40,000 | 43,164 |
| Maryland Indl. Dev. Fing. Auth. Rev. (American Ctr. for Physics Proj.) Series 2001, 5.25% 12/15/15 | | 320,000 | 321,280 |
| Maryland Trans. Auth. Passenger Facility Charge Rev. Series 2012 A, 5% 6/1/21 (a) | | 2,255,000 | 2,605,743 |
| Maryland Trans. Auth. Trans. Facility Projects Rev.: | | | |
| Series 2007, 5% 7/1/31 (FSA Insured) | | 5,000,000 | 5,344,300 |
| Series 2008: | | | |
| 5% 7/1/35 | | 880,000 | 956,771 |
| 5% 7/1/37 (FSA Insured) | | 4,485,000 | 4,865,911 |
| 6.8% 7/1/16 (Escrowed to Maturity) | | 105,000 | 110,674 |
| Montgomery County Gen. Oblig. (Trinity Health Cr. Group Proj.) Series 2011, 5% 12/1/40 | | 1,000,000 | 1,086,940 |
| Morgan State Univ. Academic & Auxiliary Facilities Fees Rev. Series 2012: | | | |
| 5% 7/1/20 | | 650,000 | 751,615 |
| 5% 7/1/22 | | 750,000 | 879,323 |
| Prince Georges County Gen. Oblig. Series 2011 A, 5% 9/15/26 | | 2,500,000 | 2,946,025 |
| Worcester County Series 2014: | | | |
| 5% 3/1/23 | | 2,225,000 | 2,673,716 |
| 5% 3/1/24 | | 1,670,000 | 2,026,161 |
|
| TOTAL MARYLAND | | | 199,118,494 |
|
| TOTAL MUNICIPAL BONDS | | | |
| (Cost $195,536,566) | | | 200,883,239 |
| TOTAL INVESTMENT PORTFOLIO - 98.5% | | | |
| (Cost $195,536,566) | | | 200,883,239 |
| NET OTHER ASSETS (LIABILITIES) - 1.5% | | | 3,076,658 |
| NET ASSETS - 100% | | | $203,959,897 |
Legend
(a) Private activity obligations whose interest is subject to the federal alternative minimum tax for individuals.
Investment Valuation
All investments are categorized as Level 2 under the Fair Value Hierarchy. The inputs or methodology used for valuing securities may not be an indication of the risk associated with investing in those securities. For more information on valuation inputs please refer to the Investment Valuation section in the accompanying Notes to Financial Statements.
Other Information
The distribution of municipal securities by revenue source, as a percentage of total Net Assets, is as follows (Unaudited):
| General Obligations | 35.6% |
| Health Care | 31.5% |
| Water & Sewer | 13.8% |
| Transportation | 7.2% |
| Education | 7.0% |
| Others (Individually Less Than 5%)(a) | 4.9% |
| | 100.0% |
(a) Includes net other assets
See accompanying notes which are an integral part of the financial statements.
Financial Statements
Statement of Assets and Liabilities
| | | August 31, 2015 |
| Assets | | |
Investment in securities, at value — See accompanying schedule:
Unaffiliated issuers (cost $195,536,566) | | $200,883,239 |
| Cash | | 1,472,584 |
| Receivable for fund shares sold | | 162,821 |
| Interest receivable | | 1,934,217 |
| Other receivables | | 720 |
| Total assets | | 204,453,581 |
| Liabilities | | |
| Payable for fund shares redeemed | $275,049 | |
| Distributions payable | 125,034 | |
| Accrued management fee | 93,599 | |
| Other affiliated payables | 2 | |
| Total liabilities | | 493,684 |
| Net Assets | | $203,959,897 |
| Net Assets consist of: | | |
| Paid in capital | | $195,990,778 |
| Undistributed net investment income | | 22,199 |
| Accumulated undistributed net realized gain (loss) on investments | | 2,600,247 |
| Net unrealized appreciation (depreciation) on investments | | 5,346,673 |
| Net Assets, for 17,889,371 shares outstanding | | $203,959,897 |
| Net Asset Value, offering price and redemption price per share ($203,959,897 ÷ 17,889,371 shares) | | $11.40 |
See accompanying notes which are an integral part of the financial statements.
Statement of Operations
| | | Year ended August 31, 2015 |
| Investment Income | | |
| Interest | | $6,441,075 |
| Expenses | | |
| Management fee | $1,114,403 | |
| Independent trustees' compensation | 846 | |
| Miscellaneous | 293 | |
| Total expenses before reductions | 1,115,542 | |
| Expense reductions | (1,635) | 1,113,907 |
| Net investment income (loss) | | 5,327,168 |
Realized and Unrealized Gain (Loss)
Net realized gain (loss) on: | | |
| Investment securities: | | |
| Unaffiliated issuers | | 2,886,649 |
| Change in net unrealized appreciation (depreciation) on investment securities | | (2,909,215) |
| Net gain (loss) | | (22,566) |
| Net increase (decrease) in net assets resulting from operations | | $5,304,602 |
See accompanying notes which are an integral part of the financial statements.
Statement of Changes in Net Assets
| | Year ended August 31, 2015 | Year ended August 31, 2014 |
| Increase (Decrease) in Net Assets | | |
| Operations | | |
| Net investment income (loss) | $5,327,168 | $5,468,750 |
| Net realized gain (loss) | 2,886,649 | 938,653 |
| Change in net unrealized appreciation (depreciation) | (2,909,215) | 11,431,432 |
| Net increase (decrease) in net assets resulting from operations | 5,304,602 | 17,838,835 |
| Distributions to shareholders from net investment income | (5,325,463) | (5,467,554) |
| Distributions to shareholders from net realized gain | (698,549) | (1,311,073) |
| Total distributions | (6,024,012) | (6,778,627) |
| Share transactions | | |
| Proceeds from sales of shares | 30,030,901 | 26,128,140 |
| Reinvestment of distributions | 4,362,937 | 4,853,494 |
| Cost of shares redeemed | (28,740,619) | (43,020,017) |
| Net increase (decrease) in net assets resulting from share transactions | 5,653,219 | (12,038,383) |
| Redemption fees | 724 | 872 |
| Total increase (decrease) in net assets | 4,934,533 | (977,303) |
| Net Assets | | |
| Beginning of period | 199,025,364 | 200,002,667 |
| End of period (including undistributed net investment income of $22,199 and undistributed net investment income of $25,027, respectively) | $203,959,897 | $199,025,364 |
Other Information
Shares | | |
| Sold | 2,620,405 | 2,351,095 |
| Issued in reinvestment of distributions | 381,295 | 437,408 |
| Redeemed | (2,512,936) | (3,908,621) |
| Net increase (decrease) | 488,764 | (1,120,118) |
See accompanying notes which are an integral part of the financial statements.
Financial Highlights
| | | | |
| Years ended August 31, | 2015 | 2014 | 2013 | 2012 | 2011 |
| Selected Per–Share Data | | | | | |
| Net asset value, beginning of period | $11.44 | $10.80 | $11.67 | $11.17 | $11.30 |
| Income from Investment Operations | | | | | |
| Net investment income (loss)A | .301 | .314 | .312 | .335 | .366 |
| Net realized and unrealized gain (loss) | – | .712 | (.862) | .500 | (.130) |
| Total from investment operations | .301 | 1.026 | (.550) | .835 | .236 |
| Distributions from net investment income | (.301) | (.314) | (.312) | (.335) | (.366) |
| Distributions from net realized gain | (.040) | (.072) | (.008) | – | – |
| Total distributions | (.341) | (.386) | (.320) | (.335) | (.366) |
| Redemption fees added to paid in capitalA,B | – | – | – | – | – |
| Net asset value, end of period | $11.40 | $11.44 | $10.80 | $11.67 | $11.17 |
| Total ReturnC | 2.66% | 9.67% | (4.84)% | 7.57% | 2.21% |
| Ratios to Average Net AssetsD | | | | | |
| Expenses before reductions | .55% | .55% | .55% | .55% | .55% |
| Expenses net of fee waivers, if any | .55% | .55% | .55% | .55% | .55% |
| Expenses net of all reductions | .55% | .55% | .55% | .55% | .55% |
| Net investment income (loss) | 2.63% | 2.83% | 2.71% | 2.93% | 3.35% |
| Supplemental Data | | | | | |
| Net assets, end of period (000 omitted) | $203,960 | $199,025 | $200,003 | $233,274 | $188,011 |
| Portfolio turnover rate | 27% | 17% | 16% | 10% | 22% |
A Calculated based on average shares outstanding during the period.
B Amount represents less than $.0005 per share.
C Total returns would have been lower if certain expenses had not been reduced during the applicable periods shown.
D Expense ratios reflect operating expenses of the Fund. Expenses before reductions do not reflect amounts reimbursed by the investment adviser or reductions from expense offset arrangements and do not represent the amount paid by the Fund during periods when reimbursements or reductions occur. Expenses net of fee waivers reflect expenses after reimbursement by the investment adviser but prior to reductions from expense offset arrangements. Expenses net of all reductions represent the net expenses paid by the Fund.
See accompanying notes which are an integral part of the financial statements.
Notes to Financial Statements
For the period ended August 31, 2015
1. Organization.
Fidelity Maryland Municipal Income Fund (the Fund) is a non-diversified fund of Fidelity Union Street Trust (the Trust) and is authorized to issue an unlimited number of shares. Share transactions on the Statement of Changes in Net Assets may contain exchanges between funds. The Trust is registered under the Investment Company Act of 1940, as amended (the 1940 Act), as an open-end management investment company organized as a Massachusetts business trust. The Fund may be affected by economic and political developments in the state of Maryland.
2. Significant Accounting Policies.
The financial statements have been prepared in conformity with accounting principles generally accepted in the United States of America (GAAP), which require management to make certain estimates and assumptions at the date of the financial statements. Actual results could differ from those estimates. Subsequent events, if any, through the date that the financial statements were issued have been evaluated in the preparation of the financial statements. The following summarizes the significant accounting policies of the Fund:
Investment Valuation. Investments are valued as of 4:00 p.m. Eastern time on the last calendar day of the period. The Board of Trustees (the Board) has delegated the day to day responsibility for the valuation of the Fund's investments to the Fidelity Management & Research Company (FMR) Fair Value Committee (the Committee). In accordance with valuation policies and procedures approved by the Board, the Fund attempts to obtain prices from one or more third party pricing vendors or brokers to value its investments. When current market prices, quotations or currency exchange rates are not readily available or reliable, investments will be fair valued in good faith by the Committee, in accordance with procedures adopted by the Board. Factors used in determining fair value vary by investment type and may include market or investment specific events, changes in interest rates and credit quality. The frequency with which these procedures are used cannot be predicted and they may be utilized to a significant extent. The Committee oversees the Fund's valuation policies and procedures and reports to the Board on the Committee's activities and fair value determinations. The Board monitors the appropriateness of the procedures used in valuing the Fund's investments and ratifies the fair value determinations of the Committee.
The Fund categorizes the inputs to valuation techniques used to value its investments into a disclosure hierarchy consisting of three levels as shown below:
- Level 1 – quoted prices in active markets for identical investments
- Level 2 – other significant observable inputs (including quoted prices for similar investments, interest rates, prepayment speeds, etc.)
- Level 3 – unobservable inputs (including the Fund's own assumptions based on the best information available)
Valuation techniques used to value the Fund's investments by major category are as follows:
Debt securities, including restricted securities, are valued based on evaluated prices received from third party pricing vendors or from brokers who make markets in such securities. Municipal securities are valued by pricing vendors who utilize matrix pricing which considers yield or price of bonds of comparable quality, coupon, maturity and type or by broker-supplied prices. When independent prices are unavailable or unreliable, debt securities may be valued utilizing pricing methodologies which consider similar factors that would be used by third party pricing vendors. Debt securities are generally categorized as Level 2 in the hierarchy but may be Level 3 depending on the circumstances.
Changes in valuation techniques may result in transfers in or out of an assigned level within the disclosure hierarchy.
Investment Transactions and Income. For financial reporting purposes, the Fund's investment holdings and NAV include trades executed through the end of the last business day of the period. The NAV per share for processing shareholder transactions is calculated as of the close of business of the New York Stock Exchange (NYSE), normally 4:00 p.m. Eastern time and includes trades executed through the end of the prior business day. Gains and losses on securities sold are determined on the basis of identified cost. Interest income is accrued as earned and includes coupon interest and amortization of premium and accretion of discount on debt securities as applicable.
Expenses. Expenses directly attributable to a fund are charged to that fund. Expenses attributable to more than one fund are allocated among the respective funds on the basis of relative net assets or other appropriate methods. Expense estimates are accrued in the period to which they relate and adjustments are made when actual amounts are known.
Income Tax Information and Distributions to Shareholders. Each year, the Fund intends to qualify as a regulated investment company under Subchapter M of the Internal Revenue Code, including distributing substantially all of its taxable income and realized gains. As a result, no provision for U.S. Federal income taxes is required. As of August 31, 2015, the Fund did not have any unrecognized tax benefits in the financial statements; nor is the Fund aware of any tax positions for which it is reasonably possible that the total amounts of unrecognized tax benefits will significantly change in the next twelve months. The Fund files a U.S. federal tax return, in addition to state and local tax returns as required. The Fund's federal income tax returns are subject to examination by the Internal Revenue Service (IRS) for a period of three fiscal years after they are filed. State and local tax returns may be subject to examination for an additional fiscal year depending on the jurisdiction.
Dividends are declared and recorded daily and paid monthly from net investment income. Distributions from realized gains, if any, are declared and recorded on the ex-dividend date. Income and capital gain distributions are determined in accordance with income tax regulations, which may differ from GAAP. In addition, the Fund claimed a portion of the payment made to redeeming shareholders as a distribution for income tax purposes.
Capital accounts within the financial statements are adjusted for permanent book-tax differences. These adjustments have no impact on net assets or the results of operations. Capital accounts are not adjusted for temporary book-tax differences which will reverse in a subsequent period.
Book-tax differences are primarily due to market discount and deferred trustees compensation.
The Fund purchases municipal securities whose interest, in the opinion of the issuer, is free from federal income tax. There is no assurance that the IRS will agree with this opinion. In the event the IRS determines that the issuer does not comply with relevant tax requirements, interest payments from a security could become federally taxable, possibly retroactively to the date the security was issued.
The federal tax cost of investment securities and unrealized appreciation (depreciation) as of period end were as follows:
| Gross unrealized appreciation | $5,888,428 |
| Gross unrealized depreciation | (536,596) |
| Net unrealized appreciation (depreciation) on securities | $5,351,832 |
| Tax Cost | $195,531,407 |
The tax-based components of distributable earnings as of period end were as follows:
| Undistributed tax-exempt income | $17,042 |
| Undistributed long-term capital gain | $2,600,246 |
| Net unrealized appreciation (depreciation) on securities and other investments | $5,351,832 |
The tax character of distributions paid was as follows:
| | August 31, 2015 | August 31, 2014 |
| Tax-exempt Income | $5,325,463 | $5,467,554 |
| Ordinary Income | 105,360 | – |
| Long-term Capital Gains | 593,189 | 1,311,073 |
| Total | $6,024,012 | $6,778,627 |
Short-Term Trading (Redemption) Fees. Shares held by investors in the Fund less than 30 days may have been subject to a redemption fee equal to .50% of the NAV of shares redeemed. All redemption fees, which reduce the proceeds of the shareholder redemption, are retained by the Fund and accounted for as an addition to paid in capital.
3. Purchases and Sales of Investments.
Purchases and sales of securities, other than short-term securities, aggregated $63,811,068 and $54,670,994, respectively.
4. Fees and Other Transactions with Affiliates.
Management Fee. Fidelity Management & Research Company (the investment adviser) and its affiliates provide the Fund with investment management related services for which the Fund pays a monthly management fee that is based on an annual rate of .55% of the Fund's average net assets. Under the management contract, the investment adviser pays all other expenses, except the compensation of the independent Trustees and certain other expenses such as interest expense, including commitment fees. The management fee is reduced by an amount equal to the fees and expenses paid by the Fund to the independent Trustees.
5. Committed Line of Credit.
The Fund participates with other funds managed by the investment adviser or an affiliate in a $4.25 billion credit facility (the "line of credit") to be utilized for temporary or emergency purposes to fund shareholder redemptions or for other short-term liquidity purposes. The Fund has agreed to pay commitment fees on its pro-rata portion of the line of credit, which amounted to $293 and is reflected in Miscellaneous expenses on the Statement of Operations. During the period, the Fund did not borrow on this line of credit.
6. Expense Reductions.
Through arrangements with the Fund's custodian, credits realized as a result of uninvested cash balances were used to reduce the Fund's management fee. During the period, these credits reduced the Fund's management fee by $1,635.
7. Other.
The Fund's organizational documents provide former and current trustees and officers with a limited indemnification against liabilities arising in connection with the performance of their duties to the Fund. In the normal course of business, the Fund may also enter into contracts that provide general indemnifications. The Fund's maximum exposure under these arrangements is unknown as this would be dependent on future claims that may be made against the Fund. The risk of material loss from such claims is considered remote.
Report of Independent Registered Public Accounting Firm
To the Trustees of Fidelity Union Street Trust and Shareholders of Fidelity® Maryland Municipal Income Fund:
In our opinion, the accompanying statement of assets and liabilities, including the schedule of investments, and the related statements of operations and of changes in net assets and the financial highlights present fairly, in all material respects, the financial position of Fidelity® Maryland Municipal Income Fund (a fund of Fidelity Union Street Trust) at August 31, 2015, the results of its operations for the year then ended, the changes in its net assets for each of the two years in the period then ended and the financial highlights for each of the five years in the period then ended, in conformity with accounting principles generally accepted in the United States of America. These financial statements and financial highlights (hereafter referred to as “financial statements”) are the responsibility of the Fidelity® Maryland Municipal Income Fund’s management. Our responsibility is to express an opinion on these financial statements based on our audits. We conducted our audits of these financial statements in accordance with the standards of the Public Company Accounting Oversight Board (United States). Those standards require that we plan and perform the audit to obtain reasonable assurance about whether the financial statements are free of material misstatement. An audit includes examining, on a test basis, evidence supporting the amounts and disclosures in the financial statements, assessing the accounting principles used and significant estimates made by management, and evaluating the overall financial statement presentation. We believe that our audits, which included confirmation of securities at August 31, 2015 by correspondence with the custodian and brokers, provide a reasonable basis for our opinion.
PricewaterhouseCoopers LLP
Boston, Massachusetts
October 13, 2015
Trustees and Officers
The Trustees, Members of the Advisory Board (if any), and officers of the trust and fund, as applicable, are listed below. The Board of Trustees governs the fund and is responsible for protecting the interests of shareholders. The Trustees are experienced executives who meet periodically throughout the year to oversee the fund's activities, review contractual arrangements with companies that provide services to the fund, oversee management of the risks associated with such activities and contractual arrangements, and review the fund's performance. Except for Elizabeth S. Acton and John Engler, each of the Trustees oversees 235 funds. Ms. Acton and Mr. Engler each oversees 219 funds.
The Trustees hold office without limit in time except that (a) any Trustee may resign; (b) any Trustee may be removed by written instrument, signed by at least two-thirds of the number of Trustees prior to such removal; (c) any Trustee who requests to be retired or who has become incapacitated by illness or injury may be retired by written instrument signed by a majority of the other Trustees; and (d) any Trustee may be removed at any special meeting of shareholders by a two-thirds vote of the outstanding voting securities of the trust. Each Trustee who is not an interested person (as defined in the 1940 Act) of the trust and the fund is referred to herein as an Independent Trustee. Each Independent Trustee shall retire not later than the last day of the month in which his or her 75th birthday occurs. The Independent Trustees may waive this mandatory retirement age policy with respect to individual Trustees. Officers and Advisory Board Members hold office without limit in time, except that any officer or Advisory Board Member may resign or may be removed by a vote of a majority of the Trustees at any regular meeting or any special meeting of the Trustees. Except as indicated, each individual has held the office shown or other offices in the same company for the past five years.
The fund’s Statement of Additional Information (SAI) includes more information about the Trustees. To request a free copy, call Fidelity at 1-800-544-8544.
Experience, Skills, Attributes, and Qualifications of the Trustees. The Governance and Nominating Committee has adopted a statement of policy that describes the experience, qualifications, attributes, and skills that are necessary and desirable for potential Independent Trustee candidates (Statement of Policy). The Board believes that each Trustee satisfied at the time he or she was initially elected or appointed a Trustee, and continues to satisfy, the standards contemplated by the Statement of Policy. The Governance and Nominating Committee also engages professional search firms to help identify potential Independent Trustee candidates who have the experience, qualifications, attributes, and skills consistent with the Statement of Policy. From time to time, additional criteria based on the composition and skills of the current Independent Trustees, as well as experience or skills that may be appropriate in light of future changes to board composition, business conditions, and regulatory or other developments, have also been considered by the professional search firms and the Governance and Nominating Committee. In addition, the Board takes into account the Trustees' commitment and participation in Board and committee meetings, as well as their leadership of standing and ad hoc committees throughout their tenure.
In determining that a particular Trustee was and continues to be qualified to serve as a Trustee, the Board has considered a variety of criteria, none of which, in isolation, was controlling. The Board believes that, collectively, the Trustees have balanced and diverse experience, qualifications, attributes, and skills, which allow the Board to operate effectively in governing the fund and protecting the interests of shareholders. Information about the specific experience, skills, attributes, and qualifications of each Trustee, which in each case led to the Board's conclusion that the Trustee should serve (or continue to serve) as a trustee of the fund, is provided below.
Board Structure and Oversight Function. Abigail P. Johnson is an interested person and currently serves as Chairman. The Trustees have determined that an interested Chairman is appropriate and benefits shareholders because an interested Chairman has a personal and professional stake in the quality and continuity of services provided to the fund. Independent Trustees exercise their informed business judgment to appoint an individual of their choosing to serve as Chairman, regardless of whether the Trustee happens to be independent or a member of management. The Independent Trustees have determined that they can act independently and effectively without having an Independent Trustee serve as Chairman and that a key structural component for assuring that they are in a position to do so is for the Independent Trustees to constitute a substantial majority for the Board. The Independent Trustees also regularly meet in executive session. Marie L. Knowles serves as Chairman of the Independent Trustees and as such (i) acts as a liaison between the Independent Trustees and management with respect to matters important to the Independent Trustees and (ii) with management prepares agendas for Board meetings.
Fidelity® funds are overseen by different Boards of Trustees. The fund's Board oversees Fidelity's investment-grade bond, money market, asset allocation and certain equity funds, and other Boards oversee Fidelity's high income, sector and other equity funds. The asset allocation funds may invest in Fidelity® funds that are overseen by such other Boards. The use of separate Boards, each with its own committee structure, allows the Trustees of each group of Fidelity® funds to focus on the unique issues of the funds they oversee, including common research, investment, and operational issues. On occasion, the separate Boards establish joint committees to address issues of overlapping consequences for the Fidelity® funds overseen by each Board.
The Trustees operate using a system of committees to facilitate the timely and efficient consideration of all matters of importance to the Trustees, the fund, and fund shareholders and to facilitate compliance with legal and regulatory requirements and oversight of the fund's activities and associated risks. The Board, acting through its committees, has charged FMR and its affiliates with (i) identifying events or circumstances the occurrence of which could have demonstrably adverse effects on the fund's business and/or reputation; (ii) implementing processes and controls to lessen the possibility that such events or circumstances occur or to mitigate the effects of such events or circumstances if they do occur; and (iii) creating and maintaining a system designed to evaluate continuously business and market conditions in order to facilitate the identification and implementation processes described in (i) and (ii) above. Because the day-to-day operations and activities of the fund are carried out by or through FMR, its affiliates, and other service providers, the fund's exposure to risks is mitigated but not eliminated by the processes overseen by the Trustees. While each of the Board's committees has responsibility for overseeing different aspects of the fund's activities, oversight is exercised primarily through the Operations and Audit Committees. In addition, an ad hoc Board committee of Independent Trustees has worked with FMR to enhance the Board's oversight of investment and financial risks, legal and regulatory risks, technology risks, and operational risks, including the development of additional risk reporting to the Board. Appropriate personnel, including but not limited to the fund's Chief Compliance Officer (CCO), FMR's internal auditor, the independent accountants, the fund's Treasurer and portfolio management personnel, make periodic reports to the Board's committees, as appropriate, including an annual review of Fidelity's risk management program for the Fidelity® funds. The responsibilities of each standing committee, including their oversight responsibilities, are described further under "Standing Committees of the Trustees."
Interested Trustees*:
Correspondence intended for a Trustee who is an interested person may be sent to Fidelity Investments, 245 Summer Street, Boston, Massachusetts 02210.
Name, Year of Birth; Principal Occupations and Other Relevant Experience+
Abigail P. Johnson (1961)
Year of Election or Appointment: 2009
Trustee
Chairman of the Board of Trustees
Ms. Johnson also serves as Trustee of other Fidelity® funds. Ms. Johnson serves as President (2013-present) and Chief Executive Officer (2014-present) of FMR LLC (diversified financial services company), President of Fidelity Financial Services (2012-present) and President of Personal, Workplace and Institutional Services (2005-present). Ms. Johnson is Chairman and Director of FMR Co., Inc. (investment adviser firm, 2011-present), Chairman and Director of FMR (investment adviser firm, 2011-present), and the Vice Chairman and Director (2007-present) of FMR LLC. Previously, Ms. Johnson served as President and a Director of FMR (2001-2005), a Trustee of other investment companies advised by FMR, Fidelity Investments Money Management, Inc. (investment adviser firm), and FMR Co., Inc. (2001-2005), Senior Vice President of the Fidelity® funds (2001-2005), and managed a number of Fidelity® funds. Ms. Abigail P. Johnson and Mr. Arthur E. Johnson are not related.
* Determined to be an “Interested Trustee” by virtue of, among other things, his or her affiliation with the trust or various entities under common control with FMR.
+ The information includes the Trustee's principal occupation during the last five years and other information relating to the experience, attributes, and skills relevant to the Trustee's qualifications to serve as a Trustee, which led to the conclusion that the Trustee should serve as a Trustee for the fund.
Independent Trustees:
Correspondence intended for an Independent Trustee may be sent to Fidelity Investments, P.O. Box 55235, Boston, Massachusetts 02205-5235.
Name, Year of Birth; Principal Occupations and Other Relevant Experience+
Elizabeth S. Acton (1951)
Year of Election or Appointment: 2013
Trustee
Ms. Acton also serves as Trustee or Member of the Advisory Board of other Fidelity® funds. Prior to her retirement in April 2012, Ms. Acton was Executive Vice President, Finance (2011-2012), Executive Vice President, Chief Financial Officer (2002-2011), and Treasurer (2004-2005) of Comerica Incorporated (financial services). Prior to joining Comerica, Ms. Acton held a variety of positions at Ford Motor Company (1983-2002), including Vice President and Treasurer (2000-2002) and Executive Vice President and Chief Financial Officer of Ford Motor Credit Company (1998-2000). Ms. Acton currently serves as a member of the Board of Directors and Audit and Finance Committees of Beazer Homes USA, Inc. (homebuilding, 2012-present).
John Engler (1948)
Year of Election or Appointment: 2014
Trustee
Mr. Engler also serves as Trustee or Member of the Advisory Board of other Fidelity® funds. He serves as president of the Business Roundtable (2011-present), and on the board of directors/trustees for Universal Forest Products (manufacturer and distributor of wood and wood-alternative products, 2003-present), K12 Inc. (technology-based education company, 2012-present), and the Annie E. Casey Foundation (2004-present). Previously, Mr. Engler served as a trustee of The Munder Funds (2003-2014), president and CEO of the National Association of Manufacturers (2004-2011) and as governor of Michigan (1991-2003). He is a past chairman of the National Governors Association.
Albert R. Gamper, Jr. (1942)
Year of Election or Appointment: 2006
Trustee
Mr. Gamper also serves as Trustee of other Fidelity® funds. Prior to his retirement in December 2004, Mr. Gamper served as Chairman of the Board of CIT Group Inc. (commercial finance). During his tenure with CIT Group Inc. Mr. Gamper served in numerous senior management positions, including Chairman (1987-1989; 1999-2001; 2002-2004), Chief Executive Officer (1987-2004), and President (2002-2003). Mr. Gamper currently serves as a member of the Board of Directors of Public Service Enterprise Group (utilities, 2000-present), and Member of the Board of Trustees of Barnabas Health Care System (1997-present). Previously, Mr. Gamper served as Chairman (2012-2015) and Vice Chairman (2011-2012) of the Independent Trustees of certain Fidelity® funds and as Chairman of the Board of Governors, Rutgers University (2004-2007).
Robert F. Gartland (1951)
Year of Election or Appointment: 2010
Trustee
Mr. Gartland also serves as Trustee of other Fidelity® funds. Mr. Gartland is Chairman and an investor in Gartland and Mellina Group Corp. (consulting, 2009-present). Previously, Mr. Gartland served as a partner and investor of Vietnam Partners LLC (investments and consulting, 2008-2011). Prior to his retirement, Mr. Gartland held a variety of positions at Morgan Stanley (financial services, 1979-2007) including Managing Director (1987-2007).
Arthur E. Johnson (1947)
Year of Election or Appointment: 2008
Trustee
Vice Chairman of the Independent Trustees
Mr. Johnson also serves as Trustee of other Fidelity® funds. Mr. Johnson serves as a member of the Board of Directors of Eaton Corporation plc (diversified power management, 2009-present), AGL Resources, Inc. (holding company, 2002-present) and Booz Allen Hamilton (management consulting, 2011-present). Prior to his retirement, Mr. Johnson served as Senior Vice President of Corporate Strategic Development of Lockheed Martin Corporation (defense contractor, 1999-2009). He previously served on the Board of Directors of IKON Office Solutions, Inc. (1999-2008) and Delta Airlines (2005-2007). Mr. Arthur E. Johnson is not related to Ms. Abigail P. Johnson.
Michael E. Kenneally (1954)
Year of Election or Appointment: 2009
Trustee
Mr. Kenneally also serves as Trustee of other Fidelity® funds. Prior to his retirement, Mr. Kenneally served as Chairman and Global Chief Executive Officer of Credit Suisse Asset Management. Before joining Credit Suisse, he was an Executive Vice President and Chief Investment Officer for Bank of America Corporation. Earlier roles at Bank of America included Director of Research, Senior Portfolio Manager and Research Analyst, and Mr. Kenneally was awarded the Chartered Financial Analyst (CFA) designation in 1991.
James H. Keyes (1940)
Year of Election or Appointment: 2007
Trustee
Mr. Keyes also serves as Trustee of other Fidelity® funds. Mr. Keyes serves as a member of the Board and Non-Executive Chairman of Navistar International Corporation (manufacture and sale of trucks, buses, and diesel engines, since 2002). Previously, Mr. Keyes served as a member of the Board of Pitney Bowes, Inc. (integrated mail, messaging, and document management solutions, 1998-2013). Prior to his retirement, Mr. Keyes served as Chairman (1993-2002) and Chief Executive Officer (1988-2002) of Johnson Controls (automotive, building, and energy) and as a member of the Board of LSI Logic Corporation (semiconductor technologies, 1984-2008).
Marie L. Knowles (1946)
Year of Election or Appointment: 2001
Trustee
Chairman of the Independent Trustees
Ms. Knowles also serves as Trustee of other Fidelity® funds. Prior to Ms. Knowles' retirement in June 2000, she served as Executive Vice President and Chief Financial Officer of Atlantic Richfield Company (ARCO) (diversified energy, 1996-2000). From 1993 to 1996, she was a Senior Vice President of ARCO and President of ARCO Transportation Company. She served as a Director of ARCO from 1996 to 1998. Ms. Knowles currently serves as a Director and Chairman of the Audit Committee of McKesson Corporation (healthcare service, since 2002). Ms. Knowles is a member of the Board of the Catalina Island Conservancy and of the Santa Catalina Island Company (2009-present). She also serves as a member of the Advisory Board for the School of Engineering of the University of Southern California. Previously, Ms. Knowles served as a Director of Phelps Dodge Corporation (copper mining and manufacturing, 1994-2007), URS Corporation (engineering and construction, 2000-2003) and America West (airline, 1999-2002). Ms. Knowles previously served as Vice Chairman of the Independent Trustees of certain Fidelity® funds (2012-2015).
+ The information includes the Trustee's principal occupation during the last five years and other information relating to the experience, attributes, and skills relevant to the Trustee's qualifications to serve as a Trustee, which led to the conclusion that the Trustee should serve as a Trustee for the fund.
Advisory Board Members and Officers:
Correspondence intended for an officer may be sent to Fidelity Investments, 245 Summer Street, Boston, Massachusetts 02210. Officers appear below in alphabetical order.
Name, Year of Birth; Principal Occupation
Geoffrey A. von Kuhn (1951)
Year of Election or Appointment: 2015
Member of the Advisory Board
Mr. von Kuhn also serves as Trustee or Member of the Advisory Board of other Fidelity funds. Mr. von Kuhn is Chief Administrative Officer for FMR LLC (diversified financial services company, 2013-present), a Director of Pembroke Real Estate, Inc. (2009-present), and a Director of Discovery Natural Resources LLC (2012-present). Previously, Mr. von Kuhn was a managing director of Crosby Group (private wealth management company, 2007-2013), a member of the management committee and senior executive in the Wealth Management Group of AmSouth Bank (2001-2006), and head of the U.S. private bank at Citigroup (2000-2001).
Elizabeth Paige Baumann (1968)
Year of Election or Appointment: 2012
Anti-Money Laundering (AML) Officer
Ms. Baumann also serves as AML Officer of other funds. She is Chief AML Officer of FMR LLC (diversified financial services company, 2012-present) and is an employee of Fidelity Investments. Previously, Ms. Baumann served as Vice President and Deputy Anti-Money Laundering Officer (2007-2012).
Marc R. Bryant (1966)
Year of Election or Appointment: 2015
Secretary and Chief Legal Officer (CLO)
Mr. Bryant also serves as Secretary and CLO of other funds. He is Senior Vice President and Deputy General Counsel of FMR LLC (diversified financial services company). Previously, Mr. Bryant served as Secretary and Chief Legal Officer of Fidelity Rutland Square Trust II (2010-2014) and Assistant Secretary of Fidelity's Fixed Income and Asset Allocation Funds (2013-2015). Prior to joining Fidelity Investments, Mr. Bryant served as a Senior Vice President and the Head of Global Retail Legal for AllianceBernstein L.P. (2006-2010), and as the General Counsel for ProFund Advisors LLC (2001-2006).
Jonathan Davis (1968)
Year of Election or Appointment: 2010
Assistant Treasurer
Mr. Davis also serves as Assistant Treasurer of other funds, and is an employee of Fidelity Investments. Previously, Mr. Davis served as Vice President and Associate General Counsel of FMR LLC (diversified financial services company, 2003-2010).
Adrien E. Deberghes (1967)
Year of Election or Appointment: 2010
Assistant Treasurer
Mr. Deberghes also serves as an officer of other funds. He is an employee of Fidelity Investments (2008-present). Prior to joining Fidelity Investments, Mr. Deberghes was Senior Vice President of Mutual Fund Administration at State Street Corporation (2007-2008), Senior Director of Mutual Fund Administration at Investors Bank & Trust (2005-2007), and Director of Finance for Dunkin' Brands (2000-2005).
Stephanie J. Dorsey (1969)
Year of Election or Appointment: 2013
President and Treasurer
Ms. Dorsey also serves as an officer of other funds. She is an employee of Fidelity Investments (2008-present) and has served in other fund officer roles. Prior to joining Fidelity Investments, Ms. Dorsey served as Treasurer (2004-2008) of the JPMorgan Mutual Funds and Vice President (2004-2008) of JPMorgan Chase Bank.
Howard J. Galligan III (1966)
Year of Election or Appointment: 2014
Chief Financial Officer
Mr. Galligan also serves as Chief Financial Officer of other funds. Mr. Galligan serves as President of Fidelity Pricing and Cash Management Services (FPCMS) (2014-present) and as a Director of Strategic Advisers, Inc. (investment adviser firm, 2008-present). Previously, Mr. Galligan served as Chief Administrative Officer of Asset Management (2011-2014) and Chief Operating Officer and Senior Vice President of Investment Support for Strategic Advisers, Inc. (2003-2011).
Scott C. Goebel (1968)
Year of Election or Appointment: 2015
Vice President
Mr. Goebel serves as an officer of other funds and is an employee of Fidelity Investments (2001-present). Mr. Goebel also serves as Secretary of Fidelity SelectCo, LLC (investment adviser firm, 2013-present), Fidelity Investments Money Management, Inc. (FIMM) (investment adviser firm, 2010-present) and Fidelity Research and Analysis Company (FRAC) (investment adviser firm, 2010-present); General Counsel, Secretary, and Senior Vice President of FMR (investment adviser firm, 2008-present) and FMR Co., Inc. (investment adviser firm, 2008-present); Chief Legal Officer of Fidelity Management & Research (Hong Kong) Limited (investment adviser firm, 2008-present); and Assistant Secretary of Fidelity Management & Research (Japan) Limited (investment adviser firm, 2008-present) and FMR Investment Management (U.K.) Limited (investment adviser firm, 2008-present). Previously, Mr. Goebel served as Secretary and CLO of certain Fidelity® funds (2008-2015), Assistant Secretary of FIMM (2008-2010), FRAC (2008-2010), and certain funds (2007-2008); and as Vice President and Secretary of Fidelity Distributors Corporation (FDC) (2005-2007).
Chris Maher (1972)
Year of Election or Appointment: 2013
Assistant Treasurer
Mr. Maher serves as Assistant Treasurer of other funds. Mr. Maher is Vice President of Valuation Oversight and is an employee of Fidelity Investments. Previously, Mr. Maher served as Vice President of Asset Management Compliance (2013), Vice President of the Program Management Group of FMR (investment adviser firm, 2010-2013), and Vice President of Valuation Oversight (2008-2010).
Jason P. Pogorelec (1975)
Year of Election or Appointment: 2015
Assistant Secretary
Mr. Pogorelec also serves Assistant Secretary of other funds. Mr. Pogorelec serves as Vice President, Associate General Counsel (2010-present) and is an employee of Fidelity Investments (2006-present).
Nancy D. Prior (1967)
Year of Election or Appointment: 2014
Vice President
Ms. Prior also serves as Vice President of other funds. Ms. Prior serves as a Director of Fidelity Investments Money Management, Inc. (FIMM) (investment adviser firm, 2014-present), President, Fixed Income (2014-present), Vice Chairman of Pyramis Global Advisors, LLC (investment adviser firm, 2014-present), and is an employee of Fidelity Investments (2002-present). Previously, Ms. Prior served as Vice President of Fidelity's Money Market Funds (2012-2014), President, Money Market and Short Duration Bond of FMR (investment adviser firm, 2013-2014), President, Money Market Group of FMR (2011-2014), Managing Director of Research (2009-2011), Senior Vice President and Deputy General Counsel (2007-2009), and Assistant Secretary of other Fidelity® funds (2008-2009).
Kenneth B. Robins (1969)
Year of Election or Appointment: 2009
Assistant Treasurer
Mr. Robins also serves as an officer of other funds. Mr. Robins serves as Executive Vice President of Fidelity Investments Money Management, Inc. (FIMM) (investment adviser firm, 2013-present) and is an employee of Fidelity Investments (2004-present). Previously, Mr. Robins served in other fund officer roles.
Stephen Sadoski (1971)
Year of Election or Appointment: 2013
Deputy Treasurer
Mr. Sadoski also serves as Deputy Treasurer of other funds. He is an employee of Fidelity Investments (2012-present) and has served in another fund officer role. Prior to joining Fidelity Investments, Mr. Sadoski served as an assistant chief accountant in the Division of Investment Management of the Securities and Exchange Commission (SEC) (2009-2012) and as a senior manager at Deloitte & Touche LLP (1997-2009).
Stacie M. Smith (1974)
Year of Election or Appointment: 2013
Assistant Treasurer
Ms. Smith also serves as an officer of other funds. She is an employee of Fidelity Investments (2009-present) and has served in other fund officer roles. Prior to joining Fidelity Investments, Ms. Smith served as Senior Audit Manager of Ernst & Young LLP (1996-2009).
Renee Stagnone (1975)
Year of Election or Appointment: 2013
Deputy Treasurer
Ms. Stagnone also serves as Deputy Treasurer of other funds. Ms. Stagnone is an employee of Fidelity Investments (1997-present).
Christine J. Thompson (1958)
Year of Election or Appointment: 2015
Vice President of Fidelity's Bond Funds
Ms. Thompson also serves as Vice President of other funds. Ms. Thompson also serves as Chief Investment Officer of FMR's Bond Group (2010-present) and is an employee of Fidelity Investments (1985-present). Previously, Ms. Thompson served as Vice President of Fidelity's Bond Funds (2010-2012).
Michael H. Whitaker (1967)
Year of Election or Appointment: 2008
Chief Compliance Officer
Mr. Whitaker also serves as Chief Compliance Officer of other funds. Mr. Whitaker also serves as Compliance Officer of FMR Co., Inc. (investment adviser firm, 2014-present), FMR (investment adviser firm, 2014-present), and Fidelity Investments Money Management, Inc. (investment adviser firm, 2014-present) and is an employee of Fidelity Investments (2007-present). Prior to joining Fidelity Investments, Mr. Whitaker worked at MFS Investment Management where he served as Senior Vice President and Chief Compliance Officer (2004-2006), and Assistant General Counsel.
Joseph F. Zambello (1957)
Year of Election or Appointment: 2011
Deputy Treasurer
Mr. Zambello also serves as Deputy Treasurer of other funds. Mr. Zambello is an employee of Fidelity Investments (1991-present). Previously, Mr. Zambello served as Vice President of the Program Management Group of FMR (investment adviser firm, 2009-2011) and Vice President of the Transfer Agent Oversight Group (2005-2009).
Shareholder Expense Example
As a shareholder of the Fund, you incur two types of costs: (1) transaction costs, including redemption fees and (2) ongoing costs, including management fees and other Fund expenses. This Example is intended to help you understand your ongoing costs (in dollars) of investing in the Fund and to compare these costs with the ongoing costs of investing in other mutual funds.
The Example is based on an investment of $1,000 invested at the beginning of the period and held for the entire period (March 1, 2015 to August 31, 2015).
Actual Expenses
The first line of the accompanying table provides information about actual account values and actual expenses. You may use the information in this line, together with the amount you invested, to estimate the expenses that you paid over the period. Simply divide your account value by $1,000.00 (for example, an $8,600 account value divided by $1,000.00 = 8.6), then multiply the result by the number in the first line under the heading entitled "Expenses Paid During Period" to estimate the expenses you paid on your account during this period. A small balance maintenance fee of $12.00 that is charged once a year may apply for certain accounts with a value of less than $2,000. This fee is not included in the table below. If it was, the estimate of expenses you paid during the period would be higher, and your ending account value lower, by this amount.
Hypothetical Example for Comparison Purposes
The second line of the accompanying table provides information about hypothetical account values and hypothetical expenses based on the Fund's actual expense ratio and an assumed rate of return of 5% per year before expenses, which is not the Fund's actual return. The hypothetical account values and expenses may not be used to estimate the actual ending account balance or expenses you paid for the period. You may use this information to compare the ongoing costs of investing in the Fund and other funds. To do so, compare this 5% hypothetical example with the 5% hypothetical examples that appear in the shareholder reports of the other funds. A small balance maintenance fee of $12.00 that is charged once a year may apply for certain accounts with a value of less than $2,000. This fee is not included in the table below. If it was, the estimate of expenses you paid during the period would be higher, and your ending account value lower, by this amount.
Please note that the expenses shown in the table are meant to highlight your ongoing costs only and do not reflect any transaction costs. Therefore, the second line of the table is useful in comparing ongoing costs only, and will not help you determine the relative total costs of owning different funds. In addition, if these transactional costs were included, your costs would have been higher.
| | Annualized Expense Ratio-A | Beginning
Account Value
March 1, 2015 | Ending
Account Value
August 31, 2015 | Expenses Paid
During Period-B
March 1, 2015
to August 31, 2015 |
| Actual | .55% | $1,000.00 | $1,003.60 | $2.78 |
| Hypothetical-C | | $1,000.00 | $1,022.43 | $2.80 |
A Annualized expense ratio reflects expenses net of applicable fee waivers.
B Expenses are equal to the Fund's annualized expense ratio, multiplied by the average account value over the period, multiplied by 184/365 (to reflect the one-half year period).
C 5% return per year before expenses
Distributions (Unaudited)
The Board of Trustees of Fidelity Maryland Municipal Income Fund voted to pay on October 12, 2015, to shareholders of record at the opening of business on October 9, 2015, a distribution of $0.146 per share derived from capital gains realized from sales of portfolio securities.
The fund hereby designates as a capital gain dividend with respect to the taxable year ended August 31, 2015, $2,782,638, or, if subsequently determined to be different, the net capital gain of such year.
During fiscal year ended 2015, 100% of the fund's income dividends was free from federal income tax, and 1.46% of the fund's income dividends was subject to the federal alternative minimum tax.
The fund will notify shareholders in January 2016 of amounts for use in preparing 2015 income tax returns.

Corporate Headquarters
245 Summer St.
Boston, MA 02210
www.fidelity.com
SMD-ANN-1015
1.536791.118
Fidelity® Arizona Municipal Income Fund
Fidelity® Arizona Municipal Money Market Fund
Annual Report August 31, 2015 |
|
Contents
To view a fund's proxy voting guidelines and proxy voting record for the 12-month period ended June 30, visit http://www.fidelity.com/proxyvotingresults or visit the Securities and Exchange Commission's (SEC) web site at http://www.sec.gov.
You may also call 1-800-544-8544 to request a free copy of the proxy voting guidelines.
Standard & Poor's, S&P and S&P 500 are registered service marks of The McGraw-Hill Companies, Inc. and have been licensed for use by Fidelity Distributors Corporation.
Other third-party marks appearing herein are the property of their respective owners.
All other marks appearing herein are registered or unregistered trademarks or service marks of FMR LLC or an affiliated company. © 2015 FMR LLC. All rights reserved.
This report and the financial statements contained herein are submitted for the general information of the shareholders of the Funds. This report is not authorized for distribution to prospective investors in the Funds unless preceded or accompanied by an effective prospectus.
A fund files its complete schedule of portfolio holdings with the SEC for the first and third quarters of each fiscal year on Form N-Q. Forms N-Q are available on the SEC’s web site at http://www.sec.gov. A fund's Forms N-Q may be reviewed and copied at the SEC’s Public Reference Room in Washington, DC. Information regarding the operation of the SEC's Public Reference Room may be obtained by calling 1-800-SEC-0330.
For a complete list of a fund's portfolio holdings, view the most recent holdings listing, semiannual report, or annual report on Fidelity's web site at http://www.fidelity.com, http://www.advisor.fidelity.com, or http://www.401k.com, as applicable.
NOT FDIC INSURED •MAY LOSE VALUE •NO BANK GUARANTEE
Neither the Funds nor Fidelity Distributors Corporation is a bank.
Fidelity® Arizona Municipal Income Fund
Performance: The Bottom Line
Average annual total return reflects the change in the value of an investment, assuming reinvestment of distributions from dividend income and capital gains (the profits earned upon the sale of securities that have grown in value, if any) and assuming a constant rate of performance each year.
The hypothetical investment and the average annual total returns do not reflect the deduction of taxes that a shareholder would pay on fund distributions or the redemption of fund shares.
During periods of reimbursement by Fidelity, a fund’s total return will be greater than it would be had the reimbursement not occurred.
How a fund did yesterday is no guarantee of how it will do tomorrow.
Average Annual Total Returns
| For the periods ended August 31, 2015 | Past 1 year | Past 5 years | Past 10 years |
| Fidelity® Arizona Municipal Income Fund | 3.28% | 4.16% | 4.30% |
$10,000 Over 10 Years
Let's say hypothetically that $10,000 was invested in Fidelity® Arizona Municipal Income Fund on August 31, 2005.
The chart shows how the value of your investment would have changed, and also shows how the Barclays® Municipal Bond Index performed over the same period.
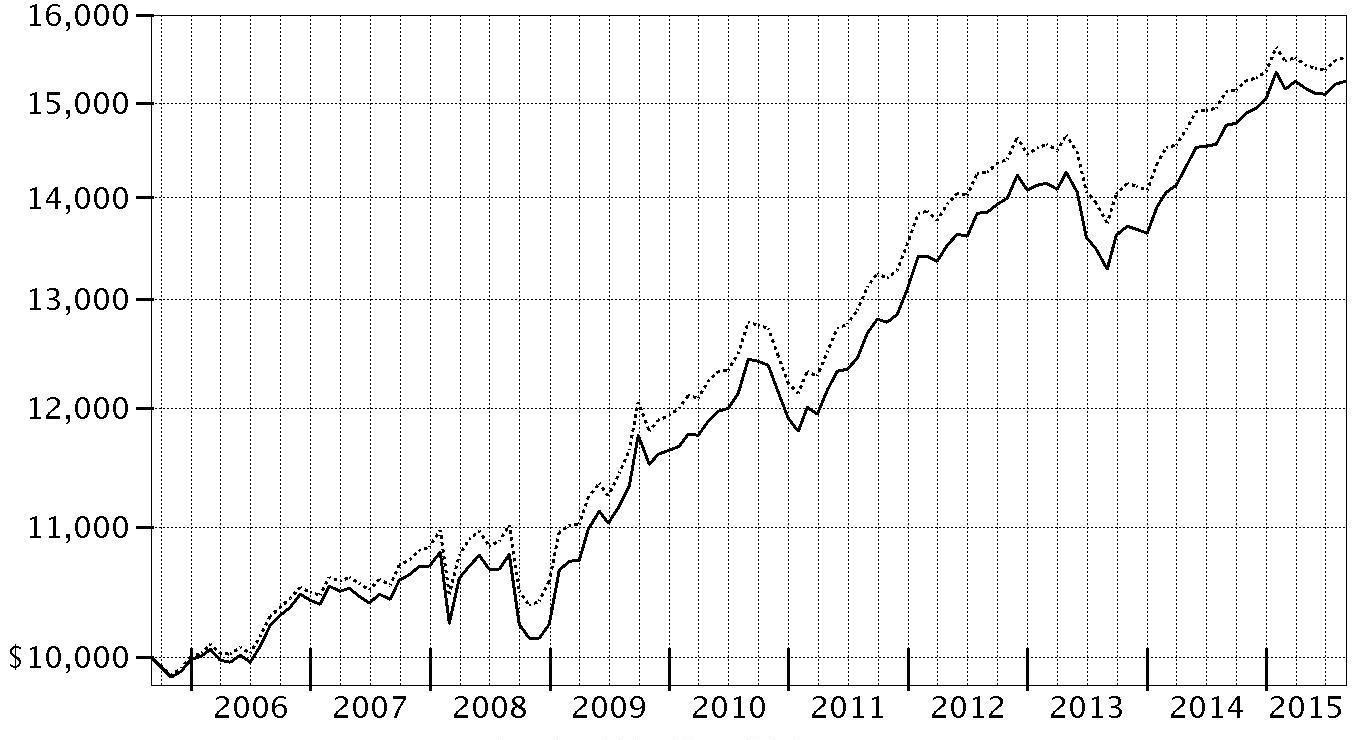
| Period Ending Values |
| $15,242 | Fidelity® Arizona Municipal Income Fund |
| $15,513 | Barclays® Municipal Bond Index |
Fidelity® Arizona Municipal Income Fund
Management's Discussion of Fund Performance
Market Recap: Tax-exempt municipal bonds posted a modestly positive return for the 12 months ending August 31, 2015, with the Barclays® Municipal Bond Index advancing 2.52%. The strongest performance occurred in the first half of the period, when many issuers exercised a level of fiscal conservatism that led to limited supply. Later in the period, new issuance increased strongly and negative headlines related to a few isolated issuers weighed on the market. Much of this new issuance was used for the purpose of refunding existing debt. Pension underfunding and partisan squabbling in Illinois, New Jersey and the city of Chicago, along with an evolving debt crisis in Puerto Rico, gave muni investors pause, despite a stable credit environment for U.S. states and local governments more broadly. Muni bonds still managed to outperform the broader taxable investment-grade bond market the past 12 months. The tax advantages of munis continued to appeal to investors, in light of higher federal income-tax rates for top earners that took effect in 2013, as well as the 3.8% Medicare tax on unearned, non-municipal investment income. At period end, investors continued to watch the flow of economic data, which the U.S. Federal Reserve has stated will help it determine the timing of any policy interest-rate increase.
Comments from Portfolio Manager Kevin Ramundo: For the year, the fund outpaced the 3.19% return of the Barclays
® Arizona 4+ Year Enhanced Municipal Bond Index. I sought to generate attractive income for the fund and protect shareholder capital. I kept the fund’s duration – a measure of its sensitivity to interest rate changes – roughly in line with the index. The fund’s overweighting in health care bonds helped relative performance, as did holdings in that sector that benefited from mergers and acquisitions. Health care securities were among the muni market’s best performers, driven by their higher yields and strong demand. Additionally, the fund’s overweighting in bonds issued by a number of hospital systems helped performance, including John C. Lincoln Health Network and the University of Arizona Medical Center Tucson. Overweighting certificates of participation (COP) issued by the state was another plus; they benefited from the state's credit-rating upgrades during the period. Holding more premium-coupon bonds and having lower-than-benchmark exposure to non-callable bonds was helpful overall, although having more exposure to a specific highly rated non-callable special-tax bond that underperformed was a drag on performance.
The views expressed above reflect those of the portfolio manager(s) only through the end of the period as stated on the cover of this report and do not necessarily represent the views of Fidelity or any other person in the Fidelity organization. Any such views are subject to change at any time based upon market or other conditions and Fidelity disclaims any responsibility to update such views. These views may not be relied on as investment advice and, because investment decisions for a Fidelity fund are based on numerous factors, may not be relied on as an indication of trading intent on behalf of any Fidelity fund.
Fidelity® Arizona Municipal Income Fund
Investment Summary (Unaudited)
Top Five Sectors as of August 31, 2015
| | % of fund's net assets | % of fund's net assets 6 months ago |
| General Obligations | 21.1 | 22.9 |
| Health Care | 16.3 | 19.1 |
| Education | 16.1 | 14.8 |
| Electric Utilities | 12.1 | 10.0 |
| Water & Sewer | 11.5 | 11.0 |
Weighted Average Maturity as of August 31, 2015
| | | 6 months ago |
| Years | 6.6 | 6.2 |
This is a weighted average of all the maturities of the securities held in a fund. Weighted Average Maturity (WAM) can be used as a measure of sensitivity to interest rate changes and market changes. Generally, the longer the maturity, the greater the sensitivity to such changes. WAM is based on the dollar-weighted average length of time until principal payments must be paid. Depending on the types of securities held in a fund, certain maturity shortening devices (e.g., demand features, interest rate resets, and call options) may be taken into account when calculating the WAM.
Duration as of August 31, 2015
| | | 6 months ago |
| Years | 6.9 | 6.3 |
Duration is a measure of a security's price sensitivity to changes in interest rates. Duration differs from maturity in that it considers a security's interest payments in addition to the amount of time until the security reaches maturity, and also takes into account certain maturity shortening features (e.g., demand features, interest rate resets, and call options) when applicable. Securities with longer durations generally tend to be more sensitive to interest rate changes than securities with shorter durations. A fund with a longer average duration generally can be expected to be more sensitive to interest rate changes than a fund with a shorter average duration.
Quality Diversification (% of fund's net assets)
| As of August 31, 2015 |
| | AAA | 2.4% |
| | AA,A | 83.4% |
| | BBB | 9.0% |
| | Not Rated | 4.1% |
| | Short-Term Investments and Net Other Assets | 1.1% |

| As of February 28, 2015 |
| | AAA | 2.3% |
| | AA,A | 81.2% |
| | BBB | 12.5% |
| | Not Rated | 2.8% |
| | Short-Term Investments and Net Other Assets | 1.2% |

We have used ratings from Moody's Investors Service, Inc. Where Moody's® ratings are not available, we have used S&P® ratings. All ratings are as of the date indicated and do not reflect subsequent changes.
Fidelity® Arizona Municipal Income Fund
Investments August 31, 2015
Showing Percentage of Net Assets
| Municipal Bonds - 98.9% | | | |
| | | Principal Amount | Value |
| Arizona - 98.0% | | | |
| Arizona Board of Regents Arizona State Univ. Rev.: | | | |
| (Polytechnic Campus Proj.) Series 2008 C, 5.75% 7/1/23 (Pre-Refunded to 7/1/18 @ 100) | | $250,000 | $283,175 |
| Series 2012 A, 5% 7/1/26 | | 1,000,000 | 1,158,030 |
| Series 2015 B, 5% 7/1/31 | | 1,510,000 | 1,759,739 |
| Arizona Board of Regents Ctfs. of Prtn. (Univ. of Arizona Projs.) Series 2012 C, 5% 6/1/26 | | 3,035,000 | 3,464,665 |
| Arizona Ctfs. of Prtn.: | | | |
| Series 2010 A, 5% 10/1/29 (FSA Insured) | | 5,000,000 | 5,599,100 |
| Series 2013 A, 5% 10/1/25 | | 1,870,000 | 2,154,483 |
| Series 2015, 5% 9/1/27 | | 1,500,000 | 1,767,330 |
| Arizona Game and Fish Dept. and Commission (AGF Administration Bldg. Proj.) Series 2006: | | | |
| 5% 7/1/21 | | 1,280,000 | 1,324,902 |
| 5% 7/1/32 | | 470,000 | 484,777 |
| Arizona Health Facilities Auth. Hosp. Sys. Rev. Series 2012 A, 5% 2/1/23 | | 1,285,000 | 1,434,638 |
| Arizona Health Facilities Auth. Rev.: | | | |
| (Banner Health Sys. Proj.): | | | |
| Series 2007 A, 5% 1/1/21 | | 1,000,000 | 1,054,670 |
| Series 2007 B, 1% 1/1/37 (a) | | 1,000,000 | 881,100 |
| Series 2008 A, 5.25% 1/1/31 | | 1,000,000 | 1,073,530 |
| Series 2008 D: | | | |
| 5.375% 1/1/32 | | 1,005,000 | 1,080,787 |
| 5.5% 1/1/38 | | 100,000 | 107,753 |
| 6% 1/1/27 | | 1,000,000 | 1,101,090 |
| (Scottsdale Lincoln Hospitals Proj.) Series 2014 A: | | | |
| 5% 12/1/26 | | 2,000,000 | 2,331,300 |
| 5% 12/1/42 | | 2,000,000 | 2,159,580 |
| Series 2011 B1, 5.25% 3/1/39 | | 1,000,000 | 1,088,870 |
| Series 2012 A, 5% 1/1/43 | | 3,500,000 | 3,845,520 |
| Arizona State Lottery Rev. Series 2010 A, 5% 7/1/21 (FSA Insured) | | 1,000,000 | 1,144,300 |
| Arizona Trans. Board Excise Tax Rev. Series 2014, 5% 7/1/25 | | 1,000,000 | 1,212,790 |
| Arizona Trans. Board Hwy. Rev. Series 2011 A, 5.25% 7/1/26 | | 1,250,000 | 1,474,650 |
| Arizona Wtr. Infrastructure Fin. Auth. Rev. Series A, 5% 10/1/28 | | 2,000,000 | 2,387,660 |
| Avondale Muni. Dev. Corp. Excise Tax Rev. 5% 7/1/28 | | 500,000 | 551,340 |
| Buckeye Excise Tax Rev. Series 2015: | | | |
| 5% 7/1/27 | | 350,000 | 409,185 |
| 5% 7/1/28 | | 500,000 | 581,315 |
| 5% 7/1/29 | | 455,000 | 525,234 |
| Chandler Gen. Oblig. Series 2014, 5% 7/1/26 | | 1,000,000 | 1,203,930 |
| Cottonwood Wtr. Sys. Rev.: | | | |
| 5% 7/1/26 (XL Cap. Assurance, Inc. Insured) | | 1,405,000 | 1,435,770 |
| 5% 7/1/30 (XL Cap. Assurance, Inc. Insured) | | 1,125,000 | 1,146,836 |
| 5% 7/1/35 (XL Cap. Assurance, Inc. Insured) | | 1,300,000 | 1,319,864 |
| Dysart Unified School District #89 Gen. Oblig. Series 2014: | | | |
| 5% 7/1/23 | | 700,000 | 833,560 |
| 5% 7/1/27 | | 1,300,000 | 1,520,051 |
| Glendale Gen. Oblig. Series 2015, 5% 7/1/22 (FSA Insured) | | 1,000,000 | 1,163,490 |
| Glendale Indl. Dev. Auth. (Midwestern Univ. Proj.) Series 2007, 5.25% 5/15/19 | | 1,000,000 | 1,115,700 |
| Glendale Indl. Dev. Auth. Hosp. Rev. (John C. Lincoln Health Network Proj.) Series 2007: | | | |
| 5% 12/1/27 (Pre-Refunded to 12/1/17 @ 100) | | 1,000,000 | 1,092,990 |
| 5% 12/1/32 (Pre-Refunded to 12/1/17 @ 100) | | 1,000,000 | 1,092,990 |
| Glendale Sr. Excise Tax Rev. Series 2015 A, 5% 7/1/28 | | 1,000,000 | 1,157,110 |
| Goodyear McDowell Road Commercial Corridor Impt. District 5.25% 1/1/17 (AMBAC Insured) | | 1,580,000 | 1,675,479 |
| Goodyear Pub. Impt. Corp. Facilities Rev. Series 2008, 6% 7/1/31 | | 1,000,000 | 1,132,150 |
| Marana Muni. Property Corp. Facilities Rev. Series A, 5.25% 7/1/22 | | 1,620,000 | 1,808,584 |
| Maricopa County Indl. Dev. Auth. Health Facilities Rev. (Catholic Healthcare West Proj.): | | | |
| Series 2007 A, 5.25% 7/1/32 | | 1,000,000 | 1,060,800 |
| Series 2009 A, 6% 7/1/39 | | 1,000,000 | 1,138,340 |
| Maricopa County Poll. Cont. Rev. (Southern California Edison Co. Proj.) Series 2000 A, 5% 6/1/35 | | 6,000,000 | 6,630,120 |
| Maricopa County School District #28 Kyrene Elementary: | | | |
| Series 2010 B: | | | |
| 5.25% 7/1/28 | | 690,000 | 803,843 |
| 5.5% 7/1/29 | | 480,000 | 567,552 |
| 5.5% 7/1/30 | | 400,000 | 470,508 |
| Series 2010 C, 4% 7/1/29 | | 650,000 | 695,799 |
| McAllister Academic Village LLC Rev. (Arizona State Univ. Hassayampa Academic Village Proj.) Series 2008, 5% 7/1/38 | | 1,000,000 | 1,083,780 |
| Mesa Util. Sys. Rev. Series 2006, 5% 7/1/24 (Nat'l. Pub. Fin. Guarantee Corp. Insured) | | 1,000,000 | 1,219,030 |
| Northern Ariz Univ. Ctfs. of Prtn.: | | | |
| (Univ. Proj.) Series 2013, 5% 9/1/24 | | 1,000,000 | 1,146,390 |
| Series 2015: | | | |
| 3% 9/1/15 (FSA Insured) | | 285,000 | 285,000 |
| 3% 9/1/16 (FSA Insured) | | 1,490,000 | 1,527,503 |
| 5% 9/1/20 (FSA Insured) | | 440,000 | 504,249 |
| Northern Arizona Univ. Revs.: | | | |
| Series 2012: | | | |
| 5% 6/1/36 | | 860,000 | 942,018 |
| 5% 6/1/41 | | 1,250,000 | 1,352,150 |
| Series 2013, 5% 8/1/27 | | 1,000,000 | 1,146,720 |
| Series 2015, 5% 6/1/30 | | 1,000,000 | 1,139,730 |
| Phoenix Civic Impt. Board Arpt. Rev.: | | | |
| Series 2008 A, 5% 7/1/33 | | 1,000,000 | 1,085,790 |
| Series 2013: | | | |
| 5% 7/1/26 (b) | | 1,100,000 | 1,262,349 |
| 5% 7/1/29 (b) | | 500,000 | 562,600 |
| Phoenix Civic Impt. Corp. District Rev. (Plaza Expansion Proj.) Series 2005 B, 5.5% 7/1/38 (Nat'l. Pub. Fin. Guarantee Corp. Insured) | | 2,000,000 | 2,515,740 |
| Phoenix Gen. Oblig. Series 2014, 4% 7/1/26 | | 2,000,000 | 2,236,280 |
| Phoenix-Mesa Gateway Arpt. Auth. (Mesa Proj.) Series 2012: | | | |
| 5% 7/1/24 (b) | | 380,000 | 431,866 |
| 5% 7/1/27 (b) | | 400,000 | 447,472 |
| Pima County Ctfs. of Prtn.: | | | |
| (Justice Bldg. Proj.) Series 2007 A: | | | |
| 5% 7/1/19 (AMBAC Insured) | | 650,000 | 694,876 |
| 5% 7/1/21 (AMBAC Insured) | | 910,000 | 972,490 |
| Series 2013 A, 5% 12/1/22 | | 1,000,000 | 1,168,290 |
| Series 2014, 5% 12/1/27 | | 1,745,000 | 2,010,554 |
| Pima County Swr. Sys. Rev.: | | | |
| Series 2011 B: | | | |
| 5% 7/1/22 | | 1,635,000 | 1,903,516 |
| 5% 7/1/25 | | 1,000,000 | 1,157,670 |
| Series 2012 A: | | | |
| 5% 7/1/25 | | 1,600,000 | 1,879,200 |
| 5% 7/1/26 | | 1,000,000 | 1,166,920 |
| Pima County Unified School District #1 Tucson (Proj. of 2004): | | | |
| Series 2007 C, 5% 7/1/23 (Nat'l. Pub. Fin. Guarantee Corp. Insured) | | 1,000,000 | 1,072,440 |
| Series 2008 D, 5% 7/1/25 (FSA Insured) | | 1,000,000 | 1,102,090 |
| Queen Creek Excise Tax & State Shared Rev. 5% 8/1/22 (Nat'l. Pub. Fin. Guarantee Corp. Insured) | | 1,125,000 | 1,210,849 |
| Salt River Proj. Agricultural Impt. & Pwr. District Elec. Sys. Rev.: | | | |
| Series 2008 A: | | | |
| 5% 1/1/24 | | 1,075,000 | 1,173,685 |
| 5% 1/1/33 | | 1,000,000 | 1,079,270 |
| 5% 1/1/38 | | 2,400,000 | 2,579,952 |
| Series 2009 A, 5% 1/1/26 | | 2,950,000 | 3,308,396 |
| Series 2015 A, 5% 12/1/34 | | 1,500,000 | 1,746,270 |
| Salt Verde Finl. Corp. Sr. Gas Rev. Series 2007: | | | |
| 5% 12/1/37 | | 1,500,000 | 1,624,530 |
| 5.5% 12/1/29 | | 3,000,000 | 3,524,220 |
| Scottsdale Indl. Dev. Auth. Hosp. Rev. (Scottsdale Healthcare Proj.): | | | |
| Series 2006 C, 5% 9/1/35 (FSA Insured) | | 420,000 | 461,143 |
| Series 2008 A, 5% 9/1/23 | | 355,000 | 387,862 |
| Surprise Pledged Rev. Series 2015, 5% 7/1/26 | | 1,010,000 | 1,211,243 |
| Tempe Excise Tax Rev. Series 2012, 5% 7/1/25 | | 1,090,000 | 1,277,949 |
| Tempe Transit Excise Tax Rev. Series 2008, 4.75% 7/1/38 | | 60,000 | 64,599 |
| Tucson Ctfs. of Prtn.: | | | |
| Series 2007, 5% 7/1/18 (Nat'l. Pub. Fin. Guarantee Corp. Insured) | | 1,000,000 | 1,069,040 |
| Series 2014: | | | |
| 4% 7/1/20 (FSA Insured) | | 500,000 | 550,150 |
| 5% 7/1/28 (FSA Insured) | | 1,000,000 | 1,156,580 |
| Tucson Wtr. Rev.: | | | |
| Series 2015, 5% 7/1/31 | | 1,000,000 | 1,158,030 |
| 5% 7/1/27 | | 1,000,000 | 1,194,480 |
| 5% 7/1/28 | | 2,000,000 | 2,370,000 |
| Univ. Med. Ctr. Corp. Hosp. Rev.: | | | |
| Series 2011, 6% 7/1/39 (Pre-Refunded to 7/1/21 @ 100) | | 2,235,000 | 2,763,220 |
| 5.625% 7/1/36 (Pre-Refunded to 7/1/23 @ 100) | | 1,000,000 | 1,244,210 |
| Univ. of Arizona Univ. Revs.: | | | |
| Series 2009 A, 5% 6/1/39 | | 1,000,000 | 1,106,920 |
| Series 2012 A, 5% 6/1/37 | | 2,225,000 | 2,464,699 |
| Series 2014, 5% 8/1/28 | | 1,000,000 | 1,165,550 |
| Series 2015 A 5% 6/1/30 | | 2,500,000 | 2,926,550 |
| Yavapai County Indl. Dev. Auth.: | | | |
| (Northern Healthcare Sys. Proj.) Series 2011, 5% 10/1/20 | | 1,000,000 | 1,151,460 |
| Series 2012 A, 5.25% 8/1/33 | | 2,000,000 | 2,192,180 |
| Yuma Indl. Dev. Auth. Hosp. Rev. Series 2014 A, 5% 8/1/27 | | 2,000,000 | 2,277,140 |
|
| TOTAL ARIZONA | | | 147,963,869 |
|
| Guam - 0.7% | | | |
| Guam Int'l. Arpt. Auth. Rev. Series 2013 C: | | | |
| 5% 10/1/18 (b) | | 300,000 | 327,072 |
| 6.375% 10/1/43 (b) | | 200,000 | 234,222 |
| Guam Pwr. Auth. Rev. Series 2012 A, 5% 10/1/21 (FSA Insured) | | 400,000 | 466,348 |
|
| TOTAL GUAM | | | 1,027,642 |
|
| Virgin Islands - 0.2% | | | |
| Virgin Islands Pub. Fin. Auth. Series 2009 B, 5% 10/1/25 | | 300,000 | 329,679 |
| TOTAL MUNICIPAL BONDS | | | |
| (Cost $141,882,437) | | | 149,321,190 |
| TOTAL INVESTMENT PORTFOLIO - 98.9% | | | |
| (Cost $141,882,437) | | | 149,321,190 |
| NET OTHER ASSETS (LIABILITIES) - 1.1% | | | 1,663,917 |
| NET ASSETS - 100% | | | $150,985,107 |
Legend
(a) Coupon rates for floating and adjustable rate securities reflect the rates in effect at period end.
(b) Private activity obligations whose interest is subject to the federal alternative minimum tax for individuals.
Investment Valuation
All investments are categorized as Level 2 under the Fair Value Hierarchy. The inputs or methodology used for valuing securities may not be an indication of the risk associated with investing in those securities. For more information on valuation inputs please refer to the Investment Valuation section in the accompanying Notes to Financial Statements.
Other Information
The distribution of municipal securities by revenue source, as a percentage of total Net Assets, is as follows (Unaudited):
| General Obligations | 21.1% |
| Health Care | 16.3% |
| Education | 16.1% |
| Electric Utilities | 12.1% |
| Water & Sewer | 11.5% |
| Special Tax | 10.7% |
| Others (Individually Less Than 5%)(a) | 12.2% |
| | 100.0% |
(a) Includes net other assets
See accompanying notes which are an integral part of the financial statements.
Fidelity® Arizona Municipal Income Fund
Financial Statements
Statement of Assets and Liabilities
| | | August 31, 2015 |
| Assets | | |
Investment in securities, at value — See accompanying schedule:
Unaffiliated issuers (cost $141,882,437) | | $149,321,190 |
| Cash | | 414,978 |
| Receivable for fund shares sold | | 46,365 |
| Interest receivable | | 1,428,637 |
| Other receivables | | 861 |
| Total assets | | 151,212,031 |
| Liabilities | | |
| Payable for fund shares redeemed | $23,082 | |
| Distributions payable | 134,154 | |
| Accrued management fee | 69,688 | |
| Total liabilities | | 226,924 |
| Net Assets | | $150,985,107 |
| Net Assets consist of: | | |
| Paid in capital | | $142,252,495 |
| Undistributed net investment income | | 46,128 |
| Accumulated undistributed net realized gain (loss) on investments | | 1,247,731 |
| Net unrealized appreciation (depreciation) on investments | | 7,438,753 |
| Net Assets, for 12,452,773 shares outstanding | | $150,985,107 |
| Net Asset Value, offering price and redemption price per share ($150,985,107 ÷ 12,452,773 shares) | | $12.12 |
See accompanying notes which are an integral part of the financial statements.
Statement of Operations
| | | Year ended August 31, 2015 |
| Investment Income | | |
| Interest | | $5,504,496 |
| Expenses | | |
| Management fee | $833,357 | |
| Independent trustees' compensation | 632 | |
| Miscellaneous | 218 | |
| Total expenses before reductions | 834,207 | |
| Expense reductions | (2,052) | 832,155 |
| Net investment income (loss) | | 4,672,341 |
Realized and Unrealized Gain (Loss)
Net realized gain (loss) on: | | |
| Investment securities: | | |
| Unaffiliated issuers | | 1,307,805 |
| Total net realized gain (loss) | | 1,307,805 |
| Change in net unrealized appreciation (depreciation) on investment securities | | (1,089,243) |
| Net gain (loss) | | 218,562 |
| Net increase (decrease) in net assets resulting from operations | | $4,890,903 |
See accompanying notes which are an integral part of the financial statements.
Statement of Changes in Net Assets
| | Year ended August 31, 2015 | Year ended August 31, 2014 |
| Increase (Decrease) in Net Assets | | |
| Operations | | |
| Net investment income (loss) | $4,672,341 | $4,834,377 |
| Net realized gain (loss) | 1,307,805 | 515,340 |
| Change in net unrealized appreciation (depreciation) | (1,089,243) | 9,853,367 |
| Net increase (decrease) in net assets resulting from operations | 4,890,903 | 15,203,084 |
| Distributions to shareholders from net investment income | (4,675,085) | (4,818,486) |
| Distributions to shareholders from net realized gain | (97,580) | (384,484) |
| Total distributions | (4,772,665) | (5,202,970) |
| Share transactions | | |
| Proceeds from sales of shares | 27,606,839 | 24,985,147 |
| Reinvestment of distributions | 3,093,920 | 3,308,880 |
| Cost of shares redeemed | (25,619,263) | (48,563,480) |
| Net increase (decrease) in net assets resulting from share transactions | 5,081,496 | (20,269,453) |
| Redemption fees | 1,002 | 4,678 |
| Total increase (decrease) in net assets | 5,200,736 | (10,264,661) |
| Net Assets | | |
| Beginning of period | 145,784,371 | 156,049,032 |
| End of period (including undistributed net investment income of $46,128 and undistributed net investment income of $58,432, respectively) | $150,985,107 | $145,784,371 |
Other Information
Shares | | |
| Sold | 2,263,762 | 2,145,415 |
| Issued in reinvestment of distributions | 254,009 | 281,835 |
| Redeemed | (2,102,640) | (4,189,157) |
| Net increase (decrease) | 415,131 | (1,761,907) |
See accompanying notes which are an integral part of the financial statements.
Financial Highlights — Fidelity Arizona Municipal Income Fund
| | | August 31, | | | |
| Years ended August 31, | 2015 | 2014 | 2013 | 2012 | 2011 |
| Selected Per–Share Data | | | | | |
| Net asset value, beginning of period | $12.11 | $11.31 | $12.19 | $11.55 | $11.76 |
| Income from Investment Operations | | | | | |
| Net investment income (loss)A | .375 | .399 | .382 | .413 | .420 |
| Net realized and unrealized gain (loss) | .018 | .831 | (.855) | .641 | (.210) |
| Total from investment operations | .393 | 1.230 | (.473) | 1.054 | .210 |
| Distributions from net investment income | (.375) | (.398) | (.382) | (.412) | (.420) |
| Distributions from net realized gain | (.008) | (.032) | (.025) | (.002) | – |
| Total distributions | (.383) | (.430) | (.407) | (.414) | (.420) |
| Redemption fees added to paid in capitalA,B | – | – | – | – | – |
| Net asset value, end of period | $12.12 | $12.11 | $11.31 | $12.19 | $11.55 |
| Total ReturnC | 3.28% | 11.06% | (4.03)% | 9.26% | 1.92% |
| Ratios to Average Net AssetsD | | | | | |
| Expenses before reductions | .55% | .55% | .55% | .55% | .55% |
| Expenses net of fee waivers, if any | .55% | .55% | .55% | .55% | .55% |
| Expenses net of all reductions | .55% | .55% | .55% | .55% | .55% |
| Net investment income (loss) | 3.08% | 3.40% | 3.16% | 3.47% | 3.71% |
| Supplemental Data | | | | | |
| Net assets, end of period (000 omitted) | $150,985 | $145,784 | $156,049 | $183,907 | $160,378 |
| Portfolio turnover rate | 17% | 8% | 20% | 12% | 10% |
A Calculated based on average shares outstanding during the period.
B Amount represents less than $.0005 per share.
C Total returns would have been lower if certain expenses had not been reduced during the applicable periods shown.
D Expense ratios reflect operating expenses of the Fund. Expenses before reductions do not reflect amounts reimbursed by the investment adviser or reductions from expense offset arrangements and do not represent the amount paid by the Fund during periods when reimbursements or reductions occur. Expenses net of fee waivers reflect expenses after reimbursement by the investment adviser but prior to reductions from expense offset arrangements. Expenses net of all reductions represent the net expenses paid by the Fund.
See accompanying notes which are an integral part of the financial statements.
Fidelity® Arizona Municipal Money Market Fund
Investment Summary/Performance (Unaudited)
Effective Maturity Diversification
| Days | % of fund's investments 8/31/15 | % of fund's investments 2/28/15 | % of fund's investments 8/31/14 |
| 1 - 7 | 17.1 | 80.9 | 84.0 |
| 8 - 30 | 67.5 | 2.6 | 0.8 |
| 31 - 60 | 6.1 | 3.1 | 4.1 |
| 61 - 90 | 0.0 | 0.0 | 2.5 |
| 91 - 180 | 3.2 | 12.4 | 2.9 |
| > 180 | 6.1 | 1.0 | 5.7 |
Effective maturity is determined in accordance with the requirements of Rule 2a-7 under the Investment Company Act of 1940.
Weighted Average Maturity
| | 8/31/15 | 2/28/15 | 8/31/14 |
| Fidelity Arizona Municipal Money Market Fund | 29 Days | 24 Days | 29 Days |
| All Tax-Free Money Market Funds Average(a) | 32 Days | 32 Days | 38 Days |
(a) Source: iMoneyNet, Inc.
This is a weighted average of all the maturities of the securities held in a fund. Weighted Average Maturity (WAM) can be used as a measure of sensitivity to interest rate changes and market changes. Generally, the longer the maturity, the greater the sensitivity to such changes. WAM is based on the dollar-weighted average length of time until principal payments must be paid. Depending on the types of securities held in a fund, certain maturity shortening devices (e.g., demand features, interest rate resets, and call options) may be taken into account when calculating the WAM.
Weighted Average Life
| | 8/31/15 | 2/28/15 | 8/31/14 |
| Fidelity Arizona Municipal Money Market Fund | 30 Days | 24 Days | 29 Days |
Weighted Average Life (WAL) is the weighted average of the life of the securities held in a fund or portfolio and can be used as a measure of sensitivity to changes in liquidity and/or credit risk. Generally, the higher the value, the greater the sensitivity. WAL is based on the dollar-weighted average length of time until principal payments must be paid, taking into account any call options exercised by the issuer and any permissible maturity shortening features other than interest rate resets. The difference between WAM and WAL is that WAM takes into account interest rate resets and WAL does not. WAL for money market funds is not the same as WAL of a mortgage- or asset-backed security.
Asset Allocation (% of fund's net assets)
| As of August 31, 2015 |
| | Variable Rate Demand Notes (VRDNs) | 66.4% |
| | Other Municipal Debt | 20.2% |
| | Investment Companies | 8.3% |
| | Net Other Assets (Liabilities) | 5.1% |

| As of February 28, 2015 |
| | Variable Rate Demand Notes (VRDNs) | 69.0% |
| | Other Municipal Debt | 19.8% |
| | Investment Companies | 9.4% |
| | Net Other Assets (Liabilities) | 1.8% |

Current And Historical 7-Day Yields
| | 8/31/15 | 5/31/15 | 2/28/15 | 11/30/14 | 8/31/14 |
| Fidelity® Arizona Municipal Money Market Fund | 0.01% | 0.01% | 0.01% | 0.01% | 0.01% |
Yield refers to the income paid by the Fund over a given period. Yields for money market funds are usually for seven-day periods, as they are here, though they are expressed as annual percentage rates. Past performance is no guarantee of future results. Yield will vary and it's possible to lose money investing in the Fund. A portion of the Fund's expenses was reimbursed and/or waived. Absent such reimbursements and/or waivers the yield for the period ending August 31, 2015, the most recent period shown in the table, would have been -0.43%.
Fidelity® Arizona Municipal Money Market Fund
Investments August 31, 2015
Showing Percentage of Net Assets
| Variable Rate Demand Note - 66.4% | | | |
| | | Principal Amount | Value |
| Alabama - 0.1% | | | |
| Decatur Indl. Dev. Board Exempt Facilities Rev. (Nucor Steel Decatur LLC Proj.) Series 2003 A, 0.22% 9/8/15, VRDN (a)(b) | | $200,000 | $200,000 |
| Arizona - 63.8% | | | |
| Arizona Board of Regents Arizona State Univ. Rev.: | | | |
| Participating VRDN Series 33 85X, 0.03% 9/8/15 (Liquidity Facility Morgan Stanley Bank, West Valley City Utah) (a)(c) | | 6,665,000 | 6,665,000 |
| Series 2008 B, 0.01% 9/8/15, LOC JPMorgan Chase Bank, VRDN (a) | | 7,800,000 | 7,800,000 |
| Arizona Health Facilities Auth. Rev.: | | | |
| (Banner Health Sys. Proj.): | | | |
| Series 2008 E, 0.02% 9/8/15, LOC Bank of America NA, VRDN (a) | | 6,400,000 | 6,400,000 |
| Series 2008 F, 0.02% 9/8/15, LOC JPMorgan Chase Bank, VRDN (a) | | 6,565,000 | 6,565,000 |
| Series 2008 G, 0.01% 9/8/15, LOC Wells Fargo Bank NA, VRDN (a) | | 34,285,000 | 34,285,000 |
| (Catholic Healthcare West Proj.): | | | |
| Series 2005 B, 0.01% 9/8/15, LOC JPMorgan Chase Bank, VRDN (a) | | 12,160,000 | 12,160,000 |
| Series 2008 B, 0.01% 9/8/15, LOC PNC Bank NA, VRDN (a) | | 14,000,000 | 14,000,000 |
| Series 2009 F, 0.01% 9/8/15, LOC Mizuho Corporate Bank Ltd., VRDN (a) | | 24,200,000 | 24,200,000 |
| Arizona Hsg. Fin. Auth. Multi-family Hsg. Rev. (Santa Carolina Apts. Proj.) Series 2005, 0.05% 9/8/15, LOC Fannie Mae, VRDN (a)(b) | | 3,645,000 | 3,645,000 |
| BB&T Muni. Trust Participating VRDN Series BBT 08 09, 0.02% 9/8/15 (Liquidity Facility Branch Banking & Trust Co.) (a)(c) | | 6,960,000 | 6,960,000 |
| Casa Grande Indl. Dev. Auth. Indl. Dev. Rev. (Price Companies, Inc. Proj.) Series A, 0.17% 9/8/15, LOC Bank of America NA, VRDN (a)(b) | | 730,000 | 730,000 |
| Coconino County Poll. Cont. Corp. Rev.: | | | |
| (Arizona Pub. Svc. Co. Navajo Proj.) Series 2009 B, 0.02% 9/1/15, LOC JPMorgan Chase Bank, VRDN (a)(b) | | 11,700,000 | 11,700,000 |
| (Tucson Elec. Pwr. Co. Navajo Proj.) Series 2010 A, 0.05% 9/8/15, LOC JPMorgan Chase Bank, VRDN (a)(b) | | 7,200,000 | 7,200,000 |
| Maricopa County Indl. Dev. Auth. Multi-family Hsg. Rev.: | | | |
| (Glenn Oaks Apts. Proj.) Series 2001, 0.03% 9/8/15, LOC Fannie Mae, VRDN (a)(b) | | 2,139,675 | 2,139,675 |
| (Ranchwood Apts. Proj.) Series 2001 A, 0.03% 9/8/15, LOC Fannie Mae, VRDN (a)(b) | | 1,400,000 | 1,400,000 |
| (San Angelin Apts. Proj.) Series 2004, 0.04% 9/8/15, LOC Fannie Mae, VRDN (a)(b) | | 1,300,000 | 1,300,000 |
| (San Martin Apts. Proj.) Series A1, 0.04% 9/8/15, LOC Fannie Mae, VRDN (a)(b) | | 6,000,000 | 6,000,000 |
| (San Remo Apts. Proj.) Series 2002, 0.04% 9/8/15, LOC Fannie Mae, VRDN (a)(b) | | 8,675,000 | 8,675,000 |
| (Village at Sun Valley Apts. Proj.) Series 2008, 0.05% 9/8/15, LOC Freddie Mac, VRDN (a)(b) | | 12,440,000 | 12,440,000 |
| (Village Square Apts. Proj.) Series 2004, 0.04% 9/8/15, LOC Fannie Mae, VRDN (a)(b) | | 1,000,000 | 1,000,000 |
| Maricopa County Indl. Dev. Auth. Rev.: | | | |
| (Clayton Homes, Inc. Proj.) Series 1998, 0.17% 9/8/15, LOC U.S. Bank NA, Cincinnati, VRDN (a)(b) | | 1,000,000 | 1,000,000 |
| (Valley of the Sun YMCA Proj.) Series 2008, 0.03% 9/8/15, LOC U.S. Bank NA, Cincinnati, VRDN (a) | | 5,900,000 | 5,900,000 |
| Maricopa County Poll. Cont. Rev. (Arizona Pub. Svc. Co. Palo Verde Proj.) Series 2009 A, 0.25% 9/8/15, VRDN (a) | | 2,100,000 | 2,100,000 |
| Mesa Util. Sys. Rev. Participating VRDN Series ROC II R 11959X, 0.03% 9/8/15 (Liquidity Facility Citibank NA) (a)(c) | | 7,250,000 | 7,250,000 |
| Phoenix Civic Impt. Corp. Wtr. Sys. Rev. Participating VRDN Series Putters 3458, 0.03% 9/8/15 (Liquidity Facility JPMorgan Chase Bank) (a)(c) | | 4,000,000 | 4,000,000 |
| Phoenix Gen. Oblig. Participating VRDN Series BBT 2012, 0.02% 9/8/15 (Liquidity Facility Branch Banking & Trust Co.) (a)(c) | | 10,815,000 | 10,815,000 |
| Phoenix Indl. Dev. Auth. Multi-family Hsg. Rev. (Del Mar Terrace Apts. Proj.) Series 1999 A, 0.02% 9/8/15, LOC Freddie Mac, VRDN (a) | | 9,800,000 | 9,800,000 |
| Phoenix Indl. Dev. Auth. Rev.: | | | |
| (Desert Botanical Garden Proj.) Series 2000, 0.01% 9/8/15, LOC JPMorgan Chase Bank, VRDN (a) | | 600,000 | 600,000 |
| (Independent Newspaper, Inc. Proj.) Series 2000, 0.2% 9/8/15, LOC Wells Fargo Bank NA, VRDN (a)(b) | | 595,000 | 595,000 |
| Pima County Indl. Dev. Auth. Multi-family Hsg. Rev.: | | | |
| (River Point Proj.) Series 2001, 0.03% 9/8/15, LOC Fannie Mae, VRDN (a)(b) | | 5,420,000 | 5,420,000 |
| Series A, 0.04% 9/8/15, LOC Fannie Mae, VRDN (a)(b) | | 3,145,000 | 3,145,000 |
| Pima County Indl. Dev. Auth. Rev. (Broadway Proper Congregate Proj.) Series 2000 A, 0.03% 9/8/15, LOC Fed. Home Ln. Bank, San Francisco, VRDN (a) | | 2,920,000 | 2,920,000 |
| Salt River Proj. Agricultural Impt. & Pwr. District Elec. Sys. Rev. Participating VRDN: | | | |
| Series BC 10 21W, 0.06% 9/8/15 (Liquidity Facility Barclays Bank PLC) (a)(c) | | 1,500,000 | 1,500,000 |
| Series MS 3078, 0.02% 9/8/15 (Liquidity Facility Cr. Suisse AG) (a)(c) | | 1,500,000 | 1,500,000 |
| Series ROC II R 11980 X, 0.02% 9/8/15 (Liquidity Facility Citibank NA) (a)(c) | | 700,000 | 700,000 |
| Scottsdale Gen. Oblig. Participating VRDN Series BBT 08 20, 0.02% 9/8/15 (Liquidity Facility Branch Banking & Trust Co.) (a)(c) | | 10,920,000 | 10,920,000 |
| Tempe Indl. Dev. Auth. Rev. (ASUF Brickyard Proj.) Series 2004 A, 0.02% 9/8/15, LOC Bank of America NA, VRDN (a) | | 11,950,000 | 11,950,000 |
| | | | 255,379,675 |
| Arkansas - 0.1% | | | |
| Osceola Solid Waste Disp. Rev. (Plum Point Energy Associates, LLC Proj.) Series 2006, 0.2% 9/8/15, LOC Royal Bank of Scotland PLC, VRDN (a)(b) | | 400,000 | 400,000 |
| Delaware - 0.2% | | | |
| Delaware Econ. Dev. Auth. Rev. (Delmarva Pwr. & Lt. Co. Proj.): | | | |
| Series 1987, 0.14% 9/1/15, VRDN (a)(b) | | 100,000 | 100,000 |
| Series 1988, 0.14% 9/1/15, VRDN (a)(b) | | 300,000 | 300,000 |
| Series 1994, 0.14% 9/1/15, VRDN (a)(b) | | 200,000 | 200,000 |
| Series 1999 A, 0.1% 9/8/15, VRDN (a) | | 400,000 | 400,000 |
| | | | 1,000,000 |
| Georgia - 0.4% | | | |
| Bartow County Dev. Auth. Poll. Cont. Rev. (Georgia Pwr. Co. Plant Bowen Proj.) First Series 2009, 0.23% 9/8/15, VRDN (a) | | 1,300,000 | 1,300,000 |
| Burke County Indl. Dev. Auth. Poll. Cont. Rev. (Georgia Pwr. Co. Plant Vogtle Proj.) Second Series 1995, 0.25% 9/1/15, VRDN (a) | | 200,000 | 200,000 |
| Monroe County Dev. Auth. Poll. Cont. Rev. (Georgia Pwr. Co. Plant Scherer Proj.) First Series 2009, 0.27% 9/8/15, VRDN (a) | | 300,000 | 300,000 |
| | | | 1,800,000 |
| Louisiana - 0.1% | | | |
| Saint James Parish Gen. Oblig. (Nucor Steel Louisiana LLC Proj.) Series 2010 A1, 0.21% 9/8/15, VRDN (a) | | 360,000 | 360,000 |
| Missouri - 0.4% | | | |
| Missouri Health & Edl. Facilities Auth. Edl. Facilities Rev. Series 2013 B, 0.01% 9/1/15, LOC Bank of America NA, VRDN (a) | | 1,465,000 | 1,465,000 |
| Nebraska - 0.0% | | | |
| Stanton County Indl. Dev. Rev. (Nucor Corp. Proj.) Series 1996, 0.22% 9/8/15, VRDN (a)(b) | | 200,000 | 200,000 |
| Nevada - 0.1% | | | |
| Clark County Arpt. Rev. Series 2008 C3, 0.02% 9/8/15, LOC Sumitomo Mitsui Banking Corp., VRDN (a)(b) | | 500,000 | 500,000 |
| New Jersey - 0.3% | | | |
| Salem County Poll. Cont. Fin. Auth. Rev. (Pub. Svc. Elec. and Gas Co. Proj.): | | | |
| Series 2003 B1, 0.14% 9/8/15, VRDN (a) | | 900,000 | 900,000 |
| Series 2012 A, 0.14% 9/8/15, VRDN (a)(b) | | 200,000 | 200,000 |
| | | | 1,100,000 |
| North Carolina - 0.1% | | | |
| Parson County Indl. Facilities and Poll. Cont. Fing. Auth. (CertainTeed Gypsum NC, Inc. Proj.) Series 2010, 0.02% 9/8/15, LOC Cr. Industriel et Commercial, VRDN (a) | | 600,000 | 600,000 |
| Tennessee - 0.2% | | | |
| Montgomery County Pub. Bldg. Auth. Pooled Fing. Rev. (Tennessee County Ln. Pool Prog.) Series 2002, 0.02% 9/1/15, LOC Bank of America NA, VRDN (a) | | 730,000 | 730,000 |
| Texas - 0.5% | | | |
| Calhoun Port Auth. Envir. Facilities Rev. (Formosa Plastics Corp. Proj.) Series 2012, 0.03% 9/8/15, LOC JPMorgan Chase Bank, VRDN (a)(b) | | 400,000 | 400,000 |
| Gulf Coast Waste Disp. Auth. Solid Waste Disp. Rev. (Waste Mgmt., Inc. Proj.) Series A, 0.03% 9/8/15, LOC JPMorgan Chase Bank, VRDN (a)(b) | | 200,000 | 200,000 |
| Port Arthur Navigation District Envir. Facilities Rev. (Motiva Enterprises LLC Proj.): | | | |
| Series 2001 A, 0.3% 9/1/15, VRDN (a) | | 850,000 | 850,000 |
| Series 2004, 0.27% 9/8/15, VRDN (a)(b) | | 200,000 | 200,000 |
| Series 2010 B, 0.3% 9/1/15, VRDN (a) | | 200,000 | 200,000 |
| | | | 1,850,000 |
| Wyoming - 0.1% | | | |
| Lincoln County Envir. (PacifiCorp Proj.) Series 1995, 0.2% 9/8/15, VRDN (a)(b) | | 250,000 | 250,000 |
| TOTAL VARIABLE RATE DEMAND NOTE | | | |
| (Cost $265,834,675) | | | 265,834,675 |
|
| Other Municipal Debt - 20.2% | | | |
| Arizona - 18.9% | | | |
| Arizona Ctfs. of Prtn. Bonds: | | | |
| Series 2010 A, 5% 10/1/15 | | 750,000 | 752,872 |
| Series 2015, 1% 9/1/15 | | 2,365,000 | 2,365,000 |
| Arizona School Facilities Board Ctfs. of Prtn. Bonds: | | | |
| Series 2005 A1, 5% 9/1/15 | | 3,995,000 | 3,995,000 |
| Series 2015 A, 2% 9/1/15 | | 4,000,000 | 4,000,000 |
| Arizona State Lottery Rev. Bonds Series 2010 A, 5% 7/1/16 | | 3,490,000 | 3,622,677 |
| Arizona Trans. Board Hwy. Rev. Bonds Series 2005 B, 5% 1/1/16 (Pre-Refunded to 1/1/16 @ 100) | | 2,500,000 | 2,539,891 |
| Arizona Wtr. Infrastructure Fin. Auth. Rev. Bonds Series 2009 A, 5% 10/1/15 | | 1,100,000 | 1,104,345 |
| Phoenix Civic Impt. Corp.: | | | |
| Series 2014 A1: | | | |
| 0.05% 10/5/15, LOC Bank of America NA, CP | | 4,000,000 | 4,000,000 |
| 0.06% 10/2/15, LOC Bank of America NA, CP | | 4,000,000 | 4,000,000 |
| Series 2014 A2, 0.09% 10/5/15, LOC Barclays Bank PLC, CP | | 4,000,000 | 4,000,000 |
| Series 2014 B1, 0.05% 10/5/15, LOC Bank of America NA, CP (b) | | 3,900,000 | 3,900,000 |
| Pima County Reg'l. Trans. Auth. Excise Tax Rev. Bonds Series 2014, 4% 6/1/16 | | 1,595,000 | 1,638,771 |
| Salt River Proj. Agricultural Impt. & Pwr. District Elec. Sys. Rev.: | | | |
| Bonds: | | | |
| (Arizona Salt River Proj.) Series 2009 B, 4% 1/1/16 | | 2,425,000 | 2,455,218 |
| Series 2005 A: | | | |
| 4.75% 1/1/16 (Pre-Refunded to 1/1/16 @ 100) | | 2,050,000 | 2,080,314 |
| 5% 1/1/16 (Pre-Refunded to 1/1/16 @ 100) | | 4,000,000 | 4,063,911 |
| Series 2006 A, 5% 1/1/16 (Pre-Refunded to 1/1/16 @ 100) | | 1,000,000 | 1,015,563 |
| Series C: | | | |
| 0.03% 9/15/15, CP | | 3,900,000 | 3,900,000 |
| 0.05% 10/5/15, CP | | 4,000,000 | 4,000,000 |
| 0.08% 9/3/15, CP | | 4,200,000 | 4,200,000 |
| Surprise Pledged Rev. Bonds Series 2015, 3% 7/1/16 | | 2,685,000 | 2,742,813 |
| Tempe Excise Tax Rev. Bonds Series 2015, 2% 7/1/16 | | 4,000,000 | 4,055,710 |
| Tucson Gen. Oblig. Bonds Series 2015, 2% 7/1/16 | | 5,700,000 | 5,773,147 |
| Tucson Street & Hwy. User Rev. Bonds Series 2015, 3% 7/1/16 | | 1,700,000 | 1,735,890 |
| Tucson Wtr. Rev. Bonds Series 2012 A, 4% 7/1/16 | | 3,480,000 | 3,586,295 |
| | | | 75,527,417 |
| Georgia - 0.4% | | | |
| Main Street Natural Gas, Inc. Georgia Gas Proj. Rev. Bonds Series 2010 A1, 0.08%, tender 2/1/16 (Liquidity Facility Royal Bank of Canada) (a) | | 1,500,000 | 1,500,000 |
| Kentucky - 0.0% | | | |
| Jefferson County Poll. Cont. Rev. Bonds (Louisville Gas & Elec. Co. Proj.) Series 2001 A, 0.25% tender 9/18/15, CP mode | | 200,000 | 200,000 |
| New Hampshire - 0.5% | | | |
| New Hampshire Bus. Fin. Auth. Poll. Cont. Rev. Bonds (New England Pwr. Co. Proj.): | | | |
| Series 1990 A, 0.45% tender 9/28/15, CP mode (b) | | 500,000 | 500,000 |
| Series 1990 A1, 0.5% tender 10/9/15, CP mode (b) | | 1,400,000 | 1,400,000 |
| | | | 1,900,000 |
| Virginia - 0.4% | | | |
| Halifax County Indl. Dev. Auth. Poll. Cont. Rev. Bonds (Virginia Elec. & Pwr. Co. Proj.) Series 1992, 0.45% tender 9/23/15, CP mode (b) | | 300,000 | 300,000 |
| Prince William County Indl. Dev. Auth. Poll. Cont. Rev. Bonds (Virginia Elec. & Pwr. Co. Proj.) Series 1986, 0.4% tender 9/23/15, CP mode | | 1,200,000 | 1,200,000 |
| | | | 1,500,000 |
| West Virginia - 0.0% | | | |
| Grant County Cmnty. Solid Waste Disp. Rev. Bonds (Virginia Elec. & Pwr. Co. Proj.) Series 1996, 0.45% tender 10/8/15, CP mode (b) | | 100,000 | 100,000 |
| TOTAL OTHER MUNICIPAL DEBT | | | |
| (Cost $80,727,417) | | | 80,727,417 |
| | | Shares | Value |
|
| Investment Company - 8.3% | | | |
| Fidelity Municipal Cash Central Fund, 0.02% (d)(e) | | 33,017,000 | 33,017,000 |
| (Cost $33,017,000) | | | |
| TOTAL INVESTMENT PORTFOLIO - 94.9% | | | |
| (Cost $379,579,092) | | | 379,579,092 |
| NET OTHER ASSETS (LIABILITIES) - 5.1% | | | 20,552,816 |
| NET ASSETS - 100% | | | $400,131,908 |
Security Type Abbreviations
CP – COMMERCIAL PAPER
VRDN – VARIABLE RATE DEMAND NOTE (A debt instrument that is payable upon demand, either daily, weekly or monthly)
The date shown for securities represents the date when principal payments must be paid, taking into account any call options exercised by the issuer and any permissible maturity shortening features other than interest rate resets.
Legend
(a) Coupon rates for floating and adjustable rate securities reflect the rates in effect at period end.
(b) Private activity obligations whose interest is subject to the federal alternative minimum tax for individuals.
(c) Provides evidence of ownership in one or more underlying municipal bonds.
(d) Information in this report regarding holdings by state and security types does not reflect the holdings of the Fidelity Municipal Cash Central Fund.
(e) Affiliated fund that is available only to investment companies and other accounts managed by Fidelity Investments. The rate quoted is the annualized seven-day yield of the fund at period end. A complete unaudited listing of the fund's holdings as of its most recent quarter end is available upon request. In addition, each Fidelity Central Fund's financial statements, which are not covered by the Fund's Report of Independent Registered Public Accounting Firm, are available on the SEC's website or upon request.
Affiliated Central Funds
Information regarding fiscal year to date income earned by the Fund from investments in Fidelity Central Funds is as follows:
| Fund | Income earned |
| Fidelity Municipal Cash Central Fund | $15,565 |
Investment Valuation
All investments are categorized as Level 2 under the Fair Value Hierarchy. The inputs or methodology used for valuing securities may not be an indication of the risk associated with investing in those securities. For more information on valuation inputs please refer to the Investment Valuation section in the accompanying Notes to Financial Statements.
See accompanying notes which are an integral part of the financial statements.
Fidelity® Arizona Municipal Money Market Fund
Financial Statements
Statement of Assets and Liabilities
| | | August 31, 2015 |
| Assets | | |
Investment in securities, at value — See accompanying schedule:
Unaffiliated issuers (cost $346,562,092) | $346,562,092 | |
| Fidelity Central Funds (cost $33,017,000) | 33,017,000 | |
| Total Investments (cost $379,579,092) | | $379,579,092 |
| Cash | | 19,801,700 |
| Receivable for fund shares sold | | 3,474,432 |
| Interest receivable | | 390,882 |
| Distributions receivable from Fidelity Central Funds | | 480 |
| Receivable from investment adviser for expense reductions | | 4,471 |
| Other receivables | | 550 |
| Total assets | | 403,251,607 |
| Liabilities | | |
| Payable for fund shares redeemed | $3,101,088 | |
| Distributions payable | 208 | |
| Accrued management fee | 18,394 | |
| Other affiliated payables | 9 | |
| Total liabilities | | 3,119,699 |
| Net Assets | | $400,131,908 |
| Net Assets consist of: | | |
| Paid in capital | | $400,123,344 |
| Accumulated undistributed net realized gain (loss) on investments | | 8,564 |
| Net Assets, for 399,865,143 shares outstanding | | $400,131,908 |
| Net Asset Value, offering price and redemption price per share ($400,131,908 ÷ 399,865,143 shares) | | $1.00 |
See accompanying notes which are an integral part of the financial statements.
Statement of Operations
| | | Year ended August 31, 2015 |
| Investment Income | | |
| Interest | | $289,059 |
| Income from Fidelity Central Funds | | 15,565 |
| Total income | | 304,624 |
| Expenses | | |
| Management fee | $2,075,348 | |
| Independent trustees' compensation | 1,744 | |
| Miscellaneous | 4,521 | |
| Total expenses before reductions | 2,081,613 | |
| Expense reductions | (1,818,515) | 263,098 |
| Net investment income (loss) | | 41,526 |
Realized and Unrealized Gain (Loss)
Net realized gain (loss) on: | | |
| Investment securities: | | |
| Unaffiliated issuers | 32,995 | |
| Total net realized gain (loss) | | 32,995 |
| Net increase in net assets resulting from operations | | $74,521 |
See accompanying notes which are an integral part of the financial statements.
Statement of Changes in Net Assets
| | Year ended August 31, 2015 | Year ended August 31, 2014 |
| Increase (Decrease) in Net Assets | | |
| Operations | | |
| Net investment income (loss) | $41,526 | $40,719 |
| Net realized gain (loss) | 32,995 | 11,323 |
| Net increase in net assets resulting from operations | 74,521 | 52,042 |
| Distributions to shareholders from net investment income | (41,500) | (40,804) |
| Share transactions at net asset value of $1.00 per share | | |
| Proceeds from sales of shares | 1,097,997,054 | 1,152,542,029 |
| Reinvestment of distributions | 38,708 | 38,505 |
| Cost of shares redeemed | (1,115,202,618) | (1,143,354,086) |
| Net increase (decrease) in net assets and shares resulting from share transactions | (17,166,856) | 9,226,448 |
| Total increase (decrease) in net assets | (17,133,835) | 9,237,686 |
| Net Assets | | |
| Beginning of period | 417,265,743 | 408,028,057 |
| End of period | $400,131,908 | $417,265,743 |
See accompanying notes which are an integral part of the financial statements.
Financial Highlights — Fidelity Arizona Municipal Money Market Fund
| | | August 31, | | | |
| Years ended August 31, | 2015 | 2014 | 2013 | 2012 | 2011 |
| Selected Per–Share Data | | | | | |
| Net asset value, beginning of period | $1.00 | $1.00 | $1.00 | $1.00 | $1.00 |
| Income from Investment Operations | | | | | |
| Net investment income (loss)A | – | – | – | – | – |
| Net realized and unrealized gain (loss)A | – | – | – | – | – |
| Total from Investment OperationsA | – | – | – | – | – |
| Distributions from net investment incomeA | – | – | – | – | – |
| Distributions from net realized gain | – | – | –A | – | – |
| Total DistributionsA | – | – | – | – | – |
| Net asset value, end of period | $1.00 | $1.00 | $1.00 | $1.00 | $1.00 |
| Total ReturnB | .01% | .01% | .02% | .01% | .01% |
| Ratios to Average Net AssetsC,D | | | | | |
| Expenses before reductions | .50% | .50% | .50% | .50% | .50% |
| Expenses net of fee waivers, if any | .06% | .09% | .16% | .19% | .26% |
| Expenses net of all reductions | .06% | .09% | .16% | .19% | .26% |
| Net investment income (loss) | .01% | .01% | .01% | .01% | .01% |
| Supplemental Data | | | | | |
| Net assets, end of period (000 omitted) | $400,132 | $417,266 | $408,028 | $388,993 | $382,688 |
A Amount represents less than $.0005 per share.
B Total returns would have been lower if certain expenses had not been reduced during the applicable periods shown.
C Fees and expenses of any underlying Fidelity Central Funds are not included in the Fund's expense ratio. The Fund indirectly bears its proportionate share of the expenses of any underlying Fidelity Central Funds.
D Expense ratios reflect operating expenses of the Fund. Expenses before reductions do not reflect amounts reimbursed or waived or reductions from expense offset arrangements and do not represent the amount paid by the Fund during periods when reimbursements, waivers or reductions occur. Expenses net of fee waivers reflect expenses after reimbursement and waivers but prior to reductions from expense offset arrangements. Expenses net of all reductions represent the net expenses paid by the Fund.
See accompanying notes which are an integral part of the financial statements.
Notes to Financial Statements
For the period ended August 31, 2015
1. Organization.
Fidelity Arizona Municipal Income Fund (the Income Fund) is a fund of Fidelity Union Street Trust. Fidelity Arizona Municipal Money Market Fund (the Money Market Fund) is a fund of Fidelity Union Street Trust II. Each Trust is registered under the Investment Company Act of 1940, as amended (the 1940 Act), as an open-end management investment company. Fidelity Union Street Trust and Fidelity Union Street Trust II (the Trusts) are organized as a Massachusetts business trust and a Delaware statutory trust, respectively. The Income Fund is a non-diversified fund. Each Fund is authorized to issue an unlimited number of shares. Share transactions on the Statement of Changes in Net Assets may contain exchanges between funds. Each Fund may be affected by economic and political developments in the state of Arizona.
2. Investments in Fidelity Central Funds.
The Funds may invest in Fidelity Central Funds, which are open-end investment companies generally available only to other investment companies and accounts managed by the investment adviser and its affiliates. The Funds' Schedules of Investments list each of the Fidelity Central Funds held as of period end, if any, as an investment of each Fund, but do not include the underlying holdings of each Fidelity Central Fund. As an Investing Fund, each Fund indirectly bears its proportionate share of the expenses of the underlying Fidelity Central Funds.
The Money Market Central Funds seek preservation of capital and current income and are managed by Fidelity Investments Money Management, Inc. (FIMM), an affiliate of the investment adviser. Annualized expenses of the Money Market Central Funds as of their most recent shareholder report date are less than .01%.
A complete unaudited list of holdings for each Fidelity Central Fund is available upon request or at the Securities and Exchange Commission (the SEC) website at www.sec.gov. In addition, the financial statements of the Fidelity Central Funds, which are not covered by the Funds' Report of Independent Registered Public Accounting Firm, are available on the SEC website or upon request.
3. Significant Accounting Policies.
The financial statements have been prepared in conformity with accounting principles generally accepted in the United States of America (GAAP), which require management to make certain estimates and assumptions at the date of the financial statements. Actual results could differ from those estimates. Subsequent events, if any, through the date that the financial statements were issued have been evaluated in the preparation of the financial statements. The following summarizes the significant accounting policies of the Funds:
Investment Valuation. Investments are valued as of 4:00 p.m. Eastern time on the last calendar day of the period. The Board of Trustees (the Board) has delegated the day to day responsibility for the valuation of the Income Fund's investments to the Fidelity Management & Research Company (FMR) Fair Value Committee (the Committee). In accordance with valuation policies and procedures approved by the Board, the Income Fund attempts to obtain prices from one or more third party pricing vendors or brokers to value its investments. When current market prices, quotations or currency exchange rates are not readily available or reliable, investments will be fair valued in good faith by the Committee, in accordance with procedures adopted by the Board. Factors used in determining fair value vary by investment type and may include market or investment specific events, changes in interest rates and credit quality. The frequency with which these procedures are used cannot be predicted and they may be utilized to a significant extent. The Committee oversees the Income Fund's valuation policies and procedures and reports to the Board on the Committee's activities and fair value determinations. The Board monitors the appropriateness of the procedures used in valuing the Income Fund's investments and ratifies the fair value determinations of the Committee.
Each Fund categorizes the inputs to valuation techniques used to value its investments into a disclosure hierarchy consisting of three levels as shown below:
- Level 1 – quoted prices in active markets for identical investments
- Level 2 – other significant observable inputs (including quoted prices for similar investments, interest rates, prepayment speeds, etc.)
- Level 3 – unobservable inputs (including the Fund's own assumptions based on the best information available)
Valuation techniques used to value each Fund's investments by major category are as follows:
For the Income Fund, debt securities, including restricted securities, are valued based on evaluated prices received from third party pricing vendors or from brokers who make markets in such securities. Municipal securities are valued by pricing vendors who utilize matrix pricing which considers yield or price of bonds of comparable quality, coupon, maturity and type or by broker-supplied prices. When independent prices are unavailable or unreliable, debt securities may be valued utilizing pricing methodologies which consider similar factors that would be used by third party pricing vendors. Debt securities are generally categorized as Level 2 in the hierarchy but may be Level 3 depending on the circumstances.
For the Money Market Fund, as permitted by compliance with certain conditions under Rule 2a-7 of the 1940 Act, securities are valued at amortized cost, which approximates fair value. The amortized cost of an instrument is determined by valuing it at its original cost and thereafter amortizing any discount or premium from its face value at a constant rate until maturity. Securities held by a money market fund are generally high quality and liquid; however, they are reflected as Level 2 because the inputs used to determine fair value are not quoted prices in an active market.
For the Income Fund, changes in valuation techniques may result in transfers in or out of an assigned level within the disclosure hierarchy.
Investment Transactions and Income. For financial reporting purposes, the Funds' investment holdings and net asset value (NAV) include trades executed through the end of the last business day of the period. The NAV per share for processing shareholder transactions is calculated as of the close of business of the New York Stock Exchange (NYSE), normally 4:00 p.m. Eastern time and includes trades executed through the end of the prior business day for the Income Fund and trades executed through the end of the current business day for the Money Market Fund. Gains and losses on securities sold are determined on the basis of identified cost. Income and capital gain distributions from Fidelity Central Funds, if any, are recorded on the ex-dividend date. Interest income is accrued as earned and includes coupon interest and amortization of premium and accretion of discount on debt securities as applicable.
Expenses. Expenses directly attributable to a fund are charged to that fund. Expenses attributable to more than one fund are allocated among the respective funds on the basis of relative net assets or other appropriate methods. Expense estimates are accrued in the period to which they relate and adjustments are made when actual amounts are known.
Income Tax Information and Distributions to Shareholders. Each year, each Fund intends to qualify as a regulated investment company under Subchapter M of the Internal Revenue Code, including distributing substantially all of its taxable income and realized gains. As a result, no provision for U.S. Federal income taxes is required. During the period, the Money Market Fund incurred a corporate tax liability on undistributed short-term capital gain and undistributed long-term capital gain which is included in Miscellaneous expense on the Statement of Operations. As of August 31, 2015, each Fund did not have any unrecognized tax benefits in the financial statements; nor is each Fund aware of any tax positions for which it is reasonably possible that the total amounts of unrecognized tax benefits will significantly change in the next twelve months. Each Fund files a U.S. federal tax return, in addition to state and local tax returns as required. Each Fund's federal income tax returns are subject to examination by the Internal Revenue Service (IRS) for a period of three fiscal years after they are filed. State and local tax returns may be subject to examination for an additional fiscal year depending on the jurisdiction.
Dividends are declared and recorded daily and paid monthly from net investment income. Distributions from realized gains, if any, are declared and recorded on the ex-dividend date. Income and capital gain distributions are determined in accordance with income tax regulations, which may differ from GAAP. In addition, each Fund claimed a portion of the payment made to redeeming shareholders as a distribution for income tax purposes.
Capital accounts within the financial statements are adjusted for permanent book-tax differences. These adjustments have no impact on net assets or the results of operations. Capital accounts are not adjusted for temporary book-tax differences which will reverse in a subsequent period.
Book-tax differences are primarily due to market discount and deferred trustees compensation.
The Funds purchase municipal securities whose interest, in the opinion of the issuer, is free from federal income tax. There is no assurance that the IRS will agree with this opinion. In the event the IRS determines that the issuer does not comply with relevant tax requirements, interest payments from a security could become federally taxable, possibly retroactively to the date the security was issued.
The federal tax cost of investment securities and unrealized appreciation (depreciation) as of period end were as follows for each Fund:
| | Tax cost | Gross unrealized appreciation | Gross unrealized depreciation | Net unrealized appreciation (depreciation) on securities |
| Fidelity Arizona Municipal Income Fund | $141,855,465 | $7,841,490 | $(375,765) | $7,465,725 |
| Fidelity Arizona Municipal Money Market Fund | 379,579,092 | – | – | – |
The tax-based components of distributable earnings as of period end were as follows for each Fund:
| | Undistributed tax-exempt income | Undistributed long-term capital gain | Net unrealized appreciation (depreciation) on securities and other investments |
| Fidelity Arizona Municipal Income Fund | $19,158 | $1,247,731 | $7,465,725 |
| Fidelity Arizona Municipal Money Market Fund | 145 | 8,422 | – |
The tax character of distributions paid was as follows:
| August 31, 2015 | | | |
| | Tax-Exempt Income | Long-term Capital Gains | Total |
| Fidelity Arizona Municipal Income Fund | $4,675,085 | $97,580 | $4,772,665 |
| Fidelity Arizona Municipal Money Market Fund | 41,500 | – | 41,500 |
| August 31, 2014 | | | |
| | Tax-Exempt Income | Long-term Capital Gains | Total |
| Fidelity Arizona Municipal Income Fund | $4,818,486 | $384,484 | $5,202,970 |
| Fidelity Arizona Municipal Money Market Fund | 40,804 | – | 40,804 |
Short-Term Trading (Redemption) Fees. Shares held by investors in the Income Fund less than 30 days may be subject to a redemption fee equal to .50% of the NAV of shares redeemed. All redemption fees, which reduce the proceeds of the shareholder redemption, are retained by the Fund and accounted for as an addition to paid in capital.
New Rule Issuance. In July 2014, the U.S. Securities and Exchange Commission issued Final Rule Release No. 33-9616, Money Market Fund Reform; Amendments to Form PF, which amends the rules governing money market funds. The final amendments impose different implementation dates for the changes that certain money market funds will need to make. Management is currently evaluating the implication of these amendments and their impact of the Final Rule to the Money Market Fund's financial statements and related disclosures.
4. Purchases and Sales of Investments.
Purchases and sales of securities, other than short-term securities, for the Income Fund aggregated $37,041,327 and $25,791,963, respectively.
5. Fees and Other Transactions with Affiliates.
Management Fee. Fidelity Management & Research Company (the investment adviser) and its affiliates provides the Funds with investment management related services for which the Funds pay a monthly management fee. The investment adviser pays all other expenses, except the compensation of the independent Trustees and certain exceptions such as interest expense, including commitment fees. The management fee is reduced by an amount equal to the fees and expenses paid by the Fund to the independent Trustees. Each Fund's management fee is equal to the following annual rate of average net assets:
| Fidelity Arizona Municipal Income Fund | .55% |
| Fidelity Arizona Municipal Money Market Fund | .50% |
6. Committed Line of Credit.
The Income Fund participates with other funds managed by the investment adviser or an affiliate in a $4.25 billion credit facility (the "line of credit") to be utilized for temporary or emergency purposes to fund shareholder redemptions or for other short-term liquidity purposes. The participating funds have agreed to pay commitment fees on their pro-rata portion of the line of credit, which are reflected in Miscellaneous expenses on the Statement of Operations, and are as follows:
| Fidelity Arizona Municipal Income Fund | $218 |
During the period, the Income Fund did not borrow on this line of credit.
7. Expense Reductions.
The investment adviser or its affiliates voluntarily agreed to waive certain fees for the Money Market Fund in order to maintain a minimum annualized yield of .01%. Such arrangements may be discontinued by the investment adviser at any time. For the period, the amount of the waiver was $1,814,760.
In addition, through arrangements with each applicable Fund's custodian, credits realized as a result of certain uninvested cash balances were used to reduce each applicable Fund's management fee. During the period, these credits reduced management fee by the following amounts:
| Fidelity Arizona Municipal Income Fund | $2,052 |
| Fidelity Arizona Municipal Money Market Fund | 3,755 |
8. Other.
The Funds' organizational documents provide former and current trustees and officers with a limited indemnification against liabilities arising in connection with the performance of their duties to the Funds. In the normal course of business, the Funds may also enter into contracts that provide general indemnifications. The Funds' maximum exposure under these arrangements is unknown as this would be dependent on future claims that may be made against the Funds. The risk of material loss from such claims is considered remote.
Report of Independent Registered Public Accounting Firm
To the Trustees of Fidelity Union Street Trust and Fidelity Union Street Trust II and the Shareholders of Fidelity Arizona Municipal Income Fund and Fidelity Arizona Municipal Money Market Fund:
In our opinion, the accompanying statements of assets and liabilities, including the schedules of investments, and the related statements of operations and of changes in net assets and the financial highlights present fairly, in all material respects, the financial position of Fidelity Arizona Municipal Income Fund (a fund of Fidelity Union Street Trust) and Fidelity Arizona Municipal Money Market Fund (a fund of Fidelity Union Street Trust II) at August 31, 2015, the results of each of their operations for the year then ended, the changes in their net assets for each of the two years in the period then ended and the financial highlights for each of the five years in the period then ended, in conformity with accounting principles generally accepted in the United States of America. These financial statements and financial highlights (hereafter referred to as “financial statements”) are the responsibility of the Fidelity Union Street Trust's and Fidelity Union Street Trust II's management. Our responsibility is to express an opinion on these financial statements based on our audits. We conducted our audits of these financial statements in accordance with the standards of the Public Company Accounting Oversight Board (United States). Those standards require that we plan and perform the audit to obtain reasonable assurance about whether the financial statements are free of material misstatement. An audit includes examining, on a test basis, evidence supporting the amounts and disclosures in the financial statements, assessing the accounting principles used and significant estimates made by management, and evaluating the overall financial statement presentation. We believe that our audits, which included confirmation of securities at August 31, 2015 by correspondence with the custodian and brokers, provide a reasonable basis for our opinion.
PricewaterhouseCoopers LLP
Boston, Massachusetts
October 13, 2015
Trustees and Officers
The Trustees, Members of the Advisory Board (if any), and officers of the trusts and funds, as applicable, are listed below. The Board of Trustees governs each fund and is responsible for protecting the interests of shareholders. The Trustees are experienced executives who meet periodically throughout the year to oversee each fund's activities, review contractual arrangements with companies that provide services to each fund, oversee management of the risks associated with such activities and contractual arrangements, and review each fund's performance. Except for Elizabeth S. Acton and John Engler, each of the Trustees oversees 235 funds. Ms. Acton and Mr. Engler each oversees 219 funds.
The Trustees hold office without limit in time except that (a) any Trustee may resign; (b) any Trustee may be removed by written instrument, signed by at least two-thirds of the number of Trustees prior to such removal; (c) any Trustee who requests to be retired or who has become incapacitated by illness or injury may be retired by written instrument signed by a majority of the other Trustees; and (d) any Trustee may be removed at any special meeting of shareholders by a two-thirds vote of the outstanding voting securities of the trust. Each Trustee who is not an interested person (as defined in the 1940 Act) of the trust and the funds is referred to herein as an Independent Trustee. Each Independent Trustee shall retire not later than the last day of the month in which his or her 75th birthday occurs. The Independent Trustees may waive this mandatory retirement age policy with respect to individual Trustees. Officers and Advisory Board Members hold office without limit in time, except that any officer or Advisory Board Member may resign or may be removed by a vote of a majority of the Trustees at any regular meeting or any special meeting of the Trustees. Except as indicated, each individual has held the office shown or other offices in the same company for the past five years.
Each fund’s Statement of Additional Information (SAI) includes more information about the Trustees. To request a free copy, call Fidelity at 1-800-544-8544.
Experience, Skills, Attributes, and Qualifications of the Trustees. The Governance and Nominating Committee has adopted a statement of policy that describes the experience, qualifications, attributes, and skills that are necessary and desirable for potential Independent Trustee candidates (Statement of Policy). The Board believes that each Trustee satisfied at the time he or she was initially elected or appointed a Trustee, and continues to satisfy, the standards contemplated by the Statement of Policy. The Governance and Nominating Committee also engages professional search firms to help identify potential Independent Trustee candidates who have the experience, qualifications, attributes, and skills consistent with the Statement of Policy. From time to time, additional criteria based on the composition and skills of the current Independent Trustees, as well as experience or skills that may be appropriate in light of future changes to board composition, business conditions, and regulatory or other developments, have also been considered by the professional search firms and the Governance and Nominating Committee. In addition, the Board takes into account the Trustees' commitment and participation in Board and committee meetings, as well as their leadership of standing and ad hoc committees throughout their tenure.
In determining that a particular Trustee was and continues to be qualified to serve as a Trustee, the Board has considered a variety of criteria, none of which, in isolation, was controlling. The Board believes that, collectively, the Trustees have balanced and diverse experience, qualifications, attributes, and skills, which allow the Board to operate effectively in governing each fund and protecting the interests of shareholders. Information about the specific experience, skills, attributes, and qualifications of each Trustee, which in each case led to the Board's conclusion that the Trustee should serve (or continue to serve) as a trustee of the funds, is provided below.
Board Structure and Oversight Function. Abigail P. Johnson is an interested person and currently serves as Chairman. The Trustees have determined that an interested Chairman is appropriate and benefits shareholders because an interested Chairman has a personal and professional stake in the quality and continuity of services provided to the funds. Independent Trustees exercise their informed business judgment to appoint an individual of their choosing to serve as Chairman, regardless of whether the Trustee happens to be independent or a member of management. The Independent Trustees have determined that they can act independently and effectively without having an Independent Trustee serve as Chairman and that a key structural component for assuring that they are in a position to do so is for the Independent Trustees to constitute a substantial majority for the Board. The Independent Trustees also regularly meet in executive session. Marie L. Knowles serves as Chairman of the Independent Trustees and as such (i) acts as a liaison between the Independent Trustees and management with respect to matters important to the Independent Trustees and (ii) with management prepares agendas for Board meetings.
Fidelity® funds are overseen by different Boards of Trustees. The funds' Board oversees Fidelity's investment-grade bond, money market, asset allocation and certain equity funds, and other Boards oversee Fidelity's high income, sector and other equity funds. The asset allocation funds may invest in Fidelity® funds that are overseen by such other Boards. The use of separate Boards, each with its own committee structure, allows the Trustees of each group of Fidelity® funds to focus on the unique issues of the funds they oversee, including common research, investment, and operational issues. On occasion, the separate Boards establish joint committees to address issues of overlapping consequences for the Fidelity® funds overseen by each Board.
The Trustees operate using a system of committees to facilitate the timely and efficient consideration of all matters of importance to the Trustees, each fund, and fund shareholders and to facilitate compliance with legal and regulatory requirements and oversight of the funds' activities and associated risks. The Board, acting through its committees, has charged FMR and its affiliates with (i) identifying events or circumstances the occurrence of which could have demonstrably adverse effects on the funds' business and/or reputation; (ii) implementing processes and controls to lessen the possibility that such events or circumstances occur or to mitigate the effects of such events or circumstances if they do occur; and (iii) creating and maintaining a system designed to evaluate continuously business and market conditions in order to facilitate the identification and implementation processes described in (i) and (ii) above. Because the day-to-day operations and activities of the funds are carried out by or through FMR, its affiliates, and other service providers, the funds' exposure to risks is mitigated but not eliminated by the processes overseen by the Trustees. While each of the Board's committees has responsibility for overseeing different aspects of the funds' activities, oversight is exercised primarily through the Operations and Audit Committees. In addition, an ad hoc Board committee of Independent Trustees has worked with FMR to enhance the Board's oversight of investment and financial risks, legal and regulatory risks, technology risks, and operational risks, including the development of additional risk reporting to the Board. The Operations Committee also worked and continues to work with FMR to enhance the stress tests required under SEC regulations for money market funds. Appropriate personnel, including but not limited to the funds' Chief Compliance Officer (CCO), FMR's internal auditor, the independent accountants, the funds' Treasurer and portfolio management personnel, make periodic reports to the Board's committees, as appropriate, including an annual review of Fidelity's risk management program for the Fidelity® funds. The responsibilities of each standing committee, including their oversight responsibilities, are described further under "Standing Committees of the Trustees."
Interested Trustees*:
Correspondence intended for a Trustee who is an interested person may be sent to Fidelity Investments, 245 Summer Street, Boston, Massachusetts 02210.
Name, Year of Birth; Principal Occupations and Other Relevant Experience+
Abigail P. Johnson (1961)
Year of Election or Appointment: 2009
Trustee
Chairman of the Board of Trustees
Ms. Johnson also serves as Trustee of other Fidelity® funds. Ms. Johnson serves as President (2013-present) and Chief Executive Officer (2014-present) of FMR LLC (diversified financial services company), President of Fidelity Financial Services (2012-present) and President of Personal, Workplace and Institutional Services (2005-present). Ms. Johnson is Chairman and Director of FMR Co., Inc. (investment adviser firm, 2011-present), Chairman and Director of FMR (investment adviser firm, 2011-present), and the Vice Chairman and Director (2007-present) of FMR LLC. Previously, Ms. Johnson served as President and a Director of FMR (2001-2005), a Trustee of other investment companies advised by FMR, Fidelity Investments Money Management, Inc. (investment adviser firm), and FMR Co., Inc. (2001-2005), Senior Vice President of the Fidelity® funds (2001-2005), and managed a number of Fidelity® funds. Ms. Abigail P. Johnson and Mr. Arthur E. Johnson are not related.
* Determined to be an “Interested Trustee” by virtue of, among other things, his or her affiliation with the trusts or various entities under common control with FMR.
+ The information includes the Trustee's principal occupation during the last five years and other information relating to the experience, attributes, and skills relevant to the Trustee's qualifications to serve as a Trustee, which led to the conclusion that the Trustee should serve as a Trustee for each fund.
Independent Trustees:
Correspondence intended for an Independent Trustee may be sent to Fidelity Investments, P.O. Box 55235, Boston, Massachusetts 02205-5235.
Name, Year of Birth; Principal Occupations and Other Relevant Experience+
Elizabeth S. Acton (1951)
Year of Election or Appointment: 2013
Trustee
Ms. Acton also serves as Trustee or Member of the Advisory Board of other Fidelity® funds. Prior to her retirement in April 2012, Ms. Acton was Executive Vice President, Finance (2011-2012), Executive Vice President, Chief Financial Officer (2002-2011), and Treasurer (2004-2005) of Comerica Incorporated (financial services). Prior to joining Comerica, Ms. Acton held a variety of positions at Ford Motor Company (1983-2002), including Vice President and Treasurer (2000-2002) and Executive Vice President and Chief Financial Officer of Ford Motor Credit Company (1998-2000). Ms. Acton currently serves as a member of the Board of Directors and Audit and Finance Committees of Beazer Homes USA, Inc. (homebuilding, 2012-present).
John Engler (1948)
Year of Election or Appointment: 2014
Trustee
Mr. Engler also serves as Trustee or Member of the Advisory Board of other Fidelity® funds. He serves as president of the Business Roundtable (2011-present), and on the board of directors/trustees for Universal Forest Products (manufacturer and distributor of wood and wood-alternative products, 2003-present), K12 Inc. (technology-based education company, 2012-present), and the Annie E. Casey Foundation (2004-present). Previously, Mr. Engler served as a trustee of The Munder Funds (2003-2014), president and CEO of the National Association of Manufacturers (2004-2011) and as governor of Michigan (1991-2003). He is a past chairman of the National Governors Association.
Albert R. Gamper, Jr. (1942)
Year of Election or Appointment: 2006
Trustee
Mr. Gamper also serves as Trustee of other Fidelity® funds. Prior to his retirement in December 2004, Mr. Gamper served as Chairman of the Board of CIT Group Inc. (commercial finance). During his tenure with CIT Group Inc. Mr. Gamper served in numerous senior management positions, including Chairman (1987-1989; 1999-2001; 2002-2004), Chief Executive Officer (1987-2004), and President (2002-2003). Mr. Gamper currently serves as a member of the Board of Directors of Public Service Enterprise Group (utilities, 2000-present), and Member of the Board of Trustees of Barnabas Health Care System (1997-present). Previously, Mr. Gamper served as Chairman (2012-2015) and Vice Chairman (2011-2012) of the Independent Trustees of certain Fidelity® funds and as Chairman of the Board of Governors, Rutgers University (2004-2007).
Robert F. Gartland (1951)
Year of Election or Appointment: 2010
Trustee
Mr. Gartland also serves as Trustee of other Fidelity® funds. Mr. Gartland is Chairman and an investor in Gartland and Mellina Group Corp. (consulting, 2009-present). Previously, Mr. Gartland served as a partner and investor of Vietnam Partners LLC (investments and consulting, 2008-2011). Prior to his retirement, Mr. Gartland held a variety of positions at Morgan Stanley (financial services, 1979-2007) including Managing Director (1987-2007).
Arthur E. Johnson (1947)
Year of Election or Appointment: 2008
Trustee
Vice Chairman of the Independent Trustees
Mr. Johnson also serves as Trustee of other Fidelity® funds. Mr. Johnson serves as a member of the Board of Directors of Eaton Corporation plc (diversified power management, 2009-present), AGL Resources, Inc. (holding company, 2002-present) and Booz Allen Hamilton (management consulting, 2011-present). Prior to his retirement, Mr. Johnson served as Senior Vice President of Corporate Strategic Development of Lockheed Martin Corporation (defense contractor, 1999-2009). He previously served on the Board of Directors of IKON Office Solutions, Inc. (1999-2008) and Delta Airlines (2005-2007). Mr. Arthur E. Johnson is not related to Ms. Abigail P. Johnson.
Michael E. Kenneally (1954)
Year of Election or Appointment: 2009
Trustee
Mr. Kenneally also serves as Trustee of other Fidelity® funds. Prior to his retirement, Mr. Kenneally served as Chairman and Global Chief Executive Officer of Credit Suisse Asset Management. Before joining Credit Suisse, he was an Executive Vice President and Chief Investment Officer for Bank of America Corporation. Earlier roles at Bank of America included Director of Research, Senior Portfolio Manager and Research Analyst, and Mr. Kenneally was awarded the Chartered Financial Analyst (CFA) designation in 1991.
James H. Keyes (1940)
Year of Election or Appointment: 2007
Trustee
Mr. Keyes also serves as Trustee of other Fidelity® funds. Mr. Keyes serves as a member of the Board and Non-Executive Chairman of Navistar International Corporation (manufacture and sale of trucks, buses, and diesel engines, since 2002). Previously, Mr. Keyes served as a member of the Board of Pitney Bowes, Inc. (integrated mail, messaging, and document management solutions, 1998-2013). Prior to his retirement, Mr. Keyes served as Chairman (1993-2002) and Chief Executive Officer (1988-2002) of Johnson Controls (automotive, building, and energy) and as a member of the Board of LSI Logic Corporation (semiconductor technologies, 1984-2008).
Marie L. Knowles (1946)
Year of Election or Appointment: 2001
Trustee
Chairman of the Independent Trustees
Ms. Knowles also serves as Trustee of other Fidelity® funds. Prior to Ms. Knowles' retirement in June 2000, she served as Executive Vice President and Chief Financial Officer of Atlantic Richfield Company (ARCO) (diversified energy, 1996-2000). From 1993 to 1996, she was a Senior Vice President of ARCO and President of ARCO Transportation Company. She served as a Director of ARCO from 1996 to 1998. Ms. Knowles currently serves as a Director and Chairman of the Audit Committee of McKesson Corporation (healthcare service, since 2002). Ms. Knowles is a member of the Board of the Catalina Island Conservancy and of the Santa Catalina Island Company (2009-present). She also serves as a member of the Advisory Board for the School of Engineering of the University of Southern California. Previously, Ms. Knowles served as a Director of Phelps Dodge Corporation (copper mining and manufacturing, 1994-2007), URS Corporation (engineering and construction, 2000-2003) and America West (airline, 1999-2002). Ms. Knowles previously served as Vice Chairman of the Independent Trustees of certain Fidelity® funds (2012-2015).
+ The information includes the Trustee's principal occupation during the last five years and other information relating to the experience, attributes, and skills relevant to the Trustee's qualifications to serve as a Trustee, which led to the conclusion that the Trustee should serve as a Trustee for each fund.
Advisory Board Members and Officers:
Correspondence intended for an officer may be sent to Fidelity Investments, 245 Summer Street, Boston, Massachusetts 02210. Officers appear below in alphabetical order.
Name, Year of Birth; Principal Occupation
Geoffrey A. von Kuhn (1951)
Year of Election or Appointment: 2015
Member of the Advisory Board
Mr. von Kuhn also serves as Trustee or Member of the Advisory Board of other Fidelity funds. Mr. von Kuhn is Chief Administrative Officer for FMR LLC (diversified financial services company, 2013-present), a Director of Pembroke Real Estate, Inc. (2009-present), and a Director of Discovery Natural Resources LLC (2012-present). Previously, Mr. von Kuhn was a managing director of Crosby Group (private wealth management company, 2007-2013), a member of the management committee and senior executive in the Wealth Management Group of AmSouth Bank (2001-2006), and head of the U.S. private bank at Citigroup (2000-2001).
Elizabeth Paige Baumann (1968)
Year of Election or Appointment: 2012
Anti-Money Laundering (AML) Officer
Ms. Baumann also serves as AML Officer of other funds. She is Chief AML Officer of FMR LLC (diversified financial services company, 2012-present) and is an employee of Fidelity Investments. Previously, Ms. Baumann served as Vice President and Deputy Anti-Money Laundering Officer (2007-2012).
Marc R. Bryant (1966)
Year of Election or Appointment: 2015
Secretary and Chief Legal Officer (CLO)
Mr. Bryant also serves as Secretary and CLO of other funds. He is Senior Vice President and Deputy General Counsel of FMR LLC (diversified financial services company). Previously, Mr. Bryant served as Secretary and Chief Legal Officer of Fidelity Rutland Square Trust II (2010-2014) and Assistant Secretary of Fidelity's Fixed Income and Asset Allocation Funds (2013-2015). Prior to joining Fidelity Investments, Mr. Bryant served as a Senior Vice President and the Head of Global Retail Legal for AllianceBernstein L.P. (2006-2010), and as the General Counsel for ProFund Advisors LLC (2001-2006).
Jonathan Davis (1968)
Year of Election or Appointment: 2010
Assistant Treasurer
Mr. Davis also serves as Assistant Treasurer of other funds, and is an employee of Fidelity Investments. Previously, Mr. Davis served as Vice President and Associate General Counsel of FMR LLC (diversified financial services company, 2003-2010).
Adrien E. Deberghes (1967)
Year of Election or Appointment: 2010
Assistant Treasurer
Mr. Deberghes also serves as an officer of other funds. He is an employee of Fidelity Investments (2008-present). Prior to joining Fidelity Investments, Mr. Deberghes was Senior Vice President of Mutual Fund Administration at State Street Corporation (2007-2008), Senior Director of Mutual Fund Administration at Investors Bank & Trust (2005-2007), and Director of Finance for Dunkin' Brands (2000-2005).
Stephanie J. Dorsey (1969)
Year of Election or Appointment: 2013
President and Treasurer
Ms. Dorsey also serves as an officer of other funds. She is an employee of Fidelity Investments (2008-present) and has served in other fund officer roles. Prior to joining Fidelity Investments, Ms. Dorsey served as Treasurer (2004-2008) of the JPMorgan Mutual Funds and Vice President (2004-2008) of JPMorgan Chase Bank.
Howard J. Galligan III (1966)
Year of Election or Appointment: 2014
Chief Financial Officer
Mr. Galligan also serves as Chief Financial Officer of other funds. Mr. Galligan serves as President of Fidelity Pricing and Cash Management Services (FPCMS) (2014-present) and as a Director of Strategic Advisers, Inc. (investment adviser firm, 2008-present). Previously, Mr. Galligan served as Chief Administrative Officer of Asset Management (2011-2014) and Chief Operating Officer and Senior Vice President of Investment Support for Strategic Advisers, Inc. (2003-2011).
Scott C. Goebel (1968)
Year of Election or Appointment: 2015
Vice President
Mr. Goebel serves as an officer of other funds and is an employee of Fidelity Investments (2001-present). Mr. Goebel also serves as Secretary of Fidelity SelectCo, LLC (investment adviser firm, 2013-present), Fidelity Investments Money Management, Inc. (FIMM) (investment adviser firm, 2010-present) and Fidelity Research and Analysis Company (FRAC) (investment adviser firm, 2010-present); General Counsel, Secretary, and Senior Vice President of FMR (investment adviser firm, 2008-present) and FMR Co., Inc. (investment adviser firm, 2008-present); Chief Legal Officer of Fidelity Management & Research (Hong Kong) Limited (investment adviser firm, 2008-present); and Assistant Secretary of Fidelity Management & Research (Japan) Limited (investment adviser firm, 2008-present) and FMR Investment Management (U.K.) Limited (investment adviser firm, 2008-present). Previously, Mr. Goebel served as Secretary and CLO of certain Fidelity® funds (2008-2015), Assistant Secretary of FIMM (2008-2010), FRAC (2008-2010), and certain funds (2007-2008); and as Vice President and Secretary of Fidelity Distributors Corporation (FDC) (2005-2007).
Timothy Huyck (1964)
Year of Election or Appointment: 2015
Vice President of Fidelity's Money Market Funds
Mr. Huyck also serves as Vice President of other funds. Mr. Huyck serves as Chief Investment Officer of Fidelity's Money Market Funds (2015-present) and is an employee of Fidelity Investments (1990-present).
Chris Maher (1972)
Year of Election or Appointment: 2013
Assistant Treasurer
Mr. Maher serves as Assistant Treasurer of other funds. Mr. Maher is Vice President of Valuation Oversight and is an employee of Fidelity Investments. Previously, Mr. Maher served as Vice President of Asset Management Compliance (2013), Vice President of the Program Management Group of FMR (investment adviser firm, 2010-2013), and Vice President of Valuation Oversight (2008-2010).
Jason P. Pogorelec (1975)
Year of Election or Appointment: 2015
Assistant Secretary
Mr. Pogorelec also serves Assistant Secretary of other funds. Mr. Pogorelec serves as Vice President, Associate General Counsel (2010-present) and is an employee of Fidelity Investments (2006-present).
Nancy D. Prior (1967)
Year of Election or Appointment: 2014
Vice President
Ms. Prior also serves as Vice President of other funds. Ms. Prior serves as a Director of Fidelity Investments Money Management, Inc. (FIMM) (investment adviser firm, 2014-present), President, Fixed Income (2014-present), Vice Chairman of Pyramis Global Advisors, LLC (investment adviser firm, 2014-present), and is an employee of Fidelity Investments (2002-present). Previously, Ms. Prior served as Vice President of Fidelity's Money Market Funds (2012-2014), President, Money Market and Short Duration Bond of FMR (investment adviser firm, 2013-2014), President, Money Market Group of FMR (2011-2014), Managing Director of Research (2009-2011), Senior Vice President and Deputy General Counsel (2007-2009), and Assistant Secretary of other Fidelity® funds (2008-2009).
Kenneth B. Robins (1969)
Year of Election or Appointment: 2009
Assistant Treasurer
Mr. Robins also serves as an officer of other funds. Mr. Robins serves as Executive Vice President of Fidelity Investments Money Management, Inc. (FIMM) (investment adviser firm, 2013-present) and is an employee of Fidelity Investments (2004-present). Previously, Mr. Robins served in other fund officer roles.
Stephen Sadoski (1971)
Year of Election or Appointment: 2013
Deputy Treasurer
Mr. Sadoski also serves as Deputy Treasurer of other funds. He is an employee of Fidelity Investments (2012-present) and has served in another fund officer role. Prior to joining Fidelity Investments, Mr. Sadoski served as an assistant chief accountant in the Division of Investment Management of the Securities and Exchange Commission (SEC) (2009-2012) and as a senior manager at Deloitte & Touche LLP (1997-2009).
Stacie M. Smith (1974)
Year of Election or Appointment: 2013
Assistant Treasurer
Ms. Smith also serves as an officer of other funds. She is an employee of Fidelity Investments (2009-present) and has served in other fund officer roles. Prior to joining Fidelity Investments, Ms. Smith served as Senior Audit Manager of Ernst & Young LLP (1996-2009).
Renee Stagnone (1975)
Year of Election or Appointment: 2013
Deputy Treasurer
Ms. Stagnone also serves as Deputy Treasurer of other funds. Ms. Stagnone is an employee of Fidelity Investments (1997-present).
Christine J. Thompson (1958)
Year of Election or Appointment: 2015
Vice President of Fidelity's Bond Funds
Ms. Thompson also serves as Vice President of other funds. Ms. Thompson also serves as Chief Investment Officer of FMR's Bond Group (2010-present) and is an employee of Fidelity Investments (1985-present). Previously, Ms. Thompson served as Vice President of Fidelity's Bond Funds (2010-2012).
Michael H. Whitaker (1967)
Year of Election or Appointment: 2008
Chief Compliance Officer
Mr. Whitaker also serves as Chief Compliance Officer of other funds. Mr. Whitaker also serves as Compliance Officer of FMR Co., Inc. (investment adviser firm, 2014-present), FMR (investment adviser firm, 2014-present), and Fidelity Investments Money Management, Inc. (investment adviser firm, 2014-present) and is an employee of Fidelity Investments (2007-present). Prior to joining Fidelity Investments, Mr. Whitaker worked at MFS Investment Management where he served as Senior Vice President and Chief Compliance Officer (2004-2006), and Assistant General Counsel.
Joseph F. Zambello (1957)
Year of Election or Appointment: 2011
Deputy Treasurer
Mr. Zambello also serves as Deputy Treasurer of other funds. Mr. Zambello is an employee of Fidelity Investments (1991-present). Previously, Mr. Zambello served as Vice President of the Program Management Group of FMR (investment adviser firm, 2009-2011) and Vice President of the Transfer Agent Oversight Group (2005-2009).
Shareholder Expense Example
As a shareholder of a Fund, you incur two types of costs: (1) transaction costs, including redemption fees and (2) ongoing costs, including management fees and other Fund expenses. This Example is intended to help you understand your ongoing costs (in dollars) of investing in the Funds and to compare these costs with the ongoing costs of investing in other mutual funds.
The Example is based on an investment of $1,000 invested at the beginning of the period and held for the entire period (March 1, 2015 to August 31, 2015).
Actual Expenses
The first line of the accompanying table for each fund provides information about actual account values and actual expenses. You may use the information in this line, together with the amount you invested, to estimate the expenses that you paid over the period. Simply divide your account value by $1,000.00 (for example, an $8,600 account value divided by $1,000.00 = 8.6), then multiply the result by the number in the first line for a fund under the heading entitled "Expenses Paid During Period" to estimate the expenses you paid on your account during this period. A small balance maintenance fee of $12.00 that is charged once a year may apply for certain accounts with a value of less than $2,000. This fee is not included in the table below. If it was, the estimate of expenses you paid during the period would be higher, and your ending account value lower, by this amount. In addition, each Fund, as a shareholder in the underlying Fidelity Central Funds, will indirectly bear its pro-rata share of the fees and expenses incurred by the underlying Fidelity Central Funds. These fees and expenses are not included in the Fund's annualized expense ratio used to calculate the expense estimate in the table below.
Hypothetical Example for Comparison Purposes
The second line of the accompanying table for each fund provides information about hypothetical account values and hypothetical expenses based on a fund's actual expense ratio and an assumed rate of return of 5% per year before expenses, which is not the Fund's actual return. The hypothetical account values and expenses may not be used to estimate the actual ending account balance or expenses you paid for the period. You may use this information to compare the ongoing costs of investing in the Fund and other funds. To do so, compare this 5% hypothetical example with the 5% hypothetical examples that appear in the shareholder reports of the other funds. A small balance maintenance fee of $12.00 that is charged once a year may apply for certain accounts with a value of less than $2,000. This fee is not included in the table below. If it was, the estimate of expenses you paid during the period would be higher, and your ending account value lower, by this amount. In addition, each Fund, as a shareholder in the underlying Fidelity Central Funds, will indirectly bear its pro-rata share of the fees and expenses incurred by the underlying Fidelity Central Funds. These fees and expenses are not included in the Fund's annualized expense ratio used to calculate the expense estimate in the table below.
Please note that the expenses shown in the table are meant to highlight your ongoing costs only and do not reflect any transaction costs. Therefore, the second line of the table is useful in comparing ongoing costs only, and will not help you determine the relative total costs of owning different funds. In addition, if these transactional costs were included, your costs would have been higher.
| | Annualized Expense Ratio-A | Beginning
Account Value
March 1, 2015 | Ending
Account Value
August 31, 2015 | Expenses Paid
During Period-B
March 1, 2015
to August 31, 2015 |
| Fidelity Arizona Municipal Income Fund | .55% | | | |
| Actual | | $1,000.00 | $1,005.60 | $2.78 |
| Hypothetical-C | | $1,000.00 | $1,022.43 | $2.80 |
| Fidelity Arizona Municipal Money Market Fund | .07% | | | |
| Actual | | $1,000.00 | $1,000.10 | $.35 |
| Hypothetical-C | | $1,000.00 | $1,024.85 | $.36 |
A Annualized expense ratio reflects expenses net of applicable fee waivers.
B Expenses are equal to each Fund's annualized expense ratio, multiplied by the average account value over the period, multiplied by 184/365 (to reflect the one-half year period).
C 5% return per year before expenses.
Distributions (Unaudited)
The Board of Trustees of each fund voted to pay to shareholders of record at the opening of business on record date, the following distributions per share derived from capital gains realized from sales of portfolio securities:
| Fund | Pay Date | Record Date | Capital Gains |
| Fidelity Arizona Municipal Income Fund | 10/12/15 | 10/09/15 | $0.102 |
| Fidelity Arizona Municipal Money Market Fund | 10/12/15 | 10/09/15 | $0.000 |
During fiscal year ended 2015, 100% of each fund's income dividends were free from federal income tax, and 1.81% and 18.02% of Fidelity Arizona Municipal Income Fund and Fidelity Arizona Municipal Money Market Fund's income dividends were subject to the federal alternative minimum tax.
The funds hereby designate as a capital gain dividend with respect to the taxable year ended August 31, 2015, or, if subsequently determined to be different, the net capital gain of such year.
| Fidelity Arizona Municipal Income Fund | $1,307,800 |
| Fidelity Arizona Municipal Money Market Fund | $27,961 |
The fund will notify shareholders in January 2016 of amounts for use in preparing 2015 income tax returns.
Corporate Headquarters
245 Summer St.
Boston, MA 02210
www.fidelity.com
AZI-SPZ-ANN-1015
1.536826.118
Item 2.
Code of Ethics
As of the end of the period, August 31, 2015, Fidelity Union Street Trust (the trust) has adopted a code of ethics, as defined in Item 2 of Form N-CSR, that applies to its President and Treasurer and its Chief Financial Officer. A copy of the code of ethics is filed as an exhibit to this Form N-CSR.
Item 3.
Audit Committee Financial Expert
The Board of Trustees of the trust has determined that Elizabeth S. Acton is an audit committee financial expert, as defined in Item 3 of Form N-CSR. Ms. Acton is independent for purposes of Item 3 of Form N-CSR.
Item 4.
Principal Accountant Fees and Services
Fees and Services
The following table presents fees billed by PricewaterhouseCoopers LLP (“PwC”) in each of the last two fiscal years for services rendered to Fidelity Arizona Municipal Income Fund and Fidelity Maryland Municipal Income Fund (the “Funds”):
Services Billed by PwC
August 31, 2015 FeesA
| | | | |
| Audit Fees | Audit-Related Fees | Tax Fees | All Other Fees |
Fidelity Arizona Municipal Income Fund | $49,000 | $- | $2,300 | $1,600 |
Fidelity Maryland Municipal Income Fund | $49,000 | $- | $2,300 | $1,700 |
| | | | |
| Audit Fees | Audit-Related Fees | Tax Fees | All Other Fees |
Fidelity Arizona Municipal Income Fund | $48,000 | $- | $2,400 | $1,700 |
Fidelity Maryland Municipal Income Fund | $48,000 | $- | $2,400 | $1,700 |
A Amounts may reflect rounding.
The following table presents fees billed by PwC that were required to be approved by the Audit Committee for services that relate directly to the operations and financial reporting of the Funds and that are rendered on behalf of Fidelity Management & Research Company (“FMR”) and entities controlling, controlled by, or under common control with FMR (not including any sub-adviser whose role is primarily portfolio management and is subcontracted with or overseen by another investment adviser) that provide ongoing services to the Funds (“Fund Service Providers”):
Services Billed by PwC
| | |
| August 31, 2015A | August 31, 2014A |
Audit-Related Fees | $4,730,000 | $4,935,000 |
Tax Fees | $- | $- |
All Other Fees | $- | $20,000 |
A Amounts may reflect rounding.
“Audit-Related Fees” represent fees billed for assurance and related services that are reasonably related to the performance of the fund audit or the review of the fund's financial statements and that are not reported under Audit Fees.
“Tax Fees” represent fees billed for tax compliance, tax advice or tax planning that relate directly to the operations and financial reporting of the fund.
“All Other Fees” represent fees billed for services provided to the fund or Fund Service Provider, a significant portion of which are assurance related, that relate directly to the operations and financial reporting of the fund, excluding those services that are reported under Audit Fees, Audit-Related Fees or Tax Fees.
Assurance services must be performed by an independent public accountant.
* * *
The aggregate non-audit fees billed by PwC for services rendered to the Funds, FMR (not including any sub-adviser whose role is primarily portfolio management and is subcontracted with or overseen by another investment adviser), and any Fund Service Provider for each of the last two fiscal years of the Funds are as follows:
| | |
Billed By | August 31, 2015 A | August 31, 2014 A |
PwC | $6,060,000 | $6,075,000 |
A Amounts may reflect rounding.
The trust's Audit Committee has considered non-audit services that were not pre-approved that were provided by PwC to Fund Service Providers to be compatible with maintaining the independence of PwC in its audit of the Funds, taking into account
representations from PwC, in accordance with Public Company Accounting Oversight Board rules, regarding its independence from the Funds and their related entities and FMR’s review of the appropriateness and permissibility under applicable law of such non-audit services prior to their provision to the Fund Service Providers.
Audit Committee Pre-Approval Policies and Procedures
The trust’s Audit Committee must pre-approve all audit and non-audit services provided by a fund’s independent registered public accounting firm relating to the operations or financial reporting of the fund. Prior to the commencement of any audit or non-audit services to a fund, the Audit Committee reviews the services to determine whether they are appropriate and permissible under applicable law.
The Audit Committee has adopted policies and procedures to, among other purposes, provide a framework for the Committee’s consideration of non-audit services by the audit firms that audit the Fidelity funds. The policies and procedures require that any non-audit service provided by a fund audit firm to a Fidelity fund and any non-audit service provided by a fund auditor to a Fund Service Provider that relates directly to the operations and financial reporting of a Fidelity fund (“Covered Service”) are subject to approval by the Audit Committee before such service is provided.
All Covered Services must be approved in advance of provision of the service either: (i) by formal resolution of the Audit Committee, or (ii) by oral or written approval of the service by the Chair of the Audit Committee (or if the Chair is unavailable, such other member of the Audit Committee as may be designated by the Chair to act in the Chair’s absence). The approval contemplated by (ii) above is permitted where the Treasurer determines that action on such an engagement is necessary before the next meeting of the Audit Committee.
Non-audit services provided by a fund audit firm to a Fund Service Provider that do not relate directly to the operations and financial reporting of a Fidelity fund are reported to the Audit Committee on a periodic basis.
Non-Audit Services Approved Pursuant to Rule 2-01(c)(7)(i)(C) and (ii) of Regulation S-X (“De Minimis Exception”)
There were no non-audit services approved or required to be approved by the Audit Committee pursuant to the De Minimis Exception during the Funds’ last two fiscal years relating to services provided to (i) the Funds or (ii) any Fund Service Provider that relate directly to the operations and financial reporting of the Funds.
Item 5.
Audit Committee of Listed Registrants
Not applicable.
Item 6.
Investments
(a)
Not applicable.
(b)
Not applicable
Item 7.
Disclosure of Proxy Voting Policies and Procedures for Closed-End Management Investment Companies
Not applicable.
Item 8.
Portfolio Managers of Closed-End Management Investment Companies
Not applicable.
Item 9.
Purchase of Equity Securities by Closed-End Management Investment Company and Affiliated Purchasers
Not applicable.
Item 10.
Submission of Matters to a Vote of Security Holders
There were no material changes to the procedures by which shareholders may recommend nominees to the trust’s Board of Trustees.
Item 11.
Controls and Procedures
(a)(i) The President and Treasurer and the Chief Financial Officer have concluded that the trust’s disclosure controls and procedures (as defined in Rule 30a-3(c) under the Investment Company Act) provide reasonable assurances that material information relating to the trust is made known to them by the appropriate persons, based on their evaluation of these controls and procedures as of a date within 90 days of the filing date of this report.
(a)(ii) There was no change in the trust’s internal control over financial reporting (as defined in Rule 30a-3(d) under the Investment Company Act) that occurred during the second fiscal quarter of the period covered by this report that has materially affected, or is reasonably likely to materially affect, the trust’s internal control over financial reporting.
Item 12.
Exhibits
| | |
(a) | (1) | Code of Ethics pursuant to Item 2 of Form N-CSR is filed and attached hereto as EX-99.CODE ETH. |
(a) | (2) | Certification pursuant to Rule 30a-2(a) under the Investment Company Act of 1940 (17 CFR 270.30a-2(a)) is filed and attached hereto as Exhibit 99.CERT. |
(a) | (3) | Not applicable. |
(b) | | Certification pursuant to Rule 30a-2(b) under the Investment Company Act of 1940 (17 CFR 270.30a-2(b)) is furnished and attached hereto as Exhibit 99.906CERT. |
SIGNATURES
Pursuant to the requirements of the Securities Exchange Act of 1934 and the Investment Company Act of 1940, the registrant has duly caused this report to be signed on its behalf by the undersigned, thereunto duly authorized.
Fidelity Union Street Trust
| |
By: | /s/ Stephanie J. Dorsey |
| Stephanie J. Dorsey |
| President and Treasurer |
| |
Date: | October 28, 2015 |
Pursuant to the requirements of the Securities Exchange Act of 1934 and the Investment Company Act of 1940, this report has been signed below by the following persons on behalf of the registrant and in the capacities and on the dates indicated.
| |
By: | /s/Stephanie J. Dorsey |
| Stephanie J. Dorsey |
| President and Treasurer |
| |
Date: | October 28, 2015 |
| |
By: | /s/Howard J. Galligan III |
| Howard J. Galligan III |
| Chief Financial Officer |
| |
Date: | October 28, 2015 |