UNITED STATES
SECURITIES AND EXCHANGE COMMISSION
Washington, D.C. 20549
FORM N-CSR
CERTIFIED SHAREHOLDER REPORT OF REGISTERED
MANAGEMENT INVESTMENT COMPANIES
Investment Company Act file number 811-01352
Fidelity Devonshire Trust
(Exact name of registrant as specified in charter)
245 Summer St., Boston, Massachusetts 02210
(Address of principal executive offices) (Zip code)
Cynthia Lo Bessette, Secretary
245 Summer St.
Boston, Massachusetts 02210
(Name and address of agent for service)
Registrant's telephone number, including area code:
617-563-7000
| |
Date of fiscal year end: | January 31 |
|
|
Date of reporting period: | January 31, 2023 |
Item 1.
Reports to Stockholders
Fidelity® Stock Selector Large Cap Value Fund
Annual Report
January 31, 2023
Includes Fidelity and Fidelity Advisor share classes
Contents
To view a fund's proxy voting guidelines and proxy voting record for the 12-month period ended June 30, visit http://www.fidelity.com/proxyvotingresults or visit the Securities and Exchange Commission's (SEC) web site at http://www.sec.gov.
You may also call 1-800-544-8544 if you're an individual investing directly with Fidelity, call 1-800-835-5092 if you're a plan sponsor or participant with Fidelity as your recordkeeper or call 1-877-208-0098 on institutional accounts or if you're an advisor or invest through one to request a free copy of the proxy voting guidelines.
Standard & Poor's, S&P and S&P 500 are registered service marks of The McGraw-Hill Companies, Inc. and have been licensed for use by Fidelity Distributors Corporation.
Other third-party marks appearing herein are the property of their respective owners.
All other marks appearing herein are registered or unregistered trademarks or service marks of FMR LLC or an affiliated company. © 2023 FMR LLC. All rights reserved.
This report and the financial statements contained herein are submitted for the general information of the shareholders of the Fund. This report is not authorized for distribution to prospective investors in the Fund unless preceded or accompanied by an effective prospectus.
A fund files its complete schedule of portfolio holdings with the SEC for the first and third quarters of each fiscal year on Form N-PORT. Forms N-PORT are available on the SEC's web site at http://www.sec.gov. A fund's Forms N-PORT may be reviewed and copied at the SEC's Public Reference Room in Washington, DC. Information regarding the operation of the SEC's Public Reference Room may be obtained by calling 1-800-SEC-0330.
For a complete list of a fund's portfolio holdings, view the most recent holdings listing, semiannual report, or annual report on Fidelity's web site at http://www.fidelity.com, http://www.institutional.fidelity.com, or http://www.401k.com, as applicable.
NOT FDIC INSURED •MAY LOSE VALUE •NO BANK GUARANTEE
Neither the Fund nor Fidelity Distributors Corporation is a bank.
Average annual total return reflects the change in the value of an investment, assuming reinvestment of distributions from dividend income and capital gains (the profits earned upon the sale of securities that have grown in value, if any) and assuming a constant rate of performance each year. The hypothetical investment and the average annual total returns do not reflect the deduction of taxes that a shareholder would pay on fund distributions or the redemption of fund shares. During periods of reimbursement by Fidelity, a fund's total return will be greater than it would be had the reimbursement not occurred. How a fund did yesterday is no guarantee of how it will do tomorrow.
| Average Annual Total Returns |
| | | | |
Periods ended January 31, 2023 | Past 1 year | Past 5 years | Past 10 years |
| Class A (incl.5.75% sales charge) | -4.76% | 5.92% | 9.12% |
| Class M (incl.3.50% sales charge) | -2.70% | 6.12% | 9.05% |
Class C (incl. contingent deferred sales charge) | -0.69% | 6.30% | 9.04% |
| Fidelity® Stock Selector Large Cap Value Fund | 1.36% | 7.50% | 10.09% |
| Class I | 1.39% | 7.49% | 10.06% |
| Class Z | 1.46% | 7.63% | 10.15% |
Class C shares' contingent deferred sales charges included in the past one year, past five years and past ten years total return figures are 1%, 0% and 0%, respectively.
The initial offering of Class Z shares took place on February 1, 2017. Returns prior to February 1, 2017, are those of Class I.
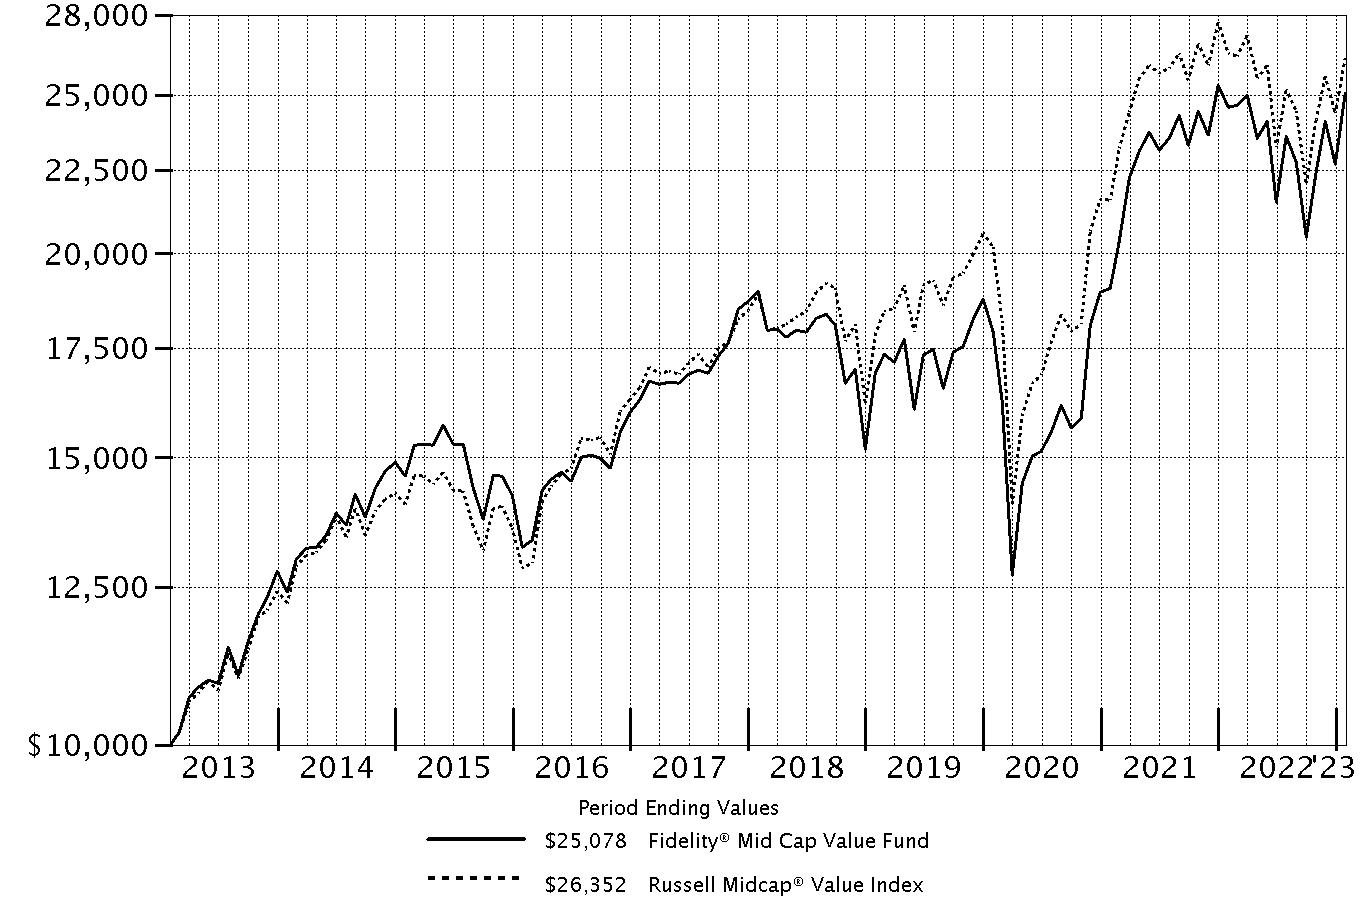
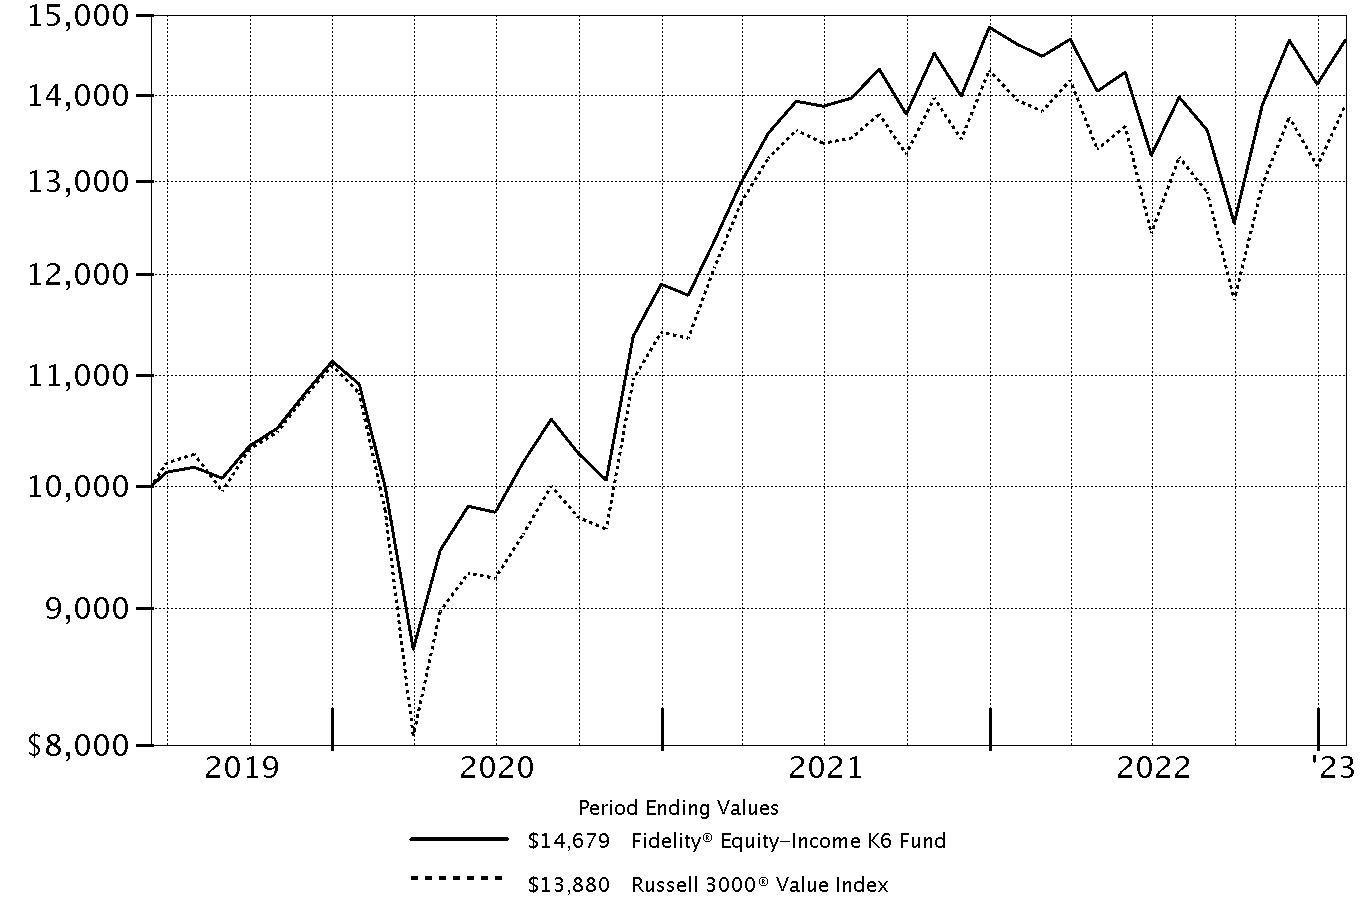
| $10,000 Over 10 Years |
| |
Let's say hypothetically that $10,000 was invested in Fidelity® Stock Selector Large Cap Value Fund, a class of the fund, on January 31, 2013. The chart shows how the value of your investment would have changed, and also shows how the Russell 1000® Value Index performed over the same period. |
|
|
Market Recap:
U.S. equities returned -8.22% for the 12 months ending January 31, 2023, according to the S&P 500® index. The new year began with an encouraging upturn in January (+6.28%), but the backdrop remains clouded by the multitude of risk factors that challenged the global economy in 2022, when the index logged its lowest calendar-year return since 2008 and first annual retreat since 2018. High inflation prompted the Federal Reserve to aggressively tighten monetary policy, and market interest rates eclipsed their highest level in a decade, stoking recession fears and sending stocks into bear market territory. Since March 2022, the Fed has hiked its benchmark rate seven times, by 4.25 percentage points - the fastest-ever pace of monetary tightening - while also shrinking its massive portfolio. The latest bump came in mid-December, along with a signal that the central bank plans to lift rates through the spring, though likely in smaller increments, to combat high inflation. Against this backdrop, stocks struggled to gain traction until a strong rally ignited heading into the summer. But in September, the S&P 500® returned -9.21%, one of its worst monthly results ever, before advancing 7.56% in Q4 as risky assets regained favor. For the full 12 months, value stocks handily outpaced growth. This headwind was most pronounced in the growth-oriented communication services (-27%), consumer discretionary (-20%) and information technology (-16%) sectors. In contrast, energy (+43%) led by a wide margin, followed by health care (+3%).
Comments from Lead Manager Matt Friedman and Co-Managers Jordan Michaels and Matthew Moulis:
For the fiscal year ending January 31, 2023, the fund's share classes (excluding sales charges, if applicable) gained about 0.2% to 1%, outperforming the -0.43% result of the benchmark Russell 1000 ® Value Index. Versus the benchmark, security selection was the primary contributor, led by the industrials sector. Picks among utilities and information technology stocks also boosted the fund's relative result. The biggest individual relative contributor was an overweight position in Nielsen Holdings (+26%), which was an investment no longer held at the end of this period. Adding further value was an outsized stake in Exxon Mobil (+59%), one of the fund's largest positions on January 31. Another notable relative contributor was the fund's non-benchmark holding in Cenovus Energy, which gained roughly 39%. In contrast, the largest detractor from performance versus the benchmark proved to be security selection in financials. Investment choices in the communication services and real estate sectors also hampered the portfolio's relative result. Not owning Chevron, a benchmark component that rose roughly 37%, was the biggest individual relative detractor, followed by a larger-than-benchmark stake in Charter Communications (-36%). Outsized exposure to Fidelity National Information Services (-36%) hurt as well. Notable changes in positioning during the period include increased exposure to the energy and consumer discretionary sectors.
Notes to shareholders:
On February 7, 2023, Matt Moulis assumed co-management responsibilities for the fund's industrials sleeve, joining Matt Friedman. On July 27, 2022, Matt Friedman assumed portfolio management responsibilities for the fund's industrials sleeve, succeeding John Mirshekari.
The views expressed above reflect those of the portfolio manager(s) only through the end of the period as stated on the cover of this report and do not necessarily represent the views of Fidelity or any other person in the Fidelity organization. Any such views are subject to change at any time based upon market or other conditions and Fidelity disclaims any responsibility to update such views. These views may not be relied on as investment advice and, because investment decisions for a Fidelity fund are based on numerous factors, may not be relied on as an indication of trading intent on behalf of any Fidelity fund.
Top Holdings (% of Fund's net assets) |
| |
| Exxon Mobil Corp. | 3.7 | |
| Wells Fargo & Co. | 3.4 | |
| Bank of America Corp. | 3.3 | |
| Johnson & Johnson | 2.4 | |
| The Travelers Companies, Inc. | 2.1 | |
| Alphabet, Inc. Class A | 2.0 | |
| Thermo Fisher Scientific, Inc. | 1.9 | |
| Verizon Communications, Inc. | 1.7 | |
| JPMorgan Chase & Co. | 1.7 | |
| Comcast Corp. Class A | 1.6 | |
| | 23.8 | |
| |
| Market Sectors (% of Fund's net assets) |
| |
| Financials | 20.2 | |
| Health Care | 15.4 | |
| Industrials | 10.3 | |
| Information Technology | 8.7 | |
| Energy | 8.3 | |
| Communication Services | 7.5 | |
| Consumer Staples | 6.5 | |
| Consumer Discretionary | 6.1 | |
| Utilities | 5.3 | |
| Real Estate | 4.6 | |
| Materials | 4.5 | |
| Investment Companies | 0.9 | |
| |
Asset Allocation (% of Fund's net assets) |
|
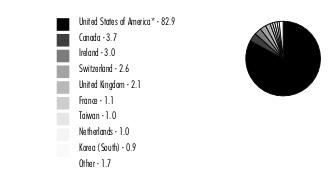
Foreign investments - 8.5% |
|
Showing Percentage of Net Assets
| Common Stocks - 97.4% |
| | | Shares | Value ($) |
| COMMUNICATION SERVICES - 7.5% | | | |
| Diversified Telecommunication Services - 1.9% | | | |
| Deutsche Telekom AG | | 37,600 | 837,683 |
| Verizon Communications, Inc. | | 203,120 | 8,443,698 |
| | | | 9,281,381 |
| Entertainment - 0.7% | | | |
| Activision Blizzard, Inc. | | 36,560 | 2,799,399 |
| Cinemark Holdings, Inc. (a)(b) | | 39,978 | 477,337 |
| | | | 3,276,736 |
| Interactive Media & Services - 2.7% | | | |
| Alphabet, Inc. Class A (a) | | 98,684 | 9,753,927 |
| Meta Platforms, Inc. Class A (a) | | 20,675 | 3,079,955 |
| | | | 12,833,882 |
| Media - 2.2% | | | |
| Charter Communications, Inc. Class A (a) | | 2,093 | 804,361 |
| Comcast Corp. Class A | | 201,999 | 7,948,661 |
| Omnicom Group, Inc. | | 24,804 | 2,132,896 |
| | | | 10,885,918 |
TOTAL COMMUNICATION SERVICES | | | 36,277,917 |
| CONSUMER DISCRETIONARY - 6.1% | | | |
| Automobiles - 0.7% | | | |
| General Motors Co. | | 90,303 | 3,550,714 |
| Hotels, Restaurants & Leisure - 1.8% | | | |
| Hilton Worldwide Holdings, Inc. | | 28,034 | 4,067,453 |
| McDonald's Corp. | | 17,217 | 4,603,826 |
| | | | 8,671,279 |
| Household Durables - 0.6% | | | |
| Tempur Sealy International, Inc. | | 72,002 | 2,934,082 |
| Multiline Retail - 0.6% | | | |
| Dollar Tree, Inc. (a) | | 19,937 | 2,994,139 |
| Specialty Retail - 2.4% | | | |
| Dick's Sporting Goods, Inc. | | 27,493 | 3,594,985 |
| Lowe's Companies, Inc. | | 28,623 | 5,960,740 |
| Williams-Sonoma, Inc. (b) | | 13,485 | 1,819,666 |
| | | | 11,375,391 |
TOTAL CONSUMER DISCRETIONARY | | | 29,525,605 |
| CONSUMER STAPLES - 6.5% | | | |
| Beverages - 1.5% | | | |
| Constellation Brands, Inc. Class A (sub. vtg.) | | 9,897 | 2,291,353 |
| Diageo PLC | | 20,300 | 887,640 |
| Keurig Dr. Pepper, Inc. | | 37,485 | 1,322,471 |
| PepsiCo, Inc. | | 1,100 | 188,122 |
| The Coca-Cola Co. | | 44,586 | 2,734,014 |
| | | | 7,423,600 |
| Food & Staples Retailing - 1.5% | | | |
| Albertsons Companies, Inc. | | 3,200 | 67,840 |
| Kroger Co. | | 7,700 | 343,651 |
| U.S. Foods Holding Corp. (a) | | 35,900 | 1,368,867 |
| Walmart, Inc. | | 36,234 | 5,212,986 |
| | | | 6,993,344 |
| Food Products - 1.0% | | | |
| Archer Daniels Midland Co. | | 10,998 | 911,184 |
| Bunge Ltd. | | 4,100 | 406,310 |
| Darling Ingredients, Inc. (a) | | 3,100 | 205,499 |
| Mondelez International, Inc. | | 45,353 | 2,967,900 |
| Tyson Foods, Inc. Class A | | 6,100 | 401,075 |
| | | | 4,891,968 |
| Household Products - 1.4% | | | |
| Colgate-Palmolive Co. | | 1,900 | 141,607 |
| Energizer Holdings, Inc. | | 13,200 | 489,720 |
| Procter & Gamble Co. | | 44,549 | 6,342,887 |
| | | | 6,974,214 |
| Tobacco - 1.1% | | | |
| Altria Group, Inc. | | 42,792 | 1,927,352 |
| Philip Morris International, Inc. | | 30,776 | 3,208,090 |
| | | | 5,135,442 |
TOTAL CONSUMER STAPLES | | | 31,418,568 |
| ENERGY - 8.3% | | | |
| Energy Equipment & Services - 1.0% | | | |
| Schlumberger Ltd. | | 81,300 | 4,632,474 |
| Oil, Gas & Consumable Fuels - 7.3% | | | |
| Canadian Natural Resources Ltd. | | 77,300 | 4,744,723 |
| Cenovus Energy, Inc. (Canada) | | 295,700 | 5,907,111 |
| Exxon Mobil Corp. | | 153,600 | 17,819,133 |
| Hess Corp. | | 27,300 | 4,099,368 |
| Valero Energy Corp. | | 20,100 | 2,814,603 |
| | | | 35,384,938 |
TOTAL ENERGY | | | 40,017,412 |
| FINANCIALS - 20.2% | | | |
| Banks - 10.5% | | | |
| Bank of America Corp. | | 453,053 | 16,074,320 |
| Citizens Financial Group, Inc. | | 22,547 | 976,736 |
| Comerica, Inc. | | 17,963 | 1,316,868 |
| First Horizon National Corp. | | 28,770 | 711,482 |
| JPMorgan Chase & Co. | | 59,305 | 8,300,328 |
| PNC Financial Services Group, Inc. | | 14,246 | 2,356,716 |
| Societe Generale Series A | | 43,922 | 1,307,408 |
| U.S. Bancorp | | 59,517 | 2,963,947 |
| Wells Fargo & Co. | | 351,448 | 16,472,368 |
| | | | 50,480,173 |
| Capital Markets - 2.9% | | | |
| Bank of New York Mellon Corp. | | 137,104 | 6,933,349 |
| BlackRock, Inc. Class A | | 4,673 | 3,547,788 |
| Cboe Global Markets, Inc. | | 9,169 | 1,126,687 |
| Intercontinental Exchange, Inc. | | 21,084 | 2,267,584 |
| | | | 13,875,408 |
| Consumer Finance - 0.9% | | | |
| Capital One Financial Corp. | | 35,227 | 4,192,013 |
| Diversified Financial Services - 1.0% | | | |
| Berkshire Hathaway, Inc. Class B (a) | | 16,078 | 5,008,619 |
| Insurance - 4.9% | | | |
| Arthur J. Gallagher & Co. | | 9,400 | 1,839,768 |
| Chubb Ltd. | | 19,200 | 4,367,808 |
| Globe Life, Inc. | | 18,172 | 2,196,086 |
| Hartford Financial Services Group, Inc. | | 64,409 | 4,998,782 |
| The Travelers Companies, Inc. | | 53,655 | 10,254,544 |
| | | | 23,656,988 |
TOTAL FINANCIALS | | | 97,213,201 |
| HEALTH CARE - 15.4% | | | |
| Biotechnology - 0.9% | | | |
| Gilead Sciences, Inc. | | 30,500 | 2,560,170 |
| Regeneron Pharmaceuticals, Inc. (a) | | 2,300 | 1,744,481 |
| | | | 4,304,651 |
| Health Care Equipment & Supplies - 2.9% | | | |
| Abbott Laboratories | | 54,700 | 6,047,085 |
| Becton, Dickinson & Co. | | 13,800 | 3,480,636 |
| Boston Scientific Corp. (a) | | 76,100 | 3,519,625 |
| Medtronic PLC | | 9,900 | 828,531 |
| | | | 13,875,877 |
| Health Care Providers & Services - 3.8% | | | |
| AmerisourceBergen Corp. | | 27,100 | 4,578,816 |
| Centene Corp. (a) | | 34,600 | 2,637,904 |
| Cigna Corp. | | 13,400 | 4,243,378 |
| CVS Health Corp. | | 8,800 | 776,336 |
| Elevance Health, Inc. | | 4,700 | 2,349,953 |
| Molina Healthcare, Inc. (a) | | 4,225 | 1,317,482 |
| UnitedHealth Group, Inc. | | 4,260 | 2,126,549 |
| | | | 18,030,418 |
| Life Sciences Tools & Services - 3.0% | | | |
| Danaher Corp. | | 20,000 | 5,287,600 |
| Thermo Fisher Scientific, Inc. | | 16,200 | 9,239,346 |
| | | | 14,526,946 |
| Pharmaceuticals - 4.8% | | | |
| Bristol-Myers Squibb Co. | | 46,400 | 3,370,960 |
| Johnson & Johnson | | 72,485 | 11,845,499 |
| Merck & Co., Inc. | | 39,500 | 4,242,695 |
| Pfizer, Inc. | | 87,100 | 3,846,336 |
| | | | 23,305,490 |
TOTAL HEALTH CARE | | | 74,043,382 |
| INDUSTRIALS - 10.3% | | | |
| Aerospace & Defense - 2.5% | | | |
| Northrop Grumman Corp. | | 5,069 | 2,271,115 |
| Raytheon Technologies Corp. | | 19,382 | 1,935,293 |
| The Boeing Co. (a) | | 37,204 | 7,924,452 |
| | | | 12,130,860 |
| Air Freight & Logistics - 0.9% | | | |
| FedEx Corp. | | 23,755 | 4,605,144 |
| Construction & Engineering - 0.6% | | | |
| Fluor Corp. (a) | | 83,100 | 3,053,925 |
| Electrical Equipment - 0.8% | | | |
| Sensata Technologies, Inc. PLC | | 79,644 | 4,049,897 |
| Industrial Conglomerates - 1.8% | | | |
| 3M Co. | | 10,736 | 1,235,499 |
| General Electric Co. | | 90,789 | 7,306,699 |
| | | | 8,542,198 |
| Machinery - 1.1% | | | |
| Crane Holdings Co. | | 21,700 | 2,515,247 |
| Flowserve Corp. | | 75,468 | 2,597,609 |
| | | | 5,112,856 |
| Professional Services - 0.5% | | | |
| Manpower, Inc. | | 27,800 | 2,423,048 |
| Road & Rail - 2.1% | | | |
| Norfolk Southern Corp. | | 12,421 | 3,053,206 |
| RXO, Inc. (a) | | 94,748 | 1,735,783 |
| U-Haul Holding Co. (non-vtg.) | | 33,600 | 2,076,144 |
| XPO, Inc. (a) | | 77,300 | 3,081,178 |
| | | | 9,946,311 |
TOTAL INDUSTRIALS | | | 49,864,239 |
| INFORMATION TECHNOLOGY - 8.7% | | | |
| Communications Equipment - 1.5% | | | |
| Cisco Systems, Inc. | | 149,121 | 7,257,719 |
| Electronic Equipment & Components - 0.6% | | | |
| Vontier Corp. | | 115,978 | 2,670,973 |
| IT Services - 4.1% | | | |
| Amdocs Ltd. | | 38,407 | 3,530,756 |
| Concentrix Corp. | | 12,100 | 1,715,901 |
| Fidelity National Information Services, Inc. | | 47,687 | 3,578,432 |
| FleetCor Technologies, Inc. (a) | | 12,155 | 2,538,086 |
| Global Payments, Inc. | | 32,088 | 3,616,959 |
| GoDaddy, Inc. (a) | | 22,901 | 1,880,859 |
| SS&C Technologies Holdings, Inc. | | 51,419 | 3,103,137 |
| | | | 19,964,130 |
| Semiconductors & Semiconductor Equipment - 2.0% | | | |
| Microchip Technology, Inc. | | 81,337 | 6,313,378 |
| Taiwan Semiconductor Manufacturing Co. Ltd. sponsored ADR | | 35,200 | 3,264,096 |
| | | | 9,577,474 |
| Software - 0.5% | | | |
| Adobe, Inc. (a) | | 5,686 | 2,105,753 |
| Black Knight, Inc. (a) | | 3,329 | 201,704 |
| | | | 2,307,457 |
TOTAL INFORMATION TECHNOLOGY | | | 41,777,753 |
| MATERIALS - 4.5% | | | |
| Chemicals - 2.4% | | | |
| Axalta Coating Systems Ltd. (a) | | 74,154 | 2,232,035 |
| Eastman Chemical Co. | | 20,562 | 1,812,952 |
| Olin Corp. | | 44,169 | 2,852,876 |
| The Chemours Co. LLC | | 64,277 | 2,339,040 |
| Westlake Corp. | | 18,971 | 2,328,690 |
| | | | 11,565,593 |
| Containers & Packaging - 0.8% | | | |
| Crown Holdings, Inc. | | 22,094 | 1,947,807 |
| O-I Glass, Inc. (a) | | 97,733 | 1,881,360 |
| | | | 3,829,167 |
| Metals & Mining - 1.3% | | | |
| Freeport-McMoRan, Inc. | | 93,023 | 4,150,686 |
| Glencore PLC | | 352,000 | 2,357,305 |
| | | | 6,507,991 |
TOTAL MATERIALS | | | 21,902,751 |
| REAL ESTATE - 4.6% | | | |
| Equity Real Estate Investment Trusts (REITs) - 4.3% | | | |
| American Tower Corp. | | 5,400 | 1,206,306 |
| Equity Lifestyle Properties, Inc. | | 41,700 | 2,993,226 |
| Essex Property Trust, Inc. | | 11,900 | 2,690,233 |
| Host Hotels & Resorts, Inc. | | 115,100 | 2,169,635 |
| Invitation Homes, Inc. | | 89,200 | 2,899,000 |
| Mid-America Apartment Communities, Inc. | | 10,300 | 1,717,216 |
| Prologis (REIT), Inc. | | 32,400 | 4,188,672 |
| Welltower, Inc. | | 38,900 | 2,919,056 |
| | | | 20,783,344 |
| Real Estate Management & Development - 0.3% | | | |
| Cushman & Wakefield PLC (a) | | 89,200 | 1,287,156 |
TOTAL REAL ESTATE | | | 22,070,500 |
| UTILITIES - 5.3% | | | |
| Electric Utilities - 3.5% | | | |
| Constellation Energy Corp. | | 34,090 | 2,909,922 |
| Edison International | | 41,846 | 2,883,189 |
| Entergy Corp. | | 22,650 | 2,452,542 |
| PG&E Corp. (a) | | 282,971 | 4,499,239 |
| Southern Co. | | 61,500 | 4,162,320 |
| | | | 16,907,212 |
| Independent Power and Renewable Electricity Producers - 1.1% | | | |
| The AES Corp. | | 121,929 | 3,342,074 |
| Vistra Corp. | | 81,023 | 1,868,390 |
| | | | 5,210,464 |
| Multi-Utilities - 0.7% | | | |
| Sempra Energy | | 22,346 | 3,582,734 |
TOTAL UTILITIES | | | 25,700,410 |
| TOTAL COMMON STOCKS (Cost $389,860,076) | | | 469,811,738 |
| | | | |
| Money Market Funds - 2.1% |
| | | Shares | Value ($) |
| Fidelity Cash Central Fund 4.38% (c) | | 7,847,796 | 7,849,365 |
| Fidelity Securities Lending Cash Central Fund 4.38% (c)(d) | | 2,230,777 | 2,231,000 |
| TOTAL MONEY MARKET FUNDS (Cost $10,080,289) | | | 10,080,365 |
| | | | |
| Equity Funds - 0.9% |
| | | Shares | Value ($) |
| Domestic Equity Funds - 0.9% | | | |
iShares Russell 1000 Value Index ETF (Cost $4,418,094) | | 27,900 | 4,448,655 |
| | | | |
| TOTAL INVESTMENT IN SECURITIES - 100.4% (Cost $404,358,459) | 484,340,758 |
NET OTHER ASSETS (LIABILITIES) - (0.4)% | (1,758,502) |
| NET ASSETS - 100.0% | 482,582,256 |
| | |
Security Type Abbreviations
Legend
| (b) | Security or a portion of the security is on loan at period end. |
| (c) | Affiliated fund that is generally available only to investment companies and other accounts managed by Fidelity Investments. The rate quoted is the annualized seven-day yield of the fund at period end. A complete unaudited listing of the fund's holdings as of its most recent quarter end is available upon request. In addition, each Fidelity Central Fund's financial statements, which are not covered by the Fund's Report of Independent Registered Public Accounting Firm, are available on the SEC's website or upon request. |
| (d) | Investment made with cash collateral received from securities on loan. |
Affiliated Central Funds
Fiscal year to date information regarding the Fund's investments in Fidelity Central Funds, including the ownership percentage, is presented below.
| Affiliate | Value, beginning of period ($) | Purchases ($) | Sales Proceeds ($) | Dividend Income ($) | Realized Gain (loss) ($) | Change in Unrealized appreciation (depreciation) ($) | Value, end of period ($) | % ownership, end of period |
| Fidelity Cash Central Fund 4.38% | 9,866,101 | 151,114,766 | 153,131,502 | 160,340 | 1 | (1) | 7,849,365 | 0.0% |
| Fidelity Securities Lending Cash Central Fund 4.38% | 3,290,175 | 92,725,132 | 93,784,307 | 11,097 | - | - | 2,231,000 | 0.0% |
| Total | 13,156,276 | 243,839,898 | 246,915,809 | 171,437 | 1 | (1) | 10,080,365 | |
| | | | | | | | | |
Amounts in the dividend income column in the above table include any capital gain distributions from underlying funds, which are presented in the corresponding line item in the Statement of Operations, if applicable.
Amount for Fidelity Securities Lending Cash Central Fund represents the income earned on investing cash collateral, less rebates paid to borrowers and any lending agent fees associated with the loan, plus any premium payments received for lending certain types of securities.
Amounts included in the purchases and sales proceeds columns may include in-kind transactions, if applicable.
Investment Valuation
The following is a summary of the inputs used, as of January 31, 2023, involving the Fund's assets and liabilities carried at fair value. The inputs or methodology used for valuing securities may not be an indication of the risk associated with investing in those securities. For more information on valuation inputs, and their aggregation into the levels used below, please refer to the Investment Valuation section in the accompanying Notes to Financial Statements.
| Valuation Inputs at Reporting Date: |
| Description | Total ($) | Level 1 ($) | Level 2 ($) | Level 3 ($) |
Investments in Securities: | | | | |
|
| Equities: | | | | |
Communication Services | 36,277,917 | 35,440,234 | 837,683 | - |
Consumer Discretionary | 29,525,605 | 29,525,605 | - | - |
Consumer Staples | 31,418,568 | 30,530,928 | 887,640 | - |
Energy | 40,017,412 | 40,017,412 | - | - |
Financials | 97,213,201 | 95,905,793 | 1,307,408 | - |
Health Care | 74,043,382 | 74,043,382 | - | - |
Industrials | 49,864,239 | 49,864,239 | - | - |
Information Technology | 41,777,753 | 41,777,753 | - | - |
Materials | 21,902,751 | 19,545,446 | 2,357,305 | - |
Real Estate | 22,070,500 | 22,070,500 | - | - |
Utilities | 25,700,410 | 25,700,410 | - | - |
|
| Money Market Funds | 10,080,365 | 10,080,365 | - | - |
|
| Equity Funds | 4,448,655 | 4,448,655 | - | - |
| Total Investments in Securities: | 484,340,758 | 478,950,722 | 5,390,036 | - |
| Statement of Assets and Liabilities |
| | | | January 31, 2023 |
| | | | | |
| Assets | | | | |
| Investment in securities, at value (including securities loaned of $2,284,602) - See accompanying schedule: | | | | |
Unaffiliated issuers (cost $394,278,170) | $ | 474,260,393 | | |
Fidelity Central Funds (cost $10,080,289) | | 10,080,365 | | |
| | | | | |
| | | | | |
| Total Investment in Securities (cost $404,358,459) | | | $ | 484,340,758 |
| Receivable for investments sold | | | | 7,223,816 |
| Receivable for fund shares sold | | | | 72,593 |
| Dividends receivable | | | | 451,916 |
| Distributions receivable from Fidelity Central Funds | | | | 28,398 |
| Prepaid expenses | | | | 457 |
Total assets | | | | 492,117,938 |
| Liabilities | | | | |
| Payable to custodian bank | $ | 368,905 | | |
| Payable for investments purchased | | 6,105,390 | | |
| Payable for fund shares redeemed | | 436,849 | | |
| Accrued management fee | | 251,526 | | |
| Distribution and service plan fees payable | | 19,540 | | |
| Other affiliated payables | | 74,581 | | |
| Other payables and accrued expenses | | 47,891 | | |
| Collateral on securities loaned | | 2,231,000 | | |
| Total Liabilities | | | | 9,535,682 |
| Net Assets | | | $ | 482,582,256 |
| Net Assets consist of: | | | | |
| Paid in capital | | | $ | 404,047,651 |
| Total accumulated earnings (loss) | | | | 78,534,605 |
| Net Assets | | | $ | 482,582,256 |
| | | | | |
| Net Asset Value and Maximum Offering Price | | | | |
| Class A : | | | | |
Net Asset Value and redemption price per share ($39,638,342 ÷ 1,643,414 shares) (a) | | | $ | 24.12 |
| Maximum offering price per share (100/94.25 of $24.12) | | | $ | 25.59 |
| Class M : | | | | |
Net Asset Value and redemption price per share ($12,319,463 ÷ 512,131 shares) (a) | | | $ | 24.06 |
| Maximum offering price per share (100/96.50 of $24.06) | | | $ | 24.93 |
| Class C : | | | | |
Net Asset Value and offering price per share ($7,898,160 ÷ 337,249 shares) (a) | | | $ | 23.42 |
| Stock Selector Large Cap Value : | | | | |
Net Asset Value , offering price and redemption price per share ($405,895,355 ÷ 16,627,409 shares) | | | $ | 24.41 |
| Class I : | | | | |
Net Asset Value , offering price and redemption price per share ($10,858,205 ÷ 442,727 shares) | | | $ | 24.53 |
| Class Z : | | | | |
Net Asset Value , offering price and redemption price per share ($5,972,731 ÷ 246,408 shares) | | | $ | 24.24 |
(a)Redemption price per share is equal to net asset value less any applicable contingent deferred sales charge. |
| Statement of Operations |
| | | | Year ended January 31, 2023 |
| Investment Income | | | | |
| Dividends | | | $ | 9,454,327 |
| Income from Fidelity Central Funds (including $11,097 from security lending) | | | | 171,437 |
| Total Income | | | | 9,625,764 |
| Expenses | | | | |
| Management fee | | | | |
| Basic fee | $ | 2,572,745 | | |
| Performance adjustment | | 364,770 | | |
| Transfer agent fees | | 756,700 | | |
| Distribution and service plan fees | | 218,003 | | |
| Accounting fees | | 177,993 | | |
| Custodian fees and expenses | | 25,706 | | |
| Independent trustees' fees and expenses | | 1,623 | | |
| Registration fees | | 94,021 | | |
| Audit | | 57,956 | | |
| Legal | | 6,858 | | |
| Interest | | 1,147 | | |
| Miscellaneous | | 2,259 | | |
| Total expenses before reductions | | 4,279,781 | | |
| Expense reductions | | (16,989) | | |
| Total expenses after reductions | | | | 4,262,792 |
| Net Investment income (loss) | | | | 5,362,972 |
| Realized and Unrealized Gain (Loss) | | | | |
| Net realized gain (loss) on: | | | | |
| Investment Securities: | | | | |
| Unaffiliated issuers | | 21,556,479 | | |
| Fidelity Central Funds | | 1 | | |
| Foreign currency transactions | | (2,214) | | |
| Total net realized gain (loss) | | | | 21,554,266 |
| Change in net unrealized appreciation (depreciation) on: | | | | |
| Investment Securities: | | | | |
| Unaffiliated issuers | | (25,324,190) | | |
| Fidelity Central Funds | | (1) | | |
| Assets and liabilities in foreign currencies | | (711) | | |
| Total change in net unrealized appreciation (depreciation) | | | | (25,324,902) |
| Net gain (loss) | | | | (3,770,636) |
| Net increase (decrease) in net assets resulting from operations | | | $ | 1,592,336 |
| Statement of Changes in Net Assets |
| |
| | Year ended January 31, 2023 | | Year ended January 31, 2022 |
| Increase (Decrease) in Net Assets | | | | |
| Operations | | | | |
| Net investment income (loss) | $ | 5,362,972 | $ | 4,974,117 |
| Net realized gain (loss) | | 21,554,266 | | 64,640,130 |
| Change in net unrealized appreciation (depreciation) | | (25,324,902) | | 41,303,206 |
| Net increase (decrease) in net assets resulting from operations | | 1,592,336 | | 110,917,453 |
| Distributions to shareholders | | (37,496,299) | | (22,628,924) |
| Share transactions - net increase (decrease) | | (22,942,895) | | 10,727,818 |
| Total increase (decrease) in net assets | | (58,846,858) | | 99,016,347 |
| | | | | |
| Net Assets | | | | |
| Beginning of period | | 541,429,114 | | 442,412,767 |
| End of period | $ | 482,582,256 | $ | 541,429,114 |
| | | | | |
| | | | | |
Financial Highlights
| Fidelity Advisor® Stock Selector Large Cap Value Fund Class A |
| |
| Years ended January 31, | | 2023 | | 2022 | | 2021 | | 2020 | | 2019 |
Selected Per-Share Data | | | | | | | | | | |
| Net asset value, beginning of period | $ | 25.78 | $ | 21.53 | $ | 20.92 | $ | 18.80 | $ | 21.26 |
| Income from Investment Operations | | | | | | | | | | |
Net investment income (loss) A,B | | .20 | | .18 | | .32 C | | .29 | | .26 |
| Net realized and unrealized gain (loss) | | (.01) | | 5.16 | | .71 | | 2.14 | | (1.45) |
| Total from investment operations | | .19 | | 5.34 | | 1.03 | | 2.43 | | (1.19) |
| Distributions from net investment income | | (.23) | | (.20) | | (.42) | | (.31) | | (.24) |
| Distributions from net realized gain | | (1.62) | | (.90) | | - | | - | | (1.03) |
| Total distributions | | (1.85) | | (1.09) D | | (.42) | | (.31) | | (1.27) |
| Net asset value, end of period | $ | 24.12 | $ | 25.78 | $ | 21.53 | $ | 20.92 | $ | 18.80 |
Total Return E,F | | 1.06% | | 24.86% | | 5.03% | | 12.92% | | (5.46)% |
Ratios to Average Net Assets B,G,H | | | | | | | | | | |
| Expenses before reductions | | 1.13% | | 1.06% | | .94% | | .93% | | .96% |
| Expenses net of fee waivers, if any | | 1.12% | | 1.05% | | .94% | | .93% | | .96% |
| Expenses net of all reductions | | 1.12% | | 1.05% | | .93% | | .93% | | .95% |
| Net investment income (loss) | | .85% | | .69% | | 1.67% C | | 1.45% | | 1.28% |
| Supplemental Data | | | | | | | | | | |
| Net assets, end of period (000 omitted) | $ | 39,638 | $ | 36,552 | $ | 22,580 | $ | 25,576 | $ | 25,204 |
Portfolio turnover rate I | | 67% | | 76% | | 104% | | 68% J | | 92% |
A Calculated based on average shares outstanding during the period.
B Net investment income (loss) is affected by the timing of the declaration of dividends by any underlying mutual funds or exchange-traded funds (ETFs). Net investment income (loss) of any mutual funds or ETFs is not included in the Fund's net investment income (loss) ratio.
C Net investment income per share reflects one or more large, non-recurring dividend(s) which amounted to $.07 per share. Excluding such non-recurring dividend(s), the ratio of net investment income (loss) to average net assets would have been 1.32%.
D Total distributions per share do not sum due to rounding.
E Total returns would have been lower if certain expenses had not been reduced during the applicable periods shown.
F Total returns do not include the effect of the sales charges.
G Fees and expenses of any underlying mutual funds or exchange-traded funds (ETFs) are not included in the Fund's expense ratio. The Fund indirectly bears its proportionate share of these expenses. For additional expense information related to investments in Fidelity Central Funds, please refer to the "Investments in Fidelity Central Funds" note found in the Notes to Financial Statements section of the most recent Annual or Semi-Annual report.
H Expense ratios reflect operating expenses of the class. Expenses before reductions do not reflect amounts reimbursed, waived, or reduced through arrangements with the investment adviser, brokerage services, or other offset arrangements, if applicable, and do not represent the amount paid by the class during periods when reimbursements, waivers or reductions occur.
I Amount does not include the portfolio activity of any underlying mutual funds or exchange-traded funds (ETFs).
J Portfolio turnover rate excludes securities received or delivered in-kind.
| Fidelity Advisor® Stock Selector Large Cap Value Fund Class M |
| |
| Years ended January 31, | | 2023 | | 2022 | | 2021 | | 2020 | | 2019 |
Selected Per-Share Data | | | | | | | | | | |
| Net asset value, beginning of period | $ | 25.72 | $ | 21.48 | $ | 20.88 | $ | 18.77 | $ | 21.24 |
| Income from Investment Operations | | | | | | | | | | |
Net investment income (loss) A,B | | .14 | | .11 | | .26 C | | .23 | | .19 |
| Net realized and unrealized gain (loss) | | (.01) | | 5.15 | | .70 | | 2.13 | | (1.44) |
| Total from investment operations | | .13 | | 5.26 | | .96 | | 2.36 | | (1.25) |
| Distributions from net investment income | | (.18) | | (.13) | | (.36) | | (.25) | | (.18) |
| Distributions from net realized gain | | (1.62) | | (.90) | | - | | - | | (1.03) |
| Total distributions | | (1.79) D | | (1.02) D | | (.36) | | (.25) | | (1.22) D |
| Net asset value, end of period | $ | 24.06 | $ | 25.72 | $ | 21.48 | $ | 20.88 | $ | 18.77 |
Total Return E,F | | .82% | | 24.55% | | 4.70% | | 12.59% | | (5.78)% |
Ratios to Average Net Assets B,G,H | | | | | | | | | | |
| Expenses before reductions | | 1.38% | | 1.32% | | 1.23% | | 1.24% | | 1.28% |
| Expenses net of fee waivers, if any | | 1.37% | | 1.31% | | 1.23% | | 1.23% | | 1.28% |
| Expenses net of all reductions | | 1.37% | | 1.31% | | 1.22% | | 1.23% | | 1.27% |
| Net investment income (loss) | | .60% | | .43% | | 1.38% C | | 1.15% | | .96% |
| Supplemental Data | | | | | | | | | | |
| Net assets, end of period (000 omitted) | $ | 12,319 | $ | 12,188 | $ | 9,526 | $ | 10,385 | $ | 9,542 |
Portfolio turnover rate I | | 67% | | 76% | | 104% | | 68% J | | 92% |
A Calculated based on average shares outstanding during the period.
B Net investment income (loss) is affected by the timing of the declaration of dividends by any underlying mutual funds or exchange-traded funds (ETFs). Net investment income (loss) of any mutual funds or ETFs is not included in the Fund's net investment income (loss) ratio.
C Net investment income per share reflects one or more large, non-recurring dividend(s) which amounted to $.07 per share. Excluding such non-recurring dividend(s), the ratio of net investment income (loss) to average net assets would have been 1.03%.
D Total distributions per share do not sum due to rounding.
E Total returns would have been lower if certain expenses had not been reduced during the applicable periods shown.
F Total returns do not include the effect of the sales charges.
G Fees and expenses of any underlying mutual funds or exchange-traded funds (ETFs) are not included in the Fund's expense ratio. The Fund indirectly bears its proportionate share of these expenses. For additional expense information related to investments in Fidelity Central Funds, please refer to the "Investments in Fidelity Central Funds" note found in the Notes to Financial Statements section of the most recent Annual or Semi-Annual report.
H Expense ratios reflect operating expenses of the class. Expenses before reductions do not reflect amounts reimbursed, waived, or reduced through arrangements with the investment adviser, brokerage services, or other offset arrangements, if applicable, and do not represent the amount paid by the class during periods when reimbursements, waivers or reductions occur.
I Amount does not include the portfolio activity of any underlying mutual funds or exchange-traded funds (ETFs).
J Portfolio turnover rate excludes securities received or delivered in-kind.
| Fidelity Advisor® Stock Selector Large Cap Value Fund Class C |
| |
| Years ended January 31, | | 2023 | | 2022 | | 2021 | | 2020 | | 2019 |
Selected Per-Share Data | | | | | | | | | | |
| Net asset value, beginning of period | $ | 25.11 | $ | 20.99 | $ | 20.40 | $ | 18.37 | $ | 20.81 |
| Income from Investment Operations | | | | | | | | | | |
Net investment income (loss) A,B | | .01 | | (.03) | | .16 C | | .12 | | .09 |
| Net realized and unrealized gain (loss) | | (.02) | | 5.02 | | .68 | | 2.08 | | (1.42) |
| Total from investment operations | | (.01) | | 4.99 | | .84 | | 2.20 | | (1.33) |
| Distributions from net investment income | | (.07) | | - | | (.25) | | (.17) | | (.08) |
| Distributions from net realized gain | | (1.62) | | (.87) | | - | | - | | (1.03) |
| Total distributions | | (1.68) D | | (.87) | | (.25) | | (.17) | | (1.11) |
| Net asset value, end of period | $ | 23.42 | $ | 25.11 | $ | 20.99 | $ | 20.40 | $ | 18.37 |
Total Return E,F | | .24% | | 23.82% | | 4.19% | | 11.96% | | (6.26)% |
Ratios to Average Net Assets B,G,H | | | | | | | | | | |
| Expenses before reductions | | 1.94% | | 1.88% | | 1.76% | | 1.78% | | 1.80% |
| Expenses net of fee waivers, if any | | 1.94% | | 1.88% | | 1.76% | | 1.77% | | 1.80% |
| Expenses net of all reductions | | 1.94% | | 1.88% | | 1.75% | | 1.77% | | 1.79% |
| Net investment income (loss) | | .04% | | (.14)% | | .86% C | | .61% | | .44% |
| Supplemental Data | | | | | | | | | | |
| Net assets, end of period (000 omitted) | $ | 7,898 | $ | 6,948 | $ | 6,723 | $ | 8,813 | $ | 9,813 |
Portfolio turnover rate I | | 67% | | 76% | | 104% | | 68% J | | 92% |
A Calculated based on average shares outstanding during the period.
B Net investment income (loss) is affected by the timing of the declaration of dividends by any underlying mutual funds or exchange-traded funds (ETFs). Net investment income (loss) of any mutual funds or ETFs is not included in the Fund's net investment income (loss) ratio.
C Net investment income per share reflects one or more large, non-recurring dividend(s) which amounted to $.06 per share. Excluding such non-recurring dividend(s), the ratio of net investment income (loss) to average net assets would have been .51%.
D Total distributions per share do not sum due to rounding.
E Total returns would have been lower if certain expenses had not been reduced during the applicable periods shown.
F Total returns do not include the effect of the contingent deferred sales charge.
G Fees and expenses of any underlying mutual funds or exchange-traded funds (ETFs) are not included in the Fund's expense ratio. The Fund indirectly bears its proportionate share of these expenses. For additional expense information related to investments in Fidelity Central Funds, please refer to the "Investments in Fidelity Central Funds" note found in the Notes to Financial Statements section of the most recent Annual or Semi-Annual report.
H Expense ratios reflect operating expenses of the class. Expenses before reductions do not reflect amounts reimbursed, waived, or reduced through arrangements with the investment adviser, brokerage services, or other offset arrangements, if applicable, and do not represent the amount paid by the class during periods when reimbursements, waivers or reductions occur.
I Amount does not include the portfolio activity of any underlying mutual funds or exchange-traded funds (ETFs).
J Portfolio turnover rate excludes securities received or delivered in-kind.
| Fidelity® Stock Selector Large Cap Value Fund |
| |
| Years ended January 31, | | 2023 | | 2022 | | 2021 | | 2020 | | 2019 |
Selected Per-Share Data | | | | | | | | | | |
| Net asset value, beginning of period | $ | 26.06 | $ | 21.73 | $ | 21.11 | $ | 18.94 | $ | 21.41 |
| Income from Investment Operations | | | | | | | | | | |
Net investment income (loss) A,B | | .28 | | .25 | | .38 C | | .35 | | .32 |
| Net realized and unrealized gain (loss) | | (.01) | | 5.23 | | .72 | | 2.16 | | (1.46) |
| Total from investment operations | | .27 | | 5.48 | | 1.10 | | 2.51 | | (1.14) |
| Distributions from net investment income | | (.30) | | (.25) | | (.48) | | (.34) | | (.29) |
| Distributions from net realized gain | | (1.62) | | (.90) | | - | | - | | (1.03) |
| Total distributions | | (1.92) | | (1.15) | | (.48) | | (.34) | | (1.33) D |
| Net asset value, end of period | $ | 24.41 | $ | 26.06 | $ | 21.73 | $ | 21.11 | $ | 18.94 |
Total Return E | | 1.36% | | 25.26% | | 5.31% | | 13.24% | | (5.20)% |
Ratios to Average Net Assets B,F,G | | | | | | | | | | |
| Expenses before reductions | | .83% | | .76% | | .64% | | .64% | | .67% |
| Expenses net of fee waivers, if any | | .83% | | .75% | | .64% | | .64% | | .67% |
| Expenses net of all reductions | | .83% | | .75% | | .63% | | .64% | | .66% |
| Net investment income (loss) | | 1.15% | | .99% | | 1.97% C | | 1.74% | | 1.57% |
| Supplemental Data | | | | | | | | | | |
| Net assets, end of period (000 omitted) | $ | 405,895 | $ | 446,926 | $ | 373,322 | $ | 432,154 | $ | 806,342 |
Portfolio turnover rate H | | 67% | | 76% | | 104% | | 68% I | | 92% |
A Calculated based on average shares outstanding during the period.
B Net investment income (loss) is affected by the timing of the declaration of dividends by any underlying mutual funds or exchange-traded funds (ETFs). Net investment income (loss) of any mutual funds or ETFs is not included in the Fund's net investment income (loss) ratio.
C Net investment income per share reflects one or more large, non-recurring dividend(s) which amounted to $.07 per share. Excluding such non-recurring dividend(s), the ratio of net investment income (loss) to average net assets would have been 1.62%.
D Total distributions per share do not sum due to rounding.
E Total returns would have been lower if certain expenses had not been reduced during the applicable periods shown.
F Fees and expenses of any underlying mutual funds or exchange-traded funds (ETFs) are not included in the Fund's expense ratio. The Fund indirectly bears its proportionate share of these expenses. For additional expense information related to investments in Fidelity Central Funds, please refer to the "Investments in Fidelity Central Funds" note found in the Notes to Financial Statements section of the most recent Annual or Semi-Annual report.
G Expense ratios reflect operating expenses of the class. Expenses before reductions do not reflect amounts reimbursed, waived, or reduced through arrangements with the investment adviser, brokerage services, or other offset arrangements, if applicable, and do not represent the amount paid by the class during periods when reimbursements, waivers or reductions occur.
H Amount does not include the portfolio activity of any underlying mutual funds or exchange-traded funds (ETFs).
I Portfolio turnover rate excludes securities received or delivered in-kind.
| Fidelity Advisor® Stock Selector Large Cap Value Fund Class I |
| |
| Years ended January 31, | | 2023 | | 2022 | | 2021 | | 2020 | | 2019 |
Selected Per-Share Data | | | | | | | | | | |
| Net asset value, beginning of period | $ | 26.17 | $ | 21.82 | $ | 21.22 | $ | 18.82 | $ | 21.28 |
| Income from Investment Operations | | | | | | | | | | |
Net investment income (loss) A,B | | .28 | | .26 | | .38 C | | .34 | | .31 |
| Net realized and unrealized gain (loss) | | (.01) | | 5.24 | | .72 | | 2.14 | | (1.45) |
| Total from investment operations | | .27 | | 5.50 | | 1.10 | | 2.48 | | (1.14) |
| Distributions from net investment income | | (.30) | | (.25) | | (.50) | | (.08) | | (.29) |
| Distributions from net realized gain | | (1.62) | | (.90) | | - | | - | | (1.03) |
| Total distributions | | (1.91) D | | (1.15) | | (.50) | | (.08) | | (1.32) |
| Net asset value, end of period | $ | 24.53 | $ | 26.17 | $ | 21.82 | $ | 21.22 | $ | 18.82 |
Total Return E | | 1.39% | | 25.26% | | 5.31% | | 13.20% | | (5.20)% |
Ratios to Average Net Assets B,F,G | | | | | | | | | | |
| Expenses before reductions | | .82% | | .75% | | .67% | | .67% | | .69% |
| Expenses net of fee waivers, if any | | .82% | | .74% | | .67% | | .66% | | .69% |
| Expenses net of all reductions | | .82% | | .74% | | .66% | | .66% | | .68% |
| Net investment income (loss) | | 1.15% | | 1.00% | | 1.94% C | | 1.72% | | 1.55% |
| Supplemental Data | | | | | | | | | | |
| Net assets, end of period (000 omitted) | $ | 10,858 | $ | 18,239 | $ | 9,420 | $ | 9,450 | $ | 98,119 |
Portfolio turnover rate H | | 67% | | 76% | | 104% | | 68% I | | 92% |
A Calculated based on average shares outstanding during the period.
B Net investment income (loss) is affected by the timing of the declaration of dividends by any underlying mutual funds or exchange-traded funds (ETFs). Net investment income (loss) of any mutual funds or ETFs is not included in the Fund's net investment income (loss) ratio.
C Net investment income per share reflects one or more large, non-recurring dividend(s) which amounted to $.07 per share. Excluding such non-recurring dividend(s), the ratio of net investment income (loss) to average net assets would have been 1.59%.
D Total distributions per share do not sum due to rounding.
E Total returns would have been lower if certain expenses had not been reduced during the applicable periods shown.
F Fees and expenses of any underlying mutual funds or exchange-traded funds (ETFs) are not included in the Fund's expense ratio. The Fund indirectly bears its proportionate share of these expenses. For additional expense information related to investments in Fidelity Central Funds, please refer to the "Investments in Fidelity Central Funds" note found in the Notes to Financial Statements section of the most recent Annual or Semi-Annual report.
G Expense ratios reflect operating expenses of the class. Expenses before reductions do not reflect amounts reimbursed, waived, or reduced through arrangements with the investment adviser, brokerage services, or other offset arrangements, if applicable, and do not represent the amount paid by the class during periods when reimbursements, waivers or reductions occur.
H Amount does not include the portfolio activity of any underlying mutual funds or exchange-traded funds (ETFs).
I Portfolio turnover rate excludes securities received or delivered in-kind.
| Fidelity Advisor® Stock Selector Large Cap Value Fund Class Z |
| |
| Years ended January 31, | | 2023 | | 2022 | | 2021 | | 2020 | | 2019 |
Selected Per-Share Data | | | | | | | | | | |
| Net asset value, beginning of period | $ | 25.88 | $ | 21.58 | $ | 20.97 | $ | 18.84 | $ | 21.30 |
| Income from Investment Operations | | | | | | | | | | |
Net investment income (loss) A,B | | .30 | | .28 | | .41 C | | .38 | | .34 |
| Net realized and unrealized gain (loss) | | (.01) | | 5.20 | | .71 | | 2.14 | | (1.45) |
| Total from investment operations | | .29 | | 5.48 | | 1.12 | | 2.52 | | (1.11) |
| Distributions from net investment income | | (.31) | | (.28) | | (.51) | | (.39) | | (.32) |
| Distributions from net realized gain | | (1.62) | | (.90) | | - | | - | | (1.03) |
| Total distributions | | (1.93) | | (1.18) | | (.51) | | (.39) | | (1.35) |
| Net asset value, end of period | $ | 24.24 | $ | 25.88 | $ | 21.58 | $ | 20.97 | $ | 18.84 |
Total Return D | | 1.46% | | 25.43% | | 5.43% | | 13.38% | | (5.04)% |
Ratios to Average Net Assets B,E,F | | | | | | | | | | |
| Expenses before reductions | | .72% | | .65% | | .52% | | .52% | | .55% |
| Expenses net of fee waivers, if any | | .71% | | .65% | | .52% | | .52% | | .55% |
| Expenses net of all reductions | | .71% | | .65% | | .51% | | .51% | | .54% |
| Net investment income (loss) | | 1.26% | | 1.10% | | 2.10% C | | 1.86% | | 1.70% |
| Supplemental Data | | | | | | | | | | |
| Net assets, end of period (000 omitted) | $ | 5,973 | $ | 20,576 | $ | 20,841 | $ | 12,905 | $ | 858 |
Portfolio turnover rate G | | 67% | | 76% | | 104% | | 68% H | | 92% |
A Calculated based on average shares outstanding during the period.
B Net investment income (loss) is affected by the timing of the declaration of dividends by any underlying mutual funds or exchange-traded funds (ETFs). Net investment income (loss) of any mutual funds or ETFs is not included in the Fund's net investment income (loss) ratio.
C Net investment income per share reflects one or more large, non-recurring dividend(s) which amounted to $.07 per share. Excluding such non-recurring dividend(s), the ratio of net investment income (loss) to average net assets would have been 1.75%.
D Total returns would have been lower if certain expenses had not been reduced during the applicable periods shown.
E Fees and expenses of any underlying mutual funds or exchange-traded funds (ETFs) are not included in the Fund's expense ratio. The Fund indirectly bears its proportionate share of these expenses. For additional expense information related to investments in Fidelity Central Funds, please refer to the "Investments in Fidelity Central Funds" note found in the Notes to Financial Statements section of the most recent Annual or Semi-Annual report.
F Expense ratios reflect operating expenses of the class. Expenses before reductions do not reflect amounts reimbursed, waived, or reduced through arrangements with the investment adviser, brokerage services, or other offset arrangements, if applicable, and do not represent the amount paid by the class during periods when reimbursements, waivers or reductions occur.
G Amount does not include the portfolio activity of any underlying mutual funds or exchange-traded funds (ETFs).
H Portfolio turnover rate excludes securities received or delivered in-kind.
For the period ended January 31, 2023
1. Organization.
Fidelity Stock Selector Large Cap Value Fund (the Fund) is a fund of Fidelity Devonshire Trust (the Trust) and is authorized to issue an unlimited number of shares. The Trust is registered under the Investment Company Act of 1940, as amended (the 1940 Act), as an open-end management investment company organized as a Massachusetts business trust. The Fund offers Class A, Class M, Class C, Stock Selector Large Cap Value, Class I and Class Z shares, each of which has equal rights as to assets and voting privileges. Each class has exclusive voting rights with respect to matters that affect that class. Class C shares will automatically convert to Class A shares after a holding period of eight years from the initial date of purchase, with certain exceptions.
2. Investments in Fidelity Central Funds.
Funds may invest in Fidelity Central Funds, which are open-end investment companies generally available only to other investment companies and accounts managed by the investment adviser and its affiliates. The Schedule of Investments lists any Fidelity Central Funds held as an investment as of period end, but does not include the underlying holdings of each Fidelity Central Fund. An investing fund indirectly bears its proportionate share of the expenses of the underlying Fidelity Central Funds.
Based on its investment objective, each Fidelity Central Fund may invest or participate in various investment vehicles or strategies that are similar to those of the investing fund. These strategies are consistent with the investment objectives of the investing fund and may involve certain economic risks which may cause a decline in value of each of the Fidelity Central Funds and thus a decline in the value of the investing fund.
| Fidelity Central Fund | Investment Manager | Investment Objective | Investment Practices | Expense Ratio A |
| Fidelity Money Market Central Funds | Fidelity Management & Research Company LLC (FMR) | Each fund seeks to obtain a high level of current income consistent with the preservation of capital and liquidity. | Short-term Investments | Less than .005% |
A Expenses expressed as a percentage of average net assets and are as of each underlying Central Fund's most recent annual or semi-annual shareholder report.
A complete unaudited list of holdings for each Fidelity Central Fund is available upon request or at the Securities and Exchange Commission website at www.sec.gov. In addition, the financial statements of the Fidelity Central Funds which contain the significant accounting policies (including investment valuation policies) of those funds, and are not covered by the Report of Independent Registered Public Accounting Firm, are available on the Securities and Exchange Commission website or upon request.
3. Significant Accounting Policies.
The Fund is an investment company and applies the accounting and reporting guidance of the Financial Accounting Standards Board (FASB) Accounting Standards Codification Topic 946 Financial Services - Investment Companies . The financial statements have been prepared in conformity with accounting principles generally accepted in the United States of America (GAAP), which require management to make certain estimates and assumptions at the date of the financial statements. Actual results could differ from those estimates. Subsequent events, if any, through the date that the financial statements were issued have been evaluated in the preparation of the financial statements. The Fund's Schedule of Investments lists any underlying mutual funds or exchange-traded funds (ETFs) but does not include the underlying holdings of these funds. The following summarizes the significant accounting policies of the Fund:
Investment Valuation. Investments are valued as of 4:00 p.m. Eastern time on the last calendar day of the period. The Board of Trustees (the Board) has designated the Fund's investment adviser as the valuation designee responsible for the fair valuation function and performing fair value determinations as needed. The investment adviser has established a Fair Value Committee (the Committee) to carry out the day-to-day fair valuation responsibilities and has adopted policies and procedures to govern the fair valuation process and the activities of the Committee. In accordance with these fair valuation policies and procedures, which have been approved by the Board, the Fund attempts to obtain prices from one or more third party pricing services or brokers to value its investments. When current market prices, quotations or currency exchange rates are not readily available or reliable, investments will be fair valued in good faith by the Committee, in accordance with the policies and procedures. Factors used in determining fair value vary by investment type and may include market or investment specific events, transaction data, estimated cash flows, and market observations of comparable investments. The frequency that the fair valuation procedures are used cannot be predicted and they may be utilized to a significant extent. The Committee manages the Fund's fair valuation practices and maintains the fair valuation policies and procedures. The Fund's investment adviser reports to the Board information regarding the fair valuation process and related material matters.
The Fund categorizes the inputs to valuation techniques used to value its investments into a disclosure hierarchy consisting of three levels as shown below:
Level 1 - unadjusted quoted prices in active markets for identical investments
Level 2 - other significant observable inputs (including quoted prices for similar investments, interest rates, prepayment speeds, etc.)
Level 3 - unobservable inputs (including the Fund's own assumptions based on the best information available)
Valuation techniques used to value the Fund's investments by major category are as follows:
Equity securities, including restricted securities, for which market quotations are readily available, are valued at the last reported sale price or official closing price as reported by a third party pricing service on the primary market or exchange on which they are traded and are categorized as Level 1 in the hierarchy. In the event there were no sales during the day or closing prices are not available, securities are valued at the last quoted bid price or may be valued using the last available price and are generally categorized as Level 2 in the hierarchy. For foreign equity securities, when market or security specific events arise, comparisons to the valuation of American Depositary Receipts (ADRs), futures contracts, ETFs and certain indexes as well as quoted prices for similar securities may be used and would be categorized as Level 2 in the hierarchy. For equity securities, including restricted securities, where observable inputs are limited, assumptions about market activity and risk are used and these securities may be categorized as Level 3 in the hierarchy.
ETFs are valued at their last sale price or official closing price as reported by a third party pricing service on the primary market or exchange on which they are traded and are categorized as Level 1 in the hierarchy. In the event there were no sales during the day but the exchange reports a closing bid level, ETFs are valued at the closing bid and would be categorized as Level 1 in the hierarchy. In the event there was no closing bid, ETFs may be valued by another method that the Board believes reflects fair value in accordance with the Board's fair value pricing policies and may be categorized as Level 2 in the hierarchy.
Investments in open-end mutual funds, including the Fidelity Central Funds, are valued at their closing net asset value (NAV) each business day and are categorized as Level 1 in the hierarchy.
Changes in valuation techniques may result in transfers in or out of an assigned level within the disclosure hierarchy. The aggregate value of investments by input level as of January 31, 2023 is included at the end of the Fund's Schedule of Investments.
Foreign Currency. Certain Funds may use foreign currency contracts to facilitate transactions in foreign-denominated securities. Gains and losses from these transactions may arise from changes in the value of the foreign currency or if the counterparties do not perform under the contracts' terms.
Foreign-denominated assets, including investment securities, and liabilities are translated into U.S. dollars at the exchange rates at period end. Purchases and sales of investment securities, income and dividends received, and expenses denominated in foreign currencies are translated into U.S. dollars at the exchange rate in effect on the transaction date.
The effects of exchange rate fluctuations on investments are included with the net realized and unrealized gain (loss) on investment securities. Other foreign currency transactions resulting in realized and unrealized gain (loss) are disclosed separately.
Investment Transactions and Income. For financial reporting purposes, the Fund's investment holdings and NAV include trades executed through the end of the last business day of the period. The NAV per share for processing shareholder transactions is calculated as of the close of business of the New York Stock Exchange (NYSE), normally 4:00 p.m. Eastern time and includes trades executed through the end of the prior business day. Gains and losses on securities sold are determined on the basis of identified cost and include proceeds received from litigation. Commissions paid to certain brokers with whom the investment adviser, or its affiliates, places trades on behalf of a fund include an amount in addition to trade execution, which may be rebated back to a fund. Any such rebates are included in net realized gain (loss) on investments in the Statement of Operations. Dividend income is recorded on the ex-dividend date, except for certain dividends from foreign securities where the ex-dividend date may have passed, which are recorded as soon as the Fund is informed of the ex-dividend date. Non-cash dividends included in dividend income, if any, are recorded at the fair market value of the securities received. Income and capital gain distributions from Fidelity Central Funds, if any, are recorded on the ex-dividend date. Certain distributions received by the Fund represent a return of capital or capital gain. The Fund determines the components of these distributions subsequent to the ex-dividend date, based upon receipt of tax filings or other correspondence relating to the underlying investment. These distributions are recorded as a reduction of cost of investments and/or as a realized gain. Investment income is recorded net of foreign taxes withheld where recovery of such taxes is uncertain. Funds may file withholding tax reclaims in certain jurisdictions to recover a portion of amounts previously withheld. Any withholding tax reclaims income is included in the Statement of Operations in dividends. Any receivables for withholding tax reclaims are included in the Statement of Assets and Liabilities in dividends receivable.
Class Allocations and Expenses. Investment income, realized and unrealized capital gains and losses, common expenses of a fund, and certain fund-level expense reductions, if any, are allocated daily on a pro-rata basis to each class based on the relative net assets of each class to the total net assets of a fund. Each class differs with respect to transfer agent and distribution and service plan fees incurred, as applicable. Certain expense reductions may also differ by class, if applicable. For the reporting period, the allocated portion of income and expenses to each class as a percent of its average net assets may vary due to the timing of recording these transactions in relation to fluctuating net assets of the classes. Expenses directly attributable to a fund are charged to that fund. Expenses attributable to more than one fund are allocated among the respective funds on the basis of relative net assets or other appropriate methods. Expenses included in the accompanying financial statements reflect the expenses of that fund and do not include any expenses associated with any underlying mutual funds or exchange-traded funds. Although not included in a fund's expenses, a fund indirectly bears its proportionate share of these expenses through the net asset value of each underlying mutual fund or exchange-traded fund. Expense estimates are accrued in the period to which they relate and adjustments are made when actual amounts are known.
Income Tax Information and Distributions to Shareholders. Each year, the Fund intends to qualify as a regulated investment company under Subchapter M of the Internal Revenue Code, including distributing substantially all of its taxable income and realized gains. As a result, no provision for U.S. Federal income taxes is required. As of January 31, 2023, the Fund did not have any unrecognized tax benefits in the financial statements; nor is the Fund aware of any tax positions for which it is reasonably possible that the total amounts of unrecognized tax benefits will significantly change in the next twelve months. The Fund files a U.S. federal tax return, in addition to state and local tax returns as required. The Fund's federal income tax returns are subject to examination by the Internal Revenue Service (IRS) for a period of three fiscal years after they are filed. State and local tax returns may be subject to examination for an additional fiscal year depending on the jurisdiction. Foreign taxes are provided for based on the Fund's understanding of the tax rules and rates that exist in the foreign markets in which it invests.
Distributions are declared and recorded on the ex-dividend date. Income and capital gain distributions are declared separately for each class. Income and capital gain distributions are determined in accordance with income tax regulations, which may differ from GAAP. In addition, the Fund claimed a portion of the payment made to redeeming shareholders as a distribution for income tax purposes.
Capital accounts within the financial statements are adjusted for permanent book-tax differences. These adjustments have no impact on net assets or the results of operations. Capital accounts are not adjusted for temporary book-tax differences which will reverse in a subsequent period.
Book-tax differences are primarily due to the foreign currency transactions and losses deferred due to wash sales.
As of period end, the cost and unrealized appreciation (depreciation) in securities, and derivatives if applicable, for federal income tax purposes were as follows:
| Gross unrealized appreciation | $93,691,025 |
| Gross unrealized depreciation | (16,712,800) |
| Net unrealized appreciation (depreciation) | $76,978,225 |
| Tax Cost | $407,362,533 |
The tax-based components of distributable earnings as of period end were as follows:
| Undistributed long-term capital gain | $1,624,153 |
| Net unrealized appreciation (depreciation) on securities and other investments | $76,977,634 |
The tax character of distributions paid was as follows:
| | January 31, 2023 | January 31, 2022 |
| Ordinary Income | $5,512,900 | $ 13,137,853 |
| Long-term Capital Gains | 31,983,399 | 9,491,071 |
| Total | $37,496,299 | $ 22,628,924 |
4. Purchases and Sales of Investments.
Purchases and sales of securities, other than short-term securities and in-kind transactions, as applicable, are noted in the table below.
| | Purchases ($) | Sales ($) |
| Fidelity Stock Selector Large Cap Value Fund | 323,069,984 | 377,208,207 |
5. Fees and Other Transactions with Affiliates.
Management Fee. Fidelity Management & Research Company LLC (the investment adviser) and its affiliates provide the Fund with investment management related services for which the Fund pays a monthly management fee. The management fee is the sum of an individual fund fee rate that is based on an annual rate of .30% of the Fund's average net assets and an annualized group fee rate that averaged .23% during the period. The group fee rate is based upon the monthly average net assets of a group of registered investment companies with which the investment adviser has management contracts. The group fee rate decreases as assets under management increase and increases as assets under management decrease. In addition, the management fee is subject to a performance adjustment (up to a maximum of +/- .20% of the Fund's average net assets over a 36 month performance period). The upward or downward adjustment to the management fee is based on the relative investment performance of the Stock Selector Large Cap Value as compared to its benchmark index, the Russell 1000 Value Index, over the same 36 month performance period. For the reporting period, the total annual management fee rate, including the performance adjustment, was .60% of the Fund's average net assets. The performance adjustment included in the management fee rate may be higher or lower than the maximum performance adjustment rate due to the difference between the average net assets for the reporting and performance periods.
Distribution and Service Plan Fees. In accordance with Rule 12b-1 of the 1940 Act, the Fund has adopted separate Distribution and Service Plans for each class of shares. Certain classes pay Fidelity Distributors Company LLC (FDC), an affiliate of the investment adviser, separate Distribution and Service Fees, each of which is based on an annual percentage of each class' average net assets. In addition, FDC may pay financial intermediaries for selling shares of the Fund and providing shareholder support services. For the period, the Distribution and Service Fee rates, total fees and amounts retained by FDC were as follows:
| | Distribution Fee | Service Fee | Total Fees | Retained by FDC |
| Class A | - % | .25% | $92,255 | $2,974 |
| Class M | .25% | .25% | 58,454 | 115 |
| Class C | .75% | .25% | 67,294 | 8,157 |
| | | | $218,003 | $11,246 |
Sales Load. FDC may receive a front-end sales charge of up to 5.75% for selling Class A shares and 3.50% for selling Class M shares, some of which is paid to financial intermediaries for selling shares of the Fund. Depending on the holding period, FDC may receive contingent deferred sales charges levied on Class A, Class M and Class C redemptions. The deferred sales charges are 1.00% for Class C shares, 1.00% for certain purchases of Class A shares and .25% for certain purchases of Class M shares.
For the period, sales charge amounts retained by FDC were as follows:
| | Retained by FDC |
| Class A | $11,915 |
| Class M | 1,093 |
Class C A | 82 |
| | $13,090 |
A When Class C shares are initially sold, FDC pays commissions from its own resources to financial intermediaries through which the sales are made.
Transfer Agent Fees. Fidelity Investments Institutional Operations Company LLC (FIIOC), an affiliate of the investment adviser, is the transfer, dividend disbursing and shareholder servicing agent for each class of the Fund. FIIOC receives account fees and asset-based fees that vary according to the account size and type of account of the shareholders of the respective classes of the Fund, except for Class Z. FIIOC receives an asset-based fee of Class Z's average net assets. FIIOC pays for typesetting, printing and mailing of shareholder reports, except proxy statements.
For the period, transfer agent fees for each class were as follows:
| | Amount | % of Class-Level Average Net Assets |
| Class A | $73,743 | .20 |
| Class M | 23,435 | .20 |
| Class C | 17,623 | .26 |
| Stock Selector Large Cap Value | 617,609 | .15 |
| Class I | 17,672 | .15 |
| Class Z | 6,618 | .04 |
| | $756,700 | |
Accounting Fees. Fidelity Service Company, Inc. (FSC), an affiliate of the investment adviser, maintains the Fund's accounting records. The accounting fee is based on the level of average net assets for each month. For the period, the fees were equivalent to the following annual rates:
| | % of Average Net Assets |
| Fidelity Stock Selector Large Cap Value Fund | .04 |
Brokerage Commissions. A portion of portfolio transactions were placed with brokerage firms which are affiliates of the investment adviser. Brokerage commissions are included in net realized gain (loss) and change in net unrealized appreciation (depreciation) in the Statement of Operations. The commissions paid to these affiliated firms were as follows:
| | Amount |
| Fidelity Stock Selector Large Cap Value Fund | $5,126 |
Interfund Lending Program. Pursuant to an Exemptive Order issued by the Securities and Exchange Commission (the SEC), the Fund, along with other registered investment companies having management contracts with Fidelity Management & Research Company LLC (FMR), or other affiliated entities of FMR, may participate in an interfund lending program. This program provides an alternative credit facility allowing the Fund to borrow from, or lend money to, other participating affiliated funds. At period end, there were no interfund loans outstanding. Activity in this program during the period for which loans were outstanding was as follows:
| | Borrower or Lender | Average Loan Balance | Weighted Average Interest Rate | Interest Expense |
| Fidelity Stock Selector Large Cap Value Fund | Borrower | $12,453,000 | 3.32% | $1,147 |
Interfund Trades. Funds may purchase from or sell securities to other Fidelity Funds under procedures adopted by the Board. The procedures have been designed to ensure these interfund trades are executed in accordance with Rule 17a-7 of the 1940 Act. Any interfund trades are included within the respective purchases and sales amounts shown in the Purchases and Sales of Investments note. Interfund trades during the period are noted in the table below.
| | Purchases ($) | Sales ($) | Realized Gain (Loss) ($) |
| Fidelity Stock Selector Large Cap Value Fund | 34,315,430 | 48,551,813 | 945,187 |
Other. During the period, the investment adviser reimbursed the Fund for certain losses as follows:
| | Amount ($) |
| Fidelity Stock Selector Large Cap Value Fund | 25,194 |
6. Committed Line of Credit.
Certain Funds participate with other funds managed by the investment adviser or an affiliate in a $4.25 billion credit facility (the "line of credit") to be utilized for temporary or emergency purposes to fund shareholder redemptions or for other short-term liquidity purposes. The participating funds have agreed to pay commitment fees on their pro-rata portion of the line of credit, which are reflected in Miscellaneous expenses on the Statement of Operations, and are listed below. During the period, there were no borrowings on this line of credit.
| | Amount |
| Fidelity Stock Selector Large Cap Value Fund | $878 |
7. Security Lending.
Funds lend portfolio securities from time to time in order to earn additional income. Lending agents are used, including National Financial Services (NFS), an affiliate of the investment adviser. Pursuant to a securities lending agreement, NFS will receive a fee, which is capped at 9.9% of a fund's daily lending revenue, for its services as lending agent. A fund may lend securities to certain qualified borrowers, including NFS. On the settlement date of the loan, a fund receives collateral (in the form of U.S. Treasury obligations, letters of credit and/or cash) against the loaned securities and maintains collateral in an amount not less than 100% of the market value of the loaned securities during the period of the loan. The market value of the loaned securities is determined at the close of business of a fund and any additional required collateral is delivered to a fund on the next business day. A fund or borrower may terminate the loan at any time, and if the borrower defaults on its obligation to return the securities loaned because of insolvency or other reasons, a fund may apply collateral received from the borrower against the obligation. A fund may experience delays and costs in recovering the securities loaned. Any cash collateral received is invested in the Fidelity Securities Lending Cash Central Fund. Any loaned securities are identified as such in the Schedule of Investments, and the value of loaned securities and cash collateral at period end, as applicable, are presented in the Statement of Assets and Liabilities. Security lending income represents the income earned on investing cash collateral, less rebates paid to borrowers and any lending agent fees associated with the loan, plus any premium payments received for lending certain types of securities. Security lending income is presented in the Statement of Operations as a component of income from Fidelity Central Funds. Affiliated security lending activity, if any, was as follows:
| | Total Security Lending Fees Paid to NFS | Security Lending Income From Securities Loaned to NFS | Value of Securities Loaned to NFS at Period End |
| Fidelity Stock Selector Large Cap Value Fund | $ 1,078 | $ - | $- |
8. Expense Reductions.
During the period the investment adviser or an affiliate reimbursed and/or waived a portion of fund-level operating expenses in the amount of $16,989.
9. Distributions to Shareholders.
Distributions to shareholders of each class were as follows:
| | Year ended January 31, 2023 | Year ended January 31, 2022 |
| Fidelity Stock Selector Large Cap Value Fund | | |
| Distributions to shareholders | | |
| Class A | $2,802,856 | $1,458,259 |
| Class M | 872,953 | 463,210 |
| Class C | 486,387 | 235,247 |
| Stock Selector Large Cap Value | 31,443,168 | 18,997,597 |
| Class I | 1,004,740 | 632,304 |
| Class Z | 886,195 | 842,307 |
| Total | $37,496,299 | $22,628,924 |
10. Share Transactions.
Share transactions for each class were as follows and may contain in-kind transactions, automatic conversions between classes or exchanges between affiliated funds:
| | Shares | Shares | Dollars | Dollars |
| | Year ended January 31, 2023 | Year ended January 31, 2022 | Year ended January 31, 2023 | Year ended January 31, 2022 |
| Fidelity Stock Selector Large Cap Value Fund | | | | |
| Class A | | | | |
| Shares sold | 335,914 | 499,669 | $8,018,993 | $12,832,213 |
| Reinvestment of distributions | 114,886 | 54,592 | 2,694,081 | 1,394,818 |
| Shares redeemed | (225,187) | (185,423) | (5,287,878) | (4,674,112) |
| Net increase (decrease) | 225,613 | 368,838 | $5,425,196 | $9,552,919 |
| Class M | | | | |
| Shares sold | 68,651 | 54,496 | $1,637,524 | $1,390,358 |
| Reinvestment of distributions | 37,248 | 18,165 | 872,853 | 463,210 |
| Shares redeemed | (67,616) | (42,334) | (1,611,031) | (1,057,097) |
| Net increase (decrease) | 38,283 | 30,327 | $899,346 | $796,471 |
| Class C | | | | |
| Shares sold | 111,397 | 78,440 | $2,543,174 | $1,947,324 |
| Reinvestment of distributions | 21,248 | 9,440 | 486,387 | 235,247 |
| Shares redeemed | (72,074) | (131,579) | (1,681,764) | (3,240,337) |
| Net increase (decrease) | 60,571 | (43,699) | $1,347,797 | $(1,057,766) |
| Stock Selector Large Cap Value | | | | |
| Shares sold | 1,256,457 | 2,740,948 | $30,696,006 | $70,395,154 |
| Reinvestment of distributions | 1,239,041 | 694,465 | 29,458,357 | 17,931,137 |
| Shares redeemed | (3,015,259) | (3,465,566) | (72,814,961) | (89,617,663) |
| Net increase (decrease) | (519,761) | (30,153) | $(12,660,598) | $(1,291,372) |
| Class I | | | | |
| Shares sold | 132,680 | 605,163 | $3,206,703 | $15,087,077 |
| Reinvestment of distributions | 40,097 | 23,134 | 965,922 | 599,870 |
| Shares redeemed | (426,883) | (363,172) | (10,544,795) | (9,302,023) |
| Net increase (decrease) | (254,106) | 265,125 | $(6,372,170) | $6,384,924 |
| Class Z | | | | |
| Shares sold | 136,141 | 332,126 | $3,345,203 | $8,567,920 |
| Reinvestment of distributions | 34,453 | 31,519 | 833,330 | 807,823 |
| Shares redeemed | (719,267) | (534,118) | (15,760,999) | (13,033,101) |
| Net increase (decrease) | (548,673) | (170,473) | $(11,582,466) | $(3,657,358) |
11. Other.
A fund's organizational documents provide former and current trustees and officers with a limited indemnification against liabilities arising in connection with the performance of their duties to the fund. In the normal course of business, a fund may also enter into contracts that provide general indemnifications. A fund's maximum exposure under these arrangements is unknown as this would be dependent on future claims that may be made against a fund. The risk of material loss from such claims is considered remote.
12. Risk and Uncertainties.
Many factors affect a fund's performance. Developments that disrupt global economies and financial markets, such as pandemics, epidemics, outbreaks of infectious diseases, war, terrorism, and environmental disasters, may significantly affect a fund's investment performance. The effects of these developments to a fund will be impacted by the types of securities in which a fund invests, the financial condition, industry, economic sector, and geographic location of an issuer, and a fund's level of investment in the securities of that issuer.
To the Board of Trustees of Fidelity Devonshire Trust and Shareholders of Fidelity Stock Selector Large Cap Value Fund
Opinion on the Financial Statements
We have audited the accompanying statement of assets and liabilities, including the schedule of investments, of Fidelity Stock Selector Large Cap Value Fund (one of the funds constituting Fidelity Devonshire Trust, referred to hereafter as the "Fund") as of January 31, 2023, the related statement of operations for the year ended January 31, 2023, the statement of changes in net assets for each of the two years in the period ended January 31, 2023, including the related notes, and the financial highlights for each of the five years in the period ended January 31, 2023 (collectively referred to as the "financial statements"). In our opinion, the financial statements present fairly, in all material respects, the financial position of the Fund as of January 31, 2023, the results of its operations for the year then ended, the changes in its net assets for each of the two years in the period ended January 31, 2023 and the financial highlights for each of the five years in the period ended January 31, 2023 in conformity with accounting principles generally accepted in the United States of America.
Basis for Opinion
These financial statements are the responsibility of the Fund's management. Our responsibility is to express an opinion on the Fund's financial statements based on our audits. We are a public accounting firm registered with the Public Company Accounting Oversight Board (United States) (PCAOB) and are required to be independent with respect to the Fund in accordance with the U.S. federal securities laws and the applicable rules and regulations of the Securities and Exchange Commission and the PCAOB.
We conducted our audits of these financial statements in accordance with the standards of the PCAOB. Those standards require that we plan and perform the audit to obtain reasonable assurance about whether the financial statements are free of material misstatement, whether due to error or fraud.
Our audits included performing procedures to assess the risks of material misstatement of the financial statements, whether due to error or fraud, and performing procedures that respond to those risks. Such procedures included examining, on a test basis, evidence regarding the amounts and disclosures in the financial statements. Our audits also included evaluating the accounting principles used and significant estimates made by management, as well as evaluating the overall presentation of the financial statements. Our procedures included confirmation of securities owned as of January 31, 2023 by correspondence with the custodian and brokers; when replies were not received from brokers, we performed other auditing procedures. We believe that our audits provide a reasonable basis for our opinion.
/s/ PricewaterhouseCoopers LLP
Boston, Massachusetts
March 16, 2023
We have served as the auditor of one or more investment companies in the Fidelity group of funds since 1932.
The Trustees, Members of the Advisory Board (if any), and officers of the trust and fund, as applicable, are listed below. The Board of Trustees governs the fund and is responsible for protecting the interests of shareholders. The Trustees are experienced executives who meet periodically throughout the year to oversee the fund's activities, review contractual arrangements with companies that provide services to the fund, oversee management of the risks associated with such activities and contractual arrangements, and review the fund's performance. Each of the Trustees oversees 318 funds.
The Trustees hold office without limit in time except that (a) any Trustee may resign; (b) any Trustee may be removed by written instrument, signed by at least two-thirds of the number of Trustees prior to such removal; (c) any Trustee who requests to be retired or who has become incapacitated by illness or injury may be retired by written instrument signed by a majority of the other Trustees; and (d) any Trustee may be removed at any special meeting of shareholders by a two-thirds vote of the outstanding voting securities of the trust. Each Trustee who is not an interested person (as defined in the 1940 Act) of the trust and the fund is referred to herein as an Independent Trustee. Each Independent Trustee shall retire not later than the last day of the calendar year in which his or her 75th birthday occurs. The Independent Trustees may waive this mandatory retirement age policy with respect to individual Trustees. Officers and Advisory Board Members hold office without limit in time, except that any officer or Advisory Board Member may resign or may be removed by a vote of a majority of the Trustees at any regular meeting or any special meeting of the Trustees. Except as indicated, each individual has held the office shown or other offices in the same company for the past five years.
The fund's Statement of Additional Information (SAI) includes more information about the Trustees. To request a free copy, call Fidelity at 1-800-544-8544 if you're an individual investing directly with Fidelity, call 1-800-835-5092 if you're a plan sponsor or participant with Fidelity as your recordkeeper or call 1-877-208-0098 on institutional accounts or if you're an advisor or invest through one.
Experience, Skills, Attributes, and Qualifications of the Trustees. The Governance and Nominating Committee has adopted a statement of policy that describes the experience, qualifications, attributes, and skills that are necessary and desirable for potential Independent Trustee candidates (Statement of Policy). The Board believes that each Trustee satisfied at the time he or she was initially elected or appointed a Trustee, and continues to satisfy, the standards contemplated by the Statement of Policy. The Governance and Nominating Committee also engages professional search firms to help identify potential Independent Trustee candidates who have the experience, qualifications, attributes, and skills consistent with the Statement of Policy. From time to time, additional criteria based on the composition and skills of the current Independent Trustees, as well as experience or skills that may be appropriate in light of future changes to board composition, business conditions, and regulatory or other developments, have also been considered by the professional search firms and the Governance and Nominating Committee. In addition, the Board takes into account the Trustees' commitment and participation in Board and committee meetings, as well as their leadership of standing and ad hoc committees throughout their tenure.
In determining that a particular Trustee was and continues to be qualified to serve as a Trustee, the Board has considered a variety of criteria, none of which, in isolation, was controlling. The Board believes that, collectively, the Trustees have balanced and diverse experience, qualifications, attributes, and skills, which allow the Board to operate effectively in governing the fund and protecting the interests of shareholders. Information about the specific experience, skills, attributes, and qualifications of each Trustee, which in each case led to the Board's conclusion that the Trustee should serve (or continue to serve) as a trustee of the fund, is provided below.
Board Structure and Oversight Function. Robert A. Lawrence is an interested person and currently serves as Chair. The Trustees have determined that an interested Chair is appropriate and benefits shareholders because an interested Chair has a personal and professional stake in the quality and continuity of services provided to the fund. Independent Trustees exercise their informed business judgment to appoint an individual of their choosing to serve as Chair, regardless of whether the Trustee happens to be independent or a member of management. The Independent Trustees have determined that they can act independently and effectively without having an Independent Trustee serve as Chair and that a key structural component for assuring that they are in a position to do so is for the Independent Trustees to constitute a substantial majority for the Board. The Independent Trustees also regularly meet in executive session. David M. Thomas serves as Lead Independent Trustee and as such (i) acts as a liaison between the Independent Trustees and management with respect to matters important to the Independent Trustees and (ii) with management prepares agendas for Board meetings.
Fidelity ® funds are overseen by different Boards of Trustees. The fund's Board oversees Fidelity's high income and certain equity funds, and other Boards oversee Fidelity's alternative investment, investment-grade bond, money market, asset allocation, and other equity funds. The asset allocation funds may invest in Fidelity ® funds overseen by the fund's Board. The use of separate Boards, each with its own committee structure, allows the Trustees of each group of Fidelity ® funds to focus on the unique issues of the funds they oversee, including common research, investment, and operational issues. On occasion, the separate Boards establish joint committees to address issues of overlapping consequences for the Fidelity ® funds overseen by each Board.
The Trustees operate using a system of committees to facilitate the timely and efficient consideration of all matters of importance to the Trustees, the fund, and fund shareholders and to facilitate compliance with legal and regulatory requirements and oversight of the fund's activities and associated risks. The Board, acting through its committees, has charged FMR and its affiliates with (i) identifying events or circumstances the occurrence of which could have demonstrably adverse effects on the fund's business and/or reputation; (ii) implementing processes and controls to lessen the possibility that such events or circumstances occur or to mitigate the effects of such events or circumstances if they do occur; and (iii) creating and maintaining a system designed to evaluate continuously business and market conditions in order to facilitate the identification and implementation processes described in (i) and (ii) above. Because the day-to-day operations and activities of the fund are carried out by or through FMR, its affiliates, and other service providers, the fund's exposure to risks is mitigated but not eliminated by the processes overseen by the Trustees. While each of the Board's committees has responsibility for overseeing different aspects of the fund's activities, oversight is exercised primarily through the Operations, Audit, and Compliance Committees. Appropriate personnel, including but not limited to the fund's Chief Compliance Officer (CCO), FMR's internal auditor, the independent accountants, the fund's Treasurer and portfolio management personnel, make periodic reports to the Board's committees, as appropriate, including an annual review of Fidelity's risk management program for the Fidelity ® funds. The responsibilities of each standing committee, including their oversight responsibilities, are described further under "Standing Committees of the Trustees."
Interested Trustees*:
Correspondence intended for a Trustee who is an interested person may be sent to Fidelity Investments, 245 Summer Street, Boston, Massachusetts 02210.
Name, Year of Birth; Principal Occupations and Other Relevant Experience+
Bettina Doulton (1964)
Year of Election or Appointment: 2020
Trustee
Ms. Doulton also serves as Trustee of other Fidelity ® funds. Prior to her retirement, Ms. Doulton served in a variety of positions at Fidelity Investments, including as a managing director of research (2006-2007), portfolio manager to certain Fidelity ® funds (1993-2005), equity analyst and portfolio assistant (1990-1993), and research assistant (1987-1990). Ms. Doulton currently owns and operates Phi Builders + Architects and Cellardoor Winery. Previously, Ms. Doulton served as a member of the Board of Brown Capital Management, LLC (2014-2018).
Robert A. Lawrence (1952)
Year of Election or Appointment: 2020
Trustee
Chair of the Board of Trustees
Mr. Lawrence also serves as Trustee of other funds. Previously, Mr. Lawrence served as a Trustee and Member of the Advisory Board of certain funds. Prior to his retirement in 2008, Mr. Lawrence served as Vice President of certain Fidelity ® funds (2006-2008), Senior Vice President, Head of High Income Division of Fidelity Management & Research Company (investment adviser firm, 2006-2008), and President of Fidelity Strategic Investments (investment adviser firm, 2002-2005).
* Determined to be an "Interested Trustee" by virtue of, among other things, his or her affiliation with the trust or various entities under common control with FMR.
+ The information includes the Trustee's principal occupation during the last five years and other information relating to the experience, attributes, and skills relevant to the Trustee's qualifications to serve as a Trustee, which led to the conclusion that the Trustee should serve as a Trustee for the fund.
Independent Trustees:
Correspondence intended for an Independent Trustee may be sent to Fidelity Investments, P.O. Box 55235, Boston, Massachusetts 02205-5235.
Name, Year of Birth; Principal Occupations and Other Relevant Experience+
Thomas P. Bostick (1956)
Year of Election or Appointment: 2021
Trustee
Lieutenant General Bostick also serves as Trustee of other Fidelity ® funds. Prior to his retirement, General Bostick (United States Army, Retired) held a variety of positions within the U.S. Army, including Commanding General and Chief of Engineers, U.S. Army Corps of Engineers (2012-2016) and Deputy Chief of Staff and Director of Human Resources, U.S. Army (2009-2012). General Bostick currently serves as a member of the Board and Finance and Governance Committees of CSX Corporation (transportation, 2020-present) and a member of the Board and Corporate Governance and Nominating Committee of Perma-Fix Environmental Services, Inc. (nuclear waste management, 2020-present). General Bostick serves as Chief Executive Officer of Bostick Global Strategies, LLC (consulting, 2016-present) and as a member of the Board of HireVue, Inc. (video interview and assessment, 2020-present). Previously, General Bostick served as a Member of the Advisory Board of certain Fidelity® funds (2021), President, Intrexon Bioengineering (2018-2020) and Chief Operating Officer (2017-2020) and Senior Vice President of the Environment Sector (2016-2017) of Intrexon Corporation (biopharmaceutical company).
Dennis J. Dirks (1948)
Year of Election or Appointment: 2005
Trustee
Mr. Dirks also serves as Trustee of other Fidelity ® funds. Prior to his retirement in May 2003, Mr. Dirks served as Chief Operating Officer and as a member of the Board of The Depository Trust & Clearing Corporation (financial markets infrastructure), President, Chief Operating Officer and a member of the Board of The Depository Trust Company (DTC), President and a member of the Board of the National Securities Clearing Corporation (NSCC), Chief Executive Officer and a member of the Board of the Government Securities Clearing Corporation and Chief Executive Officer and a member of the Board of the Mortgage-Backed Securities Clearing Corporation. Mr. Dirks currently serves as a member of the Finance Committee (2016-present) and Board (2017-present) and is Treasurer (2018-present) of the Asolo Repertory Theatre.
Donald F. Donahue (1950)
Year of Election or Appointment: 2018
Trustee
Mr. Donahue also serves as Trustee of other Fidelity ® funds. Mr. Donahue serves as President and Chief Executive Officer of Miranda Partners, LLC (risk consulting for the financial services industry, 2012-present). Previously, Mr. Donahue served as Chief Executive Officer (2006-2012), Chief Operating Officer (2003-2006) and Managing Director, Customer Marketing and Development (1999-2003) of The Depository Trust & Clearing Corporation (financial markets infrastructure). Mr. Donahue currently serves as a member (2007-present) and Co-Chairman (2016-present) of the Board of United Way of New York and a member of the Board of The Leadership Academy (previously NYC Leadership Academy) (2012-present). Mr. Donahue previously served as a member of the Advisory Board of certain Fidelity® funds (2015-2018).
Vicki L. Fuller (1957)
Year of Election or Appointment: 2020
Trustee
Ms. Fuller also serves as Trustee of other Fidelity ® funds. Previously, Ms. Fuller served as a member of the Advisory Board of certain Fidelity ® funds (2018-2020), Chief Investment Officer of the New York State Common Retirement Fund (2012-2018) and held a variety of positions at AllianceBernstein L.P. (global asset management, 1985-2012), including Managing Director (2006-2012) and Senior Vice President and Senior Portfolio Manager (2001-2006). Ms. Fuller currently serves as a member of the Board, Audit Committee and Nominating and Governance Committee of two Blackstone business development companies (2020-present), as a member of the Board of Treliant, LLC (consulting, 2019-present), as a member of the Advisory Board of Ariel Alternatives, LLC (private equity, 2021-present) and as a member of the Board and Chair of the Audit Committee of Gusto, Inc. (software, 2021-present). In addition, Ms. Fuller currently serves as a member of the Board of Roosevelt University (2019-present) and as a member of the Executive Board of New York University's Stern School of Business. Ms. Fuller previously served as a member of the Board, Audit Committee and Nominating and Governance Committee of The Williams Companies, Inc. (natural gas infrastructure, 2018-2021).
Patricia L. Kampling (1959)
Year of Election or Appointment: 2020
Trustee
Ms. Kampling also serves as Trustee of other Fidelity ® funds. Prior to her retirement, Ms. Kampling served as Chairman of the Board and Chief Executive Officer (2012-2019), President and Chief Operating Officer (2011-2012) and Executive Vice President and Chief Financial Officer (2010-2011) of Alliant Energy Corporation. Ms. Kampling currently serves as a member of the Board, Finance Committee and Governance, Compensation and Nominating Committee of Xcel Energy Inc. (utilities company, 2020-present) and as a member of the Board, Audit, Finance and Risk Committee and Safety, Environmental, Technology and Operations Committee and Chair of the Executive Development and Compensation Committee of American Water Works Company, Inc. (utilities company, 2019-present). In addition, Ms. Kampling currently serves as a member of the Board of the Nature Conservancy, Wisconsin Chapter (2019-present). Previously, Ms. Kampling served as a Member of the Advisory Board of certain Fidelity® funds (2020), a member of the Board, Compensation Committee and Executive Committee and Chair of the Audit Committee of Briggs & Stratton Corporation (manufacturing, 2011-2021), a member of the Board of Interstate Power and Light Company (2012-2019) and Wisconsin Power and Light Company (2012-2019) (each a subsidiary of Alliant Energy Corporation) and as a member of the Board and Workforce Development Committee of the Business Roundtable (2018-2019).
Thomas A. Kennedy (1955)
Year of Election or Appointment: 2021
Trustee
Mr. Kennedy also serves as Trustee of other Fidelity ® funds. Previously, Mr. Kennedy served as a Member of the Advisory Board of certain Fidelity ® funds (2020) and held a variety of positions at Raytheon Company (aerospace and defense, 1983-2020), including Chairman and Chief Executive Officer (2014-2020) and Executive Vice President and Chief Operating Officer (2013-2014). Mr. Kennedy currently serves as Executive Chairman of the Board of Directors of Raytheon Technologies Corporation (aerospace and defense, 2020-present). He is also a member of the Rutgers School of Engineering Industry Advisory Board (2011-present) and a member of the UCLA Engineering Dean's Executive Board (2016-present).
Oscar Munoz (1959)
Year of Election or Appointment: 2021
Trustee
Mr. Munoz also serves as Trustee of other Fidelity ® funds. Prior to his retirement, Mr. Munoz served as Executive Chairman (2020-2021), Chief Executive Officer (2015-2020), President (2015-2016) and a member of the Board (2010-2021) of United Airlines Holdings, Inc. Mr. Munoz currently serves as a member of the Board of CBRE Group, Inc. (commercial real estate, 2020-present), a member of the Board of Univision Communications, Inc. (Hispanic media, 2020-present) and a member of the Advisory Board of Salesforce.com, Inc. (cloud-based software, 2020-present). Previously, Mr. Munoz served as a Member of the Advisory Board of certain Fidelity ® funds (2021).
David M. Thomas (1949)
Year of Election or Appointment: 2008
Trustee
Lead Independent Trustee
Mr. Thomas also serves as Trustee of other Fidelity ® funds. Previously, Mr. Thomas served as Executive Chairman (2005-2006) and Chairman and Chief Executive Officer (2000-2005) of IMS Health, Inc. (pharmaceutical and healthcare information solutions). Mr. Thomas currently serves as a member of the Board of Fortune Brands Home and Security (home and security products, 2004-present) and as Director (2013-present) and Non-Executive Chairman of the Board (2022-present) of Interpublic Group of Companies, Inc. (marketing communication).
Susan Tomasky (1953)
Year of Election or Appointment: 2020
Trustee
Ms. Tomasky also serves as Trustee of other Fidelity ® funds. Prior to her retirement, Ms. Tomasky served in various executive officer positions at American Electric Power Company, Inc. (1998-2011), including most recently as President of AEP Transmission (2007-2011). Ms. Tomasky currently serves as a member of the Board and Sustainability Committee and as Chair of the Audit Committee of Marathon Petroleum Corporation (2018-present) and as a member of the Board, Executive Committee, Corporate Governance Committee and Organization and Compensation Committee and as Chair of the Audit Committee of Public Service Enterprise Group, Inc. (utilities company, 2012-present) and as a member of the Board of its subsidiary company, Public Service Electric and Gas Co. (2021-present). In addition, Ms. Tomasky currently serves as a member (2009-present) and President (2020-present) of the Board of the Royal Shakespeare Company - America (2009-present), as a member of the Board of the Columbus Association for the Performing Arts (2011-present) and as a member of the Board and Kenyon in the World Committee of Kenyon College (2016-present). Previously, Ms. Tomasky served as a Member of the Advisory Board of certain Fidelity ® funds (2020), as a member of the Board of the Columbus Regional Airport Authority (2007-2020), as a member of the Board (2011-2018) and Lead Independent Director (2015-2018) of Andeavor Corporation (previously Tesoro Corporation) (independent oil refiner and marketer) and as a member of the Board of Summit Midstream Partners LP (energy, 2012-2018).
Michael E. Wiley (1950)
Year of Election or Appointment: 2018
Trustee
Mr. Wiley also serves as Trustee of other Fidelity ® funds. Previously, Mr. Wiley served as a member of the Advisory Board of certain Fidelity ® funds (2018-2020), Chairman, President and CEO of Baker Hughes, Inc. (oilfield services, 2000-2004). Mr. Wiley also previously served as a member of the Board of Andeavor Corporation (independent oil refiner and marketer, 2005-2018), a member of the Board of Andeavor Logistics LP (natural resources logistics, 2015-2018) and a member of the Board of High Point Resources (exploration and production, 2005-2020).
+ The information includes the Trustee's principal occupation during the last five years and other information relating to the experience, attributes, and skills relevant to the Trustee's qualifications to serve as a Trustee, which led to the conclusion that the Trustee should serve as a Trustee for the fund.
Advisory Board Members and Officers:
Correspondence intended for a Member of the Advisory Board (if any) may be sent to Fidelity Investments, P.O. Box 55235, Boston, Massachusetts 02205-5235. Correspondence intended for an officer or Peter S. Lynch may be sent to Fidelity Investments, 245 Summer Street, Boston, Massachusetts 02210. Officers appear below in alphabetical order.
Name, Year of Birth; Principal Occupation
Peter S. Lynch (1944)
Year of Election or Appointment: 2003
Member of the Advisory Board
Mr. Lynch also serves as a Member of the Advisory Board of other Fidelity ® funds. Mr. Lynch is Vice Chairman and a Director of Fidelity Management & Research Company LLC (investment adviser firm). In addition, Mr. Lynch serves as a Trustee of Boston College and as the Chairman of the Inner-City Scholarship Fund. Previously, Mr. Lynch served as Vice Chairman and a Director of FMR Co., Inc. (investment adviser firm) and on the Special Olympics International Board of Directors (1997-2006).
Craig S. Brown (1977)
Year of Election or Appointment: 2022
Deputy Treasurer
Mr. Brown also serves as an officer of other funds. Mr. Brown serves as Assistant Treasurer of FIMM, LLC (2021-present) and is an employee of Fidelity Investments (2013-present). Previously, Mr. Brown served as Assistant Treasurer of certain Fidelity ® funds (2019-2022).
John J. Burke III (1964)
Year of Election or Appointment: 2018
Chief Financial Officer
Mr. Burke also serves as Chief Financial Officer of other funds. Mr. Burke serves as Head of Investment Operations for Fidelity Fund and Investment Operations (2018-present) and is an employee of Fidelity Investments (1998-present). Previously Mr. Burke served as head of Asset Management Investment Operations (2012-2018).
William C. Coffey (1969)
Year of Election or Appointment: 2019
Assistant Secretary
Mr. Coffey also serves as Assistant Secretary of other funds. He is Senior Vice President and Deputy General Counsel of FMR LLC (diversified financial services company, 2010-present), and is an employee of Fidelity Investments. Previously, Mr. Coffey served as Secretary and CLO of certain funds (2018-2019); CLO, Secretary, and Senior Vice President of Fidelity Management & Research Company and FMR Co., Inc. (investment adviser firms, 2018-2019); Secretary of Fidelity SelectCo, LLC and Fidelity Investments Money Management, Inc. (investment adviser firms, 2018-2019); CLO of Fidelity Management & Research (Hong Kong) Limited, FMR Investment Management (UK) Limited, and Fidelity Management & Research (Japan) Limited (investment adviser firms, 2018-2019); and Assistant Secretary of certain funds (2009-2018).
Timothy M. Cohen (1969)
Year of Election or Appointment: 2018
Vice President
Mr. Cohen also serves as Vice President of other funds. Mr. Cohen serves as Co-Head of Equity (2018-present), a Director of Fidelity Management & Research (Japan) Limited (investment adviser firm, 2016-present), and is an employee of Fidelity Investments. Previously, Mr. Cohen served as Executive Vice President of Fidelity SelectCo, LLC (2019), Head of Global Equity Research (2016-2018), Chief Investment Officer - Equity and a Director of Fidelity Management & Research (U.K.) Inc. (investment adviser firm, 2013-2015) and as a Director of Fidelity Management & Research (Hong Kong) Limited (investment adviser firm, 2017).
Jonathan Davis (1968)
Year of Election or Appointment: 2010
Assistant Treasurer
Mr. Davis also serves as an officer of other funds. Mr. Davis serves as Assistant Treasurer of FIMM, LLC (2021-present), FMR Capital, Inc. (2017-present), FD Funds GP LLC (2021-present), FD Funds Holding LLC (2021-present), and FD Funds Management LLC (2021-present); and is an employee of Fidelity Investments. Previously, Mr. Davis served as Vice President and Associate General Counsel of FMR LLC (diversified financial services company, 2003-2010).
Laura M. Del Prato (1964)
Year of Election or Appointment: 2018
Assistant Treasurer
Ms. Del Prato also serves as an officer of other funds. Ms. Del Prato serves as Assistant Treasurer of FIMM, LLC (2021-present) and is an employee of Fidelity Investments (2017-present). Previously, Ms. Del Prato served as President and Treasurer of The North Carolina Capital Management Trust: Cash Portfolio and Term Portfolio (2018-2020). Prior to joining Fidelity Investments, Ms. Del Prato served as a Managing Director and Treasurer of the JPMorgan Mutual Funds (2014-2017). Prior to JPMorgan, Ms. Del Prato served as a partner at Cohen Fund Audit Services (accounting firm, 2012-2013) and KPMG LLP (accounting firm, 2004-2012).
Colm A. Hogan (1973)
Year of Election or Appointment: 2020
Assistant Treasurer
Mr. Hogan also serves as an officer of other funds. Mr. Hogan serves as Assistant Treasurer of FIMM, LLC (2021-present) and FMR Capital, Inc. (2017-present) and is an employee of Fidelity Investments (2005-present). Previously, Mr. Hogan served as Deputy Treasurer of certain Fidelity ® funds (2016-2020) and Assistant Treasurer of certain Fidelity ® funds (2016-2018).
Pamela R. Holding (1964)
Year of Election or Appointment: 2018
Vice President
Ms. Holding also serves as Vice President of other funds. Ms. Holding serves as Co-Head of Equity (2018-present) and is an employee of Fidelity Investments (2013-present). Previously, Ms. Holding served as Executive Vice President of Fidelity SelectCo, LLC (2019) and as Chief Investment Officer of Fidelity Institutional Asset Management (2013-2018).
Cynthia Lo Bessette (1969)
Year of Election or Appointment: 2019
Secretary and Chief Legal Officer (CLO)
Ms. Lo Bessette also serves as an officer of other funds. Ms. Lo Bessette serves as CLO, Secretary, and Senior Vice President of Fidelity Management & Research Company LLC (investment adviser firm, 2019-present); CLO of Fidelity Management & Research (Hong Kong) Limited, FMR Investment Management (UK) Limited, and Fidelity Management & Research (Japan) Limited (investment adviser firms, 2019-present); Secretary of FD Funds GP LLC (2021-present), FD Funds Holding LLC (2021-present), FD Funds Management LLC (2021-present), and Fidelity Diversifying Solutions LLC (investment adviser firm, 2022-present); and Assistant Secretary of FIMM, LLC (2019-present). She is a Senior Vice President and Deputy General Counsel of FMR LLC (diversified financial services company, 2019-present), and is an employee of Fidelity Investments. Previously, Ms. Lo Bessette served as CLO, Secretary, and Senior Vice President of FMR Co., Inc. (investment adviser firm, 2019); Secretary of Fidelity SelectCo, LLC and Fidelity Investments Money Management, Inc. (investment adviser firms, 2019). Prior to joining Fidelity Investments, Ms. Lo Bessette was Executive Vice President, General Counsel (2016-2019) and Senior Vice President, Deputy General Counsel (2015-2016) of OppenheimerFunds (investment management company) and Deputy Chief Legal Officer (2013-2015) of Jennison Associates LLC (investment adviser firm).
Chris Maher (1972)
Year of Election or Appointment: 2020
Deputy Treasurer
Mr. Maher also serves as an officer of other funds. Mr. Maher serves as Assistant Treasurer of FIMM, LLC (2021-present) and FMR Capital, Inc. (2017-present), and is an employee of Fidelity Investments (2008-present). Previously, Mr. Maher served as Assistant Treasurer of certain funds (2013-2020); Vice President of Asset Management Compliance (2013), Vice President of the Program Management Group of FMR (investment adviser firm, 2010-2013), and Vice President of Valuation Oversight (2008-2010).
Jason P. Pogorelec (1975)
Year of Election or Appointment: 2020
Chief Compliance Officer
Mr. Pogorelec also serves as Chief Compliance Officer of other funds. Mr. Pogorelec is a Senior Vice President of Asset Management Compliance for Fidelity Investments and is an employee of Fidelity Investments. Mr. Pogorelec serves as Compliance Officer of Fidelity Management & Research Company LLC (investment adviser firm, 2023-present). Previously, Mr. Pogorelec served as Vice President, Associate General Counsel for Fidelity Investments (2010-2020) and Assistant Secretary of certain Fidelity ® funds (2015-2020).
Brett Segaloff (1972)
Year of Election or Appointment: 2021
Anti-Money Laundering (AML) Officer
Mr. Segaloff also serves as an AML Officer of other funds and other related entities. He is Director, Anti-Money Laundering (2007-present) of FMR LLC (diversified financial services company) and is an employee of Fidelity Investments (1996-present).
Stacie M. Smith (1974)
Year of Election or Appointment: 2016
President and Treasurer
Ms. Smith also serves as an officer of other funds. Ms. Smith serves as Assistant Treasurer of FIMM, LLC (2021-present) and FMR Capital, Inc. (2017-present), is an employee of Fidelity Investments (2009-present), and has served in other fund officer roles. Prior to joining Fidelity Investments, Ms. Smith served as Senior Audit Manager of Ernst & Young LLP (accounting firm, 1996-2009). Previously, Ms. Smith served as Assistant Treasurer (2013-2019) and Deputy Treasurer (2013-2016) of certain Fidelity ® funds.
Jim Wegmann (1979)
Year of Election or Appointment: 2019
Assistant Treasurer
Mr. Wegmann also serves as an officer of other funds. Mr. Wegmann serves as Assistant Treasurer of FIMM, LLC (2021-present) and is an employee of Fidelity Investments (2011-present). Previously, Mr. Wegmann served as Assistant Treasurer of certain Fidelity ® funds (2019-2021).
As a shareholder, you incur two types of costs: (1) transaction costs, which may include sales charges (loads) on purchase payments or redemption proceeds, as applicable and (2) ongoing costs, which generally include management fees, distribution and/or service (12b-1) fees and other Fund expenses. This Example is intended to help you understand your ongoing costs (in dollars) of investing in a fund and to compare these costs with the ongoing costs of investing in other mutual funds.
| The Example is based on an investment of $1,000 invested at the beginning of the period and held for the entire period (August 1, 2022 to January 31, 2023). |
Actual Expenses
The first line of the accompanying table provides information about actual account values and actual expenses. You may use the information in this line, together with the amount you invested, to estimate the expenses that you paid over the period. Simply divide your account value by $1,000.00 (for example, an $8,600 account value divided by $1,000.00 = 8.6), then multiply the result by the number in the first line for a class/Fund under the heading entitled "Expenses Paid During Period" to estimate the expenses you paid on your account during this period. If any fund is a shareholder of any underlying mutual funds or exchange-traded funds (ETFs) (the Underlying Funds), such fund indirectly bears its proportional share of the expenses of the Underlying Funds in addition to the direct expenses incurred presented in the table. These fees and expenses are not included in the annualized expense ratio used to calculate the expense estimate in the table below.
Hypothetical Example for Comparison Purposes
The second line of the accompanying table provides information about hypothetical account values and hypothetical expenses based on the actual expense ratio and an assumed rate of return of 5% per year before expenses, which is not the actual return. The hypothetical account values and expenses may not be used to estimate the actual ending account balance or expenses you paid for the period. You may use this information to compare the ongoing costs of investing in the Fund and other funds. To do so, compare this 5% hypothetical example with the 5% hypothetical examples that appear in the shareholder reports of the other funds. If any fund is a shareholder of any Underlying Funds, such fund indirectly bears its proportional share of the expenses of the Underlying Funds in addition to the direct expenses as presented in the table. These fees and expenses are not included in the annualized expense ratio used to calculate the expense estimate in the table below.
Please note that the expenses shown in the table are meant to highlight your ongoing costs only and do not reflect any transaction costs. Therefore, the second line of the table is useful in comparing ongoing costs only, and will not help you determine the relative total costs of owning different funds. In addition, if these transactional costs were included, your costs would have been higher.
| | | | | Annualized Expense Ratio- A | | Beginning Account Value August 1, 2022 | | Ending Account Value January 31, 2023 | | Expenses Paid During Period- C August 1, 2022 to January 31, 2023 |
| Fidelity® Stock Selector Large Cap Value Fund | | | | | | | | | | |
| Class A | | | | 1.13% | | | | | | |
| Actual | | | | | | $ 1,000 | | $ 1,066.00 | | $ 5.88 |
Hypothetical- B | | | | | | $ 1,000 | | $ 1,019.51 | | $ 5.75 |
| Class M | | | | 1.38% | | | | | | |
| Actual | | | | | | $ 1,000 | | $ 1,064.50 | | $ 7.18 |
Hypothetical- B | | | | | | $ 1,000 | | $ 1,018.25 | | $ 7.02 |
| Class C | | | | 1.94% | | | | | | |
| Actual | | | | | | $ 1,000 | | $ 1,061.70 | | $ 10.08 |
Hypothetical- B | | | | | | $ 1,000 | | $ 1,015.43 | | $ 9.86 |
| Fidelity® Stock Selector Large Cap Value Fund | | | | .84% | | | | | | |
| Actual | | | | | | $ 1,000 | | $ 1,067.40 | | $ 4.38 |
Hypothetical- B | | | | | | $ 1,000 | | $ 1,020.97 | | $ 4.28 |
| Class I | | | | .84% | | | | | | |
| Actual | | | | | | $ 1,000 | | $ 1,067.50 | | $ 4.38 |
Hypothetical- B | | | | | | $ 1,000 | | $ 1,020.97 | | $ 4.28 |
| Class Z | | | | .73% | | | | | | |
| Actual | | | | | | $ 1,000 | | $ 1,067.90 | | $ 3.80 |
Hypothetical- B | | | | | | $ 1,000 | | $ 1,021.53 | | $ 3.72 |
| |
A Annualized expense ratio reflects expenses net of applicable fee waivers.
B 5% return per year before expenses
C Expenses are equal to the annualized expense ratio, multiplied by the average account value over the period, multiplied by 184/ 365 (to reflect the one-half year period). The fees and expenses of any Underlying Funds are not included in each annualized expense ratio.
The dividend and capital gains distributions for the fund(s) are available on Fidelity.com or Institutional.Fidelity.com.
The fund hereby designates as a capital gain dividend with respect to the taxable year ended January 31, 2023, $21,984,252, or, if subsequently determined to be different, the net capital gain of such year.
The fund designates $38,233 of distributions paid during the fiscal year ended 2023 as qualifying to be taxed as section 163(j) interest dividends.
Class A, Class M, Class C, Stock Selector Large Cap Value, Class I, and Class Z designate 100% of the dividends distributed during the fiscal year as qualifying for the dividends-received deduction for corporate shareholders.
Class A, Class M, Class C, Stock Selector Large Cap Value, Class I and Class Z designate 100% of the dividends distributed during the fiscal year as amounts which may be taken into account as a dividend for purposes of the maximum rate under section 1(h)(11) of the Internal Revenue Code.
The fund will notify shareholders in January 2024 of amounts for use in preparing 2023 income tax returns.
The Securities and Exchange Commission adopted Rule 22e-4 under the Investment Company Act of 1940 (the Liquidity Rule) to promote effective liquidity risk management throughout the open-end investment company industry, thereby reducing the risk that funds will be unable to meet their redemption obligations and mitigating dilution of the interests of fund shareholders.
The Fund has adopted and implemented a liquidity risk management program (the Program) reasonably designed to assess and manage the Fund's liquidity risk and to comply with the requirements of the Liquidity Rule. The Fund's Board of Trustees (the Board) has designated the Fund's investment adviser as administrator of the Program. The Fidelity advisers have established a Liquidity Risk Management Committee (the LRM Committee) to manage the Program for each of the Fidelity Funds. The LRM Committee monitors the adequacy and effectiveness of implementation of the Program and on a periodic basis assesses each Fund's liquidity risk based on a variety of factors including (1) the Fund's investment strategy, (2) portfolio liquidity and cash flow projections during normal and reasonably foreseeable stressed conditions, (3) shareholder redemptions, (4) borrowings and other funding sources and (5) certain factors specific to ETFs including the effect of the Fund's prices and spreads, market participants, and basket compositions on the overall liquidity of the Fund's portfolio, as applicable.
In accordance with the Program, each of the Fund's portfolio investments is classified into one of four defined liquidity categories based on a determination of a reasonable expectation for how long it would take to convert the investment to cash (or sell or dispose of the investment) without significantly changing its market value.
- Highly liquid investments - cash or convertible to cash within three business days or less
- Moderately liquid investments - convertible to cash in three to seven calendar days
- Less liquid investments - can be sold or disposed of, but not settled, within seven calendar days
- Illiquid investments - cannot be sold or disposed of within seven calendar days
Liquidity classification determinations take into account a variety of factors including various market, trading and investment-specific considerations, as well as market depth, and generally utilize analysis from a third-party liquidity metrics service.
The Liquidity Rule places a 15% limit on a fund's illiquid investments and requires funds that do not primarily hold assets that are highly liquid investments to determine and maintain a minimum percentage of the fund's net assets to be invested in highly liquid investments (highly liquid investment minimum or HLIM). The Program includes provisions reasonably designed to comply with the 15% limit on illiquid investments and for determining, periodically reviewing and complying with the HLIM requirement as applicable.
At a recent meeting of the Fund's Board of Trustees, the LRM Committee provided a written report to the Board pertaining to the operation, adequacy, and effectiveness of the Program for the period December 1, 2021 through November 30, 2022. The report concluded that the Program is operating effectively and is reasonably designed to assess and manage the Fund's liquidity risk.
1.900194.113
LCV-ANN-0423
Fidelity® Mid Cap Value K6 Fund
Annual Report
January 31, 2023
Contents
To view a fund's proxy voting guidelines and proxy voting record for the 12-month period ended June 30, visit http://www.fidelity.com/proxyvotingresults or visit the Securities and Exchange Commission's (SEC) web site at http://www.sec.gov.
You may also call 1-800-835-5092 to request a free copy of the proxy voting guidelines.
Standard & Poor's, S&P and S&P 500 are registered service marks of The McGraw-Hill Companies, Inc. and have been licensed for use by Fidelity Distributors Corporation.
Other third-party marks appearing herein are the property of their respective owners.
All other marks appearing herein are registered or unregistered trademarks or service marks of FMR LLC or an affiliated company. © 2023 FMR LLC. All rights reserved.
This report and the financial statements contained herein are submitted for the general information of the shareholders of the Fund. This report is not authorized for distribution to prospective investors in the Fund unless preceded or accompanied by an effective prospectus.
A fund files its complete schedule of portfolio holdings with the SEC for the first and third quarters of each fiscal year on Form N-PORT. Forms N-PORT are available on the SEC's web site at http://www.sec.gov. A fund's Forms N-PORT may be reviewed and copied at the SEC's Public Reference Room in Washington, DC. Information regarding the operation of the SEC's Public Reference Room may be obtained by calling 1-800-SEC-0330.
For a complete list of a fund's portfolio holdings, view the most recent holdings listing, semiannual report, or annual report on Fidelity's web site at http://www.fidelity.com, http://www.institutional.fidelity.com, or http://www.401k.com, as applicable.
NOT FDIC INSURED •MAY LOSE VALUE •NO BANK GUARANTEE
Neither the Fund nor Fidelity Distributors Corporation is a bank.
Average annual total return reflects the change in the value of an investment, assuming reinvestment of distributions from dividend income and capital gains (the profits earned upon the sale of securities that have grown in value, if any) and assuming a constant rate of performance each year. The hypothetical investment and the average annual total returns do not reflect the deduction of taxes that a shareholder would pay on fund distributions or the redemption of fund shares. During periods of reimbursement by Fidelity, a fund's total return will be greater than it would be had the reimbursement not occurred. How a fund did yesterday is no guarantee of how it will do tomorrow.
| Average Annual Total Returns |
| | | | |
Periods ended January 31, 2023 | Past 1 year | Past 5 years | Life of Fund A |
| Fidelity® Mid Cap Value K6 Fund | 2.41% | 5.79% | 7.58% |
A From May 25, 2017
| $10,000 Over Life of Fund |
| |
Let's say hypothetically that $10,000 was invested in Fidelity® Mid Cap Value K6 Fund, on May 25, 2017, when the fund started. The chart shows how the value of your investment would have changed, and also shows how the Russell Midcap® Value Index performed over the same period. |
|
|
Market Recap:
U.S. equities returned -8.22% for the 12 months ending January 31, 2023, according to the S&P 500 ® index. The new year began with an encouraging upturn in January (+6.28%), but the backdrop remains clouded by the multitude of risk factors that challenged the global economy in 2022, when the index logged its lowest calendar-year return since 2008 and first annual retreat since 2018. High inflation prompted the Federal Reserve to aggressively tighten monetary policy, and market interest rates eclipsed their highest level in a decade, stoking recession fears and sending stocks into bear market territory. Since March 2022, the Fed has hiked its benchmark rate seven times, by 4.25 percentage points - the fastest-ever pace of monetary tightening - while also shrinking its massive portfolio. The latest bump came in mid-December, along with a signal that the central bank plans to lift rates through the spring, though likely in smaller increments, to combat high inflation. Against this backdrop, stocks struggled to gain traction until a strong rally ignited heading into the summer. But in September, the S&P 500 ® returned -9.21%, one of its worst monthly results ever, before advancing 7.56% in Q4 as risky assets regained favor. For the full 12 months, value stocks handily outpaced growth. This headwind was most pronounced in the growth-oriented communication services (-27%), consumer discretionary (-20%) and information technology (-16%) sectors. In contrast, energy (+43%) led by a wide margin, followed by health care (+3%).
Comments from Lead Manager Neil Nabar and Co-Manager Anastasia Zabolotnikova:
For the fiscal year ending January 31, 2023, the fund gained 2.41%, outperforming the -0.69% result of the benchmark Russell Midcap ® Value Index. Versus the benchmark, security selection was the primary contributor, led by the information technology sector. Strong picks in the communication services sector, primarily driven by the media & entertainment industry, also helped. Investment choices in industrials further lifted the fund's relative result. The fund's largest individual relative contributor was an overweight in Hess, which gained approximately 66% the past 12 months. Also boosting performance was our overweight in PG&E, which returned roughly 30%. PG&E was a new addition to the portfolio this period and among the fund's biggest holdings on January 31. Another notable relative contributor was an outsized stake in Performance Food Group (+44%). This period we decreased our investments in Performance Food and Hess. In contrast, the biggest detractor from performance versus the benchmark was security selection in materials. Stock picks in real estate also hampered relative performance. The fund's biggest individual relative detractor was an overweight in WeWork (-79%). Also holding back performance was our outsized stake in Jones Lang LaSalle, which returned about -36%. Jones Lang LaSalle was not held at period end. Further hindering relative performance was an overweight in Welltower (-11%), which was the fund's largest holding on January 31. Notable changes in positioning this period include increased exposure to the materials and utilities sectors.
The views expressed above reflect those of the portfolio manager(s) only through the end of the period as stated on the cover of this report and do not necessarily represent the views of Fidelity or any other person in the Fidelity organization. Any such views are subject to change at any time based upon market or other conditions and Fidelity disclaims any responsibility to update such views. These views may not be relied on as investment advice and, because investment decisions for a Fidelity fund are based on numerous factors, may not be relied on as an indication of trading intent on behalf of any Fidelity fund.
Top Holdings (% of Fund's net assets) |
| |
| Welltower, Inc. | 4.4 | |
| Public Storage | 1.5 | |
| Entergy Corp. | 1.4 | |
| Prologis (REIT), Inc. | 1.4 | |
| Edison International | 1.4 | |
| CBRE Group, Inc. | 1.3 | |
| M&T Bank Corp. | 1.4 | |
| PG&E Corp. | 1.3 | |
| Markel Corp. | 1.3 | |
| Hartford Financial Services Group, Inc. | 1.2 | |
| | 16.6 | |
| |
| Market Sectors (% of Fund's net assets) |
| |
| Financials | 17.0 | |
| Industrials | 15.1 | |
| Real Estate | 11.4 | |
| Consumer Discretionary | 10.9 | |
| Materials | 9.3 | |
| Information Technology | 8.4 | |
| Utilities | 7.6 | |
| Health Care | 6.6 | |
| Energy | 6.1 | |
| Consumer Staples | 3.4 | |
| Communication Services | 3.1 | |
| |
Asset Allocation (% of Fund's net assets) |
|
Foreign investments - 7.4% |
|
Showing Percentage of Net Assets
| Common Stocks - 98.9% |
| | | Shares | Value ($) |
| COMMUNICATION SERVICES - 3.1% | | | |
| Diversified Telecommunication Services - 0.5% | | | |
| Cellnex Telecom SA (a) | | 4,514 | 176,895 |
| Interactive Media & Services - 0.6% | | | |
| Ziff Davis, Inc. (b) | | 2,648 | 236,943 |
| Media - 2.0% | | | |
| iHeartMedia, Inc. (b) | | 7,012 | 54,343 |
| Liberty Broadband Corp. Class C (b) | | 1,181 | 106,030 |
| News Corp. Class A | | 13,986 | 283,356 |
| Nexstar Broadcasting Group, Inc. Class A | | 949 | 194,327 |
| Thryv Holdings, Inc. (b) | | 3,445 | 77,065 |
| | | | 715,121 |
TOTAL COMMUNICATION SERVICES | | | 1,128,959 |
| CONSUMER DISCRETIONARY - 10.9% | | | |
| Auto Components - 1.4% | | | |
| Aptiv PLC (b) | | 2,303 | 260,446 |
| Magna International, Inc. Class A | | 4,003 | 259,955 |
| | | | 520,401 |
| Diversified Consumer Services - 0.9% | | | |
| Adtalem Global Education, Inc. (b) | | 4,409 | 168,336 |
| Laureate Education, Inc. Class A | | 15,073 | 165,502 |
| | | | 333,838 |
| Hotels, Restaurants & Leisure - 2.4% | | | |
| Bowlero Corp. Class A (b) | | 3,747 | 51,521 |
| Hilton Worldwide Holdings, Inc. | | 1,251 | 181,508 |
| Light & Wonder, Inc. Class A (b) | | 3,341 | 218,000 |
| MGM Resorts International | | 5,739 | 237,652 |
| Travel+Leisure Co. | | 4,016 | 170,158 |
| | | | 858,839 |
| Household Durables - 2.2% | | | |
| Helen of Troy Ltd. (b) | | 957 | 108,246 |
| Mohawk Industries, Inc. (b) | | 1,776 | 213,227 |
| PulteGroup, Inc. | | 4,047 | 230,234 |
| Tempur Sealy International, Inc. | | 5,814 | 236,921 |
| | | | 788,628 |
| Multiline Retail - 1.6% | | | |
| Dollar Tree, Inc. (b) | | 1,273 | 191,179 |
| Franchise Group, Inc. (c) | | 6,036 | 186,452 |
| Kohl's Corp. | | 6,639 | 214,904 |
| | | | 592,535 |
| Specialty Retail - 2.4% | | | |
| Lithia Motors, Inc. Class A (sub. vtg.) | | 826 | 217,403 |
| O'Reilly Automotive, Inc. (b) | | 384 | 304,262 |
| Rent-A-Center, Inc. | | 6,282 | 168,923 |
| Victoria's Secret & Co. (b) | | 4,539 | 191,319 |
| | | | 881,907 |
TOTAL CONSUMER DISCRETIONARY | | | 3,976,148 |
| CONSUMER STAPLES - 3.4% | | | |
| Food & Staples Retailing - 2.0% | | | |
| Albertsons Companies, Inc. | | 12,711 | 269,473 |
| Performance Food Group Co. (b) | | 4,048 | 248,223 |
| U.S. Foods Holding Corp. (b) | | 5,300 | 202,089 |
| | | | 719,785 |
| Food Products - 1.4% | | | |
| Bunge Ltd. | | 3,033 | 300,570 |
| Tyson Foods, Inc. Class A | | 3,110 | 204,483 |
| | | | 505,053 |
TOTAL CONSUMER STAPLES | | | 1,224,838 |
| ENERGY - 6.1% | | | |
| Energy Equipment & Services - 1.0% | | | |
| Halliburton Co. | | 5,132 | 211,541 |
| Liberty Oilfield Services, Inc. Class A | | 10,937 | 173,133 |
| | | | 384,674 |
| Oil, Gas & Consumable Fuels - 5.1% | | | |
| Cenovus Energy, Inc. (c) | | 11,134 | 222,457 |
| Chesapeake Energy Corp. | | 2,656 | 230,328 |
| Hess Corp. | | 1,759 | 264,131 |
| Occidental Petroleum Corp. | | 4,242 | 274,839 |
| Ovintiv, Inc. | | 3,405 | 167,628 |
| Southwestern Energy Co. (b) | | 24,774 | 136,752 |
| Targa Resources Corp. | | 3,690 | 276,824 |
| Valero Energy Corp. | | 1,915 | 268,157 |
| | | | 1,841,116 |
TOTAL ENERGY | | | 2,225,790 |
| FINANCIALS - 17.0% | | | |
| Banks - 4.2% | | | |
| Citizens Financial Group, Inc. | | 9,799 | 424,493 |
| East West Bancorp, Inc. | | 3,939 | 309,290 |
| M&T Bank Corp. | | 3,172 | 494,832 |
| Signature Bank | | 2,264 | 291,943 |
| | | | 1,520,558 |
| Capital Markets - 3.3% | | | |
| Ares Management Corp. | | 2,938 | 243,825 |
| Carlyle Group LP | | 6,771 | 243,553 |
| LPL Financial | | 925 | 219,336 |
| State Street Corp. | | 4,518 | 412,629 |
| Virtu Financial, Inc. Class A | | 3,656 | 70,597 |
| | | | 1,189,940 |
| Consumer Finance - 0.7% | | | |
| OneMain Holdings, Inc. | | 5,937 | 256,122 |
| Diversified Financial Services - 1.1% | | | |
| Apollo Global Management, Inc. | | 3,934 | 278,449 |
| Corebridge Financial, Inc. | | 5,359 | 116,612 |
| | | | 395,061 |
| Insurance - 6.5% | | | |
| Arthur J. Gallagher & Co. | | 2,000 | 391,440 |
| Chubb Ltd. | | 881 | 200,419 |
| First American Financial Corp. | | 4,557 | 281,942 |
| Hartford Financial Services Group, Inc. | | 5,637 | 437,488 |
| Markel Corp. (b) | | 330 | 464,963 |
| MetLife, Inc. | | 3,354 | 244,909 |
| Old Republic International Corp. | | 13,229 | 349,113 |
| | | | 2,370,274 |
| Thrifts & Mortgage Finance - 1.2% | | | |
| NMI Holdings, Inc. (b) | | 7,614 | 176,873 |
| Walker & Dunlop, Inc. | | 2,905 | 277,079 |
| | | | 453,952 |
TOTAL FINANCIALS | | | 6,185,907 |
| HEALTH CARE - 6.6% | | | |
| Biotechnology - 0.3% | | | |
| Regeneron Pharmaceuticals, Inc. (b) | | 151 | 114,529 |
| Health Care Providers & Services - 3.7% | | | |
| AdaptHealth Corp. (b) | | 7,833 | 167,861 |
| AmerisourceBergen Corp. | | 1,511 | 255,299 |
| DaVita HealthCare Partners, Inc. (b) | | 2,592 | 213,555 |
| Molina Healthcare, Inc. (b) | | 1,061 | 330,852 |
| Tenet Healthcare Corp. (b) | | 6,947 | 381,043 |
| | | | 1,348,610 |
| Life Sciences Tools & Services - 1.9% | | | |
| Bio-Rad Laboratories, Inc. Class A (b) | | 573 | 267,855 |
| Charles River Laboratories International, Inc. (b) | | 769 | 187,059 |
| ICON PLC (b) | | 735 | 169,572 |
| Syneos Health, Inc. (b) | | 1,429 | 51,330 |
| | | | 675,816 |
| Pharmaceuticals - 0.7% | | | |
| Royalty Pharma PLC | | 6,905 | 270,607 |
TOTAL HEALTH CARE | | | 2,409,562 |
| INDUSTRIALS - 15.1% | | | |
| Aerospace & Defense - 0.6% | | | |
| Woodward, Inc. | | 2,150 | 219,859 |
| Building Products - 1.8% | | | |
| Builders FirstSource, Inc. (b) | | 5,332 | 424,960 |
| UFP Industries, Inc. | | 2,481 | 232,098 |
| | | | 657,058 |
| Commercial Services & Supplies - 0.3% | | | |
| The Brink's Co. | | 1,502 | 98,531 |
| Construction & Engineering - 1.8% | | | |
| EMCOR Group, Inc. | | 2,029 | 300,799 |
| Willscot Mobile Mini Holdings (b) | | 7,375 | 357,393 |
| | | | 658,192 |
| Electrical Equipment - 1.2% | | | |
| Regal Rexnord Corp. | | 3,140 | 437,088 |
| Machinery - 4.2% | | | |
| Crane Holdings Co. | | 1,082 | 125,415 |
| ITT, Inc. | | 1,890 | 173,105 |
| Oshkosh Corp. | | 2,529 | 254,873 |
| PACCAR, Inc. | | 3,612 | 394,828 |
| Stanley Black & Decker, Inc. | | 2,166 | 193,445 |
| Timken Co. | | 4,664 | 384,080 |
| | | | 1,525,746 |
| Professional Services - 1.1% | | | |
| CACI International, Inc. Class A (b) | | 673 | 207,345 |
| Manpower, Inc. | | 2,369 | 206,482 |
| | | | 413,827 |
| Road & Rail - 2.7% | | | |
| Knight-Swift Transportation Holdings, Inc. Class A | | 6,235 | 368,489 |
| RXO, Inc. (b) | | 7,997 | 146,505 |
| U-Haul Holding Co. (non-vtg.) | | 4,233 | 261,557 |
| XPO, Inc. (b) | | 4,710 | 187,741 |
| | | | 964,292 |
| Trading Companies & Distributors - 1.4% | | | |
| MSC Industrial Direct Co., Inc. Class A | | 2,791 | 230,816 |
| WESCO International, Inc. (b) | | 1,986 | 295,934 |
| | | | 526,750 |
TOTAL INDUSTRIALS | | | 5,501,343 |
| INFORMATION TECHNOLOGY - 8.4% | | | |
| Communications Equipment - 0.4% | | | |
| Motorola Solutions, Inc. | | 525 | 134,930 |
| Electronic Equipment & Components - 2.0% | | | |
| Flex Ltd. (b) | | 10,165 | 237,353 |
| Knowles Corp. (b) | | 5,145 | 98,938 |
| TD SYNNEX Corp. | | 2,306 | 235,558 |
| Vontier Corp. | | 7,248 | 166,921 |
| | | | 738,770 |
| IT Services - 3.4% | | | |
| Concentrix Corp. | | 1,931 | 273,835 |
| Cyxtera Technologies, Inc. Class A (b) | | 15,596 | 50,219 |
| DXC Technology Co. (b) | | 8,171 | 234,753 |
| Fidelity National Information Services, Inc. | | 3,118 | 233,975 |
| Genpact Ltd. | | 2,600 | 122,928 |
| SS&C Technologies Holdings, Inc. | | 5,155 | 311,104 |
| | | | 1,226,814 |
| Semiconductors & Semiconductor Equipment - 1.9% | | | |
| Lam Research Corp. | | 650 | 325,065 |
| Microchip Technology, Inc. | | 3,722 | 288,902 |
| Micron Technology, Inc. | | 1,573 | 94,852 |
| | | | 708,819 |
| Software - 0.7% | | | |
| Gen Digital, Inc. | | 10,757 | 247,519 |
TOTAL INFORMATION TECHNOLOGY | | | 3,056,852 |
| MATERIALS - 9.3% | | | |
| Chemicals - 4.2% | | | |
| Celanese Corp. Class A | | 2,814 | 346,685 |
| Corteva, Inc. | | 2,302 | 148,364 |
| Element Solutions, Inc. | | 7,295 | 149,402 |
| Nutrien Ltd. | | 1,529 | 126,586 |
| Olin Corp. | | 4,797 | 309,838 |
| Tronox Holdings PLC | | 7,422 | 127,287 |
| Westlake Corp. | | 2,478 | 304,175 |
| | | | 1,512,337 |
| Containers & Packaging - 2.5% | | | |
| Crown Holdings, Inc. | | 3,487 | 307,414 |
| Graphic Packaging Holding Co. | | 7,105 | 171,159 |
| International Paper Co. | | 4,401 | 184,050 |
| Packaging Corp. of America | | 1,812 | 258,572 |
| | | | 921,195 |
| Metals & Mining - 1.8% | | | |
| Arconic Corp. (b) | | 9,548 | 224,473 |
| Freeport-McMoRan, Inc. | | 5,082 | 226,759 |
| Reliance Steel & Aluminum Co. | | 955 | 217,215 |
| | | | 668,447 |
| Paper & Forest Products - 0.8% | | | |
| Louisiana-Pacific Corp. | | 3,948 | 268,819 |
TOTAL MATERIALS | | | 3,370,798 |
| REAL ESTATE - 11.4% | | | |
| Equity Real Estate Investment Trusts (REITs) - 9.9% | | | |
| Camden Property Trust (SBI) | | 3,341 | 411,645 |
| Essex Property Trust, Inc. | | 1,040 | 235,113 |
| Lamar Advertising Co. Class A | | 2,554 | 272,103 |
| Prologis (REIT), Inc. | | 3,992 | 516,086 |
| Public Storage | | 1,778 | 541,117 |
| Welltower, Inc. | | 21,551 | 1,617,183 |
| | | | 3,593,247 |
| Real Estate Management & Development - 1.5% | | | |
| CBRE Group, Inc. (b) | | 5,816 | 497,326 |
| WeWork, Inc. (b)(c) | | 38,603 | 61,379 |
| | | | 558,705 |
TOTAL REAL ESTATE | | | 4,151,952 |
| UTILITIES - 7.6% | | | |
| Electric Utilities - 5.7% | | | |
| American Electric Power Co., Inc. | | 2,265 | 212,819 |
| Edison International | | 7,322 | 504,486 |
| Entergy Corp. | | 4,988 | 540,101 |
| Exelon Corp. | | 8,543 | 360,429 |
| PG&E Corp. (b) | | 29,563 | 470,052 |
| | | | 2,087,887 |
| Gas Utilities - 1.2% | | | |
| Brookfield Infrastructure Corp. A Shares | | 9,610 | 424,954 |
| Independent Power and Renewable Electricity Producers - 0.7% | | | |
| NextEra Energy Partners LP | | 3,179 | 233,021 |
TOTAL UTILITIES | | | 2,745,862 |
| TOTAL COMMON STOCKS (Cost $33,191,932) | | | 35,978,011 |
| | | | |
| Money Market Funds - 1.1% |
| | | Shares | Value ($) |
| Fidelity Cash Central Fund 4.38% (d) | | 38,451 | 38,458 |
| Fidelity Securities Lending Cash Central Fund 4.38% (d)(e) | | 348,490 | 348,525 |
| TOTAL MONEY MARKET FUNDS (Cost $386,983) | | | 386,983 |
| | | | |
| TOTAL INVESTMENT IN SECURITIES - 100.0% (Cost $33,578,915) | 36,364,994 |
NET OTHER ASSETS (LIABILITIES) - 0.0% | 9,424 |
| NET ASSETS - 100.0% | 36,374,418 |
| | |
Legend
| (a) | Security exempt from registration under Rule 144A of the Securities Act of 1933. These securities may be resold in transactions exempt from registration, normally to qualified institutional buyers. At the end of the period, the value of these securities amounted to $176,895 or 0.5% of net assets. |
| (c) | Security or a portion of the security is on loan at period end. |
| (d) | Affiliated fund that is generally available only to investment companies and other accounts managed by Fidelity Investments. The rate quoted is the annualized seven-day yield of the fund at period end. A complete unaudited listing of the fund's holdings as of its most recent quarter end is available upon request. In addition, each Fidelity Central Fund's financial statements, which are not covered by the Fund's Report of Independent Registered Public Accounting Firm, are available on the SEC's website or upon request. |
| (e) | Investment made with cash collateral received from securities on loan. |
Affiliated Central Funds
Fiscal year to date information regarding the Fund's investments in Fidelity Central Funds, including the ownership percentage, is presented below.
| Affiliate | Value, beginning of period ($) | Purchases ($) | Sales Proceeds ($) | Dividend Income ($) | Realized Gain (loss) ($) | Change in Unrealized appreciation (depreciation) ($) | Value, end of period ($) | % ownership, end of period |
| Fidelity Cash Central Fund 4.38% | 348,969 | 7,855,717 | 8,166,228 | 1,771 | - | - | 38,458 | 0.0% |
| Fidelity Securities Lending Cash Central Fund 4.38% | 154,425 | 5,462,940 | 5,268,840 | 6,943 | - | - | 348,525 | 0.0% |
| Total | 503,394 | 13,318,657 | 13,435,068 | 8,714 | - | - | 386,983 | |
| | | | | | | | | |
Amounts in the dividend income column in the above table include any capital gain distributions from underlying funds, which are presented in the corresponding line item in the Statement of Operations, if applicable.
Amount for Fidelity Securities Lending Cash Central Fund represents the income earned on investing cash collateral, less rebates paid to borrowers and any lending agent fees associated with the loan, plus any premium payments received for lending certain types of securities.
Amounts included in the purchases and sales proceeds columns may include in-kind transactions, if applicable.
Investment Valuation
The following is a summary of the inputs used, as of January 31, 2023, involving the Fund's assets and liabilities carried at fair value. The inputs or methodology used for valuing securities may not be an indication of the risk associated with investing in those securities. For more information on valuation inputs, and their aggregation into the levels used below, please refer to the Investment Valuation section in the accompanying Notes to Financial Statements.
| Valuation Inputs at Reporting Date: |
| Description | Total ($) | Level 1 ($) | Level 2 ($) | Level 3 ($) |
Investments in Securities: | | | | |
|
| Equities: | | | | |
Communication Services | 1,128,959 | 952,064 | 176,895 | - |
Consumer Discretionary | 3,976,148 | 3,976,148 | - | - |
Consumer Staples | 1,224,838 | 1,224,838 | - | - |
Energy | 2,225,790 | 2,225,790 | - | - |
Financials | 6,185,907 | 6,185,907 | - | - |
Health Care | 2,409,562 | 2,409,562 | - | - |
Industrials | 5,501,343 | 5,501,343 | - | - |
Information Technology | 3,056,852 | 3,056,852 | - | - |
Materials | 3,370,798 | 3,370,798 | - | - |
Real Estate | 4,151,952 | 4,151,952 | - | - |
Utilities | 2,745,862 | 2,745,862 | - | - |
|
| Money Market Funds | 386,983 | 386,983 | - | - |
| Total Investments in Securities: | 36,364,994 | 36,188,099 | 176,895 | - |
| Statement of Assets and Liabilities |
| | | | January 31, 2023 |
| | | | | |
| Assets | | | | |
| Investment in securities, at value (including securities loaned of $341,229) - See accompanying schedule: | | | | |
Unaffiliated issuers (cost $33,191,932) | $ | 35,978,011 | | |
Fidelity Central Funds (cost $386,983) | | 386,983 | | |
| | | | | |
| | | | | |
| Total Investment in Securities (cost $33,578,915) | | | $ | 36,364,994 |
| Cash | | | | 32,479 |
| Receivable for investments sold | | | | 139,244 |
| Receivable for fund shares sold | | | | 313,884 |
| Dividends receivable | | | | 9,618 |
| Distributions receivable from Fidelity Central Funds | | | | 1,375 |
Total assets | | | | 36,861,594 |
| Liabilities | | | | |
| Payable for investments purchased | $ | 106,841 | | |
| Payable for fund shares redeemed | | 20,121 | | |
| Accrued management fee | | 11,689 | | |
| Collateral on securities loaned | | 348,525 | | |
| Total Liabilities | | | | 487,176 |
| Net Assets | | | $ | 36,374,418 |
| Net Assets consist of: | | | | |
| Paid in capital | | | $ | 33,813,836 |
| Total accumulated earnings (loss) | | | | 2,560,582 |
| Net Assets | | | $ | 36,374,418 |
Net Asset Value , offering price and redemption price per share ($36,374,418 ÷ 2,664,049 shares) | | | $ | 13.65 |
| Statement of Operations |
| | | | Year ended January 31, 2023 |
| Investment Income | | | | |
| Dividends | | | $ | 528,249 |
| Special dividends | | | | 70,945 |
| Income from Fidelity Central Funds (including $6,943 from security lending) | | | | 8,714 |
| Total Income | | | | 607,908 |
| Expenses | | | | |
| Management fee | $ | 143,636 | | |
| Independent trustees' fees and expenses | | 106 | | |
| Total expenses before reductions | | 143,742 | | |
| Expense reductions | | (5) | | |
| Total expenses after reductions | | | | 143,737 |
| Net Investment income (loss) | | | | 464,171 |
| Realized and Unrealized Gain (Loss) | | | | |
| Net realized gain (loss) on: | | | | |
| Investment Securities: | | | | |
| Unaffiliated issuers | | 1,733,846 | | |
| Foreign currency transactions | | (134) | | |
| Total net realized gain (loss) | | | | 1,733,712 |
| Change in net unrealized appreciation (depreciation) on investment securities | | | | (1,679,298) |
| Net gain (loss) | | | | 54,414 |
| Net increase (decrease) in net assets resulting from operations | | | $ | 518,585 |
| Statement of Changes in Net Assets |
| |
| | Year ended January 31, 2023 | | Year ended January 31, 2022 |
| Increase (Decrease) in Net Assets | | | | |
| Operations | | | | |
| Net investment income (loss) | $ | 464,171 | $ | 496,411 |
| Net realized gain (loss) | | 1,733,712 | | 6,568,315 |
| Change in net unrealized appreciation (depreciation) | | (1,679,298) | | 1,001,121 |
| Net increase (decrease) in net assets resulting from operations | | 518,585 | | 8,065,847 |
| Distributions to shareholders | | (470,724) | | (496,165) |
| Share transactions | | | | |
| Proceeds from sales of shares | | 9,720,249 | | 12,452,914 |
| Reinvestment of distributions | | 470,724 | | 496,165 |
| Cost of shares redeemed | | (8,856,637) | | (12,930,840) |
Net increase (decrease) in net assets resulting from share transactions | | 1,334,336 | | 18,239 |
| Total increase (decrease) in net assets | | 1,382,197 | | 7,587,921 |
| | | | | |
| Net Assets | | | | |
| Beginning of period | | 34,992,221 | | 27,404,300 |
| End of period | $ | 36,374,418 | $ | 34,992,221 |
| | | | | |
| Other Information | | | | |
| Shares | | | | |
| Sold | | 739,821 | | 943,131 |
| Issued in reinvestment of distributions | | 37,658 | | 36,536 |
| Redeemed | | (695,036) | | (972,886) |
| Net increase (decrease) | | 82,443 | | 6,781 |
| | | | | |
Financial Highlights
| Fidelity® Mid Cap Value K6 Fund |
| |
| Years ended January 31, | | 2023 | | 2022 | | 2021 | | 2020 | | 2019 |
Selected Per-Share Data | | | | | | | | | | |
| Net asset value, beginning of period | $ | 13.55 | $ | 10.64 | $ | 10.28 | $ | 9.85 | $ | 11.35 |
| Income from Investment Operations | | | | | | | | | | |
Net investment income (loss) A,B | | .19 C | | .19 | | .19 | | .21 | | .21 |
| Net realized and unrealized gain (loss) | | .12 | | 2.91 | | .40 | | .40 | | (1.44) |
| Total from investment operations | | .31 | | 3.10 | | .59 | | .61 | | (1.23) |
| Distributions from net investment income | | (.21) | | (.19) | | (.23) | | (.18) | | (.22) |
| Distributions from net realized gain | | - | | - | | - | | - | | (.05) |
| Total distributions | | (.21) | | (.19) | | (.23) | | (.18) | | (.27) |
| Net asset value, end of period | $ | 13.65 | $ | 13.55 | $ | 10.64 | $ | 10.28 | $ | 9.85 |
Total Return D | | 2.41% | | 29.17% | | 5.83% | | 6.15% | | (10.82)% |
Ratios to Average Net Assets B,E,F | | | | | | | | | | |
| Expenses before reductions | | .45% | | .45% | | .45% | | .45% | | .45% |
| Expenses net of fee waivers, if any | | .45% | | .45% | | .45% | | .45% | | .45% |
| Expenses net of all reductions | | .45% | | .45% | | .44% | | .44% | | .44% |
| Net investment income (loss) | | 1.45% C | | 1.45% | | 2.07% | | 2.05% | | 2.05% |
| Supplemental Data | | | | | | | | | | |
| Net assets, end of period (000 omitted) | $ | 36,374 | $ | 34,992 | $ | 27,404 | $ | 53,188 | $ | 48,924 |
Portfolio turnover rate G | | 85% H | | 100% | | 73% H | | 102% H | | 89% H |
A Calculated based on average shares outstanding during the period.
B Net investment income (loss) is affected by the timing of the declaration of dividends by any underlying mutual funds or exchange-traded funds (ETFs). Net investment income (loss) of any mutual funds or ETFs is not included in the Fund's net investment income (loss) ratio.
C Net investment income per share reflects one or more large, non-recurring dividend(s) which amounted to $.03 per share. Excluding such non-recurring dividend(s), the ratio of net investment income (loss) to average net assets would have been 1.23%.
D Total returns would have been lower if certain expenses had not been reduced during the applicable periods shown.
E Fees and expenses of any underlying mutual funds or exchange-traded funds (ETFs) are not included in the Fund's expense ratio. The Fund indirectly bears its proportionate share of these expenses. For additional expense information related to investments in Fidelity Central Funds, please refer to the "Investments in Fidelity Central Funds" note found in the Notes to Financial Statements section of the most recent Annual or Semi-Annual report.
F Expense ratios reflect operating expenses of the class. Expenses before reductions do not reflect amounts reimbursed, waived, or reduced through arrangements with the investment adviser, brokerage services, or other offset arrangements, if applicable, and do not represent the amount paid by the class during periods when reimbursements, waivers or reductions occur.
G Amount does not include the portfolio activity of any underlying mutual funds or exchange-traded funds (ETFs).
H Portfolio turnover rate excludes securities received or delivered in-kind.
For the period ended January 31, 2023
1. Organization.
Fidelity Mid Cap Value K6 Fund (the Fund) is a fund of Fidelity Devonshire Trust (the Trust) and is authorized to issue an unlimited number of shares. Share transactions on the Statement of Changes in Net Assets may contain exchanges between affiliated funds. The Trust is registered under the Investment Company Act of 1940, as amended (the 1940 Act), as an open-end management investment company organized as a Massachusetts business trust. Shares generally are available only to employer-sponsored retirement plans that are recordkept by Fidelity, or to certain employer-sponsored retirement plans that are not recordkept by Fidelity.
2. Investments in Fidelity Central Funds.
Funds may invest in Fidelity Central Funds, which are open-end investment companies generally available only to other investment companies and accounts managed by the investment adviser and its affiliates. The Schedule of Investments lists any Fidelity Central Funds held as an investment as of period end, but does not include the underlying holdings of each Fidelity Central Fund. An investing fund indirectly bears its proportionate share of the expenses of the underlying Fidelity Central Funds.
Based on its investment objective, each Fidelity Central Fund may invest or participate in various investment vehicles or strategies that are similar to those of the investing fund. These strategies are consistent with the investment objectives of the investing fund and may involve certain economic risks which may cause a decline in value of each of the Fidelity Central Funds and thus a decline in the value of the investing fund.
| Fidelity Central Fund | Investment Manager | Investment Objective | Investment Practices | Expense Ratio A |
| Fidelity Money Market Central Funds | Fidelity Management & Research Company LLC (FMR) | Each fund seeks to obtain a high level of current income consistent with the preservation of capital and liquidity. | Short-term Investments | Less than .005% |
A Expenses expressed as a percentage of average net assets and are as of each underlying Central Fund's most recent annual or semi-annual shareholder report.
A complete unaudited list of holdings for each Fidelity Central Fund is available upon request or at the Securities and Exchange Commission website at www.sec.gov. In addition, the financial statements of the Fidelity Central Funds which contain the significant accounting policies (including investment valuation policies) of those funds, and are not covered by the Report of Independent Registered Public Accounting Firm, are available on the Securities and Exchange Commission website or upon request.
3. Significant Accounting Policies.
The Fund is an investment company and applies the accounting and reporting guidance of the Financial Accounting Standards Board (FASB) Accounting Standards Codification Topic 946 Financial Services - Investment Companies . The financial statements have been prepared in conformity with accounting principles generally accepted in the United States of America (GAAP), which require management to make certain estimates and assumptions at the date of the financial statements. Actual results could differ from those estimates. Subsequent events, if any, through the date that the financial statements were issued have been evaluated in the preparation of the financial statements. The Fund's Schedule of Investments lists any underlying mutual funds or exchange-traded funds (ETFs) but does not include the underlying holdings of these funds. The following summarizes the significant accounting policies of the Fund:
Investment Valuation. Investments are valued as of 4:00 p.m. Eastern time on the last calendar day of the period. The Board of Trustees (the Board) has designated the Fund's investment adviser as the valuation designee responsible for the fair valuation function and performing fair value determinations as needed. The investment adviser has established a Fair Value Committee (the Committee) to carry out the day-to-day fair valuation responsibilities and has adopted policies and procedures to govern the fair valuation process and the activities of the Committee. In accordance with these fair valuation policies and procedures, which have been approved by the Board, the Fund attempts to obtain prices from one or more third party pricing services or brokers to value its investments. When current market prices, quotations or currency exchange rates are not readily available or reliable, investments will be fair valued in good faith by the Committee, in accordance with the policies and procedures. Factors used in determining fair value vary by investment type and may include market or investment specific events, transaction data, estimated cash flows, and market observations of comparable investments. The frequency that the fair valuation procedures are used cannot be predicted and they may be utilized to a significant extent. The Committee manages the Fund's fair valuation practices and maintains the fair valuation policies and procedures. The Fund's investment adviser reports to the Board information regarding the fair valuation process and related material matters.
The Fund categorizes the inputs to valuation techniques used to value its investments into a disclosure hierarchy consisting of three levels as shown below:
Level 1 - unadjusted quoted prices in active markets for identical investments
Level 2 - other significant observable inputs (including quoted prices for similar investments, interest rates, prepayment speeds, etc.)
Level 3 - unobservable inputs (including the Fund's own assumptions based on the best information available)
Valuation techniques used to value the Fund's investments by major category are as follows:
Equity securities, including restricted securities, for which market quotations are readily available, are valued at the last reported sale price or official closing price as reported by a third party pricing service on the primary market or exchange on which they are traded and are categorized as Level 1 in the hierarchy. In the event there were no sales during the day or closing prices are not available, securities are valued at the last quoted bid price or may be valued using the last available price and are generally categorized as Level 2 in the hierarchy. For foreign equity securities, when market or security specific events arise, comparisons to the valuation of American Depositary Receipts (ADRs), futures contracts, ETFs and certain indexes as well as quoted prices for similar securities may be used and would be categorized as Level 2 in the hierarchy. For equity securities, including restricted securities, where observable inputs are limited, assumptions about market activity and risk are used and these securities may be categorized as Level 3 in the hierarchy.
Investments in open-end mutual funds, including the Fidelity Central Funds, are valued at their closing net asset value (NAV) each business day and are categorized as Level 1 in the hierarchy.
Changes in valuation techniques may result in transfers in or out of an assigned level within the disclosure hierarchy. The aggregate value of investments by input level as of January 31, 2023 is included at the end of the Fund's Schedule of Investments.
Foreign Currency. Certain Funds may use foreign currency contracts to facilitate transactions in foreign-denominated securities. Gains and losses from these transactions may arise from changes in the value of the foreign currency or if the counterparties do not perform under the contracts' terms.
Foreign-denominated assets, including investment securities, and liabilities are translated into U.S. dollars at the exchange rates at period end. Purchases and sales of investment securities, income and dividends received, and expenses denominated in foreign currencies are translated into U.S. dollars at the exchange rate in effect on the transaction date.
The effects of exchange rate fluctuations on investments are included with the net realized and unrealized gain (loss) on investment securities. Other foreign currency transactions resulting in realized and unrealized gain (loss) are disclosed separately.
Investment Transactions and Income. For financial reporting purposes, the Fund's investment holdings and NAV include trades executed through the end of the last business day of the period. The NAV per share for processing shareholder transactions is calculated as of the close of business of the New York Stock Exchange (NYSE), normally 4:00 p.m. Eastern time and includes trades executed through the end of the prior business day. Gains and losses on securities sold are determined on the basis of identified cost and include proceeds received from litigation. Commissions paid to certain brokers with whom the investment adviser, or its affiliates, places trades on behalf of a fund include an amount in addition to trade execution, which may be rebated back to a fund. Any such rebates are included in net realized gain (loss) on investments in the Statement of Operations. Dividend income is recorded on the ex-dividend date, except for certain dividends from foreign securities where the ex-dividend date may have passed, which are recorded as soon as the Fund is informed of the ex-dividend date. Non-cash dividends included in dividend income, if any, are recorded at the fair market value of the securities received. Income and capital gain distributions from Fidelity Central Funds, if any, are recorded on the ex-dividend date. Certain distributions received by the Fund represent a return of capital or capital gain. The Fund determines the components of these distributions subsequent to the ex-dividend date, based upon receipt of tax filings or other correspondence relating to the underlying investment. These distributions are recorded as a reduction of cost of investments and/or as a realized gain. Large, non-recurring dividends recognized by the Fund are presented separately on the Statement of Operations as "Special Dividends" and the impact of these dividends is presented in the Financial Highlights. Investment income is recorded net of foreign taxes withheld where recovery of such taxes is uncertain.
Expenses. Expenses directly attributable to a fund are charged to that fund. Expenses attributable to more than one fund are allocated among the respective funds on the basis of relative net assets or other appropriate methods. Expenses included in the accompanying financial statements reflect the expenses of that fund and do not include any expenses associated with any underlying mutual funds or exchange-traded funds. Although not included in a fund's expenses, a fund indirectly bears its proportionate share of these expenses through the net asset value of each underlying mutual fund or exchange-traded fund. Expense estimates are accrued in the period to which they relate and adjustments are made when actual amounts are known.
Income Tax Information and Distributions to Shareholders. Each year, the Fund intends to qualify as a regulated investment company under Subchapter M of the Internal Revenue Code, including distributing substantially all of its taxable income and realized gains. As a result, no provision for U.S. Federal income taxes is required. As of January 31, 2023, the Fund did not have any unrecognized tax benefits in the financial statements; nor is the Fund aware of any tax positions for which it is reasonably possible that the total amounts of unrecognized tax benefits will significantly change in the next twelve months. The Fund files a U.S. federal tax return, in addition to state and local tax returns as required. The Fund's federal income tax returns are subject to examination by the Internal Revenue Service (IRS) for a period of three fiscal years after they are filed. State and local tax returns may be subject to examination for an additional fiscal year depending on the jurisdiction. Foreign taxes are provided for based on the Fund's understanding of the tax rules and rates that exist in the foreign markets in which it invests.
Distributions are declared and recorded on the ex-dividend date. Income and capital gain distributions are determined in accordance with income tax regulations, which may differ from GAAP.
Capital accounts within the financial statements are adjusted for permanent book-tax differences. These adjustments have no impact on net assets or the results of operations. Capital accounts are not adjusted for temporary book-tax differences which will reverse in a subsequent period.
Book-tax differences are primarily due to foreign currency transactions, passive foreign investment companies (PFIC), capital loss carryforwards and losses deferred due to wash sales and excise tax regulations.
As of period end, the cost and unrealized appreciation (depreciation) in securities, and derivatives if applicable, for federal income tax purposes were as follows:
| Gross unrealized appreciation | $4,700,969 |
| Gross unrealized depreciation | (2,178,449) |
| Net unrealized appreciation (depreciation) | $2,522,520 |
| Tax Cost | $33,842,474 |
The tax-based components of distributable earnings as of period end were as follows:
| Undistributed ordinary income | $61 |
| Undistributed long-term capital gain | $68,544 |
| Net unrealized appreciation (depreciation) on securities and other investments | $2,522,520 |
The tax character of distributions paid was as follows:
| | January 31, 2023 | January 31, 2022 |
| Ordinary Income | $470,724 | $496,165 |
Restricted Securities (including Private Placements). Funds may invest in securities that are subject to legal or contractual restrictions on resale. These securities generally may be resold in transactions exempt from registration or to the public if the securities are registered. Disposal of these securities may involve time-consuming negotiations and expense, and prompt sale at an acceptable price may be difficult. Information regarding restricted securities held at period end is included at the end of the Schedule of Investments, if applicable.
4. Purchases and Sales of Investments.
Purchases and sales of securities, other than short-term securities and in-kind transactions, as applicable, are noted in the table below.
| | Purchases ($) | Sales ($) |
| Fidelity Mid Cap Value K6 Fund | 28,423,348 | 27,512,671 |
Unaffiliated Exchanges In-Kind. Shares that were exchanged for investments, including accrued interest and cash, if any, are shown in the table below. The amount of in-kind exchanges is included in share transactions in the accompanying Statement of Changes in Net Assets.
| | Shares | Total Proceeds ($) |
| Fidelity Mid Cap Value K6 Fund | 30,440 | 364,276 |
5. Fees and Other Transactions with Affiliates.
Management Fee. Fidelity Management & Research Company LLC (the investment adviser) and its affiliates provide the Fund with investment management related services for which the Fund pays a monthly management fee that is based on an annual rate of .45% of average net assets. Under the management contract, the investment adviser or an affiliate pays all other expenses of the Fund, excluding fees and expenses of the independent Trustees, and certain miscellaneous expenses such as proxy and shareholder meeting expenses.
Brokerage Commissions. A portion of portfolio transactions were placed with brokerage firms which are affiliates of the investment adviser. Brokerage commissions are included in net realized gain (loss) and change in net unrealized appreciation (depreciation) in the Statement of Operations. The commissions paid to these affiliated firms were as follows:
| | Amount |
| Fidelity Mid Cap Value K6 Fund | $578 |
Interfund Trades. Funds may purchase from or sell securities to other Fidelity Funds under procedures adopted by the Board. The procedures have been designed to ensure these interfund trades are executed in accordance with Rule 17a-7 of the 1940 Act. Any interfund trades are included within the respective purchases and sales amounts shown in the Purchases and Sales of Investments note. Interfund trades during the period are noted in the table below.
| | Purchases ($) | Sales ($) | Realized Gain (Loss) ($) |
| Fidelity Mid Cap Value K6 Fund | 2,857,233 | 2,028,566 | 294,022 |
6. Committed Line of Credit.
Certain Funds participate with other funds managed by the investment adviser or an affiliate in a $4.25 billion credit facility (the "line of credit") to be utilized for temporary or emergency purposes to fund shareholder redemptions or for other short-term liquidity purposes. The commitment fees on the pro-rata portion of the line of credit are borne by the investment adviser. During the period, there were no borrowings on this line of credit.
7. Security Lending.
Funds lend portfolio securities from time to time in order to earn additional income. Lending agents are used, including National Financial Services (NFS), an affiliate of the investment adviser. Pursuant to a securities lending agreement, NFS will receive a fee, which is capped at 9.9% of a fund's daily lending revenue, for its services as lending agent. A fund may lend securities to certain qualified borrowers, including NFS. On the settlement date of the loan, a fund receives collateral (in the form of U.S. Treasury obligations, letters of credit and/or cash) against the loaned securities and maintains collateral in an amount not less than 100% of the market value of the loaned securities during the period of the loan. The market value of the loaned securities is determined at the close of business of a fund and any additional required collateral is delivered to a fund on the next business day. A fund or borrower may terminate the loan at any time, and if the borrower defaults on its obligation to return the securities loaned because of insolvency or other reasons, a fund may apply collateral received from the borrower against the obligation. A fund may experience delays and costs in recovering the securities loaned. Any cash collateral received is invested in the Fidelity Securities Lending Cash Central Fund. Any loaned securities are identified as such in the Schedule of Investments, and the value of loaned securities and cash collateral at period end, as applicable, are presented in the Statement of Assets and Liabilities. Security lending income represents the income earned on investing cash collateral, less rebates paid to borrowers and any lending agent fees associated with the loan, plus any premium payments received for lending certain types of securities. Security lending income is presented in the Statement of Operations as a component of income from Fidelity Central Funds. Affiliated security lending activity, if any, was as follows:
| | Total Security Lending Fees Paid to NFS | Security Lending Income From Securities Loaned to NFS | Value of Securities Loaned to NFS at Period End |
| Fidelity Mid Cap Value K6 Fund | $733 | $- | $- |
8. Expense Reductions.
Through arrangements with the Fund's custodian, credits realized as a result of certain uninvested cash balances were used to reduce the Fund's expenses by $5.
9. Other.
A fund's organizational documents provide former and current trustees and officers with a limited indemnification against liabilities arising in connection with the performance of their duties to the fund. In the normal course of business, a fund may also enter into contracts that provide general indemnifications. A fund's maximum exposure under these arrangements is unknown as this would be dependent on future claims that may be made against a fund. The risk of material loss from such claims is considered remote.
10. Risk and Uncertainties.
Many factors affect a fund's performance. Developments that disrupt global economies and financial markets, such as pandemics, epidemics, outbreaks of infectious diseases, war, terrorism, and environmental disasters, may significantly affect a fund's investment performance. The effects of these developments to a fund will be impacted by the types of securities in which a fund invests, the financial condition, industry, economic sector, and geographic location of an issuer, and a fund's level of investment in the securities of that issuer.
To the Board of Trustees of Fidelity Devonshire Trust and the Shareholders of Fidelity Mid Cap Value K6 Fund:
Opinion on the Financial Statements and Financial Highlights
We have audited the accompanying statement of assets and liabilities of Fidelity Mid Cap Value K6 Fund (the "Fund"), a fund of Fidelity Devonshire Trust, including the schedule of investments, as of January 31, 2023, the related statement of operations for the year then ended, the statement of changes in net assets for each of the two years in the period then ended, the financial highlights for each of the five years in the period then ended, and the related notes. In our opinion, the financial statements and financial highlights present fairly, in all material respects, the financial position of the Fund as of January 31, 2023, and the results of its operations for the year then ended, the changes in its net assets for each of the two years in the period then ended, and the financial highlights for each of the five years in the period then ended in conformity with accounting principles generally accepted in the United States of America.
Basis for Opinion
These financial statements and financial highlights are the responsibility of the Fund's management. Our responsibility is to express an opinion on the Fund's financial statements and financial highlights based on our audits. We are a public accounting firm registered with the Public Company Accounting Oversight Board (United States) (PCAOB) and are required to be independent with respect to the Fund in accordance with the U.S. federal securities laws and the applicable rules and regulations of the Securities and Exchange Commission and the PCAOB.
We conducted our audits in accordance with the standards of the PCAOB. Those standards require that we plan and perform the audit to obtain reasonable assurance about whether the financial statements and financial highlights are free of material misstatement, whether due to error or fraud. The Fund is not required to have, nor were we engaged to perform, an audit of its internal control over financial reporting. As part of our audits we are required to obtain an understanding of internal control over financial reporting but not for the purpose of expressing an opinion on the effectiveness of the Fund's internal control over financial reporting. Accordingly, we express no such opinion.
Our audits included performing procedures to assess the risks of material misstatement of the financial statements and financial highlights, whether due to error or fraud, and performing procedures that respond to those risks. Such procedures included examining, on a test basis, evidence regarding the amounts and disclosures in the financial statements and financial highlights. Our audits also included evaluating the accounting principles used and significant estimates made by management, as well as evaluating the overall presentation of the financial statements and financial highlights. Our procedures included confirmation of securities owned as of January 31, 2023, by correspondence with the custodian and brokers; when replies were not received from brokers, we performed other auditing procedures. We believe that our audits provide a reasonable basis for our opinion.
/s/ Deloitte & Touche LLP
Boston, Massachusetts
March 16, 2023
We have served as the auditor of one or more of the Fidelity investment companies since 1999.
The Trustees, Members of the Advisory Board (if any), and officers of the trust and fund, as applicable, are listed below. The Board of Trustees governs the fund and is responsible for protecting the interests of shareholders. The Trustees are experienced executives who meet periodically throughout the year to oversee the fund's activities, review contractual arrangements with companies that provide services to the fund, oversee management of the risks associated with such activities and contractual arrangements, and review the fund's performance. Each of the Trustees oversees 318 funds.
The Trustees hold office without limit in time except that (a) any Trustee may resign; (b) any Trustee may be removed by written instrument, signed by at least two-thirds of the number of Trustees prior to such removal; (c) any Trustee who requests to be retired or who has become incapacitated by illness or injury may be retired by written instrument signed by a majority of the other Trustees; and (d) any Trustee may be removed at any special meeting of shareholders by a two-thirds vote of the outstanding voting securities of the trust. Each Trustee who is not an interested person (as defined in the 1940 Act) of the trust and the fund is referred to herein as an Independent Trustee. Each Independent Trustee shall retire not later than the last day of the calendar year in which his or her 75th birthday occurs. The Independent Trustees may waive this mandatory retirement age policy with respect to individual Trustees. Officers and Advisory Board Members hold office without limit in time, except that any officer or Advisory Board Member may resign or may be removed by a vote of a majority of the Trustees at any regular meeting or any special meeting of the Trustees. Except as indicated, each individual has held the office shown or other offices in the same company for the past five years.
The fund's Statement of Additional Information (SAI) includes more information about the Trustees. To request a free copy, call Fidelity at 1-800-835-5092.
Experience, Skills, Attributes, and Qualifications of the Trustees. The Governance and Nominating Committee has adopted a statement of policy that describes the experience, qualifications, attributes, and skills that are necessary and desirable for potential Independent Trustee candidates (Statement of Policy). The Board believes that each Trustee satisfied at the time he or she was initially elected or appointed a Trustee, and continues to satisfy, the standards contemplated by the Statement of Policy. The Governance and Nominating Committee also engages professional search firms to help identify potential Independent Trustee candidates who have the experience, qualifications, attributes, and skills consistent with the Statement of Policy. From time to time, additional criteria based on the composition and skills of the current Independent Trustees, as well as experience or skills that may be appropriate in light of future changes to board composition, business conditions, and regulatory or other developments, have also been considered by the professional search firms and the Governance and Nominating Committee. In addition, the Board takes into account the Trustees' commitment and participation in Board and committee meetings, as well as their leadership of standing and ad hoc committees throughout their tenure.
In determining that a particular Trustee was and continues to be qualified to serve as a Trustee, the Board has considered a variety of criteria, none of which, in isolation, was controlling. The Board believes that, collectively, the Trustees have balanced and diverse experience, qualifications, attributes, and skills, which allow the Board to operate effectively in governing the fund and protecting the interests of shareholders. Information about the specific experience, skills, attributes, and qualifications of each Trustee, which in each case led to the Board's conclusion that the Trustee should serve (or continue to serve) as a trustee of the fund, is provided below.
Board Structure and Oversight Function. Robert A. Lawrence is an interested person and currently serves as Chair. The Trustees have determined that an interested Chair is appropriate and benefits shareholders because an interested Chair has a personal and professional stake in the quality and continuity of services provided to the fund. Independent Trustees exercise their informed business judgment to appoint an individual of their choosing to serve as Chair, regardless of whether the Trustee happens to be independent or a member of management. The Independent Trustees have determined that they can act independently and effectively without having an Independent Trustee serve as Chair and that a key structural component for assuring that they are in a position to do so is for the Independent Trustees to constitute a substantial majority for the Board. The Independent Trustees also regularly meet in executive session. David M. Thomas serves as Lead Independent Trustee and as such (i) acts as a liaison between the Independent Trustees and management with respect to matters important to the Independent Trustees and (ii) with management prepares agendas for Board meetings.
Fidelity ® funds are overseen by different Boards of Trustees. The fund's Board oversees Fidelity's high income and certain equity funds, and other Boards oversee Fidelity's alternative investment, investment-grade bond, money market, asset allocation, and other equity funds. The asset allocation funds may invest in Fidelity ® funds overseen by the fund's Board. The use of separate Boards, each with its own committee structure, allows the Trustees of each group of Fidelity ® funds to focus on the unique issues of the funds they oversee, including common research, investment, and operational issues. On occasion, the separate Boards establish joint committees to address issues of overlapping consequences for the Fidelity ® funds overseen by each Board.
The Trustees operate using a system of committees to facilitate the timely and efficient consideration of all matters of importance to the Trustees, the fund, and fund shareholders and to facilitate compliance with legal and regulatory requirements and oversight of the fund's activities and associated risks. The Board, acting through its committees, has charged FMR and its affiliates with (i) identifying events or circumstances the occurrence of which could have demonstrably adverse effects on the fund's business and/or reputation; (ii) implementing processes and controls to lessen the possibility that such events or circumstances occur or to mitigate the effects of such events or circumstances if they do occur; and (iii) creating and maintaining a system designed to evaluate continuously business and market conditions in order to facilitate the identification and implementation processes described in (i) and (ii) above. Because the day-to-day operations and activities of the fund are carried out by or through FMR, its affiliates, and other service providers, the fund's exposure to risks is mitigated but not eliminated by the processes overseen by the Trustees. While each of the Board's committees has responsibility for overseeing different aspects of the fund's activities, oversight is exercised primarily through the Operations, Audit, and Compliance Committees. Appropriate personnel, including but not limited to the fund's Chief Compliance Officer (CCO), FMR's internal auditor, the independent accountants, the fund's Treasurer and portfolio management personnel, make periodic reports to the Board's committees, as appropriate, including an annual review of Fidelity's risk management program for the Fidelity ® funds. The responsibilities of each standing committee, including their oversight responsibilities, are described further under "Standing Committees of the Trustees."
Interested Trustees*:
Correspondence intended for a Trustee who is an interested person may be sent to Fidelity Investments, 245 Summer Street, Boston, Massachusetts 02210.
Name, Year of Birth; Principal Occupations and Other Relevant Experience+
Bettina Doulton (1964)
Year of Election or Appointment: 2020
Trustee
Ms. Doulton also serves as Trustee of other Fidelity ® funds. Prior to her retirement, Ms. Doulton served in a variety of positions at Fidelity Investments, including as a managing director of research (2006-2007), portfolio manager to certain Fidelity ® funds (1993-2005), equity analyst and portfolio assistant (1990-1993), and research assistant (1987-1990). Ms. Doulton currently owns and operates Phi Builders + Architects and Cellardoor Winery. Previously, Ms. Doulton served as a member of the Board of Brown Capital Management, LLC (2014-2018).
Robert A. Lawrence (1952)
Year of Election or Appointment: 2020
Trustee
Chair of the Board of Trustees
Mr. Lawrence also serves as Trustee of other funds. Previously, Mr. Lawrence served as a Trustee and Member of the Advisory Board of certain funds. Prior to his retirement in 2008, Mr. Lawrence served as Vice President of certain Fidelity ® funds (2006-2008), Senior Vice President, Head of High Income Division of Fidelity Management & Research Company (investment adviser firm, 2006-2008), and President of Fidelity Strategic Investments (investment adviser firm, 2002-2005).
* Determined to be an "Interested Trustee" by virtue of, among other things, his or her affiliation with the trust or various entities under common control with FMR.
+ The information includes the Trustee's principal occupation during the last five years and other information relating to the experience, attributes, and skills relevant to the Trustee's qualifications to serve as a Trustee, which led to the conclusion that the Trustee should serve as a Trustee for the fund.
Independent Trustees:
Correspondence intended for an Independent Trustee may be sent to Fidelity Investments, P.O. Box 55235, Boston, Massachusetts 02205-5235.
Name, Year of Birth; Principal Occupations and Other Relevant Experience+
Thomas P. Bostick (1956)
Year of Election or Appointment: 2021
Trustee
Lieutenant General Bostick also serves as Trustee of other Fidelity ® funds. Prior to his retirement, General Bostick (United States Army, Retired) held a variety of positions within the U.S. Army, including Commanding General and Chief of Engineers, U.S. Army Corps of Engineers (2012-2016) and Deputy Chief of Staff and Director of Human Resources, U.S. Army (2009-2012). General Bostick currently serves as a member of the Board and Finance and Governance Committees of CSX Corporation (transportation, 2020-present) and a member of the Board and Corporate Governance and Nominating Committee of Perma-Fix Environmental Services, Inc. (nuclear waste management, 2020-present). General Bostick serves as Chief Executive Officer of Bostick Global Strategies, LLC (consulting, 2016-present) and as a member of the Board of HireVue, Inc. (video interview and assessment, 2020-present). Previously, General Bostick served as a Member of the Advisory Board of certain Fidelity® funds (2021), President, Intrexon Bioengineering (2018-2020) and Chief Operating Officer (2017-2020) and Senior Vice President of the Environment Sector (2016-2017) of Intrexon Corporation (biopharmaceutical company).
Dennis J. Dirks (1948)
Year of Election or Appointment: 2005
Trustee
Mr. Dirks also serves as Trustee of other Fidelity ® funds. Prior to his retirement in May 2003, Mr. Dirks served as Chief Operating Officer and as a member of the Board of The Depository Trust & Clearing Corporation (financial markets infrastructure), President, Chief Operating Officer and a member of the Board of The Depository Trust Company (DTC), President and a member of the Board of the National Securities Clearing Corporation (NSCC), Chief Executive Officer and a member of the Board of the Government Securities Clearing Corporation and Chief Executive Officer and a member of the Board of the Mortgage-Backed Securities Clearing Corporation. Mr. Dirks currently serves as a member of the Finance Committee (2016-present) and Board (2017-present) and is Treasurer (2018-present) of the Asolo Repertory Theatre.
Donald F. Donahue (1950)
Year of Election or Appointment: 2018
Trustee
Mr. Donahue also serves as Trustee of other Fidelity ® funds. Mr. Donahue serves as President and Chief Executive Officer of Miranda Partners, LLC (risk consulting for the financial services industry, 2012-present). Previously, Mr. Donahue served as Chief Executive Officer (2006-2012), Chief Operating Officer (2003-2006) and Managing Director, Customer Marketing and Development (1999-2003) of The Depository Trust & Clearing Corporation (financial markets infrastructure). Mr. Donahue currently serves as a member (2007-present) and Co-Chairman (2016-present) of the Board of United Way of New York and a member of the Board of The Leadership Academy (previously NYC Leadership Academy) (2012-present). Mr. Donahue previously served as a member of the Advisory Board of certain Fidelity® funds (2015-2018).
Vicki L. Fuller (1957)
Year of Election or Appointment: 2020
Trustee
Ms. Fuller also serves as Trustee of other Fidelity ® funds. Previously, Ms. Fuller served as a member of the Advisory Board of certain Fidelity ® funds (2018-2020), Chief Investment Officer of the New York State Common Retirement Fund (2012-2018) and held a variety of positions at AllianceBernstein L.P. (global asset management, 1985-2012), including Managing Director (2006-2012) and Senior Vice President and Senior Portfolio Manager (2001-2006). Ms. Fuller currently serves as a member of the Board, Audit Committee and Nominating and Governance Committee of two Blackstone business development companies (2020-present), as a member of the Board of Treliant, LLC (consulting, 2019-present), as a member of the Advisory Board of Ariel Alternatives, LLC (private equity, 2021-present) and as a member of the Board and Chair of the Audit Committee of Gusto, Inc. (software, 2021-present). In addition, Ms. Fuller currently serves as a member of the Board of Roosevelt University (2019-present) and as a member of the Executive Board of New York University's Stern School of Business. Ms. Fuller previously served as a member of the Board, Audit Committee and Nominating and Governance Committee of The Williams Companies, Inc. (natural gas infrastructure, 2018-2021).
Patricia L. Kampling (1959)
Year of Election or Appointment: 2020
Trustee
Ms. Kampling also serves as Trustee of other Fidelity ® funds. Prior to her retirement, Ms. Kampling served as Chairman of the Board and Chief Executive Officer (2012-2019), President and Chief Operating Officer (2011-2012) and Executive Vice President and Chief Financial Officer (2010-2011) of Alliant Energy Corporation. Ms. Kampling currently serves as a member of the Board, Finance Committee and Governance, Compensation and Nominating Committee of Xcel Energy Inc. (utilities company, 2020-present) and as a member of the Board, Audit, Finance and Risk Committee and Safety, Environmental, Technology and Operations Committee and Chair of the Executive Development and Compensation Committee of American Water Works Company, Inc. (utilities company, 2019-present). In addition, Ms. Kampling currently serves as a member of the Board of the Nature Conservancy, Wisconsin Chapter (2019-present). Previously, Ms. Kampling served as a Member of the Advisory Board of certain Fidelity® funds (2020), a member of the Board, Compensation Committee and Executive Committee and Chair of the Audit Committee of Briggs & Stratton Corporation (manufacturing, 2011-2021), a member of the Board of Interstate Power and Light Company (2012-2019) and Wisconsin Power and Light Company (2012-2019) (each a subsidiary of Alliant Energy Corporation) and as a member of the Board and Workforce Development Committee of the Business Roundtable (2018-2019).
Thomas A. Kennedy (1955)
Year of Election or Appointment: 2021
Trustee
Mr. Kennedy also serves as Trustee of other Fidelity ® funds. Previously, Mr. Kennedy served as a Member of the Advisory Board of certain Fidelity ® funds (2020) and held a variety of positions at Raytheon Company (aerospace and defense, 1983-2020), including Chairman and Chief Executive Officer (2014-2020) and Executive Vice President and Chief Operating Officer (2013-2014). Mr. Kennedy currently serves as Executive Chairman of the Board of Directors of Raytheon Technologies Corporation (aerospace and defense, 2020-present). He is also a member of the Rutgers School of Engineering Industry Advisory Board (2011-present) and a member of the UCLA Engineering Dean's Executive Board (2016-present).
Oscar Munoz (1959)
Year of Election or Appointment: 2021
Trustee
Mr. Munoz also serves as Trustee of other Fidelity ® funds. Prior to his retirement, Mr. Munoz served as Executive Chairman (2020-2021), Chief Executive Officer (2015-2020), President (2015-2016) and a member of the Board (2010-2021) of United Airlines Holdings, Inc. Mr. Munoz currently serves as a member of the Board of CBRE Group, Inc. (commercial real estate, 2020-present), a member of the Board of Univision Communications, Inc. (Hispanic media, 2020-present) and a member of the Advisory Board of Salesforce.com, Inc. (cloud-based software, 2020-present). Previously, Mr. Munoz served as a Member of the Advisory Board of certain Fidelity ® funds (2021).
David M. Thomas (1949)
Year of Election or Appointment: 2008
Trustee
Lead Independent Trustee
Mr. Thomas also serves as Trustee of other Fidelity ® funds. Previously, Mr. Thomas served as Executive Chairman (2005-2006) and Chairman and Chief Executive Officer (2000-2005) of IMS Health, Inc. (pharmaceutical and healthcare information solutions). Mr. Thomas currently serves as a member of the Board of Fortune Brands Home and Security (home and security products, 2004-present) and as Director (2013-present) and Non-Executive Chairman of the Board (2022-present) of Interpublic Group of Companies, Inc. (marketing communication).
Susan Tomasky (1953)
Year of Election or Appointment: 2020
Trustee
Ms. Tomasky also serves as Trustee of other Fidelity ® funds. Prior to her retirement, Ms. Tomasky served in various executive officer positions at American Electric Power Company, Inc. (1998-2011), including most recently as President of AEP Transmission (2007-2011). Ms. Tomasky currently serves as a member of the Board and Sustainability Committee and as Chair of the Audit Committee of Marathon Petroleum Corporation (2018-present) and as a member of the Board, Executive Committee, Corporate Governance Committee and Organization and Compensation Committee and as Chair of the Audit Committee of Public Service Enterprise Group, Inc. (utilities company, 2012-present) and as a member of the Board of its subsidiary company, Public Service Electric and Gas Co. (2021-present). In addition, Ms. Tomasky currently serves as a member (2009-present) and President (2020-present) of the Board of the Royal Shakespeare Company - America (2009-present), as a member of the Board of the Columbus Association for the Performing Arts (2011-present) and as a member of the Board and Kenyon in the World Committee of Kenyon College (2016-present). Previously, Ms. Tomasky served as a Member of the Advisory Board of certain Fidelity ® funds (2020), as a member of the Board of the Columbus Regional Airport Authority (2007-2020), as a member of the Board (2011-2018) and Lead Independent Director (2015-2018) of Andeavor Corporation (previously Tesoro Corporation) (independent oil refiner and marketer) and as a member of the Board of Summit Midstream Partners LP (energy, 2012-2018).
Michael E. Wiley (1950)
Year of Election or Appointment: 2018
Trustee
Mr. Wiley also serves as Trustee of other Fidelity ® funds. Previously, Mr. Wiley served as a member of the Advisory Board of certain Fidelity ® funds (2018-2020), Chairman, President and CEO of Baker Hughes, Inc. (oilfield services, 2000-2004). Mr. Wiley also previously served as a member of the Board of Andeavor Corporation (independent oil refiner and marketer, 2005-2018), a member of the Board of Andeavor Logistics LP (natural resources logistics, 2015-2018) and a member of the Board of High Point Resources (exploration and production, 2005-2020).
+ The information includes the Trustee's principal occupation during the last five years and other information relating to the experience, attributes, and skills relevant to the Trustee's qualifications to serve as a Trustee, which led to the conclusion that the Trustee should serve as a Trustee for the fund.
Advisory Board Members and Officers:
Correspondence intended for a Member of the Advisory Board (if any) may be sent to Fidelity Investments, P.O. Box 55235, Boston, Massachusetts 02205-5235. Correspondence intended for an officer or Peter S. Lynch may be sent to Fidelity Investments, 245 Summer Street, Boston, Massachusetts 02210. Officers appear below in alphabetical order.
Name, Year of Birth; Principal Occupation
Peter S. Lynch (1944)
Year of Election or Appointment: 2003
Member of the Advisory Board
Mr. Lynch also serves as a Member of the Advisory Board of other Fidelity ® funds. Mr. Lynch is Vice Chairman and a Director of Fidelity Management & Research Company LLC (investment adviser firm). In addition, Mr. Lynch serves as a Trustee of Boston College and as the Chairman of the Inner-City Scholarship Fund. Previously, Mr. Lynch served as Vice Chairman and a Director of FMR Co., Inc. (investment adviser firm) and on the Special Olympics International Board of Directors (1997-2006).
Craig S. Brown (1977)
Year of Election or Appointment: 2022
Deputy Treasurer
Mr. Brown also serves as an officer of other funds. Mr. Brown serves as Assistant Treasurer of FIMM, LLC (2021-present) and is an employee of Fidelity Investments (2013-present). Previously, Mr. Brown served as Assistant Treasurer of certain Fidelity ® funds (2019-2022).
John J. Burke III (1964)
Year of Election or Appointment: 2018
Chief Financial Officer
Mr. Burke also serves as Chief Financial Officer of other funds. Mr. Burke serves as Head of Investment Operations for Fidelity Fund and Investment Operations (2018-present) and is an employee of Fidelity Investments (1998-present). Previously Mr. Burke served as head of Asset Management Investment Operations (2012-2018).
William C. Coffey (1969)
Year of Election or Appointment: 2019
Assistant Secretary
Mr. Coffey also serves as Assistant Secretary of other funds. He is Senior Vice President and Deputy General Counsel of FMR LLC (diversified financial services company, 2010-present), and is an employee of Fidelity Investments. Previously, Mr. Coffey served as Secretary and CLO of certain funds (2018-2019); CLO, Secretary, and Senior Vice President of Fidelity Management & Research Company and FMR Co., Inc. (investment adviser firms, 2018-2019); Secretary of Fidelity SelectCo, LLC and Fidelity Investments Money Management, Inc. (investment adviser firms, 2018-2019); CLO of Fidelity Management & Research (Hong Kong) Limited, FMR Investment Management (UK) Limited, and Fidelity Management & Research (Japan) Limited (investment adviser firms, 2018-2019); and Assistant Secretary of certain funds (2009-2018).
Timothy M. Cohen (1969)
Year of Election or Appointment: 2018
Vice President
Mr. Cohen also serves as Vice President of other funds. Mr. Cohen serves as Co-Head of Equity (2018-present), a Director of Fidelity Management & Research (Japan) Limited (investment adviser firm, 2016-present), and is an employee of Fidelity Investments. Previously, Mr. Cohen served as Executive Vice President of Fidelity SelectCo, LLC (2019), Head of Global Equity Research (2016-2018), Chief Investment Officer - Equity and a Director of Fidelity Management & Research (U.K.) Inc. (investment adviser firm, 2013-2015) and as a Director of Fidelity Management & Research (Hong Kong) Limited (investment adviser firm, 2017).
Jonathan Davis (1968)
Year of Election or Appointment: 2010
Assistant Treasurer
Mr. Davis also serves as an officer of other funds. Mr. Davis serves as Assistant Treasurer of FIMM, LLC (2021-present), FMR Capital, Inc. (2017-present), FD Funds GP LLC (2021-present), FD Funds Holding LLC (2021-present), and FD Funds Management LLC (2021-present); and is an employee of Fidelity Investments. Previously, Mr. Davis served as Vice President and Associate General Counsel of FMR LLC (diversified financial services company, 2003-2010).
Laura M. Del Prato (1964)
Year of Election or Appointment: 2018
Assistant Treasurer
Ms. Del Prato also serves as an officer of other funds. Ms. Del Prato serves as Assistant Treasurer of FIMM, LLC (2021-present) and is an employee of Fidelity Investments (2017-present). Previously, Ms. Del Prato served as President and Treasurer of The North Carolina Capital Management Trust: Cash Portfolio and Term Portfolio (2018-2020). Prior to joining Fidelity Investments, Ms. Del Prato served as a Managing Director and Treasurer of the JPMorgan Mutual Funds (2014-2017). Prior to JPMorgan, Ms. Del Prato served as a partner at Cohen Fund Audit Services (accounting firm, 2012-2013) and KPMG LLP (accounting firm, 2004-2012).
Colm A. Hogan (1973)
Year of Election or Appointment: 2020
Assistant Treasurer
Mr. Hogan also serves as an officer of other funds. Mr. Hogan serves as Assistant Treasurer of FIMM, LLC (2021-present) and FMR Capital, Inc. (2017-present) and is an employee of Fidelity Investments (2005-present). Previously, Mr. Hogan served as Deputy Treasurer of certain Fidelity ® funds (2016-2020) and Assistant Treasurer of certain Fidelity ® funds (2016-2018).
Pamela R. Holding (1964)
Year of Election or Appointment: 2018
Vice President
Ms. Holding also serves as Vice President of other funds. Ms. Holding serves as Co-Head of Equity (2018-present) and is an employee of Fidelity Investments (2013-present). Previously, Ms. Holding served as Executive Vice President of Fidelity SelectCo, LLC (2019) and as Chief Investment Officer of Fidelity Institutional Asset Management (2013-2018).
Cynthia Lo Bessette (1969)
Year of Election or Appointment: 2019
Secretary and Chief Legal Officer (CLO)
Ms. Lo Bessette also serves as an officer of other funds. Ms. Lo Bessette serves as CLO, Secretary, and Senior Vice President of Fidelity Management & Research Company LLC (investment adviser firm, 2019-present); CLO of Fidelity Management & Research (Hong Kong) Limited, FMR Investment Management (UK) Limited, and Fidelity Management & Research (Japan) Limited (investment adviser firms, 2019-present); Secretary of FD Funds GP LLC (2021-present), FD Funds Holding LLC (2021-present), FD Funds Management LLC (2021-present), and Fidelity Diversifying Solutions LLC (investment adviser firm, 2022-present); and Assistant Secretary of FIMM, LLC (2019-present). She is a Senior Vice President and Deputy General Counsel of FMR LLC (diversified financial services company, 2019-present), and is an employee of Fidelity Investments. Previously, Ms. Lo Bessette served as CLO, Secretary, and Senior Vice President of FMR Co., Inc. (investment adviser firm, 2019); Secretary of Fidelity SelectCo, LLC and Fidelity Investments Money Management, Inc. (investment adviser firms, 2019). Prior to joining Fidelity Investments, Ms. Lo Bessette was Executive Vice President, General Counsel (2016-2019) and Senior Vice President, Deputy General Counsel (2015-2016) of OppenheimerFunds (investment management company) and Deputy Chief Legal Officer (2013-2015) of Jennison Associates LLC (investment adviser firm).
Chris Maher (1972)
Year of Election or Appointment: 2020
Deputy Treasurer
Mr. Maher also serves as an officer of other funds. Mr. Maher serves as Assistant Treasurer of FIMM, LLC (2021-present) and FMR Capital, Inc. (2017-present), and is an employee of Fidelity Investments (2008-present). Previously, Mr. Maher served as Assistant Treasurer of certain funds (2013-2020); Vice President of Asset Management Compliance (2013), Vice President of the Program Management Group of FMR (investment adviser firm, 2010-2013), and Vice President of Valuation Oversight (2008-2010).
Jason P. Pogorelec (1975)
Year of Election or Appointment: 2020
Chief Compliance Officer
Mr. Pogorelec also serves as Chief Compliance Officer of other funds. Mr. Pogorelec is a Senior Vice President of Asset Management Compliance for Fidelity Investments and is an employee of Fidelity Investments. Mr. Pogorelec serves as Compliance Officer of Fidelity Management & Research Company LLC (investment adviser firm, 2023-present). Previously, Mr. Pogorelec served as Vice President, Associate General Counsel for Fidelity Investments (2010-2020) and Assistant Secretary of certain Fidelity ® funds (2015-2020).
Brett Segaloff (1972)
Year of Election or Appointment: 2021
Anti-Money Laundering (AML) Officer
Mr. Segaloff also serves as an AML Officer of other funds and other related entities. He is Director, Anti-Money Laundering (2007-present) of FMR LLC (diversified financial services company) and is an employee of Fidelity Investments (1996-present).
Stacie M. Smith (1974)
Year of Election or Appointment: 2016
President and Treasurer
Ms. Smith also serves as an officer of other funds. Ms. Smith serves as Assistant Treasurer of FIMM, LLC (2021-present) and FMR Capital, Inc. (2017-present), is an employee of Fidelity Investments (2009-present), and has served in other fund officer roles. Prior to joining Fidelity Investments, Ms. Smith served as Senior Audit Manager of Ernst & Young LLP (accounting firm, 1996-2009). Previously, Ms. Smith served as Assistant Treasurer (2013-2019) and Deputy Treasurer (2013-2016) of certain Fidelity ® funds.
Jim Wegmann (1979)
Year of Election or Appointment: 2019
Assistant Treasurer
Mr. Wegmann also serves as an officer of other funds. Mr. Wegmann serves as Assistant Treasurer of FIMM, LLC (2021-present) and is an employee of Fidelity Investments (2011-present). Previously, Mr. Wegmann served as Assistant Treasurer of certain Fidelity ® funds (2019-2021).
As a shareholder, you incur two types of costs: (1) transaction costs, which may include sales charges (loads) on purchase payments or redemption proceeds, as applicable and (2) ongoing costs, which generally include management fees, distribution and/or service (12b-1) fees and other Fund expenses. This Example is intended to help you understand your ongoing costs (in dollars) of investing in a fund and to compare these costs with the ongoing costs of investing in other mutual funds.
| The Example is based on an investment of $1,000 invested at the beginning of the period and held for the entire period (August 1, 2022 to January 31, 2023). |
Actual Expenses
The first line of the accompanying table provides information about actual account values and actual expenses. You may use the information in this line, together with the amount you invested, to estimate the expenses that you paid over the period. Simply divide your account value by $1,000.00 (for example, an $8,600 account value divided by $1,000.00 = 8.6), then multiply the result by the number in the first line for a class/Fund under the heading entitled "Expenses Paid During Period" to estimate the expenses you paid on your account during this period. If any fund is a shareholder of any underlying mutual funds or exchange-traded funds (ETFs) (the Underlying Funds), such fund indirectly bears its proportional share of the expenses of the Underlying Funds in addition to the direct expenses incurred presented in the table. These fees and expenses are not included in the annualized expense ratio used to calculate the expense estimate in the table below.
Hypothetical Example for Comparison Purposes
The second line of the accompanying table provides information about hypothetical account values and hypothetical expenses based on the actual expense ratio and an assumed rate of return of 5% per year before expenses, which is not the actual return. The hypothetical account values and expenses may not be used to estimate the actual ending account balance or expenses you paid for the period. You may use this information to compare the ongoing costs of investing in the Fund and other funds. To do so, compare this 5% hypothetical example with the 5% hypothetical examples that appear in the shareholder reports of the other funds. If any fund is a shareholder of any Underlying Funds, such fund indirectly bears its proportional share of the expenses of the Underlying Funds in addition to the direct expenses as presented in the table. These fees and expenses are not included in the annualized expense ratio used to calculate the expense estimate in the table below.
Please note that the expenses shown in the table are meant to highlight your ongoing costs only and do not reflect any transaction costs. Therefore, the second line of the table is useful in comparing ongoing costs only, and will not help you determine the relative total costs of owning different funds. In addition, if these transactional costs were included, your costs would have been higher.
| | | | | Annualized Expense Ratio- A | | Beginning Account Value August 1, 2022 | | Ending Account Value January 31, 2023 | | Expenses Paid During Period- C August 1, 2022 to January 31, 2023 |
| | | | | | | | | | |
| Fidelity® Mid Cap Value K6 Fund | | | | .45% | | | | | | |
| Actual | | | | | | $ 1,000 | | $ 1,065.80 | | $ 2.34 |
Hypothetical- B | | | | | | $ 1,000 | | $ 1,022.94 | | $ 2.29 |
| |
A Annualized expense ratio reflects expenses net of applicable fee waivers.
B 5% return per year before expenses
C Expenses are equal to the annualized expense ratio, multiplied by the average account value over the period, multiplied by 184/ 365 (to reflect the one-half year period). The fees and expenses of any Underlying Funds are not included in each annualized expense ratio.
The dividend and capital gains distributions for the fund is available on Fidelity.com or Institutional.Fidelity.com .
The fund hereby designates as a capital gain dividend with respect to the taxable year ended January 31, 2023, $68,544, or, if subsequently determined to be different, the net capital gain of such year.
The fund designates $1,331 of distributions paid during the fiscal year ended 2023 as qualifying to be taxed as section 163(j) interest dividends.
The fund designates 100% of the dividend distributed in December during the fiscal year as qualifying for the dividends-received deduction for corporate shareholders.
The fund designates 90.23% of the dividend distributed in December during the fiscal year as amounts which may be taken into account as a dividend for the purposes of the maximum rate under section 1(h)(11) of the Internal Revenue Code.
The fund designates 9.77% of the dividend distributed during the fiscal year as a section 199A dividend.
The fund will notify shareholders in January 2024 of amounts for use in preparing 2023 income tax returns.
The Securities and Exchange Commission adopted Rule 22e-4 under the Investment Company Act of 1940 (the Liquidity Rule) to promote effective liquidity risk management throughout the open-end investment company industry, thereby reducing the risk that funds will be unable to meet their redemption obligations and mitigating dilution of the interests of fund shareholders.
The Fund has adopted and implemented a liquidity risk management program (the Program) reasonably designed to assess and manage the Fund's liquidity risk and to comply with the requirements of the Liquidity Rule. The Fund's Board of Trustees (the Board) has designated the Fund's investment adviser as administrator of the Program. The Fidelity advisers have established a Liquidity Risk Management Committee (the LRM Committee) to manage the Program for each of the Fidelity Funds. The LRM Committee monitors the adequacy and effectiveness of implementation of the Program and on a periodic basis assesses each Fund's liquidity risk based on a variety of factors including (1) the Fund's investment strategy, (2) portfolio liquidity and cash flow projections during normal and reasonably foreseeable stressed conditions, (3) shareholder redemptions, (4) borrowings and other funding sources and (5) certain factors specific to ETFs including the effect of the Fund's prices and spreads, market participants, and basket compositions on the overall liquidity of the Fund's portfolio, as applicable.
In accordance with the Program, each of the Fund's portfolio investments is classified into one of four defined liquidity categories based on a determination of a reasonable expectation for how long it would take to convert the investment to cash (or sell or dispose of the investment) without significantly changing its market value.
- Highly liquid investments - cash or convertible to cash within three business days or less
- Moderately liquid investments - convertible to cash in three to seven calendar days
- Less liquid investments - can be sold or disposed of, but not settled, within seven calendar days
- Illiquid investments - cannot be sold or disposed of within seven calendar days
Liquidity classification determinations take into account a variety of factors including various market, trading and investment-specific considerations, as well as market depth, and generally utilize analysis from a third-party liquidity metrics service.
The Liquidity Rule places a 15% limit on a fund's illiquid investments and requires funds that do not primarily hold assets that are highly liquid investments to determine and maintain a minimum percentage of the fund's net assets to be invested in highly liquid investments (highly liquid investment minimum or HLIM). The Program includes provisions reasonably designed to comply with the 15% limit on illiquid investments and for determining, periodically reviewing and complying with the HLIM requirement as applicable.
At a recent meeting of the Fund's Board of Trustees, the LRM Committee provided a written report to the Board pertaining to the operation, adequacy, and effectiveness of the Program for the period December 1, 2021 through November 30, 2022. The report concluded that the Program is operating effectively and is reasonably designed to assess and manage the Fund's liquidity risk.
1.9883983.105
MCVK6-ANN-0423
Fidelity® Series All-Sector Equity Fund
Fidelity® Series Stock Selector Large Cap Value Fund
Fidelity® Series Value Discovery Fund
Annual Report
January 31, 2023
Contents
To view a fund's proxy voting guidelines and proxy voting record for the 12-month period ended June 30, visit http://www.fidelity.com/proxyvotingresults or visit the Securities and Exchange Commission's (SEC) web site at http://www.sec.gov.
You may also call 1-800-544-8544 to request a free copy of the proxy voting guidelines.
Standard & Poor's, S&P and S&P 500 are registered service marks of The McGraw-Hill Companies, Inc. and have been licensed for use by Fidelity Distributors Corporation.
Other third-party marks appearing herein are the property of their respective owners.
All other marks appearing herein are registered or unregistered trademarks or service marks of FMR LLC or an affiliated company. © 2023 FMR LLC. All rights reserved.
This report and the financial statements contained herein are submitted for the general information of the shareholders of the Funds. This report is not authorized for distribution to prospective investors in the Funds unless preceded or accompanied by an effective prospectus.
A fund files its complete schedule of portfolio holdings with the SEC for the first and third quarters of each fiscal year on Form N-PORT. Forms N-PORT are available on the SEC's web site at http://www.sec.gov. A fund's Forms N-PORT may be reviewed and copied at the SEC's Public Reference Room in Washington, DC. Information regarding the operation of the SEC's Public Reference Room may be obtained by calling 1-800-SEC-0330.
For a complete list of a fund's portfolio holdings, view the most recent holdings listing, semiannual report, or annual report on Fidelity's web site at http://www.fidelity.com, http://www.institutional.fidelity.com, or http://www.401k.com, as applicable.
NOT FDIC INSURED •MAY LOSE VALUE •NO BANK GUARANTEE
Neither the Funds nor Fidelity Distributors Corporation is a bank.
Average annual total return reflects the change in the value of an investment, assuming reinvestment of distributions from dividend income and capital gains (the profits earned upon the sale of securities that have grown in value, if any) and assuming a constant rate of performance each year. The hypothetical investment and the average annual total returns do not reflect the deduction of taxes that a shareholder would pay on fund distributions or the redemption of fund shares. During periods of reimbursement by Fidelity, a fund's total return will be greater than it would be had the reimbursement not occurred. How a fund did yesterday is no guarantee of how it will do tomorrow.
| Average Annual Total Returns |
| | | | |
Periods ended January 31, 2023 | Past 1 year | Past 5 years | Past 10 years |
| Fidelity® Series All-Sector Equity Fund | -7.34% | 10.38% | 12.89% |
| $10,000 Over 10 Years |
| |
Let's say hypothetically that $10,000 was invested in Fidelity® Series All-Sector Equity Fund on January 31, 2013. The chart shows how the value of your investment would have changed, and also shows how the Russell 1000® Index performed over the same period. |
|
|
Fidelity® Series All-Sector Equity Fund
Market Recap:
U.S. equities returned -8.22% for the 12 months ending January 31, 2023, according to the S&P 500® index. The new year began with an encouraging upturn in January (+6.28%), but the backdrop remains clouded by the multitude of risk factors that challenged the global economy in 2022, when the index logged its lowest calendar-year return since 2008 and first annual retreat since 2018. High inflation prompted the Federal Reserve to aggressively tighten monetary policy, and market interest rates eclipsed their highest level in a decade, stoking recession fears and sending stocks into bear market territory. Since March 2022, the Fed has hiked its benchmark rate seven times, by 4.25 percentage points - the fastest-ever pace of monetary tightening - while also shrinking its massive portfolio. The latest bump came in mid-December, along with a signal that the central bank plans to lift rates through the spring, though likely in smaller increments, to combat high inflation. Against this backdrop, stocks struggled to gain traction until a strong rally ignited heading into the summer. But in September, the S&P 500® returned -9.21%, one of its worst monthly results ever, before advancing 7.56% in Q4 as risky assets regained favor. For the full 12 months, value stocks handily outpaced growth. This headwind was most pronounced in the growth-oriented communication services (-27%), consumer discretionary (-20%) and information technology (-16%) sectors. In contrast, energy (+43%) led by a wide margin, followed by health care (+3%).
Comments from Co-Managers Becky Baker, Chad Colman, and Matthew Drukker:
For the fiscal year ending January 31, 2023, the fund returned -7.34%, outperforming the -8.55% result of the S&P-Russell 1000 Composite Blend 4/1/2013 Index, as well as the broad-based Russell 1000 ® Index. Versus the benchmark, security selection was the primary contributor, led by the industrials sector. Picks among energy and utilities stocks also helped to a lesser extent. The fund's top individual relative contributor was an overweighting in Exxon Mobil, which gained 59% the past year. The company was among our biggest holdings. Also adding value was the portfolio's outsized exposure to Hess, which rose about 65%. Another notable relative contributor was an overweighting in Nielsen Holdings (+39%), a position no longer held at the end of the period. Conversely, the primary detractor from performance versus the benchmark was investment choices in the information technology sector, primarily within the software & services industry. Weak security selection in financials and real estate also hindered the fund's relative result. Not owning Chevron, a benchmark component that gained about 37%, was the largest individual relative detractor. Also hurting performance was an overweighting in EPAM Systems, which returned approximately -36%, although we meaningfully added to our position in the firm the past 12 months. Further weighing on the portfolio's relative return was an outsized stake in MongoDB, which returned -47%. Notable changes in positioning during the period include reduced exposure to the communication services sector.
Notes to shareholders:
On July 27, 2022, Chad Colman assumed portfolio management responsibilities for the fund's industrials sleeve, succeeding John Mirshekari. After nearly four decades with Fidelity, Robert Stansky retired on December 31, 2022. On January 1, 2023, Chris Lee assumed Stansky's responsibilities for the fund. On January 1, 2023, Jody Simes came off of the fund.
The views expressed above reflect those of the portfolio manager(s) only through the end of the period as stated on the cover of this report and do not necessarily represent the views of Fidelity or any other person in the Fidelity organization. Any such views are subject to change at any time based upon market or other conditions and Fidelity disclaims any responsibility to update such views. These views may not be relied on as investment advice and, because investment decisions for a Fidelity fund are based on numerous factors, may not be relied on as an indication of trading intent on behalf of any Fidelity fund.
Fidelity® Series All-Sector Equity Fund
Top Holdings (% of Fund's net assets) |
| |
| Microsoft Corp. | 5.5 | |
| Apple, Inc. | 5.1 | |
| Amazon.com, Inc. | 2.7 | |
| Exxon Mobil Corp. | 2.5 | |
| UnitedHealth Group, Inc. | 1.7 | |
| Bank of America Corp. | 1.7 | |
| NVIDIA Corp. | 1.7 | |
| Alphabet, Inc. Class C | 1.6 | |
| Eli Lilly & Co. | 1.5 | |
| Alphabet, Inc. Class A | 1.5 | |
| | 25.5 | |
| |
| Market Sectors (% of Fund's net assets) |
| |
| Information Technology | 25.3 | |
| Health Care | 14.0 | |
| Financials | 12.0 | |
| Consumer Discretionary | 11.1 | |
| Industrials | 9.1 | |
| Communication Services | 7.4 | |
| Consumer Staples | 5.9 | |
| Energy | 5.1 | |
| Real Estate | 3.1 | |
| Materials | 2.7 | |
| Utilities | 2.7 | |
| |
Asset Allocation (% of Fund's net assets) |
|
Foreign investments - 4.5% |
Futures - 0.9% |
|
Fidelity® Series All-Sector Equity Fund
Showing Percentage of Net Assets
| Common Stocks - 98.3% |
| | | Shares | Value ($) |
| COMMUNICATION SERVICES - 7.4% | | | |
| Diversified Telecommunication Services - 0.0% | | | |
| AT&T, Inc. | | 59,750 | 1,217,108 |
| Entertainment - 1.8% | | | |
| Activision Blizzard, Inc. | | 145,011 | 11,103,492 |
| Cinemark Holdings, Inc. (a)(b) | | 186,300 | 2,224,422 |
| Lions Gate Entertainment Corp. Class B (a) | | 129,700 | 988,314 |
| Netflix, Inc. (a) | | 65,010 | 23,004,439 |
| Spotify Technology SA (a) | | 23,470 | 2,645,538 |
| Take-Two Interactive Software, Inc. (a) | | 23,300 | 2,638,259 |
| The Walt Disney Co. (a) | | 69,887 | 7,582,041 |
| Warner Bros Discovery, Inc. (a) | | 27,293 | 404,482 |
| World Wrestling Entertainment, Inc. Class A (b) | | 27,800 | 2,352,436 |
| | | | 52,943,423 |
| Interactive Media & Services - 4.3% | | | |
| Alphabet, Inc.: | | | |
| Class A (a) | | 435,600 | 43,054,704 |
| Class C (a) | | 460,720 | 46,012,106 |
| Angi, Inc. (a) | | 273,300 | 795,303 |
| IAC, Inc. (a) | | 6,380 | 360,470 |
| Meta Platforms, Inc. Class A (a) | | 211,140 | 31,453,526 |
| Snap, Inc. Class A (a) | | 329,620 | 3,810,407 |
| Zoominfo Technologies, Inc. (a) | | 9,230 | 260,563 |
| | | | 125,747,079 |
| Media - 0.9% | | | |
| Altice U.S.A., Inc. Class A (a) | | 161,130 | 789,537 |
| Charter Communications, Inc. Class A (a) | | 24,700 | 9,492,457 |
| Comcast Corp. Class A | | 236,438 | 9,303,835 |
| DISH Network Corp. Class A (a) | | 17,200 | 247,508 |
| Liberty Broadband Corp.: | | | |
| Class A (a) | | 59,100 | 5,296,542 |
| Class C (a) | | 25,700 | 2,307,346 |
| | | | 27,437,225 |
| Wireless Telecommunication Services - 0.4% | | | |
| T-Mobile U.S., Inc. (a) | | 72,352 | 10,802,877 |
TOTAL COMMUNICATION SERVICES | | | 218,147,712 |
| CONSUMER DISCRETIONARY - 11.1% | | | |
| Auto Components - 0.1% | | | |
| Aptiv PLC (a) | | 29,300 | 3,313,537 |
| Automobiles - 1.2% | | | |
| Tesla, Inc. (a) | | 201,800 | 34,955,796 |
| Hotels, Restaurants & Leisure - 2.5% | | | |
| ARAMARK Holdings Corp. | | 15,404 | 685,940 |
| Booking Holdings, Inc. (a) | | 5,990 | 14,580,259 |
| Caesars Entertainment, Inc. (a) | | 128,100 | 6,668,886 |
| Chipotle Mexican Grill, Inc. (a) | | 4,600 | 7,573,348 |
| Domino's Pizza, Inc. | | 12,000 | 4,236,000 |
| Marriott International, Inc. Class A | | 62,400 | 10,868,832 |
| McDonald's Corp. | | 24,500 | 6,551,300 |
| Planet Fitness, Inc. (a) | | 61,200 | 5,180,580 |
| Starbucks Corp. | | 121,900 | 13,304,166 |
| Sweetgreen, Inc. Class A (a) | | 19,729 | 204,590 |
| Wingstop, Inc. (b) | | 21,400 | 3,391,258 |
| | | | 73,245,159 |
| Household Durables - 0.2% | | | |
| D.R. Horton, Inc. | | 59,500 | 5,872,055 |
| Internet & Direct Marketing Retail - 3.1% | | | |
| Amazon.com, Inc. (a) | | 782,700 | 80,719,851 |
| Uber Technologies, Inc. (a) | | 358,060 | 11,074,796 |
| | | | 91,794,647 |
| Multiline Retail - 0.7% | | | |
| Dollar General Corp. | | 65,575 | 15,318,320 |
| Ollie's Bargain Outlet Holdings, Inc. (a) | | 11,800 | 646,168 |
| Target Corp. | | 26,000 | 4,475,640 |
| | | | 20,440,128 |
| Specialty Retail - 2.0% | | | |
| O'Reilly Automotive, Inc. (a) | | 7,700 | 6,101,095 |
| RH (a) | | 7,100 | 2,215,129 |
| Signet Jewelers Ltd. (b) | | 53,900 | 4,140,059 |
| The Home Depot, Inc. | | 44,679 | 14,483,591 |
| TJX Companies, Inc. | | 292,396 | 23,935,537 |
| Ulta Beauty, Inc. (a) | | 9,000 | 4,625,640 |
| Victoria's Secret & Co. (a) | | 22,600 | 952,590 |
| Warby Parker, Inc. (a) | | 107,800 | 1,740,970 |
| | | | 58,194,611 |
| Textiles, Apparel & Luxury Goods - 1.3% | | | |
| Capri Holdings Ltd. (a) | | 22,700 | 1,509,323 |
| Crocs, Inc. (a) | | 40,800 | 4,968,216 |
| NIKE, Inc. Class B | | 133,300 | 16,973,089 |
| Ralph Lauren Corp. (b) | | 86,200 | 10,675,870 |
| Tapestry, Inc. | | 87,400 | 3,982,818 |
| | | | 38,109,316 |
TOTAL CONSUMER DISCRETIONARY | | | 325,925,249 |
| CONSUMER STAPLES - 5.9% | | | |
| Beverages - 2.3% | | | |
| Boston Beer Co., Inc. Class A (a) | | 4,419 | 1,717,268 |
| Celsius Holdings, Inc. (a) | | 11,000 | 1,103,520 |
| Constellation Brands, Inc. Class A (sub. vtg.) | | 49,066 | 11,359,760 |
| Duckhorn Portfolio, Inc. (a) | | 25,044 | 405,212 |
| Keurig Dr. Pepper, Inc. | | 91,251 | 3,219,335 |
| Monster Beverage Corp. (a) | | 81,456 | 8,477,940 |
| PepsiCo, Inc. | | 109,203 | 18,675,897 |
| The Coca-Cola Co. | | 374,534 | 22,966,425 |
| | | | 67,925,357 |
| Food & Staples Retailing - 1.4% | | | |
| Albertsons Companies, Inc. | | 93,558 | 1,983,430 |
| Costco Wholesale Corp. | | 37,157 | 18,992,429 |
| Sysco Corp. | | 48,932 | 3,790,273 |
| U.S. Foods Holding Corp. (a) | | 42,874 | 1,634,786 |
| Walmart, Inc. | | 104,370 | 15,015,712 |
| | | | 41,416,630 |
| Food Products - 0.9% | | | |
| Freshpet, Inc. (a)(b) | | 45,073 | 2,854,473 |
| Lamb Weston Holdings, Inc. | | 26,369 | 2,633,999 |
| McCormick & Co., Inc. (non-vtg.) | | 41,931 | 3,149,857 |
| Mondelez International, Inc. | | 160,725 | 10,517,844 |
| Sovos Brands, Inc. (a) | | 52,890 | 717,188 |
| The Hershey Co. | | 20,009 | 4,494,021 |
| TreeHouse Foods, Inc. (a) | | 25,151 | 1,218,063 |
| | | | 25,585,445 |
| Household Products - 1.1% | | | |
| Procter & Gamble Co. | | 230,343 | 32,796,236 |
| Personal Products - 0.2% | | | |
| Estee Lauder Companies, Inc. Class A | | 23,553 | 6,526,065 |
| Olaplex Holdings, Inc. (a) | | 117,300 | 740,163 |
| The Honest Co., Inc. (a) | | 20,300 | 66,990 |
| | | | 7,333,218 |
TOTAL CONSUMER STAPLES | | | 175,056,886 |
| ENERGY - 5.1% | | | |
| Energy Equipment & Services - 0.7% | | | |
| Expro Group Holdings NV (a) | | 211,700 | 3,999,013 |
| Schlumberger Ltd. | | 244,100 | 13,908,818 |
| Weatherford International PLC (a) | | 70,400 | 4,004,352 |
| | | | 21,912,183 |
| Oil, Gas & Consumable Fuels - 4.4% | | | |
| Antero Resources Corp. (a) | | 61,800 | 1,782,312 |
| Exxon Mobil Corp. | | 625,124 | 72,520,635 |
| Hess Corp. | | 202,100 | 30,347,336 |
| Phillips 66 Co. | | 115,700 | 11,601,239 |
| Valero Energy Corp. | | 90,500 | 12,672,715 |
| | | | 128,924,237 |
TOTAL ENERGY | | | 150,836,420 |
| FINANCIALS - 12.0% | | | |
| Banks - 5.1% | | | |
| Bank of America Corp. | | 1,432,533 | 50,826,271 |
| BankUnited, Inc. | | 16,771 | 631,260 |
| Citizens Financial Group, Inc. | | 100,053 | 4,334,296 |
| Comerica, Inc. | | 57,231 | 4,195,605 |
| JPMorgan Chase & Co. | | 147,828 | 20,690,007 |
| M&T Bank Corp. | | 30,459 | 4,751,604 |
| PNC Financial Services Group, Inc. | | 38,319 | 6,339,112 |
| Signature Bank | | 15,357 | 1,980,285 |
| U.S. Bancorp | | 314,106 | 15,642,479 |
| Wells Fargo & Co. | | 902,073 | 42,280,162 |
| | | | 151,671,081 |
| Capital Markets - 1.7% | | | |
| Bank of New York Mellon Corp. | | 299,308 | 15,136,006 |
| BlackRock, Inc. Class A | | 13,432 | 10,197,709 |
| Cboe Global Markets, Inc. | | 21,508 | 2,642,903 |
| Intercontinental Exchange, Inc. | | 56,204 | 6,044,740 |
| State Street Corp. | | 150,167 | 13,714,752 |
| StepStone Group, Inc. Class A | | 39,296 | 1,147,050 |
| Virtu Financial, Inc. Class A | | 108,918 | 2,103,207 |
| | | | 50,986,367 |
| Consumer Finance - 0.8% | | | |
| American Express Co. | | 38,205 | 6,683,201 |
| Capital One Financial Corp. | | 93,482 | 11,124,358 |
| NerdWallet, Inc. (a) | | 397,100 | 4,642,099 |
| | | | 22,449,658 |
| Diversified Financial Services - 0.3% | | | |
| Apollo Global Management, Inc. | | 117,200 | 8,295,416 |
| Insurance - 4.0% | | | |
| Arch Capital Group Ltd. (a) | | 75,076 | 4,831,141 |
| Arthur J. Gallagher & Co. | | 56,019 | 10,964,039 |
| Chubb Ltd. | | 66,100 | 15,037,089 |
| Globe Life, Inc. | | 72,380 | 8,747,123 |
| Hartford Financial Services Group, Inc. | | 223,238 | 17,325,501 |
| Marsh & McLennan Companies, Inc. | | 84,057 | 14,702,410 |
| Progressive Corp. | | 33,300 | 4,540,455 |
| Reinsurance Group of America, Inc. | | 27,800 | 4,219,206 |
| The Travelers Companies, Inc. | | 190,576 | 36,422,885 |
| | | | 116,789,849 |
| Thrifts & Mortgage Finance - 0.1% | | | |
| MGIC Investment Corp. | | 220,362 | 3,111,511 |
TOTAL FINANCIALS | | | 353,303,882 |
| HEALTH CARE - 14.0% | | | |
| Biotechnology - 2.4% | | | |
| Amgen, Inc. | | 18,803 | 4,745,877 |
| Gilead Sciences, Inc. | | 294,900 | 24,753,906 |
| Regeneron Pharmaceuticals, Inc. (a) | | 18,600 | 14,107,542 |
| Vertex Pharmaceuticals, Inc. (a) | | 79,200 | 25,589,520 |
| | | | 69,196,845 |
| Health Care Equipment & Supplies - 2.7% | | | |
| Abbott Laboratories | | 148,100 | 16,372,455 |
| Boston Scientific Corp. (a) | | 633,810 | 29,313,713 |
| GE HealthCare Technologies, Inc. (a) | | 65,129 | 4,527,768 |
| Intuitive Surgical, Inc. (a) | | 28,900 | 7,100,441 |
| Masimo Corp. (a) | | 37,200 | 6,326,976 |
| ResMed, Inc. | | 34,400 | 7,855,928 |
| Stryker Corp. | | 31,500 | 7,995,015 |
| | | | 79,492,296 |
| Health Care Providers & Services - 3.8% | | | |
| agilon health, Inc. (a) | | 262,566 | 5,713,436 |
| AmerisourceBergen Corp. | | 133,400 | 22,539,264 |
| Humana, Inc. | | 25,800 | 13,201,860 |
| Option Care Health, Inc. (a) | | 285,000 | 8,227,950 |
| Surgery Partners, Inc. (a) | | 347,062 | 11,522,458 |
| UnitedHealth Group, Inc. | | 103,900 | 51,865,841 |
| | | | 113,070,809 |
| Health Care Technology - 0.2% | | | |
| Veeva Systems, Inc. Class A (a) | | 38,800 | 6,617,340 |
| Life Sciences Tools & Services - 1.5% | | | |
| IQVIA Holdings, Inc. (a) | | 47,300 | 10,851,093 |
| Thermo Fisher Scientific, Inc. | | 59,600 | 33,991,668 |
| | | | 44,842,761 |
| Pharmaceuticals - 3.4% | | | |
| Bristol-Myers Squibb Co. | | 119,400 | 8,674,410 |
| Eli Lilly & Co. | | 129,166 | 44,452,479 |
| Merck & Co., Inc. | | 279,900 | 30,064,059 |
| Royalty Pharma PLC | | 442,200 | 17,329,818 |
| | | | 100,520,766 |
TOTAL HEALTH CARE | | | 413,740,817 |
| INDUSTRIALS - 9.1% | | | |
| Aerospace & Defense - 2.0% | | | |
| Howmet Aerospace, Inc. | | 132,900 | 5,407,701 |
| Lockheed Martin Corp. | | 40,100 | 18,576,726 |
| Northrop Grumman Corp. | | 15,400 | 6,899,816 |
| Raytheon Technologies Corp. | | 52,648 | 5,256,903 |
| The Boeing Co. (a) | | 88,075 | 18,759,975 |
| TransDigm Group, Inc. | | 4,800 | 3,445,200 |
| | | | 58,346,321 |
| Air Freight & Logistics - 0.1% | | | |
| United Parcel Service, Inc. Class B | | 25,000 | 4,630,750 |
| Airlines - 0.2% | | | |
| Delta Air Lines, Inc. (a) | | 146,600 | 5,732,060 |
| Building Products - 0.7% | | | |
| Trane Technologies PLC | | 111,500 | 19,971,880 |
| Electrical Equipment - 0.9% | | | |
| AMETEK, Inc. | | 136,200 | 19,738,104 |
| Emerson Electric Co. | | 81,300 | 7,334,886 |
| | | | 27,072,990 |
| Industrial Conglomerates - 0.9% | | | |
| General Electric Co. | | 195,489 | 15,732,955 |
| Honeywell International, Inc. | | 50,900 | 10,611,632 |
| | | | 26,344,587 |
| Machinery - 3.1% | | | |
| Caterpillar, Inc. | | 52,400 | 13,219,996 |
| Deere & Co. | | 20,400 | 8,625,936 |
| Dover Corp. | | 109,800 | 16,670,934 |
| Fortive Corp. | | 281,500 | 19,150,445 |
| Ingersoll Rand, Inc. | | 262,200 | 14,683,200 |
| Parker Hannifin Corp. | | 57,806 | 18,844,756 |
| | | | 91,195,267 |
| Road & Rail - 1.2% | | | |
| CSX Corp. | | 518,300 | 16,025,836 |
| Norfolk Southern Corp. | | 38,818 | 9,541,853 |
| Old Dominion Freight Lines, Inc. | | 32,600 | 10,863,624 |
| | | | 36,431,313 |
TOTAL INDUSTRIALS | | | 269,725,168 |
| INFORMATION TECHNOLOGY - 25.2% | | | |
| Electronic Equipment & Components - 1.2% | | | |
| Corning, Inc. | | 900 | 31,149 |
| Flex Ltd. (a) | | 481,500 | 11,243,025 |
| Jabil, Inc. | | 313,217 | 24,628,253 |
| | | | 35,902,427 |
| IT Services - 5.4% | | | |
| Accenture PLC Class A | | 35,800 | 9,989,990 |
| Amdocs Ltd. | | 93,200 | 8,567,876 |
| Block, Inc. Class A (a) | | 193,300 | 15,796,476 |
| Cloudflare, Inc. (a) | | 35,000 | 1,851,850 |
| DXC Technology Co. (a) | | 99,600 | 2,861,508 |
| EPAM Systems, Inc. (a) | | 62,600 | 20,823,890 |
| ExlService Holdings, Inc. (a) | | 41,400 | 7,062,840 |
| Fiserv, Inc. (a) | | 130,900 | 13,964,412 |
| Gartner, Inc. (a) | | 13,600 | 4,598,704 |
| MasterCard, Inc. Class A | | 45,600 | 16,899,360 |
| MongoDB, Inc. Class A (a) | | 63,300 | 13,559,493 |
| Snowflake, Inc. (a) | | 16,800 | 2,628,192 |
| Visa, Inc. Class A | | 169,800 | 39,089,658 |
| | | | 157,694,249 |
| Semiconductors & Semiconductor Equipment - 5.4% | | | |
| Advanced Micro Devices, Inc. (a) | | 239,126 | 17,970,319 |
| Applied Materials, Inc. | | 32,000 | 3,567,680 |
| Enphase Energy, Inc. (a) | | 25,200 | 5,578,776 |
| First Solar, Inc. (a) | | 39,600 | 7,032,960 |
| Marvell Technology, Inc. | | 450,600 | 19,443,390 |
| Microchip Technology, Inc. | | 236,830 | 18,382,745 |
| NVIDIA Corp. | | 250,720 | 48,983,166 |
| NXP Semiconductors NV | | 59,000 | 10,874,290 |
| onsemi (a) | | 381,868 | 28,048,205 |
| | | | 159,881,531 |
| Software - 7.9% | | | |
| Black Knight, Inc. (a) | | 13,900 | 842,201 |
| Crowdstrike Holdings, Inc. (a) | | 18,300 | 1,937,970 |
| Datadog, Inc. Class A (a) | | 111,700 | 8,356,277 |
| Intuit, Inc. | | 73,700 | 31,150,779 |
| Microsoft Corp. | | 655,300 | 162,389,889 |
| Palo Alto Networks, Inc. (a) | | 72,000 | 11,422,080 |
| Paycom Software, Inc. (a) | | 50,300 | 16,294,182 |
| Workday, Inc. Class A (a) | | 100 | 18,143 |
| | | | 232,411,521 |
| Technology Hardware, Storage & Peripherals - 5.3% | | | |
| Apple, Inc. | | 1,049,236 | 151,394,262 |
| Dell Technologies, Inc. | | 76,000 | 3,087,120 |
| HP, Inc. | | 1,000 | 29,140 |
| Pure Storage, Inc. Class A (a) | | 95,800 | 2,772,452 |
| | | | 157,282,974 |
TOTAL INFORMATION TECHNOLOGY | | | 743,172,702 |
| MATERIALS - 2.7% | | | |
| Chemicals - 1.8% | | | |
| Air Products & Chemicals, Inc. | | 25,477 | 8,165,633 |
| Ashland, Inc. | | 17,200 | 1,879,444 |
| Celanese Corp. Class A | | 24,000 | 2,956,800 |
| CF Industries Holdings, Inc. | | 4,300 | 364,210 |
| Corteva, Inc. | | 69,300 | 4,466,385 |
| DuPont de Nemours, Inc. | | 47,785 | 3,533,701 |
| Ecolab, Inc. | | 9,782 | 1,514,547 |
| International Flavors & Fragrances, Inc. | | 12,512 | 1,407,100 |
| Linde PLC | | 46,486 | 15,384,077 |
| LyondellBasell Industries NV Class A | | 35,100 | 3,393,819 |
| Olin Corp. | | 42,700 | 2,757,993 |
| The Chemours Co. LLC | | 66,600 | 2,423,574 |
| Tronox Holdings PLC | | 112,700 | 1,932,805 |
| Westlake Corp. | | 10,700 | 1,313,425 |
| | | | 51,493,513 |
| Construction Materials - 0.1% | | | |
| Martin Marietta Materials, Inc. | | 4,939 | 1,776,262 |
| Vulcan Materials Co. | | 10,500 | 1,924,965 |
| | | | 3,701,227 |
| Containers & Packaging - 0.2% | | | |
| Aptargroup, Inc. | | 19,700 | 2,278,108 |
| Crown Holdings, Inc. | | 4,100 | 361,456 |
| Greif, Inc. Class A | | 22,600 | 1,614,318 |
| Sealed Air Corp. | | 32,100 | 1,757,796 |
| | | | 6,011,678 |
| Metals & Mining - 0.6% | | | |
| Alcoa Corp. | | 35,500 | 1,854,520 |
| Freeport-McMoRan, Inc. | | 302,834 | 13,512,453 |
| Reliance Steel & Aluminum Co. | | 13,069 | 2,972,544 |
| | | | 18,339,517 |
TOTAL MATERIALS | | | 79,545,935 |
| REAL ESTATE - 3.1% | | | |
| Equity Real Estate Investment Trusts (REITs) - 3.0% | | | |
| American Tower Corp. | | 41,500 | 9,270,685 |
| Corporate Office Properties Trust (SBI) | | 96,600 | 2,711,562 |
| Crown Castle International Corp. | | 31,300 | 4,635,843 |
| CubeSmart | | 29,600 | 1,355,384 |
| Equinix, Inc. | | 15,400 | 11,367,202 |
| Equity Lifestyle Properties, Inc. | | 112,700 | 8,089,606 |
| Essex Property Trust, Inc. | | 21,200 | 4,792,684 |
| Host Hotels & Resorts, Inc. | | 382,100 | 7,202,585 |
| Invitation Homes, Inc. | | 291,100 | 9,460,750 |
| Life Storage, Inc. | | 10,300 | 1,112,812 |
| Mid-America Apartment Communities, Inc. | | 27,300 | 4,551,456 |
| Prologis (REIT), Inc. | | 87,600 | 11,324,928 |
| Simon Property Group, Inc. | | 7,100 | 912,066 |
| Ventas, Inc. | | 73,200 | 3,792,492 |
| Welltower, Inc. | | 101,700 | 7,631,568 |
| | | | 88,211,623 |
| Real Estate Management & Development - 0.1% | | | |
| Cushman & Wakefield PLC (a) | | 135,600 | 1,956,708 |
| Jones Lang LaSalle, Inc. (a) | | 7,700 | 1,423,499 |
| | | | 3,380,207 |
TOTAL REAL ESTATE | | | 91,591,830 |
| UTILITIES - 2.7% | | | |
| Electric Utilities - 1.9% | | | |
| Constellation Energy Corp. | | 69,997 | 5,974,944 |
| Edison International | | 49,200 | 3,389,880 |
| Exelon Corp. | | 134,793 | 5,686,917 |
| FirstEnergy Corp. | | 103,200 | 4,226,040 |
| NextEra Energy, Inc. | | 181,714 | 13,561,316 |
| PG&E Corp. (a) | | 645,493 | 10,263,339 |
| PPL Corp. | | 126,100 | 3,732,560 |
| Southern Co. | | 145,100 | 9,820,368 |
| | | | 56,655,364 |
| Independent Power and Renewable Electricity Producers - 0.1% | | | |
| The AES Corp. | | 30,000 | 822,300 |
| Vistra Corp. | | 98,000 | 2,259,880 |
| | | | 3,082,180 |
| Multi-Utilities - 0.7% | | | |
| Dominion Energy, Inc. | | 106,141 | 6,754,813 |
| NiSource, Inc. | | 108,100 | 2,999,775 |
| Public Service Enterprise Group, Inc. | | 38,000 | 2,353,340 |
| Sempra Energy | | 45,044 | 7,221,905 |
| | | | 19,329,833 |
TOTAL UTILITIES | | | 79,067,377 |
| TOTAL COMMON STOCKS (Cost $1,905,303,370) | | | 2,900,113,978 |
| | | | |
| Preferred Stocks - 0.1% |
| | | Shares | Value ($) |
| Convertible Preferred Stocks - 0.1% | | | |
| INFORMATION TECHNOLOGY - 0.1% | | | |
| Semiconductors & Semiconductor Equipment - 0.1% | | | |
| Astera Labs, Inc.: | | | |
| Series A(c)(d) | | 21,543 | 216,938 |
| Series B(c)(d) | | 3,668 | 36,937 |
| Series C(a)(c)(d) | | 107,300 | 1,080,511 |
| Series D(c)(d) | | 73,122 | 736,339 |
| GaN Systems, Inc.: | | | |
| Series F1(a)(c)(d) | | 11,470 | 61,479 |
| Series F2(a)(c)(d) | | 6,057 | 32,466 |
| | | | 2,164,670 |
| Software - 0.0% | | | |
| Skyryse, Inc. Series B (a)(c)(d) | | 37,900 | 766,338 |
| | | | |
TOTAL INFORMATION TECHNOLOGY | | | 2,931,008 |
| | | | |
| Nonconvertible Preferred Stocks - 0.0% | | | |
| INFORMATION TECHNOLOGY - 0.0% | | | |
| IT Services - 0.0% | | | |
| Checkr, Inc. Series E (a)(d) | | 69,906 | 1,029,715 |
| | | | |
| TOTAL PREFERRED STOCKS (Cost $3,703,027) | | | 3,960,723 |
| | | | |
| U.S. Treasury Obligations - 0.1% |
| | | Principal Amount (e) | Value ($) |
U.S. Treasury Bills, yield at date of purchase 4.29% to 4.38% 3/30/23 (f) (Cost $2,502,919) | | 2,520,000 | 2,502,055 |
| | | | |
| Preferred Securities - 0.0% |
| | | Principal Amount (e) | Value ($) |
| INFORMATION TECHNOLOGY - 0.0% | | | |
| Semiconductors & Semiconductor Equipment - 0.0% | | | |
GaN Systems, Inc. 0% (c)(d)(g) (Cost $268,858) | | 268,858 | 166,289 |
| | | | |
| Money Market Funds - 2.0% |
| | | Shares | Value ($) |
| Fidelity Cash Central Fund 4.38% (h) | | 50,149,396 | 50,159,426 |
| Fidelity Securities Lending Cash Central Fund 4.38% (h)(i) | | 8,468,753 | 8,469,600 |
| TOTAL MONEY MARKET FUNDS (Cost $58,627,905) | | | 58,629,026 |
| | | | |
| TOTAL INVESTMENT IN SECURITIES - 100.5% (Cost $1,970,406,079) | 2,965,372,071 |
NET OTHER ASSETS (LIABILITIES) - (0.5)% | (13,914,394) |
| NET ASSETS - 100.0% | 2,951,457,677 |
| | |
| Futures Contracts |
| | Number of contracts | Expiration Date | Notional Amount ($) | Value ($) | Unrealized Appreciation/ (Depreciation) ($) |
| Purchased | | | | | |
| | | | | | |
| Equity Index Contracts | | | | | |
| CME E-mini S&P 500 Index Contracts (United States) | 131 | Mar 2023 | 26,789,500 | 1,572,453 | 1,572,453 |
| | | | | | |
| The notional amount of futures purchased as a percentage of Net Assets is 0.9% |
Legend
| (b) | Security or a portion of the security is on loan at period end. |
| (c) | Restricted securities (including private placements) - Investment in securities not registered under the Securities Act of 1933 (excluding 144A issues). At the end of the period, the value of restricted securities (excluding 144A issues) amounted to $3,097,297 or 0.1% of net assets. |
| (e) | Amount is stated in United States dollars unless otherwise noted. |
| (f) | Security or a portion of the security was pledged to cover margin requirements for futures contracts. At period end, the value of securities pledged amounted to $1,468,468. |
| (g) | Security is perpetual in nature with no stated maturity date. |
| (h) | Affiliated fund that is generally available only to investment companies and other accounts managed by Fidelity Investments. The rate quoted is the annualized seven-day yield of the fund at period end. A complete unaudited listing of the fund's holdings as of its most recent quarter end is available upon request. In addition, each Fidelity Central Fund's financial statements, which are not covered by the Fund's Report of Independent Registered Public Accounting Firm, are available on the SEC's website or upon request. |
| (i) | Investment made with cash collateral received from securities on loan. |
| Additional information on each restricted holding is as follows: |
| Security | Acquisition Date | Acquisition Cost ($) |
| Astera Labs, Inc. Series A | 5/17/22 | 219,082 |
| | | |
| Astera Labs, Inc. Series B | 5/17/22 | 37,302 |
| | | |
| Astera Labs, Inc. Series C | 8/24/21 | 360,721 |
| | | |
| Astera Labs, Inc. Series D | 5/17/22 | 743,614 |
| | | |
| GaN Systems, Inc. Series F1 | 11/30/21 | 97,266 |
| | | |
| GaN Systems, Inc. Series F2 | 11/30/21 | 51,363 |
| | | |
| GaN Systems, Inc. 0% | 11/30/21 | 268,858 |
| | | |
| Skyryse, Inc. Series B | 10/21/21 | 935,371 |
| | | |
Affiliated Central Funds
Fiscal year to date information regarding the Fund's investments in Fidelity Central Funds, including the ownership percentage, is presented below.
| Affiliate | Value, beginning of period ($) | Purchases ($) | Sales Proceeds ($) | Dividend Income ($) | Realized Gain (loss) ($) | Change in Unrealized appreciation (depreciation) ($) | Value, end of period ($) | % ownership, end of period |
| Fidelity Cash Central Fund 4.38% | 78,729,843 | 908,288,781 | 936,859,198 | 1,140,961 | - | - | 50,159,426 | 0.1% |
| Fidelity Securities Lending Cash Central Fund 4.38% | 10,066,650 | 176,478,995 | 178,076,045 | 186,712 | - | - | 8,469,600 | 0.0% |
| Total | 88,796,493 | 1,084,767,776 | 1,114,935,243 | 1,327,673 | - | - | 58,629,026 | |
| | | | | | | | | |
Amounts in the dividend income column in the above table include any capital gain distributions from underlying funds, which are presented in the corresponding line item in the Statement of Operations, if applicable.
Amount for Fidelity Securities Lending Cash Central Fund represents the income earned on investing cash collateral, less rebates paid to borrowers and any lending agent fees associated with the loan, plus any premium payments received for lending certain types of securities.
Amounts included in the purchases and sales proceeds columns may include in-kind transactions, if applicable.
Investment Valuation
The following is a summary of the inputs used, as of January 31, 2023, involving the Fund's assets and liabilities carried at fair value. The inputs or methodology used for valuing securities may not be an indication of the risk associated with investing in those securities. For more information on valuation inputs, and their aggregation into the levels used below, please refer to the Investment Valuation section in the accompanying Notes to Financial Statements.
| Valuation Inputs at Reporting Date: |
| Description | Total ($) | Level 1 ($) | Level 2 ($) | Level 3 ($) |
Investments in Securities: | | | | |
|
| Equities: | | | | |
Communication Services | 218,147,712 | 218,147,712 | - | - |
Consumer Discretionary | 325,925,249 | 325,925,249 | - | - |
Consumer Staples | 175,056,886 | 175,056,886 | - | - |
Energy | 150,836,420 | 150,836,420 | - | - |
Financials | 353,303,882 | 353,303,882 | - | - |
Health Care | 413,740,817 | 413,740,817 | - | - |
Industrials | 269,725,168 | 269,725,168 | - | - |
Information Technology | 747,133,425 | 743,172,702 | - | 3,960,723 |
Materials | 79,545,935 | 79,545,935 | - | - |
Real Estate | 91,591,830 | 91,591,830 | - | - |
Utilities | 79,067,377 | 79,067,377 | - | - |
|
| U.S. Government and Government Agency Obligations | 2,502,055 | - | 2,502,055 | - |
|
| Preferred Securities | 166,289 | - | - | 166,289 |
|
| Money Market Funds | 58,629,026 | 58,629,026 | - | - |
| Total Investments in Securities: | 2,965,372,071 | 2,958,743,004 | 2,502,055 | 4,127,012 |
Derivative Instruments: | | | | |
|
| Assets | | | | |
Futures Contracts | 1,572,453 | 1,572,453 | - | - |
| Total Assets | 1,572,453 | 1,572,453 | - | - |
| Total Derivative Instruments: | 1,572,453 | 1,572,453 | - | - |
Value of Derivative Instruments
The following table is a summary of the Fund's value of derivative instruments by primary risk exposure as of January 31, 2023. For additional information on derivative instruments, please refer to the Derivative Instruments section in the accompanying Notes to Financial Statements.
Primary Risk Exposure / Derivative Type | Value |
| Asset ($) | Liability ($) |
| Equity Risk | | |
Futures Contracts (a) | 1,572,453 | 0 |
| Total Equity Risk | 1,572,453 | 0 |
| Total Value of Derivatives | 1,572,453 | 0 |
(a)Reflects gross cumulative appreciation (depreciation) on futures contracts as presented in the Schedule of Investments. In the Statement of Assets and Liabilities, the period end daily variation margin is included in receivable or payable for daily variation margin on futures contracts, and the net cumulative appreciation (depreciation) is included in Total accumulated earnings (loss).
Fidelity® Series All-Sector Equity Fund
| Statement of Assets and Liabilities |
| | | | January 31, 2023 |
| | | | | |
| Assets | | | | |
| Investment in securities, at value (including securities loaned of $8,506,222) - See accompanying schedule: | | | | |
Unaffiliated issuers (cost $1,911,778,174) | $ | 2,906,743,045 | | |
Fidelity Central Funds (cost $58,627,905) | | 58,629,026 | | |
| | | | | |
| | | | | |
| Total Investment in Securities (cost $1,970,406,079) | | | $ | 2,965,372,071 |
| Receivable for investments sold | | | | 21,984,355 |
| Receivable for fund shares sold | | | | 2,119,884 |
| Dividends receivable | | | | 1,051,204 |
| Distributions receivable from Fidelity Central Funds | | | | 210,841 |
| Receivable for daily variation margin on futures contracts | | | | 376,625 |
| Other receivables | | | | 92,987 |
Total assets | | | | 2,991,207,967 |
| Liabilities | | | | |
| Payable to custodian bank | $ | 424,305 | | |
| Payable for investments purchased | | 17,287,568 | | |
| Payable for fund shares redeemed | | 13,551,900 | | |
| Other payables and accrued expenses | | 16,917 | | |
| Collateral on securities loaned | | 8,469,600 | | |
| Total Liabilities | | | | 39,750,290 |
| Net Assets | | | $ | 2,951,457,677 |
| Net Assets consist of: | | | | |
| Paid in capital | | | $ | 1,944,040,518 |
| Total accumulated earnings (loss) | | | | 1,007,417,159 |
| Net Assets | | | $ | 2,951,457,677 |
Net Asset Value , offering price and redemption price per share ($2,951,457,677 ÷ 314,847,478 shares) | | | $ | 9.37 |
| Statement of Operations |
| | | | Year ended January 31, 2023 |
| Investment Income | | | | |
| Dividends | | | $ | 37,777,808 |
| Interest | | | | 55,216 |
| Income from Fidelity Central Funds (including $186,712 from security lending) | | | | 1,327,673 |
| Total Income | | | | 39,160,697 |
| Expenses | | | | |
| Custodian fees and expenses | $ | 49,835 | | |
| Independent trustees' fees and expenses | | 10,354 | | |
| Interest | | 5,442 | | |
| Total Expenses | | | | 65,631 |
| Net Investment income (loss) | | | | 39,095,066 |
| Realized and Unrealized Gain (Loss) | | | | |
| Net realized gain (loss) on: | | | | |
| Investment Securities: | | | | |
| Unaffiliated issuers | | 149,399,796 | | |
| Futures contracts | | (7,438,076) | | |
| Total net realized gain (loss) | | | | 141,961,720 |
| Change in net unrealized appreciation (depreciation) on: | | | | |
| Investment Securities: | | | | |
| Unaffiliated issuers | | (457,650,422) | | |
| Assets and liabilities in foreign currencies | | (8,852) | | |
| Futures contracts | | 2,620,445 | | |
| Total change in net unrealized appreciation (depreciation) | | | | (455,038,829) |
| Net gain (loss) | | | | (313,077,109) |
| Net increase (decrease) in net assets resulting from operations | | | $ | (273,982,043) |
| Statement of Changes in Net Assets |
| |
| | Year ended January 31, 2023 | | Year ended January 31, 2022 |
| Increase (Decrease) in Net Assets | | | | |
| Operations | | | | |
| Net investment income (loss) | $ | 39,095,066 | $ | 40,437,948 |
| Net realized gain (loss) | | 141,961,720 | | 692,564,129 |
| Change in net unrealized appreciation (depreciation) | | (455,038,829) | | 4,708,231 |
| Net increase (decrease) in net assets resulting from operations | | (273,982,043) | | 737,710,308 |
| Distributions to shareholders | | (326,028,448) | | (728,102,259) |
| Share transactions | | | | |
| Proceeds from sales of shares | | 263,781,985 | | 368,522,567 |
| Reinvestment of distributions | | 326,028,448 | | 728,102,259 |
| Cost of shares redeemed | | (753,585,560) | | (1,080,383,692) |
Net increase (decrease) in net assets resulting from share transactions | | (163,775,127) | | 16,241,134 |
| Total increase (decrease) in net assets | | (763,785,618) | | 25,849,183 |
| | | | | |
| Net Assets | | | | |
| Beginning of period | | 3,715,243,295 | | 3,689,394,112 |
| End of period | $ | 2,951,457,677 | $ | 3,715,243,295 |
| | | | | |
| Other Information | | | | |
| Shares | | | | |
| Sold | | 28,185,768 | | 30,378,267 |
| Issued in reinvestment of distributions | | 33,988,643 | | 62,382,528 |
| Redeemed | | (77,938,104) | | (86,033,870) |
| Net increase (decrease) | | (15,763,693) | | 6,726,925 |
| | | | | |
Financial Highlights
| Fidelity® Series All-Sector Equity Fund |
| |
| Years ended January 31, | | 2023 | | 2022 | | 2021 | | 2020 | | 2019 |
Selected Per-Share Data | | | | | | | | | | |
| Net asset value, beginning of period | $ | 11.24 | $ | 11.39 | $ | 10.41 | $ | 9.35 | $ | 13.46 |
| Income from Investment Operations | | | | | | | | | | |
Net investment income (loss) A,B | | .12 | | .13 | | .15 C | | .17 | | .21 |
| Net realized and unrealized gain (loss) | | (.95) | | 2.21 | | 2.22 | | 1.78 | | (.79) |
| Total from investment operations | | (.83) | | 2.34 | | 2.37 | | 1.95 | | (.58) |
| Distributions from net investment income | | (.13) | | (.14) | | (.17) | | (.18) | | (.22) |
| Distributions from net realized gain | | (.91) | | (2.35) | | (1.23) | | (.71) | | (3.31) |
| Total distributions | | (1.04) | | (2.49) | | (1.39) D | | (.89) | | (3.53) |
| Net asset value, end of period | $ | 9.37 | $ | 11.24 | $ | 11.39 | $ | 10.41 | $ | 9.35 |
Total Return E | | (7.34)% | | 20.53% | | 24.94% | | 21.33% | | (3.23)% |
Ratios to Average Net Assets B,F,G | | | | | | | | | | |
Expenses before reductions H | | -% | | -% | | -% | | -% | | -% |
Expenses net of fee waivers, if any H | | -% | | -% | | -% | | -% | | -% |
Expenses net of all reductions H | | -% | | -% | | -% | | -% | | -% |
| Net investment income (loss) | | 1.26% | | 1.04% | | 1.47% C | | 1.68% | | 1.68% |
| Supplemental Data | | | | | | | | | | |
| Net assets, end of period (000 omitted) | $ | 2,951,458 | $ | 3,715,243 | $ | 3,689,394 | $ | 3,480,874 | $ | 3,598,453 |
Portfolio turnover rate I | | 46% | | 44% | | 64% | | 59% | | 65% |
A Calculated based on average shares outstanding during the period.
B Net investment income (loss) is affected by the timing of the declaration of dividends by any underlying mutual funds or exchange-traded funds (ETFs). Net investment income (loss) of any mutual funds or ETFs is not included in the Fund's net investment income (loss) ratio.
C Net investment income per share reflects one or more large, non-recurring dividend(s) which amounted to $.02 per share. Excluding such non-recurring dividend(s), the ratio of net investment income (loss) to average net assets would have been 1.32%.
D Total distributions per share do not sum due to rounding.
E Total returns would have been lower if certain expenses had not been reduced during the applicable periods shown.
F Fees and expenses of any underlying mutual funds or exchange-traded funds (ETFs) are not included in the Fund's expense ratio. The Fund indirectly bears its proportionate share of these expenses. For additional expense information related to investments in Fidelity Central Funds, please refer to the "Investments in Fidelity Central Funds" note found in the Notes to Financial Statements section of the most recent Annual or Semi-Annual report.
G Expense ratios reflect operating expenses of the class. Expenses before reductions do not reflect amounts reimbursed, waived, or reduced through arrangements with the investment adviser, brokerage services, or other offset arrangements, if applicable, and do not represent the amount paid by the class during periods when reimbursements, waivers or reductions occur.
H Amount represents less than .005%.
I Amount does not include the portfolio activity of any underlying mutual funds or exchange-traded funds (ETFs).
Average annual total return reflects the change in the value of an investment, assuming reinvestment of distributions from dividend income and capital gains (the profits earned upon the sale of securities that have grown in value, if any) and assuming a constant rate of performance each year. The hypothetical investment and the average annual total returns do not reflect the deduction of taxes that a shareholder would pay on fund distributions or the redemption of fund shares. During periods of reimbursement by Fidelity, a fund's total return will be greater than it would be had the reimbursement not occurred. How a fund did yesterday is no guarantee of how it will do tomorrow.
| Average Annual Total Returns |
| | | | |
Periods ended January 31, 2023 | Past 1 year | Past 5 years | Past 10 years |
| Fidelity® Series Stock Selector Large Cap Value Fund | 2.10% | 8.09% | 10.26% |
| $10,000 Over 10 Years |
| |
Let's say hypothetically that $10,000 was invested in Fidelity® Series Stock Selector Large Cap Value Fund on January 31, 2013. The chart shows how the value of your investment would have changed, and also shows how the Russell 1000® Value Index performed over the same period. |
|
|
Fidelity® Series Stock Selector Large Cap Value Fund
Market Recap:
U.S. equities returned -8.22% for the 12 months ending January 31, 2023, according to the S&P 500® index. The new year began with an encouraging upturn in January (+6.28%), but the backdrop remains clouded by the multitude of risk factors that challenged the global economy in 2022, when the index logged its lowest calendar-year return since 2008 and first annual retreat since 2018. High inflation prompted the Federal Reserve to aggressively tighten monetary policy, and market interest rates eclipsed their highest level in a decade, stoking recession fears and sending stocks into bear market territory. Since March 2022, the Fed has hiked its benchmark rate seven times, by 4.25 percentage points - the fastest-ever pace of monetary tightening - while also shrinking its massive portfolio. The latest bump came in mid-December, along with a signal that the central bank plans to lift rates through the spring, though likely in smaller increments, to combat high inflation. Against this backdrop, stocks struggled to gain traction until a strong rally ignited heading into the summer. But in September, the S&P 500® returned -9.21%, one of its worst monthly results ever, before advancing 7.56% in Q4 as risky assets regained favor. For the full 12 months, value stocks handily outpaced growth. This headwind was most pronounced in the growth-oriented communication services (-27%), consumer discretionary (-20%) and information technology (-16%) sectors. In contrast, energy (+43%) led by a wide margin, followed by health care (+3%).
Comments from Lead Manager Matt Friedman and Co-Managers Jordan Michaels and Matthew Moulis:
For the fiscal year ending January 31, 2023, the fund gained 2.10%, outperforming the -0.43% result of the benchmark Russell 1000 ® Value Index. Versus the benchmark, security selection was the primary contributor, led by the industrials sector. Picks among utilities and information technology stocks also boosted the fund's relative result. The biggest individual relative contributor was an overweight position in Nielsen Holdings (+27%), which was an investment no longer held at the end of this period. Adding further value was the fund's non-benchmark holding in Cenovus Energy, which gained roughly 39%. Another notable relative contributor was an outsized stake in Exxon Mobil (+59%), one of the fund's largest positions on January 31. In contrast, the largest detractor from performance versus the benchmark proved to be security selection in financials. Investment choices in the communication services and real estate sectors also hampered the portfolio's relative result. Not owning Chevron, a benchmark component that rose roughly 37%, was the biggest individual relative detractor, followed by a larger-than-benchmark stake in Charter Communications (-36%). Outsized exposure to Fidelity National Information Services (-35%) hurt as well. Notable changes in positioning during the period include increased exposure to the energy sector.
Notes to shareholders:
On February 7, 2023, Matt Moulis assumed co-management responsibilities for the fund's industrials sleeve, joining Matt Friedman. On July 27, 2022, Matt Friedman assumed portfolio management responsibilities for the fund's industrials sleeve, succeeding John Mirshekari.
The views expressed above reflect those of the portfolio manager(s) only through the end of the period as stated on the cover of this report and do not necessarily represent the views of Fidelity or any other person in the Fidelity organization. Any such views are subject to change at any time based upon market or other conditions and Fidelity disclaims any responsibility to update such views. These views may not be relied on as investment advice and, because investment decisions for a Fidelity fund are based on numerous factors, may not be relied on as an indication of trading intent on behalf of any Fidelity fund.
Fidelity® Series Stock Selector Large Cap Value Fund
Top Holdings (% of Fund's net assets) |
| |
| Exxon Mobil Corp. | 3.7 | |
| Bank of America Corp. | 3.3 | |
| Wells Fargo & Co. | 3.0 | |
| The Travelers Companies, Inc. | 2.5 | |
| Johnson & Johnson | 2.4 | |
| Alphabet, Inc. Class A | 2.0 | |
| Thermo Fisher Scientific, Inc. | 1.9 | |
| Verizon Communications, Inc. | 1.7 | |
| The Boeing Co. | 1.7 | |
| Comcast Corp. Class A | 1.7 | |
| | 23.9 | |
| |
| Market Sectors (% of Fund's net assets) |
| |
| Financials | 19.6 | |
| Health Care | 15.3 | |
| Industrials | 10.8 | |
| Information Technology | 8.7 | |
| Energy | 8.3 | |
| Communication Services | 7.6 | |
| Consumer Staples | 6.4 | |
| Consumer Discretionary | 6.0 | |
| Utilities | 5.3 | |
| Materials | 4.5 | |
| Real Estate | 4.5 | |
| Investment Companies | 1.1 | |
| |
Asset Allocation (% of Fund's net assets) |
|
Foreign investments - 8.7% |
|
Fidelity® Series Stock Selector Large Cap Value Fund
Showing Percentage of Net Assets
| Common Stocks - 97.0% |
| | | Shares | Value ($) |
| COMMUNICATION SERVICES - 7.6% | | | |
| Diversified Telecommunication Services - 1.9% | | | |
| Deutsche Telekom AG | | 759,100 | 16,911,833 |
| Verizon Communications, Inc. | | 4,102,687 | 170,548,699 |
| | | | 187,460,532 |
| Entertainment - 0.7% | | | |
| Activision Blizzard, Inc. | | 738,124 | 56,518,155 |
| Cinemark Holdings, Inc. (a)(b) | | 807,475 | 9,641,252 |
| | | | 66,159,407 |
| Interactive Media & Services - 2.7% | | | |
| Alphabet, Inc. Class A (a) | | 1,994,334 | 197,119,973 |
| Meta Platforms, Inc. Class A (a) | | 417,035 | 62,125,704 |
| | | | 259,245,677 |
| Media - 2.3% | | | |
| Charter Communications, Inc. Class A (a) | | 40,489 | 15,560,328 |
| Comcast Corp. Class A | | 4,080,359 | 160,562,127 |
| Omnicom Group, Inc. | | 497,912 | 42,815,453 |
| | | | 218,937,908 |
TOTAL COMMUNICATION SERVICES | | | 731,803,524 |
| CONSUMER DISCRETIONARY - 6.0% | | | |
| Automobiles - 0.7% | | | |
| General Motors Co. | | 1,755,100 | 69,010,532 |
| Hotels, Restaurants & Leisure - 1.8% | | | |
| Hilton Worldwide Holdings, Inc. | | 553,200 | 80,263,788 |
| McDonald's Corp. | | 340,100 | 90,942,740 |
| | | | 171,206,528 |
| Household Durables - 0.6% | | | |
| Tempur Sealy International, Inc. | | 1,397,200 | 56,935,900 |
| Multiline Retail - 0.6% | | | |
| Dollar Tree, Inc. (a) | | 393,900 | 59,155,902 |
| Specialty Retail - 2.3% | | | |
| Dick's Sporting Goods, Inc. (b) | | 543,200 | 71,028,832 |
| Lowe's Companies, Inc. | | 565,200 | 117,702,900 |
| Williams-Sonoma, Inc. (b) | | 267,600 | 36,109,944 |
| | | | 224,841,676 |
TOTAL CONSUMER DISCRETIONARY | | | 581,150,538 |
| CONSUMER STAPLES - 6.4% | | | |
| Beverages - 1.5% | | | |
| Constellation Brands, Inc. Class A (sub. vtg.) | | 197,300 | 45,678,896 |
| Diageo PLC | | 404,300 | 17,678,466 |
| Keurig Dr. Pepper, Inc. | | 745,000 | 26,283,600 |
| PepsiCo, Inc. | | 20,900 | 3,574,318 |
| The Coca-Cola Co. | | 884,500 | 54,237,540 |
| | | | 147,452,820 |
| Food & Staples Retailing - 1.4% | | | |
| Albertsons Companies, Inc. | | 62,800 | 1,331,360 |
| Kroger Co. | | 152,700 | 6,815,001 |
| U.S. Foods Holding Corp. (a) | | 711,400 | 27,125,682 |
| Walmart, Inc. | | 719,371 | 103,495,906 |
| | | | 138,767,949 |
| Food Products - 1.0% | | | |
| Archer Daniels Midland Co. | | 219,200 | 18,160,720 |
| Bunge Ltd. | | 81,900 | 8,116,290 |
| Darling Ingredients, Inc. (a) | | 62,700 | 4,156,383 |
| Mondelez International, Inc. | | 899,752 | 58,879,771 |
| Tyson Foods, Inc. Class A | | 120,800 | 7,942,600 |
| | | | 97,255,764 |
| Household Products - 1.4% | | | |
| Colgate-Palmolive Co. | | 37,500 | 2,794,875 |
| Energizer Holdings, Inc. | | 263,600 | 9,779,560 |
| Procter & Gamble Co. | | 884,472 | 125,931,123 |
| | | | 138,505,558 |
| Tobacco - 1.1% | | | |
| Altria Group, Inc. | | 850,500 | 38,306,520 |
| Philip Morris International, Inc. | | 611,700 | 63,763,608 |
| | | | 102,070,128 |
TOTAL CONSUMER STAPLES | | | 624,052,219 |
| ENERGY - 8.3% | | | |
| Energy Equipment & Services - 0.9% | | | |
| Schlumberger Ltd. | | 1,638,700 | 93,373,126 |
| Oil, Gas & Consumable Fuels - 7.4% | | | |
| Canadian Natural Resources Ltd. | | 1,558,600 | 95,667,853 |
| Cenovus Energy, Inc. (Canada) | | 5,958,247 | 119,026,121 |
| Exxon Mobil Corp. | | 3,094,900 | 359,039,344 |
| Hess Corp. | | 549,000 | 82,437,840 |
| Valero Energy Corp. | | 405,900 | 56,838,177 |
| | | | 713,009,335 |
TOTAL ENERGY | | | 806,382,461 |
| FINANCIALS - 19.6% | | | |
| Banks - 9.6% | | | |
| Bank of America Corp. | | 9,113,083 | 323,332,185 |
| Citizens Financial Group, Inc. | | 435,758 | 18,877,037 |
| Comerica, Inc. | | 309,519 | 22,690,838 |
| JPMorgan Chase & Co. | | 1,032,403 | 144,495,124 |
| PNC Financial Services Group, Inc. | | 228,762 | 37,844,098 |
| Societe Generale Series A | | 923,971 | 27,503,462 |
| U.S. Bancorp | | 1,296,800 | 64,580,640 |
| Wells Fargo & Co. | | 6,237,843 | 292,367,701 |
| | | | 931,691,085 |
| Capital Markets - 2.7% | | | |
| Bank of New York Mellon Corp. | | 2,541,581 | 128,527,751 |
| BlackRock, Inc. Class A | | 96,562 | 73,310,836 |
| Cboe Global Markets, Inc. | | 196,140 | 24,101,683 |
| Intercontinental Exchange, Inc. | | 364,875 | 39,242,306 |
| | | | 265,182,576 |
| Consumer Finance - 0.8% | | | |
| Capital One Financial Corp. | | 609,016 | 72,472,904 |
| Diversified Financial Services - 1.0% | | | |
| Berkshire Hathaway, Inc. Class B (a) | | 301,834 | 94,027,328 |
| Insurance - 5.5% | | | |
| Arthur J. Gallagher & Co. | | 150,100 | 29,377,572 |
| Chubb Ltd. | | 461,300 | 104,941,137 |
| Globe Life, Inc. | | 350,500 | 42,357,925 |
| Hartford Financial Services Group, Inc. | | 1,413,779 | 109,723,388 |
| The Travelers Companies, Inc. | | 1,274,230 | 243,530,838 |
| | | | 529,930,860 |
TOTAL FINANCIALS | | | 1,893,304,753 |
| HEALTH CARE - 15.3% | | | |
| Biotechnology - 0.9% | | | |
| Gilead Sciences, Inc. | | 610,800 | 51,270,552 |
| Regeneron Pharmaceuticals, Inc. (a) | | 46,700 | 35,420,549 |
| | | | 86,691,101 |
| Health Care Equipment & Supplies - 2.9% | | | |
| Abbott Laboratories | | 1,090,700 | 120,576,885 |
| Becton, Dickinson & Co. | | 275,400 | 69,461,388 |
| Boston Scientific Corp. (a) | | 1,518,800 | 70,244,500 |
| Medtronic PLC | | 199,000 | 16,654,310 |
| | | | 276,937,083 |
| Health Care Providers & Services - 3.7% | | | |
| AmerisourceBergen Corp. | | 541,200 | 91,441,152 |
| Centene Corp. (a) | | 690,600 | 52,651,344 |
| Cigna Corp. | | 267,900 | 84,835,893 |
| CVS Health Corp. | | 176,200 | 15,544,364 |
| Elevance Health, Inc. | | 92,100 | 46,049,079 |
| Molina Healthcare, Inc. (a) | | 84,300 | 26,287,269 |
| UnitedHealth Group, Inc. | | 85,900 | 42,880,421 |
| | | | 359,689,522 |
| Life Sciences Tools & Services - 3.0% | | | |
| Danaher Corp. | | 400,600 | 105,910,628 |
| Thermo Fisher Scientific, Inc. | | 322,500 | 183,931,425 |
| | | | 289,842,053 |
| Pharmaceuticals - 4.8% | | | |
| Bristol-Myers Squibb Co. | | 926,800 | 67,332,020 |
| Johnson & Johnson | | 1,447,006 | 236,469,721 |
| Merck & Co., Inc. | | 787,600 | 84,596,116 |
| Pfizer, Inc. | | 1,737,500 | 76,728,000 |
| | | | 465,125,857 |
TOTAL HEALTH CARE | | | 1,478,285,616 |
| INDUSTRIALS - 10.8% | | | |
| Aerospace & Defense - 2.6% | | | |
| Northrop Grumman Corp. | | 104,356 | 46,755,662 |
| Raytheon Technologies Corp. | | 401,092 | 40,049,036 |
| The Boeing Co. (a) | | 769,715 | 163,949,295 |
| | | | 250,753,993 |
| Air Freight & Logistics - 1.0% | | | |
| FedEx Corp. | | 492,311 | 95,439,410 |
| Construction & Engineering - 0.6% | | | |
| Fluor Corp. (a) | | 1,720,000 | 63,210,000 |
| Electrical Equipment - 0.9% | | | |
| Sensata Technologies, Inc. PLC | | 1,648,970 | 83,850,125 |
| Industrial Conglomerates - 2.0% | | | |
| 3M Co. | | 222,316 | 25,584,125 |
| General Electric Co. | | 1,879,212 | 151,238,982 |
| Honeywell International, Inc. | | 66,214 | 13,804,295 |
| | | | 190,627,402 |
| Machinery - 1.1% | | | |
| Crane Holdings Co. | | 448,900 | 52,031,999 |
| Flowserve Corp. | | 1,561,911 | 53,760,977 |
| | | | 105,792,976 |
| Professional Services - 0.5% | | | |
| Manpower, Inc. | | 574,700 | 50,090,852 |
| Road & Rail - 2.1% | | | |
| Norfolk Southern Corp. | | 258,508 | 63,543,851 |
| RXO, Inc. (a) | | 1,799,243 | 32,962,132 |
| U-Haul Holding Co. (non-vtg.) | | 695,600 | 42,981,124 |
| XPO, Inc. (a) | | 1,601,100 | 63,819,846 |
| | | | 203,306,953 |
TOTAL INDUSTRIALS | | | 1,043,071,711 |
| INFORMATION TECHNOLOGY - 8.7% | | | |
| Communications Equipment - 1.5% | | | |
| Cisco Systems, Inc. | | 3,030,713 | 147,504,802 |
| Electronic Equipment & Components - 0.6% | | | |
| Vontier Corp. | | 2,355,480 | 54,246,704 |
| IT Services - 4.2% | | | |
| Amdocs Ltd. | | 780,219 | 71,725,533 |
| Concentrix Corp. | | 222,026 | 31,485,507 |
| Fidelity National Information Services, Inc. | | 968,582 | 72,682,393 |
| FleetCor Technologies, Inc. (a) | | 246,625 | 51,497,766 |
| Global Payments, Inc. | | 652,230 | 73,519,366 |
| GoDaddy, Inc. (a) | | 464,468 | 38,146,757 |
| SS&C Technologies Holdings, Inc. | | 1,043,394 | 62,968,828 |
| | | | 402,026,150 |
| Semiconductors & Semiconductor Equipment - 2.0% | | | |
| Microchip Technology, Inc. | | 1,652,599 | 128,274,734 |
| Taiwan Semiconductor Manufacturing Co. Ltd. sponsored ADR | | 715,300 | 66,329,769 |
| | | | 194,604,503 |
| Software - 0.4% | | | |
| Adobe, Inc. (a) | | 116,491 | 43,141,277 |
TOTAL INFORMATION TECHNOLOGY | | | 841,523,436 |
| MATERIALS - 4.5% | | | |
| Chemicals - 2.4% | | | |
| Axalta Coating Systems Ltd. (a) | | 1,485,100 | 44,701,510 |
| Eastman Chemical Co. | | 411,300 | 36,264,321 |
| Olin Corp. | | 885,351 | 57,184,821 |
| The Chemours Co. LLC | | 1,288,400 | 46,884,876 |
| Westlake Corp. | | 381,200 | 46,792,300 |
| | | | 231,827,828 |
| Containers & Packaging - 0.8% | | | |
| Crown Holdings, Inc. | | 441,900 | 38,957,904 |
| O-I Glass, Inc. (a) | | 1,958,665 | 37,704,301 |
| | | | 76,662,205 |
| Metals & Mining - 1.3% | | | |
| Freeport-McMoRan, Inc. | | 1,862,700 | 83,113,674 |
| Glencore PLC | | 7,048,300 | 47,201,675 |
| | | | 130,315,349 |
TOTAL MATERIALS | | | 438,805,382 |
| REAL ESTATE - 4.5% | | | |
| Equity Real Estate Investment Trusts (REITs) - 4.2% | | | |
| American Tower Corp. | | 121,600 | 27,164,224 |
| Equity Lifestyle Properties, Inc. | | 871,900 | 62,584,982 |
| Essex Property Trust, Inc. | | 230,100 | 52,018,707 |
| Host Hotels & Resorts, Inc. | | 2,247,600 | 42,367,260 |
| Invitation Homes, Inc. | | 1,914,300 | 62,214,750 |
| Mid-America Apartment Communities, Inc. | | 203,800 | 33,977,536 |
| Prologis (REIT), Inc. | | 582,063 | 75,249,105 |
| Welltower, Inc. | | 692,500 | 51,965,200 |
| | | | 407,541,764 |
| Real Estate Management & Development - 0.3% | | | |
| Cushman & Wakefield PLC (a) | | 1,872,728 | 27,023,465 |
TOTAL REAL ESTATE | | | 434,565,229 |
| UTILITIES - 5.3% | | | |
| Electric Utilities - 3.4% | | | |
| Constellation Energy Corp. | | 687,033 | 58,645,137 |
| Edison International | | 842,000 | 58,013,800 |
| Entergy Corp. | | 463,100 | 50,144,468 |
| PG&E Corp. (a) | | 5,090,395 | 80,937,281 |
| Southern Co. | | 1,235,400 | 83,611,872 |
| | | | 331,352,558 |
| Independent Power and Renewable Electricity Producers - 1.1% | | | |
| The AES Corp. | | 2,459,600 | 67,417,636 |
| Vistra Corp. | | 1,635,233 | 37,708,473 |
| | | | 105,126,109 |
| Multi-Utilities - 0.8% | | | |
| Sempra Energy | | 450,900 | 72,292,797 |
TOTAL UTILITIES | | | 508,771,464 |
| TOTAL COMMON STOCKS (Cost $7,466,276,378) | | | 9,381,716,333 |
| | | | |
| Money Market Funds - 3.3% |
| | | Shares | Value ($) |
| Fidelity Cash Central Fund 4.38% (c) | | 200,483,823 | 200,523,919 |
| Fidelity Securities Lending Cash Central Fund 4.38% (c)(d) | | 117,136,721 | 117,148,435 |
| TOTAL MONEY MARKET FUNDS (Cost $317,671,493) | | | 317,672,354 |
| | | | |
| Equity Funds - 1.1% |
| | | Shares | Value ($) |
| Domestic Equity Funds - 1.1% | | | |
iShares Russell 1000 Value Index ETF (b) (Cost $110,825,523) | | 708,100 | 112,906,545 |
| | | | |
| TOTAL INVESTMENT IN SECURITIES - 101.4% (Cost $7,894,773,394) | 9,812,295,232 |
NET OTHER ASSETS (LIABILITIES) - (1.4)% | (139,556,303) |
| NET ASSETS - 100.0% | 9,672,738,929 |
| | |
Security Type Abbreviations
Legend
| (b) | Security or a portion of the security is on loan at period end. |
| (c) | Affiliated fund that is generally available only to investment companies and other accounts managed by Fidelity Investments. The rate quoted is the annualized seven-day yield of the fund at period end. A complete unaudited listing of the fund's holdings as of its most recent quarter end is available upon request. In addition, each Fidelity Central Fund's financial statements, which are not covered by the Fund's Report of Independent Registered Public Accounting Firm, are available on the SEC's website or upon request. |
| (d) | Investment made with cash collateral received from securities on loan. |
Affiliated Central Funds
Fiscal year to date information regarding the Fund's investments in Fidelity Central Funds, including the ownership percentage, is presented below.
| Affiliate | Value, beginning of period ($) | Purchases ($) | Sales Proceeds ($) | Dividend Income ($) | Realized Gain (loss) ($) | Change in Unrealized appreciation (depreciation) ($) | Value, end of period ($) | % ownership, end of period |
| Fidelity Cash Central Fund 4.38% | 157,253,985 | 4,206,667,681 | 4,163,397,747 | 3,005,157 | - | - | 200,523,919 | 0.4% |
| Fidelity Securities Lending Cash Central Fund 4.38% | 41,215,525 | 1,692,575,077 | 1,616,642,167 | 296,984 | - | - | 117,148,435 | 0.4% |
| Total | 198,469,510 | 5,899,242,758 | 5,780,039,914 | 3,302,141 | - | - | 317,672,354 | |
| | | | | | | | | |
Amounts in the dividend income column in the above table include any capital gain distributions from underlying funds, which are presented in the corresponding line item in the Statement of Operations, if applicable.
Amount for Fidelity Securities Lending Cash Central Fund represents the income earned on investing cash collateral, less rebates paid to borrowers and any lending agent fees associated with the loan, plus any premium payments received for lending certain types of securities.
Amounts included in the purchases and sales proceeds columns may include in-kind transactions, if applicable.
Investment Valuation
The following is a summary of the inputs used, as of January 31, 2023, involving the Fund's assets and liabilities carried at fair value. The inputs or methodology used for valuing securities may not be an indication of the risk associated with investing in those securities. For more information on valuation inputs, and their aggregation into the levels used below, please refer to the Investment Valuation section in the accompanying Notes to Financial Statements.
| Valuation Inputs at Reporting Date: |
| Description | Total ($) | Level 1 ($) | Level 2 ($) | Level 3 ($) |
Investments in Securities: | | | | |
|
| Equities: | | | | |
Communication Services | 731,803,524 | 714,891,691 | 16,911,833 | - |
Consumer Discretionary | 581,150,538 | 581,150,538 | - | - |
Consumer Staples | 624,052,219 | 606,373,753 | 17,678,466 | - |
Energy | 806,382,461 | 806,382,461 | - | - |
Financials | 1,893,304,753 | 1,865,801,291 | 27,503,462 | - |
Health Care | 1,478,285,616 | 1,478,285,616 | - | - |
Industrials | 1,043,071,711 | 1,043,071,711 | - | - |
Information Technology | 841,523,436 | 841,523,436 | - | - |
Materials | 438,805,382 | 391,603,707 | 47,201,675 | - |
Real Estate | 434,565,229 | 434,565,229 | - | - |
Utilities | 508,771,464 | 508,771,464 | - | - |
|
| Money Market Funds | 317,672,354 | 317,672,354 | - | - |
|
| Equity Funds | 112,906,545 | 112,906,545 | - | - |
| Total Investments in Securities: | 9,812,295,232 | 9,702,999,796 | 109,295,436 | - |
Fidelity® Series Stock Selector Large Cap Value Fund
| Statement of Assets and Liabilities |
| | | | January 31, 2023 |
| | | | | |
| Assets | | | | |
| Investment in securities, at value (including securities loaned of $118,750,934) - See accompanying schedule: | | | | |
Unaffiliated issuers (cost $7,577,101,901) | $ | 9,494,622,878 | | |
Fidelity Central Funds (cost $317,671,493) | | 317,672,354 | | |
| | | | | |
| | | | | |
| Total Investment in Securities (cost $7,894,773,394) | | | $ | 9,812,295,232 |
| Foreign currency held at value (cost $3,035,221) | | | | 3,037,184 |
| Receivable for investments sold | | | | 15,782,651 |
| Receivable for fund shares sold | | | | 148,973,479 |
| Dividends receivable | | | | 8,777,438 |
| Distributions receivable from Fidelity Central Funds | | | | 633,878 |
Total assets | | | | 9,989,499,862 |
| Liabilities | | | | |
| Payable for investments purchased | $ | 194,227,197 | | |
| Payable for fund shares redeemed | | 5,379,909 | | |
| Other payables and accrued expenses | | 5,392 | | |
| Collateral on securities loaned | | 117,148,435 | | |
| Total Liabilities | | | | 316,760,933 |
| Net Assets | | | $ | 9,672,738,929 |
| Net Assets consist of: | | | | |
| Paid in capital | | | $ | 7,774,095,077 |
| Total accumulated earnings (loss) | | | | 1,898,643,852 |
| Net Assets | | | $ | 9,672,738,929 |
Net Asset Value , offering price and redemption price per share ($9,672,738,929 ÷ 767,080,951 shares) | | | $ | 12.61 |
| Statement of Operations |
| | | | Year ended January 31, 2023 |
| Investment Income | | | | |
| Dividends | | | $ | 187,207,877 |
| Income from Fidelity Central Funds (including $296,984 from security lending) | | | | 3,302,141 |
| Total Income | | | | 190,510,018 |
| Expenses | | | | |
| Custodian fees and expenses | $ | 81,956 | | |
| Independent trustees' fees and expenses | | 32,045 | | |
| Interest | | 39,068 | | |
| Total Expenses | | | | 153,069 |
| Net Investment income (loss) | | | | 190,356,949 |
| Realized and Unrealized Gain (Loss) | | | | |
| Net realized gain (loss) on: | | | | |
| Investment Securities: | | | | |
| Unaffiliated issuers | | 555,855,356 | | |
| Foreign currency transactions | | (57,624) | | |
| Total net realized gain (loss) | | | | 555,797,732 |
| Change in net unrealized appreciation (depreciation) on: | | | | |
| Investment Securities: | | | | |
| Unaffiliated issuers | | (596,988,936) | | |
| Assets and liabilities in foreign currencies | | (14,648) | | |
| Total change in net unrealized appreciation (depreciation) | | | | (597,003,584) |
| Net gain (loss) | | | | (41,205,852) |
| Net increase (decrease) in net assets resulting from operations | | | $ | 149,151,097 |
| Statement of Changes in Net Assets |
| |
| | Year ended January 31, 2023 | | Year ended January 31, 2022 |
| Increase (Decrease) in Net Assets | | | | |
| Operations | | | | |
| Net investment income (loss) | $ | 190,356,949 | $ | 201,625,480 |
| Net realized gain (loss) | | 555,797,732 | | 1,940,189,638 |
| Change in net unrealized appreciation (depreciation) | | (597,003,584) | | 544,625,027 |
| Net increase (decrease) in net assets resulting from operations | | 149,151,097 | | 2,686,440,145 |
| Distributions to shareholders | | (1,101,528,160) | | (1,506,418,103) |
| Share transactions | | | | |
| Proceeds from sales of shares | | 1,157,631,759 | | 1,000,109,549 |
| Reinvestment of distributions | | 1,101,528,160 | | 1,506,418,103 |
| Cost of shares redeemed | | (2,517,640,943) | | (3,734,008,455) |
Net increase (decrease) in net assets resulting from share transactions | | (258,481,024) | | (1,227,480,803) |
| Total increase (decrease) in net assets | | (1,210,858,087) | | (47,458,761) |
| | | | | |
| Net Assets | | | | |
| Beginning of period | | 10,883,597,016 | | 10,931,055,777 |
| End of period | $ | 9,672,738,929 | $ | 10,883,597,016 |
| | | | | |
| Other Information | | | | |
| Shares | | | | |
| Sold | | 92,935,392 | | 67,309,455 |
| Issued in reinvestment of distributions | | 88,994,941 | | 109,555,214 |
| Redeemed | | (197,783,315) | | (258,947,638) |
| Net increase (decrease) | | (15,852,982) | | (82,082,969) |
| | | | | |
Financial Highlights
| Fidelity® Series Stock Selector Large Cap Value Fund |
| |
| Years ended January 31, | | 2023 | | 2022 | | 2021 | | 2020 | | 2019 |
Selected Per-Share Data | | | | | | | | | | |
| Net asset value, beginning of period | $ | 13.90 | $ | 12.64 | $ | 12.46 | $ | 11.57 | $ | 13.47 |
| Income from Investment Operations | | | | | | | | | | |
Net investment income (loss) A,B | | .25 | | .26 | | .28 C | | .28 | | .29 |
| Net realized and unrealized gain (loss) | | (.03) | | 3.04 | | .39 | | 1.33 | | (1.01) |
| Total from investment operations | | .22 | | 3.30 | | .67 | | 1.61 | | (.72) |
| Distributions from net investment income | | (.27) | | (.27) | | (.28) | | (.31) | | (.27) |
| Distributions from net realized gain | | (1.23) | | (1.77) | | (.21) | | (.41) | | (.90) |
| Total distributions | | (1.51) D | | (2.04) | | (.49) | | (.72) | | (1.18) D |
| Net asset value, end of period | $ | 12.61 | $ | 13.90 | $ | 12.64 | $ | 12.46 | $ | 11.57 |
Total Return E | | 2.10% | | 26.30% | | 5.74% | | 13.98% | | (5.07)% |
Ratios to Average Net Assets B,F,G | | | | | | | | | | |
Expenses before reductions H | | -% | | -% | | -% | | -% | | -% |
Expenses net of fee waivers, if any H | | -% | | -% | | -% | | -% | | -% |
Expenses net of all reductions H | | -% | | -% | | -% | | -% | | -% |
| Net investment income (loss) | | 1.98% | | 1.75% | | 2.54% C | | 2.32% | | 2.33% |
| Supplemental Data | | | | | | | | | | |
| Net assets, end of period (000 omitted) | $ | 9,672,739 | $ | 10,883,597 | $ | 10,931,056 | $ | 9,973,648 | $ | 10,531,018 |
Portfolio turnover rate I | | 72% | | 81% | | 94% | | 65% J | | 87% K |
A Calculated based on average shares outstanding during the period.
B Net investment income (loss) is affected by the timing of the declaration of dividends by any underlying mutual funds or exchange-traded funds (ETFs). Net investment income (loss) of any mutual funds or ETFs is not included in the Fund's net investment income (loss) ratio.
C Net investment income per share reflects one or more large, non-recurring dividend(s) which amounted to $.03 per share. Excluding such non-recurring dividend(s), the ratio of net investment income (loss) to average net assets would have been 2.23%.
D Total distributions per share do not sum due to rounding.
E Total returns would have been lower if certain expenses had not been reduced during the applicable periods shown.
F Fees and expenses of any underlying mutual funds or exchange-traded funds (ETFs) are not included in the Fund's expense ratio. The Fund indirectly bears its proportionate share of these expenses. For additional expense information related to investments in Fidelity Central Funds, please refer to the "Investments in Fidelity Central Funds" note found in the Notes to Financial Statements section of the most recent Annual or Semi-Annual report.
G Expense ratios reflect operating expenses of the class. Expenses before reductions do not reflect amounts reimbursed, waived, or reduced through arrangements with the investment adviser, brokerage services, or other offset arrangements, if applicable, and do not represent the amount paid by the class during periods when reimbursements, waivers or reductions occur.
H Amount represents less than .005%.
I Amount does not include the portfolio activity of any underlying mutual funds or exchange-traded funds (ETFs).
J Portfolio turnover rate excludes securities received or delivered in-kind.
K The portfolio turnover rate does not include the assets acquired in the merger.
Average annual total return reflects the change in the value of an investment, assuming reinvestment of distributions from dividend income and capital gains (the profits earned upon the sale of securities that have grown in value, if any) and assuming a constant rate of performance each year. The hypothetical investment and the average annual total returns do not reflect the deduction of taxes that a shareholder would pay on fund distributions or the redemption of fund shares. During periods of reimbursement by Fidelity, a fund's total return will be greater than it would be had the reimbursement not occurred. How a fund did yesterday is no guarantee of how it will do tomorrow.
| Average Annual Total Returns |
| | | | |
Periods ended January 31, 2023 | Past 1 year | Past 5 years | Past 10 years |
| Fidelity® Series Value Discovery Fund | 1.55% | 8.33% | 10.19% |
| $10,000 Over 10 Years |
| |
Let's say hypothetically that $10,000 was invested in Fidelity® Series Value Discovery Fund on January 31, 2013. The chart shows how the value of your investment would have changed, and also shows how the Russell 3000® Value Index performed over the same period. |
|
|
Fidelity® Series Value Discovery Fund
Market Recap:
U.S. equities returned -8.22% for the 12 months ending January 31, 2023, according to the S&P 500 ® index. The new year began with an encouraging upturn in January (+6.28%), but the backdrop remains clouded by the multitude of risk factors that challenged the global economy in 2022, when the index logged its lowest calendar-year return since 2008 and first annual retreat since 2018. High inflation prompted the Federal Reserve to aggressively tighten monetary policy, and market interest rates eclipsed their highest level in a decade, stoking recession fears and sending stocks into bear market territory. Since March 2022, the Fed has hiked its benchmark rate seven times, by 4.25 percentage points - the fastest-ever pace of monetary tightening - while also shrinking its massive portfolio. The latest bump came in mid-December, along with a signal that the central bank plans to lift rates through the spring, though likely in smaller increments, to combat high inflation. Against this backdrop, stocks struggled to gain traction until a strong rally ignited heading into the summer. But in September, the S&P 500 ® returned -9.21%, one of its worst monthly results ever, before advancing 7.56% in Q4 as risky assets regained favor. For the full 12 months, value stocks handily outpaced growth. This headwind was most pronounced in the growth-oriented communication services (-27%), consumer discretionary (-20%) and information technology (-16%) sectors. In contrast, energy (+43%) led by a wide margin, followed by health care (+3%).
Comments from Portfolio Manager Sean Gavin:
For the fiscal year ending January 31, 2023, the fund gained 1.55%, outperforming the -0.43% result of the benchmark Russell 3000 ® Value Index. Versus the benchmark, security selection was the primary contributor, led by the health care sector. Favorable picks and an overweighting in utilities, along with investment choices among financials stocks also helped. The biggest individual relative contributor was an overweight position in Exxon Mobil (+58%), one of our largest holdings. Also bolstering performance was an outsized stake in Cigna, which gained approximately 39% and was another of the fund's biggest positions at the end of the period. Another notable relative contributor was a larger-than-benchmark holding in Constellation Energy (+62%), an investment we established this period. Conversely, the biggest detractors from performance versus the benchmark were an underweighting and security selection in energy. Subpar picks in the communication services and consumer staples sectors also hampered the fund's relative return, while the fund's foreign holdings detracted overall, in part due to a generally strong U.S. dollar. Meanwhile, not owning Chevron, a benchmark component that gained 37%, was the largest individual relative detractor. An outsized stake in Comcast (-19%), which was among our biggest holdings, hurt as well. Further holding back performance was our smaller-than-benchmark investment in ConocoPhillips, which gained 44%. This was a position we established the past 12 months. Notable changes in positioning during the period include increased exposure to the energy sector and a lower allocation to communication services firms.
The views expressed above reflect those of the portfolio manager(s) only through the end of the period as stated on the cover of this report and do not necessarily represent the views of Fidelity or any other person in the Fidelity organization. Any such views are subject to change at any time based upon market or other conditions and Fidelity disclaims any responsibility to update such views. These views may not be relied on as investment advice and, because investment decisions for a Fidelity fund are based on numerous factors, may not be relied on as an indication of trading intent on behalf of any Fidelity fund.
Fidelity® Series Value Discovery Fund
Top Holdings (% of Fund's net assets) |
| |
| Exxon Mobil Corp. | 5.1 | |
| Berkshire Hathaway, Inc. Class B | 4.6 | |
| Comcast Corp. Class A | 2.7 | |
| Cigna Corp. | 2.7 | |
| JPMorgan Chase & Co. | 2.6 | |
| Bristol-Myers Squibb Co. | 2.4 | |
| Centene Corp. | 2.3 | |
| Chubb Ltd. | 2.2 | |
| PG&E Corp. | 2.1 | |
| UnitedHealth Group, Inc. | 2.1 | |
| | 28.8 | |
| |
| Market Sectors (% of Fund's net assets) |
| |
| Financials | 22.5 | |
| Health Care | 18.9 | |
| Energy | 9.9 | |
| Utilities | 9.1 | |
| Industrials | 8.9 | |
| Consumer Staples | 7.6 | |
| Information Technology | 7.2 | |
| Communication Services | 6.0 | |
| Consumer Discretionary | 4.1 | |
| Materials | 3.2 | |
| Real Estate | 0.6 | |
| |
Asset Allocation (% of Fund's net assets) |
|
Foreign investments - 16.1% |
|
Geographic Diversification (% of Fund's net assets) |
|
* Includes Short-Term investments and Net Other Assets (Liabilities). Percentages are based on country or territory of incorporation and are adjusted for the effect of derivatives, if applicable. |
| |
Fidelity® Series Value Discovery Fund
Showing Percentage of Net Assets
| Common Stocks - 96.8% |
| | | Shares | Value ($) |
| COMMUNICATION SERVICES - 6.0% | | | |
| Entertainment - 1.4% | | | |
| Activision Blizzard, Inc. | | 1,691,400 | 129,510,498 |
| Interactive Media & Services - 1.9% | | | |
| Alphabet, Inc. Class A (a) | | 1,700,820 | 168,109,049 |
| Media - 2.7% | | | |
| Comcast Corp. Class A | | 6,261,204 | 246,378,377 |
TOTAL COMMUNICATION SERVICES | | | 543,997,924 |
| CONSUMER DISCRETIONARY - 4.1% | | | |
| Diversified Consumer Services - 1.4% | | | |
| H&R Block, Inc. | | 3,202,912 | 124,849,510 |
| Internet & Direct Marketing Retail - 0.5% | | | |
| eBay, Inc. | | 854,800 | 42,312,600 |
| Multiline Retail - 1.2% | | | |
| Dollar General Corp. | | 483,739 | 113,001,430 |
| Specialty Retail - 1.0% | | | |
| Ross Stores, Inc. | | 735,900 | 86,976,021 |
TOTAL CONSUMER DISCRETIONARY | | | 367,139,561 |
| CONSUMER STAPLES - 7.6% | | | |
| Beverages - 1.1% | | | |
| Coca-Cola European Partners PLC | | 1,673,700 | 94,095,414 |
| Food & Staples Retailing - 0.8% | | | |
| U.S. Foods Holding Corp. (a) | | 1,917,130 | 73,100,167 |
| Food Products - 2.5% | | | |
| Mondelez International, Inc. | | 2,391,200 | 156,480,128 |
| Tyson Foods, Inc. Class A | | 997,000 | 65,552,750 |
| | | | 222,032,878 |
| Household Products - 2.9% | | | |
| Procter & Gamble Co. | | 800,600 | 113,989,428 |
| Reckitt Benckiser Group PLC | | 795,600 | 56,695,205 |
| Spectrum Brands Holdings, Inc. | | 770,527 | 52,303,373 |
| The Clorox Co. (b) | | 291,400 | 42,162,666 |
| | | | 265,150,672 |
| Personal Products - 0.3% | | | |
| Unilever PLC sponsored ADR | | 526,200 | 26,888,820 |
TOTAL CONSUMER STAPLES | | | 681,267,951 |
| ENERGY - 9.8% | | | |
| Oil, Gas & Consumable Fuels - 9.8% | | | |
| Antero Resources Corp. (a) | | 808,533 | 23,318,092 |
| ConocoPhillips Co. | | 1,150,700 | 140,235,809 |
| Dynagas LNG Partners LP (a) | | 994,300 | 2,963,014 |
| Equinor ASA sponsored ADR | | 2,013,400 | 61,267,762 |
| Exxon Mobil Corp. | | 3,949,900 | 458,227,902 |
| Occidental Petroleum Corp. | | 1,228,300 | 79,581,557 |
| Ovintiv, Inc. | | 955,900 | 47,058,957 |
| Parex Resources, Inc. | | 4,065,069 | 69,199,814 |
| | | | 881,852,907 |
| FINANCIALS - 22.5% | | | |
| Banks - 8.6% | | | |
| Bank of America Corp. | | 5,146,400 | 182,594,272 |
| Cullen/Frost Bankers, Inc. | | 189,700 | 24,714,116 |
| JPMorgan Chase & Co. | | 1,699,600 | 237,876,016 |
| M&T Bank Corp. | | 618,744 | 96,524,064 |
| PNC Financial Services Group, Inc. | | 634,500 | 104,965,335 |
| Wells Fargo & Co. | | 2,713,500 | 127,181,745 |
| | | | 773,855,548 |
| Capital Markets - 3.3% | | | |
| Affiliated Managers Group, Inc. | | 415,631 | 71,796,099 |
| BlackRock, Inc. Class A | | 205,400 | 155,941,734 |
| Invesco Ltd. | | 709,724 | 13,136,991 |
| Northern Trust Corp. | | 576,400 | 55,893,508 |
| | | | 296,768,332 |
| Diversified Financial Services - 4.6% | | | |
| Berkshire Hathaway, Inc. Class B (a) | | 1,322,166 | 411,881,152 |
| Insurance - 5.7% | | | |
| Chubb Ltd. | | 871,839 | 198,334,654 |
| The Travelers Companies, Inc. | | 957,570 | 183,010,778 |
| Willis Towers Watson PLC | | 505,200 | 128,416,788 |
| | | | 509,762,220 |
| Mortgage Real Estate Investment Trusts - 0.3% | | | |
| AGNC Investment Corp. | | 911,600 | 10,574,560 |
| Annaly Capital Management, Inc. | | 445,600 | 10,458,232 |
| MFA Financial, Inc. | | 871,300 | 10,359,757 |
| | | | 31,392,549 |
TOTAL FINANCIALS | | | 2,023,659,801 |
| HEALTH CARE - 18.9% | | | |
| Biotechnology - 2.4% | | | |
| Regeneron Pharmaceuticals, Inc. (a) | | 149,600 | 113,467,112 |
| Vertex Pharmaceuticals, Inc. (a) | | 321,900 | 104,005,890 |
| | | | 217,473,002 |
| Health Care Providers & Services - 10.0% | | | |
| Centene Corp. (a) | | 2,771,803 | 211,322,261 |
| Cigna Corp. | | 752,807 | 238,391,393 |
| Elevance Health, Inc. | | 267,526 | 133,760,325 |
| Humana, Inc. | | 241,622 | 123,637,977 |
| UnitedHealth Group, Inc. | | 375,644 | 187,517,728 |
| | | | 894,629,684 |
| Pharmaceuticals - 6.5% | | | |
| AstraZeneca PLC sponsored ADR | | 1,967,254 | 128,599,394 |
| Bristol-Myers Squibb Co. | | 3,009,048 | 218,607,337 |
| Roche Holding AG (participation certificate) | | 344,009 | 107,389,428 |
| Sanofi SA sponsored ADR | | 2,689,578 | 132,165,863 |
| | | | 586,762,022 |
TOTAL HEALTH CARE | | | 1,698,864,708 |
| INDUSTRIALS - 8.9% | | | |
| Aerospace & Defense - 4.8% | | | |
| Airbus Group NV | | 227,700 | 28,545,810 |
| L3Harris Technologies, Inc. | | 350,800 | 75,358,856 |
| Lockheed Martin Corp. | | 186,000 | 86,166,360 |
| Northrop Grumman Corp. | | 278,800 | 124,913,552 |
| The Boeing Co. (a) | | 535,200 | 113,997,600 |
| | | | 428,982,178 |
| Air Freight & Logistics - 0.1% | | | |
| Deutsche Post AG | | 310,300 | 13,360,489 |
| Electrical Equipment - 1.2% | | | |
| Eaton Corp. PLC | | 113,100 | 18,345,951 |
| Regal Rexnord Corp. | | 611,700 | 85,148,640 |
| | | | 103,494,591 |
| Industrial Conglomerates - 0.5% | | | |
| Siemens AG | | 309,400 | 48,329,912 |
| Machinery - 2.3% | | | |
| Crane Holdings Co. | | 110,200 | 12,773,282 |
| ITT, Inc. | | 223,200 | 20,442,888 |
| Oshkosh Corp. | | 889,600 | 89,653,888 |
| Parker Hannifin Corp. | | 60,600 | 19,755,600 |
| Pentair PLC | | 876,500 | 48,540,570 |
| Stanley Black & Decker, Inc. | | 178,600 | 15,950,766 |
| | | | 207,116,994 |
TOTAL INDUSTRIALS | | | 801,284,164 |
| INFORMATION TECHNOLOGY - 6.1% | | | |
| Communications Equipment - 1.5% | | | |
| Cisco Systems, Inc. | | 2,690,575 | 130,950,285 |
| Electronic Equipment & Components - 0.2% | | | |
| TE Connectivity Ltd. | | 167,338 | 21,277,027 |
| IT Services - 2.7% | | | |
| Amdocs Ltd. | | 1,067,857 | 98,168,094 |
| Capgemini SA | | 192,100 | 36,317,539 |
| Cognizant Technology Solutions Corp. Class A | | 973,779 | 64,999,748 |
| Maximus, Inc. | | 623,300 | 46,654,005 |
| | | | 246,139,386 |
| Semiconductors & Semiconductor Equipment - 0.2% | | | |
| NXP Semiconductors NV | | 87,700 | 16,163,987 |
| Software - 1.5% | | | |
| Aspen Technology, Inc. (a) | | 136,352 | 27,099,960 |
| Gen Digital, Inc. | | 3,211,828 | 73,904,162 |
| Open Text Corp. | | 1,045,400 | 35,073,170 |
| | | | 136,077,292 |
TOTAL INFORMATION TECHNOLOGY | | | 550,607,977 |
| MATERIALS - 3.2% | | | |
| Chemicals - 2.2% | | | |
| DuPont de Nemours, Inc. | | 1,865,395 | 137,945,960 |
| International Flavors & Fragrances, Inc. | | 450,960 | 50,714,962 |
| The Scotts Miracle-Gro Co. Class A (b) | | 121,400 | 8,763,866 |
| | | | 197,424,788 |
| Metals & Mining - 1.0% | | | |
| Lundin Mining Corp. | | 8,878,500 | 67,195,141 |
| Newmont Corp. | | 510,229 | 27,006,421 |
| | | | 94,201,562 |
TOTAL MATERIALS | | | 291,626,350 |
| REAL ESTATE - 0.6% | | | |
| Real Estate Management & Development - 0.6% | | | |
| CBRE Group, Inc. (a) | | 639,072 | 54,647,047 |
| UTILITIES - 9.1% | | | |
| Electric Utilities - 7.4% | | | |
| Constellation Energy Corp. | | 1,352,701 | 115,466,557 |
| Duke Energy Corp. | | 271,300 | 27,794,685 |
| Edison International | | 262,300 | 18,072,470 |
| Evergy, Inc. | | 1,360,300 | 85,222,795 |
| Exelon Corp. | | 659,306 | 27,816,120 |
| NextEra Energy, Inc. | | 850,300 | 63,457,889 |
| PG&E Corp. (a) | | 11,845,041 | 188,336,152 |
| Portland General Electric Co. | | 978,800 | 46,571,304 |
| Southern Co. | | 1,422,576 | 96,279,944 |
| | | | 669,017,916 |
| Independent Power and Renewable Electricity Producers - 0.6% | | | |
| The AES Corp. | | 2,077,300 | 56,938,793 |
| Multi-Utilities - 1.1% | | | |
| Dominion Energy, Inc. | | 1,496,400 | 95,230,896 |
TOTAL UTILITIES | | | 821,187,605 |
| TOTAL COMMON STOCKS (Cost $6,650,795,046) | | | 8,716,135,995 |
| | | | |
| Nonconvertible Preferred Stocks - 1.2% |
| | | Shares | Value ($) |
| ENERGY - 0.1% | | | |
| Oil, Gas & Consumable Fuels - 0.1% | | | |
| Dynagas LNG Partners LP 9.00% | | 188,872 | 4,604,001 |
| INFORMATION TECHNOLOGY - 1.1% | | | |
| Technology Hardware, Storage & Peripherals - 1.1% | | | |
| Samsung Electronics Co. Ltd. | | 2,310,680 | 103,563,136 |
| TOTAL NONCONVERTIBLE PREFERRED STOCKS (Cost $94,765,791) | | | 108,167,137 |
| | | | |
| Money Market Funds - 1.7% |
| | | Shares | Value ($) |
| Fidelity Cash Central Fund 4.38% (c) | | 134,673,601 | 134,700,535 |
| Fidelity Securities Lending Cash Central Fund 4.38% (c)(d) | | 20,629,187 | 20,631,250 |
| TOTAL MONEY MARKET FUNDS (Cost $155,331,785) | | | 155,331,785 |
| | | | |
| TOTAL INVESTMENT IN SECURITIES - 99.7% (Cost $6,900,892,622) | 8,979,634,917 |
NET OTHER ASSETS (LIABILITIES) - 0.3% | 27,357,060 |
| NET ASSETS - 100.0% | 9,006,991,977 |
| | |
Legend
| (b) | Security or a portion of the security is on loan at period end. |
| (c) | Affiliated fund that is generally available only to investment companies and other accounts managed by Fidelity Investments. The rate quoted is the annualized seven-day yield of the fund at period end. A complete unaudited listing of the fund's holdings as of its most recent quarter end is available upon request. In addition, each Fidelity Central Fund's financial statements, which are not covered by the Fund's Report of Independent Registered Public Accounting Firm, are available on the SEC's website or upon request. |
| (d) | Investment made with cash collateral received from securities on loan. |
Affiliated Central Funds
Fiscal year to date information regarding the Fund's investments in Fidelity Central Funds, including the ownership percentage, is presented below.
| Affiliate | Value, beginning of period ($) | Purchases ($) | Sales Proceeds ($) | Dividend Income ($) | Realized Gain (loss) ($) | Change in Unrealized appreciation (depreciation) ($) | Value, end of period ($) | % ownership, end of period |
| Fidelity Cash Central Fund 4.38% | 68,176,491 | 2,261,997,312 | 2,195,473,268 | 2,682,843 | - | - | 134,700,535 | 0.3% |
| Fidelity Securities Lending Cash Central Fund 4.38% | 3,125,550 | 576,583,257 | 559,077,557 | 29,429 | - | - | 20,631,250 | 0.1% |
| Total | 71,302,041 | 2,838,580,569 | 2,754,550,825 | 2,712,272 | - | - | 155,331,785 | |
| | | | | | | | | |
Amounts in the dividend income column in the above table include any capital gain distributions from underlying funds, which are presented in the corresponding line item in the Statement of Operations, if applicable.
Amount for Fidelity Securities Lending Cash Central Fund represents the income earned on investing cash collateral, less rebates paid to borrowers and any lending agent fees associated with the loan, plus any premium payments received for lending certain types of securities.
Amounts included in the purchases and sales proceeds columns may include in-kind transactions, if applicable.
Investment Valuation
The following is a summary of the inputs used, as of January 31, 2023, involving the Fund's assets and liabilities carried at fair value. The inputs or methodology used for valuing securities may not be an indication of the risk associated with investing in those securities. For more information on valuation inputs, and their aggregation into the levels used below, please refer to the Investment Valuation section in the accompanying Notes to Financial Statements.
| Valuation Inputs at Reporting Date: |
| Description | Total ($) | Level 1 ($) | Level 2 ($) | Level 3 ($) |
Investments in Securities: | | | | |
|
| Equities: | | | | |
Communication Services | 543,997,924 | 543,997,924 | - | - |
Consumer Discretionary | 367,139,561 | 367,139,561 | - | - |
Consumer Staples | 681,267,951 | 624,572,746 | 56,695,205 | - |
Energy | 886,456,908 | 886,456,908 | - | - |
Financials | 2,023,659,801 | 2,023,659,801 | - | - |
Health Care | 1,698,864,708 | 1,591,475,280 | 107,389,428 | - |
Industrials | 801,284,164 | 711,047,953 | 90,236,211 | - |
Information Technology | 654,171,113 | 550,607,977 | 103,563,136 | - |
Materials | 291,626,350 | 291,626,350 | - | - |
Real Estate | 54,647,047 | 54,647,047 | - | - |
Utilities | 821,187,605 | 821,187,605 | - | - |
|
| Money Market Funds | 155,331,785 | 155,331,785 | - | - |
| Total Investments in Securities: | 8,979,634,917 | 8,621,750,937 | 357,883,980 | - |
Fidelity® Series Value Discovery Fund
| Statement of Assets and Liabilities |
| | | | January 31, 2023 |
| | | | | |
| Assets | | | | |
| Investment in securities, at value (including securities loaned of $20,988,873) - See accompanying schedule: | | | | |
Unaffiliated issuers (cost $6,745,560,837) | $ | 8,824,303,132 | | |
Fidelity Central Funds (cost $155,331,785) | | 155,331,785 | | |
| | | | | |
| | | | | |
| Total Investment in Securities (cost $6,900,892,622) | | | $ | 8,979,634,917 |
| Foreign currency held at value (cost $569) | | | | 569 |
| Receivable for securities sold on a delayed delivery basis | | | | 11,865,188 |
| Receivable for fund shares sold | | | | 288,781,275 |
| Dividends receivable | | | | 7,922,906 |
| Distributions receivable from Fidelity Central Funds | | | | 567,569 |
| Other receivables | | | | 59 |
Total assets | | | | 9,288,772,483 |
| Liabilities | | | | |
| Payable for investments purchased | $ | 258,326,673 | | |
| Payable for fund shares redeemed | | 2,391,957 | | |
| Other payables and accrued expenses | | 430,626 | | |
| Collateral on securities loaned | | 20,631,250 | | |
| Total Liabilities | | | | 281,780,506 |
| Net Assets | | | $ | 9,006,991,977 |
| Net Assets consist of: | | | | |
| Paid in capital | | | $ | 6,932,093,678 |
| Total accumulated earnings (loss) | | | | 2,074,898,299 |
| Net Assets | | | $ | 9,006,991,977 |
Net Asset Value , offering price and redemption price per share ($9,006,991,977 ÷ 592,366,718 shares) | | | $ | 15.21 |
| Statement of Operations |
| | | | Year ended January 31, 2023 |
| Investment Income | | | | |
| Dividends | | | $ | 172,905,312 |
| Income from Fidelity Central Funds (including $29,429 from security lending) | | | | 2,712,272 |
| Total Income | | | | 175,617,584 |
| Expenses | | | | |
| Custodian fees and expenses | $ | 165,065 | | |
| Independent trustees' fees and expenses | | 27,380 | | |
| Interest | | 39,477 | | |
| Total Expenses | | | | 231,922 |
| Net Investment income (loss) | | | | 175,385,662 |
| Realized and Unrealized Gain (Loss) | | | | |
| Net realized gain (loss) on: | | | | |
| Investment Securities: | | | | |
| Unaffiliated issuers | | 298,992,937 | | |
| Foreign currency transactions | | (63,948) | | |
| Total net realized gain (loss) | | | | 298,928,989 |
| Change in net unrealized appreciation (depreciation) on: | | | | |
| Investment Securities: | | | | |
| Unaffiliated issuers | | (379,804,812) | | |
| Assets and liabilities in foreign currencies | | 19,021 | | |
| Total change in net unrealized appreciation (depreciation) | | | | (379,785,791) |
| Net gain (loss) | | | | (80,856,802) |
| Net increase (decrease) in net assets resulting from operations | | | $ | 94,528,860 |
| Statement of Changes in Net Assets |
| |
| | Year ended January 31, 2023 | | Year ended January 31, 2022 |
| Increase (Decrease) in Net Assets | | | | |
| Operations | | | | |
| Net investment income (loss) | $ | 175,385,662 | $ | 180,441,995 |
| Net realized gain (loss) | | 298,928,989 | | 1,138,843,249 |
| Change in net unrealized appreciation (depreciation) | | (379,785,791) | | 764,430,321 |
| Net increase (decrease) in net assets resulting from operations | | 94,528,860 | | 2,083,715,565 |
| Distributions to shareholders | | (714,886,691) | | (788,264,704) |
| Share transactions | | | | |
| Proceeds from sales of shares | | 1,990,740,468 | | 1,080,295,695 |
| Reinvestment of distributions | | 714,886,691 | | 788,264,704 |
| Cost of shares redeemed | | (2,209,464,030) | | (3,004,534,639) |
Net increase (decrease) in net assets resulting from share transactions | | 496,163,129 | | (1,135,974,240) |
| Total increase (decrease) in net assets | | (124,194,702) | | 159,476,621 |
| | | | | |
| Net Assets | | | | |
| Beginning of period | | 9,131,186,679 | | 8,971,710,058 |
| End of period | $ | 9,006,991,977 | $ | 9,131,186,679 |
| | | | | |
| Other Information | | | | |
| Shares | | | | |
| Sold | | 130,968,012 | | 65,227,616 |
| Issued in reinvestment of distributions | | 47,215,366 | | 48,930,432 |
| Redeemed | | (144,612,002) | | (183,016,565) |
| Net increase (decrease) | | 33,571,376 | | (68,858,517) |
| | | | | |
Financial Highlights
| Fidelity® Series Value Discovery Fund |
| |
| Years ended January 31, | | 2023 | | 2022 | | 2021 | | 2020 | | 2019 |
Selected Per-Share Data | | | | | | | | | | |
| Net asset value, beginning of period | $ | 16.34 | $ | 14.29 | $ | 13.01 | $ | 12.19 | $ | 13.89 |
| Income from Investment Operations | | | | | | | | | | |
Net investment income (loss) A,B | | .32 | | .31 | | .32 C | | .32 | | .32 |
| Net realized and unrealized gain (loss) | | (.10) | | 3.15 | | 1.39 | | 1.03 | | (1.20) |
| Total from investment operations | | .22 | | 3.46 | | 1.71 | | 1.35 | | (.88) |
| Distributions from net investment income | | (.32) | | (.33) | | (.30) | | (.34) | | (.30) |
| Distributions from net realized gain | | (1.03) | | (1.08) | | (.13) | | (.19) | | (.52) |
| Total distributions | | (1.35) | | (1.41) | | (.43) | | (.53) | | (.82) |
| Net asset value, end of period | $ | 15.21 | $ | 16.34 | $ | 14.29 | $ | 13.01 | $ | 12.19 |
Total Return E | | 1.55% | | 24.35% | | 13.45% | | 10.95% | | (6.12)% |
Ratios to Average Net Assets B,F,G | | | | | | | | | | |
Expenses before reductions H | | -% | | -% | | -% | | -% | | -% |
Expenses net of fee waivers, if any H | | -% | | -% | | -% | | -% | | -% |
Expenses net of all reductions H | | -% | | -% | | -% | | -% | | -% |
| Net investment income (loss) | | 2.12% | | 1.87% | | 2.54% C | | 2.49% | �� | 2.47% |
| Supplemental Data | | | | | | | | | | |
| Net assets, end of period (000 omitted) | $ | 9,006,992 | $ | 9,131,187 | $ | 8,971,710 | $ | 7,556,991 | $ | 7,742,285 |
Portfolio turnover rate I | | 35% | | 38% | | 75% | | 47% | | 40% J |
A Calculated based on average shares outstanding during the period.
B Net investment income (loss) is affected by the timing of the declaration of dividends by any underlying mutual funds or exchange-traded funds (ETFs). Net investment income (loss) of any mutual funds or ETFs is not included in the Fund's net investment income (loss) ratio.
C Net investment income per share reflects one or more large, non-recurring dividend(s) which amounted to $.04 per share. Excluding such non-recurring dividend(s), the ratio of net investment income (loss) to average net assets would have been 2.25%.
D The amount shown reflects reclassifications related to book to tax differences that were made in the year shown.
E Total returns would have been lower if certain expenses had not been reduced during the applicable periods shown.
F Fees and expenses of any underlying mutual funds or exchange-traded funds (ETFs) are not included in the Fund's expense ratio. The Fund indirectly bears its proportionate share of these expenses. For additional expense information related to investments in Fidelity Central Funds, please refer to the "Investments in Fidelity Central Funds" note found in the Notes to Financial Statements section of the most recent Annual or Semi-Annual report.
G Expense ratios reflect operating expenses of the class. Expenses before reductions do not reflect amounts reimbursed, waived, or reduced through arrangements with the investment adviser, brokerage services, or other offset arrangements, if applicable, and do not represent the amount paid by the class during periods when reimbursements, waivers or reductions occur.
H Amount represents less than .005%.
I Amount does not include the portfolio activity of any underlying mutual funds or exchange-traded funds (ETFs).
J The portfolio turnover rate does not include the assets acquired in the merger.
For the period ended January 31, 2023
1. Organization.
Fidelity Series All-Sector Equity Fund, Fidelity Series Stock Selector Large Cap Value Fund and Fidelity Series Value Discovery Fund (the Funds) are funds of Fidelity Devonshire Trust (the Trust). The Trust is registered under the Investment Company Act of 1940, as amended (the 1940 Act), as an open-end management investment company organized as a Massachusetts business trust. Each Fund is authorized to issue an unlimited number of shares. Shares are offered only to certain other Fidelity funds, Fidelity managed 529 plans, and Fidelity managed collective investment trusts.
2. Investments in Fidelity Central Funds.
Funds may invest in Fidelity Central Funds, which are open-end investment companies generally available only to other investment companies and accounts managed by the investment adviser and its affiliates. The Schedule of Investments lists any Fidelity Central Funds held as an investment as of period end, but does not include the underlying holdings of each Fidelity Central Fund. An investing fund indirectly bears its proportionate share of the expenses of the underlying Fidelity Central Funds.
Based on its investment objective, each Fidelity Central Fund may invest or participate in various investment vehicles or strategies that are similar to those of the investing fund. These strategies are consistent with the investment objectives of the investing fund and may involve certain economic risks which may cause a decline in value of each of the Fidelity Central Funds and thus a decline in the value of the investing fund.
| Fidelity Central Fund | Investment Manager | Investment Objective | Investment Practices | Expense Ratio A |
| Fidelity Money Market Central Funds | Fidelity Management & Research Company LLC (FMR) | Each fund seeks to obtain a high level of current income consistent with the preservation of capital and liquidity. | Short-term Investments | Less than .005% |
A Expenses expressed as a percentage of average net assets and are as of each underlying Central Fund's most recent annual or semi-annual shareholder report.
A complete unaudited list of holdings for each Fidelity Central Fund is available upon request or at the Securities and Exchange Commission website at www.sec.gov. In addition, the financial statements of the Fidelity Central Funds which contain the significant accounting policies (including investment valuation policies) of those funds, and are not covered by the Report of Independent Registered Public Accounting Firm, are available on the Securities and Exchange Commission website or upon request.
3. Significant Accounting Policies.
Each Fund is an investment company and applies the accounting and reporting guidance of the Financial Accounting Standards Board (FASB) Accounting Standards Codification Topic 946 Financial Services - Investment Companies . The financial statements have been prepared in conformity with accounting principles generally accepted in the United States of America (GAAP), which require management to make certain estimates and assumptions at the date of the financial statements. Actual results could differ from those estimates. Subsequent events, if any, through the date that the financial statements were issued have been evaluated in the preparation of the financial statements. Each Fund's Schedule of Investments lists any underlying mutual funds or exchange-traded funds (ETFs) but does not include the underlying holdings of these funds. The following summarizes the significant accounting policies of each Fund:
Investment Valuation. Investments are valued as of 4:00 p.m. Eastern time on the last calendar day of the period. The Board of Trustees (the Board) has designated each Fund's investment adviser as the valuation designee responsible for the fair valuation function and performing fair value determinations as needed. The investment adviser has established a Fair Value Committee (the Committee) to carry out the day-to-day fair valuation responsibilities and has adopted policies and procedures to govern the fair valuation process and the activities of the Committee. In accordance with these fair valuation policies and procedures, which have been approved by the Board, each Fund attempts to obtain prices from one or more third party pricing services or brokers to value its investments. When current market prices, quotations or currency exchange rates are not readily available or reliable, investments will be fair valued in good faith by the Committee, in accordance with the policies and procedures. Factors used in determining fair value vary by investment type and may include market or investment specific events, transaction data, estimated cash flows, and market observations of comparable investments. The frequency that the fair valuation procedures are used cannot be predicted and they may be utilized to a significant extent. The Committee manages each Fund's fair valuation practices and maintains the fair valuation policies and procedures. Each Fund's investment adviser reports to the Board information regarding the fair valuation process and related material matters.
Each Fund categorizes the inputs to valuation techniques used to value its investments into a disclosure hierarchy consisting of three levels as shown below:
Level 1 - unadjusted quoted prices in active markets for identical investments
Level 2 - other significant observable inputs (including quoted prices for similar investments, interest rates, prepayment speeds, etc.)
Level 3 - unobservable inputs (including the Fund's own assumptions based on the best information available)
Valuation techniques used to value each Fund's investments by major category are as follows:
Equity securities, including restricted securities, for which market quotations are readily available, are valued at the last reported sale price or official closing price as reported by a third party pricing service on the primary market or exchange on which they are traded and are categorized as Level 1 in the hierarchy. In the event there were no sales during the day or closing prices are not available, securities are valued at the last quoted bid price or may be valued using the last available price and are generally categorized as Level 2 in the hierarchy. For foreign equity securities, when market or security specific events arise, comparisons to the valuation of American Depositary Receipts (ADRs), futures contracts, ETFs and certain indexes as well as quoted prices for similar securities may be used and would be categorized as Level 2 in the hierarchy. For equity securities, including restricted securities, where observable inputs are limited, assumptions about market activity and risk are used and these securities may be categorized as Level 3 in the hierarchy.
Debt securities, including restricted securities, are valued based on evaluated prices received from third party pricing services or from brokers who make markets in such securities. U.S. government and government agency obligations and preferred securities are valued by pricing services who utilize matrix pricing which considers yield or price of bonds of comparable quality, coupon, maturity and type or by broker-supplied prices. When independent prices are unavailable or unreliable, debt securities may be valued utilizing pricing methodologies which consider similar factors that would be used by third party pricing services. Debt securities are generally categorized as Level 2 in the hierarchy but may be Level 3 depending on the circumstances. ETFs are valued at their last sale price or official closing price as reported by a third party pricing vendor on the primary market or exchange on which they are traded and are categorized as Level 1 in the hierarchy. In the event there were no sales during the day but the exchange reports a closing bid level, ETFs are valued at the closing bid and would be categorized as Level 1 in the hierarchy. In the event there was no closing bid, ETFs may be valued by another method that the Board believes reflects fair value in accordance with the Board's fair value pricing policies and may be categorized as Level 2 in the hierarchy.
Futures contracts are valued at the settlement price established each day by the board of trade or exchange on which they are traded and are categorized as Level 1 in the hierarchy. Investments in open-end mutual funds, including the Fidelity Central Funds, are valued at their closing net asset value (NAV) each business day and are categorized as Level 1 in the hierarchy.
Changes in valuation techniques may result in transfers in or out of an assigned level within the disclosure hierarchy. The aggregate value of investments by input level as of January 31, 2023 is included at the end of each Fund's Schedule of Investments.
Foreign Currency. Certain Funds may use foreign currency contracts to facilitate transactions in foreign-denominated securities. Gains and losses from these transactions may arise from changes in the value of the foreign currency or if the counterparties do not perform under the contracts' terms.
Foreign-denominated assets, including investment securities, and liabilities are translated into U.S. dollars at the exchange rates at period end. Purchases and sales of investment securities, income and dividends received, and expenses denominated in foreign currencies are translated into U.S. dollars at the exchange rate in effect on the transaction date.
The effects of exchange rate fluctuations on investments are included with the net realized and unrealized gain (loss) on investment securities. Other foreign currency transactions resulting in realized and unrealized gain (loss) are disclosed separately.
Investment Transactions and Income. For financial reporting purposes, the Funds' investment holdings and NAV include trades executed through the end of the last business day of the period. The NAV per share for processing shareholder transactions is calculated as of the close of business of the New York Stock Exchange (NYSE), normally 4:00 p.m. Eastern time and includes trades executed through the end of the prior business day. Gains and losses on securities sold are determined on the basis of identified cost and for certain Funds include proceeds received from litigation. Commissions paid to certain brokers with whom the investment adviser, or its affiliates, places trades on behalf of a fund include an amount in addition to trade execution, which may be rebated back to a fund. Any such rebates are included in net realized gain (loss) on investments in the Statement of Operations. Dividend income is recorded on the ex-dividend date, except for certain dividends from foreign securities where the ex-dividend date may have passed, which are recorded as soon as the Funds are informed of the ex-dividend date. Non-cash dividends included in dividend income, if any, are recorded at the fair market value of the securities received. Income and capital gain distributions from Fidelity Central Funds, if any, are recorded on the ex-dividend date. Certain distributions received by the Funds represent a return of capital or capital gain. The Funds determine the components of these distributions subsequent to the ex-dividend date, based upon receipt of tax filings or other correspondence relating to the underlying investment. These distributions are recorded as a reduction of cost of investments and/or as a realized gain. Interest income is accrued as earned and includes coupon interest and amortization of premium and accretion of discount on debt securities as applicable. Investment income is recorded net of foreign taxes withheld where recovery of such taxes is uncertain. Funds may file withholding tax reclaims in certain jurisdictions to recover a portion of amounts previously withheld. Any withholding tax reclaims income is included in the Statement of Operations in dividends. Any receivables for withholding tax reclaims are included in the Statement of Assets and Liabilities in dividends receivable.
Expenses. Expenses directly attributable to a fund are charged to that fund. Expenses attributable to more than one fund are allocated among the respective funds on the basis of relative net assets or other appropriate methods. Expenses included in the accompanying financial statements reflect the expenses of that fund and do not include any expenses associated with any underlying mutual funds or exchange-traded funds. Although not included in a fund's expenses, a fund indirectly bears its proportionate share of these expenses through the net asset value of each underlying mutual fund or exchange-traded fund. Expense estimates are accrued in the period to which they relate and adjustments are made when actual amounts are known.
Income Tax Information and Distributions to Shareholders. Each year, each Fund intends to qualify as a regulated investment company under Subchapter M of the Internal Revenue Code, including distributing substantially all of its taxable income and realized gains. As a result, no provision for U.S. Federal income taxes is required. As of January 31, 2023, each Fund did not have any unrecognized tax benefits in the financial statements; nor is each Fund aware of any tax positions for which it is reasonably possible that the total amounts of unrecognized tax benefits will significantly change in the next twelve months. Each Fund files a U.S. federal tax return, in addition to state and local tax returns as required. Each Fund's federal income tax returns are subject to examination by the Internal Revenue Service (IRS) for a period of three fiscal years after they are filed. State and local tax returns may be subject to examination for an additional fiscal year depending on the jurisdiction. Foreign taxes are provided for based on each Fund's understanding of the tax rules and rates that exist in the foreign markets in which it invests.
Distributions are declared and recorded on the ex-dividend date. Income and capital gain distributions are determined in accordance with income tax regulations, which may differ from GAAP. In addition, the Funds claimed a portion of the payment made to redeeming shareholders as a distribution for income tax purposes.
Capital accounts within the financial statements are adjusted for permanent book-tax differences. These adjustments have no impact on net assets or the results of operations. Capital accounts are not adjusted for temporary book-tax differences which will reverse in a subsequent period.
Book-tax differences are primarily due to futures contracts, foreign currency transactions, passive foreign investment companies (PFIC) and losses deferred due to wash sales and excise tax regulations.
As of period end, the cost and unrealized appreciation (depreciation) in securities, and derivatives if applicable, for federal income tax purposes were as follows for each Fund:
| | Tax cost | Gross unrealized appreciation | Gross unrealized depreciation | Net unrealized appreciation (depreciation) |
| Fidelity Series All-Sector Equity Fund. | $1,978,643,358 | $1,085,016,406 | $(98,287,693) | $986,728,713 |
Fidelity Series Stock Selector Large Cap Value Fund | 7,947,873,839 | 2,168,136,759 | (303,715,366) | 1,864,421,393 |
| Fidelity Series Value Discovery Fund | 6,929,013,410 | 2,233,026,956 | (182,405,449) | 2,050,621,507 |
The tax-based components of distributable earnings as of period end were as follows for each Fund:
| | Undistributed ordinary income | Undistributed long-term capital gain | Net unrealized appreciation (depreciation) on securities and other investments |
| Fidelity Series All-Sector Equity Fund. | $602,351 | $20,161,831 | $986,652,979 |
Fidelity Series Stock Selector Large Cap Value Fund | 6,250,759 | 27,984,187 | 1,864,408,905 |
| Fidelity Series Value Discovery Fund | 8,478,116 | 15,739,868 | 2,050,680,315 |
The tax character of distributions paid was as follows:
| January 31, 2023 | | | |
| | Ordinary Income | Long-term Capital Gains | Total |
| Fidelity Series All-Sector Equity Fund. | $38,462,025 | $287,566,423 | $326,028,448 |
Fidelity Series Stock Selector Large Cap Value Fund | 238,553,592 | 862,974,568 | 1,101,528,160 |
| Fidelity Series Value Discovery Fund | 166,757,339 | 548,129,352 | 714,886,691 |
| January 31, 2022 | | | |
| | Ordinary Income | Long-term Capital Gains | Total |
| Fidelity Series All-Sector Equity Fund. | $204,040,867 | $524,061,392 | $728,102,259 |
Fidelity Series Stock Selector Large Cap Value Fund | 547,313,089 | 959,105,014 | 1,506,418,103 |
| Fidelity Series Value Discovery Fund | 424,242,020 | 364,022,684 | 788,264,704 |
Delayed Delivery Transactions and When-Issued Securities. During the period, certain Funds transacted in securities on a delayed delivery or when-issued basis. Payment and delivery may take place after the customary settlement period for that security. The price of the underlying securities and the date when the securities will be delivered and paid for are fixed at the time the transaction is negotiated. Securities purchased on a delayed delivery or when-issued basis are identified as such in the Schedule of Investments. Compensation for interest forgone in the purchase of a delayed delivery or when-issued debt security may be received. With respect to purchase commitments, each applicable Fund identifies securities as segregated in its records with a value at least equal to the amount of the commitment. Payables and receivables associated with the purchases and sales of delayed delivery securities having the same coupon, settlement date and broker are offset. Delayed delivery or when-issued securities that have been purchased from and sold to different brokers are reflected as both payables and receivables in the Statement of Assets and Liabilities under the caption "Delayed delivery", as applicable. Losses may arise due to changes in the value of the underlying securities or if the counterparty does not perform under the contract's terms, or if the issuer does not issue the securities due to political, economic, or other factors.
Restricted Securities (including Private Placements). Funds may invest in securities that are subject to legal or contractual restrictions on resale. These securities generally may be resold in transactions exempt from registration or to the public if the securities are registered. Disposal of these securities may involve time-consuming negotiations and expense, and prompt sale at an acceptable price may be difficult. Information regarding restricted securities held at period end is included at the end of the Schedule of Investments, if applicable.
4. Derivative Instruments.
Risk Exposures and the Use of Derivative Instruments. Each Fund's investment objectives allow for various types of derivative instruments, including futures contracts. Derivatives are investments whose value is primarily derived from underlying assets, indices or reference rates and may be transacted on an exchange or over-the-counter (OTC). Derivatives may involve a future commitment to buy or sell a specified asset based on specified terms, to exchange future cash flows at periodic intervals based on a notional principal amount, or for one party to make one or more payments upon the occurrence of specified events in exchange for periodic payments from the other party.
Derivatives were used to increase returns and to manage exposure to certain risks as defined below. The success of any strategy involving derivatives depends on analysis of numerous economic factors, and if the strategies for investment do not work as intended, the objectives may not be achieved.
Derivatives were used to increase or decrease exposure to the following risk(s):
| | |
| Equity Risk | Equity risk relates to the fluctuations in the value of financial instruments as a result of changes in market prices (other than those arising from interest rate risk or foreign exchange risk), whether caused by factors specific to an individual investment, its issuer, or all factors affecting all instruments traded in a market or market segment. |
Funds are also exposed to additional risks from investing in derivatives, such as liquidity risk and counterparty credit risk. Liquidity risk is the risk that a fund will be unable to close out the derivative in the open market in a timely manner. Counterparty credit risk is the risk that the counterparty will not be able to fulfill its obligation to a fund. Counterparty credit risk related to exchange-traded contracts may be mitigated by the protection provided by the exchange on which they trade.
Investing in derivatives may involve greater risks than investing in the underlying assets directly and, to varying degrees, may involve risk of loss in excess of any initial investment and collateral received and amounts recognized in the Statement of Assets and Liabilities. In addition, there may be the risk that the change in value of the derivative contract does not correspond to the change in value of the underlying instrument.
Futures Contracts. A futures contract is an agreement between two parties to buy or sell a specified underlying instrument for a fixed price at a specified future date. Futures contracts were used to manage exposure to the stock market.
Upon entering into a futures contract, a fund is required to deposit either cash or securities (initial margin) with a clearing broker in an amount equal to a certain percentage of the face value of the contract. Futures contracts are marked-to-market daily and subsequent daily payments are made or received by a fund depending on the daily fluctuations in the value of the futures contracts and are recorded as unrealized appreciation or (depreciation). This receivable and/or payable, if any, is included in daily variation margin on futures contracts in the Statement of Assets and Liabilities. Realized gain or (loss) is recorded upon the expiration or closing of a futures contract. The net realized gain (loss) and change in net unrealized appreciation (depreciation) on futures contracts during the period is presented in the Statement of Operations.
Any open futures contracts at period end are presented in the Schedule of Investments under the caption "Futures Contracts". The notional amount at value reflects each contract's exposure to the underlying instrument or index at period end, and is representative of volume of activity during the period unless an average notional amount is presented. Any securities deposited to meet initial margin requirements are identified in the Schedule of Investments. Any cash deposited to meet initial margin requirements is presented as segregated cash with brokers for derivative instruments in the Statement of Assets and Liabilities.
5. Purchases and Sales of Investments.
Purchases and sales of securities, other than short-term securities, U.S. government securities and in-kind transactions, as applicable, are noted in the table below.
| | Purchases ($) | Sales ($) |
| Fidelity Series All-Sector Equity Fund | 1,383,949,387 | 1,775,205,358 |
| Fidelity Series Stock Selector Large Cap Value Fund | 6,820,102,790 | 8,014,223,611 |
| Fidelity Series Value Discovery Fund | 2,856,049,151 | 2,953,625,834 |
6. Fees and Other Transactions with Affiliates.
Management Fee. Fidelity Management & Research Company LLC (the investment adviser) and its affiliates provide the Funds with investment management related services for which the Funds do not pay a management fee. Under the management contract, the investment adviser or an affiliate pays all ordinary operating expenses of the Funds, except custody fees, fees and expenses of the independent Trustees, and certain miscellaneous expenses such as proxy and shareholder meeting expenses.
Brokerage Commissions. A portion of portfolio transactions were placed with brokerage firms which are affiliates of the investment adviser. Brokerage commissions are included in net realized gain (loss) and change in net unrealized appreciation (depreciation) in the Statement of Operations. The commissions paid to these affiliated firms were as follows:
| | Amount |
| Fidelity Series All-Sector Equity Fund | $23,785 |
| Fidelity Series Stock Selector Large Cap Value Fund | 117,079 |
| Fidelity Series Value Discovery Fund | 48,427 |
Interfund Lending Program. Pursuant to an Exemptive Order issued by the Securities and Exchange Commission (the SEC), each Fund, along with other registered investment companies having management contracts with Fidelity Management & Research Company LLC (FMR), or other affiliated entities of FMR, may participate in an interfund lending program. This program provides an alternative credit facility allowing each Fund to borrow from, or lend money to, other participating affiliated funds. At period end, there were no interfund loans outstanding. Activity in this program during the period for which loans were outstanding was as follows:
| | Borrower or Lender | Average Loan Balance | Weighted Average Interest Rate | Interest Expense |
Fidelity Series All-Sector Equity Fund . | Borrower | $31,280,000 | 3.13% | $5,442 |
Fidelity Series Stock Selector Large Cap Value Fund | Borrower | $64,834,375 | 2.71% | $39,068 |
| Fidelity Series Value Discovery Fund | Borrower | $137,040,750 | 1.30% | $39,477 |
Interfund Trades. Funds may purchase from or sell securities to other Fidelity Funds under procedures adopted by the Board. The procedures have been designed to ensure these interfund trades are executed in accordance with Rule 17a-7 of the 1940 Act. Any interfund trades are included within the respective purchases and sales amounts shown in the Purchases and Sales of Investments note. Interfund trades during the period are noted in the table below.
| | Purchases ($) | Sales ($) | Realized Gain (Loss) ($) |
| Fidelity Series All-Sector Equity Fund | 51,597,052 | 95,316,444 | 3,124,412 |
| Fidelity Series Stock Selector Large Cap Value Fund | 642,908,733 | 692,484,686 | 41,022,078 |
| Fidelity Series Value Discovery Fund | 176,815,556 | 221,204,660 | 38,376,518 |
Other. During the period, the investment adviser reimbursed the Funds for certain losses as follows:
| | Amount ($) |
| Fidelity Series Stock Selector Large Cap Value Fund | 489,250 |
7. Committed Line of Credit.
Certain Funds participate with other funds managed by the investment adviser or an affiliate in a $4.25 billion credit facility (the "line of credit") to be utilized for temporary or emergency purposes to fund shareholder redemptions or for other short-term liquidity purposes. The commitment fees on the pro-rata portion of the line of credit are borne by the investment adviser. During the period, there were no borrowings on this line of credit.
8. Security Lending.
Funds lend portfolio securities from time to time in order to earn additional income. Lending agents are used, including National Financial Services (NFS), an affiliate of the investment adviser. Pursuant to a securities lending agreement, NFS will receive a fee, which is capped at 9.9% of a fund's daily lending revenue, for its services as lending agent. A fund may lend securities to certain qualified borrowers, including NFS. On the settlement date of the loan, a fund receives collateral (in the form of U.S. Treasury obligations, letters of credit and/or cash) against the loaned securities and maintains collateral in an amount not less than 100% of the market value of the loaned securities during the period of the loan. The market value of the loaned securities is determined at the close of business of a fund and any additional required collateral is delivered to a fund on the next business day. A fund or borrower may terminate the loan at any time, and if the borrower defaults on its obligation to return the securities loaned because of insolvency or other reasons, a fund may apply collateral received from the borrower against the obligation. A fund may experience delays and costs in recovering the securities loaned. Any cash collateral received is invested in the Fidelity Securities Lending Cash Central Fund. Any loaned securities are identified as such in the Schedule of Investments, and the value of loaned securities and cash collateral at period end, as applicable, are presented in the Statement of Assets and Liabilities. Security lending income represents the income earned on investing cash collateral, less rebates paid to borrowers and any lending agent fees associated with the loan, plus any premium payments received for lending certain types of securities. Security lending income is presented in the Statement of Operations as a component of income from Fidelity Central Funds. Affiliated security lending activity, if any, was as follows:
| | Total Security Lending Fees Paid to NFS | Security Lending Income From Securities Loaned to NFS | Value of Securities Loaned to NFS at Period End |
| Fidelity Series All-Sector Equity Fund | $19,984 | $1,335 | $- |
| Fidelity Series Stock Selector Large Cap Value Fund | $29,595 | $237 | $- |
| Fidelity Series Value Discovery Fund | $3,073 | $- | $- |
9. Other.
A fund's organizational documents provide former and current trustees and officers with a limited indemnification against liabilities arising in connection with the performance of their duties to the fund. In the normal course of business, a fund may also enter into contracts that provide general indemnifications. A fund's maximum exposure under these arrangements is unknown as this would be dependent on future claims that may be made against a fund. The risk of material loss from such claims is considered remote.
At the end of the period, mutual funds and accounts managed by the investment adviser or its affiliates were the owners of record of all of the outstanding shares of the Funds.
10. Risk and Uncertainties.
Many factors affect a fund's performance. Developments that disrupt global economies and financial markets, such as pandemics, epidemics, outbreaks of infectious diseases, war, terrorism, and environmental disasters, may significantly affect a fund's investment performance. The effects of these developments to a fund will be impacted by the types of securities in which a fund invests, the financial condition, industry, economic sector, and geographic location of an issuer, and a fund's level of investment in the securities of that issuer.
To the Board of Trustees of Fidelity Devonshire Trust and the Shareholders of Fidelity Series All-Sector Equity Fund and Fidelity Series Value Discovery Fund:
Opinion on the Financial Statements and Financial Highlights
We have audited the accompanying statements of assets and liabilities of Fidelity Series All-Sector Equity Fund and Fidelity Series Value Discovery Fund (the "Funds"), each a fund of Fidelity Devonshire Trust, including the schedules of investments, as of January 31, 2023, the related statements of operations for the year then ended, the statements of changes in net assets for each of the two years in the period then ended, the financial highlights for each of the five years in the period then ended, and the related notes. In our opinion, the financial statements and financial highlights present fairly, in all material respects, the financial position of each of the Funds as of January 31, 2023, and the results of their operations for the year then ended, the changes in their net assets for each of the two years in the period then ended, and the financial highlights for each of the five years in the period then ended in conformity with accounting principles generally accepted in the United States of America.
Basis for Opinion
These financial statements and financial highlights are the responsibility of the Funds' management. Our responsibility is to express an opinion on the Funds' financial statements and financial highlights based on our audits. We are a public accounting firm registered with the Public Company Accounting Oversight Board (United States) (PCAOB) and are required to be independent with respect to the Funds in accordance with the U.S. federal securities laws and the applicable rules and regulations of the Securities and Exchange Commission and the PCAOB.
We conducted our audits in accordance with the standards of the PCAOB. Those standards require that we plan and perform the audit to obtain reasonable assurance about whether the financial statements and financial highlights are free of material misstatement, whether due to error or fraud. The Funds are not required to have, nor were we engaged to perform, an audit of their internal control over financial reporting. As part of our audits we are required to obtain an understanding of internal control over financial reporting but not for the purpose of expressing an opinion on the effectiveness of the Funds' internal control over financial reporting. Accordingly, we express no such opinion.
Our audits included performing procedures to assess the risks of material misstatement of the financial statements and financial highlights, whether due to error or fraud, and performing procedures that respond to those risks. Such procedures included examining, on a test basis, evidence regarding the amounts and disclosures in the financial statements and financial highlights. Our audits also included evaluating the accounting principles used and significant estimates made by management, as well as evaluating the overall presentation of the financial statements and financial highlights. Our procedures included confirmation of securities owned as of January 31, 2023, by correspondence with the custodian and brokers; when replies were not received from brokers, we performed other auditing procedures. We believe that our audits provide a reasonable basis for our opinion.
/s/ Deloitte & Touche LLP
Boston, Massachusetts
March 16, 2023
We have served as the auditor of one or more of the Fidelity investment companies since 1999.
To the Board of Trustees of Fidelity Devonshire Trust and Shareholders of Fidelity Series Stock Selector Large Cap Value Fund
Opinion on the Financial Statements
We have audited the accompanying statement of assets and liabilities, including the schedule of investments, of Fidelity Series Stock Selector Large Cap Value Fund (one of the funds constituting Fidelity Devonshire Trust, referred to hereafter as the "Fund") as of January 31, 2023, the related statement of operations for the year ended January 31, 2023, the statement of changes in net assets for each of the two years in the period ended January 31, 2023, including the related notes, and the financial highlights for each of the five years in the period ended January 31, 2023 (collectively referred to as the "financial statements"). In our opinion, the financial statements present fairly, in all material respects, the financial position of the Fund as of January 31, 2023, the results of its operations for the year then ended, the changes in its net assets for each of the two years in the period ended January 31, 2023 and the financial highlights for each of the five years in the period ended January 31, 2023 in conformity with accounting principles generally accepted in the United States of America.
Basis for Opinion
These financial statements are the responsibility of the Fund's management. Our responsibility is to express an opinion on the Fund's financial statements based on our audits. We are a public accounting firm registered with the Public Company Accounting Oversight Board (United States) (PCAOB) and are required to be independent with respect to the Fund in accordance with the U.S. federal securities laws and the applicable rules and regulations of the Securities and Exchange Commission and the PCAOB.
We conducted our audits of these financial statements in accordance with the standards of the PCAOB. Those standards require that we plan and perform the audit to obtain reasonable assurance about whether the financial statements are free of material misstatement, whether due to error or fraud.
Our audits included performing procedures to assess the risks of material misstatement of the financial statements, whether due to error or fraud, and performing procedures that respond to those risks. Such procedures included examining, on a test basis, evidence regarding the amounts and disclosures in the financial statements. Our audits also included evaluating the accounting principles used and significant estimates made by management, as well as evaluating the overall presentation of the financial statements. Our procedures included confirmation of securities owned as of January 31, 2023 by correspondence with the custodian and brokers; when replies were not received from brokers, we performed other auditing procedures. We believe that our audits provide a reasonable basis for our opinion.
/s/ PricewaterhouseCoopers LLP
Boston, Massachusetts
March 16, 2023
We have served as the auditor of one or more investment companies in the Fidelity group of funds since 1932.
The Trustees, Members of the Advisory Board (if any), and officers of the trust and funds, as applicable, are listed below. The Board of Trustees governs each fund and is responsible for protecting the interests of shareholders. The Trustees are experienced executives who meet periodically throughout the year to oversee each fund's activities, review contractual arrangements with companies that provide services to each fund, oversee management of the risks associated with such activities and contractual arrangements, and review each fund's performance. Each of the Trustees oversees 318 funds.
The Trustees hold office without limit in time except that (a) any Trustee may resign; (b) any Trustee may be removed by written instrument, signed by at least two-thirds of the number of Trustees prior to such removal; (c) any Trustee who requests to be retired or who has become incapacitated by illness or injury may be retired by written instrument signed by a majority of the other Trustees; and (d) any Trustee may be removed at any special meeting of shareholders by a two-thirds vote of the outstanding voting securities of the trust. Each Trustee who is not an interested person (as defined in the 1940 Act) of the trust and the funds is referred to herein as an Independent Trustee. Each Independent Trustee shall retire not later than the last day of the calendar year in which his or her 75th birthday occurs. The Independent Trustees may waive this mandatory retirement age policy with respect to individual Trustees. Officers and Advisory Board Members hold office without limit in time, except that any officer or Advisory Board Member may resign or may be removed by a vote of a majority of the Trustees at any regular meeting or any special meeting of the Trustees. Except as indicated, each individual has held the office shown or other offices in the same company for the past five years.
The funds' Statement of Additional Information (SAI) includes more information about the Trustees. To request a free copy, call Fidelity at 1-800-544-8544.
Experience, Skills, Attributes, and Qualifications of the Trustees. The Governance and Nominating Committee has adopted a statement of policy that describes the experience, qualifications, attributes, and skills that are necessary and desirable for potential Independent Trustee candidates (Statement of Policy). The Board believes that each Trustee satisfied at the time he or she was initially elected or appointed a Trustee, and continues to satisfy, the standards contemplated by the Statement of Policy. The Governance and Nominating Committee also engages professional search firms to help identify potential Independent Trustee candidates who have the experience, qualifications, attributes, and skills consistent with the Statement of Policy. From time to time, additional criteria based on the composition and skills of the current Independent Trustees, as well as experience or skills that may be appropriate in light of future changes to board composition, business conditions, and regulatory or other developments, have also been considered by the professional search firms and the Governance and Nominating Committee. In addition, the Board takes into account the Trustees' commitment and participation in Board and committee meetings, as well as their leadership of standing and ad hoc committees throughout their tenure.
In determining that a particular Trustee was and continues to be qualified to serve as a Trustee, the Board has considered a variety of criteria, none of which, in isolation, was controlling. The Board believes that, collectively, the Trustees have balanced and diverse experience, qualifications, attributes, and skills, which allow the Board to operate effectively in governing each fund and protecting the interests of shareholders. Information about the specific experience, skills, attributes, and qualifications of each Trustee, which in each case led to the Board's conclusion that the Trustee should serve (or continue to serve) as a trustee of the funds, is provided below.
Board Structure and Oversight Function. Robert A. Lawrence is an interested person and currently serves as Chair. The Trustees have determined that an interested Chair is appropriate and benefits shareholders because an interested Chair has a personal and professional stake in the quality and continuity of services provided to the funds. Independent Trustees exercise their informed business judgment to appoint an individual of their choosing to serve as Chair, regardless of whether the Trustee happens to be independent or a member of management. The Independent Trustees have determined that they can act independently and effectively without having an Independent Trustee serve as Chair and that a key structural component for assuring that they are in a position to do so is for the Independent Trustees to constitute a substantial majority for the Board. The Independent Trustees also regularly meet in executive session. David M. Thomas serves as Lead Independent Trustee and as such (i) acts as a liaison between the Independent Trustees and management with respect to matters important to the Independent Trustees and (ii) with management prepares agendas for Board meetings.
Fidelity ® funds are overseen by different Boards of Trustees. The funds' Board oversees Fidelity's high income and certain equity funds, and other Boards oversee Fidelity's alternative investment, investment-grade bond, money market, asset allocation, and other equity funds. The asset allocation funds may invest in Fidelity ® funds overseen by the funds' Board. The use of separate Boards, each with its own committee structure, allows the Trustees of each group of Fidelity ® funds to focus on the unique issues of the funds they oversee, including common research, investment, and operational issues. On occasion, the separate Boards establish joint committees to address issues of overlapping consequences for the Fidelity ® funds overseen by each Board.
The Trustees operate using a system of committees to facilitate the timely and efficient consideration of all matters of importance to the Trustees, each fund, and fund shareholders and to facilitate compliance with legal and regulatory requirements and oversight of the funds' activities and associated risks. The Board, acting through its committees, has charged FMR and its affiliates with (i) identifying events or circumstances the occurrence of which could have demonstrably adverse effects on the funds' business and/or reputation; (ii) implementing processes and controls to lessen the possibility that such events or circumstances occur or to mitigate the effects of such events or circumstances if they do occur; and (iii) creating and maintaining a system designed to evaluate continuously business and market conditions in order to facilitate the identification and implementation processes described in (i) and (ii) above. Because the day-to-day operations and activities of the funds are carried out by or through FMR, its affiliates, and other service providers, the funds' exposure to risks is mitigated but not eliminated by the processes overseen by the Trustees. While each of the Board's committees has responsibility for overseeing different aspects of the funds' activities, oversight is exercised primarily through the Operations, Audit, and Compliance Committees. Appropriate personnel, including but not limited to the funds' Chief Compliance Officer (CCO), FMR's internal auditor, the independent accountants, the funds' Treasurer and portfolio management personnel, make periodic reports to the Board's committees, as appropriate, including an annual review of Fidelity's risk management program for the Fidelity ® funds. The responsibilities of each standing committee, including their oversight responsibilities, are described further under "Standing Committees of the Trustees."
Interested Trustees*:
Correspondence intended for a Trustee who is an interested person may be sent to Fidelity Investments, 245 Summer Street, Boston, Massachusetts 02210.
Name, Year of Birth; Principal Occupations and Other Relevant Experience+
Bettina Doulton (1964)
Year of Election or Appointment: 2020
Trustee
Ms. Doulton also serves as Trustee of other Fidelity ® funds. Prior to her retirement, Ms. Doulton served in a variety of positions at Fidelity Investments, including as a managing director of research (2006-2007), portfolio manager to certain Fidelity ® funds (1993-2005), equity analyst and portfolio assistant (1990-1993), and research assistant (1987-1990). Ms. Doulton currently owns and operates Phi Builders + Architects and Cellardoor Winery. Previously, Ms. Doulton served as a member of the Board of Brown Capital Management, LLC (2014-2018).
Robert A. Lawrence (1952)
Year of Election or Appointment: 2020
Trustee
Chair of the Board of Trustees
Mr. Lawrence also serves as Trustee of other funds. Previously, Mr. Lawrence served as a Trustee and Member of the Advisory Board of certain funds. Prior to his retirement in 2008, Mr. Lawrence served as Vice President of certain Fidelity ® funds (2006-2008), Senior Vice President, Head of High Income Division of Fidelity Management & Research Company (investment adviser firm, 2006-2008), and President of Fidelity Strategic Investments (investment adviser firm, 2002-2005).
* Determined to be an "Interested Trustee" by virtue of, among other things, his or her affiliation with the trust or various entities under common control with FMR.
+ The information includes the Trustee's principal occupation during the last five years and other information relating to the experience, attributes, and skills relevant to the Trustee's qualifications to serve as a Trustee, which led to the conclusion that the Trustee should serve as a Trustee for each fund.
Independent Trustees:
Correspondence intended for an Independent Trustee may be sent to Fidelity Investments, P.O. Box 55235, Boston, Massachusetts 02205-5235.
Name, Year of Birth; Principal Occupations and Other Relevant Experience+
Thomas P. Bostick (1956)
Year of Election or Appointment: 2021
Trustee
Lieutenant General Bostick also serves as Trustee of other Fidelity ® funds. Prior to his retirement, General Bostick (United States Army, Retired) held a variety of positions within the U.S. Army, including Commanding General and Chief of Engineers, U.S. Army Corps of Engineers (2012-2016) and Deputy Chief of Staff and Director of Human Resources, U.S. Army (2009-2012). General Bostick currently serves as a member of the Board and Finance and Governance Committees of CSX Corporation (transportation, 2020-present) and a member of the Board and Corporate Governance and Nominating Committee of Perma-Fix Environmental Services, Inc. (nuclear waste management, 2020-present). General Bostick serves as Chief Executive Officer of Bostick Global Strategies, LLC (consulting, 2016-present) and as a member of the Board of HireVue, Inc. (video interview and assessment, 2020-present). Previously, General Bostick served as a Member of the Advisory Board of certain Fidelity® funds (2021), President, Intrexon Bioengineering (2018-2020) and Chief Operating Officer (2017-2020) and Senior Vice President of the Environment Sector (2016-2017) of Intrexon Corporation (biopharmaceutical company).
Dennis J. Dirks (1948)
Year of Election or Appointment: 2005
Trustee
Mr. Dirks also serves as Trustee of other Fidelity ® funds. Prior to his retirement in May 2003, Mr. Dirks served as Chief Operating Officer and as a member of the Board of The Depository Trust & Clearing Corporation (financial markets infrastructure), President, Chief Operating Officer and a member of the Board of The Depository Trust Company (DTC), President and a member of the Board of the National Securities Clearing Corporation (NSCC), Chief Executive Officer and a member of the Board of the Government Securities Clearing Corporation and Chief Executive Officer and a member of the Board of the Mortgage-Backed Securities Clearing Corporation. Mr. Dirks currently serves as a member of the Finance Committee (2016-present) and Board (2017-present) and is Treasurer (2018-present) of the Asolo Repertory Theatre.
Donald F. Donahue (1950)
Year of Election or Appointment: 2018
Trustee
Mr. Donahue also serves as Trustee of other Fidelity ® funds. Mr. Donahue serves as President and Chief Executive Officer of Miranda Partners, LLC (risk consulting for the financial services industry, 2012-present). Previously, Mr. Donahue served as Chief Executive Officer (2006-2012), Chief Operating Officer (2003-2006) and Managing Director, Customer Marketing and Development (1999-2003) of The Depository Trust & Clearing Corporation (financial markets infrastructure). Mr. Donahue currently serves as a member (2007-present) and Co-Chairman (2016-present) of the Board of United Way of New York and a member of the Board of The Leadership Academy (previously NYC Leadership Academy) (2012-present). Mr. Donahue previously served as a member of the Advisory Board of certain Fidelity® funds (2015-2018).
Vicki L. Fuller (1957)
Year of Election or Appointment: 2020
Trustee
Ms. Fuller also serves as Trustee of other Fidelity ® funds. Previously, Ms. Fuller served as a member of the Advisory Board of certain Fidelity ® funds (2018-2020), Chief Investment Officer of the New York State Common Retirement Fund (2012-2018) and held a variety of positions at AllianceBernstein L.P. (global asset management, 1985-2012), including Managing Director (2006-2012) and Senior Vice President and Senior Portfolio Manager (2001-2006). Ms. Fuller currently serves as a member of the Board, Audit Committee and Nominating and Governance Committee of two Blackstone business development companies (2020-present), as a member of the Board of Treliant, LLC (consulting, 2019-present), as a member of the Advisory Board of Ariel Alternatives, LLC (private equity, 2021-present) and as a member of the Board and Chair of the Audit Committee of Gusto, Inc. (software, 2021-present). In addition, Ms. Fuller currently serves as a member of the Board of Roosevelt University (2019-present) and as a member of the Executive Board of New York University's Stern School of Business. Ms. Fuller previously served as a member of the Board, Audit Committee and Nominating and Governance Committee of The Williams Companies, Inc. (natural gas infrastructure, 2018-2021).
Patricia L. Kampling (1959)
Year of Election or Appointment: 2020
Trustee
Ms. Kampling also serves as Trustee of other Fidelity ® funds. Prior to her retirement, Ms. Kampling served as Chairman of the Board and Chief Executive Officer (2012-2019), President and Chief Operating Officer (2011-2012) and Executive Vice President and Chief Financial Officer (2010-2011) of Alliant Energy Corporation. Ms. Kampling currently serves as a member of the Board, Finance Committee and Governance, Compensation and Nominating Committee of Xcel Energy Inc. (utilities company, 2020-present) and as a member of the Board, Audit, Finance and Risk Committee and Safety, Environmental, Technology and Operations Committee and Chair of the Executive Development and Compensation Committee of American Water Works Company, Inc. (utilities company, 2019-present). In addition, Ms. Kampling currently serves as a member of the Board of the Nature Conservancy, Wisconsin Chapter (2019-present). Previously, Ms. Kampling served as a Member of the Advisory Board of certain Fidelity® funds (2020), a member of the Board, Compensation Committee and Executive Committee and Chair of the Audit Committee of Briggs & Stratton Corporation (manufacturing, 2011-2021), a member of the Board of Interstate Power and Light Company (2012-2019) and Wisconsin Power and Light Company (2012-2019) (each a subsidiary of Alliant Energy Corporation) and as a member of the Board and Workforce Development Committee of the Business Roundtable (2018-2019).
Thomas A. Kennedy (1955)
Year of Election or Appointment: 2021
Trustee
Mr. Kennedy also serves as Trustee of other Fidelity ® funds. Previously, Mr. Kennedy served as a Member of the Advisory Board of certain Fidelity ® funds (2020) and held a variety of positions at Raytheon Company (aerospace and defense, 1983-2020), including Chairman and Chief Executive Officer (2014-2020) and Executive Vice President and Chief Operating Officer (2013-2014). Mr. Kennedy currently serves as Executive Chairman of the Board of Directors of Raytheon Technologies Corporation (aerospace and defense, 2020-present). He is also a member of the Rutgers School of Engineering Industry Advisory Board (2011-present) and a member of the UCLA Engineering Dean's Executive Board (2016-present).
Oscar Munoz (1959)
Year of Election or Appointment: 2021
Trustee
Mr. Munoz also serves as Trustee of other Fidelity ® funds. Prior to his retirement, Mr. Munoz served as Executive Chairman (2020-2021), Chief Executive Officer (2015-2020), President (2015-2016) and a member of the Board (2010-2021) of United Airlines Holdings, Inc. Mr. Munoz currently serves as a member of the Board of CBRE Group, Inc. (commercial real estate, 2020-present), a member of the Board of Univision Communications, Inc. (Hispanic media, 2020-present) and a member of the Advisory Board of Salesforce.com, Inc. (cloud-based software, 2020-present). Previously, Mr. Munoz served as a Member of the Advisory Board of certain Fidelity ® funds (2021).
David M. Thomas (1949)
Year of Election or Appointment: 2008
Trustee
Lead Independent Trustee
Mr. Thomas also serves as Trustee of other Fidelity ® funds. Previously, Mr. Thomas served as Executive Chairman (2005-2006) and Chairman and Chief Executive Officer (2000-2005) of IMS Health, Inc. (pharmaceutical and healthcare information solutions). Mr. Thomas currently serves as a member of the Board of Fortune Brands Home and Security (home and security products, 2004-present) and as Director (2013-present) and Non-Executive Chairman of the Board (2022-present) of Interpublic Group of Companies, Inc. (marketing communication).
Susan Tomasky (1953)
Year of Election or Appointment: 2020
Trustee
Ms. Tomasky also serves as Trustee of other Fidelity ® funds. Prior to her retirement, Ms. Tomasky served in various executive officer positions at American Electric Power Company, Inc. (1998-2011), including most recently as President of AEP Transmission (2007-2011). Ms. Tomasky currently serves as a member of the Board and Sustainability Committee and as Chair of the Audit Committee of Marathon Petroleum Corporation (2018-present) and as a member of the Board, Executive Committee, Corporate Governance Committee and Organization and Compensation Committee and as Chair of the Audit Committee of Public Service Enterprise Group, Inc. (utilities company, 2012-present) and as a member of the Board of its subsidiary company, Public Service Electric and Gas Co. (2021-present). In addition, Ms. Tomasky currently serves as a member (2009-present) and President (2020-present) of the Board of the Royal Shakespeare Company - America (2009-present), as a member of the Board of the Columbus Association for the Performing Arts (2011-present) and as a member of the Board and Kenyon in the World Committee of Kenyon College (2016-present). Previously, Ms. Tomasky served as a Member of the Advisory Board of certain Fidelity ® funds (2020), as a member of the Board of the Columbus Regional Airport Authority (2007-2020), as a member of the Board (2011-2018) and Lead Independent Director (2015-2018) of Andeavor Corporation (previously Tesoro Corporation) (independent oil refiner and marketer) and as a member of the Board of Summit Midstream Partners LP (energy, 2012-2018).
Michael E. Wiley (1950)
Year of Election or Appointment: 2018
Trustee
Mr. Wiley also serves as Trustee of other Fidelity ® funds. Previously, Mr. Wiley served as a member of the Advisory Board of certain Fidelity ® funds (2018-2020), Chairman, President and CEO of Baker Hughes, Inc. (oilfield services, 2000-2004). Mr. Wiley also previously served as a member of the Board of Andeavor Corporation (independent oil refiner and marketer, 2005-2018), a member of the Board of Andeavor Logistics LP (natural resources logistics, 2015-2018) and a member of the Board of High Point Resources (exploration and production, 2005-2020).
+ The information includes the Trustee's principal occupation during the last five years and other information relating to the experience, attributes, and skills relevant to the Trustee's qualifications to serve as a Trustee, which led to the conclusion that the Trustee should serve as a Trustee for each fund.
Advisory Board Members and Officers:
Correspondence intended for a Member of the Advisory Board (if any) may be sent to Fidelity Investments, P.O. Box 55235, Boston, Massachusetts 02205-5235. Correspondence intended for an officer or Peter S. Lynch may be sent to Fidelity Investments, 245 Summer Street, Boston, Massachusetts 02210. Officers appear below in alphabetical order.
Name, Year of Birth; Principal Occupation
Peter S. Lynch (1944)
Year of Election or Appointment: 2003
Member of the Advisory Board
Mr. Lynch also serves as a Member of the Advisory Board of other Fidelity ® funds. Mr. Lynch is Vice Chairman and a Director of Fidelity Management & Research Company LLC (investment adviser firm). In addition, Mr. Lynch serves as a Trustee of Boston College and as the Chairman of the Inner-City Scholarship Fund. Previously, Mr. Lynch served as Vice Chairman and a Director of FMR Co., Inc. (investment adviser firm) and on the Special Olympics International Board of Directors (1997-2006).
Craig S. Brown (1977)
Year of Election or Appointment: 2022
Deputy Treasurer
Mr. Brown also serves as an officer of other funds. Mr. Brown serves as Assistant Treasurer of FIMM, LLC (2021-present) and is an employee of Fidelity Investments (2013-present). Previously, Mr. Brown served as Assistant Treasurer of certain Fidelity ® funds (2019-2022).
John J. Burke III (1964)
Year of Election or Appointment: 2018
Chief Financial Officer
Mr. Burke also serves as Chief Financial Officer of other funds. Mr. Burke serves as Head of Investment Operations for Fidelity Fund and Investment Operations (2018-present) and is an employee of Fidelity Investments (1998-present). Previously Mr. Burke served as head of Asset Management Investment Operations (2012-2018).
William C. Coffey (1969)
Year of Election or Appointment: 2019
Assistant Secretary
Mr. Coffey also serves as Assistant Secretary of other funds. He is Senior Vice President and Deputy General Counsel of FMR LLC (diversified financial services company, 2010-present), and is an employee of Fidelity Investments. Previously, Mr. Coffey served as Secretary and CLO of certain funds (2018-2019); CLO, Secretary, and Senior Vice President of Fidelity Management & Research Company and FMR Co., Inc. (investment adviser firms, 2018-2019); Secretary of Fidelity SelectCo, LLC and Fidelity Investments Money Management, Inc. (investment adviser firms, 2018-2019); CLO of Fidelity Management & Research (Hong Kong) Limited, FMR Investment Management (UK) Limited, and Fidelity Management & Research (Japan) Limited (investment adviser firms, 2018-2019); and Assistant Secretary of certain funds (2009-2018).
Timothy M. Cohen (1969)
Year of Election or Appointment: 2018
Vice President
Mr. Cohen also serves as Vice President of other funds. Mr. Cohen serves as Co-Head of Equity (2018-present), a Director of Fidelity Management & Research (Japan) Limited (investment adviser firm, 2016-present), and is an employee of Fidelity Investments. Previously, Mr. Cohen served as Executive Vice President of Fidelity SelectCo, LLC (2019), Head of Global Equity Research (2016-2018), Chief Investment Officer - Equity and a Director of Fidelity Management & Research (U.K.) Inc. (investment adviser firm, 2013-2015) and as a Director of Fidelity Management & Research (Hong Kong) Limited (investment adviser firm, 2017).
Jonathan Davis (1968)
Year of Election or Appointment: 2010
Assistant Treasurer
Mr. Davis also serves as an officer of other funds. Mr. Davis serves as Assistant Treasurer of FIMM, LLC (2021-present), FMR Capital, Inc. (2017-present), FD Funds GP LLC (2021-present), FD Funds Holding LLC (2021-present), and FD Funds Management LLC (2021-present); and is an employee of Fidelity Investments. Previously, Mr. Davis served as Vice President and Associate General Counsel of FMR LLC (diversified financial services company, 2003-2010).
Laura M. Del Prato (1964)
Year of Election or Appointment: 2018
Assistant Treasurer
Ms. Del Prato also serves as an officer of other funds. Ms. Del Prato serves as Assistant Treasurer of FIMM, LLC (2021-present) and is an employee of Fidelity Investments (2017-present). Previously, Ms. Del Prato served as President and Treasurer of The North Carolina Capital Management Trust: Cash Portfolio and Term Portfolio (2018-2020). Prior to joining Fidelity Investments, Ms. Del Prato served as a Managing Director and Treasurer of the JPMorgan Mutual Funds (2014-2017). Prior to JPMorgan, Ms. Del Prato served as a partner at Cohen Fund Audit Services (accounting firm, 2012-2013) and KPMG LLP (accounting firm, 2004-2012).
Colm A. Hogan (1973)
Year of Election or Appointment: 2020
Assistant Treasurer
Mr. Hogan also serves as an officer of other funds. Mr. Hogan serves as Assistant Treasurer of FIMM, LLC (2021-present) and FMR Capital, Inc. (2017-present) and is an employee of Fidelity Investments (2005-present). Previously, Mr. Hogan served as Deputy Treasurer of certain Fidelity ® funds (2016-2020) and Assistant Treasurer of certain Fidelity ® funds (2016-2018).
Pamela R. Holding (1964)
Year of Election or Appointment: 2018
Vice President
Ms. Holding also serves as Vice President of other funds. Ms. Holding serves as Co-Head of Equity (2018-present) and is an employee of Fidelity Investments (2013-present). Previously, Ms. Holding served as Executive Vice President of Fidelity SelectCo, LLC (2019) and as Chief Investment Officer of Fidelity Institutional Asset Management (2013-2018).
Cynthia Lo Bessette (1969)
Year of Election or Appointment: 2019
Secretary and Chief Legal Officer (CLO)
Ms. Lo Bessette also serves as an officer of other funds. Ms. Lo Bessette serves as CLO, Secretary, and Senior Vice President of Fidelity Management & Research Company LLC (investment adviser firm, 2019-present); CLO of Fidelity Management & Research (Hong Kong) Limited, FMR Investment Management (UK) Limited, and Fidelity Management & Research (Japan) Limited (investment adviser firms, 2019-present); Secretary of FD Funds GP LLC (2021-present), FD Funds Holding LLC (2021-present), FD Funds Management LLC (2021-present), and Fidelity Diversifying Solutions LLC (investment adviser firm, 2022-present); and Assistant Secretary of FIMM, LLC (2019-present). She is a Senior Vice President and Deputy General Counsel of FMR LLC (diversified financial services company, 2019-present), and is an employee of Fidelity Investments. Previously, Ms. Lo Bessette served as CLO, Secretary, and Senior Vice President of FMR Co., Inc. (investment adviser firm, 2019); Secretary of Fidelity SelectCo, LLC and Fidelity Investments Money Management, Inc. (investment adviser firms, 2019). Prior to joining Fidelity Investments, Ms. Lo Bessette was Executive Vice President, General Counsel (2016-2019) and Senior Vice President, Deputy General Counsel (2015-2016) of OppenheimerFunds (investment management company) and Deputy Chief Legal Officer (2013-2015) of Jennison Associates LLC (investment adviser firm).
Chris Maher (1972)
Year of Election or Appointment: 2020
Deputy Treasurer
Mr. Maher also serves as an officer of other funds. Mr. Maher serves as Assistant Treasurer of FIMM, LLC (2021-present) and FMR Capital, Inc. (2017-present), and is an employee of Fidelity Investments (2008-present). Previously, Mr. Maher served as Assistant Treasurer of certain funds (2013-2020); Vice President of Asset Management Compliance (2013), Vice President of the Program Management Group of FMR (investment adviser firm, 2010-2013), and Vice President of Valuation Oversight (2008-2010).
Jason P. Pogorelec (1975)
Year of Election or Appointment: 2020
Chief Compliance Officer
Mr. Pogorelec also serves as Chief Compliance Officer of other funds. Mr. Pogorelec is a Senior Vice President of Asset Management Compliance for Fidelity Investments and is an employee of Fidelity Investments. Mr. Pogorelec serves as Compliance Officer of Fidelity Management & Research Company LLC (investment adviser firm, 2023-present). Previously, Mr. Pogorelec served as Vice President, Associate General Counsel for Fidelity Investments (2010-2020) and Assistant Secretary of certain Fidelity ® funds (2015-2020).
Brett Segaloff (1972)
Year of Election or Appointment: 2021
Anti-Money Laundering (AML) Officer
Mr. Segaloff also serves as an AML Officer of other funds and other related entities. He is Director, Anti-Money Laundering (2007-present) of FMR LLC (diversified financial services company) and is an employee of Fidelity Investments (1996-present).
Stacie M. Smith (1974)
Year of Election or Appointment: 2016
President and Treasurer
Ms. Smith also serves as an officer of other funds. Ms. Smith serves as Assistant Treasurer of FIMM, LLC (2021-present) and FMR Capital, Inc. (2017-present), is an employee of Fidelity Investments (2009-present), and has served in other fund officer roles. Prior to joining Fidelity Investments, Ms. Smith served as Senior Audit Manager of Ernst & Young LLP (accounting firm, 1996-2009). Previously, Ms. Smith served as Assistant Treasurer (2013-2019) and Deputy Treasurer (2013-2016) of certain Fidelity ® funds.
Jim Wegmann (1979)
Year of Election or Appointment: 2019
Assistant Treasurer
Mr. Wegmann also serves as an officer of other funds. Mr. Wegmann serves as Assistant Treasurer of FIMM, LLC (2021-present) and is an employee of Fidelity Investments (2011-present). Previously, Mr. Wegmann served as Assistant Treasurer of certain Fidelity ® funds (2019-2021).
As a shareholder, you incur two types of costs: (1) transaction costs, which may include sales charges (loads) on purchase payments or redemption proceeds, as applicable and (2) ongoing costs, which generally include management fees, distribution and/or service (12b-1) fees and other Fund expenses. This Example is intended to help you understand your ongoing costs (in dollars) of investing in a fund and to compare these costs with the ongoing costs of investing in other mutual funds.
| The Example is based on an investment of $1,000 invested at the beginning of the period and held for the entire period (August 1, 2022 to January 31, 2023). |
Actual Expenses
The first line of the accompanying table provides information about actual account values and actual expenses. You may use the information in this line, together with the amount you invested, to estimate the expenses that you paid over the period. Simply divide your account value by $1,000.00 (for example, an $8,600 account value divided by $1,000.00 = 8.6), then multiply the result by the number in the first line for a class/Fund under the heading entitled "Expenses Paid During Period" to estimate the expenses you paid on your account during this period. If any fund is a shareholder of any underlying mutual funds or exchange-traded funds (ETFs) (the Underlying Funds), such fund indirectly bears its proportional share of the expenses of the Underlying Funds in addition to the direct expenses incurred presented in the table. These fees and expenses are not included in the annualized expense ratio used to calculate the expense estimate in the table below.
Hypothetical Example for Comparison Purposes
The second line of the accompanying table provides information about hypothetical account values and hypothetical expenses based on the actual expense ratio and an assumed rate of return of 5% per year before expenses, which is not the actual return. The hypothetical account values and expenses may not be used to estimate the actual ending account balance or expenses you paid for the period. You may use this information to compare the ongoing costs of investing in the Fund and other funds. To do so, compare this 5% hypothetical example with the 5% hypothetical examples that appear in the shareholder reports of the other funds. If any fund is a shareholder of any Underlying Funds, such fund indirectly bears its proportional share of the expenses of the Underlying Funds in addition to the direct expenses as presented in the table. These fees and expenses are not included in the annualized expense ratio used to calculate the expense estimate in the table below.
Please note that the expenses shown in the table are meant to highlight your ongoing costs only and do not reflect any transaction costs. Therefore, the second line of the table is useful in comparing ongoing costs only, and will not help you determine the relative total costs of owning different funds. In addition, if these transactional costs were included, your costs would have been higher.
| | | | | Annualized Expense Ratio- A | | Beginning Account Value August 1, 2022 | | Ending Account Value January 31, 2023 | | Expenses Paid During Period- C August 1, 2022 to January 31, 2023 |
| | | | | | | | | | |
| Fidelity® Series All-Sector Equity Fund | | | | -%- D | | | | | | |
| Actual | | | | | | $ 1,000 | | $ 1,013.90 | | $- E |
Hypothetical- B | | | | | | $ 1,000 | | $ 1,025.21 | | $- E |
| | | | | | | | | | |
| Fidelity® Series Stock Selector Large Cap Value Fund | | | | -%- D | | | | | | |
| Actual | | | | | | $ 1,000 | | $ 1,071.70 | | $- E |
Hypothetical- B | | | | | | $ 1,000 | | $ 1,025.21 | | $- E |
| | | | | | | | | | |
| Fidelity® Series Value Discovery Fund | | | | -%- D | | | | | | |
| Actual | | | | | | $ 1,000 | | $ 1,054.40 | | $- E |
Hypothetical- B | | | | | | $ 1,000 | | $ 1,025.21 | | $- E |
| |
A Annualized expense ratio reflects expenses net of applicable fee waivers.
B 5% return per year before expenses
C Expenses are equal to the annualized expense ratio, multiplied by the average account value over the period, multiplied by 184/ 365 (to reflect the one-half year period). The fees and expenses of any Underlying Funds are not included in each annualized expense ratio.
D Amount represents less than .005%.
E Amount represents less than $.005.
The dividend and capital gains distributions for the fund(s) are available on Fidelity.com or Institutional.Fidelity.com.
The funds hereby designate as capital gain dividend the amounts noted below for the taxable year ended January 31, 2023, or, if subsequently determined to be different, the net capital gain of such year.
| Fidelity Series All-Sector Equity Fund | $143,862,549 |
| Fidelity Series Value Discovery Fund | $346,490,321 |
| Fidelity Series Stock Selector Large Cap Value Fund | $586,105,318 |
A percentage of the dividends distributed during the fiscal year for the following funds qualify for the dividends-received deduction for corporate shareholders:
| Fidelity Series All-Sector Equity Fund | |
March 2022 December 2022 | - 83% |
| Fidelity Series Value Discovery Fund | |
March 2022 December 2022 | 96% 74% |
| Fidelity Series Stock Selector Large Cap Value Fund | |
March 2022 December 2022 | 23% 81% |
A percentage of the dividends distributed during the fiscal year for the following funds may be taken into account as a dividend for purposes of the maximum rate under section 1(h)(11) of the Internal Revenue Code.
| Fidelity Series All-Sector Equity Fund | |
March 2022 December 2022 | - 86.06% |
| Fidelity Series Value Discovery Fund | |
March 2022 December 2022 | 99.39% 95.99% |
| Fidelity Series Stock Selector Large Cap Value Fund | |
March 2022 December 2022 | 26.21% 84.76% |
A percentage of the dividends distributed during the fiscal year for the following funds qualify as a section 199A dividend:
| Fidelity Series All-Sector Equity Fund | |
| March 2022 | - |
| December 2022 | 7.62% |
| Fidelity Series Value Discovery Fund | |
March 2022 December 2022 | 0.08% 0.48% |
| Fidelity Series Stock Selector Large Cap Value Fund | |
March 2022 December 2022 | 0.12% 6.20% |
| | |
The funds hereby designate the amounts noted below as distributions paid during the fiscal year ended 2023 as qualifying to be taxed as section 163(j) interest dividends:
| Fidelity Series All-Sector Equity Fund | $1,151,475 |
| Fidelity Series Value Discovery Fund | $2,680,965 |
Fidelity Series Stock Selector Large Cap Value Fund | $3,025,420 |
The funds will notify shareholders in January 2024 of amounts for use in preparing 2023 income tax returns.
The Securities and Exchange Commission adopted Rule 22e-4 under the Investment Company Act of 1940 (the Liquidity Rule) to promote effective liquidity risk management throughout the open-end investment company industry, thereby reducing the risk that funds will be unable to meet their redemption obligations and mitigating dilution of the interests of fund shareholders.
The Funds have adopted and implemented a liquidity risk management program (the Program) reasonably designed to assess and manage each Fund's liquidity risk and to comply with the requirements of the Liquidity Rule. Each Fund's Board of Trustees (the Board) has designated each Fund's investment adviser as administrator of the Program. The Fidelity advisers have established a Liquidity Risk Management Committee (the LRM Committee) to manage the Program for each of the Fidelity Funds. The LRM Committee monitors the adequacy and effectiveness of implementation of the Program and on a periodic basis assesses each Fund's liquidity risk based on a variety of factors including (1) the Fund's investment strategy, (2) portfolio liquidity and cash flow projections during normal and reasonably foreseeable stressed conditions, (3) shareholder redemptions, (4) borrowings and other funding sources and (5) certain factor specific to ETFs including the effect of the Fund's prices and spreads, market participants, and basket compositions on the overall liquidity of the Fund's portfolio, as applicable.
In accordance with the Program, each of the Fund's portfolio investments is classified into one of four defined liquidity categories based on a determination of a reasonable expectation for how long it would take to convert the investment to cash (or sell or dispose of the investment) without significantly changing its market value.
- Highly liquid investments - cash or convertible to cash within three business days or less
- Moderately liquid investments - convertible to cash in three to seven calendar days
- Less liquid investments - can be sold or disposed of, but not settled, within seven calendar days
- Illiquid investments - cannot be sold or disposed of within seven calendar days
Liquidity classification determinations take into account a variety of factors including various market, trading and investment-specific considerations, as well as market depth, and generally utilize analysis from a third-party liquidity metrics service.
The Liquidity Rule places a 15% limit on a fund's illiquid investments and requires funds that do not primarily hold assets that are highly liquid investments to determine and maintain a minimum percentage of the fund's net assets to be invested in highly liquid investments (highly liquid investment minimum or HLIM). The Program includes provisions reasonably designed to comply with the 15% limit on illiquid investments and for determining, periodically reviewing and complying with the HLIM requirement as applicable.
At a recent meeting of the Fund's Board of Trustees, the LRM Committee provided a written report to the Board pertaining to the operation, adequacy, and effectiveness of the Program for the period December 1, 2021 through November 30, 2022. The report concluded that the Program is operating effectively and is reasonably designed to assess and manage the Fund's liquidity risk.
1.956971.110
EDT-LDT-ANN-0423
Fidelity® Mid Cap Value Fund
Annual Report
January 31, 2023
Includes Fidelity and Fidelity Advisor share classes
Contents
To view a fund's proxy voting guidelines and proxy voting record for the 12-month period ended June 30, visit http://www.fidelity.com/proxyvotingresults or visit the Securities and Exchange Commission's (SEC) web site at http://www.sec.gov.
You may also call 1-800-544-8544 if you're an individual investing directly with Fidelity, call 1-800-835-5092 if you're a plan sponsor or participant with Fidelity as your recordkeeper or call 1-877-208-0098 on institutional accounts or if you're an advisor or invest through one to request a free copy of the proxy voting guidelines.
Standard & Poor's, S&P and S&P 500 are registered service marks of The McGraw-Hill Companies, Inc. and have been licensed for use by Fidelity Distributors Corporation.
Other third-party marks appearing herein are the property of their respective owners.
All other marks appearing herein are registered or unregistered trademarks or service marks of FMR LLC or an affiliated company. © 2023 FMR LLC. All rights reserved.
This report and the financial statements contained herein are submitted for the general information of the shareholders of the Fund. This report is not authorized for distribution to prospective investors in the Fund unless preceded or accompanied by an effective prospectus.
A fund files its complete schedule of portfolio holdings with the SEC for the first and third quarters of each fiscal year on Form N-PORT. Forms N-PORT are available on the SEC's web site at http://www.sec.gov. A fund's Forms N-PORT may be reviewed and copied at the SEC's Public Reference Room in Washington, DC. Information regarding the operation of the SEC's Public Reference Room may be obtained by calling 1-800-SEC-0330.
For a complete list of a fund's portfolio holdings, view the most recent holdings listing, semiannual report, or annual report on Fidelity's web site at http://www.fidelity.com, http://www.institutional.fidelity.com, or http://www.401k.com, as applicable.
NOT FDIC INSURED •MAY LOSE VALUE •NO BANK GUARANTEE
Neither the Fund nor Fidelity Distributors Corporation is a bank.
Average annual total return reflects the change in the value of an investment, assuming reinvestment of distributions from dividend income and capital gains (the profits earned upon the sale of securities that have grown in value, if any) and assuming a constant rate of performance each year. The hypothetical investment and the average annual total returns do not reflect the deduction of taxes that a shareholder would pay on fund distributions or the redemption of fund shares. During periods of reimbursement by Fidelity, a fund's total return will be greater than it would be had the reimbursement not occurred. How a fund did yesterday is no guarantee of how it will do tomorrow.
| Average Annual Total Returns |
| | | | |
Periods ended January 31, 2023 | Past 1 year | Past 5 years | Past 10 years |
| Class A (incl.5.75% sales charge) | -4.15% | 4.20% | 8.65% |
| Class M (incl.3.50% sales charge) | -2.10% | 4.41% | 8.61% |
Class C (incl. contingent deferred sales charge) | 0.00% | 4.64% | 8.65% |
| Fidelity® Mid Cap Value Fund | 2.00% | 5.75% | 9.63% |
| Class I | 2.01% | 5.74% | 9.61% |
| Class Z | 2.15% | 5.88% | 9.70% |
Class C shares' contingent deferred sales charges included in the past one year, past five years and past ten years total return figures are 1%, 0% and 0%, respectively.
The initial offering of Class Z shares took place on February 1, 2017. Returns prior to February 1, 2017, are those of Class I.
| $10,000 Over 10 Years |
| |
Let's say hypothetically that $10,000 was invested in Fidelity® Mid Cap Value Fund, a class of the fund, on January 31, 2013. The chart shows how the value of your investment would have changed, and also shows how the Russell Midcap® Value Index performed over the same period. |
|
|
Market Recap:
U.S. equities returned -8.22% for the 12 months ending January 31, 2023, according to the S&P 500 ® index. The new year began with an encouraging upturn in January (+6.28%), but the backdrop remains clouded by the multitude of risk factors that challenged the global economy in 2022, when the index logged its lowest calendar-year return since 2008 and first annual retreat since 2018. High inflation prompted the Federal Reserve to aggressively tighten monetary policy, and market interest rates eclipsed their highest level in a decade, stoking recession fears and sending stocks into bear market territory. Since March 2022, the Fed has hiked its benchmark rate seven times, by 4.25 percentage points - the fastest-ever pace of monetary tightening - while also shrinking its massive portfolio. The latest bump came in mid-December, along with a signal that the central bank plans to lift rates through the spring, though likely in smaller increments, to combat high inflation. Against this backdrop, stocks struggled to gain traction until a strong rally ignited heading into the summer. But in September, the S&P 500 ® returned -9.21%, one of its worst monthly results ever, before advancing 7.56% in Q4 as risky assets regained favor. For the full 12 months, value stocks handily outpaced growth. This headwind was most pronounced in the growth-oriented communication services (-27%), consumer discretionary (-20%) and information technology (-16%) sectors. In contrast, energy (+43%) led by a wide margin, followed by health care (+3%).
Comments from Lead Manager Neil Nabar and Co-Manager Anastasia Zabolotnikova:
For the fiscal year ending January 31, 2023, the fund's share classes (excluding sales charges, if applicable) gained roughly 1% to 2%, outperforming the -0.69% result of the benchmark Russell Midcap ® Value Index. Versus the benchmark, security selection was the primary contributor, led by the information technology sector. Strong picks in the communication services sector, especially within the media & entertainment industry, also helped. Investment choices in industrials further lifted the fund's performance. The biggest individual relative contributor was an overweight position in Hess (+66%). We reduced our investment in this company. Also adding value was our outsized stake in PG&E, which returned roughly 30%. PG&E was a new addition to the portfolio this period and among the fund's biggest holdings on January 31. Another notable relative contributor was an overweight in Performance Food Group (+44%). This period we reduced our stake. In contrast, the largest detractor from performance versus the benchmark was security selection in materials. Stock picks in real estate also hampered the fund's relative performance. The biggest individual relative detractor was an overweight position in WeWork (-79%). Also hindering performance was our outsized position in Jones Lang LaSalle, which returned about -36%. Jones Lang LaSalle was not held at period end. Further hindering relative performance was an overweight in Welltower (-11%), which was the fund's largest position on January 31. Notable changes in positioning this period include a higher allocation to the materials and utilities sectors.
The views expressed above reflect those of the portfolio manager(s) only through the end of the period as stated on the cover of this report and do not necessarily represent the views of Fidelity or any other person in the Fidelity organization. Any such views are subject to change at any time based upon market or other conditions and Fidelity disclaims any responsibility to update such views. These views may not be relied on as investment advice and, because investment decisions for a Fidelity fund are based on numerous factors, may not be relied on as an indication of trading intent on behalf of any Fidelity fund.
Top Holdings (% of Fund's net assets) |
| |
| Welltower, Inc. | 4.5 | |
| Public Storage | 1.5 | |
| Entergy Corp. | 1.5 | |
| Prologis (REIT), Inc. | 1.4 | |
| Edison International | 1.4 | |
| CBRE Group, Inc. | 1.4 | |
| M&T Bank Corp. | 1.4 | |
| PG&E Corp. | 1.3 | |
| Brookfield Infrastructure Corp. A Shares | 1.3 | |
| Markel Corp. | 1.3 | |
| | 17.0 | |
| |
| Market Sectors (% of Fund's net assets) |
| |
| Financials | 17.2 | |
| Industrials | 15.3 | |
| Real Estate | 11.4 | |
| Consumer Discretionary | 11.0 | |
| Materials | 9.3 | |
| Information Technology | 8.6 | |
| Utilities | 7.7 | |
| Health Care | 6.7 | |
| Energy | 6.2 | |
| Consumer Staples | 3.4 | |
| Communication Services | 3.1 | |
| |
Asset Allocation (% of Fund's net assets) |
|
Foreign investments - 7.6% |
|
Showing Percentage of Net Assets
| Common Stocks - 99.9% |
| | | Shares | Value ($) |
| COMMUNICATION SERVICES - 3.1% | | | |
| Diversified Telecommunication Services - 0.5% | | | |
| Cellnex Telecom SA (a) | | 196,286 | 7,692,057 |
| Interactive Media & Services - 0.6% | | | |
| Ziff Davis, Inc. (b) | | 115,982 | 10,378,069 |
| Media - 2.0% | | | |
| iHeartMedia, Inc. (b) | | 307,217 | 2,380,932 |
| Liberty Broadband Corp. Class C (b) | | 51,294 | 4,605,175 |
| News Corp. Class A | | 612,731 | 12,413,930 |
| Nexstar Broadcasting Group, Inc. Class A | | 40,787 | 8,351,954 |
| Thryv Holdings, Inc. (b) | | 154,639 | 3,459,274 |
| | | | 31,211,265 |
TOTAL COMMUNICATION SERVICES | | | 49,281,391 |
| CONSUMER DISCRETIONARY - 11.0% | | | |
| Auto Components - 1.4% | | | |
| Aptiv PLC (b) | | 100,893 | 11,409,989 |
| Magna International, Inc. Class A (c) | | 175,350 | 11,387,229 |
| | | | 22,797,218 |
| Diversified Consumer Services - 0.9% | | | |
| Adtalem Global Education, Inc. (b) | | 193,139 | 7,374,047 |
| Laureate Education, Inc. Class A | | 660,354 | 7,250,687 |
| | | | 14,624,734 |
| Hotels, Restaurants & Leisure - 2.4% | | | |
| Bowlero Corp. Class A (b) | | 135,200 | 1,859,000 |
| Hilton Worldwide Holdings, Inc. | | 53,683 | 7,788,866 |
| Light & Wonder, Inc. Class A (b) | | 146,342 | 9,548,816 |
| MGM Resorts International | | 251,906 | 10,431,427 |
| Travel+Leisure Co. (c) | | 175,945 | 7,454,790 |
| | | | 37,082,899 |
| Household Durables - 2.2% | | | |
| Helen of Troy Ltd. (b) | | 41,897 | 4,738,970 |
| Mohawk Industries, Inc. (b) | | 77,779 | 9,338,147 |
| PulteGroup, Inc. | | 174,835 | 9,946,363 |
| Tempur Sealy International, Inc. | | 254,719 | 10,379,799 |
| | | | 34,403,279 |
| Multiline Retail - 1.6% | | | |
| Dollar Tree, Inc. (b) | | 55,781 | 8,377,191 |
| Franchise Group, Inc. (c) | | 264,435 | 8,168,397 |
| Kohl's Corp. | | 290,831 | 9,414,199 |
| | | | 25,959,787 |
| Specialty Retail - 2.5% | | | |
| Lithia Motors, Inc. Class A (sub. vtg.) | | 36,200 | 9,527,840 |
| O'Reilly Automotive, Inc. (b) | | 16,795 | 13,307,518 |
| Rent-A-Center, Inc. | | 285,260 | 7,670,641 |
| Victoria's Secret & Co. (b) | | 198,845 | 8,381,317 |
| | | | 38,887,316 |
TOTAL CONSUMER DISCRETIONARY | | | 173,755,233 |
| CONSUMER STAPLES - 3.4% | | | |
| Food & Staples Retailing - 2.0% | | | |
| Albertsons Companies, Inc. | | 556,860 | 11,805,432 |
| Performance Food Group Co. (b) | | 177,350 | 10,875,102 |
| U.S. Foods Holding Corp. (b) | | 228,500 | 8,712,705 |
| | | | 31,393,239 |
| Food Products - 1.4% | | | |
| Bunge Ltd. | | 133,300 | 13,210,030 |
| Tyson Foods, Inc. Class A | | 136,258 | 8,958,964 |
| | | | 22,168,994 |
TOTAL CONSUMER STAPLES | | | 53,562,233 |
| ENERGY - 6.2% | | | |
| Energy Equipment & Services - 1.1% | | | |
| Halliburton Co. | | 224,828 | 9,267,410 |
| Liberty Oilfield Services, Inc. Class A | | 480,365 | 7,604,178 |
| | | | 16,871,588 |
| Oil, Gas & Consumable Fuels - 5.1% | | | |
| Cenovus Energy, Inc. (c) | | 486,476 | 9,719,790 |
| Chesapeake Energy Corp. | | 115,578 | 10,022,924 |
| Hess Corp. | | 77,075 | 11,573,582 |
| Occidental Petroleum Corp. | | 188,763 | 12,229,955 |
| Ovintiv, Inc. | | 149,160 | 7,343,147 |
| Southwestern Energy Co. (b) | | 1,113,445 | 6,146,216 |
| Targa Resources Corp. | | 161,655 | 12,127,358 |
| Valero Energy Corp. | | 83,874 | 11,744,876 |
| | | | 80,907,848 |
TOTAL ENERGY | | | 97,779,436 |
| FINANCIALS - 17.2% | | | |
| Banks - 4.2% | | | |
| Citizens Financial Group, Inc. | | 429,282 | 18,596,496 |
| East West Bancorp, Inc. | | 172,555 | 13,549,019 |
| M&T Bank Corp. | | 138,963 | 21,678,228 |
| Signature Bank | | 99,481 | 12,828,075 |
| | | | 66,651,818 |
| Capital Markets - 3.3% | | | |
| Ares Management Corp. | | 127,406 | 10,573,424 |
| Carlyle Group LP | | 296,620 | 10,669,421 |
| LPL Financial | | 40,497 | 9,602,649 |
| State Street Corp. | | 197,940 | 18,077,860 |
| Virtu Financial, Inc. Class A | | 160,156 | 3,092,612 |
| | | | 52,015,966 |
| Consumer Finance - 0.8% | | | |
| OneMain Holdings, Inc. | | 297,779 | 12,846,186 |
| Diversified Financial Services - 1.1% | | | |
| Apollo Global Management, Inc. | | 174,517 | 12,352,313 |
| Corebridge Financial, Inc. (c) | | 234,784 | 5,108,900 |
| | | | 17,461,213 |
| Insurance - 6.5% | | | |
| Arthur J. Gallagher & Co. | | 86,075 | 16,846,599 |
| Chubb Ltd. | | 37,989 | 8,642,118 |
| First American Financial Corp. | | 199,645 | 12,352,036 |
| Hartford Financial Services Group, Inc. | | 244,930 | 19,009,017 |
| Markel Corp. (b) | | 14,496 | 20,424,574 |
| MetLife, Inc. | | 146,932 | 10,728,975 |
| Old Republic International Corp. | | 578,524 | 15,267,248 |
| | | | 103,270,567 |
| Thrifts & Mortgage Finance - 1.3% | | | |
| NMI Holdings, Inc. (b) | | 337,598 | 7,842,402 |
| Walker & Dunlop, Inc. | | 127,265 | 12,138,536 |
| | | | 19,980,938 |
TOTAL FINANCIALS | | | 272,226,688 |
| HEALTH CARE - 6.7% | | | |
| Biotechnology - 0.3% | | | |
| Regeneron Pharmaceuticals, Inc. (b) | | 6,599 | 5,005,144 |
| Health Care Providers & Services - 3.7% | | | |
| AdaptHealth Corp. (b) | | 343,151 | 7,353,726 |
| AmerisourceBergen Corp. | | 66,182 | 11,182,111 |
| DaVita HealthCare Partners, Inc. (b) | | 113,568 | 9,356,868 |
| Molina Healthcare, Inc. (b) | | 46,490 | 14,496,977 |
| Tenet Healthcare Corp. (b) | | 304,324 | 16,692,171 |
| | | | 59,081,853 |
| Life Sciences Tools & Services - 1.9% | | | |
| Bio-Rad Laboratories, Inc. Class A (b) | | 24,401 | 11,406,491 |
| Charles River Laboratories International, Inc. (b) | | 33,692 | 8,195,579 |
| ICON PLC (b) | | 32,192 | 7,427,016 |
| Syneos Health, Inc. (b) | | 62,596 | 2,248,448 |
| | | | 29,277,534 |
| Pharmaceuticals - 0.8% | | | |
| Royalty Pharma PLC | | 333,085 | 13,053,601 |
TOTAL HEALTH CARE | | | 106,418,132 |
| INDUSTRIALS - 15.3% | | | |
| Aerospace & Defense - 0.6% | | | |
| Woodward, Inc. | | 96,094 | 9,826,572 |
| Building Products - 1.8% | | | |
| Builders FirstSource, Inc. (b) | | 233,333 | 18,596,640 |
| UFP Industries, Inc. | | 108,667 | 10,165,798 |
| | | | 28,762,438 |
| Commercial Services & Supplies - 0.3% | | | |
| The Brink's Co. | | 65,780 | 4,315,168 |
| Construction & Engineering - 1.8% | | | |
| EMCOR Group, Inc. | | 88,874 | 13,175,571 |
| Willscot Mobile Mini Holdings (b) | | 323,096 | 15,657,232 |
| | | | 28,832,803 |
| Electrical Equipment - 1.2% | | | |
| Regal Rexnord Corp. | | 137,567 | 19,149,326 |
| Machinery - 4.2% | | | |
| Crane Holdings Co. | | 50,142 | 5,811,959 |
| ITT, Inc. | | 82,775 | 7,581,362 |
| Oshkosh Corp. | | 110,769 | 11,163,300 |
| PACCAR, Inc. | | 158,251 | 17,298,417 |
| Stanley Black & Decker, Inc. | | 94,874 | 8,473,197 |
| Timken Co. (c) | | 204,345 | 16,827,811 |
| | | | 67,156,046 |
| Professional Services - 1.2% | | | |
| CACI International, Inc. Class A (b) | | 29,492 | 9,086,190 |
| Manpower, Inc. | | 103,800 | 9,047,208 |
| | | | 18,133,398 |
| Road & Rail - 2.7% | | | |
| Knight-Swift Transportation Holdings, Inc. Class A | | 274,940 | 16,248,954 |
| RXO, Inc. (b) | | 350,335 | 6,418,137 |
| U-Haul Holding Co. (non-vtg.) | | 185,460 | 11,459,573 |
| XPO, Inc. (b) | | 206,344 | 8,224,872 |
| | | | 42,351,536 |
| Trading Companies & Distributors - 1.5% | | | |
| MSC Industrial Direct Co., Inc. Class A | | 122,267 | 10,111,481 |
| WESCO International, Inc. (b) | | 86,978 | 12,960,592 |
| | | | 23,072,073 |
TOTAL INDUSTRIALS | | | 241,599,360 |
| INFORMATION TECHNOLOGY - 8.6% | | | |
| Communications Equipment - 0.4% | | | |
| Motorola Solutions, Inc. | | 22,988 | 5,908,146 |
| Electronic Equipment & Components - 2.2% | | | |
| Flex Ltd. (b) | | 445,336 | 10,398,596 |
| Knowles Corp. (b) | | 250,400 | 4,815,192 |
| TD SYNNEX Corp. | | 115,672 | 11,815,895 |
| Vontier Corp. | | 317,523 | 7,312,555 |
| | | | 34,342,238 |
| IT Services - 3.4% | | | |
| Concentrix Corp. | | 86,576 | 12,277,343 |
| Cyxtera Technologies, Inc. Class A (b) | | 683,266 | 2,200,117 |
| DXC Technology Co. (b) | | 357,971 | 10,284,507 |
| Fidelity National Information Services, Inc. | | 140,600 | 10,550,624 |
| Genpact Ltd. | | 113,888 | 5,384,625 |
| SS&C Technologies Holdings, Inc. | | 225,830 | 13,628,841 |
| | | | 54,326,057 |
| Semiconductors & Semiconductor Equipment - 1.9% | | | |
| Lam Research Corp. | | 28,190 | 14,097,819 |
| Microchip Technology, Inc. | | 163,054 | 12,656,251 |
| Micron Technology, Inc. | | 68,895 | 4,154,369 |
| | | | 30,908,439 |
| Software - 0.7% | | | |
| Gen Digital, Inc. | | 471,250 | 10,843,463 |
TOTAL INFORMATION TECHNOLOGY | | | 136,328,343 |
| MATERIALS - 9.3% | | | |
| Chemicals - 4.2% | | | |
| Celanese Corp. Class A | | 123,266 | 15,186,371 |
| Corteva, Inc. | | 100,343 | 6,467,106 |
| Element Solutions, Inc. | | 319,606 | 6,545,531 |
| Nutrien Ltd. | | 66,984 | 5,545,605 |
| Olin Corp. | | 210,159 | 13,574,170 |
| Tronox Holdings PLC | | 325,161 | 5,576,511 |
| Westlake Corp. | | 108,572 | 13,327,213 |
| | | | 66,222,507 |
| Containers & Packaging - 2.6% | | | |
| Crown Holdings, Inc. | | 152,378 | 13,433,644 |
| Graphic Packaging Holding Co. | | 311,329 | 7,499,916 |
| International Paper Co. | | 192,787 | 8,062,352 |
| Packaging Corp. of America | | 79,378 | 11,327,241 |
| | | | 40,323,153 |
| Metals & Mining - 1.8% | | | |
| Arconic Corp. (b) | | 418,286 | 9,833,904 |
| Freeport-McMoRan, Inc. | | 221,408 | 9,879,225 |
| Reliance Steel & Aluminum Co. | | 41,826 | 9,513,324 |
| | | | 29,226,453 |
| Paper & Forest Products - 0.7% | | | |
| Louisiana-Pacific Corp. | | 172,643 | 11,755,262 |
TOTAL MATERIALS | | | 147,527,375 |
| REAL ESTATE - 11.4% | | | |
| Equity Real Estate Investment Trusts (REITs) - 9.9% | | | |
| Camden Property Trust (SBI) | | 145,948 | 17,982,253 |
| Essex Property Trust, Inc. | | 43,900 | 9,924,473 |
| Lamar Advertising Co. Class A | | 111,892 | 11,920,974 |
| Prologis (REIT), Inc. | | 174,887 | 22,609,391 |
| Public Storage | | 77,870 | 23,698,956 |
| Welltower, Inc. | | 942,033 | 70,690,156 |
| | | | 156,826,203 |
| Real Estate Management & Development - 1.5% | | | |
| CBRE Group, Inc. (b) | | 254,794 | 21,787,435 |
| WeWork, Inc. (b)(c) | | 1,691,139 | 2,688,911 |
| | | | 24,476,346 |
TOTAL REAL ESTATE | | | 181,302,549 |
| UTILITIES - 7.7% | | | |
| Electric Utilities - 5.8% | | | |
| American Electric Power Co., Inc. | | 100,649 | 9,456,980 |
| Edison International | | 320,778 | 22,101,604 |
| Entergy Corp. | | 217,140 | 23,511,919 |
| Exelon Corp. | | 374,274 | 15,790,620 |
| PG&E Corp. (b) | | 1,313,312 | 20,881,661 |
| | | | 91,742,784 |
| Gas Utilities - 1.3% | | | |
| Brookfield Infrastructure Corp. A Shares | | 463,603 | 20,500,525 |
| Independent Power and Renewable Electricity Producers - 0.6% | | | |
| NextEra Energy Partners LP | | 139,251 | 10,207,098 |
TOTAL UTILITIES | | | 122,450,407 |
| TOTAL COMMON STOCKS (Cost $1,461,667,460) | | | 1,582,231,147 |
| | | | |
| Money Market Funds - 2.2% |
| | | Shares | Value ($) |
| Fidelity Cash Central Fund 4.38% (d) | | 2,862,981 | 2,863,554 |
| Fidelity Securities Lending Cash Central Fund 4.38% (d)(e) | | 31,439,531 | 31,442,675 |
| TOTAL MONEY MARKET FUNDS (Cost $34,306,229) | | | 34,306,229 |
| | | | |
| TOTAL INVESTMENT IN SECURITIES - 102.1% (Cost $1,495,973,689) | 1,616,537,376 |
NET OTHER ASSETS (LIABILITIES) - (2.1)% | (32,795,670) |
| NET ASSETS - 100.0% | 1,583,741,706 |
| | |
Legend
| (a) | Security exempt from registration under Rule 144A of the Securities Act of 1933. These securities may be resold in transactions exempt from registration, normally to qualified institutional buyers. At the end of the period, the value of these securities amounted to $7,692,057 or 0.5% of net assets. |
| (c) | Security or a portion of the security is on loan at period end. |
| (d) | Affiliated fund that is generally available only to investment companies and other accounts managed by Fidelity Investments. The rate quoted is the annualized seven-day yield of the fund at period end. A complete unaudited listing of the fund's holdings as of its most recent quarter end is available upon request. In addition, each Fidelity Central Fund's financial statements, which are not covered by the Fund's Report of Independent Registered Public Accounting Firm, are available on the SEC's website or upon request. |
| (e) | Investment made with cash collateral received from securities on loan. |
Affiliated Central Funds
Fiscal year to date information regarding the Fund's investments in Fidelity Central Funds, including the ownership percentage, is presented below.
| Affiliate | Value, beginning of period ($) | Purchases ($) | Sales Proceeds ($) | Dividend Income ($) | Realized Gain (loss) ($) | Change in Unrealized appreciation (depreciation) ($) | Value, end of period ($) | % ownership, end of period |
| Fidelity Cash Central Fund 4.38% | 3,866,632 | 97,618,541 | 98,621,619 | 26,901 | - | - | 2,863,554 | 0.0% |
| Fidelity Securities Lending Cash Central Fund 4.38% | 98,198,294 | 553,179,775 | 619,935,394 | 362,971 | - | - | 31,442,675 | 0.1% |
| Total | 102,064,926 | 650,798,316 | 718,557,013 | 389,872 | - | - | 34,306,229 | |
| | | | | | | | | |
Amounts in the dividend income column in the above table include any capital gain distributions from underlying funds, which are presented in the corresponding line item in the Statement of Operations, if applicable.
Amount for Fidelity Securities Lending Cash Central Fund represents the income earned on investing cash collateral, less rebates paid to borrowers and any lending agent fees associated with the loan, plus any premium payments received for lending certain types of securities.
Amounts included in the purchases and sales proceeds columns may include in-kind transactions, if applicable.
Investment Valuation
The following is a summary of the inputs used, as of January 31, 2023, involving the Fund's assets and liabilities carried at fair value. The inputs or methodology used for valuing securities may not be an indication of the risk associated with investing in those securities. For more information on valuation inputs, and their aggregation into the levels used below, please refer to the Investment Valuation section in the accompanying Notes to Financial Statements.
| Valuation Inputs at Reporting Date: |
| Description | Total ($) | Level 1 ($) | Level 2 ($) | Level 3 ($) |
Investments in Securities: | | | | |
|
| Equities: | | | | |
Communication Services | 49,281,391 | 41,589,334 | 7,692,057 | - |
Consumer Discretionary | 173,755,233 | 173,755,233 | - | - |
Consumer Staples | 53,562,233 | 53,562,233 | - | - |
Energy | 97,779,436 | 97,779,436 | - | - |
Financials | 272,226,688 | 272,226,688 | - | - |
Health Care | 106,418,132 | 106,418,132 | - | - |
Industrials | 241,599,360 | 241,599,360 | - | - |
Information Technology | 136,328,343 | 136,328,343 | - | - |
Materials | 147,527,375 | 147,527,375 | - | - |
Real Estate | 181,302,549 | 181,302,549 | - | - |
Utilities | 122,450,407 | 122,450,407 | - | - |
|
| Money Market Funds | 34,306,229 | 34,306,229 | - | - |
| Total Investments in Securities: | 1,616,537,376 | 1,608,845,319 | 7,692,057 | - |
| Statement of Assets and Liabilities |
| | | | January 31, 2023 |
| | | | | |
| Assets | | | | |
| Investment in securities, at value (including securities loaned of $31,033,249) - See accompanying schedule: | | | | |
Unaffiliated issuers (cost $1,461,667,460) | $ | 1,582,231,147 | | |
Fidelity Central Funds (cost $34,306,229) | | 34,306,229 | | |
| | | | | |
| | | | | |
| Total Investment in Securities (cost $1,495,973,689) | | | $ | 1,616,537,376 |
| Foreign currency held at value (cost $37) | | | | 38 |
| Receivable for investments sold | | | | 6,819,983 |
| Receivable for fund shares sold | | | | 458,187 |
| Dividends receivable | | | | 433,897 |
| Distributions receivable from Fidelity Central Funds | | | | 18,350 |
| Prepaid expenses | | | | 1,382 |
Total assets | | | | 1,624,269,213 |
| Liabilities | | | | |
| Payable for investments purchased | $ | 6,951,256 | | |
| Payable for fund shares redeemed | | 903,804 | | |
| Accrued management fee | | 879,133 | | |
| Distribution and service plan fees payable | | 76,811 | | |
| Other affiliated payables | | 236,982 | | |
| Other payables and accrued expenses | | 48,564 | | |
| Collateral on securities loaned | | 31,430,957 | | |
| Total Liabilities | | | | 40,527,507 |
| Net Assets | | | $ | 1,583,741,706 |
| Net Assets consist of: | | | | |
| Paid in capital | | | $ | 1,459,157,643 |
| Total accumulated earnings (loss) | | | | 124,584,063 |
| Net Assets | | | $ | 1,583,741,706 |
| | | | | |
| Net Asset Value and Maximum Offering Price | | | | |
| Class A : | | | | |
Net Asset Value and redemption price per share ($172,188,028 ÷ 6,606,334 shares) (a) | | | $ | 26.06 |
| Maximum offering price per share (100/94.25 of $26.06) | | | $ | 27.65 |
| Class M : | | | | |
Net Asset Value and redemption price per share ($37,164,926 ÷ 1,435,267 shares) (a) | | | $ | 25.89 |
| Maximum offering price per share (100/96.50 of $25.89) | | | $ | 26.83 |
| Class C : | | | | |
Net Asset Value and offering price per share ($34,138,533 ÷ 1,365,822 shares) (a) | | | $ | 24.99 |
| Mid Cap Value : | | | | |
Net Asset Value , offering price and redemption price per share ($1,113,890,904 ÷ 41,922,045 shares) | | | $ | 26.57 |
| Class I : | | | | |
Net Asset Value , offering price and redemption price per share ($139,456,250 ÷ 5,304,636 shares) | | | $ | 26.29 |
| Class Z : | | | | |
Net Asset Value , offering price and redemption price per share ($86,903,065 ÷ 3,309,024 shares) | | | $ | 26.26 |
(a)Redemption price per share is equal to net asset value less any applicable contingent deferred sales charge. |
| Statement of Operations |
| | | | Year ended January 31, 2023 |
| Investment Income | | | | |
| Dividends | | | $ | 24,834,533 |
| Special dividends | | | | 3,433,891 |
| Income from Fidelity Central Funds (including $362,971 from security lending) | | | | 389,872 |
| Total Income | | | | 28,658,296 |
| Expenses | | | | |
| Management fee | | | | |
| Basic fee | $ | 7,885,399 | | |
| Performance adjustment | | 861,057 | | |
| Transfer agent fees | | 2,468,773 | | |
| Distribution and service plan fees | | 947,494 | | |
| Accounting fees | | 434,847 | | |
| Custodian fees and expenses | | 23,637 | | |
| Independent trustees' fees and expenses | | 4,950 | | |
| Registration fees | | 113,801 | | |
| Audit | | 60,147 | | |
| Legal | | 5,379 | | |
| Miscellaneous | | 6,782 | | |
| Total expenses before reductions | | 12,812,266 | | |
| Expense reductions | | (52,048) | | |
| Total expenses after reductions | | | | 12,760,218 |
| Net Investment income (loss) | | | | 15,898,078 |
| Realized and Unrealized Gain (Loss) | | | | |
| Net realized gain (loss) on: | | | | |
| Investment Securities: | | | | |
| Unaffiliated issuers | | 93,015,227 | | |
| Redemptions in-kind | | 38,755 | | |
| Foreign currency transactions | | (9,730) | | |
| Total net realized gain (loss) | | | | 93,044,252 |
| Change in net unrealized appreciation (depreciation) on: | | | | |
| Investment Securities: | | | | |
| Unaffiliated issuers | | (83,193,944) | | |
| Assets and liabilities in foreign currencies | | 1 | | |
| Total change in net unrealized appreciation (depreciation) | | | | (83,193,943) |
| Net gain (loss) | | | | 9,850,309 |
| Net increase (decrease) in net assets resulting from operations | | | $ | 25,748,387 |
| Statement of Changes in Net Assets |
| |
| | Year ended January 31, 2023 | | Year ended January 31, 2022 |
| Increase (Decrease) in Net Assets | | | | |
| Operations | | | | |
| Net investment income (loss) | $ | 15,898,078 | $ | 19,311,428 |
| Net realized gain (loss) | | 93,044,252 | | 275,877,915 |
| Change in net unrealized appreciation (depreciation) | | (83,193,943) | | 59,583,630 |
| Net increase (decrease) in net assets resulting from operations | | 25,748,387 | | 354,772,973 |
| Distributions to shareholders | | (175,153,334) | | (20,531,671) |
| Share transactions - net increase (decrease) | | 119,427,921 | | 50,003,955 |
| Total increase (decrease) in net assets | | (29,977,026) | | 384,245,257 |
| | | | | |
| Net Assets | | | | |
| Beginning of period | | 1,613,718,732 | | 1,229,473,475 |
| End of period | $ | 1,583,741,706 | $ | 1,613,718,732 |
| | | | | |
| | | | | |
Financial Highlights
| Fidelity Advisor® Mid Cap Value Fund Class A |
| |
| Years ended January 31, | | 2023 | | 2022 | | 2021 | | 2020 | | 2019 |
Selected Per-Share Data | | | | | | | | | | |
| Net asset value, beginning of period | $ | 28.85 | $ | 22.67 | $ | 21.75 | $ | 20.91 | $ | 26.62 |
| Income from Investment Operations | | | | | | | | | | |
Net investment income (loss) A,B | | .22 C | | .29 | | .35 | | .38 | | .39 |
| Net realized and unrealized gain (loss) | | .08 | | 6.21 | | .97 | | .83 | | (3.35) |
| Total from investment operations | | .30 | | 6.50 | | 1.32 | | 1.21 | | (2.96) |
| Distributions from net investment income | | (.28) | | (.32) | | (.40) | | (.37) | | (.40) |
| Distributions from net realized gain | | (2.81) | | - | | - | | - | | (2.35) |
| Total distributions | | (3.09) | | (.32) | | (.40) | | (.37) | | (2.75) |
| Net asset value, end of period | $ | 26.06 | $ | 28.85 | $ | 22.67 | $ | 21.75 | $ | 20.91 |
Total Return D,E | | 1.70% | | 28.68% | | 6.12% | | 5.72% | | (11.23)% |
Ratios to Average Net Assets B,F,G | | | | | | | | | | |
| Expenses before reductions | | 1.08% | | .86% | | .73% | | .76% | | .82% |
| Expenses net of fee waivers, if any | | 1.08% | | .86% | | .73% | | .76% | | .82% |
| Expenses net of all reductions | | 1.08% | | .86% | | .72% | | .75% | | .81% |
| Net investment income (loss) | | .84% C | | 1.05% | | 1.79% | | 1.77% | | 1.66% |
| Supplemental Data | | | | | | | | | | |
| Net assets, end of period (000 omitted) | $ | 172,188 | $ | 167,448 | $ | 122,838 | $ | 141,439 | $ | 173,538 |
Portfolio turnover rate H | | 70% I | | 80% | | 67% | | 83% I | | 80% I |
A Calculated based on average shares outstanding during the period.
B Net investment income (loss) is affected by the timing of the declaration of dividends by any underlying mutual funds or exchange-traded funds (ETFs). Net investment income (loss) of any mutual funds or ETFs is not included in the Fund's net investment income (loss) ratio.
C Net investment income per share reflects one or more large, non-recurring dividend(s) which amounted to $.06 per share. Excluding such non-recurring dividend(s), the ratio of net investment income (loss) to average net assets would have been .61%.
D Total returns would have been lower if certain expenses had not been reduced during the applicable periods shown.
E Total returns do not include the effect of the sales charges.
F Fees and expenses of any underlying mutual funds or exchange-traded funds (ETFs) are not included in the Fund's expense ratio. The Fund indirectly bears its proportionate share of these expenses. For additional expense information related to investments in Fidelity Central Funds, please refer to the "Investments in Fidelity Central Funds" note found in the Notes to Financial Statements section of the most recent Annual or Semi-Annual report.
G Expense ratios reflect operating expenses of the class. Expenses before reductions do not reflect amounts reimbursed, waived, or reduced through arrangements with the investment adviser, brokerage services, or other offset arrangements, if applicable, and do not represent the amount paid by the class during periods when reimbursements, waivers or reductions occur.
H Amount does not include the portfolio activity of any underlying mutual funds or exchange-traded funds (ETFs).
I Portfolio turnover rate excludes securities received or delivered in-kind.
| Fidelity Advisor® Mid Cap Value Fund Class M |
| |
| Years ended January 31, | | 2023 | | 2022 | | 2021 | | 2020 | | 2019 |
Selected Per-Share Data | | | | | | | | | | |
| Net asset value, beginning of period | $ | 28.68 | $ | 22.54 | $ | 21.65 | $ | 20.82 | $ | 26.51 |
| Income from Investment Operations | | | | | | | | | | |
Net investment income (loss) A,B | | .15 C | | .22 | | .29 | | .32 | | .32 |
| Net realized and unrealized gain (loss) | | .08 | | 6.18 | | .95 | | .82 | | (3.33) |
| Total from investment operations | | .23 | | 6.40 | | 1.24 | | 1.14 | | (3.01) |
| Distributions from net investment income | | (.22) | | (.26) | | (.35) | | (.31) | | (.33) |
| Distributions from net realized gain | | (2.81) | | - | | - | | - | | (2.35) |
| Total distributions | | (3.02) D | | (.26) | | (.35) | | (.31) | | (2.68) |
| Net asset value, end of period | $ | 25.89 | $ | 28.68 | $ | 22.54 | $ | 21.65 | $ | 20.82 |
Total Return E,F | | 1.45% | | 28.38% | | 5.76% | | 5.44% | | (11.48)% |
Ratios to Average Net Assets B,G,H | | | | | | | | | | |
| Expenses before reductions | | 1.34% | | 1.12% | | 1.01% | | 1.03% | | 1.10% |
| Expenses net of fee waivers, if any | | 1.34% | | 1.12% | | 1.01% | | 1.03% | | 1.10% |
| Expenses net of all reductions | | 1.34% | | 1.12% | | 1.00% | | 1.02% | | 1.09% |
| Net investment income (loss) | | .58% C | | .79% | | 1.51% | | 1.50% | | 1.39% |
| Supplemental Data | | | | | | | | | | |
| Net assets, end of period (000 omitted) | $ | 37,165 | $ | 38,920 | $ | 30,549 | $ | 35,684 | $ | 41,540 |
Portfolio turnover rate I | | 70% J | | 80% | | 67% | | 83% J | | 80% J |
A Calculated based on average shares outstanding during the period.
B Net investment income (loss) is affected by the timing of the declaration of dividends by any underlying mutual funds or exchange-traded funds (ETFs). Net investment income (loss) of any mutual funds or ETFs is not included in the Fund's net investment income (loss) ratio.
C Net investment income per share reflects one or more large, non-recurring dividend(s) which amounted to $.06 per share. Excluding such non-recurring dividend(s), the ratio of net investment income (loss) to average net assets would have been .35%.
D Total distributions per share do not sum due to rounding.
E Total returns would have been lower if certain expenses had not been reduced during the applicable periods shown.
F Total returns do not include the effect of the sales charges.
G Fees and expenses of any underlying mutual funds or exchange-traded funds (ETFs) are not included in the Fund's expense ratio. The Fund indirectly bears its proportionate share of these expenses. For additional expense information related to investments in Fidelity Central Funds, please refer to the "Investments in Fidelity Central Funds" note found in the Notes to Financial Statements section of the most recent Annual or Semi-Annual report.
H Expense ratios reflect operating expenses of the class. Expenses before reductions do not reflect amounts reimbursed, waived, or reduced through arrangements with the investment adviser, brokerage services, or other offset arrangements, if applicable, and do not represent the amount paid by the class during periods when reimbursements, waivers or reductions occur.
I Amount does not include the portfolio activity of any underlying mutual funds or exchange-traded funds (ETFs).
J Portfolio turnover rate excludes securities received or delivered in-kind.
| Fidelity Advisor® Mid Cap Value Fund Class C |
| |
| Years ended January 31, | | 2023 | | 2022 | | 2021 | | 2020 | | 2019 |
Selected Per-Share Data | | | | | | | | | | |
| Net asset value, beginning of period | $ | 27.79 | $ | 21.84 | $ | 20.99 | $ | 20.19 | $ | 25.76 |
| Income from Investment Operations | | | | | | | | | | |
Net investment income (loss) A,B | | .02 C | | .08 | | .19 | | .21 | | .21 |
| Net realized and unrealized gain (loss) | | .07 | | 5.98 | | .91 | | .80 | | (3.23) |
| Total from investment operations | | .09 | | 6.06 | | 1.10 | | 1.01 | | (3.02) |
| Distributions from net investment income | | (.08) | | (.11) | | (.25) | | (.21) | | (.20) |
| Distributions from net realized gain | | (2.81) | | - | | - | | - | | (2.35) |
| Total distributions | | (2.89) | | (.11) | | (.25) | | (.21) | | (2.55) |
| Net asset value, end of period | $ | 24.99 | $ | 27.79 | $ | 21.84 | $ | 20.99 | $ | 20.19 |
Total Return D,E | | .90% | | 27.76% | | 5.26% | | 4.96% | | (11.89)% |
Ratios to Average Net Assets B,F,G | | | | | | | | | | |
| Expenses before reductions | | 1.85% | | 1.62% | | 1.49% | | 1.51% | | 1.56% |
| Expenses net of fee waivers, if any | | 1.85% | | 1.62% | | 1.49% | | 1.51% | | 1.56% |
| Expenses net of all reductions | | 1.85% | | 1.62% | | 1.48% | | 1.50% | | 1.55% |
| Net investment income (loss) | | .07% C | | .28% | | 1.04% | | 1.02% | | .92% |
| Supplemental Data | | | | | | | | | | |
| Net assets, end of period (000 omitted) | $ | 34,139 | $ | 43,673 | $ | 43,128 | $ | 60,685 | $ | 85,519 |
Portfolio turnover rate H | | 70% I | | 80% | | 67% | | 83% I | | 80% I |
A Calculated based on average shares outstanding during the period.
B Net investment income (loss) is affected by the timing of the declaration of dividends by any underlying mutual funds or exchange-traded funds (ETFs). Net investment income (loss) of any mutual funds or ETFs is not included in the Fund's net investment income (loss) ratio.
C Net investment income per share reflects one or more large, non-recurring dividend(s) which amounted to $.06 per share. Excluding such non-recurring dividend(s), the ratio of net investment income (loss) to average net assets would have been (.16)%.
D Total returns would have been lower if certain expenses had not been reduced during the applicable periods shown.
E Total returns do not include the effect of the contingent deferred sales charge.
F Fees and expenses of any underlying mutual funds or exchange-traded funds (ETFs) are not included in the Fund's expense ratio. The Fund indirectly bears its proportionate share of these expenses. For additional expense information related to investments in Fidelity Central Funds, please refer to the "Investments in Fidelity Central Funds" note found in the Notes to Financial Statements section of the most recent Annual or Semi-Annual report.
G Expense ratios reflect operating expenses of the class. Expenses before reductions do not reflect amounts reimbursed, waived, or reduced through arrangements with the investment adviser, brokerage services, or other offset arrangements, if applicable, and do not represent the amount paid by the class during periods when reimbursements, waivers or reductions occur.
H Amount does not include the portfolio activity of any underlying mutual funds or exchange-traded funds (ETFs).
I Portfolio turnover rate excludes securities received or delivered in-kind.
| Fidelity® Mid Cap Value Fund |
| |
| Years ended January 31, | | 2023 | | 2022 | | 2021 | | 2020 | | 2019 |
Selected Per-Share Data | | | | | | | | | | |
| Net asset value, beginning of period | $ | 29.34 | $ | 23.03 | $ | 22.09 | $ | 21.23 | $ | 26.99 |
| Income from Investment Operations | | | | | | | | | | |
Net investment income (loss) A,B | | .30 C | | .38 | | .41 | | .45 | | .47 |
| Net realized and unrealized gain (loss) | | .09 | | 6.32 | | .99 | | .84 | | (3.41) |
| Total from investment operations | | .39 | | 6.70 | | 1.40 | | 1.29 | | (2.94) |
| Distributions from net investment income | | (.35) | | (.39) | | (.46) | | (.43) | | (.47) |
| Distributions from net realized gain | | (2.81) | | - | | - | | - | | (2.35) |
| Total distributions | | (3.16) | | (.39) | | (.46) | | (.43) | | (2.82) |
| Net asset value, end of period | $ | 26.57 | $ | 29.34 | $ | 23.03 | $ | 22.09 | $ | 21.23 |
Total Return D | | 2.00% | | 29.11% | | 6.37% | | 6.03% | | (10.97)% |
Ratios to Average Net Assets B,E,F | | | | | | | | | | |
| Expenses before reductions | | .79% | | .57% | | .44% | | .46% | | .53% |
| Expenses net of fee waivers, if any | | .79% | | .57% | | .43% | | .46% | | .53% |
| Expenses net of all reductions | | .79% | | .57% | | .43% | | .45% | | .52% |
| Net investment income (loss) | | 1.13% C | | 1.34% | | 2.09% | | 2.07% | | 1.96% |
| Supplemental Data | | | | | | | | | | |
| Net assets, end of period (000 omitted) | $ | 1,113,891 | $ | 1,172,691 | $ | 920,386 | $ | 1,156,286 | $ | 1,456,510 |
Portfolio turnover rate G | | 70% H | | 80% | | 67% | | 83% H | | 80% H |
A Calculated based on average shares outstanding during the period.
B Net investment income (loss) is affected by the timing of the declaration of dividends by any underlying mutual funds or exchange-traded funds (ETFs). Net investment income (loss) of any mutual funds or ETFs is not included in the Fund's net investment income (loss) ratio.
C Net investment income per share reflects one or more large, non-recurring dividend(s) which amounted to $.06 per share. Excluding such non-recurring dividend(s), the ratio of net investment income (loss) to average net assets would have been .90%.
D Total returns would have been lower if certain expenses had not been reduced during the applicable periods shown.
E Fees and expenses of any underlying mutual funds or exchange-traded funds (ETFs) are not included in the Fund's expense ratio. The Fund indirectly bears its proportionate share of these expenses. For additional expense information related to investments in Fidelity Central Funds, please refer to the "Investments in Fidelity Central Funds" note found in the Notes to Financial Statements section of the most recent Annual or Semi-Annual report.
F Expense ratios reflect operating expenses of the class. Expenses before reductions do not reflect amounts reimbursed, waived, or reduced through arrangements with the investment adviser, brokerage services, or other offset arrangements, if applicable, and do not represent the amount paid by the class during periods when reimbursements, waivers or reductions occur.
G Amount does not include the portfolio activity of any underlying mutual funds or exchange-traded funds (ETFs).
H Portfolio turnover rate excludes securities received or delivered in-kind.
| Fidelity Advisor® Mid Cap Value Fund Class I |
| |
| Years ended January 31, | | 2023 | | 2022 | | 2021 | | 2020 | | 2019 |
Selected Per-Share Data | | | | | | | | | | |
| Net asset value, beginning of period | $ | 29.06 | $ | 22.82 | $ | 21.88 | $ | 21.03 | $ | 26.77 |
| Income from Investment Operations | | | | | | | | | | |
Net investment income (loss) A,B | | .29 C | | .37 | | .41 | | .45 | | .46 |
| Net realized and unrealized gain (loss) | | .09 | | 6.26 | | .98 | | .83 | | (3.38) |
| Total from investment operations | | .38 | | 6.63 | | 1.39 | | 1.28 | | (2.92) |
| Distributions from net investment income | | (.35) | | (.39) | | (.45) | | (.43) | | (.47) |
| Distributions from net realized gain | | (2.81) | | - | | - | | - | | (2.35) |
| Total distributions | | (3.15) D | | (.39) | | (.45) | | (.43) | | (2.82) |
| Net asset value, end of period | $ | 26.29 | $ | 29.06 | $ | 22.82 | $ | 21.88 | $ | 21.03 |
Total Return E | | 2.01% | | 29.06% | | 6.41% | | 6.01% | | (10.99)% |
Ratios to Average Net Assets B,F,G | | | | | | | | | | |
| Expenses before reductions | | .81% | | .59% | | .42% | | .46% | | .53% |
| Expenses net of fee waivers, if any | | .81% | | .59% | | .42% | | .46% | | .53% |
| Expenses net of all reductions | | .81% | | .59% | | .41% | | .45% | | .52% |
| Net investment income (loss) | | 1.11% C | | 1.32% | | 2.10% | | 2.07% | | 1.95% |
| Supplemental Data | | | | | | | | | | |
| Net assets, end of period (000 omitted) | $ | 139,456 | $ | 128,301 | $ | 94,586 | $ | 127,647 | $ | 244,054 |
Portfolio turnover rate H | | 70% I | | 80% | | 67% | | 83% I | | 80% I |
A Calculated based on average shares outstanding during the period.
B Net investment income (loss) is affected by the timing of the declaration of dividends by any underlying mutual funds or exchange-traded funds (ETFs). Net investment income (loss) of any mutual funds or ETFs is not included in the Fund's net investment income (loss) ratio.
C Net investment income per share reflects one or more large, non-recurring dividend(s) which amounted to $.06 per share. Excluding such non-recurring dividend(s), the ratio of net investment income (loss) to average net assets would have been .88%.
D Total distributions per share do not sum due to rounding.
E Total returns would have been lower if certain expenses had not been reduced during the applicable periods shown.
F Fees and expenses of any underlying mutual funds or exchange-traded funds (ETFs) are not included in the Fund's expense ratio. The Fund indirectly bears its proportionate share of these expenses. For additional expense information related to investments in Fidelity Central Funds, please refer to the "Investments in Fidelity Central Funds" note found in the Notes to Financial Statements section of the most recent Annual or Semi-Annual report.
G Expense ratios reflect operating expenses of the class. Expenses before reductions do not reflect amounts reimbursed, waived, or reduced through arrangements with the investment adviser, brokerage services, or other offset arrangements, if applicable, and do not represent the amount paid by the class during periods when reimbursements, waivers or reductions occur.
H Amount does not include the portfolio activity of any underlying mutual funds or exchange-traded funds (ETFs).
I Portfolio turnover rate excludes securities received or delivered in-kind.
| Fidelity Advisor® Mid Cap Value Fund Class Z |
| |
| Years ended January 31, | | 2023 | | 2022 | | 2021 | | 2020 | | 2019 |
Selected Per-Share Data | | | | | | | | | | |
| Net asset value, beginning of period | $ | 29.03 | $ | 22.80 | $ | 21.86 | $ | 21.01 | $ | 26.76 |
| Income from Investment Operations | | | | | | | | | | |
Net investment income (loss) A,B | | .32 C | | .41 | | .43 | | .48 | | .49 |
| Net realized and unrealized gain (loss) | | .10 | | 6.25 | | .99 | | .83 | | (3.38) |
| Total from investment operations | | .42 | | 6.66 | | 1.42 | | 1.31 | | (2.89) |
| Distributions from net investment income | | (.38) | | (.43) | | (.48) | | (.46) | | (.51) |
| Distributions from net realized gain | | (2.81) | | - | | - | | - | | (2.35) |
| Total distributions | | (3.19) | | (.43) | | (.48) | | (.46) | | (2.86) |
| Net asset value, end of period | $ | 26.26 | $ | 29.03 | $ | 22.80 | $ | 21.86 | $ | 21.01 |
Total Return D | | 2.15% | | 29.20% | | 6.54% | | 6.19% | | (10.86)% |
Ratios to Average Net Assets B,E,F | | | | | | | | | | |
| Expenses before reductions | | .67% | | .45% | | .29% | | .33% | | .40% |
| Expenses net of fee waivers, if any | | .67% | | .45% | | .29% | | .33% | | .40% |
| Expenses net of all reductions | | .67% | | .45% | | .28% | | .32% | | .39% |
| Net investment income (loss) | | 1.25% C | | 1.45% | | 2.23% | | 2.20% | | 2.09% |
| Supplemental Data | | | | | | | | | | |
| Net assets, end of period (000 omitted) | $ | 86,903 | $ | 62,684 | $ | 17,987 | $ | 34,573 | $ | 35,972 |
Portfolio turnover rate G | | 70% H | | 80% | | 67% | | 83% H | | 80% H |
A Calculated based on average shares outstanding during the period.
B Net investment income (loss) is affected by the timing of the declaration of dividends by any underlying mutual funds or exchange-traded funds (ETFs). Net investment income (loss) of any mutual funds or ETFs is not included in the Fund's net investment income (loss) ratio.
C Net investment income per share reflects one or more large, non-recurring dividend(s) which amounted to $.06 per share. Excluding such non-recurring dividend(s), the ratio of net investment income (loss) to average net assets would have been 1.02%.
D Total returns would have been lower if certain expenses had not been reduced during the applicable periods shown.
E Fees and expenses of any underlying mutual funds or exchange-traded funds (ETFs) are not included in the Fund's expense ratio. The Fund indirectly bears its proportionate share of these expenses. For additional expense information related to investments in Fidelity Central Funds, please refer to the "Investments in Fidelity Central Funds" note found in the Notes to Financial Statements section of the most recent Annual or Semi-Annual report.
F Expense ratios reflect operating expenses of the class. Expenses before reductions do not reflect amounts reimbursed, waived, or reduced through arrangements with the investment adviser, brokerage services, or other offset arrangements, if applicable, and do not represent the amount paid by the class during periods when reimbursements, waivers or reductions occur.
G Amount does not include the portfolio activity of any underlying mutual funds or exchange-traded funds (ETFs).
H Portfolio turnover rate excludes securities received or delivered in-kind.
For the period ended January 31, 2023
1. Organization.
Fidelity Mid Cap Value Fund (the Fund) is a fund of Fidelity Devonshire Trust (the Trust) and is authorized to issue an unlimited number of shares. The Trust is registered under the Investment Company Act of 1940, as amended (the 1940 Act), as an open-end management investment company organized as a Massachusetts business trust. The Fund offers Class A, Class M, Class C, Mid Cap Value, Class I and Class Z shares, each of which has equal rights as to assets and voting privileges. Each class has exclusive voting rights with respect to matters that affect that class. Class C shares will automatically convert to Class A shares after a holding period of eight years from the initial date of purchase, with certain exceptions.
2. Investments in Fidelity Central Funds.
Funds may invest in Fidelity Central Funds, which are open-end investment companies generally available only to other investment companies and accounts managed by the investment adviser and its affiliates. The Schedule of Investments lists any Fidelity Central Funds held as an investment as of period end, but does not include the underlying holdings of each Fidelity Central Fund. An investing fund indirectly bears its proportionate share of the expenses of the underlying Fidelity Central Funds.
Based on its investment objective, each Fidelity Central Fund may invest or participate in various investment vehicles or strategies that are similar to those of the investing fund. These strategies are consistent with the investment objectives of the investing fund and may involve certain economic risks which may cause a decline in value of each of the Fidelity Central Funds and thus a decline in the value of the investing fund.
| Fidelity Central Fund | Investment Manager | Investment Objective | Investment Practices | Expense Ratio A |
| Fidelity Money Market Central Funds | Fidelity Management & Research Company LLC (FMR) | Each fund seeks to obtain a high level of current income consistent with the preservation of capital and liquidity. | Short-term Investments | Less than .005% |
A Expenses expressed as a percentage of average net assets and are as of each underlying Central Fund's most recent annual or semi-annual shareholder report.
A complete unaudited list of holdings for each Fidelity Central Fund is available upon request or at the Securities and Exchange Commission website at www.sec.gov. In addition, the financial statements of the Fidelity Central Funds which contain the significant accounting policies (including investment valuation policies) of those funds, and are not covered by the Report of Independent Registered Public Accounting Firm, are available on the Securities and Exchange Commission website or upon request.
3. Significant Accounting Policies.
The Fund is an investment company and applies the accounting and reporting guidance of the Financial Accounting Standards Board (FASB) Accounting Standards Codification Topic 946 Financial Services - Investment Companies . The financial statements have been prepared in conformity with accounting principles generally accepted in the United States of America (GAAP), which require management to make certain estimates and assumptions at the date of the financial statements. Actual results could differ from those estimates. Subsequent events, if any, through the date that the financial statements were issued have been evaluated in the preparation of the financial statements. The Fund's Schedule of Investments lists any underlying mutual funds or exchange-traded funds (ETFs) but does not include the underlying holdings of these funds. The following summarizes the significant accounting policies of the Fund:
Investment Valuation. Investments are valued as of 4:00 p.m. Eastern time on the last calendar day of the period. The Board of Trustees (the Board) has designated the Fund's investment adviser as the valuation designee responsible for the fair valuation function and performing fair value determinations as needed. The investment adviser has established a Fair Value Committee (the Committee) to carry out the day-to-day fair valuation responsibilities and has adopted policies and procedures to govern the fair valuation process and the activities of the Committee. In accordance with these fair valuation policies and procedures, which have been approved by the Board, the Fund attempts to obtain prices from one or more third party pricing services or brokers to value its investments. When current market prices, quotations or currency exchange rates are not readily available or reliable, investments will be fair valued in good faith by the Committee, in accordance with the policies and procedures. Factors used in determining fair value vary by investment type and may include market or investment specific events, transaction data, estimated cash flows, and market observations of comparable investments. The frequency that the fair valuation procedures are used cannot be predicted and they may be utilized to a significant extent. The Committee manages the Fund's fair valuation practices and maintains the fair valuation policies and procedures. The Fund's investment adviser reports to the Board information regarding the fair valuation process and related material matters.
The Fund categorizes the inputs to valuation techniques used to value its investments into a disclosure hierarchy consisting of three levels as shown below:
Level 1 - unadjusted quoted prices in active markets for identical investments
Level 2 - other significant observable inputs (including quoted prices for similar investments, interest rates, prepayment speeds, etc.)
Level 3 - unobservable inputs (including the Fund's own assumptions based on the best information available)
Valuation techniques used to value the Fund's investments by major category are as follows:
Equity securities, including restricted securities, for which market quotations are readily available, are valued at the last reported sale price or official closing price as reported by a third party pricing service on the primary market or exchange on which they are traded and are categorized as Level 1 in the hierarchy. In the event there were no sales during the day or closing prices are not available, securities are valued at the last quoted bid price or may be valued using the last available price and are generally categorized as Level 2 in the hierarchy. For foreign equity securities, when market or security specific events arise, comparisons to the valuation of American Depositary Receipts (ADRs), futures contracts, ETFs and certain indexes as well as quoted prices for similar securities may be used and would be categorized as Level 2 in the hierarchy. For equity securities, including restricted securities, where observable inputs are limited, assumptions about market activity and risk are used and these securities may be categorized as Level 3 in the hierarchy.
Investments in open-end mutual funds, including the Fidelity Central Funds, are valued at their closing net asset value (NAV) each business day and are categorized as Level 1 in the hierarchy.
Changes in valuation techniques may result in transfers in or out of an assigned level within the disclosure hierarchy. The aggregate value of investments by input level as of January 31, 2023 is included at the end of the Fund's Schedule of Investments.
Foreign Currency. Certain Funds may use foreign currency contracts to facilitate transactions in foreign-denominated securities. Gains and losses from these transactions may arise from changes in the value of the foreign currency or if the counterparties do not perform under the contracts' terms.
Foreign-denominated assets, including investment securities, and liabilities are translated into U.S. dollars at the exchange rates at period end. Purchases and sales of investment securities, income and dividends received, and expenses denominated in foreign currencies are translated into U.S. dollars at the exchange rate in effect on the transaction date.
The effects of exchange rate fluctuations on investments are included with the net realized and unrealized gain (loss) on investment securities. Other foreign currency transactions resulting in realized and unrealized gain (loss) are disclosed separately.
Investment Transactions and Income. For financial reporting purposes, the Fund's investment holdings and NAV include trades executed through the end of the last business day of the period. The NAV per share for processing shareholder transactions is calculated as of the close of business of the New York Stock Exchange (NYSE), normally 4:00 p.m. Eastern time and includes trades executed through the end of the prior business day. Gains and losses on securities sold are determined on the basis of identified cost and include proceeds received from litigation. Commissions paid to certain brokers with whom the investment adviser, or its affiliates, places trades on behalf of a fund include an amount in addition to trade execution, which may be rebated back to a fund. Any such rebates are included in net realized gain (loss) on investments in the Statement of Operations. Dividend income is recorded on the ex-dividend date, except for certain dividends from foreign securities where the ex-dividend date may have passed, which are recorded as soon as the Fund is informed of the ex-dividend date. Non-cash dividends included in dividend income, if any, are recorded at the fair market value of the securities received. Income and capital gain distributions from Fidelity Central Funds, if any, are recorded on the ex-dividend date. Certain distributions received by the Fund represent a return of capital or capital gain. The Fund determines the components of these distributions subsequent to the ex-dividend date, based upon receipt of tax filings or other correspondence relating to the underlying investment. These distributions are recorded as a reduction of cost of investments and/or as a realized gain. Large, non-recurring dividends recognized by the Fund are presented separately on the Statement of Operations as "Special Dividends" and the impact of these dividends is presented in the Financial Highlights. Investment income is recorded net of foreign taxes withheld where recovery of such taxes is uncertain.
Class Allocations and Expenses. Investment income, realized and unrealized capital gains and losses, common expenses of a fund, and certain fund-level expense reductions, if any, are allocated daily on a pro-rata basis to each class based on the relative net assets of each class to the total net assets of a fund. Each class differs with respect to transfer agent and distribution and service plan fees incurred, as applicable. Certain expense reductions may also differ by class, if applicable. For the reporting period, the allocated portion of income and expenses to each class as a percent of its average net assets may vary due to the timing of recording these transactions in relation to fluctuating net assets of the classes. Expenses directly attributable to a fund are charged to that fund. Expenses attributable to more than one fund are allocated among the respective funds on the basis of relative net assets or other appropriate methods. Expenses included in the accompanying financial statements reflect the expenses of that fund and do not include any expenses associated with any underlying mutual funds or exchange-traded funds. Although not included in a fund's expenses, a fund indirectly bears its proportionate share of these expenses through the net asset value of each underlying mutual fund or exchange-traded fund. Expense estimates are accrued in the period to which they relate and adjustments are made when actual amounts are known.
Income Tax Information and Distributions to Shareholders. Each year, the Fund intends to qualify as a regulated investment company under Subchapter M of the Internal Revenue Code, including distributing substantially all of its taxable income and realized gains. As a result, no provision for U.S. Federal income taxes is required. As of January 31, 2023, the Fund did not have any unrecognized tax benefits in the financial statements; nor is the Fund aware of any tax positions for which it is reasonably possible that the total amounts of unrecognized tax benefits will significantly change in the next twelve months. The Fund files a U.S. federal tax return, in addition to state and local tax returns as required. The Fund's federal income tax returns are subject to examination by the Internal Revenue Service (IRS) for a period of three fiscal years after they are filed. State and local tax returns may be subject to examination for an additional fiscal year depending on the jurisdiction. Foreign taxes are provided for based on the Fund's understanding of the tax rules and rates that exist in the foreign markets in which it invests.
Distributions are declared and recorded on the ex-dividend date. Income and capital gain distributions are declared separately for each class. Income and capital gain distributions are determined in accordance with income tax regulations, which may differ from GAAP. In addition, the Fund claimed a portion of the payment made to redeeming shareholders as a distribution for income tax purposes.
Capital accounts within the financial statements are adjusted for permanent book-tax differences. These adjustments have no impact on net assets or the results of operations. Capital accounts are not adjusted for temporary book-tax differences which will reverse in a subsequent period.
Book-tax differences are primarily due to foreign currency transactions, redemptions in-kind and losses deferred due to wash sales and excise tax regulations.
As of period end, the cost and unrealized appreciation (depreciation) in securities, and derivatives if applicable, for federal income tax purposes were as follows:
| Gross unrealized appreciation | $226,741,342 |
| Gross unrealized depreciation | (107,013,112) |
| Net unrealized appreciation (depreciation) | $119,728,230 |
| Tax Cost | $1,496,809,146 |
The tax-based components of distributable earnings as of period end were as follows:
| Undistributed long-term capital gain | $6,586,888 |
| Net unrealized appreciation (depreciation) on securities and other investments | $119,728,230 |
The Fund intends to elect to defer to its next fiscal year $461,983 of ordinary losses recognized during the period January 1, 2023 to January 31, 2023.
The tax character of distributions paid was as follows:
| | January 31, 2023 | January 31, 2022 |
| Ordinary Income | $29,264,345 | $ 20,531,671 |
| Long-term Capital Gains | 145,888,989 | - |
| Total | $175,153,334 | $ 20,531,671 |
Restricted Securities (including Private Placements). Funds may invest in securities that are subject to legal or contractual restrictions on resale. These securities generally may be resold in transactions exempt from registration or to the public if the securities are registered. Disposal of these securities may involve time-consuming negotiations and expense, and prompt sale at an acceptable price may be difficult. Information regarding restricted securities held at period end is included at the end of the Schedule of Investments, if applicable.
4. Purchases and Sales of Investments.
Purchases and sales of securities, other than short-term securities and in-kind transactions, as applicable, are noted in the table below.
| | Purchases ($) | Sales ($) |
| Fidelity Mid Cap Value Fund | 1,048,915,539 | 1,081,176,997 |
Unaffiliated Redemptions In-Kind. Shares that were redeemed in-kind for investments, including accrued interest and cash, if any, are shown in the table below. The net realized gain or loss on investments delivered through in-kind redemptions is included in the "Net realized gain (loss) on: Redemptions in-kind" line in the accompanying Statement of Operations. The amount of the in-kind redemptions is included in share transactions in the accompanying Statement of Changes in Net Assets. There was no gain or loss for federal income tax purposes.
| | Shares | Total net realized gain or loss ($) | Total Proceeds ($) | Participating classes |
| Fidelity Mid Cap Value Fund | 15,033 | 38,755 | 364,276 | Mid Cap Value |
5. Fees and Other Transactions with Affiliates.
Management Fee. Fidelity Management & Research Company LLC (the investment adviser) and its affiliates provide the Fund with investment management related services for which the Fund pays a monthly management fee. The management fee is the sum of an individual fund fee rate that is based on an annual rate of .30% of the Fund's average net assets and an annualized group fee rate that averaged .23% during the period. The group fee rate is based upon the monthly average net assets of a group of registered investment companies with which the investment adviser has management contracts. The group fee rate decreases as assets under management increase and increases as assets under management decrease. In addition, the management fee is subject to a performance adjustment (up to a maximum of +/- .20% of the Fund's average net assets over a 36 month performance period). The upward or downward adjustment to the management fee is based on the relative investment performance of Mid Cap Value as compared to its benchmark index, the Russell Midcap Value Index, over the same 36 month performance period. For the reporting period, the total annual management fee rate, including the performance adjustment, was .58% of the Fund's average net assets. The performance adjustment included in the management fee rate may be higher or lower than the maximum performance adjustment rate due to the difference between the average net assets for the reporting and performance periods.
Distribution and Service Plan Fees. In accordance with Rule 12b-1 of the 1940 Act, the Fund has adopted separate Distribution and Service Plans for each class of shares. Certain classes pay Fidelity Distributors Company LLC (FDC), an affiliate of the investment adviser, separate Distribution and Service Fees, each of which is based on an annual percentage of each class' average net assets. In addition, FDC may pay financial intermediaries for selling shares of the Fund and providing shareholder support services. For the period, the Distribution and Service Fee rates, total fees and amounts retained by FDC were as follows:
| | Distribution Fee | Service Fee | Total Fees | Retained by FDC |
| Class A | - % | .25% | $397,655 | $7,675 |
| Class M | .25% | .25% | 180,444 | 336 |
| Class C | .75% | .25% | 369,395 | 20,511 |
| | | | $947,494 | $28,522 |
Sales Load. FDC may receive a front-end sales charge of up to 5.75% for selling Class A shares and 3.50% for selling Class M shares, some of which is paid to financial intermediaries for selling shares of the Fund. Depending on the holding period, FDC may receive contingent deferred sales charges levied on Class A, Class M and Class C redemptions. The deferred sales charges are 1.00% for Class C shares, 1.00% for certain purchases of Class A shares and .25% for certain purchases of Class M shares.
For the period, sales charge amounts retained by FDC were as follows:
| | Retained by FDC |
| Class A | $35,424 |
| Class M | 2,933 |
Class C A | 501 |
| | $38,858 |
A When Class C shares are initially sold, FDC pays commissions from its own resources to financial intermediaries through which the sales are made.
Transfer Agent Fees. Fidelity Investments Institutional Operations Company LLC (FIIOC), an affiliate of the investment adviser, is the transfer, dividend disbursing and shareholder servicing agent for each class of the Fund. FIIOC receives account fees and asset-based fees that vary according to the account size and type of account of the shareholders of the respective classes of the Fund, except for Class Z. FIIOC receives an asset-based fee of Class Z's average net assets. FIIOC pays for typesetting, printing and mailing of shareholder reports, except proxy statements.
For the period, transfer agent fees for each class were as follows:
| | Amount | % of Class-Level Average Net Assets |
| Class A | $322,134 | .20 |
| Class M | 76,576 | .21 |
| Class C | 82,070 | .22 |
| Mid Cap Value | 1,730,662 | .16 |
| Class I | 229,537 | .18 |
| Class Z | 27,794 | .04 |
| | $2,468,773 | |
Accounting Fees. Fidelity Service Company, Inc. (FSC), an affiliate of the investment adviser, maintains the Fund's accounting records. The accounting fee is based on the level of average net assets for each month. For the period, the fees were equivalent to the following annual rates:
| | % of Average Net Assets |
| Fidelity Mid Cap Value Fund | .03 |
Brokerage Commissions. A portion of portfolio transactions were placed with brokerage firms which are affiliates of the investment adviser. Brokerage commissions are included in net realized gain (loss) and change in net unrealized appreciation (depreciation) in the Statement of Operations. The commissions paid to these affiliated firms were as follows:
| | Amount |
| Fidelity Mid Cap Value Fund | $21,154 |
Interfund Trades. Funds may purchase from or sell securities to other Fidelity Funds under procedures adopted by the Board. The procedures have been designed to ensure these interfund trades are executed in accordance with Rule 17a-7 of the 1940 Act. Any interfund trades are included within the respective purchases and sales amounts shown in the Purchases and Sales of Investments note. Interfund trades during the period are noted in the table below.
| | Purchases ($) | Sales ($) | Realized Gain (Loss) ($) |
| Fidelity Mid Cap Value Fund | 63,821,715 | 98,989,695 | 13,205,397 |
6.Committed Line of Credit.
Certain Funds participate with other funds managed by the investment adviser or an affiliate in a $4.25 billion credit facility (the "line of credit") to be utilized for temporary or emergency purposes to fund shareholder redemptions or for other short-term liquidity purposes. The participating funds have agreed to pay commitment fees on their pro-rata portion of the line of credit, which are reflected in Miscellaneous expenses on the Statement of Operations, and are listed below. During the period, there were no borrowings on this line of credit.
| | Amount |
| Fidelity Mid Cap Value Fund | $2,676 |
7. Security Lending.
Funds lend portfolio securities from time to time in order to earn additional income. Lending agents are used, including National Financial Services (NFS), an affiliate of the investment adviser. Pursuant to a securities lending agreement, NFS will receive a fee, which is capped at 9.9% of a fund's daily lending revenue, for its services as lending agent. A fund may lend securities to certain qualified borrowers, including NFS. On the settlement date of the loan, a fund receives collateral (in the form of U.S. Treasury obligations, letters of credit and/or cash) against the loaned securities and maintains collateral in an amount not less than 100% of the market value of the loaned securities during the period of the loan. The market value of the loaned securities is determined at the close of business of a fund and any additional required collateral is delivered to a fund on the next business day. A fund or borrower may terminate the loan at any time, and if the borrower defaults on its obligation to return the securities loaned because of insolvency or other reasons, a fund may apply collateral received from the borrower against the obligation. A fund may experience delays and costs in recovering the securities loaned. Any cash collateral received is invested in the Fidelity Securities Lending Cash Central Fund. Any loaned securities are identified as such in the Schedule of Investments, and the value of loaned securities and cash collateral at period end, as applicable, are presented in the Statement of Assets and Liabilities. Security lending income represents the income earned on investing cash collateral, less rebates paid to borrowers and any lending agent fees associated with the loan, plus any premium payments received for lending certain types of securities. Security lending income is presented in the Statement of Operations as a component of income from Fidelity Central Funds. Affiliated security lending activity, if any, was as follows:
| | Total Security Lending Fees Paid to NFS | Security Lending Income From Securities Loaned to NFS | Value of Securities Loaned to NFS at Period End |
| Fidelity Mid Cap Value Fund | $37,670 | $131,119 | $- |
8. Expense Reductions.
During the period the investment adviser or an affiliate reimbursed and/or waived a portion of fund-level operating expenses in the amount of $52,048.
9. Distributions to Shareholders.
Distributions to shareholders of each class were as follows:
| | Year ended January 31, 2023 | Year ended January 31, 2022 |
| Fidelity Mid Cap Value Fund | | |
| Distributions to shareholders | | |
| Class A | $18,606,358 | $1,853,949 |
| Class M | 4,166,167 | 356,699 |
| Class C | 4,204,855 | 185,496 |
| Mid Cap Value | 125,657,551 | 15,616,805 |
| Class I | 14,633,041 | 1,738,458 |
| Class Z | 7,885,362 | 780,264 |
| Total | $175,153,334 | $20,531,671 |
10. Share Transactions.
Share transactions for each class were as follows and may contain in-kind transactions, automatic conversions between classes or exchanges between affiliated funds:
| | Shares | Shares | Dollars | Dollars |
| | Year ended January 31, 2023 | Year ended January 31, 2022 | Year ended January 31, 2023 | Year ended January 31, 2022 |
| Fidelity Mid Cap Value Fund | | | | |
| Class A | | | | |
| Shares sold | 1,017,654 | 1,390,327 | $26,351,319 | $38,599,297 |
| Reinvestment of distributions | 723,144 | 62,691 | 18,241,865 | 1,813,639 |
| Shares redeemed | (938,553) | (1,068,584) | (24,220,025) | (29,625,079) |
| Net increase (decrease) | 802,245 | 384,434 | $20,373,159 | $10,787,857 |
| Class M | | | | |
| Shares sold | 189,266 | 315,877 | $4,995,734 | $8,713,904 |
| Reinvestment of distributions | 164,268 | 12,290 | 4,131,202 | 353,703 |
| Shares redeemed | (275,207) | (326,387) | (7,113,921) | (9,069,366) |
| Net increase (decrease) | 78,327 | 1,780 | $2,013,015 | $(1,759) |
| Class C | | | | |
| Shares sold | 154,399 | 210,777 | $3,856,902 | $5,629,261 |
| Reinvestment of distributions | 171,613 | 6,628 | 4,198,785 | 184,919 |
| Shares redeemed | (531,975) | (620,186) | (13,058,343) | (16,379,286) |
| Net increase (decrease) | (205,963) | (402,781) | $(5,002,656) | $(10,565,106) |
| Mid Cap Value | | | | |
| Shares sold | 2,761,991 | 6,790,784 | $72,994,952 | $191,633,827 |
| Reinvestment of distributions | 4,640,191 | 505,864 | 119,360,511 | 14,877,454 |
| Shares redeemed | (5,452,163) | (7,287,371) | (143,324,674) | (204,834,538) |
| Net increase (decrease) | 1,950,019 | 9,277 | $49,030,789 | $1,676,743 |
| Class I | | | | |
| Shares sold | 1,899,372 | 2,239,279 | $49,737,626 | $63,421,208 |
| Reinvestment of distributions | 568,260 | 58,660 | 14,421,992 | 1,709,349 |
| Shares redeemed | (1,577,351) | (2,028,004) | (40,544,202) | (56,357,435) |
| Net increase (decrease) | 890,281 | 269,935 | $23,615,416 | $8,773,122 |
| Class Z | | | | |
| Shares sold | 1,763,184 | 1,690,831 | $45,536,226 | $48,376,943 |
| Reinvestment of distributions | 280,528 | 23,838 | 7,087,889 | 693,672 |
| Shares redeemed | (893,611) | (344,789) | (23,225,917) | (9,737,517) |
| Net increase (decrease) | 1,150,101 | 1,369,880 | $29,398,198 | $39,333,098 |
11. Other.
A fund's organizational documents provide former and current trustees and officers with a limited indemnification against liabilities arising in connection with the performance of their duties to the fund. In the normal course of business, a fund may also enter into contracts that provide general indemnifications. A fund's maximum exposure under these arrangements is unknown as this would be dependent on future claims that may be made against a fund. The risk of material loss from such claims is considered remote.
12. Risk and Uncertainties.
Many factors affect a fund's performance. Developments that disrupt global economies and financial markets, such as pandemics, epidemics, outbreaks of infectious diseases, war, terrorism, and environmental disasters, may significantly affect a fund's investment performance. The effects of these developments to a fund will be impacted by the types of securities in which a fund invests, the financial condition, industry, economic sector, and geographic location of an issuer, and a fund's level of investment in the securities of that issuer.
To the Board of Trustees of Fidelity Devonshire Trust and Shareholders of Fidelity Mid Cap Value Fund
Opinion on the Financial Statements
We have audited the accompanying statement of assets and liabilities, including the schedule of investments, of Fidelity Mid Cap Value Fund (one of the funds constituting Fidelity Devonshire Trust, referred to hereafter as the "Fund") as of January 31, 2023, the related statement of operations for the year ended January 31, 2023, the statement of changes in net assets for each of the two years in the period ended January 31, 2023, including the related notes, and the financial highlights for each of the five years in the period ended January 31, 2023 (collectively referred to as the "financial statements"). In our opinion, the financial statements present fairly, in all material respects, the financial position of the Fund as of January 31, 2023, the results of its operations for the year then ended, the changes in its net assets for each of the two years in the period ended January 31, 2023 and the financial highlights for each of the five years in the period ended January 31, 2023 in conformity with accounting principles generally accepted in the United States of America.
Basis for Opinion
These financial statements are the responsibility of the Fund's management. Our responsibility is to express an opinion on the Fund's financial statements based on our audits. We are a public accounting firm registered with the Public Company Accounting Oversight Board (United States) (PCAOB) and are required to be independent with respect to the Fund in accordance with the U.S. federal securities laws and the applicable rules and regulations of the Securities and Exchange Commission and the PCAOB.
We conducted our audits of these financial statements in accordance with the standards of the PCAOB. Those standards require that we plan and perform the audit to obtain reasonable assurance about whether the financial statements are free of material misstatement, whether due to error or fraud.
Our audits included performing procedures to assess the risks of material misstatement of the financial statements, whether due to error or fraud, and performing procedures that respond to those risks. Such procedures included examining, on a test basis, evidence regarding the amounts and disclosures in the financial statements. Our audits also included evaluating the accounting principles used and significant estimates made by management, as well as evaluating the overall presentation of the financial statements. Our procedures included confirmation of securities owned as of January 31, 2023 by correspondence with the custodian and brokers; when replies were not received from brokers, we performed other auditing procedures. We believe that our audits provide a reasonable basis for our opinion.
/s/ PricewaterhouseCoopers LLP
Boston, Massachusetts
March 16, 2023
We have served as the auditor of one or more investment companies in the Fidelity group of funds since 1932.
The Trustees, Members of the Advisory Board (if any), and officers of the trust and fund, as applicable, are listed below. The Board of Trustees governs the fund and is responsible for protecting the interests of shareholders. The Trustees are experienced executives who meet periodically throughout the year to oversee the fund's activities, review contractual arrangements with companies that provide services to the fund, oversee management of the risks associated with such activities and contractual arrangements, and review the fund's performance. Each of the Trustees oversees 318 funds.
The Trustees hold office without limit in time except that (a) any Trustee may resign; (b) any Trustee may be removed by written instrument, signed by at least two-thirds of the number of Trustees prior to such removal; (c) any Trustee who requests to be retired or who has become incapacitated by illness or injury may be retired by written instrument signed by a majority of the other Trustees; and (d) any Trustee may be removed at any special meeting of shareholders by a two-thirds vote of the outstanding voting securities of the trust. Each Trustee who is not an interested person (as defined in the 1940 Act) of the trust and the fund is referred to herein as an Independent Trustee. Each Independent Trustee shall retire not later than the last day of the calendar year in which his or her 75th birthday occurs. The Independent Trustees may waive this mandatory retirement age policy with respect to individual Trustees. Officers and Advisory Board Members hold office without limit in time, except that any officer or Advisory Board Member may resign or may be removed by a vote of a majority of the Trustees at any regular meeting or any special meeting of the Trustees. Except as indicated, each individual has held the office shown or other offices in the same company for the past five years.
The fund's Statement of Additional Information (SAI) includes more information about the Trustees. To request a free copy, call Fidelity at 1-800-544-8544 if you're an individual investing directly with Fidelity, call 1-800-835-5092 if you're a plan sponsor or participant with Fidelity as your recordkeeper or call 1-877-208-0098 on institutional accounts or if you're an advisor or invest through one.
Experience, Skills, Attributes, and Qualifications of the Trustees. The Governance and Nominating Committee has adopted a statement of policy that describes the experience, qualifications, attributes, and skills that are necessary and desirable for potential Independent Trustee candidates (Statement of Policy). The Board believes that each Trustee satisfied at the time he or she was initially elected or appointed a Trustee, and continues to satisfy, the standards contemplated by the Statement of Policy. The Governance and Nominating Committee also engages professional search firms to help identify potential Independent Trustee candidates who have the experience, qualifications, attributes, and skills consistent with the Statement of Policy. From time to time, additional criteria based on the composition and skills of the current Independent Trustees, as well as experience or skills that may be appropriate in light of future changes to board composition, business conditions, and regulatory or other developments, have also been considered by the professional search firms and the Governance and Nominating Committee. In addition, the Board takes into account the Trustees' commitment and participation in Board and committee meetings, as well as their leadership of standing and ad hoc committees throughout their tenure.
In determining that a particular Trustee was and continues to be qualified to serve as a Trustee, the Board has considered a variety of criteria, none of which, in isolation, was controlling. The Board believes that, collectively, the Trustees have balanced and diverse experience, qualifications, attributes, and skills, which allow the Board to operate effectively in governing the fund and protecting the interests of shareholders. Information about the specific experience, skills, attributes, and qualifications of each Trustee, which in each case led to the Board's conclusion that the Trustee should serve (or continue to serve) as a trustee of the fund, is provided below.
Board Structure and Oversight Function. Robert A. Lawrence is an interested person and currently serves as Chair. The Trustees have determined that an interested Chair is appropriate and benefits shareholders because an interested Chair has a personal and professional stake in the quality and continuity of services provided to the fund. Independent Trustees exercise their informed business judgment to appoint an individual of their choosing to serve as Chair, regardless of whether the Trustee happens to be independent or a member of management. The Independent Trustees have determined that they can act independently and effectively without having an Independent Trustee serve as Chair and that a key structural component for assuring that they are in a position to do so is for the Independent Trustees to constitute a substantial majority for the Board. The Independent Trustees also regularly meet in executive session. David M. Thomas serves as Lead Independent Trustee and as such (i) acts as a liaison between the Independent Trustees and management with respect to matters important to the Independent Trustees and (ii) with management prepares agendas for Board meetings.
Fidelity ® funds are overseen by different Boards of Trustees. The fund's Board oversees Fidelity's high income and certain equity funds, and other Boards oversee Fidelity's alternative investment, investment-grade bond, money market, asset allocation, and other equity funds. The asset allocation funds may invest in Fidelity ® funds overseen by the fund's Board. The use of separate Boards, each with its own committee structure, allows the Trustees of each group of Fidelity ® funds to focus on the unique issues of the funds they oversee, including common research, investment, and operational issues. On occasion, the separate Boards establish joint committees to address issues of overlapping consequences for the Fidelity ® funds overseen by each Board.
The Trustees operate using a system of committees to facilitate the timely and efficient consideration of all matters of importance to the Trustees, the fund, and fund shareholders and to facilitate compliance with legal and regulatory requirements and oversight of the fund's activities and associated risks. The Board, acting through its committees, has charged FMR and its affiliates with (i) identifying events or circumstances the occurrence of which could have demonstrably adverse effects on the fund's business and/or reputation; (ii) implementing processes and controls to lessen the possibility that such events or circumstances occur or to mitigate the effects of such events or circumstances if they do occur; and (iii) creating and maintaining a system designed to evaluate continuously business and market conditions in order to facilitate the identification and implementation processes described in (i) and (ii) above. Because the day-to-day operations and activities of the fund are carried out by or through FMR, its affiliates, and other service providers, the fund's exposure to risks is mitigated but not eliminated by the processes overseen by the Trustees. While each of the Board's committees has responsibility for overseeing different aspects of the fund's activities, oversight is exercised primarily through the Operations, Audit, and Compliance Committees. Appropriate personnel, including but not limited to the fund's Chief Compliance Officer (CCO), FMR's internal auditor, the independent accountants, the fund's Treasurer and portfolio management personnel, make periodic reports to the Board's committees, as appropriate, including an annual review of Fidelity's risk management program for the Fidelity ® funds. The responsibilities of each standing committee, including their oversight responsibilities, are described further under "Standing Committees of the Trustees."
Interested Trustees*:
Correspondence intended for a Trustee who is an interested person may be sent to Fidelity Investments, 245 Summer Street, Boston, Massachusetts 02210.
Name, Year of Birth; Principal Occupations and Other Relevant Experience+
Bettina Doulton (1964)
Year of Election or Appointment: 2020
Trustee
Ms. Doulton also serves as Trustee of other Fidelity ® funds. Prior to her retirement, Ms. Doulton served in a variety of positions at Fidelity Investments, including as a managing director of research (2006-2007), portfolio manager to certain Fidelity ® funds (1993-2005), equity analyst and portfolio assistant (1990-1993), and research assistant (1987-1990). Ms. Doulton currently owns and operates Phi Builders + Architects and Cellardoor Winery. Previously, Ms. Doulton served as a member of the Board of Brown Capital Management, LLC (2014-2018).
Robert A. Lawrence (1952)
Year of Election or Appointment: 2020
Trustee
Chair of the Board of Trustees
Mr. Lawrence also serves as Trustee of other funds. Previously, Mr. Lawrence served as a Trustee and Member of the Advisory Board of certain funds. Prior to his retirement in 2008, Mr. Lawrence served as Vice President of certain Fidelity ® funds (2006-2008), Senior Vice President, Head of High Income Division of Fidelity Management & Research Company (investment adviser firm, 2006-2008), and President of Fidelity Strategic Investments (investment adviser firm, 2002-2005).
* Determined to be an "Interested Trustee" by virtue of, among other things, his or her affiliation with the trust or various entities under common control with FMR.
+ The information includes the Trustee's principal occupation during the last five years and other information relating to the experience, attributes, and skills relevant to the Trustee's qualifications to serve as a Trustee, which led to the conclusion that the Trustee should serve as a Trustee for the fund.
Independent Trustees:
Correspondence intended for an Independent Trustee may be sent to Fidelity Investments, P.O. Box 55235, Boston, Massachusetts 02205-5235.
Name, Year of Birth; Principal Occupations and Other Relevant Experience+
Thomas P. Bostick (1956)
Year of Election or Appointment: 2021
Trustee
Lieutenant General Bostick also serves as Trustee of other Fidelity ® funds. Prior to his retirement, General Bostick (United States Army, Retired) held a variety of positions within the U.S. Army, including Commanding General and Chief of Engineers, U.S. Army Corps of Engineers (2012-2016) and Deputy Chief of Staff and Director of Human Resources, U.S. Army (2009-2012). General Bostick currently serves as a member of the Board and Finance and Governance Committees of CSX Corporation (transportation, 2020-present) and a member of the Board and Corporate Governance and Nominating Committee of Perma-Fix Environmental Services, Inc. (nuclear waste management, 2020-present). General Bostick serves as Chief Executive Officer of Bostick Global Strategies, LLC (consulting, 2016-present) and as a member of the Board of HireVue, Inc. (video interview and assessment, 2020-present). Previously, General Bostick served as a Member of the Advisory Board of certain Fidelity® funds (2021), President, Intrexon Bioengineering (2018-2020) and Chief Operating Officer (2017-2020) and Senior Vice President of the Environment Sector (2016-2017) of Intrexon Corporation (biopharmaceutical company).
Dennis J. Dirks (1948)
Year of Election or Appointment: 2005
Trustee
Mr. Dirks also serves as Trustee of other Fidelity ® funds. Prior to his retirement in May 2003, Mr. Dirks served as Chief Operating Officer and as a member of the Board of The Depository Trust & Clearing Corporation (financial markets infrastructure), President, Chief Operating Officer and a member of the Board of The Depository Trust Company (DTC), President and a member of the Board of the National Securities Clearing Corporation (NSCC), Chief Executive Officer and a member of the Board of the Government Securities Clearing Corporation and Chief Executive Officer and a member of the Board of the Mortgage-Backed Securities Clearing Corporation. Mr. Dirks currently serves as a member of the Finance Committee (2016-present) and Board (2017-present) and is Treasurer (2018-present) of the Asolo Repertory Theatre.
Donald F. Donahue (1950)
Year of Election or Appointment: 2018
Trustee
Mr. Donahue also serves as Trustee of other Fidelity ® funds. Mr. Donahue serves as President and Chief Executive Officer of Miranda Partners, LLC (risk consulting for the financial services industry, 2012-present). Previously, Mr. Donahue served as Chief Executive Officer (2006-2012), Chief Operating Officer (2003-2006) and Managing Director, Customer Marketing and Development (1999-2003) of The Depository Trust & Clearing Corporation (financial markets infrastructure). Mr. Donahue currently serves as a member (2007-present) and Co-Chairman (2016-present) of the Board of United Way of New York and a member of the Board of The Leadership Academy (previously NYC Leadership Academy) (2012-present). Mr. Donahue previously served as a member of the Advisory Board of certain Fidelity® funds (2015-2018).
Vicki L. Fuller (1957)
Year of Election or Appointment: 2020
Trustee
Ms. Fuller also serves as Trustee of other Fidelity ® funds. Previously, Ms. Fuller served as a member of the Advisory Board of certain Fidelity ® funds (2018-2020), Chief Investment Officer of the New York State Common Retirement Fund (2012-2018) and held a variety of positions at AllianceBernstein L.P. (global asset management, 1985-2012), including Managing Director (2006-2012) and Senior Vice President and Senior Portfolio Manager (2001-2006). Ms. Fuller currently serves as a member of the Board, Audit Committee and Nominating and Governance Committee of two Blackstone business development companies (2020-present), as a member of the Board of Treliant, LLC (consulting, 2019-present), as a member of the Advisory Board of Ariel Alternatives, LLC (private equity, 2021-present) and as a member of the Board and Chair of the Audit Committee of Gusto, Inc. (software, 2021-present). In addition, Ms. Fuller currently serves as a member of the Board of Roosevelt University (2019-present) and as a member of the Executive Board of New York University's Stern School of Business. Ms. Fuller previously served as a member of the Board, Audit Committee and Nominating and Governance Committee of The Williams Companies, Inc. (natural gas infrastructure, 2018-2021).
Patricia L. Kampling (1959)
Year of Election or Appointment: 2020
Trustee
Ms. Kampling also serves as Trustee of other Fidelity ® funds. Prior to her retirement, Ms. Kampling served as Chairman of the Board and Chief Executive Officer (2012-2019), President and Chief Operating Officer (2011-2012) and Executive Vice President and Chief Financial Officer (2010-2011) of Alliant Energy Corporation. Ms. Kampling currently serves as a member of the Board, Finance Committee and Governance, Compensation and Nominating Committee of Xcel Energy Inc. (utilities company, 2020-present) and as a member of the Board, Audit, Finance and Risk Committee and Safety, Environmental, Technology and Operations Committee and Chair of the Executive Development and Compensation Committee of American Water Works Company, Inc. (utilities company, 2019-present). In addition, Ms. Kampling currently serves as a member of the Board of the Nature Conservancy, Wisconsin Chapter (2019-present). Previously, Ms. Kampling served as a Member of the Advisory Board of certain Fidelity® funds (2020), a member of the Board, Compensation Committee and Executive Committee and Chair of the Audit Committee of Briggs & Stratton Corporation (manufacturing, 2011-2021), a member of the Board of Interstate Power and Light Company (2012-2019) and Wisconsin Power and Light Company (2012-2019) (each a subsidiary of Alliant Energy Corporation) and as a member of the Board and Workforce Development Committee of the Business Roundtable (2018-2019).
Thomas A. Kennedy (1955)
Year of Election or Appointment: 2021
Trustee
Mr. Kennedy also serves as Trustee of other Fidelity ® funds. Previously, Mr. Kennedy served as a Member of the Advisory Board of certain Fidelity ® funds (2020) and held a variety of positions at Raytheon Company (aerospace and defense, 1983-2020), including Chairman and Chief Executive Officer (2014-2020) and Executive Vice President and Chief Operating Officer (2013-2014). Mr. Kennedy currently serves as Executive Chairman of the Board of Directors of Raytheon Technologies Corporation (aerospace and defense, 2020-present). He is also a member of the Rutgers School of Engineering Industry Advisory Board (2011-present) and a member of the UCLA Engineering Dean's Executive Board (2016-present).
Oscar Munoz (1959)
Year of Election or Appointment: 2021
Trustee
Mr. Munoz also serves as Trustee of other Fidelity ® funds. Prior to his retirement, Mr. Munoz served as Executive Chairman (2020-2021), Chief Executive Officer (2015-2020), President (2015-2016) and a member of the Board (2010-2021) of United Airlines Holdings, Inc. Mr. Munoz currently serves as a member of the Board of CBRE Group, Inc. (commercial real estate, 2020-present), a member of the Board of Univision Communications, Inc. (Hispanic media, 2020-present) and a member of the Advisory Board of Salesforce.com, Inc. (cloud-based software, 2020-present). Previously, Mr. Munoz served as a Member of the Advisory Board of certain Fidelity ® funds (2021).
David M. Thomas (1949)
Year of Election or Appointment: 2008
Trustee
Lead Independent Trustee
Mr. Thomas also serves as Trustee of other Fidelity ® funds. Previously, Mr. Thomas served as Executive Chairman (2005-2006) and Chairman and Chief Executive Officer (2000-2005) of IMS Health, Inc. (pharmaceutical and healthcare information solutions). Mr. Thomas currently serves as a member of the Board of Fortune Brands Home and Security (home and security products, 2004-present) and as Director (2013-present) and Non-Executive Chairman of the Board (2022-present) of Interpublic Group of Companies, Inc. (marketing communication).
Susan Tomasky (1953)
Year of Election or Appointment: 2020
Trustee
Ms. Tomasky also serves as Trustee of other Fidelity ® funds. Prior to her retirement, Ms. Tomasky served in various executive officer positions at American Electric Power Company, Inc. (1998-2011), including most recently as President of AEP Transmission (2007-2011). Ms. Tomasky currently serves as a member of the Board and Sustainability Committee and as Chair of the Audit Committee of Marathon Petroleum Corporation (2018-present) and as a member of the Board, Executive Committee, Corporate Governance Committee and Organization and Compensation Committee and as Chair of the Audit Committee of Public Service Enterprise Group, Inc. (utilities company, 2012-present) and as a member of the Board of its subsidiary company, Public Service Electric and Gas Co. (2021-present). In addition, Ms. Tomasky currently serves as a member (2009-present) and President (2020-present) of the Board of the Royal Shakespeare Company - America (2009-present), as a member of the Board of the Columbus Association for the Performing Arts (2011-present) and as a member of the Board and Kenyon in the World Committee of Kenyon College (2016-present). Previously, Ms. Tomasky served as a Member of the Advisory Board of certain Fidelity ® funds (2020), as a member of the Board of the Columbus Regional Airport Authority (2007-2020), as a member of the Board (2011-2018) and Lead Independent Director (2015-2018) of Andeavor Corporation (previously Tesoro Corporation) (independent oil refiner and marketer) and as a member of the Board of Summit Midstream Partners LP (energy, 2012-2018).
Michael E. Wiley (1950)
Year of Election or Appointment: 2018
Trustee
Mr. Wiley also serves as Trustee of other Fidelity ® funds. Previously, Mr. Wiley served as a member of the Advisory Board of certain Fidelity ® funds (2018-2020), Chairman, President and CEO of Baker Hughes, Inc. (oilfield services, 2000-2004). Mr. Wiley also previously served as a member of the Board of Andeavor Corporation (independent oil refiner and marketer, 2005-2018), a member of the Board of Andeavor Logistics LP (natural resources logistics, 2015-2018) and a member of the Board of High Point Resources (exploration and production, 2005-2020).
+ The information includes the Trustee's principal occupation during the last five years and other information relating to the experience, attributes, and skills relevant to the Trustee's qualifications to serve as a Trustee, which led to the conclusion that the Trustee should serve as a Trustee for the fund.
Advisory Board Members and Officers:
Correspondence intended for a Member of the Advisory Board (if any) may be sent to Fidelity Investments, P.O. Box 55235, Boston, Massachusetts 02205-5235. Correspondence intended for an officer or Peter S. Lynch may be sent to Fidelity Investments, 245 Summer Street, Boston, Massachusetts 02210. Officers appear below in alphabetical order.
Name, Year of Birth; Principal Occupation
Peter S. Lynch (1944)
Year of Election or Appointment: 2003
Member of the Advisory Board
Mr. Lynch also serves as a Member of the Advisory Board of other Fidelity ® funds. Mr. Lynch is Vice Chairman and a Director of Fidelity Management & Research Company LLC (investment adviser firm). In addition, Mr. Lynch serves as a Trustee of Boston College and as the Chairman of the Inner-City Scholarship Fund. Previously, Mr. Lynch served as Vice Chairman and a Director of FMR Co., Inc. (investment adviser firm) and on the Special Olympics International Board of Directors (1997-2006).
Craig S. Brown (1977)
Year of Election or Appointment: 2022
Deputy Treasurer
Mr. Brown also serves as an officer of other funds. Mr. Brown serves as Assistant Treasurer of FIMM, LLC (2021-present) and is an employee of Fidelity Investments (2013-present). Previously, Mr. Brown served as Assistant Treasurer of certain Fidelity ® funds (2019-2022).
John J. Burke III (1964)
Year of Election or Appointment: 2018
Chief Financial Officer
Mr. Burke also serves as Chief Financial Officer of other funds. Mr. Burke serves as Head of Investment Operations for Fidelity Fund and Investment Operations (2018-present) and is an employee of Fidelity Investments (1998-present). Previously Mr. Burke served as head of Asset Management Investment Operations (2012-2018).
William C. Coffey (1969)
Year of Election or Appointment: 2019
Assistant Secretary
Mr. Coffey also serves as Assistant Secretary of other funds. He is Senior Vice President and Deputy General Counsel of FMR LLC (diversified financial services company, 2010-present), and is an employee of Fidelity Investments. Previously, Mr. Coffey served as Secretary and CLO of certain funds (2018-2019); CLO, Secretary, and Senior Vice President of Fidelity Management & Research Company and FMR Co., Inc. (investment adviser firms, 2018-2019); Secretary of Fidelity SelectCo, LLC and Fidelity Investments Money Management, Inc. (investment adviser firms, 2018-2019); CLO of Fidelity Management & Research (Hong Kong) Limited, FMR Investment Management (UK) Limited, and Fidelity Management & Research (Japan) Limited (investment adviser firms, 2018-2019); and Assistant Secretary of certain funds (2009-2018).
Timothy M. Cohen (1969)
Year of Election or Appointment: 2018
Vice President
Mr. Cohen also serves as Vice President of other funds. Mr. Cohen serves as Co-Head of Equity (2018-present), a Director of Fidelity Management & Research (Japan) Limited (investment adviser firm, 2016-present), and is an employee of Fidelity Investments. Previously, Mr. Cohen served as Executive Vice President of Fidelity SelectCo, LLC (2019), Head of Global Equity Research (2016-2018), Chief Investment Officer - Equity and a Director of Fidelity Management & Research (U.K.) Inc. (investment adviser firm, 2013-2015) and as a Director of Fidelity Management & Research (Hong Kong) Limited (investment adviser firm, 2017).
Jonathan Davis (1968)
Year of Election or Appointment: 2010
Assistant Treasurer
Mr. Davis also serves as an officer of other funds. Mr. Davis serves as Assistant Treasurer of FIMM, LLC (2021-present), FMR Capital, Inc. (2017-present), FD Funds GP LLC (2021-present), FD Funds Holding LLC (2021-present), and FD Funds Management LLC (2021-present); and is an employee of Fidelity Investments. Previously, Mr. Davis served as Vice President and Associate General Counsel of FMR LLC (diversified financial services company, 2003-2010).
Laura M. Del Prato (1964)
Year of Election or Appointment: 2018
Assistant Treasurer
Ms. Del Prato also serves as an officer of other funds. Ms. Del Prato serves as Assistant Treasurer of FIMM, LLC (2021-present) and is an employee of Fidelity Investments (2017-present). Previously, Ms. Del Prato served as President and Treasurer of The North Carolina Capital Management Trust: Cash Portfolio and Term Portfolio (2018-2020). Prior to joining Fidelity Investments, Ms. Del Prato served as a Managing Director and Treasurer of the JPMorgan Mutual Funds (2014-2017). Prior to JPMorgan, Ms. Del Prato served as a partner at Cohen Fund Audit Services (accounting firm, 2012-2013) and KPMG LLP (accounting firm, 2004-2012).
Colm A. Hogan (1973)
Year of Election or Appointment: 2020
Assistant Treasurer
Mr. Hogan also serves as an officer of other funds. Mr. Hogan serves as Assistant Treasurer of FIMM, LLC (2021-present) and FMR Capital, Inc. (2017-present) and is an employee of Fidelity Investments (2005-present). Previously, Mr. Hogan served as Deputy Treasurer of certain Fidelity ® funds (2016-2020) and Assistant Treasurer of certain Fidelity ® funds (2016-2018).
Pamela R. Holding (1964)
Year of Election or Appointment: 2018
Vice President
Ms. Holding also serves as Vice President of other funds. Ms. Holding serves as Co-Head of Equity (2018-present) and is an employee of Fidelity Investments (2013-present). Previously, Ms. Holding served as Executive Vice President of Fidelity SelectCo, LLC (2019) and as Chief Investment Officer of Fidelity Institutional Asset Management (2013-2018).
Cynthia Lo Bessette (1969)
Year of Election or Appointment: 2019
Secretary and Chief Legal Officer (CLO)
Ms. Lo Bessette also serves as an officer of other funds. Ms. Lo Bessette serves as CLO, Secretary, and Senior Vice President of Fidelity Management & Research Company LLC (investment adviser firm, 2019-present); CLO of Fidelity Management & Research (Hong Kong) Limited, FMR Investment Management (UK) Limited, and Fidelity Management & Research (Japan) Limited (investment adviser firms, 2019-present); Secretary of FD Funds GP LLC (2021-present), FD Funds Holding LLC (2021-present), FD Funds Management LLC (2021-present), and Fidelity Diversifying Solutions LLC (investment adviser firm, 2022-present); and Assistant Secretary of FIMM, LLC (2019-present). She is a Senior Vice President and Deputy General Counsel of FMR LLC (diversified financial services company, 2019-present), and is an employee of Fidelity Investments. Previously, Ms. Lo Bessette served as CLO, Secretary, and Senior Vice President of FMR Co., Inc. (investment adviser firm, 2019); Secretary of Fidelity SelectCo, LLC and Fidelity Investments Money Management, Inc. (investment adviser firms, 2019). Prior to joining Fidelity Investments, Ms. Lo Bessette was Executive Vice President, General Counsel (2016-2019) and Senior Vice President, Deputy General Counsel (2015-2016) of OppenheimerFunds (investment management company) and Deputy Chief Legal Officer (2013-2015) of Jennison Associates LLC (investment adviser firm).
Chris Maher (1972)
Year of Election or Appointment: 2020
Deputy Treasurer
Mr. Maher also serves as an officer of other funds. Mr. Maher serves as Assistant Treasurer of FIMM, LLC (2021-present) and FMR Capital, Inc. (2017-present), and is an employee of Fidelity Investments (2008-present). Previously, Mr. Maher served as Assistant Treasurer of certain funds (2013-2020); Vice President of Asset Management Compliance (2013), Vice President of the Program Management Group of FMR (investment adviser firm, 2010-2013), and Vice President of Valuation Oversight (2008-2010).
Jason P. Pogorelec (1975)
Year of Election or Appointment: 2020
Chief Compliance Officer
Mr. Pogorelec also serves as Chief Compliance Officer of other funds. Mr. Pogorelec is a Senior Vice President of Asset Management Compliance for Fidelity Investments and is an employee of Fidelity Investments. Mr. Pogorelec serves as Compliance Officer of Fidelity Management & Research Company LLC (investment adviser firm, 2023-present). Previously, Mr. Pogorelec served as Vice President, Associate General Counsel for Fidelity Investments (2010-2020) and Assistant Secretary of certain Fidelity ® funds (2015-2020).
Brett Segaloff (1972)
Year of Election or Appointment: 2021
Anti-Money Laundering (AML) Officer
Mr. Segaloff also serves as an AML Officer of other funds and other related entities. He is Director, Anti-Money Laundering (2007-present) of FMR LLC (diversified financial services company) and is an employee of Fidelity Investments (1996-present).
Stacie M. Smith (1974)
Year of Election or Appointment: 2016
President and Treasurer
Ms. Smith also serves as an officer of other funds. Ms. Smith serves as Assistant Treasurer of FIMM, LLC (2021-present) and FMR Capital, Inc. (2017-present), is an employee of Fidelity Investments (2009-present), and has served in other fund officer roles. Prior to joining Fidelity Investments, Ms. Smith served as Senior Audit Manager of Ernst & Young LLP (accounting firm, 1996-2009). Previously, Ms. Smith served as Assistant Treasurer (2013-2019) and Deputy Treasurer (2013-2016) of certain Fidelity ® funds.
Jim Wegmann (1979)
Year of Election or Appointment: 2019
Assistant Treasurer
Mr. Wegmann also serves as an officer of other funds. Mr. Wegmann serves as Assistant Treasurer of FIMM, LLC (2021-present) and is an employee of Fidelity Investments (2011-present). Previously, Mr. Wegmann served as Assistant Treasurer of certain Fidelity ® funds (2019-2021).
As a shareholder, you incur two types of costs: (1) transaction costs, which may include sales charges (loads) on purchase payments or redemption proceeds, as applicable and (2) ongoing costs, which generally include management fees, distribution and/or service (12b-1) fees and other Fund expenses. This Example is intended to help you understand your ongoing costs (in dollars) of investing in a fund and to compare these costs with the ongoing costs of investing in other mutual funds.
| The Example is based on an investment of $1,000 invested at the beginning of the period and held for the entire period (August 1, 2022 to January 31, 2023). |
Actual Expenses
The first line of the accompanying table provides information about actual account values and actual expenses. You may use the information in this line, together with the amount you invested, to estimate the expenses that you paid over the period. Simply divide your account value by $1,000.00 (for example, an $8,600 account value divided by $1,000.00 = 8.6), then multiply the result by the number in the first line for a class/Fund under the heading entitled "Expenses Paid During Period" to estimate the expenses you paid on your account during this period. If any fund is a shareholder of any underlying mutual funds or exchange-traded funds (ETFs) (the Underlying Funds), such fund indirectly bears its proportional share of the expenses of the Underlying Funds in addition to the direct expenses incurred presented in the table. These fees and expenses are not included in the annualized expense ratio used to calculate the expense estimate in the table below.
Hypothetical Example for Comparison Purposes
The second line of the accompanying table provides information about hypothetical account values and hypothetical expenses based on the actual expense ratio and an assumed rate of return of 5% per year before expenses, which is not the actual return. The hypothetical account values and expenses may not be used to estimate the actual ending account balance or expenses you paid for the period. You may use this information to compare the ongoing costs of investing in the Fund and other funds. To do so, compare this 5% hypothetical example with the 5% hypothetical examples that appear in the shareholder reports of the other funds. If any fund is a shareholder of any Underlying Funds, such fund indirectly bears its proportional share of the expenses of the Underlying Funds in addition to the direct expenses as presented in the table. These fees and expenses are not included in the annualized expense ratio used to calculate the expense estimate in the table below.
Please note that the expenses shown in the table are meant to highlight your ongoing costs only and do not reflect any transaction costs. Therefore, the second line of the table is useful in comparing ongoing costs only, and will not help you determine the relative total costs of owning different funds. In addition, if these transactional costs were included, your costs would have been higher.
| | | | | Annualized Expense Ratio- A | | Beginning Account Value August 1, 2022 | | Ending Account Value January 31, 2023 | | Expenses Paid During Period- C August 1, 2022 to January 31, 2023 |
| Fidelity® Mid Cap Value Fund | | | | | | | | | | |
| Class A | | | | 1.11% | | | | | | |
| Actual | | | | | | $ 1,000 | | $ 1,061.50 | | $ 5.77 |
Hypothetical- B | | | | | | $ 1,000 | | $ 1,019.61 | | $ 5.65 |
| Class M | | | | 1.37% | | | | | | |
| Actual | | | | | | $ 1,000 | | $ 1,060.00 | | $ 7.11 |
Hypothetical- B | | | | | | $ 1,000 | | $ 1,018.30 | | $ 6.97 |
| Class C | | | | 1.89% | | | | | | |
| Actual | | | | | | $ 1,000 | | $ 1,057.10 | | $ 9.80 |
Hypothetical- B | | | | | | $ 1,000 | | $ 1,015.68 | | $ 9.60 |
| Fidelity® Mid Cap Value Fund | | | | .82% | | | | | | |
| Actual | | | | | | $ 1,000 | | $ 1,063.10 | | $ 4.26 |
Hypothetical- B | | | | | | $ 1,000 | | $ 1,021.07 | | $ 4.18 |
| Class I | | | | .84% | | | | | | |
| Actual | | | | | | $ 1,000 | | $ 1,062.80 | | $ 4.37 |
Hypothetical- B | | | | | | $ 1,000 | | $ 1,020.97 | | $ 4.28 |
| Class Z | | | | .70% | | | | | | |
| Actual | | | | | | $ 1,000 | | $ 1,063.50 | | $ 3.64 |
Hypothetical- B | | | | | | $ 1,000 | | $ 1,021.68 | | $ 3.57 |
| |
A Annualized expense ratio reflects expenses net of applicable fee waivers.
B 5% return per year before expenses
C Expenses are equal to the annualized expense ratio, multiplied by the average account value over the period, multiplied by 184/ 365 (to reflect the one-half year period). The fees and expenses of any Underlying Funds are not included in each annualized expense ratio.
The dividend and capital gains distributions for the fund(s) are available on Fidelity.com or Institutional.Fidelity.com .
The fund hereby designates as a capital gain dividend with respect to the taxable year ended January 31, 2023, $80,180,882, or, if subsequently determined to be different, the net capital gain of such year.
The fund designates 100% of the short-term capital gain dividends distributed in December, during the fiscal year as qualifying to be taxed as short-term capital gain dividends for nonresident alien shareholders.
The fund designates $16,028 of distributions paid during the fiscal year ended 2023 as qualifying to be taxed as section 163(j) interest dividends.
Class A designates 67%; Class M designates 79%; Class C designates 100%; Mid Cap Value designates 59%; Initial Class designates 60% and Class Z designates 56% of the dividends distributed in December, during the fiscal year as qualifying for the dividends-received deduction for corporate shareholders.
Class A designates 74.83%; Class M designates 87.05%; Class C designates 100%; Mid Cap Value designates 65.61%; Initial Class designates 65.98% and Class Z designates 62.14% of the dividends distributed in December during the fiscal year as amounts which may be taken into account as a dividend for the purposes of the maximum rate under section 1(h)(11) of the Internal Revenue Code.
Class A designates 17.07%; Class M designates 12.96%; Mid Cap Value designates 14.97%; Initial Class designates 15.05% and Class Z designates 14.17% of the dividends distributed in December during the fiscal year as a section 199A dividend.
The fund will notify shareholders in January 2024 of amounts for use in preparing 2023 income tax returns.
The Securities and Exchange Commission adopted Rule 22e-4 under the Investment Company Act of 1940 (the Liquidity Rule) to promote effective liquidity risk management throughout the open-end investment company industry, thereby reducing the risk that funds will be unable to meet their redemption obligations and mitigating dilution of the interests of fund shareholders.
The Fund has adopted and implemented a liquidity risk management program (the Program) reasonably designed to assess and manage the Fund's liquidity risk and to comply with the requirements of the Liquidity Rule. The Fund's Board of Trustees (the Board) has designated the Fund's investment adviser as administrator of the Program. The Fidelity advisers have established a Liquidity Risk Management Committee (the LRM Committee) to manage the Program for each of the Fidelity Funds. The LRM Committee monitors the adequacy and effectiveness of implementation of the Program and on a periodic basis assesses each Fund's liquidity risk based on a variety of factors including (1) the Fund's investment strategy, (2) portfolio liquidity and cash flow projections during normal and reasonably foreseeable stressed conditions, (3) shareholder redemptions, (4) borrowings and other funding sources and (5) certain factors specific to ETFs including the effect of the Fund's prices and spreads, market participants, and basket compositions on the overall liquidity of the Fund's portfolio, as applicable.
In accordance with the Program, each of the Fund's portfolio investments is classified into one of four defined liquidity categories based on a determination of a reasonable expectation for how long it would take to convert the investment to cash (or sell or dispose of the investment) without significantly changing its market value.
- Highly liquid investments - cash or convertible to cash within three business days or less
- Moderately liquid investments - convertible to cash in three to seven calendar days
- Less liquid investments - can be sold or disposed of, but not settled, within seven calendar days
- Illiquid investments - cannot be sold or disposed of within seven calendar days
Liquidity classification determinations take into account a variety of factors including various market, trading and investment-specific considerations, as well as market depth, and generally utilize analysis from a third-party liquidity metrics service.
The Liquidity Rule places a 15% limit on a fund's illiquid investments and requires funds that do not primarily hold assets that are highly liquid investments to determine and maintain a minimum percentage of the fund's net assets to be invested in highly liquid investments (highly liquid investment minimum or HLIM). The Program includes provisions reasonably designed to comply with the 15% limit on illiquid investments and for determining, periodically reviewing and complying with the HLIM requirement as applicable.
At a recent meeting of the Fund's Board of Trustees, the LRM Committee provided a written report to the Board pertaining to the operation, adequacy, and effectiveness of the Program for the period December 1, 2021 through November 30, 2022. The report concluded that the Program is operating effectively and is reasonably designed to assess and manage the Fund's liquidity risk.
1.900180.113
MCV-ANN-0423
Fidelity® Equity-Income Fund
Annual Report
January 31, 2023
Contents
To view a fund's proxy voting guidelines and proxy voting record for the 12-month period ended June 30, visit http://www.fidelity.com/proxyvotingresults or visit the Securities and Exchange Commission's (SEC) web site at http://www.sec.gov.
You may also call 1-800-544-8544 if you're an individual investing directly with Fidelity, call 1-800-835-5092 if you're a plan sponsor or participant with Fidelity as your recordkeeper or call 1-877-208-0098 on institutional accounts or if you're an advisor or invest through one to request a free copy of the proxy voting guidelines.
Standard & Poor's, S&P and S&P 500 are registered service marks of The McGraw-Hill Companies, Inc. and have been licensed for use by Fidelity Distributors Corporation.
Other third-party marks appearing herein are the property of their respective owners.
All other marks appearing herein are registered or unregistered trademarks or service marks of FMR LLC or an affiliated company. © 2023 FMR LLC. All rights reserved.
This report and the financial statements contained herein are submitted for the general information of the shareholders of the Fund. This report is not authorized for distribution to prospective investors in the Fund unless preceded or accompanied by an effective prospectus.
A fund files its complete schedule of portfolio holdings with the SEC for the first and third quarters of each fiscal year on Form N-PORT. Forms N-PORT are available on the SEC's web site at http://www.sec.gov. A fund's Forms N-PORT may be reviewed and copied at the SEC's Public Reference Room in Washington, DC. Information regarding the operation of the SEC's Public Reference Room may be obtained by calling 1-800-SEC-0330.
For a complete list of a fund's portfolio holdings, view the most recent holdings listing, semiannual report, or annual report on Fidelity's web site at http://www.fidelity.com, http://www.institutional.fidelity.com, or http://www.401k.com, as applicable.
NOT FDIC INSURED •MAY LOSE VALUE •NO BANK GUARANTEE
Neither the Fund nor Fidelity Distributors Corporation is a bank.
Average annual total return reflects the change in the value of an investment, assuming reinvestment of distributions from dividend income and capital gains (the profits earned upon the sale of securities that have grown in value, if any) and assuming a constant rate of performance each year. The hypothetical investment and the average annual total returns do not reflect the deduction of taxes that a shareholder would pay on fund distributions or the redemption of fund shares. During periods of reimbursement by Fidelity, a fund's total return will be greater than it would be had the reimbursement not occurred. How a fund did yesterday is no guarantee of how it will do tomorrow.
| Average Annual Total Returns |
| | | | |
Periods ended January 31, 2023 | Past 1 year | Past 5 years | Past 10 years |
| Fidelity® Equity-Income Fund | 0.05% | 7.96% | 9.96% |
| Class K | 0.14% | 8.06% | 10.08% |
| $10,000 Over 10 Years |
| |
Let's say hypothetically that $10,000 was invested in Fidelity® Equity-Income Fund, a class of the fund, on January 31, 2013. The chart shows how the value of your investment would have changed, and also shows how the Russell 3000® Value Index performed over the same period. |
|
|
Market Recap:
U.S. equities returned -8.22% for the 12 months ending January 31, 2023, according to the S&P 500 ® index. The new year began with an encouraging upturn in January (+6.28%), but the backdrop remains clouded by the multitude of risk factors that challenged the global economy in 2022, when the index logged its lowest calendar-year return since 2008 and first annual retreat since 2018. High inflation prompted the Federal Reserve to aggressively tighten monetary policy, and market interest rates eclipsed their highest level in a decade, stoking recession fears and sending stocks into bear market territory. Since March 2022, the Fed has hiked its benchmark rate seven times, by 4.25 percentage points - the fastest-ever pace of monetary tightening - while also shrinking its massive portfolio. The latest bump came in mid-December, along with a signal that the central bank plans to lift rates through the spring, though likely in smaller increments, to combat high inflation. Against this backdrop, stocks struggled to gain traction until a strong rally ignited heading into the summer. But in September, the S&P 500 ® returned -9.21%, one of its worst monthly results ever, before advancing 7.56% in Q4 as risky assets regained favor. For the full 12 months, value stocks handily outpaced growth. This headwind was most pronounced in the growth-oriented communication services (-27%), consumer discretionary (-20%) and information technology (-16%) sectors. In contrast, energy (+43%) led by a wide margin, followed by health care (+3%).
Comments from Portfolio Manager Ramona Persaud:
For the fiscal year ending January 31, 2023, the fund's share classes returned roughly 0%, outperforming the -0.43% result of the benchmark Russell 3000 ® Value Index. The top contributor to performance versus the benchmark were stock picks in health care. Also lifting the fund's relative result was an overweighting and security selection in energy and an underweighting and stock picks in real estate. The fund's biggest individual relative contributor was an outsized stake in Eli Lilly, which gained 42% the past year. Also helping performance was our overweighting in Exxon Mobil, which gained 58%. Exxon Mobil was among our largest holdings. Avoiding Intel, a benchmark component that returned -40%, also helped relative performance. Conversely, the biggest detractor from performance versus the benchmark was stock selection in financials. Stock selection and an underweighting in consumer discretionary and security selection in materials also hindered the fund's relative performance. I'll also note that the fund's foreign holdings detracted overall, in part due to a generally strong U.S. dollar. Not owning Chevron, a benchmark component that gained approximately 37%, was the biggest individual relative detractor. Also hurting performance was our outsized stake in Bank of America, which returned roughly -21%. Bank of America was one of the fund's largest holdings. The fund's non-benchmark investment in Microsoft returned approximately -19% and detracted. Notable changes in positioning include increased exposure to the energy sector and a lower allocation to consumer discretionary.
The views expressed above reflect those of the portfolio manager(s) only through the end of the period as stated on the cover of this report and do not necessarily represent the views of Fidelity or any other person in the Fidelity organization. Any such views are subject to change at any time based upon market or other conditions and Fidelity disclaims any responsibility to update such views. These views may not be relied on as investment advice and, because investment decisions for a Fidelity fund are based on numerous factors, may not be relied on as an indication of trading intent on behalf of any Fidelity fund.
Top Holdings (% of Fund's net assets) |
| |
| Exxon Mobil Corp. | 3.3 | |
| JPMorgan Chase & Co. | 3.2 | |
| Bank of America Corp. | 2.4 | |
| Johnson & Johnson | 2.0 | |
| Danaher Corp. | 2.0 | |
| Walmart, Inc. | 1.9 | |
| Linde PLC | 1.8 | |
| Wells Fargo & Co. | 1.8 | |
| T-Mobile U.S., Inc. | 1.7 | |
| Cigna Corp. | 1.5 | |
| | 21.6 | |
| |
| Market Sectors (% of Fund's net assets) |
| |
| Health Care | 17.1 | |
| Financials | 15.8 | |
| Energy | 9.8 | |
| Consumer Staples | 9.6 | |
| Information Technology | 9.3 | |
| Industrials | 8.4 | |
| Communication Services | 7.5 | |
| Utilities | 5.8 | |
| Materials | 4.9 | |
| Consumer Discretionary | 4.2 | |
| Real Estate | 1.9 | |
| |
Asset Allocation (% of Fund's net assets) |
|
Foreign investments - 16.9% |
|
Geographic Diversification (% of Fund's net assets) |
|
* Includes Short-Term investments and Net Other Assets (Liabilities). Percentages are based on country or territory of incorporation and are adjusted for the effect of derivatives, if applicable. |
| |
Showing Percentage of Net Assets
| Common Stocks - 94.3% |
| | | Shares | Value ($) (000s) |
| COMMUNICATION SERVICES - 7.5% | | | |
| Diversified Telecommunication Services - 1.8% | | | |
| AT&T, Inc. | | 3,046,797 | 62,063 |
| Verizon Communications, Inc. | | 1,679,381 | 69,812 |
| | | | 131,875 |
| Entertainment - 0.8% | | | |
| Activision Blizzard, Inc. | | 716,510 | 54,863 |
| Interactive Media & Services - 0.9% | | | |
| Alphabet, Inc. Class A (a) | | 675,411 | 66,758 |
| Media - 2.0% | | | |
| Comcast Corp. Class A | | 2,692,258 | 105,940 |
| Interpublic Group of Companies, Inc. | | 771,412 | 28,126 |
| Shaw Communications, Inc. Class B | | 459,912 | 13,688 |
| | | | 147,754 |
| Wireless Telecommunication Services - 2.0% | | | |
| Rogers Communications, Inc. Class B (non-vtg.) | | 488,867 | 23,768 |
| T-Mobile U.S., Inc. (a) | | 793,268 | 118,443 |
| | | | 142,211 |
TOTAL COMMUNICATION SERVICES | | | 543,461 |
| CONSUMER DISCRETIONARY - 4.2% | | | |
| Diversified Consumer Services - 0.3% | | | |
| H&R Block, Inc. | | 464,619 | 18,111 |
| Hotels, Restaurants & Leisure - 1.3% | | | |
| McDonald's Corp. | | 352,323 | 94,211 |
| Multiline Retail - 0.9% | | | |
| Dollar Tree, Inc. (a) | | 246,457 | 37,013 |
| Target Corp. | | 158,306 | 27,251 |
| | | | 64,264 |
| Specialty Retail - 1.6% | | | |
| Best Buy Co., Inc. | | 165,735 | 14,704 |
| Burlington Stores, Inc. (a) | | 111,575 | 25,643 |
| Dick's Sporting Goods, Inc. | | 27,675 | 3,619 |
| Lowe's Companies, Inc. | | 14,487 | 3,017 |
| TJX Companies, Inc. | | 868,467 | 71,093 |
| | | | 118,076 |
| Textiles, Apparel & Luxury Goods - 0.1% | | | |
| Columbia Sportswear Co. | | 60,145 | 5,768 |
| Tapestry, Inc. | | 105,403 | 4,803 |
| | | | 10,571 |
TOTAL CONSUMER DISCRETIONARY | | | 305,233 |
| CONSUMER STAPLES - 9.6% | | | |
| Beverages - 2.6% | | | |
| Diageo PLC | | 541,204 | 23,665 |
| Keurig Dr. Pepper, Inc. | | 2,105,740 | 74,291 |
| The Coca-Cola Co. | | 1,477,775 | 90,617 |
| | | | 188,573 |
| Food & Staples Retailing - 3.2% | | | |
| Albertsons Companies, Inc. | | 781,273 | 16,563 |
| Alimentation Couche-Tard, Inc. Class A (multi-vtg.) | | 407,172 | 18,594 |
| BJ's Wholesale Club Holdings, Inc. (a) | | 333,941 | 24,201 |
| Costco Wholesale Corp. | | 70,122 | 35,842 |
| Walmart, Inc. | | 956,389 | 137,596 |
| | | | 232,796 |
| Food Products - 1.3% | | | |
| Bunge Ltd. | | 208,455 | 20,658 |
| Mondelez International, Inc. | | 890,515 | 58,275 |
| Nestle SA (Reg. S) | | 111,604 | 13,617 |
| | | | 92,550 |
| Household Products - 1.4% | | | |
| Procter & Gamble Co. | | 693,583 | 98,752 |
| Personal Products - 0.2% | | | |
| Unilever PLC | | 312,485 | 15,905 |
| Tobacco - 0.9% | | | |
| Philip Morris International, Inc. | | 601,843 | 62,736 |
TOTAL CONSUMER STAPLES | | | 691,312 |
| ENERGY - 9.8% | | | |
| Oil, Gas & Consumable Fuels - 9.8% | | | |
| Canadian Natural Resources Ltd. | | 815,871 | 50,079 |
| ConocoPhillips Co. | | 778,126 | 94,830 |
| Enterprise Products Partners LP | | 1,662,561 | 42,562 |
| Exxon Mobil Corp. | | 2,073,349 | 240,528 |
| Hess Corp. | | 356,977 | 53,604 |
| Imperial Oil Ltd. | | 930,022 | 50,830 |
| Phillips 66 Co. | | 575,826 | 57,738 |
| Suncor Energy, Inc. | | 1,319,577 | 45,799 |
| Valero Energy Corp. | | 533,356 | 74,686 |
| | | | 710,656 |
| FINANCIALS - 15.8% | | | |
| Banks - 10.1% | | | |
| Bank of America Corp. | | 4,942,836 | 175,372 |
| Huntington Bancshares, Inc. | | 3,272,621 | 49,646 |
| JPMorgan Chase & Co. | | 1,664,345 | 232,942 |
| M&T Bank Corp. | | 441,495 | 68,873 |
| PNC Financial Services Group, Inc. | | 437,210 | 72,328 |
| Wells Fargo & Co. | | 2,782,576 | 130,419 |
| | | | 729,580 |
| Capital Markets - 0.8% | | | |
| BlackRock, Inc. Class A | | 75,543 | 57,353 |
| Consumer Finance - 1.1% | | | |
| Capital One Financial Corp. | | 668,363 | 79,535 |
| Insurance - 3.8% | | | |
| American Financial Group, Inc. | | 315,186 | 44,942 |
| Chubb Ltd. | | 386,855 | 88,006 |
| Hartford Financial Services Group, Inc. | | 656,349 | 50,939 |
| Marsh & McLennan Companies, Inc. | | 129,579 | 22,665 |
| The Travelers Companies, Inc. | | 378,752 | 72,387 |
| | | | 278,939 |
TOTAL FINANCIALS | | | 1,145,407 |
| HEALTH CARE - 17.1% | | | |
| Biotechnology - 2.1% | | | |
| AbbVie, Inc. | | 381,505 | 56,367 |
| Amgen, Inc. | | 366,071 | 92,396 |
| | | | 148,763 |
| Health Care Equipment & Supplies - 0.3% | | | |
| GE HealthCare Technologies, Inc. (a) | | 323,660 | 22,501 |
| Health Care Providers & Services - 2.9% | | | |
| Cigna Corp. | | 350,286 | 110,925 |
| UnitedHealth Group, Inc. | | 205,179 | 102,423 |
| | | | 213,348 |
| Life Sciences Tools & Services - 2.0% | | | |
| Danaher Corp. | | 550,994 | 145,672 |
| Pharmaceuticals - 9.8% | | | |
| AstraZeneca PLC (United Kingdom) | | 596,388 | 78,134 |
| Bristol-Myers Squibb Co. | | 1,500,846 | 109,036 |
| Eli Lilly & Co. | | 309,702 | 106,584 |
| Johnson & Johnson | | 896,931 | 146,576 |
| Merck & Co., Inc. | | 579,048 | 62,196 |
| Roche Holding AG (participation certificate) | | 286,397 | 89,405 |
| Royalty Pharma PLC | | 929,314 | 36,420 |
| Sanofi SA | | 809,523 | 79,272 |
| | | | 707,623 |
TOTAL HEALTH CARE | | | 1,237,907 |
| INDUSTRIALS - 8.4% | | | |
| Aerospace & Defense - 3.0% | | | |
| Huntington Ingalls Industries, Inc. | | 127,010 | 28,011 |
| Lockheed Martin Corp. | | 79,704 | 36,924 |
| Northrop Grumman Corp. | | 122,309 | 54,799 |
| The Boeing Co. (a) | | 443,812 | 94,532 |
| | | | 214,266 |
| Air Freight & Logistics - 0.5% | | | |
| United Parcel Service, Inc. Class B | | 212,445 | 39,351 |
| Building Products - 0.6% | | | |
| Johnson Controls International PLC | | 584,058 | 40,633 |
| Electrical Equipment - 0.8% | | | |
| AMETEK, Inc. | | 374,913 | 54,332 |
| Industrial Conglomerates - 1.6% | | | |
| General Electric Co. | | 970,980 | 78,144 |
| Hitachi Ltd. | | 335,745 | 17,607 |
| Siemens AG | | 150,365 | 23,488 |
| | | | 119,239 |
| Machinery - 1.4% | | | |
| Crane Holdings Co. | | 234,454 | 27,176 |
| Fortive Corp. | | 450,100 | 30,620 |
| ITT, Inc. | | 459,442 | 42,080 |
| | | | 99,876 |
| Professional Services - 0.2% | | | |
| KBR, Inc. | | 284,828 | 14,592 |
| Trading Companies & Distributors - 0.3% | | | |
| Watsco, Inc. (b) | | 81,275 | 23,356 |
TOTAL INDUSTRIALS | | | 605,645 |
| INFORMATION TECHNOLOGY - 9.3% | | | |
| Communications Equipment - 1.5% | | | |
| Cisco Systems, Inc. | | 2,204,563 | 107,296 |
| IT Services - 1.6% | | | |
| Accenture PLC Class A | | 117,254 | 32,720 |
| Amdocs Ltd. | | 621,639 | 57,147 |
| Paychex, Inc. | | 57,946 | 6,714 |
| Visa, Inc. Class A | | 78,493 | 18,070 |
| | | | 114,651 |
| Semiconductors & Semiconductor Equipment - 2.0% | | | |
| NXP Semiconductors NV | | 407,540 | 75,114 |
| Taiwan Semiconductor Manufacturing Co. Ltd. sponsored ADR | | 783,258 | 72,632 |
| | | | 147,746 |
| Software - 3.0% | | | |
| Gen Digital, Inc. | | 824,668 | 18,976 |
| Microsoft Corp. | | 338,019 | 83,764 |
| Open Text Corp. | | 1,264,969 | 42,430 |
| Roper Technologies, Inc. | | 166,890 | 71,220 |
| | | | 216,390 |
| Technology Hardware, Storage & Peripherals - 1.2% | | | |
| Apple, Inc. | | 107,506 | 15,512 |
| Samsung Electronics Co. Ltd. | | 1,344,410 | 66,884 |
| Seagate Technology Holdings PLC | | 120,913 | 8,195 |
| | | | 90,591 |
TOTAL INFORMATION TECHNOLOGY | | | 676,674 |
| MATERIALS - 4.9% | | | |
| Chemicals - 2.1% | | | |
| Linde PLC | | 397,646 | 131,597 |
| Nutrien Ltd. | | 215,151 | 17,810 |
| | | | 149,407 |
| Containers & Packaging - 1.3% | | | |
| Ball Corp. | | 589,859 | 34,353 |
| Crown Holdings, Inc. | | 712,627 | 62,825 |
| | | | 97,178 |
| Metals & Mining - 1.5% | | | |
| Anglo American PLC (United Kingdom) | | 601,480 | 25,942 |
| Freeport-McMoRan, Inc. | | 1,826,721 | 81,508 |
| | | | 107,450 |
TOTAL MATERIALS | | | 354,035 |
| REAL ESTATE - 1.9% | | | |
| Equity Real Estate Investment Trusts (REITs) - 1.9% | | | |
| American Tower Corp. | | 217,546 | 48,598 |
| Lamar Advertising Co. Class A | | 451,319 | 48,084 |
| Public Storage | | 137,347 | 41,800 |
| | | | 138,482 |
| UTILITIES - 5.8% | | | |
| Electric Utilities - 3.3% | | | |
| Constellation Energy Corp. | | 258,342 | 22,052 |
| Exelon Corp. | | 943,158 | 39,792 |
| FirstEnergy Corp. | | 590,739 | 24,191 |
| NextEra Energy, Inc. | | 1,252,398 | 93,466 |
| PG&E Corp. (a) | | 1,345,050 | 21,386 |
| Southern Co. | | 548,168 | 37,100 |
| | | | 237,987 |
| Independent Power and Renewable Electricity Producers - 0.3% | | | |
| Vistra Corp. | | 956,829 | 22,064 |
| Multi-Utilities - 2.2% | | | |
| Ameren Corp. | | 403,011 | 35,010 |
| CenterPoint Energy, Inc. | | 1,254,319 | 37,780 |
| Dominion Energy, Inc. | | 764,265 | 48,638 |
| WEC Energy Group, Inc. | | 390,878 | 36,739 |
| | | | 158,167 |
TOTAL UTILITIES | | | 418,218 |
| TOTAL COMMON STOCKS (Cost $4,584,624) | | | 6,827,030 |
| | | | |
| Money Market Funds - 3.9% |
| | | Shares | Value ($) (000s) |
| Fidelity Cash Central Fund 4.38% (c) | | 277,141,713 | 277,197 |
| Fidelity Securities Lending Cash Central Fund 4.38% (c)(d) | | 7,255,524 | 7,256 |
| TOTAL MONEY MARKET FUNDS (Cost $284,453) | | | 284,453 |
| | | | |
| TOTAL INVESTMENT IN SECURITIES - 98.2% (Cost $4,869,077) | 7,111,483 |
NET OTHER ASSETS (LIABILITIES) - 1.8% | 128,912 |
| NET ASSETS - 100.0% | 7,240,395 |
| | |
Any values shown as $0 in the Schedule of Investments may reflect amounts less than $500.
Legend
| (b) | Security or a portion of the security is on loan at period end. |
| (c) | Affiliated fund that is generally available only to investment companies and other accounts managed by Fidelity Investments. The rate quoted is the annualized seven-day yield of the fund at period end. A complete unaudited listing of the fund's holdings as of its most recent quarter end is available upon request. In addition, each Fidelity Central Fund's financial statements, which are not covered by the Fund's Report of Independent Registered Public Accounting Firm, are available on the SEC's website or upon request. |
| (d) | Investment made with cash collateral received from securities on loan. |
Affiliated Central Funds
Fiscal year to date information regarding the Fund's investments in Fidelity Central Funds, including the ownership percentage, is presented below.
| Affiliate (Amounts in thousands) | Value, beginning of period ($) | Purchases ($) | Sales Proceeds ($) | Dividend Income ($) | Realized Gain (loss) ($) | Change in Unrealized appreciation (depreciation) ($) | Value, end of period ($) | % ownership, end of period |
| Fidelity Cash Central Fund 4.38% | 10,397 | 1,027,289 | 760,489 | 5,534 | - | - | 277,197 | 0.6% |
| Fidelity Securities Lending Cash Central Fund 4.38% | 12,160 | 988,232 | 993,136 | 123 | - | - | 7,256 | 0.0% |
| Total | 22,557 | 2,015,521 | 1,753,625 | 5,657 | - | - | 284,453 | |
| | | | | | | | | |
Amounts in the dividend income column in the above table include any capital gain distributions from underlying funds, which are presented in the corresponding line item in the Statement of Operations, if applicable.
Amount for Fidelity Securities Lending Cash Central Fund represents the income earned on investing cash collateral, less rebates paid to borrowers and any lending agent fees associated with the loan, plus any premium payments received for lending certain types of securities.
Amounts included in the purchases and sales proceeds columns may include in-kind transactions, if applicable.
Investment Valuation
The following is a summary of the inputs used, as of January 31, 2023, involving the Fund's assets and liabilities carried at fair value. The inputs or methodology used for valuing securities may not be an indication of the risk associated with investing in those securities. For more information on valuation inputs, and their aggregation into the levels used below, please refer to the Investment Valuation section in the accompanying Notes to Financial Statements.
| Valuation Inputs at Reporting Date: |
Description (Amounts in thousands) | Total ($) | Level 1 ($) | Level 2 ($) | Level 3 ($) |
Investments in Securities: | | | | |
|
| Equities: | | | | |
Communication Services | 543,461 | 543,461 | - | - |
Consumer Discretionary | 305,233 | 305,233 | - | - |
Consumer Staples | 691,312 | 638,125 | 53,187 | - |
Energy | 710,656 | 710,656 | - | - |
Financials | 1,145,407 | 1,145,407 | - | - |
Health Care | 1,237,907 | 991,096 | 246,811 | - |
Industrials | 605,645 | 564,550 | 41,095 | - |
Information Technology | 676,674 | 609,790 | 66,884 | - |
Materials | 354,035 | 328,093 | 25,942 | - |
Real Estate | 138,482 | 138,482 | - | - |
Utilities | 418,218 | 418,218 | - | - |
|
| Money Market Funds | 284,453 | 284,453 | - | - |
| Total Investments in Securities: | 7,111,483 | 6,677,564 | 433,919 | - |
| Statement of Assets and Liabilities |
| Amounts in thousands (except per-share amounts) | | | | January 31, 2023 |
| | | | | |
| Assets | | | | |
| Investment in securities, at value (including securities loaned of $7,414) - See accompanying schedule: | | | | |
Unaffiliated issuers (cost $4,584,624) | $ | 6,827,030 | | |
Fidelity Central Funds (cost $284,453) | | 284,453 | | |
| | | | | |
| | | | | |
| Total Investment in Securities (cost $4,869,077) | | | $ | 7,111,483 |
| Receivable for investments sold | | | | |
Regular delivery | | | | 182,295 |
Delayed delivery | | | | 6,835 |
| Receivable for fund shares sold | | | | 3,417 |
| Dividends receivable | | | | 9,216 |
| Distributions receivable from Fidelity Central Funds | | | | 1,026 |
| Prepaid expenses | | | | 7 |
| Other receivables | | | | 609 |
Total assets | | | | 7,314,888 |
| Liabilities | | | | |
| Payable for investments purchased | $ | 58,675 | | |
| Payable for fund shares redeemed | | 4,581 | | |
| Accrued management fee | | 2,541 | | |
| Other affiliated payables | | 803 | | |
| Other payables and accrued expenses | | 637 | | |
| Collateral on securities loaned | | 7,256 | | |
| Total Liabilities | | | | 74,493 |
| Net Assets | | | $ | 7,240,395 |
| Net Assets consist of: | | | | |
| Paid in capital | | | $ | 5,000,833 |
| Total accumulated earnings (loss) | | | | 2,239,562 |
| Net Assets | | | $ | 7,240,395 |
| | | | | |
| Net Asset Value and Maximum Offering Price | | | | |
| Equity-Income : | | | | |
Net Asset Value , offering price and redemption price per share ($6,698,906 ÷ 101,253 shares) | | | $ | 66.16 |
| Class K : | | | | |
Net Asset Value , offering price and redemption price per share ($541,489 ÷ 8,191 shares) (a) | | | $ | 66.10 |
(a)Corresponding Net Asset Value does not calculate due to rounding of fractional net assets and/or shares |
| Statement of Operations |
| Amounts in thousands | | | | Year ended January 31, 2023 |
| Investment Income | | | | |
| Dividends | | | $ | 176,462 |
| Income from Fidelity Central Funds (including $123 from security lending) | | | | 5,657 |
| Total Income | | | | 182,119 |
| Expenses | | | | |
| Management fee | $ | 30,915 | | |
| Transfer agent fees | | 8,717 | | |
| Accounting fees | | 1,091 | | |
| Custodian fees and expenses | | 95 | | |
| Independent trustees' fees and expenses | | 24 | | |
| Registration fees | | 110 | | |
| Audit | | 96 | | |
| Legal | | 12 | | |
| Miscellaneous | | 34 | | |
| Total expenses before reductions | | 41,094 | | |
| Expense reductions | | (255) | | |
| Total expenses after reductions | | | | 40,839 |
| Net Investment income (loss) | | | | 141,280 |
| Realized and Unrealized Gain (Loss) | | | | |
| Net realized gain (loss) on: | | | | |
| Investment Securities: | | | | |
| Unaffiliated issuers | | 203,967 | | |
| Redemptions in-kind | | 19,241 | | |
| Foreign currency transactions | | (420) | | |
| Total net realized gain (loss) | | | | 222,788 |
| Change in net unrealized appreciation (depreciation) on: | | | | |
| Investment Securities: | | | | |
| Unaffiliated issuers | | (398,004) | | |
| Assets and liabilities in foreign currencies | | (9) | | |
| Total change in net unrealized appreciation (depreciation) | | | | (398,013) |
| Net gain (loss) | | | | (175,225) |
| Net increase (decrease) in net assets resulting from operations | | | $ | (33,945) |
| Statement of Changes in Net Assets |
| |
| Amount in thousands | | Year ended January 31, 2023 | | Year ended January 31, 2022 |
| Increase (Decrease) in Net Assets | | | | |
| Operations | | | | |
| Net investment income (loss) | $ | 141,280 | $ | 122,850 |
| Net realized gain (loss) | | 222,788 | | 591,527 |
| Change in net unrealized appreciation (depreciation) | | (398,013) | | 850,931 |
| Net increase (decrease) in net assets resulting from operations | | (33,945) | | 1,565,308 |
| Distributions to shareholders | | (314,648) | | (746,840) |
| Share transactions - net increase (decrease) | | (292,149) | | 467,705 |
| Total increase (decrease) in net assets | | (640,742) | | 1,286,173 |
| | | | | |
| Net Assets | | | | |
| Beginning of period | | 7,881,137 | | 6,594,964 |
| End of period | $ | 7,240,395 | $ | 7,881,137 |
| | | | | |
| | | | | |
Financial Highlights
| Fidelity® Equity-Income Fund |
| |
| Years ended January 31, | | 2023 | | 2022 | | 2021 | | 2020 | | 2019 |
Selected Per-Share Data | | | | | | | | | | |
| Net asset value, beginning of period | $ | 69.17 | $ | 61.74 | $ | 59.36 | $ | 54.70 | $ | 63.45 |
| Income from Investment Operations | | | | | | | | | | |
Net investment income (loss) A,B | | 1.27 | | 1.12 | | .97 | | 1.19 | | 1.44 |
| Net realized and unrealized gain (loss) | | (1.37) | | 13.26 | | 3.52 | | 7.81 | | (5.22) |
| Total from investment operations | | (.10) | | 14.38 | | 4.49 | | 9.00 | | (3.78) |
| Distributions from net investment income | | (1.23) | | (1.09) | | (.94) | | (1.10) | | (1.39) |
| Distributions from net realized gain | | (1.67) | | (5.86) | | (1.17) | | (3.24) | | (3.58) |
| Total distributions | | (2.91) C | | (6.95) | | (2.11) | | (4.34) | | (4.97) |
| Net asset value, end of period | $ | 66.16 | $ | 69.17 | $ | 61.74 | $ | 59.36 | $ | 54.70 |
Total Return D | | .05% | | 23.70% | | 7.93% | | 16.69% | | (5.91)% |
Ratios to Average Net Assets B,E,F | | | | | | | | | | |
| Expenses before reductions | | .57% | | .57% | | .60% | | .60% | | .61% |
| Expenses net of fee waivers, if any | | .57% | | .57% | | .60% | | .60% | | .61% |
| Expenses net of all reductions | | .57% | | .57% | | .59% | | .60% | | .60% |
| Net investment income (loss) | | 1.94% | | 1.59% | | 1.75% | | 2.04% | | 2.50% |
| Supplemental Data | | | | | | | | | | |
| Net assets, end of period (in millions) | $ | 6,699 | $ | 7,163 | $ | 5,940 | $ | 5,378 | $ | 5,016 |
Portfolio turnover rate G | | 22% H | | 27% H | | 50% H | | 32% H | | 24% H |
A Calculated based on average shares outstanding during the period.
B Net investment income (loss) is affected by the timing of the declaration of dividends by any underlying mutual funds or exchange-traded funds (ETFs). Net investment income (loss) of any mutual funds or ETFs is not included in the Fund's net investment income (loss) ratio.
C Total distributions per share do not sum due to rounding.
D Total returns would have been lower if certain expenses had not been reduced during the applicable periods shown.
E Fees and expenses of any underlying mutual funds or exchange-traded funds (ETFs) are not included in the Fund's expense ratio. The Fund indirectly bears its proportionate share of these expenses. For additional expense information related to investments in Fidelity Central Funds, please refer to the "Investments in Fidelity Central Funds" note found in the Notes to Financial Statements section of the most recent Annual or Semi-Annual report.
F Expense ratios reflect operating expenses of the class. Expenses before reductions do not reflect amounts reimbursed, waived, or reduced through arrangements with the investment adviser, brokerage services, or other offset arrangements, if applicable, and do not represent the amount paid by the class during periods when reimbursements, waivers or reductions occur.
G Amount does not include the portfolio activity of any underlying mutual funds or exchange-traded funds (ETFs).
H Portfolio turnover rate excludes securities received or delivered in-kind.
| Fidelity® Equity-Income Fund Class K |
| |
| Years ended January 31, | | 2023 | | 2022 | | 2021 | | 2020 | | 2019 |
Selected Per-Share Data | | | | | | | | | | |
| Net asset value, beginning of period | $ | 69.11 | $ | 61.69 | $ | 59.31 | $ | 54.67 | $ | 63.41 |
| Income from Investment Operations | | | | | | | | | | |
Net investment income (loss) A,B | | 1.33 | | 1.17 | | 1.02 | | 1.24 | | 1.51 |
| Net realized and unrealized gain (loss) | | (1.38) | | 13.26 | | 3.52 | | 7.80 | | (5.22) |
| Total from investment operations | | (.05) | | 14.43 | | 4.54 | | 9.04 | | (3.71) |
| Distributions from net investment income | | (1.29) | | (1.15) | | (.99) | | (1.16) | | (1.45) |
| Distributions from net realized gain | | (1.67) | | (5.86) | | (1.17) | | (3.24) | | (3.58) |
| Total distributions | | (2.96) | | (7.01) | | (2.16) | | (4.40) | | (5.03) |
| Net asset value, end of period | $ | 66.10 | $ | 69.11 | $ | 61.69 | $ | 59.31 | $ | 54.67 |
Total Return C | | .14% | | 23.80% | | 8.04% | | 16.77% | | (5.81)% |
Ratios to Average Net Assets B,D,E | | | | | | | | | | |
| Expenses before reductions | | .49% | | .49% | | .50% | | .51% | | .51% |
| Expenses net of fee waivers, if any | | .48% | | .48% | | .50% | | .51% | | .51% |
| Expenses net of all reductions | | .48% | | .48% | | .50% | | .50% | | .50% |
| Net investment income (loss) | | 2.03% | | 1.67% | | 1.84% | | 2.13% | | 2.60% |
| Supplemental Data | | | | | | | | | | |
| Net assets, end of period (in millions) | $ | 541 | $ | 719 | $ | 655 | $ | 788 | $ | 807 |
Portfolio turnover rate F | | 22% G | | 27% G | | 50% G | | 32% G | | 24% G |
A Calculated based on average shares outstanding during the period.
B Net investment income (loss) is affected by the timing of the declaration of dividends by any underlying mutual funds or exchange-traded funds (ETFs). Net investment income (loss) of any mutual funds or ETFs is not included in the Fund's net investment income (loss) ratio.
C Total returns would have been lower if certain expenses had not been reduced during the applicable periods shown.
D Fees and expenses of any underlying mutual funds or exchange-traded funds (ETFs) are not included in the Fund's expense ratio. The Fund indirectly bears its proportionate share of these expenses. For additional expense information related to investments in Fidelity Central Funds, please refer to the "Investments in Fidelity Central Funds" note found in the Notes to Financial Statements section of the most recent Annual or Semi-Annual report.
E Expense ratios reflect operating expenses of the class. Expenses before reductions do not reflect amounts reimbursed, waived, or reduced through arrangements with the investment adviser, brokerage services, or other offset arrangements, if applicable, and do not represent the amount paid by the class during periods when reimbursements, waivers or reductions occur.
F Amount does not include the portfolio activity of any underlying mutual funds or exchange-traded funds (ETFs).
G Portfolio turnover rate excludes securities received or delivered in-kind.
For the period ended January 31, 2023
( Amounts in thousands except percentages)
1. Organization.
Fidelity Equity-Income Fund (the Fund) is a fund of Fidelity Devonshire Trust (the Trust) and is authorized to issue an unlimited number of shares. The Trust is registered under the Investment Company Act of 1940, as amended (the 1940 Act), as an open-end management investment company organized as a Massachusetts business trust. The Fund offers Equity-Income and Class K shares, each of which has equal rights as to assets and voting privileges. Each class has exclusive voting rights with respect to matters that affect that class.
2. Investments in Fidelity Central Funds.
Funds may invest in Fidelity Central Funds, which are open-end investment companies generally available only to other investment companies and accounts managed by the investment adviser and its affiliates. The Schedule of Investments lists any Fidelity Central Funds held as an investment as of period end, but does not include the underlying holdings of each Fidelity Central Fund. An investing fund indirectly bears its proportionate share of the expenses of the underlying Fidelity Central Funds.
Based on its investment objective, each Fidelity Central Fund may invest or participate in various investment vehicles or strategies that are similar to those of the investing fund. These strategies are consistent with the investment objectives of the investing fund and may involve certain economic risks which may cause a decline in value of each of the Fidelity Central Funds and thus a decline in the value of the investing fund.
| Fidelity Central Fund | Investment Manager | Investment Objective | Investment Practices | Expense Ratio A |
| Fidelity Money Market Central Funds | Fidelity Management & Research Company LLC (FMR) | Each fund seeks to obtain a high level of current income consistent with the preservation of capital and liquidity. | Short-term Investments | Less than .005% |
A Expenses expressed as a percentage of average net assets and are as of each underlying Central Fund's most recent annual or semi-annual shareholder report.
A complete unaudited list of holdings for each Fidelity Central Fund is available upon request or at the Securities and Exchange Commission website at www.sec.gov. In addition, the financial statements of the Fidelity Central Funds which contain the significant accounting policies (including investment valuation policies) of those funds, and are not covered by the Report of Independent Registered Public Accounting Firm, are available on the Securities and Exchange Commission website or upon request.
3. Significant Accounting Policies.
The Fund is an investment company and applies the accounting and reporting guidance of the Financial Accounting Standards Board (FASB) Accounting Standards Codification Topic 946 Financial Services - Investment Companies . The financial statements have been prepared in conformity with accounting principles generally accepted in the United States of America (GAAP), which require management to make certain estimates and assumptions at the date of the financial statements. Actual results could differ from those estimates. Subsequent events, if any, through the date that the financial statements were issued have been evaluated in the preparation of the financial statements. The Fund's Schedule of Investments lists any underlying mutual funds or exchange-traded funds (ETFs) but does not include the underlying holdings of these funds. The following summarizes the significant accounting policies of the Fund:
Investment Valuation. Investments are valued as of 4:00 p.m. Eastern time on the last calendar day of the period. The Board of Trustees (the Board) has designated the Fund's investment adviser as the valuation designee responsible for the fair valuation function and performing fair value determinations as needed. The investment adviser has established a Fair Value Committee (the Committee) to carry out the day-to-day fair valuation responsibilities and has adopted policies and procedures to govern the fair valuation process and the activities of the Committee. In accordance with these fair valuation policies and procedures, which have been approved by the Board, the Fund attempts to obtain prices from one or more third party pricing services or brokers to value its investments. When current market prices, quotations or currency exchange rates are not readily available or reliable, investments will be fair valued in good faith by the Committee, in accordance with the policies and procedures. Factors used in determining fair value vary by investment type and may include market or investment specific events, transaction data, estimated cash flows, and market observations of comparable investments. The frequency that the fair valuation procedures are used cannot be predicted and they may be utilized to a significant extent. The Committee manages the Fund's fair valuation practices and maintains the fair valuation policies and procedures. The Fund's investment adviser reports to the Board information regarding the fair valuation process and related material matters.
The Fund categorizes the inputs to valuation techniques used to value its investments into a disclosure hierarchy consisting of three levels as shown below:
Level 1 - unadjusted quoted prices in active markets for identical investments
Level 2 - other significant observable inputs (including quoted prices for similar investments, interest rates, prepayment speeds, etc.)
Level 3 - unobservable inputs (including the Fund's own assumptions based on the best information available)
Valuation techniques used to value the Fund's investments by major category are as follows:
Equity securities, including restricted securities, for which market quotations are readily available, are valued at the last reported sale price or official closing price as reported by a third party pricing service on the primary market or exchange on which they are traded and are categorized as Level 1 in the hierarchy. In the event there were no sales during the day or closing prices are not available, securities are valued at the last quoted bid price or may be valued using the last available price and are generally categorized as Level 2 in the hierarchy. For foreign equity securities, when market or security specific events arise, comparisons to the valuation of American Depositary Receipts (ADRs), futures contracts, ETFs and certain indexes as well as quoted prices for similar securities may be used and would be categorized as Level 2 in the hierarchy. For equity securities, including restricted securities, where observable inputs are limited, assumptions about market activity and risk are used and these securities may be categorized as Level 3 in the hierarchy.
Investments in open-end mutual funds, including the Fidelity Central Funds, are valued at their closing net asset value (NAV) each business day and are categorized as Level 1 in the hierarchy.
Changes in valuation techniques may result in transfers in or out of an assigned level within the disclosure hierarchy. The aggregate value of investments by input level as of January 31, 2023 is included at the end of the Fund's Schedule of Investments.
Foreign Currency. Certain Funds may use foreign currency contracts to facilitate transactions in foreign-denominated securities. Gains and losses from these transactions may arise from changes in the value of the foreign currency or if the counterparties do not perform under the contracts' terms.
Foreign-denominated assets, including investment securities, and liabilities are translated into U.S. dollars at the exchange rates at period end. Purchases and sales of investment securities, income and dividends received, and expenses denominated in foreign currencies are translated into U.S. dollars at the exchange rate in effect on the transaction date.
The effects of exchange rate fluctuations on investments are included with the net realized and unrealized gain (loss) on investment securities. Other foreign currency transactions resulting in realized and unrealized gain (loss) are disclosed separately.
Investment Transactions and Income. For financial reporting purposes, the Fund's investment holdings and NAV include trades executed through the end of the last business day of the period. The NAV per share for processing shareholder transactions is calculated as of the close of business of the New York Stock Exchange (NYSE), normally 4:00 p.m. Eastern time and includes trades executed through the end of the prior business day. Gains and losses on securities sold are determined on the basis of identified cost and include proceeds received from litigation. Commissions paid to certain brokers with whom the investment adviser, or its affiliates, places trades on behalf of a fund include an amount in addition to trade execution, which may be rebated back to a fund. Any such rebates are included in net realized gain (loss) on investments in the Statement of Operations. Dividend income is recorded on the ex-dividend date, except for certain dividends from foreign securities where the ex-dividend date may have passed, which are recorded as soon as the Fund is informed of the ex-dividend date. Non-cash dividends included in dividend income, if any, are recorded at the fair market value of the securities received. Income and capital gain distributions from Fidelity Central Funds, if any, are recorded on the ex-dividend date. Certain distributions received by the Fund represent a return of capital or capital gain. The Fund determines the components of these distributions subsequent to the ex-dividend date, based upon receipt of tax filings or other correspondence relating to the underlying investment. These distributions are recorded as a reduction of cost of investments and/or as a realized gain. Investment income is recorded net of foreign taxes withheld where recovery of such taxes is uncertain. Funds may file withholding tax reclaims in certain jurisdictions to recover a portion of amounts previously withheld. Any withholding tax reclaims income is included in the Statement of Operations in dividends. Any receivables for withholding tax reclaims are included in the Statement of Assets and Liabilities in dividends receivable.
Class Allocations and Expenses. Investment income, realized and unrealized capital gains and losses, common expenses of a fund, and certain fund-level expense reductions, if any, are allocated daily on a pro-rata basis to each class based on the relative net assets of each class to the total net assets of a fund. Each class differs with respect to transfer agent and distribution and service plan fees incurred, as applicable. Certain expense reductions may also differ by class, if applicable. For the reporting period, the allocated portion of income and expenses to each class as a percent of its average net assets may vary due to the timing of recording these transactions in relation to fluctuating net assets of the classes. Expenses directly attributable to a fund are charged to that fund. Expenses attributable to more than one fund are allocated among the respective funds on the basis of relative net assets or other appropriate methods. Expenses included in the accompanying financial statements reflect the expenses of that fund and do not include any expenses associated with any underlying mutual funds or exchange-traded funds. Although not included in a fund's expenses, a fund indirectly bears its proportionate share of these expenses through the net asset value of each underlying mutual fund or exchange-traded fund. Expense estimates are accrued in the period to which they relate and adjustments are made when actual amounts are known.
Deferred Trustee Compensation. Under a Deferred Compensation Plan (the Plan) for certain Funds, certain independent Trustees have elected to defer receipt of a portion of their annual compensation. Deferred amounts are invested in affiliated mutual funds, are marked-to-market and remain in a fund until distributed in accordance with the Plan. The investment of deferred amounts and the offsetting payable to the Trustees presented below are included in the accompanying Statement of Assets and Liabilities in other receivables and other payables and accrued expenses, as applicable.
| Fidelity Equity-Income Fund | $543 |
Income Tax Information and Distributions to Shareholders. Each year, the Fund intends to qualify as a regulated investment company under Subchapter M of the Internal Revenue Code, including distributing substantially all of its taxable income and realized gains. As a result, no provision for U.S. Federal income taxes is required. As of January 31, 2023, the Fund did not have any unrecognized tax benefits in the financial statements; nor is the Fund aware of any tax positions for which it is reasonably possible that the total amounts of unrecognized tax benefits will significantly change in the next twelve months. The Fund files a U.S. federal tax return, in addition to state and local tax returns as required. The Fund's federal income tax returns are subject to examination by the Internal Revenue Service (IRS) for a period of three fiscal years after they are filed. State and local tax returns may be subject to examination for an additional fiscal year depending on the jurisdiction. Foreign taxes are provided for based on the Fund's understanding of the tax rules and rates that exist in the foreign markets in which it invests.
Distributions are declared and recorded on the ex-dividend date. Income and capital gain distributions are declared separately for each class. Income and capital gain distributions are determined in accordance with income tax regulations, which may differ from GAAP. In addition, the Fund claimed a portion of the payment made to redeeming shareholders as a distribution for income tax purposes.
Capital accounts within the financial statements are adjusted for permanent book-tax differences. These adjustments have no impact on net assets or the results of operations. Capital accounts are not adjusted for temporary book-tax differences which will reverse in a subsequent period.
Book-tax differences are primarily due to foreign currency transactions, passive foreign investment companies (PFIC), redemptions in-kind, partnerships, deferred Trustee compensation and losses deferred due to wash sales.
As of period end, the cost and unrealized appreciation (depreciation) in securities, and derivatives if applicable, for federal income tax purposes were as follows:
| Gross unrealized appreciation | $2,366,015 |
| Gross unrealized depreciation | (118,259) |
| Net unrealized appreciation (depreciation) | $2,247,756 |
| Tax Cost | $4,863,727 |
The tax-based components of distributable earnings as of period end were as follows:
| Undistributed ordinary income | $4,775 |
| Undistributed long-term capital gain | $2,240 |
| Net unrealized appreciation (depreciation) on securities and other investments | $2,233,052 |
The tax character of distributions paid was as follows:
| | January 31, 2023 | January 31, 2022 |
| Ordinary Income | $135,818 | $ 247,144 |
| Long-term Capital Gains | 178,830 | 499,696 |
| Total | $314,648 | $ 746,840 |
Delayed Delivery Transactions and When-Issued Securities. During the period, certain Funds transacted in securities on a delayed delivery or when-issued basis. Payment and delivery may take place after the customary settlement period for that security. The price of the underlying securities and the date when the securities will be delivered and paid for are fixed at the time the transaction is negotiated. Securities purchased on a delayed delivery or when-issued basis are identified as such in the Schedule of Investments. Compensation for interest forgone in the purchase of a delayed delivery or when-issued debt security may be received. With respect to purchase commitments, each applicable Fund identifies securities as segregated in its records with a value at least equal to the amount of the commitment. Payables and receivables associated with the purchases and sales of delayed delivery securities having the same coupon, settlement date and broker are offset. Delayed delivery or when-issued securities that have been purchased from and sold to different brokers are reflected as both payables and receivables in the Statement of Assets and Liabilities under the caption "Delayed delivery", as applicable. Losses may arise due to changes in the value of the underlying securities or if the counterparty does not perform under the contract's terms, or if the issuer does not issue the securities due to political, economic, or other factors.
4. Purchases and Sales of Investments.
Purchases and sales of securities, other than short-term securities and in-kind transactions, as applicable, are noted in the table below.
| | Purchases ($) | Sales ($) |
| Fidelity Equity-Income Fund | 1,535,133 | 2,347,357 |
Unaffiliated Redemptions In-Kind. Shares that were redeemed in-kind for investments, including accrued interest and cash, if any, are shown in the table below. The net realized gain or loss on investments delivered through in-kind redemptions is included in the "Net realized gain (loss) on: Redemptions in-kind" line in the accompanying Statement of Operations. The amount of the in-kind redemptions is included in share transactions in the accompanying Statement of Changes in Net Assets. There was no gain or loss for federal income tax purposes.
| | Shares | Total net realized gain or loss ($) | Total Proceeds ($) | Participating classes |
| Fidelity Equity-Income Fund | 757 | 19,241 | 48,923 | Equity-Income, Class K |
Prior Fiscal Year Unaffiliated Redemptions In-Kind. Shares that were redeemed in-kind for investments, including accrued interest and cash, if any, are shown in the table below; along with realized gain or loss on investments delivered through in-kind redemptions. The amount of the in-kind redemptions is included in share transactions in the accompanying Statement of Changes in Net Assets. There was no gain or loss for federal income tax purposes.
| | Shares | Total net realized gain or loss ($) | Total Proceeds ($) | Participating classes |
| Fidelity Equity-Income Fund | 415 | 13,022 | 29,474 | Class K |
5. Fees and Other Transactions with Affiliates.
Management Fee. Fidelity Management & Research Company LLC (the investment adviser) and its affiliates provide the Fund with investment management related services for which the Fund pays a monthly management fee. The management fee is the sum of an individual fund fee rate that is based on an annual rate of .20% of the Fund's average net assets and an annualized group fee rate that averaged .23% during the period. The group fee rate is based upon the monthly average net assets of a group of registered investment companies with which the investment adviser has management contracts. The group fee rate decreases as assets under management increase and increases as assets under management decrease. For the reporting period, the total annual management fee rate was .43% of the Fund's average net assets.
Transfer Agent Fees. Fidelity Investments Institutional Operations Company LLC (FIIOC), an affiliate of the investment adviser, is the transfer, dividend disbursing and shareholder servicing agent for each class of the Fund. FIIOC receives account fees and asset-based fees that vary according to the account size and type of account of the shareholders of the respective classes of the Fund, except for Class K. FIIOC receives an asset-based fee of Class K's average net assets. FIIOC pays for typesetting, printing and mailing of shareholder reports, except proxy statements.
For the period, transfer agent fees for each class were as follows:
| | Amount | % of Class-Level Average Net Assets |
| Equity-Income | $8,467 | .13 |
| Class K | 250 | .04 |
| | $8,717 | |
Accounting Fees. Fidelity Service Company, Inc. (FSC), an affiliate of the investment adviser, maintains the Fund's accounting records. The accounting fee is based on the level of average net assets for each month. For the period, the fees were equivalent to the following annual rates:
| | % of Average Net Assets |
| Fidelity Equity-Income Fund | .02 |
Brokerage Commissions. A portion of portfolio transactions were placed with brokerage firms which are affiliates of the investment adviser. Brokerage commissions are included in net realized gain (loss) and change in net unrealized appreciation (depreciation) in the Statement of Operations. The commissions paid to these affiliated firms were as follows:
| | Amount |
| Fidelity Equity-Income Fund | $33 |
Interfund Lending Program. Pursuant to an Exemptive Order issued by the Securities and Exchange Commission (the SEC), the Fund, along with other registered investment companies having management contracts with Fidelity Management & Research Company LLC (FMR), or other affiliated entities of FMR, may participate in an interfund lending program. This program provides an alternative credit facility allowing the Fund to borrow from, or lend money to, other participating affiliated funds. At period end, there were no interfund loans outstanding. Activity in this program during the period for which loans were outstanding was as follows:
| | Borrower or Lender | Average Loan Balance | Weighted Average Interest Rate | Interest Expense |
| Fidelity Equity-Income Fund | Borrower | $7,926 | .32% | $- A |
A In the amount of less than five hundred dollars
Interfund Trades. Funds may purchase from or sell securities to other Fidelity Funds under procedures adopted by the Board. The procedures have been designed to ensure these interfund trades are executed in accordance with Rule 17a-7 of the 1940 Act. Any interfund trades are included within the respective purchases and sales amounts shown in the Purchases and Sales of Investments note. Interfund trades during the period are noted in the table below.
| | Purchases ($) | Sales ($) | Realized Gain (Loss) ($) |
| Fidelity Equity-Income Fund | 86,887 | 291,582 | 22,136 |
6. Committed Line of Credit.
Certain Funds participate with other funds managed by the investment adviser or an affiliate in a $4.25 billion credit facility (the "line of credit") to be utilized for temporary or emergency purposes to fund shareholder redemptions or for other short-term liquidity purposes. The participating funds have agreed to pay commitment fees on their pro-rata portion of the line of credit, which are reflected in Miscellaneous expenses on the Statement of Operations, and are listed below. During the period, there were no borrowings on this line of credit.
| | Amount |
| Fidelity Equity-Income Fund | $13 |
7. Security Lending.
Funds lend portfolio securities from time to time in order to earn additional income. Lending agents are used, including National Financial Services (NFS), an affiliate of the investment adviser. Pursuant to a securities lending agreement, NFS will receive a fee, which is capped at 9.9% of a fund's daily lending revenue, for its services as lending agent. A fund may lend securities to certain qualified borrowers, including NFS. On the settlement date of the loan, a fund receives collateral (in the form of U.S. Treasury obligations, letters of credit and/or cash) against the loaned securities and maintains collateral in an amount not less than 100% of the market value of the loaned securities during the period of the loan. The market value of the loaned securities is determined at the close of business of a fund and any additional required collateral is delivered to a fund on the next business day. A fund or borrower may terminate the loan at any time, and if the borrower defaults on its obligation to return the securities loaned because of insolvency or other reasons, a fund may apply collateral received from the borrower against the obligation. A fund may experience delays and costs in recovering the securities loaned. Any cash collateral received is invested in the Fidelity Securities Lending Cash Central Fund. Any loaned securities are identified as such in the Schedule of Investments, and the value of loaned securities and cash collateral at period end, as applicable, are presented in the Statement of Assets and Liabilities. Security lending income represents the income earned on investing cash collateral, less rebates paid to borrowers and any lending agent fees associated with the loan, plus any premium payments received for lending certain types of securities. Security lending income is presented in the Statement of Operations as a component of income from Fidelity Central Funds. Affiliated security lending activity, if any, was as follows:
| | Total Security Lending Fees Paid to NFS | Security Lending Income From Securities Loaned to NFS | Value of Securities Loaned to NFS at Period End |
| Fidelity Equity-Income Fund | $13 | $- | $- |
8. Expense Reductions.
Through arrangements with the Fund's custodian, credits realized as a result of certain uninvested cash balances were used to reduce the Fund's expenses. During the period, custodian credits reduced the Fund's expenses by $3.
In addition, during the period the investment adviser or an affiliate reimbursed and/or waived a portion of fund-level operating expenses in the amount of $252.
9. Distributions to Shareholders.
Distributions to shareholders of each class were as follows:
| | Year ended January 31, 2023 | Year ended January 31, 2022 |
| Fidelity Equity-Income Fund | | |
| Distributions to shareholders | | |
| Equity-Income | $289,594 | $675,848 |
| Class K | 25,054 | 70,992 |
Total | $314,648 | $746,840 |
10. Share Transactions.
Share transactions for each class were as follows and may contain in-kind transactions, automatic conversions between classes or exchanges between affiliated funds:
| | Shares | Shares | Dollars | Dollars |
| | Year ended January 31, 2023 | Year ended January 31, 2022 | Year ended January 31, 2023 | Year ended January 31, 2022 |
| Fidelity Equity-Income Fund | | | | |
| Equity-Income | | | | |
| Shares sold | 9,359 | 11,099 | $614,890 | $772,207 |
| Reinvestment of distributions | 4,210 | 9,259 | 268,633 | 632,363 |
| Shares redeemed | (15,862) | (13,025) | (1,032,128) | (916,774) |
| Net increase (decrease) | (2,293) | 7,333 | $(148,605) | $487,796 |
| Class K | | | | |
| Shares sold | 1,656 | 2,249 | $109,657 | $156,189 |
| Reinvestment of distributions | 393 | 1,041 | 25,054 | 70,992 |
| Shares redeemed | (4,255) | (3,504) | (278,255) | (247,272) |
| Net increase (decrease) | (2,206) | (214) | $(143,544) | $(20,091) |
11. Other.
A fund's organizational documents provide former and current trustees and officers with a limited indemnification against liabilities arising in connection with the performance of their duties to the fund. In the normal course of business, a fund may also enter into contracts that provide general indemnifications. A fund's maximum exposure under these arrangements is unknown as this would be dependent on future claims that may be made against a fund. The risk of material loss from such claims is considered remote.
12. Risk and Uncertainties.
Many factors affect a fund's performance. Developments that disrupt global economies and financial markets, such as pandemics, epidemics, outbreaks of infectious diseases, war, terrorism, and environmental disasters, may significantly affect a fund's investment performance. The effects of these developments to a fund will be impacted by the types of securities in which a fund invests, the financial condition, industry, economic sector, and geographic location of an issuer, and a fund's level of investment in the securities of that issuer.
To the Board of Trustees of Fidelity Devonshire Trust and Shareholders of Fidelity Equity-Income Fund
Opinion on the Financial Statements
We have audited the accompanying statement of assets and liabilities, including the schedule of investments, of Fidelity Equity-Income Fund (one of the funds constituting Fidelity Devonshire Trust, referred to hereafter as the "Fund") as of January 31, 2023, the related statement of operations for the year ended January 31, 2023, the statement of changes in net assets for each of the two years in the period ended January 31, 2023, including the related notes, and the financial highlights for each of the five years in the period ended January 31, 2023 (collectively referred to as the "financial statements"). In our opinion, the financial statements present fairly, in all material respects, the financial position of the Fund as of January 31, 2023, the results of its operations for the year then ended, the changes in its net assets for each of the two years in the period ended January 31, 2023 and the financial highlights for each of the five years in the period ended January 31, 2023 in conformity with accounting principles generally accepted in the United States of America.
Basis for Opinion
These financial statements are the responsibility of the Fund's management. Our responsibility is to express an opinion on the Fund's financial statements based on our audits. We are a public accounting firm registered with the Public Company Accounting Oversight Board (United States) (PCAOB) and are required to be independent with respect to the Fund in accordance with the U.S. federal securities laws and the applicable rules and regulations of the Securities and Exchange Commission and the PCAOB.
We conducted our audits of these financial statements in accordance with the standards of the PCAOB. Those standards require that we plan and perform the audit to obtain reasonable assurance about whether the financial statements are free of material misstatement, whether due to error or fraud.
Our audits included performing procedures to assess the risks of material misstatement of the financial statements, whether due to error or fraud, and performing procedures that respond to those risks. Such procedures included examining, on a test basis, evidence regarding the amounts and disclosures in the financial statements. Our audits also included evaluating the accounting principles used and significant estimates made by management, as well as evaluating the overall presentation of the financial statements. Our procedures included confirmation of securities owned as of January 31, 2023 by correspondence with the custodian and brokers; when replies were not received from brokers, we performed other auditing procedures. We believe that our audits provide a reasonable basis for our opinion.
/s/ PricewaterhouseCoopers LLP
Boston, Massachusetts
March 16, 2023
We have served as the auditor of one or more investment companies in the Fidelity group of funds since 1932.
The Trustees, Members of the Advisory Board (if any), and officers of the trust and fund, as applicable, are listed below. The Board of Trustees governs the fund and is responsible for protecting the interests of shareholders. The Trustees are experienced executives who meet periodically throughout the year to oversee the fund's activities, review contractual arrangements with companies that provide services to the fund, oversee management of the risks associated with such activities and contractual arrangements, and review the fund's performance. Each of the Trustees oversees 318 funds.
The Trustees hold office without limit in time except that (a) any Trustee may resign; (b) any Trustee may be removed by written instrument, signed by at least two-thirds of the number of Trustees prior to such removal; (c) any Trustee who requests to be retired or who has become incapacitated by illness or injury may be retired by written instrument signed by a majority of the other Trustees; and (d) any Trustee may be removed at any special meeting of shareholders by a two-thirds vote of the outstanding voting securities of the trust. Each Trustee who is not an interested person (as defined in the 1940 Act) of the trust and the fund is referred to herein as an Independent Trustee. Each Independent Trustee shall retire not later than the last day of the calendar year in which his or her 75th birthday occurs. The Independent Trustees may waive this mandatory retirement age policy with respect to individual Trustees. Officers and Advisory Board Members hold office without limit in time, except that any officer or Advisory Board Member may resign or may be removed by a vote of a majority of the Trustees at any regular meeting or any special meeting of the Trustees. Except as indicated, each individual has held the office shown or other offices in the same company for the past five years.
The fund's Statement of Additional Information (SAI) includes more information about the Trustees. To request a free copy, call Fidelity at 1-800-544-8544 if you're an individual investing directly with Fidelity, call 1-800-835-5092 if you're a plan sponsor or participant with Fidelity as your recordkeeper or call 1-877-208-0098 on institutional accounts or if you're an advisor or invest through one.
Experience, Skills, Attributes, and Qualifications of the Trustees. The Governance and Nominating Committee has adopted a statement of policy that describes the experience, qualifications, attributes, and skills that are necessary and desirable for potential Independent Trustee candidates (Statement of Policy). The Board believes that each Trustee satisfied at the time he or she was initially elected or appointed a Trustee, and continues to satisfy, the standards contemplated by the Statement of Policy. The Governance and Nominating Committee also engages professional search firms to help identify potential Independent Trustee candidates who have the experience, qualifications, attributes, and skills consistent with the Statement of Policy. From time to time, additional criteria based on the composition and skills of the current Independent Trustees, as well as experience or skills that may be appropriate in light of future changes to board composition, business conditions, and regulatory or other developments, have also been considered by the professional search firms and the Governance and Nominating Committee. In addition, the Board takes into account the Trustees' commitment and participation in Board and committee meetings, as well as their leadership of standing and ad hoc committees throughout their tenure.
In determining that a particular Trustee was and continues to be qualified to serve as a Trustee, the Board has considered a variety of criteria, none of which, in isolation, was controlling. The Board believes that, collectively, the Trustees have balanced and diverse experience, qualifications, attributes, and skills, which allow the Board to operate effectively in governing the fund and protecting the interests of shareholders. Information about the specific experience, skills, attributes, and qualifications of each Trustee, which in each case led to the Board's conclusion that the Trustee should serve (or continue to serve) as a trustee of the fund, is provided below.
Board Structure and Oversight Function. Robert A. Lawrence is an interested person and currently serves as Chair. The Trustees have determined that an interested Chair is appropriate and benefits shareholders because an interested Chair has a personal and professional stake in the quality and continuity of services provided to the fund. Independent Trustees exercise their informed business judgment to appoint an individual of their choosing to serve as Chair, regardless of whether the Trustee happens to be independent or a member of management. The Independent Trustees have determined that they can act independently and effectively without having an Independent Trustee serve as Chair and that a key structural component for assuring that they are in a position to do so is for the Independent Trustees to constitute a substantial majority for the Board. The Independent Trustees also regularly meet in executive session. David M. Thomas serves as Lead Independent Trustee and as such (i) acts as a liaison between the Independent Trustees and management with respect to matters important to the Independent Trustees and (ii) with management prepares agendas for Board meetings.
Fidelity ® funds are overseen by different Boards of Trustees. The fund's Board oversees Fidelity's high income and certain equity funds, and other Boards oversee Fidelity's alternative investment, investment-grade bond, money market, asset allocation, and other equity funds. The asset allocation funds may invest in Fidelity ® funds overseen by the fund's Board. The use of separate Boards, each with its own committee structure, allows the Trustees of each group of Fidelity ® funds to focus on the unique issues of the funds they oversee, including common research, investment, and operational issues. On occasion, the separate Boards establish joint committees to address issues of overlapping consequences for the Fidelity ® funds overseen by each Board.
The Trustees operate using a system of committees to facilitate the timely and efficient consideration of all matters of importance to the Trustees, the fund, and fund shareholders and to facilitate compliance with legal and regulatory requirements and oversight of the fund's activities and associated risks. The Board, acting through its committees, has charged FMR and its affiliates with (i) identifying events or circumstances the occurrence of which could have demonstrably adverse effects on the fund's business and/or reputation; (ii) implementing processes and controls to lessen the possibility that such events or circumstances occur or to mitigate the effects of such events or circumstances if they do occur; and (iii) creating and maintaining a system designed to evaluate continuously business and market conditions in order to facilitate the identification and implementation processes described in (i) and (ii) above. Because the day-to-day operations and activities of the fund are carried out by or through FMR, its affiliates, and other service providers, the fund's exposure to risks is mitigated but not eliminated by the processes overseen by the Trustees. While each of the Board's committees has responsibility for overseeing different aspects of the fund's activities, oversight is exercised primarily through the Operations, Audit, and Compliance Committees. Appropriate personnel, including but not limited to the fund's Chief Compliance Officer (CCO), FMR's internal auditor, the independent accountants, the fund's Treasurer and portfolio management personnel, make periodic reports to the Board's committees, as appropriate, including an annual review of Fidelity's risk management program for the Fidelity ® funds. The responsibilities of each standing committee, including their oversight responsibilities, are described further under "Standing Committees of the Trustees."
Interested Trustees*:
Correspondence intended for a Trustee who is an interested person may be sent to Fidelity Investments, 245 Summer Street, Boston, Massachusetts 02210.
Name, Year of Birth; Principal Occupations and Other Relevant Experience+
Bettina Doulton (1964)
Year of Election or Appointment: 2020
Trustee
Ms. Doulton also serves as Trustee of other Fidelity ® funds. Prior to her retirement, Ms. Doulton served in a variety of positions at Fidelity Investments, including as a managing director of research (2006-2007), portfolio manager to certain Fidelity ® funds (1993-2005), equity analyst and portfolio assistant (1990-1993), and research assistant (1987-1990). Ms. Doulton currently owns and operates Phi Builders + Architects and Cellardoor Winery. Previously, Ms. Doulton served as a member of the Board of Brown Capital Management, LLC (2014-2018).
Robert A. Lawrence (1952)
Year of Election or Appointment: 2020
Trustee
Chair of the Board of Trustees
Mr. Lawrence also serves as Trustee of other funds. Previously, Mr. Lawrence served as a Trustee and Member of the Advisory Board of certain funds. Prior to his retirement in 2008, Mr. Lawrence served as Vice President of certain Fidelity ® funds (2006-2008), Senior Vice President, Head of High Income Division of Fidelity Management & Research Company (investment adviser firm, 2006-2008), and President of Fidelity Strategic Investments (investment adviser firm, 2002-2005).
* Determined to be an "Interested Trustee" by virtue of, among other things, his or her affiliation with the trust or various entities under common control with FMR.
+ The information includes the Trustee's principal occupation during the last five years and other information relating to the experience, attributes, and skills relevant to the Trustee's qualifications to serve as a Trustee, which led to the conclusion that the Trustee should serve as a Trustee for the fund.
Independent Trustees:
Correspondence intended for an Independent Trustee may be sent to Fidelity Investments, P.O. Box 55235, Boston, Massachusetts 02205-5235.
Name, Year of Birth; Principal Occupations and Other Relevant Experience+
Thomas P. Bostick (1956)
Year of Election or Appointment: 2021
Trustee
Lieutenant General Bostick also serves as Trustee of other Fidelity ® funds. Prior to his retirement, General Bostick (United States Army, Retired) held a variety of positions within the U.S. Army, including Commanding General and Chief of Engineers, U.S. Army Corps of Engineers (2012-2016) and Deputy Chief of Staff and Director of Human Resources, U.S. Army (2009-2012). General Bostick currently serves as a member of the Board and Finance and Governance Committees of CSX Corporation (transportation, 2020-present) and a member of the Board and Corporate Governance and Nominating Committee of Perma-Fix Environmental Services, Inc. (nuclear waste management, 2020-present). General Bostick serves as Chief Executive Officer of Bostick Global Strategies, LLC (consulting, 2016-present) and as a member of the Board of HireVue, Inc. (video interview and assessment, 2020-present). Previously, General Bostick served as a Member of the Advisory Board of certain Fidelity® funds (2021), President, Intrexon Bioengineering (2018-2020) and Chief Operating Officer (2017-2020) and Senior Vice President of the Environment Sector (2016-2017) of Intrexon Corporation (biopharmaceutical company).
Dennis J. Dirks (1948)
Year of Election or Appointment: 2005
Trustee
Mr. Dirks also serves as Trustee of other Fidelity ® funds. Prior to his retirement in May 2003, Mr. Dirks served as Chief Operating Officer and as a member of the Board of The Depository Trust & Clearing Corporation (financial markets infrastructure), President, Chief Operating Officer and a member of the Board of The Depository Trust Company (DTC), President and a member of the Board of the National Securities Clearing Corporation (NSCC), Chief Executive Officer and a member of the Board of the Government Securities Clearing Corporation and Chief Executive Officer and a member of the Board of the Mortgage-Backed Securities Clearing Corporation. Mr. Dirks currently serves as a member of the Finance Committee (2016-present) and Board (2017-present) and is Treasurer (2018-present) of the Asolo Repertory Theatre.
Donald F. Donahue (1950)
Year of Election or Appointment: 2018
Trustee
Mr. Donahue also serves as Trustee of other Fidelity ® funds. Mr. Donahue serves as President and Chief Executive Officer of Miranda Partners, LLC (risk consulting for the financial services industry, 2012-present). Previously, Mr. Donahue served as Chief Executive Officer (2006-2012), Chief Operating Officer (2003-2006) and Managing Director, Customer Marketing and Development (1999-2003) of The Depository Trust & Clearing Corporation (financial markets infrastructure). Mr. Donahue currently serves as a member (2007-present) and Co-Chairman (2016-present) of the Board of United Way of New York and a member of the Board of The Leadership Academy (previously NYC Leadership Academy) (2012-present). Mr. Donahue previously served as a member of the Advisory Board of certain Fidelity® funds (2015-2018).
Vicki L. Fuller (1957)
Year of Election or Appointment: 2020
Trustee
Ms. Fuller also serves as Trustee of other Fidelity ® funds. Previously, Ms. Fuller served as a member of the Advisory Board of certain Fidelity ® funds (2018-2020), Chief Investment Officer of the New York State Common Retirement Fund (2012-2018) and held a variety of positions at AllianceBernstein L.P. (global asset management, 1985-2012), including Managing Director (2006-2012) and Senior Vice President and Senior Portfolio Manager (2001-2006). Ms. Fuller currently serves as a member of the Board, Audit Committee and Nominating and Governance Committee of two Blackstone business development companies (2020-present), as a member of the Board of Treliant, LLC (consulting, 2019-present), as a member of the Advisory Board of Ariel Alternatives, LLC (private equity, 2021-present) and as a member of the Board and Chair of the Audit Committee of Gusto, Inc. (software, 2021-present). In addition, Ms. Fuller currently serves as a member of the Board of Roosevelt University (2019-present) and as a member of the Executive Board of New York University's Stern School of Business. Ms. Fuller previously served as a member of the Board, Audit Committee and Nominating and Governance Committee of The Williams Companies, Inc. (natural gas infrastructure, 2018-2021).
Patricia L. Kampling (1959)
Year of Election or Appointment: 2020
Trustee
Ms. Kampling also serves as Trustee of other Fidelity ® funds. Prior to her retirement, Ms. Kampling served as Chairman of the Board and Chief Executive Officer (2012-2019), President and Chief Operating Officer (2011-2012) and Executive Vice President and Chief Financial Officer (2010-2011) of Alliant Energy Corporation. Ms. Kampling currently serves as a member of the Board, Finance Committee and Governance, Compensation and Nominating Committee of Xcel Energy Inc. (utilities company, 2020-present) and as a member of the Board, Audit, Finance and Risk Committee and Safety, Environmental, Technology and Operations Committee and Chair of the Executive Development and Compensation Committee of American Water Works Company, Inc. (utilities company, 2019-present). In addition, Ms. Kampling currently serves as a member of the Board of the Nature Conservancy, Wisconsin Chapter (2019-present). Previously, Ms. Kampling served as a Member of the Advisory Board of certain Fidelity® funds (2020), a member of the Board, Compensation Committee and Executive Committee and Chair of the Audit Committee of Briggs & Stratton Corporation (manufacturing, 2011-2021), a member of the Board of Interstate Power and Light Company (2012-2019) and Wisconsin Power and Light Company (2012-2019) (each a subsidiary of Alliant Energy Corporation) and as a member of the Board and Workforce Development Committee of the Business Roundtable (2018-2019).
Thomas A. Kennedy (1955)
Year of Election or Appointment: 2021
Trustee
Mr. Kennedy also serves as Trustee of other Fidelity ® funds. Previously, Mr. Kennedy served as a Member of the Advisory Board of certain Fidelity ® funds (2020) and held a variety of positions at Raytheon Company (aerospace and defense, 1983-2020), including Chairman and Chief Executive Officer (2014-2020) and Executive Vice President and Chief Operating Officer (2013-2014). Mr. Kennedy currently serves as Executive Chairman of the Board of Directors of Raytheon Technologies Corporation (aerospace and defense, 2020-present). He is also a member of the Rutgers School of Engineering Industry Advisory Board (2011-present) and a member of the UCLA Engineering Dean's Executive Board (2016-present).
Oscar Munoz (1959)
Year of Election or Appointment: 2021
Trustee
Mr. Munoz also serves as Trustee of other Fidelity ® funds. Prior to his retirement, Mr. Munoz served as Executive Chairman (2020-2021), Chief Executive Officer (2015-2020), President (2015-2016) and a member of the Board (2010-2021) of United Airlines Holdings, Inc. Mr. Munoz currently serves as a member of the Board of CBRE Group, Inc. (commercial real estate, 2020-present), a member of the Board of Univision Communications, Inc. (Hispanic media, 2020-present) and a member of the Advisory Board of Salesforce.com, Inc. (cloud-based software, 2020-present). Previously, Mr. Munoz served as a Member of the Advisory Board of certain Fidelity ® funds (2021).
David M. Thomas (1949)
Year of Election or Appointment: 2008
Trustee
Lead Independent Trustee
Mr. Thomas also serves as Trustee of other Fidelity ® funds. Previously, Mr. Thomas served as Executive Chairman (2005-2006) and Chairman and Chief Executive Officer (2000-2005) of IMS Health, Inc. (pharmaceutical and healthcare information solutions). Mr. Thomas currently serves as a member of the Board of Fortune Brands Home and Security (home and security products, 2004-present) and as Director (2013-present) and Non-Executive Chairman of the Board (2022-present) of Interpublic Group of Companies, Inc. (marketing communication).
Susan Tomasky (1953)
Year of Election or Appointment: 2020
Trustee
Ms. Tomasky also serves as Trustee of other Fidelity ® funds. Prior to her retirement, Ms. Tomasky served in various executive officer positions at American Electric Power Company, Inc. (1998-2011), including most recently as President of AEP Transmission (2007-2011). Ms. Tomasky currently serves as a member of the Board and Sustainability Committee and as Chair of the Audit Committee of Marathon Petroleum Corporation (2018-present) and as a member of the Board, Executive Committee, Corporate Governance Committee and Organization and Compensation Committee and as Chair of the Audit Committee of Public Service Enterprise Group, Inc. (utilities company, 2012-present) and as a member of the Board of its subsidiary company, Public Service Electric and Gas Co. (2021-present). In addition, Ms. Tomasky currently serves as a member (2009-present) and President (2020-present) of the Board of the Royal Shakespeare Company - America (2009-present), as a member of the Board of the Columbus Association for the Performing Arts (2011-present) and as a member of the Board and Kenyon in the World Committee of Kenyon College (2016-present). Previously, Ms. Tomasky served as a Member of the Advisory Board of certain Fidelity ® funds (2020), as a member of the Board of the Columbus Regional Airport Authority (2007-2020), as a member of the Board (2011-2018) and Lead Independent Director (2015-2018) of Andeavor Corporation (previously Tesoro Corporation) (independent oil refiner and marketer) and as a member of the Board of Summit Midstream Partners LP (energy, 2012-2018).
Michael E. Wiley (1950)
Year of Election or Appointment: 2018
Trustee
Mr. Wiley also serves as Trustee of other Fidelity ® funds. Previously, Mr. Wiley served as a member of the Advisory Board of certain Fidelity ® funds (2018-2020), Chairman, President and CEO of Baker Hughes, Inc. (oilfield services, 2000-2004). Mr. Wiley also previously served as a member of the Board of Andeavor Corporation (independent oil refiner and marketer, 2005-2018), a member of the Board of Andeavor Logistics LP (natural resources logistics, 2015-2018) and a member of the Board of High Point Resources (exploration and production, 2005-2020).
+ The information includes the Trustee's principal occupation during the last five years and other information relating to the experience, attributes, and skills relevant to the Trustee's qualifications to serve as a Trustee, which led to the conclusion that the Trustee should serve as a Trustee for the fund.
Advisory Board Members and Officers:
Correspondence intended for a Member of the Advisory Board (if any) may be sent to Fidelity Investments, P.O. Box 55235, Boston, Massachusetts 02205-5235. Correspondence intended for an officer or Peter S. Lynch may be sent to Fidelity Investments, 245 Summer Street, Boston, Massachusetts 02210. Officers appear below in alphabetical order.
Name, Year of Birth; Principal Occupation
Peter S. Lynch (1944)
Year of Election or Appointment: 2003
Member of the Advisory Board
Mr. Lynch also serves as a Member of the Advisory Board of other Fidelity ® funds. Mr. Lynch is Vice Chairman and a Director of Fidelity Management & Research Company LLC (investment adviser firm). In addition, Mr. Lynch serves as a Trustee of Boston College and as the Chairman of the Inner-City Scholarship Fund. Previously, Mr. Lynch served as Vice Chairman and a Director of FMR Co., Inc. (investment adviser firm) and on the Special Olympics International Board of Directors (1997-2006).
Craig S. Brown (1977)
Year of Election or Appointment: 2022
Deputy Treasurer
Mr. Brown also serves as an officer of other funds. Mr. Brown serves as Assistant Treasurer of FIMM, LLC (2021-present) and is an employee of Fidelity Investments (2013-present). Previously, Mr. Brown served as Assistant Treasurer of certain Fidelity ® funds (2019-2022).
John J. Burke III (1964)
Year of Election or Appointment: 2018
Chief Financial Officer
Mr. Burke also serves as Chief Financial Officer of other funds. Mr. Burke serves as Head of Investment Operations for Fidelity Fund and Investment Operations (2018-present) and is an employee of Fidelity Investments (1998-present). Previously Mr. Burke served as head of Asset Management Investment Operations (2012-2018).
William C. Coffey (1969)
Year of Election or Appointment: 2019
Assistant Secretary
Mr. Coffey also serves as Assistant Secretary of other funds. He is Senior Vice President and Deputy General Counsel of FMR LLC (diversified financial services company, 2010-present), and is an employee of Fidelity Investments. Previously, Mr. Coffey served as Secretary and CLO of certain funds (2018-2019); CLO, Secretary, and Senior Vice President of Fidelity Management & Research Company and FMR Co., Inc. (investment adviser firms, 2018-2019); Secretary of Fidelity SelectCo, LLC and Fidelity Investments Money Management, Inc. (investment adviser firms, 2018-2019); CLO of Fidelity Management & Research (Hong Kong) Limited, FMR Investment Management (UK) Limited, and Fidelity Management & Research (Japan) Limited (investment adviser firms, 2018-2019); and Assistant Secretary of certain funds (2009-2018).
Timothy M. Cohen (1969)
Year of Election or Appointment: 2018
Vice President
Mr. Cohen also serves as Vice President of other funds. Mr. Cohen serves as Co-Head of Equity (2018-present), a Director of Fidelity Management & Research (Japan) Limited (investment adviser firm, 2016-present), and is an employee of Fidelity Investments. Previously, Mr. Cohen served as Executive Vice President of Fidelity SelectCo, LLC (2019), Head of Global Equity Research (2016-2018), Chief Investment Officer - Equity and a Director of Fidelity Management & Research (U.K.) Inc. (investment adviser firm, 2013-2015) and as a Director of Fidelity Management & Research (Hong Kong) Limited (investment adviser firm, 2017).
Jonathan Davis (1968)
Year of Election or Appointment: 2010
Assistant Treasurer
Mr. Davis also serves as an officer of other funds. Mr. Davis serves as Assistant Treasurer of FIMM, LLC (2021-present), FMR Capital, Inc. (2017-present), FD Funds GP LLC (2021-present), FD Funds Holding LLC (2021-present), and FD Funds Management LLC (2021-present); and is an employee of Fidelity Investments. Previously, Mr. Davis served as Vice President and Associate General Counsel of FMR LLC (diversified financial services company, 2003-2010).
Laura M. Del Prato (1964)
Year of Election or Appointment: 2018
Assistant Treasurer
Ms. Del Prato also serves as an officer of other funds. Ms. Del Prato serves as Assistant Treasurer of FIMM, LLC (2021-present) and is an employee of Fidelity Investments (2017-present). Previously, Ms. Del Prato served as President and Treasurer of The North Carolina Capital Management Trust: Cash Portfolio and Term Portfolio (2018-2020). Prior to joining Fidelity Investments, Ms. Del Prato served as a Managing Director and Treasurer of the JPMorgan Mutual Funds (2014-2017). Prior to JPMorgan, Ms. Del Prato served as a partner at Cohen Fund Audit Services (accounting firm, 2012-2013) and KPMG LLP (accounting firm, 2004-2012).
Colm A. Hogan (1973)
Year of Election or Appointment: 2020
Assistant Treasurer
Mr. Hogan also serves as an officer of other funds. Mr. Hogan serves as Assistant Treasurer of FIMM, LLC (2021-present) and FMR Capital, Inc. (2017-present) and is an employee of Fidelity Investments (2005-present). Previously, Mr. Hogan served as Deputy Treasurer of certain Fidelity ® funds (2016-2020) and Assistant Treasurer of certain Fidelity ® funds (2016-2018).
Pamela R. Holding (1964)
Year of Election or Appointment: 2018
Vice President
Ms. Holding also serves as Vice President of other funds. Ms. Holding serves as Co-Head of Equity (2018-present) and is an employee of Fidelity Investments (2013-present). Previously, Ms. Holding served as Executive Vice President of Fidelity SelectCo, LLC (2019) and as Chief Investment Officer of Fidelity Institutional Asset Management (2013-2018).
Cynthia Lo Bessette (1969)
Year of Election or Appointment: 2019
Secretary and Chief Legal Officer (CLO)
Ms. Lo Bessette also serves as an officer of other funds. Ms. Lo Bessette serves as CLO, Secretary, and Senior Vice President of Fidelity Management & Research Company LLC (investment adviser firm, 2019-present); CLO of Fidelity Management & Research (Hong Kong) Limited, FMR Investment Management (UK) Limited, and Fidelity Management & Research (Japan) Limited (investment adviser firms, 2019-present); Secretary of FD Funds GP LLC (2021-present), FD Funds Holding LLC (2021-present), FD Funds Management LLC (2021-present), and Fidelity Diversifying Solutions LLC (investment adviser firm, 2022-present); and Assistant Secretary of FIMM, LLC (2019-present). She is a Senior Vice President and Deputy General Counsel of FMR LLC (diversified financial services company, 2019-present), and is an employee of Fidelity Investments. Previously, Ms. Lo Bessette served as CLO, Secretary, and Senior Vice President of FMR Co., Inc. (investment adviser firm, 2019); Secretary of Fidelity SelectCo, LLC and Fidelity Investments Money Management, Inc. (investment adviser firms, 2019). Prior to joining Fidelity Investments, Ms. Lo Bessette was Executive Vice President, General Counsel (2016-2019) and Senior Vice President, Deputy General Counsel (2015-2016) of OppenheimerFunds (investment management company) and Deputy Chief Legal Officer (2013-2015) of Jennison Associates LLC (investment adviser firm).
Chris Maher (1972)
Year of Election or Appointment: 2020
Deputy Treasurer
Mr. Maher also serves as an officer of other funds. Mr. Maher serves as Assistant Treasurer of FIMM, LLC (2021-present) and FMR Capital, Inc. (2017-present), and is an employee of Fidelity Investments (2008-present). Previously, Mr. Maher served as Assistant Treasurer of certain funds (2013-2020); Vice President of Asset Management Compliance (2013), Vice President of the Program Management Group of FMR (investment adviser firm, 2010-2013), and Vice President of Valuation Oversight (2008-2010).
Jason P. Pogorelec (1975)
Year of Election or Appointment: 2020
Chief Compliance Officer
Mr. Pogorelec also serves as Chief Compliance Officer of other funds. Mr. Pogorelec is a Senior Vice President of Asset Management Compliance for Fidelity Investments and is an employee of Fidelity Investments. Mr. Pogorelec serves as Compliance Officer of Fidelity Management & Research Company LLC (investment adviser firm, 2023-present). Previously, Mr. Pogorelec served as Vice President, Associate General Counsel for Fidelity Investments (2010-2020) and Assistant Secretary of certain Fidelity ® funds (2015-2020).
Brett Segaloff (1972)
Year of Election or Appointment: 2021
Anti-Money Laundering (AML) Officer
Mr. Segaloff also serves as an AML Officer of other funds and other related entities. He is Director, Anti-Money Laundering (2007-present) of FMR LLC (diversified financial services company) and is an employee of Fidelity Investments (1996-present).
Stacie M. Smith (1974)
Year of Election or Appointment: 2016
President and Treasurer
Ms. Smith also serves as an officer of other funds. Ms. Smith serves as Assistant Treasurer of FIMM, LLC (2021-present) and FMR Capital, Inc. (2017-present), is an employee of Fidelity Investments (2009-present), and has served in other fund officer roles. Prior to joining Fidelity Investments, Ms. Smith served as Senior Audit Manager of Ernst & Young LLP (accounting firm, 1996-2009). Previously, Ms. Smith served as Assistant Treasurer (2013-2019) and Deputy Treasurer (2013-2016) of certain Fidelity ® funds.
Jim Wegmann (1979)
Year of Election or Appointment: 2019
Assistant Treasurer
Mr. Wegmann also serves as an officer of other funds. Mr. Wegmann serves as Assistant Treasurer of FIMM, LLC (2021-present) and is an employee of Fidelity Investments (2011-present). Previously, Mr. Wegmann served as Assistant Treasurer of certain Fidelity ® funds (2019-2021).
As a shareholder, you incur two types of costs: (1) transaction costs, which may include sales charges (loads) on purchase payments or redemption proceeds, as applicable and (2) ongoing costs, which generally include management fees, distribution and/or service (12b-1) fees and other Fund expenses. This Example is intended to help you understand your ongoing costs (in dollars) of investing in a fund and to compare these costs with the ongoing costs of investing in other mutual funds.
| The Example is based on an investment of $1,000 invested at the beginning of the period and held for the entire period (August 1, 2022 to January 31, 2023). |
Actual Expenses
The first line of the accompanying table provides information about actual account values and actual expenses. You may use the information in this line, together with the amount you invested, to estimate the expenses that you paid over the period. Simply divide your account value by $1,000.00 (for example, an $8,600 account value divided by $1,000.00 = 8.6), then multiply the result by the number in the first line for a class/Fund under the heading entitled "Expenses Paid During Period" to estimate the expenses you paid on your account during this period. If any fund is a shareholder of any underlying mutual funds or exchange-traded funds (ETFs) (the Underlying Funds), such fund indirectly bears its proportional share of the expenses of the Underlying Funds in addition to the direct expenses incurred presented in the table. These fees and expenses are not included in the annualized expense ratio used to calculate the expense estimate in the table below.
Hypothetical Example for Comparison Purposes
The second line of the accompanying table provides information about hypothetical account values and hypothetical expenses based on the actual expense ratio and an assumed rate of return of 5% per year before expenses, which is not the actual return. The hypothetical account values and expenses may not be used to estimate the actual ending account balance or expenses you paid for the period. You may use this information to compare the ongoing costs of investing in the Fund and other funds. To do so, compare this 5% hypothetical example with the 5% hypothetical examples that appear in the shareholder reports of the other funds. If any fund is a shareholder of any Underlying Funds, such fund indirectly bears its proportional share of the expenses of the Underlying Funds in addition to the direct expenses as presented in the table. These fees and expenses are not included in the annualized expense ratio used to calculate the expense estimate in the table below.
Please note that the expenses shown in the table are meant to highlight your ongoing costs only and do not reflect any transaction costs. Therefore, the second line of the table is useful in comparing ongoing costs only, and will not help you determine the relative total costs of owning different funds. In addition, if these transactional costs were included, your costs would have been higher.
| | | | | Annualized Expense Ratio- A | | Beginning Account Value August 1, 2022 | | Ending Account Value January 31, 2023 | | Expenses Paid During Period- C August 1, 2022 to January 31, 2023 |
| Fidelity® Equity-Income Fund | | | | | | | | | | |
| Fidelity® Equity-Income Fund | | | | .57% | | | | | | |
| Actual | | | | | | $ 1,000 | | $ 1,049.90 | | $ 2.95 |
Hypothetical- B | | | | | | $ 1,000 | | $ 1,022.33 | | $ 2.91 |
| Class K | | | | .48% | | | | | | |
| Actual | | | | | | $ 1,000 | | $ 1,050.40 | | $ 2.48 |
Hypothetical- B | | | | | | $ 1,000 | | $ 1,022.79 | | $ 2.45 |
| |
A Annualized expense ratio reflects expenses net of applicable fee waivers.
B 5% return per year before expenses
C Expenses are equal to the annualized expense ratio, multiplied by the average account value over the period, multiplied by 184/ 365 (to reflect the one-half year period). The fees and expenses of any Underlying Funds are not included in each annualized expense ratio.
The dividend and capital gains distributions for the fund(s) are available on Fidelity.com or Institutional.Fidelity.com.
The fund hereby designates as a capital gain dividend with respect to the taxable year ended January 31, 2023, $206,842,467, or, if subsequently determined to be different, the net capital gain of such year.
A total of 0.01% of the dividends distributed during the fiscal year was derived from interest on U.S. Government securities which is generally exempt from state income tax.
The fund designates $3,707,569 of distributions paid during the fiscal year ended 2023 as qualifying to be taxed as section 163(j) interest dividends.
Equity-Income designates 96%, 95%, 95%, and 95%; and Class K designates 92%, 91%, 91%, and 92%; of the dividends distributed in April, July, October, and December, respectively during the fiscal year as qualifying for the dividends-received deduction for corporate shareholders.
Equity-Income Fund, and Class K designate 100% of each dividend distributed during the fiscal year as amounts which may be taken into account as a dividend for purposes of the maximum rate under section 1(h)(11) of the Internal Revenue Code.
The fund will notify shareholders in January 2024 of amounts for use in preparing 2023 income tax returns.
The Securities and Exchange Commission adopted Rule 22e-4 under the Investment Company Act of 1940 (the Liquidity Rule) to promote effective liquidity risk management throughout the open-end investment company industry, thereby reducing the risk that funds will be unable to meet their redemption obligations and mitigating dilution of the interests of fund shareholders.
The Fund has adopted and implemented a liquidity risk management program (the Program) reasonably designed to assess and manage the Fund's liquidity risk and to comply with the requirements of the Liquidity Rule. The Fund's Board of Trustees (the Board) has designated the Fund's investment adviser as administrator of the Program. The Fidelity advisers have established a Liquidity Risk Management Committee (the LRM Committee) to manage the Program for each of the Fidelity Funds. The LRM Committee monitors the adequacy and effectiveness of implementation of the Program and on a periodic basis assesses each Fund's liquidity risk based on a variety of factors including (1) the Fund's investment strategy, (2) portfolio liquidity and cash flow projections during normal and reasonably foreseeable stressed conditions, (3) shareholder redemptions, (4) borrowings and other funding sources and (5) certain factors specific to ETFs including the effect of the Fund's prices and spreads, market participants, and basket compositions on the overall liquidity of the Fund's portfolio, as applicable.
In accordance with the Program, each of the Fund's portfolio investments is classified into one of four defined liquidity categories based on a determination of a reasonable expectation for how long it would take to convert the investment to cash (or sell or dispose of the investment) without significantly changing its market value.
- Highly liquid investments - cash or convertible to cash within three business days or less
- Moderately liquid investments - convertible to cash in three to seven calendar days
- Less liquid investments - can be sold or disposed of, but not settled, within seven calendar days
- Illiquid investments - cannot be sold or disposed of within seven calendar days
Liquidity classification determinations take into account a variety of factors including various market, trading and investment-specific considerations, as well as market depth, and generally utilize analysis from a third-party liquidity metrics service.
The Liquidity Rule places a 15% limit on a fund's illiquid investments and requires funds that do not primarily hold assets that are highly liquid investments to determine and maintain a minimum percentage of the fund's net assets to be invested in highly liquid investments (highly liquid investment minimum or HLIM). The Program includes provisions reasonably designed to comply with the 15% limit on illiquid investments and for determining, periodically reviewing and complying with the HLIM requirement as applicable.
At a recent meeting of the Fund's Board of Trustees, the LRM Committee provided a written report to the Board pertaining to the operation, adequacy, and effectiveness of the Program for the period December 1, 2021 through November 30, 2022. The report concluded that the Program is operating effectively and is reasonably designed to assess and manage the Fund's liquidity risk.
1.471443.126
EQU-ANN-0423
Fidelity® Equity-Income K6 Fund
Annual Report
January 31, 2023
Contents
To view a fund's proxy voting guidelines and proxy voting record for the 12-month period ended June 30, visit http://www.fidelity.com/proxyvotingresults or visit the Securities and Exchange Commission's (SEC) web site at http://www.sec.gov.
You may also call 1-800-835-5092 to request a free copy of the proxy voting guidelines.
Standard & Poor's, S&P and S&P 500 are registered service marks of The McGraw-Hill Companies, Inc. and have been licensed for use by Fidelity Distributors Corporation.
Other third-party marks appearing herein are the property of their respective owners.
All other marks appearing herein are registered or unregistered trademarks or service marks of FMR LLC or an affiliated company. © 2023 FMR LLC. All rights reserved.
This report and the financial statements contained herein are submitted for the general information of the shareholders of the Fund. This report is not authorized for distribution to prospective investors in the Fund unless preceded or accompanied by an effective prospectus.
A fund files its complete schedule of portfolio holdings with the SEC for the first and third quarters of each fiscal year on Form N-PORT. Forms N-PORT are available on the SEC's web site at http://www.sec.gov. A fund's Forms N-PORT may be reviewed and copied at the SEC's Public Reference Room in Washington, DC. Information regarding the operation of the SEC's Public Reference Room may be obtained by calling 1-800-SEC-0330.
For a complete list of a fund's portfolio holdings, view the most recent holdings listing, semiannual report, or annual report on Fidelity's web site at http://www.fidelity.com, http://www.institutional.fidelity.com, or http://www.401k.com, as applicable.
NOT FDIC INSURED •MAY LOSE VALUE •NO BANK GUARANTEE
Neither the Fund nor Fidelity Distributors Corporation is a bank.
Average annual total return reflects the change in the value of an investment, assuming reinvestment of distributions from dividend income and capital gains (the profits earned upon the sale of securities that have grown in value, if any) and assuming a constant rate of performance each year. The hypothetical investment and the average annual total returns do not reflect the deduction of taxes that a shareholder would pay on fund distributions or the redemption of fund shares. During periods of reimbursement by Fidelity, a fund's total return will be greater than it would be had the reimbursement not occurred. How a fund did yesterday is no guarantee of how it will do tomorrow.
| Average Annual Total Returns |
| | | | |
Periods ended January 31, 2023 | Past 1 year | Life of Fund A |
| Fidelity® Equity-Income K6 Fund | 0.35% | 11.13% |
A From June 13, 2019
| $10,000 Over Life of Fund |
| |
Let's say hypothetically that $10,000 was invested in Fidelity® Equity-Income K6 Fund, on June 13, 2019, when the fund started. The chart shows how the value of your investment would have changed, and also shows how the Russell 3000® Value Index performed over the same period. |
|
|
Market Recap:
U.S. equities returned -8.22% for the 12 months ending January 31, 2023, according to the S&P 500 ® index. The new year began with an encouraging upturn in January (+6.28%), but the backdrop remains clouded by the multitude of risk factors that challenged the global economy in 2022, when the index logged its lowest calendar-year return since 2008 and first annual retreat since 2018. High inflation prompted the Federal Reserve to aggressively tighten monetary policy, and market interest rates eclipsed their highest level in a decade, stoking recession fears and sending stocks into bear market territory. Since March 2022, the Fed has hiked its benchmark rate seven times, by 4.25 percentage points - the fastest-ever pace of monetary tightening - while also shrinking its massive portfolio. The latest bump came in mid-December, along with a signal that the central bank plans to lift rates through the spring, though likely in smaller increments, to combat high inflation. Against this backdrop, stocks struggled to gain traction until a strong rally ignited heading into the summer. But in September, the S&P 500 ® returned -9.21%, one of its worst monthly results ever, before advancing 7.56% in Q4 as risky assets regained favor. For the full 12 months, value stocks handily outpaced growth. This headwind was most pronounced in the growth-oriented communication services (-27%), consumer discretionary (-20%) and information technology (-16%) sectors. In contrast, energy (+43%) led by a wide margin, followed by health care (+3%).
Comments from Portfolio Manager Ramona Persaud:
For the fiscal year ending January 31, 2023, the fund gained 0.35%, outperforming the -0.43% result of the benchmark Russell 3000 ® Value Index. The top contributor to performance versus the benchmark was stock selection in health care. Also helping was an overweighting and security selection in energy and an underweighting and stock picks in real estate. The fund's largest individual relative contributor was an outsized stake in Eli Lilly, which gained 42% the past year. Also adding value was our overweighting in Exxon Mobil, which gained roughly 58%. Exxon Mobil was among our largest holdings. Avoiding Intel, a benchmark component that returned -40%, also helped relative performance. Conversely, the biggest detractor from performance versus the benchmark were stock picks in financials. Security selection and an underweighting in consumer discretionary and stock selection in materials also hindered the fund's relative performance. I'll also note that the fund's foreign holdings detracted overall, in part due to a generally strong U.S. dollar. Not owning Chevron, a benchmark component that gained approximately 37%, was the biggest individual relative detractor. Also hampering performance was our outsized stake in Bank of America, which returned about -21%. Bank of America was one of the fund's largest holdings. The fund's non-benchmark stake in Microsoft returned about -20% and detracted. Notable changes in positioning include increased exposure to the energy sector and a lower allocation to consumer discretionary.
The views expressed above reflect those of the portfolio manager(s) only through the end of the period as stated on the cover of this report and do not necessarily represent the views of Fidelity or any other person in the Fidelity organization. Any such views are subject to change at any time based upon market or other conditions and Fidelity disclaims any responsibility to update such views. These views may not be relied on as investment advice and, because investment decisions for a Fidelity fund are based on numerous factors, may not be relied on as an indication of trading intent on behalf of any Fidelity fund.
Top Holdings (% of Fund's net assets) |
| |
| Exxon Mobil Corp. | 3.3 | |
| JPMorgan Chase & Co. | 3.2 | |
| Bank of America Corp. | 2.4 | |
| Johnson & Johnson | 2.0 | |
| Danaher Corp. | 2.0 | |
| Walmart, Inc. | 1.9 | |
| Linde PLC | 1.8 | |
| Wells Fargo & Co. | 1.8 | |
| T-Mobile U.S., Inc. | 1.6 | |
| Cigna Corp. | 1.6 | |
| | 21.6 | |
| |
| Market Sectors (% of Fund's net assets) |
| |
| Health Care | 16.9 | |
| Financials | 15.8 | |
| Energy | 9.8 | |
| Consumer Staples | 9.6 | |
| Information Technology | 9.4 | |
| Industrials | 8.4 | |
| Communication Services | 7.4 | |
| Utilities | 5.8 | |
| Materials | 4.9 | |
| Consumer Discretionary | 4.2 | |
| Real Estate | 2.0 | |
| |
Asset Allocation (% of Fund's net assets) |
|
Foreign investments - 17.1% |
|
Geographic Diversification (% of Fund's net assets) |
|
* Includes Short-Term investments and Net Other Assets (Liabilities). Percentages are based on country or territory of incorporation and are adjusted for the effect of derivatives, if applicable. |
| |
Showing Percentage of Net Assets
| Common Stocks - 94.2% |
| | | Shares | Value ($) |
| COMMUNICATION SERVICES - 7.4% | | | |
| Diversified Telecommunication Services - 1.8% | | | |
| AT&T, Inc. | | 64,055 | 1,304,800 |
| Verizon Communications, Inc. | | 35,564 | 1,478,395 |
| | | | 2,783,195 |
| Entertainment - 0.8% | | | |
| Activision Blizzard, Inc. | | 15,890 | 1,216,697 |
| Interactive Media & Services - 0.9% | | | |
| Alphabet, Inc. Class A (a) | | 14,249 | 1,408,371 |
| Media - 2.0% | | | |
| Comcast Corp. Class A | | 57,757 | 2,272,738 |
| Interpublic Group of Companies, Inc. | | 17,174 | 626,164 |
| Shaw Communications, Inc. Class B | | 10,625 | 316,223 |
| | | | 3,215,125 |
| Wireless Telecommunication Services - 1.9% | | | |
| Rogers Communications, Inc. Class B (non-vtg.) | | 10,837 | 526,884 |
| T-Mobile U.S., Inc. (a) | | 17,002 | 2,538,569 |
| | | | 3,065,453 |
TOTAL COMMUNICATION SERVICES | | | 11,688,841 |
| CONSUMER DISCRETIONARY - 4.2% | | | |
| Diversified Consumer Services - 0.2% | | | |
| H&R Block, Inc. | | 10,381 | 404,651 |
| Hotels, Restaurants & Leisure - 1.3% | | | |
| McDonald's Corp. | | 7,504 | 2,006,570 |
| Multiline Retail - 0.9% | | | |
| Dollar Tree, Inc. (a) | | 5,443 | 817,430 |
| Target Corp. | | 3,509 | 604,039 |
| | | | 1,421,469 |
| Specialty Retail - 1.7% | | | |
| Best Buy Co., Inc. | | 3,550 | 314,956 |
| Burlington Stores, Inc. (a) | | 2,517 | 578,482 |
| Dick's Sporting Goods, Inc. | | 625 | 81,725 |
| Lowe's Companies, Inc. | | 313 | 65,182 |
| TJX Companies, Inc. | | 19,263 | 1,576,869 |
| | | | 2,617,214 |
| Textiles, Apparel & Luxury Goods - 0.1% | | | |
| Columbia Sportswear Co. | | 1,255 | 120,355 |
| Tapestry, Inc. | | 2,297 | 104,674 |
| | | | 225,029 |
TOTAL CONSUMER DISCRETIONARY | | | 6,674,933 |
| CONSUMER STAPLES - 9.6% | | | |
| Beverages - 2.6% | | | |
| Diageo PLC | | 12,138 | 530,748 |
| Keurig Dr. Pepper, Inc. | | 45,103 | 1,591,234 |
| The Coca-Cola Co. | | 31,727 | 1,945,500 |
| | | | 4,067,482 |
| Food & Staples Retailing - 3.2% | | | |
| Albertsons Companies, Inc. | | 17,366 | 368,159 |
| Alimentation Couche-Tard, Inc. Class A (multi-vtg.) | | 8,928 | 407,700 |
| BJ's Wholesale Club Holdings, Inc. (a) | | 7,534 | 545,989 |
| Costco Wholesale Corp. | | 1,550 | 792,267 |
| Walmart, Inc. | | 20,595 | 2,963,003 |
| | | | 5,077,118 |
| Food Products - 1.3% | | | |
| Bunge Ltd. | | 4,641 | 459,923 |
| Mondelez International, Inc. | | 19,869 | 1,300,227 |
| Nestle SA (Reg. S) | | 2,533 | 309,049 |
| | | | 2,069,199 |
| Household Products - 1.4% | | | |
| Procter & Gamble Co. | | 14,895 | 2,120,750 |
| Personal Products - 0.2% | | | |
| Unilever PLC | | 7,115 | 362,147 |
| Tobacco - 0.9% | | | |
| Philip Morris International, Inc. | | 13,357 | 1,392,334 |
TOTAL CONSUMER STAPLES | | | 15,089,030 |
| ENERGY - 9.8% | | | |
| Oil, Gas & Consumable Fuels - 9.8% | | | |
| Canadian Natural Resources Ltd. | | 16,984 | 1,042,489 |
| ConocoPhillips Co. | | 16,685 | 2,033,401 |
| Enterprise Products Partners LP | | 37,451 | 958,746 |
| Exxon Mobil Corp. | | 44,553 | 5,168,592 |
| Hess Corp. | | 7,695 | 1,155,481 |
| Imperial Oil Ltd. | | 20,823 | 1,138,062 |
| Phillips 66 Co. | | 12,839 | 1,287,367 |
| Suncor Energy, Inc. | | 29,577 | 1,026,542 |
| Valero Energy Corp. | | 11,280 | 1,579,538 |
| | | | 15,390,218 |
| FINANCIALS - 15.8% | | | |
| Banks - 9.9% | | | |
| Bank of America Corp. | | 106,137 | 3,765,741 |
| Huntington Bancshares, Inc. | | 68,408 | 1,037,749 |
| JPMorgan Chase & Co. | | 35,793 | 5,009,588 |
| M&T Bank Corp. | | 9,385 | 1,464,060 |
| PNC Financial Services Group, Inc. | | 9,425 | 1,559,178 |
| Wells Fargo & Co. | | 59,781 | 2,801,935 |
| | | | 15,638,251 |
| Capital Markets - 0.8% | | | |
| BlackRock, Inc. Class A | | 1,683 | 1,277,750 |
| Consumer Finance - 1.1% | | | |
| Capital One Financial Corp. | | 14,181 | 1,687,539 |
| Insurance - 4.0% | | | |
| American Financial Group, Inc. | | 7,070 | 1,008,111 |
| Chubb Ltd. | | 8,578 | 1,951,409 |
| Hartford Financial Services Group, Inc. | | 14,592 | 1,132,485 |
| Marsh & McLennan Companies, Inc. | | 2,921 | 510,912 |
| The Travelers Companies, Inc. | | 8,716 | 1,665,802 |
| | | | 6,268,719 |
TOTAL FINANCIALS | | | 24,872,259 |
| HEALTH CARE - 16.9% | | | |
| Biotechnology - 2.0% | | | |
| AbbVie, Inc. | | 8,000 | 1,182,000 |
| Amgen, Inc. | | 7,824 | 1,974,778 |
| | | | 3,156,778 |
| Health Care Equipment & Supplies - 0.3% | | | |
| GE HealthCare Technologies, Inc. (a) | | 6,921 | 481,148 |
| Health Care Providers & Services - 3.0% | | | |
| Cigna Corp. | | 7,521 | 2,381,675 |
| UnitedHealth Group, Inc. | | 4,433 | 2,212,909 |
| | | | 4,594,584 |
| Life Sciences Tools & Services - 2.0% | | | |
| Danaher Corp. | | 11,857 | 3,134,754 |
| Pharmaceuticals - 9.6% | | | |
| AstraZeneca PLC (United Kingdom) | | 12,614 | 1,652,592 |
| Bristol-Myers Squibb Co. | | 32,224 | 2,341,074 |
| Eli Lilly & Co. | | 6,583 | 2,265,539 |
| Johnson & Johnson | | 19,259 | 3,147,306 |
| Merck & Co., Inc. | | 12,185 | 1,308,791 |
| Roche Holding AG (participation certificate) | | 6,157 | 1,922,033 |
| Royalty Pharma PLC | | 20,686 | 810,684 |
| Sanofi SA | | 17,171 | 1,681,461 |
| | | | 15,129,480 |
TOTAL HEALTH CARE | | | 26,496,744 |
| INDUSTRIALS - 8.4% | | | |
| Aerospace & Defense - 3.0% | | | |
| Huntington Ingalls Industries, Inc. | | 2,794 | 616,189 |
| Lockheed Martin Corp. | | 1,738 | 805,146 |
| Northrop Grumman Corp. | | 2,738 | 1,226,734 |
| The Boeing Co. (a) | | 9,445 | 2,011,785 |
| | | | 4,659,854 |
| Air Freight & Logistics - 0.6% | | | |
| United Parcel Service, Inc. Class B | | 4,754 | 880,583 |
| Building Products - 0.6% | | | |
| Johnson Controls International PLC | | 13,052 | 908,028 |
| Electrical Equipment - 0.7% | | | |
| AMETEK, Inc. | | 7,807 | 1,131,390 |
| Industrial Conglomerates - 1.6% | | | |
| General Electric Co. | | 20,766 | 1,671,248 |
| Hitachi Ltd. | | 7,555 | 396,203 |
| Siemens AG | | 3,379 | 527,818 |
| | | | 2,595,269 |
| Machinery - 1.4% | | | |
| Crane Holdings Co. | | 5,327 | 617,453 |
| Fortive Corp. | | 9,956 | 677,307 |
| ITT, Inc. | | 10,220 | 936,050 |
| | | | 2,230,810 |
| Professional Services - 0.2% | | | |
| KBR, Inc. | | 6,472 | 331,561 |
| Trading Companies & Distributors - 0.3% | | | |
| Watsco, Inc. (b) | | 1,804 | 518,415 |
TOTAL INDUSTRIALS | | | 13,255,910 |
| INFORMATION TECHNOLOGY - 9.4% | | | |
| Communications Equipment - 1.5% | | | |
| Cisco Systems, Inc. | | 47,393 | 2,306,617 |
| IT Services - 1.7% | | | |
| Accenture PLC Class A | | 2,639 | 736,413 |
| Amdocs Ltd. | | 14,760 | 1,356,887 |
| Paychex, Inc. | | 1,254 | 145,288 |
| Visa, Inc. Class A | | 1,720 | 395,961 |
| | | | 2,634,549 |
| Semiconductors & Semiconductor Equipment - 2.0% | | | |
| NXP Semiconductors NV | | 8,575 | 1,580,458 |
| Taiwan Semiconductor Manufacturing Co. Ltd. sponsored ADR | | 17,360 | 1,609,793 |
| | | | 3,190,251 |
| Software - 3.0% | | | |
| Gen Digital, Inc. | | 18,199 | 418,759 |
| Microsoft Corp. | | 7,180 | 1,779,276 |
| Open Text Corp. | | 28,146 | 944,088 |
| Roper Technologies, Inc. | | 3,560 | 1,519,230 |
| | | | 4,661,353 |
| Technology Hardware, Storage & Peripherals - 1.2% | | | |
| Apple, Inc. | | 2,442 | 352,356 |
| Samsung Electronics Co. Ltd. | | 28,767 | 1,431,143 |
| Seagate Technology Holdings PLC | | 2,555 | 173,178 |
| | | | 1,956,677 |
TOTAL INFORMATION TECHNOLOGY | | | 14,749,447 |
| MATERIALS - 4.9% | | | |
| Chemicals - 2.0% | | | |
| Linde PLC | | 8,516 | 2,818,285 |
| Nutrien Ltd. | | 4,795 | 396,920 |
| | | | 3,215,205 |
| Containers & Packaging - 1.4% | | | |
| Ball Corp. | | 13,141 | 765,332 |
| Crown Holdings, Inc. | | 15,801 | 1,393,016 |
| | | | 2,158,348 |
| Metals & Mining - 1.5% | | | |
| Anglo American PLC (United Kingdom) | | 13,350 | 575,791 |
| Freeport-McMoRan, Inc. | | 38,579 | 1,721,395 |
| | | | 2,297,186 |
TOTAL MATERIALS | | | 7,670,739 |
| REAL ESTATE - 2.0% | | | |
| Equity Real Estate Investment Trusts (REITs) - 2.0% | | | |
| American Tower Corp. | | 4,816 | 1,075,846 |
| Lamar Advertising Co. Class A | | 10,105 | 1,076,587 |
| Public Storage | | 3,099 | 943,150 |
| | | | 3,095,583 |
| UTILITIES - 5.8% | | | |
| Electric Utilities - 3.3% | | | |
| Constellation Energy Corp. | | 5,582 | 476,480 |
| Exelon Corp. | | 20,890 | 881,349 |
| FirstEnergy Corp. | | 13,042 | 534,070 |
| NextEra Energy, Inc. | | 26,924 | 2,009,338 |
| PG&E Corp. (a) | | 27,864 | 443,038 |
| Southern Co. | | 12,134 | 821,229 |
| | | | 5,165,504 |
| Independent Power and Renewable Electricity Producers - 0.3% | | | |
| Vistra Corp. | | 21,140 | 487,488 |
| Multi-Utilities - 2.2% | | | |
| Ameren Corp. | | 8,990 | 780,961 |
| CenterPoint Energy, Inc. | | 27,939 | 841,523 |
| Dominion Energy, Inc. | | 15,933 | 1,013,976 |
| WEC Energy Group, Inc. | | 8,715 | 819,123 |
| | | | 3,455,583 |
TOTAL UTILITIES | | | 9,108,575 |
| TOTAL COMMON STOCKS (Cost $123,040,404) | | | 148,092,279 |
| | | | |
| Money Market Funds - 4.4% |
| | | Shares | Value ($) |
| Fidelity Cash Central Fund 4.38% (c) | | 6,466,608 | 6,467,902 |
| Fidelity Securities Lending Cash Central Fund 4.38% (c)(d) | | 506,199 | 506,250 |
| TOTAL MONEY MARKET FUNDS (Cost $6,974,152) | | | 6,974,152 |
| | | | |
| TOTAL INVESTMENT IN SECURITIES - 98.6% (Cost $130,014,556) | 155,066,431 |
NET OTHER ASSETS (LIABILITIES) - 1.4% | 2,219,756 |
| NET ASSETS - 100.0% | 157,286,187 |
| | |
Legend
| (b) | Security or a portion of the security is on loan at period end. |
| (c) | Affiliated fund that is generally available only to investment companies and other accounts managed by Fidelity Investments. The rate quoted is the annualized seven-day yield of the fund at period end. A complete unaudited listing of the fund's holdings as of its most recent quarter end is available upon request. In addition, each Fidelity Central Fund's financial statements, which are not covered by the Fund's Report of Independent Registered Public Accounting Firm, are available on the SEC's website or upon request. |
| (d) | Investment made with cash collateral received from securities on loan. |
Affiliated Central Funds
Fiscal year to date information regarding the Fund's investments in Fidelity Central Funds, including the ownership percentage, is presented below.
| Affiliate | Value, beginning of period ($) | Purchases ($) | Sales Proceeds ($) | Dividend Income ($) | Realized Gain (loss) ($) | Change in Unrealized appreciation (depreciation) ($) | Value, end of period ($) | % ownership, end of period |
| Fidelity Cash Central Fund 4.38% | 92,940 | 44,555,591 | 38,180,629 | 112,694 | - | - | 6,467,902 | 0.0% |
| Fidelity Securities Lending Cash Central Fund 4.38% | - | 2,572,173 | 2,065,923 | 156 | - | - | 506,250 | 0.0% |
| Total | 92,940 | 47,127,764 | 40,246,552 | 112,850 | - | - | 6,974,152 | |
| | | | | | | | | |
Amounts in the dividend income column in the above table include any capital gain distributions from underlying funds, which are presented in the corresponding line item in the Statement of Operations, if applicable.
Amount for Fidelity Securities Lending Cash Central Fund represents the income earned on investing cash collateral, less rebates paid to borrowers and any lending agent fees associated with the loan, plus any premium payments received for lending certain types of securities.
Amounts included in the purchases and sales proceeds columns may include in-kind transactions, if applicable.
Investment Valuation
The following is a summary of the inputs used, as of January 31, 2023, involving the Fund's assets and liabilities carried at fair value. The inputs or methodology used for valuing securities may not be an indication of the risk associated with investing in those securities. For more information on valuation inputs, and their aggregation into the levels used below, please refer to the Investment Valuation section in the accompanying Notes to Financial Statements.
| Valuation Inputs at Reporting Date: |
| Description | Total ($) | Level 1 ($) | Level 2 ($) | Level 3 ($) |
Investments in Securities: | | | | |
|
| Equities: | | | | |
Communication Services | 11,688,841 | 11,688,841 | - | - |
Consumer Discretionary | 6,674,933 | 6,674,933 | - | - |
Consumer Staples | 15,089,030 | 13,887,086 | 1,201,944 | - |
Energy | 15,390,218 | 15,390,218 | - | - |
Financials | 24,872,259 | 24,872,259 | - | - |
Health Care | 26,496,744 | 21,240,658 | 5,256,086 | - |
Industrials | 13,255,910 | 12,331,889 | 924,021 | - |
Information Technology | 14,749,447 | 13,318,304 | 1,431,143 | - |
Materials | 7,670,739 | 7,094,948 | 575,791 | - |
Real Estate | 3,095,583 | 3,095,583 | - | - |
Utilities | 9,108,575 | 9,108,575 | - | - |
|
| Money Market Funds | 6,974,152 | 6,974,152 | - | - |
| Total Investments in Securities: | 155,066,431 | 145,677,446 | 9,388,985 | - |
| Statement of Assets and Liabilities |
| | | | January 31, 2023 |
| | | | | |
| Assets | | | | |
| Investment in securities, at value (including securities loaned of $517,266) - See accompanying schedule: | | | | |
Unaffiliated issuers (cost $123,040,404) | $ | 148,092,279 | | |
Fidelity Central Funds (cost $6,974,152) | | 6,974,152 | | |
| | | | | |
| | | | | |
| Total Investment in Securities (cost $130,014,556) | | | $ | 155,066,431 |
| Foreign currency held at value (cost $42) | | | | 42 |
| Receivable for investments sold | | | | 3,907,188 |
| Receivable for fund shares sold | | | | 117,515 |
| Dividends receivable | | | | 185,353 |
| Distributions receivable from Fidelity Central Funds | | | | 22,034 |
Total assets | | | | 159,298,563 |
| Liabilities | | | | |
| Payable for investments purchased | $ | 1,360,032 | | |
| Payable for fund shares redeemed | | 102,346 | | |
| Accrued management fee | | 43,747 | | |
| Other payables and accrued expenses | | 1 | | |
| Collateral on securities loaned | | 506,250 | | |
| Total Liabilities | | | | 2,012,376 |
| Net Assets | | | $ | 157,286,187 |
| Net Assets consist of: | | | | |
| Paid in capital | | | $ | 133,905,191 |
| Total accumulated earnings (loss) | | | | 23,380,996 |
| Net Assets | | | $ | 157,286,187 |
Net Asset Value , offering price and redemption price per share ($157,286,187 ÷ 11,687,255 shares) | | | $ | 13.46 |
| Statement of Operations |
| | | | Year ended January 31, 2023 |
| Investment Income | | | | |
| Dividends | | | $ | 3,226,770 |
| Income from Fidelity Central Funds (including $156 from security lending) | | | | 112,850 |
| Total Income | | | | 3,339,620 |
| Expenses | | | | |
| Management fee | $ | 461,344 | | |
| Independent trustees' fees and expenses | | 439 | | |
| Total expenses before reductions | | 461,783 | | |
| Expense reductions | | (67) | | |
| Total expenses after reductions | | | | 461,716 |
| Net Investment income (loss) | | | | 2,877,904 |
| Realized and Unrealized Gain (Loss) | | | | |
| Net realized gain (loss) on: | | | | |
| Investment Securities: | | | | |
| Unaffiliated issuers | | (1,693,345) | | |
| Foreign currency transactions | | (3,023) | | |
| Total net realized gain (loss) | | | | (1,696,368) |
| Change in net unrealized appreciation (depreciation) on: | | | | |
| Investment Securities: | | | | |
| Unaffiliated issuers | | 1,945,555 | | |
| Assets and liabilities in foreign currencies | | 769 | | |
| Total change in net unrealized appreciation (depreciation) | | | | 1,946,324 |
| Net gain (loss) | | | | 249,956 |
| Net increase (decrease) in net assets resulting from operations | | | $ | 3,127,860 |
| Statement of Changes in Net Assets |
| |
| | Year ended January 31, 2023 | | Year ended January 31, 2022 |
| Increase (Decrease) in Net Assets | | | | |
| Operations | | | | |
| Net investment income (loss) | $ | 2,877,904 | $ | 1,725,756 |
| Net realized gain (loss) | | (1,696,368) | | 3,305,706 |
| Change in net unrealized appreciation (depreciation) | | 1,946,324 | | 12,436,617 |
| Net increase (decrease) in net assets resulting from operations | | 3,127,860 | | 17,468,079 |
| Distributions to shareholders | | (2,585,519) | | (3,781,451) |
| Share transactions | | | | |
| Proceeds from sales of shares | | 77,628,161 | | 52,489,944 |
| Reinvestment of distributions | | 2,585,519 | | 3,781,451 |
| Cost of shares redeemed | | (31,423,794) | | (26,061,658) |
Net increase (decrease) in net assets resulting from share transactions | | 48,789,886 | | 30,209,737 |
| Total increase (decrease) in net assets | | 49,332,227 | | 43,896,365 |
| | | | | |
| Net Assets | | | | |
| Beginning of period | | 107,953,960 | | 64,057,595 |
| End of period | $ | 157,286,187 | $ | 107,953,960 |
| | | | | |
| Other Information | | | | |
| Shares | | | | |
| Sold | | 6,024,855 | | 3,957,684 |
| Issued in reinvestment of distributions | | 205,000 | | 281,069 |
| Redeemed | | (2,435,873) | | (1,945,673) |
| Net increase (decrease) | | 3,793,982 | | 2,293,080 |
| | | | | |
Financial Highlights
| Fidelity® Equity-Income K6 Fund |
| |
| Years ended January 31, | | 2023 | | 2022 | | 2021 | | 2020 A |
Selected Per-Share Data | | | | | | | | |
| Net asset value, beginning of period | $ | 13.68 | $ | 11.44 | $ | 10.83 | $ | 10.00 |
| Income from Investment Operations | | | | | | | | |
Net investment income (loss) B,C | | .27 | | .24 | | .20 | | .12 |
| Net realized and unrealized gain (loss) | | (.24) D | | 2.51 | | .62 | | .79 |
| Total from investment operations | | .03 | | 2.75 | | .82 | | .91 |
| Distributions from net investment income | | (.25) | | (.23) | | (.20) | | (.08) |
| Distributions from net realized gain | | - E | | (.27) | | (.01) | | - E |
| Total distributions | | (.25) | | (.51) F | | (.21) | | (.08) |
| Net asset value, end of period | $ | 13.46 | $ | 13.68 | $ | 11.44 | $ | 10.83 |
Total Return G,H | | .35% | | 24.13% | | 7.97% | | 9.14% |
Ratios to Average Net Assets C,I,J | | | | | | | | |
| Expenses before reductions | | .34% | | .34% | | .34% | | .34% K |
| Expenses net of fee waivers, if any | | .34% | | .34% | | .34% | | .34% K |
| Expenses net of all reductions | | .34% | | .34% | | .34% | | .34% K |
| Net investment income (loss) | | 2.12% | | 1.81% | | 1.98% | | 1.78% K |
| Supplemental Data | | | | | | | | |
| Net assets, end of period (000 omitted) | $ | 157,286 | $ | 107,954 | $ | 64,058 | $ | 48,531 |
Portfolio turnover rate L | | 37% M | | 43% M | | 70% M | | 21% K,M |
A For the period June 13, 2019 (commencement of operations) through January 31, 2020.
B Calculated based on average shares outstanding during the period.
C Net investment income (loss) is affected by the timing of the declaration of dividends by any underlying mutual funds or exchange-traded funds (ETFs). Net investment income (loss) of any mutual funds or ETFs is not included in the Fund's net investment income (loss) ratio.
D The amount shown for a share outstanding does not correspond with the aggregate net gain (loss) on investments for the period due to the timing of sales and repurchases of shares in relation to fluctuating market values of the investments of the Fund.
E Amount represents less than $.005 per share.
F Total distributions per share do not sum due to rounding.
G Total returns for periods of less than one year are not annualized.
H Total returns would have been lower if certain expenses had not been reduced during the applicable periods shown.
I Fees and expenses of any underlying mutual funds or exchange-traded funds (ETFs) are not included in the Fund's expense ratio. The Fund indirectly bears its proportionate share of these expenses. For additional expense information related to investments in Fidelity Central Funds, please refer to the "Investments in Fidelity Central Funds" note found in the Notes to Financial Statements section of the most recent Annual or Semi-Annual report.
J Expense ratios reflect operating expenses of the class. Expenses before reductions do not reflect amounts reimbursed, waived, or reduced through arrangements with the investment adviser, brokerage services, or other offset arrangements, if applicable, and do not represent the amount paid by the class during periods when reimbursements, waivers or reductions occur.
K Annualized.
L Amount does not include the portfolio activity of any underlying mutual funds or exchange-traded funds (ETFs).
M Portfolio turnover rate excludes securities received or delivered in-kind.
For the period ended January 31, 2023
1. Organization.
Fidelity Equity-Income K6 Fund (the Fund) is a fund of Fidelity Devonshire Trust (the Trust) and is authorized to issue an unlimited number of shares. Share transactions on the Statement of Changes in Net Assets may contain exchanges between affiliated funds. The Trust is registered under the Investment Company Act of 1940, as amended (the 1940 Act), as an open-end management investment company organized as a Massachusetts business trust. Shares generally are available only to employer-sponsored retirement plans that are recordkept by Fidelity, or to certain employer-sponsored retirement plans that are not recordkept by Fidelity.
2. Investments in Fidelity Central Funds.
Funds may invest in Fidelity Central Funds, which are open-end investment companies generally available only to other investment companies and accounts managed by the investment adviser and its affiliates. The Schedule of Investments lists any Fidelity Central Funds held as an investment as of period end, but does not include the underlying holdings of each Fidelity Central Fund. An investing fund indirectly bears its proportionate share of the expenses of the underlying Fidelity Central Funds.
Based on its investment objective, each Fidelity Central Fund may invest or participate in various investment vehicles or strategies that are similar to those of the investing fund. These strategies are consistent with the investment objectives of the investing fund and may involve certain economic risks which may cause a decline in value of each of the Fidelity Central Funds and thus a decline in the value of the investing fund.
| Fidelity Central Fund | Investment Manager | Investment Objective | Investment Practices | Expense Ratio A |
| Fidelity Money Market Central Funds | Fidelity Management & Research Company LLC (FMR) | Each fund seeks to obtain a high level of current income consistent with the preservation of capital and liquidity. | Short-term Investments | Less than .005% |
A Expenses expressed as a percentage of average net assets and are as of each underlying Central Fund's most recent annual or semi-annual shareholder report.
A complete unaudited list of holdings for each Fidelity Central Fund is available upon request or at the Securities and Exchange Commission website at www.sec.gov. In addition, the financial statements of the Fidelity Central Funds which contain the significant accounting policies (including investment valuation policies) of those funds, and are not covered by the Report of Independent Registered Public Accounting Firm, are available on the Securities and Exchange Commission website or upon request.
3. Significant Accounting Policies.
The Fund is an investment company and applies the accounting and reporting guidance of the Financial Accounting Standards Board (FASB) Accounting Standards Codification Topic 946 Financial Services - Investment Companies . The financial statements have been prepared in conformity with accounting principles generally accepted in the United States of America (GAAP), which require management to make certain estimates and assumptions at the date of the financial statements. Actual results could differ from those estimates. Subsequent events, if any, through the date that the financial statements were issued have been evaluated in the preparation of the financial statements. The Fund's Schedule of Investments lists any underlying mutual funds or exchange-traded funds (ETFs) but does not include the underlying holdings of these funds. The following summarizes the significant accounting policies of the Fund:
Investment Valuation. Investments are valued as of 4:00 p.m. Eastern time on the last calendar day of the period. The Board of Trustees (the Board) has designated the Fund's investment adviser as the valuation designee responsible for the fair valuation function and performing fair value determinations as needed. The investment adviser has established a Fair Value Committee (the Committee) to carry out the day-to-day fair valuation responsibilities and has adopted policies and procedures to govern the fair valuation process and the activities of the Committee. In accordance with these fair valuation policies and procedures, which have been approved by the Board, the Fund attempts to obtain prices from one or more third party pricing services or brokers to value its investments. When current market prices, quotations or currency exchange rates are not readily available or reliable, investments will be fair valued in good faith by the Committee, in accordance with the policies and procedures. Factors used in determining fair value vary by investment type and may include market or investment specific events, transaction data, estimated cash flows, and market observations of comparable investments. The frequency that the fair valuation procedures are used cannot be predicted and they may be utilized to a significant extent. The Committee manages the Fund's fair valuation practices and maintains the fair valuation policies and procedures. The Fund's investment adviser reports to the Board information regarding the fair valuation process and related material matters.
The Fund categorizes the inputs to valuation techniques used to value its investments into a disclosure hierarchy consisting of three levels as shown below:
Level 1 - unadjusted quoted prices in active markets for identical investments
Level 2 - other significant observable inputs (including quoted prices for similar investments, interest rates, prepayment speeds, etc.)
Level 3 - unobservable inputs (including the Fund's own assumptions based on the best information available)
Valuation techniques used to value the Fund's investments by major category are as follows:
Equity securities, including restricted securities, for which market quotations are readily available, are valued at the last reported sale price or official closing price as reported by a third party pricing service on the primary market or exchange on which they are traded and are categorized as Level 1 in the hierarchy. In the event there were no sales during the day or closing prices are not available, securities are valued at the last quoted bid price or may be valued using the last available price and are generally categorized as Level 2 in the hierarchy. For foreign equity securities, when market or security specific events arise, comparisons to the valuation of American Depositary Receipts (ADRs), futures contracts, ETFs and certain indexes as well as quoted prices for similar securities may be used and would be categorized as Level 2 in the hierarchy. For equity securities, including restricted securities, where observable inputs are limited, assumptions about market activity and risk are used and these securities may be categorized as Level 3 in the hierarchy.
Investments in open-end mutual funds, including the Fidelity Central Funds, are valued at their closing net asset value (NAV) each business day and are categorized as Level 1 in the hierarchy.
Changes in valuation techniques may result in transfers in or out of an assigned level within the disclosure hierarchy. The aggregate value of investments by input level as of January 31, 2023 is included at the end of the Fund's Schedule of Investments.
Foreign Currency. Certain Funds may use foreign currency contracts to facilitate transactions in foreign-denominated securities. Gains and losses from these transactions may arise from changes in the value of the foreign currency or if the counterparties do not perform under the contracts' terms.
Foreign-denominated assets, including investment securities, and liabilities are translated into U.S. dollars at the exchange rates at period end. Purchases and sales of investment securities, income and dividends received, and expenses denominated in foreign currencies are translated into U.S. dollars at the exchange rate in effect on the transaction date.
The effects of exchange rate fluctuations on investments are included with the net realized and unrealized gain (loss) on investment securities. Other foreign currency transactions resulting in realized and unrealized gain (loss) are disclosed separately.
Investment Transactions and Income. For financial reporting purposes, the Fund's investment holdings and NAV include trades executed through the end of the last business day of the period. The NAV per share for processing shareholder transactions is calculated as of the close of business of the New York Stock Exchange (NYSE), normally 4:00 p.m. Eastern time and includes trades executed through the end of the prior business day. Gains and losses on securities sold are determined on the basis of identified cost. Commissions paid to certain brokers with whom the investment adviser, or its affiliates, places trades on behalf of a fund include an amount in addition to trade execution, which may be rebated back to a fund. Any such rebates are included in net realized gain (loss) on investments in the Statement of Operations. Dividend income is recorded on the ex-dividend date, except for certain dividends from foreign securities where the ex-dividend date may have passed, which are recorded as soon as the Fund is informed of the ex-dividend date. Non-cash dividends included in dividend income, if any, are recorded at the fair market value of the securities received. Income and capital gain distributions from Fidelity Central Funds, if any, are recorded on the ex-dividend date. Certain distributions received by the Fund represent a return of capital or capital gain. The Fund determines the components of these distributions subsequent to the ex-dividend date, based upon receipt of tax filings or other correspondence relating to the underlying investment. These distributions are recorded as a reduction of cost of investments and/or as a realized gain. Investment income is recorded net of foreign taxes withheld where recovery of such taxes is uncertain. Funds may file withholding tax reclaims in certain jurisdictions to recover a portion of amounts previously withheld. Any withholding tax reclaims income is included in the Statement of Operations in dividends. Any receivables for withholding tax reclaims are included in the Statement of Assets and Liabilities in dividends receivable.
Expenses. Expenses directly attributable to a fund are charged to that fund. Expenses attributable to more than one fund are allocated among the respective funds on the basis of relative net assets or other appropriate methods. Expenses included in the accompanying financial statements reflect the expenses of that fund and do not include any expenses associated with any underlying mutual funds or exchange-traded funds. Although not included in a fund's expenses, a fund indirectly bears its proportionate share of these expenses through the net asset value of each underlying mutual fund or exchange-traded fund. Expense estimates are accrued in the period to which they relate and adjustments are made when actual amounts are known.
Income Tax Information and Distributions to Shareholders. Each year, the Fund intends to qualify as a regulated investment company under Subchapter M of the Internal Revenue Code, including distributing substantially all of its taxable income and realized gains. As a result, no provision for U.S. Federal income taxes is required. As of January 31, 2023, the Fund did not have any unrecognized tax benefits in the financial statements; nor is the Fund aware of any tax positions for which it is reasonably possible that the total amounts of unrecognized tax benefits will significantly change in the next twelve months. The Fund files a U.S. federal tax return, in addition to state and local tax returns as required. The Fund's federal income tax returns are subject to examination by the Internal Revenue Service (IRS) for a period of three fiscal years after they are filed. State and local tax returns may be subject to examination for an additional fiscal year depending on the jurisdiction. Foreign taxes are provided for based on the Fund's understanding of the tax rules and rates that exist in the foreign markets in which it invests.
Distributions are declared and recorded on the ex-dividend date. Income and capital gain distributions are determined in accordance with income tax regulations, which may differ from GAAP.
Capital accounts within the financial statements are adjusted for permanent book-tax differences. These adjustments have no impact on net assets or the results of operations. Capital accounts are not adjusted for temporary book-tax differences which will reverse in a subsequent period.
Book-tax differences are primarily due to foreign currency transactions, passive foreign investment companies (PFIC), partnerships, capital loss carryforwards and losses deferred due to wash sales.
As of period end, the cost and unrealized appreciation (depreciation) in securities, and derivatives if applicable, for federal income tax purposes were as follows:
| Gross unrealized appreciation | $27,693,706 |
| Gross unrealized depreciation | (3,390,227) |
| Net unrealized appreciation (depreciation) | $24,303,479 |
| Tax Cost | $130,762,952 |
The tax-based components of distributable earnings as of period end were as follows:
| Undistributed ordinary income | $464,572 |
| Capital loss carryforward | $(1,273,433) |
| Net unrealized appreciation (depreciation) on securities and other investments | $24,189,857 |
Capital loss carryforwards are only available to offset future capital gains of the Fund to the extent provided by regulations and may be limited. The capital loss carryforward information presented below, including any applicable limitation, is estimated as of fiscal period end and is subject to adjustment.
Short-term | $(1,273,433) |
Long-term | (-) |
| Total capital loss carryforward | $(1,273,433) |
The tax character of distributions paid was as follows:
| | January 31, 2023 | January 31, 2022 |
| Ordinary Income | $2,585,519 | $1,985,782 |
| Long-term Capital Gains | - | 1,795,669 |
| Total | $2,585,519 | $3,781,451 |
4. Purchases and Sales of Investments.
Purchases and sales of securities, other than short-term securities and in-kind transactions, as applicable, are noted in the table below.
| | Purchases ($) | Sales ($) |
| Fidelity Equity-Income K6 Fund | 46,641,171 | 53,478,352 |
Unaffiliated Exchanges In-Kind. Shares that were exchanged for investments, including accrued interest and cash, if any, are shown in the table below. The amount of in-kind exchanges is included in share transactions in the accompanying Statement of Changes in Net Assets.
| | Shares | Total Proceeds ($) |
| Fidelity Equity-Income K6 Fund | 3,821,064 | 48,923,346 |
Prior Year Unaffiliated Exchanges In-Kind. Shares that were exchanged for investments, including accrued interest and cash, if any, are shown in the table below. The amount of in-kind exchanges is included in share transactions in the accompanying Statement of Changes in Net Assets.
| | Shares | Total Proceeds ($) |
| Fidelity Equity-Income K6 Fund | 2,202,584 | 29,474,296 |
5. Fees and Other Transactions with Affiliates.
Management Fee. Fidelity Management & Research Company LLC (the investment adviser) and its affiliates provide the Fund with investment management related services for which the Fund pays a monthly management fee that is based on an annual rate of .34% of average net assets. Under the management contract, the investment adviser or an affiliate pays all other expenses of the Fund, excluding fees and expenses of the independent Trustees, and certain miscellaneous expenses such as proxy and shareholder meeting expenses.
Brokerage Commissions. A portion of portfolio transactions were placed with brokerage firms which are affiliates of the investment adviser. Brokerage commissions are included in net realized gain (loss) and change in net unrealized appreciation (depreciation) in the Statement of Operations. The commissions paid to these affiliated firms were as follows:
| | Amount |
| Fidelity Equity-Income K6 Fund | $713 |
Interfund Trades. Funds may purchase from or sell securities to other Fidelity Funds under procedures adopted by the Board. The procedures have been designed to ensure these interfund trades are executed in accordance with Rule 17a-7 of the 1940 Act. Any interfund trades are included within the respective purchases and sales amounts shown in the Purchases and Sales of Investments note. Interfund trades during the period are noted in the table below.
| | Purchases ($) | Sales ($) | Realized Gain (Loss) ($) |
| Fidelity Equity-Income K6 Fund | 2,329,996 | 5,188,881 | (406,099) |
6. Committed Line of Credit.
Certain Funds participate with other funds managed by the investment adviser or an affiliate in a $4.25 billion credit facility (the "line of credit") to be utilized for temporary or emergency purposes to fund shareholder redemptions or for other short-term liquidity purposes. The commitment fees on the pro-rata portion of the line of credit are borne by the investment adviser. During the period, there were no borrowings on this line of credit.
7. Security Lending.
Funds lend portfolio securities from time to time in order to earn additional income. Lending agents are used, including National Financial Services (NFS), an affiliate of the investment adviser. Pursuant to a securities lending agreement, NFS will receive a fee, which is capped at 9.9% of a fund's daily lending revenue, for its services as lending agent. A fund may lend securities to certain qualified borrowers, including NFS. On the settlement date of the loan, a fund receives collateral (in the form of U.S. Treasury obligations, letters of credit and/or cash) against the loaned securities and maintains collateral in an amount not less than 100% of the market value of the loaned securities during the period of the loan. The market value of the loaned securities is determined at the close of business of a fund and any additional required collateral is delivered to a fund on the next business day. A fund or borrower may terminate the loan at any time, and if the borrower defaults on its obligation to return the securities loaned because of insolvency or other reasons, a fund may apply collateral received from the borrower against the obligation. A fund may experience delays and costs in recovering the securities loaned. Any cash collateral received is invested in the Fidelity Securities Lending Cash Central Fund. Any loaned securities are identified as such in the Schedule of Investments, and the value of loaned securities and cash collateral at period end, as applicable, are presented in the Statement of Assets and Liabilities. Security lending income represents the income earned on investing cash collateral, less rebates paid to borrowers and any lending agent fees associated with the loan, plus any premium payments received for lending certain types of securities. Security lending income is presented in the Statement of Operations as a component of income from Fidelity Central Funds. Affiliated security lending activity, if any, was as follows:
| | Total Security Lending Fees Paid to NFS | Security Lending Income From Securities Loaned to NFS | Value of Securities Loaned to NFS at Period End |
| Fidelity Equity-Income K6 Fund | $16 | $- | $- |
8. Expense Reductions.
Through arrangements with the Fund's custodian, credits realized as a result of certain uninvested cash balances were used to reduce the Fund's expenses by $67.
9. Other.
A fund's organizational documents provide former and current trustees and officers with a limited indemnification against liabilities arising in connection with the performance of their duties to the fund. In the normal course of business, a fund may also enter into contracts that provide general indemnifications. A fund's maximum exposure under these arrangements is unknown as this would be dependent on future claims that may be made against a fund. The risk of material loss from such claims is considered remote.
10. Risk and Uncertainties.
Many factors affect a fund's performance. Developments that disrupt global economies and financial markets, such as pandemics, epidemics, outbreaks of infectious diseases, war, terrorism, and environmental disasters, may significantly affect a fund's investment performance. The effects of these developments to a fund will be impacted by the types of securities in which a fund invests, the financial condition, industry, economic sector, and geographic location of an issuer, and a fund's level of investment in the securities of that issuer.
To the Board of Trustees of Fidelity Devonshire Trust and the Shareholders of Fidelity Equity-Income K6 Fund:
Opinion on the Financial Statements and Financial Highlights
We have audited the accompanying statement of assets and liabilities of Fidelity Equity-Income K6 Fund (the "Fund"), a fund of Fidelity Devonshire Trust, including the schedule of investments, as of January 31, 2023, the related statement of operations for the year then ended, the statement of changes in net assets for each of the two years in the period then ended, the financial highlights for each of the three years in the period then ended and for the period from June 13, 2019 (commencement of operations) through January 31, 2020, and the related notes. In our opinion, the financial statements and financial highlights present fairly, in all material respects, the financial position of the Fund as of January 31, 2023, and the results of its operations for the year then ended, the changes in its net assets for each of the two years in the period then ended, and the financial highlights for each of the three years in the period then ended and for the period from June 13, 2019 (commencement of operations) through January 31, 2020 in conformity with accounting principles generally accepted in the United States of America.
Basis for Opinion
These financial statements and financial highlights are the responsibility of the Fund's management. Our responsibility is to express an opinion on the Fund's financial statements and financial highlights based on our audits. We are a public accounting firm registered with the Public Company Accounting Oversight Board (United States) (PCAOB) and are required to be independent with respect to the Fund in accordance with the U.S. federal securities laws and the applicable rules and regulations of the Securities and Exchange Commission and the PCAOB.
We conducted our audits in accordance with the standards of the PCAOB. Those standards require that we plan and perform the audit to obtain reasonable assurance about whether the financial statements and financial highlights are free of material misstatement, whether due to error or fraud. The Fund is not required to have, nor were we engaged to perform, an audit of its internal control over financial reporting. As part of our audits we are required to obtain an understanding of internal control over financial reporting but not for the purpose of expressing an opinion on the effectiveness of the Fund's internal control over financial reporting. Accordingly, we express no such opinion.
Our audits included performing procedures to assess the risks of material misstatement of the financial statements and financial highlights, whether due to error or fraud, and performing procedures that respond to those risks. Such procedures included examining, on a test basis, evidence regarding the amounts and disclosures in the financial statements and financial highlights. Our audits also included evaluating the accounting principles used and significant estimates made by management, as well as evaluating the overall presentation of the financial statements and financial highlights. Our procedures included confirmation of securities owned as of January 31, 2023, by correspondence with the custodian and brokers; when replies were not received from brokers, we performed other auditing procedures. We believe that our audits provide a reasonable basis for our opinion.
/s/ Deloitte & Touche LLP
Boston, Massachusetts
March 14, 2023
We have served as the auditor of one or more of the Fidelity investment companies since 1999.
The Trustees, Members of the Advisory Board (if any), and officers of the trust and fund, as applicable, are listed below. The Board of Trustees governs the fund and is responsible for protecting the interests of shareholders. The Trustees are experienced executives who meet periodically throughout the year to oversee the fund's activities, review contractual arrangements with companies that provide services to the fund, oversee management of the risks associated with such activities and contractual arrangements, and review the fund's performance. Each of the Trustees oversees 318 funds.
The Trustees hold office without limit in time except that (a) any Trustee may resign; (b) any Trustee may be removed by written instrument, signed by at least two-thirds of the number of Trustees prior to such removal; (c) any Trustee who requests to be retired or who has become incapacitated by illness or injury may be retired by written instrument signed by a majority of the other Trustees; and (d) any Trustee may be removed at any special meeting of shareholders by a two-thirds vote of the outstanding voting securities of the trust. Each Trustee who is not an interested person (as defined in the 1940 Act) of the trust and the fund is referred to herein as an Independent Trustee. Each Independent Trustee shall retire not later than the last day of the calendar year in which his or her 75th birthday occurs. The Independent Trustees may waive this mandatory retirement age policy with respect to individual Trustees. Officers and Advisory Board Members hold office without limit in time, except that any officer or Advisory Board Member may resign or may be removed by a vote of a majority of the Trustees at any regular meeting or any special meeting of the Trustees. Except as indicated, each individual has held the office shown or other offices in the same company for the past five years.
The fund's Statement of Additional Information (SAI) includes more information about the Trustees. To request a free copy, call Fidelity at 1-800-835-5092.
Experience, Skills, Attributes, and Qualifications of the Trustees. The Governance and Nominating Committee has adopted a statement of policy that describes the experience, qualifications, attributes, and skills that are necessary and desirable for potential Independent Trustee candidates (Statement of Policy). The Board believes that each Trustee satisfied at the time he or she was initially elected or appointed a Trustee, and continues to satisfy, the standards contemplated by the Statement of Policy. The Governance and Nominating Committee also engages professional search firms to help identify potential Independent Trustee candidates who have the experience, qualifications, attributes, and skills consistent with the Statement of Policy. From time to time, additional criteria based on the composition and skills of the current Independent Trustees, as well as experience or skills that may be appropriate in light of future changes to board composition, business conditions, and regulatory or other developments, have also been considered by the professional search firms and the Governance and Nominating Committee. In addition, the Board takes into account the Trustees' commitment and participation in Board and committee meetings, as well as their leadership of standing and ad hoc committees throughout their tenure.
In determining that a particular Trustee was and continues to be qualified to serve as a Trustee, the Board has considered a variety of criteria, none of which, in isolation, was controlling. The Board believes that, collectively, the Trustees have balanced and diverse experience, qualifications, attributes, and skills, which allow the Board to operate effectively in governing the fund and protecting the interests of shareholders. Information about the specific experience, skills, attributes, and qualifications of each Trustee, which in each case led to the Board's conclusion that the Trustee should serve (or continue to serve) as a trustee of the fund, is provided below.
Board Structure and Oversight Function. Robert A. Lawrence is an interested person and currently serves as Chair. The Trustees have determined that an interested Chair is appropriate and benefits shareholders because an interested Chair has a personal and professional stake in the quality and continuity of services provided to the fund. Independent Trustees exercise their informed business judgment to appoint an individual of their choosing to serve as Chair, regardless of whether the Trustee happens to be independent or a member of management. The Independent Trustees have determined that they can act independently and effectively without having an Independent Trustee serve as Chair and that a key structural component for assuring that they are in a position to do so is for the Independent Trustees to constitute a substantial majority for the Board. The Independent Trustees also regularly meet in executive session. David M. Thomas serves as Lead Independent Trustee and as such (i) acts as a liaison between the Independent Trustees and management with respect to matters important to the Independent Trustees and (ii) with management prepares agendas for Board meetings.
Fidelity ® funds are overseen by different Boards of Trustees. The fund's Board oversees Fidelity's high income and certain equity funds, and other Boards oversee Fidelity's alternative investment, investment-grade bond, money market, asset allocation, and other equity funds. The asset allocation funds may invest in Fidelity ® funds overseen by the fund's Board. The use of separate Boards, each with its own committee structure, allows the Trustees of each group of Fidelity ® funds to focus on the unique issues of the funds they oversee, including common research, investment, and operational issues. On occasion, the separate Boards establish joint committees to address issues of overlapping consequences for the Fidelity ® funds overseen by each Board.
The Trustees operate using a system of committees to facilitate the timely and efficient consideration of all matters of importance to the Trustees, the fund, and fund shareholders and to facilitate compliance with legal and regulatory requirements and oversight of the fund's activities and associated risks. The Board, acting through its committees, has charged FMR and its affiliates with (i) identifying events or circumstances the occurrence of which could have demonstrably adverse effects on the fund's business and/or reputation; (ii) implementing processes and controls to lessen the possibility that such events or circumstances occur or to mitigate the effects of such events or circumstances if they do occur; and (iii) creating and maintaining a system designed to evaluate continuously business and market conditions in order to facilitate the identification and implementation processes described in (i) and (ii) above. Because the day-to-day operations and activities of the fund are carried out by or through FMR, its affiliates, and other service providers, the fund's exposure to risks is mitigated but not eliminated by the processes overseen by the Trustees. While each of the Board's committees has responsibility for overseeing different aspects of the fund's activities, oversight is exercised primarily through the Operations, Audit, and Compliance Committees. Appropriate personnel, including but not limited to the fund's Chief Compliance Officer (CCO), FMR's internal auditor, the independent accountants, the fund's Treasurer and portfolio management personnel, make periodic reports to the Board's committees, as appropriate, including an annual review of Fidelity's risk management program for the Fidelity ® funds. The responsibilities of each standing committee, including their oversight responsibilities, are described further under "Standing Committees of the Trustees."
Interested Trustees*:
Correspondence intended for a Trustee who is an interested person may be sent to Fidelity Investments, 245 Summer Street, Boston, Massachusetts 02210.
Name, Year of Birth; Principal Occupations and Other Relevant Experience+
Bettina Doulton (1964)
Year of Election or Appointment: 2020
Trustee
Ms. Doulton also serves as Trustee of other Fidelity ® funds. Prior to her retirement, Ms. Doulton served in a variety of positions at Fidelity Investments, including as a managing director of research (2006-2007), portfolio manager to certain Fidelity ® funds (1993-2005), equity analyst and portfolio assistant (1990-1993), and research assistant (1987-1990). Ms. Doulton currently owns and operates Phi Builders + Architects and Cellardoor Winery. Previously, Ms. Doulton served as a member of the Board of Brown Capital Management, LLC (2014-2018).
Robert A. Lawrence (1952)
Year of Election or Appointment: 2020
Trustee
Chair of the Board of Trustees
Mr. Lawrence also serves as Trustee of other funds. Previously, Mr. Lawrence served as a Trustee and Member of the Advisory Board of certain funds. Prior to his retirement in 2008, Mr. Lawrence served as Vice President of certain Fidelity ® funds (2006-2008), Senior Vice President, Head of High Income Division of Fidelity Management & Research Company (investment adviser firm, 2006-2008), and President of Fidelity Strategic Investments (investment adviser firm, 2002-2005).
* Determined to be an "Interested Trustee" by virtue of, among other things, his or her affiliation with the trust or various entities under common control with FMR.
+ The information includes the Trustee's principal occupation during the last five years and other information relating to the experience, attributes, and skills relevant to the Trustee's qualifications to serve as a Trustee, which led to the conclusion that the Trustee should serve as a Trustee for the fund.
Independent Trustees:
Correspondence intended for an Independent Trustee may be sent to Fidelity Investments, P.O. Box 55235, Boston, Massachusetts 02205-5235.
Name, Year of Birth; Principal Occupations and Other Relevant Experience+
Thomas P. Bostick (1956)
Year of Election or Appointment: 2021
Trustee
Lieutenant General Bostick also serves as Trustee of other Fidelity ® funds. Prior to his retirement, General Bostick (United States Army, Retired) held a variety of positions within the U.S. Army, including Commanding General and Chief of Engineers, U.S. Army Corps of Engineers (2012-2016) and Deputy Chief of Staff and Director of Human Resources, U.S. Army (2009-2012). General Bostick currently serves as a member of the Board and Finance and Governance Committees of CSX Corporation (transportation, 2020-present) and a member of the Board and Corporate Governance and Nominating Committee of Perma-Fix Environmental Services, Inc. (nuclear waste management, 2020-present). General Bostick serves as Chief Executive Officer of Bostick Global Strategies, LLC (consulting, 2016-present) and as a member of the Board of HireVue, Inc. (video interview and assessment, 2020-present). Previously, General Bostick served as a Member of the Advisory Board of certain Fidelity® funds (2021), President, Intrexon Bioengineering (2018-2020) and Chief Operating Officer (2017-2020) and Senior Vice President of the Environment Sector (2016-2017) of Intrexon Corporation (biopharmaceutical company).
Dennis J. Dirks (1948)
Year of Election or Appointment: 2005
Trustee
Mr. Dirks also serves as Trustee of other Fidelity ® funds. Prior to his retirement in May 2003, Mr. Dirks served as Chief Operating Officer and as a member of the Board of The Depository Trust & Clearing Corporation (financial markets infrastructure), President, Chief Operating Officer and a member of the Board of The Depository Trust Company (DTC), President and a member of the Board of the National Securities Clearing Corporation (NSCC), Chief Executive Officer and a member of the Board of the Government Securities Clearing Corporation and Chief Executive Officer and a member of the Board of the Mortgage-Backed Securities Clearing Corporation. Mr. Dirks currently serves as a member of the Finance Committee (2016-present) and Board (2017-present) and is Treasurer (2018-present) of the Asolo Repertory Theatre.
Donald F. Donahue (1950)
Year of Election or Appointment: 2018
Trustee
Mr. Donahue also serves as Trustee of other Fidelity ® funds. Mr. Donahue serves as President and Chief Executive Officer of Miranda Partners, LLC (risk consulting for the financial services industry, 2012-present). Previously, Mr. Donahue served as Chief Executive Officer (2006-2012), Chief Operating Officer (2003-2006) and Managing Director, Customer Marketing and Development (1999-2003) of The Depository Trust & Clearing Corporation (financial markets infrastructure). Mr. Donahue currently serves as a member (2007-present) and Co-Chairman (2016-present) of the Board of United Way of New York and a member of the Board of The Leadership Academy (previously NYC Leadership Academy) (2012-present). Mr. Donahue previously served as a member of the Advisory Board of certain Fidelity® funds (2015-2018).
Vicki L. Fuller (1957)
Year of Election or Appointment: 2020
Trustee
Ms. Fuller also serves as Trustee of other Fidelity ® funds. Previously, Ms. Fuller served as a member of the Advisory Board of certain Fidelity ® funds (2018-2020), Chief Investment Officer of the New York State Common Retirement Fund (2012-2018) and held a variety of positions at AllianceBernstein L.P. (global asset management, 1985-2012), including Managing Director (2006-2012) and Senior Vice President and Senior Portfolio Manager (2001-2006). Ms. Fuller currently serves as a member of the Board, Audit Committee and Nominating and Governance Committee of two Blackstone business development companies (2020-present), as a member of the Board of Treliant, LLC (consulting, 2019-present), as a member of the Advisory Board of Ariel Alternatives, LLC (private equity, 2021-present) and as a member of the Board and Chair of the Audit Committee of Gusto, Inc. (software, 2021-present). In addition, Ms. Fuller currently serves as a member of the Board of Roosevelt University (2019-present) and as a member of the Executive Board of New York University's Stern School of Business. Ms. Fuller previously served as a member of the Board, Audit Committee and Nominating and Governance Committee of The Williams Companies, Inc. (natural gas infrastructure, 2018-2021).
Patricia L. Kampling (1959)
Year of Election or Appointment: 2020
Trustee
Ms. Kampling also serves as Trustee of other Fidelity ® funds. Prior to her retirement, Ms. Kampling served as Chairman of the Board and Chief Executive Officer (2012-2019), President and Chief Operating Officer (2011-2012) and Executive Vice President and Chief Financial Officer (2010-2011) of Alliant Energy Corporation. Ms. Kampling currently serves as a member of the Board, Finance Committee and Governance, Compensation and Nominating Committee of Xcel Energy Inc. (utilities company, 2020-present) and as a member of the Board, Audit, Finance and Risk Committee and Safety, Environmental, Technology and Operations Committee and Chair of the Executive Development and Compensation Committee of American Water Works Company, Inc. (utilities company, 2019-present). In addition, Ms. Kampling currently serves as a member of the Board of the Nature Conservancy, Wisconsin Chapter (2019-present). Previously, Ms. Kampling served as a Member of the Advisory Board of certain Fidelity® funds (2020), a member of the Board, Compensation Committee and Executive Committee and Chair of the Audit Committee of Briggs & Stratton Corporation (manufacturing, 2011-2021), a member of the Board of Interstate Power and Light Company (2012-2019) and Wisconsin Power and Light Company (2012-2019) (each a subsidiary of Alliant Energy Corporation) and as a member of the Board and Workforce Development Committee of the Business Roundtable (2018-2019).
Thomas A. Kennedy (1955)
Year of Election or Appointment: 2021
Trustee
Mr. Kennedy also serves as Trustee of other Fidelity ® funds. Previously, Mr. Kennedy served as a Member of the Advisory Board of certain Fidelity ® funds (2020) and held a variety of positions at Raytheon Company (aerospace and defense, 1983-2020), including Chairman and Chief Executive Officer (2014-2020) and Executive Vice President and Chief Operating Officer (2013-2014). Mr. Kennedy currently serves as Executive Chairman of the Board of Directors of Raytheon Technologies Corporation (aerospace and defense, 2020-present). He is also a member of the Rutgers School of Engineering Industry Advisory Board (2011-present) and a member of the UCLA Engineering Dean's Executive Board (2016-present).
Oscar Munoz (1959)
Year of Election or Appointment: 2021
Trustee
Mr. Munoz also serves as Trustee of other Fidelity ® funds. Prior to his retirement, Mr. Munoz served as Executive Chairman (2020-2021), Chief Executive Officer (2015-2020), President (2015-2016) and a member of the Board (2010-2021) of United Airlines Holdings, Inc. Mr. Munoz currently serves as a member of the Board of CBRE Group, Inc. (commercial real estate, 2020-present), a member of the Board of Univision Communications, Inc. (Hispanic media, 2020-present) and a member of the Advisory Board of Salesforce.com, Inc. (cloud-based software, 2020-present). Previously, Mr. Munoz served as a Member of the Advisory Board of certain Fidelity ® funds (2021).
David M. Thomas (1949)
Year of Election or Appointment: 2008
Trustee
Lead Independent Trustee
Mr. Thomas also serves as Trustee of other Fidelity ® funds. Previously, Mr. Thomas served as Executive Chairman (2005-2006) and Chairman and Chief Executive Officer (2000-2005) of IMS Health, Inc. (pharmaceutical and healthcare information solutions). Mr. Thomas currently serves as a member of the Board of Fortune Brands Home and Security (home and security products, 2004-present) and as Director (2013-present) and Non-Executive Chairman of the Board (2022-present) of Interpublic Group of Companies, Inc. (marketing communication).
Susan Tomasky (1953)
Year of Election or Appointment: 2020
Trustee
Ms. Tomasky also serves as Trustee of other Fidelity ® funds. Prior to her retirement, Ms. Tomasky served in various executive officer positions at American Electric Power Company, Inc. (1998-2011), including most recently as President of AEP Transmission (2007-2011). Ms. Tomasky currently serves as a member of the Board and Sustainability Committee and as Chair of the Audit Committee of Marathon Petroleum Corporation (2018-present) and as a member of the Board, Executive Committee, Corporate Governance Committee and Organization and Compensation Committee and as Chair of the Audit Committee of Public Service Enterprise Group, Inc. (utilities company, 2012-present) and as a member of the Board of its subsidiary company, Public Service Electric and Gas Co. (2021-present). In addition, Ms. Tomasky currently serves as a member (2009-present) and President (2020-present) of the Board of the Royal Shakespeare Company - America (2009-present), as a member of the Board of the Columbus Association for the Performing Arts (2011-present) and as a member of the Board and Kenyon in the World Committee of Kenyon College (2016-present). Previously, Ms. Tomasky served as a Member of the Advisory Board of certain Fidelity ® funds (2020), as a member of the Board of the Columbus Regional Airport Authority (2007-2020), as a member of the Board (2011-2018) and Lead Independent Director (2015-2018) of Andeavor Corporation (previously Tesoro Corporation) (independent oil refiner and marketer) and as a member of the Board of Summit Midstream Partners LP (energy, 2012-2018).
Michael E. Wiley (1950)
Year of Election or Appointment: 2018
Trustee
Mr. Wiley also serves as Trustee of other Fidelity ® funds. Previously, Mr. Wiley served as a member of the Advisory Board of certain Fidelity ® funds (2018-2020), Chairman, President and CEO of Baker Hughes, Inc. (oilfield services, 2000-2004). Mr. Wiley also previously served as a member of the Board of Andeavor Corporation (independent oil refiner and marketer, 2005-2018), a member of the Board of Andeavor Logistics LP (natural resources logistics, 2015-2018) and a member of the Board of High Point Resources (exploration and production, 2005-2020).
+ The information includes the Trustee's principal occupation during the last five years and other information relating to the experience, attributes, and skills relevant to the Trustee's qualifications to serve as a Trustee, which led to the conclusion that the Trustee should serve as a Trustee for the fund.
Advisory Board Members and Officers:
Correspondence intended for a Member of the Advisory Board (if any) may be sent to Fidelity Investments, P.O. Box 55235, Boston, Massachusetts 02205-5235. Correspondence intended for an officer or Peter S. Lynch may be sent to Fidelity Investments, 245 Summer Street, Boston, Massachusetts 02210. Officers appear below in alphabetical order.
Name, Year of Birth; Principal Occupation
Peter S. Lynch (1944)
Year of Election or Appointment: 2003
Member of the Advisory Board
Mr. Lynch also serves as a Member of the Advisory Board of other Fidelity ® funds. Mr. Lynch is Vice Chairman and a Director of Fidelity Management & Research Company LLC (investment adviser firm). In addition, Mr. Lynch serves as a Trustee of Boston College and as the Chairman of the Inner-City Scholarship Fund. Previously, Mr. Lynch served as Vice Chairman and a Director of FMR Co., Inc. (investment adviser firm) and on the Special Olympics International Board of Directors (1997-2006).
Craig S. Brown (1977)
Year of Election or Appointment: 2022
Deputy Treasurer
Mr. Brown also serves as an officer of other funds. Mr. Brown serves as Assistant Treasurer of FIMM, LLC (2021-present) and is an employee of Fidelity Investments (2013-present). Previously, Mr. Brown served as Assistant Treasurer of certain Fidelity ® funds (2019-2022).
John J. Burke III (1964)
Year of Election or Appointment: 2018
Chief Financial Officer
Mr. Burke also serves as Chief Financial Officer of other funds. Mr. Burke serves as Head of Investment Operations for Fidelity Fund and Investment Operations (2018-present) and is an employee of Fidelity Investments (1998-present). Previously Mr. Burke served as head of Asset Management Investment Operations (2012-2018).
William C. Coffey (1969)
Year of Election or Appointment: 2019
Assistant Secretary
Mr. Coffey also serves as Assistant Secretary of other funds. He is Senior Vice President and Deputy General Counsel of FMR LLC (diversified financial services company, 2010-present), and is an employee of Fidelity Investments. Previously, Mr. Coffey served as Secretary and CLO of certain funds (2018-2019); CLO, Secretary, and Senior Vice President of Fidelity Management & Research Company and FMR Co., Inc. (investment adviser firms, 2018-2019); Secretary of Fidelity SelectCo, LLC and Fidelity Investments Money Management, Inc. (investment adviser firms, 2018-2019); CLO of Fidelity Management & Research (Hong Kong) Limited, FMR Investment Management (UK) Limited, and Fidelity Management & Research (Japan) Limited (investment adviser firms, 2018-2019); and Assistant Secretary of certain funds (2009-2018).
Timothy M. Cohen (1969)
Year of Election or Appointment: 2018
Vice President
Mr. Cohen also serves as Vice President of other funds. Mr. Cohen serves as Co-Head of Equity (2018-present), a Director of Fidelity Management & Research (Japan) Limited (investment adviser firm, 2016-present), and is an employee of Fidelity Investments. Previously, Mr. Cohen served as Executive Vice President of Fidelity SelectCo, LLC (2019), Head of Global Equity Research (2016-2018), Chief Investment Officer - Equity and a Director of Fidelity Management & Research (U.K.) Inc. (investment adviser firm, 2013-2015) and as a Director of Fidelity Management & Research (Hong Kong) Limited (investment adviser firm, 2017).
Jonathan Davis (1968)
Year of Election or Appointment: 2010
Assistant Treasurer
Mr. Davis also serves as an officer of other funds. Mr. Davis serves as Assistant Treasurer of FIMM, LLC (2021-present), FMR Capital, Inc. (2017-present), FD Funds GP LLC (2021-present), FD Funds Holding LLC (2021-present), and FD Funds Management LLC (2021-present); and is an employee of Fidelity Investments. Previously, Mr. Davis served as Vice President and Associate General Counsel of FMR LLC (diversified financial services company, 2003-2010).
Laura M. Del Prato (1964)
Year of Election or Appointment: 2018
Assistant Treasurer
Ms. Del Prato also serves as an officer of other funds. Ms. Del Prato serves as Assistant Treasurer of FIMM, LLC (2021-present) and is an employee of Fidelity Investments (2017-present). Previously, Ms. Del Prato served as President and Treasurer of The North Carolina Capital Management Trust: Cash Portfolio and Term Portfolio (2018-2020). Prior to joining Fidelity Investments, Ms. Del Prato served as a Managing Director and Treasurer of the JPMorgan Mutual Funds (2014-2017). Prior to JPMorgan, Ms. Del Prato served as a partner at Cohen Fund Audit Services (accounting firm, 2012-2013) and KPMG LLP (accounting firm, 2004-2012).
Colm A. Hogan (1973)
Year of Election or Appointment: 2020
Assistant Treasurer
Mr. Hogan also serves as an officer of other funds. Mr. Hogan serves as Assistant Treasurer of FIMM, LLC (2021-present) and FMR Capital, Inc. (2017-present) and is an employee of Fidelity Investments (2005-present). Previously, Mr. Hogan served as Deputy Treasurer of certain Fidelity ® funds (2016-2020) and Assistant Treasurer of certain Fidelity ® funds (2016-2018).
Pamela R. Holding (1964)
Year of Election or Appointment: 2018
Vice President
Ms. Holding also serves as Vice President of other funds. Ms. Holding serves as Co-Head of Equity (2018-present) and is an employee of Fidelity Investments (2013-present). Previously, Ms. Holding served as Executive Vice President of Fidelity SelectCo, LLC (2019) and as Chief Investment Officer of Fidelity Institutional Asset Management (2013-2018).
Cynthia Lo Bessette (1969)
Year of Election or Appointment: 2019
Secretary and Chief Legal Officer (CLO)
Ms. Lo Bessette also serves as an officer of other funds. Ms. Lo Bessette serves as CLO, Secretary, and Senior Vice President of Fidelity Management & Research Company LLC (investment adviser firm, 2019-present); CLO of Fidelity Management & Research (Hong Kong) Limited, FMR Investment Management (UK) Limited, and Fidelity Management & Research (Japan) Limited (investment adviser firms, 2019-present); Secretary of FD Funds GP LLC (2021-present), FD Funds Holding LLC (2021-present), FD Funds Management LLC (2021-present), and Fidelity Diversifying Solutions LLC (investment adviser firm, 2022-present); and Assistant Secretary of FIMM, LLC (2019-present). She is a Senior Vice President and Deputy General Counsel of FMR LLC (diversified financial services company, 2019-present), and is an employee of Fidelity Investments. Previously, Ms. Lo Bessette served as CLO, Secretary, and Senior Vice President of FMR Co., Inc. (investment adviser firm, 2019); Secretary of Fidelity SelectCo, LLC and Fidelity Investments Money Management, Inc. (investment adviser firms, 2019). Prior to joining Fidelity Investments, Ms. Lo Bessette was Executive Vice President, General Counsel (2016-2019) and Senior Vice President, Deputy General Counsel (2015-2016) of OppenheimerFunds (investment management company) and Deputy Chief Legal Officer (2013-2015) of Jennison Associates LLC (investment adviser firm).
Chris Maher (1972)
Year of Election or Appointment: 2020
Deputy Treasurer
Mr. Maher also serves as an officer of other funds. Mr. Maher serves as Assistant Treasurer of FIMM, LLC (2021-present) and FMR Capital, Inc. (2017-present), and is an employee of Fidelity Investments (2008-present). Previously, Mr. Maher served as Assistant Treasurer of certain funds (2013-2020); Vice President of Asset Management Compliance (2013), Vice President of the Program Management Group of FMR (investment adviser firm, 2010-2013), and Vice President of Valuation Oversight (2008-2010).
Jason P. Pogorelec (1975)
Year of Election or Appointment: 2020
Chief Compliance Officer
Mr. Pogorelec also serves as Chief Compliance Officer of other funds. Mr. Pogorelec is a Senior Vice President of Asset Management Compliance for Fidelity Investments and is an employee of Fidelity Investments. Mr. Pogorelec serves as Compliance Officer of Fidelity Management & Research Company LLC (investment adviser firm, 2023-present). Previously, Mr. Pogorelec served as Vice President, Associate General Counsel for Fidelity Investments (2010-2020) and Assistant Secretary of certain Fidelity ® funds (2015-2020).
Brett Segaloff (1972)
Year of Election or Appointment: 2021
Anti-Money Laundering (AML) Officer
Mr. Segaloff also serves as an AML Officer of other funds and other related entities. He is Director, Anti-Money Laundering (2007-present) of FMR LLC (diversified financial services company) and is an employee of Fidelity Investments (1996-present).
Stacie M. Smith (1974)
Year of Election or Appointment: 2016
President and Treasurer
Ms. Smith also serves as an officer of other funds. Ms. Smith serves as Assistant Treasurer of FIMM, LLC (2021-present) and FMR Capital, Inc. (2017-present), is an employee of Fidelity Investments (2009-present), and has served in other fund officer roles. Prior to joining Fidelity Investments, Ms. Smith served as Senior Audit Manager of Ernst & Young LLP (accounting firm, 1996-2009). Previously, Ms. Smith served as Assistant Treasurer (2013-2019) and Deputy Treasurer (2013-2016) of certain Fidelity ® funds.
Jim Wegmann (1979)
Year of Election or Appointment: 2019
Assistant Treasurer
Mr. Wegmann also serves as an officer of other funds. Mr. Wegmann serves as Assistant Treasurer of FIMM, LLC (2021-present) and is an employee of Fidelity Investments (2011-present). Previously, Mr. Wegmann served as Assistant Treasurer of certain Fidelity ® funds (2019-2021).
As a shareholder, you incur two types of costs: (1) transaction costs, which may include sales charges (loads) on purchase payments or redemption proceeds, as applicable and (2) ongoing costs, which generally include management fees, distribution and/or service (12b-1) fees and other Fund expenses. This Example is intended to help you understand your ongoing costs (in dollars) of investing in a fund and to compare these costs with the ongoing costs of investing in other mutual funds.
| The Example is based on an investment of $1,000 invested at the beginning of the period and held for the entire period (August 1, 2022 to January 31, 2023). |
Actual Expenses
The first line of the accompanying table provides information about actual account values and actual expenses. You may use the information in this line, together with the amount you invested, to estimate the expenses that you paid over the period. Simply divide your account value by $1,000.00 (for example, an $8,600 account value divided by $1,000.00 = 8.6), then multiply the result by the number in the first line for a class/Fund under the heading entitled "Expenses Paid During Period" to estimate the expenses you paid on your account during this period. If any fund is a shareholder of any underlying mutual funds or exchange-traded funds (ETFs) (the Underlying Funds), such fund indirectly bears its proportional share of the expenses of the Underlying Funds in addition to the direct expenses incurred presented in the table. These fees and expenses are not included in the annualized expense ratio used to calculate the expense estimate in the table below.
Hypothetical Example for Comparison Purposes
The second line of the accompanying table provides information about hypothetical account values and hypothetical expenses based on the actual expense ratio and an assumed rate of return of 5% per year before expenses, which is not the actual return. The hypothetical account values and expenses may not be used to estimate the actual ending account balance or expenses you paid for the period. You may use this information to compare the ongoing costs of investing in the Fund and other funds. To do so, compare this 5% hypothetical example with the 5% hypothetical examples that appear in the shareholder reports of the other funds. If any fund is a shareholder of any Underlying Funds, such fund indirectly bears its proportional share of the expenses of the Underlying Funds in addition to the direct expenses as presented in the table. These fees and expenses are not included in the annualized expense ratio used to calculate the expense estimate in the table below.
Please note that the expenses shown in the table are meant to highlight your ongoing costs only and do not reflect any transaction costs. Therefore, the second line of the table is useful in comparing ongoing costs only, and will not help you determine the relative total costs of owning different funds. In addition, if these transactional costs were included, your costs would have been higher.
| | | | | Annualized Expense Ratio- A | | Beginning Account Value August 1, 2022 | | Ending Account Value January 31, 2023 | | Expenses Paid During Period- C August 1, 2022 to January 31, 2023 |
| | | | | | | | | | |
| Fidelity® Equity-Income K6 Fund | | | | .34% | | | | | | |
| Actual | | | | | | $ 1,000 | | $ 1,050.70 | | $ 1.76 |
Hypothetical- B | | | | | | $ 1,000 | | $ 1,023.49 | | $ 1.73 |
| |
A Annualized expense ratio reflects expenses net of applicable fee waivers.
B 5% return per year before expenses
C Expenses are equal to the annualized expense ratio, multiplied by the average account value over the period, multiplied by 184/ 365 (to reflect the one-half year period). The fees and expenses of any Underlying Funds are not included in each annualized expense ratio.
The dividend and capital gains distributions for the fund(s) are available on Fidelity.com or Institutional.Fidelity.com .
A total of 0.01% of the dividends distributed during the fiscal year were derived from interest on U.S. Government securities which is generally exempt from state income tax.
The fund designates $91,432 of distributions paid during the fiscal year ended 2023 as qualifying to be taxed as section 163(j) interest dividends.
The fund designates 90%, 93%, 94%, 94%, and 94% of the dividends distributed in March, April, July, October, and December, respectively during the fiscal year as qualifying for the dividends-received deduction for corporate shareholders.
The fund designates 100% of the dividends distributed in March, April, July, October, and December during the fiscal year as amounts which may be taken into account as a dividend for the purposes of the maximum rate under section 1(h)(11) of the Internal Revenue Code.
The fund will notify shareholders in January 2024 of amounts for use in preparing 2023 income tax returns.
The Securities and Exchange Commission adopted Rule 22e-4 under the Investment Company Act of 1940 (the Liquidity Rule) to promote effective liquidity risk management throughout the open-end investment company industry, thereby reducing the risk that funds will be unable to meet their redemption obligations and mitigating dilution of the interests of fund shareholders.
The Fund has adopted and implemented a liquidity risk management program (the Program) reasonably designed to assess and manage the Fund's liquidity risk and to comply with the requirements of the Liquidity Rule. The Fund's Board of Trustees (the Board) has designated the Fund's investment adviser as administrator of the Program. The Fidelity advisers have established a Liquidity Risk Management Committee (the LRM Committee) to manage the Program for each of the Fidelity Funds. The LRM Committee monitors the adequacy and effectiveness of implementation of the Program and on a periodic basis assesses each Fund's liquidity risk based on a variety of factors including (1) the Fund's investment strategy, (2) portfolio liquidity and cash flow projections during normal and reasonably foreseeable stressed conditions, (3) shareholder redemptions, (4) borrowings and other funding sources and (5) certain factors specific to ETFs including the effect of the Fund's prices and spreads, market participants, and basket compositions on the overall liquidity of the Fund's portfolio, as applicable.
In accordance with the Program, each of the Fund's portfolio investments is classified into one of four defined liquidity categories based on a determination of a reasonable expectation for how long it would take to convert the investment to cash (or sell or dispose of the investment) without significantly changing its market value.
- Highly liquid investments - cash or convertible to cash within three business days or less
- Moderately liquid investments - convertible to cash in three to seven calendar days
- Less liquid investments - can be sold or disposed of, but not settled, within seven calendar days
- Illiquid investments - cannot be sold or disposed of within seven calendar days
Liquidity classification determinations take into account a variety of factors including various market, trading and investment-specific considerations, as well as market depth, and generally utilize analysis from a third-party liquidity metrics service.
The Liquidity Rule places a 15% limit on a fund's illiquid investments and requires funds that do not primarily hold assets that are highly liquid investments to determine and maintain a minimum percentage of the fund's net assets to be invested in highly liquid investments (highly liquid investment minimum or HLIM). The Program includes provisions reasonably designed to comply with the 15% limit on illiquid investments and for determining, periodically reviewing and complying with the HLIM requirement as applicable.
At a recent meeting of the Fund's Board of Trustees, the LRM Committee provided a written report to the Board pertaining to the operation, adequacy, and effectiveness of the Program for the period December 1, 2021 through November 30, 2022. The report concluded that the Program is operating effectively and is reasonably designed to assess and manage the Fund's liquidity risk.
1.9893876.103
EQU-K6-ANN-0423
Item 2.
Code of Ethics
As of the end of the period, January 31, 2023, Fidelity Devonshire Trust (the trust) has adopted a code of ethics, as defined in Item 2 of Form N-CSR, that applies to its President and Treasurer and its Chief Financial Officer. A copy of the code of ethics is filed as an exhibit to this Form N-CSR.
Item 3.
Audit Committee Financial Expert
The Board of Trustees of the trust has determined that Donald F. Donahue is an audit committee financial expert, as defined in Item 3 of Form N-CSR. Mr. Donahue is independent for purposes of Item 3 of Form N-CSR.
Item 4.
Principal Accountant Fees and Services
Fees and Services
The following table presents fees billed by Deloitte & Touche LLP, the member firms of Deloitte Touche Tohmatsu, and their respective affiliates (collectively, “Deloitte Entities”) in each of the last two fiscal years for services rendered to Fidelity Equity-Income K6 Fund, Fidelity Mid Cap Value K6 Fund, Fidelity Series All-Sector Equity Fund and Fidelity Series Value Discovery Fund (the “Funds”):
Services Billed by Deloitte Entities
January 31, 2023 FeesA
| | | | |
| Audit Fees | Audit-Related Fees | Tax Fees | All Other Fees |
Fidelity Equity-Income K6 Fund | $45,800 | $- | $10,200 | $1,100 |
Fidelity Mid Cap Value K6 Fund | $35,700 | $- | $7,800 | $900 |
Fidelity Series All-Sector Equity Fund | $41,700 | $- | $8,100 | $1,000 |
Fidelity Series Value Discovery Fund | $43,100 | $- | $10,000 | $1,100 |
|
|
|
|
|
| | | | |
| Audit Fees | Audit-Related Fees | Tax Fees | All Other Fees |
Fidelity Equity-Income K6 Fund | $45,400 | $- | $9,700 | $1,000 |
Fidelity Mid Cap Value K6 Fund | $38,200 | $- | $7,500 | $800 |
Fidelity Series All-Sector Equity Fund | $41,400 | $- | $7,800 | $1,000 |
Fidelity Series Value Discovery Fund | $42,700 | $- | $9,300 | $1,000 |
|
|
|
|
|
A Amounts may reflect rounding
The following table presents fees billed by PricewaterhouseCoopers LLP (“PwC”) in each of the last two fiscal years for services rendered to Fidelity Equity-Income Fund, Fidelity Mid Cap Value Fund, Fidelity Series Stock Selector Large Cap Value Fund and Fidelity Stock Selector Large Cap Value Fund (the “Funds”):
Services Billed by PwC
January 31, 2023 FeesA
| | | | |
| Audit Fees | Audit-Related Fees | Tax Fees | All Other Fees |
Fidelity Equity-Income Fund | $63,000 | $5,000 | $18,200 | $1,700 |
Fidelity Mid Cap Value Fund | $45,000 | $3,800 | $10,000 | $1,300 |
Fidelity Series Stock Selector Large Cap Value Fund | $40,200 | $3,300 | $8,100 | $1,200 |
Fidelity Stock Selector Large Cap Value Fund | $44,700 | $3,800 | $8,400 | $1,300 |
|
|
|
|
|
| | | | |
| Audit Fees | Audit-Related Fees | Tax Fees | All Other Fees |
Fidelity Equity-Income Fund | $57,800 | $5,400 | $15,200 | $1,700 |
Fidelity Mid Cap Value Fund | $43,100 | $4,100 | $8,800 | $1,300 |
Fidelity Series Stock Selector Large Cap Value Fund | $37,700 | $3,600 | $7,200 | $1,200 |
Fidelity Stock Selector Large Cap Value Fund | $42,700 | $4,100 | $8,000 | $1,300 |
|
|
|
|
|
|
|
|
|
|
A Amounts may reflect rounding.
The following table(s) present(s) fees billed by Deloitte Entities and PwC that were required to be approved by the Audit Committee for services that relate directly to the operations and financial reporting of the Fund(s) and that are rendered on behalf of Fidelity Management & Research Company LLC ("FMR") and entities controlling, controlled by, or under common control with FMR (not including any sub-adviser whose role is primarily portfolio management and is subcontracted with or overseen by another investment adviser) that provide ongoing services to the Fund(s) (“Fund Service Providers”):
Services Billed by Deloitte Entities
| | |
| January 31, 2023A | January 31, 2022A |
Audit-Related Fees | $- | $- |
Tax Fees | $- | $- |
All Other Fees | $- | $- |
A Amounts may reflect rounding.
Services Billed by PwC
| | |
| January 31, 2023A | January 31, 2022A |
Audit-Related Fees | $7,914,600 | $8,239,800 |
Tax Fees | $1,000 | $354,200 |
All Other Fees | $- | $- |
A Amounts may reflect rounding.
“Audit-Related Fees” represent fees billed for assurance and related services that are reasonably related to the performance of the fund audit or the review of the fund's financial statements and that are not reported under Audit Fees.
“Tax Fees” represent fees billed for tax compliance, tax advice or tax planning that relate directly to the operations and financial reporting of the fund.
“All Other Fees” represent fees billed for services provided to the fund or Fund Service Provider, a significant portion of which are assurance related, that relate directly to the operations and financial reporting of the fund, excluding those services that are reported under Audit Fees, Audit-Related Fees or Tax Fees.
Assurance services must be performed by an independent public accountant.
* * *
The aggregate non-audit fees billed by Deloitte Entities and PwC for services rendered to the Fund(s), FMR (not including any sub-adviser whose role is primarily portfolio management and is subcontracted with or overseen by another investment adviser), and any Fund Service Provider for each of the last two fiscal years of the Fund(s) are as follows:
| | |
Billed By | January 31, 2023A | January 31, 2022A |
Deloitte Entities | $498,500 | $567,600 |
PwC | $12,949,100 | $13,898,600 |
|
|
|
A Amounts may reflect rounding.
The trust's Audit Committee has considered non-audit services that were not pre-approved that were provided by Deloitte Entities and PwC to Fund Service Providers to be compatible with maintaining the independence of Deloitte Entities and PwC in its(their) audit of the Fund(s), taking into account representations from Deloitte Entities and PwC, in accordance with Public Company Accounting Oversight Board rules, regarding its independence from the Fund(s) and its(their) related entities and FMR’s review of the appropriateness and permissibility under applicable law of such non-audit services prior to their provision to the Fund(s) Service Providers.
Audit Committee Pre-Approval Policies and Procedures
The trust’s Audit Committee must pre-approve all audit and non-audit services provided by a fund’s independent registered public accounting firm relating to the operations or financial reporting of the fund. Prior to the commencement of any audit or non-audit services to a fund, the Audit Committee reviews the services to determine whether they are appropriate and permissible under applicable law.
The Audit Committee has adopted policies and procedures to, among other purposes, provide a framework for the Committee’s consideration of non-audit services by the audit firms that audit the Fidelity funds. The policies and procedures require that any non-audit service provided by a fund audit firm to a Fidelity fund and any non-audit service provided by a fund auditor to a Fund Service Provider that relates directly to the
operations and financial reporting of a Fidelity fund (“Covered Service”) are subject to approval by the Audit Committee before such service is provided.
All Covered Services must be approved in advance of provision of the service either: (i) by formal resolution of the Audit Committee, or (ii) by oral or written approval of the service by the Chair of the Audit Committee (or if the Chair is unavailable, such other member of the Audit Committee as may be designated by the Chair to act in the Chair’s absence). The approval contemplated by (ii) above is permitted where the Treasurer determines that action on such an engagement is necessary before the next meeting of the Audit Committee.
Non-audit services provided by a fund audit firm to a Fund Service Provider that do not relate directly to the operations and financial reporting of a Fidelity fund are reported to the Audit Committee periodically.
Non-Audit Services Approved Pursuant to Rule 2-01(c)(7)(i)(C) and (ii) of Regulation S-X (“De Minimis Exception”)
There were no non-audit services approved or required to be approved by the Audit Committee pursuant to the De Minimis Exception during the Fund’s(s’) last two fiscal years relating to services provided to (i) the Fund(s) or (ii) any Fund Service Provider that relate directly to the operations and financial reporting of the Fund(s).
Item 5.
Audit Committee of Listed Registrants
Not applicable.
Item 6.
Investments
(a)
Not applicable.
(b)
Not applicable.
Item 7.
Disclosure of Proxy Voting Policies and Procedures for Closed-End Management Investment Companies
Not applicable.
Item 8.
Portfolio Managers of Closed-End Management Investment Companies
Not applicable.
Item 9.
Purchase of Equity Securities by Closed-End Management Investment Company and Affiliated Purchasers
Not applicable.
Item 10.
Submission of Matters to a Vote of Security Holders
There were no material changes to the procedures by which shareholders may recommend nominees to the trust’s Board of Trustees.
Item 11.
Controls and Procedures
(a)(i) The President and Treasurer and the Chief Financial Officer have concluded that the trust’s disclosure controls and procedures (as defined in Rule 30a-3(c) under the Investment Company Act) provide reasonable assurances that material information relating to the trust is made known to them by the appropriate persons, based on their evaluation of these controls and procedures as of a date within 90 days of the filing date of this report.
(a)(ii) There was no change in the trust’s internal control over financial reporting (as defined in Rule 30a-3(d) under the Investment Company Act) that occurred during the period covered by this report that has materially affected, or is reasonably likely to materially affect, the trust’s internal control over financial reporting.
Item 12.
Disclosure of Securities Lending Activities for Closed-End Management
Investment Companies
Not applicable.
Item 13.
Exhibits
SIGNATURES
Pursuant to the requirements of the Securities Exchange Act of 1934 and the Investment Company Act of 1940, the registrant has duly caused this report to be signed on its behalf by the undersigned, thereunto duly authorized.
Fidelity Devonshire Trust
| |
By: | /s/Stacie M. Smith |
| Stacie M. Smith |
| President and Treasurer |
|
|
Date: | March 23, 2023 |
Pursuant to the requirements of the Securities Exchange Act of 1934 and the Investment Company Act of 1940, this report has been signed below by the following persons on behalf of the registrant and in the capacities and on the dates indicated.
| |
By: | /s/Stacie M. Smith |
| Stacie M. Smith |
| President and Treasurer |
|
|
Date: | March 23, 2023 |
| |
By: | /s/John J. Burke III |
| John J. Burke III |
| Chief Financial Officer |
|
|
Date: | March 23, 2023 |